UNITED STATES
SECURITIES AND EXCHANGE COMMISSION
Washington, D.C. 20549
Form N-CSR
CERTIFIED SHAREHOLDER REPORT OF
REGISTERED MANAGEMENT INVESTMENT COMPANIES
Investment Company Act file number: 811-08895
Voya Funds Trust
(Exact name of registrant as specified in charter)
| 7337 East Doubletree Ranch Road, Suite 100, Scottsdale, AZ | 85258 |
| (Address of principal executive offices) | (Zip code) |
The Corporation Trust Company, 1209 Orange Street, Wilmington, DE 19801
(Name and address of agent for service)
Registrant’s telephone number, including area code: 1-800-992-0180
Date of fiscal year end: March 31
Date of reporting period: March 31, 2024
Item 1. Reports to Stockholders.
(a) The following is a copy of the report transmitted to stockholders pursuant to Rule 30e-1 under the Act (17 CFR 270.30e-1):

Annual Report
March 31, 2024
Classes A, C, I, R, R6 and W
Fixed-Income Funds
| ◼ | Voya GNMA Income Fund | ◼ | Voya Short Duration High Income Fund |
| ◼ | Voya High Yield Bond Fund | ◼ | Voya Short Term Bond Fund |
| ◼ | Voya Intermediate Bond Fund | ◼ | Voya Strategic Income Opportunities Fund |
Effective January 24, 2023, the U.S. Securities and Exchange Commission adopted rule and form amendments to require mutual funds to transmit concise and visually engaging streamlined annual and semi-annual reports to shareholders that highlight key information deemed important for investors to assess and monitor their fund investments. Other information, including financial statements, will no longer appear in the funds’ streamlined shareholder reports but must be available online, delivered free of charge upon request, and filed on a semi-annual basis on Form N-CSR. The rule and form amendments have a compliance date of July 24, 2024.
This report is submitted for general information to shareholders of the Voya mutual funds. It is not authorized for distribution to prospective shareholders unless accompanied or preceded by a prospectus which includes details regarding the funds’ investment objectives, risks, charges, expenses and other information. This information should be read carefully.
| |  | E-Delivery Sign-up – details inside |
INVESTMENT MANAGEMENT voyainvestments.com |  |
TABLE OF CONTENTS
| Go Paperless with E-Delivery! | |
Sign up now for on-line prospectuses, fund reports, and proxy statements. Just go to individuals.voya.com/page/e-delivery, follow the directions and complete the quick 5 Steps to Enroll. You will be notified by e-mail when these communications become available on the internet. |
PROXY VOTING INFORMATION
A description of the policies and procedures that the Funds use to determine how to vote proxies related to portfolio securities is available: (1) without charge, upon request, by calling Shareholder Services toll-free at (800) 992-0180; (2) on the Funds’ website at www.voyainvestments.com; and (3) on the U.S. Securities and Exchange Commission’s (“SEC’s”) website at www.sec.gov. Information regarding how the Funds voted proxies related to portfolio securities during the most recent 12-month period ended June 30 is available without charge on the Funds’ website at www.voyainvestments.com and on the SEC’s website at www.sec.gov.
QUARTERLY PORTFOLIO HOLDINGS
The Funds file their complete schedule of portfolio holdings with the SEC for the first and third quarters of each fiscal year on Form NPORT-P. The Funds’ Forms NPORT-P are available on the SEC’s website at www.sec.gov. Each Fund’s complete schedule of portfolio holdings is available at: www.voyainvestments.com and without charge upon request from the Fund by calling Shareholder Services toll-free at (800) 992-0180.
Benchmark Descriptions
| Index | Description |
| ICE BofAML U.S. Dollar 3-Month Deposit Offered Rate Constant Maturity Index | The index is designed to track the performance of a synthetic asset paying London Interbank Offered Rate (“LIBOR”) to a stated maturity. The index is based on the assumed purchase at par of a synthetic instrument having exactly its stated maturity and with a coupon equal to that day’s fixing rate. That issue is assumed to be sold the following business day (priced at a yield equal to the current day rate) and rolled into a new instrument. |
| ICE BofA 1-3 Year U.S. Treasury Index | The index is an unmanaged index that tracks the performance of the direct sovereign debt of the U.S. Government having a maturity of at least one year and less than three years. |
| ICE BofA 1-3 Year BB U.S. Cash Pay High Yield Index | The index is a subset of ICE BofA U.S. Cash Pay High Yield Index including all securities with a remaining term to final maturity of less than 3 years and rated BB1 through BB3, inclusive. The index tracks the performance of US dollar denominated below investment grade corporate debt, currently in a coupon paying period, that is publicly issued in US domestic market. |
| Bloomberg GNMA Index | An index comprised of all fixed security mortgage pools sponsored by GNMA, including GNMA Graduated Payment Mortgages. |
| Bloomberg High Yield Bond — 2% Issuer Constrained Composite Index | An index that includes all fixed income securities having a maximum quality rating of Ba1, a minimum amount outstanding of $150 million, and at least one year to maturity. |
| Bloomberg U.S. 1-3 Year Government/Credit Bond Index | A widely recognized index of publicly issued fixed rate, investment grade debt securities, including Treasuries, Agencies and credit securities with a maturity of one to three years. |
| Bloomberg U.S. Aggregate Bond Index | An index of publicly issued investment grade U.S. government, mortgage-backed, asset-backed and corporate debt securities. |
| Bloomberg U.S. Universal Bond Index | The index represents the union of the U.S. Aggregate Index, U.S. Corporate High Yield Index, Investment Grade 144A Index, Eurodollar Index, U.S. Emerging Markets Index, and the non-ERISA eligible portion of the CMBS Index. The index covers USD-denominated, taxable bonds that are rated either investment grade or high-yield. |
| Voya GNMA Income Fund | Portfolio Managers’ Report |
Voya GNMA Income Fund (the “Fund”) seeks a high level of current income consistent with liquidity and safety of principal through investment primarily in Government National Mortgage Association (“GNMA”) mortgage-backed securities (also known as GNMA Certificates) that are guaranteed as to the timely payment of principal and interest by the U.S. government. The Fund is managed by Jeff Dutra and Justin McWhorter, Portfolio Managers of Voya Investment Management Co. LLC — the Sub- Adviser.
Securities issued by the U.S. Treasury are backed by the full faith and credit of the federal government. Securities issued by individual agencies and organizations may be backed by the full faith and credit of the federal government as to principal or interest but are not direct obligations of the U.S. Treasury. Securities of some agencies and organizations are backed solely by the entity’s own resources or by the ability of the entity to borrow from the U.S. Treasury. Government securities also include certain mortgage-related securities that are sponsored by a U.S. government agency or organization and are not direct obligations of the U.S. government.
Investment Type Allocation
as of March 31, 2024
(as a percentage of net assets)
| U.S. Government Agency Obligations | 77.5% | |
| Collateralized Mortgage Obligations | 42.8% | |
| Commercial Mortgage-Backed Securities | 3.0% | |
| Asset-Backed Securities | 0.1% | |
| Liabilities in Excess of Other Assets* | (23.4)% | |
| Net Assets | 100.0% | |
* Includes short-term investments.
Portfolio holdings are subject to change daily.
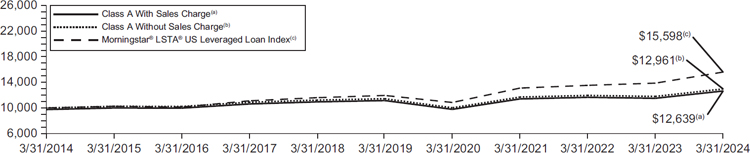
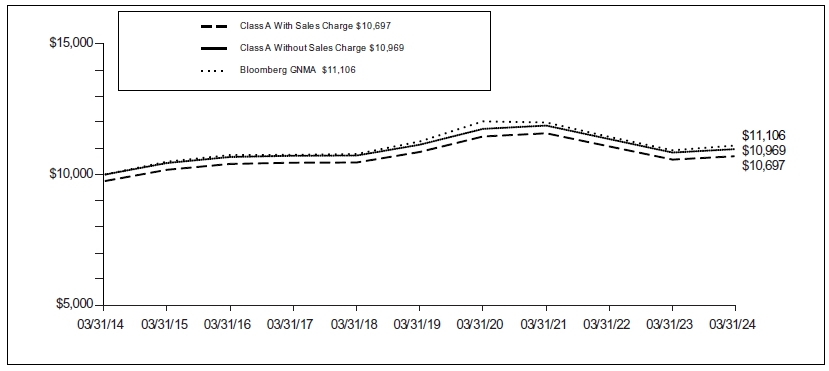
Performance: For the year ended March 31, 2024, the Fund’s Class A shares, excluding sales charges, provided a total return of 1.20%, compared to the Bloomberg GNMA Index (the “Index” or “Bloomberg GNMA”), which returned 1.65%, for the same period.
Portfolio Specifics: Excess performance of the Fund was largely driven by off-benchmark collateralized mortgage obligation (“CMO”) holdings. Detraction came in the form of duration exposure.
The NAV of the Fund decreased roughly 3.3%, driven primarily by price depreciation into the rate sell-off.
The Fund uses Treasury futures to hedge exposure to interest rate risk. The Fund had a mild overweight to duration for most of the year and the positioning detracted 0.35% for the fiscal year.
Current Strategy and Outlook: The landscape for agency mortgage-backed securities (“MBS”) and the U.S. housing market changed significantly in 2023. On a national level, home prices have been steadily increasing on a seasonally adjusted basis. While this trend offers a tailwind for home-owner equity, elevated interest-rate levels are keeping a lid on the level of cashout-refinancings. Currently, roughly 97% of the mortgage universe has no economic rate incentive to refinance according to Morgan Stanley’s Total Refinancable Index. Additionally, the combination of worsening housing affordability and declining housing inventory has led to lower turnover speeds. These factors combined have caused historically low prepayment speeds and very low organic net supply.
Monetary policy backdrop evolved from the previous year as the U.S. Federal Reserve finished its tightening campaign aimed at reducing inflation and is expecting three rate cuts in 2024 as of this writing. Since March of last year, the Fed has increased the Fed funds rate by 0.50% and interest rate curve has remained inverted throughout the year as measured by the spread between 2-year and 10-year Treasury rate. As of March 28, 2024, the difference between 2-year and 10-year rate is inverted by 42 basis points.
Going forward, the Fed will likely be data dependent when determining the timeline of easing monetary policy. Risk remains that inflation will continue to be elevated if both the labor market and economy runs hotter than expected. Our base case is that Treasury and mortgage rates should stabilize and rate volatility should decline as higher rates exert a cooling effect on the market. From a technical factors perspective, Banks’ demand for mortgage is linked to regulatory changes and interest rate curve. Until there’s more clarity for the Basel overhaul and a steeper curve, banks are unlikely to net add mortgages in size, in our view. However, we believe some banks might start selling lower coupon mortgages and rotate to higher coupon as recently produced mortgages increase yields and optimize balance sheets. From a fundamental factors perspective, the rate rally towards the end of 2023 led to faster than expected prepayment speed in newly issued, premium Veterans Affairs (VA) loans which was witnessed in early 2024 prepayment speeds on some GNMA pools. Otherwise, most prepayment speeds remain docile.
With the influences mentioned above, the Fund will continue to monitor changing trends in purchases and refinances and analyze how borrowers react to these changes.
| Portfolio Managers’ Report | Voya GNMA Income Fund |
The views expressed in this commentary are informed opinions. They should not be considered promises or advice. The views expressed reflect those of the portfolio managers, only through the end of the period as stated on the cover. The portfolio managers’ views are subject to change at any time based on market and other conditions.
Portfolio holdings and characteristics are subject to change and may not be representative of current holdings and characteristics. Fund holdings are subject to change daily. The outlook for this Fund may differ from that presented for other Voya mutual funds. The Fund’s performance returns shown reflect applicable fee waivers and/or expense limits in effect during this period. This report contains statements that may be “forward-looking” statements. Actual results may differ materially from those projected in the “forward-looking” statement. Absent such fee waivers/expense limitations, if any, performance would have been lower. Performance for the different classes of shares will vary based on differences in fees associated with each class.
| Voya GNMA Income Fund | Portfolio Managers’ Report |
| Average Annual Total Returns for the Periods Ended March 31, 2024 |
| 1 Year | 5 Year | 10 Year |
| Including Sales Charge: | | | |
| Class A(1) | -1.31% | -0.80% | 0.68% |
| Class C(2) | -0.53% | -1.04% | 0.33% |
| Class I | 1.39% | — | 1.23% |
| Class R6(3) | 1.44% | — | 1.23% |
| Class W | 1.34% | -0.05% | 1.19% |
| Excluding Sales Charge: | | | |
| Class A | 1.20% | -0.31% | 0.93% |
| Class C | 0.44% | -1.04% | 0.33% |
| Class I | 1.39% | — | 1.23% |
| Class R6(3) | 1.44% | — | 1.23% |
| Class W | 1.34% | -0.05% | 1.19% |
| Bloomberg GNMA | 1.65% | -0.28% | 1.05% |
Based on a $10,000 initial investment, the graph and table above illustrate the total return of Voya GNMA Income Fund against the index indicated. The index is unmanaged, has no cash in its portfolio and imposes no sales charges. An investor cannot invest directly in an index.
The Fund’s performance is shown both with and without the imposition of sales charges.
The performance graph and table do not reflect the deduction of taxes that a shareholder will pay on Fund distributions or the redemption of Fund shares.
The performance shown includes, if applicable, the effect of fee waivers and/or expense reimbursements by the Investment Adviser and/or other service providers, which have the effect of increasing total return. Had all fees and expenses been considered, the total returns would have been lower.
Performance data represents past performance and is no assurance of future results. Investment return and principal value of an investment in the Fund will fluctuate. Shares, when sold, may be worth more or less than their original cost. The Fund’s current performance may be lower or higher than the performance data shown. Please log on to www.voyainvestments.com or call (800) 992-0180 to get performance through the most recent month end.
Fund holdings are subject to change daily.
| (1) | Reflects deduction of the maximum Class A sales charge of 2.50%. |
| (2) | Reflects deduction of the Class C deferred sales charge of 1% for the 1 year return. Class C shares automatically convert to Class A shares after eight years. Class C shares’ performance for the periods exceeding eight years include the first eight years of Class C share performance and Class A share performance thereafter. |
| (3) | Class R6 incepted on July 31, 2020. Class R6 shares performance shown for the period prior to their inception date is the performance of Class I shares without adjustment for any differences in the expenses between the two classes. If adjusted for such differences, returns would be different. |
| Portfolio Managers’ Report | Voya High Yield Bond Fund |
Voya High Yield Bond Fund (the “Fund”) seeks to provide investors with a high level of current income and total return. The Fund is managed by Mohamed Basma, CFA and Randall Parrish, CFA, Portfolio Managers* of Voya Investment Management Co. LLC — the Sub-Adviser.
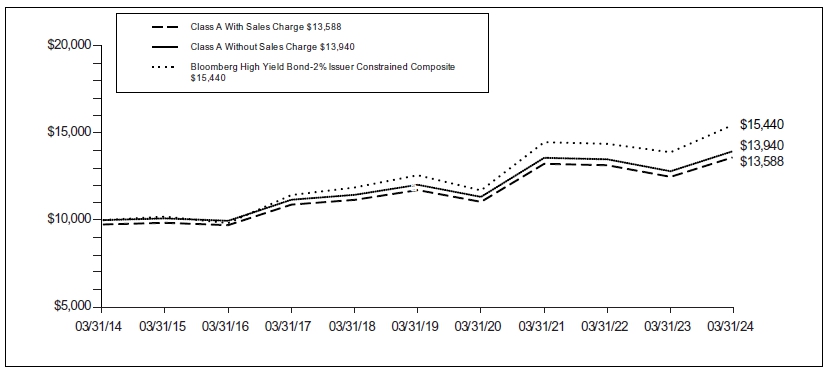
Performance: For the year ended March 31, 2024, the Fund’s Class A shares, excluding sales charges, provided a total return of 8.89%, compared to the Bloomberg High Yield Bond — 2% Issuer Constrained Composite Index (the “Index” or “Bloomberg High Yield Bond — 2% Issuer Constrained Composite”), which returned 11.15%, for the same period.
Investment Type Allocation
as of March 31, 2024
(as a percentage of net assets)
| Corporate Bonds/Notes | 93.6% | |
| Bank Loans | 2.3% | |
| Assets in Excess of Other Liabilities* | 4.1% | |
| Net Assets | 100.0% | |
| | | |
| * | Includes short-term investments. | | |
Portfolio holdings are subject to change daily.
Portfolio specifics: Despite initial concerns of a U.S. recession, risk assets performed well during the fiscal period on the back of strong economic growth and a healthy labor market, while inflationary pressures eased. A key driver was strong fiscal support that helped counteract monetary policy effects, residual consumer strength and steady corporate earnings. As a result, investor sentiment was underpinned by soft-landing optimism and a growing view that the U.S. Federal Reserve would begin cutting rates in the near term. The positive backdrop was constructive for high yield, as spreads moved tighter during the period, with the option-adjusted spread of the Bloomberg U.S. High Yield 2% Issuer Constrained Index tightening by 158 basis points (“bp”) to 299 bp. On a quality basis, risk appetite was strong, with lower-quality segments outperforming for the period. BB-, B- and CCC-rated bonds delivered respective returns of 9.08%, 11.46% and 16.63%.
Within the Fund, security selection detracted from relative performance. Specifically, the main negative driver was security selection within retailers, primarily due to the avoidance of Carvana (which recovered from distressed levels) and an overweight allocation to Victoria’s Secret. Additional headwinds included security selection within healthcare and pharmaceuticals and industrials. In contrast, building materials was a contributor, as both security selection and our overweight allocation added to performance. Specifically, within this sector, the Fund benefited from an overweight to SRS Distribution and Interface. Additional contributions included security selection in leisure and financials.
Current strategy and outlook: In our opinion, the macro outlook remains supportive, as solid economic growth should continue to underpin corporate fundamental factors. While the Fed’s hiking cycle is done, the first rate cut remains a source of debate. With inflation surprising to the upside recently, along with continued strength in economic data, the Fed’s case to remain patient on rate cuts has been bolstered. However, we believe their data-dependent stance will provide flexibility in adjusting policy measures in response to evolving economic conditions, ensuring a balanced approach to supporting economic growth while addressing inflation concerns. Market technical factors in high yield remain favorable as supply has continued to underwhelm, while demand has been supported by attractive all-in yields and strong equity market performance. However, spreads remain at tight levels, skewing outcomes negatively in the event of any surprises.
Top Ten Holdings
as of March 31, 2024*
(as a percentage of net assets)
| Royal Caribbean Cruises Ltd., 5.375%, 07/15/27 | 0.9% |
| Sirius XM Radio, Inc., 5.000%, 08/01/27 | 0.8% |
| Cloud Software Group, Inc., 6.500%, 03/31/29 | 0.7% |
| Hub International Ltd., 8.840%, 06/20/30 | 0.6% |
| Viking Cruises Ltd., 5.875%, 09/15/27 | 0.6% |
| Allied Universal Holdco LLC/Allied Universal Finance Corp./Atlas Luxco 4 Sarl, 4.625%, 06/01/28 | 0.5% |
| Scripps Escrow, Inc., 5.875%, 07/15/27 | 0.5% |
| DISH Network Corp., 11.750%, 11/15/27 | 0.5% |
| Virgin Media Vendor Financing Notes IV DAC, 5.000%, 07/15/28 | 0.5% |
| Carnival Corp., 6.000%, 05/01/29 | 0.5% |
| | * Excludes short-term investments. | |
Portfolio holdings are subject to change daily.
In sector positioning, we remain positive on the healthcare space given higher utilization rates and easing labor cost, and the energy sector which continues to benefit from firm commodity prices. However, we are less constructive on global cyclicals as a whole given still muted recovery from China and Europe. Furthermore, we maintain a cautious stance in industries that continue to face secular challenges, such as media and cable. From a ratings perspective, we are slightly overweight to B-rated bonds, while modestly underweight in BB- and CCC- rated securities. Single-name risk continues to be a key focus of ours, as dispersion remains elevated.
| Voya High Yield Bond Fund | Portfolio Managers’ Report |
* Effective May 1, 2023, Mohamed Basma, CFA was added as a portfolio manager for the Fund and Richard Cumberledge, CFA was removed as a portfolio manager for the Fund.
The views expressed in this commentary are informed opinions. They should not be considered promises or advice. The views expressed reflect those of the portfolio managers, only through the end of the period as stated on the cover. The portfolio managers’ views are subject to change at any time based on market and other conditions.
Portfolio holdings and characteristics are subject to change and may not be representative of current holdings and characteristics. Fund holdings are subject to change daily. The outlook for this Fund may differ from that presented for other Voya mutual funds. The Fund’s performance returns shown reflect applicable fee waivers and/or expense limits in effect during this period. This report contains statements that may be “forward-looking” statements. Actual results may differ materially from those projected in the “forward-looking” statement. Absent such fee waivers/expense limitations, if any, performance would have been lower. Performance for the different classes of shares will vary based on differences in fees associated with each class.
| Portfolio Managers’ Report | Voya High Yield Bond Fund |
| Average Annual Total Returns for the Periods Ended March 31, 2024 |
| 1 Year | 5 Year | 10 Year |
| Including Sales Charge: | | | |
| Class A(1) | 6.21% | 2.49% | 3.11% |
| Class C(2) | 7.08% | 2.21% | 2.76% |
| Class I | 9.28% | 3.34% | 3.74% |
| Class R | 8.62% | 2.73% | 3.14% |
| Class R6(3) | 9.34% | 3.41% | 3.70% |
| Class W | 9.16% | 3.28% | 3.65% |
| Excluding Sales Charge: | | | |
| Class A | 8.89% | 3.00% | 3.38% |
| Class C | 8.08% | 2.21% | 2.76% |
| Class I | 9.28% | 3.34% | 3.74% |
| Class R | 8.62% | 2.73% | 3.14% |
| Class R6(3) | 9.34% | 3.41% | 3.70% |
| Class W | 9.16% | 3.28% | 3.65% |
| Bloomberg High Yield Bond-2% Issuer Constrained Composite | 11.15% | 4.19% | 4.44% |
Based on a $10,000 initial investment, the graph and table above illustrate the total return of Voya High Yield Bond Fund against the index indicated. The index is unmanaged, has no cash in its portfolio and imposes no sales charges. An investor cannot invest directly in an index.
The Fund’s performance is shown both with and without the imposition of sales charges.
The performance graph and table do not reflect the deduction of taxes that a shareholder will pay on Fund distributions or the redemption of Fund shares.
The performance shown includes, if applicable, the effect of fee waivers and/or expense reimbursements by the Investment Adviser and/or other service providers, which have the effect of increasing total return. Had all fees and expenses been considered, the total returns would have been lower.
Performance data represents past performance and is no assurance of future results. Investment return and principal value of an investment in the Fund will fluctuate. Shares, when sold, may be worth more or less than their original cost. The Fund’s current performance may be lower or higher than the performance data shown. Please log on to www.voyainvestments.com or call (800) 992-0180 to get performance through the most recent month end.
Fund holdings are subject to change daily.
| (1) | Reflects deduction of the maximum Class A sales charge of 2.50%. |
| (2) | Reflects deduction of the Class C deferred sales charge of 1% for the 1 year return. Class C shares automatically convert to Class A shares after eight years. Class C shares’ performance for the periods exceeding eight years include the first eight years of Class C share performance and Class A share performance thereafter. |
| (3) | Class R6 incepted on August 3, 2016. The Class R6 shares performance shown for the period prior to their inception date is the performance of Class A shares without adjustment for any differences in the expenses between the two classes. If adjusted for such differences, returns would be different. |
| Voya Intermediate Bond Fund | Portfolio Managers' Report |
Voya Intermediate Bond Fund (the “Fund”) seeks to maximize total return through income and capital appreciation. The Fund is managed by Eric Stein, CFA, Randall Parrish, CFA, David Goodson, and Sean Banai, CFA, Portfolio Managers* of Voya Investment Management Co. LLC — the Sub-Adviser.
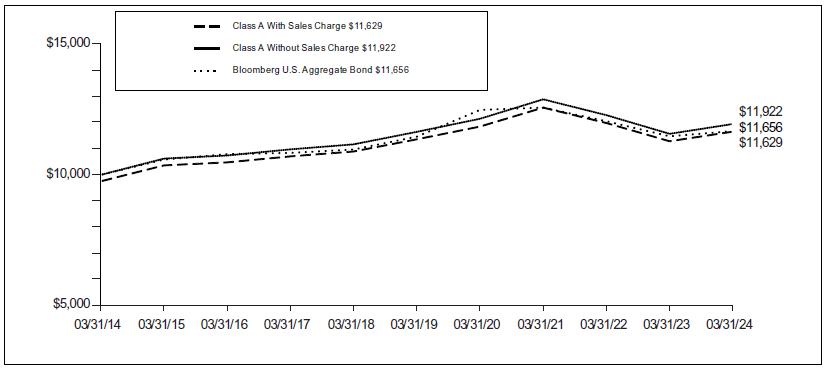
Performance: For the year ended March 31, 2024, the Fund’s Class A shares, excluding sales charges, provided a total return of 3.17% compared to the Bloomberg U.S. Aggregate Bond Index (the “Index” or “Bloomberg U.S. Aggregate Bond”), which returned 1.70% for the same period.
Investment Type Allocation
as of March 31, 2024
(as a percentage of net assets)
| Corporate Bonds/Notes | 31.3% | |
| U.S. Government Agency Obligations | 20.3% | |
| Collateralized Mortgage Obligations | 15.5% | |
| Asset-Backed Securities | 12.7% | |
| U.S. Treasury Obligations | 12.2% | |
| Commercial Mortgage-Backed Securities | 7.4% | |
| Sovereign Bonds | 0.7% | |
| Purchased Options | 0.0% | |
| Liabilities in Excess of Other Assets* | (0.1)% | |
| Net Assets | 100.0% | |
* Includes short-term investments.
Portfolio holdings are subject to change daily.
Portfolio Specifics: Trailing 12-month performance for bonds, as measured by the Bloomberg Aggregate, was positive, with a wild ride along the way. Global bond yields continued to march higher into early fourth quarter 2023, with the U.S. Treasury market leading the way. The U.S. 10-year yield crested above 5% in mid-October as stronger U.S. data sparked concerns on the need for higher rates for longer. The bond market then posted a massive rally in the final two months of 2023, as declines in inflation, a softer labor market and comments from the U.S. Federal Reserve indicating rate hikes were done sparked a rally not witnessed in years. Some of this enthusiasm was unwound in the first quarter of 2024, as a resilient labor market and a pause in downward inflation momentum challenged the market’s optimistic view for the timeline of Fed rate cuts. While higher interest rates and bond volatility were challenges for non-government sectors, they proved to be buying opportunities. Corporate sectors including high yield (“HY”) and investment grade (“IG”) outpaced most securitized sectors. While securitized outperformed, lingering concerns on commercial real estate (“CRE”) and persistent rate volatility were challenges.
Security selection added for the period. The largest source of performance contribution for the Fund came from security selection. The most notable contributions came from agency residential mortgage-backed securities (“RMBS”) that included collateralized mortgage obligations (CMO) and other non-standard pools. Asset-backed securities (“ABS”) also contributed which captures our investments in higher yielding collateralized loan obligations (“CLOs”). IG corporates also added where our preference for BBB rated issuers and limited exposure to regional banks supported performance.
Sector allocations, in aggregate, also added. While the rate volatility created episodic sell-offs, holding on to risk over the last 12 months contributed, as underweights in U.S. Treasuries in favor of non-government sectors added to performance. Allocations to non-agency RMBS and credit risk transfer (“CRTs”) added the most, supported by the strength of the U.S. housing market, a resilient economy and U.S. consumer. Allocations to HY, while modest, also added nicely as economic momentum and strength across capital markets fueled the sector’s outperformance. Meanwhile, allocations to agency RMBS were a modest detractor from performance as the sector struggled amidst ongoing rate volatility and allocations.
Top Ten Holdings
as of March 31, 2024*
(as a percentage of net assets)
| United States Treasury Bonds, 4.500%, 02/15/44 | 3.4% |
| United States Treasury Notes, 4.250%, 03/15/27 | 2.2% |
| Uniform Mortgage-Backed Securities, 2.500%, 02/01/52 | 1.4% |
| United States Treasury Notes, 4.500%, 03/31/26 | 1.3% |
| United States Treasury Notes, 4.250%, 03/31/29 | 1.1% |
| Ginnie Mae, 4.500%, 07/20/53 | 1.1% |
| Uniform Mortgage-Backed Securities, 2.000%, 02/01/52 | 1.1% |
| Uniform Mortgage-Backed Securities, 3.000%, 05/01/52 | 0.7% |
| United States Treasury Notes, 4.000%, 02/15/34 | 0.7% |
| United States Treasury Notes, 4.250%, 02/28/31 | 0.7% |
* Excludes short-term investments.
Portfolio holdings are subject to change daily.
Duration and yield curve positioning detracted from performance. The Fund’s yield curve positioning and the convexity profile weighed on performance as rate volatility remained elevated throughout the reporting period, while positive security selection within U.S. Treasuries which reflects our overall strategy helped to offset this impact.
The Fund primarily used futures and swaps for cash management purposes. The use of derivatives had a negative impact on performance during the reporting period.
Current Strategy and Outlook: While the Fed’s hiking cycle is done, the first rate cut remains a source of debate. Looking ahead, we expect economic growth in the United States to slow from 2023, but continue to grow close to trend levels, supported by robust consumer spending as real income and the wealth effect bolster economic activity. Meanwhile, we expect inflation to stabilize above the Fed's target, due to the slowing disinflationary trends in the goods sector and continued stickiness in the 1.1% services sector, the latter of which has been a product of a tight labor market. We are seeing early signs of softness in the labor market, notably a decline in the quits rate. We expect wage growth to moderate, which would also be a positive for inflation. With this backdrop, along with recent
| Portfolio Managers’ Report | Voya Intermediate Bond Fund |
strength in economic data, the Fed’s case to remain patient on rate cuts has been bolstered. However, the Fed's data-dependent stance will provide flexibility in adjusting policy measures in response to evolving economic conditions, ensuring a balanced approach to supporting economic growth while addressing inflation concerns.
While spreads for many sectors appear tight, all-in yields remain historically attractive which, in our view, allows investors to capture high quality yield without overstretching into risk. Corporate bonds illustrate this dynamic, where spreads are tight but nominal yields are enticing yield-based buyers and fundamental factors can continue to support the sector. Agency MBS valuations remain appealing given muted prepayment risk and the headwind of Fed rate hikes behind us. The outlook for non-agency RMBS is also positive as fundamental factors continue to support risk-taking in this sector. CMBS continues to exhibit cheap valuations, offering the most compelling relative value compared to other fixed income sectors. Moreover, outside of the office property type, fundamental factors in CRE are showing early signs of improvement. The additional cushion provided by higher nominal rates compels us to lean into higher-quality spread opportunities and remain underweight in U.S. Treasuries. We will continue to monitor market developments, assess sector fundamental factors and stay attuned to macroeconomic trends to capitalize on opportunities in this dynamic and evolving market environment.
_________
*Effective May 1, 2024, Matt Toms, CFA will no longer serve as a portfolio manager to the Fund and Eric Stein, CFA will be added as a portfolio manager for the Fund.
The views expressed in this commentary are informed opinions. They should not be considered promises or advice. The views expressed reflect those of the portfolio managers, only through the end of the period as stated on the cover. The portfolio managers’ views are subject to change at any time based on market and other conditions.
Portfolio holdings and characteristics are subject to change and may not be representative of current holdings and characteristics. Fund holdings are subject to change daily. The outlook for this Fund may differ from that presented for other Voya mutual funds. The Fund’s performance returns shown reflect applicable fee waivers and/or expense limits in effect during this period. This report contains statements that may be “forward-looking” statements. Actual results may differ materially from those projected in the “forward-looking” statement. Absent such fee waivers/expense limitations, if any, performance would have been lower. Performance for the different classes of shares will vary based on differences in fees associated with each class.
| Voya Intermediate Bond Fund | Portfolio Managers' Report |
| Average Annual Total Returns for the Periods Ended March 31, 2024 |
| 1 Year | 5 Year | 10 Year |
| Including Sales Charge: | | | |
| Class A(1) | 0.64% | -0.02% | 1.52% |
| Class C(2) | 1.52% | -0.26% | 1.16% |
| Class I | 3.66% | 0.85% | 2.13% |
| Class R | 2.92% | 0.25% | 1.51% |
| Class R6 | 3.60% | 0.89% | 2.15% |
| Class W | 3.55% | 0.77% | 2.04% |
| Excluding Sales Charge: | | | |
| Class A | 3.17% | 0.49% | 1.77% |
| Class C | 2.52% | -0.26% | 1.16% |
| Class I | 3.66% | 0.85% | 2.13% |
| Class R | 2.92% | 0.25% | 1.51% |
| Class R6 | 3.60% | 0.89% | 2.15% |
| Class W | 3.55% | 0.77% | 2.04% |
| Bloomberg U.S. Aggregate Bond | 1.70% | 0.36% | 1.54% |
Based on a $10,000 initial investment, the graph and table above illustrate the total return of Voya Intermediate Bond Fund against the index indicated. The index is unmanaged, has no cash in its portfolio and imposes no sales charges. An investor cannot invest directly in an index.
The Fund’s performance is shown both with and without the imposition of sales charges.
The performance graph and table do not reflect the deduction of taxes that a shareholder will pay on Fund distributions or the redemption of Fund shares.
The performance shown includes, if applicable, the effect of fee waivers and/or expense reimbursements by the Investment Adviser and/or other service providers, which have the effect of increasing total return. Had all fees and expenses been considered, the total returns would have been lower.
Performance data represents past performance and is no assurance of future results. Investment return and principal value of an investment in the Fund will fluctuate. Shares, when sold, may be worth more or less than their original cost. The Fund’s current performance may be lower or higher than the performance data shown. Please log on to www.voyainvestments.com or call (800) 992-0180 to get performance through the most recent month end.
Fund holdings are subject to change daily.
| (1) | Reflects deduction of the maximum Class A sales charge of 2.50%. |
| (2) | Reflects deduction of the Class C deferred sales charge of 1% for the 1 year return. Class C shares automatically convert to Class A shares after eight years. Class C shares’ performance for the periods exceeding eight years include the first eight years of Class C share performance and Class A share performance thereafter. |
| Portfolio Managers’ Report | Voya Short Duration High Income Fund |
Voya Short Duration High Income Fund (the “Fund”) seeks a high level of current income with lower volatility than the broader high yield market. The Fund is managed by James Dudnick, CFA, Justin Kass, CFA and Steven Gish, CFA, Portfolio Managers of Voya Investment Management Co. LLC — the Sub-Adviser.
Performance: For the year ended March 31, 2024, the Fund’s Class A shares, excluding sales charges, provided a total return of 10.91% compared to the ICE BofA 1 – 3 year U.S. Treasury Index (the “Index”) and ICE BofA 1 – 3 year BB U.S. Cash Pay High Index, which returned 2.97% and 7.96%, respectively, for the same period.
Investment Type Allocation
as of March 31, 2024
(as a percentage of net assets)
| Corporate Bonds/Notes | 89.8% | |
| Bank Loans | 3.4% | |
| Assets in Excess of Other Liabilities* | 6.8% | |
| Net Assets | 100.0% | |
| | | | |
| * | Includes short-term investments. | | |
| | | | |
Portfolio holdings are subject to change daily.
Portfolio Specifics: For the reporting period, the Fund outperformed the Index. Performance in the period benefited from industry weightings and a consistent fundamental credit selection framework. Nearly all industries aided performance in the period. Financial Services, energy and support-services contributed the most to performance whereas only one industry — Insurance — detracted from performance in the period. Over the trailing 12-months, liquidity remained in focus to pay distributions, meet redemptions and to take advantage of reinvestment opportunities.
Current Strategy and Outlook: We believe the Fund remains an attractive and actively managed solution as investors adjust to high for longer rates without taking excessive credit risk or price volatility in passive fixed income strategies. In the current market environment, the Fund can purchase securities at discounts to par, or selectively invest in high coupon new issue in seeking to produce attractive yields. The shorter maturity profile of the Fund should in our view protect capital going forward as there are fewer years to repayment to close the average price discount.
Top Ten Holdings
as of March 31, 2024*
(as a percentage of net assets)
| Caesars Entertainment, Inc., 8.125%, 07/01/27 | 3.0% |
| WESCO Distribution, Inc., 7.125%, 06/15/25 | 2.6% |
| Global Auto Holdings Ltd./AAG FH UK Ltd., 8.375%, 01/15/29 | 2.5% |
| Goodyear Tire & Rubber Co., 9.500%, 05/31/25 | 2.3% |
| Univision Communications, Inc., 8.000%, 08/15/28 | 2.2% |
| CITGO Petroleum Corp., 7.000%, 06/15/25 | 2.2% |
| DISH DBS Corp., 5.250%, 12/01/26 | 2.2% |
| Aramark Services, Inc., 5.000%, 02/01/28 | 2.1% |
| HAT Holdings I LLC / HAT Holdings II LLC, 6.000%, 04/15/25 | 2.1% |
| Asurion, LLC, 8.840%, 01/20/29 | 2.0% |
| | |
| * | Excludes short-term investments. | |
| | | |
Portfolio holdings are subject to change daily.
_________
The views expressed in this commentary are informed opinions. They should not be considered promises or advice. The views expressed reflect those of the portfolio managers, only through the end of the period as stated on the cover. The portfolio managers’ views are subject to change at any time based on market and other conditions.
Portfolio holdings and characteristics are subject to change and may not be representative of current holdings and characteristics. Fund holdings are subject to change daily. The outlook for this Fund may differ from that presented for other Voya mutual funds. This report contains statements that may be “forward-looking” statements. Actual results may differ materially from those projected in the “forward-looking” statements. The Fund’s performance returns shown reflect applicable fee waivers and/or expense limits in effect during this period. Absent such fee waivers/expense limitations, if any, performance would have been lower. Performance for the different classes of shares will vary based on differences in fees associated with each class. An index has no cash in its portfolio and imposes no sales charges. An investor cannot invest directly in an index.
| Voya Short Duration High Income Fund | Portfolio Managers' Report |

| Average Annual Total Returns for the Periods Ended March 31, 2024 |
| 1 Year | | Since
Inception of
Class A, I and R6
February 9, 2023 | | Since
Inception of Class C
April 20, 2023 |
| Including Sales Charge: | | | | | |
| Class A(1) | 8.17% | | 6.90% | | — |
| Class C(2) | — | | — | | 8.66% |
| Class I | 11.19% | | 9.61% | | — |
| Class R6 | 11.12% | | 9.54% | | — |
| Excluding Sales Charge: | | | | | |
| Class A | 10.91% | | 9.34% | | — |
| Class C | — | | — | | 9.66% |
| Class I | 11.19% | | 9.61% | | — |
| Class R6 | 11.12% | | 9.54% | | — |
| ICE BofA 1-3 year U.S. Treasury(3) | 2.97% | | 3.74% | | 2.93% |
| ICE BofA 1-3 year BB U.S. Cash Pay High Yield(3) | 7.96% | | 7.28% | | 7.63% |
Based on a $10,000 initial investment, the graph and table above illustrate the total return of Voya Short Duration High Income Fund against the indices indicated. The index is unmanaged, has no cash in its portfolio and imposes no sales charges. An investor cannot invest directly in an index.
The Fund’s performance is shown both with and without the imposition of sales charges.
The performance graph and table do not reflect the deduction of taxes that a shareholder will pay on Fund distributions or the redemption of Fund shares.
The performance shown includes, if applicable, the effect of fee waivers and/or expense reimbursements by the Investment Adviser and/or other service providers, which have the effect of increasing total return. Had all fees and expenses been considered, the total returns would have been lower.
Performance data represents past performance and is no assurance of future results. Investment return and principal value of an investment in the Fund will fluctuate. Shares, when sold, may be worth more or less than their original cost. The Fund’s current performance may be lower or higher than the performance data shown. Please log on to www.voyainvestments.com or call (800) 992-0180 to get performance through the most recent month end.
Fund holdings are subject to change daily.
| (1) | Reflects deduction of the maximum Class A sales charge of 2.50%. |
| (2) | Reflects deduction of the Class C deferred sales charge of 1% for the 1 year return. Class C shares automatically convert to Class A shares after eight years. Class C shares’ performance for the periods exceeding eight years include the first eight years of Class C share performance and Class A share performance thereafter. |
| (3) | Since inception performance for the indices is shown as of February 9, 2023 and April 20, 2023, respectively. |
| Portfolio Managers’ Report | Voya Short Term Bond Fund |
Voya Short Term Bond Fund (the “Fund”) seeks maximum total return. The Fund is managed by Randall Parrish, CFA, David Goodson, and Sean Banai, CFA, Portfolio Managers* of Voya Investment Management Co. LLC — the Sub-Adviser.
Performance: For the year ended March 31, 2024, the Fund’s Class A shares, excluding sales charges, provided a total return of 3.89% compared to the Bloomberg U.S. 1-3 Year Government/Credit Bond Index (the “Index” or “Bloomberg U.S. 1-3 Year Government/Credit Bond”), which returned 3.49%, for the same period.
Investment Type Allocation
as of March 31, 2024
(as a percentage of net assets)
| Corporate Bonds/Notes | 49.4% | |
| Asset-Backed Securities | 20.5% | |
| U.S. Treasury Obligations | 13.0% | |
| Collateralized Mortgage Obligations | 7.4% | |
| Commercial Mortgage-Backed Securities | 7.4% | |
| U.S. Government Agency Obligations | 0.1% | |
| Assets in Excess of Other Liabilities* | 2.2% | |
| Net Assets | 100.0% | |
| * | Includes short-term investments. | | |
Portfolio holdings are subject to change daily.
Portfolio Specifics: Trailing 12-month performance for bonds, as measured by the Bloomberg Aggregate, was positive, with a wild ride along the way. Global bond yields continued to march higher into early fourth quarter 2023, with the U.S. Treasury market leading the way. The U.S. 10-year yield crested above 5% in mid-October as stronger U.S. data sparked concerns on the need for higher rates for longer. The bond market then posted a massive rally in the final two months of 2023, as declines in inflation, a softer labor market and comments from the U.S. Federal Reserve indicating rate hikes were done sparked a rally not witnessed in years. Some of this enthusiasm was unwound in the first quarter of 2024, as a resilient labor market and a pause in downward inflation momentum challenged the market’s optimistic view for the timeline of Fed rate cuts. While higher interest rates and bond volatility were challenges for non-government sectors, they proved to be buying opportunities. Corporate sectors including high yield (“HY”) and investment grade (“IG”) outpaced most securitized sectors. While securitized outperformed, lingering concerns on commercial real estate (“CRE”) and persistent rate volatility were challenges.
Sector allocation contributed the most for the period, while security selection added more modestly and duration positioning detracted. Within sector allocation, our overweight to asset-backed securities contributed, driven by our allocation to higher quality commercial loan obligations. Our overweight to HY corporates also added over the period as this sector continued to be resilient as spreads did not price in a recessionary scenario. Our overweight to IG corporates also contributed as spreads continued to grind tighter as the probability of a recession lessened. Within security selection, our main driver of returns was a contribution within IG, where we continue to like financials as well as a A and BBB-rated securities. Duration detracted over the period as the Fed maintained its higher for longer stance amid hotter than expected inflation and unemployment data; we maintained a slight overweight on duration versus the benchmark for most of the period.
Top Ten Holdings
as of March 31, 2024*
(as a percentage of net assets)
| United States Treasury Notes, 4.250%, 03/15/27 | 9.4% |
| United States Treasury Notes, 2.875%, 04/30/25 | 2.1% |
| Freddie Mac REMIC Trust - Class FA, 5.983%, 04/15/36 | 1.0% |
| United States Treasury Notes, 4.500%, 03/31/26 | 0.9% |
| Freddie Mac Strips - Class F43, 6.120%, 10/25/53 | 0.9% |
| DC Commercial Mortgage Trust - Class A, 6.314%, 09/12/40 | 0.7% |
| Freddie Mac Strips - Class F44, 6.320%, 10/25/53 | 0.7% |
| ILPT Commercial Mortgage Trust - Class A, 7.570%, 10/15/39 | 0.7% |
| BRSP Ltd. - Class B, 7.341%, 08/19/38 | 0.7% |
| OHA Credit Partners XIII Ltd. - Class AR, 6.749%, 10/25/34 | 0.7% |
| | |
| * | Excludes short-term investments. | |
Portfolio holdings are subject to change daily.
During the reporting period, the Fund used futures primarily for cash management purposes, as well as some Credit Default Swap Index (“CDX”) to get efficient exposure to High Yield. As a result, derivatives had a negative impact on performance.
Current Strategy and Outlook: While the Fed’s hiking cycle is done, the first rate cut remains a source of debate. Looking ahead, we expect economic growth in the United States to slow from 2023, but continue to grow close to trend levels, supported by robust consumer spending as real income and the wealth effect bolster economic activity. Meanwhile, we expect inflation to stabilize above the Fed's target, due to the slowing disinflationary trends in the goods sector and continued stickiness in the services sector, the latter of which has been a product of a tight labor market. We are seeing early signs of softness in the labor market, notably a decline in the quits rate. We expect wage growth to moderate, which would also be a positive for inflation. With this backdrop, along with recent strength in economic data, the Fed’s case to remain patient on rate cuts has been bolstered. However, the Fed's data-dependent stance will provide flexibility in adjusting policy measures in response to evolving economic conditions, ensuring a balanced approach to supporting economic growth while addressing inflation concerns.
| Voya Short Term Bond Fund | Portfolio Managers' Report |
While spreads for many sectors appear tight, all-in yields remain historically attractive which, in our view, allows investors to capture high quality yield without overstretching into risk. Corporate bonds illustrate this dynamic, where spreads are tight but nominal yields are enticing yield-based buyers and fundamental factors can continue to support the sector. Agency mortgage-backed securities (“MBS”) valuations remain appealing given muted prepayment risk and the headwind of Fed rate hikes behind us. The outlook for non-agency residential mortgage-backed securities (“RMBS”) is also positive as fundamental factors continue to support risk-taking in this sector. Commercial mortgage-backed securities (“CMBS”) continues to exhibit cheap valuations, offering the most compelling relative value compared to other fixed income sectors. Moreover, outside of the office property type, fundamental factors in CRE are showing early signs of improvement. The additional cushion provided by higher nominal rates compels us to lean into higher-quality spread opportunities and remain underweight in U.S. Treasuries. We will continue to monitor market developments, assess sector fundamental factors, and stay attuned to macroeconomic trends to capitalize on opportunities in this dynamic and evolving market environment.
________
* Effective May 1, 2024, Matt Toms, CFA will no longer serve as a portfolio manager to the Fund.
The views expressed in this commentary are informed opinions. They should not be considered promises or advice. The views expressed reflect those of the portfolio managers, only through the end of the period as stated on the cover. The portfolio managers’ views are subject to change at any time based on market and other conditions.
Portfolio holdings and characteristics are subject to change and may not be representative of current holdings and characteristics. Fund holdings are subject to change daily. The outlook for this Fund may differ from that presented for other Voya mutual funds. The Fund’s performance returns shown reflect applicable fee waivers and/or expense limits in effect during this period. This report contains statements that may be “forward-looking” statements. Actual results may differ materially from those projected in the “forward-looking” statement. Absent such fee waivers/expense limitations, if any, performance would have been lower. Performance for the different classes of shares will vary based on differences in fees associated with each class.
| Portfolio Managers’ Report | Voya Short Term Bond Fund |

| Average Annual Total Returns for the Periods Ended March 31, 2024 |
| | 1 Year | 5 Year | 10 Year | Since Inception of Class R
July, 31 2014 |
| Including Sales Charge: | | | | |
| Class A(1) | 1.27% | 0.75% | 0.99% | — |
| Class C(2) | 2.11% | 0.55% | 0.63% | — |
| Class I | 4.17% | 1.56% | 1.53% | — |
| Class R | 3.52% | 1.08% | — | 1.04% |
| Class R6 | 4.22% | 1.62% | 1.57% | — |
| Class W | 4.15% | 1.54% | 1.52% | — |
| Excluding Sales Charge: | | | | |
| Class A | 3.89% | 1.26% | 1.25% | — |
| Class C | 3.11% | 0.55% | 0.63% | — |
| Class I | 4.17% | 1.56% | 1.53% | — |
| Class R | 3.52% | 1.08% | — | 1.04% |
| Class R6 | 4.22% | 1.62% | 1.57% | — |
| Class W | 4.15% | 1.54% | 1.52% | — |
| Bloomberg U.S. 1-3 Year Government/Credit Bond | 3.49% | 1.36% | 1.29% | 1.31% |
Based on a $10,000 initial investment, the graph and table above illustrate the total return of Voya Short Term Bond Fund against the index indicated. The index is unmanaged, has no cash in its portfolio and imposes no sales charges. An investor cannot invest directly in an index.
The Fund’s performance is shown both with and without the imposition of sales charges.
The performance graph and table do not reflect the deduction of taxes that a shareholder will pay on Fund distributions or the redemption of Fund shares.
The performance shown includes, if applicable, the effect of fee waivers and/or expense reimbursements by the Investment Adviser and/or other service providers, which have the effect of increasing total return. Had all fees and expenses been considered, the total returns would have been lower.
Performance data represents past performance and is no assurance of future results. Investment return and principal value of an investment in the Fund will fluctuate. Shares, when sold, may be worth more or less than their original cost. The Fund’s current performance may be lower or higher than the performance data shown. Please log on to www.voyainvestments.com or call (800) 992-0180 to get performance through the most recent month end.
Fund holdings are subject to change daily.
| (1) | Reflects deduction of the maximum Class A sales charge of 2.50%. |
| (2) | Reflects deduction of the Class C deferred sales charge of 1% for the 1 year return. Class C shares automatically convert to Class A shares after eight years. Class C shares’ performance for the periods exceeding eight years include the first eight years of Class C share performance and Class A share performance thereafter. |
| Voya Strategic Income Opportunities Fund | Portfolio Managers' Report |
Voya Strategic Income Opportunities Fund (the “Fund”) seeks total return through income and capital appreciation through all market cycles. The Fund is managed by Eric Stein, CFA, Brian Timberlake, Ph.D., CFA, and Sean Banai, CFA, Portfolio Managers* of Voya Investment Management Co. LLC — the Sub-Adviser.
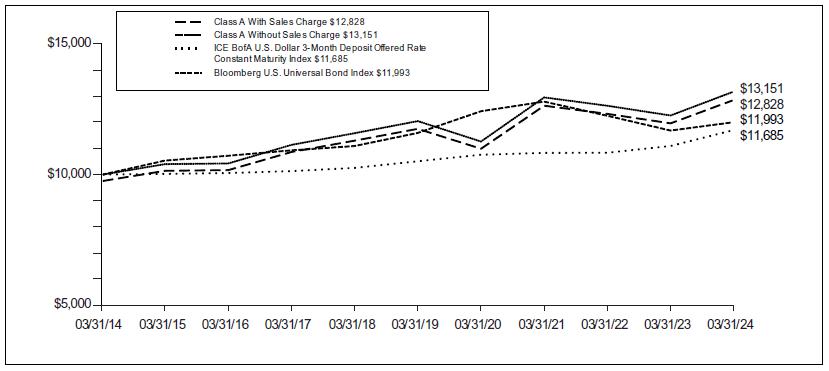
Performance: For the year ended March 31, 2024, the Fund’s Class A shares, excluding sales charges, provided a total return of 7.29% compared to the ICE BofA U.S. Dollar 3-Month Deposit Offered Rate Constant Maturity Index (the “Index”) and the Bloomberg U.S. Universal Bond Index, which returned 5.36% and 2.67% respectively, for the same period.
Portfolio Specifics: The Fund outperformed the Index. Duration and yield curve decisions detracted, while sector allocation and security selection contributed.
Investment Type Allocation
as of March 31, 2024
(as a percentage of net assets)
| Collateralized Mortgage Obligations | 25.4% | |
| Commercial Mortgage-Backed Securities | 18.1% | |
| Corporate Bonds/Notes | 16.2% | |
| Asset-Backed Securities | 13.6% | |
| Bank Loans | 7.6% | |
| U.S. Government Agency Obligations | 4.4% | |
| Sovereign Bonds | 3.5% | |
| U.S. Treasury Obligations | 1.5% | |
| Purchased Options | 0.1% | |
| Preferred Stock | 0.0% | |
| Common Stock | 0.0% | |
| Assets in Excess of Other Liabilities* | 9.6% | |
| Net Assets | 100.0% | |
| | | | |
| * | Includes short-term investments. | |
Portfolio holdings are subject to change daily.
Trailing 12-month performance for bonds, as measured by the Bloomberg Aggregate, was positive, with a wild ride along the way. Global bond yields continued to march higher into early fourth quarter 2023, with the U.S. Treasury market leading the way. The U.S. 10-year yield crested above 5% in mid-October as stronger U.S. data sparked concerns on the need for higher rates for longer. The bond market then posted a massive rally in the final two months of 2023, as declines in inflation, a softer labor market and comments from the U.S. Federal Reserve indicating rate hikes were done sparked a rally not witnessed in years. Some of this enthusiasm was unwound in the first quarter of 2024, as a resilient labor market and a pause in downward inflation momentum challenged the market’s optimistic view for the timeline of Fed rate cuts. While higher interest rates and bond volatility were challenges for non-government sectors, they proved to be buying opportunities. Corporate sectors including high yield (“HY”) and investment grade (“IG”) outpaced most securitized sectors. While securitized outperformed, lingering concerns on commercial real estate (“CRE”) and persistent rate volatility were challenges.
Duration and yield curve positioning detracted from performance. Even with a low duration profile, the persistent inflationary data, coupled with strong consumer and job markets has pushed out predicted cuts for the Fed, thereby increasing rate volatility. Sector allocation contributed to performance, as fixed income credit sectors have stayed broadly resilient amid the uncertain market environment. Credit sectors across securitized and corporates contributed, led by non-agency residential mortgage-backed securities (“RMBS”) as the housing market maintained strength, supported by a resilient consumer, despite the higher rate environment. HY corporates and bank loans also contributed meaningfully as spreads did not price in a recessionary scenario. Commercial mortgage-backed securities (“CMBS”) also contributed; during the latter half of the period, spreads priced in less of a recessionary scenario. IG corporates and emerging markets contributed, as well as asset-backed securities which continues to be a resilient sector amid uncertain market environments. Security selection within agency mortgages also contributed as prepayments speeds were supportive of the sector. IG selections also contributed, supported by our BBB rated holdings. Some of our more credit sensitive investments in CMBS detracted as the sector was at times pricing in a recessionary outcome.
The Fund primarily used futures, swaps and forward contracts for efficient portfolio and cash management purposes. As a result, derivatives had a negative impact on performance during the reporting period.
Current Strategy and Outlook: While the Fed’s hiking cycle is done, the first rate cut remains a source of debate. Looking ahead, we expect economic growth in the United States to slow from 2023, but continue to grow close to trend levels, supported by robust consumer spending as real income and the wealth effect bolster economic activity. Meanwhile, we expect inflation to stabilize above the Fed's target, due to the slowing disinflationary trends in the goods sector and continued stickiness in the services sector, the latter of which has been a product of a tight labor market. We are seeing early signs of softness in the labor market, notably a decline in the quits rate. We expect wage growth to moderate, which would also be a positive for inflation. With this backdrop, along with recent strength in economic data, the Fed’s case to remain patient on rate cuts has been bolstered. However, the Fed's data-dependent stance will provide flexibility in adjusting policy measures in response to evolving economic conditions, ensuring a balanced approach to supporting economic growth while addressing inflation concerns.
| Portfolio Managers’ Report | Voya Strategic Income Opportunities Fund |
Top Ten Holdings
as of March 31, 2024*
(as a percentage of net assets)
| Mexican Bonos, 7.750%, 05/29/31 | 1.2% |
| Republic of South Africa Government Bond, 8.875%, 02/28/35 | 0.8% |
| Fannie Mae, 5.500%, 05/01/54 | 0.7% |
| Ginnie Mae, 5.500%, 05/20/54 | 0.7% |
| United States Treasury Bonds, 4.750%, 11/15/53 | 0.6% |
| Ginnie Mae, 4.000%, 04/20/54 | 0.6% |
| Prima Capital CRE Securitization Ltd. - Class D, 4.250%, 12/25/50 | 0.6% |
| Fannie Mae, 4.000%, 05/15/54 | 0.5% |
| Med Trust - Class D, 7.439%, 11/15/38 | 0.5% |
| GS Mortgage Securities Corp. Trust - Class B, 7.090%, 11/15/36 | 0.5% |
| | | |
| * | Excludes short-term investments. |
| | |
Portfolio holdings are subject to change daily.
While spreads for many sectors appear tight, all-in yields remain historically attractive which, in our view, allows investors to capture high quality yield without overstretching into risk. Corporate bonds illustrate this dynamic, where spreads are tight but nominal yields are enticing yieldbased buyers and fundamental factors can continue to support the sector. Agency mortgage-backed securities valuations remain appealing given muted prepayment risk and the headwind of Fed rate hikes behind us. The outlook for non-agency RMBS is also positive as fundamental factors continue to support risk-taking in this sector. CMBS continues to exhibit cheap valuations, offering the most compelling relative value compared to other fixed income sectors. Moreover, outside of the office property type, fundamental factors in CRE are showing early signs of improvement. The additional cushion provided by higher nominal rates compels us to lean into higher-quality spread opportunities and remain underweight in U.S. Treasuries. We will continue to monitor market developments, assess sector fundamental factors, and stay attuned to macroeconomic trends to capitalize on opportunities in this dynamic and evolving market environment.
_______
*Effective May 1, 2024, Matt Toms, CFA will no longer serve as a portfolio manager to the Fund and Eric Stein, CFA will be added as a portfolio manager for the Fund.
The views expressed in this commentary are informed opinions. They should not be considered promises or advice. The views expressed reflect those of the portfolio managers, only through the end of the period as stated on the cover. The portfolio managers’ views are subject to change at any time based on market and other conditions.
Portfolio holdings and characteristics are subject to change and may not be representative of current holdings and characteristics. Fund holdings are subject to change daily. The outlook for this Fund may differ from that presented for other Voya mutual funds. The Fund’s performance returns shown reflect applicable fee waivers and/or expense limits in effect during this period. This report contains statements that may be “forward-looking” statements. Actual results may differ materially from those projected in the “forward-looking” statement. Absent such fee waivers/expense limitations, if any, performance would have been lower. Performance for the different classes of shares will vary based on differences in fees associated with each class.
| Voya Strategic Income Opportunities Fund | Portfolio Managers’ Report |
| Average Annual Total Returns for the Periods Ended March 31, 2024 |
| | | 1 Year | | | 5 Year | | | 10 Year | |
| Including Sales Charge: | | | | | | | | | | | | |
| Class A(1) | | | 4.61% | | | | 1.26% | | | | 2.52% | |
| Class C(2) | | | 5.64% | | | | 1.03% | | | | 2.17% | |
| Class I | | | 7.66% | | | | 2.03% | | | | 3.14% | |
| Class R | | | 7.16% | | | | 1.53% | | | | 2.54% | |
| Class R6(3) | | | 7.63% | | | | 2.08% | | | | 3.14% | |
| Class W | | | 7.68% | | | | 2.03% | | | | 3.02% | |
| Excluding Sales Charge: | | | | | | | | | | | | |
| Class A | | | 7.29% | | | | 1.78% | | | | 2.78% | |
| Class C | | | 6.64% | | | | 1.03% | | | | 2.17% | |
| Class I | | | 7.66% | | | | 2.03% | | | | 3.14% | |
| Class R | | | 7.16% | | | | 1.53% | | | | 2.54% | |
| Class R6(3) | | | 7.63% | | | | 2.08% | | | | 3.14% | |
| Class W | | | 7.68% | | | | 2.03% | | | | 3.02% | |
| ICE BofA U.S. Dollar 3-Month Deposit Offered Rate Constant Maturity Index | | | 5.36% | | | | 2.15% | | | | 1.57% | |
| Bloomberg U.S. Universal Bond Index | | | 2.67% | | | | 0.69% | | | | 1.83% | |
Based on a $10,000 initial investment, the graph and table above illustrate the total return of Voya Strategic Income Opportunities Fund against the indices indicated. An index is unmanaged, has no cash in its portfolio and imposes no sales charges. An investor cannot invest directly in an index.
The Fund’s performance is shown both with and without the imposition of sales charges.
The performance graph and table do not reflect the deduction of taxes that a shareholder will pay on Fund distributions or the redemption of Fund shares.
The performance shown includes, if applicable, the effect of fee waivers and/or expense reimbursements by the Investment Adviser and/or other service providers, which have the effect of increasing total return. Had all fees and expenses been considered, the total returns would have been lower.
Performance data represents past performance and is no assurance of future results. Investment return and principal value of an investment in the Fund will fluctuate. Shares, when sold, may be worth more or less than their original cost. The Fund’s current performance may be lower or higher than the performance data shown. Please log on to www.voyainvestments.com or call (800) 992-0180 to get performance through the most recent month end.
Fund holdings are subject to change daily.
| (1) | Reflects deduction of the maximum Class A sales charge of 2.50%. |
| (2) | Reflects deduction of the Class C deferred sales charge of 1% for the 1 year return. Class C shares automatically convert to Class A shares after eight years. Class C shares’ performance for the periods exceeding eight years include the first eight years of Class C share performance and Class A share performance thereafter. |
| Portfolio Managers’ Report | Voya Strategic Income Opportunities Fund |
| (3) | Class R6 incepted on October 23, 2015. The Class R6 shares performance shown for the period prior to their inception date is the performance of Class I shares without adjustment for any differences in the expenses between the two classes. If adjusted for such differences, returns would be different. |
SHAREHOLDER EXPENSE EXAMPLES (Unaudited)
As a shareholder of a Fund, you incur two types of costs: (1) transaction costs, including sales charges (loads) on purchase payments, redemption fees, and exchange fees; and (2) ongoing costs, including management fees, distribution and/or service (12b-1) fees, and other Fund expenses. These Examples are intended to help you understand your ongoing costs (in dollars) of investing in a Fund and to compare these costs with the ongoing costs of investing in other mutual funds.
The Examples are based on an investment of $1,000 invested at the beginning of the period and held for the entire period from October 1, 2023 to March 31, 2024. The Fund’s expenses are shown without the imposition of any sales charges or fees. Expenses would have been higher if such charges were included.
Actual Expenses
The left section of the table shown below, “Actual Fund Return,” provides information about actual account values and actual expenses. You may use the information in this section, together with the amount you invested, to estimate the expenses that you paid over the period. Simply divide your account value by $1,000 (for example, an $8,600 account value divided by $1,000 = 8.6), then multiply the result by the number in the first section under the heading entitled “Expenses Paid During the Period” to estimate the expenses you paid on your account during this period.
Hypothetical Example for Comparison Purposes
The right section of the table shown below, “Hypothetical (5% return before expenses),” provides information about hypothetical account values and hypothetical expenses based on a Fund’s actual expense ratio and an assumed rate of return of 5% per year before expenses, which is not the Fund’s actual return. The hypothetical account values and expenses may not be used to estimate the actual ending account balance or expenses you paid for the period. You may use this information to compare the ongoing costs of investing in each Fund and other mutual funds. To do so, compare this 5% hypothetical example with the 5% hypothetical examples that appear in the shareholder reports of the other mutual funds.
Please note that the expenses shown in the table are meant to highlight your ongoing costs only and do not reflect any transactional costs, such as sales charges (loads), redemption fees, or exchange fees. Therefore, the hypothetical section of the table is useful in comparing ongoing costs only, and will not help you determine the relative total costs of owning different mutual funds. In addition, if these transactional costs were included, your costs would have been higher.
| | | Actual Fund Return | | Hypothetical (5% return before expenses) |
| | | Beginning | | Ending | | | | Expenses Paid | | Beginning | | Ending | | | | Expenses Paid | |
| | | Account | | Account | | | | During the | | Account | | Account | | | | During the | |
| | | Value | | Value | | Annualized | | Period Ended | | Value | | Value | | Annualized | | Period Ended | |
| | | October 1, | | March 31, | | Expense | | March 31, | | October 1, | | March 31, | | Expense | | March 31, | |
| | | 2023 | | 2024 | | Ratio | | 2024* | | 2023 | | 2024 | | Ratio | | 2024* | |
| | | | | | | | | | | | | | | | | | | | | | | | | |
| Voya GNMA Income Fund | | | | | | | | | | | | | | | | | | | | |
| Class A | | $1,000.00 | | | $1,059.00 | | | 0.84% | | | $4.32 | | | $1,000.00 | | | $1,020.80 | | | 0.84% | | | $4.24 | |
| Class C | | 1,000.00 | | | 1,053.80 | | | 1.59 | | | 8.16 | | | 1,000.00 | | | 1,017.05 | | | 1.59 | | | 8.02 | |
| Class I | | 1,000.00 | | | 1,059.10 | | | 0.54 | | | 2.78 | | | 1,000.00 | | | 1,022.30 | | | 0.54 | | | 2.73 | |
| Class R6 | | 1,000.00 | | | 1,059.30 | | | 0.50 | | | 2.57 | | | 1,000.00 | | | 1,022.50 | | | 0.50 | | | 2.53 | |
| Class W | | 1,000.00 | | | 1,058.70 | | | 0.59 | | | 3.04 | | | 1,000.00 | | | 1,022.05 | | | 0.59 | | | 2.98 | |
| ....0 | | | | | | | | | | | | | | | | | | | | | | | | |
| Voya High Yield Bond Fund | | | | | | | | | | | | | | | | | | | | |
| Class A | | $1,000.00 | | | $1,075.70 | | | 1.04% | | | $5.40 | | | $1,000.00 | | | $1,019.80 | | | 1.04% | | | $5.25 | |
| Class C | | 1,000.00 | | | 1,071.80 | | | 1.79 | | | 9.27 | | | 1,000.00 | | | 1,016.05 | | | 1.79 | | | 9.02 | |
| Class I | | 1,000.00 | | | 1,076.10 | | | 0.70 | | | 3.63 | | | 1,000.00 | | | 1,021.50 | | | 0.70 | | | 3.54 | |
| Class R | | 1,000.00 | | | 1,074.30 | | | 1.29 | | | 6.69 | | | 1,000.00 | | | 1,018.55 | | | 1.29 | | | 6.51 | |
| Class R6 | | 1,000.00 | | | 1,077.90 | | | 0.63 | | | 3.27 | | | 1,000.00 | | | 1,021.85 | | | 0.63 | | | 3.18 | |
| Class W | | 1,000.00 | | | 1,077.00 | | | 0.79 | | | 4.10 | | | 1,000.00 | | | 1,021.05 | | | 0.79 | | | 3.99 | |
| | | | | | | | | | | | | | | | | | | | | | | | | |
| Voya Intermediate Bond Fund | | | | | | | | | | | | | | | | | | | | |
| Class A | | $1,000.00 | | | $1,067.80 | | | 0.72% | | | $3.72 | | | $1,000.00 | | | $1,021.40 | | | 0.72% | | | $3.64 | |
| Class C | | 1,000.00 | | | 1,065.20 | | | 1.47 | | | 7.59 | | | 1,000.00 | | | 1,017.65 | | | 1.47 | | | 7.41 | |
| Class I | | 1,000.00 | | | 1,071.00 | | | 0.34 | | | 1.76 | | | 1,000.00 | | | 1,023.30 | | | 0.34 | | | 1.72 | |
| Class R | | 1,000.00 | | | 1,066.40 | | | 0.97 | | | 5.01 | | | 1,000.00 | | | 1,020.15 | | | 0.97 | | | 4.90 | |
| Class R6 | | 1,000.00 | | | 1,070.00 | | | 0.29 | | | 1.50 | | | 1,000.00 | | | 1,023.55 | | | 0.29 | | | 1.47 | |
| Class W | | 1,000.00 | | | 1,070.40 | | | 0.47 | | | 2.43 | | | 1,000.00 | | | 1,022.65 | | | 0.47 | | | 2.38 | |
SHAREHOLDER EXPENSE EXAMPLES (Unaudited) (continued)
| | | Actual Fund Return | | Hypothetical (5% return before expenses) |
| | | Beginning | | Ending | | | | Expenses Paid | | Beginning | | Ending | | | | Expenses Paid | |
| | | Account | | Account | | | | During the | | Account | | Account | | | | During the | |
| | | Value | | Value | | Annualized | | Period Ended | | Value | | Value | | Annualized | | Period Ended | |
| | | October 1, | | March 31, | | Expense | | March 31, | | October 1, | | March 31, | | Expense | | March 31, | |
| | | 2023 | | 2024 | | Ratio | | 2024* | | 2023 | | 2024 | | Ratio | | 2024* | |
| | | | | | | | | | | | | | | | | | | | | | | | | |
| Voya Short Duration High Income Fund | | | | | | | | | | | | | | | | | |
| Class A | | $1,000.00 | | | $1,059.10 | | | 0.85% | | | $4.38 | | | $1,000.00 | | | $1,020.75 | | | 0.85% | | | $4.29 | |
| Class C | | 1,000.00 | | | 1,053.70 | | | 1.60 | | | 8.21 | | | 1,000.00 | | | 1,017.00 | | | 1.60 | | | 8.07 | |
| Class I | | 1,000.00 | | | 1,060.40 | | | 0.60 | | | 3.09 | | | 1,000.00 | | | 1,022.00 | | | 0.60 | | | 3.03 | |
| Class R6 | | 1,000.00 | | | 1,059.80 | | | 0.60 | | | 3.09 | | | 1,000.00 | | | 1,022.00 | | | 0.60 | | | 3.03 | |
| ... | | | | | | | | | | | | | | | | | | | | | | | | |
| Voya Short Term Bond Fund | | | | | | | | | | | | | | | | | |
| Class A | | $1,000.00 | | | $1,032.70 | | | 0.63% | | | $3.20 | | | $1,000.00 | | | $1,021.85 | | | 0.63% | | | $3.18 | |
| Class C | | 1,000.00 | | | 1,028.80 | | | 1.38 | | | 7.00 | | | 1,000.00 | | | 1,018.10 | | | 1.38 | | | 6.96 | |
| Class I | | 1,000.00 | | | 1,034.10 | | | 0.35 | | | 1.78 | | | 1,000.00 | | | 1,023.25 | | | 0.35 | | | 1.77 | |
| Class R | | 1,000.00 | | | 1,031.30 | | | 0.88 | | | 4.47 | | | 1,000.00 | | | 1,020.60 | | | 0.88 | | | 4.45 | |
| Class R6 | | 1,000.00 | | | 1,034.30 | | | 0.30 | | | 1.53 | | | 1,000.00 | | | 1,023.50 | | | 0.30 | | | 1.52 | |
| Class W | | 1,000.00 | | | 1,033.90 | | | 0.38 | | | 1.93 | | | 1,000.00 | | | 1,023.10 | | | 0.38 | | | 1.92 | |
| ... | | | | | | | | | | | | | | | | | | | | | | | | |
| Voya Strategic Income Opportunities Fund | | | | | | | | | | | | | | | | | | | |
| Class A | | $1,000.00 | | | $1,057.40 | | | 0.86% | | | $4.42 | | | $1,000.00 | | | $1,020.70 | | | 0.86% | | | $4.34 | |
| Class C | | 1,000.00 | | | 1,053.90 | | | 1.61 | | | 8.27 | | | 1,000.00 | | | 1,016.95 | | | 1.61 | | | 8.12 | |
| Class I | | 1,000.00 | | | 1,058.60 | | | 0.63 | | | 3.24 | | | 1,000.00 | | | 1,021.85 | | | 0.63 | | | 3.18 | |
| Class R | | 1,000.00 | | | 1,056.30 | | | 1.11 | | | 5.71 | | | 1,000.00 | | | 1,019.45 | | | 1.11 | | | 5.60 | |
| Class R6 | | 1,000.00 | | | 1,057.90 | | | 0.56 | | | 2.88 | | | 1,000.00 | | | 1,022.20 | | | 0.56 | | | 2.83 | |
| Class W | | 1,000.00 | | | 1,058.70 | | | 0.61 | | | 3.14 | | | 1,000.00 | | | 1,021.95 | | | 0.61 | | | 3.08 | |
| * | Expenses are equal to each Fund’s respective annualized expense ratios multiplied by the average account value over the period, multiplied by 183/366 to reflect the most recent fiscal half-year. |
REPORT OF INDEPENDENT REGISTERED PUBLIC ACCOUNTING FIRM
To the Shareholders of Voya GNMA Income Fund, Voya High Yield Bond Fund, Voya Intermediate Bond Fund, Voya Short Duration High Income Fund, Voya Short Term Bond Fund and Voya Strategic Income Opportunities Fund and the Board of Trustees of Voya Funds Trust
Opinion on the Financial Statements
We have audited the accompanying statements of assets and liabilities of Voya GNMA Income Fund, Voya High Yield Bond Fund, Voya Intermediate Bond Fund, Voya Short Duration High Income Fund, Voya Short Term Bond Fund and Voya Strategic Income Opportunities Fund (collectively referred to as the “Funds”) (six of the funds constituting Voya Funds Trust (the “Trust”)), including the portfolios of investments, as of March 31, 2024, and the related statements of operations and changes in net assets and the financial highlights for each of the periods indicated in the table below and the related notes (collectively referred to as the “financial statements”). In our opinion, the financial statements present fairly, in all material respects, the financial position of each of the Funds (six of the funds constituting Voya Funds Trust) at March 31, 2024, and the results of their operations, changes in net assets and financial highlights for each of the periods indicated in the table below, in conformity with U.S. generally accepted accounting principles.
| Individual fund constituting | | Statements of changes in | |
| Voya Funds Trust | Statement of Operations | net assets | Financial highlights |
| Voya GNMA Income Fund | For the year ended | For each of the two years in the | For each of the five years in the |
| | March 31, 2024 | period ended March 31, 2024 | period ended March 31, 2024 |
| Voya High Yield Bond Fund | For the year ended | For each of the two years in the | For each of the five years in the |
| | March 31, 2024 | period ended March 31, 2024 | period ended March 31, 2024 |
| Voya Intermediate Bond Fund | For the year ended | For each of the two years in the | For each of the five years in the |
| | March 31, 2024 | period ended March 31, 2024 | period ended March 31, 2024 |
| Voya Short Duration High Income Fund | For the year ended | For the year ended March 31, 2024 and the period from February |
| | March 31, 2024 | 9, 2023 (commencement of operations) through March 31, 2023 |
| Voya Short Term Bond Fund | For the year ended | For each of the two years in the | For each of the five years in the |
| | March 31, 2024 | period ended March 31, 2024 | period ended March 31, 2024 |
| Voya Strategic Income Opportunities Fund | For the year ended | For each of the two years in the | For each of the five years in the |
| | March 31, 2024 | period ended March 31, 2024 | period ended March 31, 2024 |
Basis for Opinion
These financial statements are the responsibility of the Trust’s management. Our responsibility is to express an opinion on each of the Funds’ financial statements based on our audits. We are a public accounting firm registered with the Public Company Accounting Oversight Board (United States) ("PCAOB") and are required to be independent with respect to the Trust in accordance with the U.S. federal securities laws and the applicable rules and regulations of the Securities and Exchange Commission and the PCAOB.
We conducted our audits in accordance with the standards of the PCAOB. Those standards require that we plan and perform the audit to obtain reasonable assurance about whether the financial statements are free of material misstatement, whether due to error or fraud. The Trust is not required to have, nor were we engaged to perform, an audit of the Trust’s internal control over financial reporting. As part of our audits, we are required to obtain an understanding of internal control over financial reporting, but not for the purpose of expressing an opinion on the effectiveness of the Trust’s internal control over financial reporting. Accordingly, we express no such opinion.
Our audits included performing procedures to assess the risks of material misstatement of the financial statements, whether due to error or fraud, and performing procedures that respond to those risks. Such procedures included examining, on a test basis, evidence regarding the amounts and disclosures in the financial statements. Our procedures included confirmation of securities owned as of March 31, 2024, by correspondence with the custodian, brokers and others; when replies were not received from brokers and others, we performed other auditing procedures. Our audits also included evaluating the accounting principles used and significant estimates made by management, as well as evaluating the overall presentation of the financial statements. We believe that our audits provide a reasonable basis for our opinion.
REPORT OF INDEPENDENT REGISTERED PUBLIC ACCOUNTING FIRM (continued)

We have served as the auditor of one or more Voya investment companies since 2019.
Boston, Massachusetts
May 30, 2024
STATEMENTS OF ASSETS AND LIABILITIES AS OF MARCH 31, 2024
| | | | Voya GNMA | | | | Voya High Yield | | | | Voya Intermediate | |
| | | | Income Fund | | | | Bond Fund | | | | Bond Fund | |
| ASSETS: | | | | | | | | | | | | |
| Investments in securities at fair value+* | | $ | 1,562,869,099 | | | $ | 456,062,834 | | | $ | 8,511,612,541 | |
| Short-term investments at fair value† | | | 34,610,626 | | | | 71,057,477 | | | | 739,333,487 | |
| Cash | | | 178,585 | | | | 2,097,765 | | | | 3,390,782 | |
| Cash collateral for futures contracts | | | 3,681,650 | | | | – | | | | 20,892,886 | |
| Cash pledged for centrally cleared swaps (Note 2) | | | – | | | | – | | | | 3,550,000 | |
| Cash pledged as collateral for OTC derivatives (Note 2) | | | – | | | | – | | | | 1,520,000 | |
| Cash pledged as collateral for delayed-delivery or when-issued securities (Note 2) | | | 80,000 | | | | – | | | | 39,000 | |
| Receivables: | | | | | | | | | | | | |
| Investment securities sold | | | 61,554,482 | | | | 7,048,194 | | | | 74,044,124 | |
| Investment securities sold on a delayed-delivery or when-issued basis | | | 228,312,431 | | | | – | | | | 35,840,805 | |
| Fund shares sold | | | 3,788,687 | | | | 135,884 | | | | 11,271,213 | |
| Dividends | | | – | | | | 3,639 | | | | 11,991 | |
| Interest | | | 4,570,941 | | | | 7,983,620 | | | | 59,056,377 | |
| Variation margin on futures contracts | | | – | | | | – | | | | 57,015 | |
| Unrealized appreciation on forward foreign currency contracts | | | – | | | | – | | | | 8,998 | |
| Unrealized appreciation on forward premium swaptions | | | – | | | | – | | | | 2,509,975 | |
| Prepaid expenses | | | 76,678 | | | | 59,409 | | | | 152,428 | |
| Reimbursement due from Investment Adviser | | | 244,853 | | | | – | | | | – | |
| Other assets | | | 46,905 | | | | 20,495 | | | | 195,754 | |
| Total assets | | | 1,900,014,937 | | | | 544,469,317 | | | | 9,463,487,376 | |
| LIABILITIES: | | | | | | | | | | | | |
| Income distribution payable | | | 545,648 | | | | 173,043 | | | | 4,387,770 | |
| Payable for investment securities purchased | | | 1,012,482 | | | | 13,210,564 | | | | 393,894,547 | |
| Payable for investment securities purchased on a delayed-delivery or | | | | | | | | | | | | |
| when-issued basis | | | 595,845,271 | | | | – | | | | 95,928,905 | |
| Payable for fund shares redeemed | | | 3,595,441 | | | | 434,699 | | | | 6,877,351 | |
| Payable upon receipt of securities loaned | | | – | | | | 52,894,773 | | | | 450,301,034 | |
| Sales commitments^^^ | | | 28,502,201 | | | | – | | | | – | |
| Unrealized depreciation on forward foreign currency contracts | | | – | | | | – | | | | 3,793 | |
| Unrealized depreciation on forward premium swaptions | | | – | | | | – | | | | 297,852 | |
| Unrealized depreciation on OTC swap agreements | | | – | | | | – | | | | 113,985 | |
| Variation margin payable on centrally cleared swaps | | | – | | | | – | | | | 48,999 | |
| Cash received as collateral for delayed-delivery or when-issued securities (Note 2) | | | 2,748,420 | | | | – | | | | – | |
| Cash received as collateral for OTC derivatives (Note 2) | | | – | | | | – | | | | 1,840,000 | |
| Payable for investment management fees | | | 462,002 | | | | 226,781 | | | | 1,938,816 | |
| Payable for distribution and shareholder service fees | | | 76,355 | | | | 12,605 | | | | 99,658 | |
| Payable to trustees under the deferred compensation plan (Note 6) | | | 46,905 | | | | 20,495 | | | | 195,754 | |
| Payable for trustee fees | | | 3,236 | | | | 1,198 | | | | 19,777 | |
| Payable for borrowings against line of credit (Note 8) | | | – | | | | 1,630,000 | | | | 3,926,000 | |
| Other accrued expenses and liabilities | | | 382,993 | | | | 246,166 | | | | 1,174,886 | |
| Written options, at fair value^ | | | – | | | | – | | | | 1,585,601 | |
| Total liabilities | | | 633,220,954 | | | | 68,850,324 | | | | 962,634,728 | |
| NET ASSETS | | $ | 1,266,793,983 | | | $ | 475,618,993 | | | $ | 8,500,852,648 | |
See Accompanying Notes to Financial Statements
STATEMENTS OF ASSETS AND LIABILITIES AS OF MARCH 31, 2024 (continued)
| | | Voya GNMA | | Voya High Yield | | Voya Intermediate |
| | | Income Fund | | Bond Fund | | Bond Fund |
| NET ASSETS WERE COMPRISED OF: | | | | | | | | | | | | |
| Paid-in capital | | $ | 1,494,790,706 | | | $ | 526,576,887 | | | $ | 9,969,358,405 | |
| Total distributable loss | | | (227,996,723 | ) | | | (50,957,894 | ) | | | (1,468,505,757 | ) |
| NET ASSETS | | $ | 1,266,793,983 | | | $ | 475,618,993 | | | $ | 8,500,852,648 | |
| + Including securities loaned at value | | $ | — | | | $ | 51,565,949 | | | $ | 440,684,448 | |
| * Cost of investments in securities | | $ | 1,685,794,567 | | | $ | 459,478,908 | | | $ | 8,924,061,299 | |
| † Cost of short-term investments | | $ | 34,610,449 | | | $ | 71,066,952 | | | $ | 739,490,773 | |
| ‡ Cost of foreign currencies | | $ | — | | | $ | — | | | $ | — | |
| ^ Premiums received on written options | | $ | — | | | $ | — | | | $ | 2,883,426 | |
| ^^^ Proceeds receivable from sales commitments | | $ | 28,626,897 | | | $ | — | | | $ | — | |
See Accompanying Notes to Financial Statements
STATEMENTS OF ASSETS AND LIABILITIES AS OF MARCH 31, 2024 (continued)
| | | Voya GNMA | | Voya High Yield | | Voya Intermediate |
| | | Income Fund | | Bond Fund | | Bond Fund |
| Class A | | | | | | | | | | | | |
| Net assets | | $ | 317,375,463 | | | $ | 35,358,426 | | | $ | 223,398,109 | |
| Shares authorized | | | unlimited | | | | unlimited | | | | unlimited | |
| Par value | | $ | 0.001 | | | $ | 0.001 | | | $ | 0.001 | |
| Shares outstanding | | | 43,497,399 | | | | 5,138,837 | | | | 25,759,658 | |
| Net asset value and redemption price per share† | | $ | 7.30 | | | $ | 6.88 | | | $ | 8.67 | |
| Maximum offering price per share (2.50%)(1) | | $ | 7.49 | | | $ | 7.06 | | | $ | 8.89 | |
| Class C | | | | | | | | | | | | |
| Net assets | | $ | 10,784,679 | | | $ | 5,982,413 | | | $ | 7,103,153 | |
| Shares authorized | | | unlimited | | | | unlimited | | | | unlimited | |
| Par value | | $ | 0.001 | | | $ | 0.001 | | | $ | 0.001 | |
| Shares outstanding | | | 1,485,766 | | | | 870,269 | | | | 820,172 | |
| Net asset value and redemption price per share† | | $ | 7.26 | | | $ | 6.87 | | | $ | 8.66 | |
| Class I | | | | | | | | | | | | |
| Net assets | | $ | 861,582,143 | | | $ | 193,043,511 | | | $ | 5,613,853,173 | |
| Shares authorized | | | unlimited | | | | unlimited | | | | unlimited | |
| Par value | | $ | 0.001 | | | $ | 0.001 | | | $ | 0.001 | |
| Shares outstanding | | | 117,865,076 | | | | 28,122,099 | | | | 646,790,759 | |
| Net asset value and redemption price per share | | $ | 7.31 | | | $ | 6.86 | | | $ | 8.68 | |
| Class R | | | | | | | | | | | | |
| Net assets | | | n/a | | | $ | 296,529 | | | $ | 112,487,135 | |
| Shares authorized | | | n/a | | | | unlimited | | | | unlimited | |
| Par value | | | n/a | | | $ | 0.001 | | | $ | 0.001 | |
| Shares outstanding | | | n/a | | | | 43,098 | | | | 12,953,061 | |
| Net asset value and redemption price per share | | | n/a | | | $ | 6.88 | | | $ | 8.68 | |
| Class R6 | | | | | | | | | | | | |
| Net assets | | $ | 28,496,573 | | | $ | 197,091,925 | | | $ | 2,440,995,887 | |
| Shares authorized | | | unlimited | | | | unlimited | | | | unlimited | |
| Par value | | $ | 0.001 | | | $ | 0.001 | | | $ | 0.001 | |
| Shares outstanding | | | 3,897,559 | | | | 28,647,656 | | | | 281,073,526 | |
| Net asset value and redemption price per share | | $ | 7.31 | | | $ | 6.88 | | | $ | 8.68 | |
| Class W | | | | | | | | | | | | |
| Net assets | | $ | 48,555,125 | | | $ | 43,846,189 | | | $ | 103,015,191 | |
| Shares authorized | | | unlimited | | | | unlimited | | | | unlimited | |
| Par value | | $ | 0.001 | | | $ | 0.001 | | | $ | 0.001 | |
| Shares outstanding | | | 6,631,365 | | | | 6,363,146 | | | | 11,887,966 | |
| Net asset value and redemption price per share | | $ | 7.32 | | | $ | 6.89 | | | $ | 8.67 | |
| (1) | Maximum offering price is computed at 100/97.50 of net asset value. On purchases of $100,000 or more, the offering price is reduced. |
| † | Redemption price per share may be reduced for any applicable contingent deferred sales charges. |
See Accompanying Notes to Financial Statements
STATEMENTS OF ASSETS AND LIABILITIES AS OF MARCH 31, 2024
| | | Voya Short | | | | | | Voya Strategic | |
| | | Duration | | | | | | Income | |
| | | High Income | | | Voya Short Term | | | Opportunities | |
| | | Fund | | | Bond Fund | | | Fund | |
| ASSETS: | | | | | | | | | | | | |
| Investments in securities at fair value+* | | $ | 126,188,710 | | | $ | 540,072,318 | | | $ | 1,671,073,520 | |
| Short-term investments at fair value† | | | 21,610,973 | | | | 21,394,892 | | | | 302,382,804 | |
| Cash | | | 25,836 | | | | 1,234,279 | | | | – | |
| Cash collateral for futures contracts | | | – | | | | 2,080,812 | | | | 6,299,576 | |
| Cash pledged for centrally cleared swaps (Note 2) | | | – | | | | – | | | | 1,896,846 | |
| Cash pledged as collateral for OTC derivatives (Note 2) | | | – | | | | – | | | | 1,930,670 | |
| Cash pledged as collateral for delayed-delivery or when-issued securities (Note 2) | | | – | | | | – | | | | 7,000 | |
| Foreign currencies at value‡ | | | – | | | | – | | | | 1,827,877 | |
| Receivables: | | | | | | | | | | | | |
| Investment securities sold | | | – | | | | 15,282,513 | | | | 155,724,877 | |
| Investment securities sold on a delayed-delivery or when-issued basis | | | – | | | | – | | | | 206,411,513 | |
| Fund shares sold | | | 304,877 | | | | 45,754 | | | | 4,287,810 | |
| Dividends | | | 35,752 | | | | 26,810 | | | | 41,276 | |
| Interest | | | 2,520,063 | | | | 4,013,313 | | | | 14,629,815 | |
| Unrealized appreciation on forward foreign currency contracts | | | – | | | | – | | | | 8,927,888 | |
| Unrealized appreciation on forward premium swaptions | | | – | | | | – | | | | 1,077,714 | |
| Prepaid expenses | | | 56,798 | | | | 60,329 | | | | 157,881 | |
| Reimbursement due from Investment Adviser | | | 2,081 | | | | 17,829 | | | | – | |
| Other assets | | | 62 | | | | 6,181 | | | | 33,884 | |
| Total assets | | | 150,745,152 | | | | 584,235,030 | | | | 2,376,710,951 | |
| LIABILITIES: | | | | | | | | | | | | |
| Income distribution payable | | | 32,329 | | | | 14,552 | | | | 654,843 | |
| Payable for investment securities purchased | | | 1,750,625 | | | | 20,648,890 | | | | 73,784,672 | |
| Payable for investment securities purchased on a delayed-delivery or when- | | | | | | | | | | | | |
| issued basis | | | – | | | | – | | | | 287,992,377 | |
| Payable for fund shares redeemed | | | 376,020 | | | | 297,715 | | | | 2,949,330 | |
| Payable upon receipt of securities loaned | | | 13,182,346 | | | | 10,816,724 | | | | 45,806,838 | |
| Sales commitments^^^ | | | – | | | | – | | | | 99,489,969 | |
| Unrealized depreciation on forward foreign currency contracts | | | – | | | | – | | | | 10,133,913 | |
| Unrealized depreciation on forward premium swaptions | | | – | | | | – | | | | 246,691 | |
| Unrealized depreciation on OTC swap agreements | | | – | | | | – | | | | 52,241 | |
| Variation margin payable on centrally cleared swaps | | | – | | | | – | | | | 77,953 | |
| Cash received as collateral for delayed-delivery or when-issued securities (Note 2) | | | – | | | | – | | | | 310,009 | |
| Cash received as collateral for OTC derivatives (Note 2) | | | – | | | | – | | | | 1,710,000 | |
| Payable for investment management fees | | | 72,047 | | | | 118,236 | | | | 743,178 | |
| Payable for distribution and shareholder service fees | | | 3,209 | | | | 954 | | | | 46,505 | |
| Payable to custodian due to bank overdraft | | | – | | | | – | | | | 325,463 | |
| Payable to trustees under the deferred compensation plan (Note 6) | | | 62 | | | | 6,181 | | | | 33,883 | |
| Payable for trustee fees | | | 145 | | | | 3,784 | | | | 17,970 | |
| Other accrued expenses and liabilities | | | 24,971 | | | | 66,044 | | | | 445,629 | |
| Unfunded loan commitments (Note 10) | | | – | | | | – | | | | 71,925 | |
| Written options, at fair value^ | | | – | | | | – | | | | 2,580,461 | |
| Total liabilities | | | 15,441,754 | | | | 31,973,080 | | | | 527,473,850 | |
| NET ASSETS | | $ | 135,303,398 | | | $ | 552,261,950 | | | $ | 1,849,237,101 | |
See Accompanying Notes to Financial Statements
STATEMENTS OF ASSETS AND LIABILITIES as of MARCH 31, 2024 (CONTINUED)
| | | | Voya Short | | | | | | Voya Strategic | |
| | | | Duration | | | | | | Income | |
| | | | High Income | | | Voya Short Term | | | Opportunities | |
| | | | Fund | | | Bond Fund | | | Fund | |
| NET ASSETS WERE COMPRISED OF: | | | | | | | | | | | | |
| Paid-in capital | | $ | 134,302,394 | | | $ | 585,496,201 | | | $ | 2,138,450,703 | |
| Total distributable earnings (loss) | | | 1,001,004 | | | | (33,234,251 | ) | | | (289,213,602 | ) |
| NET ASSETS | | $ | 135,303,398 | | | $ | 552,261,950 | | | $ | 1,849,237,101 | |
| | | | | | | | | | | | | | |
| + | Including securities loaned at value | | $ | 12,821,623 | | | $ | 10,525,092 | | | $ | 44,571,260 | |
| * | Cost of investments in securities | | $ | 125,675,366 | | | $ | 542,145,714 | | | $ | 1,761,868,574 | |
| † | Cost of short-term investments | | $ | 21,610,973 | | | $ | 21,400,835 | | | $ | 302,536,170 | |
| ‡ | Cost of foreign currencies | | $ | — | | | $ | — | | | $ | 1,827,466 | |
| ^ | Premiums received on written options | | $ | — | | | $ | — | | | $ | 4,252,617 | |
| ^^^ | Proceeds receivable from sales commitments | | $ | — | | | $ | — | | | $ | 99,045,777 | |
See Accompanying Notes to Financial Statements
STATEMENTS OF ASSETS AND LIABILITIES AS OF MARCH 31, 2024 (CONTINUED)
| | | Voya Short | | | | | | | |
| | | Duration | | | | | | Voya Strategic | |
| | | High Income | | | Voya Short Term | | | Income | |
| | | Fund | | | Bond Fund | | | Opportunities Fund | |
| Class A | | | | | | | | | | | | |
| Net assets | | $ | 13,674,284 | | | $ | 4,124,223 | | | $ | 62,536,083 | |
| Shares authorized | | | unlimited | | | | unlimited | | | | unlimited | |
| Par value | | $ | 0.001 | | | $ | 0.001 | | | $ | 0.001 | |
| Shares outstanding | | | 1,349,131 | | | | 444,886 | | | | 6,835,384 | |
| Net asset value and redemption price per share† | | $ | 10.14 | | | $ | 9.27 | | | $ | 9.15 | |
| Maximum offering price per share (2.50%)(1) | | $ | 10.40 | | | $ | 9.51 | | | $ | 9.38 | |
| Class C | | | | | | | | | | | | |
| Net assets | | $ | 348,862 | | | $ | 81,948 | | | $ | 33,295,548 | |
| Shares authorized | | | unlimited | | | | unlimited | | | | unlimited | |
| Par value | | $ | 0.001 | | | $ | 0.001 | | | $ | 0.001 | |
| Shares outstanding | | | 34,021 | | | | 8,833 | | | | 3,693,323 | |
| Net asset value and redemption price per share† | | $ | 10.25 | | | $ | 9.28 | | | $ | 9.02 | |
| Class I | | | | | | | | | | | | |
| Net assets | | $ | 94,349,332 | | | $ | 34,484,111 | | | $ | 1,477,279,648 | |
| Shares authorized | | | unlimited | | | | unlimited | | | | unlimited | |
| Par value | | $ | 0.001 | | | $ | 0.001 | | | $ | 0.001 | |
| Shares outstanding | | | 9,308,975 | | | | 3,723,355 | | | | 161,315,011 | |
| Net asset value and redemption price per share | | $ | 10.14 | | | $ | 9.26 | | | $ | 9.16 | |
| Class R | | | | | | | | | | | | |
| Net assets | | | n/a | | | $ | 33,963 | | | $ | 16,376,586 | |
| Shares authorized | | | n/a | | | | unlimited | | | | unlimited | |
| Par value | | | n/a | | | $ | 0.001 | | | $ | 0.001 | |
| Shares outstanding | | | n/a | | | | 3,651 | | | | 1,804,466 | |
| Net asset value and redemption price per share | | | n/a | | | $ | 9.30 | | | $ | 9.08 | |
| Class R6 | | | | | | | | | | | | |
| Net assets | | $ | 26,930,920 | | | $ | 503,454,978 | | | $ | 243,077,018 | |
| Shares authorized | | | unlimited | | | | unlimited | | | | unlimited | |
| Par value | | $ | 0.001 | | | $ | 0.001 | | | $ | 0.001 | |
| Shares outstanding | | | 2,657,426 | | | | 54,297,780 | | | | 26,621,174 | |
| Net asset value and redemption price per share | | $ | 10.13 | | | $ | 9.27 | | | $ | 9.13 | |
| Class W | | | | | | | | | | | | |
| Net assets | | | n/a | | | $ | 10,082,727 | | | $ | 16,672,218 | |
| Shares authorized | | | n/a | | | | unlimited | | | | unlimited | |
| Par value | | | n/a | | | $ | 0.001 | | | $ | 0.001 | |
| Shares outstanding | | | n/a | | | | 1,084,417 | | | | 1,826,700 | |
| Net asset value and redemption price per share | | | n/a | | | $ | 9.30 | | | $ | 9.13 | |
| (1) | | Maximum offering price is computed at 100/97.50 of net asset value. On purchases of $100,000 or more, the offering price is reduced. |
| † | | Redemption price per share may be reduced for any applicable contingent deferred sales charges. |
See Accompanying Notes to Financial Statements
STATEMENTS OF OPERATIONS FOR THE YEAR ENDED MARCH 31, 2024
| | | Voya GNMA | | | Voya High Yield | | | Voya Intermediate | |
| | | Income Fund | | | Bond Fund | | | Bond Fund | |
| INVESTMENT INCOME: | | | | | | | | | | | | |
| Dividends | | $ | — | | | $ | 44,901 | | | $ | 435,745 | |
| Interest, net of foreign taxes withheld* | | | 52,736,408 | | | | 34,660,572 | | | | 356,743,874 | |
| Securities lending income, net | | | — | | | | 236,603 | | | | 2,154,572 | |
| Other | | | 8,511 | | | | 3,089 | | | | 51,387 | |
| Total investment income | | | 52,744,919 | | | | 34,945,165 | | | | 359,385,578 | |
| EXPENSES: | | | | | | | | | | | | |
| Investment management fees | | | 5,765,279 | | | | 2,919,436 | | | | 21,358,181 | |
| Distribution and shareholder service fees: | | | | | | | | | | | | |
| Class A | | | 869,008 | | | | 89,192 | | | | 560,855 | |
| Class C | | | 138,718 | | | | 62,261 | | | | 77,840 | |
| Class R | | | — | | | | 1,354 | | | | 534,443 | |
| Transfer agent fees: | | | | | | | | | | | | |
| Class A | | | 380,121 | | | | 56,437 | | | | 393,896 | |
| Class C | | | 15,146 | | | | 9,849 | | | | 13,683 | |
| Class I | | | 748,189 | | | | 126,873 | | | | 2,238,661 | |
| Class R | | | — | | | | 426 | | | | 187,543 | |
| Class R6 | | | 88 | | | | 1,006 | | | | 28,723 | |
| Class W | | | 72,401 | | | | 92,085 | | | | 143,044 | |
| Shareholder reporting expense | | | 80,520 | | | | 23,790 | | | | 189,740 | |
| Registration fees | | | 153,537 | | | | 123,218 | | | | 194,443 | |
| Professional fees | | | 121,811 | | | | 33,438 | | | | 323,150 | |
| Custody and accounting expense | | | 244,236 | | | | 114,150 | | | | 513,071 | |
| Trustee fees | | | 32,357 | | | | 11,975 | | | | 197,769 | |
| Miscellaneous expense | | | 72,457 | | | | 35,918 | | | | 374,737 | |
| Interest expense | | | 520 | | | | 3,066 | | | | 3,249 | |
| Total expenses | | | 8,694,388 | | | | 3,704,474 | | | | 27,333,028 | |
| Waived and reimbursed fees | | | (464,180 | ) | | | (239,466 | ) | | | — | |
| Net expenses | | | 8,230,208 | | | | 3,465,008 | | | | 27,333,028 | |
| Net investment income | | | 44,514,711 | | | | 31,480,157 | | | | 332,052,550 | |
| REALIZED AND UNREALIZED GAIN (LOSS): | | | | | | | | | | | | |
| Net realized gain (loss) on: | | | | | | | | | | | | |
| Investments | | | (15,559,385 | ) | | | (21,723,945 | ) | | | (192,528,836 | ) |
| Forward foreign currency contracts | | | — | | | | — | | | | 28,954 | |
| Foreign currency related transactions | | | — | | | | — | | | | (109,908 | ) |
| Futures | | | 8,020,769 | | | | — | | | | (27,678,527 | ) |
| Swaps | | | — | | | | 116,797 | | | | (29,490,562 | ) |
| Written options | | | — | | | | — | | | | 31,802,819 | |
| Net realized loss | | | (7,538,616 | ) | | | (21,607,148 | ) | | | (217,976,060 | ) |
| Net change in unrealized appreciation (depreciation) on: | | | | | | | | | | | | |
| Investments | | | (23,414,022 | ) | | | 34,044,141 | | | | 174,640,054 | |
| Forward foreign currency contracts | | | — | | | | — | | | | 58,762 | |
| Foreign currency related transactions | | | — | | | | — | | | | (13,840 | ) |
| Futures | | | 1,567,240 | | | | — | | | | (880,643 | ) |
| Swaps | | | — | | | | — | | | | 2,346,772 | |
| Written options | | | — | | | | — | | | | 1,167,982 | |
| Sales commitments | | | 124,696 | | | | — | | | | — | |
| Net change in unrealized appreciation (depreciation) | | | (21,722,086 | ) | | | 34,044,141 | | | | 177,319,087 | |
| Net realized and unrealized gain (loss) | | | (29,260,702 | ) | | | 12,436,993 | | | | (40,656,973 | ) |
| Increase in net assets resulting from operations | | $ | 15,254,009 | | | $ | 43,917,150 | | | $ | 291,395,577 | |
| * Foreign taxes withheld | | $ | — | | | $ | — | | | $ | 70,524 | |
See Accompanying Notes to Financial Statements
STATEMENTS OF OPERATIONS FOR THE YEAR ENDED MARCH 31, 2024
| | | Voya Short | | | | | | | |
| | | Duration | | | | | | Voya Strategic | |
| | | High Income | | | Voya Short Term | | | Income | |
| | | Fund | | | Bond Fund | | | Opportunities Fund | |
| INVESTMENT INCOME: | | | | | | | | | | | | |
| Dividends | | $ | 204,146 | | | $ | 209,865 | | | $ | 723,523 | |
| Interest | | | 4,687,542 | | | | 24,722,217 | | | | 103,419,848 | |
| Securities lending income, net | | | 43,720 | | | | 39,726 | | | | 182,932 | |
| Other | | | 282 | | | | 3,295 | | | | 11,239 | |
| Total investment income | | | 4,935,690 | | | | 24,975,103 | | | | 104,337,542 | |
| EXPENSES: | | | | | | | | | | | | |
| Investment management fees | | | 278,442 | | | | 1,343,151 | | | | 8,334,340 | |
| Distribution and shareholder service fees: | | | | | | | | | | | | |
| Class A | | | 28,938 | | | | 15,250 | | | | 160,400 | |
| Class C | | | 407 | | | | 1,152 | | | | 348,647 | |
| Class R | | | — | | | | 142 | | | | 85,515 | |
| Transfer agent fees: | | | | | | | | | | | | |
| Class A | | | 1,002 | | | | 5,080 | | | | 36,688 | |
| Class C | | | 3 | | | | 96 | | | | 19,935 | |
| Class I | | | 7,922 | | | | 25,068 | | | | 1,020,678 | |
| Class R | | | — | | | | 23 | | | | 9,779 | |
| Class R6 | | | 124 | | | | 923 | | | | 574 | |
| Class W | | | — | | | | 9,548 | | | | 9,303 | |
| Shareholder reporting expense | | | 1,098 | | | | 10,006 | | | | 102,000 | |
| Registration fees | | | 40,082 | | | | 111,463 | | | | 217,247 | |
| Professional fees | | | 68,505 | | | | 37,271 | | | | 94,930 | |
| Custody and accounting expense | | | 14,505 | | | | 102,312 | | | | 332,635 | |
| Trustee fees | | | 1,450 | | | | 14,550 | | | | 63,000 | |
| Offering expense | | | 84,759 | | | | — | | | | — | |
| Miscellaneous expense | | | 12,924 | | | | 35,805 | | | | 107,006 | |
| Total expenses | | | 540,161 | | | | 1,711,840 | | | | 10,942,677 | |
| Waived and reimbursed fees | | | (164,240 | ) | | | (37,205 | ) | | | — | |
| Net expenses | | | 375,921 | | | | 1,674,635 | | | | 10,942,677 | |
| Net investment income | | | 4,559,769 | | | | 23,300,468 | | | | 93,394,865 | |
| REALIZED AND UNREALIZED GAIN (LOSS): | | | | | | | | | | | | |
| Net realized gain (loss) on: | | | | | | | | | | | | |
| Investments | | | 535,877 | | | | (3,944,335 | ) | | | (67,552,989 | ) |
| Forward foreign currency contracts | | | — | | | | — | | | | (8,540,315 | ) |
| Foreign currency related transactions | | | — | | | | — | | | | (3,111,039 | ) |
| Futures | | | — | | | | (3,882,910 | ) | | | 6,165,853 | |
| Swaps | | | — | | | | 242,000 | | | | (23,051,923 | ) |
| Written options | | | — | | | | — | | | | 18,343,926 | |
| Net realized gain (loss) | | | 535,877 | | | | (7,585,245 | ) | | | (77,746,487 | ) |
| Net change in unrealized appreciation (depreciation) on: | | | | | | | | | | | | |
| Investments | | | 804,480 | | | | 8,617,049 | | | | 98,914,964 | |
| Forward foreign currency contracts | | | — | | | | — | | | | (259,381 | ) |
| Foreign currency related transactions | | | — | | | | — | | | | (52,579 | ) |
| Futures | | | — | | | | (1,542,007 | ) | | | 7,682,665 | |
| Swaps | | | — | | | | — | | | | 1,886,696 | |
| Written options | | | — | | | | — | | | | 1,068,613 | |
| Sales commitments | | | — | | | | — | | | | (444,191 | ) |
| Net change in unrealized appreciation (depreciation) | | | 804,480 | | | | 7,075,042 | | | | 108,796,787 | |
| Net realized and unrealized gain (loss) | | | 1,340,357 | | | | (510,203 | ) | | | 31,050,300 | |
| Increase in net assets resulting from operations | | $ | 5,900,126 | | | $ | 22,790,265 | | | $ | 124,445,165 | |
See Accompanying Notes to Financial Statements
STATEMENTS OF CHANGES IN NET ASSETS
| | | Voya GNMA Income Fund | | | Voya High Yield Bond Fund | |
| | | Year Ended | | | Year Ended | | | Year Ended | | | Year Ended | |
| | | March 31, | | | March 31, | | | March 31, | | | March 31, | |
| | | 2024 | | | 2023 | | | 2024 | | | 2023 | |
| FROM OPERATIONS: | | | | | | | | | | | | | | | | |
| Net investment income | | $ | 44,514,711 | | | $ | 30,252,354 | | | $ | 31,480,157 | | | $ | 29,857,928 | |
| Net realized loss | | | (7,538,616 | ) | | | (32,427,693 | ) | | | (21,607,148 | ) | | | (39,906,407 | ) |
| Net change in unrealized appreciation (depreciation) | | | (21,722,086 | ) | | | (60,934,387 | ) | | | 34,044,141 | | | | (23,857,257 | ) |
| Increase (decrease) in net assets resulting from operations | | | 15,254,009 | | | | (63,109,726 | ) | | | 43,917,150 | | | | (33,905,736 | ) |
| FROM DISTRIBUTIONS TO SHAREHOLDERS: | | | | | | | | | | | | | | | | |
| Total distributions (excluding return of capital): | | | | | | | | | | | | | | | | |
| Class A | | | (12,123,296 | ) | | | (10,491,150 | ) | | | (2,259,494 | ) | | | (2,554,975 | ) |
| Class C | | | (380,277 | ) | | | (368,292 | ) | | | (347,258 | ) | | | (467,388 | ) |
| Class I | | | (31,637,063 | ) | | | (21,238,171 | ) | | | (12,955,684 | ) | | | (13,144,289 | ) |
| Class P(1)(2) | | | — | | | | (13,469 | ) | | | — | | | | (11,487,958 | ) |
| Class P3(3) | | | — | | | | — | | | | — | | | | (64,348 | ) |
| Class R | | | — | | | | — | | | | (16,515 | ) | | | (14,866 | ) |
| Class R6 | | | (1,386,386 | ) | | | (828,986 | ) | | | (12,562,699 | ) | | | (3,023,188 | ) |
| Class W | | | (2,495,272 | ) | | | (2,192,176 | ) | | | (3,810,308 | ) | | | (4,839,822 | ) |
| Total distributions | | | (48,022,294 | ) | | | (35,132,244 | ) | | | (31,951,958 | ) | | | (35,596,834 | ) |
| FROM CAPITAL SHARE TRANSACTIONS: | | | | | | | | | | | | | | | | |
| Net proceeds from sale of shares | | | 567,140,914 | | | | 649,321,039 | | | | 254,267,728 | | | | 186,065,536 | |
| Reinvestment of distributions | | | 41,021,431 | | | | 28,796,975 | | | | 30,358,921 | | | | 33,440,427 | |
| | | | 608,162,345 | | | | 678,118,014 | | | | 284,626,649 | | | | 219,505,963 | |
| Cost of shares redeemed | | | (635,223,162 | ) | | | (714,135,201 | ) | | | (205,422,210 | ) | | | (416,193,851 | ) |
| Net increase (decrease) in net assets resulting from capital share transactions | | | (27,060,817 | ) | | | (36,017,187 | ) | | | 79,204,439 | | | | (196,687,888 | ) |
| Net increase (decrease) in net assets | | | (59,829,102 | ) | | | (134,259,157 | ) | | | 91,169,631 | | | | (266,190,458 | ) |
| NET ASSETS: | | | | | | | | | | | | | | | | |
| Beginning of year or period | | | 1,326,623,085 | | | | 1,460,882,242 | | | | 384,449,362 | | | | 650,639,820 | |
| End of year or period | | $ | 1,266,793,983 | | | $ | 1,326,623,085 | | | $ | 475,618,993 | | | $ | 384,449,362 | |
| (1) | Class P of Voya High Yield Bond was fully redeemed on close of business February 24, 2023 |
| (2) | Class P of Voya GNMA Income Bond was fully redeemed on close of business March 24, 2023 |
| (3) | Class P3 of Voya High Yield Bond was fully redeemed on close of business February 22, 2023 |
See Accompanying Notes to Financial Statements
STATEMENTS OF CHANGES IN NET ASSETS
| | | | | | | | | Voya Short Duration | |
| | | Voya Intermediate Bond Fund | | | High Income Fund | |
| | | Year Ended | | | Year Ended | | | Year Ended | | | February 9, | |
| | | March 31, | | | March 31, | | | March 31, | | | 2023(1) | |
| | | 2024 | | | 2023 | | | 2024 | | | to March 31, 2023 | |
| FROM OPERATIONS: | | | | | | | | | | | | | | | | |
| Net investment income | | $ | 332,052,550 | | | $ | 267,022,346 | | | $ | 4,559,769 | | | $ | 257,841 | |
| Net realized gain (loss) | | | (217,976,060 | ) | | | (683,303,625 | ) | | | 535,877 | | | | 1,108 | |
| Net change in unrealized appreciation (depreciation) | | | 177,319,087 | | | | (132,595,254 | ) | | | 804,480 | | | | (291,137 | ) |
| Increase (decrease) in net assets resulting from operations | | | 291,395,577 | | | | (548,876,533 | ) | | | 5,900,126 | | | | (32,188 | ) |
| FROM DISTRIBUTIONS TO | | | | | | | | | | | | | | | | |
| SHAREHOLDERS: | | | | | | | | | | | | | | | | |
| Total distributions (excluding return of capital): | | | | | | | | | | | | | | | | |
| Class A | | | (8,809,565 | ) | | | (8,237,422 | ) | | | (900,991 | ) | | | (83,538 | ) |
| Class C | | | (245,467 | ) | | | (245,934 | ) | | | (2,750 | ) | | | — | |
| Class I | | | (222,485,923 | ) | | | (165,463,655 | ) | | | (2,532,932 | ) | | | (88,802 | ) |
| Class P3(2) | | | — | | | | (2,228,466 | ) | | | — | | | | — | |
| Class R | | | (3,933,902 | ) | | | (3,178,526 | ) | | | — | | | | — | |
| Class R6 | | | (101,531,654 | ) | | | (74,737,088 | ) | | | (1,172,298 | ) | | | (85,623 | ) |
| Class W | | | (3,486,173 | ) | | | (2,588,610 | ) | | | — | | | | — | |
| Total distributions | | | (340,492,684 | ) | | | (256,679,701 | ) | | | (4,608,971 | ) | | | (257,963 | ) |
| FROM CAPITAL SHARE TRANSACTIONS: | | | | | | | | | | | | | | | | |
| Net proceeds from sale of shares | | | 2,506,939,881 | | | | 3,059,416,633 | | | | 111,077,076 | | | | 25,763,674 | |
| Reinvestment of distributions | | | 298,308,043 | | | | 225,244,907 | | | | 4,530,308 | | | | 257,662 | |
| | | | 2,805,247,924 | | | | 3,284,661,540 | | | | 115,607,384 | | | | 26,021,336 | |
| Cost of shares redeemed | | | (1,929,067,994 | ) | | | (4,234,385,573 | ) | | | (7,326,326 | ) | | | — | |
| Net increase (decrease) in net assets resulting from capital share transactions | | | 876,179,930 | | | | (949,724,033 | ) | | | 108,281,058 | | | | 26,021,336 | |
| Net increase (decrease) in net assets | | | 827,082,823 | | | | (1,755,280,267 | ) | | | 109,572,213 | | | | 25,731,185 | |
| NET ASSETS: | | | | | | | | | | | | | | | | |
| Beginning of year or period | | | 7,673,769,825 | | | | 9,429,050,092 | | | | 25,731,185 | | | | — | |
| End of year or period | | $ | 8,500,852,648 | | | $ | 7,673,769,825 | | | $ | 135,303,398 | | | $ | 25,731,185 | |
| (1) | Commencement of operations. |
| (2) | Class P3 of Voya Intermediate Bond Fund was fully redeemed on close of business March 30, 2023 |
See Accompanying Notes to Financial Statements
STATEMENTS OF CHANGES IN NET ASSETS
| | | | | | | | | | | | Voya Strategic | |
| | | | Voya Short Term Bond Fund | | | | Income Opportunities Fund | |
| | | | Year Ended | | | | Year Ended | | | | Year Ended | | | | Year Ended | |
| | | | March 31, | | | | March 31, | | | | March 31, | | | | March 31, | |
| | | | 2024 | | | | 2023 | | | | 2024 | | | | 2023 | |
| FROM OPERATIONS: | | | | | | | | | | | | | | | | |
| Net investment income | | $ | 23,300,468 | | | $ | 10,653,221 | | | $ | 93,394,865 | | | $ | 84,305,716 | |
| Net realized loss | | | (7,585,245 | ) | | | (16,755,431 | ) | | | (77,746,487 | ) | | | (52,095,846 | ) |
| Net change in unrealized appreciation (depreciation) | | | 7,075,042 | | | | 2,890,194 | | | | 108,796,787 | | | | (104,208,664 | ) |
| Increase (decrease) in net assets resulting from operations | | | 22,790,265 | | | | (3,212,016 | ) | | | 124,445,165 | | | | (71,998,794 | ) |
| FROM DISTRIBUTIONS TO SHAREHOLDERS: | | | | | | | | | | | | | | | | |
| Total distributions (excluding return of capital): | | | | | | | | | | | | | | | | |
| Class A | | | (239,790 | ) | | | (294,688 | ) | | | (3,313,843 | ) | | | (3,067,098 | ) |
| Class C | | | (3,665 | ) | | | (3,065 | ) | | | (1,541,527 | ) | | | (1,177,474 | ) |
| Class I | | | (1,493,293 | ) | | | (793,011 | ) | | | (77,401,507 | ) | | | (67,551,126 | ) |
| Class P(1) | | | — | | | | — | | | | — | | | | (54 | ) |
| Class P2(2) | | | — | | | | (296,816 | ) | | | — | | | | — | |
| Class P3(2) | | | — | | | | (136,892 | ) | | | — | | | | — | |
| Class R | | | (1,092 | ) | | | (387 | ) | | | (841,060 | ) | | | (622,070 | ) |
| Class R6 | | | (21,319,070 | ) | | | (8,453,611 | ) | | | (5,783,413 | ) | | | (6,248,389 | ) |
| Class W | | | (487,725 | ) | | | (369,048 | ) | | | (880,392 | ) | | | (916,333 | ) |
| Total distributions | | | (23,544,635 | ) | | | (10,347,518 | ) | | | (89,761,742 | ) | | | (79,582,544 | ) |
| FROM CAPITAL SHARE TRANSACTIONS: | | | | | | | | | | | | | | | | |
| Net proceeds from sale of shares | | | 282,224,676 | | | | 185,484,275 | | | | 747,508,298 | | | | 654,401,823 | |
| Reinvestment of distributions | | | 23,449,458 | | | | 10,302,316 | | | | 81,532,765 | | | | 72,052,949 | |
| | | | 305,674,134 | | | | 195,786,591 | | | | 829,041,063 | | | | 726,454,772 | |
| Cost of shares redeemed | | | (143,991,340 | ) | | | (263,424,042 | ) | | | (873,990,211 | ) | | | (1,182,478,619 | ) |
| Net increase (decrease) in net assets resulting | | | | | | | | | | | | | | | | |
| from capital share transactions | | | 161,682,794 | | | | (67,637,451 | ) | | | (44,949,148 | ) | | | (456,023,847 | ) |
| Net increase (decrease) in net assets | | | 160,928,424 | | | | (81,196,985 | ) | | | (10,265,725 | ) | | | (607,605,185 | ) |
| NET ASSETS: | | | | | | | | | | | | | | | | |
| Beginning of year or period | | | 391,333,526 | | | | 472,530,511 | | | | 1,859,502,826 | | | | 2,467,108,011 | |
| End of year or period | | $ | 552,261,950 | | | $ | 391,333,526 | | | $ | 1,849,237,101 | | | $ | 1,859,502,826 | |
| (1) | Class P of Voya Strategic Income Opportunities Fund was fully redeemed on close of business September 8, 2022. |
| (2) | Class P2 and Class P3 of Voya Short Term Bond Fund were fully redeemed on close of business November 29, 2022 and November 3, 2022, respectively. |
See Accompanying Notes to Financial Statements
FINANCIAL HIGHLIGHTS
Selected data for a share of beneficial interest outstanding throughout each year or period.
| | | | Income (loss)
from investment
operations | | | | Less Distributions | | | | | | Ratios to average net assets | Supplemental
Data |
| | |  | |  | |  | |  | |  | |  | |  | |  | |  | |  | |  | |  | |  | |  | |  | |  | |  |
Year or
period ended | | ($) | | ($) | | ($) | | ($) | | ($) | | ($) | | ($) | | ($) | | ($) | | ($) | | (%) | | (%) | | (%) | | (%) | | (%) | | ($000's) | | (%) |
| | | | | | | | | | | | | | | | | | | | | | | | | | | | | | | | | | | |
| Voya GNMA Income Fund | | | | | | | | | | | | | | | | | | | | | | | | | | | | |
| Class A | | | | | | | | | | | | | | | | | | | | | | | | | | | | | | | | | | |
| 03-31-24 | | 7.47 | | 0.23• | | (0.15) | | 0.08 | | 0.25 | | — | | — | | 0.25 | | — | | 7.30 | | 1.20 | | 0.86 | | 0.84 | | 0.84 | | 3.23 | | 317,375 | | 495 |
| 03-31-23 | | 8.03 | | 0.16• | | (0.53) | | (0.37) | | 0.19 | | — | | — | | 0.19 | | — | | 7.47 | | (4.53) | | 0.83 | | 0.84 | | 0.84 | | 2.17 | | 389,829 | | 353 |
| 03-31-22 | | 8.50 | | 0.04• | | (0.40) | | (0.36) | | 0.10 | | — | | 0.01 | | 0.11 | | — | | 8.03 | | (4.36) | | 0.84 | | 0.84 | | 0.84 | | 0.45 | | 464,615 | | 539 |
| 03-31-21 | | 8.58 | | 0.07• | | 0.02 | | 0.09 | | 0.14 | | — | | 0.03 | | 0.17 | | — | | 8.50 | | 1.08 | | 0.85 | | 0.84 | | 0.84 | | 0.82 | | 591,762 | | 419 |
| 03-31-20 | | 8.36 | | 0.18• | | 0.27 | | 0.45 | | 0.23 | | — | | — | | 0.23 | | — | | 8.58 | | 5.43 | | 0.93 | | 0.92 | | 0.92 | | 2.12 | | 493,737 | | 421 |
| Class C | | | | | | | | | | | | | | | | | | | | | | | | | | | | | | | | | | |
| 03-31-24 | | 7.43 | | 0.18• | | (0.15) | | 0.03 | | 0.20 | | — | | — | | 0.20 | | — | | 7.26 | | 0.44 | | 1.61 | | 1.59 | | 1.59 | | 2.48 | | 10,785 | | 495 |
| 03-31-23 | | 7.99 | | 0.10• | | (0.52) | | (0.42) | | 0.14 | | — | | — | | 0.14 | | — | | 7.43 | | (5.28) | | 1.58 | | 1.59 | | 1.59 | | 1.39 | | 17,679 | | 353 |
| 03-31-22 | | 8.46 | | (0.03)• | | (0.40) | | (0.43) | | 0.03 | | — | | 0.01 | | 0.04 | | — | | 7.99 | | (5.10) | | 1.59 | | 1.59 | | 1.59 | | (0.32) | | 26,837 | | 539 |
| 03-31-21 | | 8.53 | | 0.01• | | 0.03 | | 0.04 | | 0.08 | | — | | 0.03 | | 0.11 | | — | | 8.46 | | 0.44 | | 1.60 | | 1.59 | | 1.59 | | 0.09 | | 48,911 | | 419 |
| 03-31-20 | | 8.31 | | 0.12• | | 0.26 | | 0.38 | | 0.16 | | — | | — | | 0.16 | | — | | 8.53 | | 4.66 | | 1.68 | | 1.67 | | 1.67 | | 1.37 | | 47,577 | | 421 |
| Class I | | | | | | | | | | | | | | | | | | | | | | | | | | | | | | | | | | |
| 03-31-24 | | 7.49 | | 0.26• | | (0.16) | | 0.10 | | 0.28 | | — | | — | | 0.28 | | — | | 7.31 | | 1.39 | | 0.59 | | 0.54 | | 0.54 | | 3.53 | | 861,582 | | 495 |
| 03-31-23 | | 8.04 | | 0.19• | | (0.52) | | (0.33) | | 0.22 | | — | | — | | 0.22 | | — | | 7.49 | | (4.11) | | 0.56 | | 0.54 | | 0.54 | | 2.48 | | 822,846 | | 353 |
| 03-31-22 | | 8.52 | | 0.06• | | (0.41) | | (0.35) | | 0.12 | | — | | 0.01 | | 0.13 | | — | | 8.04 | | (4.18) | | 0.56 | | 0.54 | | 0.54 | | 0.74 | | 834,623 | | 539 |
| 03-31-21 | | 8.59 | | 0.09• | | 0.04 | | 0.13 | | 0.17 | | — | | 0.03 | | 0.20 | | — | | 8.52 | | 1.50 | | 0.57 | | 0.54 | | 0.54 | | 1.10 | | 968,367 | | 419 |
| 03-31-20 | | 8.37 | | 0.21• | | 0.26 | | 0.47 | | 0.25 | | — | | — | | 0.25 | | — | | 8.59 | | 5.75 | | 0.67 | | 0.62 | | 0.62 | | 2.42 | | 604,194 | | 421 |
| Class R6 | | | | | | | | | | | | | | | | | | | | | | | | | | | | | | | | | | |
| 03-31-24 | | 7.49 | | 0.26• | | (0.16) | | 0.10 | | 0.28 | | — | | — | | 0.28 | | — | | 7.31 | | 1.44 | | 0.50 | | 0.50 | | 0.50 | | 3.58 | | 28,497 | | 495 |
| 03-31-23 | | 8.05 | | 0.19• | | (0.53) | | (0.34) | | 0.22 | | — | | — | | 0.22 | | — | | 7.49 | | (4.21) | | 0.49 | | 0.49 | | 0.49 | | 2.57 | | 29,707 | | 353 |
| 03-31-22 | | 8.52 | | 0.07• | | (0.41) | | (0.34) | | 0.12 | | — | | 0.01 | | 0.13 | | — | | 8.05 | | (4.06) | | 0.48 | | 0.48 | | 0.48 | | 0.81 | | 23,951 | | 539 |
| 07-31-20(4)- | | | | | | | | | | | | | | | | | | | | | | | | | | | | | | | | | | |
| 03-31-21 | | 8.58 | | 0.04• | | 0.02 | | 0.06 | | 0.09 | | — | | 0.03 | | 0.12 | | — | | 8.52 | | 0.64 | | 0.48 | | 0.48 | | 0.48 | | 0.62 | | 41,739 | | 419 |
| Class W | | | | | | | | | | | | | | | | | | | | | | | | | | | | | | | | | | |
| 03-31-24 | | 7.50 | | 0.25• | | (0.16) | | 0.09 | | 0.27 | | — | | — | | 0.27 | | — | | 7.32 | | 1.34 | | 0.61 | | 0.59 | | 0.59 | | 3.48 | | 48,555 | | 495 |
| 03-31-23 | | 8.05 | | 0.18• | | (0.52) | | (0.34) | | 0.21 | | — | | — | | 0.21 | | — | | 7.50 | | (4.15) | | 0.58 | | 0.59 | | 0.59 | | 2.36 | | 66,562 | | 353 |
| 03-31-22 | | 8.53 | | 0.06• | | (0.41) | | (0.35) | | 0.12 | | — | | 0.01 | | 0.13 | | — | | 8.05 | | (4.22) | | 0.59 | | 0.59 | | 0.59 | | 0.70 | | 110,824 | | 539 |
| 03-31-21 | | 8.60 | | 0.09• | | 0.04 | | 0.13 | | 0.17 | | — | | 0.03 | | 0.20 | | — | | 8.53 | | 1.45 | | 0.60 | | 0.59 | | 0.59 | | 1.02 | | 179,530 | | 419 |
| 03-31-20 | | 8.38 | | 0.20• | | 0.27 | | 0.47 | | 0.25 | | — | | — | | 0.25 | | — | | 8.60 | | 5.69 | | 0.68 | | 0.67 | | 0.67 | | 2.38 | | 155,915 | | 421 |
| Voya High Yield Bond Fund | | | | | | | | | | | | | | | | | | | | | | | | | | | | | | |
| Class A | | | | | | | | | | | | | | | | | | | | | | | | | | | | | | | | | | |
| 03-31-24 | | 6.73 | | 0.42• | | 0.16 | | 0.58 | | 0.43 | | — | | — | | 0.43 | | — | | 6.88 | | 8.89 | | 1.09 | | 1.04 | | 1.04 | | 6.24 | | 35,358 | | 62 |
| 03-31-23 | | 7.58 | | 0.37• | | (0.77) | | (0.40) | | 0.36 | | 0.09 | | — | | 0.45 | | — | | 6.73 | | (5.07) | | 1.08 | | 1.07 | | 1.07 | | 5.46 | | 38,546 | | 70 |
| 03-31-22 | | 7.99 | | 0.36• | | (0.40) | | (0.04) | | 0.37 | | 0.00* | | — | | 0.37 | | — | | 7.58 | | (0.62) | | 1.04 | | 1.04 | | 1.04 | | 4.55 | | 45,842 | | 63 |
| 03-31-21 | | 7.02 | | 0.38• | | 0.99 | | 1.37 | | 0.38 | | — | | 0.02 | | 0.40 | | — | | 7.99 | | 19.76 | | 1.04 | | 1.04 | | 1.04 | | 4.86 | | 49,805 | | 78 |
| 03-31-20 | | 7.86 | | 0.39• | | (0.81) | | (0.42) | | 0.42 | | — | | — | | 0.42 | | — | | 7.02 | | (5.76) | | 1.10 | | 1.10 | | 1.10 | | 4.97 | | 44,060 | | 57 |
| Class C | | | | | | | | | | | | | | | | | | | | | | | | | | | | | | | | | | |
| 03-31-24 | | 6.72 | | 0.37• | | 0.16 | | 0.53 | | 0.38 | | — | | — | | 0.38 | | — | | 6.87 | | 8.08 | | 1.84 | | 1.79 | | 1.79 | | 5.49 | | 5,982 | | 62 |
| 03-31-23 | | 7.58 | | 0.32• | | (0.77) | | (0.45) | | 0.32 | | 0.09 | | — | | 0.41 | | — | | 6.72 | | (5.87) | | 1.83 | | 1.82 | | 1.82 | | 4.69 | | 6,562 | | 70 |
| 03-31-22 | | 7.99 | | 0.30• | | (0.40) | | (0.10) | | 0.31 | | 0.00* | | — | | 0.31 | | — | | 7.58 | | (1.37) | | 1.79 | | 1.79 | | 1.79 | | 3.80 | | 9,496 | | 63 |
| 03-31-21 | | 7.02 | | 0.32• | | 0.99 | | 1.31 | | 0.32 | | — | | 0.02 | | 0.34 | | — | | 7.99 | | 18.88 | | 1.79 | | 1.79 | | 1.79 | | 4.12 | | 10,150 | | 78 |
| 03-31-20 | | 7.86 | | 0.34• | | (0.82) | | (0.48) | | 0.36 | | — | | — | | 0.36 | | — | | 7.02 | | (6.47) | | 1.85 | | 1.85 | | 1.85 | | 4.23 | | 11,215 | | 57 |
| Class I | | | | | | | | | | | | | | | | | | | | | | | | | | | | | | | | | | |
| 03-31-24 | | 6.71 | | 0.44• | | 0.16 | | 0.60 | | 0.45 | | — | | — | | 0.45 | | — | | 6.86 | | 9.28 | | 0.75 | | 0.70 | | 0.70 | | 6.59 | | 193,044 | | 62 |
| 03-31-23 | | 7.57 | | 0.40• | | (0.78) | | (0.38) | | 0.39 | | 0.09 | | — | | 0.48 | | — | | 6.71 | | (4.83) | | 0.73 | | 0.72 | | 0.72 | | 5.82 | | 188,736 | | 70 |
| 03-31-22 | | 7.98 | | 0.39• | | (0.40) | | (0.01) | | 0.40 | | 0.00* | | — | | 0.40 | | — | | 7.57 | | (0.28) | | 0.69 | | 0.69 | | 0.69 | | 4.90 | | 193,357 | | 63 |
| 03-31-21 | | 7.01 | | 0.40• | | 0.99 | | 1.39 | | 0.40 | | — | | 0.02 | | 0.42 | | — | | 7.98 | | 20.19 | | 0.69 | | 0.69 | | 0.69 | | 5.18 | | 171,058 | | 78 |
See Accompanying Notes to Financial Statements
FINANCIAL HIGHLIGHTS (continued)
| | | | Income (loss)
from investment
operations | | | | Less Distributions | | | | | | Ratios to average net assets | Supplemental
Data |
| | | | | | | | | | | | | | | | | | | | | | | | | | | | | | | | | | | |
Year or
period ended | | ($) | | ($) | | ($) | | ($) | | ($) | | ($) | | ($) | | ($) | | ($) | | ($) | | (%) | | (%) | | (%) | | (%) | | (%) | | ($000's) | | (%) |
| | | | | | | | | | | | | | | | | | | | | | | | | | | | | | | | | | | |
| Voya High Yield Bond Fund (continued) | | | | | | | | | | | | | | | | | | | | | | | | | | | | |
| Class I (continued) | | | | | | | | | | | | | | | | | | | | | | | | | | | | | | | | |
| 03-31-20 | | 7.85 | | 0.42• | | (0.81) | | (0.39) | | 0.45 | | — | | — | | 0.45 | | — | | 7.01 | | (5.45) | | 0.75 | | 0.75 | | 0.75 | | 5.32 | | 68,214 | | 57 |
| Class R | | | | | | | | | | | | | | | | | | | | | | | | | | | | | | | | | | |
| 03-31-24 | | 6.73 | | 0.40• | | 0.16 | | 0.56 | | 0.41 | | — | | — | | 0.41 | | — | | 6.88 | | 8.62 | | 1.34 | | 1.29 | | 1.29 | | 6.00 | | 297 | | 62 |
| 03-31-23 | | 7.59 | | 0.36• | | (0.78) | | (0.42) | | 0.35 | | 0.09 | | — | | 0.44 | | — | | 6.73 | | (5.38) | | 1.33 | | 1.32 | | 1.32 | | 5.26 | | 256 | | 70 |
| 03-31-22 | | 8.00 | | 0.34• | | (0.40) | | (0.06) | | 0.35 | | 0.00* | | — | | 0.35 | | — | | 7.59 | | (0.87) | | 1.29 | | 1.29 | | 1.29 | | 4.29 | | 182 | | 63 |
| 03-31-21 | | 7.03 | | 0.36• | | 0.99 | | 1.35 | | 0.36 | | — | | 0.02 | | 0.38 | | — | | 8.00 | | 19.44 | | 1.29 | | 1.29 | | 1.29 | | 4.61 | | 547 | | 78 |
| 03-31-20 | | 7.87 | | 0.37• | | (0.81) | | (0.44) | | 0.40 | | — | | — | | 0.40 | | — | | 7.03 | | (5.99) | | 1.35 | | 1.35 | | 1.35 | | 4.72 | | 684 | | 57 |
| Class R6 | | | | | | | | | | | | | | | | | | | | | | | | | | | | | | | | | | |
| 03-31-24 | | 6.73 | | 0.45• | | 0.15 | | 0.60 | | 0.45 | | — | | — | | 0.45 | | — | | 6.88 | | 9.34 | | 0.68 | | 0.63 | | 0.63 | | 6.69 | | 197,092 | | 62 |
| 03-31-23 | | 7.59 | | 0.40• | | (0.77) | | (0.37) | | 0.40 | | 0.09 | | — | | 0.49 | | — | | 6.73 | | (4.74) | | 0.67 | | 0.66 | | 0.66 | | 5.94 | | 93,175 | | 70 |
| 03-31-22 | | 8.00 | | 0.40• | | (0.41) | | (0.01) | | 0.40 | | 0.00* | | — | | 0.40 | | — | | 7.59 | | (0.21) | | 0.63 | | 0.63 | | 0.63 | | 4.91 | | 44,338 | | 63 |
| 03-31-21 | | 7.02 | | 0.41• | | 1.00 | | 1.41 | | 0.41 | | — | | 0.02 | | 0.43 | | — | | 8.00 | | 20.39 | | 0.63 | | 0.63 | | 0.63 | | 5.26 | | 242,749 | | 78 |
| 03-31-20 | | 7.87 | | 0.43• | | (0.82) | | (0.39) | | 0.46 | | — | | — | | 0.46 | | — | | 7.02 | | (5.49) | | 0.69 | | 0.69 | | 0.69 | | 5.44 | | 125,036 | | 57 |
| Class W | | | | | | | | | | | | | | | | | | | | | | | | | | | | | | | | | | |
| 03-31-24 | | 6.74 | | 0.44• | | 0.15 | | 0.59 | | 0.44 | | — | | — | | 0.44 | | — | | 6.89 | | 9.16 | | 0.84 | | 0.79 | | 0.79 | | 6.46 | | 43,846 | | 62 |
| 03-31-23 | | 7.60 | | 0.39• | | (0.77) | | (0.38) | | 0.39 | | 0.09 | | — | | 0.48 | | — | | 6.74 | | (4.88) | | 0.83 | | 0.82 | | 0.82 | | 5.70 | | 57,159 | | 70 |
| 03-31-22 | | 8.00 | | 0.38• | | (0.39) | | (0.01) | | 0.39 | | 0.00* | | — | | 0.39 | | — | | 7.60 | | (0.24) | | 0.79 | | 0.79 | | 0.79 | | 4.79 | | 84,428 | | 63 |
| 03-31-21 | | 7.03 | | 0.40• | | 0.99 | | 1.39 | | 0.40 | | — | | 0.02 | | 0.42 | | — | | 8.00 | | 20.03 | | 0.79 | | 0.79 | | 0.79 | | 5.09 | | 145,963 | | 78 |
| 03-31-20 | | 7.87 | | 0.41• | | (0.81) | | (0.40) | | 0.44 | | — | | — | | 0.44 | | — | | 7.03 | | (5.51) | | 0.85 | | 0.85 | | 0.85 | | 5.22 | | 138,971 | | 57 |
| Voya Intermediate Bond Fund | | | | | | | | | | | | | | | | | | | | | | | | | | | | |
| Class A | | | | | | | | | | | | | | | | | | | | | | | | | | | | | | | | | | |
| 03-31-24 | | 8.74 | | 0.33• | | (0.06) | | 0.27 | | 0.34 | | — | | — | | 0.34 | | — | | 8.67 | | 3.17 | | 0.72 | | 0.72 | | 0.72 | | 3.82 | | 223,398 | | 277†† |
| 03-31-23 | | 9.55 | | 0.26• | | (0.82) | | (0.56) | | 0.25 | | — | | — | | 0.25 | | — | | 8.74 | | (5.82) | | 0.72 | | 0.72 | | 0.72 | | 2.93 | | 245,387 | | 247†† |
| 03-31-22 | | 10.25 | | 0.20• | | (0.66) | | (0.46) | | 0.22 | | — | | 0.02 | | 0.24 | | — | | 9.55 | | (4.70) | | 0.69 | | 0.69 | | 0.69 | | 1.97 | | 364,121 | | 222†† |
| 03-31-21 | | 10.11 | | 0.25• | | 0.38 | | 0.63 | | 0.29 | | 0.17 | | 0.03 | | 0.49 | | — | | 10.25 | | 6.12 | | 0.70 | | 0.70 | | 0.70 | | 2.35 | | 459,960 | | 159†† |
| 03-31-20 | | 10.02 | | 0.30 | | 0.13 | | 0.43 | | 0.33 | | 0.01 | | — | | 0.34 | | — | | 10.11 | | 4.29 | | 0.69 | | 0.69 | | 0.69 | | 2.88 | | 451,338 | | 253†† |
| Class C | | | | | | | | | | | | | | | | | | | | | | | | | | | | | | | | | | |
| 03-31-24 | | 8.72 | | 0.26• | | (0.05) | | 0.21 | | 0.27 | | — | | — | | 0.27 | | — | | 8.66 | | 2.52 | | 1.47 | | 1.47 | | 1.47 | | 3.06 | | 7,103 | | 277†† |
| 03-31-23 | | 9.53 | | 0.19• | | (0.81) | | (0.62) | | 0.19 | | — | | — | | 0.19 | | — | | 8.72 | | (6.54) | | 1.47 | | 1.47 | | 1.47 | | 2.17 | | 9,687 | | 247†† |
| 03-31-22 | | 10.23 | | 0.12• | | (0.66) | | (0.54) | | 0.14 | | — | | 0.02 | | 0.16 | | — | | 9.53 | | (5.43) | | 1.44 | | 1.44 | | 1.44 | | 1.22 | | 15,564 | | 222†† |
| 03-31-21 | | 10.09 | | 0.17• | | 0.38 | | 0.55 | | 0.21 | | 0.17 | | 0.03 | | 0.41 | | — | | 10.23 | | 5.34 | | 1.45 | | 1.45 | | 1.45 | | 1.62 | | 22,702 | | 159†† |
| 03-31-20 | | 10.01 | | 0.21 | | 0.14 | | 0.35 | | 0.26 | | 0.01 | | — | | 0.27 | | — | | 10.09 | | 3.41 | | 1.44 | | 1.44 | | 1.44 | | 2.06 | | 25,556 | | 253†† |
| Class I | | | | | | | | | | | | | | | | | | | | | | | | | | | | | | | | | | |
| 03-31-24 | | 8.74 | | 0.36• | | (0.05) | | 0.31 | | 0.37 | | — | | — | | 0.37 | | — | | 8.68 | | 3.66 | | 0.34 | | 0.34 | | 0.34 | | 4.21 | | 5,613,853 | | 277†† |
| 03-31-23 | | 9.55 | | 0.29• | | (0.82) | | (0.53) | | 0.28 | | — | | — | | 0.28 | | — | | 8.74 | | (5.51) | | 0.36 | | 0.36 | | 0.36 | | 3.29 | | 4,938,036 | | 247†† |
| 03-31-22 | | 10.25 | | 0.24• | | (0.67) | | (0.43) | | 0.25 | | — | | 0.02 | | 0.27 | | — | | 9.55 | | (4.39) | | 0.35 | | 0.35 | | 0.35 | | 2.32 | | 6,092,396 | | 222†† |
| 03-31-21 | | 10.10 | | 0.29• | | 0.38 | | 0.67 | | 0.32 | | 0.17 | | 0.03 | | 0.52 | | — | | 10.25 | | 6.57 | | 0.34 | | 0.34 | | 0.34 | | 2.70 | | 6,175,479 | | 159†† |
| 03-31-20 | | 10.02 | | 0.32 | | 0.14 | | 0.46 | | 0.37 | | 0.01 | | — | | 0.38 | | — | | 10.10 | | 4.53 | | 0.36 | | 0.36 | | 0.36 | | 3.13 | | 4,988,317 | | 253†† |
| Class R | | | | | | | | | | | | | | | | | | | | | | | | | | | | | | | | | | |
| 03-31-24 | | 8.75 | | 0.31• | | (0.06) | | 0.25 | | 0.32 | | — | | — | | 0.32 | | — | | 8.68 | | 2.92 | | 0.97 | | 0.97 | | 0.97 | | 3.57 | | 112,487 | | 277†† |
| 03-31-23 | | 9.56 | | 0.24• | | (0.82) | | (0.58) | | 0.23 | | — | | — | | 0.23 | | — | | 8.75 | | (6.04) | | 0.97 | | 0.97 | | 0.97 | | 2.70 | | 115,639 | | 247†† |
| 03-31-22 | | 10.26 | | 0.18• | | (0.67) | | (0.49) | | 0.19 | | — | | 0.02 | | 0.21 | | — | | 9.56 | | (4.93) | | 0.94 | | 0.94 | | 0.94 | | 1.72 | | 143,085 | | 222†† |
| 03-31-21 | | 10.12 | | 0.22• | | 0.38 | | 0.60 | | 0.26 | | 0.17 | | 0.03 | | 0.46 | | — | | 10.26 | | 5.86 | | 0.95 | | 0.95 | | 0.95 | | 2.11 | | 175,289 | | 159†† |
| 03-31-20 | | 10.03 | | 0.26 | | 0.15 | | 0.41 | | 0.31 | | 0.01 | | — | | 0.32 | | — | | 10.12 | | 4.03 | | 0.94 | | 0.94 | | 0.94 | | 2.56 | | 186,915 | | 253†† |
| Class R6 | | | | | | | | | | | | | | | | | | | | | | | | | | | | | | | | | | |
| 03-31-24 | | 8.75 | | 0.36• | | (0.06) | | 0.30 | | 0.37 | | — | | — | | 0.37 | | — | | 8.68 | | 3.60 | | 0.29 | | 0.29 | | 0.29 | | 4.25 | | 2,440,996 | | 277†† |
| 03-31-23 | | 9.56 | | 0.30• | | (0.83) | | (0.53) | | 0.28 | | — | | — | | 0.28 | | — | | 8.75 | | (5.46) | | 0.30 | | 0.30 | | 0.30 | | 3.37 | | 2,302,998 | | 247†† |
| 03-31-22 | | 10.25 | | 0.24• | | (0.66) | | (0.42) | | 0.25 | | — | | 0.02 | | 0.27 | | — | | 9.56 | | (4.25) | | 0.29 | | 0.29 | | 0.29 | | 2.37 | | 2,563,038 | | 222†† |
| 03-31-21 | | 10.11 | | 0.29• | | 0.38 | | 0.67 | | 0.33 | | 0.17 | | 0.03 | | 0.53 | | — | | 10.25 | | 6.50 | | 0.30 | | 0.30 | | 0.30 | | 2.74 | | 2,861,963 | | 159†† |
See Accompanying Notes to Financial Statements
FINANCIAL HIGHLIGHTS (continued)
| | | | Income (loss)
from investment
operations | | | | Less Distributions | | | | | | Ratios to average net assets | Supplemental
Data |
| | | | | | | | | | | | | | | | | | | | | | | | | | | | | | | | | | | |
Year or
period ended | | ($) | | ($) | | ($) | | ($) | | ($) | | ($) | | ($) | | ($) | | ($) | | ($) | | (%) | | (%) | | (%) | | (%) | | (%) | | ($000's) | | (%) |
| | | | | | | | | | | | | | | | | | | | | | | | | | | | | | | | | | | |
| Voya Intermediate Bond Fund (continued) | | | | | | | | | | | | | | | | | | | | | | | | | | |
| Class R6 (continued) | | | | | | | | | | | | | | | | | | | | | | | | | | | | | | | |
| 03-31-20 | | 10.02 | | 0.33 | | 0.14 | | 0.47 | | 0.37 | | 0.01 | | — | | 0.38 | | — | | 10.11 | | 4.67 | | 0.30 | | 0.30 | | 0.30 | | 3.19 | | 2,306,857 | | 253†† |
| Class W | | | | | | | | | | | | | | | | | | | | | | | | | | | | | | | | | | |
| 03-31-24 | | 8.73 | | 0.35• | | (0.05) | | 0.30 | | 0.36 | | — | | — | | 0.36 | | — | | 8.67 | | 3.55 | | 0.47 | | 0.47 | | 0.47 | | 4.10 | | 103,015 | | 277†† |
| 03-31-23 | | 9.54 | | 0.28• | | (0.82) | | (0.54) | | 0.27 | | — | | — | | 0.27 | | — | | 8.73 | | (5.59) | | 0.47 | | 0.47 | | 0.47 | | 3.11 | | 62,837 | | 247†† |
| 03-31-22 | | 10.24 | | 0.23• | | (0.67) | | (0.44) | | 0.24 | | — | | 0.02 | | 0.26 | | — | | 9.54 | | (4.47) | | 0.44 | | 0.44 | | 0.44 | | 2.22 | | 174,769 | | 222†† |
| 03-31-21 | | 10.10 | | 0.27• | | 0.38 | | 0.65 | | 0.31 | | 0.17 | | 0.03 | | 0.51 | | — | | 10.24 | | 6.39 | | 0.45 | | 0.45 | | 0.45 | | 2.59 | | 268,634 | | 159†† |
| 03-31-20 | | 10.01 | | 0.32 | | 0.14 | | 0.46 | | 0.36 | | 0.01 | | — | | 0.37 | | — | | 10.10 | | 4.56 | | 0.44 | | 0.44 | | 0.44 | | 3.05 | | 249,060 | | 253†† |
| Voya Short Duration High Income Fund | | | | | | | | | | | | | | | | | | | | | | | | | | |
| Class A | | | | | | | | | | | | | | | | | | | | | | | | | | | | | | | | | | |
| 03-31-24 | | 9.88 | | 0.77• | | 0.27 | | 1.04 | | 0.78 | | — | | — | | 0.78 | | — | | 10.14 | | 10.91 | | 1.12 | | 0.85 | | 0.85 | | 7.74 | | 13,674 | | 55 |
| 02-09-23(4)- | | | | | | | | | | | | | | | | | | | | | | | | | | | | | | | | | | |
| 03-31-23 | | 10.00 | | 0.10• | | (0.12) | | (0.02) | | 0.10 | | — | | — | | 0.10 | | — | | 9.88 | | (0.21) | | 1.22 | | 0.85 | | 0.85 | | 7.35 | | 8,605 | | 1 |
| Class C | | | | | | | | | | | | | | | | | | | | | | | | | | | | | | | | | | |
| 04-20-23(4)- | | | | | | | | | | | | | | | | | | | | | | | | | | | | | | | | | | |
| 03-31-24 | | 10.00 | | 0.68• | | 0.25 | | 0.93 | | 0.68 | | — | | — | | 0.68 | | — | | 10.25 | | 9.66 | | 1.87 | | 1.60 | | 1.60 | | 7.06 | | 349 | | 55 |
| Class I | | | | | | | | | | | | | | | | | | | | | | | | | | | | | | | | | | |
| 03-31-24 | | 9.88 | | 0.79• | | 0.27 | | 1.06 | | 0.80 | | — | | — | | 0.80 | | — | | 10.14 | | 11.19 | | 0.89 | | 0.60 | | 0.60 | | 7.89 | | 94,349 | | 55 |
| 02-09-23(4)- | | | | | | | | | | | | | | | | | | | | | | | | | | | | | | | | | | |
| 03-31-23 | | 10.00 | | 0.10• | | (0.12) | | (0.02) | | 0.10 | | — | | — | | 0.10 | | — | | 9.88 | | (0.17) | | 0.97 | | 0.60 | | 0.60 | | 7.61 | | 8,805 | | 1 |
| Class R6 | | | | | | | | | | | | | | | | | | | | | | | | | | | | | | | | | | |
| 03-31-24 | | 9.88 | | 0.79• | | 0.27 | | 1.06 | | 0.81 | | — | | — | | 0.81 | | — | | 10.13 | | 11.12 | | 0.86 | | 0.60 | | 0.60 | | 7.90 | | 26,931 | | 55 |
| 02-09-23(4)- | | | | | | | | | | | | | | | | | | | | | | | | | | | | | | | | | | |
| 03-31-23 | | 10.00 | | 0.10• | | (0.12) | | (0.02) | | 0.10 | | — | | — | | 0.10 | | — | | 9.88 | | (0.17) | | 0.97 | | 0.60 | | 0.60 | | 7.59 | | 8,321 | | 1 |
| Voya Short Term Bond Fund | | | | | | | | | | | | | | | | | | | | | | | | | | | | |
| Class A | | | | | | | | | | | | | | | | | | | | | | | | | | | | | | | | | | |
| 03-31-24 | | 9.29 | | 0.36• | | (0.01) | | 0.35 | | 0.37 | | — | | — | | 0.37 | | — | | 9.27 | | 3.89 | | 0.64 | | 0.63 | | 0.63 | | 3.93 | | 4,124 | | 348 |
| 03-31-23 | | 9.58 | | 0.21• | | (0.29) | | (0.08) | | 0.21 | | — | | — | | 0.21 | | — | | 9.29 | | (0.83) | | 0.64 | | 0.62 | | 0.62 | | 2.26 | | 9,054 | | 225 |
| 03-31-22 | | 9.98 | | 0.09• | | (0.36) | | (0.27) | | 0.10 | | — | | 0.03 | | 0.13 | | — | | 9.58 | | (2.81) | | 0.64 | | 0.63 | | 0.63 | | 0.93 | | 15,351 | | 250 |
| 03-31-21 | | 9.55 | | 0.16• | | 0.46 | | 0.62 | | 0.17 | | — | | 0.02 | | 0.19 | | — | | 9.98 | | 6.48 | | 0.68 | | 0.60 | | 0.60 | | 1.62 | | 19,499 | | 145 |
| 03-31-20 | | 9.77 | | 0.22• | | (0.23) | | (0.01) | | 0.21 | | — | | — | | 0.21 | | — | | 9.55 | | (0.14) | | 0.72 | | 0.65 | | 0.65 | | 2.19 | | 6,907 | | 192 |
| Class C | | | | | | | | | | | | | | | | | | | | | | | | | | | | | | | | | | |
| 03-31-24 | | 9.30 | | 0.30• | | (0.02) | | 0.28 | | 0.30 | | — | | — | | 0.30 | | — | | 9.28 | | 3.11 | | 1.39 | | 1.38 | | 1.38 | | 3.19 | | 82 | | 348 |
| 03-31-23 | | 9.58 | | 0.13• | | (0.27) | | (0.14) | | 0.14 | | — | | — | | 0.14 | | — | | 9.30 | | (1.47) | | 1.39 | | 1.37 | | 1.37 | | 1.34 | | 149 | | 225 |
| 03-31-22 | | 9.98 | | 0.02• | | (0.37) | | (0.35) | | 0.02 | | — | | 0.03 | | 0.05 | | — | | 9.58 | | (3.54) | | 1.39 | | 1.38 | | 1.38 | | 0.18 | | 442 | | 250 |
| 03-31-21 | | 9.55 | | 0.09• | | 0.45 | | 0.54 | | 0.09 | | — | | 0.02 | | 0.11 | | — | | 9.98 | | 5.69 | | 1.43 | | 1.35 | | 1.35 | | 0.89 | | 548 | | 145 |
| 03-31-20 | | 9.76 | | 0.14• | | (0.21) | | (0.07) | | 0.14 | | — | | — | | 0.14 | | — | | 9.55 | | (0.78) | | 1.47 | | 1.40 | | 1.40 | | 1.41 | | 335 | | 192 |
| Class I | | | | | | | | | | | | | | | | | | | | | | | | | | | | | | | | | | |
| 03-31-24 | | 9.28 | | 0.40• | | (0.02) | | 0.38 | | 0.40 | | — | | — | | 0.40 | | — | | 9.26 | | 4.17 | | 0.38 | | 0.35 | | 0.35 | | 4.29 | | 34,484 | | 348 |
| 03-31-23 | | 9.57 | | 0.25• | | (0.30) | | (0.05) | | 0.24 | | — | | — | | 0.24 | | — | | 9.28 | | (0.54) | | 0.40 | | 0.35 | | 0.35 | | 2.67 | | 31,011 | | 225 |
| 03-31-22 | | 9.97 | | 0.12• | | (0.36) | | (0.24) | | 0.13 | | — | | 0.03 | | 0.16 | | — | | 9.57 | | (2.52) | | 0.40 | | 0.35 | | 0.35 | | 1.19 | | 31,691 | | 250 |
| 03-31-21 | | 9.54 | | 0.19• | | 0.46 | | 0.65 | | 0.20 | | — | | 0.02 | | 0.22 | | — | | 9.97 | | 6.81 | | 0.48 | | 0.35 | | 0.35 | | 1.91 | | 16,762 | | 145 |
| 03-31-20 | | 9.76 | | 0.24• | | (0.22) | | 0.02 | | 0.24 | | — | | — | | 0.24 | | — | | 9.54 | | 0.16 | | 0.57 | | 0.40 | | 0.40 | | 2.43 | | 11,925 | | 192 |
| Class R | | | | | | | | | | | | | | | | | | | | | | | | | | | | | | | | | | |
| 03-31-24 | | 9.33 | | 0.35• | | (0.03) | | 0.32 | | 0.35 | | — | | — | | 0.35 | | — | | 9.30 | | 3.52 | | 0.89 | | 0.88 | | 0.88 | | 3.78 | | 34 | | 348 |
| 03-31-23 | | 9.61 | | 0.20• | | (0.29) | | (0.09) | | 0.19 | | — | | — | | 0.19 | | — | | 9.33 | | (0.96) | | 0.89 | | 0.87 | | 0.87 | | 2.14 | | 23 | | 225 |
| 03-31-22 | | 10.01 | | 0.07• | | (0.37) | | (0.30) | | 0.07 | | — | | 0.03 | | 0.10 | | — | | 9.61 | | (3.04) | | 0.89 | | 0.88 | | 0.88 | | 0.66 | | 17 | | 250 |
| 03-31-21 | | 9.57 | | 0.14• | | 0.46 | | 0.60 | | 0.14 | | — | | 0.02 | | 0.16 | | — | | 10.01 | | 6.32 | | 0.93 | | 0.85 | | 0.85 | | 1.39 | | 8 | | 145 |
| 03-31-20 | | 9.77 | | 0.19• | | (0.20) | | (0.01) | | 0.19 | | — | | — | | 0.19 | | — | | 9.57 | | (0.18) | | 0.97 | | 0.90 | | 0.90 | | 1.93 | | 3 | | 192 |
See Accompanying Notes to Financial Statements
FINANCIAL HIGHLIGHTS (continued)
| | | | Income (loss)
from investment
operations | | | | Less Distributions | | | | | | Ratios to average net assets | Supplemental
Data |
| | | | | | | | | | | | | | | | | | | | | | | | | | | | | | | | | | | |
Year or
period ended | | ($) | | ($) | | ($) | | ($) | | ($) | | ($) | | ($) | | ($) | | ($) | | ($) | | (%) | | (%) | | (%) | | (%) | | (%) | | ($000's) | | (%) |
| | | | | | | | | | | | | | | | | | | | | | | | | | | | | | | | | | | |
| Voya Short Term Bond Fund (continued) | | | | | | | | | | | | | | | | | | | | | | | | | | |
| Class R6 | | | | | | | | | | | | | | | | | | | | | | | | | | | | | | | | | | |
| 03-31-24 | | 9.29 | | 0.40• | | (0.02) | | 0.38 | | 0.40 | | — | | — | | 0.40 | | — | | 9.27 | | 4.22 | | 0.31 | | 0.30 | | 0.30 | | 4.35 | | 503,455 | | 348 |
| 03-31-23 | | 9.58 | | 0.25• | | (0.30) | | (0.05) | | 0.24 | | — | | — | | 0.24 | | — | | 9.29 | | (0.50) | | 0.32 | | 0.30 | | 0.30 | | 2.63 | | 338,437 | | 225 |
| 03-31-22 | | 9.98 | | 0.12• | | (0.36) | | (0.24) | | 0.13 | | — | | 0.03 | | 0.16 | | — | | 9.58 | | (2.49) | | 0.31 | | 0.30 | | 0.30 | | 1.18 | | 372,853 | | 250 |
| 03-31-21 | | 9.55 | | 0.20• | | 0.45 | | 0.65 | | 0.20 | | — | | 0.02 | | 0.22 | | — | | 9.98 | | 6.83 | | 0.38 | | 0.30 | | 0.30 | | 2.01 | | 51,298 | | 145 |
| 03-31-20 | | 9.76 | | 0.24• | | (0.21) | | 0.03 | | 0.24 | | — | | — | | 0.24 | | — | | 9.55 | | 0.29 | | 0.42 | | 0.35 | | 0.35 | | 2.47 | | 98,380 | | 192 |
| Class W | | | | | | | | | | | | | | | | | | | | | | | | | | | | | | | | | | |
| 03-31-24 | | 9.32 | | 0.39• | | (0.01) | | 0.38 | | 0.40 | | — | | — | | 0.40 | | — | | 9.30 | | 4.15 | | 0.39 | | 0.38 | | 0.38 | | 4.22 | | 10,083 | | 348 |
| 03-31-23 | | 9.60 | | 0.23• | | (0.28) | | (0.05) | | 0.23 | | — | | — | | 0.23 | | — | | 9.32 | | (0.47) | | 0.39 | | 0.37 | | 0.37 | | 2.47 | | 12,660 | | 225 |
| 03-31-22 | | 10.01 | | 0.12• | | (0.38) | | (0.26) | | 0.12 | | — | | 0.03 | | 0.15 | | — | | 9.60 | | (2.65) | | 0.39 | | 0.38 | | 0.38 | | 1.18 | | 19,721 | | 250 |
| 03-31-21 | | 9.57 | | 0.18• | | 0.47 | | 0.65 | | 0.19 | | — | | 0.02 | | 0.21 | | — | | 10.01 | | 6.84 | | 0.43 | | 0.35 | | 0.35 | | 1.85 | | 21,981 | | 145 |
| 03-31-20 | | 9.79 | | 0.24• | | (0.22) | | 0.02 | | 0.24 | | — | | — | | 0.24 | | — | | 9.57 | | 0.12 | | 0.47 | | 0.40 | | 0.40 | | 2.41 | | 97 | | 192 |
| Voya Strategic Income Opportunities Fund | | | | | | | | | | | | | | | | | | | | | | | | | | |
| Class A | | | | | | | | | | | | | | | | | | | | | | | | | | | | | | | | | | |
| 03-31-24 | | 8.98 | | 0.49• | | 0.15 | | 0.64 | | 0.47 | | — | | — | | 0.47 | | — | | 9.15 | | 7.29 | | 0.86 | | 0.86 | | 0.86 | | 5.39 | | 62,536 | | 303 |
| 03-31-23 | | 9.59 | | 0.35• | | (0.63) | | (0.28) | | 0.33 | | — | | — | | 0.33 | | — | | 8.98 | | (2.94) | | 0.85 | | 0.85 | | 0.85 | | 3.81 | | 72,353 | | 110 |
| 03-31-22 | | 10.12 | | 0.28• | | (0.52) | | (0.24) | | 0.23 | | — | | 0.06 | | 0.29 | | — | | 9.59 | | (2.47) | | 0.85 | | 0.85 | | 0.85 | | 2.81 | | 104,975 | | 76 |
| 03-31-21 | | 9.12 | | 0.32• | | 1.03 | | 1.35 | | 0.30 | | — | | 0.05 | | 0.35 | | — | | 10.12 | | 14.99 | | 0.88 | | 0.88 | | 0.88 | | 3.26 | | 147,463 | | 45 |
| 03-31-20 | | 10.15 | | 0.35• | | (0.97) | | (0.62) | | 0.41 | | — | | — | | 0.41 | | — | | 9.12 | | (6.48) | | 0.86 | | 0.86 | | 0.86 | | 3.45 | | 146,080 | | 167 |
| Class C | | | | | | | | | | | | | | | | | | | | | | | | | | | | | | | | | | |
| 03-31-24 | | 8.84 | | 0.41• | | 0.16 | | 0.57 | | 0.39 | | — | | — | | 0.39 | | — | | 9.02 | | 6.64 | | 1.61 | | 1.61 | | 1.61 | | 4.65 | | 33,296 | | 303 |
| 03-31-23 | | 9.45 | | 0.28• | | (0.64) | | (0.36) | | 0.25 | | — | | — | | 0.25 | | — | | 8.84 | | (3.78) | | 1.60 | | 1.60 | | 1.60 | | 3.06 | | 36,708 | | 110 |
| 03-31-22 | | 9.97 | | 0.20• | | (0.51) | | (0.31) | | 0.15 | | — | | 0.06 | | 0.21 | | — | | 9.45 | | (3.18) | | 1.60 | | 1.60 | | 1.60 | | 2.07 | | 49,839 | | 76 |
| 03-31-21 | | 8.98 | | 0.24• | | 1.02 | | 1.26 | | 0.22 | | — | | 0.05 | | 0.27 | | — | | 9.97 | | 14.20 | | 1.63 | | 1.63 | | 1.63 | | 2.51 | | 53,646 | | 45 |
| 03-31-20 | | 10.00 | | 0.27• | | (0.96) | | (0.69) | | 0.33 | | — | | — | | 0.33 | | — | | 8.98 | | (7.24) | | 1.61 | | 1.61 | | 1.61 | | 2.68 | | 53,333 | | 167 |
| Class I | | | | | | | | | | | | | | | | | | | | | | | | | | | | | | | | | | |
| 03-31-24 | | 8.98 | | 0.51• | | 0.16 | | 0.67 | | 0.49 | | — | | — | | 0.49 | | — | | 9.16 | | 7.66 | | 0.63 | | 0.63 | | 0.63 | | 5.63 | | 1,477,280 | | 303 |
| 03-31-23 | | 9.61 | | 0.37• | | (0.65) | | (0.28) | | 0.35 | | — | | — | | 0.35 | | — | | 8.98 | | (2.84) | | 0.61 | | 0.61 | | 0.61 | | 4.05 | | 1,546,189 | | 110 |
| 03-31-22 | | 10.15 | | 0.31• | | (0.53) | | (0.22) | | 0.26 | | — | | 0.06 | | 0.32 | | — | | 9.61 | | (2.22) | | 0.62 | | 0.62 | | 0.62 | | 3.06 | | 2,096,038 | | 76 |
| 03-31-21 | | 9.15 | | 0.34• | | 1.04 | | 1.38 | | 0.33 | | — | | 0.05 | | 0.38 | | — | | 10.15 | | 15.35 | | 0.63 | | 0.63 | | 0.63 | | 3.51 | | 2,029,154 | | 45 |
| 03-31-20 | | 10.20 | | 0.38• | | (0.98) | | (0.60) | | 0.45 | | — | | — | | 0.45 | | — | | 9.15 | | (6.30) | | 0.60 | | 0.60 | | 0.60 | | 3.68 | | 2,046,289 | | 167 |
| Class R | | | | | | | | | | | | | | | | | | | | | | | | | | | | | | | | | | |
| 03-31-24 | | 8.90 | | 0.46• | | 0.16 | | 0.62 | | 0.44 | | — | | — | | 0.44 | | — | | 9.08 | | 7.16 | | 1.11 | | 1.11 | | 1.11 | | 5.15 | | 16,377 | | 303 |
| 03-31-23 | | 9.51 | | 0.33• | | (0.64) | | (0.31) | | 0.30 | | — | | — | | 0.30 | | — | | 8.90 | | (3.25) | | 1.10 | | 1.10 | | 1.10 | | 3.59 | | 18,607 | | 110 |
| 03-31-22 | | 10.04 | | 0.26• | | (0.53) | | (0.27) | | 0.20 | | — | | 0.06 | | 0.26 | | — | | 9.51 | | (2.76) | | 1.10 | | 1.10 | | 1.10 | | 2.58 | | 20,854 | | 76 |
| 03-31-21 | | 9.04 | | 0.29• | | 1.03 | | 1.32 | | 0.27 | | — | | 0.05 | | 0.32 | | — | | 10.04 | | 14.81 | | 1.13 | | 1.13 | | 1.13 | | 3.00 | | 22,403 | | 45 |
| 03-31-20 | | 10.07 | | 0.32• | | (0.97) | | (0.65) | | 0.38 | | — | | — | | 0.38 | | — | | 9.04 | | (6.80) | | 1.11 | | 1.11 | | 1.11 | | 3.20 | | 18,459 | | 167 |
| Class R6 | | | | | | | | | | | | | | | | | | | | | | | | | | | | | | | | | | |
| 03-31-24 | | 8.96 | | 0.52• | | 0.14 | | 0.66 | | 0.49 | | — | | — | | 0.49 | | — | | 9.13 | | 7.63 | | 0.56 | | 0.56 | | 0.56 | | 5.72 | | 243,077 | | 303 |
| 03-31-23 | | 9.58 | | 0.38• | | (0.64) | | (0.26) | | 0.36 | | — | | — | | 0.36 | | — | | 8.96 | | (2.69) | | 0.54 | | 0.54 | | 0.54 | | 4.19 | | 167,243 | | 110 |
| 03-31-22 | | 10.12 | | 0.31• | | (0.52) | | (0.21) | | 0.27 | | — | | 0.06 | | 0.33 | | — | | 9.58 | | (2.17) | | 0.54 | | 0.54 | | 0.54 | | 3.14 | | 159,175 | | 76 |
| 03-31-21 | | 9.12 | | 0.35• | | 1.04 | | 1.39 | | 0.34 | | — | | 0.05 | | 0.39 | | — | | 10.12 | | 15.46 | | 0.57 | | 0.57 | | 0.57 | | 3.59 | | 154,515 | | 45 |
| 03-31-20 | | 10.17 | | 0.38• | | (0.98) | | (0.60) | | 0.45 | | — | | — | | 0.45 | | — | | 9.12 | | (6.28) | | 0.55 | | 0.55 | | 0.55 | | 3.75 | | 229,913 | | 167 |
| Class W | | | | | | | | | | | | | | | | | | | | | | | | | | | | | | | | | | |
| 03-31-24 | | 8.95 | | 0.51• | | 0.16 | | 0.67 | | 0.49 | | — | | — | | 0.49 | | — | | 9.13 | | 7.68 | | 0.61 | | 0.61 | | 0.61 | | 5.64 | | 16,672 | | 303 |
| 03-31-23 | | 9.57 | | 0.37• | | (0.64) | | (0.27) | | 0.35 | | — | | — | | 0.35 | | — | | 8.95 | | (2.83) | | 0.60 | | 0.60 | | 0.60 | | 3.99 | | 18,980 | | 110 |
| 03-31-22 | | 10.10 | | 0.31• | | (0.53) | | (0.22) | | 0.25 | | — | | 0.06 | | 0.31 | | — | | 9.57 | | (2.24) | | 0.60 | | 0.60 | | 0.60 | | 3.06 | | 36,224 | | 76 |
| 03-31-21 | | 9.09 | | 0.34• | | 1.04 | | 1.38 | | 0.32 | | — | | 0.05 | | 0.37 | | — | | 10.10 | | 15.42 | | 0.63 | | 0.63 | | 0.63 | | 3.53 | | 48,958 | | 45 |
| 03-31-20 | | 10.13 | | 0.38• | | (0.99) | | (0.61) | | 0.43 | | — | | — | | 0.43 | | — | | 9.09 | | (6.37) | | 0.61 | | 0.61 | | 0.61 | | 3.69 | | 69,522 | | 167 |
See Accompanying Notes to Financial Statements
FINANCIAL HIGHLIGHTS (continued)
| (1) | Total return is calculated assuming reinvestment of all dividends, capital gain distributions and return of capital distributions, if any, at net asset value and excluding the deduction of sales charges or contingent deferred sales charges, if applicable. Total return for periods less than one year is not annualized. |
| (2) | Annualized for periods less than one year. |
| (3) | Ratios reflect operating expenses of a Fund. Expenses before reductions/additions do not reflect amounts reimbursed or recouped by the Investment Adviser and/or Distributor or reductions from brokerage service arrangements or other expense offset arrangements and do not represent the amount paid by a Fund during periods when reimbursements or reductions occur. Expenses net of fee waivers reflect expenses after reimbursement by the Investment Adviser and/or Distributor or recoupment of previously reimbursed fees by the Investment Adviser, but prior to reductions from brokerage service arrangements or other expense offset arrangements. Expenses net of all reductions/additions represent the net expenses paid by a Fund. Net investment income (loss) is net of all such additions or reductions. |
| (4) | Commencement of operations. |
| • | Calculated using average number of shares outstanding throughout the year or period. |
| * | Amount is less than $0.005 or 0.005% or more than $(0.005) or (0.005)%. |
| †† | The Fund’s use of treasury securities and “to be announced” (TBA) securities contribute significantly to the portfolio turnover rate. Excluding all purchase and sale transactions involving treasury securities and TBAs, the Fund’s portfolio turnover rate was 45% for the year ended March 31, 2024 and 36%, 33%, 39%, and 40% for the fiscal years ended March 31, 2023, 2022, 2021, and 2020, respectively. The Fund’s strategies involving treasury securities and TBA securities are employed to increase liquidity and to manage interest rate risk while not changing the economic exposure to treasury and mortgage backed securities. The Fund invests in treasury securities and may purchase and sell treasury securities to manage the duration of the Fund and for hedging purposes when selling or buying corporate bonds. In addition, the Fund commonly employs an investment strategy involving the purchase of the most recently issued treasury security with a particular time to maturity while selling its position in a previously issued treasury security with a substantially similar time to maturity. This strategy is employed in order for the Fund to own the most liquid treasury security available for a given time to maturity. The Fund also invests in TBA securities whereby the actual identity of the securities to be delivered at settlement is not specified, but rather the general characteristics of the securities are agreed to (i.e. issuer, mortgage type, maturity, coupon and month of settlement). The Fund may engage in rolling strategies with TBAs whereby the Fund seeks to extend the expiration or maturity of a TBA position by closing out the position before expiration and simultaneously opening a new position that has substantially similar terms except for a later expiration date. Such rolls enable the Fund to maintain continuous investment exposure to an underlying asset beyond the expiration of the initial position without delivery of the underlying asset. |
See Accompanying Notes to Financial Statements
NOTES TO FINANCIAL STATEMENTS as of March 31, 2024
NOTE 1 — ORGANIZATION
Voya Funds Trust (the “Trust”) is a Delaware statutory trust and is registered as an open-end management investment company under the Investment Company Act of 1940, as amended (“1940 Act”). The Trust was organized on August 6, 1998 and was established under a Trust Instrument dated July 30, 1998. It consists of nine separately managed series. This report is for: Voya GNMA Income Fund (“GNMA Income”), Voya High Yield Bond Fund (“High Yield Bond”), Voya Intermediate Bond Fund (“Intermediate Bond”), Voya Short Duration High Income Fund (“Short Duration High Income”), Voya Short Term Bond Fund (“Short Term Bond”) and Voya Strategic Income Opportunities Fund (“Strategic Income Opportunities”) (each, a “Fund” and collectively, the “Funds”). Each Fund is a diversified series of the Trust.
Each Fund offers at least three or more of the following classes of shares: Class A, Class C, Class I, Class R, Class R6 and Class W. The separate classes of shares differ principally in the applicable sales charges (if any), transfer agent fees, distribution fees and shareholder servicing fees, as well as differences in the amount of waiver fees and reimbursement of expenses, if any. Generally, shareholders of each class also bear certain expenses that pertain to that particular class. All shareholders are allocated the common expenses of a fund and earn income and realized gains/ losses from a fund pro rata based on the daily ending net assets of each class, without discrimination between share classes. Expenses that are specific to a fund or a class are charged directly to that fund or class. Other operating expenses shared by several funds are generally allocated among those funds based on average net assets. Dividends are determined separately for each class based on income and expenses allocated to each class. Realized gain distributions are allocated to each class pro rata based on the shares outstanding of each class on the date of the distribution. Differences in per share dividend rates generally result from the differences in separate class expenses, including distribution, and shareholder servicing fees, if applicable, as well as differences in the amount of waiver of fees and reimbursement of expenses between the share classes, if any.
Class C shares, along with their pro rata reinvested dividend shares, automatically convert to Class A shares 8 years after purchase.
Voya Investments, LLC (“Voya Investments” or the “Investment Adviser”), an Arizona limited liability company, serves as the Investment Adviser to the Funds. Voya Investment Management Co. LLC (“Voya IM”), a Delaware limited liability company, serves as the sub-adviser to the Funds. Voya Investments Distributor, LLC (“VID” or the “Distributor”), a Delaware limited liability company, serves as the principal underwriter to the Funds.
NOTE 2 — SIGNIFICANT ACCOUNTING POLICIES
The following significant accounting policies are consistently followed by the Funds in the preparation of their financial statements. Each Fund is considered an investment company under U.S. generally accepted accounting principles (“GAAP”) and follows the accounting and reporting guidance applicable to investment companies.
A. Security Valuation. Each Fund is open for business every day the New York Stock Exchange (“NYSE”) opens for regular trading (each such day, a “Business Day”). The net asset value (“NAV”) per share for each class of each Fund is determined each Business Day as of the close of the regular trading session (“Market Close”), as determined by the Consolidated Tape Association (“CTA”), the central distributor of transaction prices for exchange-traded securities (normally 4:00 p.m. Eastern Time unless otherwise designated by the CTA). The NAV per share of each class of each Fund is calculated by taking the value of the Fund’s assets attributable to that class, subtracting the Fund’s liabilities attributable to that class, and dividing by the number of shares of that class that are outstanding. On days when a Fund is closed for business, Fund shares will not be priced and a Fund does not transact purchase and redemption orders. To the extent a Fund’s assets are traded in other markets on days when a Fund does not price its shares, the value of a Fund’s assets will likely change and you will not be able to purchase or redeem shares of a Fund.
Portfolio securities for which market quotations are readily available are valued at market value. Investments in open-end registered investment companies that do not trade on an exchange are valued at the end of day NAV per share. The prospectuses of the open-end registered investment companies in which each Fund may invest explain the circumstances under which they will use fair value pricing and the effects of using fair value pricing. Foreign securities’ prices are converted into U.S. dollar amounts using the applicable exchange rates as of Market Close.
When a market quotation for a portfolio security is not readily available or is deemed unreliable (for example when trading has been halted or there are unexpected market closures or other material events that would suggest that the market quotation is unreliable) and for purposes of determining the value of other Fund assets, the asset is priced at its fair value. The Board has designated the Investment Adviser, as the valuation designee, to make fair value determinations in good faith. In determining the fair value of each Fund’s assets, the Investment Adviser, pursuant to its fair valuation policy, may consider inputs from pricing service providers, broker-dealers, or each Fund’s sub-adviser(s). Issuer specific events, transaction price, position size, nature and duration of restrictions on disposition of the security,
NOTES TO FINANCIAL STATEMENTS as of March 31, 2024 (continued)
NOTE 2 — SIGNIFICANT ACCOUNTING POLICIES (continued)
market trends, bid/ask quotes of brokers and other market data may be reviewed in the course of making a good faith determination of an asset’s fair value. Because trading hours for certain foreign securities end before Market Close, closing market quotations may become unreliable. The prices of foreign securities will generally be adjusted based on inputs from an independent pricing service that are intended to reflect valuation changes through the NYSE close. Because of the inherent uncertainties of fair valuation, the values used to determine each Fund’s NAV may materially differ from the value received upon actual sale of those investments. Thus, fair valuation may have an unintended dilutive or accretive effect on the value of shareholders’ investments in each Fund.
The Funds’ financial instruments are valued at the close of the NYSE and are reported at fair value, which GAAP defines as the price that would be received to sell an asset or paid to transfer a liability in an orderly transaction between market participants at the measurement date.
Various valuation techniques and inputs are used to determine the fair value of financial instruments. GAAP establishes the following fair value hierarchy that categorizes the inputs used to measure fair value:
Level 1 — quoted prices (unadjusted) in active markets for identical financial instruments that the fund can access at the reporting date.
Level 2 — inputs other than Level 1 quoted prices that are observable, either directly or indirectly (including, but not limited to, quoted prices for similar financial instruments in active markets, quoted prices for identical or similar financial instruments in inactive markets, interest rates and yield curves, implied volatilities, and credit spreads).
Level 3 — unobservable inputs (including the fund’s own assumptions in determining fair value).
Observable inputs are developed using market data, such as publicly available information about actual events or transactions, and reflect the assumptions that market participants would use to price the financial instrument. Unobservable inputs are those for which market data are not available and are developed using the best information available about the assumptions that market participants would use to price the financial instrument. GAAP requires valuation techniques to maximize the use of relevant observable inputs and minimize the use of unobservable inputs. When multiple inputs are used to derive fair value, the financial instrument is assigned to the level within the fair value hierarchy based on the lowest-level input that is significant to the fair value of the financial instrument. Input levels are not necessarily an indication of the risk or liquidity
associated with financial instruments at that level but rather the degree of judgment used in determining those values.
A table summarizing each Fund’s investments under these levels of classification is included within each Portfolio of Investments.
Each investment asset or liability of the Funds is assigned a level at measurement date based on the significance and source of the inputs to its valuation. Quoted prices in active markets for identical securities are classified as “Level 1”, inputs other than quoted prices for an asset or liability that are observable are classified as “Level 2” and significant unobservable inputs, including each sub-adviser’s or Pricing Committee’s judgment about the assumptions that a market participant would use in pricing an asset or liability are classified as “Level 3”. The inputs used for valuing securities are not necessarily an indication of the risks associated with investing in those securities. Short-term securities of sufficient credit quality are generally considered to be Level 2 securities under applicable accounting rules. A table summarizing each Fund’s investments under these levels of classification is included within the Portfolio of Investments.
GAAP requires a reconciliation of the beginning to ending balances for reported fair values that presents changes attributable to total realized and unrealized gains or losses, purchases and sales, and transfers in or out of the Level 3 category during the period. A reconciliation of Level 3 investments within the Portfolio of Investments is presented only when a Fund has a significant amount of Level 3 investments.
B. Securities Transactions and Revenue Recognition. Securities transactions are accounted for on the trade date. Realized gains and losses are reported on the basis of identified cost of securities sold. Interest income is recorded on an accrual basis. Dividend income is recorded on the ex-dividend date, or for certain foreign securities, when the information becomes available to the Funds. Premium amortization and discount accretion are determined by the effective yield method.
C. Foreign Currency Translation. The books and records of the Funds are maintained in U.S. dollars. Any foreign currency amounts are translated into U.S. dollars on the following basis:
| (1) | Market value of investment securities, other assets and liabilities — at the exchange rates prevailing at Market Close. |
| (2) | Purchases and sales of investment securities, income and expenses — at the rates of exchange prevailing on the respective dates of such transactions. |
NOTES TO FINANCIAL STATEMENTS as of March 31, 2024 (continued)
NOTE 2 — SIGNIFICANT ACCOUNTING POLICIES (continued)
Although the net assets and the market values are presented at the foreign exchange rates at Market Close, the Funds do not isolate the portion of the results of operations resulting from changes in foreign exchange rates on investments from the fluctuations arising from changes in market prices of securities held. Such fluctuations are included with the net realized and unrealized gains or losses from investments. For securities that are subject to foreign withholding tax upon disposition, liabilities are recorded on the Statements of Assets and Liabilities for the estimated tax withholding based on the securities’ current market values. Upon disposition, realized gains or losses on such securities are recorded net of foreign withholding tax.
Reported net realized foreign exchange gains or losses arise from sales of foreign currencies, currency gains or losses realized between the trade and settlement dates on securities transactions, the difference between the amounts of dividends, interest, and foreign withholding taxes recorded on the Funds’ books, and the U.S. dollar equivalent of the amounts actually received or paid. Net unrealized foreign exchange gains and losses arise from changes in the value of assets and liabilities other than investments in securities, resulting from changes in the exchange rate. Foreign security and currency transactions may involve certain considerations and risks not typically associated with investing in U.S. companies and U.S. government securities. These risks include, but are not limited to revaluation of currencies and future adverse political and economic developments which could cause securities and their markets to be less liquid and prices more volatile than those of comparable U.S. companies and U.S. government securities. The foregoing risks are even greater with respect to securities of issuers in emerging markets.
D. Risk Exposures and the Use of Derivative Instruments. The Funds’ investment objectives permit them to enter into various types of derivatives contracts, including, but not limited to, forward foreign currency exchange contracts, futures, purchased options, written options, and swaps. In doing so, the Funds will employ strategies in differing combinations to permit them to increase or decrease the level of risk, or change the level or types of exposure to risk factors. This may allow the Funds to pursue their objectives more quickly, and efficiently than if they were to make direct purchases or sales of securities capable of affecting a similar response to market or credit factors.
In pursuit of their investment objectives, the Funds may seek to increase or decrease their exposure to the following market or credit risk factors:
Credit Risk. The price of a bond or other debt instrument is likely to fall if the issuer’s actual or perceived financial health deteriorates, whether because of broad economic or issuer-specific reasons. In certain cases, the issuer could be late in paying interest or principal, or could fail to pay its financial obligations altogether.
Equity Risk. Stock prices may be volatile or have reduced liquidity in response to real or perceived impacts of factors including, but not limited to, economic conditions, changes in market interest rates, and political events. Stock markets tend to be cyclical, with periods when stock prices generally rise and periods when stock prices generally decline. Any given stock market segment may remain out of favor with investors for a short or long period of time, and stocks as an asset class may underperform bonds or other asset classes during some periods. Additionally, legislative, regulatory or tax policies or developments in these areas may adversely impact the investment techniques available to a manager, add to costs and impair the ability of a Fund to achieve its investment objectives.
Foreign Exchange Rate Risk. To the extent that a Fund invests directly in foreign (non-U.S.) currencies or in securities denominated in, or that trade in, foreign (non-U.S.) currencies, it is subject to the risk that those foreign (non-U.S.) currencies will decline in value relative to the U.S. dollar or, in the case of hedging positions, that the U.S. dollar will decline in value relative to the currency being hedged by a Fund through foreign currency exchange transactions.
Currency rates may fluctuate significantly over short periods of time. Currency rates may be affected by changes in market interest rates, intervention (or the failure to intervene) by U.S. or foreign governments, central banks or supranational entities such as the International Monetary Fund, by the imposition of currency controls, or other political or economic developments in the United States or abroad.
Interest Rate Risk. A rise in market interest rates generally results in a fall in the value of bonds and other debt instruments; conversely, values generally rise as market interest rates fall. Interest rate risk is generally greater for debt instruments than floating-rate instruments. The higher the credit quality of the instrument, and the longer its maturity or duration, the more sensitive it is to changes in market interest rates. Duration is a measure of sensitivity of the price of a debt instrument to a change in interest rate. The U.S. has recently experienced a rising market interest rate environment, which may increase a Fund's exposure to risks associated with rising market interest rates. Rising market interest rates have unpredictable effects on the markets and may expose debt and related markets to heightened volatility. To the extent that a mutual
NOTES TO FINANCIAL STATEMENTS as of March 31, 2024 (continued)
NOTE 2 — SIGNIFICANT ACCOUNTING POLICIES (continued)
fund invests in debt instruments, an increase in market interest rates may lead to increased redemptions and increased portfolio turnover, which could reduce liquidity for certain investments, adversely affect values, and increase costs. Increased redemptions may cause a fund to liquidate portfolio positions when it may not be advantageous to do so and may lower returns. If dealer capacity in debt markets is insufficient for market conditions, it may further inhibit liquidity and increase volatility in debt markets. Further, recent and potential future changes in government policy may affect interest rates. Negative or very low interest rates could magnify the risks associated with changes in interest rates. In general, changing interest rates, including rates that fall below zero, could have unpredictable effects on markets and may expose debt and related markets to heightened volatility. Changes to monetary policy by the U.S. Federal Reserve Board or other regulatory actions could expose debt and related markets to heightened volatility, interest rate sensitivity, and reduced liquidity, which may impact operations and return potential.
Risks of Investing in Derivatives. The Funds’ use of derivatives can result in losses due to unanticipated changes in the market or credit risk factors and the overall market. In instances where the Funds are using derivatives to decrease, or hedge, exposures to market or credit risk factors for securities held by a Fund, there are also risks that those derivatives may not perform as expected resulting in losses for the combined or hedged positions.
Derivative instruments are subject to a number of risks, including the risk of changes in the market price of the underlying securities, credit risk with respect to the counterparty, risk of loss due to changes in market interest rates and liquidity and volatility risk. The amounts required to purchase certain derivatives may be small relative to the magnitude of exposure assumed by a Fund. Therefore, the purchase of certain derivatives may have an economic leveraging effect on a Fund and exaggerate any increase or decrease in the NAV. Derivatives may not perform as expected, so a Fund may not realize the intended benefits. When used for hedging purposes, the change in value of a derivative may not correlate as expected with the currency, security or other risk being hedged. When used as an alternative or substitute for direct cash investments, the return provided by the derivative may not provide the same return as direct cash investment. In addition, given their complexity, derivatives expose a Fund to the risk of improper valuation.
Generally, derivatives are sophisticated financial instruments whose performance is derived, at least in part, from the performance of an underlying asset or assets.
Derivatives include, among other things, swap agreements, options, forwards and futures. Investments in derivatives are generally negotiated OTC with a single counterparty and as a result are subject to credit risks related to the counterparty’s ability or willingness to perform its obligations; any deterioration in the counterparty’s creditworthiness could adversely affect the value of the derivative. In addition, derivatives and their underlying securities may experience periods of illiquidity which could cause a Fund to hold a security it might otherwise sell, or to sell a security it otherwise might hold at inopportune times or at an unanticipated price. A manager might imperfectly judge the direction of the market. For instance, if a derivative is used as a hedge to offset investment risk in another security, the hedge might not correlate to the market’s movements and may have unexpected or undesired results such as a loss or a reduction in gains.
Counterparty Credit Risk and Credit Related Contingent Features. Certain derivative positions are subject to counterparty credit risk, which is the risk that the counterparty will not fulfill its obligation to the Funds. The Funds’ derivative counterparties are financial institutions who are subject to market conditions that may weaken their financial position. The Funds intend to enter into financial transactions with counterparties that they believe to be creditworthy at the time of the transaction. To reduce this risk, the Funds generally enter into master netting arrangements, established within the Funds’ International Swap and Derivatives Association, Inc. (“ISDA”) Master Agreements (“Master Agreements”). These agreements are with select counterparties and they govern transactions, including certain OTC derivative and forward foreign currency contracts, entered into by the Funds and the counterparty. The Master Agreements maintain provisions for general obligations, representations, agreements, collateral, and events of default or termination. The occurrence of a specified event of termination may give a counterparty the right to terminate all of its contracts and affect settlement of all outstanding transactions under the applicable Master Agreement.
The Funds may also enter into collateral agreements with certain counterparties to further mitigate credit risk associated with OTC derivative and forward foreign currency contracts. Subject to established minimum levels, collateral is generally determined based on the net aggregate unrealized gain or loss on contracts with a certain counterparty. Collateral pledged to or from the Funds is held in a segregated account by a third-party agent and can be in the form of cash or debt securities issued by the U.S. government or related agencies.
At March 31, 2024, the maximum amount of loss that Intermediate Bond and Strategic Income Opportunities would incur if the counterparties to their derivative
NOTES TO FINANCIAL STATEMENTS as of March 31, 2024 (continued)
NOTE 2 — SIGNIFICANT ACCOUNTING POLICIES (continued)
transactions failed to perform would be $2,528,488 and $11,086,155, respectively, which represents the gross payments to be received by the Funds on OTC purchased options, forward premium swaptions and open forward foreign currency contracts were they to be unwound as of March 31, 2024. To reduce the amount of potential loss to Intermediate Bond and Strategic Income Opportunities, the Funds received $1,840,000 and $1,710,000, respectively, in cash collateral from certain counterparties at March 31, 2024.
The Funds’ Master Agreements with derivative counterparties have credit related contingent features that if triggered would allow their derivatives counterparties to close out and demand payment or additional collateral to cover their exposure from the Funds. Credit related contingent features are established between the Funds and their derivatives counterparties to reduce the risk that the Funds will not fulfill their payment obligations to their counterparties. These triggering features include, but are not limited to, a percentage decrease in the Funds’ net assets and or a percentage decrease in the Funds’ NAV, which could cause the Funds to accelerate payment of any net liability owed to the counterparty. The contingent features are established within the Funds’ Master Agreements.
As of March 31, 2024, Intermediate Bond and Strategic Income Opportunities had a liability position of $2,001,131 and $13,013,306, respectively, on open forward foreign currency contracts, forward premium swaptions, OTC written options, and volatility swaps. If a contingent feature would have been triggered as of March 31, 2024, the Funds could have been required to pay this amount in cash to their counterparties. At March 31, 2024, Intermediate Bond and Strategic Income Opportunities had pledged $1,520,000 and $1,930,670, respectively, in cash collateral to certain counterparties for open OTC derivatives.
E. Forward Foreign Currency Transactions and Futures Contracts. Certain Funds may enter into foreign currency exchange transactions to convert to and from different foreign currencies and to and from the U.S. dollar in connection with the planned purchases or sales of securities. The Funds either enter into these transactions on a spot basis at the spot rate prevailing in the foreign currency exchange market or use forward foreign currency contracts to purchase or sell foreign currencies. When the contract is fulfilled or closed, gains or losses are realized. Until then, the gain or loss is included in unrealized appreciation or depreciation. Risks may arise upon
entering into forward contracts from the potential inability of counterparties to meet the terms of their forward contracts and from unanticipated movements in the value of foreign currencies relative to the U.S. dollar.
For the year ended March 31, 2024, Intermediate Bond and Strategic Income Opportunities entered into forward foreign currency contracts with the obligation to buy and sell specified foreign currencies in the future at a currently negotiated forward rate in order to increase or decrease exposure to foreign exchange rate risk. The Funds used forward foreign currency contracts primarily to protect any non-U.S. dollar-denominated holdings from adverse currency movements.
During the year ended March 31, 2024, Intermediate Bond and Strategic Income Opportunities had average contract amounts on forward foreign currency contracts to buy and sell as disclosed below. Please refer to the tables within the Portfolio of Investments for open forward foreign currency contracts at March 31, 2024.
| | | | Buy | | | | Sell | |
| Intermediate Bond | | $ | 117,770,801 | | | $ | 62,648,484 | |
| Strategic Income Opportunities | | | 414,846,614 | | | | 464,714,561 | |
Each Fund may enter into futures contracts involving foreign currency, interest rates, securities and securities indices. Each Fund intends to limit its use of futures contracts and futures options to “bona fide hedging” transactions, as such term is defined in applicable regulations, interpretations and practice. A futures contract obligates the seller of the contract to deliver and the purchaser of the contract to take delivery of the type of foreign currency, financial instrument or security called for in the contract at a specified future time for a specified price.
Upon entering into a futures contract, the Funds are required to deposit either cash or securities (initial margin) in an amount equal to a certain percentage of the contract value. Subsequent payments (variation margin) are made or received by the Funds each day. The variation margin payments are equal to the daily changes in the contract value and are recorded as unrealized gains and losses and, if any, shown as variation margin receivable or payable on futures contracts on the Statement of Assets and Liabilities. Open futures contracts, if any, are reported on a table within each Fund’s Portfolio of Investments. Securities held in collateralized accounts to cover initial margin requirements, if any, on open futures contracts are footnoted in the Portfolio of Investments. Cash collateral held by the broker to cover initial margin requirements on open futures contracts are noted in the each Fund’s Statement of Assets and Liabilities. The net change in unrealized appreciation and depreciation is reported in the each Fund’s Statement of Operations. Realized gains (losses) are reported in the
NOTES TO FINANCIAL STATEMENTS as of March 31, 2024 (continued)
NOTE 2 — SIGNIFICANT ACCOUNTING POLICIES (continued)
each Fund’s Statement of Operations at the closing or expiration of futures contracts.
Futures contracts are exposed to the market risk factor of the underlying financial instrument. During the year ended March 31, 2024, GNMA Income, Intermediate Bond, Short Term Bond and Strategic Income Opportunities have purchased and sold futures contracts on various bonds and notes to manage duration and yield curve exposure. Additional associated risks of entering into futures contracts include the possibility that there may be an illiquid market where a Fund is unable to liquidate the contract or enter into an offsetting position and, if used for hedging purposes, the risk that the price of the contract will correlate imperfectly with the prices of the Fund’s securities. With futures, there is minimal counterparty credit risk to a Fund since futures are exchange traded and the exchange’s clearinghouse, as counterparty to all exchange traded futures, guarantees the futures against default.
During the year ended March 31, 2024, the following Funds had an average notional value on futures contracts purchased and sold as disclosed below. Please refer to the tables within each respective Portfolio of Investments for open futures contracts at March 31, 2024.
| | | Purchased | | | Sold | |
| GNMA Income | | $ | 27,730,508 | | | $ | 226,507,120 | |
| Intermediate Bond | | | 738,559,273 | | | | 452,228,100 | |
| Short Term Bond | | | 215,113,531 | | | | 37,612,808 | |
| Strategic Income Opportunities | | | 462,841,156 | | | | 469,599,269 | |
F. Distributions to Shareholders. The Funds record distributions to their shareholders on the ex-dividend date. Each Fund distributes capital gains, if any, annually. All Funds declare dividends daily and pay dividends monthly. The characteristics of income and gains to be distributed are determined in accordance with income tax regulations, which may differ from GAAP for investment companies.
G. Federal Income Taxes. It is the policy of each Fund to comply with the requirements of subchapter M of the Internal Revenue Code that are applicable to regulated investment companies and to distribute substantially all of its net investment income and any net realized capital gains to its shareholders. Therefore, a federal income tax or excise tax provision is not required. Management has considered the sustainability of the Funds’ tax positions taken on federal income tax returns for all open tax years in making this determination. No capital gain distributions shall be made until the capital loss carryforwards have been fully utilized.
The Funds may utilize equalization accounting for tax purposes, whereby a portion of redemption payments are treated as distributions of income or gain.
H. Use of Estimates. The preparation of financial statements in conformity with GAAP requires management to make estimates and assumptions that affect the reported amounts of assets and liabilities and disclosure of contingent assets and liabilities at the date of the financial statements and the reported amounts of increases and decreases in net assets from operations during the reporting period. Actual results could differ from those estimates.
I. Repurchase Agreements. Each Fund may invest in repurchase agreements only with government securities dealers recognized by the Board of Governors of the Federal Reserve System. Under such agreements, the seller of the security agrees to repurchase it at a mutually agreed upon time and price. The resale price is in excess of the purchase price and reflects an agreed upon interest rate for the period of time the agreement is outstanding. The period of the repurchase agreements is generally short, from possibly overnight to one week, (although it may extend over a number of months) while the underlying securities generally have longer maturities. Each Fund will receive as collateral securities acceptable to it whose market value is equal to at least 100% of the carrying amount of the repurchase agreements, plus accrued interest, being invested by a Fund. The underlying collateral is valued daily on a mark to market basis to assure that the value, including accrued interest is at least equal to the repurchase price. There would be potential loss to a Fund in the event a Fund is delayed or prevented from exercising its right to dispose of the collateral, and it may incur disposition costs in liquidating the collateral. Please refer to the Portfolio of Investments for Intermediate Bond for open repurchase agreements at March 31, 2024.
J. Securities Lending. Each Fund has the option to temporarily loan up to 33 1∕3% of its total assets to brokers, dealers or other financial institutions in exchange for a negotiated lender’s fee. Securities lending involves two primary risks: “investment risk” and “borrower default risk.” When lending securities, the Funds will receive cash or U.S. government securities as collateral. Investment risk is the risk that the Funds will lose money from the investment of the cash collateral received from the borrower. Borrower default risk is the risk that the Funds will lose money due to the failure of a borrower to return a borrowed security. Loans are subject to termination at the option of the borrower or the Funds. Securities lending may result in leverage. The use of leverage may exaggerate any increase or decrease in the NAV, causing the Funds to be more volatile. The use of leverage may increase expenses and increase the impact of the Funds’ other risks.
NOTES TO FINANCIAL STATEMENTS as of March 31, 2024 (continued)
NOTE 2 — SIGNIFICANT ACCOUNTING POLICIES (continued)
K. Restricted Securities. Each Fund may invest in restricted securities which include those sold under Rule 144A of the Securities Act of 1933, as amended (“1933 Act”) or securities offered pursuant to Section 4(a)(2) of the 1933 Act, and/or are subject to legal or contractual restrictions on resale and may not be publicly sold without registration under the 1933 Act. Restricted securities are fair valued using market quotations when readily available. In the absence of market quotations, the securities are valued based upon their fair value determined in good faith under procedures approved by the Board.
Securities that are not registered for sale to the public under the 1933 Act are referred to as “restricted securities.” These securities may be sold in private placement transactions between issuers and their purchasers and may be neither listed on an exchange nor traded in other established markets. Many times these securities are subject to legal or contractual restrictions on resale. As a result of the absence of a public trading market, the prices of these securities may be more volatile, less liquid and more difficult to value than publicly traded securities. The price realized from the sale of these securities could be less than the amount originally paid or less than their fair value if they are resold in privately negotiated transactions. In addition, these securities may not be subject to disclosure and other investment protection requirements that are afforded to publicly traded securities. Certain investments may include investment in smaller, less seasoned issuers, which may involve greater risk.
L. Delayed-Delivery or When-Issued Transactions. The Funds may purchase or sell securities on a when-issued or a delayed-delivery basis. Each Fund may enter into forward commitments. The price of the underlying securities and date when the securities will be delivered and paid for are fixed at the time the transaction is negotiated. The market value of such is identified in the Funds’ Portfolio of investments. Losses may arise due to changes in the market value of the securities or from the inability of counterparties to meet the terms of the contract. In connection with such purchases, the Funds are required to segregate liquid assets with the Funds’ custodian sufficient to cover the purchase price.
To mitigate counterparty risk, the Funds have entered into Master Securities Forward Transaction Agreements (“MSFTA”) with their respective counterparties that provide or collateral and the right to offset amounts due to or from those counterparties under specified conditions. Subject to minimum transfer amounts, collateral requirements are determined and transfers made based on the net aggregate unrealized gain or loss on all the when-issued or delayed-delivery transactions with a particular counterparty. Cash
collateral, if any, is presented on the Statement of Assets and Liabilities as an asset (Cash pledged as collateral for delayed-delivery or when-issued securities) and a liability (Cash received as collateral for delayed-delivery or when-issued securities).
At March 31, 2024, GNMA Income, Intermediate Bond, and Strategic Income Opportunities had pledged $80,000, $39,000 and $7,000, respectively in cash collateral with certain counterparties for open delayed-delivery or when-issued transactions.
At March 31, 2024, GNMA Income and Strategic Income Opportunities had received $2,748,420 and $310,009, respectively, in cash collateral with certain counterparties for open delayed-delivery or when-issued transactions.
M. Mortgage Dollar Roll Transactions. Each Fund may engage in dollar roll transactions with respect to mortgage-backed securities issued or to be issued by Government National Mortgage Association, Federal National Mortgage Association and Federal Home Loan Mortgage Corp. In a dollar roll transaction, a Fund sells a mortgage-backed security to a financial institution, such as a bank or broker/ dealer, and simultaneously agrees to repurchase a substantially similar (i.e., same type, coupon, and maturity) security from the institution on a delayed delivery basis at an agreed upon price. The mortgage-backed securities that are repurchased will bear the same interest rate as those sold, but generally will be collateralized by different pools of mortgages with different prepayment histories. The Funds account for dollar roll transactions as purchases and sales.
N. Options Contracts. The Funds may write call and put options on futures, swap options (“swaptions”), securities, commodity or currencies they own or in which they may invest. Writing put options tends to increase the Funds exposure to the underlying instrument. Writing call options tends to decrease the Funds exposure to the underlying instrument. When a Fund writes a call or put option, an amount equal to the premium received is recorded as a liability and subsequently marked to market to reflect the current value of the option written. These liabilities are reflected as written options outstanding on the Statements of Assets and Liabilities. Certain options may be written with premiums to be determined on a future date. Forward premium swaptions include premiums that have extended settlement dates. The delayed settlement of the premiums is factored into the daily valuation of the option contracts. Premiums received from writing options which expire are treated as realized gains. Premiums received from writing options which are exercised or closed are added to the proceeds or offset against amounts paid on the underlying futures, swap, security or currency transaction to determine the realized gain or loss. Each Fund as a writer of an option has no control over whether the underlying instrument may
NOTES TO FINANCIAL STATEMENTS as of March 31, 2024 (continued)
NOTE 2 — SIGNIFICANT ACCOUNTING POLICIES (continued)
be sold (call) or purchased (put) and as a result bears the market risk of an unfavorable change in the price of the instrument underlying the written option. There is the risk the Funds may not be able to enter into a closing transaction because of an illiquid market.
The Funds may also purchase put and call options. Purchasing call options tends to increase the Funds’ exposure to the underlying instrument. Purchasing put options tends to decrease the Funds’ exposure to the underlying instrument. The Funds pay a premium which is included on the Statements of Assets and Liabilities as an investment and subsequently marked to market to reflect the current value of the option. Premiums paid for purchasing options which expire are treated as realized losses. Certain options may be purchased with premiums to be determined on a future date. The premiums for these options are based upon implied volatility parameters at specified terms. The risk associated with purchasing put and call options is limited to the premium paid. Premiums paid for purchasing options which are exercised or closed are added to the amounts paid or offset against the proceeds on the underlying investment transaction to determine the realized gain or loss.
During the year ended March 31, 2024, Intermediate Bond and Strategic Income Opportunities had purchased interest rate swaptions to generate income with an average notional value of $186,637,700 and $168,913,000 respectively. Please refer to the table within the Portfolio of Investments for open purchased interest rate swaptions contracts for Intermediate Bond and Strategic Income Opportunities at March 31, 2024.
During the year ended March 31, 2024, Intermediate Bond and Strategic Income Opportunities had written interest rate swaptions to generate income with an average notional value of $1,642,906,960 and $617,125,200, respectively. Please refer to the table within the Portfolio of Investments for open written interest rate swaptions contracts for Intermediate Bond and Strategic Income Opportunities at March 31, 2024.
During the year ended March 31, 2024, Intermediate Bond and Strategic Income Opportunities had purchased foreign currency options to manage their foreign exchange exposure with average notional values of $56,268,000 and $136,850,998, respectively. Please refer to the tables within the Portfolio of Investments for open purchased options on foreign currencies for Intermediate Bond and Strategic Income Opportunities at March 31, 2024.
During the year ended March 31, 2024, Strategic Income Opportunities had written foreign currency options
to generate income with an average notional value $116,131,965. Please refer to the tables within the Portfolio of Investments for open written options on foreign currency contracts for Strategic Income Opportunities at March 31, 2024. There were no written options on foreign currency contracts for Intermediate Bond at March 31, 2024.
During the year ended March 31, 2024, Intermediate Bond and Strategic Income Opportunities had purchased forward premium swaptions with average notional values of $183,410,595 and $89,297,797, respectively, to manage duration and yield curve exposures. Please refer to the tables within the Portfolio of Investments for open purchased forward premium swaptions for Intermediate Bond and Strategic Income Opportunities at March 31, 2024.
During the year ended March 31, 2024, Intermediate Bond and Strategic Income Opportunities had written forward premium swaptions with average notional values of $1,500,248,139 and $265,429,600, respectively, to generate income. Please refer to the tables within the Portfolio of Investments for open written forward premium swaptions for Intermediate Bond and Strategic Income Opportunities at March 31, 2024.
During the year ended March 31, 2024, Strategic Income Opportunities had purchased and written exchange-traded options to gain additional exposure to interest rates and to generate income. Strategic Income Opportunities had an average notional amount of $473,979,838 and $473,979,838 on purchased and written exchange-traded options, respectively. There were no open purchased or written exchange-trade options at March 31, 2024.
During the year ended March 31, 2024, Strategic Income Opportunities had purchased and written options on exchange-traded funds with an average notional value of $317,294,436 and $157,645,943, respectively, to gain additional exposure to the high yield corporate bond market and to generate income. There were no open purchased and written options on exchange-traded funds at March 31, 2024.
O. Swap Agreements. Certain Funds may enter into swap agreements. A swap is an agreement between two parties pursuant to which each party agrees to make one or more payments to the other at specified future intervals based on the return of an asset (such as a stock, bond or currency) or non-asset reference (such as an interest rate or index). The swap agreement will specify the “notional” amount of the asset or non-asset reference to which the contract relates. Subsequent changes in fair value, if any, are calculated based upon changes in the performance of the asset or non-asset reference multiplied by the notional value of the contract. A Fund may enter into credit default, interest rate,
| NOTES TO FINANCIAL STATEMENTS AS OF MARCH 31, 2024 (CONTINUED) |
NOTE 2 — SIGNIFICANT ACCOUNTING POLICIES (continued)
total return and currency swaps to manage its exposure to credit, currency and interest rate risk. All outstanding swap agreements are reported within each Fund’s Portfolio of Investments.
Swaps are marked to market daily using quotations primarily from third party pricing services, counterparties or brokers. The fair value of the swap contract is recorded on each Fund’s Statement of Assets and Liabilities. During the term of the swap, changes in the fair value of the swap, if any, are recorded as unrealized gains or losses on the Statement of Operations. Upfront payments paid or received by a Fund when entering into the agreements are reported on the Statement of Assets and Liabilities and as a component of the changes in unrealized gains or losses on the Statement of Operations. These upfront payments represent the amounts paid or received when initially entering into the swap agreement to compensate for differences between the stated terms of the swap agreement and the prevailing market conditions. The upfront payments are included as a component in the realized gains or losses on each Fund’s Statement of Operations upon termination or maturity of the swap. A Fund also records net periodic payments paid or received on the swap contract as a realized gain or loss on the Statement of Operations.
Entering into swap agreements involves the risk that the maximum potential loss of an investment exceeds the current value of the investment as reported on each Fund’s Statement of Assets and Liabilities. Other risks involve the possibility that the counterparty to the agreements may default on its obligation to perform, that there will be no liquid market for these investments and that unfavorable changes in the market will have a negative impact on the value of the index or securities underlying the respective swap agreement.
Credit Default Swap Contracts. A credit default swap is a bilateral agreement between counterparties in which the buyer of the protection agrees to make a stream of periodic payments to the seller of protection in exchange for the right to receive a specified return in the event of a default or other credit event for a referenced entity, obligation or index. As a seller of protection on credit default swaps, a Fund will generally receive from the buyer a fixed payment stream based on the notional amount of the swap contract. This fixed payment stream will continue until the swap contract expires or a defined credit event occurs.
A Fund is subject to credit risk in the normal course of pursuing its investment objectives. As a seller of protection in a credit default swap, a Fund may execute these contracts to manage its exposure to the market or certain sectors of the market. A Fund may also enter into credit default swaps
to speculate on changes in an issuer’s credit quality, to take advantage of perceived spread advantages, or to offset an existing short equivalent (i.e. buying protection on an equivalent reference entity).
Certain Funds may sell credit default swaps which expose these Funds to the risk of loss from credit risk-related events specified in the contract. Although contract specific, credit events are generally defined as bankruptcy, failure to pay, restructuring, obligation acceleration, obligation default or repudiation/moratorium. If a Fund is a seller of protection, and a credit event occurs, as defined under the terms of that particular swap agreement, a Fund will generally either (i) pay to the buyer an amount equal to the notional amount of the swap and take delivery of the referenced obligation, other deliverable obligations, or underlying securities comprising a referenced index or (ii) pay a net settlement amount in the form of cash or securities equal to the notional amount of the swap less the recovery value of the referenced obligation or underlying securities comprising a referenced index. If a Fund is a buyer of protection and a credit event occurs, as defined under the terms of that particular swap agreement, a Fund will either (i) receive from the seller of protection an amount equal to the notional amount of the swap and deliver the referenced obligation, other deliverable obligations or underlying securities comprising the referenced index or (ii) receive a net settlement amount in the form of cash or securities equal to the notional amount of the swap less the recovery value of the referenced obligation or underlying securities comprising the referenced index. Recovery values are assumed by market makers considering either industry standard recovery rates or entity specific factors and considerations until a credit event occurs. If a credit event has occurred, the recovery value is determined by a facilitated auction whereby a minimum number of allowable broker bids, together with a specified valuation method, are used to calculate the settlement value.
Implied credit spreads, represented in absolute terms, utilized in determining the fair value of credit default swap agreements on corporate issues or sovereign issues are disclosed in each Fund’s Portfolio of Investments and serve as an indicator of the current status of the payment/ performance risk and represent the likelihood or risk of default for the credit derivative. The implied credit spread of a particular referenced entity reflects the cost of buying/ selling protection and may include upfront payments required to be made to enter into the agreement. For credit default swaps on asset-backed securities or credit indices, the quoted market prices and resulting fair values serve as the indicator of the current status of the payment/ performance risk. Wider credit spreads and increasing fair values, in absolute terms when compared to the notional amount of the swap, represent a deterioration
| NOTES TO FINANCIAL STATEMENTS AS OF MARCH 31, 2024 (CONTINUED) |
NOTE 2 — SIGNIFICANT ACCOUNTING POLICIES (continued)
of the referenced entity’s credit soundness and a greater likelihood or risk of default or other credit event occurring as defined under the terms of the agreement.
The maximum amount of future payments (undiscounted) that a Fund as seller of protection could be required to make under a credit default swap agreement would be an amount equal to the notional amount of the agreement. Notional amounts of all credit default swap agreements outstanding as of March 31, 2024, if any, for which a Fund is seller of protection, are disclosed in each Fund’s Portfolio of Investments. These potential amounts would be partially offset by any recovery values of the respective referenced obligations, upfront payments received upon entering into the agreements, or net amounts received from the settlement of buy protection credit default swap agreements entered into by a Fund for the same referenced entity or entities.
For the year ended March 31, 2024, High Yield Bond, Intermediate Bond, Short Term Bond and Strategic Income Opportunities had bought and sold credit protection on credit default swap indices (“CDX”). A CDX is a basket of credit instruments or exposures designed to be representative of some part of the credit market as a whole. The Funds enter into CDX swap contracts to gain additional exposure within various credit sectors and to hedge the credit risk associated within various sectors with the credit markets. In addition, for the year ended March 31, 2024, Strategic Income Opportunities had bought credit protection on single name issuers (Corporate or Sovereign) to gain additional exposure to the credit market.
During the year ended March 31, 2024, High Yield and Strategic Income Opportunities had an average notional value on credit default swaps to buy protection of $25,000,000 and $15,120,000, respectively. There were no credit default swaps to buy protection for High Yield and Strategic Income Opportunities at March 31, 2024.
During the year ended March 31, 2024, Intermediate Bond and Short Term Bond had an average notional value on credit default swaps to sell protection of $37,997,000 and $5,603,000, respectively. There were no credit default swaps to sell protection for any Fund at March 31, 2024.
Interest Rate Swap Agreements. An interest rate swap involves the agreement between counterparties to exchange periodic payments based on interest rates. One payment will be based on a floating rate of a specified interest rate while the other will be a fixed rate. Risks involve the future fluctuations of interest rates in which a Fund may make payments that are greater than what a Fund received
from the counterparty. Other risks include credit, liquidity and market risk.
For the year ended March 31, 2024, Intermediate Bond and Strategic Income Opportunities had entered into interest rate swaps in which they pay a floating interest rate and receive a fixed interest rate (“Long interest rate swap”) in order to increase exposure to interest rate risk. The average notional amount on long interest rate swaps for Intermediate Bond and Strategic Income Opportunities was $678,694,638 and $459,927,461 respectively.
For the year ended March 31, 2024, Intermediate Bond and Strategic Income Opportunities had entered into interest rate swaps in which they pay a fixed interest rate and receive a floating interest rate (“Short interest rate swap”) in order to decrease exposure to interest rate risk. The average notional amount on short interest rate swaps for Intermediate Bond and Strategic Income Opportunities was $1,057,273,518 and $423,070,191, respectively.
Please refer to the table within the Portfolio of Investments for Intermediate Bond and Strategic Income Opportunities for open centrally cleared interest rate swaps at March 31, 2024.
At March 31, 2024, Intermediate Bond and Strategic Income Opportunities had pledged $3,550,000 and $1,896,846 as cash collateral for open centrally cleared swaps, respectively.
Volatility Swap Contracts. Certain Funds may enter into volatility swaps. Volatility swaps are agreements in which the counterparties agree to make payments in connection with changes in the volatility (i.e., the magnitude of change over a specified period of time) of an underlying referenced instrument, such as a currency, rate, index, security or other financial instrument. Volatility swaps permit the parties to attempt to hedge volatility risk and/or take positions on the projected future volatility of an underlying referenced instrument. As a receiver of the realized price volatility, the Portfolio would receive the payoff amount when the realized price volatility of the referenced instrument is greater than the strike and would owe the payoff amount when the volatility is less than the strike. As a payer of the realized price volatility, the Portfolio would owe the payoff amount when the realized price volatility of the referenced instrument is greater than the strike and would receive the payoff amount when the volatility is less than the strike.
For the year ended March 31, 2024, Intermediate Bond and Strategic Income Opportunities had an average notional amount of $1,158,000 and $22,388,500 on foreign currency volatility swaps (receiver), respectively. Please refer to the table within the Portfolio of Investments for Intermediate Bond and Strategic Income Opportunities for open foreign currency volatility swaps at March 31, 2024.
| NOTES TO FINANCIAL STATEMENTS AS OF MARCH 31, 2024 (CONTINUED) |
NOTE 2 — SIGNIFICANT ACCOUNTING POLICIES (continued)
P. Offering Cost. Costs incurred with the offering of Short Duration High Income are deferred and amortized over a twelve month period on a straight-line basis starting at the commencement of operations on February 9, 2023.
Q. Indemnifications. In the normal course of business, the Trust may enter into contracts that provide certain indemnifications. The Trust’s maximum exposure under these arrangements is dependent on future claims that may be made against the Funds and, therefore, cannot be estimated; however, based on experience, management considers risk of loss from such claims remote.
NOTE 3 — INVESTMENT TRANSACTIONS
For the year ended March 31, 2024, the cost of purchases and the proceeds from the sales of securities excluding short-term and U.S. government securities, were as follows:
| | Purchases | | Sales |
| GNMA Income | $ | 548,436,226 | | $ | 548,238,055 |
| High Yield Bond | 362,546,930 | | 284,546,569 |
| Intermediate Bond | 4,026,211,018 | | 3,297,149,653 |
| Short Duration High Income | 129,091,239 | | 30,434,590 |
| Short Term Bond | 283,648,030 | | 116,938,264 |
| Strategic Income Opportunities | 1,208,899,865 | | 1,369,335,752 |
U.S. government securities not included above were as follows:
| | Purchases | | Sales |
| GNMA Income | $ | 7,402,686,525 | | $ | 7,391,014,795 |
| Intermediate Bond | 18,765,586,076 | | 18,473,669,967 |
| Short Term Bond | 1,623,214,147 | | 1,634,085,609 |
| Strategic Income Opportunities | 3,585,544,733 | | 3,603,050,517 |
NOTE 4 — INVESTMENT MANAGEMENT FEES
The Funds have entered into an investment management agreement (“Management Agreement”) with the Investment Adviser. The Investment Adviser has overall responsibility for the management of the Funds. The Investment Adviser oversees all investment advisory and portfolio management services for the Funds and assists in managing and supervising all aspects of the general day-to-day business activities and operations of the Funds, including custodial, transfer agency, dividend disbursing, accounting, auditing, compliance and related services. This Management Agreement compensates the Investment Adviser with a management fee, computed daily and payable monthly, based on the average daily net assets of each Fund, at the following annual rates:
| Fund | | Fees |
| GNMA Income | | 0.45% on the first $1 billion, |
| | | 0.43% on the next $500 million and |
| | | 0.41% on assets thereafter |
| High Yield Bond(1) | | 0.61% on the first $500 million, |
| | | 0.55% on the next $4.5 billion and |
| | | 0.50% on assets thereafter |
| Intermediate Bond | | 0.27% on all assets |
| Short Duration High Income | | 0.48% on all assets |
| Short Term Bond | | 0.25% on all assets |
| Strategic Income Opportunities | | 0.50% on all assets |
| (1) | The Investment Adviser has agreed to waive 0.05% of the management fee through August 1, 2024. Any fees waived or reimbursed in relation to this waiver are not eligible for recoupment. Termination or modification of this waiver requires approval by the Board. |
The Investment Adviser has entered into a sub-advisory agreement with Voya IM with respect to each Fund. Voya IM provides investment advice for the Funds and is paid by the Investment Adviser based on the average daily net assets of each respective Fund. Subject to such policies as the Board or the Investment Adviser may determine, Voya IM manages each Funds’ assets in accordance with each Funds’ investment objectives, policies, and limitations.
NOTE 5 — DISTRIBUTION AND SERVICE FEES
Class A, Class C and Class R of the respective Funds each has a distribution and/or service and distribution plan (the “Plan”), whereby the Distributor is compensated by certain of the Funds for expenses incurred in the distribution and/or shareholder servicing of each Fund’s shares (“Distribution and/or Service Fees”). Pursuant to the Plan, the Distributor is entitled to payment each month for expenses incurred in the distribution and promotion of certain of each Fund’s shares, including expenses incurred in printing prospectuses and reports used for sales purposes, expenses incurred in preparing and printing sales literature and other such distribution related expenses, including any Distribution and/or Service Fees paid to securities dealers who have executed a distribution agreement with the Distributor. In addition, High Yield Bond, Intermediate Bond, Short Term Bond and Strategic Income Opportunities have a shareholder service plan for Class A and Class C shares (together with the Plan referenced above, the “Plans”). Under the Plans, each class of shares of each Fund pays the Distributor a Distribution and/or Service Fee based on average daily net assets at the following annual rates:
| NOTES TO FINANCIAL STATEMENTS AS OF MARCH 31, 2024 (CONTINUED) |
NOTE 5 — DISTRIBUTION AND SERVICE FEES (continued)
| | | Class A | | Class C | | Class R |
| GNMA Income | | 0.25% | | 1.00% | | N/A |
| High Yield Bond | | 0.25% | | 1.00% | | 0.50% |
| Intermediate Bond | | 0.25% | | 1.00% | | 0.50% |
| Short Duration High Income | | 0.25% | | 1.00% | | N/A |
| Short Term Bond | | 0.25% | | 1.00% | | 0.50% |
| Strategic Income Opportunities | | 0.25% | | 1.00% | | 0.50% |
The Distributor may also retain the proceeds of the initial sales charge paid by shareholders upon the purchase of Class A shares of the Funds and the contingent deferred sales charge paid by shareholders upon certain redemptions for Class A and Class C shares. For the year ended March 31, 2024, the Distributor retained the following amounts in sales charges:
| | Class A | | Class C |
| Initial Sales Charges: | | | |
| GNMA Income | $ | 2,383 | | $ | — |
| High Yield Bond | 2,240 | | — |
| Intermediate Bond | 5,353 | | — |
| Short Duration High Income | 671 | | — |
| Short Term Bond | 628 | | — |
| Strategic Income Opportunities | 3,063 | | — |
| | | | |
| Contingent Deferred Sales Charges: | | | |
| GNMA Income | $ | 975 | | $ | 2,853 |
| High Yield Bond | 252 | | 12 |
| Intermediate Bond | 34 | | 541 |
| Short Duration High Income | — | | 1 |
| Strategic Income Opportunities | — | | 1,084 |
NOTE 6 — OTHER TRANSACTIONS WITH AFFILIATES AND RELATED PARTIES
At March 31, 2024, the following direct or indirect, wholly owned subsidiaries of Voya Financial, Inc. or affiliated investment companies owned more than 5% of the following Funds:
| Subsidiary/Affiliated | | | | |
| Investment Company | | Fund | | Percentage |
| Voya Global Diversified Payment | | Short Duration | | |
| Fund | | High Income | 10.27% |
| Voya Index Solution Income Portfolio | | Short Term Bond | 7.15 |
| Voya Institutional Trust Company | | GNMA Income | 13.75 |
| Voya Investments, LLC | | Short Duration | |
| | High Income | 20.47 |
| Voya Retirement Conservative | | | |
| Portfolio | | Short Term Bond | 7.25 |
| Voya Retirement Growth Portfolio | | High Yield Bond | 7.83 |
| | | Short Term Bond | 23.39 |
| Voya Retirement Insurance and | | | |
| Annuity Company | | Intermediate Bond | 8.62 |
| Voya Retirement Moderate Growth | | | | |
| Portfolio | | High Yield Bond | | 5.32 |
| | | Short Term Bond | | 18.18 |
| Voya Retirement Moderate Portfolio | | High Yield Bond | | 5.85 |
| | | Short Term Bond | | 15.00 |
The Funds have adopted a deferred compensation plan (the “DC Plan”), which allows eligible independent trustees, as described in the DC Plan, to defer the receipt of all or a portion of the trustees’ fees that they are entitled to receive from the Funds. For purposes of determining the amount owed to the trustee under the DC Plan, the amounts deferred are invested in shares of the funds selected by the trustee (the “Notional Funds”). When the Funds purchase shares of the Notional Funds, which are all advised by Voya Investments, in amounts equal to the trustees’ deferred fees, this results in a Fund asset equal to the deferred compensation liability. Such assets, if applicable, are included as a component of “Other assets” on the accompanying Statements of Assets and Liabilities. Deferral of trustees’ fees under the DC Plan will not affect net assets of the Funds, and will not materially affect the Funds’ assets, liabilities or net investment income per share. Amounts will be deferred until distributed in accordance with the DC Plan.
The Funds may pay per account fees to affiliates of Voya Investments for recordkeeping services provided on certain assets. For the year ended March 31, 2024, the per account fees for affiliated recordkeeping services paid by each Fund were as follows:
| Fund | | Amount |
| GNMA Income | | $244,562 |
| High Yield Bond | 5,595 |
| Intermediate Bond | 282,548 |
| Short Term Bond | 11 |
| Strategic Income Opportunities | 18,001 |
NOTE 7 — EXPENSE LIMITATION AGREEMENTS
Pursuant to a written expense limitation agreement (“Expense Limitation Agreement”) between the Investment Adviser and the Trust, on behalf of the Funds, the Investment Adviser has agreed to limit expenses of each Fund, excluding interest, taxes, investment-related costs, leverage expenses, extraordinary expenses, and acquired fund fees and expenses, as applicable, to the levels listed below:
| | | Class | | Class | | Class | | Class | | Class | | Class |
| Fund | | A | | C | | I | | R | | R6 | | W |
| GNMA Income | | 0.84% | | 1.59% | | 0.54% | | N/A | | 0.54% | | 0.59% |
| High Yield Bond | | 1.10% | | 1.85% | | 0.85% | | 1.35% | | 0.83% | | 0.85% |
| Intermediate Bond | | 0.75% | | 1.50% | | 0.50% | | 1.00% | | 0.50% | | 0.50% |
| Short Duration High Income | | 0.85% | | 1.60% | | 0.60% | | N/A | | 0.60% | | N/A |
| Short Term Bond | | 0.65% | | 1.40% | | 0.35% | | 0.90% | | 0.30% | | 0.40% |
| Strategic Income Opportunities | | 1.15% | | 1.90% | | 0.72% | | 1.40% | | 0.60% | | 0.90% |
| NOTES TO FINANCIAL STATEMENTS AS OF MARCH 31, 2024 (CONTINUED) |
NOTE 7 — EXPENSE LIMITATION AGREEMENTS (continued)
With the exception of Strategic Income Opportunities and the non-recoupable management fee waiver for High Yield Bond, the Investment Adviser may at a later date recoup from a Fund for fees waived and/or other expenses reimbursed by the Investment Adviser during the previous 36 months, but only if, after such recoupment, a Fund’s expense ratio does not exceed the percentage described above. Waived and reimbursed fees net of any recoupment by the Investment Adviser of such waived and reimbursed fees are reflected on the accompanying Statements of Operations. Amounts payable by the Investment Adviser are reflected on the accompanying Statements of Assets and Liabilities.
As of March 31, 2024 the amounts of waived and/or reimbursed fees that are subject to possible recoupment by the Investment Adviser and the related expiration dates are as follows:
| | | March 31, | | | | |
| | | 2025 | | | 2026 | | | 2027 | | | Total | |
| Short Duration High Income | | $ | — | | | $ | 12,491 | | | $ | 155,312 | | | $ | 167,803 | |
| Short Term Bond | | | 120,887 | | | | 56,303 | | | | 28,738 | | | | 205,928 | |
In addition to the above waived and/or reimbursed fees, the amount of class specific fees waived or reimbursed that are subject to possible recoupment by the Investment Adviser, and the related expiration dates, as of March 31, 2024, are as follows:
| | | March 31, | | | | |
| | | | 2025 | | | | 2026 | | | | 2027 | | | Total | |
| GNMA Income | | | | | | | | | | | | | | | | |
| Class A | | $ | — | | | $ | — | | | $ | 54,219 | | | $ | 54,219 | |
| Class C | | | — | | | | — | | | | 1,885 | | | | 1,885 | |
| Class I | | | 169,548 | | | | 126,505 | | | | 399,458 | | | | 695,511 | |
| Class W | | | — | | | | — | | | | 8,618 | | | | 8,618 | |
| Short Duration High Income |
| Class A | | $ | — | | | $ | — | | | $ | 1,003 | | | $ | 1,003 | |
| Class C | | | — | | | | — | | | | 3 | | | | 3 | |
| Class I | | | — | | | | 7 | | | | 7,922 | | | | 7,929 | |
| Short Term Bond |
| Class I | | $ | 8,770 | | | $ | 10,349 | | | $ | 7,806 | | | $ | 26,925 | |
| Class R6 | | | — | | | | — | | | | 661 | | | | 661 | |
The Expense Limitation Agreement is contractual through August 1, 2024 and shall renew automatically for one-year terms. Termination or modification of this obligation requires approval by the Board.
NOTE 8 — LINE OF CREDIT
Effective June 12, 2023, the Funds, in addition to certain other funds managed by the Investment Adviser, entered
into a 364-day unsecured committed revolving line of credit agreement (the “Credit Agreement”) with The Bank of New York Mellon (“BNY”) for an aggregate amount of $400,000,000 through June 10, 2024. The proceeds may be used only to finance temporarily: (1) the purchase or sale of investment securities; or (2) the repurchase or redemption of shares of the Fund or certain other funds managed by the Investment Adviser. The funds to which the line of credit is available pay a commitment fee equal to 0.15% per annum on the daily unused portion of the committed line amount payable quarterly in arrears. Prior to June 12, 2023, the predecessor line of credit was for an aggregate amount of $400,000,000 and the funds to which the line of credit was available paid a commitment fee equal to 0.15% per annum on the daily unused portion of the committed line amount through June 12, 2023.
Borrowings under the Credit Agreement accrue interest at the federal funds rate plus a specified margin. Repayments generally must be made within 60 days after the date of a revolving credit advance. The following Funds utilized the line of credit during the year ended March 31, 2024:
Fund | | Days
Utilized | | | Approximate
Average
Daily Balance
For Days
Utilized | Approximate
Weighted
Average
Interest Rate
For Days
Utilized | |
| GNMA Income | | 3 | | | $ | 1,027,000 | | | | 6.08% | |
| High Yield Bond | | 9 | | | | 1,981,333 | (1) | | | 6.19 | |
| Intermediate Bond | | 7 | | | | 2,648,429 | (2) | | | 6.31 | |
| (1) | As of March 31, 2024, High Yield Bond had an outstanding balance of $1,630,000. |
| (2) | As of March 31, 2024, Intermediate Bond had an outstanding balance of $3,926,000. |
| NOTES TO FINANCIAL STATEMENTS AS OF MARCH 31, 2024 (CONTINUED) |
NOTE 9 — CAPITAL SHARES
Transactions in capital shares and dollars were as follows:
| | | | | | | | | | | | | Net | | | | | | | | | | | | |
| | | | | | | | | | | | | increase | | | | Proceeds | | | | | | | | |
| | | | | | | | | | | | | (decrease) | | | | from | | | | | | | | |
| | | | | Shares | | Reinvestment | | | | | | in | | | | shares | | Reinvestment | | | | | | |
| | | Shares | | issued in | | of | | Shares | | Shares | | shares | | Shares | | issued in | | of | | Shares | | Shares | | Net increase |
| | | sold | | merger | | distributions | | redeemed | | converted | | outstanding | | sold | | merger | | distributions | | redeemed | | converted | | (decrease) |
| Year or | | | | | | | | | | | | | | | | | | | | | | | | |
| period ended | | # | | # | | # | | # | | # | | # | | ($) | | ($) | | ($) | | ($) | | ($) | | ($) |
| GNMA Income | | | | | | | | | | | | | | | | | | | | | | | | |
| Class A | | | | | | | | | | | | | | | | | | | | | | | | |
| 3/31/2024 | | 3,310,384 | | — | | 1,485,894 | | (13,470,625) | | — | | (8,674,347) | | 24,125,160 | | — | | 10,791,825 | | (97,219,845) | | — | | (62,302,860) |
| 3/31/2023 | | 8,662,434 | | — | | 1,260,960 | | (15,637,748) | | — | | (5,714,354) | | 65,480,777 | | — | | 9,458,438 | | (118,547,474) | | — | | (43,608,259) |
| Class C | | | | | | | | | | | | | | | | | | | | | | | | |
| 3/31/2024 | | 176,750 | | — | | 50,785 | | (1,119,781) | | — | | (892,246) | | 1,277,614 | | — | | 366,959 | | (8,075,451) | | — | | (6,430,878) |
| 3/31/2023 | | 426,198 | | — | | 45,979 | | (1,454,599) | | — | | (982,422) | | 3,208,894 | | — | | 342,488 | | (10,976,750) | | — | | (7,425,368) |
| Class I | | | | | | | | | | | | | | | | | | | | | | | | |
| 3/31/2024 | | 63,549,408 | | — | | 3,575,002 | | (59,166,658) | | — | | 7,957,752 | | 463,223,480 | | — | | 26,004,389 | | (430,099,169) | | — | | 59,128,700 |
| 3/31/2023 | | 73,733,932 | | — | | 2,129,572 | | (69,747,779) | | — | | 6,115,725 | | 556,500,667 | | — | | 16,020,098 | | (527,669,156) | | — | | 44,851,609 |
| Class P(1) | | | | | | | | | | | | | | | | | | | | | | | | |
| 3/31/2024 | | — | | — | | — | | — | | — | | — | | — | | — | | — | | — | | — | | — |
| 3/31/2023 | | 150,796 | | — | | 1,514 | | (156,307) | | — | | (3,997) | | 1,141,188 | | — | | 11,243 | | (1,174,037) | | — | | (21,606) |
| Class R6 | | | | | | | | | | | | | | | | | | | | | | | | |
| 3/31/2024 | | 4,300,885 | | — | | 190,209 | | (4,557,954) | | — | | (66,860) | | 31,315,868 | | — | | 1,385,676 | | (33,426,972) | | — | | (725,428) |
| 3/31/2023 | | 1,857,031 | | — | | 110,352 | | (979,878) | | — | | 987,505 | | 14,212,219 | | — | | 828,986 | | (7,503,872) | | — | | 7,537,333 |
| Class W | | | | | | | | | | | | | | | | | | | | | | | | |
| 3/31/2024 | | 6,474,272 | | — | | 338,969 | | (9,062,582) | | — | | (2,249,341) | | 47,198,792 | | — | | 2,472,582 | | (66,401,724) | | — | | (16,730,350) |
| 3/31/2023 | | 1,154,980 | | — | | 283,020 | | (6,322,696) | | — | | (4,884,696) | | 8,777,294 | | — | | 2,135,722 | | (48,263,912) | | — | | (37,350,896) |
| High Yield Bond | | | | | | | | | | | | | | | | | | | | | | | |
| Class A | | | | | | | | | | | | | | | | | | | | | | | | |
| 3/31/2024 | | 361,829 | | — | | 298,396 | | (1,250,087) | | — | | (589,862) | | 2,449,971 | | — | | 2,011,301 | | (8,416,434) | | — | | (3,955,162) |
| 3/31/2023 | | 537,141 | | — | | 335,012 | | (1,187,397) | | — | | (315,244) | | 3,630,499 | | — | | 2,269,789 | | (8,164,961) | | — | | (2,264,673) |
| Class C | | | | | | | | | | | | | | | | | | | | | | | | |
| 3/31/2024 | | 4,651 | | — | | 51,558 | | (162,054) | | — | | (105,845) | | 31,608 | | — | | 347,254 | | (1,085,964) | | — | | (707,102) |
| 3/31/2023 | | 15,650 | | — | | 68,923 | | (360,897) | | — | | (276,324) | | 108,101 | | — | | 466,638 | | (2,470,810) | | — | | (1,896,071) |
| Class I | | | | | | | | | | | | | | | | | | | | | | | | |
| 3/31/2024 | | 8,875,745 | | — | | 1,727,448 | | (10,597,062) | | — | | 6,131 | | 59,917,986 | | — | | 11,619,274 | | (71,662,084) | | — | | (124,824) |
| 3/31/2023 | | 13,288,597 | | — | | 1,772,476 | | (12,478,237) | | — | | 2,582,836 | | 91,566,913 | | — | | 11,976,296 | | (85,981,809) | | — | | 17,561,400 |
| Class P(2) | | | | | | | | | | | | | | | | | | | | | | | | |
| 3/31/2024 | | — | | — | | — | | — | | — | | — | | — | | — | | — | | — | | — | | — |
| 3/31/2023 | | 86,486 | | — | | 1,582,416 | | (37,547,356) | | — | | (35,878,454) | | 594,949 | | — | | 10,805,849 | | (255,926,038) | | — | | (244,525,240) |
| Class P3(3) | | | | | | | | | | | | | | | | | | | | | | | | |
| 3/31/2024 | | — | | — | | — | | — | | — | | — | | — | | — | | — | | — | | — | | — |
| 3/31/2023 | | 43,956 | | — | | 9,136 | | (171,175) | | — | | (118,083) | | 304,315 | | — | | 62,023 | | (1,158,263) | | — | | (791,925) |
| Class R | | | | | | | | | | | | | | | | | | | | | | | | |
| 3/31/2024 | | 4,988 | | — | | 2,447 | | (2,354) | | — | | 5,081 | | 33,784 | | — | | 16,502 | | (15,901) | | — | | 34,385 |
| 3/31/2023 | | 18,190 | | — | | 2,198 | | (6,368) | | — | | 14,020 | | 125,231 | | — | | 14,848 | | (43,427) | | — | | 96,652 |
| Class R6 | | | | | | | | | | | | | | | | | | | | | | | | |
| 3/31/2024 | | 22,255,944 | | — | | 1,863,295 | | (9,319,419) | | — | | 14,799,820 | | 149,057,401 | | — | | 12,561,973 | | (62,809,363) | | — | | 98,810,011 |
| 3/31/2023 | | 9,147,216 | | — | | 446,194 | | (1,584,744) | | — | | 8,008,666 | | 60,873,882 | | — | | 3,023,148 | | (10,845,929) | | — | | 53,051,101 |
| Class W | | | | | | | | | | | | | | | | | | | | | | | | |
| 3/31/2024 | | 6,398,285 | | — | | 563,784 | | (9,082,366) | | — | | (2,120,297) | | 42,776,978 | | — | | 3,802,617 | | (61,432,464) | | — | | (14,852,869) |
| 3/31/2023 | | 4,246,913 | | — | | 710,179 | | (7,582,561) | | — | | (2,625,469) | | 28,861,646 | | — | | 4,821,836 | | (51,602,614) | | — | | (17,919,132) |
| Intermediate Bond | | | | | | | | | | | | | | | | | | | | | | |
| Class A | | | | | | | | | | | | | | | | | | | | | | | | |
| 3/31/2024 | | 5,977,567 | | — | | 762,513 | | (9,065,853) | | — | | (2,325,773) | | 51,208,990 | | — | | 6,538,618 | | (77,758,223) | | — | | (20,010,615) |
| 3/31/2023 | | 6,039,145 | | — | | 675,124 | | (16,764,116) | | — | | (10,049,847) | | 52,739,875 | | — | | 5,922,666 | | (147,691,741) | | — | | (89,029,200) |
| Class C | | | | | | | | | | | | | | | | | | | | | | | | |
| 3/31/2024 | | 151,165 | | — | | 23,175 | | (464,479) | | — | | (290,139) | | 1,294,652 | | — | | 198,461 | | (3,967,156) | | — | | (2,474,043) |
| 3/31/2023 | | 112,160 | | — | | 21,933 | | (656,114) | | — | | (522,021) | | 973,316 | | — | | 192,151 | | (5,773,250) | | — | | (4,607,783) |
| Class I | | | | | | | | | | | | | | | | | | | | | | | | |
| 3/31/2024 | | 207,565,223 | | — | | 22,038,851 | | (147,659,644) | | — | | 81,944,430 | | 1,774,833,300 | | — | | 189,035,741 | | (1,256,215,956) | | — | | 707,653,085 |
| 3/31/2023 | | 255,795,385 | | — | | 16,085,857 | | (344,956,757) | | — | | (73,075,515) | | 2,273,838,015 | | — | | 141,151,475 | | (3,044,798,908) | | — | | (629,809,418) |
| Class P3(4) | | | | | | | | | | | | | | | | | | | | | | | | |
| 3/31/2024 | | — | | — | | — | | — | | — | | — | | — | | — | | — | | — | | — | | — |
| 3/31/2023 | | 5,830,640 | | — | | 243,852 | | (14,037,512) | | — | | (7,963,020) | | 51,797,195 | | — | | 2,141,635 | | (122,473,358) | | — | | (68,534,528) |
| Class R | | | | | | | | | | | | | | | | | | | | | | | | |
| 3/31/2024 | | 2,526,079 | | — | | 454,892 | | (3,245,441) | | — | | (264,470) | | 21,721,201 | | — | | 3,905,475 | | (27,844,780) | | — | | (2,218,104) |
| NOTES TO FINANCIAL STATEMENTS AS OF MARCH 31, 2024 (CONTINUED) |
NOTE 9 — CAPITAL SHARES (continued)
| | | | | | | | | | | | | Net | | | | | | | | | | | | |
| | | | | | | | | | | | | increase | | | | Proceeds | | | | | | | | |
| | | | | | | | | | | | | (decrease) | | | | from | | | | | | | | |
| | | | | Shares | | Reinvestment | | | | | | in | | | | shares | | Reinvestment | | | | | | |
| | | Shares | | issued in | | of | | Shares | | Shares | | shares | | Shares | | issued in | | of | | Shares | | Shares | | Net increase |
| | | sold | | merger | | distributions | | redeemed | | converted | | outstanding | | sold | | merger | | distributions | | redeemed | | converted | | (decrease) |
| Year or | | | | | | | | | | | | | | | | | | | | | | | | |
| period ended | | # | | # | | # | | # | | # | | # | | ($) | | ($) | | ($) | | ($) | | ($) | | ($) |
| | | | | | | | | | | | | | | | | | | | | | | | | |
| Intermediate Bond (continued) | | | | | | | | | | | | | | | | | | | | |
| Class R | | | | | | | | | | | | | | | | | | | | | | | | |
| 3/31/2023 | | 1,941,190 | | — | | 359,089 | | (4,048,634) | | — | | (1,748,355) | | 17,098,433 | | — | | 3,152,853 | | (35,936,191) | | — | | (15,684,905) |
| Class R6 | | | | | | | | | | | | | | | | | | | | | | | | |
| 3/31/2024 | | 67,453,322 | | — | | 11,141,203 | | (60,758,350) | | — | | 17,836,175 | | 579,836,589 | | — | | 95,629,666 | | (520,789,748) | | — | | 154,676,507 |
| 3/31/2023 | | 73,110,166 | | — | | 8,024,827 | | (86,107,680) | | — | | (4,972,687) | | 646,791,761 | | — | | 70,443,640 | | (758,883,993) | | — | | (41,648,592) |
| Class W | | | | | | | | | | | | | | | | | | | | | | | | |
| 3/31/2024 | | 9,303,807 | | — | | 350,011 | | (4,964,061) | | — | | 4,689,757 | | 78,045,149 | | — | | 3,000,082 | | (42,492,131) | | — | | 38,553,100 |
| 3/31/2023 | | 1,815,263 | | — | | 253,869 | | (13,186,402) | | — | | (11,117,270) | | 16,178,038 | | — | | 2,240,487 | | (118,828,132) | | — | | (100,409,607) |
| Short Duration High Income | | | | | | | | | | | | | | | | | | | | | | |
| Class A | | | | | | | | | | | | | | | | | | | | | | | | |
| 3/31/2024 | | 412,758 | | — | | 89,091 | | (23,348) | | — | | 478,501 | | 4,110,562 | | — | | 893,099 | | (231,044) | | — | | 4,772,617 |
| 2/09/2023(5)- | | | | | | | | | | | | | | | | | | | | | | | | |
| 3/31/2023 | | 862,214 | | — | | 8,416 | | — | | — | | 870,630 | | 8,617,007 | | — | | 83,236 | | — | | — | | 8,700,243 |
| Class C | | | | | | | | | | | | | | | | | | | | | | | | |
| 4/20/2023(5)- | | | | | | | | | | | | | | | | | | | | | | | | |
| 3/31/2024 | | 33,769 | | — | | 269 | | (17) | | — | | 34,021 | | 345,881 | | — | | 2,750 | | (177) | | — | | 348,454 |
| Class I | | | | | | | | | | | | | | | | | | | | | | | | |
| 3/31/2024 | | 8,835,757 | | — | | 244,182 | | (661,895) | | — | | 8,418,044 | | 89,205,650 | | — | | 2,462,161 | | (6,700,266) | | — | | 84,967,545 |
| 2/09/2023(5)- | | | | | | | | | | | | | | | | | | | | | | | | |
| 3/31/2023 | | 881,952 | | — | | 8,979 | | — | | — | | 890,931 | | 8,813,333 | | — | | 88,803 | | — | | — | | 8,902,136 |
| Class R6 | | | | | | | | | | | | | | | | | | | | | | | | |
| 3/31/2024 | | 1,737,978 | | — | | 116,351 | | (38,894) | | — | | 1,815,435 | | 17,414,983 | | — | | 1,172,298 | | (394,839) | | — | | 18,192,442 |
| 2/09/2023(5)- | | | | | | | | | | | | | | | | | | | | | | | | |
| 3/31/2023 | | 833,333 | | — | | 8,657 | | — | | — | | 841,990 | | 8,333,334 | | — | | 85,623 | | — | | — | | 8,418,957 |
| Short Term Bond | | | | | | | | | | | | | | | | | | | | | | | | |
| Class A | | | | | | | | | | | | | | | | | | | | | | | | |
| 3/31/2024 | | 115,065 | | — | | 25,815 | | (670,464) | | — | | (529,584) | | 1,070,046 | | — | | 238,645 | | (6,196,518) | | — | | (4,887,827) |
| 3/31/2023 | | 110,007 | | — | | 31,688 | | (770,084) | | — | | (628,389) | | 1,028,426 | | — | | 294,501 | | (7,126,977) | | — | | (5,804,050) |
| Class C | | | | | | | | | | | | | | | | | | | | | | | | |
| 3/31/2024 | | 4,005 | | — | | 376 | | (11,557) | | — | | (7,176) | | 37,161 | | — | | 3,473 | | (107,031) | | — | | (66,397) |
| 3/31/2023 | | 2,890 | | — | | 322 | | (33,367) | | — | | (30,155) | | 26,785 | | — | | 2,997 | | (312,357) | | — | | (282,575) |
| Class I | | | | | | | | | | | | | | | | | | | | | | | | |
| 3/31/2024 | | 1,927,775 | | — | | 154,690 | | (1,700,440) | | — | | 382,025 | | 17,790,266 | | — | | 1,428,953 | | (15,749,402) | | — | | 3,469,817 |
| 3/31/2023 | | 3,028,561 | | — | | 84,847 | | (3,084,170) | | — | | 29,238 | | 27,898,398 | | — | | 786,797 | | (28,724,920) | | — | | (39,725) |
| Class P2(6) | | | | | | | | | | | | | | | | | | | | | | | | |
| 3/31/2024 | | — | | — | | — | | — | | — | | — | | 748 | | — | | — | | — | | — | | 748 |
| 3/31/2023 | | 249,092 | | — | | 30,934 | | (3,094,620) | | — | | (2,814,594) | | 2,319,764 | | — | | 287,230 | | (28,457,191) | | — | | (25,850,197) |
| Class P3(7) | | | | | | | | | | | | | | | | | | | | | | | | |
| 3/31/2024 | | — | | — | | — | | — | | — | | — | | 1 | | — | | — | | (2,664) | | — | | (2,663) |
| 3/31/2023 | | 1,135,277 | | — | | 13,935 | | (1,758,058) | | — | | (608,846) | | 10,600,984 | | — | | 129,696 | | (16,137,633) | | — | | (5,406,953) |
| Class R | | | | | | | | | | | | | | | | | | | | | | | | |
| 3/31/2024 | | 1,264 | | — | | 118 | | (184) | | — | | 1,198 | | 11,712 | | — | | 1,092 | | (1,715) | | — | | 11,089 |
| 3/31/2023 | | 1,036 | | — | | 41 | | (377) | | — | | 700 | | 9,722 | | — | | 384 | | (3,543) | | — | | 6,563 |
| Class R6 | | | | | | | | | | | | | | | | | | | | | | | | |
| 3/31/2024 | | 28,350,341 | | — | | 2,301,592 | | (12,773,278) | | — | | 17,878,655 | | 262,517,916 | | — | | 21,290,120 | | (118,109,582) | | — | | 165,698,454 |
| 3/31/2023 | | 15,171,571 | | — | | 906,987 | | (18,584,103) | | — | | (2,505,545) | | 141,319,801 | | — | | 8,431,735 | | (173,522,880) | | — | | (23,771,344) |
| Class W | | | | | | | | | | | | | | | | | | | | | | | | |
| 3/31/2024 | | 85,854 | | — | | 52,518 | | (412,476) | | — | | (274,104) | | 796,826 | | — | | 487,175 | | (3,824,428) | | — | | (2,540,427) |
| 3/31/2023 | | 242,070 | | — | | 39,541 | | (976,562) | | — | | (694,951) | | 2,280,395 | | — | | 368,976 | | (9,138,541) | | — | | (6,489,170) |
| Strategic Income Opportunities | | | | | | | | | | | | | | | | | | | | | | |
| Class A | | | | | | | | | | | | | | | | | | | | | | | | |
| 3/31/2024 | | 1,858,965 | | — | | 330,515 | | (3,414,365) | | — | | (1,224,885) | | 16,846,508 | | — | | 2,981,715 | | (30,673,283) | | — | | (10,845,060) |
| 3/31/2023 | | 2,161,239 | | — | | 308,066 | | (5,353,583) | | — | | (2,884,278) | | 19,705,733 | | — | | 2,800,165 | | (48,903,213) | | — | | (26,397,315) |
| Class C | | | | | | | | | | | | | | | | | | | | | | | | |
| 3/31/2024 | | 457,911 | | — | | 159,618 | | (1,074,816) | | — | | (457,287) | | 4,070,200 | | — | | 1,418,716 | | (9,548,534) | | — | | (4,059,618) |
| 3/31/2023 | | 528,190 | | — | | 119,786 | | (1,772,262) | | — | | (1,124,286) | | 4,781,253 | | — | | 1,071,657 | | (15,912,261) | | — | | (10,059,351) |
| Class I | | | | | | | | | | | | | | | | | | | | | | | | |
| 3/31/2024 | | 54,963,363 | | — | | 7,816,338 | | (73,556,964) | | — | | (10,777,263) | | 496,584,223 | | — | | 70,581,373 | | (663,120,840) | | — | | (95,955,244) |
| 3/31/2023 | | 65,354,991 | | — | | 6,665,654 | | (118,116,153) | | — | | (46,095,508) | | 597,442,459 | | — | | 60,676,878 | | (1,079,721,182) | | — | | (421,601,845) |
| Class P(8) | | | | | | | | | | | | | | | | | | | | | | | | |
| 3/31/2024 | | — | | — | | — | | — | | — | | — | | — | | — | | — | | — | | — | | — |
| 3/31/2023 | | — | | — | | 6 | | (346) | | — | | (340) | | — | | — | | 51 | | (3,182) | | — | | (3,131) |
| NOTES TO FINANCIAL STATEMENTS AS OF MARCH 31, 2024 (CONTINUED) |
NOTE 9 — CAPITAL SHARES (continued)
| | | | | | | | | | | | | Net | | | | | | | | | | | | |
| | | | | | | | | | | | | increase | | | | Proceeds | | | | | | | | |
| | | | | | | | | | | | | (decrease) | | | | from | | | | | | | | |
| | | | | Shares | | Reinvestment | | | | | | in | | | | shares | | Reinvestment | | | | | | Net |
| | | Shares | | issued in | | of | | Shares | | Shares | | shares | | Shares | | issued in | | of | | Shares | | Shares | | increase |
| | | sold | | merger | | distributions | | redeemed | | converted | | outstanding | | sold | | merger | | distributions | | redeemed | | converted | | (decrease) |
| Year or | | | | | | | | | | | | | | | | | | | | | | | | |
| period ended | | # | | # | | # | | # | | # | | # | | ($) | | ($) | | ($) | | ($) | | ($) | | ($) |
| | | | | | | | | | | | | | | | | | | | | | | | | |
| Strategic Income Opportunities (continued) | | | | | | | | | | | | | | | | | | | | |
| Class R | | | | | | | | | | | | | | | | | | | | | | | | |
| 3/31/2024 | | 117,724 | | — | | 94,007 | | (497,018) | | — | | (285,287) | | 1,053,945 | | — | | 841,057 | | (4,428,359) | | — | | (2,533,357) |
| 3/31/2023 | | 205,455 | | — | | 69,029 | | (376,994) | | — | | (102,510) | | 1,843,645 | | — | | 621,828 | | (3,419,516) | | — | | (954,043) |
| Class R6 | | | | | | | | | | | | | | | | | | | | | | | | |
| 3/31/2024 | | 24,859,430 | | — | | 575,826 | | (17,485,848) | | — | | 7,949,408 | | 222,565,950 | | — | | 5,228,912 | | (156,757,231) | | — | | 71,037,631 |
| 3/31/2023 | | 2,464,303 | | — | | 689,623 | | (1,102,354) | | — | | 2,051,572 | | 22,125,558 | | — | | 6,248,297 | | (10,112,323) | | — | | 18,261,532 |
| Class W | | | | | | | | | | | | | | | | | | | | | | | | |
| 3/31/2024 | | 705,782 | | — | | 53,452 | | (1,052,082) | | — | | (292,848) | | 6,387,472 | | — | | 480,992 | | (9,461,964) | | — | | (2,593,500) |
| 3/31/2023 | | 932,532 | | — | | 69,702 | | (2,669,069) | | — | | (1,666,835) | | 8,503,175 | | — | | 634,073 | | (24,406,942) | | — | | (15,269,694) |
| (1) | Class P was fully redeemed on close of business March 24, 2023 |
| (2) | Class P was fully redeemed on close of business February 24, 2023 |
| (3) | Class P3 was fully redeemed on close of business February 22, 2023 |
| (4) | Class P3 was fully redeemed on close of business March 30, 2023 |
| (5) | Commencement of operations. |
| (6) | Class P2 was fully redeemed on close of business November 29, 2022 |
| (7) | Class P3 was fully redeemed on close of business November 3, 2022 |
| (8) | Class P was fully redeemed on close of business September 8, 2022 |
NOTE 10 — UNFUNDED LOAN COMMITMENTS
Certain Funds may enter into credit agreements, all or a portion of which may be unfunded. The Funds are obligated to fund these loan commitments at the borrower’s discretion. Funded and unfunded portions of the credit agreements are presented in the Portfolio of Investments. At March 31, 2024, Strategic Income Opportunities had the following unfunded loan commitments:
| | | Unfunded | |
| | | Loan | |
| Loan | | Commitment | |
| AI Aqua Merger Sub, Inc. 2023 Incremental Term Loan | | $ | 46,687 | |
| Ryan, LLC Delayed Draw Term Loan | | | 25,238 | |
| | | $ | 71,925 | |
| * | The unrealized appreciation/(depreciation) on these commitments as of March 31, 2024 is included in the Investments in securities at fair value on the Statement of Assets and Liabilities. |
NOTE 11 — SECURITIES LENDING
Under a Master Securities Lending Agreement (the “Agreement”) with BNY, the Funds can lend their securities to approved brokers, dealers and other financial institutions. Loans are collateralized by cash and U.S. government securities. The collateral is equal to at least 105% of the market value of non-U.S. securities loaned and 102% of the market value of U.S. securities loaned. The market value of the loaned securities is determined at the Market Close of the Funds at their last sale price or official closing price on the principal exchange or system
on which they are traded and any additional collateral is delivered to the Funds on the next business day. The cash collateral received is invested in approved investments as defined in the Securities Lending Agreement with BNY (the “Agreement”). The Funds bear the risk of loss with respect to the investment of collateral with the following exception: BNY provides the Funds indemnification from loss with respect to the investment of collateral to the extent the cash collateral is invested in overnight repurchase agreements.
Cash collateral received in connection with securities lending is invested in cash equivalents, money market funds, repurchase agreements with maturities of not more than 99 days that are collateralized with U.S. Government securities, or certain short-term investments that have a remaining maturity of 190 days or less (“Permitted Investments”). Short-term investments include: securities, units, shares or other participations in short-term investment funds, pools or trusts; commercial paper, notes, bonds or other debt obligations, certificates of deposit, time deposits and other bank obligations and asset-backed commercial paper backed by diversified receivables and repurchase-backed programs. Permitted Investments are subject to certain guidelines established by the Adviser regarding liquidity, diversification, credit quality and average credit life/duration requirements. The securities purchased with cash collateral received are reflected in the Portfolio of Investments under Short-Term Investments.
Generally, in the event of counterparty default, the Funds have the right to use the collateral to offset losses incurred. The Agreement contains certain guarantees by BNY in the
| NOTES TO FINANCIAL STATEMENTS AS OF MARCH 31, 2024 (CONTINUED) |
NOTE 11 — SECURITIES LENDING (continued)
event of counterparty default and/or a borrower’s failure to return a loaned security; however, there would be a potential loss to the Funds in the event the Funds are delayed or prevented from exercising its right to dispose of the collateral. Engaging in securities lending could have a leveraging effect, which may intensify the credit, market and other risks associated with investing in a fund.
The following tables represent a summary of each respective Fund’s securities lending agreements by counterparty which are subject to offset under the Agreement as of March 31, 2024:
High Yield Bond
| Counterparty | | Securities
Loaned at Value | | Cash Collateral
Received(1) | | Net
Amount |
| Barclays Capital Inc. | | $ | 1,443,325 | | | $ | (1,443,325 | ) | | $ | — | |
| BNP Paribas | | | 611,161 | | | | (611,161 | ) | | | — | |
| BNP Paribas Prime Brokerage Int'l Ltd. | | | 950,745 | | | | (950,745 | ) | | | — | |
| Citigroup Global Markets Inc. | | | 1,177,559 | | | | (1,177,559 | ) | | | — | |
| Goldman, Sachs & Co. LLC | | | 1,820,003 | | | | (1,820,003 | ) | | | — | |
| J.P. Morgan Securities LLC | | | 34,528,936 | | | | (34,528,936 | ) | | | — | |
| Morgan Stanley & Co. LLC | | | 8,049,165 | | | | (8,049,165 | ) | | | — | |
| Scotia Capital (USA) INC | | | 1,064,282 | | | | (1,064,282 | ) | | | — | |
| TD Prime Services LLC | | | 911,552 | | | | (911,552 | ) | | | — | |
| UBS AG | | | 1,009,221 | | | | (1,009,221 | ) | | | — | |
| Total | | $ | 51,565,949 | | | $ | (51,565,949 | ) | | $ | — | |
| (1) | Cash collateral with a fair value of $52,894,773 has been received in connection with the above securities lending transactions. Excess cash collateral received from the individual counterparty is not shown for financial reporting purposes. |
Intermediate Bond
| Counterparty | | Securities
Loaned at Value | | Cash Collateral
Received(1) | | Net
Amount |
| Barclays Bank PLC | | $ | 11,797,817 | | | $ | (11,797,817 | ) | | $ | — | |
| Barclays Capital Inc. | | | 121,216,131 | | | | (121,216,131 | ) | | | — | |
| BMO Capital Markets Corp | | | 20,596,018 | | | | (20,596,018 | ) | | | — | |
| BNP Paribas | | | 1,558,856 | | | | (1,558,856 | ) | | | — | |
| BNP Paribas Prime Brokerage Int'l Ltd. | | | 1,159,957 | | | | (1,159,957 | ) | | | — | |
| Canadian Imperial Bank Of Commerce | | | 7,820,250 | | | | (7,820,250 | ) | | | — | |
| Citadel Clearing LLC | | | 2,343,482 | | | | (2,343,482 | ) | | | — | |
| Goldman, Sachs & Co. LLC | | | 54,365 | | | | (54,365 | ) | | | — | |
| J.P. Morgan Securities LLC | | | 168,039,708 | | | | (168,039,708 | ) | | | — | |
| Counterparty | | Securities
Loaned at Value | | Cash Collateral
Received(1) | | Net
Amount |
| Jefferies International Ltd | | $ | 171,165 | | | $ | (171,165 | ) | | $ | — | |
| Morgan Stanley & Co. LLC | | | 45,149,440 | | | | (45,149,440 | ) | | | — | |
| MUFG Securities Americas Inc. | | | 340,831 | | | | (340,831 | ) | | | — | |
| Nomura Securities International, Inc. | | | 983,563 | | | | (983,563 | ) | | | — | |
| RBC Capital Markets, LLC | | | 419,256 | | | | (419,256 | ) | | | — | |
| Scotia Capital (USA) INC | | | 1,338,988 | | | | (1,338,988 | ) | | | — | |
| Societe Generale | | | 14,001,706 | | | | (14,001,706 | ) | | | — | |
| TD Prime Services LLC | | | 42,846,847 | | | | (42,846,847 | ) | | | — | |
| Truist Securities INC | | | 40,206 | | | | (40,206 | ) | | | — | |
| Wells Fargo Securities LLC | | | 805,862 | | | | (805,862 | ) | | | — | |
| Total | | $ | 440,684,448 | | | $ | (440,684,448 | ) | | $ | — | |
| (1) | Cash collateral with a fair value of $450,301,034 has been received in connection with the above securities lending transactions. Excess cash collateral received from the individual counterparty is not shown for financial reporting purposes. |
Short Duration High Income
| Counterparty | | Securities
Loaned at Value | | Cash Collateral
Received(1) | | Net
Amount |
| BofA Securities Inc | | $ | 753,276 | | | $ | (753,276 | ) | | $ | — | |
| Goldman, Sachs & Co. LLC | | | 10,510,869 | | | | (10,510,869 | ) | | | — | |
| Jefferies LLC | | | 817,963 | | | | (817,963 | ) | | | — | |
| Truist Securities INC | | | 739,515 | | | | (739,515 | ) | | | — | |
| Total | | $ | 12,821,623 | | | $ | (12,821,623 | ) | | $ | — | |
| (1) | Cash collateral with a fair value of $13,182,346 has been received in connection with the above securities lending transactions. Excess cash collateral received from the individual counterparty is not shown for financial reporting purposes. |
Short Term Bond
| Counterparty | | Securities
Loaned at Value | | Cash Collateral
Received(1) | | Net
Amount |
| Barclays Capital Inc. | | $ | 284,016 | | | $ | (284,016 | ) | | $ | — | |
| BNP Paribas | | | 325,297 | | | | (325,297 | ) | | | — | |
| BofA Securities Inc | | | 98,286 | | | | (98,286 | ) | | | — | |
| Citigroup Global Markets Inc. | | | 700,521 | | | | (700,521 | ) | | | — | |
| Goldman, Sachs & Co. LLC | | | 325,779 | | | | (325,779 | ) | | | — | |
| J.P. Morgan Securities LLC | | | 3,020,929 | | | | (3,020,929 | ) | | | — | |
| Jefferies LLC | | | 169,268 | | | | (169,268 | ) | | | — | |
| Morgan Stanley & Co. LLC | | | 387,193 | | | | (387,193 | ) | | | — | |
| National Financial Services LLC | | | 475,480 | | | | (475,480 | ) | | | — | |
| RBC Capital Markets, LLC | | | 222,055 | | | | (222,055 | ) | | | — | |
| Scotia Capital (USA) INC | | | 511,124 | | | | (511,124 | ) | | | — | |
| NOTES TO FINANCIAL STATEMENTS AS OF MARCH 31, 2024 (CONTINUED) |
NOTE 11 — SECURITIES LENDING (continued)
| Counterparty | | Securities
Loaned at Value | | Cash Collateral
Received(1) | | Net
Amount |
| Societe Generale | | $ | 1,656,011 | | | $ | (1,656,011 | ) | | $ | — | |
| TD Prime Services LLC | | | 90,167 | | | | (90,167 | ) | | | — | |
| US Bancorp Investments | | | 592,326 | | | | (592,326 | ) | | | — | |
| Wells Fargo Clearing Services, LLC | | | 1,666,640 | | | | (1,666,640 | ) | | | — | |
| Total | | $ | 10,525,092 | | | $ | (10,525,092 | ) | | $ | — | |
| (1) | Cash collateral with a fair value of $10,816,724 has been received in connection with the above securities lending transactions. Excess cash collateral received from the individual counterparty is not shown for financial reporting purposes. |
Strategic Income Opportunities
| Counterparty | | Securities
Loaned at Value | | Cash Collateral
Received(1) | | Net
Amount |
| Barclays Capital Inc. | | $ | 4,865,503 | | | $ | (4,865,503 | ) | | $ | — | |
| BNP Paribas Prime Brokerage Int'l Ltd. | | | 467,078 | | | | (467,078 | ) | | | — | |
| BNP Paribas Securities Corp. | | | 131,589 | | | | (131,589 | ) | | | — | |
| Citigroup Global Markets Limited | | | 1,044,551 | | | | (1,044,551 | ) | | | — | |
| Counterparty | | Securities
Loaned at Value | | Cash Collateral
Received(1) | | Net
Amount |
| Goldman, Sachs & Co. LLC | | $ | 1,251,405 | | | $ | (1,251,405 | ) | | $ | — | |
| J.P. Morgan Securities LLC | | | 20,463,201 | | | | (20,463,201 | ) | | | — | |
| Jefferies LLC | | | 78,855 | | | | (78,855 | ) | | | — | |
| JP Morgan Securities Plc. | | | 828,987 | | | | (828,987 | ) | | | — | |
| Morgan Stanley & Co. LLC | | | 5,977,350 | | | | (5,977,350 | ) | | | — | |
| MUFG Securities Americas Inc. | | | 553,522 | | | | (553,522 | ) | | | — | |
| Nomura Securities International, Inc. | | | 248,157 | | | | (248,157 | ) | | | — | |
| RBC Capital Markets, LLC | | | 129,908 | | | | (129,908 | ) | | | — | |
| Societe Generale | | | 822,208 | | | | (822,208 | ) | | | — | |
| TD Prime Services LLC | | | 5,576,351 | | | | (5,576,351 | ) | | | — | |
| TD Securities INC | | | 206,234 | | | | (206,234 | ) | | | — | |
| Truist Securities INC | | | 6,721 | | | | (6,721 | ) | | | — | |
| UBS AG | | | 408,221 | | | | (408,221 | ) | | | — | |
| Wells Fargo Securities LLC | | | 1,511,419 | | | | (1,511,419 | ) | | | — | |
| Total | | $ | 44,571,260 | | | $ | (44,571,260 | ) | | $ | — | |
| (1) | Cash collateral with a fair value of $45,806,838 has been received in connection with the above securities lending transactions. Excess cash collateral received from the individual counterparty is not shown for financial reporting purposes. |
NOTE 12 — FEDERAL INCOME TAXES
The amount of distributions from net investment income and net realized capital gains are determined in accordance with federal income tax regulations, which may differ from GAAP for investment companies. These book/tax differences may be either temporary or permanent. Permanent differences are reclassified within the capital accounts based on their federal tax-basis treatment; temporary differences are not reclassified. Key differences include the treatment of foreign currency transactions, futures contracts, paydowns, swaps, straddle loss deferrals, and wash sale deferrals.
Dividends paid by the Funds from net investment income and distributions of net realized short-term capital gains are, for federal income tax purposes, taxable as ordinary income to shareholders.
The tax composition of dividends and distributions to shareholders was as follows:
| | | Year Ended | | | Year Ended | |
| | | March 31, 2024 | | | March 31, 2023 | |
| | | Ordinary | | | Ordinary | | | Long-term | |
| | | Income | | | Income | | | Capital Gains | |
| GNMA Income | | $ | 48,022,294 | | | $ | 35,132,244 | | | $ | — | |
| High Yield Bond | | | 31,951,958 | | | | 32,145,490 | | | | 3,451,344 | |
| Intermediate Bond | | | 340,492,684 | | | | 256,679,701 | | | | — | |
| Short Duration High Income | | | 4,608,971 | | | | 257,963 | | | | — | |
| Short Term Bond | | | 23,544,635 | | | | 10,347,518 | | | | — | |
| Strategic Income Opportunities | | | 89,761,742 | | | | 79,582,543 | | | | — | |
| NOTES TO FINANCIAL STATEMENTS AS OF MARCH 31, 2024 (CONTINUED) |
NOTE 12 — FEDERAL INCOME TAXES (continued)
The tax-basis components of distributable earnings and the capital loss carryforwards which may be used to offset future realized capital gains for federal income tax purposes as of March 31, 2024 were:
| | | Undistributed | | Undistributed | | Unrealized | | | | | | | | Total |
| | | Ordinary | | Long-term | | Appreciation/ | | Capital Loss Carryforwards | | | | Distributable |
| | | Income | | Capital Gains | | (Depreciation) | | Amount | | Character | | Other | | Earnings/(Loss) |
| GNMA Income | | $ | 192,276 | | $ | — | | $ | (126,436,197) | | $ | (80,913,785) | | Short-term | | $ | (545,648) | | $ | (227,996,723) |
| | | | | | | | | | | (20,293,369) | | Long-term | | | | |
| | | | | | | | | | $ | (101,207,154) | | | | | | |
| High Yield Bond | | 177,192 | | | — | | (4,811,008) | | | (6,088,354) | | Short-term | | (173,043) | | (50,957,894) |
| | | | | | | | | | | (40,062,681) | | Long-term | | | | |
| | | | | | | | | | $ | (46,151,035) | | | | | | |
| Intermediate Bond | | 26,878,164 | | | — | | (454,403,118) | | | (343,827,621) | | Short-term | | (4,387,770) | | (1,468,505,757) |
| | | | | | | | | | | (692,765,412) | | Long-term | | | | |
| | | | | | | | | | $ | (1,036,593,033) | | | | | | |
| Short Duration High Income | | 457,885 | | | 62,104 | | 513,344 | | | — | | — | | (32,329) | | 1,001,004 |
| Short Term Bond | | 233,682 | | | — | | (2,111,601) | | | (9,031,086) | | Short-term | | (14,552) | | (33,234,251) |
| | | | | | | | | | | (22,310,694) | | Long-term | | | | |
| | | | | | | | | | $ | (31,341,780) | | | | | | |
| Strategic Income Opportunities | | 411,148 | | | — | | (97,335,642) | | | (33,226,185) | | Short-term | | (654,843) | | (289,213,602) |
| | | | | | | | | | | (158,408,080) | | Long-term | | | | |
| | | | | | | | | | $ | (191,634,265) | | | | | | |
The Funds’ major tax jurisdictions are U.S. federal and Arizona state.
As of March 31, 2024, no provision for income tax is required in the Funds’ financial statements as a result of tax positions taken on federal and state income tax returns for open tax years. The Funds’ federal and state income and federal excise tax returns for tax years for which the applicable statutes of limitations have not expired are subject to examination by the Internal Revenue Service and state department of revenue. Generally, the preceding four tax years remain subject to examination by these jurisdictions.
NOTE 13 — LONDON INTERBANK OFFERED RATE (“LIBOR”)
The London Interbank Offered Rate (“LIBOR”) was the offered rate for short-term Eurodollar deposits between major international banks. The terms of investments, financings or other transactions (including certain derivatives transactions) to which the Fund may be a party have historically been tied to LIBOR. In connection with the global transition away from LIBOR led by regulators and market participants, LIBOR was last published on a representative basis at the end of June 2023. Alternative reference rates to LIBOR have been established in most major currencies and markets in these new rates are continuing to develop. The transition away from LIBOR to the use of replacement rates has gone relatively smoothly on the Fund and the financial instruments in which it invests;
however, longer-term impacts are still uncertain.
In addition, interest rates or other types of rates and indices which are classed as “benchmarks” have been the subject of ongoing national and international regulatory reform, including under the European Union regulation on indices used as benchmarks in financial instruments and financial contracts (known as the “Benchmarks Regulation”). The Benchmarks Regulation has been enacted into United Kingdom law by virtue of the European Union (Withdrawal) Act 2018 (as amended), subject to amendments made by the Benchmarks (Amendment and Transitional Provision) (EU Exit) Regulations 2019 (SI 2019/657) and other statutory instruments. Following the implementation of these reforms, the manner of administration of benchmarks has changed and may further change in the future, with the result that relevant benchmarks may perform differently than
| NOTES TO FINANCIAL STATEMENTS AS OF MARCH 31, 2024 (CONTINUED) |
NOTE 13 — LONDON INTERBANK OFFERED RATE (“LIBOR”) (continued)
in the past, the use of benchmarks that are not compliant with the new standards by certain supervised entities may be restricted, and certain benchmarks may be eliminated entirely. Such changes could cause increased market volatility and disruptions in liquidity for instruments that rely on or are impacted by such benchmarks. Additionally, there could be other consequences which cannot be predicted.
NOTE 14 — LIQUIDITY
Consistent with Rule 22e-4 under the 1940 Act, the Funds have established a liquidity risk management program to govern their approach to managing liquidity risk (the “Program”). The Board has approved the designation of the Funds’ Investment Adviser, Voya Investments, as the program administrator (the “Program Administrator”). The Program Administrator is responsible for implementing and monitoring the Program and has formed a Liquidity Risk Management Committee (the “Committee”) to assess and review, on an ongoing basis, each Fund’s liquidity risk.
The Program includes a number of elements that support the management and assessment of liquidity risk, including an annual assessment of liquidity risk factors and the periodic classification (or re- classification, as necessary) of a Fund’s investments into buckets (highly liquid, moderately liquid, less liquid and illiquid) that reflect the Committee’s assessment of the investments’ liquidity under current market conditions. The Committee also utilizes Fund-specific data, including information regarding a Fund’s shareholder base, characteristics of its investments, access to borrowing arrangements and historical redemptions to determine whether a Fund will be able to meet its redemption obligations in a timely manner.
During the period covered by the annual assessment, January 1, 2023 through December 31, 2023, the Program supported the Funds’ ability to honor redemption requests in a timely manner and the Program Administrator’s management of each Fund’s liquidity risk, including during any periods of market volatility and net redemptions.
There can be no assurance that the Program will achieve its objectives under all circumstances in the future. Please refer to each Fund’s prospectus for more information regarding each Fund’s exposure to liquidity risk and other risks.
NOTE 15 — MARKET DISRUPTION AND GEOPOLITICAL
The Fund is subject to the risk that geopolitical events will disrupt securities markets and adversely affect global economies and markets. Due to the increasing interdependence among global economies and markets,
conditions in one country, market, or region might adversely impact markets, issuers and/or foreign exchange rates in other countries, including the United States. Wars, terrorism, global health crises and pandemics, and other geopolitical events that have led, and may continue to lead, to increased market volatility and may have adverse short- or long-term effects on U.S. and global economies and markets, generally. For example, the COVID-19 pandemic resulted in significant market volatility, exchange suspensions and closures, declines in global financial markets, higher default rates, supply chain disruptions, and a substantial economic downturn in economies throughout the world. The economic impacts of COVID-19 have created a unique challenge for real estate markets. Many businesses have either partially or fully transitioned to a remote-working environment and this transition may negatively impact the occupancy rates of commercial real estate over time. Natural and environmental disasters and systemic market dislocations are also highly disruptive to economies and markets. In addition, military action by Russia in Ukraine has, and may continue to, adversely affect global energy and financial markets and therefore could affect the value of investments, including beyond the direct exposure to Russian issuers or nearby geographic regions. The extent and duration of the military action, sanctions, and resulting market disruptions are impossible to predict and could be substantial. A number of U.S. domestic banks and foreign (non-U.S.) banks have recently experienced financial difficulties and, in some cases, failures. There can be no certainty that the actions taken by regulators to limit the effect of those financial difficulties and failures on other banks or other financial institutions or on the U.S. or foreign (non-U.S.) economies generally will be successful. It is possible that more banks or other financial institutions will experience financial difficulties or fail, which may affect adversely other U.S. or foreign (non-U.S.) financial institutions and economies. These events as well as other changes in foreign (non-U.S.) and domestic economic, social, and political conditions also could adversely affect individual issuers or related groups of issuers, securities markets, interest rates, credit ratings, inflation, investor sentiment, and other factors affecting the value of the Fund's investments. Any of these occurrences could disrupt the operations of the Funds and of the Funds' service providers.
NOTE 16 — SUBSEQUENT EVENTS
Dividends: Subsequent to March 31, 2024, the Funds declared dividends from net investment income of:
| | | Per Share | | Payable | | Record |
| | | Amount | | Date | | Date |
| GNMA Income | | | | | | |
| Class A | | $0.0205 | | May 1, 2024 | | Daily |
| Class C | | $0.0159 | | May 1, 2024 | | Daily |
| NOTES TO FINANCIAL STATEMENTS AS OF MARCH 31, 2024 (CONTINUED) |
NOTE 16 — SUBSEQUENT EVENTS (continued)
| Class I | | $0.0223 | | May 1, 2024 | | Daily |
| Class R6 | | $0.0226 | | May 1, 2024 | | Daily |
| Class W | | $0.0221 | | May 1, 2024 | | Daily |
| High Yield Bond | | | | | | |
| Class A | | $0.0347 | | May 1, 2024 | | Daily |
| Class C | | $0.0305 | | May 1, 2024 | | Daily |
| Class I | | $0.0366 | | May 1, 2024 | | Daily |
| Class R | | $0.0333 | | May 1, 2024 | | Daily |
| Class R6 | | $0.0371 | | May 1, 2024 | | Daily |
| Class W | | $0.0362 | | May 1, 2024 | | Daily |
| Intermediate Bond | | | | | | |
| Class A | | $0.0302 | | May 1, 2024 | | Daily |
| Class C | | $0.0249 | | May 1, 2024 | | Daily |
| Class I | | $0.0329 | | May 1, 2024 | | Daily |
| Class R | | $0.0285 | | May 1, 2024 | | Daily |
| Class R6 | | $0.0333 | | May 1, 2024 | | Daily |
| Class W | | $0.0320 | | May 1, 2024 | | Daily |
| Short Duration High Income | | | | |
| Class A | | $0.0636 | | May 1, 2024 | | Daily |
| Class C | | $0.0580 | | May 1, 2024 | | Daily |
| Class I | | $0.0656 | | May 1, 2024 | | Daily |
| Class R6 | | $0.0656 | | May 1, 2024 | | Daily |
| Short Term Bond | | | | | | |
| Class A | | $0.0322 | | May 1, 2024 | | Daily |
| Class C | | $0.0265 | | May 1, 2024 | | Daily |
| Class I | | $0.0342 | | May 1, 2024 | | Daily |
| Class R | | $0.0304 | | May 1, 2024 | | Daily |
| Class R6 | | $0.0346 | | May 1, 2024 | | Daily |
| Class W | | $0.0342 | | May 1, 2024 | | Daily |
| Strategic Income Opportunities | | | | |
| Class A | | $0.0406 | | May 1, 2024 | | Daily |
| Class C | | $0.0344 | | May 1, 2024 | | Daily |
| Class I | | $0.0424 | | May 1, 2024 | | Daily |
| Class R | | $0.0383 | | May 1, 2024 | | Daily |
| Class R6 | | $0.0428 | | May 1, 2024 | | Daily |
| Class W | | $0.0423 | | May 1, 2024 | | Daily |
The Funds have evaluated events occurring after the Statements of Assets and Liabilities date through the date that the financial statements were issued (“subsequent events”) to determine whether any subsequent events necessitated adjustment to or disclosure in the financial statements. Other than the above, no such subsequent events were identified.
| Voya GNMA Income Fund | PORTFOLIO OF INVESTMENTS |
| as of March 31, 2024 |
| | | | | | | | Percentage | |
| Principal | | | | | | | of Net | |
| Amount† | | | | | Value | | Assets | |
| U.S. GOVERNMENT AGENCY OBLIGATIONS: 77.5% | | | |
| | | | Federal Home Loan Mortgage Corporation: 1.1%(1) | |
| 654,512 | | | 3.500%, 07/01/2047 | | $ | 597,773 | | | 0.1 | |
| 1,417,384 | | | 3.500%, 12/01/2047 | | | 1,298,190 | | | 0.1 | |
| 2,741,466 | | | 3.500%, 03/01/2048 | | | 2,510,925 | | | 0.2 | |
| 3,095,748 | | | 3.500%, 11/01/2048 | | | 2,835,407 | | | 0.2 | |
| 895,246 | | | 4.000%, 07/01/2047 | | | 848,302 | | | 0.1 | |
| 357,010 | | | 4.500%, 08/01/2047 | | | 347,936 | | | 0.0 | |
| 404,485 | | | 5.000%, 11/01/2035 | | | 407,282 | | | 0.1 | |
| 19,694 | | | 5.000%, 12/01/2035 | | | 19,830 | | | 0.0 | |
| 9,484 | | | 5.000%, 01/01/2038 | | | 9,550 | | | 0.0 | |
| 9,012 | | | 5.000%, 03/01/2038 | | | 9,074 | | | 0.0 | |
| 34,806 | | | 5.000%, 03/01/2038 | | | 35,047 | | | 0.0 | |
| 95,544 | | | 5.000%, 02/01/2039 | | | 95,075 | | | 0.0 | |
| 353,142 | | | 5.000%, 07/01/2039 | | | 352,976 | | | 0.1 | |
| 118,217 | | | 5.000%, 01/01/2040 | | | 118,161 | | | 0.0 | |
| 416,242 | | | 5.000%, 04/01/2040 | | | 416,661 | | | 0.1 | |
| 1,301,940 | | | 5.000%, 10/01/2040 | | | 1,300,657 | | | 0.1 | |
| 146,450 | | | 5.000%, 05/01/2041 | | | 146,200 | | | 0.0 | |
| 123,392 | | | 5.290%, 10/01/2037 | | | 125,465 | | | 0.0 | |
| 22,769 | | | 5.410%, 07/01/2037 | | | 23,237 | | | 0.0 | |
| 8,143 | | | 5.410%, 08/01/2037 | | | 8,187 | | | 0.0 | |
| 32,831 | | | 5.440%, 01/01/2037 | | | 33,537 | | | 0.0 | |
| 42,738 | | | 5.440%, 04/01/2037 | | | 43,657 | | | 0.0 | |
| 26,942 | | | 5.440%, 09/01/2037 | | | 27,493 | | | 0.0 | |
| 25,447 | | | 5.440%, 02/01/2038 | | | 25,994 | | | 0.0 | |
| 91,830 | | | 5.450%, 12/01/2037 | | | 93,249 | | | 0.0 | |
| 117,938 | | | 5.450%, 12/01/2037 | | | 119,449 | | | 0.0 | |
| 30,439 | | | 5.460%, 08/01/2037 | | | 31,113 | | | 0.0 | |
| 33,727 | | | 5.460%, 01/01/2038 | | | 34,225 | | | 0.0 | |
| 49,330 | | | 5.500%, 08/01/2037 | | | 50,438 | | | 0.0 | |
| 80,533 | | | 5.500%, 11/01/2037 | | | 82,416 | | | 0.0 | |
| 33,104 | | | 5.620%, 12/01/2036 | | | 34,004 | | | 0.0 | |
| 35,240 | | | 5.620%, 03/01/2037 | | | 35,976 | | | 0.0 | |
| 57,238 | | | 5.620%, 08/01/2037 | | | 58,732 | | | 0.0 | |
| 66,441 | | | 5.625%, 12/01/2036 | | | 68,259 | | | 0.0 | |
| 89,082 | | | 5.625%, 01/01/2037 | | | 91,449 | | | 0.0 | |
| 86,088 | | | 5.625%, 03/01/2037 | | | 88,444 | | | 0.0 | |
| 80,977 | | | 5.625%, 06/01/2037 | | | 83,103 | | | 0.0 | |
| 70,537 | | | 5.625%, 07/01/2037 | | | 72,467 | | | 0.0 | |
| 38,867 | | | 5.625%, 02/01/2038 | | | 39,930 | | | 0.0 | |
| 300,361 | | | 5.750%, 09/01/2037 | | | 308,603 | | | 0.0 | |
| 69,673 | | | 5.750%, 10/01/2037 | | | 71,862 | | | 0.0 | |
| 84,895 | | | 6.090%, 12/01/2037 | | | 86,614 | | | 0.0 | |
| 3,008 | | | 7.500%, 01/01/2030 | | | 3,061 | | | 0.0 | |
| | | | | | | 13,090,010 | | | 1.1 | |
| | | | Federal National Mortgage Association: 0.5%(1) | | |
| 59,922 | | | 3.125%, 11/01/2041 | | | 56,061 | | | 0.0 | |
| 24,997 | | | 3.250%, 04/01/2041 | | | 24,672 | | | 0.0 | |
| 89,663 | | | 3.475%, 10/01/2041 | | | 85,356 | | | 0.0 | |
| 81,331 | | | 3.750%, 09/01/2041 | | | 78,094 | | | 0.0 | |
| 58,420 | | | 3.750%, 10/01/2041 | | | 56,080 | | | 0.0 | |
| 4,308,187 | | | 4.000%, 07/01/2056 | | | 4,002,830 | | | 0.3 | |
| 660,419 | | | 4.500%, 09/01/2047 | | | 662,782 | | | 0.1 | |
| 82,153 | | | 5.290%, 09/01/2037 | | | 81,143 | | | 0.0 | |
| 242,792 | | | 5.290%, 11/01/2037 | | | 240,098 | | | 0.0 | |
| 71,987 | | | 5.290%, 12/01/2037 | | | 70,572 | | | 0.0 | |
| 111,335 | | | 5.290%, 04/01/2038 | | | 109,951 | | | 0.0 | |
| 34,530 | | | 5.350%, 04/01/2029 | | | 34,253 | | | 0.0 | |
| 59,886 | | | 5.390%, 05/01/2038 | | | 59,236 | | | 0.0 | |
| 109,467 | | | 5.440%, 08/01/2047 | | | 107,813 | | | 0.0 | |
| | | | | | | | | Percentage | |
| Principal | | | | | | | | of Net | |
| Amount† | | | | | Value | | | Assets | |
| U.S. GOVERNMENT AGENCY OBLIGATIONS: (continued) | | | | |
| | | | Federal National Mortgage Association (continued) | |
| 156,856 | | | 5.440%, 08/01/2047 | | $ | 154,699 | | | 0.0 | |
| 166,580 | | | 5.440%, 08/01/2047 | | | 164,337 | | | 0.0 | |
| 167,751 | | | 5.440%, 09/01/2047 | | | 165,497 | | | 0.0 | |
| 262,453 | | | 5.440%, 10/01/2047 | | | 259,584 | | | 0.1 | |
| 57,093 | | | 5.620%, 12/01/2036 | | | 56,754 | | | 0.0 | |
| 97,980 | | | 5.890%, 08/01/2047 | | | 96,748 | | | 0.0 | |
| 105,640 | | | 5.890%, 10/01/2047 | | | 104,541 | | | 0.0 | |
| 5,477 | | | 6.600%, 07/01/2027 | | | 5,454 | | | 0.0 | |
| 14,095 | | | 6.600%, 06/01/2028 | | | 14,037 | | | 0.0 | |
| | | | | | | 6,690,592 | | | 0.5 | |
| | | | Government National Mortgage Association: 69.7% | |
| 4,688,622 | | | 2.000%, 08/20/2050 | | | 3,850,519 | | | 0.3 | |
| 32,987,441 | | | 2.000%, 12/20/2050 | | | 27,070,431 | | | 2.2 | |
| 18,343,349 | | | 2.000%, 01/20/2051 | | | 15,049,401 | | | 1.2 | |
| 15,450,741 | | | 2.000%, 02/20/2051 | | | 12,670,213 | | | 1.0 | |
| 7,116,928 | | | 2.000%, 06/20/2051 | | | 5,834,725 | | | 0.5 | |
| 12,671,621 | | | 2.000%, 08/20/2051 | | | 10,388,561 | | | 0.8 | |
| 3,598,399 | | | 2.000%, 10/20/2051 | | | 2,950,057 | | | 0.2 | |
| 2,515,001 | | | 2.000%, 11/20/2051 | | | 2,061,854 | | | 0.2 | |
| 17,606,282 | | | 2.000%, 03/20/2052 | | | 14,439,238 | | | 1.2 | |
| 153,699,000 (2) | | | 2.000%, 04/20/2054 | | | 125,944,852 | | | 10.0 | |
| 9,409,927 | | | 2.500%, 12/20/2050 | | | 7,947,473 | | | 0.6 | |
| 33,923,217 | | | 2.500%, 03/20/2051 | | | 28,951,789 | | | 2.3 | |
| 17,107,415 | | | 2.500%, 04/20/2051 | | | 14,592,499 | | | 1.2 | |
| 16,980,883 | | | 2.500%, 05/20/2051 | | | 14,486,123 | | | 1.2 | |
| 1,195,331 | | | 2.500%, 06/20/2051 | | | 1,019,897 | | | 0.1 | |
| 3,915,442 | | | 2.500%, 08/20/2051 | | | 3,339,160 | | | 0.3 | |
| 28,707,055 | | | 2.500%, 09/20/2051 | | | 24,478,850 | | | 1.9 | |
| 51,980,702 | | | 2.500%, 10/20/2051 | | | 44,302,971 | | | 3.5 | |
| 29,419,865 | | | 2.500%, 11/20/2051 | | | 25,083,569 | | | 2.0 | |
| 3,909,569 | | | 2.500%, 12/20/2051 | | | 3,332,097 | | | 0.3 | |
| 17,262,544 | | | 2.500%, 03/20/2052 | | | 14,708,066 | | | 1.2 | |
| 155,474 | | | 3.000%, 12/15/2041 | | | 142,212 | | | 0.0 | |
| 80,498 | | | 3.000%, 01/15/2042 | | | 71,966 | | | 0.0 | |
| 161,872 | | | 3.000%, 01/15/2042 | | | 148,440 | | | 0.0 | |
| 162,480 | | | 3.000%, 01/15/2042 | | | 148,826 | | | 0.0 | |
| 458,324 | | | 3.000%, 02/15/2042 | | | 414,287 | | | 0.0 | |
| 158,633 | | | 3.000%, 03/15/2042 | | | 143,391 | | | 0.0 | |
| 132,460 | | | 3.000%, 04/15/2042 | | | 118,422 | | | 0.0 | |
| 54,748 | | | 3.000%, 05/15/2042 | | | 50,203 | | | 0.0 | |
| 42,906 | | | 3.000%, 06/15/2042 | | | 38,359 | | | 0.0 | |
| 23,878,672 | | | 3.000%, 04/20/2045 | | | 21,482,928 | | | 1.7 | |
| 324,885 | | | 3.000%, 11/20/2045 | | | 286,674 | | | 0.0 | |
| 56,994 | | | 3.000%, 12/20/2045 | | | 50,279 | | | 0.0 | |
| 88,850 | | | 3.000%, 12/20/2045 | | | 78,380 | | | 0.0 | |
| 95,329 | | | 3.000%, 12/20/2045 | | | 84,104 | | | 0.0 | |
| 54,482 | | | 3.000%, 01/20/2046 | | | 48,078 | | | 0.0 | |
| 2,020,307 | | | 3.000%, 02/20/2050 | | | 1,734,684 | | | 0.2 | |
| 2,710,173 | | | 3.000%, 10/20/2051 | | | 2,390,935 | | | 0.2 | |
| 22,338,210 | | | 3.000%, 10/20/2051 | | | 19,262,258 | | | 1.5 | |
| 18,029,442 | | | 3.000%, 11/20/2051 | | | 15,546,803 | | | 1.2 | |
| 1,472,096 | | | 3.000%, 01/20/2052 | | | 1,298,793 | | | 0.1 | |
| 8,227,634 | | | 3.000%, 03/20/2052 | | | 7,232,580 | | | 0.6 | |
| 3,817,150 | | | 3.000%, 04/20/2052 | | | 3,367,189 | | | 0.3 | |
| 48,640,000 (2) | | | 3.000%, 04/20/2054 | | | 42,900,871 | | | 3.4 | |
| 47,320 | | | 3.250%, 03/15/2041 | | | 43,464 | | | 0.0 | |
| 236,847 | | | 3.250%, 04/15/2041 | | | 217,697 | | | 0.0 | |
| 71,527 | | | 3.250%, 05/15/2041 | | | 65,767 | | | 0.0 | |
| 331,334 | | | 3.250%, 06/15/2041 | | | 304,702 | | | 0.0 | |
See Accompanying Notes to Financial Statements
| Voya GNMA Income Fund | PORTFOLIO OF INVESTMENTS |
| as of March 31, 2024 (continued) |
| | | | | | | | | Percentage | |
| Principal | | | | | | | | of Net | |
| Amount† | | | | | Value | | | Assets | |
| U.S. GOVERNMENT AGENCY OBLIGATIONS: (continued) | | | |
| | | | Government National Mortgage Association (continued) |
| 56,201 | | | 3.250%, 07/15/2041 | | $ | 51,578 | | | 0.0 | |
| 341,690 | | | 3.250%, 07/15/2041 | | | 313,903 | | | 0.0 | |
| 590,712 | | | 3.250%, 08/15/2041 | | | 542,950 | | | 0.1 | |
| 186,796 | | | 3.250%, 09/15/2041 | | | 171,787 | | | 0.0 | |
| 248,413 | | | 3.250%, 09/15/2041 | | | 228,453 | | | 0.0 | |
| 39,296 | | | 3.250%, 11/15/2041 | | | 36,064 | | | 0.0 | |
| 136,257 | | | 3.250%, 11/15/2041 | | | 125,305 | | | 0.0 | |
| 62,624 | | | 3.250%, 12/15/2041 | | | 57,590 | | | 0.0 | |
| 36,566 | | | 3.250%, 04/15/2042 | | | 33,558 | | | 0.0 | |
| 27,785 | | | 3.250%, 06/15/2042 | | | 25,537 | | | 0.0 | |
| 74,983 | | | 3.250%, 06/15/2042 | | | 68,814 | | | 0.0 | |
| 827,416 | | | 3.500%, 04/20/2043 | | | 758,652 | | | 0.1 | |
| 950,808 | | | 3.500%, 06/20/2045 | | | 874,722 | | | 0.1 | |
| 2,406,027 | | | 3.500%, 04/20/2046 | | | 2,224,373 | | | 0.2 | |
| 3,744,880 | | | 3.500%, 03/20/2047 | | | 3,505,711 | | | 0.3 | |
| 459,777 | | | 3.500%, 07/20/2047 | | | 424,618 | | | 0.0 | |
| 757,197 | | | 3.500%, 07/20/2047 | | | 698,115 | | | 0.1 | |
| 19,036,867 | | | 3.500%, 12/20/2047 | | | 17,499,800 | | | 1.4 | |
| 6,834,471 | | | 3.500%, 01/20/2048 | | | 6,296,865 | | | 0.5 | |
| 2,637,217 | | | 3.500%, 02/20/2048 | | | 2,437,108 | | | 0.2 | |
| 5,226,643 | | | 3.500%, 02/20/2048 | | | 4,805,388 | | | 0.4 | |
| 9,912,836 | | | 3.500%, 03/20/2048 | | | 9,139,925 | | | 0.7 | |
| 27,313,349 | | | 3.500%, 03/20/2052 | | | 24,858,073 | | | 2.0 | |
| 5,000,000 (2) | | | 3.500%, 04/20/2054 | | | 4,550,168 | | | 0.4 | |
| 58,675 | | | 3.640%, 10/20/2064 | | | 57,116 | | | 0.0 | |
| 48,836 | | | 3.650%, 12/15/2040 | | | 45,994 | | | 0.0 | |
| 13,965 | | | 3.750%, 09/15/2041 | | | 13,045 | | | 0.0 | |
| 235,786 | | | 3.750%, 09/15/2041 | | | 222,532 | | | 0.0 | |
| 72,315 | | | 3.750%, 10/15/2041 | | | 68,421 | | | 0.0 | |
| 104,577 | | | 3.750%, 10/15/2041 | | | 98,946 | | | 0.0 | |
| 1,683,265 | | | 3.750%, 05/20/2042 | | | 1,559,146 | | | 0.1 | |
| 2,400,112 | | | 3.750%, 05/20/2042 | | | 2,215,758 | | | 0.2 | |
| 122,965 | | | 3.900%, 10/15/2041 | | | 117,049 | | | 0.0 | |
| 49,208 | | | 4.000%, 05/20/2033 | | | 46,665 | | | 0.0 | |
| 26,328 | | | 4.000%, 01/15/2034 | | | 25,459 | | | 0.0 | |
| 274,972 | | | 4.000%, 05/20/2034 | | | 264,974 | | | 0.0 | |
| 316,450 | | | 4.000%, 07/20/2034 | | | 304,793 | | | 0.0 | |
| 391,347 | | | 4.000%, 07/20/2034 | | | 378,217 | | | 0.0 | |
| 69,112 | | | 4.000%, 08/20/2035 | | | 66,064 | | | 0.0 | |
| 598,300 | | | 4.000%, 09/20/2040 | | | 563,471 | | | 0.1 | |
| 945,705 | | | 4.000%, 07/20/2041 | | | 893,128 | | | 0.1 | |
| 4,119,493 | | | 4.000%, 08/20/2042 | | | 3,962,642 | | | 0.3 | |
| 107,944 | | | 4.000%, 09/15/2042 | | | 102,771 | | | 0.0 | |
| 673,953 | | | 4.000%, 10/20/2043 | | | 652,853 | | | 0.1 | |
| 1,199,067 | | | 4.000%, 12/20/2044 | | | 1,134,172 | | | 0.1 | |
| 1,078,662 | | | 4.000%, 01/20/2045 | | | 1,020,278 | | | 0.1 | |
| 285,617 | | | 4.000%, 06/20/2045 | | | 273,592 | | | 0.0 | |
| 1,166,335 | | | 4.000%, 07/20/2045 | | | 1,111,295 | | | 0.1 | |
| 1,297,329 | | | 4.000%, 09/20/2045 | | | 1,239,370 | | | 0.1 | |
| 62,020 | | | 4.000%, 12/20/2045 | | | 59,212 | | | 0.0 | |
| 314,306 | | | 4.000%, 01/20/2046 | | | 295,584 | | | 0.0 | |
| 2,595,426 | | | 4.000%, 01/20/2046 | | | 2,480,549 | | | 0.2 | |
| 59,937 | | | 4.000%, 02/20/2046 | | | 57,211 | | | 0.0 | |
| 1,463,584 | | | 4.000%, 03/20/2046 | | | 1,391,581 | | | 0.1 | |
| 723,406 | | | 4.000%, 04/20/2046 | | | 689,900 | | | 0.1 | |
| 309,711 | | | 4.000%, 08/20/2046 | | | 294,156 | | | 0.0 | |
| 1,259,674 | | | 4.000%, 09/20/2047 | | | 1,178,932 | | | 0.1 | |
| 11,580,715 | | | 4.000%, 02/20/2050 | | | 10,953,671 | | | 0.9 | |
| | | | | | | | | Percentage | |
| Principal | | | | | | | | of Net | |
| Amount† | | | | | Value | | | Assets | |
| U.S. GOVERNMENT AGENCY OBLIGATIONS: (continued) | |
| | | | Government National Mortgage Association (continued) |
| 11,376,356 | | | 4.000%, 06/20/2052 | | $ | 10,647,358 | | | 0.9 | |
| 5,730,000 (2) | | | 4.000%, 04/20/2054 | | | 5,362,394 | | | 0.4 | |
| 4,316 | | | 4.301%, 09/20/2062 | | | 4,164 | | | 0.0 | |
| 4,923 | | | 4.362%, 04/20/2066 | | | 4,788 | | | 0.0 | |
| 422,061 | | | 4.417%, 01/20/2065 | | | 414,295 | | | 0.0 | |
| 6,918 | | | 4.430%, 10/20/2067 | | | 6,732 | | | 0.0 | |
| 105,622 | | | 4.450%, 07/15/2040 | | | 100,000 | | | 0.0 | |
| 59,150 | | | 4.450%, 09/15/2040 | | | 56,585 | | | 0.0 | |
| 842,414 | | | 4.451%, 01/20/2065 | | | 828,441 | | | 0.1 | |
| 13,556 | | | 4.480%, 02/20/2068 | | | 13,222 | | | 0.0 | |
| 1,030,280 | | | 4.491%, 02/20/2065 | | | 1,012,300 | | | 0.1 | |
| 4,606 | | | 4.500%, 07/20/2036 | | | 4,528 | | | 0.0 | |
| 369,528 | | | 4.500%, 10/15/2039 | | | 363,848 | | | 0.0 | |
| 263,456 | | | 4.500%, 11/15/2039 | | | 259,715 | | | 0.0 | |
| 277,641 | | | 4.500%, 11/15/2039 | | | 273,613 | | | 0.0 | |
| 84,408 | | | 4.500%, 12/15/2039 | | | 83,036 | | | 0.0 | |
| 208,354 | | | 4.500%, 01/15/2040 | | | 204,432 | | | 0.0 | |
| 23,082 | | | 4.500%, 01/20/2040 | | | 22,345 | | | 0.0 | |
| 957,937 | | | 4.500%, 02/15/2040 | | | 931,942 | | | 0.1 | |
| 48,642 | | | 4.500%, 06/15/2040 | | | 47,322 | | | 0.0 | |
| 21,670 | | | 4.500%, 07/20/2040 | | | 20,980 | | | 0.0 | |
| 76,545 | | | 4.500%, 08/20/2040 | | | 74,106 | | | 0.0 | |
| 533,618 | | | 4.500%, 09/20/2041 | | | 526,029 | | | 0.1 | |
| 190,768 | | | 4.500%, 10/20/2048 | | | 185,736 | | | 0.0 | |
| 89,096 | | | 4.500%, 11/20/2048 | | | 86,741 | | | 0.0 | |
| 2,709,805 | | | 4.500%, 12/20/2048 | | | 2,638,187 | | | 0.2 | |
| 66,754 | | | 4.500%, 01/20/2049 | | | 64,983 | | | 0.0 | |
| 4,720,255 | | | 4.500%, 02/20/2049 | | | 4,594,793 | | | 0.4 | |
| 230,256 | | | 4.500%, 03/20/2049 | | | 224,148 | | | 0.0 | |
| 37,812 | | | 4.500%, 05/20/2049 | | | 36,744 | | | 0.0 | |
| 4,181,269 | | | 4.500%, 11/20/2049 | | | 4,028,415 | | | 0.3 | |
| 5,233,181 | | | 4.500%, 12/20/2049 | | | 5,094,356 | | | 0.4 | |
| 8,979,547 | | | 4.500%, 10/20/2052 | | | 8,635,195 | | | 0.7 | |
| 713,791 | | | 4.500%, 01/20/2053 | | | 686,324 | | | 0.1 | |
| 9,515,922 | | | 4.500%, 02/20/2053 | | | 9,149,240 | | | 0.7 | |
| 5,000,000 (2) | | | 4.500%, 04/20/2054 | | | 4,804,925 | | | 0.4 | |
| 56,900,000 (2) | | | 4.500%, 05/20/2054 | | | 54,706,722 | | | 4.3 | |
| 5,735 | | | 4.526%, 04/20/2065 | | | 5,616 | | | 0.0 | |
| 24,442 | | | 4.580%, 01/20/2034 | | | 23,790 | | | 0.0 | |
| 37,763 | | | 4.580%, 03/20/2034 | | | 36,756 | | | 0.0 | |
| 29,611 | | | 4.580%, 04/20/2034 | | | 28,821 | | | 0.0 | |
| 38,375 | | | 4.580%, 04/20/2034 | | | 37,352 | | | 0.0 | |
| 37,575 | | | 4.580%, 06/20/2034 | | | 36,573 | | | 0.0 | |
| 96,279 | | | 4.658%, 10/20/2064 | | | 94,450 | | | 0.0 | |
| 76,704 | | | 4.689%, 09/20/2064 | | | 75,748 | | | 0.0 | |
| 442 | | | 4.700%, 06/20/2061 | | | 431 | | | 0.0 | |
| 79,833 | | | 4.700%, 09/20/2064 | | | 78,469 | | | 0.0 | |
| 323,243 | | | 4.750%, 06/15/2029 | | | 319,268 | | | 0.0 | |
| 70,295 | | | 4.750%, 01/15/2030 | | | 69,432 | | | 0.0 | |
| 45,368 | | | 4.750%, 06/20/2033 | | | 44,112 | | | 0.0 | |
| 18,036 | | | 4.750%, 07/20/2033 | | | 17,901 | | | 0.0 | |
| 31,116 | | | 4.750%, 07/20/2033 | | | 30,684 | | | 0.0 | |
| 40,968 | | | 4.750%, 07/20/2033 | | | 39,834 | | | 0.0 | |
| 22,703 | | | 4.750%, 08/20/2033 | | | 22,031 | | | 0.0 | |
| 47,429 | | | 4.750%, 08/20/2033 | | | 46,532 | | | 0.0 | |
| 18,984 | | | 4.750%, 09/20/2033 | | | 18,422 | | | 0.0 | |
| 26,299 | | | 4.750%, 10/20/2033 | | | 25,793 | | | 0.0 | |
| 21,171 | | | 4.750%, 11/20/2033 | | | 20,544 | | | 0.0 | |
See Accompanying Notes to Financial Statements
| Voya GNMA Income Fund | PORTFOLIO OF INVESTMENTS |
| as of March 31, 2024 (continued) |
| | | | | | | | | Percentage | |
| Principal | | | | | | | | of Net | |
| Amount† | | | | | Value | | | Assets | |
| U.S. GOVERNMENT AGENCY OBLIGATIONS: (continued) | | | |
| | | | Government National Mortgage Association (continued) |
| 18,920 | | | 4.750%, 12/20/2033 | | $ | 18,350 | | | 0.0 | |
| 156,481 | | | 4.750%, 09/15/2034 | | | 154,672 | | | 0.0 | |
| 19,041 | | | 4.920%, 04/20/2033 | | | 18,699 | | | 0.0 | |
| 38,983 | | | 4.920%, 04/20/2033 | | | 38,107 | | | 0.0 | |
| 23,270 | | | 4.920%, 05/20/2033 | | | 22,719 | | | 0.0 | |
| 24,012 | | | 4.920%, 05/20/2033 | | | 23,816 | | | 0.0 | |
| 25,734 | | | 4.920%, 05/20/2033 | | | 25,124 | | | 0.0 | |
| 329,569 | | | 5.000%, 04/20/2030 | | | 327,262 | | | 0.0 | |
| 128,707 | | | 5.000%, 07/15/2033 | | | 128,848 | | | 0.0 | |
| 35,233 | | | 5.000%, 03/15/2034 | | | 35,009 | | | 0.0 | |
| 55,692 | | | 5.000%, 01/15/2035 | | | 55,339 | | | 0.0 | |
| 7,156 | | | 5.000%, 03/15/2035 | | | 7,177 | | | 0.0 | |
| 38,999 | | | 5.000%, 03/15/2035 | | | 39,297 | | | 0.0 | |
| 24,602 | | | 5.000%, 04/15/2035 | | | 24,474 | | | 0.0 | |
| 138,958 | | | 5.000%, 04/15/2035 | | | 138,967 | | | 0.0 | |
| 12,499 | | | 5.000%, 05/15/2035 | | | 12,595 | | | 0.0 | |
| 34,280 | | | 5.000%, 05/20/2035 | | | 34,534 | | | 0.0 | |
| 191,431 | | | 5.000%, 11/20/2035 | | | 193,130 | | | 0.0 | |
| 88,111 | | | 5.000%, 04/20/2036 | | | 88,676 | | | 0.0 | |
| 13,447 | | | 5.000%, 08/20/2038 | | | 13,371 | | | 0.0 | |
| 155,169 | | | 5.000%, 10/20/2038 | | | 153,383 | | | 0.0 | |
| 27,588 | | | 5.000%, 11/20/2038 | | | 26,759 | | | 0.0 | |
| 104,043 | | | 5.000%, 01/20/2039 | | | 103,435 | | | 0.0 | |
| 33,664 | | | 5.000%, 02/15/2039 | | | 34,046 | | | 0.0 | |
| 144,613 | | | 5.000%, 03/15/2039 | | | 145,813 | | | 0.0 | |
| 55,097 | | | 5.000%, 11/15/2039 | | | 55,121 | | | 0.0 | |
| 425,246 | | | 5.000%, 11/15/2039 | | | 423,155 | | | 0.0 | |
| 535,397 | | | 5.000%, 11/15/2039 | | | 536,376 | | | 0.1 | |
| 53,235 | | | 5.000%, 04/15/2040 | | | 53,209 | | | 0.0 | |
| 569,072 | | | 5.000%, 09/15/2040 | | | 564,643 | | | 0.1 | |
| 404,317 | | | 5.000%, 07/20/2041 | | | 407,917 | | | 0.0 | |
| 18,551,663 | | | 5.000%, 11/20/2052 | | | 18,252,020 | | | 1.5 | |
| 28,839,538 | | | 5.000%, 04/20/2053 | | | 28,360,365 | | | 2.3 | |
| 35,000,000 (2) | | | 5.000%, 05/15/2053 | | | 34,410,159 | | | 2.7 | |
| 13,756 | | | 5.250%, 06/15/2028 | | | 13,701 | | | 0.0 | |
| 41,465 | | | 5.250%, 06/15/2029 | | | 41,274 | | | 0.0 | |
| 750,096 | | | 5.250%, 01/20/2036 | | | 754,476 | | | 0.1 | |
| 102,621 | | | 5.290%, 07/20/2037 | | | 106,374 | | | 0.0 | |
| 70,188 | | | 5.290%, 08/20/2037 | | | 72,586 | | | 0.0 | |
| 89,004 | | | 5.290%, 09/20/2037 | | | 92,156 | | | 0.0 | |
| 110,683 | | | 5.290%, 09/20/2037 | | | 114,738 | | | 0.0 | |
| 103,199 | | | 5.290%, 01/20/2038 | | | 106,981 | | | 0.0 | |
| 21,632 | | | 5.350%, 04/20/2029 | | | 21,488 | | | 0.0 | |
| 20,179 | | | 5.350%, 06/20/2029 | | | 20,046 | | | 0.0 | |
| 23,164 | | | 5.350%, 10/20/2029 | | | 23,011 | | | 0.0 | |
| 64,083 | | | 5.350%, 07/20/2033 | | | 65,337 | | | 0.0 | |
| 11,125 | | | 5.350%, 08/20/2033 | | | 11,179 | | | 0.0 | |
| 60,732 | | | 5.390%, 08/20/2038 | | | 59,899 | | | 0.0 | |
| 66,631 | | | 5.390%, 09/15/2038 | | | 68,123 | | | 0.0 | |
| 22,012 | | | 5.490%, 08/20/2033 | | | 22,367 | | | 0.0 | |
| 37,382 | | | 5.490%, 09/20/2033 | | | 37,917 | | | 0.0 | |
| 39,306 | | | 5.490%, 09/20/2033 | | | 39,940 | | | 0.0 | |
| 160,825 | | | 5.490%, 09/20/2033 | | | 162,829 | | | 0.0 | |
| 156,979 | | | 5.490%, 10/20/2033 | | | 158,933 | | | 0.0 | |
| 237,908 | | | 5.490%, 10/20/2033 | | | 240,964 | | | 0.0 | |
| 121,116 | | | 5.490%, 11/20/2033 | | | 122,846 | | | 0.0 | |
| 226,484 | | | 5.490%, 11/20/2033 | | | 229,722 | | | 0.0 | |
| 113,497 | | | 5.490%, 12/20/2033 | | | 115,119 | | | 0.0 | |
| | | | | | | | | Percentage | |
| Principal | | | | | | | | of Net | |
| Amount† | | | | | Value | | | Assets | |
| U.S. GOVERNMENT AGENCY OBLIGATIONS: (continued) |
| | | | Government National Mortgage Association (continued) |
| 144,177 | | | 5.490%, 12/20/2033 | | $ | 146,502 | | | 0.0 | |
| 192,590 | | | 5.490%, 12/20/2033 | | | 194,479 | | | 0.0 | |
| 39,566 | | | 5.490%, 01/20/2034 | | | 40,204 | | | 0.0 | |
| 33,656 | | | 5.490%, 03/20/2034 | | | 34,199 | | | 0.0 | |
| 80,476 | | | 5.490%, 03/20/2034 | | | 81,353 | | | 0.0 | |
| 34,050 | | | 5.490%, 06/20/2034 | | | 34,599 | | | 0.0 | |
| 795 | | | 5.500%, 08/15/2024 | | | 792 | | | 0.0 | |
| 808 | | | 5.500%, 08/20/2024 | | | 806 | | | 0.0 | |
| 106 | | | 5.500%, 04/20/2029 | | | 107 | | | 0.0 | |
| 91,797 | | | 5.500%, 09/15/2029 | | | 92,004 | | | 0.0 | |
| 64,751 | | | 5.500%, 10/15/2029 | | | 64,805 | | | 0.0 | |
| 18,903 | | | 5.500%, 12/20/2032 | | | 19,341 | | | 0.0 | |
| 59,988 | | | 5.500%, 08/20/2033 | | | 61,852 | | | 0.0 | |
| 49,219 | | | 5.500%, 11/20/2033 | | | 48,744 | | | 0.0 | |
| 17,405 | | | 5.500%, 12/20/2033 | | | 17,946 | | | 0.0 | |
| 54,420 | | | 5.500%, 03/20/2034 | | | 53,922 | | | 0.0 | |
| 95,395 | | | 5.500%, 04/20/2034 | | | 94,337 | | | 0.0 | |
| 101,334 | | | 5.500%, 04/20/2034 | | | 104,485 | | | 0.0 | |
| 47,627 | | | 5.500%, 06/20/2034 | | | 47,172 | | | 0.0 | |
| 82,730 | | | 5.500%, 06/20/2034 | | | 83,990 | | | 0.0 | |
| 62,026 | | | 5.500%, 07/20/2034 | | | 63,502 | | | 0.0 | |
| 90,601 | | | 5.500%, 01/20/2035 | | | 89,680 | | | 0.0 | |
| 61,888 | | | 5.500%, 05/15/2035 | | | 63,449 | | | 0.0 | |
| 7,307 | | | 5.500%, 06/20/2035 | | | 7,264 | | | 0.0 | |
| 140,365 | | | 5.500%, 07/15/2035 | | | 143,897 | | | 0.0 | |
| 73,579 | | | 5.500%, 08/15/2035 | | | 75,431 | | | 0.0 | |
| 72,883 | | | 5.500%, 09/20/2035 | | | 73,995 | | | 0.0 | |
| 132,633 | | | 5.500%, 04/15/2036 | | | 136,304 | | | 0.0 | |
| 23,964 | | | 5.500%, 06/20/2036 | | | 24,711 | | | 0.0 | |
| 2,140 | | | 5.500%, 06/20/2038 | | | 2,148 | | | 0.0 | |
| 10,809 | | | 5.500%, 08/20/2038 | | | 10,865 | | | 0.0 | |
| 7,007 | | | 5.500%, 09/20/2038 | | | 7,021 | | | 0.0 | |
| 1,383 | | | 5.500%, 10/20/2038 | | | 1,366 | | | 0.0 | |
| 14,124 | | | 5.500%, 11/20/2038 | | | 14,175 | | | 0.0 | |
| 701 | | | 5.500%, 12/20/2038 | | | 703 | | | 0.0 | |
| 44,141 | | | 5.500%, 01/15/2039 | | | 45,364 | | | 0.0 | |
| 5,330 | | | 5.500%, 01/20/2039 | | | 5,232 | | | 0.0 | |
| 23,359 | | | 5.500%, 06/15/2039 | | | 24,005 | | | 0.0 | |
| 15,055 | | | 5.500%, 06/20/2039 | | | 14,854 | | | 0.0 | |
| 18,319 | | | 5.500%, 10/20/2039 | | | 18,891 | | | 0.0 | |
| 155,376 | | | 5.500%, 09/15/2040 | | | 160,195 | | | 0.0 | |
| 16,000,000 (2) | | | 5.500%, 05/20/2054 | | | 16,003,750 | | | 1.3 | |
| 17,596 | | | 5.580%, 12/20/2033 | | | 17,707 | | | 0.0 | |
| 33,436 | | | 5.580%, 12/20/2033 | | | 34,362 | | | 0.0 | |
| 85,974 | | | 5.580%, 01/20/2034 | | | 87,941 | | | 0.0 | |
| 42,435 | | | 5.580%, 02/20/2034 | | | 43,510 | | | 0.0 | |
| 34,661 | | | 5.580%, 03/20/2034 | | | 35,539 | | | 0.0 | |
| 40,764 | | | 5.580%, 04/20/2034 | | | 41,910 | | | 0.0 | |
| 54,403 | | | 5.580%, 04/20/2034 | | | 56,030 | | | 0.0 | |
| 110,621 | | | 5.580%, 04/20/2034 | | | 113,425 | | | 0.0 | |
| 30,545 | | | 5.580%, 06/20/2034 | | | 31,476 | | | 0.0 | |
| 48,049 | | | 5.580%, 09/20/2034 | | | 49,401 | | | 0.0 | |
| 174,435 | | | 5.590%, 06/20/2033 | | | 178,887 | | | 0.0 | |
| 11,776 | | | 5.590%, 07/20/2033 | | | 11,765 | | | 0.0 | |
| 26,676 | | | 5.590%, 07/20/2033 | | | 27,484 | | | 0.0 | |
| 79,921 | | | 5.590%, 07/20/2033 | | | 81,960 | | | 0.0 | |
| 133,918 | | | 5.590%, 07/20/2033 | | | 137,335 | | | 0.0 | |
| 71,752 | | | 5.590%, 08/20/2033 | | | 73,584 | | | 0.0 | |
See Accompanying Notes to Financial Statements
| Voya GNMA Income Fund | PORTFOLIO OF INVESTMENTS |
| as of March 31, 2024 (continued) |
| | | | | | | | Percentage | |
| Principal | | | | | | | of Net | |
| Amount† | | | | Value | | | Assets | |
| U.S. GOVERNMENT AGENCY OBLIGATIONS: (continued) | | | |
| | | Government National Mortgage Association (continued) |
| 19,538 | | 5.590%, 09/20/2033 | | $ | 19,693 | | | 0.0 | |
| 35,635 | | 5.590%, 09/20/2033 | | | 36,714 | | | 0.0 | |
| 140,457 | | 5.590%, 09/20/2033 | | | 144,043 | | | 0.0 | |
| 53,758 | | 5.590%, 10/20/2033 | | | 55,378 | | | 0.0 | |
| 22,807 | | 5.590%, 11/20/2033 | | | 23,440 | | | 0.0 | |
| 38,317 | | 5.590%, 11/20/2033 | | | 39,017 | | | 0.0 | |
| 41,372 | | 5.590%, 11/20/2033 | | | 42,622 | | | 0.0 | |
| 65,649 | | 5.590%, 12/20/2033 | | | 67,448 | | | 0.0 | |
| 72,743 | | 5.740%, 09/20/2037 | | | 74,818 | | | 0.0 | |
| 223,607 | | 5.740%, 09/20/2037 | | | 229,987 | | | 0.0 | |
| 76,673 | | 5.740%, 10/20/2037 | | | 78,861 | | | 0.0 | |
| 78,256 | | 5.740%, 04/20/2038 | | | 80,485 | | | 0.0 | |
| 470 | | 5.750%, 11/15/2024 | | | 468 | | | 0.0 | |
| 251,323 | | 5.750%, 07/15/2029 | | | 251,929 | | | 0.0 | |
| 167,213 | | 5.750%, 08/15/2029 | | | 167,287 | | | 0.0 | |
| 29,737 | | 5.750%, 11/15/2029 | | | 29,774 | | | 0.0 | |
| 258,483 | | 5.750%, 11/15/2029 | | | 259,162 | | | 0.0 | |
| 33,456 | | 5.770%, 03/20/2033 | | | 33,627 | | | 0.0 | |
| 119,680 | | 5.770%, 03/20/2033 | | | 123,130 | | | 0.0 | |
| 29,783 | | 5.770%, 04/20/2033 | | | 29,928 | | | 0.0 | |
| 61,456 | | 5.770%, 04/20/2033 | | | 63,227 | | | 0.0 | |
| 69,285 | | 5.770%, 05/20/2033 | | | 71,283 | | | 0.0 | |
| 76,437 | | 5.770%, 05/20/2033 | | | 78,641 | | | 0.0 | |
| 48,700 | | 5.770%, 07/20/2033 | | | 49,610 | | | 0.0 | |
| 52,408 | | 5.770%, 07/20/2033 | | | 53,919 | | | 0.0 | |
| 20,746 | | 5.900%, 05/20/2028 | | | 20,885 | | | 0.0 | |
| 975,579 | | 5.970%, 11/15/2031 | | | 971,884 | | | 0.1 | |
| 4,575 | | 6.000%, 10/15/2025 | | | 4,571 | | | 0.0 | |
| 29,577 | | 6.000%, 04/15/2026 | | | 29,508 | | | 0.0 | |
| 19,568 | | 6.000%, 10/20/2027 | | | 19,658 | | | 0.0 | |
| 59,182 | | 6.000%, 05/15/2029 | | | 59,033 | | | 0.0 | |
| 37,315 | | 6.000%, 07/15/2029 | | | 37,503 | | | 0.0 | |
| 35,394 | | 6.000%, 10/20/2034 | | | 36,831 | | | 0.0 | |
| 85,314 | | 6.000%, 03/15/2037 | | | 88,827 | | | 0.0 | |
| 53,358 | | 6.000%, 08/20/2038 | | | 54,946 | | | 0.0 | |
| 11,091 | | 6.000%, 09/20/2038 | | | 11,246 | | | 0.0 | |
| 12,179 | | 6.000%, 10/20/2038 | | | 12,402 | | | 0.0 | |
| 64,352 | | 6.000%, 11/15/2038 | | | 65,558 | | | 0.0 | |
| 69,205 | | 6.000%, 12/15/2038 | | | 70,503 | | | 0.0 | |
| 41,617 | | 6.000%, 08/15/2039 | | | 42,340 | | | 0.0 | |
| 145,527 | | 6.000%, 08/15/2039 | | | 149,373 | | | 0.0 | |
| 21,100,000 (2) | | 6.000%, 04/20/2054 | | | 21,287,713 | | | 1.7 | |
| 10,644 | | 6.500%, 07/20/2029 | | | 10,833 | | | 0.0 | |
| 35,478 | | 6.500%, 07/20/2032 | | | 35,958 | | | 0.0 | |
| 54,777 | | 6.500%, 02/15/2034 | | | 53,953 | | | 0.0 | |
| 158 | | 6.500%, 09/20/2034 | | | 157 | | | 0.0 | |
| 2,528 | | 7.500%, 08/20/2027 | | | 2,547 | | | 0.0 | |
| | | | | | 883,043,534 | | | 69.7 | |
| | | Uniform Mortgage-Backed Securities: 6.2% |
| 2,639,537 | | 2.000%, 12/01/2051 | | | 2,094,380 | | | 0.2 | |
| 2,558,669 | | 2.500%, 12/01/2051 | | | 2,122,848 | | | 0.2 | |
| 1,625,377 | | 2.500%, 02/01/2052 | | | 1,373,019 | | | 0.1 | |
| 2,368,189 | | 3.000%, 11/01/2051 | | | 2,042,883 | | | 0.2 | |
| 11,054,090 | | 3.000%, 11/01/2051 | | | 9,527,116 | | | 0.8 | |
| 1,637,639 | | 3.000%, 01/01/2052 | | | 1,439,147 | | | 0.1 | |
| 4,942,000 (2) | | 3.000%, 04/01/2054 | | | 4,252,322 | | | 0.4 | |
| 1,570,174 | | 3.500%, 02/01/2052 | | | 1,424,762 | | | 0.1 | |
| 4,943,376 | | 3.500%, 03/01/2052 | | | 4,489,653 | | | 0.4 | |
| | | | | | | | Percentage | |
| Principal | | | | | | | of Net | |
| Amount† | | | | Value | | | Assets | |
| U.S. GOVERNMENT AGENCY OBLIGATIONS: (continued) |
| | | Uniform Mortgage-Backed Securities (continued) |
| 4,663,942 | | 3.500%, 09/01/2052 | | $ | 4,179,267 | | | 0.3 | |
| 4,994,112 | | 4.000%, 05/01/2042 | | | 4,734,239 | | | 0.4 | |
| 298,059 | | 4.000%, 05/01/2045 | | | 282,517 | | | 0.0 | |
| 340,300 | | 4.000%, 08/01/2046 | | | 322,411 | | | 0.0 | |
| 5,535,000 (2) | | 4.000%, 05/15/2054 | | | 5,128,446 | | | 0.4 | |
| 286,070 | | 4.250%, 08/01/2035 | | | 277,160 | | | 0.0 | |
| 4,211,851 | | 4.500%, 07/01/2052 | | | 4,012,298 | | | 0.3 | |
| 45,059 | | 4.750%, 11/01/2034 | | | 44,679 | | | 0.0 | |
| 210,233 | | 4.750%, 11/01/2034 | | | 208,458 | | | 0.0 | |
| 223,012 | | 4.750%, 02/01/2035 | | | 221,128 | | | 0.0 | |
| 310,378 | | 4.750%, 04/01/2035 | | | 307,755 | | | 0.0 | |
| 353,822 | | 4.750%, 05/01/2035 | | | 350,833 | | | 0.0 | |
| 63,492 | | 4.750%, 07/01/2035 | | | 62,168 | | | 0.0 | |
| 427,059 | | 4.750%, 07/01/2035 | | | 423,452 | | | 0.0 | |
| 5,279,309 | | 5.000%, 08/01/2052 | | | 5,157,583 | | | 0.4 | |
| 4,000,000 (2) | | 5.000%, 04/01/2054 | | | 3,903,278 | | | 0.3 | |
| 24,052 | | 5.030%, 05/01/2037 | | | 24,057 | | | 0.0 | |
| 87,338 | | 5.030%, 09/01/2037 | | | 87,915 | | | 0.0 | |
| 135,478 | | 5.155%, 01/01/2037 | | | 136,897 | | | 0.0 | |
| 31,231 | | 5.250%, 04/01/2032 | | | 31,400 | | | 0.0 | |
| 47,745 | | 5.250%, 04/01/2032 | | | 48,080 | | | 0.0 | |
| 23,409 | | 5.280%, 11/01/2036 | | | 23,745 | | | 0.0 | |
| 77,444 | | 5.280%, 11/01/2036 | | | 78,552 | | | 0.0 | |
| 39,594 | | 5.280%, 01/01/2037 | | | 40,163 | | | 0.0 | |
| 79,521 | | 5.290%, 08/01/2037 | | | 80,754 | | | 0.0 | |
| 56,965 | | 5.290%, 09/01/2037 | | | 57,847 | | | 0.0 | |
| 62,244 | | 5.290%, 09/01/2037 | | | 63,154 | | | 0.0 | |
| 12,555 | | 5.300%, 10/01/2036 | | | 12,677 | | | 0.0 | |
| 63,089 | | 5.300%, 12/01/2036 | | | 63,493 | | | 0.0 | |
| 44,145 | | 5.300%, 05/01/2037 | | | 44,844 | | | 0.0 | |
| 189,077 | | 5.300%, 08/01/2037 | | | 190,232 | | | 0.0 | |
| 99,898 | | 5.390%, 12/01/2037 | | | 101,758 | | | 0.0 | |
| 147,536 | | 5.405%, 11/01/2036 | | | 150,222 | | | 0.0 | |
| 187,455 | | 5.405%, 02/01/2037 | | | 190,866 | | | 0.0 | |
| 6,000,235 | | 5.500%, 12/01/2052 | | | 5,983,673 | | | 0.5 | |
| 8,652,000 (2) | | 5.500%, 05/01/2054 | | | 8,609,730 | | | 0.7 | |
| 58,651 | | 5.740%, 07/01/2037 | | | 59,757 | | | 0.0 | |
| 4,400,000 (2) | | 6.000%, 04/01/2054 | | | 4,440,745 | | | 0.4 | |
| | | | | | 78,902,363 | | | 6.2 | |
| | | Total U.S. Government Agency Obligations
(Cost $1,031,469,537) | | | 981,726,499 | | | 77.5 | |
| | | | | | | | | | |
| COLLATERALIZED MORTGAGE OBLIGATIONS: 42.8% | | | | | |
| 119,951 (3) | | Fannie Mae REMIC Trust 2002-W1 3A, 3.666%, 04/25/2042 | | | 111,051 | | | 0.0 | |
| 604,474 (3) | | Fannie Mae REMIC Trust 2002-W6 3A, 4.839%, 01/25/2042 | | | 555,840 | | | 0.0 | |
| 3,430,307 | | Fannie Mae REMIC Trust 2002-W9 A4, 6.000%, 08/25/2042 | | | 3,410,812 | | | 0.3 | |
| 631,712 | | Fannie Mae REMIC Trust 2003-16 CX, 6.500%, 03/25/2033 | | | 652,039 | | | 0.1 | |
| 1,681,244 | | Fannie Mae REMIC Trust 2003-34 LN, 5.000%, 05/25/2033 | | | 1,674,374 | | | 0.1 | |
See Accompanying Notes to Financial Statements
| Voya GNMA Income Fund | PORTFOLIO OF INVESTMENTS |
| as of March 31, 2024 (continued) |
| | | | | | | | Percentage | |
| Principal | | | | | | | of Net | |
| Amount† | | | | Value | | | Assets | |
| COLLATERALIZED MORTGAGE OBLIGATIONS: (continued) | | |
| 2,607,475 | | Fannie Mae REMIC Trust 2003-W15 2A7, 5.550%, 08/25/2043 | | $ | 2,570,834 | | | 0.2 | |
| 2,101,403 | | Fannie Mae REMIC Trust 2004-28 PZ, 6.000%, 05/25/2034 | | | 2,122,615 | | | 0.2 | |
| 73,718 (3) | | Fannie Mae REMIC Trust 2004- 61 SH, 2.259%, (-1.000*SOFR30A + 23.530%), 11/25/2032 | | | 72,959 | | | 0.0 | |
| 17,714 | | Fannie Mae REMIC Trust 2004-68 LC, 5.000%, 09/25/2029 | | | 17,668 | | | 0.0 | |
| 1,606,419 | | Fannie Mae REMIC Trust 2004-88 ZC, 6.500%, 12/25/2034 | | | 1,698,885 | | | 0.1 | |
| 1,910,531 (3) | | Fannie Mae REMIC Trust 2004-W11 2A, 4.323%, 03/25/2043 | | | 1,785,680 | | | 0.1 | |
| 1,767,677 | | Fannie Mae REMIC Trust 2004-W3 A8, 5.500%, 05/25/2034 | | | 1,776,347 | | | 0.1 | |
| 192,208 (3) | | Fannie Mae REMIC Trust 2005- 122 SE, 4.078%, (-1.000*SOFR30A + 22.699%), 11/25/2035 | | | 192,104 | | | 0.0 | |
| 4,281,373 (3) | | Fannie Mae REMIC Trust 2005-17 B, 6.500%, 03/25/2035 | | | 4,291,571 | | | 0.3 | |
| 146,198 (3)(4) | | Fannie Mae REMIC Trust 2005- 17 ES, 1.315%, (-1.000*SOFR30A + 6.636%), 03/25/2035 | | | 2,557 | | | 0.0 | |
| 1,813,009 (3)(4) | | Fannie Mae REMIC Trust 2005- 17 SA, 1.265%, (-1.000*SOFR30A + 6.586%), 03/25/2035 | | | 152,596 | | | 0.0 | |
| 1,079,785 | | Fannie Mae REMIC Trust 2005-43 PZ, 6.000%, 05/25/2035 | | | 1,108,649 | | | 0.1 | |
| 179,644 (3) | | Fannie Mae REMIC Trust 2005- 59 NQ, 3.288%, (-1.000*SOFR30A + 16.589%), 05/25/2035 | | | 178,557 | | | 0.0 | |
| 244,730 (3) | | Fannie Mae REMIC Trust 2005- 75 GS, 3.945%, (-1.000*SOFR30A + 19.907%), 08/25/2035 | | | 261,064 | | | 0.0 | |
| 343,247 | | Fannie Mae REMIC Trust 2005-88 ZC, 5.000%, 10/25/2035 | | | 339,806 | | | 0.0 | |
| 1,861,549 | | Fannie Mae REMIC Trust 2005-99 XA, 5.500%, 12/25/2035 | | | 1,855,795 | | | 0.2 | |
| | | | | | | | Percentage | |
| Principal | | | | | | | of Net | |
| Amount† | | | | Value | | | Assets | |
| COLLATERALIZED MORTGAGE OBLIGATIONS: (continued) |
| 56,200 (3) | | Fannie Mae REMIC Trust 2006- 115 ES, 4.821%, (-1.000*SOFR30A + 26.102%), 12/25/2036 | | $ | 61,771 | | | 0.0 | |
| 384,023 (3)(4) | | Fannie Mae REMIC Trust 2006- 36 SP, 1.265%, (-1.000*SOFR30A + 6.586%), 05/25/2036 | | | 20,976 | | | 0.0 | |
| 13,471 (5) | | Fannie Mae REMIC Trust 2006-44 P, 0.000%, 12/25/2033 | | | 11,136 | | | 0.0 | |
| 1,798,851 (3)(4) | | Fannie Mae REMIC Trust 2006- 79 SH, 1.015%, (-1.000*SOFR30A + 6.336%), 08/25/2036 | | | 152,277 | | | 0.0 | |
| 3,643,118 (3)(4) | | Fannie Mae REMIC Trust 2006- 8 HL, 1.265%, (-1.000*SOFR30A + 6.586%), 03/25/2036 | | | 274,668 | | | 0.0 | |
| 580,446 (3) | | Fannie Mae REMIC Trust 2007- 1 NR, 6.195%, (-1.000*SOFR30A + 46.630%), 02/25/2037 | | | 789,985 | | | 0.1 | |
| 544,997 | | Fannie Mae REMIC Trust 2007-60 ZB, 4.750%, 05/25/2037 | | | 530,605 | | | 0.0 | |
| 94,365 (3) | | Fannie Mae REMIC Trust 2009-12 LK, 15.106%, 03/25/2039 | | | 104,300 | | | 0.0 | |
| 5,370,101 (3)(4) | | Fannie Mae REMIC Trust 2010- 147 LS, 1.015%, (-1.000*SOFR30A + 6.336%), 01/25/2041 | | | 545,745 | | | 0.0 | |
| 5,321,056 | | Fannie Mae REMIC Trust 2010-2 LC, 5.000%, 02/25/2040 | | | 5,338,705 | | | 0.4 | |
| 817,363 (3) | | Fannie Mae REMIC Trust 2010-26 F, 6.205%, (SOFR30A + 0.884%), 11/25/2036 | | | 818,949 | | | 0.1 | |
| 810,898 (3) | | Fannie Mae REMIC Trust 2010-39 FN, 6.265%, (SOFR30A + 0.944%), 05/25/2040 | | | 813,799 | | | 0.1 | |
| 621,593 | | Fannie Mae REMIC Trust 2010-80 PZ, 5.000%, 07/25/2040 | | | 623,722 | | | 0.1 | |
| 942,117 | | Fannie Mae REMIC Trust 2010-87 PL, 4.000%, 06/25/2040 | | | 909,515 | | | 0.1 | |
| 1,770,595 (3)(4) | | Fannie Mae REMIC Trust 2010- 95 SB, 1.165%, (-1.000*SOFR30A + 6.486%), 09/25/2040 | | | 106,751 | | | 0.0 | |
See Accompanying Notes to Financial Statements
| Voya GNMA Income Fund | PORTFOLIO OF INVESTMENTS |
| as of March 31, 2024 (continued) |
| | | | | | | | Percentage | |
| Principal | | | | | | | of Net | |
| Amount† | | | | Value | | | Assets | |
| COLLATERALIZED MORTGAGE OBLIGATIONS: (continued) | |
| 1,019,221 | | Fannie Mae REMIC Trust 2011-10 ZC, 5.000%, 02/25/2041 | | $ | 1,008,391 | | | 0.1 | |
| 750,000 | | Fannie Mae REMIC Trust 2011-105 MB, 4.000%, 10/25/2041 | | | 659,229 | | | 0.1 | |
| 1,039,029 | | Fannie Mae REMIC Trust 2011-30 ZA, 5.000%, 04/25/2041 | | | 1,011,121 | | | 0.1 | |
| 1,163,724 (3) | | Fannie Mae REMIC Trust 2011- 4 CS, 2.030%, (-1.000*SOFR30A + 12.671%), 05/25/2040 | | | 1,067,526 | | | 0.1 | |
| 5,176,171 | | Fannie Mae REMIC Trust 2011-99 CZ, 4.500%, 10/25/2041 | | | 4,996,156 | | | 0.4 | |
| 2,554,884 (3)(4) | | Fannie Mae REMIC Trust 2012- 128 VS, 0.815%, (-1.000*SOFR30A + 6.136%), 06/25/2042 | | | 105,184 | | | 0.0 | |
| 1,191,877 (4) | | Fannie Mae REMIC Trust 2012-137 EI, 3.000%, 12/25/2027 | | | 38,605 | | | 0.0 | |
| 959,056 (4) | | Fannie Mae REMIC Trust 2012-142 BI, 3.000%, 11/25/2027 | | | 23,148 | | | 0.0 | |
| 3,804,891 (4) | | Fannie Mae REMIC Trust 2012-148 HI, 3.500%, 05/25/2042 | | | 401,904 | | | 0.0 | |
| 6,025,611 (4) | | Fannie Mae REMIC Trust 2012-148 IM, 3.000%, 01/25/2028 | | | 220,511 | | | 0.0 | |
| 1,610,955 | | Fannie Mae REMIC Trust 2012-148 KH, 3.000%, 03/25/2042 | | | 1,508,785 | | | 0.1 | |
| 1,373,437 (4) | | Fannie Mae REMIC Trust 2012-154 PI, 4.000%, 05/25/2042 | | | 169,402 | | | 0.0 | |
| 3,755,580 | | Fannie Mae REMIC Trust 2012-17 QZ, 4.000%, 03/25/2042 | | | 3,529,859 | | | 0.3 | |
| 2,734,476 | | Fannie Mae REMIC Trust 2012-27 EZ, 4.250%, 03/25/2042 | | | 2,575,752 | | | 0.2 | |
| 2,500,000 | | Fannie Mae REMIC Trust 2012-40 MY, 3.500%, 04/25/2042 | | | 2,230,367 | | | 0.2 | |
| 1,700,000 | | Fannie Mae REMIC Trust 2012-66 KE, 4.000%, 06/25/2042 | | | 1,575,804 | | | 0.1 | |
| 962,075 (3)(4) | | Fannie Mae REMIC Trust 2012- 68 SD, 1.265%, (-1.000*SOFR30A + 6.586%), 06/25/2032 | | | 48,427 | | | 0.0 | |
| 3,457,000 | | Fannie Mae REMIC Trust 2012-97 PC, 3.500%, 09/25/2042 | | | 2,891,276 | | | 0.2 | |
| | | | | | | | Percentage | |
| Principal | | | | | | | of Net | |
| Amount† | | | | Value | | | Assets | |
| COLLATERALIZED MORTGAGE OBLIGATIONS: (continued) | | |
| 808,880 | | Fannie Mae REMIC Trust 2013-125 AZ, 4.000%, 11/25/2039 | | $ | 662,170 | | | 0.1 | |
| 433,032 (4) | | Fannie Mae REMIC Trust 2013-13 PI, 3.500%, 04/25/2042 | | | 31,253 | | | 0.0 | |
| 1,076,600 (5) | | Fannie Mae REMIC Trust 2013-135 PO, 0.000%, 01/25/2044 | | | 769,641 | | | 0.1 | |
| 48,194 | | Fannie Mae REMIC Trust 2013-18 NA, 2.000%, 12/25/2042 | | | 41,885 | | | 0.0 | |
| 1,801,278 (4) | | Fannie Mae REMIC Trust 2013-25 BI, 3.000%, 03/25/2033 | | | 122,399 | | | 0.0 | |
| 1,003,078 (4) | | Fannie Mae REMIC Trust 2013-54 ID, 3.000%, 01/25/2033 | | | 59,018 | | | 0.0 | |
| 1,242,416 | | Fannie Mae REMIC Trust 2013-55 VZ, 3.000%, 06/25/2043 | | | 1,103,421 | | | 0.1 | |
| 1,494,964 (4) | | Fannie Mae REMIC Trust 2013-62 AI, 3.000%, 06/25/2033 | | | 118,302 | | | 0.0 | |
| 1,401,927 | | Fannie Mae REMIC Trust 2015-22 DY, 3.000%, 04/25/2045 | | | 1,047,497 | | | 0.1 | |
| 1,383,326 | | Fannie Mae REMIC Trust 2015-26 UZ, 3.000%, 05/25/2045 | | | 1,037,986 | | | 0.1 | |
| 711,932 | | Fannie Mae REMIC Trust 2015-68 JW, 3.500%, 09/25/2030 | | | 666,845 | | | 0.1 | |
| 2,630,000 | | Fannie Mae REMIC Trust 2016-103 PB, 3.000%, 01/25/2047 | | | 2,201,451 | | | 0.2 | |
| 4,039,320 (3)(4) | | Fannie Mae REMIC Trust 2016- 4 DS, 0.665%, (-1.000*SOFR30A + 5.986%), 02/25/2046 | | | 395,062 | | | 0.0 | |
| 2,438,014 (3) | | Fannie Mae REMIC Trust 2016- 51 S, 0.485%, (-1.000*SOFR30A + 5.806%), 10/25/2043 | | | 2,068,732 | | | 0.2 | |
| 4,333,554 | | Fannie Mae REMIC Trust 2016-64 LD, 3.500%, 09/25/2046 | | | 3,844,913 | | | 0.3 | |
| 5,685,164 | | Fannie Mae REMIC Trust 2017-22 DZ, 4.000%, 04/25/2047 | | | 5,237,552 | | | 0.4 | |
| 7,510,000 | | Fannie Mae REMIC Trust 2018-16 TV, 3.000%, 05/25/2041 | | | 6,586,157 | | | 0.5 | |
| 443,764 | | Fannie Mae REMIC Trust 2018-25 AL, 3.500%, 04/25/2048 | | | 384,676 | | | 0.0 | |
| 568,040 | | Fannie Mae REMIC Trust 2018-37 DZ, 4.000%, 06/25/2048 | | | 526,113 | | | 0.0 | |
See Accompanying Notes to Financial Statements
| Voya GNMA Income Fund | PORTFOLIO OF INVESTMENTS |
| as of March 31, 2024 (continued) |
| | | | | | | | Percentage | |
| Principal | | | | | | | of Net | |
| Amount† | | | | Value | | | Assets | |
| COLLATERALIZED MORTGAGE OBLIGATIONS: (continued) | | |
| 4,667,699 (4) | | Fannie Mae REMIC Trust 2019-49 IG, 3.000%, 03/25/2033 | | $ | 328,277 | | | 0.0 | |
| 2,260,248 | | Fannie Mae REMIC Trust 2019-6 GZ, 4.000%, 03/25/2059 | | | 1,937,965 | | | 0.2 | |
| 23,049,278 (4) | | Fannie Mae REMIC Trust 2020-34 AI, 3.500%, 06/25/2035 | | | 1,944,313 | | | 0.2 | |
| 3,171,237 (4) | | Fannie Mae REMIC Trust 2020-44 TI, 5.500%, 12/25/2035 | | | 481,497 | | | 0.0 | |
| 1,097,113 (3) | | Fannie Mae Trust 2004-W2 3A, 4.295%, 02/25/2044 | | | 1,052,076 | | | 0.1 | |
| 907,023 (3) | | Fannie Mae Trust 2004-W2 4A, 4.240%, 02/25/2044 | | | 874,814 | | | 0.1 | |
| 247,635 (3) | | Freddie Mac REMIC Trust 2653 SC, 4.083%, (-1.000*SOFR30A + 6.743%), 07/15/2033 | | | 233,381 | | | 0.0 | |
| 552,273 | | Freddie Mac REMIC Trust 2767 ZW, 6.000%, 03/15/2034 | | | 566,005 | | | 0.0 | |
| 98,136 (5) | | Freddie Mac REMIC Trust 2974 KO, 0.000%, 05/15/2035 | | | 78,169 | | | 0.0 | |
| 42,994 (3) | | Freddie Mac REMIC Trust 3012 ST, 2.401%, (-1.000*SOFR30A + 21.548%), 04/15/2035 | | | 42,322 | | | 0.0 | |
| 162,253 (3) | | Freddie Mac REMIC Trust 3065 DC, 3.561%, (-1.000*SOFR30A + 19.517%), 03/15/2035 | | | 159,429 | | | 0.0 | |
| 246,046 | | Freddie Mac REMIC Trust 3158 NE, 5.500%, 05/15/2036 | | | 250,223 | | | 0.0 | |
| 2,259,170 (3)(4) | | Freddie Mac REMIC Trust 3181 TA, 0.500%, (-1.000*SOFR30A + 5.544%), 07/15/2036 | | | 41,438 | | | 0.0 | |
| 4,064,117 | | Freddie Mac REMIC Trust 3196 ZK, 6.500%, 04/15/2032 | | | 4,223,538 | | | 0.3 | |
| 128,219 (4) | | Freddie Mac REMIC Trust 3507 IA, 5.500%, 09/15/2035 | | | 14,634 | | | 0.0 | |
| 1,116,351 | | Freddie Mac REMIC Trust 3658 CZ, 5.000%, 04/15/2040 | | | 1,096,058 | | | 0.1 | |
| 2,996,949 | | Freddie Mac REMIC Trust 3770 GA, 4.500%, 10/15/2040 | | | 2,937,017 | | | 0.2 | |
| | | | | | | | Percentage | |
| Principal | | | | | | | of Net | |
| Amount† | | | | Value | | | Assets | |
| COLLATERALIZED MORTGAGE OBLIGATIONS: (continued) | |
| 202,399 (3) | | Freddie Mac REMIC Trust 3864 NT, 5.500%, (-1.000*SOFR30A + 59.451%), 03/15/2039 | | $ | 198,793 | | | 0.0 | |
| 1,007,355 | | Freddie Mac REMIC Trust 3888 ZG, 4.000%, 07/15/2041 | | | 967,799 | | | 0.1 | |
| 3,873,222 (3)(4) | | Freddie Mac REMIC Trust 3960 SG, 0.567%, (-1.000*SOFR30A + 5.886%), 11/15/2041 | | | 327,517 | | | 0.0 | |
| 1,529,495 | | Freddie Mac REMIC Trust 4040 UZ, 5.000%, 05/15/2042 | | | 1,459,748 | | | 0.1 | |
| 5,075,000 | | Freddie Mac REMIC Trust 4059 DY, 3.500%, 06/15/2042 | | | 4,669,647 | | | 0.4 | |
| 1,159,886 | | Freddie Mac REMIC Trust 4097 ZA, 3.500%, 08/15/2042 | | | 1,070,830 | | | 0.1 | |
| 4,213,055 | | Freddie Mac REMIC Trust 4136 ZG, 3.000%, 11/15/2042 | | | 3,733,854 | | | 0.3 | |
| 9,983,921 | | Freddie Mac REMIC Trust 4159 LZ, 3.500%, 01/15/2043 | | | 9,024,617 | | | 0.7 | |
| 4,104,543 (4) | | Freddie Mac REMIC Trust 4176 IA, 2.500%, 03/15/2028 | | | 130,313 | | | 0.0 | |
| 1,871,677 (3) | | Freddie Mac REMIC Trust 4249 CS, 0.574%, (-1.000*SOFR30A + 4.564%), 09/15/2043 | | | 1,296,135 | | | 0.1 | |
| 2,724,395 (3) | | Freddie Mac REMIC Trust 4274 US, 0.417%, (-1.000*SOFR30A + 5.736%), 10/15/2035 | | | 2,207,611 | | | 0.2 | |
| 11,061,596 | | Freddie Mac REMIC Trust 4367 MZ, 4.000%, 07/15/2044 | | | 10,369,997 | | | 0.8 | |
| 2,670,945 | | Freddie Mac REMIC Trust 4372 Z, 3.000%, 08/15/2044 | | | 2,369,829 | | | 0.2 | |
| 6,554,590 (3)(4) | | Freddie Mac REMIC Trust 4438 AS, 0.767%, (-1.000*SOFR30A + 6.086%), 02/15/2045 | | | 545,618 | | | 0.0 | |
| 5,464,977 | | Freddie Mac REMIC Trust 4480 ZX, 4.000%, 11/15/2044 | | | 5,121,930 | | | 0.4 | |
| 3,849,985 | | Freddie Mac REMIC Trust 4631 CZ, 3.500%, 11/15/2046 | | | 3,512,411 | | | 0.3 | |
| 2,232,588 | | Freddie Mac REMIC Trust 4818 GZ, 4.000%, 08/15/2048 | | | 2,050,114 | | | 0.2 | |
See Accompanying Notes to Financial Statements
| Voya GNMA Income Fund | PORTFOLIO OF INVESTMENTS |
| as of March 31, 2024 (continued) |
| | |
| | | | | | | | | Percentage | |
| Principal | | | | | | | | of Net | |
| Amount† | | | | | Value | | | Assets | |
| COLLATERALIZED MORTGAGE OBLIGATIONS: (continued) | | | | | |
| 2,271,608 | | | Freddie Mac REMIC Trust 4941 CZ, 3.000%, 11/25/2049 | | $ | 1,901,121 | | | | 0.2 | |
| 2,597,868 | | | Freddie Mac REMIC | | | | | | | | |
| | | | Trust 5000 DC, | | | | | | | | |
| | | | 2.500%, 03/25/2040 | | | 2,187,365 | | | | 0.2 | |
| 21,230,937 (4) | | | Freddie Mac REMIC Trust 5013 QI, 3.500%, 09/25/2050 | | | 4,063,425 | | | | 0.3 | |
| 1,405,048 (3) | | | Freddie Mac Securities REMIC Trust 2005- S001 2A2, 5.594%, (TSFR1M + 0.264%), 09/25/2045 | | | 1,344,575 | | | | 0.1 | |
| 870,348 (3) | | | Freddie Mac Structured Pass-Through Certificates T-48 2A, 4.098%, 07/25/2033 | | | 798,741 | | | | 0.1 | |
| 429,304 (3) | | | Freddie Mac Structured Pass-Through Certificates T-54 4A, 4.174%, 02/25/2043 | | | 386,818 | | | | 0.0 | |
| 4,871,928 | | | Freddie Mac Whole Loan Securities Trust 2017-SC02 1A2, 3.000%, 05/25/2047 | | | 4,180,764 | | | | 0.3 | |
| 55,975 | | | Ginnie Mae 2004-16 AE, 5.500%, 02/20/2034 | | | 56,170 | | | | 0.0 | |
| 533,168 | | | Ginnie Mae 2004-17 MZ, 5.500%, 03/16/2034 | | | 530,792 | | | | 0.0 | |
| 371,553 | | | Ginnie Mae 2004-28 CZ, 5.500%, 04/20/2034 | | | 373,644 | | | | 0.0 | |
| 180,562 (5) | | | Ginnie Mae 2004-37 OA, 0.000%, 04/17/2034 | | | 150,668 | | | | 0.0 | |
| 541,776 | | | Ginnie Mae 2004-65 ZG, 5.500%, 07/20/2034 | | | 544,985 | | | | 0.0 | |
| 1,342,079 | | | Ginnie Mae 2004-81 Z, 5.000%, 10/20/2034 | | | 1,333,143 | | | | 0.1 | |
| 556,443 (3)(4) | | | Ginnie Mae 2004-98 SA, 1.257%, (-1.000*TSFR1M + 6.586%), 11/20/2034 | | | 51,958 | | | | 0.0 | |
| 472,978 | | | Ginnie Mae 2005-21 Z, 5.000%, 03/20/2035 | | | 472,068 | | | | 0.0 | |
| 79,248 (3)(4) | | | Ginnie Mae 2005-25 SI, 6.000%, (-1.000*TSFR1M + 42.513%), 01/20/2034 | | | 10,174 | | | | 0.0 | |
| 303,312 (3)(4) | | | Ginnie Mae 2005-7 AH, 1.329%, (-1.000*TSFR1M + 6.656%), 02/16/2035 | | | 21,680 | | | | 0.0 | |
| 423,465 (4) | | | Ginnie Mae 2005-73 IM, 5.500%, 09/20/2035 | | | 71,021 | | | | 0.0 | |
| 807,153 | | | Ginnie Mae 2005-80 Z, 5.000%, 10/20/2035 | | | 805,432 | | | | 0.1 | |
| | | | | | | | | Percentage | |
| Principal | | | | | | | | of Net | |
| Amount† | | | | | Value | | | Assets | |
| COLLATERALIZED MORTGAGE OBLIGATIONS: (continued) | | | | | |
| 51,771 (3) | | | Ginnie Mae 2005-91 UP, 3.418%, (-1.000*TSFR1M + 14.071%), 09/16/2031 | | $ | 51,510 | | | | 0.0 | |
| 4,383,151 | | | Ginnie Mae 2006-10 ZT, 6.000%, 03/20/2036 | | | 4,479,377 | | | | 0.4 | |
| 1,367,138 | | | Ginnie Mae 2006-17 TW, 6.000%, 04/20/2036 | | | 1,394,663 | | | | 0.1 | |
| 4,163,678 (3)(4) | | | Ginnie Mae 2006-26 TB, 0.250%, (-1.000*TSFR1M + 6.386%), 06/20/2036 | | | 39,430 | | | | 0.0 | |
| 47,359 (3) | | | Ginnie Mae 2006-61 FA, 5.000%, (TSFR1M + 0.364%), 11/20/2036 | | | 45,418 | | | | 0.0 | |
| 1,201,163 | | | Ginnie Mae 2006-7 ZA, 5.500%, 02/20/2036 | | | 1,212,878 | | | | 0.1 | |
| 864,676 (4) | | | Ginnie Mae 2007-17 CI, 7.500%, 04/16/2037 | | | 147,680 | | | | 0.0 | |
| 920,821 (5) | | | Ginnie Mae 2007-41 OL, 0.000%, 07/20/2037 | | | 737,316 | | | | 0.1 | |
| 52,241 | | | Ginnie Mae 2007-45 PE, 5.500%, 07/16/2037 | | | 52,811 | | | | 0.0 | |
| 200,869 (3) | | | Ginnie Mae 2007-48 SY, 3.927%, (-1.000*TSFR1M + 19.907%), 08/16/2037 | | | 189,356 | | | | 0.0 | |
| 964,190 (3)(4) | | | Ginnie Mae 2007-53 SC, 1.057%, (-1.000*TSFR1M + 6.386%), 09/20/2037 | | | 87,806 | | | | 0.0 | |
| 32,882 (3) | | | Ginnie Mae 2007-53 SW, 3.875%, (-1.000*TSFR1M + 19.862%), 09/20/2037 | | | 33,818 | | | | 0.0 | |
| 561,235 | | | Ginnie Mae 2007-60 YZ, 5.500%, 10/20/2037 | | | 560,005 | | | | 0.0 | |
| 2,474,818 | | | Ginnie Mae 2008-20 PZ, 6.000%, 03/20/2038 | | | 2,526,614 | | | | 0.2 | |
| 313,053 (3)(4) | | | Ginnie Mae 2008-3 SA, 1.107%, (-1.000*TSFR1M + 6.436%), 01/20/2038 | | | 34,562 | | | | 0.0 | |
| 478,716 (3)(4) | | | Ginnie Mae 2008-40 PS, 1.059%, (-1.000*TSFR1M + 6.386%), 05/16/2038 | | | 31,450 | | | | 0.0 | |
| 713,403 (3)(4) | | | Ginnie Mae 2008-51 GS, 0.789%, (-1.000*TSFR1M + 6.116%), 06/16/2038 | | | 61,600 | | | | 0.0 | |
| 1,341,717 (3)(4) | | | Ginnie Mae 2008-82 SA, 0.557%, (-1.000*TSFR1M + 5.886%), 09/20/2038 | | | 118,352 | | | | 0.0 | |
| 881,807 (3)(4) | | | Ginnie Mae 2009-110 SA, 0.909%, (-1.000*TSFR1M + 6.236%), 04/16/2039 | | | 9,272 | | | | 0.0 | |
See Accompanying Notes to Financial Statements
| Voya GNMA Income Fund | PORTFOLIO OF INVESTMENTS |
| as of March 31, 2024 (continued) |
| | |
| | | | | | | | | Percentage | |
| Principal | | | | | | | | of Net | |
| Amount† | | | | | Value | | | Assets | |
| COLLATERALIZED MORTGAGE OBLIGATIONS: (continued) | | | | | |
| 6,653,843 | | | Ginnie Mae 2009-110 ZA, 5.500%, 11/16/2039 | | $ | 6,572,000 | | | | 0.5 | |
| 951,845 | | | Ginnie Mae 2009-110 ZC, 4.500%, 11/16/2039 | | | 898,827 | | | | 0.1 | |
| 1,854,267 | | | Ginnie Mae 2009-118 XZ, 5.000%, 12/20/2039 | | | 1,849,466 | | | | 0.2 | |
| 842,942 | | | Ginnie Mae 2009-121 ZQ, 5.500%, 09/20/2039 | | | 850,264 | | | | 0.1 | |
| 770,300 | | | Ginnie Mae 2009-31 BP, 5.000%, 05/20/2039 | | | 759,739 | | | | 0.1 | |
| 1,122,641 | | | Ginnie Mae 2009-31 ZL, 4.500%, 05/20/2039 | | | 1,098,455 | | | | 0.1 | |
| 925,308 | | | Ginnie Mae 2009-32 QZ, 5.500%, 05/16/2039 | | | 927,595 | | | | 0.1 | |
| 760,319 | | | Ginnie Mae 2009-32 YZ, 7.000%, 05/16/2039 | | | 796,601 | | | | 0.1 | |
| 1,136,357 | | | Ginnie Mae 2009-34 Z, 4.500%, 05/16/2039 | | | 1,116,079 | | | | 0.1 | |
| 3,935,461 | | | Ginnie Mae 2009-50 MZ, 6.000%, 07/16/2039 | | | 4,055,838 | | | | 0.3 | |
| 1,484,324 | | | Ginnie Mae 2009-53 ZB, 6.000%, 07/16/2039 | | | 1,497,812 | | | | 0.1 | |
| 292,756 | | | Ginnie Mae 2009-54 HZ, 5.000%, 07/20/2039 | | | 287,933 | | | | 0.0 | |
| 140,116 (3)(4) | | | Ginnie Mae 2009-55 BI, 1.000%, (-1.000*TSFR1M + 159.638%), 06/16/2037 | | | 5,392 | | | | 0.0 | |
| 2,051,854 | | | Ginnie Mae 2009-61 EZ, 7.500%, 08/20/2039 | | | 2,149,006 | | | | 0.2 | |
| 7,703,412 | | | Ginnie Mae 2009-61 PZ, 7.500%, 08/20/2039 | | | 8,255,967 | | | | 0.7 | |
| 6,592,339 | | | Ginnie Mae 2009-61 ZQ, 6.000%, 08/16/2039 | | | 6,897,636 | | | | 0.5 | |
| 575,339 (3)(4) | | | Ginnie Mae 2009-66 QS, 0.657%, (-1.000*TSFR1M + 5.986%), 07/20/2039 | | | 18,928 | | | | 0.0 | |
| 3,204,697 | | | Ginnie Mae 2009-68 ZC, 5.500%, 08/16/2039 | | | 3,261,869 | | | | 0.3 | |
| 418,431 (3)(4) | | | Ginnie Mae 2009-77 SA, 0.709%, (-1.000*TSFR1M + 6.036%), 09/16/2039 | | | 35,511 | | | | 0.0 | |
| 3,370,332 | | | Ginnie Mae 2009-77 ZB, 5.500%, 09/16/2039 | | | 3,411,143 | | | | 0.3 | |
| 1,288,763 | | | Ginnie Mae 2009-79 PZ, 6.000%, 09/20/2039 | | | 1,351,649 | | | | 0.1 | |
| 2,559,483 | | | Ginnie Mae 2009-87 WZ, 6.000%, 10/20/2039 | | | 2,613,982 | | | | 0.2 | |
| 726,238 | | | Ginnie Mae 2009-92 DZ, 4.500%, 10/16/2039 | | | 685,889 | | | | 0.1 | |
| 1,745,109 | | | Ginnie Mae 2009-98 MZ, 5.000%, 10/16/2039 | | | 1,714,458 | | | | 0.1 | |
| | | | | | | | | Percentage | |
| Principal | | | | | | | | of Net | |
| Amount† | | | | | Value | | | Assets | |
| COLLATERALIZED MORTGAGE OBLIGATIONS: (continued) | | | | | |
| 292,366 (3) | | | Ginnie Mae 2009-H01 FA, 6.593%, (TSFR1M + 1.264%), 11/20/2059 | | $ | 292,848 | | | | 0.0 | |
| 670,739 (4) | | | Ginnie Mae 2010-106 IP, 5.000%, 03/20/2040 | | | 47,943 | | | | 0.0 | |
| 6,227,733 | | | Ginnie Mae 2010-113 BE, 4.500%, 09/20/2040 | | | 6,114,257 | | | | 0.5 | |
| 690,700 (3)(4) | | | Ginnie Mae 2010-116 NS, 1.209%, (-1.000*TSFR1M + 6.536%), 09/16/2040 | | | 45,569 | | | | 0.0 | |
| 2,000,000 | | | Ginnie Mae 2010-116 PB, 5.000%, 06/16/2040 | | | 1,980,558 | | | | 0.2 | |
| 4,075,626 | | | Ginnie Mae 2010-117 ZQ, 4.500%, 09/20/2040 | | | 3,917,221 | | | | 0.3 | |
| 918,000 | | | Ginnie Mae 2010-121 TB, 4.000%, 09/20/2040 | | | 849,157 | | | | 0.1 | |
| 2,126,199 | | | Ginnie Mae 2010-125 BZ, 4.500%, 09/16/2040 | | | 2,113,763 | | | | 0.2 | |
| 7,577 (4) | | | Ginnie Mae 2010-130 KI, 5.500%, 09/16/2040 | | | 103 | | | | 0.0 | |
| 1,500,000 | | | Ginnie Mae 2010-14 B, 4.500%, 02/16/2040 | | | 1,466,778 | | | | 0.1 | |
| 572,506 (3)(4) | | | Ginnie Mae 2010-158 SA, 0.607%, (-1.000*TSFR1M + 5.936%), 12/20/2040 | | | 51,382 | | | | 0.0 | |
| 788,736 | | | Ginnie Mae 2010-162 ZE, 4.000%, 12/16/2040 | | | 750,753 | | | | 0.1 | |
| 6,774,255 (3)(4) | | | Ginnie Mae 2010-166 GS, 0.557%, (-1.000*TSFR1M + 5.886%), 12/20/2040 | | | 546,865 | | | | 0.0 | |
| 150,865 (4) | | | Ginnie Mae 2010-166 NI, 4.500%, 04/20/2039 | | | 2,090 | | | | 0.0 | |
| 692,558 | | | Ginnie Mae 2010-169 AW, 4.500%, 12/20/2040 | | | 682,211 | | | | 0.1 | |
| 70,071 (4) | | | Ginnie Mae 2010-19 LI, 5.000%, 07/16/2039 | | | 1,822 | | | | 0.0 | |
| 813,561 | | | Ginnie Mae 2010-31 BP, 5.000%, 03/20/2040 | | | 815,856 | | | | 0.1 | |
| 571,001 (4) | | | Ginnie Mae 2010-4 WI, 6.000%, 01/16/2040 | | | 75,944 | | | | 0.0 | |
| 4,201,153 | | | Ginnie Mae 2010-42 VZ, 5.500%, 10/20/2039 | | | 4,218,858 | | | | 0.3 | |
| 634,578 | | | Ginnie Mae 2010-59 ZA, 4.500%, 05/20/2040 | | | 621,114 | | | | 0.1 | |
| 4,325,348 (3) | | | Ginnie Mae 2010-H10 FB, 6.439%, (TSFR1M + 1.114%), 05/20/2060 | | | 4,348,455 | | | | 0.3 | |
| 1,679,875 (3) | | | Ginnie Mae 2010-H10 FC, 6.451%, (TSFR1M + 1.114%), 05/20/2060 | | | 1,689,631 | | | | 0.1 | |
| 52,924 (3) | | | Ginnie Mae 2010-H11 FA, 6.439%, (TSFR1M + 1.114%), 06/20/2060 | | | 53,190 | | | | 0.0 | |
See Accompanying Notes to Financial Statements
| Voya GNMA Income Fund | PORTFOLIO OF INVESTMENTS |
| as of March 31, 2024 (continued) |
| | |
| | | | | | | | | Percentage | |
| Principal | | | | | | | | of Net | |
| Amount† | | | | | Value | | | Assets | |
| COLLATERALIZED MORTGAGE OBLIGATIONS: (continued) | | | | | |
| 728,359 (3) | | | Ginnie Mae 2010-H20 AF, 5.774%, (TSFR1M + 0.444%), 10/20/2060 | | $ | 726,085 | | | | 0.1 | |
| 110,537 (3) | | | Ginnie Mae 2010-H26 LF, 5.794%, (TSFR1M + 0.464%), 08/20/2058 | | | 110,105 | | | | 0.0 | |
| 122,134 (4) | | | Ginnie Mae 2011-123 QI, 5.000%, 05/20/2041 | | | 9,378 | | | | 0.0 | |
| 381,821 (3) | | | Ginnie Mae 2011-128 TF, 5.891%, (TSFR1M + 0.564%), 05/16/2041 | | | 377,604 | | | | 0.0 | |
| 1,696,958 (3)(4) | | | Ginnie Mae 2011-141 PS, 1.259%, (-1.000*TSFR1M + 6.586%), 06/16/2041 | | | 92,281 | | | | 0.0 | |
| 1,472,153 (4) | | | Ginnie Mae 2011-146 EI, 5.000%, 11/16/2041 | | | 257,770 | | | | 0.0 | |
| 945,000 | | | Ginnie Mae 2011-151 PY, 3.000%, 11/20/2041 | | | 808,888 | | | | 0.1 | |
| 30,946 | | | Ginnie Mae 2011-169 BC, 7.000%, 05/16/2032 | | | 31,598 | | | | 0.0 | |
| 104,414 (3) | | | Ginnie Mae 2011-169 BG, 5.450%, 04/16/2039 | | | 104,567 | | | | 0.0 | |
| 4,909,409 | | | Ginnie Mae 2011-25 Z, 4.000%, 02/20/2041 | | | 4,687,432 | | | | 0.4 | |
| 1,218,723 | | | Ginnie Mae 2011-59 QC, 4.000%, 12/20/2040 | | | 1,181,067 | | | | 0.1 | |
| 229,831 | | | Ginnie Mae 2011-69 HW, 4.000%, 04/20/2040 | | | 228,397 | | | | 0.0 | |
| 1,780,387 | | | Ginnie Mae 2011-89 Z, 3.500%, 06/20/2041 | | | 1,642,733 | | | | 0.1 | |
| 633,403 (3) | | | Ginnie Mae 2011-H01 AF, 5.894%, (TSFR1M + 0.564%), 11/20/2060 | | | 632,647 | | | | 0.1 | |
| 951,338 (3) | | | Ginnie Mae 2011-H03 FA, 5.944%, (TSFR1M + 0.614%), 01/20/2061 | | | 950,496 | | | | 0.1 | |
| 161,256 (3) | | | Ginnie Mae 2011-H07 FA, 5.944%, (TSFR1M + 0.614%), 02/20/2061 | | | 161,080 | | | | 0.0 | |
| 110,144 (3) | | | Ginnie Mae 2011-H08 FD, 5.944%, (TSFR1M + 0.614%), 02/20/2061 | | | 110,054 | | | | 0.0 | |
| 231,434 (3) | | | Ginnie Mae 2011-H09 AF, 5.944%, (TSFR1M + 0.614%), 03/20/2061 | | | 231,240 | | | | 0.0 | |
| 330,252 (3) | | | Ginnie Mae 2011-H19 FA, 5.914%, (TSFR1M + 0.584%), 08/20/2061 | | | 329,823 | | | | 0.0 | |
| 562,816 (3) | | | Ginnie Mae 2011-H21 FT, 5.500%, (H15T1Y + 0.700%), 10/20/2061 | | | 561,764 | | | | 0.0 | |
| 625,897 (4) | | | Ginnie Mae 2012-103 IC, 3.500%, 08/16/2040 | | | 20,372 | | | | 0.0 | |
| 193,148 (4) | | | Ginnie Mae 2012-124 MI, 4.000%, 03/20/2042 | | | 16,059 | | | | 0.0 | |
| | | | | | | | | Percentage | |
| Principal | | | | | | | | of Net | |
| Amount† | | | | | Value | | | Assets | |
| COLLATERALIZED MORTGAGE OBLIGATIONS: (continued) | | | | | |
| 11,563,880 (4) | | | Ginnie Mae 2012-136 BI, 3.500%, 11/20/2042 | | $ | 1,588,068 | | | | 0.1 | |
| 1,036,983 (4) | | | Ginnie Mae 2012-146 AI, 3.000%, 10/20/2037 | | | 16,059 | | | | 0.0 | |
| 192,493 (3)(4) | | | Ginnie Mae 2012-34 MS, 1.259%, (-1.000*TSFR1M + 6.586%), 04/16/2041 | | | 7,343 | | | | 0.0 | |
| 2,218,164 (3)(4) | | | Ginnie Mae 2012-48 SA, 1.209%, (-1.000*TSFR1M + 6.536%), 04/16/2042 | | | 241,580 | | | | 0.0 | |
| 2,819,548 (3)(4) | | | Ginnie Mae 2012-60 SG, 0.659%, (-1.000*TSFR1M + 5.986%), 05/16/2042 | | | 223,013 | | | | 0.0 | |
| 3,042,254 (3) | | | Ginnie Mae 2012-77 FE, 5.831%, (TSFR1M + 0.504%), 05/16/2041 | | | 3,022,059 | | | | 0.2 | |
| 595,333 (3)(4) | | | Ginnie Mae 2012-93 NS, 0.657%, (-1.000*TSFR1M + 5.986%), 07/20/2042 | | | 45,588 | | | | 0.0 | |
| 651,212 (4) | | | Ginnie Mae 2012-98 EI, 4.000%, 04/20/2041 | | | 64,067 | | | | 0.0 | |
| 1,490,415 (3) | | | Ginnie Mae 2012-H06 FS, 6.144%, (TSFR1M + 0.814%), 03/20/2062 | | | 1,493,407 | | | | 0.1 | |
| 2,895,455 (3) | | | Ginnie Mae 2012-H08 FA, 6.044%, (TSFR1M + 0.714%), 01/20/2062 | | | 2,896,705 | | | | 0.2 | |
| 776,957 (3) | | | Ginnie Mae 2012-H08 FB, 6.044%, (TSFR1M + 0.714%), 03/20/2062 | | | 777,290 | | | | 0.1 | |
| 171,225 (3) | | | Ginnie Mae 2012-H11 FA, 6.144%, (TSFR1M + 0.814%), 02/20/2062 | | | 171,532 | | | | 0.0 | |
| 269,664 (3) | | | Ginnie Mae 2012-H11 GA, 6.024%, (TSFR1M + 0.694%), 05/20/2062 | | | 269,698 | | | | 0.0 | |
| 566,188 (3) | | | Ginnie Mae 2012-H11 VA, 6.094%, (TSFR1M + 0.764%), 05/20/2062 | | | 567,016 | | | | 0.0 | |
| 752,363 (3) | | | Ginnie Mae 2012-H12 FA, 5.994%, (TSFR1M + 0.664%), 04/20/2062 | | | 752,144 | | | | 0.1 | |
| 4,596,354 (3) | | | Ginnie Mae 2012-H12 FB, 6.494%, (TSFR1M + 1.164%), 02/20/2062 | | | 4,626,795 | | | | 0.4 | |
| 205,671 (3) | | | Ginnie Mae 2012-H14 FK, 6.024%, (TSFR1M + 0.694%), 07/20/2062 | | | 205,535 | | | | 0.0 | |
| 1,183,388 (3) | | | Ginnie Mae 2012-H20 BA, 6.004%, (TSFR1M + 0.674%), 09/20/2062 | | | 1,167,166 | | | | 0.1 | |
| 205,454 (3) | | | Ginnie Mae 2012-H29 FA, 5.959%, (TSFR1M + 0.629%), 10/20/2062 | | | 205,315 | | | | 0.0 | |
| 493,873 (3) | | | Ginnie Mae 2012-H30 GA, 5.794%, (TSFR1M + 0.464%), 12/20/2062 | | | 492,393 | | | | 0.0 | |
See Accompanying Notes to Financial Statements
| Voya GNMA Income Fund | PORTFOLIO OF INVESTMENTS |
| as of March 31, 2024 (continued) |
| | |
| | | | | | | | | Percentage | |
| Principal | | | | | | | | of Net | |
| Amount† | | | | | Value | | | Assets | |
| COLLATERALIZED MORTGAGE OBLIGATIONS: (continued) | | | | | |
| 1,052,805 | | | Ginnie Mae 2013-119 TZ, 3.000%, 08/20/2043 | | $ | 928,376 | | | | 0.1 | |
| 7,000,000 | | | Ginnie Mae 2013-147 BE, 4.000%, 12/20/2039 | | | 6,491,841 | | | | 0.5 | |
| 1,543,791 | | | Ginnie Mae 2013-167 Z, 3.000%, 10/16/2043 | | | 1,361,786 | | | | 0.1 | |
| 1,900,000 (4) | | | Ginnie Mae 2013-186 UI, 2.500%, 11/20/2043 | | | 312,726 | | | | 0.0 | |
| 441,941 (4) | | | Ginnie Mae 2013-186 VI, 4.000%, 12/20/2042 | | | 60,692 | | | | 0.0 | |
| 2,910,515 | | | Ginnie Mae 2013-186 ZE, 2.500%, 12/16/2043 | | | 2,504,768 | | | | 0.2 | |
| 2,372,160 (4) | | | Ginnie Mae 2013-20 LI, 4.500%, 12/16/2042 | | | 252,359 | | | | 0.0 | |
| 1,518,948 (4) | | | Ginnie Mae 2013-23 IO, 3.500%, 02/20/2043 | | | 241,868 | | | | 0.0 | |
| 658,079 (3)(4) | | | Ginnie Mae 2013-88 AI, 0.410%, (-1.000*TSFR1M + 5.736%), 06/20/2043 | | | 47,611 | | | | 0.0 | |
| 1,115,371 (3)(4) | | | Ginnie Mae 2013-99 SK, 0.460%, (-1.000*TSFR1M + 5.786%), 07/20/2043 | | | 68,203 | | | | 0.0 | |
| 686,956 (3) | | | Ginnie Mae 2013-H02 FD, 5.784%, (TSFR1M + 0.454%), 12/20/2062 | | | 684,535 | | | | 0.1 | |
| 140,553 (3) | | | Ginnie Mae 2013-H07 HA, 5.854%, (TSFR1M + 0.524%), 03/20/2063 | | | 140,279 | | | | 0.0 | |
| 1,139,096 (3) | | | Ginnie Mae 2013-H08 BF, 5.844%, (TSFR1M + 0.514%), 03/20/2063 | | | 1,132,417 | | | | 0.1 | |
| 643,027 (3) | | | Ginnie Mae 2013-H10 FT, 5.250%, (H15T1Y + 0.450%), 04/20/2063 | | | 640,401 | | | | 0.1 | |
| 1,184,180 (3) | | | Ginnie Mae 2013-H13 FS, 6.444%, (TSFR1M + 1.114%), 06/20/2063 | | | 1,192,867 | | | | 0.1 | |
| 830,453 (3) | | | Ginnie Mae 2013-H14 FC, 5.914%, (TSFR1M + 0.584%), 06/20/2063 | | | 829,336 | | | | 0.1 | |
| 282,793 (3) | | | Ginnie Mae 2013-H14 FD, 5.914%, (TSFR1M + 0.584%), 06/20/2063 | | | 282,382 | | | | 0.0 | |
| 296,773 (3) | | | Ginnie Mae 2013-H14 FG, 5.914%, (TSFR1M + 0.584%), 05/20/2063 | | | 296,362 | | | | 0.0 | |
| 205,996 (3) | | | Ginnie Mae 2013-H15 FA, 5.984%, (TSFR1M + 0.654%), 06/20/2063 | | | 205,915 | | | | 0.0 | |
| 326,524 (3) | | | Ginnie Mae 2013-H17 FA, 5.994%, (TSFR1M + 0.664%), 07/20/2063 | | | 326,450 | | | | 0.0 | |
| 137,470 (3) | | | Ginnie Mae 2013-H18 EA, 5.944%, (TSFR1M + 0.614%), 07/20/2063 | | | 137,348 | | | | 0.0 | |
| 808,658 (3) | | | Ginnie Mae 2013-H18 FA, 5.944%, (TSFR1M + 0.614%), 06/20/2063 | | | 807,965 | | | | 0.1 | |
| | | | | | | | | Percentage | |
| Principal | | | | | | | | of Net | |
| Amount† | | | | | Value | | | Assets | |
| COLLATERALIZED MORTGAGE OBLIGATIONS: (continued) | | | | | |
| 829,622 (3) | | | Ginnie Mae 2013-H19 DF, 6.094%, (TSFR1M + 0.764%), 05/20/2063 | | $ | 828,083 | | | | 0.1 | |
| 198,067 (3) | | | Ginnie Mae 2013-H20 FB, 6.444%, (TSFR1M + 1.114%), 08/20/2063 | | | 199,482 | | | | 0.0 | |
| 177,438 (3) | | | Ginnie Mae 2013-H21 FB, 6.144%, (TSFR1M + 0.814%), 09/20/2063 | | | 177,672 | | | | 0.0 | |
| 368,453 (3) | | | Ginnie Mae 2013-H22 FB, 6.144%, (TSFR1M + 0.814%), 08/20/2063 | | | 369,107 | | | | 0.0 | |
| 1,518,174 (3) | | | Ginnie Mae 2013-H22 FT, 5.450%, (H15T1Y + 0.650%), 04/20/2063 | | | 1,515,129 | | | | 0.1 | |
| 277,973 (3) | | | Ginnie Mae 2013-H23 FA, 6.744%, (TSFR1M + 1.414%), 09/20/2063 | | | 280,665 | | | | 0.0 | |
| 23,735 (3) | | | Ginnie Mae 2013-H24 FB, 6.174%, (TSFR1M + 0.844%), 09/20/2063 | | | 23,788 | | | | 0.0 | |
| 1,642,938 (3)(4) | | | Ginnie Mae 2014-107 XS, 0.159%, (-1.000*TSFR1M + 5.486%), 07/16/2044 | | | 105,176 | | | | 0.0 | |
| 2,793,200 | | | Ginnie Mae 2014-115 EM, 4.000%, 08/20/2044 | | | 2,570,283 | | | | 0.2 | |
| 2,585,765 | | | Ginnie Mae 2014-118 ZP, 4.000%, 08/20/2044 | | | 2,395,313 | | | | 0.2 | |
| 1,053,574 (3)(4) | | | Ginnie Mae 2014-129 WS, 0.460%, (-1.000*TSFR1M + 5.786%), 09/20/2044 | | | 73,793 | | | | 0.0 | |
| 1,850,316 | | | Ginnie Mae 2014-149 KL, 4.000%, 10/16/2044 | | | 1,647,461 | | | | 0.1 | |
| 846,386 (3)(4) | | | Ginnie Mae 2014-161 WS, 0.460%, (-1.000*TSFR1M + 5.786%), 11/20/2044 | | | 54,422 | | | | 0.0 | |
| 977,062 (4) | | | Ginnie Mae 2014-183 IM, 5.000%, 06/20/2035 | | | 145,436 | | | | 0.0 | |
| 1,152,572 (3)(4) | | | Ginnie Mae 2014-30 ES, 0.047%, (-1.000*TSFR1M + 4.886%), 03/20/2040 | | | 56,842 | | | | 0.0 | |
| 813,154 (3)(4) | | | Ginnie Mae 2014-96 SQ, 0.159%, (-1.000*TSFR1M + 5.486%), 07/16/2044 | | | 51,854 | | | | 0.0 | |
| 1,764,726 (4) | | | Ginnie Mae 2014-99 IO, 4.500%, 06/20/2044 | | | 346,540 | | | | 0.0 | |
| 6,180,597 (3) | | | Ginnie Mae 2014-H03 FS, 6.094%, (TSFR1M + 0.764%), 02/20/2064 | | | 6,187,650 | | | | 0.5 | |
| 675,780 (3) | | | Ginnie Mae 2014-H04 FB, 6.094%, (TSFR1M + 0.764%), 02/20/2064 | | | 676,369 | | | | 0.1 | |
| 814,009 (3) | | | Ginnie Mae 2014-H05 FB, 6.044%, (TSFR1M + 0.714%), 12/20/2063 | | | 814,270 | | | | 0.1 | |
See Accompanying Notes to Financial Statements
| Voya GNMA Income Fund | PORTFOLIO OF INVESTMENTS |
| as of March 31, 2024 (continued) |
| | |
| | | | | | | | | Percentage | |
| Principal | | | | | | | | of Net | |
| Amount† | | | | | Value | | | Assets | |
| COLLATERALIZED MORTGAGE OBLIGATIONS: (continued) | | | | | |
| 444,882 (3) | | | Ginnie Mae 2014-H06 FA, 6.014%, (TSFR1M + 0.684%), 03/20/2064 | | $ | 444,886 | | | | 0.0 | |
| 226,842 (3) | | | Ginnie Mae 2014-H06 HB, 6.094%, (TSFR1M + 0.764%), 03/20/2064 | | | 227,078 | | | | 0.0 | |
| 2,157,006 (3) | | | Ginnie Mae 2014-H11 VA, 5.944%, (TSFR1M + 0.614%), 06/20/2064 | | | 2,154,756 | | | | 0.2 | |
| 2,618,560 (3) | | | Ginnie Mae 2014-H15 FA, 5.944%, (TSFR1M + 0.614%), 07/20/2064 | | | 2,615,966 | | | | 0.2 | |
| 1,233,370 (3) | | | Ginnie Mae 2014-H21 FA, 6.094%, (TSFR1M + 0.764%), 10/20/2064 | | | 1,227,708 | | | | 0.1 | |
| 7,951,875 (3) | | | Ginnie Mae 2015-10 Q, 2.411%, 10/20/2044 | | | 6,686,923 | | | | 0.5 | |
| 130,000 | | | Ginnie Mae 2015-123 GY, 3.000%, 09/20/2045 | | | 99,851 | | | | 0.0 | |
| 2,364,266 (3)(4) | | | Ginnie Mae 2015-141 IX, 0.311%, (-1.000*TSFR1M + 2.060%), 06/20/2045 | | | 32,834 | | | | 0.0 | |
| 15,125,000 | | | Ginnie Mae 2015-143 B, 3.500%, 04/20/2045 | | | 13,529,045 | | | | 1.1 | |
| 1,831,152 (4) | | | Ginnie Mae 2015-149 IL, 4.500%, 10/20/2045 | | | 363,939 | | | | 0.0 | |
| 991,456 (4) | | | Ginnie Mae 2015-157 PI, 4.000%, 03/20/2044 | | | 97,287 | | | | 0.0 | |
| 2,318,011 | | | Ginnie Mae 2015-165 ZA, 3.500%, 07/20/2045 | | | 2,174,328 | | | | 0.2 | |
| 4,837,896 | | | Ginnie Mae 2015-64 ZH, 2.500%, 05/16/2045 | | | 4,106,133 | | | | 0.3 | |
| 733,944 (3) | | | Ginnie Mae 2015-H03 FA, 5.944%, (TSFR1M + 0.614%), 12/20/2064 | | | 733,306 | | | | 0.1 | |
| 2,171,263 (3) | | | Ginnie Mae 2015-H05 FC, 5.924%, (TSFR1M + 0.594%), 02/20/2065 | | | 2,156,650 | | | | 0.2 | |
| 829,020 (3) | | | Ginnie Mae 2015-H06 FA, 5.924%, (TSFR1M + 0.594%), 02/20/2065 | | | 828,026 | | | | 0.1 | |
| 1,402,407 (3) | | | Ginnie Mae 2015-H08 FC, 5.924%, (TSFR1M + 0.594%), 03/20/2065 | | | 1,401,027 | | | | 0.1 | |
| 1,303,611 (3) | | | Ginnie Mae 2015-H10 FH, 6.044%, (TSFR1M + 0.714%), 04/20/2065 | | | 1,296,916 | | | | 0.1 | |
| 150,969 (3) | | | Ginnie Mae 2015-H12 FA, 5.924%, (TSFR1M + 0.594%), 05/20/2065 | | | 150,816 | | | | 0.0 | |
| 2,658,631 (3) | | | Ginnie Mae 2015-H13 FG, 5.844%, (TSFR1M + 0.514%), 04/20/2065 | | | 2,652,920 | | | | 0.2 | |
| 212,243 (3) | | | Ginnie Mae 2015-H14 FB, 5.874%, (TSFR1M + 0.544%), 05/20/2065 | | | 211,862 | | | | 0.0 | |
| 897,436 (3) | | | Ginnie Mae 2015-H18 FB, 6.044%, (TSFR1M + 0.714%), 07/20/2065 | | | 893,145 | | | | 0.1 | |
| | | | | | | | | Percentage | |
| Principal | | | | | | | | of Net | |
| Amount† | | | | | Value | | | Assets | |
| COLLATERALIZED MORTGAGE OBLIGATIONS: (continued) | | | | | |
| 734,464 (3) | | | Ginnie Mae 2015-H20 1 1 FB, 6.044%, (TSFR1M + 0.714%), 08/20/2065 | | $ | 730,732 | | | | 0.1 | |
| 1,220,966 (3) | | | Ginnie Mae 2015-H22 FC, 6.044%, (TSFR1M + 0.714%), 09/20/2065 | | | 1,214,202 | | | | 0.1 | |
| 1,499,668 (3) | | | Ginnie Mae 2015-H23 FB, 5.964%, (TSFR1M + 0.634%), 09/20/2065 | | | 1,498,729 | | | | 0.1 | |
| 1,068,556 (3) | | | Ginnie Mae 2015-H26 FA, 5.964%, (TSFR1M + 0.634%), 10/20/2065 | | | 1,067,856 | | | | 0.1 | |
| 454,234 (3) | | | Ginnie Mae 2015-H26 FC, 6.044%, (TSFR1M + 0.714%), 08/20/2065 | | | 454,297 | | | | 0.0 | |
| 877,826 (3) | | | Ginnie Mae 2015-H26 FG, 5.964%, (TSFR1M + 0.634%), 10/20/2065 | | | 872,169 | | | | 0.1 | |
| 2,805,813 (3) | | | Ginnie Mae 2015-H29 FL, 6.044%, (TSFR1M + 0.714%), 11/20/2065 | | | 2,792,216 | | | | 0.2 | |
| 4,716,868 (3) | | | Ginnie Mae 2015-H30 FE, 6.044%, (TSFR1M + 0.714%), 11/20/2065 | | | 4,719,191 | | | | 0.4 | |
| 409,959 (3) | | | Ginnie Mae 2015-H31 FT, 6.094%, (TSFR1M + 0.764%), 11/20/2065 | | | 409,941 | | | | 0.0 | |
| 10,805,960 (4) | | | Ginnie Mae 2016-120 IM, 3.500%, 07/20/2046 | | | 1,281,847 | | | | 0.1 | |
| 4,673,119 (4) | | | Ginnie Mae 2016-145 IU, 3.500%, 10/20/2046 | | | 755,566 | | | | 0.1 | |
| 4,787,085 (3)(4) | | | Ginnie Mae 2016- 20 BS, 0.657%, (-1.000*TSFR1M + 5.986%), 02/20/2046 | | | 440,758 | | | | 0.0 | |
| 2,494,990 (3) | | | Ginnie Mae 2016-5 AB, 4.686%, 01/20/2046 | | | 2,471,120 | | | | 0.2 | |
| 4,133,944 | | | Ginnie Mae 2016-69 B, 3.000%, 05/20/2046 | | | 3,612,859 | | | | 0.3 | |
| 62,338 (4) | | | Ginnie Mae 2016-84 IO, 5.000%, 12/20/2040 | | | 338 | | | | 0.0 | |
| 177,834 (3) | | | Ginnie Mae 2016-H01 FL, 6.094%, (TSFR1M + 0.764%), 12/20/2065 | | | 177,996 | | | | 0.0 | |
| 1,121,706 (3) | | | Ginnie Mae 2016-H02 FH, 6.444%, (TSFR1M + 1.114%), 01/20/2066 | | | 1,122,651 | | | | 0.1 | |
| 278,180 (3) | | | Ginnie Mae 2016-H03 FB, 6.094%, (TSFR1M + 0.764%), 01/20/2066 | | | 276,942 | | | | 0.0 | |
| 234,216 (3) | | | Ginnie Mae 2016-H07 FK, 6.444%, (TSFR1M + 1.114%), 03/20/2066 | | | 234,330 | | | | 0.0 | |
| 843,845 (3) | | | Ginnie Mae 2016-H09 FB, 6.344%, (TSFR1M + 1.014%), 04/20/2066 | | | 843,104 | | | | 0.1 | |
| 2,414,502 (3) | | | Ginnie Mae 2016-H11 F, 6.244%, (TSFR1M + 0.914%), 05/20/2066 | | | 2,408,489 | | | | 0.2 | |
See Accompanying Notes to Financial Statements
| Voya GNMA Income Fund | PORTFOLIO OF INVESTMENTS |
| as of March 31, 2024 (continued) |
| | |
| | | | | | | | | Percentage | |
| Principal | | | | | | | | of Net | |
| Amount† | | | | | Value | | | Assets | |
| COLLATERALIZED MORTGAGE OBLIGATIONS: (continued) | | | | | |
| 739,042 (3) | | | Ginnie Mae 2016-H11 FE, 6.294%, (TSFR1M + 0.964%), 04/20/2066 | | $ | 737,889 | | | | 0.1 | |
| 853,231 (3) | | | Ginnie Mae 2016-H13 FD, 5.250%, (H15T1Y + 0.450%), 05/20/2066 | | | 849,934 | | | | 0.1 | |
| 199,947 (3) | | | Ginnie Mae 2016-H13 FT, 6.024%, (TSFR1M + 0.694%), 05/20/2066 | | | 199,977 | | | | 0.0 | |
| 6,959,709 (3) | | | Ginnie Mae 2016-H20 FB, 5.994%, (TSFR1M + 0.664%), 09/20/2066 | | | 6,957,649 | | | | 0.6 | |
| 125,842 (3) | | | Ginnie Mae 2016-H20 FG, 6.144%, (TSFR1M + 0.814%), 08/20/2066 | | | 125,778 | | | | 0.0 | |
| 1,501,402 (3) | | | Ginnie Mae 2016-H21 FH, 6.294%, (TSFR1M + 0.964%), 09/20/2066 | | | 1,498,619 | | | | 0.1 | |
| 3,530,004 (3) | | | Ginnie Mae 2016-H23 F, 6.194%, (TSFR1M + 0.864%), 10/20/2066 | | | 3,540,677 | | | | 0.3 | |
| 3,904,151 | | | Ginnie Mae 2017-107 QZ, 3.000%, 08/20/2045 | | | 3,141,550 | | | | 0.3 | |
| 1,000,000 | | | Ginnie Mae 2017-117 BE, 2.500%, 08/20/2047 | | | 806,720 | | | | 0.1 | |
| 1,000,000 | | | Ginnie Mae 2017-117 NG, 2.500%, 08/20/2047 | | | 791,468 | | | | 0.1 | |
| 1,723,545 | | | Ginnie Mae 2017-122 CZ, 3.000%, 08/20/2047 | | | 1,317,656 | | | | 0.1 | |
| 1,923,688 (4) | | | Ginnie Mae 2017-123 IO, 5.000%, 08/16/2047 | | | 403,623 | | | | 0.0 | |
| 2,890,000 | | | Ginnie Mae 2017-162 PL, 3.000%, 10/20/2047 | | | 2,226,514 | | | | 0.2 | |
| 750,000 | | | Ginnie Mae 2017-163 YA, 2.500%, 11/20/2047 | | | 604,413 | | | | 0.1 | |
| 10,000,000 | | | Ginnie Mae 2017-180 QB, 2.500%, 12/20/2047 | | | 8,329,660 | | | | 0.7 | |
| 1,191,060 | | | Ginnie Mae 2017-56 HM, 3.000%, 12/20/2046 | | | 1,076,142 | | | | 0.1 | |
| 5,198,633 | | | Ginnie Mae 2017-56 JZ, 3.000%, 04/20/2047 | | | 4,209,172 | | | | 0.3 | |
| 494,474 (3) | | | Ginnie Mae 2017-H07 FG, 5.904%, (TSFR1M + 0.574%), 02/20/2067 | | | 493,742 | | | | 0.0 | |
| 694,823 (3) | | | Ginnie Mae 2017-H14 FD, 5.914%, (TSFR1M + 0.584%), 06/20/2067 | | | 689,205 | | | | 0.1 | |
| 925,507 (3) | | | Ginnie Mae 2017-H14 FV, 5.944%, (TSFR1M + 0.614%), 06/20/2067 | | | 924,483 | | | | 0.1 | |
| 1,124,932 (3) | | | Ginnie Mae 2017-H17 FG, 5.944%, (TSFR1M + 0.614%), 08/20/2067 | | | 1,123,897 | | | | 0.1 | |
| 419,533 (3) | | | Ginnie Mae 2017-H19 FA, 5.894%, (TSFR1M + 0.564%), 08/20/2067 | | | 418,856 | | | | 0.0 | |
| | | | | | | | | Percentage | |
| Principal | | | | | | | | of Net | |
| Amount† | | | | | Value | | | Assets | |
| COLLATERALIZED MORTGAGE OBLIGATIONS: (continued) | | | | | |
| 1,312,860 | | | Ginnie Mae 2018-112 AL, 3.500%, 08/20/2048 | | $ | 1,185,197 | | | | 0.1 | |
| 358,298 | | | Ginnie Mae 2018-163 DZ, 4.500%, 11/20/2048 | | | 323,109 | | | | 0.0 | |
| 638,554 (4) | | | Ginnie Mae 2018-78 IC, 4.000%, 02/20/2047 | | | 90,998 | | | | 0.0 | |
| 1,000,000 | | | Ginnie Mae 2018-91 JN, 3.000%, 07/20/2048 | | | 825,290 | | | | 0.1 | |
| 164,406 (3) | | | Ginnie Mae 2018-H07 FE, 5.794%, (TSFR1M + 0.464%), 02/20/2068 | | | 164,043 | | | | 0.0 | |
| 9,969,943 | | | Ginnie Mae 2019-1 LZ, 3.500%, 01/20/2049 | | | 7,997,782 | | | | 0.6 | |
| 1,417,634 | | | Ginnie Mae 2019-1 Z, 4.000%, 01/20/2049 | | | 1,316,607 | | | | 0.1 | |
| 2,821,240 (3) | | | Ginnie Mae 2019-100 FD, 5.843%, (TSFR1M + 0.514%), 08/20/2049 | | | 2,775,142 | | | | 0.2 | |
| 10,658,985 | | | Ginnie Mae 2019-123 CA, 3.000%, 10/20/2049 | | | 9,449,561 | | | | 0.7 | |
| 759,936 (4) | | | Ginnie Mae 2019-29 AI, 5.000%, 07/20/2048 | | | 162,540 | | | | 0.0 | |
| 12,000,000 (4) | | | Ginnie Mae 2019-56 YI, 5.000%, 05/20/2049 | | | 2,788,733 | | | | 0.2 | |
| 109,899 | | | Ginnie Mae 2019-71 EN, 4.000%, 06/20/2049 | | | 91,518 | | | | 0.0 | |
| 63,532 (3) | | | Ginnie Mae 2019-H01 FJ, 5.744%, (TSFR1M + 0.414%), 09/20/2068 | | | 63,449 | | | | 0.0 | |
| 1,560,826 (3) | | | Ginnie Mae 2019-H01 FL, 5.894%, (TSFR1M + 0.564%), 12/20/2068 | | | 1,560,737 | | | | 0.1 | |
| 1,765,482 (3) | | | Ginnie Mae 2019-H05 FL, 5.924%, (TSFR1M + 0.594%), 03/20/2069 | | | 1,753,380 | | | | 0.1 | |
| 352,436 (3) | | | Ginnie Mae 2019-H10 FM, 5.844%, (TSFR1M + 0.514%), 05/20/2069 | | | 351,533 | | | | 0.0 | |
| 1,158,236 (3) | | | Ginnie Mae 2019-H19 FB, 5.894%, (TSFR1M + 0.564%), 11/20/2069 | | | 1,156,305 | | | | 0.1 | |
| 18,793,668 (4) | | | Ginnie Mae 2020-47 LI, 3.500%, 04/20/2050 | | | 3,407,437 | | | | 0.3 | |
| 356,048 (3) | | | Ginnie Mae 2020-H01 FT, 5.300%, (H15T1Y + 0.500%), 01/20/2070 | | | 354,454 | | | | 0.0 | |
| 52,680 (3) | | | Ginnie Mae 2020-H04 FP, 5.944%, (TSFR1M + 0.614%), 06/20/2069 | | | 52,607 | | | | 0.0 | |
| 60,512 (3) | | | Ginnie Mae 2020-H09 FL, 6.594%, (TSFR1M + 1.264%), 05/20/2070 | | | 60,857 | | | | 0.0 | |
| 8,309,965 (3)(4) | | | Ginnie Mae 2021-58 SB, 0.857%, (-1.000*TSFR1M + 6.186%), 04/20/2051 | | | 860,642 | | | | 0.1 | |
| 5,787,739 (4) | | | Ginnie Mae 2021-74 KI, 3.000%, 04/20/2051 | | | 862,471 | | | | 0.1 | |
See Accompanying Notes to Financial Statements
| Voya GNMA Income Fund | PORTFOLIO OF INVESTMENTS |
| as of March 31, 2024 (continued) |
| | |
| | | | | | | | | Percentage | |
| Principal | | | | | | | | of Net | |
| Amount† | | | | | Value | | | Assets | |
| COLLATERALIZED MORTGAGE OBLIGATIONS: (continued) | | | | | |
| 14,310,082 (3)(4) | | | Ginnie Mae 2021-77 SK, 0.286%, (-1.000*TSFR1M +3.186%), 05/20/2051 | | $ | 193,399 | | | | 0.0 | |
| 108,654 (3) | | | Ginnie Mae 2021-H09 Z, 3.083%, 10/20/2066 | | | 99,828 | | | | 0.0 | |
| 11,256,273 | | | Ginnie Mae 2022-205 ZG, 5.500%, 12/20/2052 | | | 11,134,917 | | | | 0.9 | |
| 2,346,452 | | | Ginnie Mae 2022-47 EB, 3.000%, 03/20/2037 | | | 1,915,840 | | | | 0.2 | |
| 15,000,000 (3) | | | Ginnie Mae 2024-43 F, 6.269%, (SOFR30A + 0.950%), 03/20/2054 | | | 14,982,422 | | | | 1.2 | |
| 5,476,060 | | | Seasoned Credit Risk Transfer Trust Series 2017-2 MA, 3.000%, 08/25/2056 | | | 5,026,457 | | | | 0.4 | |
| 1,402,207 (3) | | | Seasoned Credit Risk Transfer Trust Series 2018-2 HA, 3.000%, 11/25/2057 | | | 1,282,260 | | | | 0.1 | |
| 3,901,396 | | | Seasoned Credit Risk Transfer Trust Series 2019-1 M55D, 4.000%, 07/25/2058 | | | 3,625,080 | | | | 0.3 | |
| 1,661,879 | | | Seasoned Credit Risk Transfer Trust Series 2019-3 M55D, 4.000%, 10/25/2058 | | | 1,539,057 | | | | 0.1 | |
| 7,835,000 | | | Seasoned Loans Structured Transaction Series 2019-1 A2, 3.500%, 05/25/2029 | | | 7,327,832 | | | | 0.6 | |
| 3,073,798 | | | Seasoned Loans Structured Transaction Trust Series 2019-2 A1C, 2.750%, 09/25/2029 | | | 2,825,968 | | | | 0.2 | |
| 5,875,000 | | | Seasoned Loans Structured Transaction Trust Series 2019-3 A2C, 2.750%, 11/25/2029 | | | 5,240,409 | | | | 0.4 | |
| 1,209,705 | | | Vendee Mortgage Trust 2003-2 Z, 5.000%, 05/15/2033 | | | 1,198,556 | | | | 0.1 | |
| 1,622,699 | | | Vendee Mortgage Trust 2011-2 DZ, 3.750%, 10/15/2041 | | | 1,488,996 | | | | 0.1 | |
| 20,870,234 (3)(4) | | | Vendee Mortgage Trust 2011-2 IO, 0.353%, 10/15/2041 | | | 292,627 | | | | 0.0 | |
| | | | Total Collateralized Mortgage Obligations
(Cost $602,256,851) | | | 542,452,449 | | | | 42.8 | |
| | | | | | | | | Percentage | |
| Principal | | | | | | | | of Net | |
| Amount† | | | | | Value | | | Assets | |
| COMMERCIAL MORTGAGE-BACKED SECURITIES: 3.0% | | | | | |
| 8,765,181 (3)(4) | | | Freddie Mac Multifamily Structured Pass Through Certificates K106 X1, 1.318%, 01/25/2030 | | $ | 547,053 | | | | 0.1 | |
| 29,795,282 (3)(4) | | | Freddie Mac Multifamily Structured Pass Through Certificates K108 X1, 1.691%, 03/25/2030 | | | 2,397,610 | | | | 0.2 | |
| 19,348,534 (3)(4) | | | Freddie Mac Multifamily Structured Pass Through Certificates K110 X1, 1.695%, 04/25/2030 | | | 1,509,691 | | | | 0.1 | |
| 2,970,699 (3)(4) | | | Freddie Mac Multifamily Structured Pass Through Certificates K119 X1, 0.928%, 09/25/2030 | | | 138,771 | | | | 0.0 | |
| 16,435,661 (3)(4) | | | Freddie Mac Multifamily Structured Pass Through Certificates K-1516 X1, 1.510%, 05/25/2035 | | | 1,810,169 | | | | 0.2 | |
| 14,659,467 (3)(4) | | | Freddie Mac Multifamily Structured Pass Through Certificates K-1517 X1, 1.323%, 07/25/2035 | | | 1,493,641 | | | | 0.1 | |
| 33,986,520 (3)(4) | | | Freddie Mac Multifamily Structured Pass Through Certificates K-1519 X1, 0.595%, 12/25/2035 | | | 1,524,902 | | | | 0.1 | |
| 24,517,019 (3)(4) | | | Freddie Mac Multifamily Structured Pass Through Certificates K740 X1, 0.741%, 09/25/2027 | | | 529,942 | | | | 0.0 | |
| 31,466,000 (4) | | | Freddie Mac Multifamily Structured Pass Through Certificates KL06 XFX, 1.364%, 12/25/2029 | | | 1,677,120 | | | | 0.1 | |
| 34,469,783 (3)(4) | | | Freddie Mac Multifamily Structured Pass Through Certificates KLU3 X1, 1.934%, 01/25/2031 | | | 3,203,568 | | | | 0.3 | |
| 242,012 (3) | | | Ginnie Mae 2004-23 Z, 5.754%, 03/16/2044 | | | 235,279 | | | | 0.0 | |
| 2,510,738 (3)(4) | | | Ginnie Mae 2006-67 IO, 0.685%, 11/16/2046 | | | 9,580 | | | | 0.0 | |
| 42,786 (3) | | | Ginnie Mae 2007-52 Z, 4.350%, 01/16/2048 | | | 42,640 | | | | 0.0 | |
| 463,974 | | | Ginnie Mae 2008-39 Z, 4.500%, 02/16/2048 | | | 440,065 | | | | 0.0 | |
| 219,269 (3)(4) | | | Ginnie Mae 2008-45 IO, 0.860%, 02/16/2048 | | | 190 | | | | 0.0 | |
| | | | | | | | | | | | |
See Accompanying Notes to Financial Statements
| Voya GNMA Income Fund | PORTFOLIO OF INVESTMENTS |
| as of March 31, 2024 (continued) |
| | |
| | | | | | | | | Percentage | |
| Principal | | | | | | | | of Net | |
| Amount† | | | | | Value | | | Assets | |
| COMMERCIAL MORTGAGE-BACKED SECURITIES: (continued) | | | | | |
| 55,293 (3)(4) | | | Ginnie Mae 2010-123 IA, 2.050%, 10/16/2052 | | $ | 567 | | | | 0.0 | |
| 7,603,236 (3)(4) | | | Ginnie Mae 2011-47 IO, 0.214%, 01/16/2051 | | | 22,323 | | | | 0.0 | |
| 2,007,952 (3) | | | Ginnie Mae 2018-114 Z, 3.100%, 04/16/2060 | | | 1,498,329 | | | | 0.1 | |
| 11,329,108 | | | Ginnie Mae 2018-116 Z, 3.000%, 06/16/2058 | | | 9,176,245 | | | | 0.7 | |
| 2,022,366 | | | Ginnie Mae 2018-169 Z, 3.000%, 04/16/2061 | | | 1,328,048 | | | | 0.1 | |
| 2,011,826 | | | Ginnie Mae 2019-17 Z, 3.000%, 12/16/2060 | | | 1,261,705 | | | | 0.1 | |
| 2,670,404 (3) | | | Ginnie Mae 2019-19 Z, 3.200%, 11/16/2060 | | | 2,083,368 | | | | 0.2 | |
| 3,479,636 | | | Ginnie Mae 2019-53 Z, 3.000%, 06/16/2061 | | | 2,465,055 | | | | 0.2 | |
| 5,253,976 | | | Ginnie Mae 2021-79 Z, 1.750%, 08/16/2063 | | | 2,171,965 | | | | 0.2 | |
| 2,608,471 | | | Ginnie Mae 2021-80 Z, 1.500%, 12/16/2062 | | | 1,077,611 | | | | 0.1 | |
| 2,333,712 | | | Ginnie Mae 2021-90 B, 1.750%, 05/16/2061 | | | 1,040,592 | | | | 0.1 | |
| | | | Total Commercial Mortgage-Backed Securities
(Cost $51,061,006) | | | 37,686,029 | | | | 3.0 | |
| | | | | | | | | |
| ASSET-BACKED SECURITIES: 0.1% | | | | | | | | |
| | | | Other Asset-Backed Securities: 0.1% | | | | | |
| 904,679 (3) | | | Fannie Mae Grantor Trust 2001-T9 A1, 5.554%, (TSFR1M + 0.224%), 09/25/2031 | | | 896,659 | | | | 0.1 | |
| 96,360 (3) | | | Fannie Mae Grantor Trust 2003-T4 2A6, 4.447%, 07/26/2033 | | | 94,028 | | | | 0.0 | |
| 4,512 (3) | | | Fannie Mae REMIC Trust 2001-W4 AF6, 5.110%, 01/25/2032 | | | 4,459 | | | | 0.0 | |
| 5,277 (3) | | | Fannie Mae REMIC Trust 2002-W12 AF6, 5.066%, 02/25/2033 | | | 4,940 | | | | 0.0 | |
| 4,145 (3) | | | Fannie Mae REMIC Trust 2002-W2 AF6, 6.000%, 05/25/2032 | | | 4,036 | | | | 0.0 | |
| | | | | | | 1,004,122 | | | | 0.1 | |
| | | | Total Asset-Backed Securities
(Cost $1,007,173) | | | 1,004,122 | | | | 0.1 | |
| | | | Total Long-Term Investments
(Cost $1,685,794,567) | | | 1,562,869,099 | | | | 123.4 | |
| | | | | | | | | Percentage | |
| Principal | | | | | | | | of Net | |
| Amount† | | | | | Value | | | Assets | |
| SHORT-TERM INVESTMENTS: 2.7% | | | | |
| | | | U.S. Treasury Obligations: 2.2% | | | | | |
| 25,775,000 (6) | | | United States Treasury Bill, 5.030%, 04/16/2024 | | $ | 25,718,462 | | | | 2.0 | |
| 2,725,000 (6) | | | United States Treasury Bill, 5.280%, 05/28/2024 | | | 2,702,373 | | | | 0.2 | |
| | | | Total U.S. Treasury Obligations | | | | | | | | |
| | | | (Cost $28,420,596) | | | 28,420,835 | | | | 2.2 | |
| | | | | | | | | | | | |
| | | | U.S. Government Agency Obligations: 0.5% | | | | | |
| 6,190,000 | | | Federal Home Loan Banks, 5.300%, 04/19/2024 | | | 6,189,791 | | | | 0.5 | |
| | | | Total Short-Term Investments | | | | | | | | |
| | | | (Cost $34,610,449) | | | 34,610,626 | | | | 2.7 | |
| | | | Total Investments in Securities
(Cost $1,720,405,016) | | $ | 1,597,479,725 | | | | 126.1 | |
| | | | Liabilities in Excess of Other Assets | | | (330,685,742 | ) | | | (26.1 | ) |
| | | | Net Assets | | $ | 1,266,793,983 | | | | 100.0 | |
| † | Unless otherwise indicated, principal amount is shown in USD. |
| (1) | The Federal Housing Finance Agency (“FHFA”) placed the Federal Home Loan Mortgage Corporation and Federal National Mortgage Association into conservatorship with FHFA as the conservator. As such, the FHFA oversees the continuing affairs of these companies. |
| (2) | Represents or includes a TBA transaction. |
| (3) | Variable rate security. Rate shown is the rate in effect as of March 31, 2024. |
| (4) | Interest only securities represent the right to receive the monthly interest payments on an underlying pool of mortgage loans. Principal amount shown represents the notional amount on which current interest is calculated. Payments of principal on the pool reduce the value of the interest only security. |
| (5) | Principal only securities represent the right to receive the monthly principal payments on an underlying pool of mortgage loans. No payments of interest on the pool are passed through the principal only security. |
| (6) | Represents a zero coupon bond. Rate shown reflects the effective yield as of March 31, 2024. |
Reference Rate Abbreviations:
| H15T1Y | U.S. Treasury 1-Year Constant Maturity |
| SOFR30A | 30-day Secured Overnight Financing Rate |
| TSFR1M | 1-month CME Term Secured Overnight Financing Rate |
See Accompanying Notes to Financial Statements
| Voya GNMA Income Fund | PORTFOLIO OF INVESTMENTS |
| as of March 31, 2024 (continued) |
| | |
Fair Value Measurements^
The following is a summary of the fair valuations according to the inputs used as of March 31, 2024 in valuing the assets and liabilities:
| | | Quoted Prices | | | | | | | | | | |
| | | in Active Markets | | | Significant Other | | | Significant | | | | |
| | | for Identical | | | Observable | | | Unobservable | | | Fair Value | |
| | | Investments | | | Inputs | | | Inputs | | | at | |
| | | (Level 1) | | | (Level 2) | | | (Level 3) | | | March 31, 2024 | |
| Asset Table | | | | | | | | | | | | | | | | |
| Investments, at fair value | | | | | | | | | | | | | | | | |
| U.S. Government Agency Obligations | | $ | — | | | $ | 981,726,499 | | | $ | — | | | $ | 981,726,499 | |
| Collateralized Mortgage Obligations | | | — | | | | 542,452,449 | | | | — | | | | 542,452,449 | |
| Commercial Mortgage-Backed Securities | | | — | | | | 37,686,029 | | | | — | | | | 37,686,029 | |
| Asset-Backed Securities | | | — | | | | 1,004,122 | | | | — | | | | 1,004,122 | |
| Short-Term Investments | | | — | | | | 34,610,626 | | | | — | | | | 34,610,626 | |
| Total Investments, at fair value | | $ | — | | | $ | 1,597,479,725 | | | $ | — | | | $ | 1,597,479,725 | |
| Other Financial Instruments+ | | | | | | | | | | | | | | | | |
| Futures | | | 152,602 | | | | — | | | | — | | | | 152,602 | |
| Total Assets | | $ | 152,602 | | | $ | 1,597,479,725 | | | $ | — | | | $ | 1,597,632,327 | |
| Liabilities Table | | | | | | | | | | | | | | | | |
| Other Financial Instruments+ | | | | | | | | | | | | | | | | |
| Futures | | $ | (700,389 | ) | | $ | — | | | $ | — | | | $ | (700,389 | ) |
| Sales Commitments | | | — | | | | (28,502,201 | ) | | $ | — | | | | (28,502,201 | ) |
| Total Liabilities | | $ | (700,389 | ) | | $ | (28,502,201 | ) | | $ | — | | | $ | (29,202,590 | ) |
| ^ | See Note 2, “Significant Accounting Policies” in the Notes to Financial Statements for additional information. |
| + | Other Financial Instruments may include open forward foreign currency contracts, futures, centrally cleared swaps, OTC swaps and written options. Forward foreign currency contracts, futures and centrally cleared swaps are fair valued at the unrealized appreciation (depreciation) on the instrument. OTC swaps and written options are valued at the fair value of the instrument. |
At March 31, 2024, the following futures contracts were outstanding for Voya GNMA Income Fund:
| | | | | | | | | | | | Unrealized | |
| | | Number | | | Expiration | | | Notional | | | Appreciation/ | |
| Description | | of Contracts | | | Date | | | Amount | | | (Depreciation) | |
| Short Contracts: | | | | | | | | | | | | | | | | |
| U.S. Treasury 2-Year Note | | | (77) | | | | 06/28/24 | | | $ | (15,745,297 | ) | | $ | 17,297 | |
| U.S. Treasury 5-Year Note | | | (1,031) | | | | 06/28/24 | | | | (110,333,109 | ) | | | (199,362 | ) |
| U.S. Treasury 10-Year Note | | | (396) | | | | 06/18/24 | | | | (43,875,563 | ) | | | 135,305 | |
| U.S. Treasury Long Bond | | | (222) | | | | 06/18/24 | | | | (26,737,125 | ) | | | (409,787 | ) |
| U.S. Treasury Ultra 10-Year Note | | | (141) | | | | 06/18/24 | | | | (16,159,922 | ) | | | (74,097 | ) |
| U.S. Treasury Ultra Long Bond | | | (8) | | | | 06/18/24 | | | | (1,032,000 | ) | | | (17,143 | ) |
| | | | | | | | | | | $ | (213,883,016 | ) | | $ | (547,787 | ) |
The following sales commitments were held by the Voya GNMA Income Fund at March 31, 2024:
| | | | | | Contractual | | | |
| Principal Amount | | | Description | | Settlement Date | | Fair Value | |
| $ | (6,500,000) | | | Ginnie Mae, 5.000%, due 04/20/54 | | 04/18/24 | | $ | (6,345,117 | ) |
| | (5,000,000) | | | Uniform Mortgage-Backed Securities, 3.000%, due 05/01/54 | | 05/13/24 | | | (4,250,322 | ) |
| | (5,100,000) | | | Uniform Mortgage-Backed Securities, 3.500%, due 05/15/54 | | 05/13/24 | | | (4,583,426 | ) |
| | (13,448,000) | | | Uniform Mortgage-Backed Securities, 5.500%, due 04/01/54 | | 04/11/24 | | | (13,323,336 | ) |
| | | | | Total Sales Commitments | | | | | | |
| | | | | Proceeds receivable $(28,626,897) | | | | $ | (28,502,201 | ) |
See Accompanying Notes to Financial Statements
| Voya GNMA Income Fund | PORTFOLIO OF INVESTMENTS |
| as of March 31, 2024 (continued) |
| | |
A summary of derivative instruments by primary risk exposure is outlined in the following tables.
The fair value of derivative instruments as of March 31, 2024 was as follows:
| Derivatives not accounted for as hedging instruments | | Location on Statement
of Assets and Liabilities | | Fair Value | |
| Asset Derivatives | | | | | | |
| Interest rate contracts | | Variation margin receivable on futures contracts* | | $ | 152,602 | |
| Total Asset Derivatives | | | | $ | 152,602 | |
| | | | | | | |
| Liability Derivatives | | | | | | |
| Interest rate contracts | | Variation margin payable on futures contracts* | | $ | 700,389 | |
| Total Liability Derivatives | | | | $ | 700,389 | |
| * | The fair value presented above represents the cumulative unrealized appreciation (depreciation) on futures contracts as reported in the tables within the Portfolio of Investments. In the Statement of Assets and Liabilities, only current day’s unsettled variation margin is reported in receivables or payables on futures contracts and the net cumulative unrealized appreciation (depreciation) is included in total distributable earnings (loss). |
The effect of derivative instruments on the Fund's Statement of Operations for the year ended March 31, 2024 was as follows:
Amount of Realized Gain or (Loss) on Derivatives Recognized in Income
| Derivatives not accounted for as hedging instruments | | Futures | |
| Interest rate contracts | | $ | 8,020,769 | |
| | | | | |
| Total | | $ | 8,020,769 | |
Change in Unrealized Appreciation or (Depreciation) on Derivatives Recognized in Income
| Derivatives not accounted for as hedging instruments | | Futures | |
| Interest rate contracts | | $ | 1,567,240 | |
| | | | |
| Total | | $ | 1,567,240 | |
At March 31, 2024, the aggregate cost of securities and other investments and the composition of unrealized appreciation and depreciation of securities and other investments on a tax basis were:
| Cost for federal income tax purposes was $1,723,492,832. | | | |
| Net unrealized depreciation consisted of: | | | |
| Gross Unrealized Appreciation | | $ | 6,039,625 | |
| Gross Unrealized Depreciation | | | (132,475,823 | ) |
| Net Unrealized Depreciation | | $ | (126,436,198 | ) |
See Accompanying Notes to Financial Statements
| Voya High Yield Bond Fund | PORTFOLIO OF INVESTMENTS |
| as of March 31, 2024 |
| | |
| | | | | | | | Percentage | |
| Principal | | | | | | | of Net | |
| Amount† | | | | Value | | | Assets | |
| CORPORATE BONDS/NOTES: 93.6% | |
| | | Basic Materials: 6.5% | | | | | | | |
| 1,125,000 (1) | | Arsenal AIC Parent LLC, 8.000%, 10/01/2030 | | $ | 1,182,527 | | | 0.2 | |
| 1,375,000 | | ATI, Inc., 7.250%, 08/15/2030 | | | 1,422,778 | | | 0.3 | |
| 1,150,000 (1) | | Axalta Coating Systems Dutch Holding B BV, 7.250%, 02/15/2031 | | | 1,197,677 | | | 0.2 | |
| 450,000 (1) | | Axalta Coating Systems LLC, 3.375%, 02/15/2029 | | | 403,097 | | | 0.1 | |
| 1,500,000 (1) | | Cleveland-Cliffs, Inc., 4.625%, 03/01/2029 | | | 1,399,970 | | | 0.3 | |
| 600,000 (1) | | Cleveland-Cliffs, Inc., 4.875%, 03/01/2031 | | | 546,229 | | | 0.1 | |
| 1,400,000 (1)(2) | | Coeur Mining, Inc., 5.125%, 02/15/2029 | | | 1,331,557 | | | 0.3 | |
| 1,720,000 (1) | | Constellium SE, 5.625%, 06/15/2028 | | | 1,674,092 | | | 0.3 | |
| 1,350,000 (1) | | First Quantum Minerals Ltd., 6.875%, 10/15/2027 | | | 1,290,600 | | | 0.3 | |
| 1,750,000 (1) | | Hudbay Minerals, Inc., 4.500%, 04/01/2026 | | | 1,696,822 | | | 0.4 | |
| 1,475,000 (1) | | Illuminate Buyer LLC / Illuminate Holdings IV, Inc., 9.000%, 07/01/2028 | | | 1,456,877 | | | 0.3 | |
| 1,350,000 (1) | | INEOS Quattro Finance 2 PLC, 3.375%, 01/15/2026 | | | 1,289,482 | | | 0.3 | |
| 1,575,000 (1)(3) | | Iris Holdings, Inc., 8.750% (PIK Rate 9.500%, Cash Rate 8.750%), 02/15/2026 | | | 1,354,500 | | | 0.3 | |
| 860,000 (1) | | LSF11 A5 HoldCo LLC, 6.625%, 10/15/2029 | | | 775,861 | | | 0.2 | |
| 1,625,000 (1) | | Mativ Holdings, Inc., 6.875%, 10/01/2026 | | | 1,618,862 | | | 0.3 | |
| 1,075,000 (1) | | NOVA Chemicals Corp., 8.500%, 11/15/2028 | | | 1,145,540 | | | 0.2 | |
| 425,000 (1) | | Novelis Corp., 3.250%, 11/15/2026 | | | 396,446 | | | 0.1 | |
| 1,200,000 (1) | | Novelis Corp., 3.875%, 08/15/2031 | | | 1,032,049 | | | 0.2 | |
| 425,000 (1) | | Novelis Corp., 4.750%, 01/30/2030 | | | 392,470 | | | 0.1 | |
| 1,400,000 (1) (2) | | Nufarm Australia Ltd. / Nufarm Americas, Inc., 5.000%, 01/27/2030 | | | 1,285,523 | | | 0.3 | |
| 550,000 (1) (2) | | Olympus Water US Holding Corp., 4.250%, 10/01/2028 | | | 499,600 | | | 0.1 | |
| 775,000 (1) | | Olympus Water US Holding Corp., 6.250%, 10/01/2029 | | | 710,153 | | | 0.1 | |
| 800,000 (1)(2) | | Olympus Water US Holding Corp., 7.125%, 10/01/2027 | | | 808,881 | | | 0.2 | |
| | | | | | | | Percentage | |
| Principal | | | | | | | of Net | |
| Amount† | | | | Value | | | Assets | |
| CORPORATE BONDS/NOTES: (continued) | |
| | | Basic Materials: (continued) | | | | | | | |
| 1,575,000 (1) | | SPCM SA, 3.125%, 03/15/2027 | | $ | 1,458,890 | | | 0.3 | |
| 1,575,000 (1) | | Taseko Mines Ltd., 7.000%, 02/15/2026 | | | 1,583,066 | | | 0.3 | |
| 1,500,000 (1) | | Trinseo Materials Operating SCA / Trinseo Materials Finance, Inc., 5.125%, 04/01/2029 | | | 436,665 | | | 0.1 | |
| 1,400,000 (1)(2) | | Tronox, Inc., 4.625%, 03/15/2029 | | | 1,257,460 | | | 0.3 | |
| 1,650,000 (1) | | WR Grace Holdings LLC, 5.625%, 08/15/2029 | | | 1,478,284 | | | 0.3 | |
| | | | | | 31,125,958 | | | 6.5 | |
| | | | | | | | | | |
| | | Communications: 12.0% | | | | | | | |
| 2,100,000 (1) | | Altice Financing SA, 5.750%, 08/15/2029 | | | 1,684,665 | | | 0.4 | |
| 2,625,000 (1) | | Altice France SA/ France, 5.500%, 10/15/2029 | | | 1,784,444 | | | 0.4 | |
| 1,000,000 (1) | | Altice France SA/ France, 8.125%, 02/01/2027 | | | 782,538 | | | 0.2 | |
| 1,100,000 (1) | | Beasley Mezzanine Holdings LLC, 8.625%, 02/01/2026 | | | 657,629 | | | 0.1 | |
| 2,250,000 | | CCO Holdings LLC / CCO Holdings Capital Corp., 4.500%, 05/01/2032 | | | 1,809,561 | | | 0.4 | |
| 1,875,000 (1) | | CCO Holdings LLC / CCO Holdings Capital Corp., 5.000%, 02/01/2028 | | | 1,746,675 | | | 0.4 | |
| 1,825,000 (1) | | CCO Holdings LLC / CCO Holdings Capital Corp., 5.125%, 05/01/2027 | | | 1,740,003 | | | 0.4 | |
| 675,000 (1) | | CCO Holdings LLC / CCO Holdings Capital Corp., 5.500%, 05/01/2026 | | | 665,119 | | | 0.1 | |
| 1,425,000 (1) | | Connect Finco Sarl / Connect US Finco LLC, 6.750%, 10/01/2026 | | | 1,397,861 | | | 0.3 | |
| 4,025,000 (1) | | CSC Holdings LLC, 5.750%, 01/15/2030 | | | 2,133,927 | | | 0.4 | |
| 2,200,000 (1) | | CSC Holdings LLC, 11.250%, 05/15/2028 | | | 2,181,967 | | | 0.5 | |
| 1,975,000 (1) | | Directv Financing LLC / Directv Financing Co- Obligor, Inc., 5.875%, 08/15/2027 | | | 1,869,656 | | | 0.4 | |
| 1,950,000 | | DISH DBS Corp., 5.125%, 06/01/2029 | | | 814,951 | | | 0.2 | |
| 1,040,000 (1) | | DISH DBS Corp., 5.750%, 12/01/2028 | | | 716,695 | | | 0.1 | |
| 925,000 | | DISH DBS Corp., 7.375%, 07/01/2028 | | | 446,115 | | | 0.1 | |
See Accompanying Notes to Financial Statements
| Voya High Yield Bond Fund | PORTFOLIO OF INVESTMENTS |
| as of March 31, 2024 (continued) |
| | |
| | | | | | | | Percentage | |
| Principal | | | | | | | of Net | |
| Amount† | | | | Value | | | Assets | |
| CORPORATE BONDS/NOTES: (continued) | |
| | | Communications: (continued) | | | | | | | |
| 2,350,000 (1) | | DISH Network Corp., 11.750%, 11/15/2027 | | $ | 2,401,491 | | | 0.5 | |
| 1,375,000 (1) | | GCI LLC, 4.750%, 10/15/2028 | | | 1,262,003 | | | 0.3 | |
| 2,250,000 (1) (2) | | Gray Escrow II, Inc., 5.375%, 11/15/2031 | | | 1,477,517 | | | 0.3 | |
| 1,275,000 (1) (2) | | Gray Television, Inc., 7.000%, 05/15/2027 | | | 1,186,836 | | | 0.2 | |
| 2,465,000 (1) | | Level 3 Financing, Inc., 3.750%, 07/15/2029 | | | 1,109,250 | | | 0.2 | |
| 1,400,000 (1) | | Level 3 Financing, Inc., 10.500%, 05/15/2030 | | | 1,438,500 | | | 0.3 | |
| 2,150,000 (1) | | Match Group Holdings II LLC, 4.625%, 06/01/2028 | | | 2,030,520 | | | 0.4 | |
| 1,435,000 (1) | | McGraw-Hill Education, Inc., 8.000%, 08/01/2029 | | | 1,350,175 | | | 0.3 | |
| 975,000 (4) | | Paramount Global, 6.250%, 02/28/2057 | | | 858,284 | | | 0.2 | |
| 2,875,000 (1) | | Scripps Escrow, Inc., 5.875%, 07/15/2027 | | | 2,408,055 | | | 0.5 | |
| 1,525,000 (1) | | Sinclair Television Group, Inc., 4.125%, 12/01/2030 | | | 1,112,000 | | | 0.2 | |
| 670,000 (1) | | Sirius XM Radio, Inc., 3.125%, 09/01/2026 | | | 628,141 | | | 0.1 | |
| 3,875,000 (1) | | Sirius XM Radio, Inc., 5.000%, 08/01/2027 | | | 3,730,628 | | | 0.8 | |
| 1,475,000 (1) (2) | | Stagwell Global LLC, 5.625%, 08/15/2029 | | | 1,340,675 | | | 0.3 | |
| 875,000 | | Telecom Italia Capital SA, 6.000%, 09/30/2034 | | | 800,939 | | | 0.2 | |
| 975,000 | | Telecom Italia Capital SA, 6.375%, 11/15/2033 | | | 923,144 | | | 0.2 | |
| 400,000 (1) | | Telecom Italia SpA/ Milano, 5.303%, 05/30/2024 | | | 398,098 | | | 0.1 | |
| 800,000 (1) | | Uber Technologies, Inc., 4.500%, 08/15/2029 | | | 760,554 | | | 0.2 | |
| 1,450,000 (1) | | Uber Technologies, Inc., 8.000%, 11/01/2026 | | | 1,468,457 | | | 0.3 | |
| 575,000 (1)(2) | | Univision Communications, Inc., 4.500%, 05/01/2029 | | | 514,357 | | | 0.1 | |
| 2,185,000 (1) | | Univision Communications, Inc., 6.625%, 06/01/2027 | | | 2,138,940 | | | 0.4 | |
| 800,000 (1)(2) | | Univision Communications, Inc., 8.000%, 08/15/2028 | | | 815,537 | | | 0.2 | |
| 1,100,000 (1)(2) | | Viasat, Inc., 6.500%, 07/15/2028 | | | 850,486 | | | 0.2 | |
| 875,000 (1)(2) | | Viasat, Inc., 7.500%, 05/30/2031 | | | 635,108 | | | 0.1 | |
| 1,250,000 (1) | | Viavi Solutions, Inc., 3.750%, 10/01/2029 | | | 1,073,745 | | | 0.2 | |
| | | | | | | | Percentage | |
| Principal | | | | | | | of Net | |
| Amount† | | | | Value | | | Assets | |
| CORPORATE BONDS/NOTES: (continued) | |
| | | Communications: (continued) | | | | | | | |
| 2,575,000 (1) | | Virgin Media Vendor Financing Notes IV DAC, 5.000%, 07/15/2028 | | $ | 2,364,818 | | | 0.5 | |
| 1,750,000 (1) | | Vmed O2 UK Financing I PLC, 4.750%, 07/15/2031 | | | 1,510,004 | | | 0.3 | |
| | | | | | 57,020,068 | | | 12.0 | |
| | | | | | | | | | |
| | | Consumer, Cyclical: 19.7% | | | | | | | |
| 825,000 (1) (2) | | 1011778 BC ULC / New Red Finance, Inc., 3.500%, 02/15/2029 | | | 754,171 | | | 0.2 | |
| 1,775,000 (1) | | 1011778 BC ULC / New Red Finance, Inc., 4.000%, 10/15/2030 | | | 1,582,806 | | | 0.3 | |
| 1,400,000 (1) | | Adient Global Holdings Ltd., 4.875%, 08/15/2026 | | | 1,365,884 | | | 0.3 | |
| 725,000 (1) (2) | | Adient Global Holdings Ltd., 8.250%, 04/15/2031 | | | 765,628 | | | 0.2 | |
| 575,000 (1) | | Allison Transmission, Inc., 3.750%, 01/30/2031 | | | 502,237 | | | 0.1 | |
| 1,325,000 (1) | | Allison Transmission, Inc., 5.875%, 06/01/2029 | | | 1,313,099 | | | 0.3 | |
| 1,125,000 (1)(2) | | Amer Sports Co., 6.750%, 02/16/2031 | | | 1,122,187 | | | 0.2 | |
| 1,450,000 (1)(2) | | American Airlines, Inc., 7.250%, 02/15/2028 | | | 1,473,670 | | | 0.3 | |
| 555,000 (1) | | American Airlines, Inc./ AAdvantage Loyalty IP Ltd., 5.500%, 04/20/2026 | | | 551,567 | | | 0.1 | |
| 1,200,000 (1) | | Arko Corp., 5.125%, 11/15/2029 | | | 994,492 | | | 0.2 | |
| 1,175,000 | | Asbury Automotive Group, Inc., 4.500%, 03/01/2028 | | | 1,119,793 | | | 0.2 | |
| 1,000,000 | | Asbury Automotive Group, Inc., 4.750%, 03/01/2030 | | | 921,883 | | | 0.2 | |
| 1,425,000 (1) | | Ashton Woods USA LLC / Ashton Woods Finance Co., 4.625%, 08/01/2029 | | | 1,315,949 | | | 0.3 | |
| 1,450,000 (1) | | Banijay Entertainment SASU, 8.125%, 05/01/2029 | | | 1,496,675 | | | 0.3 | |
| 1,450,000 | | Bath & Body Works, Inc., 6.750%, 07/01/2036 | | | 1,465,676 | | | 0.3 | |
| 345,000 (1) | | Bath & Body Works, Inc., 9.375%, 07/01/2025 | | | 360,243 | | | 0.1 | |
| 1,075,000 (1) | | Brinker International, Inc., 5.000%, 10/01/2024 | | | 1,067,545 | | | 0.2 | |
See Accompanying Notes to Financial Statements
| Voya High Yield Bond Fund | PORTFOLIO OF INVESTMENTS |
| as of March 31, 2024 (continued) |
| | |
| | | | | | | | Percentage | |
| Principal | | | | | | | of Net | |
| Amount† | | | | Value | | | Assets | |
| CORPORATE BONDS/NOTES: (continued) | |
| | | Consumer, Cyclical: (continued) | | | | | | | |
| 1,850,000 (1)(2) | | Caesars Entertainment, Inc., 4.625%, 10/15/2029 | | $ | 1,688,441 | | | 0.3 | |
| 1,325,000 (1) | | Caesars Entertainment, Inc., 7.000%, 02/15/2030 | | | 1,360,921 | | | 0.3 | |
| 1,125,000 (1) | | Carnival Corp., 4.000%, 08/01/2028 | | | 1,046,250 | | | 0.2 | |
| 2,375,000 (1)(2) | | Carnival Corp., 6.000%, 05/01/2029 | | | 2,344,920 | | | 0.5 | |
| 1,625,000 (1) | | CCM Merger, Inc., 6.375%, 05/01/2026 | | | 1,624,883 | | | 0.3 | |
| 600,000 (2) | | Delta Air Lines, Inc., 7.375%, 01/15/2026 | | | 619,210 | | | 0.1 | |
| 1,125,000 (1) | | Dream Finders Homes, Inc., 8.250%, 08/15/2028 | | | 1,175,445 | | | 0.2 | |
| 1,750,000 | | Ford Motor Credit Co. LLC, 2.700%, 08/10/2026 | | | 1,631,816 | | | 0.3 | |
| 750,000 | | Ford Motor Credit Co. LLC, 4.542%, 08/01/2026 | | | 728,349 | | | 0.1 | |
| 1,150,000 (1) | | Foundation Building Materials, Inc., 6.000%, 03/01/2029 | | | 1,058,722 | | | 0.2 | |
| 465,000 (1)(2) | | Gap, Inc., 3.625%, 10/01/2029 | | | 407,788 | | | 0.1 | |
| 1,075,000 (1) | | Gap, Inc., 3.875%, 10/01/2031 | | | 910,445 | | | 0.2 | |
| 875,000 (1) | | Golden Entertainment, Inc., 7.625%, 04/15/2026 | | | 875,648 | | | 0.2 | |
| 1,475,000 (1) | | Hilton Domestic Operating Co., Inc., 4.000%, 05/01/2031 | | | 1,319,744 | | | 0.3 | |
| 1,375,000 (1) | | Installed Building Products, Inc., 5.750%, 02/01/2028 | | | 1,343,439 | | | 0.3 | |
| 1,550,000 (1) | | Interface, Inc., 5.500%, 12/01/2028 | | | 1,478,954 | | | 0.3 | |
| 425,000 (1) | | International Game Technology PLC, 4.125%, 04/15/2026 | | | 412,263 | | | 0.1 | |
| 2,000,000 (1) | | International Game Technology PLC, 5.250%, 01/15/2029 | | | 1,934,005 | | | 0.4 | |
| 2,050,000 (1) | | LCM Investments Holdings II LLC, 4.875%, 05/01/2029 | | | 1,886,314 | | | 0.4 | |
| 1,300,000 (1) | | Lithia Motors, Inc., 4.375%, 01/15/2031 | | | 1,165,569 | | | 0.2 | |
| 375,000 | | M/I Homes, Inc., 3.950%, 02/15/2030 | | | 337,522 | | | 0.1 | |
| 1,100,000 | | M/I Homes, Inc., 4.950%, 02/01/2028 | | | 1,050,169 | | | 0.2 | |
| 650,000 | | Macy's Retail Holdings LLC, 4.500%, 12/15/2034 | | | 572,890 | | | 0.1 | |
| | | | | | | | Percentage | |
| Principal | | | | | | | of Net | |
| Amount† | | | | Value | | | Assets | |
| CORPORATE BONDS/NOTES: (continued) | |
| | | Consumer, Cyclical: (continued) | | | | | | | |
| 950,000 (1) | | Macy's Retail Holdings LLC, 6.125%, 03/15/2032 | | $ | 921,805 | | | 0.2 | |
| 850,000 (1) (2) | | Melco Resorts Finance Ltd., 5.250%, 04/26/2026 | | | 820,781 | | | 0.2 | |
| 1,475,000 (1) (2) | | Melco Resorts Finance Ltd., 5.375%, 12/04/2029 | | | 1,347,796 | | | 0.3 | |
| 850,000 | | MGM Resorts International, 4.625%, 09/01/2026 | | | 832,112 | | | 0.2 | |
| 840,000 (2) | | MGM Resorts International, 4.750%, 10/15/2028 | | | 799,731 | | | 0.2 | |
| 400,000 | | MGM Resorts International, 6.500%, 04/15/2032 | | | 399,006 | | | 0.1 | |
| 2,475,000 (1) (2) | | Michaels Cos., Inc., 5.250%, 05/01/2028 | | | 2,111,149 | | | 0.4 | |
| 1,400,000 | | Murphy Oil USA, Inc., 4.750%, 09/15/2029 | | | 1,328,891 | | | 0.3 | |
| 460,000 | | Murphy Oil USA, Inc., 5.625%, 05/01/2027 | | | 456,070 | | | 0.1 | |
| 400,000 (1) | | NCL Corp. Ltd., 7.750%, 02/15/2029 | | | 415,678 | | | 0.1 | |
| 200,000 (1) | | NCL Corp. Ltd., 8.375%, 02/01/2028 | | | 211,409 | | | 0.0 | |
| 750,000 (1) | | NCL Finance Ltd., 6.125%, 03/15/2028 | | | 741,290 | | | 0.2 | |
| 1,500,000 (1) | | Raising Cane's Restaurants LLC, 9.375%, 05/01/2029 | | | 1,622,985 | | | 0.3 | |
| 1,100,000 (1) | | Ritchie Bros Holdings, Inc., 7.750%, 03/15/2031 | | | 1,152,242 | | | 0.2 | |
| 4,175,000 (1)(2) | | Royal Caribbean Cruises Ltd., 5.375%, 07/15/2027 | | | 4,118,816 | | | 0.9 | |
| 400,000 (1) | | Royal Caribbean Cruises Ltd., 6.250%, 03/15/2032 | | | 403,438 | | | 0.1 | |
| 1,300,000 | | Sally Holdings LLC / Sally Capital, Inc., 6.750%, 03/01/2032 | | | 1,290,929 | | | 0.3 | |
| 1,750,000 | | Sands China Ltd., 5.125%, 08/08/2025 | | | 1,726,988 | | | 0.4 | |
| 1,400,000 (1)(2) | | Scientific Games Holdings L.P./Scientific Games US FinCo, Inc., 6.625%, 03/01/2030 | | | 1,354,494 | | | 0.3 | |
| 1,725,000 (1) | | Scientific Games International, Inc., 7.000%, 05/15/2028 | | | 1,738,788 | | | 0.4 | |
| 550,000 (1) | | SRS Distribution, Inc., 6.000%, 12/01/2029 | | | 562,423 | | | 0.1 | |
| 1,350,000 (1) | | SRS Distribution, Inc., 6.125%, 07/01/2029 | | | 1,378,108 | | | 0.3 | |
| 2,300,000 (1) | | Staples, Inc., 7.500%, 04/15/2026 | | | 2,246,954 | | | 0.5 | |
See Accompanying Notes to Financial Statements
| Voya High Yield Bond Fund | PORTFOLIO OF INVESTMENTS |
| as of March 31, 2024 (continued) |
| | |
| | | | | | | | Percentage | |
| Principal | | | | | | | of Net | |
| Amount† | | | | Value | | | Assets | |
| CORPORATE BONDS/NOTES: (continued) | |
| | | Consumer, Cyclical: (continued) | | | | | | | |
| 850,000 (1) | | Staples, Inc., 10.750%, 04/15/2027 | | $ | 808,740 | | | 0.2 | |
| 1,975,000 (1) | | Station Casinos LLC, 4.500%, 02/15/2028 | | | 1,861,882 | | | 0.4 | |
| 1,025,000 (1) | | STL Holding Co. LLC, 8.750%, 02/15/2029 | | | 1,052,936 | | | 0.2 | |
| 1,325,000 (1) | | Taylor Morrison Communities, Inc., 5.125%, 08/01/2030 | | | 1,266,654 | | | 0.3 | |
| 1,200,000 (1) | | Tempur Sealy International, Inc., 3.875%, 10/15/2031 | | | 1,020,223 | | | 0.2 | |
| 275,000 (1) | | Tempur Sealy International, Inc., 4.000%, 04/15/2029 | | | 249,814 | | | 0.0 | |
| 1,520,000 | | United Airlines Holdings, Inc., 4.875%, 01/15/2025 | | | 1,508,829 | | | 0.3 | |
| 825,000 (1) | | United Airlines, Inc., 4.375%, 04/15/2026 | | | 798,116 | | | 0.2 | |
| 2,800,000 (1) | | Viking Cruises Ltd., 5.875%, 09/15/2027 | | | 2,749,082 | | | 0.6 | |
| 1,250,000 (1)(2) | | VistaJet Malta Finance PLC / Vista Management Holding, Inc., 6.375%, 02/01/2030 | | | 923,079 | | | 0.2 | |
| 1,450,000 (2) | | Walgreens Boots Alliance, Inc., 4.800%, 11/18/2044 | | | 1,221,289 | | | 0.3 | |
| 1,550,000 (1) | | White Cap Buyer LLC, 6.875%, 10/15/2028 | | | 1,522,113 | | | 0.3 | |
| 1,750,000 (1) | | William Carter Co., 5.625%, 03/15/2027 | | | 1,739,305 | | | 0.4 | |
| 1,725,000 (1) | | Wynn Las Vegas LLC / Wynn Las Vegas Capital Corp., 5.250%, 05/15/2027 | | | 1,690,592 | | | 0.3 | |
| 1,000,000 (1) | | ZF North America Capital, Inc., 4.750%, 04/29/2025 | | | 988,290 | | | 0.2 | |
| 1,300,000 (1) | | ZF North America Capital, Inc., 6.875%, 04/14/2028 | | | 1,349,628 | | | 0.3 | |
| | | | | | 93,879,667 | | | 19.7 | |
| | | | | | | | | | |
| | | Consumer, Non-cyclical: 18.5% | | | | | | | |
| 1,500,000 (1)(2) | | 1375209 BC Ltd., 9.000%, 01/30/2028 | | | 1,471,632 | | | 0.3 | |
| 1,825,000 (1) | | Acadia Healthcare Co., Inc., 5.500%, 07/01/2028 | | | 1,778,557 | | | 0.4 | |
| 1,625,000 (1) (2) | | ADT Security Corp., 4.125%, 08/01/2029 | | | 1,490,298 | | | 0.3 | |
| 1,175,000 (1) | | AHP Health Partners, Inc., 5.750%, 07/15/2029 | | | 1,075,067 | | | 0.2 | |
| | | | | | | | Percentage | |
| Principal | | | | | | | of Net | |
| Amount† | | | | Value | | | Assets | |
| CORPORATE BONDS/NOTES: (continued) | |
| | | Consumer, Non-cyclical: (continued) | | | | | | | |
| 1,075,000 (1) | | Albertsons Cos., Inc. / Safeway, Inc. / New Albertsons L.P. / Albertsons LLC, 3.500%, 03/15/2029 | | $ | 965,887 | | | 0.2 | |
| 675,000 (1) | | Albertsons Cos., Inc. / Safeway, Inc. / New Albertsons L.P. / Albertsons LLC, 4.875%, 02/15/2030 | | | 642,656 | | | 0.1 | |
| 1,225,000 (1) | | Albertsons Cos., Inc. / Safeway, Inc. / New Albertsons L.P. / Albertsons LLC, 5.875%, 02/15/2028 | | | 1,213,652 | | | 0.3 | |
| 1,100,000 (1) | | Allied Universal Holdco LLC/Allied Universal Finance Corp./Atlas Luxco 4 Sarl, 4.625%, 06/01/2028 | | | 1,001,068 | | | 0.2 | |
| 1,700,000 (1)(2) | | Allied Universal Holdco LLC/Allied Universal Finance Corp./Atlas Luxco 4 Sarl, 4.625%, 06/01/2028 | | | 1,554,329 | | | 0.3 | |
| 1,750,000 (1) | | Alta Equipment Group, Inc., 5.625%, 04/15/2026 | | | 1,715,209 | | | 0.4 | |
| 775,000 (1) | | APi Group DE, Inc., 4.125%, 07/15/2029 | | | 699,013 | | | 0.1 | |
| 890,000 (1) | | APi Group DE, Inc., 4.750%, 10/15/2029 | | | 821,124 | | | 0.2 | |
| 1,500,000 (1)(2) | | Avis Budget Car Rental LLC / Avis Budget Finance, Inc., 8.000%, 02/15/2031 | | | 1,498,694 | | | 0.3 | |
| 1,925,000 | | B&G Foods, Inc., 5.250%, 09/15/2027 | | | 1,800,549 | | | 0.4 | |
| 1,625,000 (1) | | Bausch Health Cos., Inc., 4.875%, 06/01/2028 | | | 888,353 | | | 0.2 | |
| 1,225,000 (1) | | Bausch Health Cos., Inc., 6.125%, 02/01/2027 | | | 764,455 | | | 0.2 | |
| 1,425,000 | | Bausch Lomb, 8.563%, 05/05/2027 | | | 1,412,786 | | | 0.3 | |
| 1,645,000 (1) | | BellRing Brands, Inc., 7.000%, 03/15/2030 | | | 1,696,377 | | | 0.4 | |
| 1,900,000 (1) | | Cheplapharm Arzneimittel GmbH, 5.500%, 01/15/2028 | | | 1,812,356 | | | 0.4 | |
| 950,000 (1) | | Chobani LLC / Chobani Finance Corp., Inc., 7.625%, 07/01/2029 | | | 964,250 | | | 0.2 | |
| 975,000 (1) | | CHS/Community Health Systems, Inc., 4.750%, 02/15/2031 | | | 753,336 | | | 0.2 | |
| 1,500,000 (1) | | CHS/Community Health Systems, Inc., 5.250%, 05/15/2030 | | | 1,224,423 | | | 0.3 | |
See Accompanying Notes to Financial Statements
| Voya High Yield Bond Fund | PORTFOLIO OF INVESTMENTS |
| as of March 31, 2024 (continued) |
| | |
| | | | | | | | Percentage | |
| Principal | | | | | | | of Net | |
| Amount† | | | | Value | | | Assets | |
| CORPORATE BONDS/NOTES: (continued) | |
| | | Consumer, Non-cyclical: (continued) | | | | | | | |
| 1,300,000 (1) | | CHS/Community Health Systems, Inc., 5.625%, 03/15/2027 | | $ | 1,197,898 | | | 0.3 | |
| 1,550,000 | | Cimpress PLC, 7.000%, 06/15/2026 | | | 1,552,635 | | | 0.3 | |
| 1,650,000 (1) | | CPI CG, Inc., 8.625%, 03/15/2026 | | | 1,645,358 | | | 0.3 | |
| 525,000 (1) | | DaVita, Inc., 3.750%, 02/15/2031 | | | 440,014 | | | 0.1 | |
| 2,225,000 (1) | | DaVita, Inc., 4.625%, 06/01/2030 | | | 1,993,475 | | | 0.4 | |
| 2,050,000 | | Encompass Health Corp., 4.750%, 02/01/2030 | | | 1,922,147 | | | 0.4 | |
| 1,575,000 (1)(2) | | Fiesta Purchaser, Inc., 7.875%, 03/01/2031 | | | 1,627,715 | | | 0.3 | |
| 715,000 (1) | | Garda World Security Corp., 6.000%, 06/01/2029 | | | 640,815 | | | 0.1 | |
| 1,425,000 (1) | | Graham Holdings Co., 5.750%, 06/01/2026 | | | 1,412,200 | | | 0.3 | |
| 702,000 (1) | | IQVIA, Inc., 5.000%, 10/15/2026 | | | 687,446 | | | 0.1 | |
| 800,000 (1) | | IQVIA, Inc., 6.500%, 05/15/2030 | | | 817,412 | | | 0.2 | |
| 1,970,000 (1) | | Jazz Securities DAC, 4.375%, 01/15/2029 | | | 1,836,666 | | | 0.4 | |
| 1,660,000 (1) | | Legends Hospitality Holding Co LLC / Legends Hospitality Co-Issuer, Inc., 5.000%, 02/01/2026 | | | 1,645,593 | | | 0.3 | |
| 1,700,000 (1) | | Medline Borrower L.P., 3.875%, 04/01/2029 | | | 1,548,465 | | | 0.3 | |
| 1,500,000 (1) | | Medline Borrower L.P., 5.250%, 10/01/2029 | | | 1,418,900 | | | 0.3 | |
| 1,150,000 (1)(2) | | ModivCare, Inc., 5.875%, 11/15/2025 | | | 1,120,994 | | | 0.2 | |
| 775,000 (1) | | MPH Acquisition Holdings LLC, 5.750%, 11/01/2028 | | | 611,992 | | | 0.1 | |
| 1,575,000 (1) | | NESCO Holdings II, Inc., 5.500%, 04/15/2029 | | | 1,491,867 | | | 0.3 | |
| 811,000 | | New Albertsons L.P., 7.450%, 08/01/2029 | | | 849,573 | | | 0.2 | |
| 2,250,000 (1)(2) | | Organon & Co / Organon Foreign Debt Co-Issuer BV, 5.125%, 04/30/2031 | | | 2,002,134 | | | 0.4 | |
| 1,550,000 (1)(2) | | Owens & Minor, Inc., 6.625%, 04/01/2030 | | | 1,539,706 | | | 0.3 | |
| 1,100,000 | | Perrigo Finance Unlimited Co., 4.375%, 03/15/2026 | | | 1,071,104 | | | 0.2 | |
| 1,050,000 | | Perrigo Finance Unlimited Co., 4.650%, 06/15/2030 | | | 966,114 | | | 0.2 | |
| 1,475,000 (1) | | Post Holdings, Inc., 4.625%, 04/15/2030 | | | 1,355,175 | | | 0.3 | |
| | | | | | | | Percentage | |
| Principal | | | | | | | of Net | |
| Amount† | | | | Value | | | Assets | |
| CORPORATE BONDS/NOTES: (continued) | |
| | | Consumer, Non-cyclical: (continued) | |
| 2,250,000 (1) | | Post Holdings, Inc., 5.625%, 01/15/2028 | | $ | 2,212,404 | | | 0.5 | |
| 1,125,000 (1) | | Prestige Brands, Inc., 3.750%, 04/01/2031 | | | 980,497 | | | 0.2 | |
| 2,375,000 (1) | | Prime Security Services Borrower LLC / Prime Finance, Inc., 6.250%, 01/15/2028 | | | 2,328,340 | | | 0.5 | |
| 1,585,000 (1) | | Primo Water Holdings, Inc., 4.375%, 04/30/2029 | | | 1,459,049 | | | 0.3 | |
| 1,475,000 (1) | | Select Medical Corp., 6.250%, 08/15/2026 | | | 1,478,910 | | | 0.3 | |
| 1,425,000 (1) | | Simmons Foods, Inc./ Simmons Prepared Foods,, Inc. ./ Simmons Pet Food,, Inc../Simmons Feed, 4.625%, 03/01/2029 | | | 1,260,706 | | | 0.3 | |
| 1,380,000 (1) | | Teleflex, Inc., 4.250%, 06/01/2028 | | | 1,296,075 | | | 0.3 | |
| 1,275,000 | | Tenet Healthcare Corp., 4.250%, 06/01/2029 | | | 1,186,323 | | | 0.3 | |
| 1,425,000 | | Tenet Healthcare Corp., 5.125%, 11/01/2027 | | | 1,394,908 | | | 0.3 | |
| 2,200,000 (2) | | Tenet Healthcare Corp., 6.125%, 10/01/2028 | | | 2,193,952 | | | 0.5 | |
| 2,175,000 | | Tenet Healthcare Corp., 6.125%, 06/15/2030 | | | 2,172,729 | | | 0.5 | |
| 1,550,000 (2) | | Teva Pharmaceutical Finance Netherlands III BV, 4.750%, 05/09/2027 | | | 1,496,742 | | | 0.3 | |
| 1,600,000 (1) | | Triton Water Holdings, Inc., 6.250%, 04/01/2029 | | | 1,458,832 | | | 0.3 | |
| 680,000 | | United Rentals North America, Inc., 3.750%, 01/15/2032 | | | 594,334 | | | 0.1 | |
| 1,455,000 | | United Rentals North America, Inc., 4.875%, 01/15/2028 | | | 1,417,098 | | | 0.3 | |
| 275,000 | | United Rentals North America, Inc., 5.500%, 05/15/2027 | | | 274,422 | | | 0.1 | |
| 1,575,000 (1) | | Varex Imaging Corp., 7.875%, 10/15/2027 | | | 1,600,462 | | | 0.3 | |
| 1,075,000 (1) | | VT Topco, Inc., 8.500%, 08/15/2030 | | | 1,135,781 | | | 0.2 | |
| 1,125,000 (1) | | Wand NewCo 3, Inc., 7.625%, 01/30/2032 | | | 1,164,450 | | | 0.2 | |
| 775,000 (1) | | Williams Scotsman International, Inc., 4.625%, 08/15/2028 | | | 733,833 | | | 0.2 | |
| 1,275,000 (1) | | Williams Scotsman International, Inc., 6.125%, 06/15/2025 | | | 1,270,060 | | | 0.3 | |
| | | | | | 87,749,376 | | | 18.5 | |
See Accompanying Notes to Financial Statements
| Voya High Yield Bond Fund | PORTFOLIO OF INVESTMENTS |
| as of March 31, 2024 (continued) |
| | |
| | | | | | | | Percentage | |
| Principal | | | | | | | of Net | |
| Amount† | | | | Value | | | Assets | |
| CORPORATE BONDS/NOTES: (continued) | |
| | | Energy: 11.9% | | | | | | | |
| 1,075,000 (1) | | Antero Midstream Partners L.P. / Antero Midstream Finance Corp., 5.375%, 06/15/2029 | | $ | 1,034,800 | | | 0.2 | |
| 1,300,000 (1) | | Antero Midstream Partners L.P. / Antero Midstream Finance Corp., 5.750%, 03/01/2027 | | | 1,284,580 | | | 0.3 | |
| 875,000 (1) | | Antero Resources Corp., 5.375%, 03/01/2030 | | | 841,103 | | | 0.2 | |
| 1,250,000 (1) | | Archrock Partners L.P. / Archrock Partners Finance Corp., 6.250%, 04/01/2028 | | | 1,237,578 | | | 0.3 | |
| 625,000 (1) | | Archrock Partners L.P. / Archrock Partners Finance Corp., 6.875%, 04/01/2027 | | | 627,306 | | | 0.1 | |
| 1,825,000 (1) | | Ascent Resources Utica Holdings LLC / ARU Finance Corp., 5.875%, 06/30/2029 | | | 1,741,690 | | | 0.4 | |
| 400,000 (1) | | Baytex Energy Corp., 7.375%, 03/15/2032 | | | 404,361 | | | 0.1 | |
| 1,625,000 (1) | | Baytex Energy Corp., 8.500%, 04/30/2030 | | | 1,698,244 | | | 0.4 | |
| 1,825,000 (1) | | Chord Energy Corp., 6.375%, 06/01/2026 | | | 1,833,963 | | | 0.4 | |
| 1,000,000 (1) | | CNX Midstream Partners L.P., 4.750%, 04/15/2030 | | | 892,115 | | | 0.2 | |
| 2,050,000 (1) | | Crescent Energy Finance LLC, 7.250%, 05/01/2026 | | | 2,090,738 | | | 0.4 | |
| 1,135,000 (1) | | Crescent Energy Finance LLC, 7.625%, 04/01/2032 | | | 1,144,557 | | | 0.2 | |
| 1,000,000 (1) | | Delek Logistics Partners L.P. / Delek Logistics Finance Corp., 7.125%, 06/01/2028 | | | 976,307 | | | 0.2 | |
| 1,175,000 (1) | | Delek Logistics Partners L.P. / Delek Logistics Finance Corp., 8.625%, 03/15/2029 | | | 1,200,661 | | | 0.3 | |
| 550,000 (1) | | DT Midstream, Inc., 4.125%, 06/15/2029 | | | 506,133 | | | 0.1 | |
| 1,000,000 (1) | | DT Midstream, Inc., 4.375%, 06/15/2031 | | | 906,364 | | | 0.2 | |
| 1,775,000 (1) | | Earthstone Energy Holdings LLC, 8.000%, 04/15/2027 | | | 1,829,436 | | | 0.4 | |
| 1,850,000 (1) | | Encino Acquisition Partners Holdings LLC, 8.500%, 05/01/2028 | | | 1,871,451 | | | 0.4 | |
| 1,475,000 (1) | | Enerflex Ltd., 9.000%, 10/15/2027 | | | 1,516,607 | | | 0.3 | |
| | | | | | | | Percentage | |
| Principal | | | | | | | of Net | |
| Amount† | | | | Value | | | Assets | |
| CORPORATE BONDS/NOTES: (continued) | |
| | | Energy: (continued) | | | | | | | |
| 590,000 | | EnLink Midstream Partners L.P., 4.150%, 06/01/2025 | | $ | 577,506 | | | 0.1 | |
| 945,000 (1) | | EQM Midstream Partners L.P., 6.000%, 07/01/2025 | | | 946,928 | | | 0.2 | |
| 1,025,000 (1) | | Global Partners L.P. / GLP Finance Corp., 8.250%, 01/15/2032 | | | 1,063,626 | | | 0.2 | |
| 875,000 (1) | | Hilcorp Energy I L.P. / Hilcorp Finance Co., 5.750%, 02/01/2029 | | | 853,057 | | | 0.2 | |
| 950,000 (1) | | Hilcorp Energy I L.P. / Hilcorp Finance Co., 6.000%, 04/15/2030 | | | 931,036 | | | 0.2 | |
| 975,000 (1) | | Hilcorp Energy I L.P. / Hilcorp Finance Co., 6.000%, 02/01/2031 | | | 951,670 | | | 0.2 | |
| 1,675,000 (1) | | Kinetik Holdings L.P., 5.875%, 06/15/2030 | | | 1,639,919 | | | 0.3 | |
| 1,275,000 (1) (2) | | Kodiak Gas Services LLC, 7.250%, 02/15/2029 | | | 1,299,548 | | | 0.3 | |
| 400,000 (1) | | Matador Resources Co., 6.500%, 04/15/2032 | | | 400,985 | | | 0.1 | |
| 1,950,000 (1) | | Matador Resources Co., 6.875%, 04/15/2028 | | | 1,996,459 | | | 0.4 | |
| 1,350,000 (1) | | Moss Creek Resources Holdings, Inc., 7.500%, 01/15/2026 | | | 1,349,452 | | | 0.3 | |
| 1,650,000 | | Murphy Oil Corp., 6.375%, 07/15/2028 | | | 1,662,197 | | | 0.3 | |
| 1,185,000 (1) | | NGL Energy Operating LLC / NGL Energy Finance Corp., 8.125%, 02/15/2029 | | | 1,214,432 | | | 0.3 | |
| 750,000 (1) | | NGL Energy Operating LLC / NGL Energy Finance Corp., 8.375%, 02/15/2032 | | | 769,329 | | | 0.2 | |
| 1,100,000 | | Occidental Petroleum Corp., 5.500%, 12/01/2025 | | | 1,100,062 | | | 0.2 | |
| 1,350,000 (1) | | Permian Resources Operating LLC, 5.875%, 07/01/2029 | | | 1,328,599 | | | 0.3 | |
| 2,125,000 | | Southwestern Energy Co., 5.375%, 02/01/2029 | | | 2,065,774 | | | 0.4 | |
| 300,000 | | Southwestern Energy Co., 5.700%, 01/23/2025 | | | 298,793 | | | 0.1 | |
| 700,000 | | Sunoco L.P. / Sunoco Finance Corp., 4.500%, 05/15/2029 | | | 651,300 | | | 0.1 | |
| 1,425,000 | | Sunoco L.P. / Sunoco Finance Corp., 4.500%, 04/30/2030 | | | 1,306,170 | | | 0.3 | |
| 620,000 (1) | | Talos Production, Inc., 9.000%, 02/01/2029 | | | 658,888 | | | 0.1 | |
See Accompanying Notes to Financial Statements
| Voya High Yield Bond Fund | PORTFOLIO OF INVESTMENTS |
| as of March 31, 2024 (continued) |
| | |
| | | | | | | | Percentage | |
| Principal | | | | | | | of Net | |
| Amount† | | | | Value | | | Assets | |
| CORPORATE BONDS/NOTES: (continued) | |
| | | Energy: (continued) | | | | | | | |
| 790,000 (1) | | Talos Production, Inc., 9.375%, 02/01/2031 | | $ | 842,802 | | | 0.2 | |
| 911,250 (1) | | Transocean Poseidon Ltd., 6.875%, 02/01/2027 | | | 912,893 | | | 0.2 | |
| 230,000 (1) | | Transocean Titan Financing Ltd., 8.375%, 02/01/2028 | | | 240,250 | | | 0.0 | |
| 1,125,000 (1) | | Transocean, Inc., 7.500%, 01/15/2026 | | | 1,121,635 | | | 0.2 | |
| 1,725,000 (1) | | Venture Global Calcasieu Pass LLC, 4.125%, 08/15/2031 | | | 1,535,172 | | | 0.3 | |
| 1,900,000 (1) | | Venture Global LNG, Inc., 8.125%, 06/01/2028 | | | 1,939,541 | | | 0.4 | |
| 1,675,000 (1) | | Venture Global LNG, Inc., 8.375%, 06/01/2031 | | | 1,728,422 | | | 0.4 | |
| 1,275,000 (1) | | Venture Global LNG, Inc., 9.500%, 02/01/2029 | | | 1,375,072 | | | 0.3 | |
| | | | | | 56,399,511 | | | 11.9 | |
| | | | | | | | | | |
| | | Financial: 7.0% | | | | | | | |
| 745,000 (1) | | Alliant Holdings Intermediate LLC / Alliant Holdings Co-Issuer, 7.000%, 01/15/2031 | | | 753,027 | | | 0.2 | |
| 925,000 | | Ally Financial, Inc., 5.750%, 11/20/2025 | | | 918,765 | | | 0.2 | |
| 745,000 | | Ally Financial, Inc., 6.700%, 02/14/2033 | | | 753,389 | | | 0.2 | |
| 195,000 (1) | | AmWINS Group, Inc., 6.375%, 02/15/2029 | | | 196,175 | | | 0.0 | |
| 750,000 (1) | | Ardonagh Finco Ltd., 7.750%, 02/15/2031 | | | 747,380 | | | 0.2 | |
| 800,000 (1) | | Ardonagh Group Finance Ltd., 8.875%, 02/15/2032 | | | 790,726 | | | 0.2 | |
| 1,675,000 (1) | | Aretec Escrow Issuer, Inc., 7.500%, 04/01/2029 | | | 1,596,459 | | | 0.3 | |
| 1,795,000 (1) | | BroadStreet Partners, Inc., 5.875%, 04/15/2029 | | | 1,663,102 | | | 0.3 | |
| 1,425,000 (1) | | Burford Capital Global Finance LLC, 6.875%, 04/15/2030 | | | 1,400,562 | | | 0.3 | |
| 1,100,000 (1) | | Freedom Mortgage Corp., 6.625%, 01/15/2027 | | | 1,068,263 | | | 0.2 | |
| 850,000 (1) | | Freedom Mortgage Corp., 12.250%, 10/01/2030 | | | 935,700 | | | 0.2 | |
| 1,375,000 (1) | | Ladder Capital Finance Holdings LLLP / Ladder Capital Finance Corp., 4.750%, 06/15/2029 | | | 1,251,152 | | | 0.3 | |
| | | | | | | | Percentage | |
| Principal | | | | | | | of Net | |
| Amount† | | | | Value | | | Assets | |
| CORPORATE BONDS/NOTES: (continued) | |
| | | Financial: (continued) | | | | | | | |
| 600,000 (1) | | Macquarie Airfinance Holdings Ltd., 6.400%, 03/26/2029 | | $ | 609,939 | | | 0.1 | |
| 650,000 (1) | | Midcap Financial Issuer Trust, 5.625%, 01/15/2030 | | | 560,973 | | | 0.1 | |
| 1,100,000 (1) | | Midcap Financial Issuer Trust, 6.500%, 05/01/2028 | | | 1,015,781 | | | 0.2 | |
| 1,400,000 (2) | | MPT Operating Partnership L.P. / MPT Finance Corp., 4.625%, 08/01/2029 | | | 1,075,675 | | | 0.2 | |
| 1,625,000 | | MPT Operating Partnership L.P. / MPT Finance Corp., 5.000%, 10/15/2027 | | | 1,362,603 | | | 0.3 | |
| 1,050,000 (1) | | Nationstar Mortgage Holdings, Inc., 5.000%, 02/01/2026 | | | 1,028,406 | | | 0.2 | |
| 1,890,000 (1) | | Nationstar Mortgage Holdings, Inc., 5.125%, 12/15/2030 | | | 1,716,424 | | | 0.4 | |
| 950,000 (2) | | Navient Corp., 4.875%, 03/15/2028 | | | 886,318 | | | 0.2 | |
| 700,000 (2) | | Navient Corp., 5.000%, 03/15/2027 | | | 671,127 | | | 0.1 | |
| 550,000 | | Navient Corp., 6.750%, 06/25/2025 | | | 554,581 | | | 0.1 | |
| 750,000 | | OneMain Finance Corp., 4.000%, 09/15/2030 | | | 642,586 | | | 0.1 | |
| 1,750,000 | | OneMain Finance Corp., 5.375%, 11/15/2029 | | | 1,646,789 | | | 0.3 | |
| 575,000 (2) | | OneMain Finance Corp., 7.125%, 03/15/2026 | | | 585,822 | | | 0.1 | |
| 1,685,000 (1) | | Panther Escrow Issuer LLC, 7.125%, 06/01/2031 | | | 1,714,504 | | | 0.4 | |
| 1,075,000 (1) | | PRA Group, Inc., 5.000%, 10/01/2029 | | | 906,916 | | | 0.2 | |
| 400,000 (1) | | RHP Hotel Properties L.P. / RHP Finance Corp., 6.500%, 04/01/2032 | | | 401,600 | | | 0.1 | |
| 1,875,000 (1) | | RHP Hotel Properties L.P. / RHP Finance Corp., 7.250%, 07/15/2028 | | | 1,933,348 | | | 0.4 | |
| 350,000 (1) | | RLJ Lodging Trust L.P., 3.750%, 07/01/2026 | | | 333,557 | | | 0.1 | |
| 2,050,000 (1) | | United Wholesale Mortgage LLC, 5.750%, 06/15/2027 | | | 1,994,995 | | | 0.4 | |
| 1,300,000 (1) | | XHR L.P., 4.875%, 06/01/2029 | | | 1,204,545 | | | 0.3 | |
See Accompanying Notes to Financial Statements
| Voya High Yield Bond Fund | PORTFOLIO OF INVESTMENTS |
| as of March 31, 2024 (continued) |
| | |
| | | | | | | | Percentage | |
| Principal | | | | | | | of Net | |
| Amount† | | | | Value | | | Assets | |
| CORPORATE BONDS/NOTES: (continued) | |
| | | Financial: (continued) | | | | | | | |
| 375,000 (1) | | XHR L.P., 6.375%, 08/15/2025 | | $ | 375,761 | | | 0.1 | |
| | | | | | 33,296,950 | | | 7.0 | |
| | | | | | | | | | |
| | | Industrial: 13.0% | | | | | | | |
| 1,375,000 (1) | | AAR Escrow Issuer LLC, 6.750%, 03/15/2029 | | | 1,387,298 | | | 0.3 | |
| 1,150,000 (1)(2) | | AmeriTex HoldCo Intermediate LLC, 10.250%, 10/15/2028 | | | 1,236,142 | | | 0.3 | |
| 2,300,000 (1)(3) | | ARD Finance SA, 6.500% (PIK Rate 7.250%, Cash Rate 6.500%), 06/30/2027 | | | 772,082 | | | 0.2 | |
| 2,100,000 (1)(2) | | Ardagh Packaging Finance PLC / Ardagh Holdings USA, Inc., 5.250%, 08/15/2027 | | | 1,325,257 | | | 0.3 | |
| 1,250,000 (2) | | Ball Corp., 3.125%, 09/15/2031 | | | 1,063,627 | | | 0.2 | |
| 625,000 (2) | | Ball Corp., 6.875%, 03/15/2028 | | | 642,077 | | | 0.1 | |
| 330,000 (1) | | Bombardier, Inc., 7.250%, 07/01/2031 | | | 331,084 | | | 0.1 | |
| 950,000 (1)(2) | | Bombardier, Inc., 7.500%, 02/01/2029 | | | 979,311 | | | 0.2 | |
| 1,216,000 (1) | | Bombardier, Inc., 7.875%, 04/15/2027 | | | 1,217,610 | | | 0.3 | |
| 425,000 (1)(2) | | Bombardier, Inc., 8.750%, 11/15/2030 | | | 454,336 | | | 0.1 | |
| 1,570,000 (1) | | Brundage-Bone Concrete Pumping Holdings, Inc., 6.000%, 02/01/2026 | | | 1,551,996 | | | 0.3 | |
| 1,900,000 (1) | | Builders FirstSource, Inc., 5.000%, 03/01/2030 | | | 1,814,420 | | | 0.4 | |
| 295,000 (1) | | Cascades, Inc. / Cascades USA, Inc., 5.125%, 01/15/2026 | | | 289,408 | | | 0.1 | |
| 1,475,000 (1) | | Cascades, Inc. / Cascades USA, Inc., 5.375%, 01/15/2028 | | | 1,418,174 | | | 0.3 | |
| 1,550,000 (1) | | Chart Industries, Inc., 7.500%, 01/01/2030 | | | 1,611,529 | | | 0.3 | |
| 1,550,000 (1) | | Clean Harbors, Inc., 6.375%, 02/01/2031 | | | 1,563,042 | | | 0.3 | |
| 1,600,000 (1) | | Clydesdale Acquisition Holdings, Inc., 8.750%, 04/15/2030 | | | 1,573,735 | | | 0.3 | |
| 1,875,000 (1) | | Emerald Debt Merger Sub LLC, 6.625%, 12/15/2030 | | | 1,895,331 | | | 0.4 | |
| 2,200,000 (1) | | Energizer Holdings, Inc., 4.750%, 06/15/2028 | | | 2,039,716 | | | 0.4 | |
| | | | | | | | Percentage | |
| Principal | | | | | | | of Net | |
| Amount† | | | | Value | | | Assets | |
| CORPORATE BONDS/NOTES: (continued) | |
| | | Industrial: (continued) | | | | | | | |
| 2,075,000 (1) | | Fortress Transportation and Infrastructure Investors LLC, 5.500%, 05/01/2028 | | $ | 2,012,748 | | | 0.4 | |
| 575,000 (1) | | Fortress Transportation and Infrastructure Investors LLC, 6.500%, 10/01/2025 | | | 574,581 | | | 0.1 | |
| 1,600,000 (1) | | GFL Environmental, Inc., 4.000%, 08/01/2028 | | | 1,476,629 | | | 0.3 | |
| 625,000 (1) | | GFL Environmental, Inc., 4.250%, 06/01/2025 | | | 615,236 | | | 0.1 | |
| 990,000 (1) | | GFL Environmental, Inc., 4.375%, 08/15/2029 | | | 912,961 | | | 0.2 | |
| 675,000 (1) | | Global Infrastructure Solutions, Inc., 5.625%, 06/01/2029 | | | 619,641 | | | 0.1 | |
| 700,000 (1) | | Global Infrastructure Solutions, Inc., 7.500%, 04/15/2032 | | | 685,336 | | | 0.1 | |
| 1,775,000 (1) | | Graham Packaging Co., Inc., 7.125%, 08/15/2028 | | | 1,611,431 | | | 0.3 | |
| 2,100,000 (1) | | Imola Merger Corp., 4.750%, 05/15/2029 | | | 1,970,925 | | | 0.4 | |
| 775,000 (1)(3) | | Intelligent Packaging Holdco Issuer L.P., 9.000% (PIK Rate 9.750%, Cash Rate 9.000%), 01/15/2026 | | | 735,309 | | | 0.2 | |
| 1,350,000 (1) | | Intelligent Packaging Ltd. Finco, Inc. / Intelligent Packaging Ltd. Co-Issuer LLC, 6.000%, 09/15/2028 | | | 1,283,732 | | | 0.3 | |
| 1,300,000 (1) | | Maxim Crane Works Holdings Capital LLC, 11.500%, 09/01/2028 | | | 1,411,085 | | | 0.3 | |
| 1,700,000 (1) | | New Enterprise Stone & Lime Co., Inc., 9.750%, 07/15/2028 | | | 1,743,724 | | | 0.4 | |
| 1,550,000 (1)(2) | | Owens-Brockway Glass Container, Inc., 7.250%, 05/15/2031 | | | 1,580,616 | | | 0.3 | |
| 1,315,000 (1) | | Roller Bearing Co. of America, Inc., 4.375%, 10/15/2029 | | | 1,205,683 | | | 0.3 | |
| 1,275,000 (1) | | Rolls-Royce PLC, 3.625%, 10/14/2025 | | | 1,238,137 | | | 0.3 | |
| 1,200,000 (1) | | Rolls-Royce PLC, 5.750%, 10/15/2027 | | | 1,204,327 | | | 0.3 | |
| 1,550,000 (1)(2) | | Sealed Air Corp., 4.000%, 12/01/2027 | | | 1,454,140 | | | 0.3 | |
| 275,000 (1) | | Sealed Air Corp., 5.125%, 12/01/2024 | | | 274,134 | | | 0.1 | |
See Accompanying Notes to Financial Statements
| Voya High Yield Bond Fund | PORTFOLIO OF INVESTMENTS |
| as of March 31, 2024 (continued) |
| | |
| | | | | | | | Percentage | |
| Principal | | | | | | | of Net | |
| Amount† | | | | Value | | | Assets | |
| CORPORATE BONDS/NOTES: (continued) | |
| | | Industrial: (continued) | | | | | | | |
| 910,000 (1)(2) | | Sealed Air Corp/Sealed Air Corp. US, 6.125%, 02/01/2028 | | $ | 912,666 | | | 0.2 | |
| 720,000 (1) | | Sensata Technologies BV, 5.000%, 10/01/2025 | | | 711,692 | | | 0.1 | |
| 1,875,000 (1) | | Sensata Technologies, Inc., 3.750%, 02/15/2031 | | | 1,623,782 | | | 0.3 | |
| 1,275,000 (1) | | Smyrna Ready Mix Concrete LLC, 8.875%, 11/15/2031 | | | 1,363,875 | | | 0.3 | |
| 1,575,000 (1) | | Standard Industries, Inc., 3.375%, 01/15/2031 | | | 1,322,281 | | | 0.3 | |
| 925,000 (1) | | Standard Industries, Inc., 4.375%, 07/15/2030 | | | 831,797 | | | 0.2 | |
| 1,350,000 (1) | | Summit Materials LLC / Summit Materials Finance Corp., 5.250%, 01/15/2029 | | | 1,316,827 | | | 0.3 | |
| 1,095,000 (1) | | Summit Materials LLC / Summit Materials Finance Corp., 6.500%, 03/15/2027 | | | 1,094,996 | | | 0.2 | |
| 300,000 (1) | | TK Elevator Holdco GmbH, 7.625%, 07/15/2028 | | | 294,452 | | | 0.1 | |
| 1,625,000 (2) | | TransDigm, Inc., 4.625%, 01/15/2029 | | | 1,509,959 | | | 0.3 | |
| 1,300,000 | | TransDigm, Inc., 5.500%, 11/15/2027 | | | 1,273,405 | | | 0.3 | |
| 1,190,000 (1) | | TransDigm, Inc., 6.625%, 03/01/2032 | | | 1,203,734 | | | 0.2 | |
| 1,050,000 (1) | | TransDigm, Inc., 6.875%, 12/15/2030 | | | 1,071,520 | | | 0.2 | |
| 1,375,000 (1) | | Weekley Homes LLC / Weekley Finance Corp., 4.875%, 09/15/2028 | | | 1,272,636 | | | 0.3 | |
| | | | | | 61,580,172 | | | 13.0 | |
| | | | | | | | | | |
| | | Technology: 2.9% | | | | | | | |
| 3,375,000 (1) | | Cloud Software Group, Inc., 6.500%, 03/31/2029 | | | 3,205,546 | | | 0.7 | |
| 1,125,000 (1)(2) | | Cloud Software Group, Inc., 9.000%, 09/30/2029 | | | 1,080,081 | | | 0.2 | |
| 1,075,000 (1) | | Entegris Escrow Corp., 5.950%, 06/15/2030 | | | 1,063,306 | | | 0.2 | |
| 725,000 (1) | | Entegris, Inc., 3.625%, 05/01/2029 | | | 651,861 | | | 0.1 | |
| 1,260,000 (1) | | McAfee Corp., 7.375%, 02/15/2030 | | | 1,156,858 | | | 0.2 | |
| 1,400,000 (1) | | NCR Atleos Escrow Corp., 9.500%, 04/01/2029 | | | 1,498,888 | | | 0.3 | |
| 850,000 (1) | | Open Text Corp., 3.875%, 12/01/2029 | | | 758,209 | | | 0.2 | |
| | | | | | | | Percentage | |
| Principal | | | | | | | of Net | |
| Amount† | | | | Value | | | Assets | |
| CORPORATE BONDS/NOTES: (continued) | |
| | | Technology: (continued) | | | | | | | |
| 1,725,000 (1) | | Open Text Holdings, Inc., 4.125%, 02/15/2030 | | $ | 1,546,584 | | | 0.3 | |
| 1,750,000 (1) | | UKG, Inc., 6.875%, 02/01/2031 | | | 1,784,050 | | | 0.4 | |
| 1,375,000 (1) | | Virtusa Corp., 7.125%, 12/15/2028 | | | 1,235,827 | | | 0.3 | |
| | | | | | 13,981,210 | | | 2.9 | |
| | | | | | | | | | |
| | | Utilities: 2.1% | | | | | | | |
| 1,600,000 (1) | | Atlantica Sustainable Infrastructure PLC, 4.125%, 06/15/2028 | | | 1,471,405 | | | 0.3 | |
| 1,050,000 (1) | | Calpine Corp., 4.500%, 02/15/2028 | | | 996,716 | | | 0.2 | |
| 825,000 (1) | | Calpine Corp., 5.000%, 02/01/2031 | | | 757,620 | | | 0.2 | |
| 1,175,000 (1) | | Calpine Corp., 5.125%, 03/15/2028 | | | 1,128,691 | | | 0.2 | |
| 250,000 (1) | | Calpine Corp., 5.250%, 06/01/2026 | | | 247,596 | | | 0.1 | |
| 1,400,000 | | TransAlta Corp., 7.750%, 11/15/2029 | | | 1,456,615 | | | 0.3 | |
| 1,005,000 (1) | | Vistra Operations Co. LLC, 4.375%, 05/01/2029 | | | 932,062 | | | 0.2 | |
| 1,350,000 (1) | | Vistra Operations Co. LLC, 5.500%, 09/01/2026 | | | 1,330,186 | | | 0.3 | |
| 650,000 (1) | | Vistra Operations Co. LLC, 5.625%, 02/15/2027 | | | 640,539 | | | 0.1 | |
| 1,000,000 (1) | | Vistra Operations Co. LLC, 7.750%, 10/15/2031 | | | 1,048,010 | | | 0.2 | |
| | | | | | 10,009,440 | | | 2.1 | |
| | | Total Corporate Bonds/Notes | | | | | | | |
| | | (Cost $448,560,359) | | | 445,042,352 | | | 93.6 | |
| | | | | | | | | | |
| BANK LOANS: 2.3% | |
| | | Consumer, Cyclical: 0.2% | | | | | | | |
| 906,000 | | Hilton Domestic Operating Company, Inc., 2023 Term Loan B4, 7.457%, (TSFR1M+2.000%), 11/08/2030 | | | 908,497 | | | 0.2 | |
| | | | | | | | | | |
| | | | | | | | | | |
| | | Consumer, Non-cyclical: 0.2% | | | | | | | |
| 1,230,700 | | Nielsen Consumer Inc., 2023 USD Fifth Amendment Incremental Term Loan, 11.549%, (TSFR3M+6.250%), 03/06/2028 | | | 1,224,547 | | | 0.2 | |
| | | | | | | | | | |
See Accompanying Notes to Financial Statements
| Voya High Yield Bond Fund | PORTFOLIO OF INVESTMENTS |
| as of March 31, 2024 (continued) |
| | |
| | | | | | | | Percentage | |
| Principal | | | | | | | of Net | |
| Amount† | | | | Value | | | Assets | |
| BANK LOANS: (continued) | |
| | | Financial: 1.6% | | | | | | | |
| 2,244,375 | | Acrisure LLC, 2023 Term Loan, 9.850%, (TSFR3M+4.500%), 11/06/2030 | | $ | 2,258,402 | | | 0.5 | |
| 1,425,000 | | Advisor Group, Inc., 2023 Term Loan B, 8.840%, (TSFR1M+3.500%), 08/16/2028 | | | 1,432,508 | | | 0.3 | |
| 3,047,363 | | Hub International Ltd., 2024 Term Loan B, 8.840%, (TSFR1M+3.500%), 06/20/2030 | | | 3,051,309 | | | 0.6 | |
| 712,500 | | Truist Financial, 2nd Lien Term Loan, 10.060%, (TSFR1M+3.500%), 03/31/2032 | | | 717,844 | | | 0.2 | |
| | | | | | 7,460,063 | | | 1.6 | |
| | | | | | | | | | |
| | | Health Care: 0.3% | | | | | | | |
| 1,425,000 | | Cotiviti Corporation, 2024 Term Loan, 8.571%, (TSFR1M+3.500%), 02/22/2031 | | | 1,427,375 | | | 0.3 | |
| | | | | | | | | | |
| | | Total Bank Loans | | | | | | | |
| | | (Cost $10,918,549) | | | 11,020,482 | | | 2.3 | |
| | | Total Long-Term Investments | | | | | | | |
| | | (Cost $459,478,908) | | | 456,062,834 | | | 95.9 | |
| | | | | | | | Percentage | |
| Principal | | | | | | | of Net | |
| Amount† | | RA | | Value | | | Assets | |
| SHORT-TERM INVESTMENTS: 14.9% | |
| | | Repurchase Agreements: 9.8% | | | | | | | |
| 12,515,432 (5) | | Bethesda Securities, LLC, Repurchase Agreement dated 03/28/2024, 5.430%, due 04/01/2024 (Repurchase Amount $12,522,880, collateralized by various U.S. Government/U.S. Government Agency Obligations, 2.500%- 6.070%, Market Value plus accrued interest $12,765,741, due 10/01/27-01/01/57) | | | 12,515,432 | | | 2.6 | |
| | | | | | | | Percentage | |
| Principal | | | | | | | of Net | |
| Amount† | | | | Value | | | Assets | |
| SHORT-TERM INVESTMENTS: (continued) |
| | | Repurchase Agreements (continued) | |
| 12,515,432 (5) | | Cantor Fitzgerald Securities, Repurchase Agreement dated 03/28/2024, 5.370%, due 04/01/2024 (Repurchase Amount $12,522,797, collateralized by various U.S. Government/U.S. Government Agency Obligations, 0.000%- 7.500%, Market Value plus accrued interest $12,765,741, due 12/24/26-02/20/74) | | $ | 12,515,432 | | | 2.6 | |
| 4,336,589 (5) | | Marex Capital Markets Inc., Repurchase Agreement dated 03/28/2024, 5.440%, due 04/01/2024 (Repurchase Amount $4,339,174, collateralized by various U.S. Government/U.S. Government Agency Obligations, 0.000%- 6.500%, Market Value plus accrued interest $4,423,321, due 04/25/24-02/01/57) | | | 4,336,589 | | | 0.9 | |
| 10,140,306 (5) | | Mirae Asset Securities (USA) Inc., Repurchase Agreement dated 03/28/2024, 5.380%, due 04/01/2024 (Repurchase Amount $10,146,285, collateralized by various U.S. Government/U.S. Government Agency Obligations, 0.000%- 7.645%, Market Value plus accrued interest $10,349,295, due 04/30/24-04/20/73) | | | 10,140,306 | | | 2.2 | |
See Accompanying Notes to Financial Statements
| Voya High Yield Bond Fund | PORTFOLIO OF INVESTMENTS |
| as of March 31, 2024 (continued) |
| | |
| | | | | | | | Percentage | |
| Principal | | | | | | | of Net | |
| Amount† | | | | Value | | | Assets | |
| SHORT-TERM INVESTMENTS: (continued) | | | | | | |
| | | Repurchase Agreements (continued) | | | | |
| 7,197,014 (5) | | RBC Dominion Securities Inc., Repurchase Agreement dated 03/28/2024, 5.330%, due 04/01/2024 (Repurchase Amount $7,201,218, collateralized by various U.S. Government/U.S. Government Agency Obligations, 0.000%- 8.000%, Market Value plus accrued interest $7,340,954, due 04/04/24-03/01/54) | | $ | 7,197,014 | | | 1.5 | |
| | | Total Repurchase Agreements
(Cost $46,704,773) | | | 46,704,773 | | | 9.8 | |
| | | Time Deposits: 1.3% | | | | | | | |
| 1,290,000 (5) | | Canadian Imperial Bank of Commerce, 5.310%, 04/01/2024 | | | 1,290,000 | | | 0.3 | |
| 1,140,000 (5) | | Mizuho Bank Ltd., 5.320%, 04/01/2024 | | | 1,140,000 | | | 0.2 | |
| 1,270,000 (5) | | Royal Bank of Canada, 5.320%, 04/01/2024 | | | 1,270,000 | | | 0.3 | |
| 1,290,000 (5) | | Skandinaviska Enskilda Banken AB, 5.310%, 04/01/2024 | | | 1,290,000 | | | 0.3 | |
| 1,200,000 (5) | | Societe Generale, 5.310%, 04/01/2024 | | | 1,200,000 | | | 0.2 | |
| | | Total Time Deposits
(Cost $6,190,000) | | | 6,190,000 | | | 1.3 | |
| | | Commercial Paper: 3.3% | | | | | | | |
| 4,000,000 | | Consolidated Edison, 7.240%, 04/10/2024 | | | 3,992,108 | | | 0.8 | |
| 8,000,000 | | CVS Caremark, 21.960%, 04/01/2024 | | | 7,995,204 | | | 1.7 | |
| 2,000,000 | | Dominion Energy, Inc., 6.170%, 05/01/2024 | | | 1,989,598 | | | 0.4 | |
| 2,000,000 | | Exelon Corp., 22.080%, 04/01/2024 | | | 1,998,794 | | | 0.4 | |
| | | Total Commercial Paper
(Cost $15,985,179) | | | 15,975,704 | | | 3.3 | |
| | | | | | | | Percentage | |
| | | | | | | | of Net | |
| Shares | | | | Value | | | Assets | |
| | | Mutual Funds: 0.5% | | | | | | | |
| 2,187,000 (6) | | Morgan Stanley Institutional Liquidity Funds - Government Portfolio (Institutional Share Class), 5.220% (Cost $2,187,000) | | $ | 2,187,000 | | | 0.5 | |
| | | Total Short-Term Investments
(Cost $71,066,952) | | $ | 71,057,477 | | | 14.9 | |
| | | Total Investments in Securities
(Cost $530,545,860) | | $ | 527,120,311 | | | 110.8 | |
| | | Liabilities in Excess of Other Assets | | | (51,501,318 | ) | | (10.8) | |
| | | Net Assets | | $ | 475,618,993 | | | 100.0 | |
| † | Unless otherwise indicated, principal amount is shown in USD. |
| (1) | Securities with purchases pursuant to Rule 144A or section 4(a)(2), under the Securities Act of 1933 and may not be resold subject to that rule except to qualified institutional buyers. |
| (2) | Security, or a portion of the security, is on loan. |
| (3) | All or a portion of this security is payment-in-kind (“PIK”) which may pay interest or additional principal at the issuer’s discretion. Rates shown are the current rate and possible payment rates. |
| (4) | Variable rate security. Rate shown is the rate in effect as of March 31, 2024. |
| (5) | All or a portion of the security represents securities purchased with cash collateral received for securities on loan. |
| (6) | Rate shown is the 7-day yield as of March 31, 2024. |
Reference Rate Abbreviations:
| TSFR1M | 1-month CME Term Secured Overnight Financing Rate |
| TSFR3M | 3-month CME Term Secured Overnight Financing Rate |
See Accompanying Notes to Financial Statements
| Voya High Yield Bond Fund | PORTFOLIO OF INVESTMENTS | |
| as of March 31, 2024 (continued) | |
| | | |
Fair Value Measurements^
The following is a summary of the fair valuations according to the inputs used as of March 31, 2024 in valuing the assets and liabilities:
| | | Quoted Prices | | | | | | | | | | |
| | | in Active Markets | | | Significant Other | | | Significant | | | | |
| | | for Identical | | | Observable | | | Unobservable | | | Fair Value | |
| | | Investments | | | Inputs | | | Inputs | | | at | |
| | | (Level 1) | | | (Level 2) | | | (Level 3) | | | March 31, 2024 | |
| Asset Table | | | | | | | | | | | | | | | | |
| Investments, at fair value | | | | | | | | | | | | | | | | |
| Corporate Bonds/Notes | | $ | — | | | $ | 445,042,352 | | | $ | — | | | $ | 445,042,352 | |
| Bank Loans | | | — | | | | 11,020,482 | | | | — | | | | 11,020,482 | |
| Short-Term Investments | | | 2,187,000 | | | | 68,870,477 | | | | — | | | | 71,057,477 | |
| Total Investments, at fair value | | $ | 2,187,000 | | | $ | 524,933,311 | | | $ | — | | | $ | 527,120,311 | |
___________
| ^ | See Note 2, “Significant Accounting Policies” in the Notes to Financial Statements for additional information. |
The effect of derivative instruments on the Fund's Statement of Operations for the year ended March 31, 2024 was as follows:
Amount of Realized Gain or (Loss) on Derivatives Recognized in Income
| Derivatives not accounted for as hedging instruments | | Swaps | |
| Credit contracts | | $ | 116,797 | |
| Total | | $ | 116,797 | |
At March 31, 2024, the aggregate cost of securities and other investments and the composition of unrealized appreciation and depreciation of securities and other investments on a tax basis were:
| Cost for federal income tax purposes was $531,931,319. | | | |
| Net unrealized depreciation consisted of: | | | |
| Gross Unrealized Appreciation | | $ | 8,509,026 | |
| Gross Unrealized Depreciation | | | (13,320,034 | ) |
| Net Unrealized Depreciation | | $ | (4,811,008 | ) |
See Accompanying Notes to Financial Statements
| Voya Intermediate Bond Fund | PORTFOLIO OF INVESTMENTS |
| as of March 31, 2024 |
| | |
| | | | | | | | Percentage | |
| Principal | | | | | | | of Net | |
| Amount† | | | | Value | | | Assets | |
| CORPORATE BONDS/NOTES: 31.3% | | | | | | | |
| | | Basic Materials: 0.9% | | | | | | | |
| 2,534,000 | | Air Products and Chemicals, Inc., 4.850%, 02/08/2034 | | $ | 2,508,536 | | | 0.0 | |
| 1,725,000 (1) | | Anglo American Capital PLC, 2.250%, 03/17/2028 | | | 1,537,406 | | | 0.0 | |
| 1,377,000 (1) | | Anglo American Capital PLC, 3.625%, 09/11/2024 | | | 1,362,659 | | | 0.0 | |
| 671,000 (1) | | Anglo American Capital PLC, 4.875%, 05/14/2025 | | | 664,136 | | | 0.0 | |
| 4,048,000 (1) | | Anglo American Capital PLC, 5.500%, 05/02/2033 | | | 4,029,258 | | | 0.1 | |
| 4,750,000 | | AngloGold Ashanti Holdings PLC, 3.750%, 10/01/2030 | | | 4,141,881 | | | 0.1 | |
| 2,269,000 | | BHP Billiton Finance USA Ltd., 4.900%, 02/28/2033 | | | 2,250,890 | | | 0.0 | |
| 3,146,000 | | BHP Billiton Finance USA Ltd., 5.250%, 09/08/2030 | | | 3,200,902 | | | 0.0 | |
| 3,876,000 | | BHP Billiton Finance USA Ltd., 5.250%, 09/08/2033 | | | 3,923,174 | | | 0.1 | |
| 3,735,000 (1) | | Cleveland-Cliffs, Inc., 6.750%, 04/15/2030 | | | 3,750,531 | | | 0.1 | |
| 1,785,000 (1)(2) | | Cleveland-Cliffs, Inc., 7.000%, 03/15/2032 | | | 1,810,794 | | | 0.0 | |
| 5,200,000 (1) | | Corp Nacional del Cobre de Chile, 5.950%, 01/08/2034 | | | 5,232,500 | | | 0.1 | |
| 4,125,000 (1) | | Corp Nacional del Cobre de Chile, 6.300%, 09/08/2053 | | | 4,113,398 | | | 0.1 | |
| 3,250,000 (1) | | Corp Nacional del Cobre de Chile, 6.440%, 01/26/2036 | | | 3,364,341 | | | 0.0 | |
| 8,500,000 (1)(2) | | CSN Resources SA, 8.875%, 12/05/2030 | | | 8,799,200 | | | 0.1 | |
| 1,420,000 | | FMC Corp., 5.150%, 05/18/2026 | | | 1,412,134 | | | 0.0 | |
| 1,625,000 | | GC Treasury Center Co. Ltd., 4.400%, 03/30/2032 | | | 1,480,273 | | | 0.0 | |
| 3,527,000 (1) | | Glencore Funding LLC, 5.371%, 04/04/2029 | | | 3,535,220 | | | 0.0 | |
| 1,844,000 (1) | | Glencore Funding LLC, 5.634%, 04/04/2034 | | | 1,849,901 | | | 0.0 | |
| 1,058,000 (1) | | Glencore Funding LLC, 5.893%, 04/04/2054 | | | 1,072,845 | | | 0.0 | |
| 1,500,000 (1)(2) | | Inversiones CMPC SA, 6.125%, 02/26/2034 | | | 1,528,500 | | | 0.0 | |
| 3,455,000 (1) | | Newmont Corp. / Newcrest Finance Pty Ltd., 5.300%, 03/15/2026 | | | 3,465,200 | | | 0.0 | |
| | | | | | | | Percentage | |
| Principal | | | | | | | of Net | |
| Amount† | | | | Value | | | Assets | |
| CORPORATE BONDS/NOTES: (continued) | | | | | | | |
| | | Basic Materials: (continued) | | | | | | | |
| 4,325,000 (1) | | Novelis Corp., 4.750%, 01/30/2030 | | $ | 3,993,955 | | | 0.1 | |
| 407,000 | | Nutrien Ltd., 5.875%, 12/01/2036 | | | 423,567 | | | 0.0 | |
| 4,100,000 (2) | | Olin Corp., 5.000%, 02/01/2030 | | | 3,894,553 | | | 0.1 | |
| 3,189,000 | | Steel Dynamics, Inc., 1.650%, 10/15/2027 | | | 2,843,663 | | | 0.0 | |
| 2,139,000 | | Steel Dynamics, Inc., 2.400%, 06/15/2025 | | | 2,060,424 | | | 0.0 | |
| | | | | | 78,249,841 | | | 0.9 | |
| | | Communications: 2.5% | | | | | | | |
| 2,939,000 | | Amazon.com, Inc., 2.100%, 05/12/2031 | | | 2,493,406 | | | 0.0 | |
| 3,416,000 | | Amazon.com, Inc., 3.150%, 08/22/2027 | | | 3,256,763 | | | 0.0 | |
| 1,750,000 | | AT&T, Inc., 3.500%, 06/01/2041 | | | 1,366,870 | | | 0.0 | |
| 4,426,000 | | AT&T, Inc., 3.550%, 09/15/2055 | | | 3,097,279 | | | 0.0 | |
| 9,508,000 | | AT&T, Inc., 3.650%, 09/15/2059 | | | 6,625,086 | | | 0.1 | |
| 649,000 | | AT&T, Inc., 4.500%, 05/15/2035 | | | 606,483 | | | 0.0 | |
| 3,480,000 | | AT&T, Inc., 4.900%, 08/15/2037 | | | 3,304,077 | | | 0.0 | |
| 2,314,000 | | Charter Communications Operating LLC / Charter Communications Operating Capital, 2.250%, 01/15/2029 | | | 1,969,699 | | | 0.0 | |
| 2,595,000 | | Charter Communications Operating LLC / Charter Communications Operating Capital, 4.400%, 12/01/2061 | | | 1,696,605 | | | 0.0 | |
| 3,201,000 | | Charter Communications Operating LLC / Charter Communications Operating Capital, 4.800%, 03/01/2050 | | | 2,371,518 | | | 0.0 | |
| 4,878,000 (2) | | Charter Communications Operating LLC / Charter Communications Operating Capital, 5.250%, 04/01/2053 | | | 3,867,484 | | | 0.1 | |
| 4,097,000 (2) | | Charter Communications Operating LLC / Charter Communications Operating Capital, 6.650%, 02/01/2034 | | | 4,201,312 | | | 0.1 | |
| 1,617,000 | | Cisco Systems, Inc., 4.800%, 02/26/2027 | | | 1,620,122 | | | 0.0 | |
See Accompanying Notes to Financial Statements
| Voya Intermediate Bond Fund | PORTFOLIO OF INVESTMENTS |
| as of March 31, 2024 (continued) |
| | |
| | | | | | | | Percentage | |
| Principal | | | | | | | of Net | |
| Amount† | | | | Value | | | Assets | |
| CORPORATE BONDS/NOTES: (continued) | | | | | | |
| | | Communications: (continued) | | | | | | | |
| 3,240,000 | | Cisco Systems, Inc., 4.850%, 02/26/2029 | | $ | 3,265,465 | | | 0.0 | |
| 4,040,000 | | Cisco Systems, Inc., 4.950%, 02/26/2031 | | | 4,077,751 | | | 0.1 | |
| 4,090,000 | | Cisco Systems, Inc., 5.050%, 02/26/2034 | | | 4,146,954 | | | 0.1 | |
| 2,556,000 | | Cisco Systems, Inc., 5.300%, 02/26/2054 | | | 2,625,667 | | | 0.0 | |
| 2,891,000 | | Cisco Systems, Inc., 5.350%, 02/26/2064 | | | 2,965,321 | | | 0.0 | |
| 4,012,000 | | Comcast Corp., 1.950%, 01/15/2031 | | | 3,334,766 | | | 0.0 | |
| 4,396,000 | | Comcast Corp., 2.650%, 02/01/2030 | | | 3,911,393 | | | 0.1 | |
| 2,856,000 | | Comcast Corp., 3.200%, 07/15/2036 | | | 2,347,920 | | | 0.0 | |
| 3,023,000 | | Comcast Corp., 3.900%, 03/01/2038 | | | 2,636,198 | | | 0.0 | |
| 8,557,000 | | Comcast Corp., 5.500%, 05/15/2064 | | | 8,574,807 | | | 0.1 | |
| 1,446,000 (1) | | Cox Communications, Inc., 5.800%, 12/15/2053 | | | 1,434,396 | | | 0.0 | |
| 4,420,000 (1) | | GCI LLC, 4.750%, 10/15/2028 | | | 4,056,767 | | | 0.1 | |
| 4,245,000 (1)(2) | | Gray Television, Inc., 7.000%, 05/15/2027 | | | 3,951,465 | | | 0.1 | |
| 5,000,000 (1) | | Match Group Holdings II LLC, 3.625%, 10/01/2031 | | | 4,253,314 | | | 0.1 | |
| 2,528,000 | | Meta Platforms, Inc., 3.500%, 08/15/2027 | | | 2,433,047 | | | 0.0 | |
| 9,420,000 | | Meta Platforms, Inc., 4.450%, 08/15/2052 | | | 8,381,271 | | | 0.1 | |
| 884,000 | | Meta Platforms, Inc., 4.650%, 08/15/2062 | | | 794,702 | | | 0.0 | |
| 6,909,000 | | Meta Platforms, Inc., 5.750%, 05/15/2063 | | | 7,412,629 | | | 0.1 | |
| 2,473,000 | | Motorola Solutions, Inc., 5.000%, 04/15/2029 | | | 2,461,816 | | | 0.0 | |
| 2,160,000 (1)(2) | | NBN Co. Ltd., 1.450%, 05/05/2026 | | | 2,000,142 | | | 0.0 | |
| 3,800,000 (1) | | NBN Co. Ltd., 1.625%, 01/08/2027 | | | 3,469,487 | | | 0.0 | |
| 1,803,000 (1) | | NBN Co. Ltd., 2.500%, 01/08/2032 | | | 1,505,633 | | | 0.0 | |
| 3,242,000 (1) | | NBN Co. Ltd., 6.000%, 10/06/2033 | | | 3,453,687 | | | 0.0 | |
| 3,992,000 | | Netflix, Inc., 5.875%, 11/15/2028 | | | 4,151,333 | | | 0.1 | |
| 183,000 | | Paramount Global, 4.375%, 03/15/2043 | | | 124,346 | | | 0.0 | |
| 1,157,000 | | Paramount Global, 4.950%, 05/19/2050 | | | 823,246 | | | 0.0 | |
| 2,025,000 | | Paramount Global, 5.850%, 09/01/2043 | | | 1,642,454 | | | 0.0 | |
| 4,305,000 (1) | | Sirius XM Radio, Inc., 5.500%, 07/01/2029 | | | 4,103,377 | | | 0.1 | |
| 4,944,000 | | Sprint Capital Corp., 6.875%, 11/15/2028 | | | 5,272,440 | | | 0.1 | |
| | | | | | | | Percentage | |
| Principal | | | | | | | of Net | |
| Amount† | | | | Value | | | Assets | |
| CORPORATE BONDS/NOTES: (continued) | | | | | | |
| | | Communications: (continued) | | | | | | | |
| 8,010,000 | | Sprint Capital Corp., 8.750%, 03/15/2032 | | $ | 9,718,189 | | | 0.1 | |
| 4,365,000 | | Telecom Italia Capital SA, 7.721%, 06/04/2038 | | | 4,375,232 | | | 0.1 | |
| 5,387,000 | | Time Warner Cable LLC, 5.500%, 09/01/2041 | | | 4,488,901 | | | 0.1 | |
| 2,829,000 | | Time Warner Cable LLC, 5.875%, 11/15/2040 | | | 2,452,904 | | | 0.0 | |
| 2,569,000 | | T-Mobile USA, Inc., 2.050%, 02/15/2028 | | | 2,302,591 | | | 0.0 | |
| 642,000 | | T-Mobile USA, Inc., 2.250%, 02/15/2026 | | | 607,899 | | | 0.0 | |
| 1,948,000 | | T-Mobile USA, Inc., 2.625%, 02/15/2029 | | | 1,745,068 | | | 0.0 | |
| 7,173,000 | | T-Mobile USA, Inc., 3.500%, 04/15/2031 | | | 6,484,299 | | | 0.1 | |
| 5,747,000 | | T-Mobile USA, Inc., 3.875%, 04/15/2030 | | | 5,385,381 | | | 0.1 | |
| 1,048,000 | | T-Mobile USA, Inc., 4.375%, 04/15/2040 | | | 933,912 | | | 0.0 | |
| 899,000 | | T-Mobile USA, Inc., 4.500%, 04/15/2050 | | | 779,813 | | | 0.0 | |
| 2,640,000 | | T-Mobile USA, Inc., 5.750%, 01/15/2054 | | | 2,735,740 | | | 0.0 | |
| 1,745,000 | | T-Mobile USA, Inc., 6.000%, 06/15/2054 | | | 1,866,563 | | | 0.0 | |
| 4,595,000 (1)(2) | | Univision Communications, Inc., 4.500%, 05/01/2029 | | | 4,110,385 | | | 0.1 | |
| 311,000 | | Verizon Communications, Inc., 1.750%, 01/20/2031 | | | 252,543 | | | 0.0 | |
| 4,024,000 | | Verizon Communications, Inc., 2.355%, 03/15/2032 | | | 3,308,373 | | | 0.0 | |
| 315,000 | | Verizon Communications, Inc., 2.550%, 03/21/2031 | | | 269,195 | | | 0.0 | |
| 1,312,000 | | Verizon Communications, Inc., 3.400%, 03/22/2041 | | | 1,026,082 | | | 0.0 | |
| 3,610,000 | | Verizon Communications, Inc., 3.850%, 11/01/2042 | | | 2,971,214 | | | 0.0 | |
| 1,361,000 | | Verizon Communications, Inc., 4.400%, 11/01/2034 | | | 1,283,668 | | | 0.0 | |
| 4,650,000 | | Verizon Communications, Inc., 4.812%, 03/15/2039 | | | 4,392,935 | | | 0.1 | |
| 1,778,000 | | Verizon Communications, Inc., 5.500%, 02/23/2054 | | | 1,798,498 | | | 0.0 | |
| 3,657,000 | | Verizon Communications, Inc., 6.550%, 09/15/2043 | | | 4,147,944 | | | 0.1 | |
| 4,085,000 (1)(2) | | Viasat, Inc., 5.625%, 04/15/2027 | | | 3,871,111 | | | 0.1 | |
See Accompanying Notes to Financial Statements
| Voya Intermediate Bond Fund | PORTFOLIO OF INVESTMENTS |
| as of March 31, 2024 (continued) |
| | |
| | | | | | | | Percentage | |
| Principal | | | | | | | of Net | |
| Amount† | | | | Value | | | Assets | |
| CORPORATE BONDS/NOTES: (continued) | | | | | | |
| | | Communications: (continued) | | | | | | | |
| 4,660,000 (1)(2) | | Vmed O2 UK Financing I PLC, 4.750%, 07/15/2031 | | $ | 4,020,924 | | | 0.1 | |
| 1,950,000 (1) | | Vmed O2 UK Financing I PLC, 7.750%, 04/15/2032 | | | 1,958,082 | | | 0.0 | |
| | | | | | 213,375,944 | | | 2.5 | |
| | | Consumer, Cyclical: 2.2% | | | | | | | |
| 322,304 | | American Airlines Pass Through Trust 2015-2, AA, 3.600%, 03/22/2029 | | | 305,269 | | | 0.0 | |
| 1,982,832 | | American Airlines Pass Through Trust 2016-1, AA, 3.575%, 07/15/2029 | | | 1,859,717 | | | 0.0 | |
| 387,163 | | American Airlines Pass Through Trust 2016-2, A, 3.650%, 12/15/2029 | | | 355,395 | | | 0.0 | |
| 2,618,409 | | American Airlines Pass Through Trust 2016-2, AA, 3.200%, 12/15/2029 | | | 2,408,978 | | | 0.0 | |
| 5,126,992 | | American Airlines Pass Through Trust 2017-2, AA, 3.350%, 04/15/2031 | | | 4,700,437 | | | 0.1 | |
| 1,040,605 | | American Airlines Pass Through Trust 2019-1, AA, 3.150%, 08/15/2033 | | | 932,348 | | | 0.0 | |
| 4,028,000 | | American Honda Finance Corp., 4.700%, 01/12/2028 | | | 4,013,609 | | | 0.1 | |
| 2,177,000 | | American Honda Finance Corp., 5.650%, 11/15/2028 | | | 2,244,362 | | | 0.0 | |
| 585,000 | | American Honda Finance Corp., GMTN, 4.900%, 01/10/2034 | | | 576,306 | | | 0.0 | |
| 1,893,000 | | American Honda Finance Corp., GMTN, 5.125%, 07/07/2028 | | | 1,915,369 | | | 0.0 | |
| 3,521,000 | | American Honda Finance Corp., GMTN, 5.850%, 10/04/2030 | | | 3,685,251 | | | 0.0 | |
| 4,430,000 | | Asbury Automotive Group, Inc., 4.750%, 03/01/2030 | | | 4,083,942 | | | 0.1 | |
| 1,443,000 | | AutoZone, Inc., 6.250%, 11/01/2028 | | | 1,514,423 | | | 0.0 | |
| 4,405,000 | | Bath & Body Works, Inc., 6.750%, 07/01/2036 | | | 4,452,622 | | | 0.1 | |
| 1,385,000 | | Cummins, Inc., 4.900%, 02/20/2029 | | | 1,393,770 | | | 0.0 | |
| 3,506,922 | | Delta Air Lines Pass Through Trust 20-1, A, 2.500%, 12/10/2029 | | | 3,158,304 | | | 0.0 | |
| | | | | | | | Percentage | |
| Principal | | | | | | | of Net | |
| Amount† | | | | Value | | | Assets | |
| CORPORATE BONDS/NOTES: (continued) | | | | | | |
| | | Consumer, Cyclical: (continued) | | | | | | | |
| 1,118,700 | | Delta Air Lines Pass Through Trust 2015-1, AA, 3.625%, 01/30/2029 | | $ | 1,059,321 | | | 0.0 | |
| 685,049 (1) | | Delta Air Lines, Inc. / SkyMiles IP Ltd., 4.750%, 10/20/2028 | | | 670,245 | | | 0.0 | |
| 3,850,000 (2) | | Ford Motor Co., 6.100%, 08/19/2032 | | | 3,903,706 | | | 0.1 | |
| 3,720,000 | | Ford Motor Credit Co. LLC, 5.113%, 05/03/2029 | | | 3,613,632 | | | 0.0 | |
| 3,566,000 (2) | | Ford Motor Credit Co. LLC, 5.800%, 03/08/2029 | | | 3,581,842 | | | 0.0 | |
| 2,333,000 | | General Motors Co., 6.125%, 10/01/2025 | | | 2,353,620 | | | 0.0 | |
| 1,736,000 | | General Motors Financial Co., Inc., 5.400%, 05/08/2027 | | | 1,741,072 | | | 0.0 | |
| 4,534,000 | | General Motors Financial Co., Inc., 5.750%, 02/08/2031 | | | 4,584,741 | | | 0.1 | |
| 1,908,000 | | General Motors Financial Co., Inc., 6.100%, 01/07/2034 | | | 1,959,881 | | | 0.0 | |
| 4,340,000 (1) | | H&E Equipment Services, Inc., 3.875%, 12/15/2028 | | | 3,978,514 | | | 0.1 | |
| 3,781,000 | | Home Depot, Inc., 2.700%, 04/15/2030 | | | 3,369,616 | | | 0.0 | |
| 3,568,000 | | Home Depot, Inc., 4.900%, 04/15/2029 | | | 3,604,637 | | | 0.0 | |
| 959,000 (1) | | Hyundai Capital America, 5.400%, 01/08/2031 | | | 963,526 | | | 0.0 | |
| 3,050,000 (1) | | Hyundai Capital America, 5.680%, 06/26/2028 | | | 3,093,470 | | | 0.0 | |
| 5,138,000 (1) | | Hyundai Capital America, 6.100%, 09/21/2028 | | | 5,295,865 | | | 0.1 | |
| 3,473,000 (1) | | Hyundai Capital America, 6.500%, 01/16/2029 | | | 3,645,412 | | | 0.0 | |
| 1,692,000 | | Lowe's Cos., Inc., 4.450%, 04/01/2062 | | | 1,383,805 | | | 0.0 | |
| 2,043,000 | | Lowe's Cos., Inc., 5.750%, 07/01/2053 | | | 2,110,291 | | | 0.0 | |
| 1,554,000 | | Lowe's Cos., Inc., 5.850%, 04/01/2063 | | | 1,604,439 | | | 0.0 | |
| 5,000,000 | | Macy's Retail Holdings LLC, 4.500%, 12/15/2034 | | | 4,406,846 | | | 0.1 | |
| 1,513,000 | | Marriott International, Inc., 4.875%, 05/15/2029 | | | 1,498,675 | | | 0.0 | |
| 1,958,000 | | Marriott International, Inc., 5.300%, 05/15/2034 | | | 1,937,347 | | | 0.0 | |
See Accompanying Notes to Financial Statements
| Voya Intermediate Bond Fund | PORTFOLIO OF INVESTMENTS |
| as of March 31, 2024 (continued) |
| | |
| | | | | | Percentage | |
| Principal | | | | | of Net | |
| Amount† | | Value | | | Assets | |
| CORPORATE BONDS/NOTES: (continued) | | | | | | | |
| | | Consumer, Cyclical: (continued) | | | | | | | |
| 1,350,700 (1) | | Mileage Plus Holdings LLC / Mileage Plus Intellectual Property Assets Ltd., 6.500%, 06/20/2027 | | $ | 1,359,217 | | | 0.0 | |
| 3,804,000 | | PACCAR Financial Corp. mtn, mtn, 5.000%, 03/22/2034 | | | 3,825,158 | | | 0.1 | |
| 8,295,000 | | Sally Holdings LLC / Sally Capital, Inc., 6.750%, 03/01/2032 | | | 8,237,117 | | | 0.1 | |
| 1,820,000 (1) | | Tempur Sealy International, Inc., 3.875%, 10/15/2031 | | | 1,547,338 | | | 0.0 | |
| 4,610,000 (1)(2) | | Tempur Sealy International, Inc., 4.000%, 04/15/2029 | | | 4,187,794 | | | 0.1 | |
| 4,020,000 | | Toyota Motor Credit Corp., 5.550%, 11/20/2030 | | | 4,161,103 | | | 0.1 | |
| 1,503,000 | | Toyota Motor Credit Corp., MTN, 1.900%, 01/13/2027 | | | 1,388,085 | | | 0.0 | |
| 5,032,000 | | Toyota Motor Credit Corp., MTN, 4.550%, 09/20/2027 | | | 4,985,275 | | | 0.1 | |
| 1,051,194 | | United Airlines Pass Through Trust 20-1, A, 5.875%, 04/15/2029 | | | 1,048,798 | | | 0.0 | |
| 4,116,095 | | United Airlines Pass Through Trust 2016-2, AA, 2.875%, 04/07/2030 | | | 3,735,599 | | | 0.1 | |
| 2,325,000 (1) | | United Airlines, Inc., 4.625%, 04/15/2029 | | | 2,164,843 | | | 0.0 | |
| 1,884,200 | | US Airways Pass Through Trust 2012-1, A, 5.900%, 04/01/2026 | | | 1,881,178 | | | 0.0 | |
| 198,955 | | US Airways Pass Through Trust 2012-2, A, 4.625%, 12/03/2026 | | | 195,776 | | | 0.0 | |
| 7,435,000 (1) | | Volkswagen Group of America Finance LLC, 5.250%, 03/22/2029 | | | 7,443,692 | | | 0.1 | |
| 8,045,000 (1) | | Volkswagen Group of America Finance LLC, 5.300%, 03/22/2027 | | | 8,064,257 | | | 0.1 | |
| 1,978,000 (1) | | Volkswagen Group of America Finance LLC, 5.900%, 09/12/2033 | | | 2,036,771 | | | 0.0 | |
| 6,058,000 (1) | | Volkswagen Group of America Finance LLC, 6.450%, 11/16/2030 | | | 6,439,478 | | | 0.1 | |
| 4,943,000 | | Walmart, Inc., 4.000%, 04/15/2030 | | | 4,828,009 | | | 0.1 | |
| 9,092,000 | | Warnermedia Holdings, Inc., 3.755%, 03/15/2027 | | | 8,679,189 | | | 0.1 | |
| 2,288,000 | | Warnermedia Holdings, Inc., 5.050%, 03/15/2042 | | | 1,967,616 | | | 0.0 | |
| | | | | | Percentage | |
| Principal | | | | | of Net | |
| Amount† | | Value | | | Assets | |
| CORPORATE BONDS/NOTES: (continued) | | | | | | |
| | | Consumer, Cyclical: (continued) | | | | |
| 4,990,000 | | Warnermedia Holdings, Inc., 5.141%, 03/15/2052 | | $ | 4,144,921 | | | 0.1 | |
| 1,163,000 | | Warnermedia Holdings, Inc., 5.391%, 03/15/2062 | | | 966,064 | | | 0.0 | |
| 3,925,000 (1) | | ZF North America Capital, Inc., 7.125%, 04/14/2030 | | | 4,139,450 | | | 0.1 | |
| | | | | | 185,387,333 | | | 2.2 | |
| | | Consumer, Non-cyclical: 5.3% | | | | | | | |
| 3,670,000 | | AbbVie, Inc., 2.600%, 11/21/2024 | | | 3,604,599 | | | 0.1 | |
| 1,591,000 | | AbbVie, Inc., 3.200%, 11/21/2029 | | | 1,466,473 | | | 0.0 | |
| 2,351,000 | | AbbVie, Inc., 4.050%, 11/21/2039 | | | 2,094,663 | | | 0.0 | |
| 7,016,000 | | AbbVie, Inc., 4.300%, 05/14/2036 | | | 6,592,276 | | | 0.1 | |
| 5,481,000 | | AbbVie, Inc., 4.500%, 05/14/2035 | | | 5,272,161 | | | 0.1 | |
| 1,059,000 | | AbbVie, Inc., 4.550%, 03/15/2035 | | | 1,024,050 | | | 0.0 | |
| 5,948,000 | | AbbVie, Inc., 4.950%, 03/15/2031 | | | 5,993,425 | | | 0.1 | |
| 3,606,000 | | AbbVie, Inc., 5.050%, 03/15/2034 | | | 3,652,393 | | | 0.1 | |
| 3,493,000 | | AbbVie, Inc., 5.400%, 03/15/2054 | | | 3,598,162 | | | 0.1 | |
| 3,512,000 | | AbbVie, Inc., 5.500%, 03/15/2064 | | | 3,614,739 | | | 0.1 | |
| 4,305,000 (1)(2) | | ADT Security Corp., 4.125%, 08/01/2029 | | | 3,948,143 | | | 0.1 | |
| 2,339,000 | | Aetna, Inc., 6.625%, 06/15/2036 | | | 2,566,080 | | | 0.0 | |
| 4,460,000 (1) | | Albertsons Cos., Inc. / Safeway, Inc. / New Albertsons L.P. / Albertsons LLC, 3.500%, 03/15/2029 | | | 4,007,309 | | | 0.1 | |
| 3,028,000 | | Altria Group, Inc., 6.200%, 11/01/2028 | | | 3,158,236 | | | 0.0 | |
| 3,126,000 | | Amgen, Inc., 5.750%, 03/02/2063 | | | 3,190,853 | | | 0.0 | |
| 4,324,000 | | Anheuser-Busch InBev Worldwide, Inc., 5.450%, 01/23/2039 | | | 4,466,957 | | | 0.1 | |
| 5,948,000 | | Astrazeneca Finance LLC, 4.900%, 02/26/2031 | | | 5,970,620 | | | 0.1 | |
| 265,000 | | BAT Capital Corp., 3.557%, 08/15/2027 | | | 251,024 | | | 0.0 | |
| 2,393,000 | | BAT Capital Corp., 3.734%, 09/25/2040 | | | 1,775,431 | | | 0.0 | |
| 1,771,000 | | BAT Capital Corp., 4.390%, 08/15/2037 | | | 1,489,602 | | | 0.0 | |
| 1,472,000 | | BAT Capital Corp., 5.834%, 02/20/2031 | | | 1,485,454 | | | 0.0 | |
See Accompanying Notes to Financial Statements
| Voya Intermediate Bond Fund | PORTFOLIO OF INVESTMENTS |
| as of March 31, 2024 (continued) |
| | |
| | | | | | | | Percentage | |
| Principal | | | | | | | of Net | |
| Amount† | | | | Value | | | Assets | |
| CORPORATE BONDS/NOTES: (continued) | | | | | | |
| | | Consumer, Non-cyclical: (continued) | | | | |
| 4,492,000 | | BAT Capital Corp., 6.000%, 02/20/2034 | | $ | 4,551,277 | | | 0.1 | |
| 2,657,000 | | BAT Capital Corp., 7.079%, 08/02/2043 | | | 2,836,948 | | | 0.0 | |
| 3,704,000 | | BAT Capital Corp., 7.081%, 08/02/2053 | | | 3,996,820 | | | 0.1 | |
| 4,315,000 | | Becton Dickinson & Co., 4.693%, 02/13/2028 | | | 4,272,787 | | | 0.1 | |
| 1,474,000 | | Bristol-Myers Squibb Co., 4.125%, 06/15/2039 | | | 1,306,965 | | | 0.0 | |
| 2,474,000 | | Bristol-Myers Squibb Co., 5.100%, 02/22/2031 | | | 2,499,080 | | | 0.0 | |
| 2,519,000 | | Bristol-Myers Squibb Co., 5.650%, 02/22/2064 | | | 2,593,806 | | | 0.0 | |
| 3,042,000 | | Bristol-Myers Squibb Co., 6.400%, 11/15/2063 | | | 3,479,635 | | | 0.1 | |
| 3,462,000 | | Campbell Soup Co., 5.200%, 03/21/2029 | | | 3,479,882 | | | 0.1 | |
| 1,050,000 | | Cardinal Health, Inc., 5.450%, 02/15/2034 | | | 1,061,972 | | | 0.0 | |
| 2,552,000 (1) | | Cargill, Inc., 1.700%, 02/02/2031 | | | 2,075,321 | | | 0.0 | |
| 2,183,000 (1) | | Cargill, Inc., 2.125%, 04/23/2030 | | | 1,869,123 | | | 0.0 | |
| 4,313,000 (1) | | Cargill, Inc., 2.125%, 11/10/2031 | | | 3,536,249 | | | 0.1 | |
| 3,895,000 | | Cencora, Inc., 5.125%, 02/15/2034 | | | 3,889,831 | | | 0.1 | |
| 2,936,000 | | Centene Corp., 2.500%, 03/01/2031 | | | 2,417,451 | | | 0.0 | |
| 1,790,000 | | Centene Corp., 2.625%, 08/01/2031 | | | 1,470,711 | | | 0.0 | |
| 25,057,000 | | Centene Corp., 3.000%, 10/15/2030 | | | 21,506,092 | | | 0.3 | |
| 3,190,000 | | Centene Corp., 4.625%, 12/15/2029 | | | 3,030,801 | | | 0.0 | |
| 3,471,000 | | Cigna Group, 3.250%, 04/15/2025 | | | 3,395,014 | | | 0.0 | |
| 7,297,000 | | Cigna Group, 4.800%, 08/15/2038 | | | 6,859,028 | | | 0.1 | |
| 3,597,000 | | Cigna Group, 5.250%, 02/15/2034 | | | 3,593,259 | | | 0.1 | |
| 5,104,000 | | Cigna Group, 5.600%, 02/15/2054 | | | 5,126,704 | | | 0.1 | |
| 3,225,000 (1) | | CSL Finance PLC, 5.417%, 04/03/2054 | | | 3,241,837 | | | 0.0 | |
| 4,475,000 | | CVS Health Corp., 2.700%, 08/21/2040 | | | 3,110,633 | | | 0.0 | |
| 2,465,000 | | CVS Health Corp., 3.875%, 07/20/2025 | | | 2,419,476 | | | 0.0 | |
| 3,492,000 | | CVS Health Corp., 4.125%, 04/01/2040 | | | 2,944,480 | | | 0.0 | |
| 2,326,000 | | CVS Health Corp., 4.780%, 03/25/2038 | | | 2,149,074 | | | 0.0 | |
| 2,253,000 | | CVS Health Corp., 6.000%, 06/01/2063 | | | 2,327,953 | | | 0.0 | |
| | | | | | | | Percentage | |
| Principal | | | | | | | of Net | |
| Amount† | | | | Value | | | Assets | |
| CORPORATE BONDS/NOTES: (continued) | | | | | | |
| | | Consumer, Non-cyclical: (continued) | | | | |
| 4,950,000 (1) | | DaVita, Inc., 3.750%, 02/15/2031 | | $ | 4,148,704 | | | 0.1 | |
| 4,395,000 (1) | | DaVita, Inc., 4.625%, 06/01/2030 | | | 3,937,673 | | | 0.1 | |
| 6,019,000 (1) | | Element Fleet Management Corp., 5.643%, 03/13/2027 | | | 6,039,575 | | | 0.1 | |
| 1,778,000 | | Elevance Health, Inc., 4.900%, 02/08/2026 | | | 1,767,077 | | | 0.0 | |
| 2,402,000 | | Eli Lilly & Co., 4.700%, 02/09/2034 | | | 2,389,776 | | | 0.0 | |
| 1,506,000 | | Eli Lilly & Co., 5.000%, 02/09/2054 | | | 1,498,672 | | | 0.0 | |
| 2,843,000 (1) | | ERAC USA Finance LLC, 5.200%, 10/30/2034 | | | 2,835,985 | | | 0.0 | |
| 10,098,000 | | Global Payments, Inc., 1.200%, 03/01/2026 | | | 9,344,587 | | | 0.1 | |
| 3,389,000 | | Global Payments, Inc., 5.950%, 08/15/2052 | | | 3,385,582 | | | 0.0 | |
| 1,282,000 | | HCA, Inc., 2.375%, 07/15/2031 | | | 1,054,839 | | | 0.0 | |
| 2,570,000 | | HCA, Inc., 3.125%, 03/15/2027 | | | 2,431,242 | | | 0.0 | |
| 1,245,000 | | HCA, Inc., 3.500%, 09/01/2030 | | | 1,126,326 | | | 0.0 | |
| 8,542,000 | | HCA, Inc., 4.125%, 06/15/2029 | | | 8,091,940 | | | 0.1 | |
| 3,544,000 | | HCA, Inc., 4.375%, 03/15/2042 | | | 2,976,096 | | | 0.0 | |
| 3,076,000 | | HCA, Inc., 4.500%, 02/15/2027 | | | 3,016,873 | | | 0.0 | |
| 3,572,000 | | HCA, Inc., 5.125%, 06/15/2039 | | | 3,374,224 | | | 0.0 | |
| 1,449,000 | | HCA, Inc., 5.250%, 04/15/2025 | | | 1,443,291 | | | 0.0 | |
| 3,361,000 (2) | | HCA, Inc., 5.450%, 04/01/2031 | | | 3,379,696 | | | 0.0 | |
| 2,066,000 | | HCA, Inc., 6.000%, 04/01/2054 | | | 2,098,785 | | | 0.0 | |
| 1,823,000 | | HCA, Inc., 6.100%, 04/01/2064 | | | 1,839,602 | | | 0.0 | |
| 2,509,000 (1) | | Health Care Service Corp. A Mutual Legal Reserve Co., 1.500%, 06/01/2025 | | | 2,394,549 | | | 0.0 | |
| 3,459,000 | | Humana, Inc., 5.375%, 04/15/2031 | | | 3,461,878 | | | 0.0 | |
| 3,259,000 | | Johnson & Johnson, 3.625%, 03/03/2037 | | | 2,894,066 | | | 0.0 | |
| 5,044,000 | | Kenvue, Inc., 4.900%, 03/22/2033 | | | 5,043,419 | | | 0.1 | |
| 2,085,000 | | Kenvue, Inc., 5.050%, 03/22/2028 | | | 2,108,576 | | | 0.0 | |
| 1,734,000 (2) | | Kenvue, Inc., 5.100%, 03/22/2043 | | | 1,725,558 | | | 0.0 | |
| 3,660,000 | | Kenvue, Inc., 5.200%, 03/22/2063 | | | 3,623,891 | | | 0.1 | |
| 1,776,000 | | Keurig Dr Pepper, Inc., 5.050%, 03/15/2029 | | | 1,781,868 | | | 0.0 | |
See Accompanying Notes to Financial Statements
| Voya Intermediate Bond Fund | PORTFOLIO OF INVESTMENTS |
| as of March 31, 2024 (continued) |
| | |
| | | | | | | | Percentage | |
| Principal | | | | | | | of Net | |
| Amount† | | | | Value | | | Assets | |
| CORPORATE BONDS/NOTES: (continued) | | | | | | |
| | | Consumer, Non-cyclical: (continued) | | | | |
| 2,495,000 (1) | | Mars, Inc., 3.875%, 04/01/2039 | | $ | 2,162,069 | | | 0.0 | |
| 4,875,000 (1) | | Medline Borrower L.P., 3.875%, 04/01/2029 | | | 4,440,450 | | | 0.1 | |
| 4,301,000 | | Medtronic Global Holdings SCA, 4.500%, 03/30/2033 | | | 4,175,802 | | | 0.1 | |
| 10,375,000 (1)(2) | | Minerva Luxembourg SA, 8.875%, 09/13/2033 | | | 10,958,594 | | | 0.1 | |
| 2,809,000 | | Mondelez International, Inc., 4.750%, 02/20/2029 | | | 2,791,808 | | | 0.0 | |
| 2,819,000 (1)(2) | | Nestle Capital Corp., 4.875%, 03/12/2034 | | | 2,819,910 | | | 0.0 | |
| 1,987,000 (1) | | Nestle Capital Corp., 5.100%, 03/12/2054 | | | 1,979,666 | | | 0.0 | |
| 4,220,000 (1) | | Organon & Co / Organon Foreign Debt Co-Issuer BV, 4.125%, 04/30/2028 | | | 3,935,663 | | | 0.1 | |
| 5,271,000 | | PayPal Holdings, Inc., 2.300%, 06/01/2030 | | | 4,549,538 | | | 0.1 | |
| 6,588,000 | | PayPal Holdings, Inc., 5.250%, 06/01/2062 | | | 6,316,057 | | | 0.1 | |
| 2,350,000 | | Pfizer Investment Enterprises Pte Ltd., 4.650%, 05/19/2030 | | | 2,328,346 | | | 0.0 | |
| 9,947,000 | | Pfizer Investment Enterprises Pte Ltd., 4.750%, 05/19/2033 | | | 9,798,744 | | | 0.1 | |
| 1,893,000 | | Pfizer Investment Enterprises Pte Ltd., 5.300%, 05/19/2053 | | | 1,883,471 | | | 0.0 | |
| 12,502,000 | | Pfizer Investment Enterprises Pte Ltd., 5.340%, 05/19/2063 | | | 12,260,376 | | | 0.2 | |
| 3,997,000 | | Philip Morris International, Inc., 4.875%, 02/13/2029 | | | 3,974,262 | | | 0.1 | |
| 3,079,000 | | Philip Morris International, Inc., 5.250%, 02/13/2034 | | | 3,053,109 | | | 0.0 | |
| 2,580,000 | | Philip Morris International, Inc., 5.625%, 09/07/2033 | | | 2,639,973 | | | 0.0 | |
| 3,850,000 (1) | | Post Holdings, Inc., 4.625%, 04/15/2030 | | | 3,537,237 | | | 0.1 | |
| 4,410,000 (1) | | Post Holdings, Inc., 5.500%, 12/15/2029 | | | 4,265,315 | | | 0.1 | |
| 595,000 (1) | | Post Holdings, Inc., 6.250%, 02/15/2032 | | | 600,080 | | | 0.0 | |
| 4,380,000 (1) | | Primo Water Holdings, Inc., 4.375%, 04/30/2029 | | | 4,031,946 | | | 0.1 | |
| 1,150,000 | | Quest Diagnostics, Inc., 2.800%, 06/30/2031 | | | 986,016 | | | 0.0 | |
| 1,030,000 | | Quest Diagnostics, Inc., 2.950%, 06/30/2030 | | | 914,379 | | | 0.0 | |
| 2,469,000 | | Quest Diagnostics, Inc., 6.400%, 11/30/2033 | | | 2,668,629 | | | 0.0 | |
| | | | | | | | Percentage | |
| Principal | | | | | | | of Net | |
| Amount† | | | | Value | | | Assets | |
| CORPORATE BONDS/NOTES: (continued) | | | | | | |
| | | Consumer, Non-cyclical: (continued) | | | | |
| 3,855,000 | | Reynolds American, Inc., 5.850%, 08/15/2045 | | $ | 3,579,492 | | | 0.1 | |
| 4,296,000 (1) | | Roche Holdings, Inc., 5.338%, 11/13/2028 | | | 4,402,317 | | | 0.1 | |
| 7,106,000 (1) | | Roche Holdings, Inc., 5.489%, 11/13/2030 | | | 7,376,031 | | | 0.1 | |
| 1,859,000 (1) | | Roche Holdings, Inc., 5.593%, 11/13/2033 | | | 1,951,239 | | | 0.0 | |
| 1,626,000 | | Royalty Pharma PLC, 1.200%, 09/02/2025 | | | 1,530,967 | | | 0.0 | |
| 2,055,000 | | Royalty Pharma PLC, 1.750%, 09/02/2027 | | | 1,835,792 | | | 0.0 | |
| 1,466,000 | | Royalty Pharma PLC, 2.200%, 09/02/2030 | | | 1,218,726 | | | 0.0 | |
| 4,423,000 | | Royalty Pharma PLC, 3.300%, 09/02/2040 | | | 3,298,289 | | | 0.0 | |
| 1,749,000 | | S&P Global, Inc., 1.250%, 08/15/2030 | | | 1,414,191 | | | 0.0 | |
| 5,049,000 | | S&P Global, Inc., 2.700%, 03/01/2029 | | | 4,589,497 | | | 0.1 | |
| 3,423,000 | | S&P Global, Inc., 2.900%, 03/01/2032 | | | 2,984,605 | | | 0.0 | |
| 3,592,000 | | Smith & Nephew PLC, 5.400%, 03/20/2034 | | | 3,575,623 | | | 0.1 | |
| 3,465,000 (1) | | Solventum Corp., 5.450%, 03/13/2031 | | | 3,457,210 | | | 0.0 | |
| 3,702,000 (1) | | Solventum Corp., 5.600%, 03/23/2034 | | | 3,715,763 | | | 0.1 | |
| 1,662,000 (1) | | Solventum Corp., 5.900%, 04/30/2054 | | | 1,659,266 | | | 0.0 | |
| 4,774,000 | | Thermo Fisher Scientific, Inc., 4.977%, 08/10/2030 | | | 4,810,788 | | | 0.1 | |
| 3,809,000 | | Thermo Fisher Scientific, Inc., 5.000%, 01/31/2029 | | | 3,846,745 | | | 0.1 | |
| 2,461,000 (1) | | Triton Container International Ltd., 2.050%, 04/15/2026 | | | 2,275,121 | | | 0.0 | |
| 1,814,000 (1) | | Triton Container International Ltd., 3.150%, 06/15/2031 | | | 1,470,664 | | | 0.0 | |
| 3,034,000 | | Tyson Foods, Inc., 5.400%, 03/15/2029 | | | 3,062,237 | | | 0.0 | |
| 1,425,000 | | Tyson Foods, Inc., 5.700%, 03/15/2034 | | | 1,444,575 | | | 0.0 | |
| 1,874,000 | | Unilever Capital Corp., 5.000%, 12/08/2033 | | | 1,895,965 | | | 0.0 | |
| 1,470,000 | | UnitedHealth Group, Inc., 2.750%, 05/15/2040 | | | 1,082,646 | | | 0.0 | |
| 748,000 | | UnitedHealth Group, Inc., 3.050%, 05/15/2041 | | | 566,628 | | | 0.0 | |
| 2,117,000 | | UnitedHealth Group, Inc., 3.500%, 08/15/2039 | | | 1,745,764 | | | 0.0 | |
See Accompanying Notes to Financial Statements
| Voya Intermediate Bond Fund | PORTFOLIO OF INVESTMENTS |
| as of March 31, 2024 (continued) |
| | |
| | | | | | | | Percentage | |
| Principal | | | | | | | of Net | |
| Amount† | | | | Value | | | Assets | |
| CORPORATE BONDS/NOTES: (continued) | | | | | | |
| | | Consumer, Non-cyclical: (continued) | | | | |
| 1,590,000 | | UnitedHealth Group, Inc., 3.750%, 10/15/2047 | | $ | 1,262,432 | | | 0.0 | |
| 2,880,000 | | UnitedHealth Group, Inc., 5.000%, 04/15/2034 | | | 2,886,227 | | | 0.0 | |
| 3,168,000 | | UnitedHealth Group, Inc., 5.200%, 04/15/2063 | | | 3,084,127 | | | 0.0 | |
| 2,160,000 | | UnitedHealth Group, Inc., 5.375%, 04/15/2054 | | | 2,198,466 | | | 0.0 | |
| 2,295,000 | | UnitedHealth Group, Inc., 5.500%, 04/15/2064 | | | 2,336,811 | | | 0.0 | |
| 1,454,000 | | Utah Acquisition Sub, Inc., 5.250%, 06/15/2046 | | | 1,207,541 | | | 0.0 | |
| 3,434,000 | | Viatris, Inc., 2.700%, 06/22/2030 | | | 2,913,227 | | | 0.0 | |
| 6,513,000 | | Viatris, Inc., 3.850%, 06/22/2040 | | | 4,814,324 | | | 0.1 | |
| 2,851,000 | | Zimmer Biomet Holdings, Inc., 5.350%, 12/01/2028 | | | 2,893,507 | | | 0.0 | |
| | | | | | 452,937,452 | | | 5.3 | |
| | | Energy: 2.9% | | | | | | | |
| 3,900,000 (1) | | Antero Midstream Partners L.P. / Antero Midstream Finance Corp., 6.625%, 02/01/2032 | | | 3,920,264 | | | 0.1 | |
| 2,095,000 | | BP Capital Markets America, Inc., 2.939%, 06/04/2051 | | | 1,399,798 | | | 0.0 | |
| 1,754,000 | | BP Capital Markets America, Inc., 4.893%, 09/11/2033 | | | 1,742,582 | | | 0.0 | |
| 934,000 | | BP Capital Markets America, Inc., 4.989%, 04/10/2034 | | | 933,152 | | | 0.0 | |
| 3,175,000 (3) | | BP Capital Markets PLC, 4.875%, 12/31/2199 | | | 3,038,937 | | | 0.0 | |
| 1,209,000 | | Cenovus Energy, Inc., 5.400%, 06/15/2047 | | | 1,143,335 | | | 0.0 | |
| 465,000 | | Cheniere Energy Partners L.P., 4.500%, 10/01/2029 | | | 443,018 | | | 0.0 | |
| 4,203,000 (2) | | Cheniere Energy Partners L.P., 5.950%, 06/30/2033 | | | 4,300,522 | | | 0.1 | |
| 1,562,000 (1) | | Columbia Pipelines Holding Co. LLC, 6.042%, 08/15/2028 | | | 1,596,976 | | | 0.0 | |
| 1,799,000 | | ConocoPhillips Co., 5.550%, 03/15/2054 | | | 1,855,468 | | | 0.0 | |
| 3,837,000 | | ConocoPhillips Co., 5.700%, 09/15/2063 | | | 4,024,869 | | | 0.1 | |
| | | | | | Percentage | |
| Principal | | | | | of Net | |
| Amount† | | Value | | | Assets | |
| CORPORATE BONDS/NOTES: (continued) | | | | | | |
| | | Energy: (continued) | | | | | | | |
| 1,400,000 (1)(2) | | Cosan Luxembourg SA, 7.250%, 06/27/2031 | | $ | 1,428,700 | | | 0.0 | |
| 3,850,000 (1) | | Crescent Energy Finance LLC, 9.250%, 02/15/2028 | | | 4,068,414 | | | 0.1 | |
| 3,975,000 (1) | | Crestwood Midstream Partners L.P. / Crestwood Midstream Finance Corp., 5.625%, 05/01/2027 | | | 3,963,172 | | | 0.1 | |
| 4,975,000 | | Diamondback Energy, Inc., 4.250%, 03/15/2052 | | | 4,031,927 | | | 0.1 | |
| 836,000 | | Diamondback Energy, Inc., 6.250%, 03/15/2033 | | | 891,664 | | | 0.0 | |
| 4,425,000 (1) | | DT Midstream, Inc., 4.375%, 06/15/2031 | | | 4,010,660 | | | 0.1 | |
| 8,250,000 | | Ecopetrol SA, 6.875%, 04/29/2030 | | | 8,026,177 | | | 0.1 | |
| 12,510,000 | | Ecopetrol SA, 8.375%, 01/19/2036 | | | 12,638,978 | | | 0.2 | |
| 3,450,000 (1) | | EIG Pearl Holdings Sarl, 3.545%, 08/31/2036 | | | 2,959,453 | | | 0.0 | |
| 2,900,000 (2) | | EIG Pearl Holdings Sarl, 3.545%, 08/31/2036 | | | 2,487,656 | | | 0.0 | |
| 7,100,000 | | Empresa Nacional del Petroleo, 3.750%, 08/05/2026 | | | 6,790,236 | | | 0.1 | |
| 400,000 (1) | | Empresa Nacional del Petroleo, 3.750%, 08/05/2026 | | | 382,548 | | | 0.0 | |
| 5,373,000 (3) | | Enbridge, Inc. 20-A, 5.750%, 07/15/2080 | | | 5,091,472 | | | 0.1 | |
| 325,000 | | Energy Transfer L.P., 4.250%, 04/01/2024 | | | 325,000 | | | 0.0 | |
| 444,000 | | Energy Transfer L.P., 4.900%, 03/15/2035 | | | 420,065 | | | 0.0 | |
| 4,946,000 | | Energy Transfer L.P., 5.300%, 04/01/2044 | | | 4,551,297 | | | 0.1 | |
| 1,003,000 | | Energy Transfer L.P., 5.350%, 05/15/2045 | | | 927,185 | | | 0.0 | |
| 3,602,000 | | Energy Transfer L.P., 5.550%, 05/15/2034 | | | 3,615,223 | | | 0.0 | |
| 4,165,000 | | Energy Transfer L.P., 5.950%, 05/15/2054 | | | 4,159,049 | | | 0.1 | |
| 554,000 | | Energy Transfer L.P., 6.000%, 06/15/2048 | | | 551,250 | | | 0.0 | |
| 2,704,000 | | Energy Transfer L.P. 20Y, 5.800%, 06/15/2038 | | | 2,698,986 | | | 0.0 | |
| 3,800,000 (1) | | EnLink Midstream LLC, 6.500%, 09/01/2030 | | | 3,912,902 | | | 0.1 | |
| 2,292,000 (3) | | Enterprise Products Operating LLC D, 8.573%, (TSFR3M + 3.248%), 08/16/2077 | | | 2,291,621 | | | 0.0 | |
| 2,642,000 | | Equinor ASA, 3.125%, 04/06/2030 | | | 2,427,372 | | | 0.0 | |
See Accompanying Notes to Financial Statements
| Voya Intermediate Bond Fund | PORTFOLIO OF INVESTMENTS |
| as of March 31, 2024 (continued) |
| | |
| | | | | | | | Percentage | |
| Principal | | | | | | | of Net | |
| Amount† | | | | Value | | | Assets | |
| CORPORATE BONDS/NOTES: (continued) | | | | | | |
| | | Energy: (continued) | | | | | | | |
| 700,788 (1) | | Galaxy Pipeline Assets Bidco Ltd., 2.160%, 03/31/2034 | | $ | 605,306 | | | 0.0 | |
| 933,120 (1) | | Galaxy Pipeline Assets Bidco Ltd., 2.940%, 09/30/2040 | | | 751,782 | | | 0.0 | |
| 1,225,000 (1) | | Greensaif Pipelines Bidco Sarl, 6.129%, 02/23/2038 | | | 1,249,898 | | | 0.0 | |
| 2,875,000 (1) | | Greensaif Pipelines Bidco Sarl, 6.510%, 02/23/2042 | | | 2,999,883 | | | 0.0 | |
| 5,184,000 | | Hess Corp., 4.300%, 04/01/2027 | | | 5,084,560 | | | 0.1 | |
| 4,045,000 (1) | | Hilcorp Energy I L.P. / Hilcorp Finance Co., 6.000%, 02/01/2031 | | | 3,948,212 | | | 0.1 | |
| 3,900,000 (1)(2) | | Hilcorp Energy I L.P. / Hilcorp Finance Co., 8.375%, 11/01/2033 | | | 4,231,519 | | | 0.1 | |
| 1,295,000 | | Kinder Morgan Energy Partners L.P., 4.250%, 09/01/2024 | | | 1,286,833 | | | 0.0 | |
| 2,141,000 | | Kinder Morgan Energy Partners L.P., 5.000%, 03/01/2043 | | | 1,895,605 | | | 0.0 | |
| 3,850,000 | | Marathon Petroleum Corp., 5.125%, 12/15/2026 | | | 3,853,621 | | | 0.1 | |
| 1,491,000 | | MPLX L.P., 1.750%, 03/01/2026 | | | 1,394,615 | | | 0.0 | |
| 2,969,000 | | MPLX L.P., 2.650%, 08/15/2030 | | | 2,555,121 | | | 0.0 | |
| 5,080,000 | | MPLX L.P., 4.000%, 03/15/2028 | | | 4,893,347 | | | 0.1 | |
| 1,847,000 (1) | | Northern Natural Gas Co., 3.400%, 10/16/2051 | | | 1,290,155 | | | 0.0 | |
| 5,747,000 | | Occidental Petroleum Corp., 6.125%, 01/01/2031 | | | 5,957,168 | | | 0.1 | |
| 3,999,000 | | Occidental Petroleum Corp., 6.200%, 03/15/2040 | | | 4,106,145 | | | 0.1 | |
| 1,859,000 | | Occidental Petroleum Corp., 6.600%, 03/15/2046 | | | 2,004,714 | | | 0.0 | |
| 946,000 | | Occidental Petroleum Corp., 8.500%, 07/15/2027 | | | 1,027,555 | | | 0.0 | |
| 2,785,000 | | ONEOK Partners L.P., 6.200%, 09/15/2043 | | | 2,877,435 | | | 0.0 | |
| 1,900,000 | | ONEOK, Inc., 5.850%, 01/15/2026 | | | 1,918,867 | | | 0.0 | |
| 1,169,000 | | Ovintiv, Inc., 5.650%, 05/15/2028 | | | 1,188,957 | | | 0.0 | |
| 1,725,000 | | Ovintiv, Inc., 7.100%, 07/15/2053 | | | 1,931,586 | | | 0.0 | |
| 2,280,000 | | Petroleos del Peru SA, 4.750%, 06/19/2032 | | | 1,789,800 | | | 0.0 | |
| | | | | | | | Percentage | |
| Principal | | | | | | | of Net | |
| Amount† | | | | Value | | | Assets | |
| CORPORATE BONDS/NOTES: (continued) | | | | | | |
| | | Energy: (continued) | | | | | | | |
| 4,000,000 (1) | | Petroleos del Peru SA, 4.750%, 06/19/2032 | | $ | 3,140,000 | | | 0.0 | |
| 10,350,000 | | Petroleos Mexicanos, 5.950%, 01/28/2031 | | | 8,310,015 | | | 0.1 | |
| 8,053,000 | | Petroleos Mexicanos, 6.700%, 02/16/2032 | | | 6,716,202 | | | 0.1 | |
| 3,050,000 | | Petroleos Mexicanos, 10.000%, 02/07/2033 | | | 3,034,445 | | | 0.0 | |
| 3,468,000 | | Plains All American Pipeline L.P. / PAA Finance Corp., 4.650%, 10/15/2025 | | | 3,422,586 | | | 0.0 | |
| 4,750,000 (1)(2) | | Raizen Fuels Finance SA, 6.450%, 03/05/2034 | | | 4,864,000 | | | 0.1 | |
| 1,134,000 | | Sabine Pass Liquefaction LLC, 4.200%, 03/15/2028 | | | 1,098,466 | | | 0.0 | |
| 4,352,000 | | Sabine Pass Liquefaction LLC, 5.000%, 03/15/2027 | | | 4,340,810 | | | 0.1 | |
| 2,369,000 | | Schlumberger Investment SA, 2.650%, 06/26/2030 | | | 2,099,712 | | | 0.0 | |
| 1,937,000 | | Targa Resources Corp., 6.250%, 07/01/2052 | | | 2,013,296 | | | 0.0 | |
| 1,506,000 | | Targa Resources Corp., 6.500%, 03/30/2034 | | | 1,619,040 | | | 0.0 | |
| 3,430,000 | | Targa Resources Partners L.P. / Targa Resources Partners Finance Corp., 4.875%, 02/01/2031 | | | 3,286,596 | | | 0.0 | |
| 1,163,000 | | Transcontinental Gas Pipe Line Co. LLC, 3.250%, 05/15/2030 | | | 1,053,132 | | | 0.0 | |
| 8,090,000 (1) | | Venture Global LNG, Inc., 8.375%, 06/01/2031 | | | 8,348,022 | | | 0.1 | |
| 2,220,000 | | Western Midstream Operating L.P., 4.750%, 08/15/2028 | | | 2,161,291 | | | 0.0 | |
| 9,065,000 | | Western Midstream Operating L.P., 5.300%, 03/01/2048 | | | 7,959,666 | | | 0.1 | |
| 10,875,000 | | Williams Cos., Inc., 4.000%, 09/15/2025 | | | 10,672,346 | | | 0.1 | |
| 1,266,000 | | Williams Cos., Inc., 4.900%, 03/15/2029 | | | 1,258,224 | | | 0.0 | |
| 274,000 | | Williams Cos., Inc., 5.650%, 03/15/2033 | | | 281,232 | | | 0.0 | |
| | | | | | 241,571,693 | | | 2.9 | |
| | | Financial: 9.3% | | | | | | | |
| 4,863,000 (1)(3) | | ABN AMRO Bank NV, 3.324%, 03/13/2037 | | | 3,957,348 | | | 0.1 | |
| 1,942,000 | | Alleghany Corp., 3.250%, 08/15/2051 | | | 1,379,066 | | | 0.0 | |
| 4,113,000 | | Alleghany Corp., 4.900%, 09/15/2044 | | | 3,918,980 | | | 0.1 | |
See Accompanying Notes to Financial Statements
| Voya Intermediate Bond Fund | PORTFOLIO OF INVESTMENTS |
| as of March 31, 2024 (continued) |
| | |
| | | | | | | | Percentage | |
| Principal | | | | | | | of Net | |
| Amount† | | | | Value | | | Assets | |
| CORPORATE BONDS/NOTES: (continued) | | | | | | |
| | | Financial: (continued) | | | | | | | |
| 1,468,000 (3) | | American Express Co., 4.990%, 05/01/2026 | | $ | 1,459,667 | | | 0.0 | |
| 3,352,000 (3) | | American Express Co., 5.098%, 02/16/2028 | | | 3,347,982 | | | 0.0 | |
| 6,293,000 (3) | | American Express Co., 5.282%, 07/27/2029 | | | 6,334,883 | | | 0.1 | |
| 1,264,000 | | American Homes 4 Rent L.P., 2.375%, 07/15/2031 | | | 1,028,929 | | | 0.0 | |
| 1,310,000 | | American Homes 4 Rent L.P., 3.625%, 04/15/2032 | | | 1,152,434 | | | 0.0 | |
| 6,897,000 | | American Homes 4 Rent L.P., 5.500%, 02/01/2034 | | | 6,878,828 | | | 0.1 | |
| 3,691,000 | | American International Group, Inc., 3.400%, 06/30/2030 | | | 3,378,891 | | | 0.0 | |
| 4,541,000 | | American International Group, Inc., 4.200%, 04/01/2028 | | | 4,421,621 | | | 0.1 | |
| 5,353,000 | | American International Group, Inc., 5.125%, 03/27/2033 | | | 5,326,718 | | | 0.1 | |
| 2,537,000 | | American Tower Corp., 3.650%, 03/15/2027 | | | 2,432,804 | | | 0.0 | |
| 1,787,000 | | American Tower Corp., 5.250%, 07/15/2028 | | | 1,788,076 | | | 0.0 | |
| 3,872,000 | | American Tower Corp., 5.550%, 07/15/2033 | | | 3,903,777 | | | 0.1 | |
| 2,547,000 | | Ameriprise Financial, Inc., 5.700%, 12/15/2028 | | | 2,628,742 | | | 0.0 | |
| 3,321,000 | | Aon North America, Inc., 5.125%, 03/01/2027 | | | 3,342,054 | | | 0.0 | |
| 6,248,000 | | Aon North America, Inc., 5.150%, 03/01/2029 | | | 6,286,872 | | | 0.1 | |
| 1,217,000 | | Aon North America, Inc., 5.750%, 03/01/2054 | | | 1,248,816 | | | 0.0 | |
| 5,469,000 | | Arthur J Gallagher & Co., 5.450%, 07/15/2034 | | | 5,507,782 | | | 0.1 | |
| 1,757,000 | | Arthur J Gallagher & Co., 5.750%, 03/02/2053 | | | 1,764,542 | | | 0.0 | |
| 1,725,000 | | Arthur J Gallagher & Co., 5.750%, 07/15/2054 | | | 1,728,725 | | | 0.0 | |
| 585,000 | | Arthur J Gallagher & Co., 6.750%, 02/15/2054 | | | 664,638 | | | 0.0 | |
| 9,889,000 (1) | | Athene Global Funding, 5.684%, 02/23/2026 | | | 9,930,786 | | | 0.1 | |
| 3,620,000 | | Athene Holding Ltd., 6.250%, 04/01/2054 | | | 3,678,221 | | | 0.1 | |
| 4,559,000 (1) | | Aviation Capital Group LLC, 5.500%, 12/15/2024 | | | 4,542,650 | | | 0.1 | |
| | | | | | | | Percentage | |
| Principal | | | | | | | of Net | |
| Amount† | | | | Value | | | Assets | |
| CORPORATE BONDS/NOTES: (continued) | | | | | | |
| | | Financial: (continued) | | | | | | | |
| 3,800,000 (3) | | Banco Bilbao Vizcaya Argentaria SA, 7.883%, 11/15/2034 | | $ | 4,160,704 | | | 0.1 | |
| 4,025,000 (1) | | Banco do Brasil SA/ Cayman, 6.000%, 03/18/2031 | | | 4,029,025 | | | 0.1 | |
| 3,750,000 (1) | | Banco Nacional de Panama, 2.500%, 08/11/2030 | | | 2,929,688 | | | 0.0 | |
| 2,000,000 | | Banco Nacional de Panama, 2.500%, 08/11/2030 | | | 1,562,500 | | | 0.0 | |
| 4,200,000 | | Banco Santander SA, 2.746%, 05/28/2025 | | | 4,061,194 | | | 0.1 | |
| 4,200,000 (3) | | Banco Santander SA, 5.538%, 03/14/2030 | | | 4,201,090 | | | 0.1 | |
| 7,399,000 (3) | | Bank of America Corp., 1.734%, 07/22/2027 | | | 6,823,058 | | | 0.1 | |
| 1,181,000 (3) | | Bank of America Corp., 2.299%, 07/21/2032 | | | 966,737 | | | 0.0 | |
| 4,388,000 (3) | | Bank of America Corp., 2.572%, 10/20/2032 | | | 3,641,864 | | | 0.1 | |
| 2,714,000 (3) | | Bank of America Corp., 2.687%, 04/22/2032 | | | 2,298,112 | | | 0.0 | |
| 9,300,000 (3) | | Bank of America Corp., 3.419%, 12/20/2028 | | | 8,727,232 | | | 0.1 | |
| 3,221,000 (3) | | Bank of America Corp., 5.202%, 04/25/2029 | | | 3,225,041 | | | 0.0 | |
| 2,863,000 (3) | | Bank of America Corp., 5.288%, 04/25/2034 | | | 2,855,465 | | | 0.0 | |
| 5,065,000 (3) | | Bank of America Corp., 5.468%, 01/23/2035 | | | 5,099,934 | | | 0.1 | |
| 10,809,000 (3) | | Bank of America Corp., 5.872%, 09/15/2034 | | | 11,215,397 | | | 0.1 | |
| 4,136,000 (3) | | Bank of America Corp., GMTN, 3.593%, 07/21/2028 | | | 3,932,499 | | | 0.1 | |
| 1,495,000 (3) | | Bank of America Corp., MTN, 2.015%, 02/13/2026 | | | 1,448,602 | | | 0.0 | |
| 4,896,000 (3) | | Bank of America Corp., MTN, 2.087%, 06/14/2029 | | | 4,327,918 | | | 0.1 | |
| 2,299,000 (3) | | Bank of America Corp., MTN, 2.551%, 02/04/2028 | | | 2,137,558 | | | 0.0 | |
| 4,396,000 (3) | | Bank of America Corp., MTN, 2.884%, 10/22/2030 | | | 3,907,557 | | | 0.1 | |
| 3,188,000 (3) | | Bank of America Corp., MTN, 3.194%, 07/23/2030 | | | 2,896,303 | | | 0.0 | |
| 8,454,000 (3) | | Bank of America Corp., MTN, 4.271%, 07/23/2029 | | | 8,151,973 | | | 0.1 | |
| 1,703,000 (3) | | Bank of America Corp. N, 2.651%, 03/11/2032 | | | 1,439,750 | | | 0.0 | |
| 3,090,000 (2)(3) | | Bank of America Corp. RR, 4.375%, 12/31/2199 | | | 2,904,422 | | | 0.0 | |
See Accompanying Notes to Financial Statements
| Voya Intermediate Bond Fund | PORTFOLIO OF INVESTMENTS |
| as of March 31, 2024 (continued) |
| | |
| | | | | | | | Percentage | |
| Principal | | | | | | | of Net | |
| Amount† | | | | Value | | | Assets | |
| CORPORATE BONDS/NOTES: (continued) | | | | | | |
| | | Financial: (continued) | | | | | | | |
| 4,939,000 (3) | | Bank of New York Mellon Corp., MTN, 4.975%, 03/14/2030 | | $ | 4,945,268 | | | 0.1 | |
| 9,862,000 (3) | | Bank of New York Mellon Corp., MTN, 5.188%, 03/14/2035 | | | 9,820,381 | | | 0.1 | |
| 1,157,000 (3) | | Bank of New York Mellon Corp., MTN, 6.474%, 10/25/2034 | | | 1,260,602 | | | 0.0 | |
| 1,831,000 (3) | | Bank of Nova Scotia, 4.588%, 05/04/2037 | | | 1,661,241 | | | 0.0 | |
| 6,605,000 (1) | | Banque Federative du Credit Mutuel SA, 4.935%, 01/26/2026 | | | 6,565,413 | | | 0.1 | |
| 5,825,000 (1)(3) | | BBVA Bancomer SA/Texas, 8.125%, 01/08/2039 | | | 6,048,898 | | | 0.1 | |
| 1,891,000 | | BlackRock Funding, Inc., 5.000%, 03/14/2034 | | | 1,899,646 | | | 0.0 | |
| 3,861,000 | | BlackRock Funding, Inc., 5.250%, 03/14/2054 | | | 3,883,617 | | | 0.1 | |
| 1,667,000 (1) | | Blackstone Holdings Finance Co. LLC, 1.625%, 08/05/2028 | | | 1,451,428 | | | 0.0 | |
| 6,326,000 (1) | | Blackstone Holdings Finance Co. LLC, 2.000%, 01/30/2032 | | | 4,961,468 | | | 0.1 | |
| 695,000 (1) | | Blackstone Holdings Finance Co. LLC, 2.500%, 01/10/2030 | | | 604,167 | | | 0.0 | |
| 1,676,000 (1) | | Blue Owl Credit Income Corp., 6.650%, 03/15/2031 | | | 1,637,215 | | | 0.0 | |
| 3,592,000 | | Blue Owl Credit Income Corp., 7.750%, 09/16/2027 | | | 3,682,104 | | | 0.1 | |
| 2,818,000 (1)(3) | | BNP Paribas SA, 5.176%, 01/09/2030 | | | 2,819,456 | | | 0.0 | |
| 2,094,000 (1) | | BPCE SA, 5.150%, 07/21/2024 | | | 2,085,412 | | | 0.0 | |
| 3,469,000 (1) | | BPCE SA, 5.203%, 01/18/2027 | | | 3,477,155 | | | 0.0 | |
| 3,469,000 (1)(3) | | BPCE SA, 5.716%, 01/18/2030 | | | 3,487,134 | | | 0.0 | |
| 4,317,000 | | Brookfield Finance, Inc., 3.625%, 02/15/2052 | | | 3,153,915 | | | 0.0 | |
| 2,110,000 (1)(3) | | CaixaBank SA, 5.673%, 03/15/2030 | | | 2,110,013 | | | 0.0 | |
| 4,262,000 | | Camden Property Trust, 4.900%, 01/15/2034 | | | 4,148,924 | | | 0.1 | |
| 3,593,000 | | Camden Property Trust, 5.850%, 11/03/2026 | | | 3,662,691 | | | 0.1 | |
| 3,280,000 (3) | | Capital One Financial Corp., 1.878%, 11/02/2027 | | | 3,001,544 | | | 0.0 | |
| 3,436,000 (3) | | Charles Schwab Corp., 6.196%, 11/17/2029 | | | 3,572,961 | | | 0.0 | |
| | | | | | | | Percentage | |
| Principal | | | | | | | of Net | |
| Amount† | | | | Value | | | Assets | |
| CORPORATE BONDS/NOTES: (continued) | | | | | | |
| | | Financial: (continued) | | | | | | | |
| 1,450,000 (3) | | Charles Schwab Corp. H, 4.000%, 12/31/2199 | | $ | 1,225,257 | | | 0.0 | |
| 1,971,000 | | CI Financial Corp., 4.100%, 06/15/2051 | | | 1,232,768 | | | 0.0 | |
| 4,234,000 | | Citizens Financial Group, Inc., 2.500%, 02/06/2030 | | | 3,577,876 | | | 0.1 | |
| 4,143,000 (3) | | Citizens Financial Group, Inc., 5.641%, 05/21/2037 | | | 3,870,567 | | | 0.1 | |
| 2,954,000 | | CNA Financial Corp., 5.125%, 02/15/2034 | | | 2,875,779 | | | 0.0 | |
| 1,520,000 (1) | | Commonwealth Bank of Australia, 3.743%, 09/12/2039 | | | 1,215,383 | | | 0.0 | |
| 9,767,000 (1)(3) | | Cooperatieve Rabobank UA, 5.447%, 03/05/2030 | | | 9,814,382 | | | 0.1 | |
| 1,142,000 | | Corebridge Financial, Inc., 3.850%, 04/05/2029 | | | 1,068,280 | | | 0.0 | |
| 7,016,000 | | Corebridge Financial, Inc., 3.900%, 04/05/2032 | | | 6,317,270 | | | 0.1 | |
| 1,313,000 | | Corebridge Financial, Inc., 5.750%, 01/15/2034 | | | 1,340,464 | | | 0.0 | |
| 2,734,000 (1) | | Corebridge Financial, Inc., 6.050%, 09/15/2033 | | | 2,818,968 | | | 0.0 | |
| 5,228,000 (3) | | Corebridge Financial, Inc., 6.875%, 12/15/2052 | | | 5,239,492 | | | 0.1 | |
| 2,700,000 (1) | | Corp Financiera de Desarrollo SA, 2.400%, 09/28/2027 | | | 2,421,225 | | | 0.0 | |
| 1,962,000 | | Credit Suisse AG/ New York NY, 1.250%, 08/07/2026 | | | 1,787,965 | | | 0.0 | |
| 3,808,000 | | Credit Suisse AG/ New York NY, 5.000%, 07/09/2027 | | | 3,774,510 | | | 0.1 | |
| 1,983,000 | | Crown Castle, Inc., 2.100%, 04/01/2031 | | | 1,605,966 | | | 0.0 | |
| 386,000 | | Crown Castle, Inc., 2.500%, 07/15/2031 | | | 319,596 | | | 0.0 | |
| 2,566,000 | | Crown Castle, Inc., 2.900%, 03/15/2027 | | | 2,400,923 | | | 0.0 | |
| 4,451,000 | | Crown Castle, Inc., 4.800%, 09/01/2028 | | | 4,366,571 | | | 0.1 | |
| 1,164,000 | | Crown Castle, Inc., 5.100%, 05/01/2033 | | | 1,135,792 | | | 0.0 | |
| 2,321,000 | | Crown Castle, Inc., 5.600%, 06/01/2029 | | | 2,352,825 | | | 0.0 | |
| 2,002,000 | | Crown Castle, Inc., 5.800%, 03/01/2034 | | | 2,048,912 | | | 0.0 | |
| 3,580,000 | | CubeSmart L.P., 2.250%, 12/15/2028 | | | 3,143,451 | | | 0.0 | |
| 3,257,000 (1)(3) | | Danske Bank A/S, 5.705%, 03/01/2030 | | | 3,279,088 | | | 0.0 | |
See Accompanying Notes to Financial Statements
| Voya Intermediate Bond Fund | PORTFOLIO OF INVESTMENTS |
| as of March 31, 2024 (continued) |
| | |
| | | | | | | | Percentage | |
| Principal | | | | | | | of Net | |
| Amount† | | | | Value | | | Assets | |
| CORPORATE BONDS/NOTES: (continued) | | | | | | |
| | | Financial: (continued) | | | | | | | |
| 2,407,000 (1)(3) | | Depository Trust & Clearing Corp. D, 3.375%, 12/31/2199 | | $ | 2,142,230 | | | 0.0 | |
| 2,897,000 | | Discover Bank, 4.250%, 03/13/2026 | | | 2,823,654 | | | 0.0 | |
| 2,404,000 (3) | | Discover Bank, 5.974%, 08/09/2028 | | | 2,393,704 | | | 0.0 | |
| 1,662,000 | | Extra Space Storage L.P., 4.000%, 06/15/2029 | | | 1,569,010 | | | 0.0 | |
| 6,707,000 (1) | | Federation des Caisses Desjardins du Quebec, 5.250%, 04/26/2029 | | | 6,693,716 | | | 0.1 | |
| 5,226,000 (2) | | First Horizon Bank, 5.750%, 05/01/2030 | | | 4,949,198 | | | 0.1 | |
| 4,825,000 (3) | | Goldman Sachs Bank USA/New York NY, 5.283%, 03/18/2027 | | | 4,823,994 | | | 0.1 | |
| 4,015,000 | | Goldman Sachs BDC, Inc., 6.375%, 03/11/2027 | | | 4,046,915 | | | 0.1 | |
| 1,030,000 | | Hartford Financial Services Group, Inc., 5.950%, 10/15/2036 | | | 1,084,982 | | | 0.0 | |
| 5,651,000 (1)(3) | | Hartford Financial Services Group, Inc. ICON, 7.694%, (TSFR3M + 2.387%), 02/12/2067 | | | 5,034,719 | | | 0.1 | |
| 3,980,000 | | Healthpeak OP LLC, 5.250%, 12/15/2032 | | | 3,950,163 | | | 0.1 | |
| 2,116,000 (3) | | HSBC Holdings PLC, 1.589%, 05/24/2027 | | | 1,947,557 | | | 0.0 | |
| 9,069,000 (3) | | HSBC Holdings PLC, 2.099%, 06/04/2026 | | | 8,700,526 | | | 0.1 | |
| 6,688,000 (3) | | HSBC Holdings PLC, 2.206%, 08/17/2029 | | | 5,863,811 | | | 0.1 | |
| 4,759,000 (3) | | HSBC Holdings PLC, 2.633%, 11/07/2025 | | | 4,666,294 | | | 0.1 | |
| 3,307,000 (3) | | HSBC Holdings PLC, 2.999%, 03/10/2026 | | | 3,222,229 | | | 0.0 | |
| 1,835,000 (3) | | Huntington Bancshares, Inc., 2.487%, 08/15/2036 | | | 1,400,888 | | | 0.0 | |
| 9,473,000 (3) | | Huntington Bancshares, Inc., 5.709%, 02/02/2035 | | | 9,450,190 | | | 0.1 | |
| 3,868,000 (3) | | Huntington National Bank, 4.125%, 07/02/2029 | | | 3,747,319 | | | 0.1 | |
| 5,108,000 | | Intercontinental Exchange, Inc., 2.100%, 06/15/2030 | | | 4,337,176 | | | 0.1 | |
| 7,190,000 | | Invitation Homes Operating Partnership L.P., 2.300%, 11/15/2028 | | | 6,366,525 | | | 0.1 | |
| 2,650,000 | | Jones Lang LaSalle, Inc., 6.875%, 12/01/2028 | | | 2,808,379 | | | 0.0 | |
| | | | | | | | Percentage | |
| Principal | | | | | | | of Net | |
| Amount† | | | | Value | | | Assets | |
| CORPORATE BONDS/NOTES: (continued) | | | | | | |
| | | Financial: (continued) | | | | | | | |
| 2,607,000 (3) | | JPMorgan Chase & Co., 0.969%, 06/23/2025 | | $ | 2,576,857 | | | 0.0 | |
| 3,479,000 (3) | | JPMorgan Chase & Co., 1.040%, 02/04/2027 | | | 3,220,500 | | | 0.0 | |
| 3,444,000 (3) | | JPMorgan Chase & Co., 1.470%, 09/22/2027 | | | 3,143,245 | | | 0.0 | |
| 3,798,000 (3) | | JPMorgan Chase & Co., 1.578%, 04/22/2027 | | | 3,521,843 | | | 0.0 | |
| 12,119,000 (3) | | JPMorgan Chase & Co., 2.069%, 06/01/2029 | | | 10,753,788 | | | 0.1 | |
| 3,784,000 (3) | | JPMorgan Chase & Co., 2.182%, 06/01/2028 | | | 3,462,487 | | | 0.0 | |
| 1,531,000 (3) | | JPMorgan Chase & Co., 2.595%, 02/24/2026 | | | 1,491,778 | | | 0.0 | |
| 6,475,000 (3) | | JPMorgan Chase & Co., 2.947%, 02/24/2028 | | | 6,085,814 | | | 0.1 | |
| 1,269,000 (3) | | JPMorgan Chase & Co., 3.509%, 01/23/2029 | | | 1,200,721 | | | 0.0 | |
| 4,666,000 (3) | | JPMorgan Chase & Co., 4.452%, 12/05/2029 | | | 4,550,170 | | | 0.1 | |
| 1,234,000 (3) | | JPMorgan Chase & Co., 5.012%, 01/23/2030 | | | 1,229,454 | | | 0.0 | |
| 17,638,000 (3) | | JPMorgan Chase & Co., 5.336%, 01/23/2035 | | | 17,713,623 | | | 0.2 | |
| 7,191,000 (3) | | KeyCorp, 6.401%, 03/06/2035 | | | 7,347,916 | | | 0.1 | |
| 1,649,000 (3) | | KeyCorp, MTN, 4.789%, 06/01/2033 | | | 1,510,916 | | | 0.0 | |
| 1,287,000 | | Kite Realty Group L.P., 4.000%, 10/01/2026 | | | 1,225,981 | | | 0.0 | |
| 4,890,000 (1)(2) | | Ladder Capital Finance Holdings LLLP / Ladder Capital Finance Corp., 4.750%, 06/15/2029 | | | 4,449,552 | | | 0.1 | |
| 2,539,000 (1) | | Liberty Mutual Group, Inc., 3.950%, 05/15/2060 | | | 1,852,339 | | | 0.0 | |
| 4,652,000 (2)(3) | | Lloyds Banking Group PLC, 8.000%, 12/31/2199 | | | 4,695,571 | | | 0.1 | |
| 3,715,000 (1) | | Lseg US Fin Corp., 4.875%, 03/28/2027 | | | 3,701,580 | | | 0.1 | |
| 4,856,000 (1) | | Lseg US Fin Corp., 5.297%, 03/28/2034 | | | 4,888,969 | | | 0.1 | |
| 1,619,000 | | Marsh & McLennan Cos., Inc., 5.450%, 03/15/2054 | | | 1,626,085 | | | 0.0 | |
| 4,133,000 | | Marsh & McLennan Cos., Inc., 5.700%, 09/15/2053 | | | 4,294,085 | | | 0.1 | |
| 4,768,000 (3) | | Mizuho Financial Group, Inc., 5.579%, 05/26/2035 | | | 4,822,612 | | | 0.1 | |
| 3,912,000 (3) | | Morgan Stanley, 0.790%, 05/30/2025 | | | 3,875,907 | | | 0.1 | |
| 3,968,000 (3) | | Morgan Stanley, 1.593%, 05/04/2027 | | | 3,671,090 | | | 0.1 | |
| 5,414,000 (3) | | Morgan Stanley, 2.188%, 04/28/2026 | | | 5,224,770 | | | 0.1 | |
See Accompanying Notes to Financial Statements
| Voya Intermediate Bond Fund | PORTFOLIO OF INVESTMENTS |
| as of March 31, 2024 (continued) |
| | |
| | | | | | | | Percentage | |
| Principal | | | | | | | of Net | |
| Amount† | | | | Value | | | Assets | |
| CORPORATE BONDS/NOTES: (continued) | | | | | | |
| | | Financial: (continued) | | | | | | | |
| 2,425,000 (3) | | Morgan Stanley, 2.475%, 01/21/2028 | | $ | 2,256,395 | | | 0.0 | |
| 1,722,000 (3) | | Morgan Stanley, 3.591%, 07/22/2028 | | | 1,636,591 | | | 0.0 | |
| 2,439,000 (3) | | Morgan Stanley, 4.457%, 04/22/2039 | | | 2,220,020 | | | 0.0 | |
| 5,003,000 (2)(3) | | Morgan Stanley, 5.466%, 01/18/2035 | | | 5,049,619 | | | 0.1 | |
| 13,289,000 (3) | | Morgan Stanley, 5.942%, 02/07/2039 | | | 13,215,606 | | | 0.2 | |
| 1,334,000 (3) | | Morgan Stanley, 6.296%, 10/18/2028 | | | 1,380,605 | | | 0.0 | |
| 17,410,000 (3) | | Morgan Stanley, GMTN, 1.512%, 07/20/2027 | | | 15,982,533 | | | 0.2 | |
| 2,750,000 | | Morgan Stanley, GMTN, 3.875%, 01/27/2026 | | | 2,687,282 | | | 0.0 | |
| 3,075,000 (3) | | Morgan Stanley, GMTN, 5.860%, (SOFRRATE + 0.509%), 01/22/2025 | | | 3,077,230 | | | 0.0 | |
| 1,986,000 (3) | | Morgan Stanley, MTN, 2.720%, 07/22/2025 | | | 1,966,079 | | | 0.0 | |
| 2,412,000 | | Morgan Stanley, MTN, 3.125%, 07/27/2026 | | | 2,307,639 | | | 0.0 | |
| 4,138,000 (3) | | Morgan Stanley, MTN, 5.164%, 04/20/2029 | | | 4,135,900 | | | 0.1 | |
| 2,625,000 (3) | | Morgan Stanley, MTN, 5.250%, 04/21/2034 | | | 2,605,410 | | | 0.0 | |
| 5,135,000 | | MPT Operating Partnership L.P. / MPT Finance Corp., 3.500%, 03/15/2031 | | | 3,530,389 | | | 0.0 | |
| 4,768,000 | | National Bank of Canada, 5.600%, 12/18/2028 | | | 4,849,393 | | | 0.1 | |
| 4,535,000 (1) | | Nationstar Mortgage Holdings, Inc., 5.125%, 12/15/2030 | | | 4,118,510 | | | 0.1 | |
| 3,340,000 (3) | | NatWest Group PLC, 5.076%, 01/27/2030 | | | 3,283,266 | | | 0.0 | |
| 5,415,000 (3) | | NatWest Group PLC, 5.778%, 03/01/2035 | | | 5,493,350 | | | 0.1 | |
| 4,255,000 (2) | | Navient Corp., 5.000%, 03/15/2027 | | | 4,079,490 | | | 0.1 | |
| 1,070,000 (1) | | New York Life Insurance Co., 3.750%, 05/15/2050 | | | 823,880 | | | 0.0 | |
| 772,000 (1) | | New York Life Insurance Co., 4.450%, 05/15/2069 | | | 629,966 | | | 0.0 | |
| 2,658,000 (3) | | Northern Trust Corp., 3.375%, 05/08/2032 | | | 2,478,815 | | | 0.0 | |
| 1,097,000 (1) | | Northwestern Mutual Life Insurance Co., 3.450%, 03/30/2051 | | | 786,344 | | | 0.0 | |
| 386,000 (1) | | Northwestern Mutual Life Insurance Co., 3.625%, 09/30/2059 | | | 272,102 | | | 0.0 | |
| 7,324,000 | | Old Republic International Corp., 5.750%, 03/28/2034 | | | 7,362,486 | | | 0.1 | |
| | | | | | | | Percentage | |
| Principal | | | | | | | of Net | |
| Amount† | | | | Value | | | Assets | |
| CORPORATE BONDS/NOTES: (continued) | | | | | | |
| | | Financial: (continued) | | | | | | | |
| 5,845,000 (1) | | Panther Escrow Issuer LLC, 7.125%, 06/01/2031 | | $ | 5,947,346 | | | 0.1 | |
| 2,118,000 | | Piedmont Operating Partnership L.P., 2.750%, 04/01/2032 | | | 1,526,658 | | | 0.0 | |
| 1,738,000 (3) | | PNC Financial Services Group, Inc., 5.676%, 01/22/2035 | | | 1,754,615 | | | 0.0 | |
| 1,620,000 (3) | | PNC Financial Services Group, Inc. T, 3.400%, 12/31/2199 | | | 1,419,994 | | | 0.0 | |
| 7,096,000 (3) | | PNC Financial Services Group, Inc. W, 6.250%, 12/31/2199 | | | 6,894,987 | | | 0.1 | |
| 1,926,000 | | Prologis L.P., 5.250%, 03/15/2054 | | | 1,892,910 | | | 0.0 | |
| 2,238,000 (1) | | Prologis Targeted US Logistics Fund L.P., 5.250%, 04/01/2029 | | | 2,233,154 | | | 0.0 | |
| 1,672,000 (1) | | Prologis Targeted US Logistics Fund L.P., 5.500%, 04/01/2034 | | | 1,683,186 | | | 0.0 | |
| 726,000 | | Realty Income Corp., 3.950%, 08/15/2027 | | | 703,994 | | | 0.0 | |
| 3,704,000 | | Realty Income Corp., 5.125%, 02/15/2034 | | | 3,636,045 | | | 0.1 | |
| 10,656,000 | | Rexford Industrial Realty L.P., 2.150%, 09/01/2031 | | | 8,550,460 | | | 0.1 | |
| 1,792,000 | | Sabra Health Care L.P., 3.200%, 12/01/2031 | | | 1,489,519 | | | 0.0 | |
| 3,082,000 (3) | | Santander UK Group Holdings PLC, 2.469%, 01/11/2028 | | | 2,833,456 | | | 0.0 | |
| 3,340,000 (3) | | State Street Corp., 5.684%, 11/21/2029 | | | 3,431,355 | | | 0.0 | |
| 10,627,000 (3) | | State Street Corp., 6.123%, 11/21/2034 | | | 11,084,122 | | | 0.1 | |
| 2,543,000 | | Sun Communities Operating L.P., 5.500%, 01/15/2029 | | | 2,538,375 | | | 0.0 | |
| 8,200,000 (1)(3) | | Swiss RE Subordinated Finance PLC, 5.698%, 04/05/2035 | | | 8,195,459 | | | 0.1 | |
| 1,995,000 (1) | | Swiss Re Treasury US Corp., 4.250%, 12/06/2042 | | | 1,685,200 | | | 0.0 | |
| 1,513,000 (1) | | Teachers Insurance & Annuity Association of America, 3.300%, 05/15/2050 | | | 1,062,039 | | | 0.0 | |
| 2,223,000 (1) | | Teachers Insurance & Annuity Association of America, 4.900%, 09/15/2044 | | | 2,040,703 | | | 0.0 | |
| 1,553,000 | | TPG Operating Group II L.P., 5.875%, 03/05/2034 | | | 1,575,786 | | | 0.0 | |
See Accompanying Notes to Financial Statements
| Voya Intermediate Bond Fund | PORTFOLIO OF INVESTMENTS |
| as of March 31, 2024 (continued) |
| | |
| | | | | | | | Percentage | |
| Principal | | | | | | | of Net | |
| Amount† | | | | Value | | | Assets | |
| CORPORATE BONDS/NOTES: (continued) | | | | | | |
| | | Financial: (continued) | | | | | | | |
| 673,000 | | Transatlantic Holdings, Inc., 8.000%, 11/30/2039 | | $ | 862,394 | | | 0.0 | |
| 2,281,000 (3) | | Truist Financial Corp., 6.241%, (TSFR3M + 0.912%), 03/15/2028 | | | 2,152,581 | | | 0.0 | |
| 1,384,000 (3) | | Truist Financial Corp., MTN, 1.267%, 03/02/2027 | | | 1,279,802 | | | 0.0 | |
| 4,308,000 (3) | | Truist Financial Corp., MTN, 4.916%, 07/28/2033 | | | 4,015,023 | | | 0.1 | |
| 5,485,000 (3) | | Truist Financial Corp., MTN, 5.435%, 01/24/2030 | | | 5,480,138 | | | 0.1 | |
| 6,637,000 (3) | | Truist Financial Corp., MTN, 5.711%, 01/24/2035 | | | 6,668,756 | | | 0.1 | |
| 3,180,000 | | UBS AG, 5.125%, 05/15/2024 | | | 3,173,653 | | | 0.0 | |
| 3,853,000 (1)(3) | | UBS Group AG, 1.364%, 01/30/2027 | | | 3,567,048 | | | 0.0 | |
| 1,375,000 (1)(3) | | UBS Group AG, 1.494%, 08/10/2027 | | | 1,250,700 | | | 0.0 | |
| 3,222,000 (1)(3) | | UBS Group AG, 2.193%, 06/05/2026 | | | 3,090,177 | | | 0.0 | |
| 1,736,000 (1)(3) | | UBS Group AG, 6.301%, 09/22/2034 | | | 1,818,198 | | | 0.0 | |
| 2,719,000 (1)(3) | | UBS Group AG, 9.250%, 12/31/2199 | | | 2,952,766 | | | 0.0 | |
| 877,000 (1)(3) | | UBS Group AG, 9.250%, 12/31/2199 | | | 991,919 | | | 0.0 | |
| 2,797,000 (3) | | US Bancorp, 5.384%, 01/23/2030 | | | 2,810,079 | | | 0.0 | |
| 3,083,000 (3) | | US Bancorp, MTN, 4.967%, 07/22/2033 | | | 2,916,090 | | | 0.0 | |
| 3,392,000 (3) | | Wells Fargo & Co., 5.389%, 04/24/2034 | | | 3,372,072 | | | 0.0 | |
| 2,752,000 (3) | | Wells Fargo & Co., 5.499%, 01/23/2035 | | | 2,759,515 | | | 0.0 | |
| 2,994,000 (3) | | Wells Fargo & Co., MTN, 2.164%, 02/11/2026 | | | 2,905,044 | | | 0.0 | |
| 5,017,000 (3) | | Wells Fargo & Co., MTN, 2.393%, 06/02/2028 | | | 4,593,437 | | | 0.1 | |
| 5,247,000 (3) | | Wells Fargo & Co., MTN, 3.526%, 03/24/2028 | | | 4,995,627 | | | 0.1 | |
| 3,547,000 (3) | | Wells Fargo & Co., MTN, 4.540%, 08/15/2026 | | | 3,502,676 | | | 0.0 | |
| 4,024,000 (1)(2) | | Westpac New Zealand Ltd., 5.132%, 02/26/2027 | | | 4,025,697 | | | 0.1 | |
| 1,397,000 | | Weyerhaeuser Co., 4.750%, 05/15/2026 | | | 1,384,598 | | | 0.0 | |
| 1,979,000 | | Willis North America, Inc., 5.900%, 03/05/2054 | | | 2,005,042 | | | 0.0 | |
| | | | | | | | Percentage | |
| Principal | | | | | | | of Net | |
| Amount† | | | | Value | | | Assets | |
| CORPORATE BONDS/NOTES: (continued) | | | | | | |
| | | Financial: (continued) | | | | | | | |
| 4,405,000 (1) | | XHR L.P., 4.875%, 06/01/2029 | | $ | 4,081,555 | | | 0.1 | |
| | | | | | 787,375,100 | | | 9.3 | |
| | | | | | | | | | |
| | | Industrial: 2.7% | | | | | | | |
| 2,815,000 | | AGCO Corp., 5.450%, 03/21/2027 | | | 2,828,805 | | | 0.0 | |
| 1,920,000 | | AGCO Corp., 5.800%, 03/21/2034 | | | 1,944,856 | | | 0.0 | |
| 2,571,000 | | Avnet, Inc., 5.500%, 06/01/2032 | | | 2,489,381 | | | 0.0 | |
| 2,611,000 | | Avnet, Inc., 6.250%, 03/15/2028 | | | 2,676,465 | | | 0.0 | |
| 4,830,000 (1) | | BAE Systems PLC, 5.125%, 03/26/2029 | | | 4,850,220 | | | 0.1 | |
| 1,380,000 (1) | | BAE Systems PLC, 5.250%, 03/26/2031 | | | 1,387,931 | | | 0.0 | |
| 1,990,000 (1) | | BAE Systems PLC, 5.500%, 03/26/2054 | | | 2,011,697 | | | 0.0 | |
| 4,500,000 | | Berry Global, Inc., 1.650%, 01/15/2027 | | | 4,087,956 | | | 0.1 | |
| 791,000 | | Boeing Co., 3.850%, 11/01/2048 | | | 559,489 | | | 0.0 | |
| 2,865,000 | | Boeing Co., 5.705%, 05/01/2040 | | | 2,744,313 | | | 0.0 | |
| 2,916,000 | | Boeing Co., 5.930%, 05/01/2060 | | | 2,736,615 | | | 0.0 | |
| 2,995,000 (1) | | Builders FirstSource, Inc., 6.375%, 03/01/2034 | | | 3,011,107 | | | 0.0 | |
| 3,103,000 | | Burlington Northern Santa Fe LLC, 3.900%, 08/01/2046 | | | 2,544,088 | | | 0.0 | |
| 1,722,000 | | Burlington Northern Santa Fe LLC, 5.200%, 04/15/2054 | | | 1,708,274 | | | 0.0 | |
| 1,950,000 | | Canadian Pacific Railway Co., 2.875%, 11/15/2029 | | | 1,750,059 | | | 0.0 | |
| 787,000 | | Carrier Global Corp., 2.722%, 02/15/2030 | | | 696,251 | | | 0.0 | |
| 1,262,000 | | Carrier Global Corp., 5.900%, 03/15/2034 | | | 1,326,938 | | | 0.0 | |
| 4,110,000 (1) | | Cascades, Inc. / Cascades USA, Inc., 5.375%, 01/15/2028 | | | 3,951,657 | | | 0.1 | |
| 4,250,000 (2)(3) | | Cemex SAB de CV, 5.125%, 12/31/2199 | | | 4,119,844 | | | 0.1 | |
| 1,611,000 (1) | | CIMIC Finance USA Pty Ltd., 7.000%, 03/25/2034 | | | 1,654,979 | | | 0.0 | |
| 4,775,000 | | CNH Industrial Capital LLC, 5.100%, 04/20/2029 | | | 4,763,596 | | | 0.1 | |
| 4,625,000 | | CNH Industrial Capital LLC, 5.500%, 01/12/2029 | | | 4,694,359 | | | 0.1 | |
| 3,910,000 (1) | | Emerald Debt Merger Sub LLC, 6.625%, 12/15/2030 | | | 3,952,396 | | | 0.1 | |
See Accompanying Notes to Financial Statements
| Voya Intermediate Bond Fund | PORTFOLIO OF INVESTMENTS |
| as of March 31, 2024 (continued) |
| | |
| | | | | | | | Percentage | |
| Principal | | | | | | | of Net | |
| Amount† | | | | Value | | | Assets | |
| CORPORATE BONDS/NOTES: (continued) | | | | | | |
| | | Industrial: (continued) | | | | | | | |
| 4,545,000 (1) | | Energizer Holdings, Inc., 4.375%, 03/31/2029 | | $ | 4,077,381 | | | 0.1 | |
| 1,354,000 | | FedEx Corp., 4.550%, 04/01/2046 | | | 1,168,799 | | | 0.0 | |
| 2,444,227 | | FedEx Corp. Class AA Pass Through Trust 20-1, AA, 1.875%, 08/20/2035 | | | 2,031,471 | | | 0.0 | |
| 2,097,000 | | Fortune Brands Innovations, Inc., 5.875%, 06/01/2033 | | | 2,140,374 | | | 0.0 | |
| 4,825,000 | | HEICO Corp., 5.250%, 08/01/2028 | | | 4,856,537 | | | 0.1 | |
| 6,229,000 | | Honeywell International, Inc., 5.250%, 03/01/2054 | | | 6,291,037 | | | 0.1 | |
| 3,900,000 (1) | | Imola Merger Corp., 4.750%, 05/15/2029 | | | 3,660,289 | | | 0.1 | |
| 1,616,000 | | Ingersoll Rand, Inc., 5.400%, 08/14/2028 | | | 1,638,548 | | | 0.0 | |
| 789,000 (2) | | Ingersoll Rand, Inc., 5.700%, 08/14/2033 | | | 809,721 | | | 0.0 | |
| 2,243,000 | | John Deere Capital Corp., 4.500%, 01/16/2029 | | | 2,221,997 | | | 0.0 | |
| 7,572,000 | | John Deere Capital Corp., MTN, 4.700%, 06/10/2030 | | | 7,536,546 | | | 0.1 | |
| 3,608,000 | | John Deere Capital Corp., MTN, 4.750%, 01/20/2028 | | | 3,617,302 | | | 0.1 | |
| 5,967,000 | | John Deere Capital Corp., MTN, 4.900%, 03/07/2031 | | | 5,971,614 | | | 0.1 | |
| 2,473,000 | | L3Harris Technologies, Inc., 5.050%, 06/01/2029 | | | 2,466,041 | | | 0.0 | |
| 3,368,000 | | Lockheed Martin Corp., 4.150%, 06/15/2053 | | | 2,845,483 | | | 0.0 | |
| 1,465,000 | | Lockheed Martin Corp., 4.750%, 02/15/2034 | | | 1,446,421 | | | 0.0 | |
| 2,710,000 | | Lockheed Martin Corp., 4.800%, 08/15/2034 | | | 2,681,398 | | | 0.0 | |
| 2,900,000 | | Lockheed Martin Corp., 5.200%, 02/15/2064 | | | 2,869,887 | | | 0.0 | |
| 1,470,000 | | Lockheed Martin Corp., 5.900%, 11/15/2063 | | | 1,612,413 | | | 0.0 | |
| 1,888,000 | | Mohawk Industries, Inc., 5.850%, 09/18/2028 | | | 1,944,674 | | | 0.0 | |
| 1,207,000 | | Norfolk Southern Corp., 2.550%, 11/01/2029 | | | 1,067,961 | | | 0.0 | |
| 1,953,000 | | Norfolk Southern Corp., 5.050%, 08/01/2030 | | | 1,959,920 | | | 0.0 | |
| 1,665,000 | | Norfolk Southern Corp., 5.550%, 03/15/2034 | | | 1,732,940 | | | 0.0 | |
| 5,521,000 | | Norfolk Southern Corp., 5.950%, 03/15/2064 | | | 5,900,962 | | | 0.1 | |
| | | | | | | | Percentage | |
| Principal | | | | | | | of Net | |
| Amount† | | | | Value | | | Assets | |
| CORPORATE BONDS/NOTES: (continued) | | | | | | |
| | | Industrial: (continued) | | | | | | | |
| 3,900,000 (1)(2) | | Owens-Brockway Glass Container, Inc., 7.250%, 05/15/2031 | | $ | 3,977,033 | | | 0.1 | |
| 3,618,000 (1) | | Penske Truck Leasing Co. L.P. / PTL Finance Corp., 1.200%, 11/15/2025 | | | 3,377,360 | | | 0.0 | |
| 4,922,000 (1) | | Penske Truck Leasing Co. L.P. / PTL Finance Corp., 1.700%, 06/15/2026 | | | 4,541,194 | | | 0.1 | |
| 5,931,000 (1) | | Penske Truck Leasing Co. L.P. / PTL Finance Corp., 5.350%, 03/30/2029 | | | 5,937,655 | | | 0.1 | |
| 6,481,000 (1) | | Penske Truck Leasing Co. L.P. / PTL Finance Corp., 6.200%, 06/15/2030 | | | 6,742,968 | | | 0.1 | |
| 3,933,000 | | Raytheon Technologies Corp., 4.450%, 11/16/2038 | | | 3,555,938 | | | 0.0 | |
| 7,750,000 | | Raytheon Technologies Corp., 4.500%, 06/01/2042 | | | 6,920,147 | | | 0.1 | |
| 2,472,000 | | Ryder System, Inc., 6.300%, 12/01/2028 | | | 2,589,460 | | | 0.0 | |
| 3,090,000 | | Ryder System, Inc., 6.600%, 12/01/2033 | | | 3,353,100 | | | 0.0 | |
| 3,438,000 | | Ryder System, Inc., MTN, 5.250%, 06/01/2028 | | | 3,455,490 | | | 0.0 | |
| 3,235,000 (1) | | Sealed Air Corp., 1.573%, 10/15/2026 | | | 2,923,262 | | | 0.0 | |
| 3,900,000 (1) | | Sealed Air Corp/Sealed Air Corp. US, 7.250%, 02/15/2031 | | | 4,059,650 | | | 0.1 | |
| 3,679,000 (1) | | Smurfit Kappa Treasury ULC, 5.200%, 01/15/2030 | | | 3,671,727 | | | 0.1 | |
| 3,278,000 (1) | | Smurfit Kappa Treasury ULC, 5.438%, 04/03/2034 | | | 3,284,280 | | | 0.0 | |
| 4,493,000 (1) | | Smurfit Kappa Treasury ULC, 5.777%, 04/03/2054 | | | 4,544,652 | | | 0.1 | |
| 3,850,000 (1) | | Standard Industries, Inc., 3.375%, 01/15/2031 | | | 3,232,243 | | | 0.0 | |
| 4,925,000 (1) | | Standard Industries, Inc., 4.375%, 07/15/2030 | | | 4,428,758 | | | 0.1 | |
| 4,050,000 (1) | | Summit Materials LLC / Summit Materials Finance Corp., 7.250%, 01/15/2031 | | | 4,212,575 | | | 0.1 | |
| 7,800,000 (1) | | TransDigm, Inc., 7.125%, 12/01/2031 | | | 8,048,102 | | | 0.1 | |
| 5,745,000 (1) | | TTX Co., 3.600%, 01/15/2025 | | | 5,660,073 | | | 0.1 | |
See Accompanying Notes to Financial Statements
| Voya Intermediate Bond Fund | PORTFOLIO OF INVESTMENTS |
| as of March 31, 2024 (continued) |
| | |
| | | | | | | | Percentage | |
| Principal | | | | | | | of Net | |
| Amount† | | | | Value | | | Assets | |
| CORPORATE BONDS/NOTES: (continued) | | | | | | |
| | | Industrial: (continued) | | | | | | | |
| 502,000 (1) | | TTX Co., 4.200%, 07/01/2046 | | $ | 421,134 | | | 0.0 | |
| 1,275,000 | | Union Pacific Corp., 4.050%, 11/15/2045 | | | 1,050,719 | | | 0.0 | |
| 927,000 | | Waste Management, Inc., 2.000%, 06/01/2029 | | | 814,158 | | | 0.0 | |
| 1,992,000 | | Waste Management, Inc., 4.625%, 02/15/2030 | | | 1,983,652 | | | 0.0 | |
| 1,189,000 | | Waste Management, Inc., 4.875%, 02/15/2029 | | | 1,200,869 | | | 0.0 | |
| 3,474,000 | | Waste Management, Inc., 4.875%, 02/15/2034 | | | 3,451,665 | | | 0.0 | |
| | | | | | 232,478,856 | | | 2.7 | |
| | | | | | | | | | |
| | | Technology: 1.6% | | | | | | | |
| 456,000 (1) | | Booz Allen Hamilton, Inc., 3.875%, 09/01/2028 | | | 427,643 | | | 0.0 | |
| 2,255,000 (1) | | Booz Allen Hamilton, Inc., 4.000%, 07/01/2029 | | | 2,098,372 | | | 0.0 | |
| 6,290,000 (1) | | Broadcom, Inc., 2.450%, 02/15/2031 | | | 5,305,306 | | | 0.1 | |
| 4,934,000 (1) | | Broadcom, Inc., 3.187%, 11/15/2036 | | | 3,928,677 | | | 0.1 | |
| 12,216,000 (1) | | Broadcom, Inc., 4.926%, 05/15/2037 | | | 11,599,934 | | | 0.1 | |
| 2,143,000 | | Concentrix Corp., 6.600%, 08/02/2028 | | | 2,168,760 | | | 0.0 | |
| 4,188,000 | | Concentrix Corp., 6.850%, 08/02/2033 | | | 4,165,437 | | | 0.1 | |
| 3,463,000 (1) | | Constellation Software, Inc./Canada, 5.158%, 02/16/2029 | | | 3,461,900 | | | 0.0 | |
| 2,382,000 | | Dell International LLC / EMC Corp., 5.400%, 04/15/2034 | | | 2,388,493 | | | 0.0 | |
| 797,000 | | Dell International LLC / EMC Corp., 6.020%, 06/15/2026 | | | 807,577 | | | 0.0 | |
| 3,586,000 | | Fiserv, Inc., 5.150%, 03/15/2027 | | | 3,600,372 | | | 0.0 | |
| 3,218,000 | | HP, Inc., 2.650%, 06/17/2031 | | | 2,729,925 | | | 0.0 | |
| 4,890,000 | | IBM International Capital Pte Ltd., 4.750%, 02/05/2031 | | | 4,802,325 | | | 0.1 | |
| 4,967,000 | | IBM International Capital Pte Ltd., 5.250%, 02/05/2044 | | | 4,849,802 | | | 0.1 | |
| 2,846,000 | | IBM International Capital Pte Ltd., 5.300%, 02/05/2054 | | | 2,781,133 | | | 0.0 | |
| 4,080,000 | | Intel Corp., 5.600%, 02/21/2054 | | | 4,160,113 | | | 0.1 | |
| | | | | | | | Percentage | |
| Principal | | | | | | | of Net | |
| Amount† | | | | Value | | | Assets | |
| CORPORATE BONDS/NOTES: (continued) | | | | | | |
| | | Technology: (continued) | | | | | | | |
| 2,267,000 | | Intel Corp., 5.700%, 02/10/2053 | | $ | 2,345,120 | | | 0.0 | |
| 1,517,000 | | International Business Machines Corp., 3.500%, 05/15/2029 | | | 1,429,286 | | | 0.0 | |
| 6,382,000 | | Intuit, Inc., 5.125%, 09/15/2028 | | | 6,497,896 | | | 0.1 | |
| 5,342,000 | | Intuit, Inc., 5.200%, 09/15/2033 | | | 5,443,259 | | | 0.1 | |
| 7,108,000 | | Intuit, Inc., 5.500%, 09/15/2053 | | | 7,383,988 | | | 0.1 | |
| 1,894,000 | | KLA Corp., 4.700%, 02/01/2034 | | | 1,865,466 | | | 0.0 | |
| 2,819,000 | | KLA Corp., 5.250%, 07/15/2062 | | | 2,796,323 | | | 0.0 | |
| 2,252,000 (2) | | Marvell Technology, Inc., 5.750%, 02/15/2029 | | | 2,306,745 | | | 0.0 | |
| 1,424,000 (1) | | Microsoft Corp., 2.500%, 09/15/2050 | | | 920,651 | | | 0.0 | |
| 4,533,000 | | NXP BV / NXP Funding LLC, 5.350%, 03/01/2026 | | | 4,536,218 | | | 0.1 | |
| 1,953,000 | | NXP BV / NXP Funding LLC / NXP USA, Inc., 3.250%, 05/11/2041 | | | 1,452,505 | | | 0.0 | |
| 1,900,000 | | NXP BV / NXP Funding LLC / NXP USA, Inc., 3.400%, 05/01/2030 | | | 1,725,147 | | | 0.0 | |
| 4,775,000 (1)(2) | | Open Text Holdings, Inc., 4.125%, 12/01/2031 | | | 4,194,532 | | | 0.1 | |
| 6,520,000 | | Oracle Corp., 2.300%, 03/25/2028 | | | 5,889,758 | | | 0.1 | |
| 3,215,000 | | Oracle Corp., 3.600%, 04/01/2050 | | | 2,324,599 | | | 0.0 | |
| 2,948,000 | | Oracle Corp., 3.650%, 03/25/2041 | | | 2,316,200 | | | 0.0 | |
| 4,921,000 | | Oracle Corp., 3.800%, 11/15/2037 | | | 4,128,903 | | | 0.1 | |
| 297,000 | | Oracle Corp., 3.850%, 07/15/2036 | | | 253,368 | | | 0.0 | |
| 2,069,000 | | Oracle Corp., 3.850%, 04/01/2060 | | | 1,473,748 | | | 0.0 | |
| 3,296,000 | | Oracle Corp., 3.950%, 03/25/2051 | | | 2,513,203 | | | 0.0 | |
| 2,979,000 | | Oracle Corp., 6.150%, 11/09/2029 | | | 3,141,122 | | | 0.0 | |
| 933,000 | | Oracle Corp., 6.900%, 11/09/2052 | | | 1,074,555 | | | 0.0 | |
| 5,030,000 | | QUALCOMM, Inc., 6.000%, 05/20/2053 | | | 5,629,319 | | | 0.1 | |
| 2,799,900 | | Seagate HDD Cayman, 9.625%, 12/01/2032 | | | 3,193,056 | | | 0.0 | |
| 4,698,000 | | Texas Instruments, Inc., 5.050%, 05/18/2063 | | | 4,579,116 | | | 0.1 | |
| | | | | | 138,689,852 | | | 1.6 | |
See Accompanying Notes to Financial Statements
| Voya Intermediate Bond Fund | PORTFOLIO OF INVESTMENTS |
| as of March 31, 2024 (continued) |
| | |
| | | | | | | | Percentage | |
| Principal | | | | | | | of Net | |
| Amount† | | | | Value | | | Assets | |
| CORPORATE BONDS/NOTES: (continued) | | | | | | |
| | | Utilities: 3.9% | | | | | | | |
| 3,671,000 (1) | | AEP Texas, Inc., 3.850%, 10/01/2025 | | $ | 3,556,228 | | | 0.1 | |
| 2,645,000 | | AEP Transmission Co. LLC, 5.150%, 04/01/2034 | | | 2,637,186 | | | 0.0 | |
| 2,870,000 | | AES Corp., 1.375%, 01/15/2026 | | | 2,658,909 | | | 0.0 | |
| 4,136,000 | | AES Corp., 2.450%, 01/15/2031 | | | 3,386,946 | | | 0.1 | |
| 2,714,000 (1) | | AES Corp., 3.950%, 07/15/2030 | | | 2,475,779 | | | 0.0 | |
| 3,051,000 | | AES Corp., 5.450%, 06/01/2028 | | | 3,046,392 | | | 0.0 | |
| 2,553,447 | | AES Panama Generation Holdings SRL, 4.375%, 05/31/2030 | | | 2,231,074 | | | 0.0 | |
| 1,873,000 | | Alabama Power Co., 5.850%, 11/15/2033 | | | 1,973,620 | | | 0.0 | |
| 2,470,000 (3) | | Algonquin Power & Utilities Corp., 5.365%, 06/15/2026 | | | 2,457,363 | | | 0.0 | |
| 3,851,000 | | Ameren Corp., 5.000%, 01/15/2029 | | | 3,832,207 | | | 0.1 | |
| 2,784,000 (1) | | American Transmission Systems, Inc., 2.650%, 01/15/2032 | | | 2,311,051 | | | 0.0 | |
| 4,130,000 (1) | | American Transmission Systems, Inc., 5.000%, 09/01/2044 | | | 3,745,980 | | | 0.1 | |
| 2,407,000 | | American Water Capital Corp., 5.150%, 03/01/2034 | | | 2,416,652 | | | 0.0 | |
| 6,135,000 | | American Water Capital Corp., 5.450%, 03/01/2054 | | | 6,193,203 | | | 0.1 | |
| 1,793,000 | | Appalachian Power Co. Y, 4.500%, 03/01/2049 | | | 1,454,059 | | | 0.0 | |
| 9,776,000 | | Avangrid, Inc., 3.200%, 04/15/2025 | | | 9,527,666 | | | 0.1 | |
| 2,544,000 | | Avangrid, Inc., 3.800%, 06/01/2029 | | | 2,387,042 | | | 0.0 | |
| 2,237,000 | | Black Hills Corp., 3.050%, 10/15/2029 | | | 2,007,459 | | | 0.0 | |
| 3,900,000 (1) | | Calpine Corp., 5.000%, 02/01/2031 | | | 3,581,477 | | | 0.1 | |
| 2,166,000 (1) | | Cleveland Electric Illuminating Co., 3.500%, 04/01/2028 | | | 2,023,673 | | | 0.0 | |
| 1,593,000 (3) | | CMS Energy Corp., 3.750%, 12/01/2050 | | | 1,307,195 | | | 0.0 | |
| 7,338,000 (3) | | CMS Energy Corp., 4.750%, 06/01/2050 | | | 6,767,060 | | | 0.1 | |
| 2,512,000 | | Consolidated Edison Co. of New York, Inc., 4.625%, 12/01/2054 | | | 2,200,463 | | | 0.0 | |
| 731,000 | | Consolidated Edison Co. of New York, Inc. 05-A, 5.300%, 03/01/2035 | | | 736,388 | | | 0.0 | |
| | | | | | | | Percentage | |
| Principal | | | | | | | of Net | |
| Amount† | | | | Value | | | Assets | |
| CORPORATE BONDS/NOTES: (continued) | | | | | | |
| | | Utilities: (continued) | | | | | | | |
| 731,000 (3) | | Dominion Energy, Inc. C, 4.350%, 12/31/2199 | | $ | 687,993 | | | 0.0 | |
| 7,997,000 | | DTE Energy Co., 5.100%, 03/01/2029 | | | 7,968,398 | | | 0.1 | |
| 1,295,000 | | Duke Energy Carolinas LLC, 2.550%, 04/15/2031 | | | 1,119,396 | | | 0.0 | |
| 587,000 | | Duke Energy Carolinas LLC, 3.750%, 06/01/2045 | | | 458,260 | | | 0.0 | |
| 1,542,000 | | Duke Energy Carolinas LLC, 3.875%, 03/15/2046 | | | 1,225,381 | | | 0.0 | |
| 2,366,000 | | Duke Energy Carolinas LLC, 4.000%, 09/30/2042 | | | 1,971,850 | | | 0.0 | |
| 55,000 | | Duke Energy Carolinas LLC, 4.250%, 12/15/2041 | | | 47,426 | | | 0.0 | |
| 3,011,000 | | Duke Energy Carolinas LLC, 5.350%, 01/15/2053 | | | 2,972,978 | | | 0.0 | |
| 735,000 (3) | | Duke Energy Corp., 4.875%, 12/31/2199 | | | 730,429 | | | 0.0 | |
| 4,024,000 | | Duke Energy Florida LLC, 2.400%, 12/15/2031 | | | 3,378,206 | | | 0.1 | |
| 1,501,000 | | Duke Energy Florida LLC, 5.875%, 11/15/2033 | | | 1,586,915 | | | 0.0 | |
| 1,834,000 | | Duke Energy Indiana LLC, 2.750%, 04/01/2050 | | | 1,164,439 | | | 0.0 | |
| 1,662,000 | | Duke Energy Ohio, Inc., 2.125%, 06/01/2030 | | | 1,407,742 | | | 0.0 | |
| 2,693,000 | | Duke Energy Ohio, Inc., 3.700%, 06/15/2046 | | | 2,077,332 | | | 0.0 | |
| 3,413,000 | | Duke Energy Progress LLC, 3.700%, 10/15/2046 | | | 2,636,996 | | | 0.0 | |
| 1,792,000 | | Duke Energy Progress LLC, 4.100%, 05/15/2042 | | | 1,515,621 | | | 0.0 | |
| 104,000 | | Duke Energy Progress LLC, 4.100%, 03/15/2043 | | | 86,761 | | | 0.0 | |
| 2,505,000 | | Duke Energy Progress LLC, 4.200%, 08/15/2045 | | | 2,093,750 | | | 0.0 | |
| 1,645,000 (1) | | Duquesne Light Holdings, Inc., 2.532%, 10/01/2030 | | | 1,364,999 | | | 0.0 | |
| 2,695,000 | | Entergy Arkansas LLC, 2.650%, 06/15/2051 | | | 1,642,683 | | | 0.0 | |
| 2,090,000 | | Entergy Arkansas LLC, 4.200%, 04/01/2049 | | | 1,735,722 | | | 0.0 | |
| 4,202,000 | | Entergy Corp., 0.900%, 09/15/2025 | | | 3,940,452 | | | 0.1 | |
| 2,722,000 | | Entergy Corp., 2.400%, 06/15/2031 | | | 2,262,696 | | | 0.0 | |
See Accompanying Notes to Financial Statements
| Voya Intermediate Bond Fund | PORTFOLIO OF INVESTMENTS |
| as of March 31, 2024 (continued) |
| | |
| | | | | | | | Percentage | |
| Principal | | | | | | | of Net | |
| Amount† | | | | Value | | | Assets | |
| CORPORATE BONDS/NOTES: (continued) | | | | | | |
| | | Utilities: (continued) | | | | | | | |
| 1,286,000 | | Entergy Corp., 2.800%, 06/15/2030 | | $ | 1,124,825 | | | 0.0 | |
| 3,667,000 | | Entergy Louisiana LLC, 4.200%, 04/01/2050 | | | 3,024,030 | | | 0.0 | |
| 1,024,000 | | Entergy Louisiana LLC, 5.350%, 03/15/2034 | | | 1,028,290 | | | 0.0 | |
| 3,014,000 | | Entergy Mississippi LLC, 5.000%, 09/01/2033 | | | 2,962,626 | | | 0.0 | |
| 2,172,000 | | Entergy Texas, Inc., 4.000%, 03/30/2029 | | | 2,083,023 | | | 0.0 | |
| 1,918,000 | | Essential Utilities, Inc., 5.375%, 01/15/2034 | | | 1,909,178 | | | 0.0 | |
| 1,643,000 | | Evergy Kansas Central, Inc., 3.250%, 09/01/2049 | | | 1,135,259 | | | 0.0 | |
| 1,341,000 | | Evergy Kansas Central, Inc., 5.900%, 11/15/2033 | | | 1,407,444 | | | 0.0 | |
| 2,216,000 | | Evergy Metro, Inc. 2020, 2.250%, 06/01/2030 | | | 1,892,451 | | | 0.0 | |
| 4,991,000 | | Eversource Energy, 2.900%, 03/01/2027 | | | 4,693,872 | | | 0.1 | |
| 2,041,000 | | Eversource Energy, 5.125%, 05/15/2033 | | | 2,000,860 | | | 0.0 | |
| 3,026,000 | | Eversource Energy, 5.450%, 03/01/2028 | | | 3,064,859 | | | 0.0 | |
| 2,380,000 | | Eversource Energy, 5.500%, 01/01/2034 | | | 2,381,873 | | | 0.0 | |
| 3,060,000 | | Eversource Energy, 5.950%, 02/01/2029 | | | 3,158,935 | | | 0.1 | |
| 2,943,000 | | Eversource Energy Q, 0.800%, 08/15/2025 | | | 2,757,110 | | | 0.0 | |
| 2,750,000 | | Eversource Energy U, 1.400%, 08/15/2026 | | | 2,508,268 | | | 0.0 | |
| 4,871,000 | | Exelon Corp., 5.150%, 03/15/2028 | | | 4,885,398 | | | 0.1 | |
| 4,012,000 | | Exelon Corp., 5.150%, 03/15/2029 | | | 4,022,771 | | | 0.1 | |
| 1,961,000 | | Florida Power & Light Co., 4.625%, 05/15/2030 | | | 1,949,400 | | | 0.0 | |
| 1,609,000 | | Georgia Power Co., 4.650%, 05/16/2028 | | | 1,593,839 | | | 0.0 | |
| 3,055,000 | | Georgia Power Co. A, 2.200%, 09/15/2024 | | | 3,006,677 | | | 0.0 | |
| 3,066,000 | | Interstate Power and Light Co., 3.250%, 12/01/2024 | | | 3,019,568 | | | 0.0 | |
| 2,383,000 | | IPALCO Enterprises, Inc., 4.250%, 05/01/2030 | | | 2,220,359 | | | 0.0 | |
| 1,087,000 (1) | | Jersey Central Power & Light Co., 2.750%, 03/01/2032 | | | 905,907 | | | 0.0 | |
| 3,199,000 (1) | | Jersey Central Power & Light Co., 4.300%, 01/15/2026 | | | 3,127,983 | | | 0.1 | |
| | | | | | | | Percentage | |
| Principal | | | | | | | of Net | |
| Amount† | | | | Value | | | Assets | |
| CORPORATE BONDS/NOTES: (continued) | | | | | | |
| | | Utilities: (continued) | | | | | | | |
| 1,461,000 | | Kentucky Utilities Co. KENT, 5.450%, 04/15/2033 | | $ | 1,493,263 | | | 0.0 | |
| 6,137,000 (1) | | Liberty Utilities Co., 5.869%, 01/31/2034 | | | 6,203,848 | | | 0.1 | |
| 1,461,000 | | Louisville Gas and Electric Co. LOU, 5.450%, 04/15/2033 | | | 1,493,898 | | | 0.0 | |
| 271,000 | | Mississippi Power Co., 4.750%, 10/15/2041 | | | 235,778 | | | 0.0 | |
| 4,552,000 | | Mississippi Power Co. 12-A, 4.250%, 03/15/2042 | | | 3,881,592 | | | 0.1 | |
| 2,460,000 (1) | | Monongahela Power Co., 3.550%, 05/15/2027 | | | 2,341,534 | | | 0.0 | |
| 3,279,000 (1) | | Monongahela Power Co., 5.850%, 02/15/2034 | | | 3,369,950 | | | 0.1 | |
| 2,983,000 (1) | | Narragansett Electric Co., 3.395%, 04/09/2030 | | | 2,725,151 | | | 0.0 | |
| 4,817,000 | | National Grid PLC, 5.418%, 01/11/2034 | | | 4,785,133 | | | 0.1 | |
| 4,763,000 | | National Rural Utilities Cooperative Finance Corp., 2.400%, 03/15/2030 | | | 4,133,945 | | | 0.1 | |
| 3,798,000 | | National Rural Utilities Cooperative Finance Corp., 2.750%, 04/15/2032 | | | 3,230,971 | | | 0.1 | |
| 1,016,000 | | National Rural Utilities Cooperative Finance Corp., 4.150%, 12/15/2032 | | | 943,816 | | | 0.0 | |
| 2,571,000 | | National Rural Utilities Cooperative Finance Corp., 5.800%, 01/15/2033 | | | 2,676,566 | | | 0.0 | |
| 2,160,000 (3) | | National Rural Utilities Cooperative Finance Corp., 8.489%, (TSFR3M + 3.172%), 04/30/2043 | | | 2,159,713 | | | 0.0 | |
| 2,300,000 | | National Rural Utilities Cooperative Finance Corp., GMTN, 5.000%, 02/07/2031 | | | 2,285,995 | | | 0.0 | |
| 1,234,000 | | Nevada Power Co., 6.000%, 03/15/2054 | | | 1,303,570 | | | 0.0 | |
| 4,273,000 | | NextEra Energy Capital Holdings, Inc., 1.875%, 01/15/2027 | | | 3,913,874 | | | 0.1 | |
| 5,461,000 (3) | | NextEra Energy Capital Holdings, Inc., 3.800%, 03/15/2082 | | | 4,981,696 | | | 0.1 | |
| 3,711,000 | | NextEra Energy Capital Holdings, Inc., 4.255%, 09/01/2024 | | | 3,686,681 | | | 0.1 | |
See Accompanying Notes to Financial Statements
| Voya Intermediate Bond Fund | PORTFOLIO OF INVESTMENTS |
| as of March 31, 2024 (continued) |
| | |
| | | | | | | | Percentage | |
| Principal | | | | | | | of Net | |
| Amount† | | | | Value | | | Assets | |
| CORPORATE BONDS/NOTES: (continued) | | | | | | |
| | | Utilities: (continued) | | | | | | | |
| 4,500,000 | | NextEra Energy Capital Holdings, Inc., 6.051%, 03/01/2025 | | $ | 4,518,540 | | | 0.1 | |
| 2,430,000 (2)(3) | | NextEra Energy Capital Holdings, Inc., 6.700%, 09/01/2054 | | | 2,444,011 | | | 0.0 | |
| 3,724,000 (1) | | Niagara Mohawk Power Corp., 1.960%, 06/27/2030 | | | 3,076,856 | | | 0.0 | |
| 3,682,000 (1) | | Niagara Mohawk Power Corp., 5.664%, 01/17/2054 | | | 3,666,430 | | | 0.1 | |
| 4,000,000 | | NiSource, Inc., 0.950%, 08/15/2025 | | | 3,765,922 | | | 0.1 | |
| 1,684,000 | | NSTAR Electric Co., 1.950%, 08/15/2031 | | | 1,363,083 | | | 0.0 | |
| 4,188,000 | | Pacific Gas and Electric Co., 4.300%, 03/15/2045 | | | 3,314,435 | | | 0.1 | |
| 2,484,000 | | Pacific Gas and Electric Co., 4.450%, 04/15/2042 | | | 2,038,366 | | | 0.0 | |
| 2,473,000 (1) | | Pennsylvania Electric Co., 5.150%, 03/30/2026 | | | 2,454,332 | | | 0.0 | |
| 2,410,000 | | Public Service Electric and Gas Co., MTN, 5.200%, 03/01/2034 | | | 2,439,486 | | | 0.0 | |
| 2,889,000 | | Public Service Enterprise Group, Inc., 0.800%, 08/15/2025 | | | 2,715,980 | | | 0.0 | |
| 1,749,000 | | Public Service Enterprise Group, Inc., 1.600%, 08/15/2030 | | | 1,413,842 | | | 0.0 | |
| 6,396,000 | | Public Service Enterprise Group, Inc., 2.450%, 11/15/2031 | | | 5,293,051 | | | 0.1 | |
| 7,414,000 | | Public Service Enterprise Group, Inc., 5.200%, 04/01/2029 | | | 7,423,334 | | | 0.1 | |
| 3,312,000 | | Public Service Enterprise Group, Inc., 5.850%, 11/15/2027 | | | 3,393,596 | | | 0.1 | |
| 3,213,000 | | San Diego Gas & Electric Co., 4.950%, 08/15/2028 | | | 3,226,606 | | | 0.1 | |
| 4,593,000 | | South Jersey Industries, Inc., 5.020%, 04/15/2031 | | | 3,638,234 | | | 0.1 | |
| 3,430,000 | | Southern Co., 5.113%, 08/01/2027 | | | 3,433,206 | | | 0.1 | |
| 4,457,000 (3) | | Southern Co. 21-A, 3.750%, 09/15/2051 | | | 4,172,336 | | | 0.1 | |
| 1,958,000 | | Southwestern Electric Power Co., 5.300%, 04/01/2033 | | | 1,935,687 | | | 0.0 | |
| 4,444,000 | | Southwestern Electric Power Co. N, 1.650%, 03/15/2026 | | | 4,147,119 | | | 0.1 | |
| | | | | | | | Percentage | |
| Principal | | | | | | | of Net | |
| Amount† | | | | Value | | | Assets | |
| CORPORATE BONDS/NOTES: (continued) | | | | | | |
| | | Utilities: (continued) | | | | | | | |
| 1,709,000 | | Tampa Electric Co., 4.350%, 05/15/2044 | | $ | 1,453,874 | | | 0.0 | |
| 8,850,000 (1) | | Vistra Operations Co. LLC, 4.375%, 05/01/2029 | | | 8,207,709 | | | 0.1 | |
| 4,673,000 | | WEC Energy Group, Inc., 1.375%, 10/15/2027 | | | 4,119,709 | | | 0.1 | |
| 2,748,000 | | WEC Energy Group, Inc., 2.200%, 12/15/2028 | | | 2,431,034 | | | 0.0 | |
| 927,000 | | WEC Energy Group, Inc., 5.000%, 09/27/2025 | | | 922,082 | | | 0.0 | |
| 1,297,000 | | WEC Energy Group, Inc., 5.150%, 10/01/2027 | | | 1,299,826 | | | 0.0 | |
| 1,500,000 | | Wisconsin Electric Power Co., 1.700%, 06/15/2028 | | | 1,329,668 | | | 0.0 | |
| 2,477,000 | | Wisconsin Power and Light Co., 5.375%, 03/30/2034 | | | 2,494,498 | | | 0.0 | |
| 3,590,000 | | Wisconsin Public Service Corp., 3.671%, 12/01/2042 | | | 2,843,324 | | | 0.0 | |
| | | | | | 331,679,452 | | | 3.9 | |
| | | Total Corporate Bonds/Notes | | | | | | | |
| | | (Cost $2,729,944,748) | | | 2,661,745,523 | | | 31.3 | |
| | | | | | | | | | |
| U.S. GOVERNMENT AGENCY OBLIGATIONS: 20.3% | |
| | | Federal Home Loan Mortgage Corporation: 1.6%(4) | |
| 154,735 | | 2.500%, 05/01/2030 | | | 145,186 | | | 0.0 | |
| 305,636 | | 2.500%, 05/01/2030 | | | 286,070 | | | 0.0 | |
| 392,664 | | 2.500%, 06/01/2030 | | | 369,810 | | | 0.0 | |
| 704,954 | | 3.000%, 11/01/2042 | | | 630,892 | | | 0.0 | |
| 692,697 | | 3.000%, 02/01/2043 | | | 619,563 | | | 0.0 | |
| 680,323 | | 3.000%, 03/01/2045 | | | 605,065 | | | 0.0 | |
| 896,075 | | 3.000%, 03/01/2045 | | | 800,112 | | | 0.0 | |
| 2,211,800 | | 3.000%, 04/01/2045 | | | 1,968,050 | | | 0.0 | |
| 2,320,254 | | 3.000%, 04/01/2045 | | | 2,068,397 | | | 0.0 | |
| 1,008,177 | | 3.000%, 10/01/2046 | | | 892,094 | | | 0.0 | |
| 8,429,120 | | 3.000%, 10/01/2046 | | | 7,432,387 | | | 0.1 | |
| 3,214,832 | | 3.000%, 03/01/2048 | | | 2,834,825 | | | 0.0 | |
| 4,115,822 | | 3.000%, 03/01/2048 | | | 3,633,035 | | | 0.1 | |
| 10,203,723 | | 3.000%, 08/01/2048 | | | 8,965,760 | | | 0.1 | |
| 3,308,960 | | 3.500%, 01/01/2045 | | | 3,035,410 | | | 0.1 | |
| 1,126,331 | | 3.500%, 03/01/2045 | | | 1,032,035 | | | 0.0 | |
| 5,263,383 | | 3.500%, 12/01/2046 | | | 4,822,986 | | | 0.1 | |
| 9,090,121 | | 3.500%, 12/01/2046 | | | 8,302,197 | | | 0.1 | |
| 3,967,864 | | 3.500%, 04/01/2047 | | | 3,655,532 | | | 0.1 | |
| 2,720,865 | | 3.500%, 07/01/2047 | | | 2,484,998 | | | 0.0 | |
| 2,514,209 | | 3.500%, 10/01/2047 | | | 2,298,451 | | | 0.0 | |
| 9,776,022 | | 3.500%, 01/01/2048 | | | 8,928,428 | | | 0.1 | |
| 1,333,282 | | 3.500%, 03/01/2048 | | | 1,222,645 | | | 0.0 | |
| 23,971,107 | | 3.500%, 03/01/2048 | | | 21,955,278 | | | 0.3 | |
| 15,822,709 | | 3.500%, 11/01/2048 | | | 14,492,082 | | | 0.2 | |
| 262,264 | | 4.000%, 10/01/2041 | | | 247,506 | | | 0.0 | |
See Accompanying Notes to Financial Statements
| Voya Intermediate Bond Fund | PORTFOLIO OF INVESTMENTS |
| as of March 31, 2024 (continued) |
| | | | | | | | | Percentage | |
| Principal | | | | | | | | of Net | |
| Amount† | | | | | Value | | | Assets | |
| U.S. GOVERNMENT AGENCY OBLIGATIONS: (continued) | |
| | | | Federal Home Loan Mortgage Corporation (continued) | |
| 403,626 | | | 4.000%, 12/01/2041 | | $ | 380,919 | | | | 0.0 | |
| 1,411,559 | | | 4.000%, 08/01/2044 | | | 1,339,168 | | | | 0.0 | |
| 384,108 | | | 4.000%, 07/01/2045 | | | 364,409 | | | | 0.0 | |
| 565,845 | | | 4.000%, 09/01/2045 | | | 535,630 | | | | 0.0 | |
| 967,834 | | | 4.000%, 09/01/2045 | | | 918,197 | | | | 0.0 | |
| 1,124,392 | | | 4.000%, 09/01/2045 | | | 1,066,724 | | | | 0.0 | |
| 8,777,547 | | | 4.000%, 11/01/2045 | | | 8,327,341 | | | | 0.1 | |
| 942,751 | | | 4.000%, 05/01/2046 | | | 894,400 | | | | 0.0 | |
| 599,319 | | | 4.000%, 05/01/2047 | | | 570,242 | | | | 0.0 | |
| 3,150,449 | | | 4.000%, 11/01/2047 | | | 2,959,070 | | | | 0.0 | |
| 195,977 | | | 4.000%, 03/01/2048 | | | 185,701 | | | | 0.0 | |
| 3,703,050 | | | 4.000%, 06/01/2048 | | | 3,545,845 | | | | 0.1 | |
| 3,500,000 | | | 4.350%, 01/01/2030 | | | 3,431,861 | | | | 0.1 | |
| 142,190 | | | 4.500%, 08/01/2041 | | | 139,678 | | | | 0.0 | |
| 404,386 | | | 4.500%, 09/01/2041 | | | 397,242 | | | | 0.0 | |
| 373,693 | | | 4.500%, 10/01/2041 | | | 367,091 | | | | 0.0 | |
| 1,008,014 | | | 4.500%, 03/01/2044 | | | 985,218 | | | | 0.0 | |
| 1,596,589 | | | 4.500%, 02/01/2048 | | | 1,549,236 | | | | 0.0 | |
| 230,797 | | | 4.500%, 06/01/2048 | | | 223,856 | | | | 0.0 | |
| 37,966 | | | 5.000%, 01/01/2041 | | | 37,921 | | | | 0.0 | |
| 199,839 | | | 5.000%, 04/01/2041 | | | 197,988 | | | | 0.0 | |
| 11,638 | | | 5.500%, 07/01/2037 | | | 11,900 | | | | 0.0 | |
| 709,423 | | | 5.500%, 11/01/2038 | | | 725,347 | | | | 0.0 | |
| 2,145 (3) | | | 5.501%, (RFUCCT1Y + 1.755%), 05/01/2037 | | | 2,152 | | | | 0.0 | |
| 767 | | | 6.000%, 12/01/2028 | | | 776 | | | | 0.0 | |
| 8,915 | | | 6.000%, 01/01/2029 | | | 9,006 | | | | 0.0 | |
| 1,964 | | | 6.500%, 12/01/2031 | | | 2,010 | | | | 0.0 | |
| 196,850 | | | 6.500%, 09/01/2034 | | | 201,734 | | | | 0.0 | |
| | | | | | | 133,099,456 | | | | 1.6 | |
| | | | Federal National Mortgage Association: 0.3%(4) | |
| 15,654,386 | | | 3.000%, 12/01/2054 | | | 13,432,585 | | | | 0.2 | |
| 2,206,046 | | | 3.500%, 01/01/2044 | | | 2,021,124 | | | | 0.0 | |
| 2,788,348 | | | 4.000%, 12/01/2046 | | | 2,649,718 | | | | 0.0 | |
| 1,015,562 | | | 4.500%, 09/01/2047 | | | 1,019,196 | | | | 0.0 | |
| 7,843,990 | | | 5.000%, 08/01/2056 | | | 7,740,101 | | | | 0.1 | |
| 52,517 | | | 6.000%, 05/01/2038 | | | 52,888 | | | | 0.0 | |
| | | | | | | 26,915,612 | | | | 0.3 | |
| | | | Government National Mortgage Association: 4.5% | |
| 8,708,259 | | | 2.500%, 03/20/2051 | | | 7,432,068 | | | | 0.1 | |
| 5,053,079 | | | 2.500%, 04/20/2051 | | | 4,288,087 | | | | 0.1 | |
| 20,528,897 | | | 2.500%, 04/20/2051 | | | 17,510,999 | | | | 0.2 | |
| 7,075,368 | | | 2.500%, 05/20/2051 | | | 6,035,885 | | | | 0.1 | |
| 18,402,577 | | | 2.500%, 08/20/2051 | | | 15,694,051 | | | | 0.2 | |
| 7,974,182 | | | 2.500%, 09/20/2051 | | | 6,799,681 | | | | 0.1 | |
| 31,273,744 | | | 2.500%, 10/20/2051 | | | 26,654,502 | | | | 0.3 | |
| 13,821,841 | | | 2.500%, 11/20/2051 | | | 11,784,592 | | | | 0.1 | |
| 18,373,599 | | | 2.500%, 12/20/2051 | | | 15,659,681 | | | | 0.2 | |
| 24,163,671 | | | 2.500%, 04/20/2052 | | | 20,587,962 | | | | 0.2 | |
| 5,709,347 | | | 3.000%, 10/20/2049 | | | 5,120,909 | | | | 0.1 | |
| 2,716,149 | | | 3.000%, 11/20/2049 | | | 2,436,567 | | | | 0.0 | |
| 2,555,306 | | | 3.000%, 10/20/2051 | | | 2,254,310 | | | | 0.0 | |
| 4,395,873 | | | 3.000%, 10/20/2051 | | | 3,790,565 | | | | 0.0 | |
| 2,704,416 | | | 3.000%, 11/20/2051 | | | 2,332,021 | | | | 0.0 | |
| 607,032 | | | 3.500%, 07/20/2046 | | | 552,495 | | | | 0.0 | |
| 2,960,158 | | | 3.500%, 07/20/2046 | | | 2,657,668 | | | | 0.0 | |
| 971,343 | | | 3.500%, 10/20/2046 | | | 890,823 | | | | 0.0 | |
| 445,537 | | | 3.500%, 02/20/2047 | | | 410,464 | | | | 0.0 | |
| | | | | | | | | Percentage | |
| Principal | | | | | | | | of Net | |
| Amount† | | | | | Value | | | Assets | |
| U.S. GOVERNMENT AGENCY OBLIGATIONS: (continued) | |
| | | | Government National Mortgage Association (continued) | |
| 375,693 | | | 3.500%, 03/20/2047 | | $ | 344,881 | | | | 0.0 | |
| 275,867 | | | 3.500%, 07/20/2047 | | | 254,771 | | | | 0.0 | |
| 558,850 | | | 3.500%, 08/20/2047 | | | 513,302 | | | | 0.0 | |
| 882,957 | | | 3.500%, 09/20/2047 | | | 809,421 | | | | 0.0 | |
| 5,673,238 | | | 3.500%, 12/20/2047 | | | 5,215,172 | | | | 0.1 | |
| 3,417,235 | | | 3.500%, 01/20/2048 | | | 3,148,433 | | | | 0.0 | |
| 3,011,568 | | | 3.500%, 02/20/2048 | | | 2,768,843 | | | | 0.0 | |
| 5,289,146 | | | 3.500%, 02/20/2048 | | | 4,887,811 | | | | 0.1 | |
| 558,261 | | | 3.500%, 03/20/2048 | | | 512,175 | | | | 0.0 | |
| 13,877,970 | | | 3.500%, 03/20/2048 | | | 12,795,894 | | | | 0.2 | |
| 104,904 | | | 4.000%, 11/20/2040 | | | 100,912 | | | | 0.0 | |
| 593,966 | | | 4.000%, 03/20/2046 | | | 564,745 | | | | 0.0 | |
| 7,590,290 | | | 4.000%, 09/20/2047 | | | 7,200,312 | | | | 0.1 | |
| 3,661,342 | | | 4.000%, 02/20/2050 | | | 3,463,096 | | | | 0.0 | |
| 6,024,504 | | | 4.000%, 05/20/2053 | | | 5,638,450 | | | | 0.1 | |
| 140,226 | | | 4.500%, 10/15/2039 | | | 138,071 | | | | 0.0 | |
| 102,602 | | | 4.500%, 11/15/2039 | | | 101,114 | | | | 0.0 | |
| 111,784 | | | 4.500%, 11/15/2039 | | | 110,197 | | | | 0.0 | |
| 34,683 | | | 4.500%, 12/15/2039 | | | 34,119 | | | | 0.0 | |
| 6,299,824 | | | 4.500%, 08/20/2040 | | | 6,210,223 | | | | 0.1 | |
| 7,363,887 | | | 4.500%, 09/20/2040 | | | 7,254,647 | | | | 0.1 | |
| 4,829,198 | | | 4.500%, 06/20/2041 | | | 4,760,524 | | | | 0.1 | |
| 31,476 | | | 4.500%, 08/20/2041 | | | 31,029 | | | | 0.0 | |
| 635,083 | | | 4.500%, 09/15/2047 | | | 617,298 | | | | 0.0 | |
| 95,244,762 | | | 4.500%, 07/20/2053 | | | 91,520,416 | | | | 1.1 | |
| 1,221,860 | | | 5.000%, 01/20/2053 | | | 1,201,548 | | | | 0.0 | |
| 31,079,531 | | | 5.000%, 04/20/2053 | | | 30,563,140 | | | | 0.4 | |
| 36,456,000 (5) | | | 5.000%, 05/15/2053 | | | 35,841,621 | | | | 0.4 | |
| | | | | | | 379,495,495 | | | | 4.5 | |
| | | | Uniform Mortgage-Backed Securities: 13.9% | |
| 18,288,709 | | | 2.000%, 12/01/2050 | | | 14,585,612 | | | | 0.2 | |
| 11,552,654 | | | 2.000%, 05/01/2051 | | | 9,324,831 | | | | 0.1 | |
| 24,781,586 | | | 2.000%, 05/01/2051 | | | 19,681,501 | | | | 0.2 | |
| 33,228,525 | | | 2.000%, 05/01/2051 | | | 26,441,550 | | | | 0.3 | |
| 939,768 | | | 2.000%, 07/01/2051 | | | 747,946 | | | | 0.0 | |
| 4,864,155 | | | 2.000%, 08/01/2051 | | | 3,890,837 | | | | 0.1 | |
| 10,182,514 | | | 2.000%, 08/01/2051 | | | 8,091,783 | | | | 0.1 | |
| 19,779,987 | | | 2.000%, 09/01/2051 | | | 15,714,718 | | | | 0.2 | |
| 9,322,178 | | | 2.000%, 10/01/2051 | | | 7,401,869 | | | | 0.1 | |
| 912,651 | | | 2.000%, 11/01/2051 | | | 731,510 | | | | 0.0 | |
| 2,047,358 | | | 2.000%, 11/01/2051 | | | 1,642,625 | | | | 0.0 | |
| 16,519,443 | | | 2.000%, 11/01/2051 | | | 13,287,659 | | | | 0.2 | |
| 8,435,750 | | | 2.000%, 12/01/2051 | | | 6,781,848 | | | | 0.1 | |
| 28,079,173 | | | 2.000%, 12/01/2051 | | | 22,279,839 | | | | 0.3 | |
| 4,760,343 | | | 2.000%, 01/01/2052 | | | 3,829,144 | | | | 0.1 | |
| 4,192,257 | | | 2.000%, 02/01/2052 | | | 3,374,428 | | | | 0.0 | |
| 4,764,718 | | | 2.000%, 02/01/2052 | | | 3,828,963 | | | | 0.1 | |
| 8,093,533 | | | 2.000%, 02/01/2052 | | | 6,514,792 | | | | 0.1 | |
| 8,121,486 | | | 2.000%, 02/01/2052 | | | 6,527,227 | | | | 0.1 | |
| 11,611,098 | | | 2.000%, 02/01/2052 | | | 9,331,956 | | | | 0.1 | |
| 11,709,461 | | | 2.000%, 02/01/2052 | | | 9,425,129 | | | | 0.1 | |
| 13,486,918 | | | 2.000%, 02/01/2052 | | | 10,859,648 | | | | 0.1 | |
| 23,935,646 | | | 2.000%, 02/01/2052 | | | 18,999,185 | | | | 0.2 | |
| 26,147,001 | | | 2.000%, 02/01/2052 | | | 21,020,864 | | | | 0.3 | |
| 4,735,922 | | | 2.000%, 03/01/2052 | | | 3,807,754 | | | | 0.1 | |
| 5,139,160 | | | 2.000%, 03/01/2052 | | | 4,147,359 | | | | 0.1 | |
| 5,708,303 | | | 2.000%, 03/01/2052 | | | 4,558,946 | | | | 0.1 | |
| 27,157,466 | | | 2.000%, 03/01/2052 | | | 21,525,135 | | | | 0.3 | |
See Accompanying Notes to Financial Statements
| Voya Intermediate Bond Fund | PORTFOLIO OF INVESTMENTS |
| as of March 31, 2024 (continued) |
| | | | | | | | | Percentage | |
| Principal | | | | | | | | of Net | |
| Amount† | | | | | Value | | | Assets | |
| U.S. GOVERNMENT AGENCY OBLIGATIONS: (continued) | |
| | | | Uniform Mortgage-Backed Securities (continued) | |
| 6,289,379 | | | 2.000%, 04/01/2052 | | $ | 5,062,903 | | | | 0.1 | |
| 567,274 | | | 2.500%, 05/01/2030 | | | 534,157 | | | | 0.0 | |
| 832,108 | | | 2.500%, 06/01/2030 | | | 783,974 | | | | 0.0 | |
| 1,106,575 | | | 2.500%, 06/01/2030 | | | 1,041,416 | | | | 0.0 | |
| 471,623 | | | 2.500%, 07/01/2030 | | | 443,850 | | | | 0.0 | |
| 13,895 | | | 2.500%, 02/01/2050 | | | 11,598 | | | | 0.0 | |
| 22,257 | | | 2.500%, 04/01/2050 | | | 18,581 | | | | 0.0 | |
| 18,089 | | | 2.500%, 05/01/2050 | | | 15,093 | | | | 0.0 | |
| 33,892 | | | 2.500%, 05/01/2050 | | | 28,289 | | | | 0.0 | |
| 35,034 | | | 2.500%, 05/01/2050 | | | 29,227 | | | | 0.0 | |
| 65,009 | | | 2.500%, 05/01/2050 | | | 54,258 | | | | 0.0 | |
| 175,956 | | | 2.500%, 05/01/2050 | | | 146,820 | | | | 0.0 | |
| 15,506 | | | 2.500%, 06/01/2050 | | | 12,932 | | | | 0.0 | |
| 1,652,337 | | | 2.500%, 06/01/2050 | | | 1,390,158 | | | | 0.0 | |
| 19,624,844 | | | 2.500%, 06/01/2050 | | | 16,526,231 | | | | 0.2 | |
| 217,599 | | | 2.500%, 07/01/2050 | | | 181,462 | | | | 0.0 | |
| 3,288,263 | | | 2.500%, 07/01/2050 | | | 2,745,290 | | | | 0.0 | |
| 25,920,458 | | | 2.500%, 07/01/2050 | | | 21,641,606 | | | | 0.3 | |
| 105,760 | | | 2.500%, 08/01/2050 | | | 88,313 | | | | 0.0 | |
| 706,154 | | | 2.500%, 08/01/2050 | | | 589,527 | | | | 0.0 | |
| 1,864,950 | | | 2.500%, 08/01/2050 | | | 1,555,373 | | | | 0.0 | |
| 2,096,512 | | | 2.500%, 08/01/2050 | | | 1,748,158 | | | | 0.0 | |
| 22,305,328 | | | 2.500%, 08/01/2050 | | | 18,783,384 | | | | 0.2 | |
| 25,996 | | | 2.500%, 09/01/2050 | | | 21,703 | | | | 0.0 | |
| 80,607 | | | 2.500%, 09/01/2050 | | | 67,277 | | | | 0.0 | |
| 200,981 | | | 2.500%, 09/01/2050 | | | 167,494 | | | | 0.0 | |
| 813,417 | | | 2.500%, 09/01/2050 | | | 678,430 | | | | 0.0 | |
| 939,440 | | | 2.500%, 09/01/2050 | | | 783,497 | | | | 0.0 | |
| 3,996,522 | | | 2.500%, 10/01/2050 | | | 3,332,114 | | | | 0.0 | |
| 4,287,620 | | | 2.500%, 10/01/2050 | | | 3,574,118 | | | | 0.0 | |
| 3,467,691 | | | 2.500%, 11/01/2050 | | | 2,929,265 | | | | 0.0 | |
| 81,439 | | | 2.500%, 01/01/2051 | | | 67,826 | | | | 0.0 | |
| 9,797,648 | | | 2.500%, 02/01/2051 | | | 8,122,092 | | | | 0.1 | |
| 22,671,257 | | | 2.500%, 04/01/2051 | | | 18,864,487 | | | | 0.2 | |
| 3,340,185 | | | 2.500%, 05/01/2051 | | | 2,787,163 | | | | 0.0 | |
| 37,555,746 | | | 2.500%, 06/01/2051 | | | 31,212,463 | | | | 0.4 | |
| 4,116,344 | | | 2.500%, 09/01/2051 | | | 3,446,129 | | | | 0.0 | |
| 18,668,610 | | | 2.500%, 11/01/2051 | | | 15,561,948 | | | | 0.2 | |
| 2,539,557 | | | 2.500%, 12/01/2051 | | | 2,129,670 | | | | 0.0 | |
| 16,271,260 | | | 2.500%, 12/01/2051 | | | 13,698,740 | | | | 0.2 | |
| 15,695,328 | | | 2.500%, 01/01/2052 | | | 13,173,569 | | | | 0.2 | |
| 26,019,581 | | | 2.500%, 01/01/2052 | | | 21,797,858 | | | | 0.3 | |
| 3,846,163 | | | 2.500%, 02/01/2052 | | | 3,249,004 | | | | 0.0 | |
| 4,026,022 | | | 2.500%, 02/01/2052 | | | 3,389,442 | | | | 0.0 | |
| 6,353,348 | | | 2.500%, 02/01/2052 | | | 5,297,161 | | | | 0.1 | |
| 7,205,670 | | | 2.500%, 02/01/2052 | | | 6,007,824 | | | | 0.1 | |
| 11,097,142 | | | 2.500%, 02/01/2052 | | | 9,200,868 | | | | 0.1 | |
| 110,140,456 | | | 2.500%, 02/01/2052 | | | 92,013,372 | | | | 1.1 | |
| 6,262,068 | | | 2.500%, 03/01/2052 | | | 5,248,494 | | | | 0.1 | |
| 9,603,322 | | | 2.500%, 03/01/2052 | | | 8,052,357 | | | | 0.1 | |
| 29,140,107 | | | 2.500%, 03/01/2052 | | | 24,442,794 | | | | 0.3 | |
| 17,871,606 | | | 2.500%, 04/01/2052 | | | 14,985,220 | | | | 0.2 | |
| 785,277 | | | 3.000%, 08/01/2030 | | | 750,340 | | | | 0.0 | |
| 392,909 | | | 3.000%, 09/01/2030 | | | 374,510 | | | | 0.0 | |
| 781,442 | | | 3.000%, 08/01/2035 | | | 732,205 | | | | 0.0 | |
| 1,576,429 | | | 3.000%, 04/01/2043 | | | 1,408,156 | | | | 0.0 | |
| 1,435,278 | | | 3.000%, 07/01/2043 | | | 1,282,071 | | | | 0.0 | |
| 472,264 | | | 3.000%, 08/01/2043 | | | 421,863 | | | | 0.0 | |
| 299,517 | | | 3.000%, 09/01/2043 | | | 267,583 | | | | 0.0 | |
| | | | | | | | | Percentage | |
| Principal | | | | | | | | of Net | |
| Amount† | | | | | Value | | | Assets | |
| U.S. GOVERNMENT AGENCY OBLIGATIONS: (continued) | |
| | | | Uniform Mortgage-Backed Securities (continued) | |
| 4,883,980 | | | 3.000%, 04/01/2045 | | $ | 4,348,573 | | | | 0.1 | |
| 937,041 | | | 3.000%, 08/01/2046 | | | 827,569 | | | | 0.0 | |
| 2,072,528 | | | 3.000%, 08/01/2046 | | | 1,829,191 | | | | 0.0 | |
| 668,435 | | | 3.000%, 11/01/2046 | | | 594,167 | | | | 0.0 | |
| 1,522,793 | | | 3.000%, 12/01/2046 | | | 1,340,222 | | | | 0.0 | |
| 5,881,458 | | | 3.000%, 12/01/2046 | | | 5,185,277 | | | | 0.1 | |
| 11,340,499 | | | 3.000%, 01/01/2047 | | | 9,941,732 | | | | 0.1 | |
| 2,754,757 | | | 3.000%, 02/01/2047 | | | 2,423,333 | | | | 0.0 | |
| 3,401,025 | | | 3.000%, 03/01/2047 | | | 2,992,560 | | | | 0.0 | |
| 2,701,729 | | | 3.000%, 07/01/2047 | | | 2,378,359 | | | | 0.0 | |
| 21,202,821 | | | 3.000%, 10/01/2050 | | | 18,407,458 | | | | 0.2 | |
| 1,982,204 | | | 3.000%, 03/01/2051 | | | 1,719,033 | | | | 0.0 | |
| 5,156,217 | | | 3.000%, 01/01/2052 | | | 4,531,252 | | | | 0.1 | |
| 41,643,925 | | | 3.000%, 01/01/2052 | | | 36,273,173 | | | | 0.4 | |
| 3,729,321 | | | 3.000%, 02/01/2052 | | | 3,271,510 | | | | 0.0 | |
| 4,362,140 | | | 3.000%, 02/01/2052 | | | 3,811,864 | | | | 0.1 | |
| 5,126,019 | | | 3.000%, 02/01/2052 | | | 4,463,698 | | | | 0.1 | |
| 5,379,179 | | | 3.000%, 02/01/2052 | | | 4,727,165 | | | | 0.1 | |
| 5,642,721 | | | 3.000%, 02/01/2052 | | | 4,935,582 | | | | 0.1 | |
| 11,078,502 | | | 3.000%, 02/01/2052 | | | 9,679,351 | | | | 0.1 | |
| 10,142,113 | | | 3.000%, 03/01/2052 | | | 8,866,881 | | | | 0.1 | |
| 15,792,809 | | | 3.000%, 03/01/2052 | | | 13,739,832 | | | | 0.2 | |
| 20,206,969 | | | 3.000%, 05/01/2052 | | | 17,588,033 | | | | 0.2 | |
| 45,420,593 | | | 3.000%, 05/01/2052 | | | 39,367,418 | | | | 0.5 | |
| 12,738,713 | | | 3.500%, 06/01/2034 | | | 12,195,258 | | | | 0.1 | |
| 1,834,792 | | | 3.500%, 10/01/2042 | | | 1,687,761 | | | | 0.0 | |
| 815,272 | | | 3.500%, 04/01/2043 | | | 749,078 | | | | 0.0 | |
| 2,365,500 | | | 3.500%, 08/01/2043 | | | 2,173,926 | | | | 0.0 | |
| 1,425,294 | | | 3.500%, 03/01/2044 | | | 1,306,556 | | | | 0.0 | |
| 169,407 | | | 3.500%, 01/01/2046 | | | 155,154 | | | | 0.0 | |
| 124,806 | | | 3.500%, 02/01/2046 | | | 114,289 | | | | 0.0 | |
| 261,440 | | | 3.500%, 02/01/2046 | | | 239,453 | | | | 0.0 | |
| 10,690,530 | | | 3.500%, 08/01/2046 | | | 9,786,209 | | | | 0.1 | |
| 717,265 | | | 3.500%, 08/01/2047 | | | 654,302 | | | | 0.0 | |
| 950,304 | | | 3.500%, 09/01/2047 | | | 866,874 | | | | 0.0 | |
| 12,482,219 | | | 3.500%, 11/01/2047 | | | 11,502,262 | | | | 0.1 | |
| 366,915 | | | 3.500%, 12/01/2047 | | | 334,703 | | | | 0.0 | |
| 777,405 | | | 3.500%, 02/01/2048 | | | 708,143 | | | | 0.0 | |
| 778,258 | | | 3.500%, 05/01/2048 | | | 708,311 | | | | 0.0 | |
| 7,376,328 | | | 3.500%, 07/01/2048 | | | 6,747,937 | | | | 0.1 | |
| 1,789,904 | | | 3.500%, 10/01/2049 | | | 1,642,983 | | | | 0.0 | |
| 2,355,261 | | | 3.500%, 02/01/2052 | | | 2,137,142 | | | | 0.0 | |
| 99,499 | | | 4.000%, 03/01/2042 | | | 94,322 | | | | 0.0 | |
| 94,551 | | | 4.000%, 07/01/2042 | | | 89,624 | | | | 0.0 | |
| 298,915 | | | 4.000%, 07/01/2042 | | | 282,050 | | | | 0.0 | |
| 783,988 | | | 4.000%, 07/01/2042 | | | 743,116 | | | | 0.0 | |
| 418,040 | | | 4.000%, 09/01/2043 | | | 398,993 | | | | 0.0 | |
| 1,041,876 | | | 4.000%, 01/01/2045 | | | 987,222 | | | | 0.0 | |
| 8,004,629 | | | 4.000%, 01/01/2045 | | | 7,665,811 | | | | 0.1 | |
| 946,182 | | | 4.000%, 03/01/2045 | | | 896,549 | | | | 0.0 | |
| 2,944,216 | | | 4.000%, 05/01/2045 | | | 2,790,685 | | | | 0.0 | |
| 834,254 | | | 4.000%, 06/01/2045 | | | 790,489 | | | | 0.0 | |
| 826,522 | | | 4.000%, 11/01/2045 | | | 783,501 | | | | 0.0 | |
| 2,454,376 | | | 4.000%, 02/01/2046 | | | 2,325,621 | | | | 0.0 | |
| 4,174,169 | | | 4.000%, 07/01/2047 | | | 3,950,419 | | | | 0.1 | |
| 374,228 | | | 4.000%, 08/01/2047 | | | 353,781 | | | | 0.0 | |
| 1,127,835 | | | 4.000%, 08/01/2047 | | | 1,065,977 | | | | 0.0 | |
| 96,493 | | | 4.000%, 03/01/2048 | | | 90,712 | | | | 0.0 | |
| 384,312 | | | 4.000%, 03/01/2048 | | | 363,115 | | | | 0.0 | |
See Accompanying Notes to Financial Statements
| Voya Intermediate Bond Fund | PORTFOLIO OF INVESTMENTS |
| as of March 31, 2024 (continued) |
| | | | | | | | | Percentage | |
| Principal | | | | | | | | of Net | |
| Amount† | | | | | Value | | | Assets | |
| U.S. GOVERNMENT AGENCY OBLIGATIONS: (continued) | |
| | | | Uniform Mortgage-Backed Securities (continued) | |
| 3,717,221 | | | 4.000%, 06/01/2048 | | $ | 3,492,157 | | | | 0.0 | |
| 3,045,983 | | | 4.000%, 09/01/2048 | | | 2,887,353 | | | | 0.0 | |
| 7,854,758 | | | 4.000%, 04/01/2049 | | | 7,379,223 | | | | 0.1 | |
| 8,978,919 | | | 4.000%, 05/01/2052 | | | 8,349,682 | | | | 0.1 | |
| 5,739,335 | | | 4.000%, 06/01/2052 | | | 5,383,788 | | | | 0.1 | |
| 26,628,096 | | | 4.000%, 08/01/2052 | | | 24,707,918 | | | | 0.3 | |
| 3,275,936 | | | 4.000%, 11/01/2052 | | | 3,075,546 | | | | 0.0 | |
| 957,239 | | | 4.250%, 11/01/2043 | | | 920,893 | | | | 0.0 | |
| 73,274 | | | 4.500%, 11/01/2040 | | | 71,890 | | | | 0.0 | |
| 207,250 | | | 4.500%, 11/01/2040 | | | 203,334 | | | | 0.0 | |
| 1,248,869 | | | 4.500%, 11/01/2040 | | | 1,225,280 | | | | 0.0 | |
| 2,020 | | | 4.500%, 12/01/2040 | | | 1,982 | | | | 0.0 | |
| 3,599 | | | 4.500%, 12/01/2040 | | | 3,531 | | | | 0.0 | |
| 2,200 | | | 4.500%, 01/01/2041 | | | 2,140 | | | | 0.0 | |
| 3,859 | | | 4.500%, 01/01/2041 | | | 3,786 | | | | 0.0 | |
| 151,378 | | | 4.500%, 10/01/2041 | | | 148,516 | | | | 0.0 | |
| 248,063 | | | 4.500%, 10/01/2044 | | | 240,163 | | | | 0.0 | |
| 382,017 | | | 4.500%, 12/01/2045 | | | 372,908 | | | | 0.0 | |
| 265,370 | | | 4.500%, 04/01/2047 | | | 258,816 | | | | 0.0 | |
| 915,485 | | | 4.500%, 04/01/2047 | | | 891,269 | | | | 0.0 | |
| 1,620,070 | | | 4.500%, 04/01/2047 | | | 1,577,398 | | | | 0.0 | |
| 2,152,335 | | | 4.500%, 04/01/2047 | | | 2,096,072 | | | | 0.0 | |
| 708,883 | | | 4.500%, 05/01/2047 | | | 684,426 | | | | 0.0 | |
| 764,494 | | | 4.500%, 05/01/2047 | | | 744,027 | | | | 0.0 | |
| 805,848 | | | 4.500%, 05/01/2047 | | | 787,562 | | | | 0.0 | |
| 852,851 | | | 4.500%, 05/01/2047 | | | 833,495 | | | | 0.0 | |
| 902,581 | | | 4.500%, 05/01/2047 | | | 882,095 | | | | 0.0 | |
| 294,837 | | | 4.500%, 06/01/2047 | | | 286,674 | | | | 0.0 | |
| 428,387 | | | 4.500%, 06/01/2047 | | | 416,527 | | | | 0.0 | |
| 710,600 | | | 4.500%, 06/01/2047 | | | 691,438 | | | | 0.0 | |
| 1,510,300 | | | 4.500%, 07/01/2047 | | | 1,466,151 | | | | 0.0 | |
| 101,288 | | | 4.500%, 08/01/2047 | | | 98,276 | | | | 0.0 | |
| 7,550,443 | | | 4.500%, 08/01/2052 | | | 7,246,461 | | | | 0.1 | |
| 23,340,870 | | | 4.500%, 10/01/2052 | | | 22,234,987 | | | | 0.3 | |
| 1,233,020 | | | 5.000%, 05/01/2042 | | | 1,239,983 | | | | 0.0 | |
| 14,193,423 | | | 5.000%, 10/01/2052 | | | 13,863,967 | | | | 0.2 | |
| 59,094 | | | 5.500%, 03/01/2037 | | | 59,893 | | | | 0.0 | |
| 70,430 | | | 5.500%, 06/01/2039 | | | 71,924 | | | | 0.0 | |
| 578,446 | | | 5.500%, 10/01/2039 | | | 590,727 | | | | 0.0 | |
| 52,830,567 | | | 5.500%, 06/01/2053 | | | 52,600,858 | | | | 0.6 | |
| 40,765,141 | | | 5.500%, 08/01/2053 | | | 40,581,071 | | | | 0.5 | |
| 24,350,000 (5) | | | 5.500%, 04/01/2054 | | | 24,232,938 | | | | 0.3 | |
| 35,827 | | | 6.000%, 09/01/2036 | | | 36,422 | | | | 0.0 | |
| 80 | | | 6.500%, 02/01/2028 | | | 82 | | | | 0.0 | |
| 109 | | | 6.500%, 09/01/2031 | | | 112 | | | | 0.0 | |
| 403 | | | 6.500%, 09/01/2031 | | | 412 | | | | 0.0 | |
| 11,100 | | | 6.500%, 11/01/2031 | | | 11,508 | | | | 0.0 | |
| 4,450 | | | 6.500%, 04/01/2032 | | | 4,605 | | | | 0.0 | |
| 999 | | | 6.500%, 08/01/2032 | | | 1,021 | | | | 0.0 | |
| 3,230 | | | 6.500%, 08/01/2032 | | | 3,300 | | | | 0.0 | |
| 3,304 | | | 7.000%, 12/01/2027 | | | 3,407 | | | | 0.0 | |
| 671 | | | 7.000%, 10/01/2031 | | | 692 | | | | 0.0 | |
| 466 | | | 7.000%, 03/01/2032 | | | 481 | | | | 0.0 | |
| 484 | | | 7.500%, 09/01/2030 | | | 494 | | | | 0.0 | |
| 1,488 | | | 7.500%, 09/01/2031 | | | 1,511 | | | | 0.0 | |
| | | | | | | | | Percentage | |
| Principal | | | | | | | | of Net | |
| Amount† | | | | | Value | | | Assets | |
| U.S. GOVERNMENT AGENCY OBLIGATIONS: (continued) | |
| | | | Uniform Mortgage-Backed Securities (continued) | |
| 10,092 | | | 7.500%, 02/01/2032 | | $ | 10,179 | | | | 0.0 | |
| | | | | | | 1,184,933,277 | | | | 13.9 | |
| | | | Total U.S. Government Agency Obligations
(Cost $1,859,741,009) | | | 1,724,443,840 | | | | 20.3 | |
| COLLATERALIZED MORTGAGE OBLIGATIONS: 15.5% | | |
| 1,288,755 (3) | | | Alternative Loan Trust 2004-J7 M1, 5.117%, (TSFR1M + 1.134%), 10/25/2034 | | | 1,270,302 | | | | 0.0 | |
| 365,467 (3) | | | Alternative Loan Trust 2005-53T2 2A6, 5.944%, (TSFR1M + 0.614%), 11/25/2035 | | | 199,824 | | | | 0.0 | |
| 405,466 | | | Alternative Loan Trust 2005-65CB 2A4, 5.500%, 12/25/2035 | | | 283,276 | | | | 0.0 | |
| 468,269 | | | Alternative Loan Trust 2005-6CB 1A3, 5.250%, 04/25/2035 | | | 386,497 | | | | 0.0 | |
| 931,731 (3) | | | Alternative Loan Trust 2005-J2 1A12, 5.500%, (TSFR1M + 0.514%), 04/25/2035 | | | 717,288 | | | | 0.0 | |
| 625,640 | | | Alternative Loan Trust 2006-13T1 A9, 6.000%, 05/25/2036 | | | 311,217 | | | | 0.0 | |
| 113,925 (3) | | | Alternative Loan Trust 2006-18CB A10, 5.844%, (TSFR1M + 0.514%), 07/25/2036 | | | 49,275 | | | | 0.0 | |
| 681,944 (3) | | | Alternative Loan Trust 2006-19CB A28, 6.000%, (TSFR1M + 0.714%), 08/25/2036 | | | 334,617 | | | | 0.0 | |
| 831,288 (3) | | | Alternative Loan Trust 2007-23CB A3, 5.944%, (TSFR1M + 0.614%), 09/25/2037 | | | 326,319 | | | | 0.0 | |
| 1,868,508 (3) | | | Alternative Loan Trust 2007-2CB 2A1, 5.750%, (TSFR1M + 0.714%), 03/25/2037 | | | 815,387 | | | | 0.0 | |
| 821,667 | | | Alternative Loan Trust 2007-3T1 1A11, 6.000%, 04/25/2037 | | | 388,417 | | | | 0.0 | |
| 723,421 (3) | | | Alternative Loan Trust 2007-8CB A3, 5.944%, (TSFR1M + 0.614%), 05/25/2037 | | | 333,971 | | | | 0.0 | |
| 1,292,100 (3) | | | American Home Mortgage Assets Trust 2007-4 A4, 6.024%, (TSFR1M + 0.694%), 08/25/2037 | | | 1,140,624 | | | | 0.0 | |
| 612,630 (1)(3) | | | Arroyo Mortgage Trust 2019-3 A3, 3.416%, 10/25/2048 | | | 569,112 | | | | 0.0 | |
See Accompanying Notes to Financial Statements
| Voya Intermediate Bond Fund | PORTFOLIO OF INVESTMENTS |
| as of March 31, 2024 (continued) |
| | | | | | | | | Percentage | |
| Principal | | | | | | | | of Net | |
| Amount† | | | | | Value | | | Assets | |
| COLLATERALIZED MORTGAGE OBLIGATIONS: (continued) |
| 520,488 (3) | | | Banc of America Funding Trust 2007-2 1A16, 6.000%, (TSFR1M + 0.714%), 03/25/2037 | | $ | 380,992 | | | | 0.0 | |
| 608,911 (6) | | | Banc of America Mortgage Trust 2007-2 A8, 6.000%, 05/25/2037 | | | 60,502 | | | | 0.0 | |
| 2,563,065 (1)(3) | | | Bayview MSR Opportunity Master Fund Trust 2022-2 AF, 5.000%, (SOFR30A + 0.850%), 12/25/2051 | | | 2,381,698 | | | | 0.0 | |
| 647,430 (3) | | | Bear Stearns ALT-A Trust 2005-4 23A1, 5.138%, 05/25/2035 | | | 609,417 | | | | 0.0 | |
| 834,741 (3) | | | Bear Stearns ALT-A Trust 2005-7 21A1, 5.501%, 09/25/2035 | | | 675,026 | | | | 0.0 | |
| 1,000,000 (1)(3) | | | Bellemeade Re Ltd. 2022-1 M1C, 9.020%, (SOFR30A + 3.700%), 01/26/2032 | | | 1,018,890 | | | | 0.0 | |
| 13,147,000 (1)(3) | | | Bellemeade RE Ltd. 2021-3A M1C, 6.870%, (SOFR30A + 1.550%), 09/25/2031 | | | 13,109,102 | | | | 0.2 | |
| 1,739,517 (1)(3) | | | Chase Home Lending Mortgage Trust 2019-1 B2, 3.889%, 03/25/2050 | | | 1,513,445 | | | | 0.0 | |
| 2,033,285 (1)(3) | | | Chase Home Lending Mortgage Trust 2019-1 B3, 3.889%, 03/25/2050 | | | 1,751,791 | | | | 0.0 | |
| 846,150 (3) | | | CHL Mortgage Pass-Through Trust 2004-22 A3, 4.706%, 11/25/2034 | | | 765,850 | | | | 0.0 | |
| 447,549 | | | CHL Mortgage Pass-Through Trust 2007-7 A7, 5.750%, 06/25/2037 | | | 219,919 | | | | 0.0 | |
| 667,287 (1)(3) | | | CHNGE Mortgage Trust 2022-1 A1, 3.007%, 01/25/2067 | | | 610,252 | | | | 0.0 | |
| 85,823 (1)(3) | | | CIM Trust 2019-INV1 A1, 4.000%, 02/25/2049 | | | 80,160 | | | | 0.0 | |
| 233,950 (1)(3) | | | CIM Trust 2019-INV3 A3, 3.500%, 08/25/2049 | | | 206,703 | | | | 0.0 | |
| 2,683,283 (1)(3) | | | CIM Trust 2019-J2 B2, 3.768%, 10/25/2049 | | | 2,345,894 | | | | 0.0 | |
| 895,259 (1)(3) | | | CIM Trust 2019-J2 B3, 3.768%, 10/25/2049 | | | 771,370 | | | | 0.0 | |
| 2,600,000 (1)(3) | | | CIM Trust 2019-R5 M2, 3.250%, 09/25/2059 | | | 2,322,277 | | | | 0.0 | |
| 3,012,771 (1)(3) | | | CIM Trust 2020-J1 B3, 3.445%, 07/25/2050 | | | 2,456,817 | | | | 0.0 | |
| 673,407 | | | Citicorp Mortgage Securities Trust Series 2006-3 1A4, 6.000%, 06/25/2036 | | | 590,890 | | | | 0.0 | |
| | | | | | | | | Percentage | |
| Principal | | | | | | | | of Net | |
| Amount† | | | | | Value | | | Assets | |
| COLLATERALIZED MORTGAGE OBLIGATIONS: (continued) |
| 603,514 (3) | | | Citigroup Mortgage Loan Trust 2006-AR9 2A, 5.366%, 11/25/2036 | | $ | 506,983 | | | | 0.0 | |
| 273,978 (3) | | | Citigroup Mortgage Loan Trust 2007-10 22AA, 4.496%, 09/25/2037 | | | 244,317 | | | | 0.0 | |
| 662,338 (1)(3) | | | Citigroup Mortgage Loan Trust 2015-A B2, 4.500%, 06/25/2058 | | | 633,345 | | | | 0.0 | |
| 1,294,767 (1)(3) | | | Citigroup Mortgage Loan Trust 2021-J2 B2W, 2.769%, 07/25/2051 | | | 1,052,330 | | | | 0.0 | |
| 1,455,230 (1)(3) | | | Citigroup Mortgage Loan Trust 2021-J2 B3W, 2.769%, 07/25/2051 | | | 1,146,317 | | | | 0.0 | |
| 723,727 (1)(3) | | | Connecticut Avenue Securities Trust 2019-R05 1B1, 9.535%, (SOFR30A + 4.214%), 07/25/2039 | | | 754,306 | | | | 0.0 | |
| 1,445,131 (1)(3) | | | Connecticut Avenue Securities Trust 2020-R02 2M2, 7.435%, (SOFR30A + 2.114%), 01/25/2040 | | | 1,461,039 | | | | 0.0 | |
| 800,000 (1)(3) | | | Connecticut Avenue Securities Trust 2020-SBT1 1M2, 9.085%, (SOFR30A + 3.764%), 02/25/2040 | | | 848,490 | | | | 0.0 | |
| 13,600,000 (1)(3) | | | Connecticut Avenue Securities Trust 2022-R01 1B1, 8.470%, (SOFR30A + 3.150%), 12/25/2041 | | | 13,997,207 | | | | 0.2 | |
| 615,444 (1) | | | CSMC Series 2008-2R 1A1, 6.000%, 07/25/2037 | | | 513,943 | | | | 0.0 | |
| 654,341 (1)(3) | | | CSMC Trust 2015-2 B3, 3.884%, 02/25/2045 | | | 611,850 | | | | 0.0 | |
| 50,222,588 (3)(6) | | | Deutsche Alt-B Securities Mortgage Loan Trust Series 2007-AB1 X, 0.776%, 04/25/2037 | | | 1,826,992 | | | | 0.0 | |
| 141,450 (3) | | | Fannie Mae Connecticut Avenue Securities 2016-C01 2M2, 12.385%, (SOFR30A + 7.064%), 08/25/2028 | | | 147,529 | | | | 0.0 | |
| 349,327 (1)(3) | | | Fannie Mae Connecticut Avenue Securities 2019-R01 2M2, 7.885%, (SOFR30A + 2.564%), 07/25/2031 | | | 350,224 | | | | 0.0 | |
See Accompanying Notes to Financial Statements
| Voya Intermediate Bond Fund | PORTFOLIO OF INVESTMENTS |
| as of March 31, 2024 (continued) |
| | | | | | | | | Percentage | |
| Principal | | | | | | | | of Net | |
| Amount† | | | | | Value | | | Assets | |
| COLLATERALIZED MORTGAGE OBLIGATIONS: (continued) |
| 690,143 (1)(3) | | | Fannie Mae Connecticut Avenue Securities 2020-R01 1M2, 7.485%, (SOFR30A + 2.164%), 01/25/2040 | | $ | 699,559 | | | | 0.0 | |
| 4,578,457 (1)(3) | | | Fannie Mae Connecticut Avenue Securities 2020-R02 2B1, 8.435%, (SOFR30A + 3.114%), 01/25/2040 | | | 4,712,848 | | | | 0.1 | |
| 500,000 (1)(3) | | | Fannie Mae Connecticut Avenue Securities 2020-SBT1 2M2, 9.085%, (SOFR30A + 3.764%), 02/25/2040 | | | 530,306 | | | | 0.0 | |
| 2,500,000 (1)(3) | | | Fannie Mae Connecticut Avenue Securities 2021-R02 2B1, 8.620%, (SOFR30A + 3.300%), 11/25/2041 | | | 2,582,566 | | | | 0.0 | |
| 3,000,000 (1)(3) | | | Fannie Mae Connecticut Avenue Securities 2023-R07 2M2, 8.571%, (SOFR30A + 3.250%), 09/25/2043 | | | 3,143,994 | | | | 0.1 | |
| 2,252 (3) | | | Fannie Mae Grantor Trust 1998-T2 A6, 0.027%, (US0001M + 0.550%), 01/25/2032 | | | 2,251 | | | | 0.0 | |
| 119,252 (6) | | | Fannie Mae Interest Strip 418 20, 3.000%, 05/25/2043 | | | 15,742 | | | | 0.0 | |
| 310,972 (6) | | | Fannie Mae Interest Strip 418 59, 3.000%, 08/25/2028 | | | 11,363 | | | | 0.0 | |
| 114,084,762 (6) | | | Fannie Mae Interest Strip 428 C28, 2.000%, 07/25/2037 | | | 6,326,262 | | | | 0.1 | |
| 17,002 (3)(6) | | | Fannie Mae REMIC Trust 1997-18 SG, 2.667%, (-1.000*SOFR30A + 7.986%), 03/17/2027 | | | 148 | | | | 0.0 | |
| 39,806 | | | Fannie Mae REMIC Trust 1999-33 Z, 6.000%, 07/25/2029 | | | 39,887 | | | | 0.0 | |
| 11(3)(6) | | | Fannie Mae REMIC Trust 1999-57 SC, 4.317%, (-1.000*SOFR30A + 9.636%), 11/17/2029 | | | — | | | | 0.0 | |
| 139,531 (3)(6) | | | Fannie Mae REMIC Trust 2001-72 SC, 1.000%, (-1.000*SOFR30A + 8.386%), 12/25/2031 | | | 2,879 | | | | 0.0 | |
| 10,911 (3)(6) | | | Fannie Mae REMIC Trust 2001-8 SK, 3.317%, (-1.000*SOFR30A + 8.636%), 03/18/2031 | | | 258 | | | | 0.0 | |
| | | | | | | | | Percentage | |
| Principal | | | | | | | | of Net | |
| Amount† | | | | | Value | | | Assets | |
| COLLATERALIZED MORTGAGE OBLIGATIONS: (continued) |
| 2,933,794 | | | Fannie Mae REMIC Trust 2002-W9 A4, 6.000%, 08/25/2042 | | $ | 2,917,121 | | | | 0.1 | |
| 516,404 | | | Fannie Mae REMIC Trust 2003-105 AZ, 5.500%, 10/25/2033 | | | 514,976 | | | | 0.0 | |
| 215,078 (3) | | | Fannie Mae REMIC Trust 2003-45 FJ, 6.934%, (SOFR30A + 1.614%), 06/25/2033 | | | 220,134 | | | | 0.0 | |
| 530,521 (3)(6) | | | Fannie Mae REMIC Trust 2003-49 SW, 1.565%, (-1.000*SOFR30A + 6.886%), 01/25/2033 | | | 39,403 | | | | 0.0 | |
| 657,236 (3)(6) | | | Fannie Mae REMIC Trust 2003-66 SA, 2.215%, (-1.000*SOFR30A + 7.536%), 07/25/2033 | | | 69,766 | | | | 0.0 | |
| 130,702 (6) | | | Fannie Mae REMIC Trust 2003-74 IO, 6.000%, 08/25/2033 | | | 22,939 | | | | 0.0 | |
| 282,793 | | | Fannie Mae REMIC Trust 2003-84 PZ, 5.000%, 09/25/2033 | | | 276,455 | | | | 0.0 | |
| 539,801 | | | Fannie Mae REMIC Trust 2004-50 VZ, 5.500%, 07/25/2034 | | | 542,781 | | | | 0.0 | |
| 2,381,673 (3)(6) | | | Fannie Mae REMIC Trust 2004-54 SN, 1.615%, (-1.000*SOFR30A + 6.936%), 07/25/2034 | | | 174,992 | | | | 0.0 | |
| 29,074 (3) | | | Fannie Mae REMIC Trust 2004-56 FE, 5.885%, (SOFR30A + 0.564%), 10/25/2033 | | | 28,970 | | | | 0.0 | |
| 221,188 | | | Fannie Mae REMIC Trust 2004-7 Z, 5.500%, 02/25/2034 | | | 219,424 | | | | 0.0 | |
| 483,766 | | | Fannie Mae REMIC Trust 2004-75 ZG, 4.500%, 10/25/2034 | | | 469,594 | | | | 0.0 | |
| 1,375,664 | | | Fannie Mae REMIC Trust 2005-25 Z, 5.000%, 04/25/2035 | | | 1,357,603 | | | | 0.0 | |
| 4,978,632 (3)(6) | | | Fannie Mae REMIC Trust 2005-75 ES, 0.615%, (-1.000*SOFR30A + 5.936%), 09/25/2035 | | | 329,246 | | | | 0.0 | |
| 391,569 (3)(6) | | | Fannie Mae REMIC Trust 2005-75 SP, 1.315%, (-1.000*SOFR30A + 6.636%), 08/25/2035 | | | 18,489 | | | | 0.0 | |
See Accompanying Notes to Financial Statements
| Voya Intermediate Bond Fund | PORTFOLIO OF INVESTMENTS |
| as of March 31, 2024 (continued) |
| | | | | | | | | Percentage | |
| Principal | | | | | | | | of Net | |
| Amount† | | | | | Value | | | Assets | |
| COLLATERALIZED MORTGAGE OBLIGATIONS: (continued) |
| 63,525 (3) | | | Fannie Mae REMIC Trust 2006-104 ES, 6.276%, (-1.000*SOFR30A + 32.878%), 11/25/2036 | | $ | 79,016 | | | | 0.0 | |
| 923,779 (3)(6) | | | Fannie Mae REMIC Trust 2006-12 SD, 1.315%, (-1.000*SOFR30A + 6.636%), 10/25/2035 | | | 52,632 | | | | 0.0 | |
| 374,991 (3)(6) | | | Fannie Mae REMIC Trust 2006-123 UI, 1.305%, (-1.000*SOFR30A + 6.626%), 01/25/2037 | | | 32,752 | | | | 0.0 | |
| 1,212,044 (3)(6) | | | Fannie Mae REMIC Trust 2006-56 SM, 1.315%, (-1.000*SOFR30A + 6.636%), 07/25/2036 | | | 86,172 | | | | 0.0 | |
| 36,702 (3)(6) | | | Fannie Mae REMIC Trust 2006-72 HS, 1.265%, (-1.000*SOFR30A + 6.586%), 08/25/2026 | | | 581 | | | | 0.0 | |
| 9,736 | | | Fannie Mae REMIC Trust 2007-10 Z, 6.000%, 02/25/2037 | | | 9,939 | | | | 0.0 | |
| 360,329 (3)(6) | | | Fannie Mae REMIC Trust 2007-21 SB, 0.965%, (-1.000*SOFR30A + 6.286%), 03/25/2037 | | | 11,645 | | | | 0.0 | |
| 823,144 (3)(6) | | | Fannie Mae REMIC Trust 2007-52 NS, 1.015%, (-1.000*SOFR30A + 6.336%), 06/25/2037 | | | 72,464 | | | | 0.0 | |
| 738,318 (3)(6) | | | Fannie Mae REMIC Trust 2007-85 SM, 1.025%, (-1.000*SOFR30A + 6.346%), 09/25/2037 | | | 60,883 | | | | 0.0 | |
| 1,657,301 (3)(6) | | | Fannie Mae REMIC Trust 2007-91 AS, 0.965%, (-1.000*SOFR30A + 6.286%), 10/25/2037 | | | 142,832 | | | | 0.0 | |
| 1,831,545 (3)(6) | | | Fannie Mae REMIC Trust 2008-12 SC, 0.915%, (-1.000*SOFR30A + 6.236%), 03/25/2038 | | | 118,574 | | | | 0.0 | |
| 201,046 | | | Fannie Mae REMIC Trust 2008-16 Z, 5.500%, 03/25/2038 | | | 196,868 | | | | 0.0 | |
| 845,647 | | | Fannie Mae REMIC Trust 2009-19 PW, 4.500%, 10/25/2036 | | | 829,779 | | | | 0.0 | |
| | | | | | | | | Percentage | |
| Principal | | | | | | | | of Net | |
| Amount† | | | | | Value | | | Assets | |
| COLLATERALIZED MORTGAGE OBLIGATIONS: (continued) |
| 4,320,741 (3) | | | Fannie Mae REMIC Trust 2009-50 HZ, 5.539%, 02/25/2049 | | $ | 4,328,241 | | | | 0.1 | |
| 3,902,122 (3)(6) | | | Fannie Mae REMIC Trust 2009-66 SP, 0.665%, (-1.000*SOFR30A + 5.986%), 09/25/2039 | | | 191,540 | | | | 0.0 | |
| 910,992 (3)(6) | | | Fannie Mae REMIC Trust 2009-90 TS, 0.715%, (-1.000*SOFR30A + 6.036%), 11/25/2039 | | | 74,265 | | | | 0.0 | |
| 2,630,771 (3)(6) | | | Fannie Mae REMIC Trust 2010-1 S, 0.815%, (-1.000*SOFR30A + 6.136%), 02/25/2040 | | | 206,277 | | | | 0.0 | |
| 7,599,794 (3)(6) | | | Fannie Mae REMIC Trust 2010-107 SB, 1.155%, (-1.000*SOFR30A + 6.476%), 09/25/2040 | | | 762,069 | | | | 0.0 | |
| 2,218,684 (3)(6) | | | Fannie Mae REMIC Trust 2010-123 SL, 0.635%, (-1.000*SOFR30A + 5.956%), 11/25/2040 | | | 131,641 | | | | 0.0 | |
| 4,156,121 (3)(6) | | | Fannie Mae REMIC Trust 2010-150 SJ, 1.045%, (-1.000*SOFR30A + 6.366%), 01/25/2041 | | | 380,387 | | | | 0.0 | |
| 823,959 (3)(6) | | | Fannie Mae REMIC Trust 2010-35 CS, 1.015%, (-1.000*SOFR30A + 6.336%), 04/25/2050 | | | 60,118 | | | | 0.0 | |
| 2,745,313 (3)(6) | | | Fannie Mae REMIC Trust 2010-41 SB, 0.965%, (-1.000*SOFR30A + 6.286%), 05/25/2040 | | | 187,940 | | | | 0.0 | |
| 706,521 (3)(6) | | | Fannie Mae REMIC Trust 2010-43 VS, 1.015%, (-1.000*SOFR30A + 6.336%), 05/25/2040 | | | 53,078 | | | | 0.0 | |
| 1,713,473 | | | Fannie Mae REMIC Trust 2010-53 JZ, 5.000%, 07/25/2040 | | | 1,593,594 | | | | 0.0 | |
| 4,256,554 | | | Fannie Mae REMIC Trust 2010-59 PC, 5.000%, 06/25/2040 | | | 4,289,589 | | | | 0.1 | |
| 793,103 | | | Fannie Mae REMIC Trust 2011-10 ZC, 5.000%, 02/25/2041 | | | 784,675 | | | | 0.0 | |
| 4,309,562 | | | Fannie Mae REMIC Trust 2011-101 DB, 4.000%, 10/25/2041 | | | 4,126,115 | | | | 0.1 | |
See Accompanying Notes to Financial Statements
| Voya Intermediate Bond Fund | PORTFOLIO OF INVESTMENTS |
| as of March 31, 2024 (continued) |
| | | | | | | | | Percentage | |
| Principal | | | | | | | | of Net | |
| Amount† | | | | | Value | | | Assets | |
| COLLATERALIZED MORTGAGE OBLIGATIONS: (continued) |
| 534,611 (3)(6) | | | Fannie Mae REMIC Trust 2011-102 SA, 1.165%, (-1.000*SOFR30A + 6.486%), 10/25/2041 | | $ | 52,781 | | | | 0.0 | |
| 2,618,630 | | | Fannie Mae REMIC Trust 2011-116 ZA, 3.500%, 11/25/2041 | | | 2,426,361 | | | | 0.0 | |
| 57,647 | | | Fannie Mae REMIC Trust 2011-127 UY, 3.500%, 12/25/2041 | | | 53,248 | | | | 0.0 | |
| 6,302,919 | | | Fannie Mae REMIC Trust 2011-136 PZ, 4.000%, 01/25/2042 | | | 5,945,511 | | | | 0.1 | |
| 1,870,252 | | | Fannie Mae REMIC Trust 2011-30 ZA, 5.000%, 04/25/2041 | | | 1,820,017 | | | | 0.0 | |
| 5,049,995 (3)(6) | | | Fannie Mae REMIC Trust 2011-47 GS, 0.495%, (-1.000*SOFR30A + 5.816%), 06/25/2041 | | | 267,079 | | | | 0.0 | |
| 1,886,500 | | | Fannie Mae REMIC Trust 2011-8 ZA, 4.000%, 02/25/2041 | | | 1,782,091 | | | | 0.0 | |
| 4,676,376 | | | Fannie Mae REMIC Trust 2011-84 Z, 5.250%, 09/25/2041 | | | 4,709,263 | | | | 0.1 | |
| 6,530,310 | | | Fannie Mae REMIC Trust 2011-87 GB, 4.500%, 09/25/2041 | | | 6,287,237 | | | | 0.1 | |
| 1,547,115 (3)(6) | | | Fannie Mae REMIC Trust 2011-93 GS, 1.115%, (-1.000*SOFR30A + 6.436%), 04/25/2039 | | | 145,408 | | | | 0.0 | |
| 7,050,664 | | | Fannie Mae REMIC Trust 2011-99 CZ, 4.500%, 10/25/2041 | | | 6,805,458 | | | | 0.1 | |
| 354,386 | | | Fannie Mae REMIC Trust 2012-110 CA, 3.000%, 10/25/2042 | | | 317,693 | | | | 0.0 | |
| 1,583,162 (3)(6) | | | Fannie Mae REMIC Trust 2012-111 SL, 0.665%, (-1.000*SOFR30A + 5.986%), 05/25/2041 | | | 123,529 | | | | 0.0 | |
| 2,998,121 | | | Fannie Mae REMIC Trust 2012-111 ZK, 3.500%, 10/25/2042 | | | 2,758,603 | | | | 0.1 | |
| 1,995,419 (6) | | | Fannie Mae REMIC Trust 2012-120 WI, 3.000%, 11/25/2027 | | | 65,482 | | | | 0.0 | |
| 2,742,020 (3)(6) | | | Fannie Mae REMIC Trust 2012-122 SB, 0.715%, (-1.000*SOFR30A + 6.036%), 11/25/2042 | | | 266,800 | | | | 0.0 | |
| 1,136,983 (6) | | | Fannie Mae REMIC Trust 2012-128 LI, 3.500%, 06/25/2042 | | | 60,092 | | | | 0.0 | |
| | | | | | | | | Percentage | |
| Principal | | | | | | | | of Net | |
| Amount† | | | | | Value | | | Assets | |
| COLLATERALIZED MORTGAGE OBLIGATIONS: (continued) |
| 3,399,469 (3)(6) | | | Fannie Mae REMIC Trust 2012-133 AS, 0.765%, (-1.000*SOFR30A + 6.086%), 10/25/2042 | | $ | 300,843 | | | | 0.0 | |
| 11,788,519 (3)(6) | | | Fannie Mae REMIC Trust 2012-133 NS, 0.715%, (-1.000*SOFR30A + 6.036%), 12/25/2042 | | | 1,135,767 | | | | 0.0 | |
| 464,409 (6) | | | Fannie Mae REMIC Trust 2012-149 GI, 3.500%, 06/25/2042 | | | 39,069 | | | | 0.0 | |
| 10,248,402 | | | Fannie Mae REMIC Trust 2012-15 PZ, 4.000%, 03/25/2042 | | | 9,529,891 | | | | 0.1 | |
| 1,599,298 | | | Fannie Mae REMIC Trust 2012-153 B, 7.000%, 07/25/2042 | | | 1,720,710 | | | | 0.0 | |
| 3,807,131 | | | Fannie Mae REMIC Trust 2012-17 QZ, 4.000%, 03/25/2042 | | | 3,578,311 | | | | 0.1 | |
| 3,128,572 | | | Fannie Mae REMIC Trust 2012-2 HE, 4.000%, 02/25/2042 | | | 3,002,161 | | | | 0.1 | |
| 453,725 (3)(6) | | | Fannie Mae REMIC Trust 2012-24 HS, 1.115%, (-1.000*SOFR30A + 6.436%), 09/25/2040 | | | 7,105 | | | | 0.0 | |
| 798,181 | | | Fannie Mae REMIC Trust 2012-30 AB, 4.000%, 04/25/2042 | | | 763,306 | | | | 0.0 | |
| 1,127,052 | | | Fannie Mae REMIC Trust 2012-33 BW, 4.000%, 04/25/2042 | | | 1,063,059 | | | | 0.0 | |
| 3,492 | | | Fannie Mae REMIC Trust 2012-44 KW, 3.500%, 05/25/2032 | | | 3,194 | | | | 0.0 | |
| 1,656,994 | | | Fannie Mae REMIC Trust 2012-55 PC, 3.500%, 05/25/2042 | | | 1,538,039 | | | | 0.0 | |
| 7,937,267 | | | Fannie Mae REMIC Trust 2012-63 MW, 4.000%, 05/25/2034 | | | 7,731,397 | | | | 0.1 | |
| 5,919,751 | | | Fannie Mae REMIC Trust 2012-66 EP, 4.000%, 06/25/2042 | | | 5,444,351 | | | | 0.1 | |
| 398,697 (3)(6) | | | Fannie Mae REMIC Trust 2012-68 YS, 1.265%, (-1.000*SOFR30A + 6.586%), 07/25/2042 | | | 36,366 | | | | 0.0 | |
| 500,000 | | | Fannie Mae REMIC Trust 2012-80 MY, 3.250%, 08/25/2042 | | | 422,199 | | | | 0.0 | |
| 12,815,743 | | | Fannie Mae REMIC Trust 2012-94 LZ, 3.500%, 09/25/2042 | | | 11,805,366 | | | | 0.2 | |
See Accompanying Notes to Financial Statements
| Voya Intermediate Bond Fund | PORTFOLIO OF INVESTMENTS |
| as of March 31, 2024 (continued) |
| | | | | | | | | Percentage | |
| Principal | | | | | | | | of Net | |
| Amount† | | | | | Value | | | Assets | |
| COLLATERALIZED MORTGAGE OBLIGATIONS: (continued) |
| 2,098,722 | | | Fannie Mae REMIC Trust 2013-111 BA, 3.000%, 11/25/2033 | | $ | 1,964,667 | | | | 0.0 | |
| 1,173,848 | | | Fannie Mae REMIC Trust 2013-116 UB, 4.000%, 11/25/2043 | | | 1,103,525 | | | | 0.0 | |
| 1,403,000 | | | Fannie Mae REMIC Trust 2013-13 BE, 4.000%, 03/25/2043 | | | 1,303,221 | | | | 0.0 | |
| 95,041 | | | Fannie Mae REMIC Trust 2013-16 GD, 3.000%, 03/25/2033 | | | 93,562 | | | | 0.0 | |
| 1,347,894 | | | Fannie Mae REMIC Trust 2013-20 DL, 4.000%, 03/25/2033 | | | 1,287,367 | | | | 0.0 | |
| 845,107 (3)(6) | | | Fannie Mae REMIC Trust 2013-26 JS, 0.765%, (-1.000*SOFR30A + 6.086%), 10/25/2032 | | | 30,148 | | | | 0.0 | |
| 3,592,319 (3)(6) | | | Fannie Mae REMIC Trust 2013-40 LS, 0.715%, (-1.000*SOFR30A + 6.036%), 05/25/2043 | | | 331,131 | | | | 0.0 | |
| 14,092,088 (6) | | | Fannie Mae REMIC Trust 2013-44 DI, 3.000%, 05/25/2033 | | | 1,203,188 | | | | 0.0 | |
| 3,600,731 (3)(6) | | | Fannie Mae REMIC Trust 2013-60 DS, 0.765%, (-1.000*SOFR30A + 6.086%), 06/25/2033 | | | 202,435 | | | | 0.0 | |
| 4,204,840 (6) | | | Fannie Mae REMIC Trust 2013-70 BI, 3.000%, 07/25/2033 | | | 350,848 | | | | 0.0 | |
| 4,104,178 | | | Fannie Mae REMIC Trust 2013-70 JZ, 3.000%, 07/25/2043 | | | 3,563,093 | | | | 0.1 | |
| 833,562 (3)(6) | | | Fannie Mae REMIC Trust 2013-72 YS, 0.715%, (-1.000*SOFR30A + 6.036%), 07/25/2033 | | | 44,382 | | | | 0.0 | |
| 3,426,586 (3)(6) | | | Fannie Mae REMIC Trust 2013-9 SM, 0.815%, (-1.000*SOFR30A + 6.136%), 02/25/2033 | | | 170,951 | | | | 0.0 | |
| 5,241,487 (3)(6) | | | Fannie Mae REMIC Trust 2014-15 SB, 1.215%, (-1.000*SOFR30A + 6.536%), 04/25/2044 | | | 561,849 | | | | 0.0 | |
| 648,664 (3)(6) | | | Fannie Mae REMIC Trust 2014-17 DS, 0.765%, (-1.000*SOFR30A + 6.086%), 02/25/2043 | | | 10,838 | | | | 0.0 | |
| | | | | | | | | Percentage | |
| Principal | | | | | | | | of Net | |
| Amount† | | | | | Value | | | Assets | |
| COLLATERALIZED MORTGAGE OBLIGATIONS: (continued) |
| 798,457 (3)(6) | | | Fannie Mae REMIC Trust 2014-28 BS, 0.765%, (-1.000*SOFR30A + 6.086%), 08/25/2043 | | $ | 35,904 | | | | 0.0 | |
| 970,000 | | | Fannie Mae REMIC Trust 2014-61 PY, 3.500%, 10/25/2044 | | | 831,423 | | | | 0.0 | |
| 5,395,905 (6) | | | Fannie Mae REMIC Trust 2014-70 IO, 5.500%, 10/25/2044 | | | 908,674 | | | | 0.0 | |
| 22,493,992 (3)(6) | | | Fannie Mae REMIC Trust 2014-79 KS, 0.715%, (-1.000*SOFR30A + 6.036%), 12/25/2044 | | | 2,212,268 | | | | 0.0 | |
| 19,008,468 | | | Fannie Mae REMIC Trust 2015-20 EZ, 3.500%, 04/25/2045 | | | 17,175,719 | | | | 0.2 | |
| 3,623,832 (6) | | | Fannie Mae REMIC Trust 2015-56 IC, 6.000%, 08/25/2045 | | | 614,432 | | | | 0.0 | |
| 2,000,000 | | | Fannie Mae REMIC Trust 2015-67 AV, 3.500%, 01/25/2036 | | | 1,815,049 | | | | 0.0 | |
| 2,695,783 | | | Fannie Mae REMIC Trust 2015-67 QV, 3.000%, 12/25/2040 | | | 2,615,218 | | | | 0.0 | |
| 1,499,018 (6) | | | Fannie Mae REMIC Trust 2015-76 PI, 6.000%, 09/25/2045 | | | 239,328 | | | | 0.0 | |
| 23,638,539 (3)(6) | | | Fannie Mae REMIC Trust 2015-79 SA, 0.815%, (-1.000*SOFR30A + 6.136%), 11/25/2045 | | | 1,937,847 | | | | 0.0 | |
| 12,646,055 (3)(6) | | | Fannie Mae REMIC Trust 2015-86 BS, 0.265%, (-1.000*SOFR30A + 5.586%), 11/25/2045 | | | 601,735 | | | | 0.0 | |
| 21,713,316 (6) | | | Fannie Mae REMIC Trust 2015-88 IO, 6.500%, 12/25/2045 | | | 5,109,821 | | | | 0.1 | |
| 9,424,872 (6) | | | Fannie Mae REMIC Trust 2015-9 IO, 5.500%, 03/25/2045 | | | 1,896,921 | | | | 0.0 | |
| 4,560,450 (6) | | | Fannie Mae REMIC Trust 2015-97 BI, 5.500%, 01/25/2046 | | | 775,883 | | | | 0.0 | |
| 2,820,865 (6) | | | Fannie Mae REMIC Trust 2016-104 BI, 6.000%, 01/25/2047 | | | 514,049 | | | | 0.0 | |
| 4,679,916 (6) | | | Fannie Mae REMIC Trust 2016-52 MI, 4.000%, 12/25/2045 | | | 720,767 | | | | 0.0 | |
| 14,581,205 (3)(6) | | | Fannie Mae REMIC Trust 2016-60 SB, 0.665%, (-1.000*SOFR30A + 5.986%), 09/25/2046 | | | 1,075,023 | | | | 0.0 | |
See Accompanying Notes to Financial Statements
| Voya Intermediate Bond Fund | PORTFOLIO OF INVESTMENTS |
| as of March 31, 2024 (continued) |
| | | | | | | | | Percentage | |
| Principal | | | | | | | | of Net | |
| Amount† | | | | | Value | | | Assets | |
| COLLATERALIZED MORTGAGE OBLIGATIONS: (continued) |
| 17,995,254 (3)(6) | | | Fannie Mae REMIC Trust 2016-81 CS, 0.665%, (-1.000*SOFR30A + 5.986%), 11/25/2046 | | $ | 1,073,959 | | | | 0.0 | |
| 12,203,565 (3)(6) | | | Fannie Mae REMIC Trust 2016-82 SD, 0.615%, (-1.000*SOFR30A + 5.936%), 11/25/2046 | | | 914,733 | | | | 0.0 | |
| 228,796 | | | Fannie Mae REMIC Trust 2016-88 EA, 3.500%, 01/25/2045 | | | 224,921 | | | | 0.0 | |
| 328,741 | | | Fannie Mae REMIC Trust 2016-9 D, 3.000%, 03/25/2046 | | | 294,867 | | | | 0.0 | |
| 16,049,197 (3)(6) | | | Fannie Mae REMIC Trust 2017-10 SA, 0.665%, (-1.000*SOFR30A + 5.986%), 03/25/2047 | | | 1,142,088 | | | | 0.0 | |
| 5,099,336 | | | Fannie Mae REMIC Trust 2017-108 ZD, 3.000%, 01/25/2048 | | | 3,862,540 | | | | 0.1 | |
| 4,482,310 | | | Fannie Mae REMIC Trust 2017-54 D, 3.000%, 07/25/2047 | | | 3,931,235 | | | | 0.1 | |
| 22,991,111 (3)(6) | | | Fannie Mae REMIC Trust 2018-15 SC, 0.865%, (-1.000*SOFR30A + 6.186%), 03/25/2048 | | | 2,023,340 | | | | 0.0 | |
| 3,301,691 | | | Fannie Mae REMIC Trust 2018-26 KA, 3.500%, 04/25/2048 | | | 2,962,489 | | | | 0.1 | |
| 1,025,813 | | | Fannie Mae REMIC Trust 2018-38 LA, 3.000%, 06/25/2048 | | | 887,244 | | | | 0.0 | |
| 10,154,532 | | | Fannie Mae REMIC Trust 2018-73 AB, 3.000%, 10/25/2048 | | | 9,012,350 | | | | 0.1 | |
| 1,061,687 | | | Fannie Mae REMIC Trust 2018-8 AB, 3.500%, 10/25/2047 | | | 975,435 | | | | 0.0 | |
| 28,744,510 (3)(6) | | | Fannie Mae REMIC Trust 2018-82 SA, 0.765%, (-1.000*SOFR30A + 6.086%), 11/25/2048 | | | 2,277,146 | | | | 0.0 | |
| 6,419,919 (3)(6) | | | Fannie Mae REMIC Trust 2018-86 AS, 0.765%, (-1.000*SOFR30A + 6.086%), 12/25/2048 | | | 410,757 | | | | 0.0 | |
| 29,253,434 (3)(6) | | | Fannie Mae REMIC Trust 2018-86 SM, 0.765%, (-1.000*SOFR30A + 6.086%), 12/25/2048 | | | 2,108,863 | | | | 0.0 | |
| | | | | | | | | Percentage | |
| Principal | | | | | | | | of Net | |
| Amount† | | | | | Value | | | Assets | |
| COLLATERALIZED MORTGAGE OBLIGATIONS: (continued) |
| 27,071,861 (3)(6) | | | Fannie Mae REMIC Trust 2018-91 SB, 0.665%, (-1.000*SOFR30A + 5.986%), 12/25/2058 | | $ | 2,789,736 | | | | 0.1 | |
| 9,190,365 (6) | | | Fannie Mae REMIC Trust 2019-21 AI, 5.000%, 05/25/2059 | | | 2,286,250 | | | | 0.0 | |
| 8,096,818 (3)(6) | | | Fannie Mae REMIC Trust 2019-30 SB, 0.665%, (-1.000*SOFR30A + 5.986%), 07/25/2049 | | | 735,522 | | | | 0.0 | |
| 12,893,531 (3)(6) | | | Fannie Mae REMIC Trust 2019-34 BS, 0.615%, (-1.000*SOFR30A + 5.936%), 07/25/2049 | | | 1,283,980 | | | | 0.0 | |
| 6,668,871 (3)(6) | | | Fannie Mae REMIC Trust 2019-39 SA, 0.665%, (-1.000*SOFR30A + 5.986%), 08/25/2049 | | | 534,479 | | | | 0.0 | |
| 45,226,870 (3)(6) | | | Fannie Mae REMIC Trust 2019-41 S, 0.565%, (-1.000*SOFR30A + 5.886%), 08/25/2059 | | | 3,731,728 | | | | 0.1 | |
| 4,650,231 (3)(6) | | | Fannie Mae REMIC Trust 2019-47 SB, 0.665%, (-1.000*SOFR30A + 5.986%), 05/25/2040 | | | 356,387 | | | | 0.0 | |
| 12,439,246 (3)(6) | | | Fannie Mae REMIC Trust 2019-79 SB, 0.565%, (-1.000*SOFR30A + 5.886%), 01/25/2050 | | | 1,077,077 | | | | 0.0 | |
| 6,586,468 (3)(6) | | | Fannie Mae REMIC Trust 2020-10 SE, 0.565%, (-1.000*SOFR30A + 5.886%), 03/25/2050 | | | 570,303 | | | | 0.0 | |
| 48,319,001 (6) | | | Fannie Mae REMIC Trust 2020-34 IO, 4.500%, 06/25/2050 | | | 10,828,409 | | | | 0.1 | |
| 18,982,488 (6) | | | Fannie Mae REMIC Trust 2020-35 IO, 5.000%, 06/25/2050 | | | 2,874,951 | | | | 0.1 | |
| 21,397,048 (6) | | | Fannie Mae REMIC Trust 2020-44 DI, 2.500%, 07/25/2050 | | | 2,785,934 | | | | 0.1 | |
| 9,672,456 (6) | | | Fannie Mae REMIC Trust 2020-44 EI, 3.500%, 09/25/2042 | | | 1,493,120 | | | | 0.0 | |
| 8,998,289 (6) | | | Fannie Mae REMIC Trust 2020-53 CI, 4.500%, 08/25/2050 | | | 1,997,111 | | | | 0.0 | |
| 24,805,512 (6) | | | Fannie Mae REMIC Trust 2020-74 GI, 5.000%, 10/25/2050 | | | 4,808,132 | | | | 0.1 | |
See Accompanying Notes to Financial Statements
| Voya Intermediate Bond Fund | PORTFOLIO OF INVESTMENTS |
| as of March 31, 2024 (continued) |
| | | | | | | | | Percentage | |
| Principal | | | | | | | | of Net | |
| Amount† | | | | | Value | | | Assets | |
| COLLATERALIZED MORTGAGE OBLIGATIONS: (continued) |
| 56,359,238 (6) | | | Fannie Mae REMIC Trust 2020-87 AI, 2.000%, 12/25/2050 | | $ | 7,444,159 | | | | 0.1 | |
| 31,124,170 (6) | | | Fannie Mae REMIC Trust 2020-99 IB, 3.500%, 05/25/2050 | | | 5,929,375 | | | | 0.1 | |
| 46,312,222 (6) | | | Fannie Mae REMIC Trust 2021-1 BI, 3.000%, 02/25/2049 | | | 7,321,420 | | | | 0.1 | |
| 147,546,298 (6) | | | Fannie Mae REMIC Trust 2021-10 AI, 3.000%, 03/25/2041 | | | 16,409,789 | | | | 0.2 | |
| 26,798,693 (6) | | | Fannie Mae REMIC Trust 2021-22 BI, 4.000%, 04/25/2051 | | | 5,593,265 | | | | 0.1 | |
| 35,568,512 (6) | | | Fannie Mae REMIC Trust 2021-41 MI, 5.000%, 06/25/2048 | | | 6,646,699 | | | | 0.1 | |
| 36,041,089 (3)(6) | | | Fannie Mae REMIC Trust 2021-55 SA, 0.153%, (-1.000*SOFR30A + 3.150%), 08/25/2061 | | | 535,999 | | | | 0.0 | |
| 78,912,445 (6) | | | Fannie Mae REMIC Trust 2021-77 AI, 3.500%, 11/25/2051 | | | 16,300,265 | | | | 0.2 | |
| 122,196,593 (6) | | | Fannie Mae REMIC Trust 2021-78 AI, 3.000%, 11/25/2051 | | | 20,643,648 | | | | 0.3 | |
| 25,272,215 (6) | | | Fannie Mae REMIC Trust 2021-8 TI, 4.000%, 03/25/2051 | | | 5,300,567 | | | | 0.1 | |
| 16,815,232 (6) | | | Fannie Mae REMIC Trust 2021-81 LI, 2.500%, 11/25/2051 | | | 2,493,590 | | | | 0.0 | |
| 62,325,725 (6) | | | Fannie Mae REMIC Trust 2021-93 AI, 3.000%, 01/25/2052 | | | 10,374,266 | | | | 0.1 | |
| 34,781,952 (6) | | | Fannie Mae REMIC Trust 2023-23 AI, 4.000%, 12/25/2051 | | | 7,270,249 | | | | 0.1 | |
| 92,741,725 (6) | | | Fannie Mae REMIC Trust 2024-7 IO, 3.000%, 07/25/2038 | | | 8,944,884 | | | | 0.1 | |
| 520,708 | | | First Horizon Alternative Mortgage Securities Trust 2006-FA8 1A11, 6.000%, 02/25/2037 | | | 210,501 | | | | 0.0 | |
| 1,081,672 (1)(3) | | | First Republic Mortgage Trust 2020-1 B2, 2.886%, 04/25/2050 | | | 919,847 | | | | 0.0 | |
| 1,668,734 (1)(3) | | | Flagstar Mortgage Trust 2018-1 B1, 3.939%, 03/25/2048 | | | 1,496,600 | | | | 0.0 | |
| 2,176,029 (1)(3) | | | Flagstar Mortgage Trust 2018-1 B3, 3.939%, 03/25/2048 | | | 1,932,343 | | | | 0.0 | |
| 1,143,562 (1)(3) | | | Flagstar Mortgage Trust 2018-2 B2, 4.008%, 04/25/2048 | | | 1,020,244 | | | | 0.0 | |
| | | | | | | | | Percentage | |
| Principal | | | | | | | | of Net | |
| Amount† | | | | | Value | | | Assets | |
| COLLATERALIZED MORTGAGE OBLIGATIONS: (continued) |
| 683,808 (1)(3) | | | Flagstar Mortgage Trust 2018-3INV A3, 4.000%, 05/25/2048 | | $ | 622,531 | | | | 0.0 | |
| 861,767 (1)(3) | | | Flagstar Mortgage Trust 2018-4 B3, 4.162%, 07/25/2048 | | | 773,568 | | | | 0.0 | |
| 1,644,080 (1)(3) | | | Flagstar Mortgage Trust 2018-5 B3, 4.454%, 09/25/2048 | | | 1,470,775 | | | | 0.0 | |
| 2,733,710 (1)(3) | | | Flagstar Mortgage Trust 2018-6RR B3, 4.938%, 10/25/2048 | | | 2,536,576 | | | | 0.0 | |
| 1,339,025 (1)(3) | | | Flagstar Mortgage Trust 2019-2 B2, 4.007%, 12/25/2049 | | | 1,174,552 | | | | 0.0 | |
| 1,893,693 (1)(3) | | | Flagstar Mortgage Trust 2020-1INV B1A, 4.204%, 03/25/2050 | | | 1,694,136 | | | | 0.0 | |
| 2,292,171 (1)(3) | | | Flagstar Mortgage Trust 2020-1INV B2A, 4.204%, 03/25/2050 | | | 2,037,967 | | | | 0.0 | |
| 1,420,281 (1)(3) | | | Flagstar Mortgage Trust 2021-6INV B1, 3.485%, 08/25/2051 | | | 1,183,989 | | | | 0.0 | |
| 1,476,808 | | | Freddie Mac Reference REMIC R007 ZA, 6.000%, 05/15/2036 | | | 1,519,759 | | | | 0.0 | |
| 159,739 | | | Freddie Mac Reference REMIC R008 ZA, 6.000%, 07/15/2036 | | | 164,958 | | | | 0.0 | |
| 33,008 | | | Freddie Mac REMIC Trust 2110 PG, 6.000%, 01/15/2029 | | | 33,072 | | | | 0.0 | |
| 30,351 | | | Freddie Mac REMIC Trust 2114 ZM, 6.000%, 01/15/2029 | | | 30,274 | | | | 0.0 | |
| 239,490 | | | Freddie Mac REMIC Trust 2143 ZB, 6.000%, 04/15/2029 | | | 241,546 | | | | 0.0 | |
| 1,177 (3)(6) | | | Freddie Mac REMIC Trust 2232 SA, 3.167%, (-1.000*SOFR30A + 8.486%), 05/17/2030 | | | 6 | | | | 0.0 | |
| 1,805 (3)(6) | | | Freddie Mac REMIC Trust 2301 SP, 3.817%, (-1.000*SOFR30A + 9.136%), 04/15/2031 | | | 26 | | | | 0.0 | |
| 123,901 | | | Freddie Mac REMIC Trust 2541 NE, 5.500%, 12/15/2032 | | | 125,567 | | | | 0.0 | |
| 35,781 (6) | | | Freddie Mac REMIC Trust 2594 IY, 6.000%, 04/15/2033 | | | 5,788 | | | | 0.0 | |
| 279,625 | | | Freddie Mac REMIC Trust 2845 QH, 5.000%, 08/15/2034 | | | 280,151 | | | | 0.0 | |
| 57,496 | | | Freddie Mac REMIC Trust 2861 Z, 5.500%, 09/15/2034 | | | 57,469 | | | | 0.0 | |
See Accompanying Notes to Financial Statements
| Voya Intermediate Bond Fund | PORTFOLIO OF INVESTMENTS |
| as of March 31, 2024 (continued) |
Principal
Amount† | | | | | Value | | Percentage
of Net
Assets | |
| COLLATERALIZED MORTGAGE OBLIGATIONS: (continued) | |
| 97,318 | | | Freddie Mac REMIC Trust 2930 ZL, 5.000%, 02/15/2035 | | $ | 96,205 | | | 0.0 | |
| 148,261 | | | Freddie Mac REMIC Trust 2931 ZY, 5.000%, 02/15/2035 | | | 146,645 | | | 0.0 | |
| 70,612 (3)(6) | | | Freddie Mac REMIC Trust 2993 GS, 0.717%, (-1.000*SOFR30A + 6.036%), 06/15/2025 | | | 247 | | | 0.0 | |
| 504,810 (3)(6) | | | Freddie Mac REMIC Trust 3006 SI, 1.307%, (-1.000*SOFR30A + 6.626%), 07/15/2035 | | | 44,865 | | | 0.0 | |
| 449,512 (3)(6) | | | Freddie Mac REMIC Trust 3006 YI, 1.307%, (-1.000*SOFR30A + 6.626%), 07/15/2035 | | | 37,617 | | | 0.0 | |
| 2,922,204 (3)(6) | | | Freddie Mac REMIC Trust 3045 DI, 1.297%, (-1.000*SOFR30A + 6.616%), 10/15/2035 | | | 219,576 | | | 0.0 | |
| 563,079 | | | Freddie Mac REMIC Trust 3117 ZA, 5.500%, 02/15/2036 | | | 553,668 | | | 0.0 | |
| 446,601 (3)(6) | | | Freddie Mac REMIC Trust 3171 PS, 1.052%, (-1.000*SOFR30A + 6.371%), 06/15/2036 | | | 25,930 | | | 0.0 | |
| 3,114,301 (3)(6) | | | Freddie Mac REMIC Trust 3199 S, 1.017%, (-1.000*SOFR30A + 6.336%), 08/15/2036 | | | 263,839 | | | 0.0 | |
| 2,808,722 (3)(6) | | | Freddie Mac REMIC Trust 3213 JS, 1.767%, (-1.000*SOFR30A + 7.086%), 09/15/2036 | | | 312,878 | | | 0.0 | |
| 9,876,330 (3)(6) | | | Freddie Mac REMIC Trust 3346 SC, 1.117%, (-1.000*SOFR30A + 6.436%), 10/15/2033 | | | 654,030 | | | 0.0 | |
| 261,288 | | | Freddie Mac REMIC Trust 3351 ZC, 5.500%, 07/15/2037 | | | 263,457 | | | 0.0 | |
| 720,745 (3)(6) | | | Freddie Mac REMIC Trust 3375 QI, 0.600%, (-1.000*SOFR30A + 63.455%), 10/15/2037 | | | 17,112 | | | 0.0 | |
| 88,406 | | | Freddie Mac REMIC Trust 3394 ZY, 6.000%, 11/15/2037 | | | 90,436 | | | 0.0 | |
| 4,766,419 (3)(6) | | | Freddie Mac REMIC Trust 3510 AS, 0.977%, (-1.000*SOFR30A + 6.296%), 04/15/2037 | | | 405,331 | | | 0.0 | |
Principal
Amount† | | | | | Value | | Percentage
of Net
Assets | |
| COLLATERALIZED MORTGAGE OBLIGATIONS: (continued) | |
| 127,778 (3)(6) | | | Freddie Mac REMIC Trust 3524 LA, 4.985%, 03/15/2033 | | $ | 122,277 | | | 0.0 | |
| 8,820 (3) | | | Freddie Mac REMIC Trust 3556 NT, 8.533%, (SOFR30A + 3.214%), 03/15/2038 | | | 9,105 | | | 0.0 | |
| 5,145,947 (3)(6) | | | Freddie Mac REMIC Trust 3629 CS, 0.917%, (-1.000*SOFR30A + 6.236%), 01/15/2040 | | | 482,070 | | | 0.0 | |
| 2,893,389 | | | Freddie Mac REMIC Trust 3639 ZN, 5.500%, 12/15/2034 | | | 2,882,949 | | | 0.1 | |
| 250,014 | | | Freddie Mac REMIC Trust 3662 ZB, 5.500%, 08/15/2036 | | | 253,485 | | | 0.0 | |
| 193,438 | | | Freddie Mac REMIC Trust 3724 CM, 5.500%, 06/15/2037 | | | 197,210 | | | 0.0 | |
| 1,909,417 | | | Freddie Mac REMIC Trust 3736 ZP, 4.000%, 10/15/2040 | | | 1,830,244 | | | 0.0 | |
| 1,428,263 | | | Freddie Mac REMIC Trust 3740 KE, 4.000%, 10/15/2040 | | | 1,371,799 | | | 0.0 | |
| 16,932,509 | | | Freddie Mac REMIC Trust 3753 KZ, 4.500%, 11/15/2040 | | | 16,359,601 | | | 0.2 | |
| 4,129,548 | | | Freddie Mac REMIC Trust 3775 GZ, 4.500%, 12/15/2040 | | | 3,816,141 | | | 0.1 | |
| 1,900,000 | | | Freddie Mac REMIC Trust 3820 NC, 4.500%, 03/15/2041 | | | 1,837,201 | | | 0.0 | |
| 868,356 | | | Freddie Mac REMIC Trust 3843 JZ, 5.100%, 04/15/2041 | | | 852,561 | | | 0.0 | |
| 345,307 | | | Freddie Mac REMIC Trust 3848 WX, 5.000%, 04/15/2041 | | | 348,376 | | | 0.0 | |
| 585,631 (3)(6) | | | Freddie Mac REMIC Trust 3856 KS, 1.117%, (-1.000*SOFR30A + 6.436%), 05/15/2041 | | | 53,979 | | | 0.0 | |
| 2,650,000 | | | Freddie Mac REMIC Trust 3890 ME, 5.000%, 07/15/2041 | | | 2,599,832 | | | 0.0 | |
| 1,753,181 | | | Freddie Mac REMIC Trust 3893 PU, 4.000%, 07/15/2041 | | | 1,686,718 | | | 0.0 | |
| 3,509,452 | | | Freddie Mac REMIC Trust 3919 BY, 4.000%, 09/15/2041 | | | 3,358,093 | | | 0.1 | |
| 6,897,942 | | | Freddie Mac REMIC Trust 3919 ZB, 4.000%, 09/15/2041 | | | 6,473,428 | | | 0.1 | |
See Accompanying Notes to Financial Statements
| Voya Intermediate Bond Fund | PORTFOLIO OF INVESTMENTS |
| as of March 31, 2024 (continued) |
Principal
Amount† | | | | | Value | | Percentage
of Net
Assets | |
| COLLATERALIZED MORTGAGE OBLIGATIONS: (continued) | |
| 2,795,073 | | | Freddie Mac REMIC Trust 3923 GY, 4.000%, 09/15/2041 | | $ | 2,687,798 | | | 0.0 | |
| 192,069 (3)(6) | | | Freddie Mac REMIC Trust 3925 SD, 0.617%, (-1.000*SOFR30A + 5.936%), 07/15/2040 | | | 3,591 | | | 0.0 | |
| 737,285 (3)(6) | | | Freddie Mac REMIC Trust 3925 SL, 0.617%, (-1.000*SOFR30A + 5.936%), 01/15/2041 | | | 8,590 | | | 0.0 | |
| 1,278,841 | | | Freddie Mac REMIC Trust 3934 CB, 4.000%, 10/15/2041 | | | 1,222,863 | | | 0.0 | |
| 530,353 | | | Freddie Mac REMIC Trust 3934 KB, 5.000%, 10/15/2041 | | | 534,235 | | | 0.0 | |
| 4,226,477 | | | Freddie Mac REMIC Trust 3982 LZ, 4.000%, 01/15/2042 | | | 3,969,489 | | | 0.1 | |
| 726,648 | | | Freddie Mac REMIC Trust 3997 PB, 4.000%, 02/15/2042 | | | 696,223 | | | 0.0 | |
| 117,341 | | | Freddie Mac REMIC Trust 4000 PA, 4.500%, 01/15/2042 | | | 115,620 | | | 0.0 | |
| 2,354,185 (3)(6) | | | Freddie Mac REMIC Trust 4057 SN, 1.217%, (-1.000*SOFR30A + 6.536%), 12/15/2041 | | | 157,716 | | | 0.0 | |
| 2,354,549 | | | Freddie Mac REMIC Trust 4057 ZB, 3.500%, 06/15/2042 | | | 2,172,962 | | | 0.0 | |
| 10,679,705 | | | Freddie Mac REMIC Trust 4084 TZ, 4.000%, 07/15/2042 | | | 10,131,887 | | | 0.1 | |
| 648,330 (3)(6) | | | Freddie Mac REMIC Trust 4088 CS, 0.567%, (-1.000*SOFR30A + 5.886%), 08/15/2042 | | | 56,310 | | | 0.0 | |
| 1,232,355 (3)(6) | | | Freddie Mac REMIC Trust 4090 SN, 1.267%, (-1.000*SOFR30A + 6.586%), 08/15/2032 | | | 76,469 | | | 0.0 | |
| 494,532 | | | Freddie Mac REMIC Trust 4100 JA, 3.500%, 10/15/2041 | | | 466,072 | | | 0.0 | |
| 3,400,275 (6) | | | Freddie Mac REMIC Trust 4161 WI, 3.000%, 02/15/2033 | | | 264,370 | | | 0.0 | |
| 3,346,112 (3)(6) | | | Freddie Mac REMIC Trust 4191 SA, 0.767%, (-1.000*SOFR30A + 6.086%), 03/15/2043 | | | 232,615 | | | 0.0 | |
Principal
Amount† | | | | | Value | | Percentage
of Net
Assets | |
| COLLATERALIZED MORTGAGE OBLIGATIONS: (continued) | |
| 2,128,000 | | | Freddie Mac REMIC Trust 4193 BP, 4.000%, 04/15/2043 | | $ | 1,896,582 | | | 0.0 | |
| 1,776,931 (6) | | | Freddie Mac REMIC Trust 4194 GI, 4.000%, 04/15/2043 | | | 281,846 | | | 0.0 | |
| 2,708,941 | | | Freddie Mac REMIC Trust 4203 BN, 3.000%, 04/15/2033 | | | 2,556,728 | | | 0.0 | |
| 2,080,000 | | | Freddie Mac REMIC Trust 4235 QD, 3.000%, 08/15/2033 | | | 1,949,344 | | | 0.0 | |
| 916,207 | | | Freddie Mac REMIC Trust 4246 ZX, 4.500%, 04/15/2041 | | | 884,488 | | | 0.0 | |
| 747,457 (6) | | | Freddie Mac REMIC Trust 4293 KI, 4.500%, 08/15/2043 | | | 91,339 | | | 0.0 | |
| 19,896,389 (3)(6) | | | Freddie Mac REMIC Trust 4301 SD, 0.667%, (-1.000*SOFR30A + 5.986%), 07/15/2037 | | | 1,233,604 | | | 0.0 | |
| 7,461,839 | | | Freddie Mac REMIC Trust 4310 BZ, 4.000%, 02/15/2044 | | | 6,958,591 | | | 0.1 | |
| 4,596,894 | | | Freddie Mac REMIC Trust 4316 XZ, 4.500%, 03/15/2044 | | | 4,391,522 | | | 0.1 | |
| 7,558,346 | | | Freddie Mac REMIC Trust 4335 XZ, 4.250%, 05/15/2044 | | | 7,115,955 | | | 0.1 | |
| 4,843,642 | | | Freddie Mac REMIC Trust 4335 ZX, 4.250%, 05/15/2044 | | | 4,526,706 | | | 0.1 | |
| 10,535,670 | | | Freddie Mac REMIC Trust 4348 ZX, 4.250%, 06/15/2044 | | | 10,052,959 | | | 0.1 | |
| 292,868 | | | Freddie Mac REMIC Trust 4370 AD, 3.000%, 08/15/2040 | | | 288,655 | | | 0.0 | |
| 2,427,138 (3)(6) | | | Freddie Mac REMIC Trust 4386 LS, 0.667%, (-1.000*SOFR30A + 5.986%), 09/15/2044 | | | 210,254 | | | 0.0 | |
| 2,496,427 | | | Freddie Mac REMIC Trust 4401 BL, 3.500%, 10/15/2034 | | | 2,368,219 | | | 0.0 | |
| 8,040,636 (3)(6) | | | Freddie Mac REMIC Trust 4407 CS, 0.767%, (-1.000*SOFR30A + 6.086%), 06/15/2044 | | | 556,316 | | | 0.0 | |
| 11,574,493 (3)(6) | | | Freddie Mac REMIC Trust 4407 PS, 0.167%, (-1.000*SOFR30A + 5.486%), 06/15/2044 | | | 552,617 | | | 0.0 | |
See Accompanying Notes to Financial Statements
| Voya Intermediate Bond Fund | PORTFOLIO OF INVESTMENTS |
| as of March 31, 2024 (continued) |
Principal
Amount† | | | | | Value | | Percentage
of Net
Assets | |
| COLLATERALIZED MORTGAGE OBLIGATIONS: (continued) | |
| 6,563,985 | | | Freddie Mac REMIC Trust 4444 CZ, 3.000%, 02/15/2045 | | $ | 5,644,789 | | | 0.1 | |
| 11,244,316 (3)(6) | | | Freddie Mac REMIC Trust 4461 AS, 0.167%, (-1.000*SOFR30A + 5.486%), 04/15/2045 | | | 659,860 | | | 0.0 | |
| 3,124,000 | | | Freddie Mac REMIC Trust 4492 VB, 3.500%, 05/15/2035 | | | 2,916,983 | | | 0.1 | |
| 14,382 | | | Freddie Mac REMIC Trust 4500 HC, 3.000%, 11/15/2042 | | | 14,310 | | | 0.0 | |
| 2,913,000 | | | Freddie Mac REMIC Trust 4505 PB, 3.000%, 08/15/2045 | | | 2,457,740 | | | 0.0 | |
| 8,068,266 | | | Freddie Mac REMIC Trust 4545 PL, 3.500%, 01/15/2046 | | | 7,178,211 | | | 0.1 | |
| 10,772,800 (3)(6) | | | Freddie Mac REMIC Trust 4574 ST, 0.567%, (-1.000*SOFR30A + 5.886%), 04/15/2046 | | | 1,035,477 | | | 0.0 | |
| 54,640,045 (3)(6) | | | Freddie Mac REMIC Trust 4585 AS, 0.667%, (-1.000*SOFR30A + 5.986%), 05/15/2046 | | | 4,196,634 | | | 0.1 | |
| 4,203,783 | | | Freddie Mac REMIC Trust 4608 JV, 3.500%, 01/15/2055 | | | 3,367,306 | | | 0.1 | |
| 15,435,479 (3)(6) | | | Freddie Mac REMIC Trust 4611 BS, 0.667%, (-1.000*SOFR30A + 5.986%), 06/15/2041 | | | 1,215,772 | | | 0.0 | |
| 10,043,479 | | | Freddie Mac REMIC Trust 4664 KZ, 3.500%, 02/15/2047 | | | 9,146,383 | | | 0.1 | |
| 5,922,670 | | | Freddie Mac REMIC Trust 4680 GZ, 3.500%, 03/15/2047 | | | 5,257,347 | | | 0.1 | |
| 5,699,687 | | | Freddie Mac REMIC Trust 4682 HZ, 3.500%, 04/15/2047 | | | 5,188,856 | | | 0.1 | |
| 2,320,242 | | | Freddie Mac REMIC Trust 4700 KZ, 3.500%, 07/15/2047 | | | 2,065,950 | | | 0.0 | |
| 4,210,292 | | | Freddie Mac REMIC Trust 4753 VZ, 3.000%, 12/15/2047 | | | 3,247,730 | | | 0.1 | |
| 3,447,266 | | | Freddie Mac REMIC Trust 4755 Z, 3.000%, 02/15/2048 | | | 2,926,874 | | | 0.1 | |
| 37,106,944 | | | Freddie Mac REMIC Trust 4771 HZ, 3.500%, 03/15/2048 | | | 33,075,160 | | | 0.4 | |
Principal
Amount† | | | | | Value | | Percentage
of Net
Assets | |
| COLLATERALIZED MORTGAGE OBLIGATIONS: (continued) | |
| 185,613 | | | Freddie Mac REMIC Trust 4772 VG, 4.500%, 08/15/2036 | | $ | 184,726 | | | 0.0 | |
| 14,178,402 | | | Freddie Mac REMIC Trust 4776 AZ, 4.000%, 07/15/2047 | | | 13,044,439 | | | 0.2 | |
| 387,403 | | | Freddie Mac REMIC Trust 4787 PY, 4.000%, 05/15/2048 | | | 355,834 | | | 0.0 | |
| 7,507,462 | | | Freddie Mac REMIC Trust 4795 D, 5.000%, 05/15/2048 | | | 7,270,034 | | | 0.1 | |
| 1,964,775 | | | Freddie Mac REMIC Trust 4834 AZ, 3.500%, 10/15/2048 | | | 1,800,470 | | | 0.0 | |
| 29,190,286 (3)(6) | | | Freddie Mac REMIC Trust 4879 DS, 0.667%, (-1.000*SOFR30A + 5.986%), 08/15/2034 | | | 1,597,176 | | | 0.0 | |
| 26,567,523 (3)(6) | | | Freddie Mac REMIC Trust 4892 SA, 0.617%, (-1.000*SOFR30A + 5.936%), 07/15/2049 | | | 2,555,182 | | | 0.0 | |
| 1,632,872 | | | Freddie Mac REMIC Trust 4904 HB, 3.000%, 08/25/2049 | | | 1,202,628 | | | 0.0 | |
| 7,226,277 (3)(6) | | | Freddie Mac REMIC Trust 4906 SQ, 0.615%, (-1.000*SOFR30A + 5.936%), 09/25/2049 | | | 687,073 | | | 0.0 | |
| 606,535 | | | Freddie Mac REMIC Trust 4914 DB, 3.000%, 09/25/2049 | | | 417,893 | | | 0.0 | |
| 2,271,608 | | | Freddie Mac REMIC Trust 4941 CZ, 3.000%, 11/25/2049 | | | 1,901,121 | | | 0.0 | |
| 2,768,352 | | | Freddie Mac REMIC Trust 4941 WZ, 3.000%, 11/25/2049 | | | 2,392,201 | | | 0.0 | |
| 4,457,097 | | | Freddie Mac REMIC Trust 4950 KE, 2.500%, 12/25/2049 | | | 3,800,256 | | | 0.1 | |
| 52,410,464 (6) | | | Freddie Mac REMIC Trust 4998 AI, 3.500%, 12/25/2049 | | | 11,187,726 | | | 0.1 | |
| 47,222,374 (6) | | | Freddie Mac REMIC Trust 5014 HI, 4.000%, 09/25/2050 | | | 9,759,089 | | | 0.1 | |
| 29,987,457 (6) | | | Freddie Mac REMIC Trust 5019 HI, 3.500%, 10/25/2050 | | | 5,711,987 | | | 0.1 | |
| 22,843,370 (3)(6) | | | Freddie Mac REMIC Trust 5045 BS, 0.880%, (-1.000*SOFR30A + 6.200%), 11/25/2050 | | | 2,908,980 | | | 0.1 | |
See Accompanying Notes to Financial Statements
| Voya Intermediate Bond Fund | PORTFOLIO OF INVESTMENTS |
| as of March 31, 2024 (continued) |
Principal
Amount† | | | | | Value | | Percentage
of Net
Assets | |
| COLLATERALIZED MORTGAGE OBLIGATIONS: (continued) |
| 96,824,383 (6) | | | Freddie Mac REMIC Trust 5051 BI, 3.000%, 11/25/2050 | | $ | 16,394,237 | | | 0.2 | |
| 48,188,260 (6) | | | Freddie Mac REMIC Trust 5057 IT, 3.000%, 11/25/2050 | | | 8,111,843 | | | 0.1 | |
| 27,798,895 (6) | | | Freddie Mac REMIC Trust 5072 NI, 3.000%, 01/25/2050 | | | 4,712,977 | | | 0.1 | |
| 54,962,969 (6) | | | Freddie Mac REMIC Trust 5072 QI, 3.500%, 10/25/2050 | | | 11,853,253 | | | 0.2 | |
| 43,235,799 (6) | | | Freddie Mac REMIC Trust 5082 IQ, 3.000%, 03/25/2051 | | | 7,305,047 | | | 0.1 | |
| 20,333,903 (6) | | | Freddie Mac REMIC Trust 5103 HI, 4.000%, 05/25/2051 | | | 4,182,100 | | | 0.1 | |
| 21,299,284 (6) | | | Freddie Mac REMIC Trust 5113 AI, 4.000%, 06/25/2041 | | | 3,369,453 | | | 0.1 | |
| 19,767,654 (6) | | | Freddie Mac REMIC Trust 5114 CI, 4.000%, 01/25/2050 | | | 4,011,237 | | | 0.1 | |
| 65,446,540 (6) | | | Freddie Mac REMIC Trust 5117 IO, 3.000%, 06/25/2051 | | | 9,390,525 | | | 0.1 | |
| 27,176,465 (6) | | | Freddie Mac REMIC Trust 5122 AI, 4.500%, 07/25/2051 | | | 6,086,273 | | | 0.1 | |
| 44,202,866 (6) | | | Freddie Mac REMIC Trust 5125 MI, 4.500%, 11/25/2048 | | | 11,276,982 | | | 0.2 | |
| 25,335,798 (6) | | | Freddie Mac REMIC Trust 5128 IC, 5.500%, 09/25/2041 | | | 4,982,883 | | | 0.1 | |
| 55,176,873 (6) | | | Freddie Mac REMIC Trust 5152 IQ, 4.500%, 10/25/2051 | | | 12,569,380 | | | 0.2 | |
| 68,133,569 (6) | | | Freddie Mac REMIC Trust 5200 IC, 4.000%, 03/25/2051 | | | 14,078,453 | | | 0.2 | |
| 1,426,376 | | | Freddie Mac REMIC Trust 5228 EC, 4.000%, 02/25/2050 | | | 1,337,493 | | | 0.0 | |
| 41,397,861 (6) | | | Freddie Mac REMIC Trust 5322 IO, 4.000%, 09/25/2051 | | | 8,634,700 | | | 0.1 | |
| 8,740,000 (1)(3) | | | Freddie Mac STACR REMIC Trust 2020-HQA2 B1, 9.535%, (SOFR30A + 4.214%), 03/25/2050 | | | 9,847,120 | | | 0.1 | |
| 1,000,000 (1)(3) | | | Freddie Mac STACR REMIC Trust 2021-DNA7 M2, 7.120%, (SOFR30A + 1.800%), 11/25/2041 | | | 1,006,836 | | | 0.0 | |
Principal
Amount† | | | | | Value | | Percentage
of Net
Assets | |
| COLLATERALIZED MORTGAGE OBLIGATIONS: (continued) |
| 2,908,298 (1)(3) | | | Freddie Mac STACR REMIC Trust 2021-HQA1 M2, 7.570%, (SOFR30A + 2.250%), 08/25/2033 | | $ | 2,976,306 | | | 0.1 | |
| 6,500,000 (1)(3) | | | Freddie Mac STACR REMIC Trust 2021-HQA3 M2, 7.420%, (SOFR30A + 2.100%), 09/25/2041 | | | 6,529,002 | | | 0.1 | |
| 15,000,000 (1)(3) | | | Freddie Mac STACR REMIC Trust 2021-HQA4 B1, 9.070%, (SOFR30A + 3.750%), 12/25/2041 | | | 15,476,280 | | | 0.2 | |
| 10,000,000 (1)(3) | | | Freddie Mac STACR REMIC Trust 2021-HQA4 M2, 7.670%, (SOFR30A + 2.350%), 12/25/2041 | | | 10,074,453 | | | 0.1 | |
| 13,500,000 (1)(3) | | | Freddie Mac STACR REMIC Trust 2022-DNA1 B1, 8.720%, (SOFR30A + 3.400%), 01/25/2042 | | | 13,961,379 | | | 0.2 | |
| 9,200,000 (1)(3) | | | Freddie Mac STACR REMIC Trust 2022-DNA1 M1B, 7.170%, (SOFR30A + 1.850%), 01/25/2042 | | | 9,261,566 | | | 0.1 | |
| 7,000,000 (1)(3) | | | Freddie Mac STACR REMIC Trust 2022-DNA1 M2, 7.820%, (SOFR30A + 2.500%), 01/25/2042 | | | 7,130,470 | | | 0.1 | |
| 1,400,000 (1)(3) | | | Freddie Mac STACR REMIC Trust 2022-DNA2 B1, 10.070%, (SOFR30A + 4.750%), 02/25/2042 | | | 1,493,506 | | | 0.0 | |
| 10,400,000 (1)(3) | | | Freddie Mac STACR REMIC Trust 2022-DNA2 M2, 9.070%, (SOFR30A + 3.750%), 02/25/2042 | | | 10,958,189 | | | 0.1 | |
| 1,150,000 (1)(3) | | | Freddie Mac STACR REMIC Trust 2022-HQA3 M2, 10.670%, (SOFR30A + 5.350%), 08/25/2042 | | | 1,251,318 | | | 0.0 | |
| 1,800,000 (1)(3) | | | Freddie Mac STACR REMIC Trust 2023-HQA3 M2, 8.670%, (SOFR30A + 3.350%), 11/25/2043 | | | 1,887,696 | | | 0.0 | |
| 2,321,181 | | | Freddie Mac Strips 30, 3.000%, 09/15/2042 | | | 2,065,261 | | | 0.0 | |
| 4,925,000 (6) | | | Freddie Mac Strips 303 C17, 3.500%, 01/15/2043 | | | 765,120 | | | 0.0 | |
See Accompanying Notes to Financial Statements
| Voya Intermediate Bond Fund | PORTFOLIO OF INVESTMENTS |
| as of March 31, 2024 (continued) |
Principal
Amount† | | | | | Value | | Percentage
of Net
Assets | |
| COLLATERALIZED MORTGAGE OBLIGATIONS: (continued) | |
| 24,838,740 (3)(6) | | | Freddie Mac Strips 311 S1, 0.517%, (-1.000*SOFR30A + 5.836%), 08/15/2043 | | $ | 2,381,931 | | | 0.0 | |
| 9,128,673 | | | Freddie Mac Strips 326 350, 3.500%, 03/15/2044 | | | 8,351,945 | | | 0.1 | |
| 749,430 (3)(6) | | | Freddie Mac Strips 344 68, 3.000%, 02/15/2045 | | | 88,559 | | | 0.0 | |
| 228,717 (3)(6) | | | Freddie Mac Strips 344 89, 4.500%, 02/15/2045 | | | 40,202 | | | 0.0 | |
| 3,134,877 (6) | | | Freddie Mac Strips 344 C13, 4.500%, 02/15/2045 | | | 633,028 | | | 0.0 | |
| 4,668,865 (6) | | | Freddie Mac Strips 344 C17, 4.000%, 02/15/2045 | | | 864,280 | | | 0.0 | |
| 2,277,545 (3)(6) | | | Freddie Mac Strips 344 C18, 4.000%, 02/15/2045 | | | 368,817 | | | 0.0 | |
| 2,793,854 (3)(6) | | | Freddie Mac Strips 344 C19, 3.500%, 02/15/2045 | | | 357,810 | | | 0.0 | |
| 4,517,472 (6) | | | Freddie Mac Strips 344 C2, 4.000%, 02/15/2045 | | | 836,088 | | | 0.0 | |
| 3,814,344 (6) | | | Freddie Mac Strips 344 C4, 4.000%, 02/15/2045 | | | 695,886 | | | 0.0 | |
| 6,554,905 (6) | | | Freddie Mac Strips 344 C5, 3.500%, 02/15/2045 | | | 1,102,613 | | | 0.0 | |
| 6,747,967 (6) | | | Freddie Mac Strips 344 C6, 4.000%, 02/15/2045 | | | 1,277,772 | | | 0.0 | |
| 3,680,226 (6) | | | Freddie Mac Strips 344 C7, 4.000%, 02/15/2045 | | | 696,419 | | | 0.0 | |
| 2,827,383 (6) | | | Freddie Mac Strips 344 C8, 3.500%, 02/15/2045 | | | 468,155 | | | 0.0 | |
| 3,386,932 (6) | | | Freddie Mac Strips 344 C9, 3.500%, 02/15/2045 | | | 556,522 | | | 0.0 | |
| 7,752,688 (6) | | | Freddie Mac Strips 347 C14, 3.500%, 02/15/2044 | | | 1,315,903 | | | 0.0 | |
| 4,599,567 (6) | | | Freddie Mac Strips 347 C22, 4.000%, 02/15/2044 | | | 830,580 | | | 0.0 | |
| 5,066,818 (6) | | | Freddie Mac Strips 347 C23, 4.000%, 02/15/2044 | | | 917,815 | | | 0.0 | |
| 4,781,801 (6) | | | Freddie Mac Strips 347 C24, 4.000%, 02/15/2044 | | | 857,127 | | | 0.0 | |
| 4,257,386 (6) | | | Freddie Mac Strips 347 C25, 4.000%, 02/15/2044 | | | 766,230 | | | 0.0 | |
| 5,959,876 (6) | | | Freddie Mac Strips 347 C26, 4.000%, 02/15/2044 | | | 1,114,224 | | | 0.0 | |
| 5,345,808 (6) | | | Freddie Mac Strips 347 C28, 4.500%, 02/15/2044 | | | 1,092,329 | | | 0.0 | |
| 9,061,963 (6) | | | Freddie Mac Strips 347 C5, 3.000%, 05/15/2043 | | | 1,361,726 | | | 0.0 | |
Principal
Amount† | | | | | Value | | Percentage
of Net
Assets | |
| COLLATERALIZED MORTGAGE OBLIGATIONS: (continued) | |
| 18,677,658 (6) | | | Freddie Mac Strips 365 C23, 3.500%, 10/15/2047 | | $ | 3,227,559 | | | 0.1 | |
| 5,082,115 (1)(3) | | | Freddie Mac Structured Agency Credit Risk Debt Notes 2021-DNA2 M2, 7.620%, (SOFR30A + 2.300%), 08/25/2033 | | | 5,185,413 | | | 0.1 | |
| 796,674 (3) | | | Freddie Mac Structured Pass-Through Certificates T-48 1A, 4.429%, 07/25/2033 | | | 748,828 | | | 0.0 | |
| 2,389,620 | | | Freddie Mac Whole Loan Securities Trust 2017-SC01 1A, 3.000%, 12/25/2046 | | | 2,007,858 | | | 0.0 | |
| 2,384,763 | | | Freddie Mac Whole Loan Securities Trust 2017-SC01 2A, 3.500%, 12/25/2046 | | | 2,072,312 | | | 0.0 | |
| 532,044 (1)(3) | | | Galton Funding Mortgage Trust 2018-2 A51, 4.500%, 10/25/2058 | | | 503,189 | | | 0.0 | |
| 3,685,240 (1)(3) | | | Galton Funding Mortgage Trust 2018-2 B2, 4.750%, 10/25/2058 | | | 3,471,382 | | | 0.1 | |
| 987,685 (3)(6) | | | Ginnie Mae 2005-37 SI, 0.707%, (-1.000*TSFR1M + 6.036%), 05/20/2035 | | | 64,522 | | | 0.0 | |
| 227,090 (3)(6) | | | Ginnie Mae 2005-7 AH, 1.329%, (-1.000*TSFR1M + 6.656%), 02/16/2035 | | | 16,232 | | | 0.0 | |
| 4,814,904 (3)(6) | | | Ginnie Mae 2007-17 IC, 0.809%, (-1.000*TSFR1M + 6.136%), 04/16/2037 | | | 223,727 | | | 0.0 | |
| 854,118 (3)(6) | | | Ginnie Mae 2007-23 ST, 0.757%, (-1.000*TSFR1M + 6.086%), 04/20/2037 | | | 59,084 | | | 0.0 | |
| 1,069,086 (3)(6) | | | Ginnie Mae 2007-40 SE, 1.307%, (-1.000*TSFR1M + 6.636%), 07/20/2037 | | | 111,908 | | | 0.0 | |
| 5,524,923 (3)(6) | | | Ginnie Mae 2007-41 SL, 1.257%, (-1.000*TSFR1M + 6.586%), 07/20/2037 | | | 469,941 | | | 0.0 | |
| 684,145 (3)(6) | | | Ginnie Mae 2007-7 EI, 0.757%, (-1.000*TSFR1M + 6.086%), 02/20/2037 | | | 56,478 | | | 0.0 | |
| 627,992 (3)(6) | | | Ginnie Mae 2008-2 SW, 1.107%, (-1.000*TSFR1M + 6.436%), 01/20/2038 | | | 60,022 | | | 0.0 | |
See Accompanying Notes to Financial Statements
| Voya Intermediate Bond Fund | PORTFOLIO OF INVESTMENTS |
| as of March 31, 2024 (continued) |
Principal
Amount† | | | | | Value | | Percentage
of Net
Assets | |
| COLLATERALIZED MORTGAGE OBLIGATIONS: (continued) |
| 320,310 (3)(6) | | | Ginnie Mae 2008-35 SN, 0.957%, (-1.000*TSFR1M + 6.286%), 04/20/2038 | | $ | 22,451 | | | 0.0 | |
| 165,360 (3)(6) | | | Ginnie Mae 2008-40 PS, 1.059%, (-1.000*TSFR1M + 6.386%), 05/16/2038 | | | 10,864 | | | 0.0 | |
| 494,149 (3)(6) | | | Ginnie Mae 2009-25 KS, 0.757%, (-1.000*TSFR1M + 6.086%), 04/20/2039 | | | 43,951 | | | 0.0 | |
| 381,565 | | | Ginnie Mae 2009-29 PB, 4.750%, 05/20/2039 | | | 378,049 | | | 0.0 | |
| 343,029 | | | Ginnie Mae 2009-31 ZL, 4.500%, 05/20/2039 | | | 335,639 | | | 0.0 | |
| 7,680,586 | | | Ginnie Mae 2009-33 ZB, 6.000%, 05/20/2039 | | | 7,843,899 | | | 0.1 | |
| 757,572 | | | Ginnie Mae 2009-34 Z, 4.500%, 05/16/2039 | | | 744,053 | | | 0.0 | |
| 766,918 | | | Ginnie Mae 2009-98 DA, 3.250%, 07/16/2039 | | | 737,834 | | | 0.0 | |
| 2,039,865 | | | Ginnie Mae 2010-108 WL, 4.000%, 04/16/2040 | | | 1,958,726 | | | 0.0 | |
| 2,502,687 (3)(6) | | | Ginnie Mae 2010-11 SA, 0.979%, (-1.000*TSFR1M + 6.306%), 01/16/2040 | | | 206,989 | | | 0.0 | |
| 780,791 (3)(6) | | | Ginnie Mae 2010-116 NS, 1.209%, (-1.000*TSFR1M + 6.536%), 09/16/2040 | | | 51,512 | | | 0.0 | |
| 2,770,852 (3)(6) | | | Ginnie Mae 2010-116 SK, 1.177%, (-1.000*TSFR1M + 6.506%), 08/20/2040 | | | 222,758 | | | 0.0 | |
| 1,082,353 (3)(6) | | | Ginnie Mae 2010-14 SB, 1.357%, (-1.000*TSFR1M + 6.686%), 11/20/2035 | | | 101,667 | | | 0.0 | |
| 1,725,437 (3)(6) | | | Ginnie Mae 2010-149 HS, 0.659%, (-1.000*TSFR1M + 5.986%), 05/16/2040 | | | 17,901 | | | 0.0 | |
| 305,307 | | | Ginnie Mae 2010-164 MD, 4.000%, 12/20/2040 | | | 291,184 | | | 0.0 | |
| 1,091,181 (6) | | | Ginnie Mae 2010-168 BI, 5.000%, 04/20/2040 | | | 170,185 | | | 0.0 | |
| 669,825 (3)(6) | | | Ginnie Mae 2010- 68 MS, 0.407%, (-1.000*TSFR1M + 5.736%), 06/20/2040 | | | 50,424 | | | 0.0 | |
| 731,971 (6) | | | Ginnie Mae 2010-99 IT, 5.000%, 08/16/2040 | | | 95,046 | | | 0.0 | |
| 865,832 | | | Ginnie Mae 2011-52 PA, 4.250%, 02/16/2041 | | | 847,659 | | | 0.0 | |
Principal
Amount† | | | | | Value | | Percentage
of Net
Assets | |
| COLLATERALIZED MORTGAGE OBLIGATIONS: (continued) | |
| 1,571,971 (3)(6) | | | Ginnie Mae 2011-72 SA, 0.192%, (-1.000*TSFR1M + 5.236%), 05/16/2041 | | $ | 93,027 | | | 0.0 | |
| 172,262 (6) | | | Ginnie Mae 2012-91 QI, 4.500%, 09/20/2041 | | | 14,717 | | | 0.0 | |
| 2,333,459 (3)(6) | | | Ginnie Mae 2013-111 SA, 1.257%, (-1.000*TSFR1M + 6.586%), 07/20/2043 | | | 235,775 | | | 0.0 | |
| 612,131 | | | Ginnie Mae 2013-116 KB, 3.500%, 12/20/2042 | | | 592,869 | | | 0.0 | |
| 2,954,909 (6) | | | Ginnie Mae 2013-167 PI, 5.500%, 11/20/2043 | | | 451,598 | | | 0.0 | |
| 7,766,535 | | | Ginnie Mae 2013-170 ZD, 2.500%, 11/16/2043 | | | 6,685,348 | | | 0.1 | |
| 68,148 | | | Ginnie Mae 2013-27 KA, 2.250%, 02/20/2043 | | | 61,270 | | | 0.0 | |
| 352,985 | | | Ginnie Mae 2013-69 KA, 1.250%, 08/20/2042 | | | 305,279 | | | 0.0 | |
| 73,835 (6) | | | Ginnie Mae 2014-10 GI, 4.500%, 01/16/2029 | | | 904 | | | 0.0 | |
| 2,243,482 (3)(6) | | | Ginnie Mae 2014-185 SB, 0.157%, (-1.000*TSFR1M + 5.486%), 12/20/2044 | | | 136,261 | | | 0.0 | |
| 1,437,333 (3)(6) | | | Ginnie Mae 2014-3 QS, 0.707%, (-1.000*TSFR1M + 6.036%), 03/20/2043 | | | 63,595 | | | 0.0 | |
| 3,812,293 (3)(6) | | | Ginnie Mae 2014-3 SU, 0.607%, (-1.000*TSFR1M + 5.936%), 07/20/2039 | | | 297,147 | | | 0.0 | |
| 2,121,410 (3)(6) | | | Ginnie Mae 2014-56 SP, 0.759%, (-1.000*TSFR1M + 6.086%), 12/16/2039 | | | 129,670 | | | 0.0 | |
| 5,347,924 (3)(6) | | | Ginnie Mae 2014-58 SG, 0.159%, (-1.000*TSFR1M + 5.486%), 04/16/2044 | | | 245,031 | | | 0.0 | |
| 15,072,684 (3)(6) | | | Ginnie Mae 2015-110 MS, 0.267%, (-1.000*TSFR1M + 5.596%), 08/20/2045 | | | 1,264,821 | | | 0.0 | |
| 1,026,637 | | | Ginnie Mae 2015-27 PB, 3.000%, 08/20/2044 | | | 996,038 | | | 0.0 | |
| 13,563,044 (3)(6) | | | Ginnie Mae 2016-160 GS, 0.657%, (-1.000*TSFR1M + 5.986%), 11/20/2046 | | | 1,262,028 | | | 0.0 | |
| 376,394 | | | Ginnie Mae 2016-44 JA, 3.500%, 03/20/2046 | | | 339,883 | | | 0.0 | |
| 29,049,384 (3)(6) | | | Ginnie Mae 2016-6 SB, 0.207%, (-1.000*TSFR1M + 5.536%), 01/20/2046 | | | 1,994,168 | | | 0.0 | |
See Accompanying Notes to Financial Statements
| Voya Intermediate Bond Fund | PORTFOLIO OF INVESTMENTS |
| as of March 31, 2024 (continued) |
Principal
Amount† | | | | | Value | | Percentage
of Net
Assets | |
| COLLATERALIZED MORTGAGE OBLIGATIONS: (continued) | |
| 6,643,999 (3)(6) | | | Ginnie Mae 2017-101 SA, 0.757%, (-1.000*TSFR1M + 6.086%), 07/20/2047 | | $ | 700,517 | | | 0.0 | |
| 14,231,776 (3)(6) | | | Ginnie Mae 2017-163 SH, 0.757%, (-1.000*TSFR1M + 6.086%), 11/20/2047 | | | 1,543,773 | | | 0.0 | |
| 4,571,175 | | | Ginnie Mae 2018-1 LZ, 3.000%, 01/20/2048 | | | 3,524,000 | | | 0.1 | |
| 344,736 | | | Ginnie Mae 2018-104 HZ, 3.500%, 08/20/2048 | | | 256,103 | | | 0.0 | |
| 1,088,166 | | | Ginnie Mae 2018-120 DE, 3.500%, 09/20/2048 | | | 997,679 | | | 0.0 | |
| 206,278 | | | Ginnie Mae 2018-122 GZ, 3.500%, 09/20/2048 | | | 162,068 | | | 0.0 | |
| 1,479,509 | | | Ginnie Mae 2018-126 A, 3.500%, 09/20/2048 | | | 1,341,659 | | | 0.0 | |
| 206,824 | | | Ginnie Mae 2018-147 KZ, 3.750%, 10/20/2048 | | | 167,255 | | | 0.0 | |
| 14,369,135 (3)(6) | | | Ginnie Mae 2018-167 CS, 0.657%, (-1.000*TSFR1M + 5.986%), 12/20/2048 | | | 1,279,685 | | | 0.0 | |
| 176,532 | | | Ginnie Mae 2019-100 JB, 3.000%, 08/20/2049 | | | 131,525 | | | 0.0 | |
| 532,322 | | | Ginnie Mae 2019-100 KB, 3.000%, 08/20/2049 | | | 395,809 | | | 0.0 | |
| 1,349,931 | | | Ginnie Mae 2019-100 MC, 3.000%, 08/20/2049 | | | 960,973 | | | 0.0 | |
| 86,512,338 (6) | | | Ginnie Mae 2019-129 AI, 3.500%, 10/20/2049 | | | 15,452,332 | | | 0.2 | |
| 19,369,717 (3)(6) | | | Ginnie Mae 2019-159 SM, 0.607%, (-1.000*TSFR1M + 5.936%), 12/20/2049 | | | 2,065,548 | | | 0.0 | |
| 1,081,376 | | | Ginnie Mae 2019- 23 NG, 3.500%, 02/20/2049 | | | 831,181 | | | 0.0 | |
| 71,326 | | | Ginnie Mae 2019-54 AB, 3.000%, 04/20/2049 | | | 54,765 | | | 0.0 | |
| 798,785 | | | Ginnie Mae 2019-78 MB, 3.000%, 06/20/2049 | | | 592,256 | | | 0.0 | |
| 416,445 | | | Ginnie Mae 2019-89 KB, 3.000%, 07/20/2049 | | | 311,694 | | | 0.0 | |
| 299,424 | | | Ginnie Mae 2019-89 WB, 3.000%, 07/20/2049 | | | 219,273 | | | 0.0 | |
| 76,881,047 (6) | | | Ginnie Mae 2020-187 BI, 2.500%, 12/20/2050 | | | 10,593,055 | | | 0.1 | |
| 19,789,201 (6) | | | Ginnie Mae 2020-188 PI, 3.500%, 06/20/2050 | | | 3,534,161 | | | 0.1 | |
| 18,640,220 (3)(6) | | | Ginnie Mae 2020-32 SG, 0.657%, (-1.000*TSFR1M + 5.986%), 03/20/2050 | | | 1,985,862 | | | 0.0 | |
Principal
Amount† | | | | | Value | | Percentage
of Net
Assets | |
| COLLATERALIZED MORTGAGE OBLIGATIONS: (continued) | |
| 16,129,182 (3)(6) | | | Ginnie Mae 2020- 34 SQ, 0.607%, (-1.000*TSFR1M + 5.936%), 10/20/2049 | | $ | 1,578,528 | | | 0.0 | |
| 28,261,293 (3)(6) | | | Ginnie Mae 2020-46 BS, 0.336%, (-1.000*TSFR1M + 3.236%), 04/20/2050 | | | 395,221 | | | 0.0 | |
| 14,530,546 (3)(6) | | | Ginnie Mae 2020-77 JS, 0.657%, (-1.000*TSFR1M + 5.986%), 10/20/2048 | | | 1,094,554 | | | 0.0 | |
| 85,152,184 (6) | | | Ginnie Mae 2021-139 PI, 2.500%, 08/20/2051 | | | 11,705,692 | | | 0.2 | |
| 32,276,304 (6) | | | Ginnie Mae 2021-57 IG, 3.500%, 09/20/2050 | | | 5,764,135 | | | 0.1 | |
| 1,881,177 | | | Ginnie Mae 2023-99 DV, 5.000%, 07/20/2034 | | | 1,868,818 | | | 0.0 | |
| 295,089 (1)(3) | | | GS Mortage-Backed Securities Trust 2020-PJ1 A1, 3.500%, 05/25/2050 | | | 260,435 | | | 0.0 | |
| 473,266 (1)(3) | | | GS Mortage-Backed Securities Trust 2020-PJ1 A4, 3.500%, 05/25/2050 | | | 417,210 | | | 0.0 | |
| 1,180,414 (1)(3) | | | GS Mortage-Backed Securities Trust 2020-PJ1 A8, 3.500%, 05/25/2050 | | | 1,038,526 | | | 0.0 | |
| 324,067 (1)(3) | | | GS Mortgage-Backed Securities Corp. Trust 2019-PJ2 A1, 4.000%, 11/25/2049 | | | 300,191 | | | 0.0 | |
| 2,777,870 (1)(3) | | | GS Mortgage-Backed Securities Corp. Trust 2019-PJ2 B3, 4.375%, 11/25/2049 | | | 2,494,034 | | | 0.0 | |
| 1,048,092 (1)(3) | | | GS Mortgage-Backed Securities Corp. Trust 2019-PJ3 B1, 3.948%, 03/25/2050 | | | 942,529 | | | 0.0 | |
| 1,508,729 (1)(3) | | | GS Mortgage-Backed Securities Corp. Trust 2020-PJ3 B2A, 3.423%, 10/25/2050 | | | 1,281,424 | | | 0.0 | |
| 929,806 (1)(3) | | | GS Mortgage-Backed Securities Corp. Trust 2020-PJ3 B4, 3.423%, 10/25/2050 | | | 717,631 | | | 0.0 | |
| 1,398,476 (1)(3) | | | GS Mortgage-Backed Securities Trust 2021-GR3 B4, 3.382%, 04/25/2052 | | | 1,093,310 | | | 0.0 | |
| 3,676,229 (1)(3) | | | GS Mortgage-Backed Securities Trust 2023-PJ4 A3, 6.000%, 01/25/2054 | | | 3,676,314 | | | 0.1 | |
See Accompanying Notes to Financial Statements
| Voya Intermediate Bond Fund | PORTFOLIO OF INVESTMENTS |
| as of March 31, 2024 (continued) |
Principal
Amount† | | | | | Value | | Percentage
of Net
Assets | |
| COLLATERALIZED MORTGAGE OBLIGATIONS: (continued) |
| 2,087,794 (1)(3) | | | GS Mortgage-Backed Securities Trust 2023-PJ6 B2, 6.963%, 04/25/2054 | | $ | 2,125,120 | | | 0.0 | |
| 1,496,620 (1)(3) | | | GS Mortgage-Backed Securities Trust 2024-PJ1 B2, 7.303%, 06/25/2054 | | | 1,588,683 | | | 0.0 | |
| 112,707 | | | GSR Mortgage Loan Trust 2007-1F 3A13, 6.000%, 01/25/2037 | | | 69,277 | | | 0.0 | |
| 1,384,178 (3) | | | HarborView Mortgage Loan Trust 2007-5 A1A, 5.821%, (TSFR1M + 0.494%), 09/19/2037 | | | 1,155,255 | | | 0.0 | |
| 41,103 (3) | | | HomeBanc Mortgage Trust 2004-1 2A, 6.304%, (TSFR1M + 0.974%), 08/25/2029 | | | 39,428 | | | 0.0 | |
| 412,334 (3) | | | Impac CMB Trust Series 2005-1 M1, 6.134%, (TSFR1M + 0.804%), 04/25/2035 | | | 376,501 | | | 0.0 | |
| 2,000,000 (1)(3) | | | Imperial Fund Mortgage Trust 2021-NQM4 M1, 3.446%, 01/25/2057 | | | 1,447,701 | | | 0.0 | |
| 1,471,247 (3) | | | IndyMac INDX Mortgage Loan Trust 2006-AR2 2A1, 5.864%, (TSFR1M + 0.534%), 02/25/2046 | | | 1,041,465 | | | 0.0 | |
| 45,302 (1)(3) | | | J.P. Morgan Mortgage Trust 2019-2 A3, 4.000%, 08/25/2049 | | | 42,513 | | | 0.0 | |
| 2,168,487 (1)(3) | | | J.P. Morgan Mortgage Trust 2021-14 B4, 3.155%, 05/25/2052 | | | 1,683,341 | | | 0.0 | |
| 2,282,581 (1)(3) | | | J.P. Morgan Mortgage Trust 2023-8 B3, 6.348%, 02/25/2054 | | | 2,263,471 | | | 0.0 | |
| 7,815,406 (1)(3) | | | J.P. Morgan Mortgage Trust 2024-1 A9, 6.000%, 06/25/2054 | | | 7,693,174 | | | 0.1 | |
| 305,691 | | | JP Morgan Alternative Loan Trust 2005-S1 1A1, 5.500%, 12/25/2035 | | | 102,210 | | | 0.0 | |
| 1,565,564 (3) | | | JP Morgan Mortgage Trust 2005-A4 B1, 5.086%, 07/25/2035 | | | 1,434,208 | | | 0.0 | |
| 915,671 (1)(3) | | | JP Morgan Mortgage Trust 2017-1 B4, 3.452%, 01/25/2047 | | | 783,665 | | | 0.0 | |
| 1,255,657 (1)(3) | | | JP Morgan Mortgage Trust 2017-6 B3, 3.777%, 12/25/2048 | | | 1,105,735 | | | 0.0 | |
| 1,816,012 (1)(3) | | | JP Morgan Mortgage Trust 2018-1 B1, 3.609%, 06/25/2048 | | | 1,605,328 | | | 0.0 | |
Principal
Amount† | | | | | Value | | Percentage
of Net
Assets | |
| COLLATERALIZED MORTGAGE OBLIGATIONS: (continued) | |
| 1,747,986 (1)(3) | | | JP Morgan Mortgage Trust 2018-1 B2, 3.609%, 06/25/2048 | | $ | 1,540,905 | | | 0.0 | |
| 2,309,953 (1)(3) | | | JP Morgan Mortgage Trust 2018-1 B3, 3.609%, 06/25/2048 | | | 2,004,071 | | | 0.0 | |
| 1,945,121 (1)(3) | | | JP Morgan Mortgage Trust 2018-4 B2, 3.711%, 10/25/2048 | | | 1,716,611 | | | 0.0 | |
| 2,667,110 (1)(3) | | | JP Morgan Mortgage Trust 2018-9 B3, 4.251%, 02/25/2049 | | | 2,374,437 | | | 0.0 | |
| 149,626 (1)(3) | | | JP Morgan Mortgage Trust 2019-1 A3, 4.000%, 05/25/2049 | | | 139,672 | | | 0.0 | |
| 261,726 (1)(3) | | | JP Morgan Mortgage Trust 2019-8 A15, 3.500%, 03/25/2050 | | | 231,220 | | | 0.0 | |
| 581,616 (1)(3) | | | JP Morgan Mortgage Trust 2019-8 A5, 3.500%, 03/25/2050 | | | 514,400 | | | 0.0 | |
| 1,660,493 (1)(3) | | | JP Morgan Mortgage Trust 2019-INV1 B3, 4.943%, 10/25/2049 | | | 1,567,968 | | | 0.0 | |
| 780,002 (1)(3) | | | JP Morgan Mortgage Trust 2020-1 A7, 3.500%, 06/25/2050 | | | 685,800 | | | 0.0 | |
| 258,850 (1)(3) | | | JP Morgan Mortgage Trust 2020-2 A15, 3.500%, 07/25/2050 | | | 227,946 | | | 0.0 | |
| 289,864 (1)(3) | | | JP Morgan Mortgage Trust 2020-3 A15, 3.500%, 08/25/2050 | | | 253,970 | | | 0.0 | |
| 1,971,341 (1)(3) | | | JP Morgan Mortgage Trust 2020-5 B3, 3.572%, 12/25/2050 | | | 1,635,002 | | | 0.0 | |
| 908,304 (1)(3) | | | JP Morgan Mortgage Trust 2020-8 B2, 3.504%, 03/25/2051 | | | 773,284 | | | 0.0 | |
| 210,438 (1)(3) | | | JP Morgan Mortgage Trust 2020-INV1 A3, 3.500%, 08/25/2050 | | | 185,708 | | | 0.0 | |
| 1,399,276 (1)(3) | | | JP Morgan Mortgage Trust 2023-10 B3, 6.522%, 05/25/2054 | | | 1,359,492 | | | 0.0 | |
| 4,306,779 (1)(3) | | | JP Morgan Mortgage Trust 2024-2 A9, 6.500%, 08/25/2054 | | | 4,318,153 | | | 0.1 | |
| 12,085,090 (3)(6) | | | Lehman Mortgage Trust 2006-7 2A4, 1.106%, (-1.000*TSFR1M + 6.436%), 11/25/2036 | | | 1,200,055 | | | 0.0 | |
| 8,438,403 (3)(6) | | | Lehman Mortgage Trust 2006-9 2A5, 1.176%, (-1.000*TSFR1M + 6.506%), 01/25/2037 | | | 786,663 | | | 0.0 | |
| 238,135 (1)(3) | | | MFA Trust 2020-NQM3 A3, 1.632%, 01/26/2065 | | | 218,942 | | | 0.0 | |
| 1,100,000 (1)(3) | | | Mill City Mortgage Loan Trust 2017-1 M2, 3.250%, 11/25/2058 | | | 1,058,935 | | | 0.0 | |
See Accompanying Notes to Financial Statements
| Voya Intermediate Bond Fund | PORTFOLIO OF INVESTMENTS |
| as of March 31, 2024 (continued) |
Principal
Amount† | | | | | Value | | Percentage
of Net
Assets | |
| COLLATERALIZED MORTGAGE OBLIGATIONS: (continued) | |
| 3,300,449 (1)(3) | | | Mill City Mortgage Loan Trust 2017-2 M2, 3.250%, 07/25/2059 | | $ | 3,092,850 | | | 0.1 | |
| 2,482,000 (1)(3) | | | Mill City Mortgage Trust 2015-2 B2, 1.984%, 09/25/2057 | | | 2,221,116 | | | 0.0 | |
| 1,000,000 (1)(3) | | | Morgan Stanley Residential Mortgage Loan Trust 2020-1 A5A, 2.500%, 12/25/2050 | | | 658,156 | | | 0.0 | |
| 1,877,938 (1)(3) | | | New Residential Mortgage Loan Trust 2017-3A B2, 4.750%, 04/25/2057 | | | 1,798,399 | | | 0.0 | |
| 623,008 (1)(3) | | | New Residential Mortgage Loan Trust 2017-6A B2, 4.000%, 08/27/2057 | | | 592,825 | | | 0.0 | |
| 1,000,000 (1)(3) | | | Oaktown Re VI Ltd. 2021-1A M1C, 8.320%, (SOFR30A + 3.000%), 10/25/2033 | | | 1,018,885 | | | 0.0 | |
| 6,000,000 (1)(3) | | | Oaktown Re VII Ltd. 2021-2 M1C, 8.670%, (SOFR30A + 3.350%), 04/25/2034 | | | 6,121,724 | | | 0.1 | |
| 84,378 (1)(3) | | | OBX Trust 2019-EXP1 1A3, 4.000%, 01/25/2059 | | | 81,052 | | | 0.0 | |
| 289,392 (1)(3) | | | OBX Trust 2019-INV2 A25, 4.000%, 05/27/2049 | | | 264,935 | | | 0.0 | |
| 1,539,183,954 (1)(6) | | | PMTT4 2017-PM1 XIO, 13.000%, 10/25/2048 | | | 5,870,678 | | | 0.1 | |
| 65,267 | | | Prime Mortgage Trust 2007-1 A4, 5.500%, 03/25/2037 | | | 54,738 | | | 0.0 | |
| 1,166,770 (1)(3) | | | Provident Funding Mortgage Trust 2020-1 B3, 3.245%, 02/25/2050 | | | 962,347 | | | 0.0 | |
| 9,674,879 (1)(3) | | | Radnor RE Ltd. 2021-1 M1C, 8.020%, (SOFR30A + 2.700%), 12/27/2033 | | | 9,809,186 | | | 0.1 | |
| 708,248 (1)(3) | | | RCKT Mortgage Trust 2019-1 A13, 3.500%, 09/25/2049 | | | 625,288 | | | 0.0 | |
| 898,564 (1)(3) | | | RCKT Mortgage Trust 2019-1 B4, 3.838%, 09/25/2049 | | | 753,696 | | | 0.0 | |
| 32,868,564 (3) | | | Seasoned Credit Risk Transfer Trust 2017-4 HT, 3.250%, 06/25/2057 | | | 29,034,311 | | | 0.4 | |
| 206,155 (1)(3) | | | Seasoned Credit Risk Transfer Trust Series 2016-1 M2, 3.750%, 09/25/2055 | | | 185,289 | | | 0.0 | |
Principal
Amount† | | | | | Value | | Percentage
of Net
Assets | |
| COLLATERALIZED MORTGAGE OBLIGATIONS: (continued) |
| 3,378,506 | | | Seasoned Credit Risk Transfer Trust Series 2018-2 HT, 3.000%, 11/25/2057 | | $ | 2,903,529 | | | 0.1 | |
| 7,738,619 | | | Seasoned Credit Risk Transfer Trust Series 2018-2 MV, 3.500%, 11/25/2057 | | | 7,030,999 | | | 0.1 | |
| 3,509,828 | | | Seasoned Credit Risk Transfer Trust Series 2018-3 HT, 3.000%, 08/25/2057 | | | 2,995,149 | | | 0.1 | |
| 2,751,823 | | | Seasoned Credit Risk Transfer Trust Series 2018-4 HT, 3.000%, 03/25/2058 | | | 2,352,371 | | | 0.0 | |
| 3,146,423 | | | Seasoned Credit Risk Transfer Trust Series 2019-1 HT, 3.000%, 07/25/2058 | | | 2,696,683 | | | 0.1 | |
| 1,614,092 | | | Seasoned Credit Risk Transfer Trust Series 2019-2 HT, 3.000%, 08/25/2058 | | | 1,388,400 | | | 0.0 | |
| 729,317 | | | Seasoned Credit Risk Transfer Trust Series 2019-3 HT, 3.000%, 10/25/2058 | | | 624,637 | | | 0.0 | |
| 1,841,554 | | | Seasoned Credit Risk Transfer Trust Series 2019-3 MA, 3.500%, 10/25/2058 | | | 1,725,710 | | | 0.0 | |
| 828,147 | | | Seasoned Credit Risk Transfer Trust Series 2019-4 M55D, 4.000%, 02/25/2059 | | | 769,632 | | | 0.0 | |
| 83,348 | | | Seasoned Credit Risk Transfer Trust Series 2020-3 TTU, 2.500%, 05/25/2060 | | | 75,055 | | | 0.0 | |
| 32,340,000 | | | Seasoned Loans Structured Transaction Trust Series 2019-3 A2C, 2.750%, 11/25/2029 | | | 28,846,779 | | | 0.4 | |
| 850,693 (1)(3) | | | Sequoia Mortgage Trust 2015-2 B3, 3.756%, 05/25/2045 | | | 722,741 | | | 0.0 | |
| 982,625 (1)(3) | | | Sequoia Mortgage Trust 2015-3 B3, 3.726%, 07/25/2045 | | | 708,616 | | | 0.0 | |
| 636,132 (1)(3) | | | Sequoia Mortgage Trust 2017-5 B3, 3.782%, 08/25/2047 | | | 553,568 | | | 0.0 | |
| 127,588 (1)(3) | | | Sequoia Mortgage Trust 2018-CH1 A19, 4.000%, 03/25/2048 | | | 117,720 | | | 0.0 | |
| 2,224,549 (1) | | | Sequoia Mortgage Trust 2018-CH1 B2B, 4.438%, 03/25/2048 | | | 2,067,761 | | | 0.0 | |
See Accompanying Notes to Financial Statements
| Voya Intermediate Bond Fund | PORTFOLIO OF INVESTMENTS |
| as of March 31, 2024 (continued) |
Principal
Amount† | | | | | Value | | Percentage
of Net
Assets | |
| COLLATERALIZED MORTGAGE OBLIGATIONS: (continued) |
| 549,176 (1)(3) | | | Sequoia Mortgage Trust 2019-4 A19, 3.500%, 11/25/2049 | | $ | 481,736 | | | 0.0 | |
| 75,815 (1)(3) | | | Sequoia Mortgage Trust 2019-CH2 A1, 4.500%, 08/25/2049 | | | 74,599 | | | 0.0 | |
| 1,836,627 (1)(3) | | | Sequoia Mortgage Trust 2020-2 B2, 3.639%, 03/25/2050 | | | 1,581,222 | | | 0.0 | |
| 2,793,349 (1)(3) | | | Sequoia Mortgage Trust 2020-3 B2, 3.320%, 04/25/2050 | | | 2,355,549 | | | 0.0 | |
| 1,077,042 (1)(3) | | | Sequoia Mortgage Trust 2021-5 A19, 2.500%, 07/25/2051 | | | 860,051 | | | 0.0 | |
| 944,826 (1)(3) | | | Sequoia Mortgage Trust 2021-5 B3, 3.049%, 07/25/2051 | | | 744,765 | | | 0.0 | |
| 1,500,000 (1)(3) | | | Sequoia Mortgage Trust 2024-3 A19, 6.000%, 04/25/2054 | | | 1,483,945 | | | 0.0 | |
| 1,658,999 (1)(3) | | | Shellpoint Co-Originator Trust 2017-2 B2, 3.644%, 10/25/2047 | | | 1,485,959 | | | 0.0 | |
| 1,000,000 (1)(3) | | | Starwood Mortgage Residential Trust 2022-2 M1, 4.200%, 02/25/2067 | | | 776,751 | | | 0.0 | |
| 2,144,201 (1)(3) | | | TIAA Bank Mortgage Loan Trust 2018-2 B2, 3.675%, 07/25/2048 | | | 1,896,198 | | | 0.0 | |
| 1,400,000 (1)(3) | | | Towd Point Mortgage Trust 2015-2 1B1, 3.698%, 11/25/2060 | | | 1,353,661 | | | 0.0 | |
| 2,640,000 (1)(3) | | | Towd Point Mortgage Trust 2015-2 2B2, 4.780%, 11/25/2057 | | | 2,568,945 | | | 0.0 | |
| 4,346,000 (1)(3) | | | Towd Point Mortgage Trust 2016-2 M1, 3.000%, 08/25/2055 | | | 4,197,501 | | | 0.1 | |
| 3,200,000 (1)(3) | | | Towd Point Mortgage Trust 2017-1 M1, 3.750%, 10/25/2056 | | | 3,066,056 | | | 0.1 | |
| 2,200,000 (1)(3) | | | Towd Point Mortgage Trust 2017-3 M1, 3.500%, 07/25/2057 | | | 2,061,236 | | | 0.0 | |
| 10,200,000 (1)(3) | | | Triangle Re Ltd. 2021-3 M1B, 8.220%, (SOFR30A + 2.900%), 02/25/2034 | | | 10,269,342 | | | 0.1 | |
| 330,537 (3) | | | Wachovia Mortgage Loan Trust LLC Series Trust 2005-B 2A1, 6.164%, 10/20/2035 | | | 318,042 | | | 0.0 | |
| 1,095,328 (3) | | | WaMu Mortgage Pass-Through Certificates 2005-AR11 A1C3, 6.464%, (TSFR1M + 1.134%), 08/25/2045 | | | 1,043,325 | | | 0.0 | |
Principal
Amount† | | | | | Value | | Percentage
of Net
Assets | |
| COLLATERALIZED MORTGAGE OBLIGATIONS: (continued) |
| 39,208,933 (3)(6) | | | WaMu Mortgage Pass-Through Certificates 2005-AR11 X, 1.410%, 08/25/2045 | | $ | 38,027 | | | 0.0 | |
| 217,297 (3) | | | WaMu Mortgage Pass-Through Certificates 2006-AR12 1A1, 4.480%, 10/25/2036 | | | 192,945 | | | 0.0 | |
| 155,437 (3) | | | WaMu Mortgage Pass-Through Certificates 2006-AR12 2A3, 3.794%, 10/25/2036 | | | 136,967 | | | 0.0 | |
| 470,123 (3) | | | WaMu Mortgage Pass-Through Certificates 2006-AR14 1A4, 4.019%, 11/25/2036 | | | 397,946 | | | 0.0 | |
| 545,221 (3) | | | WaMu Mortgage Pass-Through Certificates 2006-AR16 2A1, 4.364%, 12/25/2036 | | | 469,745 | | | 0.0 | |
| 744,226 (3) | | | WaMu Mortgage Pass-Through Certificates 2006-AR8 1A4, 4.384%, 08/25/2046 | | | 649,560 | | | 0.0 | |
| 1,081,309 (3) | | | WaMu Mortgage Pass-Through Certificates 2007-HY2 1A1, 3.992%, 12/25/2036 | | | 948,471 | | | 0.0 | |
| 300,102 (3) | | | WaMu Mortgage Pass-Through Certificates 2007-HY3 1A1, 3.915%, 03/25/2037 | | | 238,641 | | | 0.0 | |
| 1,910,894 (3) | | | WaMu Mortgage Pass-Through Certificates Series Trust 2004-AR4 A6, 5.048%, 06/25/2034 | | | 1,836,838 | | | 0.0 | |
| 766,471 (3) | | | WaMu Mortgage Pass-Through Certificates Series Trust 2005-AR13 A1C3, 6.424%, (TSFR1M + 1.094%), 10/25/2045 | | | 721,901 | | | 0.0 | |
| 1,260,492 (3) | | | WaMu Mortgage Pass-Through Certificates Series Trust 2006-AR16 2A3, 4.364%, 12/25/2036 | | | 1,085,999 | | | 0.0 | |
| 913,757 (3) | | | Washington Mutual Mortgage Pass-Through Certificates WMALT 2005-10 2A3, 5.750%, (TSFR1M + 1.014%), 11/25/2035 | | | 773,734 | | | 0.0 | |
| 524,250 | | | Washington Mutual Mortgage Pass-Through Certificates WMALT 2005-5 CB3, 5.500%, 07/25/2035 | | | 469,967 | | | 0.0 | |
See Accompanying Notes to Financial Statements
| Voya Intermediate Bond Fund | PORTFOLIO OF INVESTMENTS |
| as of March 31, 2024 (continued) |
| | | | | | | | | Percentage | |
| Principal | | | | | | | | of Net | |
| Amount† | | | | | Value | | Assets | |
| COLLATERALIZED MORTGAGE OBLIGATIONS: (continued) | |
| 2,955,879 (3) | | | Washington Mutual Mortgage Pass-Through Certificates WMALT 2006-AR6 2A, 6.049%, (12MTA + 0.960%),08/25/2046 | | $ | 1,609,916 | | | 0.0 | |
| 923,932 (3) | | | Washington Mutual Mortgage Pass-Through Certificates WMALT 2007-OC1 A4, 6.084%, (TSFR1M + 0.754%),01/25/2047 | | | 850,103 | | | 0.0 | |
| 226,983 | | | Washington Mutual Mortgage Pass-Through Certificates WMALT Series Trust 2005-8 1A2, 5.500%,10/25/2035 | | | 199,894 | | | 0.0 | |
| 445,978 (3) | | | Washington Mutual Mortgage Pass-Through Certificates WMALT Series Trust 2007-OC1 A3, 5.904%, (TSFR1M + 0.574%), 01/25/2047 | | | 406,521 | | | 0.0 | |
| 378,815 (3) | | | Wells Fargo Alternative Loan Trust 2007-PA2 2A1, 5.874%, (TSFR1M + 0.544%), 06/25/2037 | | | 308,466 | | | 0.0 | |
| 390,424 | | | Wells Fargo Alternative Loan Trust 2007-PA3 3A1, 6.250%,07/25/2037 | | | 329,580 | | | 0.0 | |
| 115,059 (3) | | | Wells Fargo Mortgage Backed Securities Trust 2006-AR4 2A4, 6.185%, 04/25/2036 | | | 107,587 | | | 0.0 | |
| 1,853,368 (1)(3) | | | Wells Fargo Mortgage Backed Securities Trust 2019-4 B3, 3.518%,09/25/2049 | | | 1,322,575 | | | 0.0 | |
| 553,351 (1)(3) | | | WinWater Mortgage Loan Trust 2015-5 B3, 3.754%, 08/20/2045 | | | 506,501 | | | 0.0 | |
| 902,693 (1)(3) | | | WinWater Mortgage Loan Trust 2015-5 B4, 3.754%, 08/20/2045 | | | 811,993 | | | 0.0 | |
| | | | Total Collateralized Mortgage Obligations (Cost $1,461,166,691) | | | 1,320,655,404 | | | 15.5 | |
| ASSET-BACKED SECURITIES: 12.7% | | | | | |
| | | | Automobile Asset-Backed Securities: 1.1% | | | |
| 4,107,679 | | | AmeriCredit Automobile Receivables Trust 2019-3 D, 2.580%,09/18/2025 | | | 4,101,120 | | | 0.1 | |
| 13,000,000 (1)(3) | | | Bayview Opportunity Master Fund VII LLC 2024-CAR1 A, (SOFR30A + 1.100%),12/26/2031 | | | 13,000,000 | | | 0.2 | |
| | | | | | | | Percentage | |
| Principal | | | | | | | of Net | |
| Amount† | | | | | | Value | | | Assets | |
| ASSET-BACKED SECURITIES: (continued) | | | | | | | |
| | | | Automobile Asset-Backed Securities: (continued) |
| 14,950,000 (1) | | | Bayview Opportunity Master Fund VII Trust 2024-SN1 A3, 5.660%,03/15/2028 | | $ | 14,970,706 | | | 0.2 | |
| 550,000 | | | Drive Auto Receivables Trust 2021-2 D,1.390%, 03/15/2029 | | | 526,688 | | | 0.0 | |
| 3,250,000 (1) | | | GLS Auto Receivables Issuer Trust 2021-4A C, 1.940%, 10/15/2027 | | | 3,175,949 | | | 0.0 | |
| 23,950,000 (1) | | | GM Financial Revolving Receivables Trust 2024-1 A, 4.980%,12/11/2036 | | | 24,090,031 | | | 0.3 | |
| 12,500,000 (1) | | | GreenState Auto Receivables Trust 2024-1A A3, 5.190%,01/16/2029 | | | 12,486,706 | | | 0.1 | |
| 985,016 | | | Santander Drive Auto Receivables Trust 2020-2 D, 2.220%,09/15/2026 | | | 979,058 | | | 0.0 | |
| 4,058,644 (1) | | | Westlake Automobile Receivables Trust 2021-2A C, 0.890%,07/15/2026 | | | 4,006,447 | | | 0.1 | |
| 11,850,000 (1) | | | Westlake Automobile Receivables Trust 2024-1A B, 5.550%,11/15/2027 | | | 11,848,202 | | | 0.1 | |
| | | | | | | 89,184,907 | | | 1.1 | |
| | | | Home Equity Asset-Backed Securities: 0.1% | | | |
| 2,585,499 (1)(3) | | | ACE Securities Corp. Mortgage Loan Trust Series 2007-D1 A2, 6.336%, 02/25/2038 | | | 2,005,391 | | | 0.0 | |
| 4,150,141 (3) | | | Freddie Mac Structured Pass-Through Certificates T-31 A7, 5.685%, (SOFR30A + 0.364%), 05/25/2031 | | | 4,136,154 | | | 0.1 | |
| 2,621,909 (3) | | | GSAA Trust 2006-7 AF2, 5.995%,03/25/2046 | | | 962,994 | | | 0.0 | |
| 126,191 (3) | | | HSI Asset Loan Obligation Trust 2007-WF1 A6, 4.491%,12/25/2036 | | | 93,274 | | | 0.0 | |
| 459,176 (3) | | | Nomura Home Equity Loan, Inc. Home Equity Loan Trust Series 2007-1 2A3, 5.764%, (TSFR1M + 0.434%),02/25/2037 | | | 402,363 | | | 0.0 | |
See Accompanying Notes to Financial Statements
| Voya Intermediate Bond Fund | PORTFOLIO OF INVESTMENTS |
| as of March 31, 2024 (continued) |
| | | | | | | | Percentage | |
| Principal | | | | | | | of Net | |
| Amount† | | | | | Value | | Assets | |
| ASSET-BACKED SECURITIES: (continued) | | | | | | | |
| | | | Home Equity Asset-Backed Securities: (continued) |
| 554,412 (3) | | | Nomura Home Equity Loan, Inc. Home Equity Loan Trust Series 2007-1 2A4A, 5.904%, (TSFR1M + 0.574%),02/25/2037 | | $ | 488,505 | | | 0.0 | |
| 747,138 (3) | | | Renaissance Home Equity Loan Trust 2005-3 AF4, 5.140%,11/25/2035 | | | 736,704 | | | 0.0 | |
| | | | | | | 8,825,385 | | | 0.1 | |
| | | | Other Asset-Backed Securities: 10.1% | | | |
| 6,800,000 (1)(3) | | | AB BSL CLO 4 Ltd. 2023-4A A, 7.318%, (TSFR3M + 2.000%),04/20/2036 | | | 6,854,890 | | | 0.1 | |
| 6,750,000 (1)(3) | | | AIG CLO LLC 2021-1A C, 7.329%, (TSFR3M + 2.012%), 04/22/2034 | | | 6,671,369 | | | 0.1 | |
| 1,023,560 (1)(3)(6)(7) | | | American Homes 4 Rent Trust 2015-SFR1 XS, 3.232%,04/17/2052 | | | — | | | — | |
| 16,400,000 (1)(3) | | | Apidos Clo Xxv 2016-25A A1R2, 6.458%, (TSFR3M + 1.150%),10/20/2031 | | | 16,415,186 | | | 0.2 | |
| 10,000,000 (1)(3) | | | Apidos CLO XXXV 2021-35A C, 7.229%, (TSFR3M + 1.912%),04/20/2034 | | | 9,833,070 | | | 0.1 | |
| 2,029,500 (1) | | | Applebee's Funding LLC / IHOP Funding LLC 2019-1A A2II, 4.723%, 06/05/2049 | | | 1,954,501 | | | 0.0 | |
| 536,846 (1) | | | Aqua Finance Trust 2019-A A, 3.140%,07/16/2040 | | | 504,968 | | | 0.0 | |
| 1,115,242 (1) | | | Aqua Finance Trust 2020-AA A, 1.900%,07/17/2046 | | | 1,036,406 | | | 0.0 | |
| 6,550,000 (1)(3) | | | Arbor Realty Commercial Real Estate Notes Ltd. 2021-FL2 AS, 6.840%, (TSFR1M + 1.514%), 05/15/2036 | | | 6,499,177 | | | 0.1 | |
| 8,130,000 (1)(3) | | | Arbor Realty Commercial Real Estate Notes Ltd.A, 2021-FL3 6.510%, (TSFR1M + 1.184%), 08/15/2034 | | | 8,063,590 | | | 0.1 | |
| 5,100,000 (1)(3) | | | Arbor Realty Commercial Real Estate Notes Ltd.A, 2021-FL4 6.790%, (TSFR1M + 1.464%), 11/15/2036 | | | 5,073,027 | | | 0.1 | |
| 7,044,500 (1) | | | Arbys Funding LLC 2020-1A A2, 3.237%,07/30/2050 | | | 6,524,666 | | | 0.1 | |
| | | | | | | | Percentage | |
| Principal | | | | | | | of Net | |
| Amount† | | | | | Value | | Assets | |
| ASSET-BACKED SECURITIES: (continued) | | | | | | | |
| | | | Other Asset-Backed Securities: (continued) | | | |
| 10,200,000 (1)(3) | | | ARES LII CLO Ltd.2019-52A A1R,6.629%, (TSFR3M + 1.312%), 04/22/2031 | | $ | 10,211,281 | | | 0.1 | |
| 6,106,851 (1)(3) | | | Bain Capital Credit CLO Ltd. 2017-1A A1R,6.549%, (TSFR3M + 1.232%), 07/20/2030 | | | 6,109,336 | | | 0.1 | |
| 3,750,000 (1)(3) | | | Barings Clo Ltd.2019-4A C, 8.376%, (TSFR3M + 3.062%), 01/15/2033 | | | 3,752,839 | | | 0.0 | |
| 3,890,000 (1)(3) | | | Barings CLO Ltd.2017-1A A2, 6.910%, (TSFR3M + 1.612%), 07/18/2029 | | | 3,891,852 | | | 0.0 | |
| 6,361,000 (1)(3) | | | Barings CLO Ltd.2018-3A A2, 6.879%, (TSFR3M + 1.562%), 07/20/2029 | | | 6,363,233 | | | 0.1 | |
| 6,597,500 (1) | | | Beacon Container Finance II LLC 2021-1A A, 2.250%, 10/22/2046 | | | 5,896,203 | | | 0.1 | |
| 450,000 (1)(3) | | | Benefit Street Partners CLO VIII Ltd. 2015-8A A1BR, 6.779%, (TSFR3M + 1.462%),01/20/2031 | | | 450,270 | | | 0.0 | |
| 5,000,000 (1)(3) | | | Benefit Street Partners CLO XIV Ltd. 2018-14A A2, 6.729%, (TSFR3M + 1.412%), 04/20/2031 | | | 4,992,720 | | | 0.1 | |
| 4,600,000 (1)(3) | | | Benefit Street Partners CLO XXIII Ltd. 2021-23A C, 7.786%, (TSFR3M + 2.462%), 04/25/2034 | | | 4,604,881 | | | 0.1 | |
| 2,000,000 (1)(3) | | | BlueMountain CLO Ltd. 2014-2A A2R2, 6.979%, (TSFR3M + 1.662%), 10/20/2030 | | | 1,995,028 | | | 0.0 | |
| 21,930,000 (1)(3) | | | BlueMountain CLO Ltd. 2016-3A A1R2, (TSFR3M + 1.200%),11/15/2030 | | | 21,950,351 | | | 0.3 | |
| 5,350,000 (1)(3) | | | BlueMountain CLO XXVIII Ltd. 2021-28A C, 7.576%, (TSFR3M + 2.262%), 04/15/2034 | | | 5,296,891 | | | 0.1 | |
| 6,386,250 (1) | | | Bojangles Issuer LLC 2020-1A A2, 3.832%,10/20/2050 | | | 6,031,249 | | | 0.1 | |
| 7,570,000 (1)(3) | | | Broad River Bsl Funding Clo Ltd. 2020-1A AR,6.749%, (TSFR3M + 1.432%), 07/20/2034 | | | 7,573,793 | | | 0.1 | |
| 4,400,000 (1)(3) | | | Broad River Bsl Funding Clo Ltd. 2020-1A CR,7.579%, (TSFR3M + 2.262%), 07/20/2034 | | | 4,403,414 | | | 0.0 | |
See Accompanying Notes to Financial Statements
| Voya Intermediate Bond Fund | PORTFOLIO OF INVESTMENTS |
| as of March 31, 2024 (continued) |
| | | | | | | | Percentage | |
| Principal | | | | | | | of Net | |
| Amount† | | | | | Value | | Assets | |
| ASSET-BACKED SECURITIES: (continued) | | | | | | | |
| | | | Other Asset-Backed Securities: (continued) | | | |
| 5,000,000 (1)(3) | | | BSPRT Issuer Ltd. 2023-FL10 A, 7.584%, (TSFR1M + 2.259%), 09/15/2035 | | $ | 5,030,962 | | | 0.1 | |
| 6,600,000 (1)(3) | | | California Street CLO IX L.P. 2012-9A CR3, 8.076%, (TSFR3M + 2.762%), 07/16/2032 | | | 6,524,734 | | | 0.1 | |
| 4,892,863 (1)(3) | | | Carlyle Global Market Strategies CLO Ltd. 2014-1A A1R2, 6.548%, (TSFR3M + 1.232%), 04/17/2031 | | | 4,894,600 | | | 0.1 | |
| 3,250,000 (1)(3) | | | Carlyle Global Market Strategies CLO Ltd. 2014-1A A2R2, 6.708%, (TSFR3M + 1.392%), 04/17/2031 | | | 3,250,725 | | | 0.0 | |
| 25,190,000 (1)(3) | | | Carlyle Global Market Strategies CLO Ltd. 2015-4A A1RR, (TSFR3M + 1.220%),07/20/2032 | | | 25,208,892 | | | 0.3 | |
| 10,000,000 (1)(3) | | | Cedar Funding IV CLO Ltd. 2014-4A CRR,7.577%, (TSFR3M + 2.262%), 07/23/2034 | | | 9,959,600 | | | 0.1 | |
| 11,200,000 (1)(3) | | | Cedar Funding VIII Clo Ltd. 2017-8A A2R,7.028%, (TSFR3M + 1.712%), 10/17/2034 | | | 11,200,818 | | | 0.1 | |
| 37,149 (3) | | | Chase Funding Trust Series 2003-5 2A2, 6.044%, (TSFR1M + 0.714%), 07/25/2033 | | | 36,256 | | | 0.0 | |
| 6,091,627 (1)(3) | | | CIFC Funding Ltd. 2017-3A A1, 6.799%, (TSFR3M + 1.482%),07/20/2030 | | | 6,095,020 | | | 0.1 | |
| 6,807,914 (1)(3) | | | CIFC Funding Ltd. 2018-2A A1, 6.619%, (TSFR3M + 1.302%),04/20/2031 | | | 6,811,216 | | | 0.1 | |
| 3,000,000 (1)(3) | | | CIFC Funding Ltd. 2019-6A A2, 7.326%, (TSFR3M + 2.012%),01/16/2033 | | | 3,000,903 | | | 0.0 | |
| 2,154,562 (1) | | | CLI Funding VI LLC 2020-1A A, 2.080%, 09/18/2045 | | | 1,942,071 | | | 0.0 | |
| 6,793,095 (1) | | | CLI Funding VIII LLC 2021-1A A, 1.640%, 02/18/2046 | | | 6,035,762 | | | 0.1 | |
| 8,672,213 (1) | | | CLI Funding VIII LLC 2022-1A A, 2.720%, 01/18/2047 | | | 7,742,294 | | | 0.1 | |
| 4,536,250 (1) | | | DB Master Finance LLC 2019-1A A23, 4.352%, 05/20/2049 | | | 4,333,769 | | | 0.0 | |
| | | | | | | | Percentage | |
| Principal | | | | | | | of Net | |
| Amount† | | | | | Value | | Assets | |
| ASSET-BACKED SECURITIES: (continued) | | | | | | | |
| | | | Other Asset-Backed Securities: (continued) | | | |
| 2,339,750 (1) | | | DB Master Finance LLC 2019-1A A2II, 4.021%,05/20/2049 | | $ | 2,266,924 | | | 0.0 | |
| 15,444,500 (1) | | | DB Master Finance LLC 2021-1A A23, 2.791%,11/20/2051 | | | 12,964,767 | | | 0.1 | |
| 2,510,875 (1) | | | Domino's Pizza Master Issuer LLC 2018-1A A2II, 4.328%,07/25/2048 | | | 2,424,452 | | | 0.0 | |
| 10,752,000 (1) | | | Domino's Pizza Master Issuer LLC 2019-1A A2, 3.668%, 10/25/2049 | | | 9,915,876 | | | 0.1 | |
| 11,475,500 (1) | | | Domino's Pizza Master Issuer LLC 2021-1A A2II, 3.151%,04/25/2051 | | | 9,993,781 | | | 0.1 | |
| 2,214,875 (1) | | | Driven Brands Funding LLC 2018-1A A2, 4.739%, 04/20/2048 | | | 2,175,827 | | | 0.0 | |
| 5,557,500 (1) | | | Driven Brands Funding LLC 2019-1A A2, 4.641%, 04/20/2049 | | | 5,392,139 | | | 0.1 | |
| 5,327,375 (1) | | | Driven Brands Funding LLC 2021-1A A2, 2.791%, 10/20/2051 | | | 4,648,387 | | | 0.1 | |
| 4,340,000 (1)(3) | | | Dryden 38 Senior Loan Fund 2015-38A ARR, 6.475%, (TSFR3M + 1.150%), 07/15/2030 | | | 4,341,983 | | | 0.0 | |
| 6,400,000 (1)(3) | | | Dryden 49 Senior Loan Fund 2017-49A CR, 7.610%, (TSFR3M + 2.312%), 07/18/2030 | | | 6,391,437 | | | 0.1 | |
| 11,400,000 (1)(3) | | | Dryden 75 CLO Ltd. 2019-75A CR2, 7.376%, (TSFR3M + 2.062%), 04/15/2034 | | | 11,119,731 | | | 0.1 | |
| 8,000,000 (1)(3) | | | Eaton Vance Clo Ltd. 2015-1A A2R, 6.829%, (TSFR3M + 1.512%), 01/20/2030 | | | 7,959,224 | | | 0.1 | |
| 5,250,000 (1) | | | Five Guys Holdings,Inc. 2023-1A A2, 7.549%, 01/26/2054 | | | 5,467,701 | | | 0.1 | |
| 7,123,247 (1)(3) | | | FS Rialto 2021-FL3 A,6.691%, (TSFR1M + 1.364%), 11/16/2036 | | | 7,106,087 | | | 0.1 | |
| 4,714,375 (1) | | | Goddard Funding LLC 2022-1A A2, 6.864%,10/30/2052 | | | 4,757,359 | | | 0.1 | |
| 5,324,258 (1)(3) | | | Goldentree Loan Management US Clo 2 Ltd. 2017-2A AR,6.489%, (TSFR3M + 1.172%), 11/20/2030 | | | 5,325,946 | | | 0.1 | |
| 473,433 (1) | | | HERO Funding Trust 2015-2A A, 3.990%,09/20/2040 | | | 432,734 | | | 0.0 | |
See Accompanying Notes to Financial Statements
| Voya Intermediate Bond Fund | PORTFOLIO OF INVESTMENTS |
| as of March 31, 2024 (continued) |
| | | | | | | | Percentage | |
| Principal | | | | | | | of Net | |
| Amount† | | | | | Value | | Assets | |
| ASSET-BACKED SECURITIES: (continued) | | | | | | | |
| | | | Other Asset-Backed Securities: (continued) | | | |
| 458,594 (1) | | | HERO Funding Trust 2016-2A A, 3.750%,09/20/2041 | | $ | 415,591 | | | 0.0 | |
| 1,157,876 (1) | | | HERO Funding Trust 2016-4A A2, 4.290%,09/20/2047 | | | 1,058,856 | | | 0.0 | |
| 3,126,150 (1) | | | JG Wentworth XLII LLC 2018-2A A, 3.960%,10/15/2075 | | | 2,864,919 | | | 0.0 | |
| 2,230,344 (1) | | | JGWPT XXXIII LLC 2014-3A A, 3.500%,06/15/2077 | | | 1,979,895 | | | 0.0 | |
| 6,000,000 (1)(3) | | | LCM 26 Ltd. 26A A2, 6.829%, (TSFR3M + 1.512%), 01/20/2031 | | | 6,002,652 | | | 0.1 | |
| 7,980,000 (1)(3) | | | LCM 30 Ltd. 30A AR, 6.659%, (TSFR3M + 1.342%), 04/20/2031 | | | 7,984,181 | | | 0.1 | |
| 5,000,000 (1)(3) | | | LCM XVIII L.P. 18A A2R, 6.799%, (TSFR3M + 1.482%), 04/20/2031 | | | 4,980,570 | | | 0.1 | |
| 11,900,000 (1)(3) | | | LCM XXIV Ltd. 24A CR, 7.479%, (TSFR3M + 2.162%), 03/20/2030 | | | 11,849,318 | | | 0.1 | |
| 7,793,648 (1) | | | Loanpal Solar Loan Ltd.2021-2GS A, 2.220%, 03/20/2048 | | | 6,080,305 | | | 0.1 | |
| 6,150,000 (1)(3) | | | Madison Park Funding XLVIII Ltd. 2021-48A C, 7.571%, (TSFR3M + 2.262%), 04/19/2033 | | | 6,158,881 | | | 0.1 | |
| 6,250,000 (1)(3) | | | Madison Park Funding XXI Ltd. 2016-21A ABRR, 6.976%, (TSFR3M + 1.662%),10/15/2032 | | | 6,252,956 | | | 0.1 | |
| 1,400,000 (1)(3) | | | Madison Park Funding XXVII Ltd. 2018-27A B, 7.379%, (TSFR3M + 2.062%), 04/20/2030 | | | 1,397,827 | | | 0.0 | |
| 14,656,220 (1)(3) | | | Magnetite XII Ltd. 2015-12A AR4, 6.472%, (TSFR3M + 1.150%), 10/15/2031 | | | 14,669,821 | | | 0.2 | |
| 31,780,000 (1)(3) | | | Magnetite XXXI Ltd. 2021-31A A1, 6.676%, (TSFR3M + 1.362%),07/15/2034 | | | 31,808,252 | | | 0.4 | |
| 4,000,000 (1)(3) | | | MF1 LLC 2023-FL12 A, 7.392%, (TSFR1M + 2.066%), 10/19/2038 | | | 4,021,006 | | | 0.0 | |
| 10,000,000 (1)(3) | | | MF1 Ltd. 2021-FL6 AS, 6.891%, (TSFR1M + 1.564%), 07/16/2036 | | | 9,867,250 | | | 0.1 | |
| 5,968,835 (1)(3) | | | MF1 Ltd. 2022-FL8 A, 6.676%, (TSFR1M + 1.350%), 02/19/2037 | | | 5,934,703 | | | 0.1 | |
| 628,173 (1) | | | Mill City Solar Loan Ltd. 2019-1A A, 4.340%,03/20/2043 | | | 583,200 | | | 0.0 | |
| | | | | | | | Percentage | |
| Principal | | | | | | | of Net | |
| Amount† | | | | | Value | | Assets | |
| ASSET-BACKED SECURITIES: (continued) | | | | | | | |
| | | | Other Asset-Backed Securities: (continued) | | | | |
| 3,205,093 (1) | | | Mill City Solar Loan Ltd. 2019-2GS A, 3.690%, 07/20/2043 | | $ | 2,873,277 | | | 0.0 | |
| 2,176,396 (1) | | | Mosaic Solar Loan Trust 2018-1A A, 4.010%, 06/22/2043 | | | 2,039,305 | | | 0.0 | |
| 3,699,934 (1) | | | Mosaic Solar Loan Trust 2018-2GS A, 4.200%,02/22/2044 | | | 3,444,461 | | | 0.0 | |
| 475,677 (1) | | | Mosaic Solar Loan Trust 2018-2GS B, 4.740%, 02/22/2044 | | | 425,306 | | | 0.0 | |
| 2,708,471 (1) | | | Mosaic Solar Loan Trust 2019-2A A, 2.880%, 09/20/2040 | | | 2,416,535 | | | 0.0 | |
| 3,401,778 (1) | | | Mosaic Solar Loan Trust 2020-1A B, 3.100%, 04/20/2046 | | | 2,977,627 | | | 0.0 | |
| 6,790,884 (1) | | | Mosaic Solar Loan Trust 2020-2A A, 1.440%, 08/20/2046 | | | 5,727,494 | | | 0.1 | |
| 3,023,348 (1) | | | Mosaic Solar Loan Trust 2021-1A B, 2.050%, 12/20/2046 | | | 2,379,446 | | | 0.0 | |
| 1,296,199 (1) | | | Mosaic Solar Loans LLC 2017-2A A,3.820%, 06/22/2043 | | | 1,211,082 | | | 0.0 | |
| 6,837,865 (1) | | | Mosaic Solar Loans LLC 2024-1A A,5.500%, 09/20/2049 | | | 6,838,222 | | | 0.1 | |
| 6,679,258 (1)(3) | | | Neuberger Berman CLO XVII Ltd. 2014-17A AR2, 6.609%, (TSFR3M + 1.292%), 04/22/2029 | | | 6,683,045 | | | 0.1 | |
| 5,890,000 (1)(3) | | | OCP Clo Ltd. 2019-17AA1R, 6.619%, (TSFR3M + 1.302%), 07/20/2032 | | | 5,893,917 | | | 0.1 | |
| 13,400,000 (1)(3) | | | Octagon Investment Partners 29 Ltd. 2016-1A AR, 6.760%, (TSFR3M + 1.442%), 01/24/2033 | | | 13,413,588 | | | 0.2 | |
| 3,500,000 (1)(3) | | | Octagon Investment Partners 32 Ltd. 2017-1A CR, 7.626%, (TSFR3M + 2.312%), 07/15/2029 | | | 3,504,228 | | | 0.0 | |
| 4,060,000 (1)(3) | | | Octagon Investment Partners XV Ltd. 2013-1A A2R, 6.921%, (TSFR3M + 1.612%), 07/19/2030 | | | 4,053,780 | | | 0.0 | |
| 6,000,000 (1)(3) | | | Octagon Investment Partners XXI Ltd. 2014-1A BR3, 7.318%, (TSFR3M + 2.012%), 02/14/2031 | | | 5,975,376 | | | 0.1 | |
See Accompanying Notes to Financial Statements
| Voya Intermediate Bond Fund | PORTFOLIO OF INVESTMENTS |
| as of March 31, 2024 (continued) |
| | | | | | | | Percentage | |
| Principal | | | | | | | of Net | |
| Amount† | | | | | Value | | Assets | |
| ASSET-BACKED SECURITIES: (continued) | | | | | | | |
| | | | Other Asset-Backed Securities: (continued) | | | | |
| 5,750,000 (1)(3) | | | OHA Credit Funding 8 Ltd. 2021-8A C,7.460%, (TSFR3M + 2.162%), 01/18/2034 | | $ | 5,757,383 | | | 0.1 | |
| 6,700,000 (1)(3) | | | OHA Credit Funding 9 Ltd. 2021-9A C,7.471%, (TSFR3M + 2.162%), 07/19/2035 | | | 6,708,857 | | | 0.1 | |
| 10,700,000 (1)(3) | | | OHA Credit Partners VII Ltd. 2012-7A CR3, 7.381%, (TSFR3M + 2.062%), 02/20/2034 | | | 10,721,796 | | | 0.1 | |
| 807,037 (1) | | | Pagaya AI Debt Selection Trust 2021-HG1 A, 1.220%, 01/16/2029 | | | 789,121 | | | 0.0 | |
| 1,356,625 (1) | | | Pagaya AI Debt Trust 2022-1 A, 2.030%, 10/15/2029 | | | 1,343,493 | | | 0.0 | |
| 5,800,000 (1)(3) | | | Palmer Square CLO Ltd. 2021-1A B, 7.279%, (TSFR3M + 1.962%), 04/20/2034 | | | 5,765,490 | | | 0.1 | |
| 7,550,000 (1)(3) | | | Palmer Square CLO Ltd. 2021-3A A2, 6.976%, (TSFR3M + 1.662%), 01/15/2035 | | | 7,554,930 | | | 0.1 | |
| 73,024 (3) | | | Popular ABS Mortgage Pass-Through Trust 2005-D A5, 3.520%,01/25/2036 | | | 71,845 | | | 0.0 | |
| 4,885,875 (1) | | | Primrose Funding LLC 2019-1A A2, 4.475%,07/30/2049 | | | 4,689,476 | | | 0.1 | |
| 7,130,000 (1)(3) | | | Rad CLO 1 Ltd. 2018-1A CR, 7.326%, (TSFR3M + 2.012%), 07/15/2031 | | | 7,085,081 | | | 0.1 | |
| 6,000,000 (1)(3) | | | Rad CLO 6 Ltd. 2019-6A A2, 7.429%, (TSFR3M + 2.112%), 01/20/2033 | | | 6,002,598 | | | 0.1 | |
| 9,150,000 (1)(3) | | | Rockland Park CLO Ltd. 2021-1A C, 7.479%, (TSFR3M + 2.162%), 04/20/2034 | | | 9,095,603 | | | 0.1 | |
| 5,750,000 (1) | | | Servpro Master Issuer LLC 2024-1A A2, 6.174%, 01/25/2054 | | | 5,830,463 | | | 0.1 | |
| 2,350,000 (1) | | | SoFi Consumer Loan Program Trust 2021-1 C, 1.610%, 09/25/2030 | | | 2,303,606 | | | 0.0 | |
| 7,038,417 (1) | | | Sonic Capital LLC 2020-1A A2I, 3.845%, 01/20/2050 | | | 6,673,212 | | | 0.1 | |
| 3,900,000 (1) | | | Sonic Capital LLC 2021-1A A2II, 2.636%, 08/20/2051 | | | 3,167,722 | | | 0.0 | |
| | | | | | | | Percentage | |
| Principal | | | | | | | of Net | |
| Amount† | | | | | Value | | Assets | |
| ASSET-BACKED SECURITIES: (continued) | | | | | | | |
| | | | Other Asset-Backed Securities: (continued) | | | | |
| 18,000,000 (1)(3) | | | Sound Point Clo XVI Ltd. 2017-2A CR, 7.786%, (TSFR3M + 2.462%), 07/25/2030 | | $ | 17,842,770 | | | 0.2 | |
| 9,950,000 (1)(3) | | | Sound Point CLO XXIX Ltd. 2021-1A C1, 7.886%, (TSFR3M + 2.562%), 04/25/2034 | | | 9,936,030 | | | 0.1 | |
| 4,040,185 (1) | | | Sunnova Helios II Issuer LLC 2018-1A A,4.870%, 07/20/2048 | | | 3,828,407 | | | 0.0 | |
| 3,103,210 (1) | | | Sunnova Helios V Issuer LLC 2021-A A,1.800%, 02/20/2048 | | | 2,714,906 | | | 0.0 | |
| 13,186,867 (1) | | | Sunnova Helios XI Issuer LLC 2023-A A,5.300%, 05/20/2050 | | | 12,985,464 | | | 0.1 | |
| 7,203,597 (1) | | | Sunnova Sol II Issuer LLC 2020-2A A,2.730%, 11/01/2055 | | | 5,479,652 | | | 0.1 | |
| 8,526,381 (1) | | | Sunnova Sol III Issuer LLC 2021-1 A,2.580%, 04/28/2056 | | | 7,156,706 | | | 0.1 | |
| 4,384,305 (1) | | | Sunrun Athena Issuer LLC 2018-1 A,5.310%, 04/30/2049 | | | 4,205,350 | | | 0.0 | |
| 4,207,113 (1) | | | Sunrun Jupiter Issuer LLC 2022-1A A,4.750%, 07/30/2057 | | | 3,934,198 | | | 0.0 | |
| 3,257,492 (1) | | | Sunrun Xanadu Issuer LLC 2019-1A A,3.980%, 06/30/2054 | | | 3,044,709 | | | 0.0 | |
| 8,450,000 (1)(3) | | | Symphony CLO XXVI Ltd. 2021-26A CR,7.579%, (TSFR3M + 2.262%), 04/20/2033 | | | 8,297,587 | | | 0.1 | |
| 20,470,388 (1) | | | Taco Bell Funding LLC 2021-1A A23, 2.542%,08/25/2051 | | | 16,949,722 | | | 0.2 | |
| 5,000,000 (1)(3) | | | TCW CLO Ltd. 2017-1A A2RR, 7.031%, (TSFR3M + 1.712%), 10/29/2034 | | | 5,002,150 | | | 0.1 | |
| 13,150,000 (1)(3) | | | TCW CLO Ltd. 2021-1A C, 7.479%, (TSFR3M + 2.162%), 03/18/2034 | | | 13,016,067 | | | 0.1 | |
| 13,950,000 (1)(3) | | | Texas Debt Capital CLO Ltd. 2023-1A A, 7.118%, (TSFR3M + 1.800%), 04/20/2036 | | | 14,032,235 | | | 0.2 | |
| 5,474,000 (1) | | | Textainer Marine Containers Ltd. 2021-3A A, 1.940%, 08/20/2046 | | | 4,723,645 | | | 0.1 | |
| 4,633,000 (1) | | | Textainer Marine Containers VII Ltd. 2021-1A A, 1.680%, 02/20/2046 | | | 4,095,324 | | | 0.0 | |
See Accompanying Notes to Financial Statements
| Voya Intermediate Bond Fund | PORTFOLIO OF INVESTMENTS |
| as of March 31, 2024 (continued) |
| | | | | | | | Percentage | |
| Principal | | | | | | | of Net | |
| Amount† | | | | | Value | | Assets | |
| ASSET-BACKED SECURITIES: (continued) | | | | | | | |
| | | | Other Asset-Backed Securities: (continued) | | | | |
| 32,120,000 (1)(3) | | | THL Credit Wind River CLO Ltd. 2015-1A A1R3, (TSFR3M + 1.200%), 10/20/2030 | | $ | 32,120,000 | | | 0.4 | |
| 4,500,000 (1) | | | Trafigura Securitisation Finance PLC 2021-1A A2, 1.080%, 01/15/2025 | | | 4,406,314 | | | 0.0 | |
| 9,349,750 (1) | | | Triton Container Finance VIII LLC 2021-1A A, 1.860%, 03/20/2046 | | | 8,220,117 | | | 0.1 | |
| 3,459,150 (1) | | | Wendy's Funding LLC 2018-1A A2II, 3.884%, 03/15/2048 | | | 3,270,734 | | | 0.0 | |
| 8,363,485 (1) | | | Wendy's Funding LLC 2021-1A A2II, 2.775%, 06/15/2051 | | | 7,049,469 | | | 0.1 | |
| 10,000,000 (1)(3) | | | Wind River CLO Ltd. 2021-1A C, 7.529%, (TSFR3M + 2.212%), 04/20/2034 | | | 9,834,020 | | | 0.1 | |
| 15,453,750 (1) | | | Zaxby's Funding LLC 2021-1A A2, 3.238%, 07/30/2051 | | | 13,707,359 | | | 0.2 | |
| | | | | | | 860,886,651 | | | 10.1 | |
| | | | Student Loan Asset-Backed Securities: 1.4% | | | | |
| 265,915 (1) | | | Commonbond Student Loan Trust 2016-B B,4.000%, 10/25/2040 | | | 243,939 | | | 0.0 | |
| 589,216 (1) | | | Commonbond Student Loan Trust-GS 2017-BGS B, 3.260%, 09/25/2042 | | | 524,215 | | | 0.0 | |
| 947,922 (1) | | | Commonbond Student Loan Trust-GS 2018-AGS A1, 3.210%, 02/25/2044 | | | 881,565 | | | 0.0 | |
| 69,007 (1) | | | Commonbond Student Loan Trust-GS 2018-AGS C, 3.820%, 02/25/2044 | | | 56,916 | | | 0.0 | |
| 2,970,119 (1) | | | Commonbond Student Loan Trust-GS 2020-AGS A, 1.980%, 08/25/2050 | | | 2,586,340 | | | 0.0 | |
| 1,565,152 (1)(3) | | | ELFI Graduate Loan Program LLC 2021-A B, 2.090%, 12/26/2046 | | | 1,291,245 | | | 0.0 | |
| 342,021 (1) | | | Laurel Road Prime Student Loan Trust 2017-B BFX, 3.020%, 08/25/2042 | | | 335,172 | | | 0.0 | |
| 4,139,674 (1) | | | Laurel Road Prime Student Loan Trust 2020-A A2FX, 1.400%, 11/25/2050 | | | 3,745,991 | | | 0.1 | |
| | | | | | | | Percentage | |
| Principal | | | | | | | of Net | |
| Amount† | | | | | Value | | Assets | |
| ASSET-BACKED SECURITIES: (continued) | | | | | | | |
| | | | Student Loan Asset-Backed Securities: (continued) | |
| 2,194,151 (1) | | | Navient Private Education Refi Loan Trust 2020-DA A,1.690%, 05/15/2069 | | $ | 2,004,014 | | | 0.0 | |
| 2,633,980 (1) | | | Navient Private Education Refi Loan Trust 2020-GA A,1.170%, 09/16/2069 | | | 2,376,319 | | | 0.0 | |
| 4,667,081 (1) | | | Navient Private Education Refi Loan Trust 2021-BA A,0.940%, 07/15/2069 | | | 4,083,356 | | | 0.1 | |
| 1,850,000 (1) | | | Navient Private Education Refi Loan Trust 2021-FA B,2.120%, 02/18/2070 | | | 1,202,129 | | | 0.0 | |
| 2,700,000 (1) | | | SMB Private Education Loan Trust 2014-A C,4.500%, 09/15/2045 | | | 2,354,850 | | | 0.0 | |
| 1,450,000 (1) | | | SMB Private Education Loan Trust 2017-A B,3.500%, 06/17/2041 | | | 1,363,695 | | | 0.0 | |
| 13,895,407 (1) | | | SMB Private Education Loan Trust 2019-B A2A, 2.840%, 06/15/2037 | | | 13,248,936 | | | 0.2 | |
| 2,474,432 (1) | | | SMB Private Education Loan Trust 2023-A A1A, 5.380%, 01/15/2053 | | | 2,473,818 | | | 0.0 | |
| 17,400,000 (1) | | | SMB Private Education Loan Trust 2024-A A1A, 5.240%, 03/15/2056 | | | 17,484,048 | | | 0.2 | |
| 24,137,161 (1) | | | SMB Private Education Loan Trust-A 2020-PTA A2A, 1.600%, 09/15/2054 | | | 22,010,155 | | | 0.3 | |
| 2,724,327 (1)(3) | | | Sofi Professional Loan Program LLC 2017-C B, 3.560%, 07/25/2040 | | | 2,623,241 | | | 0.0 | |
| 3,250,000 (1) | | | Sofi Professional Loan Program LLC 2018-A B, 3.610%, 02/25/2042 | | | 2,954,745 | | | 0.0 | |
| 3,000,000 (1) | | | Sofi Professional Loan Program LLC 2019-B BFX, 3.730%, 08/17/2048 | | | 2,639,643 | | | 0.0 | |
| 3,900,000 (1) | | | SoFi Professional Loan Program LLC 2017-F BFX, 3.620%, 01/25/2041 | | | 3,534,755 | | | 0.1 | |
| 8,000,000 (1) | | | Sofi Professional Loan Program Trust 2018-B BFX, 3.830%, 08/25/2047 | | | 7,316,858 | | | 0.1 | |
| 2,810,969 (1) | | | Sofi Professional Loan Program Trust 2018-C A2FX, 3.590%, 01/25/2048 | | | 2,729,299 | | | 0.0 | |
See Accompanying Notes to Financial Statements
| Voya Intermediate Bond Fund | PORTFOLIO OF INVESTMENTS |
| as of March 31, 2024 (continued) |
| | | | | | | | Percentage | |
| Principal | | | | | | | of Net | |
| Amount† | | | | | Value | | Assets | |
| ASSET-BACKED SECURITIES: (continued) | | | | | | | |
| | | | Student Loan Asset-Backed Securities: (continued) | |
| 1,320,301 (1) | | | Sofi Professional Loan Program Trust 2018-D A2FX, 3.600%, 02/25/2048 | | $ | 1,280,586 | | | 0.0 | |
| 5,800,000 (1) | | | SoFi Professional Loan Program Trust 2018-C BFX, 4.130%, 01/25/2048 | | | 5,280,040 | | | 0.1 | |
| 6,000,000 (1) | | | SoFi Professional Loan Program Trust 2018-D BFX, 4.140%, 02/25/2048 | | | 5,446,078 | | | 0.1 | |
| 6,399,729 (1) | | | SoFi Professional Loan Program Trust 2020-C AFX, 1.950%, 02/15/2046 | | | 5,836,208 | | | 0.1 | |
| | | | | | | 117,908,156 | | | 1.4 | |
| | | | Total Asset-Backed Securities | | | | | | | |
| | | | (Cost $1,114,362,954) | | | 1,076,805,099 | | | 12.7 | |
| U.S. TREASURY OBLIGATIONS: 12.2% | | | | | | | |
| | | | United States Treasury Bonds: 4.3% | | | | |
| 58,000 | | | 1.250%, 05/15/2050 | | | 29,684 | | | 0.0 | |
| 2,699,000 | | | 1.375%, 11/15/2040 | | | 1,736,479 | | | 0.0 | |
| 268,000 | | | 1.625%, 11/15/2050 | | | 151,462 | | | 0.0 | |
| 9,469,100 | | | 2.875%, 05/15/2052 | | | 7,167,665 | | | 0.1 | |
| 14,333,300 | | | 3.250%, 05/15/2042 | | | 12,188,344 | | | 0.1 | |
| 289,070,500 (2) | | | 4.500%, 02/15/2044 | | | 290,741,689 | | | 3.4 | |
| 52,128,000 | | | 4.750%, 11/15/2053 | | | 55,658,858 | | | 0.7 | |
| | | | | | | 367,674,181 | | | 4.3 | |
| | | | United States Treasury Notes: 7.9% | | | | |
| 132,000 | | | 0.625%, 05/15/2030 | | | 106,637 | | | 0.0 | |
| 8,184,600 | | | 1.250%, 11/30/2026 | | | 7,527,274 | | | 0.1 | |
| 25,131,200 | | | 1.250%, 09/30/2028 | | | 22,055,573 | | | 0.3 | |
| 3,309,100 | | | 1.500%, 01/31/2027 | | | 3,052,128 | | | 0.0 | |
| 17,183,400 | | | 1.500%, 11/30/2028 | | | 15,201,939 | | | 0.2 | |
| 50,000,000 | | | 2.750%, 05/15/2025 | | | 48,798,828 | | | 0.6 | |
| 4,089,400 | | | 2.750%, 08/15/2032 | | | 3,668,479 | | | 0.0 | |
| 9,680,000 | | | 2.875%, 04/30/2025 | | | 9,465,981 | | | 0.1 | |
| 57,374,700 | | | 4.000%, 02/15/2034 | | | 56,433,396 | | | 0.7 | |
| 191,711,000 | | | 4.250%, 03/15/2027 | | | 190,842,310 | | | 2.2 | |
| 26,245,200 (2) | | | 4.250%, 02/28/2029 | | | 26,284,158 | | | 0.3 | |
| 95,395,000 | | | 4.250%, 03/31/2029 | | | 94,988,826 | | | 1.1 | |
| 56,139,000 | | | 4.250%, 02/28/2031 | | | 56,248,646 | | | 0.7 | |
| 111,931,000 | | | 4.500%, 03/31/2026 | | | 111,655,545 | | | 1.3 | |
| 22,530,000 (2) | | | 4.625%, 02/28/2026 | | | 22,513,279 | | | 0.3 | |
| | | | | | | 668,842,999 | | | 7.9 | |
| | | | Total U.S. Treasury Obligations | | | | | | | |
| | | | (Cost $1,042,244,974) | | | 1,036,517,180 | | | 12.2 | |
| | | | | | | | |
| COMMERCIAL MORTGAGE-BACKED SECURITIES: 7.4% | | |
| 11,831,576 (1)(3) | | | AREIT LLC 2023-CRE8 A, 7.438%, (TSFR1M + 2.112%), 08/17/2041 | | | 11,869,286 | | | 0.1 | |
| 4,656,000 (1) | | | BANK 2017-BNK4 D,3.357%, 05/15/2050 | | | 3,143,998 | | | 0.0 | |
| | | | | | | | Percentage | |
| Principal | | | | | | | of Net | |
| Amount† | | | | | | Value | | | Assets | |
| COMMERCIAL MORTGAGE-BACKED SECURITIES: (continued) |
| 28,695,773 (3)(6) | | | BANK 2017-BNK4 XA,1.335%, 05/15/2050 | | $ | 874,659 | | | 0.0 | |
| 167,655,000 (3)(6) | | | BANK 2017-BNK8 XB,0.183%, 11/15/2050 | | | 1,032,311 | | | 0.0 | |
| 3,600,000 (1) | | | BANK 2017-BNK9 D,2.800%, 11/15/2054 | | | 2,268,756 | | | 0.0 | |
| 179,014,055 (3)(6) | | | BANK 2018-BN14 XA,0.497%, 09/15/2060 | | | 3,094,177 | | | 0.0 | |
| 19,110,000 (1)(3)(6) | | | BANK 2018-BN14 XD,1.615%, 09/15/2060 | | | 1,149,237 | | | 0.0 | |
| 23,466,296 (3)(6) | | | BANK 2019-BN16 XA,0.940%, 02/15/2052 | | | 853,440 | | | 0.0 | |
| 98,542,989 (3)(6) | | | BANK 2019-BN19 XA,0.940%, 08/15/2061 | | | 3,819,546 | | | 0.1 | |
| 1,000,000 (3) | | | BANK 2019-BN24 C,3.517%, 11/15/2062 | | | 805,874 | | | 0.0 | |
| 6,057,763 (3)(6) | | | BANK 2020-BN30 XA,1.294%, 12/15/2053 | | | 370,612 | | | 0.0 | |
| 92,840,000 (1)(3)(6) | | | BBCCRE Trust 2015-GTP XA, 0.597%,08/10/2033 | | | 638,591 | | | 0.0 | |
| 10,884,601 (3)(6) | | | BBCMS Mortgage Trust 2022-C17 XA, 1.151%,09/15/2055 | | | 801,218 | | | 0.0 | |
| 1,500,000 | | | BBCMS Mortgage Trust 2024-C24 C, 6.000%,02/15/2057 | | | 1,492,960 | | | 0.0 | |
| 20,112,121 (3)(6) | | | BBCMS Trust 2021-C10 XA, 1.282%,07/15/2054 | | | 1,277,653 | | | 0.0 | |
| 4,000,000 (3) | | | Benchmark Mortgage Trust 2018-B5 C,4.602%, 07/15/2051 | | | 3,467,672 | | | 0.0 | |
| 51,967,066 (3)(6) | | | Benchmark Mortgage Trust 2019-B12 XA,1.024%, 08/15/2052 | | | 2,008,106 | | | 0.0 | |
| 3,000,000 (3) | | | Benchmark Mortgage Trust 2019-B14 C,3.772%, 12/15/2062 | | | 2,226,598 | | | 0.0 | |
| 34,782,178 (3)(6) | | | Benchmark Mortgage Trust 2019-B9 XA,1.015%, 03/15/2052 | | | 1,304,930 | | | 0.0 | |
| 92,216,552 (3)(6) | | | Benchmark Mortgage Trust 2020-B17 XA,1.414%, 03/15/2053 | | | 4,439,577 | | | 0.1 | |
| 108,903,086 (3)(6) | | | Benchmark Mortgage Trust 2020-B19 XA,1.764%, 09/15/2053 | | | 6,910,124 | | | 0.1 | |
| 59,592,025 (3)(6) | | | Benchmark Mortgage Trust 2020-B20 XA,1.608%, 10/15/2053 | | | 3,707,452 | | | 0.0 | |
| 47,248,285 (3)(6) | | | Benchmark Mortgage Trust 2020-B21 XA,1.445%, 12/17/2053 | | | 3,030,810 | | | 0.0 | |
| 4,908,040 (3)(6) | | | Benchmark Mortgage Trust 2021-B28 XA,1.271%, 08/15/2054 | | | 314,551 | | | 0.0 | |
| 2,250,000 (1) | | | Benchmark Mortgage Trust 2021-B30 D,2.000%, 11/15/2054 | | | 1,348,540 | | | 0.0 | |
See Accompanying Notes to Financial Statements
| Voya Intermediate Bond Fund | PORTFOLIO OF INVESTMENTS |
| as of March 31, 2024 (continued) |
| | | | | | | | Percentage | |
| Principal | | | | | | | of Net | |
| Amount† | | | | | Value | | Assets | |
| COMMERCIAL MORTGAGE-BACKED SECURITIES: (continued) |
| 2,670,000 (3) | | | Benchmark Mortgage Trust 2023-V3 A3, 6.363%, 07/15/2056 | $ | | 2,792,785 | | | 0.0 | |
| 4,500,000 | | | Benchmark Mortgage Trust 2024-V6 B,6.785%, 03/15/2029 | | | 4,663,530 | | | 0.1 | |
| 2,100,000 (1)(3) | | | BIG Commercial Mortgage Trust 2022-BIG B, 7.067%, (TSFR1M + 1.741%),02/15/2039 | | | 2,076,800 | | | 0.0 | |
| 1,000,000 (1)(3) | | | BLP Commercial Mortgage Trust 2023-IND D, 8.565%, (TSFR1M + 3.240%),03/15/2040 | | | 1,002,285 | | | 0.0 | |
| 2,500,000 (1)(3) | | | BLP Commercial Mortgage Trust 2024-IND2 C, 7.217%, (TSFR1M + 1.891%),03/15/2041 | | | 2,505,007 | | | 0.0 | |
| 11,041,000 (1)(8) | | | BMD2 Re-Remic Trust 2019-FRR1 3AB, 0.000%, 05/25/2052 | | | 7,975,411 | | | 0.1 | |
| 5,414,000 (1) | | | BMD2 Re-Remic Trust 2019-FRR1 6B10, 2.449%, 05/25/2052 | | | 4,198,107 | | | 0.1 | |
| 3,000,000 (1)(3) | | | BOCA Commercial Mortgage Trust 2022-BOCA A, 7.095%, (TSFR1M + 1.770%),05/15/2039 | | | 3,006,468 | | | 0.0 | |
| 5,302,500 (1)(3) | | | BX Commercial Mortgage Trust 2021-21M E, 7.610%, (TSFR1M + 2.285%),10/15/2036 | | | 5,236,419 | | | 0.1 | |
| 4,000,000 (1)(3) | | | BX Commercial Mortgage Trust 2021-IRON E, 7.789%, (TSFR1M + 2.464%),02/15/2038 | | | 3,805,518 | | | 0.1 | |
| 3,120,500 (1)(3) | | | BX Commercial Mortgage Trust 2021-SOAR D, 6.840%, (TSFR1M + 1.514%),06/15/2038 | | | 3,089,577 | | | 0.0 | |
| 1,898,475 (1)(3) | | | BX Commercial Mortgage Trust 2021-VOLT A, 6.140%, (TSFR1M + 0.814%),09/15/2036 | | | 1,885,613 | | | 0.0 | |
| 750,108 (1)(3) | | | BX Commercial Mortgage Trust 2021-VOLT D, 7.090%, (TSFR1M + 1.764%),09/15/2036 | | | 740,111 | | | 0.0 | |
| | | | | | | | Percentage | |
| Principal | | | | | | | of Net | |
| Amount† | | | | | Value | | Assets | |
| COMMERCIAL MORTGAGE-BACKED SECURITIES: (continued) |
| 1,500,000 (1)(3) | | | BX Commercial Mortgage Trust 2021-VOLT F, 7.840%, (TSFR1M + 2.514%),09/15/2036 | $ | | 1,487,384 | | | 0.0 | |
| 5,270,000 (1)(3) | | | BX Commercial Mortgage Trust 2023-VLT2 A, 7.606%, (TSFR1M + 2.281%),06/15/2040 | | | 5,301,810 | | | 0.1 | |
| 5,000,000 (1)(3) | | | BX Commercial Mortgage Trust 2023-VLT3 A, 7.265%, (TSFR1M + 1.940%),11/15/2028 | | | 5,009,665 | | | 0.1 | |
| 5,000,000 (1)(3) | | | BX Commercial Mortgage Trust 2023-XL3 A, 7.087%, (TSFR1M + 1.761%),12/09/2040 | | | 5,039,337 | | | 0.1 | |
| 5,981,000 (1)(3) | | | BX Commercial Mortgage Trust 2024-MF D, 8.015%, (TSFR1M + 2.690%),02/15/2039 | | | 5,994,604 | | | 0.1 | |
| 10,000,000 (1)(3) | | | BX Commercial Mortgage Trust 2024-XL5 C, 7.241%, (TSFR1M + 1.941%),03/15/2041 | | | 10,008,294 | | | 0.1 | |
| 3,800,000 (1)(3) | | | BX Trust 2021-LBA EJV, 7.440%, (TSFR1M + 2.114%), 02/15/2036 | | | 3,728,199 | | | 0.0 | |
| 1,423,458 (1)(3) | | | BX Trust 2021-LBA EV, 7.440%, (TSFR1M + 2.114%), 02/15/2036 | | | 1,396,561 | | | 0.0 | |
| 959,253 (1)(3) | | | BX Trust 2021-SDMF E, 7.026%, (TSFR1M + 1.701%), 09/15/2034 | | | 938,473 | | | 0.0 | |
| 816,889 (1)(3) | | | BX Trust 2022-FOX2 C, 6.635%, (TSFR1M + 1.309%), 04/15/2039 | | | 800,668 | | | 0.0 | |
| 1,180,000 (1)(3) | | | BX Trust 2022-LBA6 C, 6.925%, (TSFR1M + 1.600%), 01/15/2039 | | | 1,169,673 | | | 0.0 | |
| 1,250,000 (1)(3) | | | BX Trust 2022-LBA6 D, 7.325%, (TSFR1M + 2.000%), 01/15/2039 | | | 1,238,195 | | | 0.0 | |
| 10,000,000 (1)(3) | | | BX Trust 2024-BIO B,7.266%, (TSFR1M + 1.941%), 02/15/2041 | | | 10,020,266 | | | 0.1 | |
| 1,800,000 (1)(3) | | | BX Trust 2024-CNYN C, 7.241%, (TSFR1M + 1.941%), 04/15/2029 | | | 1,801,540 | | | 0.0 | |
| 1,250,000 (1)(3) | | | BX Trust 2024-CNYN D, 7.990%, (TSFR1M + 2.690%), 04/15/2029 | | | 1,254,526 | | | 0.0 | |
| 71,441,405 (3)(6) | | | CCUBS Commercial Mortgage Trust 2017-C1 XA, 1.012%,11/15/2050 | | | 1,997,652 | | | 0.0 | |
See Accompanying Notes to Financial Statements
| Voya Intermediate Bond Fund | PORTFOLIO OF INVESTMENTS |
| as of March 31, 2024 (continued) |
| | | | | | | | Percentage | |
| Principal | | | | | | | of Net | |
| Amount† | | | | | Value | | Assets | |
| COMMERCIAL MORTGAGE-BACKED SECURITIES: (continued) |
| 20,434,931 (3)(6) | | | CD Mortgage Trust 2016-CD1 XA, 1.357%, 08/10/2049 | $ | | 429,158 | | | 0.0 | |
| 45,113,000 (1)(3)(6) | | | CD Mortgage Trust 2016-CD1 XB, 0.685%, 08/10/2049 | | | 598,947 | | | 0.0 | |
| 26,436,416 (3)(6) | | | CD Mortgage Trust 2017-CD4 XA, 1.222%, 05/10/2050 | | | 746,276 | | | 0.0 | |
| 4,000,000 (3) | | | CFCRE Commercial Mortgage Trust 2016-C7 C, 4.367%, 12/10/2054 | | | 3,505,278 | | | 0.0 | |
| 5,000,000 (3) | | | Citigroup Commercial Mortgage Trust 2015-GC35 AS, 4.072%, 11/10/2048 | | | 4,592,151 | | | 0.1 | |
| 35,354,463 (3)(6) | | | Citigroup Commercial Mortgage Trust 2016-P4 XA, 1.884%, 07/10/2049 | | | 1,102,432 | | | 0.0 | |
| 63,935,285 (3)(6) | | | Citigroup Commercial Mortgage Trust 2017-C4 XA, 0.981%, 10/12/2050 | | | 1,727,512 | | | 0.0 | |
| 38,182,611 (3)(6) | | | Citigroup Commercial Mortgage Trust 2017-P8 XA, 0.866%, 09/15/2050 | | | 856,171 | | | 0.0 | |
| 69,796,213 (3)(6) | | | Citigroup Commercial Mortgage Trust 2018-C5 XA, 0.666%, 06/10/2051 | | | 1,657,091 | | | 0.0 | |
| 2,000,000 (3) | | | Citigroup Commercial Mortgage Trust 2020-GC46 B, 3.150%, 02/15/2053 | | | 1,703,881 | | | 0.0 | |
| 651,000 (1)(3) | | | Citigroup Commercial Mortgage Trust 2023-SMRT C, 5.852%, 10/12/2040 | | | 643,836 | | | 0.0 | |
| 1,000,000 (1)(3) | | | Citigroup Commercial Mortgage Trust 2023-SMRT D, 5.852%, 10/12/2040 | | | 954,052 | | | 0.0 | |
| 4,100,000 (1)(3) | | | CLNY Trust 2019-IKPR A, 6.565%, (TSFR1M + 1.243%), 11/15/2038 | | | 4,055,975 | | | 0.1 | |
| 27,260,000 (1)(3)(6) | | | COMM Mortgage Trust 2012-CR4 XB, 0.401%,10/15/2045 | | | 266,385 | | | 0.0 | |
| 2,097,754 (1)(3) | | | COMM Mortgage Trust 2013-CR10 E, 4.363%, 08/10/2046 | | | 1,887,440 | | | 0.0 | |
| 3,500,000 (3) | | | COMM Mortgage Trust 2015-CR27 B, 4.337%,10/10/2048 | | | 3,325,705 | | | 0.0 | |
| 3,000,000 (3) | | | COMM Mortgage Trust 2015-DC1 B, 4.035%, 02/10/2048 | | | 2,803,466 | | | 0.0 | |
| | | | | | | | Percentage | |
| Principal | | | | | | | of Net | |
| Amount† | | | | | Value | | Assets | |
| COMMERCIAL MORTGAGE-BACKED SECURITIES: (continued) |
| 85,324,691 (1)(3)(6) | | | COMM Mortgage Trust 2015-PC1 XA, 0.373%, 07/10/2050 | | $ | 242,151 | | | 0.0 | |
| 55,369,546 (3)(6) | | | COMM Mortgage Trust 2016-CR28 XA,0.674%, 02/10/2049 | | | 595,264 | | | 0.0 | |
| 32,566,678 (3)(6) | | | COMM Mortgage Trust 2017-COR2 XA,1.153%, 09/10/2050 | | | 975,089 | | | 0.0 | |
| 8,261,000 (1)(3) | | | COMM Mortgage Trust 2020-CBM F, 3.633%, 02/10/2037 | | | 7,727,543 | | | 0.1 | |
| 3,746,000 (3) | | | CSAIL Commercial Mortgage Trust 2020-C19 B, 3.476%, 03/15/2053 | | | 3,104,308 | | | 0.0 | |
| 5,000,000 (1) | | | DC Commercial Mortgage Trust 2023-DC A, 6.314%, 09/12/2040 | | | 5,118,478 | | | 0.1 | |
| 7,000,000 (1) | | | DC Trust 2024-HLTN A, 5.727%, 04/13/2028 | | | 7,023,242 | | | 0.1 | |
| 4,000,000 (1)(3) | | | DK Trust 2024-SPBX C, 7.300%, (TSFR1M + 1.950%), 03/15/2034 | | | 4,005,797 | | | 0.1 | |
| 2,750,000 (1)(3) | | | DK Trust 2024-SPBX D, 8.100%, (TSFR1M + 2.750%), 03/15/2034 | | | 2,760,218 | | | 0.0 | |
| 2,000,000 (1)(3) | | | DTP Commercial Mortgage Trust 2023-STE2 A, 5.648%,01/15/2041 | | | 2,008,099 | | | 0.0 | |
| 4,571,279 (1)(3) | | | Extended Stay America Trust 2021-ESH A,6.519%, (TSFR1M + 1.194%), 07/15/2038 | | | 4,572,780 | | | 0.1 | |
| 3,529,027 (1)(3) | | | Extended Stay America Trust 2021-ESH E,8.289%, (TSFR1M + 2.964%), 07/15/2038 | | | 3,528,927 | | | 0.0 | |
| 10,099,863 (1) | | | Freddie Mac Multifamily ML Certificates 2021-ML11 XUS, 0.769%, 03/25/2038 | | | 504,200 | | | 0.0 | |
| 15,296,413 | | | Freddie Mac Multifamily ML Certificates US XUS, 1.846%, 07/25/2037 | | | 2,052,642 | | | 0.0 | |
| 68,111,962 (3)(6) | | | Freddie Mac Multifamily Structured Pass Through Certificates K109 X1, 1.578%, 04/25/2030 | | | 5,095,395 | | | 0.1 | |
| 100,607,672 (3)(6) | | | Freddie Mac Multifamily Structured Pass Through Certificates K119 X1, 0.928%, 09/25/2030 | | | 4,699,706 | | | 0.1 | |
See Accompanying Notes to Financial Statements
| Voya Intermediate Bond Fund | PORTFOLIO OF INVESTMENTS |
| as of March 31, 2024 (continued) |
| | | | | | | | Percentage | |
| Principal | | | | | | | of Net | |
| Amount† | | | | | Value | | Assets | |
| COMMERCIAL MORTGAGE-BACKED SECURITIES: (continued) |
| 40,828,337 (3)(6) | | | Freddie Mac Multifamily Structured Pass Through Certificates K123 X1, 0.771%,12/25/2030 | | $ | 1,636,767 | | | 0.0 | |
| 73,784,877 (3)(6) | | | Freddie Mac Multifamily Structured Pass Through Certificates K151 X1, 0.359%,04/25/2030 | | | 1,269,284 | | | 0.0 | |
| 13,267,341 (3)(6) | | | Freddie Mac Multifamily Structured Pass Through Certificates K-1516 X1, 1.510%,05/25/2035 | | | 1,461,220 | | | 0.0 | |
| 1,531,606 (1)(3) | | | FRR Re-REMIC Trust 2018-C1 B725, 0.222%, 02/27/2050 | | | 1,524,955 | | | 0.0 | |
| 5,000,000 (1)(8) | | | FRR Re-REMIC Trust 2018-C1 C725, 0.000%, 02/27/2050 | | | 4,977,856 | | | 0.1 | |
| 8,971,340 (1)(8) | | | FRR Re-REMIC Trust 2018-C1 CK43, 0.000%, 02/27/2048 | | | 8,317,978 | | | 0.1 | |
| 9,132,000 (1)(8) | | | GAM Re-REMIC Trust 2021-FRR1 1B,0.000%, 11/29/2050 | | | 7,034,149 | | | 0.1 | |
| 15,763,000 (1)(8) | | | GAM Re-REMIC Trust 2021-FRR1 2B, 0.000%, 11/29/2050 | | | 11,965,521 | | | 0.1 | |
| 12,445,000 (1)(8) | | | GAM RE-REMIC Trust 2022-FRR3 BK61, 0.000%, 11/27/2049 | | | 9,683,852 | | | 0.1 | |
| 18,282,000 (1) | | | GAM RE-REMIC Trust 2022-FRR3 BK71, 2.010%, 11/27/2050 | | | 14,885,228 | | | 0.2 | |
| 10,668,000 (1)(8) | | | GAM RE-REMIC Trust 2022-FRR3 BK89, 0.000%, 01/27/2052 | | | 7,295,758 | | | 0.1 | |
| 7,076,000 (1)(8) | | | GAM RE-REMIC Trust 2022-FRR3 C728, 0.000%, 08/27/2050 | | | 6,743,548 | | | 0.1 | |
| 7,212,000 (1)(8) | | | GAM RE-REMIC Trust 2022-FRR3 CK47, 0.000%, 05/27/2048 | | | 6,489,893 | | | 0.1 | |
| 8,725,000 (1)(8) | | | GAM RE-REMIC Trust 2022-FRR3 CK61, 0.000%, 11/27/2049 | | | 6,485,268 | | | 0.1 | |
| 7,080,000 (1)(8) | | | GAM RE-REMIC Trust 2022-FRR3 D728, 0.000%, 08/27/2050 | | | 6,676,316 | | | 0.1 | |
| 5,626,000 (1)(8) | | | GAM RE-REMIC Trust 2022-FRR3 DK41, 0.000%, 10/27/2047 | | | 5,313,515 | | | 0.1 | |
| 7,208,000 (1)(8) | | | GAM RE-REMIC Trust 2022-FRR3 DK47, 0.000%, 05/27/2048 | | | 6,413,263 | | | 0.1 | |
| 11,599,000 (1) | | | GAM RE-REMIC TRUST 2021-FRR2 BK78, 2.410%,09/27/2051 | | | 9,176,893 | | | 0.1 | |
| | | | | | | | Percentage | |
| Principal | | | | | | | of Net | |
| Amount† | | | | | Value | | Assets | |
| COMMERCIAL MORTGAGE-BACKED SECURITIES: (continued) |
| 8,825,000 (1)(8) | | | GAM RE-REMIC TRUST 2021-FRR2 C730, 0.000%, 09/27/2051 | | $ | 8,158,619 | | | 0.1 | |
| 10,728,000 (1)(8) | | | GAM RE-REMIC TRUST 2021-FRR2 CK44, 0.000%, 09/27/2051 | | | 9,843,255 | | | 0.1 | |
| 6,689,324 (1) | | | GAM RE-REMIC TRUST 2021-FRR2 CK49, 1.010%, 09/27/2051 | | | 5,999,002 | | | 0.1 | |
| 7,409,000 (1)(8) | | | GAM RE-REMIC TRUST 2021-FRR2 CK78, 0.000%, 09/27/2051 | | | 4,972,179 | | | 0.1 | |
| 8,821,000 (1)(8) | | | GAM RE-REMIC TRUST 2021-FRR2 D730, 0.000%, 09/27/2051 | | | 8,121,223 | | | 0.1 | |
| 8,724,000 (1)(8) | | | GAM RE-REMIC TRUST 2021-FRR2 DK49, 0.000%, 09/27/2051 | | | 7,552,955 | | | 0.1 | |
| 6,900,000 (1)(3) | | | Great Wolf Trust 2024-WOLF D, 8.190%, (TSFR1M + 2.890%), 03/15/2039 | | | 6,930,713 | | | 0.1 | |
| 2,800,000 (1)(3) | | | GS Mortgage Securities Corp. Trust 2021-ARDN A, 6.690%, (TSFR1M + 1.364%), 11/15/2036 | | | 2,756,276 | | | 0.0 | |
| 37,640,599 (3)(6) | | | GS Mortgage Securities Trust 2014-GC22 XA, 0.889%, 06/10/2047 | | | 25,754 | | | 0.0 | |
| 5,000,000 (3) | | | GS Mortgage Securities Trust 2015-GC30 AS, 3.777%, 05/10/2050 | | | 4,834,161 | | | 0.1 | |
| 2,500,000 (3) | | | GS Mortgage Securities Trust 2016-GS3 C, 3.982%, 10/10/2049 | | | 2,243,142 | | | 0.0 | |
| 56,413,334 (3)(6) | | | GS Mortgage Securities Trust 2016-GS4 XA, 0.562%, 11/10/2049 | | | 629,415 | | | 0.0 | |
| 66,768,719 (3)(6) | | | GS Mortgage Securities Trust 2017-GS6 XA, 1.009%, 05/10/2050 | | | 1,653,764 | | | 0.0 | |
| 500,000 (3) | | | GS Mortgage Securities Trust 2018-GS9 B, 4.321%, 03/10/2051 | | | 469,616 | | | 0.0 | |
| 66,964,680 (3)(6) | | | GS Mortgage Securities Trust 2019-GC38 XA, 1.008%, 02/10/2052 | | | 2,687,939 | | | 0.0 | |
| 3,261,000 | | | GS Mortgage Securities Trust 2019-GC39 B, 3.970%, 05/10/2052 | | | 2,789,297 | | | 0.0 | |
See Accompanying Notes to Financial Statements
| Voya Intermediate Bond Fund | PORTFOLIO OF INVESTMENTS |
| as of March 31, 2024 (continued) |
| | |
| | | | | | | | Percentage | |
| Principal | | | | | | | of Net | |
| Amount† | | | | | Value | | Assets | |
| COMMERCIAL MORTGAGE-BACKED SECURITIES: (continued) |
| 6,000,000 (1)(3) | | | ILPT Commercial Mortgage Trust 2022-LPF2 A, 7.570%, (TSFR1M + 2.245%), 10/15/2039 | | $ | 6,004,907 | | | 0.1 | |
| 4,734,000 | | | JP Morgan Chase Commercial Mortgage Securities Trust 2016-JP2 B, 3.460%, 08/15/2049 | | | 4,106,262 | | | 0.1 | |
| 75,324,701 (3)(6) | | | JP Morgan Chase Commercial Mortgage Securities Trust 2016-JP4 XA, 0.570%, 12/15/2049 | | | 863,116 | | | 0.0 | |
| 650,000 (1)(3) | | | JP Morgan Chase Commercial Mortgage Securities Trust 2021-NYAH E, 7.280%, (TSFR1M + 1.954%), 06/15/2038 | | | 561,361 | | | 0.0 | |
| 1,681,958 (3)(6) | | | JPMBB Commercial Mortgage Securities Trust 2014-C19 XA, 0.466%, 04/15/2047 | | | 437 | | | 0.0 | |
| 2,592,839 (3) | | | JPMBB Commercial Mortgage Securities Trust 2014-C23 C, 4.480%, 09/15/2047 | | | 2,502,924 | | | 0.0 | |
| 4,998,000 (3) | | | JPMBB Commercial Mortgage Securities Trust 2014-C25 B, 4.347%, 11/15/2047 | | | 4,598,532 | | | 0.1 | |
| 1,060,920 (3)(6) | | | JPMBB Commercial Mortgage Securities Trust 2015-C28 XA, 0.913%, 10/15/2048 | | | 5,997 | | | 0.0 | |
| 3,000,000 (3) | | | JPMBB Commercial Mortgage Securities Trust 2015-C29 AS, 3.917%, 05/15/2048 | | | 2,911,705 | | | 0.0 | |
| 3,200,000 (3) | | | JPMBB Commercial Mortgage Securities Trust 2015-C29 B, 4.118%, 05/15/2048 | | | 3,033,823 | | | 0.0 | |
| 5,000,000 (3) | | | JPMBB Commercial Mortgage Securities Trust 2015-C29 C, 4.187%, 05/15/2048 | | | 4,540,763 | | | 0.1 | |
| 4,958,600 (1)(3) | | | KIND Trust 2021-KIND A, 6.394%, (TSFR1M + 1.064%), 08/15/2038 | | | 4,871,171 | | | 0.1 | |
| 5,000,000 (1)(3) | | | KSL Commercial Mortgage Trust 2023-HT A, 7.616%, (TSFR1M + 2.290%), 12/15/2036 | | | 5,040,473 | | | 0.1 | |
| 2,486,653 (1)(3) | | | LAQ Mortgage Trust 2023-LAQ A, 7.417%, (TSFR1M + 2.091%), 03/15/2036 | | | 2,498,634 | | | 0.0 | |
| | | | | | | | Percentage | |
| Principal | | | | | | | of Net | |
| Amount† | | | | | Value | | Assets | |
| COMMERCIAL MORTGAGE-BACKED SECURITIES: (continued) |
| 589,782 (1)(3) | | | Life Mortgage Trust 2021-BMR F, 7.789%, (TSFR1M + 2.464%), 03/15/2038 | | $ | 571,658 | | | 0.0 | |
| 5,000,000 (1)(3) | | | Life Mortgage Trust 2022-BMR2 A1, 6.621%, (TSFR1M + 1.295%), 05/15/2039 | | | 4,961,858 | | | 0.1 | |
| 34,535,330 (1)(3)(6) | | | LSTAR Commercial Mortgage Trust 2017-5X, 0.827%, 03/10/2050 | | | 496,741 | | | 0.0 | |
| 4,000,000 (1)(3) | | | MCR Mortgage Trust 2024-HTL D, 9.231%, (TSFR1M + 3.905%), 02/15/2037 | | | 4,002,011 | | | 0.1 | |
| 10,449,849 (1)(3) | | | Med Trust 2021-MDLND, 7.439%, (TSFR1M + 2.114%), 11/15/2038 | | | 10,424,606 | | | 0.1 | |
| 2,089,970 (1)(3) | | | Med Trust 2021-MDLNF, 9.439%, (TSFR1M + 4.114%), 11/15/2038 | | | 2,090,914 | | | 0.0 | |
| 5,000,000 (1)(3) | | | MF1 LLC 2024-FL14A, 7.063%, (TSFR1M + 1.737%), 03/19/2039 | | | 5,016,868 | | | 0.1 | |
| 6,250,000 | | | Morgan Stanley Bank of America Merrill Lynch Trust 2015-C20 A4, 3.249%, 02/15/2048 | | | 6,124,593 | | | 0.1 | |
| 500,000 (3) | | | Morgan Stanley Bank of America Merrill Lynch Trust 2015-C27 B, 4.489%, 12/15/2047 | | | 478,563 | | | 0.0 | |
| 57,242,064 (3)(6) | | | Morgan Stanley Bank of America Merrill Lynch Trust 2014 C19 2014-C19 XA, 0.950%, 12/15/2047 | | | 96,158 | | | 0.0 | |
| 37,173,939 (3)(6) | | | Morgan Stanley Capital I 2017-HR2 XA,0.849%, 12/15/2050 | | | 959,088 | | | 0.0 | |
| 31,163,641 (3)(6) | | | Morgan Stanley Capital I Trust 2021-L6 XA,1.205%, 06/15/2054 | | | 1,629,100 | | | 0.0 | |
| 5,000,000 (1)(3) | | | MTN Commercial Mortgage Trust 2022-LPFL A, 6.727%, (TSFR1M + 1.397%), 03/15/2039 | | | 4,953,541 | | | 0.1 | |
| 10,000,000 (1)(3) | | | ORL Trust 2023-GLKSA, 7.676%, (TSFR1M + 2.350%), 10/19/2036 | | | 10,058,528 | | | 0.1 | |
| 10,000,000 (1)(3) | | | PFP Ltd. 2023-10 A,7.692%, (TSFR1M + 2.365%), 09/16/2038 | | | 10,064,984 | | | 0.1 | |
| 16,840,000 (1) | | | RFM Reremic Trust 2022-FRR1 AB55,0.990%, 03/28/2049 | | | 14,356,398 | | | 0.2 | |
| 14,290,000 (1)(3) | | | RFM Reremic Trust 2022-FRR1 AB60, 2.410%, 11/08/2049 | | | 12,293,841 | | | 0.2 | |
See Accompanying Notes to Financial Statements
| Voya Intermediate Bond Fund | PORTFOLIO OF INVESTMENTS |
| as of March 31, 2024 (continued) |
| | |
| | | | | | | | Percentage | |
| Principal | | | | | | | of Net | |
| Amount† | | | | | Value | | Assets | |
| COMMERCIAL MORTGAGE-BACKED SECURITIES: (continued) | | | | |
| 19,500,000 (1)(3) | | | RFM Reremic Trust 2022-FRR1 AB64, 2.260%, 03/01/2050 | | $ | 16,611,170 | | | 0.2 | |
| 5,260,000 (1)(8) | | | RFM Reremic Trust 2022-FRR1 CK55, 0.000%, 03/28/2049 | | | 4,357,547 | | | 0.1 | |
| 6,590,000 (1)(8) | | | RFM Reremic Trust 2022-FRR1 CK60, 0.000%, 11/08/2049 | | | 5,129,367 | | | 0.1 | |
| 3,655,000 (1)(3) | | | SMRT 2022-MINI D, 7.276%, (TSFR1M + 1.950%), 01/15/2039 | | | 3,596,626 | | | 0.0 | |
| 5,000,000 (1) | | | THPT Mortgage Trust 2023-THL A, 6.994%, 12/10/2034 | | | 5,121,973 | | | 0.1 | |
| 839,564 (1)(3) | | | TTAN 2021-MHC D, 7.190%, (TSFR1M + 1.864%), 03/15/2038 | | | 832,138 | | | 0.0 | |
| 5,293,000 | | | Wells Fargo Commercial Mortgage Trust 2015-C27 A5, 3.451%, 02/15/2048 | | | 5,167,551 | | | 0.1 | |
| 6,500,000 (3) | | | Wells Fargo Commercial Mortgage Trust 2016-C35 C, 4.176%, 07/15/2048 | | | 6,060,811 | | | 0.1 | |
| 1,800,000 | | | Wells Fargo Commercial Mortgage Trust 2017-RC1 C, 4.591%, 01/15/2060 | | | 1,646,257 | | | 0.0 | |
| 7,097,000 (3) | | | WFRBS Commercial Mortgage Trust 2014-C21 B, 4.213%, 08/15/2047 | | | 6,736,480 | | | 0.1 | |
| 70,123,215 (3)(6) | | | WFRBS Commercial Mortgage Trust 2014-C25 XA, 0.781%, 11/15/2047 | | | 129,311 | | | 0.0 | |
| 7,000,000 (1) | | | WSTN Trust 2023-MAUI A, 6.297%, 07/05/2037 | | | 7,065,026 | | | 0.1 | |
| | | | Total Commercial Mortgage-Backed Securities
(Cost $633,306,346) | | | 626,877,137 | | | 7.4 | |
| SOVEREIGN BONDS: 0.7% | | | | | | | |
| 1,725,000 (1) | | | Bahrain Government International Bond,7.500%, 02/12/2036 | | | 1,773,516 | | | 0.0 | |
| 4,825,000 | | | Brazilian Government International Bond,6.125%, 03/15/2034 | | | 4,781,575 | | | 0.1 | |
| 3,125,000 | | | Brazilian Government International Bond,7.125%, 05/13/2054 | | | 3,154,688 | | | 0.0 | |
| 1,000,000 | | | Colombia Government International Bond,3.125%, 04/15/2031 | | | 801,000 | | | 0.0 | |
| | | | | | | | | | Percentage | |
| Principal | | | | | | | | | of Net | |
| Amount† | | | | | | Value | | | Assets | |
| SOVEREIGN BONDS: (continued) | | | | | | | |
| 350,000 | | | Colombia Government International Bond,3.875%, 04/25/2027 | | $ | 330,050 | | | 0.0 | |
| 3,000,000 | | | Mexico Government International Bond,3.750%, 04/19/2071 | | | 1,926,563 | | | 0.0 | |
| 1,750,000 | | | Mexico Government International Bond,3.771%, 05/24/2061 | | | 1,145,156 | | | 0.0 | |
| 1,346,000 | | | Mexico Government International Bond,6.338%, 05/04/2053 | | | 1,335,484 | | | 0.0 | |
| 3,900,000 | | | Mexico Government International Bond,6.400%, 05/07/2054 | | | 3,906,094 | | | 0.1 | |
| 2,500,000 (1)(2) | | | Morocco Government International Bond,2.375%, 12/15/2027 | | | 2,235,937 | | | 0.0 | |
| 1,200,000 | | | Panama Government International Bond,3.298%, 01/19/2033 | | | 925,125 | | | 0.0 | |
| 3,600,000 | | | Panama Government International Bond,6.875%, 01/31/2036 | | | 3,517,875 | | | 0.0 | |
| 2,760,000 | | | Panama Government International Bond,7.500%, 03/01/2031 | | | 2,865,225 | | | 0.0 | |
| 3,610,000 | | | Panama Government International Bond,8.000%, 03/01/2038 | | | 3,787,792 | | | 0.1 | |
| 2,525,000 | | | Peruvian Government International Bond,2.780%, 12/01/2060 | | | 1,465,289 | | | 0.0 | |
| 8,700,000 | | | Republic of South Africa Government International Bond, 4.850%, 09/30/2029 | | | 7,819,125 | | | 0.1 | |
| 2,800,000 | | | Republic of South Africa Government International Bond, 5.875%, 04/20/2032 | | | 2,530,500 | | | 0.0 | |
| 9,154,000 (1) | | | Romanian Government International Bond, 6.375%, 01/30/2034 | | | 9,317,056 | | | 0.1 | |
| 2,450,000 (1) | | | Saudi Government International Bond, 3.450%, 02/02/2061 | | | 1,639,969 | | | 0.0 | |
| 4,000,000 (1) | | | Saudi Government International Bond,5.750%, 01/16/2054 | | | 3,968,750 | | | 0.1 | |
| 500,000 (9) | | | Ukraine Government International Bond, 7.375%, 09/25/2034 | | | 147,625 | | | 0.0 | |
| 10,400,000 (9) | | | Ukraine Government International Bond, 7.750%, 09/01/2027 | | | 3,564,600 | | | 0.1 | |
| 1,890,000 (9) | | | Ukraine Government International Bond, 7.750%, 09/01/2028 | | | 634,567 | | | 0.0 | |
See Accompanying Notes to Financial Statements
| Voya Intermediate Bond Fund | PORTFOLIO OF INVESTMENTS |
| as of March 31, 2024 (continued) |
| | |
| | | | | | | | | | Percentage | |
| Principal | | | | | | | | | of Net | |
| Amount† | | | | | | Value | | | Assets | |
| SOVEREIGN BONDS: (continued) | | | | | | | |
| 850,000 (9) | | | Ukraine Government International Bond,7.750%, 09/01/2029 | | $ | 283,687 | | | 0.0 | |
| 389,000 (9) | | | Ukraine Government International Bond,9.750%, 11/01/2030 | | | 137,220 | | | 0.0 | |
| 1,500,000 (9) | | | Ukraine Government International Bond regs, 7.750%,09/01/2025 | | | 564,375 | | | 0.0 | |
| | | | Total Sovereign Bonds
(Cost $80,324,147) | | | 64,558,843 | | | 0.7 | |
| PURCHASED OPTIONS(10): 0.0% | | | | | | | |
| | | | Total Purchased Options
(Cost $2,970,430) | | | 9,515 | | | 0.0 | |
| | | | Total Long-Term Investments
(Cost $8,924,061,299) | | | 8,511,612,541 | | | 100.1 | |
| | | | | | | | Percentage | |
| Principal | | | | | | | of Net | |
| Amount† | | | | | Value | | Assets | |
| SHORT-TERM INVESTMENTS: 8.7% | | | | | | | |
| | | | Commercial Paper: 3.2% | | | | | | | |
| 25,000,000 | | | American Electric Power Co., Inc.,7.410%, 04/09/2024 | | | 24,954,516 | | | 0.3 | |
| 25,000,000 | | | American Electric Power Co., Inc.,22.080%, 04/01/2024 | | | 24,984,928 | | | 0.3 | |
| 8,011,000 | | | Concord Minutemen Capital Co. LLC, 10.890%,04/03/2024 | | | 8,003,859 | | | 0.1 | |
| 15,000,000 | | | Dominion Energy, Inc.,6.160%, 05/02/2024 | | | 14,919,670 | | | 0.2 | |
| 5,000,000 | | | Dominion Energy, Inc.,6.580%, 04/17/2024 | | | 4,984,769 | | | 0.1 | |
| 12,000,000 | | | Duke Energy Co.,6.220%, 05/02/2024 | | | 11,935,075 | | | 0.1 | |
| 5,000,000 | | | EIDP, Inc., 5.620%,06/20/2024 | | | 4,938,540 | | | 0.1 | |
| 10,000,000 | | | EIDP, Inc., 5.780%,07/24/2024 | | | 9,821,599 | | | 0.1 | |
| 18,000,000 | | | Entergy Corp., 6.420%,04/22/2024 | | | 17,930,785 | | | 0.2 | |
| 1,500,000 | | | Entergy Corp., 6.620%,04/17/2024 | | | 1,495,404 | | | 0.0 | |
| 56,000,000 | | | Entergy Corp.,21.960%, 04/01/2024 | | | 55,966,427 | | | 0.7 | |
| 20,000,000 | | | Johnson Controls International plc,13.740%, 04/02/2024 | | | 19,985,000 | | | 0.2 | |
| 20,000,000 | | | Sherwin-Williams Co.,22.060%, 04/01/2024 | | | 19,987,952 | | | 0.2 | |
| 50,000,000 | | | UnitedHealth Group Inc., 21.650%,04/01/2024 | | | 49,970,436 | | | 0.6 | |
| | | | | | | | | | Percentage | |
| Principal | | | | | | | | | of Net | |
| Amount† | | | | | | Value | | | Assets | |
| SHORT-TERM INVESTMENTS: (continued) | | | | | | | |
| | | | Commercial Paper (continued) | | | | |
| 2,500,000 | | | Verizon Global, | | | | | | | |
| | | | 22.080%, 04/01/2024 | | $ | 2,498,493 | | | 0.0 | |
| | | | Total Commercial Paper
(Cost $272,534,739) | | | 272,377,453 | | | 3.2 | |
| | | | Repurchase Agreements: 4.6% | | | | |
| 9,258,799 (11) | | | ASL Capital Markets Inc., Repurchase Agreement dated 03/28/2024, 5.420%,due 04/01/2024 (Repurchase Amount $9,264,298,collateralized by various U.S. Government Agency Obligations,2.000%-8.000%, Market Value plus accrued interest $9,443,975, due 04/15/31-04/20/72) | | | 9,258,799 | | | 0.1 | |
| 66,085,739 (11) | | | Bethesda Securities,LLC, Repurchase Agreement dated 03/28/2024, 5.430%,due 04/01/2024 (Repurchase Amount $66,125,065,collateralized by various U.S. Government/U.S.Government Agency Obligations, 2.500%-6.070%, Market Value plus accrued interest $67,407,454, due 10/01/27-01/01/57) | | | 66,085,739 | | | 0.8 | |
| 106,541,406 (11) | | | Cantor Fitzgerald Securities, Repurchase Agreement dated 03/28/2024, 5.370%,due 04/01/2024 (Repurchase Amount $106,604,105,collateralized by various U.S. Government/U.S.Government Agency Obligations, 0.000%-7.500%, Market Value plus accrued interest $108,672,234, due 12/24/26-02/20/74) | | | 106,541,406 | | | 1.2 | |
See Accompanying Notes to Financial Statements
| Voya Intermediate Bond Fund | PORTFOLIO OF INVESTMENTS |
| as of March 31, 2024 (continued) |
| |
| | | | | | | | | Percentage | |
| Principal | | | | | | | | of Net | |
| Amount† | | | | | Value | | | Assets | |
| SHORT-TERM INVESTMENTS: (continued) | | | | | | |
| | | | Repurchase Agreements (continued) | | | |
| 13,152,541 (11) | | | CF Secured, LLC, Repurchase Agreement dated 03/28/2024, 5.370%, due 04/01/2024 (Repurchase Amount $13,160,281, collateralized by various U.S. Government/U.S. Government Agency Obligations, 0.000%- 7.000%, Market Value plus accrued interest $13,415,595, due 05/15/24-10/01/53) | | $ | 13,152,541 | | | 0.2 | |
| 20,265,879 (11) | | | Marex Capital Markets Inc., Repurchase Agreement dated 03/28/2024, 5.440%, due 04/01/2024 (Repurchase Amount $20,277,961, collateralized by various U.S. Government/U.S. Government Agency Obligations, 0.000%- 6.500%, Market Value plus accrued interest $20,671,200, due 04/25/24-02/01/57) | | | 20,265,879 | | | 0.2 | |
| 53,948,845 (11) | | | Mirae Asset Securities (USA) Inc., Repurchase Agreement dated 03/28/2024, 5.380%, due 04/01/2024 (Repurchase Amount $53,980,653, collateralized by various U.S. Government/U.S. Government Agency Obligations, 0.000%- 7.645%, Market Value plus accrued interest $55,060,718, due 04/30/24-04/20/73) | | | 53,948,845 | | | 0.6 | |
| | | | | | | | | | Percentage | |
| Principal | | | | | | | | | of Net | |
| Amount† | | | | | | Value | | | Assets | |
| SHORT-TERM INVESTMENTS: (continued) | | | | |
| | | | Repurchase Agreements (continued) | | | | |
| 13,250,243(11) | | | RBC Dominion Securities Inc., Repurchase Agreement dated 03/28/2024, 5.330%, due 04/01/2024 (Repurchase Amount $13,257,983, collateralized by various U.S. Government/U.S. Government Agency Obligations, 0.000%- 8.000%, Market Value plus accrued interest $13,515,248, due 04/04/24-03/01/54) | | $ | 13,250,243 | | | 0.2 | |
| 107,617,582(11) | | | State Of Wisconsin Investment Board, Repurchase Agreement dated 03/28/2024, 5.400%, due 04/01/2024 (Repurchase Amount $107,681,268, collateralized by various U.S. Government Securities, 0.125%- 3.625%, Market Value plus accrued interest $109,811,196, due 04/15/25-02/15/53) | | | | | | | |
| | | | | | | 107,617,582 | | | 1.3 | |
| | | | Total Repurchase Agreements
(Cost $390,121,034) | | | 390,121,034 | | | 4.6 | |
| | | | Time Deposits: 0.7% | | | | | | | |
| 11,070,000(11) | | | Canadian Imperial Bank of Commerce, 5.310%, 04/01/2024 | | | 11,070,000 | | | 0.1 | |
| 6,860,000(11) | | | Landesbank Hessen Thueringen Girozentrale, 5.320%, 04/01/2024 | | | 6,860,000 | | | 0.1 | |
| 9,840,000(11) | | | Mizuho Bank Ltd., 5.320%, 04/01/2024 | | | 9,840,000 | | | 0.1 | |
| 10,960,000(11) | | | Royal Bank of Canada, 5.320%, 04/01/2024 | | | 10,960,000 | | | 0.1 | |
| 11,130,000(11) | | | Skandinaviska Enskilda Banken AB, 5.310%, 04/01/2024 | | | 11,130,000 | | | 0.2 | |
| 10,320,000(11) | | | Societe Generale, 5.310%, 04/01/2024 | | | 10,320,000 | | | 0.1 | |
| | | | Total Time Deposits
(Cost $60,180,000) | | | 60,180,000 | | | 0.7 | |
See Accompanying Notes to Financial Statements
| Voya Intermediate Bond Fund | PORTFOLIO OF INVESTMENTS |
| as of March 31, 2024 (continued) |
| | |
| | | | | | Percentage | |
| | | | | | of Net | |
| Shares | | Value | | | Assets | |
| | | | Mutual Funds: 0.2% | | | | | | | |
| 16,655,000 (12) | | | Morgan Stanley Institutional Liquidity Funds - Government Portfolio (Institutional Share Class), 5.220%
(Cost $16,655,000) | | $ | 16,655,000 | | | 0.2 | |
| | | | | | | | | | | |
| | | | Total Short-Term Investments
(Cost $739,490,773) | | $ | 739,333,487 | | | 8.7 | |
| | | | Total Investments in Securities
(Cost $9,663,552,072) | | $ | 9,250,946,028 | | | 108.8 | |
| | | | Liabilities in Excess of Other Assets | | | (750,093,380 | ) | | (8.8 | ) |
| | | | Net Assets | | $ | 8,500,852,648 | | | 100.0 | |
| † | Unless otherwise indicated, principal amount is shown in USD. |
| (1) | Securities with purchases pursuant to Rule 144A or section 4(a)(2), under the Securities Act of 1933 and may not be resold subject to that rule except to qualified institutional buyers. |
| (2) | Security, or a portion of the security, is on loan. |
| (3) | Variable rate security. Rate shown is the rate in effect as of March 31, 2024. |
| (4) | The Federal Housing Finance Agency (“FHFA”) placed the Federal Home Loan Mortgage Corporation and Federal National Mortgage Association into conservatorship with FHFA as the conservator. As such, the FHFA oversees the continuing affairs of these companies. |
| (5) | Represents or includes a TBA transaction. |
| (6) | Interest only securities represent the right to receive the monthly interest payments on an underlying pool of mortgage loans. Principal amount shown represents the notional amount on which current interest is calculated. Payments of principal on the pool reduce the value of the interest only security. |
| (7) | For fair value measurement disclosure purposes, security is categorized as Level 3, whose value was determined using significant unobservable inputs. |
| (8) | Principal only securities represent the right to receive the monthly principal payments on an underlying pool of mortgage loans. No payments of interest on the pool are passed through the principal only security. |
| (9) | Defaulted security. |
| (10) | The tables within the Portfolio of Investments detail open purchased options which are non-income producing securities. |
| (11) | All or a portion of the security represents securities purchased with cash collateral received for securities on loan. |
| (12) | Rate shown is the 7-day yield as of March 31, 2024. |
| Currency Abbreviations: |
| EUR | EU Euro |
| | |
| Reference Rate Abbreviations: |
| 12MTA | 12-month Treasury Average |
| RFUCCT1Y | FTSE USD IBOR Consumer Cash Fallbacks Term 1Y |
| SOFR30A | 30-day Secured Overnight Financing Rate |
| SOFRRATE | 1-day Secured Overnight Financing Rate |
| TSFR1M | 1-month CME Term Secured Overnight Financing Rate |
| TSFR3M | 3-month CME Term Secured Overnight Financing Rate |
See Accompanying Notes to Financial Statements
| Voya Intermediate Bond Fund | PORTFOLIO OF INVESTMENTS |
| as of March 31, 2024 (continued) |
| | |
Fair Value Measurements^
The following is a summary of the fair valuations according to the inputs used as of March 31, 2024 in valuing the assets and liabilities:
| | | Quoted Prices | | | | | | | | | | |
| | | in Active Markets | | | Significant Other | | | Significant | | | | |
| | | for Identical | | | Observable | | | Unobservable | | | Fair Value | |
| | | Investments | | | Inputs | | | Inputs | | | at | |
| | | (Level 1) | | | (Level 2) | | | (Level 3) | | | March 31, 2024 | |
| Asset Table | | | | | | | | | | | | | | | | |
| Investments, at fair value | | | | | | | | | | | | | | | | |
| Corporate Bonds/Notes | | $ | — | | | $ | 2,661,745,523 | | | $ | — | | | $ | 2,661,745,523 | |
| U.S. Government Agency Obligations | | | — | | | | 1,724,443,840 | | | | — | | | | 1,724,443,840 | |
| Collateralized Mortgage Obligations | | | — | | | | 1,320,655,404 | | | | — | | | | 1,320,655,404 | |
| Asset-Backed Securities | | | — | | | | 1,076,805,099 | | | | — | | | | 1,076,805,099 | |
| U.S. Treasury Obligations | | | — | | | | 1,036,517,180 | | | | — | | | | 1,036,517,180 | |
| Commercial Mortgage-Backed Securities | | | — | | | | 626,877,137 | | | | — | | | | 626,877,137 | |
| Sovereign Bonds | | | — | | | | 64,558,843 | | | | — | | | | 64,558,843 | |
| Purchased Options | | | — | | | | 9,515 | | | | — | | | | 9,515 | |
| Short-Term Investments | | | 16,655,000 | | | | 722,678,487 | | | | — | | | | 739,333,487 | |
| Total Investments, at fair value | | $ | 16,655,000 | | | $ | 9,234,291,028 | | | $ | — | | | $ | 9,250,946,028 | |
| Other Financial Instruments + | | | | | | | | | | | | | | | | |
| Centrally Cleared Interest Rate Swaps | | | — | | | | 93,193 | | | | — | | | | 93,193 | |
| Forward Foreign Currency Contracts | | | — | | | | 8,998 | | | | — | | | | 8,998 | |
| Forward Premium Swaptions | | | — | | | | 2,509,975 | | | | — | | | | 2,509,975 | |
| Futures | | | 6,934,923 | | | | — | | | | — | | | | 6,934,923 | |
| Total Assets | | $ | 23,589,923 | | | $ | 9,236,903,194 | | | $ | — | | | $ | 9,260,493,117 | |
| Liabilities Table | | | | | | | | | | | | | | | | |
| Other Financial Instruments + | | | | | | | | | | | | | | | | |
| Centrally Cleared Interest Rate Swaps | | $ | — | | | $ | (62,503) | | | $ | — | | | $ | (62,503) | |
| Forward Foreign Currency Contracts | | | — | | | | (3,793) | | | | — | | | | (3,793) | |
| Forward Premium Swaptions | | | — | | | | (297,852) | | | | — | | | | (297,852) | |
| Futures | | | (1,251,916) | | | | — | | | | — | | | | (1,251,916) | |
| OTC volatility swaps | | | — | | | | (113,985) | | | | — | | | | (113,985) | |
| Written Options | | | — | | | | (1,585,601) | | | | — | | | | (1,585,601) | |
| Total Liabilities | | $ | (1,251,916) | | | $ | (2,063,734) | | | $ | — | | | $ | (3,315,650) | |
| ^ | See Note 2, “Significant Accounting Policies” in the Notes to Financial Statements for additional information. |
| + | Other Financial Instruments may include open forward foreign currency contracts, futures, centrally cleared swaps, OTC swaps and written options. Forward foreign currency contracts, futures and centrally cleared swaps are fair valued at the unrealized appreciation (depreciation) on the instrument. OTC swaps and written options are valued at the fair value of the instrument. |
At March 31, 2024, the following forward foreign currency contracts were outstanding for Voya Intermediate Bond Fund:
| | | | | | | | | | | | | | | Unrealized | |
| | | | | | | | | | | | | | | Appreciation | |
| Currency Purchased | | Currency Sold | | Counterparty | | Settlement Date | | (Depreciation) | |
| EUR | | | 1,370,955 | | | USD | | | 1,482,245 | | | Morgan Stanley Capital Services LLC | | 04/12/24 | | $ | (2,595 | ) |
| USD | | | 1,050,804 | | | EUR | | | 965,275 | | | Standard Chartered Bank | | 04/12/24 | | | 8,998 | |
| EUR | | | 212,435 | | | USD | | | 230,476 | | | Standard Chartered Bank | | 04/12/24 | | | (1,198 | ) |
| | | | | | | | | | | | | | | | | $ | 5,205 | |
At March 31, 2024, the following futures contracts were outstanding for Voya Intermediate Bond Fund:
| | | | | | | | | | | | Unrealized | |
| | | Number | | | Expiration | | | Notional | | | Appreciation/ | |
| Description | | of Contracts | | | Date | | | Amount | | | (Depreciation) | |
| Long Contracts: | | | | | | | | | | | | | | | | |
| U.S. Treasury 2-Year Note | | | 2,635 | | | | 06/28/24 | | | $ | 538,816,328 | | | $ | (198,828 | ) |
| U.S. Treasury 5-Year Note | | | 1,364 | | | | 06/28/24 | | | | 145,969,313 | | | | 212,308 | |
| U.S. Treasury Long Bond | | | 1,320 | | | | 06/18/24 | | | | 158,977,500 | | | | 2,390,535 | |
| U.S. Treasury Ultra Long Bond | | | 2,501 | | | | 06/18/24 | | | | 322,629,000 | | | | 4,332,080 | |
| | | | | | | | | | | $ | 1,166,392,141 | | | $ | 6,736,095 | |
See Accompanying Notes to Financial Statements
| Voya Intermediate Bond Fund | PORTFOLIO OF INVESTMENTS |
| as of March 31, 2024 (continued) |
| | |
| | | | | | | | | | | | Unrealized | |
| | | Number | | | Expiration | | | Notional | | | Appreciation/ | |
| Description | | of Contracts | | | Date | | | Amount | | | (Depreciation) | |
| Short Contracts: | | | | | | | | | | | | | | | | |
| U.S. Treasury 10-Year Note | | | (483) | | | | 06/18/24 | | | $ | (53,514,891) | | | $ | (26,866) | |
| U.S. Treasury Ultra 10-Year Note | | | (1,877) | | | | 06/18/24 | | | | (215,121,797) | | | | (1,026,222) | |
| | | | | | | | | | | $ | (268,636,688) | | | $ | (1,053,088) | |
At March 31, 2024, the following centrally cleared interest rate swaps were outstanding for Voya Intermediate Bond Fund:
| | | | | Floating | | | | | | | | | | | | | | | | |
| | | | | Rate Index | | | | Fixed Rate | | | | | | | | | | | Unrealized | |
| Pay/Receive | | | | Payment | | Fixed | | Payment | | Maturity | | | Notional | | | Fair | | | Appreciation/ | |
| Floating Rate | | Floating Rate Index | | Frequency | | Rate | | Frequency | | Date | | | Amount | | | Value | | | (Depreciation) | |
| Pay | | 28-day MXN TIIE-BANXICO | | Monthly | | 9.000% | | Monthly | | 08/14/28 | | MXN | | 489,980,000 | | | $ | 89,295 | | | $ | 89,295 | |
| Pay | | 28-day MXN TIIE-BANXICO | | Monthly | | 8.860 | | Monthly | | 08/09/28 | | MXN | | 493,596,000 | | | | (62,503) | | | | (62,503) | |
| Pay | | 1-day Secured Overnight Financing Rate | | Annual | | 3.610 | | Annual | | 04/30/54 | | USD | | 4,269,000 | | | | 3,898 | | | | 3,898 | |
| | | | | | | | | | | | | | | | | | $ | 30,690 | | | $ | 30,690 | |
At March 31, 2024, the following OTC volatility swaps were outstanding for Voya Intermediate Bond Fund:
| Pay/ | | Volatility | | | | | | | | | | | Unrealized | |
| Receive | | Strike | | | | Maturity | | | Notional | | | | Appreciation | |
| Volatility(1) | Reference Entity | Rate | | Counterparty | | Date | | Currency | Amount | | Fair Value | | (Depreciation) | |
| Receive | USD vs. CAD Spot Exchange Rate | | 5.187% | | BNP Paribas | | 09/13/24 | | USD | | 179,000 | | $ | (22,158) | | $ | (22,158) | |
| Receive | GBP vs. USD Spot Exchange Rate | | 6.625% | | BNP Paribas | | 09/17/24 | | USD | | 88,000 | | | (8,740) | | | (8,740) | |
| Receive | USD vs. CAD Spot Exchange Rate | | 5.200% | | Deutsche Bank AG | | 09/13/24 | | USD | | 179,000 | | | (24,428) | | | (24,428) | |
| Receive | GBP vs. USD Spot Exchange Rate | | 6.600% | | Deutsche Bank AG | | 09/17/24 | | USD | | 88,000 | | | (6,594) | | | (6,594) | |
| Receive | USD vs. CAD Spot Exchange Rate | | 5.250% | | Goldman Sachs International | | 09/19/24 | | USD | | 179,000 | | | (22,021) | | | (22,021) | |
| Receive | GBP vs. USD Spot Exchange Rate | | 6.525% | | Goldman Sachs International | | 09/17/24 | | USD | | 88,000 | | | (156) | | | (156) | |
| Receive | GBP vs. USD Spot Exchange Rate | | 6.675% | | Goldman Sachs International | | 09/19/24 | | USD | | 357,000 | | | (29,888) | | | (29,888) | |
| | | | | | | | | | | | | | $ | (113,985) | | $ | (113,985) | |
| (1) | Fund pays the exercise rate semi-annually and receives the floating rate index quarterly. |
| (2) | Fund receives the exercise rate semi-annually and pays the floating rate index quarterly. |
| (3) | Forward premium swaption exercise rates represent the premium price on each respective swaption contract. Final exercise rate will be determined at the expiration of each respective swaption contract. |
| (4) | Forward premium swaptions include premiums receivable/(payable) that have extended settlement dates. Premiums are not exchanged until the expiration date of each respective forward premium swaption contract. |
At March 31, 2024, the following OTC purchased foreign currency options were outstanding for Voya Intermediate Bond Fund:
| | | | | Expiration | | Exercise | | | | | | | | |
| Description | | Counterparty | | Date | | Price | | Notional Amount | Cost | | Fair Value | |
| Call JPY vs. Put USD | | BNP Paribas | | 02/27/25 | | 107.500 | | USD | | 19,009,400 | | $ | 942,866 | | $ | 9,160 | |
| | | | | | | | | | | | | $ | 942,866 | | $ | 9,160 | |
At March 31, 2024, the following OTC purchased interest rate swaptions were outstanding for Voya Intermediate Bond Fund:
| | | | | Pay/ | | | | | | | | | | | | | | |
| | | | | Receive | | | | | | | | | | | | | | |
| | | | | Exercise | | Exercise | | Floating Rate | | Expiration | | | Notional | | | | | |
| Description | | Counterparty | | Rate | | Rate | | Index | | Date | | | Amount | | Cost | | Fair Value | |
| Call on 10-Year Interest | | | | | | | | 1-day Secured Overnight | | | | | | | | | | | | | |
| Rate Swap(1) | | BNP Paribas | | Receive | | 2.225% | | Financing Rate | | 05/16/24 | | USD | | 101,802,400 | | $ | 1,102,859 | | $ | 199 | |
| Call on 10-Year Interest | | JPMorgan Chase | | | | | | 1-day Secured Overnight | | | | | | | | | | | | | |
| Rate Swap(1) | | Bank N.A. | | Receive | | 2.213% | | Financing Rate | | 05/16/24 | | USD | | 84,835,300 | | | 924,705 | | | 156 | |
| | | | | | | | | | | | | | | | | $ | 2,027,564 | | $ | 355 | |
See Accompanying Notes to Financial Statements
| Voya Intermediate Bond Fund | PORTFOLIO OF INVESTMENTS |
| as of March 31, 2024 (continued) |
| | |
At March 31, 2024, the following OTC written interest rate swaptions were outstanding for Voya Intermediate Bond Fund:
| | | | | Pay/Receive | | | | | | | | | | | | | | | | | |
| | | | | Exercise | | Exercise | | Floating Rate | | Expiration | | | | Notional | | | Premiums | | | | |
| Description | | Counterparty | | Rate | | Rate | | Index | | Date | | | | Amount | | | Received | | | Fair Value | |
| Call on 10-Year Interest | | Mizuho Capital | | | | | | 1-day Secured Overnight | | | | | | | | | | | | | |
| Rate Swap(2) | | Markets LLC | | Pay | | 3.675% | | Financing Rate | | 04/26/24 | | USD | | 26,679,000 | | $ | 427,931 | | $ | (592,520) | |
| Put on 10-Year Interest | | | | | | | | 1-day Secured Overnight | | | | | | | | | | | | | |
| Rate Swap(1) | | BNP Paribas | | Receive | | 4.050% | | Financing Rate | | 05/16/24 | | USD | | 101,802,400 | | | 1,102,859 | | | (402,389) | |
| Put on 10-Year Interest | | JPMorgan Chase | | | | | | 1-day Secured Overnight | | | | | | | | | | | | | |
| Rate Swap(1) | | Bank N.A. | | Receive | | 4.050% | | Financing Rate | | 05/16/24 | | USD | | 84,835,300 | | | 924,705 | | | (335,324) | |
| Put on 10-Year Interest | | Mizuho Capital | | | | | | 1-day Secured Overnight | | | | | | | | | | | | | |
| Rate Swap(1) | | Markets LLC | | Receive | | 3.675% | | Financing Rate | | 04/26/24 | | USD | | 26,679,000 | | | 427,931 | | | (255,368) | |
| | | | | | | | | | | | | | | | | $ | 2,883,426 | | $ | (1,585,601) | |
At March 31, 2024, the following OTC purchased forward premium swaptions were outstanding for Voya Intermediate Bond Fund:
| | | | | | | Pay/ | | | | | | | | | | | Premium | | | |
| | | | | | | Receive | | | | | | | | | | | receivable/ | | Unrealized | |
| | | | | Exercise | | Exercise | | Floating Rate | | Expiration | | | | Notional | | | (payable) | | Appreciation/ | |
| Description | | Counterparty | | Rate(3) | | Rate | | Index | | Date | | | | Amount | | | at expiration(4) | | (Depreciation) | |
| Call on 10-Year | | Goldman Sachs | | | | | | | | | | | | | | | | | | | |
| Interest Rate Swap | | International | | 2.500% | | Receive | | 6-month EUR-EURIBOR | | 02/20/26 | | EUR | | 35,420,000 | | $ | (3,456,365) | | $ | (107,919) | |
| Call on 30-Year | | | | | | | | 1-day Secured Overnight | | | | | | | | | | | | | |
| Interest Rate Swap | | Barclays Bank PLC | | 17.500% | | Receive | | Financing Rate | | 06/14/27 | | USD | | 39,935,000 | | | (6,988,625) | | | 513,235 | |
| Call on 30-Year | | | | | | | | 1-day Secured Overnight | | | | | | | | | | | | | |
| Interest Rate Swap | | Barclays Bank PLC | | 17.700% | | Receive | | Financing Rate | | 05/28/27 | | USD | | 66,490,400 | | | (11,768,801) | | | 771,718 | |
| Put on 10-Year | | Goldman Sachs | | | | | | | | | | | | | | | | | | | |
| Interest Rate Swap | | International | | 2.500% | | Pay | | 6-month EUR-EURIBOR | | 02/20/26 | | EUR | | 35,420,000 | | | (3,456,365) | | | (189,933) | |
| Put on 30-Year | | | | | | | | 1-day Secured Overnight | | | | | | | | | | | | | |
| Interest Rate Swap | | Barclays Bank PLC | | 18.000% | | Pay | | Financing Rate | | 05/25/27 | | USD | | 61,700,000 | | | (11,106,000) | | | 558,663 | |
| | | | | | | | | | | | | | | | | $ | (36,776,156) | | $ | 1,545,764 | |
At March 31, 2024, the following OTC written forward premium swaptions were outstanding for Voya Intermediate Bond Fund:
| | | | | | | Pay/ | | | | | | | | | | | Premium | | | |
| | | | | | | Receive | | | | | | | | | | | receivable/ | | Unrealized | |
| | | | | Exercise | | Exercise | | Floating Rate | | Expiration | | | | Notional | | | (payable) | | Appreciation/ | |
| Description | | Counterparty | | Rate(3) | | Rate | | Index | | Date | | | | Amount | | | at expiration(4) | | (Depreciation) | |
| Call on 10-Year | | | | | | | | 1-day Secured Overnight | | | | | | | | | | | | | |
| Interest Rate Swap | | Bank of America N.A. | | 3.800% | | Pay | | Financing Rate | | 02/20/26 | | USD | | 35,420,000 | | $ | 1,856,008 | | $ | 34,219 | |
| Put on 10-Year | | | | | | | | 1-day Secured Overnight | | | | | | | | | | | | | |
| Interest Rate Swap | | Bank of America N.A. | | 3.800% | | Receive | | Financing Rate | | 02/20/26 | | USD | | 35,420,000 | | | 1,746,206 | | | 323,912 | |
| Put on 5-Year Interest | | Morgan Stanley | | | | | | | | | | | | | | | | | | | |
| Rate Swap | | Capital Services LLC | | 3.200% | | Receive | | 6-month EUR-EURIBOR | | 01/30/29 | | EUR | | 69,985,000 | | | 1,970,643 | | | 308,228 | |
| | | | | | | | | | | | | | | | | $ | 5,572,857 | | $ | 666,359 | |
| (1) | Fund pays the exercise rate semi-annually and receives the floating rate index quarterly. |
| (2) | Fund receives the exercise rate semi-annually and pays the floating rate index quarterly. |
| (3) | Forward premium swaption exercise rates represent the premium price on each respective swaption contract. Final exercise rate will be determined at the expiration of each respective swaption contract. |
| (4) | Forward premium swaptions include premiums receivable/(payable) that have extended settlement dates. Premiums are not exchanged until the expiration date of each respective forward premium swaption contract. |
| Currency Abbreviations: |
| EUR — EU Euro |
| MXN — Mexican Peso |
| USD — United States Dollar |
See Accompanying Notes to Financial Statements
| Voya Intermediate Bond Fund | PORTFOLIO OF INVESTMENTS |
| as of March 31, 2024 (continued) |
| | |
A summary of derivative instruments by primary risk exposure is outlined in the following tables.
The fair value of derivative instruments as of March 31, 2024 was as follows:
| | Location on Statement | | |
| Derivatives not accounted for as hedging instruments | of Assets and Liabilities | Fair Value | |
| Asset Derivatives | | | | |
| Foreign exchange contracts | Investments in securities at value* | $ | 9,160 | |
| Interest rate contracts | Investments in securities at value* | | 355 | |
| Foreign exchange contracts | Unrealized appreciation on forward foreign currency contracts | | 8,998 | |
| Interest rate contracts | Unrealized appreciation on forward premium swaptions | | 2,509,975 | |
| Interest rate contracts | Variation margin receivable on futures contracts** | | 6,934,923 | |
| Interest rate contracts | Variation margin receivable on centrally cleared swaps** | | 93,193 | |
| Total Asset Derivatives | | $ | 9,556,604 | |
| Liability Derivatives | | | | |
| Foreign exchange contracts | Unrealized depreciation on forward foreign currency contracts | $ | 3,793 | |
| Interest rate contracts | Unrealized depreciation on forward premium swaptions | | 297,852 | |
| Interest rate contracts | Variation margin payable on futures contracts** | | 1,251,916 | |
| Interest rate contracts | Variation margin payable on centrally cleared swaps** | | 62,503 | |
| Foreign exchange contracts | Unrealized depreciation on OTC swap agreements | | 113,985 | |
| Interest rate contracts | Written options, at fair value | | 1,585,601 | |
| Total Liability Derivatives | | $ | 3,315,650 | |
| * | Includes purchased options. |
| ** | The fair value presented above represents the cumulative unrealized appreciation (depreciation) on futures contracts and centrally cleared swaps as reported in the tables within the Portfolio of Investments. In the Statement of Assets and Liabilities, only current day’s unsettled variation margin is reported in receivables or payables on futures contracts and centrally cleared swaps and the net cumulative unrealized appreciation (depreciation) is included in total distributable earnings (loss). |
The effect of derivative instruments on the Fund's Statement of Operations for the year ended March 31, 2024 was as follows:
Amount of Realized Gain or (Loss) on Derivatives Recognized in Income
| | | | Forward | | | | | | | | | |
| | | | foreign | | | | | | | | | |
| Derivatives not accounted for as hedging | | | currency | | | | | | Written | | | |
| instruments | | Investments* | | contracts | | Futures | | Swaps | | options | | Total | |
| Credit contracts | $ | — | | $ | — | | $ | — | | $ | 1,645,815 | | $ | — | | $ | 1,645,815 | |
| Equity contracts | | — | | | — | | | (369,196) | | | — | | | — | | | (369,196) | |
| Foreign exchange contracts | | (2,149,244) | | | 28,954 | | | — | | | — | | | — | | | (2,120,290) | |
| Interest rate contracts | | (239,108) | | | — | | | (27,309,331) | | | (31,136,377) | | | 31,802,819 | | | (26,881,997) | |
| Total | $ | (2,388,352) | | $ | 28,954 | | $ | (27,678,527) | | $ | (29,490,562) | | $ | 31,802,819 | | $ | (27,725,668) | |
Change in Unrealized Appreciation or (Depreciation) on Derivatives Recognized in Income
| | | | Forward | | | | | | | | | |
| | | | foreign | | | | | | | | | |
| Derivatives not accounted for as hedging | | | currency | | | | | | Written | | | |
| instruments | Investments* | | contracts | | Futures | | Swaps | | options | | Total | |
| Foreign exchange contracts | $ | 1,851,164 | | $ | 58,762 | | $ | — | | $ | (113,985) | | $ | — | | $ | 1,795,941 | |
| Interest rate contracts | | (1,482,070) | | | — | | | (880,643) | | | 2,460,757 | | | 1,167,982 | | | 1,266,026 | |
| Total | $ | 369,094 | | $ | 58,762 | | $ | (880,643) | | $ | 2,346,772 | | $ | 1,167,982 | | $ | 3,061,967 | |
| * | Amounts recognized for purchased options are included in net realized gain (loss) on investments and net change in unrealized appreciation or depreciation on investments. |
See Accompanying Notes to Financial Statements
| Voya Intermediate Bond Fund | PORTFOLIO OF INVESTMENTS |
| as of March 31, 2024 (continued) |
| | |
The following is a summary by counterparty of the fair value of OTC derivative instruments subject to Master Netting Agreements and collateral pledged (received), if any, at March 31, 2024:
| | | | | | | | | | | | | | | | Morgan | | | | | |
| | | | | | | | | | Goldman | | JPMorgan | | Mizuho | | Stanley | | Standard | | | |
| | Bank of | | Barclays Bank | | | | Deutsche | | Sachs | | Chase Bank | | Capital | | Capital | | Chartered | | | |
| | America N.A. | | PLC | | BNP Paribas | | Bank AG | | International | | N.A. | | Markets LLC | | Services LLC | | Bank | | Total | |
| Assets: | | | | | | | | | | | | | | | | | | | | | | | | | | | | | | |
| Purchased options | $ | — | | $ | — | | $ | 9,359 | | $ | — | | $ | — | | $ | 156 | | $ | — | | $ | — | | $ | — | | $ | 9,515 | |
| Forward foreign currency contracts | | — | | | — | | | — | | | — | | | — | | | — | | | — | | | — | | | 8,998 | | | 8,998 | |
| Forward premium swaptions | | 358,131 | | | 1,843,616 | | | — | | | — | | | — | | | — | | | — | | | 308,228 | | | — | | | 2,509,975 | |
| Total Assets | $ | 358,131 | | $ | 1,843,616 | | $ | 9,359 | | $ | — | | $ | — | | $ | 156 | | $ | — | | $ | 308,228 | | $ | 8,998 | | $ | 2,528,488 | |
| Liabilities: | | | | | | | | | | | | | | | | | | | | | | | | | | | | | | |
| Forward foreign currency contracts | $ | — | | $ | — | | $ | — | | $ | — | | $ | — | | $ | — | | $ | — | | $ | 2,595 | | $ | 1,198 | | $ | 3,793 | |
| Forward premium swaptions | | — | | | — | | | — | | | — | | | 297,852 | | | — | | | — | | | — | | | — | | | 297,852 | |
| Volatility Swaps | | — | | | — | | | 30,898 | | | 31,022 | | | 52,065 | | | — | | | — | | | — | | | — | | | 113,985 | |
| Written options | | — | | | — | | | 402,389 | | | — | | | — | | | 335,324 | | | 847,888 | | | — | | | — | | | 1,585,601 | |
| Total Liabilities | $ | — | | $ | — | | $ | 433,287 | | $ | 31,022 | | $ | 349,917 | | $ | 335,324 | | $ | 847,888 | | $ | 2,595 | | $ | 1,198 | | $ | 2,001,231 | |
| Net OTC derivative instruments by | | | | | | | | | | | | | | | | | | | | | | | | | | | | | | |
| counterparty, at fair value | $ | 358,131 | | $ | 1,843,616 | | $ | (423,928) | | $ | (31,022) | | $ | (349,917) | | $ | (335,168) | | $ | (847,888) | | $ | 305,633 | | $ | 7,800 | | $ | 527,257 | |
| Total collateral pledged by the Fund/ (Received from counterparty)(1) | $ | — | | $ | (1,420,000) | | $ | 423,928 | | $ | — | | $ | 210,000 | | $ | 335,168 | | $ | — | | $ | (305,633) | | $ | — | | $ | (756,537) | |
| Net Exposure(2) | $ | 358,131 | | $ | 423,616 | | $ | — | | $ | (31,022) | | $ | (139,917) | | $ | — | | $ | (847,888) | | $ | — | | $ | 7,800 | | $ | (229,280) | |
| (1) | At March 31, 2024, the Fund had pledged $550,000 and $760,000 in cash collateral to BNP Paribas and JPMorgan Chase Bank N.A., respectively. In addition, the Fund had received $420,000 in cash collateral from Morgan Stanley Capital Services LLC. Excess cash collateral is not shown for financial reporting purposes. |
| (2) | Positive net exposure represents amounts due from each respective counterparty. Negative exposure represents amounts due from the Fund. Please refer to Note 2 for additional details regarding counterparty credit risk and credit related contingent features. |
At March 31, 2024, the aggregate cost of securities and other investments and the composition of unrealized appreciation and depreciation of securities and other investments on a tax basis were:
| Cost for federal income tax purposes was $9,711,555,934. | | |
| Net unrealized depreciation consisted of: | | |
| Gross Unrealized Appreciation | $ | 59,781,418 | |
| Gross Unrealized Depreciation | | (514,184,536) | |
| Net Unrealized Depreciation | $ | (454,403,118) | |
See Accompanying Notes to Financial Statements
| Voya Short Duration High Income Fund | PORTFOLIO OF INVESTMENTS
as of March 31, 2024 |
Principal
Amount† | | | | Value | | | Percentage
of Net
Assets | |
| CORPORATE BONDS/NOTES: 89.8% | | | | | |
| | | Basic Materials: 1.8% | |
| 1,000,000 (1) | | Cleveland-Cliffs, Inc., 5.875%, 06/01/2027 | | $ | 999,017 | | | | 0.7 | |
| 500,000 (1)(2) | | INEOS Finance PLC, 6.750%, 05/15/2028 | | | 494,225 | | | | 0.4 | |
| 400,000 (2) | | INEOS Quattro Finance 2 PLC, 9.625%, 03/15/2029 | | | 431,443 | | | | 0.3 | |
| 500,000 (2) | | SCIL IV LLC / SCIL USA Holdings LLC, 5.375%, 11/01/2026 | | | 485,810 | | | | 0.4 | |
| | | | | | 2,410,495 | | | | 1.8 | |
| | | | | | | | | | | |
| | | Communications: 13.6% | |
| 1,500,000 (2) | | Clear Channel Outdoor Holdings, Inc., 9.000%, 09/15/2028 | | | 1,563,773 | | | | 1.2 | |
| 500,000 (2) | | Directv Financing LLC / Directv Financing Co-Obligor, Inc., 5.875%, 08/15/2027 | | | 473,331 | | | | 0.4 | |
| 3,750,000 (2) | | DISH DBS Corp., 5.250%, 12/01/2026 | | | 2,959,814 | | | | 2.2 | |
| 400,000 (2) | | Gen Digital, Inc., 6.750%, 09/30/2027 | | | 406,108 | | | | 0.3 | |
| 3,900,000 (2) | | Millennium Escrow Corp., 6.625%, 08/01/2026 | | | 2,315,616 | | | | 1.7 | |
| 1,000,000 | | Sprint LLC, 7.125%, 06/15/2024 | | | 1,002,338 | | | | 0.7 | |
| 750,000 | | Sprint LLC, 7.625%, 02/15/2025 | | | 759,359 | | | | 0.6 | |
| 1,000,000 (2) | | Summer BC Bidco B LLC, 5.500%, 10/31/2026 | | | 966,487 | | | | 0.7 | |
| 1,550,000 (2) | | Townsquare Media, Inc., 6.875%, 02/01/2026 | | | 1,512,412 | | | | 1.1 | |
| 2,000,000 (2) | | Uber Technologies, Inc., 7.500%, 09/15/2027 | | | 2,049,456 | | | | 1.5 | |
| 500,000 (2) | | Univision Communications, Inc., 6.625%, 06/01/2027 | | | 489,460 | | | | 0.4 | |
| 2,950,000 (2) | | Univision Communications, Inc., 8.000%, 08/15/2028 | | | 3,007,292 | | | | 2.2 | |
| 900,000 (2) | | Viasat, Inc., 5.625%, 04/15/2027 | | | 852,876 | | | | 0.6 | |
| | | | | | 18,358,322 | | | | 13.6 | |
| | | | | | | | | | | |
| | | Consumer, Cyclical: 21.4% | |
| 3,000,000 (2) | | Aramark Services, Inc., 5.000%, 02/01/2028 | | | 2,898,011 | | | | 2.1 | |
| 4,000,000 (2) | | Caesars Entertainment, Inc., 8.125%, 07/01/2027 | | | 4,099,264 | | | | 3.0 | |
| 500,000 (2) | | Delta Air Lines, Inc., 7.000%, 05/01/2025 | | | 506,729 | | | | 0.4 | |
| 900,000 (2) | | Dream Finders Homes, Inc., 8.250%, 08/15/2028 | | | 940,356 | | | | 0.7 | |
Principal
Amount† | | | | Value | | | Percentage
of Net
Assets | |
| CORPORATE BONDS/NOTES: (continued) | | | | | |
| | | Consumer, Cyclical: (continued) | |
| 750,000 (2) | | eG Global Finance PLC, 12.000%, 11/30/2028 | | $ | 797,829 | | | | 0.6 | |
| 3,500,000 (2) | | Global Auto Holdings Ltd./AAG FH UK Ltd., 8.375%, 01/15/2029 | | | 3,423,403 | | | | 2.5 | |
| 3,100,000 | | Goodyear Tire & Rubber Co., 9.500%, 05/31/2025 | | | 3,128,895 | | | | 2.3 | |
| 1,500,000 (2) | | LGI Homes, Inc., 8.750%, 12/15/2028 | | | 1,583,637 | | | | 1.2 | |
| 200,000 | | Marriott International, Inc., 5.450%, 09/15/2026 | | | 201,100 | | | | 0.2 | |
| 1,700,000 | | MGM Resorts International, 6.750%, 05/01/2025 | | | 1,700,282 | | | | 1.3 | |
| 2,600,000 (2) | | Mileage Plus Holdings LLC / Mileage Plus Intellectual Property Assets Ltd., 6.500%, 06/20/2027 | | | 2,616,396 | | | | 1.9 | |
| 700,000 (2) | | SeaWorld Parks & Entertainment, Inc., 8.750%, 05/01/2025 | | | 701,092 | | | | 0.5 | |
| 1,500,000 (2) | | Six Flags Theme Parks, Inc., 7.000%, 07/01/2025 | | | 1,503,102 | | | | 1.1 | |
| 1,500,000 (1)(2) | | VistaJet Malta Finance PLC / Vista Management Holding, Inc., 7.875%, 05/01/2027 | | | 1,269,719 | | | | 0.9 | |
| 2,850,000 (1)(2) | | VistaJet Malta Finance PLC / Vista Management Holding, Inc., 9.500%, 06/01/2028 | | | 2,426,327 | | | | 1.8 | |
| 750,000 (2) | | Wynn Las Vegas LLC / Wynn Las Vegas Capital Corp., 5.250%, 05/15/2027 | | | 735,040 | | | | 0.6 | |
| 400,000 (2) | | ZF North America Capital, Inc., 6.875%, 04/14/2028 | | | 415,270 | | | | 0.3 | |
| | | | | | 28,946,452 | | | | 21.4 | |
| | | | | | | | | | | |
| | | Consumer, Non-cyclical: 7.8% | |
| 500,000 (2) | | Albion Financing 1 Sarl / Aggreko Holdings, Inc., 6.125%, 10/15/2026 | | | 495,927 | | | | 0.4 | |
| 2,450,000 (2) | | Albion Financing 2SARL, 8.750%, 04/15/2027 | | | 2,453,102 | | | | 1.8 | |
| 700,000 (1)(2) | | Champions Financing, Inc., 8.750%, 02/15/2029 | | | 733,913 | | | | 0.5 | |
| 250,000 | | HCA, Inc., 5.375%, 02/01/2025 | | | 249,336 | | | | 0.2 | |
| 1,300,000 | | HCA, Inc., 5.875%, 02/15/2026 | | | 1,305,987 | | | | 0.9 | |
See Accompanying Notes to Financial Statements
| Voya Short Duration High Income Fund | PORTFOLIO OF INVESTMENTS
as of March 31, 2024 (continued) |
Principal
Amount† | | | | Value | | | Percentage
of Net
Assets | |
| CORPORATE BONDS/NOTES: (continued) | | | | | |
| | | Consumer, Non-cyclical: (continued) | |
| 500,000 (2) | | Legends Hospitality Holding Co LLC / Legends Hospitality Co-Issuer, Inc., 5.000%, 02/01/2026 | | $ | 495,661 | | | | 0.4 | |
| 500,000 (2) | | Mobius Merger Sub, Inc., 9.000%, 06/01/2030 | | | 496,197 | | | | 0.4 | |
| 2,000,000 (2) | | Performance Food Group, Inc., 6.875%, 05/01/2025 | | | 2,001,510 | | | | 1.5 | |
| 896,415 (1)(2)(3) | | Radiology Partners, Inc., 8.500% (PIK Rate 3.500%, Cash Rate 5.000%), 01/31/2029 | | | 832,814 | | | | 0.6 | |
| 100,000 (2) | | Shift4 Payments LLC / Shift4 Payments Finance Sub, Inc., 4.625%, 11/01/2026 | | | 96,772 | | | | 0.1 | |
| 1,400,000 (2) | | WASH Multifamily Acquisition, Inc., 5.750%, 04/15/2026 | | | 1,369,532 | | | | 1.0 | |
| | | | | | 10,530,751 | | | | 7.8 | |
| | | | | | | | | | | |
| | | Energy: 17.4% | |
| 2,993,000 (2) | | CITGO Petroleum Corp., 7.000%, 06/15/2025 | | | 2,991,139 | | | | 2.2 | |
| 600,000 (2) | | CITGO Petroleum Corp., 8.375%, 01/15/2029 | | | 630,907 | | | | 0.5 | |
| 1,250,000 (2) | | CVR Energy, Inc., 5.750%, 02/15/2028 | | | 1,173,064 | | | | 0.9 | |
| 1,500,000 (2) | | CVR Energy, Inc., 8.500%, 01/15/2029 | | | 1,519,938 | | | | 1.1 | |
| 1,250,000 (2) | | Delek Logistics Partners L.P. / Delek Logistics Finance Corp., 7.125%, 06/01/2028 | | | 1,220,383 | | | | 0.9 | |
| 1,750,000 (2) | | Delek Logistics Partners L.P. / Delek Logistics Finance Corp., 8.625%, 03/15/2029 | | | 1,788,218 | | | | 1.3 | |
| 1,500,000 | | Genesis Energy L.P. / Genesis Energy Finance Corp., 8.250%, 01/15/2029 | | | 1,541,161 | | | | 1.1 | |
| 1,500,000 (2) | | HF Sinclair Corp., 6.375%, 04/15/2027 | | | 1,508,980 | | | | 1.1 | |
| 675,000 (2) | | Martin Midstream Partners L.P. / Martin Midstream Finance Corp., 11.500%, 02/15/2028 | | | 717,665 | | | | 0.5 | |
| 2,000,000 (2) | | New Fortress Energy, Inc., 6.500%, 09/30/2026 | | | 1,926,931 | | | | 1.4 | |
| 649,000 (2) | | New Fortress Energy, Inc., 6.750%, 09/15/2025 | | | 645,170 | | | | 0.5 | |
Principal
Amount† | | | | Value | | | Percentage
of Net
Assets | |
| CORPORATE BONDS/NOTES: (continued) | | | | | |
| | | Energy: (continued) | |
| 2,500,000 (1)(2) | | New Fortress Energy, Inc., 8.750%, 03/15/2029 | | $ | 2,492,670 | | | | 1.9 | |
| 1,100,000 (2) | | Sunnova Energy Corp., 5.875%, 09/01/2026 | | | 857,456 | | | | 0.6 | |
| 3,000,000 (1)(2) | | Sunnova Energy Corp., 11.750%, 10/01/2028 | | | 2,344,218 | | | | 1.7 | |
| 625,000 (2) | | Sunoco L.P. / Sunoco Finance Corp., 7.000%, 09/15/2028 | | | 639,136 | | | | 0.5 | |
| 1,250,000 (2) | | Venture Global LNG, Inc., 8.125%, 06/01/2028 | | | 1,276,014 | | | | 1.0 | |
| 250,000 (2) | | Venture Global LNG, Inc., 9.500%, 02/01/2029 | | | 269,622 | | | | 0.2 | |
| | | | | | 23,542,672 | | | | 17.4 | |
| | | | | | | | | | | |
| | | Financial: 16.9% | |
| 500,000 | | AerCap Ireland Capital DAC / AerCap Global Aviation Trust, 6.500%, 07/15/2025 | | | 504,996 | | | | 0.4 | |
| 500,000 | | Air Lease Corp., 5.850%, 12/15/2027 | | | 507,929 | | | | 0.4 | |
| 2,000,000 (2) | | Aircastle Ltd., 5.950%, 02/15/2029 | | | 2,002,203 | | | | 1.5 | |
| 1,100,000 (2) | | Avolon Holdings Funding Ltd., 6.375%, 05/04/2028 | | | 1,122,242 | | | | 0.8 | |
| 365,000 (2) | | Bread Financial Holdings, Inc., 7.000%, 01/15/2026 | | | 367,720 | | | | 0.3 | |
| 1,250,000 (2) | | Bread Financial Holdings, Inc., 9.750%, 03/15/2029 | | | 1,302,040 | | | | 1.0 | |
| 200,000 (2) | | Castlelake Aviation Finance DAC, 5.000%, 04/15/2027 | | | 192,824 | | | | 0.1 | |
| 2,500,000 (2) | | Freedom Mortgage Holdings LLC, 9.250%, 02/01/2029 | | | 2,560,867 | | | | 1.9 | |
| 2,862,000 (2) | | HAT Holdings I LLC / HAT Holdings II LLC, 6.000%, 04/15/2025 | | | 2,852,773 | | | | 2.1 | |
| 750,000 (2) | | HAT Holdings I LLC / HAT Holdings II LLC, 8.000%, 06/15/2027 | | | 782,962 | | | | 0.6 | |
| 250,000 (2) | | Iron Mountain, Inc., 7.000%, 02/15/2029 | | | 255,038 | | | | 0.2 | |
| 2,457,000 (2) | | LD Holdings Group LLC, 6.125%, 04/01/2028 | | | 2,038,811 | | | | 1.5 | |
| 900,000 (2) | | LD Holdings Group LLC, 6.500%, 11/01/2025 | | | 874,520 | | | | 0.6 | |
| 1,000,000 (2) | | Macquarie Airfinance Holdings Ltd., 6.400%, 03/26/2029 | | | 1,016,565 | | | | 0.7 | |
See Accompanying Notes to Financial Statements
| Voya Short Duration High Income Fund | PORTFOLIO OF INVESTMENTS
as of March 31, 2024 (continued) |
Principal
Amount† | | | | Value | | | Percentage
of Net
Assets | |
| CORPORATE BONDS/NOTES: (continued) | | | | | |
| | | Financial: (continued) | |
| 750,000 (2) | | Macquarie Airfinance Holdings Ltd., 8.375%, 05/01/2028 | | $ | 795,604 | | | | 0.6 | |
| 200,000 | | Nasdaq, Inc., 5.650%, 06/28/2025 | | | 200,683 | | | | 0.1 | |
| 750,000 (2) | | Panther Escrow Issuer LLC, 7.125%, 06/01/2031 | | | 763,133 | | | | 0.6 | |
| 2,200,000 (2) | | Park Intermediate Holdings LLC / PK Domestic Property LLC / PK Finance Co-Issuer, 7.500%, 06/01/2025 | | | 2,205,775 | | | | 1.6 | |
| 750,000 (2) | | PennyMac Financial Services, Inc., 5.375%, 10/15/2025 | | | 741,783 | | | | 0.5 | |
| 750,000 (2) | | PennyMac Financial Services, Inc., 7.875%, 12/15/2029 | | | 771,334 | | | | 0.6 | |
| 250,000 (2) | | RHP Hotel Properties L.P. / RHP Finance Corp., 7.250%, 07/15/2028 | | | 257,780 | | | | 0.2 | |
| 500,000 | | SLM Corp., 4.200%, 10/29/2025 | | | 488,329 | | | | 0.4 | |
| 250,000 (2) | | United Wholesale Mortgage LLC, 5.500%, 11/15/2025 | | | 247,974 | | | | 0.2 | |
| | | | | | 22,853,885 | | | | 16.9 | |
| | | | | | | | | | | |
| | | Industrial: 7.2% | |
| 800,000 (2) | | AAR Escrow Issuer LLC, 6.750%, 03/15/2029 | | | 807,155 | | | | 0.6 | |
| 1,000,000 (2) | | Esab Corp., 6.250%, 04/15/2029 | | | 1,005,933 | | | | 0.7 | |
| 2,000,000 (2) | | Fortress Transportation and Infrastructure Investors LLC, 6.500%, 10/01/2025 | | | 1,998,544 | | | | 1.5 | |
| 400,000 (2) | | Fortress Transportation and Infrastructure Investors LLC, 9.750%, 08/01/2027 | | | 414,553 | | | | 0.3 | |
| 2,000,000 | | Hillenbrand, Inc., 6.250%, 02/15/2029 | | | 2,019,658 | | | | 1.5 | |
| 3,500,000 (2) | | WESCO Distribution, Inc., 7.125%, 06/15/2025 | | | 3,505,052 | | | | 2.6 | |
| | | | | | 9,750,895 | | | | 7.2 | |
| | | | | | | | | | | |
| | | Technology: 2.0% | |
| 586,000 (2) | | Consensus Cloud Solutions, Inc., 6.000%, 10/15/2026 | | | 557,522 | | | | 0.4 | |
| 2,450,000 (1)(2) | | Consensus Cloud Solutions, Inc., 6.500%, 10/15/2028 | | | 2,180,818 | | | | 1.6 | |
| | | | | | 2,738,340 | | | | 2.0 | |
Principal
Amount† | | | | Value | | | Percentage
of Net
Assets | |
| CORPORATE BONDS/NOTES: (continued) | | | | | |
| | | Utilities: 1.7% | |
| 2,300,000 (2) | | AmeriGas Partners L.P. / AmeriGas Finance Corp., 9.375%, 06/01/2028 | | $ | 2,383,306 | | | | 1.7 | |
| | | Total Corporate Bonds/ Notes
(Cost $120,837,812) | | | 121,515,118 | | | | 89.8 | |
| | | | | | | | | | | |
| BANK LOANS: 3.4% | | | | | |
| | | Consumer, Cyclical: 1.4% | |
| 2,000,000 | | Hunter Douglas, USD Term Loan B1, 8.840%, (TSFR1M+3.500%), 02/26/2029 | | | 1,980,468 | | | | 1.4 | |
| | | | | | | | | | | |
| | | Financial: 2.0% | |
| 3,000,000 | | Asurion, LLC, 2021 Second Lien Term Loan B4, 8.840%, (TSFR1M+3.500%), 01/20/2029 | | | 2,693,124 | | | | 2.0 | |
| | | Total Bank Loans
(Cost $4,837,554) | | | 4,673,592 | | | | 3.4 | |
| | | Total Long-Term Investments
(Cost $125,675,366) | | | 126,188,710 | | | | 93.2 | |
| | | | | | | | | | | |
Principal
Amount† | | | | Value | | | Percentage
of Net
Assets | |
| SHORT-TERM INVESTMENTS: 16.0% | | | | | |
| | | Repurchase Agreements: 9.8% | |
| 3,119,074 (4) | | Cantor Fitzgerald Securities, Repurchase Agreement dated 03/28/2024, 5.370%, due 04/01/2024 (Repurchase Amount $3,120,910, collateralized by various U.S. Government/U.S. Government Agency Obligations, 0.000%-7.500%, Market Value plus accrued interest $3,181,455, due 12/24/26-02/20/74) | | | 3,119,074 | | | | 2.3 | |
See Accompanying Notes to Financial Statements
| Voya Short Duration High Income Fund | PORTFOLIO OF INVESTMENTS
as of March 31, 2024 (continued) |
Principal
Amount† | | | | Value | | | Percentage
of Net
Assets | |
| SHORT-TERM INVESTMENTS: (continued) | | | | | |
| | | Repurchase Agreements (continued) | |
| 3,150,580 (4) | | Daiwa Capital Markets America Inc., Repurchase Agreement dated 03/28/2024, 5.360%, due 04/01/2024 (Repurchase Amount $3,152,431, collateralized by various U.S. Government/U.S. Government Agency Obligations, 0.375%-7.000%, Market Value plus accrued interest $3,213,592, due 05/31/24-04/01/54) | | $ | 3,150,580 | | | | 2.4 | |
| 3,150,580 (4) | | Deutsche Bank Securities Inc., Repurchase Agreement dated 03/28/2024, 5.330%, due 04/01/2024 (Repurchase Amount $3,152,420, collateralized by various U.S. Government Agency Obligations, 1.500%-7.500%, Market Value plus accrued interest $3,213,592, due 06/01/36-04/01/54) | | | 3,150,580 | | | | 2.3 | |
| 643,038 (4) | | HSBC Securities (USA) Inc., Repurchase Agreement dated 03/28/2024, 5.340%, due 04/01/2024 (Repurchase Amount $643,414, collateralized by various U.S. Government Agency Obligations, 1.500%-7.500%, Market Value plus accrued interest $655,899, due 01/01/31-08/01/59) | | | 643,038 | | | | 0.5 | |
Principal
Amount† | | | | Value | | | Percentage
of Net
Assets | |
| SHORT-TERM INVESTMENTS: (continued) | | | | | |
| | | Repurchase Agreements (continued) | |
| 3,119,074 (4) | | Mirae Asset Securities (USA) Inc., Repurchase Agreement dated 03/28/2024, 5.380%, due 04/01/2024 (Repurchase Amount $3,120,913, collateralized by various U.S. Government/U.S. Government Agency Obligations, 0.000%-7.645%, Market Value plus accrued interest $3,183,357, due 04/30/24-04/20/73) | | $ | 3,119,074 | | | | 2.3 | |
| | | Total Repurchase Agreements
(Cost $13,182,346) | | | 13,182,346 | | | | 9.8 | |
| | | | | | | | | | | |
| Shares | | | | Value | | | Percentage
of Net
Assets | |
| | | Mutual Funds: 6.2% | |
| 8,428,627 (5) | | BlackRock Liquidity Funds, FedFund, Institutional Class, 5.200%
(Cost $8,428,627) | | $ | 8,428,627 | | | | 6.2 | |
| | | Total Short-Term Investments
(Cost $21,610,973) | | | 21,610,973 | | | | 16.0 | |
| | | Total Investments in Securities
(Cost $147,286,339) | | $ | 147,799,683 | | | | 109.2 | |
| | | Liabilities in Excess of Other Assets | | | (12,496,285 | ) | | | (9.2) | |
| | | Net Assets | | $ | 135,303,398 | | | | 100.0 | |
| † | Unless otherwise indicated, principal amount is shown in USD. |
| (1) | Security, or a portion of the security, is on loan. |
| (2) | Securities with purchases pursuant to Rule 144A or section 4(a)(2), under the Securities Act of 1933 and may not be resold subject to that rule except to qualified institutional buyers. |
| (3) | All or a portion of this security is payment-in-kind (“PIK”) which may pay interest or additional principal at the issuer’s discretion. Rates shown are the current rate and possible payment rates. |
| (4) | All or a portion of the security represents securities purchased with cash collateral received for securities on loan. |
| (5) | Rate shown is the 7-day yield as of March 31, 2024. |
Reference Rate Abbreviations:
| TSFR1M | 1-month CME Term Secured Overnight Financing Rate |
See Accompanying Notes to Financial Statements
| Voya Short Duration High Income Fund | PORTFOLIO OF INVESTMENTS
as of March 31, 2024 (continued) |
Fair Value Measurements^
The following is a summary of the fair valuations according to the inputs used as of March 31, 2024 in valuing the assets and liabilities:
| | | Quoted Prices
in Active Markets
for Identical
Investments
(Level 1) | | Significant Other
Observable
Inputs
(Level 2) | | Significant
Unobservable
Inputs
(Level 3) | | Fair Value
at
March 31, 2024 |
| Asset Table | | | | | | | | | | | | | | | | |
| Investments, at fair value | | | | | | | | | | | | | | | | |
| Corporate Bonds/Notes | | $ | — | | | $ | 121,515,118 | | | $ | — | | | $ | 121,515,118 | |
| Bank Loans | | | — | | | | 4,673,592 | | | | — | | | | 4,673,592 | |
| Short-Term Investments | | | 8,428,627 | | | | 13,182,346 | | | | — | | | | 21,610,973 | |
| Total Investments, at fair value | | $ | 8,428,627 | | | $ | 139,371,056 | | | $ | — | | | $ | 147,799,683 | |
| ^ | See Note 2, “Significant Accounting Policies” in the Notes to Financial Statements for additional information. |
At March 31, 2024, the aggregate cost of securities and other investments and the composition of unrealized appreciation and depreciation of securities and other investments on a tax basis were:
| Cost for federal income tax purposes was $147,286,339. |
| Net unrealized appreciation consisted of: | | | |
| Gross Unrealized Appreciation | | $ | 1,860,827 | |
| Gross Unrealized Depreciation | | | (1,347,483 | ) |
| Net Unrealized Appreciation | | $ | 513,344 | |
See Accompanying Notes to Financial Statements
| Voya Short Term Bond Fund | PORTFOLIO OF INVESTMENTS |
| as of March 31, 2024 |
| | |
Principal
Amount† | | | RA | | Value | | | Percentage
of Net
Assets |
| CORPORATE BONDS/NOTES: 49.4% | |
| | | | Basic Materials: 1.4% |
| 389,000 (1) | | | Albemarle Corp., 4.650%, 06/01/2027 | | $ | 381,936 | | | | 0.1 | |
| 656,000 | | | BHP Billiton Finance USA Ltd., 5.250%, 09/08/2026 | | | 660,088 | | | | 0.1 | |
| 600,000 (2) | | | Constellium SE, 5.875%, 02/15/2026 | | | 596,300 | | | | 0.1 | |
| 641,000 | | | Ecolab, Inc., 1.650%, 02/01/2027 | | | 587,488 | | | | 0.1 | |
| 678,000 | | | Ecolab, Inc., 2.700%, 11/01/2026 | | | 644,141 | | | | 0.1 | |
| 417,000 | | | EIDP, Inc., 4.500%, 05/15/2026 | | | 412,334 | | | | 0.1 | |
| 666,000 | | | Freeport-McMoRan, Inc., 4.550%, 11/14/2024 | | | 661,365 | | | | 0.1 | |
| 827,000 (2) | | | Georgia-Pacific LLC, 1.750%, 09/30/2025 | | | 785,260 | | | | 0.1 | |
| 625,000 (2) | | | Hudbay Minerals, Inc., 4.500%, 04/01/2026 | | | 606,008 | | | | 0.1 | |
| 625,000 (2) | | | Mativ Holdings, Inc., 6.875%, 10/01/2026 | | | 622,639 | | | | 0.1 | |
| 625,000 (2) | | | Novelis Corp., 3.250%, 11/15/2026 | | | 583,009 | | | | 0.1 | |
| 252,000 | | | Nucor Corp., 2.000%, 06/01/2025 | | | 242,292 | | | | 0.1 | |
| 65,000 | | | Nutrien Ltd., 4.900%, 03/27/2028 | | | 64,692 | | | | 0.0 | |
| 1,098,000 | | | Nutrien Ltd., 5.950%, 11/07/2025 | | | 1,107,419 | | | | 0.2 | |
| | | | | | | 7,954,971 | | | | 1.4 | |
| | | | | | | | | | | | |
| | | | Communications: 2.5% |
| 906,000 | | | Amazon.com, Inc., 3.000%, 04/13/2025 | | | 887,393 | | | | 0.2 | |
| 602,000 | | | Amazon.com, Inc., 3.150%, 08/22/2027 | | | 573,938 | | | | 0.1 | |
| 513,000 | | | AT&T, Inc., 1.700%, 03/25/2026 | | | 479,863 | | | | 0.1 | |
| 575,000 (2) | | | CCO Holdings LLC / CCO Holdings Capital Corp., 5.500%, 05/01/2026 | | | 566,583 | | | | 0.1 | |
| 215,000 | | | Cisco Systems, Inc., 4.800%, 02/26/2027 | | | 215,415 | | | | 0.0 | |
| 214,000 | | | Cisco Systems, Inc., 4.850%, 02/26/2029 | | | 215,682 | | | | 0.0 | |
| 529,000 | | | Comcast Corp., 4.550%, 01/15/2029 | | | 525,003 | | | | 0.1 | |
| 406,000 | | | Comcast Corp., 5.250%, 11/07/2025 | | | 407,748 | | | | 0.1 | |
| 600,000 (2) | | | Connect Finco Sarl / Connect US Finco LLC, 6.750%, 10/01/2026 | | | 588,573 | | | | 0.1 | |
| 444,000 | | | Fox Corp., 3.050%, 04/07/2025 | | | 433,018 | | | | 0.1 | |
| 581,000 | | | Meta Platforms, Inc., 3.500%, 08/15/2027 | | | 559,177 | | | | 0.1 | |
| 83,000 | | | Motorola Solutions, Inc., 4.000%, 09/01/2024 | | | 82,326 | | | | 0.0 | |
Principal
Amount† | | | | | Value | | | Percentage
of Net
Assets |
| CORPORATE BONDS/NOTES: (continued) | |
| | | | Communications: (continued) | | | | | | | | |
| 1,497,000 (2) | | | NBN Co. Ltd., 1.450%, 05/05/2026 | | $ | 1,386,210 | | | | 0.3 | |
| 349,000 (2) | | | NBN Co. Ltd., 5.750%, 10/06/2028 | | | 361,050 | | | | 0.1 | |
| 423,000 (2) | | | NTT Finance Corp., 4.142%, 07/26/2024 | | | 421,030 | | | | 0.1 | |
| 700,000 (1) | | | Rogers Communications, Inc., 5.000%, 02/15/2029 | | | 695,431 | | | | 0.1 | |
| 625,000 (2) | | | Sirius XM Radio, Inc., 3.125%, 09/01/2026 | | | 585,953 | | | | 0.1 | |
| 1,147,000 | | | Sprint Capital Corp., 6.875%, 11/15/2028 | | | 1,223,197 | | | | 0.2 | |
| 575,000 (2) | | | Telecom Italia SpA/Milano, 5.303%, 05/30/2024 | | | 572,266 | | | | 0.1 | |
| 429,000 | | | T-Mobile USA, Inc., 2.250%, 02/15/2026 | | | 406,213 | | | | 0.1 | |
| 283,000 | | | T-Mobile USA, Inc., 2.625%, 04/15/2026 | | | 268,998 | | | | 0.0 | |
| 733,000 | | | T-Mobile USA, Inc., 3.750%, 04/15/2027 | | | 706,126 | | | | 0.1 | |
| 291,000 | | | T-Mobile USA, Inc., 4.950%, 03/15/2028 | | | 290,415 | | | | 0.1 | |
| 625,000 (2) | | | Univision Communications, Inc., 6.625%, 06/01/2027 | | | 611,825 | | | | 0.1 | |
| 649,000 | | | Verizon Communications, Inc., 0.850%, 11/20/2025 | | | 605,123 | | | | 0.1 | |
| | | | | | | 13,668,556 | | | | 2.5 | |
| | | | | | | | | | | | |
| | | | Consumer, Cyclical: 5.0% |
| 361,000 (2) | | | 7-Eleven, Inc., 0.950%, 02/10/2026 | | | 333,734 | | | | 0.1 | |
| 600,000 (2) | | | Adient Global Holdings Ltd., 4.875%, 08/15/2026 | | | 585,379 | | | | 0.1 | |
| 17,365 | | | American Airlines Pass Through Trust 2016-1, AA, 3.575%, 07/15/2029 | | | 16,287 | | | | 0.0 | |
| 351,000 | | | American Honda Finance Corp., GMTN, 4.950%, 01/09/2026 | | | 350,319 | | | | 0.1 | |
| 432,000 | | | American Honda Finance Corp., GMTN, 5.800%, 10/03/2025 | | | 435,690 | | | | 0.1 | |
| 195,000 | | | American Honda Finance Corp., MTN, 1.300%, 09/09/2026 | | | 178,711 | | | | 0.0 | |
| 656,000 (2) | | | BMW US Capital LLC, 1.250%, 08/12/2026 | | | 601,655 | | | | 0.1 | |
| 682,000 (2) | | | BMW US Capital LLC, 3.250%, 04/01/2025 | | | 668,677 | | | | 0.1 | |
| 95,000 | | | Cummins, Inc., 4.900%, 02/20/2029 | | | 95,602 | | | | 0.0 | |
| 1,035,000 (2) | | | Daimler Truck Finance North America LLC, 3.500%, 04/07/2025 | | | 1,014,046 | | | | 0.2 | |
See Accompanying Notes to Financial Statements
| Voya Short Term Bond Fund | PORTFOLIO OF INVESTMENTS |
| as of March 31, 2024 (continued) |
| | |
Principal
Amount† | | | | | Value | | | Percentage
of Net
Assets |
| CORPORATE BONDS/NOTES: (continued) | |
| | | | Consumer, Cyclical: (continued) | |
| 410,000 (2) | | | Daimler Truck Finance North America LLC, 5.000%, 01/15/2027 | | $ | 408,960 | | | | 0.1 | |
| 186,662 | | | Delta Air Lines Pass Through Trust 20-1, A, 2.500%, 12/10/2029 | | | 168,106 | | | | 0.0 | |
| 160,000 | | | Delta Air Lines Pass Through Trust 2019-1, A, 3.404%, 10/25/2025 | | | 159,536 | | | | 0.0 | |
| 625,000 | | | Delta Air Lines, Inc., 2.900%, 10/28/2024 | | | 614,021 | | | | 0.1 | |
| 300,000 (1) | | | Ford Motor Credit Co. LLC, 5.800%, 03/08/2029 | | | 301,333 | | | | 0.1 | |
| 500,000 | | | Ford Motor Credit Co. LLC, GMTN, 4.389%, 01/08/2026 | | | 487,927 | | | | 0.1 | |
| 410,000 | | | General Motors Financial Co., Inc., 3.800%, 04/07/2025 | | | 402,667 | | | | 0.1 | |
| 586,000 | | | General Motors Financial Co., Inc., 5.250%, 03/01/2026 | | | 584,456 | | | | 0.1 | |
| 415,000 | | | General Motors Financial Co., Inc., 5.400%, 04/06/2026 | | | 415,283 | | | | 0.1 | |
| 487,000 | | | General Motors Financial Co., Inc., 5.400%, 05/08/2027 | | | 488,423 | | | | 0.1 | |
| 565,000 (2) | | | Hilton Domestic Operating Co., Inc., 5.375%, 05/01/2025 | | | 564,655 | | | | 0.1 | |
| 714,000 | | | Home Depot, Inc., 4.950%, 09/30/2026 | | | 715,366 | | | | 0.1 | |
| 874,000 | | | Honda Motor Co. Ltd., 2.534%, 03/10/2027 | | | 819,494 | | | | 0.2 | |
| 561,000 (2) | | | Hyundai Capital America, 1.300%, 01/08/2026 | | | 521,737 | | | | 0.1 | |
| 264,000 (2) | | | Hyundai Capital America, 5.650%, 06/26/2026 | | | 264,931 | | | | 0.0 | |
| 262,000 (2) | | | Hyundai Capital America, 5.950%, 09/21/2026 | | | 265,123 | | | | 0.1 | |
| 493,000 (2) | | | Hyundai Capital America, 6.250%, 11/03/2025 | | | 498,234 | | | | 0.1 | |
| 600,000 (2) | | | International Game Technology PLC, 4.125%, 04/15/2026 | | | 582,018 | | | | 0.1 | |
| 888,000 | | | Lennar Corp., 4.500%, 04/30/2024 | | | 887,005 | | | | 0.2 | |
| 252,000 | | | Lowe’s Cos., Inc., 3.350%, 04/01/2027 | | | 240,845 | | | | 0.0 | |
| 100,000 | | | Marriott International, Inc., 4.875%, 05/15/2029 | | | 99,053 | | | | 0.0 | |
| 999,000 (2) | | | Mattel, Inc., 3.375%, 04/01/2026 | | | 956,119 | | | | 0.2 | |
Principal
Amount† | | | | | Value | | | Percentage
of Net
Assets |
| CORPORATE BONDS/NOTES: (continued) | |
| | | | Consumer, Cyclical: (continued) | |
| 493,000 (2) | | | Mercedes-Benz Finance North America LLC, 5.100%, 08/03/2028 | | $ | 495,121 | | | | 0.1 | |
| 600,000 (1) | | | MGM Resorts International, 4.625%, 09/01/2026 | | | 587,373 | | | | 0.1 | |
| 157,585 (2) | | | Mileage Plus Holdings LLC / Mileage Plus Intellectual Property Assets Ltd., 6.500%, 06/20/2027 | | | 158,579 | | | | 0.0 | |
| 1,112,000 | | | Ross Stores, Inc., 4.600%, 04/15/2025 | | | 1,101,878 | | | | 0.2 | |
| 625,000 (2) | | | Royal Caribbean Cruises Ltd., 4.250%, 07/01/2026 | | | 603,568 | | | | 0.1 | |
| 840,000 | | | Toll Brothers Finance Corp., 4.350%, 02/15/2028 | | | 812,375 | | | | 0.1 | |
| 344,000 | | | Toyota Motor Credit Corp., 4.625%, 01/12/2028 | | | 342,758 | | | | 0.1 | |
| 718,000 | | | Toyota Motor Credit Corp., 5.400%, 11/20/2026 | | | 726,544 | | | | 0.1 | |
| 708,000 | | | Toyota Motor Credit Corp., 5.600%, 09/11/2025 | | | 712,947 | | | | 0.1 | |
| 702,000 | | | Toyota Motor Credit Corp. B, B, 5.000%, 03/19/2027 | | | 704,376 | | | | 0.1 | |
| 545,000 | | | TRI Pointe Group, Inc. / TRI Pointe Homes, Inc., 5.875%, 06/15/2024 | | | 544,680 | | | | 0.1 | |
| 43,725 | | | United Airlines Pass Through Trust 20-1, A, 5.875%, 04/15/2029 | | | 43,625 | | | | 0.0 | |
| 625,000 (2) | | | United Airlines, Inc., 4.375%, 04/15/2026 | | | 604,633 | | | | 0.1 | |
| 54,718 | | | US Airways Pass Through Trust 2012-1, A, 5.900%, 04/01/2026 | | | 54,630 | | | | 0.0 | |
| 535,000 (2) | | | Volkswagen Group of America Finance LLC, 5.300%, 03/22/2027 | | | 536,281 | | | | 0.1 | |
| 500,000 (1)(2) | | | Volkswagen Group of America Finance LLC, 5.650%, 09/12/2028 | | | 509,804 | | | | 0.1 | |
| 385,000 (2) | | | Volkswagen Group of America Finance LLC, 6.450%, 11/16/2030 | | | 409,244 | | | | 0.1 | |
| 625,000 | | | Walgreens Boots Alliance, Inc., 3.800%, 11/18/2024 | | | 616,116 | | | | 0.1 | |
| 409,000 | | | Walmart, Inc., 3.950%, 09/09/2027 | | | 402,009 | | | | 0.1 | |
| 710,000 | | | Walmart, Inc., 4.000%, 04/15/2026 | | | 700,944 | | | | 0.1 | |
See Accompanying Notes to Financial Statements
| Voya Short Term Bond Fund | PORTFOLIO OF INVESTMENTS |
| as of March 31, 2024 (continued) |
| | |
Principal
Amount† | | | | | Value | | | Percentage
of Net
Assets |
| CORPORATE BONDS/NOTES: (continued) | |
| | | | Consumer, Cyclical: (continued) | |
| 864,000 | | | Warnermedia Holdings, Inc., 3.755%, 03/15/2027 | | $ | 824,771 | | | | 0.2 | |
| 625,000 (2) | | | William Carter Co., 5.625%, 03/15/2027 | | | 621,180 | | | | 0.1 | |
| 575,000 (2) | | | ZF North America Capital, Inc., 4.750%, 04/29/2025 | | | 568,267 | | | | 0.1 | |
| | | | | | | 27,407,095 | | | | 5.0 | |
| | | | | | | | | | | | |
| | | | Consumer, Non-cyclical: 7.1% | |
| 728,000 | | | AbbVie, Inc., 2.600%, 11/21/2024 | | | 715,027 | | | | 0.1 | |
| 1,088,000 | | | AbbVie, Inc., 3.200%, 05/14/2026 | | | 1,050,491 | | | | 0.2 | |
| 456,000 | | | AbbVie, Inc., 4.800%, 03/15/2027 | | | 456,631 | | | | 0.1 | |
| 651,000 | | | AbbVie, Inc., 4.800%, 03/15/2029 | | | 652,301 | | | | 0.1 | |
| 625,000 (2) | | | Albertsons Cos., Inc. / Safeway, Inc. / New Albertsons L.P. / Albertsons LLC, 3.250%, 03/15/2026 | | | 596,557 | | | | 0.1 | |
| 680,000 | | | Amgen, Inc., 3.200%, 11/02/2027 | | | 642,296 | | | | 0.1 | |
| 1,044,000 | | | Amgen, Inc., 5.250%, 03/02/2025 | | | 1,041,124 | | | | 0.2 | |
| 930,000 | | | Astrazeneca Finance LLC, 4.800%, 02/26/2027 | | | 929,908 | | | | 0.2 | |
| 1,215,000 | | | AstraZeneca PLC, 3.375%, 11/16/2025 | | | 1,184,579 | | | | 0.2 | |
| 695,000 | | | Becton Dickinson & Co., 4.693%, 02/13/2028 | | | 688,201 | | | | 0.1 | |
| 403,000 | | | Boston Scientific Corp., 1.900%, 06/01/2025 | | | 387,308 | | | | 0.1 | |
| 645,000 | | | Bristol-Myers Squibb Co., 0.750%, 11/13/2025 | | | 602,952 | | | | 0.1 | |
| 223,000 | | | Bristol-Myers Squibb Co., 4.900%, 02/22/2027 | | | 223,564 | | | | 0.0 | |
| 311,000 | | | Bristol-Myers Squibb Co., 4.900%, 02/22/2029 | | | 312,540 | | | | 0.1 | |
| 760,000 | | | Bunge Ltd. Finance Corp., 1.630%, 08/17/2025 | | | 720,153 | | | | 0.1 | |
| 270,000 | | | Cardinal Health, Inc., 5.125%, 02/15/2029 | | | 270,645 | | | | 0.1 | |
| 215,000 (2) | | | Cargill, Inc., 3.500%, 04/22/2025 | | | 211,176 | | | | 0.0 | |
| 263,000 (2) | | | Cargill, Inc., 3.625%, 04/22/2027 | | | 253,417 | | | | 0.1 | |
| 370,000 | | | Cigna Group, 1.250%, 03/15/2026 | | | 342,908 | | | | 0.1 | |
| 517,000 | | | Cigna Group, 5.000%, 05/15/2029 | | | 517,977 | | | | 0.1 | |
Principal
Amount† | | | | | Value | | | Percentage
of Net
Assets |
| CORPORATE BONDS/NOTES: (continued) | |
| | | | Consumer, Non-cyclical: (continued) | |
| 625,000 (2) | | | CPI CG, Inc., 8.625%, 03/15/2026 | | $ | 623,242 | | | | 0.1 | |
| 314,000 (2) | | | CSL Finance PLC, 3.850%, 04/27/2027 | | | 303,370 | | | | 0.1 | |
| 1,247,000 | | | CVS Health Corp., 3.875%, 07/20/2025 | | | 1,223,970 | | | | 0.2 | |
| 1,398,000 | | | Diageo Capital PLC, 1.375%, 09/29/2025 | | | 1,323,436 | | | | 0.2 | |
| 681,000 | | | Diageo Capital PLC, 5.300%, 10/24/2027 | | | 690,499 | | | | 0.1 | |
| 629,000 (2) | | | Element Fleet Management Corp., 3.850%, 06/15/2025 | | | 614,347 | | | | 0.1 | |
| 398,000 (2) | | | Element Fleet Management Corp., 5.643%, 03/13/2027 | | | 399,360 | | | | 0.1 | |
| 694,000 | | | Eli Lilly & Co., 4.500%, 02/09/2027 | | | 692,223 | | | | 0.1 | |
| 315,000 | | | Equifax, Inc., 2.600%, 12/15/2025 | | | 300,893 | | | | 0.1 | |
| 486,000 (2) | | | ERAC USA Finance LLC, 5.000%, 02/15/2029 | | | 487,094 | | | | 0.1 | |
| 933,000 | | | GE HealthCare Technologies, Inc., 5.600%, 11/15/2025 | | | 936,457 | | | | 0.2 | |
| 920,000 | | | Global Payments, Inc., 1.200%, 03/01/2026 | | | 851,359 | | | | 0.2 | |
| 575,000 (2) | | | Graham Holdings Co., 5.750%, 06/01/2026 | | | 569,835 | | | | 0.1 | |
| 999,000 | | | HCA, Inc., 5.875%, 02/15/2026 | | | 1,003,600 | | | | 0.2 | |
| 600,000 (2) | | | Health Care Service Corp. A Mutual Legal Reserve Co., 1.500%, 06/01/2025 | | | 572,630 | | | | 0.1 | |
| 1,348,000 | | | Humana, Inc., 5.750%, 03/01/2028 | | | 1,377,944 | | | | 0.3 | |
| 600,000 (2) | | | IQVIA, Inc., 5.000%, 10/15/2026 | | | 587,561 | | | | 0.1 | |
| 259,000 | | | Kenvue, Inc., 5.500%, 03/22/2025 | | | 259,547 | | | | 0.1 | |
| 118,000 | | | Keurig Dr Pepper, Inc., 5.050%, 03/15/2029 | | | 118,390 | | | | 0.0 | |
| 185,000 | | | Mondelez International, Inc., 4.750%, 02/20/2029 | | | 183,868 | | | | 0.0 | |
| 766,000 (2) | | | Nestle Holdings, Inc., 4.125%, 10/01/2027 | | | 750,439 | | | | 0.1 | |
| 715,000 | | | PepsiCo, Inc., 3.600%, 02/18/2028 | | | 691,015 | | | | 0.1 | |
| 258,000 | | | PepsiCo, Inc., 5.250%, 11/10/2025 | | | 259,574 | | | | 0.1 | |
| 600,000 | | | Perrigo Finance Unlimited Co., 4.375%, 03/15/2026 | | | 584,239 | | | | 0.1 | |
| 1,360,000 | | | Pfizer Investment Enterprises Pte Ltd., 4.450%, 05/19/2026 | | | 1,346,297 | | | | 0.2 | |
See Accompanying Notes to Financial Statements
| Voya Short Term Bond Fund | PORTFOLIO OF INVESTMENTS |
| as of March 31, 2024 (continued) |
| | |
Principal
Amount† | | | | | Value | | | Percentage
of Net
Assets |
| CORPORATE BONDS/NOTES: (continued) | |
| | | | Consumer, Non-cyclical: (continued) | |
| 267,000 | | | Philip Morris International, Inc., 4.875%, 02/13/2029 | | $ | 265,481 | | | | 0.1 | |
| 726,000 (2) | | | Roche Holdings, Inc., 5.338%, 11/13/2028 | | | 743,967 | | | | 0.1 | |
| 1,361,000 | | | Royalty Pharma PLC, 1.200%, 09/02/2025 | | | 1,281,455 | | | | 0.2 | |
| 748,000 | | | S&P Global, Inc., 2.450%, 03/01/2027 | | | 700,321 | | | | 0.1 | |
| 1,151,000 | | | S&P Global, Inc., 2.700%, 03/01/2029 | | | 1,046,249 | | | | 0.2 | |
| 705,000 | | | Smith & Nephew PLC, 5.150%, 03/20/2027 | | | 705,087 | | | | 0.1 | |
| 695,000 (2) | | | Solventum Corp., 5.450%, 02/25/2027 | | | 697,573 | | | | 0.1 | |
| 256,000 | | | Stryker Corp., 3.650%, 03/07/2028 | | | 245,120 | | | | 0.1 | |
| 625,000 | | | Tenet Healthcare Corp., 6.250%, 02/01/2027 | | | 625,240 | | | | 0.1 | |
| 715,000 | | | Thermo Fisher Scientific, Inc., 5.000%, 12/05/2026 | | | 718,123 | | | | 0.1 | |
| 1,164,000 (2) | | | Triton Container International Ltd., 1.150%, 06/07/2024 | | | 1,152,989 | | | | 0.2 | |
| 201,000 | | | Tyson Foods, Inc., 5.400%, 03/15/2029 | | | 202,871 | | | | 0.0 | |
| 498,000 (1) | | | UnitedHealth Group, Inc., 2.950%, 10/15/2027 | | | 468,772 | | | | 0.1 | |
| 486,000 | | | UnitedHealth Group, Inc., 3.375%, 04/15/2027 | | | 467,814 | | | | 0.1 | |
| 659,000 | | | Viatris, Inc., 1.650%, 06/22/2025 | | | 626,870 | | | | 0.1 | |
| 522,000 | | | Zoetis, Inc., 5.400%, 11/14/2025 | | | 522,858 | | | | 0.1 | |
| | | | | | | 39,021,734 | | | | 7.1 | |
| | | | | | | | | | | | |
| | | | Energy: 2.4% |
| 516,000 | | | Baker Hughes Holdings LLC / Baker Hughes Co-Obligor, Inc., 2.061%, 12/15/2026 | | | 476,995 | | | | 0.1 | |
| 625,000 (1)(2) | | | Baytex Energy Corp., 8.750%, 04/01/2027 | | | 652,344 | | | | 0.1 | |
| 748,000 | | | Canadian Natural Resources Ltd., 2.050%, 07/15/2025 | | | 715,853 | | | | 0.1 | |
| 550,000 (2) | | | Chord Energy Corp., 6.375%, 06/01/2026 | | | 552,701 | | | | 0.1 | |
| 625,000 (2) | | | Crescent Energy Finance LLC, 7.250%, 05/01/2026 | | | 637,420 | | | | 0.1 | |
| 550,000 (2) | | | Earthstone Energy Holdings LLC, 8.000%, 04/15/2027 | | | 566,867 | | | | 0.1 | |
| 625,000 (1) | | | EnLink Midstream Partners L.P., 4.150%, 06/01/2025 | | | 611,765 | | | | 0.1 | |
Principal
Amount† | | | | | Value | | | Percentage
of Net
Assets |
| CORPORATE BONDS/NOTES: (continued) | |
| | | | Energy: (continued) | | | | | | | | |
| 243,000 | | | Equinor ASA, 2.875%, 04/06/2025 | | $ | 237,433 | | | | 0.0 | |
| 590,000 | | | Kinder Morgan, Inc., 1.750%, 11/15/2026 | | | 541,534 | | | | 0.1 | |
| 625,000 (1) | | | Matador Resources Co., 5.875%, 09/15/2026 | | | 625,458 | | | | 0.1 | |
| 625,000 (2) | | | Moss Creek Resources Holdings, Inc., 7.500%, 01/15/2026 | | | 624,747 | | | | 0.1 | |
| 916,000 | | | Occidental Petroleum Corp., 3.500%, 06/15/2025 | | | 894,974 | | | | 0.2 | |
| 1,252,000 | | | ONEOK, Inc., 5.850%, 01/15/2026 | | | 1,264,433 | | | | 0.2 | |
| 385,000 | | | Ovintiv Exploration, Inc., 5.375%, 01/01/2026 | | | 383,673 | | | | 0.1 | |
| 25,000 (2) | | | Permian Resources Operating LLC, 5.375%, 01/15/2026 | | | 24,767 | | | | 0.0 | |
| 551,000 | | | Phillips 66, 3.850%, 04/09/2025 | | | 542,772 | | | | 0.1 | |
| 647,000 | | | Pioneer Natural Resources Co., 1.125%, 01/15/2026 | | | 602,439 | | | | 0.1 | |
| 1,252,000 | | | Plains All American Pipeline L.P. / PAA Finance Corp., 4.650%, 10/15/2025 | | | 1,235,605 | | | | 0.2 | |
| 263,000 | | | Schlumberger Investment SA, 4.500%, 05/15/2028 | | | 261,931 | | | | 0.1 | |
| 625,000 | | | Southwestern Energy Co., 5.700%, 01/23/2025 | | | 622,486 | | | | 0.1 | |
| 333,000 | | | TransCanada PipeLines Ltd., 1.000%, 10/12/2024 | | | 324,707 | | | | 0.1 | |
| 889,000 | | | Williams Cos., Inc., 4.550%, 06/24/2024 | | | 886,692 | | | | 0.2 | |
| | | | | | | 13,287,596 | | | | 2.4 | |
| | | | | | | | | | | | |
| | | | Financial: 19.8% |
| 653,000 | | | Aflac, Inc., 1.125%, 03/15/2026 | | | 605,269 | | | | 0.1 | |
| 670,000 | | | Ally Financial, Inc., 3.875%, 05/21/2024 | | | 668,012 | | | | 0.1 | |
| 366,000 | | | American Express Co., 2.500%, 07/30/2024 | | | 362,281 | | | | 0.1 | |
| 298,000 (3) | | | American Express Co., 4.990%, 05/01/2026 | | | 296,308 | | | | 0.1 | |
| 224,000 (3) | | | American Express Co., 5.098%, 02/16/2028 | | | 223,731 | | | | 0.0 | |
| 541,000 (3) | | | American Express Co., 5.389%, 07/28/2027 | | | 542,998 | | | | 0.1 | |
| 438,000 | | | American Tower Corp., 3.650%, 03/15/2027 | | | 420,011 | | | | 0.1 | |
| 112,000 | | | American Tower Corp., 5.250%, 07/15/2028 | | | 112,067 | | | | 0.0 | |
See Accompanying Notes to Financial Statements
| Voya Short Term Bond Fund | PORTFOLIO OF INVESTMENTS |
| as of March 31, 2024 (continued) |
| | |
Principal
Amount† | | | | | Value | | | Percentage
of Net
Assets |
| CORPORATE BONDS/NOTES: (continued) | |
| | | | Financial: (continued) | | | | | | | | |
| 850,000 | | | Ameriprise Financial, Inc., 3.000%, 04/02/2025 | | $ | 830,595 | | | | 0.1 | |
| 220,000 | | | Aon North America, Inc., 5.125%, 03/01/2027 | | | 221,395 | | | | 0.0 | |
| 413,000 | | | Aon North America, Inc., 5.150%, 03/01/2029 | | | 415,570 | | | | 0.1 | |
| 698,000 (2) | | | Athene Global Funding, 5.684%, 02/23/2026 | | | 700,949 | | | | 0.1 | |
| 958,000 (2) | | | Aviation Capital Group LLC, 5.500%, 12/15/2024 | | | 954,564 | | | | 0.2 | |
| 577,000 (2) | | | Aviation Capital Group LLC, 6.375%, 07/15/2030 | | | 594,567 | | | | 0.1 | |
| 1,175,000 (1)(2) | | | Avolon Holdings Funding Ltd., 2.528%, 11/18/2027 | | | 1,045,539 | | | | 0.2 | |
| 200,000 (3) | | | Banco Santander SA, 5.538%, 03/14/2030 | | | 200,052 | | | | 0.0 | |
| 400,000 | | | Banco Santander SA, 5.588%, 08/08/2028 | | | 405,879 | | | | 0.1 | |
| 1,406,000 (3) | | | Bank of America Corp., 0.976%, 04/22/2025 | | | 1,401,842 | | | | 0.3 | |
| 1,422,000 (3) | | | Bank of America Corp., 1.734%, 07/22/2027 | | | 1,311,311 | | | | 0.2 | |
| 38,000 (3) | | | Bank of America Corp., 3.419%, 12/20/2028 | | | 35,660 | | | | 0.0 | |
| 123,000 (3) | | | Bank of America Corp., 3.705%, 04/24/2028 | | | 117,725 | | | | 0.0 | |
| 422,000 (3) | | | Bank of America Corp., 4.376%, 04/27/2028 | | | 412,114 | | | | 0.1 | |
| 1,165,000 (3) | | | Bank of America Corp., 5.202%, 04/25/2029 | | | 1,166,462 | | | | 0.2 | |
| 1,281,000 (3) | | | Bank of America Corp., MTN, 1.319%, 06/19/2026 | | | 1,218,046 | | | | 0.2 | |
| 684,000 (3) | | | Bank of America Corp., MTN, 2.015%, 02/13/2026 | | | 662,772 | | | | 0.1 | |
| 239,000 (3) | | | Bank of America Corp. N, 1.658%, 03/11/2027 | | | 222,711 | | | | 0.0 | |
| 271,000 | | | Bank of America NA, 5.526%, 08/18/2026 | | | 273,813 | | | | 0.0 | |
| 1,055,000 | | | Bank of Montreal, 5.300%, 06/05/2026 | | | 1,058,140 | | | | 0.2 | |
| 229,000 (3) | | | Bank of New York Mellon Corp., 4.414%, 07/24/2026 | | | 226,306 | | | | 0.0 | |
| 447,000 (3) | | | Bank of New York Mellon Corp., 4.947%, 04/26/2027 | | | 445,068 | | | | 0.1 | |
| 325,000 (1)(3) | | | Bank of New York Mellon Corp., MTN, 4.975%, 03/14/2030 | | | 325,412 | | | | 0.1 | |
| 598,000 | | | Bank of Nova Scotia, 0.700%, 04/15/2024 | | | 596,948 | | | | 0.1 | |
| 593,000 | | | Bank of Nova Scotia, 1.450%, 01/10/2025 | | | 575,073 | | | | 0.1 | |
Principal
Amount† | | | | | Value | | | Percentage
of Net
Assets |
| CORPORATE BONDS/NOTES: (continued) | |
| | | | Financial: (continued) | | | | | | | | |
| 522,000 | | | Bank of Nova Scotia, MTN, 3.450%, 04/11/2025 | | $ | 511,810 | | | | 0.1 | |
| 788,000 (2) | | | Blackstone Holdings Finance Co. LLC, 1.625%, 08/05/2028 | | | 686,098 | | | | 0.1 | |
| 329,000 (2) | | | Blackstone Holdings Finance Co. LLC, 2.500%, 01/10/2030 | | | 286,001 | | | | 0.1 | |
| 457,000 (2) | | | Blackstone Holdings Finance Co. LLC, 5.900%, 11/03/2027 | | | 469,096 | | | | 0.1 | |
| 280,000 | | | Blue Owl Credit Income Corp., 7.750%, 09/16/2027 | | | 287,024 | | | | 0.1 | |
| 297,000 | | | Brookfield Finance, Inc., 4.000%, 04/01/2024 | | | 297,000 | | | | 0.1 | |
| 220,000 (1)(2)(3) | | | CaixaBank SA, 5.673%, 03/15/2030 | | | 220,001 | | | | 0.0 | |
| 328,000 (2)(3) | | | CaixaBank SA, 6.684%, 09/13/2027 | | | 335,271 | | | | 0.1 | |
| 304,000 | | | Camden Property Trust, 4.100%, 10/15/2028 | | | 295,251 | | | | 0.1 | |
| 315,000 (3) | | | Capital One Financial Corp., 1.878%, 11/02/2027 | | | 288,258 | | | | 0.1 | |
| 598,000 (3) | | | Capital One Financial Corp., 4.166%, 05/09/2025 | | | 596,792 | | | | 0.1 | |
| 535,000 (3) | | | Capital One Financial Corp., 5.468%, 02/01/2029 | | | 533,441 | | | | 0.1 | |
| 551,000 (1)(3) | | | Capital One Financial Corp., 5.700%, 02/01/2030 | | | 555,827 | | | | 0.1 | |
| 526,000 | | | Charles Schwab Corp., 5.875%, 08/24/2026 | | | 534,899 | | | | 0.1 | |
| 377,000 (3) | | | Charles Schwab Corp., 6.196%, 11/17/2029 | | | 392,027 | | | | 0.1 | |
| 615,000 (2) | | | CNO Global Funding, 1.650%, 01/06/2025 | | | 594,329 | | | | 0.1 | |
| 550,000 (2)(3) | | | Cooperatieve Rabobank UA, 1.339%, 06/24/2026 | | | 522,550 | | | | 0.1 | |
| 714,000 | | | Cooperatieve Rabobank UA, 4.800%, 01/09/2029 | | | 709,761 | | | | 0.1 | |
| 507,000 | | | Corebridge Financial, Inc., 3.650%, 04/05/2027 | | | 484,300 | | | | 0.1 | |
| 651,000 (2) | | | Corebridge Global Funding, 0.900%, 09/22/2025 | | | 609,153 | | | | 0.1 | |
| 711,000 (2)(3) | | | Credit Agricole SA, 5.335%, 01/10/2030 | | | 709,192 | | | | 0.1 | |
| 121,000 | | | Credit Suisse AG/New York NY, 2.950%, 04/09/2025 | | | 117,840 | | | | 0.0 | |
See Accompanying Notes to Financial Statements
| Voya Short Term Bond Fund | PORTFOLIO OF INVESTMENTS |
| as of March 31, 2024 (continued) |
| | |
Principal
Amount† | | | | | Value | | | Percentage
of Net
Assets |
| CORPORATE BONDS/NOTES: (continued) | |
| | | | Financial: (continued) | | | | | | | | |
| 1,776,000 | | | Credit Suisse AG/New York NY, MTN, 3.625%, 09/09/2024 | | $ | 1,759,598 | | | | 0.3 | |
| 1,210,000 | | | Crown Castle, Inc., 1.350%, 07/15/2025 | | | 1,149,337 | | | | 0.2 | |
| 628,000 (2)(3) | | | Danske Bank A/S, 0.976%, 09/10/2025 | | | 614,090 | | | | 0.1 | |
| 556,000 (2)(3) | | | Danske Bank A/S, 4.298%, 04/01/2028 | | | 536,724 | | | | 0.1 | |
| 714,000 (3) | | | Deutsche Bank AG/New York NY, 2.311%, 11/16/2027 | | | 653,012 | | | | 0.1 | |
| 947,000 | | | Discover Financial Services, 3.950%, 11/06/2024 | | | 936,377 | | | | 0.2 | |
| 836,000 (2)(3) | | | DNB Bank ASA, 5.896%, 10/09/2026 | | | 840,128 | | | | 0.2 | |
| 703,000 | | | Equinix, Inc., 1.250%, 07/15/2025 | | | 665,245 | | | | 0.1 | |
| 1,654,000 (2) | | | Federation des Caisses Desjardins du Quebec, 2.050%, 02/10/2025 | | | 1,606,960 | | | | 0.3 | |
| 487,000 (2) | | | Federation des Caisses Desjardins du Quebec, 5.250%, 04/26/2029 | | | 486,035 | | | | 0.1 | |
| 597,000 | | | Fifth Third Bank NA, 3.850%, 03/15/2026 | | | 575,296 | | | | 0.1 | |
| 625,000 (2) | | | Freedom Mortgage Corp., 7.625%, 05/01/2026 | | | 624,588 | | | | 0.1 | |
| 600,000 (2) | | | GA Global Funding Trust, 3.850%, 04/11/2025 | | | 588,941 | | | | 0.1 | |
| 315,000 (3) | | | Goldman Sachs Bank USA/New York NY, 5.283%, 03/18/2027 | | | 314,934 | | | | 0.1 | |
| 265,000 | | | Goldman Sachs BDC, Inc., 6.375%, 03/11/2027 | | | 267,106 | | | | 0.0 | |
| 354,000 (3) | | | Goldman Sachs Group, Inc., 2.640%, 02/24/2028 | | | 329,804 | | | | 0.1 | |
| 285,000 (3) | | | Goldman Sachs Group, Inc., 5.836%, (SOFRRATE + 0.486%), 10/21/2024 | | | 285,192 | | | | 0.0 | |
| 324,000 | | | Hanover Insurance Group, Inc., 4.500%, 04/15/2026 | | | 318,268 | | | | 0.1 | |
| 667,000 (3) | | | HSBC Holdings PLC, 1.589%, 05/24/2027 | | | 613,904 | | | | 0.1 | |
| 1,000,000 (3) | | | HSBC Holdings PLC, 2.099%, 06/04/2026 | | | 959,370 | | | | 0.2 | |
| 407,000 (3) | | | HSBC Holdings PLC, 2.633%, 11/07/2025 | | | 399,072 | | | | 0.1 | |
| 736,000 (3) | | | ING Groep NV, 4.017%, 03/28/2028 | | | 709,414 | | | | 0.1 | |
| 309,000 (3) | | | ING Groep NV, 6.083%, 09/11/2027 | | | 312,925 | | | | 0.1 | |
Principal
Amount† | | | | | Value | | | Percentage
of Net
Assets |
| CORPORATE BONDS/NOTES: (continued) | |
| | | | Financial: (continued) | | | | | | | | |
| 1,487,000 (3) | | | JPMorgan Chase & Co., 0.824%, 06/01/2025 | | $ | 1,474,178 | | | | 0.3 | |
| 519,000 (3) | | | JPMorgan Chase & Co., 0.969%, 06/23/2025 | | | 512,999 | | | | 0.1 | |
| 593,000 (3) | | | JPMorgan Chase & Co., 1.470%, 09/22/2027 | | | 541,215 | | | | 0.1 | |
| 519,000 (3) | | | JPMorgan Chase & Co., 1.578%, 04/22/2027 | | | 481,263 | | | | 0.1 | |
| 900,000 (3) | | | JPMorgan Chase & Co., 2.069%, 06/01/2029 | | | 798,615 | | | | 0.1 | |
| 995,000 (3) | | | JPMorgan Chase & Co., 2.083%, 04/22/2026 | | | 958,991 | | | | 0.2 | |
| 36,000 (3) | | | JPMorgan Chase & Co., 2.301%, 10/15/2025 | | | 35,370 | | | | 0.0 | |
| 169,000 (3) | | | JPMorgan Chase & Co., 2.595%, 02/24/2026 | | | 164,670 | | | | 0.0 | |
| 691,000 (3) | | | JPMorgan Chase & Co., 2.947%, 02/24/2028 | | | 649,467 | | | | 0.1 | |
| 500,000 (3) | | | JPMorgan Chase & Co., 3.509%, 01/23/2029 | | | 473,097 | | | | 0.1 | |
| 119,000 (3) | | | JPMorgan Chase & Co., 3.960%, 01/29/2027 | | | 116,207 | | | | 0.0 | |
| 968,000 (3) | | | JPMorgan Chase & Co., 5.012%, 01/23/2030 | | | 964,434 | | | | 0.2 | |
| 720,000 (3) | | | JPMorgan Chase & Co., 5.040%, 01/23/2028 | | | 717,742 | | | | 0.1 | |
| 300,000 (3) | | | JPMorgan Chase & Co., 5.299%, 07/24/2029 | | | 302,353 | | | | 0.1 | |
| 1,566,000 (3) | | | JPMorgan Chase & Co., 5.546%, 12/15/2025 | | | 1,565,290 | | | | 0.3 | |
| 712,000 (3) | | | JPMorgan Chase & Co., 6.070%, 10/22/2027 | | | 726,678 | | | | 0.1 | |
| 597,000 | | | KeyBank NA/Cleveland OH, 4.390%, 12/14/2027 | | | 563,960 | | | | 0.1 | |
| 625,000 (2) | | | Ladder Capital Finance Holdings LLLP / Ladder Capital Finance Corp., 4.250%, 02/01/2027 | | | 585,180 | | | | 0.1 | |
| 491,000 (3) | | | Lloyds Banking Group PLC, 3.870%, 07/09/2025 | | | 488,461 | | | | 0.1 | |
| 707,000 (3) | | | Lloyds Banking Group PLC, 5.985%, 08/07/2027 | | | 713,880 | | | | 0.1 | |
| 232,000 (2) | | | Lseg US Fin Corp., 4.875%, 03/28/2027 | | | 231,162 | | | | 0.0 | |
| 1,047,000 (2) | | | LSEGA Financing PLC, 0.650%, 04/06/2024 | | | 1,046,323 | | | | 0.2 | |
| 806,000 (2) | | | LSEGA Financing PLC, 1.375%, 04/06/2026 | | | 747,471 | | | | 0.1 | |
| 548,000 | | | Main Street Capital Corp., 6.950%, 03/01/2029 | | | 557,100 | | | | 0.1 | |
| 717,000 (2) | | | Met Tower Global Funding, 4.850%, 01/16/2027 | | | 717,330 | | | | 0.1 | |
| 681,000 (3) | | | Mitsubishi UFJ Financial Group, Inc., 0.953%, 07/19/2025 | | | 670,962 | | | | 0.1 | |
See Accompanying Notes to Financial Statements
| Voya Short Term Bond Fund | PORTFOLIO OF INVESTMENTS |
| as of March 31, 2024 (continued) |
| | |
Principal
Amount† | | | | | Value | | | Percentage
of Net
Assets |
| CORPORATE BONDS/NOTES: (continued) | |
| | | | Financial: (continued) | | | | | | | | |
| 753,000 (3) | | | Mitsubishi UFJ Financial Group, Inc., 0.962%, 10/11/2025 | | $ | 733,795 | | | | 0.1 | |
| 400,000 | | | Mitsubishi UFJ Financial Group, Inc., 1.412%, 07/17/2025 | | | 380,555 | | | | 0.1 | |
| 720,000 (3) | | | Mitsubishi UFJ Financial Group, Inc., 1.538%, 07/20/2027 | | | 663,383 | | | | 0.1 | |
| 316,000 (3) | | | Mitsubishi UFJ Financial Group, Inc., 4.788%, 07/18/2025 | | | 314,918 | | | | 0.1 | |
| 200,000 (3) | | | Mizuho Financial Group, Inc., 2.555%, 09/13/2025 | | | 197,129 | | | | 0.0 | |
| 421,000 (3) | | | Mizuho Financial Group, Inc., 5.376%, 05/26/2030 | | | 423,106 | | | | 0.1 | |
| 1,624,000 (3) | | | Morgan Stanley, 0.790%, 05/30/2025 | | | 1,609,017 | | | | 0.3 | |
| 715,000 (3) | | | Morgan Stanley, 1.593%, 05/04/2027 | | | 661,499 | | | | 0.1 | |
| 311,000 (3) | | | Morgan Stanley, 2.188%, 04/28/2026 | | | 300,130 | | | | 0.1 | |
| 574,000 (3) | | | Morgan Stanley, 2.475%, 01/21/2028 | | | 534,091 | | | | 0.1 | |
| 425,000 (3) | | | Morgan Stanley, 5.123%, 02/01/2029 | | | 424,130 | | | | 0.1 | |
| 644,000 (3) | | | Morgan Stanley, 6.407%, 11/01/2029 | | | 675,555 | | | | 0.1 | |
| 914,000 (3) | | | Morgan Stanley, GMTN, 1.512%, 07/20/2027 | | | 839,060 | | | | 0.2 | |
| 1,218,000 (3) | | | Morgan Stanley, GMTN, 5.860%, (SOFRRATE + 0.509%), 01/22/2025 | | | 1,218,883 | | | | 0.2 | |
| 1,381,000 (3) | | | Morgan Stanley, MTN, 1.164%, 10/21/2025 | | | 1,344,833 | | | | 0.2 | |
| 154,000 (3) | | | Morgan Stanley, MTN, 2.720%, 07/22/2025 | | | 152,455 | | | | 0.0 | |
| 447,000 | | | Morgan Stanley, MTN, 3.125%, 07/27/2026 | | | 427,660 | | | | 0.1 | |
| 1,167,000 (3) | | | Morgan Stanley, MTN, 5.164%, 04/20/2029 | | | 1,166,408 | | | | 0.2 | |
| 533,000 | | | Morgan Stanley Bank NA, 4.754%, 04/21/2026 | | | 529,650 | | | | 0.1 | |
| 374,000 | | | National Australia Bank Ltd./New York, 3.500%, 06/09/2025 | | | 367,090 | | | | 0.1 | |
| 487,000 | | | National Bank of Canada FXD, 0.750%, 08/06/2024 | | | 478,830 | | | | 0.1 | |
| 556,000 (2) | | | National Securities Clearing Corp., 5.000%, 05/30/2028 | | | 560,068 | | | | 0.1 | |
| 625,000 (2) | | | Nationstar Mortgage Holdings, Inc., 5.000%, 02/01/2026 | | | 612,147 | | | | 0.1 | |
Principal
Amount† | | | | | Value | | | Percentage
of Net
Assets |
| CORPORATE BONDS/NOTES: (continued) | |
| | | | Financial: (continued) | | | | | | | | |
| 532,000 (2) | | | Nationwide Building Society, 1.500%, 10/13/2026 | | $ | 485,632 | | | | 0.1 | |
| 419,000 (3) | | | NatWest Group PLC, 5.583%, 03/01/2028 | | | 421,251 | | | | 0.1 | |
| 545,000 | | | Navient Corp., 6.750%, 06/25/2025 | | | 549,539 | | | | 0.1 | |
| 403,000 (2) | | | Nordea Bank Abp, 0.625%, 05/24/2024 | | | 400,140 | | | | 0.1 | |
| 374,000 (2) | | | Nordea Bank Abp, 3.600%, 06/06/2025 | | | 367,003 | | | | 0.1 | |
| 551,000 (2) | | | Northwestern Mutual Global Funding, 0.800%, 01/14/2026 | | | 511,466 | | | | 0.1 | |
| 893,000 | | | Old Republic International Corp., 4.875%, 10/01/2024 | | | 887,997 | | | | 0.2 | |
| 625,000 | | | OneMain Finance Corp., 3.500%, 01/15/2027 | | | 580,822 | | | | 0.1 | |
| 219,000 (2) | | | Pacific Life Global Funding II, 1.200%, 06/24/2025 | | | 208,484 | | | | 0.0 | |
| 394,000 (2) | | | Pacific Life Global Funding II, 1.375%, 04/14/2026 | | | 364,767 | | | | 0.1 | |
| 700,000 (3) | | | PNC Financial Services Group, Inc., 5.300%, 01/21/2028 | | | 700,973 | | | | 0.1 | |
| 488,000 (2) | | | Principal Life Global Funding II, 5.100%, 01/25/2029 | | | 487,254 | | | | 0.1 | |
| 352,000 | | | Prologis L.P., 4.875%, 06/15/2028 | | | 352,581 | | | | 0.1 | |
| 148,000 (2) | | | Prologis Targeted US Logistics Fund L.P., 5.250%, 04/01/2029 | | | 147,680 | | | | 0.0 | |
| 551,000 | | | Public Storage Operating Co., 5.125%, 01/15/2029 | | | 560,413 | | | | 0.1 | |
| 625,000 (2) | | | RLJ Lodging Trust L.P., 3.750%, 07/01/2026 | | | 595,638 | | | | 0.1 | |
| 457,000 | | | Royal Bank of Canada, GMTN, 1.150%, 07/14/2026 | | | 418,681 | | | | 0.1 | |
| 592,000 | | | Royal Bank of Canada, GMTN, 1.600%, 01/21/2025 | | | 574,354 | | | | 0.1 | |
| 332,000 | | | Royal Bank of Canada, GMTN, 4.950%, 02/01/2029 | | | 332,989 | | | | 0.1 | |
| 722,000 | | | Royal Bank of Canada, GMTN, 5.200%, 07/20/2026 | | | 724,585 | | | | 0.1 | |
| 727,000 (3) | | | Santander UK Group Holdings PLC, 6.833%, 11/21/2026 | | | 739,320 | | | | 0.1 | |
| 562,000 | | | Sixth Street Specialty Lending, Inc., 3.875%, 11/01/2024 | | | 555,033 | | | | 0.1 | |
See Accompanying Notes to Financial Statements
| Voya Short Term Bond Fund | PORTFOLIO OF INVESTMENTS |
| as of March 31, 2024 (continued) |
| | |
Principal
Amount† | | | | | Value | | | Percentage
of Net
Assets |
| CORPORATE BONDS/NOTES: (continued) | |
| | | | Financial: (continued) | | | | | | | | |
| 810,000 (2) | | | Skandinaviska Enskilda Banken AB, 0.650%, 09/09/2024 | | $ | 792,303 | | | | 0.1 | |
| 534,000 (2) | | | Skandinaviska Enskilda Banken AB, 3.700%, 06/09/2025 | | | 524,718 | | | | 0.1 | |
| 710,000 (2) | | | Skandinaviska Enskilda Banken AB, 5.125%, 03/05/2027 | | | 711,416 | | | | 0.1 | |
| 744,000 (2)(3) | | | Societe Generale SA, 2.226%, 01/21/2026 | | | 721,417 | | | | 0.1 | |
| 644,000 (3) | | | State Street Corp., 5.684%, 11/21/2029 | | | 661,615 | | | | 0.1 | |
| 888,000 | | | Sumitomo Mitsui Financial Group, Inc., 1.474%, 07/08/2025 | | | 845,657 | | | | 0.2 | |
| 750,000 | | | Sumitomo Mitsui Financial Group, Inc., 2.696%, 07/16/2024 | | | 743,901 | | | | 0.1 | |
| 230,000 | | | Sumitomo Mitsui Financial Group, Inc., 5.716%, 09/14/2028 | | | 236,629 | | | | 0.0 | |
| 535,000 (2) | | | Sumitomo Mitsui Trust Bank Ltd., 0.800%, 09/16/2024 | | | 523,634 | | | | 0.1 | |
| 1,000,000 (2) | | | Sumitomo Mitsui Trust Bank Ltd., 5.200%, 03/07/2027 | | | 1,001,233 | | | | 0.2 | |
| 241,000 (2) | | | Sumitomo Mitsui Trust Bank Ltd., 5.650%, 09/14/2026 | | | 243,389 | | | | 0.0 | |
| 533,000 (2) | | | Svenska Handelsbanken AB, 3.650%, 06/10/2025 | | | 523,568 | | | | 0.1 | |
| 447,000 (2) | | | Swedbank AB, 3.356%, 04/04/2025 | | | 438,346 | | | | 0.1 | |
| 576,000 | | | Toronto-Dominion Bank, 3.766%, 06/06/2025 | | | 565,958 | | | | 0.1 | |
| 595,000 | | | Toronto-Dominion Bank, GMTN, 4.980%, 04/05/2027 | | | 594,316 | | | | 0.1 | |
| 594,000 | | | Toronto-Dominion Bank, MTN, 0.700%, 09/10/2024 | | | 581,781 | | | | 0.1 | |
| 859,000 | | | Toronto-Dominion Bank, MTN, 5.532%, 07/17/2026 | | | 866,838 | | | | 0.2 | |
| 592,000 | | | Toronto-Dominion Bank FXD, 1.450%, 01/10/2025 | | | 574,259 | | | | 0.1 | |
| 370,000 (3) | | | Truist Financial Corp., MTN, 1.267%, 03/02/2027 | | | 342,144 | | | | 0.1 | |
| 491,000 (3) | | | Truist Financial Corp., MTN, 1.887%, 06/07/2029 | | | 426,416 | | | | 0.1 | |
| 425,000 (3) | | | Truist Financial Corp., MTN, 4.260%, 07/28/2026 | | | 418,216 | | | | 0.1 | |
Principal
Amount† | | | | | Value | | | Percentage
of Net
Assets |
| CORPORATE BONDS/NOTES: (continued) | |
| | | | Financial: (continued) | | | | | | | | |
| 661,000 (3) | | | Truist Financial Corp., MTN, 5.435%, 01/24/2030 | | $ | 660,414 | | | | 0.1 | |
| 515,000 (1)(2) | | | UBS AG/London, 0.700%, 08/09/2024 | | | 505,723 | | | | 0.1 | |
| 321,000 | | | UBS AG/London, 5.800%, 09/11/2025 | | | 323,414 | | | | 0.1 | |
| 1,249,000 (2)(3) | | | UBS Group AG, 2.193%, 06/05/2026 | | | 1,197,899 | | | | 0.2 | |
| 451,000 (2)(3) | | | UBS Group AG, 4.488%, 05/12/2026 | | | 444,713 | | | | 0.1 | |
| 539,000 (2)(3) | | | UBS Group AG, 4.490%, 08/05/2025 | | | 536,364 | | | | 0.1 | |
| 702,000 (2)(3) | | | UBS Group AG, 5.428%, 02/08/2030 | | | 703,263 | | | | 0.1 | |
| 625,000 (2) | | | United Wholesale Mortgage LLC, 5.500%, 11/15/2025 | | | 619,935 | | | | 0.1 | |
| 440,000 (3) | | | US Bancorp, 5.384%, 01/23/2030 | | | 442,058 | | | | 0.1 | |
| 406,000 (3) | | | US Bancorp, 5.775%, 06/12/2029 | | | 413,201 | | | | 0.1 | |
| 999,000 (1)(2) | | | VICI Properties L.P. / VICI Note Co., Inc., 3.500%, 02/15/2025 | | | 977,733 | | | | 0.2 | |
| 777,000 (2) | | | VICI Properties L.P. / VICI Note Co., Inc., 4.625%, 06/15/2025 | | | 765,752 | | | | 0.1 | |
| 97,000 (3) | | | Wells Fargo & Co., MTN, 2.164%, 02/11/2026 | | | 94,118 | | | | 0.0 | |
| 601,000 (3) | | | Wells Fargo & Co., MTN, 2.879%, 10/30/2030 | | | 531,477 | | | | 0.1 | |
| 383,000 (3) | | | Wells Fargo & Co., MTN, 3.526%, 03/24/2028 | | | 364,651 | | | | 0.1 | |
| 116,000 (3) | | | Wells Fargo & Co., MTN, 4.540%, 08/15/2026 | | | 114,550 | | | | 0.0 | |
| 281,000 (3) | | | Wells Fargo & Co., MTN, 5.574%, 07/25/2029 | | | 284,417 | | | | 0.0 | |
| 574,000 | | | Wells Fargo Bank NA, 5.450%, 08/07/2026 | | | 578,012 | | | | 0.1 | |
| 276,000 (1)(2) | | | Westpac New Zealand Ltd., 5.132%, 02/26/2027 | | | 276,116 | | | | 0.0 | |
| 550,000 (2) | | | XHR L.P., 6.375%, 08/15/2025 | | | 551,117 | | | | 0.1 | |
| | | | | | | 109,339,504 | | | | 19.8 | |
| | | | | | | | | | | | |
| | | | Industrial: 3.4% |
| 185,000 | | | AGCO Corp., 5.450%, 03/21/2027 | | | 185,907 | | | | 0.0 | |
| 735,000 | | | Avnet, Inc., 6.250%, 03/15/2028 | | | 753,428 | | | | 0.1 | |
| 325,000 (2) | | | BAE Systems PLC, 5.125%, 03/26/2029 | | | 326,361 | | | | 0.1 | |
See Accompanying Notes to Financial Statements
| Voya Short Term Bond Fund | PORTFOLIO OF INVESTMENTS |
| as of March 31, 2024 (continued) |
| | |
Principal
Amount† | | | | | Value | | | Percentage
of Net
Assets |
| CORPORATE BONDS/NOTES: (continued) | |
| | | | Industrial: (continued) | | | | | | | | |
| 625,000 (2) | | | Brundage-Bone Concrete Pumping Holdings, Inc., 6.000%, 02/01/2026 | | $ | 617,833 | | | | 0.1 | |
| 625,000 (2) | | | Cascades, Inc. /Cascades USA, Inc., 5.125%, 01/15/2026 | | | 613,152 | | | | 0.1 | |
| 315,000 | | | CNH Industrial Capital LLC, 5.100%, 04/20/2029 | | | 314,248 | | | | 0.1 | |
| 1,225,000 | | | CNH Industrial Capital LLC, 5.450%, 10/14/2025 | | | 1,227,918 | | | | 0.2 | |
| 625,000 (2) | | | Fortress Transportation and Infrastructure Investors LLC, 6.500%, 10/01/2025 | | | 624,545 | | | | 0.1 | |
| 560,000 | | | GATX Corp., 5.400%, 03/15/2027 | | | 564,130 | | | | 0.1 | |
| 625,000 (2) | | | GFL Environmental, Inc., 5.125%, 12/15/2026 | | | 614,564 | | | | 0.1 | |
| 480,000 (2) | | | Graphic Packaging International LLC, 0.821%, 04/15/2024 | | | 479,105 | | | | 0.1 | |
| 368,000 | | | HEICO Corp., 5.250%, 08/01/2028 | | | 370,405 | | | | 0.1 | |
| 697,000 | | | Honeywell International, Inc., 4.875%, 09/01/2029 | | | 702,064 | | | | 0.1 | |
| 251,000 (1) | | | John Deere Capital Corp., MTN, 2.350%, 03/08/2027 | | | 234,413 | | | | 0.1 | |
| 976,000 | | | John Deere Capital Corp., MTN, 4.850%, 03/05/2027 | | | 976,790 | | | | 0.2 | |
| 178,000 | | | John Deere Capital Corp., MTN, 4.950%, 07/14/2028 | | | 179,457 | | | | 0.0 | |
| 271,000 | | | L3Harris Technologies, Inc., 5.400%, 01/15/2027 | | | 273,048 | | | | 0.1 | |
| 396,000 | | | Lockheed Martin Corp., 5.100%, 11/15/2027 | | | 400,670 | | | | 0.1 | |
| 705,000 (2) | | | Penske Truck Leasing Co. L.P. / PTL Finance Corp., 5.350%, 01/12/2027 | | | 705,862 | | | | 0.1 | |
| 743,000 (2) | | | Penske Truck Leasing Co. L.P. / PTL Finance Corp., 6.050%, 08/01/2028 | | | 764,942 | | | | 0.1 | |
| 1,239,000 | | | Raytheon Technologies Corp., 3.950%, 08/16/2025 | | | 1,219,076 | | | | 0.2 | |
| 347,000 | | | Raytheon Technologies Corp., 5.000%, 02/27/2026 | | | 346,258 | | | | 0.1 | |
| 777,000 | | | Republic Services, Inc., 2.500%, 08/15/2024 | | | 767,894 | | | | 0.2 | |
Principal
Amount† | | | | | Value | | | Percentage
of Net
Assets |
| CORPORATE BONDS/NOTES: (continued) | |
| | | | Industrial: (continued) | | | | | | | | |
| 600,000 (2) | | | Rolls-Royce PLC, 3.625%, 10/14/2025 | | $ | 582,653 | | | | 0.1 | |
| 707,000 | | | Ryder System, Inc., MTN, 5.250%, 06/01/2028 | | | 710,597 | | | | 0.1 | |
| 488,000 | | | Ryder System, Inc., MTN, 5.375%, 03/15/2029 | | | 492,416 | | | | 0.1 | |
| 550,000 (2) | | | Sealed Air Corp., 5.500%, 09/15/2025 | | | 548,440 | | | | 0.1 | |
| 625,000 (2) | | | Standard Industries, Inc., 5.000%, 02/15/2027 | | | 606,770 | | | | 0.1 | |
| 920,000 | | | Teledyne Technologies, Inc., 0.950%, 04/01/2024 | | | 920,000 | | | | 0.2 | |
| 707,000 (2) | | | Veralto Corp., 5.500%, 09/18/2026 | | | 710,016 | | | | 0.1 | |
| 690,000 | | | Waste Management, Inc., 4.875%, 02/15/2029 | | | 696,887 | | | | 0.1 | |
| | | | | | | 18,529,849 | | | | 3.4 | |
| | | | | | | | | | | | |
| | | | Technology: 3.2% |
| 364,000 | | | Analog Devices, Inc., 2.950%, 04/01/2025 | | | 355,804 | | | | 0.1 | |
| 252,000 | | | Apple, Inc., 1.125%, 05/11/2025 | | | 241,370 | | | | 0.0 | |
| 30,000 (2) | | | Booz Allen Hamilton, Inc., 3.875%, 09/01/2028 | | | 28,134 | | | | 0.0 | |
| 149,000 (1)(2) | | | Booz Allen Hamilton, Inc., 4.000%, 07/01/2029 | | | 138,651 | | | | 0.0 | |
| 731,000 | | | Broadcom, Inc., 3.459%, 09/15/2026 | | | 703,565 | | | | 0.1 | |
| 999,000 | | | CDW LLC / CDW Finance Corp., 5.500%, 12/01/2024 | | | 995,317 | | | | 0.2 | |
| 89,000 | | | Concentrix Corp., 6.600%, 08/02/2028 | | | 90,070 | | | | 0.0 | |
| 1,244,000 | | | Fidelity National Information Services, Inc., 1.150%, 03/01/2026 | | | 1,152,212 | | | | 0.2 | |
| 1,044,000 | | | Fiserv, Inc., 2.750%, 07/01/2024 | | | 1,036,289 | | | | 0.2 | |
| 237,000 | | | Fiserv, Inc., 5.150%, 03/15/2027 | | | 237,950 | | | | 0.0 | |
| 685,000 | | | Fiserv, Inc., 5.450%, 03/02/2028 | | | 693,357 | | | | 0.1 | |
| 1,059,000 | | | HP, Inc., 2.200%, 06/17/2025 | | | 1,019,681 | | | | 0.2 | |
| 702,000 (1) | | | IBM International Capital Pte Ltd., 4.600%, 02/05/2029 | | | 692,526 | | | | 0.1 | |
| 297,000 | | | Intel Corp., 3.700%, 07/29/2025 | | | 291,191 | | | | 0.1 | |
| 659,000 | | | Intel Corp., 3.750%, 08/05/2027 | | | 637,417 | | | | 0.1 | |
See Accompanying Notes to Financial Statements
| Voya Short Term Bond Fund | PORTFOLIO OF INVESTMENTS |
| as of March 31, 2024 (continued) |
| | |
Principal
Amount† | | | | | Value | | | Percentage
of Net
Assets |
| CORPORATE BONDS/NOTES: (continued) | |
| | | | Technology: (continued) | | | | | | | | |
| 1,039,000 | | | Intel Corp., 4.875%, 02/10/2026 | | $ | 1,036,077 | | | | 0.2 | |
| 651,000 | | | International Business Machines Corp., 4.000%, 07/27/2025 | | | 641,004 | | | | 0.1 | |
| 427,000 | | | International Business Machines Corp., 6.500%, 01/15/2028 | | | 454,570 | | | | 0.1 | |
| 1,060,000 | | | Intuit, Inc., 5.250%, 09/15/2026 | | | 1,070,161 | | | | 0.2 | |
| 999,000 | | | Microchip Technology, Inc., 4.250%, 09/01/2025 | | | 982,966 | | | | 0.2 | |
| 1,008,000 | | | NetApp, Inc., 1.875%, 06/22/2025 | | | 964,428 | | | | 0.2 | |
| 923,000 | | | NXP BV / NXP Funding LLC / NXP USA, Inc., 2.700%, 05/01/2025 | | | 895,130 | | | | 0.2 | |
| 643,000 | | | Oracle Corp., 1.650%, 03/25/2026 | | | 600,492 | | | | 0.1 | |
| 313,000 | | | Oracle Corp., 2.500%, 04/01/2025 | | | 303,675 | | | | 0.1 | |
| 633,000 | | | Oracle Corp., 2.650%, 07/15/2026 | | | 599,203 | | | | 0.1 | |
| 682,000 | | | Take-Two Interactive Software, Inc., 3.550%, 04/14/2025 | | | 669,215 | | | | 0.1 | |
| 780,000 | | | VMware, Inc., 1.000%, 08/15/2024 | | | 766,397 | | | | 0.1 | |
| 421,000 | | | VMware, Inc., 1.400%, 08/15/2026 | | | 384,589 | | | | 0.1 | |
| 290,000 | | | Workday, Inc., 3.500%, 04/01/2027 | | | 277,764 | | | | 0.0 | |
| | | | | | | 17,959,205 | | | | 3.2 | |
| | | | | | | | | | | | |
| | | | Utilities: 4.6% |
| 518,000 (2) | | | AEP Texas, Inc., 3.850%, 10/01/2025 | | | 501,805 | | | | 0.1 | |
| 399,000 | | | AES Corp., 1.375%, 01/15/2026 | | | 369,653 | | | | 0.1 | |
| 1,119,000 | | | AES Corp., 5.450%, 06/01/2028 | | | 1,117,310 | | | | 0.2 | |
| 579,000 | | | Alabama Power Co., 3.750%, 09/01/2027 | | | 557,851 | | | | 0.1 | |
| 502,000 | | | Ameren Corp., 5.700%, 12/01/2026 | | | 508,818 | | | | 0.1 | |
| 607,000 | | | Ameren Illinois Co., 3.800%, 05/15/2028 | | | 588,360 | | | | 0.1 | |
| 637,000 | | | American Electric Power Co., Inc., 5.200%, 01/15/2029 | | | 638,865 | | | | 0.1 | |
| 286,000 (2) | | | Aquarion Co., 4.000%, 08/15/2024 | | | 283,438 | | | | 0.0 | |
| 169,000 | | | Arizona Public Service Co., 3.350%, 06/15/2024 | | | 168,112 | | | | 0.0 | |
| 551,000 | | | Avangrid, Inc., 3.200%, 04/15/2025 | | | 537,003 | | | | 0.1 | |
| 403,000 | | | Black Hills Corp., 1.037%, 08/23/2024 | | | 395,860 | | | | 0.1 | |
Principal
Amount† | | | | | Value | | | Percentage
of Net
Assets |
| CORPORATE BONDS/NOTES: (continued) | |
| | | | Utilities: (continued) | | | | | | | | |
| 359,000 | | | Connecticut Light and Power Co., 4.650%, 01/01/2029 | | $ | 355,189 | | | | 0.1 | |
| 315,000 | | | Consumers Energy Co., 4.900%, 02/15/2029 | | | 316,258 | | | | 0.1 | |
| 582,000 (3) | | | DTE Energy Co., 4.220%, 11/01/2024 | | | 576,722 | | | | 0.1 | |
| 534,000 | | | DTE Energy Co., 5.100%, 03/01/2029 | | | 532,090 | | | | 0.1 | |
| 1,032,000 (2) | | | East Ohio Gas Co., 1.300%, 06/15/2025 | | | 981,693 | | | | 0.2 | |
| 697,000 (2) | | | Enel Finance International NV, 6.800%, 10/14/2025 | | | 711,223 | | | | 0.1 | |
| 927,000 | | | Entergy Corp., 0.900%, 09/15/2025 | | | 869,300 | | | | 0.2 | |
| 438,000 | | | Eversource Energy, 2.900%, 03/01/2027 | | | 411,925 | | | | 0.1 | |
| 713,000 | | | Eversource Energy, 4.750%, 05/15/2026 | | | 705,840 | | | | 0.1 | |
| 266,000 | | | Exelon Corp., 5.150%, 03/15/2029 | | | 266,714 | | | | 0.0 | |
| 306,000 | | | Florida Power & Light Co., 4.400%, 05/15/2028 | | | 302,998 | | | | 0.0 | |
| 1,238,000 | | | Florida Power & Light Co., 4.450%, 05/15/2026 | | | 1,226,476 | | | | 0.2 | |
| 697,000 | | | Georgia Power Co., 5.004%, 02/23/2027 | | | 698,178 | | | | 0.1 | |
| 369,000 | | | Interstate Power and Light Co., 3.250%, 12/01/2024 | | | 363,412 | | | | 0.1 | |
| 351,000 | | | IPALCO Enterprises, Inc., 3.700%, 09/01/2024 | | | 350,935 | | | | 0.1 | |
| 320,000 (1)(2) | | | Liberty Utilities Co., 5.577%, 01/31/2029 | | | 321,962 | | | | 0.1 | |
| 307,000 | | | National Rural Utilities Cooperative Finance Corp., GMTN, 4.850%, 02/07/2029 | | | 307,001 | | | | 0.1 | |
| 417,000 | | | National Rural Utilities Cooperative Finance Corp., MTN, 1.875%, 02/07/2025 | | | 404,992 | | | | 0.1 | |
| 359,000 | | | National Rural Utilities Cooperative Finance Corp., MTN, 5.600%, 11/13/2026 | | | 364,108 | | | | 0.1 | |
| 392,000 (2) | | | New York State Electric & Gas Corp., 5.650%, 08/15/2028 | | | 401,185 | | | | 0.1 | |
| 516,000 | | | NextEra Energy Capital Holdings, Inc., 1.875%, 01/15/2027 | | | 472,633 | | | | 0.1 | |
| 446,000 | | | NextEra Energy Capital Holdings, Inc., 1.900%, 06/15/2028 | | | 395,231 | | | | 0.1 | |
See Accompanying Notes to Financial Statements
| Voya Short Term Bond Fund | PORTFOLIO OF INVESTMENTS |
| as of March 31, 2024 (continued) |
| | |
Principal
Amount† | | | | | Value | | | Percentage
of Net
Assets |
| CORPORATE BONDS/NOTES: (continued) | |
| | | | Utilities: (continued) | | | | | | | | |
| 464,000 | | | NextEra Energy Capital Holdings, Inc., 4.625%, 07/15/2027 | | $ | 457,733 | | | | 0.1 | |
| 257,000 | | | NextEra Energy Capital Holdings, Inc., 4.900%, 02/28/2028 | | | 256,312 | | | | 0.0 | |
| 535,000 (2) | | | Niagara Mohawk Power Corp., 1.960%, 06/27/2030 | | | 442,030 | | | | 0.1 | |
| 621,000 | | | NiSource, Inc., 0.950%, 08/15/2025 | | | 584,659 | | | | 0.1 | |
| 418,000 (2) | | | NRG Energy, Inc., 3.750%, 06/15/2024 | | | 415,810 | | | | 0.1 | |
| 632,000 (1) | | | ONE Gas, Inc., 5.100%, 04/01/2029 | | | 636,594 | | | | 0.1 | |
| 617,459 | | | PG&E Wildfire Recovery Funding LLC A-1, 3.594%, 06/01/2032 | | | 592,675 | | | | 0.1 | |
| 647,000 | | | Public Service Enterprise Group, Inc., 0.800%, 08/15/2025 | | | 608,252 | | | | 0.1 | |
| 170,000 | | | Public Service Enterprise Group, Inc., 5.850%, 11/15/2027 | | | 174,188 | | | | 0.0 | |
| 220,000 | | | Sempra Energy, 5.400%, 08/01/2026 | | | 220,725 | | | | 0.0 | |
| 1,252,000 | | | Sierra Pacific Power Co., 2.600%, 05/01/2026 | | | 1,190,211 | | | | 0.2 | |
| 238,000 | | | Southern Co., 5.500%, 03/15/2029 | | | 242,636 | | | | 0.0 | |
| 283,000 | | | Southern Co. Gas Capital Corp., 3.250%, 06/15/2026 | | | 271,186 | | | | 0.0 | |
| 417,000 | | | Tampa Electric Co., 4.900%, 03/01/2029 | | | 417,665 | | | | 0.1 | |
| 351,000 (2) | | | Trans-Allegheny Interstate Line Co., 3.850%, 06/01/2025 | | | 343,914 | | | | 0.1 | |
| 625,000 (2) | | | Vistra Operations Co. LLC, 5.500%, 09/01/2026 | | | 615,827 | | | | 0.1 | |
| 23,000 | | | WEC Energy Group, Inc., 2.200%, 12/15/2028 | | | 20,347 | | | | 0.0 | |
| 815,000 | | | WEC Energy Group, Inc., 4.750%, 01/09/2026 | | | 807,829 | | | | 0.1 | |
| 51,000 | | | WEC Energy Group, Inc., 5.000%, 09/27/2025 | | | 50,729 | | | | 0.0 | |
| 71,000 | | | WEC Energy Group, Inc., 5.150%, 10/01/2027 | | | 71,155 | | | | 0.0 | |
| | | | | | | 25,423,617 | | | | 4.6 | |
| | | | Total Corporate Bonds/Notes
(Cost $274,048,156) | | | 272,592,127 | | | | 49.4 | |
Principal
Amount† | | | | | Value | | | Percentage
of Net
Assets |
| ASSET-BACKED SECURITIES: 20.5% | |
| | | | Automobile Asset-Backed Securities: 5.8% |
| 750,000 | | | Americredit Automobile Receivables Trust 2023-1 A3, 5.620%, 11/18/2027 | | $ | 753,766 | | | | 0.1 | |
| 45,473 | | | AmeriCredit Automobile Receivables Trust 2020-1 C, 1.590%, 10/20/2025 | | | 45,331 | | | | 0.0 | |
| 468,638 | | | AmeriCredit Automobile Receivables Trust 2021-3 A3, 0.760%, 08/18/2026 | | | 459,674 | | | | 0.1 | |
| 700,000 | | | AmeriCredit Automobile Receivables Trust 2021-3 B, 1.170%, 08/18/2027 | | | 668,667 | | | | 0.1 | |
| 2,850,000 | | | BMW Vehicle Lease Trust 2024-1 A4, 5.000%, 06/25/2027 | | | 2,843,643 | | | | 0.5 | |
| 2,850,000 | | | Carmax Auto Owner Trust 2023-3 B, 5.470%, 02/15/2029 | | | 2,854,663 | | | | 0.5 | |
| 150,000 | | | CarMax Auto Owner Trust 2021-2 B, 1.030%, 12/15/2026 | | | 142,446 | | | | 0.0 | |
| 300,000 | | | CarMax Auto Owner Trust 2022-1 B, 1.950%, 09/15/2027 | | | 281,619 | | | | 0.1 | |
| 554,907 | | | Carvana Auto Receivables Trust 2022-P1 A3, 3.350%, 02/10/2027 | | | 546,277 | | | | 0.1 | |
| 1,650,000 (2) | | | Chase Auto Owner Trust 2023-AA A3, 5.680%, 01/25/2029 | | | 1,671,224 | | | | 0.3 | |
| 1,050,000 (2) | | | Citizens Auto Receivables Trust 2024-1 A3, 5.110%, 04/17/2028 | | | 1,049,395 | | | | 0.2 | |
| 900,000 | | | Ford Credit Auto Owner Trust 2022-A B, 1.910%, 07/15/2027 | | | 847,931 | | | | 0.2 | |
| 450,000 | | | GM Financial Automobile Leasing Trust 2023-1 A4, 5.160%, 01/20/2027 | | | 449,025 | | | | 0.1 | |
| 400,000 | | | GM Financial Consumer Automobile Receivables Trust 2022-4 B, 5.500%, 08/16/2028 | | | 401,421 | | | | 0.1 | |
| 550,000 | | | GM Financial Consumer Automobile Receivables Trust 2023-1 A3, 4.660%, 02/16/2028 | | | 545,708 | | | | 0.1 | |
| 1,750,000 | | | GM Financial Consumer Automobile Receivables Trust 2023-3 A4, 5.340%, 12/18/2028 | | | 1,762,875 | | | | 0.3 | |
See Accompanying Notes to Financial Statements
| Voya Short Term Bond Fund | PORTFOLIO OF INVESTMENTS |
| as of March 31, 2024 (continued) |
| | |
Principal
Amount† | | | | | Value | | | Percentage
of Net
Assets |
| ASSET-BACKED SECURITIES: (continued) | |
| | | | Automobile Asset-Backed Securities: (continued) | |
| 2,600,000 (2) | | | GM Financial Revolving Receivables Trust 2021-1 A, 1.170%, 06/12/2034 | | $ | 2,368,663 | | | | 0.4 | |
| 1,050,000 | | | Hyundai Auto Receivables Trust 2021-C B, 1.490%, 12/15/2027 | | | 983,950 | | | | 0.2 | |
| 141,957 (2) | | | JPMorgan Chase Bank NA - CACLN 2021-3 B, 0.760%, 02/26/2029 | | | 137,819 | | | | 0.0 | |
| 1,600,000 | | | Nissan Auto Lease Trust 2023-B A4, 5.610%, 11/15/2027 | | | 1,605,031 | | | | 0.3 | |
| 399,465 (2) | | | Oscar US Funding XIII LLC 2021-2A A3, 0.860%, 09/10/2025 | | | 396,522 | | | | 0.1 | |
| 1,250,000 (2) | | | Porsche Financial Auto Securitization Trust 2023-1A A4, 4.720%, 06/23/2031 | | | 1,240,183 | | | | 0.2 | |
| 2,600,000 | | | Santander Drive Auto Receivables Trust 2023-3 B, 5.610%, 07/17/2028 | | | 2,607,535 | | | | 0.5 | |
| 1,800,000 (2) | | | Tesla Auto Lease Trust 2023-A A3, 5.890%, 06/22/2026 | | | 1,810,487 | | | | 0.3 | |
| 2,750,000 | | | Toyota Auto Receivables Owner Trust 2024-A A3, 4.830%, 10/16/2028 | | | 2,741,101 | | | | 0.5 | |
| 3,050,000 | | | World Omni Auto Receivables Trust 2024-A A3, 4.860%, 03/15/2029 | | | 3,042,642 | | | | 0.5 | |
| | | | | | | 32,257,598 | | | | 5.8 | |
| | | | | | | | | | | | |
| | | | Credit Card Asset-Backed Securities: 0.7% |
| 800,000 (2) | | | CARDS II Trust 2021-1A A, 0.602%, 04/15/2027 | | | 798,359 | | | | 0.1 | |
| 3,150,000 | | | Chase Issuance Trust 2024-A2I A, 4.720%, 01/15/2031 | | | 3,142,076 | | | | 0.6 | |
| | | | | | | 3,940,435 | | | | 0.7 | |
| | | | | | | | | | | | |
| | | | Other Asset-Backed Securities: 12.5% |
| 550,000 (2)(3) | | | AB BSL CLO 4 Ltd. 2023-4A A, 7.318%, (TSFR3M + 2.000%), 04/20/2036 | | | 554,440 | | | | 0.1 | |
| 802,683 (2)(3) | | | AMMC CLO 22 Ltd. 2018-22A A, 6.616%, (TSFR3M + 1.292%), 04/25/2031 | | | 803,265 | | | | 0.2 | |
Principal
Amount† | | | | | Value | | | Percentage
of Net
Assets |
| ASSET-BACKED SECURITIES: (continued) |
| | | | Other Asset-Backed Securities: (continued) | |
| 2,000,000 (2)(3) | | | Arbor Realty Commercial Real Estate Notes Ltd. 2021-FL4 A, 6.790%, (TSFR1M + 1.464%), 11/15/2036 | | $ | 1,989,422 | | | | 0.4 | |
| 400,000 (2)(3) | | | ARES XLVI CLO Ltd. 2017-46A A2, 6.806%, (TSFR3M + 1.492%), 01/15/2030 | | | 400,103 | | | | 0.1 | |
| 1,900,000 (2)(3) | | | Ballyrock CLO 17 Ltd. 2021-17A A1B, 6.979%, (TSFR3M + 1.662%), 10/20/2034 | | | 1,900,479 | | | | 0.3 | |
| 500,000 (2)(3) | | | Barings Clo Ltd. 2019-4A A1, 6.906%, (TSFR3M + 1.592%), 01/15/2033 | | | 500,195 | | | | 0.1 | |
| 2,454,824 (2)(3) | | | Barings CLO Ltd. 2015-IA AR, 6.569%, (TSFR3M + 1.252%), 01/20/2031 | | | 2,456,113 | | | | 0.4 | |
| 250,000 (2)(3) | | | Barings CLO Ltd. 2017-1A A2, 6.910%, (TSFR3M + 1.612%), 07/18/2029 | | | 250,119 | | | | 0.0 | |
| 2,750,000 (2)(3) | | | Barings CLO Ltd. 2024-1A A, 6.899%, (TSFR3M + 1.630%), 01/20/2037 | | | 2,765,810 | | | | 0.5 | |
| 1,256,321 (2)(3) | | | Benefit Street Partners CLO IX Ltd. 2016-9A AR, 6.689%, (TSFR3M + 1.372%), 07/20/2031 | | | 1,257,137 | | | | 0.2 | |
| 2,000,000 (2)(3) | | | Benefit Street Partners CLO XX Ltd. 2020-20A AR, 6.746%, (TSFR3M + 1.432%), 07/15/2034 | | | 2,001,068 | | | | 0.4 | |
| 2,500,000 (2)(3) | | | BlueMountain CLO XXXII Ltd. 2021-32A A, 6.746%, (TSFR3M + 1.432%), 10/15/2034 | | | 2,501,228 | | | | 0.5 | |
| 1,319,082 (2)(3) | | | BlueMountain Fuji US Clo I Ltd. 2017-1A A1R, 6.559%, (TSFR3M + 1.242%), 07/20/2029 | | | 1,319,868 | | | | 0.2 | |
| 4,000,000 (2)(3) | | | BRSP Ltd. 2021-FL1 B, 7.341%, (TSFR1M + 2.014%), 08/19/2038 | | | 3,810,302 | | | | 0.7 | |
| 450,000 (2)(3) | | | Carlyle US Clo Ltd. 2017-2A AJR, 6.979%, (TSFR3M + 1.662%), 07/20/2031 | | | 449,738 | | | | 0.1 | |
| 800,000 (2)(3) | | | CARLYLE US CLO Ltd. 2021-4A A2, 6.979%, (TSFR3M + 1.662%), 04/20/2034 | | | 800,336 | | | | 0.1 | |
| 250,000 (2)(3) | | | CIFC Funding Ltd. 2019-6A A2, 7.326%, (TSFR3M + 2.012%), 01/16/2033 | | | 250,075 | | | | 0.0 | |
See Accompanying Notes to Financial Statements
| Voya Short Term Bond Fund | PORTFOLIO OF INVESTMENTS |
| as of March 31, 2024 (continued) |
| | |
Principal
Amount† | | | | | Value | | | Percentage
of Net
Assets |
| ASSET-BACKED SECURITIES: (continued) | |
| | | | Other Asset-Backed Securities: (continued) | |
| 1,143,214 | | | CNH Equipment Trust 2021-B A3, 0.440%, 08/17/2026 | | $ | 1,110,202 | | | | 0.2 | |
| 418,512 | | | CNH Equipment Trust 2021-C A3, 0.810%, 12/15/2026 | | | 405,451 | | | | 0.1 | |
| 119,312 (2)(3) | | | Deer Creek Clo Ltd. 2017-1A A, 6.759%, (TSFR3M + 1.442%), 10/20/2030 | | | 119,388 | | | | 0.0 | |
| 1,750,000 (2) | | | DLLAA LLC 2023-1A A3, 5.640%, 02/22/2028 | | | 1,769,267 | | | | 0.3 | |
| 1,630,000 (2)(3) | | | Dryden 72 CLO Ltd. 2019-72A AR, 6.649%, (TSFR3M + 1.342%), 05/15/2032 | | | 1,631,190 | | | | 0.3 | |
| 306,020 (2)(3) | | | Dryden XXVIII Senior Loan Fund 2013-28A A1LR, 6.769%, (TSFR3M + 1.462%), 08/15/2030 | | | 306,172 | | | | 0.1 | |
| 250,000 (2)(3) | | | Eaton Vance Clo Ltd. 2015-1A A2R, 6.829%, (TSFR3M + 1.512%), 01/20/2030 | | | 248,726 | | | | 0.0 | |
| 61,106 (2)(3) | | | Elevation CLO Ltd. 2014-2A A1R, 6.808%, (TSFR3M + 1.492%), 10/15/2029 | | | 61,129 | | | | 0.0 | |
| 1,210,000 (2)(3) | | | Goldentree Loan Management US Clo 4 Ltd. 2019-4A ARR, 6.477%, (TSFR3M + 1.150%), 04/24/2031 | | | 1,211,222 | | | | 0.2 | |
| 400,000 (2)(3) | | | HGI CRE CLO Ltd. 2022-FL3 A, 7.019%, (SOFR30A + 1.700%), 04/20/2037 | | | 400,013 | | | | 0.1 | |
| 450,000 (2)(3) | | | Invesco US CLO Ltd. 2023-1A AR, 6.856%, (TSFR3M + 1.570%), 04/22/2037 | | | 450,135 | | | | 0.1 | |
| 1,119,885 | | | John Deere Owner Trust 2021-B A3, 0.520%, 03/16/2026 | | | 1,093,747 | | | | 0.2 | |
| 450,000 | | | John Deere Owner Trust 2022 2022-A A4, 2.490%, 01/16/2029 | | | 431,745 | | | | 0.1 | |
| 1,270,072 (2) | | | Kubota Credit Owner Trust 2021-2A A3, 0.560%, 11/17/2025 | | | 1,242,210 | | | | 0.2 | |
| 1,100,000 (2) | | | Kubota Credit Owner Trust 2023-1A A3, 5.020%, 06/15/2027 | | | 1,096,254 | | | | 0.2 | |
| 1,322,356 (2)(3) | | | LCM 26 Ltd. 26A A1, 6.649%, (TSFR3M + 1.332%), 01/20/2031 | | | 1,323,355 | | | | 0.2 | |
Principal
Amount† | | | | | Value | | | Percentage
of Net
Assets |
| ASSET-BACKED SECURITIES: (continued) |
| | | | Other Asset-Backed Securities: (continued) | |
| 527,960 (2)(3) | | | Madison Park Funding XI Ltd. 2013-11A AR2, 6.477%, (TSFR3M + 1.162%), 07/23/2029 | | $ | 528,222 | | | | 0.1 | |
| 2,750,000 (2)(3) | | | Magnetite XXVI Ltd. 2020-26A A2R, 6.986%, (TSFR3M + 1.662%), 07/25/2034 | | | 2,739,586 | | | | 0.5 | |
| 1,575,000 (2)(3) | | | MF1 Ltd. 2021-FL6 C, 7.291%, (TSFR1M + 1.964%), 07/16/2036 | | | 1,523,588 | | | | 0.3 | |
| 971,806 (2)(3) | | | MF1 Ltd. 2022-FL8 A, 6.676%, (TSFR1M + 1.350%), 02/19/2037 | | | 966,249 | | | | 0.2 | |
| 1,710,708 (2)(3) | | | Neuberger Berman Loan Advisers CLO 26 Ltd. 2017-26A AR, 6.480%, (TSFR3M + 1.182%), 10/18/2030 | | | 1,711,072 | | | | 0.3 | |
| 1,550,000 (2)(3) | | | OCP CLO Ltd. 2020-19A AR, 6.729%, (TSFR3M + 1.412%), 10/20/2034 | | | 1,550,952 | | | | 0.3 | |
| 300,000 (2)(3) | | | Octagon 61 Ltd. 2023-2A A, 7.168%, (TSFR3M + 1.850%), 04/20/2036 | | | 301,456 | | | | 0.1 | |
| 250,000 (2)(3) | | | Octagon Investment Partners XV Ltd. 2013-1A A2R, 6.921%, (TSFR3M + 1.612%), 07/19/2030 | | | 249,617 | | | | 0.0 | |
| 1,105,746 (2)(3) | | | Octagon Loan Funding Ltd. 2014-1A ARR, 6.761%, (TSFR3M + 1.442%), 11/18/2031 | | | 1,107,054 | | | | 0.2 | |
| 3,700,000 (2)(3) | | | OHA Credit Partners XIII Ltd. 2016-13A AR, 6.749%, (TSFR3M + 1.432%), 10/25/2034 | | | 3,704,059 | | | | 0.7 | |
| 3,000,000 (2)(3) | | | OHA Credit Partners XVI 2021-16A A, 6.710%, (TSFR3M + 1.412%), 10/18/2034 | | | 3,003,924 | | | | 0.5 | |
| 500,000 (2)(3) | | | OHA Loan Funding Ltd. 2015-1A AR3, 6.721%, (TSFR3M + 1.412%), 01/19/2037 | | | 500,653 | | | | 0.1 | |
| 292,948 (2)(3) | | | Palmer Square CLO Ltd. 2015-2A A1R2, 6.679%, (TSFR3M + 1.362%), 07/20/2030 | | | 293,097 | | | | 0.1 | |
| 1,850,000 (2)(3) | | | Palmer Square CLO Ltd. 2018-1A A1R, 6.844%, (TSFR3M + 1.520%), 04/18/2037 | | | 1,850,588 | | | | 0.3 | |
| 1,650,000 (2)(3) | | | Palmer Square CLO Ltd. 2019-1A A1R, 6.718%, (TSFR3M + 1.412%), 11/14/2034 | | | 1,650,538 | | | | 0.3 | |
See Accompanying Notes to Financial Statements
| Voya Short Term Bond Fund | PORTFOLIO OF INVESTMENTS |
| as of March 31, 2024 (continued) |
| | |
Principal
Amount† | | | | | Value | | | Percentage
of Net
Assets |
| ASSET-BACKED SECURITIES: (continued) |
| | | | Other Asset-Backed Securities: (continued) | |
| 350,000 (2) | | | PFS Financing Corp. 2021-B A, 0.770%, 08/15/2026 | | $ | 343,493 | | | | 0.1 | |
| 600,000 (2) | | | PFS Financing Corp. 2022-D A, 4.270%, 08/15/2027 | | | 590,950 | | | | 0.1 | |
| 950,000 (2) | | | PFS Financing Corp. 2023-C A, 5.520%, 10/15/2028 | | | 959,506 | | | | 0.2 | |
| 750,000 (2)(3) | | | Rad CLO 6 Ltd. 2019-6A A1, 6.959%, (TSFR3M + 1.642%), 01/20/2033 | | | 750,289 | | | | 0.1 | |
| 2,361,909 (2)(3) | | | Sound Point CLO XVIII Ltd. 2017-4A A1, 6.699%, (TSFR3M + 1.382%), 01/21/2031 | | | 2,364,519 | | | | 0.4 | |
| 410,000 (2)(3) | | | Sound Point CLO XXV Ltd. 2019-4A A1R, 6.605%, (TSFR3M + 1.280%), 04/25/2033 | | | 403,477 | | | | 0.1 | |
| 1,290,568 (2)(3) | | | TCI-Symphony CLO Ltd. 2017-1A AR, 6.506%, (TSFR3M + 1.192%), 07/15/2030 | | | 1,291,020 | | | | 0.2 | |
| 500,000 (2)(3) | | | THL Credit Wind River CLO Ltd. 2019-1A AR, 6.739%, (TSFR3M + 1.422%), 07/20/2034 | | | 500,177 | | | | 0.1 | |
| 1,650,000 (2) | | | Trafigura Securitisation Finance PLC 2021-1A A2, 1.080%, 01/15/2025 | | | 1,615,649 | | | | 0.3 | |
| 300,000 (2)(3) | | | Wellman Park CLO Ltd. 2021-1A A, 6.676%, (TSFR3M + 1.362%), 07/15/2034 | | | 300,189 | | | | 0.1 | |
| 1,250,000 (2)(3) | | | Wind River CLO Ltd. 2022-1A A, 6.848%, (TSFR3M + 1.530%), 07/20/2035 | | | 1,250,913 | | | | 0.2 | |
| | | | | | | 68,960,741 | | | | 12.5 | |
| | | | | | | | | | | | |
| | | | Student Loan Asset-Backed Securities: 1.5% |
| 1,995,947 (2) | | | Commonbond Student Loan Trust-GS 2019-AGS A1, 2.540%, 01/25/2047 | | | 1,777,033 | | | | 0.3 | |
| 3,344 (2) | | | Laurel Road Prime Student Loan Trust 2018-B A2FX, 3.540%, 05/26/2043 | | | 3,334 | | | | 0.0 | |
| 134,814 (2)(3) | | | Navient Private Education Loan Trust 2014-AA A3, 7.040%, (TSFR1M + 1.714%), 10/15/2031 | | | 135,151 | | | | 0.0 | |
| 153,178 (2) | | | Navient Private Education Refi Loan Trust 2019-FA A2, 2.600%, 08/15/2068 | | | 143,451 | | | | 0.0 | |
Principal
Amount† | | | | | Value | | | Percentage
of Net
Assets |
| ASSET-BACKED SECURITIES: (continued) | |
| | | | Student Loan Asset-Backed Securities: (continued) | |
| 48,687 (2) | | | Navient Private Education Refi Loan Trust 2020-GA A, 1.170%, 09/16/2069 | | $ | 43,925 | | | | 0.0 | |
| 88,908 (2) | | | Navient Private Education Refi Loan Trust 2021-A A, 0.840%, 05/15/2069 | | | 78,034 | | | | 0.0 | |
| 1,362,414 (2) | | | Navient Private Education Refi Loan Trust 2021-EA A, 0.970%, 12/16/2069 | | | 1,179,001 | | | | 0.2 | |
| 325,829 (2) | | | Navient Private Education Refi Loan Trust 2021-FA A, 1.110%, 02/18/2070 | | | 278,553 | | | | 0.1 | |
| 2,807,343 (2) | | | Navient Private Education Refi Loan Trust 2023-A A, 5.510%, 10/15/2071 | | | 2,821,810 | | | | 0.5 | |
| 210,319 (2) | | | Sofi Professional Loan Program LLC 2018-A A2B, 2.950%, 02/25/2042 | | | 205,238 | | | | 0.1 | |
| 372,593 (2) | | | SoFi Professional Loan Program Trust 2021-B AFX, 1.140%, 02/15/2047 | | | 317,208 | | | | 0.1 | |
| 1,446,591 (2) | | | Sofi Proffesional Loan Program Trust 2021-A AFX, 1.030%, 08/17/2043 | | | 1,240,850 | | | | 0.2 | |
| | | | | | | 8,223,588 | | | | 1.5 | |
| | | | | | | | | | | | |
| | | | Total Asset-Backed Securities
(Cost $114,140,292) | | | 113,382,362 | | | | 20.5 | |
| |
| U.S. TREASURY OBLIGATIONS: 13.0% |
| | | | United States Treasury Notes: 13.0% |
| 11,530,000 | | | 2.875%, 04/30/2025 | | | 11,275,079 | | | | 2.1 | |
| 113,000 | | | 4.250%, 12/15/2026 | | | 112,739 | | | | 0.0 | |
| 52,004,000 | | | 4.250%, 03/15/2027 | | | 51,768,357 | | | | 9.4 | |
| 1,747,700 (1) | | | 4.250%, 02/28/2029 | | | 1,750,294 | | | | 0.3 | |
| 5,122,000 | | | 4.500%, 03/31/2026 | | | 5,109,395 | | | | 0.9 | |
| 1,651,000 (1) | | | 4.625%, 02/28/2026 | | | 1,649,775 | | | | 0.3 | |
| | | | | | | 71,665,639 | | | | 13.0 | |
| | | | Total U.S. Treasury Obligations
(Cost $71,763,468) | | | 71,665,639 | | | | 13.0 | |
| |
| COLLATERALIZED MORTGAGE OBLIGATIONS: 7.4% |
| 1,000,000 (2)(3) | | | Fannie Mae Connecticut Avenue Securities 2021-R01 1M2, 6.870%, (SOFR30A + 1.550%), 10/25/2041 | | | 1,004,706 | | | | 0.2 | |
| 67,551 | | | Fannie Mae Interest Strip 404 8, 3.000%, 05/25/2040 | | | 61,313 | | | | 0.0 | |
See Accompanying Notes to Financial Statements
| Voya Short Term Bond Fund | PORTFOLIO OF INVESTMENTS |
| as of March 31, 2024 (continued) |
| | |
Principal
Amount† | | | | | Value | | | Percentage
of Net
Assets |
| COLLATERALIZED MORTGAGE OBLIGATIONS: (continued) |
| 8,633 | | | Fannie Mae REMIC Trust 2010-54 LC, 3.000%, 04/25/2040 | | $ | 8,457 | | | | 0.0 | |
| 264,086 | | | Fannie Mae REMIC Trust 2013-114 NA, 3.000%, 08/25/2032 | | | 255,357 | | | | 0.1 | |
| 546,160 (3) | | | Fannie Mae REMIC Trust 2013-34 PF, 5.785%, (SOFR30A + 0.464%), 08/25/2042 | | | 543,241 | | | | 0.1 | |
| 87,507 | | | Freddie Mac REMIC Trust 2103 TE, 6.000%, 12/15/2028 | | | 87,954 | | | | 0.0 | |
| 791,626 (3) | | | Freddie Mac REMIC Trust 3049 XF, 5.783%, (SOFR30A + 0.464%), 05/15/2033 | | | 784,723 | | | | 0.1 | |
| 3,550,080 (3) | | | Freddie Mac REMIC Trust 3114 PF, 5.833%, (SOFR30A + 0.514%), 02/15/2036 | | | 3,511,603 | | | | 0.6 | |
| 5,331,358 (3) | | | Freddie Mac REMIC Trust 3136 FA, 5.983%, (SOFR30A + 0.664%), 04/15/2036 | | | 5,294,284 | | | | 1.0 | |
| 1,052,372 (3) | | | Freddie Mac REMIC Trust 3153 UF, 5.863%, (SOFR30A + 0.544%), 05/15/2036 | | | 1,047,208 | | | | 0.2 | |
| 413,602 (3) | | | Freddie Mac REMIC Trust 3255 FA, 5.713%, (SOFR30A + 0.394%), 12/15/2036 | | | 406,213 | | | | 0.1 | |
| 22,956 (3) | | | Freddie Mac REMIC Trust 3747 FA, 5.933%, (SOFR30A + 0.614%), 10/15/2040 | | | 22,702 | | | | 0.0 | |
| 545,024 (3) | | | Freddie Mac REMIC Trust 4879 DF, 5.833%, (SOFR30A + 0.514%), 08/15/2034 | | | 539,900 | | | | 0.1 | |
| 1,201,067 (2)(3) | | | Freddie Mac STACR REMIC Trust 2021-HQA1 M2, 7.570%, (SOFR30A + 2.250%), 08/25/2033 | | | 1,229,153 | | | | 0.2 | |
| 1,500,000 (2)(3) | | | Freddie Mac STACR REMIC Trust 2022-DNA2 M1B, 7.720%, (SOFR30A + 2.400%), 02/25/2042 | | | 1,529,306 | | | | 0.3 | |
| 4,789,896 (3) | | | Freddie Mac Strips 406 F43, 6.120%, (SOFR30A + 0.800%), 10/25/2053 | | | 4,808,306 | | | | 0.9 | |
| 4,038,595 (3) | | | Freddie Mac Strips 406 F44, 6.320%, (SOFR30A + 1.000%), 10/25/2053 | | | 4,075,575 | | | | 0.7 | |
Principal
Amount† | | | | | Value | | | Percentage
of Net
Assets |
| COLLATERALIZED MORTGAGE OBLIGATIONS: (continued) |
| 677,615 (2)(3) | | | Freddie Mac Structured Agency Credit Risk Debt Notes 2021-DNA2 M2, 7.620%, (SOFR30A + 2.300%), 08/25/2033 | | $ | 691,388 | | | | 0.1 | |
| 180,448 (3) | | | Ginnie Mae 2010-H03 FA, 5.989%, (TSFR1M + 0.664%), 03/20/2060 | | | 180,404 | | | | 0.0 | |
| 15,337 (3) | | | Ginnie Mae 2010-H10 FC, 6.451%, (TSFR1M + 1.114%), 05/20/2060 | | | 15,426 | | | | 0.0 | |
| 1,409,029 (3) | | | Ginnie Mae 2010-H11 FA, 6.439%, (TSFR1M + 1.114%), 06/20/2060 | | | 1,416,104 | | | | 0.3 | |
| 139,599 (3) | | | Ginnie Mae 2011-H03 FA, 5.944%, (TSFR1M + 0.614%), 01/20/2061 | | | 139,475 | | | | 0.0 | |
| 34,150 (3) | | | Ginnie Mae 2011-H05 FA, 5.944%, (TSFR1M + 0.614%), 12/20/2060 | | | 34,121 | | | | 0.0 | |
| 70,438 (3) | | | Ginnie Mae 2011-H05 FB, 5.944%, (TSFR1M + 0.614%), 12/20/2060 | | | 70,375 | | | | 0.0 | |
| 302,240 (3) | | | Ginnie Mae 2011-H06 FA, 5.894%, (TSFR1M + 0.564%), 02/20/2061 | | | 301,779 | | | | 0.1 | |
| 24,086 (3) | | | Ginnie Mae 2011-H07 FA, 5.944%, (TSFR1M + 0.614%), 02/20/2061 | | | 24,060 | | | | 0.0 | |
| 72,057 (3) | | | Ginnie Mae 2011-H08 FD, 5.944%, (TSFR1M + 0.614%), 02/20/2061 | | | 71,998 | | | | 0.0 | |
| 258,602 (3) | | | Ginnie Mae 2011-H08 FG, 5.924%, (TSFR1M + 0.594%), 03/20/2061 | | | 258,349 | | | | 0.1 | |
| 313,945 (3) | | | Ginnie Mae 2011-H09 AF, 5.944%, (TSFR1M + 0.614%), 03/20/2061 | | | 313,682 | | | | 0.1 | |
| 74,698 (3) | | | Ginnie Mae 2012-H18 NA, 5.964%, (TSFR1M + 0.634%), 08/20/2062 | | | 74,591 | | | | 0.0 | |
| 483,372 (3) | | | Ginnie Mae 2012-H23 WA, 5.964%, (TSFR1M + 0.634%), 10/20/2062 | | | 483,056 | | | | 0.1 | |
| 272,604 | | | Ginnie Mae 2014-3 EP, 2.750%, 02/16/2043 | | | 252,241 | | | | 0.0 | |
| 149,828 (3) | | | Ginnie Mae 2014-53 JM, 6.981%, 04/20/2039 | | | 156,584 | | | | 0.0 | |
| 3,171,772 (3) | | | Ginnie Mae 2015-H32 FH, 6.104%, (TSFR1M + 0.774%), 12/20/2065 | | | 3,175,920 | | | | 0.6 | |
| 2,977,498 (3) | | | Ginnie Mae 2016-H16 FE, 6.105%, (TSFR12M + 1.095%), 06/20/2066 | | | 2,974,856 | | | | 0.5 | |
| 965,969 (3) | | | Ginnie Mae 2017-H06 FE, 5.994%, (TSFR1M + 0.664%), 02/20/2067 | | | 965,762 | | | | 0.2 | |
| 633,940 (3) | | | Ginnie Mae 2017-H07 FG, 5.904%, (TSFR1M + 0.574%), 02/20/2067 | | | 633,003 | | | | 0.1 | |
See Accompanying Notes to Financial Statements
| Voya Short Term Bond Fund | PORTFOLIO OF INVESTMENTS |
| as of March 31, 2024 (continued) |
| | |
Principal
Amount† | | | | | Value | | | Percentage
of Net
Assets |
| COLLATERALIZED MORTGAGE OBLIGATIONS: (continued) |
| 1,881,650 | | | Ginnie Mae 2023-86 DA, 5.500%, 08/20/2050 | | $ | 1,887,613 | | | | 0.3 | |
| 983,530 (2)(3) | | | JP Morgan Mortgage Trust 2021-INV6 A5A, 2.500%, 04/25/2052 | | | 783,541 | | | | 0.1 | |
| 1,114,292 | | | Seasoned Credit Risk Transfer Trust Series 2018-2 MA, 3.500%, 11/25/2057 | | | 1,053,538 | | | | 0.2 | |
| | | | Total Collateralized Mortgage Obligations
(Cost $40,939,930) | | | 41,167,867 | | | | 7.4 | |
| | | | | | | | | | | | |
| COMMERCIAL MORTGAGE-BACKED SECURITIES: 7.4% |
| 1,478,947 (2)(3) | | | AREIT LLC 2023-CRE8 A, 7.438%, (TSFR1M + 2.112%), 08/17/2041 | | | 1,483,661 | | | | 0.3 | |
| 604,500 (2)(3) | | | AREIT Trust 2019-CRE3 C, 7.340%, (TSFR1M + 2.014%), 09/14/2036 | | | 559,319 | | | | 0.1 | |
| 2,917,000 (2)(3) | | | BHMS 2018-ATLS C, 7.522%, (TSFR1M + 2.197%), 07/15/2035 | | | 2,857,078 | | | | 0.5 | |
| 291,180 (2)(3) | | | BX 2021-MFM1 B, 6.389%, (TSFR1M + 1.064%), 01/15/2034 | | | 288,823 | | | | 0.0 | |
| 1,550,000 (2)(3) | | | BX Trust 2021-ARIA C, 7.085%, (TSFR1M + 1.760%), 10/15/2036 | | | 1,530,809 | | | | 0.3 | |
| 1,000,000 (2)(3) | | | BX Trust 2021-LGCY A, 5.945%, (TSFR1M + 0.620%), 10/15/2036 | | | 987,555 | | | | 0.2 | |
| 1,280,755 (2)(3) | | | BX Trust 2022-PSB A, 7.776%, (TSFR1M + 2.451%), 08/15/2039 | | | 1,290,353 | | | | 0.2 | |
| 1,300,000 | | | COMM Mortgage Trust 2015-CR26 A4, 3.630%, 10/10/2048 | | | 1,259,542 | | | | 0.2 | |
| 1,200,000 | | | Csail Commercial Mortgage Trust 2015-C2 A4, 3.504%, 06/15/2057 | | | 1,170,483 | | | | 0.2 | |
| 2,013,173 | | | DBJPM Mortgage Trust 2017-C6 A3, 3.269%, 06/10/2050 | | | 1,958,410 | | | | 0.4 | |
| 4,000,000 (2) | | | DC Commercial Mortgage Trust 2023-DC A, 6.314%, 09/12/2040 | | | 4,094,783 | | | | 0.7 | |
| 1,046,823 (2)(3) | | | Extended Stay America Trust 2021-ESH A, 6.519%, (TSFR1M + 1.194%), 07/15/2038 | | | 1,047,167 | | | | 0.2 | |
| 710,000 (2)(4) | | | GAM Re-REMIC Trust 2021-FRR1 2B, 0.000%, 11/29/2050 | | | 538,953 | | | | 0.1 | |
| 52,036 | | | Ginnie Mae 2017-100 AB, 2.300%, 04/16/2052 | | | 49,485 | | | | 0.0 | |
Principal
Amount† | | | | | Value | | | Percentage
of Net
Assets |
| COMMERCIAL MORTGAGE-BACKED SECURITIES: (continued) |
| 6,197 | | | Ginnie Mae 2017-51 AB, 2.350%, 04/16/2057 | | $ | 6,111 | | | | 0.0 | |
| 293 | | | Ginnie Mae 2017-69 AB, 2.350%, 05/16/2053 | | | 292 | | | | 0.0 | |
| 3,365 | | | Ginnie Mae 2017-70 A, 2.500%, 10/16/2057 | | | 3,327 | | | | 0.0 | |
| 28,910 | | | Ginnie Mae 2017-86 AB, 2.300%, 11/16/2051 | | | 28,167 | | | | 0.0 | |
| 22,464 | | | Ginnie Mae 2017-89 A, 2.500%, 08/16/2057 | | | 22,068 | | | | 0.0 | |
| 6,630 | | | Ginnie Mae 2018-41 A, 2.400%, 09/16/2058 | | | 6,507 | | | | 0.0 | |
| 1,039,000 (2)(3) | | | GS Mortgage Securities Corp. Trust 2017-SLP E, 4.605%, 10/10/2032 | | | 974,129 | | | | 0.2 | |
| 190,000 (2) | | | GSCG Trust 2019-600C A, 2.936%, 09/06/2034 | | | 147,254 | | | | 0.0 | |
| 330,000 (2) | | | Houston Galleria Mall Trust 2015-HGLR A1A2, 3.087%, 03/05/2037 | | | 319,104 | | | | 0.1 | |
| 4,000,000 (2)(3) | | | ILPT Commercial Mortgage Trust 2022-LPF2 A, 7.570%, (TSFR1M + 2.245%), 10/15/2039 | | | 4,003,271 | | | | 0.7 | |
| 113,909 (3) | | | JP Morgan Chase Commercial Mortgage Securities Trust 2013-C10 C, 4.074%, 12/15/2047 | | | 106,704 | | | | 0.0 | |
| 360,000 (2) | | | JP Morgan Chase Commercial Mortgage Securities Trust 2018-WPT CFX, 4.950%, 07/05/2033 | | | 293,467 | | | | 0.1 | |
| 100,000 (2)(3) | | | JP Morgan Chase Commercial Mortgage Securities Trust 2020-LOOP E, 3.861%, 12/05/2038 | | | 26,077 | | | | 0.0 | |
| 820,000 (3) | | | JPMBB Commercial Mortgage Securities Trust 2014-C19 C, 4.657%, 04/15/2047 | | | 805,652 | | | | 0.1 | |
| 2,000,000 (2)(3) | | | Life Mortgage Trust 2022-BMR2 A1, 6.621%, (TSFR1M + 1.295%), 05/15/2039 | | | 1,984,743 | | | | 0.4 | |
| 2,239,253 (2)(3) | | | Med Trust 2021-MDLN A, 6.389%, (TSFR1M + 1.064%), 11/15/2038 | | | 2,235,234 | | | | 0.4 | |
| 400,000 (2)(3) | | | MTN Commercial Mortgage Trust 2022-LPFL A, 6.727%, (TSFR1M + 1.397%), 03/15/2039 | | | 396,283 | | | | 0.1 | |
| 1,200,000 (2)(3) | | | PFP Ltd. 2023-10 A, 7.692%, (TSFR1M + 2.365%), 09/16/2038 | | | 1,207,798 | | | | 0.2 | |
See Accompanying Notes to Financial Statements
| Voya Short Term Bond Fund | PORTFOLIO OF INVESTMENTS |
| as of March 31, 2024 (continued) |
| | |
Principal
Amount† | | | | | Value | | | Percentage
of Net
Assets |
| COMMERCIAL MORTGAGE-BACKED SECURITIES: (continued) |
| 2,000,000 (2)(3) | | | SMRT 2022-MINI F, 8.676%, (TSFR1M + 3.350%), 01/15/2039 | | $ | 1,861,962 | | | | 0.3 | |
| 1,900,000 (2) | | | THPT Mortgage Trust 2023-THL A, 6.994%, 12/10/2034 | | | 1,946,350 | | | | 0.4 | |
| 1,085,000 | | | Wells Fargo Commercial Mortgage Trust 2016-LC25 A4, 3.640%, 12/15/2059 | | | 1,037,773 | | | | 0.2 | |
| 2,000,000 (3) | | | WFRBS Commercial Mortgage Trust 2014-C21 B, 4.213%, 08/15/2047 | | | 1,898,402 | | | | 0.3 | |
| 2,500,000 (2) | | | WSTN Trust 2023-MAUI A, 6.297%, 07/05/2037 | | | 2,523,224 | | | | 0.5 | |
| | | | Total Commercial Mortgage-Backed Securities
(Cost $40,926,228) | | | 40,950,320 | | | | 7.4 | |
| |
| U.S. GOVERNMENT AGENCY OBLIGATIONS: 0.1% |
| | | | Federal Home Loan Mortgage Corporation: 0.1%(5) |
| 10,874 | | | 5.500%, 01/01/2037 | | | 11,117 | | | | 0.0 | |
| 17,190 | | | 5.500%, 08/01/2038 | | | 17,532 | | | | 0.0 | |
| 5,197 | | | 5.500%, 10/01/2038 | | | 5,300 | | | | 0.0 | |
| 105,170 | | | 5.500%, 11/01/2038 | | | 107,531 | | | | 0.1 | |
| 92,775 | | | 5.500%, 02/01/2039 | | | 94,565 | | | | 0.0 | |
| | | | | | | 236,045 | | | | 0.1 | |
| | | | Uniform Mortgage-Backed Securities: 0.0% |
| 459 | | | 5.000%, 03/01/2027 | | | 459 | | | | 0.0 | |
| 77,064 | | | 5.000%, 05/01/2042 | | | 77,499 | | | | 0.0 | |
| | | | | | | 77,958 | | | | 0.0 | |
| | | | Total U.S. Government Agency Obligations
(Cost $327,640) | | | 314,003 | | | | 0.1 | |
| | | | Total Long-Term Investments
(Cost $542,145,714) | | | 540,072,318 | | | | 97.8 | |
Principal
Amount† | | | RA | | Value | | | Percentage
of Net
Assets |
| SHORT-TERM INVESTMENTS: 3.9% |
| | | | Repurchase Agreements: 1.7% |
| 2,585,197 (6) | | | Bank Of Montreal, Repurchase Agreement dated 03/28/2024, 5.330%, due 04/01/2024 (Repurchase Amount $2,586,707, collateralized by various U.S. Government Agency Obligations, 3.500%-7.000%, Market Value plus accrued interest $2,636,901, due 08/01/33-03/01/54) | | $ | 2,585,197 | | | | 0.4 | |
| 2,585,197 (6) | | | Daiwa Capital Markets America Inc., Repurchase Agreement dated 03/28/2024, 5.360%, due 04/01/2024 (Repurchase Amount $2,586,716, collateralized by various U.S. Government/U.S. Government Agency Obligations, 0.375%-7.000%, Market Value plus accrued interest $2,636,901, due 05/31/24-04/01/54) | | | 2,585,197 | | | | 0.5 | |
| 2,585,197 (6) | | | Deutsche Bank Securities Inc., Repurchase Agreement dated 03/28/2024, 5.330%, due 04/01/2024 (Repurchase Amount $2,586,707, collateralized by various U.S. Government Agency Obligations, 1.500%-7.500%, Market Value plus accrued interest $2,636,901, due 06/01/36-04/01/54) | | | 2,585,197 | | | | 0.5 | |
See Accompanying Notes to Financial Statements
| Voya Short Term Bond Fund | PORTFOLIO OF INVESTMENTS |
| as of March 31, 2024 (continued) |
| | |
Principal
Amount† | | | RA | | Value | | | Percentage
of Net
Assets |
| SHORT-TERM INVESTMENTS: (continued) | |
| | | | Repurchase Agreements (continued) | |
| 1,611,133 (6) | | | HSBC Securities (USA) Inc., Repurchase Agreement dated 03/28/2024, 5.340%, due 04/01/2024 (Repurchase Amount $1,612,076, collateralized by various U.S. Government Agency Obligations, 1.500%-7.500%, Market Value plus accrued interest $1,643,356, due 01/01/31-08/01/59) | | $ | 1,611,133 | | | | 0.3 | |
| | | | Total Repurchase Agreements
(Cost $9,366,724) | | | 9,366,724 | | | | 1.7 | |
| | | | | | | | | | | | |
| | | | Time Deposits: 0.3% |
| 250,000 (6) | | | Canadian Imperial Bank of Commerce, 5.310%, 04/01/2024 | | | 250,000 | | | | 0.1 | |
| 240,000 (6) | | | Landesbank Hessen Thueringen Girozentrale, 5.320%, 04/01/2024 | | | 240,000 | | | | 0.0 | |
| 220,000 (6) | | | Mizuho Bank Ltd., 5.320%, 04/01/2024 | | | 220,000 | | | | 0.0 | |
| 250,000 (6) | | | Royal Bank of Canada, 5.320%, 04/01/2024 | | | 250,000 | | | | 0.1 | |
| 250,000 (6) | | | Skandinaviska Enskilda Banken AB, 5.310%, 04/01/2024 | | | 250,000 | | | | 0.1 | |
| 240,000 (6) | | | Societe Generale, 5.310%, 04/01/2024 | | | 240,000 | | | | 0.0 | |
| | | | Total Time Deposits
(Cost $1,450,000) | | | 1,450,000 | | | | 0.3 | |
| | | | | | | | | | | | |
| | | | Commercial Paper: 1.8% |
| 600,000 | | | Consolidated Edison, 7.240%, 04/10/2024 | | | 598,816 | | | | 0.1 | |
| 6,200,000 | | | CVS Caremark, 21.960%, 04/01/2024 | | | 6,196,283 | | | | 1.1 | |
| 2,000,000 | | | Dominion Energy, Inc., 6.060%, 05/13/2024 | | | 1,985,870 | | | | 0.3 | |
| 1,500,000 | | | Dominion Energy, Inc., 6.170%, 05/01/2024 | | | 1,492,199 | | | | 0.3 | |
| | | | Total Commercial Paper
(Cost $10,279,111) | | | 10,273,168 | | | | 1.8 | |
| Shares | | | | | Value | | | Percentage
of Net
Assets |
| | | | Mutual Funds: 0.1% |
| 305,000 (7) | | | Morgan Stanley Institutional Liquidity Funds - Government Portfolio (Institutional Share Class), 5.220%
(Cost $305,000) | | $ | 305,000 | | | | 0.1 | |
| | | | Total Short-Term Investments
(Cost $21,400,835) | | $ | 21,394,892 | | | | 3.9 | |
| | | | Total Investments in
Securities
(Cost $563,546,549) | | $ | 561,467,210 | | | | 101.7 | |
| | | | Liabilities in Excess of Other Assets | | | (9,205,260) | | | | (1.7 | ) |
| | | | Net Assets | | $ | 552,261,950 | | | | 100.0 | |
| † | Unless otherwise indicated, principal amount is shown in USD. |
| (1) | Security, or a portion of the security, is on loan. |
| (2) | Securities with purchases pursuant to Rule 144A or section 4(a)(2), under the Securities Act of 1933 and may not be resold subject to that rule except to qualified institutional buyers. |
| (3) | Variable rate security. Rate shown is the rate in effect as of March 31, 2024. |
| (4) | Principal only securities represent the right to receive the monthly principal payments on an underlying pool of mortgage loans. No payments of interest on the pool are passed through the principal only security. |
| (5) | The Federal Housing Finance Agency (“FHFA”) placed the Federal Home Loan Mortgage Corporation and Federal National Mortgage Association into conservatorship with FHFA as the conservator. As such, the FHFA oversees the continuing affairs of these companies. |
| (6) | All or a portion of the security represents securities purchased with cash collateral received for securities on loan. |
| (7) | Rate shown is the 7-day yield as of March 31, 2024. |
| Reference Rate Abbreviations: |
| |
| SOFR30A | 30-day Secured Overnight Financing Rate |
| SOFRRATE | 1-day Secured Overnight Financing Rate |
| TSFR1M | 1-month CME Term Secured Overnight Financing Rate |
| TSFR3M | 3-month CME Term Secured Overnight Financing Rate |
See Accompanying Notes to Financial Statements
| Voya Short Term Bond Fund | PORTFOLIO OF INVESTMENTS |
| as of March 31, 2024 (continued) |
| | |
Fair Value Measurements^
The following is a summary of the fair valuations according to the inputs used as of March 31, 2024 in valuing the assets and liabilities:
| | | Quoted Prices
in Active Markets
for Identical
Investments
(Level 1) | | Significant Other
Observable
Inputs
(Level 2) | | Significant
Unobservable
Inputs
(Level 3) | | Fair Value
at
March 31, 2024 |
| Asset Table | | | | | | | | | | | | | | | | |
| Investments, at fair value | | | | | | | | | | | | | | | | |
| Corporate Bonds/Notes | | $ | — | | | $ | 272,592,127 | | | $ | — | | | $ | 272,592,127 | |
| Asset-Backed Securities | | | — | | | | 113,382,362 | | | | — | | | | 113,382,362 | |
| U.S. Treasury Obligations | | | — | | | | 71,665,639 | | | | — | | | | 71,665,639 | |
| Collateralized Mortgage Obligations | | | — | | | | 41,167,867 | | | | — | | | | 41,167,867 | |
| Commercial Mortgage-Backed Securities | | | — | | | | 40,950,320 | | | | — | | | | 40,950,320 | |
| U.S. Government Agency Obligations | | | — | | | | 314,003 | | | | — | | | | 314,003 | |
| Short-Term Investments | | | 305,000 | | | | 21,089,892 | | | | — | | | | 21,394,892 | |
| Total Investments, at fair value | | $ | 305,000 | | | $ | 561,162,210 | | | $ | — | | | $ | 561,467,210 | |
| Liabilities Table | | | | | | | | | | | | | | | | |
| Other Financial Instruments+ | | | | | | | | | | | | | | | | |
| Futures | | $ | (331,879 | ) | | $ | — | | | $ | — | | | $ | (331,879 | ) |
| Total Liabilities | | $ | (331,879 | ) | | $ | — | | | $ | — | | | $ | (331,879 | ) |
| ^ | See Note 2, “Significant Accounting Policies” in the Notes to Financial Statements for additional information. |
| + | Other Financial Instruments may include open forward foreign currency contracts, futures, centrally cleared swaps, OTC swaps and written options. Forward foreign currency contracts, futures and centrally cleared swaps are fair valued at the unrealized appreciation (depreciation) on the instrument. OTC swaps and written options are valued at the fair value of the instrument. |
At March 31, 2024, the following futures contracts were outstanding for Voya Short Term Bond Fund:
| Description | | Number
of Contracts | | Expiration
Date | | Notional
Amount | | Unrealized
Depreciation |
| Long Contracts: | | | | | | | | | | | | | | |
| U.S. Treasury 2-Year Note | | | 1,843 | | | 06/28/24 | | $ | 376,864,703 | | | $ | (137,349 | ) |
| | | | | | | | | $ | 376,864,703 | | | $ | (137,349 | ) |
| Short Contracts: | | | | | | | | | | | | | | |
| U.S. Treasury 5-Year Note | | | (489) | | | 06/28/24 | | | (52,330,641 | ) | | | (153,923 | ) |
| U.S. Treasury 10-Year Note | | | (41) | | | 06/18/24 | | | (4,542,672 | ) | | | (27,686 | ) |
| U.S. Treasury Long Bond | | | (7) | | | 06/18/24 | | | (843,062 | ) | | | (12,921 | ) |
| | | | | | | | | $ | (57,716,375 | ) | | $ | (194,530 | ) |
A summary of derivative instruments by primary risk exposure is outlined in the following tables.
The fair value of derivative instruments as of March 31, 2024 was as follows:
| Derivatives not accounted for as hedging instruments | | Location on Statement
of Assets and Liabilities | | Fair Value | |
| | | | | | | |
| Liability Derivatives | | | | | | |
| Interest rate contracts | | Variation margin payable on futures contracts* | | $ | 331,879 | |
| Total Liability Derivatives | | | | $ | 331,879 | |
| * | The fair value presented above represents the cumulative unrealized appreciation (depreciation) on futures contracts as reported in the tables within the Portfolio of Investments. In the Statement of Assets and Liabilities, only current day’s unsettled variation margin is reported in receivables or payables on futures contracts and the net cumulative unrealized appreciation (depreciation) is included in total distributable earnings (loss). |
See Accompanying Notes to Financial Statements
| Voya Short Term Bond Fund | PORTFOLIO OF INVESTMENTS |
| as of March 31, 2024 (continued) |
| | |
The effect of derivative instruments on the Fund’s Statement of Operations for the year ended March 31, 2024 was as follows:
Amount of Realized Gain or (Loss) on Derivatives Recognized in Income
| Derivatives not accounted for as hedging instruments | | Futures | | Swaps | | Total |
| Credit contracts | | $ | — | | | $ | 242,000 | | | $ | 242,000 | |
| Interest rate contracts | | | (3,882,910 | ) | | | — | | | | (3,882,910 | ) |
| Total | | $ | (3,882,910 | ) | | $ | 242,000 | | | $ | (3,640,910 | ) |
Change in Unrealized Appreciation or (Depreciation) on Derivatives Recognized in Income
| Derivatives not accounted for as hedging instruments | | Futures |
| Interest rate contracts | | $ | (1,542,007 | ) |
| Total | | $ | (1,542,007 | ) |
At March 31, 2024, the aggregate cost of securities and other investments and the composition of unrealized appreciation and depreciation of securities and other investments on a tax basis were:
| Cost for federal income tax purposes was $563,246,932. |
| Net unrealized depreciation consisted of: |
| Gross Unrealized Appreciation | | $ | 2,372,195 | |
| Gross Unrealized Depreciation | | | (4,483,796 | ) |
| Net Unrealized Depreciation | | $ | (2,111,601 | ) |
See Accompanying Notes to Financial Statements
Voya Strategic
Income Opportunities Fund | PORTFOLIO OF INVESTMENTS
as of March 31, 2024 |
Principal
Amount† | | | | | Value | | | Percentage
of Net
Assets |
| COLLATERALIZED MORTGAGE OBLIGATIONS: 25.4% |
| 184,538 (1) | | | Adjustable Rate Mortgage Trust 2006-2 1A1, 4.761%, 05/25/2036 | | $ | 159,756 | | | | 0.0 | |
| 966,572 (1)(2) | | | Agate Bay Mortgage Trust 2015-2 B3, 3.622%, 03/25/2045 | | | 878,079 | | | | 0.1 | |
| 475,938 (1)(2) | | | Agate Bay Mortgage Trust 2015-4 B3, 3.498%, 06/25/2045 | | | 371,131 | | | | 0.0 | |
| 1,425,889 (1)(2) | | | Agate Bay Mortgage Trust 2016-1 B3, 3.654%, 12/25/2045 | | | 1,240,491 | | | | 0.1 | |
| 1,000,000 (1)(2) | | | Agate Bay Mortgage Trust 2016-1 B4, 3.654%, 12/25/2045 | | | 738,358 | | | | 0.0 | |
| 1,137,085 (1)(2) | | | Agate Bay Mortgage Trust 2016-2 B4, 3.760%, 03/25/2046 | | | 855,434 | | | | 0.1 | |
| 3,089,000 (1)(2) | | | Ajax Mortgage Loan Trust 2019-D A2, 3.500%, 09/25/2065 | | | 2,795,002 | | | | 0.2 | |
| 4,234,000 (1)(2) | | | Ajax Mortgage Loan Trust 2019-F A2, 3.500%, 07/25/2059 | | | 3,917,731 | | | | 0.2 | |
| 332,582 (1) | | | Alternative Loan Trust 2004-J7 M1, 5.117%, (TSFR1M + 1.134%), 10/25/2034 | | | 327,820 | | | | 0.0 | |
| 289,812 (1) | | | Alternative Loan Trust 2005-10CB 1A2, 5.500%, (TSFR1M + 0.564%), 05/25/2035 | | | 218,833 | | | | 0.0 | |
| 290,506 | | | Alternative Loan Trust 2005-23CB A15, 5.500%, 07/25/2035 | | | 234,540 | | | | 0.0 | |
| 17,724 (1) | | | Alternative Loan Trust 2005-53T2 2A6, 5.944%, (TSFR1M + 0.614%), 11/25/2035 | | | 9,691 | | | | 0.0 | |
| 32,388 | | | Alternative Loan Trust 2005-6CB 1A3, 5.250%, 04/25/2035 | | | 26,732 | | | | 0.0 | |
| 162,661 (1) | | | Alternative Loan Trust 2005-J2 1A12, 5.500%, (TSFR1M + 0.514%), 04/25/2035 | | | 125,223 | | | | 0.0 | |
| 30,519 | | | Alternative Loan Trust 2006-13T1 A9, 6.000%, 05/25/2036 | | | 15,181 | | | | 0.0 | |
| 455,699 (1) | | | Alternative Loan Trust 2006-18CB A10, 5.844%, (TSFR1M + 0.514%), 07/25/2036 | | | 197,099 | | | | 0.0 | |
| 108,341 (1) | | | Alternative Loan Trust 2006-19CB A12, 5.844%, (TSFR1M + 0.514%), 08/25/2036 | | | 51,467 | | | | 0.0 | |
Principal
Amount† | | | | | Value | | | Percentage
of Net
Assets |
| COLLATERALIZED MORTGAGE OBLIGATIONS: (continued) |
| 458,801 (1) | | | Alternative Loan Trust 2006-19CB A28, 6.000%, (TSFR1M + 0.714%), 08/25/2036 | | $ | 225,125 | | | | 0.0 | |
| 776,002 | | | Alternative Loan Trust 2006-27CB A5, 6.000%, 11/25/2036 | | | 427,634 | | | | 0.0 | |
| 233,695 (1) | | | Alternative Loan Trust 2006-HY11 A1, 5.684%, (TSFR1M + 0.354%), 06/25/2036 | | | 205,360 | | | | 0.0 | |
| 810,984 | | | Alternative Loan Trust 2007-15CB A5, 5.750%, 07/25/2037 | | | 473,305 | | | | 0.0 | |
| 116,846 (1) | | | Alternative Loan Trust 2007-2CB 2A1, 5.750%, (TSFR1M + 0.714%), 03/25/2037 | | | 50,990 | | | | 0.0 | |
| 158,743 (1) | | | Alternative Loan Trust 2007-HY8C A1, 5.764%, (TSFR1M + 0.434%), 09/25/2047 | | | 142,181 | | | | 0.0 | |
| 500,607 (1) | | | Alternative Loan Trust 2007-OA4 A1, 5.784%, (TSFR1M + 0.454%), 05/25/2047 | | | 422,613 | | | | 0.0 | |
| 408,420 (1)(2) | | | Arroyo Mortgage Trust 2019-3 A3, 3.416%, 10/25/2048 | | | 379,408 | | | | 0.0 | |
| 276,150 (1) | | | Banc of America Funding Trust 2007-2 1A16, 6.000%, (TSFR1M + 0.714%), 03/25/2037 | | | 202,139 | | | | 0.0 | |
| 1,278,356 (1) | | | Banc of America Funding Trust 2007-C 7A1, 5.863%, (TSFR1M + 0.534%), 05/20/2047 | | | 1,148,013 | | | | 0.1 | |
| 102,538 (1) | | | Bear Stearns ALT-A Trust 2005-3 4A3, 4.517%, 04/25/2035 | | | 98,937 | | | | 0.0 | |
| 372,659 (1) | | | Bear Stearns ALT-A Trust 2006-6 31A1, 4.333%, 11/25/2036 | | | 207,098 | | | | 0.0 | |
| 530,607 (1) | | | Bear Stearns ALT-A Trust 2006-6 32A1, 4.576%, 11/25/2036 | | | 279,201 | | | | 0.0 | |
| 76,114 (1) | | | Bear Stearns Structured Products, Inc. Trust 2007-R6 1A1, 5.115%, 01/26/2036 | | | 57,572 | | | | 0.0 | |
| 2,100,000 (1)(2) | | | Bellemeade RE Ltd. 2021-3A M1C, 6.870%, (SOFR30A + 1.550%), 09/25/2031 | | | 2,093,947 | | | | 0.1 | |
| 905,527 (1)(2) | | | Chase Home Lending Mortgage Trust 2019-1 B2, 3.889%, 03/25/2050 | | | 787,842 | | | | 0.1 | |
| 1,177,928 (1)(2) | | | Chase Home Lending Mortgage Trust 2019-1 B3, 3.889%, 03/25/2050 | | | 1,014,853 | | | | 0.1 | |
See Accompanying Notes to Financial Statements
Voya Strategic
Income Opportunities Fund | PORTFOLIO OF INVESTMENTS
as of March 31, 2024 (continued) |
Principal
Amount† | | | | | Value | | | Percentage
of Net
Assets |
| COLLATERALIZED MORTGAGE OBLIGATIONS: (continued) |
| 120,860 (1)(2) | | | Chase Home Lending Mortgage Trust 2019-ATR2 A3, 3.500%, 07/25/2049 | | $ | 107,544 | | | | 0.0 | |
| 882,609 (1)(2) | | | Chase Home Lending Mortgage Trust Series 2024-1 A9, 6.500%, 01/25/2055 | | | 884,940 | | | | 0.1 | |
| 265,883 (1) | | | Chase Mortgage Finance Trust Series 2006-A1 2A3, 5.120%, 09/25/2036 | | | 230,381 | | | | 0.0 | |
| 35,343 (1) | | | CHL Mortgage Pass-Through Trust 2004-22 A3, 4.706%, 11/25/2034 | | | 31,989 | | | | 0.0 | |
| 222,173 (1) | | | CHL Mortgage Pass-Through Trust 2005-HYB9 2A1, 7.873%, (TSFR12M + 2.465%), 02/20/2036 | | | 197,532 | | | | 0.0 | |
| 1,668,216 (1)(2) | | | CHNGE Mortgage Trust 2022-1 A1, 3.007%, 01/25/2067 | | | 1,525,630 | | | | 0.1 | |
| 117,031 (1)(2) | | | CIM Trust 2019-INV1 A1, 4.000%, 02/25/2049 | | | 109,309 | | | | 0.0 | |
| 144,432 (1)(2) | | | CIM Trust 2019-INV2 A3, 4.000%, 05/25/2049 | | | 133,054 | | | | 0.0 | |
| 155,967 (1)(2) | | | CIM Trust 2019-INV3 A15, 3.500%, 08/25/2049 | | | 137,648 | | | | 0.0 | |
| 233,950 (1)(2) | | | CIM Trust 2019-INV3 A3, 3.500%, 08/25/2049 | | | 206,703 | | | | 0.0 | |
| 1,544,299 (1)(2) | | | CIM Trust 2019-J1 B3, 3.941%, 08/25/2049 | | | 1,376,581 | | | | 0.1 | |
| 2,908,678 (1)(2) | | | CIM Trust 2019-J2 B2, 3.768%, 10/25/2049 | | | 2,542,949 | | | | 0.1 | |
| 1,828,118 (1)(2) | | | CIM Trust 2019-J2 B3, 3.768%, 10/25/2049 | | | 1,575,138 | | | | 0.1 | |
| 1,190,089 (1)(2) | | | CIM Trust 2020-J2 B3, 2.758%, 01/25/2051 | | | 919,844 | | | | 0.1 | |
| 1,772,132 (1)(2) | | | CIM Trust 2021-J3 B3, 2.616%, 06/25/2051 | | | 1,330,033 | | | | 0.1 | |
| 359,735 | | | Citicorp Mortgage Securities Trust Series 2006-3 1A4, 6.000%, 06/25/2036 | | | 315,655 | | | | 0.0 | |
| 68,655 (1) | | | Citigroup Mortgage Loan Trust 2006-AR2 1A1, 5.493%, 03/25/2036 | | | 52,254 | | | | 0.0 | |
| 30,902 (1) | | | Citigroup Mortgage Loan Trust 2006-AR9 2A, 5.366%, 11/25/2036 | | | 25,959 | | | | 0.0 | |
| 147,186 (1)(2) | | | Citigroup Mortgage Loan Trust 2015-A B2, 4.500%, 06/25/2058 | | | 140,743 | | | | 0.0 | |
| 47,311 (1) | | | Citigroup Mortgage Loan Trust, Inc. 2005-4 A, 5.861%, 08/25/2035 | | | 46,241 | | | | 0.0 | |
Principal
Amount† | | | | | Value | | | Percentage
of Net
Assets |
| COLLATERALIZED MORTGAGE OBLIGATIONS: (continued) |
| 190,297 | | | Citigroup Mortgage Loan Trust, Inc. 2005-9 22A2, 6.000%, 11/25/2035 | | $ | 187,946 | | | | 0.0 | |
| 723,727 (1)(2) | | | Connecticut Avenue Securities Trust 2019-R05 1B1, 9.535%, (SOFR30A + 4.214%), 07/25/2039 | | | 754,306 | | | | 0.0 | |
| 1,098,682 (1)(2) | | | Connecticut Avenue Securities Trust 2020-R02 2M2, 7.435%, (SOFR30A + 2.114%), 01/25/2040 | | | 1,110,777 | | | | 0.1 | |
| 1,700,000 (1)(2) | | | Connecticut Avenue Securities Trust 2020-SBT1 1M2, 9.085%, (SOFR30A + 3.764%), 02/25/2040 | | | 1,803,041 | | | | 0.1 | |
| 282,112 | | | CSMC Mortgage-Backed Trust 2007-2 3A6, 5.400%, 03/25/2037 | | | 137,111 | | | | 0.0 | |
| 404,455 (1)(2) | | | CSMC Trust 2013-7 A11, 3.500%, 08/25/2043 | | | 364,306 | | | | 0.0 | |
| 261,631 (1)(2) | | | CSMC Trust 2017-HL1 A12, 3.500%, 06/25/2047 | | | 230,813 | | | | 0.0 | |
| 1,446,572 (1)(2) | | | CSMC Trust 2019-AFC1 A3, 3.877%, 07/25/2049 | | | 1,351,597 | | | | 0.1 | |
| 2,969,575 (1)(2) | | | CSMC Trust 2021-AFC1 M1, 2.193%, 03/25/2056 | | | 1,813,345 | | | | 0.1 | |
| 5,318,455 (2) | | | Deephaven Residential Mortgage Trust 2022-2 A1, 4.300%, 03/25/2067 | | | 5,092,408 | | | | 0.3 | |
| 359,218 (1) | | | Deutsche Alt-B Securities Mortgage Loan Trust Series 2007-AB1 A1, 5.744%, (TSFR1M + 0.414%), 04/25/2037 | | | 243,950 | | | | 0.0 | |
| 77,764 (1)(2) | | | Deutsche Mortgage Securities, Inc. Re-REMIC Trust Certificates Series 2007-WM1 A1, 4.046%, 06/27/2037 | | | 66,677 | | | | 0.0 | |
| 841,551 (1)(2) | | | Ellington Financial Mortgage Trust 2022-2 A1, 4.299%, 04/25/2067 | | | 816,736 | | | | 0.1 | |
| 136,580 (1)(2) | | | Fannie Mae Connecticut Avenue Securities 2019-R01 2M2, 7.885%, (SOFR30A + 2.564%), 07/25/2031 | | | 136,931 | | | | 0.0 | |
See Accompanying Notes to Financial Statements
Voya Strategic
Income Opportunities Fund | PORTFOLIO OF INVESTMENTS
as of March 31, 2024 (continued) |
Principal
Amount† | | | | | Value | | | Percentage
of Net
Assets |
| COLLATERALIZED MORTGAGE OBLIGATIONS: (continued) |
| 909,734 (1)(2) | | | Fannie Mae Connecticut Avenue Securities 2020-R01 1M2, 7.485%, (SOFR30A + 2.164%), 01/25/2040 | | $ | 922,146 | | | | 0.1 | |
| 3,540,000 (1)(2) | | | Fannie Mae Connecticut Avenue Securities 2020-R02 2B1, 8.435%, (SOFR30A + 3.114%), 01/25/2040 | | | 3,643,910 | | | | 0.2 | |
| 3,898,000 (1)(2) | | | Fannie Mae Connecticut Avenue Securities 2020-SBT1 2M2, 9.085%, (SOFR30A + 3.764%), 02/25/2040 | | | 4,134,268 | | | | 0.2 | |
| 750,000 (1)(2) | | | Fannie Mae Connecticut Avenue Securities 2022-R04 1B1, 10.570%, (SOFR30A + 5.250%), 03/25/2042 | | | 817,589 | | | | 0.1 | |
| 2,000,000 (1)(2) | | | Fannie Mae Connecticut Avenue Securities 2022-R05 2B2, 12.320%, (SOFR30A + 7.000%), 04/25/2042 | | | 2,183,385 | | | | 0.1 | |
| 6,000,000 (1)(2) | | | Fannie Mae Connecticut Avenue Securities 2023-R07 2M2, 8.571%, (SOFR30A + 3.250%), 09/25/2043 | | | 6,287,988 | | | | 0.3 | |
| 364,491 (3) | | | Fannie Mae Interest Strip 343 6, 5.000%, 10/25/2033 | | | 53,447 | | | | 0.0 | |
| 12,133,172 (3) | | | Fannie Mae Interest Strip 426 C38, 2.000%, 03/25/2052 | | | 1,573,591 | | | | 0.1 | |
| 20,053,075 (3) | | | Fannie Mae Interest Strip 427 C13, 3.500%, 03/25/2037 | | | 2,284,545 | | | | 0.1 | |
| 15,892,926 (3) | | | Fannie Mae Interest Strip 427 C18, 3.500%, 03/25/2039 | | | 2,307,228 | | | | 0.1 | |
| 29,264,638 (3) | | | Fannie Mae Interest Strip 427 C38, 3.000%, 04/25/2049 | | | 5,381,946 | | | | 0.3 | |
| 71,208 (1)(3) | | | Fannie Mae REMIC Trust 2000-26 SP, 3.065%, (-1.000*SOFR30A + 8.386%), 08/25/2030 | | | 4,315 | | | | 0.0 | |
| 70,023 (1)(3) | | | Fannie Mae REMIC Trust 2002-13 SR, 1.165%, (-1.000*SOFR30A + 6.486%), 03/25/2032 | | | 2,465 | | | | 0.0 | |
| 952,588 (1)(3) | | | Fannie Mae REMIC Trust 2004-53 UC, 2.115%, (-1.000*SOFR30A + 7.436%), 07/25/2034 | | | 102,543 | | | | 0.0 | |
Principal
Amount† | | | | | Value | | | Percentage
of Net
Assets |
| COLLATERALIZED MORTGAGE OBLIGATIONS: (continued) |
| 73,846 (1)(3) | | | Fannie Mae REMIC Trust 2004-64 SW, 1.615%, (-1.000*SOFR30A + 6.936%), 08/25/2034 | | $ | 4,728 | | | | 0.0 | |
| 57,091 (1)(3) | | | Fannie Mae REMIC Trust 2004-66 SE, 1.065%, (-1.000*SOFR30A + 6.386%), 09/25/2034 | | | 2,950 | | | | 0.0 | |
| 529,143 (1)(3) | | | Fannie Mae REMIC Trust 2005-59 NS, 1.315%, (-1.000*SOFR30A + 6.636%), 05/25/2035 | | | 12,791 | | | | 0.0 | |
| 258,231 (1) | | | Fannie Mae REMIC Trust 2006-11 FA, 5.735%, (SOFR30A + 0.414%), 03/25/2036 | | | 256,000 | | | | 0.0 | |
| 93,067 (1) | | | Fannie Mae REMIC Trust 2006-46 SP, 4.272%, (-1.000*SOFR30A + 23.780%), 06/25/2036 | | | 104,847 | | | | 0.0 | |
| 318,483 (1)(3) | | | Fannie Mae REMIC Trust 2007-18 BS, 1.165%, (-1.000*SOFR30A + 6.486%), 06/25/2035 | | | 24,215 | | | | 0.0 | |
| 2,877,878 (1)(3) | | | Fannie Mae REMIC Trust 2007-22 SD, 0.965%, (-1.000*SOFR30A + 6.286%), 03/25/2037 | | | 243,776 | | | | 0.0 | |
| 1,532,264 (1)(3) | | | Fannie Mae REMIC Trust 2007-55 S, 1.325%, (-1.000*SOFR30A + 6.646%), 06/25/2037 | | | 128,089 | | | | 0.0 | |
| 1,301,519 (1)(3) | | | Fannie Mae REMIC Trust 2008-94 SI, 0.065%, (-1.000*SOFR30A + 5.386%), 04/25/2036 | | | 75,925 | | | | 0.0 | |
| 191,800 (1)(3) | | | Fannie Mae REMIC Trust 2009-25 SN, 1.115%, (-1.000*SOFR30A + 6.436%), 04/25/2039 | | | 9,358 | | | | 0.0 | |
| 791,183 (1)(3) | | | Fannie Mae REMIC Trust 2009-70 PS, 1.315%, (-1.000*SOFR30A + 6.636%), 01/25/2037 | | | 73,059 | | | | 0.0 | |
| 129,516 (1) | | | Fannie Mae REMIC Trust 2010-15 FD, 6.175%, (SOFR30A + 0.854%), 03/25/2040 | | | 129,920 | | | | 0.0 | |
See Accompanying Notes to Financial Statements
Voya Strategic
Income Opportunities Fund | PORTFOLIO OF INVESTMENTS
as of March 31, 2024 (continued) |
Principal
Amount† | | | | | Value | | | Percentage
of Net
Assets |
| COLLATERALIZED MORTGAGE OBLIGATIONS: (continued) |
| 337,239 (1) | | | Fannie Mae REMIC Trust 2011-47 GF, 6.005%, (SOFR30A + 0.684%), 06/25/2041 | | $ | 335,646 | | | | 0.0 | |
| 41,762 (1) | | | Fannie Mae REMIC Trust 2012-10 UF, 5.985%, (SOFR30A + 0.664%), 02/25/2042 | | | 41,353 | | | | 0.0 | |
| 5,486,034 (3) | | | Fannie Mae REMIC Trust 2012-111 UI, 3.000%, 10/25/2027 | | | 185,589 | | | | 0.0 | |
| 462,391 (3) | | | Fannie Mae REMIC Trust 2012-121 DI, 2.500%, 11/25/2027 | | | 13,275 | | | | 0.0 | |
| 4,511,354 (3) | | | Fannie Mae REMIC Trust 2012-128 KI, 3.000%, 11/25/2027 | | | 161,371 | | | | 0.0 | |
| 6,411,078 (1)(3) | | | Fannie Mae REMIC Trust 2012-133 NS, 0.715%, (-1.000*SOFR30A + 6.036%), 12/25/2042 | | | 617,677 | | | | 0.0 | |
| 1,032,794 (3) | | | Fannie Mae REMIC Trust 2012-148 IB, 3.500%, 01/25/2028 | | | 38,705 | | | | 0.0 | |
| 3,619,808 (1)(3) | | | Fannie Mae REMIC Trust 2012-150 PS, 0.715%, (-1.000*SOFR30A + 6.036%), 01/25/2043 | | | 322,857 | | | | 0.0 | |
| 7,943,769 (1)(3) | | | Fannie Mae REMIC Trust 2012-66 IB, 0.050%, (-1.000*SOFR30A + 5.936%), 06/25/2042 | | | 17,885 | | | | 0.0 | |
| 136,657 (1)(3) | | | Fannie Mae REMIC Trust 2012-84 KI, 6.000%, (SOFR30A + 6.000%), 08/25/2042 | | | 26,700 | | | | 0.0 | |
| 236,208 (3) | | | Fannie Mae REMIC Trust 2012-93 IL, 3.000%, 09/25/2027 | | | 7,250 | | | | 0.0 | |
| 4,835,562 (3) | | | Fannie Mae REMIC Trust 2013-1 LI, 2.500%, 02/25/2028 | | | 153,508 | | | | 0.0 | |
| 107,648 (1)(3) | | | Fannie Mae REMIC Trust 2013-116 SC, 0.765%, (-1.000*SOFR30A + 6.086%), 04/25/2033 | | | 834 | | | | 0.0 | |
| 1,361,653 (3) | | | Fannie Mae REMIC Trust 2013-137 PI, 5.000%, 10/25/2041 | | | 265,085 | | | | 0.0 | |
| 5,968,859 (1)(3) | | | Fannie Mae REMIC Trust 2013-19 JS, 0.765%, (-1.000*SOFR30A + 6.086%), 10/25/2041 | | | 247,012 | | | | 0.0 | |
| 1,098,027 (3) | | | Fannie Mae REMIC Trust 2013-2 NI, 4.000%, 02/25/2043 | | | 153,699 | | | | 0.0 | |
Principal
Amount† | | | | | Value | | | Percentage
of Net
Assets |
| COLLATERALIZED MORTGAGE OBLIGATIONS: (continued) |
| 1,920,405 (3) | | | Fannie Mae REMIC Trust 2013-21 KI, 3.000%, 03/25/2028 | | $ | 63,492 | | | | 0.0 | |
| 3,411,473 (3) | | | Fannie Mae REMIC Trust 2013-32 EI, 2.500%, 04/25/2033 | | | 235,001 | | | | 0.0 | |
| 759,569 (3) | | | Fannie Mae REMIC Trust 2013-41 BI, 3.000%, 05/25/2028 | | | 29,287 | | | | 0.0 | |
| 1,477,475 (3) | | | Fannie Mae REMIC Trust 2013-67 AI, 3.000%, 07/25/2028 | | | 48,330 | | | | 0.0 | |
| 1,030,187 (3) | | | Fannie Mae REMIC Trust 2013-69 PI, 3.000%, 04/25/2033 | | | 60,867 | | | | 0.0 | |
| 2,610,797 (1)(3) | | | Fannie Mae REMIC Trust 2013-97 JS, 0.715%, (-1.000*SOFR30A + 6.036%), 04/25/2038 | | | 164,573 | | | | 0.0 | |
| 7,293,897 (3) | | | Fannie Mae REMIC Trust 2015-40 AI, 6.000%, 05/25/2037 | | | 1,319,696 | | | | 0.1 | |
| 5,219,506 (1)(3) | | | Fannie Mae REMIC Trust 2016-19 SB, 0.665%, (-1.000*SOFR30A + 5.986%), 04/25/2046 | | | 315,071 | | | | 0.0 | |
| 1,728,370 (3) | | | Fannie Mae REMIC Trust 2016-4 BI, 4.000%, 02/25/2046 | | | 312,263 | | | | 0.0 | |
| 1,179,176 (3) | | | Fannie Mae REMIC Trust 2016-61 PI, 4.500%, 01/25/2046 | | | 197,175 | | | | 0.0 | |
| 12,393,493 (1)(3) | | | Fannie Mae REMIC Trust 2017-16 SG, 0.615%, (-1.000*SOFR30A + 5.936%), 03/25/2047 | | | 1,238,897 | | | | 0.1 | |
| 24,364,391 (1)(3) | | | Fannie Mae REMIC Trust 2018-86 US, 0.765%, (-1.000*SOFR30A + 6.086%), 12/25/2048 | | | 1,580,918 | | | | 0.1 | |
| 8,431,457 (3) | | | Fannie Mae REMIC Trust 2019-15 AI, 4.000%, 04/25/2059 | | | 1,810,333 | | | | 0.1 | |
| 12,259,160 (1)(3) | | | Fannie Mae REMIC Trust 2019-17 SA, 0.665%, (-1.000*SOFR30A + 5.986%), 04/25/2049 | | | 815,745 | | | | 0.1 | |
| 10,786,495 (1)(3) | | | Fannie Mae REMIC Trust 2019-8 SB, 0.665%, (-1.000*SOFR30A + 5.986%), 03/25/2049 | | | 725,778 | | | | 0.0 | |
| 12,027,406 (3) | | | Fannie Mae REMIC Trust 2020-47 PI, 4.000%, 07/25/2050 | | | 2,539,760 | | | | 0.1 | |
See Accompanying Notes to Financial Statements
Voya Strategic
Income Opportunities Fund | PORTFOLIO OF INVESTMENTS
as of March 31, 2024 (continued) |
Principal
Amount† | | | | | Value | | | Percentage
of Net
Assets |
| COLLATERALIZED MORTGAGE OBLIGATIONS: (continued) |
| 12,860,987 (1)(3) | | | Fannie Mae REMIC Trust 2020-47 SH, 0.665%, (-1.000*SOFR30A + 5.986%), 07/25/2050 | | $ | 1,370,432 | | | | 0.1 | |
| 18,336,283 (1)(3) | | | Fannie Mae REMIC Trust 2020-49 SB, 0.665%, (-1.000*SOFR30A + 5.986%), 07/25/2050 | | | 2,520,991 | | | | 0.1 | |
| 13,576,000 (3) | | | Fannie Mae REMIC Trust 2020-52 AI, 4.000%, 08/25/2050 | | | 2,250,880 | | | | 0.1 | |
| 37,872,612 (3) | | | Fannie Mae REMIC Trust 2020-64 IO, 3.000%, 09/25/2050 | | | 7,245,334 | | | | 0.4 | |
| 20,026,163 (3) | | | Fannie Mae REMIC Trust 2020-65 CI, 4.000%, 09/25/2050 | | | 3,622,979 | | | | 0.2 | |
| 20,491,893 (3) | | | Fannie Mae REMIC Trust 2020-67 JI, 4.000%, 09/25/2050 | | | 4,221,129 | | | | 0.2 | |
| 25,930,033 (3) | | | Fannie Mae REMIC Trust 2020-94 MI, 4.500%, 04/25/2050 | | | 5,828,288 | | | | 0.3 | |
| 9,234,791 (3) | | | Fannie Mae REMIC Trust 2021-18 AI, 3.500%, 05/25/2050 | | | 1,724,646 | | | | 0.1 | |
| 15,535,527 (3) | | | Fannie Mae REMIC Trust 2021-18 IY, 4.500%, 08/25/2049 | | | 3,981,658 | | | | 0.2 | |
| 18,216,803 (3) | | | Fannie Mae REMIC Trust 2021-2 PI, 2.000%, 02/25/2051 | | | 1,949,905 | | | | 0.1 | |
| 19,139,227 (3) | | | Fannie Mae REMIC Trust 2021-23 JI, 3.000%, 04/25/2051 | | | 3,178,683 | | | | 0.2 | |
| 19,430,880 (3) | | | Fannie Mae REMIC Trust 2021-28 GI, 4.000%, 05/25/2051 | | | 4,016,635 | | | | 0.2 | |
| 36,280,878 (3) | | | Fannie Mae REMIC Trust 2021-65 KI, 3.500%, 10/25/2051 | | | 6,271,208 | | | | 0.3 | |
| 19,042,626 (3) | | | Fannie Mae REMIC Trust 2021-74 AI, 3.000%, 11/25/2051 | | | 3,155,306 | | | | 0.2 | |
| 63,099 | | | First Horizon Alternative Mortgage Securities Trust 2006-FA8 1A7, 6.000%, 02/25/2037 | | | 25,508 | | | | 0.0 | |
| 151,777 (1)(2) | | | Flagstar Mortgage Trust 2017-2 A7, 3.500%, 10/25/2047 | | | 134,968 | | | | 0.0 | |
| 584,057 (1)(2) | | | Flagstar Mortgage Trust 2018-1 B3, 3.939%, 03/25/2048 | | | 518,650 | | | | 0.0 | |
| 697,194 (1)(2) | | | Flagstar Mortgage Trust 2018-3INV A3, 4.000%, 05/25/2048 | | | 634,717 | | | | 0.0 | |
Principal
Amount† | | | | | Value | | | Percentage
of Net
Assets |
| COLLATERALIZED MORTGAGE OBLIGATIONS: (continued) |
| 3,447,067 (1)(2) | | | Flagstar Mortgage Trust 2018-4 B3, 4.162%, 07/25/2048 | | $ | 3,094,272 | | | | 0.2 | |
| 875,442 (1)(2) | | | Flagstar Mortgage Trust 2018-5 B3, 4.454%, 09/25/2048 | | | 783,160 | | | | 0.1 | |
| 219,056 (1)(2) | | | Flagstar Mortgage Trust 2018-6RR 1A7, 4.000%, 10/25/2048 | | | 200,567 | | | | 0.0 | |
| 3,300,391 (1)(2) | | | Flagstar Mortgage Trust 2018-6RR B1, 4.938%, 10/25/2048 | | | 3,130,927 | | | | 0.2 | |
| 1,359,877 (1)(2) | | | Flagstar Mortgage Trust 2019-2 B1, 4.007%, 12/25/2049 | | | 1,198,095 | | | | 0.1 | |
| 1,903,828 (1)(2) | | | Flagstar Mortgage Trust 2019-2 B2, 4.007%, 12/25/2049 | | | 1,669,979 | | | | 0.1 | |
| 3,228,409 (1)(2) | | | Flagstar Mortgage Trust 2020-1INV B2A, 4.204%, 03/25/2050 | | | 2,870,376 | | | | 0.2 | |
| 2,767,208 (1)(2) | | | Flagstar Mortgage Trust 2020-1INV B3, 4.204%, 03/25/2050 | | | 2,435,488 | | | | 0.1 | |
| 3,550,253 (1)(2) | | | Flagstar Mortgage Trust 2021-2 B3, 2.782%, 04/25/2051 | | | 2,860,958 | | | | 0.2 | |
| 1,037 (1)(3) | | | Freddie Mac REMIC Trust 2266 S, 3.117%, (-1.000*SOFR30A + 8.436%), 11/15/2030 | | | 31 | | | | 0.0 | |
| 86,187 (1)(3) | | | Freddie Mac REMIC Trust 2374 S, 2.667%, (-1.000*SOFR30A + 7.986%), 06/15/2031 | | | 7,078 | | | | 0.0 | |
| 44,483 (1)(3) | | | Freddie Mac REMIC Trust 2417 SY, 2.967%, (-1.000*SOFR30A + 8.286%), 12/15/2031 | | | 4,648 | | | | 0.0 | |
| 184,163 (1)(3) | | | Freddie Mac REMIC Trust 2525 SM, 2.567%, (-1.000*SOFR30A + 7.886%), 02/15/2032 | | | 17,772 | | | | 0.0 | |
| 85,758 (1)(3) | | | Freddie Mac REMIC Trust 2577 SA, 2.017%, (-1.000*SOFR30A + 7.336%), 02/15/2033 | | | 7,685 | | | | 0.0 | |
| 919,114 (1)(3) | | | Freddie Mac REMIC Trust 2781 SB, 1.717%, (-1.000*SOFR30A + 7.036%), 04/15/2034 | | | 77,313 | | | | 0.0 | |
| 188,635 (1) | | | Freddie Mac REMIC Trust 2921 PF, 5.783%, (SOFR30A + 0.464%), 01/15/2035 | | | 186,727 | | | | 0.0 | |
See Accompanying Notes to Financial Statements
Voya Strategic
Income Opportunities Fund | PORTFOLIO OF INVESTMENTS
as of March 31, 2024 (continued) |
Principal
Amount† | | | | | Value | | | Percentage
of Net
Assets |
| COLLATERALIZED MORTGAGE OBLIGATIONS: (continued) |
| 164,199 (1)(3) | | | Freddie Mac REMIC Trust 2981 CS, 1.287%, (-1.000*SOFR30A + 6.606%), 05/15/2035 | | $ | 9,497 | | | | 0.0 | |
| 80,838 (1)(3) | | | Freddie Mac REMIC Trust 2981 SU, 2.367%, (-1.000*SOFR30A + 7.686%), 05/15/2030 | | | 5,103 | | | | 0.0 | |
| 236,955 (1)(3) | | | Freddie Mac REMIC Trust 2989 HS, 1.717%, (-1.000*SOFR30A + 7.036%), 08/15/2034 | | | 33,190 | | | | 0.0 | |
| 93,713 (1)(3) | | | Freddie Mac REMIC Trust 3018 SM, 1.767%, (-1.000*SOFR30A + 7.086%), 08/15/2035 | | | 9,645 | | | | 0.0 | |
| 112,258 (1) | | | Freddie Mac REMIC Trust 3031 BP, 8.000%, (-1.000*SOFR30A + 44.205%), 08/15/2035 | | | 112,881 | | | | 0.0 | |
| 310,806 (1)(3) | | | Freddie Mac REMIC Trust 3049 PI, 1.217%, (-1.000*SOFR30A + 6.536%), 10/15/2035 | | | 26,856 | | | | 0.0 | |
| 2,304,139 (1)(3) | | | Freddie Mac REMIC Trust 3128 JI, 1.197%, (-1.000*SOFR30A + 6.516%), 03/15/2036 | | | 200,237 | | | | 0.0 | |
| 42,151 (4) | | | Freddie Mac REMIC Trust 3151 PO, 0.000%, 05/15/2036 | | | 34,308 | | | | 0.0 | |
| 1,078,836 (1)(3) | | | Freddie Mac REMIC Trust 3222 SN, 1.167%, (-1.000*SOFR30A + 6.486%), 09/15/2036 | | | 86,423 | | | | 0.0 | |
| 1,080,390 (1)(3) | | | Freddie Mac REMIC Trust 3298 S, 0.677%, (-1.000*SOFR30A + 5.996%), 04/15/2037 | | | 75,909 | | | | 0.0 | |
| 358,831 (1)(3) | | | Freddie Mac REMIC Trust 3523 SA, 0.567%, (-1.000*SOFR30A + 5.886%), 09/15/2036 | | | 22,347 | | | | 0.0 | |
| 334,962 (1)(3) | | | Freddie Mac REMIC Trust 3582 MS, 0.717%, (-1.000*SOFR30A + 6.036%), 10/15/2039 | | | 25,497 | | | | 0.0 | |
| 130,277 (1)(3) | | | Freddie Mac REMIC Trust 3624 TS, 0.116%, (-1.000*SOFR30A + 4.686%), 01/15/2040 | | | 3,296 | | | | 0.0 | |
Principal
Amount† | | | | | Value | | | Percentage
of Net
Assets |
| COLLATERALIZED MORTGAGE OBLIGATIONS: (continued) |
| 452,948 (3) | | | Freddie Mac REMIC Trust 3688 BI, 5.000%, 07/15/2040 | | $ | 68,480 | | | | 0.0 | |
| 302,618 (1) | | | Freddie Mac REMIC Trust 3740 FB, 5.933%, (SOFR30A + 0.614%), 10/15/2040 | | | 298,803 | | | | 0.0 | |
| 1,364,402 (3) | | | Freddie Mac REMIC Trust 4097 IC, 2.500%, 08/15/2027 | | | 37,480 | | | | 0.0 | |
| 659,506 (3) | | | Freddie Mac REMIC Trust 4116 IL, 4.500%, 05/15/2042 | | | 70,208 | | | | 0.0 | |
| 4,784,116 (3) | | | Freddie Mac REMIC Trust 4120 TI, 2.500%, 10/15/2027 | | | 141,669 | | | | 0.0 | |
| 639,314 (3) | | | Freddie Mac REMIC Trust 4136 QI, 3.000%, 11/15/2032 | | | 29,114 | | | | 0.0 | |
| 451,230 (3) | | | Freddie Mac REMIC Trust 4143 IK, 4.000%, 10/15/2041 | | | 29,711 | | | | 0.0 | |
| 10,688,301 (1)(3) | | | Freddie Mac REMIC Trust 4146 SA, 0.717%, (-1.000*SOFR30A + 6.036%), 12/15/2042 | | | 1,051,818 | | | | 0.1 | |
| 265,962 (3) | | | Freddie Mac REMIC Trust 4153 YI, 3.000%, 09/15/2042 | | | 5,246 | | | | 0.0 | |
| 1,534,948 (3) | | | Freddie Mac REMIC Trust 4157 IH, 3.500%, 01/15/2043 | | | 232,935 | | | | 0.0 | |
| 637,592 (3) | | | Freddie Mac REMIC Trust 4162 DI, 2.000%, 02/15/2028 | | | 15,224 | | | | 0.0 | |
| 2,333,135 (3) | | | Freddie Mac REMIC Trust 4182 IL, 3.000%, 03/15/2028 | | | 92,605 | | | | 0.0 | |
| 1,796,494 (3) | | | Freddie Mac REMIC Trust 4186 IA, 3.000%, 03/15/2033 | | | 147,359 | | | | 0.0 | |
| 67,814 (3) | | | Freddie Mac REMIC Trust 4261 ID, 6.500%, 06/15/2032 | | | 3,618 | | | | 0.0 | |
| 20,577,842 (1)(3) | | | Freddie Mac REMIC Trust 4273 PS, 0.667%, (-1.000*SOFR30A + 5.986%), 11/15/2043 | | | 1,459,518 | | | | 0.1 | |
| 331,574 (3) | | | Freddie Mac REMIC Trust 4287 CI, 4.500%, 07/15/2041 | | | 33,477 | | | | 0.0 | |
| 1,482,181 (3) | | | Freddie Mac REMIC Trust 4290 EI, 5.000%, 12/15/2043 | | | 273,016 | | | | 0.0 | |
| 66,377 (3) | | | Freddie Mac REMIC Trust 4333 AI, 5.500%, 02/15/2044 | | | 10,533 | | | | 0.0 | |
See Accompanying Notes to Financial Statements
Voya Strategic
Income Opportunities Fund | PORTFOLIO OF INVESTMENTS
as of March 31, 2024 (continued) |
Principal
Amount† | | | | | Value | | | Percentage
of Net
Assets |
| COLLATERALIZED MORTGAGE OBLIGATIONS: (continued) |
| 1,454,790 (3) | | | Freddie Mac REMIC Trust 4494 LI, 5.000%, 12/15/2043 | | $ | 141,117 | | | | 0.0 | |
| 5,730,054 (1)(3) | | | Freddie Mac REMIC Trust 4618 SA, 0.567%, (-1.000*SOFR30A + 5.886%), 09/15/2046 | | | 561,401 | | | | 0.0 | |
| 1,424,850 (3) | | | Freddie Mac REMIC Trust 4625 BI, 3.500%, 06/15/2046 | | | 238,259 | | | | 0.0 | |
| 1,526,313 (3) | | | Freddie Mac REMIC Trust 4708 KI, 4.500%, 11/15/2046 | | | 229,462 | | | | 0.0 | |
| 10,592,002 (3) | | | Freddie Mac REMIC Trust 4813 IO, 5.500%, 08/15/2048 | | | 2,085,346 | | | | 0.1 | |
| 18,912,735 (1)(3) | | | Freddie Mac REMIC Trust 4903 NS, 0.665%, (-1.000*SOFR30A + 5.986%), 08/25/2049 | | | 1,753,042 | | | | 0.1 | |
| 10,596,741 (1)(3) | | | Freddie Mac REMIC Trust 4909 SJ, 0.615%, (-1.000*SOFR30A + 5.936%), 09/25/2049 | | | 1,260,842 | | | | 0.1 | |
| 4,186,640 (1)(3) | | | Freddie Mac REMIC Trust 4910 SD, 0.617%, (-1.000*SOFR30A + 5.936%), 06/15/2049 | | | 480,270 | | | | 0.0 | |
| 13,367,638 (1)(3) | | | Freddie Mac REMIC Trust 4910 SH, 0.615%, (-1.000*SOFR30A + 5.936%), 09/25/2049 | | | 1,609,899 | | | | 0.1 | |
| 17,726,571 (1)(3) | | | Freddie Mac REMIC Trust 4924 SY, 0.615%, (-1.000*SOFR30A + 5.936%), 10/25/2049 | | | 2,189,162 | | | | 0.1 | |
| 12,298,546 (3) | | | Freddie Mac REMIC Trust 4967 IQ, 4.000%, 02/25/2050 | | | 2,577,545 | | | | 0.1 | |
| 32,712,047 (3) | | | Freddie Mac REMIC Trust 4974 I, 4.000%, 04/25/2050 | | | 6,788,891 | | | | 0.4 | |
| 20,553,249 (1)(3) | | | Freddie Mac REMIC Trust 5009 TS, 0.765%, (-1.000*SOFR30A + 6.086%), 09/25/2050 | | | 2,283,238 | | | | 0.1 | |
| 30,058,710 (3) | | | Freddie Mac REMIC Trust 5010 MI, 3.000%, 09/25/2050 | | | 4,455,768 | | | | 0.2 | |
| 18,024,209 (3) | | | Freddie Mac REMIC Trust 5036 CI, 4.000%, 12/25/2049 | | | 3,771,279 | | | | 0.2 | |
Principal
Amount† | | | | | Value | | | Percentage
of Net
Assets |
| COLLATERALIZED MORTGAGE OBLIGATIONS: (continued) |
| 25,714,585 (3) | | | Freddie Mac REMIC Trust 5049 UI, 3.000%, 12/25/2050 | | $ | 4,848,061 | | | | 0.3 | |
| 9,600,267 (3) | | | Freddie Mac REMIC Trust 5052 BI, 5.000%, 12/25/2050 | | | 2,240,224 | | | | 0.1 | |
| 13,232,820 (3) | | | Freddie Mac REMIC Trust 5074 GI, 2.000%, 02/25/2051 | | | 1,499,454 | | | | 0.1 | |
| 22,219,694 (3) | | | Freddie Mac REMIC Trust 5081 CI, 2.000%, 03/25/2051 | | | 2,540,409 | | | | 0.1 | |
| 41,076,011 (3) | | | Freddie Mac REMIC Trust 5083 IP, 4.000%, 11/25/2048 | | | 8,598,248 | | | | 0.5 | |
| 14,772,525 (3) | | | Freddie Mac REMIC Trust 5133 CI, 4.500%, 07/25/2039 | | | 2,574,158 | | | | 0.1 | |
| 16,185,381 (3) | | | Freddie Mac REMIC Trust 5138 CI, 4.000%, 07/25/2050 | | | 3,396,625 | | | | 0.2 | |
| 10,295,388 (3) | | | Freddie Mac REMIC Trust 5142 LI, 2.500%, 09/25/2051 | | | 1,704,517 | | | | 0.1 | |
| 5,339,362 (3) | | | Freddie Mac REMIC Trust 5152 GI, 4.500%, 06/25/2048 | | | 1,198,404 | | | | 0.1 | |
| 19,943,285 (3) | | | Freddie Mac REMIC Trust 5214 IO, 2.000%, 03/25/2051 | | | 2,564,298 | | | | 0.1 | |
| 8,693,194 (3) | | | Freddie Mac REMIC Trust 5261 IC, 4.000%, 01/25/2050 | | | 1,665,769 | | | | 0.1 | |
| 5,100,000 (1)(2) | | | Freddie Mac STACR REMIC Trust 2021-DNA6 B1, 8.720%, (SOFR30A + 3.400%), 10/25/2041 | | | 5,285,639 | | | | 0.3 | |
| 6,100,000 (1)(2) | | | Freddie Mac STACR REMIC Trust 2021-HQA4 B1, 9.070%, (SOFR30A + 3.750%), 12/25/2041 | | | 6,293,687 | | | | 0.3 | |
| 5,000,000 (1)(2) | | | Freddie Mac STACR REMIC Trust 2021-HQA4 M2, 7.670%, (SOFR30A + 2.350%), 12/25/2041 | | | 5,037,227 | | | | 0.3 | |
| 2,800,000 (1)(2) | | | Freddie Mac STACR REMIC Trust 2022-DNA1 B1, 8.720%, (SOFR30A + 3.400%), 01/25/2042 | | | 2,895,693 | | | | 0.2 | |
| 3,000,000 (1)(2) | | | Freddie Mac STACR REMIC Trust 2022-DNA1 M2, 7.820%, (SOFR30A + 2.500%), 01/25/2042 | | | 3,055,916 | | | | 0.2 | |
See Accompanying Notes to Financial Statements
Voya Strategic
Income Opportunities Fund | PORTFOLIO OF INVESTMENTS
as of March 31, 2024 (continued) |
Principal
Amount† | | | | | Value | | | Percentage
of Net
Assets |
| COLLATERALIZED MORTGAGE OBLIGATIONS: (continued) | |
| 2,500,000 (1)(2) | | | Freddie Mac STACR REMIC Trust 2022-DNA2 B1, 10.070%, (SOFR30A + 4.750%), 02/25/2042 | | $ | 2,666,974 | | | | 0.2 | |
| 3,400,000 (1)(2) | | | Freddie Mac STACR REMIC Trust 2022-DNA3 M2, 9.670%, (SOFR30A + 4.350%), 04/25/2042 | | | 3,649,727 | | | | 0.2 | |
| 1,000,000 (1)(2) | | | Freddie Mac STACR REMIC Trust 2022-DNA6 M2, 11.070%, (SOFR30A + 5.750%), 09/25/2042 | | | 1,126,517 | | | | 0.1 | |
| 2,500,000 (1)(2) | | | Freddie Mac STACR REMIC Trust 2023-HQA3 M2, 8.670%, (SOFR30A + 3.350%), 11/25/2043 | | | 2,621,800 | | | | 0.1 | |
| 609,237 (3) | | | Freddie Mac Strips 224 IO, 6.000%, 03/01/2033 | | | 98,130 | | | | 0.0 | |
| 310,438 (1)(3) | | | Freddie Mac Strips 237 S23, 1.667%, (-1.000*SOFR30A + 6.986%), 05/15/2036 | | | 33,855 | | | | 0.0 | |
| 379,388 (3) | | | Freddie Mac Strips 260 33, 4.000%, 05/15/2039 | | | 58,858 | | | | 0.0 | |
| 577,412 (3) | | | Freddie Mac Strips 287 IO, 3.000%, 10/15/2027 | | | 18,479 | | | | 0.0 | |
| 191,611 (1)(3) | | | Freddie Mac Strips 324 144, 6.000%, 06/15/2039 | | | 37,667 | | | | 0.0 | |
| 9,125,588 (3) | | | Freddie Mac Strips 390 C3, 3.500%, 11/15/2037 | | | 1,131,190 | | | | 0.1 | |
| 1,544,577 (1)(2) | | | Galton Funding Mortgage Trust 2018-2 B2, 4.750%, 10/25/2058 | | | 1,454,943 | | | | 0.1 | |
| 2,305,336 (1)(2) | | | Galton Funding Mortgage Trust 2019-1 B1, 4.250%, 02/25/2059 | | | 2,131,857 | | | | 0.1 | |
| 1,848,487 (1)(2) | | | Galton Funding Mortgage Trust 2019-1 B2, 4.500%, 02/25/2059 | | | 1,727,816 | | | | 0.1 | |
| 2,854,848 (1)(3) | | | Ginnie Mae 2007-59 SC, 1.057%, (-1.000*TSFR1M + 6.386%), 07/20/2037 | | | 269,536 | | | | 0.0 | |
| 268,300 (1)(3) | | | Ginnie Mae 2008-40 SA, 0.959%, (-1.000*TSFR1M + 6.286%), 05/16/2038 | | | 11,327 | | | | 0.0 | |
| 381,255 (3) | | | Ginnie Mae 2010-143 JI, 4.000%, 08/16/2039 | | | 16,664 | | | | 0.0 | |
| 664,077 (3) | | | Ginnie Mae 2010-4 IP, 5.000%, 01/16/2039 | | | 41,683 | | | | 0.0 | |
| 416,983 (1)(3) | | | Ginnie Mae 2010-4 SL, 0.959%, (-1.000*TSFR1M + 6.286%), 01/16/2040 | | | 38,603 | | | | 0.0 | |
Principal
Amount† | | | | | Value | | | Percentage
of Net
Assets |
| COLLATERALIZED MORTGAGE OBLIGATIONS: (continued) |
| 7,609 (1)(3) | | | Ginnie Mae 2010-98 QS, 1.157%, (-1.000*TSFR1M + 6.486%), 01/20/2040 | | $ | 26 | | | | 0.0 | |
| 1,179,230 (1)(3) | | | Ginnie Mae 2011-101 BI, 0.650%, (-1.000*TSFR1M + 6.536%), 11/20/2037 | | | 27,183 | | | | 0.0 | |
| 94,435 (1)(3) | | | Ginnie Mae 2011-101 EI, 3.849%, (-1.000*TSFR1M + 106.946%), 10/16/2039 | | | 21,142 | | | | 0.0 | |
| 967,494 (3) | | | Ginnie Mae 2011-124 KI, 4.000%, 08/20/2039 | | | 42,016 | | | | 0.0 | |
| 3,272,939 (1)(3) | | | Ginnie Mae 2011-25 AS, 0.617%, (-1.000*TSFR1M + 5.946%), 02/20/2041 | | | 207,713 | | | | 0.0 | |
| 863,189 (3) | | | Ginnie Mae 2012-148 IP, 3.500%, 04/20/2041 | | | 24,283 | | | | 0.0 | |
| 12,553 (3) | | | Ginnie Mae 2012-149 BI, 3.500%, 10/20/2041 | | | 1,112 | | | | 0.0 | |
| 1,326,303 (3) | | | Ginnie Mae 2012-39 PI, 4.000%, 03/16/2042 | | | 124,455 | | | | 0.0 | |
| 2,486,047 (1)(3) | | | Ginnie Mae 2013-103 DS, 0.707%, (-1.000*TSFR1M + 6.036%), 07/20/2043 | | | 210,063 | | | | 0.0 | |
| 15,303,542 (1)(3) | | | Ginnie Mae 2013-130 SB, 0.016%, (-1.000*TSFR1M + 4.936%), 09/16/2043 | | | 427,356 | | | | 0.0 | |
| 4,479,660 (1)(3) | | | Ginnie Mae 2013-134 DS, 0.657%, (-1.000*TSFR1M + 5.986%), 09/20/2043 | | | 350,820 | | | | 0.0 | |
| 139,191 (3) | | | Ginnie Mae 2013-44 LI, 4.500%, 01/16/2043 | | | 15,789 | | | | 0.0 | |
| 533,879 (3) | | | Ginnie Mae 2013-81 IO, 4.500%, 01/16/2040 | | | 35,389 | | | | 0.0 | |
| 6,621,758 (1)(3) | | | Ginnie Mae 2014-58 SM, 0.659%, (-1.000*TSFR1M + 5.986%), 04/16/2044 | | | 573,781 | | | | 0.0 | |
| 1,565,619 (3) | | | Ginnie Mae 2014-84 PI, 4.500%, 04/20/2043 | | | 171,405 | | | | 0.0 | |
| 1,464,315 (3) | | | Ginnie Mae 2015-132 BI, 4.000%, 11/20/2044 | | | 184,100 | | | | 0.0 | |
| 2,341,404 (1)(3) | | | Ginnie Mae 2015-69 IL, 0.200%, (-1.000*TSFR1M + 6.586%), 07/20/2034 | | | 16,874 | | | | 0.0 | |
| 157,218 (3) | | | Ginnie Mae 2015-94 IU, 4.000%, 08/20/2044 | | | 21,608 | | | | 0.0 | |
| 5,251,895 (1)(3) | | | Ginnie Mae 2016-66 ES, 0.607%, (-1.000*TSFR1M + 5.936%), 05/20/2046 | | | 490,051 | | | | 0.0 | |
| 326,329 (3) | | | Ginnie Mae 2016-8 PI, 4.000%, 10/20/2044 | | | 39,216 | | | | 0.0 | |
See Accompanying Notes to Financial Statements
Voya Strategic
Income Opportunities Fund | PORTFOLIO OF INVESTMENTS
as of March 31, 2024 (continued) |
Principal
Amount† | | | | | Value | | | Percentage
of Net
Assets |
| COLLATERALIZED MORTGAGE OBLIGATIONS: (continued) |
| 4,759,320 (1)(3) | | | Ginnie Mae 2018-153 SQ, 0.757%, (-1.000*TSFR1M + 6.086%), 11/20/2048 | | $ | 347,003 | | | | 0.0 | |
| 11,390,795 (1)(3) | | | Ginnie Mae 2018-93 SJ, 0.757%, (-1.000*TSFR1M + 6.086%), 07/20/2048 | | | 927,093 | | | | 0.1 | |
| 137,676 (3) | | | Ginnie Mae 2019-111 TI, 5.000%, 09/20/2049 | | | 23,750 | | | | 0.0 | |
| 79,254 (3) | | | Ginnie Mae 2019-86 GI, 6.500%, 07/20/2049 | | | 14,358 | | | | 0.0 | |
| 326,213 (3) | | | Ginnie Mae 2019-86 HI, 5.500%, 07/20/2049 | | | 66,376 | | | | 0.0 | |
| 10,187,633 (1)(3) | | | Ginnie Mae 2019-89 SC, 0.657%, (-1.000*TSFR1M + 5.986%), 07/20/2049 | | | 1,064,476 | | | | 0.1 | |
| 20,372,503 (3) | | | Ginnie Mae 2020-7 EI, 3.500%, 01/20/2050 | | | 3,662,809 | | | | 0.2 | |
| 22,453,338 (3) | | | Ginnie Mae 2021-152 ID, 3.000%, 08/20/2051 | | | 3,449,084 | | | | 0.2 | |
| 39,724,407 (3) | | | Ginnie Mae 2021-194 IK, 3.000%, 11/20/2051 | | | 6,420,775 | | | | 0.4 | |
| 20,610,957 (3) | | | Ginnie Mae 2023-24 ID, 3.500%, 06/20/2050 | | | 3,654,937 | | | | 0.2 | |
| 238,881 (1)(2) | | | GS Mortage-Backed Securities Trust 2020-PJ1 A1, 3.500%, 05/25/2050 | | | 210,828 | | | | 0.0 | |
| 379,400 (1)(2) | | | GS Mortage-Backed Securities Trust 2020-PJ1 A4, 3.500%, 05/25/2050 | | | 334,462 | | | | 0.0 | |
| 955,573 (1)(2) | | | GS Mortage-Backed Securities Trust 2020-PJ1 A8, 3.500%, 05/25/2050 | | | 840,712 | | | | 0.1 | |
| 2,226,242 (1)(2) | | | GS Mortage-Backed Securities Trust 2020-PJ1 B2, 3.630%, 05/25/2050 | | | 1,893,275 | | | | 0.1 | |
| 3,514,382 (1)(2) | | | GS Mortage-Backed Securities Trust 2020-PJ1 B3, 3.630%, 05/25/2050 | | | 2,953,069 | | | | 0.2 | |
| 1,479,646 (1)(2) | | | GS Mortgage-Backed Securities Corp. Trust 2019-PJ1 B3, 4.043%, 08/25/2049 | | | 1,253,494 | | | | 0.1 | |
| 64,814 (1)(2) | | | GS Mortgage-Backed Securities Corp. Trust 2019-PJ2 A1, 4.000%, 11/25/2049 | | | 60,038 | | | | 0.0 | |
| 3,580,849 (1)(2) | | | GS Mortgage-Backed Securities Corp. Trust 2019-PJ2 B2, 4.375%, 11/25/2049 | | | 3,284,838 | | | | 0.2 | |
Principal
Amount† | | | | | Value | | | Percentage
of Net
Assets |
| COLLATERALIZED MORTGAGE OBLIGATIONS: (continued) |
| 3,703,826 (1)(2) | | | GS Mortgage-Backed Securities Corp. Trust 2019-PJ2 B3, 4.375%, 11/25/2049 | | $ | 3,325,378 | | | | 0.2 | |
| 436,705 (1)(2) | | | GS Mortgage-Backed Securities Corp. Trust 2019-PJ3 B1, 3.948%, 03/25/2050 | | | 392,721 | | | | 0.0 | |
| 445,419 (1)(2) | | | GS Mortgage-Backed Securities Corp. Trust 2019-PJ3 B2, 3.948%, 03/25/2050 | | | 399,348 | | | | 0.0 | |
| 1,718,281 (1)(2) | | | GS Mortgage-Backed Securities Corp. Trust 2020-PJ3 B4, 3.423%, 10/25/2050 | | | 1,326,182 | | | | 0.1 | |
| 1,619,853 (1)(2) | | | GS Mortgage-Backed Securities Corp. Trust 2021-PJ3 B3, 2.648%, 08/25/2051 | | | 1,226,657 | | | | 0.1 | |
| 3,702,933 (1)(2) | | | GS Mortgage-Backed Securities Corp. Trust 2021-PJ4 B3, 2.614%, 09/25/2051 | | | 2,873,209 | | | | 0.2 | |
| 4,790,736 (1)(2) | | | GS Mortgage-Backed Securities Corp. Trust 2021-PJ5 B3, 2.585%, 10/25/2051 | | | 3,676,088 | | | | 0.2 | |
| 947,633 (1)(2) | | | GS Mortgage-Backed Securities Trust 2021-GR3 B3, 3.382%, 04/25/2052 | | | 757,279 | | | | 0.0 | |
| 950,051 (1)(2) | | | GS Mortgage-Backed Securities Trust 2021-GR3 B4, 3.382%, 04/25/2052 | | | 742,738 | | | | 0.0 | |
| 2,395,874 (2) | | | GS Mortgage-Backed Securities Trust 2021-PJ9 A4, 2.500%, 02/26/2052 | | | 1,910,194 | | | | 0.1 | |
| 2,301,997 (2) | | | GS Mortgage-Backed Securities Trust 2022-NQM1 A4, 4.000%, 05/25/2062 | | | 2,092,957 | | | | 0.1 | |
| 2,985,406 (1)(2) | | | GS Mortgage-Backed Securities Trust 2023-PJ6 B2, 6.963%, 04/25/2054 | | | 3,038,780 | | | | 0.2 | |
| 997,747 (1)(2) | | | GS Mortgage-Backed Securities Trust 2024-PJ1 B2, 7.303%, 06/25/2054 | | | 1,059,122 | | | | 0.1 | |
| 307,595 (1) | | | HarborView Mortgage Loan Trust 2007-5 A1A, 5.821%, (TSFR1M + 0.494%), 09/19/2037 | | | 256,723 | | | | 0.0 | |
| 765 (1) | | | HomeBanc Mortgage Trust 2004-1 2A, 6.304%, (TSFR1M + 0.974%), 08/25/2029 | | | 734 | | | | 0.0 | |
See Accompanying Notes to Financial Statements
Voya Strategic
Income Opportunities Fund | PORTFOLIO OF INVESTMENTS
as of March 31, 2024 (continued) |
Principal
Amount† | | | | | Value | | | Percentage
of Net
Assets |
| COLLATERALIZED MORTGAGE OBLIGATIONS: (continued) |
| 2,600,000 (1)(2) | | | Imperial Fund Mortgage Trust 2021-NQM4 M1, 3.446%, 01/25/2057 | | $ | 1,882,011 | | | | 0.1 | |
| 50,327 (1) | | | IndyMac INDX Mortgage Loan Trust 2006-AR2 1A1B, 5.864%, (TSFR1M + 0.534%), 04/25/2046 | | | 41,326 | | | | 0.0 | |
| 61,775 (1)(2) | | | J.P. Morgan Mortgage Trust 2019-2 A3, 4.000%, 08/25/2049 | | | 57,972 | | | | 0.0 | |
| 1,019,590 (1)(2) | | | J.P. Morgan Mortgage Trust 2019-2 B1, 4.455%, 08/25/2049 | | | 935,652 | | | | 0.1 | |
| 2,470,372 (1)(2) | | | J.P. Morgan Mortgage Trust 2019-2 B2, 4.455%, 08/25/2049 | | | 2,257,098 | | | | 0.1 | |
| 1,207,087 (1)(2) | | | J.P. Morgan Mortgage Trust 2019-LTV1 B2, 4.576%, 06/25/2049 | | | 1,129,480 | | | | 0.1 | |
| 2,372,524 (1)(2) | | | J.P. Morgan Mortgage Trust 2021-14 B4, 3.155%, 05/25/2052 | | | 1,841,729 | | | | 0.1 | |
| 906,072 (1)(2) | | | J.P. Morgan Mortgage Trust 2022-5 A9, 2.800%, 09/25/2052 | | | 730,218 | | | | 0.0 | |
| 976,926 (1)(2) | | | J.P. Morgan Mortgage Trust 2024-1 A9, 6.000%, 06/25/2054 | | | 961,647 | | | | 0.1 | |
| 1,324,154 (1) | | | JP Morgan Mortgage Trust 2005-A4 B1, 5.086%, 07/25/2035 | | | 1,213,053 | | | | 0.1 | |
| 70,450 | | | JP Morgan Mortgage Trust 2005-S3 1A10, 6.000%, 01/25/2036 | | | 33,295 | | | | 0.0 | |
| 144,912 | | | JP Morgan Mortgage Trust 2006-S2 1A18, 6.000%, 07/25/2036 | | | 71,536 | | | | 0.0 | |
| 379,122 | | | JP Morgan Mortgage Trust 2006-S3 1A30, 6.500%, 08/25/2036 | | | 123,619 | | | | 0.0 | |
| 784,352 (1)(2) | | | JP Morgan Mortgage Trust 2014-5 B3, 2.739%, 10/25/2029 | | | 696,205 | | | | 0.0 | |
| 430,837 (1)(2) | | | JP Morgan Mortgage Trust 2016-1 B3, 3.796%, 05/25/2046 | | | 389,708 | | | | 0.0 | |
| 2,095,000 (1)(2) | | | JP Morgan Mortgage Trust 2016-1 B4, 3.796%, 05/25/2046 | | | 1,583,421 | | | | 0.1 | |
| 343,208 (1)(2) | | | JP Morgan Mortgage Trust 2016-4 A13, 3.500%, 10/25/2046 | | | 305,605 | | | | 0.0 | |
| 771,416 (1)(2) | | | JP Morgan Mortgage Trust 2017-1 B4, 3.452%, 01/25/2047 | | | 660,207 | | | | 0.0 | |
| 1,248,335 (1)(2) | | | JP Morgan Mortgage Trust 2017-3 B1, 3.764%, 08/25/2047 | | | 1,134,257 | | | | 0.1 | |
Principal
Amount† | | | | | Value | | | Percentage
of Net
Assets |
| COLLATERALIZED MORTGAGE OBLIGATIONS: (continued) |
| 1,685,838 (1)(2) | | | JP Morgan Mortgage Trust 2017-5 B1, 4.257%, 10/26/2048 | | $ | 1,627,853 | | | | 0.1 | |
| 502,263 (1)(2) | | | JP Morgan Mortgage Trust 2017-6 B3, 3.777%, 12/25/2048 | | | 442,294 | | | | 0.0 | |
| 1,418,162 (1)(2) | | | JP Morgan Mortgage Trust 2017-6 B4, 3.777%, 12/25/2048 | | | 1,229,795 | | | | 0.1 | |
| 981,174 (1)(2) | | | JP Morgan Mortgage Trust 2017-6 B5, 3.777%, 12/25/2048 | | | 733,594 | | | | 0.0 | |
| 2,069,233 (1)(2) | | | JP Morgan Mortgage Trust 2018-1 B2, 3.609%, 06/25/2048 | | | 1,824,094 | | | | 0.1 | |
| 2,122,414 (1)(2) | | | JP Morgan Mortgage Trust 2018-3 B3, 3.709%, 09/25/2048 | | | 1,853,737 | | | | 0.1 | |
| 427,312 (1)(2) | | | JP Morgan Mortgage Trust 2018-4 B2, 3.711%, 10/25/2048 | | | 377,112 | | | | 0.0 | |
| 1,722,093 (1)(2) | | | JP Morgan Mortgage Trust 2018-5 A13, 3.500%, 10/25/2048 | | | 1,490,922 | | | | 0.1 | |
| 98,388 (1)(2) | | | JP Morgan Mortgage Trust 2018-6 1A10, 3.500%, 12/25/2048 | | | 86,702 | | | | 0.0 | |
| 148,027 (1)(2) | | | JP Morgan Mortgage Trust 2018-8 A3, 4.000%, 01/25/2049 | | | 135,465 | | | | 0.0 | |
| 3,492,918 (1)(2) | | | JP Morgan Mortgage Trust 2018-8 B2, 4.027%, 01/25/2049 | | | 3,127,916 | | | | 0.2 | |
| 892,504 (1)(2) | | | JP Morgan Mortgage Trust 2018-9 B2, 4.251%, 02/25/2049 | | | 808,536 | | | | 0.1 | |
| 1,763,961 (1)(2) | | | JP Morgan Mortgage Trust 2018-9 B3, 4.251%, 02/25/2049 | | | 1,570,395 | | | | 0.1 | |
| 162,637 (1)(2) | | | JP Morgan Mortgage Trust 2019-1 A3, 4.000%, 05/25/2049 | | | 151,818 | | | | 0.0 | |
| 375,745 (1)(2) | | | JP Morgan Mortgage Trust 2019-5 A3, 4.000%, 11/25/2049 | | | 346,769 | | | | 0.0 | |
| 2,704,832 (1)(2) | | | JP Morgan Mortgage Trust 2019-5 B1, 4.454%, 11/25/2049 | | | 2,519,490 | | | | 0.1 | |
| 96,530 (1)(2) | | | JP Morgan Mortgage Trust 2019-6 A3, 3.500%, 12/25/2049 | | | 86,197 | | | | 0.0 | |
| 893,441 (1)(2) | | | JP Morgan Mortgage Trust 2019-7 B3A, 3.240%, 02/25/2050 | | | 754,068 | | | | 0.0 | |
| 407,129 (1)(2) | | | JP Morgan Mortgage Trust 2019-8 A15, 3.500%, 03/25/2050 | | | 359,675 | | | | 0.0 | |
| 910,079 (1)(2) | | | JP Morgan Mortgage Trust 2019-8 B3A, 3.424%, 03/25/2050 | | | 759,155 | | | | 0.0 | |
See Accompanying Notes to Financial Statements
Voya Strategic
Income Opportunities Fund | PORTFOLIO OF INVESTMENTS
as of March 31, 2024 (continued) |
Principal
Amount† | | | | | Value | | | Percentage
of Net
Assets |
| COLLATERALIZED MORTGAGE OBLIGATIONS: (continued) |
| 3,613,695 (1)(2) | | | JP Morgan Mortgage Trust 2019-INV1 B2, 4.943%, 10/25/2049 | | $ | 3,421,711 | | | | 0.2 | |
| 239,820 (1)(2) | | | JP Morgan Mortgage Trust 2019-INV2 A15, 3.500%, 02/25/2050 | | | 215,172 | | | | 0.0 | |
| 3,866,721 (1)(2) | | | JP Morgan Mortgage Trust 2019-INV3 B3, 4.355%, 05/25/2050 | | | 3,373,482 | | | | 0.2 | |
| 1,732,332 (1)(2) | | | JP Morgan Mortgage Trust 2019-LTV2 B2, 4.697%, 12/25/2049 | | | 1,628,327 | | | | 0.1 | |
| 1,756,039 (1)(2) | | | JP Morgan Mortgage Trust 2019-LTV2 B3, 4.697%, 12/25/2049 | | | 1,640,214 | | | | 0.1 | |
| 2,582,681 (1)(2) | | | JP Morgan Mortgage Trust 2019-LTV3 B2, 4.379%, 03/25/2050 | | | 2,335,567 | | | | 0.1 | |
| 6,011,613 (1)(2) | | | JP Morgan Mortgage Trust 2019-LTV3 B3, 4.379%, 03/25/2050 | | | 5,298,383 | | | | 0.3 | |
| 258,850 (1)(2) | | | JP Morgan Mortgage Trust 2020-2 A15, 3.500%, 07/25/2050 | | | 227,946 | | | | 0.0 | |
| 82,265 (1)(2) | | | JP Morgan Mortgage Trust 2020-LTV1 A15, 3.500%, 06/25/2050 | | | 80,121 | | | | 0.0 | |
| 424,984 (1)(2) | | | JP Morgan Mortgage Trust 2020-LTV1 A5, 3.500%, 06/25/2050 | | | 414,095 | | | | 0.0 | |
| 3,069,397 (1)(2) | | | JP Morgan Mortgage Trust 2021-6 B3, 2.863%, 10/25/2051 | | | 2,388,847 | | | | 0.1 | |
| 2,415,171 (1)(2) | | | JP Morgan Mortgage Trust 2022-2 B3, 3.129%, 08/25/2052 | | | 1,856,454 | | | | 0.1 | |
| 995,218 (1)(2) | | | JP Morgan Mortgage Trust 2023-10 B3, 6.522%, 05/25/2054 | | | 966,922 | | | | 0.1 | |
| 2,104,449 (1)(2) | | | JP Morgan Mortgage Trust 2024-2 A9, 6.500%, 08/25/2054 | | | 2,110,007 | | | | 0.1 | |
| 491,215 (1)(2) | | | JP Morgan Trust 2015-3 B3, 3.596%, 05/25/2045 | | | 451,763 | | | | 0.0 | |
| 1,327,529 (1)(2) | | | JP Morgan Trust 2015-3 B4, 3.596%, 05/25/2045 | | | 1,007,636 | | | | 0.1 | |
| 61,244 (1) | | | Lehman XS Trust Series 2005-5N 1A2, 5.804%, (TSFR1M + 0.474%), 11/25/2035 | | | 58,868 | | | | 0.0 | |
| 1,776,147 (1)(2) | | | Mello Mortgage Capital Acceptance 2021-MTG3 B3, 2.903%, 07/01/2051 | | | 1,365,725 | | | | 0.1 | |
| 2,745,332 (1)(2) | | | Mello Mortgage Capital Acceptance 2022-INV1 B3, 3.320%, 03/25/2052 | | | 2,169,464 | | | | 0.1 | |
| 2,000,000 (1)(2) | | | MFA Trust 2021-INV2 M1, 3.199%, 11/25/2056 | | | 1,498,453 | | | | 0.1 | |
Principal
Amount† | | | | | Value | | | Percentage
of Net
Assets |
| COLLATERALIZED MORTGAGE OBLIGATIONS: (continued) |
| 655,000 (1) | | | Morgan Stanley Mortgage Loan Trust 2005-5AR 1B1, 7.244%, (TSFR1M + 1.914%), 09/25/2035 | | $ | 650,393 | | | | 0.0 | |
| 965,481 (1) | | | Morgan Stanley Mortgage Loan Trust 2006-9AR A2, 5.744%, (TSFR1M + 0.414%), 08/25/2036 | | | 239,265 | | | | 0.0 | |
| 293,428 (1)(2) | | | New Residential Mortgage Loan Trust 2017-3A B2, 4.750%, 04/25/2057 | | | 281,000 | | | | 0.0 | |
| 1,300,000 (1)(2) | | | Oaktown Re VII Ltd. 2021-2 M1C, 8.670%, (SOFR30A + 3.350%), 04/25/2034 | | | 1,326,373 | | | | 0.1 | |
| 196,833 (1)(2) | | | OBX Trust 2019-EXP3 1A9, 3.500%, 10/25/2059 | | | 176,701 | | | | 0.0 | |
| 330,733 (1)(2) | | | OBX Trust 2019-INV2 A25, 4.000%, 05/27/2049 | | | 302,783 | | | | 0.0 | |
| 242,480 (1)(2) | | | OBX Trust 2020-INV1 A21, 3.500%, 12/25/2049 | | | 213,568 | | | | 0.0 | |
| 1,823,314 (1)(2) | | | OBX Trust 2022-J1 A14, 2.500%, 02/25/2052 | | | 1,450,340 | | | | 0.1 | |
| 2,500,000 (1)(2) | | | OBX Trust 2022-NQM4 A1B, 3.900%, 04/25/2062 | | | 2,304,813 | | | | 0.1 | |
| 2,126,449 (1)(2) | | | Oceanview Mortgage Trust 2021-1 B3, 2.721%, 05/25/2051 | | | 1,618,968 | | | | 0.1 | |
| 1,111,931,372 (2)(3) | | | PMTT4 2017-PM1 XIO, 13.000%, 10/25/2048 | | | 4,241,073 | | | | 0.2 | |
| 15,851 | | | Prime Mortgage Trust 2007-1 A4, 5.500%, 03/25/2037 | | | 13,294 | | | | 0.0 | |
| 135,628 (1)(2) | | | PSMC Trust 2019-3 A12, 3.500%, 11/25/2049 | | | 127,328 | | | | 0.0 | |
| 6,633,097 (1)(2) | | | Radnor RE Ltd. 2021-1 M1C, 8.020%, (SOFR30A + 2.700%), 12/27/2033 | | | 6,725,178 | | | | 0.4 | |
| 2,247,029 (1)(2) | | | RCKT Mortgage Trust 2019-1 B2A, 3.838%, 09/25/2049 | | | 1,983,942 | | | | 0.1 | |
| 1,519,590 (1)(2) | | | RCKT Mortgage Trust 2020-1 B2A, 3.466%, 02/25/2050 | | | 1,314,216 | | | | 0.1 | |
| 2,413,061 (1)(2) | | | RCKT Mortgage Trust 2021-4 A21, 2.500%, 09/25/2051 | | | 1,926,902 | | | | 0.1 | |
| 5,294,393 (1)(2) | | | RCKT Mortgage Trust 2021-6 B3, 2.793%, 12/25/2051 | | | 3,979,367 | | | | 0.2 | |
See Accompanying Notes to Financial Statements
Voya Strategic
Income Opportunities Fund | PORTFOLIO OF INVESTMENTS
as of March 31, 2024 (continued) |
Principal
Amount† | | | | | Value | | | Percentage
of Net
Assets |
| COLLATERALIZED MORTGAGE OBLIGATIONS: (continued) |
| 917,612 (1)(2) | | | RCKT Mortgage Trust 2022-3 A21, 3.000%, 05/25/2052 | | $ | 762,483 | | | | 0.0 | |
| 711,397 (2) | | | Sequoia Mortgage Trust 2013-9 B2, 3.500%, 07/25/2043 | | | 662,579 | | | | 0.0 | |
| 1,306,103 (1)(2) | | | Sequoia Mortgage Trust 2017-1 B2, 3.606%, 02/25/2047 | | | 1,189,258 | | | | 0.1 | |
| 1,065,080 (1)(2) | | | Sequoia Mortgage Trust 2018-6 B1, 4.162%, 07/25/2048 | | | 983,749 | | | | 0.1 | |
| 492,520 (2) | | | Sequoia Mortgage Trust 2018-CH1 B2B, 4.438%, 03/25/2048 | | | 457,807 | | | | 0.0 | |
| 1,560,029 (1)(2) | | | Sequoia Mortgage Trust 2019-2 B2, 4.256%, 06/25/2049 | | | 1,434,506 | | | | 0.1 | |
| 1,475,146 (1)(2) | | | Sequoia Mortgage Trust 2019-2 B3, 4.256%, 06/25/2049 | | | 1,313,141 | | | | 0.1 | |
| 1,934,866 (1)(2) | | | Sequoia Mortgage Trust 2019-5 B2, 3.710%, 12/25/2049 | | | 1,706,046 | | | | 0.1 | |
| 1,935,755 (1)(2) | | | Sequoia Mortgage Trust 2019-5 B3, 3.710%, 12/25/2049 | | | 1,671,128 | | | | 0.1 | |
| 721,507 (1)(2) | | | Sequoia Mortgage Trust 2019-CH1 B2B, 4.909%, 03/25/2049 | | | 698,578 | | | | 0.0 | |
| 53,391 (1)(2) | | | Sequoia Mortgage Trust 2019-CH2 A1, 4.500%, 08/25/2049 | | | 52,534 | | | | 0.0 | |
| 167,140 (1)(2) | | | Sequoia Mortgage Trust 2019-CH3 A13, 4.000%, 09/25/2049 | | | 154,528 | | | | 0.0 | |
| 1,822,363 (1)(2) | | | Sequoia Mortgage Trust 2019-CH3 B1B, 4.502%, 09/25/2049 | | | 1,694,288 | | | | 0.1 | |
| 178,272 (1)(2) | | | Sequoia Mortgage Trust 2020-1 A1, 3.500%, 02/25/2050 | | | 158,744 | | | | 0.0 | |
| 1,380,473 (1)(2) | | | Sequoia Mortgage Trust 2020-2 B3, 3.639%, 03/25/2050 | | | 1,162,424 | | | | 0.1 | |
| 537,902 (1)(2) | | | Sequoia Mortgage Trust 2021-3 B3, 2.651%, 05/25/2051 | | | 415,977 | | | | 0.0 | |
| 1,185,757 (1)(2) | | | Sequoia Mortgage Trust 2021-5 B3, 3.049%, 07/25/2051 | | | 934,680 | | | | 0.1 | |
| 1,056,636 (1)(2) | | | Sequoia Mortgage Trust 2022-1 B3, 2.947%, 02/25/2052 | | | 832,329 | | | | 0.1 | |
| 3,000,000 (1)(2) | | | Sequoia Mortgage Trust 2024-3 A19, 6.000%, 04/25/2054 | | | 2,967,891 | | | | 0.2 | |
| 2,778,824 (1)(2) | | | Shellpoint Co.-Originator Trust 2017-2 B3, 3.644%, 10/25/2047 | | | 2,470,286 | | | | 0.1 | |
Principal
Amount† | | | | | Value | | | Percentage
of Net
Assets |
| COLLATERALIZED MORTGAGE OBLIGATIONS: (continued) |
| 2,096,146 (1)(2) | | | Shellpoint Co-Originator Trust 2017-2 B2, 3.644%, 10/25/2047 | | $ | 1,877,509 | | | | 0.1 | |
| 2,000,000 (1)(2) | | | Starwood Mortgage Residential Trust 2022-2 M1, 4.200%, 02/25/2067 | | | 1,553,503 | | | | 0.1 | |
| 23,609 (1) | | | Structured Adjustable Rate Mortgage Loan Trust Series 2005-4 3A1, 6.013%, 03/25/2035 | | | 21,439 | | | | 0.0 | |
| 6,000,000 (1)(2) | | | Triangle Re Ltd. 2021-3 M1B, 8.220%, (SOFR30A + 2.900%), 02/25/2034 | | | 6,040,789 | | | | 0.3 | |
| 2,418,089 (1)(2) | | | UWM Mortgage Trust 2021-INV4 B3, 3.224%, 12/25/2051 | | | 1,898,441 | | | | 0.1 | |
| 57,756,879 (1)(3) | | | WaMu Mortgage Pass-Through Certificates 2005-AR1 X, 0.147%, 01/25/2045 | | | 580 | | | | 0.0 | |
| 22,139,791 (1)(3) | | | WaMu Mortgage Pass-Through Certificates 2005-AR2 X, 0.089%, 01/25/2045 | | | 223 | | | | 0.0 | |
| 10,712 (1) | | | WaMu Mortgage Pass-Through Certificates 2006-AR12 1A1, 4.480%, 10/25/2036 | | | 9,512 | | | | 0.0 | |
| 51,959 (1) | | | WaMu Mortgage Pass-Through Certificates 2006-AR12 2A3, 3.794%, 10/25/2036 | | | 45,785 | | | | 0.0 | |
| 268,097 (1) | | | WaMu Mortgage Pass-Through Certificates 2006-AR14 1A4, 4.019%, 11/25/2036 | | | 226,937 | | | | 0.0 | |
| 36,936 (1) | | | WaMu Mortgage Pass-Through Certificates 2006-AR8 1A4, 4.384%, 08/25/2046 | | | 32,238 | | | | 0.0 | |
| 66,495 (1) | | | WaMu Mortgage Pass-Through Certificates 2007-HY2 1A1, 3.992%, 12/25/2036 | | | 58,326 | | | | 0.0 | |
| 346,053 (1) | | | WaMu Mortgage Pass-Through Certificates 2007-HY3 1A1, 3.915%, 03/25/2037 | | | 275,181 | | | | 0.0 | |
| 40,569 (1) | | | WaMu Mortgage Pass-Through Certificates 2007-HY7 2A2, 3.781%, 07/25/2037 | | | 32,733 | | | | 0.0 | |
| 716,139 (1) | | | WaMu Mortgage Pass-Through Certificates Series 2004-AR7 A6, 4.945%, 07/25/2034 | | | 669,534 | | | | 0.0 | |
See Accompanying Notes to Financial Statements
Voya Strategic
Income Opportunities Fund | PORTFOLIO OF INVESTMENTS
as of March 31, 2024 (continued) |
Principal
Amount† | | | | | Value | | | Percentage
of Net
Assets |
| COLLATERALIZED MORTGAGE OBLIGATIONS: (continued) |
| 107,794 (1) | | | WaMu Mortgage Pass-Through Certificates Series Trust 2004-AR4 A6, 5.048%, 06/25/2034 | | $ | 103,617 | | | | 0.0 | |
| 69,761 (1) | | | WaMu Mortgage Pass-Through Certificates Series Trust 2006-AR14 1A3, 4.019%, 11/25/2036 | | | 59,051 | | | | 0.0 | |
| 394,577 (1) | | | Washington Mutual Mortgage Pass-Through Certificates WMALT 2005-10 2A3, 5.750%, (TSFR1M + 1.014%), 11/25/2035 | | | 334,113 | | | | 0.0 | |
| 461,786 | | | Washington Mutual Mortgage Pass-Through Certificates WMALT 2005-5 CB3, 5.500%, 07/25/2035 | | | 413,971 | | | | 0.0 | |
| 571,922 (1) | | | Washington Mutual Mortgage Pass-Through Certificates WMALT 2006-5 2CB2, 6.000%, (TSFR1M + 0.714%), 07/25/2036 | | | 361,339 | | | | 0.0 | |
| 1,537,110 (1) | | | Washington Mutual Mortgage Pass-Through Certificates WMALT 2006-AR5 3A, 6.029%, (12MTA + 0.940%), 07/25/2046 | | | 923,293 | | | | 0.1 | |
| 629,900 (1) | | | Washington Mutual Mortgage Pass-Through Certificates WMALT 2006-AR6 2A, 6.049%, (12MTA + 0.960%), 08/25/2046 | | | 343,074 | | | | 0.0 | |
| 418,369 | | | Washington Mutual Mortgage Pass-Through Certificates WMALT Series Trust 2005-10 2A9, 6.000%, 11/25/2035 | | | 370,581 | | | | 0.0 | |
| 87,586 | | | Washington Mutual Mortgage Pass-Through Certificates WMALT Series Trust 2005-8 1A2, 5.500%, 10/25/2035 | | | 77,133 | | | | 0.0 | |
| 18,707 (1) | | | Wells Fargo Alternative Loan Trust 2007-PA2 2A1, 5.874%, (TSFR1M + 0.544%), 06/25/2037 | | | 15,233 | | | | 0.0 | |
| 1,297,218 (1)(2) | | | Wells Fargo Mortgage Backed Securities 2018-1 B3, 3.657%, 07/25/2047 | | | 1,110,473 | | | | 0.1 | |
Principal
Amount† | | | | | Value | | | Percentage
of Net
Assets |
| COLLATERALIZED MORTGAGE OBLIGATIONS: (continued) |
| 387,822 (1) | | | Wells Fargo Mortgage Backed Securities Trust 2006-AR12 1A1, 6.105%, 09/25/2036 | | $ | 345,477 | | | | 0.0 | |
| 78,338 (1) | | | Wells Fargo Mortgage Backed Securities Trust 2007-AR7 A1, 5.880%, 12/28/2037 | | | 67,473 | | | | 0.0 | |
| 1,453,622 (1)(2) | | | Wells Fargo Mortgage Backed Securities Trust 2019-4 B3, 3.518%, 09/25/2049 | | | 1,037,314 | | | | 0.1 | |
| 1,846,155 (1)(2) | | | Wells Fargo Mortgage Backed Securities Trust 2020-1 B3, 3.377%, 12/25/2049 | | | 1,544,504 | | | | 0.1 | |
| 2,706,454 (1)(2) | | | Wells Fargo Mortgage Backed Securities Trust 2020-4 B2, 3.160%, 07/25/2050 | | | 2,320,167 | | | | 0.1 | |
| 1,877,578 (1)(2) | | | Wells Fargo Mortgage Backed Securities Trust 2021-1 B3, 2.707%, 12/25/2050 | | | 1,362,596 | | | | 0.1 | |
| 361,077 (1)(2) | | | WinWater Mortgage Loan Trust 2015-5 B4, 3.754%, 08/20/2045 | | | 324,797 | | | | 0.0 | |
| | | | Total Collateralized Mortgage Obligations (Cost $518,547,149) | | | 469,814,033 | | | | 25.4 | |
| | | | | | | | | | | | |
|
| COMMERCIAL MORTGAGE-BACKED SECURITIES: 18.1% |
| 3,998,929 (1)(2) | | | Arbor Realty Commercial Real Estate Notes Ltd. 2021-FL2 A, 6.540%, (TSFR1M + 1.214%), 05/15/2036 | | | 3,990,344 | | | | 0.2 | |
| 1,971,929 (1)(2) | | | AREIT LLC 2023-CRE8 A, 7.438%, (TSFR1M + 2.112%), 08/17/2041 | | | 1,978,214 | | | | 0.1 | |
| 555,000 (1) | | | BANK 2017-BNK4 C, 4.372%, 05/15/2050 | | | 473,560 | | | | 0.0 | |
| 5,320,000 (1)(2)(3) | | | BANK 2017-BNK4 XE, 1.476%, 05/15/2050 | | | 192,864 | | | | 0.0 | |
| 4,380,000 (2) | | | BANK 2017-BNK6 D, 3.100%, 07/15/2060 | | | 3,445,154 | | | | 0.2 | |
| 16,600,000 (1)(2)(3) | | | BANK 2017-BNK6 XE, 1.500%, 07/15/2060 | | | 668,696 | | | | 0.0 | |
| 9,768,177 (1)(3) | | | BANK 2019-BN16 XA, 0.940%, 02/15/2052 | | | 355,256 | | | | 0.0 | |
| 48,722,230 (1)(3) | | | BANK 2019-BN17 XA, 0.998%, 04/15/2052 | | | 1,945,847 | | | | 0.1 | |
| 28,765,610 (1)(3) | | | BANK 2019-BN19 XA, 0.940%, 08/15/2061 | | | 1,114,961 | | | | 0.1 | |
| 57,701,122 (1)(3) | | | BANK 2019-BN22 XA, 0.590%, 11/15/2062 | | | 1,580,662 | | | | 0.1 | |
| 1,500,000 (1) | | | BANK 2019-BN24 C, 3.517%, 11/15/2062 | | | 1,208,811 | | | | 0.1 | |
| 10,616,095 (1)(3) | | | BBCMS Trust 2021-C10 XA, 1.282%, 07/15/2054 | | | 674,403 | | | | 0.0 | |
See Accompanying Notes to Financial Statements
Voya Strategic
Income Opportunities Fund | PORTFOLIO OF INVESTMENTS
as of March 31, 2024 (continued) |
Principal
Amount† | | | | | Value | | | Percentage
of Net
Assets |
| COMMERCIAL MORTGAGE-BACKED SECURITIES: (continued) |
| 97,831,366 (1)(3) | | | Benchmark Mortgage Trust 2018-B7 XA, 0.405%, 05/15/2053 | | $ | 1,369,223 | | | | 0.1 | |
| 44,234,474 (1)(3) | | | Benchmark Mortgage Trust 2019-B10 XA, 1.189%, 03/15/2062 | | | 2,116,965 | | | | 0.1 | |
| 42,285,000 (1)(2)(3) | | | Benchmark Mortgage Trust 2019-B10 XB, 0.877%, 03/15/2062 | | | 1,660,860 | | | | 0.1 | |
| 41,895,707 (1)(3) | | | Benchmark Mortgage Trust 2019-B12 XA, 1.024%, 08/15/2052 | | | 1,618,930 | | | | 0.1 | |
| 1,000,000 (1) | | | Benchmark Mortgage Trust 2019-B14 C, 3.772%, 12/15/2062 | | | 742,200 | | | | 0.0 | |
| 3,090,000 (2) | | | Benchmark Mortgage Trust 2019-B9 D, 3.000%, 03/15/2052 | | | 1,626,076 | | | | 0.1 | |
| 7,330,000 (1)(2)(3) | | | Benchmark Mortgage Trust 2019-B9 XD, 1.993%, 03/15/2052 | | | 575,707 | | | | 0.0 | |
| 17,413,613 (1)(3) | | | Benchmark Mortgage Trust 2021-B24 XA, 1.146%, 03/15/2054 | | | 909,212 | | | | 0.0 | |
| 9,817,066 (1)(3) | | | Benchmark Mortgage Trust 2021-B28 XA, 1.271%, 08/15/2054 | | | 629,164 | | | | 0.0 | |
| 2,000,000 | | | Benchmark Mortgage Trust 2024-V6 B, 6.785%, 03/15/2029 | | | 2,072,680 | | | | 0.1 | |
| 2,100,000 (1)(2) | | | BIG Commercial Mortgage Trust 2022-BIG B, 7.067%, (TSFR1M + 1.741%), 02/15/2039 | | | 2,076,800 | | | | 0.1 | |
| 1,000,000 (1)(2) | | | BLP Commercial Mortgage Trust 2023-IND D, 8.565%, (TSFR1M + 3.240%), 03/15/2040 | | | 1,002,285 | | | | 0.1 | |
| 2,500,000 (1)(2) | | | BLP Commercial Mortgage Trust 2024-IND2 C, 7.217%, (TSFR1M + 1.891%), 03/15/2041 | | | 2,505,007 | | | | 0.1 | |
| 2,653,000 (2)(4) | | | BMD2 Re-Remic Trust 2019-FRR1 3AB, 0.000%, 05/25/2052 | | | 1,916,381 | | | | 0.1 | |
| 3,002,000 (2) | | | BMD2 Re-Remic Trust 2019-FRR1 6B10, 2.449%, 05/25/2052 | | | 2,327,801 | | | | 0.1 | |
| 4,970,000 (1)(2) | | | BX Commercial Mortgage Trust 2021-21M E, 7.610%, (TSFR1M + 2.285%), 10/15/2036 | | | 4,908,062 | | | | 0.3 | |
| 3,116,086 (1)(2) | | | BX Commercial Mortgage Trust 2021-SOAR D, 6.840%, (TSFR1M + 1.514%), 06/15/2038 | | | 3,085,207 | | | | 0.2 | |
Principal
Amount† | | | | | Value | | | Percentage
of Net
Assets |
| COMMERCIAL MORTGAGE-BACKED SECURITIES: (continued) |
| 750,000 (1)(2) | | | BX Commercial Mortgage Trust 2021-VOLT D, 7.090%, (TSFR1M + 1.764%), 09/15/2036 | | $ | 740,005 | | | | 0.0 | |
| 1,500,000 (1)(2) | | | BX Commercial Mortgage Trust 2021-VOLT F, 7.840%, (TSFR1M + 2.514%), 09/15/2036 | | | 1,487,384 | | | | 0.1 | |
| 5,000,000 (1)(2) | | | BX Commercial Mortgage Trust 2023-XL3 A, 7.087%, (TSFR1M + 1.761%), 12/09/2040 | | | 5,039,337 | | | | 0.3 | |
| 1,500,000 (1)(2) | | | BX Commercial Mortgage Trust 2024-MF D, 8.015%, (TSFR1M + 2.690%), 02/15/2039 | | | 1,503,412 | | | | 0.1 | |
| 1,500,000 (1)(2) | | | BX Commercial Mortgage Trust 2024-XL4 C, 7.516%, (TSFR1M + 2.191%), 02/15/2039 | | | 1,502,927 | | | | 0.1 | |
| 5,000,000 (1)(2) | | | BX Commercial Mortgage Trust 2024-XL5 C, 7.241%, (TSFR1M + 1.941%), 03/15/2041 | | | 5,004,147 | | | | 0.3 | |
| 3,500,000 (1)(2) | | | BX Trust 2021-LBA EJV, 7.440%, (TSFR1M + 2.114%), 02/15/2036 | | | 3,433,868 | | | | 0.2 | |
| 2,767,834 (1)(2) | | | BX Trust 2021-LBA EV, 7.440%, (TSFR1M + 2.114%), 02/15/2036 | | | 2,715,536 | | | | 0.1 | |
| 2,000,000 (1)(2) | | | BX Trust 2021-LGCY A, 5.945%, (TSFR1M + 0.620%), 10/15/2036 | | | 1,975,111 | | | | 0.1 | |
| 959,253 (1)(2) | | | BX Trust 2021-SDMF D, 6.826%, (TSFR1M + 1.501%), 09/15/2034 | | | 941,312 | | | | 0.0 | |
| 1,438,879 (1)(2) | | | BX Trust 2021-SDMF E, 7.026%, (TSFR1M + 1.701%), 09/15/2034 | | | 1,407,709 | | | | 0.1 | |
| 816,889 (1)(2) | | | BX Trust 2022-FOX2 C, 6.635%, (TSFR1M + 1.309%), 04/15/2039 | | | 800,668 | | | | 0.0 | |
| 1,180,000 (1)(2) | | | BX Trust 2022-LBA6 C, 6.925%, (TSFR1M + 1.600%), 01/15/2039 | | | 1,169,673 | | | | 0.1 | |
| 1,000,000 (1)(2) | | | BX Trust 2022-LBA6 D, 7.325%, (TSFR1M + 2.000%), 01/15/2039 | | | 990,556 | | | | 0.1 | |
| 1,500,000 (1)(2) | | | BX Trust 2022-VAMF F, 8.624%, (TSFR1M + 3.299%), 01/15/2039 | | | 1,406,728 | | | | 0.1 | |
| 7,000,000 (2) | | | BX Trust 2023-LIFE C, 5.884%, 02/15/2028 | | | 6,801,712 | | | | 0.4 | |
See Accompanying Notes to Financial Statements
Voya Strategic
Income Opportunities Fund | PORTFOLIO OF INVESTMENTS
as of March 31, 2024 (continued) |
Principal
Amount† | | | | | Value | | | Percentage
of Net
Assets |
| COMMERCIAL MORTGAGE-BACKED SECURITIES: (continued) |
| 4,500,000 (1)(2) | | | BX Trust 2024-BIO B, 7.266%, (TSFR1M + 1.941%), 02/15/2041 | | $ | 4,509,120 | | | | 0.2 | |
| 1,800,000 (1)(2) | | | BX Trust 2024-CNYN C, 7.241%, (TSFR1M + 1.941%), 04/15/2029 | | | 1,801,540 | | | | 0.1 | |
| 1,250,000 (1)(2) | | | BX Trust 2024-CNYN D, 7.990%, (TSFR1M + 2.690%), 04/15/2029 | | | 1,254,527 | | | | 0.1 | |
| 90,634,658 (1)(3) | | | Cantor Commercial Real Estate Lending 2019-CF1 XA, 1.126%, 05/15/2052 | | | 3,856,849 | | | | 0.2 | |
| 35,838,210 (1)(3) | | | Cantor Commercial Real Estate Lending 2019-CF2 XA, 1.204%, 11/15/2052 | | | 1,621,360 | | | | 0.1 | |
| 1,250,000 (1) | | | CCUBS Commercial Mortgage Trust 2017-C1 B, 4.159%, 11/15/2050 | | | 1,146,020 | | | | 0.1 | |
| 6,683,022 (1)(3) | | | CD Mortgage Trust 2016-CD1 XA, 1.357%, 08/10/2049 | | | 140,351 | | | | 0.0 | |
| 14,660,000 (1)(2)(3) | | | CD Mortgage Trust 2016-CD1 XB, 0.685%, 08/10/2049 | | | 194,635 | | | | 0.0 | |
| 1,000,000 (1) | | | CFCRE Commercial Mortgage Trust 2016-C7 C, 4.367%, 12/10/2054 | | | 876,320 | | | | 0.0 | |
| 469,509 (1)(2) | | | Citigroup Commercial Mortgage Trust 2013-GC17 D, 5.114%, 11/10/2046 | | | 429,701 | | | | 0.0 | |
| 6,540,000 (1)(2) | | | Citigroup Commercial Mortgage Trust 2016-P4 E, 4.682%, 07/10/2049 | | | 3,438,746 | | | | 0.2 | |
| 5,790,000 (1)(2) | | | Citigroup Commercial Mortgage Trust 2016-P4 F, 4.682%, 07/10/2049 | | | 1,853,269 | | | | 0.1 | |
| 8,661,000 (2) | | | Citigroup Commercial Mortgage Trust 2016-P5 D, 3.000%, 10/10/2049 | | | 5,080,002 | | | | 0.3 | |
| 21,366,960 (1)(3) | | | Citigroup Commercial Mortgage Trust 2017-C4 XA, 0.981%, 10/12/2050 | | | 577,329 | | | | 0.0 | |
| 40,182,365 (1)(3) | | | Citigroup Commercial Mortgage Trust 2019-GC41 XA, 1.039%, 08/10/2056 | | | 1,586,944 | | | | 0.1 | |
| 910,768 (1)(2) | | | COMM Mortgage Trust 2013-CR10 E, 4.363%, 08/10/2046 | | | 819,458 | | | | 0.0 | |
| 1,000,000 (1) | | | COMM Mortgage Trust 2015-CR27 B, 4.337%, 10/10/2048 | | | 950,201 | | | | 0.1 | |
Principal
Amount† | | | | | Value | | | Percentage
of Net
Assets |
| COMMERCIAL MORTGAGE-BACKED SECURITIES: (continued) |
| 1,779,000 (1) | | | COMM Mortgage Trust 2015-DC1 B, 4.035%, 02/10/2048 | | $ | 1,662,455 | | | | 0.1 | |
| 9,411,074 (1)(3) | | | COMM Mortgage Trust 2016-COR1 XA, 1.302%, 10/10/2049 | | | 207,855 | | | | 0.0 | |
| 2,261,729 (1)(3) | | | COMM Mortgage Trust 2016-CR28 XA, 0.674%, 02/10/2049 | | | 24,315 | | | | 0.0 | |
| 1,500,000 (1) | | | COMM Mortgage Trust 2017-COR2 B, 4.206%, 09/10/2050 | | | 1,348,533 | | | | 0.1 | |
| 5,725,000 (1)(2) | | | COMM Mortgage Trust 2020-CBM F, 3.633%, 02/10/2037 | | | 5,355,306 | | | | 0.3 | |
| 4,698,845 (1)(2)(3) | | | Commercial Mortgage Pass Through Certificates 2012-LTRT XA, 0.791%, 10/05/2030 | | | 18,566 | | | | 0.0 | |
| 1,597,000 | | | DBJPM Mortgage Trust 2016-C3 B, 3.264%, 08/10/2049 | | | 1,439,330 | | | | 0.1 | |
| 208,881 (2) | | | DC Trust 2024-HLTN A, 5.727%, 04/13/2028 | | | 3,511,621 | | | | 0.2 | |
| 4,000,000 (1)(2) | | | DK Trust 2024-SPBX C, 7.300%, (TSFR1M + 1.950%), 03/15/2034 | | | 4,005,797 | | | | 0.2 | |
| 2,750,000 (1)(2) | | | DK Trust 2024-SPBX D, 8.100%, (TSFR1M + 2.750%), 03/15/2034 | | | 2,760,218 | | | | 0.1 | |
| 2,000,000 (1)(2) | | | DTP Commercial Mortgage Trust 2023-STE2 A, 5.648%, 01/15/2041 | | | 2,008,099 | | | | 0.1 | |
| 7,759,844 (1)(2) | | | EQUS Mortgage Trust 2021-EQAZ C, 6.790%, (TSFR1M + 1.464%), 10/15/2038 | | | 7,698,295 | | | | 0.4 | |
| 914,256 (1)(2) | | | Extended Stay America Trust 2021-ESH E, 8.289%, (TSFR1M + 2.964%), 07/15/2038 | | | 914,230 | | | | 0.0 | |
| 1,828,512 (1)(2) | | | Extended Stay America Trust 2021-ESH F, 9.139%, (TSFR1M + 3.814%), 07/15/2038 | | | 1,829,724 | | | | 0.1 | |
| 19,950,392 (1)(3) | | | Freddie Mac Multifamily Structured Pass Through Certificates K109 X1, 1.578%, 04/25/2030 | | | 1,492,471 | | | | 0.1 | |
| 2,431,679 (1)(3) | | | Freddie Mac Multifamily Structured Pass Through Certificates K-1521 X1, 0.979%, 08/25/2036 | | | 185,528 | | | | 0.0 | |
| 9,878,000 (2)(4) | | | FREMF Mortgage Trust 2019-KG01 C, 0.000%, 05/25/2029 | | | 6,206,673 | | | | 0.3 | |
See Accompanying Notes to Financial Statements
Voya Strategic
Income Opportunities Fund | PORTFOLIO OF INVESTMENTS
as of March 31, 2024 (continued) |
Principal
Amount† | | | | | Value | | | Percentage
of Net
Assets |
| COMMERCIAL MORTGAGE-BACKED SECURITIES: (continued) |
| 188,706,152 (2)(3) | | | FREMF Mortgage Trust 2019-KG01 X2A, 0.100%, 04/25/2029 | | $ | 484,248 | | | | 0.0 | |
| 21,120,000 (2)(3) | | | FREMF Mortgage Trust 2019-KG01 X2B, 0.100%, 05/25/2029 | | | 78,369 | | | | 0.0 | |
| 612,642 (1)(2) | | | FRR Re-REMIC Trust 2018-C1 B725, 0.222%, 02/27/2050 | | | 609,982 | | | | 0.0 | |
| 1,268,740 (2)(4) | | | FRR Re-REMIC Trust 2018-C1 C725, 0.000%, 02/27/2050 | | | 1,263,121 | | | | 0.1 | |
| 3,192,000 (2)(4) | | | GAM RE-REMIC Trust 2022-FRR3 BK61, 0.000%, 11/27/2049 | | | 2,483,797 | | | | 0.1 | |
| 4,690,000 (2) | | | GAM RE-REMIC Trust 2022-FRR3 BK71, 2.010%, 11/27/2050 | | | 3,818,604 | | | | 0.2 | |
| 2,676,000 (2)(4) | | | GAM RE-REMIC Trust 2022-FRR3 BK89, 0.000%, 01/27/2052 | | | 1,830,094 | | | | 0.1 | |
| 1,815,000 (2)(4) | | | GAM RE-REMIC Trust 2022-FRR3 C728, 0.000%, 08/27/2050 | | | 1,729,726 | | | | 0.1 | |
| 1,850,000 (2)(4) | | | GAM RE-REMIC Trust 2022-FRR3 CK47, 0.000%, 05/27/2048 | | | 1,664,767 | | | | 0.1 | |
| 2,238,000 (2)(4) | | | GAM RE-REMIC Trust 2022-FRR3 CK61, 0.000%, 11/27/2049 | | | 1,663,499 | | | | 0.1 | |
| 1,816,000 (2)(4) | | | GAM RE-REMIC Trust 2022-FRR3 D728, 0.000%, 08/27/2050 | | | 1,712,456 | | | | 0.1 | |
| 1,849,000 (2)(4) | | | GAM RE-REMIC Trust 2022-FRR3 DK47, 0.000%, 05/27/2048 | | | 1,645,134 | | | | 0.1 | |
| 2,975,000 (2) | | | GAM RE-REMIC TRUST 2021-FRR2 BK78, 2.410%, 09/27/2051 | | | 2,353,760 | | | | 0.1 | |
| 2,263,000 (2)(4) | | | GAM RE-REMIC TRUST 2021-FRR2 C730, 0.000%, 09/27/2051 | | | 2,092,119 | | | | 0.1 | |
| 2,751,000 (2)(4) | | | GAM RE-REMIC TRUST 2021-FRR2 CK44, 0.000%, 09/27/2051 | | | 2,524,123 | | | | 0.1 | |
| 2,238,000 (2) | | | GAM RE-REMIC TRUST 2021-FRR2 CK49, 1.010%, 09/27/2051 | | | 2,007,044 | | | | 0.1 | |
| 1,900,000 (2)(4) | | | GAM RE-REMIC TRUST 2021-FRR2 CK78, 0.000%, 09/27/2051 | | | 1,275,090 | | | | 0.1 | |
| 2,263,000 (2)(4) | | | GAM RE-REMIC TRUST 2021-FRR2 D730, 0.000%, 09/27/2051 | | | 2,083,474 | | | | 0.1 | |
Principal
Amount† | | | | | Value | | | Percentage
of Net
Assets |
| COMMERCIAL MORTGAGE-BACKED SECURITIES: (continued) |
| 2,237,000 (2)(4) | | | GAM RE-REMIC TRUST 2021-FRR2 DK49, 0.000%, 09/27/2051 | | $ | 1,936,722 | | | | 0.1 | |
| 5,000,000 (1)(2) | | | Great Wolf Trust 2024-WOLF D, 8.190%, (TSFR1M + 2.890%), 03/15/2039 | | | 5,022,256 | | | | 0.3 | |
| 10,000,000 (1)(2) | | | GS Mortgage Securities Corp. Trust 2021-ARDN B, 7.090%, (TSFR1M + 1.764%), 11/15/2036 | | | 9,829,281 | | | | 0.5 | |
| 1,000,000 (1) | | | GS Mortgage Securities Trust 2015-GC30 AS, 3.777%, 05/10/2050 | | | 966,832 | | | | 0.1 | |
| 1,162,000 (1) | | | GS Mortgage Securities Trust 2016-GS3 C, 3.982%, 10/10/2049 | | | 1,042,613 | | | | 0.1 | |
| 500,000 (1) | | | GS Mortgage Securities Trust 2018-GS9 B, 4.321%, 03/10/2051 | | | 469,616 | | | | 0.0 | |
| 13,173,184 (1)(3) | | | GS Mortgage Securities Trust 2019-GC38 XA, 1.008%, 02/10/2052 | | | 528,767 | | | | 0.0 | |
| 32,912,787 (1)(3) | | | GS Mortgage Securities Trust 2019-GC40 XA, 1.139%, 07/10/2052 | | | 1,425,033 | | | | 0.1 | |
| 660,000 | | | GS Mortgage Securities Trust 2019-GSA1 B, 3.511%, 11/10/2052 | | | 576,821 | | | | 0.0 | |
| 81,350,594 (1)(3) | | | GS Mortgage Securities Trust 2019-GSA1 XA, 0.806%, 11/10/2052 | | | 2,848,918 | | | | 0.2 | |
| 180,000 (1)(2) | | | IMT Trust 2017-APTS EFX, 3.497%, 06/15/2034 | | | 177,536 | | | | 0.0 | |
| 1,972,300 (1)(2) | | | INTOWN Mortgage Trust 2022-STAY D, 9.459%, (TSFR1M + 4.134%), 08/15/2039 | | | 1,988,213 | | | | 0.1 | |
| 4,050,000 (1)(2) | | | J.P. Morgan Chase Commercial Mortgage Securities Trust 2019-MFP E, 7.533%, (TSFR1M + 2.207%), 07/15/2036 | | | 3,917,576 | | | | 0.2 | |
| 1,300,000 (1)(2) | | | JP Morgan Chase Commercial Mortgage Securities Trust 2013-C13 F, 3.986%, 01/15/2046 | | | 1,022,903 | | | | 0.1 | |
| 5,910,000 (1)(2) | | | JP Morgan Chase Commercial Mortgage Securities Trust 2018-WPT FFX, 5.364%, 07/05/2033 | | | 3,972,037 | | | | 0.2 | |
See Accompanying Notes to Financial Statements
Voya Strategic
Income Opportunities Fund | PORTFOLIO OF INVESTMENTS
as of March 31, 2024 (continued) |
Principal
Amount† | | | | | Value | | | Percentage
of Net
Assets |
| COMMERCIAL MORTGAGE-BACKED SECURITIES: (continued) |
| 3,810,000 (1)(2) | | | JP Morgan Chase Commercial Mortgage Securities Trust 2020-LOOP E, 3.861%, 12/05/2038 | | $ | 993,545 | | | | 0.1 | |
| 675,000 (1)(2) | | | JP Morgan Chase Commercial Mortgage Securities Trust 2021-NYAH E, 7.280%, (TSFR1M + 1.954%), 06/15/2038 | | | 582,952 | | | | 0.0 | |
| 1,405,000 (1) | | | JPMBB Commercial Mortgage Securities Trust 2014-C21 C, 4.619%, 08/15/2047 | | | 1,304,498 | | | | 0.1 | |
| 42,060,144 (1)(3) | | | JPMBB Commercial Mortgage Securities Trust 2015-C28 XA, 0.913%, 10/15/2048 | | | 237,770 | | | | 0.0 | |
| 1,500,000 (1) | | | JPMBB Commercial Mortgage Securities Trust 2015-C29 AS, 3.917%, 05/15/2048 | | | 1,455,853 | | | | 0.1 | |
| 1,487,580 (1)(2) | | | KIND Trust 2021-KIND A, 6.394%, (TSFR1M + 1.064%), 08/15/2038 | | | 1,461,351 | | | | 0.1 | |
| 5,000,000 (1)(2) | | | KSL Commercial Mortgage Trust 2023-HT A, 7.616%, (TSFR1M + 2.290%), 12/15/2036 | | | 5,040,473 | | | | 0.3 | |
| 5,000,000 (1)(2) | | | Life Mortgage Trust 2022-BMR2 A1, 6.621%, (TSFR1M + 1.295%), 05/15/2039 | | | 4,961,858 | | | | 0.3 | |
| 9,493,887 (1)(2)(3) | | | LSTAR Commercial Mortgage Trust 2017-5 X, 0.827%, 03/10/2050 | | | 136,556 | | | | 0.0 | |
| 1,520,000 (1)(2) | | | MCR Mortgage Trust 2024-HTL D, 9.231%, (TSFR1M + 3.905%), 02/15/2037 | | | 1,520,764 | | | | 0.1 | |
| 9,952,237 (1)(2) | | | Med Trust 2021-MDLN D, 7.439%, (TSFR1M + 2.114%), 11/15/2038 | | | 9,928,196 | | | | 0.5 | |
| 5,000,000 (1)(2) | | | MF1 LLC 2024-FL14 A, 7.063%, (TSFR1M + 1.737%), 03/19/2039 | | | 5,016,868 | | | | 0.3 | |
| 5,250,000 (1)(2) | | | MHP 2021-STOR F, 7.640%, (TSFR1M + 2.314%), 07/15/2038 | | | 5,185,626 | | | | 0.3 | |
| 2,917,165 (1)(2) | | | MHP 2022-MHIL E, 7.936%, (TSFR1M + 2.611%), 01/15/2027 | | | 2,898,638 | | | | 0.2 | |
| 5,287,000 | | | Morgan Stanley Bank of America Merrill Lynch Trust 2015-C25 D, 3.068%, 10/15/2048 | | | 4,428,077 | | | | 0.2 | |
Principal
Amount† | | | | | Value | | | Percentage
of Net
Assets |
| COMMERCIAL MORTGAGE-BACKED SECURITIES: (continued) |
| 14,605,969 (1)(3) | | | Morgan Stanley Bank of America Merrill Lynch Trust 2017-C34 XA, 0.768%, 11/15/2052 | | $ | 316,071 | | | | 0.0 | |
| 10,731,360 (1)(3) | | | Morgan Stanley Bank of America Merrill Lynch Trust 2014 C19 2014-C19 XA, 0.950%, 12/15/2047 | | | 18,027 | | | | 0.0 | |
| 30,697,632 (1)(3) | | | Morgan Stanley Capital I 2017-HR2 XA, 0.849%, 12/15/2050 | | | 791,999 | | | | 0.0 | |
| 4,841,000 (1)(2) | | | Morgan Stanley Capital I Trust 2016-BNK2 D, 3.000%, 11/15/2049 | | | 2,301,262 | | | | 0.1 | |
| 25,660,000 (1)(2)(3) | | | Morgan Stanley Capital I Trust 2018-L1 XD, 1.782%, 10/15/2051 | | | 1,735,336 | | | | 0.1 | |
| 22,026,187 (1)(3) | | | Morgan Stanley Capital I Trust 2021-L6 XA, 1.205%, 06/15/2054 | | | 1,151,433 | | | | 0.1 | |
| 1,650,000 (1)(2) | | | MTN Commercial Mortgage Trust 2022-LPFL A, 6.727%, (TSFR1M + 1.397%), 03/15/2039 | | | 1,634,669 | | | | 0.1 | |
| 5,000,000 (1)(2) | | | ORL Trust 2023-GLKS A, 7.676%, (TSFR1M + 2.350%), 10/19/2036 | | | 5,029,264 | | | | 0.3 | |
| 13,000,000 (2) | | | Prima Capital CRE Securitization Ltd. 2019-7A D, 4.250%, 12/25/2050 | | | 10,696,385 | | | | 0.6 | |
| 7,030,000 (2) | | | RFM Reremic Trust 2022-FRR1 AB55, 0.990%, 03/28/2049 | | | 5,993,199 | | | | 0.3 | |
| 5,950,000 (1)(2) | | | RFM Reremic Trust 2022-FRR1 AB60, 2.410%, 11/08/2049 | | | 5,118,849 | | | | 0.3 | |
| 8,960,000 (1)(2) | | | RFM Reremic Trust 2022-FRR1 AB64, 2.260%, 03/01/2050 | | | 7,632,619 | | | | 0.4 | |
| 2,190,000 (2)(4) | | | RFM Reremic Trust 2022-FRR1 CK55, 0.000%, 03/28/2049 | | | 1,814,264 | | | | 0.1 | |
| 2,750,000 (2)(4) | | | RFM Reremic Trust 2022-FRR1 CK60, 0.000%, 11/08/2049 | | | 2,140,480 | | | | 0.1 | |
| 3,000,000 (1)(2) | | | SMRT 2022-MINI E, 8.026%, (TSFR1M + 2.700%), 01/15/2039 | | | 2,913,510 | | | | 0.2 | |
| 5,000,000 (2) | | | THPT Mortgage Trust 2023-THL A, 6.994%, 12/10/2034 | | | 5,121,973 | | | | 0.3 | |
| 839,564 (1)(2) | | | TTAN 2021-MHC D, 7.190%, (TSFR1M + 1.864%), 03/15/2038 | | | 832,138 | | | | 0.0 | |
| 21,781,554 (1)(3) | | | UBS Commercial Mortgage Trust 2019-C16 XA, 1.521%, 04/15/2052 | | | 1,216,724 | | | | 0.1 | |
See Accompanying Notes to Financial Statements
Voya Strategic
Income Opportunities Fund | PORTFOLIO OF INVESTMENTS
as of March 31, 2024 (continued) |
Principal
Amount† | | | | | Value | | | Percentage
of Net
Assets |
| COMMERCIAL MORTGAGE-BACKED SECURITIES: (continued) |
| 2,000,000 (1) | | | Wells Fargo Commercial Mortgage Trust 2016-C35 C, 4.176%, 07/15/2048 | | $ | 1,864,865 | | | | 0.1 | |
| 1,661,000 (1) | | | Wells Fargo Commercial Mortgage Trust 2017-C41 C, 4.489%, 11/15/2050 | | | 1,446,984 | | | | 0.1 | |
| 2,588,000 | | | Wells Fargo Commercial Mortgage Trust 2019-C49 B, 4.546%, 03/15/2052 | | | 2,436,613 | | | | 0.1 | |
| 2,500,000 (2) | | | Wells Fargo Commercial Mortgage Trust 2021-C59 E, 2.500%, 04/15/2054 | | | 1,430,972 | | | | 0.1 | |
| 19,030,205 (1)(3) | | | Wells Fargo Commercial Mortgage Trust 2021-C59 XA, 1.517%, 04/15/2054 | | | 1,372,882 | | | | 0.1 | |
| 1,500,000 (1)(2) | | | WFLD Mortgage Trust 2014-MONT D, 3.755%, 08/10/2031 | | | 765,371 | | | | 0.0 | |
| | | | Total Commercial Mortgage-Backed Securities (Cost $355,584,427) | | | 334,470,250 | | | | 18.1 | |
| | | | | | | | | | | | |
| CORPORATE BONDS/NOTES: 16.2% |
| | | | Basic Materials: 1.5% |
| 2,450,000 | | | AngloGold Ashanti Holdings PLC, 3.750%, 10/01/2030 | | | 2,136,339 | | | | 0.1 | |
| 535,000 (2) | | | Arsenal AIC Parent LLC, 8.000%, 10/01/2030 | | | 562,357 | | | | 0.0 | |
| 775,000 | | | ATI, Inc., 7.250%, 08/15/2030 | | | 801,930 | | | | 0.1 | |
| 600,000 (2) | | | Axalta Coating Systems Dutch Holding B BV, 7.250%, 02/15/2031 | | | 624,875 | | | | 0.0 | |
| 150,000 (2) | | | Axalta Coating Systems LLC, 3.375%, 02/15/2029 | | | 134,366 | | | | 0.0 | |
| 700,000 (2) | | | Cleveland-Cliffs, Inc., 4.625%, 03/01/2029 | | | 653,319 | | | | 0.0 | |
| 275,000 (2) | | | Cleveland-Cliffs, Inc., 4.875%, 03/01/2031 | | | 250,355 | | | | 0.0 | |
| 675,000 (2)(5) | | | Coeur Mining, Inc., 5.125%, 02/15/2029 | | | 642,001 | | | | 0.0 | |
| 875,000 (2) | | | Constellium SE, 5.625%, 06/15/2028 | | | 851,646 | | | | 0.1 | |
| 1,075,000 (2) | | | Corp Nacional del Cobre de Chile, 5.950%, 01/08/2034 | | | 1,081,719 | | | | 0.1 | |
| 550,000 (2) | | | Corp Nacional del Cobre de Chile, 6.300%, 09/08/2053 | | | 548,453 | | | | 0.0 | |
| 625,000 (2) | | | Corp Nacional del Cobre de Chile, 6.440%, 01/26/2036 | | | 646,989 | | | | 0.0 | |
Principal
Amount† | | | | | Value | | | Percentage
of Net
Assets |
| CORPORATE BONDS/NOTES: (continued) |
| | | | Basic Materials: (continued) |
| 1,750,000 (2) | | | CSN Resources SA, 8.875%, 12/05/2030 | | $ | 1,811,600 | | | | 0.1 | |
| 600,000 (2) | | | First Quantum Minerals Ltd., 6.875%, 10/15/2027 | | | 573,600 | | | | 0.0 | |
| 1,800,000 (2)(5) | | | GC Treasury Center Co. Ltd., 4.400%, 03/30/2032 | | | 1,639,687 | | | | 0.1 | |
| 900,000 (2) | | | Hudbay Minerals, Inc., 4.500%, 04/01/2026 | | | 872,651 | | | | 0.1 | |
| 685,000 (2) | | | Illuminate Buyer LLC / Illuminate Holdings IV, Inc., 9.000%, 07/01/2028 | | | 676,583 | | | | 0.0 | |
| 800,000 (2) | | | INEOS Quattro Finance 2 PLC, 3.375%, 01/15/2026 | | | 764,137 | | | | 0.1 | |
| 1,750,000 (2) | | | Inversiones CMPC SA, 6.125%, 02/26/2034 | | | 1,783,250 | | | | 0.1 | |
| 925,000 (2)(6) | | | Iris Holdings, Inc., 8.750% (PIK Rate 9.500%, Cash Rate 8.750%), 02/15/2026 | | | 795,500 | | | | 0.1 | |
| 1,050,000 | | | JSW Steel Ltd., 5.050%, 04/05/2032 | | | 926,297 | | | | 0.1 | |
| 370,000 (2) | | | LSF11 A5 HoldCo LLC, 6.625%, 10/15/2029 | | | 333,801 | | | | 0.0 | |
| 775,000 (2) | | | Mativ Holdings, Inc., 6.875%, 10/01/2026 | | | 772,073 | | | | 0.1 | |
| 425,000 (2) | | | NOVA Chemicals Corp., 8.500%, 11/15/2028 | | | 452,888 | | | | 0.0 | |
| 200,000 (2) | | | Novelis Corp., 3.250%, 11/15/2026 | | | 186,563 | | | | 0.0 | |
| 600,000 (2) | | | Novelis Corp., 3.875%, 08/15/2031 | | | 516,024 | | | | 0.0 | |
| 250,000 (2) | | | Novelis Corp., 4.750%, 01/30/2030 | | | 230,864 | | | | 0.0 | |
| 675,000 (2)(5) | | | Nufarm Australia Ltd. / Nufarm Americas, Inc., 5.000%, 01/27/2030 | | | 619,806 | | | | 0.0 | |
| 200,000 (2) | | | Olympus Water US Holding Corp., 4.250%, 10/01/2028 | | | 181,673 | | | | 0.0 | |
| 350,000 (2) | | | Olympus Water US Holding Corp., 6.250%, 10/01/2029 | | | 320,714 | | | | 0.0 | |
| 400,000 (2)(5) | | | Olympus Water US Holding Corp., 7.125%, 10/01/2027 | | | 404,440 | | | | 0.0 | |
| 800,000 (2) | | | SPCM SA, 3.125%, 03/15/2027 | | | 741,023 | | | | 0.1 | |
| 750,000 (2) | | | Taseko Mines Ltd., 7.000%, 02/15/2026 | | | 753,841 | | | | 0.1 | |
| 810,000 (2) | | | Trinseo Materials Operating SCA / Trinseo Materials Finance, Inc., 5.125%, 04/01/2029 | | | 235,799 | | | | 0.0 | |
| 675,000 (2)(5) | | | Tronox, Inc., 4.625%, 03/15/2029 | | | 606,276 | | | | 0.0 | |
See Accompanying Notes to Financial Statements
Voya Strategic
Income Opportunities Fund | PORTFOLIO OF INVESTMENTS
as of March 31, 2024 (continued) |
Principal
Amount† | | | | | Value | | | Percentage
of Net
Assets |
| CORPORATE BONDS/NOTES: (continued) | |
| | | | Basic Materials: (continued) |
| 1,800,000 (2) | | | WE Soda Investments Holding PLC, 9.375%, 02/14/2031 | | $ | 1,852,758 | | | | 0.1 | |
| 750,000 (2) | | | WR Grace Holdings LLC, 5.625%, 08/15/2029 | | | 671,947 | | | | 0.0 | |
| | | | | | | 27,658,144 | | | | 1.5 | |
| | | | | | | | | | | | |
| | | | Communications: 1.6% |
| 900,000 (2) | | | Altice Financing SA, 5.750%, 08/15/2029 | | | 721,999 | | | | 0.1 | |
| 1,200,000 (2)(5) | | | Altice France SA/ France, 5.500%, 10/15/2029 | | | 815,746 | | | | 0.1 | |
| 375,000 (2) | | | Altice France SA/ France, 8.125%, 02/01/2027 | | | 293,452 | | | | 0.0 | |
| 525,000 (2) | | | Beasley Mezzanine Holdings LLC, 8.625%, 02/01/2026 | | | 313,868 | | | | 0.0 | |
| 1,025,000 | | | CCO Holdings LLC / CCO Holdings Capital Corp., 4.500%, 05/01/2032 | | | 824,355 | | | | 0.1 | |
| 875,000 (2) | | | CCO Holdings LLC / CCO Holdings Capital Corp., 5.000%, 02/01/2028 | | | 815,115 | | | | 0.1 | |
| 850,000 (2) | | | CCO Holdings LLC / CCO Holdings Capital Corp., 5.125%, 05/01/2027 | | | 810,413 | | | | 0.1 | |
| 300,000 (2) | | | CCO Holdings LLC / CCO Holdings Capital Corp., 5.500%, 05/01/2026 | | | 295,609 | | | | 0.0 | |
| 650,000 (2) | | | Connect Finco Sarl / Connect US Finco LLC, 6.750%, 10/01/2026 | | | 637,621 | | | | 0.0 | |
| 1,500,000 (2) | | | CSC Holdings LLC, 5.750%, 01/15/2030 | | | 795,252 | | | | 0.1 | |
| 900,000 (2) | | | CSC Holdings LLC, 11.250%, 05/15/2028 | | | 892,623 | | | | 0.1 | |
| 2,075,000 | | | CT Trust, 5.125%, 02/03/2032 | | | 1,836,375 | | | | 0.1 | |
| 925,000 (2) | | | Directv Financing LLC / Directv Financing Co-Obligor, Inc., 5.875%, 08/15/2027 | | | 875,662 | | | | 0.1 | |
| 775,000 | | | DISH DBS Corp., 5.125%, 06/01/2029 | | | 323,891 | | | | 0.0 | |
| 475,000 (2) | | | DISH DBS Corp., 5.750%, 12/01/2028 | | | 327,337 | | | | 0.0 | |
| 575,000 | | | DISH DBS Corp., 7.375%, 07/01/2028 | | | 277,315 | | | | 0.0 | |
| 1,075,000 (2) | | | DISH Network Corp., 11.750%, 11/15/2027 | | | 1,098,554 | | | | 0.1 | |
| 625,000 (2) | | | GCI LLC, 4.750%, 10/15/2028 | | | 573,638 | | | | 0.0 | |
Principal
Amount† | | | | | Value | | | Percentage
of Net
Assets |
| CORPORATE BONDS/NOTES: (continued) | |
| | | | Communications: (continued) |
| 1,025,000 (2)(5) | | | Gray Escrow II, Inc., 5.375%, 11/15/2031 | | $ | 673,091 | | | | 0.0 | |
| 600,000 (2)(5) | | | Gray Television, Inc., 7.000%, 05/15/2027 | | | 558,511 | | | | 0.0 | |
| 1,025,000 (2) | | | Level 3 Financing, Inc., 3.750%, 07/15/2029 | | | 461,250 | | | | 0.0 | |
| 575,000 (2) | | | Level 3 Financing, Inc., 10.500%, 05/15/2030 | | | 590,812 | | | | 0.0 | |
| 1,025,000 (2) | | | Match Group Holdings II LLC, 4.625%, 06/01/2028 | | | 968,039 | | | | 0.1 | |
| 700,000 (2) | | | McGraw-Hill Education, Inc., 8.000%, 08/01/2029 | | | 658,622 | | | | 0.0 | |
| 475,000 (1) | | | Paramount Global, 6.250%, 02/28/2057 | | | 418,138 | | | | 0.0 | |
| 865,000 (1)(5) | | | Paramount Global, 6.375%, 03/30/2062 | | | 800,064 | | | | 0.1 | |
| 1,325,000 (2)(5) | | | Scripps Escrow, Inc., 5.875%, 07/15/2027 | | | 1,109,799 | | | | 0.1 | |
| 700,000 (2) | | | Sinclair Television Group, Inc., 4.125%, 12/01/2030 | | | 510,426 | | | | 0.0 | |
| 300,000 (2) | | | Sirius XM Radio, Inc., 3.125%, 09/01/2026 | | | 281,257 | | | | 0.0 | |
| 1,800,000 (2) | | | Sirius XM Radio, Inc., 5.000%, 08/01/2027 | | | 1,732,937 | | | | 0.1 | |
| 675,000 (2)(5) | | | Stagwell Global LLC, 5.625%, 08/15/2029 | | | 613,529 | | | | 0.0 | |
| 400,000 | | | Telecom Italia Capital SA, 6.000%, 09/30/2034 | | | 366,143 | | | | 0.0 | |
| 450,000 | | | Telecom Italia Capital SA, 6.375%, 11/15/2033 | | | 426,066 | | | | 0.0 | |
| 200,000 (2) | | | Telecom Italia SpA/ Milano, 5.303%, 05/30/2024 | | | 199,049 | | | | 0.0 | |
| 400,000 (2) | | | Uber Technologies, Inc., 4.500%, 08/15/2029 | | | 380,277 | | | | 0.0 | |
| 535,000 (2) | | | Uber Technologies, Inc., 8.000%, 11/01/2026 | | | 541,810 | | | | 0.0 | |
| 275,000 (2)(5) | | | Univision Communications, Inc., 4.500%, 05/01/2029 | | | 245,997 | | | | 0.0 | |
| 1,025,000 (2) | | | Univision Communications, Inc., 6.625%, 06/01/2027 | | | 1,003,393 | | | | 0.1 | |
| 365,000 (2) | | | Univision Communications, Inc., 8.000%, 08/15/2028 | | | 372,089 | | | | 0.0 | |
| 525,000 (2)(5) | | | Viasat, Inc., 6.500%, 07/15/2028 | | | 405,914 | | | | 0.0 | |
| 425,000 (2)(5) | | | Viasat, Inc., 7.500%, 05/30/2031 | | | 308,481 | | | | 0.0 | |
| 625,000 (2) | | | Viavi Solutions, Inc., 3.750%, 10/01/2029 | | | 536,873 | | | | 0.0 | |
| 1,300,000 (2)(5) | | | Virgin Media Vendor Financing Notes IV DAC, 5.000%, 07/15/2028 | | | 1,193,889 | | | | 0.1 | |
See Accompanying Notes to Financial Statements
Voya Strategic
Income Opportunities Fund | PORTFOLIO OF INVESTMENTS
as of March 31, 2024 (continued) |
Principal
Amount† | | | | | Value | | | Percentage
of Net
Assets |
| CORPORATE BONDS/NOTES: (continued) | |
| | | | Communications: (continued) |
| 765,000 (2) | | | Vmed O2 UK Financing I PLC, 4.750%, 07/15/2031 | | $ | 660,087 | | | | 0.0 | |
| | | | | | | 28,545,368 | | | | 1.6 | |
| | | | | | | | | | | | |
| | | | Consumer, Cyclical: 2.5% |
| 375,000 (2)(5) | | | 1011778 BC ULC / New Red Finance, Inc., 3.500%, 02/15/2029 | | | 342,805 | | | | 0.0 | |
| 850,000 (2) | | | 1011778 BC ULC / New Red Finance, Inc., 4.000%, 10/15/2030 | | | 757,963 | | | | 0.1 | |
| 600,000 (2) | | | Adient Global Holdings Ltd., 4.875%, 08/15/2026 | | | 585,379 | | | | 0.0 | |
| 300,000 (2)(5) | | | Adient Global Holdings Ltd., 8.250%, 04/15/2031 | | | 316,811 | | | | 0.0 | |
| 275,000 (2) | | | Allison Transmission, Inc., 3.750%, 01/30/2031 | | | 240,201 | | | | 0.0 | |
| 625,000 (2) | | | Allison Transmission, Inc., 5.875%, 06/01/2029 | | | 619,386 | | | | 0.0 | |
| 525,000 (2)(5) | | | Amer Sports Co., 6.750%, 02/16/2031 | | | 523,688 | | | | 0.0 | |
| 775,000 (2)(5) | | | American Airlines, Inc., 7.250%, 02/15/2028 | | | 787,651 | | | | 0.1 | |
| 150,000 (2) | | | American Airlines, Inc./ AAdvantage Loyalty IP Ltd., 5.500%, 04/20/2026 | | | 149,072 | | | | 0.0 | |
| 550,000 (2) | | | Arko Corp., 5.125%, 11/15/2029 | | | 455,809 | | | | 0.0 | |
| 525,000 | | | Asbury Automotive Group, Inc., 4.500%, 03/01/2028 | | | 500,333 | | | | 0.0 | |
| 475,000 | | | Asbury Automotive Group, Inc., 4.750%, 03/01/2030 | | | 437,894 | | | | 0.0 | |
| 650,000 (2) | | | Ashton Woods USA LLC / Ashton Woods Finance Co., 4.625%, 08/01/2029 | | | 600,258 | | | | 0.0 | |
| 700,000 (2) | | | Banijay Entertainment SASU, 8.125%, 05/01/2029 | | | 722,533 | | | | 0.1 | |
| 750,000 | | | Bath & Body Works, Inc., 6.750%, 07/01/2036 | | | 758,108 | | | | 0.1 | |
| 75,000 (2) | | | Bath & Body Works, Inc., 9.375%, 07/01/2025 | | | 78,314 | | | | 0.0 | |
| 450,000 (2) | | | Brinker International, Inc., 5.000%, 10/01/2024 | | | 446,879 | | | | 0.0 | |
| 925,000 (2)(5) | | | Caesars Entertainment, Inc., 4.625%, 10/15/2029 | | | 844,221 | | | | 0.1 | |
Principal
Amount† | | | | | Value | | | Percentage
of Net
Assets |
| CORPORATE BONDS/NOTES: (continued) | |
| | | | Consumer, Cyclical: (continued) |
| 625,000 (2) | | | Caesars Entertainment, Inc., 7.000%, 02/15/2030 | | $ | 641,944 | | | | 0.0 | |
| 525,000 (2) | | | Carnival Corp., 4.000%, 08/01/2028 | | | 488,250 | | | | 0.0 | |
| 1,100,000 (2)(5) | | | Carnival Corp., 6.000%, 05/01/2029 | | | 1,086,068 | | | | 0.1 | |
| 750,000 (2) | | | CCM Merger, Inc., 6.375%, 05/01/2026 | | | 749,946 | | | | 0.1 | |
| 200,000 (5) | | | Delta Air Lines, Inc., 7.375%, 01/15/2026 | | | 206,403 | | | | 0.0 | |
| 108,782 (2) | | | Delta Air Lines, Inc. / SkyMiles IP Ltd., 4.750%, 10/20/2028 | | | 106,431 | | | | 0.0 | |
| 550,000 (2) | | | Dream Finders Homes, Inc., 8.250%, 08/15/2028 | | | 574,662 | | | | 0.0 | |
| 1,400,000 | | | Ford Motor Credit Co. LLC, 2.700%, 08/10/2026 | | | 1,305,453 | | | | 0.1 | |
| 1,250,000 | | | Ford Motor Credit Co. LLC, 4.125%, 08/17/2027 | | | 1,186,832 | | | | 0.1 | |
| 600,000 | | | Ford Motor Credit Co. LLC, 4.542%, 08/01/2026 | | | 582,679 | | | | 0.0 | |
| 525,000 (2) | | | Foundation Building Materials, Inc., 6.000%, 03/01/2029 | | | 483,330 | | | | 0.0 | |
| 225,000 (2) | | | Gap, Inc., 3.625%, 10/01/2029 | | | 197,317 | | | | 0.0 | |
| 600,000 (2)(5) | | | Gap, Inc., 3.875%, 10/01/2031 | | | 508,155 | | | | 0.0 | |
| 320,000 (2) | | | Golden Entertainment, Inc., 7.625%, 04/15/2026 | | | 320,237 | | | | 0.0 | |
| 675,000 (2) | | | Hilton Domestic Operating Co., Inc., 4.000%, 05/01/2031 | | | 603,950 | | | | 0.0 | |
| 650,000 (2) | | | Installed Building Products, Inc., 5.750%, 02/01/2028 | | | 635,080 | | | | 0.0 | |
| 725,000 (2) | | | Interface, Inc., 5.500%, 12/01/2028 | | | 691,769 | | | | 0.1 | |
| 200,000 (2) | | | International Game Technology PLC, 4.125%, 04/15/2026 | | | 194,006 | | | | 0.0 | |
| 900,000 (2) | | | International Game Technology PLC, 5.250%, 01/15/2029 | | | 870,302 | | | | 0.1 | |
| 975,000 (2) | | | LCM Investments Holdings II LLC, 4.875%, 05/01/2029 | | | 897,149 | | | | 0.1 | |
| 600,000 (2)(5) | | | Lithia Motors, Inc., 4.375%, 01/15/2031 | | | 537,955 | | | | 0.0 | |
| 225,000 | | | M/I Homes, Inc., 3.950%, 02/15/2030 | | | 202,513 | | | | 0.0 | |
| 525,000 | | | M/I Homes, Inc., 4.950%, 02/01/2028 | | | 501,217 | | | | 0.0 | |
See Accompanying Notes to Financial Statements
Voya Strategic
Income Opportunities Fund | PORTFOLIO OF INVESTMENTS
as of March 31, 2024 (continued) |
Principal
Amount† | | | | | Value | | | Percentage
of Net
Assets |
| CORPORATE BONDS/NOTES: (continued) | |
| | | | Consumer, Cyclical: (continued) |
| 325,000 | | | Macy’s Retail Holdings LLC, 4.500%, 12/15/2034 | | $ | 286,445 | | | | 0.0 | |
| 450,000 (2)(5) | | | Macy’s Retail Holdings LLC, 6.125%, 03/15/2032 | | | 436,645 | | | | 0.0 | |
| 800,000 (2) | | | Melco Resorts Finance Ltd., 5.375%, 12/04/2029 | | | 731,008 | | | | 0.1 | |
| 400,000 (5) | | | MGM Resorts International, 4.625%, 09/01/2026 | | | 391,582 | | | | 0.0 | |
| 400,000 (5) | | | MGM Resorts International, 4.750%, 10/15/2028 | | | 380,825 | | | | 0.0 | |
| 190,000 | | | MGM Resorts International, 6.500%, 04/15/2032 | | | 189,528 | | | | 0.0 | |
| 1,150,000 (2)(5) | | | Michaels Cos., Inc., 5.250%, 05/01/2028 | | | 980,938 | | | | 0.1 | |
| 150,000 (2) | | | Murphy Oil USA, Inc., 3.750%, 02/15/2031 | | | 131,137 | | | | 0.0 | |
| 650,000 | | | Murphy Oil USA, Inc., 4.750%, 09/15/2029 | | | 616,985 | | | | 0.0 | |
| 200,000 | | | Murphy Oil USA, Inc., 5.625%, 05/01/2027 | | | 198,291 | | | | 0.0 | |
| 225,000 (2) | | | NCL Corp. Ltd., 7.750%, 02/15/2029 | | | 233,819 | | | | 0.0 | |
| 150,000 (2) | | | NCL Corp. Ltd., 8.375%, 02/01/2028 | | | 158,557 | | | | 0.0 | |
| 500,000 (2) | | | NCL Finance Ltd., 6.125%, 03/15/2028 | | | 494,193 | | | | 0.0 | |
| 700,000 (2) | | | Raising Cane’s Restaurants LLC, 9.375%, 05/01/2029 | | | 757,393 | | | | 0.1 | |
| 500,000 (2) | | | Ritchie Bros Holdings, Inc., 7.750%, 03/15/2031 | | | 523,747 | | | | 0.0 | |
| 1,935,000 (2)(5) | | | Royal Caribbean Cruises Ltd., 5.375%, 07/15/2027 | | | 1,908,960 | | | | 0.1 | |
| 165,000 (2) | | | Royal Caribbean Cruises Ltd., 6.250%, 03/15/2032 | | | 166,418 | | | | 0.0 | |
| 625,000 (5) | | | Sally Holdings LLC / Sally Capital, Inc., 6.750%, 03/01/2032 | | | 620,639 | | | | 0.0 | |
| 750,000 | | | Sands China Ltd., 5.125%, 08/08/2025 | | | 740,138 | | | | 0.1 | |
| 650,000 (2)(5) | | | Scientific Games Holdings L.P./Scientific Games US FinCo, Inc., 6.625%, 03/01/2030 | | | 628,872 | | | | 0.0 | |
| 800,000 (2) | | | Scientific Games International, Inc., 7.000%, 05/15/2028 | | | 806,394 | | | | 0.1 | |
| 250,000 (2) | | | SRS Distribution, Inc., 6.000%, 12/01/2029 | | | 255,647 | | | | 0.0 | |
| 625,000 (2) | | | SRS Distribution, Inc., 6.125%, 07/01/2029 | | | 638,013 | | | | 0.0 | |
Principal
Amount† | | | | | Value | | | Percentage
of Net
Assets |
| CORPORATE BONDS/NOTES: (continued) |
| | | | Consumer, Cyclical: (continued) |
| 1,050,000 (2) | | | Staples, Inc., 7.500%, 04/15/2026 | | $ | 1,025,784 | | | | 0.1 | |
| 400,000 (2) | | | Staples, Inc., 10.750%, 04/15/2027 | | | 380,584 | | | | 0.0 | |
| 955,000 (2)(5) | | | Station Casinos LLC, 4.500%, 02/15/2028 | | | 900,302 | | | | 0.1 | |
| 475,000 (2) | | | STL Holding Co. LLC, 8.750%, 02/15/2029 | | | 487,946 | | | | 0.0 | |
| 650,000 (2) | | | Taylor Morrison Communities, Inc., 5.125%, 08/01/2030 | | | 621,377 | | | | 0.0 | |
| 625,000 (2) | | | Tempur Sealy International, Inc., 3.875%, 10/15/2031 | | | 531,366 | | | | 0.0 | |
| 150,000 (2)(5) | | | Tempur Sealy International, Inc., 4.000%, 04/15/2029 | | | 136,262 | | | | 0.0 | |
| 725,000 | | | United Airlines Holdings, Inc., 4.875%, 01/15/2025 | | | 719,672 | | | | 0.1 | |
| 400,000 (2) | | | United Airlines, Inc., 4.375%, 04/15/2026 | | | 386,965 | | | | 0.0 | |
| 1,300,000 (2) | | | Viking Cruises Ltd., 5.875%, 09/15/2027 | | | 1,276,360 | | | | 0.1 | |
| 600,000 (2)(5) | | | VistaJet Malta Finance PLC / Vista Management Holding, Inc., 6.375%, 02/01/2030 | | | 443,078 | | | | 0.0 | |
| 675,000 (5) | | | Walgreens Boots Alliance, Inc., 4.800%, 11/18/2044 | | | 568,531 | | | | 0.0 | |
| 725,000 (2) | | | White Cap Buyer LLC, 6.875%, 10/15/2028 | | | 711,956 | | | | 0.1 | |
| 800,000 (2) | | | William Carter Co., 5.625%, 03/15/2027 | | | 795,111 | | | | 0.1 | |
| 950,000 (2) | | | Wynn Las Vegas LLC / Wynn Las Vegas Capital Corp., 5.250%, 05/15/2027 | | | 931,051 | | | | 0.1 | |
| 450,000 (2) | | | ZF North America Capital, Inc., 4.750%, 04/29/2025 | | | 444,730 | | | | 0.0 | |
| 590,000 (2) | | | ZF North America Capital, Inc., 6.875%, 04/14/2028 | | | 612,524 | | | | 0.0 | |
| | | | | | | 45,988,726 | | | | 2.5 | |
| | | | | | | | | | | | |
| | | | Consumer, Non-cyclical: 2.5% |
| 700,000 (2)(5) | | | 1375209 BC Ltd., 9.000%, 01/30/2028 | | | 686,761 | | | | 0.0 | |
| 850,000 (2) | | | Acadia Healthcare Co., Inc., 5.500%, 07/01/2028 | | | 828,369 | | | | 0.1 | |
| 805,000 (2)(5) | | | ADT Security Corp., 4.125%, 08/01/2029 | | | 738,271 | | | | 0.1 | |
| 550,000 (2) | | | AHP Health Partners, Inc., 5.750%, 07/15/2029 | | | 503,223 | | | | 0.0 | |
See Accompanying Notes to Financial Statements
Voya Strategic
Income Opportunities Fund | PORTFOLIO OF INVESTMENTS
as of March 31, 2024 (continued) |
Principal
Amount† | | | | | Value | | | Percentage
of Net
Assets |
| CORPORATE BONDS/NOTES: (continued) | |
| | | | Consumer, Non-cyclical: (continued) |
| 525,000 (2) | | | Albertsons Cos., Inc. / Safeway, Inc. / New Albertsons L.P. / Albertsons LLC, 3.500%, 03/15/2029 | | $ | 471,712 | | | | 0.0 | |
| 300,000 (2) | | | Albertsons Cos., Inc. / Safeway, Inc. / New Albertsons L.P. / Albertsons LLC, 4.875%, 02/15/2030 | | | 285,625 | | | | 0.0 | |
| 575,000 (2) | | | Albertsons Cos., Inc. / Safeway, Inc. / New Albertsons L.P. / Albertsons LLC, 5.875%, 02/15/2028 | | | 569,673 | | | | 0.0 | |
| 850,000 (2) | | | Allied Universal Holdco LLC/Allied Universal Finance Corp./Atlas Luxco 4 Sarl, 4.625%, 06/01/2028 | | | 777,164 | | | | 0.1 | |
| 500,000 (2) | | | Allied Universal Holdco LLC/Allied Universal Finance Corp./Atlas Luxco 4 Sarl, 4.625%, 06/01/2028 | | | 455,031 | | | | 0.0 | |
| 800,000 (2) | | | Alta Equipment Group, Inc., 5.625%, 04/15/2026 | | | 784,096 | | | | 0.1 | |
| 375,000 (2) | | | APi Group DE, Inc., 4.125%, 07/15/2029 | | | 338,232 | | | | 0.0 | |
| 425,000 (2) | | | APi Group DE, Inc., 4.750%, 10/15/2029 | | | 392,110 | | | | 0.0 | |
| 700,000 (2)(5) | | | Avis Budget Car Rental LLC / Avis Budget Finance, Inc., 8.000%, 02/15/2031 | | | 699,390 | | | | 0.0 | |
| 900,000 | | | B&G Foods, Inc., 5.250%, 09/15/2027 | | | 841,815 | | | | 0.1 | |
| 650,000 (2) | | | Bausch & Lomb Escrow Corp., 8.375%, 10/01/2028 | | | 673,342 | | | | 0.0 | |
| 750,000 (2) | | | Bausch Health Cos., Inc., 4.875%, 06/01/2028 | | | 410,009 | | | | 0.0 | |
| 565,000 (2) | | | Bausch Health Cos., Inc., 6.125%, 02/01/2027 | | | 352,585 | | | | 0.0 | |
| 750,000 (2) | | | BellRing Brands, Inc., 7.000%, 03/15/2030 | | | 773,424 | | | | 0.1 | |
| 1,750,000 | | | Central American Bottling Corp. / CBC Bottling Holdco SL / Beliv Holdco SL, 5.250%, 04/27/2029 | | | 1,667,750 | | | | 0.1 | |
| 1,000,000 (2) | | | Cheplapharm Arzneimittel GmbH, 5.500%, 01/15/2028 | | | 953,872 | | | | 0.1 | |
| 450,000 (2) | | | Chobani LLC / Chobani Finance Corp., Inc., 7.625%, 07/01/2029 | | | 456,750 | | | | 0.0 | |
Principal
Amount† | | | | | Value | | | Percentage
of Net
Assets |
| CORPORATE BONDS/NOTES: (continued) | |
| | | | Consumer, Non-cyclical: (continued) |
| 450,000 (2) | | | CHS/Community Health Systems, Inc., 4.750%, 02/15/2031 | | $ | 347,693 | | | | 0.0 | |
| 700,000 (2) | | | CHS/Community Health Systems, Inc., 5.250%, 05/15/2030 | | | 571,398 | | | | 0.0 | |
| 600,000 (2) | | | CHS/Community Health Systems, Inc., 5.625%, 03/15/2027 | | | 552,876 | | | | 0.0 | |
| 750,000 | | | Cimpress PLC, 7.000%, 06/15/2026 | | | 751,275 | | | | 0.1 | |
| 880,000 (2) | | | CPI CG, Inc., 8.625%, 03/15/2026 | | | 877,525 | | | | 0.1 | |
| 275,000 (2) | | | DaVita, Inc., 3.750%, 02/15/2031 | | | 230,484 | | | | 0.0 | |
| 1,050,000 (2) | | | DaVita, Inc., 4.625%, 06/01/2030 | | | 940,741 | | | | 0.1 | |
| 1,025,000 | | | Encompass Health Corp., 4.750%, 02/01/2030 | | | 961,073 | | | | 0.1 | |
| 725,000 (2)(5) | | | Fiesta Purchaser, Inc., 7.875%, 03/01/2031 | | | 749,266 | | | | 0.1 | |
| 345,000 (2) | | | Garda World Security Corp., 6.000%, 06/01/2029 | | | 309,204 | | | | 0.0 | |
| 650,000 (2) | | | Graham Holdings Co., 5.750%, 06/01/2026 | | | 644,161 | | | | 0.0 | |
| 400,000 (2) | | | IQVIA, Inc., 5.000%, 10/15/2026 | | | 391,707 | | | | 0.0 | |
| 400,000 (2) | | | IQVIA, Inc., 6.500%, 05/15/2030 | | | 408,706 | | | | 0.0 | |
| 1,000,000 (2) | | | Jazz Securities DAC, 4.375%, 01/15/2029 | | | 932,318 | | | | 0.1 | |
| 685,000 (2) | | | Legends Hospitality Holding Co LLC / Legends Hospitality Co-Issuer, Inc., 5.000%, 02/01/2026 | | | 679,055 | | | | 0.0 | |
| 800,000 (2) | | | Medline Borrower L.P., 3.875%, 04/01/2029 | | | 728,689 | | | | 0.1 | |
| 700,000 (2) | | | Medline Borrower L.P., 5.250%, 10/01/2029 | | | 662,153 | | | | 0.0 | |
| 1,000,000 (5) | | | Minerva Luxembourg SA, 4.375%, 03/18/2031 | | | 835,000 | | | | 0.1 | |
| 1,600,000 (2) | | | Minerva Luxembourg SA, 8.875%, 09/13/2033 | | | 1,690,000 | | | | 0.1 | |
| 550,000 (2) | | | ModivCare, Inc., 5.875%, 11/15/2025 | | | 536,127 | | | | 0.0 | |
| 350,000 (2) | | | MPH Acquisition Holdings LLC, 5.750%, 11/01/2028 | | | 276,384 | | | | 0.0 | |
| 750,000 (2) | | | NESCO Holdings II, Inc., 5.500%, 04/15/2029 | | | 710,413 | | | | 0.0 | |
| 400,000 | | | New Albertsons L.P., 7.450%, 08/01/2029 | | | 419,025 | | | | 0.0 | |
| 1,100,000 (2)(5) | | | Organon & Co / Organon Foreign Debt Co-Issuer BV, 5.125%, 04/30/2031 | | | 978,821 | | | | 0.1 | |
See Accompanying Notes to Financial Statements
Voya Strategic
Income Opportunities Fund | PORTFOLIO OF INVESTMENTS
as of March 31, 2024 (continued) |
Principal
Amount† | | | | | Value | | | Percentage
of Net
Assets |
| CORPORATE BONDS/NOTES: (continued) | |
| | | | Consumer, Non-cyclical: (continued) |
| 750,000 (2)(5) | | | Owens & Minor, Inc., 6.625%, 04/01/2030 | | $ | 745,019 | | | | 0.1 | |
| 500,000 | | | Perrigo Finance Unlimited Co., 4.375%, 03/15/2026 | | | 486,866 | | | | 0.0 | |
| 500,000 | | | Perrigo Finance Unlimited Co., 4.650%, 06/15/2030 | | | 460,054 | | | | 0.0 | |
| 675,000 (2) | | | Post Holdings, Inc., 4.625%, 04/15/2030 | | | 620,165 | | | | 0.0 | |
| 1,050,000 (2) | | | Post Holdings, Inc., 5.625%, 01/15/2028 | | | 1,032,455 | | | | 0.1 | |
| 525,000 (2) | | | Prestige Brands, Inc., 3.750%, 04/01/2031 | | | 457,565 | | | | 0.0 | |
| 1,100,000 (2) | | | Prime Security Services Borrower LLC / Prime Finance, Inc., 6.250%, 01/15/2028 | | | 1,078,389 | | | | 0.1 | |
| 760,000 (2) | | | Primo Water Holdings, Inc., 4.375%, 04/30/2029 | | | 699,607 | | | | 0.0 | |
| 675,000 (2) | | | Select Medical Corp., 6.250%, 08/15/2026 | | | 676,789 | | | | 0.0 | |
| 685,000 (2) | | | Simmons Foods, Inc./ Simmons Prepared Foods,, Inc. ./ Simmons Pet Food,, Inc../Simmons Feed, 4.625%, 03/01/2029 | | | 606,024 | | | | 0.0 | |
| 640,000 (2) | | | Teleflex, Inc., 4.250%, 06/01/2028 | | | 601,079 | | | | 0.0 | |
| 605,000 | | | Tenet Healthcare Corp., 4.250%, 06/01/2029 | | | 562,922 | | | | 0.0 | |
| 650,000 | | | Tenet Healthcare Corp., 5.125%, 11/01/2027 | | | 636,274 | | | | 0.0 | |
| 1,075,000 (5) | | | Tenet Healthcare Corp., 6.125%, 10/01/2028 | | | 1,072,045 | | | | 0.1 | |
| 1,015,000 | | | Tenet Healthcare Corp., 6.125%, 06/15/2030 | | | 1,013,940 | | | | 0.1 | |
| 800,000 (5) | | | Teva Pharmaceutical Finance Netherlands III BV, 4.750%, 05/09/2027 | | | 772,512 | | | | 0.1 | |
| 760,000 (2) | | | Triton Water Holdings, Inc., 6.250%, 04/01/2029 | | | 692,945 | | | | 0.0 | |
| 325,000 | | | United Rentals North America, Inc., 3.750%, 01/15/2032 | | | 284,057 | | | | 0.0 | |
| 700,000 (5) | | | United Rentals North America, Inc., 4.875%, 01/15/2028 | | | 681,765 | | | | 0.0 | |
| 125,000 | | | United Rentals North America, Inc., 5.250%, 01/15/2030 | | | 122,026 | | | | 0.0 | |
| 725,000 (2) | | | Varex Imaging Corp., 7.875%, 10/15/2027 | | | 736,720 | | | | 0.1 | |
| 575,000 (2) | | | VT Topco, Inc., 8.500%, 08/15/2030 | | | 607,511 | | | | 0.0 | |
| 550,000 (2) | | | Wand NewCo 3, Inc., 7.625%, 01/30/2032 | | | 569,287 | | | | 0.0 | |
Principal
Amount† | | | | | Value | | | Percentage
of Net
Assets |
| CORPORATE BONDS/NOTES: (continued) |
| | | | Consumer, Non-cyclical: (continued) |
| 375,000 (2) | | | Williams Scotsman International, Inc., 4.625%, 08/15/2028 | | $ | 355,080 | | | | 0.0 | |
| 593,000 (2) | | | Williams Scotsman International, Inc., 6.125%, 06/15/2025 | | | 590,703 | | | | 0.0 | |
| | | | | | | 46,005,097 | | | | 2.5 | |
| | | | | | | | | | | | |
| | | | Energy: 2.8% |
| 500,000 (2) | | | Antero Midstream Partners L.P. / Antero Midstream Finance Corp., 5.375%, 06/15/2029 | | | 481,302 | | | | 0.0 | |
| 625,000 (2) | | | Antero Midstream Partners L.P. / Antero Midstream Finance Corp., 5.750%, 03/01/2027 | | | 617,587 | | | | 0.0 | |
| 400,000 (2) | | | Antero Resources Corp., 5.375%, 03/01/2030 | | | 384,504 | | | | 0.0 | |
| 635,000 (2) | | | Archrock Partners L.P. / Archrock Partners Finance Corp., 6.250%, 04/01/2028 | | | 628,690 | | | | 0.0 | |
| 300,000 (2)(5) | | | Archrock Partners L.P. / Archrock Partners Finance Corp., 6.875%, 04/01/2027 | | | 301,107 | | | | 0.0 | |
| 850,000 (2) | | | Ascent Resources Utica Holdings LLC / ARU Finance Corp., 5.875%, 06/30/2029 | | | 811,198 | | | | 0.1 | |
| 165,000 (2) | | | Baytex Energy Corp., 7.375%, 03/15/2032 | | | 166,799 | | | | 0.0 | |
| 750,000 (2) | | | Baytex Energy Corp., 8.500%, 04/30/2030 | | | 783,805 | | | | 0.1 | |
| 310,000 | | | Cenovus Energy, Inc., 5.250%, 06/15/2037 | | | 296,775 | | | | 0.0 | |
| 850,000 (2) | | | Chord Energy Corp., 6.375%, 06/01/2026 | | | 854,174 | | | | 0.1 | |
| 500,000 (2) | | | CNX Midstream Partners L.P., 4.750%, 04/15/2030 | | | 446,057 | | | | 0.0 | |
| 450,000 (2) | | | Cosan Luxembourg SA, 7.250%, 06/27/2031 | | | 459,225 | | | | 0.0 | |
| 950,000 (2) | | | Crescent Energy Finance LLC, 7.250%, 05/01/2026 | | | 968,878 | | | | 0.1 | |
| 470,000 (2) | | | Crescent Energy Finance LLC, 7.625%, 04/01/2032 | | | 473,958 | | | | 0.0 | |
| 475,000 (2) | | | Delek Logistics Partners L.P. / Delek Logistics Finance Corp., 7.125%, 06/01/2028 | | | 463,746 | | | | 0.0 | |
See Accompanying Notes to Financial Statements
Voya Strategic
Income Opportunities Fund | PORTFOLIO OF INVESTMENTS
as of March 31, 2024 (continued) |
Principal
Amount† | | | | | Value | | | Percentage
of Net
Assets |
| CORPORATE BONDS/NOTES: (continued) | |
| | | | Energy: (continued) |
| 550,000 (2) | | | Delek Logistics Partners L.P. / Delek Logistics Finance Corp., 8.625%, 03/15/2029 | | $ | 562,011 | | | | 0.0 | |
| 162,000 | | | Devon Energy Corp., 4.500%, 01/15/2030 | | | 156,259 | | | | 0.0 | |
| 275,000 (2) | | | DT Midstream, Inc., 4.125%, 06/15/2029 | | | 253,067 | | | | 0.0 | |
| 475,000 (2) | | | DT Midstream, Inc., 4.375%, 06/15/2031 | | | 430,523 | | | | 0.0 | |
| 820,000 (2) | | | Earthstone Energy Holdings LLC, 8.000%, 04/15/2027 | | | 845,148 | | | | 0.1 | |
| 2,500,000 | | | Ecopetrol SA, 6.875%, 04/29/2030 | | | 2,432,175 | | | | 0.1 | |
| 1,030,000 | | | Ecopetrol SA, 8.375%, 01/19/2036 | | | 1,040,619 | | | | 0.1 | |
| 1,700,000 | | | Ecopetrol SA, 8.875%, 01/13/2033 | | | 1,791,536 | | | | 0.1 | |
| 1,450,000 (2) | | | EIG Pearl Holdings Sarl, 3.545%, 08/31/2036 | | | 1,243,828 | | | | 0.1 | |
| 500,000 | | | Empresa Nacional del Petroleo, 3.750%, 08/05/2026 | | | 478,186 | | | | 0.0 | |
| 340,000 (2) | | | Empresa Nacional del Petroleo, 5.250%, 11/06/2029 | | | 332,352 | | | | 0.0 | |
| 1,200,000 | | | Empresa Nacional del Petroleo, 5.250%, 11/06/2029 | | | 1,173,006 | | | | 0.1 | |
| 850,000 (2) | | | Encino Acquisition Partners Holdings LLC, 8.500%, 05/01/2028 | | | 859,856 | | | | 0.1 | |
| 700,000 (2) | | | Enerflex Ltd., 9.000%, 10/15/2027 | | | 719,746 | | | | 0.0 | |
| 2,725,000 (1) | | | Energy Transfer L.P. G, 7.125%, 12/31/2199 | | | 2,667,192 | | | | 0.2 | |
| 1,200,000 | | | EnLink Midstream LLC, 5.375%, 06/01/2029 | | | 1,178,968 | | | | 0.1 | |
| 225,000 | | | EnLink Midstream Partners L.P., 4.150%, 06/01/2025 | | | 220,235 | | | | 0.0 | |
| 425,000 (2) | | | EQM Midstream Partners L.P., 6.000%, 07/01/2025 | | | 425,867 | | | | 0.0 | |
| 500,000 (2) | | | Global Partners L.P. / GLP Finance Corp., 8.250%, 01/15/2032 | | | 518,842 | | | | 0.0 | |
| 400,000 (2) | | | Greensaif Pipelines Bidco Sarl, 6.129%, 02/23/2038 | | | 408,130 | | | | 0.0 | |
| 725,000 (2) | | | Greensaif Pipelines Bidco Sarl, 6.510%, 02/23/2042 | | | 756,492 | | | | 0.0 | |
| 425,000 (2) | | | Hilcorp Energy I L.P. / Hilcorp Finance Co., 5.750%, 02/01/2029 | | | 414,342 | | | | 0.0 | |
| 450,000 (2) | | | Hilcorp Energy I L.P. / Hilcorp Finance Co., 6.000%, 04/15/2030 | | | 441,017 | | | | 0.0 | |
Principal
Amount† | | | | | Value | | | Percentage
of Net
Assets |
| CORPORATE BONDS/NOTES: (continued) | |
| | | | Energy: (continued) |
| 450,000 (2) | | | Hilcorp Energy I L.P. / Hilcorp Finance Co., 6.000%, 02/01/2031 | | $ | 439,232 | | | | 0.0 | |
| 1,575,000 (2)(5) | | | Hunt Oil Co. of Peru LLC Sucursal Del Peru, 8.550%, 09/18/2033 | | | 1,683,990 | | | | 0.1 | |
| 775,000 (2) | | | Kinetik Holdings L.P., 5.875%, 06/15/2030 | | | 758,769 | | | | 0.0 | |
| 600,000 (2)(5) | | | Kodiak Gas Services LLC, 7.250%, 02/15/2029 | | | 611,552 | | | | 0.0 | |
| 170,000 (2) | | | Matador Resources Co., 6.500%, 04/15/2032 | | | 170,419 | | | | 0.0 | |
| 900,000 (2) | | | Matador Resources Co., 6.875%, 04/15/2028 | | | 921,442 | | | | 0.1 | |
| 1,000,000 (5) | | | Medco Maple Tree Pte Ltd., 8.960%, 04/27/2029 | | | 1,043,125 | | | | 0.1 | |
| 625,000 (2) | | | Moss Creek Resources Holdings, Inc., 7.500%, 01/15/2026 | | | 624,746 | | | | 0.0 | |
| 775,000 | | | Murphy Oil Corp., 6.375%, 07/15/2028 | | | 780,729 | | | | 0.1 | |
| 550,000 (2) | | | NGL Energy Operating LLC / NGL Energy Finance Corp., 8.125%, 02/15/2029 | | | 563,660 | | | | 0.0 | |
| 350,000 (2) | | | NGL Energy Operating LLC / NGL Energy Finance Corp., 8.375%, 02/15/2032 | | | 359,020 | | | | 0.0 | |
| 825,000 (2) | | | Permian Resources Operating LLC, 5.875%, 07/01/2029 | | | 811,922 | | | | 0.1 | |
| 1,000,000 | | | Petroleos del Peru SA, 4.750%, 06/19/2032 | | | 785,000 | | | | 0.1 | |
| 4,700,000 | | | Petroleos Mexicanos, 5.950%, 01/28/2031 | | | 3,773,630 | | | | 0.2 | |
| 33,000 | | | Petroleos Mexicanos, 6.700%, 02/16/2032 | | | 27,522 | | | | 0.0 | |
| 3,300,000 (5) | | | Petroleos Mexicanos, 10.000%, 02/07/2033 | | | 3,283,170 | | | | 0.2 | |
| 1,500,000 (2)(5) | | | Raizen Fuels Finance SA, 6.450%, 03/05/2034 | | | 1,536,000 | | | | 0.1 | |
| 1,025,000 | | | Southwestern Energy Co., 5.375%, 02/01/2029 | | | 996,432 | | | | 0.1 | |
| 315,000 | | | Sunoco L.P. / Sunoco Finance Corp., 4.500%, 05/15/2029 | | | 293,085 | | | | 0.0 | |
| 690,000 | | | Sunoco L.P. / Sunoco Finance Corp., 4.500%, 04/30/2030 | | | 632,461 | | | | 0.0 | |
| 300,000 (2)(5) | | | Talos Production, Inc., 9.000%, 02/01/2029 | | | 318,817 | | | | 0.0 | |
| 375,000 (2) | | | Talos Production, Inc., 9.375%, 02/01/2031 | | | 400,064 | | | | 0.0 | |
| 438,750 (2) | | | Transocean Poseidon Ltd., 6.875%, 02/01/2027 | | | 439,541 | | | | 0.0 | |
See Accompanying Notes to Financial Statements
Voya Strategic
Income Opportunities Fund | PORTFOLIO OF INVESTMENTS
as of March 31, 2024 (continued) |
Principal
Amount† | | | | | Value | | | Percentage
of Net
Assets |
| CORPORATE BONDS/NOTES: (continued) | |
| | | | Energy: (continued) |
| 95,000 (2) | | | Transocean Titan Financing Ltd., 8.375%, 02/01/2028 | | $ | 99,234 | | | | 0.0 | |
| 525,000 (2) | | | Transocean, Inc., 7.500%, 01/15/2026 | | | 523,430 | | | | 0.0 | |
| 800,000 (2) | | | Venture Global Calcasieu Pass LLC, 4.125%, 08/15/2031 | | | 711,964 | | | | 0.0 | |
| 875,000 (2) | | | Venture Global LNG, Inc., 8.125%, 06/01/2028 | | | 893,210 | | | | 0.1 | |
| 775,000 (2) | | | Venture Global LNG, Inc., 8.375%, 06/01/2031 | | | 799,718 | | | | 0.1 | |
| 600,000 (2) | | | Venture Global LNG, Inc., 9.500%, 02/01/2029 | | | 647,093 | | | | 0.0 | |
| | | | | | | 52,416,179 | | | | 2.8 | |
| | | | | | | | | | | | |
| | | | Financial: 2.1% |
| 385,000 (2) | | | Alliant Holdings Intermediate LLC / Alliant Holdings Co-Issuer, 7.000%, 01/15/2031 | | | 389,148 | | | | 0.0 | |
| 425,000 (5) | | | Ally Financial, Inc., 5.750%, 11/20/2025 | | | 422,135 | | | | 0.0 | |
| 350,000 | | | Ally Financial, Inc., 6.700%, 02/14/2033 | | | 353,941 | | | | 0.0 | |
| 85,000 (2) | | | AmWINS Group, Inc., 6.375%, 02/15/2029 | | | 85,512 | | | | 0.0 | |
| 300,000 (2) | | | Ardonagh Finco Ltd., 7.750%, 02/15/2031 | | | 298,952 | | | | 0.0 | |
| 300,000 (2) | | | Ardonagh Group Finance Ltd., 8.875%, 02/15/2032 | | | 296,522 | | | | 0.0 | |
| 775,000 (2) | | | Aretec Escrow Issuer, Inc., 7.500%, 04/01/2029 | | | 738,660 | | | | 0.1 | |
| 1,350,000 (2) | | | Banco do Brasil SA/ Cayman, 6.000%, 03/18/2031 | | | 1,351,350 | | | | 0.1 | |
| 1,250,000 | | | Banco Nacional de Panama, 2.500%, 08/11/2030 | | | 976,563 | | | | 0.1 | |
| 3,000,000 (1) | | | Bank of America Corp., MTN, 3.384%, 04/02/2026 | | | 2,935,043 | | | | 0.2 | |
| 226,000 (1)(5) | | | Bank of America Corp. RR, 4.375%, 12/31/2199 | | | 212,427 | | | | 0.0 | |
| 1,800,000 (1)(2) | | | BBVA Bancomer SA/Texas, 8.450%, 06/29/2038 | | | 1,906,312 | | | | 0.1 | |
| 825,000 (2) | | | BroadStreet Partners, Inc., 5.875%, 04/15/2029 | | | 764,379 | | | | 0.1 | |
| 625,000 (2) | | | Burford Capital Global Finance LLC, 6.875%, 04/15/2030 | | | 614,282 | | | | 0.0 | |
Principal
Amount† | | | | | Value | | | Percentage
of Net
Assets |
| CORPORATE BONDS/NOTES: (continued) | |
| | | | Financial: (continued) |
| 2,000,000 (1) | | | Capital One Financial Corp., 4.166%, 05/09/2025 | | $ | 1,995,959 | | | | 0.1 | |
| 1,800,000 (1)(2) | | | Danske Bank A/S, 6.466%, 01/09/2026 | | | 1,806,899 | | | | 0.1 | |
| 500,000 (2) | | | Freedom Mortgage Corp., 6.625%, 01/15/2027 | | | 485,574 | | | | 0.0 | |
| 430,000 (2) | | | Freedom Mortgage Corp., 12.250%, 10/01/2030 | | | 473,354 | | | | 0.0 | |
| 2,000,000 (1) | | | JPMorgan Chase & Co., 2.083%, 04/22/2026 | | | 1,927,620 | | | | 0.1 | |
| 198,000 (1) | | | JPMorgan Chase & Co., 4.452%, 12/05/2029 | | | 193,085 | | | | 0.0 | |
| 650,000 (2)(5) | | | Ladder Capital Finance Holdings LLLP / Ladder Capital Finance Corp., 4.750%, 06/15/2029 | | | 591,454 | | | | 0.0 | |
| 250,000 (2) | | | Macquarie Airfinance Holdings Ltd., 6.400%, 03/26/2029 | | | 254,141 | | | | 0.0 | |
| 400,000 (2) | | | Midcap Financial Issuer Trust, 5.625%, 01/15/2030 | | | 345,214 | | | | 0.0 | |
| 515,000 (2) | | | Midcap Financial Issuer Trust, 6.500%, 05/01/2028 | | | 475,570 | | | | 0.0 | |
| 2,000,000 (1) | | | Morgan Stanley, 0.985%, 12/10/2026 | | | 1,853,647 | | | | 0.1 | |
| 2,000,000 (1) | | | Morgan Stanley, 2.188%, 04/28/2026 | | | 1,930,096 | | | | 0.1 | |
| 2,500,000 (1) | | | Morgan Stanley, 4.679%, 07/17/2026 | | | 2,473,954 | | | | 0.1 | |
| 9,000 (1) | | | Morgan Stanley, 5.466%, 01/18/2035 | | | 9,084 | | | | 0.0 | |
| 16,000 (1) | | | Morgan Stanley, 6.627%, 11/01/2034 | | | 17,515 | | | | 0.0 | |
| 61,000 (1) | | | Morgan Stanley, MTN, 5.424%, 07/21/2034 | | | 61,215 | | | | 0.0 | |
| 650,000 | | | MPT Operating Partnership L.P. / MPT Finance Corp., 4.625%, 08/01/2029 | | | 499,420 | | | | 0.0 | |
| 750,000 (5) | | | MPT Operating Partnership L.P. / MPT Finance Corp., 5.000%, 10/15/2027 | | | 628,894 | | | | 0.1 | |
| 475,000 (2) | | | Nationstar Mortgage Holdings, Inc., 5.000%, 02/01/2026 | | | 465,231 | | | | 0.0 | |
| 875,000 (2) | | | Nationstar Mortgage Holdings, Inc., 5.125%, 12/15/2030 | | | 794,641 | | | | 0.1 | |
| 500,000 (5) | | | Navient Corp., 4.875%, 03/15/2028 | | | 466,483 | | | | 0.0 | |
| 350,000 (5) | | | Navient Corp., 5.000%, 03/15/2027 | | | 335,563 | | | | 0.0 | |
| 250,000 | | | Navient Corp., 6.750%, 06/25/2025 | | | 252,082 | | | | 0.0 | |
See Accompanying Notes to Financial Statements
Voya Strategic Income Opportunities Fund | PORTFOLIO OF INVESTMENTS as of March 31, 2024 (continued) |
Principal
Amount† | | | | | Value | | | Percentage
of Net
Assets |
| CORPORATE BONDS/NOTES: (continued) |
| | | | Financial: (continued) | | | | | | | | |
| 187,000 (1) | | | Northern Trust Corp., 3.375%, 05/08/2032 | | $ | 174,394 | | | | 0.0 | |
| 340,000 | | | OneMain Finance Corp., 4.000%, 09/15/2030 | | | 291,306 | | | | 0.0 | |
| 800,000 (5) | | | OneMain Finance Corp., 5.375%, 11/15/2029 | | | 752,818 | | | | 0.1 | |
| 275,000 | | | OneMain Finance Corp., 7.125%, 03/15/2026 | | | 280,176 | | | | 0.0 | |
| 675,000 (2) | | | Panther Escrow Issuer LLC, 7.125%, 06/01/2031 | | | 686,819 | | | | 0.1 | |
| 500,000 (2) | | | PRA Group, Inc., 5.000%, 10/01/2029 | | | 421,822 | | | | 0.0 | |
| 165,000 (2) | | | RHP Hotel Properties L.P. / RHP Finance Corp., 6.500%, 04/01/2032 | | | 165,660 | | | | 0.0 | |
| 925,000 (2) | | | RHP Hotel Properties L.P. / RHP Finance Corp., 7.250%, 07/15/2028 | | | 953,785 | | | | 0.1 | |
| 175,000 (2) | | | RLJ Lodging Trust L.P., 3.750%, 07/01/2026 | | | 166,779 | | | | 0.0 | |
| 10,000 (1) | | | Truist Financial Corp., MTN, 5.711%, 01/24/2035 | | | 10,048 | | | | 0.0 | |
| 1,750,000 (2) | | | Trust Fibra Uno, 7.375%, 02/13/2034 | | | 1,752,581 | | | | 0.1 | |
| 980,000 (2) | | | United Wholesale Mortgage LLC, 5.750%, 06/15/2027 | | | 953,705 | | | | 0.1 | |
| 63,000 (1) | | | Wells Fargo & Co., 5.499%, 01/23/2035 | | | 63,172 | | | | 0.0 | |
| 2,000,000 (1) | | | Wells Fargo & Co., MTN, 4.540%, 08/15/2026 | | | 1,975,007 | | | | 0.1 | |
| 70,000 (1) | | | Wells Fargo & Co., MTN, 5.557%, 07/25/2034 | | | 70,301 | | | | 0.0 | |
| 625,000 (2) | | | XHR L.P., 4.875%, 06/01/2029 | | | 579,108 | | | | 0.0 | |
| 100,000 (2) | | | XHR L.P., 6.375%, 08/15/2025 | | | 100,203 | | | | 0.0 | |
| | | | | | | 39,079,605 | | | | 2.1 | |
| | | | | | | | | | | | |
| | | | Industrial: 1.7% | | | | | | | | |
| 650,000 (2) | | | AAR Escrow Issuer LLC, 6.750%, 03/15/2029 | | | 655,814 | | | | 0.0 | |
| 775,000 (2) | | | Ambipar Lux Sarl, 9.875%, 02/06/2031 | | | 776,085 | | | | 0.1 | |
| 525,000 (2) | | | AmeriTex HoldCo Intermediate LLC, 10.250%, 10/15/2028 | | | 564,326 | | | | 0.0 | |
Principal
Amount† | | | | | Value | | | Percentage
of Net
Assets |
| CORPORATE BONDS/NOTES: (continued) |
| | | | Industrial: (continued) | | | | | | | | |
| 1,025,000 (2)(6) | | | ARD Finance SA, 6.500% (PIK Rate 7.250%, Cash Rate 6.500%), 06/30/2027 | | $ | 344,080 | | | | 0.0 | |
| 1,025,000 (2)(5) | | | Ardagh Packaging Finance PLC / Ardagh Holdings USA, Inc., 5.250%, 08/15/2027 | | | 646,852 | | | | 0.0 | |
| 575,000 | | | Ball Corp., 3.125%, 09/15/2031 | | | 489,269 | | | | 0.0 | |
| 300,000 (5) | | | Ball Corp., 6.875%, 03/15/2028 | | | 308,197 | | | | 0.0 | |
| 140,000 (2) | | | Bombardier, Inc., 7.250%, 07/01/2031 | | | 140,460 | | | | 0.0 | |
| 475,000 (2)(5) | | | Bombardier, Inc., 7.500%, 02/01/2029 | | | 489,656 | | | | 0.0 | |
| 518,000 (2) | | | Bombardier, Inc., 7.875%, 04/15/2027 | | | 518,686 | | | | 0.0 | |
| 200,000 (2)(5) | | | Bombardier, Inc., 8.750%, 11/15/2030 | | | 213,805 | | | | 0.0 | |
| 725,000 (2) | | | Brundage-Bone Concrete Pumping Holdings, Inc., 6.000%, 02/01/2026 | | | 716,686 | | | | 0.1 | |
| 875,000 (2) | | | Builders FirstSource, Inc., 5.000%, 03/01/2030 | | | 835,588 | | | | 0.1 | |
| 150,000 (2) | | | Cascades, Inc. / Cascades USA, Inc., 5.125%, 01/15/2026 | | | 147,156 | | | | 0.0 | |
| 775,000 (2) | | | Cascades, Inc. / Cascades USA, Inc., 5.375%, 01/15/2028 | | | 745,142 | | | | 0.1 | |
| 1,775,000 (1) | | | Cemex SAB de CV, 5.125%, 12/31/2199 | | | 1,720,641 | | | | 0.1 | |
| 800,000 (2) | | | Chart Industries, Inc., 7.500%, 01/01/2030 | | | 831,757 | | | | 0.1 | |
| 725,000 (2) | | | Clean Harbors, Inc., 6.375%, 02/01/2031 | | | 731,100 | | | | 0.1 | |
| 725,000 (2) | | | Clydesdale Acquisition Holdings, Inc., 8.750%, 04/15/2030 | | | 713,099 | | | | 0.0 | |
| 875,000 (2) | | | Emerald Debt Merger Sub LLC, 6.625%, 12/15/2030 | | | 884,488 | | | | 0.1 | |
| 1,025,000 (2) | | | Energizer Holdings, Inc., 4.750%, 06/15/2028 | | | 950,322 | | | | 0.1 | |
| 950,000 (2) | | | Fortress Transportation and Infrastructure Investors LLC, 5.500%, 05/01/2028 | | | 921,499 | | | | 0.1 | |
| 275,000 (2) | | | Fortress Transportation and Infrastructure Investors LLC, 6.500%, 10/01/2025 | | | 274,800 | | | | 0.0 | |
| 750,000 (2) | | | GFL Environmental, Inc., 4.000%, 08/01/2028 | | | 692,170 | | | | 0.0 | |
See Accompanying Notes to Financial Statements
Voya Strategic Income Opportunities Fund | PORTFOLIO OF INVESTMENTS as of March 31, 2024 (continued) |
Principal
Amount† | | | | | Value | | | Percentage
of Net
Assets |
| CORPORATE BONDS/NOTES: (continued) |
| | | | Industrial: (continued) | | | | | | | | |
| 300,000 (2)(5) | | | GFL Environmental, Inc., 4.250%, 06/01/2025 | | $ | 295,313 | | | | 0.0 | |
| 450,000 (2) | | | GFL Environmental, Inc., 4.375%, 08/15/2029 | | | 414,982 | | | | 0.0 | |
| 325,000 (2) | | | Global Infrastructure Solutions, Inc., 5.625%, 06/01/2029 | | | 298,346 | | | | 0.0 | |
| 350,000 (2) | | | Global Infrastructure Solutions, Inc., 7.500%, 04/15/2032 | | | 342,668 | | | | 0.0 | |
| 825,000 (2) | | | Graham Packaging Co., Inc., 7.125%, 08/15/2028 | | | 748,975 | | | | 0.1 | |
| 975,000 (2) | | | Imola Merger Corp., 4.750%, 05/15/2029 | | | 915,072 | | | | 0.1 | |
| 400,000 (2)(6) | | | Intelligent Packaging Holdco Issuer L.P., 9.000% (PIK Rate 9.750%, Cash Rate 9.000%), 01/15/2026 | | | 379,514 | | | | 0.0 | |
| 650,000 (2) | | | Intelligent Packaging Ltd. Finco, Inc. / Intelligent Packaging Ltd. Co-Issuer LLC, 6.000%, 09/15/2028 | | | 618,093 | | | | 0.0 | |
| 575,000 (2) | | | Maxim Crane Works Holdings Capital LLC, 11.500%, 09/01/2028 | | | 624,134 | | | | 0.0 | |
| 800,000 (2) | | | New Enterprise Stone & Lime Co., Inc., 9.750%, 07/15/2028 | | | 820,576 | | | | 0.1 | |
| 700,000 (2)(5) | | | Owens-Brockway Glass Container, Inc., 7.250%, 05/15/2031 | | | 713,826 | | | | 0.0 | |
| 625,000 (2) | | | Roller Bearing Co. of America, Inc., 4.375%, 10/15/2029 | | | 573,043 | | | | 0.0 | |
| 400,000 (2) | | | Rolls-Royce PLC, 3.625%, 10/14/2025 | | | 388,435 | | | | 0.0 | |
| 800,000 (2) | | | Rolls-Royce PLC, 5.750%, 10/15/2027 | | | 802,885 | | | | 0.1 | |
| 725,000 (2)(5) | | | Sealed Air Corp., 4.000%, 12/01/2027 | | | 680,162 | | | | 0.0 | |
| 125,000 (2) | | | Sealed Air Corp., 5.125%, 12/01/2024 | | | 124,606 | | | | 0.0 | |
| 425,000 (2)(5) | | | Sealed Air Corp/Sealed Air Corp. US, 6.125%, 02/01/2028 | | | 426,245 | | | | 0.0 | |
| 325,000 (2) | | | Sensata Technologies BV, 5.000%, 10/01/2025 | | | 321,250 | | | | 0.0 | |
| 875,000 (2) | | | Sensata Technologies, Inc., 3.750%, 02/15/2031 | | | 757,765 | | | | 0.1 | |
| 600,000 (2) | | | Smyrna Ready Mix Concrete LLC, 8.875%, 11/15/2031 | | | 641,824 | | | | 0.0 | |
Principal
Amount† | | | | | Value | | | Percentage
of Net
Assets |
| CORPORATE BONDS/NOTES: (continued) |
| | | | Industrial: (continued) | | | | | | | | |
| 870,000 (2) | | | Standard Industries, Inc., 3.375%, 01/15/2031 | | $ | 730,403 | | | | 0.1 | |
| 510,000 (2) | | | Standard Industries, Inc., 4.375%, 07/15/2030 | | | 458,613 | | | | 0.0 | |
| 625,000 (2)(5) | | | Summit Materials LLC / Summit Materials Finance Corp., 5.250%, 01/15/2029 | | | 609,642 | | | | 0.0 | |
| 440,000 (2) | | | Summit Materials LLC / Summit Materials Finance Corp., 6.500%, 03/15/2027 | | | 439,998 | | | | 0.0 | |
| 200,000 (2) | | | TK Elevator Holdco GmbH, 7.625%, 07/15/2028 | | | 196,301 | | | | 0.0 | |
| 775,000 (5) | | | TransDigm, Inc., 4.625%, 01/15/2029 | | | 720,134 | | | | 0.1 | |
| 600,000 | | | TransDigm, Inc., 5.500%, 11/15/2027 | | | 587,725 | | | | 0.0 | |
| 550,000 (2) | | | TransDigm, Inc., 6.625%, 03/01/2032 | | | 556,348 | | | | 0.0 | |
| 475,000 (2) | | | TransDigm, Inc., 6.875%, 12/15/2030 | | | 484,735 | | | | 0.0 | |
| 650,000 (2) | | | Weekley Homes LLC / Weekley Finance Corp., 4.875%, 09/15/2028 | | | 601,610 | | | | 0.0 | |
| | | | | | | 31,584,901 | | | | 1.7 | |
| | | | | | | | | | | | |
| | | | Technology: 0.4% | | | | | | | | |
| 1,650,000 (2) | | | Cloud Software Group, Inc., 6.500%, 03/31/2029 | | | 1,567,156 | | | | 0.1 | |
| 525,000 (2)(5) | | | Cloud Software Group, Inc., 9.000%, 09/30/2029 | | | 504,038 | | | | 0.0 | |
| 500,000 (2) | | | Entegris Escrow Corp., 5.950%, 06/15/2030 | | | 494,561 | | | | 0.0 | |
| 350,000 (2) | | | Entegris, Inc., 3.625%, 05/01/2029 | | | 314,692 | | | | 0.0 | |
| 575,000 (2) | | | McAfee Corp., 7.375%, 02/15/2030 | | | 527,931 | | | | 0.0 | |
| 650,000 (2) | | | NCR Atleos Escrow Corp., 9.500%, 04/01/2029 | | | 695,912 | | | | 0.1 | |
| 400,000 (2) | | | Open Text Corp., 3.875%, 12/01/2029 | | | 356,804 | | | | 0.0 | |
| 800,000 (2) | | | Open Text Holdings, Inc., 4.125%, 02/15/2030 | | | 717,256 | | | | 0.1 | |
| 800,000 (2) | | | UKG, Inc., 6.875%, 02/01/2031 | | | 815,566 | | | | 0.1 | |
| 625,000 (2) | | | Virtusa Corp., 7.125%, 12/15/2028 | | | 561,739 | | | | 0.0 | |
| | | | | | | 6,555,655 | | | | 0.4 | |
See Accompanying Notes to Financial Statements
Voya Strategic Income Opportunities Fund | PORTFOLIO OF INVESTMENTS as of March 31, 2024 (continued) |
Principal
Amount† | | | | | Value | | | Percentage
of Net
Assets |
| CORPORATE BONDS/NOTES: (continued) |
| | | | Utilities: 1.1% | | | | | | | | |
| 392,838 | | | AES Panama Generation Holdings SRL, 4.375%, 05/31/2030 | | $ | 343,242 | | | | 0.0 | |
| 1,301,275 (2) | | | AES Panama Generation Holdings SRL, 4.375%, 05/31/2030 | | | 1,136,989 | | | | 0.1 | |
| 800,000 (2) | | | Atlantica Sustainable Infrastructure PLC, 4.125%, 06/15/2028 | | | 735,703 | | | | 0.1 | |
| 475,000 (2) | | | Calpine Corp., 4.500%, 02/15/2028 | | | 450,895 | | | | 0.0 | |
| 375,000 (2) | | | Calpine Corp., 5.000%, 02/01/2031 | | | 344,373 | | | | 0.0 | |
| 550,000 (2) | | | Calpine Corp., 5.125%, 03/15/2028 | | | 528,324 | | | | 0.0 | |
| 100,000 (2) | | | Calpine Corp., 5.250%, 06/01/2026 | | | 99,038 | | | | 0.0 | |
| 1,250,000 (2) | | | Comision Federal de Electricidad, 4.688%, 05/15/2029 | | | 1,178,906 | | | | 0.1 | |
| 4,028,000 (1) | | | Dominion Energy, Inc. B, 4.650%, 12/31/2199 | | | 3,962,843 | | | | 0.2 | |
| 743,000 (1) | | | Duke Energy Corp., 4.875%, 12/31/2199 | | | 738,379 | | | | 0.1 | |
| 3,681,000 (1) | | | National Rural Utilities Cooperative Finance Corp., 8.489%, (TSFR3M + 3.172%), 04/30/2043 | | | 3,680,512 | | | | 0.2 | |
| 2,875,000 (1) | | | NextEra Energy Capital Holdings, Inc., 5.650%, 05/01/2079 | | | 2,764,105 | | | | 0.2 | |
| 2,950,000 | | | South Jersey Industries, Inc., 5.020%, 04/15/2031 | | | 2,336,771 | | | | 0.1 | |
| 660,000 | | | TransAlta Corp., 7.750%, 11/15/2029 | | | 686,690 | | | | 0.0 | |
| 475,000 (2) | | | Vistra Operations Co. LLC, 4.375%, 05/01/2029 | | | 440,527 | | | | 0.0 | |
| 625,000 (2) | | | Vistra Operations Co. LLC, 5.500%, 09/01/2026 | | | 615,827 | | | | 0.0 | |
| 300,000 (2) | | | Vistra Operations Co. LLC, 5.625%, 02/15/2027 | | | 295,633 | | | | 0.0 | |
| 475,000 (2) | | | Vistra Operations Co. LLC, 7.750%, 10/15/2031 | | | 497,805 | | | | 0.0 | |
| | | | | | | 20,836,562 | | | | 1.1 | |
| | | | Total Corporate Bonds/ Notes (Cost $305,684,713) | | | 298,670,237 | | | | 16.2 | |
Principal
Amount† | | | | | Value | | | Percentage
of Net
Assets |
| ASSET-BACKED SECURITIES: 13.6% |
| | | | Automobile Asset-Backed Securities: 0.3% | |
| 1,992,834 | | | AmeriCredit Automobile Receivables Trust 2019-3 D, 2.580%, 09/18/2025 | | $ | 1,989,652 | | | | 0.1 | |
| 4,400,000 | | | AmeriCredit Automobile Receivables Trust 2020-1 D, 1.800%, 12/18/2025 | | | 4,348,580 | | | | 0.2 | |
| | | | | | | 6,338,232 | | | | 0.3 | |
| | | | | | | | | | | | |
| | | | Home Equity Asset-Backed Securities: 0.5% | |
| 2,010,944 (1)(2) | | | ACE Securities Corp. Mortgage Loan Trust Series 2007-D1 A2, 6.336%, 02/25/2038 | | | 1,559,749 | | | | 0.1 | |
| 2,743,729 (1)(2) | | | ACE Securities Corp. Mortgage Loan Trust Series 2007-D1 A3, 7.250%, 02/25/2038 | | | 2,088,974 | | | | 0.1 | |
| 294,417 (1) | | | GSAA Home Equity Trust 2006-3 A3, 6.044%, (TSFR1M + 0.714%), 03/25/2036 | | | 145,106 | | | | 0.0 | |
| 1,890,114 (1) | | | GSAA Home Equity Trust 2006-4 4A3, 4.230%, 03/25/2036 | | | 1,151,429 | | | | 0.1 | |
| 822,790 (1) | | | GSAA Home Equity Trust 2007-1 1A1, 5.604%, (TSFR1M + 0.274%), 02/25/2037 | | | 233,445 | | | | 0.0 | |
| 810,722 (1) | | | GSAA Trust 2006-7 AF2, 5.995%, 03/25/2046 | | | 297,768 | | | | 0.0 | |
| 714,759 (1) | | | Morgan Stanley Mortgage Loan Trust 2007-10XS A2, 6.250%, 02/25/2037 | | | 397,707 | | | | 0.0 | |
| 336,858 (1) | | | Nomura Home Equity Loan, Inc. Home Equity Loan Trust Series 2007-1 2A4A, 5.904%, (TSFR1M + 0.574%), 02/25/2037 | | | 296,813 | | | | 0.0 | |
| 2,968,534 (1) | | | Renaissance Home Equity Loan Trust 2004-4 MF2, 5.818%, 02/25/2035 | | | 2,581,977 | | | | 0.2 | |
| | | | | | | 8,752,968 | | | | 0.5 | |
| | | | | | | | | | | | |
| | | | Other Asset-Backed Securities: 11.8% | |
| 3,650,000 (2) | | | ACHV ABS TRUST 2024-1PL A, 5.900%, 04/25/2031 | | | 3,651,849 | | | | 0.2 | |
| 2,000,000 (1)(2) | | | AMMC CLO XI Ltd. 2012-11A CR2, 7.479%, (TSFR3M + 2.162%), 04/30/2031 | | | 1,986,068 | | | | 0.1 | |
See Accompanying Notes to Financial Statements
Voya Strategic Income Opportunities Fund | PORTFOLIO OF INVESTMENTS as of March 31, 2024 (continued) |
Principal
Amount† | | | | | Value | | | Percentage
of Net
Assets |
| ASSET-BACKED SECURITIES: (continued) |
| | | | Other Asset-Backed Securities: (continued) | |
| 2,700,000 (1)(2) | | | Apidos CLO XXIV 2016-24A BRR, 7.629%, (TSFR3M + 2.312%), 10/20/2030 | | $ | 2,703,367 | | | | 0.1 | |
| 2,900,000 (1)(2) | | | Apidos CLO XXXIII 2020-33A CR, 7.480%, (TSFR3M + 2.162%), 10/24/2034 | | | 2,892,498 | | | | 0.2 | |
| 742,500 (2) | | | Applebee’s Funding LLC / IHOP Funding LLC 2019-1A A2II, 4.723%, 06/05/2049 | | | 715,061 | | | | 0.0 | |
| 263,543 (2) | | | Aqua Finance Trust 2019-A A, 3.140%, 07/16/2040 | | | 247,893 | | | | 0.0 | |
| 3,000,000 (1)(2) | | | Arbor Realty Commercial Real Estate Notes Ltd. 2021-FL4 A, 6.790%, (TSFR1M + 1.464%), 11/15/2036 | | | 2,984,133 | | | | 0.2 | |
| 500,000 (1)(2) | | | Arbor Realty Commercial Real Estate Notes Ltd. 2021-FL4 D, 8.340%, (TSFR1M + 3.014%), 11/15/2036 | | | 478,384 | | | | 0.0 | |
| 2,500,000 (2) | | | Atrium XIV LLC 14A A2BR, 2.304%, 08/23/2030 | | | 2,275,148 | | | | 0.1 | |
| 3,600,000 (1)(2) | | | Bain Capital CLO Ltd. 2024-1A C, 7.725%, (TSFR3M + 2.400%), 04/16/2037 | | | 3,602,560 | | | | 0.2 | |
| 2,000,000 (1)(2) | | | Barings CLO Ltd. 2018-3A C, 7.479%, (TSFR3M + 2.162%), 07/20/2029 | | | 2,001,556 | | | | 0.1 | |
| 2,000,000 (1)(2) | | | Benefit Street Partners CLO V-B Ltd. 2018-5BA B, 7.729%, (TSFR3M + 2.412%), 04/20/2031 | | | 2,002,936 | | | | 0.1 | |
| 1,000,000 (1)(2) | | | BlueMountain CLO Ltd. 2013-2A CR, 7.529%, (TSFR3M + 2.212%), 10/22/2030 | | | 986,746 | | | | 0.1 | |
| 1,000,000 (1)(2) | | | BlueMountain CLO Ltd. 2015-4A CR, 7.479%, (TSFR3M + 2.162%), 04/20/2030 | | | 996,323 | | | | 0.1 | |
| 2,000,000 (1)(2) | | | BlueMountain CLO XXIX Ltd. 2020-29A CR, 7.686%, (TSFR3M + 2.362%), 07/25/2034 | | | 1,991,826 | | | | 0.1 | |
| 1,250,000 (1)(2) | | | BlueMountain CLO XXVIII Ltd. 2021-28A C, 7.576%, (TSFR3M + 2.262%), 04/15/2034 | | | 1,237,591 | | | | 0.1 | |
| 1,866,750 (2) | | | Bojangles Issuer LLC 2020-1A A2, 3.832%, 10/20/2050 | | | 1,762,980 | | | | 0.1 | |
Principal
Amount† | | | | | Value | | | Percentage
of Net
Assets |
| ASSET-BACKED SECURITIES: (continued) |
| | | | Other Asset-Backed Securities: (continued) | |
| 4,000,000 (1)(2) | | | Bristol Park CLO Ltd. 2016-1A CR, 7.526%, (TSFR3M + 2.212%), 04/15/2029 | | $ | 4,004,820 | | | | 0.2 | |
| 750,000 (1)(2) | | | Buttermilk Park CLO Ltd. 2018-1A C, 7.676%, (TSFR3M + 2.362%), 10/15/2031 | | | 750,576 | | | | 0.0 | |
| 1,000,000 (1)(2) | | | Carlyle C17 CLO Ltd. C17A BR, 7.429%, (TSFR3M + 2.112%), 04/30/2031 | | | 1,000,882 | | | | 0.1 | |
| 4,500,000 (1)(2) | | | Carlyle Global Market Strategies CLO Ltd. 2014-1A CR2, 7.378%, (TSFR3M + 2.062%), 04/17/2031 | | | 4,469,643 | | | | 0.2 | |
| 4,600,000 (1)(2) | | | Carlyle US CLO Ltd. 2017-3A BR, 7.579%, (TSFR3M + 2.262%), 07/20/2029 | | | 4,605,515 | | | | 0.2 | |
| 4,100,000 (1)(2) | | | Carlyle US CLO Ltd. 2019-3A BRR, 7.923%, (TSFR3M + 2.600%), 04/20/2037 | | | 4,104,953 | | | | 0.2 | |
| 5,500,000 (1)(2) | | | CIFC Funding Ltd. 2019-2A CR, 7.678%, (TSFR3M + 2.362%), 04/17/2034 | | | 5,508,806 | | | | 0.3 | |
| 5,000,000 (1)(2) | | | Crown City CLO V 2023-5A B, 8.918%, (TSFR3M + 3.600%), 04/20/2034 | | | 5,004,720 | | | | 0.3 | |
| 676,010 (1) | | | CWABS Asset-Backed Certificates Trust 2005-AB2 M1, 6.149%, (TSFR1M + 0.819%), 09/25/2035 | | | 647,334 | | | | 0.0 | |
| 811,750 (2) | | | DB Master Finance LLC 2019-1A A23, 4.352%, 05/20/2049 | | | 775,517 | | | | 0.0 | |
| 429,750 (2) | | | DB Master Finance LLC 2019-1A A2II, 4.021%, 05/20/2049 | | | 416,374 | | | | 0.0 | |
| 4,007,750 (2) | | | DB Master Finance LLC 2021-1A A23, 2.791%, 11/20/2051 | | | 3,364,275 | | | | 0.2 | |
| 3,000,000 (1)(2) | | | Dewolf Park CLO Ltd. 2017-1A DR, 8.426%, (TSFR3M + 3.112%), 10/15/2030 | | | 3,003,246 | | | | 0.2 | |
| 556,500 (2) | | | Domino’s Pizza Master Issuer LLC 2015-1A A2II, 4.474%, 10/25/2045 | | | 546,437 | | | | 0.0 | |
| 1,034,000 (2) | | | Domino’s Pizza Master Issuer LLC 2017-1A A23, 4.118%, 07/25/2047 | | | 991,422 | | | | 0.1 | |
See Accompanying Notes to Financial Statements
Voya Strategic Income Opportunities Fund | PORTFOLIO OF INVESTMENTS as of March 31, 2024 (continued) |
Principal
Amount† | | | | | Value | | | Percentage
of Net
Assets |
| ASSET-BACKED SECURITIES: (continued) |
| | | | Other Asset-Backed Securities: (continued) | |
| 2,236,100 (2) | | | Domino’s Pizza Master Issuer LLC 2018-1A A2I, 4.116%, 07/25/2048 | | $ | 2,177,088 | | | | 0.1 | |
| 3,408,000 (2) | | | Domino’s Pizza Master Issuer LLC 2019-1A A2, 3.668%, 10/25/2049 | | | 3,142,979 | | | | 0.2 | |
| 1,178,125 (2) | | | Driven Brands Funding LLC 2018-1A A2, 4.739%, 04/20/2048 | | | 1,157,355 | | | | 0.1 | |
| 2,090,000 (2) | | | Driven Brands Funding LLC 2019-1A A2, 4.641%, 04/20/2049 | | | 2,027,813 | | | | 0.1 | |
| 2,750,000 (1)(2) | | | Dryden 30 Senior Loan Fund 2013-30A DR, 8.169%, (TSFR3M + 2.862%), 11/15/2028 | | | 2,719,062 | | | | 0.1 | |
| 1,750,000 (1)(2) | | | Dryden 55 CLO Ltd. 2018-55A C, 7.476%, (TSFR3M + 2.162%), 04/15/2031 | | | 1,746,927 | | | | 0.1 | |
| 5,000,000 (1)(2) | | | Dryden 75 CLO Ltd. 2019-75A CR2, 7.376%, (TSFR3M + 2.062%), 04/15/2034 | | | 4,877,075 | | | | 0.3 | |
| 4,748,831 (1)(2) | | | FS Rialto 2021-FL3 A, 6.691%, (TSFR1M + 1.364%), 11/16/2036 | | | 4,737,392 | | | | 0.3 | |
| 5,650,000 (1)(2) | | | Invesco US CLO Ltd. 2023-1A CR, 7.686%, (TSFR3M + 2.400%), 04/22/2037 | | | 5,656,040 | | | | 0.3 | |
| 898,068 (2) | | | JG Wentworth XLII LLC 2018-2A B, 4.700%, 10/15/2077 | | | 808,687 | | | | 0.0 | |
| 1,350,000 (1)(2) | | | LCM XVIII L.P. 18A CR, 7.429%, (TSFR3M + 2.112%), 04/20/2031 | | | 1,350,227 | | | | 0.1 | |
| 2,800,000 (1)(2) | | | LCM XXIV Ltd. 24A CR, 7.479%, (TSFR3M + 2.162%), 03/20/2030 | | | 2,788,075 | | | | 0.1 | |
| 760,828 (2) | | | LCSS Financing LLC 2018-A A, 4.700%, 12/15/2062 | | | 647,874 | | | | 0.0 | |
| 1,000,000 (1)(2) | | | Madison Park Funding XIII Ltd. 2014-13A CR2, 7.471%, (TSFR3M + 2.162%), 04/19/2030 | | | 1,001,192 | | | | 0.1 | |
| 1,413,863 (2) | | | Marlette Funding Trust 2023-1A A, 6.070%, 04/15/2033 | | | 1,414,114 | | | | 0.1 | |
| 3,000,000 (1)(2) | | | MF1 LLC 2023-FL12 A, 7.392%, (TSFR1M + 2.066%), 10/19/2038 | | | 3,015,754 | | | | 0.2 | |
| 7,000,000 (1)(2) | | | MF1 Ltd. 2021-FL6 D, 7.991%, (TSFR1M + 2.664%), 07/16/2036 | | | 6,665,570 | | | | 0.4 | |
| 3,000,000 (1)(2) | | | MF1 Ltd. 2021-FL7 AS, 6.891%, (TSFR1M + 1.564%), 10/16/2036 | | | 2,947,897 | | | | 0.2 | |
Principal
Amount† | | | | | Value | | | Percentage
of Net
Assets |
| ASSET-BACKED SECURITIES: (continued) |
| | | | Other Asset-Backed Securities: (continued) | |
| 1,943,613 (1)(2) | | | MF1 Ltd. 2022-FL8 A, 6.676%, (TSFR1M + 1.350%), 02/19/2037 | | $ | 1,932,498 | | | | 0.1 | |
| 1,409,332 (2) | | | Mill City Solar Loan Ltd. 2019-2GS A, 3.690%, 07/20/2043 | | | 1,263,427 | | | | 0.1 | |
| 446,044 (2) | | | Mosaic Solar Loan Trust 2018-1A A, 4.010%, 06/22/2043 | | | 417,948 | | | | 0.0 | |
| 570,083 (2) | | | Mosaic Solar Loan Trust 2018-2GS B, 4.740%, 02/22/2044 | | | 509,715 | | | | 0.0 | |
| 997,067 (2) | | | Mosaic Solar Loan Trust 2019-1A A, 4.370%, 12/21/2043 | | | 937,464 | | | | 0.0 | |
| 451,412 (2) | | | Mosaic Solar Loan Trust 2019-2A A, 2.880%, 09/20/2040 | | | 402,756 | | | | 0.0 | |
| 777,719 (2) | | | Mosaic Solar Loans LLC 2017-2A A, 3.820%, 06/22/2043 | | | 726,649 | | | | 0.0 | |
| 3,500,000 (1)(2) | | | Neuberger Berman Loan Advisers CLO 24 Ltd. 2017-24A CR, 7.521%, (TSFR3M + 2.212%), 04/19/2030 | | | 3,502,807 | | | | 0.2 | |
| 2,300,000 (1)(2) | | | Neuberger Berman Loan Advisers CLO 33 Ltd. 2019-33A CR, 7.476%, (TSFR3M + 2.162%), 10/16/2033 | | | 2,302,840 | | | | 0.1 | |
| 4,750,000 (1)(2) | | | Neuberger Berman Loan Advisers Clo 44 Ltd. 2021-44A C, 7.476%, (TSFR3M + 2.162%), 10/16/2034 | | | 4,753,087 | | | | 0.3 | |
| 6,000,000 (1)(2) | | | Oaktree CLO Ltd. 2021-1A C, 7.526%, (TSFR3M + 2.212%), 07/15/2034 | | | 5,942,148 | | | | 0.3 | |
| 2,150,000 (1)(2) | | | Oaktree CLO Ltd. 2024-25A C, 7.804%, (TSFR3M + 2.500%), 04/20/2037 | | | 2,150,630 | | | | 0.1 | |
| 1,000,000 (1)(2) | | | Octagon Investment Partners 31 Ltd. 2017-1A DRR, 8.869%, (TSFR3M + 3.550%), 07/20/2030 | | | 1,001,976 | | | | 0.1 | |
| 4,500,000 (1)(2) | | | Octagon Investment Partners 32 Ltd. 2017-1A CR, 7.626%, (TSFR3M + 2.312%), 07/15/2029 | | | 4,505,436 | | | | 0.2 | |
| 600,000 (1)(2) | | | Octagon Investment Partners 33 Ltd. 2017-1A B, 7.429%, (TSFR3M + 2.112%), 01/20/2031 | | | 599,394 | | | | 0.0 | |
See Accompanying Notes to Financial Statements
Voya Strategic Income Opportunities Fund | PORTFOLIO OF INVESTMENTS as of March 31, 2024 (continued) |
Principal
Amount† | | | | | Value | | | Percentage
of Net
Assets |
| ASSET-BACKED SECURITIES: (continued) |
| | | | Other Asset-Backed Securities: (continued) | |
| 4,500,000 (1)(2) | | | Octagon Investment Partners XIV Ltd. 2012-1A BRR, 7.676%, (TSFR3M + 2.362%), 07/15/2029 | | $ | 4,506,894 | | | | 0.2 | |
| 1,500,000 (1)(2) | | | OHA Credit Funding 9 Ltd. 2021-9A C, 7.471%, (TSFR3M + 2.162%), 07/19/2035 | | | 1,501,983 | | | | 0.1 | |
| 4,250,000 (1)(2) | | | Palmer Square Loan Funding Ltd. 2021-2A C, 7.981%, (TSFR3M + 2.662%), 05/20/2029 | | | 4,254,603 | | | | 0.2 | |
| 3,000,000 (1)(2) | | | Peebles Park CLO Ltd. 2024-1A C, 7.704%, (TSFR3M + 2.400%), 04/21/2037 | | | 3,002,754 | | | | 0.2 | |
| 70,216 (1) | | | Popular ABS Mortgage Pass-Through Trust 2005-D A5, 3.520%, 01/25/2036 | | | 69,082 | | | | 0.0 | |
| 2,370,375 (2) | | | Primrose Funding LLC 2019-1A A2, 4.475%, 07/30/2049 | | | 2,275,092 | | | | 0.1 | |
| 1,710,000 (1)(2) | | | Rad CLO 1 Ltd. 2018-1A CR, 7.326%, (TSFR3M + 2.012%), 07/15/2031 | | | 1,699,227 | | | | 0.1 | |
| 1,600,000 (1)(2) | | | Rad CLO 10 Ltd. 2021-10A C, 7.327%, (TSFR3M + 2.012%), 04/23/2034 | | | 1,601,938 | | | | 0.1 | |
| 1,100,000 (1)(2) | | | Recette Clo Ltd. 2015-1A CRR, 7.329%, (TSFR3M + 2.012%), 04/20/2034 | | | 1,079,695 | | | | 0.1 | |
| 2,050,000 (1)(2) | | | Rockland Park CLO Ltd. 2021-1A C, 7.479%, (TSFR3M + 2.162%), 04/20/2034 | | | 2,037,813 | | | | 0.1 | |
| 2,250,000 (2) | | | Servpro Master Issuer LLC 2024-1A A2, 6.174%, 01/25/2054 | | | 2,281,485 | | | | 0.1 | |
| 3,270,000 (1)(2) | | | Shackleton CLO Ltd. 2019-15A CR, 7.726%, (TSFR3M + 2.412%), 01/15/2032 | | | 3,272,593 | | | | 0.2 | |
| 415,252 (2) | | | SoFi Consumer Loan Program Trust 2023-1S A, 5.810%, 05/15/2031 | | | 415,069 | | | | 0.0 | |
| 1,880,125 (2) | | | Sonic Capital LLC 2020-1A A2I, 3.845%, 01/20/2050 | | | 1,782,570 | | | | 0.1 | |
| 1,000,000 (1)(2) | | | Sound Point CLO VII-R Ltd. 2014-3RA C, 7.827%, (TSFR3M + 2.512%), 10/23/2031 | | | 991,654 | | | | 0.1 | |
Principal
Amount† | | | | | Value | | | Percentage
of Net
Assets |
| ASSET-BACKED SECURITIES: (continued) |
| | | | Other Asset-Backed Securities: (continued) | |
| 750,000 (1)(2) | | | Stewart Park CLO Ltd. 2015-1A DR, 8.176%, (TSFR3M + 2.862%), 01/15/2030 | | $ | 746,238 | | | | 0.0 | |
| 808,037 (2) | | | Sunnova Helios II Issuer LLC 2018-1A A, 4.870%, 07/20/2048 | | | 765,681 | | | | 0.0 | |
| 2,997,956 (2) | | | Sunnova Helios II Issuer LLC 2018-1A B, 7.710%, 07/20/2048 | | | 2,637,145 | | | | 0.1 | |
| 1,342,663 (2) | | | Sunnova Helios XI Issuer LLC 2023-A B, 5.600%, 05/20/2050 | | | 1,307,073 | | | | 0.1 | |
| 4,507,895 (2) | | | Sunnova Sol Issuer LLC 2020-1A A, 3.350%, 02/01/2055 | | | 3,919,749 | | | | 0.2 | |
| 1,753,722 (2) | | | Sunrun Athena Issuer LLC 2018-1 A, 5.310%, 04/30/2049 | | | 1,682,140 | | | | 0.1 | |
| 3,370,394 (2) | | | Sunrun Atlas Issuer LLC 2019-2 A, 3.610%, 02/01/2055 | | | 3,086,083 | | | | 0.2 | |
| 5,455,377 (2) | | | Sunrun Jupiter Issuer LLC 2022-1A A, 4.750%, 07/30/2057 | | | 5,101,487 | | | | 0.3 | |
| 1,375,500 (2) | | | Taco Bell Funding LLC 2021-1A A23, 2.542%, 08/25/2051 | | | 1,138,930 | | | | 0.1 | |
| 1,000,000 (1)(2) | | | TCI-Flatiron Clo Ltd. 2017-1A C, 7.431%, (TSFR3M + 2.112%), 11/18/2030 | | | 999,938 | | | | 0.1 | |
| 2,250,000 (1)(2) | | | TCI-Flatiron Clo Ltd. 2018-1A CR, 7.331%, (TSFR3M + 2.012%), 01/29/2032 | | | 2,246,227 | | | | 0.1 | |
| 3,100,000 (1)(2) | | | TCW CLO Ltd. 2021-1A C, 7.479%, (TSFR3M + 2.162%), 03/18/2034 | | | 3,068,427 | | | | 0.2 | |
| 1,500,000 (1)(2) | | | Upland CLO Ltd. 2016-1A BR, 7.429%, (TSFR3M + 2.112%), 04/20/2031 | | | 1,501,357 | | | | 0.1 | |
| 707,296 (2) | | | Upstart Securitization Trust 2023-1 A, 6.590%, 02/20/2033 | | | 707,070 | | | | 0.0 | |
| 1,213,983 (2) | | | Wendy’s Funding LLC 2018-1A A2II, 3.884%, 03/15/2048 | | | 1,147,859 | | | | 0.1 | |
| 3,051,390 (2) | | | Wendy’s Funding LLC 2019-1A A2I, 3.783%, 06/15/2049 | | | 2,930,710 | | | | 0.2 | |
| 2,000,000 (1)(2) | | | Wind River CLO Ltd. 2014-1A CRR, 7.510%, (TSFR3M + 2.212%), 07/18/2031 | | | 1,985,246 | | | | 0.1 | |
| | | | | | | 217,285,147 | | | | 11.8 | |
See Accompanying Notes to Financial Statements
Voya Strategic Income Opportunities Fund | PORTFOLIO OF INVESTMENTS as of March 31, 2024 (continued) |
Principal
Amount† | | | | | Value | | | Percentage
of Net
Assets |
| ASSET-BACKED SECURITIES: (continued) |
| | | | Student Loan Asset-Backed Securities: 1.0% | |
| 63,570 (2) | | | Commonbond Student Loan Trust-GS 2018-CGS C, 4.350%, 02/25/2046 | | $ | 55,033 | | | | 0.0 | |
| 213,861 (2) | | | ELFI Graduate Loan Program LLC 2018-A B, 4.000%, 08/25/2042 | | | 194,360 | | | | 0.0 | |
| 479,703 (1)(2) | | | ELFI Graduate Loan Program LLC 2019-A B, 2.940%, 03/25/2044 | | | 382,564 | | | | 0.0 | |
| 1,092,294 (2) | | | Laurel Road Prime Student Loan Trust 2018-B BFX, 3.720%, 05/26/2043 | | | 1,045,210 | | | | 0.1 | |
| 3,002,285 (2) | | | Navient Private Education Refi Loan Trust 2019-FA A2, 2.600%, 08/15/2068 | | | 2,811,635 | | | | 0.2 | |
| 4,000,000 (2) | | | SMB Private Education Loan Trust 2014-A C, 4.500%, 09/15/2045 | | | 3,488,667 | | | | 0.2 | |
| 1,000,000 (2) | | | SMB Private Education Loan Trust 2017-A B, 3.500%, 06/17/2041 | | | 940,479 | | | | 0.1 | |
| 2,000,000 (2) | | | Sofi Professional Loan Program LLC 2019-B BFX, 3.730%, 08/17/2048 | | | 1,759,762 | | | | 0.1 | |
| 3,000,000 (2) | | | Sofi Professional Loan Program LLC 2019-C BFX, 3.050%, 11/16/2048 | | | 2,537,153 | | | | 0.1 | |
| 1,000,000 (1)(2) | | | SoFi Professional Loan Program LLC 2017-C C, 4.210%, 07/25/2040 | | | 924,910 | | | | 0.0 | |
| 1,000,000 (2) | | | SoFi Professional Loan Program LLC 2017-E C, 4.160%, 11/26/2040 | | | 920,172 | | | | 0.0 | |
| 1,000,000 (2) | | | SoFi Professional Loan Program Trust 2018-D BFX, 4.140%, 02/25/2048 | | | 907,680 | | | | 0.0 | |
| 4,400,000 (2) | | | SoFi Professional Loan Program Trust 2020-B BFX, 2.730%, 05/15/2046 | | | 3,437,508 | | | | 0.2 | |
| | | | | | | 19,405,133 | | | | 1.0 | |
| | | | | | | | | | | | |
| | | | Total Asset-Backed Securities (Cost $260,451,455) | | | 251,781,480 | | | | 13.6 | |
| | | | | | | | | | | | |
| BANK LOANS: 7.6% |
| | | | Aerospace & Defense: 0.1% | | | | | | | | |
| 149,250 | | | Barnes Group Inc, 2024 Term Loan, 7.940%, (TSFR3M+2.500%), 09/03/2030 | | | 149,530 | | | | 0.0 | |
Principal
Amount† | | | | | Value | | | Percentage
of Net
Assets |
| BANK LOANS: (continued) |
| | | | Aerospace & Defense: (continued) | |
| 139,300 | | | Dynasty Acquisition Co., Inc., 2023 Term Loan B1, 9.882%, (TSFR1M+4.000%), 08/24/2028 | | $ | 139,692 | | | | 0.0 | |
| 59,700 | | | Dynasty Acquisition Co., Inc., 2023 Term Loan B2, 9.882%, (TSFR1M+4.000%), 08/24/2028 | | | 59,868 | | | | 0.0 | |
| 64,955 | | | Dynasty Acquisition Co., Inc., 2024 Term Loan B1, 8.840%, (TSFR1M+3.500%), 08/24/2028 | | | 65,056 | | | | 0.0 | |
| 25,045 | | | Dynasty Acquisition Co., Inc., 2024 Term Loan B2, 8.840%, (TSFR1M+3.500%), 08/24/2028 | | | 25,076 | | | | 0.0 | |
| 1,502,668 | | | Peraton Corp., Term Loan B, 8.953%, (TSFR1M+3.750%), 02/01/2028 | | | 1,503,741 | | | | 0.1 | |
| 150,000 | | | Swissport, Term Loan, 8.840%, (TSFR1M+3.500%), 03/26/2031 | | | 149,250 | | | | 0.0 | |
| | | | | | | 2,092,213 | | | | 0.1 | |
| | | | | | | | | | | | |
| | | | Air Transport: 0.1% | | | | | | | | |
| 185,426 | | | LaserShip, Inc., 2021 Term Loan, 9.693%, (TSFR3M+4.500%), 05/07/2028 | | | 173,373 | | | | 0.0 | |
| 350,000 | | | Savage Enterprises LLC, 2021 Term Loan B, 8.606%, (TSFR1M+3.250%), 09/15/2028 | | | 350,750 | | | | 0.0 | |
| 460,296 | | | Worldwide Express Operations, LLC, 2021 1st Lien Term Loan, 9.504%, (TSFR3M+4.000%), 07/26/2028 | | | 458,713 | | | | 0.1 | |
| 170,000 | | | Worldwide Express Operations, LLC, 2021 2nd Lien Term Loan, 12.504%, (TSFR3M+7.000%), 07/26/2029 | | | 152,965 | | | | 0.0 | |
| | | | | | | 1,135,801 | | | | 0.1 | |
See Accompanying Notes to Financial Statements
Voya Strategic Income Opportunities Fund | PORTFOLIO OF INVESTMENTS as of March 31, 2024 (continued) |
Principal
Amount† | | | | | Value | | | Percentage
of Net
Assets |
| BANK LOANS: (continued) |
| | | | Auto Components: 0.1% | | | | | | | | |
| 633,503 | | | American Axle and Manufacturing, Inc., 2022 Term Loan B, 9.382%, (TSFR1M+3.500%), 12/13/2029 | | $ | 635,878 | | | | 0.1 | |
| 521,441 | | | Holley Purchaser, Inc., 2021 Term Loan, 9.184%, (TSFR1M+3.750%), 11/17/2028 | | | 516,506 | | | | 0.0 | |
| 320,187 | | | RC Buyer, Inc., 2021 Term Loan, 9.004%, (TSFR1M+3.500%), 07/28/2028 | | | 319,187 | | | | 0.0 | |
| 296,780 | | | RealTruck Group, Inc., 2021 Term Loan B, 8.967%, (TSFR1M+3.500%), 01/31/2028 | | | 294,462 | | | | 0.0 | |
| | | | | | | 1,766,033 | | | | 0.1 | |
| | | | | | | | | | | | |
| | | | Automotive: 0.1% | | | | | | | | |
| 369,005 | | | Dealer Tire Financial, LLC, 2024 Term Loan B3, 9.090%, (TSFR1M+3.750%), 12/14/2027 | | | 372,234 | | | | 0.0 | |
| 283,833 | | | IXS Holdings, Inc., 2020 Term Loan B, 9.479%, (TSFR6M+4.250%), 03/05/2027 | | | 270,959 | | | | 0.0 | |
| 399,555 | | | MajorDrive Holdings IV LLC, Term Loan B, 9.500%, (TSFR3M+4.000%), 06/01/2028 | | | 400,637 | | | | 0.1 | |
| | | | | | | 1,043,830 | | | | 0.1 | |
| | | | | | | | | | | | |
| | | | Basic Materials: 0.2% | | | | | | | | |
| 199,001 | | | Arsenal AIC Parent LLC, 2024 Term Loan B, 9.090%, (TSFR1M+3.750%), 08/19/2030 | | | 200,037 | | | | 0.0 | |
| 149,625 | | | Element Solutions Inc., 2023 Term Loan B, 8.800%, (TSFR1M+2.000%), 12/15/2030 | | | 149,879 | | | | 0.0 | |
| 496,250 | | | INEOS Quattro Holdings UK Ltd, 2023 USD Term Loan, 9.632%, (US0006M+3.750%), 03/14/2030 | | | 495,630 | | | | 0.0 | |
Principal
Amount† | | | | | Value | | | Percentage
of Net
Assets |
| BANK LOANS: (continued) |
| | | | Basic Materials: (continued) | |
| 704,675 | | | Ineos US Finance LLC, 2023 USD Term Loan B, 8.753%, (US0006M+3.500%), 02/09/2030 | | $ | 705,556 | | | | 0.1 | |
| 600,463 | | | Starfruit Finco B.V, 2023 Term Loan B, 8.990%, (US0006M+4.000%), 04/03/2028 | | | 602,620 | | | | 0.1 | |
| 363,673 | | | U.S. Silica Company, 2023 Term Loan B, 9.953%, (US0006M+4.750%), 03/25/2030 | | | 364,582 | | | | 0.0 | |
| 568,546 | | | W.R. Grace & Co.-Conn., 2021 Term Loan B, 9.190%, (TSFR3M+3.750%), 09/22/2028 | | | 570,619 | | | | 0.0 | |
| | | | | | | 3,088,923 | | | | 0.2 | |
| | | | | | | | | | | | |
| | | | Building & Development: 0.1% |
| 496,164 | | | Cornerstone Building Brands, Inc., 2021 Term Loan B, 9.132%, (TSFR1M+3.250%), 04/12/2028 | | | 494,419 | | | | 0.1 | |
| 278,008 | | | LBM Acquisition LLC, Term Loan B, 9.632%, (TSFR1M+3.750%), 12/17/2027 | | | 277,603 | | | | 0.0 | |
| 288,426 | | | LHS Borrower, LLC, 2022 Term Loan B, 9.953%, (US0006M+4.750%), 02/16/2029 | | | 274,485 | | | | 0.0 | |
| 85,000 | | | Quikrete Holdings, Inc., 2024 Term Loan B, 8.840%, (TSFR1M+3.500%), 04/12/2031 | | | 85,106 | | | | 0.0 | |
| 440,651 | | | Standard Industries Inc., 2021 Term Loan B, 7.692%, (TSFR1M+2.250%), 09/22/2028 | | | 441,370 | | | | 0.0 | |
| 248,082 | | | Wilsonart LLC, 2021 Term Loan E, 9.132%, (TSFR3M+3.250%), 12/31/2026 | | | 248,616 | | | | 0.0 | |
| | | | | | | 1,821,599 | | | | 0.1 | |
| | | | | | | | | | | | |
| | | | Business Equipment & Services: 0.1% |
| 170,712 | | | Ensono, LP, 2021 Term Loan, 9.288%, (TSFR3M+4.000%), 05/26/2028 | | | 166,018 | | | | 0.0 | |
See Accompanying Notes to Financial Statements
Voya Strategic Income Opportunities Fund | PORTFOLIO OF INVESTMENTS as of March 31, 2024 (continued) |
Principal
Amount† | | | | | Value | | | Percentage
of Net
Assets |
| BANK LOANS: (continued) |
| | | | Business Equipment & Services: (continued) | |
| 752,567 | | | Open Text Corporation, 2023 Term Loan B, 8.632%, (TSFR1M+2.750%), 01/31/2030 | | $ | 754,174 | | | | 0.1 | |
| 418,656 | | | VM Consolidated, Inc., 2024 Term Loan B, 8.090%, (TSFR1M+2.750%), 03/26/2028 | | | 420,880 | | | | 0.0 | |
| 1,042 | | | West Corporation, 2023 Term Loan B3, 9.882%, (TSFR3M+4.000%), 10/10/2024 | | | 1,023 | | | | 0.0 | |
| | | | | | | 1,342,095 | | | | 0.1 | |
| | | | | | | | | | | | |
| | | | Chemicals & Plastics: 0.2% | | | | | | | | |
| 720,353 | | | Charter NEX US, Inc., 2024 Term Loan B, 8.840%, (TSFR1M+3.500%), 12/01/2027 | | | 722,399 | | | | 0.1 | |
| 456,421 | | | ECO Services Operations Corp, 2021 Term Loan B, 7.645%, (TSFR3M+2.500%), 06/09/2028 | | | 456,742 | | | | 0.0 | |
| 99,237 | | | GEON Performance Solutions, LLC, 2021 Term Loan, 10.382%, (TSFR3M+4.750%), 08/18/2028 | | | 99,485 | | | | 0.0 | |
| 415,884 | | | Ineos US Finance LLC, 2021 USD Term Loan B, 7.584%, (TSFR1M+2.500%), 11/08/2028 | | | 413,181 | | | | 0.0 | |
| 475,399 | | | Lonza Group AG, USD Term Loan B, 9.267%, (TSFR3M+3.925%), 07/03/2028 | | | 448,212 | | | | 0.0 | |
| 690,284 | | | LSF11 A5 Holdco LLC, Term Loan, 8.717%, (US0006M+3.500%), 10/15/2028 | | | 691,147 | | | | 0.1 | |
| 148,858 | | | Olympus Water US Holding Corporation, 2021 USD Term Loan B, 9.632%, (US0006M+3.750%), 11/09/2028 | | | 149,090 | | | | 0.0 | |
| 39,898 | | | Sparta U.S. HoldCo LLC, 2021 Term Loan, 9.132%, (US0006M+3.250%), 08/02/2028 | | | 39,998 | | | | 0.0 | |
| | | | | | | 3,020,254 | | | | 0.2 | |
Principal
Amount† | | | | | Value | | | Percentage
of Net
Assets |
| BANK LOANS: (continued) |
| | | | Clothing/Textiles: 0.0% | | | | | | | | |
| 263,013 | | | Samsonite International S.A., 2023 Term Loan, 7.826%, (TSFR1M+2.750%), 06/10/2030 | | $ | 263,793 | | | | 0.0 | |
| | | | | | | | | | | | |
| | | | Commodities: 0.2% | | | | | | | | |
| 801,171 | | | Core & Main LP, 2021 Term Loan B, 7.686%, (TSFR6M+2.500%), 08/01/2024 | | | 802,006 | | | | 0.1 | |
| 425,735 | | | Foundation Building Materials Holding Company LLC, 2021 Term Loan, 8.523%, (TSFR3M+3.250%), 01/31/2028 | | | 426,678 | | | | 0.0 | |
| 145,000 | | | Foundation Building Materials Holding Company LLC, 2024 Term Loan B2, 9.340%, (TSFR1M+4.000%), 01/26/2031 | | | 145,770 | | | | 0.0 | |
| 695,000 | | | Setanta Aircraft Leasing Designated Activity Company, Term Loan B, 7.538%, (TSFR3M+2.000%), 11/05/2028 | | | 697,358 | | | | 0.0 | |
| 430,584 | | | Specialty Building Products Holdings, LLC, 2021 Term Loan B, 8.443%, (US0006M+3.750%), 10/15/2028 | | | 429,844 | | | | 0.0 | |
| 248,724 | | | SRS Distribution Inc., 2021 Term Loan B, 9.382%, (US0006M+3.500%), 06/05/2028 | | | 250,486 | | | | 0.0 | |
| 908,520 | | | White Cap Buyer LLC, Term Loan B, 8.853%, (TSFR1M+3.750%), 10/19/2027 | | | 912,259 | | | | 0.1 | |
| 249,560 | | | Windsor Holdings III, LLC, USD Term Loan B, 9.580%, (TSFR1M+4.500%), 08/01/2030 | | | 250,680 | | | | 0.0 | |
| | | | | | | 3,915,081 | | | | 0.2 | |
| | | | | | | | | | | | |
| | | | Communications: 0.4% | |
| 363,568 | | | AP Core Holdings II, LLC, Amortization Term Loan B1, 10.693%, (US0006M+5.500%), 09/01/2027 | | | 357,115 | | | | 0.0 | |
See Accompanying Notes to Financial Statements
Voya Strategic Income Opportunities Fund | PORTFOLIO OF INVESTMENTS as of March 31, 2024 (continued) |
Principal
Amount† | | | | | Value | | | Percentage
of Net
Assets |
| BANK LOANS: (continued) |
| | | | Communications: (continued) | |
| 58,605 | | | Arches Buyer Inc., 2021 Term Loan B, 8.590%, (TSFR1M+3.250%), 12/06/2027 | | $ | 56,890 | | | | 0.0 | |
| 190,000 | | | Cengage Learning, Inc., 2024 Term Loan B, 9.690%, (TSFR3M+4.250%), 03/24/2031 | | | 190,007 | | | | 0.0 | |
| 839,018 | | | Charter Communications Operating, LLC, 2019 Term Loan B2, 6.795%, (TSFR1M+1.750%), 02/01/2027 | | | 839,562 | | | | 0.1 | |
| 498,750 | | | CNT Holdings I Corp, 2020 Term Loan, 8.840%, (TSFR1M+3.500%), 11/08/2027 | | | 500,246 | | | | 0.1 | |
| 398,977 | | | Dotdash Meredith Inc, Term Loan B, 8.840%, (TSFR1M+3.500%), 12/01/2028 | | | 396,151 | | | | 0.0 | |
| 150,000 | | | Fleet Midco I Limited, 2024 Term Loan B, 8.690%, (TSFR3M+3.250%), 01/31/2031 | | | 150,375 | | | | 0.0 | |
| 826,768 | | | Go Daddy Operating Company, LLC, 2024 Term Loan B6, 7.340%, (TSFR1M+2.000%), 11/12/2029 | | | 827,113 | | | | 0.1 | |
| 299,104 | | | GOGO Intermediate Holdings LLC, Term Loan B, 8.840%, (TSFR1M+3.500%), 04/30/2028 | | | 298,987 | | | | 0.0 | |
| 349,068 | | | GoodRx, Inc., 1st Lien Term Loan, 8.840%, (TSFR1M+3.500%), 10/10/2025 | | | 349,177 | | | | 0.0 | |
| 91,976 | | | GoTo Group, Inc., 2024 First Out Term Loan, 10.190%, (TSFR3M+4.750%), 08/31/2027 | | | 87,895 | | | | 0.0 | |
| 91,976 | | | GoTo Group, Inc., 2024 Second Out Term Loan, 10.190%, (TSFR3M+4.750%), 08/31/2027 | | | 70,821 | | | | 0.0 | |
| 250,000 | | | I-Logic Technologies Bidco Limited, 2021 USD Term Loan B, 9.882%, (TSFR3M+4.000%), 02/16/2028 | | | 250,000 | | | | 0.0 | |
Principal
Amount† | | | | | Value | | | Percentage
of Net
Assets |
| BANK LOANS: (continued) |
| | | | Communications: (continued) | |
| 265,000 | | | Magnite Inc, 2024 Term Loan B, 9.940%, (TSFR3M+4.500%), 01/30/2031 | | $ | 265,662 | | | | 0.0 | |
| 334,158 | | | MH Sub I, LLC, 2023 Term Loan, 9.590%, (TSFR1M+4.250%), 05/03/2028 | | | 332,696 | | | | 0.0 | |
| 638,367 | | | Proofpoint, Inc., 1st Lien Term Loan, 8.840%, (TSFR1M+3.500%), 08/31/2028 | | | 639,165 | | | | 0.1 | |
| 200,000 | | | Tiger Acquisition, LLC, 2021 Term Loan, 8.840%, (TSFR1M+3.500%), 06/01/2028 | | | 198,625 | | | | 0.0 | |
| 390,246 | | | Uber Technologies, Inc., 2023 Term Loan B, 8.014%, (TSFR3M+2.750%), 03/03/2030 | | | 392,414 | | | | 0.0 | |
| 260,000 | | | WeddingWire, Inc., 2023 Term Loan, 9.922%, (TSFR1M+4.500%), 01/29/2028 | | | 260,000 | | | | 0.0 | |
| | | | | | | 6,462,901 | | | | 0.4 | |
| | | | | | | | | | | | |
| | | | Consumer, Cyclical: 0.6% | |
| 498,750 | | | 84 Lumber Company, 2023 Term Loan B, 8.206%, (TSFR1M+2.750%), 12/02/2030 | | | 501,140 | | | | 0.0 | |
| 150,000 | | | Amer Sports Company, USD Term Loan, 8.690%, (TSFR3M+3.250%), 02/18/2031 | | | 150,375 | | | | 0.0 | |
| 123,417 | | | American Airlines, Inc., 2017 1st Lien Term Loan, 7.090%, (TSFR1M+1.750%), 02/15/2031 | | | 123,348 | | | | 0.0 | |
| 87,500 | | | American Airlines, Inc., 2021 Term Loan, 10.190%, (TSFR3M+4.750%), 04/20/2028 | | | 91,021 | | | | 0.0 | |
| 481,932 | | | Ascend Learning, LLC, 2021 Term Loan, 8.584%, (US0006M+3.500%), 12/10/2028 | | | 479,996 | | | | 0.0 | |
| 604,774 | | | Autokiniton US Holdings, Inc., 2024 Term Loan B, 9.440%, (TSFR3M+4.000%), 04/06/2028 | | | 607,528 | | | | 0.1 | |
See Accompanying Notes to Financial Statements
Voya Strategic Income Opportunities Fund | PORTFOLIO OF INVESTMENTS as of March 31, 2024 (continued) |
Principal
Amount† | | | | | Value | | | Percentage
of Net
Assets |
| BANK LOANS: (continued) |
| | | | Consumer, Cyclical: (continued) | |
| 495,000 | | | Caesars Entertainment Inc., 2024 Term Loan B1, 8.190%, (TSFR3M+2.750%), 02/06/2031 | | $ | 496,052 | | | | 0.0 | |
| 826,928 | | | Clarios Global LP, 2024 Term Loan B, 8.340%, (TSFR1M+3.000%), 05/06/2030 | | | 829,512 | | | | 0.1 | |
| 86,380 | | | Crocs, Inc., 2024 Term Loan, 7.590%, (TSFR1M+2.250%), 02/19/2029 | | | 86,672 | | | | 0.0 | |
| 750,000 | | | Delta 2 (LUX) S.a.r.l., 2022 Term Loan B, 7.598%, (TSFR3M+2.250%), 01/15/2030 | | | 751,688 | | | | 0.1 | |
| 234,450 | | | First Brands Group, LLC, 2022 Incremental Term Loan, 10.440%, (TSFR3M+5.000%), 03/30/2027 | | | 235,095 | | | | 0.0 | |
| 852,863 | | | Flutter Financing B.V., Term Loan B, 7.698%, (TSFR3M+2.250%), 11/16/2030 | | | 854,004 | | | | 0.1 | |
| 419,691 | | | GVC Holdings (Gibraltar) Limited, 2022 USD Term Loan B2, 8.437%, (US0006M+3.500%), 10/31/2029 | | | 421,746 | | | | 0.0 | |
| 290,000 | | | Hilton Domestic Operating Company, Inc., 2023 Term Loan B4, 7.457%, (TSFR1M+2.000%), 11/08/2030 | | | 290,799 | | | | 0.0 | |
| 300,000 | | | Homeserve USA Holding Corp, Term Loan, 8.358%, (TSFR1M+3.000%), 10/21/2030 | | | 301,078 | | | | 0.0 | |
| 498,731 | | | Hunter Douglas, USD Term Loan B1, 8.840%, (TSFR1M+3.500%), 02/26/2029 | | | 493,860 | | | | 0.0 | |
| 400,833 | | | IRB Holding Corp, 2024 Term Loan B, 8.090%, (TSFR1M+2.750%), 12/15/2027 | | | 401,402 | | | | 0.0 | |
| 295,000 | | | Kodiak Building Partners Inc., 2024 Term Loan B2, 8.840%, (TSFR1M+3.500%), 03/12/2028 | | | 295,645 | | | | 0.0 | |
Principal
Amount† | | | | | Value | | | Percentage
of Net
Assets |
| BANK LOANS: (continued) |
| | | | Consumer, Cyclical: (continued) | |
| 689,500 | | | Light and Wonder International, Inc., 2024 Term Loan, 8.090%, (TSFR1M+2.750%), 04/16/2029 | | $ | 691,762 | | | | 0.1 | |
| 349,112 | | | PENN Entertainment, Inc., 2022 Term Loan B, 8.840%, (TSFR1M+3.500%), 05/03/2029 | | | 349,810 | | | | 0.0 | |
| 80,000 | | | RealTruck Group, Inc., 2023 Incremental Term Loan, 10.882%, (TSFR1M+5.000%), 01/31/2028 | | | 79,450 | | | | 0.0 | |
| 95,000 | | | SRS Distribution Inc., 2022 Incremental Term Loan, 8.590%, (TSFR1M+3.250%), 06/05/2028 | | | 95,475 | | | | 0.0 | |
| 150,000 | | | Staples, Inc., Term Loan B2, 9.840%, (US0001M+4.500%), 09/12/2024 | | | 150,375 | | | | 0.0 | |
| 670,000 | | | Station Casinos LLC, 2024 Term Loan B, 7.690%, (TSFR3M+2.250%), 03/07/2031 | | | 669,940 | | | | 0.1 | |
| 150,000 | | | Thor Industries, Inc., 2023 USD Term Loan B2, 8.112%, (TSFR1M+2.750%), 11/15/2030 | | | 150,656 | | | | 0.0 | |
| 249,359 | | | Tory Burch LLC, Term Loan B, 8.840%, (TSFR1M+3.500%), 04/16/2028 | | | 249,292 | | | | 0.0 | |
| 495,000 | | | United Airlines, Inc., 2024 Term Loan B, 8.190%, (TSFR3M+2.750%), 02/14/2031 | | | 496,276 | | | | 0.0 | |
| | | | | | | 10,343,997 | | | | 0.6 | |
| | | | | | | | | | | | |
| | | | Consumer, Non-cyclical: 0.7% | |
| 200,000 | | | American Airlines, Inc., 2023 1st Lien Term Loan, 8.869%, (TSFR6M+3.500%), 06/01/2029 | | | 200,819 | | | | 0.0 | |
| 390,000 | | | Auris Luxembourg III S.a.r.l., 2024 USD Term Loan B2, 8.840%, (TSFR1M+3.500%), 02/14/2029 | | | 391,706 | | | | 0.0 | |
See Accompanying Notes to Financial Statements
Voya Strategic Income Opportunities Fund | PORTFOLIO OF INVESTMENTS as of March 31, 2024 (continued) |
Principal
Amount† | | | | | Value | | | Percentage
of Net
Assets |
| BANK LOANS: (continued) |
| | | | Consumer, Non-cyclical: (continued) | |
| 468,825 | | | Avis Budget Car Rental, LLC, 2023 Term Loan C, 8.456%, (TSFR1M+3.000%), 03/16/2029 | | $ | 470,231 | | | | 0.0 | |
| 556,997 | | | Bausch & Lomb Corporation, Term Loan, 8.592%, (TSFR1M+3.250%), 05/10/2027 | | | 552,223 | | | | 0.1 | |
| 894,647 | | | Belron Finance US LLC, 2023 USD Term Loan, 7.340%, (TSFR1M+2.000%), 04/21/2028 | | | 896,510 | | | | 0.1 | |
| 500,000 | | | Camelot U.S. Acquisition LLC, 2024 Term Loan B, 8.840%, (TSFR1M+3.500%), 01/31/2031 | | | 500,365 | | | | 0.0 | |
| 150,000 | | | Ceva Sante Animale, 2023 USD Term Loan B, 9.616%, (TSFR3M+4.250%), 11/11/2030 | | | 150,703 | | | | 0.0 | |
| 805,000 | | | Cotiviti Corporation, 2024 Term Loan, 8.840%, (TSFR1M+3.500%), 08/27/2025 | | | 806,342 | | | | 0.1 | |
| 460,350 | | | Covetrus, Inc., Term Loan, 10.242%, (TSFR3M+5.000%), 10/13/2029 | | | 461,309 | | | | 0.0 | |
| 275,000 | | | Fiesta Purchaser, Inc., 2024 Term Loan B, 9.440%, (TSFR3M+4.000%), 01/31/2031 | | | 275,709 | | | | 0.0 | |
| 64,511 | | | Fugue Finance B.V., 2023 USD Term Loan B, 9.388%, (TSFR3M+4.000%), 01/31/2028 | | | 64,713 | | | | 0.0 | |
| 208,519 | | | Hertz Corporation, (The), 2021 Term Loan B, 8.720%, (TSFR1M+3.250%), 06/30/2028 | | | 202,242 | | | | 0.0 | |
| 40,409 | | | Hertz Corporation, (The), 2021 Term Loan C, 8.720%, (TSFR1M+3.250%), 06/30/2028 | | | 39,197 | | | | 0.0 | |
| 174,563 | | | Hertz Corporation, (The), 2023 Incremental Term Loan B, 9.108%, (TSFR1M+3.750%), 06/30/2028 | | | 169,726 | | | | 0.0 | |
Principal
Amount† | | | | | Value | | | Percentage
of Net
Assets |
| BANK LOANS: (continued) |
| | | | Consumer, Non-cyclical: (continued) | |
| 324,188 | | | IQVIA Inc., 2023 USD Term Loan B4, 7.348%, (TSFR3M+2.000%), 01/02/2031 | | $ | 325,748 | | | | 0.0 | |
| 982,761 | | | Jazz Financing Lux S.a.r.l., 2024 Term Loan B, 8.340%, (TSFR1M+3.000%), 05/05/2028 | | | 988,630 | | | | 0.1 | |
| 272,938 | | | Kingpin Intermediate Holdings LLC, 2023 Term Loan B, 8.584%, (TSFR1M+3.500%), 02/08/2028 | | | 273,279 | | | | 0.0 | |
| 502,774 | | | KUEHG Corp., 2023 Term Loan, 10.239%, (TSFR3M+5.000%), 06/12/2030 | | | 504,929 | | | | 0.0 | |
| 150,000 | | | Mister Car Wash Holdings, Inc., 2024 Term Loan B, 8.840%, (TSFR1M+3.500%), 05/14/2026 | | | 150,469 | | | | 0.0 | |
| 421,147 | | | Nielsen Consumer Inc., 2023 USD Fifth Amendment Incremental Term Loan, 12.132%, (TSFR1M+6.250%), 03/06/2028 | | | 419,042 | | | | 0.0 | |
| 250,000 | | | Organon & Co, USD Term Loan, 8.472%, (TSFR1M+3.000%), 06/02/2028 | | | 250,898 | | | | 0.0 | |
| 179,537 | | | Packaging Coordinators Midco, Inc., 2020 1st Lien Term Loan, 8.940%, (TSFR3M+3.500%), 11/30/2027 | | | 180,123 | | | | 0.0 | |
| 666,579 | | | Pegasus BidCo BV, 2024 USD Term Loan, 9.190%, (TSFR3M+3.750%), 07/12/2029 | | | 667,691 | | | | 0.1 | |
| 498,734 | | | Perrigo Investments, LLC, Term Loan B, 7.690%, (TSFR3M+2.250%), 04/20/2029 | | | 498,111 | | | | 0.0 | |
| 314,213 | | | Prime Security Services Borrower, LLC, 2023 Term Loan B, 7.841%, (TSFR3M+2.500%), 10/13/2030 | | | 314,780 | | | | 0.0 | |
| 149,620 | | | R1 RCM, Inc., 2022 Term Loan B, 8.440%, (TSFR3M+3.000%), 06/21/2029 | | | 150,200 | | | | 0.0 | |
See Accompanying Notes to Financial Statements
Voya Strategic Income Opportunities Fund | PORTFOLIO OF INVESTMENTS as of March 31, 2024 (continued) |
Principal
Amount† | | | | | Value | | | Percentage
of Net
Assets |
| BANK LOANS: (continued) |
| | | | Consumer, Non-cyclical: (continued) | |
| 25,238 (7) | | | Ryan, LLC, Delayed Draw Term Loan, 8.800%, (TSFR3M+4.500%), 11/08/2030 | | $ | 25,396 | | | | 0.0 | |
| 239,762 | | | Ryan, LLC, Term Loan, 9.856%, (TSFR1M+4.500%), 11/08/2030 | | | 241,260 | | | | 0.0 | |
| 266,858 | | | Sabre GLBL Inc., 2022 1st Lien Term Loan B, 10.203%, (US0006M+5.000%), 06/30/2028 | | | 232,611 | | | | 0.0 | |
| 264,338 | | | Spring Education Group, Inc, Term Loan, 9.799%, (TSFR3M+4.500%), 10/04/2030 | | | 265,924 | | | | 0.0 | |
| 732,544 | | | Surgery Center Holdings, Inc., 2023 Term Loan, 8.856%, (TSFR1M+3.500%), 12/04/2030 | | | 736,710 | | | | 0.1 | |
| 179,550 | | | Triton Water Holdings, Inc, 2024 Incremental Term Loan B, 9.440%, (TSFR3M+4.000%), 03/31/2028 | | | 178,353 | | | | 0.0 | |
| 448,040 | | | TruGreen Limited Partnership, 2020 Term Loan, 8.800%, (TSFR1M+4.000%), 11/02/2027 | | | 436,979 | | | | 0.0 | |
| 189,338 | | | Upfield B.V., 2023 USD Term Loan B7, 8.840%, (TSFR1M+3.500%), 01/03/2028 | | | 188,786 | | | | 0.0 | |
| 655,000 | | | Wand NewCo 3, Inc., 2024 Term Loan B, 9.090%, (TSFR1M+3.750%), 01/30/2031 | | | 657,501 | | | | 0.1 | |
| | | | | | | 12,869,215 | | | | 0.7 | |
| | | | | | | | | | | | |
| | | | Containers & Glass Products: 0.2% | |
| 329,907 | | | Altium Packaging LLC, 2021 Term Loan B, 7.943%, (US0006M+2.750%), 02/03/2028 | | | 329,624 | | | | 0.0 | |
| 618,975 | | | Clydesdale Acquisition Holdings Inc, Term Loan B, 9.378%, (TSFR1M+3.675%), 04/13/2029 | | | 620,440 | | | | 0.1 | |
Principal
Amount† | | | | | Value | | | Percentage
of Net
Assets |
| BANK LOANS: (continued) |
| | | | Containers & Glass Products: (continued) | |
| 82,780 | | | Plastipak Packaging, Inc., 2021 Term Loan B, 7.750%, (TSFR1M+2.500%), 12/01/2028 | | $ | 82,763 | | | | 0.0 | |
| 248,077 | | | Plaze, Inc., 2020 Incremental Term Loan, 9.632%, (TSFR1M+3.750%), 08/03/2026 | | | 244,976 | | | | 0.0 | |
| 159,511 | | | Pretium Packaging, LLC, First Out Term Loan A, 10.395%, (TSFR3M+5.000%), 10/02/2028 | | | 162,269 | | | | 0.0 | |
| 548,155 | | | Pro Mach Group, Inc., 2021 Term Loan B, 9.193%, (TSFR1M+3.750%), 08/31/2028 | | | 550,759 | | | | 0.0 | |
| 280,000 | | | Proampac PG Borrower LLC, 2023 Term Loan, 8.840%, (TSFR1M+3.500%), 09/26/2028 | | | 280,000 | | | | 0.0 | |
| 292,042 | | | Proampac PG Borrower LLC, 2023 Term Loan, 10.382%, (TSFR1M+4.500%), 09/15/2028 | | | 292,918 | | | | 0.0 | |
| 430,156 | | | Reynolds Consumer Products LLC, Term Loan, 6.834%, (US0006M+1.750%), 02/04/2027 | | | 431,400 | | | | 0.0 | |
| 590,618 | | | Reynolds Group Holdings Inc., 2021 Term Loan B, 8.467%, (US0006M+3.250%), 09/25/2028 | | | 593,232 | | | | 0.1 | |
| 231,464 | | | TricorBraun Holdings, Inc., 2021 Term Loan, 8.467%, (TSFR1M+3.250%), 03/03/2028 | | | 229,236 | | | | 0.0 | |
| 360,102 | | | Trident TPI Holdings, Inc., 2021 Term Loan B3, 9.538%, (TSFR3M+4.000%), 09/15/2028 | | | 360,749 | | | | 0.0 | |
| | | | | | | 4,178,366 | | | | 0.2 | |
| | | | | | | | | | | | |
| | | | Diversified: 0.0% | | | | | | | | |
| 465,000 | | | First Eagle Investment Management, LLC, 2024 Term Loan B, 8.440%, (TSFR3M+3.000%), 02/14/2029 | | | 461,571 | | | | 0.0 | |
See Accompanying Notes to Financial Statements
Voya Strategic Income Opportunities Fund | PORTFOLIO OF INVESTMENTS as of March 31, 2024 (continued) |
Principal
Amount† | | | | | Value | | | Percentage
of Net
Assets |
| BANK LOANS: (continued) |
| | | | Electronics/Electrical: 0.1% | | | | | | | | |
| 247,481 | | | Altar Bidco, Inc., 2021 Term Loan, 8.142%, (SOFRRATE+3.100%), 02/01/2029 | | $ | 247,437 | | | | 0.0 | |
| 376,832 | | | Chamberlain Group Inc, Term Loan B, 8.453%, (TSFR1M+3.250%), 11/03/2028 | | | 376,799 | | | | 0.0 | |
| 198,610 | | | Creation Technologies Inc., 2021 Term Loan, 10.723%, (TSFR3M+5.500%), 10/05/2028 | | | 193,645 | | | | 0.0 | |
| 160,000 | | | DG Investment Intermediate Holdings 2, Inc., 2021 2nd Lien Term Loan, 11.967%, (TSFR1M+6.750%), 03/30/2029 | | | 150,133 | | | | 0.0 | |
| 444,646 | | | DG Investment Intermediate Holdings 2, Inc., 2021 Term Loan, 8.967%, (TSFR1M+3.750%), 03/31/2028 | | | 444,878 | | | | 0.0 | |
| 318,561 | | | II-VI Incorporated, 2022 Term Loan B, 7.967%, (TSFR1M+2.750%), 07/02/2029 | | | 319,596 | | | | 0.0 | |
| 486,903 | | | Illuminate Merger Sub Corp., 1st Lien Term Loan, 8.476%, (TSFR3M+3.000%), 07/21/2028 | | | 486,396 | | | | 0.1 | |
| 98,933 | | | Project Boost Purchaser, LLC, 2019 Term Loan B, 9.382%, (TSFR1M+3.500%), 05/29/2026 | | | 99,248 | | | | 0.0 | |
| | | | | | | 2,318,132 | | | | 0.1 | |
| | | | | | | | | | | | |
| | | | Energy: 0.1% | | | | | | | | |
| 379,688 | | | Brazos Delaware II, LLC, 2023 Term Loan B, 8.896%, (TSFR1M+3.750%), 02/11/2030 | | | 381,111 | | | | 0.0 | |
| 174,488 | | | GIP III Stetson I, L.P, 2023 Term Loan B, 9.706%, (TSFR1M+4.250%), 10/05/2028 | | | 175,433 | | | | 0.0 | |
| 199,499 | | | NorthRiver Midstream Finance LP, 2023 USD Term Loan B, 8.395%, (TSFR3M+3.000%), 08/16/2030 | | | 199,873 | | | | 0.0 | |
Principal
Amount† | | | | | Value | | | Percentage
of Net
Assets |
| BANK LOANS: (continued) |
| | | | Energy: (continued) | | | | | | | | |
| 619,529 | | | Oryx Midstream Services Permian Basin LLC, 2024 Term Loan B, 8.340%, (TSFR1M+3.000%), 10/05/2028 | | $ | 622,460 | | | | 0.1 | |
| | | | | | | 1,378,877 | | | | 0.1 | |
| | | | | | | | | | | | |
| | | | Financial: 0.4% | | | | | | | | |
| 563,413 | | | Alliant Holdings Intermediate, LLC, 2023 Term Loan B6, 8.865%, (TSFR1M+3.500%), 01/06/2031 | | | 566,295 | | | | 0.1 | |
| 231,444 | | | AmWINS Group, Inc., 2023 Incremental Term Loan B, 7.834%, (TSFR1M+2.750%), 02/21/2028 | | | 232,149 | | | | 0.0 | |
| 573,141 | | | AqGen Island Holdings, Inc., Term Loan, 8.693%, (US0006M+3.500%), 08/02/2028 | | | 571,780 | | | | 0.1 | |
| 169,575 | | | Aragorn Parent Corporation, Term Loan, 8.800%, (TSFR1M+4.250%), 12/07/2028 | | | 170,465 | | | | 0.0 | |
| 382,968 | | | Aretec Group, Inc., 2023 Incremental Term Loan, 9.956%, (TSFR1M+4.500%), 08/09/2030 | | | 385,362 | | | | 0.0 | |
| 555,750 | | | Castlelake Aviation Limited, Term Loan B, 8.302%, (TSFR3M+2.500%), 10/22/2026 | | | 556,488 | | | | 0.0 | |
| 674,811 | | | Citadel Securities LP, 2024 Term Loan B, 7.590%, (TSFR1M+2.250%), 07/29/2030 | | | 674,980 | | | | 0.1 | |
| 503,738 | | | Cushman & Wakefield U.S. Borrower, LLC, 2023 Term Loan B, 9.882%, (TSFR1M+4.000%), 01/31/2030 | | | 505,626 | | | | 0.0 | |
| 532,285 | | | Edelman Financial Center, LLC, 2021 Term Loan B, 8.943%, (TSFR1M+3.500%), 05/23/2025 | | | 533,007 | | | | 0.0 | |
| 131,684 | | | Focus Financial Partners, LLC, 2021 Term Loan B4, 7.603%, (TSFR1M+2.500%), 06/30/2028 | | | 131,355 | | | | 0.0 | |
See Accompanying Notes to Financial Statements
Voya Strategic Income Opportunities Fund | PORTFOLIO OF INVESTMENTS as of March 31, 2024 (continued) |
Principal
Amount† | | | | | Value | | | Percentage
of Net
Assets |
| BANK LOANS: (continued) |
| | | | Financial: (continued) | | | | | | | | |
| 169,151 | | | Focus Financial Partners, LLC, 2024 Term Loan B7, 8.090%, (TSFR1M+2.750%), 06/30/2028 | | $ | 168,869 | | | | 0.0 | |
| 300,000 | | | GTCR W Merger Sub LLC, USD Term Loan B, 8.299%, (TSFR1M+3.000%), 09/20/2030 | | | 301,242 | | | | 0.0 | |
| 253,432 | | | HighTower Holdings LLC, 2021 Term Loan B, 9.150%, (TSFR3M+4.000%), 04/21/2028 | | | 254,185 | | | | 0.0 | |
| 305,000 | | | Hub International Ltd., 2024 Term Loan B, 8.840%, (TSFR1M+3.500%), 06/20/2030 | | | 305,395 | | | | 0.0 | |
| 559,108 | | | Jane Street Group, LLC, 2024 Term Loan B, 7.840%, (TSFR1M+2.500%), 01/26/2028 | | | 559,923 | | | | 0.1 | |
| 150,000 | | | Kestra Advisor Services Holdings A, Inc., 2024 Term Loan, 8.840%, (TSFR1M+3.500%), 03/18/2031 | | | 150,375 | | | | 0.0 | |
| 518,700 | | | Nuvei Technologies Corp., USD Term Loan, 8.340%, (TSFR1M+3.000%), 09/29/2025 | | | 520,645 | | | | 0.0 | |
| 123,900 | | | RHP Hotel Properties, LP, 2023 Term Loan B, 7.853%, (TSFR1M+2.750%), 05/18/2030 | | | 124,171 | | | | 0.0 | |
| 370,000 | | | Truist Insurance Holdings LLC, 1st Lien Term Loan, 8.840%, (TSFR1M+3.500%), 03/24/2031 | | | 372,775 | | | | 0.0 | |
| 150,000 | | | Truist Insurance Holdings LLC, 2nd Lien Term Loan, 8.840%, (TSFR1M+3.500%), 03/07/2032 | | | 151,125 | | | | 0.0 | |
| 357,369 | | | VFH Parent LLC, 2022 Term Loan B, 8.189%, (US0006M+3.000%), 01/13/2029 | | | 357,369 | | | | 0.0 | |
| 227,700 | | | Walker & Dunlop, Inc., 2023 Incremental Term Loan B, 8.203%, (TSFR1M+3.000%), 12/16/2028 | | | 227,985 | | | | 0.0 | |
| | | | | | | 7,821,566 | | | | 0.4 | |
Principal
Amount† | | | | | Value | | | Percentage
of Net
Assets |
| BANK LOANS: (continued) |
| | | | Financial Intermediaries: 0.0% | |
| 765,732 | | | Advisor Group, Inc., 2023 Term Loan B, 10.382%, (TSFR1M+4.500%), 08/17/2028 | | $ | 769,766 | | | | 0.0 | |
| | | | | | | | | | | | |
| | | | Food Products: 0.1% | | | | | | | | |
| 479,747 | | | 8th Avenue Food & Provisions, Inc., 2018 1st Lien Term Loan, 8.967%, (TSFR1M+3.750%), 10/01/2025 | | | 471,801 | | | | 0.0 | |
| 672,750 | | | 8th Avenue Food & Provisions, Inc., 2021 Incremental Term Loan, 9.834%, (TSFR1M+4.750%), 10/01/2025 | | | 661,818 | | | | 0.1 | |
| 74,428 | | | BCPE North Star US HoldCo 2, Inc., Term Loan, 9.882%, (TSFR1M+4.000%), 06/09/2028 | | | 69,218 | | | | 0.0 | |
| 152,458 | | | CHG PPC Parent LLC, 2021 Term Loan, 8.239%, (US0006M+3.000%), 12/08/2028 | | | 152,839 | | | | 0.0 | |
| 149,625 | | | Chobani, LLC, 2023 Incremental Term Loan, 9.112%, (TSFR1M+3.750%), 10/25/2027 | | | 150,404 | | | | 0.0 | |
| 466,705 | | | Primary Products Finance LLC, 2024 Term Loan B, 8.940%, (TSFR3M+3.500%), 04/02/2029 | | | 467,164 | | | | 0.0 | |
| | | | | | | 1,973,244 | | | | 0.1 | |
| | | | | | | | | | | | |
| | | | Food/Drug Retailers: 0.0% | | | | | | | | |
| 653,206 | | | US Foods, Inc., 2019 Term Loan B, 7.193%, (TSFR1M+2.000%), 09/13/2026 | | | 655,116 | | | | 0.0 | |
| | | | | | | | | | | | |
| | | | Government: 0.0% | | | | | | | | |
| 265,000 | | | Fugue Finance B.V., 2024 USD Term Loan B, 9.190%, (TSFR3M+3.750%), 02/12/2031 | | | 265,994 | | | | 0.0 | |
See Accompanying Notes to Financial Statements
Voya Strategic Income Opportunities Fund | PORTFOLIO OF INVESTMENTS as of March 31, 2024 (continued) |
Principal
Amount† | | | | | Value | | | Percentage
of Net
Assets |
| BANK LOANS: (continued) |
| | | | Health Care: 0.4% | | | | | | | | |
| 353,634 | | | Amneal Pharmaceuticals LLC, 2018 Term Loan B, 8.584%, (TSFR1M+3.500%), 05/05/2025 | | $ | 353,722 | | | | 0.0 | |
| 745,793 | | | Athenahealth Group, Inc., 2022 Term Loan B, 8.589%, (TSFR1M+3.250%), 02/15/2029 | | | 739,682 | | | | 0.1 | |
| 711,750 | | | CHG Healthcare Services Inc., 2021 Term Loan, 8.443%, (US0006M+3.250%), 09/29/2028 | | | 713,085 | | | | 0.1 | |
| 148,861 | | | Embecta Corp, Term Loan B, 8.882%, (TSFR1M+3.000%), 03/30/2029 | | | 138,231 | | | | 0.0 | |
| 289,206 | | | Gloves Buyer, Inc., 2021 Term Loan, 9.217%, (TSFR1M+4.000%), 12/29/2027 | | | 289,206 | | | | 0.0 | |
| 246,268 | | | Hunter Holdco 3 Limited, USD Term Loan B, 9.592%, (TSFR3M+4.250%), 08/21/2028 | | | 246,268 | | | | 0.0 | |
| 149,625 | | | IVC Acquisition Ltd, 2023 USD Term Loan B, 8.800%, (TSFR3M+5.500%), 11/16/2028 | | | 150,124 | | | | 0.0 | |
| 1,216,538 | | | Medline Borrower, LP, USD Term Loan B, 8.353%, (US0006M+3.250%), 10/23/2028 | | | 1,218,471 | | | | 0.1 | |
| 248,092 | | | MPH Acquisition Holdings LLC, 2021 Term Loan B, 10.132%, (US0006M+4.250%), 09/01/2028 | | | 240,477 | | | | 0.0 | |
| 363,724 | | | Pacific Dental Services, LLC, 2024 Term Loan B, 8.690%, (TSFR3M+3.250%), 03/07/2031 | | | 363,724 | | | | 0.0 | |
| 600,000 | | | Phoenix Guarantor Inc, 2024 Term Loan, 8.590%, (TSFR1M+3.250%), 02/13/2031 | | | 592,828 | | | | 0.0 | |
| 478,697 | | | Select Medical Corporation, 2023 Term Loan B1, 8.882%, (TSFR1M+3.000%), 03/08/2027 | | | 480,043 | | | | 0.0 | |
Principal
Amount† | | | | | Value | | | Percentage
of Net
Assets |
| BANK LOANS: (continued) |
| | | | Health Care: (continued) | | | | | | | | |
| 635,000 | | | Sotera Health Holdings, LLC, 2021 Term Loan, 8.023%, (US0006M+2.750%), 12/11/2026 | | $ | 633,412 | | | | 0.0 | |
| 195,000 | | | Star Parent, Inc., Term Loan B, 9.882%, (TSFR3M+4.000%), 09/27/2030 | | | 193,989 | | | | 0.0 | |
| 711,966 | | | Verscend Holding Corp., 2021 Term Loan B, 9.217%, (TSFR1M+4.000%), 08/27/2025 | | | 712,602 | | | | 0.1 | |
| | | | | | | 7,065,864 | | | | 0.4 | |
| | | | | | | | | | | | |
| | | | Home Furnishings: 0.0% | | | | | | | | |
| 651,231 | | | APX Group, Inc., 2021 Term Loan B, 8.461%, (PRIME+2.250%), 07/10/2028 | | | 653,560 | | | | 0.0 | |
| 242,629 | | | Restoration Hardware, Inc., Term Loan B, 7.693%, (US0006M+2.500%), 10/20/2028 | | | 237,413 | | | | 0.0 | |
| | | | | | | 890,973 | | | | 0.0 | |
| | | | | | | | | | | | |
| | | | Industrial: 0.8% | | | | | | | | |
| 250,520 | | | ADS Tactical, Inc., 2021 Term Loan B, 10.943%, (TSFR1M+5.750%), 03/19/2026 | | | 252,399 | | | | 0.0 | |
| 249,436 | | | Aegion Corporation, 2024 Term Loan, 8.840%, (TSFR1M+3.500%), 05/17/2028 | | | 250,683 | | | | 0.0 | |
| 240,757 | | | AlixPartners, LLP, 2021 USD Term Loan B, 7.717%, (TSFR1M+2.500%), 02/04/2028 | | | 241,342 | | | | 0.0 | |
| 542,576 | | | Allied Universal Holdco LLC, 2021 USD Incremental Term Loan B, 8.953%, (TSFR1M+3.750%), 05/12/2028 | | | 542,388 | | | | 0.1 | |
| 515,818 | | | Amentum Government Services Holdings LLC, 2022 Term Loan, 9.147%, (TSFR1M+4.000%), 02/15/2029 | | | 517,913 | | | | 0.1 | |
See Accompanying Notes to Financial Statements
Voya Strategic Income Opportunities Fund | PORTFOLIO OF INVESTMENTS as of March 31, 2024 (continued) |
Principal
Amount† | | | | | Value | | | Percentage
of Net
Assets |
| BANK LOANS: (continued) |
| | | | Industrial: (continued) | | | | | | | | |
| 487,277 | | | American Builders & Contractors Supply Co., Inc., 2024 Term Loan B, 7.340%, (TSFR1M+2.000%), 01/29/2031 | | $ | 488,008 | | | | 0.0 | |
| 488,421 | | | Belfor Holdings Inc., 2023 USD Term Loan B, 9.106%, (TSFR1M+3.750%), 10/25/2030 | | | 491,474 | | | | 0.0 | |
| 816,252 | | | Berry Global, Inc., 2023 Term Loan AA, 7.222%, (TSFR1M+1.750%), 07/02/2029 | | | 816,743 | | | | 0.1 | |
| 488,579 | | | Bombardier Recreational Products, Inc., 2024 Term Loan B4, 8.090%, (TSFR1M+2.750%), 01/12/2031 | | | 488,884 | | | | 0.0 | |
| 165,000 | | | Brown Group Holding, LLC, 2022 Incremental Term Loan B2, 8.340%, (TSFR1M+3.000%), 07/02/2029 | | | 165,206 | | | | 0.0 | |
| 135,000 | | | Chamberlain Group Inc, 2024 Incremental Term Loan B, 9.090%, (TSFR1M+3.750%), 11/03/2028 | | | 135,443 | | | | 0.0 | |
| 355,368 | | | Chart Industries, Inc., 2023 Term Loan, 8.691%, (TSFR1M+3.250%), 03/18/2030 | | | 357,293 | | | | 0.0 | |
| 295,000 | | | Crown Subsea Communications Holding,Inc., 2024 Term Loan B, 10.190%, (TSFR3M+4.750%), 01/27/2031 | | | 297,102 | | | | 0.0 | |
| 133,244 | | | Deerfield Dakota Holding, LLC, 2020 USD Term Loan B, 9.632%, (TSFR3M+3.750%), 04/09/2027 | | | 132,728 | | | | 0.0 | |
| 172,407 | | | Emrld Borrower LP, Term Loan B, 8.264%, (TSFR3M+2.500%), 05/06/2030 | | | 172,429 | | | | 0.0 | |
| 50,081 | | | Filtration Group Corporation, 2021 Incremental Term Loan, 8.840%, (TSFR1M+3.500%), 10/21/2028 | | | 50,264 | | | | 0.0 | |
Principal
Amount† | | | | | Value | | | Percentage
of Net
Assets |
| BANK LOANS: (continued) | | | | |
| | | | Industrial: (continued) | |
| 316 | | | Foley Products Company, LLC, 2021 Term Loan, 10.142%, (US0006M+4.750%), 12/29/2028 | | $ | 318 | | | | 0.0 | |
| 975,162 | | | Garda World Security Corporation, 2022 Term Loan B, 9.327%, (TSFR3M+4.250%), 02/01/2029 | | | 978,007 | | | | 0.1 | |
| 497,500 | | | GFL Environmental Inc., 2023 First Lien Term Loan, 8.800%, (TSFR3M+2.500%), 05/31/2027 | | | 499,899 | | | | 0.0 | |
| 789,973 | | | Ingram Micro Inc., 2023 Term Loan, 8.610%, (TSFR3M+3.000%), 07/02/2028 | | | 792,442 | | | | 0.1 | |
| 180,985 | | | LSF11 Trinity Bidco, Inc., 2023 Term Loan, 9.358%, (TSFR1M+4.000%), 06/14/2030 | | | 181,890 | | | | 0.0 | |
| 144,628 | | | Madison IAQ LLC, Term Loan, 8.590%, (TSFR1M+3.250%), 06/21/2028 | | | 144,571 | | | | 0.0 | |
| 155,000 | | | MI Windows and Doors, LLC, 2024 Term Loan B2, 8.840%, (TSFR1M+3.500%), 03/28/2031 | | | 155,920 | | | | 0.0 | |
| 199,300 | | | NCR Atleos LLC, Term Loan B, 10.632%, (TSFR1M+4.750%), 03/27/2029 | | | 200,421 | | | | 0.0 | |
| 13,289 | | | Pre-Paid Legal Services, Inc., 2021 2nd Lien Term Loan, 12.193%, (TSFR1M+7.000%), 12/14/2029 | | | 13,023 | | | | 0.0 | |
| 346,453 | | | Pre-Paid Legal Services, Inc., 2021 Term Loan, 8.943%, (TSFR1M+3.750%), 12/15/2028 | | | 345,289 | | | | 0.0 | |
| 140,978 | | | Pretium Packaging, LLC, Second Out Term Loan A1, 9.995%, (TSFR3M+4.600%), 10/02/2028 | | | 126,997 | | | | 0.0 | |
| 643,321 | | | Quikrete Holdings, Inc., 2023 Term Loan B, 8.220%, (TSFR1M+2.750%), 03/19/2029 | | | 644,673 | | | | 0.1 | |
See Accompanying Notes to Financial Statements
Voya Strategic Income Opportunities Fund | PORTFOLIO OF INVESTMENTS as of March 31, 2024 (continued) |
Principal
Amount† | | | | | Value | | | Percentage
of Net
Assets |
| BANK LOANS: (continued) |
| | | | Industrial: (continued) | | | | | | | | |
| 252,982 | | | Rockwood Service Corporation, 2020 Term Loan, 9.882%, (TSFR1M+4.250%), 01/25/2027 | | $ | 254,089 | | | | 0.0 | |
| 393,985 | | | Service Logic Acquisition, Inc, Term Loan, 9.440%, (TSFR3M+4.000%), 10/29/2027 | | | 394,477 | | | | 0.0 | |
| 229,634 | | | Smyrna Ready Mix Concrete, LLC, 2023 Term Loan, 8.858%, (TSFR1M+3.500%), 04/02/2029 | | | 231,356 | | | | 0.0 | |
| 292,439 | | | St. George Warehousing & Trucking Co. of California, Inc., 2022 Term Loan, 11.392%, (TSFR3M+6.000%), 03/24/2028 | | | 191,547 | | | | 0.0 | |
| 310,000 | | | Summit Materials LLC, 2023 Incremental Term Loan B, 8.800%, (TSFR3M+2.500%), 01/12/2029 | | | 311,993 | | | | 0.0 | |
| 290,000 | | | Titan Acquisition Limited, 2024 Term Loan B, 8.840%, (TSFR1M+3.500%), 02/01/2029 | | | 290,943 | | | | 0.0 | |
| 1,361,313 | | | Trans Union, LLC, 2019 Term Loan B5, 6.953%, (TSFR1M+1.750%), 11/16/2026 | | | 1,361,975 | | | | 0.1 | |
| 997,500 | | | TransDigm, Inc., 2024 Term Loan K, 8.190%, (TSFR3M+2.750%), 03/14/2030 | | | 1,000,686 | | | | 0.1 | |
| 198,622 | | | Tutor Perini Corporation, Term Loan B, 10.254%, (TSFR1M+4.750%), 08/18/2027 | | | 198,291 | | | | 0.0 | |
| 149,625 | | | VT Topco, Inc., 2023 Term Loan B, 10.132%, (TSFR1M+4.250%), 08/09/2030 | | | 150,151 | | | | 0.0 | |
| | | | | | | 13,869,257 | | | | 0.8 | |
| | | | | | | | | | | | |
| | | | Industrial Equipment: 0.2% | | | | | | | | |
| 455,000 (7) | | | AI Aqua Merger Sub, Inc., 2023 Incremental Term Loan, 8.800%, (TSFR3M+2.125%), 07/31/2028 | | | 456,955 | | | | 0.0 | |
Principal
Amount† | | | | | Value | | | Percentage
of Net
Assets |
| BANK LOANS: (continued) |
| | | | Industrial Equipment: (continued) | |
| 283,475 | | | Albion Financing 3 SARL, USD Term Loan, 10.523%, (US0006M+5.250%), 08/17/2026 | | $ | 285,188 | | | | 0.0 | |
| 422,198 | | | Alliance Laundry Systems LLC, Term Loan B, 8.559%, (TSFR3M+3.500%), 10/08/2027 | | | 424,309 | | | | 0.0 | |
| 130,459 | | | American Trailer World Corp., Term Loan B, 8.855%, (US0006M+3.750%), 03/03/2028 | | | 127,542 | | | | 0.0 | |
| 497,118 | | | Clark Equipment Company, 2022 Term Loan B, 7.948%, (TSFR3M+2.500%), 04/20/2029 | | | 498,360 | | | | 0.0 | |
| 516,750 | | | Conair Holdings, LLC, Term Loan B, 9.288%, (US0006M+3.750%), 05/17/2028 | | | 513,391 | | | | 0.1 | |
| 410,850 | | | Filtration Group Corporation, 2023 USD Term Loan, 9.326%, (US0006M+4.250%), 10/21/2028 | | | 412,941 | | | | 0.0 | |
| 469,830 | | | Gates Global LLC, 2021 Term Loan B3, 7.703%, (TSFR1M+2.500%), 03/31/2027 | | | 471,185 | | | | 0.0 | |
| 149,625 | | | LSF12 Badger Bidco LLC, Term Loan B, 11.882%, (TSFR1M+6.000%), 08/30/2030 | | | 150,467 | | | | 0.0 | |
| 20,000 | | | SPX Flow, Inc., 2022 Term Loan, 9.840%, (TSFR1M+4.500%), 04/05/2029 | | | 20,108 | | | | 0.0 | |
| 489,573 | | | Titan Acquisition Limited, 2018 Term Loan B, 8.731%, (TSFR1M+3.000%), 03/28/2025 | | | 489,573 | | | | 0.0 | |
| 648,966 | | | Vertical US Newco Inc, Term Loan B, 8.602%, (US0006M+3.500%), 07/30/2027 | | | 650,551 | | | | 0.1 | |
| | | | | | | 4,500,570 | | | | 0.2 | |
| | | | | | | | | | | | |
| | | | Insurance: 0.3% | | | | | | | | |
| 538,994 | | | Acrisure, LLC, 2020 Term Loan B, 8.693%, (US0001M+3.500%), 11/22/2023 | | | 539,289 | | | | 0.0 | |
See Accompanying Notes to Financial Statements
Voya Strategic Income Opportunities Fund | PORTFOLIO OF INVESTMENTS as of March 31, 2024 (continued) |
Principal
Amount† | | | | | Value | | | Percentage
of Net
Assets |
| BANK LOANS: (continued) |
| | | | Insurance: (continued) | | | | | | | | |
| 452,996 | | | Acrisure, LLC, 2021 First Lien Term Loan B, 9.428%, (US0001M+4.250%), 02/15/2027 | | $ | 454,765 | | | | 0.0 | |
| 342,576 | | | AssuredPartners, Inc., 2020 Term Loan B, 8.717%, (US0006M+3.500%), 02/12/2027 | | | 343,341 | | | | 0.0 | |
| 224,970 | | | AssuredPartners, Inc., 2021 Term Loan B, 8.584%, (TSFR1M+3.500%), 02/12/2027 | | | 225,462 | | | | 0.0 | |
| 377,300 | | | AssuredPartners, Inc., 2022 Term Loan, 8.603%, (TSFR1M+3.500%), 02/12/2027 | | | 378,054 | | | | 0.0 | |
| 487,231 | | | Broadstreet Partners, Inc., 2020 Term Loan B, 7.943%, (TSFR1M+3.000%), 01/27/2027 | | | 487,954 | | | | 0.0 | |
| 378,066 | | | IMA Financial Group, Inc., Term Loan, 9.221%, (TSFR1M+3.750%), 10/16/2028 | | | 379,248 | | | | 0.0 | |
| 386,846 | | | NFP Corp., 2020 Term Loan, 8.467%, (US0006M+3.250%), 01/08/2024 | | | 387,764 | | | | 0.0 | |
| 646,656 | | | OneDigital Borrower LLC, 2021 Term Loan, 9.453%, (US0006M+4.250%), 11/16/2027 | | | 647,465 | | | | 0.1 | |
| 540,105 | | | Ryan Specialty Group, LLC, Term Loan, 8.882%, (TSFR1M+2.750%), 09/01/2027 | | | 541,455 | | | | 0.1 | |
| 801,886 | | | Sedgwick Claims Management Services, Inc., 2023 Term Loan B, 8.853%, (TSFR1M+3.750%), 02/24/2028 | | | 804,140 | | | | 0.1 | |
| 302,480 | | | USI, Inc., 2023 Acquisition Term Loan, 9.132%, (TSFR3M+3.250%), 09/27/2030 | | | 303,213 | | | | 0.0 | |
| 493,759 | | | USI, Inc., 2023 Term Loan B, 8.440%, (TSFR3M+3.000%), 11/22/2029 | | | 494,608 | | | | 0.0 | |
| | | | | | | 5,986,758 | | | | 0.3 | |
Principal
Amount† | | | | | Value | | | Percentage
of Net
Assets |
| BANK LOANS: (continued) |
| | | | Leisure Good/Activities/Movies: 0.2% | |
| 392,191 | | | 24 Hour Fitness Worldwide, Inc., 2021 Delayed Draw Term Loan, 14.476%, (TSFR3M+2.000%), 09/29/2025 | | $ | 372,582 | | | | 0.0 | |
| 1,067,273 | | | Alterra Mountain Company, 2021 Series B-2 Consenting Term Loan, 8.693%, (US0006M+3.500%), 07/30/2028 | | | 1,072,942 | | | | 0.1 | |
| 302,447 | | | Cinemark USA, Inc., 2023 Term Loan B, 8.834%, (TSFR1M+3.750%), 05/24/2030 | | | 303,897 | | | | 0.0 | |
| 299,235 | | | City Football Group Limited, Term Loan, 8.840%, (TSFR1M+3.500%), 07/21/2028 | | | 299,422 | | | | 0.0 | |
| 557,399 | | | Hayward Industries, Inc., 2021 Term Loan, 7.967%, (US0006M+2.750%), 05/30/2028 | | | 558,618 | | | | 0.1 | |
| 487,469 | | | Playtika Holding Corp, 2021 Term Loan, 7.943%, (TSFR1M+2.750%), 03/13/2028 | | | 488,577 | | | | 0.0 | |
| | | | | | | 3,096,038 | | | | 0.2 | |
| | | | | | | | | | | | |
| | | | Lodging & Casinos: 0.2% | | | | | | | | |
| 498,750 | | | 1011778 B.C. Unlimited Liability Company, 2023 Term Loan B5, 8.132%, (TSFR1M+2.250%), 09/20/2030 | | | 498,999 | | | | 0.0 | |
| 148,857 | | | Century Casinos, Inc, 2022 Term Loan, 11.882%, (TSFR1M+6.000%), 04/02/2029 | | | 146,531 | | | | 0.0 | |
| 678,126 | | | Fertitta Entertainment, LLC, 2022 Term Loan B, 9.103%, (US0006M+3.750%), 01/27/2029 | | | 679,692 | | | | 0.1 | |
| 476,205 | | | Flynn Restaurant Group LP, 2021 Term Loan B, 9.467%, (US0006M+4.250%), 12/01/2028 | | | 478,289 | | | | 0.0 | |
| 253,088 | | | Golden Entertainment, Inc., 2023 Term Loan B, 7.939%, (US0006M+2.750%), 05/13/2030 | | | 253,298 | | | | 0.0 | |
See Accompanying Notes to Financial Statements
Voya Strategic Income Opportunities Fund | PORTFOLIO OF INVESTMENTS
as of March 31, 2024 (continued) |
Principal
Amount† | | | | | Value | | | Percentage
of Net
Assets | |
| BANK LOANS: (continued) | |
| | | | Lodging & Casinos: (continued) | | | | | |
| 728,788 | | | Hilton Grand Vacations Borrower LLC, 2021 Term Loan B, 8.239%, (TSFR1M+2.750%), 08/02/2028 | | $ | 730,154 | | | | 0.1 | |
| 407,538 | | | Scientific Games Holdings LP, 2022 USD Term Loan B, 8.421%, (TSFR3M+3.250%), 04/04/2029 | | | 407,974 | | | | 0.0 | |
| 413,435 | | | Whatabrands LLC, 2021 Term Loan B, 8.882%, (TSFR1M+3.250%), 08/03/2028 | | | 414,153 | | | | 0.0 | |
| | | | | | | 3,609,090 | | | | 0.2 | |
| | | | | | | | | | | | |
| | | | Mortgage REITs: 0.0% | | | | | |
| 148,849 | | | Blackstone Mortgage Trust, Inc., 2021 Term Loan B2, 8.632%, (US0006M+2.750%), 04/23/2026 | | | 149,035 | | | | 0.0 | |
| | | | | | | | | | | | |
| | | | Oil & Gas: 0.0% |
| 154,613 | | | GIP Pilot Acquisition Partners LP, Term Loan, 8.882%, (TSFR3M+3.000%), 10/04/2030 | | | 155,225 | | | | 0.0 | |
| 203,969 | | | Medallion Midland Acquisition, LLC, 2023 Term Loan, 8.864%, (TSFR3M+3.500%), 10/18/2028 | | | 204,542 | | | | 0.0 | |
| 545,553 | | | TransMontaigne Operating Company L.P., Term Loan B, 8.698%, (US0006M+3.500%), 11/17/2028 | | | 546,284 | | | | 0.0 | |
| | | | | | | 906,051 | | | | 0.0 | |
| | | | | | | | | | | | |
| | | | Pipelines: 0.0% | | | | | |
| 250,000 | | | WhiteWater DBR HoldCo, LLC, Term Loan B, 8.190%, (TSFR3M+2.750%), 02/28/2031 | | | 250,833 | | | | 0.0 | |
| | | | | | | | | | | | |
| | | | Radio & Television: 0.2% | | | | | |
| 660,220 | | | ABG Intermediate Holdings 2 LLC, 2021 Term Loan B1, 8.703%, (US0006M+3.500%), 12/21/2028 | | | 663,367 | | | | 0.1 | |
| 480,996 | | | DirecTV Financing, LLC, Term Loan, 10.217%, (TSFR1M+5.000%), 08/02/2027 | | | 483,552 | | | | 0.0 | |
| | | | | | | | | | | | |
Principal
Amount† | | | | | Value | | | Percentage
of Net
Assets | |
| BANK LOANS: (continued) | |
| | | | Radio & Television: (continued) | | | | | |
| 248,049 | | | Eagle Broadband Investments LLC, Term Loan, 8.882%, (US0006M+3.000%), 11/12/2027 | | $ | 246,654 | | | | 0.0 | |
| 545,683 | | | Gray Television, Inc., 2021 Term Loan D, 8.882%, (TSFR1M+3.000%), 12/01/2028 | | | 512,686 | | | | 0.1 | |
| 297,994 | | | Gray Television, Inc., 2023 Term Loan E, 7.840%, (TSFR1M+2.500%), 01/02/2026 | | | 294,828 | | | | 0.0 | |
| 248,111 | | | Houghton Mifflin Harcourt Publishing Company, 2022 Term Loan, 11.132%, (TSFR1M+5.250%), 04/09/2029 | | | 246,294 | | | | 0.0 | |
| 198,995 | | | Red Ventures, LLC, 2023 Term Loan B, 8.356%, (TSFR1M+3.000%), 03/03/2030 | | | 198,518 | | | | 0.0 | |
| 215,000 | | | Simon & Schuster Inc, Term Loan B, 9.882%, (TSFR3M+4.000%), 10/30/2030 | | | 216,075 | | | | 0.0 | |
| 148,864 | | | Sinclair Television Group Inc., 2022 Term Loan B4, 9.632%, (TSFR1M+3.750%), 04/23/2029 | | | 120,133 | | | | 0.0 | |
| 33,065 | | | Sinclair Television Group Inc., Term Loan B2B, 8.382%, (TSFR1M+2.500%), 09/30/2026 | | | 31,582 | | | | 0.0 | |
| | | | | | | 3,013,689 | | | | 0.2 | |
| | | | | | | | | | | | |
| | | | Rail Industries: 0.1% | | | | | |
| 729,114 | | | Genesee & Wyoming Inc. (New), Term Loan, 7.342%, (TSFR3M+2.000%), 12/30/2026 | | | 730,123 | | | | 0.1 | |
| 492,014 | | | Kenan Advantage Group, Inc., 2024 Term Loan B3, 9.090%, (TSFR1M+3.750%), 01/25/2029 | | | 492,875 | | | | 0.0 | |
| 155,000 | | | XPO Logistics, Inc., 2023 Term Loan, 8.800%, (TSFR1M+2.000%), 02/15/2031 | | | 155,083 | | | | 0.0 | |
| | | | | | | | | | | | |
See Accompanying Notes to Financial Statements
Voya Strategic Income Opportunities Fund | PORTFOLIO OF INVESTMENTS
as of March 31, 2024 (continued) |
Principal
Amount† | | | | | Value | | | Percentage
of Net
Assets | |
| BANK LOANS: (continued) | |
| | | | Rail Industries: (continued) | | | | | |
| 190,000 | | | XPO Logistics, Inc., 2023 Term Loan B, 7.080%, (TSFR1M+2.000%), 05/24/2028 | | $ | 190,855 | | | | 0.0 | |
| | | | | | | 1,568,936 | | | | 0.1 | |
| | | | | | | | | | | | |
| | | | Retailers (Except Food & Drug): 0.2% | | | | | |
| 161,317 | | | CWGS Group, LLC, 2021 Term Loan B, 7.662%, (US0006M+2.500%), 06/03/2028 | | | 157,553 | | | | 0.0 | |
| 382,482 | | | Great Outdoors Group, LLC, 2021 Term Loan B1, 8.943%, (TSFR1M+3.750%), 03/06/2028 | | | 383,199 | | | | 0.0 | |
| 898,432 | | | Harbor Freight Tools USA, Inc., 2021 Term Loan B, 7.967%, (TSFR1M+2.750%), 10/19/2027 | | | 898,970 | | | | 0.1 | |
| 190,155 | | | Les Schwab Tire Centers, Term Loan B, 8.443%, (US0006M+3.250%), 11/02/2027 | | | 190,660 | | | | 0.0 | |
| 425,290 | | | Leslie’s Poolmart, Inc., 2021 Term Loan B, 7.967%, (TSFR1M+2.750%), 03/09/2028 | | | 425,556 | | | | 0.1 | |
| 452,391 | | | Michaels Companies, Inc., 2021 Term Loan B, 9.754%, (TSFR3M+4.250%), 04/15/2028 | | | 406,190 | | | | 0.0 | |
| 331,583 | | | Petco Health and Wellness Company, Inc., 2021 Term Loan B, 8.754%, (US0006M+3.250%), 03/03/2028 | | | 307,440 | | | | 0.0 | |
| 213,630 | | | Staples, Inc., 7 Year Term Loan, 10.299%, (US0001M+5.000%), 04/13/2026 | | | 211,725 | | | | 0.0 | |
| | | | | | | 2,981,293 | | | | 0.2 | |
| | | | | | | | | | | | |
| | | | Technology: 0.9% | | | | | |
| 74,806 | | | Amentum Government Services Holdings LLC, Term Loan B, 9.340%, (TSFR1M+4.000%), 01/31/2027 | | | 75,110 | | | | 0.0 | |
| | | | | | | | | | | | |
Principal
Amount† | | | | | Value | | | Percentage
of Net
Assets | |
| BANK LOANS: (continued) | |
| | | | Technology: (continued) | | | | | |
| 521,063 | | | Applied Systems, Inc., 2024 1st Lien Term Loan, 8.940%, (TSFR3M+3.500%), 02/24/2031 | | $ | 524,808 | | | | 0.0 | |
| 115,000 | | | Applied Systems, Inc., 2024 2nd Lien Term Loan, 10.690%, (TSFR3M+5.250%), 02/07/2032 | | | 119,277 | | | | 0.0 | |
| 790,295 | | | AppLovin Corporation, 2024 Term Loan (2028), 7.840%, (TSFR1M+2.500%), 10/25/2028 | | | 790,913 | | | | 0.1 | |
| 330,000 | | | Asurion LLC, 2021 2nd Lien Term Loan B3, 10.453%, (TSFR1M+5.250%), 01/31/2028 | | | 299,166 | | | | 0.0 | |
| 721,467 | | | Banff Merger Sub Inc, 2023 USD Term Loan, 9.875%, (TSFR1M+4.250%), 12/29/2028 | | | 726,502 | | | | 0.1 | |
| 445,495 | | | Cloud Software Group, Inc., 2022 USD Term Loan B, 9.842%, (US0006M+4.500%), 03/20/2029 | | | 443,718 | | | | 0.0 | |
| 285,000 | | | Cloud Software Group, Inc., 2024 Term Loan, 8.840%, (TSFR1M+3.500%), 03/18/2031 | | | 283,575 | | | | 0.0 | |
| 248,096 | | | ConnectWise, LLC, 2021 Term Loan B, 9.382%, (US0006M+3.500%), 09/29/2028 | | | 248,329 | | | | 0.0 | |
| 248,498 | | | Constant Contact Inc, Term Loan, 9.882%, (TSFR3M+4.000%), 02/10/2028 | | | 241,975 | | | | 0.0 | |
| 278,762 | | | Cvent, Inc., 2023 Term Loan B, 9.004%, (TSFR3M+3.750%), 06/17/2030 | | | 279,502 | | | | 0.0 | |
| 215,000 | | | Dun & Bradstreet Corporation (The), 2024 Term Loan B, 8.090%, (TSFR1M+2.750%), 01/18/2029 | | | 215,202 | | | | 0.0 | |
| 278,560 | | | ECI Macola Max Holding, LLC, 2020 Term Loan, 8.800%, (TSFR3M+3.750%), 11/09/2027 | | | 279,535 | | | | 0.0 | |
| | | | | | | | | | | | |
See Accompanying Notes to Financial Statements
Voya Strategic Income Opportunities Fund | PORTFOLIO OF INVESTMENTS
as of March 31, 2024 (continued) |
Principal
Amount† | | | | | Value | | | Percentage
of Net
Assets | |
| BANK LOANS: (continued) | |
| | | | Technology: (continued) | | | | | |
| 681,994 | | | Endure Digital Inc., Term Loan, 8.792%, (TSFR6M+3.500%), 02/10/2028 | | $ | 667,289 | | | | 0.1 | |
| 528,675 | | | Epicor Software Corporation, 2023 Incremental Term Loan, 9.632%, (TSFR1M+3.750%), 07/30/2027 | | | 532,034 | | | | 0.1 | |
| 248,077 | | | Gainwell Acquisition Corp., Term Loan B, 9.882%, (US0006M+4.000%), 10/01/2027 | | | 238,076 | | | | 0.0 | |
| 1,022,647 | | | Greeneden U.S. Holdings II, LLC, 2020 USD Term Loan B4, 9.193%, (TSFR1M+4.000%), 12/01/2027 | | | 1,026,961 | | | | 0.1 | |
| 291,790 | | | Helios Software Holdings, Inc., 2021 USD Term Loan B, 8.989%, (TSFR3M+3.750%), 03/11/2028 | | | 290,057 | | | | 0.0 | |
| 149,250 | | | Idemia Group, 2024 Term Loan B5, 9.690%, (TSFR3M+4.250%), 09/30/2028 | | | 150,276 | | | | 0.0 | |
| 350,000 | | | Imagine Learning LLC, Term Loan, 8.840%, (TSFR1M+3.500%), 12/17/2029 | | | 349,417 | | | | 0.0 | |
| 599,738 | | | Informatica LLC, 2021 USD Term Loan B, 8.000%, (TSFR1M+2.750%), 10/27/2028 | | | 600,937 | | | | 0.1 | |
| 544,600 | | | ION Trading Finance Limited, 2021 USD Term Loan, 10.288%, (US0006M+4.750%), 04/03/2028 | | | 544,649 | | | | 0.1 | |
| 295,585 | | | Ivanti Software, Inc., 2021 Term Loan B, 9.420%, (TSFR3M+4.250%), 12/01/2027 | | | 276,557 | | | | 0.0 | |
| 112,563 | | | KBR, Inc., 2024 Term Loan B, 7.590%, (TSFR1M+2.250%), 01/17/2031 | | | 112,932 | | | | 0.0 | |
| 493,719 | | | McAfee, LLC, 2022 USD Term Loan B, 9.010%, (US0006M+3.750%), 03/01/2029 | | | 494,182 | | | | 0.0 | |
| | | | | | | | | | | | |
Principal
Amount† | | | | | Value | | | Percentage
of Net
Assets | |
| BANK LOANS: (continued) | |
| | | | Technology: (continued) | | | | | |
| 280,000 | | | MH Sub I, LLC, 2021 2nd Lien Term Loan, 11.353%, (TSFR1M+6.250%), 09/15/2025 | | $ | 270,754 | | | | 0.0 | |
| 356,215 | | | Mitchell International, Inc., 2021 Term Loan B, 8.943%, (TSFR1M+3.750%), 10/15/2028 | | | 356,623 | | | | 0.0 | |
| 487,628 | | | MKS Instruments, Inc., 2023 USD Term Loan B, 7.840%, (TSFR1M+2.500%), 08/17/2029 | | | 488,238 | | | | 0.0 | |
| 195,000 | | | Mosel Bidco SE, USD Term Loan B, 10.632%, (TSFR3M+4.750%), 09/16/2030 | | | 195,731 | | | | 0.0 | |
| 98,863 | | | OceanKey (U.S.) II Corp., 2021 Term Loan, 9.382%, (US0006M+3.500%), 12/15/2028 | | | 97,948 | | | | 0.0 | |
| 206,373 | | | Paysafe Holdings (US) Corp, USD Term Loan B1, 7.967%, (TSFR1M+2.750%), 06/28/2028 | | | 205,194 | | | | 0.0 | |
| 448,846 | | | Project Boost Purchaser, LLC, 2021 Incremental Term Loan, 9.382%, (TSFR3M+3.500%), 05/30/2026 | | | 450,296 | | | | 0.0 | |
| 225,000 | | | Project Ruby Ultimate Parent Corp., 2024 Incremental Term Loan, 8.840%, (TSFR1M+3.500%), 03/10/2028 | | | 225,563 | | | | 0.0 | |
| 174,125 | | | Quartz Acquireco LLC, Term Loan B, 8.580%, (TSFR3M+3.500%), 06/28/2030 | | | 174,941 | | | | 0.0 | |
| 51,545 | | | Rackspace Technology Global, Inc., 2024 First Lien First Out Term Loan, 11.690%, (TSFR3M+6.250%), 05/15/2028 | | | 51,287 | | | | 0.0 | |
| 230,806 | | | Rackspace Technology Global, Inc., 2024 First Lien Second Out Term Loan, 8.840%, (TSFR1M+3.500%), 05/15/2028 | | | 114,249 | | | | 0.0 | |
| | | | | | | | | | | | |
See Accompanying Notes to Financial Statements
Voya Strategic Income Opportunities Fund | PORTFOLIO OF INVESTMENTS
as of March 31, 2024 (continued) |
Principal
Amount† | | | | | Value | | | Percentage
of Net
Assets | |
| BANK LOANS: (continued) | |
| | | | Technology: (continued) | | | | | |
| 368,152 | | | Renaissance Holding Corp., 2024 Term Loan, 9.590%, (TSFR1M+4.250%), 04/05/2030 | | $ | 369,237 | | | | 0.0 | |
| 300,178 | | | SkillSoft Corporation, 2021 Term Loan, 10.511%, (TSFR1M+5.250%), 07/14/2028 | | | 269,785 | | | | 0.0 | |
| 366,369 | | | Skopima Merger Sub Inc., Term Loan B, 9.193%, (TSFR1M+4.000%), 05/12/2028 | | | 365,275 | | | | 0.0 | |
| 305,000 | | | SonicWall US Holdings Inc., 2023 Term Loan, 10.882%, (TSFR3M+5.000%), 05/18/2028 | | | 303,284 | | | | 0.0 | |
| 226,439 | | | SS&C Technologies Inc., 2022 Term Loan B6, 7.453%, (TSFR1M+2.250%), 03/22/2029 | | | 226,913 | | | | 0.0 | |
| 440,122 | | | SS&C Technologies Inc., 2022 Term Loan B7, 7.453%, (TSFR1M+2.250%), 03/22/2029 | | | 441,043 | | | | 0.0 | |
| 245,197 | | | Tenable Holdings, Inc., Term Loan B, 8.632%, (US0006M+2.750%), 07/07/2028 | | | 245,554 | | | | 0.0 | |
| 1,001,823 | | | UKG Inc., 2024 Term Loan B, 8.940%, (TSFR3M+3.500%), 02/10/2031 | | | 1,007,328 | | | | 0.1 | |
| 500,000 | | | Virtusa Corporation, 2022 Incremental Term Loan, 8.840%, (TSFR1M+3.500%), 02/15/2029 | | | 501,485 | | | | 0.0 | |
| 750,000 | | | Waystar Technologies, Inc., 2024 Term Loan B, 9.340%, (TSFR1M+4.000%), 10/31/2029 | | | 752,579 | | | | 0.1 | |
| 352,929 | | | Xperi Corporation, 2020 Term Loan B, 9.382%, (TSFR1M+3.500%), 06/08/2028 | | | 353,518 | | | | 0.0 | |
| | | | | | | 17,277,804 | | | | 0.9 | |
| | | | | | | | | | | | |
| | | | Telecommunications: 0.2% | | | | | |
| 301,979 | | | Altice France S.A., 2023 USD Term Loan B14, 11.382%, (TSFR3M+5.500%), 08/15/2028 | | | 237,809 | | | | 0.0 | |
| | | | | | | | | | | | |
Principal
Amount† | | | | | Value | | | Percentage
of Net
Assets | |
| BANK LOANS: (continued) | |
| | | | Telecommunications: (continued) | | | | | |
| 406,509 | | | Asurion LLC, 2023 Term Loan B11, 10.132%, (TSFR1M+4.250%), 08/19/2028 | | $ | 392,789 | | | | 0.0 | |
| 149,229 | | | Cablevision Lightpath LLC, Term Loan B, 9.132%, (TSFR1M+3.250%), 11/30/2027 | | | 147,774 | | | | 0.0 | |
| 1,064,359 | | | CCI Buyer, Inc., Term Loan, 9.242%, (TSFR3M+4.000%), 12/17/2027 | | | 1,059,417 | | | | 0.1 | |
| 1,451 | | | CenturyLink, Inc., 2020 Term Loan B, 7.467%, (US0006M+2.250%), 03/15/2027 | | | 1,078 | | | | 0.0 | |
| 750,000 | | | UPC Financing Partnership, 2021 USD Term Loan AX, 8.118%, (TSFR1M+3.000%), 01/31/2029 | | | 747,070 | | | | 0.0 | |
| 247,481 | | | ViaSat, Inc., Term Loan, 9.603%, (TSFR1M+4.500%), 03/05/2029 | | | 240,923 | | | | 0.0 | |
| 810,000 | | | Virgin Media Bristol LLC, 2020 USD Term Loan Q, 8.443%, (TSFR1M+3.250%), 01/31/2029 | | | 804,544 | | | | 0.1 | |
| | | | | | | 3,631,404 | | | | 0.2 | |
| | | | | | | | | | | | |
| | | | Utilities: 0.1% | | | | | |
| 290,000 | | | BIP PipeCo Holdings LLC, Term Loan B, 8.616%, (TSFR3M+3.250%), 12/15/2030 | | | 290,816 | | | | 0.0 | |
| 44,502 | | | Generation Bridge Northeast, LLC, Term Loan B, 10.132%, (TSFR1M+3.500%), 08/22/2029 | | | 44,724 | | | | 0.0 | |
| 245,000 | | | Kohler Energy Co LLC, USD Term Loan B, 8.840%, (TSFR1M+3.500%), 02/15/2031 | | | 245,000 | | | | 0.0 | |
| 197,574 | | | Nautilus Power, LLC, 2023 Term Loan B, 10.240%, (US0006M+5.250%), 11/16/2026 | | | 167,938 | | | | 0.0 | |
| 235,000 | | | NGL Energy Partners LP, 2024 Term Loan B, 9.840%, (TSFR1M+4.500%), 02/03/2031 | | | 235,852 | | | | 0.0 | |
| | | | | | | | | | | | |
See Accompanying Notes to Financial Statements
Voya Strategic Income Opportunities Fund | PORTFOLIO OF INVESTMENTS
as of March 31, 2024 (continued) |
Principal
Amount† | | | | | Value | | | Percentage
of Net
Assets | |
| BANK LOANS: (continued) | |
| | | | Utilities: (continued) | | | | | |
| 270,000 | | | NRG Energy, Inc., Term Loan, 8.840%, (TSFR1M+3.500%), 03/26/2031 | | $ | 269,325 | | | | 0.0 | |
| 568,575 | | | Vistra Operations Company LLC, 1st Lien Term Loan B3, 8.800%, (TSFR1M+2.000%), 12/20/2030 | | | 568,510 | | | | 0.1 | |
| 528,119 | | | Waterbridge Midstream Operating LLC, Term Loan B, 11.005%, (US0006M+5.750%), 06/22/2026 | | | 530,209 | | | | 0.0 | |
| | | | | | | 2,352,374 | | | | 0.1 | |
| | | | | | | | | | | | |
| | | | Total Bank Loans (Cost $139,474,201) | | | 140,138,336 | | | | 7.6 | |
| | | | | | | | | | | | |
| U.S. GOVERNMENT AGENCY OBLIGATIONS: 4.4% |
| | | | Government National Mortgage Association: 2.3% | |
| 10,000,000 (8) | | | 3.500%, 04/20/2054 | | | 9,100,336 | | | | 0.5 | |
| 11,460,000 (8) | | | 4.000%, 04/20/2054 | | | 10,724,788 | | | | 0.6 | |
| 10,000,000 (8) | | | 4.500%, 04/20/2054 | | | 9,609,851 | | | | 0.5 | |
| 12,000,000 (8) | | | 5.500%, 05/20/2054 | | | 12,002,812 | | | | 0.7 | |
| | | | | | | 41,437,787 | | | | 2.3 | |
| | | | Uniform Mortgage-Backed Securities: 2.1% | |
| 9,884,000 (8) | | | 3.000%, 04/01/2054 | | | 8,504,644 | | | | 0.5 | |
| 11,070,000 (8) | | | 4.000%, 05/15/2054 | | | 10,256,892 | | | | 0.5 | |
| 8,000,000 (8) | | | 5.000%, 04/01/2054 | | | 7,806,555 | | | | 0.4 | |
| 2,642 | | | 5.500%, 10/01/2039 | | | 2,698 | | | | 0.0 | |
| 12,978,000 (8) | | | 5.500%, 05/01/2054 | | | 12,914,595 | | | | 0.7 | |
| | | | | | | 39,485,384 | | | | 2.1 | |
| | | | | | | | | | | | |
| | | | Total U.S. Government Agency Obligations (Cost $80,861,692) | | | 80,923,171 | | | | 4.4 | |
| | | | | | | | | | | | |
| SOVEREIGN BONDS: 3.5% |
| 725,000 (2) | | | Bahrain Government International Bond, 7.500%, 02/12/2036 | | | 745,391 | | | | 0.0 | |
| BRL5,320,000 | | | Brazil Notas do Tesouro Nacional Serie B NTNB, 6.000%, 08/15/2050 | | | 4,647,650 | | | | 0.2 | |
| 1,050,000 | | | Brazilian Government International Bond, 6.125%, 03/15/2034 | | | 1,040,550 | | | | 0.1 | |
| 675,000 | | | Brazilian Government International Bond, 7.125%, 05/13/2054 | | | 681,413 | | | | 0.0 | |
| 1,000,000 | | | Colombia Government International Bond, 5.200%, 05/15/2049 | | | 736,250 | | | | 0.0 | |
| 6,200,000 | | | European Bank for Reconstruction & Development, GMTN, 20.000%, 03/19/2025 | | | 6,478,194 | | | | 0.3 | |
| | | | | | | | | | | | |
Principal
Amount† | | | | | Value | | | Percentage
of Net
Assets | |
| SOVEREIGN BONDS: (continued) | | | | | |
| MXN385,750,000 | | | Mexican Bonos M, 7.750%, 05/29/2031 | | $ | 21,383,665 | | | | 1.2 | |
| 700,000 | | | Mexico Government International Bond, 3.750%, 04/19/2071 | | | 449,531 | | | | 0.0 | |
| 1,500,000 | | | Mexico Government International Bond, 6.338%, 05/04/2053 | | | 1,488,281 | | | | 0.1 | |
| 600,000 | | | Panama Government International Bond, 3.160%, 01/23/2030 | | | 500,062 | | | | 0.0 | |
| 1,000,000 | | | Panama Government International Bond, 6.875%, 01/31/2036 | | | 977,187 | | | | 0.1 | |
| 1,200,000 | | | Panama Government International Bond, 7.500%, 03/01/2031 | | | 1,245,750 | | | | 0.1 | |
| 1,580,000 | | | Panama Government International Bond, 8.000%, 03/01/2038 | | | 1,657,815 | | | | 0.1 | |
| ZAR335,750,000 | | | Republic of South Africa Government Bond 2035, 8.875%, 02/28/2035 | | | 14,148,388 | | | | 0.8 | |
| 3,365,000 | | | Republic of South Africa Government International Bond, 4.850%, 09/30/2029 | | | 3,024,294 | | | | 0.2 | |
| 625,000 | | | Republic of South Africa Government International Bond, 5.875%, 04/20/2032 | | | 564,844 | | | | 0.0 | |
| 2,638,000 (2) | | | Romanian Government International Bond, 6.375%, 01/30/2034 | | | 2,684,989 | | | | 0.1 | |
| 1,100,000 (2) | | | Saudi Government International Bond, 5.750%, 01/16/2054 | | | 1,091,406 | | | | 0.1 | |
| 450,000 (9) | | | Ukraine Government International Bond, 7.375%, 09/25/2034 | | | 132,862 | | | | 0.0 | |
| 4,550,000 (9) | | | Ukraine Government International Bond, 7.750%, 09/01/2027 | | | 1,559,513 | | | | 0.1 | |
| 975,000 (9) | | | Ukraine Government International Bond regs, 7.750%, 09/01/2025 | | | 366,844 | | | | 0.0 | |
| | | | | | | | | | | | |
| | | | Total Sovereign Bonds (Cost $68,057,621) | | | 65,604,879 | | | | 3.5 | |
| | | | | | | | | | | | |
| U.S. TREASURY OBLIGATIONS: 1.5% | | | | | |
| | | | United States Treasury Bonds: 0.6% | | | | | |
| 10,069,300 | | | 4.750%, 11/15/2053 | | | 10,751,338 | | | | 0.6 | |
| | | | | | | | | | | | |
| | | | United States Treasury Notes: 0.9% | | | | | |
| 858,000 | | | 0.375%, 09/30/2027 | | | 748,488 | | | | 0.0 | |
| 94,000 | | | 2.750%, 08/15/2032 | | | 84,325 | | | | 0.0 | |
| 121,000 | | | 2.875%, 04/30/2025 | | | 118,325 | | | | 0.0 | |
| 9,230,700 | | | 4.000%, 02/15/2034 | | | 9,079,259 | | | | 0.5 | |
| 4,343,400 (5) | | | 4.250%, 02/28/2029 | | | 4,349,847 | | | | 0.2 | |
| | | | | | | | | | | | |
See Accompanying Notes to Financial Statements
Voya Strategic Income Opportunities Fund | PORTFOLIO OF INVESTMENTS
as of March 31, 2024 (continued) |
Principal
Amount† | | | | | Value | | | Percentage
of Net
Assets | |
| U.S. TREASURY OBLIGATIONS: (continued) |
| | | | United States Treasury Notes (continued) | | | | | |
| 2,277,000 | | | 4.250%, 02/28/2031 | | $ | 2,281,447 | | | | 0.1 | |
| 828,000 (5) | | | 4.625%, 02/28/2026 | | | 827,385 | | | | 0.1 | |
| | | | | | | 17,489,076 | | | | 0.9 | |
| | | | | | | | | | | | |
| | | | Total U.S. Treasury Obligations (Cost $28,248,025) | | | 28,240,414 | | | | 1.5 | |
| | | | | | | | | | | | |
| Shares | | | | | Value | | | Percentage
of Net
Assets | |
| COMMON STOCK: 0.0% |
| | | | Business Equipment & Services: 0.0% | | | | | |
| 5,366 (10) | | | Yak Access LLC Series A | | | 5,232 | | | | 0.0 | |
| 1,157 (10) | | | Yak Access LLC Series B | | | 1,128 | | | | 0.0 | |
| | | | | | | 6,360 | | | | 0.0 | |
| | | | | | | | | | | | |
| | | | Consumer Discretionary: 0.0% | | | | | |
| 142,000 (10) | | | 24 Hour Fitness Worldwide, Inc. | | | 1,136 | | | | 0.0 | |
| 113 (10) | | | Travelport Tech Ltd. | | | 160,460 | | | | 0.0 | |
| | | | | | | 161,596 | | | | 0.0 | |
| | | | | | | | | | | | |
| | | | Consumer Staples: —% |
| 2,038 (10) | | | Save-A-Lot, Inc./Moran Foods | | | — | | | | — | |
| | | | | | | | | | | | |
| | | | Total Common Stock (Cost $548,230) | | | 167,956 | | | | 0.0 | |
| |
| PREFERRED STOCK: 0.0% |
| | | | Business Equipment & Services: 0.0% | | | | | |
| 175,362 | | | Yak Access LLC Series B-1 | | | 175,362 | | | | 0.0 | |
| 4,957 | | | Yak Access LLC Series B-2 | | | 4,957 | | | | 0.0 | |
| | | | | | | 180,319 | | | | 0.0 | |
| | | | | | | | | | | | |
| | | | Consumer Discretionary: 0.0% | | | | | |
| 189,193 (10) | | | 24 Hour Fitness Worldwide, Inc. | | | 1,892 | | | | 0.0 | |
| | | | | | | | | | | | |
| | | | Total Preferred Stock (Cost $236,030) | | | 182,211 | | | | 0.0 | |
| |
| PURCHASED OPTIONS(11): 0.1% |
| | | | Total Purchased Options (Cost $4,175,031) | | | 1,080,553 | | | | 0.1 | |
| | | | Total Long-Term Investments (Cost $1,761,868,574) | | | 1,671,073,520 | | | | 90.4 | |
| | | | | | | | | | | | |
Principal
Amount† | | | | | Value | | | Percentage
of Net
Assets | |
| SHORT-TERM INVESTMENTS: 16.4% | |
| | | | Commercial Paper: 13.6% | | | | | |
| 10,000,000 | | | American Electric Power Co., Inc., 5.990%, 06/12/2024 | | $ | 9,881,876 | | | | 0.5 | |
| 5,620,000 | | | American Honda Finance Corp., 6.190%, 05/03/2024 | | | 5,588,820 | | | | 0.3 | |
| 15,000,000 | | | American Honda Finance Corp., 11.010%, 04/03/2024 | | | 14,986,479 | | | | 0.8 | |
| 5,000,000 | | | Consolidated Edison, 7.410%, 04/09/2024 | | | 4,990,903 | | | | 0.3 | |
| 10,000,000 | | | Consolidated Edison, Inc., 13.800%, 04/02/2024 | | | 9,992,462 | | | | 0.6 | |
| 7,000,000 | | | Dominion Energy, Inc., 6.060%, 05/13/2024 | | | 6,950,543 | | | | 0.4 | |
| 6,000,000 | | | Dominion Energy, Inc., 6.170%, 05/01/2024 | | | 5,968,796 | | | | 0.3 | |
| 8,000,000 | | | Dominion Energy, Inc., 6.580%, 04/17/2024 | | | 7,975,630 | | | | 0.4 | |
| 4,270,000 | | | Dominion Energy, Inc., 6.630%, 04/16/2024 | | | 4,257,655 | | | | 0.2 | |
| 700,000 | | | Dominion Energy, Inc., 7.210%, 04/10/2024 | | | 698,624 | | | | 0.0 | |
| 2,400,000 | | | Duke Energy Co., 6.080%, 05/17/2024 | | | 2,381,400 | | | | 0.1 | |
| 17,000,000 | | | Duke Energy Co., 6.140%, 05/09/2024 | | | 16,889,489 | | | | 0.9 | |
| 900,000 | | | Duke Energy Co., 6.660%, 04/16/2024 | | | 897,389 | | | | 0.1 | |
| 5,000,000 | | | EIDP, Inc., 5.620%, 06/20/2024 | | | 4,938,540 | | | | 0.3 | |
| 2,500,000 | | | EIDP, Inc., 5.750%, 07/19/2024 | | | 2,457,530 | | | | 0.1 | |
| 1,000,000 | | | EIDP, Inc., 5.770%, 07/22/2024 | | | 982,502 | | | | 0.1 | |
| 5,000,000 | | | EIDP, Inc., 5.810%, 05/22/2024 | | | 4,959,055 | | | | 0.3 | |
| 7,250,000 | | | EIDP, Inc., 6.330%, 04/24/2024 | | | 7,220,048 | | | | 0.4 | |
| 4,350,000 | | | Enbridge (US) Inc., 6.280%, 05/07/2024 | | | 4,322,547 | | | | 0.2 | |
| 20,000,000 | | | Enbridge (US) Inc., 22.490%, 04/01/2024 | | | 19,987,721 | | | | 1.1 | |
| 417,000 | | | Entergy Corp., 6.050%, 05/17/2024 | | | 413,788 | | | | 0.0 | |
| 8,000,000 | | | Entergy Corp., 6.150%, 05/08/2024 | | | 7,949,242 | | | | 0.4 | |
| 5,000,000 | | | Entergy Corp., 6.620%, 04/17/2024 | | | 4,984,681 | | | | 0.3 | |
| 15,000,000 | | | HP, Inc., 6.770%, 04/17/2024 | | | 14,954,325 | | | | 0.8 | |
| 15,000,000 | | | McCormick & Company, Inc., 6.210%, 05/03/2024 | | | 14,916,510 | | | | 0.8 | |
| 5,000,000 | | | McCormick & Company, Inc., 6.660%, 04/16/2024 | | | 4,985,492 | | | | 0.3 | |
| 5,000,000 | | | National Grid, 5.980%, 06/20/2024 | | | 4,934,690 | | | | 0.3 | |
| | | | | | | | | | | | |
See Accompanying Notes to Financial Statements
Voya Strategic Income Opportunities Fund | PORTFOLIO OF INVESTMENTS
as of March 31, 2024 (continued) |
Principal
Amount† | | | | | Value | | | Percentage
of Net
Assets | |
| SHORT-TERM INVESTMENTS: (continued) | |
| | | | Commercial Paper (continued) | | | | | |
| 5,000,000 | | | Old Line Funding, LLC, 6.030%, 05/01/2024 | | $ | 4,974,613 | | | | 0.3 | |
| 10,000,000 | | | Oracle Corp., 6.450%, 04/17/2024 | | | 9,970,152 | | | | 0.6 | |
| 2,550,000 | | | Oracle Corp., 7.630%, 04/08/2024 | | | 2,545,757 | | | | 0.1 | |
| 7,800,000 | | | Parker-Hannifin Corp., 6.180%, 05/02/2024 | | | 7,758,089 | | | | 0.4 | |
| 2,300,000 | | | Parker-Hannifin Corp., 7.220%, 04/10/2024 | | | 2,295,471 | | | | 0.1 | |
| 2,050,000 | | | Sherwin-Williams Co., 6.300%, 04/22/2024 | | | 2,042,260 | | | | 0.1 | |
| 1,800,000 | | | Sherwin-Williams Co., 6.530%, 04/17/2024 | | | 1,794,559 | | | | 0.1 | |
| 2,000,000 | | | Verizon Global, 22.080%, 04/01/2024 | | | 1,998,794 | | | | 0.1 | |
| 10,675,000 | | | Volkswagen Group, 6.370%, 04/29/2024 | | | 10,621,407 | | | | 0.6 | |
| 17,000,000 | | | Volkswagen Group, 7.170%, 04/12/2024 | | | 16,960,142 | | | | 0.9 | |
| | | | Total Commercial Paper (Cost $250,581,347) | | | 250,427,981 | | | | 13.6 | |
| | | | | | | | | | | | |
| | | | Repurchase Agreements: 2.2% | | | | | |
| 6,958,072 (12) | | | Bethesda Securities, LLC, Repurchase Agreement dated 03/28/2024, 5.430%, due 04/01/2024 (Repurchase Amount $6,962,213, collateralized by various U.S. Government/U.S. Government Agency Obligations, 2.500%-6.070%, Market Value plus accrued interest $7,097,233, due 10/01/27-01/01/57) | | | 6,958,072 | | | | 0.4 | |
| 10,837,979 (12) | | | Cantor Fitzgerald Securities, Repurchase Agreement dated 03/28/2024, 5.370%, due 04/01/2024 (Repurchase Amount $10,844,357, collateralized by various U.S. Government/U.S. Government Agency Obligations, 0.000%-7.500%, Market Value plus accrued interest $11,054,739, due 12/24/26-02/20/74) | | | 10,837,979 | | | | 0.6 | |
| | | | | | | | | | | | |
Principal
Amount† | | | | | Value | | | Percentage
of Net
Assets | |
| SHORT-TERM INVESTMENTS: (continued) |
| | | | Repurchase Agreements (continued) | | | | | |
| 5,320,699 (12) | | | Mirae Asset Securities (USA) Inc., Repurchase Agreement dated 03/28/2024, 5.380%, due 04/01/2024 (Repurchase Amount $5,323,836, collateralized by various U.S. Government/U.S. Government Agency Obligations, 0.000%-7.645%, Market Value plus accrued interest $5,430,357, due 04/30/24-04/20/73) | | $ | 5,320,699 | | | | 0.3 | |
| 6,232,635 (12) | | | RBC Dominion Securities Inc., Repurchase Agreement dated 03/28/2024, 5.330%, due 04/01/2024 (Repurchase Amount $6,236,276, collateralized by various U.S. Government/U.S. Government Agency Obligations, 0.000%-8.000%, Market Value plus accrued interest $6,357,288, due 04/04/24-03/01/54) | | | 6,232,635 | | | | 0.3 | |
| 10,947,453 (12) | | | State Of Wisconsin Investment Board, Repurchase Agreement dated 03/28/2024, 5.400%, due 04/01/2024 (Repurchase Amount $10,953,931, collateralized by various U.S. Government Securities, 0.125%-3.625%, Market Value plus accrued interest $11,170,599, due 04/15/25-02/15/53) | | | 10,947,453 | | | | 0.6 | |
| | | | Total Repurchase Agreements (Cost $40,296,838) | | | 40,296,838 | | | | 2.2 | |
| | | | | | | | | | | | |
| | | | Time Deposits: 0.3% | | | | | |
| 1,120,000 (12) | | | Canadian Imperial Bank of Commerce, 5.310%, 04/01/2024 | | | 1,120,000 | | | | 0.1 | |
| 130,000 (12) | | | Landesbank Hessen Thueringen Girozentrale, 5.320%, 04/01/2024 | | | 130,000 | | | | 0.0 | |
| 990,000 (12) | | | Mizuho Bank Ltd., 5.320%, 04/01/2024 | | | 990,000 | | | | 0.0 | |
| | | | | | | | | | | | |
See Accompanying Notes to Financial Statements
Voya Strategic Income Opportunities Fund | PORTFOLIO OF INVESTMENTS
as of March 31, 2024 (continued) |
Principal
Amount† | | | | | Value | | | Percentage
of Net
Assets | |
| SHORT-TERM INVESTMENTS: (continued) |
| | | | Time Deposits (continued) | | | | | |
| 1,110,000 (12) | | | Royal Bank of Canada, 5.320%, 04/01/2024 | | $ | 1,110,000 | | | | 0.1 | |
| 1,120,000 (12) | | | Skandinaviska Enskilda Banken AB, 5.310%, 04/01/2024 | | | 1,120,000 | | | | 0.1 | |
| 1,040,000 (12) | | | Societe Generale, 5.310%, 04/01/2024 | | | 1,040,000 | | | | 0.0 | |
| | | | Total Time Deposits (Cost $5,510,000) | | | 5,510,000 | | | | 0.3 | |
| | | | | | | | | | | | |
| Shares | | | | | Value | | | Percentage
of Net
Assets | |
| | | | Mutual Funds: 0.3% | | | | | |
| 4,169,985 (13) | | | BlackRock Liquidity Funds, FedFund, Institutional Class, 5.200% | | | 4,169,985 | | | | 0.2 | |
| 1,978,000 (13) | | | Morgan Stanley Institutional Liquidity Funds - Government Portfolio (Institutional Share Class), 5.220% | | | 1,978,000 | | | | 0.1 | |
| | | | Total Mutual Funds (Cost $6,147,985) | | | 6,147,985 | | | | 0.3 | |
| | | | Total Short-Term Investments (Cost $302,536,170) | | | 302,382,804 | | | | 16.4 | |
| | | | Total Investments in Securities (Cost $2,064,404,744) | | $ | 1,973,456,324 | | | | 106.8 | |
| | | | Liabilities in Excess of Other Assets | | | (124,219,223) | | | | (6.8) | |
| | | | Net Assets | | $ | 1,849,237,101 | | | | 100.0 | |
| | | | | | | | | | | | |
| † | Unless otherwise indicated, principal amount is shown in USD. |
| (1) | Variable rate security. Rate shown is the rate in effect as of March 31, 2024. |
| (2) | Securities with purchases pursuant to Rule 144A or section 4(a)(2), under the Securities Act of 1933 and may not be resold subject to that rule except to qualified institutional buyers. |
| (3) | Interest only securities represent the right to receive the monthly interest payments on an underlying pool of mortgage loans. Principal amount shown represents the notional amount on which current interest is calculated. Payments of principal on the pool reduce the value of the interest only security. |
| (4) | Principal only securities represent the right to receive the monthly principal payments on an underlying pool of mortgage loans. No payments of interest on the pool are passed through the principal only security. |
| (5) | Security, or a portion of the security, is on loan. |
| (6) | All or a portion of this security is payment-in-kind (“PIK”) which may pay interest or additional principal at the issuer’s discretion. Rates shown are the current rate and possible payment rates. |
| (7) | All or a portion of this holding is subject to unfunded loan commitments. Please refer to Note 10 for additional details. |
| (8) | Represents or includes a TBA transaction. |
| (9) | Defaulted security. |
| (10) | For fair value measurement disclosure purposes, security is categorized as Level 3, whose value was determined using significant unobservable inputs. |
| (11) | The tables within the Portfolio of Investments detail open purchased options which are non-income producing securities. |
| (12) | All or a portion of the security represents securities purchased with cash collateral received for securities on loan. |
| (13) | Rate shown is the 7-day yield as of March 31, 2024. |
| Currency Abbreviations: |
| |
| BRL | Brazilian Real |
| CHF | Swiss Franc |
| EUR | EU Euro |
| MXN | Mexican Peso |
| ZAR | South African Rand |
| Reference Rate Abbreviations: |
| |
| 12MTA | 12-month Treasury Average |
| PRIME | Federal Reserve Bank Prime Loan Rate |
| SOFR30A | 30-day Secured Overnight Financing Rate |
| SOFRRATE | 1-day Secured Overnight Financing Rate |
| TSFR1M | 1-month CME Term Secured Overnight Financing Rate |
| TSFR3M | 3-month CME Term Secured Overnight Financing Rate |
| US0001M | 1-month LIBOR |
| US0006M | 6-month LIBOR |
See Accompanying Notes to Financial Statements
Voya Strategic Income Opportunities Fund | PORTFOLIO OF INVESTMENTS
as of March 31, 2024 (continued) |
| Fair Value Measurements^ |
| |
| The following is a summary of the fair valuations according to the inputs used as of March 31, 2024 in valuing the assets and liabilities: |
| | | Quoted Prices
in Active Markets
for Identical
Investments
(Level 1) | | Significant Other
Observable
Inputs
(Level 2) | | Significant
Unobservable
Inputs
(Level 3) | | Fair Value
at
March 31, 2024 |
| Asset Table |
| Investments, at fair value | | | | | | | | | | | | | | | | |
| Collateralized Mortgage Obligations | | $ | — | | | $ | 469,814,033 | | | $ | — | | | $ | 469,814,033 | |
| Commercial Mortgage-Backed Securities | | | — | | | | 334,470,250 | | | | — | | | | 334,470,250 | |
| Corporate Bonds/Notes | | | — | | | | 298,670,237 | | | | — | | | | 298,670,237 | |
| Asset-Backed Securities | | | — | | | | 251,781,480 | | | | — | | | | 251,781,480 | |
| Bank Loans | | | — | | | | 140,138,336 | | | | — | | | | 140,138,336 | |
| U.S. Government Agency Obligations | | | — | | | | 80,923,171 | | | | — | | | | 80,923,171 | |
| Sovereign Bonds | | | — | | | | 65,604,879 | | | | — | | | | 65,604,879 | |
| U.S. Treasury Obligations | | | — | | | | 28,240,414 | | | | — | | | | 28,240,414 | |
| Purchased Options | | | — | | | | 1,080,553 | | | | — | | | | 1,080,553 | |
| Preferred Stock | | | — | | | | 180,319 | | | | 1,892 | | | | 182,211 | |
| Common Stock | | | — | | | | — | | | | 167,956 | | | | 167,956 | |
| Short-Term Investments | | | 6,147,985 | | | | 296,234,819 | | | | — | | | | 302,382,804 | |
| Total Investments, at fair value | | $ | 6,147,985 | | | $ | 1,967,138,491 | | | $ | 169,848 | | | $ | 1,973,456,324 | |
| Other Financial Instruments+ | | | | | | | | | | | | | | | | |
| Centrally Cleared Interest Rate Swaps | | | — | | | | 4,927 | | | | — | | | | 4,927 | |
| Forward Foreign Currency Contracts | | | — | | | | 8,927,888 | | | | — | | | | 8,927,888 | |
| Forward Premium Swaptions | | | — | | | | 1,077,714 | | | | — | | | | 1,077,714 | |
| Futures | | | 427,259 | | | | — | | | | — | | | | 427,259 | |
| Total Assets | | $ | 6,575,244 | | | $ | 1,977,149,020 | | | $ | 169,848 | | | $ | 1,983,894,112 | |
| Liabilities Table | | | | | | | | | | | | | | | | |
| Other Financial Instruments+ | | | | | | | | | | | | | | | | |
| Centrally Cleared Interest Rate Swaps | | $ | — | | | $ | (1,961,811 | ) | | $ | — | | | $ | (1,961,811 | ) |
| Forward Foreign Currency Contracts | | | — | | | | (10,133,913 | ) | | | — | | | | (10,133,913 | ) |
| Forward Premium Swaptions | | | — | | | | (246,691 | ) | | | — | | | | (246,691 | ) |
| Futures | | | (2,639,812 | ) | | | — | | | | — | | | | (2,639,812 | ) |
| OTC volatility swaps | | | — | | | | (52,241 | ) | | | — | | | | (52,241 | ) |
| Sales Commitments | | | — | | | | (99,489,969 | ) | | | — | | | | (99,489,969 | ) |
| Written Options | | | — | | | | (2,580,461 | ) | | | — | | | | (2,580,461 | ) |
| Total Liabilities | | $ | (2,639,812 | ) | | $ | (114,465,086 | ) | | $ | — | | | $ | (117,104,898 | ) |
| ^ | See Note 2, “Significant Accounting Policies” in the Notes to Financial Statements for additional information. |
| + | Other Financial Instruments may include open forward foreign currency contracts, futures, centrally cleared swaps, OTC swaps and written options. Forward foreign currency contracts, futures and centrally cleared swaps are fair valued at the unrealized appreciation (depreciation) on the instrument. OTC swaps and written options are valued at the fair value of the instrument. |
At March 31, 2024, the following forward foreign currency contracts were outstanding for Voya Strategic Income Opportunities Fund:
| Currency Purchased | | Currency Sold | | Counterparty | | Settlement Date | | Unrealized
Appreciation
(Depreciation) | |
| USD | 10,003,100 | | | NOK | 105,389,831 | | | Bank of America N.A. | | 04/12/24 | | $ | 293,074 | |
| USD | 6,132,081 | | | CHF | 5,302,503 | | | Bank of America N.A. | | 04/12/24 | | | 245,967 | |
| USD | 4,757,608 | | | NOK | 49,745,080 | | | Bank of America N.A. | | 04/12/24 | | | 174,376 | |
| USD | 8,397,190 | | | CAD | 11,317,338 | | | Bank of America N.A. | | 04/12/24 | | | 40,917 | |
| AUD | 7,274,311 | | | USD | 4,702,464 | | | Bank of America N.A. | | 04/12/24 | | | 39,200 | |
| USD | 3,074,492 | | | AUD | 4,668,926 | | | Bank of America N.A. | | 04/12/24 | | | 31,115 | |
| GBP | 12,127,131 | | | USD | 15,279,372 | | | Bank of America N.A. | | 04/12/24 | | | 27,701 | |
| USD | 5,117,389 | | | CAD | 6,899,883 | | | Bank of America N.A. | | 04/12/24 | | | 22,789 | |
| USD | 5,820,010 | | | CAD | 7,865,290 | | | Bank of America N.A. | | 04/12/24 | | | 12,592 | |
| USD | 3,755,150 | | | GBP | 2,972,046 | | | Bank of America N.A. | | 04/12/24 | | | 3,783 | |
| USD | 2,319,526 | | | EUR | 2,145,738 | | | Bank of America N.A. | | 04/12/24 | | | 3,664 | |
| USD | 6,787,593 | | | AUD | 10,410,578 | | | Bank of America N.A. | | 04/12/24 | | | 1,595 | |
| USD | 11,176,115 | | | GBP | 8,854,080 | | | Bank of America N.A. | | 04/12/24 | | | 343 | |
See Accompanying Notes to Financial Statements
Voya Strategic Income Opportunities Fund | PORTFOLIO OF INVESTMENTS
as of March 31, 2024 (continued) |
| Currency Purchased | | Currency Sold | | Counterparty | | Settlement Date | | Unrealized Appreciation (Depreciation) | |
| EUR | 422,780 | | | USD | 459,964 | | | Bank of America N.A. | | 04/12/24 | | $ | (3,664 | ) |
| USD | 6,660,582 | | | EUR | 6,175,511 | | | Bank of America N.A. | | 04/12/24 | | | (4,552 | ) |
| EUR | 2,719,928 | | | USD | 2,958,033 | | | Bank of America N.A. | | 04/12/24 | | | (22,457 | ) |
| CAD | 9,118,466 | | | USD | 6,778,007 | | | Bank of America N.A. | | 04/12/24 | | | (45,293 | ) |
| EUR | 13,809,842 | | | USD | 14,959,980 | | | Bank of America N.A. | | 04/12/24 | | | (55,232 | ) |
| CAD | 17,290,995 | | | USD | 12,825,416 | | | Bank of America N.A. | | 04/12/24 | | | (58,431 | ) |
| CAD | 9,498,503 | | | USD | 7,072,912 | | | Bank of America N.A. | | 04/12/24 | | | (59,594 | ) |
| EUR | 5,860,046 | | | USD | 6,389,156 | | | Bank of America N.A. | | 04/12/24 | | | (64,498 | ) |
| USD | 12,607,102 | | | EUR | 11,742,917 | | | Bank of America N.A. | | 04/12/24 | | | (66,847 | ) |
| AUD | 14,261,642 | | | USD | 9,375,775 | | | Bank of America N.A. | | 04/12/24 | | | (79,512 | ) |
| NZD | 8,479,822 | | | USD | 5,187,785 | | | Bank of America N.A. | | 04/12/24 | | | (121,445 | ) |
| CHF | 2,902,735 | | | USD | 3,393,464 | | | Bank of America N.A. | | 04/12/24 | | | (171,244 | ) |
| SEK | 56,343,251 | | | USD | 5,439,294 | | | Bank of America N.A. | | 04/12/24 | | | (173,428 | ) |
| CHF | 3,501,532 | | | USD | 4,066,684 | | | Bank of America N.A. | | 04/12/24 | | | (179,761 | ) |
| CHF | 6,649,019 | | | USD | 7,584,810 | | | Bank of America N.A. | | 04/12/24 | | | (203,978 | ) |
| NZD | 30,315,776 | | | USD | 18,510,085 | | | Bank of America N.A. | | 04/12/24 | | | (397,670 | ) |
| USD | 5,034,906 | | | SEK | 52,516,670 | | | Barclays Bank PLC | | 04/12/24 | | | 126,674 | |
| USD | 11,248,970 | | | CHF | 9,582,804 | | | BNP Paribas | | 04/12/24 | | | 611,450 | |
| USD | 15,344,934 | | | NOK | 160,081,129 | | | BNP Paribas | | 04/12/24 | | | 595,960 | |
| USD | 14,145,565 | | | JPY | 2,073,874,250 | | | BNP Paribas | | 04/12/24 | | | 424,829 | |
| USD | 12,630,615 | | | NZD | 20,734,583 | | | BNP Paribas | | 04/12/24 | | | 242,563 | |
| USD | 6,573,073 | | | NOK | 68,968,430 | | | BNP Paribas | | 04/12/24 | | | 218,710 | |
| USD | 14,501,077 | | | NZD | 23,920,999 | | | BNP Paribas | | 04/12/24 | | | 209,275 | |
| USD | 11,726,298 | | | NZD | 19,382,615 | | | BNP Paribas | | 04/12/24 | | | 145,992 | |
| USD | 5,826,519 | | | NOK | 61,858,610 | | | BNP Paribas | | 04/12/24 | | | 127,215 | |
| USD | 5,216,937 | | | CHF | 4,599,374 | | | BNP Paribas | | 04/12/24 | | | 111,341 | |
| USD | 8,227,490 | | | SEK | 87,038,979 | | | BNP Paribas | | 04/12/24 | | | 92,788 | |
| USD | 2,369,228 | | | SEK | 24,543,525 | | | BNP Paribas | | 04/12/24 | | | 75,380 | |
| USD | 1,372,228 | | | SEK | 14,249,334 | | | BNP Paribas | | 04/12/24 | | | 40,479 | |
| USD | 21,435,910 | | | CAD | 28,984,118 | | | BNP Paribas | | 04/12/24 | | | 35,187 | |
| USD | 6,436,928 | | | AUD | 9,837,198 | | | BNP Paribas | | 04/12/24 | | | 24,681 | |
| GBP | 8,050,506 | | | USD | 10,140,426 | | | BNP Paribas | | 04/12/24 | | | 21,061 | |
| GBP | 6,633,031 | | | USD | 8,358,161 | | | BNP Paribas | | 04/12/24 | | | 14,165 | |
| USD | 7,929,135 | | | AUD | 12,146,548 | | | BNP Paribas | | 04/12/24 | | | 11,569 | |
| USD | 3,388,916 | | | GBP | 2,676,485 | | | BNP Paribas | | 04/12/24 | | | 10,611 | |
| AUD | 6,535,702 | | | USD | 4,250,597 | | | BNP Paribas | | 04/12/24 | | | 9,614 | |
| USD | 5 | | | EUR | 5 | | | BNP Paribas | | 04/12/24 | | | — | |
| CAD | 1,687,450 | | | USD | 1,250,453 | | | BNP Paribas | | 04/12/24 | | | (4,507 | ) |
| AUD | 3,213,660 | | | USD | 2,101,224 | | | BNP Paribas | | 04/12/24 | | | (6,442 | ) |
| AUD | 4,755,574 | | | USD | 3,107,708 | | | BNP Paribas | | 04/12/24 | | | (7,850 | ) |
| AUD | 11,654,601 | | | USD | 7,613,587 | | | BNP Paribas | | 04/12/24 | | | (16,690 | ) |
| AUD | 7,237,418 | | | USD | 4,742,479 | | | BNP Paribas | | 04/12/24 | | | (24,864 | ) |
| CAD | 12,251,196 | | | USD | 9,088,422 | | | BNP Paribas | | 04/12/24 | | | (42,624 | ) |
| GBP | 7,219,024 | | | USD | 9,160,947 | | | BNP Paribas | | 04/12/24 | | | (48,970 | ) |
| AUD | 5,301,228 | | | USD | 3,505,452 | | | BNP Paribas | | 04/12/24 | | | (49,917 | ) |
| CAD | 11,902,072 | | | USD | 8,875,907 | | | BNP Paribas | | 04/12/24 | | | (87,888 | ) |
| EUR | 18,575,820 | | | USD | 20,147,645 | | | BNP Paribas | | 04/12/24 | | | (99,049 | ) |
| SEK | 39,674,523 | | | USD | 3,844,276 | | | BNP Paribas | | 04/12/24 | | | (136,278 | ) |
| NZD | 16,638,841 | | | USD | 10,084,472 | | | BNP Paribas | | 04/12/24 | | | (143,457 | ) |
| NZD | 12,044,396 | | | USD | 7,395,464 | | | BNP Paribas | | 04/12/24 | | | (199,438 | ) |
| JPY | 1,004,255,661 | | | USD | 6,850,723 | | | BNP Paribas | | 04/12/24 | | | (206,576 | ) |
| CHF | 8,300,463 | | | USD | 9,430,981 | | | BNP Paribas | | 04/12/24 | | | (216,941 | ) |
| NOK | 184,056,728 | | | USD | 17,576,977 | | | BNP Paribas | | 04/12/24 | | | (619,026 | ) |
| USD | 4,340,338 | | | BRL | 21,587,150 | | | Citibank N.A. | | 04/26/24 | | | 46,569 | |
| USD | 12,191,079 | | | NZD | 19,873,142 | | | Goldman Sachs International | | 04/12/24 | | | 317,704 | |
| USD | 8,676,521 | | | NOK | 91,089,327 | | | Goldman Sachs International | | 04/12/24 | | | 284,063 | |
| USD | 17,885,700 | | | JPY | 2,663,279,118 | | | Goldman Sachs International | | 04/12/24 | | | 265,467 | |
| USD | 6,109,411 | | | CHF | 5,313,074 | | | Goldman Sachs International | | 04/12/24 | | | 211,562 | |
| USD | 32,820,645 | | | EUR | 30,264,058 | | | Goldman Sachs International | | 04/12/24 | | | 157,114 | |
| USD | 6,969,699 | | | NZD | 11,475,324 | | | Goldman Sachs International | | 04/12/24 | | | 113,670 | |
| GBP | 12,807,155 | | | USD | 16,124,950 | | | Goldman Sachs International | | 04/12/24 | | | 40,461 | |
| USD | 3,393,395 | | | GBP | 2,661,343 | | | Goldman Sachs International | | 04/12/24 | | | 34,203 | |
See Accompanying Notes to Financial Statements
Voya Strategic Income Opportunities Fund | PORTFOLIO OF INVESTMENTS
as of March 31, 2024 (continued) |
| Currency Purchased | | Currency Sold | | Counterparty | | Settlement Date | | Unrealized Appreciation (Depreciation) | |
| USD | 2,942,807 | | | JPY | 440,093,536 | | | Goldman Sachs International | | 04/12/24 | | $ | 31,152 | |
| USD | 3,081,335 | | | EUR | 2,837,703 | | | Goldman Sachs International | | 04/12/24 | | | 18,646 | |
| USD | 14,692,959 | | | GBP | 11,627,378 | | | Goldman Sachs International | | 04/12/24 | | | 16,683 | |
| CAD | 14,008,086 | | | USD | 10,328,741 | | | Goldman Sachs International | | 04/12/24 | | | 14,274 | |
| EUR | 3,315,917 | | | USD | 3,573,885 | | | Goldman Sachs International | | 04/12/24 | | | 4,933 | |
| USD | 6,779,111 | | | AUD | 10,429,209 | | | Goldman Sachs International | | 04/12/24 | | | (19,031 | ) |
| GBP | 5,406,055 | | | USD | 6,861,554 | | | Goldman Sachs International | | 04/12/24 | | | (37,939 | ) |
| CAD | 14,553,544 | | | USD | 10,820,873 | | | Goldman Sachs International | | 04/12/24 | | | (75,113 | ) |
| NZD | 4,706,585 | | | USD | 2,915,423 | | | Goldman Sachs International | | 04/12/24 | | | (103,435 | ) |
| NOK | 49,925,431 | | | USD | 4,734,999 | | | Goldman Sachs International | | 04/12/24 | | | (135,151 | ) |
| JPY | 1,486,925,803 | | | USD | 9,992,103 | | | Goldman Sachs International | | 04/12/24 | | | (154,613 | ) |
| CHF | 4,878,008 | | | USD | 5,570,571 | | | Goldman Sachs International | | 04/12/24 | | | (155,673 | ) |
| NZD | 9,588,158 | | | USD | 5,888,529 | | | Goldman Sachs International | | 04/12/24 | | | (160,003 | ) |
| CHF | 5,445,337 | | | USD | 6,212,739 | | | Goldman Sachs International | | 04/12/24 | | | (168,070 | ) |
| NOK | 67,373,964 | | | USD | 6,402,923 | | | Goldman Sachs International | | 04/12/24 | | | (195,465 | ) |
| NOK | 59,647,615 | | | USD | 5,723,360 | | | Goldman Sachs International | | 04/12/24 | | | (227,765 | ) |
| NZD | 11,434,494 | | | USD | 7,078,981 | | | Goldman Sachs International | | 04/12/24 | | | (247,346 | ) |
| JPY | 2,154,744,853 | | | USD | 14,879,591 | | | Goldman Sachs International | | 04/12/24 | | | (623,817 | ) |
| USD | 23,149,117 | | | CHF | 20,309,304 | | | Morgan Stanley Capital Services LLC | | 04/12/24 | | | 604,502 | |
| USD | 18,159,519 | | | NOK | 191,971,779 | | | Morgan Stanley Capital Services LLC | | 04/12/24 | | | 472,320 | |
| USD | 12,676,770 | | | JPY | 1,891,059,473 | | | Morgan Stanley Capital Services LLC | | 04/12/24 | | | 165,536 | |
| USD | 4,993,256 | | | SEK | 52,761,959 | | | Morgan Stanley Capital Services LLC | | 04/12/24 | | | 62,099 | |
| USD | 1,491,549 | | | SEK | 15,363,680 | | | Morgan Stanley Capital Services LLC | | 04/12/24 | | | 55,653 | |
| USD | 7,777,770 | | | CAD | 10,469,507 | | | Morgan Stanley Capital Services LLC | | 04/12/24 | | | 47,501 | |
| USD | 1,837,608 | | | SEK | 19,173,654 | | | Morgan Stanley Capital Services LLC | | 04/12/24 | | | 45,629 | |
| EUR | 11,041,809 | | | USD | 11,907,734 | | | Morgan Stanley Capital Services LLC | | 04/12/24 | | | 9,520 | |
| USD | 1,354,824 | | | CAD | 1,823,669 | | | Morgan Stanley Capital Services LLC | | 04/12/24 | | | 8,299 | |
| USD | 19,369,680 | | | GBP | 15,339,548 | | | Morgan Stanley Capital Services LLC | | 04/12/24 | | | 7,838 | |
| USD | 4,816,764 | | | GBP | 3,815,234 | | | Morgan Stanley Capital Services LLC | | 04/12/24 | | | 1,109 | |
| EUR | 204,612 | | | USD | 224,100 | | | Morgan Stanley Capital Services LLC | | 04/12/24 | | | (3,265 | ) |
| EUR | 1,658,096 | | | USD | 1,795,937 | | | Morgan Stanley Capital Services LLC | | 04/12/24 | | | (6,379 | ) |
| AUD | 22,422,417 | | | USD | 14,630,194 | | | Morgan Stanley Capital Services LLC | | 04/12/24 | | | (14,439 | ) |
| USD | 8,339,748 | | | EUR | 7,742,034 | | | Morgan Stanley Capital Services LLC | | 04/12/24 | | | (16,110 | ) |
| NOK | 17,278,946 | | | USD | 1,620,097 | | | Morgan Stanley Capital Services LLC | | 04/12/24 | | | (28,112 | ) |
| SEK | 27,167,789 | | | USD | 2,601,676 | | | Morgan Stanley Capital Services LLC | | 04/12/24 | | | (62,563 | ) |
| SEK | 20,476,104 | | | USD | 1,979,428 | | | Morgan Stanley Capital Services LLC | | 04/12/24 | | | (65,722 | ) |
| SEK | 39,225,318 | | | USD | 3,737,672 | | | Morgan Stanley Capital Services LLC | | 04/12/24 | | | (71,656 | ) |
| JPY | 1,505,930,912 | | | USD | 10,077,128 | | | Morgan Stanley Capital Services LLC | | 04/12/24 | | | (113,902 | ) |
| CHF | 8,794,199 | | | USD | 10,024,937 | | | Morgan Stanley Capital Services LLC | | 04/12/24 | | | (262,819 | ) |
| NOK | 175,715,425 | | | USD | 16,597,443 | | | Morgan Stanley Capital Services LLC | | 04/12/24 | | | (408,013 | ) |
| CHF | 15,629,213 | | | USD | 18,094,061 | | | Morgan Stanley Capital Services LLC | | 04/12/24 | | | (744,643 | ) |
| USD | 6,457,183 | | | JPY | 940,613,447 | | | Standard Chartered Bank | | 04/12/24 | | | 234,092 | |
| USD | 2,772,830 | | | CHF | 2,372,151 | | | Standard Chartered Bank | | 04/12/24 | | | 139,592 | |
| USD | 3,862,909 | | | NZD | 6,329,520 | | | Standard Chartered Bank | | 04/12/24 | | | 81,284 | |
| USD | 2,604,640 | | | SEK | 27,050,776 | | | Standard Chartered Bank | | 04/12/24 | | | 76,463 | |
| USD | 4,304,070 | | | AUD | 6,560,283 | | | Standard Chartered Bank | | 04/12/24 | | | 27,837 | |
| GBP | 2,694,233 | | | USD | 3,384,532 | | | Standard Chartered Bank | | 04/12/24 | | | 16,175 | |
| EUR | 116,142 | | | USD | 126,005 | | | Standard Chartered Bank | | 04/12/24 | | | (655 | ) |
| JPY | 203,637,734 | | | USD | 1,363,554 | | | Standard Chartered Bank | | 04/12/24 | | | (16,288 | ) |
| EUR | 2,810,907 | | | USD | 3,057,836 | | | Standard Chartered Bank | | 04/12/24 | | | (24,068 | ) |
| GBP | 5,454,250 | | | USD | 6,915,305 | | | Standard Chartered Bank | | 04/12/24 | | | (30,856 | ) |
| JPY | 273,630,772 | | | USD | 1,860,306 | | | Standard Chartered Bank | | 04/12/24 | | | (49,967 | ) |
| CHF | 1,589,295 | | | USD | 1,815,532 | | | Standard Chartered Bank | | 04/12/24 | | | (51,314 | ) |
| JPY | 398,855,389 | | | USD | 2,694,835 | | | Standard Chartered Bank | | 04/12/24 | | | (56,011 | ) |
| USD | 7,067,301 | | | CHF | 6,032,505 | | | State Street Bank and Trust Co. | | 04/12/24 | | | 370,838 | |
| USD | 5,189,777 | | | NZD | 8,376,239 | | | State Street Bank and Trust Co. | | 04/12/24 | | | 185,323 | |
| USD | 4,867,113 | | | CHF | 4,225,955 | | | State Street Bank and Trust Co. | | 04/12/24 | | | 176,035 | |
| USD | 7,842,410 | | | AUD | 11,862,179 | | | State Street Bank and Trust Co. | | 04/12/24 | | | 110,206 | |
| USD | 4,700,434 | | | SEK | 49,209,685 | | | State Street Bank and Trust Co. | | 04/12/24 | | | 101,275 | |
| USD | 4,383,010 | | | NZD | 7,203,910 | | | State Street Bank and Trust Co. | | 04/12/24 | | | 78,973 | |
| USD | 6,324,479 | | | CAD | 8,460,888 | | | State Street Bank and Trust Co. | | 04/12/24 | | | 77,294 | |
| USD | 9,334,913 | | | GBP | 7,338,737 | | | State Street Bank and Trust Co. | | 04/12/24 | | | 71,833 | |
See Accompanying Notes to Financial Statements
Voya Strategic Income Opportunities Fund | PORTFOLIO OF INVESTMENTS
as of March 31, 2024 (continued) |
| Currency Purchased | | | Currency Sold | | Counterparty | | Settlement Date | | Unrealized Appreciation (Depreciation) | |
| USD | 5,503,041 | | | CAD | 7,364,572 | | | State Street Bank and Trust Co. | | 04/12/24 | | $ | 65,333 | |
| USD | 929,032 | | | NZD | 1,515,610 | | | State Street Bank and Trust Co. | | 04/12/24 | | | 23,518 | |
| USD | 3,410,269 | | | EUR | 3,155,362 | | | State Street Bank and Trust Co. | | 04/12/24 | | | 4,735 | |
| USD | 6,563,547 | | | GBP | 5,196,912 | | | State Street Bank and Trust Co. | | 04/12/24 | | | 3,915 | |
| USD | 12,245,113 | | | CAD | 16,584,351 | | | State Street Bank and Trust Co. | | 04/12/24 | | | (113 | ) |
| EUR | 7,138,867 | | | USD | 7,715,104 | | | State Street Bank and Trust Co. | | 04/12/24 | | | (10,235 | ) |
| USD | 3,688,170 | | | EUR | 3,429,095 | | | State Street Bank and Trust Co. | | 04/12/24 | | | (12,800 | ) |
| CAD | 8,898,415 | | | USD | 6,595,767 | | | State Street Bank and Trust Co. | | 04/12/24 | | | (25,531 | ) |
| USD | 10,973,299 | | | AUD | 16,890,987 | | | State Street Bank and Trust Co. | | 04/12/24 | | | (36,867 | ) |
| SEK | 23,851,744 | | | USD | 2,283,970 | | | State Street Bank and Trust Co. | | 04/12/24 | | | (54,775 | ) |
| SEK | 42,390,959 | | | USD | 4,034,573 | | | State Street Bank and Trust Co. | | 04/12/24 | | | (72,695 | ) |
| NOK | 26,177,592 | | | USD | 2,508,728 | | | State Street Bank and Trust Co. | | 04/12/24 | | | (96,872 | ) |
| JPY | 675,702,421 | | | USD | 4,569,203 | | | State Street Bank and Trust Co. | | 04/12/24 | | | (98,761 | ) |
| SEK | 36,355,457 | | | USD | 3,502,252 | | | State Street Bank and Trust Co. | | 04/12/24 | | | (104,455 | ) |
| NZD | 6,417,467 | | | USD | 3,959,872 | | | State Street Bank and Trust Co. | | 04/12/24 | | | (125,703 | ) |
| SEK | 56,561,019 | | | USD | 5,414,745 | | | State Street Bank and Trust Co. | | 04/12/24 | | | (128,527 | ) |
| NZD | 8,367,166 | | | USD | 5,135,355 | | | State Street Bank and Trust Co. | | 04/12/24 | | | (136,321 | ) |
| NZD | 10,895,035 | | | USD | 6,723,583 | | | State Street Bank and Trust Co. | | 04/12/24 | | | (214,253 | ) |
| NOK | 148,564,379 | | | USD | 14,046,860 | | | State Street Bank and Trust Co. | | 04/12/24 | | | (358,975 | ) |
| USD | 14,311,178 | | | ZAR | 274,024,255 | | | State Street Bank and Trust Co. | | 04/26/24 | | | (129,179 | ) |
| JPY | 303,567,783 | | | USD | 2,034,913 | | | The Bank of Montreal | | 04/12/24 | | | (26,511 | ) |
| USD | 20,135,458 | | | MXN | 345,216,994 | | | Toronto Dominion Securities | | 04/26/24 | | | (553,014 | ) |
| | | | | | | | | | | | $ | (1,206,025 | ) |
At March 31, 2024, the following futures contracts were outstanding for Voya Strategic Income Opportunities Fund:
| Description | | Number
of Contracts | | Expiration
Date | | Notional
Amount | | Unrealized
Appreciation/
(Depreciation) |
| Long Contracts: | | | | | | | | | | | | | | |
| U.S. Treasury 2-Year Note | | | 1,949 | | | 06/28/24 | | $ | 398,540,047 | | | $ | (127,912 | ) |
| U.S. Treasury 5-Year Note | | | 3,339 | | | 06/28/24 | | | 357,325,172 | | | | 427,259 | |
| | | | | | | | | $ | 755,865,219 | | | $ | 299,347 | |
| Short Contracts: | | | | | | | | | | | | | | |
| U.S. Treasury 10-Year Note | | | (1,431 | ) | | 06/18/24 | | | (158,550,328 | ) | | | (545,056 | ) |
| U.S. Treasury Long Bond | | | (709 | ) | | 06/18/24 | | | (85,390,188 | ) | | | (1,308,736 | ) |
| U.S. Treasury Ultra 10-Year Note | | | (1,078 | ) | | 06/18/24 | | | (123,548,906 | ) | | | (546,966 | ) |
| U.S. Treasury Ultra Long Bond | | | (60 | ) | | 06/18/24 | | | (7,740,000 | ) | | | (111,142 | ) |
| | | | | | | | | $ | (375,229,422 | ) | | $ | (2,511,900 | ) |
| | | | | | | | | | | | | | | |
At March 31, 2024, the following centrally cleared interest rate swaps were outstanding for Voya Strategic Income Opportunities Fund:
Pay/Receive Floating Rate | | Floating Rate Index | | Floating Rate Index Payment Frequency | | Fixed Rate | | Fixed Rate Payment Frequency | | Maturity Date | | Notional Amount | | Fair Value | | | Unrealized
Appreciation/
(Depreciation) | |
| | | | | | | | | | | | | | | | | | | | | | | |
| Pay | | 1-day Overnight Brazil Interbank Deposit | | Annual | | 9.693% | | Annual | | 01/02/26 | | BRL | 205,354,322 | | | $ | (154,895 | ) | | $ | (154,895 | ) |
| Pay | | 28-day MXN TIIE-BANXICO | | Monthly | | 8.440 | | Monthly | | 07/20/28 | | MXN | 359,415,000 | | | | (377,568 | ) | | | (377,568 | ) |
| Pay | | 28-day MXN TIIE-BANXICO | | Monthly | | 9.310 | | Monthly | | 02/03/27 | | MXN | 373,533,000 | | | | 1,556 | | | | 1,556 | |
| Pay | | 1-day Secured Overnight Financing Rate | | Annual | | 3.610 | | Annual | | 04/30/54 | | USD | 3,692,000 | | | | 3,371 | | | | 3,371 | |
| Pay | | 1-day Secured Overnight Financing Rate | | Annual | | 3.391 | | Annual | | 08/25/24 | | USD | 160,000,000 | | | | (1,304,656 | ) | | | (1,304,656 | ) |
| Receive | | 28-day MXN TIIE-BANXICO | | Monthly | | 8.960 | | Monthly | | 11/03/33 | | MXN | 148,329,000 | | | | (124,692 | ) | | | (124,692 | ) |
| | | | | | | | | | | | | | | | | $ | (1,956,884 | ) | | $ | (1,956,884 | ) |
At March 31, 2024, the following OTC volatility swaps were outstanding for Voya Strategic Income Opportunities Fund:
| |
Pay/ Receive Volatility(1) | | Reference Entity | | Volatility Strike Rate | | Counterparty | | Maturity Date | | Currency | | Notional Amount | | | Fair Value | | | Unrealized
Appreciation
(Depreciation) | |
| Receive | | USD vs. CAD Spot Exchange Rate | | 5.187% | | BNP Paribas | | 09/13/24 | | USD | | 150,000 | | | $ | (18,568 | ) | | $ | (18,568 | ) |
| | | | | | | | | | | | | | | | | | | | | | |
See Accompanying Notes to Financial Statements
Voya Strategic Income Opportunities Fund | PORTFOLIO OF INVESTMENTS
as of March 31, 2024 (continued) |
| |
Pay/ Receive Volatility(1) | | Reference Entity | | Volatility Strike Rate | | Counterparty | | Maturity Date | | Currency | | Notional Amount | | | Fair Value | | | Unrealized
Appreciation
(Depreciation) | |
| Receive | | GBP vs. USD Spot Exchange Rate | | 6.625% | | BNP Paribas | | 09/17/24 | | USD | | 75,000 | | | $ | (7,449 | ) | | $ | (7,449 | ) |
| Receive | | USD vs. CAD Spot Exchange Rate | | 5.200% | | Deutsche Bank AG | | 09/13/24 | | USD | | 150,000 | | | | (20,471 | ) | | | (20,471 | ) |
| Receive | | GBP vs. USD Spot Exchange Rate | | 6.600% | | Deutsche Bank AG | | 09/17/24 | | USD | | 75,000 | | | | (5,620 | ) | | | (5,620 | ) |
| Receive | | GBP vs. USD Spot Exchange Rate | | 6.525% | | Goldman Sachs International | | 09/17/24 | | USD | | 75,000 | | | | (133 | ) | | | (133 | ) |
| | | | | | | | | | | | | | | | $ | (52,241 | ) | | $ | (52,241 | ) |
| | | | | | | | | | | | | | | | | | | | | | |
| (1) | Fund pays the exercise rate semi-annually and receives the floating rate index quarterly. |
| (2) | Fund receives the exercise rate semi-annually and pays the floating rate index quarterly. |
| (3) | Forward premium swaption exercise rates represent the premium price on each respective swaption contract. Final exercise rate will be determined at the expiration of each respective swaption contract. |
| (4) | Forward premium swaptions include premiums receivable/(payable) that have extended settlement dates. Premiums are not exchanged until the expiration date of each respective forward premium swaption contract. |
At March 31, 2024, the following OTC purchased foreign currency options were outstanding for Voya Strategic Income Opportunities Fund:
| Description | | Counterparty | | Expiration
Date | | Exercise
Price | | | Notional Amount | | | Cost | | | Fair Value | |
| Call JPY vs. Put CHF | | Morgan Stanley Capital Services LLC | | 04/05/24 | | 165.000 | | | CHF | 17,420,000 | | | $ | 213,511 | | | $ | 10,002 | |
| Call JPY vs. Put USD | | BNP Paribas | | 02/27/25 | | 107.500 | | | USD | 12,280,000 | | | | 609,088 | | | | 5,917 | |
| Call USD vs. Put EUR | | BNP Paribas | | 06/13/24 | | 1.040 | | | USD | 1,430,000 | | | | 178,707 | | | | 86,645 | |
| Call USD vs. Put EUR | | Morgan Stanley Capital Services LLC | | 05/31/24 | | 1.040 | | | USD | 70,940,047 | | | | 108,042 | | | | 47,138 | |
| Call USD vs. Put EUR | | Morgan Stanley Capital Services LLC | | 05/31/24 | | 1.044 | | | USD | 70,940,047 | | | | 143,417 | | | | 61,651 | |
| Call USD vs. Put GBP | | Standard Chartered Bank | | 05/02/24 | | 1.250 | | | USD | 17,162,000 | | | | 175,653 | | | | 57,171 | |
| Call USD vs. Put JPY | | Bank of America N.A. | | 09/09/32 | | 140.000 | | | USD | 15,517,000 | | | | 276,203 | | | | 262,963 | |
| Call USD vs. Put JPY | | BNP Paribas | | 09/09/32 | | 140.000 | | | USD | 15,517,000 | | | | 296,064 | | | | 262,963 | |
| Call USD vs. Put JPY | | Goldman Sachs International | | 11/26/25 | | 165.000 | | | USD | 2,862,000 | | | | 180,306 | | | | 202,796 | |
| Put EUR vs. Call BRL | | Bank of America N.A. | | 06/12/24 | | 5.400 | | | EUR | 17,646,000 | | | | 75,189 | | | | 83,285 | |
| | | | | | | | | | | | | | $ | 2,256,180 | | | $ | 1,080,531 | |
At March 31, 2024, the following OTC written foreign currency options were outstanding for Voya Strategic Income Opportunities Fund:
| Description | | Counterparty | | Expiration Date | | Exercise Price | | | Notional Amount | | | Premiums Received | | | Fair Value | |
| Call EUR vs. Put BRL | | Bank of America N.A. | | 09/12/24 | | 5.750 | | | EUR | 17,420,000 | | | $ | 292,145 | | | $ | (257,679 | ) |
| Call JPY vs. Put CHF | | Morgan Stanley Capital Services LLC | | 04/05/24 | | 160.000 | | | CHF | 17,420,000 | | | | 94,891 | | | | (649 | ) |
| Call USD vs. Put EUR | | Morgan Stanley Capital Services LLC | | 05/31/24 | | 1.088 | | | USD | 8,867,507 | | | | 116,687 | | | | (102,529 | ) |
| Call USD vs. Put GBP | | Standard Chartered Bank | | 05/02/24 | | 1.230 | | | USD | 17,162,000 | | | | 94,992 | | | | (14,675 | ) |
| Call USD vs. Put JPY | | Bank of America N.A. | | 09/09/27 | | 140.000 | | | USD | 15,517,000 | | | | 439,441 | | | | (474,296 | ) |
| Call USD vs. Put JPY | | BNP Paribas | | 09/09/27 | | 140.000 | | | USD | 15,517,000 | | | | 425,166 | | | | (474,296 | ) |
| Put EUR vs. Call BRL | | Bank of America N.A. | | 09/12/24 | | 5.250 | | | EUR | 17,420,000 | | | | 160,505 | | | | (132,654 | ) |
| | | | | | | | | | | | | | $ | 1,623,827 | | | $ | (1,456,778 | ) |
At March 31, 2024, the following OTC purchased interest rate swaptions were outstanding for Voya Strategic Income Opportunities Fund:
| Description | | Counterparty | | Pay/ Receive Exercise Rate | | Exercise Rate | | Floating Rate Index | | Expiration Date | | | Notional Amount | | Cost | | | Fair Value | |
| Call on 10-Year Interest Rate Swap(1) | | Bank of America N.A. | | Receive | | 2.200% | | 1-day Secured Overnight Financing Rate | | 04/25/24 | | | USD | 33,783,000 | | $ | 391,883 | | | $ | 1 | |
| Call on 10-Year Interest Rate Swap(1) | | Bank of America N.A. | | Receive | | 2.200% | | 1-day Secured Overnight Financing Rate | | 04/25/24 | | | USD | 101,347,000 | | | 1,155,355 | | | | 1 | |
| Call on 10-Year Interest Rate Swap(1) | | JPMorgan Chase Bank N.A. | | Receive | | 2.208% | | 1-day Secured Overnight Financing Rate | | 05/09/24 | | | USD | 33,783,000 | | | 371,613 | | | | 20 | |
| | | | | | | | | | | | | | | | $ | 1,918,851 | | | $ | 22 | |
See Accompanying Notes to Financial Statements
Voya Strategic Income Opportunities Fund | PORTFOLIO OF INVESTMENTS
as of March 31, 2024 (continued) |
At March 31, 2024, the following OTC written interest rate swaptions were outstanding for Voya Strategic Income Opportunities Fund:
| Description | | Counterparty | | Pay/Receive
Exercise
Rate | | Exercise Rate | | Floating Rate Index | | Expiration Date | | | Notional Amount | | Premiums Received | | | Fair Value | |
| Call on 10-Year Interest Rate Swap(2) | | Mizuho Capital Markets LLC | | Pay | | 3.675% | | 1-day Secured Overnight Financing Rate | | 04/26/24 | | | USD | 23,078,000 | | $ | 370,171 | | | $ | (512,545 | ) |
| Put on 10-Year Interest Rate Swap(1) | | Bank of America N.A. | | Receive | | 4.050% | | 1-day Secured Overnight Financing Rate | | 04/25/24 | | | USD | 101,347,000 | | | 1,124,952 | | | | (208,074 | ) |
| Put on 10-Year Interest Rate Swap(1) | | Bank of America N.A. | | Receive | | 4.050% | | 1-day Secured Overnight Financing Rate | | 04/25/24 | | | USD | 33,783,000 | | | 391,883 | | | | (69,359 | ) |
| Put on 10-Year Interest Rate Swap(1) | | JPMorgan Chase Bank N.A. | | Receive | | 4.050% | | 1-day Secured Overnight Financing Rate | | 05/09/24 | | | USD | 33,783,000 | | | 371,613 | | | | (112,805 | ) |
| Put on 10-Year Interest Rate Swap(1) | | Mizuho Capital Markets LLC | | Receive | | 3.675% | | 1-day Secured Overnight Financing Rate | | 04/26/24 | | | USD | 23,078,000 | | | 370,171 | | | | (220,900 | ) |
| | | | | | | | | | | | | | | | | $ | 2,628,790 | | | $ | (1,123,683 | ) |
At March 31, 2024, the following OTC purchased forward premium swaptions were outstanding for Voya Strategic Income Opportunities Fund:
| Description | | Counterparty | | Exercise Rate(3) | | Pay/ Receive Exercise Rate | | Floating Rate Index | | Expiration Date | | | Notional Amount | | Premium receivable/ (payable) at expiration(4) | | | Unrealized
Appreciation/
(Depreciation) | |
| Call on 10-Year Interest Rate Swap | | Goldman Sachs International | | 2.500% | | Receive | | 6-month EUR-EURIBOR | | 02/20/26 | | | EUR | 29,336,000 | | $ | (2,862,674 | ) | | $ | (89,382 | ) |
| Call on 30-Year Interest Rate Swap | | Barclays Bank PLC | | 17.500% | | Receive | | 1-day Secured Overnight Financing Rate | | 06/14/27 | | | USD | 22,958,000 | | | (4,017,650 | ) | | | 295,051 | |
| Put on 10-Year Interest Rate Swap | | Goldman Sachs International | | 2.500% | | Pay | | 6-month EUR-EURIBOR | | 02/20/26 | | | EUR | 29,336,000 | | | (2,862,674 | ) | | | (157,309 | ) |
| Put on 30-Year Interest Rate Swap | | Barclays Bank PLC | | 18.000% | | Pay | | 1-day Secured Overnight Financing Rate | | 05/25/27 | | | USD | 53,680,100 | | | (9,662,418 | ) | | | 486,047 | |
| | | | | | | | | | | | | | | | | $ | (19,405,416 | ) | | $ | 534,407 | |
| | | | | | | | | | | | | | | | | | | | | | | |
At March 31, 2024, the following OTC written forward premium swaptions were outstanding for Voya Strategic Income Opportunities Fund:
| Description | | Counterparty | | Exercise Rate(3) | | Pay/ Receive Exercise Rate | | Floating Rate Index | | Expiration Date | | | Notional Amount | | Premium receivable/ (payable) at expiration(4) | | | Unrealized Appreciation/ (Depreciation) | |
| Call on 10-Year Interest Rate Swap | | Bank of America N.A. | | 3.800% | | Pay | | 1-day Secured Overnight Financing Rate | | 02/20/26 | | | USD | 29,336,000 | | $ | 1,537,206 | | | $ | 28,341 | |
| Put on 10-Year Interest Rate Swap | | Bank of America N.A. | | 3.800% | | Receive | | 1-day Secured Overnight Financing Rate | | 02/20/26 | | | USD | 29,336,000 | | | 1,446,265 | | | | 268,275 | |
| | | | | | | | | | | | | | | | | $ | 2,983,471 | | | $ | 296,616 | |
| | | | | | | | | | | | | | | | | | | | | | | |
| (1) | Fund pays the exercise rate semi-annually and receives the floating rate index quarterly. |
| (2) | Fund receives the exercise rate semi-annually and pays the floating rate index quarterly. |
| (3) | Forward premium swaption exercise rates represent the premium price on each respective swaption contract. Final exercise rate will be determined at the expiration of each respective swaption contract. |
| (4) | Forward premium swaptions include premiums receivable/(payable) that have extended settlement dates. Premiums are not exchanged until the expiration date of each respective forward premium swaption contract. |
The following sales commitments were held by the Voya Strategic Income Opportunities Fund at March 31, 2024:
| Principal Amount | | Description | | Contractual
Settlement Date | | Fair Value |
| $ | (17,040,000 | ) | | Fannie Mae, 6.500%, due 04/01/54 | | 04/11/24 | | $ | (17,411,036 | ) |
| | (10,000,000 | ) | | Ginnie Mae, 3.000%, due 04/20/54 | | 04/18/24 | | | (8,854,688 | ) |
| | (10,000,000 | ) | | Ginnie Mae, 5.000%, due 05/15/53 | | 05/20/24 | | | (9,831,474 | ) |
| | (13,000,000 | ) | | Ginnie Mae, 5.000%, due 04/20/54 | | 04/18/24 | | | (12,777,869 | ) |
| | (17,800,000 | ) | | Ginnie Mae, 6.000%, due 04/20/54 | | 04/18/24 | | | (17,955,574 | ) |
| | (10,000,000 | ) | | Uniform Mortgage-Backed Securities, 3.000%, due 05/01/54 | | 05/13/24 | | | (8,992,767 | ) |
| | (7,650,000 | ) | | Uniform Mortgage-Backed Securities, 3.500%, due 05/15/54 | | 05/13/24 | | | (6,851,788 | ) |
| | (16,896,000 | ) | | Uniform Mortgage-Backed Securities, 5.500%, due 04/01/54 | | 04/11/24 | | | (16,814,773 | ) |
| | | | | Total Sales Commitments
Proceeds receivable $(99,045,777) | | | | $ | (99,489,969 | ) |
See Accompanying Notes to Financial Statements
Voya Strategic Income Opportunities Fund | PORTFOLIO OF INVESTMENTS
as of March 31, 2024 (continued) |
| Currency Abbreviations: |
| |
| AUD | — | Australian Dollar |
| BRL | — | Brazilian Real |
| CAD | — | Canadian Dollar |
| CHF | — | Swiss Franc |
| EUR | — | EU Euro |
| GBP | — | British Pound |
| JPY | — | Japanese Yen |
| MXN | — | Mexican Peso |
| NOK | — | Norwegian Krone |
| NZD | — | New Zealand Dollar |
| Currency Abbreviations: |
| |
| SEK | — | Swedish Krona |
| USD | — | United States Dollar |
| ZAR | — | South African Rand |
A summary of derivative instruments by primary risk exposure is outlined in the following tables.
The fair value of derivative instruments as of March 31, 2024 was as follows:
| Derivatives not accounted for as hedging instruments | | Location on Statement of Assets and Liabilities | | Fair Value | |
| Asset Derivatives | | | | | | |
| Foreign exchange contracts | | Investments in securities at value* | | $ | 1,080,531 | |
| Interest rate contracts | | Investments in securities at value* | | | 22 | |
| Foreign exchange contracts | | Unrealized appreciation on forward foreign currency contracts | | | 8,927,888 | |
| Interest rate contracts | | Unrealized appreciation on forward premium swaptions | | | 1,077,714 | |
| Interest rate contracts | | Variation margin receivable on futures contracts** | | | 427,259 | |
| Interest rate contracts | | Variation margin receivable on centrally cleared swaps** | | | 4,927 | |
| Total Asset Derivatives | | | | $ | 11,518,341 | |
| | | | | | | |
| Liability Derivatives | | | | | | |
| Foreign exchange contracts | | Unrealized depreciation on forward foreign currency contracts | | $ | 10,133,913 | |
| Interest rate contracts | | Unrealized depreciation on forward premium swaptions | | | 246,691 | |
| Interest rate contracts | | Variation margin payable on futures contracts** | | | 2,639,812 | |
| Interest rate contracts | | Variation margin payable on centrally cleared swaps** | | | 1,961,811 | |
| Foreign exchange contracts | | Unrealized depreciation on OTC swap agreements | | | 52,241 | |
| Foreign exchange contracts | | Written options, at fair value | | | 1,456,778 | |
| Interest rate contracts | | Written options, at fair value | | | 1,123,683 | |
| Total Liability Derivatives | | | | $ | 17,614,929 | |
| | | | | | | |
| * | Includes purchased options. |
| ** | The fair value presented above represents the cumulative unrealized appreciation (depreciation) on futures contracts and centrally cleared swaps as reported in the tables within the Portfolio of Investments. In the Statement of Assets and Liabilities, only current day’s unsettled variation margin is reported in receivables or payables on futures contracts and centrally cleared swaps and the net cumulative unrealized appreciation (depreciation) is included in total distributable earnings (loss). |
The effect of derivative instruments on the Fund’s Statement of Operations for the year ended March 31, 2024 was as follows:
Amount of Realized Gain or (Loss) on Derivatives Recognized in Income
Derivatives not accounted for as hedging
instruments | | Investments* | | Forward
foreign
currency
contracts | | Futures | | Swaps | | Written options | | Total |
| Credit contracts | | $ | — | | | $ | — | | | $ | — | | | $ | 680,932 | | | $ | — | | | $ | 680,932 | |
| Equity contracts | | | 479,695 | | | | — | | | | (163,628 | ) | | | — | | | | (2,634,832 | ) | | | (2,318,765 | ) |
| Foreign exchange contracts | | | (2,294,738 | ) | | | (8,540,315 | ) | | | — | | | | — | | | | 2,230,396 | | | | (8,604,657 | ) |
| Interest rate contracts | | | (729,794 | ) | | | — | | | | 6,329,481 | | | | (23,732,855 | ) | | | 18,748,362 | | | | 615,194 | |
| Total | | $ | (2,544,837 | ) | | $ | (8,540,315 | ) | | $ | 6,165,853 | | | $ | (23,051,923 | ) | | $ | 18,343,926 | | | $ | (9,627,296 | ) |
See Accompanying Notes to Financial Statements
Voya Strategic Income Opportunities Fund | PORTFOLIO OF INVESTMENTS
as of March 31, 2024 (continued) |
Change in Unrealized Appreciation or (Depreciation) on Derivatives Recognized in Income
Derivatives not accounted for as hedging instruments | | Investments* | | Forward
foreign
currency
contracts | | Futures | | Swaps | | Written
options | | Total |
| Foreign exchange contracts | | $ | 855,010 | | | $ | (259,381 | ) | | $ | — | | | $ | (51,978 | ) | | $ | 375,266 | | | $ | 918,917 | |
| Interest rate contracts | | | (1,781,764 | ) | | | — | | | | 7,682,665 | | | | 1,938,674 | | | | 693,347 | | | | 8,532,922 | |
| Total | | $ | (926,754 | ) | | $ | (259,381 | ) | | $ | 7,682,665 | | | $ | 1,886,696 | | | $ | 1,068,613 | | | $ | 9,451,839 | |
| * | Amounts recognized for purchased options are included in net realized gain (loss) on investments and net change in unrealized appreciation or depreciation on investments. |
The following is a summary by counterparty of the fair value of OTC derivative instruments subject to Master Netting Agreements and collateral pledged (received), if any, at March 31, 2024:
| | | Bank of
America N.A. | | Barclays Bank
PLC | | BNP Paribas | | Citibank N.A. | | Deutsche
Bank AG | | Goldman
Sachs
International | | JPMorgan
Chase Bank
N.A. | | Mizuho
Capital
Markets LLC | | Morgan
Stanley
Capital
Services LLC | | Standard
Chartered
Bank | | State Street
Bank and
Trust Co. |
| Assets: |
| Purchased options | | $ | 346,250 | | | $ | — | | | $ | 355,525 | | | $ | — | | | $ | — | | | $ | 202,796 | | | $ | 20 | | | $ | — | | | $ | 118,791 | | | $ | 57,171 | | | $ | — | |
| Forward foreign currency contracts | | | 897,116 | | | | 126,674 | | | | 3,022,870 | | | | 46,569 | | | | — | | | | 1,509,932 | | | | — | | | | — | | | | 1,480,006 | | | | 575,443 | | | | 1,269,278 | |
| Forward premium swaptions | | | 296,616 | | | | 781,098 | | | | — | | | | — | | | | — | | | | — | | | | — | | | | — | | | | — | | | | — | | | | — | |
| Total Assets | | $ | 1,539,982 | | | $ | 907,772 | | | $ | 3,378,395 | | | $ | 46,569 | | | $ | — | | | $ | 1,712,728 | | | $ | 20 | | | $ | — | | | $ | 1,598,797 | | | $ | 632,614 | | | $ | 1,269,278 | |
| Liabilities: | | | | | | | | | | | | | | | | | | | | | | | | | | | | | | | | | | | | | | | | | | | | |
| Forward foreign currency contracts | | $ | 1,707,606 | | | $ | — | | | $ | 1,910,517 | | | $ | — | | | $ | — | | | $ | 2,303,421 | | | $ | — | | | $ | — | | | $ | 1,797,623 | | | $ | 229,159 | | | $ | 1,606,062 | |
| Forward premium swaptions | | | — | | | | — | | | | — | | | | — | | | | — | | | | 246,691 | | | | — | | | | — | | | | — | | | | — | | | | — | |
| Volatility Swaps | | | — | | | | — | | | | 26,017 | | | | — | | | | 26,091 | | | | 133 | | | | — | | | | — | | | | — | | | | — | | | | — | |
| Written options | | | 1,142,062 | | | | — | | | | 474,296 | | | | — | | | | — | | | | — | | | | 112,805 | | | | 733,445 | | | | 103,178 | | | | 14,675 | | | | — | |
| Total Liabilities | | $ | 2,849,668 | | | $ | — | | | $ | 2,410,830 | | | $ | — | | | $ | 26,091 | | | $ | 2,550,245 | | | $ | 112,805 | | | $ | 733,445 | | | $ | 1,900,801 | | | $ | 243,834 | | | $ | 1,606,062 | |
| Net OTC derivative instruments by counterparty, at fair value | | $ | (1,309,686 | ) | | $ | 907,772 | | | $ | 967,565 | | | $ | 46,569 | | | $ | (26,091 | ) | | $ | (837,517 | ) | | $ | (112,785 | ) | | $ | (733,445 | ) | | $ | (302,004 | ) | | $ | 388,780 | | | $ | (336,784 | ) |
| Total collateral pledged by the Fund/(Received from counterparty)(1) | | $ | 1,309,686 | | | $ | (830,000 | ) | | $ | (610,000 | ) | | $ | — | | | $ | — | | | $ | — | | | $ | — | | | $ | — | | | $ | 120,632 | | | $ | (270,000 | ) | | $ | — | |
| Net Exposure(2) | | $ | — | | | $ | 77,772 | | | $ | 357,565 | | | $ | 46,569 | | | $ | (26,091 | ) | | $ | (837,517 | ) | | $ | (112,785 | ) | | $ | (733,445 | ) | | $ | (181,372 | ) | | $ | 118,780 | | | $ | (336,784 | ) |
| | | The Bank of Montreal | | Toronto Dominion Securities | | Total |
| Assets: |
| Purchased options | | $ | — | | | $ | — | | | $ | 1,080,553 | |
| Forward foreign currency contracts | | | — | | | | — | | | | 8,927,888 | |
| Forward premium swaptions | | | — | | | | — | | | | 1,077,714 | |
| Total Assets | | $ | — | | | $ | — | | | $ | 11,086,155 | |
| Liabilities: |
| Forward foreign currency contracts | | $ | 26,511 | | | $ | 553,014 | | | $ | 10,133,913 | |
| Forward premium swaptions | | | — | | | | — | | | | 246,691 | |
| Volatility Swaps | | | — | | | | — | | | | 52,241 | |
| Written options | | | — | | | | — | | | | 2,580,461 | |
| Total Liabilities | | $ | 26,511 | | | $ | 553,014 | | | $ | 13,013,306 | |
| Net OTC derivative instruments by counterparty, at fair value | | $ | (26,511 | ) | | $ | (553,014 | ) | | $ | (1,927,151 | ) |
| Total collateral pledged by the Fund/(Received from counterparty)(1) | | $ | — | | | $ | 420,000 | | | $ | 140,318 | |
| Net Exposure(2) | | $ | (26,511 | ) | | $ | (133,014 | ) | | $ | (1,786,833 | ) |
| | | | | | | | | | | | | |
| (1) | At March 31, 2024, the Fund had pledged $1,390,038 to Bank of America N.A. Excess cash collateral is not shown for financial reporting purposes. |
| (2) | Positive net exposure represents amounts due from each respective counterparty. Negative exposure represents amounts due from the Fund. Please refer to Note 2 for additional details regarding counterparty credit risk and credit related contingent features. |
See Accompanying Notes to Financial Statements
Voya Strategic Income Opportunities Fund | PORTFOLIO OF INVESTMENTS
as of March 31, 2024 (continued) |
At March 31, 2024, the aggregate cost of securities and other investments and the composition of unrealized appreciation and depreciation of securities and other investments on a tax basis were:
| Cost for federal income tax purposes was $2,065,005,484. |
| Net unrealized depreciation consisted of: |
| Gross Unrealized Appreciation | | $ | 26,094,134 | |
| Gross Unrealized Depreciation | | | (123,429,776 | ) |
| Net Unrealized Depreciation | | $ | (97,335,642 | ) |
See Accompanying Notes to Financial Statements
[This Page Intentionally Left Blank]
TAX INFORMATION (Unaudited)
Dividends and distributions paid during the year ended March 31, 2024 were as follows:
| Fund Name | | Type | | | Per Share
Amount | |
| Voya GNMA Income Fund | | | | | | | |
| Class A | | NII | | | | $0.2539 | |
| Class C | | NII | | | | $0.1993 | |
| Class I | | NII | | | | $0.2775 | |
| Class R6 | | NII | | | | $0.2814 | |
| Class W | | NII | | | | $0.2743 | |
| Voya High Yield Bond Fund | | | | | | | |
| Class A | | NII | | | | $0.4268 | |
| Class C | | NII | | | | $0.3759 | |
| Class I | | NII | | | | $0.4494 | |
| Class R | | NII | | | | $0.4099 | |
| Class R6 | | NII | | | | $0.4544 | |
| Class W | | NII | | | | $0.4443 | |
| Voya Intermediate Bond Fund | | | | | | | |
| Class A | | NII | | | | $0.3372 | |
| Class C | | NII | | | | $0.2724 | |
| Class I | | NII | | | | $0.3681 | |
| Class R | | NII | | | | $0.3161 | |
| Class R6 | | NII | | | | $0.3735 | |
| Class W | | NII | | | | $0.3584 | |
| Fund Name | | Type | | | Per Share
Amount | |
| Voya Short Duration High Income Fund | | | | | | | |
| Class A | | NII | | | | $0.7796 | |
| Class I | | NII | | | | $0.6761 | |
| Class R | | NII | | | | $0.8049 | |
| Class R6 | | NII | | | | $0.8082 | |
| Voya Short Term Bond Fund | | | | | | | |
| Class A | | NII | | | | $0.3732 | |
| Class C | | NII | | | | $0.3040 | |
| Class I | | NII | | | | $0.3980 | |
| Class R | | NII | | | | $0.3515 | |
| Class R6 | | NII | | | | $0.4031 | |
| Class W | | NII | | | | $0.3975 | |
| Voya Strategic Income Opportunities Fund | | | | | | | |
| Class A | | NII | | | | $0.4668 | |
| Class C | | NII | | | | $0.3932 | |
| Class I | | NII | | | | $0.4887 | |
| Class R | | NII | | | | $0.4406 | |
| Class R6 | | NII | | | | $0.4938 | |
| Class W | | NII | | | | $0.4882 | |
NII - Net investment income
Pursuant to Internal Revenue Code Section 871(k)(1), the Funds designate the following percentages of net investment income distributions as interest-related dividends:
| Voya GNMA Income Fund | | | 99.98 | % |
| Voya High Yield Bond Fund | | | 80.46 | % |
| Voya Intermediate Bond Fund | | | 100.00 | % |
| Voya Short Duration High Income Fund | | | 85.85 | % |
| Voya Short Term Bond Fund | | | 98.91 | % |
| Voya Strategic Income Opportunities Fund | | | 87.95 | % |
Above figures may differ from those cited elsewhere in this report due to differences in the calculation of income and gains under U.S. generally accepted accounting principles (book) purposes and Internal Revenue Service (tax) purposes.
Shareholders are strongly advised to consult their own tax advisers with respect to the tax consequences of their investments in the Funds. In January, shareholders, receive an IRS 1099-DIV regarding the federal tax status of the dividends and distributions they received in the calendar year.
TRUSTEE AND OFFICER INFORMATION (Unaudited)
The business and affairs of the Trust are managed under the direction of the Board. A Trustee, who is not an interested person of the Trust, as defined in the 1940 Act, is an independent trustee (“Independent Trustee”). The Trustees and Officers of the Trust are listed below. The Statement of Additional Information includes additional information about Trustees of the Trust and is available, without charge, upon request at (800) 992-0180.
Name, Address and Year of
Birth | | Position(s)
Held with the
Trust | | Term of Office and
Length of Time
Served(1) | | Principal
Occupation(s) –
During the Past 5 Years | Number of
funds in
Fund
Complex
Overseen
by
Trustee(2) | | Other Board Positions
Held by Trustee |
| Independent Trustees | | | | | | | | | |
Colleen D. Baldwin
(1960)
7337 East Doubletree Ranch Rd.
Suite 100
Scottsdale, Arizona 85258 | | Chairperson Trustee | | January 2020 – Present November 2007 – Present | | President, Glantuam Partners, LLC, a business consulting firm (January 2009 – Present). | 138 | | Stanley Global Engineering (2020 – Present). |
John V. Boyer
(1953)
7337 East Doubletree Ranch Rd.
Suite 100
Scottsdale, Arizona 85258 | | Trustee | | January 2005 – Present | | Retired. Formerly, President and Chief Executive Officer, Bechtler Arts Foundation, an arts and education foundation (January 2008 – December 2019). | 138 | | None. |
Martin J. Gavin
(1950)
7337 East Doubletree Ranch Rd.
Suite 100
Scottsdale, AZ 85258 | | Trustee | | August 2015 – Present | | Retired. | 138 | | None. |
Joseph E. Obermeyer
(1957)
7337 East Doubletree Ranch Rd.
Suite 100
Scottsdale, Arizona 85258 | | Trustee | | May 2013 – Present | | President, Obermeyer & Associates, Inc., a provider of financial and economic consulting services (November 1999 – Present). | 138 | | None. |
Sheryl K. Pressler
(1950)
7337 East Doubletree Ranch Rd.
Suite 100
Scottsdale, Arizona 85258 | | Trustee | | January 2006 – Present | | Consultant (May 2001 – Present). | 138 | | Centerra Gold Inc. (May 2008 – Present). |
Christopher P. Sullivan
(1954)
7337 East Doubletree Ranch Rd.
Suite 100
Scottsdale, Arizona 85258 | | Trustee | | October 2015 – Present | | Retired. | 138 | | None. |
TRUSTEE AND OFFICER INFORMATION (Unaudited) (continued)
| (1) | Trustees serve until their successors are duly elected and qualified. The tenure of each Trustee who is not an “interested person” as defined in the 1940 Act, of each Fund (“Independent Trustee”) is subject to the Board’s retirement policy which states that each duly elected or appointed Independent Trustee shall retire from and cease to be a member of the Board of Trustees at the close of business on December 31 of the calendar year in which the Independent Trustee attains the age of 75. A majority vote of the Board’s other Independent Trustees may extend the retirement date of an Independent Trustee if the retirement would trigger a requirement to hold a meeting of shareholders of the Trust under applicable law, whether for the purposes of appointing a successor to the Independent Trustee or otherwise comply under applicable law, in which case the extension would apply until such time as the shareholder meeting can be held or is no longer required (as determined by a vote of a majority of the other Independent Trustees). |
| (2) | For the purposes of this table, “Fund Complex” means the Voya family of funds including the following investment companies: Voya Asia Pacific High Dividend Equity Income Fund; Voya Balanced Portfolio, Inc.; Voya Credit Income Fund; Voya Emerging Markets High Dividend Equity Fund; Voya Equity Trust; Voya Funds Trust; Voya Global Advantage and Premium Opportunity Fund; Voya Global Equity Dividend and Premium Opportunity Fund; Voya Government Money Market Portfolio; Voya Infrastructure, Industrials and Materials Fund; Voya Intermediate Bond Portfolio; Voya Investors Trust; Voya Mutual Funds; Voya Partners, Inc.; Voya Separate Portfolios Trust; Voya Strategic Allocation Portfolios, Inc.; Voya Variable Funds; Voya Variable Insurance Trust; Voya Variable Portfolios, Inc.; and Voya Variable Products Trust. The number of funds in the Fund Complex is as of April 30, 2024. |
TRUSTEE AND OFFICER INFORMATION (Unaudited) (continued)
Name, Address and Year of
Birth | | Position(s) Held
with the Trust | | Term of Office and
Length of Time
Served(1) | | Principal Occupation(s) – During the Past 5 Years |
Andy Simonoff
(1973)
5780 Powers Ferry Road NW
Atlanta, Georgia 30327 | | President and Chief Executive Officer | | January 2023– Present | | Director, President and Chief Executive Officer, Voya Funds Services, LLC, Voya Capital, LLC and Voya Investments, LLC (January 2023 – Present); Managing Director, Chief Strategy and Transformation Officer, Voya Investment Management (January 2020 – Present). Formerly, Managing Director, Head of Business Management, Voya Investment Management (March 2019 – January 2020); Managing Director, Head of Business Management, Fixed Income, Voya Investment Management (November 2015 – March 2019). |
Jonathan Nash
(1967)
230 Park Avenue
New York, New York 10169 | | Executive Vice President and Chief Investment Risk Officer | | March 2020 – Present | | Head of Investment Risk for Equity and Funds, Voya Investment Management (April 2024 – Present); Executive Vice President and Chief Investment Risk Officer, Voya Investments, LLC (March 2020 – Present). Formerly, Senior Vice President, Investment Risk Management, Voya Investment Management (March 2017 – March 2024); Vice President, Voya Investments, LLC (September 2018 – March 2020). |
Steven Hartstein
(1963)
230 Park Avenue
New York, New York 10169 | | Chief Compliance Officer | | December 2022 – Present | | Senior Vice President, Voya Investment Management (December 2022 – Present). Formerly, Head of Funds Compliance, Brighthouse Financial, Inc. and Chief Compliance Officer – Brighthouse Funds and Brighthouse Investment Advisers, LLC (March 2017- December 2022). |
Todd Modic
(1967)
7337 East Doubletree Ranch Rd.
Suite 100
Scottsdale, Arizona 85258 | | Senior Vice President, Chief/ Principal Financial Officer and Assistant Secretary | | March 2005 – Present | | Director and Senior Vice President, Voya Capital, LLC, and Voya Funds Services, LLC (September 2022 – Present); Director, Voya Investments, LLC (September 2022 – Present); Senior Vice President, Voya Investments, LLC (April 2005 – Present). Formerly, President, Voya Funds Services, LLC (March 2018 – September 2022). |
Kimberly A. Anderson
(1964)
7337 East Doubletree Ranch Rd.
Suite 100
Scottsdale, Arizona 85258 | | Senior Vice President | | November 2003 – Present | | Senior Vice President, Voya Investments, LLC (September 2003 – Present). |
Sara M. Donaldson
(1959)
7337 East Doubletree Ranch Rd.
Suite 100
Scottsdale, Arizona 85258 | | Senior Vice President | | June 2022 – Present | | Senior Vice President, Voya Investments, LLC (February 2022 – Present); Senior Vice President, Head of Active Ownership, Voya Investment Management (September 2021 – Present). Formerly, Vice President, Voya Investments, LLC (October 2015 – February 2022); Vice President, Head of Proxy Voting, Voya Investment Management (October 2015 – August 2021). |
Jason Kadavy
(1976)
7337 East Doubletree Ranch Rd.
Suite 100
Scottsdale, Arizona 85258 | | Senior Vice President | | September 2023 - Present | | Senior Vice President, Voya Investments, LLC and Voya Funds Services, LLC (September 2023 – Present); Formerly, Vice President, Voya Investments, LLC (October 2015 - September 2023); Vice President, Voya Funds Services, LLC (July 2007 – September 2023). |
Andrew K. Schlueter
(1976)
7337 East Doubletree Ranch Rd.
Suite 100
Scottsdale, Arizona 85258 | | Senior Vice President | | June 2022 – Present | | Senior Vice President, Head of Investment Operations Support, Voya Investment Management (April 2023 – Present); Vice President, Voya Investments Distributor, LLC (April 2018 – Present); Vice President, Voya Investments, LLC and Voya Funds Services, LLC (March 2018-Present); Formerly, Vice President, Head of Mutual Fund Operations, Voya Investment Management (March 2022 – March 2023); Vice President, Head of Mutual Fund Operations, Voya Investment Management (February 2018 – February 2022). |
TRUSTEE AND OFFICER INFORMATION (Unaudited) (continued)
Name, Address and Year of
Birth | | Position(s) Held
with the Trust | | Term of Office and
Length of Time
Served(1) | | Principal Occupation(s) – During the Past 5 Years |
Joanne F. Osberg
(1982)
7337 East Doubletree Ranch Rd.
Suite 100
Scottsdale, Arizona 85258 | | Senior Vice President
Secretary | | March 2023 - Present
September 2020 – Present | | Senior Vice President and Chief Counsel, Voya Investment Management – Mutual Fund Legal Department, Senior Vice President and Secretary, Voya Investments, LLC, Voya Capital, LLC, and Voya Funds Services, LLC (March 2023 – Present). Formerly, Secretary, Voya Capital, LLC (August 2022 - March 2023); Vice President and Secretary, Voya Investments, LLC and Voya Funds Services, LLC, Vice President and Senior Counsel, Voya Investment Management – Mutual Fund Legal Department (September 2020 – March 2023). Vice President and Counsel, Voya Investment Management – Mutual Fund Legal Department (January 2013 – September 2020). |
Robert Terris
(1970)
5780 Powers Ferry Road NW
Atlanta, Georgia 30327 | | Senior Vice President | | May 2006 – Present | | Senior Vice President, Head of Future State Operating Model Design, Voya Investment Management (April 2023 – Present); Senior Vice President, Voya Investments Distributor, LLC (April 2018 – Present); Senior Vice President, Head of Investment Services, Voya Investments, LLC (April 2018 – Present); Senior Vice President, Head of Investment Services, Voya Funds Services, LLC (March 2006 – Present). |
Fred Bedoya
(1973)
7337 East Doubletree Ranch Rd.
Suite 100
Scottsdale, Arizona 85258 | | Vice President Principal Accounting Officer and Treasurer | | September 2012 – Present | | Vice President, Voya Investments, LLC (October 2015 – Present); Vice President, Voya Funds Services, LLC (July 2012 – Present). |
Robyn L. Ichilov
(1967)
7337 East Doubletree Ranch Rd.
Suite 100
Scottsdale, Arizona 85258 | | Vice President | | October 2000 – Present | | Vice President, Voya Investments, LLC (August 1997 – Present); Vice President, Voya Funds Services, LLC (November 1995 – Present). |
Erica McKenna
(1972)
7337 East Doubletree Ranch Rd.
Suite 100
Scottsdale, Arizona 85258 | | Vice President | | June 2022 – Present | | Vice President, Head of Mutual Fund Compliance, and Chief Compliance Officer, Voya Investments, LLC (May 2022 – Present). Formerly, Vice President, Fund Compliance Manager, Voya Investments, LLC (March 2021 – May 2022); Assistant Vice President, Fund Compliance Manager, Voya Investments, LLC (December 2016 – March 2021). |
Craig Wheeler
(1969)
7337 East Doubletree Ranch Rd.
Suite 100
Scottsdale, Arizona 85258 | | Vice President | | May 2013 – Present | | Vice President – Director of Tax, Voya Investments, LLC (October 2015 – Present). |
Gizachew Wubishet
(1976)
7337 East Doubletree Ranch Rd.
Suite 100
Scottsdale, Arizona 85258 | | Vice President and Assistant Secretary | | March 2024 - Present | | Vice President and Counsel, Voya Investment Management – Mutual Fund Legal Department (March 2024 – Present). Formerly, Assistant Vice President and Counsel, Voya Investment Management – Mutual Fund Legal Department (May 2019 – February 2024); Attorney, Ropes & Gray LLP (October 2011 – April 2019). |
Nicholas C.D. Ward
(1993)
7337 East Doubletree Ranch Rd.
Suite 100
Scottsdale, Arizona 85258 | | Assistant Vice President and Assistant Secretary | | June 2022 – Present | | Assistant Vice President and Counsel, Voya Investment Management – Mutual Fund Legal Department (March 2024 – Present). Formerly, Counsel, Voya Investment Management – Mutual Fund Legal Department (November 2021 – February 2024); Associate, Dechert LLP (October 2018 – November 2021). |
TRUSTEE AND OFFICER INFORMATION (Unaudited) (continued)
Name, Address and Year of
Birth | | Position(s) Held
with the Trust | | Term of Office and
Length of Time
Served(1) | | Principal Occupation(s) – During the Past 5 Years |
Monia Piacenti
(1976)
One Orange Way
Windsor, Connecticut 06095 | | Anti-Money Laundering Officer | | June 2018 – Present | | Compliance Manager, Voya Financial, Inc. (March 2023 – Present); Anti-Money Laundering Officer, Voya Investments Distributor, LLC, Voya Investment Management and Voya Investment Management Trust Co. (June 2018 – Present). Formerly, Compliance Consultant, Voya Financial, Inc. (January 2019 – February 2023). |
| (1) | The Officers hold office until the next annual meeting of the Board of Trustees and until their successors shall have been elected and qualified. |
ADVISORY AND SUB-ADVISORY CONTRACT APPROVAL DISCUSSION (Unaudited)
BOARD CONSIDERATION AND APPROVAL OF INVESTMENT MANAGEMENT CONTRACTS AND SUB-ADVISORY CONTRACTS
At a meeting held on November 16, 2023, the Board of Trustees (“Board”) of Voya Funds Trust (the “Trust”), including a majority of the Board members who have no direct or indirect interest in the investment management and sub-advisory contracts, and who are not “interested persons” of Voya GNMA Income Fund, Voya High Yield Bond Fund, Voya Intermediate Bond Fund, Voya Short Term Bond Fund, and Voya Strategic Income Opportunities Fund, each a series of the Trust (the “Funds”), as such term is defined under the Investment Company Act of 1940, as amended (the “Independent Trustees”), considered and approved the renewal of the investment management contracts (the “Management Contracts”) between Voya Investments, LLC (the “Manager”) and the Trust, on behalf of the Funds, and the sub-advisory contracts (the “Sub-Advisory Contracts,” and together with the Management Contracts, the “Contracts”) with Voya Investment Management Co. LLC, the sub-adviser to each Fund (the “Sub-Adviser”), for an additional one-year period ending November 30, 2024.
In addition to the Board meeting on November 16, 2023, the Independent Trustees also held meetings outside the presence of representatives of the Manager and Sub-Adviser (collectively, such persons are referred to herein as “management”) on October 9, 2023 and November 14, 2023. At those meetings, the Board members reviewed and considered materials related to the proposed continuance of the Contracts that they had requested and believed to be relevant to the renewal of the Contracts in light of their own business judgment and the legal advice furnished to them by K&L Gates LLP, their independent legal counsel. The Board also considered information furnished to it throughout the year at meetings of the Board and its committees, including information regarding performance, expenses, and other relevant matters. While the Board considered the renewal of the management contracts and sub-advisory contracts for all of the applicable investment companies in the Voya family of funds at the same meetings, the Board considered each Voya fund’s investment management and sub-advisory relationships separately.
The Board has established a Contracts Committee and two Investment Review Committees (the “IRCs”), each of which includes only Independent Trustees as members. The Contracts Committee meets several times throughout the year to provide oversight with respect to the management and sub-advisory contracts approval and renewal process for the Voya funds, among other functions, and each IRC meets several times throughout the year with respect to each Voya fund (assigned to that IRC) to provide oversight
regarding the investment performance of the sub-advisers, as well as the Manager’s role in monitoring the sub-advisers.
The Contracts Committee oversees, and annually recommends Board approval of updates to, a methodology guide for the Voya funds (“Methodology Guide”), which sets out a framework pursuant to which the Independent Trustees request, and management provides, certain information that the Independent Trustees deem to be important or potentially relevant to the contracts renewal process for the Voya funds. The Independent Trustees retain the services of an independent consultant with experience in the mutual fund industry to assist the Contracts Committee in developing and recommending to the Board: (1) a selected peer group of investment companies for each Fund (“Selected Peer Group”) based on that Fund’s particular attributes; and (2) updates to the Methodology Guide with respect to the content and format of various data prepared in connection with the renewal process. In addition, the Independent Trustees periodically have retained an independent firm to test and verify the accuracy of certain information presented to the Board for a representative sample of the Voya funds.
The Manager or Sub-Adviser may not have been able to, or opted not to, provide information in response to certain information requests, in which case the Board conducted its evaluation based on the information that was provided. In such cases, the omission of any such information was determined to not be material to the Board’s considerations.
Provided below is an overview of certain material factors that the Board considered at its meetings regarding the renewal of the Contracts and the compensation to be paid thereunder. The Board members did not identify any particular information or factor that was most relevant to its consideration.
Nature, Extent and Quality of Services
The Manager oversees, subject to the authority of the Board, and is responsible for the provision of, all investment advisory and portfolio management services for the Funds, but may delegate certain of these responsibilities to one or more sub-advisers. In addition, the Manager provides administrative services reasonably necessary for the operation of the Funds as set forth in the Management Contracts, including oversight of the Funds’ operations and risk management and the oversight of their various other service providers.
The Board considered the “manager-of-managers” structure of the Voya funds that has been developed by the Manager pursuant to which the Manager selects, subject to the Board’s approval, sub-advisers to provide day-to-day
ADVISORY AND SUB-ADVISORY CONTRACT APPROVAL DISCUSSION (Unaudited) (continued)
management services to all or a portion of each Voya fund. The Board recognized that the Manager is responsible for monitoring the Sub-Adviser’s investment program, performance, developments, ongoing operations, and compliance with applicable regulations and investment policies and restrictions with respect to the Funds under this manager-of-managers arrangement. The Board also considered the techniques and resources that the Manager has developed to provide this ongoing due diligence and oversight with respect to the sub-advisers and to recommend appropriate changes in investment strategies, sub-advisers, or allocation among sub-advisers in an effort to improve a Voya fund’s performance. In connection with the Manager’s performance of these duties, the Board considered that the Manager has developed an oversight process formulated by its Manager Research & Selection Group that reviews, among other matters, performance data, the Sub-Adviser’s management team, portfolio data and attribution analysis related to the Sub-Adviser through various means, including, but not limited to, in-person meetings, on-site or virtual visits, and telephonic meetings with the Sub-Adviser.
Further, the Board considered periodic compliance reports it receives from the Trust’s Chief Compliance Officer evaluating, among other related matters, whether the regulatory compliance systems and procedures of the Manager and Sub-Adviser are reasonably designed to ensure compliance with the federal securities laws and whether the investment policies and restrictions for each Fund are complied with on a consistent basis.
The Board considered the portfolio management team assigned by the Sub-Adviser to the Funds and the level of resources committed to the Funds (and other relevant funds in the Voya funds) by the Manager and the Sub-Adviser, and whether those resources are sufficient to provide high-quality services to the Funds.
Based on their deliberations and the materials presented to them, the Board concluded that the nature, extent and quality of the overall services provided by the Manager and Sub-Adviser under the Contracts were appropriate.
Fund Performance
In assessing the investment management and sub-advisory relationships, the Board placed emphasis on the investment returns of each Fund, including its investment performance over certain time periods compared to the Fund’s Morningstar, Inc. (“Morningstar”) (an independent provider of mutual fund data) category and primary benchmark, a broad-based securities market index. The Board also considered information from the Manager Research & Selection Group and received reports summarizing a
separate analysis of each Fund’s performance and risk, including risk-adjusted investment return information, from the Trust’s Chief Investment Risk Officer.
Economies of Scale
When evaluating the reasonableness of the management fee schedules, the Board considered whether economies of scale have been or likely will be realized by the Manager and the Sub-Adviser as a Fund grows larger and the extent to which any such economies are shared with the Fund. In this regard, the Board noted any breakpoints in the management fee schedules that will result in a lower management fee rate when a Fund achieves sufficient asset levels to receive a breakpoint discount. The Board also considered that, while some of the Funds do not have management fee breakpoints, the Funds may have fee waiver and expense reimbursement arrangements. The Board considered the extent to which economies of scale realized by the Manager or the Sub-Adviser could be shared with each Fund through such fee waivers, expense reimbursements or other expense reductions. In the case of sub-advisory fees, the Board considered that breakpoints, if any, would inure to the benefit of the Manager.
Information Regarding Services, Performance, and Fee Schedules Offered to Other Clients
The Board considered comparative information regarding the nature of services, performance, and fee schedules offered by the Manager and Sub-Adviser to other clients with similar investment objectives, if applicable, including other registered investment companies and relevant institutional accounts. When the fee schedules offered to or the performance of such other clients differed materially from a Fund, the Board took into account the underlying rationale provided by the Manager or Sub-Adviser, as applicable, for these differences.
Fee Schedules, Profitability, and Fall-out Benefits
The Board reviewed and considered the contractual management fee schedule and net management fee rate payable by each Fund to the Manager compared to the Fund’s Selected Peer Group. The Board also considered the compensation payable by the Manager to the Sub-Adviser for sub-advisory services for each Fund, including the portion of the contractual and net management fee rates that are paid to the Sub-Adviser, as compared to the compensation paid to the Manager. In addition, the Board considered any fee waivers, expense limitations, and recoupment arrangements that apply to the fees payable by the Funds, including whether the Manager proposed any changes thereto. For each Fund, the Board separately determined that the fees payable to the Manager and the
ADVISORY AND SUB-ADVISORY CONTRACT APPROVAL DISCUSSION (Unaudited) (continued)
fee schedule payable to the Sub-Adviser are reasonable for the services that each performs, which were considered in light of the nature, extent and quality of the services that each has performed and is expected to perform.
For each Fund, the Board considered information on revenues, costs and profits or losses realized by the Manager and the Voya-affiliated Sub-Adviser related to their services to the Fund. In analyzing the profitability of the Manager and its affiliates in connection with services they render to a Fund, the Board took into account the sub-advisory fee rate payable by the Manager to the Sub-Adviser. The Board also considered the profitability of the Manager and its affiliated Sub-Adviser attributable to servicing each Fund both with and without taking into account the profitability of the distributor of the Funds and any revenue sharing payments made by the Manager.
Although the Methodology Guide establishes a framework for profit calculation by the Manager and its affiliated Sub-Adviser, the Board recognized that there is no uniform methodology within the asset management industry for determining profitability for this purpose. The Board also recognized that the use of different reasonable methodologies can give rise to dramatically different reported profit and loss results with respect to the Manager and the Voya-affiliated Sub-Adviser, as well as other industry participants with whom the profits of the Manager and its affiliated Sub-Adviser could be compared. In addition, the Board recognized that management’s calculations regarding its costs incurred in establishing the infrastructure necessary for the Funds’ operations may not be fully reflected in the expenses allocated to each Fund in determining profitability. The Board also recognized that the information presented may not portray all of the costs borne by the Manager or reflect all of the risks associated with offering and managing a mutual fund complex in the current regulatory and market environment, including entrepreneurial, regulatory, legal and operational risks.
The Board also considered that the Manager and the Voya-affiliated Sub-Adviser are entitled to earn a reasonable level of profits for the services that they provide to the Funds. The Board also considered information regarding the potential fall-out benefits to the Manager and Sub-Adviser and their respective affiliates from their association with the Funds. Following its reviews, the Board determined that the Manager’s and the Voya-affiliated Sub-Adviser’s profitability with respect to their services to the Funds and the Manager’s and Sub-Adviser’s potential fall-out benefits were not unreasonable.
Fund-by-Fund Analysis
Set forth below are certain of the specific factors that the
Board considered at its October 9, 2023, November 14, 2023, and/or November 16, 2023 meetings in relation to approving each Fund’s Contracts and the conclusions reached by the Board. These specific factors are in addition to those considerations discussed above. The performance data provided to the Board primarily was for various periods ended March 31, 2023. In addition, the Board also considered at its October 9, 2023, November 14, 2023, and/or November 16, 2023 meetings certain additional data regarding each Fund’s more recent performance, asset levels and asset flows. Each Fund’s management fee rate and expense ratio were compared to the management fee rates and expense ratios of the funds in its Selected Peer Group. With respect to the quintile rankings noted below, the first quintile represents the range of funds with the highest performance or the lowest management fee rate or expense ratio, as applicable, and the fifth quintile represents the range of funds with the lowest performance or the highest management fee rate or expense ratio, as applicable.
Voya GNMA Income Fund
In considering whether to approve the renewal of the Contracts for Voya GNMA Income Fund, the Board considered that, based on performance data for the periods ended March 31, 2023: (1) the Fund is ranked in the first quintile of its Morningstar category for the three-year and ten-year periods, and the second quintile for the year-to-date, one-year and five-year periods; and (2) the Fund outperformed its primary benchmark for all periods presented.
In considering the fees payable under the Contracts for the Fund, the Board took into account the factors described above and also considered: (1) the economies of scale benefits to the Fund and its shareholders from breakpoint discounts applicable to the Fund’s management fee rate, which result in lower fees at higher asset levels; and (2) the pricing structure (including the net expense ratio to be borne by shareholders) of the Fund, as compared to its Selected Peer Group, including that: (a) the net management fee rate for the Fund is ranked in the fifth quintile of net management fee rates of the funds in its Selected Peer Group; (b) the contractual management fee rate for the Fund is ranked in the fourth quintile of contractual management fee rates of the funds in its Selected Peer Group; and (c) the net expense ratio for the Fund is ranked in the third quintile of net expense ratios of the funds in its Selected Peer Group.
In analyzing this fee data, the Board took into account management’s representations regarding the competitiveness of the Fund’s net expense ratio.
Voya High Yield Bond Fund
ADVISORY AND SUB-ADVISORY CONTRACT APPROVAL DISCUSSION (Unaudited) (continued)
In considering whether to approve the renewal of the Contracts for Voya High Yield Bond Fund, the Board considered that, based on performance data for the periods ended March 31, 2023: (1) the Fund is ranked in the first quintile of its Morningstar category for the year-to-date period, the second quintile for the ten-year period, the third quintile for the five-year period, and the fourth quintile for the one-year and three-year periods; and (2) the Fund underperformed its primary benchmark for all periods presented, with the exception of the year-to-date period, during which it outperformed.
In analyzing this performance data, the Board took into account management’s representations regarding: (1) the competitiveness of the Fund’s performance during certain periods; and (2) the recent changes to the Fund’s portfolio management team.
In considering the fees payable under the Contracts for the Fund, the Board took into account the factors described above and also considered: (1) the economies of scale benefits to the Fund and its shareholders from breakpoint discounts applicable to the Fund’s management fee rate, which result in lower fees at higher asset levels; and (2) the pricing structure (including the net expense ratio to be borne by shareholders) of the Fund, as compared to its Selected Peer Group, including that: (a) the net management fee rate for the Fund is ranked in the fourth quintile of net management fee rates of the funds in its Selected Peer Group; (b) the contractual management fee rate for the Fund is ranked in the fourth quintile of contractual management fee rates of the funds in its Selected Peer Group; and (c) the net expense ratio for the Fund is ranked in the third quintile of net expense ratios of the funds in its Selected Peer Group.
In analyzing this fee data, the Board took into account management’s representations regarding the competitiveness of the Fund’s net expense ratio.
Voya Intermediate Bond Fund
In considering whether to approve the renewal of the Contracts for Voya Intermediate Bond Fund, the Board considered that, based on performance data for the periods ended March 31, 2023: (1) the Fund is ranked in the first quintile of its Morningstar category for the ten-year period, and the third quintile for the year-to-date, one-year, three-year and five-year periods; and (2) the Fund outperformed its primary benchmark for all periods presented, with the exception of the one-year period, during which it underperformed.
In considering the fees payable under the Contracts for the Fund, the Board took into account the factors
described above and also considered: (1) the fairness of the compensation under a Management Contract with a level fee rate that does not include breakpoints; and (2) the pricing structure (including the net expense ratio to be borne by shareholders) of the Fund, as compared to its Selected Peer Group, including that: (a) the net management fee rate for the Fund is ranked in the first quintile of net management fee rates of the funds in its Selected Peer Group; (b) the contractual management fee rate for the Fund is ranked in the first quintile of contractual management fee rates of the funds in its Selected Peer Group; and (c) the net expense ratio for the Fund is ranked in the first quintile of net expense ratios of the funds in its Selected Peer Group.
Voya Short Term Bond Fund
In considering whether to approve the renewal of the Contracts for Voya Short Term Bond Fund, the Board considered that, based on performance data for the periods ended March 31, 2023: (1) the Fund is ranked in the second quintile of its Morningstar category for the three-year and ten-year periods, and the third quintile for the year-to-date, one-year and five-year periods; and (2) the Fund outperformed its primary benchmark for all periods presented, with the exception of the one-year period, during which it underperformed.
In considering the fees payable under the Contracts for the Fund, the Board took into account the factors described above and also considered: (1) the fairness of the compensation under a Management Contract with a level fee rate that does not include breakpoints; and (2) the pricing structure (including the net expense ratio to be borne by shareholders) of the Fund, as compared to its Selected Peer Group, including that: (a) the net management fee rate for the Fund is ranked in the first quintile of net management fee rates of the funds in its Selected Peer Group; (b) the contractual management fee rate for the Fund is ranked in the first quintile of contractual management fee rates of the funds in its Selected Peer Group; and (c) the net expense ratio for the Fund is ranked in the first quintile of net expense ratios of the funds in its Selected Peer Group.
Voya Strategic Income Opportunities Fund
In considering whether to approve the renewal of the Contracts for Voya Strategic Income Opportunities Fund, the Board considered that, based on performance data for the periods ended March 31, 2023: (1) the Fund is ranked in the first quintile of its Morningstar category for the ten-year period, the third quintile for the year-to-date, three-year and five-year periods, and the fourth quintile for the one-year period; and (2) the Fund outperformed its primary
ADVISORY AND SUB-ADVISORY CONTRACT APPROVAL DISCUSSION (Unaudited) (continued)
benchmark for all periods presented, with the exception of the one-year and five-year periods, during which it underperformed.
In analyzing this performance data, the Board took into account management’s representations regarding the Fund’s performance during certain periods.
In considering the fees payable under the Contracts for the Fund, the Board took into account the factors described above and also considered: (1) the fairness of the compensation under a Management Contract with a level fee rate that does not include breakpoints; and (2) the pricing structure (including the net expense ratio to be borne by shareholders) of the Fund, as compared to its Selected Peer Group, including that: (a) the net management fee rate for the Fund is ranked in the third quintile of net management fee rates of the funds in its Selected Peer Group; (b) the contractual management fee rate for the Fund is ranked in the second quintile of contractual management fee rates of the funds in its Selected Peer Group; and (c) the net expense ratio for the Fund is ranked in the third quintile of net expense ratios of the funds in its Selected Peer Group.
Board Conclusions
After its deliberation, the Board concluded that, in its business judgment, the terms of the Contracts are fair and reasonable to each Fund and that approval of the continuation of the Contracts is in the best interests of each Fund and its shareholders. In doing so, the Board reviewed all factors it considered to be material, including those discussed above. Within the context of its overall conclusions regarding the Contracts, and based on the information provided and management’s related representations, the Board concluded that it was satisfied with management’s responses relating to each Fund’s investment performance and the fees payable under the Contracts. During this renewal process, each Board member may have accorded different weight to various factors in reaching his or her conclusions. Based on these conclusions and other factors, the Board voted to renew the Contracts for each Fund for the year ending November 30, 2024.
| Investment Adviser | Independent Registered Public Accounting Firm |
| Voya Investments, LLC | Ernst & Young LLP |
| 7337 East Doubletree Ranch Road, Suite 100 | 200 Clarendon Street |
| Scottsdale, Arizona 85258 | Boston, Massachusetts 02116 |
| | |
| Distributor | Custodian |
| Voya Investments Distributor, LLC | The Bank of New York Mellon |
| 7337 East Doubletree Ranch Road, Suite 100 | 225 Liberty Street |
| Scottsdale, Arizona 85258 | New York, New York 10286 |
| | |
| Transfer Agent | Legal Counsel |
| BNY Mellon Investment Servicing (U.S.) Inc. | Ropes & Gray LLP |
| 301 Bellevue Parkway | Prudential Tower |
| Wilmington, Delaware 19809 | 800 Boylston Street
Boston, Massachusetts 02199 |
For more complete information, or to obtain a prospectus on any Voya mutual fund, please call your financial advisor or Voya Investments Distributor, LLC at (800) 992-0180 or log on to www.voyainvestments.com. The prospectus should be read carefully before investing. Consider the fund’s investment objectives, risks, charges and expenses carefully before investing. The prospectus contains this information and other information about the fund.
RETIREMENT | INVESTMENTS | INSURANCE | 
|
| voyainvestments.com | 163059 (0324) |

Annual Report
March 31, 2024
Voya Government Money Market Fund
Classes A, C, I, and W
| Effective January 24, 2023, the U.S. Securities and Exchange Commission adopted rule and form amendments to require mutual funds to transmit concise and visually engaging streamlined annual and semi-annual reports to shareholders that highlight key information deemed important for investors to assess and monitor their fund investments. Other information, including financial statements, will no longer appear in the funds’ streamlined shareholder reports but must be available online, delivered free of charge upon request, and filed on a semi-annual basis on Form N-CSR. The rule and form amendments have a compliance date of July 24, 2024. |
| This report is submitted for general information to shareholders of the Voya mutual funds. It is not authorized for distribution to prospective shareholders unless accompanied or preceded by a prospectus which includes details regarding the funds’ investment objectives, risks, charges, expenses and other information. This information should be read carefully. |
|  | E-Delivery Sign-up – details inside |
INVESTMENT MANAGEMENT voyainvestments.com |  |
TABLE OF CONTENTS
| | Go Paperless with E-Delivery! | |
| |
Sign up now for on-line prospectuses, fund reports, and proxy statements. Just go to individuals.voya.com/page/e-delivery, follow the directions and complete the quick 5 Steps to Enroll. You will be notified by e-mail when these communications become available on the internet. |
PROXY VOTING INFORMATION
A description of the policies and procedures that the Fund uses to determine how to vote proxies related to portfolio securities is available: (1) without charge, upon request, by calling Shareholder Services toll-free at (800) 992-0180; (2) on the Fund’s website at www.voyainvestments.com; and (3) on the U.S. Securities and Exchange Commission’s (“SEC’s”) website at www.sec.gov. Information regarding how the Fund voted proxies related to portfolio securities during the most recent 12-month period ended June 30 is available without charge on the Fund’s website at www.voyainvestments.com and on the SEC’s website at www.sec.gov.
PORTFOLIO HOLDINGS
The Fund files its complete schedule of portfolio holdings with the SEC monthly on Form N-MFP. The Fund’s Forms N-MFP are available on the SEC’s website at www.sec.gov or the monthly schedule of portfolio holdings are also available at: www.voyainvestments.com and without charge upon request from the Fund by calling Shareholder Services toll-free at (800) 992-0180.
Please note that your investment: is not a bank deposit, is not insured or guaranteed by the Federal Deposit Insurance Corporation (“FDIC”), the Federal Reserve Board or any other government agency. Although the Fund seeks to preserve the value of your investment at $1.00 per share, it is possible to lose money by investing in the Fund. There is no guarantee that the Fund will achieve its investment objective. The Fund’s sponsor has no legal obligation to provide financial support to the Fund, and you should not expect that the sponsor will provide financial support to the Fund at any time.
| Portfolio Managers’ Report | Voya Government Money Market Fund |
Voya Government Money Market Fund (the “Fund”) seeks to provide investors with a high level of current income consistent with preservation of capital and liquidity and the maintenance of a stable $1.00 net asset value per share. The Fund is managed by David S. Yealy, Portfolio Manager of Voya Investment Management Co. LLC — the Sub-Adviser.
Performance Update: Preservation of capital, limiting interest rate risk and keeping an excess liquidity cushion were our primary objectives for the Fund during the Fund’s fiscal year. Maximizing the yield and the total return of the Fund remained a secondary objective. The Fund outperformed its benchmark before the deduction of fees and operating expenses and benefited from its high liquidity and by maintaining a very short weighted average maturity (“WAM”) to take advantage of rate increases early in the period. Exposure to floating rate U.S. agency securities tied to secured overnight financing rate (“SOFR”) and U.S. Treasury securities tied to 3-month Treasury bills further added to performance.
| | Investment Type Allocation as of March 31, 2024 (as a percentage of net assets) | |
| | U.S. Treasury Debt | | | 46.4 | % | |
| | U.S. Treasury Repurchase Agreements | | | 32.8 | % | |
| | U.S. Government Agency Debt | | | 27.5 | % | |
| | Liabilities in Excess of Other Assets | | | (6.7 | )% | |
| | Net Assets | | | 100.0 | % | |
| | | |
| | Portfolio holdings are subject to change daily. | |
Portfolio Specifics: During the period, the Federal Open Market Committee (“FOMC”) implemented two increases totaling 50 basis points (“bp”) in the U.S. Federal Reserve funds rate. The rate peaked in July and then the FOMC held rates steady through the remainder of the period through March 31, 2024. With peak rates likely reached, investors anticipated when and by how much the FOMC would cut rates in 2024.
The Fund maintained an extremely short WAM as it rode the rising rates. Early in 2024, the Fund extended its maturity in anticipation of rate cuts in 2024 and beyond. The Fund held short-term overnight securities and Treasury bills and short-term floating rate agency securities to take advantage of the rising rates and add incremental yield over repo and short-term Treasury bills.
Current Strategy & Outlook: The Fed dot plot anticipates three cuts in 2024 and further cuts in 2025. We believe that if data shows a decrease in inflation and softness in the labor market, consumer spending and economic growth, the Fed will cut rates late in the year. We will continue to look for opportunities to extend the Fund’s maturity if the market prices in two or fewer cuts for 2024. We expect to maintain exposure to floating rate securities as they offer a yield advantage to short-term Treasury bills and overnight repo.
Principal Risk Factors: Although the Fund seeks to preserve the value of your investment at $1.00 per share, it is possible to lose money by investing in the Fund.
You could lose money by investing in the Fund. Although the Fund seeks to preserve the value of your investment at $1.00 per share, it cannot guarantee it will do so. An investment in the Fund is not insured or guaranteed by the Federal Deposit Insurance Corporation or any other government agency. The Fund’s sponsor has no legal obligation to provide financial support to the Fund, and you should not expect that the sponsor will provide financial support to the Fund at any time.
The views expressed in this commentary are informed opinions. They should not be considered promises or advice. The views expressed reflect those of the portfolio managers, only through the end of the period as stated on the cover. The portfolio managers’ views are subject to change at any time based on market and other conditions.
Portfolio holdings and characteristics are subject to change and may not be representative of current holdings and characteristics. Fund holdings are subject to change daily. The outlook for this Fund may differ from that presented for other Voya mutual funds. This report contains statements that may be “forward-looking” statements. Actual results may differ materially from those projected in the “forward-looking” statements. The Fund’s performance returns shown reflect applicable fee waivers and/or expense limits in effect during this period. Absent such fee waivers/expense limitations, if any, performance would have been lower. Performance for the different classes of shares will vary based on differences in fees associated with each class.
SHAREHOLDER EXPENSE EXAMPLE (Unaudited)
As a shareholder of the Fund, you incur two types of costs: (1) transaction costs, including sales charges (loads) on purchase payments, redemption fees, and exchange fees, and (2) ongoing costs, including management fees, distribution and/or service (12b-1) fees, and other Fund expenses. These Examples are intended to help you understand your ongoing costs (in dollars) of investing in the Fund and to compare these costs with the ongoing costs of investing in other mutual funds.
The Examples are based on an investment of $1,000 invested at the beginning of the period and held for the entire period from October 1, 2023 to March 31, 2024. The Fund’s expenses are shown without the imposition of any sales charges or fees. Expenses would have been higher if such charges were included.
Actual Expenses
The left section of the table shown below, “Actual Fund Return,” provides information about actual account values and actual expenses. You may use the information in this section, together with the amount you invested, to estimate the expenses that you paid over the period. Simply divide your account value by $1,000 (for example, an $8,600 account value divided by $1,000 = 8.6), then multiply the result by the number in the first section under the heading entitled “Expenses Paid During the Period” to estimate the expenses you paid on your account during this period.
Hypothetical Example for Comparison Purposes
The right section of the table shown below, “Hypothetical (5% return before expenses)” provides information about hypothetical account values and hypothetical expenses based on the Fund’s actual expense ratio and an assumed rate of return of 5% per year before expenses, which is not the Fund’s actual return. The hypothetical account values and expenses may not be used to estimate the actual ending account balance or expenses you paid for the period. You may use this information to compare the ongoing costs of investing in the Fund and other mutual funds. To do so, compare this 5% hypothetical example with the 5% hypothetical examples that appear in the shareholder reports of the other mutual funds.
Please note that the expenses shown in the table are meant to highlight your ongoing costs only and do not reflect any transactional costs, such as sales charges (loads), redemption fees, or exchange fees. Therefore, the hypothetical section of the table is useful in comparing ongoing costs only, and will not help you determine the relative total costs of owning different mutual funds. In addition, if these transactional costs were included, your costs would have been higher.
| | | Actual Fund Return | | | Hypothetical (5% return before expenses) | |
| | | Beginning
Account
Value
October 1,
2023 | | | Ending
Account
Value
March 31,
2024 | | | Annualized
Expense
Ratio* | | | Expenses Paid
During the
Period Ended
March 31,
2024** | | | Beginning
Account
Value
October 1,
2023 | | | Ending
Account
Value
March 31,
2024 | | | Annualized
Expense
Ratio* | | | Expenses Paid
During the
Period Ended
March 31,
2024** | |
| Class A | | | $1,000.00 | | | | $1,025.30 | | | | 0.39% | | | | $1.97 | | | | $1,000.00 | | | | $1,023.05 | | | | 0.39% | | | | $1.97 | |
| Class C | | | 1,000.00 | | | | 1,020.20 | | | | 1.39 | | | | 7.02 | | | | 1,000.00 | | | | 1,018.05 | | | | 1.39 | | | | 7.01 | |
| Class I | | | 1,000.00 | | | | 1,025.30 | | | | 0.39 | | | | 1.97 | | | | 1,000.00 | | | | 1,023.05 | | | | 0.39 | | | | 1.97 | |
| Class W | | | 1,000.00 | | | | 1,025.40 | | | | 0.39 | | | | 1.97 | | | | 1,000.00 | | | | 1,023.05 | | | | 0.39 | | | | 1.97 | |
| * | The annualized expense ratios reflect waivers of 0.00%, 0.00%, 0.00% and 0.00% of management, distribution and shareholder servicing fees for Classes A, C, I and W, respectively, in order to maintain a net yield of not less than zero (Note 4). |
| ** | Expenses are equal to the Fund’s annualized expense ratios multiplied by the average account value over the period, multiplied by 183/366 to reflect the most recent fiscal half-year. |
REPORT OF INDEPENDENT REGISTERED PUBLIC ACCOUNTING FIRM
To the Shareholders of Voya Government Money Market Fund and the Board of Trustees of Voya Funds Trust
Opinion on the Financial Statements
We have audited the accompanying statement of assets and liabilities of Voya Government Money Market Fund (the “Fund”) (one of the funds constituting Voya Funds Trust (the “Trust”)), including the portfolio of investments, as of March 31, 2024, and the related statement of operations for the year then ended, the statements of changes in net assets for each of the two years in the period then ended, the financial highlights for each of the five years in the period then ended and the related notes (collectively referred to as the “financial statements”). In our opinion, the financial statements present fairly, in all material respects, the financial position of the Fund (one of the funds constituting Voya Funds Trust) at March 31, 2024, the results of its operations for the year then ended, the changes in its net assets for each of the two years in the period then ended and its financial highlights for each of the five years in the period then ended, in conformity with U.S. generally accepted accounting principles.
Basis for Opinion
These financial statements are the responsibility of the Trust’s management. Our responsibility is to express an opinion on the Fund’s financial statements based on our audits. We are a public accounting firm registered with the Public Company Accounting Oversight Board (United States) (“PCAOB”) and are required to be independent with respect to the Trust in accordance with the U.S. federal securities laws and the applicable rules and regulations of the Securities and Exchange Commission and the PCAOB.
We conducted our audits in accordance with the standards of the PCAOB. Those standards require that we plan and perform the audit to obtain reasonable assurance about whether the financial statements are free of material misstatement, whether due to error or fraud. The Trust is not required to have, nor were we engaged to perform, an audit of the Trust’s internal control over financial reporting. As part of our audits, we are required to obtain an understanding of internal control over financial reporting, but not for the purpose of expressing an opinion on the effectiveness of the Trust’s internal control over financial reporting. Accordingly, we express no such opinion.
Our audits included performing procedures to assess the risks of material misstatement of the financial statements, whether due to error or fraud, and performing procedures that respond to those risks. Such procedures included examining, on a test basis, evidence regarding the amounts and disclosures in the financial statements. Our procedures included confirmation of securities owned as of March 31, 2024, by correspondence with the custodian, brokers and others; when replies were not received from brokers and others, we performed other auditing procedures. Our audits also included evaluating the accounting principles used and significant estimates made by management, as well as evaluating the overall presentation of the financial statements. We believe that our audits provide a reasonable basis for our opinion.

We have served as the auditor of one or more Voya investment companies since 2019
Boston, Massachusetts
May 30, 2024
STATEMENT OF ASSETS AND LIABILITIES as of March 31, 2024
| ASSETS: | | | |
| Short-term investments at amortized cost | | $ | 249,818,886 | |
| Repurchase agreements | | | 111,044,000 | |
| Cash | | | 22,026 | |
| Receivables: | | | | |
| Investment securities sold | | | 14,702,528 | |
| Fund shares sold | | | 4,797,708 | |
| Dividends | | | 4,426 | |
| Interest | | | 585,174 | |
| Prepaid expenses | | | 52,687 | |
| Reimbursement due from Investment Adviser | | | 26,994 | |
| Other assets | | | 21,184 | |
| Total assets | | | 381,075,613 | |
| | | | | |
| LIABILITIES: | | | | |
| Income distribution payable | | | 4,709 | |
| Payable for investment securities purchased | | | 41,645,174 | |
| Payable for fund shares redeemed | | | 528,210 | |
| Payable for investment management fees | | | 103,604 | |
| Payable for distribution and shareholder service fees | | | 1,780 | |
| Payable to trustees under the deferred compensation plan (Note 5) | | | 21,184 | |
| Payable for trustee fees | | | 684 | |
| Other accrued expenses and liabilities | | | 374,959 | |
| Total liabilities | | | 42,680,304 | |
| NET ASSETS | | $ | 338,395,309 | |
| | | | | |
| NET ASSETS WERE COMPRISED OF: | | | | |
| Paid-in capital | | $ | 338,409,527 | |
| Total distributable loss | | | (14,218 | ) |
| NET ASSETS | | $ | 338,395,309 | |
See Accompanying Notes to Financial Statements
STATEMENT OF ASSETS AND LIABILITIES as of March 31, 2024 (continued)
| Class A | | | |
| Net assets | | $ | 265,846,285 | |
| Shares authorized | | | unlimited | |
| Par value | | $ | 0.001 | |
| Shares outstanding | | | 265,851,755 | |
| Net asset value and redemption price per share† | | $ | 1.00 | |
| | | | | |
| Class C | | | | |
| Net assets | | $ | 2,115,577 | |
| Shares authorized | | | unlimited | |
| Par value | | $ | 0.001 | |
| Shares outstanding | | | 2,115,622 | |
| Net asset value and redemption price per share† | | $ | 1.00 | |
| | | | | |
| Class I | | | | |
| Net assets | | $ | 58,966,080 | |
| Shares authorized | | | unlimited | |
| Par value | | $ | 0.001 | |
| Shares outstanding | | | 58,967,282 | |
| Net asset value and redemption price per share | | $ | 1.00 | |
| | | | | |
| Class W | | | | |
| Net assets | | $ | 11,467,367 | |
| Shares authorized | | | unlimited | |
| Par value | | $ | 0.001 | |
| Shares outstanding | | | 11,467,613 | |
| Net asset value and redemption price per share | | $ | 1.00 | |
| † | Redemption price per share may be reduced for any applicable contingent deferred sales charges. |
See Accompanying Notes to Financial Statements
STATEMENT OF OPERATIONS for the year ended March 31, 2024
| INVESTMENT INCOME: | | | |
| Dividends | | $ | 48,088 | |
| Interest | | | 16,761,084 | |
| Other | | | 2,019 | |
| Total investment income | | | 16,811,191 | |
| EXPENSES: | | | | |
| Investment management fees | | | 1,106,229 | |
| Distribution and shareholder service fees: | | | | |
| Class C | | | 21,497 | |
| Transfer agent fees: | | | | |
| Class A | | | 409,846 | |
| Class C | | | 3,694 | |
| Class I | | | 43,102 | |
| Class W | | | 14,560 | |
| Shareholder reporting expense | | | 16,470 | |
| Registration fees | | | 94,730 | |
| Professional fees | | | 38,558 | |
| Custody and accounting expense | | | 14,640 | |
| Trustee fees | | | 3,660 | |
| Miscellaneous expense | | | 14,458 | |
| Total expenses | | | 1,781,444 | |
| Waived and reimbursed fees | | | (533,496 | ) |
| Net expenses | | | 1,247,948 | |
| Net investment income | | | 15,563,243 | |
| REALIZED AND UNREALIZED GAIN (LOSS): | | | | |
| Net realized gain on investments | | | 44,938 | |
| Increase in net assets resulting from operations | | $ | 15,608,181 | |
See Accompanying Notes to Financial Statements
STATEMENTS OF CHANGES IN NET ASSETS
| | | Year Ended
March 31, 2024 | | | Year Ended
March 31, 2023 | |
| FROM OPERATIONS: | | | | | | | | |
| Net investment income | | $ | 15,563,243 | | | $ | 6,363,180 | |
| Net realized gain (loss) | | | 44,938 | | | | (4,142 | ) |
| Increase in net assets resulting from operations | | | 15,608,181 | | | | 6,359,038 | |
| FROM DISTRIBUTIONS TO SHAREHOLDERS: | | | | | | | | |
| Total distributions (excluding return of capital): | | | | | | | | |
| Class A | | | (12,215,598 | ) | | | (5,001,800 | ) |
| Class C | | | (84,235 | ) | | | (35,525 | ) |
| Class I | | | (2,815,104 | ) | | | (1,290,155 | ) |
| Class W | | | (448,234 | ) | | | (36,370 | ) |
| Total distributions | | | (15,563,171 | ) | | | (6,363,850 | ) |
| FROM CAPITAL SHARE TRANSACTIONS: | | | | | | | | |
| Net proceeds from sale of shares | | | 1,474,342,746 | | | | 1,140,832,736 | |
| Reinvestment of distributions | | | 15,507,497 | | | | 6,347,946 | |
| | | | 1,489,850,243 | | | | 1,147,180,682 | |
| Cost of shares redeemed | | | (1,428,809,700 | ) | | | (1,070,424,026 | ) |
| Net increase in net assets resulting from capital share transactions | | | 61,040,543 | | | | 76,756,656 | |
| Net increase in net assets | | | 61,085,553 | | | | 76,751,844 | |
| NET ASSETS: | | | | | | | | |
| Beginning of year or period | | | 277,309,756 | | | | 200,557,912 | |
| End of year or period | | $ | 338,395,309 | | | $ | 277,309,756 | |
See Accompanying Notes to Financial Statements
FINANCIAL HIGHLIGHTS
Selected data for a share of beneficial interest outstanding throughout each year or period.
| | | | | | | | | | | | | | | | | | | | | | | | | | | | | | | | | | | |
| | | | | Income (loss)
from investment
operations | | | | Less Distributions | | | | | | | | | | | | | Ratios to average net assets | | Supplemental
Data | |
| | |  | | |  | | |  | | |  | | |  | | |  | | |  | | |  | | |  | | |  | | |  | | |  | | |  | | |  | | |  | | |  | | |  | |
Year or
period ended | | ($) | | | ($) | | | ($) | | | ($) | | | ($) | | | ($) | | | ($) | | | ($) | | | ($) | | | ($) | | | (%) | | | (%) | | | (%) | | | (%) | | | (%) | | | ($000’s) | | | (%) | |
| Class A | | | | | | | | | | | | | | | | | | | | | | | | | | | | | | | | | | | | | | | | | | | | | | | | | | | |
| 03-31-24 | | 1.00 | | | 0.05 | • | | 0.00 | * | | 0.05 | | | 0.05 | | | — | | | — | | | 0.05 | | | — | | | 1.00 | | | 5.04 | | | 0.57 | | | 0.39 | (4) | | 0.39 | | | 4.93 | | | 265,846 | | | — | |
| 03-31-23 | | 1.00 | | | 0.03 | | | (0.01 | ) | | 0.02 | | | 0.02 | | | — | | | — | | | 0.02 | | | — | | | 1.00 | | | 2.48 | | | 0.62 | | | 0.39 | (5) | | 0.39 | | | 2.63 | | | 217,392 | | | — | |
| 03-31-22 | | 1.00 | | | (0.00 | )*• | | 0.00 | * | | 0.00 | * | | — | | | 0.00 | * | | — | | | 0.00 | * | | — | | | 1.00 | | | 0.09 | | | 0.64 | | | 0.05 | (6) | | 0.05 | | | (0.00 | )* | | 156,626 | | | — | |
| 03-31-21 | | 1.00 | | | 0.00 | *• | | 0.00 | * | | 0.00 | * | | 0.00 | * | | 0.00 | * | | — | | | 0.00 | * | | — | | | 1.00 | | | 0.04 | | | 0.68 | | | 0.11 | (7) | | 0.11 | | | 0.01 | | | 156,808 | | | — | |
| 03-31-20 | | 1.00 | | | 0.02 | | | 0.00 | * | | 0.02 | | | 0.02 | | | 0.00 | * | | — | | | 0.02 | | | — | | | 1.00 | | | 1.61 | | | 0.63 | | | 0.41 | (8) | | 0.41 | | | 1.49 | | | 161,828 | | | — | |
| Class C | | | | | | | | | | | | | | | | | | | | | | | | | | | | | | | | | | | | | | | | | | | | | | | | | | | |
| 03-31-24 | | 1.00 | | | 0.04 | • | | 0.00 | * | | 0.04 | | | 0.04 | | | — | | | — | | | 0.04 | | | — | | | 1.00 | | | 3.99 | | | 1.57 | | | 1.39 | (4) | | 1.39 | | | 3.92 | | | 2,116 | | | — | |
| 03-31-23 | | 1.00 | | | 0.02 | • | | 0.00 | * | | 0.02 | | | 0.02 | | | — | | | — | | | 0.02 | | | — | | | 1.00 | | | 1.63 | | | 1.62 | | | 1.23 | (5) | | 1.23 | | | 1.62 | | | 2,220 | | | — | |
| 03-31-22 | | 1.00 | | | — | • | | 0.00 | * | | 0.00 | | | — | | | 0.00 | * | | — | | | 0.00 | * | | — | | | 1.00 | | | 0.09 | | | 1.64 | | | 0.05 | (6) | | 0.05 | | | 0.00 | * | | 2,015 | | | — | |
| 03-31-21 | | 1.00 | | | 0.00 | *• | | 0.00 | * | | 0.00 | * | | 0.00 | * | | 0.00 | * | | — | | | 0.00 | * | | — | | | 1.00 | | | 0.03 | | | 1.68 | | | 0.11 | (7) | | 0.11 | | | 0.01 | | | 2,321 | | | — | |
| 03-31-20 | | 1.00 | | | 0.01 | | | 0.00 | * | | 0.01 | | | 0.01 | | | 0.00 | * | | — | | | 0.01 | | | — | | | 1.00 | | | 0.65 | | | 1.63 | | | 1.41 | (8) | | 1.41 | | | 0.56 | | | 2,870 | | | — | |
| Class I | | | | | | | | | | | | | | | | | | | | | | | | | | | | | | | | | | | | | | | | | | | | | | | | | | | |
| 03-31-24 | | 1.00 | | | 0.05 | • | | 0.00 | * | | 0.05 | | | 0.05 | | | — | | | — | | | 0.05 | | | — | | | 1.00 | | | 5.04 | | | 0.48 | | | 0.39 | (4) | | 0.39 | | | 4.93 | | | 58,966 | | | — | |
| 03-31-23 | | 1.00 | | | 0.03 | | | (0.01 | ) | | 0.02 | | | 0.02 | | | — | | | — | | | 0.02 | | | — | | | 1.00 | | | 2.48 | | | 0.49 | | | 0.39 | (5) | | 0.39 | | | 2.63 | | | 56,466 | | | — | |
| 03-31-22 | | 1.00 | | | (0.00 | )*• | | 0.00 | * | | 0.00 | * | | — | | | 0.00 | * | | — | | | 0.00 | * | | — | | | 1.00 | | | 0.09 | | | 0.50 | | | 0.05 | (6) | | 0.05 | | | (0.00 | )* | | 41,745 | | | — | |
| 03-31-21 | | 1.00 | | | 0.00 | *• | | 0.00 | * | | 0.00 | * | | 0.00 | * | | 0.00 | * | | — | | | 0.00 | * | | — | | | 1.00 | | | 0.03 | | | 0.57 | | | 0.11 | (7) | | 0.11 | | | 0.01 | | | 45,260 | | | — | |
| 03-31-20 | | 1.00 | | | 0.02 | | | 0.00 | * | | 0.02 | | | 0.02 | | | 0.00 | * | | — | | | 0.02 | | | — | | | 1.00 | | | 1.63 | | | 0.61 | | | 0.41 | (8) | | 0.41 | | | 1.53 | | | 43,994 | | | — | |
| Class W | | | | | | | | | | | | | | | | | | | | | | | | | | | | | | | | | | | | | | | | | | | | | | | | | | | |
| 03-31-24 | | 1.00 | | | 0.05 | • | | 0.00 | * | | 0.05 | | | 0.05 | | | — | | | — | | | 0.05 | | | — | | | 1.00 | | | 5.04 | | | 0.57 | | | 0.39 | (4) | | 0.39 | | | 4.99 | | | 11,467 | | | — | |
| 03-31-23 | | 1.00 | | | 0.03 | • | | (0.01 | ) | | 0.02 | | | 0.02 | | | — | | | — | | | 0.02 | | | — | | | 1.00 | | | 2.50 | | | 0.62 | | | 0.39 | (5) | | 0.39 | | | 3.37 | | | 1,232 | | | — | |
| 03-31-22 | | 1.00 | | | 0.00 | *• | | 0.00 | * | | 0.00 | * | | — | | | 0.00 | * | | — | | | 0.00 | * | | — | | | 1.00 | | | 0.09 | | | 0.64 | | | 0.05 | (6) | | 0.05 | | | 0.00 | * | | 173 | | | — | |
| 03-31-21 | | 1.00 | | | 0.00 | *• | | 0.00 | * | | 0.00 | * | | 0.00 | * | | 0.00 | * | | — | | | 0.00 | * | | — | | | 1.00 | | | 0.04 | | | 0.68 | | | 0.11 | (7) | | 0.11 | | | 0.01 | | | 386 | | | — | |
| 03-31-20 | | 1.00 | | | 0.02 | | | 0.00 | * | | 0.02 | | | 0.02 | | | 0.00 | * | | — | | | 0.02 | | | — | | | 1.00 | | | 1.61 | | | 0.63 | | | 0.41 | (8) | | 0.41 | | | 1.52 | | | 236 | | | — | |
| (1) | Total return is calculated assuming reinvestment of all dividends, capital gain distributions and return of capital distributions, if any, at net asset value and excluding the deduction of sales charges or contingent deferred sales charges, if applicable. Total return for periods less than one year is not annualized. |
| (2) | Annualized for periods less than one year. |
| (3) | Ratios reflect operating expenses of a Fund. Expenses before reductions/additions do not reflect amounts reimbursed or recouped by the Investment Adviser and/or Distributor or reductions from brokerage service arrangements or other expense offset arrangements and do not represent the amount paid by a Fund during periods when reimbursements or reductions occur. Expenses net of fee waivers reflect expenses after reimbursement by the Investment Adviser and/or Distributor or recoupment of previously reimbursed fees by the Investment Adviser, but prior to reductions from brokerage service arrangements or other expense offset arrangements. Expenses net of all reductions/additions represent the net expenses paid by a Fund. Net investment income (loss) is net of all such additions or reductions. |
| (4) | Expense ratios reflect waivers of 0.00%, 0.00%, 0.00% and 0.00% of management fees, distribution and shareholder servicing fees for Classes A, C, I, and W, respectively, in order to maintain a net yield of not less than zero. |
| (5) | Expense ratios reflect waivers of 0.01%, 0.18%, 0.01% and 0.01% of management fees, distribution and shareholder servicing fees for Classes A, C, I, and W, respectively, in order to maintain a net yield of not less than zero. |
| (6) | Expense ratios reflect waivers of 0.35%, 1.35%, 0.35% and 0.35% of management fees, distribution and shareholder servicing fees for Classes A, C, I, and W, respectively, in order to maintain a net yield of not less than zero. |
| (7) | Expense ratios reflect waivers of 0.30%, 1.30%, 0.30% and 0.30% of management fees, distribution and shareholder servicing fees for Classes A, C, I, and W, respectively, in order to maintain a net yield of not less than zero. |
| (8) | Expense ratios reflect waivers of 0.01%, 0.01%, 0.01% and 0.01% of management fees, distribution and shareholder servicing fees for Classes A, C, I and W, respectively, in order to maintain a net yield of not less than zero. |
| • | Calculated using average number of shares outstanding throughout the year or period. |
| * | Amount is less than $0.005 or 0.005% or more than $(0.005) or (0.005)%. |
See Accompanying Notes to Financial Statements
NOTES TO FINANCIAL STATEMENTS as of March 31, 2024
NOTE 1 — ORGANIZATION
Voya Funds Trust (the “Trust”) is a Delaware statutory trust and is registered as an open-end management investment company under the Investment Company Act of 1940, as amended (“1940 Act”). The Trust was organized on August 6, 1998 and was established under a Trust Instrument dated July 30, 1998. It consists of nine separately managed series. This report is for Voya Government Money Market Fund (“Government Money Market” or the “Fund”), a diversified series of the Trust.
The Fund offers the following classes of shares: Class A, Class C, Class I and Class W. The separate classes of shares differ principally in the applicable sales charges (if any), distribution fees and shareholder servicing fees, as well as differences in the amount of waiver fees and reimbursement of expenses, if any. Generally, shareholders of each class also bear certain expenses that pertain to that particular class. All shareholders are allocated the common expenses of a fund and earn income and realized gains/losses from a fund pro rata based on the daily ending net assets of each class, without discrimination between share classes. Expenses that are specific to a fund or a class are charged directly to that fund or class. Other operating expenses shared by several funds are generally allocated among those funds based on average net assets. Dividends are determined separately for each class based on income and expenses allocated to each class. Realized gain distributions are allocated to each class pro rata based on the shares outstanding of each class on the date of distribution. Differences in per share dividend rates generally result from the differences in separate class expenses, including distribution and shareholder servicing fees, if applicable, as well as differences in the amount of waiver of fees and reimbursement of expenses between the share classes, if any.
Class C shares, along with their pro rata reinvested dividend shares, automatically convert to Class A shares 8 years after purchase.
Voya Investments, LLC (“Voya Investments” or the “Investment Adviser”), an Arizona limited liability company, serves as the Investment Adviser to the Fund. Voya Investment Management Co. LLC (“Voya IM”), a Delaware limited liability company, serves as the sub-adviser to the Fund. Voya Investments Distributor, LLC (“VID” or the “Distributor”), a Delaware limited liability company, serves as the principal underwriter to the Fund.
NOTE 2 — SIGNIFICANT ACCOUNTING POLICIES
The following significant accounting policies are consistently followed by the Fund in the preparation of its financial statements. The Fund is considered an investment company under U.S. generally accepted accounting
principles (“GAAP”) and follows the accounting and reporting guidance applicable to investment companies.
A. Security Valuation. The Fund is open for business every day the New York Stock Exchange (“NYSE”) opens for regular trading (each such day, a “Business Day”). The net asset value (“NAV”) per share for each class of the Fund is determined each Business Day as of the close of the regular trading session (“Market Close”), as determined by the Consolidated Tape Association (“CTA”), the central distributor of transaction prices for exchange-traded securities (normally 4:00 p.m. Eastern Time unless otherwise designated by the CTA). The NAV per share of each class of the Fund is calculated by taking the value of the Fund’s assets attributable to that class, subtracting the Fund’s liabilities attributable to that class, and dividing by the number of shares of that class that are outstanding. On days when the Fund is closed for business, Fund shares will not be priced and the Fund does not transact purchase and redemption orders. To the extent the Fund’s assets are traded in other markets on days when the Fund does not price its shares, the value of the Fund’s assets will likely change and you will not be able to purchase or redeem shares of the Fund.
The Fund uses the amortized cost method to value its portfolio securities and seeks to maintain a constant NAV of $1.00 per share, although there may be circumstances under which this goal cannot be achieved. The amortized cost method involves valuing a security at its cost and amortizing any discount or premium over the period until maturity, regardless of the impact of fluctuating interest rates or the market value of the security. Although the Fund’s Board of Trustees (“Board”) has established procedures designed to stabilize, to the extent reasonably possible, the share price of the Fund, there can be no assurance that the Fund’s NAV can be maintained at $1.00 per share.
Each investment asset or liability of the Fund is assigned a level at measurement date based on the significance and source of the inputs to its valuation. Quoted prices in active markets for identical securities are classified as “Level 1,” inputs other than quoted prices for an asset or liability that are observable are classified as “Level 2” and significant unobservable inputs, including the sub-adviser’s or pricing committee’s judgment about the assumptions that a market participant would use in pricing an asset or liability are classified as “Level 3.” The inputs used for valuing securities are not necessarily an indication of the risks associated with investing in those securities. Short-term securities of sufficient credit quality are generally considered to be Level 2 securities under applicable accounting rules. A table summarizing the Fund’s investments under these levels of classification is included within the Portfolio of Investments.
NOTES TO FINANCIAL STATEMENTS as of March 31, 2024 (continued)
NOTE 2 — SIGNIFICANT ACCOUNTING POLICIES (continued)
The Board has delegated to the Investment Adviser responsibility for overseeing the implementation of the Fund’s valuation procedures. The Board has also designated the Investment Adviser, as the valuation designee, to make fair value determinations in good faith. In determining the fair value of the Fund’s assets, the Investment Adviser, pursuant to its fair valuation policy, may consider inputs from pricing service providers, broker-dealers, or the Fund’s sub-adviser(s).
GAAP requires a reconciliation of the beginning to ending balances for reported fair values that presents changes attributable to total realized and unrealized gains or losses, purchases and sales, and transfers in or out of the Level 3 category during the period. A reconciliation of Level 3 investments within the Portfolio of investments is presented only when the Fund has a significant amount of Level 3 investments.
B. Securities Transactions and Revenue Recognition. Securities transactions are accounted for on the trade date. Realized gains and losses are reported on the basis of identified cost of securities sold. Interest income is recorded on an accrual basis. Premium amortization and discount accretion are determined by the effective yield method.
C. Distributions to Shareholders. The Fund records distributions to its shareholders on the ex-dividend date. Dividends are declared daily from net investment income and paid monthly. The Fund distributes capital gains, if any, annually. The Fund may make distributions on a more frequent basis to comply with the distribution requirements of the Internal Revenue Code. The characteristics of income and gains to be distributed are determined in accordance with income tax regulations, which may differ from U.S. GAAP for investment companies.
D. Federal Income Taxes. It is the policy of the Fund to comply with the requirements of subchapter M of the Internal Revenue Code that are applicable to regulated investment companies and to distribute substantially all of its net investment income and any net realized capital gains to its shareholders. Therefore, a federal income tax or excise tax provision is not required. Management has considered the sustainability of the Fund’s tax positions taken on federal income tax returns for all open tax years in making this determination. No capital gain distributions shall be made until the capital loss carryforwards have been fully utilized.
The Fund may utilize equalization accounting for tax purposes, whereby a portion of redemption payments are treated as distributions of income or gain.
E. Use of Estimates. The preparation of financial statements in conformity with GAAP requires management to make estimates and assumptions that affect the reported amounts of assets and liabilities and disclosure of contingent assets and liabilities at the date of the financial statements and the reported amounts of increases and decreases in net assets from operations during the reporting period. Actual results could differ from those estimates.
F. Repurchase Agreements. The Fund may invest in repurchase agreements only with government securities dealers recognized by the Board of Governors of the Federal Reserve System. Under such agreements, the seller of the security agrees to repurchase it at a mutually agreed upon time and price. The resale price is in excess of the purchase price and reflects an agreed upon interest rate for the period of time the agreement is outstanding. The period of the repurchase agreements is generally short, from overnight to one week (although it may extend over a number of months), while the underlying securities generally have longer maturities. The Fund will receive, as collateral, securities acceptable to it whose market value is equal to at least 100% of the carrying amount of the repurchase agreements, plus accrued interest, being invested by the Fund. The underlying collateral is valued daily on a mark to market basis to assure that the value, including accrued interest is at least equal to the repurchase price. There would be potential loss to the Fund in the event the Fund is delayed or prevented from exercising its right to dispose of the collateral, and it might incur disposition costs in liquidating the collateral.
Repurchase agreements are entered into by the Fund under Master Repurchase Agreements (“MRA”) which permit the Fund, under certain circumstances, including an event of default (such as bankruptcy or insolvency), to offset receivables or payables under the MRA with collateral held and/or pledged by the counterparty and create one single net payment due to or from the Fund.
Please refer to the table within the Portfolio of Investments for open repurchase agreements subject to the MRA on a net basis at March 31, 2024.
G. Restricted Securities. The Fund may invest in restricted securities which include those sold under Rule 144A of the Securities Act of 1933, as amended (“1933 Act”) or securities offered pursuant to Section 4(a)(2) of the 1933 Act, and/ or are subject to legal or contractual restrictions on resale and may not be publicly sold without registration under the 1933 Act. Restricted securities are fair valued using market quotations when readily available. In the absence of market quotations, the securities are valued based upon their fair value determined in good faith under procedures approved by the Board.
NOTES TO FINANCIAL STATEMENTS as of March 31, 2024 (continued)
NOTE 2 — SIGNIFICANT ACCOUNTING POLICIES (continued)
Securities that are not registered for sale to the public under the 1933 Act are referred to as “restricted securities.” These securities may be sold in private placement transactions between issuers and their purchasers and may be neither listed on an exchange nor traded in other established markets. Many times these securities are subject to legal or contractual restrictions on resale. As a result of the absence of a public trading market, the prices of these securities may be more volatile, less liquid and more difficult to value than publicly traded securities. The price realized from the sale of these securities could be less than the amount originally paid or less than their fair value if they are resold in privately negotiated transactions. In addition, these securities may not be subject to disclosure and other investment protection requirements that are afforded to publicly traded securities. Certain investments may include investment in smaller, less seasoned issuers, which may involve greater risk.
H. Indemnifications. In the normal course of business, the Trust may enter into contracts that provide certain indemnifications. The Trust’s maximum exposure under these arrangements is dependent on future claims that may be made against the Fund and, therefore, cannot be estimated; however, based on experience, management considers risk of loss from such claims remote.
NOTE 3 — INVESTMENT MANAGEMENT FEES
The Fund has entered into an investment management agreement (“Management Agreement”) with the Investment Adviser. The Investment Adviser has overall responsibility for the management of the Fund. The Investment Adviser oversees all investment advisory and portfolio management services for the Fund and assists in managing and supervising all aspects of the general day-to-day business activities and operations of the Fund, including custodial, transfer agency, dividend disbursing, accounting, auditing, compliance and related services. This Management Agreement compensates the Investment Adviser with a management fee, computed daily and payable monthly, at an annual rate of 0.35% of the Fund’s average daily net assets.
The Investment Adviser has entered into a sub-advisory agreement with Voya IM. Voya IM provides investment advice for the Fund and is paid by the Investment Adviser based on the average daily net assets of the Fund. Subject to such policies as the Board or the Investment Adviser may determine, Voya IM manages the Fund’s assets in accordance with the Fund’s investment objectives, policies, and limitations.
NOTE 4 — DISTRIBUTION AND SERVICE FEES
Class C shares of the Fund have a service and distribution plan (the “Plan”), whereby the Distributor is paid an annual fee at the rate of 1.00% for Class C shares of the value of average daily net assets of the class for expenses incurred in the distribution and/or shareholder servicing of the Fund’s Class C shares. Pursuant to the Plan, the Distributor is entitled to a payment each month for the distribution and promotion of the Fund’s Class C shares, including expenses incurred in printing prospectuses and reports used for sales purposes, expenses incurred in preparing and printing sales literature and other such distribution related expenses, including any distribution or shareholder servicing fees paid to securities dealers who have executed a distribution agreement with the Distributor.
The Distributor and Investment Adviser have contractually agreed to waive a portion of their distribution and/or shareholder servicing fees and management fees, as applicable, and to reimburse certain expenses to the extent necessary to assist the Fund in maintaining a net yield of not less than zero through August 1, 2024. There is no guarantee the Fund will maintain such a yield. Distribution and shareholder servicing fees waived are not subject to recoupment. Management fees waived or expenses reimbursed are subject to possible recoupment by the Investment Adviser within three years subject to certain restrictions. For the year ended March 31, 2024, there were no waivers or reimbursements necessary to assist the Fund in maintaining a net yield of not less than zero.
Termination or modification of this obligation requires approval by the Board. Please note that these waivers or reimbursements are in addition to existing contractual expense limitations.
As of March 31, 2024, amounts of waived and/or reimbursed fees that are subject to possible recoupment by the Investment Adviser, and the related expiration dates are as follows:
| March 31, | | | | |
| 2025 | | | 2026 | | | 2027 | | | Total | |
| $745,440 | | | | $25,222 | | | | $— | | | | $770,662 | |
The Distributor may also retain the proceeds of the contingent deferred sales charge paid by shareholders upon certain redemptions for Class C shares. For the year ended March 31, 2024, the Distributor retained the following amounts in sales charges:
| | | Class C | |
| Contingent Deferred Sales Charges: | | $ | 57 | |
NOTES TO FINANCIAL STATEMENTS as of March 31, 2024 (continued)
NOTE 5 — OTHER TRANSACTIONS WITH AFFILIATES AND RELATED PARTIES
At March 31, 2024, the following direct or indirect, wholly-owned subsidiaries of Voya Financial, Inc. owned more than 5% of the Fund:
| Subsidiary | | Percentage |
| Voya Institutional Trust Company | | | 21.63 | % |
| | | | | |
| Voya Investments Distributor, LLC | | | 9.38 | |
| | | | | |
| Voya Retirement Insurance and Annuity Company | | | 28.47 | |
The Fund has adopted a deferred compensation plan (the “DC Plan”), which allows eligible independent trustees, as described in the DC Plan, to defer the receipt of all or a portion of the trustees’ fees that they are entitled to receive from the Fund. For purposes of determining the amount owed to the trustee under the DC Plan, the amounts deferred are invested in shares of the funds selected by the trustee (the “Notional Funds”). When the Fund purchases shares of the Notional Funds, which are all advised by Voya Investments, in amounts equal to the trustees’ deferred fees, this results in a Fund asset equal to the deferred compensation liability. Such assets, if applicable, are included as a component of “Other assets” on the accompanying Statement of Assets and Liabilities. Deferral of trustees’ fees under the DC Plan will not affect net assets of the Fund, and will not materially affect the Fund’s assets, liabilities or net investment income per share. Amounts will be deferred until distributed in accordance with the DC Plan.
The Fund may pay per account fees to affiliates of Voya Investments for recordkeeping services provided on certain assets. For the year ended March 31, 2024, the per account fees for affiliated recordkeeping services paid by the Fund were $203,594.
NOTE 6 — EXPENSE LIMITATION AGREEMENT
Pursuant to a written expense limitation agreement (“Expense Limitation Agreement”) between the Investment Adviser and the Trust, on behalf of the Fund, the Investment Adviser has agreed to limit expenses of the Fund, excluding interest, taxes, investment-related costs, leverage expenses, extraordinary expenses and acquired fund fees and expenses to the levels listed below:
| Class A | | Class C | | Class I | | Class W |
| 0.35% | | 1.35% | | 0.35% | | 0.35% |
Prior to January 1, 2024, the expense limits were 0.40%, 1.40% 0.40% and 0.40% for Class A, C, I and W, respectively.
The Investment Adviser may at a later date recoup from the Fund for fees waived and/or other expenses reimbursed by the Investment Adviser during the previous 36 months,
but only if, after such recoupment, the Fund’s expense ratio does not exceed the percentage described above. Waived and reimbursed fees net of any recoupment by the Investment Adviser of such waived and reimbursed fees are reflected on the accompanying Statement of Operations. Amounts payable by the Investment Adviser are reflected on the accompanying Statement of Assets and Liabilities.
As of March 31, 2024, the amounts of waived and/or reimbursed fees that are subject to possible recoupment by the Investment Adviser, and the related expiration dates are as follows:
| March 31, | | | | |
| 2025 | | | 2026 | | | 2027 | | | Total | |
| $ | 209,753 | | | $ | 207,322 | | | $ | 62,718 | | | $ | 479,793 | |
In addition to the above waived and/or reimbursed fees, the amount of class specific fees waived or reimbursed that are subject to possible recoupment by the Investment Adviser, and the related expiration dates as of March 31, 2024 are as follows:
| | | March 31, | | | | |
| | | 2025 | | | 2026 | | | 2027 | | | Total | |
| Class A | | $ | 230,726 | | | $ | 258,466 | | | $ | 409,470 | | | $ | 898,662 | |
| Class C | | | 3,050 | | | | 2,972 | | | | 3,694 | | | | 9,716 | |
| Class I | | | — | | | | — | | | | 43,086 | | | | 43,086 | |
| Class W | | | 452 | | | | 1,457 | | | | 14,528 | | | | 16,437 | |
The Expense Limitation Agreement is contractual through August 1, 2025 and shall renew automatically for one-year terms. Termination or modification of this obligation requires approval by the Board.
NOTE 7 — LINE OF CREDIT
Effective June 12, 2023, the Fund, in addition to certain other funds managed by the Investment Adviser, entered into a 364-day unsecured committed revolving line of credit agreement (the “Credit Agreement”) with The Bank of New York Mellon (“BNY”) for an aggregate amount of $400,000,000 through June 10, 2024. The proceeds may be used only to finance temporarily: (1) the purchase or sale of investment securities; or (2) the repurchase or redemption of shares of the Fund or certain other funds managed by the Investment Adviser. The funds to which the line of credit is available pay a commitment fee equal to 0.15% per annum on the daily unused portion of the committed line amount payable quarterly in arrears. Prior to June 12, 2023, the predecessor line of credit was for an aggregate amount of $400,000,000 and the funds to which the line of credit was available paid a commitment fee equal to 0.15% per annum on the daily unused portion of the committed line amount through June 12, 2023.
Borrowings under the Credit Agreement accrue interest at the federal funds rate plus a specified margin. Repayments
NOTES TO FINANCIAL STATEMENTS as of March 31, 2024 (continued)
NOTE 7 — LINE OF CREDIT (continued)
generally must be made within 60 days after the date of a revolving credit advance. During the year ended March 31, 2024, the Fund did not utilize the line of credit.
NOTE 8 — CAPITAL SHARES
Transactions in capital shares and dollars were as follows:
| | | Shares
sold | | | Shares
issued in
merger | | Reinvestment
of
distributions | | | Shares
redeemed | | | Shares
converted | | | Net
increase
(decrease)
in
shares
outstanding | | | Shares
sold | | | Proceeds
from
shares
issued in
merger | | Reinvestment
of
distributions | | | Shares
redeemed | | | Shares
converted | | | Net increase
(decrease) | |
| Year or | | | | | | | | | | | | | | | | | | | | | | | | | | | | | | | | | | |
| period ended | | # | | | # | | # | | | # | | | # | | | # | | | ($) | | | ($) | | ($) | | | ($) | | | ($) | | | ($) | |
| Class A | | | | | | | | | | | | | | | | | | | | | | | | | | | | | | | | | | | | | | | | | | | | |
| 3/31/2024 | | | 1,430,435,227 | | | — | | | 12,170,677 | | | | (1,394,187,271 | ) | | | — | | | | 48,418,633 | | | | 1,430,435,227 | | | — | | | 12,170,677 | | | | (1,394,187,271 | ) | | | — | | | | 48,418,633 | |
| 3/31/2023 | | | 1,112,542,488 | | | — | | | 4,989,049 | | | | (1,056,761,685 | ) | | | — | | | | 60,769,852 | | | | 1,112,542,488 | | | — | | | 4,989,049 | | | | (1,056,761,685 | ) | | | — | | | | 60,769,852 | |
| Class C | | | | | | | | | | | | | | | | | | | | | | | | | | | | | | | | | | | | | | | | | | | | |
| 3/31/2024 | | | 480,854 | | | — | | | 83,555 | | | | (669,070 | ) | | | — | | | | (104,661 | ) | | | 480,854 | | | — | | | 83,555 | | | | (669,070 | ) | | | — | | | | (104,661 | ) |
| 3/31/2023 | | | 672,786 | | | — | | | 35,247 | | | | (502,725 | ) | | | — | | | | 205,308 | | | | 672,786 | | | — | | | 35,247 | | | | (502,725 | ) | | | — | | | | 205,308 | |
| Class I | | | | | | | | | | | | | | | | | | | | | | | | | | | | | | | | | | | | | | | | | | | | |
| 3/31/2024 | | | 23,042,711 | | | — | | | 2,805,031 | | | | (23,356,641 | ) | | | — | | | | 2,491,101 | | | | 23,042,711 | | | — | | | 2,805,031 | | | | (23,356,641 | ) | | | — | | | | 2,491,101 | |
| 3/31/2023 | | | 25,864,127 | | | — | | | 1,287,280 | | | | (12,429,103 | ) | | | — | | | | 14,722,304 | | | | 25,864,127 | | | — | | | 1,287,280 | | | | (12,429,103 | ) | | | — | | | | 14,722,304 | |
| Class W | | | | | | | | | | | | | | | | | | | | | | | | | | | | | | | | | | | | | | | | | | | | |
| 3/31/2024 | | | 20,383,954 | | | — | | | 448,234 | | | | (10,596,718 | ) | | | — | | | | 10,235,470 | | | | 20,383,954 | | | — | | | 448,234 | | | | (10,596,718 | ) | | | — | | | | 10,235,470 | |
| 3/31/2023 | | | 1,753,335 | | | — | | | 36,370 | | | | (730,513 | ) | | | — | | | | 1,059,192 | | | | 1,753,335 | | | — | | | 36,370 | | | | (730,513 | ) | | | — | | | | 1,059,192 | |
NOTE 9 — FEDERAL INCOME TAXES
The amount of distributions from net investment income and net realized capital gains are determined in accordance with federal income tax regulations, which may differ from GAAP for investment companies. These book/ tax differences may be either temporary or permanent. Permanent differences are reclassified within the capital accounts based on their
federal tax-basis treatment; temporary differences are not reclassified.
Dividends paid by the Fund from net investment income and distributions of net realized short-term capital gains are, for federal income tax purposes, taxable as ordinary income to shareholders.
The tax composition of dividends and distributions to shareholders was as follows:
| Year Ended | | | Year Ended | |
| March 31, 2024 | | | March 31, 2023 | |
| Ordinary | | | Ordinary | |
| Income | | | Income | |
| $ | 15,563,171 | | | $ | 6,363,850 | |
The tax-basis components of distributable earnings and the capital loss carryforwards which may be used to offset future realized capital gains for federal income tax purposes as of March 31, 2024 were:
| Undistributed | | Unrealized | | | | | | | | Total | |
| Ordinary | | Appreciation/ | | Capital Loss Carryforwards | | | | Distributable | |
| Income | | (Depreciation) | | Amount | | Character | | Other | | Earnings/(Loss) | |
| $ | 2,999 | | $ | (33) | | $ | (12,475) | | | Short-term | | $ | (4,709) | | $ | (14,218) | |
NOTES TO FINANCIAL STATEMENTS as of March 31, 2024 (continued)
NOTE 9 — FEDERAL INCOME TAXES (continued)
The Fund’s major tax jurisdictions are U.S. federal and Arizona state.
As of March 31, 2024, no provision for income tax is required in the Fund’s financial statements as a result of tax positions taken on federal and state income tax returns for open tax years. The Fund’s federal and state income and federal excise tax returns for tax years for which the applicable statutes of limitations have not expired are subject to examination by the Internal Revenue Service and state department of revenue. Generally, the preceding four tax years remain subject to examination by these jurisdictions.
NOTE 10 — LONDON INTERBANK OFFERED RATE (“LIBOR”)
The London Interbank Offered Rate (“LIBOR”) was the offered rate for short-term Eurodollar deposits between major international banks. The terms of investments, financings or other transactions (including certain derivatives transactions) to which the Fund may be a party have historically been tied to LIBOR. In connection with the global transition away from LIBOR led by regulators and market participants, LIBOR was last published on a representative basis at the end of June 2023. Alternative reference rates to LIBOR have been established in most major currencies and markets in these new rates are continuing to develop. The transition away from LIBOR to the use of replacement rates has gone relatively smoothly on the Fund and the financial instruments in which it invests; however, longer-term impacts are still uncertain.
In addition, interest rates or other types of rates and indices which are classed as “benchmarks” have been the subject of ongoing national and international regulatory reform, including under the European Union regulation on indices used as benchmarks in financial instruments and financial contracts (known as the “Benchmarks Regulation”). The Benchmarks Regulation has been enacted into United Kingdom law by virtue of the European Union (Withdrawal) Act 2018 (as amended), subject to amendments made by the Benchmarks (Amendment and Transitional Provision) (EU Exit) Regulations 2019 (SI 2019/657) and other statutory instruments. Following the implementation of these reforms, the manner of administration of benchmarks has changed and may further change in the future, with the result that relevant benchmarks may perform differently than in the past, the use of benchmarks that are not compliant with the new standards by certain supervised entities may be restricted, and certain benchmarks may be eliminated entirely. Such changes could cause increased market volatility and disruptions in liquidity for instruments that rely on or are impacted by such benchmarks. Additionally, there
could be other consequences which cannot be predicted.
NOTE 11 — MARKET DISRUPTION AND GEOPOLITICAL
The Fund is subject to the risk that geopolitical events will disrupt securities markets and adversely affect global economies and markets. Due to the increasing interdependence among global economies and markets, conditions in one country, market, or region might adversely impact markets, issuers and/or foreign exchange rates in other countries, including the United States. Wars, terrorism, global health crises and pandemics, and other geopolitical events that have led, and may continue to lead, to increased market volatility and may have adverse short- or long-term effects on U.S. and global economies and markets, generally. For example, the COVID-19 pandemic resulted in significant market volatility, exchange suspensions and closures, declines in global financial markets, higher default rates, supply chain disruptions, and a substantial economic downturn in economies throughout the world. The economic impacts of COVID-19 have created a unique challenge for real estate markets. Many businesses have either partially or fully transitioned to a remote-working environment and this transition may negatively impact the occupancy rates of commercial real estate over time. Natural and environmental disasters and systemic market dislocations are also highly disruptive to economies and markets. In addition, military action by Russia in Ukraine has, and may continue to, adversely affect global energy and financial markets and therefore could affect the value of investments, including beyond the direct exposure to Russian issuers or nearby geographic regions. The extent and duration of the military action, sanctions, and resulting market disruptions are impossible to predict and could be substantial. A number of U.S. domestic banks and foreign (non-U.S.) banks have recently experienced financial difficulties and, in some cases, failures. There can be no certainty that the actions taken by regulators to limit the effect of those financial difficulties and failures on other banks or other financial institutions or on the U.S. or foreign (non-U.S.) economies generally will be successful. It is possible that more banks or other financial institutions will experience financial difficulties or fail, which may affect adversely other U.S. or foreign (non-U.S.) financial institutions and economies. These events as well as other changes in foreign (non-U.S.) and domestic economic, social, and political conditions also could adversely affect individual issuers or related groups of issuers, securities markets, interest rates, credit ratings, inflation, investor sentiment, and other factors affecting the value of the Fund’s investments. Any of these occurrences could disrupt the operations of the Fund and of the Fund’s service providers.
NOTES TO FINANCIAL STATEMENTS as of March 31, 2024 (continued)
NOTE 12 — SUBSEQUENT EVENTS
Dividends. Subsequent to March 31, 2024, the Fund declared dividends from net investment income of:
| | | Per Share
Amount | | Payable
Date | | Record Date |
| Class A | | $0.0041 | | May 1, 2024 | | Daily |
| Class C | | $0.0033 | | May 1, 2024 | | Daily |
| Class I | | $0.0041 | | May 1, 2024 | | Daily |
| Class W | | $0.0041 | | May 1, 2024 | | Daily |
The Fund has evaluated events occurring after the Statement of Assets and Liabilities date through the date that the financial statements were issued (“subsequent events”) to determine whether any subsequent events necessitated adjustment to or disclosure in the financial statements. Other than the above, no such subsequent events were identified.
| Voya Government Money Market Fund | PORTFOLIO OF INVESTMENTS |
| March 31, 2024 |
Principal
Amount† | | | | Value | | | Percentage
of Net
Assets | |
| U.S. GOVERNMENT AGENCY DEBT: 27.5% | | | | | | | | |
| 650,000 (1) | | Federal Farm Credit Banks Funding Corp., 5.420%, (SOFRRATE + 0.090%), 09/16/2024 | | $ | 649,962 | | | | 0.2 | |
| 3,000,000 (2) | | Federal Home Loan Bank Discount Notes, 4.880%, 01/27/2025 | | | 2,883,864 | | | | 0.9 | |
| 10,000,000 (2) | | Federal Home Loan Bank Discount Notes, 4.890%, 01/10/2025 | | | 9,633,167 | | | | 2.8 | |
| 975,000 | | Federal Home Loan Banks, 2.400%, 04/22/2024 | | | 973,311 | | | | 0.3 | |
| 800,000 | | Federal Home Loan Banks, 5.330%, 04/26/2024 | | | 799,958 | | | | 0.2 | |
| 6,500,000 (1) | | Federal Home Loan Banks, 5.330%, (SOFRRATE + 0.000%), 05/21/2024 | | | 6,500,000 | | | | 1.9 | |
| 4,000,000 (1) | | Federal Home Loan Banks, 5.330%, (SOFRRATE + 0.000%), 06/11/2024 | | | 4,000,000 | | | | 1.2 | |
| 15,500,000 (1) | | Federal Home Loan Banks, 5.330%, (SOFRRATE + 0.000%), 07/09/2024 | | | 15,500,000 | | | | 4.6 | |
| 7,605,000 (1) | | Federal Home Loan Banks, 5.340%, (SOFRRATE + 0.010%), 08/27/2024 | | | 7,605,000 | | | | 2.2 | |
| 550,000 (1) | | Federal Home Loan Banks, 5.390%, (SOFRRATE + 0.060%), 05/20/2024 | | | 549,995 | | | | 0.2 | |
| 13,000,000 (1) | | Federal Home Loan Banks 0001, 5.335%, (SOFRRATE + 0.005%), 06/20/2024 | | | 13,000,000 | | | | 3.8 | |
| 31,000,000 (1) | | Federal Home Loan Banks 0002, 5.330%, (SOFRRATE + 0.000%), 06/03/2024 | | | 31,000,000 | | | | 9.2 | |
| | | Total U.S. Government Agency Debt | | | | | | | | |
| | | (Cost $93,095,257) | | | 93,095,257 | | | | 27.5 | |
| U.S. TREASURY DEBT: 46.3% | | | | | | | | |
| 12,250,000 (2) | | United States Treasury Bill, 4.880%, 12/26/2024 | | | 11,823,923 | | | | 3.5 | |
| 41,817,000 (2) | | United States Treasury Bill, 5.030%, 04/30/2024 | | | 41,645,174 | | | | 12.3 | |
| 14,750,000 (2) | | United States Treasury Bill, 5.150%, 04/23/2024 | | | 14,702,406 | | | | 4.3 | |
| 60,500,000 (2) | | United States Treasury Bill, 5.250%, 05/09/2024 | | | 60,163,226 | | | | 17.8 | |
Principal
Amount† | | | | Value | | | Percentage
of Net
Assets | |
| U.S. TREASURY DEBT: (continued) | |
| 15,000,000 (2) | | United States Treasury Bill, 5.290%, 05/21/2024 | | $ | 14,890,271 | | | | 4.4 | |
| 13,500,000 (1) | | United States Treasury Floating Rate Notes, 5.225%, (USBMMY3M + (0.075)%), 04/30/2024 | | | 13,498,629 | | | | 4.0 | |
| | | Total U.S. Treasury Debt | | | | | | | | |
| | | (Cost $156,723,629) | | | 156,723,629 | | | | 46.3 | |
| U.S. TREASURY REPURCHASE AGREEMENTS: 32.8% | |
| 111,044,000 | | Deutsche Bank AG, Repurchase Agreement dated 03/28/2024, 5.300%, due 04/01/2024 $111,109,393 to be received upon repurchase (Collateralized by $149,482,099, Various U.S. Treasury Obligations , 0.000%, Market Value plus accrued interest and principal $114,375,320 due 02/15/25-05/15/39) | | | 111,044,000 | | | | 32.8 | |
| | | | | | | | | | | |
| | | | | | | | | | | |
| | | Total U.S. Treasury Repurchase Agreements | | | | | | | | |
| | | (Cost $111,044,000) | | | 111,044,000 | | | | 32.8 | |
| | | | | | | | | | | |
| | | Total Long-Term Investments | | | | | | | | |
| | | (Cost $360,862,886) | | | 360,862,886 | | | | 106.6 | |
| | | | | | | | | | | |
| | | Total Investments in Securities | | | | | | | | |
| | | (Cost $360,862,886) | | $ | 360,862,886 | | | | 106.6 | |
| | | | | | | | | | | |
| | | Liabilities in Excess of Other Assets | | | (22,467,577 | ) | | | (6.6 | ) |
| | | Net Assets | | $ | 338,395,309 | | | | 100.0 | |
| † | Unless otherwise indicated, principal amount is shown in USD. |
| (1) | Variable rate security. Rate shown is the rate in effect as of March 31, 2024. |
| (2) | Represents a zero coupon bond. Rate shown reflects the effective yield as of March 31, 2024. |
Reference Rate Abbreviations:
| SOFRRATE | 1-day Secured Overnight Financing Rate |
| USBMMY3M | U.S. Treasury 3-month Bill Money Market Yield |
See Accompanying Notes to Financial Statements
| | PORTFOLIO OF INVESTMENTS |
| Voya Government Money Market Fund | March 31, 2024 (continued) |
| | |
Fair Value Measurements^
The following is a summary of the fair valuations according to the inputs used as of March 31, 2024 in valuing the assets and liabilities:
| | | Quoted Prices
in Active Markets
for Identical
Investments
(Level 1) | | | Significant Other
Observable
Inputs
(Level 2) | | | Significant
Unobservable
Inputs
(Level 3) | | | Fair Value
at
March 31, 2024 | |
| Asset Table | | | | | | | | | | | | | | | | |
| Investments, at fair value | | | | | | | | | | | | | | | | |
| U.S. Government Agency Debt | | $ | — | | | $ | 93,095,257 | | | $ | — | | | $ | 93,095,257 | |
| U.S. Treasury Debt | | | — | | | | 156,723,629 | | | | — | | | | 156,723,629 | |
| U.S. Treasury Repurchase Agreements | | | — | | | | 111,044,000 | | | | — | | | | 111,044,000 | |
| Total Investments, at fair value | | $ | — | | | $ | 360,862,886 | | | $ | — | | | $ | 360,862,886 | |
| ^ | See Note 2, “Significant Accounting Policies” in the Notes to Financial Statements for additional information. |
The following table is a summary of the Fund’s treasury repurchase agreement by counterparty which is subject to offset under a MRA as of March 31, 2024:
| Counterparty | | U.S. Treasury
Repurchase
Agreements,
at fair value | | | Fair Value of
Non-Cash Collateral
Received Including
Accrued Interest(1) | | | Net Amount | |
| Deutsche Bank AG | | $ | 111,044,000 | | | $ | (111,044,000) | | | $ | — | |
| Totals | | $ | 111,044,000 | | | $ | (111,044,000) | | | $ | — | |
| (1) | Collateral with a fair value of $114,375,320 has been pledged in connection with the above treasury repurchase agreement. Excess collateral received from the individual counterparty is not shown for financial reporting purposes. |
At March 31, 2024, the aggregate cost of securities and other investments and the composition of unrealized appreciation and depreciation of securities and other investments on a tax basis were:
| Cost for federal income tax purposes was $360,862,919. | | | |
| Net unrealized depreciation consisted of: | | | |
| Gross Unrealized Appreciation | | $ | — | |
| Gross Unrealized Depreciation | | | (33) | |
| Net Unrealized Depreciation | | $ | (33) | |
See Accompanying Notes to Financial Statements
TAX INFORMATION (Unaudited)
Dividends and distributions paid during the tax year ended March 31, 2024 were as follows:
| Fund Name | | Type | | | Per Share Amount | |
| Voya Government Money Market Fund | | | | | | | |
| Class A | | NII | | | $ | 0.0493 | |
| Class C | | NII | | | $ | 0.0392 | |
| Class I | | NII | | | $ | 0.0492 | |
| Class W | | NII | | | $ | 0.0493 | |
NII — Net investment income
Pursuant to Internal Revenue Code Section 871(k)(1), Voya Government Money Market Fund designates 99.70% of net investment income distributions as interest-related dividends.
Above figures may differ from those cited elsewhere in this report due to differences in the calculation of income and gains under U.S. generally accepted accounting principles (book) purposes and Internal Revenue Service (tax) purposes.
Shareholders are strongly advised to consult their own tax advisers with respect to the tax consequences of their investments in the Fund. In January, shareholders, excluding corporate shareholders, receive an IRS 1099-DIV regarding the federal tax status of the dividends and distributions they received in the calendar year.
TRUSTEE AND OFFICER INFORMATION (Unaudited)
The business and affairs of the Trust are managed under the direction of the Board. A Trustee, who is not an interested person of the Trust, as defined in the 1940 Act, is an independent trustee (“Independent Trustee”). The Trustees and Officers of the Trust are listed below. The Statement of Additional Information includes additional information about Trustees of the Trust and is available, without charge, upon request at (800) 992-0180.
Name, Address and Year of
Birth | | Position(s) Held with the
Trust | | Term of Office and
Length of Time
Served(1) | | Principal
Occupation(s) –
During the Past 5 Years | | Number of
funds in
Fund
Complex
Overseen
by
Trustee(2) | | Other Board Positions Held by Trustee |
| | | | | | | | | | | |
| Independent Trustees: |
| |
Colleen D. Baldwin (1960)
7337 East Doubletree Ranch Rd. Suite 100
Scottsdale, Arizona 85258 | | Chairperson
Trustee | | January 2020 - Present
November 2007 – Present | | President, Glantuam Partners, LLC, a business consulting firm (January 2009–Present). | | 138 | | Stanley Global Engineering 2020–Present). |
| | | | | | | | | | | |
John V. Boyer (1953)
7337 East Doubletree Ranch Rd. Suite 100
Scottsdale, Arizona 85258 | | Trustee | | January 2005 – Present | | Retired. Formerly, President and Chief Executive Officer, Bechtler Arts Foundation, an arts and education foundation (January 2008–December 2019). | | 138 | | None. |
| | | | | | | | | | | |
Martin J. Gavin (1950)
7337 East Doubletree Ranch Rd. Suite 100
Scottsdale, AZ 85258 | | Trustee | | August 2015 – Present | | Retired. | | 138 | | None. |
| | | | | | | | | | | |
Joseph E. Obermeyer (1957)
7337 East Doubletree Ranch Rd. Suite 100
Scottsdale, Arizona 85258 | | Trustee | | May 2013 – Present | | President, Obermeyer & Associates, Inc., a provider of financial and economic consulting services (November 1999–Present). | | 138 | | None. |
| | | | | | | | | | | |
Sheryl K. Pressler (1950)
7337 East Doubletree Ranch Rd. Suite 100
Scottsdale, Arizona 85258 | | Trustee | | January 2006 – Present | | Consultant (May 2001–Present). | | 138 | | Centerra Gold Inc. (May 2008–Present). |
| | | | | | | | | | | |
Christopher P. Sullivan (1954)
7337 East Doubletree Ranch Rd. Suite 100
Scottsdale, Arizona 85258 | | Trustee | | October 2015 – Present | | Retired. | | 138 | | None. |
TRUSTEE AND OFFICER INFORMATION (Unaudited) (continued)
| (1) | Trustees serve until their successors are duly elected and qualified. The tenure of each Trustee who is not an “interested person” as defined in the 1940 Act, of each Fund (“Independent Trustee”) is subject to the Board’s retirement policy which states that each duly elected or appointed Independent Trustee shall retire from and cease to be a member of the Board of Trustees at the close of business on December 31 of the calendar year in which the Independent Trustee attains the age of 75. A majority vote of the Board’s other Independent Trustees may extend the retirement date of an Independent Trustee if the retirement would trigger a requirement to hold a meeting of shareholders of the Trust under applicable law, whether for the purposes of appointing a successor to the Independent Trustee or otherwise comply under applicable law, in which case the extension would apply until such time as the shareholder meeting can be held or is no longer required (as determined by a vote of a majority of the other Independent Trustees). |
| (2) | For the purposes of this table, “Fund Complex” means the Voya family of funds including the following investment companies: Voya Asia Pacific High Dividend Equity Income Fund; Voya Balanced Portfolio, Inc.; Voya Credit Income Fund; Emerging Markets High Dividend Equity Fund; Voya Equity Trust; Voya Funds Trust; Voya Global Advantage and Premium Opportunity Fund; Voya Global Equity Dividend and Premium Opportunity Fund; Voya Government Money Market Portfolio; Voya Infrastructure, Industrials and Materials Fund; Voya Intermediate Bond Portfolio; Voya Investors Trust; Voya Mutual Funds; Voya Partners, Inc.; Voya Separate Portfolios Trust; Voya Strategic Allocation Portfolios, Inc.; Voya Variable Funds; Voya Variable Insurance Trust; Voya Variable Portfolios, Inc.; and Voya Variable Products Trust. The number of funds in the Fund Complex is as of April 30, 2024. |
TRUSTEE AND OFFICER INFORMATION (Unaudited) (continued)
Name, Address and Year of
Birth | | Position(s) Held with the
Trust | | Term of Office and
Length of Time
Served(1) | | Principal Occupation(s) – During the Past 5 Years |
Andy Simonoff (1973)
5780 Powers Ferry Road NW
Atlanta, Georgia 30327 | | President and Chief
Executive Officer | | January 2023 - Present | | Director, President and Chief Executive Officer, Voya Funds Services, LLC, Voya Capital, LLC and Voya Investments, LLC (January 2023 – Present); Managing Director, Chief Strategy and Transformation Officer, Voya Investment Management (January 2020 – Present). Formerly, Managing Director, Head of Business Management, Voya Investment Management (March 2019 – January 2020); Managing Director, Head of Business Management, Fixed Income, Voya Investment Management (November 2015 – March 2019). |
| | | | | | | |
Jonathan Nash (1967)
230 Park Avenue
New York, New York 10169 | | Executive Vice President Chief Investment Risk Officer | | March 2020 – Present | | Head of Investment Risk for Equity and Funds, Voya Investment Management (April 2024 – Present); Executive Vice President and Chief Investment Risk Officer, Voya Investments, LLC (March 2020 – Present). Formerly, Senior Vice President, Investment Risk Management, Voya Investment Management (March 2017 – March 2024); Vice President, Voya Investments, LLC (September 2018 – March 2020). |
| | | | | | | |
Steven Hartstein (1963)
230 Park Avenue
New York, New York 10169 | | Chief Compliance Officer | | December 2022 - Present | | Senior Vice President, Voya Investment Management (December 2022 – Present). Formerly, Head of Funds Compliance, Brighthouse Financial, Inc. and Chief Compliance Officer – Brighthouse Funds and Brighthouse Investment Advisers, LLC (March 2017- December 2022). |
| | | | | | | |
Todd Modic (1967)
7337 East Doubletree Ranch Rd.
Suite 100
Scottsdale, Arizona 85258 | | Senior Vice President, Chief/ Principal Financial Officer and Assistant Secretary | | March 2005 – Present | | Director and Senior Vice President, Voya Capital, LLC, and Voya Funds Services, LLC (September 2022 – Present); Director, Voya Investments, LLC (September 2022 – Present); Senior Vice President, Voya Investments, LLC (April 2005 – Present). Formerly, President, Voya Funds Services, LLC (March 2018 – September 2022). |
| | | | | | | |
Kimberly A. Anderson (1964)
7337 East Doubletree Ranch Rd.
Suite 100
Scottsdale, Arizona 85258 | | Senior Vice President | | November 2003 – Present | | Senior Vice President, Voya Investments, LLC (September 2003−Present). |
| | | | | | | |
Sara M. Donaldson (1959)
7337 East Doubletree Ranch Rd.
Suite 100
Scottsdale, Arizona 85258 | | Senior Vice President | | June 2022 – Present | | Senior Vice President, Voya Investments, LLC (February 2022 – Present); Senior Vice President, Head of Active Ownership, Voya Investment Management (September 2021 – Present). Formerly, Vice President, Voya Investments, LLC (October 2015 – February 2022); Vice President, Head of Proxy Voting, Voya Investment Management (October 2015 – August 2021). |
| | | | | | | |
Jason Kadavy (1976)
7337 East Doubletree Ranch Rd.
Suite 100
Scottsdale, Arizona 85258 | | Senior Vice President | | September 2023 - Present | | Senior Vice President, Voya Investments, LLC and Voya Funds Services, LLC (September 2023 – Present); Formerly, Vice President, Voya Investments, LLC (October 2015 - September 2023); Vice President, Voya Funds Services, LLC (July 2007 – September 2023). |
| | | | | | | |
Andrew K. Schlueter (1976)
7337 East Doubletree Ranch Rd.
Suite 100
Scottsdale, Arizona 85258 | | Senior Vice President | | June 2022 - Present | | Senior Vice President, Head of Investment Operations Support, Voya Investment Management (April 2023 – Present); Vice President, Voya Investments Distributor, LLC (April 2018 – Present); Vice President, Voya Investments, LLC and Voya Funds Services, LLC (March 2018-Present); Formerly, Vice President, Head of Mutual Fund Operations, Voya Investment Management (March 2022 – March 2023); Vice President, Head of Mutual Fund Operations, Voya Investment Management (February 2018 – February 2022). |
TRUSTEE AND OFFICER INFORMATION (Unaudited) (continued)
Name, Address and Year of
Birth | | Position(s) Held with the
Trust | | Term of Office and
Length of Time
Served(1) | | Principal Occupation(s) – During the Past 5 Years |
Joanne F. Osberg (1982)
7337 East Doubletree Ranch Rd.
Suite 100
Scottsdale, Arizona 85258 | | Senior Vice President Secretary | | March 2023 - Present
September 2020 – Present | | Senior Vice President and Chief Counsel, Voya Investment Management – Mutual Fund Legal Department, Senior Vice President and Secretary, Voya Investments, LLC, Voya Capital, LLC, and Voya Funds Services, LLC (March 2023 – Present). Formerly, Secretary, Voya Capital, LLC (August 2022 - March 2023); Vice President and Secretary, Voya Investments, LLC and Voya Funds Services, LLC, Vice President and Senior Counsel, Voya Investment Management – Mutual Fund Legal Department (September 2020 – March 2023). Vice President and Counsel, Voya Investment Management – Mutual Fund Legal Department (January 2013 – September 2020). |
| | | | | | | |
Robert Terris (1970)
5780 Powers Ferry Road NW
Atlanta, Georgia 30327 | | Senior Vice President | | May 2006 – Present | | Senior Vice President, Head of Future State Operating Model Design, Voya Investment Management (April 2023 – Present); Senior Vice President, Voya Investments Distributor, LLC (April 2018 – Present); Senior Vice President, Head of Investment Services, Voya Investments, LLC (April 2018 – Present); Senior Vice President, Head of Investment Services, Voya Funds Services, LLC (March 2006 – Present). |
| | | | | | | |
Fred Bedoya (1973)
7337 East Doubletree Ranch Rd.
Suite 100
Scottsdale, Arizona 85258 | | Vice President
Principal Accounting
Officer and Treasurer | | September 2012 – Present | | Vice President, Voya Investments, LLC (October 2015 – Present); Vice President, Voya Funds Services, LLC (July 2012 – Present). |
| | | | | | | |
Robyn L. Ichilov (1967)
7337 East Doubletree Ranch Rd.
Suite 100
Scottsdale, Arizona 85258 | | Vice President | | October 2000 – Present | | Vice President, Voya Investments, LLC (August 1997 – Present); Vice President, Voya Funds Services, LLC (November 1995 – Present). |
| | | | | | | |
Erica McKenna (1972)
7337 East Doubletree Ranch Rd.
Suite 100
Scottsdale, Arizona 85258 | | Vice President | | June 2022 - Present | | Vice President, Head of Mutual Fund Compliance, and Chief Compliance Officer, Voya Investments, LLC (May 2022 – Present). Formerly, Vice President, Fund Compliance Manager, Voya Investments, LLC (March 2021 – May 2022); Assistant Vice President, Fund Compliance Manager, Voya Investments, LLC (December 2016 – March 2021). |
| | | | | | | |
Craig Wheeler (1969)
7337 East Doubletree Ranch Rd.
Suite 100
Scottsdale, Arizona 85258 | | Vice President | | May 2013 – Present | | Vice President–Director of Tax, Voya Investments, LLC (October 2015–Present). |
| | | | | | | |
Gizachew Wubishet (1976)
7337 East Doubletree Ranch Rd.
Suite 100
Scottsdale, Arizona 85258 | | Vice President and Assistant Secretary | | March 2024 - Present | | Vice President and Counsel, Voya Investment Management – Mutual Fund Legal Department (March 2024 – Present). Formerly, Assistant Vice President and Counsel, Voya Investment Management – Mutual Fund Legal Department (May 2019 – February 2024); Attorney, Ropes & Gray LLP (October 2011 – April 2019). |
| | | | | | | |
Nicholas C.D. Ward (1993)
7337 East Doubletree Ranch Rd.
Suite 100
Scottsdale, Arizona 85258 | | Assistant Vice
President and
Assistant Secretary | | June 2022 - Present | | Assistant Vice President and Counsel, Voya Investment Management – Mutual Fund Legal Department (March 2024 – Present). Formerly, Counsel, Voya Investment Management – Mutual Fund Legal Department (November 2021 – February 2024); Associate, Dechert LLP (October 2018 – November 2021). |
TRUSTEE AND OFFICER INFORMATION (Unaudited) (continued)
Name, Address and Year of
Birth | | Position(s) Held with the
Trust | | Term of Office and
Length of Time
Served(1) | | Principal Occupation(s) – During the Past 5 Years |
Monia Piacenti (1976)
One Orange Way
Windsor, Connecticut 06095 | | Anti-Money Laundering Officer | | June 2018 –Present | | Compliance Manager, Voya Financial, Inc. (March 2023 – Present); Anti-Money Laundering Officer, Voya Investments Distributor, LLC, Voya Investment Management and Voya Investment Management Trust Co. (June 2018 – Present). Formerly, Compliance Consultant, Voya Financial, Inc. (January 2019 – February 2023). |
| (1) | The Officers hold office until the next annual meeting of the Board of Trustees and until their successors shall have been elected and qualified. |
ADVISORY AND SUB-ADVISORY CONTRACT APPROVAL DISCUSSION (Unaudited)
BOARD CONSIDERATION AND APPROVAL OF INVESTMENT MANAGEMENT CONTRACT AND SUB-ADVISORY CONTRACT
At a meeting held on November 16, 2023, the Board of Trustees (“Board”) of Voya Funds Trust (the “Trust”), including a majority of the Board members who have no direct or indirect interest in the investment management and sub-advisory contracts, and who are not “interested persons” of Voya Government Money Market Fund, a series of the Trust (the “Fund”), as such term is defined under the Investment Company Act of 1940, as amended (the “Independent Trustees”), considered and approved the renewal of the investment management contract (the “Management Contract”) between Voya Investments, LLC (the “Manager”) and the Trust, on behalf of the Fund, and the sub-advisory contract (the “Sub-Advisory Contract,” and together with the Management Contract, the “Contracts”) with Voya Investment Management Co. LLC, the sub-adviser to the Fund (the “Sub-Adviser”), for an additional one-year period ending November 30, 2024.
In addition to the Board meeting on November 16, 2023, the Independent Trustees also held meetings outside the presence of representatives of the Manager and Sub-Adviser (collectively, such persons are referred to herein as “management”) on October 9, 2023 and November 14, 2023. At those meetings, the Board members reviewed and considered materials related to the proposed continuance of the Contracts that they had requested and believed to be relevant to the renewal of the Contracts in light of their own business judgment and the legal advice furnished to them by K&L Gates LLP, their independent legal counsel. The Board also considered information furnished to it throughout the year at meetings of the Board and its committees, including information regarding performance, expenses, and other relevant matters. While the Board considered the renewal of the management contracts and sub-advisory contracts for all of the applicable investment companies in the Voya family of funds at the same meetings, the Board considered each Voya fund’s investment management and sub-advisory relationships separately.
The Board has established a Contracts Committee and two Investment Review Committees (the “IRCs”), each of which includes only Independent Trustees as members. The Contracts Committee meets several times throughout the year to provide oversight with respect to the management and sub-advisory contracts approval and renewal process for the Voya funds, among other functions, and each IRC meets several times throughout the year with respect to each Voya fund (assigned to that IRC) to provide oversight regarding the investment performance of the sub-advisers, as well as the Manager’s role in monitoring the sub-advisers.
The Contracts Committee oversees, and annually recommends Board approval of updates to, a methodology guide for the Voya funds (“Methodology Guide”), which sets out a framework pursuant to which the Independent Trustees request, and management provides, certain information that the Independent Trustees deem to be important or potentially relevant to the contracts renewal process for the Voya funds. The Independent Trustees retain the services of an independent consultant with experience in the mutual fund industry to assist the Contracts Committee in developing and recommending to the Board: (1) a selected peer group of investment companies for the Fund (“Selected Peer Group”) based on the Fund’s particular attributes; and (2) updates to the Methodology Guide with respect to the content and format of various data prepared in connection with the renewal process. In addition, the Independent Trustees periodically have retained an independent firm to test and verify the accuracy of certain information presented to the Board for a representative sample of the Voya funds.
The Manager or Sub-Adviser may not have been able to, or opted not to, provide information in response to certain information requests, in which case the Board conducted its evaluation based on the information that was provided. In such cases, the omission of any such information was determined to not be material to the Board’s considerations.
Provided below is an overview of certain material factors that the Board considered at its meetings regarding the renewal of the Contracts and the compensation to be paid thereunder. The Board members did not identify any particular information or factor that was most relevant to its consideration.
Nature, Extent and Quality of Services
The Manager oversees, subject to the authority of the Board, and is responsible for the provision of, all investment advisory and portfolio management services for the Fund, but may delegate certain of these responsibilities to one or more sub-advisers. In addition, the Manager provides administrative services reasonably necessary for the operation of the Fund as set forth in the Management Contract, including oversight of the Fund’s operations and risk management and the oversight of its various other service providers.
The Board considered the “manager-of-managers” structure of the Voya funds that has been developed by the Manager pursuant to which the Manager selects, subject to the Board’s approval, sub-advisers to provide day-to-day management services to all or a portion of each Voya fund. The Board recognized that the Manager is responsible for monitoring the Sub-Adviser’s investment program, performance, developments, ongoing operations, and compliance with applicable regulations and investment
ADVISORY AND SUB-ADVISORY CONTRACT APPROVAL DISCUSSION (Unaudited) (continued)
policies and restrictions with respect to the Fund under this manager-of-managers arrangement. The Board also considered the techniques and resources that the Manager has developed to provide this ongoing due diligence and oversight with respect to the sub-advisers and to recommend appropriate changes in investment strategies, sub-advisers, or allocation among sub-advisers in an effort to improve a Voya fund’s performance. In connection with the Manager’s performance of these duties, the Board considered that the Manager has developed an oversight process formulated by its Manager Research & Selection Group that reviews, among other matters, performance data, the Sub-Adviser’s management team, portfolio data and attribution analysis related to the Sub-Adviser through various means, including, but not limited to, in-person meetings, on-site or virtual visits, and telephonic meetings with the Sub-Adviser.
Further, the Board considered periodic compliance reports it receives from the Trust’s Chief Compliance Officer evaluating, among other related matters, whether the regulatory compliance systems and procedures of the Manager and Sub-Adviser are reasonably designed to ensure compliance with the federal securities laws and whether the investment policies and restrictions for the Fund are complied with on a consistent basis.
The Board considered the portfolio management team assigned by the Sub-Adviser to the Fund and the level of resources committed to the Fund (and other relevant funds in the Voya funds) by the Manager and the Sub-Adviser, and whether those resources are sufficient to provide high-quality services to the Fund.
Based on their deliberations and the materials presented to them, the Board concluded that the nature, extent and quality of the overall services provided by the Manager and Sub-Adviser under the Contracts were appropriate.
Fund Performance
In assessing the investment management and sub-advisory relationships, the Board placed emphasis on the investment returns of the Fund, including its investment performance over certain time periods compared to the Fund’s Morningstar, Inc. (an independent provider of mutual fund data) category and primary benchmark, a broad-based securities market index. The Board also considered information from the Manager Research & Selection Group and received reports summarizing a separate analysis of the Fund’s performance and risk, including risk-adjusted investment return information, from the Trust’s Chief Investment Risk Officer.
Economies of Scale
When evaluating the reasonableness of the management fee schedule, the Board considered whether economies of
scale have been or likely will be realized by the Manager and the Sub-Adviser as the Fund grows larger and the extent to which any such economies are shared with the Fund. The Board considered that, while the Fund does not have management fee breakpoints, the Fund has fee waiver and expense reimbursement arrangements. The Board considered the extent to which economies of scale realized by the Manager could be shared with the Fund through such fee waivers, expense reimbursements or other expense reductions.
Information Regarding Services, Performance, and Fee Schedules Offered to Other Clients
The Board considered comparative information regarding the nature of services, performance, and fee schedules offered by the Manager and Sub-Adviser to other clients with similar investment objectives, if applicable, including other registered investment companies and relevant institutional accounts. When the fee schedules offered to or the performance of such other clients differed materially from the Fund, the Board took into account the underlying rationale provided by the Manager or Sub-Adviser, as applicable, for these differences.
Fee Schedules, Profitability, and Fall-out Benefits
The Board reviewed and considered the contractual management fee schedule and net management fee rate payable by the Fund to the Manager compared to the Fund’s Selected Peer Group. The Board also considered the compensation payable by the Manager to the Sub-Adviser for sub-advisory services for the Fund, including the portion of the contractual and net management fee rates that are paid to the Sub-Adviser, as compared to the compensation paid to the Manager. In addition, the Board considered the fee waivers, expense limitations, and recoupment arrangements that apply to the fees payable by the Fund, including whether the Manager proposed any changes thereto. The Board separately determined that the fees payable to the Manager and the fee schedule payable to the Sub-Adviser are reasonable for the services that each performs, which were considered in light of the nature, extent and quality of the services that each has performed and is expected to perform.
The Board considered information on revenues, costs and profits or losses realized by the Manager and the Voya-affiliated Sub-Adviser related to their services to the Fund. In analyzing the profitability of the Manager and its affiliates in connection with services they render to a Fund, the Board took into account the sub-advisory fee rate payable by the Manager to the Sub-Adviser. The Board also considered the profitability of the Manager and its affiliated Sub-Adviser attributable to servicing the Fund both with and without taking into account the profitability of the distributor
ADVISORY AND SUB-ADVISORY CONTRACT APPROVAL DISCUSSION (Unaudited) (continued)
of the Fund and any revenue sharing payments made by the Manager.
Although the Methodology Guide establishes a framework for profit calculation by the Manager and its affiliated Sub-Adviser, the Board recognized that there is no uniform methodology within the asset management industry for determining profitability for this purpose. The Board also recognized that the use of different reasonable methodologies can give rise to dramatically different reported profit and loss results with respect to the Manager and the Voya-affiliated Sub-Adviser, as well as other industry participants with whom the profits of the Manager and its affiliated Sub-Adviser could be compared. In addition, the Board recognized that management’s calculations regarding its costs incurred in establishing the infrastructure necessary for the Fund’s operations may not be fully reflected in the expenses allocated to the Fund in determining profitability. The Board also recognized that the information presented may not portray all of the costs borne by the Manager or reflect all of the risks associated with offering and managing a mutual fund complex in the current regulatory and market environment, including entrepreneurial, regulatory, legal and operational risks.
The Board also considered that the Manager and the Voya-affiliated Sub-Adviser are entitled to earn a reasonable level of profits for the services that they provide to the Fund. The Board also considered information regarding the potential fall-out benefits to the Manager and Sub-Adviser and their respective affiliates from their association with the Fund. Following its reviews, the Board determined that the Manager’s and the Voya-affiliated Sub-Adviser’s profitability with respect to their services to the Fund and the Manager’s and Sub-Adviser’s potential fall-out benefits were not unreasonable.
Fund Analysis
Set forth below are certain of the specific factors that the Board considered at its October 9, 2023, November 14, 2023, and/or November 16, 2023 meetings in relation to approving the Fund’s Contracts and the conclusions reached by the Board. These specific factors are in addition to those considerations discussed above. The performance data provided to the Board primarily was for various periods ended March 31, 2023. In addition, the Board also considered at its October 9, 2023, November 14, 2023, and/or November 16, 2023 meetings certain additional data regarding the Fund’s more recent performance, asset levels and asset flows. The Fund’s management fee rate and expense ratio were compared to the management fee rates and expense ratios of the funds in its Selected Peer Group. With respect to the quintile rankings noted below, the first quintile represents the range of funds with the highest performance or the lowest management fee
rate or expense ratio, as applicable, and the fifth quintile represents the range of funds with the lowest performance or the highest management fee rate or expense ratio, as applicable.
In considering whether to approve the renewal of the Contracts for the Fund, the Board considered that, based on performance data for the periods ended March 31, 2023: (1) the Fund outperformed its Morningstar, Inc. category average for all periods presented; and (2) the Fund outperformed its primary benchmark for all periods presented, with the exception of the year-to-date period, during which its performance was equal to the performance of its primary benchmark, and the ten-year period, during which it underperformed.
In considering the fees payable under the Contracts for the Fund, the Board took into account the factors described above and also considered: (1) the fairness of the compensation under a Management Contract with a level fee rate that does not include breakpoints; and (2) the pricing structure (including the net expense ratio to be borne by shareholders) of the Fund, as compared to its Selected Peer Group, including that: (a) the net management fee rate for the Fund is ranked in the fifth quintile of net management fee rates of the funds in its Selected Peer Group; (b) the contractual management fee rate for the Fund is ranked in the fourth quintile of contractual management fee rates of the funds in its Selected Peer Group; and (c) the net expense ratio for the Fund is ranked in the fifth quintile of net expense ratios of the funds in its Selected Peer Group.
In analyzing this fee data, the Board took into account: (1) management’s representations regarding its belief that the Fund’s pricing is competitive; and (2) that, as a result of the Board’s request during the 2023 annual contract renewal cycle, lower expense limits would be implemented for the Fund, effective on January 1, 2024.
Board Conclusions
After its deliberation, the Board concluded that, in its business judgment, the terms of the Contracts are fair and reasonable to the Fund and that approval of the continuation of the Contracts is in the best interests of the Fund and its shareholders. In doing so, the Board reviewed all factors it considered to be material, including those discussed above. Within the context of its overall conclusions regarding the Contracts, and based on the information provided and management’s related representations, the Board concluded that it was satisfied with management’s responses relating to the Fund’s investment performance and the fees payable under the Contracts. During this renewal process, each Board member may have accorded different weight to various factors in reaching his or her conclusions. Based on these conclusions and other factors,
ADVISORY AND SUB-ADVISORY CONTRACT APPROVAL DISCUSSION (Unaudited) (continued)
the Board voted to renew the Contracts for the Fund for the year ending November 30, 2024.
[This Page Intentionally Left Blank]
[This Page Intentionally Left Blank]
| Investment Adviser | Independent Registered Public Accounting Firm |
Voya Investments, LLC 7337 East Doubletree Ranch Road, Suite 100 Scottsdale, Arizona 85258 | Ernst & Young LLP 200 Clarendon Street Boston, Massachusetts 02116 |
| | |
| Distributor | Custodian |
Voya Investments Distributor, LLC 7337 East Doubletree Ranch Road, Suite 100 Scottsdale, Arizona 85258 | The Bank of New York Mellon 225 Liberty Street New York, New York 10286 |
| | |
| Transfer Agent | Legal Counsel |
BNY Mellon Investment Servicing (U.S.) Inc. 301 Bellevue Parkway Wilmington, Delaware 19809 | Ropes & Gray LLP Prudential Tower 800 Boylston Street Boston, Massachusetts 02199 |
For more complete information, or to obtain a prospectus on any Voya mutual fund, please call your financial advisor or Voya Investments Distributor, LLC at (800) 992-0180 or log on to www.voyainvestments.com. The prospectus should be read carefully before investing. Consider the fund’s investment objectives, risks, charges and expenses carefully before investing. The prospectus contains this information and other information about the fund.
| RETIREMENT | INVESTMENTS | INSURANCE |  |
| | |
| voyainvestments.com | 163052 (0324) |

Annual Report
March 31, 2024
| ■ | Voya VACS Series EMCD Fund |
| | |
| ■ | Voya VACS Series EMHCD Fund |
| ■ | Voya VACS Series HYB Fund |
| ■ | Voya VACS Series SC Fund |
Effective January 24, 2023, the U.S. Securities and Exchange Commission adopted rule and form amendments to require mutual funds to transmit concise and visually engaging streamlined annual and semi-annual reports to shareholders that highlight key information deemed important for investors to assess and monitor their fund investments. Other information, including financial statements, will no longer appear in the funds’ streamlined shareholder reports but must be available online, delivered free of charge upon request, and filed on a semi-annual basis on Form N-CSR. The rule and form amendments have a compliance date of July 24, 2024. |
This report is submitted for general information to shareholders of the Voya mutual funds. It is not authorized for distribution to prospective shareholders unless accompanied or preceded by a prospectus which includes details regarding the funds’ investment objectives, risks, charges, expenses and other information. This information should be read carefully. |
 | E-Delivery Sign-up – details inside |  |
| | |
| INVESTMENT MANAGEMENT |
| | |
| voyainvestments.com |
TABLE OF CONTENTS
 | Go Paperless with E-Delivery! | |
| |
| Sign up now for on-line prospectuses, fund reports, and proxy statements. |
| | | |
| Just go to individuals.voya.com/page/e-delivery, follow the directions and complete the quick 5 Steps to Enroll. |
| | | |
| You will be notified by e-mail when these communications become available on the internet. |
| |
PROXY VOTING INFORMATION
A description of the policies and procedures that the Funds use to determine how to vote proxies related to portfolio securities is available: (1) without charge, upon request, by calling Shareholder Services toll-free at (800) 992-0180; (2) on the Funds’ website at www.voyainvestments.com; and (3) on the U.S. Securities and Exchange Commission’s (“SEC’s”) website at www.sec.gov. Information regarding how the Funds voted proxies related to portfolio securities during the most recent 12-month period ended June 30 is available without charge and upon request, by calling 1-800-992-0180, or by accessing the SEC’s website at www.sec.gov.
QUARTERLY PORTFOLIO HOLDINGS
The Funds file their complete schedule of portfolio holdings with the SEC for the first and third quarters of each fiscal year on Form NPORT-P. The Funds’ Forms NPORT-P are available on the SEC’s website at www.sec.gov.
Benchmark Descriptions
| Index | Description |
| Bloomberg High Yield Bond — 2% Issuer Constrained Composite Index | An index that includes all fixed income securities having a maximum quality rating of Ba1, a minimum amount outstanding of $150 million, and at least one year to maturity. |
| Bloomberg U.S. Securitized MBS/ABS/CMBS Index | An index of asset-backed securities, collateralized mortgage-backed securities (ERISA eligible), and fixed-rate mortgage-backed securities. |
| JP Morgan Corporate Emerging Markets Bond Index Diversified | A liquid global benchmark for US-dollar corporate emerging market bonds. The Corporate Emerging Markets Bond Index (“CEMBI”) Diversified limits the weights of those index countries with larger corporate debt stocks by only including a specified portion of these countries’ eligible current face amounts of debt outstanding. The CEMBI Diversified results in well-distributed, balanced weightings for countries included in the index. |
| JP Morgan Emerging Markets Bond Index Global Diversified | Tracks total returns for US dollar-denominated debt instruments issued by emerging market sovereign and quasi-sovereign entities: Brady bonds, loans, and Eurobonds. It limits the weights of those index countries with larger debt stocks by only including specified portions of these countries’ eligible current face amounts of debt outstanding. |
| Voya VACS Series EMCD Fund | Portfolio Managers’ Report |
| | Geographic Diversification
as of March 31, 2024
(as a percentage of net assets) | |
| | Mexico | 7.3% | |
| | South Korea | 7.0% | |
| | India | 5.3% | |
| | Colombia | 5.3% | |
| | Brazil | 4.2% | |
| | Luxembourg | 4.1% | |
| | Hong Kong | 3.8% | |
| | Chile | 3.6% | |
| | United Arab Emirates | 3.6% | |
| | China | 3.4% | |
| | Countries between 0.2% - 3.4%^ | 45.6% | |
| | Assets in Excess of Other Liabilities* | 6.8% | |
| | Net Assets | 100.0% | |
| | | | | |
| | * | Includes short-term investments. | |
| | ^ | Includes 30 countries, which each 0.2% - 3.4% of net assets. | |
| Portfolio holdings are subject to change daily. |
| | | | |
| | | | | |
Voya VACS Series EMCD Fund (the “Fund”) seeks to maximize total return through a combination of current income and capital appreciation. The Fund is managed by Anthony Routh and Anil Katarya, Portfolio Managers of Voya Investment Management Co. LLC — the Sub-Adviser.
Performance: For the year ended March 31, 2024, the Fund’s shares returned 10.37%, compared to the JP Morgan Corporate Emerging Markets Bond Index Diversified (the “Index” or “JPM CEMBI”), which returned 8.79% for the same period.
Portfolio Specifics: The Fund outperformed the Index for the reporting period. The Fund maintained an overweight to corporates and quasi-sovereigns within Latin America, which was the largest driver of outperformance for the Fund over the period. Within Latin America, the Fund’s overweights to issuers in Mexico, Colombia, Guatemala and Panama contributed most. Elsewhere, top contributors from a country standpoint included overweights in India, Poland and South Korea, as well as underweights to China and Zambia. From a quality standpoint, the Fund’s overweight to BB- and BBB-rated issuers and its underweight to Single-A issuers was additive to relative results, while its underweight to below-CCC-rated and distressed issuers detracted modestly.
| | | Top Ten Holdings as of March 31, 2024* (as a percentage of net assets) | |
| | Melco Resorts Finance Ltd., 5.750%, 07/21/28 | 1.7% | |
| | CK Hutchison International 23 Ltd., 4.875%, 04/21/33 | 1.6% | |
| | Petroleos Mexicanos, 10.000%, 02/07/33 | 1.6% | |
| | Sands China Ltd., 5.400%, 08/08/28 | 1.5% | |
| | POSCO, 4.875%, 01/23/27 | 1.5% | |
| | Gold Fields Orogen Holdings BVI Ltd., 5.125%, 05/15/24 | 1.4% | |
| | Ecopetrol SA, 8.875%, 01/13/33 | 1.4% | |
| | Oversea-Chinese Banking Corp. Ltd., 1.832%, 09/10/30 | 1.4% | |
| | CSN Resources SA, 8.875%, 12/05/30 | 1.3% | |
| | CT Trust, 5.125%, 02/03/32 | 1.3% | |
| | | | |
| | * | Excludes short-term investments. | | |
| | | | | |
| Portfolio holdings are subject to change daily. | |
| | | | | |
Current Strategy and Outlook: In our opinion, emerging markets (“EM”) continue to face a more benign macro environment as external pressures receded and a U.S. soft landing remains firmly priced into markets. This backdrop should support risk if Fed rate cuts remain the base case scenario. Persistently firm economic data and a push back in the beginning of the easing cycle have not derailed the recent rally. We believe that EM central banks should still have the room to move policy rates lower and external financing costs are much improved.
In our view, the EM growth outlook remains modest. Activity, in our opinion, will pick up slightly this year as domestic rates move lower; however, risks are skewed to the downside. Rate cutting cycles will continue across Latin America and Europe as disinflation proceeds with recent prints surprising to the downside. Notably, several major economies hold elections in 2024, but we broadly expect policy continuity with incumbent parties likely to win in India, Mexico and South Africa. EM corporate fundamental factors bottomed out in mid-2023 and have improved since, while financial policy remains prudent. Default rates are expected to be lower due to fewer defaults in Asia and Europe.
Absolute yields for emerging market debt (“EMD”) remain attractive relative to historical levels. However, on a spread basis, most segments of the market continue to screen relatively tight. Given the outperformance this year, EM credit spreads now screen as fair versus domestic peers. We believe that EM corporates are more attractive relative to hard currency sovereigns and U.S. peers, particularly U.S. HY (“High Yield”). We continue to see the most opportunities in Latam corporates.
The views expressed in this commentary are informed opinions. They should not be considered promises or advice. The views expressed reflect those of the portfolio managers, only through the end of the period as stated on the cover. The portfolio managers’ views are subject to change at any time based on market and other conditions.
Portfolio holdings and characteristics are subject to change and may not be representative of current holdings and characteristics. Fund holdings are subject to change daily. The outlook for this Fund may differ from that presented for other Voya mutual funds. This report contains statements that may be “forward-looking” statements. Actual results may differ materially from those projected in the “forward-looking” statements. The Fund’s performance returns shown reflect applicable fee waivers and/or expense limits in effect during this period. Absent such fee waivers/expense limitations, if any, performance would have been lower. Performance for the different classes of shares will vary based on differences in fees associated with each class. An index has no cash in its portfolio and imposes no sales charges. An investor cannot invest directly in an index.
| Portfolio Managers’ Report | Voya VACS Series EMCD Fund |
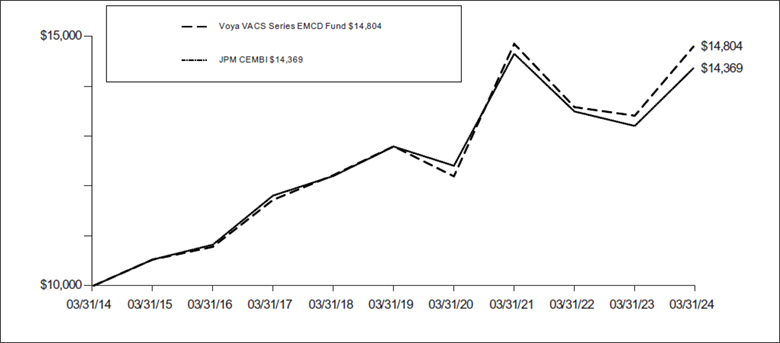
| Average Annual Total Returns for the Periods Ended March 31, 2024 |
| | 1 Year | 5 Year | 10 Year |
| Voya VACS Series EMCD Fund | 10.37% | 2.96% | 4.00% |
| JPM CEMBI | 8.79% | 2.35% | 3.69% |
Based on a $10,000 initial investment, the graph and table above illustrate the total return of Voya VACS Series EMCD Fund against the index indicated. The index is unmanaged, has no cash in its portfolio and imposes no sales charges. An investor cannot invest directly in an index.
The performance graph and table do not reflect the deduction of taxes that a shareholder will pay on Fund distributions or the redemption of Fund shares.
The performance shown includes, if applicable, the effect of fee waivers and/or expense reimbursements by the Investment Adviser and/or other service providers, which have the effect of increasing total net return. Had all fees and expenses been considered, the total net returns would have been lower.
Performance data represents past performance and is no assurance of future results. Investment return and principal value of an investment in the Fund will fluctuate. Shares, when sold, may be worth more or less than their original cost. The Fund’s current performance may be lower or higher than the performance data shown. Please log on to www.voyainvestments.com or call (800) 992-0180 to get performance through the most recent month end.
Fund holdings are subject to change daily.
| Voya VACS Series EMHCD Fund | Portfolio Managers’ Report |
| | Geographic Diversification
as of March 31, 2024
(as a percentage of net assets) | |
| | Mexico | 9.5% | |
| | Indonesia | 5.2% | |
| | Panama | 4.8% | |
| | Brazil | 4.4% | |
| | Turkey | 4.3% | |
| | Chile | 3.9% | |
| | Colombia | 3.8% | |
| | Peru | 3.7% | |
| | Luxembourg | 3.5% | |
| | Romania | 3.2% | |
| | Countries between 0.1% - 3.0%^ | 48.6% | |
| | Assets in Excess of Other Liabilities* | 5.1% | |
| | Net Assets | 100.0% | |
| | | | | |
| | * | Includes short-term investments. | |
| | ^ | Includes 40 countries, which each 0.1% - 3.0% of net assets. | |
| Portfolio holdings are subject to change daily. |
| | | | |
| | | | | |
Voya VACS Series EMHCD Fund (the “Fund”) seeks to maximize total return through a combination of current income and capital appreciation. The Fund is managed by Anthony Routh and Anil Katarya, Portfolio Managers of Voya Investment Management Co. LLC — the Sub-Adviser.
Performance: For the year ended March 31, 2024, the Fund’s shares returned 12.98% compared to the JP Morgan Emerging Markets Bond Index Global Diversified (the “Index” or “JPM EMBI”), which returned 11.28% for the same period.
Portfolio Specifics: The Fund outperformed the Index for the period. The Fund’s overweight to emerging markets (“EM”) corporate and quasi-sovereign issuers was a key driver of outperformance. From a quality standpoint, the Fund’s overweight BBB- and BB-rated issuers contributed to outperformance, while the Fund’s underweight CCC-rated and distressed issuers detracted slightly from relative results. Regionally, the Fund maintained an overweight to Latin America and underweight to Europe and Africa, which was additive, while its underweight to Asia, mostly driven by an underweight to China, detracted. From a country perspective, key outperformers included overweights to Mexico, Russia, Chile, Ghana and Brazil were the top drivers of performance, while underweights to Pakistan, Egypt and China detracted.
| | | Top Ten Holdings as of March 31, 2024 (as a percentage of net assets) | |
| | Bahrain Government International Bond, 7.375%, 05/14/30 | 1.7% | |
| | Mexico Government International Bond, 6.338%, 05/04/53 | 1.4% | |
| | Indonesia Government International Bond, 8.500%, 10/12/35 | 1.3% | |
| | Romanian Government International Bond, 6.375%, 01/30/34 | 1.2% | |
| | Saudi Government International Bond, 3.450%, 02/02/61 | 1.2% | |
| | Perusahaan Perseroan Persero PT Perusahaan Listrik Negara, 4.125%, 05/15/27 | 1.1% | |
| | Petroleos Mexicanos, 10.000%, 02/07/33 | 1.1% | |
| | Republic of South Africa Government International Bond, 4.300%, 10/12/28 | 1.1% | |
| | Republic of Poland Government International Bond, 5.750%, 11/16/32 | 1.0% | |
| | OQ SAOC, 5.125%, 05/06/28 | 1.0% | |
| | | | |
| | | | | |
| Portfolio holdings are subject to change daily. | |
| | | | | |
Current Strategy and Outlook: In our opinion, emerging markets (“EM”) continue to face a more benign macro environment as external pressures receded and a U.S. soft landing remains firmly priced into markets. This backdrop should support risk if Fed rate cuts remain the base case scenario. Persistently firm economic data and a push back in the beginning of the easing cycle have not derailed the recent rally. EM central banks should still have the room to move policy rates lower and external financing costs are much improved.
In our view, the EM growth outlook remains modest. Activity, in our opinion, will pick up slightly this year as domestic rates move lower; however, risks are skewed to the downside. Rate cutting cycles will continue across Latin America and Europe as disinflation proceeds with recent prints surprising to the downside. Notably, several major economies hold elections in 2024, but we broadly expect policy continuity with incumbent parties likely to win in India, Mexico and South Africa. EM corporate fundamental factors bottomed out in mid-2023 and have improved since, while financial policy remains prudent. Default rates are expected to be lower due to fewer defaults in Asia and Europe.
Absolute yields for emerging market debt (“EMD”) remain attractive relative to historical levels. However, on a spread basis, most segments of the market continue to screen relatively tight. Given the outperformance this year, EM credit spreads now screen as fair versus domestic peers. EM corporates are more attractive relative to hard currency sovereigns and U.S. peers, particularly U.S. HY (“High Yield”). We continue to see the most opportunities in Latam corporates.
| Portfolio Managers’ Report | Voya VACS Series EMHCD Fund |
The views expressed in this commentary are informed opinions. They should not be considered promises or advice. The views expressed reflect those of the portfolio managers, only through the end of the period as stated on the cover. The portfolio managers’ views are subject to change at any time based on market and other conditions.
Portfolio holdings and characteristics are subject to change and may not be representative of current holdings and characteristics. Fund holdings are subject to change daily. The outlook for this Fund may differ from that presented for other Voya mutual funds. This report contains statements that may be “forward-looking” statements. Actual results may differ materially from those projected in the “forward-looking” statements. The Fund’s performance returns shown reflect applicable fee waivers and/or expense limits in effect during this period. Absent such fee waivers/expense limitations, if any, performance would have been lower. Performance for the different classes of shares will vary based on differences in fees associated with each class. An index has no cash in its portfolio and imposes no sales charges. An investor cannot invest directly in an index.
| Voya VACS Series EMHCD Fund | Portfolio Managers’ Report |

| Average Annual Total Returns for the Periods Ended March 31, 2024 |
| | | Since |
| | 1 Year | Inception |
| Voya VACS Series EMHCD Fund(1) | 12.98% | 12.54% |
| JPM EMBI(2) | 11.28% | 10.83% |
Based on a $10,000 initial investment, the graph and table above illustrate the total return of Voya VACS Series EMHCD Fund against the index indicated. The index is unmanaged, has no cash in its portfolio and imposes no sales charges. An investor cannot invest directly in an index.
The Fund’s performance is shown both with and without the imposition of sales charges.
The performance graph and table do not reflect the deduction of taxes that a shareholder will pay on Fund distributions or the redemption of Fund shares.
The performance shown includes, if applicable, the effect of fee waivers and/or expense reimbursements by the Investment Adviser and/or other service providers, which have the effect of increasing total net return. Had all fees and expenses been considered, the total net returns would have been lower.
Performance data represents past performance and is no assurance of future results. Investment return and principal value of an investment in the Fund will fluctuate. Shares, when sold, may be worth more or less than their original cost. The Fund’s current performance may be lower or higher than the performance data shown. Please log on to www.voyainvestments.com or call (800) 992-0180 to get performance through the most recent month end.
Fund holdings are subject to change daily.
| (1) | Fund incepted on February 17, 2023. |
| (2) | Since inception performance for the index is shown as of February 17, 2023. |
| Portfolio Managers’ Report | Voya VACS Series HYB Fund |
| | Investment Type Allocation
as of March 31, 2024
(as a percentage of net assets) | |
| | Corporate Bonds/Notes | 93.4% | |
| | Bank Loans | 2.3% | |
| | Assets in Excess of Other Liabilities* | 4.3% | |
| | Net Assets | 100.0% | |
| | | | | |
| | * | Includes short-term investments. | |
| | | | |
| Portfolio holdings are subject to change daily. | |
| | | | |
| | | | | |
Voya VACS Series HYB Fund (the “Fund”) seeks seeks to provide investors with a high level of current income and total return. The Fund is managed by Mohamed Basma, CFA and Randall Parrish, CFA, Portfolio Managers of Voya Investment Management Co. LLC — the Sub-Adviser.
Performance: For the year ended March 31, 2024, the Fund’s shares provided a total return of 9.85% compared to the Bloomberg High Yield — 2% Issuer Constrained Composite, which returned 11.15% for the same period.
Portfolio Specifics: Despite initial concerns of a U.S. recession, risk assets performed well during the fiscal period on the back of strong economic growth and a healthy labor market, while inflationary pressures eased. A key driver was strong fiscal support that helped counteract monetary policy effects, residual consumer strength and steady corporate earnings. As a result, investor sentiment was underpinned by soft-landing optimism and a growing view that the U.S. Federal Reserve would begin cutting rates in the near term. The positive backdrop was constructive for high yield (“HY”), as spreads moved tighter during the period, with the option-adjusted spread of the Bloomberg U.S. High Yield - 2% Issuer Constrained Index tightening by 158 basis points (“bp”) to 299 bp. On a quality basis, risk appetite was strong, with lower-quality segments outperforming for the period. BB, B and CCC rated bonds delivered respective returns of 9.08%, 11.46% and 16.63%.
Within the Fund, security selection detracted from relative performance. Specifically, the main negative driver was security selection within retailers, primarily due to the avoidance of Carvana (which recovered from distressed levels) and an overweight allocation in Victoria’s Secret. Additional headwinds included security selection within healthcare and pharma and chemicals. In contrast, building materials was a contributor, as both security selection and our overweight allocation added to performance. Specifically, within this sector, the Fund benefited from an overweight to SRS Distribution and Interface. Additional contributions included security selection in leisure and restaurants.
Current Strategy & Outlook: In our opinion, the macro outlook remains supportive, as solid economic growth should continue to underpin corporate fundamental factors. While the Fed’s hiking cycle is done, the first rate cut remains a source of debate. With inflation surprising to the upside recently, along with continued strength in economic data, the Fed’s case to remain patient on rate cuts has been bolstered. However, we believe their data-dependent stance will provide flexibility in adjusting policy measures in response to evolving economic conditions, ensuring a balanced approach to supporting economic growth while addressing inflation concerns. Market technical factors in HY remain favorable as supply has continued to underwhelm, while demand has been supported by attractive all-in yields and strong equity market performance. However, spreads remain at tight levels, skewing outcomes negatively in the event of any surprises.
| | | Top Ten Holdings as of March 31, 2024* (as a percentage of net assets) | |
| | Royal Caribbean Cruises Ltd., 5.375%, 07/15/27 | 0.9% | |
| | Sirius XM Radio, Inc., 5.000%, 08/01/27 | 0.8% | |
| | Cloud Software Group, Inc., 6.500%, 03/31/29 | 0.7% | |
| | Hub International Ltd., 8.840%, 06/20/30 | 0.6% | |
| | Viking Cruises Ltd., 5.875%, 09/15/27 | 0.6% | |
| | Allied Universal Holdco LLC/Allied Universal Finance Corp./Atlas Luxco 4 Sarl, 4.625%, 06/01/28 | 0.5% | |
| | Prime Security Services Borrower LLC / Prime Finance, Inc., 6.250%, 01/15/28 | 0.5% | |
| | Scripps Escrow, Inc., 5.875%, 07/15/27 | 0.5% | |
| | International Game Technology PLC, 5.250%, 01/15/29 | 0.5% | |
| | Carnival Corp., 6.000%, 05/01/29 | 0.5% | |
| | | | |
| | * | Excludes short-term investments. | | |
| | | | | |
| Portfolio holdings are subject to change daily. | |
| | | | | |
In sector positioning, we remain positive on the healthcare space given higher utilization rates and easing labor cost, and the energy sector which continues to benefit from firm commodity prices. However, we are less constructive on global cyclicals as a whole given still muted recovery from China and Europe. Furthermore, we maintain a cautious stance in industries that continue to face secular challenges, such as media and cable. From a ratings perspective, we are slightly overweight to B rated bonds, while modestly underweight in BB and CCC rated bonds. Single-name risk continues to be a key focus of ours, as dispersion remains elevated.
| Voya VACS Series HYB Fund | Portfolio Managers’ Report |
The views expressed in this commentary are informed opinions. They should not be considered promises or advice. The views expressed reflect those of the portfolio managers, only through the end of the period as stated on the cover. The portfolio managers’ views are subject to change at any time based on market and other conditions.
Portfolio holdings and characteristics are subject to change and may not be representative of current holdings and characteristics. Fund holdings are subject to change daily. The outlook for this Fund may differ from that presented for other Voya mutual funds. This report contains statements that may be “forward-looking” statements. Actual results may differ materially from those projected in the “forward-looking” statements. The Fund’s performance returns shown reflect applicable fee waivers and/or expense limits in effect during this period. Absent such fee waivers/expense limitations, if any, performance would have been lower. Performance for the different classes of shares will vary based on differences in fees associated with each class. An index has no cash in its portfolio and imposes no sales charges. An investor cannot invest directly in an index.
| Portfolio Managers’ Report | Voya VACS Series HYB Fund |

| Average Annual Total Returns for the Periods Ended March 31, 2024 |
| | | Since |
| | 1 Year | Inception |
| Voya VACS Series HYB Fund(1) | 9.85% | 10.79% |
| Bloomberg High Yield Bond-2% Issuer Constrained Composite(2) | 11.15% | 11.67% |
Based on a $10,000 initial investment, the graph and table above illustrate the total return of Voya VACS Series HYB Fund against the index indicated. The index is unmanaged, has no cash in its portfolio and imposes no sales charges. An investor cannot invest directly in an index.
The Fund’s performance is shown both with and without the imposition of sales charges.
The performance graph and table do not reflect the deduction of taxes that a shareholder will pay on Fund distributions or the redemption of Fund shares.
The performance shown includes, if applicable, the effect of fee waivers and/or expense reimbursements by the Investment Adviser and/or other service providers, which have the effect of increasing total net return. Had all fees and expenses been considered, the total net returns would have been lower.
Performance data represents past performance and is no assurance of future results. Investment return and principal value of an investment in the Fund will fluctuate. Shares, when sold, may be worth more or less than their original cost. The Fund’s current performance may be lower or higher than the performance data shown. Please log on to www.voyainvestments.com or call (800) 992-0180 to get performance through the most recent month end.
It is important to note that the Fund has a limited operating history. Performance over a longer period of time may be more meaningful than short-term performance.
Fund holdings are subject to change daily.
| (1) | Fund incepted on February 24, 2023. |
| (2) | Since inception performance for the index is shown as of February 24, 2023 |
| Voya VACS Series SC Fund | Portfolio Managers’ Report |
| | Investment Type Allocation
as of March 31, 2024
(as a percentage of net assets) | |
| | Commercial Mortgage-Backed Securities | 38.6% | |
| | Collateralized Mortgage Obligations | 33.9% | |
| | Asset-Backed Securities | 22.7% | |
| | Assets in Excess of Other Liabilities* | 4.8% | |
| | Net Assets | 100.0% | |
| | | | | |
| | * | Includes short-term investments. | |
| | | | |
| Portfolio holdings are subject to change daily. | |
| | | | |
| | | | | |
Voya VACS Series SC Fund (the “Fund”) seeks to maximize total return through a combination of current income and capital appreciation. The Fund is managed by David Goodson and Jonathan Abshire, CFA, Portfolio Managers of Voya Investment Management Co. LLC — the Sub-Adviser.
Performance: For the year ended March 31, 2024, the Fund’s shares provided a total return of 9.21% compared to the Bloomberg U.S. Securitized MBS/ABS/CMBS Index (the “Index” or “Bloomberg U.S. Securitized”), which returned 1.61% for the same period.
Portfolio Specifics: Duration was the key driver of return outperformance over the period as the Fund maintained a modest underweight in duration that proved positive given the level of interest rate volatility and higher level of rates to end the period. On a stand-alone basis, all securitized credit sectors contributed to excess returns. The Fund’s allocation to non-agency residential mortgage-backed securities (“RMBS”) was the largest contributor as credit fundamental factors remain well-supported by elevated home prices and a robust labor market. The Fund’s overweight to asset-backed securities (“ABS”) contributed modestly, but security selection within ABS was the next largest contributor to excess return over the period led by allocations to higher-yielding, floating rate collateralized loan obligations (“CLOs”). Allocations to commercial mortgage-backed securities (“CMBS”) also added to return on net. However, the Fund’s exposure to the below investment-grade (“IG”) rated parts of the CMBS capital structure and idiosyncratic commercial real estate (“CRE”) collateral developments detracted from return over the period.
| | | Top Ten Holdings as of March 31, 2024* (as a percentage of net assets) | |
| | RFM Reremic Trust - Class AB55, 0.990%, 03/28/49 | 2.0% | |
| | RFM Reremic Trust - Class AB60, 2.410%, 11/08/49 | 1.8% | |
| | Freddie Mac STACR REMIC Trust - Class B1, 8.720%, 01/25/42 | 1.5% | |
| | Freddie Mac STACR REMIC Trust - Class B1, 10.070%, 02/25/42 | 1.5% | |
| | Series RR Trust - Class E, 05/25/47 | 1.3% | |
| | Prima Capital CRE Securitization Ltd. - Class D, 4.250%, 12/25/50 | 1.2% | |
| | GAM Re-REMIC Trust - Class 1D, 11/29/50 | 1.2% | |
| | GAM RE-REMIC Trust - Class BK71, 2.010%, 11/27/50 | 1.2% | |
| | BMD2 Re-Remic Trust - Class 6B10, 2.449%, 05/25/52 | 1.0% | |
| | Fannie Mae Connecticut Avenue Securities - Class 1B1, 10.870%, 01/25/43 | 1.0% | |
| | | | |
| | * | Excludes short-term investments. | | |
| | | | | |
| Portfolio holdings are subject to change daily. | |
| | | | | |
Current Strategy and Outlook: Having better rationalized a resilient economy, ‘sticky’ inflation and the impact on monetary policy, the set-up in markets is more favorable for holders of risk, especially the interest rate variety, in our opinion. Additionally, materially improved financial conditions continue to have positive implications for the economy, reducing tail risk and ‘hard landing’ scenario probabilities — positive for holders of credit risk. In our opinion, the attractive relative value offered in securitized credit should draw risk-takers to the space.
We believe the somewhat extended housing market rally is vulnerable as improved financial conditions triggers selling pressure. In our opinion, crippling affordability, the key ingredient for home price declines if and as supply increases. Regardless, mortgage credit behavior remains insulated by “golden handcuffs” of less than 4% mortgages, tight labor markets and buffered by historically high homeowners’ equity. Rock-bottom prepayment speeds remain priced and limited new issuance keep market technical factors favorable. It is our believe that RMBS is poised to deliver positive excess returns across the widest range of scenarios. CMBS remains attractive for investors willing to accept a certain level of risk. Stubbornly higher interest rates harm refinancing prospects with CRE, forcing lenders to reckon with defaults and lower valuations. This will test more subordinated CMBS tranches. However, in a departure from the previous, long-standing paradigm of “location, location, location”, property type has emerged as the key dimension that will likely drive future credit performance. Offices remain ground zero for stress; attractive opportunities for taking credit risk across retail, industrial and multifamily deals are here. Our outlook for ABS is constructive based on the balance struck between issuers and investors, which attracts durable capital with attractive return opportunities. Within ABS, we focus on the consumer-oriented products that provide access to a unique combination of fixed income attributes: U.S. centric, diverse mix of sub-sectors, wide array of forms of consumer credit, housed in robust structures that command liquidity with relatively short spread durations and an income component. With ‘hard landing’ risk diminished, CLOs have delivered sustained outperformance, even as broader fixed income returns buckled under higher rates. However, we believe CLOs remain the securitized sector most vulnerable to a turn in the cycle. Robust structural protections will help insulate the space from a deep credit cycle but expect more volatility in this ‘late cycle’ sector. Our allocation here remains on the lower end of its historical range, and more heavily concentrated up the stack.
| Portfolio Managers’ Report | Voya VACS Series SC Fund |
The views expressed in this commentary are informed opinions. They should not be considered promises or advice. The views expressed reflect those of the portfolio managers, only through the end of the period as stated on the cover. The portfolio managers’ views are subject to change at any time based on market and other conditions.
Portfolio holdings and characteristics are subject to change and may not be representative of current holdings and characteristics. Fund holdings are subject to change daily. The outlook for this Fund may differ from that presented for other Voya mutual funds. This report contains statements that may be “forward-looking” statements. Actual results may differ materially from those projected in the “forward-looking” statements. The Fund’s performance returns shown reflect applicable fee waivers and/or expense limits in effect during this period. Absent such fee waivers/expense limitations, if any, performance would have been lower. Performance for the different classes of shares will vary based on differences in fees associated with each class. An index has no cash in its portfolio and imposes no sales charges. An investor cannot invest directly in an index.
| Voya VACS Series SC Fund | Portfolio Managers’ Report |

| Average Annual Total Returns for the Periods Ended March 31, 2024 |
| | | Since |
| | 1 Year | Inception |
| Voya VACS Series SC Fund(1) | 9.21% | 8.87% |
| Bloomberg U.S. Securitized(2) | 1.61% | 3.63% |
Based on a $10,000 initial investment, the graph and table above illustrate the total return of Voya VACS Series SC Fund against the index indicated. The index is unmanaged, has no cash in its portfolio and imposes no sales charges. An investor cannot invest directly in an index.
The Fund’s performance is shown both with and without the imposition of sales charges.
The performance graph and table do not reflect the deduction of taxes that a shareholder will pay on Fund distributions or the redemption of Fund shares.
The performance shown includes, if applicable, the effect of fee waivers and/or expense reimbursements by the Investment Adviser and/or other service providers, which have the effect of increasing total net return. Had all fees and expenses been considered, the total net returns would have been lower.
Performance data represents past performance and is no assurance of future results. Investment return and principal value of an investment in the Fund will fluctuate. Shares, when sold, may be worth more or less than their original cost. The Fund’s current performance may be lower or higher than the performance data shown. Please log on to www.voyainvestments.com or call (800) 992-0180 to get performance through the most recent month end.
It is important to note that the Fund has a limited operating history. Performance over a longer period of time may be more meaningful than short-term performance.
Fund holdings are subject to change daily.
| (1) | Fund incepted on March 3, 2023. |
| (2) | Since inception performance for the index is shown as of March 3, 2023. |
SHAREHOLDER EXPENSE EXAMPLES (Unaudited)
As a shareholder of a Fund, you incur two types of costs: (1) transaction costs, including sales charges (loads) on purchase payments, redemption fees, and exchange fees, and (2) ongoing costs, including management fees, distribution and/or service (12b-1) fees, and other Fund expenses. These Examples are intended to help you understand your ongoing costs (in dollars) of investing in a Fund and to compare these costs with the ongoing costs of investing in other mutual funds.
The Examples are based on an investment of $1,000 invested at the beginning of the period and held for the entire period from October 1, 2023 to March 31, 2024. The Funds’ expenses are shown without the imposition of any sales charges or fees. Expenses would have been higher if such charges were included.
Actual Expenses
The left section of the table shown below, “Actual Fund Return,” provides information about actual account values and actual expenses. You may use the information in this section, together with the amount you invested, to estimate the expenses that you paid over the period. Simply divide your account value by $1,000 (for example, an $8,600 account value divided by $1,000 = 8.6), then multiply the result by the number in the first section under the heading entitled “Expenses Paid During the Period” to estimate the expenses you paid on your account during this period.
Hypothetical Example for Comparison Purposes
The right section of the table shown below, “Hypothetical (5% return before expenses)” provides information about hypothetical account values and hypothetical expenses based on a Fund’s actual expense ratio and an assumed rate of return of 5% per year before expenses, which is not the Fund’s actual return. The hypothetical account values and expenses may not be used to estimate the actual ending account balance or expenses you paid for the period. You may use this information to compare the ongoing costs of investing in each Fund and other mutual funds. To do so, compare this 5% hypothetical example with the 5% hypothetical examples that appear in the shareholder reports of the other mutual funds.
Please note that the expenses shown in the table are meant to highlight your ongoing costs only and do not reflect any transactional costs, such as sales charges (loads), redemption fees, or exchange fees. Therefore, the hypothetical section of the table is useful in comparing ongoing costs only, and will not help you determine the relative total costs of owning different mutual funds. In addition, if these transactional costs were included, your costs would have been higher.
| | | Actual Fund Return | | Hypothetical (5% return before expenses) |
| | | Beginning
Account
Value
October 1,
2023 | | Ending
Account
Value
March 31,
2024 | | Annualized
Expense
Ratio | | Expenses
Paid
During the
Period Ended
March 31,
2024* | | Beginning
Account
Value
October 1,
2023 | | Ending
Account
Value
March 31,
2024 | | Annualized
Expense
Ratio | | Expenses
Paid
During the
Period Ended
March 31,
2024* |
| Voya VACS Series EMCD Fund | | $1,000.00 | | $1,083.60 | | 0.11% | | $0.57 | | | $1,000.00 | | $1,024.45 | | 0.11% | | $0.56 | |
| Voya VACS Series EMHCD Fund | | 1,000.00 | | 1,121.10 | | 0.13% | | 0.69 | | | 1,000.00 | | 1,024.35 | | 0.13% | | 0.66 | |
| Voya VACS Series HYB Fund | | 1,000.00 | | 1,078.90 | | 0.12% | | 0.62 | | | 1,000.00 | | 1,024.40 | | 0.12% | | 0.61 | |
| Voya VACS Series SC Fund | | 1,000.00 | | 1,053.70 | | 0.05% | | 0.26 | | | 1,000.00 | | 1,024.75 | | 0.05% | | 0.25 | |
| * | Expenses are equal to each Fund’s respective annualized expense ratios multiplied by the average account value over the period, multiplied by 183/366 to reflect the most recent fiscal half-year. |
REPORT OF INDEPENDENT REGISTERED PUBLIC ACCOUNTING FIRM
To the Shareholders of Voya VACS Series EMCD Fund, Voya VACS Series EMHCD Fund, Voya VACS Series HYB Fund and Voya VACS Series SC Fund and the Board of Trustees of Voya Separate Portfolios Trust and Voya Funds Trust
Opinion on the Financial Statements
We have audited the accompanying statements of assets and liabilities of Voya VACS Series EMCD Fund, Voya VACS Series EMHCD Fund, Voya VACS Series HYB Fund and Voya VACS Series SC Fund (collectively referred to as the “Funds”) (each a fund constituting Voya Separate Portfolios Trust, Voya Separate Portfolios Trust, Voya Funds Trust and Voya Separate Portfolios Trust, respectively (collectively referred to as the “Trusts”)), including the portfolios of investments, as of March 31, 2024, and the related statements of operations and changes in net assets and the financial highlights for each of the periods indicated in the table below and the related notes (collectively referred to as the “financial statements”). In our opinion, the financial statements present fairly, in all material respects, the financial position of each of the Funds at March 31, 2024 and the results of their operations, changes in net assets and financial highlights for each of the periods indicated in the table below, in conformity with U.S. generally accepted accounting principles.
| Individual fund constituting the Trusts | Statement of Operations | Statements of changes in net assets | Financial highlights |
| Voya VACS Series EMCD Fund | For the year ended March 31, 2024 | For each of the two years in the period ended March 31, 2024 | For each of the five years in the period ended March 31, 2024 |
| Voya VACS Series EMHCD Fund | For the year ended March 31, 2024 | For the year ended March 31, 2024 and the period from February 17, 2023 through March 31, 2023 |
| Voya VACS Series HYB Fund | For the year ended March 31, 2024 | For the year ended March 31, 2024 and the period from February 24, 2023 through March 31, 2023 |
| Voya VACS Series SC Fund | For the year ended March 31, 2024 | For the year ended March 31, 2024 and the period from March 3, 2023 through March 31, 2023 |
Basis for Opinion
These financial statements are the responsibility of the Trusts’ management. Our responsibility is to express an opinion on each of the Funds’ financial statements based on our audits. We are a public accounting firm registered with the Public Company Accounting Oversight Board (United States) (“PCAOB”) and are required to be independent with respect to the Trusts in accordance with the U.S. federal securities laws and the applicable rules and regulations of the Securities and Exchange Commission and the PCAOB.
We conducted our audits in accordance with the standards of the PCAOB. Those standards require that we plan and perform the audit to obtain reasonable assurance about whether the financial statements are free of material misstatement, whether due to error or fraud. The Trusts are not required to have, nor were we engaged to perform, an audit of the Trusts’ internal control over financial reporting. As part of our audits, we are required to obtain an understanding of internal control over financial reporting but not for the purpose of expressing an opinion on the effectiveness of the Trusts’ internal control over financial reporting. Accordingly, we express no such opinion.
Our audits included performing procedures to assess the risks of material misstatement of the financial statements, whether due to error or fraud, and performing procedures that respond to those risks. Such procedures included examining, on a test basis, evidence regarding the amounts and disclosures in the financial statements. Our procedures included confirmation of securities owned as of March 31, 2024, by correspondence with the custodian, brokers and others; when replies were not received from brokers and others, we performed other auditing procedures. Our audits also included evaluating the accounting principles used and significant estimates made by management, as well as evaluating the overall presentation of the financial statements. We believe that our audits provide a reasonable basis for our opinion.
REPORT OF INDEPENDENT REGISTERED PUBLIC ACCOUNTING FIRM (continued)

We have served as the auditor of one or more Voya investment companies since 2019.
Boston, Massachusetts
May 30, 2024
STATEMENTS OF ASSETS AND LIABILITIES as of March 31, 2024
| | | Voya VACS
Series
EMCD Fund | | | Voya VACS
Series
EMHCD Fund | | | Voya VACS
Series
HYB Fund | | | Voya VACS
Series
SC Fund | |
| ASSETS: | | | | | | | | | | | | | | | | |
| Investments in securities at fair value+* | | $ | 52,134,774 | | | $ | 117,583,813 | | | $ | 122,297,121 | | | $ | 192,826,741 | |
| Short-term investments at fair value† | | | 10,193,238 | | | | 6,543,254 | | | | 7,162,167 | | | | 8,699,405 | |
| Cash | | | – | | | | 29,599 | | | | 473,351 | | | | 160,183 | |
| Cash collateral for futures contracts | | | 143,409 | | | | 193,132 | | | | – | | | | 507,557 | |
| Foreign currencies at value‡ | | | – | | | | 378 | | | | – | | | | – | |
| Receivables: | | | | | | | | | | | | | | | | |
| Investment securities sold | | | 3,893,993 | | | | 4,510,223 | | | | 1,862,910 | | | | 10,461 | |
| Dividends | | | 2,708 | | | | 3,255 | | | | 5,510 | | | | 6,337 | |
| Interest | | | 673,732 | | | | 1,660,586 | | | | 2,111,267 | | | | 815,480 | |
| Prepaid expenses | | | 8,984 | | | | 15,833 | | | | 19,956 | | | | 15,271 | |
| Reimbursement due from Investment Adviser | | | – | | | | – | | | | – | | | | 22,703 | |
| Other assets | | | 3,416 | | | | 216 | | | | 182 | | | | 325 | |
| Total assets | | | 67,054,254 | | | | 130,540,289 | | | | 133,932,464 | | | | 203,064,463 | |
| | | | | | | | | | | | | | | | | |
| LIABILITIES: | | | | | | | | | | | | | | | | |
| Income distribution payable | | | – | | | | – | | | | – | | | | 466,596 | |
| Payable for investment securities purchased | | | 4,434,322 | | | | 4,499,134 | | | | 3,604,204 | | | | 10,461 | |
| Payable for fund shares redeemed | | | – | | | | 2,154 | | | | 3,648 | | | | 14,423 | |
| Payable upon receipt of securities loaned | | | 6,591,510 | | | | 2,136,903 | | | | 2,438,961 | | | | – | |
| Payable to custodian due to bank overdraft | | | 1,584 | | | | – | | | | – | | | | – | |
| Payable to trustees under the deferred compensation plan (Note 5) | | | 3,416 | | | | 216 | | | | 182 | | | | 325 | |
| Payable for trustee fees | | | 207 | | | | 342 | | | | 306 | | | | 538 | |
| Payable for foreign capital gains tax | | | 61,827 | | | | – | | | | – | | | | – | |
| Other accrued expenses and liabilities | | | 34,782 | | | | 46,826 | | | | 41,908 | | | | 57,381 | |
| Total liabilities | | | 11,127,648 | | | | 6,685,575 | | | | 6,089,209 | | | | 549,724 | |
| NET ASSETS | | $ | 55,926,606 | | | $ | 123,854,714 | | | $ | 127,843,255 | | | $ | 202,514,739 | |
| | | | | | | | | | | | | | | | | |
| NET ASSETS WERE COMPRISED OF: | | | | | | | | | | | | | | | | |
| Paid-in capital | | $ | 69,775,011 | | | $ | 116,639,588 | | | $ | 124,916,662 | | | $ | 195,408,028 | |
| Total distributable earnings (loss) | | | (13,848,405 | ) | | | 7,215,126 | | | | 2,926,593 | | | | 7,106,711 | |
| NET ASSETS | | $ | 55,926,606 | | | $ | 123,854,714 | | | $ | 127,843,255 | | | $ | 202,514,739 | |
| | | | | | | | | | | | | | | | | |
| + | Including securities loaned at value | | $ | 6,409,533 | | | $ | 2,086,136 | | | $ | 2,377,866 | | | $ | — | |
| * | Cost of investments in securities | | $ | 54,035,306 | | | $ | 111,806,881 | | | $ | 119,115,796 | | | $ | 184,083,488 | |
| † | Cost of short-term investments | | $ | 10,195,206 | | | $ | 6,545,374 | | | $ | 7,164,582 | | | $ | 8,703,634 | |
| ‡ | Cost of foreign currencies | | $ | — | | | $ | 376 | | | $ | — | | | $ | — | |
| | | | | | | | | | | | | | | | | |
| Net assets | | $ | 55,926,606 | | | $ | 123,854,714 | | | $ | 127,843,255 | | | $ | 202,514,739 | |
| Shares authorized | | | unlimited | | | | unlimited | | | | unlimited | | | | unlimited | |
| Par value | | $ | 0.001 | | | $ | 0.001 | | | $ | 0.001 | | | $ | 0.001 | |
| Shares outstanding | | | 6,525,900 | | | | 11,765,391 | | | | 12,483,922 | | | | 19,600,084 | |
| Net asset value and redemption price per share | | $ | 8.57 | | | $ | 10.53 | | | $ | 10.24 | | | $ | 10.33 | |
See Accompanying Notes to Financial Statements
STATEMENTS OF OPERATIONS for the year ended March 31, 2024
| | | Voya VACS Series
EMCD Fund | | | Voya VACS Series
EMHCD Fund | | | Voya VACS Series
HYB Fund | | | Voya VACS Series
SC Fund | |
| INVESTMENT INCOME: | | | | | | | | | | | | |
| Dividends | | $ | 57,516 | | | $ | 45,432 | | | $ | 31,465 | | | $ | 157,175 | |
| Interest, net of foreign taxes withheld* | | | 4,896,160 | | | | 9,262,410 | | | | 10,084,668 | | | | 11,411,819 | |
| Securities lending income, net | | | 35,361 | | | | 9,900 | | | | 19,880 | | | | — | |
| Other | | | 573 | | | | 800 | | | | 692 | | | | 1,212 | |
| Total investment income | | | 4,989,610 | | | | 9,318,542 | | | | 10,136,705 | | | | 11,570,206 | |
| EXPENSES: | | | | | | | | | | | | | | | | |
| Transfer agent fees | | | 175 | | | | 351 | | | | 848 | | | | 416 | |
| Shareholder reporting expense | | | 590 | | | | 1,464 | | | | 1,272 | | | | 6,954 | |
| Registration fees | | | 20,836 | | | | 25,795 | | | | 10,461 | | | | 7,849 | |
| Professional fees | | | 25,503 | | | | 54,496 | | | | 53,132 | | | | 72,842 | |
| Custody and accounting expense | | | 32,577 | | | | 44,064 | | | | 25,790 | | | | 38,072 | |
| Trustee fees | | | 2,067 | | | | 3,423 | | | | 3,055 | | | | 5,379 | |
| Offering expense | | | — | | | | 31,260 | | | | 31,836 | | | | 32,603 | |
| Miscellaneous expense | | | 10,403 | | | | 16,886 | | | | 14,354 | | | | 15,887 | |
| Total expenses | | | 92,151 | | | | 177,739 | | | | 140,748 | | | | 180,002 | |
| Waived and reimbursed fees | | | — | | | | — | | | | — | | | | (67,007 | ) |
| Net expenses | | | 92,151 | | | | 177,739 | | | | 140,748 | | | | 112,995 | |
| Net investment income | | | 4,897,459 | | | | 9,140,803 | | | | 9,995,957 | | | | 11,457,211 | |
| REALIZED AND UNREALIZED GAIN (LOSS): | | | | | | | | | | | | | | | | |
| Net realized gain (loss) on: | | | | | | | | | | | | | | | | |
| Investments | | | (2,710,000 | ) | | | 2,315,384 | | | | (305,492 | ) | | | (2,521,172 | ) |
| Futures | | | 46,025 | | | | 76,890 | | | | — | | | | 1,283,590 | |
| Net realized gain (loss) | | | (2,663,975 | ) | | | 2,392,274 | | | | (305,492 | ) | | | (1,237,582 | ) |
| Net change in unrealized appreciation (depreciation) on: | | | | | | | | | | | | | | | | |
| Investments | | | 5,844,608 | | | | 5,214,863 | | | | 1,852,476 | | | | 7,411,768 | |
| Foreign currency related transactions | | | — | | | | 2 | | | | — | | | | — | |
| Futures | | | 138,059 | | | | 300,535 | | | | — | | | | 1,528,703 | |
| Net change in unrealized appreciation (depreciation) | | | 5,982,667 | | | | 5,515,400 | | | | 1,852,476 | | | | 8,940,471 | |
| Net realized and unrealized gain | | | 3,318,692 | | | | 7,907,674 | | | | 1,546,984 | | | | 7,702,889 | |
| Increase in net assets resulting from operations | | $ | 8,216,151 | | | $ | 17,048,477 | | | $ | 11,542,941 | | | $ | 19,160,100 | |
| | | | | | | | | | | | | | | | | |
| * Foreign taxes withheld | | $ | — | | | $ | 368 | | | $ | — | | | $ | — | |
See Accompanying Notes to Financial Statements
STATEMENTS OF CHANGES IN NET ASSETS
| | | Voya VACS Series EMCD Fund | | | Voya VACS Series EMHCD Fund | |
| | | Year Ended
March 31,
2024 | | | Year Ended
March 31,
2023 | | | Year Ended
March 31,
2024 | | | February 17,
2023(1)
to March 31, 2023 | |
| FROM OPERATIONS: | | | | | | | | | | | | | | | | |
| Net investment income | | $ | 4,897,459 | | | $ | 4,575,070 | | | $ | 9,140,803 | | | $ | 957,824 | |
| Net realized gain (loss) | | | (2,663,975 | ) | | | (9,105,570 | ) | | | 2,392,274 | | | | 137,327 | |
| Net change in unrealized appreciation (depreciation) | | | 5,982,667 | | | | 3,037,088 | | | | 5,515,400 | | | | 260,545 | |
| Increase (decrease) in net assets resulting from operations | | | 8,216,151 | | | | (1,493,412 | ) | | | 17,048,477 | | | | 1,355,696 | |
| | | | | | | | | | | | | | | | | |
| FROM DISTRIBUTIONS TO SHAREHOLDERS: | | | | | | | | | | | | | | | | |
| Total distributions (excluding return of capital)(2) | | | (4,953,886 | ) | | | (4,740,003 | ) | | | (10,236,184 | ) | | | (952,864 | ) |
| Total distributions | | | (4,953,886 | ) | | | (4,740,003 | ) | | | (10,236,184 | ) | | | (952,864 | ) |
| | | | | | | | | | | | | | | | | |
| FROM CAPITAL SHARE TRANSACTIONS: | | | | | | | | | | | | | | | | |
| Net proceeds from sale of shares | | | — | | | | — | | | | 191,064 | | | | 140,354,256 | |
| Reinvestment of distributions | | | 4,953,886 | | | | 4,740,003 | | | | 10,236,184 | | | | 952,864 | |
| | | | 4,953,886 | | | | 4,740,003 | | | | 10,427,248 | | | | 141,307,120 | |
| Cost of shares redeemed | | | (45,000,000 | ) | | | (2,999,993 | ) | | | (35,087,866 | ) | | | (6,913 | ) |
| Net increase (decrease) in net assets resulting from capital share transactions | | | (40,046,114 | ) | | | 1,740,010 | | | | (24,660,618 | ) | | | 141,300,207 | |
| Net increase (decrease) in net assets | | | (36,783,849 | ) | | | (4,493,405 | ) | | | (17,848,325 | ) | | | 141,703,039 | |
| | | | | | | | | | | | | | | | | |
| NET ASSETS: | | | | | | | | | | | | | | | | |
| Beginning of year or period | | | 92,710,455 | | | | 97,203,860 | | | | 141,703,039 | | | | — | |
| End of year or period | | $ | 55,926,606 | | | $ | 92,710,455 | | | $ | 123,854,714 | | | $ | 141,703,039 | |
| (1) | Commencement of operations. |
| (2) | Prior to November 18, 2022, Voya VACS Series EMCD Fund had a Class P shares designation. |
See Accompanying Notes to Financial Statements
STATEMENTS OF CHANGES IN NET ASSETS
| | | Voya VACS Series HYB Fund | | | Voya VACS Series SC Fund | |
| | | Year Ended
March 31,
2024 | | | February 24,
2023(1)
to March 31, 2023 | | | Year Ended
March 31,
2024 | | | March 3, 2023(1)
to March 31, 2023 | |
| FROM OPERATIONS: | | | | | | | | | | | | | | | | |
| Net investment income | | $ | 9,995,957 | | | $ | 918,323 | | | $ | 11,457,211 | | | $ | 866,747 | |
| Net realized loss | | | (305,492 | ) | | | (4,715 | ) | | | (1,237,582 | ) | | | (10,231 | ) |
| Net change in unrealized appreciation (depreciation) | | | 1,852,476 | | | | 1,326,434 | | | | 8,940,471 | | | | (119,786 | ) |
| Increase in net assets resulting from operations | | | 11,542,941 | | | | 2,240,042 | | | | 19,160,100 | | | | 736,730 | |
| | | | | | | | | | | | | | | | | |
| FROM DISTRIBUTIONS TO SHAREHOLDERS: | | | | | | | | | | | | | | | | |
| Total distributions (excluding return of capital) | | | (9,938,067 | ) | | | (918,323 | ) | | | (11,969,446 | ) | | | (820,674 | ) |
| Total distributions | | | (9,938,067 | ) | | | (918,323 | ) | | | (11,969,446 | ) | | | (820,674 | ) |
| | | | | | | | | | | | | | | | | |
| FROM CAPITAL SHARE TRANSACTIONS: | | | | | | | | | | | | | | | | |
| Net proceeds from sale of shares | | | 232,044 | | | | 122,013,715 | | | | 4,851,900 | | | | 236,189,763 | |
| Reinvestment of distributions | | | 9,938,067 | | | | 918,323 | | | | 5,140,590 | | | | 386,086 | |
| | | | 10,170,111 | | | | 122,932,038 | | | | 9,992,490 | | | | 236,575,849 | |
| Cost of shares redeemed | | | (8,177,674 | ) | | | (7,813 | ) | | | (51,131,440 | ) | | | (28,870 | ) |
| Net increase (decrease) in net assets resulting from capital share transactions | | | 1,992,437 | | | | 122,924,225 | | | | (41,138,950 | ) | | | 236,546,979 | |
| Net increase (decrease) in net assets | | | 3,597,311 | | | | 124,245,944 | | | | (33,948,296 | ) | | | 236,463,035 | |
| | | | | | | | | | | | | | | | | |
| NET ASSETS: | | | | | | | | | | | | | | | | |
| Beginning of year or period | | | 124,245,944 | | | | — | | | | 236,463,035 | | | | — | |
| End of year or period | | $ | 127,843,255 | | | $ | 124,245,944 | | | $ | 202,514,739 | | | $ | 236,463,035 | |
| (1) | Commencement of operations. |
See Accompanying Notes to Financial Statements
FINANCIAL HIGHLIGHTS
Selected data for a share of beneficial interest outstanding throughout each year or period.
| | | | | | | Income (loss)
from investment
operations | | | | Less Distributions | | | | | | | | | | | | | | | | | Ratios to average net assets | | Supplemental
Data | |
| | | |  | | |  | | |  | | |  | | |  | | |  | | |  | | |  | | |  | | |  | | |  | | |  | | |  | | |  | | |  | | |  | | |  | |
| Year or period ended | | | ($) | | | ($) | | | ($) | | | ($) | | | ($) | | | ($) | | | ($) | | | ($) | | | ($) | | | ($) | | | (%) | | | (%) | | | (%) | | | (%) | | | (%) | | | ($000’s) | | | (%) | |
| | | | | | | | | | | | | | | | | | | | | | | | | | | | | | | | | | | | | | | | | | | | | | | | | | | | | |
| Voya VACS Series EMCD Fund | | | | | | | | | | | | | | | | | | | | | | | | | | | | | | | | | | | | | | | | | | | | |
| 03-31-24 | | | 8.24 | | | 0.49 | • | | 0.34 | | | 0.83 | | | 0.50 | | | — | | | — | | | 0.50 | | | — | | | 8.57 | | | 10.37 | | | 0.11 | | | 0.11 | | | 0.11 | | | 5.92 | | | 55,927 | | | 165 | |
| 03-31-23(4) | | | 8.79 | | | 0.41 | • | | (0.53 | ) | | (0.12 | ) | | 0.41 | | | 0.02 | | | — | | | 0.43 | | | — | | | 8.24 | | | (1.27 | ) | | 0.71 | | | 0.10 | | | 0.10 | | | 5.00 | | | 92,710 | | | 101 | |
| 03-31-22 | | | 10.27 | | | 0.46 | • | | (1.28 | ) | | (0.82 | ) | | 0.45 | | | 0.21 | | | — | | | 0.66 | | | — | | | 8.79 | | | (8.54 | ) | | 1.02 | | | 0.07 | | | 0.07 | | | 4.54 | | | 97,204 | | | 35 | |
| 03-31-21 | | | 8.84 | | | 0.47 | • | | 1.44 | | | 1.91 | | | 0.48 | | | — | | | — | | | 0.48 | | | — | | | 10.27 | | | 21.79 | | | 1.03 | | | 0.08 | | | 0.08 | | | 4.63 | | | 105,330 | | | 48 | |
| 03-31-20 | | | 9.77 | | | 0.49 | • | | (0.90 | ) | | (0.41 | ) | | 0.49 | | | — | | | 0.03 | | | 0.52 | | | — | | | 8.84 | | | (4.70 | ) | | 1.04 | | | 0.09 | | | 0.09 | | | 4.87 | | | 90,701 | | | 50 | |
| Voya VACS Series EMHCD Fund | | | | | | | | | | | | | | | | | | | | | | | | | | | | | | | | | | | | | | | | | | | | |
| 03-31-24 | | | 10.03 | | | 0.67 | • | | 0.58 | | | 1.25 | | | 0.67 | | | 0.08 | | | — | | | 0.75 | | | — | | | 10.53 | | | 12.98 | | | 0.13 | | | 0.13 | | | 0.13 | | | 6.68 | | | 123,855 | | | 120 | |
| 02-17-23(5)- | | | | | | | | | | | | | | | | | | | | | | | | | | | | | | | | | | | | | | | | | | | | | | | | | | | | |
| 03-31-23 | | | 10.00 | | | 0.07 | • | | 0.03 | | | 0.10 | | | 0.07 | | | — | | | — | | | 0.07 | | | — | | | 10.03 | | | 0.98 | | | 0.08 | | | 0.08 | | | 0.08 | | | 6.43 | | | 141,703 | | | 14 | |
| Voya VACS Series HYB Fund | | | | | | | | | | | | | | | | | | | | | | | | | | | | | | | | | | | | | | | | | | | | |
| 03-31-24 | | | 10.11 | | | 0.82 | • | | 0.13 | | | 0.95 | | | 0.82 | | | — | | | — | | | 0.82 | | | — | | | 10.24 | | | 9.85 | | | 0.12 | | | 0.12 | | | 0.12 | | | 8.18 | | | 127,843 | | | 56 | |
| 02-24-23(5)- | | | | | | | | | | | | | | | | | | | | | | | | | | | | | | | | | | | | | | | | | | | | | | | | | | | | |
| 03-31-23 | | | 10.00 | | | 0.08 | • | | 0.11 | | | 0.19 | | | 0.08 | | | — | | | — | | | 0.08 | | | — | | | 10.11 | | | 1.86 | | | 0.07 | | | 0.07 | | | 0.07 | | | 8.38 | | | 124,241 | | | 2 | |
| Voya VACS Series SC Fund | | | | | | | | | | | | | | | | | | | | | | | | | | | | | | | | | | | | | | | | | | | | |
| 03-31-24 | | | 10.00 | | | 0.54 | • | | 0.36 | | | 0.90 | | | 0.50 | | | 0.07 | | | — | | | 0.57 | | | — | | | 10.33 | | | 9.21 | | | 0.08 | | | 0.05 | | | 0.05 | | | 5.32 | | | 202,515 | | | 16 | |
| 03-03-23(5)- | | | | | | | | | | | | | | | | | | | | | | | | | | | | | | | | | | | | | | | | | | | | | | | | | | | | |
| 03-31-23 | | | 10.00 | | | 0.04 | • | | (0.01 | ) | | 0.03 | | | 0.03 | | | — | | | — | | | 0.03 | | | — | | | 10.00 | | | 0.35 | | | 0.07 | | | 0.05 | | | 0.05 | | | 5.17 | | | 236,463 | | | — | |
| (1) | Total return is calculated assuming reinvestment of all dividends, capital gain distributions and return of capital distributions, if any, at net asset value and excluding the deduction of sales charges or contingent deferred sales charges, if applicable. Total return for periods less than one year is not annualized. |
| (2) | Annualized for periods less than one year. |
| (3) | Ratios reflect operating expenses of a Fund. Expenses before reductions/additions do not reflect amounts reimbursed or recouped by the Investment Adviser and/or Distributor or reductions from brokerage service arrangements or other expense offset arrangements and do not represent the amount paid by a Fund during periods when reimbursements or reductions occur. Expenses net of fee waivers reflect expenses after reimbursement by the Investment Adviser and/or Distributor or recoupment of previously reimbursed fees by the Investment Adviser, but prior to reductions from brokerage service arrangements or other expense offset arrangements. Expenses net of all reductions/additions represent the net expenses paid by a Fund. Net investment income (loss) is net of all such additions or reductions. |
| (4) | Prior to November 18, 2022, Voya VACS Series EMCD Fund had a Class P shares designation. |
| (5) | Commencement of operations. |
| • | Calculated using average number of shares outstanding throughout the year or period. |
See Accompanying Notes to Financial Statements
NOTES TO FINANCIAL STATEMENTS as of March 31, 2024
NOTE 1 — ORGANIZATION
Voya Funds Trust is a Delaware statutory trust and is registered as an open-end management investment company under the Investment Company Act of 1940, as amended (“1940 Act”). It was organized on August 6, 1998 and was established under a Trust Instrument dated July 30, 1998. It consists of nine separately managed series. This report is for Voya VACS Series HYB Fund (“HYB”), a diversified series of Voya Funds Trust.
Voya Separate Portfolios Trust is a Delaware statutory trust and is registered as an open-end management investment company under the Investment Company Act of 1940, as amended (“1940 Act”). It was organized on March 2, 2007 and was established under a Declaration of Trust dated March 2, 2007. It consists of fifteen separately managed series. This report is for Voya VACS Series EMCD Fund (“EMCD”), Voya VACS Series EMHCD Fund (“EMHCD”), and Voya Series SC Fund (“SC”), each a diversified series of Voya Separate Portfolios Trust, except EMHCD, which is non-diversified.
Voya Funds Trust and Voya Separate Portfolios Trust are each a “Trust” and collectively referred to as the “Trusts.” HYB, EMCD, EMHCD and SC are each a “Fund” and collectively referred as the “Funds.” The investment objective of the Funds is described in each Fund’s Prospectus.
The Funds’ shares are not registered under the Securities Act of 1933 (the “1933 Act”) because the shares are issued solely in private placement transactions that do not involve any “public offering” within the meaning of Section 4(a)(2) of the 1933 Act. Investments in a Fund may only be made by “accredited investors,” within the meaning of Regulation D under the 1933 Act.
The Funds do not have a share class designation. All shareholders are allocated the common expenses of a fund and earn income and realized gains/ losses from a fund. Expenses that are specific to a fund are charged directly to that fund. Other operating expenses shared by several funds are generally allocated among those funds based on average net assets.
Voya Investments, LLC (“Voya Investments” or the “Investment Adviser”), an Arizona limited liability company, serves as the Investment Adviser to the Funds. Voya Investment Management Co. LLC (“Voya IM”), a Delaware limited liability company, serves as the sub-adviser to the Funds. Voya Investments Distributor, LLC (“VID”), a Delaware limited liability company, serves as the principal underwriter to the Funds.
NOTE 2 — SIGNIFICANT ACCOUNTING POLICIES
The following significant accounting policies are consistently followed by the Funds in the preparation of their financial
statements. Each Fund is considered an investment company under U.S. generally accepted accounting principles (“GAAP”) and follows the accounting and reporting guidance applicable to investment companies.
A. Security Valuation. Each Fund is open for business every day the New York Stock Exchange (“NYSE”) opens for regular trading (each such day, a “Business Day”). The net asset value (“NAV”) per share for each class of each Fund is determined each Business Day as of the close of the regular trading session (“Market Close”), as determined by the Consolidated Tape Association (“CTA”), the central distributor of transaction prices for exchange-traded securities (normally 4:00 p.m. Eastern Time unless otherwise designated by the CTA). The NAV per share of each class of each Fund is calculated by taking the value of the Fund’s assets attributable to that class, subtracting the Fund’s liabilities attributable to that class, and dividing by the number of shares of that class that are outstanding. On days when a Fund is closed for business, Fund shares will not be priced and a Fund does not transact purchase and redemption orders. To the extent each Fund’s assets are traded in other markets on days when a Fund does not price its shares, the value of a Fund’s assets will likely change and you will not be able to purchase or redeem shares of a Fund.
Portfolio securities for which market quotations are readily available are valued at market value. Investments in open-end registered investment companies that do not trade on an exchange are valued at the end of day NAV per share. The prospectuses of the open-end registered investment companies in which each Fund may invest explain the circumstances under which they will use fair value pricing and the effects of using fair value pricing. Foreign securities’ prices are converted into U.S. dollar amounts using the applicable exchange rates as of Market Close.
When a market quotation for a portfolio security is not readily available or is deemed unreliable (for example when trading has been halted or there are unexpected market closures or other material events that would suggest that the market quotation is unreliable) and for purposes of determining the value of other Fund assets, the asset is priced at its fair value. The Board has designated the Investment Adviser, as the valuation designee, to make fair value determinations in good faith. In determining the fair value of each Fund’s assets, the Investment Adviser, pursuant to its fair valuation policy, may consider inputs from pricing service providers, broker-dealers, or each Fund’s sub-adviser(s). Issuer specific events, transaction price, position size, nature and duration of restrictions on disposition of the security, market trends, bid/ask quotes of brokers and other market data may be reviewed in the course of making a good faith determination of an asset’s fair value. Because trading hours for certain foreign securities end before Market
NOTES TO FINANCIAL STATEMENTS as of March 31, 2024 (continued)
NOTE 2 — SIGNIFICANT ACCOUNTING POLICIES (continued)
Close, closing market quotations may become unreliable. The prices of foreign securities will generally be adjusted based on inputs from an independent pricing service that are intended to reflect valuation changes through the NYSE close. Because of the inherent uncertainties of fair valuation, the values used to determine each Fund’s NAV may materially differ from the value received upon actual sale of those investments. Thus, fair valuation may have an unintended dilutive or accretive effect on the value of shareholders’ investments in each Fund.
The Funds’ financial instruments are valued at the close of the NYSE and are reported at fair value, which GAAP defines as the price that would be received to sell an asset or paid to transfer a liability in an orderly transaction between market participants at the measurement date.
Various valuation techniques and inputs are used to determine the fair value of financial instruments. GAAP establishes the following fair value hierarchy that categorizes the inputs used to measure fair value:
Level 1 – quoted prices (unadjusted) in active markets for identical financial instruments that the fund can access at the reporting date.
Level 2 – inputs other than Level 1 quoted prices that are observable, either directly or indirectly (including, but not limited to, quoted prices for similar financial instruments in active markets, quoted prices for identical or similar financial instruments in inactive markets, interest rates and yield curves, implied volatilities, and credit spreads).
Level 3 – unobservable inputs (including the fund’s own assumptions in determining fair value).
Observable inputs are developed using market data, such as publicly available information about actual events or transactions, and reflect the assumptions that market participants would use to price the financial instrument. Unobservable inputs are those for which market data are not available and are developed using the best information available about the assumptions that market participants would use to price the financial instrument. GAAP requires valuation techniques to maximize the use of relevant observable inputs and minimize the use of unobservable inputs. When multiple inputs are used to derive fair value, the financial instrument is assigned to the level within the fair value hierarchy based on the lowest-level input that is significant to the fair value of the financial instrument. Input levels are not necessarily an indication of the risk or liquidity associated with financial instruments at that level but rather the degree of judgment used in determining those values.
A table summarizing each Fund’s investments under these levels of classification is included within each Portfolio of
Investments.
Each investment asset or liability of the Funds is assigned a level at measurement date based on the significance and source of the inputs to its valuation. Quoted prices in active markets for identical securities are classified as “Level 1,” inputs other than quoted prices for an asset or liability that are observable are classified as “Level 2” and significant unobservable inputs, including the Sub-Adviser’s or Pricing Committee’s judgment about the assumptions that a market participant would use in pricing an asset or liability are classified as “Level 3.” The inputs used for valuing securities are not necessarily an indication of the risks associated with investing in those securities. Short-term securities of sufficient credit quality are generally considered to be Level 2 securities under applicable accounting rules. The Funds classify each of their investments in the Underlying Funds as Level 1, without consideration as to the classification level of the specific investments held by the Underlying Funds. A table summarizing each Fund’s investments under these levels of classification is included within the Portfolio of Investments.
GAAP requires a reconciliation of the beginning to ending balances for reported fair values that presents changes attributable to total realized and unrealized gains or losses, purchases and sales, and transfers in or out of the Level 3 category during the period. A reconciliation of Level 3 investments within the Portfolio of Investments is presented only when a Fund has a significant amount of Level 3 investments.
B. Securities Transactions and Revenue Recognition. Securities transactions are accounted for on the trade date. Realized gains and losses are reported on the basis of identified cost of securities sold. Interest income is recorded on an accrual basis. Dividend income is recorded on the ex-dividend date, or for certain foreign securities, when the information becomes available to the Funds. Premium amortization and discount accretion are determined by the effective yield method.
C. Foreign Currency Translation. The books and records of the Funds are maintained in U.S. dollars. Any foreign currency amounts are translated into U.S. dollars on the following basis:
| (1) | Market value of investment securities, other assets and liabilities — at the exchange rates prevailing at Market Close. |
| (2) | Purchases and sales of investment securities, income and expenses — at the rates of exchange prevailing on the respective dates of such transactions. |
Although the net assets and the market values are presented at the foreign exchange rates at Market Close, the Funds do not isolate the portion of the results of operations resulting
NOTES TO FINANCIAL STATEMENTS as of March 31, 2024 (continued)
NOTE 2 — SIGNIFICANT ACCOUNTING POLICIES (continued)
from changes in foreign exchange rates on investments from the fluctuations arising from changes in market prices of securities held. Such fluctuations are included with the net realized and unrealized gains or losses from investments. For securities that are subject to foreign withholding tax upon disposition, liabilities are recorded on the Statements of Assets and Liabilities for the estimated tax withholding based on the securities’ current market values. Upon disposition, realized gains or losses on such securities are recorded net of foreign withholding tax.
Reported net realized foreign exchange gains or losses arise from sales of foreign currencies, currency gains or losses realized between the trade and settlement dates on securities transactions, the difference between the amounts of dividends, interest, and foreign withholding taxes recorded on the Funds books, and the U.S. dollar equivalent of the amounts actually received or paid. Net unrealized foreign exchange gains and losses arise from changes in the value of assets and liabilities other than investments in securities, resulting from changes in the exchange rate. Foreign security and currency transactions may involve certain considerations and risks not typically associated with investing in U.S. companies and U.S. government securities. These risks include, but are not limited to revaluation of currencies and future adverse political and economic developments which could cause securities and their markets to be less liquid and prices more volatile than those of comparable U.S. companies and U.S. government securities. The foregoing risks are even greater with respect to securities of issuers in emerging markets.
D. Risk Exposures and the Use of Derivative Instruments. Each Fund’s investment objectives permit them to enter into various types of derivatives contracts, including, but not limited to, forward foreign currency exchange contracts, futures, purchased options, written options, and swaps. In doing so, the Funds will employ strategies in differing combinations to permit them to increase or decrease the level of risk, or change the level or types of exposure to risk factors. This may allow each Fund to pursue its objectives more quickly, and efficiently than if they were to make direct purchases or sales of securities capable of affecting a similar response to market or credit factors.
In pursuit of their investment objectives, each Fund may seek to increase or decrease their exposure to the following market or credit risk factors:
Credit Risk. The price of a bond or other debt instrument is likely to fall if the issuer’s actual or perceived financial health deteriorates, whether because of broad economic or
issuer-specific reasons. In certain cases, the issuer could be late in paying interest or principal, or could fail to pay its financial obligations altogether.
Foreign Exchange Rate Risk. To the extent that each Fund invests directly in foreign (non-U.S.) currencies or in securities denominated in, or that trade in, foreign (non-U.S.) currencies, it is subject to the risk that those foreign (non-U.S.) currencies will decline in value relative to the U.S. dollar or, in the case of hedging positions, that the U.S. dollar will decline in value relative to the currency being hedged by a Fund through foreign currency exchange transactions.
Currency rates may fluctuate significantly over short periods of time. Currency rates may be affected by changes in market interest rates, intervention (or the failure to intervene) by U.S. or foreign governments, central banks or supranational entities such as the International Monetary Fund, by the imposition of currency controls, or other political or economic developments in the United States or abroad.
Interest Rate Risk. A rise in market interest rates generally results in a fall in the value of bonds and other debt instruments; conversely, values generally rise as market interest rates fall. Interest rate risk is generally greater for debt instruments than floating-rate instruments. The higher the credit quality of the instrument, and the longer its maturity or duration, the more sensitive it is to changes in market interest rates. Duration is a measure of sensitivity of the price of a debt instrument to a change in interest rate. The U.S. has recently experienced a rising market interest rate environment, which may increase [a Fund’s] exposure to risks associated with rising market interest rates. Rising market interest rates have unpredictable effects on the markets and may expose debt and related markets to heightened volatility. To the extent that a mutual fund invests in debt instruments, an increase in market interest rates may lead to increased redemptions and increased portfolio turnover, which could reduce liquidity for certain investments, adversely affect values, and increase costs. Increased redemptions may cause a fund to liquidate portfolio positions when it may not be advantageous to do so and may lower returns. If dealer capacity in debt markets is insufficient for market conditions, it may further inhibit liquidity and increase volatility in debt markets. Further, recent and potential future changes in government policy may affect interest rates. Negative or very low interest rates could magnify the risks associated with changes in interest rates. In general, changing interest rates, including rates that fall below zero, could have unpredictable effects on markets and may expose debt and related markets to heightened volatility. Changes to monetary policy by the U.S. Federal Reserve Board or other regulatory actions could expose debt and related markets to heightened
NOTES TO FINANCIAL STATEMENTS as of March 31, 2024 (continued)
NOTE 2 — SIGNIFICANT ACCOUNTING POLICIES (continued)
volatility, interest rate sensitivity, and reduced liquidity, which may impact operations and return potential.
Risks of Investing in Derivatives. Each Fund’s use of derivatives can result in losses due to unanticipated changes in the market or credit risk factors and the overall market. In instances where the Funds are using derivatives to decrease, or hedge, exposures to market or credit risk factors for securities held by a Fund, there are also risks that those derivatives may not perform as expected resulting in losses for the combined or hedged positions. Derivative instruments are subject to a number of risks, including the risk of changes in the market price of the underlying securities, credit risk with respect to the counterparty, risk of loss due to changes in market interest rates and liquidity and volatility risk. The amounts required to purchase certain derivatives may be small relative to the magnitude of exposure assumed by a Fund. Therefore, the purchase of certain derivatives may have an economic leveraging effect on a Fund and exaggerate any increase or decrease in the NAV. Derivatives may not perform as expected, so a Fund may not realize the intended benefits. When used for hedging purposes, the change in value of a derivative may not correlate as expected with the currency, security or other risk being hedged. When used as an alternative or substitute for direct cash investments, the return provided by the derivative may not provide the same return as direct cash investment. In addition, given their complexity, derivatives expose a Fund to the risk of improper valuation.
Generally, derivatives are sophisticated financial instruments whose performance is derived, at least in part, from the performance of an underlying asset or assets. Derivatives include, among other things, swap agreements, options, forwards and futures. Investments in derivatives are generally negotiated OTC with a single counterparty and as a result are subject to credit risks related to the counterparty’s ability or willingness to perform its obligations; any deterioration in the counterparty’s creditworthiness could adversely affect the value of the derivative. In addition, derivatives and their underlying securities may experience periods of illiquidity which could cause a Fund to hold a security it might otherwise sell, or to sell a security it otherwise might hold at inopportune times or at an unanticipated price. A manager might imperfectly judge the direction of the market. For instance, if a derivative is used as a hedge to offset investment risk in another security, the hedge might not correlate to the market’s movements and may have unexpected or undesired results such as a loss or a reduction in gains.
Counterparty Credit Risk and Credit Related Contingent Features. Certain derivative positions are
subject to counterparty credit risk, which is the risk that the counterparty will not fulfill its obligation to the Funds. Each Fund’s derivative counterparties are financial institutions who are subject to market conditions that may weaken their financial position. The Fund intends to enter into financial transactions with counterparties that they believe to be creditworthy at the time of the transaction. To reduce this risk, the Fund generally enters into master netting arrangements, established within the Fund’s International Swap and Derivatives Association, Inc. (“ISDA”) Master Agreements (“Master Agreements”). These agreements are with select counterparties and they govern transactions, including certain OTC derivative and forward foreign currency contracts, entered into by the Fund and the counterparty. The Master Agreements maintain provisions for general obligations, representations, agreements, collateral, and events of default or termination. The occurrence of a specified event of termination may give a counterparty the right to terminate all of its contracts and affect settlement of all outstanding transactions under the applicable Master Agreement.
Each Fund may also enter into collateral agreements with certain counterparties to further mitigate credit risk associated with OTC derivative and forward foreign currency contracts. Subject to established minimum levels, collateral is generally determined based on the net aggregate unrealized gain or loss on contracts with a certain counterparty. Collateral pledged to or from the Funds is held in a segregated account by a third-party agent and can be in the form of cash or debt securities issued by the U.S. government or related agencies.
Each Fund’s Master Agreements with derivative counterparties have credit related contingent features that if triggered would allow their derivatives counterparties to close out and demand payment or additional collateral to cover their exposure from the Fund. Credit related contingent features are established between a Fund and its derivatives counterparties to reduce the risk that the Fund will not fulfill their payment obligations to their counterparties. These triggering features include, but are not limited to, a percentage decrease in a Fund’s net assets and or a percentage decrease in the Fund’s NAV, which could cause the Fund to accelerate payment of any net liability owed to the counterparty. The contingent features are established within each Fund’s Master Agreements.
E. Forward Foreign Currency Transactions and Futures Contracts. Each Fund may enter into foreign currency exchange transactions to convert to and from different foreign currencies and to and from the U.S. dollar in connection with the planned purchases or sales of securities. The Fund either enters into these transactions on a spot basis at the spot rate prevailing in the foreign currency exchange market or use forward foreign currency contracts to purchase or
NOTES TO FINANCIAL STATEMENTS as of March 31, 2024 (continued)
NOTE 2 — SIGNIFICANT ACCOUNTING POLICIES (continued)
sell foreign currencies. When the contract is fulfilled or closed, gains or losses are realized. Until then, the gain or loss is included in unrealized appreciation or depreciation. Risks may arise upon entering into forward contracts from the potential inability of counterparties to meet the terms of their forward contracts and from unanticipated movements in the value of foreign currencies relative to the U.S. dollar.
Each Fund may enter into futures contracts involving foreign currency, interest rates, securities and securities indices. The Funds intend to limit its use of futures contracts and futures options to “bona fide hedging” transactions, as such term is defined in applicable regulations, interpretations and practice. A futures contract obligates the seller of the contract to deliver and the purchaser of the contract to take delivery of the type of foreign currency, financial instrument or security called for in the contract at a specified future time for a specified price.
Upon entering into a futures contract, each Fund is required to deposit either cash or securities (initial margin) in an amount equal to a certain percentage of the contract value. Subsequent payments (variation margin) are made or received by a Fund each day. The variation margin payments are equal to the daily changes in the contract value and are recorded as unrealized gains and losses and, if any, shown as variation margin receivable or payable on futures contracts on the Statement of Assets and Liabilities. Open futures contracts, if any, are reported on a table within each Fund’s Portfolio of Investments. Securities held in collateralized accounts to cover initial margin requirements, if any, on open futures contracts are footnoted in the Portfolio of Investments. Cash collateral held by the broker to cover initial margin requirements on open futures contracts are noted in each Fund’s Statement of Assets and Liabilities. The net change in unrealized appreciation and depreciation is reported in each Fund’s Statement of Operations. Realized gains (losses) are reported in the Fund’s Statement of Operations at the closing or expiration of futures contracts.
Futures contracts are exposed to the market risk factor of the underlying financial instrument. During the year ended March 31, 2024, EMCD, EMHCD, and SC had purchased and sold futures contracts on various bonds and notes to gain exposure to different parts of the yield curve while maintaining overall duration. Additional associated risks of entering into futures contracts include the possibility that there may be an illiquid market where a Fund is unable to liquidate the contract or enter into an offsetting position and, if used for hedging purposes, the risk that the price of the contract will correlate imperfectly with the prices of the Fund’s securities. With futures, there is minimal counterparty
credit risk to a Fund since futures are exchange traded and the exchange’s clearinghouse, as counterparty to all exchange traded futures, guarantees the futures against default.
During the year ended March 31, 2024, the Funds had average notional values on futures contracts purchased and sold as disclosed below:
| | | | Purchased | | | Sold | |
| EMCD | | | $ | 16,153,981 | | | $ | 13,118,120 | |
| EMHCD | | | | 18,326,791 | | | | 16,399,547 | |
| SC | | | | 10,303,036 | | | | 55,034,585 | |
Please refer to the tables within the Portfolio of Investments for open futures contracts at March 31, 2024. HYB did not enter into any futures contracts during the year ended March 31, 2024.
F. Distributions to Shareholders. Each Fund records distributions to the shareholders on the ex-dividend date. The Funds distribute capital gains, if any, annually. The Funds declare dividends daily and pay dividends monthly. The characteristics of income and gains to be distributed are determined in accordance with income tax regulations, which may differ from GAAP for investment companies.
G. Federal Income Taxes. It is the policy of each Fund to comply with the requirements of subchapter M of the Internal Revenue Code that are applicable to regulated investment companies and to distribute substantially all of its net investment income and any net realized capital gains to its shareholders. Therefore, a federal income tax or excise tax provision is not required. Management has considered the sustainability of a Fund’s tax positions taken on federal income tax returns for all open tax years in making this determination. No capital gain distributions shall be made until the capital loss carryforwards have been fully utilized.
Each Fund may utilize equalization accounting for tax purposes, whereby a portion of redemption payments are treated as distributions of income or gain.
H. Use of Estimates. The preparation of financial statements in conformity with GAAP requires management to make estimates and assumptions that affect the reported amounts of assets and liabilities and disclosure of contingent assets and liabilities at the date of the financial statements and the reported amounts of increases and decreases in net assets from operations during the reporting period. Actual results could differ from those estimates.
I. Restricted Securities. Each Fund may invest in restricted securities which include those sold under Rule 144A of the Securities Act of 1933, as amended (“1933 Act”) or securities offered pursuant to Section 4(a)(2) of
NOTES TO FINANCIAL STATEMENTS as of March 31, 2024 (continued)
NOTE 2 — SIGNIFICANT ACCOUNTING POLICIES (continued)
the 1933 Act, and/or are subject to legal or contractual restrictions on resale and may not be publicly sold without registration under the 1933 Act. Restricted securities are fair valued using market quotations when readily available. In the absence of market quotations, the securities are valued based upon their fair value determined in good faith under procedures approved by the Board.
Securities that are not registered for sale to the public under the 1933 Act are referred to as “restricted securities.” These securities may be sold in private placement transactions between issuers and their purchasers and may be neither listed on an exchange nor traded in other established markets. Many times these securities are subject to legal or contractual restrictions on resale. As a result of the absence of a public trading market, the prices of these securities may be more volatile, less liquid and more difficult to value than publicly traded securities. The price realized from the sale of these securities could be less than the amount originally paid or less than their fair value if they are resold in privately negotiated transactions. In addition, these securities may not be subject to disclosure and other investment protection requirements that are afforded to publicly traded securities. Certain investments may include investment in smaller, less seasoned issuers, which may involve greater risk.
J. Offering Costs. Costs incurred with the offering of EMHCD, HYB and SC are deferred and amortized over a twelve month period on a straight-line basis starting at the commencement of operations.
K. Indemnifications. In the normal course of business, the Trusts may enter into contracts that provide certain indemnifications. The Trusts’ maximum exposure under these arrangements is dependent on future claims that may be made against the Funds and, therefore, cannot be estimated; however, based on experience, management considers risk of loss from such claims remote.
NOTE 3 — INVESTMENT TRANSACTIONS
For the year ended March 31, 2024, the cost of purchases and the proceeds from the sales of securities excluding short-term and U.S. government securities, were as follows:
| | | | Purchases | | | Sales | |
| EMCD | | | $ | 125,436,144 | | | $ | 160,669,507 | |
| EMHCD | | | | 157,798,340 | | | | 178,696,197 | |
| HYB | | | | 67,230,653 | | | | 65,346,768 | |
| SC | | | | 32,046,428 | | | | 60,710,910 | |
U.S. government securities not included above were as follows:
| | | | Sales | |
| EMHCD | | | $ | 2,704,484 | |
| SC | | | | 5,855,448 | |
NOTE 4 — INVESTMENT MANAGEMENT FEES
Each Fund has entered into an investment management agreement (“Management Agreement”) with the Investment Adviser. The Investment Adviser has overall responsibility for the management of the Funds. The Investment Adviser oversees all investment advisory and portfolio management services for the Funds and assists in managing and supervising all aspects of the general day-to-day business activities and operations of the Funds, including custodial, transfer agency, dividend disbursing, accounting, auditing, compliance and related services.
There is no management fee charged per the Management Agreement for EMCD, EMHCD, HYB, and SC.
The Investment Adviser has entered into a sub-advisory agreement with Voya IM with respect to each Fund. Voya IM provides investment advice for the Funds and is paid by the Investment Adviser based on the average daily net assets of each respective Fund. Subject to such policies as the Board or the Investment Adviser may determine, Voya IM manages each Fund’s assets in accordance with each Fund’s investment objectives, policies, and limitations.
NOTE 5 — OTHER TRANSACTIONS WITH AFFILIATES AND RELATED PARTIES
At March 31, 2024, the following direct or indirect, wholly-owned subsidiaries of Voya Financial, Inc. or affiliated investment companies owned more than 5% of the following Funds:
Subsidiary/Affiliated
Investment Company | | Fund | | | Percentage |
| Voya Global Bond Portfolio | | | EMCD | | | | 7.18 | % |
| Voya Intermediate Bond Portfolio | | | EMCD | | | | 91.21 | |
| | | | EMHCD | | | | 79.42 | |
| | | | HYB | | | | 56.68 | |
| | | | SC | | | | 53.33 | |
| Voya Investment Management Co. LLC | | | EMHCD | | | | 14.34 | |
| | | | HYB | | | | 27.97 | |
| | | | SC | | | | 36.39 | |
The Funds have adopted a deferred compensation plan (the “DC Plan”), which allows eligible independent trustees, as described in the DC Plan, to defer the receipt of all or a portion of the trustees’ fees that they are entitled to receive from the Funds. For purposes of determining the amount owed to the trustee under the DC Plan, the amounts deferred are invested in shares of the funds selected by the trustee (the “Notional Funds”). When the Funds purchase shares of the Notional Funds, which are all advised by Voya Investments,
NOTES TO FINANCIAL STATEMENTS as of March 31, 2024 (continued)
NOTE 5 — OTHER TRANSACTIONS WITH AFFILIATES AND RELATED PARTIES (continued)
in amounts equal to the trustees’ deferred fees, this results in a Fund asset equal to the deferred compensation liability. Such assets, if applicable, are included as a component of “Other assets” on the accompanying Statements of Assets and Liabilities. Deferral of trustees’ fees under the DC Plan will not affect net assets of the Funds, and will not materially affect the Funds’ assets, liabilities or net investment income per share. Amounts will be deferred until distributed in accordance with the DC Plan.
The Funds may pay per account fees to affiliates of Voya Investments for recordkeeping services provided on certain assets. For the year ended March 31, 2024, the Funds did not pay any amounts for affiliated recordkeeping services.
NOTE 6 — EXPENSE LIMITATION AGREEMENTS
Pursuant to a written expense limitation agreement (“Expense Limitation Agreement”) between the Investment Adviser and the Trusts, on behalf of each Fund, the Investment Adviser has agreed to limit expenses of each Fund, excluding interest, taxes, investment-related costs, leverage expenses, extraordinary expenses and acquired fund fees and expenses to the levels listed below:
| Fund | | | Expense Limit |
| EMCD | | | 0.15% |
| EMHCD | | | 0.15% |
| HYB | | | 0.15% |
| SC | | | 0.05% |
The Investment Adviser may at a later date recoup from the Fund for fees waived and/or other expenses reimbursed by the Investment Adviser during the previous 36 months, but only if, after such recoupment, the Fund’s expense ratio does not exceed the percentage described above. Waived and reimbursed fees net of any recoupment by the Investment Adviser of such waived and reimbursed fees are reflected on the accompanying Statements of Operations. Amounts payable by the Investment Adviser are reflected on the accompanying Statements of Assets and Liabilities.
As of March 31, 2024, the amounts of waived and/or reimbursed fees that are subject to possible recoupment by the Investment Adviser and the related expiration dates are as follows:
| | | | | March 31, | | | | | |
| | | | 2025 | | | 2026 | | | 2027 | | | Total | |
| SC | | | $ | — | | | $ | 3,164 | | | $ | 67,007 | | | $ | 70,171 | |
The Expense Limitation Agreement is contractual through August 1, 2024 and shall renew automatically for one-year terms. Termination or modification of this obligation requires approval by the Board.
NOTE 7 — LINE OF CREDIT
Effective on June 12, 2023, the Funds, in addition to certain other funds managed by the Investment Adviser, each Fund entered into a 364-day unsecured committed revolving line of credit agreement (the “Credit Agreement”) with The Bank of New York Mellon (“BNY”) for an aggregate amount of $400,000,000 through June 10, 2024. The proceeds may be used only to finance temporarily: (1) the purchase or sale of investment securities; or (2) the repurchase or redemption of shares of the Fund or certain other funds managed by the Investment Adviser. The funds to which the line of credit is available pay a commitment fee equal to 0.15% per annum on the daily unused portion of the committed line amount payable quarterly in arrears. Prior to June 12, 2023, the predecessor line of credit was for an aggregate amount of $400,000,000 and the funds to which the line of credit for EMCD was available paid a commitment fee equal to 0.15% per annum on the daily unused portion of the committed line amount through June 13, 2023.
Borrowings under the Credit Agreement accrue interest at the federal funds rate plus a specified margin. Repayments generally must be made within 60 days after the date of a revolving credit advance.
The Funds did not utilize the line of credit during the year ended March 31, 2024.
NOTE 8 — CAPITAL SHARES
Transactions in capital shares and dollars are as follows:
| | | | Shares
sold | | | Shares issued in merger | | Reinvestment of distributions | | | Shares
redeemed | | | Shares
converted | | | Net increase (decrease) in shares outstanding | | | Shares
sold | | | Proceeds from shares issued in merger | | Reinvestment of distributions | | | Shares
redeemed | | | Shares
converted | | | Net increase
(decrease) | |
| Year or period ended | | | # | | | # | | # | | | # | | | # | | | # | | | ($) | | | ($) | | ($) | | | ($) | | | ($) | | | ($) | |
| EMCD(1) | | | | | | | | | | | | | | | | | | | | | | | | | | | | | | | | | | | | | | | | | | | | | |
| 3/31/2024 | | | | — | | | — | | | 596,347 | | | | (5,319,149 | ) | | | — | | | | (4,722,802 | ) | | | — | | | — | | | 4,953,886 | | | | (45,000,000 | ) | | | — | | | | (40,046,114 | ) |
| 3/31/2023 | | | | — | | | — | | | 579,354 | | | | (386,597 | ) | | | — | | | | 192,757 | | | | — | | | — | | | 4,740,003 | | | | (2,999,993 | ) | | | — | | | | 1,740,010 | |
| EMHCD | | | | | | | | | | | | | | | | | | | | | | | | | | | | | | | | | | | | | | | | | | | | | |
| 3/31/2024 | | | | 19,005 | | | — | | | 1,013,377 | | | | (3,396,842 | ) | | | — | | | | (2,364,460 | ) | | | 191,064 | | | — | | | 10,236,184 | | | | (35,087,866 | ) | | | — | | | | (24,660,618 | ) |
NOTES TO FINANCIAL STATEMENTS as of March 31, 2024 (continued)
NOTE 8 — CAPITAL SHARES (continued)
| | | Shares
sold | | | Shares issued in merger | | Reinvestment of distributions | | | Shares
redeemed | | | Shares
converted | | | Net increase (decrease) in shares outstanding | | | Shares
sold | | | Proceeds from shares issued in merger | | Reinvestment of distributions | | | Shares
redeemed | | | Shares
converted | | | Net increase
(decrease) | |
| Year or period ended | | # | | | # | | # | | | # | | | # | | | # | | | ($) | | | ($) | | ($) | | | ($) | | | ($) | | | ($) | |
| EMHCD (continued) | | | | | | | | | | | | | | | | | | | | | | | | | | | | | | | | | | | | | | | | | |
| 2/17/2023(2)- | | | | | | | | | | | | | | | | | | | | | | | | | | | | | | | | | | | | | | | | | | | | |
| 3/31/2023 | | | 14,035,444 | | | — | | | 95,098 | | | | (692 | ) | | | — | | | | 14,129,850 | | | | 140,354,256 | | | — | | | 952,864 | | | | (6,913 | ) | | | — | | | | 141,300,207 | |
| HYB | | | | | | | | | | | | | | | | | | | | | | | | | | | | | | | | | | | | | | | | | | | | |
| 3/31/2024 | | | 23,074 | | | — | | | 987,151 | | | | (817,694 | ) | | | — | | | | 192,531 | | | | 232,044 | | | — | | | 9,938,067 | | | | (8,177,674 | ) | | | — | | | | 1,992,437 | |
| 2/24/2023(2)- | | | | | | | | | | | | | | | | | | | | | | | | | | | | | | | | | | | | | | | | | | | | |
| 3/31/2023 | | | 12,201,299 | | | — | | | 90,872 | | | | (779 | ) | | | — | | | | 12,291,392 | | | | 122,013,715 | | | — | | | 918,323 | | | | (7,813 | ) | | | — | | | | 122,924,225 | |
| SC | | | | | | | | | | | | | | | | | | | | | | | | | | | | | | | | | | | | | | | | | | | | |
| 3/31/2024 | | | 474,327 | | | — | | | 506,298 | | | | (5,035,221 | ) | | | — | | | | (4,054,596 | ) | | | 4,851,900 | | | — | | | 5,140,590 | | | | (51,131,440 | ) | | | — | | | | (41,138,950 | ) |
| 3/03/2023(2)- | | | | | | | | | | | | | | | | | | | | | | | | | | | | | | | | | | | | | | | | | | | | |
| 3/31/2023 | | | 23,618,952 | | | — | | | 38,608 | | | | (2,881 | ) | | | — | | | | 23,654,679 | | | | 236,189,763 | | | — | | | 386,086 | | | | (28,870 | ) | | | — | | | | 236,546,979 | |
| (1) | Prior to November 18, 2022, EMCD had a Class P shares designation. |
| (2) | Commencement of operations. |
NOTE 9 — SECURITIES LENDING
Under a Master Securities Lending Agreement (the “Agreement”) with BNY, the Funds can lend their securities to approved brokers, dealers and other financial institutions. Loans are collateralized by cash and U.S. government securities. The collateral is equal to at least 105% of the market value of non-U.S. securities loaned and 102% of the market value of U.S. securities loaned. The market value of the loaned securities is determined at the close of business of the Funds at their last sale price or official closing price on the principal exchange or system on which they are traded and any additional collateral is delivered to the Fund on the next business day. The cash collateral received is invested in approved investments as defined in the Securities Lending Agreement with BNY (the “Agreement”). The Funds bear the risk of loss with respect to the investment of collateral with the following exception: BNY provides the Funds indemnification from loss with respect to the investment of collateral to the extent the cash collateral is invested in overnight repurchase agreements.
Cash collateral received in connection with securities lending is invested in cash equivalents, money market funds, repurchase agreements with maturities of not more than 99 days that are collateralized with U.S. Government securities, or certain short-term investments that have a remaining maturity of 190 days or less (“Permitted Investments”). Short-term investments include: securities, units, shares or other participations in short-term investment funds, pools or trusts; commercial paper, notes, bonds or other debt obligations, certificates of deposit, time deposits and other bank obligations and asset-backed commercial paper backed by diversified receivables and repurchase-backed programs. Permitted Investments are subject to certain guidelines established by the Adviser regarding liquidity, diversification, credit quality and average credit
life/duration requirements. The securities purchased with cash collateral received are reflected in the Portfolio of Investments under Short-Term Investments.
Generally, in the event of counterparty default, the Funds have the right to use the collateral to offset losses incurred. The Agreement contains certain guarantees by BNY in the event of counterparty default and/or a borrower’s failure to return a loaned security; however, there would be a potential loss to the Funds in the event the Funds are delayed or prevented from exercising its right to dispose of the collateral. Engaging in securities lending could have a leveraging effect, which may intensify the credit, market and other risks associated with investing in a fund.
The following tables represent a summary of each respective Fund’s securities lending agreements by counterparty which are subject to offset under the Agreement as of March 31, 2024:
EMCD
| Counterparty | | Securities Loaned at Value | | | Cash Collateral Received(1) | | | Net
Amount | |
| Barclays Capital Inc. | | $ | 1,593,668 | | | $ | (1,593,668 | ) | | $ | — | |
| BNP Paribas Prime Brokerage Int’l Ltd. | | | 439,964 | | | | (439,964 | ) | | | — | |
| Citigroup Global Markets Limited | | | 268,019 | | | | (268,019 | ) | | | — | |
| Goldman Sachs International | | | 384,043 | | | | (384,043 | ) | | | — | |
| Goldman, Sachs & Co. LLC | | | 106,984 | | | | (106,984 | ) | | | — | |
| HSBC Securities (USA) Inc. | | | 554,039 | | | | (554,039 | ) | | | — | |
| J.P. Morgan Securities LLC | | | 847,921 | | | | (847,921 | ) | | | — | |
| Morgan Stanley & Co. LLC | | | 372,806 | | | | (372,806 | ) | | | — | |
| Scotia Capital (USA) INC | | | 6,094 | | | | (6,094 | ) | | | — | |
| US Bancorp Investments | | | 356,163 | | | | (356,163 | ) | | | — | |
NOTES TO FINANCIAL STATEMENTS as of March 31, 2024 (continued)
NOTE 9 — SECURITIES LENDING (continued)
| Counterparty | | Securities
Loaned at Value | | Cash Collateral
Received(1) | | | Net
Amount | |
| Wells Fargo | | | | | | | | | | | | |
| Securities LLC | | $ | 1,479,832 | | | $ | (1,479,832 | ) | | $ | — | |
| Total | | $ | 6,409,533 | | | $ | (6,409,533 | ) | | $ | — | |
| (1) | Cash collateral with a fair value of $6,591,510 has been received in connection with the above securities lending transactions. Excess cash collateral received from the individual counterparty is not shown for financial reporting purposes. |
EMHCD
| Counterparty | | Securities
Loaned at Value | | Cash Collateral
Received(1) | | | | Net
Amount | |
| BofA Securities Inc | | $ | 87,802 | | | $ | (87,802 | ) | | $ | — | |
| HSBC Securities (USA) Inc. | | | 604,406 | | | | (604,406 | ) | | | — | |
| Jefferies LLC | | | 978,173 | | | | (978,173 | ) | | | — | |
| Wells Fargo Securities LLC | | | 415,755 | | | | (415,755 | ) | | | — | |
| Total | | $ | 2,086,136 | | | $ | (2,086,136 | ) | | $ | — | |
| (1) | Cash collateral with a fair value of $2,136,903 has been received in connection with the above securities lending transactions. Excess cash collateral received from the individual counterparty is not shown for financial reporting purposes. |
HYB
| Counterparty | | Securities
Loaned at Value | | | Cash Collateral
Received(1) | | | Net
Amount | |
| BofA Securities Inc | | $ | 505,203 | | | $ | (505,203 | ) | | $ | — | |
| Citadel Clearing LLC | | | 124,080 | | | | (124,080 | ) | | | — | |
| Jefferies LLC | | | 691,061 | | | | (691,061 | ) | | | — | |
| State Street Bank and Trust Company | | | 230,500 | | | | (230,500 | ) | | | — | |
| Truist Securities INC | | | 827,022 | | | | (827,022 | ) | | | — | |
| Total | | $ | 2,377,866 | | | $ | (2,377,866 | ) | | $ | — | |
| (1) | Cash collateral with a fair value of $2,438,961 has been received in connection with the above securities lending transactions. Excess cash collateral received from the individual counterparty is not shown for financial reporting purposes. |
NOTE 10 — FEDERAL INCOME TAXES
The amount of distributions from net investment income and net realized capital gains are determined in accordance with federal income tax regulations, which may differ from GAAP for investment companies. These book/tax differences may be either temporary or permanent. Permanent differences are reclassified within the capital accounts based on their federal tax-basis treatment; temporary differences are not reclassified. Key differences include the treatment of futures contracts, paydowns and perpetual preferred securities.
Dividends paid by the Funds from net investment income and distributions of net realized short-term capital gains are, for federal income tax purposes, taxable as ordinary income to shareholders.
The tax composition of dividends and distributions to shareholders was as follows:
| | | Year Ended
March 31, 2024 | | | Year Ended
March 31, 2023 | |
| | | Ordinary
Income | | | Long-term
Capital Gains | | | Ordinary
Income | | | Long-term
Capital Gains | |
| EMCD | | $ | 4,953,886 | | | $ | — | | | $ | 4,565,018 | | | $ | 174,985 | |
| EMHCD | | | 9,795,774 | | | | 440,410 | | | | 952,864 | | | | — | |
| HYB | | | 9,938,067 | | | | — | | | | 918,323 | | | | — | |
| SC | | | 11,312,104 | | | | 657,342 | | | | 820,674 | | | | — | |
The tax-basis components of distributable earnings and the capital loss carryforwards which may be used to offset future realized capital gains for federal income tax purposes as of March 31, 2024 were:
NOTES TO FINANCIAL STATEMENTS as of March 31, 2024 (continued)
NOTE 10 — FEDERAL INCOME TAXES (continued)
| | | | Undistributed
Ordinary | | | Undistributed
Long-term | | Post-
October
Capital
Losses | | | Unrealized
Appreciation/ | | | Capital Loss Carryforwards | | | | | | Total
Distributable | |
| | | | Income | | | Capital Gains | | Deferred | | | (Depreciation) | | | Amount | | | Character | | | Other | | | Earnings/(Loss) | |
| EMCD | | | $ | 17,302 | | | $ | — | | | $ | — | | | $ | (1,947,401 | ) | | $ | (11,856,479 | ) | | | Long-term | | | $ | (61,827 | ) | | $ | (13,848,405 | ) |
| EMHCD | | | | 1,228,513 | | | | 225,245 | | | | — | | | | 5,761,368 | | | | — | | | | — | | | | — | | | | 7,215,126 | |
| HYB | | | | 57,893 | | | | — | | | | — | | | | 3,169,140 | | | | (158,653 | ) | | | Short-term | | | | — | | | | 2,926,593 | |
| | | | | | | | | | | | | | | | | | | | | (141,787 | ) | | | Long-term | | | | | | | | | |
| | | | | | | | | | | | | | | | | | | | | | | | | | | | | | | | | | |
| | | | | | | | | | | | | | | | | | | | $ | (300,440 | ) | | | | | | | | | | | | |
| SC | | | | 1,411,858 | | | | — | | | | (2,577,575 | ) | | | 8,739,024 | | | | — | | | | — | | | | (466,596 | ) | | | 7,106,711 | |
The Funds’ major tax jurisdictions are U.S. federal and Arizona state.
As of March 31, 2024, no provision for income tax is required in the Funds’ financial statements as a result of tax positions taken on federal and state income tax returns for open tax years. The Funds’ federal and state income and federal excise tax returns for tax years for which the applicable statutes of limitations have not expired are subject to examination by the Internal Revenue Service and state department of revenue. Generally, the preceding four tax years remain subject to examination by these jurisdictions.
NOTE 11 — LONDON INTERBANK OFFERED RATE (“LIBOR”)
The London Interbank Offered Rate (“LIBOR”) was the offered rate for short-term Eurodollar deposits between major international banks. The terms of investments, financings or other transactions (including certain derivatives transactions) to which the Fund may be a party have historically been tied to LIBOR. In connection with the global transition away from LIBOR led by regulators and market participants, LIBOR was last published on a representative basis at the end of June 2023. Alternative reference rates to LIBOR have been established in most major currencies and markets in these new rates are continuing to develop. The transition away from LIBOR to the use of replacement rates has gone relatively smoothly on the Fund and the financial instruments in which it invests; however, longer-term impacts are still uncertain.
In addition, interest rates or other types of rates and indices which are classed as “benchmarks” have been the subject of ongoing national and international regulatory reform, including under the European Union regulation on indices used as benchmarks in financial instruments and financial contracts (known as the “Benchmarks Regulation”). The Benchmarks Regulation has been enacted into United Kingdom law by virtue of the European Union (Withdrawal) Act 2018 (as amended), subject to amendments made by the Benchmarks (Amendment and Transitional Provision) (EU Exit) Regulations 2019 (SI 2019/657) and other statutory instruments. Following the implementation of these reforms, the manner of administration of benchmarks
has changed and may further change in the future, with the result that relevant benchmarks may perform differently than in the past, the use of benchmarks that are not compliant with the new standards by certain supervised entities may be restricted, and certain benchmarks may be eliminated entirely. Such changes could cause increased market volatility and disruptions in liquidity for instruments that rely on or are impacted by such benchmarks. Additionally, there could be other consequences which cannot be predicted.
NOTE 12 — LIQUIDITY
Consistent with Rule 22e-4 under the 1940 Act, the Funds have established a liquidity risk management program to govern their approach to managing liquidity risk (the “Program”). The Board has approved the designation of the Funds’ Investment Adviser, Voya Investments, as the program administrator (the “Program Administrator”). The Program Administrator is responsible for implementing and monitoring the Program and has formed a Liquidity Risk Management Committee (the “Committee”) to assess and review, on an ongoing basis, each Fund’s liquidity risk.
The Program includes a number of elements that support the management and assessment of liquidity risk, including an annual assessment of liquidity risk factors and the periodic classification (or re- classification, as necessary) of a Fund’s investments into buckets (highly liquid, moderately liquid, less liquid and illiquid) that reflect the Committee’s assessment of the investments’ liquidity under current market conditions. The Committee also utilizes Fund-specific data, including information regarding a Fund’s
NOTES TO FINANCIAL STATEMENTS as of March 31, 2024 (continued)
NOTE 12 — LIQUIDITY (continued)
shareholder base, characteristics of its investments, access to borrowing arrangements and historical redemptions to determine whether a Fund will be able to meet its redemption obligations in a timely manner.
During the period covered by the annual assessment, January 1, 2023 through December 31, 2023, the Program supported the Funds’ ability to honor redemption requests in a timely manner and the Program Administrator’s management of each Fund’s liquidity risk, including during any periods of market volatility and net redemptions.
There can be no assurance that the Program will achieve its objectives under all circumstances in the future. Please refer to each Fund’s prospectus for more information regarding each Fund’s exposure to liquidity risk and other risks.
NOTE 13 — MARKET DISRUPTION AND GEOPOLITICAL
The Fund is subject to the risk that geopolitical events will disrupt securities markets and adversely affect global economies and markets. Due to the increasing interdependence among global economies and markets, conditions in one country, market, or region might adversely impact markets, issuers and/or foreign exchange rates in other countries, including the United States. Wars, terrorism, global health crises and pandemics, and other geopolitical events that have led, and may continue to lead, to increased market volatility and may have adverse short- or long-term effects on U.S. and global economies and markets, generally. For example, the COVID-19 pandemic resulted in significant market volatility, exchange suspensions and closures, declines in global financial markets, higher default rates, supply chain disruptions, and a substantial economic downturn in economies throughout the world. The economic impacts of COVID-19 have created a unique challenge for real estate markets. Many businesses have either partially or fully transitioned to a remote-working environment and this transition may negatively impact the occupancy rates of commercial real estate over time. Natural and environmental disasters and
systemic market dislocations are also highly disruptive to economies and markets. In addition, military action by Russia in Ukraine has, and may continue to, adversely affect global energy and financial markets and therefore could affect the value of investments, including beyond the direct exposure to Russian issuers or nearby geographic regions. The extent and duration of the military action, sanctions, and resulting market disruptions are impossible to predict and could be substantial. A number of U.S. domestic banks and foreign (non-U.S.) banks have recently experienced financial difficulties and, in some cases, failures. There can be no certainty that the actions taken by regulators to limit the effect of those financial difficulties and failures on other banks or other financial institutions or on the U.S. or foreign (non-U.S.) economies generally will be successful. It is possible that more banks or other financial institutions will experience financial difficulties or fail, which may affect adversely other U.S. or foreign (non-U.S.) financial institutions and economies. These events as well as other changes in foreign (non-U.S.) and domestic economic, social, and political conditions also could adversely affect individual issuers or related groups of issuers, securities markets, interest rates, credit ratings, inflation, investor sentiment, and other factors affecting the value of a Fund’s investments. Any of these occurrences could disrupt the operations of a Fund and of the Funds’ service providers.
NOTE 14 — SUBSEQUENT EVENTS
Dividends: Subsequent to March 31, 2024, the Funds declared dividends from net investment income of:
| | Per Share
Amount | | Payable
Date | | Record
Date |
| EMCD | $0.0414 | | May 1, 2024 | | Daily |
| EMHCD | $0.0551 | | May 1, 2024 | | Daily |
| HYB | $0.0654 | | May 1, 2024 | | Daily |
| SC | $0.0407 | | May 1, 2024 | | Daily |
The Funds have evaluated events occurring after the Statements of Assets and Liabilities date through the date that the financial statements were issued (“subsequent events”) to determine whether any subsequent events necessitated adjustment to or disclosure in the financial statements. Other than the above, no such subsequent events were identified.
| Voya VACS Series EMCD Fund | PORTFOLIO OF INVESTMENTS
as of March 31, 2024 |
Principal
Amount† | | | | | Value | | | Percentage
of Net
Assets | |
| CORPORATE BONDS/NOTES: 92.8% | |
| | | | Argentina: 0.9% | |
| 475,000 (1) | | | YPF SA, 9.500%, 01/17/2031 | | $ | 485,307 | | | | 0.9 | |
| | | | | | | | | | | | |
| | | Brazil: 4.2% | | | | | | | | |
| 325,000 (1) | | | Ambipar Lux Sarl, 9.875%, 02/06/2031 | | | 325,455 | | | | 0.6 | |
| 300,000 (1) | | | Banco do Brasil SA/ Cayman, 6.000%, 03/18/2031 | | | 300,300 | | | | 0.5 | |
| 400,000 (1) | | | Cosan Luxembourg SA, 7.250%, 06/27/2031 | | | 408,200 | | | | 0.7 | |
| 400,000 | | | NBM US Holdings, Inc., 7.000%, 05/14/2026 | | | 401,852 | | | | 0.7 | |
| 575,000 (1)(2) | | | Raizen Fuels Finance SA, 6.450%, 03/05/2034 | | | 588,800 | | | | 1.1 | |
| 300,000 (1) | | | Suzano Austria GmbH, 7.000%, 03/16/2047 | | | 315,832 | | | | 0.6 | |
| | | | | | | 2,340,439 | | | | 4.2 | |
| | | | Cayman Islands: 1.6% | | | | | | | | |
| 925,000 (1)(2) | | | CK Hutchison International 23 Ltd., 4.875%, 04/21/2033 | | | 918,641 | | | | 1.6 | |
| | | | | | | | | | | | |
| | | Chile: 3.6% | | | | | | | | |
| 200,000 | | | Antofagasta PLC, 5.625%, 05/13/2032 | | | 200,500 | | | | 0.3 | |
| 200,000 | | | Banco de Credito e Inversiones SA, 2.875%, 10/14/2031 | | | 171,312 | | | | 0.3 | |
| 300,000 (1)(2) | | | Celulosa Arauco y Constitucion SA, 4.200%, 01/29/2030 | | | 275,062 | | | | 0.5 | |
| 500,000 (2) | | | Engie Energia Chile SA, 3.400%, 01/28/2030 | | | 436,875 | | | | 0.8 | |
| 550,000 (1) | | | Inversiones CMPC SA, 6.125%, 02/26/2034 | | | 560,450 | | | | 1.0 | |
| 200,000 (1) | | | Sociedad Quimica y Minera de Chile SA, 6.500%, 11/07/2033 | | | 208,700 | | | | 0.4 | |
| 200,000 | | | Telefonica Moviles Chile SA, 3.537%, 11/18/2031 | | | 151,438 | | | | 0.3 | |
| | | | | | | 2,004,337 | | | | 3.6 | |
| | | | China: 3.4% | | | | | | | | |
| 650,000 | | | Alibaba Group Holding Ltd., 3.600%, 11/28/2024 | | | 641,209 | | | | 1.2 | |
| 600,000 (1) | | | ENN Clean Energy International Investment Ltd., 3.375%, 05/12/2026 | | | 570,981 | | | | 1.0 | |
Principal
Amount† | | | | | Value | | | Percentage
of Net
Assets | |
| CORPORATE BONDS/NOTES: (continued) | |
| | | | China: (continued) | | | | | | | | |
| 700,000 (1) | | | Tencent Holdings Ltd., 3.595%, 01/19/2028 | | $ | 665,000 | | | | 1.2 | |
| | | | | | | 1,877,190 | | | | 3.4 | |
| | | | Colombia: 5.3% | | | | | | | | |
| 550,000 (3) | | | Bancolombia SA, 4.625%, 12/18/2029 | | | 534,325 | | | | 1.0 | |
| 450,000 | | | Ecopetrol SA, 8.375%, 01/19/2036 | | | 454,639 | | | | 0.8 | |
| 725,000 | | | Ecopetrol SA, 8.875%, 01/13/2033 | | | 764,038 | | | | 1.4 | |
| 400,000 (1) | | | Geopark Ltd., 5.500%, 01/17/2027 | | | 364,932 | | | | 0.6 | |
| 400,000 (1) | | | Grupo Energia Bogota SA ESP, 7.850%, 11/09/2033 | | | 442,875 | | | | 0.8 | |
| 404,000 | | | Oleoducto Central SA, 4.000%, 07/14/2027 | | | 378,624 | | | | 0.7 | |
| | | | | | | 2,939,433 | | | | 5.3 | |
| | | | Ghana: 0.3% | | | | | | | | |
| 200,000 (1) | | | Tullow Oil PLC, 10.250%, 05/15/2026 | | | 191,040 | | | | 0.3 | |
| | | | | | | | | | | | |
| | | | Guatemala: 1.3% | | | | | | | | |
| 500,000 | | | CT Trust, 5.125%, 02/03/2032 | | | 442,500 | | | | 0.8 | |
| 300,000 (1) | | | CT Trust, 5.125%, 02/03/2032 | | | 265,500 | | | | 0.5 | |
| | | | | | | 708,000 | | | | 1.3 | |
| | | | Hong Kong: 3.8% | | | | | | | | |
| 500,000 (1) | | | AIA Group Ltd., 5.375%, 04/05/2034 | | | 501,424 | | | | 0.9 | |
| 635,000 (1)(2) | | | Lenovo Group Ltd., 6.536%, 07/27/2032 | | | 670,520 | | | | 1.2 | |
| 800,000 (1) | | | Melco Resorts Finance Ltd., 5.750%, 07/21/2028 | | | 759,141 | | | | 1.4 | |
| 200,000 (2) | | | Melco Resorts Finance Ltd., 5.750%, 07/21/2028 | | | 189,785 | | | | 0.3 | |
| | | | | | | 2,120,870 | | | | 3.8 | |
| | | | India: 5.3% | | | | | | | | |
| 250,000 | | | Adani Ports & Special Economic Zone Ltd., 4.375%, 07/03/2029 | | | 223,125 | | | | 0.4 | |
| 600,000 (1) | | | IRB Infrastructure Developers Ltd., 7.110%, 03/11/2032 | | | 609,563 | | | | 1.1 | |
| 700,000 (1)(2) | | | JSW Steel Ltd., 5.050%, 04/05/2032 | | | 617,531 | | | | 1.1 | |
| 525,000 (1)(3) | | | Network i2i Ltd., 3.975%, 12/31/2199 | | | 499,570 | | | | 0.9 | |
| 535,000 (1)(2) | | | Reliance Industries Ltd., 2.875%, 01/12/2032 | | | 454,750 | | | | 0.8 | |
See Accompanying Notes to Financial Statements
| Voya VACS Series EMCD Fund | PORTFOLIO OF INVESTMENTS
as of March 31, 2024 (continued) |
Principal
Amount† | | | | | Value | | | Percentage
of Net
Assets | |
| CORPORATE BONDS/NOTES: (continued) | |
| | | | India: (continued) | | | | | | | | |
| 700,000 (1) | | | Summit Digitel Infrastructure Ltd., 2.875%, 08/12/2031 | | $ | 584,719 | | | | 1.0 | |
| | | | | | 2,989,258 | | | | 5.3 | |
| | | Indonesia: 0.3% | | | | | | | | |
| 200,000 (1) | | | Medco Bell Pte Ltd., 6.375%, 01/30/2027 | | | 195,312 | | | | 0.3 | |
| | | | | | | | | | | | |
| | | | Isle of Man: 0.5% | | | | | | | | |
| 300,000 | | | AngloGold Ashanti Holdings PLC, 3.375%, 11/01/2028 | | | 271,051 | | | | 0.5 | |
| | | | | | | | | | | | |
| | | | Israel: 1.5% | | | | | | | | |
| 200,000 (1)(2) | | | Energean Israel Finance Ltd., 8.500%, 09/30/2033 | | | 198,625 | | | | 0.4 | |
| 400,000 (1) | | | Israel Discount Bank Ltd., 5.375%, 01/26/2028 | | | 392,250 | | | | 0.7 | |
| 250,000 (1) | | | Israel Electric Corp. Ltd., 4.250%, 08/14/2028 | | | 233,359 | | | | 0.4 | |
| | | | | | 824,234 | | | | 1.5 | |
| | | | Kazakhstan: 0.9% | | | | | | | | |
| 300,000 | | | KazMunayGas National Co. JSC, 3.500%, 04/14/2033 | | | 250,500 | | | | 0.4 | |
| 300,000 | | | KazMunayGas National Co. JSC, 6.375%, 10/24/2048 | | | 281,438 | | | | 0.5 | |
| | | | | | 531,938 | | | | 0.9 | |
| | | | Kuwait: 1.8% | | | | | | | | |
| 575,000 | | | MEGlobal BV, 4.250%, 11/03/2026 | | | 554,156 | | | | 1.0 | |
| 500,000 (1)(3) | | | NBK Tier 1 Financing 2 Ltd., 4.500%, 12/31/2199 | | | 483,750 | | | | 0.8 | |
| | | | | | 1,037,906 | | | | 1.8 | |
| | | | Luxembourg: 4.1% | | | | | | | | |
| 450,000 (1) | | | Altice Financing SA, 5.750%, 08/15/2029 | | | 361,000 | | | | 0.6 | |
| 200,000 (1) | | | Chile Electricity Lux MPC Sarl, 6.010%, 01/20/2033 | | | 203,000 | | | | 0.4 | |
| 700,000 (1) | | | CSN Resources SA, 8.875%, 12/05/2030 | | | 724,640 | | | | 1.3 | |
| 325,000 (1) | | | Greensaif Pipelines Bidco Sarl, 6.510%, 02/23/2042 | | | 339,117 | | | | 0.6 | |
| 625,000 (1) | | | Minerva Luxembourg SA, 8.875%, 09/13/2033 | | | 660,156 | | | | 1.2 | |
| | | | | | 2,287,913 | | | | 4.1 | |
Principal
Amount† | | | | | Value | | | Percentage
of Net
Assets | |
| CORPORATE BONDS/NOTES: (continued) | |
| | | | Macao: 2.2% |
| 400,000 | | | MGM China Holdings Ltd., 4.750%, 02/01/2027 | | $ | 381,080 | | | | 0.7 | |
| 875,000 | | | Sands China Ltd., 5.400%, 08/08/2028 | | | 860,554 | | | | 1.5 | |
| | | | | | 1,241,634 | | | | 2.2 | |
| | | | Malaysia: 1.8% | | | | | | | | |
| 375,000 (1) | | | CIMB Bank Bhd, 2.125%, 07/20/2027 | | | 341,133 | | | | 0.6 | |
| 300,000 (1)(2) | | | GENM Capital Labuan Ltd., 3.882%, 04/19/2031 | | | 263,835 | | | | 0.5 | |
| 400,000 (1) | | | MISC Capital Two Labuan Ltd., 3.750%, 04/06/2027 | | | 382,000 | | | | 0.7 | |
| | | | | | 986,968 | | | | 1.8 | |
| | | | Mexico: 7.3% | | | | | | | | |
| 550,000 (1) | | | Alpek SAB de CV, 4.250%, 09/18/2029 | | | 514,078 | | | | 0.9 | |
| 600,000 (3) | | | Banco Mercantil del Norte SA/Grand Cayman, 7.500%, 12/31/2199 | | | 597,188 | | | | 1.1 | |
| 225,000 (1)(3) | | | BBVA Bancomer SA/Texas, 8.125%, 01/08/2039 | | | 233,648 | | | | 0.4 | |
| 200,000 (1) | | | Buffalo Energy Mexico Holdings / Buffalo Energy Infrastructure / Buffalo Energy, 7.875%, 02/15/2039 | | | 215,828 | | | | 0.4 | |
| 525,000 (3) | | | Cemex SAB de CV, 5.125%, 12/31/2199 | | | 508,922 | | | | 0.9 | |
| 400,000 (1) | | | GCC SAB de CV, 3.614%, 04/20/2032 | | | 343,232 | | | | 0.6 | |
| 250,000 | | | Industrias Penoles SAB de CV, 4.150%, 09/12/2029 | | | 233,750 | | | | 0.4 | |
| 875,000 (2) | | | Petroleos Mexicanos, 10.000%, 02/07/2033 | | | 870,538 | | | | 1.6 | |
| 550,000 (1)(2) | | | Trust Fibra Uno, 7.375%, 02/13/2034 | | | 550,811 | | | | 1.0 | |
| | | | | | 4,067,995 | | | | 7.3 | |
| | | | Morocco: 0.8% | | | | | | | | |
| 500,000 | | | OCP SA, 6.875%, 04/25/2044 | | | 473,945 | | | | 0.8 | |
| | | | | | | | | | | | |
| | | | Netherlands: 2.6% | | | | | | | | |
| 500,000 (1) | | | Embraer Netherlands Finance BV, 7.000%, 07/28/2030 | | | 523,600 | | | | 0.9 | |
| 400,000 (1)(2) | | | Sigma Finance Netherlands BV, 4.875%, 03/27/2028 | | | 391,500 | | | | 0.7 | |
See Accompanying Notes to Financial Statements
| Voya VACS Series EMCD Fund | PORTFOLIO OF INVESTMENTS
as of March 31, 2024 (continued) |
Principal
Amount† | | | | | Value | | | Percentage
of Net
Assets | |
| CORPORATE BONDS/NOTES: (continued) | |
| | | | Netherlands: (continued) |
| 500,000 (2) | | | Teva Pharmaceutical Finance Netherlands III BV, 8.125%, 09/15/2031 | | $ | 547,710 | | | | 1.0 | |
| | | | | | | 1,462,810 | | | | 2.6 | |
| | | | Nigeria: 0.4% | | | | | | | | |
| 250,000 | | | IHS Netherlands Holdco BV, 8.000%, 09/18/2027 | | | 240,000 | | | | 0.4 | |
| | | | | | | | | | | | |
| | | | Oman: 0.4% | | | | | | | | |
| 250,000 (1)(2) | | | Oryx Funding Ltd., 5.800%, 02/03/2031 | | | 250,871 | | | | 0.4 | |
| | | | | | | | | | | | |
| | | | Panama: 1.2% | | | | | | | | |
| 515,600 | | | AES Panama Generation Holdings SRL, 4.375%, 05/31/2030 | | | 450,506 | | | | 0.8 | |
| 250,000 | | | C&W Senior Financing DAC, 6.875%, 09/15/2027 | | | 237,656 | | | | 0.4 | |
| | | | | | | 688,162 | | | | 1.2 | |
| | | | Peru: 3.3% | | | | | | | | |
| 525,000 (1) | | | Banco de Credito del Peru S.A., 5.850%, 01/11/2029 | | | 530,906 | | | | 1.0 | |
| 600,000 (1) | | | Hunt Oil Co. of Peru LLC Sucursal Del Peru, 8.550%, 09/18/2033 | | | 641,520 | | | | 1.1 | |
| 700,000 | | | Southern Copper Corp., 3.875%, 04/23/2025 | | | 688,172 | | | | 1.2 | |
| | | | | | | 1,860,598 | | | | 3.3 | |
| | | | Poland: 0.9% | | | | | | | | |
| 300,000 (1) | | | Bank Gospodarstwa Krajowego, 5.375%, 05/22/2033 | | | 299,250 | | | | 0.5 | |
| 200,000 (1) | | | Canpack SA / Canpack US LLC, 3.125%, 11/01/2025 | | | 191,774 | | | | 0.4 | |
| | | | | | | 491,024 | | | | 0.9 | |
| | | | Qatar: 0.3% | | | | | | | | |
| 200,000 (1) | | | Ooredoo International Finance Ltd., 2.625%, 04/08/2031 | | | 172,565 | | | | 0.3 | |
| | | | | | | | | | | | |
| | | | Russia: 0.2% | | | | | | | | |
| 1,000,000 (1)(4) | | | Alfa Bank AO Via Alfa Bond Issuance PLC, 5.950%, 04/15/2030 | | | 60,000 | | | | 0.1 | |
Principal
Amount† | | | | | Value | | | Percentage
of Net
Assets | |
| CORPORATE BONDS/NOTES: (continued) | |
| | | | Russia: (continued) |
| 500,000 (1) | | | Sovcombank Via SovCom Capital DAC, 7.750%, 12/31/2199 | | $ | 43,437 | | | | 0.1 | |
| | | | | | | 103,437 | | | | 0.2 | |
| | | | Saudi Arabia: 3.3% | | | | | | | | |
| 200,000 (1) | | | Arabian Centres Sukuk II Ltd., 5.625%, 10/07/2026 | | | 189,687 | | | | 0.3 | |
| 525,000 (1) | | | EIG Pearl Holdings Sarl, 3.545%, 08/31/2036 | | | 450,352 | | | | 0.8 | |
| 650,000 | | | EIG Pearl Holdings Sarl, 4.387%, 11/30/2046 | | | 510,569 | | | | 0.9 | |
| 700,000 | | | Saudi Arabian Oil Co., 2.875%, 04/16/2024 | | | 699,125 | | | | 1.3 | |
| | | | | | | 1,849,733 | | | | 3.3 | |
| | | | Singapore: 2.5% | | | | | | | | |
| 600,000 (1)(2) | | | Medco Maple Tree Pte Ltd., 8.960%, 04/27/2029 | | | 625,875 | | | | 1.1 | |
| 800,000 (1)(3) | | | Oversea-Chinese Banking Corp. Ltd., 1.832%, 09/10/2030 | | | 756,750 | | | | 1.4 | |
| | | | | | | 1,382,625 | | | | 2.5 | |
| | | | South Africa: 1.2% | | | | | | | | |
| 400,000 | | | Bidvest Group UK PLC, 3.625%, 09/23/2026 | | | 373,310 | | | | 0.7 | |
| 300,000 (1) | | | Bidvest Group UK PLC, 3.625%, 09/23/2026 | | | 280,050 | | | | 0.5 | |
| | | | | | | 653,360 | | | | 1.2 | |
| | | | South Korea: 7.0% | | | | | | | | |
| 350,000 (1) | | | GS Caltex Corp., 5.375%, 08/07/2028 | | | 351,094 | | | | 0.6 | |
| 500,000 (1) | | | Hanwha Q Cells Americas Holdings Corp., 5.000%, 07/27/2028 | | | 498,657 | | | | 0.9 | |
| 700,000 (1) | | | Kookmin Bank, 2.500%, 11/04/2030 | | | 583,625 | | | | 1.1 | |
| 200,000 (1)(3) | | | Kookmin Bank, 4.350%, 12/31/2199 | | | 198,700 | | | | 0.4 | |
| 500,000 (1) | | | LG Energy Solution Ltd., 5.750%, 09/25/2028 | | | 507,500 | | | | 0.9 | |
| 850,000 (1) | | | POSCO, 4.875%, 01/23/2027 | | | 839,375 | | | | 1.5 | |
| 200,000 (1)(3) | | | Shinhan Financial Group Co. Ltd., 2.875%, 12/31/2199 | | | 186,000 | | | | 0.3 | |
| 400,000 (1) | | | Shinhan Financial Group Co. Ltd., 5.000%, 07/24/2028 | | | 397,104 | | | | 0.7 | |
See Accompanying Notes to Financial Statements
| Voya VACS Series EMCD Fund | PORTFOLIO OF INVESTMENTS
as of March 31, 2024 (continued) |
Principal
Amount† | | | | | Value | | | Percentage
of Net
Assets | |
| CORPORATE BONDS/NOTES: (continued) | |
| | | | South Korea: (continued) |
| 400,000 (1) | | | SK Hynix, Inc., 2.375%, 01/19/2031 | | $ | 329,158 | | | | 0.6 | |
| | | | | | | 3,891,213 | | | | 7.0 | |
| | | | Tanzania: 1.2% |
| 775,000 | | | AngloGold Ashanti Holdings PLC, 3.750%, 10/01/2030 | | | 675,781 | | | | 1.2 | |
| | | | | | | | | | | | |
| | | | Thailand: 2.6% |
| 500,000 (3) | | | Bangkok Bank PCL/ Hong Kong, 3.733%, 09/25/2034 | | | 445,593 | | | | 0.8 | |
| 300,000 | | | GC Treasury Center Co. Ltd., 4.400%, 03/30/2032 | | | 273,281 | | | | 0.5 | |
| 200,000 (1)(2) | | | GC Treasury Center Co. Ltd., 4.400%, 03/30/2032 | | | 182,187 | | | | 0.3 | |
| 200,000 (1) | | | PTTEP Treasury Center Co. Ltd., 3.903%, 12/06/2059 | | | 154,813 | | | | 0.3 | |
| 400,000 | | | Thaioil Treasury Center Co. Ltd., 4.625%, 11/20/2028 | | | 387,875 | | | | 0.7 | |
| | | | | | | 1,443,749 | | | | 2.6 | |
| | | | Turkey: 3.4% |
| 250,000 (1) | | | Akbank TAS, 6.800%, 02/06/2026 | | | 252,266 | | | | 0.5 | |
| 260,000 (1)(3) | | | Akbank TAS, 9.369%, 12/31/2199 | | | 259,610 | | | | 0.5 | |
| 250,000 (1) | | | Turk Telekomunikasyon AS, 6.875%, 02/28/2025 | | | 250,000 | | | | 0.4 | |
| 500,000 (1) | | | Turkiye Sise ve Cam Fabrikalari AS, 6.950%, 03/14/2026 | | | 503,457 | | | | 0.9 | |
| 300,000 (1) | | | Yapi ve Kredi Bankasi AS, 9.250%, 10/16/2028 | | | 319,350 | | | | 0.6 | |
| 285,000 (1)(3) | | | Yapi ve Kredi Bankasi AS, 9.250%, 01/17/2034 | | | 293,550 | | | | 0.5 | |
| | | | | | | 1,878,233 | | | | 3.4 | |
| | | | United Arab Emirates: 3.6% |
| 400,000 | | | DP World Ltd./United Arab Emirates, 6.850%, 07/02/2037 | | | 438,375 | | | | 0.8 | |
| 400,000 (3) | | | Emirates NBD Bank PJSC, 6.125%, 12/31/2199 | | | 399,375 | | | | 0.7 | |
| 533,141 | | | Galaxy Pipeline Assets Bidco Ltd., 1.750%, 09/30/2027 | | | 496,093 | | | | 0.9 | |
| 373,248 (1) | | | Galaxy Pipeline Assets Bidco Ltd., 2.940%, 09/30/2040 | | | 300,713 | | | | 0.5 | |
Principal
Amount† | | | | | Value | | | Percentage
of Net
Assets | |
| CORPORATE BONDS/NOTES: (continued) |
| | | | United Arab Emirates: (continued) |
| 498,314 (1) | | | Sweihan PV Power Co. PJSC, 3.625%, 01/31/2049 | | $ | 399,274 | | | | 0.7 | |
| | | | | | | 2,033,830 | | | | 3.6 | |
| | | | United Kingdom: 2.6% |
| 350,000 (1)(2) | | | Anglo American Capital PLC, 5.500%, 05/02/2033 | | | 348,380 | | | | 0.6 | |
| 550,000 (1)(3) | | | Standard Chartered PLC, 6.301%, 01/09/2029 | | | 565,031 | | | | 1.0 | |
| 525,000 (1) | | | WE Soda Investments Holding PLC, 9.500%, 10/06/2028 | | | 546,265 | | | | 1.0 | |
| | | | | | | 1,459,676 | | | | 2.6 | |
| | | | United States: 1.9% |
| 400,000 (3) | | | Commercial Bank PSQC, 4.500%, 12/31/2199 | | | 372,125 | | | | 0.7 | |
| 300,000 (1)(2) | | | Hyundai Capital America, 5.400%, 01/08/2031 | | | 301,416 | | | | 0.5 | |
| 400,000 (1) | | | Sasol Financing USA LLC, 8.750%, 05/03/2029 | | | 408,375 | | | | 0.7 | |
| | | | | | | 1,081,916 | | | | 1.9 | |
| | | | Virgin Islands (British): 2.1% |
| 400,000 (1) | | | Central American Bottling Corp. / CBC Bottling Holdco SL / Beliv Holdco SL, 5.250%, 04/27/2029 | | | 381,200 | | | | 0.7 | |
| 775,000 (1) | | | Gold Fields Orogen Holdings BVI Ltd., 5.125%, 05/15/2024 | | | 773,287 | | | | 1.4 | |
| | | | | | | 1,154,487 | | | | 2.1 | |
| | | | Zambia: 1.2% |
| 200,000 | | | First Quantum Minerals Ltd., 6.875%, 10/15/2027 | | | 191,200 | | | | 0.4 | |
| 450,000 (1) | | | First Quantum Minerals Ltd., 9.375%, 03/01/2029 | | | 468,468 | | | | 0.8 | |
| | | | | | | 659,668 | | | | 1.2 | |
| | | | Total Corporate Bonds/Notes (Cost $53,835,308) | | | 51,927,149 | | | | 92.8 | |
| SOVEREIGN BONDS: 0.4% | | | | | | | | |
| | | | Panama: 0.4% |
| 200,000 | | | Panama Government International Bond, 7.500%, 03/01/2031 | | | 207,625 | | | | 0.4 | |
| | | Total Sovereign Bonds
(Cost $199,998) | | | 207,625 | | | | 0.4 | |
See Accompanying Notes to Financial Statements
| Voya VACS Series EMCD Fund | PORTFOLIO OF INVESTMENTS
as of March 31, 2024 (continued) |
Principal
Amount† | | | | | Value | | | Percentage
of Net
Assets | |
| SOVEREIGN BONDS: (continued) | |
| | | | Panama: (continued) |
| | | | Total Long-Term Investments (Cost $54,035,306) | | $ | 52,134,774 | | | | 93.2 | |
| | | | | | | | | | | | |
| | | | | | | | | | | | |
| SHORT-TERM INVESTMENTS: 18.2% | | | | | | | | |
| | | | Commercial Paper: 5.8% |
| 1,000,000 | | | Consolidated Edison, 22.080%, 04/01/2024 | | | 999,397 | | | | 1.8 | |
| 1,000,000 | | | Enbridge (US) Inc., 22.490%, 04/01/2024 | | | 999,386 | | | | 1.8 | |
| 1,000,000 | | | HP, Inc., 11.050%, 04/03/2024 | | | 999,095 | | | | 1.8 | |
| 250,000 | | | Sherwin-Williams Co., 22.060%, 04/01/2024 | | | 249,850 | | | | 0.4 | |
| | | | Total Commercial Paper
(Cost $3,249,696) | | | 3,247,728 | | | | 5.8 | |
| | | | Repurchase Agreements: 11.8% |
| 1,575,371 (5) | | | Bank of America Inc., Repurchase Agreement dated 03/28/2024, 5.330%, due 04/01/2024 (Repurchase Amount $1,576,291, collateralized by various U.S. Government/U.S. Government Agency Obligations, 1.500%- 7.657%, Market Value plus accrued interest $1,606,878, due 09/01/28-03/20/72) | | | 1,575,371 | | | | 2.8 | |
| 1,575,371 (5) | | | Citigroup, Inc., Repurchase Agreement dated 03/28/2024, 5.340%, due 04/01/2024 (Repurchase Amount $1,576,293, collateralized by various U.S. Government Agency Obligations, 2.000%- 6.500%, Market Value plus accrued interest $1,606,878, due 09/20/44-01/20/54) | | | 1,575,371 | | | | 2.8 | |
Principal
Amount† | | | | | Value | | | Percentage
of Net
Assets | |
| SHORT-TERM INVESTMENTS: (continued) |
| | | | Repurchase Agreements (continued) |
| 290,026 (5) | | | Deutsche Bank Securities Inc., Repurchase Agreement dated 03/28/2024, 5.330%, due 04/01/2024 (Repurchase Amount $290,195, collateralized by various U.S. Government Agency Obligations, 1.500%- 7.500%, Market Value plus accrued interest $295,827, due 06/01/36-04/01/54) | | $ | 290,026 | | | | 0.6 | |
| 1,575,371 (5) | | | Nomura Securities International, Inc., Repurchase Agreement dated 03/28/2024, 5.320%, due 04/01/2024 (Repurchase Amount $1,576,289, collateralized by various U.S. Government/U.S. Government Agency Obligations, 2.000%- 6.000%, Market Value plus accrued interest $1,606,879, due 01/01/28-07/15/58) | | | 1,575,371 | | | | 2.8 | |
| 1,575,371 (5) | | | RBC Dominion Securities Inc., Repurchase Agreement dated 03/28/2024, 5.280%, due 04/01/2024 (Repurchase Amount $1,576,283, collateralized by various U.S. Government/U.S. Government Agency Obligations, 0.000%- 7.500%, Market Value plus accrued interest $1,606,878, due 04/04/24-02/01/54) | | | 1,575,371 | | | | 2.8 | |
| | | | Total Repurchase Agreements (Cost $6,591,510) | | | 6,591,510 | | | | 11.8 | |
See Accompanying Notes to Financial Statements
| Voya VACS Series EMCD Fund | PORTFOLIO OF INVESTMENTS
as of March 31, 2024 (continued) |
| Shares | | | | | Value | | | Percentage
of Net
Assets | |
| SHORT-TERM INVESTMENTS: (continued) |
| | | | Mutual Funds: 0.6% |
| 354,000 (6) | | | Morgan Stanley Institutional Liquidity Funds - Government Portfolio (Institutional Share Class), 5.220%
(Cost $354,000) | | $ | 354,000 | | | | 0.6 | |
| | | | Total Short-Term Investments
(Cost $10,195,206) | | $ | 10,193,238 | | | | 18.2 | |
| | | | Total Investments in Securities
(Cost $64,230,512) | | $ | 62,328,012 | | | | 111.4 | |
| | | | Liabilities in Excess of Other Assets | | | (6,401,406 | ) | | | (11.4) | |
| | | | Net Assets | | $ | 55,926,606 | | | | 100.0 | |
| † | Unless otherwise indicated, principal amount is shown in USD. |
| (1) | Securities with purchases pursuant to Rule 144A or section 4(a)(2), under the Securities Act of 1933 and may not be resold subject to that rule except to qualified institutional buyers. |
| (2) | Security, or a portion of the security, is on loan. |
| (3) | Variable rate security. Rate shown is the rate in effect as of March 31, 2024. |
| (4) | Defaulted security. |
| (5) | All or a portion of the security represents securities purchased with cash collateral received for securities on loan. |
| (6) | Rate shown is the 7-day yield as of March 31, 2024. |
| Sector Diversification | | Percentage
of Net Assets |
| Energy | | | 21.0 | % |
| Basic Materials | | | 18.5 | |
| Financial | | | 18.3 | |
| Consumer, Cyclical | | | 8.4 | |
| Industrial | | | 6.6 | |
| Consumer, Non-cyclical | | | 6.6 | |
| Communications | | | 6.6 | |
| Utilities | | | 5.0 | |
| Technology | | | 1.8 | |
| Sovereign Bonds | | | 0.4 | |
| Short-Term Investments | | | 18.2 | |
| Liabilities in Excess of Other Assets | | | (11.4 | ) |
| Net Assets | | | 100.0 | % |
Portfolio holdings are subject to change daily.
See Accompanying Notes to Financial Statements
| Voya VACS Series EMCD Fund | PORTFOLIO OF INVESTMENTS
as of March 31, 2024 (continued) |
Fair Value Measurements^
The following is a summary of the fair valuations according to the inputs used as of March 31, 2024 in valuing the assets and liabilities:
| | | Quoted Prices
in Active Markets
for Identical
Investments
(Level 1) | | Significant Other
Observable
Inputs
(Level 2) | | Significant
Unobservable
Inputs
(Level 3) | | Fair Value
at
March 31, 2024 |
| Asset Table |
| Investments, at fair value | | | | | | | | | | | | | | | | |
| Corporate Bonds/Notes | | $ | — | | | $ | 51,927,149 | | | $ | — | | | $ | 51,927,149 | |
| Sovereign Bonds | | | — | | | | 207,625 | | | | — | | | | 207,625 | |
| Short-Term Investments | | | 354,000 | | | | 9,839,238 | | | | — | | | | 10,193,238 | |
| Total Investments, at fair value | | $ | 354,000 | | | $ | 61,974,012 | | | $ | — | | | $ | 62,328,012 | |
| Other Financial Instruments+ | | | | | | | | | | | | | | | | |
| Futures | | | 36,004 | | | | — | | | | — | | | | 36,004 | |
| Total Assets | | $ | 390,004 | | | $ | 61,974,012 | | | $ | — | | | $ | 62,364,016 | |
| Liabilities Table | | | | | | | | | | | | | | | | |
| Other Financial Instruments+ | | | | | | | | | | | | | | | | |
| Futures | | $ | (37,572 | ) | | $ | — | | | $ | — | | | $ | (37,572 | ) |
| Total Liabilities | | $ | (37,572 | ) | | $ | — | | | $ | — | | | $ | (37,572 | ) |
| ^ | See Note 2, “Significant Accounting Policies” in the Notes to Financial Statements for additional information. |
| + | Other Financial Instruments may include open forward foreign currency contracts, futures, centrally cleared swaps, OTC swaps and written options. Forward foreign currency contracts, futures and centrally cleared swaps are fair valued at the unrealized appreciation (depreciation) on the instrument. OTC swaps and written options are valued at the fair value of the instrument. |
At March 31, 2024, the following futures contracts were outstanding for Voya VACS Series EMCD Fund:
| Description | | Number
of Contracts | | Expiration
Date | | Notional
Amount | | Unrealized
Appreciation/
(Depreciation) |
| Long Contracts: | | | | | | | | | | | | | | |
| U.S. Treasury 2-Year Note | | | 49 | | | 06/28/24 | | $ | 10,019,734 | | | $ | (3,204 | ) |
| U.S. Treasury Long Bond | | | 20 | | | 06/18/24 | | | 2,408,750 | | | | 36,004 | |
| U.S. Treasury Ultra Long Bond | | | 2 | | | 06/18/24 | | | 258,000 | | | | (2,161 | ) |
| | | | | | | | | $ | 12,686,484 | | | $ | 30,639 | |
| Short Contracts: | | | | | | | | | | | | | | |
| U.S. Treasury 5-Year Note | | | (10 | ) | | 06/28/24 | | | (1,070,156 | ) | | | (1,457 | ) |
| U.S. Treasury 10-Year Note | | | (36 | ) | | 06/18/24 | | | (3,988,687 | ) | | | (8,826 | ) |
| U.S. Treasury Ultra 10-Year Note | | | (39 | ) | | 06/18/24 | | | (4,469,766 | ) | | | (21,924 | ) |
| | | | | | | | | $ | (9,528,609 | ) | | $ | (32,207 | ) |
A summary of derivative instruments by primary risk exposure is outlined in the following tables.
The fair value of derivative instruments as of March 31, 2024 was as follows:
| Derivatives not accounted for as hedging instruments | | Location on Statement of Assets and Liabilities | | Fair Value | |
| Asset Derivatives | | | | | | |
| Interest rate contracts | | Variation margin receivable on futures contracts* | | $ | 36,004 | |
| Total Asset Derivatives | | | | $ | 36,004 | |
| | | | | | | |
| Liability Derivatives | | | | | | |
| Interest rate contracts | | Variation margin payable on futures contracts* | | $ | 37,572 | |
| Total Liability Derivatives | | | | $ | 37,572 | |
See Accompanying Notes to Financial Statements
| Voya VACS Series EMCD Fund | PORTFOLIO OF INVESTMENTS
as of March 31, 2024 (continued) |
| | * | The fair value presented above represents the cumulative unrealized appreciation (depreciation) on futures contracts as reported in the tables within the Portfolio of Investments. In the Statement of Assets and Liabilities, only current day’s unsettled variation margin is reported in receivables or payables on futures contracts and the net cumulative unrealized appreciation (depreciation) is included in total distributable earnings (loss). |
The effect of derivative instruments on the Fund’s Statement of Operations for the year ended March 31, 2024 was as follows:
Amount of Realized Gain or (Loss) on Derivatives Recognized in Income
| Derivatives not accounted for as hedging instruments | | Futures | |
| Interest rate contracts | | $ | 46,025 | |
| Total | | $ | 46,025 | |
Change in Unrealized Appreciation or (Depreciation) on Derivatives Recognized in Income
| Derivatives not accounted for as hedging instruments | | Futures | |
| Interest rate contracts | | $ | 138,059 | |
| Total | | $ | 138,059 | |
At March 31, 2024, the aggregate cost of securities and other investments and the composition of unrealized appreciation and depreciation of securities and other investments on a tax basis were:
| Cost for federal income tax purposes was $64,273,845. |
| Net unrealized depreciation consisted of: | | | |
| Gross Unrealized Appreciation | | $ | 1,083,238 | |
| Gross Unrealized Depreciation | | | (3,030,639 | ) |
| Net Unrealized Depreciation | | $ | (1,947,401 | ) |
See Accompanying Notes to Financial Statements
| Voya VACS Series EMHCD Fund | PORTFOLIO OF INVESTMENTS as of March 31, 2024 |
Principal
Amount† | | | | | Value | | | Percentage of Net Assets | |
| SOVEREIGN BONDS: 61.2% | |
| | | | Angola: 1.3% | |
| 750,000 (1) | | | Angolan Government International Bond, 8.000%, 11/26/2029 | | $ | 701,953 | | | | 0.6 | |
| 950,000 | | | Angolan Government International Bond, 8.750%, 04/14/2032 | | | 875,612 | | | | 0.7 | |
| | | | | | 1,577,565 | | | | 1.3 | |
| | | Argentina: 1.8% | | | | | | | | |
| 1,408,777 (2) | | | Argentine Republic Government International Bond, 0.750% (Step Rate @ 1.750% on 07/09/2027), 07/09/2030 | | | 734,765 | | | | 0.6 | |
| 274,111 | | | Argentine Republic Government International Bond, 1.000%, 07/09/2029 | | | 146,821 | | | | 0.1 | |
| 2,556,220 (2) | | | Argentine Republic Government International Bond, 3.625% (Step Rate @ 4.125% on 07/09/2024), 07/09/2035 | | | 1,064,665 | | | | 0.9 | |
| 526,019 (2) | | | Argentine Republic Government International Bond, 4.250% (Step Rate @ 5.000% on 07/09/2024), 01/09/2038 | | | 244,862 | | | | 0.2 | |
| | | | | | 2,191,113 | | | | 1.8 | |
| | | Bahrain: 2.4% | | | | | | | | |
| 2,000,000 | | | Bahrain Government International Bond, 7.375%, 05/14/2030 | | | 2,086,875 | | | | 1.7 | |
| 800,000 (1) | | | Bahrain Government International Bond, 7.500%, 02/12/2036 | | | 822,500 | | | | 0.7 | |
| | | | | | 2,909,375 | | | | 2.4 | |
| | | Brazil: 2.9% | | | | | | | | |
| 700,000 | | | Brazilian Government International Bond, 5.625%, 02/21/2047 | | | 602,175 | | | | 0.5 | |
| 700,000 | | | Brazilian Government International Bond, 6.000%, 10/20/2033 | | | 694,400 | | | | 0.6 | |
| 200,000 | | | Brazilian Government International Bond, 6.125%, 03/15/2034 | | | 198,200 | | | | 0.2 | |
| 1,145,000 | | | Brazilian Government International Bond, 6.250%, 03/18/2031 | | | 1,169,045 | | | | 0.9 | |
| | | | | | | | | | | | |
Principal
Amount† | | | | | Value | | | Percentage of Net Assets | |
| SOVEREIGN BONDS: (continued) | |
| | | | Brazil: (continued) |
| 900,000 | | | Brazilian Government International Bond, 7.125%, 05/13/2054 | | $ | 908,550 | | | | 0.7 | |
| | | | | | | 3,572,370 | | | | 2.9 | |
| | | | Chile: 0.7% |
| 750,000 | | | Chile Government International Bond, 3.500%, 01/31/2034 | | | 660,190 | | | | 0.5 | |
| 250,000 | | | Chile Government International Bond, 4.000%, 01/31/2052 | | | 198,515 | | | | 0.2 | |
| | | | | | | 858,705 | | | | 0.7 | |
| | | | Colombia: 2.2% |
| 500,000 | | | Colombia Government International Bond, 3.250%, 04/22/2032 | | | 390,750 | | | | 0.3 | |
| 1,000,000 | | | Colombia Government International Bond, 4.125%, 05/15/2051 | | | 625,250 | | | | 0.5 | |
| 750,000 | | | Colombia Government International Bond, 5.000%, 06/15/2045 | | | 545,437 | | | | 0.4 | |
| 500,000 | | | Colombia Government International Bond, 6.125%, 01/18/2041 | | | 433,125 | | | | 0.4 | |
| 664,000 | | | Colombia Government International Bond, 8.000%, 04/20/2033 | | | 703,508 | | | | 0.6 | |
| | | | | | | 2,698,070 | | | | 2.2 | |
| | | | Costa Rica: 1.0% |
| 775,000 | | | Costa Rica Government International Bond, 6.125%, 02/19/2031 | | | 786,625 | | | | 0.6 | |
| 450,000 (1) | | | Costa Rica Government International Bond, 7.300%, 11/13/2054 | | | 479,953 | | | | 0.4 | |
| | | | | | | 1,266,578 | | | | 1.0 | |
| | | | Cote d’Ivoire: 0.7% |
| 300,000 (1) | | | Ivory Coast Government International Bond, 7.625%, 01/30/2033 | | | 298,875 | | | | 0.2 | |
| 375,000 (1) | | | Ivory Coast Government International Bond, 8.250%, 01/30/2037 | | | 376,875 | | | | 0.3 | |
| 191,689 (3) | | | Ivory Coast Government International Bond REGs, 5.750%, 12/31/2032 | | | 182,806 | | | | 0.2 | |
| | | | | | | 858,556 | | | | 0.7 | |
See Accompanying Notes to Financial Statements
| Voya VACS Series EMHCD Fund | PORTFOLIO OF INVESTMENTS as of March 31, 2024 (continued) |
Principal
Amount† | | | | | Value | | | Percentage of Net Assets | |
| SOVEREIGN BONDS: (continued) | |
| | | | Dominican Republic: 2.9% |
| 200,000 (1) | | | Dominican Republic International Bond, 4.875%, 09/23/2032 | | $ | 179,937 | | | | 0.1 | |
| 500,000 (1) | | | Dominican Republic International Bond, 5.300%, 01/21/2041 | | | 427,031 | | | | 0.3 | |
| 1,200,000 | | | Dominican Republic International Bond, 5.875%, 01/30/2060 | | | 1,024,875 | | | | 0.8 | |
| 700,000 | | | Dominican Republic International Bond, 6.000%, 07/19/2028 | | | 698,688 | | | | 0.6 | |
| 500,000 (1) | | | Dominican Republic International Bond, 6.000%, 02/22/2033 | | | 487,969 | | | | 0.4 | |
| 500,000 (1) | | | Dominican Republic International Bond, 6.875%, 01/29/2026 | | | 506,250 | | | | 0.4 | |
| 300,000 (1) | | | Dominican Republic International Bond, 7.050%, 02/03/2031 | | | 311,625 | | | | 0.3 | |
| | | | | | | 3,636,375 | | | | 2.9 | |
| | | | Ecuador: 1.1% |
| 517,550 (1)(2) | | | Ecuador Government International Bond, 2.500% (Step Rate @ 5.000% on 07/31/2024), 07/31/2040 | | | 252,564 | | | | 0.2 | |
| 1,357,845 (1)(2) | | | Ecuador Government International Bond, 3.500% (Step Rate @ 5.500% on 07/31/2024), 07/31/2035 | | | 716,263 | | | | 0.6 | |
| 600,850 (1)(2) | | | Ecuador Government International Bond, 6.000% (Step Rate @ 6.900% on 07/31/2024), 07/31/2030 | | | 408,879 | | | | 0.3 | |
| | | | | | | 1,377,706 | | | | 1.1 | |
| | | | Egypt: 2.2% |
| 1,000,000 | | | Egypt Government International Bond, 5.800%, 09/30/2027 | | | 906,875 | | | | 0.7 | |
| 500,000 (1) | | | Egypt Government International Bond, 7.500%, 02/16/2061 | | | 360,312 | | | | 0.3 | |
| 1,500,000 (1) | | | Egypt Government International Bond, 8.700%, 03/01/2049 | | | 1,221,094 | | | | 1.0 | |
| 350,000 (1) | | | Egypt Government International Bond, 8.875%, 05/29/2050 | | | 289,297 | | | | 0.2 | |
| | | | | | | 2,777,578 | | | | 2.2 | |
Principal
Amount† | | | | | Value | | | Percentage of Net Assets | |
| SOVEREIGN BONDS: (continued) | |
| | | | El Salvador: 0.5% |
| 750,000 (1) | | | El Salvador Government International Bond, 6.375%, 01/18/2027 | | $ | 656,250 | | | | 0.5 | |
| | | | | | | | | | | | |
| | | | Gabon: 0.2% |
| 300,000 (1) | | | Gabon Government International Bond, 6.625%, 02/06/2031 | | | 257,063 | | | | 0.2 | |
| | | | | | | | | | | | |
| | | | Ghana: 1.2% |
| 550,000 (4) | | | Ghana Government International Bond, 7.875%, 03/26/2027 | | | 287,547 | | | | 0.3 | |
| 1,500,000 (4) | | | Ghana Government International Bond, 7.875%, 02/11/2035 | | | 778,125 | | | | 0.6 | |
| 750,000 (4) | | | Ghana Government International Bond, 8.750%, 03/11/2061 | | | 386,719 | | | | 0.3 | |
| | | | | | | 1,452,391 | | | | 1.2 | |
| | | | Guatemala: 1.1% |
| 635,000 (1) | | | Guatemala Government Bond, 5.250%, 08/10/2029 | | | 617,253 | | | | 0.5 | |
| 700,000 (1) | | | Guatemala Government Bond, 6.600%, 06/13/2036 | | | 717,719 | | | | 0.6 | |
| | | | | | | 1,334,972 | | | | 1.1 | |
| | | | Honduras: 0.3% |
| 250,000 | | | Honduras Government International Bond, 5.625%, 06/24/2030 | | | 223,398 | | | | 0.2 | |
| 200,000 | | | Honduras Government International Bond, 6.250%, 01/19/2027 | | | 193,813 | | | | 0.1 | |
| | | | | | | 417,211 | | | | 0.3 | |
| | | | Hungary: 1.9% |
| 750,000 (1) | | | Hungary Government International Bond, 3.125%, 09/21/2051 | | | 478,125 | | | | 0.4 | |
| 700,000 (1) | | | Hungary Government International Bond, 5.500%, 06/16/2034 | | | 690,812 | | | | 0.5 | |
| 500,000 | | | Hungary Government International Bond, 7.625%, 03/29/2041 | | | 579,844 | | | | 0.5 | |
| 650,000 (1) | | | Magyar Export-Import Bank Zrt, 6.125%, 12/04/2027 | | | 656,094 | | | | 0.5 | |
| | | | | | | 2,404,875 | | | | 1.9 | |
| | | | India: 0.9% |
| 500,000 (5) | | | Export-Import Bank of India, 2.250%, 01/13/2031 | | | 413,593 | | | | 0.3 | |
See Accompanying Notes to Financial Statements
| Voya VACS Series EMHCD Fund | PORTFOLIO OF INVESTMENTS as of March 31, 2024 (continued) |
Principal
Amount† | | | | | Value | | | Percentage of Net Assets | |
| SOVEREIGN BONDS: (continued) | |
| | | | India: (continued) |
| 700,000 (1)(5) | | | Export-Import Bank of India, 5.500%, 01/18/2033 | | $ | 708,094 | | | | 0.6 | |
| | | | | | | 1,121,687 | | | | 0.9 | |
| | | | Indonesia: 2.0% |
| 550,000 | | | Indonesia Government International Bond, 5.250%, 01/17/2042 | | | 553,437 | | | | 0.4 | |
| 320,000 | | | Indonesia Government International Bond, 5.450%, 09/20/2052 | | | 324,500 | | | | 0.3 | |
| 1,250,000 | | | Indonesia Government International Bond, 8.500%, 10/12/2035 | | | 1,605,469 | | | | 1.3 | |
| | | | | | | 2,483,406 | | | | 2.0 | |
| | | | Jamaica: 0.9% |
| 400,000 | | | Jamaica Government International Bond, 7.875%, 07/28/2045 | | | 472,875 | | | | 0.4 | |
| 500,000 | | | Jamaica Government International Bond, 8.000%, 03/15/2039 | | | 596,250 | | | | 0.5 | |
| | | | | | | 1,069,125 | | | | 0.9 | |
| | | | Jordan: 0.9% |
| 1,000,000 (1) | | | Jordan Government International Bond, 5.850%, 07/07/2030 | | | 924,375 | | | | 0.7 | |
| 200,000 (1) | | | Jordan Government International Bond, 7.500%, 01/13/2029 | | | 200,563 | | | | 0.2 | |
| | | | | | | 1,124,938 | | | | 0.9 | |
| | | | Kenya: 0.9% |
| 500,000 | | | Republic of Kenya Government International Bond, 7.250%, 02/28/2028 | | | 479,180 | | | | 0.4 | |
| 625,000 (1) | | | Republic of Kenya Government International Bond, 9.750%, 02/16/2031 | | | 641,406 | | | | 0.5 | |
| | | | | | | 1,120,586 | | | | 0.9 | |
| | | | Lebanon: 0.2% |
| 2,000,000 (4) | | | Lebanon Government International Bond, 6.850%, 03/23/2027 | | | 136,000 | | | | 0.1 | |
| 2,000,000 (4) | | | Lebanon Government International Bond, 6.100%, 10/04/2022 | | | 136,000 | | | | 0.1 | |
| | | | | | | 272,000 | | | | 0.2 | |
| | | | Mexico: 3.0% |
| 940,000 | | | Mexico Government International Bond, 3.250%, 04/16/2030 | | | 839,420 | | | | 0.7 | |
Principal
Amount† | | | | | Value | | | Percentage of Net Assets | |
| SOVEREIGN BONDS: (continued) | |
| | | | Mexico: (continued) |
| 1,150,000 | | | Mexico Government International Bond, 4.875%, 05/19/2033 | | $ | 1,093,219 | | | | 0.9 | |
| 1,829,000 | | | Mexico Government International Bond, 6.338%, 05/04/2053 | | | 1,814,711 | | | | 1.4 | |
| | | | | | | 3,747,350 | | | | 3.0 | |
| | | | Morocco: 0.3% |
| 500,000 (1) | | | Morocco Government International Bond, 4.000%, 12/15/2050 | | | 343,750 | | | | 0.3 | |
| | | | | | | | | | | | |
| | | | Nigeria: 2.0% |
| 500,000 | | | Nigeria Government International Bond, 6.500%, 11/28/2027 | | | 472,344 | | | | 0.4 | |
| 750,000 (1) | | | Nigeria Government International Bond, 7.375%, 09/28/2033 | | | 644,297 | | | | 0.5 | |
| 500,000 | | | Nigeria Government International Bond, 7.696%, 02/23/2038 | | | 413,437 | | | | 0.4 | |
| 675,000 | | | Nigeria Government International Bond, 7.875%, 02/16/2032 | | | 614,461 | | | | 0.5 | |
| 300,000 | | | Nigeria Government International Bond, 7.875%, 02/16/2032 | | | 273,094 | | | | 0.2 | |
| | | | | | | 2,417,633 | | | | 2.0 | |
| | | | Oman: 0.9% |
| 600,000 | | | Oman Government International Bond, 6.000%, 08/01/2029 | | | 615,187 | | | | 0.5 | |
| 550,000 (1) | | | Oman Government International Bond, 6.500%, 03/08/2047 | | | 556,875 | | | | 0.4 | |
| | | | | | | 1,172,062 | | | | 0.9 | |
| | | | Panama: 3.0% |
| 500,000 | | | Panama Government International Bond, 4.500%, 04/16/2050 | | | 338,125 | | | | 0.3 | |
| 550,000 | | | Panama Government International Bond, 4.500%, 01/19/2063 | | | 353,719 | | | | 0.3 | |
| 1,000,000 | | | Panama Government International Bond, 6.400%, 02/14/2035 | | | 946,750 | | | | 0.8 | |
| 550,000 | | | Panama Government International Bond, 6.700%, 01/26/2036 | | | 534,463 | | | | 0.4 | |
| 600,000 | | | Panama Government International Bond, 6.875%, 01/31/2036 | | | 586,312 | | | | 0.5 | |
| 410,000 | | | Panama Government International Bond, 7.500%, 03/01/2031 | | | 425,631 | | | | 0.3 | |
See Accompanying Notes to Financial Statements
| Voya VACS Series EMHCD Fund | PORTFOLIO OF INVESTMENTS as of March 31, 2024 (continued) |
Principal
Amount† | | | | | Value | | | Percentage of Net Assets | |
| SOVEREIGN BONDS: (continued) | |
| | | | Panama: (continued) |
| 540,000 | | | Panama Government International Bond, 8.000%, 03/01/2038 | | $ | 566,595 | | | | 0.4 | |
| | | | | | 3,751,595 | | | | 3.0 | |
| | | | Paraguay: 1.7% |
| 145,000 | | | Paraguay Government International Bond, 5.000%, 04/15/2026 | | | 143,302 | | | | 0.1 | |
| 650,000 | | | Paraguay Government International Bond, 5.600%, 03/13/2048 | | | 593,328 | | | | 0.5 | |
| 750,000 (1) | | | Paraguay Government International Bond, 5.850%, 08/21/2033 | | | 754,453 | | | | 0.6 | |
| 625,000 (1) | | | Paraguay Government International Bond, 6.000%, 02/09/2036 | | | 635,742 | | | | 0.5 | |
| | | | | | | 2,126,825 | | | | 1.7 | |
| | | | Peru: 0.8% |
| 500,000 | | | Peruvian Government International Bond, 2.783%, 01/23/2031 | | | 430,781 | | | | 0.4 | |
| 500,000 | | | Peruvian Government International Bond, 5.625%, 11/18/2050 | | | 498,375 | | | | 0.4 | |
| | | | | | 929,156 | | | | 0.8 | |
| | | | Philippines: 1.1% |
| 750,000 | | | Philippine Government International Bond, 5.500%, 01/17/2048 | | | 762,187 | | | | 0.6 | |
| 500,000 | | | Philippine Government International Bond, 5.950%, 10/13/2047 | | | 536,563 | | | | 0.5 | |
| | | | | | | 1,298,750 | | | | 1.1 | |
| | | | Poland: 1.6% |
| 725,000 | | | Republic of Poland Government International Bond, 4.875%, 10/04/2033 | | | 715,680 | | | | 0.6 | |
| 1,225,000 | | | Republic of Poland Government International Bond, 5.750%, 11/16/2032 | | | 1,286,262 | | | | 1.0 | |
| | | | | | | 2,001,942 | | | | 1.6 | |
| | | | Qatar: 0.8% |
| 550,000 (1) | | | Qatar Government International Bond, 4.400%, 04/16/2050 | | | 488,984 | | | | 0.4 | |
| 500,000 (1) | | | Qatar Government International Bond, 4.817%, 03/14/2049 | | | 469,950 | | | | 0.4 | |
| | | | | | | 958,934 | | | | 0.8 | |
Principal
Amount† | | | | | Value | | | Percentage of Net Assets | |
| SOVEREIGN BONDS: (continued) | |
| | | | Romania: 3.2% | |
| 1,500,000 (1) | | | Romanian Government International Bond, 3.000%, 02/14/2031 | | $ | 1,265,625 | | | | 1.0 | |
| 600,000 (1) | | | Romanian Government International Bond, 3.625%, 03/27/2032 | | | 517,687 | | | | 0.4 | |
| 200,000 | | | Romanian Government International Bond, 4.000%, 02/14/2051 | | | 142,576 | | | | 0.1 | |
| 400,000 | | | Romanian Government International Bond, 5.125%, 06/15/2048 | | | 341,000 | | | | 0.3 | |
| 1,468,000 (1) | | | Romanian Government International Bond, 6.375%, 01/30/2034 | | | 1,494,149 | | | | 1.2 | |
| 200,000 | | | Romanian Government International Bond, 7.625%, 01/17/2053 | | | 222,875 | | | | 0.2 | |
| | | | | | | 3,983,912 | | | | 3.2 | |
| | | | Saudi Arabia: 2.6% |
| 2,200,000 | | | Saudi Government International Bond, 3.450%, 02/02/2061 | | | 1,472,625 | | | | 1.2 | |
| 800,000 | | | Saudi Government International Bond, 3.750%, 01/21/2055 | | | 581,250 | | | | 0.5 | |
| 1,100,000 (1) | | | Saudi Government International Bond, 5.500%, 10/25/2032 | | | 1,142,969 | | | | 0.9 | |
| | | | | | | 3,196,844 | | | | 2.6 | |
| | | | Senegal: 0.3% |
| 500,000 | | | Senegal Government International Bond, 6.250%, 05/23/2033 | | | 429,063 | | | | 0.3 | |
| | | | | | | | | | | | |
| | | | Serbia: 0.4% |
| 250,000 | | | Serbia International Bond, 2.125%, 12/01/2030 | | | 198,985 | | | | 0.2 | |
| 275,000 (1) | | | Serbia International Bond, 6.500%, 09/26/2033 | | | 281,617 | | | | 0.2 | |
| | | | | | | 480,602 | | | | 0.4 | |
| | | | South Africa: 2.3% |
| 1,500,000 | | | Republic of South Africa Government International Bond, 4.300%, 10/12/2028 | | | 1,348,125 | | | | 1.1 | |
See Accompanying Notes to Financial Statements
| Voya VACS Series EMHCD Fund | PORTFOLIO OF INVESTMENTS as of March 31, 2024 (continued) |
Principal
Amount† | | | | | Value | | | Percentage of Net Assets | |
| SOVEREIGN BONDS: (continued) | |
| | | | South Africa: (continued) |
| 950,000 | | | Republic of South Africa Government International Bond, 5.875%, 04/20/2032 | | $ | 858,563 | | | | 0.7 | |
| 800,000 | | | Republic of South Africa Government International Bond, 6.300%, 06/22/2048 | | | 632,000 | | | | 0.5 | |
| | | | | | | 2,838,688 | | | | 2.3 | |
| | | | Sri Lanka: 1.2% |
| 500,000 (1)(4) | | | Sri Lanka Government International Bond, 5.875%, 07/25/2022 | | | 288,382 | | | | 0.2 | |
| 1,500,000 (1)(4) | | | Sri Lanka Government International Bond, 6.825%, 07/18/2026 | | | 900,458 | | | | 0.7 | |
| 550,000 (4) | | | Sri Lanka Government International Bond, 7.550%, 03/28/2030 | | | 325,188 | | | | 0.3 | |
| | | | | | | 1,514,028 | | | | 1.2 | |
| | | | Turkey: 3.8% |
| 400,000 (1) | | | Hazine Mustesarligi Varlik Kiralama AS, 8.509%, 01/14/2029 | | | 425,000 | | | | 0.3 | |
| 500,000 | | | Turkey Government International Bond, 5.125%, 02/17/2028 | | | 476,562 | | | | 0.4 | |
| 550,000 | | | Turkey Government International Bond, 6.000%, 01/14/2041 | | | 455,297 | | | | 0.4 | |
| 595,000 | | | Turkey Government International Bond, 6.500%, 09/20/2033 | | | 560,044 | | | | 0.5 | |
| 1,000,000 | | | Turkey Government International Bond, 7.625%, 04/26/2029 | | | 1,024,375 | | | | 0.8 | |
| 1,000,000 | | | Turkey Government International Bond, 9.875%, 01/15/2028 | | | 1,105,313 | | | | 0.9 | |
| 600,000 (1) | | | Turkiye Ihracat Kredi Bankasi AS, 9.000%, 01/28/2027 | | | 628,395 | | | | 0.5 | |
| | | | | | | 4,674,986 | | | | 3.8 | |
| | | | Ukraine: 1.1% |
| 1,111,000 (4) | | | Ukraine Government International Bond, 7.253%, 03/15/2035 | | | 326,912 | | | | 0.3 | |
| 650,000 (4) | | | Ukraine Government International Bond, 7.375%, 09/25/2034 | | | 191,913 | | | | 0.1 | |
| 346,000 (1)(4) | | | Ukraine Government International Bond, 7.750%, 09/01/2024 | | | 131,134 | | | | 0.1 | |
| 346,000 (1)(4) | | | Ukraine Government International Bond, 7.750%, 09/01/2025 | | | 130,182 | | | | 0.1 | |
Principal
Amount† | | | | | Value | | Percentage of Net Assets | |
| SOVEREIGN BONDS: (continued) |
| | | | Ukraine: (continued) |
| 346,000 (1)(4) | | | Ukraine Government International Bond, 7.750%, 09/01/2026 | | $ | 124,992 | | | | 0.1 | |
| 346,000 (1)(4) | | | Ukraine Government International Bond, 7.750%, 09/01/2027 | | | 118,592 | | | | 0.1 | |
| 346,000 (1)(4) | | | Ukraine Government International Bond, 7.750%, 09/01/2028 | | | 116,169 | | | | 0.1 | |
| 225,000 (1)(4) | | | Ukraine Government International Bond, 7.750%, 09/01/2029 | | | 75,094 | | | | 0.1 | |
| 500,000 (4) | | | Ukraine Government International Bond, 9.750%, 11/01/2030 | | | 176,375 | | | | 0.1 | |
| | | | | | | 1,391,363 | | | | 1.1 | |
| | | | United Arab Emirates: 0.2% |
| 250,000 (1) | | | Finance Department Government of Sharjah, 6.500%, 11/23/2032 | | | 260,434 | | | | 0.2 | |
| | | | | | | | | | | | |
| | | | Uruguay: 0.1% |
| 123,334 | | | Uruguay Government International Bond, 4.375%, 10/27/2027 | | | 122,486 | | | | 0.1 | |
| 51,825 | | | Uruguay Government International Bond, 4.375%, 01/23/2031 | | | 50,837 | | | | 0.0 | |
| | | | | | | 173,323 | | | | 0.1 | |
| | | | Zambia: 0.6% |
| 450,000 (1)(4) | | | Zambia Government International Bond, 8.500%, 04/14/2024 | | | 333,000 | | | | 0.3 | |
| 500,000 (1)(4) | | | Zambia Government International Bond, 8.970%, 07/30/2027 | | | 368,750 | | | | 0.3 | |
| | | | | | | 701,750 | | | | 0.6 | |
| | | | Total Sovereign Bonds
(Cost $70,792,083) | | | 75,831,485 | | | | 61.2 | |
| CORPORATE BONDS/NOTES: 33.7% |
| | | | Brazil: 1.5% |
| 600,000 (1) | | | Ambipar Lux Sarl, 9.875%, 02/06/2031 | | | 600,840 | | | | 0.5 | |
| 525,000 | | | Minerva Luxembourg SA, 4.375%, 03/18/2031 | | | 438,375 | | | | 0.3 | |
| 825,000 (1) | | | Raizen Fuels Finance SA, 6.450%, 03/05/2034 | | | 844,800 | | | | 0.7 | |
| | | | | | | 1,884,015 | | | | 1.5 | |
| | | | Chile: 3.2% |
| 500,000 (1) | | | Corp Nacional del Cobre de Chile, 4.500%, 08/01/2047 | | | 396,563 | | | | 0.3 | |
See Accompanying Notes to Financial Statements
| Voya VACS Series EMHCD Fund | PORTFOLIO OF INVESTMENTS as of March 31, 2024 (continued) |
Principal
Amount† | | | | | Value | | | Percentage of Net Assets | |
| CORPORATE BONDS/NOTES: (continued) | |
| | | | Chile: (continued) |
| 250,000 | | | Corp Nacional del Cobre de Chile, 5.125%, 02/02/2033 | | $ | 238,203 | | | | 0.2 | |
| 725,000 (1) | | | Corp Nacional del Cobre de Chile, 5.950%, 01/08/2034 | | | 729,531 | | | | 0.6 | |
| 625,000 (1) | | | Corp Nacional del Cobre de Chile, 6.300%, 09/08/2053 | | | 623,242 | | | | 0.5 | |
| 400,000 (1) | | | Empresa de Transporte de Pasajeros Metro SA, 3.693%, 09/13/2061 | | | 269,000 | | | | 0.2 | |
| 450,000 (1) | | | Empresa Nacional del Petroleo, 3.450%, 09/16/2031 | | | 384,056 | | | | 0.3 | |
| 1,100,000 (1) | | | Empresa Nacional del Petroleo, 3.750%, 08/05/2026 | | | 1,052,008 | | | | 0.9 | |
| 300,000 (1) | | | Empresa Nacional del Petroleo, 4.500%, 09/14/2047 | | | 225,940 | | | | 0.2 | |
| | | | | | | 3,918,543 | | | | 3.2 | |
| | | | Colombia: 1.6% |
| 990,000 | | | Ecopetrol SA, 8.375%, 01/19/2036 | | | 1,000,207 | | | | 0.8 | |
| 900,000 | | | Ecopetrol SA, 8.625%, 01/19/2029 | | | 952,749 | | | | 0.8 | |
| | | | | | | 1,952,956 | | | | 1.6 | |
| | | | Guatemala: 0.5% |
| 700,000 (1) | | | CT Trust, 5.125%, 02/03/2032 | | | 619,500 | | | | 0.5 | |
| | | | | | | | | | | | |
| | | | India: 0.3% |
| 425,000 (1) | | | IRB Infrastructure Developers Ltd., 7.110%, 03/11/2032 | | | 431,773 | | | | 0.3 | |
| | | | | | | | | | | | |
| | | | Indonesia: 3.2% |
| 500,000 (1) | | | Hutama Karya Persero PT, 3.750%, 05/11/2030 | | | 461,875 | | | | 0.4 | |
| 500,000 (1) | | | Pertamina Persero PT, 3.100%, 01/21/2030 | | | 448,437 | | | | 0.3 | |
| 750,000 | | | Pertamina Persero PT, 5.625%, 05/20/2043 | | | 736,934 | | | | 0.6 | |
| 550,000 | | | Perusahaan Perseroan Persero PT Perusahaan Listrik Negara, 3.000%, 06/30/2030 | | | 480,502 | | | | 0.4 | |
| 675,000 (1) | | | Perusahaan Perseroan Persero PT Perusahaan Listrik Negara, 4.125%, 05/15/2027 | | | 650,093 | | | | 0.5 | |
Principal
Amount† | | | | | Value | | | Percentage of Net Assets | |
| CORPORATE BONDS/NOTES: (continued) | |
| | | | Indonesia: (continued) |
| 750,000 | | | Perusahaan Perseroan Persero PT Perusahaan Listrik Negara, 4.125%, 05/15/2027 | | $ | 722,325 | | | | 0.6 | |
| 500,000 (1) | | | Perusahaan Perseroan Persero PT Perusahaan Listrik Negara, 6.250%, 01/25/2049 | | | 507,880 | | | | 0.4 | |
| | | | | | | 4,008,046 | | | | 3.2 | |
| | | | Isle of Man: 0.3% |
| 400,000 | | | AngloGold Ashanti Holdings PLC, 3.375%, 11/01/2028 | | | 361,402 | | | | 0.3 | |
| | | | | | | | | | | | |
| | | | Kazakhstan: 0.5% |
| 750,000 (1) | | | KazMunayGas National Co. JSC, 3.500%, 04/14/2033 | | | 626,250 | | | | 0.5 | |
| | | | | | | | | | | | |
| | | | Luxembourg: 3.5% |
| 850,000 (1) | | | Chile Electricity Lux MPC Sarl, 6.010%, 01/20/2033 | | | 862,750 | | | | 0.7 | |
| 1,200,000 (1) | | | CSN Resources SA, 8.875%, 12/05/2030 | | | 1,242,240 | | | | 1.0 | |
| 750,000 (1) | | | EIG Pearl Holdings Sarl, 4.387%, 11/30/2046 | | | 589,117 | | | | 0.5 | |
| 550,000 (1) | | | Greensaif Pipelines Bidco Sarl, 6.510%, 02/23/2042 | | | 573,891 | | | | 0.5 | |
| 950,000 (1) | | | Minerva Luxembourg SA, 8.875%, 09/13/2033 | | | 1,003,438 | | | | 0.8 | |
| | | | | | | 4,271,436 | | | | 3.5 | |
| | | | Malaysia: 1.1% |
| 300,000 | | | Petronas Capital Ltd., 2.480%, 01/28/2032 | | | 250,996 | | | | 0.2 | |
| 1,250,000 (1) | | | Petronas Capital Ltd., 4.800%, 04/21/2060 | | | 1,137,294 | | | | 0.9 | |
| | | | | | | 1,388,290 | | | | 1.1 | |
| | | | Mexico: 6.5% |
| 750,000 (1) | | | Banco Nacional de Comercio Exterior SNC/Cayman Islands, 4.375%, 10/14/2025 | | | 737,109 | | | | 0.6 | |
| 600,000 (3) | | | Cemex SAB de CV, 5.125%, 12/31/2199 | | | 581,625 | | | | 0.5 | |
| 350,000 (1)(3) | | | Cemex SAB de CV, 9.125%, 12/31/2199 | | | 378,928 | | | | 0.3 | |
| 425,000 (1) | | | Comision Federal de Electricidad, 4.688%, 05/15/2029 | | | 400,828 | | | | 0.3 | |
See Accompanying Notes to Financial Statements
| Voya VACS Series EMHCD Fund | PORTFOLIO OF INVESTMENTS as of March 31, 2024 (continued) |
Principal
Amount† | | | | | Value | | | Percentage of Net Assets | |
| CORPORATE BONDS/NOTES: (continued) | |
| | | | Mexico: (continued) |
| 1,000,000 (1)(5) | | | Comision Federal de Electricidad, 6.264%, 02/15/2052 | | $ | 872,500 | | | | 0.7 | |
| 350,000 | | | Petroleos Mexicanos, 5.500%, 06/27/2044 | | | 213,292 | | | | 0.2 | |
| 800,000 | | | Petroleos Mexicanos, 6.500%, 03/13/2027 | | | 754,008 | | | | 0.6 | |
| 500,000 | | | Petroleos Mexicanos, 6.500%, 01/23/2029 | | | 448,750 | | | | 0.3 | |
| 1,135,000 | | | Petroleos Mexicanos, 6.700%, 02/16/2032 | | | 946,590 | | | | 0.8 | |
| 500,000 | | | Petroleos Mexicanos, 6.750%, 09/21/2047 | | | 331,500 | | | | 0.3 | |
| 600,000 | | | Petroleos Mexicanos, 6.950%, 01/28/2060 | | | 397,830 | | | | 0.3 | |
| 1,375,000 | | | Petroleos Mexicanos, 10.000%, 02/07/2033 | | | 1,367,987 | | | | 1.1 | |
| 600,000 (1)(5) | | | Trust Fibra Uno, 7.375%, 02/13/2034 | | | 600,885 | | | | 0.5 | |
| | | | | | | 8,031,832 | | | | 6.5 | |
| | | | Oman: 1.0% |
| 1,300,000 (1) | | | OQ SAOC, 5.125%, 05/06/2028 | | | 1,276,844 | | | | 1.0 | |
| | | | | | | | | | | | |
| | | | Panama: 1.8% |
| 540,152 | | | AES Panama Generation Holdings SRL, 4.375%, 05/31/2030 | | | 471,958 | | | | 0.4 | |
| 1,075,000 | | | Banco Nacional de Panama, 2.500%, 08/11/2030 | | | 839,844 | | | | 0.7 | |
| 1,200,000 (1) | | | Empresa de Transmision Electrica SA, 5.125%, 05/02/2049 | | | 874,500 | | | | 0.7 | |
| | | | | | | 2,186,302 | | | | 1.8 | |
| | | | Peru: 2.9% |
| 1,175,000 (1) | | | Banco de Credito del Peru S.A., 5.850%, 01/11/2029 | | | 1,188,219 | | | | 1.0 | |
| 400,000 (1) | | | Corp Financiera de Desarrollo SA, 2.400%, 09/28/2027 | | | 358,700 | | | | 0.3 | |
| 1,050,000 (1) | | | Hunt Oil Co. of Peru LLC Sucursal Del Peru, 8.550%, 09/18/2033 | | | 1,122,660 | | | | 0.9 | |
| 250,000 | | | Petroleos del Peru SA, 4.750%, 06/19/2032 | | | 196,250 | | | | 0.2 | |
| 1,000,000 (1) | | | Petroleos del Peru SA, 5.625%, 06/19/2047 | | | 668,500 | | | | 0.5 | |
| | | | | | | 3,534,329 | | | | 2.9 | |
| | | | Poland: 1.4% |
| 875,000 (1) | | | Bank Gospodarstwa Krajowego, 5.375%, 05/22/2033 | | | 872,813 | | | | 0.7 | |
Principal
Amount† | | | | | Value | | | Percentage of Net Assets | |
| CORPORATE BONDS/NOTES: (continued) |
| | | | Poland: (continued) |
| 850,000 (1) | | | Bank Gospodarstwa Krajowego, 6.250%, 10/31/2028 | | $ | 888,802 | | | | 0.7 | |
| | | | | | | 1,761,615 | | | | 1.4 | |
| | | | Qatar: 0.6% |
| 1,000,000 (1) | | | QatarEnergy, 3.300%, 07/12/2051 | | | 709,375 | | | | 0.6 | |
| | | | | | | | | | | | |
| | | | South Africa: 0.6% |
| 800,000 (1) | | | Eskom Holdings SOC Ltd., 6.350%, 08/10/2028 | | | 769,000 | | | | 0.6 | |
| | | | | | | | | | | | |
| | | | Tanzania: 0.4% |
| 600,000 | | | AngloGold Ashanti Holdings PLC, 3.750%, 10/01/2030 | | | 523,185 | | | | 0.4 | |
| | | | | | | | | | | | |
| | | | Turkey: 0.5% |
| 625,000 (1) | | | WE Soda Investments Holding PLC, 9.375%, 02/14/2031 | | | 643,319 | | | | 0.5 | |
| | | | | | | | | | | | |
| | | | United Arab Emirates: 2.1% |
| 550,000 | | | DP World Crescent Ltd., 3.875%, 07/18/2029 | | | 517,859 | | | | 0.4 | |
| 254,832 (1) | | | Galaxy Pipeline Assets Bidco Ltd., 2.160%, 03/31/2034 | | | 220,111 | | | | 0.2 | |
| 583,200 (1) | | | Galaxy Pipeline Assets Bidco Ltd., 2.940%, 09/30/2040 | | | 469,864 | | | | 0.4 | |
| 975,000 (1) | | | MDGH GMTN RSC Ltd., 4.375%, 11/22/2033 | | | 930,516 | | | | 0.8 | |
| 400,000 (1) | | | MDGH GMTN RSC Ltd., 5.500%, 04/28/2033 | | | 414,966 | | | | 0.3 | |
| | | | | | | 2,553,316 | | | | 2.1 | |
| | | | Venezuela: 0.2% |
| 1,000,000 (4) | | | Petroleos de Venezuela SA, 9.000%, 11/17/2021 | | | 105,000 | | | | 0.1 | |
| 1,750,000 (4) | | | Petroleos de Venezuela SA, 9.750%, 05/17/2035 | | | 196,000 | | | | 0.1 | |
| | | | | | | 301,000 | | | | 0.2 | |
| | | | Total Corporate Bonds/Notes (Cost $41,014,798) | | | 41,752,328 | | | | 33.7 | |
| | | | Total Long-Term Investments (Cost $111,806,881) | | | 117,583,813 | | | | 94.9 | |
See Accompanying Notes to Financial Statements
| Voya VACS Series EMHCD Fund | PORTFOLIO OF INVESTMENTS as of March 31, 2024 (continued) |
Principal
Amount† | | | RA | | Value | | | Percentage of Net Assets | |
| SHORT-TERM INVESTMENTS: 5.3% | |
| | | | Commercial Paper: 2.9% | |
| 500,000 | | | Duke Energy Co., 9.670%, 04/04/2024 | | $ | 499,472 | | | | 0.4 | |
| 1,000,000 | | | Enbridge (US) Inc., 22.490%, 04/01/2024 | | | 999,386 | | | | 0.8 | |
| 1,000,000 | | | HP, Inc., 11.050%, 04/03/2024 | | | 999,095 | | | | 0.8 | |
| 1,000,000 | | | Sherwin-Williams Co., 22.060%, 04/01/2024 | | | 999,398 | | | | 0.9 | |
| | | | Total Commercial Paper
(Cost $3,499,471) | | | 3,497,351 | | | | 2.9 | |
| | | | Repurchase Agreements: 1.7% | |
| 1,000,000 (6) | | | Bank of America Inc., Repurchase Agreement dated 03/28/2024, 5.320%, due 04/01/2024 (Repurchase Amount $1,000,583, collateralized by various U.S. Government Securities, 0.000%-4.500%, Market Value plus accrued interest $1,020,000, due 10/15/26-08/15/35) | | | 1,000,000 | | | | 0.8 | |
| 1,000,000 (6) | | | Daiwa Capital Markets America Inc., Repurchase Agreement dated 03/28/2024, 5.350%, due 04/01/2024 (Repurchase Amount $1,000,586, collateralized by various U.S. Government Securities, 0.000%-4.125%, Market Value plus accrued interest $1,020,000, due 06/11/24-02/15/42) | | | 1,000,000 | | | | 0.8 | |
Principal
Amount† | | | | | Value | | | Percentage of Net Assets | |
| SHORT-TERM INVESTMENTS: (continued) |
| | | | Repurchase Agreements (continued) |
| 136,903 (6) | | | HSBC Securities (USA) Inc., Repurchase Agreement dated 03/28/2024, 5.320%, due 04/01/2024 (Repurchase Amount $136,983, collateralized by various U.S. Government Securities, 0.625%-4.000%, Market Value plus accrued interest $139,641, due 02/15/25-02/15/48) | | $ | 136,903 | | | | 0.1 | |
| | | | Total Repurchase Agreements (Cost $2,136,903) | | | 2,136,903 | | | | 1.7 | |
| Shares | | | | | Value | | | Percentage of Net Assets | |
| | | | Mutual Funds: 0.7% |
| 3,000 (7) | | | BlackRock Liquidity Funds, FedFund, Institutional Class, 5.200% | | | 3,000 | | | | 0.0 | |
| 906,000 (7) | | | Morgan Stanley Institutional Liquidity Funds - Government Portfolio (Institutional Share Class), 5.220% | | | 906,000 | | | | 0.7 | |
| | | | Total Mutual Funds
(Cost $909,000) | | | 909,000 | | | | 0.7 | |
| | | | Total Short-Term Investments
(Cost $6,545,374) | | | 6,543,254 | | | | 5.3 | |
| | | | Total Investments in Securities
(Cost $118,352,255) | | $ | 124,127,067 | | | | 100.2 | |
| | | | Liabilities in Excess of Other Assets | | | (272,353 | ) | | | (0.2) | |
| | | | Net Assets | | $ | 123,854,714 | | | | 100.0 | |
See Accompanying Notes to Financial Statements
| Voya VACS Series EMHCD Fund | PORTFOLIO OF INVESTMENTS as of March 31, 2024 (continued) |
| † | Unless otherwise indicated, principal amount is shown in USD. |
| (1) | Securities with purchases pursuant to Rule 144A or section 4(a)(2), under the Securities Act of 1933 and may not be resold subject to that rule except to qualified institutional buyers. |
| (2) | Step-up bond that pays an initial coupon rate for the first period and then a higher coupon rate for the following periods. Rates shown reflect the current and next coupon rate as of March 31, 2024. |
| (3) | Variable rate security. Rate shown is the rate in effect as of March 31, 2024. |
| (4) | Defaulted security. |
| (5) | Security, or a portion of the security, is on loan. |
| (6) | All or a portion of the security represents securities purchased with cash collateral received for securities on loan. |
| (7) | Rate shown is the 7-day yield as of March 31, 2024. |
| Sector Diversification | | Percentage of Net Assets | |
| Sovereign Bonds | | | 61.2 | % | |
| Energy | | | 14.7 | | |
| Financial | | | 5.5 | | |
| Utilities | | | 5.3 | | |
| Basic Materials | | | 3.9 | | |
| Consumer, Non-cyclical | | | 2.0 | | |
| Industrial | | | 1.8 | | |
| Communications | | | 0.5 | | |
| Short-Term Investments | | | 5.3 | | |
| Liabilities in Excess of Other Assets | | | (0.2 | ) | |
| Net Assets | | | 100.0 | % | |
Portfolio holdings are subject to change daily.
See Accompanying Notes to Financial Statements
| Voya VACS Series EMHCD Fund | PORTFOLIO OF INVESTMENTS as of March 31, 2024 (continued) |
Fair Value Measurements^
The following is a summary of the fair valuations according to the inputs used as of March 31, 2024 in valuing the assets and liabilities:
| | | Quoted Prices in Active Markets for Identical Investments (Level 1) | | Significant Other Observable Inputs (Level 2) | | | Significant Unobservable Inputs (Level 3) | | | Fair Value at March 31, 2024 | |
| Asset Table |
| Investments, at fair value | | | | | | | | | | | | | | | | |
| Sovereign Bonds | | $ | — | | | $ | 75,831,485 | | | $ | — | | | $ | 75,831,485 | |
| Corporate Bonds/Notes | | | — | | | | 41,752,328 | | | | — | | | | 41,752,328 | |
| Short-Term Investments | | | 909,000 | | | | 5,634,254 | | | | — | | | | 6,543,254 | |
| Total Investments, at fair value | | $ | 909,000 | | | $ | 123,218,067 | | | $ | — | | | $ | 124,127,067 | |
| Other Financial Instruments+ | | | | | | | | | | | | | | | | |
| Futures | | | 83,565 | | | | — | | | | — | | | | 83,565 | |
| Total Assets | | $ | 992,565 | | | $ | 123,218,067 | | | $ | — | | | $ | 124,210,632 | |
| Liabilities Table | | | | | | | | | | | | | | | | |
| Other Financial Instruments+ | | | | | | | | | | | | | | | | |
| Futures | | $ | (82,434 | ) | | $ | — | | | $ | — | | | $ | (82,434 | ) |
| Total Liabilities | | $ | (82,434 | ) | | $ | — | | | $ | — | | | $ | (82,434 | ) |
| | | | | | | | | | | | | | | | | |
| ^ | See Note 2, “Significant Accounting Policies” in the Notes to Financial Statements for additional information. |
| + | Other Financial Instruments may include open forward foreign currency contracts, futures, centrally cleared swaps, OTC swaps and written options. Forward foreign currency contracts, futures and centrally cleared swaps are fair valued at the unrealized appreciation (depreciation) on the instrument. OTC swaps and written options are valued at the fair value of the instrument. |
At March 31, 2024, the following futures contracts were outstanding for Voya VACS Series EMHCD Fund:
| Description | | Number
of Contracts | | | Expiration
Date | | Notional
Amount | | | Unrealized
Appreciation/
(Depreciation) | |
| Long Contracts: |
| U.S. Treasury 2-Year Note | | | 25 | | | 06/28/24 | | $ | 5,112,110 | | | $ | (1,585 | ) |
| U.S. Treasury 5-Year Note | | | 82 | | | 06/28/24 | | | 8,775,281 | | | | 16,769 | |
| U.S. Treasury Long Bond | | | 8 | | | 06/18/24 | | | 963,500 | | | | 14,670 | |
| U.S. Treasury Ultra Long Bond | | | 25 | | | 06/18/24 | | | 3,225,000 | | | | 52,126 | |
| | | | | | | | $ | 18,075,891 | | | $ | 81,980 | |
| Short Contracts: |
| U.S. Treasury 10-Year Note | | | (29) | | | 06/18/24 | | | (3,213,110 | ) | | | (11,252 | ) |
| U.S. Treasury Ultra 10-Year Note | | | (115) | | | 06/18/24 | | | (13,180,078 | ) | | | (69,597 | ) |
| | | | | | | | $ | (16,393,188 | ) | | $ | (80,849 | ) |
A summary of derivative instruments by primary risk exposure is outlined in the following tables.
The fair value of derivative instruments as of March 31, 2024 was as follows:
| Derivatives not accounted for as hedging instruments | | Location on Statement of Assets and Liabilities | | Fair Value | |
| Asset Derivatives |
| Interest rate contracts | | Variation margin receivable on futures contracts* | | $ | 83,565 | |
| Total Asset Derivatives | | | | $ | 83,565 | |
| |
| Liability Derivatives |
| Interest rate contracts | | Variation margin payable on futures contracts* | | $ | 82,434 | |
| Total Liability Derivatives | | | | $ | 82,434 | |
| * | The fair value presented above represents the cumulative unrealized appreciation (depreciation) on futures contracts as reported in the tables within the Portfolio of Investments. In the Statement of Assets and Liabilities, only current day’s unsettled variation margin is reported in receivables or payables on futures contracts and the net cumulative unrealized appreciation (depreciation) is included in total distributable earnings (loss). |
See Accompanying Notes to Financial Statements
| Voya VACS Series EMHCD Fund | PORTFOLIO OF INVESTMENTS as of March 31, 2024 (continued) |
The effect of derivative instruments on the Fund’s Statement of Operations for the year ended March 31, 2024 was as follows:
Amount of Realized Gain or (Loss) on Derivatives Recognized in Income
| Derivatives not accounted for as hedging instruments | | Futures | |
| Interest rate contracts | | $ | 76,890 | |
| Total | | $ | 76,890 | |
Change in Unrealized Appreciation or (Depreciation) on Derivatives Recognized in Income
| Derivatives not accounted for as hedging instruments | | Futures | |
| Interest rate contracts | | $ | 300,535 | |
| Total | | $ | 300,535 | |
At March 31, 2024, the aggregate cost of securities and other investments and the composition of unrealized appreciation and depreciation of securities and other investments on a tax basis were:
| Cost for federal income tax purposes was $118,367,208. |
| Net unrealized appreciation consisted of: |
| Gross Unrealized Appreciation | | $ | 6,565,622 | |
| Gross Unrealized Depreciation | | | (804,254 | ) |
| Net Unrealized Appreciation | | $ | 5,761,368 | |
See Accompanying Notes to Financial Statements
| Voya VACS Series HYB Fund | PORTFOLIO OF INVESTMENTS as of March 31, 2024 |
Principal
Amount† | | | | Value | | | Percentage
of Net
Assets | |
| CORPORATE BONDS/NOTES: 93.4% |
| | | Basic Materials: 6.6% | | | | | | | | |
| 290,000 (1) | | Arsenal AIC Parent LLC, 8.000%, 10/01/2030 | | $ | 304,829 | | | | 0.2 | |
| 445,000 | | ATI, Inc., 7.250%, 08/15/2030 | | | 460,463 | | | | 0.4 | |
| 300,000 (1) | | Axalta Coating Systems Dutch Holding B BV, 7.250%, 02/15/2031 | | | 312,437 | | | | 0.2 | |
| 150,000 (1) | | Axalta Coating Systems LLC, 3.375%, 02/15/2029 | | | 134,366 | | | | 0.1 | |
| 395,000 (1) | | Cleveland-Cliffs, Inc., 4.625%, 03/01/2029 | | | 368,659 | | | | 0.3 | |
| 165,000 (1) | | Cleveland-Cliffs, Inc., 4.875%, 03/01/2031 | | | 150,213 | | | | 0.1 | |
| 380,000 (1) | | Coeur Mining, Inc., 5.125%, 02/15/2029 | | | 361,423 | | | | 0.3 | |
| 368,000 (1) | | Constellium SE, 5.625%, 06/15/2028 | | | 358,178 | | | | 0.3 | |
| 245,000 (1) | | First Quantum Minerals Ltd., 6.875%, 10/15/2027 | | | 234,220 | | | | 0.2 | |
| 490,000 (1) | | Hudbay Minerals, Inc., 4.500%, 04/01/2026 | | | 475,110 | | | | 0.4 | |
| 390,000 (1) | | Illuminate Buyer LLC /Illuminate Holdings IV, Inc., 9.000%, 07/01/2028 | | | 385,208 | | | | 0.3 | |
| 436,000 (1) | | INEOS Quattro Finance 2 PLC, 3.375%, 01/15/2026 | | | 416,455 | | | | 0.3 | |
| 454,000 (1)(2) | | Iris Holdings, Inc., 8.750% (PIK Rate 9.500%, Cash Rate 8.750%), 02/15/2026 | | | 390,440 | | | | 0.3 | |
| 225,000 (1) | | LSF11 A5 HoldCo LLC, 6.625%, 10/15/2029 | | | 202,987 | | | | 0.2 | |
| 415,000 (1) | | Mativ Holdings, Inc., 6.875%, 10/01/2026 | | | 413,432 | | | | 0.3 | |
| 285,000 (1) | | NOVA Chemicals Corp., 8.500%, 11/15/2028 | | | 303,701 | | | | 0.2 | |
| 65,000 (1) | | Novelis Corp., 3.250%, 11/15/2026 | | | 60,633 | | | | 0.0 | |
| 350,000 (1) | | Novelis Corp., 3.875%, 08/15/2031 | | | 301,014 | | | | 0.2 | |
| 135,000 (1) | | Novelis Corp., 4.750%, 01/30/2030 | | | 124,667 | | | | 0.1 | |
| 375,000 (1) | | Nufarm Australia Ltd. / Nufarm Americas, Inc., 5.000%, 01/27/2030 | | | 344,336 | | | | 0.3 | |
| 200,000 (1) | | Olympus Water US Holding Corp., 4.250%, 10/01/2028 | | | 181,673 | | | | 0.1 | |
| 205,000 (1) | | Olympus Water US Holding Corp., 6.250%, 10/01/2029 | | | 187,847 | | | | 0.1 | |
| 200,000 (1) | | Olympus Water US Holding Corp., 7.125%, 10/01/2027 | | | 202,220 | | | | 0.2 | |
Principal
Amount† | | | | Value | | | Percentage
of Net
Assets | |
| CORPORATE BONDS/NOTES: (continued) |
| | | Basic Materials: (continued) | | | | | | | | |
| 480,000 (1) | | SPCM SA, 3.125%, 03/15/2027 | | $ | 444,614 | | | | 0.4 | |
| 465,000 (1) | | Taseko Mines Ltd., 7.000%, 02/15/2026 | | | 467,381 | | | | 0.4 | |
| 490,000 (1) | | Trinseo Materials Operating SCA / Trinseo Materials Finance, Inc., 5.125%, 04/01/2029 | | | 142,644 | | | | 0.1 | |
| 375,000 (1) | | Tronox, Inc., 4.625%, 03/15/2029 | | | 336,820 | | | | 0.3 | |
| 445,000 (1) | | WR Grace Holdings LLC, 5.625%, 08/15/2029 | | | 398,689 | | | | 0.3 | |
| | | | | | 8,464,659 | | | | 6.6 | |
| | | | | | | | | | | |
| | | Communications: 11.8% | | | | | | | | |
| 600,000 (1) | | Altice Financing SA, 5.750%, 08/15/2029 | | | 481,333 | | | | 0.4 | |
| 577,000 (1) | | Altice France SA/France, 5.500%, 10/15/2029 | | | 392,238 | | | | 0.3 | |
| 245,000 (1) | | Altice France SA/France, 8.125%, 02/01/2027 | | | 191,722 | | | | 0.1 | |
| 355,000 (1) | | Beasley Mezzanine Holdings LLC, 8.625%, 02/01/2026 | | | 212,235 | | | | 0.2 | |
| 600,000 | | CCO Holdings LLC / CCO Holdings Capital Corp., 4.500%, 05/01/2032 | | | 482,550 | | | | 0.4 | |
| 505,000 (1) | | CCO Holdings LLC / CCO Holdings Capital Corp., 5.000%, 02/01/2028 | | | 470,438 | | | | 0.4 | |
| 485,000 (1) | | CCO Holdings LLC / CCO Holdings Capital Corp., 5.125%, 05/01/2027 | | | 462,412 | | | | 0.4 | |
| 180,000 (1) | | CCO Holdings LLC / CCO Holdings Capital Corp., 5.500%, 05/01/2026 | | | 177,365 | | | | 0.1 | |
| 440,000 (1) | | Connect Finco Sarl / Connect US Finco LLC, 6.750%, 10/01/2026 | | | 431,620 | | | | 0.3 | |
| 900,000 (1) | | CSC Holdings LLC, 5.750%, 01/15/2030 | | | 477,151 | | | | 0.4 | |
| 600,000 (1) | | CSC Holdings LLC, 11.250%, 05/15/2028 | | | 595,082 | | | | 0.5 | |
| 530,000 (1) | | Directv Financing LLC / Directv Financing Co-Obligor, Inc., 5.875%, 08/15/2027 | | | 501,730 | | | | 0.4 | |
| 465,000 | | DISH DBS Corp., 5.125%, 06/01/2029 | | | 194,334 | | | | 0.1 | |
| 282,000 (1) | | DISH DBS Corp., 5.750%, 12/01/2028 | | | 194,335 | | | | 0.1 | |
| 325,000 | | DISH DBS Corp., 7.375%, 07/01/2028 | | | 156,743 | | | | 0.1 | |
See Accompanying Notes to Financial Statements
| Voya VACS Series HYB Fund | PORTFOLIO OF INVESTMENTS as of March 31, 2024 (continued) |
Principal
Amount† | | | | Value | | | Percentage
of Net
Assets | |
| CORPORATE BONDS/NOTES: (continued) |
| | | Communications: (continued) | |
| 550,000 (1) | | DISH Network Corp., 11.750%, 11/15/2027 | | $ | 562,051 | | | | 0.4 | |
| 370,000 (1) | | GCI LLC, 4.750%, 10/15/2028 | | | 339,594 | | | | 0.3 | |
| 610,000 (1) | | Gray Escrow II, Inc., 5.375%, 11/15/2031 | | | 400,571 | | | | 0.3 | |
| 340,000 (1) | | Gray Television, Inc., 7.000%, 05/15/2027 | | | 316,490 | | | | 0.2 | |
| 585,000 (1) | | Level 3 Financing, Inc., 3.750%, 07/15/2029 | | | 263,250 | | | | 0.2 | |
| 335,000 (1) | | Level 3 Financing, Inc., 10.500%, 05/15/2030 | | | 344,213 | | | | 0.3 | |
| 610,000 (1) | | Match Group Holdings II LLC, 4.625%, 06/01/2028 | | | 576,101 | | | | 0.4 | |
| 385,000 (1) | | McGraw-Hill Education, Inc., 8.000%, 08/01/2029 | | | 362,242 | | | | 0.3 | |
| 319,000 (3) | | Paramount Global, 6.250%, 02/28/2057 | | | 280,813 | | | | 0.2 | |
| 770,000 (1) | | Scripps Escrow, Inc., 5.875%, 07/15/2027 | | | 644,940 | | | | 0.5 | |
| 390,000 (1) | | Sinclair Television Group, Inc., 4.125%, 12/01/2030 | | | 284,380 | | | | 0.2 | |
| 155,000 (1) | | Sirius XM Radio, Inc., 3.125%, 09/01/2026 | | | 145,316 | | | | 0.1 | |
| 1,035,000 (1) | | Sirius XM Radio, Inc., 5.000%, 08/01/2027 | | | 996,439 | | | | 0.8 | |
| 435,000 (1) | | Stagwell Global LLC, 5.625%, 08/15/2029 | | | 395,385 | | | | 0.3 | |
| 200,000 | | Telecom Italia Capital SA, 6.000%, 09/30/2034 | | | 183,072 | | | | 0.1 | |
| 220,000 | | Telecom Italia Capital SA, 6.375%, 11/15/2033 | | | 208,299 | | | | 0.2 | |
| 200,000 (1) | | Telecom Italia SpA/Milano, 5.303%, 05/30/2024 | | | 199,049 | | | | 0.2 | |
| 230,000 (1) | | Uber Technologies, Inc., 4.500%, 08/15/2029 | | | 218,659 | | | | 0.2 | |
| 335,000 (1) | | Uber Technologies, Inc., 8.000%, 11/01/2026 | | | 339,264 | | | | 0.3 | |
| 180,000 (1) | | Univision Communications, Inc., 4.500%, 05/01/2029 | | | 161,016 | | | | 0.1 | |
| 620,000 (1) | | Univision Communications, Inc., 6.625%, 06/01/2027 | | | 606,930 | | | | 0.5 | |
| 200,000 (1) | | Univision Communications, Inc., 8.000%, 08/15/2028 | | | 203,884 | | | | 0.2 | |
| 275,000 (1) | | Viasat, Inc., 6.500%, 07/15/2028 | | | 212,622 | | | | 0.2 | |
| 215,000 (1) | | Viasat, Inc., 7.500%, 05/30/2031 | | | 156,055 | | | | 0.1 | |
| 360,000 (1) | | Viavi Solutions, Inc., 3.750%, 10/01/2029 | | | 309,239 | | | | 0.2 | |
Principal
Amount† | | | | Value | | | Percentage
of Net
Assets | |
| CORPORATE BONDS/NOTES: (continued) |
| | | Communications: (continued) | |
| 651,000 (1) | | Virgin Media Vendor Financing Notes IV DAC, 5.000%, 07/15/2028 | | $ | 597,863 | | | | 0.5 | |
| 417,000 (1) | | Vmed O2 UK Financing I PLC, 4.750%, 07/15/2031 | | | 359,812 | | | | 0.3 | |
| | | | | | 15,088,837 | | | | 11.8 | |
| | | | | | | | | | | |
| | | Consumer, Cyclical: 19.9% | |
| 220,000 (1) | | 1011778 BC ULC / New Red Finance, Inc., 3.500%, 02/15/2029 | | | 201,112 | | | | 0.2 | |
| 475,000 (1) | | 1011778 BC ULC / New Red Finance, Inc., 4.000%, 10/15/2030 | | | 423,568 | | | | 0.3 | |
| 315,000 (1) | | Adient Global Holdings Ltd., 4.875%, 08/15/2026 | | | 307,324 | | | | 0.2 | |
| 235,000 (1)(4) | | Adient Global Holdings Ltd., 8.250%, 04/15/2031 | | | 248,169 | | | | 0.2 | |
| 160,000 (1) | | Allison Transmission, Inc., 3.750%, 01/30/2031 | | | 139,753 | | | | 0.1 | |
| 350,000 (1)(4) | | Allison Transmission, Inc., 5.875%, 06/01/2029 | | | 346,856 | | | | 0.3 | |
| 300,000 (1) | | Amer Sports Co., 6.750%, 02/16/2031 | | | 299,250 | | | | 0.2 | |
| 440,000 (1)(4) | | American Airlines, Inc., 7.250%, 02/15/2028 | | | 447,183 | | | | 0.4 | |
| 93,750 (1) | | American Airlines, Inc./AAdvantage Loyalty IP Ltd., 5.500%, 04/20/2026 | | | 93,170 | | | | 0.1 | |
| 310,000 (1) | | Arko Corp., 5.125%, 11/15/2029 | | | 256,910 | | | | 0.2 | |
| 315,000 | | Asbury Automotive Group, Inc., 4.500%, 03/01/2028 | | | 300,200 | | | | 0.2 | |
| 266,000 | | Asbury Automotive Group, Inc., 4.750%, 03/01/2030 | | | 245,221 | | | | 0.2 | |
| 380,000 (1) | | Ashton Woods USA LLC / Ashton Woods Finance Co., 4.625%, 08/01/2029 | | | 350,920 | | | | 0.3 | |
| 300,000 (1) | | Banijay Entertainment SASU, 8.125%, 05/01/2029 | | | 309,657 | | | | 0.2 | |
| 390,000 | | Bath & Body Works, Inc., 6.750%, 07/01/2036 | | | 394,216 | | | | 0.3 | |
| 93,000 (1) | | Bath & Body Works, Inc., 9.375%, 07/01/2025 | | | 97,109 | | | | 0.1 | |
| 310,000 (1) | | Brinker International, Inc., 5.000%, 10/01/2024 | | | 307,850 | | | | 0.2 | |
See Accompanying Notes to Financial Statements
| Voya VACS Series HYB Fund | PORTFOLIO OF INVESTMENTS as of March 31, 2024 (continued) |
Principal
Amount† | | | | Value | | | Percentage
of Net
Assets | |
| CORPORATE BONDS/NOTES: (continued) | |
| | | Consumer, Cyclical: (continued) |
| 485,000 (1) | | Caesars Entertainment, Inc., 4.625%, 10/15/2029 | | $ | 442,645 | | | | 0.3 | |
| 355,000 (1) | | Caesars Entertainment, Inc., 7.000%, 02/15/2030 | | | 364,624 | | | | 0.3 | |
| 300,000 (1) | | Carnival Corp., 4.000%, 08/01/2028 | | | 279,000 | | | | 0.2 | |
| 635,000 (1)(4) | | Carnival Corp., 6.000%, 05/01/2029 | | | 626,958 | | | | 0.5 | |
| 440,000 (1) | | CCM Merger, Inc., 6.375%, 05/01/2026 | | | 439,968 | | | | 0.3 | |
| 160,000 | | Delta Air Lines, Inc., 7.375%, 01/15/2026 | | | 165,123 | | | | 0.1 | |
| 295,000 (1) | | Dream Finders Homes, Inc., 8.250%, 08/15/2028 | | | 308,228 | | | | 0.2 | |
| 385,000 | | Ford Motor Credit Co. LLC, 2.700%, 08/10/2026 | | | 359,000 | | | | 0.3 | |
| 275,000 | | Ford Motor Credit Co. LLC, 4.542%, 08/01/2026 | | | 267,061 | | | | 0.2 | |
| 310,000 (1) | | Foundation Building Materials, Inc., 6.000%, 03/01/2029 | | | 285,395 | | | | 0.2 | |
| 103,000 (1) | | Gap, Inc., 3.625%, 10/01/2029 | | | 90,327 | | | | 0.1 | |
| 347,000 (1) | | Gap, Inc., 3.875%, 10/01/2031 | | | 293,883 | | | | 0.2 | |
| 225,000 (1) | | Golden Entertainment, Inc., 7.625%, 04/15/2026 | | | 225,167 | | | | 0.2 | |
| 395,000 (1) | | Hilton Domestic Operating Co., Inc., 4.000%, 05/01/2031 | | | 353,423 | | | | 0.3 | |
| 436,000 (1) | | Installed Building Products, Inc., 5.750%, 02/01/2028 | | | 425,992 | | | | 0.3 | |
| 435,000 (1) | | Interface, Inc., 5.500%, 12/01/2028 | | | 415,061 | | | | 0.3 | |
| 657,000 (1) | | International Game Technology PLC, 5.250%, 01/15/2029 | | | 635,321 | | | | 0.5 | |
| 550,000 (1) | | LCM Investments Holdings II LLC, 4.875%, 05/01/2029 | | | 506,084 | | | | 0.4 | |
| 355,000 (1) | | Lithia Motors, Inc., 4.375%, 01/15/2031 | | | 318,290 | | | | 0.2 | |
| 130,000 | | M/I Homes, Inc., 3.950%, 02/15/2030 | | | 117,008 | | | | 0.1 | |
| 310,000 | | M/I Homes, Inc., 4.950%, 02/01/2028 | | | 295,957 | | | | 0.2 | |
| 170,000 | | Macy’s Retail Holdings LLC, 4.500%, 12/15/2034 | | | 149,833 | | | | 0.1 | |
| 255,000 (1) | | Macy’s Retail Holdings LLC, 6.125%, 03/15/2032 | | | 247,432 | | | | 0.2 | |
Principal
Amount† | | | | Value | | | Percentage
of Net
Assets | |
| CORPORATE BONDS/NOTES: (continued) | |
| | | Consumer, Cyclical: (continued) |
| 208,000 (1) | | Melco Resorts Finance Ltd., 5.250%, 04/26/2026 | | $ | 200,850 | | | | 0.2 | |
| 472,000 (1) | | Melco Resorts Finance Ltd., 5.375%, 12/04/2029 | | | 431,295 | | | | 0.3 | |
| 230,000 (4) | | MGM Resorts International, 4.625%, 09/01/2026 | | | 225,160 | | | | 0.2 | |
| 225,000 | | MGM Resorts International, 4.750%, 10/15/2028 | | | 214,214 | | | | 0.2 | |
| 110,000 | | MGM Resorts International, 6.500%, 04/15/2032 | | | 109,726 | | | | 0.1 | |
| 655,000 (1) | | Michaels Cos., Inc., 5.250%, 05/01/2028 | | | 558,708 | | | | 0.4 | |
| 375,000 | | Murphy Oil USA, Inc., 4.750%, 09/15/2029 | | | 355,953 | | | | 0.3 | |
| 125,000 | | Murphy Oil USA, Inc., 5.625%, 05/01/2027 | | | 123,932 | | | | 0.1 | |
| 130,000 (1) | | NCL Corp. Ltd., 7.750%, 02/15/2029 | | | 135,095 | | | | 0.1 | |
| 85,000 (1) | | NCL Corp. Ltd., 8.375%, 02/01/2028 | | | 89,849 | | | | 0.1 | |
| 270,000 (1) | | NCL Finance Ltd., 6.125%, 03/15/2028 | | | 266,864 | | | | 0.2 | |
| 400,000 (1) | | Raising Cane’s Restaurants LLC, 9.375%, 05/01/2029 | | | 432,796 | | | | 0.3 | |
| 270,000 (1) | | Ritchie Bros Holdings, Inc., 7.750%, 03/15/2031 | | | 282,823 | | | | 0.2 | |
| 1,115,000 (1) | | Royal Caribbean Cruises Ltd., 5.375%, 07/15/2027 | | | 1,099,995 | | | | 0.9 | |
| 105,000 (1) | | Royal Caribbean Cruises Ltd., 6.250%, 03/15/2032 | | | 105,902 | | | | 0.1 | |
| 345,000 | | Sally Holdings LLC / Sally Capital, Inc., 6.750%, 03/01/2032 | | | 342,593 | | | | 0.3 | |
| 500,000 | | Sands China Ltd., 5.125%, 08/08/2025 | | | 493,425 | | | | 0.4 | |
| 375,000 (1) | | Scientific Games Holdings L.P./Scientific Games US FinCo, Inc., 6.625%, 03/01/2030 | | | 362,811 | | | | 0.3 | |
| 455,000 (1) | | Scientific Games International, Inc., 7.000%, 05/15/2028 | | | 458,637 | | | | 0.4 | |
| 145,000 (1) | | SRS Distribution, Inc., 6.000%, 12/01/2029 | | | 148,275 | | | | 0.1 | |
| 360,000 (1) | | SRS Distribution, Inc., 6.125%, 07/01/2029 | | | 367,496 | | | | 0.3 | |
| 610,000 (1) | | Staples, Inc., 7.500%, 04/15/2026 | | | 595,931 | | | | 0.5 | |
| 235,000 (1) | | Staples, Inc., 10.750%, 04/15/2027 | | | 223,593 | | | | 0.2 | |
See Accompanying Notes to Financial Statements
| Voya VACS Series HYB Fund | PORTFOLIO OF INVESTMENTS as of March 31, 2024 (continued) |
Principal
Amount† | | | | Value | | | Percentage
of Net
Assets | |
| CORPORATE BONDS/NOTES: (continued) | |
| | | Consumer, Cyclical: (continued) | |
| 530,000 (1) | | Station Casinos LLC, 4.500%, 02/15/2028 | | $ | 499,644 | | | | 0.4 | |
| 275,000 (1) | | STL Holding Co. LLC, 8.750%, 02/15/2029 | | | 282,495 | | | | 0.2 | |
| 375,000 (1) | | Taylor Morrison Communities, Inc., 5.125%, 08/01/2030 | | | 358,487 | | | | 0.3 | |
| 351,000 (1) | | Tempur Sealy International, Inc., 3.875%, 10/15/2031 | | | 298,415 | | | | 0.2 | |
| 69,000 (1) | | Tempur Sealy International, Inc., 4.000%, 04/15/2029 | | | 62,681 | | | | 0.0 | |
| 405,000 | | United Airlines Holdings, Inc., 4.875%, 01/15/2025 | | | 402,023 | | | | 0.3 | |
| 220,000 (1) | | United Airlines, Inc., 4.375%, 04/15/2026 | | | 212,831 | | | | 0.2 | |
| 750,000 (1) | | Viking Cruises Ltd., 5.875%, 09/15/2027 | | | 736,361 | | | | 0.6 | |
| 410,000 (1) | | VistaJet Malta Finance PLC / Vista Management Holding, Inc., 6.375%, 02/01/2030 | | | 302,770 | | | | 0.2 | |
| 385,000 | | Walgreens Boots Alliance, Inc., 4.800%, 11/18/2044 | | | 324,273 | | | | 0.3 | |
| 390,000 (1) | | White Cap Buyer LLC, 6.875%, 10/15/2028 | | | 382,983 | | | | 0.3 | |
| 460,000 (1) | | William Carter Co., 5.625%, 03/15/2027 | | | 457,189 | | | | 0.4 | |
| 545,000 (1) | | Wynn Las Vegas LLC / Wynn Las Vegas Capital Corp., 5.250%, 05/15/2027 | | | 534,129 | | | | 0.4 | |
| 200,000 (1) | | ZF North America Capital, Inc., 4.750%, 04/29/2025 | | | 197,658 | | | | 0.2 | |
| 330,000 (1) | | ZF North America Capital, Inc., 6.875%, 04/14/2028 | | | 342,598 | | | | 0.3 | |
| | | | | | 25,400,708 | | | | 19.9 | |
| | | | | | | | | | | |
| | | Consumer, Non-cyclical: 18.3% | |
| 395,000 (1) | | 1375209 BC Ltd., 9.000%, 01/30/2028 | | | 387,530 | | | | 0.3 | |
| 490,000 (1) | | Acadia Healthcare Co., Inc., 5.500%, 07/01/2028 | | | 477,530 | | | | 0.4 | |
| 495,000 (1) | | ADT Security Corp., 4.125%, 08/01/2029 | | | 453,968 | | | | 0.4 | |
| 300,000 (1) | | AHP Health Partners, Inc., 5.750%, 07/15/2029 | | | 274,485 | | | | 0.2 | |
| 285,000 (1) | | Albertsons Cos., Inc. / Safeway, Inc. / New Albertsons L.P. / Albertsons LLC, 3.500%, 03/15/2029 | | | 256,072 | | | | 0.2 | |
Principal
Amount† | | | | Value | | | Percentage
of Net
Assets | |
| CORPORATE BONDS/NOTES: (continued) | |
| | | Consumer, Non-cyclical: (continued) | |
| 180,000 (1) | | Albertsons Cos., Inc. / Safeway, Inc. / New Albertsons L.P. / Albertsons LLC, 4.875%, 02/15/2030 | | $ | 171,375 | | | | 0.1 | |
| 330,000 (1) | | Albertsons Cos., Inc. / Safeway, Inc. / New Albertsons L.P. / Albertsons LLC, 5.875%, 02/15/2028 | | | 326,943 | | | | 0.3 | |
| 750,000 (1) | | Allied Universal Holdco LLC/Allied Universal Finance Corp./Atlas Luxco 4 Sarl, 4.625%, 06/01/2028 | | | 684,458 | | | | 0.5 | |
| 465,000 (1) | | Alta Equipment Group, Inc., 5.625%, 04/15/2026 | | | 455,756 | | | | 0.4 | |
| 205,000 (1) | | APi Group DE, Inc., 4.125%, 07/15/2029 | | | 184,900 | | | | 0.1 | |
| 240,000 (1) | | APi Group DE, Inc., 4.750%, 10/15/2029 | | | 221,427 | | | | 0.2 | |
| 385,000 (1) | | Avis Budget Car Rental LLC / Avis Budget Finance, Inc., 8.000%, 02/15/2031 | | | 384,665 | | | | 0.3 | |
| 505,000 | | B&G Foods, Inc., 5.250%, 09/15/2027 | | | 472,352 | | | | 0.4 | |
| 440,000 (1) | | Bausch Health Cos., Inc., 4.875%, 06/01/2028 | | | 240,539 | | | | 0.2 | |
| 325,000 (1) | | Bausch Health Cos., Inc., 6.125%, 02/01/2027 | | | 202,815 | | | | 0.2 | |
| 375,000 | | Bausch Lomb, 8.563%, 05/05/2027 | | | 371,786 | | | | 0.3 | |
| 430,000 (1) | | BellRing Brands, Inc., 7.000%, 03/15/2030 | | | 443,430 | | | | 0.3 | |
| 509,000 (1) | | Cheplapharm Arzneimittel GmbH, 5.500%, 01/15/2028 | | | 485,521 | | | | 0.4 | |
| 250,000 (1) | | Chobani LLC / Chobani Finance Corp., Inc., 7.625%, 07/01/2029 | | | 253,750 | | | | 0.2 | |
| 255,000 (1) | | CHS/Community Health Systems, Inc., 4.750%, 02/15/2031 | | | 197,026 | | | | 0.2 | |
| 395,000 (1) | | CHS/Community Health Systems, Inc., 5.250%, 05/15/2030 | | | 322,431 | | | | 0.2 | |
| 335,000 (1) | | CHS/Community Health Systems, Inc., 5.625%, 03/15/2027 | | | 308,689 | | | | 0.2 | |
| 365,000 | | Cimpress PLC, 7.000%, 06/15/2026 | | | 365,620 | | | | 0.3 | |
| 480,000 (1) | | CPI CG, Inc., 8.625%, 03/15/2026 | | | 478,650 | | | | 0.4 | |
| 160,000 (1) | | DaVita, Inc., 3.750%, 02/15/2031 | | | 134,100 | | | | 0.1 | |
See Accompanying Notes to Financial Statements
| Voya VACS Series HYB Fund | PORTFOLIO OF INVESTMENTS as of March 31, 2024 (continued) |
Principal
Amount† | | | | Value | | | Percentage
of Net
Assets | |
| CORPORATE BONDS/NOTES: (continued) | |
| | | Consumer, Non-cyclical: (continued) | |
| 605,000 (1) | | DaVita, Inc., 4.625%, 06/01/2030 | | $ | 542,046 | | | | 0.4 | |
| 550,000 | | Encompass Health Corp., 4.750%, 02/01/2030 | | | 515,698 | | | | 0.4 | |
| 410,000 (1) | | Fiesta Purchaser, Inc., 7.875%, 03/01/2031 | | | 423,723 | | | | 0.3 | |
| 195,000 (1) | | Garda World Security Corp., 6.000%, 06/01/2029 | | | 174,768 | | | | 0.1 | |
| 377,000 (1) | | Graham Holdings Co., 5.750%, 06/01/2026 | | | 373,614 | | | | 0.3 | |
| 200,000 (1) | | IQVIA, Inc., 5.000%, 10/15/2026 | | | 195,854 | | | | 0.1 | |
| 200,000 (1) | | IQVIA, Inc., 6.500%, 05/15/2030 | | | 204,353 | | | | 0.2 | |
| 466,000 (1) | | Jazz Securities DAC, 4.375%, 01/15/2029 | | | 434,460 | | | | 0.3 | |
| 383,000 (1) | | Legends Hospitality Holding Co LLC / Legends Hospitality Co-Issuer, Inc., 5.000%, 02/01/2026 | | | 379,676 | | | | 0.3 | |
| 455,000 (1) | | Medline Borrower L.P., 3.875%, 04/01/2029 | | | 414,442 | | | | 0.3 | |
| 400,000 (1) | | Medline Borrower L.P., 5.250%, 10/01/2029 | | | 378,373 | | | | 0.3 | |
| 345,000 (1)(4) | | ModivCare, Inc., 5.875%, 11/15/2025 | | | 336,298 | | | | 0.3 | |
| 282,000 (1) | | MPH Acquisition Holdings LLC, 5.750%, 11/01/2028 | | | 222,686 | | | | 0.2 | |
| 430,000 (1) | | NESCO Holdings II, Inc., 5.500%, 04/15/2029 | | | 407,303 | | | | 0.3 | |
| 264,000 | | New Albertsons L.P., 7.450%, 08/01/2029 | | | 276,556 | | | | 0.2 | |
| 614,000 (1) | | Organon & Co / Organon Foreign Debt Co-Issuer BV, 5.125%, 04/30/2031 | | | 546,360 | | | | 0.4 | |
| 415,000 (1) | | Owens & Minor, Inc., 6.625%, 04/01/2030 | | | 412,244 | | | | 0.3 | |
| 200,000 | | Perrigo Finance Unlimited Co., 4.375%, 03/15/2026 | | | 194,746 | | | | 0.1 | |
| 300,000 | | Perrigo Finance Unlimited Co., 4.650%, 06/15/2030 | | | 276,032 | | | | 0.2 | |
| 390,000 (1) | | Post Holdings, Inc., 4.625%, 04/15/2030 | | | 358,317 | | | | 0.3 | |
| 600,000 (1) | | Post Holdings, Inc., 5.625%, 01/15/2028 | | | 589,974 | | | | 0.5 | |
| 300,000 (1) | | Prestige Brands, Inc., 3.750%, 04/01/2031 | | | 261,466 | | | | 0.2 | |
| 690,000 (1) | | Prime Security Services Borrower LLC / Prime Finance, Inc., 6.250%, 01/15/2028 | | | 676,444 | | | | 0.5 | |
Principal
Amount† | | | | Value | | | Percentage
of Net
Assets | |
| CORPORATE BONDS/NOTES: (continued) | |
| | | Consumer, Non-cyclical: (continued) | |
| 415,000 (1) | | Primo Water Holdings, Inc., 4.375%, 04/30/2029 | | $ | 382,022 | | | | 0.3 | |
| 385,000 (1) | | Select Medical Corp., 6.250%, 08/15/2026 | | | 386,021 | | | | 0.3 | |
| 380,000 (1) | | Simmons Foods, Inc./Simmons Prepared Foods,, Inc. ./Simmons Pet Food,, Inc../Simmons Feed, 4.625%, 03/01/2029 | | | 336,188 | | | | 0.3 | |
| 345,000 (1) | | Teleflex, Inc., 4.250%, 06/01/2028 | | | 324,019 | | | | 0.3 | |
| 350,000 | | Tenet Healthcare Corp., 4.250%, 06/01/2029 | | | 325,657 | | | | 0.3 | |
| 380,000 | | Tenet Healthcare Corp., 5.125%, 11/01/2027 | | | 371,975 | | | | 0.3 | |
| 580,000 | | Tenet Healthcare Corp., 6.125%, 10/01/2028 | | | 578,406 | | | | 0.4 | |
| 570,000 | | Tenet Healthcare Corp., 6.125%, 06/15/2030 | | | 569,405 | | | | 0.4 | |
| 393,000 | | Teva Pharmaceutical Finance Netherlands III BV, 4.750%, 05/09/2027 | | | 379,497 | | | | 0.3 | |
| 431,000 (1) | | Triton Water Holdings, Inc., 6.250%, 04/01/2029 | | | 392,973 | | | | 0.3 | |
| 155,000 | | United Rentals North America, Inc., 3.750%, 01/15/2032 | | | 135,473 | | | | 0.1 | |
| 310,000 | | United Rentals North America, Inc., 4.875%, 01/15/2028 | | | 301,925 | | | | 0.2 | |
| 100,000 | | United Rentals North America, Inc., 5.250%, 01/15/2030 | | | 97,621 | | | | 0.1 | |
| 70,000 | | United Rentals North America, Inc., 5.500%, 05/15/2027 | | | 69,853 | | | | 0.1 | |
| 350,000 (1) | | Varex Imaging Corp., 7.875%, 10/15/2027 | | | 355,658 | | | | 0.3 | |
| 340,000 (1) | | VT Topco, Inc., 8.500%, 08/15/2030 | | | 359,224 | | | | 0.3 | |
| 305,000 (1) | | Wand NewCo 3, Inc., 7.625%, 01/30/2032 | | | 315,695 | | | | 0.2 | |
| 210,000 (1) | | Williams Scotsman International, Inc., 4.625%, 08/15/2028 | | | 198,845 | | | | 0.2 | |
| 340,000 (1) | | Williams Scotsman International, Inc., 6.125%, 06/15/2025 | | | 338,683 | | | | 0.3 | |
| | | | | | 23,370,391 | | | | 18.3 | |
| | | | | | | | | | | |
| | | Energy: 11.8% | |
| 290,000 (1) | | Antero Midstream Partners L.P. / Antero Midstream Finance Corp., 5.375%, 06/15/2029 | | | 279,155 | | | | 0.2 | |
See Accompanying Notes to Financial Statements
| Voya VACS Series HYB Fund | PORTFOLIO OF INVESTMENTS as of March 31, 2024 (continued) |
Principal
Amount† | | | | Value | | | Percentage
of Net
Assets | |
| CORPORATE BONDS/NOTES: (continued) | |
| | | Energy: (continued) | |
| 350,000 (1) | | Antero Midstream Partners L.P. / Antero Midstream Finance Corp., 5.750%, 03/01/2027 | | $ | 345,849 | | | | 0.3 | |
| 230,000 (1) | | Antero Resources Corp., 5.375%, 03/01/2030 | | | 221,090 | | | | 0.2 | |
| 365,000 (1) | | Archrock Partners L.P. / Archrock Partners Finance Corp., 6.250%, 04/01/2028 | | | 361,373 | | | | 0.3 | |
| 135,000 (1) | | Archrock Partners L.P. / Archrock Partners Finance Corp., 6.875%, 04/01/2027 | | | 135,498 | | | | 0.1 | |
| 465,000 (1) | | Ascent Resources Utica Holdings LLC / ARU Finance Corp., 5.875%, 06/30/2029 | | | 443,773 | | | | 0.3 | |
| 105,000 (1) | | Baytex Energy Corp., 7.375%, 03/15/2032 | | | 106,145 | | | | 0.1 | |
| 430,000 (1) | | Baytex Energy Corp., 8.500%, 04/30/2030 | | | 449,381 | | | | 0.3 | |
| 486,000 (1) | | Chord Energy Corp., 6.375%, 06/01/2026 | | | 488,387 | | | | 0.4 | |
| 275,000 (1) | | CNX Midstream Partners L.P., 4.750%, 04/15/2030 | | | 245,332 | | | | 0.2 | |
| 540,000 (1) | | Crescent Energy Finance LLC, 7.250%, 05/01/2026 | | | 550,731 | | | | 0.4 | |
| 295,000 (1) | | Crescent Energy Finance LLC, 7.625%, 04/01/2032 | | | 297,484 | | | | 0.2 | |
| 270,000 (1) | | Delek Logistics Partners L.P. / Delek Logistics Finance Corp., 7.125%, 06/01/2028 | | | 263,603 | | | | 0.2 | |
| 315,000 (1) | | Delek Logistics Partners L.P. / Delek Logistics Finance Corp., 8.625%, 03/15/2029 | | | 321,879 | | | | 0.2 | |
| 150,000 (1) | | DT Midstream, Inc., 4.125%, 06/15/2029 | | | 138,036 | | | | 0.1 | |
| 265,000 (1) | | DT Midstream, Inc., 4.375%, 06/15/2031 | | | 240,186 | | | | 0.2 | |
| 445,000 (1) | | Earthstone Energy Holdings LLC, 8.000%, 04/15/2027 | | | 458,647 | | | | 0.4 | |
| 500,000 (1) | | Encino Acquisition Partners Holdings LLC, 8.500%, 05/01/2028 | | | 505,798 | | | | 0.4 | |
| 390,000 (1) | | Enerflex Ltd., 9.000%, 10/15/2027 | | | 401,001 | | | | 0.3 | |
| 125,000 | | EnLink Midstream Partners L.P., 4.150%, 06/01/2025 | | | 122,353 | | | | 0.1 | |
Principal
Amount† | | | | Value | | | Percentage
of Net
Assets | |
| CORPORATE BONDS/NOTES: (continued) | |
| | | Energy: (continued) | |
| 225,000 (1) | | EQM Midstream Partners L.P., 6.000%, 07/01/2025 | | $ | 225,459 | | | | 0.2 | |
| 245,000 (1) | | Global Partners L.P. / GLP Finance Corp., 8.250%, 01/15/2032 | | | 254,233 | | | | 0.2 | |
| 240,000 (1) | | Hilcorp Energy I L.P. / Hilcorp Finance Co., 5.750%, 02/01/2029 | | | 233,981 | | | | 0.2 | |
| 255,000 (1) | | Hilcorp Energy I L.P. / Hilcorp Finance Co., 6.000%, 04/15/2030 | | | 249,910 | | | | 0.2 | |
| 255,000 (1) | | Hilcorp Energy I L.P. / Hilcorp Finance Co., 6.000%, 02/01/2031 | | | 248,898 | | | | 0.2 | |
| 445,000 (1) | | Kinetik Holdings L.P., 5.875%, 06/15/2030 | | | 435,680 | | | | 0.3 | |
| 340,000 (1) | | Kodiak Gas Services LLC, 7.250%, 02/15/2029 | | | 346,546 | | | | 0.3 | |
| 105,000 (1) | | Matador Resources Co., 6.500%, 04/15/2032 | | | 105,259 | | | | 0.1 | |
| 525,000 (1) | | Matador Resources Co., 6.875%, 04/15/2028 | | | 537,508 | | | | 0.4 | |
| 355,000 (1) | | Moss Creek Resources Holdings, Inc., 7.500%, 01/15/2026 | | | 354,856 | | | | 0.3 | |
| 425,000 | | Murphy Oil Corp., 6.375%, 07/15/2028 | | | 428,142 | | | | 0.3 | |
| 315,000 (1) | | NGL Energy Operating LLC / NGL Energy Finance Corp., 8.125%, 02/15/2029 | | | 322,824 | | | | 0.3 | |
| 210,000 (1) | | NGL Energy Operating LLC / NGL Energy Finance Corp., 8.375%, 02/15/2032 | | | 215,412 | | | | 0.2 | |
| 415,000 | | Occidental Petroleum Corp., 5.500%, 12/01/2025 | | | 415,023 | | | | 0.3 | |
| 485,000 (1) | | Permian Resources Operating LLC, 5.875%, 07/01/2029 | | | 477,311 | | | | 0.4 | |
| 570,000 | | Southwestern Energy Co., 5.375%, 02/01/2029 | | | 554,114 | | | | 0.4 | |
| 75,000 | | Southwestern Energy Co., 5.700%, 01/23/2025 | | | 74,698 | | | | 0.1 | |
| 170,000 (4) | | Sunoco L.P. / Sunoco Finance Corp., 4.500%, 05/15/2029 | | | 158,173 | | | | 0.1 | |
| 390,000 | | Sunoco L.P. / Sunoco Finance Corp., 4.500%, 04/30/2030 | | | 357,478 | | | | 0.3 | |
| 165,000 (1) | | Talos Production, Inc., 9.000%, 02/01/2029 | | | 175,349 | | | | 0.1 | |
| 210,000 (1) | | Talos Production, Inc., 9.375%, 02/01/2031 | | | 224,036 | | | | 0.2 | |
See Accompanying Notes to Financial Statements
| Voya VACS Series HYB Fund | PORTFOLIO OF INVESTMENTS as of March 31, 2024 (continued) |
Principal
Amount† | | | | Value | | | Percentage
of Net
Assets | |
| CORPORATE BONDS/NOTES: (continued) | |
| | | Energy: (continued) | |
| 243,000 (1) | | Transocean Poseidon Ltd., 6.875%, 02/01/2027 | | $ | 243,438 | | | | 0.2 | |
| 55,000 (1) | | Transocean Titan Financing Ltd., 8.375%, 02/01/2028 | | | 57,451 | | | | 0.0 | |
| 305,000 (1) | | Transocean, Inc., 7.500%, 01/15/2026 | | | 304,088 | | | | 0.2 | |
| 445,000 (1) | | Venture Global Calcasieu Pass LLC, 4.125%, 08/15/2031 | | | 396,030 | | | | 0.3 | |
| 505,000 (1) | | Venture Global LNG, Inc., 8.125%, 06/01/2028 | | | 515,510 | | | | 0.4 | |
| 450,000 (1) | | Venture Global LNG, Inc., 8.375%, 06/01/2031 | | | 464,352 | | | | 0.4 | |
| 340,000 (1) | | Venture Global LNG, Inc., 9.500%, 02/01/2029 | | | 366,686 | | | | 0.3 | |
| | | | | | 15,118,146 | | | | 11.8 | |
| | | | | | | | | | | |
| | | Financial: 7.0% | |
| 190,000 (1) | | Alliant Holdings Intermediate LLC / Alliant Holdings Co-Issuer, 7.000%, 01/15/2031 | | | 192,047 | | | | 0.1 | |
| 245,000 | | Ally Financial, Inc., 5.750%, 11/20/2025 | | | 243,348 | | | | 0.2 | |
| 200,000 | | Ally Financial, Inc., 6.700%, 02/14/2033 | | | 202,252 | | | | 0.2 | |
| 55,000 (1) | | AmWINS Group, Inc., 6.375%, 02/15/2029 | | | 55,331 | | | | 0.0 | |
| 200,000 (1) | | Ardonagh Finco Ltd., 7.750%, 02/15/2031 | | | 199,301 | | | | 0.2 | |
| 200,000 (1) | | Ardonagh Group Finance Ltd., 8.875%, 02/15/2032 | | | 197,682 | | | | 0.2 | |
| 450,000 (1) | | Aretec Escrow Issuer, Inc., 7.500%, 04/01/2029 | | | 428,899 | | | | 0.3 | |
| 485,000 (1) | | BroadStreet Partners, Inc., 5.875%, 04/15/2029 | | | 449,362 | | | | 0.4 | |
| 393,000 (1) | | Burford Capital Global Finance LLC, 6.875%, 04/15/2030 | | | 386,260 | | | | 0.3 | |
| 265,000 (1) | | Freedom Mortgage Corp., 6.625%, 01/15/2027 | | | 257,354 | | | | 0.2 | |
| 250,000 (1) | | Freedom Mortgage Corp., 12.250%, 10/01/2030 | | | 275,206 | | | | 0.2 | |
| 410,000 (1) | | Ladder Capital Finance Holdings LLLP / Ladder Capital Finance Corp., 4.750%, 06/15/2029 | | | 373,071 | | | | 0.3 | |
Principal
Amount† | | | | Value | | | Percentage
of Net
Assets | |
| CORPORATE BONDS/NOTES: (continued) | |
| | | Financial: (continued) | |
| 160,000 (1) | | Macquarie Airfinance Holdings Ltd., 6.400%, 03/26/2029 | | $ | 162,650 | | | | 0.1 | |
| 214,000 (1) | | Midcap Financial Issuer Trust, 5.625%, 01/15/2030 | | | 184,690 | | | | 0.1 | |
| 380,000 (1) | | Midcap Financial Issuer Trust, 6.500%, 05/01/2028 | | | 350,906 | | | | 0.3 | |
| 360,000 | | MPT Operating Partnership L.P. / MPT Finance Corp., 4.625%, 08/01/2029 | | | 276,602 | | | | 0.2 | |
| 420,000 (4) | | MPT Operating Partnership L.P. / MPT Finance Corp., 5.000%, 10/15/2027 | | | 352,181 | | | | 0.3 | |
| 275,000 (1) | | Nationstar Mortgage Holdings, Inc., 5.000%, 02/01/2026 | | | 269,344 | | | | 0.2 | |
| 505,000 (1) | | Nationstar Mortgage Holdings, Inc., 5.125%, 12/15/2030 | | | 458,621 | | | | 0.4 | |
| 290,000 (4) | | Navient Corp., 4.875%, 03/15/2028 | | | 270,560 | | | | 0.2 | |
| 185,000 | | Navient Corp., 5.000%, 03/15/2027 | | | 177,369 | | | | 0.1 | |
| 130,000 | | Navient Corp., 6.750%, 06/25/2025 | | | 131,083 | | | | 0.1 | |
| 200,000 | | OneMain Finance Corp., 4.000%, 09/15/2030 | | | 171,356 | | | | 0.1 | |
| 470,000 (4) | | OneMain Finance Corp., 5.375%, 11/15/2029 | | | 442,281 | | | | 0.3 | |
| 160,000 | | OneMain Finance Corp., 7.125%, 03/15/2026 | | | 163,011 | | | | 0.1 | |
| 450,000 (1) | | Panther Escrow Issuer LLC, 7.125%, 06/01/2031 | | | 457,880 | | | | 0.4 | |
| 280,000 (1) | | PRA Group, Inc., 5.000%, 10/01/2029 | | | 236,220 | | | | 0.2 | |
| 110,000 (1) | | RHP Hotel Properties L.P. / RHP Finance Corp., 6.500%, 04/01/2032 | | | 110,440 | | | | 0.1 | |
| 500,000 (1) | | RHP Hotel Properties L.P. / RHP Finance Corp., 7.250%, 07/15/2028 | | | 515,560 | | | | 0.4 | |
| 95,000 (1) | | RLJ Lodging Trust L.P., 3.750%, 07/01/2026 | | | 90,537 | | | | 0.1 | |
| 540,000 (1) | | United Wholesale Mortgage LLC, 5.750%, 06/15/2027 | | | 525,511 | | | | 0.4 | |
| 350,000 (1) | | XHR L.P., 4.875%, 06/01/2029 | | | 324,301 | | | | 0.3 | |
See Accompanying Notes to Financial Statements
| Voya VACS Series HYB Fund | PORTFOLIO OF INVESTMENTS as of March 31, 2024 (continued) |
Principal
Amount† | | | | Value | | | Percentage
of Net
Assets | |
| CORPORATE BONDS/NOTES: (continued) | |
| | | Financial: (continued) | |
| 65,000 (1) | | XHR L.P., 6.375%, 08/15/2025 | | $ | 65,132 | | | | 0.0 | |
| | | | | | 8,996,348 | | | | 7.0 | |
| | | | | | | | | | | |
| | | Industrial: 12.9% | |
| 365,000 (1) | | AAR Escrow Issuer LLC, 6.750%, 03/15/2029 | | | 368,265 | | | | 0.3 | |
| 310,000 (1) | | AmeriTex HoldCo Intermediate LLC, 10.250%, 10/15/2028 | | | 333,221 | | | | 0.3 | |
| 485,000 (1)(2) | | ARD Finance SA, 6.500% (PIK Rate 7.250%, Cash Rate 6.500%), 06/30/2027 | | | 162,809 | | | | 0.1 | |
| 525,000 (1) | | Ardagh Packaging Finance PLC / Ardagh Holdings USA, Inc., 5.250%, 08/15/2027 | | | 331,314 | | | | 0.3 | |
| 350,000 | | Ball Corp., 3.125%, 09/15/2031 | | | 297,816 | | | | 0.2 | |
| 195,000 | | Ball Corp., 6.875%, 03/15/2028 | | | 200,328 | | | | 0.2 | |
| 80,000 (1) | | Bombardier, Inc., 7.250%, 07/01/2031 | | | 80,263 | | | | 0.1 | |
| 270,000 (1) | | Bombardier, Inc., 7.500%, 02/01/2029 | | | 278,331 | | | | 0.2 | |
| 297,000 (1) | | Bombardier, Inc., 7.875%, 04/15/2027 | | | 297,393 | | | | 0.2 | |
| 115,000 (1) | | Bombardier, Inc., 8.750%, 11/15/2030 | | | 122,938 | | | | 0.1 | |
| 420,000 (1) | | Brundage-Bone Concrete Pumping Holdings, Inc., 6.000%, 02/01/2026 | | | 415,184 | | | | 0.3 | |
| 505,000 (1) | | Builders FirstSource, Inc., 5.000%, 03/01/2030 | | | 482,254 | | | | 0.4 | |
| 65,000 (1) | | Cascades, Inc. / Cascades USA, Inc., 5.125%, 01/15/2026 | | | 63,768 | | | | 0.0 | |
| 423,000 (1) | | Cascades, Inc. / Cascades USA, Inc., 5.375%, 01/15/2028 | | | 406,703 | | | | 0.3 | |
| 445,000 (1) | | Chart Industries, Inc., 7.500%, 01/01/2030 | | | 462,665 | | | | 0.4 | |
| 395,000 (1) | | Clean Harbors, Inc., 6.375%, 02/01/2031 | | | 398,323 | | | | 0.3 | |
| 435,000 (1) | | Clydesdale Acquisition Holdings, Inc., 8.750%, 04/15/2030 | | | 427,859 | | | | 0.3 | |
| 505,000 (1) | | Emerald Debt Merger Sub LLC, 6.625%, 12/15/2030 | | | 510,476 | | | | 0.4 | |
| 575,000 (1) | | Energizer Holdings, Inc., 4.750%, 06/15/2028 | | | 533,108 | | | | 0.4 | |
Principal
Amount† | | | | Value | | | Percentage
of Net
Assets | |
| CORPORATE BONDS/NOTES: (continued) | |
| | | Industrial: (continued) | |
| 554,000 (1) | | Fortress Transportation and Infrastructure Investors LLC, 5.500%, 05/01/2028 | | $ | 537,379 | | | | 0.4 | |
| 140,000 (1) | | Fortress Transportation and Infrastructure Investors LLC, 6.500%, 10/01/2025 | | | 139,898 | | | | 0.1 | |
| 460,000 (1) | | GFL Environmental, Inc., 4.000%, 08/01/2028 | | | 424,531 | | | | 0.3 | |
| 125,000 (1) | | GFL Environmental, Inc., 4.250%, 06/01/2025 | | | 123,047 | | | | 0.1 | |
| 270,000 (1) | | GFL Environmental, Inc., 4.375%, 08/15/2029 | | | 248,989 | | | | 0.2 | |
| 190,000 (1) | | Global Infrastructure Solutions, Inc., 5.625%, 06/01/2029 | | | 174,417 | | | | 0.1 | |
| 196,000 (1) | | Global Infrastructure Solutions, Inc., 7.500%, 04/15/2032 | | | 191,894 | | | | 0.1 | |
| 475,000 (1) | | Graham Packaging Co., Inc., 7.125%, 08/15/2028 | | | 431,228 | | | | 0.3 | |
| 550,000 (1) | | Imola Merger Corp., 4.750%, 05/15/2029 | | | 516,195 | | | | 0.4 | |
| 225,000 (1)(2) | | Intelligent Packaging Holdco Issuer L.P., 9.000% (PIK Rate 9.750%, Cash Rate 9.000%), 01/15/2026 | | | 213,477 | | | | 0.2 | |
| 355,000 (1) | | Intelligent Packaging Ltd. Finco, Inc. / Intelligent Packaging Ltd. Co-Issuer LLC, 6.000%, 09/15/2028 | | | 337,574 | | | | 0.3 | |
| 340,000 (1) | | Maxim Crane Works Holdings Capital LLC, 11.500%, 09/01/2028 | | | 369,053 | | | | 0.3 | |
| 455,000 (1) | | New Enterprise Stone & Lime Co., Inc., 9.750%, 07/15/2028 | | | 466,703 | | | | 0.4 | |
| 395,000 (1) | | Owens-Brockway Glass Container, Inc., 7.250%, 05/15/2031 | | | 402,802 | | | | 0.3 | |
| 360,000 (1) | | Roller Bearing Co. of America, Inc., 4.375%, 10/15/2029 | | | 330,073 | | | | 0.3 | |
| 208,000 (1) | | Rolls-Royce PLC, 3.625%, 10/14/2025 | | | 201,986 | | | | 0.2 | |
| 386,000 (1) | | Rolls-Royce PLC, 5.750%, 10/15/2027 | | | 387,392 | | | | 0.3 | |
| 415,000 (1) | | Sealed Air Corp., 4.000%, 12/01/2027 | | | 389,334 | | | | 0.3 | |
| 65,000 (1) | | Sealed Air Corp., 5.125%, 12/01/2024 | | | 64,795 | | | | 0.0 | |
See Accompanying Notes to Financial Statements
| Voya VACS Series HYB Fund | PORTFOLIO OF INVESTMENTS as of March 31, 2024 (continued) |
Principal
Amount† | | | | Value | | | Percentage
of Net
Assets | |
| CORPORATE BONDS/NOTES: (continued) | |
| | | Industrial: (continued) | |
| 245,000 (1) | | Sealed Air Corp/Sealed Air Corp. US, 6.125%, 02/01/2028 | | $ | 245,718 | | | | 0.2 | |
| 170,000 (1) | | Sensata Technologies BV, 5.000%, 10/01/2025 | | | 168,038 | | | | 0.1 | |
| 520,000 (1) | | Sensata Technologies, Inc., 3.750%, 02/15/2031 | | | 450,329 | | | | 0.3 | |
| 330,000 (1) | | Smyrna Ready Mix Concrete LLC, 8.875%, 11/15/2031 | | | 353,003 | | | | 0.3 | |
| 445,000 (1) | | Standard Industries, Inc., 3.375%, 01/15/2031 | | | 373,597 | | | | 0.3 | |
| 255,000 (1) | | Standard Industries, Inc., 4.375%, 07/15/2030 | | | 229,306 | | | | 0.2 | |
| 365,000 (1) | | Summit Materials LLC / Summit Materials Finance Corp., 5.250%, 01/15/2029 | | | 356,031 | | | | 0.3 | |
| 298,000 (1) | | Summit Materials LLC / Summit Materials Finance Corp., 6.500%, 03/15/2027 | | | 297,999 | | | | 0.2 | |
| 200,000 (1) | | TK Elevator Holdco GmbH, 7.625%, 07/15/2028 | | | 196,301 | | | | 0.2 | |
| 435,000 | | TransDigm, Inc., 4.625%, 01/15/2029 | | | 404,204 | | | | 0.3 | |
| 350,000 | | TransDigm, Inc., 5.500%, 11/15/2027 | | | 342,840 | | | | 0.3 | |
| 320,000 (1) | | TransDigm, Inc., 6.625%, 03/01/2032 | | | 323,693 | | | | 0.3 | |
| 280,000 (1) | | TransDigm, Inc., 6.875%, 12/15/2030 | | | 285,739 | | | | 0.2 | |
| 405,000 (1) | | Weekley Homes LLC / Weekley Finance Corp., 4.875%, 09/15/2028 | | | 374,849 | | | | 0.3 | |
| | | | | | 16,525,432 | | | | 12.9 | |
| | | | | | | | | | | |
| | | Technology: 3.0% | |
| 910,000 (1) | | Cloud Software Group, Inc., 6.500%, 03/31/2029 | | | 864,310 | | | | 0.7 | |
| 300,000 (1) | | Cloud Software Group, Inc., 9.000%, 09/30/2029 | | | 288,022 | | | | 0.2 | |
| 290,000 (1) | | Entegris Escrow Corp., 5.950%, 06/15/2030 | | | 286,846 | | | | 0.2 | |
| 195,000 (1) | | Entegris, Inc., 3.625%, 05/01/2029 | | | 175,328 | | | | 0.1 | |
| 335,000 (1) | | McAfee Corp., 7.375%, 02/15/2030 | | | 307,577 | | | | 0.3 | |
| 370,000 (1) | | NCR Atleos Escrow Corp., 9.500%, 04/01/2029 | | | 396,135 | | | | 0.3 | |
| 220,000 (1) | | Open Text Corp., 3.875%, 12/01/2029 | | | 196,242 | | | | 0.2 | |
Principal
Amount† | | | | Value | | | Percentage
of Net
Assets | |
| CORPORATE BONDS/NOTES: (continued) | |
| | | Technology: (continued) | |
| 465,000 (1) | | Open Text Holdings, Inc., 4.125%, 02/15/2030 | | $ | 416,905 | | | | 0.3 | |
| 460,000 (1) | | UKG, Inc., 6.875%, 02/01/2031 | | | 468,950 | | | | 0.4 | |
| 399,000 (1) | | Virtusa Corp., 7.125%, 12/15/2028 | | | 358,615 | | | | 0.3 | |
| | | | | | 3,758,930 | | | | 3.0 | |
| | | | | | | | | | | |
| | | Utilities: 2.1% | |
| 466,000 (1) | | Atlantica Sustainable Infrastructure PLC, 4.125%, 06/15/2028 | | | 428,547 | | | | 0.3 | |
| 280,000 (1) | | Calpine Corp., 4.500%, 02/15/2028 | | | 265,791 | | | | 0.2 | |
| 220,000 (1) | | Calpine Corp., 5.000%, 02/01/2031 | | | 202,032 | | | | 0.2 | |
| 310,000 (1) | | Calpine Corp., 5.125%, 03/15/2028 | | | 297,782 | | | | 0.2 | |
| 60,000 (1) | | Calpine Corp., 5.250%, 06/01/2026 | | | 59,423 | | | | 0.1 | |
| 365,000 | | TransAlta Corp., 7.750%, 11/15/2029 | | | 379,760 | | | | 0.3 | |
| 270,000 (1) | | Vistra Operations Co. LLC, 4.375%, 05/01/2029 | | | 250,405 | | | | 0.2 | |
| 360,000 (1) | | Vistra Operations Co. LLC, 5.500%, 09/01/2026 | | | 354,716 | | | | 0.3 | |
| 185,000 (1) | | Vistra Operations Co. LLC, 5.625%, 02/15/2027 | | | 182,307 | | | | 0.1 | |
| 270,000 (1) | | Vistra Operations Co. LLC, 7.750%, 10/15/2031 | | | 282,963 | | | | 0.2 | |
| | | | | | 2,703,726 | | | | 2.1 | |
| | | | | | | | | | | |
| | | Total Corporate Bonds/Notes
(Cost $116,266,489) | | | 119,427,177 | | | | 93.4 | |
| | | | | | | | | | | |
| BANK LOANS: 2.3% | |
| | | Consumer, Non-cyclical: 0.2% | |
| 292,788 | | Nielsen Consumer Inc., 2023 USD Fifth Amendment Incremental Term Loan, 11.549%, (TSFR3M+6.250%), 03/06/2028 | | | 291,323 | | | | 0.2 | |
| | | | | | | | | | | |
| |
| | | Financial: 1.5% | |
| 525,000 | | Acrisure LLC, 2023 Term Loan, 9.850%, (TSFR3M+4.500%), 11/06/2030 | | | 528,281 | | | | 0.4 | |
See Accompanying Notes to Financial Statements
| Voya VACS Series HYB Fund | PORTFOLIO OF INVESTMENTS as of March 31, 2024 (continued) |
Principal
Amount† | | | | Value | | | Percentage
of Net
Assets | |
| BANK LOANS: (continued) | |
| | | Financial: (continued) | |
| 375,000 | | Advisor Group, Inc., 2023 Term Loan B, 8.840%, (TSFR1M+3.500%), 08/16/2028 | | $ | 376,976 | | | | 0.3 | |
| 812,963 | | Hub International Ltd., 2024 Term Loan B, 8.840%, (TSFR1M+3.500%), 06/20/2030 | | | 814,016 | | | | 0.6 | |
| 187,500 | | Truist Financial, 2nd Lien Term Loan, 10.060%, (TSFR1M+3.500%), 03/31/2032 | | | 188,906 | | | | 0.2 | |
| | | | | | 1,908,179 | | | | 1.5 | |
| | | | | | | | | | | |
| | | Health Care: 0.3% | |
| 375,000 | | Cotiviti Corporation, 2024 Term Loan, 8.571%, (TSFR1M+3.500%), 02/22/2031 | | | 375,625 | | | | 0.3 | |
| | | | | | | | | | | |
| | | Lodging & Casinos: 0.3% | |
| 294,000 | | Hilton Worldwide 06/22/2026, 2019 Term Loan B2, 6.939%, (TSFR1M+1.750%), 06/22/2026 | | | 294,817 | | | | 0.3 | |
| | | | | | | | | | | |
| | | Total Bank Loans
(Cost $2,849,307) | | | 2,869,944 | | | | 2.3 | |
| | | | | | | | | | | |
| | | Total Long-Term Investments (Cost $119,115,796) | | | 122,297,121 | | | | 95.7 | |
Principal
Amount† | | | | Value | | | Percentage
of Net
Assets | |
| SHORT-TERM INVESTMENTS: 5.6% | |
| | | Commercial Paper: 3.1% | |
| 1,000,000 | | Consolidated Edison, 22.080%, 04/01/2024 | | | 999,397 | | | | 0.8 | |
| 500,000 | | Duke Energy Co., 13.800%, 04/02/2024 | | | 499,623 | | | | 0.4 | |
| 500,000 | | Enbridge (US) Inc., 22.490%, 04/01/2024 | | | 499,693 | | | | 0.4 | |
| 1,000,000 | | HP, Inc., 11.050%, 04/03/2024 | | | 999,095 | | | | 0.7 | |
| 1,000,000 | | Sherwin-Williams Co., 22.060%, 04/01/2024 | | | 999,398 | | | | 0.8 | |
| | | Total Commercial Paper (Cost $3,999,621) | | | 3,997,206 | | | | 3.1 | |
Principal
Amount† | | | | Value | | | Percentage
of Net
Assets | |
| SHORT-TERM INVESTMENTS: (continued) | |
| | | Repurchase Agreements: 1.9% | |
| 1,000,000 (5) | | Bank of America Inc., Repurchase Agreement dated 03/28/2024, 5.320%, due 04/01/2024 (Repurchase Amount $1,000,583, collateralized by various U.S. Government Securities, 0.000%-4.500%, Market Value plus accrued interest $1,020,000, due 10/15/26-08/15/35) | | $ | 1,000,000 | | | | 0.8 | |
| 1,000,000 (5) | | Daiwa Capital Markets America Inc., Repurchase Agreement dated 03/28/2024, 5.350%, due 04/01/2024 (Repurchase Amount $1,000,586, collateralized by various U.S. Government Securities, 0.000%-4.125%, Market Value plus accrued interest $1,020,000, due 06/11/24-02/15/42) | | | 1,000,000 | | | | 0.8 | |
| 438,961 (5) | | HSBC Securities (USA) Inc., Repurchase Agreement dated 03/28/2024, 5.320%, due 04/01/2024 (Repurchase Amount $439,217, collateralized by various U.S. Government Securities, 0.625%-4.000%, Market Value plus accrued interest $447,740, due 02/15/25-02/15/48) | | | 438,961 | | | | 0.3 | |
| | | Total Repurchase Agreements
(Cost $2,438,961) | | | 2,438,961 | | | | 1.9 | |
See Accompanying Notes to Financial Statements
| Voya VACS Series HYB Fund | PORTFOLIO OF INVESTMENTS as of March 31, 2024 (continued) |
| Shares | | | | Value | | | Percentage of Net Assets | |
| SHORT-TERM INVESTMENTS: (continued) | |
| | | Mutual Funds: 0.6% | |
| 726,000 (6) | | Morgan Stanley Institutional Liquidity Funds - Government Portfolio (Institutional Share Class), 5.220%
(Cost $726,000) | | $ | 726,000 | | | | 0.6 | |
| | | | | | | | | | | |
| | | Total Short-Term Investments
(Cost $7,164,582) | | $ | 7,162,167 | | | | 5.6 | |
| | | Total Investments in Securities
(Cost $126,280,378) | | $ | 129,459,288 | | | | 101.3 | |
| | | Liabilities in Excess of Other Assets | | | (1,616,033 | ) | | | (1.3 | ) |
| Shares | | | | Value | | | Percentage of Net Assets | |
| SHORT-TERM INVESTMENTS: (continued) | |
| | Mutual Funds (continued) | | | | | | | | |
| | | Net Assets | | $ | 127,843,255 | | | | 100.0 | |
| † | Unless otherwise indicated, principal amount is shown in USD. |
| (1) | Securities with purchases pursuant to Rule 144A or section 4(a)(2), under the Securities Act of 1933 and may not be resold subject to that rule except to qualified institutional buyers. |
| (2) | All or a portion of this security is payment-in-kind (“PIK”) which may pay interest or additional principal at the issuer’s discretion. Rates shown are the current rate and possible payment rates. |
| (3) | Variable rate security. Rate shown is the rate in effect as of March 31, 2024. |
| (4) | Security, or a portion of the security, is on loan. |
| (5) | All or a portion of the security represents securities purchased with cash collateral received for securities on loan. |
| (6) | Rate shown is the 7-day yield as of March 31, 2024. |
| Reference Rate Abbreviations: |
| |
| TSFR1M | 1-month CME Term Secured Overnight Financing Rate |
| TSFR3M | 3-month CME Term Secured Overnight Financing Rate |
Fair Value Measurements^
The following is a summary of the fair valuations according to the inputs used as of March 31, 2024 in valuing the assets and liabilities:
| | | Quoted Prices
in Active Markets
for Identical
Investments
(Level 1) | | | Significant Other
Observable
Inputs
(Level 2) | | | Significant
Unobservable
Inputs
(Level 3) | | | Fair Value
at
March 31, 2024 | |
| Asset Table |
| Investments, at fair value |
| Corporate Bonds/Notes | | $ | — | | | $ | 119,427,177 | | | $ | — | | | $ | 119,427,177 | |
| Bank Loans | | | — | | | | 2,869,944 | | | | — | | | | 2,869,944 | |
| Short-Term Investments | | | 726,000 | | | | 6,436,167 | | | | — | | | | 7,162,167 | |
| Total Investments, at fair value | | $ | 726,000 | | | $ | 128,733,288 | | | $ | — | | | $ | 129,459,288 | |
| | | | | | | | | | | | | | | | | |
| ^ | See Note 2, “Significant Accounting Policies” in the Notes to Financial Statements for additional information. |
At March 31, 2024, the aggregate cost of securities and other investments for federal income tax purposes was the same as for financial statement purposes. The composition of unrealized appreciation and depreciation of securities and other investments was:
| Cost for federal income tax purposes was $126,290,148. |
| Net unrealized appreciation consisted of: | | | |
| Gross Unrealized Appreciation | | $ | 4,592,981 | |
| Gross Unrealized Depreciation | | | (1,423,841 | ) |
| Net Unrealized Appreciation | | $ | 3,169,140 | |
See Accompanying Notes to Financial Statements
| Voya VACS Series SC Fund | PORTFOLIO OF INVESTMENTS as of March 31, 2024 |
Principal
Amount† | | | | Value | | | Percentage
of Net
Assets |
| COMMERCIAL MORTGAGE-BACKED SECURITIES: 38.6% |
| 776,962 (1) | | Arbor Multifamily Mortgage Securities Trust 2021-MF3 D, 2.000%, 10/15/2054 | | $ | 483,085 | | | | 0.2 | |
| 1,701,186 (1) | | Arbor Multifamily Mortgage Securities Trust 2021-MF3 E, 2.000%, 10/15/2054 | | | 971,239 | | | | 0.5 | |
| 1,054,000 (1)(2) | | AREIT Trust 2019-CRE3 D, 8.090%, (TSFR1M + 2.764%), 09/14/2036 | | | 979,272 | | | | 0.5 | |
| 500,000 (1)(2) | | Atrium Hotel Portfolio Trust 2017-ATRM C, 7.273%, (TSFR1M + 1.947%), 12/15/2036 | | | 474,263 | | | | 0.2 | |
| 662,526 (1) | | BANK 2017-BNK4 D, 3.357%, 05/15/2050 | | | 447,376 | | | | 0.2 | |
| 6,369,284 (1)(2)(3) | | BANK 2017-BNK8 XE, 1.294%, 11/15/2050 | | | 250,668 | | | | 0.1 | |
| 15,834,663 (2)(3) | | BANK 2020-BN27 XA, 1.157%, 04/15/2063 | | | 824,484 | | | | 0.4 | |
| 5,270,154 (2)(3) | | BANK 2020-BN30 XA, 1.294%, 12/15/2053 | | | 322,427 | | | | 0.2 | |
| 900,000 (2) | | Bank of America Merrill Lynch Commercial Mortgage Trust 2017-BNK3 C, 4.352%, 02/15/2050 | | | 822,812 | | | | 0.4 | |
| 13,605,683 (2)(3) | | Barclays Commercial Mortgage Trust 2019-C4 XA, 1.552%, 08/15/2052 | | | 793,933 | | | | 0.4 | |
| 5,710,974 (1)(2)(3) | | Benchmark Mortgage Trust 2018-B5 XD, 1.500%, 07/15/2051 | | | 298,370 | | | | 0.2 | |
| 5,086,839 (2)(3) | | Benchmark Mortgage Trust 2019-B10 XA, 1.189%, 03/15/2062 | | | 243,445 | | | | 0.1 | |
| 4,489,366 (1)(2)(3) | | Benchmark Mortgage Trust 2019-B14 XD, 1.272%, 12/15/2062 | | | 269,514 | | | | 0.1 | |
| 1,841,521 (1) | | Benchmark Mortgage Trust 2020-B18 AGNF, 4.139%, 07/15/2053 | | | 1,676,888 | | | | 0.8 | |
| 6,618,054 (2)(3) | | Benchmark Mortgage Trust 2020-B18 XA, 1.780%, 07/15/2053 | | | 415,392 | | | | 0.2 | |
| 4,782,933 (2)(3) | | Benchmark Mortgage Trust 2020-B22 XA, 1.511%, 01/15/2054 | | | 365,770 | | | | 0.2 | |
| 5,517,428 (2)(3) | | Benchmark Mortgage Trust 2021-B23 XA, 1.265%, 02/15/2054 | | | 318,451 | | | | 0.2 | |
| 10,328,638 (2)(3) | | Benchmark Mortgage Trust 2021-B25 XA, 1.089%, 04/15/2054 | | | 537,904 | | | | 0.3 | |
| 1,981,555 (1)(4) | | BMD2 Re-Remic Trust 2019-FRR1 3AB, 0.000%, 05/25/2052 | | | 1,431,366 | | | | 0.7 | |
Principal
Amount† | | | | Value | | | Percentage
of Net
Assets |
| COMMERCIAL MORTGAGE-BACKED SECURITIES: (continued) |
| 1,008,846 (1)(4) | | BMD2 Re-Remic Trust 2019-FRR1 4A, 0.000%, 05/25/2052 | | $ | 695,331 | | | | 0.3 | |
| 2,537,173 (1) | | BMD2 Re-Remic Trust 2019-FRR1 6B10, 2.449%, 05/25/2052 | | | 1,967,367 | | | | 1.0 | |
| 850,000 (1)(2) | | BOCA Commercial Mortgage Trust 2022-BOCA D, 8.644%, (TSFR1M + 3.318%), 05/15/2039 | | | 850,054 | | | | 0.4 | |
| 723,659 (1)(2) | | BX Commercial Mortgage Trust 2019-IMC D, 7.271%, (TSFR1M + 1.946%), 04/15/2034 | | | 722,119 | | | | 0.4 | |
| 602,296 (1)(2) | | BX Commercial Mortgage Trust 2021-VOLT F, 7.840%, (TSFR1M + 2.514%), 09/15/2036 | | | 597,230 | | | | 0.3 | |
| 1,000,000 (1)(2) | | BX Commercial Mortgage Trust 2022-CSMO B, 8.466%, (TSFR1M + 3.141%), 06/15/2027 | | | 1,004,905 | | | | 0.5 | |
| 750,000 (1)(2) | | BX Commercial Mortgage Trust 2023-XL3 D, 8.914%, (TSFR1M + 3.589%), 12/09/2040 | | | 758,043 | | | | 0.4 | |
| 200,000 (1)(2) | | BX Trust 2018-GW C, 6.843%, (TSFR1M + 1.517%), 05/15/2035 | | | 198,619 | | | | 0.1 | |
| 5,291,039 (2)(3) | | CD Mortgage Trust 2019-CD8 XA, 1.397%, 08/15/2057 | | | 287,787 | | | | 0.1 | |
| 1,274,158 (1)(2) | | Citigroup Commercial Mortgage Trust 2016-P4 E, 4.682%, 07/10/2049 | | | 669,955 | | | | 0.3 | |
| 605,308 (1)(2) | | Citigroup Commercial Mortgage Trust 2016-P4 F, 4.682%, 07/10/2049 | | | 193,748 | | | | 0.1 | |
| 1,550,913 (1) | | Citigroup Commercial Mortgage Trust 2016-P5 D, 3.000%, 10/10/2049 | | | 909,669 | | | | 0.5 | |
| 6,220,215 (1)(2)(3) | | Citigroup Commercial Mortgage Trust 2017-P8 XE, 1.257%, 09/15/2050 | | | 229,152 | | | | 0.1 | |
| 674,572 (1)(2) | | Citigroup COmmercial Mortgage Trust 2018-C6 D, 5.059%, 11/10/2051 | | | 424,564 | | | | 0.2 | |
| 548,090 (1)(2) | | COMM Mortgage Trust 2020-CBM F, 3.633%, 02/10/2037 | | | 512,697 | | | | 0.3 | |
See Accompanying Notes to Financial Statements
| Voya VACS Series SC Fund | PORTFOLIO OF INVESTMENTS as of March 31, 2024 (continued) |
Principal
Amount† | | | | Value | | | Percentage
of Net
Assets |
| COMMERCIAL MORTGAGE-BACKED SECURITIES: (continued) |
| 1,250,000 (1)(2) | | DK Trust 2024-SPBX D, 8.100%, (TSFR1M + 2.750%), 03/15/2034 | | $ | 1,254,644 | | | | 0.6 | |
| 3,907,922 (2)(3) | | Freddie Mac Multifamily Structured Pass Through Certificates K-1521 X1, 0.979%, 08/25/2036 | | | 298,159 | | | | 0.2 | |
| 6,637,004 (2)(3) | | Freddie Mac Multifamily Structured Pass Through Certificates KG01 X3, 3.124%, 05/25/2029 | | | 878,172 | | | | 0.4 | |
| 1,455,653 (1)(4) | | FREMF Mortgage Trust 2016-K57 D, 0.000%, 08/25/2049 | | | 1,152,194 | | | | 0.6 | |
| 603,444 (1)(4) | | GAM Re-REMIC Trust 2021-FRR1 1B, 0.000%, 11/29/2050 | | | 464,818 | | | | 0.2 | |
| 2,235,423 (1)(4) | | GAM Re-REMIC Trust 2021-FRR1 1C, 0.000%, 11/29/2050 | | | 1,667,731 | | | | 0.8 | |
| 3,356,899 (1)(4) | | GAM Re-REMIC Trust 2021-FRR1 1D, 0.000%, 11/29/2050 | | | 2,464,846 | | | | 1.2 | |
| 2,415,208 (1)(4) | | GAM Re-REMIC Trust 2021-FRR1 2C, 0.000%, 11/29/2050 | | | 1,755,316 | | | | 0.9 | |
| 2,992,509 (1) | | GAM RE-REMIC Trust 2022-FRR3 BK71, 2.010%, 11/27/2050 | | | 2,436,505 | | | | 1.2 | |
| 1,616,752 (1)(4) | | GAM RE-REMIC Trust 2022-FRR3 BK89, 0.000%, 01/27/2052 | | | 1,105,683 | | | | 0.6 | |
| 1,158,216 (1)(4) | | GAM RE-REMIC Trust 2022-FRR3 C728, 0.000%, 08/27/2050 | | | 1,103,800 | | | | 0.6 | |
| 1,178,995 (1)(4) | | GAM RE-REMIC Trust 2022-FRR3 CK47, 0.000%, 05/27/2048 | | | 1,060,947 | | | | 0.5 | |
| 1,428,647 (1)(4) | | GAM RE-REMIC Trust 2022-FRR3 CK61, 0.000%, 11/27/2049 | | | 1,061,909 | | | | 0.5 | |
| 1,159,119 (1)(4) | | GAM RE-REMIC Trust 2022-FRR3 D728, 0.000%, 08/27/2050 | | | 1,093,029 | | | | 0.5 | |
| 1,178,694 (1)(4) | | GAM RE-REMIC Trust 2022-FRR3 DK47, 0.000%, 05/27/2048 | | | 1,048,734 | | | | 0.5 | |
| 2,134,237 (1) | | GAM RE-REMIC TRUST 2021-FRR2 BK78, 2.410%, 09/27/2051 | | | 1,688,565 | | | | 0.8 | |
| 1,624,694 (1)(4) | | GAM RE-REMIC TRUST 2021-FRR2 C730, 0.000%, 09/27/2051 | | | 1,502,012 | | | | 0.7 | |
| 1,974,628 (1)(4) | | GAM RE-REMIC TRUST 2021-FRR2 CK44, 0.000%, 09/27/2051 | | | 1,811,779 | | | | 0.9 | |
Principal
Amount† | | | | Value | | | Percentage
of Net
Assets |
| COMMERCIAL MORTGAGE-BACKED SECURITIES: (continued) |
| 1,362,997 (1)(4) | | GAM RE-REMIC TRUST 2021-FRR2 CK78, 0.000%, 09/27/2051 | | $ | 914,707 | | | | 0.5 | |
| 1,623,791 (1)(4) | | GAM RE-REMIC TRUST 2021-FRR2 D730, 0.000%, 09/27/2051 | | | 1,494,974 | | | | 0.7 | |
| 1,605,421 (1)(4) | | GAM RE-REMIC TRUST 2021-FRR2 DK49, 0.000%, 09/27/2051 | | | 1,389,921 | | | | 0.7 | |
| 653,492 (1) | | GS Mortgage Securities Trust 2019-GC39 D, 3.000%, 05/10/2052 | | | 373,250 | | | | 0.2 | |
| 542,067 (1) | | GS Mortgage Securities Trust 2021-GSA3 D, 2.250%, 12/15/2054 | | | 324,396 | | | | 0.2 | |
| 1,000,000 (1)(2) | | Hawaii Hotel Trust 2019-MAUI E, 7.533%, (TSFR1M + 2.207%), 05/15/2038 | | | 991,383 | | | | 0.5 | |
| 500,000 (1)(2) | | INTOWN Mortgage Trust 2022-STAY B, 8.611%, (TSFR1M + 3.286%), 08/15/2039 | | | 503,920 | | | | 0.3 | |
| 1,760,000 (1)(2) | | J.P. Morgan Chase Commercial Mortgage Securities Trust 2019-ICON E, 5.220%, 01/05/2034 | | | 1,614,376 | | | | 0.8 | |
| 401,000 (1)(2) | | JP Morgan Chase Commercial Mortgage Securities Trust 2020-LOOP E, 3.861%, 12/05/2038 | | | 104,570 | | | | 0.1 | |
| 1,250,000 (1)(2) | | KSL Commercial Mortgage Trust 2023-HT C, 8.764%, (TSFR1M + 3.439%), 12/15/2036 | | | 1,257,130 | | | | 0.6 | |
| 375,000 (1)(2) | | LAQ Mortgage Trust 2023-LAQ D, 9.514%, (TSFR1M + 4.188%), 03/15/2036 | | | 371,164 | | | | 0.2 | |
| 497,612 (1)(2) | | Med Trust 2021-MDLN F, 9.439%, (TSFR1M + 4.114%), 11/15/2038 | | | 497,837 | | | | 0.3 | |
| 377,495 (1)(2) | | MHC Commercial Mortgage Trust 2021-MHC F, 8.040%, (TSFR1M + 2.715%), 04/15/2038 | | | 374,476 | | | | 0.2 | |
| 360,000 (1)(2) | | MHC Trust 2021-MHC2 E, 7.389%, (TSFR1M + 2.064%), 05/15/2038 | | | 355,297 | | | | 0.2 | |
| 4,684,360 (1)(2)(3) | | Morgan Stanley Capital I 2017-HR2 XD, 1.588%, 12/15/2050 | | | 234,275 | | | | 0.1 | |
See Accompanying Notes to Financial Statements
| Voya VACS Series SC Fund | PORTFOLIO OF INVESTMENTS as of March 31, 2024 (continued) |
Principal
Amount† | | | | Value | | | Percentage
of Net
Assets |
| COMMERCIAL MORTGAGE-BACKED SECURITIES: (continued) |
| 478,826 (1)(2) | | Morgan Stanley Capital I Trust 2016-BNK2 D, 3.000%, 11/15/2049 | | $ | 227,619 | | | | 0.1 | |
| 12,016,348 (2)(3) | | Morgan Stanley Capital I Trust 2019-H7 XA, 1.289%, 07/15/2052 | | | 563,479 | | | | 0.3 | |
| 653,492 (1) | | Prima Capital CRE Securitization Ltd. 2019-7A C, 3.250%, 12/25/2050 | | | 602,129 | | | | 0.3 | |
| 3,011,482 (1) | | Prima Capital CRE Securitization Ltd. 2019-7A D, 4.250%, 12/25/2050 | | | 2,477,844 | | | | 1.2 | |
| 4,842,462 (1) | | RFM Reremic Trust 2022-FRR1 AB55, 0.990%, 03/28/2049 | | | 4,128,285 | | | | 2.0 | |
| 4,104,649 (1)(2) | | RFM Reremic Trust 2022-FRR1 AB60, 2.410%, 11/08/2049 | | | 3,531,274 | | | | 1.8 | |
| 2,179,560 (1)(2) | | RFM Reremic Trust 2022-FRR1 AB64, 2.260%, 03/01/2050 | | | 1,856,669 | | | | 0.9 | |
| 1,508,752 (1)(4) | | RFM Reremic Trust 2022-FRR1 CK55, 0.000%, 03/28/2049 | | | 1,249,897 | | | | 0.6 | |
| 1,897,233 (1)(4) | | RFM Reremic Trust 2022-FRR1 CK60, 0.000%, 11/08/2049 | | | 1,476,723 | | | | 0.7 | |
| 2,730,209 (4) | | Series RR Trust 2014-1 E, 0.000%, 05/25/2047 | | | 2,718,168 | | | | 1.3 | |
| 1,000,000 (1)(2) | | SG Commercial Mortgage Securities Trust 2020-COVE E, 3.728%, 03/15/2037 | | | 892,883 | | | | 0.4 | |
| 500,000 (1)(2) | | SMRT 2022-MINI D, 7.276%, (TSFR1M + 1.950%), 01/15/2039 | | | 492,015 | | | | 0.2 | |
| 750,000 (1)(2) | | Wells Fargo Commercial Mortgage Trust 2016-C37 D, 3.166%, 12/15/2049 | | | 625,205 | | | | 0.3 | |
| 9,458,009 (2)(3) | | Wells Fargo Commercial Mortgage Trust 2017-C40 XA, 0.862%, 10/15/2050 | | | 219,906 | | | | 0.1 | |
| 6,115,847 (2)(3) | | Wells Fargo Commercial Mortgage Trust 2021-C60 XA, 1.529%, 08/15/2054 | | | 449,646 | | | | 0.2 | |
| | | Total Commercial Mortgage-Backed Securities
(Cost $73,672,019) | | | 78,110,160 | | | | 38.6 | |
| | | | | | | | | | | |
| COLLATERALIZED MORTGAGE OBLIGATIONS: 33.9% |
| 422,109 (1)(2) | | Agate Bay Mortgage Trust 2015-1 B4, 3.654%, 01/25/2045 | | | 320,197 | | | | 0.2 | |
Principal
Amount† | | | | Value | | | Percentage
of Net
Assets |
| COLLATERALIZED MORTGAGE OBLIGATIONS: (continued) |
| 326,613 (1)(2) | | Agate Bay Mortgage Trust 2016-2 B3, 3.760%, 03/25/2046 | | $ | 300,411 | | | | 0.1 | |
| 903,444 (1)(2) | | Ajax Mortgage Loan Trust 2019-D A2, 3.500%, 09/25/2065 | | | 817,458 | | | | 0.4 | |
| 451,722 (1)(2) | | Ajax Mortgage Loan Trust 2019-F A2, 3.500%, 07/25/2059 | | | 417,979 | | | | 0.2 | |
| 570,333 (1)(2) | | Bayview MSR Opportunity Master Fund Trust 2021-5 B3A, 3.484%, 11/25/2051 | | | 464,821 | | | | 0.2 | |
| 598,624 (1)(2) | | Bayview MSR Opportunity Master Fund Trust 2022-2 B3A, 3.400%, 12/25/2051 | | | 476,924 | | | | 0.2 | |
| 730,372 (1)(2) | | Bayview Opportunity Master Fund VI Trust 2021-6 B3A, 3.388%, 10/25/2051 | | | 586,934 | | | | 0.3 | |
| 338,361 (2) | | Bear Stearns ALT-A Trust 2005-9 26A1, 4.066%, 11/25/2035 | | | 187,497 | | | | 0.1 | |
| 527,084 (1)(2) | | CIM Trust 2019-INV3 B1A, 4.684%, 08/25/2049 | | | 489,595 | | | | 0.2 | |
| 372,678 (1)(2) | | CIM Trust 2021-J1 A19, 2.500%, 03/25/2051 | | | 297,594 | | | | 0.1 | |
| 433,080 (1)(2) | | Citigroup Mortgage Loan Trust 2021-J3 B3W, 2.859%, 09/25/2051 | | | 338,845 | | | | 0.2 | |
| 1,154,008 (1)(2) | | COLT Mortgage Loan Trust 2021-1 A1, 0.910%, 06/25/2066 | | | 946,770 | | | | 0.5 | |
| 873,330 (1)(2) | | Connecticut Avenue Securities Trust 2020-SBT1 1M2, 9.085%, (SOFR30A + 3.764%), 02/25/2040 | | | 926,265 | | | | 0.5 | |
| 1,054,019 (1)(2) | | Connecticut Avenue Securities Trust 2022-R01 1B1, 8.470%, (SOFR30A + 3.150%), 12/25/2041 | | | 1,084,803 | | | | 0.5 | |
| 602,296 (1)(2) | | Deephaven Residential Mortgage Trust 2021-4 M1, 3.257%, 11/25/2066 | | | 453,615 | | | | 0.2 | |
| 602,296 (1)(2) | | Fannie Mae Connecticut Avenue Securities 2020-R02 2B1, 8.435%, (SOFR30A + 3.114%), 01/25/2040 | | | 619,975 | | | | 0.3 | |
See Accompanying Notes to Financial Statements
| Voya VACS Series SC Fund | PORTFOLIO OF INVESTMENTS as of March 31, 2024 (continued) |
Principal
Amount† | | | | Value | | | Percentage
of Net
Assets |
| COLLATERALIZED MORTGAGE OBLIGATIONS: (continued) |
| 301,148 (1)(2) | | Fannie Mae Connecticut Avenue Securities 2021-R02 2B1, 8.620%, (SOFR30A + 3.300%), 11/25/2041 | | $ | 311,094 | | | | 0.2 | |
| 1,761,717 (1)(2) | | Fannie Mae Connecticut Avenue Securities 2023-R02 1B1, 10.870%, (SOFR30A + 5.550%), 01/25/2043 | | | 1,946,910 | | | | 1.0 | |
| 398,882 (1)(2) | | Flagstar Mortgage Trust 2018-4 B3, 4.162%, 07/25/2048 | | | 358,058 | | | | 0.2 | |
| 1,559,943 (1)(2) | | Flagstar Mortgage Trust 2019-1INV B2A, 4.527%, 10/25/2049 | | | 1,396,321 | | | | 0.7 | |
| 1,388,858 (1)(2) | | Flagstar Mortgage Trust 2020-1INV B2A, 4.204%, 03/25/2050 | | | 1,234,832 | | | | 0.6 | |
| 692,213 (1)(2) | | Flagstar Mortgage Trust 2020-1INV B3, 4.204%, 03/25/2050 | | | 609,234 | | | | 0.3 | |
| 516,713 (1)(2) | | Freddie Mac STACR REMIC Trust 2021-HQA1 M2, 7.570%, (SOFR30A + 2.250%), 08/25/2033 | | | 528,796 | | | | 0.3 | |
| 1,505,741 (1)(2) | | Freddie Mac STACR REMIC Trust 2021-HQA4 B1, 9.070%, (SOFR30A + 3.750%), 12/25/2041 | | | 1,553,551 | | | | 0.8 | |
| 3,011,482 (1)(2) | | Freddie Mac STACR REMIC Trust 2022-DNA1 B1, 8.720%, (SOFR30A + 3.400%), 01/25/2042 | | | 3,114,403 | | | | 1.5 | |
| 2,845,850 (1)(2) | | Freddie Mac STACR REMIC Trust 2022-DNA2 B1, 10.070%, (SOFR30A + 4.750%), 02/25/2042 | | | 3,035,923 | | | | 1.5 | |
| 1,505,741 (1)(2) | | Freddie Mac STACR REMIC Trust 2022-DNA2 M1B, 7.720%, (SOFR30A + 2.400%), 02/25/2042 | | | 1,535,159 | | | | 0.8 | |
| 1,656,315 (1)(2) | | Freddie Mac STACR REMIC Trust 2022-DNA2 M2, 9.070%, (SOFR30A + 3.750%), 02/25/2042 | | | 1,745,213 | | | | 0.9 | |
| 408,125 (1)(2) | | Freddie Mac Structured Agency Credit Risk Debt Notes 2021-DNA2 M2, 7.620%, (SOFR30A + 2.300%), 08/25/2033 | | | 416,421 | | | | 0.2 | |
| 490,061 (1)(2) | | GCAT Trust 2022-INV3 B1, 4.620%, 08/25/2052 | | | 439,857 | | | | 0.2 | |
Principal
Amount† | | | | Value | | | Percentage
of Net
Assets |
| COLLATERALIZED MORTGAGE OBLIGATIONS: (continued) |
| 978,949 (1)(2) | | GCAT Trust 2023-NQM1 A2, 4.250%, 10/25/2057 | | $ | 902,814 | | | | 0.4 | |
| 615,482 (1)(2) | | GS Mortage-Backed Securities Trust 2020-PJ1 B3, 3.630%, 05/25/2050 | | | 517,178 | | | | 0.3 | |
| 996,638 (1)(2) | | GS Mortgage-Backed Securities Corp. Trust 2019-PJ3 B2, 3.948%, 03/25/2050 | | | 893,552 | | | | 0.4 | |
| 853,896 (1)(2) | | GS Mortgage-Backed Securities Corp. Trust 2019-PJ3 B3, 3.948%, 03/25/2050 | | | 758,683 | | | | 0.4 | |
| 1,251,750 (1)(2) | | GS Mortgage-Backed Securities Trust 2022-PJ5 B3, 2.990%, 10/25/2052 | | | 981,207 | | | | 0.5 | |
| 889,824 (1)(2) | | GS Mortgage-Backed Securities Trust 2022-PJ6 A24, 3.000%, 01/25/2053 | | | 739,393 | | | | 0.4 | |
| 919,057 (1)(2) | | GS Mortgage-Backed Securities Trust 2023-PJ4 A3, 6.000%, 01/25/2054 | | | 919,079 | | | | 0.5 | |
| 718,804 (1)(2) | | Hundred Acre Wood Trust 2021-INV3 B3, 3.320%, 12/25/2051 | | | 581,345 | | | | 0.3 | |
| 451,722 (1)(2) | | Imperial Fund Mortgage Trust 2021-NQM4 M1, 3.446%, 01/25/2057 | | | 326,979 | | | | 0.2 | |
| 653,653 (2) | | IndyMac INDX Mortgage Loan Trust 2006-AR2 2A1, 5.864%, (TSFR1M + 0.534%), 02/25/2046 | | | 462,708 | | | | 0.2 | |
| 248,719 (1)(2) | | J.P. Morgan Mortgage Trust 2019-LTV1 B2, 4.576%, 06/25/2049 | | | 232,728 | | | | 0.1 | |
| 428,688 (1)(2) | | J.P. Morgan Mortgage Trust 2021-14 B4, 3.155%, 05/25/2052 | | | 332,780 | | | | 0.2 | |
| 487,013 (1)(2) | | J.P. Morgan Mortgage Trust 2022-1 B3, 3.090%, 07/25/2052 | | | 372,948 | | | | 0.2 | |
| 1,166,876 (1)(2) | | J.P. Morgan Mortgage Trust 2022-6 B3, 3.305%, 11/25/2052 | | | 936,375 | | | | 0.5 | |
| 902,277 (1)(2) | | J.P. Morgan Mortgage Trust 2023-2 A15B, 5.500%, 07/25/2053 | | | 874,437 | | | | 0.4 | |
| 782,550 (1)(2) | | J.P. Morgan Mortgage Trust 2023-2 B3, 5.735%, 07/25/2053 | | | 737,259 | | | | 0.4 | |
| 907,060 (1)(2) | | J.P. Morgan Mortgage Trust 2023-3 A15A, 5.000%, 10/25/2053 | | | 862,562 | | | | 0.4 | |
See Accompanying Notes to Financial Statements
| Voya VACS Series SC Fund | PORTFOLIO OF INVESTMENTS as of March 31, 2024 (continued) |
Principal
Amount† | | | | Value | | | Percentage
of Net
Assets |
| COLLATERALIZED MORTGAGE OBLIGATIONS: (continued) |
| 315,614 (1)(2) | | JP Morgan Mortgage Trust 2014-1 B5, 3.687%, 01/25/2044 | | $ | 270,312 | | | | 0.1 | |
| 929,243 (1)(2) | | JP Morgan Mortgage Trust 2017-1 B4, 3.452%, 01/25/2047 | | | 795,280 | | | | 0.4 | |
| 374,896 (1)(2) | | JP Morgan Mortgage Trust 2017-4 B2, 3.871%, 11/25/2048 | | | 334,421 | | | | 0.2 | |
| 379,736 (1)(2) | | JP Morgan Mortgage Trust 2017-6 B4, 3.777%, 12/25/2048 | | | 329,298 | | | | 0.2 | |
| 413,921 (1)(2) | | JP Morgan Mortgage Trust 2018-3 B2, 3.709%, 09/25/2048 | | | 364,627 | | | | 0.2 | |
| 586,494 (1)(2) | | JP Morgan Mortgage Trust 2018-3 B3, 3.709%, 09/25/2048 | | | 512,250 | | | | 0.2 | |
| 591,947 (1)(2) | | JP Morgan Mortgage Trust 2018-4 B2, 3.711%, 10/25/2048 | | | 522,406 | | | | 0.3 | |
| 806,098 (1)(2) | | JP Morgan Mortgage Trust 2019-7 B3A, 3.240%, 02/25/2050 | | | 680,350 | | | | 0.3 | |
| 815,902 (1)(2) | | JP Morgan Mortgage Trust 2019-8 B3A, 3.424%, 03/25/2050 | | | 680,596 | | | | 0.3 | |
| 877,800 (1)(2) | | JP Morgan Mortgage Trust 2019-HYB1 B1, 4.924%, 10/25/2049 | | | 837,655 | | | | 0.4 | |
| 473,664 (1)(2) | | JP Morgan Mortgage Trust 2019-INV1 B2, 4.943%, 10/25/2049 | | | 448,500 | | | | 0.2 | |
| 970,380 (1)(2) | | JP Morgan Mortgage Trust 2019-INV3 B3, 4.355%, 05/25/2050 | | | 846,599 | | | | 0.4 | |
| 528,828 (1)(2) | | JP Morgan Mortgage Trust 2019-LTV2 B2, 4.697%, 12/25/2049 | | | 497,078 | | | | 0.2 | |
| 528,828 (1)(2) | | JP Morgan Mortgage Trust 2019-LTV2 B3, 4.697%, 12/25/2049 | | | 493,947 | | | | 0.2 | |
| 696,302 (1)(2) | | JP Morgan Mortgage Trust 2019-LTV3 B3, 4.379%, 03/25/2050 | | | 613,691 | | | | 0.3 | |
| 690,630 (1)(2) | | JP Morgan Mortgage Trust 2020-5 B1, 3.572%, 12/25/2050 | | | 594,057 | | | | 0.3 | |
| 410,301 (1)(2) | | JP Morgan Mortgage Trust 2020-8 B3, 3.504%, 03/25/2051 | | | 352,793 | | | | 0.2 | |
| 355,426 (1)(2) | | JP Morgan Mortgage Trust 2021-INV6 A5A, 2.500%, 04/25/2052 | | | 283,154 | | | | 0.1 | |
| 995,218 (1)(2) | | JP Morgan Mortgage Trust 2023-10 B3, 6.522%, 05/25/2054 | | | 966,922 | | | | 0.5 | |
| 303,201 (1)(2) | | JP Morgan Trust 2015-1 B3, 6.677%, 12/25/2044 | | | 290,670 | | | | 0.1 | |
Principal
Amount† | | | | Value | | | Percentage
of Net
Assets |
| COLLATERALIZED MORTGAGE OBLIGATIONS: (continued) |
| 560,082 (1)(2) | | Mello Mortgage Capital Acceptance 2018-MTG2 B2, 4.319%, 10/25/2048 | | $ | 514,830 | | | | 0.3 | |
| 719,415 (1)(2) | | Mello Mortgage Capital Acceptance 2022-INV1 B3, 3.320%, 03/25/2052 | | | 568,508 | | | | 0.3 | |
| 1,050,706 (1)(2) | | MFA Trust 2021-INV2 M1, 3.199%, 11/25/2056 | | | 787,217 | | | | 0.4 | |
| 542,067 (1)(2) | | Mill City Mortgage Trust 2015-2 B2, 1.984%, 09/25/2057 | | | 485,090 | | | | 0.2 | |
| 469,044 (1)(2) | | New Residential Mortgage Loan Trust 2017-6A B2, 4.000%, 08/27/2057 | | | 446,320 | | | | 0.2 | |
| 1,144,363 (1)(2) | | Oaktown Re VII Ltd. 2021-2 M1C, 8.670%, (SOFR30A + 3.350%), 04/25/2034 | | | 1,167,579 | | | | 0.6 | |
| 411,815 (1)(2) | | OBX Trust 2022-J1 A14, 2.500%, 02/25/2052 | | | 327,575 | | | | 0.2 | |
| 1,103,391 (1)(2) | | Oceanview Mortgage Trust 2021-5 B3, 2.972%, 10/25/2051 | | | 859,073 | | | | 0.4 | |
| 844,936 (1)(2) | | Radnor RE Ltd. 2021-1 M1C, 8.020%, (SOFR30A + 2.700%), 12/27/2033 | | | 856,666 | | | | 0.4 | |
| 555,366 (1)(2) | | RCKT Mortgage Trust 2020-1 B2A, 3.466%, 02/25/2050 | | | 480,308 | | | | 0.2 | |
| 511,511 (1)(2) | | Sequoia Mortgage Trust 2017-2 B2, 3.557%, 02/25/2047 | | | 464,605 | | | | 0.2 | |
| 713,039 (1)(2) | | Sequoia Mortgage Trust 2017-5 B3, 3.782%, 08/25/2047 | | | 620,494 | | | | 0.3 | |
| 389,910 (1)(2) | | Sequoia Mortgage Trust 2019-2 B3, 4.256%, 06/25/2049 | | | 347,089 | | | | 0.2 | |
| 479,406 (1)(2) | | Sequoia Mortgage Trust 2019-CH2 B2B, 4.925%, 08/25/2049 | | | 458,294 | | | | 0.2 | |
| 838,294 (1)(2) | | Sequoia Mortgage Trust 2019-CH3 B1B, 4.502%, 09/25/2049 | | | 779,379 | | | | 0.4 | |
| 493,647 (1)(2) | | Sequoia Mortgage Trust 2019-CH3 B2B, 4.502%, 09/25/2049 | | | 461,965 | | | | 0.2 | |
| 690,938 (1)(2) | | Sequoia Mortgage Trust 2020-2 B3, 3.639%, 03/25/2050 | | | 581,802 | | | | 0.3 | |
| 555,647 (1)(2) | | Sequoia Mortgage Trust 2020-3 B3, 3.320%, 04/25/2050 | | | 457,872 | | | | 0.2 | |
| 719,165 (1)(2) | | Sequoia Mortgage Trust 2021-7 B3, 2.864%, 11/25/2051 | | | 562,465 | | | | 0.3 | |
See Accompanying Notes to Financial Statements
| Voya VACS Series SC Fund | PORTFOLIO OF INVESTMENTS as of March 31, 2024 (continued) |
Principal
Amount† | | | | Value | | | Percentage
of Net
Assets |
| COLLATERALIZED MORTGAGE OBLIGATIONS: (continued) |
| 601,735 (1)(2) | | Sequoia Mortgage Trust 2023-1 B2, 5.146%, 01/25/2053 | | $ | 560,332 | | | | 0.3 | |
| 983,050 (1)(2) | | Sequoia Mortgage Trust 2024-2 A19, 6.000%, 12/25/2053 | | | 975,700 | | | | 0.5 | |
| 1,000,000 (1)(2) | | Sequoia Mortgage Trust 2024-3 A19, 6.000%, 04/25/2054 | | | 989,297 | | | | 0.5 | |
| 374,703 (1)(2) | | Shellpoint Co.-Originator Trust 2017-2 B3, 3.644%, 10/25/2047 | | | 333,099 | | | | 0.2 | |
| 309,250 (1)(2) | | STAR Trust 2021-1 A3, 1.528%, 05/25/2065 | | | 268,527 | | | | 0.1 | |
| 903,444 (1)(2) | | Starwood Mortgage Residential Trust 2020-1 M1, 2.878%, 02/25/2050 | | | 786,516 | | | | 0.4 | |
| 602,296 (1)(2) | | Starwood Mortgage Residential Trust 2020-3 A2, 2.240%, 04/25/2065 | | | 539,128 | | | | 0.3 | |
| 752,870 (1) | | Starwood Mortgage Residential Trust 2020-INV1 M1, 2.501%, 11/25/2055 | | | 656,458 | | | | 0.3 | |
| 1,109,362 (2) | | TBW Mortgage-Backed Trust 2006-6 A5B, 6.540%, 01/25/2037 | | | 255,981 | | | | 0.1 | |
| 331,263 (1)(2) | | Towd Point Mortgage Trust 2015-2 2B2, 4.780%, 11/25/2057 | | | 322,347 | | | | 0.2 | |
| 566,556 (1)(2) | | UWM Mortgage Trust 2021-INV1 B1, 3.156%, 08/25/2051 | | | 466,783 | | | | 0.2 | |
| 429,872 (1)(2) | | UWM Mortgage Trust 2021-INV4 B3, 3.224%, 12/25/2051 | | | 337,492 | | | | 0.2 | |
| 1,405,182 (1)(2) | | UWM Mortgage Trust 2021-INV5 B3, 3.235%, 01/25/2052 | | | 1,114,492 | | | | 0.5 | |
| 291,995 (1)(2) | | Verus Securitization Trust 2021-3 A1, 1.046%, 06/25/2066 | | | 243,440 | | | | 0.1 | |
| 588,213 (1)(2) | | Wells Fargo Mortgage Backed Securities Trust 2020-1 B3, 3.377%, 12/25/2049 | | | 492,102 | | | | 0.2 | |
| | | Total Collateralized Mortgage Obligations
(Cost $65,409,315) | | | 68,670,913 | | | | 33.9 | |
| | | | | | | | | | | |
| ASSET-BACKED SECURITIES: 22.7% |
| | | Automobile Asset-Backed Securities: 0.7% |
| 820,722 | | AmeriCredit Automobile Receivables Trust 2019-3 D, 2.580%, 09/18/2025 | | | 819,412 | | | | 0.4 | |
Principal
Amount† | | | | Value | | | Percentage
of Net
Assets |
| ASSET-BACKED SECURITIES: (continued) |
| | | Automobile Asset-Backed Securities: (continued) |
| 708,000 | | AmeriCredit Automobile Receivables Trust 2020-2 D, 2.130%, 03/18/2026 | | $ | 691,534 | | | | 0.3 | |
| | | | | | 1,510,946 | | | | 0.7 | |
| | | | | | | | | | | |
| | | Other Asset-Backed Securities: 18.2% |
| 1,000,000 (1)(2) | | AMMC CLO 30 Ltd. 2024-30A C, 7.941%, (TSFR3M + 2.650%), 01/15/2037 | | | 1,000,922 | | | | 0.5 | |
| 1,150,000 (1)(2) | | AMMC CLO XI Ltd. 2012-11A CR2, 7.479%, (TSFR3M + 2.162%), 04/30/2031 | | | 1,141,989 | | | | 0.6 | |
| 350,000 (1)(2) | | Apidos CLO XV 2013-15A CRR, 7.429%, (TSFR3M + 2.112%), 04/20/2031 | | | 349,819 | | | | 0.2 | |
| 730,000 (1)(2) | | Apidos CLO XXIV 2016-24A BRR, 7.629%, (TSFR3M + 2.312%), 10/20/2030 | | | 730,910 | | | | 0.4 | |
| 327,690 (1) | | Applebee’s Funding LLC / IHOP Funding LLC 2019-1A A2II, 4.723%, 06/05/2049 | | | 315,580 | | | | 0.2 | |
| 1,747,000 (1) | | Aqua Finance Trust 2021-A B, 2.400%, 07/17/2046 | | | 1,443,752 | | | | 0.7 | |
| 827,970 (1) | | Arbys Funding LLC 2020-1A A2, 3.237%, 07/30/2050 | | | 766,872 | | | | 0.4 | |
| 1,041,500 (1) | | Atrium XIV LLC 14A A2BR, 2.304%, 08/23/2030 | | | 947,827 | | | | 0.5 | |
| 937,350 (1) | | Barings CLO Ltd. 2018-3A B2R, 2.268%, 07/20/2029 | | | 886,878 | | | | 0.4 | |
| 781,125 (1)(2) | | BlueMountain CLO XXX Ltd. 2020-30A CR, 7.464%, (TSFR3M + 2.150%), 04/15/2035 | | | 772,626 | | | | 0.4 | |
| 1,360,763 (1) | | Bojangles Issuer LLC 2020-1A A2, 3.832%, 10/20/2050 | | | 1,285,120 | | | | 0.6 | |
| 800,000 (1)(2) | | Cedar Funding V CLO Ltd. 2016-5A CR, 7.678%, (TSFR3M + 2.362%), 07/17/2031 | | | 799,014 | | | | 0.4 | |
| 726,182 (1) | | CLI Funding VIII LLC 2021-1A A, 1.640%, 02/18/2046 | | | 645,223 | | | | 0.3 | |
| 414,058 (1) | | Domino’s Pizza Master Issuer LLC 2018-1A A2I, 4.116%, 07/25/2048 | | | 403,130 | | | | 0.2 | |
See Accompanying Notes to Financial Statements
| Voya VACS Series SC Fund | PORTFOLIO OF INVESTMENTS as of March 31, 2024 (continued) |
Principal
Amount† | | | | Value | | | Percentage
of Net
Assets |
| ASSET-BACKED SECURITIES: (continued) |
| | | Other Asset-Backed Securities: (continued) |
| 550,498 (1) | | Domino’s Pizza Master Issuer LLC 2018-1A A2II, 4.328%, 07/25/2048 | | $ | 531,550 | | | | 0.3 | |
| 390,720 (1) | | Domino’s Pizza Master Issuer LLC 2019-1A A2, 3.668%, 10/25/2049 | | | 360,336 | | | | 0.2 | |
| 780,000 (1)(2) | | Galaxy XV CLO Ltd. 2013-15A CRR, 7.426%, (TSFR3M + 2.112%), 10/15/2030 | | | 780,952 | | | | 0.4 | |
| 672,915 (1) | | Goddard Funding LLC 2022-1A A2, 6.864%, 10/30/2052 | | | 679,050 | | | | 0.3 | |
| 491,134 (1) | | Loanpal Solar Loan Ltd. 2020-3GS B, 3.450%, 12/20/2047 | | | 378,276 | | | | 0.2 | |
| 504,086 (1) | | Marlette Funding Trust 2023-1A A, 6.070%, 04/15/2033 | | | 504,175 | | | | 0.2 | |
| 403,881 (1) | | Mill City Solar Loan Ltd. 2019-2GS A, 3.690%, 07/20/2043 | | | 362,068 | | | | 0.2 | |
| 261,233 (1) | | Mosaic Solar Loan Trust 2018-1A A, 4.010%, 06/22/2043 | | | 244,778 | | | | 0.1 | |
| 332,949 (1) | | Mosaic Solar Loan Trust 2020-1A B, 3.100%, 04/20/2046 | | | 291,435 | | | | 0.1 | |
| 1,500,000 (1)(2) | | Oaktree CLO Ltd. 2019-4A CR, 7.829%, (TSFR3M + 2.512%), 10/20/2032 | | | 1,479,978 | | | | 0.7 | |
| 250,000 (1)(2) | | Oaktree CLO Ltd. 2024-25A C, 7.804%, (TSFR3M + 2.500%), 04/20/2037 | | | 250,073 | | | | 0.1 | |
| 450,000 (1)(2) | | Octagon Investment Partners XVI Ltd. 2013-1A CR, 7.428%, (TSFR3M + 2.112%), 07/17/2030 | | | 444,830 | | | | 0.2 | |
| 800,000 (1)(2) | | Palmer Square CLO Ltd. 2018-2A BR, 7.822%, (TSFR3M + 2.500%), 04/16/2037 | | | 802,142 | | | | 0.4 | |
| 650,937 (1)(2) | | Palmer Square Loan Funding Ltd. 2021-2A D, 10.581%, (TSFR3M + 5.262%), 05/20/2029 | | | 652,185 | | | | 0.3 | |
| 1,000,000 (1)(2) | | Parallel Ltd. 2023-1A B, 8.818%, (TSFR3M + 3.500%), 07/20/2036 | | | 1,008,691 | | | | 0.5 | |
| 149,260 (1) | | SoFi Consumer Loan Program Trust 2023-1S A, 5.810%, 05/15/2031 | | | 149,194 | | | | 0.1 | |
| 1,050,000 (1)(2) | | Sound Point CLO XXIX Ltd. 2021-1A C1, 7.886%, (TSFR3M + 2.562%), 04/25/2034 | | | 1,048,526 | | | | 0.5 | |
Principal
Amount† | | | | Value | | | Percentage
of Net
Assets |
| ASSET-BACKED SECURITIES: (continued) |
| | | Other Asset-Backed Securities: (continued) |
| 500,000 (1)(2) | | Sound Point CLO XXXII Ltd. 2021-4A C, 7.736%, (TSFR3M + 2.412%), 10/25/2034 | | $ | 494,749 | | | | 0.2 | |
| 541,431 (1) | | Sunnova Helios II Issuer LLC 2018-1A B, 7.710%, 07/20/2048 | | | 476,268 | | | | 0.2 | |
| 2,155,762 (1) | | Sunnova Helios II Issuer LLC 2021-B B, 2.010%, 07/20/2048 | | | 1,788,093 | | | | 0.9 | |
| 415,536 (1) | | Sunnova Helios IV Issuer LLC 2020-AA A, 2.980%, 06/20/2047 | | | 383,248 | | | | 0.2 | |
| 1,091,866 (1) | | Sunnova Sol II Issuer LLC 2020-2A A, 2.730%, 11/01/2055 | | | 830,564 | | | | 0.4 | |
| 962,094 (1) | | Sunrun Atlas Issuer LLC 2019-2 A, 3.610%, 02/01/2055 | | | 880,936 | | | | 0.4 | |
| 741,771 (1) | | Sunrun Iris Issuer LLC 2023-1A A, 5.750%, 01/30/2059 | | | 714,909 | | | | 0.4 | |
| 1,935,272 (1) | | Sunrun Jupiter Issuer LLC 2022-1A A, 4.750%, 07/30/2057 | | | 1,809,731 | | | | 0.9 | |
| 423,715 (1) | | Sunrun Xanadu Issuer LLC 2019-1A A, 3.980%, 06/30/2054 | | | 396,038 | | | | 0.2 | |
| 1,041,500 (1)(2) | | THL Credit Wind River CLO Ltd. 2017-3A CR, 8.076%, (TSFR3M + 2.762%), 04/15/2035 | | | 1,042,799 | | | | 0.5 | |
| 518,884 (1) | | TIF Funding II LLC 2021-1A A, 1.650%, 02/20/2046 | | | 451,401 | | | | 0.2 | |
| 738,000 (1) | | Trafigura Securitisation Finance PLC 2021-1A B, 1.780%, 01/15/2025 | | | 714,159 | | | | 0.3 | |
| 672,735 (1) | | Triton Container Finance VIII LLC 2021-1A B, 2.580%, 03/20/2046 | | | 575,410 | | | | 0.3 | |
| 333,280 (1)(2) | | Venture 33 CLO Ltd. 2018-33A CR, 7.856%, (TSFR3M + 2.542%), 07/15/2031 | | | 328,935 | | | | 0.2 | |
| 350,000 (1)(2) | | VERDE CLO Ltd. 2019-1A CR, 7.576%, (TSFR3M + 2.262%), 04/15/2032 | | | 350,376 | | | | 0.2 | |
| 621,509 (1) | | Vivint Solar Financing VII LLC 2020-1A A, 2.210%, 07/31/2051 | | | 513,057 | | | | 0.3 | |
| 416,600 (1)(2) | | Wind River CLO Ltd. 2014-1A CRR, 7.510%, (TSFR3M + 2.212%), 07/18/2031 | | | 413,527 | | | | 0.2 | |
| 1,712,154 (1) | | Wingstop Funding LLC 2020-1A A2, 2.841%, 12/05/2050 | | | 1,556,896 | | | | 0.8 | |
See Accompanying Notes to Financial Statements
| Voya VACS Series SC Fund | PORTFOLIO OF INVESTMENTS as of March 31, 2024 (continued) |
Principal
Amount† | | | | Value | | | Percentage
of Net
Assets |
| ASSET-BACKED SECURITIES: (continued) |
| | | Other Asset-Backed Securities: (continued) |
| 1,923,207 (1) | | Zaxby’s Funding LLC 2021-1A A2, 3.238%, 07/30/2051 | | $ | 1,705,870 | | | | 0.8 | |
| | | | | | 36,884,867 | | | | 18.2 | |
| | | | | | | | | | | |
| | | Student Loan Asset-Backed Securities: 3.8% |
| 312,158 (1) | | Laurel Road Prime Student Loan Trust 2019-A BFX, 3.000%, 10/25/2048 | | | 290,824 | | | | 0.1 | |
| 1,684,956 (1) | | Navient Private Education Refi Loan Trust 2019-FA A2, 2.600%, 08/15/2068 | | | 1,577,958 | | | | 0.8 | |
| 790,000 (1) | | SMB Private Education Loan Trust 2014-A C, 4.500%, 09/15/2045 | | | 689,012 | | | | 0.3 | |
| 376,000 (1)(2) | | SoFi Professional Loan Program LLC 2017-C C, 4.210%, 07/25/2040 | | | 347,766 | | | | 0.2 | |
| 376,000 (1) | | SoFi Professional Loan Program LLC 2017-D BFX, 3.610%, 09/25/2040 | | | 340,841 | | | | 0.2 | |
| 1,205,000 (1) | | SoFi Professional Loan Program LLC 2017-F BFX, 3.620%, 01/25/2041 | | | 1,092,149 | | | | 0.5 | |
| 602,000 (1) | | SoFi Professional Loan Program Trust 2018-C BFX, 4.130%, 01/25/2048 | | | 548,032 | | | | 0.3 | |
| 632,000 (1) | | SoFi Professional Loan Program Trust 2018-D BFX, 4.140%, 02/25/2048 | | | 573,654 | | | | 0.3 | |
| 1,521,000 (1) | | SoFi Professional Loan Program Trust 2020-B BFX, 2.730%, 05/15/2046 | | | 1,188,284 | | | | 0.6 | |
| 1,235,000 (1) | | SoFi Professional Loan Program Trust 2020-C BFX, 3.360%, 02/15/2046 | | | 1,001,335 | | | | 0.5 | |
| | | | | | 7,649,855 | | | | 3.8 | |
| | | | | | | | | | | |
| | | Total Asset-Backed Securities
(Cost $45,002,154) | | | 46,045,668 | | | | 22.7 | |
| | | | | | | | | | | |
| | | Total Long-Term Investments (Cost $184,083,488) | | | 192,826,741 | | | | 95.2 | |
| | | | | | | | | | | |
Principal
Amount† | | | | Value | | | Percentage
of Net
Assets |
| SHORT-TERM INVESTMENTS: 4.3% |
| | | Commercial Paper: 3.5% |
| 1,000,000 | | Consolidated Edison, 22.080%, 04/01/2024 | | | 999,397 | | | | 0.5 | |
Principal
Amount† | | | | Value | | | Percentage
of Net
Assets |
| SHORT-TERM INVESTMENTS: (continued) | |
| | | Commercial Paper (continued) |
| 1,000,000 | | CVS Caremark, 8.800%, 04/05/2024 | | $ | 998,799 | | | | 0.5 | |
| 2,000,000 | | Enbridge (US) Inc., 22.490%, 04/01/2024 | | | 1,998,772 | | | | 1.0 | |
| 2,000,000 | | HP, Inc., 11.050%, 04/03/2024 | | | 1,998,191 | | | | 1.0 | |
| 1,000,000 | | Keurig Dr. Pepper, Inc., 13.800%, 04/02/2024 | | | 999,246 | | | | 0.5 | |
| | | Total Commercial Paper
(Cost $6,998,634) | | | 6,994,405 | | | | 3.5 | |
| Shares | | | | Value | | | Percentage
of Net Assets |
| | | Mutual Funds: 0.8% |
| 1,705,000 (5) | | Morgan Stanley Institutional Liquidity Funds - Government Portfolio (Institutional Share Class), 5.220%
(Cost $1,705,000) | | $ | 1,705,000 | | | | 0.8 | |
| | | | | | | | | | | |
| | | Total Short-Term Investments
(Cost $8,703,634) | | | 8,699,405 | | | | 4.3 | |
| | | Total Investments in Securities
(Cost $192,787,122) | | $ | 201,526,146 | | | | 99.5 | |
| | | Assets in Excess of Other Liabilities | | | 988,593 | | | | 0.5 | |
| | | Net Assets | | $ | 202,514,739 | | | | 100.0 | |
| † | Unless otherwise indicated, principal amount is shown in USD. |
| (1) | Securities with purchases pursuant to Rule 144A or section 4(a)(2), under the Securities Act of 1933 and may not be resold subject to that rule except to qualified institutional buyers. |
| (2) | Variable rate security. Rate shown is the rate in effect as of March 31, 2024. |
| (3) | Interest only securities represent the right to receive the monthly interest payments on an underlying pool of mortgage loans. Principal amount shown represents the notional amount on which current interest is calculated. Payments of principal on the pool reduce the value of the interest only security. |
| (4) | Principal only securities represent the right to receive the monthly principal payments on an underlying pool of mortgage loans. No payments of interest on the pool are passed through the principal only security. |
| (5) | Rate shown is the 7-day yield as of March 31, 2024. |
| Reference Rate Abbreviations: |
| |
| SOFR30A | 30-day Secured Overnight Financing Rate |
| TSFR1M | 1-month CME Term Secured Overnight Financing Rate |
| TSFR3M | 3-month CME Term Secured Overnight Financing Rate |
See Accompanying Notes to Financial Statements
| Voya VACS Series SC Fund | PORTFOLIO OF INVESTMENTS
as of March 31, 2024 (continued) |
Fair Value Measurements^
The following is a summary of the fair valuations according to the inputs used as of March 31, 2024 in valuing the assets and liabilities:
| | | Quoted Prices
in Active Markets
for Identical
Investments
(Level 1) | | | Significant Other
Observable
Inputs
(Level 2) | | | Significant
Unobservable
Inputs
(Level 3) | | | Fair Value
at
March 31, 2024 | |
| Asset Table | | | | | | | | | | | | | | | | |
| Investments, at fair value | | | | | | | | | | | | | | | | |
| Commercial Mortgage-Backed Securities | | $ | — | | | $ | 78,110,160 | | | $ | — | | | $ | 78,110,160 | |
| Collateralized Mortgage Obligations | | | — | | | | 68,670,913 | | | | — | | | | 68,670,913 | |
| Asset-Backed Securities | | | — | | | | 46,045,668 | | | | — | | | | 46,045,668 | |
| Short-Term Investments | | | 1,705,000 | | | | 6,994,405 | | | | — | | | | 8,699,405 | |
| Total Investments, at fair value | | $ | 1,705,000 | | | $ | 199,821,146 | | | $ | — | | | $ | 201,526,146 | |
| Other Financial Instruments+ | | | | | | | | | | | | | | | | |
| Futures | | | 168,708 | | | | — | | | | — | | | | 168,708 | |
| Total Assets | | $ | 1,873,708 | | | $ | 199,821,146 | | | $ | — | | | $ | 201,694,854 | |
| Liabilities Table | | | | | | | | | | | | | | | | |
| Other Financial Instruments+ | | | | | | | | | | | | | | | | |
| Futures | | $ | (87,047 | ) | | $ | — | | | $ | — | | | $ | (87,047 | ) |
| Total Liabilities | | $ | (87,047 | ) | | $ | — | | | $ | — | | | $ | (87,047 | ) |
| ^ | See Note 2, “Significant Accounting Policies” in the Notes to Financial Statements for additional information. |
| + | Other Financial Instruments may include open forward foreign currency contracts, futures, centrally cleared swaps, OTC swaps and written options. Forward foreign currency contracts, futures and centrally cleared swaps are fair valued at the unrealized appreciation (depreciation) on the instrument. OTC swaps and written options are valued at the fair value of the instrument. |
At March 31, 2024, the following futures contracts were outstanding for Voya VACS Series SC Fund:
| | | | | | | | | | | | Unrealized | |
| | | Number | | | Expiration | | | Notional | | | Appreciation/ | |
| Description | | of Contracts | | | Date | | | Amount | | | (Depreciation) | |
| Long Contracts: | | | | | | | | | | | | | | | | |
| U.S. Treasury 2-Year Note | | | 85 | | | | 06/28/24 | | | $ | 17,381,172 | | | $ | (4,483 | ) |
| U.S. Treasury Long Bond | | | 18 | | | | 06/18/24 | | | | 2,167,875 | | | | 33,008 | |
| U.S. Treasury Ultra Long Bond | | | 9 | | | | 06/18/24 | | | | 1,161,000 | | | | 13,993 | |
| | | | | | | | | | | $ | 20,710,047 | | | $ | 42,518 | |
| Short Contracts: | | | | | | | | | | | | | | | | |
| U.S. Treasury 5-Year Note | | | (182) | | | | 06/28/24 | | | | (19,476,844 | ) | | | 121,707 | |
| U.S. Treasury 10-Year Note | | | (47) | | | | 06/18/24 | | | | (5,207,453 | ) | | | (31,738 | ) |
| U.S. Treasury Ultra 10-Year Note | | | (82) | | | | 06/18/24 | | | | (9,397,969 | ) | | | (50,826 | ) |
| | | | | | | | | | | $ | (34,082,266 | ) | | $ | 39,143 | |
A summary of derivative instruments by primary risk exposure is outlined in the following tables.
The fair value of derivative instruments as of March 31, 2024 was as follows:
| | | Location on Statement | | | |
| Derivatives not accounted for as hedging instruments | | of Assets and Liabilities | | Fair Value | |
| Asset Derivatives | | | | | | |
| Interest rate contracts | | Variation margin receivable on futures contracts* | | $ | 168,708 | |
| Total Asset Derivatives | | | | $ | 168,708 | |
See Accompanying Notes to Financial Statements
| Voya VACS Series SC Fund | PORTFOLIO OF INVESTMENTS
as of March 31, 2024 (continued) |
| | | Location on Statement | | | |
| Derivatives not accounted for as hedging instruments | | of Assets and Liabilities | | Fair Value | |
| Liability Derivatives | | | | | | |
| Interest rate contracts | | Variation margin payable on futures contracts* | | $ | 87,047 | |
| Total Liability Derivatives | | | | $ | 87,047 | |
| * | The fair value presented above represents the cumulative unrealized appreciation (depreciation) on futures contracts as reported in the tables within the Portfolio of Investments. In the Statement of Assets and Liabilities, only current day’s unsettled variation margin is reported in receivables or payables on futures contracts and the net cumulative unrealized appreciation (depreciation) is included in total distributable earnings (loss). |
The effect of derivative instruments on the Fund’s Statement of Operations for the year ended March 31, 2024 was as follows:
Amount of Realized Gain or (Loss) on Derivatives Recognized in Income
| Derivatives not accounted for as hedging instruments | | Futures | |
| Interest rate contracts | | $ | 1,283,590 | |
| Total | | $ | 1,283,590 | |
Change in Unrealized Appreciation or (Depreciation) on Derivatives Recognized in Income
| Derivatives not accounted for as hedging instruments | | Futures | |
| Interest rate contracts | | $ | 1,528,703 | |
| Total | | $ | 1,528,703 | |
At March 31, 2024, the aggregate cost of securities and other investments and the composition of unrealized appreciation and depreciation of securities and other investments on a tax basis were:
| Cost for federal income tax purposes was $192,868,783. | | | |
| Net unrealized appreciation consisted of: | | | |
| Gross Unrealized Appreciation | | $ | 9,980,427 | |
| Gross Unrealized Depreciation | | | (1,241,403 | ) |
| Net Unrealized Appreciation | | $ | 8,739,024 | |
See Accompanying Notes to Financial Statements
TAX INFORMATION (Unaudited)
Dividends and distributions paid during the year ended March 31, 2024 were as follows:
| Fund Name | Type | Per Share
Amount |
| Voya VACS Series EMCD Fund | NII | $0.4967 |
| Voya VACS Series EMHCD Fund | NII | $0.6652 |
| All Classes | STCG | $0.0489 |
| All Classes | LTCG | $0.0298 |
| Voya VACS Series HYB Fund | NII | $0.8183 |
| Voya VACS Series SC Fund | NII | $0.4974 |
| All Classes | STCG | $0.0365 |
| All Classes | LTCG | $0.0320 |
NII - Net investment income
STCG - Short-term capital gain
LTCG - Long-term capital gain
Pursuant to Internal Revenue Code Section 871(k)(1), the Funds designate the following percentages of net investment income distributions as interest-related dividends:
| Voya VACS Series EMCD Fund | 12.51% |
| | |
| Voya VACS Series EMHCD Fund | 27.25% |
| | |
| Voya VACS Series HYB Fund | 99.49% |
| | |
| Voya VACS Series SC Fund | 84.49% |
The Funds designate the following amounts of long-term capital gain distributions as 20% rate long-term capital gain dividends under Internal Revenue Code Section 852(b)(3)(C):
| Voya VACS Series EMHCD Fund | $ 440,410 |
| | |
| Voya VACS Series SC Fund | $ 657,342 |
Above figures may differ from those cited elsewhere in this report due to differences in the calculation of income and gains under U.S. generally accepted accounting principles (book) purposes and Internal Revenue Service (tax) purposes.
Shareholders are strongly advised to consult their own tax advisers with respect to the tax consequences of their investments in the Funds. In January, shareholders, excluding corporate shareholders, receive an IRS 1099-DIV regarding the federal tax status of the dividends and distributions they received in the calendar year.
TRUSTEE AND OFFICER INFORMATION (Unaudited)
The business and affairs of each Trust are managed under the direction of the Board. A Trustee, who is not an interested person of a Trust, as defined in the 1940 Act, is an independent trustee (“Independent Trustee”). The Trustees and Officers of the Trust are listed below. The Statement of Additional Information includes additional information about Trustees of the Trust and is available, without charge, upon request at (800) 992-0180.
Name, Address and Year of
Birth | | Position(s)
Held with the
Trust | | Term of Office and
Length of Time
Served(1) | | Principal
Occupation(s) –
During the Past 5 Years | | Number of funds in
Fund
Complex
Overseen
by
Trustee(2) | | Other Board Positions
Held by Trustee |
| | | | | | | | | | | |
| Independent Trustees |
| |
Colleen D. Baldwin (1960) 7337 East Doubletree Ranch Rd.
Suite 100
Scottsdale, Arizona 85258 | | Chairperson Trustee | | January 2020 – Present VFT – November 2007 – Present VSPT – July 2007 – Present | | President, Glantuam Partners, LLC, a business consulting firm (January 2009 – Present). | | 138 | | Stanley Global Engineering (2020 – Present). |
| | | | | | | | | | | |
John V. Boyer (1953) 7337 East Doubletree Ranch Rd.
Suite 100
Scottsdale, Arizona 85258 | | Trustee | | VFT – January 2005 – Present
VSPT – May 2007 – Present | | Retired. Formerly, President and Chief Executive Officer, Bechtler Arts Foundation, an arts and education foundation (January 2008 – December 2019). | | 138 | | None. |
| | | | | | | | | | | |
Martin J. Gavin (1950) 7337 East Doubletree Ranch Rd.
Suite 100
Scottsdale, Arizona 85258 | | Trustee | | August 2015 – Present | | Retired. | | 138 | | None. |
| | | | | | | | | | | |
Joseph E. Obermeyer (1957) 7337 East Doubletree Ranch Rd.
Suite 100
Scottsdale, Arizona 85258 | | Trustee | | May 2013 – Present | | President, Obermeyer & Associates, Inc., a provider of financial and economic consulting services (November 1999 – Present). | | 138 | | None. |
| | | | | | | | | | | |
Sheryl K. Pressler (1950) 7337 East Doubletree Ranch Rd.
Suite 100
Scottsdale, Arizona 85258 | | Trustee | | VFT – January 2006 – Present
VSPT – May 2007 – Present | | Consultant (May 2001 – Present). | | 138 | | Centerra Gold Inc. (May 2008 – Present) |
| | | | | | | | | | | |
Christopher P. Sullivan (1954) 7337 East Doubletree Ranch Rd.
Suite 100
Scottsdale, Arizona 85258 | | Trustee | | October 2015 – Present | | Retired. | | 138 | | None. |
TRUSTEE AND OFFICER INFORMATION (Unaudited) (continued)
| (1) | Trustees serve until their successors are duly elected and qualified. The tenure of each Trustee who is not an “interested person” as defined in the 1940 Act, of each Fund (“Independent Trustee”) is subject to the Board’s retirement policy which states that each duly elected or appointed Independent Trustee shall retire from and cease to be a member of the Board of Trustees at the close of business on December 31 of the calendar year in which the Independent Trustee attains the age of 75. A majority vote of the Board’s other Independent Trustees may extend the retirement date of an Independent Trustee if the retirement would trigger a requirement to hold a meeting of shareholders of the Trust under applicable law, whether for the purposes of appointing a successor to the Independent Trustee or otherwise comply under applicable law, in which case the extension would apply until such time as the shareholder meeting can be held or is no longer required (as determined by a vote of a majority of the other Independent Trustees). |
| (2) | For the purposes of this table, “Fund Complex” means the Voya family of funds including the following investment companies: Voya Asia Pacific High Dividend Equity Income Fund; Voya Balanced Portfolio, Inc.; Voya Credit Income Fund; Voya Emerging Markets High Dividend Equity Fund; Voya Equity Trust; Voya Funds Trust; Voya Global Advantage and Premium Opportunity Fund; Voya Global Equity Dividend and Premium Opportunity Fund; Voya Government Money Market Portfolio; Voya Infrastructure, Industrials and Materials Fund; Voya Intermediate Bond Portfolio; Voya Investors Trust; Voya Mutual Funds; Voya Partners, Inc.; Voya Separate Portfolios Trust; Voya Strategic Allocation Portfolios, Inc.; Voya Variable Funds; Voya Variable Insurance Trust; Voya Variable Portfolios, Inc.; and Voya Variable Products Trust. The number of funds in the Fund Complex is as of April 30, 2024. |
TRUSTEE AND OFFICER INFORMATION (Unaudited) (continued)
Name, Address and Year of
Birth | | Position(s)
Held with the
Trust | | Term of Office and
Length of Time
Served(1) | | Principal
Occupation(s) –
During the Past 5 Years |
Andy Simonoff (1973) 5780 Powers Ferry Road NW Atlanta, Georgia 30327 | | President and Chief Executive Officer | | January 2023 – Present | | Director, President and Chief Executive Officer, Voya Funds Services, LLC, Voya Capital, LLC and Voya Investments, LLC (January 2023 – Present); Managing Director, Chief Strategy and Transformation Officer, Voya Investment Management (January 2020 – Present). Formerly, Managing Director, Head of Business Management, Voya Investment Management (March 2019 – January 2020); Managing Director, Head of Business Management, Fixed Income, Voya Investment Management (November 2015 – March 2019). |
| | | | | | | |
Jonathan Nash (1967) 230 Park Avenue New York, New York 10169 | | Executive Vice President and Chief Investment Risk Officer | | March 2020 – Present | | Head of Investment Risk for Equity and Funds, Voya Investment Management (April 2024 – Present); Executive Vice President and Chief Investment Risk Officer, Voya Investments, LLC (March 2020 – Present). Formerly, Senior Vice President, Investment Risk Management, Voya Investment Management (March 2017 – March 2024); Vice President, Voya Investments, LLC (September 2018 – March 2020). |
| | | | | | | |
Steven Hartstein (1963) 230 Park Avenue New York, New York 10169 | | Chief Compliance Officer | | December 2022 – Present | | Senior Vice President, Voya Investment Management (December 2022 – Present). Formerly, Head of Funds Compliance, Brighthouse Financial, Inc. and Chief Compliance Officer – Brighthouse Funds and Brighthouse Investment Advisers, LLC (March 2017- December 2022). |
| | | | | | | |
Todd Modic (1967) 7337 East Doubletree Ranch Rd.
Suite 100
Scottsdale, Arizona 85258 | | Senior Vice President, Chief/ Principal Financial Officer and Assistant Secretary | | VFT – March 2005 – Present
VSPT – March 2007 – Present | | Director and Senior Vice President, Voya Capital, LLC, and Voya Funds Services, LLC (September 2022 – Present); Director, Voya Investments, LLC (September 2022 – Present); Senior Vice President, Voya Investments, LLC (April 2005 – Present). Formerly, President, Voya Funds Services, LLC (March 2018 – September 2022). |
| | | | | | | |
Kimberly A. Anderson (1964) 7337 East Doubletree Ranch Rd.
Suite 100
Scottsdale, Arizona 85258 | | Senior Vice President | | VFT – November 2003 – Present
VSPT – March 2007 – Present | | Senior Vice President, Voya Investments, LLC (September 2003 − Present). |
| | | | | | | |
Sara M. Donaldson (1959) 7337 East Doubletree Ranch Rd.
Suite 100
Scottsdale, Arizona 85258 | | Senior Vice President | | June 2022 – Present | | Senior Vice President, Voya Investments, LLC (February 2022 – Present); Senior Vice President, Head of Active Ownership, Voya Investment Management (September 2021 – Present). Formerly, Vice President, Voya Investments, LLC (October 2015 – February 2022); Vice President, Head of Proxy Voting, Voya Investment Management (October 2015 – August 2021). |
| | | | | | | |
Jason Kadavy (1976) 7337 East Doubletree Ranch Rd.
Suite 100
Scottsdale, Arizona 85258 | | Senior Vice President | | September 2023 - Present | | Senior Vice President, Voya Investments, LLC and Voya Funds Services, LLC (September 2023 – Present); Formerly, Vice President, Voya Investments, LLC (October 2015 - September 2023); Vice President, Voya Funds Services, LLC (July 2007 – September 2023). |
| | | | | | | |
Andrew K. Schlueter (1976) 7337 East Doubletree Ranch Rd.
Suite 100
Scottsdale, Arizona 85258 | | Senior Vice President | | June 2022 – Present | | Senior Vice President, Head of Investment Operations Support, Voya Investment Management (April 2023 – Present); Vice President, Voya Investments Distributor, LLC (April 2018 – Present); Vice President, Voya Investments, LLC and Voya Funds Services, LLC (March 2018-Present); Formerly, Vice President, Head of Mutual Fund Operations, Voya Investment Management (March 2022 – March 2023); Vice President, Head of Mutual Fund Operations, Voya Investment Management (February 2018 – February 2022). |
TRUSTEE AND OFFICER INFORMATION (Unaudited) (continued)
Name, Address and Year of
Birth | | Position(s) Held with the
Trust | | Term of Office and
Length of Time
Served(1) | | Principal
Occupation(s) –
During the Past 5 Years |
Joanne F. Osberg (1982) 7337 East Doubletree Ranch Rd.
Suite 100
Scottsdale, Arizona 85258 | | Senior Vice President Secretary | | March 2023 - Present September 2020 – Present | | Senior Vice President and Chief Counsel, Voya Investment Management – Mutual Fund Legal Department, Senior Vice President and Secretary, Voya Investments, LLC, Voya Capital, LLC, and Voya Funds Services, LLC (March 2023 – Present). Formerly, Secretary, Voya Capital, LLC (August 2022 - March 2023); Vice President and Secretary, Voya Investments, LLC and Voya Funds Services, LLC, Vice President and Senior Counsel, Voya Investment Management – Mutual Fund Legal Department (September 2020 – March 2023). Vice President and Counsel, Voya Investment Management – Mutual Fund Legal Department (January 2013 – September 2020). |
| | | | | | | |
Robert Terris (1970) 5780 Powers Ferry Road NW Atlanta, Georgia 30327 | | Senior Vice President | | VFT – May 2006 – Present
VSPT – March 2007 – Present | | Senior Vice President, Head of Future State Operating Model Design, Voya Investment Management (April 2023 – Present); Senior Vice President, Voya Investments Distributor, LLC (April 2018 – Present); Senior Vice President, Head of Investment Services, Voya Investments, LLC (April 2018 – Present); Senior Vice President, Head of Investment Services, Voya Funds Services, LLC (March 2006 – Present). |
| | | | | | | |
Fred Bedoya (1973) 7337 East Doubletree Ranch Rd.
Suite 100
Scottsdale, Arizona 85258 | | Vice President Principal Accounting Officer and Treasurer | | September 2012 – Present | | Vice President, Voya Investments, LLC (October 2015 – Present); Vice President, Voya Funds Services, LLC (July 2012 - Present). |
| | | | | | | |
Robyn L. Ichilov (1967) 7337 East Doubletree Ranch Rd.
Suite 100
Scottsdale, Arizona 85258 | | Vice President | | VFT – October 2000 – Present VSPT – March 2007 – Present | | Vice President, Voya Investments, LLC (August 1997 – Present); Vice President, Voya Funds Services, LLC (November 1995 - Present). |
| | | | | | | |
Erica McKenna (1972) 7337 East Doubletree Ranch Rd.
Suite 100
Scottsdale, Arizona 85258 | | Vice President | | June 2022 – Present | | Vice President, Head of Mutual Fund Compliance, and Chief Compliance Officer, Voya Investments, LLC (May 2022 – Present). Formerly, Vice President, Fund Compliance Manager, Voya Investments, LLC (March 2021 – May 2022); Assistant Vice President, Fund Compliance Manager, Voya Investments, LLC (December 2016 – March 2021). |
| | | | | | | |
Craig Wheeler (1969) 7337 East Doubletree Ranch Rd.
Suite 100
Scottsdale, Arizona 85258 | | Vice President | | May 2013 – Present | | Vice President – Director of Tax, Voya Investments, LLC (October 2015 – Present). |
| | | | | | | |
Gizachew Wubishet (1976) 7337 East Doubletree Ranch Rd.
Suite 100
Scottsdale, Arizona 85258 | | Vice President and Assistant Secretary | | March 2024 - Present | | Vice President and Counsel, Voya Investment Management – Mutual Fund Legal Department (March 2024 – Present). Formerly, Assistant Vice President and Counsel, Voya Investment Management – Mutual Fund Legal Department (May 2019 – February 2024); Attorney, Ropes & Gray LLP (October 2011 – April 2019). |
| | | | | | | |
Nicholas C.D. Ward (1993) 7337 East Doubletree Ranch Rd.
Suite 100
Scottsdale, Arizona 85258 | | Assistant Vice President and Assistant Secretary | | June 2022 – Present | | Assistant Vice President and Counsel, Voya Investment Management – Mutual Fund Legal Department (March 2024 – Present). Formerly, Counsel, Voya Investment Management – Mutual Fund Legal Department (November 2021 – February 2024); Associate, Dechert LLP (October 2018 – November 2021). |
TRUSTEE AND OFFICER INFORMATION (Unaudited) (continued)
Name, Address and Year of
Birth | | Position(s)
Held with the
Trust | | Term of Office and
Length of Time
Served(1) | | Principal
Occupation(s) –
During the Past 5 Years |
Monia Piacenti (1976) One Orange Way Windsor, Connecticut 06095 | | Anti-Money Laundering Officer | | June 2018 – Present | | Compliance Manager, Voya Financial, Inc. (March 2023 – Present); Anti-Money Laundering Officer, Voya Investments Distributor, LLC, Voya Investment Management and Voya Investment Management Trust Co. (June 2018 – Present). Formerly, Compliance Consultant, Voya Financial, Inc. (January 2019 – February 2023). |
(1) The Officers hold office until the next annual meeting of the Board of Trustees and until their successors shall have been elected and qualified.
ADVISORY AND SUB-ADVISORY CONTRACT APPROVAL DISCUSSION (Unaudited)
BOARD CONSIDERATION AND APPROVAL OF INVESTMENT MANAGEMENT CONTRACTS AND SUB-ADVISORY CONTRACTS
At a meeting held on November 16, 2023, the Board of Trustees (“Board”) of Voya Funds Trust and Voya Separate Portfolios Trust (collectively, the “Trusts”), including a majority of the Board members who have no direct or indirect interest in the investment management and sub-advisory contracts, and who are not “interested persons” of Voya VACS Series EMCD Fund (the “EMCD Fund”), Voya VACS Series EMHCD Fund (the “EMHCD Fund”), Voya VACS Series SC Fund (the “SC Fund”), and Voya VACS Series HYB Fund (the “HYB Fund,” and together with the EMCD Fund, EMHCD Fund and SC Fund, the “Funds”), each a series of the Trusts, as such term is defined under the Investment Company Act of 1940, as amended (the “Independent Trustees”), considered and approved the renewal of the investment management contracts (the “Management Contracts”) between Voya Investments, LLC (the “Manager”) and the Trusts, on behalf of the Funds, and the sub-advisory contracts (the “Sub-Advisory Contracts,” and together with the Management Contracts, the “Contracts”) with Voya Investment Management Co. LLC, the sub-adviser to each Fund (the “Sub-Adviser”), for an additional one-year period ending November 30, 2024.
In addition to the Board meeting on November 16, 2023, the Independent Trustees also held meetings outside the presence of representatives of the Manager and Sub-Adviser (collectively, such persons are referred to herein as “management”) on October 9, 2023 and November 14, 2023. At those meetings, the Board members reviewed and considered materials related to the proposed continuance of the Contracts that they had requested and believed to be relevant to the renewal of the Contracts in light of their own business judgment and the legal advice furnished to them by K&L Gates LLP, their independent legal counsel. The Board also considered information furnished to it throughout the year at meetings of the Board and its committees, including information regarding performance, expenses, and other relevant matters. While the Board considered the renewal of the management contracts and sub-advisory contracts for all of the applicable investment companies in the Voya family of funds at the same meetings, the Board considered each Voya fund’s investment management and sub-advisory relationships separately.
The Board has established a Contracts Committee and two Investment Review Committees (the “IRCs”), each of which includes only Independent Trustees as members. The Contracts Committee meets several times throughout the year to provide oversight with respect to the management and sub-advisory contracts approval and renewal process for the Voya funds, among other functions, and each IRC
meets several times throughout the year with respect to each Voya fund (assigned to that IRC) to provide oversight regarding the investment performance of the sub-advisers, as well as the Manager’s role in monitoring the sub-advisers.
The Contracts Committee oversees, and annually recommends Board approval of updates to, a methodology guide for the Voya funds (“Methodology Guide”), which sets out a framework pursuant to which the Independent Trustees request, and management provides, certain information that the Independent Trustees deem to be important or potentially relevant to the contracts renewal process for the Voya funds. The Independent Trustees retain the services of an independent consultant with experience in the mutual fund industry to assist the Contracts Committee in developing and recommending to the Board: (1) a selected peer group of investment companies for each Fund (“Selected Peer Group”) based on that Fund’s particular attributes; and (2) updates to the Methodology Guide with respect to the content and format of various data prepared in connection with the renewal process. In addition, the Independent Trustees periodically have retained an independent firm to test and verify the accuracy of certain information presented to the Board for a representative sample of the Voya funds.
The Manager or Sub-Adviser may not have been able to, or opted not to, provide information in response to certain information requests, in which case the Board conducted its evaluation based on the information that was provided. In such cases, the omission of any such information was determined to not be material to the Board’s considerations.
Provided below is an overview of certain material factors that the Board considered at its meetings regarding the renewal of the Contracts and the compensation to be paid thereunder. The Board members did not identify any particular information or factor that was most relevant to its consideration.
Nature, Extent and Quality of Services
The Manager oversees, subject to the authority of the Board, and is responsible for the provision of, all investment advisory and portfolio management services for the Funds, but may delegate certain of these responsibilities to one or more sub-advisers. In addition, the Manager provides administrative services reasonably necessary for the operation of the Funds as set forth in the Management Contracts, including oversight of the Funds’ operations and risk management and the oversight of their various other service providers.
The Board considered the “manager-of-managers” structure of the Voya funds that has been developed by the
ADVISORY AND SUB-ADVISORY CONTRACT APPROVAL DISCUSSION (Unaudited) (continued)
Manager pursuant to which the Manager selects, subject to the Board’s approval, sub-advisers to provide day-to-day management services to all or a portion of each Voya fund. The Board recognized that the Manager is responsible for monitoring the Sub-Adviser’s investment program, performance, developments, ongoing operations, and compliance with applicable regulations and investment policies and restrictions with respect to the Funds under this manager-of-managers arrangement. The Board also considered the techniques and resources that the Manager has developed to provide this ongoing due diligence and oversight with respect to the sub-advisers and to recommend appropriate changes in investment strategies, sub-advisers, or allocation among sub-advisers in an effort to improve a Voya fund’s performance. In connection with the Manager’s performance of these duties, the Board considered that the Manager has developed an oversight process formulated by its Manager Research & Selection Group that reviews, among other matters, performance data, the Sub-Adviser’s management team, portfolio data and attribution analysis related to the Sub-Adviser through various means, including, but not limited to, in-person meetings, on-site or virtual visits, and telephonic meetings with the Sub-Adviser.
Further, the Board considered periodic compliance reports it receives from the Trusts’ Chief Compliance Officer evaluating, among other related matters, whether the regulatory compliance systems and procedures of the Manager and Sub-Adviser are reasonably designed to ensure compliance with the federal securities laws and whether the investment policies and restrictions for each Fund are complied with on a consistent basis.
The Board considered the portfolio management team assigned by the Sub-Adviser to the Funds and the level of resources committed to the Funds (and other relevant funds in the Voya funds) by the Manager and Sub-Adviser, and whether those resources are sufficient to provide high-quality services to the Funds.
Based on their deliberations and the materials presented to them, the Board concluded that the nature, extent and quality of the overall services provided by the Manager and Sub-Adviser under the Contracts were appropriate.
Fund Performance
In assessing the investment management and sub-advisory relationships, the Board placed emphasis on the investment returns of the EMCD Fund, including its investment performance over certain time periods compared to the Fund’s Morningstar, Inc. (an independent provider of mutual fund data) category and primary benchmark, a broad-based securities market index. The Board also
considered information from the Manager Research & Selection Group and received reports summarizing a separate analysis of EMCD Fund’s performance and risk, including risk-adjusted investment return information, from the Trusts’ Chief Investment Risk Officer. With respect to the EMHCD Fund, the SC Fund and HYB Fund, the Board considered that each Fund had limited performance history as it was launched in early 2023 and that it was reasonable to provide more time for the purpose of evaluating the Fund’s performance.
Economies of Scale
When evaluating the reasonableness of the management fee schedules, the Board considered whether economies of scale have been or likely will be realized by the Manager and Sub-Adviser as a Fund grows larger and the extent to which any such economies are shared with the Fund. The Board also considered that, while the Funds do not have management fee breakpoints, they have fee waiver and expense reimbursement arrangements. The Board considered the extent to which economies of scale realized by the Manager could be shared with the Funds through such fee waivers, expense reimbursements or other expense reductions.
Information Regarding Services, Performance, and Fee Schedules Offered to Other Clients
The Board considered comparative information regarding the nature of services, performance, and fee schedules offered by the Manager and Sub-Adviser to other clients with similar investment objectives, if applicable, including other registered investment companies and relevant institutional accounts. When the fee schedules offered to or the performance of such other clients differed materially from the Funds, the Board took into account the underlying rationale provided by the Manager or Sub-Adviser, as applicable, for these differences.
Fee Schedules, Profitability, and Fall-out Benefits
The Board reviewed and considered the contractual management fee schedule and net management fee rate payable by each Fund to the Manager compared to the Fund’s Selected Peer Group. The Board also considered the compensation payable by the Manager to the Sub-Adviser for sub-advisory services for each Fund, including the portion of the contractual and net management fee rates that are paid to the Sub-Adviser, as compared to the compensation paid to the Manager. In addition, the Board considered the fee waivers, expense limitations, and recoupment arrangements that apply to the fees payable by the Funds, including whether the Manager proposed any changes thereto. For each Fund, the Board separately
ADVISORY AND SUB-ADVISORY CONTRACT APPROVAL DISCUSSION (Unaudited) (continued)
determined that the fees payable to the Manager and the fee schedule payable to the Sub-Adviser are reasonable for the services that each performs, which were considered in light of the nature, extent and quality of the services that each has performed and is expected to perform.
For each Fund, the Board considered information on revenues, costs and profits or losses realized by the Manager and the Voya-affiliated Sub-Adviser related to their services to the Fund. In analyzing the profitability of the Manager and its affiliates in connection with services they render to the Funds, the Board took into account the sub-advisory fee rate payable by the Manager to the Sub-Adviser. The Board also considered the profitability of the Manager and its affiliated Sub-Adviser attributable to servicing each Fund both with and without taking into account the profitability of the distributor of the Funds and any revenue sharing payments made by the Manager.
Although the Methodology Guide establishes a framework for profit calculation by the Manager and its affiliated Sub-Adviser, the Board recognized that there is no uniform methodology within the asset management industry for determining profitability for this purpose. The Board also recognized that the use of different reasonable methodologies can give rise to dramatically different reported profit and loss results with respect to the Manager and the Voya-affiliated Sub-Adviser, as well as other industry participants with whom the profits of the Manager and its affiliated Sub-Adviser could be compared. In addition, the Board recognized that management’s calculations regarding its costs incurred in establishing the infrastructure necessary for the Funds’ operations may not be fully reflected in the expenses allocated to each Fund in determining profitability. The Board also recognized that the information presented may not portray all of the costs borne by the Manager or reflect all of the risks associated with offering and managing a mutual fund complex in the current regulatory and market environment, including entrepreneurial, regulatory, legal and operational risks.
The Board also considered that the Manager and the Voya-affiliated Sub-Adviser are entitled to earn a reasonable level of profits for the services that they provide to the Funds. The Board also considered information regarding the potential fall-out benefits to the Manager and Sub-Adviser and their respective affiliates from their association with the Funds. Following its reviews, the Board determined that the Manager’s and the Voya-affiliated Sub-Adviser’s profitability with respect to their services to the Funds and the Manager’s and Sub-Adviser’s potential fall-out benefits were not unreasonable.
Fund-by-Fund Analysis
Set forth below are certain of the specific factors that the Board considered at its October 9, 2023, November 14, 2023, and/or November 16, 2023 meetings in relation to approving each Fund’s Contracts and the conclusions reached by the Board. These specific factors are in addition to those considerations discussed above. The performance data provided to the Board for the EMCD Fund primarily was for various periods ended March 31, 2023. In addition, the Board also considered at its October 9, 2023, November 14, 2023, and/or November 16, 2023 meetings certain additional data regarding the EMCD Fund’s more recent performance, asset levels and asset flows. Each Fund’s management fee rate and expense ratio were compared to the management fee rates and expense ratios of the funds in its Selected Peer Group. With respect to the quintile and quartile rankings noted below, the first quintile or quartile represents the range of funds with the highest performance or the lowest management fee rate or expense ratio, as applicable, and the fifth quintile or fourth quartile represents the range of funds with the lowest performance or the highest management fee rate or expense ratio, as applicable.
EMCD Fund
In considering whether to approve the renewal of the Contracts for the EMCD Fund, the Board considered that, based on performance data for the periods ended March 31, 2023: (1) the Fund is ranked in the first quintile of its Morningstar, Inc. category for the one-year, three-year, five-year and ten-year periods, and the third quintile for the year-to-date period; and (2) the Fund outperformed its primary benchmark for all periods presented, with the exception of the year-to-date period, during which it underperformed.
In considering the fees payable under the Contracts for the Fund, the Board took into account the factors described above and also considered: (1) the fairness of the compensation under a Management Contract with a level fee rate that does not include breakpoints; and (2) the pricing structure (including the net expense ratio to be borne by shareholders) of the Fund, as compared to its Selected Peer Group, including that: (a) the net management fee rate for the Fund is ranked in the second quintile of net management fee rates of the funds in its Selected Peer Group; (b) the contractual management fee rate for the Fund is ranked in the first quintile of contractual management fee rates of the funds in its Selected Peer Group; and (c) the net expense ratio for the Fund is ranked in the fourth quintile of net expense ratios of the funds in its Selected Peer Group.
ADVISORY AND SUB-ADVISORY CONTRACT APPROVAL DISCUSSION (Unaudited) (continued)
EMHCD Fund
In considering whether to approve the renewal of the Contracts for the EMHCD Fund, the Board considered that the Fund had limited performance history as it was launched in February 2023.
In considering the fees payable under the Contracts for the Fund, the Board took into account the factors described above and also considered: (1) the fairness of the compensation under a Management Contract with a level fee rate that does not include breakpoints; and (2) the pricing structure (including the net expense ratio to be borne by shareholders) of the Fund, as compared to its Selected Peer Group, including that: (a) the contractual management fee rate for the Fund is ranked in the first quartile of contractual management fee rates of the funds in its Selected Peer Group; and (b) the net expense ratio for the Fund is ranked in the third quartile of net expense ratios of the funds in its Selected Peer Group.
SC Fund
In considering whether to approve the renewal of the Contracts for the SC Fund, the Board considered that the Fund had limited performance history as it was launched in January 2023.
In considering the fees payable under the Contracts for the Fund, the Board took into account the factors described above and also considered: (1) the fairness of the compensation under a Management Contract with a level fee rate that does not include breakpoints; and (2) the pricing structure (including the net expense ratio to be borne by shareholders) of the Fund, as compared to its Selected Peer Group, including that: (a) the contractual management fee rate for the Fund is ranked in the first quartile of contractual management fee rates of the funds in its Selected Peer Group; and (b) the net expense ratio for the Fund is ranked in the first quartile of net expense ratios of the funds in its Selected Peer Group.
HYB Fund
In considering whether to approve the renewal of the Contracts for the HYB Fund, the Board considered that the Fund had limited performance history as it was launched in February 2023.
In considering the fees payable under the Contracts for the Fund, the Board took into account the factors described above and also considered: (1) the fairness of the compensation under a Management Contract with a level fee rate that does not include breakpoints; and (2) the pricing structure (including the net expense ratio to be borne by shareholders) of the Fund, as compared to its Selected Peer Group, including that: (a) the contractual
management fee rate for the Fund is ranked in the first quartile of contractual management fee rates of the funds in its Selected Peer Group; and (b) the net expense ratio for the Fund is ranked in the second quartile of net expense ratios of the funds in its Selected Peer Group.
Board Conclusions
After its deliberation, the Board concluded that, in its business judgment, the terms of the Contracts are fair and reasonable to each Fund and that approval of the continuation of the Contracts is in the best interests of each Fund and its shareholders. In doing so, the Board reviewed all factors it considered to be material, including those discussed above. Within the context of its overall conclusions regarding the Contracts, and based on the information provided and management’s related representations, the Board concluded that it was satisfied with management’s responses relating to each Fund’s investment performance and the fees payable under the Contracts. During this renewal process, each Board member may have accorded different weight to various factors in reaching his or her conclusions. Based on these conclusions and other factors, the Board voted to renew the Contracts for each Fund for the year ending November 30, 2024.
| Investment Adviser | Independent Registered Public Accounting Firm |
| Voya Investments, LLC | Ernst & Young LLP |
| 7337 East Doubletree Ranch Road, Suite 100 | 200 Clarendon Street |
| Scottsdale, Arizona 85258 | Boston, Massachusetts 02116 |
| | |
| Distributor | Custodian |
| Voya Investments Distributor, LLC | The Bank of New York Mellon |
| 7337 East Doubletree Ranch Road, Suite 100 | 225 Liberty Street |
| Scottsdale, Arizona 85258 | New York, New York 10286 |
| | |
| Placement Agent | Legal Counsel |
| BNY Mellon Investment Servicing (U.S.) Inc. | Ropes & Gray LLP |
| 301 Bellevue Parkway | Prudential Tower |
| Wilmington, Delaware 19809 | 800 Boylston Street |
| | Boston, Massachusetts 02199 |
For more complete information, or to obtain a prospectus on any Voya mutual fund, please call your financial advisor or Voya Investments Distributor, LLC at (800) 992-0180 or log on to www.voyainvestments.com. The prospectus should be read carefully before investing. Consider the fund’s investment objectives, risks, charges and expenses carefully before investing. The prospectus contains this information and other information about the fund.
| RETIREMENT | INVESTMENTS | INSURANCE | |
| voyainvestments.com | 220645 (0324) |

Annual Report
March 31, 2024
Voya Floating Rate Fund
Classes A, C, I, R and W
Effective January 24, 2023, the U.S. Securities and Exchange Commission adopted rule and form amendments to require mutual funds to transmit concise and visually engaging streamlined annual and semi-annual reports to shareholders that highlight key information deemed important for investors to assess and monitor their fund investments. Other information, including financial statements, will no longer appear in the funds’ streamlined shareholder reports but must be available online, delivered free of charge upon request, and filed on a semi-annual basis on Form N-CSR. The rule and form amendments have a compliance date of July 24, 2024. |
This report is submitted for general information to shareholders of the Voya mutual funds. It is not authorized for distribution to prospective shareholders unless accompanied or preceded by a prospectus which includes details regarding the fund’s investment objectives, risks, charges, expenses and other information. This information should be read carefully. |
 | E-Delivery Sign-up – details inside |  |
| | |
| INVESTMENT MANAGEMENT |
| | |
| voyainvestments.com |
TABLE OF CONTENTS
| Go Paperless with E-Delivery! | |
| |
| Sign up now for on-line prospectuses, fund reports, and proxy statements. |
| | | |
| Just go to www.individuals.voya.com/page/e-delivery, follow the directions and complete the quick 5 Steps to Enroll. |
| | | |
| You will be notified by e-mail when these communications become available on the internet. |
| |
PROXY VOTING INFORMATION
A description of the policies and procedures that the Fund uses to determine how to vote proxies related to portfolio securities is available: (1) without charge, upon request, by calling Shareholder Services toll-free at (800) 992-0180; (2) on the Fund’s website at www.voyainvestments.com; and (3) on the U.S. Securities and Exchange Commission’s (“SEC’s”) website at www.sec.gov. Information regarding how the Fund voted proxies related to portfolio securities during the most recent 12-month period ended June 30 is available without charge on the Fund’s website at www.voyainvestments.com and on the SEC’s website at www.sec.gov.
QUARTERLY PORTFOLIO HOLDINGS
The Fund files its complete schedule of portfolio holdings with the SEC for the first and third quarters of each fiscal year on Form NPORT-P. The Fund’s Forms NPORT-P are available on the SEC’s website at www.sec.gov. The Fund’s complete schedule of portfolio holdings is available at: www.voyainvestments.com and without charge upon request from the Fund by calling Shareholder Services toll-free at (800) 992-0180.
Benchmark Descriptions
| Index | Description |
| Morningstar LSTA US Leveraged Loan Index | An unmanaged total return index that captures accrued interest, repayments, and market value changes. It represents a broad cross section of leveraged loans syndicated in the United States, including dollar-denominated loans to overseas issuers. Standard & Poor’s (“S&P”) and the Loan Syndications and Trading Association (“LSTA”) conceived the index to establish a performance benchmark for the syndicated leveraged loan industry. |
| Voya Floating Rate Fund | Portfolio Managers’ Report |
Voya Floating Rate Fund (the “Fund”) seeks to provide investors with a high level of current income. The Fund is managed by Mohamed Basma, CFA, and Randall Parrish, CFA Portfolio Managers of Voya Investment Management Co. LLC — the Sub-Adviser.
Performance: For the year ended March 31, 2024, the Fund’s Class A shares, excluding sales charges, provided a total return of 9.81% compared to the Morningstar® LSTA® US Leveraged Loan Index (the “Index”), which returned 12.47% for the same period.
Portfolio Specifics: Despite initial concerns of a U.S. recession, risk assets performed well during the fiscal period on the back of strong economic growth and a healthy labor market, while inflationary pressures eased. A key driver was strong fiscal support that helped counteract monetary policy effects, residual consumer strength and steady corporate earnings. As a result, investor sentiment was underpinned by soft-landing optimism and a growing view that the U.S. Federal Reserve would begin cutting rates in the near term. Given the floating rate component of loans and related elevated carry, the Morningstar® LSTA® US Leveraged Loan Index returned 12.47% during the fiscal year. Further contributing to returns was the increase in the average Index bid price, which closed out the period at 96.73, representing a 335 basis points increase from the end of the prior fiscal period. By ratings, lower-rated loans outperformed their higher-rated counterparts. BB, B and CCC rated loans returned 10.05%, 13.46% and 16.63%, respectively.
| | Ratings Distribution
as of March 31, 2024
| |
| | BB or above | 27.42% | |
| | B | 65.86% | |
| | CCC or below | 2.94% | |
| | Not rated* | 3.78% | |
| | | | | |
| | Loan ratings apply to the underlying holdings of the Fund and not the Fund itself. Ratings distribution shows the percentage of the Fund’s loan commitments (excluding cash and foreign cash) that are rated in each ratings category, based upon the categories provided by Standard & Poor. Ratings distribution is based on Standard & Poor’s senior secured facility ratings. The Standard & Poor’s rating scale is as follows, from excellent (high grade) to poor (including default): AAA to D, with intermediate ratings offered at each level between AA and CCC. Anything lower than a BBB-rating is considered a non-investment grade or junk bond. Any security that is not rated by Standard & Poor’s is placed in the NR (Not Rated) category. Ratings can change from time to time, and current ratings may not fully reflect the actual credit condition or risks posed by a loan. | |
| | | |
| | * | Not rated includes loans to non-U.S. borrowers (which are typically unrated) and loans for which the rating has been withdrawn. | |
| | | | |
A rally in the secondary market and limited new issuance in the primary market created a favorable condition for opportunistic deals to launch in the market, as most of the issuance was concentrated in refinancings and repricings. However, merger and acquisition and leveraged buyouts (“LBO”) were nonexistent due to increased cost of funding. Overall, supply volume for the fiscal year amounted to $334.1 billion. Turning to the investor demand front, collateralized loan obligations (“CLO”) remained the dominant buyers in the loan market, providing a tailwind to the asset class. Total CLO issuance amounted to roughly $142 billion for the fiscal year, with about $48.8 billion issued in 1Q24 alone. Meanwhile, retail mutual funds and exchange traded funds (“ETF”) saw net outflows of about $9.92 billion during this fiscal year; however, the last month saw strong inflows.
| | | TOP TEN LOAN ISSUERS
AS OF MARCH 31, 2024
AS A PERCENTAGE OF: | |
| | | NET
ASSETS | |
| | Asurion, LLC | 0.9% | |
| | UKG Inc. | 0.8% | |
| | Acrisure, LLC | 0.7% | |
| | Peraton Corp | 0.7% | |
| | Gray Television, Inc. | 0.7% | |
| | HUB International Limited | 0.7% | |
| | Titan Acquisition Limited | 0.7% | |
| | Great Outdoors Group, LLC | 0.7% | |
| | Medline Borrower, LP | 0.7% | |
| | AAdvantage Loyalty IP Ltd | 0.6% | |
| | | | | |
The Fund underperformed the Index during the fiscal period. By ratings, the Fund was negatively impacted by selection in CCC rated loans and non-rated loans. From an industry perspective, the main drag was selection in Consumer Staples Distribution and Retail, which stemmed from overweight to Save-A-lot. Additionally, selection in Semiconductors and Semiconductor Equipment as well as Specialty Retail detracted from performance. At the issuer level, the primary relative laggards were overweight to Save-A-Lot and Lumileds. Each company experienced weak earnings and liquidity challenges. In contrast, the Fund benefited from the equity position in Yak Mat, as the company was acquired during the period, which was accretive to performance. Additional benefits included exposure to a few names that underperformed in the past but saw their loan prices move higher during the period, including, Diamond Sports Group LLC, 24 Hour Fitness Worldwide, Inc., Telesat and Nautilus Power, LLC. Away from loan-level performance, the Fund was modestly weighed down by its exposure to high yield (“HY”) bonds, as the HY bond market underperformed loans during the timeframe (11.15% return for the Bloomberg U.S. Corporate High Yield Index).
Current Strategy & Outlook: In our opinion, the macro-outlook remains supportive, as U.S. growth is currently above trend coupled with a strong job market and rising real wages providing additional support to consumer spending. In addition, corporate balance sheets are generally in good shape, helping cushion any potential deceleration in growth. The markets
| Portfolio Managers’ Report | Voya Floating Rate Fund |
will continue to monitor the Fed policy, especially in light of the recently higher-than-expected inflation prints. While the timing of the first rate cut remains uncertain, the Fed’s data-dependent stance should provide some flexibility in adjusting policy measures in response to evolving economic conditions.
Looking ahead, we expect the technical backdrop to remain supportive in the loan market, as CLO issuance continues at a strong clip, while retail demand has firmed recently given attractive yields offered by the asset class. Fundamental factors have held up better than expected (mainly among stronger rated issuers) with generally stable demand and improving margins. In our view sectoral themes and sub sector secular developments remain prominent and worth paying close attention to. Although default activity remains muted, we expect trailing averages to gradually increase through the balance of the year, as higher rates further weigh on the weaker issuers with the stressed pockets of the market exhibiting increased activity in liability management exercises and distressed exchanges. Therefore, we generally maintain previously held cautious sectoral views and up-in-quality positioning.
The views expressed in this commentary are informed opinions. They should not be considered promises or advice. The views expressed reflect those of the portfolio managers, only through the end of the period as stated on the cover. The portfolio managers’ views are subject to change at any time based on market and other conditions.
Portfolio holdings and characteristics are subject to change and may not be representative of current holdings and characteristics. Fund holdings are subject to change daily. The outlook for this Fund may differ from that presented for other Voya mutual funds. This report contains statements that may be “forward-looking” statements. Actual results may differ materially from those projected in the “forward-looking” statements. The Fund’s performance returns shown reflect applicable fee waivers and/or expense limits in effect during this period. Absent such fee waivers/expense limitations, if any, performance would have been lower. Performance for the different classes of shares will vary based on differences in fees associated with each class. An index has no cash in its portfolio and imposes no sales charges. An investor cannot invest directly in an index.
The commentary provided was based in part upon attribution analysis from FactSet and is for informational purposes only and is not intended as investment advice. The commentary may reference current holdings as well as holdings that may have been sold during the period. Performance figures for individual sectors and individual holdings in FactSet attribution are gross of fees. Results are on a gross of fees basis.
The attribution analysis from FactSet compares loan level performance of the portfolio to the index. FactSet attribution does not include any other fund performance attribution impact (e.g., structural impacts, intraday trade prices, fee income, cash, etc). Further, certain assumptions are made in FactSet’s model for the calculation of daily total returns for loans in the portfolio, including how FactSet accrues income and calculates coupon, both of which may have an impact on the derived total return used in the attribution analysis. FactSet obtains daily weights and returns for the index directly from S&P/LCD. The calculated returns used in the attribution analysis are not accounting-based returns. Investment performance presented differs from actual performance and was not constructed according to the input, calculation, presentation, and disclosure requirements of the Global Investment Performance Standards (GIPS). Attribution analysis is intended only to directionally understand drivers of performance and is not intended to convey unintended precision or accuracy. FactSet attribution results can vary, even for historical periods, from previously run attribution reports for those same periods. These variances can be a result of changes to FactSet’s system, improvements or revisions to calculation methodology, or data reconciliation efforts. Voya IM believes that attribution and statements based on attribution are directionally useful for understanding performance, but Voya IM does not represent that such information is accurate or complete.
| Voya Floating Rate Fund | Portfolio Managers’ Report |
Average Annual Total Returns for the Periods Ended March 31, 2024
| | | 1 Year | | | 5 Year | | | 10 Year | |
| Including Sales Charge: | | | | | | | | | | | | |
| Class A(1) | | | 7.16 | % | | | 2.01 | % | | | 2.37 | % |
| Class C(2) | | | 8.19 | % | | | 1.77 | % | | | 2.00 | % |
| Class I | | | 10.27 | % | | | 2.81 | % | | | 2.91 | % |
| Class R | | | 9.75 | % | | | 2.28 | % | | | 2.39 | % |
| Class W | | | 10.26 | % | | | 2.81 | % | | | 2.89 | % |
| Excluding Sales Charge: | | | | | | | | | | | | |
| Class A | | | 9.87 | % | | | 2.53 | % | | | 2.63 | % |
| Class C | | | 9.19 | % | | | 1.77 | % | | | 2.00 | % |
| Class I | | | 10.27 | % | | | 2.81 | % | | | 2.91 | % |
| Class R | | | 9.75 | % | | | 2.28 | % | | | 2.39 | % |
| Class W | | | 10.26 | % | | | 2.81 | % | | | 2.89 | % |
| Morningstar® LSTA® US Leveraged Loan Index | | | 12.47 | % | | | 5.48 | % | | | 4.55 | % |
Based on a $10,000 initial investment, the graph and table above illustrate the total return of Voya Floating Rate Fund against the index indicated. The index is unmanaged, has no cash in its portfolio and imposes no sales charges. An investor cannot invest directly in an index.
The Fund’s performance is shown both with and without the imposition of sales charges.
The performance graph and table do not reflect the deduction of taxes that a shareholder will pay on Fund distributions or the redemption of Fund shares.
The performance shown includes, if applicable, the effect of fee waivers and/or expense reimbursements by the Investment Adviser and/or other service providers, which have the effect of increasing total net return. Had all fees and expenses been considered, the total net returns would have been lower.
Performance data represents past performance and is no assurance of future results. Investment return and principal value of an investment in the Fund will fluctuate. Shares, when sold, may be worth more or less than their original cost. The Fund’s current performance may be lower or higher than the performance data shown. Please log on to www.voyainvestments.com or call (800) 992-0180 to get performance through the most recent month end.
Fund holdings are subject to change daily.
| (1) | Reflects deduction of the maximum Class A sales charge of 2.50%. |
| (2) | Reflects deduction of the Class C deferred sales charge of 1% for the 1 year return. |
SHAREHOLDER EXPENSE EXAMPLE (Unaudited)
As a shareholder of the Fund, you incur two types of costs: (1) transaction costs, including sales charges (loads) on purchase payments, redemption fees and exchange fees, and (2) ongoing costs, including management fees, distribution and/or service (12b-1) fees, and other Fund expenses. These Examples are intended to help you understand your ongoing costs (in dollars) of investing in the Fund and to compare these costs with the ongoing costs of investing in other mutual funds.
The Examples are based on an investment of $1,000 invested at the beginning of the period and held for the entire period from October 1, 2023 to March 31, 2024. The Fund’s expenses are shown without the imposition of any sales charges or fees. Expenses would have been higher if such charges were included.
Actual Expenses
The left section of the table shown below, “Actual Fund Return,” provides information about actual account values and actual expenses. You may use the information in this section, together with the amount you invested, to estimate the expenses that you paid over the period. Simply divide your account value by $1,000 (for example, an $8,600 account value divided by $1,000 = 8.6), then multiply the result by the number in the first section under the heading entitled “Expenses Paid During the Period” to estimate the expenses you paid on your account during this period.
Hypothetical Example for Comparison Purposes
The right section of the table shown below, “Hypothetical (5% return before expenses),” provides information about hypothetical account values and hypothetical expenses based on the Fund’s actual expense ratio and an assumed rate of return of 5% per year before expenses, which is not the Fund’s actual return. The hypothetical account values and expenses may not be used to estimate the actual ending account balance or expenses you paid for the period. You may use this information to compare the ongoing costs of investing in the Fund and other mutual funds. To do so, compare this 5% hypothetical example with the 5% hypothetical examples that appear in the shareholder reports of the other mutual funds.
Please note that the expenses shown in the table are meant to highlight your ongoing costs only and do not reflect any transactional costs, such as sales charges (loads), redemption fees or exchange fees. Therefore, the hypothetical section of the table is useful in comparing ongoing costs only, and will not help you determine the relative total costs of owning different mutual funds. In addition, if these transactional costs were included, your costs would have been higher.
| | | Actual Fund Return | | Hypothetical (5% return before expenses) |
| | | Beginning
Account
Value
October 1,
2023 | | Ending
Account
Value
March 31,
2024 | | Annualized
Expense
Ratio | | Expenses
Paid
During the
Period Ended
March 31,
2024* | | Beginning
Account
Value
October 1,
2023 | | Ending
Account
Value
March 31,
2024 | | Annualized
Expense
Ratio | | Expenses
Paid
During the
Period Ended
March 31,
2024* |
| Class A | | $1,000.00 | | | $1,047.20 | | | 0.99 | % | | $5.07 | | | $1,000.00 | | | $1,020.05 | | | 0.99 | % | | $5.00 | |
| Class C | | 1,000.00 | | | 1,043.30 | | | 1.74 | | | 8.89 | | | 1,000.00 | | | 1,016.30 | | | 1.74 | | | 8.77 | |
| Class I | | 1,000.00 | | | 1,049.70 | | | 0.74 | | | 3.79 | | | 1,000.00 | | | 1,021.30 | | | 0.74 | | | 3.74 | |
| Class R | | 1,000.00 | | | 1,046.00 | | | 1.24 | | | 6.34 | | | 1,000.00 | | | 1,018.80 | | | 1.24 | | | 6.26 | |
| Class W | | 1,000.00 | | | 1,048.40 | | | 0.74 | | | 3.79 | | | 1,000.00 | | | 1,021.30 | | | 0.74 | | | 3.74 | |
| * | Expenses are equal to the Fund’s annualized expense ratios multiplied by the average account value over the period, multiplied by 183/366 to reflect the most recent fiscal half-year. |
REPORT OF INDEPENDENT REGISTERED PUBLIC ACCOUNTING FIRM
To the Shareholders of Voya Floating Rate Fund and the Board of Trustees of Voya Funds Trust
Opinion on the Financial Statements
We have audited the accompanying statement of assets and liabilities of Voya Floating Rate Fund (the “Fund”) (one of the funds constituting Voya Funds Trust (the “Trust”)), including the portfolio of investments, as of March 31, 2024, and the related statement of operations for the year then ended, the statements of changes in net assets for each of the two years in the period then ended, the financial highlights for each of the five years in the period then ended and the related notes (collectively referred to as the “financial statements”). In our opinion, the financial statements present fairly, in all material respects, the financial position of the Fund (one of the funds constituting Voya Funds Trust) at March 31, 2024, the results of its operations for the year then ended, the changes in its net assets for each of the two years in the period then ended and its financial highlights for each of the five years in the period then ended, in conformity with U.S. generally accepted accounting principles.
Basis for Opinion
These financial statements are the responsibility of the Trust’s management. Our responsibility is to express an opinion on the Fund’s financial statements based on our audits. We are a public accounting firm registered with the Public Company Accounting Oversight Board (United States) (“PCAOB”) and are required to be independent with respect to the Trust in accordance with the U.S. federal securities laws and the applicable rules and regulations of the Securities and Exchange Commission and the PCAOB.
We conducted our audits in accordance with the standards of the PCAOB. Those standards require that we plan and perform the audit to obtain reasonable assurance about whether the financial statements are free of material misstatement, whether due to error or fraud. The Trust is not required to have, nor were we engaged to perform, an audit of the Trust’s internal control over financial reporting. As part of our audits, we are required to obtain an understanding of internal control over financial reporting, but not for the purpose of expressing an opinion on the effectiveness of the Trust’s internal control over financial reporting. Accordingly, we express no such opinion.
Our audits included performing procedures to assess the risks of material misstatement of the financial statements, whether due to error or fraud, and performing procedures that respond to those risks. Such procedures included examining, on a test basis, evidence regarding the amounts and disclosures in the financial statements. Our procedures included confirmation of securities owned as of March 31, 2024, by correspondence with the custodian, brokers and others; when replies were not received from brokers and others, we performed other auditing procedures. Our audits also included evaluating the accounting principles used and significant estimates made by management, as well as evaluating the overall presentation of the financial statements. We believe that our audits provide a reasonable basis for our opinion.

We have served as the auditor of one or more Voya investment companies since 2019.
Boston, Massachusetts
May 30, 2024
STATEMENT OF ASSETS AND LIABILITIES as of March 31, 2024
| ASSETS: | | | |
| Investments in securities at fair value (Cost $228,570,647) | | $ | 229,189,514 | |
| Cash | | | 2,419,721 | |
| Receivables: | | | | |
| Investment securities sold | | | 15,353,300 | |
| Fund shares sold | | | 133,265 | |
| Interest | | | 1,249,947 | |
| Dividend | | | 39,276 | |
| Prepaid structuring fee (Note 7) | | | 4,898 | |
| Prepaid expenses | | | 83,417 | |
| Reimbursement due from Investment Adviser | | | 2,547 | |
| Other assets | | | 44,338 | |
| Total assets | | | 248,520,223 | |
| | | | | |
| LIABILITIES: | | | | |
| Payable for investment securities purchased | | | 19,706,953 | |
| Payable for fund shares redeemed | | | 434,646 | |
| Income distribution payable | | | 35,075 | |
| Payable for investment management fees | | | 122,109 | |
| Payable for distribution and shareholder service fees | | | 46,681 | |
| Payable for trustee fees | | | 8,256 | |
| Payable to trustees under the deferred compensation plan (Note 8) | | | 44,338 | |
| Payable for commitment fees on line of credit (Note 7) | | | 34,700 | |
| Unfunded loan commitments (Note 9) | | | 96,072 | |
| Other accrued expenses and liabilities | | | 469,790 | |
| Total liabilities | | | 20,998,620 | |
| NET ASSETS | | $ | 227,521,603 | |
| | | | | |
| NET ASSETS WERE COMPRISED OF: | | | | |
| Paid-in capital | | | 453,701,998 | |
| Total distributable loss | | | (226,180,395 | ) |
| NET ASSETS | | $ | 227,521,603 | |
See Accompanying Notes to Financial Statements
STATEMENT OF ASSETS AND LIABILITIES as of March 31, 2024 (Continued)
| Class A: | | | |
| Net assets | | $ | 34,473,850 | |
| Shares authorized | | | unlimited | |
| Par value | | $ | 0.001 | |
| Shares outstanding | | | 4,151,154 | |
| Net asset value and redemption price per share(2) | | $ | 8.30 | |
| Maximum offering price per share (2.50%)(1) | | $ | 8.51 | |
| Class C: | | | | |
| Net assets | | $ | 5,633,390 | |
| Shares authorized | | | unlimited | |
| Par value | | $ | 0.001 | |
| Shares outstanding | | | 678,524 | |
| Net asset value and redemption price per share(2) | | $ | 8.30 | |
| Class I: | | | | |
| Net assets | | $ | 99,303,344 | |
| Shares authorized | | | unlimited | |
| Par value | | $ | 0.001 | |
| Shares outstanding | | | 11,953,076 | |
| Net asset value and redemption price per share | | $ | 8.31 | |
| Class R: | | | | |
| Net assets | | $ | 81,838,423 | |
| Shares authorized | | | unlimited | |
| Par value | | $ | 0.001 | |
| Shares outstanding | | | 9,875,748 | |
| Net asset value and redemption price per share | | $ | 8.29 | |
| Class W: | | | | |
| Net assets | | $ | 6,272,596 | |
| Shares authorized | | | unlimited | |
| Par value | | $ | 0.001 | |
| Shares outstanding | | | 753,765 | |
| Net asset value and redemption price per share | | $ | 8.32 | |
| (1) | Maximum offering price is computed at 100/97.50 of net asset value. On purchases of $100,000 or more, the offering price is reduced. |
| (2) | Redemption price per share may be reduced for any applicable contingent deferred sales charge. |
See Accompanying Notes to Financial Statements
STATEMENT OF OPERATIONS for the year ended March 31, 2024
| INVESTMENT INCOME: | | | |
| Interest | | $ | 23,081,646 | |
| Dividend | | | 490,746 | |
| Total investment income | | | 23,572,392 | |
| | | | | |
| EXPENSES: | | | | |
| Investment management fees | | | 1,536,257 | |
| Distribution and shareholder service fees: | | | | |
| Class A | | | 83,969 | |
| Class C | | | 60,672 | |
| Class R | | | 428,156 | |
| Transfer agent fees: | | | | |
| Class A | | | 10,375 | |
| Class C | | | 1,894 | |
| Class I | | | 31,757 | |
| Class R | | | 26,543 | |
| Class W | | | 2,376 | |
| Shareholder reporting expense | | | 10,980 | |
| Custody and accounting expense | | | 200,800 | |
| Registration fees | | | 99,633 | |
| Professional fees | | | 49,410 | |
| Trustees fees | | | 3,660 | |
| Commitment fees on line of credit (Note 7) | | | 87,233 | |
| Miscellaneous expense | | | 59,510 | |
| Structuring Fee (Note 7) | | | 53,517 | |
| Interest expense | | | 2,581 | |
| Total expenses | | | 2,749,323 | |
| Waived and reimbursed fees | | | (422,605 | ) |
| Net expenses | | | 2,326,718 | |
| Net investment income | | | 21,245,674 | |
| | | | | |
| REALIZED AND UNREALIZED GAIN (LOSS): | | | | |
| Net realized loss on investments | | | (20,054,880 | ) |
| Net change in unrealized appreciation (depreciation) on Investments | | | 21,161,169 | |
| Net realized and unrealized gain | | | 1,106,289 | |
| Increase in net assets resulting from operations | | | 22,351,963 | |
See Accompanying Notes to Financial Statements
STATEMENTS OF CHANGES IN NET ASSETS
| | | Year Ended
March 31,
2024 | | | Year Ended
March 31,
2023 | |
| FROM OPERATIONS: | | | | | | | | |
| Net investment income | | $ | 21,245,674 | | | $ | 23,626,623 | |
| Net realized loss | | | (20,054,880 | ) | | | (21,570,125 | ) |
| Net change in unrealized appreciation (depreciation) | | | 21,161,169 | | | | (12,909,447 | ) |
| Net increase (decrease) in net assets resulting from operations | | | 22,351,963 | | | | (10,852,949 | ) |
| | | | | | | | | |
| FROM DISTRIBUTIONS TO SHAREHOLDERS: | | | | | | | | |
| Total distributions (excluding return of capital): | | | | | | | | |
| Class A | | | (3,132,997 | ) | | | (2,220,292 | ) |
| Class C | | | (518,426 | ) | | | (411,867 | ) |
| Class I | | | (9,886,804 | ) | | | (10,054,986 | ) |
| Class P(1) | | | — | | | | (2,878,797 | ) |
| Class R | | | (7,774,883 | ) | | | (5,900,552 | ) |
| Class W | | | (705,359 | ) | | | (787,192 | ) |
| Total distributions | | | (22,018,469 | ) | | | (22,253,686 | ) |
| | | | | | | | | |
| FROM CAPITAL SHARE TRANSACTIONS: | | | | | | | | |
| Net proceeds from sale of shares | | | 40,377,458 | | | | 88,312,943 | |
| Reinvestment of distributions | | | 21,637,575 | | | | 21,736,937 | |
| | | | 62,015,033 | | | | 110,049,880 | |
| Cost of shares redeemed | | | (91,916,202 | ) | | | (305,895,536 | ) |
| Net decrease in net assets resulting from capital share transactions | | | (29,901,169 | ) | | | (195,845,656 | ) |
| Net decrease in net assets | | | (29,567,675 | ) | | | (228,952,291 | ) |
| | | | | | | | | |
| NET ASSETS: | | | | | | | | |
| Beginning of year or period | | | 257,089,278 | | | | 486,041,569 | |
| End of year or period | | $ | 227,521,603 | | | $ | 257,089,278 | |
| (1) | Class P liquidated on March 24, 2023. |
See Accompanying Notes to Financial Statements
Financial Highlights
Selected data for a share of beneficial interest outstanding throughout each year or period.
| | | | | | | Income (loss) from investment operations | | | | | | Less Distributions | | | | | | | | | | | | Ratios to average net assets | | | Supplemental Data | |
| | | |  | | |  | | |  | | |  | | |  | | |  | | |  | | |  | | |  | | |  | | |  | | |  | | |  | | |  | | |  | | |  | |
Year or
period ended | | | ($) | | | ($) | | | ($) | | | ($) | | | ($) | | | ($) | | | ($) | | | ($) | | | ($) | | | (%) | | | (%) | | | (%) | | | (%) | | | (%) | | | ($000’s) | | | (%) | |
| Class A | | | | | | | | | | | | | | | | | | | | | | | | | | | | | | | | | | | | | | | | | | | | | | | | | |
| 03-31-24 | | | 8.29 | | | 0.74* | | | 0.04 | | | 0.78 | | | 0.77 | | | — | | | — | | | 0.77 | | | 8.30 | | | 9.87 | | | 1.17 | | | 0.99 | | | 0.99 | | | 8.97 | | | 34,474 | | | 72 | |
| 03-31-23 | | | 8.94 | | | 0.55* | | | (0.68) | | | (0.13) | | | 0.52 | | | — | | | — | | | 0.52 | | | 8.29 | | | (1.28) | | | 1.26 | | | 1.06 | | | 1.06 | | | 6.48 | | | 33,686 | | | 38 | |
| 03-31-22 | | | 9.04 | | | 0.30* | | | (0.11) | | | 0.19 | | | 0.29 | | | — | | | — | | | 0.29 | | | 8.94 | | | 2.15 | | | 1.20 | | | 1.02 | | | 1.02 | | | 3.37 | | | 41,990 | | | 89 | |
| 03-31-21 | | | 8.00 | | | 0.29* | | | 1.03 | | | 1.32 | | | 0.28 | | | — | | | — | | | 0.28 | | | 9.04 | | | 16.69 | | | 1.34 | | | 1.13 | | | 1.13 | | | 3.35 | | | 39,518 | | | 60 | |
| 03-31-20 | | | 9.59 | | | 0.46 | | | (1.58) | | | (1.12) | | | 0.47 | | | — | | | — | | | 0.47 | | | 8.00 | | | (12.34) | | | 1.18 | | | 1.10 | | | 1.10 | | | 4.83 | | | 52,014 | | | 52 | |
| Class C | | | | | | | | | | | | | | | | | | | | | | | | | | | | | | | | | | | | | | | | | | | | | | | | | |
| 03-31-24 | | | 8.28 | | | 0.68* | | | 0.05 | | | 0.73 | | | 0.71 | | | — | | | — | | | 0.71 | | | 8.30 | | | 9.19 | | | 1.92 | | | 1.74 | | | 1.74 | | | 8.23 | | | 5,633 | | | 72 | |
| 03-31-23 | | | 8.93 | | | 0.48* | | | (0.67) | | | (0.19) | | | 0.46 | | | — | | | — | | | 0.46 | | | 8.28 | | | (2.03) | | | 2.01 | | | 1.81 | | | 1.81 | | | 5.69 | | | 6,743 | | | 38 | |
| 03-31-22 | | | 9.04 | | | 0.23* | | | (0.11) | | | 0.12 | | | 0.23 | | | — | | | — | | | 0.23 | | | 8.93 | | | 1.27 | | | 1.95 | | | 1.77 | | | 1.77 | | | 2.59 | | | 9,658 | | | 89 | |
| 03-31-21 | | | 8.00 | | | 0.23* | | | 1.03 | | | 1.26 | | | 0.22 | | | — | | | — | | | 0.22 | | | 9.04 | | | 15.83 | | | 2.09 | | | 1.88 | | | 1.88 | | | 2.59 | | | 14,914 | | | 60 | |
| 03-31-20 | | | 9.59 | | | 0.38 | | | (1.58) | | | (1.20) | | | 0.39 | | | — | | | — | | | 0.39 | | | 8.00 | | | (13.00) | | | 1.93 | | | 1.85 | | | 1.85 | | | 4.12 | | | 20,446 | | | 52 | |
| Class I | | | | | | | | | | | | | | | | | | | | | | | | | | | | | | | | | | | | | | | | | | | | | | | | | |
| 03-31-24 | | | 8.29 | | | 0.77* | | | 0.04 | | | 0.81 | | | 0.79 | | | — | | | — | | | 0.79 | | | 8.31 | | | 10.27 | | | 0.92 | | | 0.74 | | | 0.74 | | | 9.24 | | | 99,303 | | | 72 | |
| 03-31-23 | | | 8.94 | | | 0.55* | | | (0.65) | | | (0.10) | | | 0.55 | | | — | | | — | | | 0.55 | | | 8.29 | | | (1.03) | | | 0.92 | | | 0.81 | | | 0.81 | | | 6.50 | | | 116,954 | | | 38 | |
| 03-31-22 | | | 9.04 | | | 0.33* | | | (0.11) | | | 0.22 | | | 0.32 | | | — | | | — | | | 0.32 | | | 8.94 | | | 2.41 | | | 0.85 | | | 0.77 | | | 0.77 | | | 3.60 | | | 225,339 | | | 89 | |
| 03-31-21 | | | 8.00 | | | 0.31* | | | 1.03 | | | 1.34 | | | 0.30 | | | — | | | — | | | 0.30 | | | 9.04 | | | 16.97 | | | 1.00 | | | 0.88 | | | 0.88 | | | 3.61 | | | 235,804 | | | 60 | |
| 03-31-20 | | | 9.59 | | | 0.48 | | | (1.58) | | | (1.10) | | | 0.49 | | | — | | | — | | | 0.49 | | | 8.00 | | | (12.12) | | | 0.88 | | | 0.85 | | | 0.85 | | | 5.15 | | | 427,504 | | | 52 | |
| Class R | | | | | | | | | | | | | | | | | | | | | | | | | | | | | | | | | | | | | | | | | | | | | | | | | |
| 03-31-24 | | | 8.27 | | | 0.72* | | | 0.05 | | | 0.77 | | | 0.75 | | | — | | | — | | | 0.75 | | | 8.29 | | | 9.75 | | | 1.42 | | | 1.24 | | | 1.24 | | | 8.72 | | | 81,838 | | | 72 | |
| 03-31-23 | | | 8.92 | | | 0.53* | | | (0.68) | | | (0.15) | | | 0.50 | | | — | | | — | | | 0.50 | | | 8.27 | | | (1.53) | | | 1.51 | | | 1.31 | | | 1.31 | | | 6.26 | | | 88,959 | | | 38 | |
| 03-31-22 | | | 9.03 | | | 0.28* | | | (0.12) | | | 0.16 | | | 0.27 | | | — | | | — | | | 0.27 | | | 8.92 | | | 1.78 | | | 1.45 | | | 1.27 | | | 1.27 | | | 3.12 | | | 109,837 | | | 89 | |
| 03-31-21 | | | 7.99 | | | 0.27* | | | 1.03 | | | 1.30 | | | 0.26 | | | — | | | — | | | 0.26 | | | 9.03 | | | 16.42 | | | 1.59 | | | 1.38 | | | 1.38 | | | 3.08 | | | 91,934 | | | 60 | |
| 03-31-20 | | | 9.58 | | | 0.43 | | | (1.58) | | | (1.15) | | | 0.44 | | | — | | | — | | | 0.44 | | | 7.99 | | | (12.57) | | | 1.43 | | | 1.35 | | | 1.35 | | | 4.60 | | | 99,774 | | | 52 | |
| Class W | | | | | | | | | | | | | | | | | | | | | | | | | | | | | | | | | | | | | | | | | | | | | | | | | |
| 03-31-24 | | | 8.30 | | | 0.77* | | | 0.04 | | | 0.81 | | | 0.79 | | | — | | | — | | | 0.79 | | | 8.32 | | | 10.26 | | | 0.92 | | | 0.74 | | | 0.74 | | | 9.26 | | | 6,273 | | | 72 | |
| 03-31-23 | | | 8.95 | | | 0.57* | | | (0.67) | | | (0.10) | | | 0.55 | | | — | | | — | | | 0.55 | | | 8.30 | | | (1.04) | | | 1.01 | | | 0.81 | | | 0.81 | | | 6.76 | | | 10,747 | | | 38 | |
| 03-31-22 | | | 9.06 | | | 0.33* | | | (0.12) | | | 0.21 | | | 0.32 | | | — | | | — | | | 0.32 | | | 8.95 | | | 2.29 | | | 0.95 | | | 0.77 | | | 0.77 | | | 3.62 | | | 12,984 | | | 89 | |
| 03-31-21 | | | 8.01 | | | 0.32* | | | 1.03 | | | 1.35 | | | 0.30 | | | — | | | — | | | 0.30 | | | 9.06 | | | 17.08 | | | 1.09 | | | 0.88 | | | 0.88 | | | 3.69 | | | 11,426 | | | 60 | |
| 03-31-20 | | | 9.60 | | | 0.48 | | | (1.58) | | | (1.10) | | | 0.49 | | | — | | | — | | | 0.49 | | | 8.01 | | | (12.10) | | | 0.93 | | | 0.85 | | | 0.85 | | | 5.11 | | | 35,543 | | | 52 | |
| (1) | Total return is calculated assuming reinvestment of all dividends, capital gain distributions and return of capital distributions, if any, at net asset value and excluding the deduction of sales charges or contingent deferred sales charges, if applicable. Total return for periods less than one year is not annualized. |
| (2) | Annualized for periods less than one year. |
| (3) | Ratios reflect operating expenses of a Fund. Expenses before reductions/additions do not reflect amounts reimbursed by the Investment Adviser and/or Distributor or reductions from brokerage service arrangements or other expense offset arrangements and do not represent the amount paid by a Fund during periods when reimbursements or reductions occur. Expenses net of fee waivers reflect expenses after reimbursement by an Investment Adviser and/or Distributor but prior to reductions from brokerage service arrangements or other expense offset arrangements. Expenses net of all reductions/additions represent the net expenses paid by a Fund. Net investment income (loss) is net of all such additions or reductions. |
| * | Calculated using average number of shares outstanding throughout the period. |
See Accompanying Notes to Financial Statements
NOTES TO FINANCIAL STATEMENTS as of March 31, 2024
NOTE 1 — ORGANIZATION
Voya Funds Trust (the “Trust”) is a Delaware statutory trust and is registered as an open-end management investment company under the Investment Company Act of 1940, as amended (“1940 Act”). The Trust was organized on August 6, 1998 and was established under a Trust Instrument dated July 30, 1998. It consists of nine separately managed series. This report is for Voya Floating Rate Fund (“Floating Rate” or the “Fund”), a diversified series of the Trust.
The Fund offers the following classes of shares: Class A, Class C, Class I, Class R and Class W. The separate classes of shares differ principally in the applicable sales charges (if any), transfer agent fees, distribution fees, shareholder servicing fees, as well as differences in the amount of waiver of fees and reimbursement of expenses, if any. Generally, shareholders of each class also bear certain expenses that pertain to that particular class. All shareholders bear the common expenses of a fund and earn income and realized gains/losses from a fund pro rata based on the daily ending net assets of each class, without distinction between share classes. Differences in per share dividend rates generally result from the differences in separate class expenses, including distribution, and shareholder servicing fees, if applicable, as well as differences in the amount of waiver of fees and reimbursement of expenses between the share classes, if any.
Class C shares, along with their pro rata reinvested dividend shares, automatically convert to Class A shares 8 years after purchase.
Voya Investments, LLC (“Voya Investments” or the “Investment Adviser”), an Arizona limited liability company, serves as the Investment Adviser to the Fund. Voya Investment Management Co. LLC (“Voya IM”), a Delaware limited liability company, serves as the sub-adviser to the Fund. Voya Investments Distributor, LLC (“VID” or the “Distributor”), a Delaware limited liability company, serves as the principal underwriter to the Fund.
NOTE 2 — SIGNIFICANT ACCOUNTING POLICIES
The following significant accounting policies are consistently followed by the Fund in the preparation of its financial statements. The Fund is considered an investment company under U.S. generally accepted accounting principles (“GAAP”) and follows the accounting and reporting guidance applicable to investment companies.
A. Loan and Other Security Valuation. The Fund is open for business every day the New York Stock Exchange (“NYSE”) opens for regular trading (each such day, a
“Business Day”). The net asset value (“NAV”) per share for each class of the Fund is determined each Business Day as of the close of the regular trading session (“Market Close”), as determined by the Consolidated Tape Association (“CTA”), the central distributor of transaction prices for exchange-traded securities (normally 4:00 p.m. Eastern time unless otherwise designated by the CTA). The NAV per share of each class of the Fund is calculated by taking the value of the Fund’s assets attributable to that class, subtracting the Fund’s liabilities attributable to that class, and dividing by the number of shares of that class that are outstanding. On days when the Fund is closed for business, Fund shares will not be priced and the Fund does not transact purchase and redemption orders. To the extent the Fund’s assets are traded in other markets on days when the Fund does not price its shares, the value of the Fund’s assets will likely change and you will not be able to purchase or redeem shares of the Fund.
Portfolio securities for which market quotations are readily available are valued at market value. Investments in open-end registered investment companies that do not trade on an exchange are valued at the end of day NAV per share. The prospectuses of the open-end registered investment companies in which the Fund may invest explain the circumstances under which they will use fair value pricing and the effects of using fair value pricing. Foreign securities’ prices are converted into U.S. dollar amounts using the applicable exchange rates as of Market Close.
When a market quotation for a portfolio security is not readily available or is deemed unreliable (for example when trading has been halted or there are unexpected market closures or other material events that would suggest that the market quotation is unreliable) and for purposes of determining the value of other Fund assets, the asset is priced at its fair value. The Board has designated the Investment Adviser, as the valuation designee, to make fair value determinations in good faith. In determining the fair value of the Fund’s assets, the Investment Adviser, pursuant to its fair valuation policy, may consider inputs from pricing service providers, broker-dealers, or the Fund’s sub-adviser(s). Issuer specific events, transaction price, position size, nature and duration of restrictions on disposition of the security, market trends, bid/ask quotes of brokers and other market data may be reviewed in the course of making a good faith determination of an asset’s fair value. Because trading hours for certain foreign securities end before Market Close, closing market quotations may become unreliable. The prices of foreign securities will generally be adjusted based on inputs from an independent pricing service that are intended to reflect valuation changes through the NYSE close. Because of the inherent uncertainties of fair
NOTES TO FINANCIAL STATEMENTS as of March 31, 2024 (continued)
NOTE 2 — SIGNIFICANT ACCOUNTING POLICIES (continued)
valuation, the values used to determine the Fund’s NAV may materially differ from the value received upon actual sale of those investments.
Thus, fair valuation may have an unintended dilutive or accretive effect on the value of shareholders’ investments in the Fund.
The Fund’s financial instruments are valued at the close of the NYSE and are reported at fair value, which GAAP defines as the price that would be received to sell an asset or paid to transfer a liability in an orderly transaction between market participants at the measurement date.
Various valuation techniques and inputs are used to determine the fair value of financial instruments. GAAP establishes the following fair value hierarchy that categorizes the inputs used to measure fair value:
Level 1 — quoted prices (unadjusted) in active markets for identical financial instruments that the fund can access at the reporting date.
Level 2 — inputs other than Level 1 quoted prices that are observable, either directly or indirectly (including, but not limited to, quoted prices for similar financial instruments in active markets, quoted prices for identical or similar financial instruments in inactive markets, interest rates and yield curves, implied volatilities, and credit spreads).
Level 3 — unobservable inputs (including the fund’s own assumptions in determining fair value).
Observable inputs are developed using market data, such as publicly available information about actual events or transactions, and reflect the assumptions that market participants would use to price the financial instrument. Unobservable inputs are those for which market data are not available and are developed using the best information available about the assumptions that market participants would use to price the financial instrument. GAAP requires valuation techniques to maximize the use of relevant observable inputs and minimize the use of unobservable inputs. When multiple inputs are used to derive fair value, the financial instrument is assigned to the level within the fair value hierarchy based on the lowest-level input that is significant to the fair value of the financial instrument. Input levels are not necessarily an indication of the risk or liquidity associated with financial instruments at that level but rather the degree of judgment used in determining those values.
A table summarizing the Fund’s investments under these levels of classification is included within the Portfolio of Investments.
Each investment asset or liability of the Fund is assigned a level at measurement date based on the significance and source of the inputs to its valuation. Quoted prices in active markets for identical securities are classified as “Level 1,” inputs other than quoted prices for an asset or liability that are observable are classified as “Level 2” and unobservable inputs, including the sub-adviser’s or Pricing Committee’s judgment about the assumptions that a market participant would use in pricing an asset or liability are classified as “Level 3.” The inputs used for valuing securities are not necessarily an indication of the risks associated with investing in those securities. Short-term securities of sufficient credit quality are generally considered to be Level 2 securities under applicable accounting rules. A table summarizing the Fund’s investments under these levels of classification is included within the Portfolio of Investments.
GAAP requires a reconciliation of the beginning to ending balances for reported fair values that presents changes attributable to total realized and unrealized gains or losses, purchases and sales, and transfers in or out of the Level 3 category during the period. A reconciliation of Level 3 investments within the Portfolio of Investments is presented only when the Fund has a significant amount of Level 3 investments.
B. Security Transactions and Revenue Recognition. Security transactions and senior loans are accounted for on trade date (date the order to buy or sell is executed). Realized gains or losses are reported on the basis of identified cost of securities sold. Interest income is recorded on an accrual basis at the then-current loan rate. The accrual of interest on loans is partially or fully discontinued when, in the opinion of management, there is an indication that the borrower may be unable to meet payments as they become due. If determined to be uncollectible, unpaid accrued interest is also written off. Cash collections on non-accrual loans are generally applied as a reduction to the recorded investment of the loan. Loans are generally returned to accrual status only after all past due amounts have been received and the borrower has demonstrated sustained performance. Premium amortization and discount accretion are deferred and recognized over the lives of the respective loans. Arrangement fees received on revolving credit facilities, which represent non-refundable fees or purchase discounts associated with the acquisition of loans, are deferred and recognized using the effective yield method over the lives of the respective loans. No such fees are recognized on loans which have been placed on non-accrual status. Arrangement fees associated with all other loans, except revolving credit facilities, are treated as discounts and are accreted as described above. Dividend income is recorded on the ex-dividend date. Amendment
NOTES TO FINANCIAL STATEMENTS as of March 31, 2024 (continued)
NOTE 2 — SIGNIFICANT ACCOUNTING POLICIES (continued)
fees are earned as compensation for evaluating and accepting changes to an original loan agreement and are recognized when received. Amendment fees and other fees earned are reported as other income on the Statement of Operations.
C. Distributions to Shareholders. The Fund declares and goes ex-dividend daily and pays dividends monthly from net investment income. Distributions from capital gains, if any, are declared and paid annually. The Fund may make additional distributions to comply with the distribution requirements of the Internal Revenue Code. The character and amounts of income and gains to be distributed are determined in accordance with federal income tax regulations, which may differ from GAAP for investment companies. Distributions in excess of net investment income and/or net realized capital gains for tax purposes are reported as return of capital. The Fund records distributions to its shareholders on the ex-dividend date.
D. When-Issued and Delayed-Delivery Transactions. Securities purchased or sold on a when-issued, delayed-delivery or forward purchase commitment basis may have extended settlement periods. The value of the security so purchased is subject to market fluctuations during this period. Due to the nature of the loan market, the actual settlement date may not be certain at the time of the purchase or sale for some of the loans. Interest income on such loans is not accrued until settlement date.
E. Federal Income Taxes. It is the policy of the Fund to comply with the requirements of subchapter M of the Internal Revenue Code that are applicable to regulated investment companies and to distribute substantially all of its net investment income and any net realized capital gains to its shareholders. Therefore, a federal income tax or excise tax provision is not required. Management has considered the sustainability of the Fund’s tax positions taken on federal income tax returns for all open tax years in making this determination. No capital gain distributions shall be made until the capital loss carryforwards have been fully utilized.
The Fund may utilize equalization accounting for tax purposes, whereby a portion of redemption payments are treated as distributions of income or gain.
F. Use of Estimates. The preparation of financial statements in conformity with GAAP requires management to make estimates and assumptions that affect the reported amounts of assets and liabilities and disclosure of contingent assets and liabilities at the date of the financial statements and the reported amounts of increases and
decreases in net assets from operations during the reporting period. Actual results could differ from those estimates.
G. Foreign Currency Translation. The books and records of the Fund are maintained in U.S. dollars. Any foreign currency amounts are translated into U.S. dollars on the following basis:
| (1) | Market value of investment securities, other assets and liabilities — at the exchange rates prevailing at Market Close. |
| (2) | Purchases and sales of investment securities, income and expenses — at the rates of exchange prevailing on the respective dates of such transactions. |
Although the net assets and the market values are presented at the foreign exchange rates at Market Close, the Fund does not isolate the portion of the results of operations resulting from changes in foreign exchange rates on investments from the fluctuations arising from changes in market prices of securities held. Such fluctuations are included with the net realized and unrealized gains or losses from investments. For securities, which are subject to foreign withholding tax upon disposition, liabilities are recorded on the Statement of Assets and Liabilities for the estimated tax withholding based on the securities current market value. Upon disposition, realized gains or losses on such securities are recorded net of foreign withholding tax.
Reported net realized foreign exchange gains or losses arise from sales of foreign currencies, currency gains or losses realized between the trade and settlement dates on securities transactions, the difference between the amounts of dividends, interest, and foreign withholding taxes recorded on the Fund’s books, and the U.S. dollar equivalent of the amounts actually received or paid. Net unrealized foreign exchange gains and losses arise from changes in the value of assets and liabilities other than investments in securities, resulting from changes in the exchange rate. Foreign security and currency transactions may involve certain considerations and risks not typically associated with investing in U.S. companies and the U.S. government. These risks include, but are not limited to, revaluation of currencies and future adverse political and economic developments which could cause securities and their markets to be less liquid and prices more volatile than those of comparable U.S. companies and U.S. government securities. The foregoing risks are even greater with respect to securities of issuers in emerging markets.
H. Indemnifications. In the normal course of business, the Trust may enter into contracts that provide certain indemnifications. The Trust’s maximum exposure under
NOTES TO FINANCIAL STATEMENTS as of March 31, 2024 (continued)
NOTE 2 — SIGNIFICANT ACCOUNTING POLICIES (continued)
these arrangements is dependent on future claims that may be made against the Fund and, therefore, cannot be estimated; however, management believes based on experience, the risk of loss from such claims is considered remote.
NOTE 3 — INVESTMENTS
For the year ended March 31, 2024, the cost of purchases and the proceeds from principal repayment and sales of investments, excluding short-term investments, totaled $177,161,603 and $168,658,118, respectively.
The loans acquired by the Fund typically take the form of a direct lending relationship with the borrower acquired through an assignment of another lender’s interest in a loan. The lead lender in a typical corporate loan syndicate administers the loan and monitors collateral. In the event that the lead lender becomes insolvent, enters Federal Deposit Insurance Corporation (“FDIC”) receivership or, if not FDIC insured, enters into bankruptcy, the Fund may incur certain costs and delays in realizing payment, or may suffer a loss of principal and/or interest.
NOTE 4 — INVESTMENT MANAGEMENT FEES
The Fund has entered into an investment management agreement (“Management Agreement”) with the Investment Adviser. The Investment Adviser has overall responsibility for the management of the Fund. The Investment Adviser oversees all investment advisory and portfolio management services for the Fund and assists in managing and supervising all aspects of the general day-to-day business activities and operations of the Fund, including custodial, transfer agency, dividend disbursing, accounting, auditing, compliance and related services. This Management Agreement compensates the Investment Adviser with a management fee, computed daily and payable monthly, at an annual rate of 0.650% on the first $300 million; 0.625% on the next $200 million; and 0.600% thereafter, of the Fund’s average daily net assets.
Effective January 1, 2023, the Investment Adviser has agreed to waive 0.02% of the management fee through August 1, 2024. Any fees waived or reimbursed in relation to this waiver are not eligible for recoupment. Termination or modification of this obligation requires approval by the Board.
The Investment Adviser has entered into a sub-advisory agreement with Voya IM. Voya IM provides investment advice for the Fund and is paid by the Investment Adviser based on the average daily net assets of the Fund. Subject to such policies as the Board or the Investment Adviser
may determine, Voya IM manages the Fund’s assets in accordance with the Fund’s investment objectives, policies, and limitations.
NOTE 5 — DISTRIBUTION AND SERVICE FEES
Class A, Class C and Class R shares of the Fund each has a distribution and/or distribution and service plan (the “Plan”), whereby the Distributor is compensated by the Fund for expenses incurred in the distribution and/or shareholder servicing of the Fund’s shares (“Distribution and/or Service Fees”). Pursuant to the Plan, the Distributor is entitled to payment each month for expenses incurred in the distribution and promotion of the Fund’s shares, including expenses incurred in printing prospectuses and reports used for sales purposes, expenses incurred in preparing and printing sales literature and other such distribution related expenses, including any Distribution and/or Service Fees paid to securities dealers who have executed a distribution agreement with the Distributor. In addition, the Fund has a shareholder service plan for Class A and Class C shares (together with the Plan referenced above, the “Plans”). Under the Plans, each class of shares of the Fund pays the Distributor a Distribution and/ or Service Fee based on average daily net assets at the following annual rates:
| Class A | | Class C | | Class R |
| 0.25% | | 1.00% | | 0.50% |
The Distributor may also retain the proceeds of the initial sales charge paid by shareholders upon the purchase of Class A shares of the Fund and the contingent deferred sales charge paid by shareholders upon certain redemptions for Class A and Class C shares. For the year ended March 31, 2024, the Distributor retained the following amounts:
| | Class A | | Class C |
| Initial Sales Charges | $5,320 | | $ — |
| Contingent Deferred Sales Charges | — | | 1,012 |
NOTE 6 — EXPENSE LIMITATION AGREEMENT
Pursuant to a written expense limitation agreement (“Expense Limitation Agreement”) with the Fund, the Investment Adviser has agreed to limit expenses, excluding interest, taxes, investment-related costs, leverage expenses, extraordinary expenses, and acquired fund fees and expenses, to the levels listed below:
Maximum Operating Expense Limit(1)
(as a percentage of average daily net assets)
Class A — 1.00%
Class C — 1.75%
Class I — 0.75%
Class R — 1.25%
Class W — 0.75%
NOTES TO FINANCIAL STATEMENTS as of March 31, 2024 (continued)
NOTE 6 — EXPENSE LIMITATION AGREEMENT (continued)
| (1) | Pursuant to a side letter agreement through August 1, 2024, the Investment Adviser has further lowered expenses to 0.95%, 1.70%, 0.70%, 1.20% and 0.70% for Class A, Class C, Class I, Class R and Class W, respectively. Any fees waived pursuant to the side letter agreement shall not be eligible for recoupment. Termination or modification of this obligation requires approval by the Board. |
Unless otherwise specified above and with the exception of the non-recoupable management fee waiver for the Fund, the Investment Adviser may at a later date recoup from the Fund for fees waived and/or other expenses assumed by the Investment Adviser during the previous 36 months, but only if, after such recoupment, the Fund’s expense ratio does not exceed the percentage described above. Waived and reimbursed fees net of any recoupment by the Investment Adviser of such waived and reimbursed fees are reflected on the accompanying Statement of Operations. Amounts payable by the Investment Adviser are reflected on the accompanying Statement of Assets and Liabilities.
As of March 31, 2024, there are no amounts of waived and/or reimbursed fees that are subject to possible recoupment by the Investment Advisor.
The Expense Limitation Agreement is contractual through August 1, 2024 and shall renew automatically for one-year terms. Termination or modification of this obligation requires approval by the Board.
NOTE 7 — LINE OF CREDIT
Effective May 24, 2023, the Fund has entered into an unsecured committed revolving line of credit agreement (the “Credit Agreement”) with State Street Bank and Trust Company (“SSB”) for an aggregate amount of $50,000,000, through May 3, 2024. The proceeds may be used only: (1) for cash management purposes; or (2) to temporarily finance the redemption of shares of an investor in the Fund. The Fund pays a commitment fee equal to 0.15% per annum on the daily unused portion of the committed line amount payable quarterly in arrears of $87,233 and a structuring fee of $53,517 which is expensed over a year. Prior to May 24, 2023, the aggregate amount was $100,000,000 and the commitment fee was equal to 0.15% per annum on the daily unused portion of the committed line amount payable quarterly in arrears through May 24, 2023. Generally, borrowings under the Credit Agreement accrue interest at the higher of the federal funds rate and the overnight bank funding rate, plus
a specified margin and 0.10%. Repayments generally must be made within 45 days after the date of a revolving credit advance.
The Fund utilized the line of credit during the year ended March 31, 2024, as below:
| | | | | Approximate |
| | | Approximate | | Weighted |
| | | Average Daily | | Average Interest |
| Days | | Balance For | | Rate For Days |
| Utilized | | Days Utilized | | Utilized |
| 7 | | $2,000,000 | | 1.82% |
NOTE 8 — OTHER TRANSACTIONS WITH AFFILIATES AND RELATED PARTIES
At March 31, 2024, the following direct or indirect, wholly-owned subsidiaries of Voya Financial, Inc. owned more than 5% of the Fund:
| Subsidiary | | Percentage |
| | | |
| Voya Institutional Trust Company | 36.34% |
The Fund has adopted a deferred compensation plan (the “DC Plan”), which allows eligible independent trustees, as described in the DC Plan, to defer the receipt of all or a portion of the trustees’ fees that they are entitled to receive from the Fund. For purposes of determining the amount owed to the trustee under the DC Plan, the amounts deferred are invested in shares of the funds selected by the trustee (the “Notional Funds”). When the Fund purchases shares of the Notional Funds, which are all advised by Voya Investments, in amounts equal to the trustees’ deferred fees, this results in a Fund asset equal to the deferred compensation liability. Such assets, if applicable, are included as a component of “Other assets” on the accompanying Statement of Assets and Liabilities. Deferral of trustees’ fees under the DC Plan will not affect net assets of the Fund, and will not materially affect the Fund’s assets, liabilities or net investment income per share. Amounts will be deferred until distributed in accordance with the DC Plan.
The Fund may pay per account fees to affiliates of Voya Investments for recordkeeping services provided on certain assets. For the year ended March 31, 2024, the per account fees for affiliated recordkeeping services paid by the Fund were $114,163.
NOTE 9 — UNFUNDED LOAN COMMITMENTS
The Fund may enter into credit agreements, all or a portion of which may be unfunded. The Fund is obligated to fund these loan commitments at the borrower’s discretion.
NOTES TO FINANCIAL STATEMENTS as of March 31, 2024 (continued)
NOTE 9 — UNFUNDED LOAN COMMITMENTS (continued)
Funded and unfunded portions of the credit agreements are presented within the Portfolio of Investments. At March 31, 2024, the Fund had the following unfunded loan commitments:
NOTE 10 — CAPITAL SHARES
Transactions in capital shares and dollars were as follows:
| | Unfunded Loan |
| | Commitment |
| AI Aqua Merger Sub, Inc. 2023 Incremental Term Loan | $52,263 | |
| Ryan, LLC Delayed Draw Term Loan | 43,809 | |
| | | $96,072 | |
| | | Shares
sold | | Reinvestment
of
distributions | | Shares redeemed | | Net increase
(decrease)
in shares
outstanding | | Shares
sold | | Reinvestment
of
distributions | | Shares
redeemed | | Net
increase
(decrease) | |
Year or
period ended | | # | | # | | # | | # | | ($) | | ($) | | ($) | | ($) | |
| Class A | | | | | | | | | | | | | | | | | |
| 03-31-24 | | 390,198 | | 353,193 | | (657,957) | | 85,434 | | 3,234,809 | | 2,930,584 | | (5,464,929) | | 700,464 | |
| 03-31-23 | | 573,399 | | 249,450 | | (1,456,250) | | (633,401) | | 4,904,872 | | 2,083,167 | | (12,312,445) | | (5,324,406) | |
| Class C | | | | | | | | | | | | | | | | | |
| 03-31-24 | | 73,792 | | 56,693 | | (265,921) | | (135,436) | | 612,738 | | 470,290 | | (2,205,054) | | (1,122,026) | |
| 03-31-23 | | 168,424 | | 45,196 | | (480,806) | | (267,186) | | 1,441,713 | | 377,266 | | (4,088,327) | | (2,269,348) | |
| Class I | | | | | | | | | | | | | | | | | |
| 03-31-24 | | 4,014,603 | | 1,176,783 | | (7,341,145) | | (2,149,759) | | 33,350,145 | | 9,764,546 | | (60,808,038) | | (17,693,347) | |
| 03-31-23 | | 7,929,585 | | 1,182,486 | | (20,227,255) | | (11,115,184) | | 66,613,524 | | 9,899,009 | | (170,300,201) | | (93,787,668) | |
| Class P(1) | | | | | | | | | | | | | | | | | |
| 03-31-24 | | — | | — | | — | | — | | — | | — | | — | | — | |
| 03-31-23 | | 498 | | 320,838 | | (10,009,923) | | (9,688,587) | | 4,080 | | 2,700,960 | | (83,216,320) | | (80,511,280) | |
| Class R | | | | | | | | | | | | | | | | | |
| 03-31-24 | | 281,499 | | 939,075 | | (2,101,110) | | (880,536) | | 2,333,960 | | 7,774,875 | | (17,399,214) | | (7,290,379) | |
| 03-31-23 | | 1,484,278 | | 708,077 | | (3,751,074) | | (1,558,719) | | 12,839,002 | | 5,900,444 | | (31,468,699) | | (12,729,253) | |
| Class W | | | | | | | | | | | | | | | | | |
| 03-31-24 | | 101,546 | | 83,906 | | (726,289) | | (540,837) | | 845,546 | | 697,280 | | (6,038,967) | | (4,496,141) | |
| 03-31-23 | | 288,496 | | 92,762 | | (537,377) | | (156,119) | | 2,509,752 | | 776,091 | | (4,509,544) | | (1,223,701) | |
| (1) | Share class was fully redeemed on March 24, 2023. |
NOTE 11 — FEDERAL INCOME TAXES
The amount of distributions from net investment income and net realized capital gains are determined in accordance with federal income tax regulations, which may differ from GAAP for investment companies. These book/ tax differences may be either temporary or permanent. Permanent differences are reclassified within the capital accounts based on their federal tax-basis treatment; temporary differences are not reclassified. Key differences include wash sale deferrals.
Dividends paid by the Fund from net investment income and distributions of net realized short-term capital gains are, for federal income tax purposes, taxable as ordinary income to shareholders.
The tax composition of dividends and distributions to shareholders was as follows:
| Year Ended | | Year Ended |
| March 31, 2024 | | March 31, 2023 |
| Ordinary | | Ordinary |
| Income | | Income |
| $22,018,469 | | $22,253,686 |
The tax-basis components of distributable earnings and the capital loss carryforwards which may be used to offset future realized capital gains for federal income tax purposes as of March 31, 2024 were:
NOTES TO FINANCIAL STATEMENTS as of March 31, 2024 (continued)
NOTE 11 — FEDERAL INCOME TAXES (continued)
| Undistributed | | Unrealized | | | | | | | | Total |
| Ordinary | | Appreciation/ | | Capital Loss Carryforwards | | | | Distributable |
| Income | | (Depreciation) | | Amount | | Character | | Other | | Earnings/(Loss) |
| $3,025,139 | | $509,614 | | $(48,995,991) | | Short-term | | $(35,075) | | $(226,180,395) |
| | | | | (180,684,082) | | Long-term | | | | |
| | | | | $(229,680,073) | | | | | | |
The Fund’s major tax jurisdictions are U.S. federal and Arizona state.
As of March 31, 2024, no provision for income tax is required in the Fund’s financial statements as a result of tax positions taken on federal and state income tax returns for open tax years. The Fund’s federal and state income and federal excise tax returns for tax years for which the applicable statutes of limitations have not expired are subject to examination by the Internal Revenue Service and state department of revenue. Generally, the preceding four tax years remain subject to examination by these jurisdictions.
NOTE 12 — LONDON INTERBANK OFFERED RATE (“LIBOR”)
In 2017, the UK Financial Conduct Authority announced its intention to cease compelling banks to provide the quotations needed to sustain LIBOR after 2021. On March 5, 2021, ICE Benchmark Administration, the administrator of LIBOR, stated that non-U.S. dollar LIBOR reference rates and the one-week and two-month LIBOR reference rates ceased to be provided or no longer be representative immediately after December 31, 2021 and the remaining more commonly used LIBOR settings will cease to be provided or no longer be representative immediately after June 30, 2023. In addition, global regulators have announced that, with limited exceptions, no new LIBOR-based contracts should be entered into after 2021. Actions by regulators have resulted in the establishment of alternative reference rates to LIBOR in most major currencies (e.g., the Secured Overnight Financing Rate for U.S. Dollar LIBOR and the Sterling Overnight Interbank Average Rate for Sterling LIBOR).
Discontinuance of LIBOR and adoption/implementation of alternative rates pose a number of risks, including among others whether any substitute rate will experience the market participation and liquidity necessary to provide a workable substitute for LIBOR; the effect on parties’ existing contractual arrangements, hedging transactions, and investment strategies generally from a conversion from LIBOR to alternative rates; the effect on the Fund’s existing investments (including, for example, fixed-income investments, senior loans, CLOs and CDOs, and derivatives transactions), including the possibility that some of those investments may terminate or their terms
adjusted to the disadvantage of the Fund; and the risk of general market disruption during the period of the conversion. It is difficult to predict at this time the likely impact of the transition away from LIBOR on the Fund.
NOTE 13 — LIQUIDITY
Consistent with Rule 22e-4 under the 1940 Act, the Fund has established a liquidity risk management program to govern its approach to managing liquidity risk (the “Program”). The Board has approved the designation of the Fund’s Investment Adviser, Voya Investments, as the program administrator (the “Program Administrator”). The Program Administrator is responsible for implementing and monitoring the Program and has formed a Liquidity Risk Management Committee (the “Committee”) to assess and review, on an ongoing basis, the Fund’s liquidity risk.
The Program includes a number of elements that support the management and assessment of liquidity risk, including an annual assessment of liquidity risk factors and the periodic classification (or re-classification, as necessary) of the Fund’s investments into buckets (highly liquid, moderately liquid, less liquid and illiquid) that reflect the Committee’s assessment of the investments’ liquidity under current market conditions. The Committee also utilizes Fund-specific data, including information regarding the Fund’s shareholder base, characteristics of its investments, access to borrowing arrangements and historical redemptions to determine whether the Fund will be able to meet its redemption obligations in a timely manner.
During the period covered by the annual assessment, January 1, 2023 through December 31, 2023, the Program supported the Fund’s ability to honor redemption requests in a timely manner and the Program Administrator’s management of the Fund’s liquidity risk, including during any periods of market volatility and net redemptions.
There can be no assurance that the Program will achieve its objectives under all circumstances in the future. Please refer to the Fund’s prospectus for more information regarding the Fund’s exposure to liquidity risk and other risks.
NOTE 14 — MARKET DISRUPTION AND GEOPOLITICAL
The Fund is subject to the risk that geopolitical events will disrupt securities markets and adversely affect global economies and markets. Due to the increasing interdependence among global economies and markets, conditions in one country, market, or region might adversely impact markets, issuers and/or foreign exchange rates in other countries, including the United States. Wars, terrorism, global health crises and pandemics, and other
NOTES TO FINANCIAL STATEMENTS as of March 31, 2024 (continued)
NOTE 14 — MARKET DISRUPTION AND GEOPOLITICAL (continued)
geopolitical events that have led, and may continue to lead, to increased market volatility and may have adverse short-or long-term effects on U.S. and global economies and markets, generally. For example, the COVID-19 pandemic resulted in significant market volatility, exchange suspensions and closures, declines in global financial markets, higher default rates, supply chain disruptions, and a substantial economic downturn in economies throughout the world. The economic impacts of COVID-19 have created a unique challenge for real estate markets. Many businesses have either partially or fully transitioned to a remote-working environment and this transition may negatively impact the occupancy rates of commercial real estate over time. Natural and environmental disasters and systemic market dislocations are also highly disruptive to economies and markets. In addition, military action by Russia in Ukraine has, and may continue to, adversely affect global energy and financial markets and therefore could affect the value of the Fund’s investments, including beyond the Fund’s direct exposure to Russian issuers or nearby geographic regions. The extent and duration of the military action, sanctions, and resulting market disruptions are impossible to predict and could be substantial. A number of U.S. domestic banks and foreign (non-U.S.) banks have recently experienced financial difficulties and, in some cases, failures. There can be no certainty that the actions taken by regulators to limit the effect of those financial difficulties and failures on other banks or other financial institutions or on the U.S. or foreign (non-U.S.) economies generally will be successful. It is possible that more banks or other financial institutions will experience financial difficulties or fail, which may affect adversely other U.S. or foreign (non-U.S.) financial institutions and economies. These events as well as other changes in foreign (non-U.S.) and domestic economic, social, and political conditions also could adversely affect individual issuers or related groups of issuers, securities markets, interest rates, credit ratings, inflation, investor sentiment,
and other factors affecting the value of the Fund’s investments. Any of these occurrences could disrupt the operations of the Fund and of the Fund’s service providers.
NOTE 15 — SUBSEQUENT EVENTS
Custodian: Effective after close of business May 3, 2024, the Fund’s custodian changed to The Bank of New York Mellon.
Dividends: Subsequent to March 31, 2024, the Fund declared dividends from net investment income of:
| | Per Share
Amount | | Payable Date | | Record
Date |
| Class A | $0.0824 | | May 1, 2024 | | Daily |
| Class C | $0.0773 | | May 1, 2024 | | Daily |
| Class I | $0.0842 | | May 1, 2024 | | Daily |
| Class R | $0.0807 | | May 1, 2024 | | Daily |
| Class W | $0.0842 | | May 1, 2024 | | Daily |
Line of Credit: Effective after close of business May 3, 2024, the Credit Agreement was terminated. Effective May 6, 2024, the Fund joined certain other funds managed by the Investment Adviser in an unsecured committed revolving line of credit agreement with The Bank of New York Mellon for an aggregate amount of $400,000,000 through June 10, 2024. The proceeds may be used only to finance temporarily: (1) the purchase or sale of investment securities; or (2) the repurchase or redemption of shares of the Fund or certain other funds managed by the Investment Adviser. The funds to which the line of credit is available pay a commitment fee equal to 0.15% per annum on the daily unused portion of the committed line amount payable quarterly in arrears.
The Fund has evaluated events occurring after the Statement of Assets and Liabilities date through the date that the financial statements were issued (“subsequent events”) to determine whether any subsequent events necessitated adjustment to or disclosure in the financial statements. Other than above, no such subsequent events were identified.
| | PORTFOLIO OF INVESTMENTS |
| Voya Floating Rate Fund | as of March 31, 2024 |
Principal
Amount† | | | Borrower/Tranche
Description | | Fair
Value | | | Percentage
of Net
Assets | |
| LOANS*: 94.0% | | | | |
| | | | Advertising: 0.3% | | | | | | |
| 699,362 | | | Dotdash Meredith Inc Term Loan B, 9.426%, (TSFR1M + 4.000%), 12/01/28 | | $ | 694,409 | | | | 0.3 | |
| | | | | | | | | | | | |
| | | | Aerospace & Defense: 3.3% | | | | | | | | |
| 1,420,833 | | | AAdvantage Loyalty IP Ltd. 2021 Term Loan, 10.329%, (US0003M + 4.750%), 04/20/28 | | | 1,477,999 | | | | 0.6 | |
| 835,157 | | | Amentum Government Services Holdings LLC 2022 Term Loan, 9.329%, (TSFR1M + 4.000%), 02/15/29 | | | 838,549 | | | | 0.4 | |
| 248,750 | | | Barnes Group Inc 2024 Term Loan, 7.826%, (TSFR1M + 2.500%), 09/03/30 | | | 249,216 | | | | 0.1 | |
| 257,705 | | | Dynasty Acquisition Co., Inc. 2023 Term Loan B1, 9.329%, (TSFR1M + 4.000%), 08/24/28 | | | 258,430 | | | | 0.1 | |
| 110,445 | | | Dynasty Acquisition Co., Inc. 2023 Term Loan B2, 9.329%, (TSFR1M + 4.000%), 08/24/28 | | | 110,756 | | | | 0.0 | |
| 287,671 | | | Dynasty Acquisition Co., Inc. 2024 Term Loan B1, 8.829%, (TSFR1M + 3.500%), 08/24/28 | | | 288,750 | | | | 0.1 | |
| 123,288 | | | Dynasty Acquisition Co., Inc. 2024 Term Loan B2, 8.829%, (TSFR1M + 3.500%), 08/24/28 | | | 123,750 | | | | 0.1 | |
| 1,711,048 | | | Peraton Corp. Term Loan B, 9.080%, (TSFR1M + 3.750%), 02/01/28 | | | 1,712,270 | | | | 0.7 | |
| 1,000,000 | | | SkyMiles IP Ltd. 2020 Skymiles Term Loan B, 9.068%, (US0003M + 3.750%), 10/20/27 | | | 1,032,188 | | | | 0.5 | |
| 418,950 | | | TransDigm, Inc. 2023 Term Loan J, 8.598%, (TSFR3M + 3.250%), 02/14/31 | | | 421,415 | | | | 0.2 | |
| 410,000 | | | TransDigm, Inc. 2024 Term Loan K, 8.070%, (TSFR3M + 2.750%), 02/22/30 | | | 411,309 | | | | 0.2 | |
| 596,244 | | | Vertex Aerospace Services Corp. 2021 First Lien Term Loan, 8.579%, (TSFR1M + 3.750%), 12/06/28 | | | 598,108 | | | | 0.3 | |
| | | | | | | 7,522,740 | | | | 3.3 | |
Principal
Amount† | | | Borrower/Tranche
Description | | Fair
Value | | | Percentage
of Net
Assets | |
| LOANS*: (continued) | | | | | |
| | | | Air Transport: 0.5% | | | | | | | | |
| 323,426 | | | LaserShip, Inc. 2021 Term Loan, 10.396%, (US0001M + 4.500%), 05/07/28 | | $ | 302,403 | | | | 0.1 | |
| 540,934 | | | Savage Enterprises LLC 2021 Term Loan B, 8.691%, (TSFR1M + 3.250%), 09/15/28 | | | 542,093 | | | | 0.3 | |
| 460,358 | | | ST GEO WARE + TR CO OF CAL INC 2022 TERM LOAN, 11.498%, (TSFR3M + 6.000%), 03/24/28 | | | 301,535 | | | | 0.1 | |
| | | | | | | 1,146,031 | | | | 0.5 | |
| | | | Airlines: 0.3% | | | | | | | | |
| 335,000 | | | American Airlines, Inc. 2023 1st Lien Term Loan, 8.775%, (TSFR3M + 3.500%), 06/04/29 | | | 336,372 | | | | 0.1 | |
| 430,000 | | | United Airlines, Inc. 2024 Term Loan B, 8.076%, (TSFR3M + 2.750%), 02/15/31 | | | 431,109 | | | | 0.2 | |
| | | | | | | 767,481 | | | | 0.3 | |
| | | | Apparel: 0.1% | | | | | | | | |
| 160,000 | | | Fugue Finance B.V. 2024 USD Term Loan B, 9.074%, (TSFR3M + 3.750%), 02/12/31 | | | 160,600 | | | | 0.1 | |
| | | | | | | | | | | | |
| | | | Auto Components: 1.1% | | | | | | | | |
| 148,837 | | | Broadstreet Partners, Inc. 2020 Term Loan B, 8.445%, (US0001M + 3.000%), 01/27/27 | | | 149,058 | | | | 0.0 | |
| 678,772 | | | Holley Purchaser, Inc. 2021 Term Loan, 9.195%, (TSFR1M + 3.750%), 11/17/28 | | | 672,349 | | | | 0.3 | |
| 926,950 | | | RC Buyer, Inc. 2021 Term Loan, 8.941%, (TSFR3M + 3.500%), 07/28/28 | | | 924,053 | | | | 0.4 | |
| 863,187 | | | Truck Hero, Inc. 2021 Term Loan B, 8.945%, (TSFR1M + 3.750%), 01/31/28 | | | 856,444 | | | | 0.4 | |
| | | | | | | 2,601,904 | | | | 1.1 | |
| | | | Auto Parts&Equipment: 0.5% | | | | | | | | |
| 827,360 | | | Autokiniton US Holdings, Inc. 2024 Term Loan B, 9.441%, (TSFR1M + 4.000%), 04/06/28 | | | 831,128 | | | | 0.3 | |
| 394,076 | | | First Brands Group, LLC 2022 Incremental Term Loan, 10.574%, (TSFR3M + 5.000%), 03/30/27 | | | 394,980 | | | | 0.2 | |
| | | | | | | 1,226,108 | | | | 0.5 | |
See Accompanying Notes to Financial Statements
| | PORTFOLIO OF INVESTMENTS |
| Voya Floating Rate Fund | as of March 31, 2024 (continued) |
Principal
Amount† | | | Borrower/Tranche
Description | | Fair
Value | | | Percentage
of Net
Assets | |
| LOANS*: (continued) | | | | | |
| | | | Automotive: 0.8% | | | | | | | | |
| 421,349 | | | Gates Global LLC 2021 Term Loan B3, 7.930%, (TSFR1M + 2.500%), 03/31/27 | | $ | 422,565 | | | | 0.2 | |
| 500,000 | | | IXS Holdings, Inc. 2020 Term Loan B, 9.693%, (TSFR3M + 4.250%), 03/05/27 | | | 477,321 | | | | 0.2 | |
| 999,536 | | | Les Schwab Tire Centers Term Loan B, 8.684%, (US0001M + 3.250%), 11/02/27 | | | 1,002,191 | | | | 0.4 | |
| | | | | | | 1,902,077 | | | | 0.8 | |
| | | | Basic Materials: 0.4% | | | | | | | | |
| 843,003 | | | INEOS US Finance LLC 2023 USD Term Loan B, 8.926%, (TSFR1M + 3.500%), 02/18/30 | | | 844,057 | | | | 0.4 | |
| | | | | | | | | | | | |
| | | | Beverages: 0.1% | | | | | | | | |
| 294,263 | | | Triton Water Holdings, Inc 2024 Incremental Term Loan B, 9.326%, (TSFR3M + 4.000%), 03/31/28 | | | 292,301 | | | | 0.1 | |
| | | | | | | | | | | | |
| | | | Building & Development: 2.1% | | | | | | | | |
| 1,091,320 | | | Applecaramel Buyer, LLC Term Loan B, 9.080%, (TSFR1M + 3.750%), 10/19/27 | | | 1,095,810 | | | | 0.5 | |
| 353 | | | Latham Pool Products, Inc. 2022 Term Loan B, 9.179%, (SOFRRATE + 4.000%), 02/23/29 | | | 348 | | | | 0.0 | |
| 798,955 | | | LBM Acquisition LLC Term Loan B, 9.176%, (TSFR3M + 3.750%), 12/17/27 | | | 797,790 | | | | 0.3 | |
| 603,386 | | | LHS Borrower, LLC 2022 Term Loan B, 10.180%, (SOFRRATE + 4.750%), 02/16/29 | | | 574,222 | | | | 0.3 | |
| 642,120 | | | Oscar AcquisitionCo, LLC Term Loan B, 9.948%, (SOFRRATE + 4.500%), 04/29/29 | | | 644,350 | | | | 0.3 | |
| 1,132,074 | | | Quikrete Holdings, Inc. 2023 Term Loan B, 8.195%, (TSFR1M + 2.750%), 03/19/29 | | | 1,134,454 | | | | 0.5 | |
| 521,933 | | | Wilsonart LLC 2021 Term Loan E, 8.698%, (US0003M + 3.500%), 12/31/26 | | | 523,057 | | | | 0.2 | |
| | | | | | | 4,770,031 | | | | 2.1 | |
Principal
Amount† | | | Borrower/Tranche
Description | | Fair
Value | | | Percentage
of Net
Assets | |
| LOANS*: (continued) | | |
| | | | Building Materials: 0.3% | | | | | | | | |
| 100,000 | | | Chamberlain Group Inc 2024 Incremental Term Loan B, 9.080%, (TSFR1M + 3.750%), 11/03/28 | | $ | 100,328 | | | | 0.0 | |
| 347,140 | | | Smyrna Ready Mix Concrete, LLC 2023 Term Loan, 8.829%, (TSFR1M + 3.500%), 04/02/29 | | | 349,744 | | | | 0.2 | |
| 312,591 | | | Summit Materials LLC 2023 Incremental Term Loan B, 7.827%, (TSFR3M + 2.500%), 11/30/28 | | | 314,600 | | | | 0.1 | |
| | | | | | | 764,672 | | | | 0.3 | |
| | | | Business Equipment & Services: 3.5% | |
| 247,716 | | | Anticimex International AB 2021 USD Term Loan B1, 8.461%, (TSFR3M + 3.150%), 11/16/28 | | | 248,284 | | | | 0.1 | |
| 674,536 | | | APX Group, Inc. 2021 Term Loan B, 3.254%, (TSFR1M + 3.250%), 07/10/28 | | | 676,948 | | | | 0.3 | |
| 597,824 | | | Cimpress Public Limited Company USD Term Loan B, 8.941%, (US0001M + 3.500%), 05/17/28 | | | 598,385 | | | | 0.3 | |
| 1,257,122 | | | Endure Digital Inc. Term Loan, 9.422%, (US0001M + 3.500%), 02/10/28 | | | 1,230,016 | | | | 0.6 | |
| 509,740 | | | Ensono, LP 2021 Term Loan, 9.441%, (TSFR1M + 4.000%), 05/26/28 | | | 495,722 | | | | 0.2 | |
| 500,683 | | | Garda World Security Corporation 2022 Term Loan B, 9.583%, (SOFRRATE + 4.250%), 02/01/29 | | | 502,144 | | | | 0.2 | |
| 542,632 | | | Indy US Bidco, LLC 2021 USD Term Loan, 9.080%, (TSFR1M + 3.750%), 03/05/28 | | | 526,126 | | | | 0.2 | |
| 505,366 | | | ION Trading Finance Limited 2021 USD Term Loan, 10.198%, (US0003M + 4.750%), 04/03/28 | | | 505,411 | | | | 0.2 | |
| 1,013,519 | | | Milano Acquisition Corp Term Loan B, 9.409%, (TSFR3M + 4.000%), 10/01/27 | | | 972,662 | | | | 0.4 | |
See Accompanying Notes to Financial Statements
| | PORTFOLIO OF INVESTMENTS |
| Voya Floating Rate Fund | as of March 31, 2024 (continued) |
Principal
Amount† | | | Borrower/Tranche
Description | | Fair
Value | | | Percentage
of Net
Assets | |
| LOANS*: (continued) |
| | | | Business Equipment & Services (continued) | |
| 17,719 | | | Pre-Paid Legal Services, Inc. 2021 2nd Lien Term Loan, 12.445%, (US0003M + 7.000%), 12/14/29 | | $ | 17,364 | | | | 0.0 | |
| 636,320 | | | Pre-Paid Legal Services, Inc. 2021 Term Loan, 9.195%, (US0001M + 3.750%), 12/15/28 | | | 634,183 | | | | 0.3 | |
| 708,863 | | | Skopima Merger Sub Inc. Term Loan B, 9.445%, (US0001M + 4.000%), 05/12/28 | | | 706,746 | | | | 0.3 | |
| 796,418 | | | TruGreen Limited Partnership 2020 Term Loan, 9.329%, (US0001M + 4.000%), 11/02/27 | | | 776,756 | | | | 0.4 | |
| | | | | | | 7,890,747 | | | | 3.5 | |
| | | | Chemicals: 0.2% | | | | | | | | |
| 497,494 | | | INEOS Quattro Holdings UK Ltd 2023 USD Term Loan, 9.180%, (TSFR1M + 3.750%), 03/14/30 | | | 496,872 | | | | 0.2 | |
| | | | | | | | | | | | |
| | | | Chemicals & Plastics: 1.9% | | | | | | | | |
| 248,724 | | | GEON Performance Solutions, LLC 2021 Term Loan, 10.360%, (US0001M + 4.500%), 08/18/28 | | | 249,346 | | | | 0.1 | |
| 248,026 | | | INEOS Styrolution US Holding LLC 2021 USD Term Loan B, 8.191%, (TSFR1M + 2.750%), 01/29/26 | | | 248,398 | | | | 0.1 | |
| 577,584 | | | INEOS US Finance LLC 2021 USD Term Loan B, 7.829%, (US0001M + 2.500%), 11/08/28 | | | 573,830 | | | | 0.3 | |
| 349,364 | | | Lonza Group AG USD Term Loan B, 9.334%, (TSFR3M + 3.930%), 07/03/28 | | | 329,385 | | | | 0.1 | |
| 849,086 | | | LSF11 A5 Holdco LLC 2023 Incremental Term Loan B, 9.676%, (TSFR1M + 4.250%), 10/15/28 | | | 851,474 | | | | 0.4 | |
| 579,410 | | | Olympus Water US Holding Corporation 2021 USD Term Loan B, 9.321%, (TSFR3M + 3.750%), 11/09/28 | | | 580,315 | | | | 0.3 | |
| 197,191 | | | PQ Corporation 2021 Term Loan B, 7.913%, (US0003M + 2.500%), 06/09/28 | | | 197,329 | | | | 0.1 | |
Principal
Amount† | | | Borrower/Tranche
Description | | Fair
Value | | | Percentage
of Net
Assets | |
| LOANS*: (continued) |
| | | | Chemicals & Plastics (continued) | |
| 439,898 | | | Sparta U.S. HoldCo LLC 2021 Term Loan, 8.687%, (TSFR1M + 3.250%), 08/02/28 | | $ | 440,998 | | | | 0.2 | |
| 761,755 | | | W.R. Grace & Co.-Conn. 2021 Term Loan B, 9.321%, (US0003M + 3.750%), 09/22/28 | | | 764,532 | | | | 0.3 | |
| | | | | | | 4,235,607 | | | | 1.9 | |
| | | | Clothing/Textiles: 0.7% | |
| 822,333 | | | ABG Intermediate Holdings 2 LLC 2021 Term Loan B1, 8.926%, (SOFRRATE + 3.500%), 12/21/28 | | | 826,252 | | | | 0.4 | |
| 218,435 | | | Birkenstock GmbH & Co. KG USD Term Loan B, 8.827%, (US0003M + 3.250%), 04/28/28 | | | 219,151 | | | | 0.1 | |
| 456,550 | | | Samsonite International S.A. 2023 Term Loan, 3.250%, (TSFR1M + 2.750%), 06/21/30 | | | 457,905 | | | | 0.2 | |
| | | | | | | 1,503,308 | | | | 0.7 | |
| | | | Commercial Services: 1.5% | |
| 371,450 | | | Albion Financing 3 SARL USD Term Loan, 10.827%, (TSFR3M + 5.250%), 08/17/26 | | | 373,695 | | | | 0.2 | |
| 818,886 | | | Avis Budget Car Rental, LLC 2023 Term Loan C, 8.430%, (TSFR1M + 3.000%), 03/16/29 | | | 821,342 | | | | 0.3 | |
| 4,056 | | | Belron Finance US LLC 2023 USD Term Loan, 7.578%, (TSFR3M + 2.000%), 04/13/28 | | | 4,064 | | | | 0.0 | |
| 750,000 | | | R1 RCM, Inc. 2022 Term Loan B, 8.326%, (TSFR3M + 3.000%), 06/21/29 | | | 752,906 | | | | 0.3 | |
| 416,190 | | | Ryan, LLC Term Loan, 9.830%, (TSFR1M + 4.500%), 11/14/30 | | | 418,792 | | | | 0.2 | |
| 1,115,000 | | | Wand NewCo 3, Inc. 2024 Term Loan B, 9.080%, (TSFR1M + 3.750%), 01/30/31 | | | 1,119,258 | | | | 0.5 | |
| | | | | | | 3,490,057 | | | | 1.5 | |
| | | | Commodities: 1.0% | |
| 218,152 | | | Core & Main LP 2021 Term Loan B, 7.971%, (US0003M + 2.500%), 07/27/28 | | | 218,379 | | | | 0.1 | |
See Accompanying Notes to Financial Statements
| | PORTFOLIO OF INVESTMENTS |
| Voya Floating Rate Fund | as of March 31, 2024 (continued) |
Principal
Amount† | | | Borrower/Tranche
Description | | Fair
Value | | | Percentage
of Net
Assets | |
| LOANS*: (continued) | | | | | |
| | | | Commodities (continued) | |
| 841,212 | | | Foundation Building Materials Holding Company LLC 2021 Term Loan, 8.824%, (US0001M + 3.250%), 01/31/28 | | $ | 843,077 | | | | 0.4 | |
| 560,422 | | | Specialty Building Products Holdings, LLC 2021 Term Loan B, 9.176%, (TSFR1M + 3.250%), 10/15/28 | | | 559,459 | | | | 0.2 | |
| 583,538 | | | Windsor Holdings III, LLC USD Term Loan B, 9.823%, (TSFR1M + 4.500%), 08/01/30 | | | 587,184 | | | | 0.3 | |
| | | | | | | 2,208,099 | | | | 1.0 | |
| | | | Communications: 1.6% | |
| 499,441 | | | AP Core Holdings II, LLC Amortization Term Loan B1, 10.945%, (TSFR1M + 5.500%), 09/01/27 | | | 490,576 | | | | 0.2 | |
| 165,000 | | | Connect Finco SARL 2024 Extended Term Loan B, 9.829%, (TSFR1M + 4.500%), 09/28/29 | | | 162,525 | | | | 0.1 | |
| 920,000 | | | Fleet Midco I Limited 2024 Term Loan B, 8.580%, (TSFR3M + 3.250%), 02/21/31 | | | 922,300 | | | | 0.4 | |
| 455,000 | | | Magnite Inc. 2024 Term Loan B, 9.798%, (TSFR3M + 4.500%), 02/06/31 | | | 456,138 | | | | 0.2 | |
| 482,625 | | | Tiger Acquisition, LLC 2021 Term Loan, 8.680%, (TSFR1M + 3.250%), 06/01/28 | | | 479,307 | | | | 0.2 | |
| 495,000 | | | Virgin Media Bristol LLC 2023 USD Term Loan Y, 8.790%, (TSFR6M + 3.250%), 03/31/31 | | | 487,527 | | | | 0.2 | |
| 575,000 | | | WeddingWire, Inc. 2023 Term Loan, 9.827%, (TSFR3M + 4.500%), 01/31/28 | | | 575,000 | | | | 0.3 | |
| | | | | | | 3,573,373 | | | | 1.6 | |
| | | | Computers: 0.6% | |
| 368,705 | | | NCR Atleos LLC Term Loan B, 10.163%, (TSFR1M + 4.750%), 03/27/29 | | | 370,779 | | | | 0.2 | |
| 620,000 | | | SonicWall US Holdings Inc. 2023 Term Loan, 10.313%, (TSFR3M + 5.000%), 05/16/28 | | | 616,513 | | | | 0.3 | |
Principal
Amount† | | | Borrower/Tranche
Description | | Fair
Value | | | Percentage
of Net
Assets | |
| LOANS*: (continued) | |
| | | | Computers (continued) | |
| 365,925 | | | World Wide Technology Holding Co. LLC 2024 Term Loan, 8.175%, (TSFR1M + 2.750%), 03/01/30 | | $ | 368,898 | | | | 0.1 | |
| | | | | | | 1,356,190 | | | | 0.6 | |
| | | | Consumer, Cyclical: 3.2% | |
| 578,231 (5) | | | Air Canada 2024 Term Loan B, 03/21/31 | | | 580,807 | | | | 0.2 | |
| 427,200 | | | American Axle and Manufacturing, Inc. 2022 Term Loan B, 8.918%, (TSFR6M + 3.500%), 12/13/29 | | | 428,802 | | | | 0.2 | |
| 894,034 | | | Ascend Learning, LLC 2021 Term Loan, 8.927%, (TSFR1M + 3.500%), 12/11/28 | | | 890,442 | | | | 0.4 | |
| 898,659 | | | Bombardier Recreational Products. Inc. 2023 TERM LOAN B3, 8.079%, (TSFR1M + 2.750%), 12/13/29 | | | 900,999 | | | | 0.4 | |
| 497,487 | | | Caesars Entertainment Corp Term Loan B, 8.663%, (TSFR1M + 3.250%), 01/20/30 | | | 499,314 | | | | 0.2 | |
| 828,713 | | | GVC Holdings (Gibraltar) Limited 2022 Term Loan B, 3.500%, (TSFR1M + 3.500%), 10/31/29 | | | 832,770 | | | | 0.4 | |
| 610,000 | | | Homeserve USA Holding Corp Term Loan, 8.329%, (TSFR1M + 3.000%), 10/21/30 | | | 612,193 | | | | 0.3 | |
| 490,000 | | | Kodiak Building Partners Inc. 2024 Term Loan B2, 9.048%, (TSFR3M + 3.750%), 03/13/28 | | | 491,072 | | | | 0.2 | |
| 704,434 | | | Mileage Plus Holdings LLC 2020 Term Loan B, 10.733%, (US0003M + 5.250%), 06/21/27 | | | 726,327 | | | | 0.3 | |
| 662,764 | | | Penn National Gaming, Inc. 2022 Term Loan B 1L, 8.176%, (TSFR1M + 2.750%), 05/03/29 | | | 664,089 | | | | 0.3 | |
| 652,715 | | | Spring Education Group, Inc Term Loan, 9.820%, (TSFR3M + 4.500%), 10/04/30 | | | 656,632 | | | | 0.3 | |
| | | | | | | 7,283,447 | | | | 3.2 | |
| | | | Consumer, Non-cyclical: 1.6% | | | | | | | | |
| 947,879 | | | Bausch + Lomb Corp. 1st Lien Term Loan B, 8.677%, (TSFR1M + 3.250%), 05/10/27 | | | 939,755 | | | | 0.4 | |
See Accompanying Notes to Financial Statements
| | PORTFOLIO OF INVESTMENTS |
| Voya Floating Rate Fund | as of March 31, 2024 (continued) |
Principal
Amount† | | | Borrower/Tranche
Description | | Fair
Value | | | Percentage
of Net
Assets | |
| LOANS*: (continued) |
| | | | Consumer, Non-cyclical (continued) | |
| 596,298 | | | Fugue Finance B.V. 2023 USD Term Loan B, 9.343%, (TSFR3M + 4.000%), 01/31/28 | | $ | 598,161 | | | | 0.3 | |
| 940,898 | | | KUEHG Corp. 2023 Term Loan, 10.348%, (TSFR3M + 5.000%), 06/12/30 | | | 944,931 | | | | 0.4 | |
| 150,000 | | | Mister Car Wash Holdings Inc. 2024 Term Loan B, 8.298%, (TSFR3M + 3.000%), 03/27/31 | | | 150,469 | | | | 0.1 | |
| 948,024 | | | Pegasus BidCo BV 2024 USD Term Loan, 9.057%, (TSFR3M + 3.750%), 07/12/29 | | | 949,605 | | | | 0.4 | |
| 43,810 (1)(5) | | | Ryan, LLC Delayed Draw Term Loan, 11/14/30 | | | 44,083 | | | | 0.0 | |
| | | | | | | 3,627,004 | | | | 1.6 | |
| | | | Containers & Glass Products: 3.2% | |
| 867,407 | | | Altium Packaging LLC 2021 Term Loan B, 8.191%, (TSFR1M + 2.750%), 02/03/28 | | | 866,662 | | | | 0.4 | |
| 894,075 | | | Clydesdale Acquisition Holdings Inc Term Loan B, 9.105%, (TSFR1M + 4.180%), 04/13/29 | | | 896,191 | | | | 0.4 | |
| 4,799 | | | Graham Packaging Company Inc. 2021 Term Loan, 8.445%, (TSFR1M + 3.000%), 08/04/27 | | | 4,803 | | | | 0.0 | |
| 281,768 | | | Plastipak Packaging, Inc. 2021 Term Loan B, 7.930%, (US0001M + 2.500%), 12/01/28 | | | 281,709 | | | | 0.1 | |
| 518,509 | | | Plaze, Inc. 2020 Incremental Term Loan, 9.191%, (US0001M + 3.750%), 08/03/26 | | | 512,028 | | | | 0.2 | |
| 1,019,490 | | | Pro Mach Group, Inc. 2021 Term Loan B, 9.076%, (US0001M + 4.000%), 08/31/28 | | | 1,024,333 | | | | 0.5 | |
| 523,688 | | | ProAmpac PG Borrower LLC 2023 Term Loan, 9.806%, (TSFR3M + 4.500%), 09/15/28 | | | 525,259 | | | | 0.2 | |
| 861,766 | | | Reynolds Group Holdings Inc. 2021 Term Loan B, 8.695%, (TSFR1M + 3.250%), 09/24/28 | | | 865,582 | | | | 0.4 | |
| 1,077,424 | | | Titan Acquisition Limited 2018 Term Loan B, 8.441%, (US0003M + 3.000%), 03/28/25 | | | 1,077,424 | | | | 0.5 | |
Principal
Amount† | | | Borrower/Tranche
Description | | Fair
Value | | | Percentage
of Net
Assets | |
| LOANS*: (continued) |
| | | | Containers & Glass Products (continued) | |
| 735,045 | | | TricorBraun Holdings, Inc. 2021 Term Loan, 8.691%, (TSFR1M + 3.250%), 03/03/28 | | $ | 727,970 | | | | 0.3 | |
| 429,130 | | | Trident TPI Holdings, Inc. 2021 Incremental Term Loan, 9.571%, (US0003M + 4.000%), 09/15/28 | | | 429,901 | | | | 0.2 | |
| | | | | | | 7,211,862 | | | | 3.2 | |
| | | | Distribution/Wholesale: 0.2% |
| 446,514 | | | Dealer Tire Financial, LLC 2024 Term Loan B3, 9.080%, (TSFR1M + 3.750%), 12/14/27 | | | 450,421 | | | | 0.2 | |
| | | | | | | | | | | | |
| | | | Diversified Finan Serv: 1.5% | |
| 725,831 | | | Aretec Group, Inc. 2023 Incremental Term Loan, 9.926%, (TSFR1M + 4.500%), 08/09/30 | | | 730,504 | | | | 0.3 | |
| 220,000 | | | Blackhawk Network Holdings, Inc 2024 Term Loan, 10.319%, (TSFR1M + 5.000%), 03/12/29 | | | 220,608 | | | | 0.1 | |
| 541,767 | | | Focus Financial Partners, LLC 2024 Term Loan B7, 8.080%, (TSFR1M + 2.750%), 06/30/28 | | | 540,864 | | | | 0.3 | |
| 959,725 (5) | | | Jane Street Group, LLC 2024 Term Loan B, 7.941%, 01/26/28 | | | 961,125 | | | | 0.4 | |
| 972,562 | | | Nuvei Technologies Corp. USD Term Loan, 8.430%, (US0003M + 3.000%), 12/19/30 | | | 976,210 | | | | 0.4 | |
| | | | | | | 3,429,311 | | | | 1.5 | |
| | | | Drugs: 0.4% | |
| 573,385 | | | Amneal Pharmaceuticals LLC 2018 Term Loan B, 8.945%, (TSFR1M + 3.500%), 05/04/25 | | | 573,543 | | | | 0.3 | |
| 248,438 | | | Amneal Pharmaceuticals LLC 2023 Term Loan B, 10.830%, (TSFR1M + 5.500%), 05/04/28 | | | 248,500 | | | | 0.1 | |
| | | | | | | 822,043 | | | | 0.4 | |
| | | | Electronics: 0.1% | |
| 233,825 | | | MX Holdings US, Inc. 2023 USD Term Loan B1D, 8.195%, (TSFR1M + 2.750%), 07/31/28 | | | 234,458 | | | | 0.1 | |
| | | | | | | | | | | | |
| | | | Electronics/Electrical: 4.0% | |
| 697,394 | | | Altar Bidco, Inc. 2021 Term Loan, 7.947%, (US0003M + 3.100%), 02/01/29 | | | 697,269 | | | | 0.3 | |
See Accompanying Notes to Financial Statements
| | PORTFOLIO OF INVESTMENTS |
| Voya Floating Rate Fund | as of March 31, 2024 (continued) |
Principal
Amount† | | | Borrower/Tranche
Description | | Fair
Value | | | Percentage
of Net
Assets | |
| LOANS*: (continued) |
| | | | Electronics/Electrical (continued) | |
| 766,688 | | | Chamberlain Group Inc Term Loan B, 8.680%, (TSFR1M + 3.250%), 11/03/28 | | $ | 766,620 | | | | 0.3 | |
| 367,578 | | | Creation Technologies Inc. 2021 Term Loan, 11.092%, (US0003M + 5.500%), 10/05/28 | | | 358,389 | | | | 0.2 | |
| 225,000 | | | DG Investment Intermediate Holdings 2, Inc. 2021 2nd Lien Term Loan, 12.195%, (TSFR1M + 6.750%), 03/30/29 | | | 211,125 | | | | 0.1 | |
| 539,910 | | | DG Investment Intermediate Holdings 2, Inc. 2021 Term Loan, 9.195%, (TSFR1M + 3.750%), 03/31/28 | | | 540,192 | | | | 0.2 | |
| 44,501 | | | Generation Bridge Northeast, LLC Term Loan B, 8.826%, (TSFR3M + 4.250%), 08/22/29 | | | 44,723 | | | | 0.0 | |
| 1,136,376 | | | Greeneden U.S. Holdings II, LLC 2020 USD Term Loan B, 9.441%, (TSFR1M + 4.000%), 12/01/27 | | | 1,141,171 | | | | 0.5 | |
| 778,530 | | | II-VI Incorporated 2022 Term Loan B, 8.079%, (TSFR1M + 2.750%), 07/02/29 | | | 781,060 | | | | 0.3 | |
| 604,203 | | | Illuminate Merger Sub Corp. 1st Lien Term Loan, 8.571%, (US0003M + 3.000%), 07/21/28 | | | 603,574 | | | | 0.3 | |
| 949,226 | | | Ingram Micro Inc. 2023 Term Loan, 8.610%, (TSFR3M + 3.000%), 06/30/28 | | | 952,193 | | | | 0.4 | |
| 147,979 | | | Mediaocean LLC 2021 Term Loan, 8.930%, (US0001M + 3.500%), 12/15/28 | | | 146,610 | | | | 0.1 | |
| 365,000 | | | MH Sub I, LLC 2021 2nd Lien Term Loan, 11.580%, (TSFR1M + 6.250%), 02/23/29 | | | 352,947 | | | | 0.1 | |
| 869,801 | | | Mitchell International, Inc. 2021 Term Loan B, 9.079%, (US0001M + 3.750%), 10/15/28 | | | 870,798 | | | | 0.4 | |
| 1,129 | | | Planview Parent, Inc. Term Loan, 9.610%, (TSFR3M + 4.000%), 12/17/27 | | | 1,127 | | | | 0.0 | |
| 247,333 | | | Project Boost Purchaser, LLC 2019 Term Loan B, 8.945%, (US0001M + 3.500%), 06/01/26 | | | 248,121 | | | | 0.1 | |
Principal
Amount† | | | Borrower/Tranche
Description | | Fair
Value | | | Percentage
of Net
Assets | |
| LOANS*: (continued) |
| | | | Electronics/Electrical (continued) | |
| 1,067,270 | | | Proofpoint, Inc. 1st Lien Term Loan, 8.579%, (TSFR1M + 3.250%), 08/31/28 | | $ | 1,068,605 | | | | 0.5 | |
| 568,317 | | | Rackspace Technology Global, Inc. 2021 Term Loan B, 8.184%, (TSFR1M + 2.750%), 02/15/28 | | | 193,938 | | | | 0.1 | |
| 245,940 | | | Ultra Clean Holdings, Inc 2021 Term Loan B, 9.191%, (US0001M + 3.750%), 08/27/25 | | | 246,801 | | | | 0.1 | |
| | | | | | | 9,225,263 | | | | 4.0 | |
| | | | Energy: 0.3% | |
| 576,563 | | | Brazos Delaware II, LLC 2023 Term Loan B, 9.079%, (TSFR1M + 3.750%), 02/11/30 | | | 578,725 | | | | 0.2 | |
| 197,500 | | | UGI Energy Services, LLC 2023 Term Loan B, 8.680%, (TSFR1M + 3.250%), 02/22/30 | | | 198,699 | | | | 0.1 | |
| | | | | | | 777,424 | | | | 0.3 | |
| | | | Engineering & Construction: 0.5% | |
| 500,000 | | | Crown Subsea Communications Holding,Inc. 2024 Term Loan B, 10.067%, (TSFR3M + 4.750%), 01/30/31 | | | 503,562 | | | | 0.2 | |
| 708,978 | | | VM Consolidated, Inc. 2024 Term Loan B, 8.076%, (TSFR1M + 2.750%), 03/24/28 | | | 712,744 | | | | 0.3 | |
| | | | | | | 1,216,306 | | | | 0.5 | |
| | | | Entertainment: 0.6% | |
| 340,000 | | | Caesars Entertainment Inc. 2024 Term Loan B1, 8.041%, (TSFR3M + 2.750%), 02/06/31 | | | 340,722 | | | | 0.2 | |
| 985,000 | | | Light and Wonder International, Inc. 2024 Term Loan, 8.075%, (TSFR1M + 2.750%), 04/14/29 | | | 988,232 | | | | 0.4 | |
| | | | | | | 1,328,954 | | | | 0.6 | |
| | | | Environmental Control: 0.2% | |
| 355,866 | | | GFL Environmental Inc. 2023 First Lien Term Loan, 7.816%, (TSFR3M + 3.000%), 05/31/27 | | | 357,581 | | | | 0.2 | |
| | | | | | | | | | | | |
| | | | Farming/Agriculture: 0.1% | |
| 270,000 | | | Ceva Sante Animale 2023 USD Term Loan B, 9.564%, (TSFR3M + 4.250%), 11/01/30 | | | 271,266 | | | | 0.1 | |
See Accompanying Notes to Financial Statements
| | PORTFOLIO OF INVESTMENTS |
| Voya Floating Rate Fund | as of March 31, 2024 (continued) |
Principal
Amount† | | | Borrower/Tranche
Description | | Fair
Value | | | Percentage
of Net
Assets | |
| LOANS*: (continued) | | |
| | | | Financial: 2.6% | |
| 243,959 | | | AllSpring Buyer LLC Term Loan B, 8.887%, (TSFR3M + 3.250%), 11/01/28 | | $ | 244,050 | | | | 0.1 | |
| 825,769 | | | AmWINS Group, Inc. 2023 Incremental Term Loan B, 8.195%, (TSFR1M + 2.750%), 02/19/28 | | | 828,285 | | | | 0.4 | |
| 181,335 | | | Brookfield Property REIT Inc. 1st Lien Term Loan B, 7.926%, (TSFR1M + 2.500%), 08/27/25 | | | 180,995 | | | | 0.1 | |
| 723,188 | | | Cushman & Wakefield U.S. Borrower, LLC 2023 Term Loan B, 9.330%, (TSFR1M + 4.000%), 01/31/30 | | | 725,899 | | | | 0.3 | |
| 966,484 | | | Edelman Financial Center, LLC 2021 Term Loan B, 8.941%, (US0001M + 3.750%), 04/07/28 | | | 967,794 | | | | 0.4 | |
| 434,081 | | | Focus Financial Partners, LLC 2021 Term Loan, 7.830%, (TSFR1M + 2.500%), 06/30/28 | | | 432,995 | | | | 0.2 | |
| 550,000 | | | GTCR W Merger Sub LLC USD Term Loan B, 8.309%, (TSFR1M + 3.000%), 09/20/30 | | | 552,278 | | | | 0.2 | |
| 443,557 | | | HighTower Holdings LLC 2021 Term Loan B, 9.586%, (US0001M + 4.000%), 04/21/28 | | | 444,874 | | | | 0.2 | |
| 160,000 | | | Kestra Financial, Inc. First Lien Term Loan, 9.298%, (TSFR3M + 4.000%), 06/04/26 | | | 160,400 | | | | 0.1 | |
| 218,300 | | | RHP Hotel Properties, LP 2023 Term Loan B, 8.076%, (TSFR1M + 2.750%), 05/18/30 | | | 218,778 | | | | 0.1 | |
| 675,000 (5) | | | Truist Insurance Holdings LLC 1st Lien Term Loan, 03/24/31 | | | 674,717 | | | | 0.3 | |
| 195,000 (5) | | | Truist Insurance Holdings LLC 2nd Lien Term Loan, 03/08/32 | | | 196,463 | | | | 0.1 | |
| 341,550 | | | Walker & Dunlop, Inc. 2022 Incremental Term Loan B, 8.329%, (SOFRRATE + 3.000%), 12/16/28 | | | 341,977 | | | | 0.1 | |
| | | | | | | 5,969,505 | | | | 2.6 | |
| | | | Financial Intermediaries: 1.4% | |
| 792,540 | | | Advisor Group, Inc. 2023 Term Loan B, 9.826%, (TSFR3M + 4.500%), 08/17/28 | | | 796,550 | | | | 0.4 | |
Principal
Amount† | | | Borrower/Tranche
Description | | Fair
Value | | | Percentage
of Net
Assets | |
| LOANS*: (continued) |
| | | | Financial Intermediaries (continued) | |
| 661,874 | | | AqGen Island Holdings, Inc. Term Loan, 8.945%, (TSFR1M + 3.500%), 08/02/28 | | $ | 660,302 | | | | 0.3 | |
| 726,375 | | | Castlelake Aviation Limited Term Loan B, 7.829%, (US0003M + 2.750%), 10/22/26 | | | 727,340 | | | | 0.3 | |
| 311,752 | | | Deerfield Dakota Holding, LLC 2020 USD Term Loan B, 9.059%, (TSFR3M + 3.750%), 04/09/27 | | | 310,544 | | | | 0.1 | |
| 636,744 | | | VFH Parent LLC 2022 Term Loan B, 8.430%, (SOFRRATE + 3.000%), 01/13/29 | | | 636,744 | | | | 0.3 | |
| | | | | | | 3,131,480 | | | | 1.4 | |
| | | | Food: 0.7% | |
| 149,625 | | | Chobani, LLC 2023 Incremental Term Loan, 9.075%, (TSFR1M + 3.750%), 10/25/27 | | | 150,404 | | | | 0.1 | |
| 715,000 | | | Fiesta Purchaser, Inc. 2024 Term Loan B, 9.318%, (TSFR1M + 4.000%), 02/12/31 | | | 716,844 | | | | 0.3 | |
| 726,154 | | | Primary Products Finance LLC 2024 Term Loan B, 8.941%, (TSFR3M + 3.500%), 04/01/29 | | | 726,804 | | | | 0.3 | |
| | | | | | | 1,594,052 | | | | 0.7 | |
| | | | Food Products: 0.8% | |
| 715,689 | | | 8th Avenue Food & Provisions, Inc. 2018 1st Lien Term Loan, 9.191%, (TSFR1M + 3.750%), 10/01/25 | | | 703,836 | | | | 0.3 | |
| 288,747 | | | 8th Avenue Food & Provisions, Inc. 2021 Incremental Term Loan, 10.191%, (TSFR1M + 4.750%), 10/01/25 | | | 284,055 | | | | 0.1 | |
| 630,169 | | | CHG PPC Parent LLC 2021 Term Loan, 8.441%, (TSFR1M + 3.000%), 12/08/28 | | | 631,745 | | | | 0.3 | |
| 320,000 | | | Upfield B.V. 2023 USD Term Loan B, 10.050%, (TSFR6M + 3.000%), 01/31/28 | | | 319,066 | | | | 0.1 | |
| | | | | | | 1,938,702 | | | | 0.8 | |
| | | | Forest Products: 0.2% | |
| 352,364 | | | Spa Holdings 3 Oy USD Term Loan B, 9.571%, (US0003M + 3.750%), 02/04/28 | | | 352,474 | | | | 0.2 | |
See Accompanying Notes to Financial Statements
| | PORTFOLIO OF INVESTMENTS |
| Voya Floating Rate Fund | as of March 31, 2024 (continued) |
Principal
Amount† | | | Borrower/Tranche
Description | | Fair
Value | | | Percentage
of Net
Assets | |
| LOANS*: (continued) | | |
| | | | Gas: 0.2% | |
| 395,000 | | | NGL Energy Partners LP 2024 Term Loan B, 9.830%, (TSFR1M + 4.500%), 02/02/31 | | $ | 396,432 | | | | 0.2 | |
| | | | | | | | | | | | |
| | | | Health Care: 6.1% | |
| 1,457,580 | | | Athenahealth, Inc. 2022 Term Loan B, 8.580%, (TSFR1M + 3.500%), 02/15/29 | | | 1,445,637 | | | | 0.6 | |
| 650,000 | | | Auris Luxembourg III S.a.r.l. 2019 USD Term Loan B, 4.154%, (US0001M + 3.750%), 02/27/26 | | | 646,750 | | | | 0.3 | |
| 950,625 | | | CHG Healthcare Services Inc. 2021 Term Loan, 8.691%, (US0001M + 3.250%), 09/29/28 | | | 952,407 | | | | 0.4 | |
| 1,345,000 (5) | | | Cotiviti Corporation 2024 Term Loan, 02/21/31 | | | 1,347,242 | | | | 0.6 | |
| 638,550 | | | Covetrus, Inc. 2022 1st Lien Term Loan, 10.309%, (TSFR3M + 5.000%), 10/13/29 | | | 639,880 | | | | 0.3 | |
| 483,729 | | | Gloves Buyer, Inc. 2021 Term Loan, 9.441%, (TSFR1M + 4.000%), 12/29/27 | | | 483,729 | | | | 0.2 | |
| 587,107 | | | GoodRx, Inc. 1st Lien Term Loan, 8.176%, (US0001M + 2.750%), 10/10/25 | | | 587,290 | | | | 0.3 | |
| 142,400 | | | Hunter Holdco 3 Limited USD Term Loan B, 9.659%, (US0003M + 4.250%), 08/19/28 | | | 142,400 | | | | 0.1 | |
| 154,613 | | | IVC Acquisition Ltd 2023 USD Term Loan B, 10.820%, (TSFR3M + 5.500%), 11/17/28 | | | 155,128 | | | | 0.1 | |
| 1,472,713 | | | Medline Borrower, LP USD Term Loan B, 8.441%, (TSFR1M + 3.250%), 10/23/28 | | | 1,475,053 | | | | 0.7 | |
| 547,957 | | | MPH Acquisition Holdings LLC 2021 Term Loan B, 9.855%, (US0003M + 4.250%), 09/01/28 | | | 531,138 | | | | 0.2 | |
| 500,000 | | | Organon & Co USD Term Loan, 8.433%, (US0003M + 3.000%), 06/02/28 | | | 501,797 | | | | 0.2 | |
| 700,958 | | | Packaging Coordinators Midco, Inc. 2020 1st Lien Term Loan, 9.071%, (TSFR3M + 3.500%), 11/30/27 | | | 703,246 | | | | 0.3 | |
Principal
Amount† | | | Borrower/Tranche
Description | | Fair
Value | | | Percentage
of Net
Assets | |
| LOANS*: (continued) | | |
| | | | Health Care (continued) | |
| 265,950 | | | Perrigo Investments, LLC Term Loan B, 7.680%, (TSFR1M + 2.350%), 04/20/29 | | $ | 265,618 | | | | 0.1 | |
| 547,903 | | | RxBenefits, Inc. 2020 Term Loan, 9.825%, (TSFR1M + 4.500%), 12/20/27 | | | 550,643 | | | | 0.2 | |
| 835,000 | | | Sotera Health Holdings, LLC 2021 Term Loan, 8.195%, (US0003M + 2.750%), 12/11/26 | | | 832,913 | | | | 0.4 | |
| 619,706 | | | Star Parent, Inc. Term Loan B, 9.309%, (TSFR3M + 4.000%), 09/27/30 | | | 616,491 | | | | 0.3 | |
| 950,566 | | | Surgery Center Holdings, Inc. 2023 Term Loan, 8.829%, (TSFR1M + 3.500%), 12/19/30 | | | 955,972 | | | | 0.4 | |
| 978,569 | | | Verscend Holding Corp. 2021 Term Loan B, 9.445%, (US0001M + 4.000%), 08/27/25 | | | 979,443 | | | | 0.4 | |
| | | | | | | 13,812,777 | | | | 6.1 | |
| | | | Healthcare-Services: 0.9% | |
| 607,381 | | | Pacific Dental Services, LLC 2024 Term Loan B, 8.575%, (TSFR3M + 3.250%), 03/07/31 | | | 607,381 | | | | 0.3 | |
| 1,017,326 | | | Phoenix Guarantor Inc 2024 Term Loan, 8.576%, (TSFR1M + 3.250%), 02/21/31 | | | 1,005,165 | | | | 0.4 | |
| 382,958 | | | Select Medical Corporation 2023 Term Loan B1, 8.330%, (TSFR1M + 3.000%), 03/06/27 | | | 384,035 | | | | 0.2 | |
| | | | | | | 1,996,581 | | | | 0.9 | |
| | | | Holding Companies-Divers: 0.7% | |
| 878,219 | | | Belfor Holdings Inc. 2023 USD Term Loan B, 9.080%, (TSFR1M + 3.750%), 11/01/30 | | | 883,707 | | | | 0.4 | |
| 780,000 | | | First Eagle Investment Management, LLC 2024 Term Loan B, 8.334%, (TSFR3M + 3.000%), 02/22/29 | | | 774,248 | | | | 0.3 | |
| | | | | | | 1,657,955 | | | | 0.7 | |
| | | | Home Builders: 0.1% | |
| 170,000 | | | Thor Industries, Inc. 2023 USD Term Loan B2, 8.077%, (TSFR1M + 2.750%), 11/15/30 | | | 170,744 | | | | 0.1 | |
See Accompanying Notes to Financial Statements
| | PORTFOLIO OF INVESTMENTS |
| Voya Floating Rate Fund | as of March 31, 2024 (continued) |
Principal
Amount† | | | Borrower/Tranche
Description | | Fair
Value | | | Percentage
of Net
Assets | |
| LOANS*: (continued) | | |
| | | | Home Furnishings: 0.4% | |
| 889,138 | | | Solis IV BV USD Term Loan B1, 8.824%, (TSFR3M + 3.500%), 02/26/29 | | $ | 880,454 | | | | 0.4 | |
| | | | | | | | | | | | |
| | | | Industrial: 3.7% | |
| 344,735 | | | ADS Tactical, Inc. 2021 Term Loan B, 11.195%, (US0001M + 5.750%), 03/19/26 | | | 347,321 | | | | 0.2 | |
| 665,775 | | | AlixPartners, LLP 2021 USD Term Loan B, 7.945%, (US0001M + 2.750%), 02/04/28 | | | 667,394 | | | | 0.3 | |
| 909,346 | | | Allied Universal Holdco LLC 2021 USD Incremental Term Loan B, 9.180%, (TSFR1M + 3.750%), 05/12/28 | | | 909,030 | | | | 0.4 | |
| 274,038 | | | Amentum Government Services Holdings LLC Term Loan B, 9.445%, (US0001M + 3.500%), 01/29/27 | | | 275,151 | | | | 0.1 | |
| 609,695 | | | Brown Group Holding LLC 2022 Term Loan B2 1L, 8.723%, (TSFR3M + 3.750%), 07/02/29 | | | 610,458 | | | | 0.3 | |
| 963,062 | | | Emrld Borrower LP Term Loan B, 7.791%, (TSFR3M + 3.000%), 05/31/30 | | | 963,182 | | | | 0.4 | |
| 50,081 | | | Filtration Group Corporation 2021 Incremental Term Loan, 8.941%, (US0001M + 3.500%), 10/21/28 | | | 50,264 | | | | 0.0 | |
| 220,000 | | | Kaman Corporation 2024 Term Loan, 8.798%, (TSFR3M + 3.500%), 03/27/31 | | | 220,413 | | | | 0.1 | |
| 298,381 | | | LSF11 Trinity Bidco, Inc. 2023 Term Loan, 9.329%, (TSFR1M + 4.000%), 06/14/30 | | | 299,873 | | | | 0.1 | |
| 255,000 | | | MI Windows and Doors LLC 2024 Term Loan B2, 8.798%, (TSFR3M + 3.500%), 12/18/27 | | | 256,514 | | | | 0.1 | |
| 404,625 | | | Northstar Group Services, INC. 2020 Term Loan B, 10.945%, (TSFR1M + 5.500%), 11/12/26 | | | 406,058 | | | | 0.2 | |
| 150,000 | | | ProAmpac PG Borrower LLC 2024 Term Loan, 9.329%, (TSFR1M + 4.000%), 09/15/28 | | | 150,450 | | | | 0.1 | |
Principal
Amount† | | | Borrower/Tranche
Description | | Fair
Value | | | Percentage
of Net
Assets | |
| LOANS*: (continued) | | |
| | | | Industrial (continued) | |
| 150,000 | | | Radar Bidco Sarl 2024 USD Term Loan B, 9.548%, (TSFR3M + 4.250%), 03/27/31 | | $ | 150,188 | | | | 0.1 | |
| 498,721 | | | Refficiency Holdings LLC 2021 Term Loan, 8.930%, (TSFR1M + 3.750%), 12/16/27 | | | 499,656 | | | | 0.2 | |
| 471,720 | | | Rockwood Service Corporation 2020 Term Loan, 9.691%, (TSFR1M + 4.000%), 01/23/27 | | | 473,783 | | | | 0.2 | |
| 666,942 | | | Service Logic Acquisition, Inc Term Loan, 9.574%, (US0003M + 4.000%), 10/29/27 | | | 667,775 | | | | 0.3 | |
| 451,588 | | | TransDigm, Inc. 2023 Term Loan I, 8.570%, (TSFR3M + 3.250%), 08/24/28 | | | 453,018 | | | | 0.2 | |
| 182,498 | | | Tutor Perini Corporation Term Loan B, 10.191%, (TSFR1M + 4.750%), 08/18/27 | | | 182,194 | | | | 0.1 | |
| 544,134 | | | U.S. Silica Company 2023 Term Loan B, 10.082%, (TSFR1M + 4.750%), 03/25/30 | | | 545,494 | | | | 0.2 | |
| 279,300 | | | VT Topco, Inc. 2023 Term Loan B, 9.579%, (TSFR3M + 4.250%), 08/10/30 | | | 280,282 | | | | 0.1 | |
| | | | | | | 8,408,498 | | | | 3.7 | |
| | | | Industrial Equipment: 3.0% | |
| 378,237 | | | AI Aqua Merger Sub, Inc. 2021 1st Lien Term Loan B, 9.072%, (TSFR1M + 3.750%), 07/31/28 | | | 379,065 | | | | 0.2 | |
| 665,000 (1) | | | AI Aqua Merger Sub, Inc. 2023 Incremental Term Loan, 9.576%, (TSFR1M + 4.250%), 07/31/28 | | | 667,858 | | | | 0.3 | |
| 438,159 | | | Alliance Laundry Systems LLC Term Loan B, 8.926%, (TSFR3M + 3.500%), 10/08/27 | | | 440,350 | | | | 0.2 | |
| 581,283 | | | Clark Equipment Company 2022 Term Loan B, 7.809%, (TSFR3M + 2.500%), 04/20/29 | | | 582,736 | | | | 0.2 | |
| 745,875 | | | Conair Holdings, LLC Term Loan B, 9.191%, (US0003M + 3.750%), 05/17/28 | | | 741,027 | | | | 0.3 | |
| 259,350 | | | CPM Holdings, Inc. 2023 Term Loan, 9.826%, (TSFR1M + 4.500%), 09/28/28 | | | 260,079 | | | | 0.1 | |
See Accompanying Notes to Financial Statements
| | PORTFOLIO OF INVESTMENTS |
| Voya Floating Rate Fund | as of March 31, 2024 (continued) |
Principal
Amount† | | | Borrower/Tranche
Description | | Fair
Value | | | Percentage
of Net
Assets | |
| LOANS*: (continued) |
| | | | Industrial Equipment (continued) | |
| 742,500 | | | Filtration Group Corporation 2023 USD Term Loan, 9.695%, (TSFR1M + 4.250%), 10/21/28 | | $ | 746,279 | | | | 0.3 | |
| 733,065 | | | Madison IAQ LLC Term Loan, 8.693%, (US0003M + 3.250%), 06/21/28 | | | 732,773 | | | | 0.3 | |
| 820,000 | | | SPX Flow, Inc. 2022 Term Loan, 9.926%, (TSFR1M + 4.500%), 04/05/29 | | | 824,407 | | | | 0.4 | |
| 924,919 | | | Vertical US Newco Inc Term Loan B, 9.081%, (US0006M + 3.500%), 07/30/27 | | | 927,179 | | | | 0.4 | |
| 617,160 | | | Watlow Electric Manufacturing Company Term Loan B, 9.329%, (TSFR3M + 3.750%), 03/02/28 | | | 619,860 | | | | 0.3 | |
| | | | | | | 6,921,613 | | | | 3.0 | |
| | | | Insurance: 5.2% | |
| 761,413 | | | Acrisure, LLC 2020 Term Loan B, 8.945%, (US0001M + 3.500%), 02/15/27 | | | 761,830 | | | | 0.3 | |
| 715,692 | | | Acrisure, LLC 2021 First Lien Term Loan B, 9.695%, (US0001M + 4.250%), 02/15/27 | | | 718,488 | | | | 0.3 | |
| 259,557 | | | Acrisure, LLC 2021 Incremental Term Loan B, 9.195%, (US0001M + 3.750%), 02/15/27 | | | 259,946 | | | | 0.1 | |
| 1,109,554 | | | Alliant Holdings Intermediate LLC, 8.827%, (TSFR1M + 3.500%), 11/06/30 | | | 1,115,228 | | | | 0.5 | |
| 497,462 | | | AssuredPartners, Inc. 2022 Term Loan, 8.826%, (TSFR1M + 3.500%), 02/12/27 | | | 498,457 | | | | 0.2 | |
| 601,753 | | | AssuredPartners, Inc. 2023 Term Loan B4, 9.080%, (TSFR1M + 3.750%), 02/12/27 | | | 603,007 | | | | 0.3 | |
| 861,603 | | | Broadstreet Partners, Inc. 2023 Term Loan B3, 9.080%, (TSFR1M + 4.000%), 01/27/29 | | | 865,103 | | | | 0.4 | |
| 1,620,000 | | | HUB International Limited 2024 Term Loan B, 8.574%, (TSFR3M + 3.250%), 06/20/30 | | | 1,622,098 | | | | 0.7 | |
Principal
Amount† | | | Borrower/Tranche
Description | | Fair
Value | | | Percentage
of Net
Assets | |
| LOANS*: (continued) | | |
| | | | Insurance (continued) | |
| 866,643 | | | IMA Financial Group, Inc. Term Loan, 9.191%, (US0001M + 3.500%), 11/01/28 | | $ | 869,351 | | | | 0.4 | |
| 819 | | | NFP Corp. 2020 Term Loan, 8.695%, (TSFR1M + 3.250%), 02/15/27 | | | 821 | | | | 0.0 | |
| 1,129,241 | | | OneDigital Borrower LLC 2021 Term Loan, 9.680%, (SOFRRATE + 4.250%), 11/16/27 | | | 1,130,653 | | | | 0.5 | |
| 1,035,326 | | | Ryan Specialty Group, LLC Term Loan, 8.080%, (TSFR1M + 3.000%), 09/01/27 | | | 1,037,914 | | | | 0.5 | |
| 944,698 | | | Sedgwick Claims Management Services, Inc. 2023 Term Loan B, 9.076%, (TSFR1M + 3.750%), 02/17/28 | | | 947,354 | | | | 0.4 | |
| 1,420,860 | | | USI, Inc. 2023 Acquisition Term Loan, 8.598%, (TSFR3M + 3.250%), 09/14/30 | | | 1,424,301 | | | | 0.6 | |
| | | | | | | 11,854,551 | | | | 5.2 | |
| | | | Internet: 0.4% | |
| 1,036,137 | | | MH Sub I, LLC 2023 Term Loan, 9.580%, (TSFR1M + 4.250%), 05/03/28 | | | 1,031,604 | | | | 0.4 | |
| | | | | | | | | | | | |
| | | | Investment Companies: 0.2% | |
| 397,514 | | | Aragorn Parent Corporation Term Loan, 9.577%, (TSFR1M + 4.250%), 06/15/28 | | | 399,601 | | | | 0.2 | |
| | | | | | | | | | | | |
| | | | Leisure Good/Activities/Movies: 2.4% | |
| 735,604 (2) | | | 24 Hour Fitness Worldwide, Inc. 2021 Delayed Draw Term Loan, 7.605% (PIK Rate 7.000%, Cash Rate 7.650%), 09/29/25 | | | 698,824 | | | | 0.3 | |
| 346,351 | | | Alterra Mountain Company 2021 Series B-2 Consenting Term Loan, 8.945%, (US0001M + 3.500%), 08/17/28 | | | 348,191 | | | | 0.2 | |
| 720,496 | | | Cinemark USA, Inc. 2023 Term Loan B, 9.083%, (TSFR1M + 3.750%), 05/24/30 | | | 723,949 | | | | 0.3 | |
See Accompanying Notes to Financial Statements
| | PORTFOLIO OF INVESTMENTS |
| Voya Floating Rate Fund | as of March 31, 2024 (continued) |
Principal
Amount† | | | Borrower/Tranche
Description | | Fair
Value | | | Percentage
of Net
Assets | |
| LOANS*: (continued) |
| | | | Leisure Good/Activities/Movies (continued) | |
| 571,829 | | | City Football Group Limited Term Loan, 8.443%, (US0003M + 3.000%), 07/21/28 | | $ | 572,186 | | | | 0.3 | |
| 440,908 | | | ClubCorp Holdings, Inc. 2023 Term Loan B2, 10.320%, (TSFR3M + 5.000%), 09/18/26 | | | 442,231 | | | | 0.2 | |
| 300,129 | | | CWGS Group, LLC 2021 Term Loan B, 7.943%, (US0001M + 2.500%), 06/03/28 | | | 293,126 | | | | 0.1 | |
| 464,730 | | | MajorDrive Holdings IV LLC Term Loan B, 9.571%, (US0003M + 4.000%), 06/01/28 | | | 465,988 | | | | 0.2 | |
| 934,561 | | | Playtika Holding Corp 2021 Term Loan, 8.195%, (US0001M + 2.750%), 03/13/28 | | | 936,685 | | | | 0.4 | |
| 475,067 | | | SRAM, LLC 2021 Term Loan B, 8.195%, (US0001M + 2.750%), 05/18/28 | | | 475,364 | | | | 0.2 | |
| 466,796 | | | Topgolf Callaway Brands Corp. Term Loan B, 8.926%, (TSFR1M + 3.500%), 03/15/30 | | | 467,769 | | | | 0.2 | |
| | | | | | | 5,424,313 | | | | 2.4 | |
| | | | Leisure Time: 0.2% | | | | | | | | |
| 95,000 (5) | | | Alterra Mountain Company 2024 Add-on Term Loan B, 05/31/30 | | | 95,594 | | | | 0.0 | |
| 150,000 | | | Amer Sports Company USD Term Loan, 8.576%, (TSFR3M + 3.250%), 02/17/31 | | | 150,375 | | | | 0.1 | |
| 300,000 | | | Bombardier Recreational Products, Inc. 2024 Term Loan B4, 8.079%, (TSFR1M + 2.750%), 01/22/31 | | | 300,187 | | | | 0.1 | |
| | | | | | | 546,156 | | | | 0.2 | |
| | | | Lodging & Casinos: 2.6% | | | | | | | | |
| 208,425 | | | Alterra Mountain Company 2023 Term Loan B, 9.180%, (TSFR1M + 3.750%), 05/31/30 | | | 209,728 | | | | 0.1 | |
| 824,807 | | | Arches Buyer Inc. 2021 Term Loan B, 8.680%, (US0001M + 3.250%), 12/06/27 | | | 800,664 | | | | 0.3 | |
Principal
Amount† | | | Borrower/Tranche
Description | | Fair
Value | | | Percentage
of Net
Assets | |
| LOANS*: (continued) |
| | | | Lodging & Casinos (continued) | |
| 198,476 | | | Century Casinos, Inc 2022 Term Loan, 11.426%, (TSFR1M + 6.000%), 04/02/29 | | $ | 195,375 | | | | 0.1 | |
| 1,055,392 | | | Fertitta Entertainment, LLC 2022 Term Loan B, 9.077%, (SOFRRATE + 4.000%), 01/27/29 | | | 1,059,102 | | | | 0.5 | |
| 608,481 | | | Flynn Restaurant Group LP 2021 Term Loan B, 9.579%, (TSFR1M + 4.250%), 12/01/28 | | | 611,144 | | | | 0.3 | |
| 456,550 | | | Golden Entertainment, Inc. 2023 Term Loan B, 8.180%, (TSFR1M + 2.750%), 05/28/30 | | | 456,930 | | | | 0.2 | |
| 3,186 | | | Hilton Grand Vacations Borrower LLC 2021 Term Loan B, 8.191%, (TSFR1M + 3.000%), 08/02/28 | | | 3,192 | | | | 0.0 | |
| 670,935 | | | Kingpin Intermediate Holdings LLC 2023 Term Loan B, 8.830%, (TSFR1M + 3.500%), 02/08/28 | | | 671,774 | | | | 0.3 | |
| 982,825 | | | Scientific Games Holdings LP 2022 USD Term Loan B, 8.580%, (TSFR3M + 3.500%), 04/04/29 | | | 983,877 | | | | 0.4 | |
| 961,652 | | | Whatabrands LLC 2021 Term Loan B, 8.691%, (US0001M + 3.250%), 08/03/28 | | | 963,322 | | | | 0.4 | |
| | | | | | | 5,955,108 | | | | 2.6 | |
| | | | Machinery — Diversified: 1.0% | |
| 569,500 | | | Chart Industries, Inc. 2023 Term Loan B, 8.673%, (TSFR1M + 3.250%), 03/15/30 | | | 572,585 | | | | 0.2 | |
| 665,000 (5) | | | Kohler Energy Co LLC USD Term Loan B, 01/30/31 | | | 665,000 | | | | 0.3 | |
| 438,900 | | | LSF12 Badger Bidco LLC Term Loan B, 11.330%, (TSFR1M + 6.000%), 08/30/30 | | | 441,369 | | | | 0.2 | |
| 490,000 (5) | | | Titan Acquisition Limited 2024 Term Loan B, 02/01/29 | | | 491,592 | | | | 0.2 | |
| 147,688 | | | TK Elevator US Newco Inc USD Term Loan B, 8.798%, (TSFR3M + 3.500%), 04/30/30 | | | 148,242 | | | | 0.1 | |
| | | | | | | 2,318,788 | | | | 1.0 | |
See Accompanying Notes to Financial Statements
| | PORTFOLIO OF INVESTMENTS |
| Voya Floating Rate Fund | as of March 31, 2024 (continued) |
Principal
Amount† | | | Borrower/Tranche
Description | | Fair
Value | | | Percentage
of Net
Assets | |
| LOANS*: (continued) | | |
| | | | Media: 0.6% | | | | | | | | |
| 320,000 | | | Cengage Learning, Inc. 2024 Term Loan B, 9.579%, (TSFR3M + 4.250%), 03/15/31 | | $ | 320,011 | | | | 0.2 | |
| 993,314 | | | Gray Television, Inc. 2023 Term Loan E, 7.940%, (TSFR1M + 2.500%), 01/02/26 | | | 982,761 | | | | 0.4 | |
| | | | | | | 1,302,772 | | | | 0.6 | |
| | | | Mining: 0.2% | | | | | | | | |
| 373,127 | | | Arsenal AIC Parent LLC 2024 Term Loan B, 9.080%, (TSFR1M + 3.750%), 08/18/30 | | | 375,071 | | | | 0.2 | |
| | | | | | | | | | | | |
| | | | Mortgage REITs: 0.2% | | | | | | | | |
| 571,928 | | | Blackstone Mortgage Trust, Inc. 2021 Term Loan B2, 8.195%, (US0001M + 2.750%), 04/23/26 | | | 572,643 | | | | 0.2 | |
| | | | Oil & Gas: 0.6% | | | | | | | | |
| 285,000 | | | GIP Pilot Acquisition Partners LP Term Loan, 8.327%, (TSFR3M + 3.000%), 10/04/30 | | | 286,128 | | | | 0.1 | |
| 404,146 | | | M6 ETX Holdings II Midco LLC 2022 Term Loan B 1L, 9.926%, (TSFR1M + 4.500%), 09/19/29 | | | 405,599 | | | | 0.2 | |
| 663,777 | | | TransMontaigne Operating Company L.P. Term Loan B, 8.941%, (TSFR1M + 3.500%), 11/17/28 | | | 664,665 | | | | 0.3 | |
| | | | | | | 1,356,392 | | | | 0.6 | |
| | | | Packaging&Containers: 0.9% | | | | | | | | |
| 1,113,698 | | | Charter NEX US, Inc. 2024 Term Loan B, 8.826%, (TSFR1M + 3.500%), 12/01/27 | | | 1,116,862 | | | | 0.5 | |
| 240,149 | | | Pretium Packaging, LLC First Out Term Loan A, 10.306%, 10/02/28 | | | 244,301 | | | | 0.1 | |
| 228,658 | | | Pretium Packaging, LLC Second Out Term Loan A1, 9.906%, 10/02/28 | | | 205,983 | | | | 0.1 | |
| 425,304 | | | Trident TPI Holdings, Inc. 2023 USD Term Loan, 9.809%, (TSFR3M + 4.500%), 09/15/28 | | | 426,042 | | | | 0.2 | |
| | | | | | | 1,993,188 | | | | 0.9 | |
| | | | Pharmaceuticals: 0.4% | | | | | | | | |
| 937,529 (5) | | | Jazz Financing Lux S.a.r.l. 2024 Term Loan B, 8.445%, 05/05/28 | | | 943,127 | | | | 0.4 | |
Principal
Amount† | | | Borrower/Tranche
Description | | Fair
Value | | | Percentage
of Net
Assets | |
| LOANS*: (continued) | | |
| | | | Pipelines: 1.4% | | | | | | | | |
| 610,000 | | | BIP PipeCo Holdings LLC Term Loan B, 8.580%, (TSFR3M + 3.250%), 12/06/30 | | $ | 611,715 | | | | 0.3 | |
| 315,964 | | | GIP III Stetson I, L.P 2023 Term Loan B, 9.680%, (TSFR1M + 4.250%), 10/31/28 | | | 317,676 | | | | 0.2 | |
| 470,898 | | | Medallion Midland Acquisition, LLC 2023 Term Loan, 8.830%, (TSFR3M + 3.500%), 10/18/28 | | | 472,221 | | | | 0.2 | |
| 249,373 | | | NorthRiver Midstream Finance LP 2023 USD Term Loan B, 8.330%, (TSFR3M + 3.000%), 08/16/30 | | | 249,841 | | | | 0.1 | |
| 752,102 | | | Oryx Midstream Services Permian Basin LLC 2024 Term Loan B, 8.436%, (TSFR1M + 3.000%), 10/05/28 | | | 755,661 | | | | 0.3 | |
| 415,000 | | | WhiteWater DBR HoldCo, LLC Term Loan B, 8.070%, (TSFR3M + 2.750%), 03/03/31 | | | 416,383 | | | | 0.2 | |
| 276,619 | | | Whitewater Whistler Holdings, LLC 2023 Term Loan B, 8.125%, (TSFR3M + 2.750%), 02/15/30 | | | 277,181 | | | | 0.1 | |
| | | | | | | 3,100,678 | | | | 1.4 | |
| | | | Publishing: 0.3% | | | | | | | | |
| 693,232 | | | McGraw-Hill Global Education Holdings, LLC 2021 Term Loan, 10.191%, (TSFR3M + 4.750%), 07/28/28 | | | 695,351 | | | | 0.3 | |
| | | | | | | | | | | | |
| | | | Radio & Television: 1.4% | |
| 680,853 | | | DirecTV Financing, LLC Term Loan, 10.445%, (TSFR1M + 5.000%), 08/02/27 | | | 684,470 | | | | 0.3 | |
| 286,995 | | | E.W. Scripps Company (The) 2019 Term Loan B2, 8.003%, (US0001M + 2.560%), 05/01/26 | | | 285,171 | | | | 0.1 | |
| 695,234 | | | Gray Television, Inc. 2021 Term Loan D, 8.440%, (TSFR1M + 3.000%), 12/01/28 | | | 653,194 | | | | 0.3 | |
| 695,715 | | | Houghton Mifflin Harcourt Publishing Company 2022 Term Loan, 10.676%, (TSFR1M + 5.250%), 04/09/29 | | | 690,622 | | | | 0.3 | |
See Accompanying Notes to Financial Statements
| | PORTFOLIO OF INVESTMENTS |
| Voya Floating Rate Fund | as of March 31, 2024 (continued) |
Principal
Amount† | | | Borrower/Tranche
Description | | Fair
Value | | | Percentage
of Net
Assets | |
| LOANS*: (continued) |
| | | | Radio & Television (continued) | |
| 397,990 | | | Red Ventures, LLC 2023 Term Loan B, 8.329%, (TSFR1M + 3.000%), 03/03/30 | | $ | 397,036 | | | | 0.2 | |
| 390,000 | | | Simon & Schuster Inc Term Loan B, 9.317%, (TSFR3M + 4.000%), 10/30/30 | | | 391,950 | | | | 0.2 | |
| | | | | | | 3,102,443 | | | | 1.4 | |
| | | | Rail Industries: 0.6% | |
| 417,038 | | | Hertz Corporation, (The) 2021 Term Loan B, 8.691%, (US0003M + 3.250%), 06/30/28 | | | 404,483 | | | | 0.2 | |
| 80,818 | | | Hertz Corporation, (The) 2021 Term Loan C, 8.691%, (US0001M + 3.250%), 06/30/28 | | | 78,394 | | | | 0.0 | |
| 249,375 | | | Hertz Corporation, (The) 2023 Incremental Term Loan B, 9.079%, (TSFR1M + 3.750%), 06/30/28 | | | 242,465 | | | | 0.1 | |
| 579,456 | | | Uber Technologies, Inc. 2023 Term Loan B, 8.079%, (TSFR3M + 2.750%), 03/03/30 | | | 582,676 | | | | 0.3 | |
| | | | | | | 1,308,018 | | | | 0.6 | |
| | | | Retail: 0.8% | | | | | | | | |
| 65,000 | | | Foundation Building Materials Holding Company LLC 2024 Term Loan B2, 9.313%, (TSFR1M + 4.000%), 01/29/31 | | | 65,346 | | | | 0.0 | |
| 1,142,801 | | | IRB Holding Corp 2024 Term Loan B, 8.176%, (TSFR1M + 2.750%), 12/15/27 | | | 1,144,424 | | | | 0.5 | |
| 350,000 | | | Restoration Hardware, Inc. 2022 Incremental Term Loan, 8.676%, (TSFR1M + 3.250%), 10/20/28 | | | 344,677 | | | | 0.2 | |
| 95,000 | | | SRS Distribution Inc. 2022 Incremental Term Loan, 8.680%, (TSFR1M + 3.250%), 06/02/28 | | | 95,475 | | | | 0.0 | |
| 150,000 | | | Staples, Inc. Term Loan B2, 9.940%, (US0001M + 4.500%), 09/12/24 | | | 150,375 | | | | 0.1 | |
| | | | | | | 1,800,297 | | | | 0.8 | |
| | | | Retailers (Except Food & Drug): 2.7% | | | | | |
| 594,161 | | | CNT Holdings I Corp 2020 Term Loan, 8.817%, (TSFR3M + 3.500%), 11/08/27 | | | 595,461 | | | | 0.3 | |
Principal
Amount† | | | Borrower/Tranche
Description | | Fair
Value | | | Percentage
of Net
Assets | |
| LOANS*: (continued) | | |
| | | | Retailers (Except Food & Drug) (continued) | |
| 3 | | | Empire Today, LLC 2021 Term Loan B, 10.574%, (US0001M + 5.000%), 04/03/28 | | $ | 2 | | | | 0.0 | |
| 1,478,460 | | | Great Outdoors Group, LLC 2021 Term Loan B1, 9.195%, (US0001M + 3.750%), 03/06/28 | | | 1,481,232 | | | | 0.7 | |
| 1,186,635 | | | Harbor Freight Tools USA, Inc. 2021 Term Loan B, 8.195%, (TSFR1M + 2.750%), 10/19/27 | | | 1,187,346 | | | | 0.5 | |
| 503,245 | | | Leslies Poolmart, Inc. 2021 Term Loan B, 8.079%, (US0003M + 2.750%), 03/09/28 | | | 503,559 | | | | 0.2 | |
| 750,117 | | | Michaels Companies, Inc. 2021 Term Loan B, 9.570%, (TSFR3M + 4.250%), 04/15/28 | | | 673,511 | | | | 0.3 | |
| 745,473 | | | Petco Health and Wellness Company, Inc. 2021 Term Loan B, 8.821%, (TSFR3M + 3.250%), 03/03/28 | | | 691,194 | | | | 0.3 | |
| 387,152 | | | Restoration Hardware, Inc. Term Loan B, 7.941%, (US0001M + 2.500%), 10/20/28 | | | 378,829 | | | | 0.2 | |
| 556,247 | | | Staples, Inc. 7 Year Term Loan, 10.440%, (US0003M + 5.000%), 04/16/26 | | | 551,285 | | | | 0.2 | |
| | | | | | | 6,062,419 | | | | 2.7 | |
| | | | Semiconductors: 0.6% | |
| 1,454,326 | | | MKS Instruments, Inc. 2023 Term Loan B, 7.823%, (TSFR1M + 2.500%), 08/17/29 | | | 1,456,144 | | | | 0.6 | |
| | | | | | | | | | | | |
| | | | Software: 5.0% | |
| 715,770 | | | Applied Systems, Inc. 2024 1st Lien Term Loan, 8.809%, (TSFR1M + 3.500%), 02/07/31 | | | 720,915 | | | | 0.3 | |
| 195,000 | | | Applied Systems, Inc. 2024 2nd Lien Term Loan, 10.559%, (TSFR3M + 5.250%), 02/06/32 | | | 202,252 | | | | 0.1 | |
| 940,122 | | | AppLovin Corporation 2024 Term Loan (2028), 7.830%, (TSFR1M + 2.500%), 10/25/28 | | | 940,856 | | | | 0.4 | |
| 363,798 | | | AppLovin Corporation 2024 Term Loan (2030), 7.820%, (TSFR1M + 2.500%), 08/16/30 | | | 364,026 | | | | 0.2 | |
See Accompanying Notes to Financial Statements
| | PORTFOLIO OF INVESTMENTS |
| Voya Floating Rate Fund | as of March 31, 2024 (continued) |
Principal
Amount† | | | Borrower/Tranche
Description | | Fair
Value | | | Percentage
of Net
Assets | |
| LOANS*: (continued) | | |
| | | | Software (continued) | |
| 1,230,869 | | | Banff Merger Sub Inc 2023 USD Term Loan, 9.580%, (TSFR1M + 4.250%), 12/02/28 | | $ | 1,239,459 | | | | 0.5 | |
| 700,000 | | | Camelot U.S. Acquisition LLC 2024 Term Loan B, 8.076%, (TSFR1M + 2.750%), 01/25/31 | | | 700,510 | | | | 0.3 | |
| 960,000 | | | Dun & Bradstreet Corporation (The) 2024 Term Loan B, 8.082%, (TSFR1M + 2.750%), 01/18/29 | | | 960,900 | | | | 0.4 | |
| 298,502 | | | Helios Software Holdings, Inc. 2024 Term Loan, 9.075%, (TSFR3M + 3.750%), 07/18/30 | | | 296,139 | | | | 0.1 | |
| 600,000 | | | Imagine Learning LLC Term Loan, 8.941%, (TSFR1M + 3.500%), 12/21/29 | | | 599,000 | | | | 0.3 | |
| 690,049 | | | Open Text Corporation 2023 Term Loan B, 8.176%, (TSFR1M + 2.750%), 01/31/30 | | | 691,522 | | | | 0.3 | |
| 725,000 (5) | | | Project Ruby Ultimate Parent Corp. 2024 Incremental Term Loan, 8.941%, 03/10/28 | | | 726,812 | | | | 0.3 | |
| 263,675 | | | Quartz Acquireco LLC Term Loan B, 8.809%, (TSFR3M + 3.500%), 06/28/30 | | | 264,911 | | | | 0.1 | |
| 108,192 | | | Rackspace Technology Global, Inc. 2024 First Lien First Out Term Loan, 11.580%, (TSFR1M + 6.250%), 05/15/28 | | | 107,651 | | | | 0.1 | |
| 797,253 | | | Renaissance Holding Corp. 2024 Term Loan, 9.576%, (TSFR1M + 4.250%), 04/05/30 | | | 799,602 | | | | 0.4 | |
| 1,696,786 | | | UKG Inc. 2024 Term Loan B, 8.814%, (TSFR3M + 3.500%), 02/10/31 | | | 1,706,110 | | | | 0.8 | |
| 1,000,000 | | | Waystar Technologies, Inc. 2024 Term Loan B, 9.329%, (TSFR1M + 4.000%), 10/22/29 | | | 1,003,438 | | | | 0.4 | |
| | | | | | | 11,324,103 | | | | 5.0 | |
| | | | Surface Transport: 0.2% | |
| 197,292 | | | American Trailer World Corp. Term Loan B, 9.176%, (TSFR1M + 3.750%), 03/03/28 | | | 192,880 | | | | 0.1 | |
| 373,779 | | | Worldwide Express Operations, LLC 2021 1st Lien Term Loan, 9.571%, (TSFR3M + 4.000%), 07/26/28 | | | 372,494 | | | | 0.1 | |
| | | | | | | 565,374 | | | | 0.2 | |
Principal
Amount† | | | Borrower/Tranche
Description | | Fair
Value | | | Percentage
of Net
Assets | |
| LOANS*: (continued) | | |
| | | | Technology: 5.2% | |
| 1,056,666 | | | Asurion LLC 2020 Term Loan B8, 8.691%, (US0003M + 3.250%), 12/23/26 | | $ | 1,037,954 | | | | 0.5 | |
| 530,000 | | | Asurion LLC 2021 2nd Lien Term Loan B3, 10.691%, (US0001M + 5.250%), 01/31/28 | | | 480,478 | | | | 0.2 | |
| 8,791 | | | Bright Bidco B.V. 2022 Exit Term Loan, 6.317%, 10/31/27 | | | 2,373 | | | | 0.0 | |
| 744,995 | | | ConnectWise, LLC 2021 Term Loan B, 9.110%, (US0003M + 3.500%), 09/29/28 | | | 745,693 | | | | 0.3 | |
| 386,666 | | | Constant Contact Inc Term Loan, 9.588%, (US0003M + 4.000%), 02/10/28 | | | 376,516 | | | | 0.2 | |
| 192,244 | | | Cornerstone OnDemand, Inc. 2021 Term Loan, 9.079%, (TSFR3M + 3.750%), 10/16/28 | | | 189,000 | | | | 0.1 | |
| 497,788 | | | Cvent, Inc. 2023 Term Loan B, 9.098%, (TSFR3M + 3.750%), 06/17/30 | | | 499,111 | | | | 0.2 | |
| 625,837 | | | ECI Macola Max Holding, LLC 2020 Term Loan, 9.360%, (TSFR3M + 3.750%), 11/09/27 | | | 628,028 | | | | 0.3 | |
| 197,772 | | | Epicor Software Corporation 2020 Term Loan, 8.691%, (US0001M + 3.250%), 07/30/27 | | | 198,668 | | | | 0.1 | |
| 538,650 | | | Epicor Software Corporation 2023 Incremental Term Loan, 9.076%, (TSFR1M + 3.750%), 07/30/27 | | | 542,073 | | | | 0.2 | |
| 198,500 | | | Indy US Bidco, LLC 2023 USD Fifth Amendment Incremental Term Loan, 11.580%, (TSFR1M + 6.250%), 03/06/28 | | | 197,507 | | | | 0.1 | |
| 648,522 | | | Informatica LLC 2021 USD Term Loan B, 8.195%, (US0001M + 2.750%), 10/27/28 | | | 649,819 | | | | 0.3 | |
| 587,079 | | | Intrado Corporation 2023 Term Loan B, 8.809%, (TSFR3M + 4.000%), 01/31/30 | | | 588,792 | | | | 0.3 | |
| 501,170 | | | Ivanti Software, Inc. 2021 Term Loan B, 9.839%, (US0001M + 4.250%), 12/01/27 | | | 468,907 | | | | 0.2 | |
See Accompanying Notes to Financial Statements
| | PORTFOLIO OF INVESTMENTS |
| Voya Floating Rate Fund | as of March 31, 2024 (continued) |
Principal
Amount† | | | Borrower/Tranche
Description | | Fair
Value | | | Percentage
of Net
Assets | |
| LOANS*: (continued) | | |
| | | | Technology (continued) | |
| 1,186,930 | | | McAfee, LLC 2022 USD Term Loan B, 9.176%, (TSFR1M + 3.750%), 03/01/29 | | $ | 1,188,043 | | | | 0.5 | |
| 365,000 | | | Mosel Bidco SE USD Term Loan B, 10.059%, (TSFR3M + 4.750%), 08/01/30 | | | 366,369 | | | | 0.2 | |
| 758,051 | | | Project Boost Purchaser LLC, 8.968%, (US0001M + 3.500%), 05/30/26 | | | 760,499 | | | | 0.3 | |
| 348,125 | | | SkillSoft Corporation 2021 Term Loan, 10.693%, (TSFR1M + 5.250%), 07/14/28 | | | 312,878 | | | | 0.1 | |
| 67,517 | | | SS&C Technologies Inc. 2022 Term Loan B6, 7.680%, (TSFR1M + 2.250%), 03/22/29 | | | 67,659 | | | | 0.0 | |
| 131,231 | | | SS&C Technologies Inc. 2022 Term Loan B7, 7.680%, (TSFR1M + 2.250%), 03/22/29 | | | 131,506 | | | | 0.1 | |
| 1,166,202 | | | Tibco Software Inc. 2022 USD Term Loan, 9.909%, (TSFR3M + 4.500%), 03/30/29 | | | 1,161,549 | | | | 0.5 | |
| 398,349 | | | Virtusa Corporation 2022 Incremental Term Loan, 9.060%, (SOFRRATE + 3.750%), 02/15/29 | | | 399,532 | | | | 0.2 | |
| 765,099 | | | Xperi Corporation 2020 Term Loan B, 8.945%, (US0001M + 3.500%), 06/08/28 | | | 766,374 | | | | 0.3 | |
| | | | | | | 11,759,328 | | | | 5.2 | |
| | | | Telecommunications: 2.6% | |
| 495,273 | | | Altice France S.A. 2023 USD Term Loan B14, 10.814%, (TSFR3M + 5.500%), 08/15/28 | | | 390,028 | | | | 0.2 | |
| 457,920 | | | Asurion LLC 2021 Term Loan B9, 8.691%, (US0003M + 3.250%), 07/31/27 | | | 441,415 | | | | 0.2 | |
| 427,434 | | | Cablevision Lightpath LLC Term Loan B, 8.690%, (US0001M + 3.250%), 11/30/27 | | | 423,267 | | | | 0.2 | |
| 670,678 | | | CCI Buyer, Inc. Term Loan, 9.320%, (TSFR3M + 4.000%), 12/17/27 | | | 667,564 | | | | 0.3 | |
| 1,059 | | | CenturyLink, Inc. 2020 Term Loan B, 7.691%, (US0001M + 2.250%), 03/15/27 | | | 786 | | | | 0.0 | |
| 748,057 | | | Connect Finco Sarl 2021 Term Loan B, 8.826%, (US0001M + 3.500%), 12/11/26 | | | 748,317 | | | | 0.3 | |
Principal
Amount† | | | Borrower/Tranche
Description | | Fair
Value | | | Percentage
of Net
Assets | |
| LOANS*: (continued) |
| | | | Telecommunications (continued) | |
| 447,122 | | | Eagle Broadband Investments LLC Term Loan, 8.571%, (US0003M + 3.000%), 11/12/27 | | $ | 444,607 | | | | 0.2 | |
| 570,562 | | | GOGO Intermediate Holdings LLC Term Loan B, 9.191%, (US0003M + 3.750%), 04/30/28 | | | 570,339 | | | | 0.2 | |
| 158,845 | | | GoTo Group, Inc. 2024 First Out Term Loan, 10.173%, (TSFR1M + 4.750%), 04/30/28 | | | 151,797 | | | | 0.1 | |
| 158,845 (5) | | | GoTo Group, Inc. 2024 Second Out Term Loan, 10.173%, 04/30/28 | | | 122,311 | | | | 0.0 | |
| 597,722 | | | ViaSat, Inc. Term Loan, 9.826%, (TSFR1M + 4.500%), 03/02/29 | | | 581,882 | | | | 0.3 | |
| 910,000 | | | Virgin Media Bristol LLC 2020 USD Term Loan Q, 8.690%, (US0001M + 3.250%), 01/31/29 | | | 903,870 | | | | 0.4 | |
| 450,000 | | | Ziggo Financing Partnership USD Term Loan I, 7.940%, (US0001M + 2.500%), 04/30/28 | | | 443,531 | | | | 0.2 | |
| | | | | | | 5,889,714 | | | | 2.6 | |
| | | | Transportation: 0.2% | |
| 499,956 | | | Kenan Advantage Group, Inc. 2024 Term Loan B3, 9.080%, (TSFR1M + 3.750%), 01/25/29 | | | 500,832 | | | | 0.2 | |
| 39,344 | | | XPO Logistics, Inc. 2023 Term Loan, 7.319%, (TSFR1M + 2.000%), 02/28/31 | | | 39,365 | | | | 0.0 | |
| | | | | | | 540,197 | | | | 0.2 | |
| | | | Utilities: 0.6% | |
| 242,723 | | | Nautilus Power, LLC 2023 Term Loan B, 10.860%, (TSFR3M + 5.250%), 11/16/26 | | | 206,315 | | | | 0.1 | |
| 450,000 | | | NRG Energy Inc. 2024 Term Loan, 7.298%, (TSFR3M + 2.000%), 04/16/31 | | | 449,721 | | | | 0.2 | |
| 718,412 | | | Waterbridge Midstream Operating LLC Term Loan B, 11.336%, (US0003M + 5.750%), 06/22/26 | | | 721,255 | | | | 0.3 | |
| | | | | | | 1,377,291 | | | | 0.6 | |
| | | | Total Loans | | | | | | | | |
| | | | (Cost $213,211,797) | | | 213,967,942 | | | | 94.0 | |
See Accompanying Notes to Financial Statements
| | PORTFOLIO OF INVESTMENTS |
| Voya Floating Rate Fund | as of March 31, 2024 (continued) |
Principal
Amount† | | | Borrower/Tranche
Description | | Fair
Value | | | Percentage
of Net
Assets | |
| CORPORATE BONDS/NOTES: 5.2% | | |
| | | | Basic Materials: 0.2% | |
| 500,000 # | | | INEOS Quattro Finance 2 Plc, 3.375%, 01/15/26 | | $ | 477,586 | | | | 0.2 | |
| | | | | | | | | | | | |
| | | | Communications: 0.2% | |
| 500,000 # | | | ViaSat, Inc., 5.625%, 04/15/27 | | | 473,820 | | | | 0.2 | |
| | | | | | | | | | | | |
| | | | Consumer, Cyclical: 1.5% | |
| 300,000 | | | Ford Motor Credit Co. LLC, 4.125%, 08/17/27 | | | 284,840 | | | | 0.1 | |
| 500,000 # | | | Gap, Inc./The, 3.875%, 10/01/31 | | | 423,463 | | | | 0.2 | |
| 350,000 # | | | Lithia Motors, Inc., 4.375%, 01/15/31 | | | 313,807 | | | | 0.2 | |
| 500,000 # | | | SRS Distribution, Inc., 6.125%, 07/01/29 | | | 510,410 | | | | 0.2 | |
| 500,000 # | | | Taylor Morrison Communities, Inc., 5.750%, 01/15/28 | | | 496,927 | | | | 0.2 | |
| 500,000 # | | | Tempur Sealy International, Inc., 3.875%, 10/15/31 | | | 425,093 | | | | 0.2 | |
| 500,000 # | | | Williams Scotsman International, Inc., 4.625%, 08/15/28 | | | 473,440 | | | | 0.2 | |
| 500,000 # | | | Wynn Las Vegas LLC / Wynn Las Vegas Capital Corp., 5.250%, 05/15/27 | | | 490,027 | | | | 0.2 | |
| | | | | | | 3,418,007 | | | | 1.5 | |
| | | | Consumer, Non-cyclical: 0.8% | |
| 500,000 # | | | ADT Security Corp./The, 4.125%, 08/01/29 | | | 458,553 | | | | 0.2 | |
| 500,000 # | | | Albertsons Cos, Inc. / Safeway, Inc. / New Albertsons L.P. / Albertsons LLC, 4.875%, 02/15/30 | | | 476,041 | | | | 0.2 | |
| 500,000 # | | | Primo Water Holdings, Inc., 4.375%, 04/30/29 | | | 460,268 | | | | 0.2 | |
| 500,000 | | | Teva Pharmaceutical Finance Netherlands III BV, 4.750%, 05/09/27 | | | 482,820 | | | | 0.2 | |
| | | | | | | 1,877,682 | | | | 0.8 | |
| | | | Energy: 0.9% | | | | | | | | |
| 500,000 # | | | Archrock Partners L.P. / Archrock Partners Finance Corp., 6.250%, 04/01/28 | | | 495,032 | | | | 0.3 | |
| 500,000 # | | | Atlantica Sustainable Infrastructure PLC, 4.125%, 06/15/28 | | | 459,814 | | | | 0.2 | |
| 500,000 # | | | Hilcorp Energy I L.P. / Hilcorp Finance Co., 6.000%, 04/15/30 | | | 490,019 | | | | 0.2 | |
Principal
Amount† | | | Borrower/Tranche
Description | | Fair
Value | | | Percentage
of Net
Assets | |
| CORPORATE BONDS/NOTES: (continued) | | |
| | | | Energy (continued) | | | | | | | | |
| 500,000 | | | Sunoco L.P. / Sunoco Finance Corp., 4.500%, 05/15/29 | | $ | 465,214 | | | | 0.2 | |
| | | | | | | 1,910,079 | | | | 0.9 | |
| | | | Financial: 0.6% | | | | | | | | |
| 500,000 # | | | OneMain Finance Corp., 5.375%, 11/15/29 | | | 470,511 | | | | 0.2 | |
| 500,000 # | | | PRA Group, Inc., 5.000%, 10/01/29 | | | 421,822 | | | | 0.2 | |
| 500,000 # | | | United Wholesale Mortgage LLC, 5.750%, 06/15/27 | | | 486,584 | | | | 0.2 | |
| | | | | | | 1,378,917 | | | | 0.6 | |
| | | | Industrial: 0.6% | | | | | | | | |
| 250,000 # | | | Cascades, Inc./Cascades USA, Inc., 5.375%, 01/15/28 | | | 240,368 | | | | 0.1 | |
| 500,000 # | | | Rolls-Royce PLC, 5.750%, 10/15/27 | | | 501,803 | | | | 0.3 | |
| 500,000 # | | | Standard Industries, Inc./NJ, 4.750%, 01/15/28 | | | 477,581 | | | | 0.2 | |
| | | | | | | 1,219,752 | | | | 0.6 | |
| | | | Technology: 0.4% | | | | | | | | |
| 550,000 # | | | Entegris Escrow Corp., 6.950%, 06/15/30 | | | 544,017 | | | | 0.2 | |
| 500,000 # | | | Open Text Corp., 3.875%, 12/01/29 | | | 446,005 | | | | 0.2 | |
| | | | | | | 990,022 | | | | 0.4 | |
| | | | Total Corporate Bonds/Notes
(Cost $11,662,611) | | | 11,745,865 | | | | 5.2 | |
| Shares | | | | Value | | | Percentage
of Net
Assets | |
| EQUITIES AND OTHER ASSETS: 1.5% | | |
| 408,271 (3)(4) | | | 24 Hour Fitness Worldwide, Inc. | | | 3,266 | | | | 0.0 | |
| 544,388 (3)(4) | | | 24 Hour Fitness Worldwide, Inc. - Preferred | | | 54 | | | | 0.0 | |
| 39,445 (4) | | | Cumulus Media, Inc. Class-A | | | 141,607 | | | | 0.1 | |
| 3,911 (3) | | | Harvey Gulf International Marine LLC | | | 125,152 | | | | 0.1 | |
| 7,471 (3)(4) | | | iQor | | | 6,851 | | | | 0.0 | |
| 102,480 (3) | | | Longview Power LLC | | | 368,928 | | | | 0.1 | |
| 5,913,978 (3)(4) | | | Save-A-Lot, Inc. / Moran Foods | | | — | | | | 0.0 | |
| 42,856 (3)(4) | | | The Oneida Group (formerly EveryWare Global, Inc.) | | | 429 | | | | 0.0 | |
| 188 (3)(4) | | | Travelport Finance (Luxembourg) S.a.r.l. | | | 266,960 | | | | 0.1 | |
| 30,272 (3)(4) | | | Yak Access LLC Common Unit Series A | | | 29,516 | | | | 0.0 | |
See Accompanying Notes to Financial Statements
| | PORTFOLIO OF INVESTMENTS |
| Voya Floating Rate Fund | as of March 31, 2024 (continued) |
| Shares | | | | | Value | | | Percentage
of Net
Assets |
| EQUITIES AND OTHER ASSETS: (continued) | | |
| 5,388 (3)(4) | | | Yak Access LLC Common Unit Series B | | $ | 5,253 | | | | 0.0 | |
| 2,504,610 (4) | | | Yak Access LLC Preferred Series B1 | | | 2,504,611 | | | | 1.1 | |
| 23,080 (4) | | | Yak Access LLC Preferred Series B2 | | | 23,080 | | | | 0.0 | |
| | | | Total Equities and Other Assets
(Cost $3,696,239) | | | 3,475,707 | | | | 1.5 | |
| | | | Total Investments
(Cost $228,570,647) | | $ | 229,189,514 | | | | 100.7 | |
| | | | Liabilities in Excess of Other Assets | | | (1,667,911 | ) | | | (0.7 | ) |
| | | | Net Assets | | $ | 227,521,603 | | | | 100.0 | |
| * | Loans, while exempt from registration under the Securities Act of 1933, as amended, contain certain restrictions on resale and cannot be sold publicly. These loans bear interest (unless otherwise noted) at rates that float periodically at a margin above the London Inter-Bank Offered Rate (“LIBOR”) and other short-term rates. |
| † | Unless otherwise indicated, principal amount is shown in USD. |
| # | Securities with purchases pursuant to Rule 144A or section 4(2), under the Securities Act of 1933 and may not be resold subject to that rule except to qualified institutional buyers. |
| (1) | All or a portion of this holding is subject to unfunded loan commitments. Please refer to Note 9 for additional details. |
| (2) | All or a portion of this Loan is payment-in-kind (“PIK”) which may pay interest or additional principal at the issuer’s discretion. Rates shown are the current rate and possible payment rates. |
| (3) | For fair value measurement disclosure purposes, security is categorized as Level 3, whose value was determined using significant unobservable inputs. |
| (4) | Non-income producing security. |
| (5) | Contract rates that are not disclosed do not take effect until settlement date and have yet to be determined. |
Reference Rate Abbreviations:
| SOFRRATE | 1-day Secured Overnight Financing Rate |
| TSFR1M | 1-month CME Term Secured Overnight Financing Rate |
| TSFR3M | 3-month CME Term Secured Overnight Financing Rate |
Fair Value Measurements^
The following is a summary of the fair valuations according to the inputs used as of March 31, 2024 in valuing the assets and liabilities
| | Quoted Prices
in Active Markets
for Identical
Investments
(Level 1) | | Significant
Other
Observable
Inputs
(Level 2) | | Significant
Unobservable
Inputs
(Level 3) | | Fair Value
at
March 31, 2024 | |
| Asset Table | | | | | | | | | | | | | | | | |
| Investments, at fair value | | | | | | | | | | | | | | | | |
| Loans | | $ | — | | | $ | 213,967,942 | | | $ | — | | | $ | 213,967,942 | |
| Equities and Other Assets | | | 141,607 | | | | 2,527,691 | | | | 806,409 | | | | 3,475,707 | |
| Corporate Bonds/Notes | | | — | | | | 11,745,865 | | | | — | | | | 11,745,865 | |
| Total Investments, at fair value | | $ | 141,607 | | | $ | 228,241,498 | | | $ | 806,409 | | | $ | 229,189,514 | |
| ^ | See Note 2, “Significant Accounting Policies” in the Notes to Financial Statements for additional information. |
At March 31, 2024, the aggregate cost of securities and other investments and the composition of unrealized appreciation and depreciation of securities and other investments on a tax basis were:
Cost for federal income tax purposes was $228,679,900.
| Net unrealized appreciation consisted of: | | | |
| | | | |
| Gross Unrealized Appreciation | | $ | 4,706,197 | |
| Gross Unrealized Depreciation | | | (4,196,583 | ) |
| Net Unrealized Appreciation | | $ | 509,614 | |
See Accompanying Notes to Financial Statements
TAX INFORMATION (Unaudited)
Dividends and distributions paid during the year ended March 31, 2024 were as follows:
| | | | Per Share | |
| Fund Name | | Type | | Amount | |
| | | | | | |
| Voya Floating Rate Fund | | | | |
| Class A | NII | | $0.7740 | |
| Class C | NII | | $0.7116 | |
| Class I | NII | | $0.7948 | |
| Class R | NII | | $0.7533 | |
| Class W | NII | | $0.7948 | |
NII – Net investment income
Pursuant to Internal Revenue Code Section 871(k)(1), Voya Floating Rate Fund designates 95.45% of net investment income distributions as interest-related dividends.
Above figures may differ from those cited elsewhere in this report due to differences in the calculation of income and gains under U.S. generally accepted accounting principles (book) purposes and Internal Revenue Service (tax) purposes.
Shareholders are strongly advised to consult their own tax advisers with respect to the tax consequences of their investments in the Fund. In January, shareholders, excluding corporate shareholders, receive an IRS 1099-DIV regarding the federal tax status of the dividends and distributions they received in the calendar year.
TRUSTEE AND OFFICER INFORMATION (Unaudited)
The business and affairs of the Trust are managed under the direction of the Board. A Trustee, who is not an interested person of the Trust, as defined in the 1940 Act, is an independent trustee (“Independent Trustee”). The Trustees and Officers of the Trust are listed below. The Statement of Additional Information includes additional information about Trustees of the Trust and is available, without charge, upon request at (800) 992-0180.
Name, Address and Year of
Birth | | Position(s)
Held with the
Trust | | Term of Office and
Length of Time
Served(1) | | Principal
Occupation(s) –
During the Past 5 Years | | Number of
funds in
Fund
Complex
Overseen by
Trustee(2) | | Other Board Positions
Held by Trustee |
| Independent Trustees | | | | | | | | | | |
| | | | | | | | | | | |
Colleen D. Baldwin
(1960)
7337 East Doubletree Ranch Rd.
Suite 100
Scottsdale, Arizona 85258 | | Chairperson Trustee | | January 2020 – Present November 2007 – Present | | President, Glantuam Partners, LLC, a business consulting firm (January 2009 – Present). | | 138 | | Stanley Global Engineering (2020 – Present). |
| | | | | | | | | | | |
John V. Boyer
(1953)
7337 East Doubletree Ranch Rd.
Suite 100
Scottsdale, Arizona 85258 | | Trustee | | January 2005 – Present | | Retired. Formerly, President and Chief Executive Officer, Bechtler Arts Foundation, an arts and education foundation (January 2008 – December 2019). | | 138 | | None. |
| | | | | | | | | | | |
Martin J. Gavin
(1950)
7337 East Doubletree Ranch Rd.
Suite 100
Scottsdale, AZ 85258 | | Trustee | | August 2015 – Present | | Retired. | | 138 | | None. |
| | | | | | | | | | | |
Joseph E. Obermeyer
(1957)
7337 East Doubletree Ranch Rd.
Suite 100
Scottsdale, Arizona 85258 | | Trustee | | May 2013 – Present | | President, Obermeyer & Associates, Inc., a provider of financial and economic consulting services (November 1999 – Present). | | 138 | | None. |
| | | | | | | | | | | |
Sheryl K. Pressler
(1950)
7337 East Doubletree Ranch Rd.
Suite 100
Scottsdale, Arizona 85258 | | Trustee | | January 2006 – Present | | Consultant (May 2001 – Present). | | 138 | | Centerra Gold Inc. (May 2008 – Present). |
| | | | | | | | | | | |
Christopher P. Sullivan
(1954)
7337 East Doubletree Ranch Rd.
Suite 100
Scottsdale, Arizona 85258 | | Trustee | | October 2015 – Present | | Retired. | | 138 | | None. |
| (1) | Trustees serve until their successors are duly elected and qualified. The tenure of each Trustee who is not an “interested person” as defined in the 1940 Act, of each Fund (“Independent Trustee”) is subject to the Board’s retirement policy which states that each duly elected or appointed Independent Trustee shall retire from and cease to be a member of the Board of Trustees at the close of business on December 31 of the calendar year in which the Independent Trustee attains the age of 75. A majority vote of the Board’s other Independent Trustees may extend the retirement date of an Independent Trustee if the retirement would trigger a requirement to hold a meeting of shareholders of the Trust under applicable law, whether for the purposes of appointing a successor to the Independent Trustee or otherwise comply under applicable law, in which case the extension would apply until such time as the shareholder meeting can be held or is no longer required (as determined by a vote of a majority of the other Independent Trustees). |
| (2) | For the purposes of this table, “Fund Complex” means the Voya family of funds including the following investment companies: Voya Asia Pacific High Dividend Equity Income Fund; Voya Balanced Portfolio, Inc.; Voya Credit Income Fund; Voya Emerging Markets High Dividend Equity Fund; Voya Equity Trust; Voya Funds Trust; Voya Global Advantage and Premium Opportunity Fund; Voya Global Equity Dividend and Premium Opportunity Fund; Voya Government Money Market Portfolio; Voya Infrastructure, Industrials and Materials Fund; Voya Intermediate Bond Portfolio; Voya Investors Trust; Voya Mutual Funds; Voya Partners, Inc.; Voya Separate Portfolios Trust; Voya Strategic Allocation Portfolios, Inc.; Voya Variable Funds; Voya Variable Insurance Trust; Voya Variable Portfolios, Inc.; and Voya Variable Products Trust. The number of funds in the Fund Complex is as of April 30, 2024. |
TRUSTEE AND OFFICER INFORMATION (Unaudited) (continued)
Name, Address and Year of
Birth | | Position(s) Held with
the Trust | | Term of Office and
Length of Time Served(1) | | Principal Occupation(s) –
During the Past 5 Years |
Andy Simonoff
(1973)
5780 Powers Ferry Road NW
Atlanta, Georgia 30327 | | President and Chief Executive Officer | | January 2023 – Present | | Director, President and Chief Executive Officer, Voya Funds Services, LLC, Voya Capital, LLC and Voya Investments, LLC (January 2023 – Present); Managing Director, Chief Strategy and Transformation Officer, Voya Investment Management (January 2020 – Present). Formerly, Managing Director, Head of Business Management, Voya Investment Management (March 2019 – January 2020); Managing Director, Head of Business Management, Fixed Income, Voya Investment Management (November 2015 – March 2019). |
| | | | | | | |
Jonathan Nash
(1967)
230 Park Avenue
New York, New York 10169 | | Executive Vice President and Chief Investment Risk Officer | | March 2020 – Present | | Head of Investment Risk for Equity and Funds, Voya Investment Management (April 2024 – Present); Executive Vice President and Chief Investment Risk Officer, Voya Investments, LLC (March 2020 – Present). Formerly, Senior Vice President, Investment Risk Management, Voya Investment Management (March 2017 – March 2024); Vice President, Voya Investments, LLC (September 2018 – March 2020). |
| | | | | | | |
Steven Hartstein
(1963)
230 Park Avenue
New York, New York 10169 | | Chief Compliance Officer | | December 2022 – Present | | Senior Vice President, Voya Investment Management (December 2022 – Present). Formerly, Head of Funds Compliance, Brighthouse Financial, Inc. and Chief Compliance Officer – Brighthouse Funds and Brighthouse Investment Advisers, LLC (March 2017 – December 2022). |
| | | | | | | |
Todd Modic
(1967)
7337 East Doubletree Ranch Rd.
Suite 100
Scottsdale, Arizona 85258 | | Senior Vice President, Chief/Principal Financial Officer and Assistant Secretary | | March 2005 – Present | | Director and Senior Vice President, Voya Capital, LLC, and Voya Funds Services, LLC (September 2022 – Present); Director, Voya Investments, LLC (September 2022 – Present); Senior Vice President, Voya Investments, LLC (April 2005 – Present). Formerly, President, Voya Funds Services, LLC (March 2018 – September 2022). |
| | | | | | | |
Kimberly A. Anderson
(1964)
7337 East Doubletree Ranch Rd.
Suite 100
Scottsdale, Arizona 85258 | | Senior Vice President | | November 2003 – Present | | Senior Vice President, Voya Investments, LLC (September 2003 – Present). |
| | | | | | | |
Sara M. Donaldson
(1959)
7337 East Doubletree Ranch Rd.
Suite 100
Scottsdale, Arizona 85258 | | Senior Vice President | | June 2022 – Present | | Senior Vice President, Voya Investments, LLC (February 2022 – Present); Senior Vice President, Head of Active Ownership, Voya Investment Management (September 2021 – Present). Formerly, Vice President, Voya Investments, LLC (October 2015 – February 2022); Vice President, Head of Proxy Voting, Voya Investment Management (October 2015 – August 2021). |
| | | | | | | |
Jason Kadavy
(1976)
7337 East Doubletree Ranch Rd.
Suite 100
Scottsdale, Arizona 85258 | | Senior Vice President | | September 2023 – Present | | Senior Vice President, Voya Investments, LLC and Voya Funds Services, LLC (September 2023 – Present); Formerly, Vice President, Voya Investments, LLC (October 2015 – September 2023); Vice President, Voya Funds Services, LLC (July 2007 – September 2023). |
| | | | | | | |
Andrew K. Schlueter
(1976)
7337 East Doubletree Ranch Rd.
Suite 100
Scottsdale, Arizona 85258 | | Senior Vice President | | June 2022 – Present | | Senior Vice President, Head of Investment Operations Support, Voya Investment Management (April 2023 – Present); Vice President, Voya Investments Distributor, LLC (April 2018 – Present); Vice President, Voya Investments, LLC and Voya Funds Services, LLC (March 2018-Present); Formerly, Vice President, Head of Mutual Fund Operations, Voya Investment Management (March 2022 – March 2023); Vice President, Head of Mutual Fund Operations, Voya Investment Management (February 2018 – February 2022). |
TRUSTEE AND OFFICER INFORMATION (Unaudited) (continued)
Name, Address and Year of
Birth | | Position(s) Held with
the Trust | | Term of Office and
Length of Time Served(1) | | Principal Occupation(s) –
During the Past 5 Years |
Joanne F. Osberg
(1982)
7337 East Doubletree Ranch Rd.
Suite 100
Scottsdale, Arizona 85258 | | Senior Vice President Secretary | | March 2023 – Present September 2020 – Present | | Senior Vice President and Chief Counsel, Voya Investment Management – Mutual Fund Legal Department, Senior Vice President and Secretary, Voya Investments, LLC, Voya Capital, LLC, and Voya Funds Services, LLC (March 2023 – Present). Formerly, Secretary, Voya Capital, LLC (August 2022 – March 2023); Vice President and Secretary, Voya Investments, LLC and Voya Funds Services, LLC, Vice President and Senior Counsel, Voya Investment Management – Mutual Fund Legal Department (September 2020 – March 2023). Vice President and Counsel, Voya Investment Management – Mutual Fund Legal Department (January 2013 – September 2020). |
| | | | | | | |
Robert Terris
(1970)
5780 Powers Ferry Road NW
Atlanta, Georgia 30327 | | Senior Vice President | | May 2006 – Present | | Senior Vice President, Head of Future State Operating Model Design, Voya Investment Management (April 2023 – Present); Senior Vice President, Voya Investments Distributor, LLC (April 2018 – Present); Senior Vice President, Head of Investment Services, Voya Investments, LLC (April 2018 – Present); Senior Vice President, Head of Investment Services, Voya Funds Services, LLC (March 2006 – Present). |
| | | | | | | |
Fred Bedoya
(1973)
7337 East Doubletree Ranch Rd.
Suite 100
Scottsdale, Arizona 85258 | | Vice President Principal Accounting Officer and Treasurer | | September 2012 – Present | | Vice President, Voya Investments, LLC (October 2015 – Present); Vice President, Voya Funds Services, LLC (July 2012 – Present). |
| | | | | | | |
Robyn L. Ichilov
(1967)
7337 East Doubletree Ranch Rd.
Suite 100
Scottsdale, Arizona 85258 | | Vice President | | October 2000 – Present | | Vice President, Voya Investments, LLC (August 1997 – Present); Vice President, Voya Funds Services, LLC (November 1995 – Present). |
| | | | | | | |
Erica McKenna
(1972)
7337 East Doubletree Ranch Rd.
Suite 100
Scottsdale, Arizona 85258 | | Vice President | | June 2022 – Present | | Vice President, Head of Mutual Fund Compliance, and Chief Compliance Officer, Voya Investments, LLC (May 2022 – Present). Formerly, Vice President, Fund Compliance Manager, Voya Investments, LLC (March 2021 – May 2022); Assistant Vice President, Fund Compliance Manager, Voya Investments, LLC (December 2016 – March 2021). |
| | | | | | | |
Craig Wheeler
(1969)
7337 East Doubletree Ranch Rd.
Suite 100
Scottsdale, Arizona 85258 | | Vice President | | May 2013 – Present | | Vice President – Director of Tax, Voya Investments, LLC (October 2015 – Present). |
| | | | | | | |
Gizachew Wubishet
(1976)
7337 East Doubletree Ranch Rd.
Suite 100
Scottsdale, Arizona 85258 | | Vice President and Assistant Secretary | | March 2024 – Present | | Vice President and Counsel, Voya Investment Management – Mutual Fund Legal Department (March 2024 – Present). Formerly, Assistant Vice President and Counsel, Voya Investment Management – Mutual Fund Legal Department (May 2019 – February 2024); Attorney, Ropes & Gray LLP (October 2011 – April 2019). |
| | | | | | | |
Nicholas C.D. Ward
(1993)
7337 East Doubletree Ranch Rd.
Suite 100
Scottsdale, Arizona 85258 | | Assistant Vice President and Assistant Secretary | | June 2022 – Present | | Assistant Vice President and Counsel, Voya Investment Management – Mutual Fund Legal Department (March 2024 – Present). Formerly, Counsel, Voya Investment Management – Mutual Fund Legal Department (November 2021 – February 2024); Associate, Dechert LLP (October 2018 – November 2021). |
| | | | | | | |
Monia Piacenti
(1976)
One Orange Way
Windsor, Connecticut 06095 | | Anti-Money Laundering Officer | | June 2018 – Present | | Compliance Manager, Voya Financial, Inc. (March 2023 – Present); Anti-Money Laundering Officer, Voya Investments Distributor, LLC, Voya Investment Management and Voya Investment Management Trust Co. (June 2018 – Present). Formerly, Compliance Consultant, Voya Financial, Inc. (January 2019 – February 2023). |
| (1) | The Officers hold office until the next annual meeting of the Board of Trustees and until their successors shall have been elected and qualified. |
ADVISORY AND SUB-ADVISORY CONTRACT APPROVAL DISCUSSION
BOARD CONSIDERATION AND APPROVAL OF INVESTMENT MANAGEMENT CONTRACT AND SUB-ADVISORY CONTRACT
At a meeting held on November 16, 2023, the Board of Trustees (“Board”) of Voya Funds Trust (the “Trust”), including a majority of the Board members who have no direct or indirect interest in the investment management and sub-advisory contracts, and who are not “interested persons” of Voya Floating Rate Fund, a series of the Trust (the “Fund”), as such term is defined under the Investment Company Act of 1940, as amended (the “Independent Trustees”), considered and approved the renewal of the investment management contract (the “Management Contract”) between Voya Investments, LLC (the “Manager”) and the Trust, on behalf of the Fund, and the sub-advisory contract (the “Sub-Advisory Contract,” and together with the Management Contract, the “Contracts”) with Voya Investment Management Co. LLC, the sub-adviser to the Fund (the “Sub-Adviser”), for an additional one-year period ending November 30, 2024.
In addition to the Board meeting on November 16, 2023, the Independent Trustees also held meetings outside the presence of representatives of the Manager and Sub-Adviser (collectively, such persons are referred to herein as “management”) on October 9, 2023 and November 14, 2023. At those meetings, the Board members reviewed and considered materials related to the proposed continuance of the Contracts that they had requested and believed to be relevant to the renewal of the Contracts in light of their own business judgment and the legal advice furnished to them by K&L Gates LLP, their independent legal counsel. The Board also considered information furnished to it throughout the year at meetings of the Board and its committees, including information regarding performance, expenses, and other relevant matters. While the Board considered the renewal of the management contracts and sub-advisory contracts for all of the applicable investment companies in the Voya family of funds at the same meetings, the Board considered each Voya fund’s investment management and sub-advisory relationships separately.
The Board has established a Contracts Committee and two Investment Review Committees (the “IRCs”), each of which includes only Independent Trustees as members. The Contracts Committee meets several times throughout the year to provide oversight with respect to the management and sub-advisory contracts approval and renewal process for the Voya funds, among other functions, and each IRC meets several times throughout the year with respect to each Voya fund (assigned to that IRC) to provide oversight regarding the investment performance of the sub-advisers, as well as the Manager’s role in monitoring the sub-advisers.
The Contracts Committee oversees, and annually recommends Board approval of updates to, a methodology guide for the Voya funds (“Methodology Guide”), which sets out a framework pursuant to which the Independent Trustees request, and management provides, certain information that the Independent Trustees deem to be important or potentially relevant to the contracts renewal process for the Voya funds. The Independent Trustees retain the services of an independent consultant with experience in the mutual fund industry to assist the Contracts Committee in developing and recommending to the Board: (1) a selected peer group of investment companies for the Fund (“Selected Peer Group”) based on the Fund’s particular attributes; and (2) updates to the Methodology Guide with respect to the content and format of various data prepared in connection with the renewal process. In addition, the Independent Trustees periodically have retained an independent firm to test and verify the accuracy of certain information presented to the Board for a representative sample of the Voya funds.
The Manager or Sub-Adviser may not have been able to, or opted not to, provide information in response to certain information requests, in which case the Board conducted its evaluation based on the information that was provided. In such cases, the omission of any such information was determined to not be material to the Board’s considerations.
Provided below is an overview of certain material factors that the Board considered at its meetings regarding the renewal of the Contracts and the compensation to be paid thereunder. The Board members did not identify any particular information or factor that was most relevant to its consideration.
Nature, Extent and Quality of Services
The Manager oversees, subject to the authority of the Board, and is responsible for the provision of, all investment advisory and portfolio management services for the Fund, but may delegate certain of these responsibilities to one or more sub-advisers. In addition, the Manager provides administrative services reasonably necessary for the operation of the Fund as set forth in the Management Contract, including oversight of the Fund’s operations and risk management and the oversight of its various other service providers.
The Board considered the “manager-of-managers” structure of the Voya funds that has been developed by the Manager pursuant to which the Manager selects, subject to the Board’s approval, sub-advisers to provide day-to-day management services to all or a portion of each Voya fund. The Board recognized that the Manager is responsible for monitoring the Sub-Adviser’s investment program,
ADVISORY AND SUB-ADVISORY CONTRACT APPROVAL DISCUSSION (continued)
performance, developments, ongoing operations, and compliance with applicable regulations and investment policies and restrictions with respect to the Fund under this manager-of-managers arrangement. The Board also considered the techniques and resources that the Manager has developed to provide this ongoing due diligence and oversight with respect to the sub-advisers and to recommend appropriate changes in investment strategies, sub-advisers, or allocation among sub-advisers in an effort to improve a Voya fund’s performance. In connection with the Manager’s performance of these duties, the Board considered that the Manager has developed an oversight process formulated by its Manager Research & Selection Group that reviews, among other matters, performance data, the Sub-Adviser’s management team, portfolio data and attribution analysis related to the Sub-Adviser through various means, including, but not limited to, in-person meetings, on-site or virtual visits, and telephonic meetings with the Sub-Adviser.
Further, the Board considered periodic compliance reports it receives from the Trust’s Chief Compliance Officer evaluating, among other related matters, whether the regulatory compliance systems and procedures of the Manager and Sub-Adviser are reasonably designed to ensure compliance with the federal securities laws and whether the investment policies and restrictions for the Fund are complied with on a consistent basis.
The Board considered the portfolio management team assigned by the Sub-Adviser to the Fund and the level of resources committed to the Fund (and other relevant funds in the Voya funds) by the Manager and the Sub-Adviser, and whether those resources are sufficient to provide high-quality services to the Fund.
Based on their deliberations and the materials presented to them, the Board concluded that the nature, extent and quality of the overall services provided by the Manager and Sub-Adviser under the Contracts were appropriate.
Fund Performance
In assessing the investment management and sub-advisory relationships, the Board placed emphasis on the investment returns of the Fund, including its investment performance over certain time periods compared to the Fund’s Morningstar, Inc. (an independent provider of mutual fund data) category and primary benchmark, a broad-based securities market index. The Board also considered information from the Manager Research & Selection Group and received reports summarizing a separate analysis of the Fund’s performance and risk, including risk-adjusted investment return information, from the Trust’s Chief Investment Risk Officer.
Economies of Scale
When evaluating the reasonableness of the management fee schedule, the Board considered whether economies of scale have been or likely will be realized by the Manager and the Sub-Adviser as the Fund grows larger and the extent to which any such economies are shared with the Fund. In this regard, the Board noted the breakpoints in the management fee schedule that will result in a lower management fee rate when the Fund achieves sufficient asset levels to receive a breakpoint discount. The Board also considered that, in addition to the management fee breakpoints, the Fund has fee waiver and expense reimbursement arrangements. The Board considered the extent to which economies of scale realized by the Manager or the Sub-Adviser could be shared with the Fund through such fee waivers, expense reimbursements or other expense reductions. In the case of sub-advisory fees, the Board considered that breakpoints, if any, would inure to the benefit of the Manager.
Information Regarding Services, Performance, and Fee Schedules Offered to Other Clients
The Board considered comparative information regarding the nature of services, performance, and fee schedules offered by the Manager and Sub-Adviser to other clients with similar investment objectives, if applicable, including other registered investment companies and relevant institutional accounts. When the fee schedules offered to or the performance of such other clients differed materially from the Fund, the Board took into account the underlying rationale provided by the Manager or Sub-Adviser, as applicable, for these differences.
Fee Schedules, Profitability, and Fall-out Benefits
The Board reviewed and considered the contractual management fee schedule and net management fee rate payable by the Fund to the Manager compared to the Fund’s Selected Peer Group. The Board also considered the compensation payable by the Manager to the Sub-Adviser for sub-advisory services for the Fund, including the portion of the contractual and net management fee rates that are paid to the Sub-Adviser, as compared to the compensation paid to the Manager. In addition, the Board considered the fee waivers, expense limitations, and recoupment arrangements that apply to the fees payable by the Fund, including whether the Manager proposed any changes thereto. The Board separately determined that the fees payable to the Manager and the fee schedule payable to the Sub-Adviser are reasonable for the services that each performs, which were considered in light of the nature, extent and quality of the services that each has performed and is expected to perform.
ADVISORY AND SUB-ADVISORY CONTRACT APPROVAL DISCUSSION (continued)
The Board considered information on revenues, costs and profits or losses realized by the Manager and the Voya-affiliated Sub-Adviser related to its services to the Fund. In analyzing the profitability of the Manager and its affiliates in connection with services they render to a Fund, the Board took into account the sub-advisory fee rate payable by the Manager to the Sub-Adviser. The Board also considered the profitability of the Manager and its affiliated Sub-Adviser attributable to servicing the Fund both with and without taking into account the profitability of the distributor of the Fund and any revenue sharing payments made by the Manager.
Although the Methodology Guide establishes a framework for profit calculation by the Manager and its affiliated Sub-Adviser, the Board recognized that there is no uniform methodology within the asset management industry for determining profitability for this purpose. The Board also recognized that the use of different reasonable methodologies can give rise to dramatically different reported profit and loss results with respect to the Manager and the Voya-affiliated Sub-Adviser, as well as other industry participants with whom the profits of the Manager and its affiliated Sub-Adviser could be compared. In addition, the Board recognized that management’s calculations regarding its costs incurred in establishing the infrastructure necessary for the Fund’s operations may not be fully reflected in the expenses allocated to the Fund in determining profitability. The Board also recognized that the information presented may not portray all of the costs borne by the Manager or reflect all of the risks associated with offering and managing a mutual fund complex in the current regulatory and market environment, including entrepreneurial, regulatory, legal and operational risks.
The Board also considered that the Manager and the Voya-affiliated Sub-Adviser are entitled to earn a reasonable level of profits for the services that they provide to the Fund. The Board also considered information regarding the potential fall-out benefits to the Manager and Sub-Adviser and their respective affiliates from their association with the Fund. Following its reviews, the Board determined that the Manager’s and the Voya-affiliated Sub-Adviser’s profitability with respect to their services to the Fund and the Manager’s and Sub-Adviser’s potential fall-out benefits were not unreasonable.
Fund Analysis
Set forth below are certain of the specific factors that the Board considered at its October 9, 2023, November 14, 2023, and/or November 16, 2023 meetings in relation to approving the Fund’s Contracts and the conclusions reached by the Board. These specific factors are in addition to those considerations discussed above. The
performance data provided to the Board primarily was for various periods ended March 31, 2023. In addition, the Board also considered at its October 9, 2023, November 14, 2023, and/or November 16, 2023 meetings certain additional data regarding the Fund’s more recent performance, asset levels and asset flows. The Fund’s management fee rate and expense ratio were compared to the management fee rates and expense ratios of the funds in its Selected Peer Group. With respect to the quintile rankings noted below, the first quintile represents the range of funds with the highest performance or the lowest management fee rate or expense ratio, as applicable, and the fifth quintile represents the range of funds with the lowest performance or the highest management fee rate or expense ratio, as applicable.
In considering whether to approve the renewal of the Contracts for the Fund, the Board considered that, based on performance data for the periods ended March 31, 2023: (1) the Fund is ranked in the second quintile of its Morningstar, Inc. category for the year-to-date period, the fourth quintile for the three-year period, and the fifth quintile for the one-year, five-year and ten-year periods; and (2) the Fund underperformed its primary benchmark for all periods presented.
In analyzing this performance data, the Board took into account management’s representations regarding: (1) the impact of security selection and sector positioning on the Fund’s performance; (2) changes to the Fund’s investment strategy in November 2021 and the Board’s consideration that it is reasonable to provide more time for the purpose of evaluating any impact on performance; (3) its confidence in the Sub-Adviser’s ability to execute the Fund’s investment strategy; and (4) the recent changes to the Fund’s portfolio management team.
In considering the fees payable under the Contracts for the Fund, the Board took into account the factors described above and also considered: (1) the fairness of the compensation under a Management Contract with a breakpoint fee schedule where the asset level necessary to achieve a breakpoint discount had not been reached by the Fund; and (2) the pricing structure (including the net expense ratio to be borne by shareholders) of the Fund, as compared to its Selected Peer Group, including that: (a) the net management fee rate for the Fund is ranked in the second quintile of net management fee rates of the funds in its Selected Peer Group; (b) the contractual management fee rate for the Fund is ranked in the third quintile of contractual management fee rates of the funds in its Selected Peer Group; and (c) the net expense ratio for the Fund is ranked in the fourth quintile of net expense ratios of the funds in its Selected Peer Group.
ADVISORY AND SUB-ADVISORY CONTRACT APPROVAL DISCUSSION (continued)
In analyzing this fee data, the Board took into account management’s representations regarding its belief that the Fund’s pricing is competitive.
Board Conclusions
After its deliberation, the Board concluded that, in its business judgment, the terms of the Contracts are fair and reasonable to the Fund and that approval of the continuation of the Contracts is in the best interests of the Fund and its shareholders. In doing so, the Board reviewed all factors it considered to be material, including those
discussed above. Within the context of its overall conclusions regarding the Contracts, and based on the information provided and management’s related representations, the Board concluded that it was satisfied with management’s responses relating to the Fund’s investment performance and the fees payable under the Contracts. During this renewal process, each Board member may have accorded different weight to various factors in reaching his or her conclusions. Based on these conclusions and other factors, the Board voted to renew the Contracts for the Fund for the year ending November 30, 2024.
| Investment Adviser | Independent Registered Public Accounting Firm |
| Voya Investments, LLC | Ernst & Young LLP |
| 7337 East Doubletree Ranch Road, Suite 100 | 200 Clarendon Street |
| Scottsdale, Arizona 85258 | Boston, Massachusetts 02116 |
| | |
| Distributor | Custodian |
| Voya Investments Distributor, LLC | State Street Bank and Trust Company |
| 7337 East Doubletree Ranch Road, Suite 100 | 801 Pennsylvania Avenue |
| Scottsdale, Arizona 85258 | Kansas City, Missouri 64105 |
| | |
| Transfer Agent | Legal Counsel |
| BNY Mellon Investment Servicing (U.S.) Inc. | Ropes & Gray LLP |
| 301 Bellevue Parkway | Prudential Tower |
| Wilmington, Delaware 19809 | 800 Boylston Street |
| | Boston, Massachusetts 02199 |
For more complete information, or to obtain a prospectus on any Voya mutual fund, please call your financial advisor or Voya Investments Distributor, LLC at (800) 992-0180 or log on to www.voyainvestments.com. The prospectus should be read carefully before investing. Consider the fund’s investment objectives, risks, charges and expenses carefully before investing. The prospectus contains this information and other information about the fund.
RETIREMENT | INVESTMENTS | INSURANCE voyainvestments.com | 
163061 (0324) |
Item 2. Code of Ethics.
As of the end of the period covered by this report, Registrant had adopted a code of ethics, as defined in Item 2 of Form N-CSR, that applies to the Registrant’s principal executive officer and principal financial officer. There were no amendments to the Code during the period covered by the report. The Registrant did not grant any waivers, including implicit waivers, from any provisions of the Code during the period covered by this report. The code of ethics is filed herewith pursuant to Item 13(a)(1), Ex-99.CODE ETH.
Item 3. Audit Committee Financial Expert.
The Board of Trustees has determined that Colleen D. Baldwin, Martin J. Gavin, and Joseph E. Obermeyer are audit committee financial experts, as defined in Item 3 of Form N-CSR. Ms. Baldwin, Mr. Gavin, and Mr. Obermeyer are “independent” for purposes of Item 3 of Form N-CSR.
Item 4. Principal Accountant Fees and Services.
Below are the amount of fees that Ernst & Young LLP (“EY”), the Registrant’s current Independent Registered Public Accounting Firm, billed and paid to the Fund during the Fund’s fiscal years ended March 31, 2024 and March 31, 2023.
| (a) | Audit Fees: The aggregate fees billed and paid for each of the last two fiscal years for professional services rendered by Ernst & Young LLP (“EY”), the principal accountant for the audit of the registrant’s annual financial statements or services that are normally provided by the accountant in connection with statutory and regulatory filings or engagements for those fiscal years were $241,753 for the year ended March 31, 2024 and $227,340 for the year ended March 31, 2023. |
| (b) | Audit-Related Fees: The aggregate fees billed and paid in each of the last two fiscal years for assurance and related services by EY that are reasonably related to the performance of the audit of the registrant’s financial statements and are not reported under paragraph (a) of this Item were $0 for the year ended March 31, 2024 and $0 for the year ended March 31, 2023. |
| (c) | Tax Fees: The aggregate fees billed and paid in each of the last two fiscal years for professional services rendered by EY for tax compliance, tax advice, and tax planning were $87,892 for the year ended March 31, 2024 and $61,300 for the year ended March 31, 2023. Such services included review of excise distribution calculations (if applicable), preparation of the Registrants’ federal, state, and excise tax returns, tax services related to mergers and routine consulting. |
| (d) | All Other Fees: The aggregate fees billed and paid in each of the last two fiscal years for products and services provided by EY, other than the services reported in paragraphs (a) through (c) of this Item were $0 for the year ended March 31, 2024 and $0 for the year ended March 31, 2023. |
| (e)(1) | Audit Committee Pre-Approval Policies and Procedures |
Appendix A
AUDIT AND NON-AUDIT SERVICES
PRE-APPROVAL POLICY
I. Statement of Principles
Under the Sarbanes-Oxley Act of 2002 (the “Act”), the Audit Committee of the Board of Directors or Trustees (the “Committee”) of the Voya funds (each a “Fund,” collectively, the “Funds”) set out on Exhibit A to this Audit and Non-Audit Services Pre-Approval Policy (“Policy”) is responsible for the oversight of the work of the Funds’ independent auditors. As part of its responsibilities, the Committee must pre-approve the audit and non-audit services performed by the auditors in order to assure that the provision of these services does not impair the auditors’ independence from the Funds. The Committee has adopted, and the Board has ratified, this Policy, which sets out the procedures and conditions under which the services of the independent auditors may be pre-approved.
Under Securities and Exchange Commission (“SEC”) rules promulgated in accordance with the Act, the Funds may establish two different approaches to pre-approving audit and non-audit services. The Committee may approve services without consideration of specific case-by-case services (“general pre-approval”) or it may pre-approve specific services (“specific pre-approval”). The Committee believes that the combination of these approaches contemplated in this Policy results in an effective and efficient method for pre-approving audit and non-audit services to be performed by the Funds’ independent auditors. Under this Policy, services that are not of a type that may receive general pre-approval require specific pre-approval by the Committee. Any proposed services that exceed pre-approved cost levels or budgeted amounts will also require the Committee’s specific pre-approval.
For both types of approval, the Committee considers whether the subject services are consistent with the SEC’s rules on auditor independence and that such services are compatible with maintaining the auditors independence. The Committee also considers whether a particular audit firm is in the best position to provide effective and efficient services to the Funds. Reasons that the auditors are in the best position include the auditors’ familiarity with the Funds’ business, personnel, culture, accounting systems, risk profile, and other factors, and whether the services will enhance the Funds’ ability to manage and control risk or improve audit quality. Such factors will be considered as a whole, with no one factor being determinative.
The appendices attached to this Policy describe the audit, audit-related, tax-related, and other services that have the Committee’s general pre-approval. For any service that has been approved through general pre-approval, the general pre-approval will remain in place for a period 12 months from the date of pre-approval, unless the Committee determines that a different period is appropriate. The Committee will annually review and pre-approve the services that may be provided by the independent auditors without specific pre-approval. The Committee will revise the list of services subject to general pre-approval as appropriate. This Policy does not serve as a delegation to Fund management of the Committee’s duty to pre-approve services performed by the Funds’ independent auditors.
II. Audit Services
The annual audit services engagement terms and fees are subject to the Committee’s specific pre-approval. Audit services are those services that are normally provided by auditors in connection with statutory and regulatory filings or engagements or those that generally only independent auditors can reasonably provide. They include the Funds’ annual financial statement audit and procedures that the independent auditors must perform in order to form an opinion on the Funds’ financial statements (e.g., information systems and procedural reviews and testing). The Committee will monitor the audit services engagement and approve any changes in terms, conditions or fees deemed by the Committee to be necessary or appropriate.
The Committee may grant general pre-approval to other audit services, such as statutory audits and services associated with SEC registration statements, periodic reports and other documents filed with the SEC or issued in connection with securities offerings.
The Committee has pre-approved the audit services listed on Appendix A. The Committee must specifically approve all audit services not listed on Appendix A.
III. Audit-related Services
Audit-related services are assurance and related services that are reasonably related to the performance of the audit or the review of the Funds’ financial statements or are traditionally performed by the independent auditors. The Committee believes that the provision of audit-related services will not impair the independent auditors’ independence, and therefore may grant pre-approval to audit-related services. Audit-related services include accounting consultations related to accounting, financial reporting or disclosure matters not classified as “audit services;” assistance with understanding and implementing new accounting and financial reporting guidance from rulemaking authorities; agreed-upon or expanded audit procedures relating to accounting and/or billing records required to respond to or comply with financial, accounting or regulatory reporting matters; and assistance with internal control reporting requirements under Form N-CEN or Form N-CSR.
The Committee has pre-approved the audit-related services listed on Appendix B. The Committee must specifically approve all audit-related services not listed on Appendix B.
IV. Tax Services
The Committee believes the independent auditors can provide tax services to the Funds, including tax compliance, tax planning, and tax advice, without compromising the auditors’ independence. Therefore, the Committee may grant general pre-approval with respect to tax services historically provided by the Funds’ independent auditors that do not, in the Committee’s view, impair auditor independence and that are consistent with the SEC’s rules on auditor independence.
The Committee will not grant pre-approval if the independent auditors initially recommends a transaction the sole business purpose of which is tax avoidance and the tax treatment of which may not be supported in the Internal Revenue Code and related regulations. The Committee may consult
outside counsel to determine that tax planning and reporting positions are consistent with this Policy.
The Committee has pre-approved the tax-related services listed on Appendix C. The Committee must specifically approve all tax-related services not listed on Appendix C.
V. Other Services
The Committee believes it may grant approval of non-audit services that are permissible services for independent auditors to a Fund. The Committee has determined to grant general pre-approval to other services that it believes are routine and recurring, do not impair auditor independence, and are consistent with SEC rules on auditor independence.
The Committee has pre-approved the non-audit services listed on Appendix D. The Committee must specifically approve all non-audit services not listed on Appendix D.
A list of the SEC’s prohibited non-audit services is attached to this Policy as Appendix E. The SEC’s rules and relevant guidance should be consulted to determine the precise definitions of these impermissible services and the applicability of exceptions to certain of the SEC’s prohibitions.
VI. Pre-approval of Fee levels and Budgeted Amounts
The Committee will annually establish pre-approval fee levels or budgeted amounts for audit, audit-related, tax and non-audit services to be provided to the Funds by the independent auditors. Any proposed services exceeding these levels or amounts require the Committee’s specific pre-approval. The Committee considers fees for audit and non-audit services when deciding whether to pre-approve services. The Committee may determine, for a pre-approval period of 12 months, the appropriate ratio between the total amount of fees for the Fund’s audit, audit-related, and tax services (including fees for services provided to Fund affiliates that are subject to pre-approval), and the total amount of fees for certain permissible non-audit services for the Fund classified as other services (including any such services provided to Fund affiliates that are subject to pre-approval).
VII. Procedures
Requests or applications for services to be provided by the independent auditors will be submitted to management. If management determines that the services do not fall within those services generally pre-approved by the Committee and set out in the appendices to these procedures, management will submit the services to the Committee or its delagee. Any such submission will include a detailed description of the services to be rendered. Notwithstanding this paragraph, the Committee will, on a quarterly basis, receive from the independent auditors a list of services provided for the previous calendar quarter on a cumulative basis by the auditors during the Pre-Approval Period.
VIII. Delegation
The Committee may delegate pre-approval authority to one or more of the Committee’s members. Any member or members to whom such pre-approval authority is delegated must report any pre-approval decisions, including any pre-approved services, to the Committee at its next scheduled meeting. The Committee will identify any member to whom pre-approval authority is delegated in writing. The member will retain such authority for a period of 12 months from the date of pre-approval unless the Committee determines that a different period is appropriate. The period of delegated authority may be terminated by the Committee or at the option of the member.
IX. Additional Requirements
The Committee will take any measures the Committee deems necessary or appropriate to oversee the work of the independent auditors and to assure the auditors’ independence from the Funds. This may include reviewing a formal written statement from the independent auditors delineating all relationships between the auditors and the Funds, consistent with Independence Standards Board No. 1, and discussing with the auditors their methods and procedures for ensuring independence.
Last Approved: November 16, 2023
Appendix A
Pre-Approved Audit Services for the Pre-Approval Period January 1, 2024 through December 31, 2024
| Service |
| | The Fund(s) | Fee Range |
| Statutory audits or financial audits (including tax services associated with audit services) | √ | As presented to Audit Committee1 |
| Services associated with SEC registration statements, periodic reports and other documents filed with the SEC or other documents issued in connection with securities offerings (e.g., consents), and assistance in responding to SEC comment letters. | √ | Not to exceed $9,750 per filing |
| Consultations by Fund management with respect to accounting or disclosure treatment of transactions or events and/or the actual or potential effect of final or proposed rules, standards or interpretations by the SEC, Financial Accounting Standards Board, or other regulatory or standard setting bodies. | √ | Not to exceed $8,000 during the Pre-Approval Period |
| Seed capital audit and related review and issuance of consent on the N-2 registration statement | √ | Not to exceed $14,750 per audit |
| Audit of summary portfolio of investments | √ | Not to exceed $840 per fund |
| 1 | For new Funds launched during the Pre-Approval Period, the fee ranges pre-approved will be the same as those for existing Funds, pro-rated in accordance with inception dates as provided in the auditors’ Proposal or any Engagement Letter covering the period at issue. Fees in the Engagement Letter will be controlling. |
Appendix B
Pre-Approved Audit-Related Services for the Pre-Approval Period January 1, 2024 through December 31, 2024
| Service |
| | The Fund(s) | Fund Affiliates | Fee Range |
| Services related to Fund mergers (Excludes tax services - See Appendix C for tax services associated with Fund mergers) | √ | √ | Not to exceed $10,000 per merger |
| Consultations by Fund management with respect to accounting or disclosure treatment of transactions or events and/or the actual or potential effect of final or proposed rules, standards or interpretations by the SEC, Financial Accounting Standards Board, or other regulatory or standard setting bodies. [Note: Under SEC rules some consultations may be “audit” services and others may be “audit-related” services.] | √ | | Not to exceed $5,000 per occurrence during the Pre-Approval Period |
| Review of the Funds’ semi-annual and quarterly financial statements | √ | | Not to exceed $2,700 per set of financial statements per fund |
| Reports to regulatory or government agencies related to the annual engagement | √ | | Up to $5,000 per occurrence during the Pre-Approval Period |
| Regulatory compliance assistance | √ | √ | Not to exceed $5,000 per quarter |
| Training courses | | √ | Not to exceed $5,000 per course |
Appendix C
Pre-Approved Tax Services for the Pre-Approval Period January 1, 2024 through December 31, 2024
| Service |
| | The Fund(s) | Fund
Affiliates | Fee Range |
| Preparation of federal and state income tax returns and federal excise tax returns for the Funds including assistance and review with excise tax distributions (Funds fees) | √ | | As presented to Audit Committee2 |
| Review of IRC Sections 851(b) and 817(h) diversification testing on a real-time basis | √ | | As presented to Audit Committee2 |
| Tax assistance and advice regarding statutory, regulatory or administrative developments | √ | √ | Not to exceed $5,000 for the Funds or for the Funds’ investment adviser during the Pre-Approval Period |
| 2 | For new Funds launched during the Pre-Approval Period, the fee ranges pre-approved will be the same as those for existing Funds, pro-rated in accordance with inception dates as provided in the auditors’ Proposal or any Engagement Letter covering the period at issue. Fees in the Engagement Letter will be controlling. |
Appendix C, continued Pre-Approved Tax Services for the Pre-Approval Period January 1, 2024 through December 31, 2024
| Service |
| | The Fund(s) | Fund
Affiliates | Fee Range |
| Tax and technology training sessions | | √ | Not to exceed $5,000 per course during the Pre-Approval Period |
| Tax services associated with Fund mergers | √ | √ | Not to exceed $4,000 per fund per merger during the Pre-Approval Period |
Tax compliance services related to return preparation for the Funds (Adviser Fees) | | √ | As presented to Audit Committee3 |
| Other tax-related assistance and consultation, including, without limitation, assistance in evaluating derivative financial instruments and international tax issues, qualification and distribution issues, year-end reporting for 1099’s, tax compliance services in foreign jurisdictions and similar routine tax consultations as requested. | √ | | Not to exceed $300,000 during the Pre-Approval Period |
| EU Reclaims IRS Closing Agreement Filings | √ | | $20,000 per Fund first closing agreement, $5,000 for subsequent closing agreements for same Fund |
| 3 | For new Funds launched during the Pre-Approval Period, the fee ranges pre-approved will be the same as those for existing Funds, pro-rated in accordance with inception dates as provided in the auditors’ Proposal or any Engagement Letter covering the period at issue. Fees in the Engagement Letter will be controlling. |
Appendix D
Pre-Approved Other Services for the Pre-Approval Period January 1, 2024 through December 31, 2024
| Service |
| | The Fund(s) | Fund Affiliates | Fee Range |
| Agreed-upon procedures for Class B share 12b-1 programs | | √ | Not to exceed $60,000 during the Pre-Approval Period |
Security counts performed pursuant to Rule 17f-2 of the 1940 Act (i.e., counts for Funds holding securities with affiliated sub-custodians) Cost to be borne 50% by the Funds and 50% by Voya Investments, LLC. | √ | √ | Not to exceed $5,700 per Fund during the Pre-Approval Period |
| Agreed upon procedures for 15 (c) FACT Books | √ | | Not to exceed $50,000 during the Pre-Approval Period |
Appendix E
Prohibited Non-Audit Services
Dated: January 1, 2024 to December 31, 2024
| ● | Bookkeeping or other services related to the accounting records or financial statements of the Funds |
| ● | Financial information systems design and implementation |
| ● | Appraisal or valuation services, fairness opinions, or contribution-in-kind reports |
| ● | Internal audit outsourcing services |
| ● | Broker-dealer, investment adviser, or investment banking services |
| ● | Expert services unrelated to the audit |
| ● | Any other service that the Public Company Accounting Oversight Board determines, by regulation, is impermissible. |
EXHIBIT A
VOYA ASIA PACIFIC HIGH DIVIDEND EQUITY INCOME FUND
VOYA BALANCED PORTFOLIO, INC.
VOYA CREDIT INCOME FUND
VOYA EMERGING MARKETS HIGH DIVIDEND EQUITY FUND
VOYA EQUITY TRUST
VOYA FUNDS TRUST
VOYA GLOBAL ADVANTAGE AND PREMIUM OPPORTUNITY FUND
VOYA GLOBAL EQUITY DIVIDEND AND PREMIUM OPPORTUNITY FUND
VOYA INFRASTRUCTURE, INDUSTRIALS, AND MATERIALS FUND
VOYA INTERMEDIATE BOND PORTFOLIO
VOYA INVESTORS TRUST
VOYA GOVERNMENT MONEY MARKET PORTFOLIO
VOYA MUTUAL FUNDS
VOYA PARTNERS, INC.
VOYA SEPARATE PORTFOLIOS TRUST
VOYA STRATEGIC ALLOCATIONS PORTFOLIOS, INC.
VOYA VARIABLE FUNDS
VOYA VARIABLE INSURANCE TRUST
VOYA VARIABLE PORTFOLIOS INC,
VOYA VARIABLE PRODUCTS TRUST
| (e)(2) | Percentage of services referred to in 4(b) – (4)(d) that were approved by the audit committee |
100% of the services were approved by the audit committee.
| (f) | Percentage of hours expended attributable to work performed by other than full time employees of EY if greater than 50% |
Not applicable.
| (g) | Non-Audit Fees: The following table presents (i) the aggregate non-audit fees (i.e., fees for audit-related, tax, and other services) billed and paid to the Registrant by the independent registered public accounting firm for the Registrant’s fiscal years ended March 31, 2024 and March 31, 2023; and (ii) the aggregate non-audit fees billed to the investment adviser, or any of its affiliates that provide ongoing services to the registrant, by the independent registered public accounting firm for the same time periods. |
| Registrant/Investment Adviser | | 2024 | | | 2023 | |
| Voya Funds Trust | | $ | 87,892 | | | $ | 61,300 | |
| Voya Investments, LLC (1) | | $ | 20,108,761 | | | $ | 12,786,749 | |
(1) The Registrant’s investment adviser and any of its affiliates, which are subsidiaries of Voya Financial, Inc.
| (h) | Principal Accountants Independence: The Registrant’s Audit committee has considered whether the provision of non-audit services that were rendered to the registrant’s investment adviser and any entity controlling, controlled by, or under common control with the investment adviser that provides ongoing services to the registrant that were not pre-approved pursuant to Rule 2-01(c)(7)(ii) of Regulation S-X is compatible with maintaining EY’s independence. |
(i) Not applicable.
(j) Not applicable.
Item 5. Audit Committee of Listed Registrants.
Not applicable.
Item 6. Schedule of Investments.
(a) Schedule is included as part of the report to shareholders filed under Item 1 of this Form.
(b) Not applicable.
Item 7. Disclosure of Proxy Voting Policies and Procedures for Closed-End Management Investment Companies.
Not applicable.
Item 8. Portfolio Managers of Closed-End Management Investment Companies.
Not applicable.
Item 9. Purchases of Equity Securities by Closed-End Management Investment Company and Affiliated Purchasers.
Not applicable.
Item 10. Submission of Matters to a Vote of Security Holders.
There have been no material changes to the procedures by which the shareholders may recommend nominees to the registrant’s board of directors, where those changes were implemented after the registrant last provided disclosure in response to the requirements of Item 407(c)(2)(iv) of Regulation S-K (17 CFR 229.407) (as required by Item 22(b)(15) of Schedule 14A (17 CFR 240.14a-101)), or this Item.
Item 11. Controls and Procedures.
| (a) | Based on our evaluation conducted within 90 days of the filing date, hereof, the design and operation of the registrant’s disclosure controls and procedures are effective to ensure that material information relating to the registrant is made known to the certifying officers by others within the appropriate entities, particularly during the period in which Forms N-CSR are being prepared, and the registrant’s disclosure controls and procedures allow timely preparation and review of the information for the registrant’s Form N-CSR and the officer certifications of such Form N-CSR. |
| (b) | There were no significant changes in the registrant’s internal controls that occurred during the period covered by this report that has materially affected, or is reasonably likely to materially affect, the registrant’s internal control over financial reporting. |
Item 12. Disclosure of Securities Lending Activities for Closed-End Management Investment Companies.
Not applicable.
Item 13. Exhibits.
SIGNATURES
Pursuant to the requirements of the Securities Exchange Act of 1934 and the Investment Company Act of 1940, the registrant has duly caused this report to be signed on its behalf by the undersigned, thereunto duly authorized.
(Registrant): Voya Funds Trust
| By | /s/ Andy Simonoff | |
| | Andy Simonoff | |
| | Chief Executive Officer | |
Date: June 7, 2024
Pursuant to the requirements of the Securities Exchange Act of 1934 and the Investment Company Act of 1940, this report has been signed below by the following persons on behalf of the registrant and in the capacities and on the dates indicated.
| By | /s/ Andy Simonoff | |
| | Andy Simonoff | |
| | Chief Executive Officer | |
Date: June 7, 2024
| By | /s/ Todd Modic | |
| | Todd Modic | |
| | Senior Vice President and Chief Financial Officer | |
Date: June 7, 2024