|
| OMB APPROVAL |
| OMB Number: 3235-0570 |
| Expires: January 31, 2014 |
| Estimated average burden |
| hours per response.....20.6 |
UNITED STATES
SECURITIES AND EXCHANGE COMMISSION
Washington, D.C. 20549
FORM N-CSR
CERTIFIED SHAREHOLDER REPORT OF REGISTERED
MANAGEMENT INVESTMENT COMPANIES
Investment Company Act file number 811-08941
The Vantagepoint Funds
(Exact name of registrant as specified in charter)
777 North Capitol Street, NE, Suite 600, Washington D.C. 20002-4240
(Address of principal executive offices) (Zip code)
Angela Montez, Secretary of the Registrant
777 North Capitol Street, NE, Suite 600, Washington D.C. 20002-4240
(Name and address of agent for service)
Registrant’s telephone number, including area code: 202-962-4600
Date of fiscal year end: 12/31/13
Date of reporting period: 01/01/13 - 12/31/13
Item 1 (Report to Shareholders): The annual report is set forth below.
TABLE OF CONTENTS
| | | | |
Shareholder Expenses | | | 1 | |
| |
Management’s Discussion of Market Conditions | | | 3 | |
| |
Management’s Discussion of Fund Performance | | | 4 | |
| |
| Vantagepoint Funds | | | | |
| |
Report of Independent Registered Public Accounting Firm | | | 88 | |
| |
Statements of Assets and Liabilities | | | 89 | |
| |
Statements of Operations | | | 96 | |
| |
Statements of Changes in Net Assets | | | 103 | |
| |
Financial Highlights | | | 118 | |
| |
Notes to Financial Statements | | | 152 | |
| |
Schedules of Investments | | | 201 | |
| |
Additional Information | | | 360 | |
Shareholder Expenses
As a shareholder of a Vantagepoint Fund, you incur ongoing expenses, such as advisory fees and other fund expenses. The following example is intended to help you understand your ongoing expenses (in dollars and cents) of investing in a fund and to compare these expenses with the ongoing expenses of investing in other mutual funds. The example is based on an investment of $1,000 invested at the beginning of the period and held for the entire period from July 1, 2013 to December 31, 2013.
Actual Expenses
The first section in the example below provides information about the actual account values and actual expenses. You may use the information in this section, together with the amount you invested, to estimate the expenses that you paid over the period. Simply divide your account value by $1,000 (for example, an $8,600 account value divided by $1,000 = 8.6), then multiply the result by the number for your fund under the heading entitled “Expenses Paid During Period” to estimate the expenses you paid on your account during this period.
Hypothetical Example for Comparison Purposes
The second section in the example below provides information about the hypothetical account values and hypothetical expenses based on each fund’s actual expense ratio and an assumed rate of return of 5% per year before expenses, which is not the fund’s actual return. The hypothetical account values and expenses may not be used to estimate the actual ending account balance or expenses you paid for the period. You may use this information to compare the ongoing costs of investing in your fund and other funds. To do so, compare this 5% hypothetical example with the 5% hypothetical examples that appear in the shareholder reports of the other funds.
| | | | | | | | | | | | | | | | | | | | | | | | | | | | | | |
| ACTUAL | | | | | HYPOTHETICAL | |
Beginning
Account
Value
7/01/13 | | Ending
Account
Value
12/31/13 | | | 2013
Annualized
Expense
Ratio(a) | | | Expenses
Paid
During
Period* | | | Vantagepoint Funds | | Beginning
Account
Value
7/01/13 | | | Ending
Account
Value
12/31/13 | | | 2013
Annualized
Expense
Ratio | | | Expenses
Paid
During
Period* | |
| $1,000.00 | | $ | 1,012.20 | | | | 0.64% | | | $ | 3.25 | | | Low Duration Bond Investor Shares | | $ | 1,000.00 | | | $ | 1,021.98 | | | | 0.64% | | | $ | 3.26 | |
| $1,000.00 | | $ | 1,013.30 | | | | 0.39% | | | $ | 1.98 | | | Low Duration Bond T Shares | | $ | 1,000.00 | | | $ | 1,023.24 | | | | 0.39% | | | $ | 1.99 | |
| $1,000.00 | | $ | 984.00 | | | | 0.65% | | | $ | 3.25 | | | Inflation Protected Securities Investor Shares | | $ | 1,000.00 | | | $ | 1,021.93 | | | | 0.65% | | | $ | 3.31 | |
| $1,000.00 | | $ | 986.00 | | | | 0.40% | | | $ | 2.00 | | | Inflation Protected Securities T Shares | | $ | 1,000.00 | | | $ | 1,023.19 | | | | 0.40% | | | $ | 2.04 | |
| $1,000.00 | | $ | 1,155.90 | | | | 0.82% | | | $ | 4.46 | | | Equity Income Investor Shares | | $ | 1,000.00 | | | $ | 1,021.07 | | | | 0.82% | | | $ | 4.18 | |
| $1,000.00 | | $ | 1,156.90 | | | | 0.57% | | | $ | 3.10 | | | Equity Income T Shares | | $ | 1,000.00 | | | $ | 1,022.33 | | | | 0.57% | | | $ | 2.91 | |
| $1,000.00 | | $ | 1,169.70 | | | | 0.78% | | | $ | 4.27 | | | Growth & Income Investor Shares | | $ | 1,000.00 | | | $ | 1,021.27 | | | | 0.78% | | | $ | 3.97 | |
| $1,000.00 | | $ | 1,170.90 | | | | 0.53% | | | $ | 2.90 | | | Growth & Income T Shares | | $ | 1,000.00 | | | $ | 1,022.53 | | | | 0.53% | | | $ | 2.70 | |
| $1,000.00 | | $ | 1,211.00 | | | | 0.78% | | | $ | 4.35 | | | Growth Investor Shares | | $ | 1,000.00 | | | $ | 1,021.27 | | | | 0.78% | | | $ | 3.97 | |
| $1,000.00 | | $ | 1,212.10 | | | | 0.53% | | | $ | 2.96 | | | Growth T Shares | | $ | 1,000.00 | | | $ | 1,022.53 | | | | 0.53% | | | $ | 2.70 | |
| $1,000.00 | | $ | 1,165.60 | | | | 0.98% | | | $ | 5.35 | | | Select Value Investor Shares | | $ | 1,000.00 | | | $ | 1,020.27 | | | | 0.98% | | | $ | 4.99 | |
| $1,000.00 | | $ | 1,167.30 | | | | 0.73% | | | $ | 3.99 | | | Select Value T Shares | | $ | 1,000.00 | | | $ | 1,021.53 | | | | 0.73% | | | $ | 3.72 | |
| $1,000.00 | | $ | 1,201.60 | | | | 0.84% | | | $ | 4.66 | | | Aggressive Opportunities Investor Shares | | $ | 1,000.00 | | | $ | 1,020.97 | | | | 0.84% | | | $ | 4.28 | |
| $1,000.00 | | $ | 1,202.70 | | | | 0.59% | | | $ | 3.28 | | | Aggressive Opportunities T Shares | | $ | 1,000.00 | | | $ | 1,022.23 | | | | 0.59% | | | $ | 3.01 | |
| $1,000.00 | | $ | 1,211.80 | | | | 0.95% | | | $ | 5.30 | | | Discovery Investor Shares | | $ | 1,000.00 | | | $ | 1,020.42 | | | | 0.95% | | | $ | 4.84 | |
| $1,000.00 | | $ | 1,212.80 | | | | 0.70% | | | $ | 3.90 | | | Discovery T Shares | | $ | 1,000.00 | | | $ | 1,021.68 | | | | 0.70% | | | $ | 3.57 | |
| $1,000.00 | | $ | 1,147.90 | | | | 0.99% | | | $ | 5.36 | | | International Investor Shares | | $ | 1,000.00 | | | $ | 1,020.21 | | | | 0.99% | | | $ | 5.04 | |
| $1,000.00 | | $ | 1,149.10 | | | | 0.75% | | | $ | 4.06 | | | International T Shares | | $ | 1,000.00 | | | $ | 1,021.42 | | | | 0.75% | | | $ | 3.82 | |
| $1,000.00 | | $ | 1,043.70 | | | | 0.55% | | | $ | 2.83 | | | Diversifying Strategies T Shares | | $ | 1,000.00 | | | $ | 1,022.43 | | | | 0.55% | | | $ | 2.80 | |
| $1,000.00 | | $ | 1,001.40 | | | | 0.41% | | | $ | 2.07 | | | Core Bond Index Class I | | $ | 1,000.00 | | | $ | 1,023.14 | | | | 0.41% | | | $ | 2.09 | |
| $1,000.00 | | $ | 1,002.40 | | | | 0.21% | | | $ | 1.06 | | | Core Bond Index Class II | | $ | 1,000.00 | | | $ | 1,024.15 | | | | 0.21% | | | $ | 1.07 | |
| $1,000.00 | | $ | 1,002.70 | | | | 0.16% | | | $ | 0.81 | | | Core Bond Index T Shares | | $ | 1,000.00 | | | $ | 1,024.40 | | | | 0.16% | | | $ | 0.82 | |
| $1,000.00 | | $ | 1,160.90 | | | | 0.41% | | | $ | 2.23 | | | 500 Stock Index Class I | | $ | 1,000.00 | | | $ | 1,023.14 | | | | 0.41% | | | $ | 2.09 | |
| $1,000.00 | | $ | 1,161.00 | | | | 0.21% | | | $ | 1.14 | | | 500 Stock Index Class II | | $ | 1,000.00 | | | $ | 1,024.15 | | | | 0.21% | | | $ | 1.07 | |
| $1,000.00 | | $ | 1,161.80 | | | | 0.16% | | | $ | 0.87 | | | 500 Stock Index T Shares | | $ | 1,000.00 | | | $ | 1,024.40 | | | | 0.16% | | | $ | 0.82 | |
| $1,000.00 | | $ | 1,168.90 | | | | 0.41% | | | $ | 2.24 | | | Broad Market Index Class I | | $ | 1,000.00 | | | $ | 1,023.14 | | | | 0.41% | | | $ | 2.09 | |
(continued)
1
| | | | | | | | | | | | | | | | | | | | | | | | | | | | | | |
| ACTUAL | | | | | HYPOTHETICAL | |
Beginning
Account
Value
7/01/13 | | Ending
Account
Value
12/31/13 | | | 2013
Annualized
Expense
Ratio(a) | | | Expenses
Paid
During
Period* | | | Vantagepoint Funds | | Beginning
Account
Value
7/01/13 | | | Ending
Account
Value
12/31/13 | | | 2013
Annualized
Expense
Ratio | | | Expenses
Paid
During
Period* | |
| $1,000.00 | | $ | 1,170.20 | | | | 0.21% | | | $ | 1.15 | | | Broad Market Index Class II | | $ | 1,000.00 | | | $ | 1,024.15 | | | �� | 0.21% | | | $ | 1.07 | |
| $1,000.00 | | $ | 1,170.40 | | | | 0.16% | | | $ | 0.88 | | | Broad Market Index T Shares | | $ | 1,000.00 | | | $ | 1,024.40 | | | | 0.16% | | | $ | 0.82 | |
| $1,000.00 | | $ | 1,183.80 | | | | 0.42% | | | $ | 2.31 | | | Mid/Small Company Index Class I | | $ | 1,000.00 | | | $ | 1,023.09 | | | | 0.42% | | | $ | 2.14 | |
| $1,000.00 | | $ | 1,185.00 | | | | 0.22% | | | $ | 1.21 | | | Mid/Small Company Index Class II | | $ | 1,000.00 | | | $ | 1,024.10 | | | | 0.22% | | | $ | 1.12 | |
| $1,000.00 | | $ | 1,185.10 | | | | 0.17% | | | $ | 0.94 | | | Mid/Small Company Index T Shares | | $ | 1,000.00 | | | $ | 1,024.35 | | | | 0.17% | | | $ | 0.87 | |
| $1,000.00 | | $ | 1,175.90 | | | | 0.54% | | | $ | 2.96 | | | Overseas Equity Index Class I | | $ | 1,000.00 | | | $ | 1,022.48 | | | | 0.54% | | | $ | 2.75 | |
| $1,000.00 | | $ | 1,177.60 | | | | 0.34% | | | $ | 1.87 | | | Overseas Equity Index Class II | | $ | 1,000.00 | | | $ | 1,023.49 | | | | 0.34% | | | $ | 1.73 | |
| $1,000.00 | | $ | 1,178.00 | | | | 0.29% | | | $ | 1.59 | | | Overseas Equity Index T Shares | | $ | 1,000.00 | | | $ | 1,023.74 | | | | 0.29% | | | $ | 1.48 | |
| $1,000.00 | | $ | 1,074.10 | | | | 0.86% | | | $ | 4.50 | | | Model Portfolio Conservative Growth Investor M Shares** | | $ | 1,000.00 | | | $ | 1,020.87 | | | | 0.86% | | | $ | 4.38 | |
| $1,000.00 | | $ | 1,075.40 | | | | 0.61% | | | $ | 3.19 | | | Model Portfolio Conservative Growth TM Shares** | | $ | 1,000.00 | | | $ | 1,022.13 | | | | 0.61% | | | $ | 3.11 | |
| $1,000.00 | | $ | 1,109.20 | | | | 0.88% | | | $ | 4.68 | | | Model Portfolio Traditional Growth Investor M Shares** | | $ | 1,000.00 | | | $ | 1,020.77 | | | | 0.88% | | | $ | 4.48 | |
| $1,000.00 | | $ | 1,110.40 | | | | 0.63% | | | $ | 3.35 | | | Model Portfolio Traditional Growth TM Shares** | | $ | 1,000.00 | | | $ | 1,022.03 | | | | 0.63% | | | $ | 3.21 | |
| $1,000.00 | | $ | 1,133.60 | | | | 0.91% | | | $ | 4.89 | | | Model Portfolio Long-Term Growth Investor M Shares** | | $ | 1,000.00 | | | $ | 1,020.62 | | | | 0.91% | | | $ | 4.63 | |
| $1,000.00 | | $ | 1,135.20 | | | | 0.66% | | | $ | 3.55 | | | Model Portfolio Long-Term Growth TM Shares** | | $ | 1,000.00 | | | $ | 1,021.88 | | | | 0.66% | | | $ | 3.36 | |
| $1,000.00 | | $ | 1,172.30 | | | | 0.98% | | | $ | 5.37 | | | Model Portfolio All-Equity Growth Investor M Shares** | | $ | 1,000.00 | | | $ | 1,020.27 | | | | 0.98% | | | $ | 4.99 | |
| $1,000.00 | | $ | 1,173.80 | | | | 0.73% | | | $ | 4.00 | | | Model Portfolio All-Equity Growth TM Shares** | | $ | 1,000.00 | | | $ | 1,021.53 | | | | 0.73% | | | $ | 3.72 | |
| $1,000.00 | | $ | 1,046.60 | | | | 0.84% | | | $ | 4.33 | | | Milestone Retirement Income Investor M Shares** | | $ | 1,000.00 | | | $ | 1,020.97 | | | | 0.84% | | | $ | 4.28 | |
| $1,000.00 | | $ | 1,048.50 | | | | 0.59% | | | $ | 3.05 | | | Milestone Retirement Income TM Shares** | | $ | 1,000.00 | | | $ | 1,022.23 | | | | 0.59% | | | $ | 3.01 | |
| $1,000.00 | | $ | 1,074.90 | | | | 0.88% | | | $ | 4.60 | | | Milestone 2010 Investor M Shares** | | $ | 1,000.00 | | | $ | 1,020.77 | | | | 0.88% | | | $ | 4.48 | |
| $1,000.00 | | $ | 1,076.90 | | | | 0.63% | | | $ | 3.30 | | | Milestone 2010 TM Shares** | | $ | 1,000.00 | | | $ | 1,022.03 | | | | 0.63% | | | $ | 3.21 | |
| $1,000.00 | | $ | 1,087.40 | | | | 0.87% | | | $ | 4.58 | | | Milestone 2015 Investor M Shares** | | $ | 1,000.00 | | | $ | 1,020.82 | | | | 0.87% | | | $ | 4.43 | |
| $1,000.00 | | $ | 1,088.60 | | | | 0.62% | | | $ | 3.26 | | | Milestone 2015 TM Shares** | | $ | 1,000.00 | | | $ | 1,022.08 | | | | 0.62% | | | $ | 3.16 | |
| $1,000.00 | | $ | 1,101.80 | | | | 0.85% | | | $ | 4.50 | | | Milestone 2020 Investor M Shares** | | $ | 1,000.00 | | | $ | 1,020.92 | | | | 0.85% | | | $ | 4.33 | |
| $1,000.00 | | $ | 1,102.90 | | | | 0.60% | | | $ | 3.18 | | | Milestone 2020 TM Shares** | | $ | 1,000.00 | | | $ | 1,022.18 | | | | 0.60% | | | $ | 3.06 | |
| $1,000.00 | | $ | 1,115.90 | | | | 0.85% | | | $ | 4.53 | | | Milestone 2025 Investor M Shares** | | $ | 1,000.00 | | | $ | 1,020.92 | | | | 0.85% | | | $ | 4.33 | |
| $1,000.00 | | $ | 1,117.80 | | | | 0.60% | | | $ | 3.20 | | | Milestone 2025 TM Shares** | | $ | 1,000.00 | | | $ | 1,022.18 | | | | 0.60% | | | $ | 3.06 | |
| $1,000.00 | | $ | 1,129.10 | | | | 0.86% | | | $ | 4.62 | | | Milestone 2030 Investor M Shares** | | $ | 1,000.00 | | | $ | 1,020.87 | | | | 0.86% | | | $ | 4.38 | |
| $1,000.00 | | $ | 1,131.00 | | | | 0.61% | | | $ | 3.28 | | | Milestone 2030 TM Shares** | | $ | 1,000.00 | | | $ | 1,022.13 | | | | 0.61% | | | $ | 3.11 | |
| $1,000.00 | | $ | 1,142.10 | | | | 0.87% | | | $ | 4.70 | | | Milestone 2035 Investor M Shares** | | $ | 1,000.00 | | | $ | 1,020.82 | | | | 0.87% | | | $ | 4.43 | |
| $1,000.00 | | $ | 1,143.20 | | | | 0.62% | | | $ | 3.35 | | | Milestone 2035 TM Shares** | | $ | 1,000.00 | | | $ | 1,022.08 | | | | 0.62% | | | $ | 3.16 | |
| $1,000.00 | | $ | 1,153.40 | | | | 0.87% | | | $ | 4.72 | | | Milestone 2040 Investor M Shares** | | $ | 1,000.00 | | | $ | 1,020.82 | | | | 0.87% | | | $ | 4.43 | |
| $1,000.00 | | $ | 1,154.50 | | | | 0.62% | | | $ | 3.37 | | | Milestone 2040 TM Shares** | | $ | 1,000.00 | | | $ | 1,022.08 | | | | 0.62% | | | $ | 3.16 | |
| $1,000.00 | | $ | 1,155.40 | | | | 0.94% | | | $ | 5.11 | | | Milestone 2045 Investor M Shares** | | $ | 1,000.00 | | | $ | 1,020.47 | | | | 0.94% | | | $ | 4.79 | |
| $1,000.00 | | $ | 1,157.20 | | | | 0.69% | | | $ | 3.75 | | | Milestone 2045 TM Shares** | | $ | 1,000.00 | | | $ | 1,021.73 | | | | 0.69% | | | $ | 3.52 | |
| $1,000.00 | | $ | 1,152.10 | | | | 1.09% | | | $ | 5.91 | | | Milestone 2050 Investor M Shares** | | $ | 1,000.00 | | | $ | 1,019.71 | | | | 1.09% | | | $ | 5.55 | |
| $1,000.00 | | $ | 1,152.90 | | | | 0.84% | | | $ | 4.56 | | | Milestone 2050 TM Shares** | | $ | 1,000.00 | | | $ | 1,020.97 | | | | 0.84% | | | $ | 4.28 | |
| (a) | | Net of waivers, if any. |
| * | | Expenses are calculated using each fund’s annualized expense ratio (as disclosed in the table), multiplied by the average account value over the period, multiplied by [number of days in most recent fiscal half year divided by total number of days in fiscal year e.g. 184/365] (to reflect the one-half year period). |
| ** | | This fund invests in one or more other mutual funds. The annualized expense ratio includes this fund’s proportionate share of the expense ratio of such other mutual fund(s). |
2
MANAGEMENT’S DISCUSSION OF MARKET CONDITIONS FOR THE YEAR ENDED DECEMBER 31, 2013
The following is a brief discussion of Vantagepoint Investment Advisers, LLC’s (“VIA”) views of the major market conditions that prevailed in 2013. This commentary should not be considered a complete discussion of all market conditions for the year. This commentary should be read together with each Fund’s Management’s Discussion of Fund Performance because it provides additional context regarding a Fund’s performance.
Equity and fixed income securities markets offered mixed returns in 2013, with equity securities generally outperforming fixed income securities. Equities in the U.S. and developed foreign country markets generally offered double-digit returns in 2013 while emerging market equities generally declined for the year. U.S. fixed income and equity security returns were generally influenced by expectations for changes to the fixed income securities purchasing program of the Federal Reserve System (“Federal Reserve”), the U.S. central bank. Higher quality and longer maturity fixed income securities generally declined in value as interest rates increased, while fixed income securities with lesser sensitivity to changes in longer-term interest rates, such as high yield and shorter maturity fixed income securities, produced positive returns for the year.
In the first quarter, U.S. equity markets rallied, buoyed by encouraging economic data and the accommodative monetary policy of the Federal Reserve. An announcement by the Federal Reserve toward the end of the first quarter that its fixed income securities purchasing program would continue helped the S&P 500 Index, an index representing the larger capitalization stocks traded in the U.S., reach a new high. Fears of a future tapering of the fixed income securities purchasing program resulted in a rise in longer-term interest rates.
In the second quarter, the S&P 500 Index recorded a new closing high before falling back after Federal Reserve Chairman Bernanke indicated a possible tapering of the fixed income securities buying program later in the year. The yield on the benchmark 10-year Treasury note, which typically moves opposite of prices, rose from 1.63% at the beginning of May to close the quarter at 2.49%. Returns were negative for most fixed income sectors. International markets declined in the quarter amid concerns over U.S. monetary policy and tepid economic growth projections.
The third quarter began with a decline in U.S. equity markets amid renewed investor fears that the Federal Reserve would taper its fixed income securities buying program, but U.S. equity markets rose to a new high in September after the Federal Reserve announced it would maintain the program. High yield fixed income securities provided positive returns, while long-term treasuries fell. International equities of developed countries and emerging market countries provided positive returns in the quarter reflecting improving economic data and rising investor sentiment.
In the fourth quarter, the Federal Reserve announced that tapering of its fixed income securities buying program would begin in 2014. Equity markets reached new highs, and high yield fixed income securities produced positive returns while U.S. Treasury returns were generally negative, as the benchmark 10-year Treasury note closed the year with a yield of 3.03%.
U.S. fixed income markets offered mixed returns in 2013, with high yield fixed income securities generally producing the strongest returns, and shorter-maturity fixed income securities rising more modestly. Returns for longer maturity U.S. Treasury securities and Treasury inflation-protected securities, or TIPS, declined as interest rates rose in anticipation of the Federal Reserve tapering its fixed income securities purchasing program.
The U.S. equity market offered double-digit returns in 2013, with all sectors of the S&P 500 Index providing positive returns. The returns were led by the Consumer Discretionary sector, and followed closely by the Health Care, Industrials, and Financial sectors, each with returns in excess of 35%. “Growth-oriented” equities generally offered higher returns than “value-oriented” equities, most notably for smaller capitalization companies. Equities of small-capitalization size companies generally outperformed equities of mid- and large-capitalization companies.
The equity markets of developed market countries outside the U.S. generally offered positive double-digit returns for the year, with Europe, the U.K., and Japan each returning over 20% on average for U.S. investors. While the Japanese yen weakened against the dollar and dampened U.S. dollar returns, returns were still robust for U.S. investors. Emerging market countries generally fell for the year primarily reflecting losses in the second quarter as China suffered from slower-than-expected growth.
3
Vantagepoint Low Duration Bond Fund
The Vantagepoint Low Duration Bond Fund’s investment objective is to seek total return that is consistent with preservation of capital. The Fund invests, under normal circumstances, at least 80% of its net assets in bonds and other fixed income securities of varying maturities, and normally invests at least 65% of its net assets in bonds and other fixed income securities with more than one year to maturity. The Fund seeks to maintain a portfolio effective duration of no greater than three years. Effective duration is a measure of the expected change in value of a fixed income security for a given change in interest rates, and takes into account that expected cash flows will fluctuate as interest rates change. The Fund’s investments may include securities issued or guaranteed by the U.S. Government or foreign governments and their agencies and instrumentalities, or supra-national organizations (such as the World Bank); securities issued by U.S. or foreign companies; U.S. and foreign mortgage-backed and asset-backed securities; and municipal securities. The Fund generally invests in investment grade fixed income securities (i.e., securities rated within the four highest grades by a major ratings agency or unrated securities that the Fund’s subadvisers determine are of comparable quality). The Fund may invest up to 10% of its net assets in securities that are rated below investment grade (commonly known as “high yield securities” or “junk bonds”) and may invest up to 10% of its net assets in floating rate loans. However, the Fund limits its investments in (i) high yield securities and (ii) floating rate loans so that together, they equal no more than 10% of the Fund’s net assets. Investments in foreign securities are limited to 30% of the Fund’s net assets. The Fund primarily invests in securities that are denominated in the U.S. dollar, but can invest up to 10% of its net assets in securities that are denominated in foreign currencies.
The Fund may invest up to 10% of its net assets in derivative instruments. The Fund’s subadvisers may use futures, options, and swap agreements to manage risk or obtain or adjust investment exposure. The Fund’s subadvisers also may use forward currency contracts to obtain or adjust investment exposure or to manage foreign currency risks. The Fund’s investments in credit default swaps, if any, will be less than 5% of the Fund’s net assets.
Performance
The Vantagepoint Low Duration Bond Fund’s Investor Shares gained 0.75% in 2013. The Fund’s market benchmark, the BofA Merrill Lynch 1–3 Year US Corporate & Government Index, gained 0.70% while the Fund’s peer group, the Morningstar Short-Term Bond Funds Average, a group of mutual funds with similar investment objectives, gained 0.45%.
On an absolute basis, the Fund’s performance in 2013 benefitted from positive returns in the short-term corporate securities sector included in the Fund. Additionally, the Fund benefitted from an allocation to high-yield securities (“junk bonds”).
Relative to its market benchmark, the Fund outperformed primarily due to an overweight allocation to investment-grade corporate securities. Additionally, the Fund’s performance benefitted from an overweight allocation to high yield securities.
Relative to its peer group, the Fund outperformed primarily due to an overweight allocation to corporate securities.
The Fund used U.S. Treasury futures contracts to seek to manage interest rate risk and to seek to obtain investment exposure based on anticipated changes in interest rates. The use of these derivatives did not have a material impact to the Fund’s return. The Fund used forward currency contracts to manage foreign currency risk associated with the Fund’s foreign bond exposure, which reduced the volatility of returns, but detracted modestly from performance.
VIA uses more than one subadviser to manage the Fund’s assets. This multi-management strategy seeks to improve consistency of returns over time by eliminating reliance on the results of a single subadviser. The Fund’s subadvisers are as follows:
| | |
| Subadviser Data |
| |
| Payden & Rygel | | |
| |
| Investment Style: | | Low duration |
|
| Schroder Investment Management North America Inc. |
| |
| Investment Style: | | Low duration |
4
Vantagepoint Low Duration Bond Fund
Sector Allocation as of December 31, 2013 (% of Net Assets)
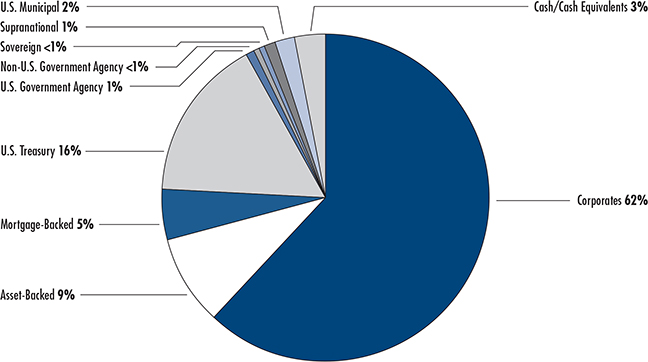
The primary source of sector allocation classification is BondEdge. Due to rounding, pie chart allocations may not add up to 100%.
Vantagepoint Low Duration Bond Fund—Investor Shares vs. BofA Merrill Lynch 1–3 Year US Corporate & Government Index | Growth of $10,000 Invested December 31, 2003*
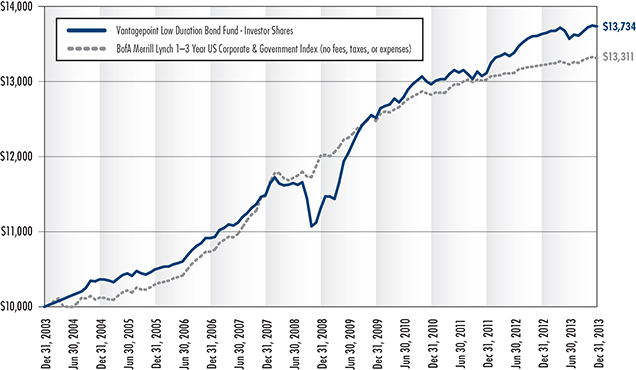
Source for Benchmark Returns: Morningstar®
5
Vantagepoint Low Duration Bond Fund
Average Annual Total Returns for the periods ended December 31, 2013*
| | | | |
| | | INVESTOR SHARES | | T SHARES |
One Year | | 0.75% | | 0.96% |
Three Years | | 1.95% | | 2.01% |
Five Years | | 3.96% | | 4.00% |
Ten Years | | 3.22% | | 3.24% |
Class Inception Date | | December 4, 2000 | | March 1, 2013 |
| * | Management’s Discussion of Fund Performance describes the performance of the Fund’s Investor Shares (the Fund’s outstanding shares were renamed “Investor Shares” on March 1, 2013). In the table, performance information for T Shares prior to the inception date of that share class (March 1, 2013) is based on the performance of the Fund’s Investor Shares. This prior performance has not been adjusted to reflect the actual fees and expenses paid by T Shares. |
Current performance may be higher or lower than the past performance presented in this report. Past performance is no guarantee of future performance. Investment returns and principal value will fluctuate so that shares, when redeemed, may be worth more or less than their original cost. The graph and the table do not reflect the deduction of taxes that a shareholder would pay on fund distributions or the redemption of fund shares. Current performance is available by calling 800-669-7400 or at www.icmarc.org/vpperformance.
The Fund’s market benchmark, the BofA Merrill Lynch 1–3 Year US Corporate & Government Index, tracks the performance of U.S. dollar-denominated investment grade government and corporate public debt securities issued in the U.S. domestic bond market with maturities ranging between 1 and 3 years. An index is not available for direct investment, is unmanaged, and does not reflect the costs of portfolio management or trading. The Fund’s portfolio may differ significantly from the securities in the index.
6
Vantagepoint Inflation Protected Securities Fund
The Vantagepoint Inflation Protected Securities Fund’s investment objective is to offer current income. The Fund invests, under normal circumstances, at least 80% of its net assets in inflation-adjusted U.S. and foreign fixed income securities and normally invests at least 50% of its net assets in U.S. Treasury inflation-protected securities (“TIPS”). The Fund’s investments in these securities may include fixed income securities issued or guaranteed by the U.S. government, foreign governments (national, regional, or local), their agencies or instrumentalities, or supra-national organizations (such as the World Bank); U.S. and foreign corporate fixed income securities; and municipal securities. Investments in U.S. and foreign fixed income securities whose values are not linked to adjustments in inflation rates are limited to 20% of the Fund’s net assets.
The Fund may invest up to 20% of its net assets in derivative instruments. The Fund’s subadvisers may use futures, options, and swap agreements to manage risk or obtain or adjust investment exposure. The Fund’s subadvisers also may use forward currency contracts to obtain or adjust investment exposure or to manage foreign currency risks. The Fund’s investments in credit default swaps, if any, will be less than 5% of the Fund’s net assets.
Performance
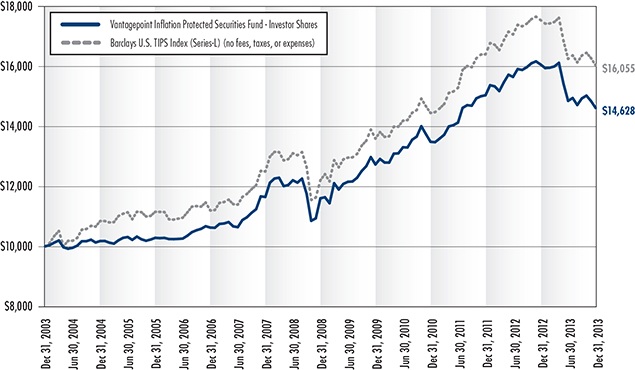
The Vantagepoint Inflation Protected Securities Fund’s Investor Shares lost 9.05% in 2013. The Fund’s market benchmark, the Barclays U.S. Treasury Inflation Protected Securities (TIPS) Index (Series-L), lost 8.61%, while the Fund’s peer group, the Morningstar Inflation-Protected Bond Funds Average, a group of mutual funds with similar investment objectives, lost 7.85%.
On an absolute basis, the Fund’s negative return in 2013 was primarily the result of unfavorable market conditions, with inflation-protected securities negatively impacted by the increase in real yields. Holdings in large corporate fixed income securities issued by large U.S. banks and non-agency mortgage-backed securities partly offset the loss.
Relative to its market benchmark, the Fund’s underperformance primarily resulted from a steepening in the yield curve as longer-term interest rates increased, while the Fund was positioned for a flatter yield curve. This underperformance was partially offset by exposure to investment-grade corporate fixed income securities and mortgage-backed securities.
Relative to its peer group, the Fund’s underperformance primarily reflected the portfolio’s longer duration as yields rose, and an overweight allocation to inflation-protected fixed income securities, which generally underperformed non-inflation protected fixed income securities.
The Fund used derivative instruments during the year to seek to manage interest rate risk and to seek to obtain investment exposure based on the Fund subadvisers’ views on interest rates, yield curves, and inflation. Derivatives used included bond futures, options, and swaps. The use of derivatives had a positive impact on the Fund’s return, partially offsetting its underperformance relative to its peer group and market benchmark.
VIA uses more than one subadviser to manage the Fund’s assets. This multi-management strategy seeks to improve consistency of returns over time by eliminating reliance on the results of a single subadviser. The Fund’s subadvisers are as follows:
| | |
| Subadviser Data | | |
|
| BlackRock Financial Management, Inc. |
| |
| Investment Style: | | Broad-based inflation-linked |
|
Pacific Investment Management Company, LLC |
| |
| Investment Style: | | Broad-based inflation-linked |
7
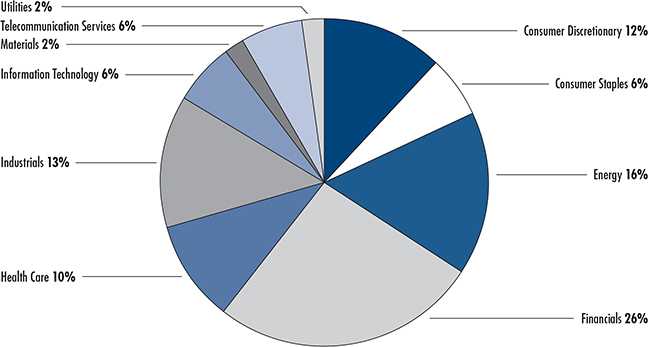
Vantagepoint Inflation Protected Securities Fund
Sector Allocation as of December 31, 2013 (% of Net Assets)
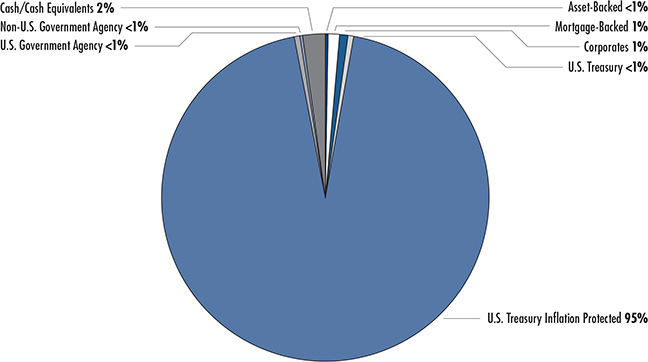
The primary source of sector allocation classification is BondEdge. Due to rounding, pie chart allocations may not add up to 100%.
Vantagepoint Inflation Protected Securities Fund—Investor Shares vs. Barclays U.S. TIPS Index (Series-L)
Growth of $10,000 Invested December 31, 2003*
Source for Benchmark Returns: Morningstar®
8
Vantagepoint Inflation Protected Securities Fund
Average Annual Total Returns for the periods ended December 31, 2013*
| | | | |
| | | INVESTOR SHARES | | T SHARES |
One Year | | –9.05% | | –8.81% |
Three Years | | 2.72% | | 2.81% |
Five Years | | 4.74% | | 4.79% |
Ten Years | | 3.88% | | 3.90% |
Class Inception Date | | July 1, 1992 | | March 1, 2013 |
| * | Management’s Discussion of Fund Performance describes the performance of the Fund’s Investor Shares (the Fund’s outstanding shares were renamed “Investor Shares” on March 1, 2013). In the table, performance information for T Shares prior to the inception date of that share class (March 1, 2013) is based on the performance of the Fund’s Investor Shares. This prior performance has not been adjusted to reflect the actual fees and expenses paid by T Shares. |
Current performance may be higher or lower than the past performance presented in this report. Past performance is no guarantee of future performance. Investment returns and principal value will fluctuate so that shares, when redeemed, may be worth more or less than their original cost. The graph and the table do not reflect the deduction of taxes that a shareholder would pay on fund distributions or the redemption of fund shares. Current performance is available by calling 800-669-7400 or at www.icmarc.org/vpperformance.
The Fund’s market benchmark, the Barclays U.S. Treasury Inflation Protected Securities (TIPS) Index (Series-L), consists of all U.S. Treasury inflation protected securities rated investment grade or better, having at least one year to final maturity and at least $250 million par amount outstanding. The Series-L reference identifies this index as the former Lehman Brothers U.S. TIPS Index. An index is not available for direct investment, is unmanaged, and does not reflect the costs of portfolio management or trading. The Fund’s portfolio may differ significantly from the securities held in the index.
9
Vantagepoint Equity Income Fund*
The Vantagepoint Equity Income Fund’s investment objective is to offer long-term capital growth with consistency derived from dividend yield. Throughtout 2013, the Fund’s principal investment strategy was to invest, under normal circumstances, at least 80% of its net assets in equity securities.* The Fund seeks to invest primarily in the common stocks of U.S. companies that the Fund’s subadvisers believe will pay dividends at above-market levels. As a result of the Fund’s income focus, certain sectors or industries may be emphasized. The Fund may exhibit greater sensitivity to certain economic factors, such as changing interest rates, than will the general stock market. The Fund may invest across companies of all sizes but generally focuses on larger capitalization companies, which tend to have stable long-term earnings and dividend-paying records. The Fund also may invest in foreign equity securities, U.S. and foreign convertible securities, and U.S. preferred stock.
Performance
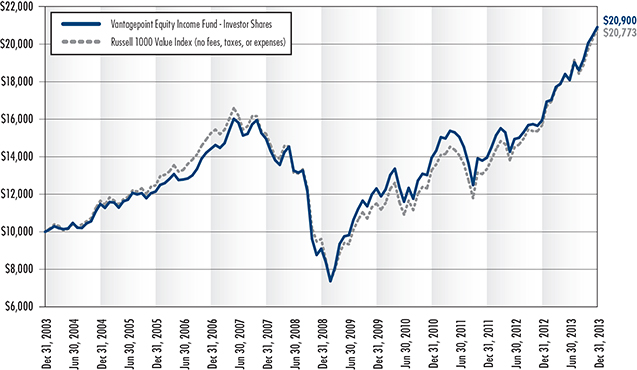
The Vantagepoint Equity Income Fund’s Investor Shares gained 31.11% in 2013. The Fund’s market benchmark, the Russell 1000 Value Index, gained 32.53%, while the Fund’s peer group, the Morningstar Large Value Funds Average, a group of mutual funds with similar investment objectives, gained 31.21%.
On an absolute basis, the Fund’s performance reflected the generally positive returns of the U.S. equity market in 2013. This positive performance resulted from the returns of all sectors in which the Fund had holdings, and particularly from performance in the Financials, Industrials, and Energy sectors.
Relative to its market benchmark, the Fund’s underperformance primarily resulted from the performance of holdings in the Information Technology and Health Care sectors. Performance of the Fund’s holdings in these sectors provided returns that were positive but lower than returns of the benchmark’s holdings in these sectors. Favorable performance from holdings in the Energy and Financials sectors partially offset this underperformance.
The Fund’s underperformance relative to its peer group primarily reflected returns from holdings in the Health Care and Consumer Discretionary sectors. This underperformance was partially offset by returns from holdings in the Energy and Information Technology sectors.
VIA uses more than one subadviser to manage the Fund’s assets. This multi-management strategy seeks to improve consistency of returns over time by eliminating reliance on the results of a single subadviser. The Fund’s subadvisers are as follows:
| | |
| Subadviser Data* | | |
|
| Barrow, Hanley, Mewhinney & Strauss, LLC |
| |
| Investment Style: | | Contrarian value |
|
| Southeastern Asset Management, Inc. |
| |
| Investment Style: | | Special situations |
|
| T. Rowe Price Associates, Inc. |
| |
| Investment Style: | | Relative yield value |
| * | On February 4, 2014, the Fund included an additional strategy which is an indexed or “passively managed” strategy. In addition, two new subadvisers, SSgA Funds Management, Inc. and Wellington Management Company, were added and a subadviser, Barrow, Hanley, Mewhinney & Strauss, LLC was terminated effective on that date. Please see the prospectus dated May 1, 2013 as revised February 4, 2014 for additional information. |
10
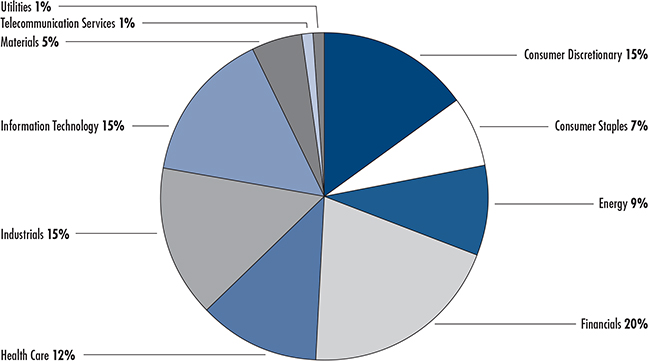
Vantagepoint Equity Income Fund
Sector Allocation as of December 31, 2013 (% of Total Investments)
The primary source of sector allocation classification is FactSet. Due to rounding, pie chart allocations may not add up to 100%.
Vantagepoint Equity Income Fund—Investor Shares vs. Russell 1000 Value Index
Growth of $10,000 Invested December 31, 2003*
Source for Benchmark Returns: Morningstar®
11
Vantagepoint Equity Income Fund
Average Annual Total Returns for the periods ended December 31, 2013*
| | | | |
| | | INVESTOR SHARES | | T SHARES |
One Year | | 31.11% | | 31.36% |
Three Years | | 14.46% | | 14.53% |
Five Years | | 18.10% | | 18.15% |
Ten Years | | 7.65% | | 7.67% |
Class Inception Date | | April 1, 1994 | | March 1, 2013 |
| * | Management’s Discussion of Fund Performance describes the performance of the Fund’s Investor Shares (the Fund’s outstanding shares were renamed “Investor Shares” on March 1, 2013). In the table, performance information for T Shares prior to the inception date of that share class (March 1, 2013) is based on the performance of the Fund’s Investor Shares. This prior performance has not been adjusted to reflect the actual fees and expenses paid by T Shares. |
Current performance may be higher or lower than the past performance presented in this report. Past performance is no guarantee of future performance. Investment returns and principal value will fluctuate so that shares, when redeemed, may be worth more or less than their original cost. The graph and the table do not reflect the deduction of taxes that a shareholder would pay on fund distributions or the redemption of fund shares. Current performance is available by calling 800-669-7400 or at www.icmarc.org/vpperformance.
The Fund’s market benchmark, the Russell 1000 Value Index, measures the performance of the large-cap value segment of the U.S. equity universe. It includes those Russell 1000 Index companies with lower price-to-book ratios and lower expected growth values. An index is not available for direct investment, is unmanaged, and does not reflect the costs of portfolio management or trading. The Fund’s portfolio may differ significantly from the securities in the index.
12
Vantagepoint Growth & Income Fund
The Vantagepoint Growth & Income Fund’s investment objective is to offer long-term capital growth and current income. The Fund invests, under normal circumstances, primarily in U.S. common stocks that the Fund’s subadvisers believe offer the potential for capital appreciation or that may provide current income by paying dividends. Strategies used by the Fund’s subadvisers include: (i) focusing on large-capitalization U.S. companies whose common stocks are believed to offer potential for price appreciation because of undervaluation, earnings growth or both; and (ii) emphasizing U.S. stocks that may pay dividends. The Fund also may invest in foreign equity securities, mid-capitalization equity securities, U.S. preferred stock, and U.S. convertible securities.
Performance
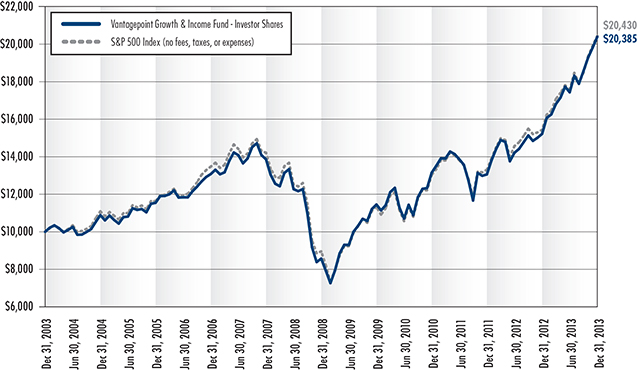
The Vantagepoint Growth & Income Fund’s Investor Shares gained 34.01% in 2013. The Fund’s market benchmark, the S&P 500 Index, gained 32.39%, while the Fund’s peer group, the Morningstar Large Blend Funds Average, a group of mutual funds with similar investment objectives, gained 31.50%.
On an absolute basis, the Fund’s performance reflected the generally positive returns of the U.S. equity market in 2013. This positive performance resulted from the returns of all sectors in which the Fund had holdings and particularly from performance in the Financials, Industrials, and Consumer Discretionary sectors.
The Fund’s outperformance relative to its market benchmark primarily resulted from the performance of holdings in the Financials, Information Technology, and Industrials sectors.
Relative to its peer group, the Fund’s outperformance primarily reflected returns from holdings in the Financials and Health Care sectors.
VIA uses more than one subadviser to manage the Fund’s assets. This multi-management strategy seeks to improve consistency of returns over time by eliminating reliance on the results of a single subadviser. The Fund’s subadvisers are as follows:
| | |
| Subadviser Data | | |
|
| Fiduciary Management, Inc. |
| |
| Investment Style: | | Large-cap blend |
|
| T. Rowe Price Associates, Inc. |
| |
| Investment Style: | | Blue chip growth |
|
| Wellington Management Company, LLP |
| |
| Investment Style: | | Yield focused |
13
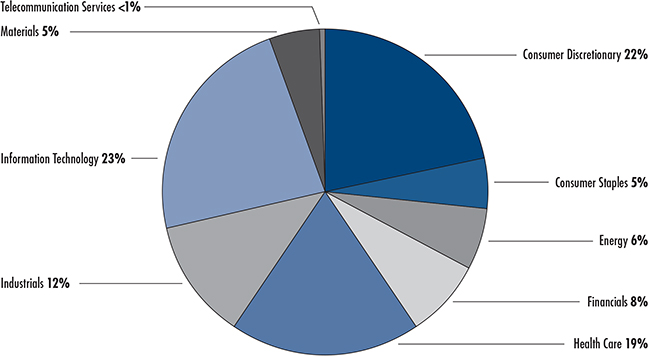
Vantagepoint Growth & Income Fund
Sector Allocation as of December 31, 2013 (% of Total Investments)
The primary source of sector allocation classification is FactSet. Due to rounding, pie chart allocations may not add up to 100%.
Vantagepoint Growth & Income Fund—Investor Shares vs. S&P 500 Index
Growth of $10,000 Invested December 31, 2003*
Source for Benchmark Returns: Morningstar®
14
Vantagepoint Growth & Income Fund
Average Annual Total Returns for the periods ended December 31, 2013*
| | | | |
| | | INVESTOR SHARES | | T SHARES |
One Year | | 34.01% | | 34.26% |
Three Years | | 15.75% | | 15.82% |
Five Years | | 18.93% | | 18.97% |
Ten Years | | 7.38% | | 7.40% |
Class Inception Date | | October 2, 1998 | | March 1, 2013 |
| * | Management’s Discussion of Fund Performance describes the performance of the Fund’s Investor Shares (the Fund’s outstanding shares were renamed “Investor Shares” on March 1, 2013). In the table, performance information for T Shares prior to the inception date of that share class (March 1, 2013) is based on the performance of the Fund’s Investor Shares. This prior performance has not been adjusted to reflect the actual fees and expenses paid by T Shares. |
Current performance may be higher or lower than the past performance presented in this report. Past performance is no guarantee of future performance. Investment returns and principal value will fluctuate so that shares, when redeemed, may be worth more or less than their original cost. The graph and the table do not reflect the deduction of taxes that a shareholder would pay on fund distributions or the redemption of fund shares. Current performance is available by calling 800-669-7400 or at www.icmarc.org/vpperformance.
The Fund’s market benchmark, the S&P 500 Index, consists of 500 companies representing larger capitalization stocks traded in the U.S. An index is not available for direct investment, is unmanaged, and does not reflect the costs of portfolio management or trading. The Fund’s portfolio may differ significantly from the securities in the index.
15
Vantagepoint Growth Fund
The Vantagepoint Growth Fund’s investment objective is to offer long-term capital growth. The Fund invests, under normal circumstances, primarily in U.S. common stocks that are considered by the Fund’s subadvisers to have above-average potential for growth. The subadvisers emphasize stocks of seasoned medium- and large-capitalization firms. The Fund also may invest in foreign equity securities, small-capitalization equity securities, U.S. preferred stock, and U.S. convertible securities.
Performance
The Vantagepoint Growth Fund’s Investor Shares gained 33.71% in 2013. The Fund’s market benchmark, the Russell 1000 Growth Index, gained 33.48% for the year. The Fund’s peer group, the Morningstar Large Growth Funds Average, a group of mutual funds with similar investment objectives, gained 33.92%.
On an absolute basis, the Fund’s performance reflected the generally positive returns of the U.S. equity market in 2013. This positive performance resulted from returns in all sectors in which the Fund had holdings and particularly from performance in the Consumer Discretionary and Health Care sectors.
The Fund’s outperformance relative to its market benchmark primarily resulted from the performance of holdings in the Health Care, Financials, and Consumer Discretionary sectors.
The Fund’s underperformance relative to its peer group primarily resulted from the returns of holdings in the Health Care and Consumer Discretionary sectors. While the Fund’s holdings in Health Care outperformed the market benchmark holdings in this sector, they underperformed the peer benchmark performance in this sector. The Fund’s underperformance relative to its peer group was partially offset by returns from holdings in the Consumer Staples and Financials sectors.
VIA uses more than one subadviser to manage the Fund’s assets. This multi-management strategy seeks to improve consistency of returns over time by eliminating reliance on the results of a single subadviser. The Fund’s subadvisers are as follows:
| | |
| Subadviser Data | | |
|
| Atlanta Capital Management Company, LLC |
| |
| Investment Style: | | Large-cap growth |
|
| Columbus Circle Investors |
| |
| Investment Style: | | Large-cap growth |
|
| Victory Capital Management Inc. |
| |
| Investment Style: | | Large-cap growth |
|
| Westfield Capital Management Company, L.P. |
| |
| Investment Style: | | Large-cap growth |
16
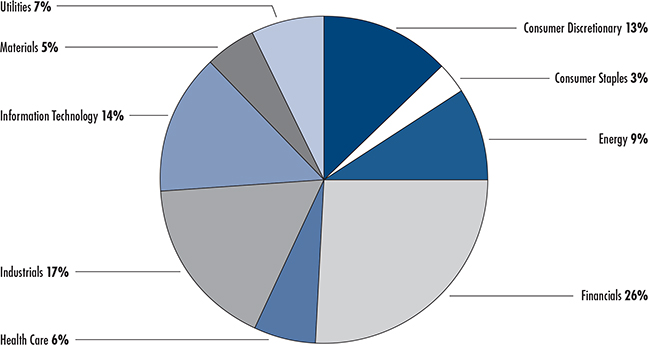
Vantagepoint Growth Fund
Sector Allocation as of December 31, 2013 (% of Total Investments)
The primary source of sector allocation classification is FactSet. Due to rounding, pie chart allocations may not equal 100%.
Vantagepoint Growth Fund—Investor Shares vs. Russell 1000 Growth Index
Growth of $10,000 Invested December 31, 2003*
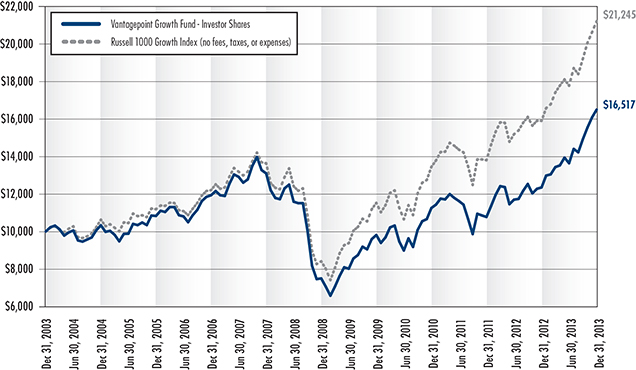
Source for Benchmark Returns: Morningstar®
17
Vantagepoint Growth Fund
Average Annual Total Returns for the periods ended December 31, 2013*
| | | | |
| | | INVESTOR SHARES | | T SHARES |
One Year | | 33.71% | | 34.06% |
Three Years | | 13.65% | | 13.75% |
Five Years | | 17.15% | | 17.21% |
Ten Years | | 5.15% | | 5.17% |
Class Inception Date | | April 1, 1983 | | March 1, 2013 |
| * | Management’s Discussion of Fund Performance describes the performance of the Fund’s Investor Shares (the Fund’s outstanding shares were renamed “Investor Shares” on March 1, 2013). In the table, performance information for T Shares prior to the inception date of that share class (March 1, 2013) is based on the performance of the Fund’s Investor Shares. This prior performance has not been adjusted to reflect the actual fees and expenses paid by T Shares. |
Current performance may be higher or lower than the past performance presented in this report. Past performance is no guarantee of future performance. Investment returns and principal value will fluctuate so that shares, when redeemed, may be worth more or less than their original cost. The graph and the table do not reflect the deduction of taxes that a shareholder would pay on fund distributions or the redemption of fund shares. Current performance is available by calling 800-669-7400 or at www.icmarc.org/vpperformance.
The Fund’s market benchmark, the Russell 1000 Growth Index, measures the performance of the large-cap growth segment of the U.S. equity universe. It includes those Russell 1000 Index companies with higher price-to-book ratios and higher forecasted growth values. An index is not available for direct investment, is unmanaged, and does not reflect the costs of portfolio management or trading. The Fund’s portfolio may differ significantly from the securities in the index.
18
Vantagepoint Select Value Fund
The Vantagepoint Select Value Fund’s investment objective is to offer long-term growth from dividend income and capital appreciation. The Fund invests, under normal circumstances, primarily in common stocks of mid-capitalization U.S. companies that the Fund’s subadvisers believe present attractive investment opportunities at favorable prices in relation to the intrinsic worth of the issuer and may also offer the possibility for growth through reinvestment of dividends. The Fund generally seeks to invest in common stocks of companies with market capitalizations that fall within the range of companies in the Russell Midcap® Value Index. The Fund may invest up to 10% of its net assets in real estate investment trusts. The Fund also may invest in foreign equity securities, U.S. preferred stocks, U.S. convertible securities, and small-capitalization equity securities.
Performance
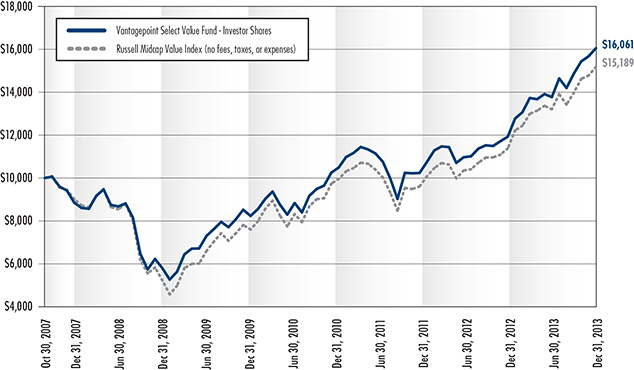
The Vantagepoint Select Value Fund’s Investor Shares gained 34.65% in 2013. The Fund’s market benchmark, the Russell Midcap Value Index, gained 33.46%, while the Fund’s peer group, the Morningstar Mid-Cap Value Funds Average, a group of mutual funds with similar investment objectives, gained 35.14%.
On an absolute basis, the Fund’s positive performance reflected the generally positive returns for mid-capitalization stocks in the U.S. equity market in 2013. This positive performance resulted from returns in all sectors in which the Fund had holdings and particularly from performance in the Financials, Industrials, and Information Technology sectors.
Relative to its market benchmark, the Fund’s outperformance primarily resulted from the performance of holdings in the Financials and Industrials sectors and an underweight allocation to the Utilities sector, which was the weakest performing sector in the market benchmark.
The Fund’s underperformance relative to its peer group primarily reflected returns from the Fund’s holdings in the Financials, Utilities, and Information Technology sectors. While performance from the Fund’s holdings in these sectors was positive, and in some cases better than the market benchmark performance in these sectors, the peer benchmark performance in these sectors was higher. The Fund’s underperformance relative to its benchmark was partially offset by favorable returns from holdings in the Consumer Staples sector.
VIA uses more than one subadviser to manage the Fund’s assets. This multi-management strategy seeks to improve consistency of returns over time by eliminating reliance on the results of a single subadviser. The Fund’s subadvisers are as follows:
| | |
| Subadviser Data | | |
|
| Artisan Partners Limited Partnership |
| |
| Investment Style: | | Contrarian value |
|
| Systematic Financial Management, L.P. |
| |
| Investment Style: | | Relative value |
|
| WEDGE Capital Management, L.L.P. |
| |
| Investment Style: | | Concentrated traditional value |
19
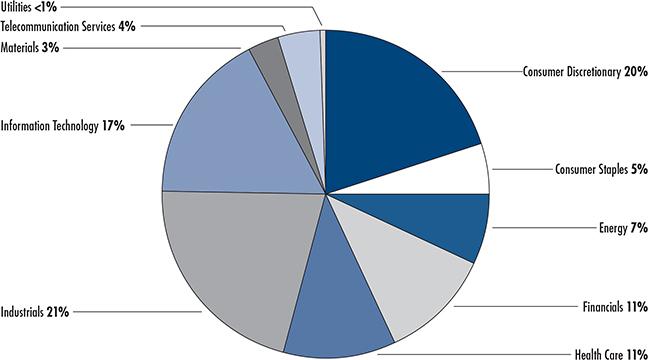
Vantagepoint Select Value Fund
Sector Allocation as of December 31, 2013 (% of Total Investments)
The primary source of sector allocation classification is FactSet. Due to rounding, pie chart allocations may not add up to 100%.
Vantagepoint Select Value Fund—Investor Shares vs. Russell Midcap Value Index
Growth of $10,000 Invested October 30, 2007*
Source for Benchmark Returns: Morningstar®
20
Vantagepoint Select Value Fund
Average Annual Total Returns for the periods ended December 31, 2013*
| | | | |
| | | INVESTOR SHARES | | T SHARES |
One Year | | 34.65% | | 34.96% |
Three Years | | 16.15% | | 16.24% |
Five Years | | 20.90% | | 20.96% |
Since Inception | | 7.97% | | 8.01% |
Class Inception Date | | October 30, 2007 | | March 1, 2013 |
| * | Management’s Discussion of Fund Performance describes the performance of the Fund’s Investor Shares (the Fund’s outstanding shares were renamed “Investor Shares” on March 1, 2013). In the table, performance information for T Shares prior to the inception date of that share class (March 1, 2013) is based on the performance of the Fund’s Investor Shares. This prior performance has not been adjusted to reflect the actual fees and expenses paid by T Shares. |
Current performance may be higher or lower than the past performance presented in this report. Past performance is no guarantee of future performance. Investment returns and principal value will fluctuate so that shares, when redeemed, may be worth more or less than their original cost. The graph and the table do not reflect the deduction of taxes that a shareholder would pay on fund distributions or the redemption of fund shares. Current performance is available by calling 800-669-7400 or at www.icmarc.org/vpperformance.
The Fund’s market benchmark, the Russell Midcap Value Index, measures the performance of the mid-cap value segment of the U.S. equity universe. It includes those Russell Midcap Index companies with lower price-to-book ratios and lower forecasted growth values. An index is not available for direct investment, is unmanaged, and does not reflect the costs of portfolio management or trading. The Fund’s portfolio may differ significantly from the securities in the index.
21
Vantagepoint Aggressive Opportunities Fund
The Vantagepoint Aggressive Opportunities Fund’s investment objective is to offer high long-term capital appreciation. The Fund invests, under normal circumstances, primarily in common stocks of small- to mid-capitalization U.S. and foreign companies. One or more of the Fund’s subadvisers employing an “actively-managed” strategy seeks to select common stocks it believes offer the opportunity for high capital appreciation. In addition, a portion of the Fund invests in (or obtains exposure to) stocks included in a custom version of the Russell Midcap® Growth Index, following an indexed or “passively managed” approach to investing. The range of stocks in which the Fund normally invests is expected to be that of the Russell Midcap® Index. The Fund also may invest in foreign equity securities (including those of issuers located in emerging market countries), U.S. preferred stock, and U.S. and foreign convertible securities.
The Fund’s subadvisers may use futures and options to manage risk or to obtain or adjust investment exposure. The Fund’s subadvisers also may manage foreign currency risks by using forward currency contracts. Investments in derivatives are limited to 10% of the Fund’s net assets but normally will not exceed 5% of the Fund’s net assets.
Performance
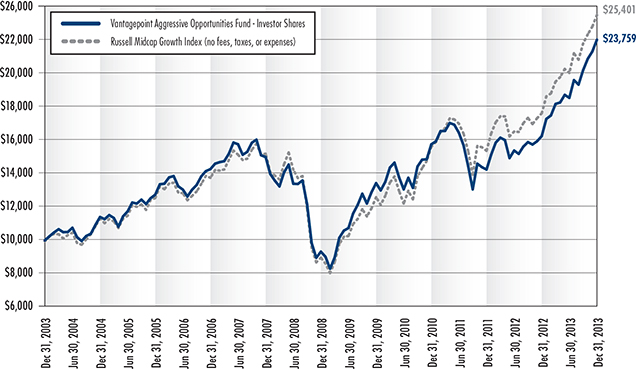
The Vantagepoint Aggressive Opportunities Fund’s Investor Shares gained 38.53% in 2013. The Fund’s market benchmark, the Russell Midcap Growth Index, gained 35.74%, while its peer group, the Morningstar Mid-Cap Growth Funds Average, a group of mutual funds with similar investment objectives, gained 34.93%.
On an absolute basis, the Fund’s performance reflected the generally positive returns for mid- and small- capitalization stocks in the U.S. equity market in 2013. This positive performance resulted from returns in all sectors in which the Fund had holdings and particularly from performance in the Consumer Discretionary, Industrials, and Information Technology sectors.
The Fund’s outperformance relative to its market benchmark primarily resulted from the performance of holdings in the Information Technology, Industrials, and Financials sectors.
The Fund’s outperformance relative to its peer group primarily reflected returns from holdings in the Industrials, Consumer Staples, and Consumer Discretionary sectors.
VIA uses more than one subadviser to manage the Fund’s assets. This multi-management strategy seeks to improve consistency of returns over time by eliminating reliance on the results of a single subadviser. The Fund’s subadvisers are as follows:
| | |
| |
| Subadviser Data | | |
|
| Southeastern Asset Management, Inc. |
| |
| Investment Style: | | Special situations |
|
| SSgA Funds Management, Inc. |
| |
| Investment Style: | | Passive indexing |
|
| TimesSquare Capital Management, LLC |
| |
| Investment Style: | | Growth opportunities |
|
| Wells Capital Management Inc. |
| |
| Investment Style: | | Fundamental small and medium capitalization growth equity |
22
Vantagepoint Aggressive Opportunities Fund
Sector Allocation as of December 31, 2013 (% of Total Investments)
The primary source of sector allocation classification is FactSet. Due to rounding, pie chart allocations may not add up to 100%.
Vantagepoint Aggressive Opportunities Fund—Investor Shares vs. Russell Midcap Growth Index
Growth of $10,000 Invested December 31, 2003*
Source for Benchmark Returns: Morningstar®
23
Vantagepoint Aggressive Opportunities Fund
Average Annual Total Returns for the periods ended December 31, 2013*
| | | | |
| | | INVESTOR SHARES | | T SHARES |
One Year | | 38.53% | | 38.78% |
Three Years | | 12.73% | | 12.80% |
Five Years | | 20.83% | | 20.88% |
Ten Years | | 9.04% | | 9.06% |
Class Inception Date | | October 1, 1994 | | March 1, 2013 |
| * | Management’s Discussion of Fund Performance describes the performance of the Fund’s Investor Shares (the Fund’s outstanding shares were renamed “Investor Shares” on March 1, 2013). In the table, performance information for T Shares prior to the inception date of that share class (March 1, 2013) is based on the performance of the Fund’s Investor Shares. This prior performance has not been adjusted to reflect the actual fees and expenses paid by T Shares. |
Current performance may be higher or lower than the past performance presented in this report. Past performance is no guarantee of future performance. Investment returns and principal value will fluctuate so that shares, when redeemed, may be worth more or less than their original cost. The graph and the table do not reflect the deduction of taxes that a shareholder would pay on fund distributions or the redemption of fund shares. Current performance is available by calling 800-669-7400 or at www.icmarc.org/vpperformance.
The Fund’s market benchmark, the Russell Midcap Growth Index, measures the performance of the mid-cap growth segment of the U.S. equity universe. It includes those Russell Midcap Index companies with higher price-to-book ratios and higher forecasted growth values. An index is not available for direct investment, is unmanaged, and does not reflect the costs of portfolio management or trading. The Fund’s portfolio may differ significantly from the securities in the index.
24
Vantagepoint Discovery Fund
The Vantagepoint Discovery Fund’s investment objective is to offer long-term capital growth. The Fund invests, under normal circumstances, primarily in a combination of common stocks of U.S. small capitalization companies, Russell 2000® Index futures contracts, and U.S. and foreign fixed income securities. The Fund’s subadvisers select stocks that they believe have above average potential for growth and that generally have market capitalizations that fall within the range of companies in the Russell 2000® Index. The Fund’s U.S. and foreign fixed income securities (1) are held, in part, as collateral in conjunction with the Fund’s use of futures contracts; (2) may include: government and agency securities, corporate bonds, mortgage-backed securities, asset-backed securities, and municipal securities; and (3) at all times have a portfolio effective duration no greater than three years. Effective duration is a measure of the expected change in value of a fixed income security for a given change in interest rates, and takes into account that expected cash flows will fluctuate as interest rates change. The Fund also may invest in foreign equity securities (including those of issuers located in emerging market countries), U.S. preferred stock, and U.S. and foreign convertible securities. The Fund’s fixed income securities are generally investment grade securities (i.e., securities rated within the four highest grades by a major ratings agency or unrated securities that the Fund’s subadvisers determine are of comparable quality). In addition to Russell 2000 Index futures contracts, the Fund’s subadvisers may use futures, options, and swap agreements to manage risk, or to obtain or adjust investment exposure. The Fund’s subadvisers also may use forward currency contracts to obtain or adjust investment exposure or to manage foreign currency risks. The Fund’s investments in derivative instruments are limited to 15% of the Fund’s net assets.
Performance
The Vantagepoint Discovery Fund’s Investor Shares gained 39.34% in 2013. The Fund’s market benchmark, the Russell 2000 Index, gained 38.82%, while its peer group, the Morningstar Small Blend Funds Average, a group of mutual funds with similar investment objectives, gained 37.39%.
On an absolute basis, the Fund’s performance primarily reflected the generally positive returns for small-capitalization stocks and futures on those stocks in the U.S. equity market in 2013. The positive return for the Fund primarily resulted from the performance of holdings in the Consumer Discretionary, Industrials, and Information Technology sectors. The Fund’s fixed income securities, held in conjunction with the Russell 2000 Index futures contracts, generated positive returns.
The Fund’s outperformance relative to its market benchmark primarily resulted from the performance of holdings in the Consumer Discretionary and Industrial sectors.
The Fund’s outperformance relative to its peer group primarily reflected returns from holdings in the Information Technology, Consumer Discretionary, and Industrials sectors.
The Fund used derivative instruments during the year. Consistent with the Fund’s principal investment strategy, the Fund invested in Russell 2000 Index futures to seek to gain market exposure to U.S. small-capitalization stocks. The use of Russell 2000 Index futures had a material positive impact on Fund performance. In conjunction with the fixed income securities associated with the Russell 2000 Index futures contracts, the Fund used bond futures during the year to seek to manage interest rate risk and to seek to obtain investment exposure based on the Fund subadvisers’ views on interest rates and yield curves. These bond futures did not have a material impact on the Fund’s performance. The Fund used forward currency contracts to manage foreign currency risk associated with the Fund’s foreign bond exposure. The use of forward currency contracts reduced the volatility of returns to the Fund throughout the year but did not have a material impact on the Fund’s return.
VIA uses more than one subadviser to manage the Fund’s assets. This multi-management strategy seeks to improve consistency of returns over time by eliminating reliance on the results of a single subadviser. The Fund’s subadvisers are as follows:
| | |
| Subadviser Data | | |
| |
| Payden & Rygel | | |
| |
| Investment Style: | | Enhanced index |
|
| Wellington Management Company, LLP |
| |
| Investment Style: | | Diversified small-blend |
25
Vantagepoint Discovery Fund Asset Class Exposure
as of December 31, 2013* (% of Net Assets)
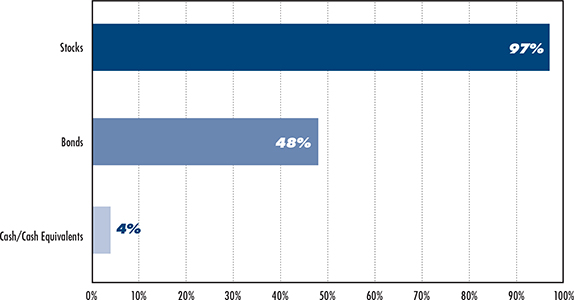
| * | For the Vantagepoint Discovery Fund, portfolio exposures represent the market value of physical securities and a measurement of exposure through the derivative instruments held by the Fund as a percentage of the Fund’s net assets. For the purpose of displaying this allocation information, exposure through derivatives is measured based on the value of the underlying assets, rate or index represented by the derivative. This measurement is different from the valuation used for the purposes of calculating the Fund’s net asset value, is intended to reflect the “economic exposure” of the derivative, and results in a total percentage in the chart that exceeds 100%. |
Vantagepoint Discovery Fund
Fixed Income Sector Allocation as of December 31, 2013* (% of Net Assets excluding Equities)
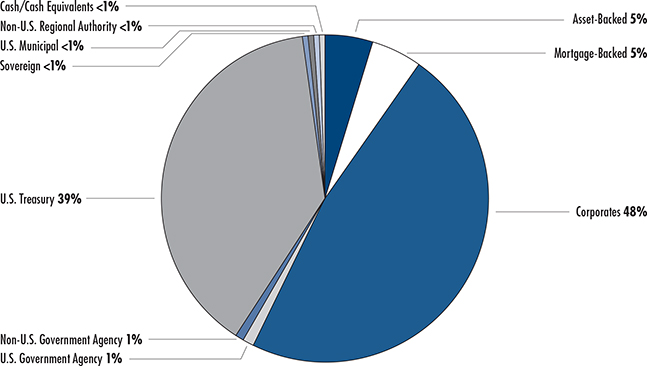
| * | The Fixed Income Sector Allocation reflected in this pie chart was calculated using the actual fixed income securities held by the Fund. This pie chart represents the portion of the Fund classified as Bonds in the Asset Class Exposure Table. The primary source of fixed income sector classification is BondEdge. Due to rounding, pie chart allocations may not equal 100%. |
26
Vantagepoint Discovery Fund
Equity Sector Allocation as of December 31, 2013* (% of Total Investments excluding Bonds and Cash/Cash Equivalents)
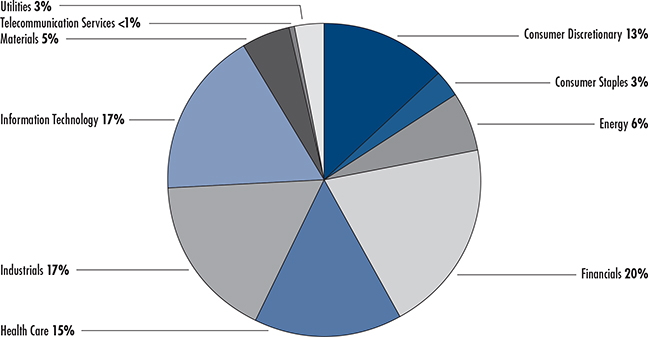
| * | The Equity Sector Allocation reflected in this pie chart was calculated using the actual equity securities held by the Fund and blending them with the sectors represented in the Russell 2000 Index futures held by this Fund. This pie chart represents the portion of the Fund classified as Stocks in the Asset Class Exposure Table. |
The primary source of equity sector classification is FactSet. Due to rounding, pie chart allocations may not equal 100%.
Vantagepoint Discovery Fund—Investor Shares vs. Russell 2000 Index
Growth of $10,000 Invested October 30, 2007*
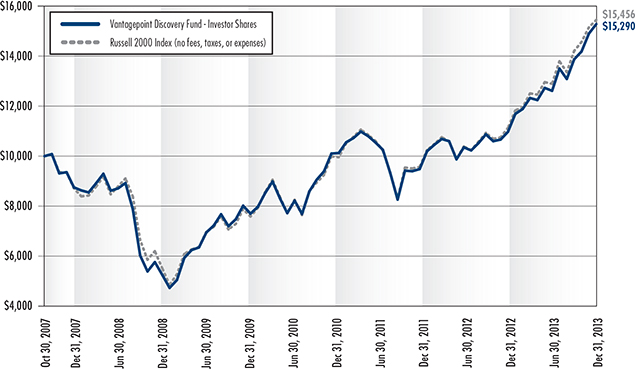
Source for Benchmark Returns: Morningstar®
27
Vantagepoint Discovery Fund
Average Annual Total Returns for the periods ended December 31, 2013*
| | | | |
| | | INVESTOR SHARES | | T SHARES |
One Year | | 39.34% | | 39.58% |
Three Years | | 14.81% | | 14.88% |
Five Years | | 21.60% | | 21.64% |
Since Inception | | 7.12% | | 7.14% |
Class Inception Date | | October 30, 2007 | | March 1, 2013 |
| * | Management’s Discussion of Fund Performance describes the performance of the Fund’s Investor Shares (the Fund’s outstanding shares were renamed “Investor Shares” on March 1, 2013). In the table, performance information for T Shares prior to the inception date of that share class (March 1, 2013) is based on the performance of the Fund’s Investor Shares. This prior performance has not been adjusted to reflect the actual fees and expenses paid by T Shares. |
Current performance may be higher or lower than the past performance presented in this report. Past performance is no guarantee of future performance. Investment returns and principal value will fluctuate so that shares, when redeemed, may be worth more or less than their original cost. The graph and the table do not reflect the deduction of taxes that a shareholder would pay on fund distributions or the redemption of fund shares. Current performance is available by calling 800-669-7400 or at www.icmarc.org/vpperformance.
The Fund’s market benchmark, the Russell 2000 Index, measures the performance of the small-cap segment of the U.S. equity universe. The Russell 2000 Index is a subset of the Russell 3000 Index, and includes approximately 2,000 of the smallest securities based on a combination of their market cap and current index membership. An index is not available for direct investment, is unmanaged, and does not reflect the costs of portfolio management or trading. The Fund’s portfolio may differ significantly from the securities in the index.
28
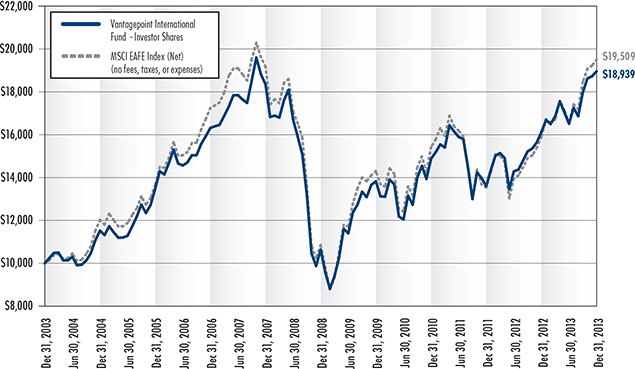
Vantagepoint International Fund
The Vantagepoint International Fund’s investment objective is to offer long-term capital growth and diversification by country. The Fund invests primarily in the common stocks of companies headquartered outside of the United States. Under normal circumstances, the Fund invests at least 80% of its net assets in foreign equity securities, including those of issuers located in emerging market countries. Strategies used by the Fund’s subadvisers include: 1) investing in equity securities believed to have above average potential for growth across multiple capitalization sizes; and 2) investing in equity securities believed to be priced below fair market value at the time of purchase. The Fund also may invest in U.S. or foreign fixed income securities, U.S. equity securities, and U.S. or foreign convertible securities.
The Fund’s subadvisers may use futures and options to manage risk or to obtain or adjust investment exposure. The Fund’s subadvisers also may use forward currency contracts to obtain or adjust investment exposure or to manage foreign currency risks. Investments in derivatives are limited to 10% of the Fund’s net assets but normally will not exceed 5% of the Fund’s net assets.
Performance
The Vantagepoint International Fund’s Investor Shares gained 17.43% in 2013. The Fund’s market benchmark, the MSCI Europe Australasia and Far East (EAFE) Index (Net), gained 22.78%, while its peer group, the Morningstar Foreign Large Blend Funds Average, a group of mutual funds with similar investment objectives, gained 19.44%.
On an absolute basis, the Fund’s return reflected the generally positive returns to U.S. investors from stocks of companies in developed foreign countries. The Fund experienced gains in all geographic regions with the exception of the emerging markets. The positive return for the Fund primarily resulted from the performance of holdings in continental Europe, the U.K, and Japan, with returns to U.S. investors in Japan reduced by the currency effect of a weakened yen.
The Fund’s underperformance relative to its market benchmark primarily resulted from an overweight allocation to emerging markets, which underperformed developed markets. This underperformance was partially offset by returns from holdings in the U.K. and an underweight allocation to Asia excluding Japan.
The Fund’s underperformance relative to its peer group primarily reflected the Fund’s performance in the emerging market countries, which was partially offset by outperformance in Japan and from holdings in the U.K.
The Fund used forward foreign currency contracts during the year to manage foreign currency risk, which served to reduce the impact of foreign currency fluctuations on U.S. dollar returns and, to obtain or adjust investment exposure to foreign currencies to facilitate the trading of the foreign securities in which the Fund is invested. The use of foreign currency contracts did not have a material impact on the Fund’s return.
VIA uses more than one subadviser to manage the Fund’s assets. This multi-management strategy seeks to improve consistency of returns over time by eliminating reliance on the results of a single subadviser. The Fund’s subadvisers are as follows:
| | |
| Subadviser Data | | |
|
| Artisan Partners Limited Partnership |
| |
| Investment Style: | | International growth opportunities |
|
| GlobeFlex Capital, LP |
| |
| Investment Style: | | Diversified all-cap |
|
| Mondrian Investment Partners Limited |
| |
| Investment Style: | | Value-oriented international |
|
| Walter Scott & Partners Limited |
| |
| Investment Style: | | Emerging Markets |
| | Concentrated Growth |
29
Vantagepoint International Fund
Country Allocation as of December 31, 2013 (% of Net Assets)
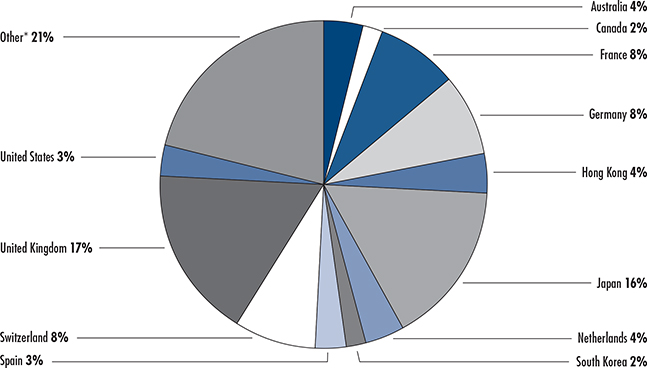
*Other represents countries with under a 2.0% individual weighting.
The primary source of country allocation classification is FactSet. Due to rounding, pie chart allocations may not add up to 100%.
Vantagepoint International Fund—Investor Shares vs. MSCI EAFE Index (Net)
Growth of $10,000 Invested December 31, 2003*
Source for Benchmark Returns: Morningstar®
30
Vantagepoint International Fund
Average Annual Total Returns for the periods ended December 31, 2013*
| | | | |
| | | INVESTOR SHARES | | T SHARES |
One Year | | 17.43% | | 17.77% |
Three Years | | 8.38% | | 8.49% |
Five Years | | 12.23% | | 12.30% |
Ten Years | | 6.59% | | 6.63% |
Class Inception Date | | October 1, 1994 | | March 1, 2013 |
| * | Management’s Discussion of Fund Performance describes the performance of the Fund’s Investor Shares (the Fund’s outstanding shares were renamed “Investor Shares” on March 1, 2013). In the table, performance information for T Shares prior to the inception date of that share class (March 1, 2013) is based on the performance of the Fund’s Investor Shares. This prior performance has not been adjusted to reflect the actual fees and expenses paid by T Shares. |
Current performance may be higher or lower than the past performance presented in this report. Past performance is no guarantee of future performance. Investment returns and principal value will fluctuate so that shares, when redeemed, may be worth more or less than their original cost. The graph and the table do not reflect the deduction of taxes that a shareholder would pay on fund distributions or the redemption of fund shares. Current performance is available by calling 800-669-7400 or at www.icmarc.org/vpperformance.
The Fund’s market benchmark, the MSCI Europe Australasia Far East (EAFE) Index (Net), is a free float-adjusted market capitalization index of equity securities that is designed to measure the equity market performance of developed markets, excluding the U.S. and Canada, and approximates the minimum possible dividend reinvestment after deduction of withholding tax according to MSCI Barra’s methodology. An index is not available for direct investment, is unmanaged, and does not reflect the costs of portfolio management or trading. The Fund’s portfolio may differ significantly from the securities in the index.
31
Vantagepoint Diversifying Strategies Fund*
The Vantagepoint Diversifying Strategies Fund’s investment objective is to offer long-term capital growth. The Fund employs multiple investment strategies to seek long-term growth of capital, with lower volatility over time than that of stocks in general and a risk/return profile different from that of traditional asset classes, such as stocks and fixed income securities (i.e., a “low correlation” to such asset classes).* In combination, the Fund’s investment strategies seek to provide investment exposure to U.S. and foreign stocks, fixed income securities, convertible securities, and foreign currencies through direct investments or through the use of derivative instruments. The Fund employed three strategies in 2013 — a global tactical asset allocation strategy, a low duration-plus fixed income strategy, and a convertible securities strategy. The Fund’s assets allocated to the global tactical asset allocation strategy are invested in derivative instruments that provide investment exposure to fixed income securities, and currencies and equity securities issued by issuers located in any part of the world, including emerging market countries. The Fund’s assets allocated to the low duration-plus fixed income strategy are invested in core short and intermediate maturity U.S. and foreign fixed income securities that combined generally have a portfolio effective duration of no greater than three years. Effective duration is a measure of the expected change in value of a fixed income security for a given change in interest rates, and takes into account that expected cash flows will fluctuate as interest rates change. The Fund’s assets allocated to the convertible securities strategy are invested in U.S. and foreign convertible securities (which may include securities of issuers located in emerging market countries), and also may be invested in a combination of either convertible or non-convertible bonds, and common stocks or equity options, to seek to replicate the investment exposure of convertible securities or to seek to manage risk. In addition, the Fund’s assets allocated to this strategy may also be invested in non-convertible bonds, common stocks as well as restricted securities.
The Fund uses derivative instruments, including futures and options, swap agreements, and forward currency contracts to achieve desired investment exposure, enhance portfolio efficiency, or manage risk. Trading in derivative instruments is used as an alternative to, or in conjunction with, buying, selling, and holding stocks and fixed income securities. The Fund may take both long and short positions in derivatives. The market value of the Fund’s net assets held in short positions in derivative instruments is not expected to exceed 25% of the market value of the Fund’s net assets. Normally, on average and over the long term, this percentage is expected to be between 0% and 10%. The Fund’s investments in credit default swaps, if any, will be less than 5% of the Fund’s net assets.
Performance
The Vantagepoint Diversifying Strategies Fund gained 5.81% during 2013. The Fund’s market benchmark, the Barclays U.S. Intermediate Aggregate Bond Index, lost 1.02%. The Fund’s custom benchmark, which is comprised of 50% S&P 500 Index and 50% Barclays U.S. Intermediate Aggregate Bond Index, gained 14.31%.
On an absolute basis, the Fund’s positive performance in 2013 resulted from positive returns from each of the Fund’s strategies, with the convertible securities strategy providing double-digit returns. The low duration-plus fixed income strategy and the global tactical asset allocation strategy each provided single-digit results.
Relative to its market benchmark, the Fund’s outperformance resulted from each of the three strategies producing positive returns, while the market benchmark return was negative. This outperformance primarily reflected returns of the convertible securities strategy. The global tactical asset allocation strategy benefitted from asset class tilts between stocks and fixed income securities. The low duration-plus fixed income strategy outperformance reflected the strength of its high yield (“junk bond”) holdings. Additionally, the Fund’s performance benefitted from a shorter duration than the market benchmark in an environment where shorter duration strategies produced higher returns.
The Fund’s underperformance relative to its custom benchmark resulted from each underlying strategy trailing the custom benchmark as the fixed income holdings within each strategy underperformed the equity component of the custom benchmark. The Fund used derivatives in 2013, primarily in executing its global tactical asset allocation strategy. The Fund used exchange-traded interest rate futures and options on interest rate futures to take long and short positions in U.S. and foreign government fixed income securities. It also used exchange-traded equity futures and, to a lesser extent, over-the-
| * | On February 4, 2014, the Fund changed its principal investment strategies to include a revised convertible securities strategy and the replacement of Calamos Advisors LLC with Oaktree Capital Management, L.P. to manage that strategy. Please see the prospectus dated May 1, 2013 as revised February 4, 2014 for additional information. |
32
counter options to gain long and short exposure to global equity markets. Additionally, the Fund utilized forward currency contracts to gain or alter exposure to currencies. In combination, the Fund used derivatives positions to seek to gain or adjust exposure and to provide efficiency in implementing the Fund’s strategy. Taken together, the Fund’s use of derivatives did not have a material impact on the Fund’s performance.
VIA uses more than one subadviser to manage the Fund’s assets. This multi-management strategy seeks to improve consistency of returns over time by eliminating reliance on the results of a single subadviser. The Fund’s subadvisers are as follows:
| | |
| Subadviser Data | | |
|
| Calamos Advisors LLC |
| |
| Investment Style: | | Global convertible securities |
|
| Mellon Capital Management Corporation |
| |
| Investment Style: | | Global tactical asset allocation |
|
| Payden & Rygel |
| |
| Investment Style: | | Low duration-plus fixed income |
| | Enhanced cash management |
|
| Shenkman Capital Management, Inc. |
| |
| Investment Style: | | Convertible securities |
Vantagepoint Diversifying Strategies Fund Asset Class Exposure
as of December 31, 2013* (% of Net Assets)
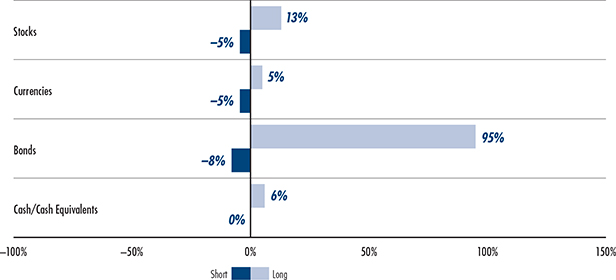
| * | The Fund’s investments in convertible preferred stocks are categorized as stocks and the Fund’s investments in convertible bonds are categorized as bonds in the above chart. These convertible securities may consist of direct holdings of such securities or exposures to such securities obtained through the use of derivative instruments. Portfolio exposures represent the market value of physical securities and a measurement of exposure to asset classes through the derivative instruments held by the fund as a percentage of the fund’s net assets. For the purpose of displaying this allocation information, exposure through derivatives is measured based on the value of the underlying assets, rate, or index represented by the derivative. This measurement is different from the valuation used for the purposes of calculating the fund’s net asset value, is intended to reflect the “economic exposure” of the derivative, and results in a total percentage reflected in the chart that exceeds 100%. In its use of derivative instruments, the fund may take both long positions (the values of which move in the same direction as the prices of the underlying investments, pools of investments, indexes or currencies) and short positions (the values of which move in the opposite direction as the prices of the underlying investments, pools of investments, indexes or currencies). These long and short positions are reflected above. |
33
Vantagepoint Diversifying Strategies Fund vs. Barclays U.S. Intermediate Aggregate Bond Index and Custom Benchmark | Growth of $10,000 Invested October 30, 2007*
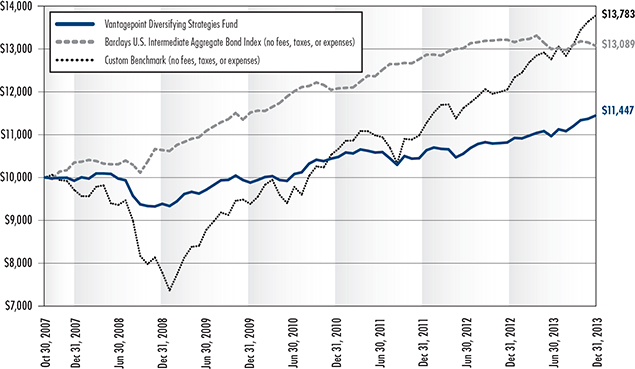
Source for Benchmark Returns: Morningstar®
Vantagepoint Diversifying Strategies Fund
Average Annual Total Returns for the periods ended December 31, 2013*
| | |
| | | T SHARES |
One Year | | 5.81% |
Three Years | | 3.12% |
Five Years | | 4.20% |
Since Inception | | 2.21% |
Class Inception Date | | October 30, 2007 |
| * | Current performance may be higher or lower than the past performance presented in this report. Past performance is no guarantee of future performance. Investment returns and principal value will fluctuate so that shares, when redeemed, may be worth more or less than their original cost. The graph and the table do not reflect the deduction of taxes that a shareholder would pay on fund distributions or the redemption of fund shares. Current performance is available by calling 800-669-7400 or at www.icmarc.org/vpperformance. |
The Fund’s market benchmark, the Barclays U.S. Intermediate Aggregate Bond Index, consists of investment-grade U.S. fixed income securities with maturities of 1 to 10 years. The Fund’s custom benchmark is comprised of 50% Barclays Capital U.S. Intermediate Aggregate Bond Index and 50% S&P 500 Index, which consists of 500 companies representing larger capitalization stocks traded in the U.S. An index is not available for direct investment, is unmanaged, and does not reflect the costs of portfolio management or trading. The Fund’s portfolio may differ significantly from the securities in the indexes.
34
Vantagepoint Index Funds
The Vantagepoint Index Funds follow an indexed or “passively managed” approach to investing. The Index Funds invest in securities that are selected to try to approximate the investment characteristics and performance of their respective benchmarks. Because it can be very expensive to buy and sell all of the securities in a target benchmark, the Core Bond Index Fund and Broad Market Index Fund employ sampling techniques to approximate benchmark characteristics, such as capitalization and industry weightings, using fewer securities than are contained in the benchmark. Therefore, the performance of the Core Bond Index Fund and Broad Market Index Fund versus their respective benchmarks may deviate more than that of funds investing in all of the securities contained in the benchmark.
| | 1. | The Vantagepoint Core Bond Index Fund’s investment objective is to offer current income by approximating the performance of the Barclays U.S. Aggregate Bond Index. |
| | 2. | The Vantagepoint 500 Stock Index Fund’s investment objective is to offer long-term capital growth by approximating the performance of the S&P 500 Index. |
| | 3. | The Vantagepoint Broad Market Index Fund’s investment objective is to offer long-term capital growth by approximating the performance of the Russell 3000® Index. On May 1, 2013, the Fund changed its investment objective index and market benchmark from the Wilshire 5000 Total Market Index to the Russell 3000® Index. |
| | 4. | The Vantagepoint Mid/Small Company Index Fund’s investment objective is to offer long-term capital growth by approximating the performance of the Russell 2500™ Index. On May 1, 2013, the Fund changed its investment objective index and market benchmark from the Wilshire 4500 Completion Index to the Russell 2500™ Index. |
| | 5. | The Vantagepoint Overseas Equity Index Fund’s investment objective is to offer long-term capital growth and diversification by approximating the performance of the MSCI Europe Australasia Far East (EAFE) Index (Net). |
Performance
Performance of the Index Funds will differ from the underlying indexes for several reasons. First, fund fees and expenses reduce Fund performance, while the indexes themselves bear no management fees, transaction costs or other expenses. Second, due to sampling techniques used by the Core Bond Fund and Broad Market Fund, there will be additional tracking differences error, which may impact Fund performance positively or negatively. Third, changes to the indexes, such as additions or deletions in the securities contained in an index and the timing of the rebalancing, can cause tracking error which may impact the Fund’s performance positively or negatively as compared to its benchmark index. Fourth, the timing of cash flows into and out of a Fund will affect its ability to precisely track its underlying index. Fifth, there may be pricing differences if the underlying index and the Fund use different pricing sources. This is more common in the Overseas Equity Index Fund and the Core Bond Index Fund.
The Vantagepoint Core Bond Index Fund lost 2.62% (Class I shares) and 2.38% (Class II shares). The Fund’s market benchmark, the Barclays U.S. Aggregate Bond Index, lost 2.02%.
The Vantagepoint 500 Stock Index Fund gained 31.78% (Class I shares) and 32.23% (Class II shares). The Fund’s market benchmark, the S&P 500 Index, gained 32.39%.
The Vantagepoint Broad Market Index Fund gained 33.04% (Class I shares) and 33.36% (Class II shares). The Fund’s market benchmark, the Russell 3000® Index, gained 33.55%1.
The Vantagepoint Mid/Small Company Index Fund gained 37.19% (Class I shares) and 37.42% (Class II shares). The Fund’s market benchmark, the Russell 2500™ Index, gained 36.80%2.
The Vantagepoint Overseas Equity Index Fund gained 21.35% (Class I shares) and 21.68% (Class II shares). The Fund’s market benchmark, the MSCI EAFE Index (Net), gained 22.78%.
The 500 Stock Index Fund, Broad Market Index Fund, Mid/Small Company Index Fund, and Overseas Equity Index Fund used futures to obtain or adjust investment exposure to equity issues when it was believed that using futures would be more efficient or cost effective than trading in the securities directly. The Overseas Equity Fund also used forward currency contracts to manage foreign currency risk associated with the Fund’s foreign equity exposure. The use of forward currency contracts reduced the Fund’s foreign currency risk exposure throughout the year.
The Index Funds’ subadviser is Mellon Capital Management Corporation.
35
| 1 | Prior to May 1, 2013, the Fund compared its performance to the Wilshire 5000 Total Market Index, an unmanaged index that consists of all U.S. equity securities with readily available price data (which includes common stocks, interests in real estate investment trusts and limited partnership interests of U.S. companies, that have their primary market listing in the U.S.) and is calculated using a float-adjusted market capitalization weighting. The float-adjusted methodology adjusts an individual stock’s market capitalization to account for (by excluding) shares that may be restricted or otherwise unavailable for purchase. This change was made because the Fund’s adviser believed that tracking error would be improved. |
| 2 | Prior to May 1, 2013 the Fund compared it performance to the Wilshire 4500 Completion Index an unmanaged index that consists of all U.S. equity securities included in the Wilshire 5000 Total Market Index, excluding the companies in the S&P 500 Index. As such, it consists of small- and mid-capitalization U.S. equity securities. It is calculated using a float adjusted market capitalization weighting, which adjusts an individual stock’s market capitalization to account for (by excluding) shares that may be restricted or otherwise unavailable for purchase. This change was made because the Fund’s adviser believed that tracking error would be improved. |
Subadviser Data
Mellon Capital Management Corporation
| | |
| Investment Style: | | Indexing |
Vantagepoint Core Bond Index Fund
Sector Allocation as of December 31, 2013 (% of Net Assets)
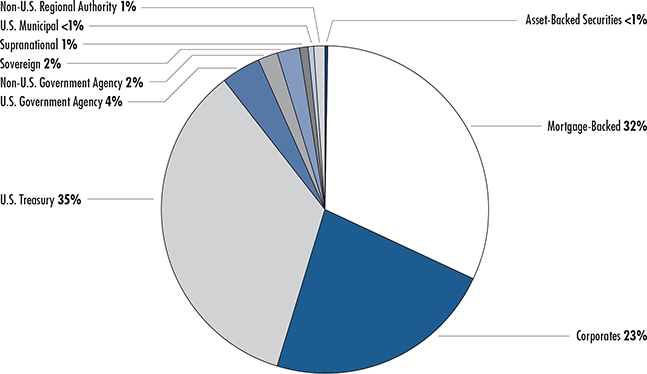
The primary source of sector allocation classification is BondEdge. Due to rounding, pie chart allocations may not add up to 100%.
36
Vantagepoint Core Bond Index Fund—Class I Shares vs. Barclays U.S. Aggregate Bond Index
Growth of $10,000 Invested December 31, 2003*
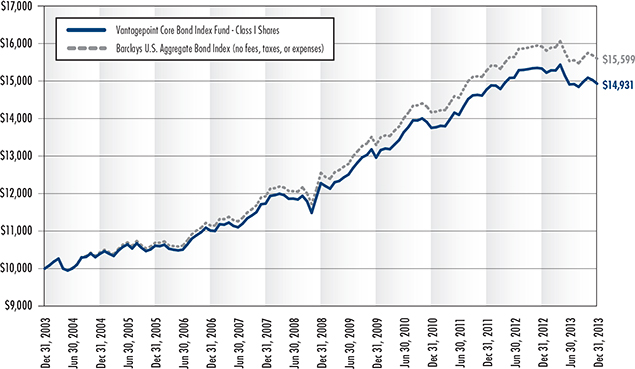
Source for Benchmark Returns: Morningstar®
Vantagepoint Core Bond Index Fund
Average Annual Total Returns for the periods ended December 31, 2013*
| | | | | | |
| | | T SHARES | | CLASS I SHARES | | CLASS II SHARES |
One Year | | –2.38% | | –2.62% | | –2.38% |
Three Years | | 2.86% | | 2.78% | | 2.97% |
Five Years | | 4.05% | | 3.99% | | 4.20% |
Ten Years | | 4.12% | | 4.09% | | 4.30% |
Class Inception Date | | March 1, 2013 | | June 2, 1997 | | April 5, 1999 |
| * | Management’s Discussion of Fund Performance describes the performance of the Fund’s Class I and Class II Shares. In the table, performance information for T Shares prior to the inception date of that share class (March 1, 2013) is based on the performance of the Fund’s Class I Shares. This prior performance has not been adjusted to reflect the actual fees and expenses paid by T Shares. |
Current performance may be higher or lower than the past performance presented in this report. Past performance is no guarantee of future performance. Investment returns and principal value will fluctuate so that shares, when redeemed, may be worth more or less than their original cost. The graph and the table do not reflect the deduction of taxes that a shareholder would pay on fund distributions or the redemption of fund shares. Current performance is available by calling 800-669-7400 or at www.icmarc.org/vpperformance.
The Fund’s market benchmark, the Barclays U.S. Aggregate Bond Index, consists of investment-grade U.S. fixed income securities. An index is not available for direct investment, is unmanaged, and does not reflect the costs of portfolio management or trading. Securities held by the Fund may differ from those in the index.
37
Vantagepoint 500 Stock Index Fund
Sector Allocation as of December 31, 2013 (% of Total Investments)
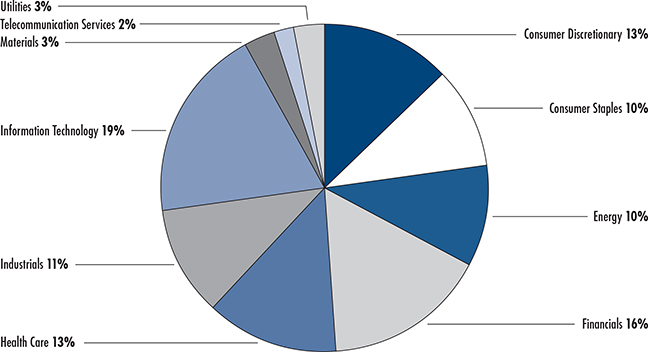
The primary source of sector allocation classification is FactSet. Due to rounding, pie chart allocations may not add up to 100%.
Vantagepoint 500 Stock Index Fund—Class I Shares vs. S&P 500 Index
Growth of $10,000 Invested December 31, 2003*
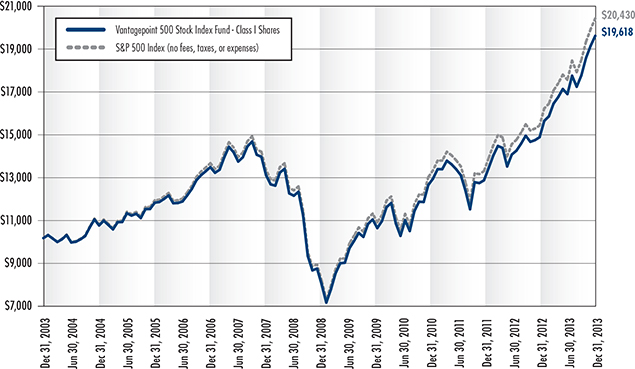
Source for Benchmark Returns: Morningstar®
38
Vantagepoint 500 Stock Index Fund
Average Annual Total Returns for the periods ended December 31, 2013*
| | | | | | |
| | | T SHARES | | CLASS I SHARES | | CLASS II SHARES |
One Year | | 32.09% | | 31.78% | | 32.23% |
Three Years | | 15.82% | | 15.72% | | 15.99% |
Five Years | | 17.55% | | 17.50% | | 17.75% |
Ten Years | | 7.00% | | 6.97% | | 7.18% |
Class Inception Date | | March 1, 2013 | | June 2, 1997 | | April 5, 1999 |
| * | Management’s Discussion of Fund Performance describes the performance of the Fund’s Class I and Class II Shares. In the table, performance information for T Shares prior to the inception date of that share class (March 1, 2013) is based on the performance of the Fund’s Class I Shares. This prior performance has not been adjusted to reflect the actual fees and expenses paid by T Shares. |
Current performance may be higher or lower than the past performance presented in this report. Past performance is no guarantee of future performance. Investment returns and principal value will fluctuate so that shares, when redeemed, may be worth more or less than their original cost. The graph and the table do not reflect the deduction of taxes that a shareholder would pay on fund distributions or the redemption of fund shares. Current performance is available by calling 800-669-7400 or at www.icmarc.org/vpperformance.
The Fund’s market benchmark, the S&P 500 Index, consists of 500 companies representing larger capitalization stocks traded in the U.S. An index is not available for direct investment, is unmanaged, and does not reflect the costs of portfolio management or trading.
39
Vantagepoint Broad Market Index Fund
Sector Allocation as of December 31, 2013 (% of Total Investments)
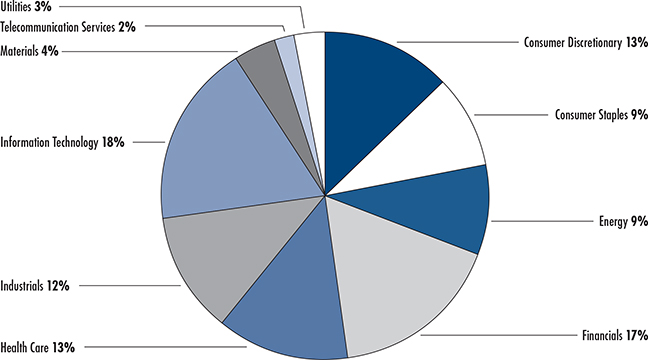
The primary source of sector allocation classification is FactSet. Due to rounding, pie chart allocations may not add up to 100%.
Vantagepoint Broad Market Index Fund—Class I Shares vs. Russell 3000 Index and Wilshire 5000 Total Market Index | Growth of $10,000 Invested December 31, 2003*
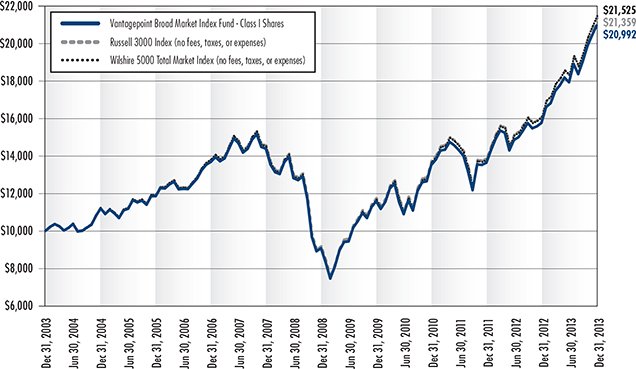
Source for Benchmark Returns: Morningstar®
40
Vantagepoint Broad Market Index Fund
Average Annual Total Returns for the periods ended December 31, 2013*
| | | | | | |
| | | T SHARES | | CLASS I SHARES | | CLASS II SHARES |
One Year | | 33.39% | | 33.04% | | 33.36% |
Three Years | | 15.87% | | 15.77% | | 16.01% |
Five Years | | 18.36% | | 18.30% | | 18.55% |
Ten Years | | 7.73% | | 7.70% | | 7.92% |
Class Inception Date | | March 1, 2013 | | October 1, 1994 | | April 5, 1999 |
| * | Management’s Discussion of Fund Performance describes the performance of the Fund’s Class I and Class II Shares. In the table, performance information for T Shares prior to the inception date of that share class (March 1, 2013) is based on the performance of the Fund’s Class I Shares. This prior performance has not been adjusted to reflect the actual fees and expenses paid by T Shares. |
Current performance may be higher or lower than the past performance presented in this report. Past performance is no guarantee of future performance. Investment returns and principal value will fluctuate so that shares, when redeemed, may be worth more or less than their original cost. The graph and the table do not reflect the deduction of taxes that a shareholder would pay on fund distributions or the redemption of fund shares. Current performance is available by calling 800-669-7400 or at www.icmarc.org/vpperformance.
On May 1, 2013, the Fund changed its market benchmark index from the Wilshire 5000 Total Market Index to the Russell 3000® Index which includes, and measures the performance of, the largest 3,000 U.S. publicly traded companies based on market capitalization, representing a substantial portion of the investable U.S. equity market. An index is not available for direct investment, is unmanaged, and does not reflect the costs of portfolio management or trading. Securities held by the Fund may differ from those in the index.
41
Vantagepoint Mid/Small Company Index Fund
Sector Allocation as of December 31, 2013 (% of Total Investments)
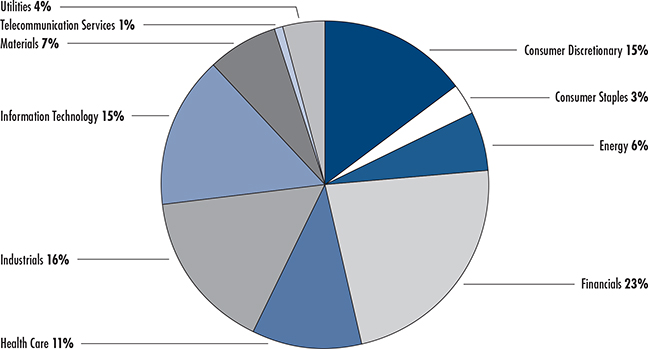
The primary source of sector allocation classification is FactSet. Due to rounding, pie chart allocations may not add up to 100%.
Vantagepoint Mid/Small Company Index Fund—Class I Shares vs. Russell 2500 Index and Wilshire 4500 Completion Index | Growth of $10,000 Invested December 31, 2003*
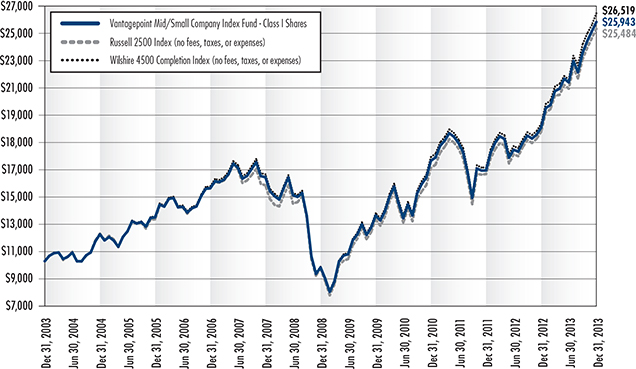
Source for Benchmark Returns: Morningstar®
42
Vantagepoint Mid/Small Company Index Fund
Average Annual Total Returns for the periods ended December 31, 2013*
| | | | | | |
| | | T SHARES | | CLASS I SHARES | | CLASS II SHARES |
One Year | | 37.49% | | 37.19% | | 37.42% |
Three Years | | 15.92% | | 15.83% | | 16.07% |
Five Years | | 22.10% | | 22.04% | | 22.29% |
Ten Years | | 10.03% | | 10.00% | | 10.22% |
Class Inception Date | | March 1, 2013 | | June 2, 1997 | | April 5, 1999 |
| * | Management’s Discussion of Fund Performance describes the performance of the Fund’s Class I and Class II Shares. In the table, performance information for T Shares prior to the inception date of that share class (March 1, 2013) is based on the performance of the Fund’s Class I Shares. This prior performance has not been adjusted to reflect the actual fees and expenses paid by T Shares. |
Current performance may be higher or lower than the past performance presented in this report. Past performance is no guarantee of future performance. Investment returns and principal value will fluctuate so that shares, when redeemed, may be worth more or less than their original cost. The graph and the table do not reflect the deduction of taxes that a shareholder would pay on fund distributions or the redemption of fund shares. Current performance is available by calling 800-669-7400 or at www.icmarc.org/vpperformance.
On May 1, 2013, the Fund changed its market benchmark index from the Wilshire 4500 Completion Index to the Russell 2500™ Index which measures the performance of the small to mid-cap segment of the U.S. equity universe, commonly referred to as “smid” cap. The Russell 2500™ Index is a subset of the Russell 3000® Index, and includes approximately 2,500 of the smallest securities in the Russell 3000® Index, based on a combination of their market capitalization and current index membership. An index is not available for direct investment, is unmanaged, and does not reflect the costs of portfolio management or trading.
43
Vantagepoint Overseas Equity Index Fund
Country Allocation as of December 31, 2013 (% of Net Assets)
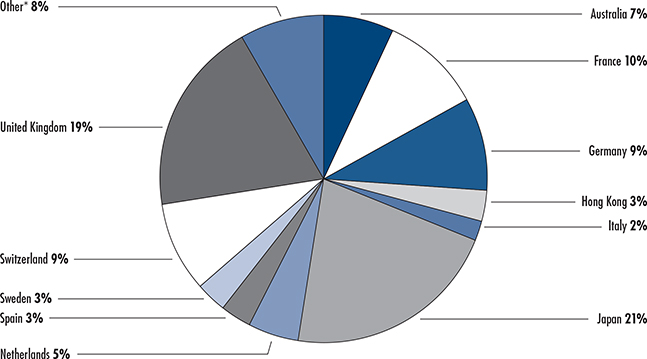
*Other represents countries with under a 2.0% individual weighting.
The primary source of country allocation classification is FactSet. Due to rounding, pie chart allocations may not equal 100%.
Vantagepoint Overseas Equity Index Fund—Class I Shares vs. MSCI EAFE Index (Net)
Growth of $10,000 Invested December 31, 2003*
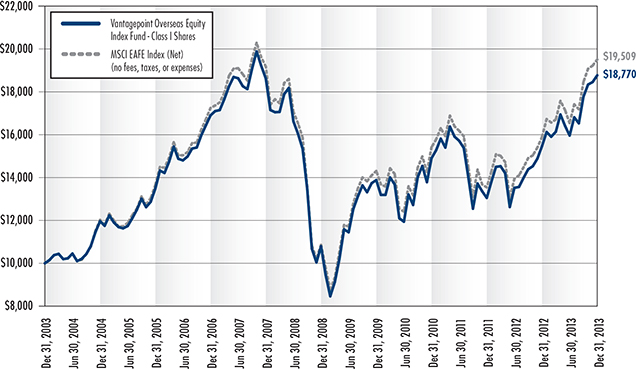
Source for Benchmark Returns: Morningstar®
44
Vantagepoint Overseas Equity Index Fund
Average Annual Total Returns for the periods ended December 31, 2013*
| | | | | | |
| | | T SHARES | | CLASS I SHARES | | CLASS II SHARES |
One Year | | 21.68% | | 21.35% | | 21.68% |
Three Years | | 8.09% | | 7.99% | | 8.22% |
Five Years | | 11.77% | | 11.71% | | 11.93% |
Ten Years | | 6.53% | | 6.50% | | 6.74% |
Class Inception Date | | March 1, 2013 | | June 2, 1997 | | April 5, 1999 |
| * | Management’s Discussion of Fund Performance describes the performance of the Fund’s Class I and Class II Shares. In the table, performance information for T Shares prior to the inception date of that share class (March 1, 2013) is based on the performance of the Fund’s Class I Shares. This prior performance has not been adjusted to reflect the actual fees and expenses paid by T Shares. |
Current performance may be higher or lower than the past performance presented in this report. Past performance is no guarantee of future performance. Investment returns and principal value will fluctuate so that shares, when redeemed, may be worth more or less than their original cost. The graph and the table do not reflect the deduction of taxes that a shareholder would pay on fund distributions or the redemption of fund shares. Current performance is available by calling 800-669-7400 or at www.icmarc.org/vpperformance.
The Fund’s market benchmark, the MSCI Europe Australasia Far East (EAFE) Index (Net), is a free float-adjusted market capitalization index of equity securities that is designed to measure the equity market performance of developed markets, excluding the U.S. and Canada and approximates the minimum possible dividend reinvestment after deduction of withholding tax according to MSCI Barra’s methodology. An index is not available for direct investment, is unmanaged, and does not reflect the costs of portfolio management or trading.
45
Vantagepoint Model Portfolio Conservative Growth Fund
The Vantagepoint Model Portfolio Conservative Growth Fund’s investment objective is to offer reasonable current income and capital preservation, with modest potential for capital growth. The Fund invests in a combination of other Vantagepoint Funds and one or more third party exchange-traded funds (“ETFs”)1 to seek to obtain exposure to approximately 41% fixed income investments, 40% equity investments, and 19% investments in asset classes and strategies that have historically exhibited a low correlation to traditional fixed income and equity investments (a “multi-strategy” Fund). The Fund’s investment strategy is implemented by investing in the following funds at target allocations within the percentage ranges indicated:
| | |
| FIXED INCOME | | |
Low Duration Bond Fund | | 14%–24% |
Core Bond Index Fund | | 7%–17% |
Inflation Protected Securities Fund | | 5%–15% |
| EQUITY | | |
Equity Income Fund | | 6%–16% |
Growth & Income Fund | | 4%–14% |
Growth Fund | | 1%–11% |
Select Value Fund | | 0%–8% |
Aggressive Opportunities Fund | | 0%–8% |
International Fund | | 2%–12% |
Third Party Emerging Markets ETF | | 0%–5% |
| MULTI-STRATEGY | | |
Diversifying Strategies Fund | | 17%–21% |
Performance2
The Vantagepoint Model Portfolio Conservative Growth Fund’s Investor M Shares gained 11.03% in 2013. The Fund’s market benchmark, the Barclays U.S. Intermediate Aggregate Bond Index (“Barclays Index”), lost 1.02%, while the Fund’s peer group, the Morningstar Conservative Allocation Funds Average, a group of mutual funds with similar investment objectives, gained 7.23%. The Fund’s custom benchmark gained 11.38%. The Fund’s custom benchmark is composed of the Barclays Index and the S&P 500 Index, in weighted percentages corresponding to the historical target allocations for the asset classes these indexes represent.
The Model Portfolio Conservative Growth Fund’s performance reflected the generally positive returns of the U.S. and developed foreign equity markets in 2013 and the generally negative returns of fixed income markets and emerging market equities. The positive performance primarily resulted from allocations to the underlying equity funds. Six of the seven underlying equity funds produced positive results, with returns ranging between 38.78% for the Aggressive Opportunities Fund and 17.77% for the International Fund. The seventh underlying equity fund, the emerging markets ETF, lost 3.74% in the period since it was added to the Fund on May 1, 2013. The Fund’s three underlying fixed income funds produced mixed results, as the Low Duration Bond Fund gained 0.96%, while the Core Bond Index Fund lost 2.38% and Inflation Protected Securities Fund decreased 8.81%. The Diversifying Strategies Fund gained 5.81%. Please refer to each underlying Vantagepoint Fund’s commentary within this report for more information.
| 1 | On May 1, 2013, exposure to emerging market stocks through a third party ETF was added to the Fund. |
| 2 | As of March 1, 2013, the Fund began investing in “T Shares” of the underlying Vantagepoint Funds. Prior to March 1, 2013, the Fund invested in the Investor Shares of each underlying actively managed Vantagepoint Fund and the Class I Shares of Vantagepoint Index Funds. The underlying Vantagepoint Funds’ performance noted above reflects the returns for the T Shares from their inception date, March 1, 2013, through December 31, 2013. Prior to March 1, 2013, performance of the underlying funds is based on the Investor Shares of the actively managed Vantagepoint Funds, and the Class I Shares of the Vantagepoint Index Funds. As a result, performance of the underlying Vantagepoint Funds shown may vary from the returns discussed in their commentaries elsewhere within this report. |
46
The Fund’s outperformance relative to its fixed income market benchmark primarily resulted from its allocation to the underlying equity funds, with the exception of the emerging market ETF, as these underlying funds outperformed the market benchmark. Performance also benefitted from returns in the underlying Diversifying Strategies Fund and Low Duration Bond Fund.
The Fund’s outperformance relative to its peer group primarily resulted from an overweight allocation to equity funds, which generally outperformed fixed income funds. Additionally, an overweight allocation to growth-style equity securities in the underlying equity funds, which generally outperformed value-style equity securities, benefitted performance. The Fund’s shorter duration exposure resulting from the underlying fixed income funds added to performance, as shorter duration funds generally outperformed longer duration funds.
The Fund’s underperformance relative to its custom benchmark primarily resulted from overweight allocations to the underlying foreign equity funds, which generally underperformed U.S. equity funds. The Fund’s allocations to the Equity Income Fund, International Fund, emerging markets ETF, Inflation Protected Securities Fund, and Core Bond Index Fund underperformed their respective broad market index in the Fund’s custom benchmark. The Fund’s allocations to the Low Duration Bond Fund, Diversifying Strategies Fund, Growth & Income Fund, Growth Fund, Select Value Fund, and Aggressive Opportunities Fund partially offset this underperformance as these underlying funds outperformed their respective broad market index in the Fund’s custom benchmark.
Vantagepoint Model Portfolio Conservative Growth Fund
Underlying Fund Allocation as of December 31, 2013 (% of Net Assets)
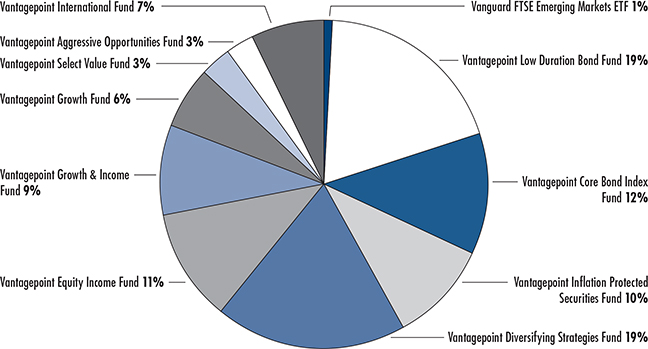
Due to rounding, pie chart allocations may not add up to 100%.
47
Vantagepoint Model Portfolio Conservative Growth Fund—Investor M Shares vs. Barclays U.S. Intermediate
Aggregate Bond Index and Custom Benchmark | Growth of $10,000 Invested December 31, 2003*
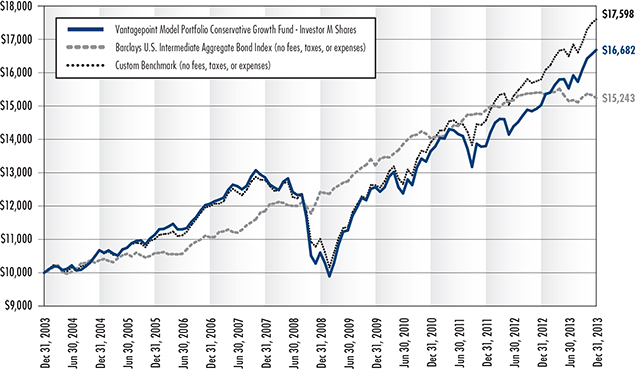
Source for Benchmark Returns: Morningstar®
Vantagepoint Model Portfolio Conservative Growth Fund
Average Annual Total Returns for the periods ended December 31, 2013*
| | | | |
| | | INVESTOR M SHARES | | TM SHARES |
One Year | | 11.03% | | 11.25% |
Three Years | | 6.93% | | 7.00% |
Five Years | | 9.49% | | 9.53% |
Ten Years | | 5.25% | | 5.27% |
Class Inception Date | | April 1, 1996 | | March 1, 2013 |
| * | Management’s Discussion of Fund Performance describes the performance of the Fund’s Investor M Shares (the Fund’s outstanding shares were renamed “Investor M Shares” on March 1, 2013). In the table, performance information for TM Shares prior to the inception date of that share class (March 1, 2013) is based on the performance of the Fund’s Investor M Shares. This prior performance has not been adjusted to reflect the actual fees and expenses paid by TM Shares. |
Current performance may be higher or lower than the past performance presented in this report. Past performance is no guarantee of future performance. Investment returns and principal value will fluctuate so that shares, when redeemed, may be worth more or less than their original cost. The graph and the table do not reflect the deduction of taxes that a shareholder would pay on fund distributions or the redemption of fund shares. Current performance is available by calling 800-669-7400 or at www.icmarc.org/vpperformance.
The Fund’s market benchmark, the Barclays U.S. Intermediate Aggregate Bond Index (the Barclays Index), consists of investment-grade U.S. fixed income securities with maturities of 1 to 10 years. The custom benchmark is composed of the Barclays Index and S&P 500 Index in weighted percentages that correspond to the historical target allocations for the asset classes these indexes represent. These weightings will change to correspond with any changes in the Fund’s target percentage allocations. The S&P 500 Index is an index consisting of 500 companies representing larger capitalization stocks traded in the U.S. An index is not available for direct investment, is unmanaged, and does not reflect the costs of portfolio management or trading. A fund’s exposure, through the underlying funds, to specific securities (or types of securities) may differ significantly from the securities held in the indexes.
48
Vantagepoint Model Portfolio Traditional Growth Fund
The Vantagepoint Model Portfolio Traditional Growth Fund’s investment objective is to offer moderate capital growth and reasonable current income. The Fund invests in a combination of other Vantagepoint Funds and one or more third party exchange-traded funds (“ETFs”)1 to seek to obtain exposure to approximately 25% fixed income investments, 60% equity investments, and 15% investments in asset classes and strategies that have historically exhibited a low correlation to traditional fixed income and equity investments (a “multi-strategy” Fund). The Fund’s investment strategy is implemented by investing in the following funds at target allocations within the percentage ranges indicated:
| | |
FIXED INCOME | | |
Low Duration Bond Fund | | 3%–13% |
Core Bond Index Fund | | 8%–18% |
Inflation Protected Securities Fund | | 0%–9% |
EQUITY | | |
Equity Income Fund | | 7%–17% |
Growth & Income Fund | | 7%–17% |
Growth Fund | | 5%–15% |
Select Value Fund | | 1%–11% |
Aggressive Opportunities Fund | | 1%–11% |
Discovery Fund | | 0%–8% |
International Fund | | 6%–16% |
Third Party Emerging Markets ETF | | 0%–5% |
MULTI-STRATEGY | | |
Diversifying Strategies Fund | | 13%–17% |
Performance2
The Vantagepoint Model Portfolio Traditional Growth Fund’s Investor M Shares gained 17.74% in 2013. The Fund’s market benchmark, the S&P 500 Index, gained 32.39%, while the Fund’s peer group, the Morningstar Moderate Allocation Funds Average, a group of mutual funds with similar investment objectives, gained 16.48%. The Fund’s custom benchmark gained 18.05%. The Fund’s custom benchmark is composed of the S&P 500 Index and the Barclays U.S. Intermediate Aggregate Bond Index (“Barclays Index”), in weighted percentages corresponding to the historical target allocations for the asset classes these indexes represent.
The Model Portfolio Traditional Growth Fund’s performance reflected the generally positive returns of the U.S. and developed foreign equity markets in 2013 and the generally negative returns of fixed income markets and emerging market equities. The positive performance primarily resulted from allocations to the underlying equity funds. Seven of the eight underlying equity funds produced positive results, with returns ranging between 39.58% for the Discovery Fund and 17.77% for the International Fund. The eighth underlying equity fund, the emerging markets ETF, lost 3.74% in the period since it was added to the Fund on May 1, 2013. The Fund’s three underlying fixed income funds produced mixed results, as the Low Duration Bond Fund gained 0.96%, while the Core Bond Index Fund lost 2.38% and Inflation Protected Securities Fund decreased 8.81%. The Diversifying Strategies Fund gained 5.81% in the year. Please refer to each underlying Vantagepoint Fund’s commentary within this report for more information.
| 1 | On May 1, 2013, exposure to emerging market stocks through a third party ETF was added to the Fund. |
| 2 | As of March 1, 2013, the Fund began investing in “T Shares” of the underlying Vantagepoint Funds. Prior to March 1, 2013, the Fund invested in the Investor Shares of each underlying actively managed Vantagepoint Fund and the Class I Shares of Vantagepoint Index Funds. The underlying Vantagepoint Funds’ performance noted above reflects the returns for the T Shares from their inception date, March 1, 2013, through December 31, 2013. Prior to March 1, 2013, performance of the underlying funds is based on the Investor Shares of the actively managed Vantagepoint Funds, and the Class I Shares of the Vantagepoint Index Funds. As a result, performance of the underlying Vantagepoint Funds shown may vary from the returns discussed in their commentaries elsewhere within this report. |
49
The Fund’s underperformance relative to its equity market benchmark primarily resulted from its allocation to the underlying fixed income funds, multi-strategy fund, and foreign equity funds, including the emerging markets ETF, as these underlying funds generally trailed the Fund’s market benchmark. Additionally, the Equity Income Fund trailed the market benchmark. Returns from the Fund’s underlying allocations to the Growth & Income Fund, Growth Fund, Select Value Fund, Aggressive Opportunities Fund, and Discovery Fund partially offset this underperformance, as these underlying funds outperformed the Fund’s market benchmark.
The Fund’s outperformance relative to its peer group primarily resulted from an overweight allocation to equity funds, which generally outperformed fixed income funds. Additionally, performance benefitted from an overweight allocation to growth-style equity securities in the underlying equity funds, which generally outperformed value-style equity securities, as well as a bias toward smaller-capitalization securities, which generally outperformed large-capitalization securities. The Funds shorter duration exposure resulting from the underlying fixed income funds added to performance, as shorter duration funds generally outperformed longer duration funds.
The Fund’s underperformance relative to its custom benchmark primarily resulted from an overweight allocation to the underlying foreign equity funds, which generally underperformed U.S. equity funds. The Fund’s allocations to the underlying Equity Income Fund, International Fund, emerging markets ETF, Inflation Protected Securities Fund, and Core Bond Index Fund underperformed their respective broad market index in the Fund’s custom benchmark. The Fund’s allocations to the Low Duration Bond Fund, Diversifying Strategies Fund, Growth & Income Fund, Growth Fund, Select Value Fund, Aggressive Opportunities Fund, and Discovery Fund partially offset this underperformance as these underlying funds outperformed their respective broad market index in the Fund’s custom benchmark.
Vantagepoint Model Portfolio Traditional Growth Fund
Underlying Fund Allocation as of December 31, 2013 (% of Net Assets)
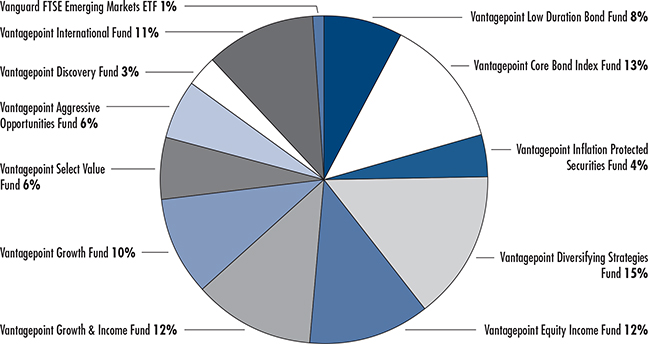
Due to rounding, pie chart allocations may not add up to 100%.
50
Vantagepoint Model Portfolio Traditional Growth Fund—Investor M Shares vs. S&P 500 Index and Custom Benchmark
Growth of $10,000 Invested December 31, 2003*
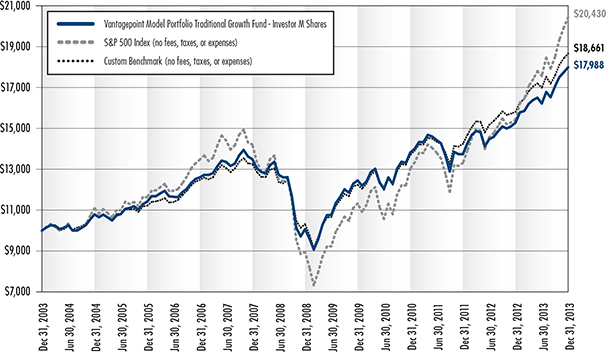
Source for Benchmark Returns: Morningstar®
Vantagepoint Model Portfolio Traditional Growth Fund
Average Annual Total Returns for the periods ended December 31, 2013*
| | | | |
| | | INVESTOR M SHARES | | TM SHARES |
One Year | | 17.74% | | 17.97% |
Three Years | | 9.20% | | 9.26% |
Five Years | | 12.31% | | 12.36% |
Ten Years | | 6.05% | | 6.07% |
Class Inception Date | | April 1, 1996 | | March 1, 2013 |
| * | Management’s Discussion of Fund Performance describes the performance of the Fund’s Investor M Shares (the Fund’s outstanding shares were renamed “Investor M Shares” on March 1, 2013). In the table, performance information for TM Shares prior to the inception date of that share class (March 1, 2013) is based on the performance of the Fund’s Investor M Shares. This prior performance has not been adjusted to reflect the actual fees and expenses paid by TM Shares. |
Current performance may be higher or lower than the past performance presented in this report. Past performance is no guarantee of future performance. Investment returns and principal value will fluctuate so that shares, when redeemed, may be worth more or less than their original cost. The graph and the table do not reflect the deduction of taxes that a shareholder would pay on fund distributions or the redemption of fund shares. Current performance is available by calling 800-669-7400 or at www.icmarc.org/vpperformance.
The Fund’s market benchmark, the S&P 500 Index, is an index consisting of 500 companies representing larger capitalization stocks traded in the U.S. The custom benchmark is composed of the S&P 500 Index and the Barclays U.S. Intermediate Aggregate Bond Index (the Barclays Index) in weighted percentages that correspond to the historical target allocations for the asset classes these indexes represent. These weightings will change to correspond with any changes in the Fund’s target percentage allocations. The Barclays Index consists of investment-grade U.S. fixed income securities with maturities of 1 to 10 years. An index is not available for direct investment, is unmanaged and does not reflect the costs of portfolio management or trading. A fund’s exposure, through the underlying funds, to specific securities (or types of securities) may differ significantly from the securities held in the indexes.
51
Vantagepoint Model Portfolio Long-Term Growth Fund
The Vantagepoint Model Portfolio Long-Term Growth Fund’s investment objective is to offer high long-term capital growth and modest current income. The Fund invests in a combination of other Vantagepoint Funds and one or more third party exchange-traded funds (“ETFs”)1 to seek to obtain exposure to approximately 13% fixed income investments, 75% equity investments, and 12% investments in asset classes and strategies that have historically exhibited a low correlation to traditional fixed income and equity investments (a “multi-strategy” Fund). The Fund’s investment strategy is implemented by investing in the following funds at target allocations within the percentage ranges indicated:
| | |
FIXED INCOME | | |
Core Bond Index Fund | | 8%–18% |
EQUITY | | |
Equity Income Fund | | 8%–18% |
Growth & Income Fund | | 8%–18% |
Growth Fund | | 7%–17% |
Select Value Fund | | 4%–14% |
Aggressive Opportunities Fund | | 4%–14% |
Discovery Fund | | 0%–10% |
International Fund | | 9%–19% |
Third Party Emerging Markets ETF | | 0%–5% |
MULTI-STRATEGY | | |
Diversifying Strategies Fund | | 10%–14% |
Performance2
The Vantagepoint Model Portfolio Long-Term Growth Fund’s Investor M Shares gained 22.55% in 2013. The Fund’s market benchmark, the S&P 500 Index, gained 32.39%, while the Fund’s peer group, the Morningstar Aggressive Allocation Funds Average, a group of mutual funds with similar investment objectives, gained 21.31%. The Fund’s custom benchmark gained 23.27%. The Fund’s custom benchmark is composed of the S&P 500 Index and the Barclays U.S. Intermediate Aggregate Bond Index (“Barclays Index”), in weighted percentages corresponding to the historical target allocations for the asset classes these indexes represent.
The Model Portfolio Long-Term Growth Fund’s performance reflected the generally positive returns in the U.S. and developed foreign equity markets in 2013 and generally negative returns of fixed income markets and emerging market equities. The positive performance primarily resulted from allocations to the underlying equity funds. Seven of the eight underlying equity funds produced positive results, with returns ranging between 39.58% for the Discovery Fund and 17.77% for the International Fund. The eighth underlying equity fund, the emerging markets ETF, lost 3.74% in the period since it was added to the Fund on May 1, 2013. The Fund’s single underlying fixed income fund, the Core Bond Index Fund, lost 2.38%. The Diversifying Strategies Fund gained 5.81% in the year. Please refer to each underlying Vantagepoint Fund’s commentary within this report for more information.
The Fund’s underperformance relative to its equity market benchmark primarily resulted from its allocation to the Core Bond Index Fund, Diversifying Strategies Fund, and foreign equity funds, including the emerging markets ETF, as these underlying funds generally trailed the Fund’s market benchmark. Additionally, the Equity Income Fund trailed the benchmark. The Fund’s allocations to the Growth & Income Fund, Growth Fund, Select Value Fund, Aggressive Opportunities Fund, and Discovery Fund partially offset this underperformance, as these underlying funds outperformed the Fund’s market benchmark.
| 1 | On May 1, 2013, exposure to emerging market stocks through a third party ETF was added to the Fund. |
| 2 | As of March 1, 2013, the Fund began investing in “T Shares” of the underlying Vantagepoint Funds. Prior to March 1, 2013, the Fund invested in the Investor Shares of each underlying actively managed Vantagepoint Fund and the Class I Shares of Vantagepoint Index Funds. The underlying Vantagepoint Funds’ performance noted above reflects the returns for the T Shares from their inception date, March 1, 2013, through December 31, 2013. Prior to March 1, 2013, performance of the underlying funds is based on the Investor Shares of the actively managed Vantagepoint Funds, and the Class I Shares of the Vantagepoint Index Funds. As a result, performance of the underlying Vantagepoint Funds shown may vary from the returns discussed in their commentaries elsewhere within this report. |
52
The Fund’s outperformance relative to its peer group primarily resulted from an overweight allocation to growth-style equity securities in the underlying equity funds, which generally outperformed value-style equity securities, as well as a bias toward smaller-capitalization securities, which generally outperformed large-capitalization securities. The Fund’s shorter duration exposure resulting from the underlying fixed income fund added to relative performance as shorter duration funds generally outperformed longer duration funds.
The Fund’s underperformance relative to its custom benchmark primarily resulted from an overweight allocation to underlying foreign equity funds, which generally underperformed the U.S. equity funds. Additionally, returns from the underlying Core Bond Index Fund underperformed the Barclays Index portion of their custom benchmark. The Fund’s allocations to the Diversifying Strategies Fund and U.S. equity funds, with the exception of the Equity Income Fund, partially offset this underperformance, as these underlying funds outperformed their respective broad market index in the Fund’s custom benchmark.
Vantagepoint Model Portfolio Long-Term Growth Fund
Underlying Fund Allocation as of December 31, 2013 (% of Net Assets)
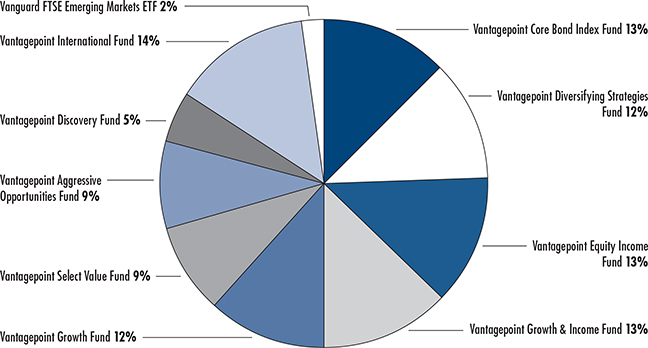
Due to rounding, pie chart allocations may not add up to 100%.
53
Vantagepoint Model Portfolio Long-Term Growth Fund—Investor M Shares vs. S&P 500 Index and Custom Benchmark | Growth of $10,000 Invested December 31, 2003*
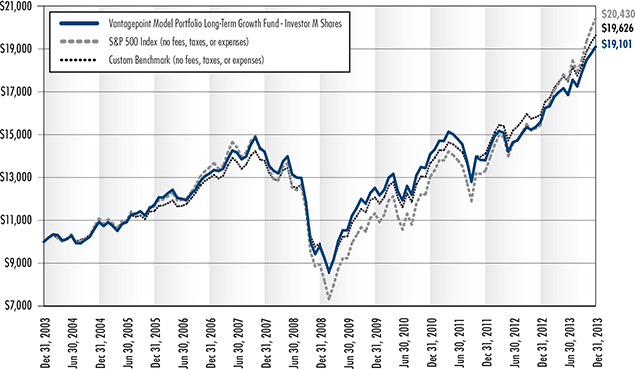
Source for Benchmark Returns: Morningstar®
Vantagepoint Model Portfolio Long-Term Growth Fund
Average Annual Total Returns for the periods ended December 31, 2013*
| | | | |
| | | INVESTOR M SHARES | | TM SHARES |
One Year | | 22.55% | | 22.83% |
Three Years | | 10.70% | | 10.79% |
Five Years | | 14.28% | | 14.33% |
Ten Years | | 6.69% | | 6.71% |
Class Inception Date | | April 1, 1996 | | March 1, 2013 |
| * | Management’s Discussion of Fund Performance describes the performance of the Fund’s Investor M Shares (the Fund’s outstanding shares were renamed “Investor M Shares” on March 1, 2013). In the table, performance information for TM Shares prior to the inception date of that share class (March 1, 2013) is based on the performance of the Fund’s Investor M Shares. This prior performance has not been adjusted to reflect the actual fees and expenses paid by TM Shares. |
Current performance may be higher or lower than the past performance presented in this report. Past performance is no guarantee of future performance. Investment returns and principal value will fluctuate so that shares, when redeemed, may be worth more or less than their original cost. The graph and the table do not reflect the deduction of taxes that a shareholder would pay on fund distributions or the redemption of fund shares. Current performance is available by calling 800-669-7400 or at www.icmarc.org/vpperformance.
The Fund’s market benchmark, the S&P 500 Index, is an index consisting of 500 companies representing larger capitalization stocks traded in the U.S. The custom benchmark is composed of the S&P 500 Index and the Barclays U.S. Intermediate Aggregate Bond Index (the Barclays Index) in weighted percentages that correspond to the historical target allocations for the asset classes these indexes represent. These weightings will change to correspond with any changes in the Fund’s target percentage allocations. The Barclays Index consists of investment-grade U.S. fixed income securities with maturities of 1 to 10 years. An index is not available for direct investment, is unmanaged and does not reflect the costs of portfolio management or trading. A fund’s exposure, through the underlying funds, to specific securities (or types of securities) may differ significantly from the securities held in the indexes.
54
Vantagepoint Model Portfolio All-Equity Growth Fund
The Vantagepoint Model Portfolio All-Equity Growth Fund’s investment objective is to offer high long-term capital growth. The Fund invests, under normal circumstances, 100% in equity funds by investing in a combination of other Vantagepoint Funds and one or more third party exchange-traded funds (“ETFs”)1 whose assets are invested, under normal circumstances, at least 80% in equity securities (common and preferred stock) or instruments that provide equity exposure. The Fund’s investment strategy is implemented by investing in the following funds at target allocations within the percentage ranges indicated:
| | |
EQUITY | | |
Equity Income Fund | | 13%–23% |
Growth & Income Fund | | 12%–22% |
Growth Fund | | 12%–22% |
Select Value Fund | | 5%–15% |
Aggressive Opportunities Fund | | 5%–15% |
Discovery Fund | | 4%–14% |
International Fund | | 12%–22% |
Third Party Emerging Markets ETF | | 0%–5% |
Performance2
The Vantagepoint Model Portfolio All-Equity Growth Fund’s Investor M Shares gained 30.36% in 2013. The Fund’s market benchmark, the S&P 500 Index, gained 32.39%, while the Fund’s peer group, the Morningstar Large Blend Funds Average, a group of mutual funds with similar investment objectives, gained 31.50%. The Fund’s custom benchmark gained 30.54%. The Fund’s custom benchmark is composed of the S&P 500 Index and the MSCI EAFE Index (Net) (“MSCI-EAFE Index”), in weighted percentages corresponding to the historical target allocations for the asset classes these indexes represent.
The Model Portfolio All-Equity Growth Fund’s performance reflected the generally positive returns of the U.S. and developed foreign equity markets in 2013. The positive performance was due to the positive returns from seven of the eight underlying equity funds, with performance ranging between 39.58% for the Discovery Fund and 17.77% for the International Fund. The eighth underlying equity fund, the emerging markets ETF, lost 3.74% in the period since it was added to the Fund on May 1, 2013. Please refer to each underlying Vantagepoint Fund’s commentary within this report for more information.
The Fund’s underperformance relative to its equity market benchmark primarily resulted from its allocation to foreign equity funds, both in developed and emerging equity markets, as these underlying funds generally trailed the Fund’s S&P 500 market benchmark, along with returns from the underlying Equity Income Fund. The Fund’s allocations to the Growth & Income Fund, Growth Fund, Select Value Fund, Aggressive Opportunities Fund, and Discovery Fund partially offset this underperformance, as these underlying funds outperformed the Fund’s market benchmark.
The Fund’s underperformance relative to its peer group was primarily due to an overweight allocation to the underlying foreign equity funds, which generally underperformed U.S. equity funds. An overweight allocation to smaller-capitalization securities, which generally outperformed large-capitalization securities, partially offset this underperformance.
| 1 | On May 1, 2013, exposure to emerging market stocks through a third party ETF was added to the Fund. |
| 2 | As of March 1, 2013, the Fund began investing in “T Shares” of the underlying Vantagepoint Funds. Prior to March 1, 2013, the Fund invested in the Investor Shares of each underlying actively managed Vantagepoint Fund and the Class I Shares of Vantagepoint Index Funds. The underlying Vantagepoint Funds’ performance noted above reflects the returns for the T Shares from their inception date, March 1, 2013, through December 31, 2013. Prior to March 1, 2013, performance of the underlying funds is based on the Investor Shares of the actively managed Vantagepoint Funds, and the Class I Shares of the Vantagepoint Index Funds. As a result, performance of the underlying Vantagepoint Funds shown may vary from the returns discussed in their commentaries elsewhere within this report. |
55
The Fund’s underperformance relative to its custom benchmark primarily resulted from the Fund’s overweight allocation to emerging market equities, which generally underperformed both developed foreign equity markets and the U.S. equity market. The Fund’s allocations to the underlying Equity Income Fund, International Fund, and emerging markets ETF underperformed their respective broad market index in the Fund’s custom benchmark. The Fund’s allocations to the Growth & Income Fund, Growth Fund, Select Value Fund, Aggressive Opportunities Fund, and Discovery Fund partially offset this underperformance as these underlying funds outperformed their broad market index.
Vantagepoint Model Portfolio All-Equity Growth Fund
Underlying Fund Allocation as of December 31, 2013 (% of Net Assets)
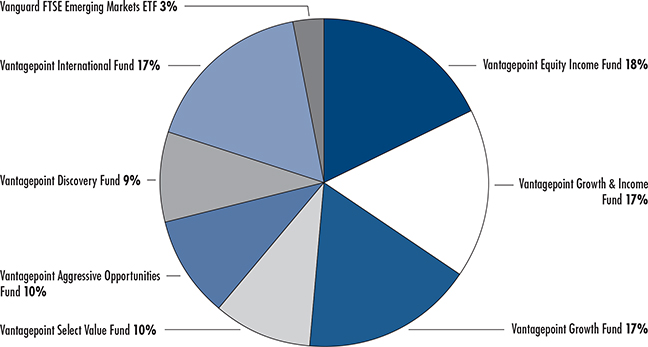
Due to rounding, pie chart allocations may not add up to 100%.
56
Vantagepoint Model Portfolio All-Equity Growth Fund—Investor M Shares vs. S&P 500 Index and Custom Benchmark | Growth of $10,000 Invested December 31, 2003*
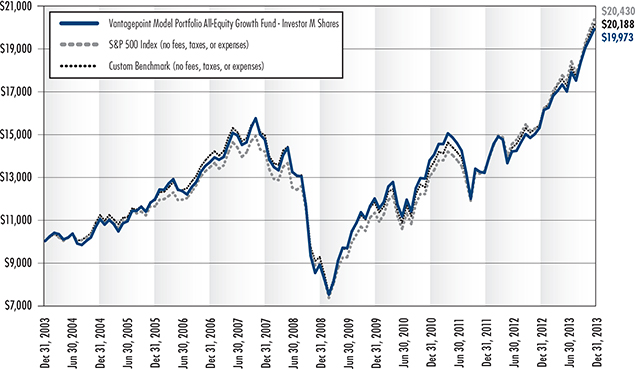
Source for Benchmark Returns: Morningstar®
Vantagepoint Model Portfolio All-Equity Growth Fund
Average Annual Total Returns for the periods ended December 31, 2013*
| | | | |
| | | INVESTOR M SHARES | | TM SHARES |
One Year | | 30.36% | | 30.64% |
Three Years | | 13.13% | | 13.22% |
Five Years | | 17.59% | | 17.64% |
Ten Years | | 7.16% | | 7.19% |
Class Inception Date | | October 1, 2000 | | March 1, 2013 |
| * | Management’s Discussion of Fund Performance describes the performance of the Fund’s Investor M Shares (the Fund’s outstanding shares were renamed “Investor M Shares” on March 1, 2013). In the table, performance information for TM Shares prior to the inception date of that share class (March 1, 2013) is based on the performance of the Fund’s Investor M Shares. This prior performance has not been adjusted to reflect the actual fees and expenses paid by TM Shares. |
Current performance may be higher or lower than the past performance presented in this report. Past performance is no guarantee of future performance. Investment returns and principal value will fluctuate so that shares, when redeemed, may be worth more or less than their original cost. The graph and the table do not reflect the deduction of taxes that a shareholder would pay on fund distributions or the redemption of fund shares. Current performance is available by calling 800-669-7400 or at www.icmarc.org/vpperformance.
The Fund’s market benchmark, the S&P 500 Index, is an index consisting of 500 companies representing larger capitalization stocks traded in the U.S. The custom benchmark is composed of the S&P 500 Index and the MSCI Europe Australasia Far East (EAFE) Index (Net) (the MSCI-EAFE Index) in weighted percentages that correspond to the historical target allocations for the asset classes these indexes represent. These weightings will change to correspond with any changes in the Fund’s target percentage allocations. The MSCI-EAFE Index is a free float-adjusted market capitalization index of equity securities that is designed to measure the equity market performance of developed markets, excluding the U.S. and Canada, and approximates the minimum possible dividend reinvestment after deduction of withholding tax according to MSCI Barra’s methodology. An index is not available for direct investment, is unmanaged and does not reflect the costs of portfolio management or trading. A fund’s exposure, through the underlying funds, to specific securities (or types of securities) may differ significantly from the securities held in the indexes.
57
Vantagepoint Milestone Retirement Income Fund
The Vantagepoint Milestone Retirement Income Fund’s objective is to seek to offer current income and opportunities for capital growth that have limited risk. The Fund’s principal investment strategy is to invest in a combination of other Vantagepoint Funds and one or more third party exchange-traded funds (“ETFs”)1 to seek to obtain exposure to approximately 55% fixed income investments, 25% equity investments, and 20% investments in asset classes and strategies that have historically exhibited a low correlation to traditional fixed income and equity investments (a “multi-strategy” Fund). The Fund’s investment strategy is implemented by investing in the following funds at target allocations within the percentage ranges indicated:
| | |
FIXED INCOME | | |
Low Duration Bond Fund | | 26%–36% |
Core Bond Index Fund | | 4%–14% |
Inflation Protected Securities Fund | | 10%–20% |
EQUITY | | |
Equity Income Fund | | 5%–15% |
Growth & Income Fund | | 5%–15% |
International Fund | | 0%–9% |
Third Party Emerging Markets ETF | | 0%–5% |
MULTI-STRATEGY | | |
Diversifying Strategies Fund | | 15%–25% |
Performance2
The Vantagepoint Milestone Retirement Income Fund’s Investor M Shares gained 6.14% in 2013. The Fund’s market benchmark, the Barclays U.S. Intermediate Aggregate Bond Index (“Barclays Index”), lost 1.02%, while the Fund’s peer group, the Morningstar Retirement Income Funds Average, a group of mutual funds with similar investment objectives, gained 7.36%. The Fund’s custom benchmark gained 6.59%. The Fund’s custom benchmark is composed of the Barclays Index and the S&P 500 Index, in weighted percentages corresponding to the historical target allocations for the asset classes these indexes represent.
The Milestone Retirement Income Fund’s performance reflected the generally positive returns of the U.S. and developed foreign equity markets in 2013 and the generally negative returns of fixed income markets and emerging market equities. The positive performance primarily resulted from allocations to the underlying equity funds. The Growth & Income Fund gained 34.26%, Equity Income Fund returned 31.36%, and International Fund gained 17.77%. The Diversifying Strategies Fund gained 5.81%. The Fund’s three underlying fixed income funds produced mixed results, as the Low Duration Bond Fund gained 0.96%, while the Core Bond Index Fund lost 2.38% and Inflation Protected Securities Fund decreased 8.81%. The third party emerging markets ETF lost 3.74% in the period since it was added to the Fund on May 1, 2013. Please refer to each underlying Vantagepoint Fund’s commentary within this report for more information.
The Fund’s outperformance relative to its fixed income market benchmark primarily resulted from its allocation to the underlying equity funds, with the exception of the emerging market ETF, as these underlying funds outperformed the market benchmark. Performance also benefitted from returns in the underlying Diversifying Strategies Fund and Low Duration Bond Fund.
| 1 | On May 1, 2013, exposure to emerging market stocks through a third party ETF was added to the Fund. |
| 2 | As of March 1, 2013, the Fund began investing in “T Shares” of the underlying Vantagepoint Funds. Prior to March 1, 2013, the Fund invested in the Investor Shares of each underlying actively managed Vantagepoint Fund and the Class I Shares of Vantagepoint Index Funds. The underlying Vantagepoint Funds’ performance noted above reflects the returns for the T Shares from their inception date, March 1, 2013, through December 31, 2013. Prior to March 1, 2013, performance of the underlying funds is based on the Investor Shares of the actively managed Vantagepoint Funds, and the Class I Shares of the Vantagepoint Index Funds. As a result, performance of the underlying Vantagepoint Funds shown may vary from the returns discussed in their commentaries elsewhere within this report. |
58
The Fund’s underperformance relative to its peer group primarily resulted from an underweight allocation to equity funds, which generally outperformed fixed income securities. Additionally, a high quality focus in the underlying fixed income funds detracted from performance as lower quality securities generally outperformed higher quality securities. The Fund’s shorter duration exposure resulting from the underlying fixed income funds partially offset the underperformance as shorter duration funds generally outperformed longer duration funds.
The Fund’s underperformance relative to its custom benchmark primarily resulted from overweight allocations to the underlying foreign equity funds, which generally underperformed U.S. equities. An overweight allocation to growth-style equity securities in the underlying equity funds, which generally outperformed value-style equity securities, as well as a bias toward smaller-capitalization securities, which generally outperformed large-capitalization securities, partially offset this underperformance. The Fund’s allocations to the Equity Income Fund, International Fund, emerging markets ETF, Inflation Protected Securities Fund, and Core Bond Index Fund underperformed their respective broad market indexes in the Fund’s custom benchmark. The Fund’s allocations to the Low Duration Bond Fund, Diversifying Strategies Fund, and Growth & Income Fund, partially offset this underperformance as these underlying funds outperformed their respective broad market indexes in the Fund’s custom benchmark.
Vantagepoint Milestone Retirement Income Fund
Underlying Fund Allocation as of December 31, 2013 (% of Net Assets)
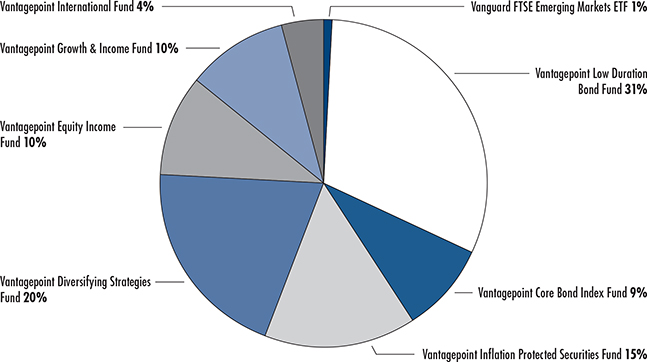
Due to rounding, pie chart allocations may not add up to 100%.
59
Vantagepoint Milestone Retirement Income Fund—Investor M Shares vs. Barclays U.S. Intermediate Aggregate Bond Index and Custom Benchmark | Growth of $10,000 Invested January 3, 2005*
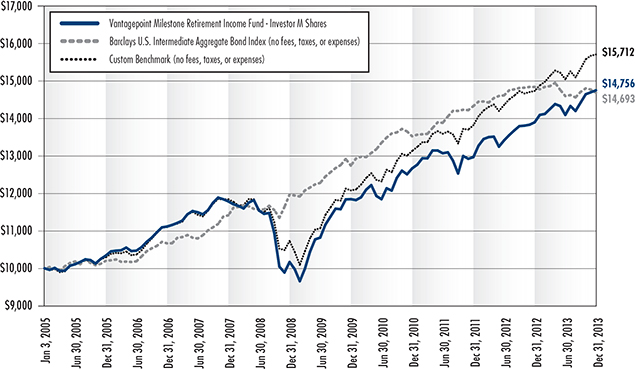
Source for Benchmark Returns: Morningstar®
Vantagepoint Milestone Retirement Income Fund
Average Annual Total Returns for the periods ended December 31, 2013*
| | | | |
| | | INVESTOR M SHARES | | TM SHARES |
One Year | | 6.14% | | 6.44% |
Three Years | | 5.21% | | 5.31% |
Five Years | | 7.73% | | 7.79% |
Since Inception | | 4.41% | | 4.45% |
Class Inception Date | | January 3, 2005 | | March 1, 2013 |
| * | Management’s Discussion of Fund Performance describes the performance of the Fund’s Investor M Shares (the Fund’s outstanding shares were renamed “Investor M Shares” on March 1, 2013). In the table, performance information for TM Shares prior to the inception date of that share class (March 1, 2013) is based on the performance of the Fund’s Investor M Shares. This prior performance has not been adjusted to reflect the actual fees and expenses paid by TM Shares. |
Current performance may be higher or lower than the past performance presented in this report. Past performance is no guarantee of future performance. Investment returns and principal value will fluctuate so that shares, when redeemed, may be worth more or less than their original cost. The graph and the table do not reflect the deduction of taxes that a shareholder would pay on fund distributions or the redemption of fund shares. Current performance is available by calling 800-669-7400 or at www.icmarc.org/vpperformance.
The Fund’s market benchmark, the Barclays U.S. Intermediate Aggregate Bond Index (the Barclays Index), consists of investment-grade U.S. fixed income securities with maturities of 1 to 10 years. The custom benchmark is composed of the Barclays Index and the S&P 500 Index in weighted percentages that correspond to the historical target allocations for the asset classes these indexes represent. These weightings will change to correspond with any changes in the Fund’s target percentage allocations. The S&P 500 Index is an index consisting of 500 companies representing larger capitalization stocks traded in the U.S. An index is not available for direct investment, is unmanaged and does not reflect the costs of portfolio management or trading. A fund’s exposure, through the underlying funds, to specific securities (or types of securities) may differ significantly from the securities held in the indexes.
60
Vantagepoint Milestone 2010 Fund
The Vantagepoint Milestone 2010 Fund’s objective is to offer high total return consistent with the Fund’s current asset allocation. The Fund’s principal investment strategy is to invest in a combination of other Vantagepoint Funds and one or more third party exchange-traded funds (“ETFs”)1 using an asset allocation strategy designed for investors who retired in or around the year 2010 and would like to make gradual withdrawals from the Fund.
At year end, the Fund was invested in the following funds at target allocations within the percentage ranges indicated:
| | |
FIXED INCOME | | |
Low Duration Bond Fund | | 12%–22% |
Core Bond Index Fund | | 2%–12% |
Inflation Protected Securities Fund | | 10%–20% |
EQUITY | | |
Equity Income Fund | | 12%–22% |
Growth & Income Fund | | 6%–16% |
Growth Fund | | 1%–11% |
International Fund | | 3%–13% |
Third Party Emerging Markets ETF | | 0%–5% |
MULTI-STRATEGY | | |
Diversifying Strategies Fund | | 13%–23% |
The Fund follows a strategy that as time elapses, the Fund’s allocation to equity investments will periodically decrease and the Fund’s allocation to fixed income and multi-strategy investments will correspondingly increase so that by June 30 of the year 2020 (ten years after the year indicated in the Fund name), the Fund’s net assets will be invested approximately 25% in equity funds, 55% in fixed income funds, and 20% in the multi-strategy fund.
Performance2
The Vantagepoint Milestone 2010 Fund’s Investor M Shares gained 11.12% in 2013. The Fund’s market benchmark, the Barclays U.S. Intermediate Aggregate Bond Index (“Barclay’s Index”), lost 1.02%, while the Fund’s peer group, the Morningstar Target Date 2000-2010 Funds Average, a group of mutual funds with similar investment objectives, gained 8.30%. The Fund’s custom benchmark gained 12.49%. The Fund’s custom benchmark is composed of the Barclays Index and the S&P 500 Index, in weighted percentages corresponding to the historical target allocations for the asset classes these indexes represent.
The Milestone 2010 Fund’s performance reflected the generally positive returns of the U.S. and developed foreign equity markets in 2013 and the generally negative returns of fixed income markets and emerging market equities. The positive performance primarily resulted from allocations to the underlying equity funds. Four of the five underlying equity funds produced positive results, with returns ranging between 34.26% for the Growth & Income Fund and 17.77% for the International Fund. The fifth underlying equity fund, the emerging markets ETF, lost 3.74% in the period since it was added to the Fund on May 1, 2013. The Fund’s three underlying fixed income funds produced mixed results, as the Low Duration Bond Fund gained 0.96%, while the Core Bond Index Fund lost 2.38% and Inflation Protected Securities Fund decreased 8.81%. The Diversifying Strategies Fund gained 5.81%. Please refer to each underlying Vantagepoint Fund’s commentary within this report for more information.
| 1 | On May 1, 2013, exposure to emerging market stocks through a third party ETF was added to the Fund. |
| 2 | As of March 1, 2013, the Fund began investing in “T Shares” of the underlying Vantagepoint Funds. Prior to March 1, 2013, the Fund invested in the Investor Shares of each underlying actively managed Vantagepoint Fund and the Class I Shares of Vantagepoint Index Funds. The underlying Vantagepoint Funds’ performance noted above reflects the returns for the T Shares from their inception date, March 1, 2013, through December 31, 2013. Prior to March 1, 2013, performance of the underlying funds is based on the Investor Shares of the actively managed Vantagepoint Funds, and the Class I Shares of the Vantagepoint Index Funds. As a result, performance of the underlying Vantagepoint Funds shown may vary from the returns discussed in their commentaries elsewhere within this report. |
61
The Fund’s outperformance relative to its fixed income market benchmark primarily resulted from its allocation to the underlying equity funds, with the exception of the emerging market ETF, as these underlying funds outperformed the market benchmark. Performance also benefitted from returns in the underlying Diversifying Strategies Fund and Low Duration Bond Fund.
The Fund’s outperformance relative to its peer group primarily resulted from an overweight allocation to equity funds, which generally outperformed fixed income funds. Additionally, an overweight allocation to U.S. equity funds was beneficial as U.S. equity securities generally outperformed foreign equities. The Fund’s shorter duration exposure resulting from the underlying fixed income funds added to performance, as shorter duration funds generally outperformed longer duration funds.
The Fund’s underperformance relative to its custom benchmark primarily resulted from overweight allocations to the underlying foreign equity funds, which generally underperformed U.S. equity funds. An overweight allocation to growth-style equity securities in the underlying equity funds, which generally outperformed value-style equity securities, as well as a bias toward smaller-capitalization securities, which generally outperformed large-capitalization securities, partially offset this underperformance. The Fund’s allocations to the Equity Income Fund, International Fund, emerging markets ETF, Inflation Protected Securities Fund, and Core Bond Index Fund underperformed their respective broad market index in the Fund’s custom benchmark. The Fund’s allocations to the Low Duration Bond Fund, Diversifying Strategies Fund, Growth & Income Fund, and Growth Fund partially offset this underperformance as these underlying funds outperformed their respective broad market index in the Fund’s custom benchmark.
Vantagepoint Milestone 2010 Fund
Underlying Fund Allocation as of December 31, 2013 (% of Net Assets)
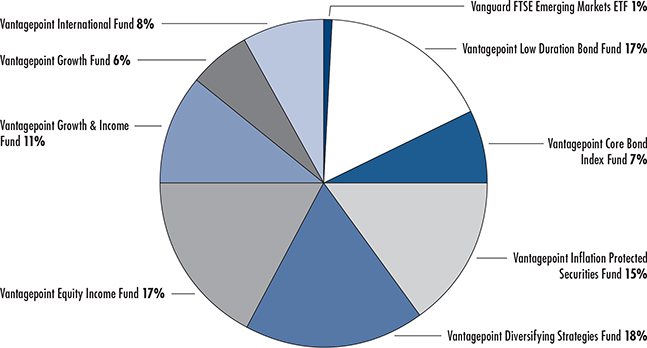
Due to rounding, pie chart allocations may not add up to 100%.
62
Vantagepoint Milestone 2010 Fund—Investor M Shares vs. Barclays and Custom Benchmark
Growth of $10,000 Invested January 3, 2005*
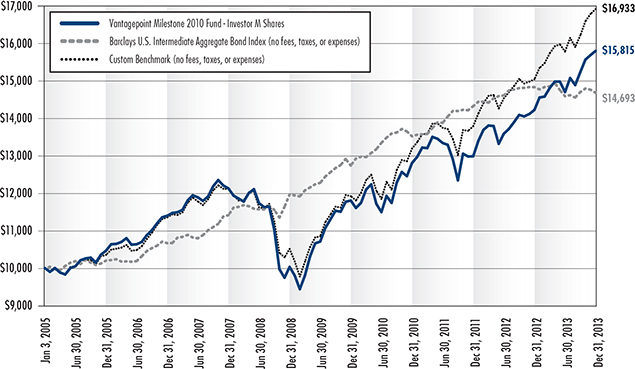
Source for Benchmark Returns: Morningstar®
Vantagepoint Milestone 2010 Fund
Average Annual Total Returns for the periods ended December 31, 2013*
| | | | |
| | | INVESTOR M SHARES | | TM SHARES |
One Year | | 11.12% | | 11.43% |
Three Years | | 7.27% | | 7.37% |
Five Years | | 9.53% | | 9.60% |
Since Inception | | 5.22% | | 5.25% |
Class Inception Date | | January 3, 2005 | | March 1, 2013 |
| * | Management’s Discussion of Fund Performance describes the performance of the Fund’s Investor M Shares (the Fund’s outstanding shares were renamed “Investor M Shares” on March 1, 2013). In the table, performance information for TM Shares prior to the inception date of that share class (March 1, 2013) is based on the performance of the Fund’s Investor M Shares. This prior performance has not been adjusted to reflect the actual fees and expenses paid by TM Shares. |
Current performance may be higher or lower than the past performance presented in this report. Past performance is no guarantee of future performance. Investment returns and principal value will fluctuate so that shares, when redeemed, may be worth more or less than their original cost. The graph and the table do not reflect the deduction of taxes that a shareholder would pay on fund distributions or the redemption of fund shares. Current performance is available by calling 800-669-7400 or at www.icmarc.org/vpperformance.
The Fund’s market benchmark, the Barclays U.S. Intermediate Aggregate Bond Index (the Barclays Index), consists of investment-grade U.S. fixed income securities with maturities of 1 to 10 years. The custom benchmark is composed of the Barclays Index and the S&P 500 Index in weighted percentages that correspond to the historical target allocations for the asset classes these indexes represent. These weightings will change to correspond with any changes in the Fund’s target percentage allocations. The S&P 500 Index is an index consisting of 500 companies representing larger capitalization stocks traded in the U.S. An index is not available for direct investment, is unmanaged and does not reflect the costs of portfolio management or trading. A fund’s exposure, through the underlying funds, to specific securities (or types of securities) may differ significantly from the securities held in the indexes.
63
Vantagepoint Milestone 2015 Fund
The Vantagepoint Milestone 2015 Fund’s objective is to offer high total return consistent with the Fund’s current asset allocation. The Fund’s principal investment strategy is to invest in a combination of other Vantagepoint Funds and one or more third party exchange-traded funds (“ETFs”)1 using an asset allocation strategy designed for investors expecting to begin making gradual withdrawals from the Fund, typically at or after retirement (assumed to occur at age 60), around the year 2015.
At year end, the Fund was invested in the following funds at target allocations within the percentage ranges indicated:
| | | | |
FIXED INCOME | | | | |
Low Duration Bond Fund | | | 7%–17% | |
Core Bond Index Fund | | | 3%–13% | |
Inflation Protected Securities Fund | | | 7%–17% | |
EQUITY | | | | |
Equity Income Fund | | | 14%–24% | |
Growth & Income Fund | | | 6%–16% | |
Growth Fund | | | 3%–13% | |
Mid/Small Company Index Fund | | | 0%–8% | |
International Fund | | | 4%–14% | |
Third Party Emerging Markets ETF | | | 0%–5% | |
MULTI-STRATEGY | | | | |
Diversifying Strategies Fund | | | 12%–22% | |
The Fund follows a strategy that as time elapses, the Fund’s allocation to equity funds will periodically decrease and the Fund’s allocation to fixed income and multi-strategy funds would correspondingly increase so that by June 30 of the year 2025 (ten years after the year indicated in the Fund name), the Fund’s asset allocation would be approximately 25% equity funds, 55% fixed income funds, and 20% in a multi-strategy fund.
Performance2
The Vantagepoint Milestone 2015 Fund’s Investor M Shares gained 13.75% in 2013. The Fund’s market benchmark, the S&P 500 Index, gained 32.39%, while the Fund’s peer group, the Morningstar Target Date 2011–2015 Funds Average, a group of mutual funds with similar investment objectives, gained 9.65%. The Fund’s custom benchmark gained 15.00%. The Fund’s custom benchmark is composed of the S&P 500 Index and the Barclays U.S. Intermediate Aggregate Bond Index (“Barclays Index”), in weighted percentages corresponding to the historical target allocations for the asset classes these indexes represent.
The Milestone 2015 Fund’s performance reflected the generally positive returns of the U.S. and developed foreign equity markets in 2013 and the generally negative returns of fixed income markets and emerging market equities. The positive performance primarily resulted from allocations to the underlying equity funds. Five of the six underlying equity funds produced positive results, with returns ranging between 37.49% for the Mid/Small Company Index Fund and 17.77% for the International Fund. The sixth underlying equity fund, the emerging markets ETF, lost 3.74% in the period since it was added to the Fund on May 1, 2013. The Fund’s three underlying fixed income funds produced mixed results, as the Low Duration Bond Fund gained 0.96%, while the Core Bond Index Fund lost 2.38% and Inflation Protected Securities Fund decreased 8.81%. The Diversifying Strategies Fund gained 5.81% in the year. Please refer to each underlying Vantagepoint Fund’s commentary within this report for more information.
| 1 | On May 1, 2013, exposure to emerging market stocks through a third party ETF was added to the Fund. |
| 2 | As of March 1, 2013, the Fund began investing in “T Shares” of the underlying Vantagepoint Funds. Prior to March 1, 2013, the Fund invested in the Investor Shares of each underlying actively managed Vantagepoint Fund and the Class I Shares of Vantagepoint Index Funds. The underlying Vantagepoint Funds’ performance noted above reflects the returns for the T Shares from their inception date, March 1, 2013, through December 31, 2013. Prior to March 1, 2013, performance of the underlying funds is based on the Investor Shares of the actively managed Vantagepoint Funds, and the Class I Shares of the Vantagepoint Index Funds. As a result, performance of the underlying Vantagepoint Funds shown may vary from the returns discussed in their commentaries elsewhere within this report. |
64
The Fund’s underperformance relative to its equity market benchmark primarily resulted from its allocation to the underlying fixed income funds, multi-strategy fund, and foreign equity funds, including the emerging markets ETF, as these underlying funds generally trailed the Fund’s market benchmark. Additionally, the Equity Income Fund trailed the market benchmark. Returns from the Fund’s underlying allocations to the Growth & Income Fund, Growth Fund, and Mid/Small Company Index Fund partially offset this underperformance, as these underlying funds outperformed the Fund’s market benchmark.
The Fund’s outperformance relative to its peer group primarily resulted from an overweight allocation to equity funds, which generally outperformed fixed income funds. Additionally, an overweight allocation to U.S. equity funds was beneficial as U.S. equity securities generally outperformed foreign equities. The Fund’s shorter duration exposure resulting from the underlying fixed income funds added to performance, as shorter duration funds generally outperformed longer duration funds.
The Fund’s underperformance relative to its custom benchmark primarily resulted from an overweight allocation to the underlying foreign equity funds, which generally underperformed U.S. equity funds. An overweight allocation to growth-style equity securities in the underlying equity funds, which generally outperformed value-style equity securities, as well as a bias toward smaller-capitalization securities, which generally outperformed large-capitalization securities, partially offset this underperformance. The Fund’s allocations to the underlying Equity Income Fund, International Fund, emerging markets ETF, Inflation Protected Securities Fund, and Core Bond Index Fund underperformed their respective broad market index in the Fund’s custom benchmark. The Fund’s allocations to the Low Duration Bond Fund, Diversifying Strategies Fund, Growth & Income Fund, Growth Fund, and Mid/Small Company Index Fund partially offset this underperformance as these underlying funds outperformed their respective broad market index in the Fund’s custom benchmark.
Vantagepoint Milestone 2015 Fund
Underlying Fund Allocation as of December 31, 2013 (% of Net Assets)
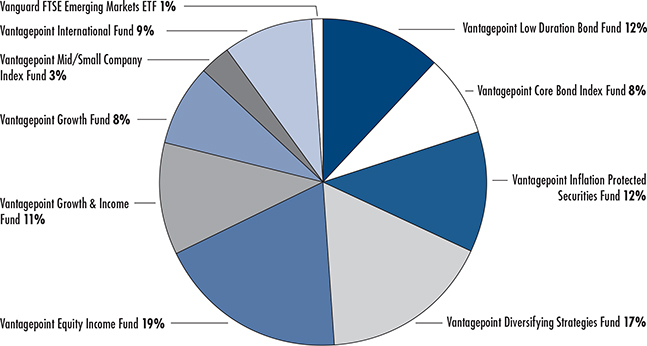
Due to rounding, pie chart allocations may not add up to 100%.
65
Vantagepoint Milestone 2015 Fund—Investor M Shares vs. S&P 500 Index and Custom Benchmark
Growth of $10,000 Invested January 3, 2005*
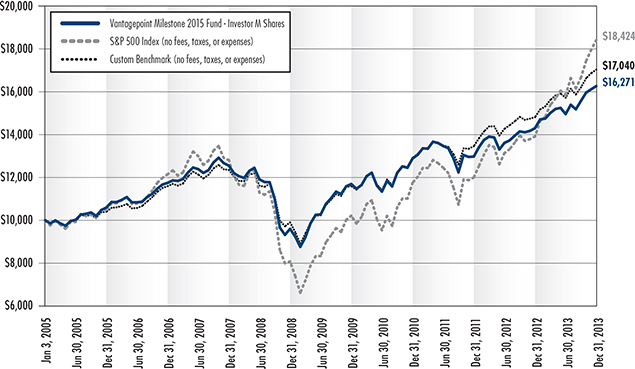
Source for Benchmark Returns: Morningstar®
Vantagepoint Milestone 2015 Fund
Average Annual Total Returns for the periods ended December 31, 2013*
| | | | |
| | | INVESTOR M SHARES | | TM SHARES |
One Year | | 13.75% | | 13.97% |
Three Years | | 8.09% | | 8.16% |
Five Years | | 11.14% | | 11.18% |
Since Inception | | 5.55% | | 5.58% |
Class Inception Date | | January 3, 2005 | | March 1, 2013 |
| * | Management’s Discussion of Fund Performance describes the performance of the Fund’s Investor M Shares (the Fund’s outstanding shares were renamed “Investor M Shares” on March 1, 2013). In the table, performance information for TM Shares prior to the inception date of that share class (March 1, 2013) is based on the performance of the Fund’s Investor M Shares. This prior performance has not been adjusted to reflect the actual fees and expenses paid by TM Shares. |
Current performance may be higher or lower than the past performance presented in this report. Past performance is no guarantee of future performance. Investment returns and principal value will fluctuate so that shares, when redeemed, may be worth more or less than their original cost. The graph and the table do not reflect the deduction of taxes that a shareholder would pay on fund distributions or the redemption of fund shares. Current performance is available by calling 800-669-7400 or at www.icmarc.org/vpperformance.
The Fund’s market benchmark, the S&P 500 Index, is an index consisting of 500 companies representing larger capitalization stocks traded in the U.S. The custom benchmark is composed of the S&P 500 Index and the Barclays U.S. Intermediate Aggregate Bond Index (the Barclays Index) in weighted percentages that correspond to the historical target allocations for the asset classes these indexes represent. These weightings will change to correspond with any changes in the Fund’s target percentage allocations. The Barclays Index consists of investment-grade U.S. fixed income securities with maturities of 1 to 10 years. An index is not available for direct investment, is unmanaged and does not reflect the costs of portfolio management or trading. A fund’s exposure, through the underlying funds, to specific securities (or types of securities) may differ significantly from the securities held in the indexes.
66
Vantagepoint Milestone 2020 Fund
The Vantagepoint Milestone 2020 Fund’s objective is to offer high total return consistent with the Fund’s current asset allocation. The Fund’s principal investment strategy is to invest in a combination of other Vantagepoint Funds and one or more third party exchange-traded funds (“ETFs”)1 using an asset allocation strategy designed for investors expecting to begin making gradual withdrawals from the Fund, typically at or after retirement (assumed to occur at age 60), around the year 2020.
At year end, the Fund was invested in the following funds at target allocations within the percentage ranges indicated:
| | |
FIXED INCOME | | |
Low Duration Bond Fund | | 3%–13% |
Core Bond Index Fund | | 7%–17% |
Inflation Protected Securities Fund | | 0%–10% |
EQUITY | | |
Equity Income Fund | | 15%–25% |
Growth & Income Fund | | 6%–16% |
Growth Fund | | 3%–13% |
Mid/Small Company Index Fund | | 3%–13% |
International Fund | | 5%–15% |
Third Party Emerging Markets ETF | | 0%–5% |
MULTI-STRATEGY | | |
Diversifying Strategies Fund | | 11%–21% |
The Fund follows a strategy that as time elapses, the Fund’s allocation to equity investments will periodically decrease and the Fund’s allocation to fixed income and multi-strategy investments will correspondingly increase so that by June 30 of the year 2030 (ten years after the year indicated in the Fund name), the Fund’s net assets will be invested approximately 25% in equity funds, 55% in fixed income funds, and 20% in the multi-strategy fund.
Performance2
The Vantagepoint Milestone 2020 Fund’s Investor M Shares gained 16.83% in 2013. The Fund’s market benchmark, the S&P 500 Index, gained 32.39%, while the Fund’s peer group, the Morningstar Target Date 2016-2020 Funds Average, a group of mutual funds with similar investment objectives, gained 11.57%. The Fund’s custom benchmark gained 17.86%. The Fund’s custom benchmark is composed of the S&P 500 Index and the Barclays U.S. Intermediate Aggregate Bond Index (“Barclays Index”), in weighted percentages corresponding to the historical target allocations for the asset classes these indexes represent.
The Milestone 2020 Fund’s performance reflected the generally positive returns of the U.S. and developed foreign equity markets in 2013 and the generally negative returns of fixed income markets and emerging market equities. The positive performance primarily resulted from allocations to the underlying equity funds. Five of the six underlying equity funds produced positive results, with returns ranging between 37.49% for the Mid/Small Company Index Fund and 17.77% for the International Fund. The sixth underlying equity fund, the emerging markets ETF, lost 3.74% in the period since it was added to the Fund on May 1, 2013. The Fund’s three underlying fixed income funds produced mixed results, as the Low Duration Bond Fund gained 0.96%, while the Core Bond Index Fund lost 2.38% and Inflation Protected Securities Fund decreased 8.81%. The Diversifying Strategies Fund gained 5.81% in the year. Please refer to each underlying Vantagepoint Fund’s commentary within this report for more information.
| 1 | On May 1, 2013, exposure to emerging market stocks through a third party ETF was added to the Fund. |
| 2 | As of March 1, 2013, the Fund began investing in “T Shares” of the underlying Vantagepoint Funds. Prior to March 1, 2013, the Fund invested in the Investor Shares of each underlying actively managed Vantagepoint Fund and the Class I Shares of Vantagepoint Index Funds. The underlying Vantagepoint Funds’ performance noted above reflects the returns for the T Shares from their inception date, March 1, 2013, through December 31, 2013. Prior to March 1, 2013, performance of the underlying funds is based on the Investor Shares of the actively managed Vantagepoint Funds, and the Class I Shares of the Vantagepoint Index Funds. As a result, performance of the underlying Vantagepoint Funds shown may vary from the returns discussed in their commentaries elsewhere within this report. |
67
The Fund’s underperformance relative to its equity market benchmark primarily resulted from its allocation to the underlying fixed income funds, multi-strategy fund, and foreign equity funds, including the emerging market ETF, as these underlying funds generally trailed the Fund’s market benchmark. Additionally, the Equity Income Fund trailed the market benchmark. Returns from the Fund’s underlying allocations to the Growth & Income Fund, Growth Fund, and Mid/ Small Company Index Fund partially offset this underperformance, as these underlying funds outperformed the Fund’s market benchmark.
The Fund’s outperformance relative to its peer group primarily resulted from an overweight allocation to equity funds, which generally outperformed fixed income funds. Additionally, an overweight allocation to U.S. equity funds was beneficial, as U.S. equity funds generally outperformed foreign equity funds. The Fund’s shorter duration exposure resulting from the underlying fixed income funds added to performance, as shorter duration funds generally outperformed longer duration funds. An underweight allocation to inflation protected fixed income securities within the underlying funds benefitted performance since returns from inflation protected fixed income securities generally trailed non-inflation protected fixed income securities.
The Fund’s underperformance relative to its custom benchmark primarily resulted from an overweight allocation to underlying foreign equity funds, which generally underperformed U.S. equity funds. An overweight allocation to growth-style equity securities in the underlying equity funds, which generally outperformed value-style equity securities, as well as a bias toward smaller-capitalization securities, which generally outperformed large-capitalization securities, partially offset this underperformance. The Fund’s allocations to the underlying Equity Income Fund, International Fund, emerging markets ETF, Inflation Protected Securities Fund, and Core Bond Index Fund underperformed their respective broad market index in the Fund’s custom benchmark. The Fund’s allocations to the Low Duration Bond Fund, Diversifying Strategies Fund, Growth & Income Fund, Growth Fund, and Mid/Small Company Index Fund partially offset this underperformance as these underlying funds outperformed their respective broad market index in the Fund’s custom benchmark.
Vantagepoint Milestone 2020 Fund
Underlying Fund Allocation as of December 31, 2013 (% of Net Assets)
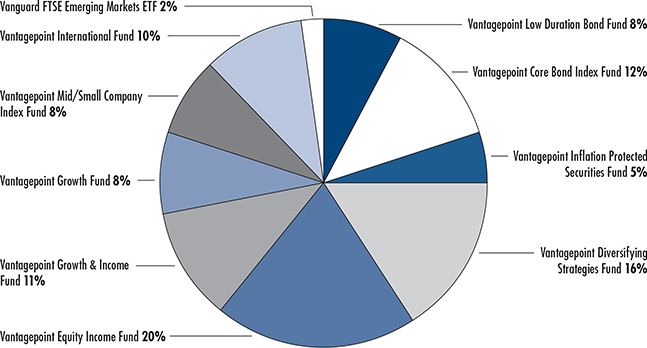
Due to rounding, pie chart allocations may not add up to 100%.
68
Vantagepoint Milestone 2020 Fund—Investor M Shares vs. S&P 500 Index and Custom Benchmark
Growth of $10,000 Invested January 3, 2005*
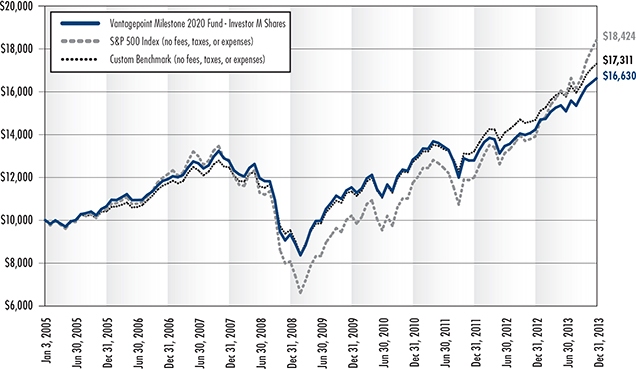
Source for Benchmark Returns: Morningstar®
Vantagepoint Milestone 2020 Fund
Average Annual Total Returns for the periods ended December 31, 2013*
| | | | |
| | | INVESTOR M SHARES | | TM SHARES |
One Year | | 16.83% | | 17.05% |
Three Years | | 9.03% | | 9.10% |
Five Years | | 12.23% | | 12.27% |
Since Inception | | 5.81% | | 5.83% |
Class Inception Date | | January 3, 2005 | | March 1, 2013 |
| * | Management’s Discussion of Fund Performance describes the performance of the Fund’s Investor M Shares (the Fund’s outstanding shares were renamed “Investor M Shares” on March 1, 2013). In the table, performance information for TM Shares prior to the inception date of that share class (March 1, 2013) is based on the performance of the Fund’s Investor M Shares. This prior performance has not been adjusted to reflect the actual fees and expenses paid by TM Shares. |
Current performance may be higher or lower than the past performance presented in this report. Past performance is no guarantee of future performance. Investment returns and principal value will fluctuate so that shares, when redeemed, may be worth more or less than their original cost. The graph and the table do not reflect the deduction of taxes that a shareholder would pay on fund distributions or the redemption of fund shares. Current performance is available by calling 800-669-7400 or at www.icmarc.org/vpperformance.
The Fund’s market benchmark, the S&P 500 Index, is an index consisting of 500 companies representing larger capitalization stocks traded in the U.S. The custom benchmark is composed of the S&P 500 Index and the Barclays U.S. Intermediate Aggregate Bond Index (the Barclays Index) in weighted percentages that correspond to the historical target allocations for the asset classes these indexes represent. These weightings will change to correspond with any changes in the Fund’s target percentage allocations. The Barclays Index consists of investment-grade U.S. fixed income securities with maturities of 1 to 10 years. An index is not available for direct investment, is unmanaged and does not reflect the costs of portfolio management or trading. A fund’s exposure, through the underlying funds, to specific securities (or types of securities) may differ significantly from the securities held in the indexes.
69
Vantagepoint Milestone 2025 Fund
The Vantagepoint Milestone 2025 Fund’s objective is to offer high total return consistent with the Fund’s current asset allocation. The Fund’s principal investment strategy is to invest in a combination of other Vantagepoint Funds and one or more third party exchange-traded funds (“ETFs”)1 using an asset allocation strategy designed for investors expecting to begin making gradual withdrawals from the Fund, typically at or after retirement (assumed to occur at age 60), around the year 2025.
At year end, the Fund was invested in the following funds at target allocations within the percentage ranges indicated:
| | |
FIXED INCOME | | |
Low Duration Bond Fund | | 0%–10% |
Core Bond Index Fund | | 9%–19% |
EQUITY | | |
Equity Income Fund | | 17%–27% |
Growth & Income Fund | | 7%–17% |
Growth Fund | | 4%–14% |
Mid/Small Company Index Fund | | 5%–15% |
International Fund | | 7%–17% |
Third Party Emerging Markets ETF | | 0%–5% |
MULTI-STRATEGY | | |
Diversifying Strategies Fund | | 9%–19% |
The Fund follows a strategy that as time elapses, the Fund’s allocation to equity investments will periodically decrease and the Fund’s allocation to fixed income and multi-strategy investments will correspondingly increase so that by June 30 of the year 2035 (ten years after the year indicated in the Fund name), the Fund’s net assets will be invested approximately 25% in equity funds, 55% in fixed income funds, and 20% in the multi-strategy fund.
Performance2
The Vantagepoint Milestone 2025 Fund’s Investor M Shares gained 19.67% in 2013. The Fund’s market benchmark, the S&P 500 Index, gained 32.39%, while the Fund’s peer group, the Morningstar Target Date 2021–2025 Funds Average, a group of mutual funds with similar investment objectives, gained 15.30%. The Fund’s custom benchmark gained 20.76%. The Fund’s custom benchmark is composed of the S&P 500 Index and the Barclays U.S. Intermediate Aggregate Bond Index (“Barclays Index”), in weighted percentages corresponding to the historical target allocations for the asset classes these indexes represent.
The Milestone 2025 Fund’s performance reflected the generally positive returns of the U.S. and developed foreign equity markets in 2013, and the generally negative returns of fixed income markets and emerging market equities. The positive performance primarily resulted from allocations to the underlying equity funds. Five of the six underlying equity funds produced positive results, with returns ranging between 37.49% for the Mid/Small Company Index Fund and 17.77% for the International Fund. The sixth underlying equity fund, the emerging markets ETF, lost 3.74% in the period since it was added to the Fund on May 1, 2013. The Fund’s two underlying fixed income funds produced mixed returns as the Low Duration Bond Fund gained 0.96%, while the Core Bond Index Fund lost 2.38%. The Diversifying Strategies Fund gained 5.81% in the year. Please refer to each underlying Vantagepoint Fund’s commentary within this report for more information.
| 1 | On May 1, 2013, exposure to emerging market stocks through a third party ETF was added to the Fund. |
| 2 | As of March 1, 2013, the Fund began investing in “T Shares” of the underlying Vantagepoint Funds. Prior to March 1, 2013, the Fund invested in the Investor Shares of each underlying actively managed Vantagepoint Fund and the Class I Shares of Vantagepoint Index Funds. The underlying Vantagepoint Funds’ performance noted above reflects the returns for the T Shares from their inception date, March 1, 2013, through December 31, 2013. Prior to March 1, 2013, performance of the underlying funds is based on the Investor Shares of the actively managed Vantagepoint Funds, and the Class I Shares of the Vantagepoint Index Funds. As a result, performance of the underlying Vantagepoint Funds shown may vary from the returns discussed in their commentaries elsewhere within this report. |
70
The Fund’s underperformance relative to its equity market benchmark primarily resulted from its allocation to the underlying fixed income funds, multi-strategy fund, and foreign equity funds, including the emerging market ETF, as these underlying funds generally trailed the Fund’s market benchmark. Additionally, the Equity Income Fund trailed the market benchmark. Returns from the Fund’s underlying allocations to the Growth & Income Fund, Growth Fund, and Mid/ Small Company Index Fund partially offset this underperformance, as these underlying funds outperformed the Fund’s market benchmark.
The Fund’s outperformance relative to its peer group primarily resulted from an overweight allocation to equity funds, which generally outperformed fixed income funds. Additionally, an overweight allocation to U.S. equity funds was beneficial, as U.S. equity funds generally outperformed foreign equity funds. The Fund’s shorter duration exposure resulting from the underlying fixed income funds added to performance, as shorter duration funds generally outperformed longer duration funds. An underweight allocation to inflation protected fixed income securities within the underlying funds benefitted performance since returns from inflation protected fixed income securities generally trailed non-inflation protected fixed income securities.
The Fund’s underperformance relative to its custom benchmark primarily resulted from an overweight allocation to underlying foreign equity funds, which generally underperformed U.S. equity funds. An overweight allocation to growth-style equity securities in the underlying equity funds, which generally outperformed value-style equity securities, as well as a bias toward smaller-capitalization securities, which generally outperformed large-capitalization securities, partially offset this underperformance. The Fund’s allocations to the underlying Equity Income Fund, International Fund, emerging markets ETF, and Core Bond Index Fund underperformed their respective broad market index in the Fund’s custom benchmark. The Fund’s allocations to the Low Duration Bond Fund, Diversifying Strategies Fund, Growth & Income Fund, Growth Fund, and Mid/Small Company Index Fund partially offset this underperformance as these underlying funds outperformed their respective broad market index in the Fund’s custom benchmark.
Vantagepoint Milestone 2025 Fund
Underlying Fund Allocation as of December 31, 2013 (% of Net Assets)
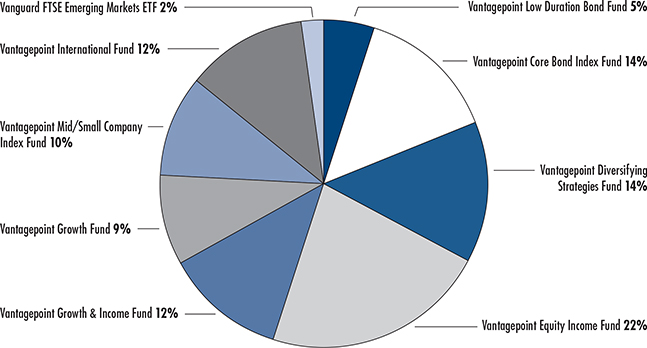
Due to rounding, pie chart allocations may not add up to 100%.
71
Vantagepoint Milestone 2025 Fund—Investor M Shares vs. S&P 500 Index and Custom Benchmark
Growth of $10,000 Invested January 3, 2005*
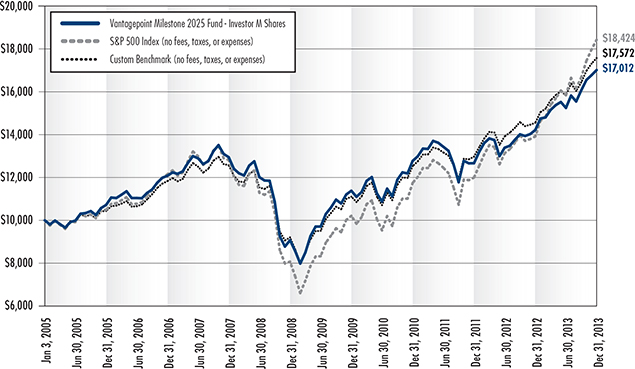
Source for Benchmark Returns: Morningstar®
Vantagepoint Milestone 2025 Fund
Average Annual Total Returns for the periods ended December 31, 2013*
| | | | |
| | | INVESTOR M SHARES | | TM SHARES |
One Year | | 19.67% | | 19.98% |
Three Years | | 10.02% | | 10.12% |
Five Years | | 13.39% | | 13.45% |
Since Inception | | 6.08% | | 6.11% |
Class Inception Date | | January 3, 2005 | | March 1, 2013 |
| * | Management’s Discussion of Fund Performance describes the performance of the Fund’s Investor M Shares (the Fund’s outstanding shares were renamed “Investor M Shares” on March 1, 2013). In the table, performance information for TM Shares prior to the inception date of that share class (March 1, 2013) is based on the performance of the Fund’s Investor M Shares. This prior performance has not been adjusted to reflect the actual fees and expenses paid by TM Shares. |
Current performance may be higher or lower than the past performance presented in this report. Past performance is no guarantee of future performance. Investment returns and principal value will fluctuate so that shares, when redeemed, may be worth more or less than their original cost. The graph and the table do not reflect the deduction of taxes that a shareholder would pay on fund distributions or the redemption of fund shares. Current performance is available by calling 800-669-7400 or at www.icmarc.org/vpperformance.
The Fund’s market benchmark, the S&P 500 Index, is an index consisting of 500 companies representing larger capitalization stocks traded in the U.S. The custom benchmark is composed of the S&P 500 Index and the Barclays U.S. Intermediate Aggregate Bond Index (the Barclays Index) in weighted percentages that correspond to the historical target allocations for the asset classes these indexes represent. These weightings will change to correspond with any changes in the Fund’s target percentage allocations. The Barclays Index consists of investment-grade U.S. fixed income securities with maturities of 1 to 10 years. An index is not available for direct investment, is unmanaged and does not reflect the costs of portfolio management or trading. A fund’s exposure, through the underlying funds, to specific securities (or types of securities) may differ significantly from the securities held in the indexes.
72
Vantagepoint Milestone 2030 Fund
The Vantagepoint Milestone 2030 Fund’s objective is to offer high total return consistent with the Fund’s current asset allocation. The Fund’s principal investment strategy is to invest in a combination of other Vantagepoint Funds and one or more third party exchange-traded funds (“ETFs”)1 using an asset allocation strategy designed for investors expecting to begin making gradual withdrawals from the Fund, typically at or after retirement (assumed to occur at age 60), around the year 2030.
At year end, the Fund was invested in the following funds at target allocations within the percentage ranges indicated:
| | |
FIXED INCOME | | |
Low Duration Bond Fund | | 0%–7% |
Core Bond Index Fund | | 6%–16% |
EQUITY | | |
Equity Income Fund | | 19%–29% |
Growth & Income Fund | | 9%–19% |
Growth Fund | | 5%–15% |
Mid/Small Company Index Fund | | 8%–18% |
International Fund | | 8%–18% |
Third Party Emerging Markets ETF | | 0%–5% |
MULTI-STRATEGY | | |
Diversifying Strategies Fund | | 7%–17% |
The Fund follows a strategy that as time elapses, the Fund’s allocation to equity investments will periodically decrease and the Fund’s allocation to fixed income and multi-strategy investments will correspondingly increase so that by June 30 of the year 2040 (ten years after the year indicated in the Fund name), the Fund’s net assets will be invested approximately 25% in equity funds, 55% in fixed income funds, and 20% in the multi-strategy fund.
Performance2
The Vantagepoint Milestone 2030 Fund’s Investor M Shares gained 22.33% in 2013. The Fund’s market benchmark, the S&P 500 Index, gained 32.39%, while the Fund’s peer group, the Morningstar Target Date 2026–2030 Funds Average, a group of mutual funds with similar investment objectives, gained 16.65%. The Fund’s custom benchmark gained 23.71%. The Fund’s custom benchmark is composed of the S&P 500 Index and the Barclays U.S. Intermediate Aggregate Bond Index (“Barclays Index”), in weighted percentages corresponding to the historical target allocations for the asset classes these indexes represent.
The Milestone 2030 Fund’s performance reflected the generally positive returns of the U.S. and developed foreign equity markets in 2013 and the generally negative returns of fixed income markets and emerging market equities. The positive performance primarily resulted from allocations to the underlying equity funds. Five of the six underlying equity funds produced positive results, with returns ranging between 37.49% for the Mid/Small Company Index Fund and 17.77% for the International Fund. The sixth underlying equity fund, the emerging markets ETF, lost 3.74% in the period since it was added to the Fund on May 1, 2013. The Fund’s two underlying fixed income funds produced mixed returns as the Low Duration Bond Fund gained 0.96%, while the Core Bond Index Fund lost 2.38%. The Diversifying Strategies Fund gained 5.81% in the year. Please refer to each underlying Vantagepoint Fund’s commentary within this report for more information.
| 1 | On May 1, 2013, exposure to emerging market stocks through a third party ETF was added to the Fund. |
| 2 | As of March 1, 2013, the Fund began investing in “T Shares” of the underlying Vantagepoint Funds. Prior to March 1, 2013, the Fund invested in the Investor Shares of each underlying actively managed Vantagepoint Fund and the Class I Shares of Vantagepoint Index Funds. The underlying Vantagepoint Funds’ performance noted above reflects the returns for the T Shares from their inception date, March 1, 2013, through December 31, 2013. Prior to March 1, 2013, performance of the underlying funds is based on the Investor Shares of the actively managed Vantagepoint Funds, and the Class I Shares of the Vantagepoint Index Funds. As a result, performance of the underlying Vantagepoint Funds shown may vary from the returns discussed in their commentaries elsewhere within this report. |
73
The Fund’s underperformance relative to its equity market benchmark primarily resulted from its allocation to the underlying fixed income funds, multi-strategy fund, and foreign equity funds, including the emerging markets ETF, as these underlying funds generally trailed the Fund’s market benchmark. Additionally, the Equity Income Fund trailed the market benchmark. Returns from the Fund’s underlying allocations to the Growth & Income Fund, Growth Fund, and Mid/Small Company Index Fund partially offset this underperformance, as these underlying funds outperformed the Fund’s market benchmark.
The Fund’s outperformance relative to its peer group primarily resulted from an overweight allocation to equity funds, which generally outperformed fixed income funds. Additionally, an overweight allocation to U.S. equity funds was beneficial, as U.S. equity funds generally outperformed foreign equity funds. The Fund’s shorter duration exposure resulting from the underlying fixed income funds added to performance, as shorter duration funds generally outperformed longer duration funds. An underweight allocation to inflation protected fixed income securities within the underlying funds benefitted performance since returns from inflation protected fixed income securities generally trailed non-inflation protected fixed income securities.
The Fund’s underperformance relative to its custom benchmark primarily resulted from an overweight allocation to underlying foreign equity funds, which generally underperformed U.S. equity funds. An overweight allocation to growth-style equity securities in the underlying equity funds, which generally outperformed value-style equity securities, as well as a bias toward smaller-capitalization securities, which generally outperformed large-capitalization securities, partially offset this underperformance. The Fund’s allocations to the underlying Equity Income Fund, International Fund, emerging markets ETF, and Core Bond Index Fund underperformed their respective broad market index in the Fund’s custom benchmark. The Fund’s allocations to the Low Duration Bond Fund, Diversifying Strategies Fund, Growth & Income Fund, Growth Fund, and Mid/Small Company Index Fund partially offset this underperformance as these underlying funds outperformed their respective broad market index in the Fund’s custom benchmark.
Vantagepoint Milestone 2030 Fund
Underlying Fund Allocation as of December 31, 2013 (% of Net Assets)
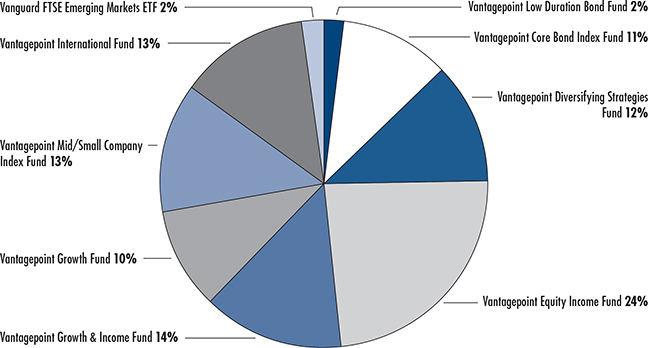
Due to rounding, pie chart allocations may not add up to 100%.
74
Vantagepoint Milestone 2030 Fund—Investor M Shares vs. S&P 500 Index and Custom Benchmark
Growth of $10,000 Invested January 3, 2005*
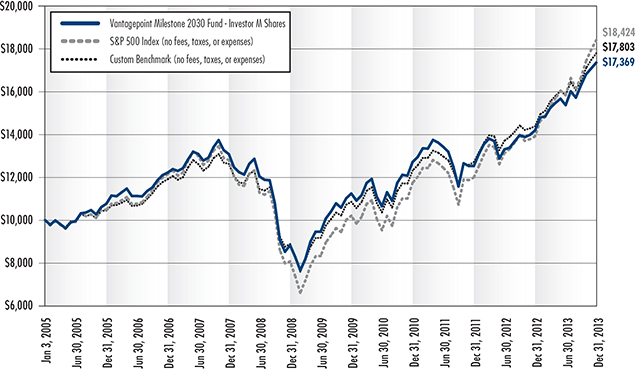
Source for Benchmark Returns: Morningstar®
Vantagepoint Milestone 2030 Fund
Average Annual Total Returns for the periods ended December 31, 2013*
| | | | |
| | | INVESTOR M SHARES | | TM SHARES |
One Year | | 22.33% | | 22.64% |
Three Years | | 10.94% | | 11.03% |
Five Years | | 14.48% | | 14.54% |
Since Inception | | 6.32% | | 6.35% |
Class Inception Date | | January 3, 2005 | | March 1, 2013 |
| * | Management’s Discussion of Fund Performance describes the performance of the Fund’s Investor M Shares (the Fund’s outstanding shares were renamed “Investor M Shares” on March 1, 2013). In the table, performance information for TM Shares prior to the inception date of that share class (March 1, 2013) is based on the performance of the Fund’s Investor M Shares. This prior performance has not been adjusted to reflect the actual fees and expenses paid by TM Shares. |
Current performance may be higher or lower than the past performance presented in this report. Past performance is no guarantee of future performance. Investment returns and principal value will fluctuate so that shares, when redeemed, may be worth more or less than their original cost. The graph and the table do not reflect the deduction of taxes that a shareholder would pay on fund distributions or the redemption of fund shares. Current performance is available by calling 800-669-7400 or at www.icmarc.org/vpperformance.
The Fund’s market benchmark, the S&P 500 Index, is an index consisting of 500 companies representing larger capitalization stocks traded in the U.S. The custom benchmark is composed of the S&P 500 Index and the Barclays U.S. Intermediate Aggregate Bond Index (the Barclays Index) in weighted percentages that correspond to the historical target allocations for the asset classes these indexes represent. These weightings will change to correspond with any changes in the Fund’s target percentage allocations. The Barclays Index consists of investment-grade U.S. fixed income securities with maturities of 1 to 10 years. An index is not available for direct investment, is unmanaged and does not reflect the costs of portfolio management or trading. A fund’s exposure, through the underlying funds, to specific securities (or types of securities) may differ significantly from the securities held in the indexes.
75
Vantagepoint Milestone 2035 Fund
The Vantagepoint Milestone 2035 Fund’s objective is to offer high total return consistent with the Fund’s current asset allocation. The Fund’s principal investment strategy is to invest in a combination of other Vantagepoint Funds and one or more third party exchange-traded funds (“ETFs”)1 using an asset allocation strategy designed for investors expecting to begin making gradual withdrawals from the Fund, typically at or after retirement (assumed to occur at age 60), around the year 2035.
At year end, the Fund was invested in the following funds at target allocations within the percentage ranges indicated:
| | |
FIXED INCOME | | |
Low Duration Bond Fund | | 0%–6% |
Core Bond Index Fund | | 2%–12% |
EQUITY | | |
Equity Income Fund | | 20%–30% |
Growth & Income Fund | | 10%–20% |
Growth Fund | | 6%–16% |
Mid/Small Company Index Fund | | 11%–21% |
International Fund | | 9%–19% |
Third Party Emerging Markets ETF | | 0%–5% |
MULTI-STRATEGY | | |
Diversifying Strategies Fund | | 3%–13% |
The Fund follows a strategy that as time elapses, the Fund’s allocation to equity investments will periodically decrease and the Fund’s allocation to fixed income and multi-strategy investments will correspondingly increase so that by June 30 of the year 2045 (ten years after the year indicated in the Fund name), the Fund’s net assets will be invested approximately 25% in equity funds, 55% in fixed income funds, and 20% in the multi-strategy fund.
Performance2
The Vantagepoint Milestone 2035 Fund Investor M Shares gained 25.02% in 2013. The Fund’s market benchmark, the S&P 500 Index, gained 32.39%, while the Fund’s peer group, the Morningstar Target Date 2031–2035 Funds Average, a group of mutual funds with similar investment objectives, gained 20.00%. The Fund’s custom benchmark gained 26.87%. The Fund’s custom benchmark is composed of the S&P 500 Index and the Barclays U.S. Intermediate Aggregate Bond Index (“Barclays Index”), in weighted percentages corresponding to the historical target allocations for the asset classes these indexes represent.
The Milestone 2035 Fund’s performance reflected the generally positive returns of the U.S. and developed foreign equity markets in 2013, and the generally negative returns of fixed income markets and emerging market equities. The positive performance primarily resulted from allocations to the underlying equity funds. Five of the six underlying equity funds produced positive results, with returns ranging between 37.49% for the Mid/Small Company Index Fund and 17.77% for the International Fund. The sixth underlying equity fund, the emerging markets ETF, lost 3.74% in the period since it was added to the Fund on May 1, 2013. The Fund’s two underlying fixed income funds produced mixed returns as the Low Duration Bond Fund gained 0.96%, while the Core Bond Index Fund lost 2.38%. The Diversifying Strategies Fund gained 5.81% in the year. Please refer to each underlying Vantagepoint Fund’s commentary within this report for more information.
| 1 | On May 1, 2013, exposure to emerging market stocks through a third party ETF was added to the Fund. |
| 2 | As of March 1, 2013, the Fund began investing in “T Shares” of the underlying Vantagepoint Funds. Prior to March 1, 2013, the Fund invested in the Investor Shares of each underlying actively managed Vantagepoint Fund and the Class I Shares of Vantagepoint Index Funds. The underlying Vantagepoint Funds’ performance noted above reflects the returns for the T Shares from their inception date, March 1, 2013, through December 31, 2013. Prior to March 1, 2013, performance of the underlying funds is based on the Investor Shares of the actively managed Vantagepoint Funds, and the Class I Shares of the Vantagepoint Index Funds. As a result, performance of the underlying Vantagepoint Funds shown may vary from the returns discussed in their commentaries elsewhere within this report. |
76
The Fund’s underperformance relative to its equity market benchmark primarily resulted from its allocation to the underlying fixed income funds, multi-strategy fund, and foreign equity funds, including the emerging markets ETF, as these underlying funds generally trailed the Fund’s market benchmark. Additionally, returns from the Equity Income Fund trailed the market benchmark. Returns from the Fund’s underlying allocations to the Growth & Income Fund, Growth Fund, and Mid/Small Company Index Fund partially offset this underperformance, as these underlying funds outperformed the Fund’s market benchmark.
The Fund’s outperformance relative to its peer group primarily resulted from an overweight allocation to equity funds, which generally outperformed fixed income funds. Additionally, an overweight allocation to U.S. equity funds was beneficial, as U.S. equity funds generally outperformed foreign equity funds. The Fund’s shorter duration exposure resulting from the underlying fixed income funds added to performance, as shorter duration funds generally outperformed longer duration funds. An underweight allocation to inflation protected fixed income securities within the underlying funds benefitted performance since returns from inflation protected securities generally trailed non-inflation protected securities.
The Fund’s underperformance relative to its custom benchmark primarily resulted from an overweight allocation to underlying foreign equity funds, which generally underperformed U.S. equity funds. An overweight allocation to growth-style equity securities in the underlying equity funds, which generally outperformed value-style equity securities, as well as a bias toward smaller-capitalization securities, which generally outperformed large-capitalization securities, partially offset this underperformance. The Fund’s allocations to the underlying Equity Income Fund, International Fund, emerging markets ETF, and Core Bond Index Fund underperformed their respective broad market index in the Fund’s custom benchmark The Fund’s allocations to the Low Duration Bond Fund, Diversifying Strategies Fund, Growth & Income Fund, Growth Fund, and Mid/Small Company Index Fund partially offset this underperformance as these underlying funds outperformed their respective broad market index in the Fund’s custom benchmark.
Vantagepoint Milestone 2035 Fund
Underlying Fund Allocation as of December 31, 2013 (% of Net Assets)
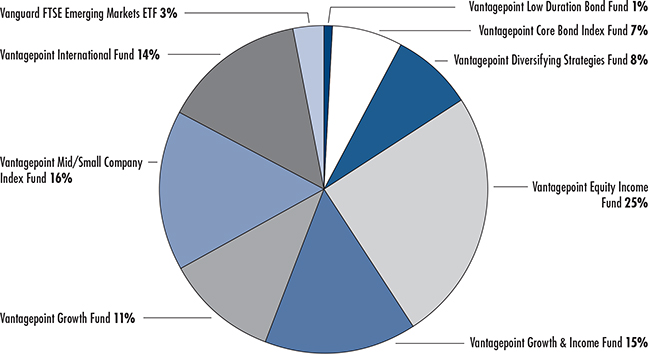
Due to rounding, pie chart allocations may not add up to 100%.
77
Vantagepoint Milestone 2035 Fund—Investor M Shares vs. S&P 500 Index and Custom Benchmark
Growth of $10,000 Invested January 3, 2005*
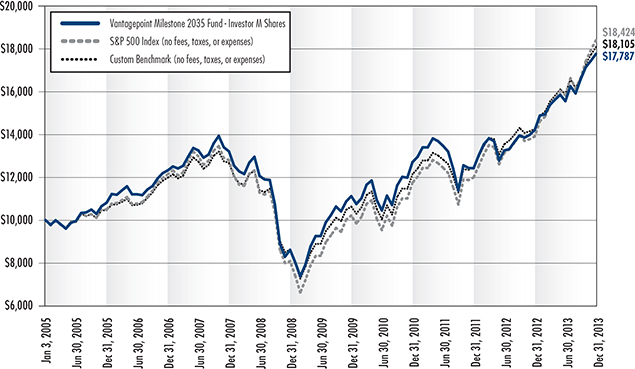
Source for Benchmark Returns: Morningstar®
Vantagepoint Milestone 2035 Fund
Average Annual Total Returns for the periods ended December 31, 2013*
| | | | |
| | | INVESTOR M SHARES | | TM SHARES |
One Year | | 25.02% | | 25.24% |
Three Years | | 11.84% | | 11.91% |
Five Years | | 15.63% | | 15.67% |
Since Inception | | 6.60% | | 6.62% |
Class Inception Date | | January 3, 2005 | | March 1, 2013 |
| * | Management’s Discussion of Fund Performance describes the performance of the Fund’s Investor M Shares (the Fund’s outstanding shares were renamed “Investor M Shares” on March 1, 2013). In the table, performance information for TM Shares prior to the inception date of that share class (March 1, 2013) is based on the performance of the Fund’s Investor M Shares. This prior performance has not been adjusted to reflect the actual fees and expenses paid by TM Shares. |
Current performance may be higher or lower than the past performance presented in this report. Past performance is no guarantee of future performance. Investment returns and principal value will fluctuate so that shares, when redeemed, may be worth more or less than their original cost. The graph and the table do not reflect the deduction of taxes that a shareholder would pay on fund distributions or the redemption of fund shares. Current performance is available by calling 800-669-7400 or at www.icmarc.org/vpperformance.
The Fund’s market benchmark, the S&P 500 Index, is an index consisting of 500 companies representing larger capitalization stocks traded in the U.S. The custom benchmark is composed of the S&P 500 Index and the Barclays U.S. Intermediate Aggregate Bond Index (the Barclays Index) in weighted percentages that correspond to the historical target allocations for the asset classes these indexes represent. These weightings will change to correspond with any changes in the Fund’s target percentage allocations. The Barclays Index consists of investment-grade U.S. fixed income securities with maturities of 1 to 10 years. An index is not available for direct investment, is unmanaged and does not reflect the costs of portfolio management or trading. A fund’s exposure, through the underlying funds, to specific securities (or types of securities) may differ significantly from the securities held in the indexes.
78
Vantagepoint Milestone 2040 Fund
The Vantagepoint Milestone 2040 Fund’s objective is to offer high total return consistent with the Fund’s current asset allocation. The Fund’s principal investment strategy is to invest in a combination of other Vantagepoint Funds and one or more third party exchange-traded funds (“ETFs”)1 using an asset allocation strategy designed for investors expecting to begin making gradual withdrawals from the Fund, typically at or after retirement (assumed to occur at age 60), around the year 2040.
At year end, the Fund was invested in the following funds at target allocations within the percentage ranges indicated:
| | |
FIXED INCOME FUND | | |
Core Bond Index Fund | | 0%–10% |
EQUITY FUNDS | | |
Equity Income Fund | | 22%–32% |
Growth & Income Fund | | 10%–20% |
Growth Fund | | 7%–17% |
Mid/Small Company Index Fund | | 14%–24% |
International Fund | | 10%–20% |
Third Party Emerging Markets ETF | | 0%–5% |
MULTI-STRATEGY FUND | | |
Diversifying Strategies Fund | | 0%–8% |
The Fund follows a strategy that as time elapses, the Fund’s allocation to equity investments will periodically decrease and the Fund’s allocation to fixed income and multi-strategy investments will increase so that by June 30 of the year 2050 (ten years after the year indicated in the Fund name), the Fund’s net assets will be invested approximately 25% in equity funds, 55% in fixed income funds, and 20% in the multi-strategy fund.
Performance2
The Vantagepoint Milestone 2040 Fund’s Investor M Shares gained 27.12% in 2013. The Fund’s market benchmark, the S&P 500 Index, gained 32.39%, while the Fund’s peer group, the Morningstar Target Date 2036–2040 Funds Average, a group of mutual funds with similar investment objectives, gained 19.97%. The Fund’s custom benchmark gained 30.68%. The Fund’s custom benchmark is composed of the S&P 500 Index and the MSCI EAFE Index (Net) (“MSCI-EAFE Index”), in weighted percentages corresponding to the historical target allocations for the asset classes these indexes represent.
The Milestone 2040 Fund’s performance reflected the generally positive returns of the U.S. and developed foreign equity markets in 2013 and the generally negative returns of fixed income markets and emerging market equities. The positive performance primarily resulted from allocations to the underlying equity funds. Five of the six underlying equity funds produced positive results, with returns ranging between 37.49% for the Mid/Small Company Index Fund and 17.77% for the International Fund. The sixth underlying equity fund, the emerging markets ETF, lost 3.74% in the period since it was added to the Fund on May 1, 2013. The Fund’s single underlying fixed income fund, the Core Bond Index Fund, lost 2.38%. The Diversifying Strategies Fund gained 5.81% in the year. Please refer to each underlying Vantagepoint Fund’s commentary within this report for more information.
| 1 | On May 1, 2013, exposure to emerging market stocks through a third party ETF was added to the Fund. |
| 2 | As of March 1, 2013, the Fund began investing in “T Shares” of the underlying Vantagepoint Funds. Prior to March 1, 2013, the Fund invested in the Investor Shares of each underlying actively managed Vantagepoint Fund and the Class I Shares of Vantagepoint Index Funds. The underlying Vantagepoint Funds’ performance noted above reflects the returns for the T Shares from their inception date, March 1, 2013, through December 31, 2013. Prior to March 1, 2013, performance of the underlying funds is based on the Investor Shares of the actively managed Vantagepoint Funds, and the Class I Shares of the Vantagepoint Index Funds. As a result, performance of the underlying Vantagepoint Funds shown may vary from the returns discussed in their commentaries elsewhere within this report. |
79
The Fund’s underperformance relative to its equity market benchmark primarily resulted from its allocation to the Core Bond Index Fund, the Diversifying Strategies Fund, and foreign equity funds, including the emerging market ETF, as these underlying funds generally trailed the Fund’s market benchmark. Additionally, the Equity Income Fund trailed the benchmark. The Fund’s allocations to the Growth & Income Fund, Growth Fund, and Mid/Small Company Index Fund partially offset this underperformance, as these underlying funds outperformed the Fund’s market benchmark.
The Fund’s outperformance relative to its peer group primarily resulted from an overweight allocation to equity funds, which generally outperformed fixed income funds. Additionally, an overweight allocation to U.S. equity funds was beneficial as U.S. equity funds generally outperformed foreign equity funds. The Fund’s shorter duration exposure resulting from the underlying fixed income funds added to performance, as shorter duration funds generally outperformed longer duration funds. An underweight allocation to inflation protected fixed income securities within the underlying funds benefitted performance since returns from inflation protected fixed income securities generally trailed non-inflation protected securities.
The Fund’s underperformance relative to its custom benchmark primarily resulted from allocations to fixed income securities and emerging market equities in the underlying funds, which generally underperformed both the U.S. and developed foreign equity markets represented in the benchmark. An overweight allocation to growth-style equity securities in the underlying equity funds, which generally outperformed value-style equity securities, as well as a bias toward smaller-capitalization securities, which generally outperformed large-capitalization securities, partially offset this underperformance. The Fund’s allocations to the Equity Income Fund and Diversifying Strategies Fund also detracted from performance. The Fund’s allocations to the Growth & Income Fund, Growth Fund, and Mid/Small Company Index Fund partially offset this underperformance as these underlying funds outperformed their respective broad market index in the Fund’s custom benchmark.
Vantagepoint Milestone 2040 Fund
Underlying Fund Allocation as of December 31, 2013 (% of Net Assets)
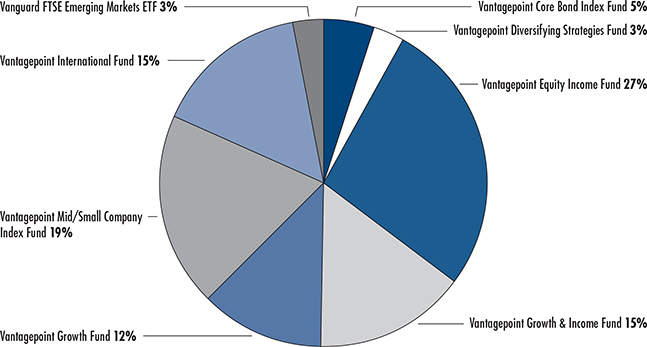
Due to rounding, pie chart allocations may not add up to 100%.
80
Vantagepoint Milestone 2040 Fund—Investor M Shares vs. S&P 500 Index and Custom Benchmark
Growth of $10,000 Invested January 3, 2005*
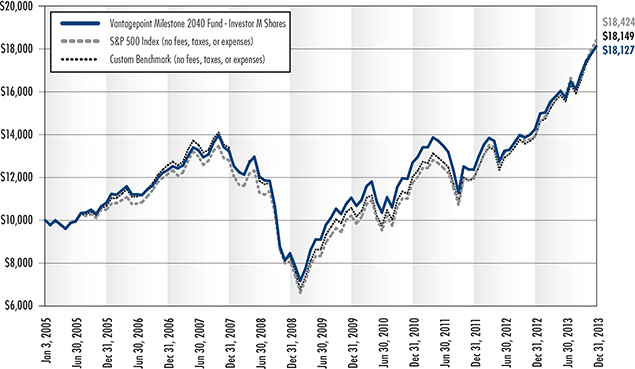
Source for Benchmark Returns: Morningstar®
Vantagepoint Milestone 2040 Fund
Average Annual Total Returns for the periods ended December 31, 2013*
| | | | |
| | | INVESTOR M SHARES | | TM SHARES |
One Year | | 27.12% | | 27.34% |
Three Years | | 12.61% | | 12.67% |
Five Years | | 16.48% | | 16.52% |
Since Inception | | 6.83% | | 6.85% |
Class Inception Date | | January 3, 2005 | | March 1, 2013 |
| * | Management’s Discussion of Fund Performance describes the performance of the Fund’s Investor M Shares (the Fund’s outstanding shares were renamed “Investor M Shares” on March 1, 2013). In the table, performance information for TM Shares prior to the inception date of that share class (March 1, 2013) is based on the performance of the Fund’s Investor M Shares. This prior performance has not been adjusted to reflect the actual fees and expenses paid by TM Shares. |
Current performance may be higher or lower than the past performance presented in this report. Past performance is no guarantee of future performance. Investment returns and principal value will fluctuate so that shares, when redeemed, may be worth more or less than their original cost. The graph and the table do not reflect the deduction of taxes that a shareholder would pay on fund distributions or the redemption of fund shares. Current performance is available by calling 800-669-7400 or at www.icmarc.org/vpperformance.
The Fund’s market benchmark, the S&P 500 Index, is an index consisting of 500 companies representing larger capitalization stocks traded in the U.S. The custom benchmark is composed of the S&P 500 Index and the MSCI Europe Australasia Far East (EAFE) Index (Net) (the MSCI-EAFE Index) in weighted percentages that correspond to the historical target allocations for the asset classes these indexes represent. These weightings will change to correspond with any changes in the Fund’s target percentage allocations. The MSCI-EAFE Index is a free float-adjusted market capitalization index of equity securities that is designed to measure the equity market performance of developed markets, excluding the U.S. and Canada, and approximates the minimum possible dividend reinvestment after deduction of withholding tax according to MSCI Barra’s methodology. An index is not available for direct investment, is unmanaged and does not reflect the costs of portfolio management or trading. A fund’s exposure, through the underlying funds, to specific securities (or types of securities) may differ significantly from the securities held in the indexes.
81
Vantagepoint Milestone 2045 Fund
The Vantagepoint Milestone 2045 Fund’s objective is to offer high total return consistent with the Fund’s current asset allocation. The Fund’s principal investment strategy is to invest in a combination of other Vantagepoint Funds and one or more third party exchange-traded funds (“ETFs”)1 using an asset allocation strategy designed for investors expecting to begin making gradual withdrawals from the Fund, typically at or after retirement (assumed to occur at age 60), around the year 2045.
At year end, the Fund was invested in the following funds at target allocations within the percentage ranges indicated:
| | |
FIXED INCOME | | |
Core Bond Index Fund | | 0%–10% |
EQUITY | | |
Equity Income Fund | | 22%–32% |
Growth & Income Fund | | 11%–21% |
Growth Fund | | 8%–18% |
Mid/Small Company Index Fund | | 15%–25% |
International Fund | | 11%–21% |
Third Party Emerging Markets ETF | | 0%–5% |
The Fund follows a strategy that as time elapses, the Fund’s allocation to equity investments will periodically decrease and the Fund’s allocation to fixed income and multi-strategy investments will increase so that by June 30 of the year 2055 (ten years after the year indicated in the Fund name), the Fund’s net assets will be invested approximately 25% in equity funds, 55% in fixed income funds, and 20% in the multi-strategy fund.
Performance2
The Vantagepoint Milestone 2045 Fund’s Investor M Shares gained 27.69% in 2013. The Fund’s market benchmark, the S&P 500 Index, gained 32.39%, while the Fund’s peer group, the Morningstar Target Date 2041–2045 Funds Average, a group of mutual funds with similar investment objectives, gained 22.00%. The Fund’s custom benchmark gained 30.64%. The Fund’s custom benchmark is composed of the S&P 500 Index and the MSCI EAFE Index (Net) (“MSCI-EAFE Index”), in weighted percentages corresponding to the historical target allocations for the asset classes these indexes represent.
The Milestone 2045 Fund’s performance reflected the generally positive returns of the U.S. and developed foreign equity markets in 2013 and the generally negative returns of fixed income markets and emerging market equities. The positive performance primarily resulted from allocations to the underlying equity funds. Five of the six underlying equity funds produced positive results, with returns ranging between 37.49% for the Mid/Small Company Index Fund and 17.77% for the International Fund. The sixth underlying equity fund, the emerging markets ETF, lost 3.74% in the period since it was added to the Fund on May 1, 2013. The Fund’s single underlying fixed income fund, the Core Bond Index Fund, lost 2.38%. Please refer to each underlying Vantagepoint Fund’s commentary within this report for more information.
The Fund’s underperformance relative to its equity market benchmark primarily resulted from its allocation to the Core Bond Index Fund and foreign equity funds, including the emerging markets ETF, as these underlying funds generally trailed the Fund’s market benchmark. Additionally, the Equity Income Fund trailed the benchmark. The Fund’s allocations to the Growth & Income Fund, Growth Fund, and Mid/Small Company Index Fund partially offset this underperformance, as these underlying funds outperformed the Fund’s market benchmark.
| 1 | On May 1, 2013, exposure to emerging market stocks through a third party ETF was added to the Fund. |
| 2 | As of March 1, 2013, the Fund began investing in “T Shares” of the underlying Vantagepoint Funds. Prior to March 1, 2013, the Fund invested in the Investor Shares of each underlying actively managed Vantagepoint Fund and the Class I Shares of Vantagepoint Index Funds. The underlying Vantagepoint Funds’ performance noted above reflects the returns for the T Shares from their inception date, March 1, 2013, through December 31, 2013. Prior to March 1, 2013, performance of the underlying funds is based on the Investor Shares of the actively managed Vantagepoint Funds, and the Class I Shares of the Vantagepoint Index Funds. As a result, performance of the underlying Vantagepoint Funds shown may vary from the returns discussed in their commentaries elsewhere within this report. |
82
The Fund’s outperformance relative to its peer group primarily resulted from an overweight allocation to equity funds, which generally outperformed fixed income funds. Additionally, an overweight allocation to U.S. equity funds was beneficial as U.S. equity funds generally outperformed foreign equity funds. The Fund’s shorter duration exposure resulting from the underlying fixed income funds added to performance, as shorter duration funds generally outperformed longer duration funds. An underweight allocation to inflation protected fixed income securities within the underlying funds benefitted performance since returns from inflation protected fixed income securities generally trailed non-inflation protected fixed income securities.
The Fund’s underperformance relative to its custom benchmark primarily resulted from allocations to fixed income securities and emerging market equities in the underlying funds, which generally underperformed both the U.S. and developed foreign equity markets represented in the benchmark. An overweight allocation to growth-style equity securities in the underlying equity funds, which generally outperformed value-style equity securities, as well as a bias toward smaller-capitalization securities, which generally outperformed large-capitalization securities, partially offset this underperformance. The Fund’s allocation to the Equity Income Fund also detracted from performance. The Fund’s allocations to the Growth & Income Fund, Growth Fund, and Mid/Small Company Index Fund partially offset this underperformance as these underlying funds outperformed their respective broad market index in the Fund’s custom benchmark.
Vantagepoint Milestone 2045 Fund
Underlying Fund Allocation as of December 31, 2013 (% of Net Assets)
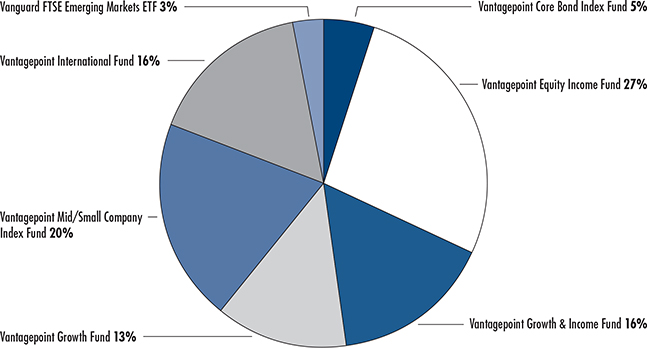
Due to rounding, pie chart allocations may not add up to 100%.
83
Vantagepoint Milestone 2045 Fund—Investor M Shares vs. S&P 500 Index and Custom Benchmark
Growth of $10,000 Invested January 4, 2010*
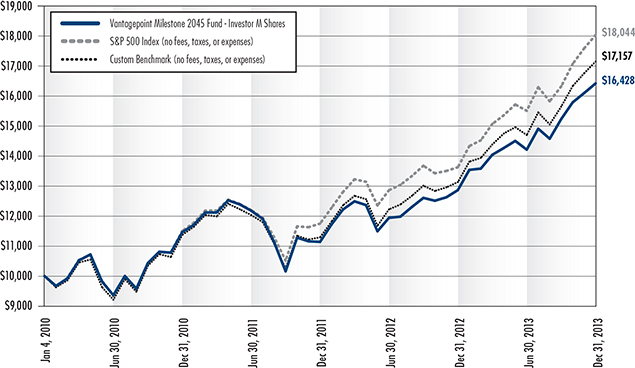
Source for Benchmark Returns: Morningstar®
Vantagepoint Milestone 2045 Fund
Average Annual Total Returns for the periods ended December 31, 2013*
| | | | |
| | | INVESTOR M SHARES | | TM SHARES |
One Year | | 27.69% | | 27.98% |
Three Years | | 12.75% | | 12.84% |
Since Inception | | 13.20% | | 13.27% |
Class Inception Date | | January 4, 2010 | | March 1, 2013 |
| * | Management’s Discussion of Fund Performance describes the performance of the Fund’s Investor M Shares (the Fund’s outstanding shares were renamed “Investor M Shares” on March 1, 2013). In the table, performance information for TM Shares prior to the inception date of that share class (March 1, 2013) is based on the performance of the Fund’s Investor M Shares. This prior performance has not been adjusted to reflect the actual fees and expenses paid by TM Shares. |
Current performance may be higher or lower than the past performance presented in this report. Past performance is no guarantee of future performance. Investment returns and principal value will fluctuate so that shares, when redeemed, may be worth more or less than their original cost. The graph and the table do not reflect the deduction of taxes that a shareholder would pay on fund distributions or the redemption of fund shares. Current performance is available by calling 800-669-7400 or at www.icmarc.org/vpperformance.
The Fund’s market benchmark, the S&P 500 Index, is an index consisting of 500 companies representing larger capitalization stocks traded in the U.S. The custom benchmark is composed of the S&P 500 Index and the MSCI Europe Australasia Far East (EAFE) Index (Net) (the MSCI-EAFE Index) in weighted percentages that correspond to the historical target allocations for the asset classes these indexes represent. These weightings will change to correspond with any changes in the Fund’s target percentage allocations. The MSCI-EAFE Index is a free float-adjusted market capitalization index of equity securities that is designed to measure the equity market performance of developed markets, excluding the U.S. and Canada, and approximates the minimum possible dividend reinvestment after deduction of withholding tax according to MSCI Barra’s methodology. An index is not available for direct investment, is unmanaged and does not reflect the costs of portfolio management or trading. A fund’s exposure, through the underlying funds, to specific securities (or types of securities) may differ significantly from the securities held in the indexes.
84
Vantagepoint Milestone 2050 Fund
The Vantagepoint Milestone 2050 Fund’s objective is to offer high total return consistent with the Fund’s current asset allocation. The Fund’s principal investment strategy is to invest in a combination of other Vantagepoint Funds and one or more third party exchange-traded funds (“ETFs”)1 using an asset allocation strategy designed for investors expecting to begin making gradual withdrawals from the Fund, typically at or after retirement (assumed to occur at age 60), around the year 2050.
At year end, the Fund was invested in the following funds at target allocations within the percentage ranges indicated:
| | |
FIXED INCOME | | |
Core Bond Index Fund | | 0%–10% |
EQUITY | | |
Equity Income Fund | | 22%–32% |
Growth & Income Fund | | 11%–21% |
Growth Fund | | 8%–18% |
Mid/Small Company Index Fund | | 15%–25% |
International Fund | | 11%–21% |
Third Party Emerging Markets ETF | | 0%–5% |
The Fund follows a strategy that as time elapses, the Fund’s allocation to equity investments will periodically decrease and the Fund’s allocation to fixed income and multi-strategy investments will increase so that by June 30 of the year 2060 (ten years after the year indicated in the Fund name), the Fund’s net assets will be invested approximately 25% in equity funds, 55% in fixed income funds, and 20% in the multi-strategy fund.
Performance2
The Vantagepoint Milestone 2050 Fund’s Investor M Shares gained 27.24% in 2013. The Fund’s market benchmark, the S&P 500 Index, gained 32.39%, while the Fund’s peer group, the Morningstar Target Date 2046–2050 Funds Average, a group of mutual funds with similar investment objectives, gained 21.02%. The Fund’s custom benchmark gained 30.64%. The Fund’s custom benchmark is composed of the S&P 500 Index and the MSCI EAFE Index (Net) (“MSCI-EAFE Index”), in weighted percentages corresponding to the historical target allocations for the asset classes these indexes represent.
The Milestone 2050 Fund’s performance reflected the generally positive returns of the U.S. and developed foreign equity markets in 2013 and the generally negative returns of fixed income markets and emerging market equities. The positive performance primarily resulted from allocations to the underlying equity funds. Five of the six underlying equity funds produced positive results, with returns ranging between 37.49% for the Mid/Small Company Index Fund and 17.77% for the International Fund. The sixth underlying equity fund, the emerging markets ETF, lost 3.74% in the period since it was added to the Fund on May 1, 2013. The Fund’s single underlying fixed income fund, the Core Bond Index Fund, lost 2.38%. Please refer to each underlying Vantagepoint Fund’s commentary within this report for more information.
The Fund’s underperformance relative to its equity market benchmark primarily resulted from its allocation to the Core Bond Index Fund and foreign equity funds, including the emerging markets ETF, as these underlying funds generally trailed the Fund’s market benchmark. Additionally, the Equity Income Fund trailed the benchmark. The Fund’s allocations to the Growth & Income Fund, Growth Fund, and Mid/Small Company Index Fund partially offset this underperformance, as these underlying funds outperformed the Fund’s market benchmark.
| 1 | On May 1, 2013, exposure to emerging market stocks through a third party ETF was added to the Fund. |
| 2 | As of March 1, 2013, the Fund began investing in “T Shares” of the underlying Vantagepoint Funds. Prior to March 1, 2013, the Fund invested in the Investor Shares of each underlying actively managed Vantagepoint Fund and the Class I Shares of Vantagepoint Index Funds. The underlying Vantagepoint Funds’ performance noted above reflects the returns for the T Shares from their inception date, March 1, 2013, through December 31, 2013. Prior to March 1, 2013, performance of the underlying funds is based on the Investor Shares of the actively managed Vantagepoint Funds, and the Class I Shares of the Vantagepoint Index Funds. As a result, performance of the underlying Vantagepoint Funds shown may vary from the returns discussed in their commentaries elsewhere within this report. |
85
The Fund’s outperformance relative to its peer group primarily resulted from an overweight allocation to equity funds, which generally outperformed fixed income funds. Additionally, an overweight allocation to U.S. equity funds was beneficial as U.S. equity funds generally outperformed foreign equity funds. The Fund’s shorter duration exposure resulting from the underlying fixed income funds added to performance, as shorter duration funds generally outperformed longer duration funds. An underweight allocation to inflation protected fixed income securities within the underlying funds benefitted performance since returns from inflation protected fixed income securities generally trailed non-inflation protected fixed income securities.
The Fund’s underperformance relative to its custom benchmark primarily resulted from allocations to fixed income securities and emerging market equities in the underlying funds, which generally underperformed both the U.S. and developed foreign equity markets represented in the benchmark. An overweight allocation to growth-style equity securities in the underlying equity funds, which generally outperformed value-style equity securities, as well as a bias toward smaller-capitalization securities, which generally outperformed large-capitalization securities, partially offset this underperformance. The Fund’s allocation to the Equity Income Fund also detracted from performance. The Fund’s allocations to the Growth & Income Fund, Growth Fund, and Mid/Small Company Index Fund partially offset this underperformance as these underlying funds outperformed their respective broad market index in the Fund’s custom benchmark.
Vantagepoint Milestone 2050 Fund
Underlying Fund Allocation as of December 31, 2013 (% of Net Assets)

Due to rounding, pie chart allocations may not add up to 100%.
86
Vantagepoint Milestone 2050 Fund—Investor M Shares vs. S&P 500 Index and Custom Benchmark
Growth of $10,000 Invested September 11, 2012*
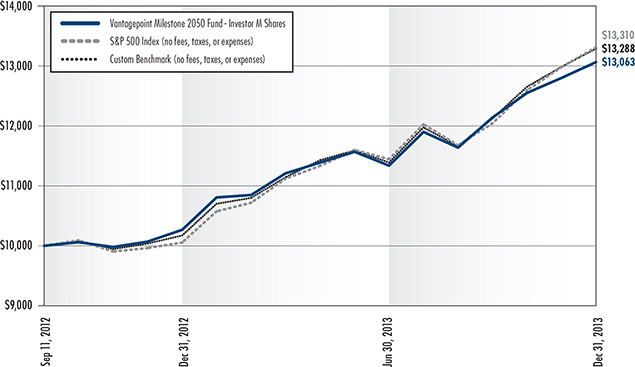
Source for Benchmark Returns: Morningstar®
Vantagepoint Milestone 2050 Fund
Average Annual Total Returns for the periods ended December 31, 2013*
| | | | |
| | | INVESTOR M SHARES | | TM SHARES |
One Year | | 27.24% | | 27.43% |
Since Inception | | 22.68% | | 22.83% |
Class Inception Date | | September 11, 2012 | | March 1, 2013 |
| * | Management’s Discussion of Fund Performance describes the performance of the Fund’s Investor M Shares (the Fund’s outstanding shares were renamed “Investor M Shares” on March 1, 2013). In the table, performance information for TM Shares prior to the inception date of that share class (March 1, 2013) is based on the performance of the Fund’s Investor M Shares. This prior performance has not been adjusted to reflect the actual fees and expenses paid by TM Shares. |
87
Report of Independent Registered Public Accounting Firm
To the Shareholders and Board of Directors
of The Vantagepoint Funds:
In our opinion, the accompanying statements of assets and liabilities, including the schedules of investments and the related statements of operations and changes in net assets and the financial highlights present fairly, in all material respects, the financial position of the Low Duration Bond Fund, Inflation Protected Securities Fund, Equity Income Fund, Growth & Income Fund, Growth Fund, Select Value Fund, Aggressive Opportunities Fund, Discovery Fund, International Fund, Diversifying Strategies Fund (formerly Diversified Assets Fund), Core Bond Index Fund, 500 Stock Index Fund, Broad Market Index Fund, Mid/Small Company Index Fund, Overseas Equity Index Fund, Model Portfolio Conservative Growth Fund, Model Portfolio Traditional Growth Fund, Model Portfolio Long-Term Growth Fund, Model Portfolio All-Equity Growth Fund, Milestone Retirement Income Fund, Milestone 2010 Fund, Milestone 2015 Fund, Milestone 2020 Fund, Milestone 2025 Fund, Milestone 2030 Fund, Milestone 2035 Fund, Milestone 2040 Fund, Milestone 2045 Fund and Milestone 2050 Fund comprising The Vantagepoint Funds (hereafter referred to as the “Funds”) at December 31, 2013, the results of each of their operations for the year then ended and the changes in each of their net assets and the financial highlights for each of the periods indicated, in conformity with accounting principles generally accepted in the United States of America. These financial statements and financial highlights (hereafter referred to as “financial statements”) are the responsibility of the Funds’ management; our responsibility is to express an opinion on these financial statements based on our audits. We conducted our audits of these financial statements in accordance with the standards of the Public Company Accounting Oversight Board (United States). Those standards require that we plan and perform the audits to obtain reasonable assurance about whether the financial statements are free of material misstatement. An audit includes examining, on a test basis, evidence supporting the amounts and disclosures in the financial statements, assessing the accounting principles used and significant estimates made by management, and evaluating the overall financial statement presentation. We believe that our audits, which included confirmation of securities at December 31, 2013 by correspondence with the custodian and brokers, and confirmation of the underlying funds by correspondence with the transfer agent, provide a reasonable basis for our opinion.
PricewaterhouseCoopers LLP
Baltimore, Maryland
February 28, 2014
88
THE VANTAGEPOINT FUNDS
Statements of Assets and Liabilities
December 31, 2013
| | | | | | | | | | | | |
| | | Low Duration
Bond | | | Inflation
Protected
Securities | | | Equity
Income | |
ASSETS: | | | | | | | | | | | | |
Investment in securities, at value† | | $ | 614,208,650 | | | $ | 582,403,845 | | | $ | 2,492,048,241 | |
Cash | | | 23,468 | | | | 306 | | | | 36,433 | |
Cash denominated in foreign currencies | | | 5,772 | | | | — | | | | — | |
Receivables: | | | | | | | | | | | | |
Dividends | | | 1,468 | | | | 1,219 | | | | 2,716,604 | |
Interest | | | 2,873,576 | | | | 2,823,735 | | | | — | |
Security lending income | | | 2,583 | | | | — | | | | 4,469 | |
Investments sold | | | — | | | | 2,754,739 | | | | 1,380,691 | |
Fund shares sold | | | 2,253,103 | | | | 11,981,845 | | | | 231,126 | |
Variation margin on futures contracts | | | 9,098 | | | | 60,293 | | | | — | |
Due from broker—swap agreements collateral | | | — | | | | 427,000 | | | | — | |
Swap agreements, at value (Premium $0, ($492,775) and $0) | | | — | | | | 647,662 | | | | — | |
Unrealized appreciation on forward foreign currency exchange contracts | | | 51,849 | | | | — | | | | — | |
| | | | | | | | | | | | |
Total Assets | | | 619,429,567 | | | | 601,100,644 | | | | 2,496,417,564 | |
| | | | | | | | | | | | |
LIABILITIES: | | | | | | | | | | | | |
Payables: | | | | | | | | | | | | |
Investments purchased | | | 4,004,886 | | | | 4,871,359 | | | | 938,982 | |
Distributions | | | 1,921,856 | | | | 11,509,071 | | | | — | |
Fund shares redeemed | | | 353,374 | | | | 535,454 | | | | 512,100 | |
Collateral for securities loaned | | | 10,332,748 | | | | — | | | | 4,737,432 | |
Swap agreements, at value (Premium, $0, $48,419 and $0) | | | — | | | | 694,614 | | | | — | |
Foreign currency overdraft payable | | | — | | | | 143,983 | | | | — | |
Written Options, at value (Premium $0, $252,893 and $0) | | | — | | | | 76,171 | | | | — | |
Unrealized depreciation on forward foreign currency exchange contracts | | | 107,505 | | | | — | | | | — | |
Accrued Expenses: | | | | | | | | | | | | |
Advisory fees | | | 50,989 | | | | 49,777 | | | | 206,145 | |
Subadviser fees | | | 211,292 | | | | 214,394 | | | | 2,075,031 | |
Fund services fees | | | 61,062 | | | | 55,922 | | | | 218,720 | |
Administration fees | | | 8,832 | | | | 8,832 | | | | 8,832 | |
Directors’ fees and expenses | | | 1,584 | | | | 1,914 | | | | 6,338 | |
Other accrued expenses | | | 119,098 | | | | 120,611 | | | | 271,630 | |
| | | | | | | | | | | | |
Total Liabilities | | | 17,173,226 | | | | 18,282,102 | | | | 8,975,210 | |
| | | | | | | | | | | | |
NET ASSETS | | $ | 602,256,341 | | | $ | 582,818,542 | | | $ | 2,487,442,354 | |
| | | | | | | | | | | | |
NET ASSETS REPRESENTED BY: | | | | | | | | | | | | |
Paid-in capital | | $ | 597,000,330 | | | $ | 598,819,721 | | | $ | 1,802,957,604 | |
Undistributed net investment income (loss) | | | (73,067 | ) | | | — | | | | 242,642 | |
Accumulated net realized gain (loss) on investments, futures contracts, foreign currency transactions, written options and swap agreements | | | 460,466 | | | | (5,887,067 | ) | | | (9,249,503 | ) |
Net unrealized appreciation (depreciation) on investments, futures contracts, foreign currency transactions, written options and swap agreements | | | 4,868,612 | | | | (10,114,112 | ) | | | 693,491,611 | |
| | | | | | | | | | | | |
NET ASSETS | | $ | 602,256,341 | | | $ | 582,818,542 | | | $ | 2,487,442,354 | |
| | | | | | | | | | | | |
CAPITAL SHARES: | | | | | | | | | | | | |
Net Assets—Investor Shares | | $ | 47,700,011 | | | $ | 28,441,144 | | | $ | 60,614,251 | |
Shares Outstanding—Investor Shares | | | 4,715,625 | | | | 2,710,560 | | | | 5,460,376 | |
Net Asset Value—Investor Shares offering and redemption price per share
(net assets divided by shares outstanding) | | $ | 10.12 | | | $ | 10.49 | | | $ | 11.10 | |
Net Assets—T Shares | | $ | 554,556,330 | | | $ | 554,377,398 | | | $ | 2,426,828,103 | |
Shares Outstanding—T Shares | | | 54,817,721 | | | | 52,811,424 | | | | 218,576,573 | |
Net Asset Value—T Shares offering and redemption price per share
(net assets divided by shares outstanding) | | $ | 10.12 | | | $ | 10.50 | | | $ | 11.10 | |
Cost of investments | | $ | 609,387,962 | | | $ | 592,271,115 | | | $ | 1,798,559,527 | |
Cost of cash denominated in foreign currencies | | $ | 5,717 | | | $ | — | | | $ | — | |
| | | | | | | | | | | | |
† Includes securities on loan with values of (Note 7): | | $ | 10,121,348 | | | $ | — | | | $ | 4,674,325 | |
See Notes to Financial Statements
89
THE VANTAGEPOINT FUNDS
Statements of Assets and Liabilities
December 31, 2013
| | | | | | | | | | | | | | | | |
| | | Growth &
Income | | | Growth | | | Select Value | | | Aggressive
Opportunities | |
ASSETS: | |
Investment in securities, at value† | | $ | 1,761,052,790 | | | $ | 2,330,772,277 | | | $ | 494,204,514 | | | $ | 1,270,001,496 | |
Cash | | | 37,585 | | | | 103 | | | | — | | | | 51,374 | |
Receivables: | | | | | | | | | | | | |
Dividends | | | 1,999,399 | | | | 2,179,191 | | | | 730,256 | | | | 500,876 | |
Security lending income | | | 5,896 | | | | 1,560 | | | | 24,612 | | | | 46,936 | |
Investments sold | | | 1,570,233 | | | | 2,128,460 | | | | 1,880,960 | | | | 22,188,814 | |
Fund shares sold | | | 616,515 | | | | 1,110,752 | | | | 205,960 | | | | 38,765 | |
Recoverable foreign taxes | | | 686 | | | | — | | | | — | | | | 7,605 | |
| | | | | | | | | | | | | | | | |
Total Assets | | | 1,765,283,104 | | | | 2,336,192,343 | | | | 497,046,302 | | | | 1,292,835,866 | |
| | | | | | | | | | | | | | | | |
LIABILITIES: | | | | | | | | | | | | | | | | |
Payables: | | | | | | | | | | | | |
Investments purchased | | | 1,517,069 | | | | 5,090,817 | | | | 2,374,081 | | | | 24,159,930 | |
Distributions | | | — | | | | 689,134 | | | | — | | | | — | |
Fund shares redeemed | | | 860,797 | | | | 2,555,609 | | | | 45,267 | | | | 118,308 | |
Collateral for securities loaned | | | 25,057,093 | | | | — | | | | 17,144,545 | | | | 24,403,679 | |
Accrued Expenses: | | | | | | | | | | | | |
Advisory fees | | | 142,609 | | | | 193,759 | | | | 38,925 | | | | 102,113 | |
Subadviser fees | | | 1,288,377 | | | | 1,709,161 | | | | 564,818 | | | | 1,048,588 | |
Fund services fees | | | 150,837 | | | | 200,335 | | | | 40,799 | | | | 108,772 | |
Administration fees | | | 8,832 | | | | 8,823 | | | | 8,832 | | | | 8,832 | |
Directors’ fees and expenses | | | 4,172 | | | | 5,554 | | | | 1,183 | | | | 2,529 | |
Other accrued expenses | | | 187,282 | | | | 259,421 | | | | 92,293 | | | | 167,514 | |
| | | | | | | | | | | | | | | | |
Total Liabilities | | | 29,217,068 | | | | 10,712,613 | | | | 20,310,743 | | | | 50,120,265 | |
| | | | | | | | | | | | | | | | |
NET ASSETS | | $ | 1,736,066,036 | | | $ | 2,325,479,730 | | | $ | 476,735,559 | | | $ | 1,242,715,601 | |
| | | | | | | | | | | | | | | | |
NET ASSETS REPRESENTED BY: | | | | | | | | | | | | | | | | |
Paid-in capital | | $ | 1,208,691,404 | | | $ | 1,845,671,410 | | | $ | 362,911,976 | | | $ | 899,270,723 | |
Undistributed net investment income | | | 111,728 | | | | 515,017 | | | | 656,367 | | | | 3,572,909 | |
Accumulated net realized gain (loss) on investments and foreign currency transactions | | | 10,191,574 | | | | (179,692,090 | ) | | | 8,351,982 | | | | 21,309,929 | |
Net unrealized appreciation on investments and foreign currency transactions | | | 517,071,330 | | | | 658,985,393 | | | | 104,815,234 | | | | 318,562,040 | |
| | | | | | | | | | | | | | | | |
NET ASSETS | | $ | 1,736,066,036 | | | $ | 2,325,479,730 | | | $ | 476,735,559 | | | $ | 1,242,715,601 | |
| | | | | | | | | | | | | | | | |
CAPITAL SHARES: | | | | | | | | | | | | | | | | |
Net Assets—Investor Shares | | $ | 39,943,959 | | | $ | 31,156,826 | | | $ | 9,119,715 | | | $ | 32,513,311 | |
Shares Outstanding—Investor Shares | | | 3,022,469 | | | | 2,452,492 | | | | 708,900 | | | | 2,530,557 | |
Net Asset Value—Investor Shares offering and redemption price per share (net assets divided by shares outstanding) | | $ | 13.22 | | | $ | 12.70 | | | $ | 12.86 | | | $ | 12.85 | |
Net Assets—T Shares | | $ | 1,696,122,077 | | | $ | 2,294,322,904 | | | $ | 467,615,844 | | | $ | 1,210,202,290 | |
Shares Outstanding—T Shares | | | 128,310,511 | | | | 180,519,390 | | | | 36,330,959 | | | | 94,166,082 | |
Net Asset Value—T Shares offering and redemption price per share
(net assets divided by shares outstanding) | | $ | 13.22 | | | $ | 12.71 | | | $ | 12.87 | | | $ | 12.85 | |
Cost of investments | | $ | 1,243,981,489 | | | $ | 1,671,786,884 | | | $ | 389,389,280 | | | $ | 951,439,525 | |
| | | | | | | | | | | | | | | | |
† Includes securities on loan with values of (Note 7): | | $ | 24,623,622 | | | $ | — | | | $ | 16,907,739 | | | $ | 23,976,158 | |
See Notes to Financial Statements
90
THE VANTAGEPOINT FUNDS
Statements of Assets and Liabilities
December 31, 2013
| | | | | | | | | | | | |
| | | Discovery | | | International | | | Diversifying
Strategies(1) | |
ASSETS: | |
Investment in securities, at value† | | $ | 298,338,859 | | | $ | 1,459,191,001 | | | $ | 1,098,044,662 | |
Cash | | | 597 | | | | 18,391 | | | | 1,999 | |
Cash denominated in foreign currencies | | | 35 | | | | 2,145,463 | | | | 3,272 | |
Receivables: | | | | | | | | | | | | |
Dividends | | | 146,702 | | | | 1,591,407 | | | | 32,809 | |
Interest | | | 460,653 | | | | — | | | | 3,862,834 | |
Security lending income | | | 74,048 | | | | 45,107 | | | | — | |
Investments sold | | | 1,468,345 | | | | 2,623,400 | | | | 198,941 | |
Fund shares sold | | | 80,795 | | | | 556,895 | | | | 424,579 | |
Recoverable foreign taxes | | | — | | | | 962,935 | | | | 61,195 | |
Variation margin on futures contracts | | | 563,716 | | | | — | | | | 62,618 | |
Due from broker—forward foreign currency exchange contracts collateral | | | — | | | | — | | | | 230,000 | |
Due from broker—options contracts collateral | | | — | | | | — | | | | 130,000 | |
Unrealized appreciation on forward foreign currency exchange contracts | | | 3,988 | | | | — | | | | 594,023 | |
| | | | | | | | | | | | |
Total Assets | | | 301,137,738 | | | | 1,467,134,599 | | | | 1,103,646,932 | |
| | | | | | | | | | | | |
LIABILITIES: | | | | | | | | | | | | |
Payables: | | | | | | | | | | | | |
Investments purchased | | | 3,157,914 | | | | 5,628,079 | | | | 7,978,812 | |
Distributions | | | — | | | | 389,962 | | | | — | |
Fund shares redeemed | | | 111,936 | | | | 49,206 | | | | — | |
Foreign taxes | | | — | | | | 22,579 | | | | — | |
Collateral for securities loaned | | | 18,578,865 | | | | 23,247,526 | | | | — | |
Written Options, at value (Premium $0, $0 and $178,401) | | | — | | | | — | | | | 424,561 | |
Unrealized depreciation on forward foreign currency exchange contracts | | | 1,719 | | | | 21,599 | | | | 384,139 | |
Other | | | — | | | | 36,895 | | | | — | |
Accrued Expenses: | | | | | | | | | | | | |
Advisory fees | | | 22,635 | | | | 118,242 | | | | 91,743 | |
Subadviser fees | | | 277,318 | | | | 1,633,739 | | | | 901,222 | |
Fund services fees | | | 23,380 | | | | 121,652 | | | | 91,747 | |
Administration fees | | | 8,832 | | | | 8,832 | | | | 8,832 | |
Directors’ fees and expenses | | | 650 | | | | 3,606 | | | | 2,893 | |
Other accrued expenses | | | 104,512 | | | | 417,247 | | | | 173,611 | |
| | | | | | | | | | | | |
Total Liabilities | | | 22,287,761 | | | | 31,699,164 | | | | 10,057,560 | |
| | | | | | | | | | | | |
NET ASSETS | | $ | 278,849,977 | | | $ | 1,435,435,435 | | | $ | 1,093,589,372 | |
| | | | | | | | | | | | |
NET ASSETS REPRESENTED BY: | | | | | | | | | | | | |
Paid-in capital | | $ | 234,356,614 | | | $ | 1,245,092,651 | | | $ | 1,050,102,223 | |
Undistributed net investment income (loss) | | | 145,641 | | | | 12,131,676 | | | | (3,342,826 | ) |
Accumulated net realized gain (loss) on investments, futures contracts, foreign currency transactions, purchased options on Euro-Bund Futures and written options | | | 8,487,833 | | | | (63,310,477 | ) | | | 7,424,983 | |
Net unrealized appreciation on investments, futures contracts, foreign currency transactions, purchased options on Euro-Bund Futures and written options | | | 35,859,889 | | | | 241,521,585 | | | | 39,404,992 | |
| | | | | | | | | | | | |
NET ASSETS | | $ | 278,849,977 | | | $ | 1,435,435,435 | | | $ | 1,093,589,372 | |
| | | | | | | | | | | | |
CAPITAL SHARES: | | | | | | | | | | | | |
Net Assets—Investor Shares | | $ | 3,742,490 | | | $ | 16,439,829 | | | $ | — | |
Shares Outstanding—Investor Shares | | | 344,716 | | | | 1,483,072 | | | | — | |
Net Asset Value—Investor Shares offering and redemption price per share
(net assets divided by shares outstanding) | | $ | 10.86 | | | $ | 11.08 | | | $ | — | |
Net Assets—T Shares | | $ | 275,107,487 | | | $ | 1,418,995,606 | | | $ | 1,093,589,372 | |
Shares Outstanding—T Shares | | | 25,331,677 | | | | 127,989,182 | | | | 104,856,178 | |
Net Asset Value—T Shares offering and redemption price per share
(net assets divided by shares outstanding) | | $ | 10.86 | | | $ | 11.09 | | | $ | 10.43 | |
Cost of investments | | $ | 265,963,431 | | | $ | 1,217,686,042 | | | $ | 1,061,217,025 | |
Cost of cash denominated in foreign currencies | | $ | 35 | | | $ | 2,134,719 | | | $ | 3,217 | |
| | | | | | | | | | | | |
† Includes securities on loan with values of (Note 7): | | $ | 17,958,030 | | | $ | 22,232,808 | | | $ | — | |
| (1) | Formerly Diversified Assets Fund. |
See Notes to Financial Statements
91
THE VANTAGEPOINT FUNDS
Statements of Assets and Liabilities
December 31, 2013
| | | | | | | | | | | | | | | | | | | | |
| | | Core Bond
Index | | | 500 Stock
Index | | | Broad Market
Index | | | Mid/Small
Company
Index | | | Overseas
Equity Index | |
ASSETS: | | | | | | | | | | | | | | | | | | | | |
Investment in securities, at value† | | $ | 1,388,562,225 | | | $ | 664,137,184 | | | $ | 792,810,681 | | | $ | 764,823,436 | | | $ | 297,377,160 | |
Cash | | | 2,242 | | | | 319 | | | | 240 | | | | 3,390 | | | | — | |
Cash denominated in foreign currencies | | | — | | | | — | | | | — | | | | — | | | | 863,917 | |
Receivables: | | | | | | | | | | | | | | | | |
Dividends | | | 7,671 | | | | 872,803 | | | | 1,012,982 | | | | 810,899 | | | | 250,331 | |
Interest | | | 7,580,921 | | | | — | | | | — | | | | — | | | | — | |
Security lending income | | | 1,456 | | | | 1,461 | | | | 23,099 | | | | 82,762 | | | | 7,349 | |
Investments sold | | | 18,338,730 | | | | — | | | | 536 | | | | 3,144 | | | | 2,278,220 | |
Fund shares sold | | | 5,488,728 | | | | 162,240 | | | | 54,720 | | | | 492,169 | | | | 134,406 | |
Due from investment adviser | | | 52,365 | | | | 26,187 | | | | 30,121 | | | | 28,080 | | | | 11,723 | |
Recoverable foreign taxes | | | — | | | | — | | | | — | | | | — | | | | 260,017 | |
Variation margin on futures contracts | | | — | | | | 49,919 | | | | 47,015 | | | | 51,428 | | | | — | |
Unrealized appreciation on forward foreign currency exchange contracts | | | — | | | | — | | | | — | | | | — | | | | 33,143 | |
| | | | | | | | | | | | | | | | | | | | |
Total Assets | | | 1,420,034,338 | | | | 665,250,113 | | | | 793,979,394 | | | | 766,295,308 | | | | 301,216,266 | |
| | | | | | | | | | | | | | | | | | | | |
LIABILITIES: | | | | | | | | | | | | | | | | | | | | |
Payables: | | | | | | | | | | | | | | | | | | | | |
Investments purchased | | | 127,158,310 | | | | — | | | | — | | | | — | | | | 1,585 | |
Distributions | | | 3,477,939 | | | | — | | | | — | | | | — | | | | — | |
Fund shares redeemed | | | 420,043 | | | | 42,618 | | | | 313,473 | | | | 12,455 | | | | 373 | |
Variation margin on futures contracts | | | — | | | | — | | | | — | | | | — | | | | 339 | |
Collateral for securities loaned | | | 9,023,177 | | | | 3,179,674 | | | | 13,336,357 | | | | 45,190,289 | | | | 3,724,169 | |
Due to custodian | | | — | | | | — | | | | — | | | | — | | | | 311,678 | |
Unrealized depreciation on forward foreign currency exchange contracts | | | — | | | | — | | | | — | | | | — | | | | 43,329 | |
Accrued Expenses: | | | | | | | | | | | | | | | | | | | | |
Advisory fees | | | 54,387 | | | | 27,605 | | | | 32,276 | | | | 29,462 | | | | 12,315 | |
Subadviser fees | | | 32,640 | | | | 16,144 | | | | 31,425 | | | | 24,908 | | | | 29,620 | |
Fund services fees | | | 112,536 | | | | 60,505 | | | | 70,499 | | | | 63,543 | | | | 26,450 | |
Administration fees | | | 8,832 | | | | 8,832 | | | | 8,832 | | | | 8,832 | | | | 8,832 | |
Directors’ fees and expenses | | | 3,839 | | | | 1,843 | | | | 1,832 | | | | 1,832 | | | | 706 | |
Other accrued expenses | | | 197,777 | | | | 125,461 | | | | 103,549 | | | | 117,446 | | | | 145,307 | |
| | | | | | | | | | | | | | | | | | | | |
Total Liabilities | | | 140,489,480 | | | | 3,462,682 | | | | 13,898,243 | | | | 45,448,767 | | | | 4,304,703 | |
| | | | | | | | | | | | | | | | | | | | |
NET ASSETS | | $ | 1,279,544,858 | | | $ | 661,787,431 | | | $ | 780,081,151 | | | $ | 720,846,541 | | | $ | 296,911,563 | |
| | | | | | | | | | | | | | | | | | | | |
NET ASSETS REPRESENTED BY: | | | | | | | | | | | | | | | | | | | | |
Paid-in capital | | $ | 1,293,272,912 | | | $ | 385,706,677 | | | $ | 432,198,008 | | | $ | 512,904,440 | | | $ | 266,210,672 | |
Undistributed net investment income (loss) | | | 5,799 | | | | 470,014 | | | | 6,210,984 | | | | 1,651,660 | | | | (1,096,591 | ) |
Accumulated net realized gain (loss) on investments, futures contracts and foreign currency transactions | | | (23,898,132 | ) | | | (3,787,103 | ) | | | (2,644,014 | ) | | | 783,892 | | | | (5,986,412 | ) |
Net unrealized appreciation on investments, futures contracts and foreign currency transactions | | | 10,164,279 | | | | 279,397,843 | | | | 344,316,173 | | | | 205,506,549 | | | | 37,783,894 | |
| | | | | | | | | | | | | | | | | | | | |
NET ASSETS | | $ | 1,279,544,858 | | | $ | 661,787,431 | | | $ | 780,081,151 | | | $ | 720,846,541 | | | $ | 296,911,563 | |
| | | | | | | | | | | | | | | | | | | | |
CAPITAL SHARES: | | | | | | | | | | | | | | | | | | | | |
Net Assets—Class I | | $ | 22,054,824 | | | $ | 31,916,393 | | | $ | 36,075,552 | | | $ | 28,366,804 | | | $ | 11,103,296 | |
Shares Outstanding—Class I | | | 2,205,162 | | | | 2,176,785 | | | | 2,276,945 | | | | 1,436,362 | | | | 881,697 | |
Net Asset Value—Class I offering and redemption price per share (net assets divided by shares outstanding) | | $ | 10.00 | | | $ | 14.66 | | | $ | 15.84 | | | $ | 19.75 | | | $ | 12.59 | |
Net Assets—Class II | | $ | 26,489,693 | | | $ | 2,270,822 | | | $ | 15,887,118 | | | $ | 5,541,047 | | | $ | 3,326,693 | |
Shares Outstanding—Class II | | | 2,633,278 | | | | 164,611 | | | | 1,071,867 | | | | 299,076 | | | | 283,120 | |
Net Asset Value—Class II offering and redemption price per share (net assets divided by shares outstanding) | | $ | 10.06 | | | $ | 13.80 | | | $ | 14.82 | | | $ | 18.53 | | | $ | 11.75 | |
Net Assets—T Shares | | $ | 1,231,000,341 | | | $ | 627,600,216 | | | $ | 728,118,481 | | | $ | 686,938,690 | | | $ | 282,481,574 | |
Shares Outstanding—T Shares | | | 123,128,224 | | | | 42,787,406 | | | | 45,952,415 | | | | 34,770,146 | | | | 22,427,854 | |
Net Asset Value—T Shares offering and redemption price per share (net assets divided by shares outstanding) | | $ | 10.00 | | | $ | 14.67 | | | $ | 15.85 | | | $ | 19.76 | | | $ | 12.60 | |
Cost of investments | | $ | 1,378,397,946 | | | $ | 385,147,746 | | | $ | 448,863,393 | | | $ | 559,790,067 | | | $ | 259,668,712 | |
Cost of cash denominated in foreign currencies | | $ | — | | | $ | — | | | $ | — | | | $ | — | | | $ | 859,653 | |
| | | | | | | | | | | | | | | | | | | | |
† Includes securities on loan with values of (Note 7): | | $ | 8,827,990 | | | $ | 3,085,663 | | | $ | 13,005,266 | | | $ | 43,990,337 | | | $ | 3,532,862 | |
See Notes to Financial Statements
92
THE VANTAGEPOINT FUNDS
Statements of Assets and Liabilities
December 31, 2013
| | | | | | | | | | | | | | | | |
| | | Model Portfolio Funds | |
| | | Conservative
Growth | | | Traditional
Growth | | | Long-Term
Growth | | | All-Equity
Growth | |
ASSETS: | |
Investment in securities, at value | | $ | 6,803,901 | | | $ | 16,890,350 | | | $ | 43,518,072 | | | $ | 27,630,152 | |
Investments in securities of affiliated Mutual Funds, at value(a) | | | 654,724,942 | | | | 1,673,391,406 | | | | 2,168,868,874 | | | | 898,555,714 | |
Cash | | | 1,651,578 | | | | 1,620,959 | | | | — | | | | — | |
Receivables: | | | | | | | | | | | | |
Dividends | | | 241,691 | | | | 672,311 | | | | 886,068 | | | | 89,260 | |
Investments sold | | | 278,619 | | | | 164,467 | | | | 420,744 | | | | 252,497 | |
Fund shares sold | | | 20,887,777 | | | | 64,359,168 | | | | 97,025,217 | | | | 33,762,904 | |
| | | | | | | | | | | | | | | | |
Total Assets | | | 684,588,508 | | | | 1,757,098,661 | | | | 2,310,718,975 | | | | 960,290,527 | |
| | | | | | | | | | | | | | | | |
LIABILITIES: | | | | | | | | | | | | | | | | |
Payables: | | | | | | | | | | | | |
Investments purchased | | | 1,893,220 | | | | 2,380,966 | | | | 885,961 | | | | 89,214 | |
Distributions | | | 20,836,387 | | | | 64,273,224 | | | | 97,008,277 | | | | 33,746,170 | |
Fund shares redeemed | | | 251,794 | | | | 2,603 | | | | 249,055 | | | | 183,114 | |
Accrued Expenses: | | | | | | | | | | | | |
Advisory fees | | | 57,796 | | | | 133,851 | | | | 170,644 | | | | 78,022 | |
Fund services fees | | | 22,909 | | | | 27,561 | | | | 23,998 | | | | 10,851 | |
Administration fees | | | 7,406 | | | | 7,406 | | | | 7,406 | | | | 7,406 | |
Directors’ fees and expenses | | | 4,090 | | | | 10,611 | | | | 13,286 | | | | 5,272 | |
Other accrued expenses | | | 84,048 | | | | 176,308 | | | | 220,475 | | | | 102,926 | |
| | | | | | | | | | | | | | | | |
Total Liabilities | | | 23,157,650 | | | | 67,012,530 | | | | 98,579,102 | | | | 34,222,975 | |
| | | | | | | | | | | | | | | | |
NET ASSETS | | $ | 661,430,858 | | | $ | 1,690,086,131 | | | $ | 2,212,139,873 | | | $ | 926,067,552 | |
| | | | | | | | | | | | | | | | |
NET ASSETS REPRESENTED BY: | | | | | | | | | | | | | | | | |
Paid-in capital | | $ | 574,487,224 | | | $ | 1,400,261,242 | | | $ | 1,757,458,326 | | | $ | 700,684,262 | |
Undistributed net investment income | | | 9,433 | | | | 170,681 | | | | 212,596 | | | | 1,317,786 | |
Accumulated net realized gain on investments | | | 210,798 | | | | 15,911,669 | | | | 55,269,884 | | | | 21,151,931 | |
Net unrealized appreciation on investments | | | 86,723,403 | | | | 273,742,539 | | | | 399,199,067 | | | | 202,913,573 | |
| | | | | | | | | | | | | | | | |
NET ASSETS | | $ | 661,430,858 | | | $ | 1,690,086,131 | | | $ | 2,212,139,873 | | | $ | 926,067,552 | |
| | | | | | | | | | | | | | | | |
CAPITAL SHARES: | | | | | | | | | | | | | | | | |
Net Assets—Investor M Shares | | $ | 102,862,028 | | | $ | 124,345,787 | | | $ | 108,361,863 | | | $ | 49,173,506 | |
Shares Outstanding—Investor M Shares | | | 3,836,710 | | | | 4,713,997 | | | | 4,157,508 | | | | 1,831,112 | |
Net Asset Value—Investor M Shares offering and redemption price per share (net assets divided by shares outstanding) | | $ | 26.81 | | | $ | 26.38 | | | $ | 26.06 | | | $ | 26.85 | |
Net Assets—TM Shares | | $ | 558,568,830 | | | $ | 1,565,740,344 | | | $ | 2,103,778,010 | | | $ | 876,894,046 | |
Shares Outstanding—TM Shares | | | 20,831,345 | | | | 59,345,571 | | | | 80,696,653 | | | | 32,643,400 | |
Net Asset Value—TM Shares offering and redemption price per share (net assets divided by shares outstanding) | | $ | 26.81 | | | $ | 26.38 | | | $ | 26.07 | | | $ | 26.86 | |
Cost of investments | | $ | 7,043,125 | | | $ | 17,556,146 | | | $ | 45,590,648 | | | $ | 28,887,393 | |
Cost of securities of affiliated Mutual Funds | | $ | 567,762,315 | | | $ | 1,398,983,071 | | | $ | 1,767,597,231 | | | $ | 694,384,900 | |
| (a) | Investment in other Vantagepoint Funds (Note 1). |
See Notes to Financial Statements
93
THE VANTAGEPOINT FUNDS
Statements of Assets and Liabilities
December 31, 2013
| | | | | | | | | | | | | | | | | | | | |
| | | Milestone Funds | |
| | | Milestone
Retirement
Income | | | Milestone
2010 | | | Milestone
2015 | | | Milestone
2020 | | | Milestone
2025 | |
ASSETS: | | | | | | | | | | | | | | | | | | | | |
Investment in securities, at value | | $ | 3,314,528 | | | $ | 3,096,801 | | | $ | 7,974,091 | | | $ | 13,726,257 | | | $ | 11,135,776 | |
Investments in securities of affiliated Mutual Funds, at value(a) | | | 320,345,457 | | | | 287,012,403 | | | | 548,248,925 | | | | 635,384,578 | | | | 529,916,404 | |
Cash | | | 1,261,143 | | | | 1,001,364 | | | | 1,504,707 | | | | 736,063 | | | | 75,623 | |
Receivables: | | | | | | | | | | | | | | | | | | | | |
Dividends | | | 86,514 | | | | 65,228 | | | | 150,360 | | | | 252,282 | | | | 237,482 | |
Investments sold | | | 181,889 | | | | 40,663 | | | | 70,859 | | | | 77,229 | | | | 64,855 | |
Fund shares sold | | | 10,283,545 | | | | 12,813,843 | | | | 21,001,999 | | | | 24,594,141 | | | | 19,251,058 | |
| | | | | | | | | | | | | | | | | | | | |
Total Assets | | | 335,473,076 | | | | 304,030,302 | | | | 578,950,941 | | | | 674,770,550 | | | | 560,681,198 | |
| | | | | | | | | | | | | | | | | | | | |
LIABILITIES: | | | | | | | | | | | | | | | | | | | | |
Payables: | | | | | | | | | | | | | | | | | | | | |
Investments purchased | | | 1,634,893 | | | | 1,111,594 | | | | 1,807,603 | | | | 1,635,775 | | | | 721,998 | |
Distributions | | | 9,932,554 | | | | 12,763,740 | | | | 20,824,755 | | | | 23,871,412 | | | | 18,787,230 | |
Fund shares redeemed | | | 165,531 | | | | — | | | | 11,769 | | | | — | | | | — | |
Accrued Expenses: | | | | | | | | | | | | | | | | | | | | |
Advisory fees | | | 29,165 | | | | 25,954 | | | | 49,511 | | | | 57,450 | | | | 47,850 | |
Fund services fees | | | 19,229 | | | | 16,050 | | | | 23,679 | | | | 22,333 | | | | 19,147 | |
Administration fees | | | 7,406 | | | | 7,406 | | | | 7,406 | | | | 7,406 | | | | 7,406 | |
Directors’ fees and expenses | | | 1,746 | | | | 1,576 | | | | 2,430 | | | | 2,390 | | | | 1,903 | |
Other accrued expenses | | | 50,291 | | | | 51,421 | | | | 67,279 | | | | 67,242 | | | | 62,827 | |
| | | | | | | | | | | | | | | | | | | | |
Total Liabilities | | | 11,840,815 | | | | 13,977,741 | | | | 22,794,432 | | | | 25,664,008 | | | | 19,648,361 | |
| | | | | | | | | | | | | | | | | | | | |
NET ASSETS | | $ | 323,632,261 | | | $ | 290,052,561 | | | $ | 556,156,509 | | | $ | 649,106,542 | | | $ | 541,032,837 | |
| | | | | | | | | | | | | | | | | | | | |
NET ASSETS REPRESENTED BY: | | | | | | | | | | | | | | | | | | | | |
Paid-in capital | | $ | 308,608,239 | | | $ | 262,534,174 | | | $ | 486,593,694 | | | $ | 553,317,253 | | | $ | 447,293,108 | |
Undistributed net investment income | | | — | | | | — | | | | — | | | | — | | | | — | |
Accumulated net realized gain on investments | | | 3,349,973 | | | | 4,319,025 | | | | 1,967,448 | | | | 3,302,818 | | | | 4,795,981 | |
Net unrealized appreciation on investments | | | 11,674,049 | | | | 23,199,362 | | | | 67,595,367 | | | | 92,486,471 | | | | 88,943,748 | |
| | | | | | | | | | | | | | | | | | | | |
NET ASSETS | | $ | 323,632,261 | | | $ | 290,052,561 | | | $ | 556,156,509 | | | $ | 649,106,542 | | | $ | 541,032,837 | |
| | | | | | | | | | | | | | | | | | | | |
CAPITAL SHARES: | | | | | | | | | | | | | | | | | | | | |
Net Assets—Investor M Shares | | $ | 86,047,888 | | | $ | 71,804,170 | | | $ | 106,284,716 | | | $ | 101,058,992 | | | $ | 86,764,336 | |
Shares Outstanding—Investor M Shares | | | 7,891,888 | | | | 6,335,726 | | | | 8,916,880 | | | | 8,196,738 | | | | 6,878,099 | |
Net Asset Value—Investor M Shares offering and redemption price per share
(net assets divided by shares outstanding) | | $ | 10.90 | | | $ | 11.33 | | | $ | 11.92 | | | $ | 12.33 | | | $ | 12.61 | |
Net Assets—TM Shares | | $ | 237,584,373 | | | $ | 218,248,391 | | | $ | 449,871,793 | | | $ | 548,047,550 | | | $ | 454,268,501 | |
Shares Outstanding—TM Shares | | | 21,786,135 | | | | 19,253,884 | | | | 37,738,656 | | | | 44,442,519 | | | | 36,000,174 | |
Net Asset Value—TM Shares offering and redemption price per share
(net assets divided by shares outstanding) | | $ | 10.91 | | | $ | 11.34 | | | $ | 11.92 | | | $ | 12.33 | | | $ | 12.62 | |
Cost of investments | | $ | 3,437,232 | | | $ | 3,211,090 | | | $ | 8,311,873 | | | $ | 14,220,338 | | | $ | 11,526,510 | |
Cost of securities of affiliated Mutual Funds | | $ | 308,548,704 | | | $ | 263,698,752 | | | $ | 480,315,776 | | | $ | 542,404,026 | | | $ | 440,581,922 | |
| (a) | Investment in other Vantagepoint Funds (Note 1). |
See Notes to Financial Statements
94
THE VANTAGEPOINT FUNDS
Statements of Assets and Liabilities
December 31, 2013
| | | | | | | | | | | | | | | | | | | | |
| | | Milestone Funds | |
| | | Milestone
2030 | | | Milestone
2035 | | | Milestone
2040 | | | Milestone
2045 | | | Milestone
2050 | |
ASSETS: | | | | | | | | | | | | | | | | | | | | |
Investment in securities, at value | | $ | 9,182,038 | | | $ | 9,005,208 | | | $ | 8,913,053 | | | $ | 3,324,912 | | | $ | 729,190 | |
Investments in securities of affiliated Mutual Funds, at value(a) | | | 430,149,895 | | | | 294,262,085 | | | | 285,865,868 | | | | 94,866,833 | | | | 21,611,960 | |
Cash | | | 23,521 | | | | 6,303 | | | | — | | | | — | | | | — | |
Receivables: | | | | | | | | | | | | | | | | | | | | |
Dividends | | | 159,496 | | | | 77,910 | | | | 62,392 | | | | 21,183 | | | | 4,776 | |
Investments sold | | | 54,160 | | | | 38,269 | | | | 36,713 | | | | 13,328 | | | | 1,403 | |
Fund shares sold | | | 16,225,459 | | | | 12,160,133 | | | | 14,919,211 | | | | 5,263,378 | | | | 574,862 | |
Due from investment adviser | | | — | | | | — | | | | — | | | | — | | | | 1,289 | |
| | | | | | | | | | | | | | | | | | | | |
Total Assets | | | 455,794,569 | | | | 315,549,908 | | | | 309,797,237 | | | | 103,489,634 | | | | 22,923,480 | |
| | | | | | | | | | | | | | | | | | | | |
LIABILITIES: | | | | | | | | | | | | | | | | | | | | |
Payables: | | | | | | | | | | | | | | | | | | | | |
Investments purchased | | | 374,566 | | | | 338,977 | | | | 252,449 | | | | 45,436 | | | | 34,773 | |
Distributions | | | 15,998,204 | | | | 11,871,531 | | | | 14,657,320 | | | | 5,173,333 | | | | 538,062 | |
Fund shares redeemed | | | — | | | | 246 | | | | 8,576 | | | | 10,299 | | | | — | |
Accrued Expenses: | | | | | | | | | | | | | | | | | | | | |
Advisory fees | | | 38,729 | | | | 26,685 | | | | 25,944 | | | | 8,495 | | | | 1,874 | |
Fund services fees | | | 17,228 | | | | 12,860 | | | | 11,804 | | | | 5,290 | | | | 1,480 | |
Administration fees | | | 7,406 | | | | 7,406 | | | | 7,406 | | | | 7,546 | | | | 9,574 | |
Directors’ fees and expenses | | | 1,510 | | | | 940 | | | | 997 | | | | 326 | | | | 24 | |
Other accrued expenses | | | 56,831 | | | | 49,099 | | | | 49,985 | | | | 43,223 | | | | 47,798 | |
| | | | | | | | | | | | | | | | | | | | |
Total Liabilities | | | 16,494,474 | | | | 12,307,744 | | | | 15,014,481 | | | | 5,293,948 | | | | 633,585 | |
| | | | | | | | | | | | | | | | | | | | |
NET ASSETS | | $ | 439,300,095 | | | $ | 303,242,164 | | | $ | 294,782,756 | | | $ | 98,195,686 | | | $ | 22,289,895 | |
| | | | | | | | | | | | | | | | | | | | |
NET ASSETS REPRESENTED BY: | | | | | | | | | | | | | | | | | | | | |
Paid-in capital | | $ | 353,081,861 | | | $ | 239,006,524 | | | $ | 225,760,523 | | | $ | 80,416,223 | | | $ | 19,800,594 | |
Undistributed net investment income | | | 288 | | | | 1 | | | | — | | | | — | | | | — | |
Accumulated net realized gain on investments | | | 4,998,879 | | | | 4,293,439 | | | | 3,978,752 | | | | 3,295,348 | | | | 791,226 | |
Net unrealized appreciation on investments | | | 81,219,067 | | | | 59,942,200 | | | | 65,043,481 | | | | 14,484,115 | | | | 1,698,075 | |
| | | | | | | | | | | | | | | | | | | | |
NET ASSETS | | $ | 439,300,095 | | | $ | 303,242,164 | | | $ | 294,782,756 | | | $ | 98,195,686 | | | $ | 22,289,895 | |
| | | | | | | | | | | | | | | | | | | | |
CAPITAL SHARES: | | | | | | | | | | | | | | | | | | | | |
Net Assets—Investor M Shares | | $ | 78,294,611 | | | $ | 58,606,747 | | | $ | 53,970,194 | | | $ | 24,388,455 | | | $ | 6,847,604 | |
Shares Outstanding—Investor M Shares | | | 6,012,323 | | | | 4,433,674 | | | | 3,998,713 | | | | 1,679,386 | | | | 537,679 | |
Net Asset Value—Investor M Shares offering and redemption price per share
(net assets divided by shares outstanding) | | $ | 13.02 | | | $ | 13.22 | | | $ | 13.50 | | | $ | 14.52 | | | $ | 12.74 | |
Net Assets—TM Shares | | $ | 361,005,484 | | | $ | 244,635,417 | | | $ | 240,812,562 | | | $ | 73,807,231 | | | $ | 15,442,291 | |
Shares Outstanding—TM Shares | | | 27,711,273 | | | | 18,500,957 | | | | 17,835,796 | | | | 5,079,851 | | | | 1,211,835 | |
Net Asset Value—TM Shares offering and redemption price per share
(net assets divided by shares outstanding) | | $ | 13.03 | | | $ | 13.22 | | | $ | 13.50 | | | $ | 14.53 | | | $ | 12.74 | |
Cost of investments | | $ | 9,498,489 | | | $ | 9,345,243 | | | $ | 9,241,539 | | | $ | 3,395,084 | | | $ | 732,092 | |
Cost of securities of affiliated Mutual Funds | | $ | 348,614,377 | | | $ | 233,979,850 | | | $ | 220,493,901 | | | $ | 80,312,546 | | | $ | 19,910,983 | |
| (a) | Investment in other Vantagepoint Funds (Note 1). |
See Notes to Financial Statements
95
THE VANTAGEPOINT FUNDS
Statements of Operations
For the Period from January 1, 2013 to December 31, 2013
| | | | | | | | | | | | |
| | | Low
Duration
Bond | | | Inflation
Protected
Securities | | | Equity
Income | |
INVESTMENT INCOME: | | | | | | | | | | | | |
Dividends | | $ | 28,562 | | | $ | 17,676 | | | $ | 46,291,006 | |
Interest | | | 10,715,616 | | | | 5,886,901 | | | | — | |
Security lending income | | | 23,198 | | | | 6 | | | | 369,914 | |
Foreign taxes withheld on dividends | | | — | | | | — | | | | (180,026 | ) |
| | | | | | | | | | | | |
Total investment income | | | 10,767,376 | | | | 5,904,583 | | | | 46,480,894 | |
| | | | | | | | | | | | |
EXPENSES: | | | | | | | | | | | | |
Advisory (Note 4) | | | 584,145 | | | | 606,377 | | | | 2,244,225 | |
Subadviser | | | 804,559 | | | | 897,490 | | | | 7,782,652 | |
Fund services Investor Shares | | | 476,597 | | | | 483,214 | | | | 1,358,007 | |
Fund services T Shares | | | 447,970 | | | | 468,323 | | | | 1,856,297 | |
Custodian | | | 84,335 | | | | 56,417 | | | | 64,964 | |
Administration | | | 17,956 | | | | 17,956 | | | | 17,956 | |
Fund accounting | | | 22,500 | | | | 22,500 | | | | 70,510 | |
Legal | | | 65,924 | | | | 61,206 | | | | 202,427 | |
Audit | | | 26,516 | | | | 26,517 | | | | 26,517 | |
Directors | | | 13,283 | | | | 14,621 | | | | 48,152 | |
State license fees and memberships | | | 27,848 | | | | 32,139 | | | | 32,290 | |
Other expenses | | | 40,113 | | | | 45,625 | | | | 121,057 | |
| | | | | | | | | | | | |
Total expenses | | | 2,611,746 | | | | 2,732,385 | | | | 13,825,054 | |
Less waivers (Note 4) | | | — | | | | — | | | | (93,010 | ) |
| | | | | | | | | | | | |
Net Expenses | | | 2,611,746 | | | | 2,732,385 | | | | 13,732,044 | |
| | | | | | | | | | | | |
NET INVESTMENT INCOME | | | 8,155,630 | | | | 3,172,198 | | | | 32,748,850 | |
| | | | | | | | | | | | |
NET REALIZED AND UNREALIZED GAIN (LOSS) (Note 2): | | | | | | | | | | | | |
Net realized gain (loss) on: | | | | | | | | | | | | |
Investments | | | 2,660,971 | | | | 4,874,753 | | | | 125,238,415 | |
Forward contracts and foreign currency transactions | | | (586,648 | ) | | | (923 | ) | | | (2,050 | ) |
Futures contracts | | | (212,510 | ) | | | 1,593,792 | | | | — | |
Written options | | | — | | | | 420,402 | | | | — | |
Swap agreements | | | — | | | | (41,309 | ) | | | — | |
| | | | | | | | | | | | |
Net realized gain | | | 1,861,813 | | | | 6,846,715 | | | | 125,236,365 | |
| | | | | | | | | | | | |
Net change in unrealized appreciation (depreciation) on: | | | | | | | | | | | | |
Investments | | | (4,593,957 | ) | | | (65,343,864 | ) | | | 451,643,367 | |
Forward contracts and foreign currency transactions | | | (58,158 | ) | | | 2,455 | | | | 2,060 | |
Futures contracts | | | 17,440 | | | | (79,189 | ) | | | — | |
Written options | | | — | | | | 188,342 | | | | — | |
Swap agreements | | | — | | | | (773,933 | ) | | | — | |
| | | | | | | | | | | | |
Net change in unrealized appreciation (depreciation) | | | (4,634,675 | ) | | | (66,006,189 | ) | | | 451,645,427 | |
| | | | | | | | | | | | |
NET GAIN (LOSS) | | | (2,772,862 | ) | | | (59,159,474 | ) | | | 576,881,792 | |
| | | | | | | | | | | | |
NET INCREASE (DECREASE) IN NET ASSETS RESULTING FROM OPERATIONS | | $ | 5,382,768 | | | $ | (55,987,276 | ) | | $ | 609,630,642 | |
| | | | | | | | | | | | |
See Notes to Financial Statements
96
THE VANTAGEPOINT FUNDS
Statements of Operations
For the Period from January 1, 2013 to December 31, 2013
| | | | | | | | | | | | | | | | |
| | | Growth &
Income | | | Growth | | | Select Value | | | Aggressive
Opportunities | |
INVESTMENT INCOME: | | | | | | | | | | | | | | | | |
Dividends | | $ | 25,374,778 | | | $ | 23,452,648 | | | $ | 8,472,413 | | | $ | 10,141,421 | |
Interest | | | — | | | | 21 | | | | — | | | | — | |
Security lending income | | | 117,056 | | | | 266,314 | | | | 46,065 | | | | 765,667 | |
Foreign taxes withheld on dividends | | | (115,770 | ) | | | (99,509 | ) | | | (10,757 | ) | | | (52,832 | ) |
| | | | | | | | | | | | | | | | |
Total investment income | | | 25,376,064 | | | | 23,619,474 | | | | 8,507,721 | | | | 10,854,256 | |
| | | | | | | | | | | | | | | | |
EXPENSES: | | | | | | | | | | | | | | | | |
Advisory (Note 4) | | | 1,479,291 | | | | 2,089,351 | | | | 418,918 | | | | 1,112,494 | |
Subadviser | | | 4,560,398 | | | | 6,373,755 | | | | 2,056,793 | | | | 3,927,821 | |
Fund services Investor Shares | | | 876,356 | | | | 1,191,172 | | | | 235,003 | | | | 677,468 | |
Fund services T Shares | | | 1,228,951 | | | | 1,749,085 | | | | 351,789 | | | | 918,970 | |
Custodian | | | 40,516 | | | | 54,599 | | | | 16,832 | | | | 63,593 | |
Administration | | | 17,956 | | | | 17,956 | | | | 17,956 | | | | 17,956 | |
Fund accounting | | | 47,440 | | | | 55,230 | | | | 22,823 | | | | 40,760 | |
Legal | | | 131,195 | | | | 187,691 | | | | 36,806 | | | | 100,859 | |
Audit | | | 26,517 | | | | 26,517 | | | | 26,516 | | | | 26,518 | |
Directors | | | 31,238 | | | | 45,877 | | | | 8,811 | | | | 26,075 | |
State license fees and memberships | | | 33,559 | | | | 28,392 | | | | 25,013 | | | | 56,258 | |
Other expenses | | | 74,827 | | | | 108,515 | | | | 20,401 | | | | 65,677 | |
| | | | | | | | | | | | | | | | |
Total expenses | | | 8,548,244 | | | | 11,928,140 | | | | 3,237,661 | | | | 7,034,449 | |
Less waivers (Note 4) | | | (56,674 | ) | | | — | | | | — | | | | — | |
| | | | | | | | | | | | | | | | |
Net Expenses | | | 8,491,570 | | | | 11,928,140 | | | | 3,237,661 | | | | 7,034,449 | |
| | | | | | | | | | | | | | | | |
NET INVESTMENT INCOME | | | 16,884,494 | | | | 11,691,334 | | | | 5,270,060 | | | | 3,819,807 | |
| | | | | | | | | | | | | | | | |
NET REALIZED AND UNREALIZED GAIN (LOSS) (Note 2): | | | | | | | | | | | | | | | | |
Net realized gain (loss) on: | | | | | | | | | | | | | | | | |
Investments | | | 141,010,185 | | | | 191,835,786 | | | | 65,520,186 | | | | 124,685,545 | |
Forward contracts and foreign currency transactions | | | 2,475 | | | | — | | | | — | | | | 329 | |
| | | | | | | | | | | | | | | | |
Net realized gain | | | 141,012,660 | | | | 191,835,786 | | | | 65,520,186 | | | | 124,685,874 | |
| | | | | | | | | | | | | | | | |
Net change in unrealized appreciation (depreciation) on: | | | | | | | | | | | | | | | | |
Investments | | | 275,905,273 | | | | 411,408,786 | | | | 52,501,065 | | | | 235,361,506 | |
Forward contracts and foreign currency transactions | | | 29 | | | | — | | | | — | | | | 308 | |
| | | | | | | | | | | | | | | | |
Net change in unrealized appreciation | | | 275,905,302 | | | | 411,408,786 | | | | 52,501,065 | | | | 235,361,814 | |
| | | | | | | | | | | | | | | | |
NET GAIN | | | 416,917,962 | | | | 603,244,572 | | | | 118,021,251 | | | | 360,047,688 | |
| | | | | | | | | | | | | | | | |
NET INCREASE IN NET ASSETS RESULTING FROM OPERATIONS | | $ | 433,802,456 | | | $ | 614,935,906 | | | $ | 123,291,311 | | | $ | 363,867,495 | |
| | | | | | | | | | | | | | | | |
See Notes to Financial Statements
97
THE VANTAGEPOINT FUNDS
Statements of Operations
For the Period from January 1, 2013 to December 31, 2013
| | | | | | | | | | | | |
| | | Discovery | | | International | | | Diversifying
Strategies(1) | |
INVESTMENT INCOME: | | | | | | | | | | | | |
Dividends | | $ | 1,909,927 | | | $ | 39,916,458 | | | $ | 1,777,548 | |
Interest | | | 1,709,910 | | | | — | | | | 16,565,182 | |
Security lending income | | | 542,001 | | | | 859,719 | | | | — | |
Foreign taxes withheld on dividends | | | (7,903 | ) | | | (2,833,384 | ) | | | (57,844 | ) |
| | | | | | | | | | | | |
Total investment income | | | 4,153,935 | | | | 37,942,793 | | | | 18,284,886 | |
| | | | | | | | | | | | |
EXPENSES: | | | | | | | | | | | | |
Advisory (Note 4) | | | 241,449 | | | | 1,327,752 | | | | 1,022,348 | |
Subadviser | | | 1,049,910 | | | | 6,347,730 | | | | 3,824,770 | |
Fund services Investor Shares | | | 137,228 | | | | 804,519 | | | | — | |
Fund services T Shares | | | 202,249 | | | | 1,097,934 | | | | 1,422,000 | |
Custodian | | | 51,048 | | | | 398,028 | | | | 140,087 | |
Administration | | | 17,956 | | | | 17,956 | | | | 17,956 | |
Fund accounting | | | 22,585 | | | | 52,310 | | | | 43,340 | |
Legal | | | 21,773 | | | | 126,082 | | | | 94,036 | |
Audit | | | 27,518 | | | | 113,019 | | | | 27,518 | |
Directors | | | 5,293 | | | | 30,081 | | | | 22,188 | |
State license fees and memberships | | | 23,406 | | | | 33,429 | | | | 20,098 | |
Other expenses | | | 12,860 | | | | 81,744 | | | | 68,451 | |
| | | | | | | | | | | | |
Total expenses | | | 1,813,275 | | | | 10,430,584 | | | | 6,702,792 | |
Less waivers (Note 4) | | | — | | | | — | | | | (635,701 | ) |
| | | | | | | | | | | | |
Net Expenses | | | 1,813,275 | | | | 10,430,584 | | | | 6,067,091 | |
| | | | | | | | | | | | |
NET INVESTMENT INCOME | | | 2,340,660 | | | | 27,512,209 | | | | 12,217,795 | |
| | | | | | | | | | | | |
NET REALIZED AND UNREALIZED GAIN (LOSS) (Note 2): | | | | | | | | | | | | |
Net realized gain (loss) on: | | | | | | | | | | | | |
Investments | | | 16,844,039 | | | | 95,450,408 | | | | 29,644,646 | |
Forward contracts and foreign currency transactions | | | (19,039 | ) | | | 605,487 | | | | (2,328,594 | ) |
Futures contracts | | | 36,407,618 | | | | — | | | | 2,086,498 | |
Written options | | | — | | | | — | | | | (608,929 | ) |
Purchased options on Euro Bond futures contracts | | | — | | | | — | | | | (51,238 | ) |
| | | | | | | | | | | | |
Net realized gain | | | 53,232,618 | | | | 96,055,895 | | | | 28,742,383 | |
| | | | | | | | | | | | |
Net change in unrealized appreciation (depreciation) on: | | | | | | | | | | | | |
Investments | | | 22,265,695 | | | | 99,082,289 | (a) | | | 13,588,886 | |
Forward contracts and foreign currency transactions | | | 3,063 | | | | 179,135 | | | | 566,080 | |
Futures contracts | | | 2,879,398 | | | | — | | | | 3,138,576 | |
Written options | | | — | | | | — | | | | (285,860 | ) |
Purchased options on Euro-Bund futures contracts | | | — | | | | — | | | | (99,100 | ) |
| | | | | | | | | | | | |
Net change in unrealized appreciation | | | 25,148,156 | | | | 99,261,424 | | | | 16,908,582 | |
| | | | | | | | | | | | |
NET GAIN | | | 78,380,774 | | | | 195,317,319 | | | | 45,650,965 | |
| | | | | | | | | | | | |
NET INCREASE IN NET ASSETS RESULTING FROM OPERATIONS | | $ | 80,721,434 | | | $ | 222,829,528 | | | $ | 57,868,760 | |
| | | | | | | | | | | | |
| (1) | Formerly Diversified Assets Fund. |
| (a) | Net of increase in deferred foreign tax of $108,458. |
See Notes to Financial Statements
98
THE VANTAGEPOINT FUNDS
Statements of Operations
For the Period from January 1, 2013 to December 31, 2013
| | | | | | | | | | | | | | | | | | | | |
| | | Core Bond
Index | | | 500 Stock
Index | | | Broad Market
Index | | | Mid/Small
Company
Index | | | Overseas
Equity Index | |
INVESTMENT INCOME: | | | | | | | | | | | | | | | | | | | | |
Dividends | | $ | 105,079 | | | $ | 11,876,139 | | | $ | 13,011,756 | | | $ | 9,604,791 | | | $ | 7,751,483 | |
Interest | | | 30,369,604 | | | | 266 | | | | 213 | | | | 195 | | | | 140 | |
Security lending income | | | 88,791 | | | | 24,920 | | | | 206,367 | | | | 850,533 | | | | 202,457 | |
Foreign taxes withheld on dividends | | | — | | | | (1,773 | ) | | | (3,340 | ) | | | (6,166 | ) | | | (460,565 | ) |
| | | | | | | | | | | | | | | | | | | | |
Total investment income | | | 30,563,474 | | | | 11,899,552 | | | | 13,214,996 | | | | 10,449,353 | | | | 7,493,515 | |
| | | | | | | | | | | | | | | | | | | | |
EXPENSES: | | | | | | | | | | | | | | | | | | | | |
Advisory | | | 630,862 | | | | 282,457 | | | | 323,619 | | | | 298,333 | | | | 128,046 | |
Subadviser | | | 133,350 | | | | 58,965 | | | | 97,178 | | | | 93,415 | | | | 110,189 | |
Fund services Class I | | | 505,224 | | | | 123,753 | | | | 146,852 | | | | 208,312 | | | | 51,563 | |
Fund services Class II | | | 75,250 | | | | 59,177 | | | | 82,261 | | | | 37,267 | | | | 30,083 | |
Fund services T Shares (Note 4) | | | 1,018,061 | | | | 464,485 | | | | 516,025 | | | | 489,960 | | | | 208,820 | |
Custodian | | | 213,537 | | | | 50,342 | | | | 59,431 | | | | 85,077 | | | | 146,743 | |
Administration | | | 17,956 | | | | 17,956 | | | | 17,956 | | | | 17,956 | | | | 17,956 | |
Fund accounting | | | 40,270 | | | | 22,500 | | | | 22,500 | | | | 22,500 | | | | 22,500 | |
Legal | | | 118,532 | | | | 47,122 | | | | 57,130 | | | | 51,396 | | | | 22,136 | |
Audit | | | 26,516 | | | | 26,516 | | | | 26,516 | | | | 26,516 | | | | 71,516 | |
Directors | | | 26,885 | | | | 10,522 | | | | 13,504 | | | | 11,731 | | | | 5,344 | |
State license fees and memberships | | | 44,404 | | | | 76,574 | | | | 35,711 | | | | 47,591 | | | | 57,302 | |
Other expenses | | | 82,739 | | | | 29,088 | | | | 32,828 | | | | 33,670 | | | | 46,686 | |
| | | | | | | | | | | | | | | | | | | | |
Total expenses | | | 2,933,586 | | | | 1,269,457 | | | | 1,431,511 | | | | 1,423,724 | | | | 918,884 | |
Less waivers (Note 4) | | | (509,031 | ) | | | (232,243 | ) | | | (258,012 | ) | | | (244,980 | ) | | | (104,410 | ) |
| | | | | | | | | | | | | | | | | | | | |
Net Expenses | | | 2,424,555 | | | | 1,037,214 | | | | 1,173,499 | | | | 1,178,744 | | | | 814,474 | |
| | | | | | | | | | | | | | | | | | | | |
NET INVESTMENT INCOME | | | 28,138,919 | | | | 10,862,338 | | | | 12,041,497 | | | | 9,270,609 | | | | 6,679,041 | |
| | | | | | | | | | | | | | | | | | | | |
NET REALIZED AND UNREALIZED GAIN (LOSS) (Note 2): | | | | | | | | | | | | | | | | | | | | |
Net realized gain (loss) on: | | | | | | | | | | | | | | | | |
Investments | | | 917,714 | | | | 19,186,685 | | | | 15,348,699 | | | | 49,178,560 | | | | 2,058,857 | |
Forward contracts and foreign currency transactions | | | — | | | | — | | | | — | | | | – | | | | (147,922 | ) |
Futures contracts | | | — | | | | 2,768,560 | | | | 2,221,772 | | | | 2,218,485 | | | | 596,797 | |
| | | | | | | | | | | | | | | | | | | | |
Net realized gain | | | 917,714 | | | | 21,955,245 | | | | 17,570,471 | | | | 51,397,045 | | | | 2,507,732 | |
| | | | | | | | | | | | | | | | | | | | |
Net change in unrealized appreciation (depreciation) on: | | | | | | | | | | | | | | | | |
Investments | | | (59,225,189 | ) | | | 120,612,627 | | | | 155,046,924 | | | | 126,236,911 | | | | 41,623,846 | |
Forward contracts and foreign currency transactions | | | — | | | | — | | | | — | | | | — | | | | 5,012 | |
Futures contracts | | | — | | | | 420,449 | | | | 351,567 | | | | 435,753 | | | | 73,626 | |
| | | | | | | | | | | | | | | | | | | | |
Net change in unrealized appreciation (depreciation) | | | (59,225,189 | ) | | | 121,033,076 | | | | 155,398,491 | | | | 126,672,664 | | | | 41,702,484 | |
| | | | | | | | | | | | | | | | | | | | |
NET GAIN (LOSS) | | | (58,307,475 | ) | | | 142,988,321 | | | | 172,968,962 | | | | 178,069,709 | | | | 44,210,216 | |
| | | | | | | | | | | | | | | | | | | | |
NET INCREASE (DECREASE) IN NET ASSETS RESULTING FROM OPERATIONS | | $ | (30,168,556 | ) | | $ | 153,850,659 | | | $ | 185,010,459 | | | $ | 187,340,318 | �� | | $ | 50,889,257 | |
| | | | | | | | | | | | | | | | | | | | |
See Notes to Financial Statements
99
THE VANTAGEPOINT FUNDS
Statements of Operations
For the Period from January 1, 2013 to December 31, 2013
| | | | | | | | | | | | | | | | |
| | | Model Portfolio Funds | |
| | | Conservative
Growth | | | Traditional
Growth | | | Long-Term
Growth | | | All-Equity
Growth | |
INVESTMENT INCOME: | |
Dividend income from affiliated mutual funds(a) | | $ | 9,696,838 | | | $ | 24,266,445 | | | $ | 30,908,416 | | | $ | 10,287,245 | |
Dividend income from non-affiliates | | | 162,318 | | | | 401,195 | | | | 1,041,316 | | | | 631,978 | |
| | | | | | | | | | | | | | | | |
Total investment income | | | 9,859,156 | | | | 24,667,640 | | | | 31,949,732 | | | | 10,919,223 | |
| | | | | | | | | | | | | | | | |
EXPENSES: | | | | | | | | | | | | | | | | |
Advisory (Note 4) | | | 623,962 | | | | 1,418,814 | | | | 1,786,370 | | | | 782,817 | |
Fund services Investor M Shares | | | 202,003 | | | | 236,656 | | | | 206,252 | | | | 89,337 | |
Custodian | | | 2,190 | | | | 2,190 | | | | 2,190 | | | | 2,190 | |
Administration | | | 15,014 | | | | 15,014 | | | | 15,014 | | | | 15,014 | |
Fund accounting | | | 17,885 | | | | 48,230 | | | | 61,980 | | | | 25,010 | |
Legal | | | 59,118 | | | | 139,802 | | | | 180,805 | | | | 72,104 | |
Audit | | | 19,941 | | | | 19,942 | | | | 19,942 | | | | 19,942 | |
Directors | | | 14,204 | | | | 35,612 | | | | 45,263 | | | | 17,634 | |
State license fees and memberships | | | 28,088 | | | | 35,063 | | | | 36,369 | | | | 28,710 | |
Other expenses | | | 36,904 | | | | 87,746 | | | | 111,155 | | | | 37,846 | |
| | | | | | | | | | | | | | | | |
Total expenses | | | 1,019,309 | | | | 2,039,069 | | | | 2,465,340 | | | | 1,090,604 | |
| | | | | | | | | | | | | | | | |
NET INVESTMENT INCOME | | | 8,839,847 | | | | 22,628,571 | | | | 29,484,392 | | | | 9,828,619 | |
| | | | | | | | | | | | | | | | |
NET REALIZED AND UNREALIZED GAIN (LOSS) (Note 2): | | | | | | | | | | | | | | | | |
Net realized gain (loss) on: | | | | | | | | | | | | | | | | |
Investments with non-affiliates | | | (79,780 | ) | | | (124,846 | ) | | | (189,589 | ) | | | (85,045 | ) |
Investments with affiliates | | | 4,989,248 | | | | 14,969,657 | | | | 26,325,324 | | | | (1,507,903 | ) |
Realized gain distributions from affiliated mutual funds | | | 15,109,383 | | | | 57,410,940 | | | | 93,343,859 | | | | 50,581,334 | |
| | | | | | | | | | | | | | | | |
Net realized gain | | | 20,018,851 | | | | 72,255,751 | | | | 119,479,594 | | | | 48,988,386 | |
| | | | | | | | | | | | | | | | |
Net change in unrealized appreciation (depreciation) on: | | | | | | | | | | | | | | | | |
Investments with non-affiliates | | | (239,224 | ) | | | (665,796 | ) | | | (2,072,576 | ) | | | (1,257,241 | ) |
Investments with affiliates | | | 39,138,533 | | | | 168,032,872 | | | | 272,770,840 | | | | 158,991,166 | |
| | | | | | | | | | | | | | | | |
Net change in unrealized appreciation on investments | | | 38,899,309 | | | | 167,367,076 | | | | 270,698,264 | | | | 157,733,925 | |
| | | | | | | | | | | | | | | | |
NET GAIN | | | 58,918,160 | | | | 239,622,827 | | | | 390,177,858 | | | | 206,722,311 | |
| | | | | | | | | | | | | | | | |
NET INCREASE IN NET ASSETS RESULTING FROM OPERATIONS | | $ | 67,758,007 | | | $ | 262,251,398 | | | $ | 419,662,250 | | | $ | 216,550,930 | |
| | | | | | | | | | | | | | | | |
| (a) | Received from other Vantagepoint Funds (Note 1). |
See Notes to Financial Statements
100
THE VANTAGEPOINT FUNDS
Statements of Operations
For the Period from January 1, 2013 to December 31, 2013
| | | | | | | | | | | | | | | | | | | | |
| | | Milestone Funds | |
| | | Milestone
Retirement
Income | | | Milestone
2010 | | | Milestone
2015 | | | Milestone
2020 | | | Milestone
2025 | |
INVESTMENT INCOME: | | | | | | | | | | | | | | | | | | | | |
Dividend income from affiliated mutual funds(a) | | $ | 4,678,380 | | | $ | 4,025,972 | | | $ | 7,814,246 | | | $ | 9,542,578 | | | $ | 8,172,892 | |
Dividend income from non-affiliates | | | 82,989 | | | | 71,873 | | | | 196,876 | | | | 302,395 | | | | 250,555 | |
| | | | | | | | | | | | | | | | | | | | |
Total investment income | | | 4,761,369 | | | | 4,097,845 | | | | 8,011,122 | | | | 9,844,973 | | | | 8,423,447 | |
| | | | | | | | | | | | | | | | | | | | |
EXPENSES: | | | | | | | | | | | | | | | | | | | | |
Advisory (Note 4) | | | 302,379 | | | | 271,705 | | | | 508,193 | | | | 564,703 | | | | 463,437 | |
Fund services Investor M Shares | | | 166,727 | | | | 142,523 | | | | 210,208 | | | | 192,670 | | | | 158,910 | |
Custodian | | | 365 | | | | 365 | | | | 1,643 | | | | 1,756 | | | | 1,153 | |
Administration | | | 15,014 | | | | 15,014 | | | | 15,014 | | | | 15,014 | | | | 15,014 | |
Fund accounting | | | 12,500 | | | | 12,500 | | | | 16,156 | | | | 16,586 | | | | 13,791 | |
Legal | | | 25,041 | | | | 23,524 | | | | 44,323 | | | | 48,298 | | | | 39,428 | |
Audit | | | 19,942 | | | | 19,942 | | | | 19,942 | | | | 19,942 | | | | 19,942 | |
Directors | | | 6,110 | | | | 5,631 | | | | 10,355 | | | | 10,698 | | | | 8,655 | |
State license fees and memberships | | | 26,930 | | | | 26,904 | | | | 28,916 | | | | 29,129 | | | | 27,247 | |
Other expenses | | | 15,775 | | | | 13,699 | | | | 28,901 | | | | 34,264 | | | | 29,337 | |
| | | | | | | | | | | | | | | | | | | | |
Total expenses | | | 590,783 | | | | 531,807 | | | | 883,651 | | | | 933,060 | | | | 776,914 | |
| | | | | | | | | | | | | | | | | | | | |
NET INVESTMENT INCOME | | | 4,170,586 | | | | 3,566,038 | | | | 7,127,471 | | | | 8,911,913 | | | | 7,646,533 | |
| | | | | | | | | | | | | | | | | | | | |
NET REALIZED AND UNREALIZED GAIN (LOSS) (Note 2): | | | | | | | | | | | | | | | | | | | | |
Net realized gain (loss) on: | | | | | | | | | | | | | | | | |
Investments with non-affiliates | | | (50,264 | ) | | | (42,140 | ) | | | (86,052 | ) | | | (110,900 | ) | | | (68,195 | ) |
Investments with affiliates | | | 4,253,150 | | | | 8,364,849 | | | | 10,111,246 | | | | 8,801,248 | | | | 5,730,380 | |
Realized gain distributions from affiliated mutual funds | | | 5,951,328 | | | | 6,283,682 | | | | 13,093,617 | | | | 16,713,690 | | | | 15,098,674 | |
| | | | | | | | | | | | | | | | | | | | |
Net realized gain | | | 10,154,214 | | | | 14,606,391 | | | | 23,118,811 | | | | 25,404,038 | | | | 20,760,859 | |
| | | | | | | | | | | | | | | | | | | | |
Net change in unrealized appreciation (depreciation) on: | | | | | | | | | | | | | | | | |
Investments with non-affiliates | | | (122,704 | ) | | | (114,289 | ) | | | (337,782 | ) | | | (494,081 | ) | | | (390,734 | ) |
Investments with affiliates | | | 3,601,066 | | | | 10,687,784 | | | | 35,158,901 | | | | 53,883,433 | | | | 55,319,264 | |
| | | | | | | | | | | | | | | | | | | | |
Net change in unrealized appreciation on investments | | | 3,478,362 | | | | 10,573,495 | | | | 34,821,119 | | | | 53,389,352 | | | | 54,928,530 | |
| | | | | | | | | | | | | | | | | | | | |
NET GAIN | | | 13,632,576 | | | | 25,179,886 | | | | 57,939,930 | | | | 78,793,390 | | | | 75,689,389 | |
| | | | | | | | | | | | | | | | | | | | |
NET INCREASE IN NET ASSETS RESULTING FROM OPERATIONS | | $ | 17,803,162 | | | $ | 28,745,924 | | | $ | 65,067,401 | | | $ | 87,705,303 | | | $ | 83,335,922 | |
| | | | | | | | | | | | | | | | | | | | |
| (a) | Received from other Vantagepoint Funds (Note 1). |
See Notes to Financial Statements
101
THE VANTAGEPOINT FUNDS
Statements of Operations
For the Period from January 1, 2013 to December 31, 2013
| | | | | | | | | | | | | | | | | | | | |
| | | Milestone Funds | |
| | | Milestone
2030 | | | Milestone
2035 | | | Milestone
2040 | | | Milestone
2045 | | | Milestone
2050 | |
INVESTMENT INCOME: | | | | | | | | | | | | | | | | | | | | |
Dividend income from affiliated mutual funds(a) | | $ | 6,416,511 | | | $ | 4,177,935 | | | $ | 3,953,375 | | | $ | 1,277,810 | | | $ | 282,538 | |
Dividend income from non-affiliates | | | 198,709 | | | | 201,985 | | | | 199,967 | | | | 61,108 | | | | 10,950 | |
| | | | | | | | | | | | | | | | | | | | |
Total investment income | | | 6,615,220 | | | | 4,379,920 | | | | 4,153,342 | | | | 1,338,918 | | | | 293,488 | |
| | | | | | | | | | | | | | | | | | | | |
EXPENSES: | | | | | | | | | | | | | | | | | | | | |
Advisory (Note 4) | | | 369,429 | | | | 250,400 | | | | 244,205 | | | | 73,292 | | | | 12,808 | |
Fund services Class Investor M | | | 137,182 | | | | 102,746 | | | | 95,378 | | | | 40,657 | | | | 10,567 | |
Custodian | | | 365 | | | | 365 | | | | 365 | | | | 704 | | | | 366 | |
Administration | | | 15,014 | | | | 15,014 | | | | 15,014 | | | | 15,002 | | | | 12,632 | |
Fund accounting | | | 12,500 | | | | 12,500 | | | | 12,500 | | | | 12,500 | | | | 10,546 | |
Legal | | | 31,324 | | | | 21,016 | | | | 20,519 | | | | 5,794 | | | | 4,797 | |
Audit | | | 19,942 | | | | 19,942 | | | | 19,942 | | | | 19,942 | | | | 19,941 | |
Directors | | | 6,876 | | | | 4,584 | | | | 4,524 | | | | 1,546 | | | | 207 | |
State license fees and memberships | | | 25,950 | | | | 25,336 | | | | 25,311 | | | | 24,719 | | | | 36,926 | |
Other expenses | | | 23,410 | | | | 16,312 | | | | 15,615 | | | | 8,181 | | | | 5,863 | |
| | | | | | | | | | | | | | | | | | | | |
Total expenses | | | 641,992 | | | | 468,215 | | | | 453,373 | | | | 202,337 | | | | 114,653 | |
Less reimbursements/waivers (Note 4) | | | — | | | | — | | | | — | | | | — | | | | (56,992 | ) |
| | | | | | | | | | | | | | | | | | | | |
Net Expenses | | | 641,992 | | | | 468,215 | | | | 453,373 | | | | 202,337 | | | | 57,661 | |
| | | | | | | | | | | | | | | | | | | | |
NET INVESTMENT INCOME | | | 5,973,228 | | | | 3,911,705 | | | | 3,699,969 | | | | 1,136,581 | | | | 235,827 | |
| | | | | | | | | | | | | | | | | | | | |
NET REALIZED AND UNREALIZED GAIN (LOSS) (Note 2): | | | | | | | | | | | | | | | | | | | | |
Net realized gain (loss) on: | | | | | | | | | | | | | | | | |
Investments with non-affiliates | | | (66,560 | ) | | | (34,882 | ) | | | (62,655 | ) | | | (32,694 | ) | | | (14,888 | ) |
Investments with affiliates | | | 4,764,034 | | | | 4,159,749 | | | | 6,734,228 | | | | 1,446,275 | | | | 281,142 | |
Realized gain distributions from affiliated mutual funds | | | 13,599,665 | | | | 10,348,549 | | | | 10,842,089 | | | | 3,643,177 | | | | 819,241 | |
| | | | | | | | | | | | | | | | | | | | |
Net realized gain | | | 18,297,139 | | | | 14,473,416 | | | | 17,513,662 | | | | 5,056,758 | | | | 1,085,495 | |
| | | | | | | | | | | | | | | | | | | | |
Net change in unrealized appreciation (depreciation) on: | | | | | | | | | | | | | | | | |
Investments with non-affiliates | | | (316,451 | ) | | | (340,035 | ) | | | (328,486 | ) | | | (70,172 | ) | | | (2,902 | ) |
Investments with affiliates | | | 50,419,194 | | | | 37,670,106 | | | | 37,540,206 | | | | 11,729,350 | | | | 1,712,032 | |
| | | | | | | | | | | | | | | | | | | | |
Net change in unrealized appreciation on investments | | | 50,102,743 | | | | 37,330,071 | | | | 37,211,720 | | | | 11,659,178 | | | | 1,709,130 | |
| | | | | | | | | | | | | | | | | | | | |
NET GAIN | | | 68,399,882 | | | | 51,803,487 | | | | 54,725,382 | | | | 16,715,936 | | | | 2,794,625 | |
| | | | | | | | | | | | | | | | | | | | |
NET INCREASE IN NET ASSETS RESULTING FROM OPERATIONS | | $ | 74,373,110 | | | $ | 55,715,192 | | | $ | 58,425,351 | | | $ | 17,852,517 | | | $ | 3,030,452 | |
| | | | | | | | | | | | | | | | | | | | |
| (a) | Received from other Vantagepoint Funds (Note 1). |
See Notes to Financial Statements
102
THE VANTAGEPOINT FUNDS
Statements of Changes in Net Assets
| | | | | | | | | | | | | | | | |
| | | Low Duration Bond | | | Inflation Protected Securities | |
| | | For the
Year Ended
December 31,
2013 | | | For the
Year Ended
December 31,
2012 | | | For the
Year Ended
December 31,
2013 | | | For the
Year Ended
December 31,
2012 | |
Increase (decrease) in net assets resulting from operations: | | | | | | | | | | | | | | | | |
Net investment income | | $ | 8,155,630 | | | $ | 8,838,699 | | | $ | 3,172,198 | | | $ | 9,029,538 | |
Net realized gain | | | 1,861,813 | | | | 2,366,080 | | | | 6,846,715 | | | | 18,362,110 | |
Net change in unrealized appreciation (depreciation) | | | (4,634,675 | ) | | | 10,839,794 | | | | (66,006,189 | ) | | | 15,011,485 | |
| | | | | | | | | | | | | | | | |
Net increase (decrease) in net assets resulting from operations | | | 5,382,768 | | | | 22,044,573 | | | | (55,987,276 | ) | | | 42,403,133 | |
| | | | | | | | | | | | | | | | |
Distributions to shareholders from: | | | | | | | | | | | | | | | | |
Net investment income—Investor Shares | | | (1,663,838 | ) | | | (9,195,945 | ) | | | (221,562 | ) | | | (9,370,228 | ) |
Net investment income—T Shares | | | (5,940,188 | ) | | | — | | | | (4,325,100 | ) | | | — | |
Net realized gain—Investor Shares | | | (150,290 | ) | | | — | | | | (623,505 | ) | | | (23,995,221 | ) |
Net realized gain—T Shares | | | (1,748,177 | ) | | | — | | | | (11,975,515 | ) | | | — | |
| | | | | | | | | | | | | | | | |
Total distributions | | | (9,502,493 | ) | | | (9,195,945 | ) | | | (17,145,682 | ) | | | (33,365,449 | ) |
| | | | | | | | | | | | | | | | |
Capital share transactions: | | | | | | | | | | | | | | | | |
Proceeds from sale of shares—Investor Shares | | | 40,565,488 | (a) | | | 74,689,158 | | | | 26,955,242 | (a) | | | 113,074,031 | |
Proceeds from sale of shares—T Shares | | | 659,825,940 | (b) | | | — | | | | 737,014,517 | (b) | | | — | |
Reinvestment of distributions—Investor Shares | | | 1,814,128 | (a) | | | 9,195,945 | | | | 845,067 | (a) | | | 33,365,449 | |
Reinvestment of distributions—T Shares | | | 7,688,365 | (b) | | | — | | | | 16,300,599 | (b) | | | — | |
Value of shares redeemed—Investor Shares | | | (587,049,907 | )(a) | | | (28,934,930 | ) | | | (660,016,790 | )(a) | | | (70,332,779 | ) |
Value of shares redeemed—T Shares | | | (108,729,626 | )(b) | | | — | | | | (134,483,013 | )(b) | | | — | |
| | | | | | | | | | | | | | | | |
Net increase (decrease) from capital share transactions | | | 14,114,388 | | | | 54,950,173 | | | | (13,384,378 | ) | | | 76,106,701 | |
| | | | | | | | | | | | | | | | |
Total increase (decrease) in net assets | | | 9,994,663 | | | | 67,798,801 | | | | (86,517,336 | ) | | | 85,144,385 | |
| | | | | | | | | | | | | | | | |
NET ASSETS at beginning of year | | | 592,261,678 | | | | 524,462,877 | | | | 669,335,878 | | | | 584,191,493 | |
| | | | | | | | | | | | | | | | |
NET ASESTS at end of year | | $ | 602,256,341 | | | $ | 592,261,678 | | | $ | 582,818,542 | | | $ | 669,335,878 | |
| | | | | | | | | | | | | | | | |
Accumulated net investment loss included in net assets at end of year | | $ | (73,067 | ) | | $ | (125,031 | ) | | $ | — | | | $ | — | |
| | | | | | | | | | | | | | | | |
SHARE TRANSACTIONS: | | | | | | | | | | | | | | | | |
Number of shares sold—Investor Shares | | | 3,985,435 | (a) | | | 7,394,386 | | | | 2,298,837 | (a) | | | 9,419,976 | |
Number of shares issued through reinvestment of dividends and distributions—Investor Shares | | | 178,277 | (a) | | | 908,506 | | | | 78,875 | (a) | | | 2,793,474 | |
Number of shares redeemed—Investor Shares | | | (57,568,197 | )(a) | | | (2,857,768 | ) | | | (56,096,884 | )(a) | | | (5,809,873 | ) |
| | | | | | | | | | | | | | | | |
Net increase (decrease) in shares outstanding—Investor Shares | | | (53,404,485 | ) | | | 5,445,124 | | | | (53,719,172 | ) | | | 6,403,577 | |
| | | | | | | | | | | | | | | | |
Number of shares sold—T Shares | | | 64,728,519 | (b) | | | — | | | | 63,122,487 | (b) | | | — | |
Number of shares issued through reinvestment of dividends and distributions—T Shares | | | 758,360 | (b) | | | — | | | | 1,522,013 | (b) | | | — | |
Number of shares redeemed—T Shares | | | (10,669,158 | )(b) | | | — | | | | (11,833,076 | )(b) | | | — | |
| | | | | | | | | | | | | | | | |
Net increase in shares outstanding—T Shares | | | 54,817,721 | | | | — | | | | 52,811,424 | | | | — | |
| | | | | | | | | | | | | | | | |
| (a) | On March 1, 2013 all outstanding shares were renamed Investor Shares. |
| (b) | T Shares commenced operations on March 1, 2013. |
See Notes to Financial Statements
103
THE VANTAGEPOINT FUNDS
Statements of Changes in Net Assets
| | | | | | | | | | | | | | | | |
| | | Equity Income | | | Growth & Income | |
| | | For the
Year Ended
December 31,
2013 | | | For the
Year Ended
December 31,
2012 | | | For the
Year Ended
December 31,
2013 | | | For the
Year Ended
December 31,
2012 | |
Increase (decrease) in net assets resulting from operations: | | | | | | | | | | | | | | | | |
Net investment income | | $ | 32,748,850 | | | $ | 32,040,619 | | | $ | 16,884,494 | | | $ | 16,644,174 | |
Net realized gain | | | 125,236,365 | | | | 75,277,866 | | | | 141,012,660 | | | | 49,270,103 | |
Net change in unrealized appreciation | | | 451,645,427 | | | | 150,843,642 | | | | 275,905,302 | | | | 124,758,582 | |
| | | | | | | | | | | | | | | | |
Net increase in net assets resulting from operations | | | 609,630,642 | | | | 258,162,127 | | | | 433,802,456 | | | | 190,672,859 | |
| | | | | | | | | | | | | | | | |
Distributions to shareholders from: | | | | | | | | | | | | | | | | |
Net investment income—Investor Shares | | | (737,715 | ) | | | (34,190,956 | ) | | | (366,671 | ) | | | (21,868,329 | ) |
Net investment income—T Shares | | | (33,945,922 | ) | | | — | | | | (18,622,686 | ) | | | — | |
Net realized gain—Investor Shares | | | (2,872,559 | ) | | | (61,060,518 | ) | | | (2,734,608 | ) | | | (19,147,346 | ) |
Net realized gain—T Shares | | | (114,400,246 | ) | | | — | | | | (115,428,501 | ) | | | — | |
| | | | | | | | | | | | | | | | |
Total distributions | | | (151,956,442 | ) | | | (95,251,474 | ) | | | (137,152,466 | ) | | | (41,015,675 | ) |
| | | | | | | | | | | | | | | | |
Capital share transactions: | | | | | | | | | | | | | | | | |
Proceeds from sale of shares—Investor Shares | | | 15,231,439 | (a) | | | 102,361,335 | | | | 15,028,134 | (a) | | | 67,838,551 | |
Proceeds from sale of shares—T Shares | | | 2,201,358,047 | (b) | | | — | | | | 1,513,212,382 | (b) | | | — | |
Reinvestment of distributions—Investor Shares | | | 3,608,020 | (a) | | | 95,250,056 | | | | 3,098,476 | (a) | | | 41,014,805 | |
Reinvestment of distributions—T Shares | | | 148,346,169 | (b) | | | — | | | | 134,051,187 | (b) | | | — | |
Value of shares redeemed—Investor Shares | | | (2,123,810,070 | )(a) | | | (157,774,830 | ) | | | (1,377,006,631 | )(a) | | | (115,488,486 | ) |
Value of shares redeemed—T Shares | | | (235,269,955 | )(b) | | | — | | | | (154,471,604 | )(b) | | | — | |
| | | | | | | | | | | | | | | | |
Net increase (decrease) from capital share transactions | | | 9,463,650 | | | | 39,836,561 | | | | 133,911,944 | | | | (6,635,130 | ) |
| | | | | | | | | | | | | | | | |
Total increase in net assets | | | 467,137,850 | | | | 202,747,214 | | | | 430,561,934 | | | | 143,022,054 | |
| | | | | | | | | | | | | | | | |
NET ASSETS at beginning of year | | | 2,020,304,504 | | | | 1,817,557,290 | | | | 1,305,504,102 | | | | 1,162,482,048 | |
| | | | | | | | | | | | | | | | |
NET ASESTS at end of year | | $ | 2,487,442,354 | | | $ | 2,020,304,504 | | | $ | 1,736,066,036 | | | $ | 1,305,504,102 | |
| | | | | | | | | | | | | | | | |
Accumulated net investment income included in net assets at end of year | | $ | 242,642 | | | $ | 345,542 | | | $ | 111,728 | | | $ | 299,354 | |
| | | | | | | | | | | | | | | | |
SHARE TRANSACTIONS: | | | | | | | | | | | | | | | | |
Number of shares sold—Investor Shares | | | 1,541,223 | (a) | | | 11,427,458 | | | | 1,280,956 | (a) | | | 6,455,591 | |
Number of shares issued through reinvestment of dividends and distributions—Investor Shares | | | 330,405 | (a) | | | 10,654,369 | | | | 238,711 | (a) | | | 3,876,635 | |
Number of shares redeemed—Investor Shares | | | (220,690,078 | )(a) | | | (17,564,208 | ) | | | (120,341,046 | )(a) | | | (10,937,516 | ) |
| | | | | | | | | | | | | | | | |
Net increase (decrease) in shares outstanding—Investor Shares | | | (218,818,450 | ) | | | 4,517,619 | | | | (118,821,379 | ) | | | (605,290 | ) |
| | | | | | | | | | | | | | | | |
Number of shares sold—T Shares | | | 227,428,866 | (b) | | | — | | | | 130,400,734 | (b) | | | — | |
Number of shares issued through reinvestment of dividends and distributions—T Shares | | | 13,584,814 | (b) | | | — | | | | 10,327,518 | (b) | | | — | |
Number of shares redeemed—T Shares | | | (22,437,107 | )(b) | | | — | | | | (12,417,741 | )(b) | | | — | |
| | | | | | | | | | | | | | | | |
Net increase in shares outstanding—T Shares | | | 218,576,573 | | | | — | | | | 128,310,511 | | | | — | |
| | | | | | | | | | | | | | | | |
| (a) | On March 1, 2013 all outstanding shares were renamed Investor Shares. |
| (b) | T Shares commenced operations on March 1, 2013. |
See Notes to Financial Statements
104
THE VANTAGEPOINT FUNDS
Statements of Changes in Net Assets
| | | | | | | | | | | | | | | | |
| | | Growth | | | Select Value | |
| | | For the
Year Ended
December 31,
2013 | | | For the
Year Ended
December 31,
2012 | | | For the
Year Ended
December 31,
2013 | | | For the
Year Ended
December 31,
2012 | |
Increase (decrease) in net assets resulting from operations: | | | | | | | | | | | | | | | | |
Net investment income | | $ | 11,691,334 | | | $ | 10,742,413 | | | $ | 5,270,060 | | | $ | 5,978,461 | |
Net realized gain | | | 191,835,786 | | | | 155,001,081 | | | | 65,520,186 | | | | 20,361,611 | |
Net change in unrealized appreciation | | | 411,408,786 | | | | 88,427,325 | | | | 52,501,065 | | | | 26,243,397 | |
| | | | | | | | | | | | | | | | |
Net increase in net assets resulting from operations | | | 614,935,906 | | | | 254,170,819 | | | | 123,291,311 | | | | 52,583,469 | |
| | | | | | | | | | | | | | | | |
Distributions to shareholders from: | | | | | | | | | | | | | | | | |
Net investment income—Investor Shares | | | (103,933 | ) | | | (11,011,407 | ) | | | (80,138 | ) | | | (5,605,375 | ) |
Net investment income—T Shares | | | (11,657,940 | ) | | | — | | | | (4,823,744 | ) | | | — | |
Net realized gain—Investor Shares | | | — | | | | — | | | | (1,063,558 | ) | | | (6,532,872 | ) |
Net realized gain—T Shares | | | — | | | | — | | | | (54,180,973 | ) | | | — | |
| | | | | | | | | | | | | | | | |
Total distributions | | | (11,761,873 | ) | | | (11,011,407 | ) | | | (60,148,413 | ) | | | (12,138,247 | ) |
| | | | | | | | | | | | | | | | |
Capital share transactions: | | | | | | | | | | | | | | | | |
Proceeds from sale of shares—Investor Shares | | | 10,947,178 | (a) | | | 63,823,414 | | | | 9,493,907 | (a) | | | 23,846,471 | |
Proceeds from sale of shares—T Shares | | | 2,006,555,579 | (b) | | | — | | | | 448,840,305 | (b) | | | — | |
Reinvestment of distributions—Investor Shares | | | 103,933 | (a) | | | 11,011,407 | | | | 1,143,696 | (a) | | | 12,138,247 | |
Reinvestment of distributions—T Shares | | | 11,657,940 | (b) | | | — | | | | 59,004,717 | (b) | | | — | |
Value of shares redeemed—Investor Shares | | | (1,974,576,991 | )(a) | | | (188,140,810 | ) | | | (391,615,933 | )(a) | | | (40,858,911 | ) |
Value of shares redeemed—T Shares | | | (213,310,811 | )(b) | | | — | | | | (68,864,249 | )(b) | | | — | |
| | | | | | | | | | | | | | | | |
Net increase (decrease) from capital share transactions | | | (158,623,172 | ) | | | (113,305,989 | ) | | | 58,002,443 | | | | (4,874,193 | ) |
| | | | | | | | | | | | | | | | |
Total increase in net assets | | | 444,550,861 | | | | 129,853,423 | | | | 121,145,341 | | | | 35,571,029 | |
| | | | | | | | | | | | | | | | |
NET ASSETS at beginning of year | | | 1,880,928,869 | | | | 1,751,075,446 | | | | 355,590,218 | | | | 320,019,189 | |
| | | | | | | | | | | | | | | | |
NET ASESTS at end of year | | $ | 2,325,479,730 | | | $ | 1,880,928,869 | | | $ | 476,735,559 | | | $ | 355,590,218 | |
| | | | | | | | | | | | | | | | |
Accumulated net investment income included in net assets at end of year | | $ | 515,017 | | | $ | 431,376 | | | $ | 656,367 | | | $ | 691,050 | |
| | | | | | | | | | | | | | | | |
SHARE TRANSACTIONS: | | | | | | | | | | | | | | | | |
Number of shares sold—Investor Shares | | | 1,068,641 | (a) | | | 6,923,599 | | | | 766,624 | (a) | | | 2,257,052 | |
Number of shares issued through reinvestment of dividends and distributions—Investor Shares | | | 8,278 | (a) | | | 1,171,947 | | | | 90,268 | (a) | | | 1,119,598 | |
Number of shares redeemed—Investor Shares | | | (195,986,441 | )(a) | | | (20,167,715 | ) | | | (32,626,490 | )(a) | | | (3,780,155 | ) |
| | | | | | | | | | | | | | | | |
Net decrease in shares outstanding—Investor Shares | | | (194,909,522 | ) | | | (12,072,169 | ) | | | (31,769,598 | ) | | | (403,505 | ) |
| | | | | | | | | | | | | | | | |
Number of shares sold—T Shares | | | 198,573,974 | (b) | | | — | | | | 36,926,297 | (b) | | | — | |
Number of shares issued through reinvestment of dividends and distributions—T Shares | | | 928,935 | (b) | | | — | | | | 4,653,369 | (b) | | | — | |
Number of shares redeemed—T Shares | | | (18,983,519 | )(b) | | | — | | | | (5,248,707 | )(b) | | | — | |
| | | | | | | | | | | | | | | | |
Net increase in shares outstanding—T Shares | | | 180,519,390 | | | | — | | | | 36,330,959 | | | | — | |
| | | | | | | | | | | | | | | | |
| (a) | On March 1, 2013 all outstanding shares were renamed Investor Shares. |
| (b) | T Shares commenced operations on March 1, 2013. |
See Notes to Financial Statements
105
THE VANTAGEPOINT FUNDS
Statements of Changes in Net Assets
| | | | | | | | | | | | | | | | |
| | | Aggressive Opportunities | | | Discovery | |
| | | For the
Year Ended
December 31,
2013 | | | For the
Year Ended
December 31,
2012 | | | For the
Year Ended
December 31,
2013 | | | For the
Year Ended
December 31,
2012 | |
Increase (decrease) in net assets resulting from operations: | | | | | | | | | | | | | | | | |
Net investment income | | $ | 3,819,807 | | | $ | 6,127,736 | | | $ | 2,340,660 | | | $ | 2,577,818 | |
Net realized gain | | | 124,685,874 | | | | 78,790,503 | | | | 53,232,618 | | | | 21,333,068 | |
Net change in unrealized appreciation | | | 235,361,814 | | | | 58,962,020 | | | | 25,148,156 | | | | 6,110,932 | |
| | | | | | | | | | | | | | | | |
Net increase in net assets resulting from operations | | | 363,867,495 | | | | 143,880,259 | | | | 80,721,434 | | | | 30,021,818 | |
| | | | | | | | | | | | | | | | |
Distributions to shareholders from: | | | | | | | | | | | | | | | | |
Net investment income—Investor Shares | | | (102,553 | ) | | | (2,217,223 | ) | | | (24,674 | ) | | | (3,314,675 | ) |
Net investment income—T Shares | | | (5,981,960 | ) | | | — | | | | (2,278,117 | ) | | | — | |
Net realized gain—Investor Shares | | | (2,784,111 | ) | | | (43,171,399 | ) | | | (623,318 | ) | | | (9,858,896 | ) |
Net realized gain—T Shares | | | (103,621,112 | ) | | | — | | | | (45,897,970 | ) | | | — | |
| | | | | | | | | | | | | | | | |
Total distributions | | | (112,489,736 | ) | | | (45,388,622 | ) | | | (48,824,079 | ) | | | (13,173,571 | ) |
| | | | | | | | | | | | | | | | |
Capital share transactions: | | | | | | | | | | | | | | | | |
Proceeds from sale of shares—Investor Shares | | | 7,008,302 | (a) | | | 28,827,592 | | | | 6,437,198 | (a) | | | 18,557,402 | |
Proceeds from sale of shares—T Shares | | | 1,075,216,812 | (b) | | | — | | | | 247,226,760 | (b) | | | — | |
Reinvestment of distributions—Investor Shares | | | 2,886,664 | (a) | | | 45,388,622 | | | | 647,992 | (a) | | | 13,173,571 | |
Reinvestment of distributions—T Shares | | | 109,603,072 | (b) | | | — | | | | 48,176,087 | (b) | | | — | |
Value of shares redeemed—Investor Shares | | | (1,057,021,153 | )(a) | | | (136,249,782 | ) | | | (234,034,688 | )(a) | | | (29,578,107 | ) |
Value of shares redeemed—T Shares | | | (140,084,683 | )(b) | | | — | | | | (34,373,522 | )(b) | | | — | |
| | | | | | | | | | | | | | | | |
Net increase (decrease) from capital share transactions | | | (2,390,986 | ) | | | (62,033,568 | ) | | | 34,079,827 | | | | 2,152,866 | |
| | | | | | | | | | | | | | | | |
Total increase in net assets | | | 248,986,773 | | | | 36,458,069 | | | | 65,977,182 | | | | 19,001,113 | |
| | | | | | | | | | | | | | | | |
NET ASSETS at beginning of year | | | 993,728,828 | | | | 957,270,759 | | | | 212,872,795 | | | | 193,871,682 | |
| | | | | | | | | | | | | | | | |
NET ASESTS at end of year | | $ | 1,242,715,601 | | | $ | 993,728,828 | | | $ | 278,849,977 | | | $ | 212,872,795 | |
| | | | | | | | | | | | | | | | |
Accumulated net investment income (loss) included in net assets at end of year | | $ | 3,572,909 | | | $ | 5,422,729 | | | $ | 145,641 | | | $ | (639,208 | ) |
| | | | | | | | | | | | | | | | |
SHARE TRANSACTIONS: | | | | | | | | | | | | | | | | |
Number of shares sold—Investor Shares | | | 610,544 | (a) | | | 2,843,708 | | | | 621,093 | (a) | | | 1,934,581 | |
Number of shares issued through reinvestment of dividends and distributions—Investor Shares | | | 228,737 | (a) | | | 4,504,812 | | | | 60,673 | (a) | | | 1,413,473 | |
Number of shares redeemed—Investor Shares | | | (95,752,156 | )(a) | | | (13,311,635 | ) | | | (22,791,895 | )(a) | | | (3,073,906 | ) |
| | | | | | | | | | | | | | | | |
Net increase (decrease) in shares outstanding—Investor Shares | | | (94,912,875 | ) | | | (5,963,115 | ) | | | (22,110,129 | ) | | | 274,148 | |
| | | | | | | | | | | | | | | | |
Number of shares sold—T Shares | | | 96,959,354 | (b) | | | — | | | | 23,883,843 | (b) | | | — | |
Number of shares issued through reinvestment of dividends and distributions—T Shares | | | 8,684,871 | (b) | | | — | | | | 4,510,870 | (b) | | | — | |
Number of shares redeemed—T Shares | | | (11,478,143 | )(b) | | | — | | | | (3,063,036 | )(b) | | | — | |
| | | | | | | | | | | | | | | | |
Net increase in shares outstanding—T Shares | | | 94,166,082 | | | | — | | | | 25,331,677 | | | | — | |
| | | | | | | | | | | | | | | | |
| (a) | On March 1, 2013 all outstanding shares were renamed Investor Shares. |
| (b) | T Shares commenced operations on March 1, 2013. |
See Notes to Financial Statements
106
THE VANTAGEPOINT FUNDS
Statements of Changes in Net Assets
| | | | | | | | | | | | | | | | |
| | | International | | | Diversifying Strategies(1) | |
| | | For the
Year Ended
December 31,
2013 | | | For the
Year Ended
December 31,
2012 | | | For the
Year Ended
December 31,
2013 | | | For the
Year Ended
December 31,
2012 | |
Increase (decrease) in net assets resulting from operations: | | | | | | | | | | | | | | | | |
Net investment income | | $ | 27,512,209 | | | $ | 28,819,042 | | | $ | 12,217,795 | | | $ | 10,416,670 | |
Net realized gain | | | 96,055,895 | | | | 18,493,004 | | | | 28,742,383 | | | | 6,534,965 | |
Net change in unrealized appreciation | | | 99,261,424 | | | | 165,118,811 | | | | 16,908,582 | | | | 13,734,042 | |
| | | | | | | | | | | | | | | | |
Net increase in net assets resulting from operations | | | 222,829,528 | | | | 212,430,857 | | | | 57,868,760 | | | | 30,685,677 | |
| | | | | | | | | | | | | | | | |
Distributions to shareholders from: | | | | | | | | | | | | | | | | |
Net investment income—Investor Shares | | | (324,174 | ) | | | (31,260,095 | ) | | | — | | | | — | |
Net investment income—T Shares | | | (30,641,649 | ) | | | — | | | | (19,309,467 | ) | | | (16,028,376 | ) |
Net realized gain—T Shares | | | — | | | | — | | | | (12,954,725 | ) | | | (2,847,974 | ) |
| | | | | | | | | | | | | | | | |
Total distributions | | | (30,965,823 | ) | | | (31,260,095 | ) | | | (32,264,192 | ) | | | (18,876,350 | ) |
| | | | | | | | | | | | | | | | |
Capital share transactions: | | | | | | | | | | | | | | | | |
Proceeds from sale of shares—Investor Shares | | | 33,149,320 | (a) | | | 89,461,948 | | | | — | | | | — | |
Proceeds from sale of shares—T Shares | | | 1,484,852,766 | (b) | | | — | | | | 158,059,115 | (c) | | | 105,861,883 | |
Reinvestment of distributions—Investor Shares | | | 324,174 | (a) | | | 31,260,095 | | | | — | | | | — | |
Reinvestment of distributions—T Shares | | | 30,641,649 | (b) | | | — | | | | 32,264,192 | (c) | | | 18,876,350 | |
Value of shares redeemed—Investor Shares | | | (1,354,343,436 | )(a) | | | (136,346,319 | ) | | | — | | | | — | |
Value of shares redeemed—T Shares | | | (256,562,888 | )(b) | | | — | | | | (87,112,245 | )(c) | | | (21,550,584 | ) |
| | | | | | | | | | | | | | | | |
Net increase (decrease) from capital share transactions | | | (61,938,415 | ) | | | (15,624,276 | ) | | | 103,211,062 | | | | 103,187,649 | |
| | | | | | | | | | | | | | | | |
Total increase in net assets | | | 129,925,290 | | | | 165,546,486 | | | | 128,815,630 | | | | 114,996,976 | |
| | | | | | | | | | | | | | | | |
NET ASSETS at beginning of year | | | 1,305,510,145 | | | | 1,139,963,659 | | | | 964,773,742 | | | | 849,776,766 | |
| | | | | | | | | | | | | | | | |
NET ASESTS at end of year | | $ | 1,435,435,435 | | | $ | 1,305,510,145 | | | $ | 1,093,589,372 | | | $ | 964,773,742 | |
| | | | | | | | | | | | | | | | |
Accumulated net investment income (loss) included in net assets at end of year | | $ | 12,131,676 | | | $ | 13,387,816 | | | $ | (3,342,826 | ) | | $ | (2,889,496 | ) |
| | | | | | | | | | | | | | | | |
SHARE TRANSACTIONS: | | | | | | | | | | | | | | | | |
Number of shares sold—Investor Shares | | | 3,349,541 | (a) | | | 10,120,707 | | | | — | | | | — | |
Number of shares issued through reinvestment of dividends and distributions—Investor Shares | | | 29,923 | (a) | | | 3,294,004 | | | | — | | | | — | |
Number of shares redeemed—Investor Shares | | | (137,437,695 | )(a) | | | (14,870,811 | ) | | | — | | | | — | |
| | | | | | | | | | | | | | | | |
Net decrease in shares outstanding | | | (134,058,231 | ) | | | (1,456,100 | ) | | | — | | | | — | |
| | | | | | | | | | | | | | | | |
Number of shares sold—T Shares | | | 149,658,231 | (b) | | | — | | | | 15,219,041 | (c) | | | 10,340,064 | |
Number of shares issued through reinvestment of dividends and distributions—T Shares | | | 2,828,496 | (b) | | | — | | | | 3,111,301 | (c) | | | 1,856,104 | |
Number of shares redeemed—T Shares | | | (24,497,545 | )(b) | | | — | | | | (8,441,046 | )(c) | | | (2,113,189 | ) |
| | | | | | | | | | | | | | | | |
Net increase in shares outstanding—T Shares | | | 127,989,182 | | | | — | | | | 9,889,296 | | | | 10,082,979 | |
| | | | | | | | | | | | | | | | |
| (1) | Formerly Diversified Assets Fund. |
| (a) | On March 1, 2013 all outstanding shares were renamed Investor Shares. |
| (b) | T Shares commenced operations on March 1, 2013. |
| (c) | On March 1, 2013 all outstanding shares were renamed T Shares. |
See Notes to Financial Statements
107
THE VANTAGEPOINT FUNDS
Statements of Changes in Net Assets
| | | | | | | | | | | | | | | | |
| | | Core Bond Index | | | 500 Stock Index | |
| | | For the
Year Ended
December 31,
2013 | | | For the
Year Ended
December 31,
2012 | | | For the
Year Ended
December 31,
2013 | | | For the
Year Ended
December 31,
2012 | |
Increase (decrease) in net assets resulting from operations: | | | | | | | | | | | | | | | | |
Net investment income | | $ | 28,138,919 | | | $ | 29,602,613 | | | $ | 10,862,338 | | | $ | 8,945,898 | |
Net realized gain | | | 917,714 | | | | 13,542,146 | | | | 21,955,245 | | | | 7,716,196 | |
Net change in unrealized appreciation (depreciation) | | | (59,225,189 | ) | | | 3,036,355 | | | | 121,033,076 | | | | 44,847,156 | |
| | | | | | | | | | | | | | | | |
Net increase (decrease) in net assets resulting from operations | | | (30,168,556 | ) | | | 46,181,114 | | | | 153,850,659 | | | | 61,509,250 | |
| | | | | | | | | | | | | | | | |
Distributions to shareholders from: | | | | | | | | | | | | | | | | |
Net investment income—Class I | | | (4,513,580 | ) | | | (27,044,821 | ) | | | (461,525 | ) | | | (1,890,180 | ) |
Net investment income—Class II | | | (2,139,819 | ) | | | (10,930,787 | ) | | | (38,570 | ) | | | (6,894,722 | ) |
Net investment income—T Shares | | | (29,373,097 | ) | | | — | | | | (10,123,159 | ) | | | — | |
Net realized gain—Class I | | | — | | | | — | | | | (82,039 | ) | | | — | |
Net realized gain—Class II | | | — | | | | — | | | | (6,159 | ) | | | — | |
Net realized gain—T Shares | | | — | | | | — | | | | (1,610,120 | ) | | | — | |
| | | | | | | | | | | | | | | | |
Total distributions | | | (36,026,496 | ) | | | (37,975,608 | ) | | | (12,321,572 | ) | | | (8,784,902 | ) |
| | | | | | | | | | | | | | | | |
Capital share transactions: | | | | | | | | | | | | | | | | |
Proceeds from sale of shares—Class I | | | 38,640,943 | | | | 125,028,027 | | | | 10,246,532 | | | | 14,459,474 | |
Proceeds from sale of shares—Class II | | | 16,454,467 | | | | 47,202,200 | | | | 7,762,420 | | | | 47,596,437 | |
Proceeds from sale of shares—T Shares | | | 1,368,035,424 | (a) | | | — | | | | 568,091,459 | (a) | | | — | |
Reinvestment of distributions—Class I | | | 4,513,580 | | | | 27,044,821 | | | | 542,591 | | | | 1,889,425 | |
Reinvestment of distributions—Class II | | | 2,139,819 | | | | 10,930,787 | | | | 44,729 | | | | 6,894,722 | |
Reinvestment of distributions—T Shares | | | 29,373,097 | (a) | | | — | | | | 11,733,279 | (a) | | | — | |
Value of shares redeemed—Class I | | | (919,028,097 | ) | | | (65,957,493 | ) | | | (102,782,107 | ) | | | (11,998,451 | ) |
Value of shares redeemed—Class II | | | (326,228,097 | ) | | | (43,568,322 | ) | | | (369,855,589 | ) | | | (39,854,238 | ) |
Value of shares redeemed—T Shares | | | (111,286,830 | )(a) | | | — | | | | (58,506,142 | )(a) | | | — | |
| | | | | | | | | | | | | | | | |
Net increase from capital share transactions | | | 102,614,306 | | | | 100,680,020 | | | | 67,277,172 | | | | 18,987,369 | |
| | | | | | | | | | | | | | | | |
Total increase in net assets | | | 36,419,254 | | | | 108,885,526 | | | | 208,806,259 | | | | 71,711,717 | |
| | | | | | | | | | | | | | | | |
NET ASSETS at beginning of year | | | 1,243,125,604 | | | | 1,134,240,078 | | | | 452,981,172 | | | | 381,269,455 | |
| | | | | | | | | | | | | | | | |
NET ASESTS at end of year | | $ | 1,279,544,858 | | | $ | 1,243,125,604 | | | $ | 661,787,431 | | | $ | 452,981,172 | |
| | | | | | | | | | | | | | | | |
Accumulated net investment income (loss) included in net assets at end of year | | $ | 5,799 | | | $ | (15,245 | ) | | $ | 470,014 | | | $ | 363,007 | |
| | | | | | | | | | | | | | | | |
SHARE TRANSACTIONS: | | | | | | | | | | | | | | | | |
Number of shares sold—Class I | | | 3,697,944 | | | | 11,916,165 | | | | 794,249 | | | | 1,313,072 | |
Number of shares issued through reinvestment of dividends and distributions—Class I | | | 433,197 | | | | 2,564,393 | | | | 37,628 | | | | 166,488 | |
Number of shares redeemed—Class I | | | (87,871,264 | ) | | | (6,249,159 | ) | | | (8,499,916 | ) | | | (1,091,486 | ) |
| | | | | | | | | | | | | | | | |
Net increase (decrease) in shares outstanding—Class I | | | (83,740,123 | ) | | | 8,231,399 | | | | (7,668,039 | ) | | | 388,074 | |
| | | | | | | | | | | | | | | | |
Number of shares sold—Class II | | | 1,579,374 | | | | 4,455,403 | | | | 681,224 | | | | 4,624,818 | |
Number of shares issued through reinvestment of dividends and distributions—Class II | | | 205,027 | | | | 1,030,560 | | | | 3,298 | | | | 645,041 | |
Number of shares redeemed—Class II | | | (31,008,363 | ) | | | (4,102,957 | ) | | | (32,577,371 | ) | | | (3,785,518 | ) |
| | | | | | | | | | | | | | | | |
Net increase (decrease) in shares outstanding—Class II | | | (29,223,962 | ) | | | 1,383,006 | | | | (31,892,849 | ) | | | 1,484,341 | |
| | | | | | | | | | | | | | | | |
Number of shares sold—T Shares | | | 131,110,998 | (a) | | | — | | | | 46,268,985 | (a) | | | — | |
Number of shares issued through reinvestment of dividends and distributions—T Shares | | | 2,884,304 | (a) | | | — | | | | 813,681 | (a) | | | — | |
Number of shares redeemed—T Shares | | | (10,867,078 | )(a) | | | — | | | | (4,295,260 | )(a) | | | — | |
| | | | | | | | | | | | | | | | |
Net increase in shares outstanding—T Shares | | | 123,128,224 | | | | — | | | | 42,787,406 | | | | — | |
| | | | | | | | | | | | | | | | |
| (a) | T Shares commenced operations on March 1, 2013. |
See Notes to Financial Statements
108
THE VANTAGEPOINT FUNDS
Statements of Changes in Net Assets
| | | | | | | | | | | | | | | | |
| | | Broad Market Index | | | Mid/Small Company Index | |
| | | For the
Year Ended
December 31,
2013 | | | For the
Year Ended
December 31,
2012 | | | For the
Year Ended
December 31,
2013 | | | For the
Year Ended
December 31,
2012 | |
Increase (decrease) in net assets resulting from operations: | | | | | | | | | | | | | | | | |
Net investment income | | $ | 12,041,497 | | | $ | 11,072,458 | | | $ | 9,270,609 | | | $ | 9,044,196 | |
Net realized gain | | | 17,570,471 | | | | 9,394,023 | | | | 51,397,045 | | | | 20,083,974 | |
Net change in unrealized appreciation | | | 155,398,491 | | | | 57,592,159 | | | | 126,672,664 | | | | 45,030,225 | |
| | | | | | | | | | | | | | | | |
Net increase in net assets resulting from operations | | | 185,010,459 | | | | 78,058,640 | | | | 187,340,318 | | | | 74,158,395 | |
| | | | | | | | | | | | | | | | |
Distributions to shareholders from: | | | | | | | | | | | | | | | | |
Net investment income—Class I | | | (470,033 | ) | | | (2,166,992 | ) | | | (293,878 | ) | | | (4,730,696 | ) |
Net investment income—Class II | | | (257,019 | ) | | | (8,699,581 | ) | | | (70,206 | ) | | | (3,711,943 | ) |
Net investment income—T Shares | | | (10,904,466 | ) | | | — | | | | (8,292,024 | ) | | | — | |
Net realized gain—Class I | | | (468,022 | ) | | | (1,045,053 | ) | | | (1,955,310 | ) | | | (10,544,555 | ) |
Net realized gain—Class II | | | (223,484 | ) | | | (3,740,641 | ) | | | (407,156 | ) | | | (7,396,025 | ) |
Net realized gain—T Shares | | | (9,439,615 | ) | | | — | | | | (47,372,342 | ) | | | — | |
| | | | | | | | | | | | | | | | |
Total distributions | | | (21,762,639 | ) | | | (15,652,267 | ) | | | (58,390,916 | ) | | | (26,383,219 | ) |
| | | | | | | | | | | | | | | | |
Capital share transactions: | | | | | | | | | | | | | | | | |
Proceeds from sale of shares—Class I | | | 14,150,568 | | | | 12,310,831 | | | | 10,979,689 | | | | 43,397,455 | |
Proceeds from sale of shares—Class II | | | 15,290,639 | | | | 28,629,139 | | | | 8,884,721 | | | | 31,228,368 | |
Proceeds from sale of shares—T Shares | | | 663,654,017 | (a) | | | — | | | | 594,343,313 | (a) | | | — | |
Reinvestment of distributions—Class I | | | 938,055 | | | | 3,212,045 | | | | 2,247,341 | | | | 15,274,349 | |
Reinvestment of distributions—Class II | | | 480,503 | | | | 12,440,222 | | | | 477,362 | | | | 11,107,968 | |
Reinvestment of distributions—T Shares | | | 20,344,081 | (a) | | | — | | | | 55,664,366 | (a) | | | — | |
Value of shares redeemed—Class I | | | (120,738,735 | ) | | | (17,799,369 | ) | | | (308,904,404 | ) | | | (37,977,127 | ) |
Value of shares redeemed—Class II | | | (458,360,911 | ) | | | (50,603,222 | ) | | | (214,664,650 | ) | | | (27,094,717 | ) |
Value of shares redeemed—T Shares | | | (73,226,360 | )(a) | | | — | | | | (49,283,497 | )(a) | | | — | |
| | | | | | | | | | | | | | | | |
Net increase (decrease) from capital share transactions | | | 62,531,857 | | | | (11,810,354 | ) | | | 99,744,241 | | | | 35,936,296 | |
| | | | | | | | | | | | | | | | |
Total increase in net assets | | | 225,779,677 | | | | 50,596,019 | | | | 228,693,643 | | | | 83,711,472 | |
| | | | | | | | | | | | | | | | |
NET ASSETS at beginning of year | | | 554,301,474 | | | | 503,705,455 | | | | 492,152,898 | | | | 408,441,426 | |
| | | | | | | | | | | | | | | | |
NET ASESTS at end of year | | $ | 780,081,151 | | | $ | 554,301,474 | | | $ | 720,846,541 | | | $ | 492,152,898 | |
| | | | | | | | | | | | | | | | |
Accumulated net investment income included in net assets at end of year | | $ | 6,210,984 | | | $ | 6,132,598 | | | $ | 1,651,660 | | | $ | 1,449,095 | |
| | | | | | | | | | | | | | | | |
SHARE TRANSACTIONS: | | | | | | | | | | | | | | | | |
Number of shares sold—Class I | | | 1,008,725 | | | | 1,026,718 | | | | 608,104 | | | | 2,815,097 | |
Number of shares issued through reinvestment of dividends and distributions—Class I | | | 60,209 | | | | 261,994 | | | | 115,783 | | | | 996,796 | |
Number of shares redeemed—Class I | | | (9,162,704 | ) | | | (1,487,554 | ) | | | (18,261,777 | ) | | | (2,503,348 | ) |
| | | | | | | | | | | | | | | | |
Net increase (decrease) in shares outstanding—Class I | | | (8,093,770 | ) | | | (198,842 | ) | | | (17,537,890 | ) | | | 1,308,545 | |
| | | | | | | | | | | | | | | | |
Number of shares sold—Class II | | | 1,190,627 | | | | 2,519,512 | | | | 550,752 | | | | 2,137,836 | |
Number of shares issued through reinvestment of dividends and distributions—Class II | | | 32,979 | | | | 1,082,700 | | | | 26,214 | | | | 768,552 | |
Number of shares redeemed—Class II | | | (37,439,109 | ) | | | (4,495,362 | ) | | | (13,459,569 | ) | | | (1,841,487 | ) |
| | | | | | | | | | | | | | | | |
Net increase (decrease) in shares outstanding—Class II | | | (36,215,503 | ) | | | (893,150 | ) | | | (12,882,603 | ) | | | 1,064,901 | |
| | | | | | | | | | | | | | | | |
Number of shares sold—T Shares | | | 49,665,300 | (a) | | | — | | | | 34,488,614 | (a) | | | — | |
Number of shares issued through reinvestment of dividends and distributions—T Shares | | | 1,305,782 | (a) | | | — | | | | 2,866,342 | (a) | | | — | |
Number of shares redeemed—T Shares | | | (5,018,667 | )(a) | | | — | | | | (2,584,810 | )(a) | | | — | |
| | | | | | | | | | | | | | | | |
Net increase in shares outstanding—T Shares | | | 45,952,415 | | | | — | | | | 34,770,146 | | | | — | |
| | | | | | | | | | | | | | | | |
| (a) | T Shares commenced operations on March 1, 2013. |
See Notes to Financial Statements
109
THE VANTAGEPOINT FUNDS
Statements of Changes in Net Assets
| | | | | | | | |
| | | Overseas Equity Index | |
| | | For the
Year Ended
December 31,
2013 | | | For the
Year Ended
December 31,
2012 | |
Increase (decrease) in net assets resulting from operations: | | | | | | | | |
Net investment income | | $ | 6,679,041 | | | $ | 6,349,858 | |
Net realized gain | | | 2,507,732 | | | | 39,555 | |
Net change in unrealized appreciation | | | 41,702,484 | | | | 29,402,054 | |
| | | | | | | | |
Net increase in net assets resulting from operations | | | 50,889,257 | | | | 35,791,467 | |
| | | | | | | | |
Distributions to shareholders from: | | | | | | | | |
Net investment income—Class I | | | (240,007 | ) | | | (1,426,695 | ) |
Net investment income—Class II | | | (82,655 | ) | | | (5,187,054 | ) |
Net investment income—T Shares | | | (6,648,183 | ) | | | — | |
| | | | | | | | |
Total distributions | | | (6,970,845 | ) | | | (6,613,749 | ) |
| | | | | | | | |
Capital share transactions: | | | | | | | | |
Proceeds from sale of shares—Class I | | | 1,940,484 | | | | 7,660,129 | |
Proceeds from sale of shares—Class II | | | 2,707,121 | | | | 31,420,598 | |
Proceeds from sale of shares—T Shares | | | 256,960,991 | (a) | | | — | |
Reinvestment of distributions—Class I | | | 240,007 | | | | 1,426,695 | |
Reinvestment of distributions—Class II | | | 82,655 | | | | 5,187,054 | |
Reinvestment of distributions—T Shares | | | 6,648,183 | (a) | | | — | |
Value of shares redeemed—Class I | | | (49,421,053 | ) | | | (5,761,884 | ) |
Value of shares redeemed—Class II | | | (178,163,745 | ) | | | (18,205,185 | ) |
Value of shares redeemed—T Shares | | | (16,690,596 | )(a) | | | — | |
| | | | | | | | |
Net increase from capital share transactions | | | 24,304,047 | | | | 21,727,407 | |
| | | | | | | | |
Total increase in net assets | | | 68,222,459 | | | | 50,905,125 | |
| | | | | | | | |
NET ASSETS at beginning of year | | | 228,689,104 | | | | 177,783,979 | |
| | | | | | | | |
NET ASESTS at end of year | | $ | 296,911,563 | | | $ | 228,689,104 | |
| | | | | | | | |
Accumulated net investment loss included in net assets at end of year | | $ | (1,096,591 | ) | | $ | (795,485 | ) |
| | | | | | | | |
SHARE TRANSACTIONS: | | | | | | | | |
Number of shares sold—Class I | | | 166,440 | | | | 778,774 | |
Number of shares issued through reinvestment of dividends and distributions—Class I | | | 19,576 | | | | 135,104 | |
Number of shares redeemed—Class I | | | (4,520,876 | ) | | | (585,466 | ) |
| | | | | | | | |
Net increase (decrease) in shares outstanding—Class I | | | (4,334,860 | ) | | | 328,412 | |
| | | | | | | | |
Number of shares sold—Class II | | | 258,290 | | | | 3,426,664 | |
Number of shares issued through reinvestment of dividends and distributions—Class II | | | 7,225 | | | | 525,537 | |
Number of shares redeemed—Class II | | | (17,470,108 | ) | | | (1,911,367 | ) |
| | | | | | | | |
Net increase (decrease) in shares outstanding—Class II | | | (17,204,593 | ) | | | 2,040,834 | |
| | | | | | | | |
Number of shares sold—T Shares | | | 23,280,767 | (a) | | | — | |
Number of shares issued through reinvestment of dividends and distributions—T Shares | | | 542,266 | (a) | | | — | |
Number of shares redeemed—T Shares | | | (1,395,179 | )(a) | | | — | |
| | | | | | | | |
Net increase in shares outstanding—T Shares | | | 22,427,854 | | | | — | |
| | | | | | | | |
| (a) | T Shares commenced operations on March 1, 2013. |
See Notes to Financial Statements
110
THE VANTAGEPOINT FUNDS
Statements of Changes in Net Assets
| | | | | | | | | | | | | | | | |
| | | Model Portfolio Funds | |
| | | Conservative Growth | | | Traditional Growth | |
| | | For the
Year Ended
December 31,
2013 | | | For the
Year Ended
December 31,
2012 | | | For the
Year Ended
December 31,
2013 | | | For the
Year Ended
December 31,
2012 | |
Increase (decrease) in net assets resulting from operations: | | | | | | | | | | | | | | | | |
Net investment income | | $ | 8,839,847 | | | $ | 9,847,375 | | | $ | 22,628,571 | | | $ | 24,231,669 | |
Net realized gain | | | 20,018,851 | | | | 5,350,725 | | | | 72,255,751 | | | | 22,693,852 | |
Net change in unrealized appreciation | | | 38,899,309 | | | | 34,557,925 | | | | 167,367,076 | | | | 105,912,759 | |
| | | | | | | | | | | | | | | | |
Net increase in net assets resulting from operations | | | 67,758,007 | | | | 49,756,025 | | | | 262,251,398 | | | | 152,838,280 | |
| | | | | | | | | | | | | | | | |
Distributions to shareholders from: | | | | | | | | | | | | | | | | |
Net investment income—Investor M Shares | | | (1,271,018 | ) | | | (11,072,837 | ) | | | (1,468,448 | ) | | | (24,263,241 | ) |
Net investment income—TM Shares | | | (7,985,806 | ) | | | — | | | | (21,410,541 | ) | | | — | |
Net realized gain—Investor M Shares | | | (1,802,655 | ) | | | (4,460,716 | ) | | | (3,051,680 | ) | | | (18,255,201 | ) |
Net realized gain—TM Shares | | | (9,776,908 | ) | | | — | | | | (38,342,555 | ) | | | — | |
| | | | | | | | | | | | | | | | |
Total distributions | | | (20,836,387 | ) | | | (15,533,553 | ) | | | (64,273,224 | ) | | | (42,518,442 | ) |
| | | | | | | | | | | | | | | | |
Capital share transactions: | | | | | | | | | | | | | | | | |
Proceeds from sale of shares—Investor M Shares | | | 32,223,906 | (a) | | | 49,678,988 | | | | 32,466,818 | (a) | | | 73,465,717 | |
Proceeds from sale of shares—TM Shares | | | 587,736,769 | (b) | | | — | | | | 1,525,232,391 | (b) | | | — | |
Reinvestment of distributions—Investor M Shares | | | 3,073,673 | (a) | | | 15,527,586 | | | | 4,512,090 | (a) | | | 42,512,679 | |
Reinvestment of distributions—TM Shares | | | 17,762,714 | (b) | | | — | | | | 59,753,096 | (b) | | | — | |
Value of shares redeemed—Investor M Shares | | | (560,219,752 | )(a) | | | (47,781,283 | ) | | | (1,472,696,770 | )(a) | | | (98,727,759 | ) |
Value of shares redeemed—TM Shares | | | (73,879,778 | )(b) | | | — | | | | (150,837,906 | )(b) | | | — | |
| | | | | | | | | | | | | | | | |
Net increase (decrease) from capital share transactions | | | 6,697,532 | | | | 17,425,291 | | | | (1,570,281 | ) | | | 17,250,637 | |
| | | | | | | | | | | | | | | | |
Total increase in net assets | | | 53,619,152 | | | | 51,647,763 | | | | 196,407,893 | | | | 127,570,475 | |
| | | | | | | | | | | | | | | | |
NET ASSETS at beginning of year | | | 607,811,706 | | | | 556,163,943 | | | | 1,493,678,238 | | | | 1,366,107,763 | |
| | | | | | | | | | | | | | | | |
NET ASESTS at end of year | | $ | 661,430,858 | | | $ | 607,811,706 | | | $ | 1,690,086,131 | | | $ | 1,493,678,238 | |
| | | | | | | | | | | | | | | | |
Accumulated net investment income included in net assets at end of year | | $ | 9,433 | | | $ | 22,760 | | | $ | 170,681 | | | $ | 230,327 | |
| | | | | | | | | | | | | | | | |
SHARE TRANSACTIONS: | | | | | | | | | | | | | | | | |
Number of shares sold—Investor M Shares | | | 1,247,752 | (a) | | | 2,012,063 | | | | 1,318,544 | (a) | | | 3,201,885 | |
Number of shares issued through reinvestment of dividends and distributions—Investor M Shares | | | 114,646 | (a) | | | 623,848 | | | | 171,042 | (a) | | | 1,828,502 | |
Number of shares redeemed—Investor M Shares | | | (21,946,062 | )(a) | | | (1,922,911 | ) | | | (61,033,131 | )(a) | | | (4,267,774 | ) |
| | | | | | | | | | | | | | | | |
Net increase (decrease) in shares outstanding—Investor M Shares | | | (20,583,664 | ) | | | 713,000 | | | | (59,543,545 | ) | | | 762,613 | |
| | | | | | | | | | | | | | | | |
Number of shares sold—TM Shares | | | 22,968,407 | (b) | | | — | | | | 63,033,994 | (b) | | | — | |
Number of shares issued through reinvestment of dividends and distributions—TM Shares | | | 662,541 | (b) | | | — | | | | 2,265,091 | (b) | | | — | |
Number of shares redeemed—TM Shares | | | (2,799,603 | )(b) | | | — | | | | (5,953,514 | )(b) | | | — | |
| | | | | | | | | | | | | | | | |
Net increase in shares outstanding—TM Shares | | | 20,831,345 | | | | — | | | | 59,345,571 | | | | — | |
| | | | | | | | | | | | | | | | |
| (a) | On March 1, 2013 all outstanding shares were renamed Investor M Shares. |
| (b) | TM Shares commenced operations on March 1, 2013. |
See Notes to Financial Statements
111
THE VANTAGEPOINT FUNDS
Statements of Changes in Net Assets
| | | | | | | | | | | | | | | | |
| | | Model Portfolio Funds | |
| | | Long-Term Growth | | | All-Equity Growth | |
| | | For the
Year Ended
December 31,
2013 | | | For the
Year Ended
December 31,
2012 | | | For the
Year Ended
December 31,
2013 | | | For the
Year Ended
December 31,
2012 | |
Increase (decrease) in net assets resulting from operations: | | | | | | | | | | | | | | | | |
Net investment income | | $ | 29,484,392 | | | $ | 30,300,513 | | | $ | 9,828,619 | | | $ | 9,634,777 | |
Net realized gain | | | 119,479,594 | | | | 40,945,544 | | | | 48,988,386 | | | | 4,660,440 | |
Net change in unrealized appreciation | | | 270,698,264 | | | | 149,978,316 | | | | 157,733,925 | | | | 86,562,999 | |
| | | | | | | | | | | | | | | | |
Net increase in net assets resulting from operations | | | 419,662,250 | | | | 221,224,373 | | | | 216,550,930 | | | | 100,858,216 | |
| | | | | | | | | | | | | | | | |
Distributions to shareholders from: | | | | | | | | | | | | | | | | |
Net investment income—Investor M Shares | | | (1,254,788 | ) | | | (30,205,709 | ) | | | (580,022 | ) | | | (6,229,845 | ) |
Net investment income—TM Shares | | | (28,295,742 | ) | | | — | | | | (11,900,690 | ) | | | — | |
Net realized gain—Investor M Shares | | | (3,310,194 | ) | | | (31,564,539 | ) | | | (1,131,430 | ) | | | (4,893,466 | ) |
Net realized gain—TM Shares | | | (64,147,553 | ) | | | — | | | | (20,134,028 | ) | | | — | |
| | | | | | | | | | | | | | | | |
Total distributions | | | (97,008,277 | ) | | | (61,770,248 | ) | | | (33,746,170 | ) | | | (11,123,311 | ) |
| | | | | | | | | | | | | | | | |
Capital share transactions: | | | | | | | | | | | | | | | | |
Proceeds from sale of shares—Investor M Shares | | | 21,355,292 | (a) | | | 78,109,011 | | | | 15,102,545 | (a) | | | 48,246,562 | |
Proceeds from sale of shares—TM Shares | | | 1,982,361,477 | (b) | | | — | | | | 780,616,173 | (b) | | | — | |
Reinvestment of distributions—Investor M Shares | | | 4,564,982 | (a) | | | 61,770,248 | | | | 1,711,452 | (a) | | | 11,123,311 | |
Reinvestment of distributions—TM Shares | | | 92,443,295 | (b) | | | — | | | | 32,034,718 | (b) | | | — | |
Value of shares redeemed—Investor M Shares | | | (1,914,940,449 | )(a) | | | (114,749,215 | ) | | | (728,190,049 | )(a) | | | (89,600,456 | ) |
Value of shares redeemed—TM Shares | | | (193,110,980 | )(b) | | | — | | | | (67,341,878 | )(b) | | | — | |
| | | | | | | | | | | | | | | | |
Net increase (decrease) from capital share transactions | | | (7,326,383 | ) | | | 25,130,044 | | | | 33,932,961 | | | | (30,230,583 | ) |
| | | | | | | | | | | | | | | | |
Total increase in net assets | | | 315,327,590 | | | | 184,584,169 | | | | 216,737,721 | | | | 59,504,322 | |
| | | | | | | | | | | | | | | | |
NET ASSETS at beginning of year | | | 1,896,812,283 | | | | 1,712,228,114 | | | | 709,329,831 | | | | 649,825,509 | |
| | | | | | | | | | | | | | | | |
NET ASESTS at end of year | | $ | 2,212,139,873 | | | $ | 1,896,812,283 | | | $ | 926,067,552 | | | $ | 709,329,831 | |
| | | | | | | | | | | | | | | | |
Accumulated net investment income included in net assets at end of year | | $ | 212,596 | | | $ | 288,674 | | | $ | 1,317,786 | | | $ | 4,295,110 | |
| | | | | | | | | | | | | | | | |
SHARE TRANSACTIONS: | | | | | | | | | | | | | | | | |
Number of shares sold—Investor M Shares | | | 900,020 | (a) | | | 3,580,777 | | | | 645,327 | (a) | | | 2,358,603 | |
Number of shares issued through reinvestment of dividends and distributions—Investor M Shares | | | 175,172 | (a) | | | 2,782,443 | | | | 63,741 | (a) | | | 521,242 | |
Number of shares redeemed—Investor M Shares | | | (82,345,030 | )(a) | | | (5,211,374 | ) | | | (32,117,940 | )(a) | | | (4,404,229 | ) |
| | | | | | | | | | | | | | | | |
Net increase (decrease) in shares outstanding—Investor M Shares | | | (81,269,838 | ) | | | 1,151,846 | | | | (31,408,872 | ) | | | (1,524,384 | ) |
| | | | | | | | | | | | | | | | |
Number of shares sold—TM Shares | | | 84,934,039 | (b) | | | — | | | | 34,143,678 | (b) | | | — | |
Number of shares issued through reinvestment of dividends and distributions—TM Shares | | | 3,545,964 | (b) | | | — | | | | 1,192,655 | (b) | | | — | |
Number of shares redeemed—TM Shares | | | (7,783,350 | )(b) | | | — | | | | (2,692,933 | )(b) | | | — | |
| | | | | | | | | | | | | | | | |
Net increase in shares outstanding—TM Shares | | | 80,696,653 | | | | — | | | | 32,643,400 | | | | — | |
| | | | | | | | | | | | | | | | |
| (a) | On March 1, 2013 all outstanding shares were renamed Investor M Shares. |
| (b) | TM Shares commenced operations on March 1, 2013. |
See Notes to Financial Statements
112
THE VANTAGEPOINT FUNDS
Statements of Changes in Net Assets
| | | | | | | | | | | | | | | | |
| | | Milestone Funds | |
| | | Milestone Retirement Income | | | Milestone 2010 | |
| | | For the
Year Ended
December 31,
2013 | | | For the
Year Ended
December 31,
2012 | | | For the
Year Ended
December 31,
2013 | | | For the
Year Ended
December 31,
2012 | |
Increase (decrease) in net assets resulting from operations: | | | | | | | | | | | | | | | | |
Net investment income | | $ | 4,170,586 | | | $ | 3,819,949 | | | $ | 3,566,038 | | | $ | 3,668,401 | |
Net realized gain | | | 10,154,214 | | | | 4,670,798 | | | | 14,606,391 | | | | 6,541,786 | |
Net change in unrealized appreciation | | | 3,478,362 | | | | 7,308,088 | | | | 10,573,495 | | | | 10,575,970 | |
| | | | | | | | | | | | | | | | |
Net increase in net assets resulting from operations | | | 17,803,162 | | | | 15,798,835 | | | | 28,745,924 | | | | 20,786,157 | |
| | | | | | | | | | | | | | | | |
Distributions to shareholders from: | | | | | | | | | | | | | | | | |
Net investment income—Investor M Shares | | | (1,011,400 | ) | | | (3,808,078 | ) | | | (796,931 | ) | | | (3,657,537 | ) |
Net investment income—TM Shares | | | (3,250,401 | ) | | | — | | | | (2,849,079 | ) | | | — | |
Net realized gain—Investor M Shares | | | (1,508,016 | ) | | | (3,414,215 | ) | | | (2,260,305 | ) | | | (5,079,056 | ) |
Net realized gain—TM Shares | | | (4,162,737 | ) | | | — | | | | (6,857,425 | ) | | | — | |
| | | | | | | | | | | | | | | | |
Total distributions | | | (9,932,554 | ) | | | (7,222,293 | ) | | | (12,763,740 | ) | | | (8,736,593 | ) |
| | | | | | | | | | | | | | | | |
Capital share transactions: | | | | | | | | | | | | | | | | |
Proceeds from sale of shares—Investor M Shares | | | 45,005,846 | (a) | | | 29,712,090 | | | | 12,834,084 | (a) | | | 22,369,356 | |
Proceeds from sale of shares—TM Shares | | | 261,724,284 | (b) | | | — | | | | 231,362,185 | (b) | | | — | |
Reinvestment of distributions—Investor M Shares | | | 2,519,416 | (a) | | | 7,222,293 | | | | 3,057,236 | (a) | | | 8,736,593 | |
Reinvestment of distributions—TM Shares | | | 7,413,138 | (b) | | | — | | | | 9,706,504 | (b) | | | — | |
Value of shares redeemed—Investor M Shares | | | (204,305,240 | )(a) | | | (27,415,547 | ) | | | (186,522,600 | )(a) | | | (31,407,381 | ) |
Value of shares redeemed—TM Shares | | | (34,753,717 | )(b) | | | — | | | | (30,389,825 | )(b) | | | — | |
| | | | | | | | | | | | | | | | |
Net increase (decrease) from capital share transactions | | | 77,603,727 | | | | 9,518,836 | | | | 40,047,584 | | | | (301,432 | ) |
| | | | | | | | | | | | | | | | |
Total increase in net assets | | | 85,474,335 | | | | 18,095,378 | | | | 56,029,768 | | | | 11,748,132 | |
| | | | | | | | | | | | | | | | |
NET ASSETS at beginning of year | | | 238,157,926 | | | | 220,062,548 | | | | 234,022,793 | | | | 222,274,661 | |
| | | | | | | | | | | | | | | | |
NET ASESTS at end of year | | $ | 323,632,261 | | | $ | 238,157,926 | | | $ | 290,052,561 | | | $ | 234,022,793 | |
| | | | | | | | | | | | | | | | |
Accumulated net investment income included in net assets at end of year | | $ | — | | | $ | — | | | $ | — | | | $ | — | |
| | | | | | | | | | | | | | | | |
SHARE TRANSACTIONS: | | | | | | | | | | | | | | | | |
Number of shares sold—Investor M Shares | | | 4,148,859 | (a) | | | 2,792,687 | | | | 1,154,028 | (a) | | | 2,097,640 | |
Number of shares issued through reinvestment of dividends and distributions—Investor M Shares | | | 231,139 | (a) | | | 682,636 | | | | 269,835 | (a) | | | 820,338 | |
Number of shares redeemed—Investor M Shares | | | (18,998,384 | )(a) | | | (2,583,551 | ) | | | (17,069,520 | )(a) | | | (2,934,016 | ) |
| | | | | | | | | | | | | | | | |
Net increase (decrease) in shares outstanding—Investor M Shares | | | (14,618,386 | ) | | | 891,772 | | | | (15,645,657 | ) | | | (16,038 | ) |
| | | | | | | | | | | | | | | | |
Number of shares sold—TM Shares | | | 24,267,945 | (b) | | | — | | | | 21,068,755 | (b) | | | — | |
Number of shares issued through reinvestment of dividends and distributions—TM Shares | | | 679,481 | (b) | | | — | | | | 855,953 | (b) | | | — | |
Number of shares redeemed—TM Shares | | | (3,161,291 | )(b) | | | — | | | | (2,670,824 | )(b) | | | — | |
| | | | | | | | | | | | | | | | |
Net increase in shares outstanding—TM Shares | | | 21,786,135 | | | | — | | | | 19,253,884 | | | | — | |
| | | | | | | | | | | | | | | | |
| (a) | On March 1, 2013 all outstanding shares were renamed Investor M Shares. |
| (b) | TM Shares commenced operations on March 1, 2013. |
See Notes to Financial Statements
113
THE VANTAGEPOINT FUNDS
Statements of Changes in Net Assets
| | | | | | | | | | | | | | | | |
| | | Milestone Funds | |
| | | Milestone 2015 | | | Milestone 2020 | |
| | | For the
Year Ended
December 31,
2013 | | | For the
Year Ended
December 31,
2012 | | | For the
Year Ended
December 31,
2013 | | | For the
Year Ended
December 31,
2012 | |
Increase (decrease) in net assets resulting from operations: | | | | | | | | | | | | | | | | |
Net investment income | | $ | 7,127,471 | | | $ | 6,963,262 | | | $ | 8,911,913 | | | $ | 7,905,069 | |
Net realized gain | | | 23,118,811 | | | | 7,040,623 | | | | 25,404,038 | | | | 4,305,341 | |
Net change in unrealized appreciation | | | 34,821,119 | | | | 26,079,472 | | | | 53,389,352 | | | | 32,885,504 | |
| | | | | | | | | | | | | | | | |
Net increase in net assets resulting from operations | | | 65,067,401 | | | | 40,083,357 | | | | 87,705,303 | | | | 45,095,914 | |
| | | | | | | | | | | | | | | | |
Distributions to shareholders from: | | | | | | | | | | | | | | | | |
Net investment income—Investor M Shares | | | (1,216,906 | ) | | | (6,931,087 | ) | | | (1,235,710 | ) | | | (7,863,109 | ) |
Net investment income—TM Shares | | | (6,029,907 | ) | | | — | | | | (7,723,260 | ) | | | — | |
Net realized gain—Investor M Shares | | | (2,597,739 | ) | | | (5,906,820 | ) | | | (2,326,410 | ) | | | (4,527,980 | ) |
Net realized gain—TM Shares | | | (10,980,203 | ) | | | — | | | | (12,586,031 | ) | | | — | |
| | | | | | | | | | | | | | | | |
Total distributions | | | (20,824,755 | ) | | | (12,837,907 | ) | | | (23,871,411 | ) | | | (12,391,089 | ) |
| | | | | | | | | | | | | | | | |
Capital share transactions: | | | | | | | | | | | | | | | | |
Proceeds from sale of shares—Investor M Shares | | | 26,550,128 | (a) | | | 48,957,538 | | | | 33,566,002 | (a) | | | 69,703,195 | |
Proceeds from sale of shares—TM Shares | | | 448,531,568 | (b) | | | — | | | | 520,272,956 | (b) | | | — | |
Reinvestment of distributions—Investor M Shares | | | 3,814,645 | (a) | | | 12,837,907 | | | | 3,562,120 | (a) | | | 12,391,089 | |
Reinvestment of distributions—TM Shares | | | 17,010,110 | (b) | | | — | | | | 20,309,291 | (b) | | | — | |
Value of shares redeemed—Investor M Shares | | | (378,073,874 | )(a) | | | (36,258,178 | ) | | | (431,264,028 | )(a) | | | (30,461,850 | ) |
Value of shares redeemed—TM Shares | | | (40,556,891 | )(b) | | | — | | | | (31,837,937 | )(b) | | | — | |
| | | | | | | | | | | | | | | | |
Net increase from capital share transactions | | | 77,275,686 | | | | 25,537,267 | | | | 114,608,404 | | | | 51,632,434 | |
| | | | | | | | | | | | | | | | |
Total increase in net assets | | | 121,518,332 | | | | 52,782,717 | | | | 178,442,296 | | | | 84,337,259 | |
| | | | | | | | | | | | | | | | |
NET ASSETS at beginning of year | | | 434,638,177 | | | | 381,855,460 | | | | 470,664,246 | | | | 386,326,987 | |
| | | | | | | | | | | | | | | | |
NET ASESTS at end of year | | $ | 556,156,509 | | | $ | 434,638,177 | | | $ | 649,106,542 | | | $ | 470,664,246 | |
| | | | | | | | | | | | | | | | |
Accumulated net investment income included in net assets at end of year | | $ | — | | | $ | — | | | $ | — | | | $ | 1,887 | |
| | | | | | | | | | | | | | | | |
SHARE TRANSACTIONS: | | | | | | | | | | | | | | | | |
Number of shares sold—Investor M Shares | | | 2,339,923 | (a) | | | 4,538,870 | | | | 2,898,947 | (a) | | | 6,464,854 | |
Number of shares issued through reinvestment of dividends and distributions—Investor M Shares | | | 320,020 | (a) | | | 1,181,040 | | | | 288,899 | (a) | | | 1,132,641 | |
Number of shares redeemed—Investor M Shares | | | (33,711,861 | )(a) | | | (3,351,540 | ) | | | (38,014,893 | )(a) | | | (2,811,250 | ) |
| | | | | | | | | | | | | | | | |
Net increase (decrease) in shares outstanding—Investor M Shares | | | (31,051,918 | ) | | | 2,368,370 | | | | (34,827,047 | ) | | | 4,786,245 | |
| | | | | | | | | | | | | | | | |
Number of shares sold—TM Shares | | | 39,748,654 | (b) | | | — | | | | 45,416,955 | (b) | | | — | |
Number of shares issued through reinvestment of dividends and distributions—TM Shares | | | 1,427,023 | (b) | | | — | | | | 1,647,144 | (b) | | | — | |
Number of shares redeemed—TM Shares | | | (3,437,021 | )(b) | | | — | | | | (2,621,580 | )(b) | | | — | |
| | | | | | | | | | | | | | | | |
Net increase in shares outstanding—TM Shares | | | 37,738,656 | | | | — | | | | 44,442,519 | | | | — | |
| | | | | | | | | | | | | | | | |
| (a) | On March 1, 2013 all outstanding shares were renamed Investor M Shares. |
| (b) | TM Shares commenced operations on March 1, 2013. |
See Notes to Financial Statements
114
THE VANTAGEPOINT FUNDS
Statements of Changes in Net Assets
| | | | | | | | | | | | | | | | |
| | | Milestone Funds | |
| | | Milestone 2025 | | | Milestone 2030 | |
| | | For the
Year Ended
December 31,
2013 | | | For the
Year Ended
December 31,
2012 | | | For the
Year Ended
December 31,
2013 | | | For the
Year Ended
December 31,
2012 | |
Increase (decrease) in net assets resulting from operations: | | | | | | | | | | | | | | | | |
Net investment income | | $ | 7,646,533 | | | $ | 6,478,423 | | | $ | 5,973,228 | | | $ | 4,992,955 | |
Net realized gain | | | 20,760,859 | | | | 2,631,701 | | | | 18,297,139 | | | | 2,559,714 | |
Net change in unrealized appreciation | | | 54,928,530 | | | | 29,869,079 | | | | 50,102,743 | | | | 25,744,393 | |
| | | | | | | | | | | | | | | | |
Net increase in net assets resulting from operations | | | 83,335,922 | | | | 38,979,203 | | | | 74,373,110 | | | | 33,297,062 | |
| | | | | | | | | | | | | | | | |
Distributions to shareholders from: | | | | | | | | | | | | | | | | |
Net investment income—Investor M Shares | | | (1,095,217 | ) | | | (6,440,201 | ) | | | (954,213 | ) | | | (4,958,210 | ) |
Net investment income—TM Shares | | | (6,549,444 | ) | | | — | | | | (5,017,660 | ) | | | — | |
Net realized gain—Investor M Shares | | | (1,789,541 | ) | | | (3,500,724 | ) | | | (1,789,614 | ) | | | (3,048,097 | ) |
Net realized gain—TM Shares | | | (9,353,028 | ) | | | — | | | | (8,236,717 | ) | | | — | |
| | | | | | | | | | | | | | | | |
Total distributions | | | (18,787,230 | ) | | | (9,940,925 | ) | | | (15,998,204 | ) | | | (8,006,307 | ) |
| | | | | | | | | | | | | | | | |
Capital share transactions: | | | | | | | | | | | | | | | | |
Proceeds from sale of shares—Investor M Shares | | | 27,965,467 | (a) | | | 60,708,794 | | | | 26,713,652 | (a) | | | 50,506,476 | |
Proceeds from sale of shares—TM Shares | | | 422,682,368 | (b) | | | — | | | | 328,832,656 | (b) | | | — | |
Reinvestment of distributions—Investor M Shares | | | 2,884,757 | (a) | | | 9,940,925 | | | | 2,743,826 | (a) | | | 8,006,307 | |
Reinvestment of distributions—TM Shares | | | 15,902,473 | (b) | | | — | | | | 13,254,378 | (b) | | | — | |
Value of shares redeemed—Investor M Shares | | | (351,116,315 | )(a) | | | (17,516,434 | ) | | | (277,940,491 | )(a) | | | (15,178,840 | ) |
Value of shares redeemed—TM Shares | | | (25,280,797 | )(b) | | | — | | | | (17,756,010 | )(b) | | | — | |
| | | | | | | | | | | | | | | | |
Net increase from capital share transactions | | | 93,037,953 | | | | 53,133,285 | | | | 75,848,011 | | | | 43,333,943 | |
| | | | | | | | | | | | | | | | |
Total increase in net assets | | | 157,586,645 | | | | 82,171,563 | | | | 134,222,917 | | | | 68,624,698 | |
| | | | | | | | | | | | | | | | |
NET ASSETS at beginning of year | | | 383,446,192 | | | | 301,274,629 | | | | 305,077,178 | | | | 236,452,480 | |
| | | | | | | | | | | | | | | | |
NET ASESTS at end of year | | $ | 541,032,837 | | | $ | 383,446,192 | | | $ | 439,300,095 | | | $ | 305,077,178 | |
| | | | | | | | | | | | | | | | |
Accumulated net investment income included in net assets at end of year | | $ | — | | | $ | 4,557 | | | $ | 288 | | | $ | 5,290 | |
| | | | | | | | | | | | | | | | |
SHARE TRANSACTIONS: | | | | | | | | | | | | | | | | |
Number of shares sold—Investor M Shares | | | 2,405,905 | (a) | | | 5,681,571 | | | | 2,226,363 | (a) | | | 4,674,073 | |
Number of shares issued through reinvestment of dividends and distributions—Investor M Shares | | | 228,767 | (a) | | | 912,011 | | | | 210,739 | (a) | | | 725,866 | |
Number of shares redeemed—Investor M Shares | | | (30,933,961 | )(a) | | | (1,633,111 | ) | | | (24,077,206 | )(a) | | | (1,398,751 | ) |
| | | | | | | | | | | | | | | | |
Net increase (decrease) in shares outstanding—Investor M Shares | | | (28,299,289 | ) | | | 4,960,471 | | | | (21,640,104 | ) | | | 4,001,188 | |
| | | | | | | | | | | | | | | | |
Number of shares sold—TM Shares | | | 36,785,148 | (b) | | | — | | | | 28,103,480 | (b) | | | — | |
Number of shares issued through reinvestment of dividends and distributions—TM Shares | | | 1,260,101 | (b) | | | — | | | | 1,017,220 | (b) | | | — | |
Number of shares redeemed—TM Shares | | | (2,045,075 | )(b) | | | — | | | | (1,409,427 | )(b) | | | — | |
| | | | | | | | | | | | | | | | |
Net increase in shares outstanding—TM Shares | | | 36,000,174 | | | | — | | | | 27,711,273 | | | | — | |
| | | | | | | | | | | | | | | | |
| (a) | On March 1, 2013 all outstanding shares were renamed Investor M Shares. |
| (b) | TM Shares commenced operations on March 1, 2013. |
See Notes to Financial Statements
115
THE VANTAGEPOINT FUNDS
Statements of Changes in Net Assets
| | | | | | | | | | | | | | | | |
| | | Milestone Funds | |
| | | Milestone 2035 | | | Milestone 2040 | |
| | | For the
Year Ended
December 31,
2013 | | | For the
Year Ended
December 31,
2012 | | | For the
Year Ended
December 31,
2013 | | | For the
Year Ended
December 31,
2012 | |
Increase (decrease) in net assets resulting from operations: | | | | | | | | | | | | | | | | |
Net investment income | | $ | 3,911,705 | | | $ | 3,202,658 | | | $ | 3,699,969 | | | $ | 3,108,813 | |
Net realized gain | | | 14,473,416 | | | | 2,111,874 | | | | 17,513,662 | | | | 4,883,349 | |
Net change in unrealized appreciation | | | 37,330,071 | | | | 18,030,907 | | | | 37,211,720 | | | | 16,035,152 | |
| | | | | | | | | | | | | | | | |
Net increase in net assets resulting from operations | | | 55,715,192 | | | | 23,345,439 | | | | 58,425,351 | | | | 24,027,314 | |
| | | | | | | | | | | | | | | | |
Distributions to shareholders from: | | | | | | | | | | | | | | | | |
Net investment income—Investor M Shares | | | (673,540 | ) | | | (3,176,280 | ) | | | (590,736 | ) | | | (3,024,927 | ) |
Net investment income—TM Shares | | | (3,237,669 | ) | | | — | | | | (3,051,767 | ) | | | — | |
Net realized gain—Investor M Shares | | | (1,538,095 | ) | | | (2,144,702 | ) | | | (2,020,014 | ) | | | (642,204 | ) |
Net realized gain—TM Shares | | | (6,422,227 | ) | | | — | | | | (8,994,803 | ) | | | — | |
| | | | | | | | | | | | | | | | |
Total distributions | | | (11,871,531 | ) | | | (5,320,982 | ) | | | (14,657,320 | ) | | | (3,667,131 | ) |
| | | | | | | | | | | | | | | | |
Capital share transactions: | | | | | | | | | | | | | | | | |
Proceeds from sale of shares—Investor M Shares | | | 17,844,578 | (a) | | | 38,485,630 | | | | 16,621,561 | (a) | | | 36,970,041 | |
Proceeds from sale of shares—TM Shares | | | 218,318,139 | (b) | | | — | | | | 215,609,580 | (b) | | | — | |
Reinvestment of distributions—Investor M Shares | | | 2,211,635 | (a) | | | 5,320,982 | | | | 2,610,752 | (a) | | | 3,667,131 | |
Reinvestment of distributions—TM Shares | | | 9,659,896 | (b) | | | — | | | | 12,046,568 | (b) | | | — | |
Value of shares redeemed—Investor M Shares | | | (180,867,654 | )(a) | | | (9,654,080 | ) | | | (179,518,922 | )(a) | | | (9,653,377 | ) |
Value of shares redeemed—TM Shares | | | (10,416,698 | )(b) | | | — | | | | (13,731,164 | )(b) | | | — | |
| | | | | | | | | | | | | | | | |
Net increase from capital share transactions | | | 56,749,896 | | | | 34,152,532 | | | | 53,638,375 | | | | 30,983,795 | |
| | | | | | | | | | | | | | | | |
Total increase in net assets | | | 100,593,557 | | | | 52,176,989 | | | | 97,406,406 | | | | 51,343,978 | |
| | | | | | | | | | | | | | | | |
NET ASSETS at beginning of year | | | 202,648,607 | | | | 150,471,618 | | | | 197,376,350 | | | | 146,032,372 | |
| | | | | | | | | | | | | | | | |
NET ASESTS at end of year | | $ | 303,242,164 | | | $ | 202,648,607 | | | $ | 294,782,756 | | | $ | 197,376,350 | |
| | | | | | | | | | | | | | | | |
Accumulated net investment income included in net assets at end of year | | $ | 1 | | | $ | 2,332 | | | $ | — | | | $ | 33,460 | |
| | | | | | | | | | | | | | | | |
SHARE TRANSACTIONS: | | | | | | | | | | | | | | | | |
Number of shares sold—Investor M Shares | | | 1,476,728 | (a) | | | 3,583,774 | | | | 1,351,686 | (a) | | | 3,428,611 | |
Number of shares issued through reinvestment of dividends and distributions—Investor M Shares | | | 167,295 | (a) | | | 484,166 | | | | 193,389 | (a) | | | 328,596 | |
Number of shares redeemed—Investor M Shares | | | (15,647,615 | )(a) | | | (894,994 | ) | | | (15,234,060 | )(a) | | | (887,216 | ) |
| | | | | | | | | | | | | | | | |
Net increase (decrease) in shares outstanding—Investor M Shares | | | (14,003,592 | ) | | | 3,172,946 | | | | (13,688,985 | ) | | | 2,869,991 | |
| | | | | | | | | | | | | | | | |
Number of shares sold—TM Shares | | | 18,583,828 | (b) | | | — | | | | 17,981,957 | (b) | | | — | |
Number of shares issued through reinvestment of dividends and distributions—TM Shares | | | 730,703 | (b) | | | — | | | | 892,338 | (b) | | | — | |
Number of shares redeemed—TM Shares | | | (813,574 | )(b) | | | — | | | | (1,038,499 | )(b) | | | — | |
| | | | | | | | | | | | | | | | |
Net increase in shares outstanding—TM Shares | | | 18,500,957 | | | | — | | | | 17,835,796 | | | | — | |
| | | | | | | | | | | | | | | | |
| (a) | On March 1, 2013 all outstanding shares were renamed Investor M Shares. |
| (b) | TM Shares commenced operations on March 1, 2013. |
See Notes to Financial Statements
116
THE VANTAGEPOINT FUNDS
Statements of Changes in Net Assets
| | | | | | | | | | | | | | | | |
| | | Milestone Funds | |
| | | Milestone 2045 | | | Milestone 2050 | |
| | | For the
Year Ended
December 31,
2013 | | | For the
Year Ended
December 31,
2012 | | | For the
Year Ended
December 31,
2013 | | | For the
Period from
September 10,
2012* to
December 31,
2012 | |
Increase (decrease) in net assets resulting from operations: | | | | | | | | | | | | | | | | |
Net investment income | | $ | 1,136,581 | | | $ | 881,339 | | | $ | 235,827 | | | $ | 9,240 | |
Net realized gain | | | 5,056,758 | | | | 2,540,955 | | | | 1,085,495 | | | | 9,385 | |
Net change in unrealized appreciation (depreciation) | | | 11,659,178 | | | | 2,733,334 | | | | 1,709,130 | | | | (11,055 | ) |
| | | | | | | | | | | | | | | | |
Net increase in net assets resulting from operations | | | 17,852,517 | | | | 6,155,628 | | | | 3,030,452 | | | | 7,570 | |
| | | | | | | | | | | | | | | | |
Distributions to shareholders from: | | | | | | | | | | | | | | | | |
Net investment income—Investor M Shares | | | (252,470 | ) | | | (874,188 | ) | | | (65,323 | ) | | | (9,717 | ) |
Net investment income—TM Shares | | | (883,710 | ) | | | — | | | | (170,449 | ) | | | — | |
Net realized gain—Investor M Shares | | | (1,004,404 | ) | | | (774,787 | ) | | | (92,986 | ) | | | (942 | ) |
Net realized gain—TM Shares | | | (3,032,750 | ) | | | — | | | | (209,304 | ) | | | — | |
| | | | | | | | | | | | | | | | |
Total distributions | | | (5,173,334 | ) | | | (1,648,975 | ) | | | (538,062 | ) | | | (10,659 | ) |
| | | | | | | | | | | | | | | | |
Capital share transactions: | | | | | | | | | | | | | | | | |
Proceeds from sale of shares—Investor M Shares | | | 11,376,091 | (a) | | | 23,702,921 | | | | 5,197,749 | (a) | | | 6,761,657 | |
Proceeds from sale of shares—TM Shares | | | 67,433,261 | (b) | | | — | | | | 15,741,828 | (b) | | | — | |
Reinvestment of distributions—Investor M Shares | | | 1,256,876 | (a) | | | 1,648,975 | | | | 158,309 | (a) | | | 10,659 | |
Reinvestment of distributions—TM Shares | | | 3,916,458 | (b) | | | — | | | | 379,753 | (b) | | | — | |
Value of shares redeemed—Investor M Shares | | | (47,604,661 | )(a) | | | (9,468,094 | ) | | | (6,466,841 | )(a) | | | (292 | ) |
Value of shares redeemed—TM Shares | | | (4,685,630 | )(b) | | | — | | | | (1,982,228 | )(b) | | | — | |
| | | | | | | | | | | | | | | | |
Net increase from capital share transactions | | | 31,692,395 | | | | 15,883,802 | | | | 13,028,570 | | | | 6,772,024 | |
| | | | | | | | | | | | | | | | |
Total increase in net assets | | | 44,371,578 | | | | 20,390,455 | | | | 15,520,960 | | | | 6,768,935 | |
| | | | | | | | | | | | | | | | |
NET ASSETS at beginning of year | | | 53,824,108 | | | | 33,433,653 | | | | 6,768,935 | | | | — | |
| | | | | | | | | | | | | | | | |
NET ASESTS at end of year | | $ | 98,195,686 | | | $ | 53,824,108 | | | $ | 22,289,895 | | | $ | 6,768,935 | |
| | | | | | | | | | | | | | | | |
Accumulated net investment income included in net assets at end of year | | $ | — | | | $ | — | | | $ | — | | | $ | — | |
| | | | | | | | | | | | | | | | |
SHARE TRANSACTIONS: | | | | | | | | | | | | | | | | |
Number of shares sold—Investor M Shares | | | 857,877 | (a) | | | 2,008,411 | | | | 458,283 | (a) | | | 659,208 | |
Number of shares issued through reinvestment of dividends and distributions—Investor M Shares | | | 86,562 | (a) | | | 137,529 | | | | 12,426 | (a) | | | 1,040 | |
Number of shares redeemed—Investor M Shares | | | (3,753,550 | )(a) | | | (779,357 | ) | | | (593,250 | )(a) | | | (28 | ) |
| | | | | | | | | | | | | | | | |
Net increase (decrease) in shares outstanding—Investor M Shares | | | (2,809,111 | ) | | | 1,366,583 | | | | (122,541 | ) | | | 660,220 | |
| | | | | | | | | | | | | | | | |
Number of shares sold—TM Shares | | | 5,150,114 | (b) | | | — | | | | 1,348,827 | (b) | | | — | |
Number of shares issued through reinvestment of dividends and distributions—TM Shares | | | 269,543 | (b) | | | — | | | | 29,808 | (b) | | | — | |
Number of shares redeemed—TM Shares | | | (339,806 | )(b) | | | — | | | | (166,800 | )(b) | | | — | |
| | | | | | | | | | | | | | | | |
Net increase in shares outstanding—TM Shares | | | 5,079,851 | | | | — | | | | 1,211,835 | | | | — | |
| | | | | | | | | | | | | | | | |
| * | Commencement of operations |
| (a) | On March 1, 2013 all outstanding shares were renamed Investor M Shares. |
| (b) | TM Shares commenced operations on March 1, 2013. |
See Notes to Financial Statements
117
THE VANTAGEPOINT FUNDS
Financial Highlights
(For a share outstanding throughout each period)
| | | | | | | | | | | | | | | | | | | | |
| | | Low Duration Bond Investor Shares(1) | |
| | | For the Year Ended December 31, | |
| | | 2013 | | | 2012 | | | 2011 | | | 2010 | | | 2009 | |
Net Asset Value, beginning of year | | $ | 10.19 | | | $ | 9.96 | | | $ | 10.04 | | | $ | 9.95 | | | $ | 9.28 | |
Income from investment operations: | | | | | | | | | | | | | | | | | | | | |
Net investment income | | | 0.13 | ^ | | | 0.16 | | | | 0.19 | | | | 0.25 | | | | 0.32 | |
Net realized and unrealized gain (loss) | | | (0.06 | ) | | | 0.23 | | | | (0.08 | ) | | | 0.10 | | | | 0.65 | |
| | | | | | | | | | | | | | | | | | | | |
Total from investment operations | | | 0.07 | | | | 0.39 | | | | 0.11 | | | | 0.35 | | | | 0.97 | |
| | | | | | | | | | | | | | | | | | | | |
Less distributions: | | | | | | | | | | | | | | | | | | | | |
Net investment income | | | (0.11 | ) | | | (0.16 | ) | | | (0.19 | ) | | | (0.26 | ) | | | (0.30 | ) |
Realized gains | | | (0.03 | ) | | | — | | | | — | | | | — | | | | — | |
| | | | | | | | | | | | | | | | | | | | |
Total distributions | | | (0.14 | ) | | | (0.16 | ) | | | (0.19 | ) | | | (0.26 | ) | | | (0.30 | ) |
| | | | | | | | | | | | | | | | | | | | |
Net Asset Value, end of year | | $ | 10.12 | | | $ | 10.19 | | | $ | 9.96 | | | $ | 10.04 | | | $ | 9.95 | |
| | | | | | | | | | | | | | | | | | | | |
Total return | | | 0.75 | % | | | 3.97 | % | | | 1.14 | % | | | 3.58 | % | | | 10.63 | % |
Ratios to Average Net Assets: | | | | | | | | | | | | | | | | | | | | |
Expenses | | | 0.63 | % | | | 0.63 | % | | | 0.62 | % | | | 0.64 | % | | | 0.66 | % |
Net investment income | | | 1.30 | % | | | 1.55 | % | | | 1.93 | % | | | 2.51 | % | | | 3.27 | % |
Supplemental Data: | | | | | | | | | | | | | | | | | | | | |
Net assets, end of year (000) | | $ | 47,700 | | | $ | 592,262 | | | $ | 524,463 | | | $ | 537,709 | | | $ | 517,659 | |
Portfolio turnover | | | 64 | % | | | 63 | % | | | 66 | % | | | 70 | % | | | 63 | % |
| | | | |
| | | Low Duration
Bond T
Shares(1) | |
| | | For the Period
from March 1,
2013* to
December 31,
2013 | |
Net Asset Value, beginning of year | | $ | 10.20 | |
Income from investment operations: | | | | |
Net investment income | | | 0.12 | ^ |
Net realized and unrealized loss | | | (0.06 | ) |
| | | | |
Total from investment operations | | | 0.06 | |
| | | | |
Less distributions: | | | | |
Net investment income | | | (0.11 | ) |
Realized gains | | | (0.03 | ) |
| | | | |
Total distributions | | | (0.14 | ) |
| | | | |
Net Asset Value, end of year | | $ | 10.12 | |
| | | | |
Total return | | | 0.65 | %†† |
Ratios to Average Net Assets: | | | | |
Expenses | | | 0.39 | %† |
Net investment income | | | 1.43 | %† |
Supplemental Data: | | | | |
Net assets, end of year (000) | | $ | 554,556 | |
Portfolio turnover | | | 64 | %†† |
| (1) | Formerly Short-Term Bond Fund. |
| * | Commencement of operations |
| ^ | Calculated based upon average shares outstanding. |
See Notes to Financial Statements
118
THE VANTAGEPOINT FUNDS
Financial Highlights
(For a share outstanding throughout each period)
| | | | | | | | | | | | | | | | | | | | |
| | | Inflation Protected Securities Investor Shares(1) | |
| | | For the Year Ended December 31, | |
| | | 2013 | | | 2012 | | | 2011 | | | 2010 | | | 2009 | |
Net Asset Value, beginning of year | | $ | 11.86 | | | $ | 11.68 | | | $ | 10.99 | | | $ | 10.72 | | | $ | 9.88 | |
Income from investment operations: | | | | | | | | | | | | | | | | | | | | |
Net investment income (loss) | | | (0.31 | )^ | | | 0.17 | | | | 0.34 | | | | 0.19 | | | | 0.11 | |
Net realized and unrealized gain (loss) | | | (0.76 | ) | | | 0.62 | | | | 0.91 | | | | 0.44 | | | | 0.85 | |
| | | | | | | | | | | | | | | | | | | | |
Total from investment operations | | | (1.07 | ) | | | 0.79 | | | | 1.25 | | | | 0.63 | | | | 0.96 | |
| | | | | | | | | | | | | | | | | | | | |
Less distributions: | | | | | | | | | | | | | | | | | | | | |
Net investment income | | | (0.07 | ) | | | (0.17 | ) | | | (0.36 | ) | | | (0.19 | ) | | | (0.12 | ) |
Realized gains | | | (0.23 | ) | | | (0.44 | ) | | | (0.20 | ) | | | (0.17 | ) | | | — | |
| | | | | | | | | | | | | | | | | | | | |
Total distributions | | | (0.30 | ) | | | (0.61 | ) | | | (0.56 | ) | | | (0.36 | ) | | | (0.12 | ) |
| | | | | | | | | | | | | | | | | | | | |
Net Asset Value, end of year | | $ | 10.49 | | | $ | 11.86 | | | $ | 11.68 | | | $ | 10.99 | | | $ | 10.72 | |
| | | | | | | | | | | | | | | | | | | | |
Total return | | | (9.05 | )% | | | 6.84 | % | | | 11.53 | % | | | 5.95 | % | | | 9.75 | % |
Ratios to Average Net Assets: | | | | | | | | | | | | | | | | | | | | |
Expenses | | | 0.64 | % | | | 0.63 | % | | | 0.64 | % | | | 0.65 | % | | | 0.67 | % |
Net investment income (loss) | | | (2.67 | )% | | | 1.39 | % | | | 2.94 | % | | | 1.73 | % | | | 1.13 | % |
Supplemental Data: | | | | | | | | | | | | | | | | | | | | |
Net assets, end of year (000) | | $ | 28,441 | | | $ | 669,336 | | | $ | 584,191 | | | $ | 492,002 | | | $ | 338,790 | |
Portfolio turnover | | | 57 | % | | | 73 | % | | | 109 | % | | | 97 | % | | | 105 | % |
| | | | |
| | | Inflation
Protected
Securities T
Shares(1) | |
| | | For the Period
from March 1,
2013* to
December 31,
2013 | |
Net Asset Value, beginning of year | | $ | 11.78 | |
Income from investment operations: | | | | |
Net investment income | | | 0.14 | ^ |
Net realized and unrealized loss | | | (1.10 | ) |
| | | | |
Total from investment operations | | | (0.96 | ) |
| | | | |
Less distributions: | | | | |
Net investment income | | | (0.09 | ) |
Realized gains | | | (0.23 | ) |
| | | | |
Total distributions | | | (0.32 | ) |
| | | | |
Net Asset Value, end of year | | $ | 10.50 | |
| | | | |
Total return | | | (8.19 | )%†† |
Ratios to Average Net Assets: | | | | |
Expenses | | | 0.40 | %† |
Net investment income | | | 1.46 | %† |
Supplemental Data: | | | | |
Net assets, end of year (000) | | $ | 554,377 | |
Portfolio turnover | | | 57 | %†† |
| (1) | Formerly US Government Securities Fund. |
| ^ | Calculated based upon average shares outstanding. |
| * | Commencement of operations |
See Notes to Financial Statements
119
THE VANTAGEPOINT FUNDS
Financial Highlights
(For a share outstanding throughout each period)
| | | | | | | | | | | | | | | | | | | | |
| | | Equity Income Investor Shares | |
| | | For the Year Ended December 31, | |
| | | 2013 | | | 2012 | | | 2011 | | | 2010 | | | 2009 | |
Net Asset Value, beginning of year | | $ | 9.01 | | | $ | 8.27 | | | $ | 8.64 | | | $ | 7.70 | | | $ | 5.79 | |
Income from investment operations: | | | | | | | | | | | | | | | | | | | | |
Net investment income | | | 0.16 | ^ | | | 0.15 | | | | 0.12 | | | | 0.08 | | | | 0.09 | |
Net realized and unrealized gain (loss) | | | 2.63 | | | | 1.03 | | | | (0.13 | ) | | | 0.94 | | | | 1.95 | |
| | | | | | | | | | | | | | | | | | | | |
Total from investment operations | | | 2.79 | | | | 1.18 | | | | (0.01 | ) | | | 1.02 | | | | 2.04 | |
| | | | | | | | | | | | | | | | | | | | |
Less distributions: | | | | | | | | | | | | | | | | | | | | |
Net investment income | | | (0.14 | ) | | | (0.16 | ) | | | (0.22 | ) | | | (0.08 | ) | | | (0.13 | ) |
Realized gains | | | (0.56 | ) | | | (0.28 | ) | | | (0.14 | ) | | | — | | | | — | |
| | | | | | | | | | | | | | | | | | | | |
Total distributions | | | (0.70 | ) | | | (0.44 | ) | | | (0.36 | ) | | | (0.08 | ) | | | (0.13 | ) |
| | | | | | | | | | | | | | | | | | | | |
Net Asset Value, end of year | | $ | 11.10 | | | $ | 9.01 | | | $ | 8.27 | | | $ | 8.64 | | | $ | 7.70 | |
| | | | | | | | | | | | | | | | | | | | |
Total return | | | 31.11 | % | | | 14.33 | % | | | 0.04 | % | | | 13.28 | % | | | 35.28 | % |
Ratios to Average Net Assets: | | | | | | | | | | | | | | | | | | | | |
Expenses before reimbursements/waivers | | | 0.81 | % | | | 0.82 | % | | | 0.84 | % | | | 0.85 | % | | | 0.88 | % |
Expenses net of reimbursements/waivers, if any | | | 0.81 | % | | | 0.82 | % | | | 0.83 | % | | | 0.85 | % | | | 0.88 | % |
Net investment income before reimbursements/waivers | | | 1.69 | % | | | 1.64 | % | | | 1.32 | % | | | 1.19 | % | | | 1.49 | % |
Net investment income net of reimbursements/waivers, if any | | | 1.69 | % | | | 1.64 | % | | | 1.32 | % | | | 1.19 | % | | | 1.49 | % |
Supplemental Data: | | | | | | | | | | | | | | | | | | | | |
Net assets, end of year (000) | | $ | 60,614 | | | $ | 2,020,305 | | | $ | 1,817,557 | | | $ | 1,867,505 | | | $ | 1,516,199 | |
Portfolio turnover | | | 18 | % | | | 15 | % | | | 18 | % | | | 18 | % | | | 22 | % |
| | | | |
| | | Equity Income
T Shares | |
| | | For the Period
from March 1,
2013* to
December 31,
2013 | |
Net Asset Value, beginning of year | | $ | 9.62 | |
Income from investment operations: | | | | |
Net investment income | | | 0.13 | ^ |
Net realized and unrealized gain | | | 2.08 | |
| | | | |
Total from investment operations | | | 2.21 | |
| | | | |
Less distributions: | | | | |
Net investment income | | | (0.17 | ) |
Realized gains | | | (0.56 | ) |
| | | | |
Total distributions | | | (0.73 | ) |
| | | | |
Net Asset Value, end of year | | $ | 11.10 | |
| | | | |
Total return | | | 23.03 | %†† |
Ratios to Average Net Assets: | | | | |
Expenses before reimbursements/waivers | | | 0.57 | %† |
Expenses net of reimbursements/waivers, if any | | | 0.57 | %† |
Net investment income before reimbursements/waivers | | | 1.41 | %† |
Net investment income net of reimbursements/waivers, if any | | | 1.41 | %† |
Supplemental Data: | | | | |
Net assets, end of year (000) | | $ | 2,426,828 | |
Portfolio turnover | | | 18 | %†† |
| ^ | Calculated based upon average shares outstanding. |
| * | Commencement of operations |
See Notes to Financial Statements
120
THE VANTAGEPOINT FUNDS
Financial Highlights
(For a share outstanding throughout each period)
| | | | | | | | | | | | | | | | | | | | |
| | | Growth & Income Investor Shares | |
| | | For the Year Ended December 31, | |
| | | 2013 | | | 2012 | | | 2011 | | | 2010 | | | 2009 | |
Net Asset Value, beginning of year | | $ | 10.71 | | | $ | 9.49 | | | $ | 9.67 | | | $ | 8.49 | | | $ | 6.43 | |
Income from investment operations: | | | | | | | | | | | | | | | | | | | | |
Net investment income | | | 0.11 | ^ | | | 0.14 | | | | 0.11 | | | | 0.08 | | | | 0.10 | |
Net realized and unrealized gain (loss) | | | 3.51 | | | | 1.42 | | | | (0.18 | ) | | | 1.18 | | | | 2.06 | |
| | | | | | | | | | | | | | | | | | | | |
Total from investment operations | | | 3.62 | | | | 1.56 | | | | (0.07 | ) | | | 1.26 | | | | 2.16 | |
| | | | | | | | | | | | | | | | | | | | |
Less distributions: | | | | | | | | | | | | | | | | | | | | |
Net investment income | | | (0.13 | ) | | | (0.18 | ) | | | (0.11 | ) | | | (0.08 | ) | | | (0.10 | ) |
Realized gains | | | (0.98 | ) | | | (0.16 | ) | | | — | | | | — | | | | — | |
| | | | | | | | | | | | | | | | | | | | |
Total distributions | | | (1.11 | ) | | | (0.34 | ) | | | (0.11 | ) | | | (0.08 | ) | | | (0.10 | ) |
| | | | | | | | | | | | | | | | | | | | |
Net Asset Value, end of year | | $ | 13.22 | | | $ | 10.71 | | | $ | 9.49 | | | $ | 9.67 | | | $ | 8.49 | |
| | | | | | | | | | | | | | | | | | | | |
Total return | | | 34.01 | % | | | 16.53 | % | | | (0.69 | )% | | | 14.81 | % | | | 33.61 | % |
Ratios to Average Net Assets: | | | | | | | | | | | | | | | | | | | | |
Expenses before reimbursements/waivers | | | 0.78 | % | | | 0.78 | % | | | 0.78 | % | | | 0.79 | % | | | 0.82 | % |
Expenses net of reimbursements/waivers, if any | | | 0.78 | % | | | 0.78 | % | | | 0.78 | % | | | 0.79 | % | | | 0.81 | % |
Net investment income before reimbursements/waivers | | | 0.93 | % | | | 1.32 | % | | | 1.12 | % | | | 0.91 | % | | | 1.39 | % |
Net investment income net of reimbursements/waivers, if any | | | 0.93 | % | | | 1.32 | % | | | 1.12 | % | | | 0.91 | % | | | 1.39 | % |
Supplemental Data: | | | | | | | | | | | | | | | | | | | | |
Net assets, end of year (000) | | $ | 39,944 | | | $ | 1,305,504 | | | $ | 1,162,482 | | | $ | 1,228,122 | | | $ | 1,023,636 | |
Portfolio turnover | | | 35 | % | | | 25 | % | | | 40 | % | | | 46 | % | | | 111 | % |
| | | | |
| | | Growth &
Income
T Shares | |
| | | For the Period
from March 1,
2013* to
December 31,
2013 | |
Net Asset Value, beginning of year | | $ | 11.44 | |
Income from investment operations: | | | | |
Net investment income | | | 0.13 | ^ |
Net realized and unrealized gain | | | 2.79 | |
| | | | |
Total from investment operations | | | 2.92 | |
| | | | |
Less distributions: | | | | |
Net investment income | | | (0.16 | ) |
Realized gains | | | (0.98 | ) |
| | | | |
Total distributions | | | (1.14 | ) |
| | | | |
Net Asset Value, end of year | | $ | 13.22 | |
| | | | |
Total return | | | 25.69 | %†† |
Ratios to Average Net Assets: | | | | |
Expenses before reimbursements/waivers | | | 0.54 | %† |
Expenses net of reimbursements/waivers, if any | | | 0.53 | %† |
Net investment income before reimbursements/waivers | | | 1.18 | %† |
Net investment income net of reimbursements/waivers, if any | | | 1.18 | %† |
Supplemental Data: | | | | |
Net assets, end of year (000) | | $ | 1,696,122 | |
Portfolio turnover | | | 35 | %†† |
| ^ | Calculated based upon average shares outstanding. |
| * | Commencement of operations |
See Notes to Financial Statements
121
THE VANTAGEPOINT FUNDS
Financial Highlights
(For a share outstanding throughout each period)
| | | | | | | | | | | | | | | | | | | | |
| | | Growth Investor Shares | |
| | | For the Year Ended December 31, | |
| | | 2013 | | | 2012 | | | 2011 | | | 2010 | | | 2009 | |
Net Asset Value, beginning of year | | $ | 9.53 | | | $ | 8.36 | | | $ | 8.78 | | | $ | 7.70 | | | $ | 5.91 | |
Income from investment operations: | | | | | | | | | | | | | | | | | | | | |
Net investment income | | | 0.03 | ^ | | | 0.05 | | | | 0.04 | | | | 0.05 | | | | 0.04 | |
Net realized and unrealized gain (loss) | | | 3.18 | | | | 1.18 | | | | (0.42 | ) | | | 1.09 | | | | 1.79 | |
| | | | | | | | | | | | | | | | | | | | |
Total from investment operations | | | 3.21 | | | | 1.23 | | | | (0.38 | ) | | | 1.14 | | | | 1.83 | |
| | | | | | | | | | | | | | | | | | | | |
Less distributions: | | | | | | | | | | | | | | | | | | | | |
Net investment income | | | (0.04 | ) | | | (0.06 | ) | | | (0.04 | ) | | | (0.06 | ) | | | (0.04 | ) |
Realized gains | | | — | | | | — | | | | — | | | | — | | | | — | |
| | | | | | | | | | | | | | | | | | | | |
Total distributions | | | (0.04 | ) | | | (0.06 | ) | | | (0.04 | ) | | | (0.06 | ) | | | (0.04 | ) |
| | | | | | | | | | | | | | | | | | | | |
Net Asset Value, end of year | | $ | 12.70 | ** | | $ | 9.53 | | | $ | 8.36 | | | $ | 8.78 | | | $ | 7.70 | |
| | | | | | | | | | | | | | | | | | | | |
Total return | | | 33.71 | %** | | | 14.67 | % | | | (4.27 | )% | | | 14.76 | % | | | 31.02 | % |
Ratios to Average Net Assets: | | | | | | | | | | | | | | | | | | | | |
Expenses before reimbursements/waivers | | | 0.77 | % | | | 0.78 | % | | | 0.83 | % | | | 0.86 | % | | | 0.86 | % |
Expenses net of reimbursements/waivers, if any | | | 0.77 | % | | | 0.78 | % | | | 0.81 | % | | | 0.84 | % | | | 0.84 | % |
Net Investment Income before reimbursements/waivers | | | 0.33 | % | | | 0.57 | % | | | 0.47 | % | | | 0.64 | % | | | 0.64 | % |
Net Investment Income net of reimbursements/waivers, if any | | | 0.33 | % | | | 0.57 | % | | | 0.49 | % | | | 0.66 | % | | | 0.66 | % |
Supplemental Data: | | | | | | | | | | | | | | | | | | | | |
Net assets, end of year (000) | | $ | 31,157 | | | $ | 1,880,929 | | | $ | 1,751,075 | | | $ | 1,971,807 | | | $ | 1,814,533 | |
Portfolio turnover | | | 53 | % | | | 87 | % | | | 70 | % | | | 117 | % | | | 89 | % |
| | | | |
| | | Growth
T Shares | |
| | | For the Period
from March 1,
2013* to
December 31,
2013 | |
Net Asset Value, beginning of year | | $ | 10.07 | |
Income from investment operations: | | | | |
Net investment income | | | 0.06 | ^ |
Net realized and unrealized gain | | | 2.64 | |
| | | | |
Total from investment operations | | | 2.70 | |
| | | | |
Less distributions: | | | | |
Net investment income | | | (0.06 | ) |
Realized gains | | | — | |
| | | | |
Total distributions | | | (0.06 | ) |
| | | | |
Net Asset Value, end of year | | $ | 12.71 | |
| | | | |
Total return | | | 26.87 | %†† |
Ratios to Average Net Assets: | | | | |
Expenses | | | 0.53 | %† |
Net investment income | | | 0.60 | %† |
Supplemental Data: | | | | |
Net assets, end of year (000) | | $ | 2,294,323 | |
Portfolio turnover | | | 53 | %†† |
| ^ | Calculated based upon average shares outstanding. |
| * | Commencement of operations |
| ** | Financial reporting includes trade date activity as of December 31, 2013. The inclusion of this activity caused the Fund’s NAV to round down to $12.70 (the adjusted price) from $12.71 (the stated price for December 31, 2013, prior to the inclusion of that day’s activity). |
See Notes to Financial Statements
122
THE VANTAGEPOINT FUNDS
Financial Highlights
(For a share outstanding throughout each period)
| | | | | | | | | | | | | | | | | | | | |
| | | Select Value Investor Shares | |
| | | For the Year Ended December 31, | |
| | | 2013 | | | 2012 | | | 2011 | | | 2010 | | | 2009 | |
Net Asset Value, beginning of year | | $ | 10.95 | | | $ | 9.73 | | | $ | 9.84 | | | $ | 8.25 | | | $ | 6.07 | |
Income from investment operations: | | | | | | | | | | | | | | | | | | | | |
Net investment income | | | 0.10 | ^ | | | 0.19 | | | | 0.10 | | | | 0.09 | | | | 0.10 | |
Net realized and unrealized gain (loss) | | | 3.67 | | | | 1.42 | | | | (0.12 | ) | | | 1.59 | | | | 2.14 | |
| | | | | | | | | | | | | | | | | | | | |
Total from investment operations | | | 3.77 | | | | 1.61 | | | | (0.02 | ) | | | 1.68 | | | | 2.24 | |
| | | | | | | | | | | | | | | | | | | | |
Less distributions: | | | | | | | | | | | | | | | | | | | | |
Net investment income | | | (0.13 | ) | | | (0.18 | ) | | | (0.09 | ) | | | (0.09 | ) | | | (0.06 | ) |
Realized gains | | | (1.73 | ) | | | (0.21 | ) | | | — | | | | — | | | | — | |
| | | | | | | | | | | | | | | | | | | | |
Total distributions | | | (1.86 | ) | | | (0.39 | ) | | | (0.09 | ) | | | (0.09 | ) | | | (0.06 | ) |
| | | | | | | | | | | | | | | | | | | | |
Net Asset Value, end of year | | $ | 12.86 | | | $ | 10.95 | | | $ | 9.73 | | | $ | 9.84 | | | $ | 8.25 | |
| | | | | | | | | | | | | | | | | | | | |
Total return | | | 34.65 | % | | | 16.55 | % | | | (0.16 | )% | | | 20.34 | % | | | 36.99 | % |
Ratios to Average Net Assets: | | | | | | | | | | | | | | | | | | | | |
Expenses | | | 0.98 | % | | | 0.99 | % | | | 0.99 | % | | | 1.00 | % | | | 1.04 | % |
Net investment income | | | 0.84 | % | | | 1.73 | % | | | 0.96 | % | | | 1.01 | % | | | 1.42 | % |
Supplemental Data: | | | | | | | | | | | | | | | | | | | | |
Net assets, end of year (000) | | $ | 9,120 | | | $ | 355,590 | | | $ | 320,019 | | | $ | 338,336 | | | $ | 295,800 | |
Portfolio turnover | | | 77 | % | | | 51 | % | | | 60 | % | | | 68 | % | | | 85 | % |
| | | | |
| | | Select Value
T Shares | |
| | | For the Period
from March 1,
2013* to
December 31,
2013 | |
Net Asset Value, beginning of year | | $ | 12.00 | |
Income from investment operations: | | | | |
Net investment income | | | 0.15 | ^ |
Net realized and unrealized gain | | | 2.60 | |
| | | | |
Total from investment operations | | | 2.75 | |
| | | | |
Less distributions: | | | | |
Net investment income | | | (0.15 | ) |
Realized gains | | | (1.73 | ) |
| | | | |
Total distributions | | | (1.88 | ) |
| | | | |
Net Asset Value, end of year | | $ | 12.87 | |
| | | | |
Total return | | | 23.15 | %†† |
Ratios to Average Net Assets: | | | | |
Expenses | | | 0.73 | %† |
Net investment income | | | 1.34 | %† |
Supplemental Data: | | | | |
Net assets, end of year (000) | | $ | 467,616 | |
Portfolio turnover | | | 77 | %†† |
| ^ | Calculated based upon average shares outstanding. |
| * | Commencement of operations |
See Notes to Financial Statements
123
THE VANTAGEPOINT FUNDS
Financial Highlights
(For a share outstanding throughout each period)
| | | | | | | | | | | | | | | | | | | | |
| | | Aggressive Opportunities Investor Shares | |
| | | For the Year Ended December 31, | |
| | | 2013 | | | 2012 | | | 2011 | | | 2010 | | | 2009 | |
Net Asset Value, beginning of year | | $ | 10.20 | | | $ | 9.26 | | | $ | 11.34 | | | $ | 9.52 | | | $ | 6.32 | |
Income from investment operations: | | | | | | | | | | | | | | | | | | | | |
Net investment income | | | 0.00 | #^ | | | 0.07 | | | | 0.03 | | | | 0.01 | | | | 0.00 | # |
Net realized and unrealized gain (loss) | | | 3.90 | | | | 1.35 | | | | (1.23 | ) | | | 1.81 | | | | 3.22 | |
| | | | | | | | | | | | | | | | | | | | |
Total from investment operations | | | 3.90 | | | | 1.42 | | | | (1.20 | ) | | | 1.82 | | | | 3.22 | |
| | | | | | | | | | | | | | | | | | | | |
Less distributions: | | | | | | | | | | | | | | | | | | | | |
Net investment income | | | (0.04 | ) | | | (0.02 | ) | | | (0.04 | ) | | | — | | | | (0.02 | ) |
Realized gains | | | (1.21 | ) | | | (0.46 | ) | | | (0.84 | ) | | | — | | | | — | |
| | | | | | | | | | | | | | | | | | | | |
Total distributions | | | (1.25 | ) | | | (0.48 | ) | | | (0.88 | ) | | | — | | | | (0.02 | ) |
| | | | | | | | | | | | | | | | | | | | |
Net Asset Value, end of year | | $ | 12.85 | | | $ | 10.20 | | | $ | 9.26 | | | $ | 11.34 | | | $ | 9.52 | |
| | | | | | | | | | | | | | | | | | | | |
Total return | | | 38.53 | % | | | 15.44 | % | | | (10.42 | )% | | | 19.12 | % | | | 50.95 | % |
Ratios to Average Net Assets: | | | | | | | | | | | | | | | | | | | | |
Expenses before reimbursements/waivers | | | 0.82 | % | | | 0.90 | % | | | 0.91 | % | | | 0.93 | % | | | 0.99 | % |
Expenses net of reimbursements/waivers, if any | | | 0.82 | % | | | 0.90 | % | | | 0.91 | % | | | 0.93 | % | | | 0.98 | % |
Net investment income (loss) before reimbursements/waivers | | | 0.00 | %** | | | 0.61 | % | | | 0.21 | % | | | 0.05 | % | | | (0.02 | )% |
Net investment income (loss) net of reimbursements/waivers, if any | | | 0.00 | %** | | | 0.61 | % | | | 0.21 | % | | | 0.05 | % | | | (0.02 | )% |
Supplemental Data: | | | | | | | | | | | | | | | | | | | | |
Net assets, end of year (000) | | $ | 32,513 | | | $ | 993,729 | | | $ | 957,271 | | | $ | 1,147,570 | | | $ | 1,010,098 | |
Portfolio turnover | | | 51 | % | | | 94 | % | | | 53 | % | | | 96 | % | | | 53 | % |
| | | | |
| | | Aggressive
Opportunities
T Shares | |
| | | For the Period
from March 1,
2013* to
December 31,
2013 | |
Net Asset Value, beginning of year | | $ | 11.04 | |
Income from investment operations: | | | | |
Net investment income | | | 0.04 | ^ |
Net realized and unrealized gain | | | 3.05 | |
| | | | |
Total from investment operations | | | 3.09 | |
| | | | |
Less distributions: | | | | |
Net investment income | | | (0.07 | ) |
Realized gains | | | (1.21 | ) |
| | | | |
Total distributions | | | (1.28 | ) |
| | | | |
Net Asset Value, end of year | | $ | 12.85 | |
| | | | |
Total return | | | 28.23 | %†† |
Ratios to Average Net Assets: | | | | |
Expenses | | | 0.59 | %† |
Net investment income | | | 0.42 | %† |
Supplemental Data: | | | | |
Net assets, end of year (000) | | $ | 1,210,202 | |
Portfolio turnover | | | 51 | %†† |
| ^ | Calculated based upon average shares outstanding. |
| * | Commencement of operations |
| ** | Rounds to less than 0.01% |
| # | Rounds to less than $0.01 |
See Notes to Financial Statements
124
THE VANTAGEPOINT FUNDS
Financial Highlights
(For a share outstanding throughout each period)
| | | | | | | | | | | | | | | | | | | | |
| | | Discovery Investor Shares | |
| | | For the Year Ended December 31, | |
| | | 2013 | | | 2012 | | | 2011 | | | 2010 | | | 2009 | |
Net Asset Value, beginning of year | | $ | 9.48 | | | $ | 8.74 | | | $ | 9.42 | | | $ | 7.54 | | | $ | 5.46 | |
Income from investment operations: | | | | | | | | | | | | | | | | | | | | |
Net investment income | | | 0.08 | ^ | | | 0.12 | | | | 0.10 | | | | 0.08 | | | | 0.08 | |
Net realized and unrealized gain (loss) | | | 3.61 | | | | 1.25 | | | | (0.68 | ) | | | 1.89 | | | | 2.07 | |
| | | | | | | | | | | | | | | | | | | | |
Total from investment operations | | | 3.69 | | | | 1.37 | | | | (0.58 | ) | | | 1.97 | | | | 2.15 | |
| | | | | | | | | | | | | | | | | | | | |
Less distributions: | | | | | | | | | | | | | | | | | | | | |
Net investment income | | | (0.09 | ) | | | (0.16 | ) | | | (0.10 | ) | | | (0.09 | ) | | | (0.07 | ) |
Realized gains | | | (2.22 | ) | | | (0.47 | ) | | | — | | | | — | | | | — | |
| | | | | | | | | | | | | | | | | | | | |
Total distributions | | | (2.31 | ) | | | (0.63 | ) | | | (0.10 | ) | | | (0.09 | ) | | | (0.07 | ) |
| | | | | | | | | | | | | | | | | | | | |
Net Asset Value, end of year | | $ | 10.86 | | | $ | 9.48 | | | $ | 8.74 | | | $ | 9.42 | | | $ | 7.54 | |
| | | | | | | | | | | | | | | | | | | | |
Total return | | | 39.34 | % | | | 15.74 | % | | | (6.15 | )% | | | 26.08 | % | | | 39.32 | % |
Ratios to Average Net Assets: | | | | | | | | | | | | | | | | | | | | |
Expenses | | | 0.97 | % | | | 0.97 | % | | | 0.95 | % | | | 0.98 | % | | | 0.99 | % |
Net investment income | | | 0.79 | % | | | 1.25 | % | | | 1.05 | % | | | 0.97 | % | | | 1.35 | % |
Supplemental Data: | | | | | | | | | | | | | | | | | | | | |
Net assets, end of year (000) | | $ | 3,742 | | | $ | 212,873 | | | $ | 193,872 | | | $ | 212,770 | | | $ | 178,174 | |
Portfolio turnover | | | 77 | % | | | 81 | % | | | 86 | % | | | 73 | % | | | 85 | % |
| | | | |
| | | Discovery
T Shares | |
| | | For the Period
from March 1,
2013* to
December 31,
2013 | |
Net Asset Value, beginning of year | | $ | 10.27 | |
Income from investment operations: | | | | |
Net investment income | | | 0.10 | ^ |
Net realized and unrealized gain | | | 2.82 | |
| | | | |
Total from investment operations | | | 2.92 | |
| | | | |
Less distributions: | | | | |
Net investment income | | | (0.11 | ) |
Realized gains | | | (2.22 | ) |
| | | | |
Total distributions | | | (2.33 | ) |
| | | | |
Net Asset Value, end of year | | $ | 10.86 | |
| | | | |
Total return | | | 28.84 | %†† |
Ratios to Average Net Assets: | | | | |
Expenses | | | 0.71 | %† |
Net investment income | | | 1.00 | %† |
Supplemental Data: | | | | |
Net assets, end of year (000) | | $ | 275,107 | |
Portfolio turnover | | | 77 | %†† |
| ^ | Calculated based upon average shares outstanding. |
| * | Commencement of operations |
See Notes to Financial Statements
125
THE VANTAGEPOINT FUNDS
Financial Highlights
(For a share outstanding throughout each period)
| | | | | | | | | | | | | | | | | | | | |
| | | International Investor Shares | |
| | | For the Year Ended December 31, | |
| | | 2013 | | | 2012 | | | 2011 | | | 2010 | | | 2009 | |
Net Asset Value, beginning of year | | $ | 9.63 | | | $ | 8.32 | | | $ | 9.34 | | | $ | 8.85 | | | $ | 6.94 | |
Income from investment operations: | | | | | | | | | | | | | | | | | | | | |
Net investment income | | | 0.06 | ^ | | | 0.22 | | | | 0.20 | | | | 0.15 | | | | 0.12 | |
Net realized and unrealized gain (loss) | | | 1.61 | | | | 1.32 | | | | (1.01 | ) | | | 0.52 | | | | 1.96 | |
| | | | | | | | | | | | | | | | | | | | |
Total from investment operations | | | 1.67 | | | | 1.54 | | | | (0.81 | ) | | | 0.67 | | | | 2.08 | |
| | | | | | | | | | | | | | | | | | | | |
Less distributions: | | | | | | | | | | | | | | | | | | | | |
Net investment income | | | (0.22 | ) | | | (0.23 | ) | | | (0.21 | ) | | | (0.18 | ) | | | (0.17 | ) |
Realized gains | | | — | | | | — | | | | — | | | | — | | | | — | |
| | | | | | | | | | | | | | | | | | | | |
Total distributions | | | (0.22 | ) | | | (0.23 | ) | | | (0.21 | ) | | | (0.18 | ) | | | (0.17 | ) |
| | | | | | | | | | | | | | | | | | | | |
Net Asset Value, end of year | | $ | 11.08 | ** | | $ | 9.63 | | | $ | 8.32 | | | $ | 9.34 | | | $ | 8.85 | |
| | | | | | | | | | | | | | | | | | | | |
Total return | | | 17.43 | %** | | | 18.57 | % | | | (8.57 | )% | | | 7.61 | % | | | 29.97 | % |
Ratios to Average Net Assets: | | | | | | | | | | | | | | | | | | | | |
Expenses before reimbursements/waivers | | | 0.97 | % | | | 0.98 | % | | | 0.97 | % | | | 0.98 | % | | | 1.05 | % |
Expenses net of reimbursements/waivers, if any | | | 0.97 | % | | | 0.98 | % | | | 0.95 | % | | | 0.98 | % | | | 1.05 | % |
Net Investment Income before reimbursements/waivers | | | 0.61 | % | | | 2.32 | % | | | 2.25 | % | | | 1.95 | % | | | 1.70 | % |
Net Investment Income net of reimbursements/waivers, if any | | | 0.61 | % | | | 2.32 | % | | | 2.26 | % | | | 1.95 | % | | | 1.70 | % |
Supplemental Data: | | | | | | | | | | | | | | | | | | | | |
Net assets, end of year (000) | | $ | 16,440 | | | $ | 1,305,510 | | | $ | 1,139,964 | | | $ | 1,218,763 | | | $ | 1,015,627 | |
Portfolio turnover | | | 51 | % | | | 49 | % | | | 50 | % | | | 53 | % | | | 164 | % |
| | | | |
| | | International
T Shares | |
| | | For the Period
from March 1,
2013* to
December 31,
2013 | |
Net Asset Value, beginning of year | | $ | 9.85 | |
Income from investment operations: | | | | |
Net investment income | | | 0.21 | ^ |
Net realized and unrealized gain | | | 1.28 | |
| | | | |
Total from investment operations | | | 1.49 | |
| | | | |
Less distributions: | | | | |
Net investment income | | | (0.25 | ) |
Realized gains | | | — | |
| | | | |
Total distributions | | | (0.25 | ) |
| | | | |
Net Asset Value, end of year | | $ | 11.09 | |
| | | | |
Total return | | | 15.14 | %†† |
Ratios to Average Net Assets: | | | | |
Expenses | | | 0.75 | %† |
Net investment income | | | 2.38 | %† |
Supplemental Data: | | | | |
Net assets, end of year (000) | | $ | 1,418,996 | |
Portfolio turnover | | | 51 | %†† |
| ^ | Calculated based upon average shares outstanding. |
| * | Commencement of operations |
| ** | Financial reporting includes trade date activity as of December 31, 2013. The inclusion of this activity caused the Fund’s NAV to round down to $11.08 (the adjusted price) from $11.09 (the stated price for December 31, 2013, prior to the inclusion of that day’s activity). |
See Notes to Financial Statements
126
THE VANTAGEPOINT FUNDS
Financial Highlights
(For a share outstanding throughout each period)
| | | | | | | | | | | | | | | | | | | | |
| | | Diversifying Strategies T Shares(1) | |
| | | For the Year Ended December 31, | |
| | | 2013 | | | 2012 | | | 2011 | | | 2010 | | | 2009 | |
Net Asset Value, beginning of year | | $ | 10.16 | | | $ | 10.01 | | | $ | 10.16 | | | $ | 9.85 | | | $ | 9.28 | |
Income from investment operations: | | | | | | | | | | | | | | | | | | | | |
Net investment income | | | 0.12 | ^ | | | 0.12 | | | | 0.10 | | | | 0.06 | | | | 0.09 | |
Net realized and unrealized gain (loss) | | | 0.47 | | | | 0.23 | | | | (0.09 | ) | | | 0.44 | | | | 0.53 | |
| | | | | | | | | | | | | | | | | | | | |
Total from investment operations | | | 0.59 | | | | 0.35 | | | | 0.01 | | | | 0.50 | | | | 0.62 | |
| | | | | | | | | | | | | | | | | | | | |
Less distributions: | | | | | | | | | | | | | | | | | | | | |
Net investment income | | | (0.19 | ) | | | (0.17 | ) | | | (0.02 | ) | | | (0.19 | ) | | | (0.05 | ) |
Realized gains | | | (0.13 | ) | | | (0.03 | ) | | | (0.14 | ) | | | — | | | | — | |
| | | | | | | | | | | | | | | | | | | | |
Total distributions | | | (0.32 | ) | | | (0.20 | ) | | | (0.16 | ) | | | (0.19 | ) | | | (0.05 | ) |
| | | | | | | | | | | | | | | | | | | | |
Net Asset Value, end of year | | $ | 10.43 | | | $ | 10.16 | | | $ | 10.01 | | | $ | 10.16 | | | $ | 9.85 | |
| | | | | | | | | | | | | | | | | | | | |
Total return | | | 5.81 | % | | | 3.53 | % | | | 0.10 | % | | | 5.04 | % | | | 6.64 | % |
Ratios to Average Net Assets: | | | | | | | | | | | | | | | | | | | | |
Expenses before reimbursements/waivers | | | 0.66 | % | | | 0.89 | % | | | 0.91 | % | | | 0.91 | % | | | 0.96 | % |
Expenses net of reimbursements/waivers, if any | | | 0.59 | % | | | 0.80 | % | | | 0.85 | % | | | 0.91 | % | | | 0.95 | % |
Net Investment Income before reimbursements/waivers | | | 1.13 | % | | | 1.04 | % | | | 0.93 | % | | | 1.06 | % | | | 1.05 | % |
Net Investment Income net of reimbursements/waivers, if any | | | 1.19 | % | | | 1.12 | % | | | 1.00 | % | | | 1.06 | % | | | 1.06 | % |
Supplemental Data: | | | | | | | | | | | | | | | | | | | | |
Net assets, end of year (000) | | $ | 1,093,589 | | | $ | 964,774 | | | $ | 849,777 | | | $ | 870,591 | | | $ | 453,196 | |
Portfolio turnover | | | 70 | % | | | 71 | % | | | 73 | % | | | 63 | % | | | 129 | % |
| ^ | Calculated based upon average shares outstanding. |
| (1) | Formerly Diversified Assets Fund. |
See Notes to Financial Statements
127
THE VANTAGEPOINT FUNDS
Financial Highlights
(For a share outstanding throughout each period)
| | | | | | | | | | | | | | | | | | | | |
| | | Core Bond Index Class I | |
| | | For the Year Ended December 31, | |
| | | 2013 | | | 2012 | | | 2011 | | | 2010 | | | 2009 | |
Net Asset Value, beginning of year | | $ | 10.54 | | | $ | 10.47 | | | $ | 10.10 | | | $ | 9.89 | | | $ | 9.81 | |
Income from investment operations: | | | | | | | | | | | | | | | | | | | | |
Net investment income | | | 0.23 | ^ | | | 0.25 | | | | 0.31 | | | | 0.34 | | | | 0.40 | |
Net realized and unrealized gain (loss) | | | (0.50 | ) | | | 0.14 | | | | 0.42 | | | | 0.26 | | | | 0.13 | |
| | | | | | | | | | | | | | | | | | | | |
Total from investment operations | | | (0.27 | ) | | | 0.39 | | | | 0.73 | | | | 0.60 | | | | 0.53 | |
| | | | | | | | | | | | | | | | | | | | |
Less distributions: | | | | | | | | | | | | | | | | | | | | |
Net investment income | | | (0.27 | ) | | | (0.32 | ) | | | (0.36 | ) | | | (0.39 | ) | | | (0.45 | ) |
Realized gains | | | — | | | | — | | | | — | | | | — | | | | — | |
| | | | | | | | | | | | | | | | | | | | |
Total distributions | | | (0.27 | ) | | | (0.32 | ) | | | (0.36 | ) | | | (0.39 | ) | | | (0.45 | ) |
| | | | | | | | | | | | | | | | | | | | |
Net Asset Value, end of year | | $ | 10.00 | | | $ | 10.54 | | | $ | 10.47 | | | $ | 10.10 | | | $ | 9.89 | |
| | | | | | | | | | | | | | | | | | | | |
Total return | | | (2.62 | )% | | | 3.80 | % | | | 7.41 | % | | | 6.13 | % | | | 5.57 | % |
Ratios to Average Net Assets: | | | | | | | | | | | | | | | | | | | | |
Expenses | | | 0.40 | % | | | 0.41 | % | | | 0.41 | % | | | 0.42 | % | | | 0.42 | % |
Net investment income | | | 2.23 | % | | | 2.38 | % | | | 3.00 | % | | | 3.31 | % | | | 3.99 | % |
Supplemental Data: | | | | | | | | | | | | | | | | | | | | |
Net assets, end of year (000) | | $ | 22,055 | | | $ | 905,486 | | | $ | 813,431 | | | $ | 824,963 | | | $ | 857,504 | |
Portfolio turnover | | | 120 | % | | | 64 | % | | | 57 | % | | | 85 | % | | | 60 | % |
| | | | | | | | | | | | | | | | | | | | |
| | | Core Bond Index Class II | |
| | | For the Year Ended December 31, | |
| | | 2013 | | | 2012 | | | 2011 | | | 2010 | | | 2009 | |
Net Asset Value, beginning of year | | $ | 10.60 | | | $ | 10.53 | | | $ | 10.16 | | | $ | 9.94 | | | $ | 9.86 | |
Income from investment operations: | | | | | | | | | | | | | | | | | | | | |
Net investment income | | | 0.25 | ^ | | | 0.27 | | | | 0.33 | | | | 0.36 | | | | 0.42 | |
Net realized and unrealized gain (loss) | | | (0.50 | ) | | | 0.14 | | | | 0.43 | | | | 0.27 | | | | 0.13 | |
| | | | | | | | | | | | | | | | | | | | |
Total from investment operations | | | (0.25 | ) | | | 0.41 | | | | 0.76 | | | | 0.63 | | | | 0.55 | |
| | | | | | | | | | | | | | | | | | | | |
Less distributions: | | | | | | | | | | | | | | | | | | | | |
Net investment income | | | (0.29 | ) | | | (0.34 | ) | | | (0.39 | ) | | | (0.41 | ) | | | (0.47 | ) |
Realized gains | | | — | | | | — | | | | — | | | | — | | | | — | |
| | | | | | | | | | | | | | | | | | | | |
Total distributions | | | (0.29 | ) | | | (0.34 | ) | | | (0.39 | ) | | | (0.41 | ) | | | (0.47 | ) |
| | | | | | | | | | | | | | | | | | | | |
Net Asset Value, end of year | | $ | 10.06 | | | $ | 10.60 | | | $ | 10.53 | | | $ | 10.16 | | | $ | 9.94 | |
| | | | | | | | | | | | | | | | | | | | |
Total return | | | (2.38 | )% | | | 3.98 | % | | | 7.57 | % | | | 6.41 | % | | | 5.74 | % |
Ratios to Average Net Assets: | | | | | | | | | | | | | | | | | | | | |
Expenses | | | 0.20 | % | | | 0.21 | % | | | 0.21 | % | | | 0.22 | % | | | 0.22 | % |
Net investment income | | | 2.40 | % | | | 2.59 | % | | | 3.15 | % | | | 3.51 | % | | | 4.21 | % |
Supplemental Data: | | | | | | | | | | | | | | | | | | | | |
Net assets, end of year (000) | | $ | 26,490 | | | $ | 337,639 | | | $ | 320,809 | | | $ | 282,359 | | | $ | 238,193 | |
Portfolio turnover | | | 120 | % | | | 64 | % | | | 57 | % | | | 85 | % | | | 60 | % |
| ^ | Calculated based upon average shares outstanding. |
See Notes to Financial Statements
128
THE VANTAGEPOINT FUNDS
Financial Highlights
(For a share outstanding throughout each period)
| | | | |
| | | Core Bond
Index
T Shares | |
| | | For the Period
from March 1,
2013* to
December 31,
2013 | |
Net Asset Value, beginning of year | | $ | 10.46 | |
Income from investment operations: | | | | |
Net investment income | | | 0.19 | ^ |
Net realized and unrealized loss | | | (0.40 | ) |
| | | | |
Total from investment operations | | | (0.21 | ) |
| | | | |
Less distributions: | | | | |
Net investment income | | | (0.25 | ) |
Realized gains | | | — | |
| | | | |
Total distributions | | | (0.25 | ) |
| | | | |
Net Asset Value, end of year | | $ | 10.00 | |
| | | | |
Total return | | | (2.06 | )%†† |
Ratios to Average Net Assets: | | | | |
Expenses before reimbursements/waivers | | | 0.21 | %† |
Expenses net of reimbursements/waivers, if any | | | 0.16 | %† |
Net Investment Income before reimbursements/waivers | | | 2.17 | %† |
Net Investment Income net of reimbursements/waivers, if any | | | 2.22 | %† |
Supplemental Data: | | | | |
Net assets, end of year (000) | | $ | 1,231,000 | |
Portfolio turnover | | | 120 | %†† |
| ^ | Calculated based upon average shares outstanding. |
| * | Commencement of operations |
See Notes to Financial Statements
129
THE VANTAGEPOINT FUNDS
Financial Highlights
(For a share outstanding throughout each period)
| | | | | | | | | | | | | | | | | | | | |
| | | 500 Stock Index Class I | |
| | | For the Year Ended December 31, | |
| | | 2013 | | | 2012 | | | 2011 | | | 2010 | | | 2009 | |
Net Asset Value, beginning of year | | $ | 11.32 | | | $ | 9.96 | | | $ | 9.95 | | | $ | 8.81 | | | $ | 7.12 | |
Income from investment operations: | | | | | | | | | | | | | | | | | | | | |
Net investment income | | | 0.23 | ^ | | | 0.20 | | | | 0.17 | | | | 0.15 | | | | 0.16 | |
Net realized and unrealized gain | | | 3.36 | | | | 1.36 | | | | 0.00 | # | | | 1.13 | | | | 1.70 | |
| | | | | | | | | | | | | | | | | | | | |
Total from investment operations | | | 3.59 | | | | 1.56 | | | | 0.17 | | | | 1.28 | | | | 1.86 | |
| | | | | | | | | | | | | | | | | | | | |
Less distributions: | | | | | | | | | | | | | | | | | | | | |
Net investment income | | | (0.21 | ) | | | (0.20 | ) | | | (0.16 | ) | | | (0.14 | ) | | | (0.17 | ) |
Realized gains | | | (0.04 | ) | | | — | | | | — | | | | — | | | | — | |
| | | | | | | | | | | | | | | | | | | | |
Total distributions | | | (0.25 | ) | | | (0.20 | ) | | | (0.16 | ) | | | (0.14 | ) | | | (0.17 | ) |
| | | | | | | | | | | | | | | | | | | | |
Net Asset Value, end of year | | $ | 14.66 | | | $ | 11.32 | | | $ | 9.96 | | | $ | 9.95 | | | $ | 8.81 | |
| | | | | | | | | | | | | | | | | | | | |
Total return | | | 31.78 | % | | | 15.62 | % | | | 1.72 | % | | | 14.56 | % | | | 26.13 | % |
Ratios to Average Net Assets: | | | | | | | | | | | | | | | | | | | | |
Expenses | | | 0.41 | % | | | 0.42 | % | | | 0.42 | % | | | 0.43 | % | | | 0.44 | % |
Net investment income | | | 1.78 | % | | | 1.89 | % | | | 1.65 | % | | | 1.63 | % | | | 2.19 | % |
Supplemental Data: | | | | | | | | | | | | | | | | | | | | |
Net assets, end of year (000) | | $ | 31,916 | | | $ | 111,410 | | | $ | 94,197 | | | $ | 102,642 | | | $ | 85,772 | |
Portfolio turnover | | | 8 | % | | | 3 | % | | | 3 | % | | | 3 | % | | | 15 | % |
| | | | | | | | | | | | | | | | | | | | |
| | | 500 Stock Index Class II | |
| | | For the Year Ended December 31, | |
| | | 2013 | | | 2012 | | | 2011 | | | 2010 | | | 2009 | |
Net Asset Value, beginning of year | | $ | 10.65 | *** | | $ | 9.39 | | | $ | 9.39 | | | $ | 8.32 | | | $ | 6.73 | |
Income from investment operations: | | | | | | | | | | | | | | | | | | | | |
Net investment income | | | 0.24 | ^ | | | 0.22 | | | | 0.18 | | | | 0.16 | | | | 0.19 | |
Net realized and unrealized gain | | | 3.19 | | | | 1.26 | | | | 0.00 | # | | | 1.07 | | | | 1.58 | |
| | | | | | | | | | | | | | | | | | | | |
Total from investment operations | | | 3.43 | | | | 1.48 | | | | 0.18 | | | | 1.23 | | | | 1.77 | |
| | | | | | | | | | | | | | | | | | | | |
Less distributions: | | | | | | | | | | | | | | | | | | | | |
Net investment income | | | (0.24 | ) | | | (0.22 | ) | | | (0.18 | ) | | | (0.16 | ) | | | (0.18 | ) |
Realized gains | | | (0.04 | ) | | | — | | | | — | | | | — | | | | — | |
| | | | | | | | | | | | | | | | | | | | |
Total distributions | | | (0.28 | ) | | | (0.22 | ) | | | (0.18 | ) | | | (0.16 | ) | | | (0.18 | ) |
| | | | | | | | | | | | | | | | | | | | |
Net Asset Value, end of year | | $ | 13.80 | ** | | $ | 10.65 | *** | | $ | 9.39 | | | $ | 9.39 | | | $ | 8.32 | |
| | | | | | | | | | | | | | | | | | | | |
Total return | | | 32.23 | %** | | | 15.74 | %*** | | | 1.97 | % | | | 14.78 | % | | | 26.35 | % |
Ratios to Average Net Assets: | | | | | | | | | | | | | | | | | | | | |
Expenses | | | 0.21 | % | | | 0.22 | % | | | 0.22 | % | | | 0.23 | % | | | 0.24 | % |
Net investment income | | | 2.12 | % | | | 2.09 | % | | | 1.86 | % | | | 1.84 | % | | | 2.40 | % |
Supplemental Data: | | | | | | | | | | | | | | | | | | | | |
Net assets, end of year (000) | | $ | 2,271 | | | $ | 341,571 | | | $ | 287,072 | | | $ | 281,443 | | | $ | 237,743 | |
Portfolio turnover | | | 8 | % | | | 3 | % | | | 3 | % | | | 3 | % | | | 15 | % |
| ^ | Calculated based upon average shares outstanding. |
| # | Rounds to less than $0.01 |
| ** | Financial reporting includes trade date activity as of December 31, 2013. The inclusion of this activity caused the Fund’s NAV to round up to $13.80 (the adjusted price) from $13.79 (the stated price for December 31, 2013, prior to the inclusion of that day’s activity). |
| *** | Financial reporting includes trade date activity as of December 31, 2012. The inclusion of this activity caused the Fund’s NAV to round down to $10.65 (the adjusted price) from $10.66 (the stated price for December 31, 2012, prior to the inclusion of that day’s activity). |
See Notes to Financial Statements
130
THE VANTAGEPOINT FUNDS
Financial Highlights
(For a share outstanding throughout each period)
| | | | |
| | | 500 Stock
Index T Shares | |
| | | For the Period
from March 1,
2013* to
December 31,
2013 | |
Net Asset Value, beginning of year | | $ | 12.06 | |
Income from investment operations: | | | | |
Net investment income | | | 0.22 | ^ |
Net realized and unrealized gain | | | 2.67 | |
| | | | |
Total from investment operations | | | 2.89 | |
| | | | |
Less distributions: | | | | |
Net investment income | | | (0.24 | ) |
Realized gains | | | (0.04 | ) |
| | | | |
Total distributions | | | (0.28 | ) |
| | | | |
Net Asset Value, end of year | | $ | 14.67 | |
| | | | |
Total return | | | 23.99 | %†† |
Ratios to Average Net Assets: | | | | |
Expenses before reimbursements/waivers | | | 0.21 | %† |
Expenses net of reimbursements/waivers, if any | | | 0.16 | %† |
Net Investment Income before reimbursements/waivers | | | 1.86 | %† |
Net Investment Income net of reimbursements/waivers, if any | | | 1.91 | %† |
Supplemental Data: | | | | |
Net assets, end of year (000) | | $ | 627,600 | |
Portfolio turnover | | | 8 | %†† |
| ^ | Calculated based upon average shares outstanding. |
| * | Commencement of operations |
See Notes to Financial Statements
131
THE VANTAGEPOINT FUNDS
Financial Highlights
(For a share outstanding throughout each period)
| | | | | | | | | | | | | | | | | | | | |
| | | Broad Market Index Class I | |
| | | For the Year Ended December 31, | |
| | | 2013 | | | 2012 | | | 2011 | | | 2010 | | | 2009 | |
Net Asset Value, beginning of year | | $ | 12.23 | | | $ | 10.85 | | | $ | 10.92 | | | $ | 9.47 | | | $ | 7.53 | |
Income from investment operations: | | | | | | | | | | | | | | | | | | | | |
Net investment income | | | 0.23 | ^ | | | 0.24 | | | | 0.20 | | | | 0.16 | | | | 0.17 | |
Net realized and unrealized gain (loss) | | | 3.80 | | | | 1.45 | | | | (0.11 | ) | | | 1.43 | | | | 1.92 | |
| | | | | | | | | | | | | | | | | | | | |
Total from investment operations | | | 4.03 | | | | 1.69 | | | | 0.09 | | | | 1.59 | | | | 2.09 | |
| | | | | | | | | | | | | | | | | | | | |
Less distributions: | | | | | | | | | | | | | | | | | | | | |
Net investment income | | | (0.21 | ) | | | (0.21 | ) | | | (0.16 | ) | | | (0.14 | ) | | | (0.15 | ) |
Realized gains | | | (0.21 | ) | | | (0.10 | ) | | | — | | | | — | | | | — | |
| | | | | | | | | | | | | | | | | | | | |
Total distributions | | | (0.42 | ) | | | (0.31 | ) | | | (0.16 | ) | | | (0.14 | ) | | | (0.15 | ) |
| | | | | | | | | | | | | | | | | | | | |
Net Asset Value, end of year | | $ | 15.84 | | | $ | 12.23 | | | $ | 10.85 | | | $ | 10.92 | | | $ | 9.47 | |
| | | | | | | | | | | | | | | | | | | | |
Total return | | | 33.04 | % | | | 15.64 | % | | | 0.85 | % | | | 16.84 | % | | | 27.78 | % |
Ratios to Average Net Assets: | | | | | | | | | | | | | | | | | | | | |
Expenses | | | 0.40 | % | | | 0.42 | % | | | 0.41 | % | | | 0.42 | % | | | 0.43 | % |
Net investment income | | | 1.68 | % | | | 1.89 | % | | | 1.56 | % | | | 1.55 | % | | | 2.05 | % |
Supplemental Data: | | | | | | | | | | | | | | | | | | | | |
Net assets, end of year (000) | | $ | 36,076 | | | $ | 126,835 | | | $ | 114,674 | | | $ | 131,673 | | | $ | 119,777 | |
Portfolio turnover | | | 9 | % | | | 3 | % | | | 1 | % | | | 6 | % | | | 7 | % |
| | | | | | | | | | | | | | | | | | | | |
| | | Broad Market Index Class II | |
| | | For the Year Ended December 31, | |
| | | 2013 | | | 2012 | | | 2011 | | | 2010 | | | 2009 | |
Net Asset Value, beginning of year | | $ | 11.46 | | | $ | 10.19 | | | $ | 10.27 | | | $ | 8.91 | | | $ | 7.09 | |
Income from investment operations: | | | | | | | | | | | | | | | | | | | | |
Net investment income | | | 0.24 | ^ | | | 0.24 | | | | 0.19 | | | | 0.16 | | | | 0.18 | |
Net realized and unrealized gain (loss) | | | 3.57 | | | | 1.37 | | | | (0.09 | ) | | | 1.36 | | | | 1.81 | |
| | | | | | | | | | | | | | | | | | | | |
Total from investment operations | | | 3.81 | | | | 1.61 | | | | 0.10 | | | | 1.52 | | | | 1.99 | |
| | | | | | | | | | | | | | | | | | | | |
Less distributions: | | | | | | | | | | | | | | | | | | | | |
Net investment income | | | (0.24 | ) | | | (0.24 | ) | | | (0.18 | ) | | | (0.16 | ) | | | (0.17 | ) |
Realized gains | | | (0.21 | ) | | | (0.10 | ) | | | — | | | | — | | | | — | |
| | | | | | | | | | | | | | | | | | | | |
Total distributions | | | (0.45 | ) | | | (0.34 | ) | | | (0.18 | ) | | | (0.16 | ) | | | (0.17 | ) |
| | | | | | | | | | | | | | | | | | | | |
Net Asset Value, end of year | | $ | 14.82 | | | $ | 11.46 | | | $ | 10.19 | | | $ | 10.27 | | | $ | 8.91 | |
| | | | | | | | | | | | | | | | | | | | |
Total return | | | 33.36 | % | | | 15.82 | % | | | 1.07 | % | | | 17.12 | % | | | 28.04 | % |
Ratios to Average Net Assets: | | | | | | | | | | | | | | | | | | | | |
Expenses | | | 0.20 | % | | | 0.22 | % | | | 0.21 | % | | | 0.22 | % | | | 0.23 | % |
Net investment income | | | 1.97 | % | | | 2.09 | % | | | 1.77 | % | | | 1.75 | % | | | 2.26 | % |
Supplemental Data: | | | | | | | | | | | | | | | | | | | | |
Net assets, end of year (000) | | $ | 15,887 | | | $ | 427,467 | | | $ | 389,031 | | | $ | 406,029 | | | $ | 358,250 | |
Portfolio turnover | | | 9 | % | | | 3 | % | | | 1 | % | | | 6 | % | | | 7 | % |
| ^ | Calculated based upon average shares outstanding. |
See Notes to Financial Statements
132
THE VANTAGEPOINT FUNDS
Financial Highlights
(For a share outstanding throughout each period)
| | | | |
| | | Broad Market
Index T Shares | |
| | | For the Period
from March 1,
2013* to
December 31,
2013 | |
Net Asset Value, beginning of year | | $ | 13.05 | |
Income from investment operations: | | | | |
Net investment income | | | 0.23 | ^ |
Net realized and unrealized gain | | | 3.02 | |
| | | | |
Total from investment operations | | | 3.25 | |
| | | | |
Less distributions: | | | | |
Net investment income | | | (0.24 | ) |
Realized gains | | | (0.21 | ) |
| | | | |
Total distributions | | | (0.45 | ) |
| | | | |
Net Asset Value, end of year | | $ | 15.85 | ** |
| | | | |
Total return | | | 25.01 | %††** |
Ratios to Average Net Assets: | | | | |
Expenses before reimbursements/waivers | | | 0.21 | %† |
Expenses net of reimbursements/waivers, if any | | | 0.16 | %† |
Net Investment Income before reimbursements/waivers | | | 1.81 | %† |
Net Investment Income net of reimbursements/waivers, if any | | | 1.86 | %† |
Supplemental Data: | | | | |
Net assets, end of year (000) | | $ | 728,118 | |
Portfolio turnover | | | 9 | %†† |
| ^ | Calculated based upon average shares outstanding. |
| * | Commencement of operations |
| ** | Financial reporting includes trade date activity as of December 31, 2013. The inclusion of this activity caused the Fund’s NAV to round up to $15.85 (the adjusted price) from $15.84 (the stated price for December 31, 2013, prior to the inclusion of that day’s activity). |
See Notes to Financial Statements
133
THE VANTAGEPOINT FUNDS
Financial Highlights
(For a share outstanding throughout each period)
| | | | | | | | | | | | | | | | | | | | |
| | | Mid/Small Company Index Class I | |
| | | For the Year Ended December 31, | |
| | | 2013 | | | 2012 | | | 2011 | | | 2010 | | | 2009 | |
Net Asset Value, beginning of year | | $ | 15.67 | | | $ | 14.02 | | | $ | 15.39 | | | $ | 12.35 | | | $ | 9.17 | |
Income from investment operations: | | | | | | | | | | | | | | | | | | | | |
Net investment income | | | 0.19 | ^ | | | 0.28 | | | | 0.16 | | | | 0.13 | | | | 0.13 | |
Net realized and unrealized gain (loss) | | | 5.60 | | | | 2.21 | | | | (0.78 | ) | | | 3.31 | | | | 3.19 | |
| | | | | | | | | | | | | | | | | | | | |
Total from investment operations | | | 5.79 | | | | 2.49 | | | | (0.62 | ) | | | 3.44 | | | | 3.32 | |
| | | | | | | | | | | | | | | | | | | | |
Less distributions: | | | | | | | | | | | | | | | | | | | | |
Net investment income | | | (0.22 | ) | | | (0.26 | ) | | | (0.15 | ) | | | (0.12 | ) | | | (0.14 | ) |
Realized gains | | | (1.49 | ) | | | (0.58 | ) | | | (0.60 | ) | | | (0.28 | ) | | | — | |
| | | | | | | | | | | | | | | | | | | | |
Total distributions | | | (1.71 | ) | | | (0.84 | ) | | | (0.75 | ) | | | (0.40 | ) | | | (0.14 | ) |
| | | | | | | | | | | | | | | | | | | | |
Net Asset Value, end of year | | $ | 19.75 | | | $ | 15.67 | | | $ | 14.02 | | | $ | 15.39 | | | $ | 12.35 | |
| | | | | | | | | | | | | | | | | | | | |
Total return | | | 37.19 | % | | | 17.89 | % | | | (3.91 | )% | | | 27.93 | % | | | 36.19 | % |
Ratios to Average Net Assets: | | | | | | | | | | | | | | | | | | | | |
Expenses | | | 0.41 | % | | | 0.43 | % | | | 0.43 | % | | | 0.45 | % | | | 0.48 | % |
Net investment income | | | 1.10 | % | | | 1.87 | % | | | 1.11 | % | | | 1.16 | % | | | 1.46 | % |
Supplemental Data: | | | | | | | | | | | | | | | | | | | | |
Net assets, end of year (000) | | $ | 28,367 | | | $ | 297,378 | | | $ | 247,732 | | | $ | 243,794 | | | $ | 134,165 | |
Portfolio turnover | | | 37 | % | | | 14 | % | | | 15 | % | | | 14 | % | | | 25 | % |
| | | | | | | | | | | | | | | | | | | | |
| |
| | | Mid/Small Company Index Class II | |
| | | For the Year Ended December 31, | |
| | | 2013 | | | 2012 | | | 2011 | | | 2010 | | | 2009 | |
Net Asset Value, beginning of year | | $ | 14.78 | | | $ | 13.26 | | | $ | 14.60 | | | $ | 11.73 | | | $ | 8.71 | |
Income from investment operations: | | | | | | | | | | | | | | | | | | | | |
Net investment income | | | 0.20 | ^ | | | 0.30 | | | | 0.19 | | | | 0.15 | | | | 0.17 | |
Net realized and unrealized gain (loss) | | | 5.30 | | | | 2.09 | | | | (0.76 | ) | | | 3.14 | | | | 3.00 | |
| | | | | | | | | | | | | | | | | | | | |
Total from investment operations | | | 5.50 | | | | 2.39 | | | | (0.57 | ) | | | 3.29 | | | | 3.17 | |
| | | | | | | | | | | | | | | | | | | | |
Less distributions: | | | | | | | | | | | | | | | | | | | | |
Net investment income | | | (0.26 | ) | | | (0.29 | ) | | | (0.17 | ) | | | (0.14 | ) | | | (0.15 | ) |
Realized gains | | | (1.49 | ) | | | (0.58 | ) | | | (0.60 | ) | | | (0.28 | ) | | | — | |
| | | | | | | | | | | | | | | | | | | | |
Total distributions | | | (1.75 | ) | | | (0.87 | ) | | | (0.77 | ) | | | (0.42 | ) | | | (0.15 | ) |
| | | | | | | | | | | | | | | | | | | | |
Net Asset Value, end of year | | $ | 18.53 | | | $ | 14.78 | | | $ | 13.26 | | | $ | 14.60 | | | $ | 11.73 | |
| | | | | | | | | | | | | | | | | | | | |
Total return | | | 37.42 | % | | | 18.17 | % | | | (3.70 | )% | | | 28.15 | % | | | 36.47 | % |
Ratios to Average Net Assets: | | | | | | | | | | | | | | | | | | | | |
Expenses | | | 0.21 | % | | | 0.23 | % | | | 0.23 | % | | | 0.25 | % | | | 0.28 | % |
Net investment income | | | 1.23 | % | | | 2.07 | % | | | 1.30 | % | | | 1.35 | % | | | 1.66 | % |
Supplemental Data: | | | | | | | | | | | | | | | | | | | | |
Net assets, end of year (000) | | $ | 5,541 | | | $ | 194,775 | | | $ | 160,710 | | | $ | 161,178 | | | $ | 97,453 | |
Portfolio turnover | | | 37 | % | | | 14 | % | | | 15 | % | | | 14 | % | | | 25 | % |
| ^ | Calculated based upon average shares outstanding. |
See Notes to Financial Statements
134
THE VANTAGEPOINT FUNDS
Financial Highlights
(For a share outstanding throughout each period)
| | | | |
| | | Mid/Small
Company
Index T Shares | |
| | | For the Period
from March 1,
2013* to
December 31,
2013 | |
Net Asset Value, beginning of year | | $ | 16.91 | |
Income from investment operations: | | | | |
Net investment income | | | 0.26 | ^ |
Net realized and unrealized gain | | | 4.34 | |
| | | | |
Total from investment operations | | | 4.60 | |
| | | | |
Less distributions: | | | | |
Net investment income | | | (0.26 | ) |
Realized gains | | | (1.49 | ) |
| | | | |
Total distributions | | | (1.75 | ) |
| | | | |
Net Asset Value, end of year | | $ | 19.76 | |
| | | | |
Total return | | | 27.41 | %†† |
Ratios to Average Net Assets: | | | | |
Expenses before reimbursements/waivers | | | 0.22 | %† |
Expenses net of reimbursements/waivers, if any | | | 0.17 | %† |
Net Investment Income before reimbursements/waivers | | | 1.59 | %† |
Net Investment Income net of reimbursements/waivers, if any | | | 1.64 | %† |
Supplemental Data: | | | | |
Net assets, end of year (000) | | $ | 686,939 | |
Portfolio turnover | | | 37 | %†† |
| ^ | Calculated based upon average shares outstanding. |
| * | Commencement of operations |
See Notes to Financial Statements
135
THE VANTAGEPOINT FUNDS
Financial Highlights
(For a share outstanding throughout each period)
| | | | | | | | | | | | | | | | | | | | |
| | | Overseas Equity Index Class I | |
| | | For the Year Ended December 31, | |
| | | 2013 | | | 2012 | | | 2011 | | | 2010 | | | 2009 | |
Net Asset Value, beginning of year | | $ | 10.61 | | | $ | 9.19 | | | $ | 10.82 | | | $ | 10.30 | | | $ | 8.20 | |
Income from investment operations: | | | | | | | | | | | | | | | | | | | | |
Net investment income | | | 0.22 | ^ | | | 0.29 | | | | 0.33 | | | | 0.23 | | | | 0.22 | |
Net realized and unrealized gain (loss) | | | 2.04 | | | | 1.41 | | | | (1.68 | ) | | | 0.52 | | | | 2.12 | |
| | | | | | | | | | | | | | | | | | | | |
Total from investment operations | | | 2.26 | | | | 1.70 | | | | (1.35 | ) | | | 0.75 | | | | 2.34 | |
| | | | | | | | | | | | | | | | | | | | |
Less distributions: | | | | | | | | | | | | | | | | | | | | |
Net investment income | | | (0.28 | ) | | | (0.28 | ) | | | (0.28 | ) | | | (0.23 | ) | | | (0.24 | ) |
Realized gains | | | — | | | | — | | | | — | | | | — | | | | — | |
| | | | | | | | | | | | | | | | | | | | |
Total distributions | | | (0.28 | ) | | | (0.28 | ) | | | (0.28 | ) | | | (0.23 | ) | | | (0.24 | ) |
| | | | | | | | | | | | | | | | | | | | |
Net Asset Value, end of year | | $ | 12.59 | | | $ | 10.61 | | | $ | 9.19 | | | $ | 10.82 | | | $ | 10.30 | |
| | | | | | | | | | | | | | | | | | | | |
Total return | | | 21.35 | % | | | 18.51 | % | | | (12.42 | )% | | | 7.37 | % | | | 28.63 | % |
Ratios to Average Net Assets: | | | | | | | | | | | | | | | | | | | | |
Expenses | | | 0.54 | % | | | 0.55 | % | | | 0.54 | % | | | 0.56 | % | | | 0.59 | % |
Net investment income | | | 1.91 | % | | | 2.92 | % | | | 2.93 | % | | | 2.27 | % | | | 2.61 | % |
Supplemental Data: | | | | | | | | | | | | | | | | | | | | |
Net assets, end of year (000) | | $ | 11,103 | | | $ | 55,335 | | | $ | 44,911 | | | $ | 57,649 | | | $ | 52,937 | |
Portfolio turnover | | | 11 | % | | | 6 | % | | | 2 | % | | | 2 | % | | | 5 | % |
| | | | | | | | | | | | | | | | | | | | |
| |
| | | Overseas Equity Index Class II | |
| | | For the Year Ended December 31, | |
| | | 2013 | | | 2012 | | | 2011 | | | 2010 | | | 2009 | |
Net Asset Value, beginning of year | | $ | 9.91 | | | $ | 8.60 | | | $ | 10.16 | | | $ | 9.69 | | | $ | 7.72 | |
Income from investment operations: | | | | | | | | | | | | | | | | | | | | |
Net investment income | | | 0.15 | ^ | | | 0.29 | | | | 0.31 | | | | 0.23 | | | | 0.23 | |
Net realized and unrealized gain (loss) | | | 1.99 | | | | 1.32 | | | | (1.57 | ) | | | 0.50 | | | | 2.00 | |
| | | | | | | | | | | | | | | | | | | | |
Total from investment operations | | | 2.14 | | | | 1.61 | | | | (1.26 | ) | | | 0.73 | | | | 2.23 | |
| | | | | | | | | | | | | | | | | | | | |
Less distributions: | | | | | | | | | | | | | | | | | | | | |
Net investment income | | | (0.30 | ) | | | (0.30 | ) | | | (0.30 | ) | | | (0.26 | ) | | | (0.26 | ) |
Realized gains | | | — | | | | — | | | | — | | | | — | | | | — | |
| | | | | | | | | | | | | | | | | | | | |
Total distributions | | | (0.30 | ) | | | (0.30 | ) | | | (0.30 | ) | | | (0.26 | ) | | | (0.26 | ) |
| | | | | | | | | | | | | | | | | | | | |
Net Asset Value, end of year | | $ | 11.75 | | | $ | 9.91 | | | $ | 8.60 | | | $ | 10.16 | | | $ | 9.69 | |
| | | | | | | | | | | | | | | | | | | | |
Total return | | | 21.68 | % | | | 18.74 | % | | | (12.28 | )% | | | 7.54 | % | | | 28.94 | % |
Ratios to Average Net Assets: | | | | | | | | | | | | | | | | | | | | |
Expenses | | | 0.34 | % | | | 0.35 | % | | | 0.34 | % | | | 0.36 | % | | | 0.39 | % |
Net investment income | | | 1.49 | % | | | 3.10 | % | | | 3.11 | % | | | 2.45 | % | | | 2.83 | % |
Supplemental Data: | | | | | | | | | | | | | | | | | | | | |
Net assets, end of year (000) | | $ | 3,327 | | | $ | 173,354 | | | $ | 132,873 | | | $ | 149,208 | | | $ | 128,002 | |
Portfolio turnover | | | 11 | % | | | 6 | % | | | 2 | % | | | 2 | % | | | 5 | % |
| ^ | Calculated based upon average shares outstanding. |
See Notes to Financial Statements
136
THE VANTAGEPOINT FUNDS
Financial Highlights
(For a share outstanding throughout each period)
| | | | |
| | | Overseas
Equity Index T
Shares | |
| | | For the Period
from March 1,
2013* to
December 31,
2013 | |
Net Asset Value, beginning of year | | $ | 10.91 | |
Income from investment operations: | | | | |
Net investment income | | | 0.28 | ^ |
Net realized and unrealized gain | | | 1.71 | |
| | | | |
Total from investment operations | | | 1.99 | |
| | | | |
Less distributions: | | | | |
Net investment income | | | (0.30 | ) |
Realized gains | | | — | |
| | | | |
Total distributions | | | (0.30 | ) |
| | | | |
Net Asset Value, end of year | | $ | 12.60 | |
| | | | |
Total return | | | 18.34 | %†† |
Ratios to Average Net Assets: | | | | |
Expenses before reimbursements/waivers | | | 0.35 | %† |
Expenses net of reimbursements/waivers, if any | | | 0.30 | %† |
Net Investment Income before reimbursements/waivers | | | 2.78 | %† |
Net Investment Income net of reimbursements/waivers, if any | | | 2.83 | %† |
Supplemental Data: | | | | |
Net assets, end of year (000) | | $ | 282,482 | |
Portfolio turnover | | | 11 | %†† |
| ^ | Calculated based upon average shares outstanding. |
| * | Commencement of operations |
See Notes to Financial Statements
137
THE VANTAGEPOINT FUNDS
Financial Highlights
(For a share outstanding throughout each period)
| | | | | | | | | | | | | | | | | | | | |
| | | Model Portfolio Conservative Growth Investor M Shares | |
| | | For the Year Ended December 31, | |
| | | 2013 | | | 2012 | | | 2011 | | | 2010 | | | 2009 | |
Net Asset Value, beginning of year | | $ | 24.89 | | | $ | 23.46 | | | $ | 23.62 | | | $ | 22.13 | | | $ | 19.04 | |
Income from investment operations: | | | | | | | | | | | | | | | | | | | | |
Net investment income | | | 0.22 | ^ | | | 0.46 | | | | 0.43 | | | | 0.40 | | | | 0.44 | |
Net realized and unrealized gain (loss) | | | 2.52 | | | | 1.62 | | | | (0.16 | ) | | | 1.50 | | | | 3.08 | |
| | | | | | | | | | | | | | | | | | | | |
Total from investment operations | | | 2.74 | | | | 2.08 | | | | 0.27 | | | | 1.90 | | | | 3.52 | |
| | | | | | | | | | | | | | | | | | | | |
Less distributions: | | | | | | | | | | | | | | | | | | | | |
Net investment income | | | (0.34 | ) | | | (0.51 | ) | | | (0.43 | ) | | | (0.41 | ) | | | (0.43 | ) |
Realized gains | | | (0.48 | ) | | | (0.14 | ) | | | — | | | | — | | | | — | |
| | | | | | | | | | | | | | | | | | | | |
Total distributions | | | (0.82 | ) | | | (0.65 | ) | | | (0.43 | ) | | | (0.41 | ) | | | (0.43 | ) |
| | | | | | | | | | | | | | | | | | | | |
Net Asset Value, end of year | | $ | 26.81 | | | $ | 24.89 | | | $ | 23.46 | | | $ | 23.62 | | | $ | 22.13 | |
| | | | | | | | | | | | | | | | | | | | |
Total return | | | 11.03 | % | | | 8.88 | % | | | 1.15 | % | | | 8.60 | % | | | 18.50 | % |
Ratios to Average Net Assets: | | | | | | | | | | | | | | | | | | | | |
Expenses | | | 0.24 | % | | | 0.13 | % | | | 0.12 | % | | | 0.13 | % | | | 0.15 | % |
Net investment income | | | 0.86 | % | | | 1.66 | % | | | 1.67 | % | | | 1.80 | % | | | 2.20 | % |
Supplemental Data: | | | | | | | | | | | | | | | | | | | | |
Net assets, end of year (000) | | $ | 102,862 | | | $ | 607,812 | | | $ | 556,164 | | | $ | 586,912 | | | $ | 528,183 | |
Portfolio turnover | | | 11 | % | | | 7 | % | | | 14 | % | | | 23 | % | | | 13 | % |
| | | | |
| | | Model
Portfolio
Conservative
Growth TM
Shares | |
| | | For the Period
from March 1,
2013* to
December 31,
2013 | |
Net Asset Value, beginning of year | | $ | 25.52 | |
Income from investment operations: | | | | |
Net investment income | | | 0.35 | ^ |
Net realized and unrealized gain | | | 1.82 | |
| | | | |
Total from investment operations | | | 2.17 | |
| | | | |
Less distributions: | | | | |
Net investment income | | | (0.40 | ) |
Realized gains | | | (0.48 | ) |
| | | | |
Total distributions | | | (0.88 | ) |
| | | | |
Net Asset Value, end of year | | $ | 26.81 | |
| | | | |
Total return | | | 8.50 | %†† |
Ratios to Average Net Assets: | | | | |
Expenses | | | 0.13 | %† |
Net investment income | | | 1.59 | %† |
Supplemental Data: | | | | |
Net assets, end of year (000) | | $ | 558,569 | |
Portfolio turnover | | | 11 | %†† |
| ^ | Calculated based upon average shares outstanding. |
| * | Commencement of operations |
See Notes to Financial Statements
138
THE VANTAGEPOINT FUNDS
Financial Highlights
(For a share outstanding throughout each period)
| | | | | | | | | | | | | | | | | | | | |
| | | Model Portfolio Traditional Growth Investor M Shares | |
| | | For the Year Ended December 31, | |
| | | 2013 | | | 2012 | | | 2011 | | | 2010 | | | 2009 | |
Net Asset Value, beginning of year | | $ | 23.25 | | | $ | 21.52 | | | $ | 22.17 | | | $ | 20.28 | | | $ | 16.65 | |
Income from investment operations: | | | | | | | | | | | | | | | | | | | | |
Net investment income | | | 0.16 | ^ | | | 0.42 | | | | 0.38 | | | | 0.33 | | | | 0.33 | |
Net realized and unrealized gain (loss) | | | 3.96 | | | | 1.99 | | | | (0.50 | ) | | | 1.89 | | | | 3.62 | |
| | | | | | | | | | | | | | | | | | | | |
Total from investment operations | | | 4.12 | | | | 2.41 | | | | (0.12 | ) | | | 2.22 | | | | 3.95 | |
| | | | | | | | | | | | | | | | | | | | |
Less distributions: | | | | | | | | | | | | | | | | | | | | |
Net investment income | | | (0.32 | ) | | | (0.42 | ) | | | (0.48 | ) | | | (0.33 | ) | | | (0.30 | ) |
Realized gains | | | (0.67 | ) | | | (0.26 | ) | | | (0.05 | ) | | | — | | | | (0.02 | ) |
| | | | | | | | | | | | | | | | | | | | |
Total distributions | | | (0.99 | ) | | | (0.68 | ) | | | (0.53 | ) | | | (0.33 | ) | | | (0.32 | ) |
| | | | | | | | | | | | | | | | | | | | |
Net Asset Value, end of year | | $ | 26.38 | | | $ | 23.25 | | | $ | 21.52 | | | $ | 22.17 | | | $ | 20.28 | |
| | | | | | | | | | | | | | | | | | | | |
Total return | | | 17.74 | % | | | 11.20 | % | | | (0.56 | )% | | | 10.95 | % | | | 23.72 | % |
Ratios to Average Net Assets: | | | | | | | | | | | | | | | | | | | | |
Expenses | | | 0.18 | % | | | 0.11 | % | | | 0.11 | % | | | 0.12 | % | | | 0.13 | % |
Net investment income | | | 0.64 | % | | | 1.66 | % | | | 1.52 | % | | | 1.57 | % | | | 1.86 | % |
Supplemental Data: | | | | | | | | | | | | | | | | | | | | |
Net assets, end of year (000) | | $ | 124,346 | | | $ | 1,493,678 | | | $ | 1,366,108 | | | $ | 1,495,757 | | | $ | 1,353,050 | |
Portfolio turnover | | | 9 | % | | | 7 | % | | | 13 | % | | | 15 | % | | | 8 | % |
| | | | |
| | | Model
Portfolio
Traditional
Growth TM
Shares | |
| | | For the Period
from March 1,
2013* to
December 31,
2013 | |
Net Asset Value, beginning of year | | $ | 24.12 | |
Income from investment operations: | | | | |
Net investment income | | | 0.35 | ^ |
Net realized and unrealized gain | | | 2.96 | |
| | | | |
Total from investment operations | | | 3.31 | |
| | | | |
Less distributions: | | | | |
Net investment income | | | (0.38 | ) |
Realized gains | | | (0.67 | ) |
| | | | |
Total distributions | | | (1.05 | ) |
| | | | |
Net Asset Value, end of year | | $ | 26.38 | |
| | | | |
Total return | | | 13.71 | %†† |
Ratios to Average Net Assets: | | | | |
Expenses | | | 0.12 | %† |
Net investment income | | | 1.64 | %† |
Supplemental Data: | | | | |
Net assets, end of year (000) | | $ | 1,565,740 | |
Portfolio turnover | | | 9 | %†† |
| ^ | Calculated based upon average shares outstanding. |
| * | Commencement of operations |
See Notes to Financial Statements
139
THE VANTAGEPOINT FUNDS
Financial Highlights
(For a share outstanding throughout each period)
| | | | | | | | | | | | | | | | | | | | |
| | | Model Portfolio Long-Term Growth Investor M Shares | |
| | | For the Year Ended December 31, | |
| | | 2013 | | | 2012 | | | 2011 | | | 2010 | | | 2009 | |
Net Asset Value, beginning of year | | $ | 22.20 | | | $ | 20.32 | | | $ | 21.41 | | | $ | 19.30 | | | $ | 15.35 | |
Income from investment operations: | | | | | | | | | | | | | | | | | | | | |
Net investment income | | | 0.11 | ^ | | | 0.38 | | | | 0.35 | | | | 0.27 | | | | 0.26 | |
Net realized and unrealized gain (loss) | | | 4.90 | | | | 2.24 | | | | (0.77 | ) | | | 2.15 | | | | 3.99 | |
| | | | | | | | | | | | | | | | | | | | |
Total from investment operations | | | 5.01 | | | | 2.62 | | | | (0.42 | ) | | | 2.42 | | | | 4.25 | |
| | | | | | | | | | | | | | | | | | | | |
Less distributions: | | | | | | | | | | | | | | | | | | | | |
Net investment income | | | (0.32 | ) | | | (0.38 | ) | | | (0.40 | ) | | | (0.31 | ) | | | (0.21 | ) |
Realized gains | | | (0.83 | ) | | | (0.36 | ) | | | (0.27 | ) | | | — | | | | (0.09 | ) |
| | | | | | | | | | | | | | | | | | | | |
Total distributions | | | (1.15 | ) | | | (0.74 | ) | | | (0.67 | ) | | | (0.31 | ) | | | (0.30 | ) |
| | | | | | | | | | | | | | | | | | | | |
Net Asset Value, end of year | | $ | 26.06 | | | $ | 22.20 | | | $ | 20.32 | | | $ | 21.41 | | | $ | 19.30 | |
| | | | | | | | | | | | | | | | | | | | |
Total return | | | 22.55 | % | | | 12.93 | % | | | (1.98 | )% | | | 12.54 | % | | | 27.67 | % |
Ratios to Average Net Assets: | | | | | | | | | | | | | | | | | | | | |
Expenses | | | 0.16 | % | | | 0.11 | % | | | 0.11 | % | | | 0.12 | % | | | 0.13 | % |
Net investment income | | | 0.48 | % | | | 1.65 | % | | | 1.42 | % | | | 1.40 | % | | | 1.63 | % |
Supplemental Data: | | | | | | | | | | | | | | | | | | | | |
Net assets, end of year (000) | | $ | 108,362 | | | $ | 1,896,812 | | | $ | 1,712,228 | | | $ | 1,848,430 | | | $ | 1,621,102 | |
Portfolio turnover | | | 10 | % | | | 7 | % | | | 11 | % | | | 10 | % | | | 5 | % |
| | | | |
| | | Model
Portfolio Long-
Term Growth
TM Shares | |
| | | For the Period
from March 1,
2013* to
December 31,
2013 | |
Net Asset Value, beginning of year | | $ | 23.25 | |
Income from investment operations: | | | | |
Net investment income | | | 0.35 | ^ |
Net realized and unrealized gain | | | 3.67 | |
| | | | |
Total from investment operations | | | 4.02 | |
| | | | |
Less distributions: | | | | |
Net investment income | | | (0.37 | ) |
Realized gains | | | (0.83 | ) |
| | | | |
Total distributions | | | (1.20 | ) |
| | | | |
Net Asset Value, end of year | | $ | 26.07 | |
| | | | |
Total return | | | 17.28 | %†† |
Ratios to Average Net Assets: | | | | |
Expenses | | | 0.11 | %† |
Net investment income | | | 1.67 | %† |
Supplemental Data: | | | | |
Net assets, end of year (000) | | $ | 2,103,778 | |
Portfolio turnover | | | 10 | %†† |
| ^ | Calculated based upon average shares outstanding. |
| * | Commencement of operations |
See Notes to Financial Statements
140
THE VANTAGEPOINT FUNDS
Financial Highlights
(For a share outstanding throughout each period)
| | | | | | | | | | | | | | | | | | | | |
| | | Model Portfolio All-Equity Growth Investor M Shares | |
| | | For the Year Ended December 31, | |
| | | 2013 | | | 2012 | | | 2011 | | | 2010 | | | 2009 | |
Net Asset Value, beginning of year | | $ | 21.34 | | | $ | 18.69 | | | $ | 19.81 | | | $ | 17.38 | | | $ | 13.07 | |
Income from investment operations: | | | | | | | | | | | | | | | | | | | | |
Net investment income | | | 0.05 | ^ | | | 0.32 | | | | 0.28 | | | | 0.16 | | | | 0.18 | |
Net realized and unrealized gain (loss) | | | 6.43 | | | | 2.67 | | | | (1.12 | ) | | | 2.43 | | | | 4.41 | |
| | | | | | | | | | | | | | | | | | | | |
Total from investment operations | | | 6.48 | | | | 2.99 | | | | (0.84 | ) | | | 2.59 | | | | 4.59 | |
| | | | | | | | | | | | | | | | | | | | |
Less distributions: | | | | | | | | | | | | | | | | | | | | |
Net investment income | | | (0.33 | ) | | | (0.22 | ) | | | (0.28 | ) | | | (0.16 | ) | | | (0.15 | ) |
Realized gains | | | (0.64 | ) | | | (0.12 | ) | | | — | | | | — | | | | (0.13 | ) |
| | | | | | | | | | | | | | | | | | | | |
Total distributions | | | (0.97 | ) | | | (0.34 | ) | | | (0.28 | ) | | | (0.16 | ) | | | (0.28 | ) |
| | | | | | | | | | | | | | | | | | | | |
Net Asset Value, end of year | | $ | 26.85 | | | $ | 21.34 | | | $ | 18.69 | | | $ | 19.81 | | | $ | 17.38 | |
| | | | | | | | | | | | | | | | | | | | |
Total return | | | 30.36 | % | | | 16.00 | % | | | (4.23 | )% | | | 14.93 | % | | | 35.07 | % |
Ratios to Average Net Assets: | | | | | | | | | | | | | | | | | | | | |
Expenses | | | 0.17 | % | | | 0.12 | % | | | 0.12 | % | | | 0.13 | % | | | 0.14 | % |
Net investment income | | | 0.20 | % | | | 1.37 | % | | | 1.24 | % | | | 0.95 | % | | | 1.30 | % |
Supplemental Data: | | | | | | | | | | | | | | | | | | | | |
Net assets, end of year (000) | | $ | 49,174 | | | $ | 709,330 | | | $ | 649,826 | | | $ | 715,090 | | | $ | 591,533 | |
Portfolio turnover | | | 8 | % | | | 9 | % | | | 9 | % | | | 6 | % | | | 3 | % |
| | | | |
| | | Model
Portfolio All-
Equity Growth
TM Shares | |
| | | For the Period
from March 1,
2013* to
December 31,
2013 | |
Net Asset Value, beginning of year | | $ | 22.67 | |
Income from investment operations: | | | | |
Net investment income | | | 0.30 | ^ |
Net realized and unrealized gain | | | 4.91 | |
| | | | |
Total from investment operations | | | 5.21 | |
| | | | |
Less distributions: | | | | |
Net investment income | | | (0.38 | ) |
Realized gains | | | (0.64 | ) |
| | | | |
Total distributions | | | (1.02 | ) |
| | | | |
Net Asset Value, end of year | | $ | 26.86 | |
| | | | |
Total return | | | 22.98 | %†† |
Ratios to Average Net Assets: | | | | |
Expenses | | | 0.12 | %† |
Net investment income | | | 1.45 | %† |
Supplemental Data: | | | | |
Net assets, end of year (000) | | $ | 876,894 | |
Portfolio turnover | | | 8 | %†† |
| ^ | Calculated based upon average shares outstanding. |
| * | Commencement of operations |
See Notes to Financial Statements
141
THE VANTAGEPOINT FUNDS
Financial Highlights
(For a share outstanding throughout each period)
| | | | | | | | | | | | | | | | | | | | |
| | | Milestone Retirement Income Investor M Shares | |
| | | For the Year Ended December 31, | |
| | | 2013 | | | 2012 | | | 2011 | | | 2010 | | | 2009 | |
Net Asset Value, beginning of year | | $ | 10.58 | | | $ | 10.18 | | | $ | 10.33 | | | $ | 9.81 | | | $ | 8.56 | |
Income from investment operations: | | | | | | | | | | | | | | | | | | | | |
Net investment income | | | 0.11 | ^ | | | 0.20 | | | | 0.20 | | | | 0.12 | | | | 0.16 | |
Net realized and unrealized gain | | | 0.54 | | | | 0.53 | | | | 0.05 | | | | 0.56 | | | | 1.26 | |
| | | | | | | | | | | | | | | | | | | | |
Total from investment operations | | | 0.65 | | | | 0.73 | | | | 0.25 | | | | 0.68 | | | | 1.42 | |
| | | | | | | | | | | | | | | | | | | | |
Less distributions: | | | | | | | | | | | | | | | | | | | | |
Net investment income | | | (0.13 | ) | | | (0.20 | ) | | | (0.20 | ) | | | (0.15 | ) | | | (0.15 | ) |
Realized gains | | | (0.20 | ) | | | (0.13 | ) | | | (0.20 | ) | | | (0.01 | ) | | | (0.02 | ) |
| | | | | | | | | | | | | | | | | | | | |
Total distributions | | | (0.33 | ) | | | (0.33 | ) | | | (0.40 | ) | | | (0.16 | ) | | | (0.17 | ) |
| | | | | | | | | | | | | | | | | | | | |
Net Asset Value, end of year | | $ | 10.90 | | | $ | 10.58 | | | $ | 10.18 | | | $ | 10.33 | | | $ | 9.81 | |
| | | | | | | | | | | | | | | | | | | | |
Total return | | | 6.14 | % | | | 7.18 | % | | | 2.37 | % | | | 6.93 | % | | | 16.53 | % |
Ratios to Average Net Assets: | | | | | | | | | | | | | | | | | | | | |
Expenses before reimbursements/waivers | | | 0.30 | % | | | 0.14 | % | | | 0.15 | % | | | 0.18 | % | | | 0.25 | % |
Expenses net of reimbursements/waivers, if any | | | 0.30 | % | | | 0.14 | % | | | 0.15 | % | | | 0.18 | % | | | 0.20 | % |
Net Investment Income before reimbursements/waivers | | | 1.04 | % | | | 1.66 | % | | | 1.79 | % | | | 2.49 | % | | | 2.29 | % |
Net Investment Income net of reimbursements/waivers, if any | | | 1.04 | % | | | 1.66 | % | | | 1.79 | % | | | 2.49 | % | | | 2.34 | % |
Supplemental Data: | | | | | | | | | | | | | | | | | | | | |
Net assets, end of year (000) | | $ | 86,048 | | | $ | 238,158 | | | $ | 220,063 | | | $ | 215,961 | | | $ | 76,683 | |
Portfolio turnover | | | 10 | % | | | 8 | % | | | 19 | % | | | 25 | % | | | 14 | % |
| | | | |
| | | Milestone
Retirement
Income TM
Shares | |
| | | For the Period
from March 1,
2013* to
December 31,
2013 | |
Net Asset Value, beginning of year | | $ | 10.75 | |
Income from investment operations: | | | | |
Net investment income | | | 0.14 | ^ |
Net realized and unrealized gain | | | 0.37 | |
| | | | |
Total from investment operations | | | 0.51 | |
| | | | |
Less distributions: | | | | |
Net investment income | | | (0.15 | ) |
Realized gains | | | (0.20 | ) |
| | | | |
Total distributions | | | (0.35 | ) |
| | | | |
Net Asset Value, end of year | | $ | 10.91 | |
| | | | |
Total return | | | 4.76 | %†† |
Ratios to Average Net Assets: | | | | |
Expenses | | | 0.14 | %† |
Net investment income | | | 1.56 | %† |
Supplemental Data: | | | | |
Net assets, end of year (000) | | $ | 237,584 | |
Portfolio turnover | | | 10 | %†† |
| ^ | Calculated based upon average shares outstanding. |
| * | Commencement of operations |
See Notes to Financial Statements
142
THE VANTAGEPOINT FUNDS
Financial Highlights
(For a share outstanding throughout each period)
| | | | | | | | | | | | | | | | | | | | |
| | | Milestone 2010 Investor M Shares | |
| | | For the Year Ended December 31, | |
| | | 2013 | | | 2012 | | | 2011 | | | 2010 | | | 2009 | |
Net Asset Value, beginning of year | | $ | 10.65 | | | $ | 10.10 | | | $ | 10.24 | | | $ | 9.56 | | | $ | 8.27 | |
Income from investment operations: | | | | | | | | | | | | | | | | | | | | |
Net investment income | | | 0.10 | ^ | | | 0.20 | | | | 0.19 | | | | 0.10 | | | | 0.18 | |
Net realized and unrealized gain (loss) | | | 1.08 | | | | 0.76 | | | | (0.04 | ) | | | 0.71 | | | | 1.29 | |
| | | | | | | | | | | | | | | | | | | | |
Total from investment operations | | | 1.18 | | | | 0.96 | | | | 0.15 | | | | 0.81 | | | | 1.47 | |
| | | | | | | | | | | | | | | | | | | | |
Less distributions: | | | | | | | | | | | | | | | | | | | | |
Net investment income | | | (0.13 | ) | | | (0.20 | ) | | | (0.21 | ) | | | (0.13 | ) | | | (0.14 | ) |
Realized gains | | | (0.37 | ) | | | (0.21 | ) | | | (0.08 | ) | | | — | | | | (0.04 | ) |
| | | | | | | | | | | | | | | | | | | | |
Total distributions | | | (0.50 | ) | | | (0.41 | ) | | | (0.29 | ) | | | (0.13 | ) | | | (0.18 | ) |
| | | | | | | | | | | | | | | | | | | | |
Net Asset Value, end of year | | $ | 11.33 | | | $ | 10.65 | | | $ | 10.10 | | | $ | 10.24 | | | $ | 9.56 | |
| | | | | | | | | | | | | | | | | | | | |
Total return | | | 11.12 | % | | | 9.53 | % | | | 1.41 | % | | | 8.51 | % | | | 17.71 | % |
Ratios to Average Net Assets: | | | | | | | | | | | | | | | | | | | | |
Expenses before reimbursements/waivers | | | 0.29 | % | | | 0.14 | % | | | 0.15 | % | | | 0.18 | % | | | 0.22 | % |
Expenses net of reimbursements/waivers, if any | | | 0.29 | % | | | 0.14 | % | | | 0.15 | % | | | 0.18 | % | | | 0.19 | % |
Net Investment Income before reimbursements/waivers | | | 0.88 | % | | | 1.58 | % | | | 1.75 | % | | | 2.11 | % | | | 2.15 | % |
Net Investment Income net of reimbursements/waivers, if any | | | 0.88 | % | | | 1.58 | % | | | 1.75 | % | | | 2.11 | % | | | 2.17 | % |
Supplemental Data: | | | | | | | | | | | | | | | | | | | | |
Net assets, end of year (000) | | $ | 71,804 | | | $ | 234,023 | | | $ | 222,275 | | | $ | 217,770 | | | $ | 90,790 | |
Portfolio turnover | | | 15 | % | | | 11 | % | | | 22 | % | | | 33 | % | | | 20 | % |
| | | | |
| | | Milestone 2010
TM Shares | |
| | | For the Period
from March 1,
2013* to
December 31,
2013 | |
Net Asset Value, beginning of year | | $ | 10.92 | |
Income from investment operations: | | | | |
Net investment income | | | 0.15 | ^ |
Net realized and unrealized gain | | | 0.79 | |
| | | | |
Total from investment operations | | | 0.94 | |
| | | | |
Less distributions: | | | | |
Net investment income | | | (0.15 | ) |
Realized gains | | | (0.37 | ) |
| | | | |
Total distributions | | | (0.52 | ) |
| | | | |
Net Asset Value, end of year | | $ | 11.34 | |
| | | | |
Total return | | | 8.68 | %†† |
Ratios to Average Net Assets: | | | | |
Expenses | | | 0.14 | %† |
Net investment income | | | 1.54 | %† |
Supplemental Data: | | | | |
Net assets, end of year (000) | | $ | 218,248 | |
Portfolio turnover | | | 15 | %†† |
| ^ | Calculated based upon average shares outstanding. |
| * | Commencement of operations |
See Notes to Financial Statements
143
THE VANTAGEPOINT FUNDS
Financial Highlights
(For a share outstanding throughout each period)
| | | | | | | | | | | | | | | | | | | | |
| | | Milestone 2015 Investor M Shares | |
| | | For the Year Ended December 31, | |
| | | 2013 | | | 2012 | | | 2011 | | | 2010 | | | 2009 | |
Net Asset Value, beginning of year | | $ | 10.87 | | | $ | 10.16 | | | $ | 10.35 | | | $ | 9.53 | | | $ | 7.96 | |
Income from investment operations: | | | | | | | | | | | | | | | | | | | | |
Net investment income | | | 0.10 | ^ | | | 0.20 | | | | 0.18 | | | | 0.12 | | | | 0.16 | |
Net realized and unrealized gain (loss) | | | 1.39 | | | | 0.84 | | | | (0.10 | ) | | | 0.85 | | | | 1.58 | |
| | | | | | | | | | | | | | | | | | | | |
Total from investment operations | | | 1.49 | | | | 1.04 | | | | 0.08 | | | | 0.97 | | | | 1.74 | |
| | | | | | | | | | | | | | | | | | | | |
Less distributions: | | | | | | | | | | | | | | | | | | | | |
Net investment income | | | (0.14 | ) | | | (0.20 | ) | | | (0.21 | ) | | | (0.14 | ) | | | (0.11 | ) |
Realized gains | | | (0.30 | ) | | | (0.13 | ) | | | (0.06 | ) | | | (0.01 | ) | | | (0.06 | ) |
| | | | | | | | | | | | | | | | | | | | |
Total distributions | | | (0.44 | ) | | | (0.33 | ) | | | (0.27 | ) | | | (0.15 | ) | | | (0.17 | ) |
| | | | | | | | | | | | | | | | | | | | |
Net Asset Value, end of year | | $ | 11.92 | | | $ | 10.87 | | | $ | 10.16 | | | $ | 10.35 | | | $ | 9.53 | |
| | | | | | | | | | | | | | | | | | | | |
Total return | | | 13.75 | % | | | 10.25 | % | | | 0.70 | % | | | 10.20 | % | | | 21.84 | % |
Ratios to Average Net Assets: | | | | | | | | | | | | | | | | | | | | |
Expenses before reimbursements/waivers | | | 0.26 | % | | | 0.13 | % | | | 0.14 | % | | | 0.15 | % | | | 0.18 | % |
Expenses net of reimbursements/waivers, if any | | | 0.26 | % | | | 0.13 | % | | | 0.14 | % | | | 0.15 | % | | | 0.17 | % |
Net Investment Income before reimbursements/waivers | | | 0.86 | % | | | 1.68 | % | | | 1.72 | % | | | 1.96 | % | | | 2.06 | % |
Net Investment Income net of reimbursements/waivers, if any | | | 0.86 | % | | | 1.68 | % | | | 1.72 | % | | | 1.96 | % | | | 2.07 | % |
Supplemental Data: | | | | | | | | | | | | | | | | | | | | |
Net assets, end of year (000) | | $ | 106,285 | | | $ | 434,638 | | | $ | 381,855 | | | $ | 363,144 | | | $ | 185,989 | |
Portfolio turnover | | | 11 | % | | | 8 | % | | | 20 | % | | | 15 | % | | | 12 | % |
| | | | |
| | | Milestone 2015
TM Shares | |
| | | For the Period
from March 1,
2013* to
December 31,
2013 | |
Net Asset Value, beginning of year | | $ | 11.21 | |
Income from investment operations: | | | | |
Net investment income | | | 0.16 | ^ |
Net realized and unrealized gain | | | 1.02 | |
| | | | |
Total from investment operations | | | 1.18 | |
| | | | |
Less distributions: | | | | |
Net investment income | | | (0.17 | ) |
Realized gains | | | (0.30 | ) |
| | | | |
Total distributions | | | (0.47 | ) |
| | | | |
Net Asset Value, end of year | | $ | 11.92 | |
| | | | |
Total return | | | 10.51 | %†† |
Ratios to Average Net Assets: | | | | |
Expenses | | | 0.13 | %† |
Net investment income | | | 1.65 | %† |
Supplemental Data: | | | | |
Net assets, end of year (000) | | $ | 449,872 | |
Portfolio turnover | | | 11 | %†† |
| ^ | Calculated based upon average shares outstanding. |
| * | Commencement of operations |
See Notes to Financial Statements
144
THE VANTAGEPOINT FUNDS
Financial Highlights
(For a share outstanding throughout each period)
| | | | | | | | | | | | | | | | | | | | |
| | | Milestone 2020 Investor M Shares | |
| | | For the Year Ended December 31, | |
| | | 2013 | | | 2012 | | | 2011 | | | 2010 | | | 2009 | |
Net Asset Value, beginning of year | | $ | 10.94 | | | $ | 10.10 | | | $ | 10.34 | | | $ | 9.43 | | | $ | 7.83 | |
Income from investment operations: | | | | | | | | | | | | | | | | | | | | |
Net investment income | | | 0.11 | ^ | | | 0.21 | | | | 0.18 | | | | 0.14 | | | | 0.16 | |
Net realized and unrealized gain (loss) | | | 1.73 | | | | 0.92 | | | | (0.20 | ) | | | 0.92 | | | | 1.68 | |
| | | | | | | | | | | | | | | | | | | | |
Total from investment operations | | | 1.84 | | | | 1.13 | | | | (0.02 | ) | | | 1.06 | | | | 1.84 | |
| | | | | | | | | | | | | | | | | | | | |
Less distributions: | | | | | | | | | | | | | | | | | | | | |
Net investment income | | | (0.16 | ) | | | (0.20 | ) | | | (0.18 | ) | | | (0.14 | ) | | | (0.16 | ) |
Realized gains | | | (0.29 | ) | | | (0.09 | ) | | | (0.04 | ) | | | (0.01 | ) | | | (0.08 | ) |
| | | | | | | | | | | | | | | | | | | | |
Total distributions | | | (0.45 | ) | | | (0.29 | ) | | | (0.22 | ) | | | (0.15 | ) | | | (0.24 | ) |
| | | | | | | | | | | | | | | | | | | | |
Net Asset Value, end of year | | $ | 12.33 | | | $ | 10.94 | | | $ | 10.10 | | | $ | 10.34 | | | $ | 9.43 | |
| | | | | | | | | | | | | | | | | | | | |
Total return | | | 16.83 | % | | | 11.25 | % | | | (0.26 | )% | | | 11.27 | % | | | 23.43 | % |
Ratios to Average Net Assets: | | | | | | | | | | | | | | | | | | | | |
Expenses before reimbursements/waivers | | | 0.25 | % | | | 0.13 | % | | | 0.13 | % | | | 0.15 | % | | | 0.18 | % |
Expenses net of reimbursements/waivers, if any | | | 0.25 | % | | | 0.13 | % | | | 0.13 | % | | | 0.15 | % | | | 0.17 | % |
Net Investment Income before reimbursements/waivers | | | 0.92 | % | | | 1.81 | % | | | 1.73 | % | | | 1.93 | % | | | 2.16 | % |
Net Investment Income net of reimbursements/waivers, if any | | | 0.92 | % | | | 1.81 | % | | | 1.73 | % | | | 1.93 | % | | | 2.17 | % |
Supplemental Data: | | | | | | | | | | | | | | | | | | | | |
Net assets, end of year (000) | | $ | 101,059 | | | $ | 470,664 | | | $ | 386,327 | | | $ | 344,033 | | | $ | 186,148 | |
Portfolio turnover | | | 9 | % | | | 7 | % | | | 16 | % | | | 10 | % | | | 7 | % |
| | | | |
| | | Milestone 2020
TM Shares | |
| | | For the Period
from March 1,
2013* to
December 31,
2013 | |
Net Asset Value, beginning of year | | $ | 11.33 | |
Income from investment operations: | | | | |
Net investment income | | | 0.18 | ^ |
Net realized and unrealized gain | | | 1.29 | |
| | | | |
Total from investment operations | | | 1.47 | |
| | | | |
Less distributions: | | | | |
Net investment income | | | (0.18 | ) |
Realized gains | | | (0.29 | ) |
| | | | |
Total distributions | | | (0.47 | ) |
| | | | |
Net Asset Value, end of year | | $ | 12.33 | |
| | | | |
Total return | | | 13.02 | %†† |
Ratios to Average Net Assets: | | | | |
Expenses | | | 0.13 | %† |
Net investment income | | | 1.83 | %† |
Supplemental Data: | | | | |
Net assets, end of year (000) | | $ | 548,048 | |
Portfolio turnover | | | 9 | %†† |
| ^ | Calculated based upon average shares outstanding. |
| * | Commencement of operations |
See Notes to Financial Statements
145
THE VANTAGEPOINT FUNDS
Financial Highlights
(For a share outstanding throughout each period)
| | | | | | | | | | | | | | | | | | | | |
| | | Milestone 2025 Investor M Shares | |
| | | For the Year Ended December 31, | |
| | | 2013 | | | 2012 | | | 2011 | | | 2010 | | | 2009 | |
Net Asset Value, beginning of year | | $ | 10.90 | | | $ | 9.97 | | | $ | 10.27 | | | $ | 9.28 | | | $ | 7.58 | |
Income from investment operations: | | | | | | | | | | | | | | | | | | | | |
Net investment income | | | 0.11 | ^ | | | 0.20 | | | | 0.17 | | | | 0.13 | | | | 0.14 | |
Net realized and unrealized gain (loss) | | | 2.03 | | | | 1.02 | | | | (0.26 | ) | | | 1.00 | | | | 1.78 | |
| | | | | | | | | | | | | | | | | | | | |
Total from investment operations | | | 2.14 | | | | 1.22 | | | | (0.09 | ) | | | 1.13 | | | | 1.92 | |
| | | | | | | | | | | | | | | | | | | | |
Less distributions: | | | | | | | | | | | | | | | | | | | | |
Net investment income | | | (0.16 | ) | | | (0.20 | ) | | | (0.17 | ) | | | (0.12 | ) | | | (0.14 | ) |
Realized gains | | | (0.27 | ) | | | (0.09 | ) | | | (0.04 | ) | | | (0.02 | ) | | | (0.08 | ) |
| | | | | | | | | | | | | | | | | | | | |
Total distributions | | | (0.43 | ) | | | (0.29 | ) | | | (0.21 | ) | | | (0.14 | ) | | | (0.22 | ) |
| | | | | | | | | | | | | | | | | | | | |
Net Asset Value, end of year | | $ | 12.61 | | | $ | 10.90 | | | $ | 9.97 | | | $ | 10.27 | | | $ | 9.28 | |
| | | | | | | | | | | | | | | | | | | | |
Total return | | | 19.67 | % | | | 12.24 | % | | | (0.85 | )% | | | 12.25 | % | | | 25.40 | % |
Ratios to Average Net Assets: | | | | | | | | | | | | | | | | | | | | |
Expenses before reimbursements/waivers | | | 0.26 | % | | | 0.14 | % | | | 0.14 | % | | | 0.16 | % | | | 0.19 | % |
Expenses net of reimbursements/waivers, if any | | | 0.26 | % | | | 0.14 | % | | | 0.14 | % | | | 0.16 | % | | | 0.18 | % |
Net Investment Income before reimbursements/waivers | | | 0.97 | % | | | 1.85 | % | | | 1.71 | % | | | 1.77 | % | | | 2.03 | % |
Net Investment Income net of reimbursements/waivers, if any | | | 0.97 | % | | | 1.85 | % | | | 1.71 | % | | | 1.77 | % | | | 2.04 | % |
Supplemental Data: | | | | | | | | | | | | | | | | | | | | |
Net assets, end of year (000) | | $ | 86,764 | | | $ | 383,446 | | | $ | 301,275 | | | $ | 267,155 | | | $ | 146,397 | |
Portfolio turnover | | | 8 | % | | | 5 | % | | | 15 | % | | | 7 | % | | | 5 | % |
| | | | |
| | | Milestone 2025
TM Shares | |
| | | For the Period
from March 1,
2013* to
December 31,
2013 | |
Net Asset Value, beginning of year | | $ | 11.35 | |
Income from investment operations: | | | | |
Net investment income | | | 0.19 | ^ |
Net realized and unrealized gain | | | 1.54 | |
| | | | |
Total from investment operations | | | 1.73 | |
| | | | |
Less distributions: | | | | |
Net investment income | | | (0.19 | ) |
Realized gains | | | (0.27 | ) |
| | | | |
Total distributions | | | (0.46 | ) |
| | | | |
Net Asset Value, end of year | | $ | 12.62 | |
| | | | |
Total return | | | 15.23 | %†† |
Ratios to Average Net Assets: | | | | |
Expenses | | | 0.13 | %† |
Net investment income | | | 1.91 | %† |
Supplemental Data: | | | | |
Net assets, end of year (000) | | $ | 454,269 | |
Portfolio turnover | | | 8 | %†† |
| ^ | Calculated based upon average shares outstanding. |
| * | Commencement of operations |
See Notes to Financial Statements
146
THE VANTAGEPOINT FUNDS
Financial Highlights
(For a share outstanding throughout each period)
| | | | | | | | | | | | | | | | | | | | |
| | | Milestone 2030 Investor M Shares | |
| | | For the Year Ended December 31, | |
| | | 2013 | | | 2012 | | | 2011 | | | 2010 | | | 2009 | |
Net Asset Value, beginning of year | | $ | 11.03 | | | $ | 10.00 | | | $ | 10.34 | | | $ | 9.26 | | | $ | 7.45 | |
Income from investment operations: | | | | | | | | | | | | | | | | | | | | |
Net investment income | | | 0.11 | ^ | | | 0.20 | | | | 0.17 | | | | 0.12 | | | | 0.13 | |
Net realized and unrealized gain (loss) | | | 2.35 | | | | 1.13 | | | | (0.32 | ) | | | 1.09 | | | | 1.90 | |
| | | | | | | | | | | | | | | | | | | | |
Total from investment operations | | | 2.46 | | | | 1.33 | | | | (0.15 | ) | | | 1.21 | | | | 2.03 | |
| | | | | | | | | | | | | | | | | | | | |
Less distributions: | | | | | | | | | | | | | | | | | | | | |
Net investment income | | | (0.16 | ) | | | (0.20 | ) | | | (0.17 | ) | | | (0.12 | ) | | | (0.13 | ) |
Realized gains | | | (0.31 | ) | | | (0.10 | ) | | | (0.02 | ) | | | (0.01 | ) | | | (0.09 | ) |
| | | | | | | | | | | | | | | | | | | | |
Total distributions | | | (0.47 | ) | | | (0.30 | ) | | | (0.19 | ) | | | (0.13 | ) | | | (0.22 | ) |
| | | | | | | | | | | | | | | | | | | | |
Net Asset Value, end of year | | $ | 13.02 | | | $ | 11.03 | | | $ | 10.00 | | | $ | 10.34 | | | $ | 9.26 | |
| | | | | | | | | | | | | | | | | | | | |
Total return | | | 22.33 | % | | | 13.28 | % | | | (1.46 | )% | | | 13.11 | % | | | 27.33 | % |
Ratios to Average Net Assets: | | | | | | | | | | | | | | | | | | | | |
Expenses before reimbursements/waivers | | | 0.27 | % | | | 0.14 | % | | | 0.15 | % | | | 0.16 | % | | | 0.20 | % |
Expenses net of reimbursements/waivers, if any | | | 0.27 | % | | | 0.14 | % | | | 0.15 | % | | | 0.16 | % | | | 0.19 | % |
Net Investment Income before reimbursements/waivers | | | 0.95 | % | | | 1.81 | % | | | 1.65 | % | | | 1.53 | % | | | 1.89 | % |
Net Investment Income net of reimbursements/waivers, if any | | | 0.95 | % | | | 1.81 | % | | | 1.65 | % | | | 1.53 | % | | | 1.90 | % |
Supplemental Data: | | | | | | | | | | | | | | | | | | | | |
Net assets, end of year (000) | | $ | 78,295 | | | $ | 305,077 | | | $ | 236,452 | | | $ | 211,155 | | | $ | 121,219 | |
Portfolio turnover | | | 8 | % | | | 5 | % | | | 14 | % | | | 7 | % | | | 4 | % |
��
| | | | |
| | | Milestone 2030
TM Shares | |
| | | For the Period
from March 1,
2013* to
December 31,
2013 | |
Net Asset Value, beginning of year | | $ | 11.54 | |
Income from investment operations: | | | | |
Net investment income | | | 0.20 | ^ |
Net realized and unrealized gain | | | 1.79 | |
| | | | |
Total from investment operations | | | 1.99 | |
| | | | |
Less distributions: | | | | |
Net investment income | | | (0.19 | ) |
Realized gains | | | (0.31 | ) |
| | | | |
Total distributions | | | (0.50 | ) |
| | | | |
Net Asset Value, end of year | | $ | 13.03 | |
| | | | |
Total return | | | 17.22 | %†† |
Ratios to Average Net Assets: | | | | |
Expenses | | | 0.14 | %† |
Net investment income | | | 1.88 | %† |
Supplemental Data: | | | | |
Net assets, end of year (000) | | $ | 361,005 | |
Portfolio turnover | | | 8 | %†† |
| ^ | Calculated based upon average shares outstanding. |
| * | Commencement of operations |
See Notes to Financial Statements
147
THE VANTAGEPOINT FUNDS
Financial Highlights
(For a share outstanding throughout each period)
| | | | | | | | | | | | | | | | | | | | |
| | | Milestone 2035 Investor M Shares | |
| | | For the Year Ended December 31, | |
| | | 2013 | | | 2012 | | | 2011 | | | 2010 | | | 2009 | |
Net Asset Value, beginning of year | | $ | 10.99 | | | $ | 9.86 | | | $ | 10.28 | | | $ | 9.10 | | | $ | 7.21 | |
Income from investment operations: | | | | | | | | | | | | | | | | | | | | |
Net investment income | | | 0.11 | ^ | | | 0.20 | | | | 0.16 | | | | 0.10 | | | | 0.13 | |
Net realized and unrealized gain (loss) | | | 2.64 | | | | 1.23 | | | | (0.39 | ) | | | 1.20 | | | | 1.98 | |
| | | | | | | | | | | | | | | | | | | | |
Total from investment operations | | | 2.75 | | | | 1.43 | | | | (0.23 | ) | | | 1.30 | | | | 2.11 | |
| | | | | | | | | | | | | | | | | | | | |
Less distributions: | | | | | | | | | | | | | | | | | | | | |
Net investment income | | | (0.16 | ) | | | (0.20 | ) | | | (0.16 | ) | | | (0.10 | ) | | | (0.13 | ) |
Realized gains | | | (0.36 | ) | | | (0.10 | ) | | | (0.03 | ) | | | (0.02 | ) | | | (0.09 | ) |
| | | | | | | | | | | | | | | | | | | | |
Total distributions | | | (0.52 | ) | | | (0.30 | ) | | | (0.19 | ) | | | (0.12 | ) | | | (0.22 | ) |
| | | | | | | | | | | | | | | | | | | | |
Net Asset Value, end of year | | $ | 13.22 | | | $ | 10.99 | | | $ | 9.86 | | | $ | 10.28 | | | $ | 9.10 | |
| | | | | | | | | | | | | | | | | | | | |
Total return | | | 25.02 | % | | | 14.47 | % | | | (2.24 | )% | | | 14.33 | % | | | 29.22 | % |
Ratios to Average Net Assets: | | | | | | | | | | | | | | | | | | | | |
Expenses before reimbursements/waivers | | | 0.29 | % | | | 0.15 | % | | | 0.17 | % | | | 0.19 | % | | | 0.25 | % |
Expenses net of reimbursements/waivers, if any | | | 0.29 | % | | | 0.15 | % | | | 0.17 | % | | | 0.19 | % | | | 0.22 | % |
Net Investment Income before reimbursements/waivers | | | 0.90 | % | | | 1.78 | % | | | 1.62 | % | | | 1.35 | % | | | 1.92 | % |
Net Investment Income net of reimbursements/waivers, if any | | | 0.90 | % | | | 1.78 | % | | | 1.62 | % | | | 1.35 | % | | | 1.95 | % |
Supplemental Data: | | | | | | | | | | | | | | | | | | | | |
Net assets, end of year (000) | | $ | 58,607 | | | $ | 202,649 | | | $ | 150,472 | | | $ | 133,121 | | | $ | 76,875 | |
Portfolio turnover | | | 8 | % | | | 5 | % | | | 13 | % | | | 7 | % | | | 4 | % |
| | | | |
| | | Milestone 2035
TM Shares | |
| | | For the Period
from March 1,
2013* to
December 31,
2013 | |
Net Asset Value, beginning of year | | $ | 11.55 | |
Income from investment operations: | | | | |
Net investment income | | | 0.20 | ^ |
Net realized and unrealized gain | | | 2.01 | |
| | | | |
Total from investment operations | | | 2.21 | |
| | | | |
Less distributions: | | | | |
Net investment income | | | (0.18 | ) |
Realized gains | | | (0.36 | ) |
| | | | |
Total distributions | | | (0.54 | ) |
| | | | |
Net Asset Value, end of year | | $ | 13.22 | |
| | | | |
Total return | | | 19.17 | %†† |
Ratios to Average Net Assets: | | | | |
Expenses | | | 0.14 | %† |
Net investment income | | | 1.85 | %† |
Supplemental Data: | | | | |
Net assets, end of year (000) | | $ | 244,635 | |
Portfolio turnover | | | 8 | %†† |
| ^ | Calculated based upon average shares outstanding. |
| * | Commencement of operations |
See Notes to Financial Statements
148
THE VANTAGEPOINT FUNDS
Financial Highlights
(For a share outstanding throughout each period)
| | | | | | | | | | | | | | | | | | | | |
| | | Milestone 2040 Investor M Shares | |
| | | For the Year Ended December 31, | |
| | | 2013 | | | 2012 | | | 2011 | | | 2010 | | | 2009 | |
Net Asset Value, beginning of year | | $ | 11.16 | | | $ | 9.86 | | | $ | 10.30 | | | $ | 9.07 | | | $ | 7.10 | |
Income from investment operations: | | | | | | | | | | | | | | | | | | | | |
Net investment income | | | 0.10 | ^ | | | 0.20 | | | | 0.17 | | | | 0.10 | | | | 0.13 | |
Net realized and unrealized gain (loss) | | | 2.93 | | | | 1.31 | | | | (0.44 | ) | | | 1.25 | | | | 2.05 | |
| | | | | | | | | | | | | | | | | | | | |
Total from investment operations | | | 3.03 | | | | 1.51 | | | | (0.27 | ) | | | 1.35 | | | | 2.18 | |
| | | | | | | | | | | | | | | | | | | | |
Less distributions: | | | | | | | | | | | | | | | | | | | | |
Net investment income | | | (0.16 | ) | | | (0.19 | ) | | | (0.17 | ) | | | (0.10 | ) | | | (0.13 | ) |
Realized gains | | | (0.53 | ) | | | (0.02 | ) | | | — | | | | (0.02 | ) | | | (0.08 | ) |
| | | | | | | | | | | | | | | | | | | | |
Total distributions | | | (0.69 | ) | | | (0.21 | ) | | | (0.17 | ) | | | (0.12 | ) | | | (0.21 | ) |
| | | | | | | | | | | | | | | | | | | | |
Net Asset Value, end of year | | $ | 13.50 | | | $ | 11.16 | | | $ | 9.86 | | | $ | 10.30 | | | $ | 9.07 | |
| | | | | | | | | | | | | | | | | | | | |
Total return | | | 27.12 | % | | | 15.33 | % | | | (2.61 | )% | | | 14.91 | % | | | 30.70 | % |
Ratios to Average Net Assets: | | | | | | | | | | | | | | | | | | | | |
Expenses before reimbursements/waivers | | | 0.28 | % | | | 0.16 | % | | | 0.17 | % | | | 0.18 | % | | | 0.23 | % |
Expenses net of reimbursements/waivers, if any | | | 0.28 | % | | | 0.16 | % | | | 0.17 | % | | | 0.18 | % | | | 0.21 | % |
Net Investment Income before reimbursements/waivers | | | 0.82 | % | | | 1.77 | % | | | 1.67 | % | | | 1.20 | % | | | 2.05 | % |
Net Investment Income net of reimbursements/waivers, if any | | | 0.82 | % | | | 1.77 | % | | | 1.67 | % | | | 1.20 | % | | | 2.06 | % |
Supplemental Data: | | | | | | | | | | | | | | | | | | | | |
Net assets, end of year (000) | | $ | 53,970 | | | $ | 197,376 | | | $ | 146,032 | | | $ | 132,306 | | | $ | 91,348 | |
Portfolio turnover | | | 8 | % | | | 4 | % | | | 14 | % | | | 21 | % | | | 4 | % |
| | | | |
| | | Milestone 2040
TM Shares | |
| | | For the Period
from March 1,
2013* to
December 31,
2013 | |
Net Asset Value, beginning of year | | $ | 11.77 | |
Income from investment operations: | | | | |
Net investment income | | | 0.20 | ^ |
Net realized and unrealized gain | | | 2.24 | |
| | | | |
Total from investment operations | | | 2.44 | |
| | | | |
Less distributions: | | | | |
Net investment income | | | (0.18 | ) |
Realized gains | | | (0.53 | ) |
| | | | |
Total distributions | | | (0.71 | ) |
| | | | |
Net Asset Value, end of year | | $ | 13.50 | |
| | | | |
Total return | | | 20.74 | %†† |
Ratios to Average Net Assets: | | | | |
Expenses | | | 0.14 | %† |
Net investment income | | | 1.80 | %† |
Supplemental Data: | | | | |
Net assets, end of year (000) | | $ | 240,813 | |
Portfolio turnover | | | 8 | %†† |
| ^ | Calculated based upon average shares outstanding. |
| * | Commencement of operations |
See Notes to Financial Statements
149
THE VANTAGEPOINT FUNDS
Financial Highlights
(For a share outstanding throughout each period)
| | | | | | | | | | | | | | | | |
| | | Milestone 2045 Investor M Shares | |
| | | For the Year Ended December 31, | | | For the Period
from January 4,
2010* to
December 31,
2010 | |
| | | 2013 | | | 2012 | | | 2011 | | |
Net Asset Value, beginning of year | | $ | 11.99 | | | $ | 10.71 | | | $ | 11.33 | | | $ | 10.00 | |
Income from investment operations: | | | | | | | | | | | | | | | | |
Net investment income | | | 0.13 | ^ | | | 0.22 | | | | 0.17 | | | | 0.10 | |
Net realized and unrealized gain (loss) | | | 3.19 | | | | 1.43 | | | | (0.49 | ) | | | 1.36 | |
| | | | | | | | | | | | | | | | |
Total from investment operations | | | 3.32 | | | | 1.65 | | | | (0.32 | ) | | | 1.46 | |
| | | | | | | | | | | | | | | | |
Less distributions: | | | | | | | | | | | | | | | | |
Net investment income | | | (0.16 | ) | | | (0.22 | ) | | | (0.17 | ) | | | (0.10 | ) |
Realized gains | | | (0.63 | ) | | | (0.15 | ) | | | (0.13 | ) | | | (0.03 | ) |
| | | | | | | | | | | | | | | | |
Total distributions | | | (0.79 | ) | | | (0.37 | ) | | | (0.30 | ) | | | (0.13 | ) |
| | | | | | | | | | | | | | | | |
Net Asset Value, end of year | | $ | 14.52 | | | $ | 11.99 | | | $ | 10.71 | | | $ | 11.33 | |
| | | | | | | | | | | | | | | | |
Total return | | | 27.69 | % | | | 15.49 | % | | | (2.81 | )% | | | 14.62 | %†† |
Ratios to Average Net Assets: | | | | | | | | | | | | | | | | |
Expenses before reimbursements/waivers | | | 0.39 | % | | | 0.25 | % | | | 0.36 | % | | | 0.87 | %† |
Expenses net of reimbursements/waivers, if any | | | 0.39 | % | | | 0.25 | % | | | 0.35 | % | | | 0.34 | %† |
Net Investment Income before reimbursements/waivers | | | 0.95 | % | | | 1.91 | % | | | 1.68 | % | | | 1.67 | %† |
Net Investment Income net of reimbursements/waivers, if any | | | 0.95 | % | | | 1.91 | % | | | 1.69 | % | | | 2.19 | %† |
Supplemental Data: | | | | | | | | | | | | | | | | |
Net assets, end of year (000) | | $ | 24,388 | | | $ | 53,824 | | | $ | 33,434 | | | $ | 22,363 | |
Portfolio turnover | | | 9 | % | | | 18 | % | | | 14 | % | | | 8 | %†† |
| | | | |
| | | Milestone 2045
TM Shares | |
| | | For the Period
from March 1,
2013* to
December 31,
2013 | |
Net Asset Value, beginning of year | | $ | 12.66 | |
Income from investment operations: | | | | |
Net investment income | | | 0.22 | ^ |
Net realized and unrealized gain | | | 2.46 | |
| | | | |
Total from investment operations | | | 2.68 | |
| | | | |
Less distributions: | | | | |
Net investment income | | | (0.18 | ) |
Realized gains | | | (0.63 | ) |
| | | | |
Total distributions | | | (0.81 | ) |
| | | | |
Net Asset Value, end of year | | $ | 14.53 | |
| | | | |
Total return | | | 21.21 | %†† |
Ratios to Average Net Assets: | | | | |
Expenses | | | 0.21 | %† |
Net investment income | | | 1.87 | %† |
Supplemental Data: | | | | |
Net assets, end of year (000) | | $ | 73,807 | |
Portfolio turnover | | | 9 | %†† |
| ^ | Calculated based upon average shares outstanding. |
| * | Commencement of operations |
See Notes to Financial Statements
150
THE VANTAGEPOINT FUNDS
Financial Highlights
(For a share outstanding throughout each period)
| | | | | | | | |
| | | Milestone 2050 Investor M Shares | |
| | | For the Year
Ended
December 31,
2013 | | | For the Period
from September 10,
2012* to
December 31,
2012 | |
Net Asset Value, beginning of year | | $ | 10.25 | | | $ | 10.00 | |
Income from investment operations: | | | | | | | | |
Net investment income | | | 0.13 | ^ | | | 0.02 | |
Net realized and unrealized gain | | | 2.66 | | | | 0.25 | |
| | | | | | | | |
Total from investment operations | | | 2.79 | | | | 0.27 | |
| | | | | | | | |
Less distributions: | | | | | | | | |
Net investment income | | | (0.12 | ) | | | (0.02 | ) |
Realized gains | | | (0.18 | ) | | | — | |
| | | | | | | | |
Total distributions | | | (0.30 | ) | | | (0.02 | ) |
| | | | | | | | |
Net Asset Value, end of year | | $ | 12.74 | | | $ | 10.25 | |
| | | | | | | | |
Total return | | | 27.24 | % | | | 2.66 | %†† |
Ratios to Average Net Assets: | | | | | | | | |
Expenses before reimbursements/waivers | | | 1.05 | % | | | 9.98 | %† |
Expenses net of reimbursements/waivers, if any | | | 0.56 | % | | | 0.36 | %† |
Net Investment income (loss) before reimbursements/waivers | | | 0.65 | % | | | (6.43 | )%† |
Net Investment Income net of reimbursements/waivers, if any | | | 1.14 | % | | | 3.19 | %† |
Supplemental Data: | | | | | | | | |
Net assets, end of year (000) | | $ | 6,848 | | | $ | 6,769 | |
Portfolio turnover | | | 24 | % | | | 1 | %†† |
| | | | |
| | | Milestone 2050
TM Shares | |
| | | For the Period
from March 1,
2013* to
December 31,
2013 | |
Net Asset Value, beginning of year | | $ | 10.83 | |
Income from investment operations: | | | | |
Net investment income | | | 0.24 | ^ |
Net realized and unrealized gain | | | 1.99 | |
| | | | |
Total from investment operations | | | 2.23 | |
| | | | |
Less distributions: | | | | |
Net investment income | | | (0.14 | ) |
Realized gains | | | (0.18 | ) |
| | | | |
Total distributions | | | (0.32 | ) |
| | | | |
Net Asset Value, end of year | | $ | 12.74 | |
| | | | |
Total return | | | 20.61 | %†† |
Ratios to Average Net Assets: | | | | |
Expenses before reimbursements/waivers | | | 0.78 | %† |
Expenses net of reimbursements/waivers, if any | | | 0.37 | %† |
Net Investment Income before reimbursements/waivers | | | 1.95 | %† |
Net Investment Income net of reimbursements/waivers, if any | | | 2.36 | %† |
Supplemental Data: | | | | |
Net assets, end of year (000) | | $ | 15,442 | |
Portfolio turnover | | | 24 | %†† |
| ^ | Calculated based upon average shares outstanding. |
| * | Commencement of operations |
See Notes to Financial Statements
151
THE VANTAGEPOINT FUNDS
NOTES TO FINANCIAL STATEMENTS
The Vantagepoint Funds (the “Company”) was organized as a Delaware statutory trust on July 28, 1998 and is registered under the Investment Company Act of 1940, as amended (the “1940 Act”), as an open-end management investment company. The Company consisted of the following series on December 31, 2013:
| | |
| |
| The “Actively Managed Funds”: | | The “Index Funds”: |
Low Duration Bond Fund | | Core Bond Index Fund |
Inflation Protected Securities Fund | | 500 Stock Index Fund |
Equity Income Fund | | Broad Market Index Fund |
Growth & Income Fund | | Mid/Small Company Index Fund |
Growth Fund | | Overseas Equity Index Fund |
Select Value Fund | | |
Aggressive Opportunities Fund | | |
Discovery Fund | | |
International Fund | | |
Diversifying Strategies Fund | | |
| |
| The “Milestone Funds”: | | The “Model Portfolio Funds”: |
Milestone Retirement Income Fund | | Model Portfolio Conservative Growth Fund |
Milestone 2010 Fund | | Model Portfolio Traditional Growth Fund |
Milestone 2015 Fund | | Model Portfolio Long-Term Growth Fund |
Milestone 2020 Fund | | Model Portfolio All-Equity Growth Fund |
Milestone 2025 Fund | | |
Milestone 2030 Fund | | |
Milestone 2035 Fund | | |
Milestone 2040 Fund | | |
Milestone 2045 Fund | | |
Milestone 2050 Fund | | |
Through February 28, 2013, each fund, other than the Index Funds, only offered a single share class, and the Index Funds only offered two share classes: Class I and Class II Shares. Beginning March 1, 2013, the outstanding shares of the Actively Managed Funds (other than the Diversifying Strategies Fund) were renamed “Investor Shares,” the outstanding shares of the Model Portfolio Funds and Milestone Funds were renamed “Investor M Shares,” and the outstanding shares of the Diversifying Strategies Fund were renamed “T Shares.” In addition, beginning March 1, 2013, the Index Funds and the Actively Managed Funds (other than the Diversifying Strategies Fund) each offer a new share class, called “T Shares,” and the Model Portfolio Funds and Milestone Funds each offer a new share class, called “TM Shares.”
In addition, at a meeting held on January 18, 2013, Vantagepoint Investment Advisers, LLC (“VIA” or the “Adviser”) recommended and the Board approved the liquidation and termination of the Model Portfolio Savings Oriented Fund. This liquidation and termination occurred on March 22, 2013.
The Model Portfolio Funds Structure
The Model Portfolio Funds invest in a combination of other Vantagepoint Funds and one or more third party exchange-traded funds (“ETFs” and together with other Vantagepoint Funds “underlying funds”). Subject to the supervision of the Company’s Board of Directors (“Board”), VIA may make changes to the underlying fund allocations for the Model Portfolios based on its periodic analysis to identify the allocation of assets among the different underlying fund allocations for the Model Portfolio Funds that it believes is appropriate for each Model Portfolio Fund. Each Model Portfolio Fund has a different degree of potential risk and reward and is diversified
152
THE VANTAGEPOINT FUNDS
NOTES TO FINANCIAL STATEMENTS — (Continued)
among various underlying funds in differing allocations. The underlying funds of each Model Portfolio Fund and the target investment allocation to each underlying fund as of December 31, 2013 were as follows:
| | | | | | | | | | | | | | | | |
| | | Conservative
Growth | | | Traditional
Growth | | | Long-
Term
Growth | | | All-Equity
Growth | |
Fixed Income—% | | | | | | | | | | | | | | | | |
Low Duration Bond | | | 19.00 | % | | | 8.00 | % | | | 0.00 | % | | | 0.00 | % |
Core Bond Index | | | 12.00 | % | | | 13.00 | % | | | 13.00 | % | | | 0.00 | % |
Inflation Protected Securities | | | 10.00 | % | | | 4.00 | % | | | 0.00 | % | | | 0.00 | % |
| | | | | | | | | | | | | | | | |
Total Fixed Income—% | | | 41.00 | % | | | 25.00 | % | | | 13.00 | % | | | 0.00 | % |
| | | | | | | | | | | | | | | | |
| | | | |
Equity—% | | | | | | | | | | | | | | | | |
Equity Income | | | 11.00 | % | | | 12.00 | % | | | 13.00 | % | | | 18.00 | % |
Growth & Income | | | 9.00 | % | | | 12.00 | % | | | 13.00 | % | | | 17.00 | % |
Growth | | | 6.00 | % | | | 10.00 | % | | | 11.50 | % | | | 17.00 | % |
Select Value | | | 3.00 | % | | | 5.50 | % | | | 8.50 | % | | | 9.50 | % |
Aggressive Opportunities | | | 3.00 | % | | | 5.50 | % | | | 8.50 | % | | | 9.50 | % |
Discovery | | | 0.00 | % | | | 3.00 | % | | | 4.50 | % | | | 9.00 | % |
International | | | 7.00 | % | | | 11.00 | % | | | 14.00 | % | | | 17.00 | % |
Third Party Emerging Markets ETF | | | 1.00 | % | | | 1.00 | % | | | 2.00 | % | | | 3.00 | % |
| | | | | | | | | | | | | | | | |
Total Equity—% | | | 40.00 | % | | | 60.00 | % | | | 75.00 | % | | | 100.00 | % |
| | | | | | | | | | | | | | | | |
| | | | |
Multi-Strategy—% | | | | | | | | | | | | | | | | |
Diversifying Strategies | | | 19.00 | % | | | 15.00 | % | | | 12.00 | % | | | 0.00 | % |
| | | | | | | | | | | | | | | | |
Total Multi-Strategy—% | | | 19.00 | % | | | 15.00 | % | | | 12.00 | % | | | 0.00 | % |
| | | | | | | | | | | | | | | | |
| | | | |
Total—% | | | 100.00 | % | | | 100.00 | % | | | 100.00 | % | | | 100.00 | % |
| | | | | | | | | | | | | | | | |
As of March 1, 2013, the Model Portfolio Funds began investing in the T Shares of the underlying Vantagepoint Funds.
The Milestone Funds Structure
The Milestone Funds invest in the underlying funds as defined above. Subject to the supervision of the Board, VIA may make changes to the underlying fund allocations for the Milestone Funds based on its periodic analysis to identify the allocation of assets among the different underlying funds that it believes is appropriate for each Milestone Fund. Each Milestone Fund invests in a combination of underlying funds that is believed to be appropriate for investors who expect to begin making gradual withdrawals from the Milestone Fund, typically at or after retirement, in or around the year stated in the Milestone Fund’s name, except for the Milestone Retirement Income Fund. VIA adjusts the asset allocation of each “dated” Milestone Fund to become more conservative over time until the Milestone Fund achieves a constant asset allocation approximately ten years after the year designated in its name. The Milestone 2045 and the Milestone 2050 Fund have not yet been adjusted because of their long remaining time horizon. Each Milestone Fund has a different degree of potential risk and reward and is diversified among various underlying funds
153
THE VANTAGEPOINT FUNDS
NOTES TO FINANCIAL STATEMENTS — (Continued)
in differing allocations. The underlying funds of each Milestone Fund and the target investment allocation to each underlying fund as of December 31, 2013, were as follows:
| | | | | | | | | | | | | | | | | | | | |
| | | Milestone Funds | |
| | | Retirement
Income | | | 2010 | | | 2015 | | | 2020 | | | 2025 | |
Fixed Income—% | | | | | | | | | | | | | | | | | | | | |
Low Duration Bond | | | 31.00 | % | | | 17.19 | % | | | 12.42 | % | | | 8.38 | % | | | 4.52 | % |
Core Bond Index | | | 9.00 | % | | | 6.61 | % | | | 8.17 | % | | | 12.48 | % | | | 14.19 | % |
Inflation Protected Securities | | | 15.00 | % | | | 15.00 | % | | | 12.00 | % | | | 4.50 | % | | | 0.00 | % |
| | | | | | | | | | | | | | | | | | | | |
Total Fixed Income—% | | | 55.00 | % | | | 38.80 | % | | | 32.59 | % | | | 25.36 | % | | | 18.71 | % |
| | | | | | | | | | | | | | | | | | | | |
| | | | | |
Equity—% | | | | | | | | | | | | | | | | | | | | |
Equity Income | | | 10.00 | % | | | 17.02 | % | | | 19.04 | % | | | 20.13 | % | | | 22.30 | % |
Growth & Income | | | 10.00 | % | | | 11.00 | % | | | 11.02 | % | | | 11.32 | % | | | 12.33 | % |
Growth | | | 0.00 | % | | | 6.30 | % | | | 7.51 | % | | | 7.91 | % | | | 8.88 | % |
Mid/Small Company Index | | | 0.00 | % | | | 0.00 | % | | | 2.70 | % | | | 7.73 | % | | | 10.23 | % |
International | | | 4.00 | % | | | 7.63 | % | | | 8.74 | % | | | 9.80 | % | | | 11.55 | % |
Third Party Emerging Markets ETF | | | 1.00 | % | | | 1.00 | % | | | 1.40 | % | | | 2.00 | % | | | 2.00 | % |
| | | | | | | | | | | | | | | | | | | | |
Total Equity—% | | | 25.00 | % | | | 42.95 | % | | | 50.41 | % | | | 58.89 | % | | | 67.29 | % |
| | | | | | | | | | | | | | | | | | | | |
| | | | | |
Multi-Strategy—% | | | | | | | | | | | | | | | | | | | | |
Diversifying Strategies | | | 20.00 | % | | | 18.25 | % | | | 17.00 | % | | | 15.75 | % | | | 14.00 | % |
| | | | | | | | | | | | | | | | | | | | |
Total Multi-Strategy—% | | | 20.00 | % | | | 18.25 | % | | | 17.00 | % | | | 15.75 | % | | | 14.00 | % |
| | | | | | | | | | | | | | | | | | | | |
| | | | | |
Total—% | | | 100.00 | % | | | 100.00 | % | | | 100.00 | % | | | 100.00 | % | | | 100.00 | % |
| | | | | | | | | | | | | | | | | | | | |
| |
| | | Milestone Funds | |
| | | 2030 | | | 2035 | | | 2040 | | | 2045 | | | 2050 | |
Fixed Income—% | | | | | | | | | | | | | | | | | | | | |
Low Duration Bond | | | 1.73 | % | | | 0.67 | % | | | 0.00 | % | | | 0.00 | % | | | 0.00 | % |
Core Bond Index | | | 11.09 | % | | | 6.91 | % | | | 5.00 | % | | | 5.00 | % | | | 5.00 | % |
Inflation Protected Securities | | | 0.00 | % | | | 0.00 | % | | | 0.00 | % | | | 0.00 | % | | | 0.00 | % |
| | | | | | | | | | | | | | | | | | | | |
Total Fixed Income—% | | | 12.82 | % | | | 7.58 | % | | | 5.00 | % | | | 5.00 | % | | | 5.00 | % |
| | | | | | | | | | | | | | | | | | | | |
| | | | | |
Equity—% | | | | | | | | | | | | | | | | | | | | |
Equity Income | | | 23.80 | % | | | 25.19 | % | | | 26.59 | % | | | 27.40 | % | | | 27.40 | % |
Growth & Income | | | 13.66 | % | | | 14.59 | % | | | 15.42 | % | | | 16.00 | % | | | 16.00 | % |
Growth | | | 9.96 | % | | | 11.21 | % | | | 12.25 | % | | | 12.60 | % | | | 12.60 | % |
Mid/Small Company Index | | | 12.98 | % | | | 16.46 | % | | | 19.34 | % | | | 20.00 | % | | | 20.00 | % |
International | | | 13.28 | % | | | 14.07 | % | | | 15.40 | % | | | 16.00 | % | | | 16.00 | % |
Third Party Emerging Markets ETF | | | 2.00 | % | | | 2.90 | % | | | 3.00 | % | | | 3.00 | % | | | 3.00 | % |
| | | | | | | | | | | | | | | | | | | | |
Total Equity—% | | | 75.68 | % | | | 84.42 | % | | | 92.00 | % | | | 95.00 | % | | | 95.00 | % |
| | | | | | | | | | | | | | | | | | | | |
| | | | | |
Multi-Strategy—% | | | | | | | | | | | | | | | | | | | | |
Diversifying Strategies | | | 11.50 | % | | | 8.00 | % | | | 3.00 | % | | | 0.00 | % | | | 0.00 | % |
| | | | | | | | | | | | | | | | | | | | |
Total Multi-Strategy—% | | | 11.50 | % | | | 8.00 | % | | | 3.00 | % | | | 0.00 | % | | | 0.00 | % |
| | | | | | | | | | | | | | | | | | | | |
| | | | | |
Total—% | | | 100.00 | % | | | 100.00 | % | | | 100.00 | % | | | 100.00 | % | | | 100.00 | % |
| | | | | | | | | | | | | | | | | | | | |
As of March 1, 2013, the Milestone Funds began investing in the T Shares of the underlying Vantagepoint Funds.
154
THE VANTAGEPOINT FUNDS
NOTES TO FINANCIAL STATEMENTS — (Continued)
Since the Model Portfolio Funds and Milestone Funds invested entirely in underlying funds during the year ended December 31, 2013 period, investment earnings for this period are composed of:
| | 1. | ordinary and capital gain dividends from the underlying funds, |
| | 2. | unrealized appreciation/depreciation on investments in the underlying funds, and |
| | 3. | realized gain/loss from sales of the shares of the underlying funds triggered by net outflows associated with normal capital stock activity and rebalancing of the Model Portfolio Funds and Milestone Funds. |
Subadviser Changes from January 1, 2013 to December 31, 2013
On October 11, 2013, Schroder Investment Management North America Inc. (“SIMNA”) began managing the assets of the Low Duration Bond Fund previously allocated and managed by SIMNA’s affiliate, STW Fixed Income Management, LLC. VIA had recommended and the Board had approved these changes at a meeting held on July 1, 2013.
At a meeting held on December 3, 2013 (the “December 2013 Meeting”), VIA recommended, and the Board approved, the termination of Barrow Hanley Mewhinney & Strauss, LLC, and the appointment of SSgA Funds Management, Inc. and Wellington Management Company, LLP as subadvisers to the Equity Income Fund. These changes were effective on February 4, 2014.
In addition at the December 2013 Meeting, VIA recommended, and the Board approved, the termination of Calamos Advisors LLC, and the appointment of Oaktree Capital Management, L.P., as a subadviser to the Diversifying Strategies Fund. These changes were effective on February 4, 2014.
Lastly and also at the December 2013 Meeting, VIA recommended, and the Board approved, the appointment of SSgA Funds Management, Inc. as a subadviser to the Diversifying Strategies Fund in conjunction with upcoming changes to the fund’s principal investment strategies to be effective on May 1, 2014.
| 2. | | Significant Accounting Policies |
The Company’s significant accounting policies are consistently applied in the preparation of its financial statements in accordance with accounting principles generally accepted in the United States of America (“GAAP”). Management makes estimates and assumptions in the preparation of financial statements that affect the reported amounts of assets and liabilities, including the disclosure of contingent assets and liabilities at the date of the financial statements as well as changes in net assets resulting from operations during the reporting period. Actual results could differ from those estimates and those differences could be material.
Fair Value Measurements
The Board has established procedures for valuing portfolio securities and other assets (the “Valuation Procedures”). Pursuant to the Valuation Procedures, if market quotations are not readily available (or otherwise reliable) for a particular security or other asset, a fund must use the fair value of the asset, as determined in good faith by the Board (or its appointee). The Valuation Procedures include guidelines for making fair value determinations (the “Guidelines”). The Board has appointed a pricing committee (the “Pricing Committee”) for the purpose of implementing the Guidelines. The Pricing Committee includes representatives from VIA and officers of the Company. When applicable under the Valuation Procedures, the Pricing Committee is authorized to make all necessary determinations of the fair value of portfolio securities and other assets for which market quotations are not readily available (or otherwise reliable), based on the Guidelines, and reports such determinations to the Board.
The types of securities or other assets for which such fair value pricing may be necessary include, but are not limited to: certain foreign securities, securities of an issuer that has entered into a restructuring; securities whose trading has been halted or suspended; fixed income securities for which there is no current market value quotation; and securities that are restricted as to transfer or resale; and certain derivatives. The need to fair value a fund’s portfolio securities or other assets may also result from low trading volume in foreign markets or thinly traded domestic securities, such as certain small cap securities. Securities or other assets may also be priced using fair value pricing methods when their closing prices do not reflect their market values at the time a fund calculates its NAV because an event that will affect their value has occurred since the closing prices were established on the relevant domestic or foreign exchange or market but before the fund’s NAV calculation.
In making a fair value determination for a given security or asset, the Pricing Committee considers one or more of the following factors regarding the security or other asset, as appropriate: fundamental analytical data relating to the
155
THE VANTAGEPOINT FUNDS
NOTES TO FINANCIAL STATEMENTS — (Continued)
investment in the security; nature and duration of any restriction on the disposition of the security; evaluation of the forces that influence the market in which the security is purchased and sold; type of security or asset; financial statements of issuer; cost at date of purchase; size of holding; discount from market value of unrestricted securities of the same class at the time of purchase; special reports prepared by analysts; information as to any transactions or offers with respect to the security or asset; existence of merger proposals or tender offers affecting the security or asset; price and extent of public trading in similar securities or other instruments of the issuer or comparable companies and other relevant matters; most recent closing market prices; existence of shelf registration for restricted securities; existence of any undertaking to register the security; other acceptable methods of valuing securities or other assets based on: (a) earnings multiples; (b) a discount from market of a similar freely traded security or other instrument; (c) yield to maturity with respect to debt issues; or (d) a combination of these methods; the value of other financial instruments, including derivative securities, traded on other markets or among dealers; trading volumes on markets, exchanges, or among dealers; values of baskets of securities or other instruments traded on other markets, exchanges, or among dealers; changes in interest rates; observations from financial institutions; government (domestic or foreign) actions or pronouncements; other news events and factors; with respect to securities or other instruments traded on foreign markets: (a) the value of foreign securities traded on other foreign markets; (b) ADR trading; (c) closed- end fund trading; (d) foreign currency exchange activity; and (e) the trading prices of financial products that are tied to baskets of foreign securities or other assets; with respect to an emergency or other unusual situation, an evaluation of (a) the nature and duration of the event; (b) the forces influencing the operation of the financial markets; (c) the factors relating to the event that precipitated the problem; (d) whether the event is likely to recur; (e) whether the effects of the event are isolated or whether they affect entire markets, countries, or regions; quotations obtained from one or more broker-dealers of the prices at which they would be willing to buy the security or other asset; and Black-Scholes model for valuing rights, warrants and financial contracts (and similarly structured instruments).
The Pricing Committee reviews its previous fair value determinations on a monthly basis or more frequently as necessary. Fair value processes and controls, and fair value determinations, are subject to review by the Chief Compliance Officer of the Company and by the Board.
Valuing securities or other assets at fair value involves greater reliance on judgment than valuing securities that have readily available (and otherwise reliable) market quotations. There can be no assurance that the fund could obtain the fair value assigned to a security or instrument if it were to sell the security or other asset at approximately the time at which the fund determines its NAV per share. As a result, the fund’s sale or redemption of its shares at NAV, at a time when a holding or holdings are valued at fair value, may have the effect of diluting or increasing the economic interest of existing shareholders.
The Company adopted FASB ASC 820, Fair Value Measurements and Disclosures, effective January 1, 2008. In accordance with ASC 820, fair value is defined as the price that the fund would receive upon selling an investment in an orderly transaction to an independent buyer in the principal or most advantageous market for the investment. ASC 820 established a three-tier hierarchy, which maximizes the use of observable market data and minimizes the use of unobservable inputs to establish classification of fair value measurements for disclosure purposes. Inputs refer broadly to the assumptions that market participants would use in pricing the asset or liability, including assumptions about risk, for example, the risk inherent in a particular valuation technique used to measure fair value including a pricing model and/or the risk inherent in the inputs to the valuation technique. Inputs may be observable or unobservable.
Observable inputs are inputs that reflect the assumptions market participants would use in pricing the asset or liability, developed based on market data obtained from sources independent of the reporting entity. Unobservable inputs are inputs that reflect the reporting entity’s own assumptions about the assumptions market participants would use in pricing the asset or liability based on the best information available in the circumstances. The three-tier hierarchy of inputs is summarized in the three broad levels listed below.
| | | | |
| Level 1 | | — | | quoted prices in active markets for identical investments |
| | |
| Level 2 | | — | | other significant observable inputs (including quoted prices for similar investments in active markets, interest rates and yield curves, prepayment speeds, credit risks, etc.) |
| | |
| Level 3 | | — | | significant unobservable inputs (including the fund’s own assumptions about the assumptions that market participants would use in determining the fair value of investments) |
156
THE VANTAGEPOINT FUNDS
NOTES TO FINANCIAL STATEMENTS — (Continued)
The significant unobservable inputs used in the fair value measurement of the fund’s investments include the probability of default, loss severity in the event of default, increases in market interest rates, downgrades to the issuer’s credit rating, potential for insolvency, government actions or pronouncements, and other financial and non-financial news. Significant changes in any of those inputs in isolation would result in a significantly lower or higher fair value measurement. Generally, a change in the inputs used for fair valuations are accompanied by directionally similar changes in the assumption used for fair valuation determinations.
Investment Policy and Security Valuation
All equity securities that are traded on a national securities exchange (other than NASDAQ Global/Global Select and Capital Market securities traded primarily on the Nasdaq Stock Market, Inc. exchange (“NASDAQ”)) held by each fund normally will be valued at the last reported sale price or official close price (if available) on the exchange on which the security is primarily traded, and are categorized as Level 1 in the fair value hierarchy. If, on a particular day, an exchange-traded security does not trade on its primary exchange, then the price normally will be the mean between the closing bid and closing offer reported to the primary exchange and made available to quotation vendors or disseminated through an automated quotation system, or obtained by a pricing service from other quotation sources believed to be reliable and is generally categorized as Level 2 in the fair value hierarchy. NASDAQ Global/Global Select and Capital Market securities traded primarily on NASDAQ will be valued at the NASDAQ Official Closing Price (“NOCP”). If, on any given day, no NOCP is available, the price of such securities normally will be the mean between the closing bid and closing offer reported on NASDAQ prior to the calculation of the net asset value (“NAV”) of a fund and are generally categorized as Level 1 in the fair value hierarchy. All equity securities not traded on a national securities exchange (“OTC Equities”) normally will be priced at the last reported sale price in the over-the-counter market and are generally categorized as Level 1 in the fair value hierarchy. If an OTC Equity does not trade in an over-the-counter market on a particular day, then the price normally will be the mean between the closing bid and closing offer obtained from a quotation service or other source believed to be reliable and is generally categorized as Level 1 in the fair value hierarchy. Short-term debt instruments, such as commercial paper, bankers’ acceptances, and U.S. Treasury Bills, with a remaining maturity of less than 60 days may be valued at amortized cost and are generally categorized as Level 2 in the fair value hierarchy. Prices for debt instruments and floating rate loans normally will be obtained from a pricing service. In determining prices, the pricing service may employ methodologies designed to identify the market value of debt instruments, which may include reference to actual market transactions, broker-dealer supplied quotations or valuations, matrix pricing, or other valuation techniques. These techniques generally consider such factors as securities’ prices, yields, maturities, call features, ratings and developments relating to specific securities in arriving at valuations and are generally categorized as Level 2 in the fair value hierarchy. In the event a pricing service is unable to provide a price for a particular security, the security may be priced based on the average of two or more independent broker-dealer quotations and is generally categorized as Level 2 or Level 3 in the fair value hierarchy. Any security for which market value as described above is not readily available is valued at fair value as determined in good faith in accordance with the Guidelines and is generally categorized as Level 2 or Level 3 in the fair value hierarchy depending on the observability of market inputs. Except for certain foreign equity securities described later in this note, foreign exchange traded securities are valued in the same manner as domestic exchange traded equity securities and are generally categorized as Level 1 in the fair value hierarchy.
Shares of the underlying funds in which the Model Portfolio and Milestone Funds invest are valued by using the underlying funds’ current NAVs for purchase and/or redemption orders that day and are categorized as Level 1 in the hierarchy.
Valuation of Certain Foreign Equity Securities
For foreign equity securities that are primarily traded in markets outside North and South America, the Board has approved the use of a third party fair valuation service. The service uses a multifactor model to calculate a factor that is then applied to adjust the market price for each such security, which are generally categorized as Level 2 in the fair value hierarchy. Additionally, the Board has approved the use of the fair value prices provided by this service on a daily basis without a market trigger or confidence interval filter for all foreign equity securities held by the funds that are primarily traded in markets outside North and South America which are generally categorized as Level 2 in the fair value hierarchy. In the event prices for such foreign securities are not available through the service or another fair
157
THE VANTAGEPOINT FUNDS
NOTES TO FINANCIAL STATEMENTS — (Continued)
value pricing service approved by the Board, the securities may be priced at the average of two or more independent broker-dealer quotations or at the fair value of the security in accordance with the Company’s Valuation Procedures and are generally categorized as Level 2 or Level 3 in the fair value hierarchy.
The valuation techniques used by the funds to measure fair value during the year ended December 31, 2013 maximized the use of observable inputs and minimized the use of unobservable inputs. The funds utilized fair value techniques such as a multi-dimensional relational pricing model and option adjusted spread pricing to estimate prices that would have prevailed in a liquid market given information available at the time of evaluation.
The following is a summary of the inputs used as of December 31, 2013, in valuing each fund’s investments carried at value:
| | | | | | | | | | | | | | | | |
Investment Type | | Level 1 | | | Level 2 | | | Level 3 | | | Total | |
Low Duration Bond Fund | | | | | | | | | |
Investments in Securities: | | | | | | | | | | | | | | | | |
Corporate Obligations | | $ | — | | | $ | 368,175,459 | | | $ | — | | | $ | 368,175,459 | |
Floating Rate Loans | | | — | | | | 4,317,010 | | | | — | | | | 4,317,010 | |
Mortgage-Backed Securities | | | — | | | | 30,946,412 | | | | — | | | | 30,946,412 | |
U.S. Treasury Obligations | | | — | | | | 96,040,914 | | | | — | | | | 96,040,914 | |
Government Related Obligations | | | — | | | | 27,110,722 | | | | — | | | | 27,110,722 | |
Asset-Backed Securities | | | — | | | | 55,552,223 | | | | — | | | | 55,552,223 | |
Money Market Funds | | | 32,065,910 | | | | — | | | | — | | | | 32,065,910 | |
| | | | | | | | | | | | | | | | |
Total Investments in Securities | | $ | 32,065,910 | | | $ | 582,142,740 | | | $ | — | | | $ | 614,208,650 | |
| | | | | | | | | | | | | | | | |
Derivative Instruments: | | | | | | | | | | | | | | | | |
Assets: | | | | | | | | | | | | | | | | |
Futures | | | 124,010 | | | | — | | | | — | | | | 124,010 | |
Forward Currency Contracts | | | — | | | | 51,849 | | | | — | | | | 51,849 | |
| | | | | | | | | | | | | | | | |
Total Assets | | $ | 124,010 | | | $ | 51,849 | | | $ | — | | | $ | 175,859 | |
| | | | | | | | | | | | | | | | |
Liabilities: | | | | | | | | | | | | | | | | |
Futures | | | (20,489 | ) | | | — | | | | — | | | | (20,489 | ) |
Forward Currency Contracts | | | — | | | | (107,505 | ) | | | — | | | | (107,505 | ) |
| | | | | | | | | | | | | | | | |
Total Liabilities | | $ | (20,489 | ) | | $ | (107,505 | ) | | $ | — | | | $ | (127,994 | ) |
| | | | | | | | | | | | | | | | |
Total Derivative Instruments | | $ | 103,521 | | | $ | (55,656 | ) | | $ | — | | | $ | 47,865 | |
| | | | | | | | | | | | | | | | |
| | | | |
Inflation Protected Securities Fund | | | | | | | | | | | | | | | | |
Investments in Securities: | | | | | | | | | | | | | | | | |
Corporate Obligations | | $ | — | | | $ | 8,397,534 | | | $ | — | | | $ | 8,397,534 | |
Mortgage-Backed Security | | | — | | | | 2,821,777 | | | | — | | | | 2,821,777 | |
U.S. Treasury Obligations | | | — | | | | 553,352,027 | | | | — | | | | 553,352,027 | |
Government Related Obligations | | | — | | | | 2,000,747 | | | | — | | | | 2,000,747 | |
Asset-Backed Securities | | | — | | | | 2,047,313 | | | | — | | | | 2,047,313 | |
Money Market Fund | | | 13,784,447 | | | | — | | | | — | | | | 13,784,447 | |
| | | | | | | | | | | | | | | | |
Total Investments in Securities | | $ | 13,784,447 | | | $ | 568,619,398 | | | $ | — | | | $ | 582,403,845 | |
| | | | | | | | | | | | | | | | |
Derivative Instruments: | | | | | | | | | | | | | | | | |
Assets: | | | | | | | | | | | | | | | | |
Futures | | | 207,001 | | | | — | | | | — | | | | 207,001 | |
Swap Agreements | | | — | | | | 154,887 | | | | — | | | | 154,887 | |
| | | | | | | | | | | | | | | | |
Total Assets | | $ | 207,001 | | | $ | 154,887 | | | $ | — | | | $ | 361,888 | |
| | | | | | | | | | | | | | | | |
158
THE VANTAGEPOINT FUNDS
NOTES TO FINANCIAL STATEMENTS — (Continued)
| | | | | | | | | | | | | | | | |
Investment Type | | Level 1 | | | Level 2 | | | Level 3 | | | Total | |
Liabilities: | | | | | | | | | | | | | | | | |
Written Options | | $ | — | | | $ | (76,171 | ) | | $ | — | | | $ | (76,171 | ) |
Futures | | | (42,318 | ) | | | — | | | | — | | | | (42,318 | ) |
Swap Agreements | | | — | | | | (743,033 | ) | | | — | | | | (743,033 | ) |
| | | | | | | | | | | | | | | | |
Total Liabilities | | $ | (42,318 | ) | | $ | (819,204 | ) | | $ | — | | | $ | (861,522 | ) |
| | | | | | | | | | | | | | | | |
Total Derivative Instruments | | $ | 164,683 | | | $ | (664,317 | ) | | $ | — | | | $ | (499,634 | ) |
| | | | | | | | | | | | | | | | |
| | | | |
Equity Income Fund | | | | | | | | | | | | | | | | |
Investments in Securities: | | | | | | | | | | | | | | | | |
Common Stocks | | $ | 2,307,213,236 | | | $ | 12,285,804 | | | $ | — | | | $ | 2,319,499,040 | |
Convertible Preferred Stock | | | 400,686 | | | | — | | | | — | | | | 400,686 | |
Money Market Funds | | | 172,148,515 | | | | — | | | | — | | | | 172,148,515 | |
| | | | | | | | | | | | | | | | |
Total Investments in Securities | | $ | 2,479,762,437 | | | $ | 12,285,804 | | | $ | — | | | $ | 2,492,048,241 | |
| | | | | | | | | | | | | | | | |
| | | | |
Growth & Income Fund | | | | | | | | | | | | | | | | |
Investments in Securities: | | | | | | | | | | | | | | | | |
Common Stocks | | $ | 1,639,456,023 | | | $ | 18,958,768 | | | $ | — | | | $ | 1,658,414,791 | |
Money Market Funds | | | 102,637,999 | | | | — | | | | — | | | | 102,637,999 | |
| | | | | | | | | | | | | | | | |
Total Investments in Securities | | $ | 1,742,094,022 | | | $ | 18,958,768 | | | $ | — | | | $ | 1,761,052,790 | |
| | | | | | | | | | | | | | | | |
Growth Fund | | | | | | | | | | | | | | | | |
Investments in Securities: | | | | | | | | | | | | | | | | |
Common Stocks | | $ | 2,268,355,758 | | | $ | — | | | $ | — | | | $ | 2,268,355,758 | |
Money Market Fund | | | 62,416,519 | | | | — | | | | — | | | | 62,416,519 | |
| | | | | | | | | | | | | | | | |
Total Investments in Securities | | $ | 2,330,772,277 | | | $ | — | | | $ | — | | | $ | 2,330,772,277 | |
| | | | | | | | | | | | | | | | |
| | | | |
Select Value Fund | | | | | | | | | | | | | | | | |
Investments in Securities: | | | | | | | | | | | | | | | | |
Common Stocks | | $ | 450,213,551 | | | $ | — | | | $ | — | | | $ | 450,213,551 | |
Money Market Funds | | | 43,990,963 | | | | — | | | | — | | | | 43,990,963 | |
| | | | | | | | | | | | | | | | |
Total Investments in Securities | | $ | 494,204,514 | | | $ | — | | | $ | — | | | $ | 494,204,514 | |
| | | | | | | | | | | | | | | | |
| | | | |
Aggressive Opportunities Fund | | | | | | | | | | | | | | | | |
Investments in Securities: | | | | | | | | | | | | | | | | |
Common Stocks | | $ | 1,188,973,919 | | | $ | 4,381,703 | | | $ | — | | | $ | 1,193,355,622 | |
Money Market Funds | | | 76,645,874 | | | | — | | | | — | | | | 76,645,874 | |
| | | | | | | | | | | | | | | | |
Total Investments in Securities | | $ | 1,265,619,793 | | | $ | 4,381,703 | | | $ | — | | | $ | 1,270,001,496 | |
| | | | | | | | | | | | | | | | |
| | | | |
Discovery Fund | | | | | | | | | | | | | | | | |
Investments in Securities: | | | | | | | | | | | | | | | | |
Common Stocks | | $ | 134,412,736 | | | $ | 3,003,885 | | | $ | — | | | $ | 137,416,621 | |
Corporate Obligations | | | — | | | | 62,968,841 | | | | — | | | | 62,968,841 | |
Mortgage-Backed Securities | | | — | | | | 7,399,162 | | | | — | | | | 7,399,162 | |
U.S. Treasury Obligations | | | — | | | | 51,102,586 | | | | — | | | | 51,102,586 | |
Government Related Obligations | | | — | | | | 3,347,798 | | | | — | | | | 3,347,798 | |
Asset-Backed Securities | | | — | | | | 7,037,921 | | | | — | | | | 7,037,921 | |
Warrants | | | — | | | | 12,713 | | | | — | | | | 12,713 | |
Money Market Funds | | | 29,053,217 | | | | — | | | | — | | | | 29,053,217 | |
| | | | | | | | | | | | | | | | |
Total Investments in Securities | | $ | 163,465,953 | | | $ | 134,872,906 | | | $ | — | | | $ | 298,338,859 | |
| | | | | | | | | | | | | | | | |
159
THE VANTAGEPOINT FUNDS
NOTES TO FINANCIAL STATEMENTS — (Continued)
| | | | | | | | | | | | | | | | |
Investment Type | | Level 1 | | | Level 2 | | | Level 3 | | | Total | |
Derivative Instruments: | | | | | | | | | | | | | | | | |
Assets: | | | | | | | | | | | | | | | | |
Futures | | $ | 3,500,407 | | | $ | — | | | $ | — | | | $ | 3,500,407 | |
Forward Currency Contracts | | | — | | | | 3,988 | | | | — | | | | 3,988 | |
| | | | | | | | | | | | | | | | |
Total Assets | | $ | 3,500,407 | | | $ | 3,988 | | | $ | — | | | $ | 3,504,395 | |
| | | | | | | | | | | | | | | | |
Liabilities: | | | | | | | | | | | | | | | | |
Futures | | | (18,440 | ) | | | — | | | | — | | | | (18,440 | ) |
Forward Currency Contracts | | | — | | | | (1,719 | ) | | | — | | | | (1,719 | ) |
| | | | | | | | | | | | | | | | |
Total Liabilities | | $ | (18,440 | ) | | $ | (1,719 | ) | | $ | — | | | $ | (20,159 | ) |
| | | | | | | | | | | | | | | | |
Total Derivative Instruments | | $ | 3,481,967 | | | $ | 2,269 | | | $ | — | | | $ | 3,484,236 | |
| | | | | | | | | | | | | | | | |
International Fund | | | | | | | | | | | | | | | | |
Investments in Securities: | | | | | | | | | | | | | | | | |
Common Stocks | | $ | 129,046,011 | | | $ | 1,267,325,752 | | | $ | — | | | $ | 1,396,371,763 | |
Preferred Stocks | | | — | | | | 9,310,646 | | | | — | | | | 9,310,646 | |
Money Market Funds | | | 53,508,592 | | | | — | | | | — | | | | 53,508,592 | |
| | | | | | | | | | | | | | | | |
Total Investments in Securities | | $ | 182,554,603 | | | $ | 1,276,636,398 | | | $ | — | | | $ | 1,459,191,001 | |
| | | | | | | | | | | | | | | | |
Derivative Instruments: | | | | | | | | | | | | | | | | |
Liabilities: | | | | | | | | | | | | | | | | |
Forward Currency Contracts | | | — | | | | (21,599 | ) | | | — | | |
| (21,599
| )
|
| | | | | | | | | | | | | | | | |
Total Liabilities | | $ | — | | | $ | (21,599 | ) | | $ | — | | | $ | (21,599 | ) |
| | | | | | | | | | | | | | | | |
Total Derivative Instruments | | $ | — | | | $ | (21,599 | ) | | $ | — | | | $ | (21,599 | ) |
| | | | | | | | | | | | | | | | |
| | | | |
Diversifying Strategies Fund | | | | | | | | | | | | | | | | |
Investments in Securities: | | | | | | | | | | | | | | | | |
Common Stocks | | $ | 13,519,427 | | | $ | 18,068,496 | | | $ | — | | | $ | 31,587,923 | |
Convertible Preferred Stocks | | | 23,060,237 | | | | 8,405,041 | | | | — | | | | 31,465,278 | |
Corporate Obligations | | | — | | | | 354,350,566 | | | | — | | | | 354,350,566 | |
Mortgage-Backed Securities | | | — | | | | 48,116,066 | | | | — | | | | 48,116,066 | |
Convertible Debt Obligations | | | — | | | | 400,970,671 | | | | — | | | | 400,970,671 | |
U.S. Treasury Obligations | | | — | | | | 128,158,303 | | | | — | | | | 128,158,303 | |
Government Related Obligations | | | — | | | | 9,924,772 | | | �� | — | | | | 9,924,772 | |
Asset-Backed Securities | | | — | | | | 47,360,315 | | | | — | | | | 47,360,315 | |
Purchased Options | | | 36,094 | | | | 89,404 | | | | — | | | | 125,498 | |
Commercial Paper | | | — | | | | 1,599,397 | | | | — | | | | 1,599,397 | |
Money Market Fund | | | 44,385,873 | | | | — | | | | — | | | | 44,385,873 | |
| | | | | | | | | | | | | | | | |
Total Investments in Securities | | $ | 81,001,631 | | | $ | 1,017,043,031 | | | $ | — | | | $ | 1,098,044,662 | |
| | | | | | | | | | | | | | | | |
Derivative Instruments: | | | | | | | | | | | | | | | | |
Assets: | | | | | | | | | | | | | | | | |
Futures | | | 4,328,204 | | | | — | | | | — | | | | 4,328,204 | |
Forward Currency Contracts | | | — | | | | 594,023 | | | | — | | | | 594,023 | |
| | | | | | | | | | | | | | | | |
Total Assets | | $ | 4,328,204 | | | $ | 594,023 | | | $ | — | | | $ | 4,922,227 | |
| | | | | | | | | | | | | | | | |
160
THE VANTAGEPOINT FUNDS
NOTES TO FINANCIAL STATEMENTS — (Continued)
| | | | | | | | | | | | | | | | |
Investment Type | | Level 1 | | | Level 2 | | | Level 3 | | | Total | |
Liabilities: | | | | | | | | | | | | | | | | |
Purchased Option on Euro-Bund Future | | $ | (13,223 | ) | | $ | — | | | $ | — | | | $ | (13,223 | ) |
Written Options | | | — | | | | (424,561 | ) | | | — | | | | (424,561 | ) |
Futures | | | (1,720,841 | ) | | | — | | | | — | | | | (1,720,841 | ) |
Forward Currency Contracts | | | — | | | | (384,139 | ) | | | — | | | | (384,139 | ) |
| | | | | | | | | | | | | | | | |
Total Liabilities | | $ | (1,734,064 | ) | | $ | (808,700 | ) | | $ | — | | | $ | (2,542,764 | ) |
| | | | | | | | | | | | | | | | |
Total Derivative Instruments | | $ | 2,594,140 | | | $ | (214,677 | ) | | $ | — | | | $ | 2,379,463 | |
| | | | | | | | | | | | | | | | |
Core Bond Index Fund | | | | | | | | | | | | | | | | |
Investments in Securities: | | | | | | | | | | | | | | | | |
Corporate Obligations | | $ | — | | | $ | 290,504,993 | | | $ | — | | | $ | 290,504,993 | |
Mortgage-Backed Securities | | | — | | | | 402,941,480 | | | | — | | | | 402,941,480 | |
U.S. Treasury Obligations | | | — | | | | 450,297,031 | | | | — | | | | 450,297,031 | |
Government Related Obligations | | | — | | | | 120,786,163 | | | | — | | | | 120,786,163 | |
Asset-Backed Securities | | | — | | | | 4,537,459 | | | | — | | | | 4,537,459 | |
Money Market Funds | | | 119,495,099 | | | | — | | | | — | | | | 119,495,099 | |
| | | | | | | | | | | | | | | | |
Total Investments in Securities | | $ | 119,495,099 | | | $ | 1,269,067,126 | | | $ | — | | | $ | 1,388,562,225 | |
| | | | | | | | | | | | | | | | |
| | | | |
500 Stock Index Fund | | | | | | | | | | | | | | | | |
Investments in Securities: | | | | | | | | | | | | | | | | |
Common Stocks | | $ | 648,392,953 | | | $ | — | | | $ | — | | | $ | 648,392,953 | |
U.S. Treasury Obligations | | | — | | | | 724,889 | | | | — | | | | 724,889 | |
Money Market Funds | | | 15,019,342 | | | | — | | | | — | | | | 15,019,342 | |
| | | | | | | | | | | | | | | | |
Total Investments in Securities | | $ | 663,412,295 | | | $ | 724,889 | | | $ | — | | | $ | 664,137,184 | |
| | | | | | | | | | | | | | | | |
Derivative Instruments: | | | | | | | | | | | | | | | | |
Assets: | | | | | | | | | | | | | | | | |
Futures | | | 408,405 | | | | — | | | | — | | | | 408,405 | |
| | | | | | | | | | | | | | | | |
Total Assets | | $ | 408,405 | | | $ | — | | | $ | — | | | $ | 408,405 | |
| | | | | | | | | | | | | | | | |
Total Derivative Instruments | | $ | 408,405 | | | $ | — | | | $ | — | | | $ | 408,405 | |
| | | | | | | | | | | | | | | | |
| | | | |
Broad Market Index Fund | | | | | | | | | | | | | | | | |
Investments in Securities: | | | | | | | | | | | | | | | | |
Common Stocks | | $ | 766,855,387 | | | $ | 10,789 | | | $ | — | | | $ | 766,866,176 | |
U.S. Treasury Obligations | | | — | | | | 594,836 | | | | — | | | | 594,836 | |
Rights | | | 1,395 | | | | — | | | | 1,099 | | | | 2,494 | |
Warrants | | | — | | | | 1,045 | | | | — | | | | 1,045 | |
Money Market Funds | | | 25,346,130 | | | | — | | | | — | | | | 25,346,130 | |
| | | | | | | | | | | | | | | | |
Total Investments in Securities | | $ | 792,202,912 | | | $ | 606,670 | | | $ | 1,099 | | | $ | 792,810,681 | |
| | | | | | | | | | | | | | | | |
Derivative Instruments: | | | | | | | | | | | | | | | | |
Assets: | | | | | | | | | | | | | | | | |
Futures | | | 368,885 | | | | — | | | | — | | | | 368,885 | |
| | | | | | | | | | | | | | | | |
Total Assets | | $ | 368,885 | | | $ | — | | | $ | — | | | $ | 368,885 | |
| | | | | | | | | | | | | | | | |
Total Derivative Instruments | | $ | 368,885 | | | $ | — | | | $ | — | | | $ | 368,885 | |
| | | | | | | | | | | | | | | | |
161
THE VANTAGEPOINT FUNDS
NOTES TO FINANCIAL STATEMENTS — (Continued)
| | | | | | | | | | | | | | | | |
Investment Type | | Level 1 | | | Level 2 | | | Level 3 | | | Total | |
Mid/Small Company Index Fund | | | | | | | | | | | | | | | | |
Investments in Securities: | | | | | | | | | | | | | | | | |
Common Stocks | | $ | 705,128,208 | | | $ | 6,019 | | | $ | — | | | $ | 705,134,227 | |
U.S. Treasury Obligations | | | — | | | | 784,747 | | | | — | | | | 784,747 | |
Rights | | | 4,074 | | | | — | | | | 1,604 | | | | 5,678 | |
Warrants | | | — | | | | 3,199 | | | | — | | | | 3,199 | |
Money Market Funds | | | 58,895,585 | | | | — | | | | — | | | | 58,895,585 | |
| | | | | | | | | | | | | | | | |
Total Investments in Securities | | $ | 764,027,867 | | | $ | 793,965 | | | $ | 1,604 | | | $ | 764,823,436 | |
| | | | | | | | | | | | | | | | |
Derivative Instruments: | | | | | | | | | | | | | | | | |
Assets: | | | | | | | | | | | | | | | | |
Futures | | | 473,180 | | | | — | | | | — | | | | 473,180 | |
| | | | | | | | | | | | | | | | |
Total Assets | | $ | 473,180 | | | $ | — | | | $ | — | | | $ | 473,180 | |
| | | | | | | | | | | | | | | | |
Total Derivative Instruments | | $ | 473,180 | | | $ | — | | | $ | — | | | $ | 473,180 | |
| | | | | | | | | | | | | | | | |
| | | | |
Overseas Equity Index Fund | | | | | | | | | | | | | | | | |
Investments in Securities: | | | | | | | | | | | | | | | | |
Common Stocks | | $ | — | | | $ | 291,474,316 | | | $ | — | | | $ | 291,474,316 | |
Preferred Stocks | | | — | | | | 1,915,562 | | | | — | | | | 1,915,562 | |
U.S. Treasury Obligation | | | — | | | | 249,903 | | | | — | | | | 249,903 | |
Rights | | | — | | | | 13,210 | | | | — | | | | 13,210 | |
Money Market Funds | | | 3,724,169 | | | | — | | | | — | | | | 3,724,169 | |
| | | | | | | | | | | | | | | | |
Total Investments in Securities | | $ | 3,724,169 | | | $ | 293,652,991 | | | $ | — | | | $ | 297,377,160 | |
| | | | | | | | | | | | | | | | |
Derivative Instruments: | | | | | | | | | | | | | | | | |
Assets: | | | | | | | | | | | | | | | | |
Futures | | | 67,372 | | | | — | | | | — | | | | 67,372 | |
Forward Currency Contracts | | | — | | | | 33,143 | | | | — | | | | 33,143 | |
| | | | | | | | | | | | | | | | |
Total Assets | | $ | 67,372 | | | $ | 33,143 | | | $ | — | | | $ | 100,515 | |
| | | | | | | | | | | | | | | | |
Liabilities: | | | | | | | | | | | | | | | | |
Forward Currency Contracts | | | — | | | | (43,329 | ) | | | — | | | | (43,329 | ) |
| | | | | | | | | | | | | | | | |
Total Liabilities | | $ | — | | | $ | (43,329 | ) | | $ | — | | | $ | (43,329 | ) |
| | | | | | | | | | | | | | | | |
Total Derivative Instruments | | $ | 67,372 | | | $ | (10,186 | ) | | $ | — | | | $ | 57,186 | |
| | | | | | | | | | | | | | | | |
See Schedule of Investments for identification of securities by industry classification.
As of December 31, 2013 the funds did not hold significant investments in Level 3 securities. During the year ended December 31, 2013, the International Fund had securities transferred from Level 1 to Level 2 with a total market value of $15,406,509 or 1.1% of the net assets of the fund. There were no transfers within other funds.
When Issued Securities
The funds may purchase securities on a when-issued basis. The purchase price and the interest rate payable, if any, on the securities are fixed on the purchase commitment date or at the time the settlement date is fixed. The value of the securities is subject to market fluctuation beginning on the purchase commitment date. Typically, no income accrues on securities that a fund has committed to purchase prior to the time delivery of the securities is made, although the fund may earn income on securities it has segregated to cover these positions.
162
THE VANTAGEPOINT FUNDS
NOTES TO FINANCIAL STATEMENTS — (Continued)
To Be Announced (“TBA”) Securities
A TBA is a forward mortgage-backed securities trade. Pass-through securities issued by Freddie Mac, Fannie Mae and Ginnie Mae trade in the TBA market. The term TBA is derived from the fact that the actual mortgage-backed security that will be delivered to fulfill a TBA trade is not designated at the time the trade is made. The securities are “to be announced” 48 hours prior to the established trade settlement date. The fund also relies on the seller to complete the transaction. The seller’s failure to do so may cause a fund to miss a price or yield considered advantageous to the fund, and a fund bears the risk of loss in the event of the default or bankruptcy of the seller.
Foreign Currency
The accounting records of the funds are maintained in U.S. dollars. Investment securities and other assets and liabilities denominated in foreign currencies will be translated (but not actually converted) into U.S. Dollars daily at the closing spot rates supplied by the WM/Reuters Intraday Spot exchange rates provided as of 4:00 pm Eastern Time. Purchases and sales of securities, income receipts and expense payments are translated (but not actually converted) into U.S. dollars at the prevailing exchange rates on the respective dates of such transactions. Unrealized gains and losses, not relating to securities, that result from changes in foreign currency exchange rates, have been included in unrealized appreciation/(depreciation) of securities. Net realized foreign currency gains and losses include foreign currency gains and losses resulting from changes in exchange rates between trade date and settlement date on investment securities transactions, gains and losses on foreign currency transactions, and the difference between the amounts of interest and dividends recorded on the books of the funds and the amounts actually received. The portion of foreign currency gains and losses related to fluctuations in exchange rates between the initial purchase trade date and subsequent sale trade date is included in realized gains/(losses) from security transactions.
Currency symbols utilized throughout the notes to these financial statements are defined as follows:
| | | | | | |
| AUD | | — Australian Dollar | | JPY | | — Japanese Yen |
| BRL | | — Brazilian Real | | NOK | | — Norwegian Krona |
| CAD | | — Canadian Dollar | | NZD | | — New Zealand Dollar |
| CHF | | — Swiss Franc | | SEK | | — Swedish Krona |
| EUR | | — European Monetary Unit | | USD | | — U.S. Dollar |
| GBP | | — British Pound | | | | |
Options (other than Swaptions)
Exchange traded options normally will be priced based on the last reported sale price or official closing price (if available) on the exchange on which the option is primarily traded, as provided by a pricing service. If on a particular day, an option does not trade on its primary exchange, the fund’s custodian will calculate and use the mean between the closing bid and closing offer reported to the exchange and obtained from a pricing service and such options are generally categorized as Level 1 in the hierarchy.
Purchased options on Euro-Bund futures trade on foreign exchanges and are marked to market daily with variation margin payments received or made by the funds daily based on fluctuation in value. There is no premium paid at the time of purchase. These options are generally categorized as Level 1 in the hierarchy.
Non-exchange traded (i.e., over-the-counter) options normally will be priced using an option valuation model, which incorporates relevant parameters (e.g., implied volatility; current value of underlier). Such prices will be provided by a pricing service and these options are generally categorized as Level 2 in the hierarchy.
In the event a pricing service is unable to provide a price for a particular option, the option may be priced based on the average of two or more independent broker-dealer quotations, pursuant to the Valuation Procedures, or at its fair value determined in accordance with the Valuation Procedures and is generally categorized as Level 2 in the hierarchy.
163
THE VANTAGEPOINT FUNDS
NOTES TO FINANCIAL STATEMENTS — (Continued)
Futures
Futures contracts normally will be priced at their settlement prices established and reported each day on the exchange on which they are traded, as provided by a pricing service and are generally categorized as Level 1 in the hierarchy. In the event a pricing service is unable to provide a price for a particular futures contract, the value of the contract will be priced at its fair value in accordance with the Valuation Procedures and generally such futures are categorized as Level 2 in the hierarchy.
Futures exchange abbreviations utilized throughout the notes to these financial statements are defined as follows:
| | | | | | |
| CBT | | — Chicago Board of Trade Exchange | | MFM | | — Meff Renta Variable Exchange |
| CME | | — Chicago Mercantile Exchange | | MIL | | — Milan Stock Exchange |
| EOE | | — Dutch Options Exchange | | MSE | | — Montreal Exchange |
| EOP | | — NYSE – Liffe Exchange | | NYF | | — New York Futures Exchange |
| EUX | | — Eurex Deutschland Exchange | | SFE | | — Sydney Futures Exchange |
| HKG | | — Hong Kong Futures Exchange | | SGX | | — Singapore Exchange |
| LIF | | — Liffe Exchange | | TSE | | — Tokyo Stock Exchange |
Forward Currency Contracts
Forward currency contracts normally will be priced using the WM/Reuters Intraday Forwards rates provided as of 4:00 pm Eastern Time. In the event WM/Reuters (or a designated pricing service) is unable to provide a rate for a particular contract, the fair value of the contract will be determined in accordance with the Valuation Procedures and generally such contracts are categorized as Level 2 in the hierarchy.
Interest Rate Swaps and Inflation Swaps
Interest rate and inflation swaps normally will be priced based on the applicable swap valuation model (i.e., interest rate or inflation) which incorporates a snapshot of the relevant swap curve (interest rate curve or inflation rate curve, as applicable). Such prices will be provided by a pricing service. In the event a pricing service is unable to provide a price for a particular swap, the swap will be priced at its fair value in accordance with the Valuation Procedures and generally such swaps are categorized as Level 2 in the hierarchy.
Interest Rate Swaptions
Interest rate swaptions normally will be priced based on a snapshot taken of the relevant swap curve, deriving an implied volatility surface from actual and/or indicative broker-dealer swaption prices, and combining them in a swaption valuation model. Such prices will be provided by a pricing service. In the event a pricing service is unable to provide a price for a particular swaption, the swaption will be priced at its fair value in accordance with the Valuation Procedures and generally such swaptions are categorized as Level 2 in the hierarchy.
Total Return Swaps
Total return swaps are normally priced based on a valuation model that incorporates cash flow forecasts for the reference asset and a snapshot of the relevant interest rate swap curve. Such prices will be provided by a pricing service. In the event a pricing service is unable to provide a price for a particular total return swap, the total return swap will be priced at its fair value in accordance with the Valuation Procedures and generally such swaps are categorized as Level 2 in the hierarchy.
Floating Rate Loans
Floating rate loans are debt securities or other interests issued by companies or other entities with floating interest rates that reset periodically. Most floating rate loans are secured by specific collateral of the borrower and are senior to most other securities of the borrower (e.g., common stock or debt instruments) in the event of bankruptcy. Floating rate loans are often issued in connection with recapitalizations, acquisitions, leveraged buyouts, and refinancings.
164
THE VANTAGEPOINT FUNDS
NOTES TO FINANCIAL STATEMENTS — (Continued)
Floating rate loans are typically structured and administered by a financial institution that acts as the agent of the lenders participating in the floating rate loan. Floating rate loans may be acquired from a lender or through the agent as an assignment from another lender who holds a floating rate loan , or as a participation interest in another lender’s portion of the floating rate loan or portion therof. Investments in floating rate loans have risks that are similar to those of fixed income securities. In addition, floating rate loans carry the risk of impairment of collateral. The value of the collateral securing a floating rate loan can decline, be insufficient to meet the obligations of the borrower, or be difficult to liquidate. As such, a floating rate loan may not be fully collateralized and can decline significantly in value. Floating rate loans may also carry liquidity risk. Floating rate loans generally are subject to legal or contractual restrictions on resale. Therefore, the liquidity of floating rate loans, including the volume and frequency of secondary market trading in such loans, varies significantly over time and among individual floating rate loans. If the credit quality of a floating rate loan suffers a significant decline, the secondary trading market for that same loan may also decline, making it more difficult to sell and to value. Difficulty in selling a floating rate loan can result in a loss.
Security Transactions and Income Recognition
Security transactions are accounted for on the date the securities are purchased or sold (trade date). Dividend income is recognized on the ex-dividend date and interest income is accrued daily. Realized gains or losses are reported on the basis of identified cost of securities delivered. Bond discounts and premiums are amortized for both financial reporting and tax purposes, except for the Core Bond Index Fund, which does not amortize bond premium for tax purposes. Paydown gains and losses are recorded as an adjustment to interest income. Inflation adjustments to the principal amount of inflation-indexed bonds are reflected as interest income.
Dividends and Distributions to Shareholders
Dividends received from mutual fund investments are reflected as dividend income; capital gain distributions are reflected as realized gain/(loss). Dividends from net investment income, if any, are declared and paid monthly to shareholders of the Core Bond Index, Low Duration Bond, and Inflation Protected Securities Funds. For the remaining funds, dividends from net investment income, if any, are declared and paid annually to shareholders. Distributions from net realized capital gains, if any, are generally declared and paid annually to shareholders. Income and capital gain distributions are determined in accordance with income tax regulations which may differ from GAAP. These differences are primarily due to differing treatments of income and gains on investment securities, and differing characterizations of distributions being made by each fund.
Certain differences are permanent, and result in reclassifications among paid-in capital, net investment income or realized gains. These may include net operating losses not utilized during the current year, commission adjustments, pay-down gains and losses, bond premium amortization, foreign currency gains and losses, treasury inflation-protected securities adjustments, taxable over-distributions or returns of capital, distribution reclassifications, and adjustments relating to income received from, or dispositions of, swaps, securities with special dividends, or any real estate investment trust, passive foreign investment company, publicly traded partnerships, contingent payment debt instruments, and mutual fund company securities. These reclassifications have no effect on net assets or net asset values per share, and they do not affect the net investment income per share calculations presented in the Financial Highlights.
| | | | | | | | | | | | |
Fund | | Paid-in Capital
Increase/(Decrease) | | | Undistributed Net
Investment Income
Increase/(Decrease) | | | Accumulated Net
Realized Gain/(Loss)
Increase/(Decrease) | |
Low Duration Bond | | $ | — | | | $ | (499,640 | ) | | $ | 499,640 | |
Inflation Protected Securities | | | — | | | | 1,374,464 | | | | (1,374,464 | ) |
Equity Income | | | — | | | | 1,831,887 | | | | (1,831,887 | ) |
Growth & Income | | | — | | | | 1,917,237 | | | | (1,917,237 | ) |
Growth | | | — | | | | 154,180 | | | | (154,180 | ) |
Select Value | | | — | | | | (400,861 | ) | | | 400,861 | |
Aggressive Opportunities | | | (2 | ) | | | 414,886 | | | | (414,884 | ) |
Discovery | | | — | | | | 746,980 | | | | (746,980 | ) |
International | | | — | | | | 2,197,474 | | | | (2,197,474 | ) |
165
THE VANTAGEPOINT FUNDS
NOTES TO FINANCIAL STATEMENTS — (Continued)
| | | | | | | | | | | | |
Fund | | Paid-in Capital
Increase/(Decrease) | | | Undistributed Net
Investment Income
Increase/(Decrease) | | | Accumulated Net
Realized Gain/(Loss)
Increase/(Decrease) | |
Diversifying Strategies | | $ | (35,881 | ) | | $ | 6,638,342 | | | $ | (6,602,461 | ) |
Core Bond Index | | | — | | | | 7,908,621 | | | | (7,908,621 | ) |
500 Stock Index | | | 14,799,500 | | | | (132,077 | ) | | | (14,667,423 | ) |
Broad Market Index | | | 12,090,850 | | | | (331,593 | ) | | | (11,759,257 | ) |
Mid/Small Company Index | | | 3,329,933 | | | | (411,936 | ) | | | (2,917,997 | ) |
Overseas Equity Index | | | 1,437,589 | | | | (9,302 | ) | | | (1,428,287 | ) |
Model Portfolio Conservative Growth | | | — | | | | 403,650 | | | | (403,650 | ) |
Model Portfolio Traditional Growth | | | — | | | | 190,772 | | | | (190,772 | ) |
Model Portfolio Long-Term Growth | | | — | | | | (9,940 | ) | | | 9,940 | |
Model Portfolio All-Equity Growth | | | — | | | | (325,231 | ) | | | 325,231 | |
Milestone Retirement Income | | | — | | | | 91,215 | | | | (91,215 | ) |
Milestone 2010 | | | — | | | | 79,972 | | | | (79,972 | ) |
Milestone 2015 | | | — | | | | 119,342 | | | | (119,342 | ) |
Milestone 2020 | | | — | | | | 45,170 | | | | (45,170 | ) |
Milestone 2025 | | | — | | | | (6,429 | ) | | | 6,429 | |
Milestone 2030 | | | — | | | | (6,357 | ) | | | 6,357 | |
Milestone 2035 | | | — | | | | (2,827 | ) | | | 2,827 | |
Milestone 2040 | | | — | | | | (90,926 | ) | | | 90,926 | |
Milestone 2045 | | | — | | | | (401 | ) | | | 401 | |
Milestone 2050 | | | — | | | | (55 | ) | | | 55 | |
Federal Income Taxes
Each fund intends to qualify as a regulated investment company under Subchapter M of the Internal Revenue Code for federal tax purposes. Accordingly, each fund intends to make distributions of substantially all of its net investment company taxable income and any net realized capital gains (after reduction for capital loss carry forwards) sufficient to relieve it from all, or substantially all, federal income and excise taxes. Any taxable income or gains remaining at fiscal year-end are distributed in the following year. Therefore, no provision for federal income or excise taxes was required.
The FASB issued Interpretation ASC 740, “Income Taxes,” (“ASC 740”) which establishes guidelines for recognizing, measuring, and disclosing tax return positions in financial statements. Management has evaluated the Company’s tax positions and determined that the application of ASC 740 had no material impact on the Company’s financial statements. Accordingly, no adjustments for unrecognized tax benefits or related interest or penalties were required as of December 31, 2013. If applicable, the Company recognizes interest accrued related to unrecognized tax benefits in interest expense and penalties in “Other Expenses” in the Statement of Operations. The Company is not aware of any tax positions for which it is reasonably possible that the total amounts of unrecognized tax benefits will significantly increase or decrease in the next twelve months.
The Regulated Investment Company Modernization Act of 2010 (the “Act”) changed various technical rules governing the tax treatment of regulated investment companies, which are generally effective beginning with the Company’s taxable year ending December 31, 2011. Under the Act, the funds are permitted to carry forward capital losses incurred in taxable years beginning after the enactment date indefinitely. However, any losses incurred during post-enactment taxable years are required to be utilized prior to the losses incurred in pre-enactment taxable years, which expires, according to their original schedule. As a result of this ordering rule, pre-enactment capital loss carry forwards may be more likely to expire unused.
Additionally, post-enactment capital loss carryforwards will retain their character as either short-term or long-term capital losses rather than being considered entirely short-term as required under prior law.
166
THE VANTAGEPOINT FUNDS
NOTES TO FINANCIAL STATEMENTS — (Continued)
At December 31, 2013, the components of distributable earnings on a tax basis were as follows:
| | | | | | | | | | | | |
Fund | | Undistributed
Ordinary Income | | | Undistributed
Long-Term Gains | | | Total Distributable
Earnings | |
Low Duration Bond | | $ | — | | | $ | 712,247 | | | $ | 712,247 | |
Inflation Protected Securities | | | 265,031 | | | | — | | | | 265,031 | |
Equity Income | | | — | | | | 17,693,722 | | | | 17,693,722 | |
Growth & Income | | | — | | | | 19,333,403 | | | | 19,333,403 | |
Growth | | | 416,556 | | | | — | | | | 416,556 | |
Select Value | | | 3,907,507 | | | | 6,724,056 | | | | 10,631,563 | |
Aggressive Opportunities | | | 10,751,891 | | | | 18,348,029 | | | | 29,099,920 | |
Discovery | | | 4,005,744 | | | | 8,640,061 | | | | 12,645,805 | |
International | | | 15,432,272 | | | | — | | | | 15,432,272 | |
Diversifying Strategies | | | 3,306,985 | | | | 5,420,447 | | | | 8,727,432 | |
Core Bond Index | | | 5,799 | | | | — | | | | 5,799 | |
500 Stock Index | | | 158,106 | | | | 1,583,282 | | | | 1,741,388 | |
Broad Market Index | | | 5,518,248 | | | | 469,887 | | | | 5,988,135 | |
Mid/Small Company Index | | | 838,902 | | | | 1,436,345 | | | | 2,275,247 | |
Overseas Equity Index | | | 19,702 | | | | — | | | | 19,702 | |
Model Portfolio Conservative Growth | | | — | | | | 13,575,545 | | | | 13,575,545 | |
Model Portfolio Traditional Growth | | | — | | | | 47,133,676 | | | | 47,133,676 | |
Model Portfolio Long-Term Growth | | | — | | | | 75,834,294 | | | | 75,834,294 | |
Model Portfolio All-Equity Growth | | | 1,201,870 | | | | 36,701,757 | | | | 37,903,627 | |
Milestone Retirement Income | | | — | | | | 6,053,096 | | | | 6,053,096 | |
Milestone 2010 | | | — | | | | 6,484,474 | | | | 6,484,474 | |
Milestone 2015 | | | — | | | | 13,694,592 | | | | 13,694,592 | |
Milestone 2020 | | | — | | | | 15,546,440 | | | | 15,546,440 | |
Milestone 2025 | | | — | | | | 14,118,866 | | | | 14,118,866 | |
Milestone 2030 | | | — | | | | 12,752,396 | | | | 12,752,396 | |
Milestone 2035 | | | — | | | | 9,644,964 | | | | 9,644,964 | |
Milestone 2040 | | | — | | | | 10,352,742 | | | | 10,352,742 | |
Milestone 2045 | | | — | | | | 3,330,950 | | | | 3,330,950 | |
Milestone 2050 | | | 60,551 | | | | 748,882 | | | | 809,433 | |
The tax character of distributions during 2013 was as follows:
| | | | | | | | | | | | | | | | |
Fund | | Distributions Paid from
Ordinary Income | | | Distributions Paid from
Long-Term Gains | | | Return of Capital | | | Total
Distributions | |
Low Duration Bond | | $ | 7,992,861 | | | $ | 1,509,632 | | | $ | — | | | $ | 9,502,493 | |
Inflation Protected Securities | | | 8,171,405 | | | | 8,974,277 | | | | — | | | | 17,145,682 | |
Equity Income | | | 45,935,807 | | | | 106,020,635 | | | | — | | | | 151,956,442 | |
Growth & Income | | | 25,453,231 | | | | 111,699,235 | | | | — | | | | 137,152,466 | |
Growth | | | 11,761,873 | | | | — | | | | — | | | | 11,761,873 | |
Select Value | | | 20,611,827 | | | | 39,536,586 | | | | — | | | | 60,148,413 | |
Aggressive Opportunities | | | 45,549,946 | | | | 66,939,790 | | | | — | | | | 112,489,736 | |
Discovery | | | 23,025,790 | | | | 25,798,289 | | | | — | | | | 48,824,079 | |
International | | | 30,965,823 | | | | — | | | | — | | | | 30,965,823 | |
Diversifying Strategies | | | 20,271,969 | | | | 11,992,223 | | | | — | | | | 32,264,192 | |
Core Bond Index | | | 36,026,496 | | | | — | | | | — | | | | 36,026,496 | |
500 Stock Index | | | 10,623,254 | | | | 1,698,318 | | | | — | | | | 12,321,572 | |
Broad Market Index | | | 12,780,921 | | | | 8,981,718 | | | | — | | | | 21,762,639 | |
Mid/Small Company Index | | | 13,776,960 | | | | 44,613,956 | | | | — | | | | 58,390,916 | |
Overseas Equity Index | | | 6,970,845 | | | | — | | | | — | | | | 6,970,845 | |
Model Portfolio Conservative Growth | | | 11,329,321 | | | | 9,507,066 | | | | — | | | | 20,836,387 | |
167
THE VANTAGEPOINT FUNDS
NOTES TO FINANCIAL STATEMENTS — (Continued)
| | | | | | | | | | | | | | | | |
Fund | | Distributions Paid from
Ordinary Income | | | Distributions Paid from
Long-Term Gains | | | Return of Capital | | | Total
Distributions | |
Model Portfolio Traditional Growth | | $ | 35,340,349 | | | $ | 28,932,875 | | | $ | — | | | $ | 64,273,224 | |
Model Portfolio Long-Term Growth | | | 52,434,385 | | | | 44,573,892 | | | | — | | | | 97,008,277 | |
Model Portfolio All-Equity Growth | | | 26,128,168 | | | | 7,618,002 | | | | — | | | | 33,746,170 | |
Milestone Retirement Income | | | 4,870,032 | | | | 5,062,522 | | | | — | | | | 9,932,554 | |
Milestone 2010 | | | 4,261,429 | | | | 8,502,311 | | | | — | | | | 12,763,740 | |
Milestone 2015 | | | 8,488,602 | | | | 12,336,153 | | | | — | | | | 20,824,755 | |
Milestone 2020 | | | 10,443,369 | | | | 13,428,042 | | | | — | | | | 23,871,411 | |
Milestone 2025 | | | 8,923,472 | | | | 9,863,758 | | | | — | | | | 18,787,230 | |
Milestone 2030 | | | 7,126,570 | | | | 8,871,634 | | | | — | | | | 15,998,204 | |
Milestone 2035 | | | 4,799,154 | | | | 7,072,377 | | | | — | | | | 11,871,531 | |
Milestone 2040 | | | 4,638,073 | | | | 10,019,247 | | | | — | | | | 14,657,320 | |
Milestone 2045 | | | 1,452,065 | | | | 3,721,269 | | | | — | | | | 5,173,334 | |
Milestone 2050 | | | 530,085 | | | | 7,977 | | | | — | | | | 538,062 | |
The tax character of distributions during 2012 was as follows:
| | | | | | | | | | | | | | | | |
Fund | | Distributions Paid from
Ordinary Income | | | Distributions Paid from
Long-Term Gains | | | Return of Capital | | | Total
Distributions | |
Low Duration Bond | | $ | 9,121,831 | | | $ | 74,114 | | | $ | — | | | $ | 9,195,945 | |
Inflation Protected Securities | | | 18,143,128 | | | | 15,222,321 | | | | — | | | | 33,365,449 | |
Equity Income | | | 41,422,148 | | | | 53,829,326 | | | | — | | | | 95,251,474 | |
Growth & Income | | | 19,726,072 | | | | 21,289,603 | | | | — | | | | 41,015,675 | |
Growth | | | 11,011,407 | | | | — | | | | — | | | | 11,011,407 | |
Select Value | | | 5,580,470 | | | | 6,557,777 | | | | — | | | | 12,138,247 | |
Aggressive Opportunities | | | 2,304,541 | | | | 43,084,081 | | | | — | | | | 45,388,622 | |
Discovery | | | 4,690,497 | | | | 8,483,074 | | | | — | | | | 13,173,571 | |
International | | | 31,260,095 | | | | — | | | | — | | | | 31,260,095 | |
Diversifying Strategies | | | 16,028,717 | | | | 2,847,633 | | | | — | | | | 18,876,350 | |
Core Bond Index | | | 37,975,608 | | | | — | | | | — | | | | 37,975,608 | |
500 Stock Index | | | 8,784,902 | | | | — | | | | — | | | | 8,784,902 | |
Broad Market Index | | | 11,312,422 | | | | 4,339,845 | | | | — | | | | 15,652,267 | |
Mid/Small Company Index | | | 10,462,333 | | | | 15,920,886 | | | | — | | | | 26,383,219 | |
Overseas Equity Index | | | 6,613,749 | | | | — | | | | — | | | | 6,613,749 | |
Model Portfolio Savings Oriented | | | 6,259,037 | | | | 1,798,094 | | | | — | | | | 8,057,131 | |
Model Portfolio Conservative Growth | | | 11,913,449 | | | | 3,620,104 | | | | — | | | | 15,533,553 | |
Model Portfolio Traditional Growth | | | 25,650,562 | | | | 16,867,880 | | | | — | | | | 42,518,442 | |
Model Portfolio Long-Term Growth | | | 31,338,840 | | | | 30,431,408 | | | | — | | | | 61,770,248 | |
Model Portfolio All-Equity Growth | | | 7,107,423 | | | | 4,015,888 | | | | — | | | | 11,123,311 | |
Milestone Retirement Income | | | 4,331,325 | | | | 2,890,968 | | | | — | | | | 7,222,293 | |
Milestone 2010 | | | 4,231,454 | | | | 4,505,139 | | | | — | | | | 8,736,593 | |
Milestone 2015 | | | 7,842,787 | | | | 4,995,120 | | | | — | | | | 12,837,907 | |
Milestone 2020 | | | 8,501,616 | | | | 3,889,473 | | | | — | | | | 12,391,089 | |
Milestone 2025 | | | 6,871,979 | | | | 3,068,946 | | | | — | | | | 9,940,925 | |
Milestone 2030 | | | 5,347,663 | | | | 2,658,644 | | | | — | | | | 8,006,307 | |
Milestone 2035 | | | 3,475,580 | | | | 1,845,402 | | | | — | | | | 5,320,982 | |
Milestone 2040 | | | 3,367,926 | | | | 299,205 | | | | — | | | | 3,667,131 | |
Milestone 2045 | | | 970,078 | | | | 678,897 | | | | — | | | | 1,648,975 | |
Milestone 2050 | | | 10,052 | | | | 607 | | | | — | | | | 10,659 | |
At December 31, 2013, the following funds had net capital loss carryovers.
168
THE VANTAGEPOINT FUNDS
NOTES TO FINANCIAL STATEMENTS — (Continued)
Post-enactment losses incurred that will be carried forward under the provisions of the Act are as follows:
| | | | | | | | |
| | | Loss carryforward character | |
Fund | | Short Term | | | Long Term | |
Core Bond Index | | $ | (3,950,861 | ) | | $ | (876,297 | ) |
Overseas Equity Index | | | — | | | | (812,489 | ) |
At December 31, 2013, the following funds had pre-enactment capital loss carryforwards for federal income tax purposes available to offset future capital gains through indicated expiration dates.
| | | | | | | | | | | | |
| | | Expiring December 31 | |
Fund | | 2014 | | | 2015 | | | 2016 | |
Core Bond Index | | $ | — | | | $ | (457,462 | ) | | $ | (2,798,291 | ) |
| | |
| | | | | | Expiring December 31 | |
Fund | | | | | 2017 | | | 2018 | |
Growth | | | | | | $ | (169,307,912 | ) | | $ | — | |
International | | | | | | | (56,466,550 | ) | | | — | |
Core Bond Index | | | | | | | (4,404,280 | ) | | | — | |
Overseas Equity Index | | | | | | | (2,991,434 | ) | | | (444,126 | ) |
At December 31, 2013, the following funds elected to defer post-October net capital losses and specified losses of:
| | | | | | | | |
Fund | | Capital Losses | | | Specified Losses | |
Low Duration Bond | | $ | 104,336 | | | $ | 128,723 | |
Inflation Protected Securities | | | 625,420 | | | | — | |
Equity Income | | | — | | | | 1,764 | |
Growth & Income | | | — | | | | 1,020 | |
Growth | | | 2,358,008 | | | | — | |
Aggressive Opportunities | | | — | | | | 64,629 | |
Discovery | | | — | | | | 45,316 | |
Core Bond Index | | | 1,447,851 | | | | — | |
Overseas Equity Index | | | — | | | | 150,377 | |
Model Portfolio Conservative Growth | | | 29,564 | | | | — | |
Model Portfolio Traditional Growth | | | 41,694 | | | | — | |
Milestone Retirement Income | | | 30,906 | | | | — | |
Milestone 2010 | | | 12,602 | | | | — | |
Milestone 2015 | | | 35,157 | | | | — | |
| 3. | | Investments in Derivative Instruments |
Some of the funds use derivative instruments in pursuing their investment objectives. The following table and discussion provides more detailed information about a fund’s derivative usage. The table below shows the average monthly notional balance, settlement value, or market value (as applicable) of the derivative instruments held by each fund during the reporting period.
| | | | | | | | | | | | | | | | |
| | | Low Duration
Bond Fund | | | Inflation
Protected
Securities Fund | | | Discovery Fund | | | Diversifying
Strategies
Fund | |
Futures Contracts: | | | | | | | | | | | | | | | | |
Average Notional Balance Long | | $ | 5,690,055 | | | $ | 24,567,164 | | | $ | 124,384,804 | | | $ | 71,918,058 | |
Average Notional Balance Short | | | 12,789,701 | | | | 26,546,517 | | | | 3,546,523 | | | | 85,305,789 | |
169
THE VANTAGEPOINT FUNDS
NOTES TO FINANCIAL STATEMENTS — (Continued)
| | | | | | | | | | | | | | | | |
| | | Low Duration
Bond Fund | | | Inflation
Protected
Securities Fund | | | Discovery Fund | | | Diversifying
Strategies
Fund | |
Forward Foreign Currency Exchange Contracts: | | | | | | | | | | | | | | | | |
Average Settlement Value—Deliver USD | | $ | 1,243,711 | | | $ | — | | | $ | 101,023 | | | $ | 58,925,367 | |
Average Settlement Value—Receive USD | | | 8,433,986 | | | | — | | | | 476,387 | | | | 70,059,728 | |
Exchange-Traded Options: | | | | | | | | | | | | | | | | |
Average Market Value Purchased | | $ | — | | | $ | 67,767 | | | $ | — | | | $ | 501,005 | |
Average Market Value Written | | | — | | | | 171,865 | | | | — | | | | — | |
Average Market Value Purchased Options on Euro-Bund futures | | | — | | | | — | | | | — | | | | 494,448 | |
Over the Counter Options: | | | | | | | | | | | | | | | | |
Average Market Value Purchased | | $ | — | | | $ | — | | | $ | — | | | $ | 95,346 | |
Average Market Value Written | | | — | | | | — | | | | — | | | | 280,297 | |
Swaptions: | | | | | | | | | | | | | | | | |
Average Notional Balance Purchased | | $ | — | | | $ | — | | | $ | — | | | $ | — | |
Average Notional Balance Written | | | — | | | | 53,346,154 | | | | — | | | | — | |
| | | | |
| | | Low Duration
Bond Fund | | | Inflation
Protected
Securities Fund | | | Discovery Fund | | | Diversifying
Strategies
Fund | |
Inflation Linked Swaps: | | | | | | | | | | | | | | | | |
Average Notional Balance—Pays Fixed Rate | | $ | — | | | $ | 19,100,000 | | | $ | — | | | $ | — | |
Average Notional Balance—Receives Fixed Rate | | | — | | | | — | | | | — | | | | — | |
Interest Rate Swaps: | | | | | | | | | | | | | | | | |
Average Notional Balance—Pays Fixed Rate | | $ | — | | | $ | 4,100,000 | | | $ | — | | | $ | — | |
Average Notional Balance—Receives Fixed Rate | | | — | | | | 8,238,462 | | | | — | | | | — | |
| | | | |
| | | 500 Stock
Index Fund | | | Broad Market
Index Fund | | | Mid/Small
Company Index
Fund | | | Overseas
Equity Index
Fund | |
Futures Contracts: | | | | | | | | | | | | | | | | |
Average Notional Balance Long | | $ | 10,811,588 | | | $ | 8,520,311 | | | $ | 10,336,315 | | | $ | 5,423,375 | |
Average Notional Balance Short | | | — | | | | — | | | | — | | | | — | |
Forward Foreign Currency Exchange Contracts: | | | | | | | | | | | | | | | | |
Average Settlement Value—Deliver USD | | $ | — | | | $ | — | | | $ | — | | | $ | 13,035,076 | |
Average Settlement Value—Receive USD | | | — | | | | — | | | | — | | | | 9,246,756 | |
| | | | |
| | | International
Fund | | | | | | | | | | |
Forward Foreign Currency Exchange Contracts: | | | | | | | | | | | | | | | | |
Average Settlement Value—Deliver USD | | $ | 313,345 | | | | | | | | | | | | | |
Average Settlement Value—Receive USD | | | 10,508,682 | | | | | | | | | | | | | |
Futures Contracts (“Futures”)
A futures contract is an agreement to buy or sell a specific amount of a commodity or financial instrument at a particular price on a stipulated future date.
Certain funds may enter into futures to manage certain risks. These risks may include interest rate risk (the risk that interest rates will rise, causing fixed income securities prices to fall), credit risk (the risk that the issuer of a fixed income security will default on its obligation to pay interest and/or principal in a timely manner on the instrument),
170
THE VANTAGEPOINT FUNDS
NOTES TO FINANCIAL STATEMENTS — (Continued)
stock market risk (the risk that stock prices overall will decline over short or extended periods), or foreign currency risk (the risk that foreign currency values will decline relative to the U.S. dollar).
Certain funds may use futures to seek to increase portfolio value, by increasing or decreasing their exposure to changes in the market value of the specific underlying security, foreign currency, or index.
Futures may be used by the following funds for the following purposes:
| | | | | | | | | | | | | | | | | | | | | | | | |
| | | Manage Risk: | | | Obtain or Adjust Investment Exposure: | |
Fund | | Interest
Rate
Risk | | | Credit
Risk | | | Stock
Market
Risk | | | Foreign
Currency
Risk | | | To Certain Assets
or Asset Classes | | | To Foreign
Currencies | |
Low Duration Bond | | | * | | | | * | | | | | | | | * | | | | * | | | | * | |
Inflation Protected Securities | | | * | | | | * | | | | | | | | * | | | | * | | | | * | |
Equity Income | | | | | | | | | | | * | | | | * | | | | * | | | | | |
Growth & Income | | | | | | | | | | | * | | | | * | | | | * | | | | | |
Growth | | | | | | | | | | | * | | | | * | | | | * | | | | | |
Select Value | | | | | | | | | | | * | | | | * | | | | * | | | | | |
Aggressive Opportunities | | | | | | | | | | | * | | | | * | | | | * | | | | | |
Discovery | | | * | | | | * | | | | * | | | | * | | | | * | | | | * | |
International | | | | | | | | | | | * | | | | * | | | | * | | | | * | |
Diversifying Strategies | | | * | | | | * | | | | * | | | | * | | | | * | | | | * | |
Core Bond Index | | | * | | | | | | | | | | | | | | | | * | | | | | |
500 Stock Index | | | | | | | | | | | | | | | | | | | * | | | | | |
Broad Market Index | | | | | | | | | | | | | | | | | | | * | | | | | |
Mid/Small Company Index | | | | | | | | | | | | | | | | | | | * | | | | | |
Overseas Equity Index | | | | | | | | | | | | | | | * | | | | * | | | | | |
Upon entering into the futures contract, the fund agrees to deposit an amount equal to a certain percentage of the contract notional value (initial margin). The fund agrees to subsequently receive or pay an amount of cash equal to the daily fluctuation in the value of the contract. Such receipts or payments are known as “variation margin” and are recorded by the fund as unrealized gains or losses. When the contract is closed, the fund records a realized gain or loss equal to the difference between the value of the contract at the time it was opened and the value at the time it was closed. Realized gains and losses are a component of net realized gain (loss) on futures in the Statement of Operations.
Use of futures may involve risks different from, or possibly greater than, the risks associated with more traditional investments, and may involve a small amount of investment relative to the amount of risk assumed. Risks associated with futures include: the risk that a particular future may be difficult to purchase or sell (liquidity risk); the risk that certain futures may be more sensitive than traditional investments to interest rate changes and market price fluctuations (interest rate and market risks); the risk of mispricing or improper valuation of the future, and the inability of the future to correlate perfectly, or at all, with the value of the underlying asset, reference rate, or index it is designed to closely track (valuation risk); the risk that the fund may lose substantially more than the amount invested and that the fund may be forced to liquidate portfolio positions when it may not be advantageous to do so (leverage risk).
During the year ended December 31, 2013, the following funds purchased and/or sold futures contracts: Low Duration Bond Fund, Inflation Protected Securities Fund, Discovery Fund, Diversifying Strategies Fund, 500 Stock Index Fund, Broad Market Index Fund, Mid/Small Company Index Fund, and Overseas Equity Index Fund.
171
THE VANTAGEPOINT FUNDS
NOTES TO FINANCIAL STATEMENTS — (Continued)
As of December 31, 2013, the following funds had open futures contracts outstanding:
Low Duration Bond Fund
| | | | | | | | | | | | | | | | |
Number of
Contracts | | | Exchange | | Contract | | Expiration Date | | Contract Value | | | Net
Unrealized
Appreciation/
(Depreciation) | |
| | Purchased | | | | | | | | | | | | | | | |
| | 50 | | | CBT | | U.S. 2 Year Treasury Note | | March 2014 | | $ | 10,990,625 | | | $ | (20,489 | ) |
| | | | | | | | | | | | | | | | |
| | Sold | | | | | | | | | | | | | | | |
| | 97 | | | CBT | | U.S. 5 Year Treasury Note | | March 2014 | | $ | 11,573,313 | | | $ | 124,010 | |
| | | | | | | | | | | | | | | | |
| | | | | | | | | $ | 103,521 | |
| | | | | | | | | | | | | | | | |
Inflation Protected Securities Fund
| | | | | | | | | | | | | | | | |
Number of
Contracts | | | Exchange | | Contract | | Expiration Date | | Contract Value | | | Net
Unrealized
Appreciation/
(Depreciation) | |
| | Purchased | | | | | | | | | | | | | | | |
| | 41 | | | CBT | | U.S. 10 Year Treasury Note | | March 2014 | | $ | 5,044,922 | | | $ | (9,430 | ) |
| | 87 | | | CBT | | U.S. 5 Year Treasury Note | | March 2014 | | | 10,380,188 | | | | (32,888 | ) |
| | | | | | | | | | | | | | | | |
| | | | | | | | | | | | | | $ | (42,318 | ) |
| | | | | | | | | | | | | | | | |
| | Sold | | | | | | | | | | | | | | | |
| | 11 | | | CBT | | U.S. 2 Year Treasury Note | | March 2014 | | $ | 2,417,938 | | | $ | 4,485 | |
| | 40 | | | CBT | | U.S. Long Bond | | March 2014 | | | 5,132,500 | | | | 36,793 | |
| | 67 | | | CBT | | U.S. Ultra Bond | | March 2014 | | | 9,128,750 | | | | 165,723 | |
| | | | | | | | | | | | | | | | |
| | | | | | | | | | | | | | $ | 207,001 | |
| | | | | | | | | | | | | | | | |
| | | | | | | | | | | | | | $ | 164,683 | |
| | | | | | | | | | | | | | | | |
Discovery Fund
| | | | | | | | | | | | | | | | |
Number of
Contracts | | | Exchange | | Contract | | Expiration Date | | Contract Value | | | Net
Unrealized
Appreciation/
(Depreciation) | |
| | Purchased | | | | | | | | | | | | | | | |
| | 1,167 | | | NYF | | E-MINI Russell 2000 Index | | March 2014 | | $ | 135,535,380 | | | $ | 3,443,039 | |
| | 45 | | | CBT | | U.S. 2 Year Treasury Note | | March 2014 | | | 9,891,563 | | | | (18,440 | ) |
| | | | | | | | | | | | | | | | |
| | | | | | | | | | | | | | $ | 3,424,599 | |
| | | | | | | | | | | | | | | | |
| | Sold | | | | | | | | | | | | | | | |
| | 42 | | | CBT | | U.S. 5 Year Treasury Note | | March 2014 | | $ | 5,011,125 | | | $ | 57,368 | |
| | | | | | | | | | | | | | | | |
| | | | | | | | | | | | | | $ | 3,481,967 | |
| | | | | | | | | | | | | | | | |
172
THE VANTAGEPOINT FUNDS
NOTES TO FINANCIAL STATEMENTS — (Continued)
Diversifying Strategies Fund
| | | | | | | | | | | | | | | | |
Number of
Contracts | | | Exchange | | Contract | | Expiration Date | | Contract Value | | | Net
Unrealized
Appreciation/
(Depreciation) | |
| | Purchased | | | | | | | | | | | | | | | |
| | 5 | | | EOE | | Amsterdam Index | | January 2014 | | $ | 553,513 | | | $ | 30,879 | |
| | 307 | | | SFE | | Australian Government
10 Year Bond | | March 2014 | | | 31,431,530 | | | | 287,967 | |
| | 84 | | | EOP | | CAC40 10 Euro Future | | January 2014 | | | 4,967,295 | | | | 233,020 | |
| | 23 | | | MSE | | Canadian Government
10 Year Bond | | March 2014 | | | 2,744,194 | | | | (28,814 | ) |
| | 69 | | | EUX | | DAX Index | | March 2014 | | | 22,794,644 | | | | 1,018,995 | |
| | 23 | | | MIL | | FTSE/MIB Index | | March 2014 | | | 3,009,860 | | | | 130,613 | |
| | 107 | | | HKG | | Hang Seng Index | | January 2014 | | | 16,098,365 | | | | 235,490 | |
| | 163 | | | SFE | | SPI 200 Index | | March 2014 | | | 19,349,902 | | | | 1,002,876 | |
| | 70 | | | TSE | | TOPIX Index | | March 2014 | | | 8,657,772 | | | | 255,636 | |
| | 108 | | | CBT | | U.S. 10 Year Treasury Note | | March 2014 | | | 13,289,063 | | | | (213,815 | ) |
| | | | | | | | | | | | | | | | |
| | | | | | | | | | | | | | $ | 2,952,847 | |
| | | | | | | | | | | | | | | | |
| | Sold | | | | | | | | | | | | | | | |
| | 86 | | | SGX | | 10 Year Mini-JGB | | March 2014 | | $ | 11,699,953 | | | $ | 69,888 | |
| | 99 | | | CME | | E-MINI S&P 500 Index | | March 2014 | | | 9,113,445 | | | | (329,873 | ) |
| | 180 | | | EUX | | Euro-Bund Futures | | March 2014 | | | 34,462,111 | | | | 376,290 | |
| | 246 | | | LIF | | FTSE 100 Index | | March 2014 | | | 27,283,184 | | | | (803,906 | ) |
| | 37 | | | MFM | | IBEX 35 Index | | January 2014 | | | 5,023,613 | | | | (263,434 | ) |
| | 13 | | | MSE | | S&P/TSX 60 Index | | March 2014 | | | 1,911,358 | | | | (80,999 | ) |
| | 101 | | | CBT | | U.S. 5 Year Treasury Note | | March 2014 | | | 12,050,563 | | | | 133,212 | |
| | 156 | | | LIF | | UK Gilt Long Bond | | March 2014 | | | 27,527,453 | | | | 553,338 | |
| | | | | | | | | | | | | | | | |
| | | | | | | | | | | | | | $ | (345,484 | ) |
| | | | | | | | | | | | | | | | |
| | | | | | | | | | | | | | $ | 2,607,363 | |
| | | | | | | | | | | | | | | | |
500 Stock Index Fund
| | | | | | | | | | | | | | | | |
Number of
Contracts | | | Exchange | | Contract | | Expiration Date | | Contract Value | | | Net
Unrealized
Appreciation | |
| | Purchased | | | | | | | | | | | | | | | |
| | 146 | | | CME | | E-MINI S&P 500 Index | | March 2014 | | $ | 13,440,030 | | | $ | 408,405 | |
| | | | | | | | | | | | | | | | |
Broad Market Index Fund
| | | | | | | | | | | | | | | | |
Number of
Contracts | | | Exchange | | Contract | | Expiration Date | | Contract Value | | | Net
Unrealized
Appreciation | |
| | Purchased | | | | | | | | | | | | | | | |
| | 12 | | | NYF | | E-MINI Russell 2000 Index | | March 2014 | | $ | 1,393,680 | | | $ | 53,798 | |
| | 118 | | | CME | | E-MINI S&P 500 Index | | March 2014 | | | 10,862,490 | | | | 275,562 | |
| | 10 | | | CME | | E-MINI S&P MidCap 400 Index | | March 2014 | | | 1,339,400 | | | | 39,525 | |
| | | | | | | | | | | | | | | | |
| | | | | | | | | | | | | | $ | 368,885 | |
| | | | | | | | | | | | | | | | |
173
THE VANTAGEPOINT FUNDS
NOTES TO FINANCIAL STATEMENTS — (Continued)
Mid/Small Company Index Fund
| | | | | | | | | | | | | | | | |
Number of
Contracts | | | Exchange | | Contract | | Expiration Date | | Contract Value | | | Net
Unrealized
Appreciation | |
| | Purchased | | | | | | | | | | | | | | | |
| | 70 | | | NYF | | E-MINI Russell 2000 Index | | March 2014 | | $ | 8,129,800 | | | $ | 282,705 | |
| | 53 | | | CME | | E-MINI S&P MidCap 400 Index | | March 2014 | | | 7,098,820 | | | | 190,475 | |
| | | | | | | | | | | | | | | | |
| | | | | | | | | | | | | | $ | 473,180 | |
| | | | | | | | | | | | | | | | |
Overseas Equity Index Fund
| | | | | | | | | | | | | | | | |
Number of
Contracts | | | Exchange | | Contract | | Expiration Date | | Contract Value | | | Net
Unrealized
Appreciation | |
| | Purchased | | | | | | | | | | | | | | | |
| | 29 | | | EUX | | DJ Euro STOXX 50 | | March 2014 | | $ | 1,239,946 | | | $ | 27,145 | |
| | 11 | | | LIF | | FTSE 100 Index | | March 2014 | | | 1,219,980 | | | | 17,518 | |
| | 4 | | | SFE | | SPI 200 Index | | March 2014 | | | 474,844 | | | | 11,439 | |
| | 7 | | | TSE | | TOPIX Index | | March 2014 | | | 865,777 | | | | 11,270 | |
| | | | | | | | | | | | | | | | |
| | | | | | | | | | | | | | $ | 67,372 | |
| | | | | | | | | | | | | | | | |
Forward Currency Contracts
A forward currency contract involves a privately negotiated obligation to purchase or sell a specific currency at a future date at a price set in the contract.
Certain funds may enter into forward currency contracts to manage foreign currency risk. Foreign currency risk is the risk that a fund’s investment in or exposure to foreign currencies or securities denominated in foreign currencies may cause the fund to experience gains or losses solely based on changes in the exchange rate between foreign currencies and the U.S. dollar, or, in the case of hedged positions, the risk that the U.S. dollar will decline relative to the currency being hedged. Currency rates in foreign countries may fluctuate significantly over short periods of time. A decline in the value of foreign currencies relative to the U.S. dollar will reduce the value of securities held by a fund denominated in those currencies.
Certain funds also may enter into forward currency contracts to obtain or adjust investment exposure to a foreign currency.
Forward currency contracts may be used by the following funds for the following purposes:
| | | | | | | | |
Fund | | Manage Foreign
Currency Risk | | | Obtain or Adjust Investment
Exposure to Foreign
Currencies | |
Low Duration Bond | | | * | | | | * | |
Inflation Protected Securities | | | * | | | | * | |
Equity Income | | | * | | | | | |
Growth & Income | | | * | | | | | |
Growth | | | * | | | | | |
Select Value | | | * | | | | | |
Aggressive Opportunities | | | * | | | | | |
Discovery | | | * | | | | * | |
International | | | * | | | | * | |
Diversifying Strategies | | | * | | | | * | |
Overseas Equity Index | | | * | | | | | |
174
THE VANTAGEPOINT FUNDS
NOTES TO FINANCIAL STATEMENTS — (Continued)
Risks of entering into forward currency contracts include the possibility that a fund may lose money. For example, foreign currency values may change unfavorably relative to the U.S. dollar, there may be an illiquid market or a change in the value of the contracts may not correlate with changes in the value of the underlying currency. The use of over-the-counter forward currency contracts includes counterparty risk, which is the risk that the other party to a contract may not fulfill its obligations.
The net U.S. dollar value of foreign currency underlying all contractual commitments held by a fund and the resulting unrealized appreciation or depreciation are determined daily using prevailing exchange rates. Realized gain or loss is recorded upon the termination of the contract. Net realized and unrealized gains or losses occurring during the holding period of forward currency contracts are components of net realized gain (loss) on foreign currency transactions and change in net unrealized appreciation (depreciation) on forward currency contracts and foreign currency transactions in the Statement of Operations, respectively.
During the year ended December 31, 2013, the following funds purchased and/or sold forward foreign currency exchange contracts: Low Duration Bond Fund, Discovery Fund, International Fund, Diversifying Strategies Fund, and Overseas Equity Index Fund.
As of December 31, 2013, the following funds had open forward currency contracts outstanding:
Low Duration Bond Fund
| | | | | | | | | | | | | | | | | | | | | | | | | | |
Contract
Type | | Counterparty | | Currency to
Deliver | | | In Exchange
For | | | Exchange Date | | | Foreign Currency
Cost/Proceeds
(U.S.$) | | | U.S. Dollar Value at
December 31, 2013 | | | Net
Unrealized
Appreciation/
(Depreciation) | |
Purchase | | JPMorgan Chase Bank NA | | | USD | | | | GBP | | | | 03/04/2014 | | | $ | 4,452,141 | | | $ | 4,503,990 | | | $ | 51,849 | |
| | | | | | | | | | | | | | | | | | | | | | | | | | |
Sale | | HSBC Bank plc | | | GBP | | | | USD | | | | 01/09/2014 | | | $ | 1,126,569 | | | $ | 1,139,247 | | | $ | (12,678 | ) |
Sale | | JPMorgan Chase Bank NA | | | GBP | | | | USD | | | | 03/04/2014 | | | | 4,409,163 | | | | 4,503,990 | | | | (94,827 | ) |
| | | | | | | | | | | | | | | | | | | | | | | | | | |
| | | | | | | | | | | | | | | | $ | (107,505 | ) |
| | | | | | | | | | | | | | | | | | | | | | | | | | |
| | | | | | | | | | | | | | | | | | | | | | | | $ | (55,656 | ) |
| | | | | | | | | | | | | | | | | | | | | | | | | | |
Discovery Fund
| | | | | | | | | | | | | | | | | | | | | | | | | | |
Contract
Type | | Counterparty | | Currency to
Deliver | | | In Exchange
For | | | Exchange Date | | | Foreign Currency
Cost/Proceeds
(U.S.$) | | | U.S. Dollar Value at
December 31, 2013 | | | Net
Unrealized
Appreciation/
(Depreciation) | |
Purchase | | Citibank NA | | | USD | | | | EUR | | | | 01/09/2014 | | | $ | 142,886 | | | $ | 143,072 | | | $ | 186 | |
| | | | | | | | | | | | | | | | | | | | | | | | | | |
Sale | | HSBC Bank plc | | | BRL | | | | USD | | | | 01/30/2014 | | | $ | 442,388 | | | $ | 438,586 | | | $ | 3,802 | |
Sale | | Citibank NA | | | EUR | | | | USD | | | | 01/09/2014 | | | | 141,352 | | | | 143,071 | | | | (1,719 | ) |
| | | | | | | | | | | | | | | | | | | | | | | | | | |
| | | | | | | | | | | | | | | | $ | 2,083 | |
| | | | | | | | | | | | | | | | | | | | | | | | | | |
| | | | | | | | | | | | | | | | | | | | | | | | $ | 2,269 | |
| | | | | | | | | | | | | | | | | | | | | | | | | | |
International Fund
| | | | | | | | | | | | | | | | | | | | | | | | |
Contract
Type | | Counterparty | | Currency to
Deliver | | In Exchange
For | | | Exchange Date | | | Foreign Currency
Cost/Proceeds
(U.S.$) | | | U.S. Dollar Value at
December 31, 2013 | | | Net
Unrealized
Appreciation/
(Depreciation) | |
| Sale | | JPMorgan Chase Bank NA | | AUD | | | USD | | | | 01/31/2014 | | | $ | 8,251,519 | | | $ | 8,273,118 | | | $ | (21,599 | ) |
| | | | | | | | | | | | | | | | | | | | | | | | |
175
THE VANTAGEPOINT FUNDS
NOTES TO FINANCIAL STATEMENTS — (Continued)
| | | | | | | | | | | | | | | | | | | | | | | | |
Diversifying Strategies Fund | | | | | |
Contract
Type | | Counterparty | | Currency to
Deliver | | In Exchange
For | | | Exchange Date | | | Foreign Currency
Cost/Proceeds
(U.S.$) | | | U.S. Dollar Value at
December 31, 2013 | | | Net
Unrealized
Appreciation/
(Depreciation) | |
| Purchase | | Deutsche Bank AG | | USD | | | AUD | | | | 01/10/2014 | | | $ | 7,002,433 | | | $ | 7,044,900 | | | $ | 42,467 | |
| Purchase | | Deutsche Bank AG | | USD | | | CAD | | | | 01/10/2014 | | | | 661,991 | | | | 666,397 | | | | 4,406 | |
| Purchase | | Deutsche Bank AG | | USD | | | CHF | | | | 01/10/2014 | | | | 169,691 | | | | 170,370 | | | | 679 | |
| Purchase | | Deutsche Bank AG | | USD | | | EUR | | | | 01/10/2014 | | | | 13,412,630 | | | | 13,405,867 | | | | (6,763 | ) |
| Purchase | | Deutsche Bank AG | | USD | | | GBP | | | | 01/10/2014 | | | | 27,326,626 | | | | 27,616,176 | | | | 289,550 | |
| Purchase | | JPMorgan Chase Bank NA | | USD | | | GBP | | | | 03/04/2014 | | | | 5,810,199 | | | | 5,877,864 | | | | 67,665 | |
| Purchase | | Deutsche Bank AG | | USD | | | JPY | | | | 01/10/2014 | | | | 2,763,355 | | | | 2,707,705 | | | | (55,650 | ) |
| | | | | | | | | | | | | | | | | | | | | | | | |
| | | | | | | | | | | | | | | | | | | | | | $ | 342,354 | |
| | | | | | | | | | | | | | | | | | | | | | | | |
| Sale | | Deutsche Bank AG | | AUD | | | USD | | | | 01/10/2014 | | | $ | 1,554,742 | | | $ | 1,562,303 | | | $ | (7,561 | ) |
| Sale | | Deutsche Bank AG | | CAD | | | USD | | | | 01/10/2014 | | | | 13,378,906 | | | | 13,431,657 | | | | (52,751 | ) |
| Sale | | Deutsche Bank AG | | CHF | | | USD | | | | 01/10/2014 | | | | 27,967,324 | | | | 27,802,405 | | | | 164,919 | |
| Sale | | JPMorgan Chase Bank NA | | EUR | | | USD | | | | 01/09/2014 | | | | 1,798,568 | | | | 1,820,040 | | | | (21,472 | ) |
| Sale | | Deutsche Bank AG | | EUR | | | USD | | | | 01/10/2014 | | | | 9,623,339 | | | | 9,695,863 | | | | (72,524 | ) |
| Sale | | JPMorgan Chase Bank NA | | GBP | | | USD | | | | 01/09/2014 | | | | 1,719,891 | | | | 1,738,676 | | | | (18,785 | ) |
| Sale | | JPMorgan Chase Bank NA | | GBP | | | USD | | | | 03/04/2014 | | | | 5,754,111 | | | | 5,877,863 | | | | (123,752 | ) |
| Sale | | Deutsche Bank AG | | JPY | | | USD | | | | 01/10/2014 | | | | 2,505,737 | | | | 2,481,400 | | | | 24,337 | |
| Sale | | Deutsche Bank AG | | NOK | | | USD | | | | 01/10/2014 | | | | 2,435,788 | | | | 2,456,377 | | | | (20,589 | ) |
| Sale | | Deutsche Bank AG | | NZD | | | USD | | | | 01/10/2014 | | | | 1,740,000 | | | | 1,740,387 | | | | (387 | ) |
| Sale | | Deutsche Bank AG | | SEK | | | USD | | | | 01/10/2014 | | | | 247,847 | | | | 251,752 | | | | (3,905 | ) |
| | | | | | | | | | | | | | | | | | | | | | | | |
| | | | | | | | | | | | | | $ | (132,470 | ) |
| | | | | | | | | | | | | | | | | | | | | | | | |
| | | | | | | | | | | | | | | | | | | | | | $ | 209,884 | |
| | | | | | | | | | | | | | | | | | | | | | | | |
| |
Overseas Equity Index Fund | | | | | |
Contract
Type | | Counterparty | | Currency to
Deliver | | In Exchange
For | | | Exchange Date | | | Foreign Currency
Cost/Proceeds
(U.S.$) | | | U.S. Dollar Value at
December 31, 2013 | | | Net
Unrealized
Appreciation/
(Depreciation) | |
| Purchase | | Bank of America NA | | USD | | | AUD | | | | 03/19/2014 | | | $ | 352,691 | | | $ | 354,259 | | | $ | 1,568 | |
| Purchase | | Goldman Sachs International | | USD | | | AUD | | | | 03/19/2014 | | | | 149,376 | | | | 146,794 | | | | (2,582 | ) |
| Purchase | | Standard Chartered Bank | | USD | | | AUD | | | | 03/19/2014 | | | | 79,766 | | | | 78,351 | | | | (1,415 | ) |
| Purchase | | Bank of America NA | | USD | | | EUR | | | | 03/19/2014 | | | | 759,657 | | | | 758,819 | | | | (838 | ) |
| Purchase | | Citibank NA | | USD | | | EUR | | | | 03/19/2014 | | | | 675,290 | | | | 673,965 | | | | (1,325 | ) |
| Purchase | | Bank of America NA | | USD | | | GBP | | | | 03/19/2014 | | | | 766,602 | | | | 769,610 | | | | 3,008 | |
| Purchase | | Barclays Bank plc | | USD | | | GBP | | | | 03/19/2014 | | | | 213,402 | | | | 216,153 | | | | 2,751 | |
| Purchase | | Citibank NA | | USD | | | GBP | | | | 03/19/2014 | | | | 451,158 | | | | 456,142 | | | | 4,984 | |
| Purchase | | UBS AG | | USD | | | GBP | | | | 03/19/2014 | | | | 515,236 | | | | 520,609 | | | | 5,373 | |
| Purchase | | Bank of America NA | | USD | | | JPY | | | | 03/19/2014 | | | | 723,290 | | | | 721,003 | | | | (2,287 | ) |
| Purchase | | Citibank NA | | USD | | | JPY | | | | 03/19/2014 | | | | 214,960 | | | | 209,343 | | | | (5,617 | ) |
| Purchase | | Goldman Sachs International | | USD | | | JPY | | | | 03/19/2014 | | | | 423,825 | | | | 412,797 | | | | (11,028 | ) |
| Purchase | | UBS AG | | USD | | | JPY | | | | 03/19/2014 | | | | 32,942 | | | | 32,056 | | | | (886 | ) |
| | | | | | | | | | | | | | | | | | | | | | | | |
| | | | | | | | | | | | | | | | | | | | | | $ | (8,294 | ) |
| | | | | | | | | | | | | | | | | | | | | | | | |
176
THE VANTAGEPOINT FUNDS
NOTES TO FINANCIAL STATEMENTS — (Continued)
| | | | | | | | | | | | | | | | | | | | | | | | |
Contract
Type | | Counterparty | | Currency to
Deliver | | In Exchange
For | | | Exchange Date | | | Foreign Currency
Cost/Proceeds
(U.S.$) | | | U.S. Dollar Value at
December 31, 2013 | | | Net
Unrealized
Appreciation/
(Depreciation) | |
| Sale | | Barclays Bank plc | | AUD | | | USD | | | | 03/19/2014 | | | $ | 224,346 | | | $ | 224,888 | | | $ | (542 | ) |
| Sale | | Royal Bank of Canada | | AUD | | | USD | | | | 03/19/2014 | | | | 118,440 | | | | 118,353 | | | | 87 | |
| Sale | | Barclays Bank plc | | EUR | | | USD | | | | 03/19/2014 | | | | 746,203 | | | | 746,025 | | | | 178 | |
| Sale | | Royal Bank of Canada | | EUR | | | USD | | | | 03/19/2014 | | | | 163,402 | | | | 163,567 | | | | (165 | ) |
| Sale | | Bank of America NA | | EUR | | | USD | | | | 03/19/2014 | | | | 82,501 | | | | 83,091 | | | | (590 | ) |
| Sale | | Royal Bank of Canada | | GBP | | | USD | | | | 03/19/2014 | | | | 107,196 | | | | 108,242 | | | | (1,046 | ) |
| Sale | | Bank of America NA | | GBP | | | USD | | | | 03/19/2014 | | | | 418,803 | | | | 426,347 | | | | (7,544 | ) |
| Sale | | Barclays Bank plc | | GBP | | | USD | | | | 03/19/2014 | | | | 975,982 | | | | 983,446 | | | | (7,464 | ) |
| Sale | | Credit Suisse International | | JPY | | | USD | | | | 01/07/2014 | | | | 628,081 | | | | 626,098 | | | | 1,983 | |
| Sale | | Bank of America NA | | JPY | | | USD | | | | 03/19/2014 | | | | 483,341 | | | | 476,203 | | | | 7,138 | |
| Sale | | Barclays Bank plc | | JPY | | | USD | | | | 03/19/2014 | | | | 484,842 | | | | 478,769 | | | | 6,073 | |
| | | | | | | | | | | | | | | | | | | | | | | | |
| | | | | | | | | | | | | | $ | (1,892 | ) |
| | | | | | | | | | | | | | | | | | | | | | | | |
| | | | | | | | | | | | | | | | | | | | | | $ | (10,186 | ) |
| | | | | | | | | | | | | | | | | | | | | | | | |
Option Contracts (“Options”)
An option gives the holder the right but not the obligation to enter into a transaction (e.g., the purchase or sale of a security, an index of securities or another instrument, such as a futures contract) with another party on or before a specific date at a specified price (called the strike price). The counterparty is obligated to enter into the transaction if the holder elects to exercise the option. A call option gives the holder the right to purchase the underlying security or instrument from the other party; a put option gives the holder the right to sell the underlying security or instrument to the other party.
Certain funds may enter into options to manage certain risks. These risks may include interest rate risk (the risk that interest rates will rise, causing prices of fixed income securities to fall), credit risk (the risk that the issuer of a fixed income security will default on its obligation to pay interest and/or principal on the instrument in a timely manner), stock market risk (the risk that stock prices overall will decline over short or extended periods), and foreign currency risk (the risk that foreign currency values will decline relative to the U.S. dollar). Some funds also may use options, including options on Euro-Bund futures contracts, to obtain or adjust investment exposure to certain assets, asset classes, or foreign currencies.
Option contracts may be used by the following funds for the following purposes:
| | | | | | | | | | | | | | | | | | | | | | | | |
| | | Manage Risk: | | | Obtain or Adjust Investment
Exposure: | |
Fund | | Interest
Rate
Risk | | | Credit Risk | | | Stock
Market
Risk | | | Foreign
Currency
Risk | | | To Certain
Assets or Asset
Classes | | | To Foreign
Currencies | |
Low Duration Bond | | | * | | | | * | | | | | | | | * | | | | * | | | | * | |
Inflation Protected Securities | | | * | | | | * | | | | | | | | * | | | | * | | | | * | |
Equity Income | | | | | | | | | | | * | | | | | | | | * | | | | | |
Growth & Income | | | | | | | | | | | * | | | | | | | | * | | | | | |
Growth | | | | | | | | | | | * | | | | | | | | * | | | | | |
Select Value | | | | | | | | | | | * | | | | | | | | * | | | | | |
Aggressive Opportunities | | | | | | | | | | | * | | | | | | | | * | | | | | |
Discovery | | | * | | | | * | | | | * | | | | * | | | | * | | | | * | |
International | | | | | | | | | | | * | | | | * | | | | * | | | | * | |
Diversifying Strategies | | | * | | | | * | | | | * | | | | * | | | | * | | | | * | |
177
THE VANTAGEPOINT FUNDS
NOTES TO FINANCIAL STATEMENTS — (Continued)
Purchases of put and call options are recorded as an investment, the value of which is marked to market at each valuation date. When a purchased option expires, the fund will realize a loss equal to the premium paid. When a fund enters into a closing sale transaction, the fund will realize a gain or loss depending on whether the sales proceeds from the closing sale transaction are greater or less than the cost of the option. When a fund exercises a put option, it will realize a gain or loss from the sale of the underlying security and the proceeds from such sale will be decreased by the premium originally paid. When a fund exercises a call option, the cost of the security that the fund purchases upon exercise will be increased by the premium originally paid. When a fund writes (sells) a call or put option, an amount equal to the premium received by the fund is recorded as a liability, and the value of each option is marked to market at each valuation date. When a written option expires, the fund realizes a gain equal to the amount of the premium originally received. When a fund enters into a closing purchase transaction, the fund realizes a gain (or loss if the cost of the closing purchase transaction exceeds the premium originally received when the option was sold/written) without regard to any unrealized gain or loss on the underlying security, and the liability related to such option is eliminated. When a written call option is exercised, the fund realizes a gain or loss from the sale of the underlying security and the proceeds from such sale are increased by the amount of the premium originally received. When a written put option is exercised, the amount of the premium originally received will reduce the cost of the security that the fund purchased upon exercise. Option contract transactions may incur a commission, in addition to the premium paid or received. Options written are reported as a liability in a fund’s Statement of Assets and Liabilities.
Purchased options on Euro-Bund futures are recorded, accounted for and reported in the financial statements very much like futures contracts. There is no premium paid at the time of purchase and they are marked to market daily with variation margin payments received or made by the funds daily based on fluctuation in value and recorded as unrealized gain or loss. At the expiration of the option, the accumulated variation margin received or paid is recorded as realized gain or loss. If the option is exercised, the transaction is recorded as a normal purchase or sale of a futures contract.
A risk in writing (selling) a call option is that the fund gives up the opportunity for profit if the market price of the security increases to or above the strike price and the option is exercised. A risk in writing (selling) a call option on a futures contract, including a Euro-Bund futures contract, is that the fund may incur a loss if the market value of the underlying futures contract increases and the option is exercised. A risk in writing a put option is that the fund may incur a loss if the market price of the security, or futures contract including a Euro-Bund futures contract, decreases and the option is exercised. A risk in buying an option, including an option on a Euro-Bund futures contract, is that the fund pays a premium whether or not the option is exercised. The use of over-the-counter option contracts may also include counterparty risk, which is the risk that the other party to the contract may not fulfill its obligations.
During the year ended December 31, 2013, the following funds purchased and/or sold put and/or call options: Inflation Protected Securities Fund and Diversifying Strategies Fund.
Written option activity for the year ended December 31, 2013 was as follows:
| | | | | | | | | | | | | | | | | | | | | | | | |
| | | Call Options | | | Put Options | | | Total | |
Inflation Protected Securities Fund | | Number of
Contracts | | | Premium | | | Number of
Contracts | | | Premium | | | Number of
Contracts | | | Premium | |
Beginning balance as of 12/31/2012 | | | 71 | | | $ | 44,231 | | | | 41 | | | $ | 8,245 | | | | 112 | | | $ | 52,476 | |
| | | | | | | | | | | | | | | | | | | | | | | | |
Written | | | 197 | | | | 102,216 | | | | 791 | | | | 323,369 | | | | 988 | | | | 425,585 | |
Closed | | | (103 | ) | | | (67,847 | ) | | | (288 | ) | | | (191,580 | ) | | | (391 | ) | | | (259,427 | ) |
Expired | | | (165 | ) | | | (78,600 | ) | | | (544 | ) | | | (140,034 | ) | | | (709 | ) | | | (218,634 | ) |
| | | | | | | | | | | | | | | | | | | | | | | | |
Ending balance as of 12/31/2013 | | | — | | | $ | — | | | | — | | | $ | — | | | | — | | | $ | — | |
| | | | | | | | | | | | | | | | | | | | | | | | |
| | | |
| | | Call Options | | | Put Options | | | Total | |
Diversifying Strategies Fund | | Number of
Contracts | | | Premium | | | Number of
Contracts | | | Premium | | | Number of
Contracts | | | Premium | |
Beginning balance as of 12/31/2012 | | | 1,010 | | | $ | 154,502 | | | | — | | | $ | — | | | | 1,010 | | | $ | 154,502 | |
| | | | | | | | | | | | | | | | | | | | | | | | |
Written | | | 4,360 | | | | 988,434 | | | | — | | | | — | | | | 4,360 | | | | 988,434 | |
Closed | | | (4,460 | ) | | | (964,535 | ) | | | — | | | | — | | | | (4,460 | ) | | | (964,535 | ) |
Expired | | | — | | | | — | | | | — | | | | — | | | | — | | | | — | |
| | | | | | | | | | | | | | | | | | | | | | | | |
Ending balance as of 12/31/2013 | | | 910 | | | $ | 178,401 | | | | — | | | $ | — | | | | 910 | | | $ | 178,401 | |
| | | | | | | | | | | | | | | | | | | | | | | | |
178
THE VANTAGEPOINT FUNDS
NOTES TO FINANCIAL STATEMENTS — (Continued)
As of December 31, 2013, the following funds had open written option contracts or open purchased option contracts on Euro-Bund futures:
Diversifying Strategies Fund
| | | | | | | | | | | | | | | | |
Option Type | | Description | | # Contracts | | Strike Price | | | Expiration
Date | | | Net Unrealized
Appreciation/
(Depreciation) | |
| Written Call | | Swiss Market Index | | 910 | | | CHF 7,800.00 | | | | 3/21/2014 | | | $ | (246,160 | ) |
| | | | | | | | | | | | | | | | |
| | | | | | | | | | | | | | | | |
Option Type | | Description | | # Contracts | | Strike Price | | | Expiration
Date | | | Unrealized
Gain/(Loss) | |
| Purchased Call | | Euro-Bund | | 6 | | | EUR 110.00 | | | | 2/21/2014 | | | $ | (13,223 | ) |
| | | | | | | | | | | | | | | | |
Swap Agreements (“Swaps”)
Generally, swap agreements are contracts between a fund and another party (the swap counterparty) involving the exchange of payments on specified terms over periods ranging from a few days to multiple years. A swap agreement may be negotiated bilaterally and traded over-the-counter between the two parties or, in some instances, must be transacted through a futures commission merchant and cleared through a clearinghouse that serves as a central counterparty. In a cleared swap, a fund’s ultimate counterparty is the central clearinghouse. In a typical “swap” transaction, two parties agree to exchange the returns (or differentials in rates of return) earned or realized on particular predetermined investments or instruments, such as specified interest rates, a particular foreign currency, or a “basket” of securities or commodities as represented by a particular index. The gross returns to be exchanged or “swapped” between the parties are generally calculated based on the return on or change in value of a “notional amount”, i.e. the predetermined dollar amount on which the dollar amount of gross returns are calculated.
Swap contract provisions and underlying assets are varied and may be customized to the specifications of the swap parties. Total return swaps are contracts in which one party agrees to make periodic payments to another party based on the change in market value of the assets underlying the contract, which may include a specified security, basket of securities or securities indexes during the specified period, in return for periodic payments based on a fixed or variable interest rate or the total return from other underlying assets. Total return swaps may be used to obtain exposure to a security or market without owning or taking physical custody of such security or investing directly in such market. Credit default swaps are contracts whereby one party makes periodic payments to a counterparty in exchange for the right to receive from the counterparty a payment equal to the par (or other agreed-upon) value of a referenced fixed income security in the event of a default or other agreed upon credit related event by the issuer of the debt obligation. Interest rate swaps involve the exchange by a fund with another party of their respective commitments to pay or receive interest, e.g., an exchange of floating rate payments for fixed rate payments with respect to a notional amount of principal. Inflation rate swaps involve the exchange by a fund with another party of their respective commitments to pay or receive a fixed rate in exchange for the rate of change of an inflation index with respect to a notional amount of principal.
Certain funds may enter into swaps to manage certain risks (e.g. interest rate risk, which is the risk that interest rates will rise, causing prices of fixed income securities to fall, and credit risk, which is the risk that the issuer of a fixed income security will default on its obligation to pay interest and/or principal on the instrument in a timely manner). Some funds also may use swaps to manage foreign currency risk or to obtain or adjust investment exposure to certain assets or asset classes.
179
THE VANTAGEPOINT FUNDS
NOTES TO FINANCIAL STATEMENTS — (Continued)
Swaps may be used by the following funds for the following purposes:
| | | | | | | | | | | | | | | | |
| | | Manage Risk: | | | Obtain or Adjust Investment
Exposure: | |
Fund | | Interest
Rate
Risk | | | Credit
Risk | | | Foreign
Currency
Risk | | | To Certain Assets or
Asset Classes | |
Low Duration Bond | | | * | | | | * | | | | * | | | | * | |
Inflation Protected Securities | | | * | | | | * | | | | * | | | | * | |
Discovery | | | * | | | | * | | | | * | | | | * | |
Diversifying Strategies | | | * | | | | * | | | | * | | | | * | |
The risks of entering into swaps include the possible lack of liquidity and unfavorable changes in the underlying investments or instruments. The use of swaps may also include counterparty risk, which is the risk that the other party to a swap may not fulfill its obligations.
In certain types of swap transactions, the risk of loss is increased because the fund may be required to make additional or higher payments to the counterparty as a result of market volatility. In addition, swaps are not traded on exchanges or other organized markets and are generally illiquid.
Swap value changes, including the periodic amounts of interest to be paid or received on swaps, are recorded as unrealized appreciation (depreciation) on swaps. A realized gain or loss is recorded upon receipt or payment of a periodic settlement or termination of a swap. Net realized and unrealized gains and losses occurring during the holding period of swaps are a component of net realized gain (loss) on swaps and change in net unrealized appreciation (depreciation) on swaps in the Statement of Operations, respectively.
During the year ended December 31, 2013, the Inflation Protected Securities Fund participated in interest rate and inflation linked swaps.
As of December 31, 2013 the following swaps were outstanding:
Inflation Protected Securities Fund
| | | | | | | | | | | | | | | | | | |
| Centrally Cleared Interest Rate Swaps | |
Rates Exchanged | | | | | | | | | | | | |
Payments Made
By The Fund | | Payments Received
By The Fund | | | Termination Date | | Notional
Amount | | | Premium | | | Net Unrealized
Appreciation
(Depreciation)
| |
2.75% | | | 3 Month Libor | | | 06/19/2043 | | | USD 1,000,000 | | | $ | 117,550 | | | $ | 91,842 | |
3.50% | |
| 3 Month Libor
|
| | 12/18/2043 | | | USD 5,500,000 | | | | 364,756 | | | | 49,333 | |
3 Month Libor | | | 1.50 | % | | 09/16/2016 | | | USD 2,700,000 | | | | (5,184 | ) | | | 10,281 | |
3 Month Libor | | | 1.60 | % | | 07/05/2018 | | | USD 8,100,000 | | | | — | | | | (178,329 | ) |
3 Month Libor | | | 1.25 | % | | 09/05/2018 | | | USD 4,300,000 | | | | — | | | | (60,658 | ) |
3 Month Libor | | | 1.45 | % | | 09/05/2018 | | | USD 3,900,000 | | | | — | | | | (16,989 | ) |
3 Month Libor | | | 1.40 | % | | 09/05/2018 | | | USD 1,300,000 | | | | — | | | | (8,832 | ) |
3 Month Libor | | | 2.00 | % | | 12/18/2018 | | | USD 1,600,000 | | | | 16,315 | | | | 2,847 | |
| | | | | | | | | | | | | | | | | | |
| | | | | | | | | | | | $ | 493,437 | | �� | $ | (110,505 | ) |
| | | | | | | | | | | | | | | | | | |
180
THE VANTAGEPOINT FUNDS
NOTES TO FINANCIAL STATEMENTS — (Continued)
Inflation Protected Securities Fund
| | | | | | | | | | | | | | | | | | | | | | |
| Inflation Linked Swaps | |
| | | Rates Exchanged | | | | | | | | | | | Net Unrealized
Appreciation/
(Depreciation) | |
Swap Counterparty | | Payments Made
By The Fund | | | Payments Received
By The Fund | | Termination
Date | | | Notional
Amount | | | Premium | | |
BNP Paribas SA | | | 1.83 | % | | CPI Urban Consumers NSA | | | 11/29/2016 | | | | USD 1,100,000 | | | $ | (245 | ) | | $ | (553 | ) |
BNP Paribas SA | | | 2.25 | % | | CPI Urban Consumers NSA | | | 07/15/2017 | | | | USD 5,100,000 | | | | 6,020 | | | | (134,049 | ) |
BNP Paribas SA | | | 2.50 | % | | CPI Urban Consumers NSA | | | 07/15/2022 | | | | USD 3,700,000 | | | | 53,930 | | | | (132,753 | ) |
Deutsche Bank AG | | | 1.73 | % | | CPI Urban Consumers NSA | | | 12/19/2015 | | | | USD 900,000 | | | | 45 | | | | 105 | |
Deutsche Bank AG | | | 1.86 | % | | CPI Urban Consumers NSA | | | 11/05/2016 | | | | USD 2,000,000 | | | | — | | | | (4,167 | ) |
Deutsche Bank AG | | | 1.83 | % | | CPI Urban Consumers NSA | | | 11/29/2016 | | | | USD 2,400,000 | | | | (706 | ) | | | 479 | |
Deutsche Bank AG | | | 1.85 | % | | CPI Urban Consumers NSA | | | 11/29/2016 | | | | USD 3,600,000 | | | | — | | | | (2,541 | ) |
Deutsche Bank AG | | | 2.17 | % | | CPI Urban Consumers NSA | | | 11/01/2018 | | | | USD 1,300,000 | | | | — | | | | (7,637 | ) |
Deutsche Bank AG | | | 2.50 | % | | CPI Urban Consumers NSA | | | 07/15/2022 | | | | USD 500,000 | | | | 3,650 | | | | (14,302 | ) |
Goldman Sachs Bank USA | | | 1.73 | % | | CPI Urban Consumers NSA | | | 04/15/2016 | | | | USD 7,900,000 | | | | (14,005 | ) | | | (9,444 | ) |
Goldman Sachs Bank USA | | | 2.21 | % | | CPI Urban Consumers NSA | | | 10/11/2018 | | | | USD 5,200,000 | | | | — | | | | (40,795 | ) |
Royal Bank of Scotland plc | | | 1.94 | % | | CPI Urban Consumers NSA | | | 10/23/2016 | | | | USD 1,100,000 | | | | (3,245 | ) | | | (1,626 | ) |
Royal Bank of Scotland plc | | | 1.93 | % | | CPI Urban Consumers NSA | | | 10/31/2016 | | | | USD 5,300,000 | | | | — | | | | (22,610 | ) |
Royal Bank of Scotland plc | | | 2.25 | % | | CPI Urban Consumers NSA | | | 07/15/2017 | | | | USD 4,200,000 | | | | 2,313 | | | | (107,748 | ) |
| | | | | | | | | | | | | | | | | | | | | | |
| | | | | | | | | | | | | | | | | $47,757 | | | $ | (477,641 | ) |
| | | | | | | | | | | | | | | | | | | | | | |
Swap Options (“Swaptions”)
A swaption is a contract that gives the holder the right (but not the obligation), in return for the payment of a premium, to enter into a new swap agreement, or shorten, extend, cancel or otherwise modify an existing swap agreement, at some designated future time on specified terms.
Certain funds may enter into swaptions to manage certain risks (e.g., interest rate risk, which is the risk that interest rates will rise, causing bond prices to fall, and credit risk, which is the risk that the issuer of a debt instrument will default on its obligation to pay interest and/or principal on the instrument in a timely manner). Some funds also may use swaptions to manage foreign currency risk or to obtain or adjust investment exposure to certain assets or asset classes.
Swaptions may be used by the following funds for the following purposes:
| | | | | | | | | | | | |
| | | Manage Risk: | | | Obtain or Adjust Investment Exposure: | |
Fund | | Interest Rate Risk | | | Credit Risk | | | To Certain Assets or Asset Classes | |
Low Duration Bond | | | * | | |
| *
* * * |
| | | * | |
Inflation Protected Securities | | | * | | | | | * | |
Discovery | | | * | | | | | * | |
Diversifying Strategies | | | * | | | | | * | |
When a fund purchases a swaption, it risks losing the amount of the premium it has paid should it decide to let the option expire unexercised. However, when a fund writes a swaption, upon exercise of the option the fund will become obligated according to the terms of the underlying agreement (i.e., the fund may be required to enter into a new swap agreement, or to shorten, extend, cancel, or otherwise modify an existing swap agreement, even when there has been an unfavorable change in the value of the underlying swap). The use of swaptions includes counterparty risk, which is the risk that the other party to a swaption may not fulfill its obligations.
When a fund writes a call or put swaption, an amount equal to the premium received is recorded as a liability and subsequently marked to market to reflect the current value of the swaption written. These liabilities are reflected as written options at value on the Statement of Assets and Liabilities. Certain swaptions may be written with premiums to be determined on a future date. Premiums received from writing swaptions that expire are treated as realized gains. Premiums received from writing swaptions that are exercised or closed are added to the proceeds or offset against amounts paid on the underlying swap to determine the realized gain or loss.
181
THE VANTAGEPOINT FUNDS
NOTES TO FINANCIAL STATEMENTS — (Continued)
Funds may also purchase put and call swaptions. Purchasing put or call swaptions tends to increase the fund’s potential opportunity to benefit from favorable market value changes in the underlying swap without obligating the fund to participate in unfavorable market changes that may occur. The fund pays a premium that is included on the fund’s Statement of Assets and Liabilities as an investment and subsequently marked to market to reflect the current value of the swaption. Premiums paid for purchasing swaptions that expire are treated as realized losses. Certain swaptions may be purchased with premiums to be determined on a future date. The premiums for these swaptions are based upon implied volatility parameters at specified terms. When a fund enters into a closing sale transaction, the fund will realize a gain or loss depending on whether the sales proceeds from the closing sale transaction are greater or less than the cost of the swaption. When a fund exercises a put swaption, it will realize a gain or loss from the underlying swap and the proceeds will be decreased by the premium originally paid. When a fund exercises a call swaption, the cost of the swap that the fund purchases upon exercise will be increased by the premium originally paid. Swaptions written are reported as a liability in a fund’s Statement of Assets and Liabilities. Gains and losses are reported in a fund’s Statement of Operations.
During the year ended December 31, 2013, the Inflation Protected Securities Fund participated in interest rate swaptions.
Written swaption activity for the year ended December 31, 2013 was as follows:
| | | | | | | | | | | | | | | | | | | | | | | | |
| | | Call Swaptions | | | Put Swaptions | | | Total | |
Inflation Protected Securities Fund | | Notional
Amount | | | Premium | | | Notional
Amount | | | Premium | | | Notional
Amount | | | Premium | |
Beginning balance as of 12/31/2012 | | $ | 21,300,000 | | | $ | 142,061 | | | $ | 21,600,000 | | | $ | 218,680 | | | $ | 42,900,000 | | | $ | 360,741 | |
| | | | | | | | | | | | | | | | | | | | | | | | |
Written | | | 47,800,000 | | | | 157,703 | | | | 106,300,000 | | | | 523,299 | | | | 154,100,000 | | | | 681,002 | |
Closed | | | (51,000,000 | ) | | | (206,946 | ) | | | (75,500,000 | ) | | | (554,806 | ) | | | (126,500,000 | ) | | | (761,752 | ) |
Expired | | | (3,900,000 | ) | | | (7,815 | ) | | | (3,900,000 | ) | | | (19,283 | ) | | | (7,800,000 | ) | | | (27,098 | ) |
| | | | | | | | | | | | | | | | | | | | | | | | |
Ending balance as of 12/31/2013 | | $ | 14,200,000 | | | $ | 85, 003 | | | $ | 48,500,000 | | | $ | 167,890 | | | $ | 62,700,000 | | | $ | 252,893 | |
| | | | | | | | | | | | | | | | | | | | | | | | |
As of December 31, 2013, the following fund had open written swaption contracts outstanding:
Inflation Protected Securities Fund
| | | | | | | | | | | | | | | | | | | | |
Exchange | | Counterparty | | Contract | | Notional
Amount | | | Strike Rate | | | Expiration
Date
| | | Net
Unrealized
Appreciation/
(Depreciation) | |
OTC | | Goldman Sachs | | Put—Interest Rate Swaption | | $ | 36,000,000 | | | | 2.00% | | | | 3/31/2014 | | | $ | (27,876 | ) |
OTC | | Royal Bank of Scotland plc | | Call—Interest Rate Swaption | | | 12,600,000 | | | | 2.50% | | | | 1/27/2014 | | | | 80,857 | |
OTC | | Royal Bank of Scotland plc | | Put—Interest Rate Swaption | | | 11,800,000 | | | | 3.50% | | | | 1/27/2014 | | | | 122,195 | |
OTC | | Royal Bank of Scotland plc | | Call—Interest Rate Swaption | | | 900,000 | | | | 2.50% | | | | 3/03/2014 | | | | 3,073 | |
OTC | | Goldman Sachs | | Put—Interest Rate Swaption | | | 700,000 | | | | 1.90% | | | | 3/17/2014 | | | | (2,336 | ) |
OTC | | Goldman Sachs | | Call—Interest Rate Swaption | | | 700,000 | | | | 1.30% | | | | 3/17/2014 | | | | 809 | |
| | | | | | | | | | | | | | | | | | | | |
| | | | | | | | | | | | | | | | | | $ | 176,722 | |
| | | | | | | | | | | | | | | | | | | | |
Derivative Risk Exposure
In April 2009, the Company adopted FASB ASC 815 “Disclosure about Derivative Instruments and Hedging Activities” (“ASC 815”), which requires enhanced disclosures about the funds’ derivatives and hedging activities. The following tables reflect the value of the funds’ derivative contracts by certain risk exposure types (primary risks to which a fund is exposed as a result of holding the derivative contract) as of December 31, 2013. Note that the risk exposure listed below is not indicative of the intended purpose of the related derivative (e.g., managing risk or obtaining or adjusting investment exposure, as discussed elsewhere in this report).
182
THE VANTAGEPOINT FUNDS
NOTES TO FINANCIAL STATEMENTS — (Continued)
| | | | | | | | | | | | |
| | | Asset Derivatives | | | Liability Derivatives | |
Risk Exposure | | Statement of Assets and Liabilities
Location | | Value | | | Statement of Assets and Liabilities
Location | | Value | |
Low Duration Bond Fund | |
| Interest rate | | Receivable for variation margin on futures contracts | | $ | 124,010 | * | | Payable for variation margin on futures contracts | | $ | 20,489 | * |
| Foreign currency | | Unrealized appreciation on forward foreign currency exchange contracts | | | 51,849 | | | Unrealized depreciation on forward foreign currency exchange contracts | | | 107,505 | |
| | | | | | | | | | | | |
| Total | | | | $ | 175,859 | | | | | $ | 127,994 | |
| | | | �� | | | | | | | | |
Inflation Protected Securities Fund | |
| Interest rate | | Swap agreements, at value and receivable for variation margin on futures contracts | | $ | 854,663 | * | | Swap agreements, at value, payable for variation margin on futures contracts and written options, at value | | $ | 813,103 | * |
| | | | | | | | | | | | |
| Total | | | | $ | 854,663 | | | | | $ | 813,103 | |
| | | | | | | | | | | | |
Discovery Fund | |
| Interest rate | | Receivable for variation margin on futures contracts | | $ | 57,368 | * | | Payable for variation margin on futures contracts | | $ | 18,440 | * |
| Foreign currency | | Unrealized appreciation on forward foreign currency exchange contracts | | | 3,988 | | | Unrealized depreciation on forward foreign currency exchange contracts | | | 1,719 | |
| Stock market | | Receivable for variation margin on futures contracts | | | 3,443,039 | * | | Payable for variation margin on futures contracts | | | — | |
| | | | | | | | | | | | |
| Total | | | | $ | 3,504,395 | | | | | $ | 20,159 | |
| | | | | | | | | | | | |
International Fund | |
| Foreign currency | | Unrealized appreciation on forward foreign currency exchange contracts | | $ | — | | | Unrealized depreciation on forward foreign currency exchange contracts | | $ | 21,599 | |
| | | | | | | | | | | | |
| Total | | | | $ | — | | | | | $ | 21,599 | |
| | | | | | | | | | | | |
Diversifying Strategies Fund | |
| Interest rate | | Investments in Securities, at value—purchased options and receivable for variation margin on futures contracts | | $ | 1,456,789 | * | | Payable for variation margin for options on Euro-Bund futures contracts and payable for variation margin on futures contracts | | $ | 255,852 | *^ |
| Foreign currency | | Unrealized appreciation on forward foreign currency exchange contracts | | | 594,023 | | | Unrealized depreciation on forward foreign currency exchange contracts | | | 384,139 | |
| Stock market | | Investments in Securities, at value—purchased options and receivable for variation margin on futures contracts | | | 2,996,913 | * | | Payable for variation margin on futures contracts and written options, at value | | | 1,902,773 | * |
| | | | | | | | | | | | |
| Total | | | | $ | 5,047,725 | | | | | $ | 2,542,764 | |
| | | | | | | | | | | | |
183
THE VANTAGEPOINT FUNDS
NOTES TO FINANCIAL STATEMENTS — (Continued)
| | | | | | | | | | | | |
| | | Asset Derivatives | | | Liability Derivatives | |
Risk Exposure | | Statement of Assets and Liabilities
Location | | Value | | | Statement of Assets and Liabilities
Location | | Value | |
500 Stock Index Fund | |
| Stock market | | Receivable for variation margin on futures contracts | | $ | 408,405 | * | | Payable for variation margin on futures contracts | | $ | — | |
| | | | | | | | | | | | |
| Total | | | | $ | 408,405 | | | | | $ | — | |
| | | | | | | | | | | | |
Broad Market Index Fund | |
| Stock market | | Receivable for variation margin on futures contracts | | $ | 368,885 | * | | Payable for variation margin on futures contracts | | $ | — | |
| | | | | | | | | | | | |
| Total | | | | $ | 368,885 | | | | | $ | — | |
| | | | | | | | | | | | |
Mid/Small Company Index Fund | |
| Stock market | | Receivable for variation margin on futures contracts | | $ | 473,180 | * | | Payable for variation margin on futures contracts | | $ | — | |
| | | | | | | | | | | | |
| Total | | | | $ | 473,180 | | | | | $ | — | |
| | | | | | | | | | | | |
Overseas Equity Index Fund | |
| Foreign currency | | Unrealized appreciation on forward foreign currency exchange contracts | | $ | 33,143 | | | Unrealized depreciation on forward foreign currency exchange contracts | | $ | 43,329 | |
| Stock market | | Receivable for variation margin on futures contracts | | | 67,372 | * | | Payable for variation margin on futures contracts | | | — | |
| | | | | | | | | | | | |
| Total | | | | $ | 100,515 | | | | | $ | 43,329 | |
| | | | | | | | | | | | |
| * | | Includes cumulative appreciation (depreciation) of futures contracts as reported in the Notes to Financial Statements. Only the current day’s variation margin is reported within the asset and liability sections of the Statements of Assets and Liabilities. |
| ^ | | Includes cumulative appreciation (depreciation) of options on Euro-Bund futures and options contracts at value as reported in the Notes to Financial Statements and Schedule of Investments. Only the current day’s variation margin is reported within the asset and liability sections of the Statements of Assets and Liabilities for the options on Euro-Bund futures. |
The following tables reflect the funds’ gains (losses) related to derivative activities by certain risk exposure types (primary risks to which a fund is exposed as a result of holding the derivative contract) for the year ended December 31, 2013, in accordance with ASC 815. These gains (losses) are included in net realized gain (loss) or net change in unrealized appreciation (depreciation) in the Statements of Operations. Note that the risk exposure listed below are not indicative of the intended purpose of the related derivative (e.g., managing risk or obtaining or adjusting investment exposure, as discussed elsewhere in this report).
| | | | | | | | | | | | | | | | | | | | |
|
Low Duration Bond Fund1 | |
| Realized Gain (Loss) | |
Risk Exposure | | Options | | | Futures | | | Forward
Currency Contracts | | | Swap Agreements | | | Total | |
Interest rate | | $ | — | | | $ | (212,510 | ) | | $ | — | | | $ | — | | | $ | (212,510 | ) |
Foreign currency | | | — | | | | — | | | | (623,842 | ) | | | — | | | | (623,842 | ) |
| | | | | | | | | | | | | | | | | | | | |
Total | | $ | — | | | $ | (212,510 | ) | | $ | (623,842 | ) | | $ | — | | | $ | (836,352 | ) |
| | | | | | | | | | | | | | | | | | | | |
184
THE VANTAGEPOINT FUNDS
NOTES TO FINANCIAL STATEMENTS — (Continued)
| | | | | | | | | | | | | | | | | | | | |
| Change in Unrealized Appreciation (Depreciation) | |
Risk Exposure | | Options | | | Futures | | | Forward
Currency Contracts | | | Swap Agreements | | | Total | |
Interest rate | | $ | — | | | $ | 17,440 | | | $ | — | | | $ | — | | | $ | 17,440 | |
Foreign currency | | | — | | | | — | | | | (53,106 | ) | | | — | | | | (53,106 | ) |
| | | | | | | | | | | | | | | | | | | | |
Total | | $ | — | | | $ | 17,440 | | | $ | (53,106 | ) | | $ | — | | | $ | (35,666 | ) |
| | | | | | | | | | | | | | | | | | | | |
|
Inflation Protected Securities Fund2 | |
| Realized Gain (Loss) | |
Risk Exposure | | Options | | | Futures | | | Forward
Currency Contracts | | | Swap Agreements | | | Total | |
Interest rate | | $ | 464,109 | ** | | $ | 1,593,792 | | | $ | — | | | $ | (41,309 | ) | | $ | 2,016,592 | |
| | | | | | | | | | | | | | | | | | | | |
| | | | | | | | | | | | | | | | | | | | | |
| Change in Unrealized Appreciation (Depreciation) | |
Risk Exposure | | Options | | | Futures | | | Forward
Currency Contracts | | | Swap Agreements | | | Total | |
Interest rate | | $ | 247,924 | ** | | $ | (79,189 | ) | | $ | — | | | $ | (773,933 | ) | | $ | (605,198 | ) |
| | | | | | | | | | | | | | | | | | | | |
|
Discovery Fund3 | |
| Realized Gain (Loss) | |
Risk Exposure | | Options | | | Futures | | | Forward
Currency Contracts | | | Swap Agreements | | | Total | |
Interest rate | | $ | — | | | $ | (82,513 | ) | | $ | — | | | $ | — | | | $ | (82,513 | ) |
Foreign currency | | | — | | | | — | | | | (41,003 | ) | | | — | | | | (41,003 | ) |
Stock market | | | — | | | | 36,490,131 | | | | — | | | | — | | | | 36,490,131 | |
| | | | | | | | | | | | | | | | | | | | |
Total | | $ | — | | | $ | 36,407,618 | | | $ | (41,003 | ) | | $ | — | | | $ | 36,366,615 | |
| | | | | | | | | | | | | | | | | | | | |
| | | | | | | | | | | | | | | | | | | | | |
| Change in Unrealized Appreciation (Depreciation) | |
Risk Exposure | | Options | | | Futures | | | Forward
Currency Contracts | | | Swap Agreements | | | Total | |
Interest rate | | $ | — | | | $ | 14,334 | | | $ | — | | | $ | — | | | $ | 14,334 | |
Foreign currency | | | — | | | | — | | | | 2,826 | | | | — | | | | 2,826 | |
Stock market | | | — | | | | 2,865,064 | | | | — | | | | — | | | | 2,865,064 | |
| | | | | | | | | | | | | | | | | | | | |
Total | | $ | — | | | $ | 2,879,398 | | | $ | 2,826 | | | $ | — | | | $ | 2,882,224 | |
| | | | | | | | | | | | | | | | | | | | |
|
International Fund4 | |
| Realized Gain (Loss) | |
Risk Exposure | | Options | | | Futures | | | Forward
Currency Contracts | | | Swap Agreements | | | Total | |
Foreign currency | | $ | — | | | $ | — | | | $ | 1,643,433 | | | $ | — | | | $ | 1,643,433 | |
| | | | | | | | | | | | | | | | | | | | |
| | | | | | | | | | | | | | | | | | | | | |
| Change in Unrealized Appreciation (Depreciation) | |
Risk Exposure | | Options | | | Futures | | | Forward
Currency Contracts | | | Swap Agreements | | | Total | |
Foreign currency | | $ | — | | | $ | — | | | $ | 78,953 | | | $ | — | | | $ | 78,953 | |
| | | | | | | | | | | | | | | | | | | | |
185
THE VANTAGEPOINT FUNDS
NOTES TO FINANCIAL STATEMENTS — (Continued)
| | | | | | | | | | | | | | | | | | | | |
Diversifying Strategies Fund5 | |
| Realized Gain (Loss) | |
Risk Exposure | | Options | | | Futures | | | Forward
Currency Contracts | | | Swap Agreements | | | Total | |
Interest rate | | $ | (347,567 | )** | | $ | (64,099 | ) | | $ | — | | | $ | — | | | $ | (411,666 | ) |
Foreign currency | | | — | | | | — | | | | (2,912,165 | ) | | | — | | | | (2,912,165 | ) |
Stock market | | | (1,401,756 | )** | | | 2,150,597 | | | | — | | | | — | | | | 748,841 | |
| | | | | | | | | | | | | | | | | | | | |
Total | | $ | (1,749,323 | )** | | $ | 2,086,498 | | | $ | (2,912,165 | ) | | $ | — | | | $ | (2,574,990 | ) |
| | | | | | | | | | | | | | | | | | | | |
| | | | | | | | | | | | | | | | | | | | | |
| Change in Unrealized Appreciation (Depreciation) | |
Risk Exposure | | Options | | | Futures | | | Forward
Currency Contracts | | | Swap Agreements | | | Total | |
Interest rate | | $ | (93,500 | )** | | $ | 1,032,253 | | | $ | — | | | $ | — | | | $ | 938,753 | |
Foreign currency | | | — | | | | — | | | | 623,123 | | | | — | | | | 623,123 | |
Stock market | | | (449,775 | )** | | | 2,106,323 | | | | — | | | | — | | | | 1,656,548 | |
| | | | | | | | | | | | | | | | | | | | |
Total | | $ | (543,275 | )** | | $ | 3,138,576 | | | $ | 623,123 | | | $ | — | | | $ | 3,218,424 | |
| | | | | | | | | | | | | | | | | | | | |
|
500 Stock Index Fund6 | |
| Realized Gain (Loss) | |
Risk Exposure | | Options | | | Futures | | | Forward
Currency Contracts | | | Swap Agreements | | | Total | |
Stock market | | $ | — | | | $ | 2,768,560 | | | $ | — | | | $ | — | | | $ | 2,768,560 | |
| | | | | | | | | | | | | | | | | | | | |
| | | | | | | | | | | | | | | | | | | | | |
| Change in Unrealized Appreciation (Depreciation) | |
Risk Exposure | | Options | | | Futures | | | Forward
Currency Contracts | | | Swap Agreements | | | Total | |
Stock market | | $ | — | | | $ | 420,449 | | | $ | — | | | $ | — | | | $ | 420,449 | |
| | | | | | | | | | | | | | | | | | | | |
|
Broad Market Index Fund7 | |
| Realized Gain (Loss) | |
Risk Exposure | | Options | | | Futures | | | Forward
Currency Contracts | | | Swap Agreements | | | Total | |
Stock market | | $ | — | | | $ | 2,221,772 | | | $ | — | | | $ | — | | | $ | 2,221,772 | |
| | | | | | | | | | | | | | | | | | | | |
| | | | | | | | | | | | | | | | | | | | | |
| Change in Unrealized Appreciation (Depreciation) | |
Risk Exposure | | Options | | | Futures | | | Forward
Currency Contracts | | | Swap Agreements | | | Total | |
Stock market | | $ | — | | | $ | 351,567 | | | $ | — | | | $ | — | | | $ | 351,567 | |
| | | | | | | | | | | | | | | | | | | | |
|
Mid/Small Company Index Fund8 | |
| Realized Gain (Loss) | |
Risk Exposure | | Options | | | Futures | | | Forward
Currency Contracts | | | Swap Agreements | | | Total | |
Stock market | | $ | — | | | $ | 2,218,485 | | | $ | — | | | $ | — | | | $ | 2,218,485 | |
| | | | | | | | | | | | | | | | | | | | |
| | | | | | | | | | | | | | | | | | | | | |
| Change in Unrealized Appreciation (Depreciation) | |
Risk Exposure | | Options | | | Futures | | | Forward
Currency Contracts | | | Swap Agreements | | | Total | |
Stock market | | $ | — | | | $ | 435,753 | | | $ | — | | | $ | — | | | $ | 435,753 | |
| | | | | | | | | | | | | | | | | | | | |
186
THE VANTAGEPOINT FUNDS
NOTES TO FINANCIAL STATEMENTS — (Continued)
| | | | | | | | | | | | | | | | | | | | |
Overseas Equity Index Fund9 | |
| Realized Gain (Loss) | |
Risk Exposure | | Options | | | Futures | | | Forward
Currency Contracts | | | Swap Agreements | | | Total | |
Foreign currency | | $ | — | | | $ | — | | | $ | 147,895 | | | $ | — | | | $ | 147,895 | |
Stock market | | | — | | | | 596,797 | | | | — | | | | — | | | | 596,797 | |
| | | | | | | | | | | | | | | | | | | | |
Total | | $ | — | | | $ | 596,797 | | | $ | 147,895 | | | $ | — | | | $ | 744,692 | |
| | | | | | | | | | | | | | | | | | | | |
| | | | | | | | | | | | | | | | | | | | | |
| Change in Unrealized Appreciation (Depreciation) | |
Risk Exposure | | Options | | | Futures | | | Forward
Currency Contracts | | | Swap Agreements | | | Total | |
Foreign currency | | $ | — | | | $ | — | | | $ | (14,651 | ) | | $ | — | | | $ | (14,651 | ) |
Stock market | | | — | | | | 73,626 | | | | — | | | | — | | | | 73,626 | |
| | | | | | | | | | | | | | | | | | | | |
Total | | $ | — | | | $ | 73,626 | | | $ | (14,651 | ) | | $ | — | | | $ | 58,975 | |
| | | | | | | | | | | | | | | | | | | | |
| | ** | The realized gain (loss) and unrealized appreciation (depreciation) for purchased options is reported in the Statements of Operations within realized gains (losses) on investments and net change in unrealized appreciation (depreciation) on investments. The realized gain (loss) and unrealized appreciation (depreciation) for purchased options on Euro-Bund futures is reported in the Statements of Operations within realized gains(losses) on purchased options on Euro-Bund futures contracts and net change in unrealized appreciation (depreciation) on purchased options on Euro-Bund futures contracts. |
| | (1) | The Low Duration Bond Fund used futures to manage interest rate risk inherent in its fixed income securities and to obtain or adjust investment exposure based on the subadvisers’ views on interest rates and yield curves. The fund used forward currency contracts to manage foreign currency risk inherent in its foreign fixed income holdings and to obtain or adjust investment exposure to foreign currencies. |
| | (2) | The Inflation Protected Securities Fund used futures, options (including swaptions), and swaps to manage interest rate risk inherent in its fixed income securities. The fund used futures, options (including swaptions), and swaps to obtain or adjust investment exposure to segments of the fixed income market. |
| | (3) | The Discovery Fund used Russell 2000 Index futures to obtain or adjust investment exposure to U.S. common stocks and used bond futures to manage interest rate risk inherent in its fixed income securities and to seek to obtain investment exposure based on anticipated changes in interest rates. The fund used forward currency contracts to manage foreign currency risk inherent in its foreign fixed income holdings. |
| | (4) | The International Fund used forward currency contracts to manage foreign currency risk and to obtain and adjust investment exposure to foreign currencies to facilitate the trading of the foreign securities in the fund. |
| | (5) | The Diversifying Strategies Fund, used (1) foreign currency contracts to obtain and adjust investment exposure to foreign currencies; (2) futures to obtain and adjust investment exposure to stocks and to fixed income securities; and (3) options and options on futures to obtain and adjust investment exposure to stocks and to fixed income securities. |
| | (6) | The 500 Stock Index Fund used futures to obtain or adjust investment exposure to stocks when it was believed that using futures would be more efficient or cost effective than trading in the securities directly. |
| | (7) | The Broad Market Index Fund used futures to obtain or adjust investment exposure to equity issues when it was believed that using futures would be more efficient or cost effective than trading in the securities directly. |
| | (8) | The Mid/Small Company Index Fund used futures to obtain or adjust investment exposure to equity issues when it was believed that using futures would be more efficient or cost effective than trading in the securities directly. |
| | (9) | The Overseas Equity Index Fund used forward foreign currency contracts to manage currency risks inherent in the fund’s foreign equity securities. The fund used futures to obtain or adjust investment exposure to foreign equity securities, when it was believed that using futures would be more efficient or cost effective than trading in the securities directly. |
187
THE VANTAGEPOINT FUNDS
NOTES TO FINANCIAL STATEMENTS — (Continued)
In December 2011, the Financial Accounting Standards Board (“FASB”) issued Accounting Standards Update (“ASU”) No. 2011-11: Disclosures about Offsetting Assets and Liabilities (“netting”) on the Statements of Assets and Liabilities that are subject to master netting arrangements or similar agreements. ASU No. 2013-01 was issued in January 2013 to clarify which investments and transactions are subject to the netting disclosure. The scope of the disclosure requirements is limited to derivative instruments, repurchase agreements and reverse repurchase agreements and securities borrowing and securities lending transactions. This information will enable users of the Funds’ financial statements to evaluate the effect or potential effect of netting arrangements on the Funds’ financial position. The ASU is effective for financial statements with fiscal years beginning on or after January 1, 2013, and interim periods within those fiscal years. The Funds adopted the disclosure requirement for the current reporting period.
For financial reporting purposes, the Funds do not offset financial assets and financial liabilities that are subject to master netting arrangements or similar agreements on the Statement of Assets and Liabilities.
Low Duration Bond
| | | | | | | | | | | | | | | | | | | | |
| | | | | | | | | Gross Amounts Not Offset
in the Statement of Assets
& Liabilities | | | | |
Description | | Gross Amounts
of Recognized
Assets | | | Gross Amounts
of Recognized
Liabilities | | | Financial
Instruments | | | Collateral
Pledged(a) | | | Net Amount | |
Futures Contracts | | $ | 124,010 | | | $ | (20,489 | ) | | $ | — | | | $ | — | | | $ | 103,521 | |
Forward Foreign Currency Contracts | | | 51,849 | | | | (107,505 | ) | | | — | | | | — | | | | (55,656 | ) |
| | | | | | | | | | | | | | | | | | | | |
Total derivatives subject to a master netting arrangement or similar arrangement | | | 51,849 | | | | (107,505 | ) | | | — | | | | — | | | | (55,656 | ) |
Total derivatives not subject to a master netting arrangement or similar arrangement | | | 124,010 | | | | (20,489 | ) | | | — | | | | — | | | | 103,521 | |
| | | | | | | | | | | | | | | | | | | | |
Total derivatives | | $ | 175,859 | | | $ | (127,994 | ) | | $ | — | | | $ | — | | | $ | 47,865 | |
| | | | | | | | | | | | | | | | | | | | |
| | (a) | Per GAAP disclosure requirements, the table above does not include the additional collateral received from or pledged to the counterparty. |
Inflation Protected Securities
| | | | | | | | | | | | | | | | | | | | |
| | | | | | | | | Gross Amounts Not Offset
in the Statement of Assets
& Liabilities | | | | |
Description | | Gross Amounts
of Recognized
Assets | | | Gross Amounts
of Recognized
Liabilities | | | Financial
Instruments | | | Collateral
Pledged(a) | | | Net Amount | |
Futures Contracts | | $ | 207,001 | | | $ | (42,318 | ) | | $ | — | | | $ | — | | | $ | 164,683 | |
Written Options | | | — | | | | (76,171 | ) | | | — | | | | — | | | | (76,171 | ) |
Swap agreements | | | 647,662 | | | | (694,614 | ) | | | — | | | | 46,952 | | | | — | |
| | | | | | | | | | | | | | | | | | | | |
Total derivatives subject to a master netting arrangement or similar arrangement | | | 647,662 | | | | (770,785 | ) | | | — | | | | 46,952 | | | | (76,171 | ) |
Total derivatives not subject to a master netting arrangement or similar arrangement | | | 207,001 | | | | (42,318 | ) | | | — | | | | — | | | | 164,683 | |
| | | | | | | | | | | | | | | | | | | | |
Total derivatives | | $ | 854,663 | | | $ | (813,103 | ) | | $ | — | | | $ | 46,952 | | | $ | 88,512 | |
| | | | | | | | | | | | | | | | | | | | |
| | (a) | Per GAAP disclosure requirements, the table above does not include the additional collateral received from or pledged to the counterparty. Total additional collateral pledged was $380,048. |
188
THE VANTAGEPOINT FUNDS
NOTES TO FINANCIAL STATEMENTS — (Continued)
Discovery
| | | | | | | | | | | | | | | | | | | | |
| | | | | | | | | Gross Amounts Not
Offset in the Statement
of Assets & Liabilities | | | | |
Description | | Gross Amounts
of Recognized
Assets | | | Gross Amounts
of Recognized
Liabilities | | | Financial
Instruments | | | Collateral
Pledged(a) | | | Net Amount | |
Futures Contracts | | $ | 3,500,407 | | | $ | (18,440 | ) | | $ | — | | | $ | — | | | $ | 3,481,967 | |
Forward Foreign Currency Contracts | | | 3,988 | | | | (1,719 | ) | | | — | | | | — | | | | 2,269 | |
| | | | | | | | | | | | | | | | | | | | |
Total derivatives subject to a master netting arrangement or similar arrangement | | | 3,988 | | | | (1,719 | ) | | | — | | | | — | | | | 2,269 | |
Total derivatives not subject to a master netting arrangement or similar arrangement | | | 3,500,407 | | | | (18,440 | ) | | | — | | | | — | | | | 3,481,967 | |
| | | | | | | | | | | | | | | | | | | | |
Total derivatives | | $ | 3,504,395 | | | $ | (20,159 | ) | | $ | — | | | $ | — | | | $ | 3,484,236 | |
| | | | | | | | | | | | | | | | | | | | |
| | (a) | Per GAAP disclosure requirements, the table above does not include the additional collateral received from or pledged to the counterparty. |
International
| | | | | | | | | | | | | | | | | | | | |
| | | | | | | | | Gross Amounts Not
Offset in the Statement
of Assets & Liabilities | | | | |
Description | | Gross Amounts
of Recognized
Assets | | | Gross Amounts
of Recognized
Liabilities | | | Financial
Instruments | | | Collateral
Pledged(a) | | | Net Amount | |
Forward Foreign Currency Contracts | | $ | — | | | $ | (21,599 | ) | | $ | — | | | $ | — | | | $ | (21,599 | ) |
| | | | | | | | | | | | | | | | | | | | |
Total derivatives subject to a master netting arrangement or similar arrangement | | | — | | | | (21,599 | ) | | | — | | | | — | | | | (21,599 | ) |
| | | | | | | | | | | | | | | | | | | | |
Total derivatives | | $ | — | | | $ | (21,599 | ) | | $ | — | | | $ | — | | | $ | (21,599 | ) |
| | | | | | | | | | | | | | | | | | | | |
| | (a) | Per GAAP disclosure requirements, the table above does not include the additional collateral received from or pledged to the counterparty. |
Diversifying Strategies
| | | | | | | | | | | | | | | | | | | | |
| | | | | | | | | Gross Amounts Not
Offset in the Statement of
Assets & Liabilities | | | | |
Description | | Gross Amounts
of Recognized
Assets | | | Gross Amounts
of Recognized
Liabilities | | | Financial
Instruments | | | Collateral
Pledged(a) | | | Net Amount | |
Futures Contracts | | $ | 4,328,204 | | | $ | (1,720,841 | ) | | $ | — | | | $ | — | | | $ | 2,607,363 | |
Forward Foreign Currency Contracts | | | 594,023 | | | | (384,139 | ) | | | — | | | | — | | | | 209,884 | |
Written Options | | | — | | | | (424,561 | ) | | | — | | | | 130,000 | | | | (294,561 | ) |
Purchased Option on Euro-Bund Future | | | — | | | | (13,223 | ) | | | — | | | | — | | | | (13,223 | ) |
| | | | | | | | | | | | | | | | | | | | |
Total derivatives subject to a master netting arrangement or similar arrangement | | | 594,023 | | | | (821,923 | ) | | | — | | | | 130,000 | | | | (97,900 | ) |
Total derivatives not subject to a master netting arrangement or similar arrangement | | | 4,328,204 | | | | (1,720,841 | ) | | | — | | | | — | | | | 2,607,363 | |
| | | | | | | | | | | | | | | | | | | | |
Total derivatives | | $ | 4,922,227 | | | $ | (2,542,764 | ) | | $ | — | | | $ | 130,000 | | | $ | 2,509,463 | |
| | | | | | | | | | | | | | | | | | | | |
| | (a) | Per GAAP disclosure requirements, the table above does not include the additional collateral received from or pledged to the counterparty. Total additional collateral pledged was $230,000. |
189
THE VANTAGEPOINT FUNDS
NOTES TO FINANCIAL STATEMENTS — (Continued)
500 Stock Index
| | | | | | | | | | | | | | | | | | | | |
| | | | | | | | | Gross Amounts Not Offset
in the Statement of Assets
& Liabilities | | | | |
Description | | Gross Amounts
of Recognized
Assets | | | Gross Amounts
of Recognized
Liabilities | | | Financial
Instruments | | | Collateral
Pledged(a) | | | Net Amount | |
Futures Contracts | | $ | 408,405 | | | $ | — | | | $ | — | | | $ | — | | | $ | 408,405 | |
| | | | | | | | | | | | | | | | | | | | |
Total derivatives not subject to a master netting arrangement or similar arrangement | | | 408,405 | | | | — | | | | — | | | | — | | | | 408,405 | |
| | | | | | | | | | | | | | | | | | | | |
Total derivatives | | $ | 408,405 | | | $ | — | | | $ | — | | | $ | — | | | $ | 408,405 | |
| | | | | | | | | | | | | | | | | | | | |
| | (a) | Per GAAP disclosure requirements, the table above does not include the additional collateral received from or pledged to the counterparty. |
Broad Market Index
| | | | | | | | | | | | | | | | | | | | |
| | | | | | | | | Gross Amounts Not Offset
in the Statement of Assets
& Liabilities | | | | |
Description | | Gross Amounts
of Recognized
Assets | | | Gross Amounts
of Recognized
Liabilities | | | Financial
Instruments | | | Collateral
Pledged(a) | | | Net Amount | |
Futures Contracts | | $ | 368,885 | | | $ | — | | | $ | — | | | $ | — | | | $ | 368,885 | |
| | | | | | | | | | | | | | | | | | | | |
Total derivatives not subject to a master netting arrangement or similar arrangement | | | 368,885 | | | | — | | | | — | | | | — | | | | 368,885 | |
| | | | | | | | | | | | | | | | | | | | |
Total derivatives | | $ | 368,885 | | | $ | — | | | $ | — | | | $ | — | | | $ | 368,885 | |
| | | | | | | | | | | | | | | | | | | | |
| (a) | Per GAAP disclosure requirements, the table above does not include the additional collateral received from or pledged to the counterparty. |
Mid/Small Company Index
| | | | | | | | | | | | | | | | | | | | |
| | | | | | | | | Gross Amounts Not Offset
in the Statement of Assets
& Liabilities | | | | |
Description | | Gross Amounts
of Recognized
Assets | | | Gross Amounts
of Recognized
Liabilities | | | Financial
Instruments | | | Collateral
Pledged(a) | | | Net
Amount | |
Futures Contracts | | $ | 473,180 | | | $ | — | | | $ | — | | | $ | — | | | $ | 473,180 | |
| | | | | | | | | | | | | | | | | | | | |
Total derivatives not subject to a master netting arrangement or similar arrangement | | | 473,180 | | | | — | | | | — | | | | — | | | | 473,180 | |
| | | | | | | | | | | | | | | | | | | | |
Total derivatives | | $ | 473,180 | | | $ | — | | | $ | — | | | $ | — | | | $ | 473,180 | |
| | | | | | | | | | | | | | | | | | | | |
| (a) | Per GAAP disclosure requirements, the table above does not include the additional collateral received from or pledged to the counterparty. |
190
THE VANTAGEPOINT FUNDS
NOTES TO FINANCIAL STATEMENTS — (Continued)
Overseas Equity Index
| | | | | | | | | | | | | | | | | | | | |
| | | | | | | | | Gross Amounts Not Offset
in the Statement of Assets
& Liabilities | | | | |
Description | | Gross Amounts
of Recognized
Assets | | | Gross Amounts
of Recognized
Liabilities | | | Financial
Instruments | | | Collateral
Pledged(a) | | | Net
Amount | |
Futures Contracts | | $ | 67,372 | | | $ | — | | | $ | — | | | $ | — | | | $ | 67,372 | |
Forward Foreign Currency Contracts | | | 33,143 | | | | (43,329 | ) | | | — | | | | — | | | | (10,186 | ) |
| | | | | | | | | | | | | | | | | | | | |
Total derivatives subject to a master netting arrangement or similar arrangement | | | 33,143 | | | | (43,329 | ) | | | — | | | | — | | | | (10,186 | ) |
Total derivatives not subject to a master netting arrangement or similar arrangement | | | 67,372 | | | | — | | | | — | | | | — | | | | 67,372 | |
| | | | | | | | | | | | | | | | | | | | |
Total derivatives | | $ | 100,515 | | | $ | (43,329 | ) | | $ | — | | | $ | — | | | $ | 57,186 | |
| | | | | | | | | | | | | | | | | | | | |
| | (a) | Per GAAP disclosure requirements, the table above does not include the additional collateral received from or pledged to the counterparty. |
| 4. | | Agreements and Other Transactions with Affiliates |
VIA, a wholly owned subsidiary of ICMA Retirement Corporation (“ICMA-RC”), provides investment advisory services to each of the funds. Pursuant to Master Advisory Agreements, VIA is entitled to receive 0.10% of the average daily net assets of each Actively Managed and Milestone Fund and 0.05% of the average daily net assets of the Index Funds. Effective July 1, 2005, VIA is entitled to receive 0.10% on the first $500 million of net assets, 0.09% on the next $500 million of net assets, and 0.08% on net assets over $1 billion for each Model Portfolio Fund. For these services, VIA earned $20,142,677 in the aggregate for the year ended December 31, 2013.
Vantagepoint Transfer Agents, LLC (“VTA”), a wholly owned subsidiary of ICMA-RC, provides certain transfer agency and administrative shareholder support services for the funds related to the retirement plans investing in the funds. Pursuant to a Transfer Agency and Administrative Services Agreement with the Company, VTA is entitled to receive a fee for fund services. Effective March 1, 2013, VTA receives 0.35% of the average daily net assets for the Investor Shares of the Actively Managed Funds, 0.10% of the average daily net assets for the T Shares of the Actively Managed Funds, 0.30% of the average daily net assets of Class I shares of the Index Funds, 0.10% of the average daily net assets of the Class II and T Shares of the Index Funds, and 0.25% of the average daily net assets for the Investor M Shares of the Model Portfolio and Milestone Funds. VTA has contractually agreed to waive 0.05% of its 0.10% fee on T Shares of the Index Funds from March 1, 2013 through April 30, 2014. Prior to March 1, 2013, VTA received 0.35% of the average daily net assets of each Actively Managed Fund, 0.30% of the average daily net assets of the Class I shares of the Index Funds and 0.10% of the average daily net assets of the Class II shares of the Index Funds. For these services, VTA earned $22,696,465 in the aggregate for the year ended December 31, 2013.
VIA and the Company contract with one or more subadvisers (“Subadvisers”) for the day-to-day management of each of the funds other than the Model Portfolio Funds and Milestone Funds. Each Subadviser is paid a fee by the funds during the year based on average net assets under management, except that the subadvisory fees for Mellon Capital Management Corporation for the Diversifying Strategies Fund are calculated based on the average net asset value of the fund’s assets allocated and assigned to it by VIA. The fee structure for many of the Subadvisers provides for a range of fees so that as average net assets under management increases the rate of fee paid to the Subadviser decreases. Other Subadvisers charge one fee no matter what amount of assets they have under management. Additional information about each Subadviser’s fee is presented in the Company’s prospectus and statement of additional information. Fees paid by each fund to Subadvisers during the year ended December 31, 2013 are presented in the “Additional Information” section of these Notes. The Subadvisers’ fees during the year ended December 31, 2013 are shown here as an annual percentage of average net assets under management, except the subadvisory fees for Mellon
191
THE VANTAGEPOINT FUNDS
NOTES TO FINANCIAL STATEMENTS — (Continued)
Capital Management Corporation for the Diversifying Strategies Fund, which were calculated based on the average net asset value of the assets allocated and assigned to it by VIA.
| | | | | | |
Fund | | Subadviser | | Actual Fee as a Percentage of
Average Daily Net Assets (net of
any subadviser fee waivers) | |
| Low Duration Bond | | Payden & Rygel | | | 0.10 | % |
| | Schroder Investment Management North America Inc. (1) | | | 0.18 | % |
| | |
| Inflation Protected Securities | | Pacific Investment Management Company, LLC | | | 0.20 | % |
| | BlackRock Financial Management, Inc. | | | 0.10 | % |
| | |
| Equity Income | | Barrow, Hanley, Mewhinney & Strauss, LLC | | | 0.21 | % |
| | T. Rowe Price Associates, Inc. | | | 0.30 | % |
| | Southeastern Asset Management, Inc. | | | 0.52 | % |
| | |
| Growth & Income | | Fiduciary Management, Inc. | | | 0.29 | % |
| | T. Rowe Price Associates, Inc. | | | 0.38 | % |
| | Wellington Management Company, LLP | | | 0.27 | % |
| | |
| Growth | | Atlanta Capital Management Company, LLC | | | 0.30 | % |
| | Columbus Circle Investors | | | 0.33 | % |
| | Victory Capital Management Inc. (2) | | | 0.26 | % |
| | Westfield Capital Management Company, L.P. | | | 0.33 | % |
| | |
| Select Value | | Artisan Partners Limited Partnership | | | 0.55 | % |
| | Systematic Financial Management, L.P. | | | 0.41 | % |
| | WEDGE Capital Management LLP | | | 0.51 | % |
| | |
| Aggressive Opportunities | | Southeastern Asset Management, Inc. | | | 0.58 | % |
| | SSgA Funds Management, Inc. | | | 0.03 | % |
| | TimesSquare Capital Management, LLC | | | 0.50 | % |
| | Wells Capital Management Inc. | | | 0.43 | % |
| | |
| Discovery | | Payden & Rygel | | | 0.15 | % |
| | Wellington Management Company, LLP | | | 0.73 | % |
| | |
| International | | Artisan Partners Limited Partnership | | | 0.64 | % |
| | GlobeFlex Capital, LP | | | 0.40 | % |
| | Mondrian Investment Partners Limited | | | 0.43 | % |
| | Walter Scott & Partners Limited | | | 0.54 | % |
| | |
| Diversifying Strategies | | Calamos Advisors LLC | | | 0.53 | % |
| | Mellon Capital Management Corporation (3) | | | 0.33 | % |
| | Payden & Rygel (Enhanced Cash Management) | | | 0.10 | % |
| | Payden & Rygel (Low Duration-Plus Fixed Income) | | | 0.09 | % |
| | Shenkman Capital Management, Inc. | | | 0.38 | % |
| | |
| Core Bond Index | | Mellon Capital Management Corporation (4) | | | 0.01 | % |
| | |
| 500 Stock Index | | Mellon Capital Management Corporation (4) | | | 0.01 | % |
| | |
| Broad Market Index | | Mellon Capital Management Corporation (4) | | | 0.01 | % |
| | |
| Mid/Small Company Index | | Mellon Capital Management Corporation (4) | | | 0.02 | % |
| | |
| Overseas Equity Index | | Mellon Capital Management Corporation (4) | | | 0.04 | % |
| | (1) | Effective October 11, 2013, STW Fixed Income Management, LLC (“STW”) was integrated into the operations of Schroeder Investment Management North American Inc. (“SIMNA”). On that date, SIMNA replaced STW as subadviser to the Low Duration Bond Fund. |
192
THE VANTAGEPOINT FUNDS
NOTES TO FINANCIAL STATEMENTS — (Continued)
| | (2) | Effective August 1, 2013, the fee schedule charged by Victory Capital Management, Inc. (“Victory”) to the Growth Fund was amended and the percentage shown above represents a blended rate of the previous fee schedule and the new fee schedule |
| | (3) | Mellon Capital Management Corporation has contractually agreed to reduce its subadvisory fee through February 4, 2015. |
| | (4) | Effective January 18, 2013, the fee schedule charged by Mellon Capital Management Corporation for each Index Fund was amended and the percentages shown above represent a blended rate of the previous fee schedules and the new fee schedules. |
Expenses
The Model Portfolio Funds and Milestone Funds incur fees and expenses indirectly as shareholders in their respective underlying funds. Because the underlying funds have varied expense and fee levels and the Model Portfolio and Milestone Funds may own different proportions of such funds at different times, the amount of fees and expenses indirectly incurred by the Model Portfolio and Milestone Funds will vary.
Fee Waivers
VIA will waive its management fee or reimburse expenses to the extent necessary as a result of any increase in subadvisory fees payable by the Growth Fund that would cause the aggregate management and subadvisory fees of the Growth Fund to exceed 0.54% as a result of subadvisory changes. This commitment will continue until such time as shareholders approve an increase in this limit. For the year ended December 31, 2013 no waiver or reimbursement was required.
From January 4, 2010 through April 30, 2011, from May 1, 2011 through April 30, 2012, and from May 1, 2012 through April 30, 2013, VIA contractually agreed to waive fees or reimburse expenses (other than the extraordinary expenses) of the Milestone 2045 Fund to limit the fund’s total annual operating expenses to 0.85% for the TM Shares and 1.10% for the Investor M Shares. For the year ended December 31, 2013, no waiver or reimbursement was required.
From September 10, 2012 through April 30, 2014 VIA contractually agreed to waive fees or reimburse expenses (other than the extraordinary expenses) of the Milestone 2050 Fund to limit the fund’s total annual operating expenses to 0.85% for the TM Shares and 1.10% for the Investor M Shares. For the year ended December 31, 2013, the waiver or reimbursement was $56,992.
For the Index Funds, VTA has contractually agreed to waive a portion of its fees (0.05% of daily net assets) of the T Shares beginning March 1, 2013 through April 30, 2014. For the year ended December 31, 2013 the amount of this waiver for the Core Bond Index Fund was $509,031, 500 Stock Index Fund was $232,243, Broad Market Index Fund $258,012, Mid/Small Company Index Fund was $244,980, and Overseas Equity Index Fund $104,410.
T. Rowe Price Associates, Inc. (“T. Rowe Price”) voluntarily waives a portion of its aggregate subadvisory fees for the Growth & Income and Equity Income Funds. These voluntary fee waivers were first implemented on May 1, 2003. The fee for each fund managed by T. Rowe Price is voluntarily reduced by the following percentages, which are determined based on the total amount of assets managed by T. Rowe Price for the Company: a 2.5% waiver on the first $500 million in total assets provided the total amount of assets managed by T. Rowe Price is between $250 and $500 million and a 5% waiver on total assets above $500 million. For the year ended December 31, 2013, the fee waiver for the Growth & Income Fund totaled $56,674 and the fee waiver for the Equity Income Fund totaled $93,010.
Mellon Capital Management Corporation has agreed to reduce its subadvisory fee through February 4, 2015 so that its fee for the Diversifying Strategies Fund does not exceed 0.325% of the average daily market value of the assets managed in the Diversifying Strategies Fund. This waiver totaled $635,701 for the year ended December 31, 2013.
193
THE VANTAGEPOINT FUNDS
NOTES TO FINANCIAL STATEMENTS — (Continued)
| 5. | | Investment Portfolio Transactions |
Purchases and sales of investments, exclusive of short-term securities, for each fund for the year ended December 31, 2013 were as follows:
| | | | | | | | | | | | | | | | |
| | | U.S. Government Obligations | | | Other Securities | |
Fund | | Purchases at Cost | | | Sales Proceeds | | | Purchases at Cost | | | Sales Proceeds | |
Low Duration Bond | | $ | 112,798,568 | | | $ | 77,973,798 | | | $ | 268,668,214 | | | $ | 280,947,413 | |
Inflation Protected Securities | | | 61,013,334 | | | | 66,940,551 | | | | 283,393,581 | | | | 267,043,150 | |
Equity Income | | | — | | | | — | | | | 370,056,534 | | | | 563,196,873 | |
Growth & Income | | | — | | | | — | | | | 34,508,623 | | | | 39,786,957 | |
Growth | | | — | | | | — | | | | 1,077,461,104 | | | | 1,238,895,644 | |
Select Value | | | — | | | | — | | | | 305,377,911 | | | | 315,234,306 | |
Aggressive Opportunities | | | — | | | | — | | | | 544,964,766 | | | | 684,666,133 | |
Discovery | | | 64,548,754 | | | | 37,714,464 | | | | 141,045,912 | | | | 141,913,570 | |
International | | | — | | | | — | | | | 658,398,220 | | | | 736,302,764 | |
Diversifying Strategies | | | 163,644,679 | | | | 85,208,034 | | | | 589,680,302 | | | | 569,138,927 | |
Core Bond Index | | | 356,893,545 | | | | 335,183,915 | | | | 1,277,158,163 | | | | 1,198,504,116 | |
500 Stock Index | | | — | | | | — | | | | 102,648,476 | | | | 42,385,916 | |
Broad Market Index | | | — | | | | — | | | | 103,023,116 | | | | 55,257,441 | |
Mid/Small Company Index | | | — | | | | — | | | | 255,755,177 | | | | 215,634,912 | |
Overseas Equity Index | | | — | | | | — | | | | 52,164,802 | | | | 28,206,595 | |
Model Portfolio Conservative Growth | | | — | | | | — | | | | 77,255,817 | | | | 68,173,060 | |
Model Portfolio Traditional Growth | | | — | | | | — | | | | 154,755,466 | | | | 141,994,522 | |
Model Portfolio Long-Term Growth | | | — | | | | — | | | | 222,218,187 | | | | 204,631,317 | |
Model Portfolio All-Equity Growth | | | — | | | | — | | | | 124,691,866 | | | | 64,732,684 | |
Milestone Retirement Income | | | — | | | | — | | | | 107,890,883 | | | | 30,452,398 | |
Milestone 2010 | | | — | | | | — | | | | 77,713,742 | | | | 41,016,440 | |
Milestone 2015 | | | — | | | | — | | | | 132,148,792 | | | | 56,107,007 | |
Milestone 2020 | | | — | | | | — | | | | 165,886,036 | | | | 50,804,986 | |
Milestone 2025 | | | — | | | | — | | | | 134,197,636 | | | | 37,981,445 | |
Milestone 2030 | | | — | | | | — | | | | 109,393,805 | | | | 30,727,048 | |
Milestone 2035 | | | — | | | | — | | | | 79,088,968 | | | | 20,419,823 | |
Milestone 2040 | | | — | | | | — | | | | 73,062,083 | | | | 19,911,885 | |
Milestone 2045 | | | — | | | | — | | | | 37,632,134 | | | | 6,869,786 | |
Milestone 2050 | | | — | | | | — | | | | 16,573,685 | | | | 3,086,293 | |
| 6. | | Tax Basis Unrealized Appreciation (Depreciation) |
As of December 31, 2013, net unrealized appreciation (depreciation) on investments was as follows:
| | | | | | | | | | | | | | | | |
Fund | | Federal Income
Tax Cost | | | Gross
Unrealized
Appreciation | | | Gross
Unrealized
Depreciation | | | Tax Basis Net
Unrealized
Appreciation/
(Depreciation) | |
Low Duration Bond | | $ | 609,431,885 | | | $ | 6,421,945 | | | $ | 1,645,180 | | | $ | 4,776,765 | |
Inflation Protected Securities | | | 597,633,110 | | | | 5,026,663 | | | | 20,255,928 | | | | (15,229,265 | ) |
Equity Income | | | 1,825,258,350 | | | | 703,012,416 | | | | 36,222,525 | | | | 666,789,891 | |
Growth & Income | | | 1,253,010,565 | | | | 518,165,946 | | | | 10,123,721 | | | | 508,042,225 | |
Growth | | | 1,679,714,591 | | | | 654,327,521 | | | | 3,269,835 | | | | 651,057,686 | |
Select Value | | | 391,012,492 | | | | 108,586,182 | | | | 5,394,160 | | | | 103,192,022 | |
Aggressive Opportunities | | | 955,591,978 | | | | 323,259,086 | | | | 8,849,568 | | | | 314,409,518 | |
Discovery | | | 266,446,202 | | | | 34,960,976 | | | | 3,068,319 | | | | 31,892,657 | |
International | | | 1,227,857,519 | | | | 273,686,288 | | | | 42,352,806 | | | | 231,333,482 | |
Diversifying Strategies | | | 1,064,936,405 | | | | 38,897,624 | | | | 5,789,367 | | | | 33,108,257 | |
194
THE VANTAGEPOINT FUNDS
NOTES TO FINANCIAL STATEMENTS — (Continued)
| | | | | | | | | | | | | | | | |
Fund | | Federal Income
Tax Cost | | | Gross
Unrealized
Appreciation | | | Gross
Unrealized
Depreciation | | | Tax Basis Net
Unrealized
Appreciation/
(Depreciation) | |
Core Bond Index | | $ | 1,388,361,036 | | | $ | 29,406,777 | | | $ | 29,205,588 | | | $ | 201,189 | |
500 Stock Index | | | 389,797,817 | | | | 281,935,256 | | | | 7,595,889 | | | | 274,339,367 | |
Broad Market Index | | | 450,915,673 | | | | 366,242,406 | | | | 24,347,398 | | | | 341,895,008 | |
Mid/Small Company Index | | | 559,156,580 | | | | 227,899,525 | | | | 22,232,669 | | | | 205,666,856 | |
Overseas Equity Index | | | 262,337,327 | | | | 58,461,173 | | | | 23,421,340 | | | | 35,039,833 | |
Model Portfolio Conservative Growth | | | 588,131,188 | | | | 77,864,978 | | | | 4,467,323 | | | | 73,397,655 | |
Model Portfolio Traditional Growth | | | 1,447,548,851 | | | | 247,403,247 | | | | 4,670,342 | | | | 242,732,905 | |
Model Portfolio Long-Term Growth | | | 1,833,539,691 | | | | 383,705,483 | | | | 4,858,228 | | | | 378,847,255 | |
Model Portfolio All-Equity Growth | | | 738,706,204 | | | | 188,831,360 | | | | 1,351,698 | | | | 187,479,662 | |
Milestone Retirement Income | | | 314,658,156 | | | | 14,573,029 | | | | 5,571,200 | | | | 9,001,829 | |
Milestone 2010 | | | 269,062,691 | | | | 25,440,289 | | | | 4,393,776 | | | | 21,046,513 | |
Milestone 2015 | | | 500,319,637 | | | | 63,928,584 | | | | 8,025,205 | | | | 55,903,379 | |
Milestone 2020 | | | 568,867,986 | | | | 86,198,033 | | | | 5,955,184 | | | | 80,242,849 | |
Milestone 2025 | | | 461,431,319 | | | | 82,323,698 | | | | 2,702,837 | | | | 79,620,861 | |
Milestone 2030 | | | 365,866,093 | | | | 75,333,327 | | | | 1,867,487 | | | | 73,465,840 | |
Milestone 2035 | | | 248,676,618 | | | | 55,651,825 | | | | 1,061,150 | | | | 54,590,675 | |
Milestone 2040 | | | 236,109,430 | | | | 59,521,773 | | | | 852,282 | | | | 58,669,491 | |
Milestone 2045 | | | 83,743,232 | | | | 14,689,183 | | | | 240,670 | | | | 14,448,513 | |
Milestone 2050 | | | 20,661,282 | | | | 1,713,127 | | | | 33,259 | | | | 1,679,868 | |
| 7. | | Portfolio Securities Loaned |
Certain funds lend securities to approved borrowers to seek to earn additional income. As of December 31, 2013 certain funds had loaned securities, which were collateralized by cash or other forms of collateral at least equal to the market value of the securities loaned as provided for in the Company’s Securities Lending Agency Agreement with JPMorgan Chase Bank, N.A. The funds receive dividends and interest on the loaned securities and a portion of interest earned on reinvested collateral. All securities loaned are marked to market daily in U.S. dollars and collateral is received and released accordingly on the following day to achieve the required collateralization for the previous day’s market value. The fund may terminate a loan at any time and generally expects to receive the securities loaned within the normal settlement period for the security involved. As with other extensions of credit, there are risks of delay in recovery or even loss of rights in collateral in the event of default or insolvency of the borrower. The fund may not retain voting rights on securities while they are on loan. Voting rights on the loaned securities may pass to the borrower. The funds, however, are entitled to terminate or recall the loans to vote proxies or otherwise obtain rights to vote or consent with respect to a material event.
The funds will be indemnified by the custodian for securities lending programs conducted through the custodian if, at the time of a default by a borrower, some or all of the loaned securities have not been returned by the borrower. The custodian, as soon as practicable after the time of default, shall deposit in the funds’ accounts securities of the same number, issue, type, class and series of the unreturned loaned securities. If the custodian is unable to purchase replacement securities, it will credit to the funds’ accounts an amount equal to the market value of the unreturned loaned securities. For purposes of calculating the amount of credit to a fund’s account, the market value of U.S. securities will be determined as of the date on which the custodian posts the credit to the fund and the market value of the U.S. securities may be more or less than it was on the date the securities were due to be returned to the fund. For non-U.S. securities, the market value of the securities to be credited to a fund is determined as of the date the securities were due to be returned to the fund.
195
THE VANTAGEPOINT FUNDS
NOTES TO FINANCIAL STATEMENTS — (Continued)
The market value of the securities on loan and the value of the related collateral as of December 31, 2013, were as follows:
| | | | | | | | | | | | |
Fund | | Securities on
Loan | | | Collateral | | | Collateralization | |
Low Duration Bond | | $ | 10,121,348 | | | $ | 10,332,748 | | | | 102 | % |
Equity Income | | | 4,674,325 | | | | 4,737,432 | | | | 101 | % |
Growth & Income | | | 24,623,622 | | | | 25,057,093 | | | | 102 | % |
Select Value | | | 16,907,739 | | | | 17,144,545 | | | | 101 | % |
Aggressive Opportunities | | | 23,976,158 | | | | 24,403,679 | | | | 102 | % |
Discovery | | | 17,958,030 | | | | 18,578,865 | | | | 103 | % |
International | | | 22,232,808 | | | | 23,247,526 | | | | 105 | % |
Core Bond Index | | | 8,827,990 | | | | 9,023,177 | | | | 102 | % |
500 Stock Index | | | 3,085,663 | | | | 3,179,674 | | | | 103 | % |
Broad Market Index | | | 13,005,266 | | | | 13,336,357 | | | | 103 | % |
Mid/Small Company Index | | | 43,990,337 | | | | 45,190,289 | | | | 103 | % |
Overseas Equity Index | | | 3,532,862 | | | | 3,724,169 | | | | 105 | % |
| 8. | | Transactions with Affiliated Funds |
As of December 31, 2013, the Model Portfolio Funds and Milestone Funds held investments in a number of the other Vantagepoint Funds. The figures presented below represent the percentages of shares outstanding in each of the underlying Vantagepoint Funds owned by the Model Portfolio and Milestone Funds on December 31, 2013:
| | | | | | | | | | | | | | | | | | | | |
Vantagepoint Fund | | Model Portfolio
Conservative
Growth | | | Model Portfolio
Traditional
Growth | | | Model Portfolio
Long-Term
Growth | | | Model Portfolio
All-Equity
Growth | | | Milestone
Retirement
Income | |
Low Duration Bond | | | 20.45 | % | | | 21.12 | % | | | 0.00 | % | | | 0.00 | % | | | 16.53 | % |
Inflation Protected Securities | | | 10.98 | % | | | 10.60 | % | | | 0.00 | % | | | 0.00 | % | | | 8.26 | % |
Equity Income | | | 2.99 | % | | | 8.37 | % | | | 11.72 | % | | | 6.67 | % | | | 1.32 | % |
Growth and Income | | | 3.55 | % | | | 12.17 | % | | | 17.03 | % | | | 9.09 | % | | | 1.90 | % |
Growth | | | 1.77 | % | | | 7.66 | % | | | 11.30 | % | | | 6.78 | % | | | 0.00 | % |
Select Value | | | 4.27 | % | | | 20.07 | % | | | 40.09 | % | | | 18.38 | % | | | 0.00 | % |
Aggressive Opportunities | | | 1.66 | % | | | 7.85 | % | | | 15.67 | % | | | 7.13 | % | | | 0.00 | % |
Discovery | | | 0.00 | % | | | 19.33 | % | | | 37.37 | % | | | 30.33 | % | | | 0.00 | % |
International | | | 3.27 | % | | | 13.06 | % | | | 21.57 | % | | | 10.90 | % | | | 0.92 | % |
Diversifying Strategies | | | 11.42 | % | | | 22.45 | % | | | 23.17 | % | | | 0.00 | % | | | 5.92 | % |
Core Bond Index | | | 6.06 | % | | | 16.15 | % | | | 20.75 | % | | | 0.00 | % | | | 2.26 | % |
| | | | | |
Vantagepoint Fund | | Milestone
2010 | | | Milestone
2015 | | | Milestone
2020 | | | Milestone
2025 | | | Milestone
2030 | |
Low Duration Bond | | | 8.18 | % | | | 11.28 | % | | | 8.92 | % | | | 3.99 | % | | | 1.24 | % |
Inflation Protected Securities | | | 7.36 | % | | | 11.23 | % | | | 4.96 | % | | | 0.00 | % | | | 0.00 | % |
Equity Income | | | 2.01 | % | | | 4.31 | % | | | 5.27 | % | | | 4.87 | % | | | 4.20 | % |
Growth and Income | | | 1.87 | % | | | 3.60 | % | | | 4.27 | % | | | 3.88 | % | | | 3.49 | % |
Growth | | | 0.80 | % | | | 1.82 | % | | | 2.22 | % | | | 2.08 | % | | | 1.89 | % |
International | | | 1.57 | % | | | 3.43 | % | | | 4.46 | % | | | 4.38 | % | | | 4.07 | % |
Diversifying Strategies | | | 4.81 | % | | | 8.56 | % | | | 9.26 | % | | | 6.84 | % | | | 4.56 | % |
Core Bond Index | | | 1.48 | % | | | 3.49 | % | | | 6.25 | % | | | 5.90 | % | | �� | 3.74 | % |
Mid/Small Index | | | 0.00 | % | | | 2.13 | % | | | 7.03 | % | | | 7.76 | % | | | 7.97 | % |
| | | | | |
Vantagepoint Fund | | Milestone
2035 | | | Milestone
2040 | | | Milestone
2045 | | | Milestone
2050 | | | | |
Low Duration Bond | | | 0.33 | % | | | 0.00 | % | | | 0.00 | % | | | 0.00 | % | | | | |
Equity Income | | | 3.06 | % | | | 3.14 | % | | | 1.08 | % | | | 0.24 | % | | | | |
Growth and Income | | | 2.57 | % | | | 2.63 | % | | | 0.90 | % | | | 0.21 | % | | | | |
196
THE VANTAGEPOINT FUNDS
NOTES TO FINANCIAL STATEMENTS — (Continued)
| | | | | | | | | | | | | | | | | | |
| | | | | |
Vantagepoint Fund | | Milestone
2035 | | | Milestone
2040 | | | Milestone
2045 | | | Milestone
2050 | | | |
Growth | | | 1.46 | % | | | 1.55 | % | | | 0.53 | % | | | 0.12 | % | | |
International | | | 2.97 | % | | | 3.16 | % | | | 1.09 | % | | | 0.25 | % | | |
Diversifying Strategies | | | 2.19 | % | | | 0.80 | % | | | 0.00 | % | | | 0.00 | % | | |
Core Bond Index | | | 1.61 | % | | | 1.14 | % | | | 0.38 | % | | | 0.09 | % | | |
Mid/Small Index | | | 6.97 | % | | | 7.96 | % | | | 2.71 | % | | | 0.62 | % | | |
| 9. | | Control Persons and Principal Holders of Securities |
A majority of the voting shares of each fund are held either directly, or indirectly through the Model Portfolio Funds and the Milestone Funds, by VantageTrust, a group trust sponsored and maintained by VantageTrust Company, LLC (“Trust Company”), 777 N. Capitol Street, N.E. Washington, DC 20002. VantageTrust was established for the purpose of holding and investing the assets of public sector retirement and deferred compensation plans. The Trust Company, a New Hampshire non-depository banking company, has the power to vote the shares of the funds directly held by VantageTrust and pursuant to the proxy voting policies adopted by the Company’s Adviser (“Adviser”), the Adviser generally will seek instructions from the board of directors of the Trust Company on how to vote the shares of the underlying Funds held by the Model Portfolio Funds and the Milestone Funds, and will cast such votes in accordance with the instructions received. The Trust Company, therefore, directly or indirectly has the power to vote more than 25% of each fund’s voting securities and is therefore considered a “control person” of the funds for purposes of the 1940 Act. Both the Trust Company and the Funds’ Adviser are wholly owned subsidiaries of ICMA-RC. As a control person of each fund, the Trust Company has the ability to control the outcome of matters submitted to the vote of shareholders. The following represents the percentage of total shares outstanding in each of the funds held, directly or indirectly, by VantageTrust as of December 31, 2013:
| | | | |
Fund | | % owned by
VantageTrust | |
Low Duration Bond | | | 76.45 | % |
Inflation Protected Securities | | | 80.85 | % |
Equity Income | | | 90.02 | % |
Growth & Income | | | 86.65 | % |
Growth | | | 94.61 | % |
Select Value | | | 93.00 | % |
Aggressive Opportunities | | | 95.40 | % |
Discovery | | | 93.79 | % |
International Fund | | | 87.75 | % |
Diversifying Strategies | | | 87.11 | % |
Core Bond Index | | | 88.21 | % |
500 Stock Index | | | 94.81 | % |
Broad Market Index | | | 83.66 | % |
Mid/Small Company Index | | | 87.41 | % |
Overseas Equity Index | | | 95.06 | % |
Model Portfolio Conservative Growth | | | 84.45 | % |
Model Portfolio Traditional Growth | | | 92.64 | % |
Model Portfolio Long-Term Growth | | | 95.10 | % |
Model Portfolio All-Equity Growth | | | 94.69 | % |
Milestone Retirement Income | | | 73.41 | % |
Milestone 2010 | | | 75.24 | % |
Milestone 2015 | | | 80.89 | % |
Milestone 2020 | | | 84.43 | % |
Milestone 2025 | | | 83.96 | % |
Milestone 2030 | | | 82.17 | % |
Milestone 2035 | | | 80.67 | % |
Milestone 2040 | | | 81.69 | % |
Milestone 2045 | | | 75.15 | % |
Milestone 2050 | | | 69.27 | % |
197
THE VANTAGEPOINT FUNDS
NOTES TO FINANCIAL STATEMENTS — (Continued)
Principal Holders. Below are the names, addresses, and percentage of ownership of each person (or entity) that owns of record or is known to own beneficially 5% or more of any class of any fund’s outstanding shares as of December 31, 2013:
| | | | | | | | |
Name | | Address | | Fund and Class | | Percentage
Owned | |
| VantageTrust | | 777 N. Capitol Street, NE
Washington, DC 20002 | | Low Duration Bond Fund—T Shares | | | 83.03 | % |
| | | Inflation Protected Securities Fund—T Shares | | | 85.00 | % |
| | | | Equity Income Fund—T Shares | | | 92.27 | % |
| | | | Growth & Income Fund—T Shares | | | 88.69 | % |
| | | | Growth Fund—T Shares | | | 95.90 | % |
| | | | Select Value Fund—T Shares | | | 94.82 | % |
| | | | Aggressive Opportunities Fund—T Shares | | | 97.96 | % |
| | | | Discovery Fund—T Shares | | | 95.07 | % |
| | | | International Fund—T Shares | | | 88.77 | % |
| | | | Diversifying Strategies Fund—T Shares | | | 87.11 | % |
| | | | Core Bond Index Fund—T Shares | | | 91.68 | % |
| | | | 500 Stock Index Fund—T Shares | | | 100.00 | % |
| | | | Broad Market Index Fund—T Shares | | | 89.76 | % |
| | | | Mid/Small Company Index Fund—T Shares | | | 91.77 | % |
| | | | Overseas Index Fund—T Shares | | | 100.00 | % |
| | | | Model Portfolio Conservative Growth Fund—TM Shares | | | 100.00 | % |
| | | | Model Portfolio Traditional Growth Fund—TM Shares | | | 100.00 | % |
| | | | Model Portfolio Long-Term Growth Fund—TM Shares | | | 100.00 | % |
| | | | Model Portfolio All-Equity Growth Fund—TM Shares | | | 100.00 | % |
| | | | Milestone Retirement Income Fund—TM Shares | | | 100.00 | % |
| | | | Milestone 2010 Fund—TM Shares | | | 100.00 | % |
| | | | Milestone 2015 Fund—TM Shares | | | 100.00 | % |
| | | | Milestone 2020 Fund—TM Shares | | | 100.00 | % |
| | | | Milestone 2025 Fund—TM Shares | | | 100.00 | % |
| | | | Milestone 2030 Fund—TM Shares | | | 100.00 | % |
| | | | Milestone 2035 Fund—TM Shares | | | 100.00 | % |
| | | | Milestone 2040 Fund—TM Shares | | | 100.00 | % |
| | | | Milestone 2045 Fund—TM Shares | | | 100.00 | % |
| | | | Milestone 2050 Fund—TM Shares | | | 100.00 | % |
| | | |
State College
Borough General
Employees Pension Plan | | 243 South Allen Street
State College, PA 16801 | | International Fund—Investor Shares | | | 7.71 | % |
| | | Growth Fund—Investor Shares | | | 12.20 | % |
| | | Growth & Income Fund—Investor Shares | | | 9.52 | % |
| | | | Equity Income Fund—Investor Shares | | | 6.27 | % |
| | | | Broad Market Index Fund—Class II | | | 15.96 | % |
| | | | Core Bond Index Fund—Class II | | | 38.27 | % |
| | | |
State College Borough
Police Pension Plan | | 243 South Allen Street
State College, PA 16801 | | International Fund—Investor Shares | | | 8.72 | % |
| | | Growth Fund—Investor Shares | | | 13.81 | % |
| | | Growth & Income Fund—Investor Shares | | | 10.77 | % |
| | | | Equity Income Fund—Investor Shares | | | 7.10 | % |
| | | | Broad Market Index Fund—Class II | | | 18.06 | % |
| | | | Core Bond Index Fund—Class II | | | 43.33 | % |
198
THE VANTAGEPOINT FUNDS
NOTES TO FINANCIAL STATEMENTS — (Continued)
| | | | | | | | |
Name | | Address | | Fund and Class | | Percentage
Owned | |
ICMA Retirement
Corporation | | 777 N. Capitol Street, NE
Washington, DC 20002 | | Milestone 2050 Fund—Investor M Shares | | | 9.53 | % |
| | | |
Prudential
Retirement & Annuity | | One Commercial Plaza
280 Trumbull Street Hartford, CT 06103-3599 | | Broad Market Index Fund—T Shares | | | 10.24 | % |
| | | Inflation Protected Securities Fund—T Shares | | | 5.09 | % |
| | | | | | | |
| | | |
New York Life Trust
Company | | 169 Lackawanna Ave
Parsippany, NJ 07054-
1007 | | Aggressive Opportunities Fund—Investor Shares | | | 9.01 | % |
| | | International Fund—Investor Shares | | | 9.96 | % |
| | | Growth & Income Fund—Investor Shares | | | 6.49 | % |
| | | | Equity Income Fund—Investor Shares | | | 6.77 | % |
| | | | Broad Market Index Fund—Class I | | | 12.11 | % |
| | | | Inflation Protected Securities Fund—Investor Shares | | | 8.28 | % |
| | | | Discovery Fund—Investor Shares | | | 17.63 | % |
| | | | Select Value Fund—Investor Shares | | | 16.66 | % |
| | | | Model Portfolio All-Equity Growth Fund—Investor M Shares | | | 5.02 | % |
| | | |
| County of Sacramento | | 700 H Street
Suite 4667 Sacramento, CA 95814 | | Milestone 2020 Fund—Investor M Shares Milestone 2025 Fund—Investor M Shares Milestone 2030 Fund—Investor M Shares Milestone 2040 Fund—Investor M Shares Milestone 2045 Fund—Investor M Shares Mid/Small Company Index Fund—Class II 500 Stock Index Fund—Class II Overseas Equity Index Fund—Class II | |
| 7.38
10.44 12.00 15.58 21.68 12.74 14.55 10.40 | %
% % % % % % % |
| | | |
| County of Orange | | 333 NW. Santa Anna
Blvd. 2nd FloorSanta Ana, CA 92701 | | Select Value Fund—Investor Shares Aggressive Opportunities Fund Investor Shares Overseas Equity Index Fund—Class II Mid/Small Company Index Fund—Class II 500 Stock Index Fund—Class II Milestone 2020 Fund—Investor M Shares
Milestone 2025 Fund—Investor M Shares Milestone 2030 Fund—Investor M Shares Milestone 2040 Fund—Investor M Shares | |
| 6.33
5.02 15.55 39.18 52.19 5.14 6.20 6.01 13.65 | %
% % % % % % % % |
| | | |
Orange County Library
District | | 101 East Central Blvd.
Orlando, FL 32801 | | Low Duration Bond Fund—Investor Class Overseas Equity Index Fund—Class II Mid/Small Company Index Fund—Class II Broad Market Index Fund—Class II | |
| 5.42
6.59 27.68 27.45 | %
% % % |
| | | |
| City of St. Charles | | 200 North Second Street
St. Charles, MO 63301 | | Core Bond Index Fund—Class II | | | 7.28 | % |
| | | |
| City of San Ramon | | 2226 Camino Ramon
San Ramon, CA 94582 | | Model Portfolio Conservative Growth Fund—Investor M Shares | | | 7.42 | % |
| | | | Model Portfolio Long-Term Growth Fund—Investor M Shares | | | 8.17 | % |
| | | |
| City of San Pablo | | 1 Alvarado Square
San Pablo, CA 94086 | | Model Portfolio Long-Term Growth Fund—Investor M Shares | | | 6.35 | % |
| | | |
| Delta Charter Township | | 7710 W. Saginaw Hwy
Lansing, MI 48917 | | Model Portfolio Conservative Growth Fund—Investor M Shares | | | 7.95 | % |
199
THE VANTAGEPOINT FUNDS
NOTES TO FINANCIAL STATEMENTS — (Continued)
| | | | | | | | |
Name | | Address | | Fund and Class | | Percentage
Owned | |
| | | |
| City of Port St.Lucie | | 121 S.W. Port St. Lucie
Blvd.Port St. Lucie, FL 34984 | | Low Duration Bond Fund—Investor Class Broad Market Index Fund—Class II | |
| 6.04
29.88 | %
% |
| | | |
City of Glendale—
Management | | 141 North Glendale
Suite 346 Glendale, CA 91206 | | 500 Stock Index Fund—Class II | | | 16.09 | % |
| | | |
City of Glendale—
Fire | | 141 North Glendale
Suite 346 Glendale, CA 91206 | | 500 Stock Index Fund—Class II | | | 11.06 | % |
| | | |
| Town of Concord | | P.O. Box 535
Concord, MA 01742 | | Milestone 2030 Fund—Investor M Shares | | | 7.00 | % |
| 10. | | Rebates of Brokerage Commissions |
VIA has entered into agreements with brokers whereby the brokers will rebate a portion of the funds’ brokerage commissions on behalf of certain funds. Such amounts, under such agreements, are included in net realized gain (loss) on the sale of investments presented in the Statements of Operations. For the year ended December 31, 2013, the funds recaptured the following amounts of brokerage commissions:
| | | | |
Fund | | Recaptured Brokerage
Commissions | |
Equity Income | | $ | 30,848 | |
Growth & Income | | | 34,021 | |
Growth | | | 222,371 | |
Select Value | | | 92,733 | |
Aggressive Opportunities | | | 100,952 | |
Discovery | | | 10,510 | |
International | | | 194,231 | |
Diversifying Strategies | | | 714 | |
Management has evaluated events or transactions that may have occurred since December 31, 2013, that would merit recognition or disclosure in the financial statements. Subsequent events occurring after the date of this report have been evaluated for potential impact to this report through the date the financial statements were issued. There were no subsequent events that required disclosure.
| 12. | | Capital Stock Authorization |
The Company’s Amended Declaration of Trust permits it to issue an unlimited number of full and fractional shares of beneficial interest of each fund, without par value, and to divide or combine the shares of any series into a greater or lesser number of shares of that fund without thereby changing the proportionate beneficial interests in that fund and to divide such shares into classes. Each share of a class of a fund represents an equal proportional interest in the fund with each other share in the same class.
200
SCHEDULE OF INVESTMENTS
December 31, 2013
| | | | | | | | | | | | | | |
Vantagepoint Low
Duration Bond Fund | | | | | | |
| | | | |
Coupon
Rate | | Maturity
Date | | | | | Face | | | Value | |
| | | | | | | | | | | | | | |
| CORPORATE OBLIGATIONS—61.1% | | | | | |
| Aerospace & Defense—0.2% | | | | | |
United Technologies Corp. | | | | | |
0.739% | | | 06/01/2015 | | | # | | $ | 1,285,000 | | | $ | 1,293,512 | |
| | | | | | | | | | | | | | |
| Auto Components—0.5% | | | | | |
Johnson Controls, Inc. | | | | | |
1.750% | | | 03/01/2014 | | | | | | 3,000,000 | | | | 3,006,716 | |
| | | | | | | | | | | | | | |
| Automobiles—0.7% | | | | | |
Daimler Finance North America LLC | | | | | |
2.300% | | | 01/09/2015 | | | ^ | | | 1,290,000 | | | | 1,308,251 | |
1.250% | | | 01/11/2016 | | | ^ | | | 650,000 | | | | 650,783 | |
Jaguar Land Rover Automotive plc (United Kingdom) | |
4.125% | | | 12/15/2018 | | | ^ | | | 600,000 | | | | 606,750 | |
Nissan Motor Acceptance Corp. | | | | | |
1.950% | | | 09/12/2017 | | | ^ | | | 650,000 | | | | 645,605 | |
1.000% | | | 03/15/2016 | | | ^ | | | 1,115,000 | | | | 1,110,181 | |
| | | | | | | | | | | | | | |
| | | | | | | | | | | | | 4,321,570 | |
| | | | | | | | | | | | | | |
| Beverages—0.4% | | | | | |
Anheuser-Busch InBev Worldwide, Inc. | | | | | |
0.800% | | | 07/15/2015 | | | | | | 610,000 | | | | 613,270 | |
Heineken NV (Netherlands) | | | | | |
0.800% | | | 10/01/2015 | | | ^ | | | 250,000 | | | | 250,177 | |
SABMiller Holdings, Inc. | | | | | |
2.450% | | | 01/15/2017 | | | ^ | | | 720,000 | | | | 737,808 | |
1.850% | | | 01/15/2015 | | | ^ | | | 590,000 | | | | 597,225 | |
0.932% | | | 08/01/2018 | | | #^ | | | 370,000 | | | | 372,249 | |
| | | | | | | | | | | | | | |
| | | | | | | | | | | | | 2,570,729 | |
| | | | | | | | | | | | | | |
| Biotechnology—0.2% | | | | | |
Amgen, Inc. | | | | | |
1.875% | | | 11/15/2014 | | | | | | 860,000 | | | | 869,770 | |
Gilead Sciences, Inc. | | | | | |
2.400% | | | 12/01/2014 | | | | | | 370,000 | | | | 376,182 | |
| | | | | | | | | | | | | | |
| | | | | | | | | | | | | 1,245,952 | |
| | | | | | | | | | | | | | |
| Building Products—0.1% | | | | | |
Masco Corp. | | | | | |
4.800% | | | 06/15/2015 | | | | | | 465,000 | | | | 487,088 | |
| | | | | | | | | | | | | | |
| Capital Markets—1.9% | | | | | |
Bank of New York Mellon Corp. (The) | | | | | |
0.802% | | | 08/01/2018 | | | # | | | 750,000 | | | | 752,882 | |
Bank of New York Mellon Corp. (The) MTN | | | | | |
1.200% | | | 02/20/2015 | | | | | | 300,000 | | | | 302,383 | |
E*TRADE Financial Corp. | | | | | |
6.000% | | | 11/15/2017 | | | | | | 525,000 | | | | 560,438 | |
Goldman Sachs Group, Inc. (The) | | | | | |
3.625% | | | 02/07/2016 | | | | | | 1,350,000 | | | | 1,417,516 | |
Goldman Sachs Group, Inc. (The) MTN | | | | | |
1.341% | | | 11/15/2018 | | | # | | | 1,470,000 | | | | 1,475,183 | |
Hutchison Whampoa International 12 II Ltd. (Cayman Islands) | |
2.000% | | | 11/08/2017 | | | ^ | | | 480,000 | | | | 474,942 | |
ING Bank NV (Netherlands) | | | | | |
3.750% | | | 03/07/2017 | | | ^ | | | 1,200,000 | | | | 1,264,813 | |
Morgan Stanley | | | | | |
1.488% | | | 02/25/2016 | | | # | | | 1,150,000 | | | | 1,165,571 | |
Morgan Stanley MTN | | | | | |
1.518% | | | 04/25/2018 | | | # | | | 1,610,000 | | | | 1,634,707 | |
Nomura Holdings, Inc. MTN (Japan) | | | | | |
1.694% | | | 09/13/2016 | | | # | | | 1,310,000 | | | | 1,334,611 | |
| | | | | | | | | | | | | | |
| | | | | |
Coupon
Rate | |
| Maturity
Date |
| | | | | Face | | | | Value | |
| | | | | | | | | | | | | | |
TD Ameritrade Holding Corp. | | | | | |
4.150% | | | 12/01/2014 | | | | | $ | 1,140,000 | | | $ | 1,177,270 | |
| | | | | | | | | | | | | | |
| | | | | | | | | | | | | 11,560,316 | |
| | | | | | | | | | | | | | |
| Chemicals—0.5% | | | | | |
Ashland, Inc. | | | | | |
3.000% | | | 03/15/2016 | | | | | | 900,000 | | | | 922,500 | |
Dow Chemical Co. (The) | | | | | |
2.500% | | | 02/15/2016 | | | | | | 690,000 | | | | 711,848 | |
Ecolab, Inc. | | | | | |
2.375% | | | 12/08/2014 | | | | | | 290,000 | | | | 294,609 | |
Grupo Idesa SA de CV (Mexico) | | | | | |
7.875% | | | 12/18/2020 | | | ^ | | | 800,000 | | | | 812,000 | |
| | | | | | | | | | | | | | |
| | | | | | | | | | | | | 2,740,957 | |
| | | | | | | | | | | | | | |
| Commercial Banks—10.3% | | | | | |
ABN AMRO Bank NV (Netherlands) | | | | | |
1.036% | | | 10/28/2016 | | | #^ | | | 730,000 | | | | 731,314 | |
ANZ New Zealand Int’l Ltd. (New Zealand) | | | | | |
1.125% | | | 03/24/2016 | | | ^ | | | 710,000 | | | | 709,023 | |
Australia & New Zealand Banking Group Ltd. (Australia) | |
0.801% | | | 05/15/2018 | | | # | | | 1,380,000 | | | | 1,380,334 | |
Banco Bradesco SA (Brazil) | | | | | |
2.338% | | | 05/16/2014 | | | #^ | | | 300,000 | | | | 300,307 | |
Banco Nacional de Costa Rica (Costa Rica) | | | | | |
4.875% | | | 11/01/2018 | | | ^ | | | 600,000 | | | | 589,500 | |
Bancolombia SA (Colombia) | | | | | |
4.250% | | | 01/12/2016 | | | † | | | 260,000 | | | | 271,050 | |
Bank of Montreal MTN (Canada) | | | | | |
0.843% | | | 04/09/2018 | | | # | | | 680,000 | | | | 684,144 | |
0.800% | | | 11/06/2015 | | | | | | 1,020,000 | | | | 1,025,999 | |
Bank of Nova Scotia (Canada) | | | | | |
0.764% | | | 07/15/2016 | | | # | | | 660,000 | | | | 663,074 | |
0.750% | | | 10/09/2015 | | | | | | 1,000,000 | | | | 1,003,707 | |
Bank of Tokyo-Mitsubishi UFJ Ltd. (The) (Japan) | | | | | |
0.687% | | | 02/26/2016 | | | #^ | | | 1,250,000 | | | | 1,251,794 | |
Banque Federative du Credit Mutuel SA (France) | | | | | |
1.089% | | | 10/28/2016 | | | #^ | | | 1,500,000 | | | | 1,505,619 | |
Barclays Bank plc (United Kingdom) | | | | | |
3.900% | | | 04/07/2015 | | | | | | 2,590,000 | | | | 2,696,571 | |
BB&T Corp. MTN | | | | | |
1.600% | | | 08/15/2017 | | | | | | 420,000 | | | | 416,615 | |
BBVA Banco Continental SA (Peru) | | | | | |
2.250% | | | 07/29/2016 | | | ^ | | | 600,000 | | | | 600,000 | |
BNP Paribas SA (France) | | | | | |
0.832% | | | 12/12/2016 | | | # | | | 1,520,000 | | | | 1,523,324 | |
BNP Paribas SA MTN (France) | | | | | |
3.600% | | | 02/23/2016 | | | | | | 720,000 | | | | 758,419 | |
Canadian Imperial Bank of Commerce (Canada) | | | | | |
0.900% | | | 10/01/2015 | | | | | | 1,300,000 | | | | 1,307,687 | |
Capital One Bank USA NA, Bank Note | | | | | |
1.150% | | | 11/21/2016 | | | | | | 430,000 | | | | 428,428 | |
Capital One Financial Corp. | | | | | |
7.375% | | | 05/23/2014 | | | | | | 3,630,000 | | | | 3,723,843 | |
2.150% | | | 03/23/2015 | | | | | | 2,250,000 | | | | 2,287,998 | |
2.125% | | | 07/15/2014 | | | | | | 860,000 | | | | 866,931 | |
CIT Group, Inc. | | | | | |
4.750% | | | 02/15/2015 | | | ^ | | | 700,000 | | | | 727,125 | |
Credit Agricole SA (France) | | | | | |
1.404% | | | 04/15/2016 | | | #^ | | | 1,080,000 | | | | 1,094,045 | |
1.096% | | | 10/03/2016 | | | #^† | | | 1,090,000 | | | | 1,093,693 | |
Discover Bank | | | | | |
2.000% | | | 02/21/2018 | | | | | | 1,710,000 | | | | 1,681,156 | |
Fifth Third Bank/Ohio, Bank Note | | | | | |
1.150% | | | 11/18/2016 | | | | | | 900,000 | | | | 900,011 | |
See accompanying notes to financial statements
201
SCHEDULE OF INVESTMENTS—(Continued)
December 31, 2013
| | | | | | | | | | | | | | |
Vantagepoint Low
Duration Bond Fund | | | | | | |
| | | | |
Coupon
Rate | | Maturity
Date | | | | | Face | | | Value | |
| | | | | | | | | | | | | | |
| CORPORATE OBLIGATIONS—(Continued) | |
HSBC Bank plc (United Kingdom) | | | | | |
0.881% | | | 05/15/2018 | | | #^ | | $ | 1,340,000 | | | $ | 1,344,344 | |
Huntington National Bank (The) | | | | | |
1.350% | | | 08/02/2016 | | | | | | 300,000 | | | | 300,079 | |
Huntington National Bank (The), Bank Note | | | | | |
1.300% | | | 11/20/2016 | | | | | | 590,000 | | | | 590,506 | |
KeyBank NA, Bank Note | | | | | |
4.950% | | | 09/15/2015 | | | | | | 520,000 | | | | 553,355 | |
1.100% | | | 11/25/2016 | | | | | | 320,000 | | | | 319,550 | |
KeyCorp MTN | | | | | |
3.750% | | | 08/13/2015 | | | | | | 560,000 | | | | 585,846 | |
Lloyds Bank plc (United Kingdom) | | | | | |
2.300% | | | 11/27/2018 | | | | | | 320,000 | | | | 319,538 | |
Macquarie Bank Ltd. (Australia) | | | | | |
2.000% | | | 08/15/2016 | | | ^ | | | 1,300,000 | | | | 1,315,618 | |
National Australia Bank Ltd. (Australia) | | | | | |
0.900% | | | 01/20/2016 | | | † | | | 1,500,000 | | | | 1,500,588 | |
0.788% | | | 07/25/2016 | | | # | | | 1,340,000 | | | | 1,345,624 | |
National Bank of Canada (Canada) | | | | | |
1.500% | | | 06/26/2015 | | | | | | 780,000 | | | | 790,345 | |
Nordea Bank AB (Sweden) | | | | | |
0.875% | | | 05/13/2016 | | | ^ | | | 1,490,000 | | | | 1,483,452 | |
Oversea-Chinese Banking Corp. Ltd. (Singapore) | | | | | |
1.625% | | | 03/13/2015 | | | ^ | | | 700,000 | | | | 709,823 | |
PNC Bank NA, Bank Note | | | | | |
1.150% | | | 11/01/2016 | | | | | | 400,000 | | | | 400,760 | |
Regions Financial Corp. | | | | | |
2.000% | | | 05/15/2018 | | | | | | 920,000 | | | | 891,770 | |
Royal Bank of Scotland Group plc (United Kingdom) | |
2.550% | | | 09/18/2015 | | | | | | 445,000 | | | | 455,317 | |
Royal Bank of Scotland plc (The) (United Kingdom) | |
4.375% | | | 03/16/2016 | | | † | | | 274,000 | | | | 292,565 | |
3.950% | | | 09/21/2015 | | | | | | 4,990,000 | | | | 5,228,796 | |
Santander US Debt SAU (Spain) | | | | | |
3.781% | | | 10/07/2015 | | | ^ | | | 900,000 | | | | 927,797 | |
Societe Generale SA (France) | | | | | |
1.327% | | | 10/01/2018 | | | #† | | | 1,400,000 | | | | 1,409,656 | |
Standard Chartered plc (United Kingdom) | | | | | |
3.200% | | | 05/12/2016 | | | ^ | | | 3,800,000 | | | | 3,971,794 | |
Sumitomo Mitsui Banking Corp. (Japan) | | | | | |
0.912% | | | 07/19/2016 | | | # | | | 330,000 | | | | 332,041 | |
0.900% | | | 01/18/2016 | | | | | | 480,000 | | | | 479,327 | |
Svenska Handelsbanken AB (Sweden) | | | | | |
0.696% | | | 03/21/2016 | | | # | | | 1,500,000 | | | | 1,504,238 | |
Toronto-Dominion Bank (The) MTN (Canada) | | | | | |
2.500% | | | 07/14/2016 | | | | | | 1,800,000 | | | | 1,868,240 | |
Wachovia Bank NA, Bank Note | | | | | |
4.800% | | | 11/01/2014 | | | | | | 1,385,000 | | | | 1,436,724 | |
Wells Fargo & Co. | | | | | |
0.869% | | | 04/23/2018 | | | # | | | 250,000 | | | | 251,646 | |
Westpac Banking Corp. MTN (Australia) | | | | | |
0.950% | | | 01/12/2016 | | | | | | 1,460,000 | | | | 1,463,232 | |
| | | | | | | | | | | | | | |
| | | | | | | | | | | | | 62,294,282 | |
| | | | | | | | | | | | | | |
| Computers & Peripherals—1.7% | | | | | |
Apple, Inc. | | | | | |
1.000% | | | 05/03/2018 | | | | | | 685,000 | | | | 663,057 | |
0.492% | | | 05/03/2018 | | | # | | | 1,410,000 | | | | 1,409,122 | |
0.450% | | | 05/03/2016 | | | | | | 610,000 | | | | 605,921 | |
| | | | | | | | | | | | | | |
| | | | | |
Coupon
Rate | |
| Maturity
Date |
| | | | | Face | | | | Value | |
Hewlett-Packard Co. | | | | | |
3.000% | | | 09/15/2016 | | | | | $ | 4,436,000 | | | $ | 4,617,419 | |
2.650% | | | 06/01/2016 | | | | | | 750,000 | | | | 773,239 | |
2.350% | | | 03/15/2015 | | | | | | 1,100,000 | | | | 1,117,545 | |
Seagate HDD Cayman (Cayman Islands) | | | | | |
3.750% | | | 11/15/2018 | | | ^ | | | 780,000 | | | | 790,725 | |
| | | | | | | | | | | | | | |
| | | | | | | | | | | | | 9,977,028 | |
| | | | | | | | | | | | | | |
| Construction & Engineering—0.6% | | | | | |
Heathrow Funding Ltd. (Jersey, Channel Islands) | |
2.500% | | | 06/25/2015 | | | ^ | | | 3,500,000 | | | | 3,547,509 | |
| | | | | | | | | | | | | | |
| Consumer Finance—5.5% | | | | | |
Ally Financial, Inc. | | | | | |
3.500% | | | 07/18/2016 | | | | | | 1,420,000 | | | | 1,468,768 | |
American Express Co. | | | | | |
0.828% | | | 05/22/2018 | | | # | | | 1,410,000 | | | | 1,410,540 | |
American Express Credit Corp. | | | | | |
0.747% | | | 07/29/2016 | | | # | | | 1,120,000 | | | | 1,126,158 | |
American Express Credit Corp. MTN | | | | | |
5.125% | | | 08/25/2014 | | | | | | 3,177,000 | | | | 3,274,264 | |
2.750% | | | 09/15/2015 | | | | | | 2,500,000 | | | | 2,588,222 | |
1.750% | | | 06/12/2015 | | | | | | 2,975,000 | | | | 3,024,085 | |
American Honda Finance Corp. | | | | | |
1.450% | | | 02/27/2015 | | | ^ | | | 1,190,000 | | | | 1,201,451 | |
1.125% | | | 10/07/2016 | | | | | | 600,000 | | | | 602,862 | |
0.612% | | | 05/26/2016 | | | #^ | | | 200,000 | | | | 200,579 | |
Caterpillar Financial Services Corp. | | | | | |
0.700% | | | 11/06/2015 | | | | | | 1,270,000 | | | | 1,272,116 | |
Ford Motor Credit Co. LLC | | | | | |
3.875% | | | 01/15/2015 | | | | | | 1,280,000 | | | | 1,321,110 | |
1.489% | | | 05/09/2016 | | | # | | | 690,000 | | | | 700,528 | |
General Motors Financial Co., Inc. | | | | | |
4.750% | | | 08/15/2017 | | | ^ | | | 990,000 | | | | 1,055,588 | |
2.750% | | | 05/15/2016 | | | ^ | | | 500,000 | | | | 507,500 | |
Harley-Davidson Financial Services, Inc. | | | | | |
1.150% | | | 09/15/2015 | | | ^ | | | 420,000 | | | | 421,562 | |
HSBC Finance Corp. | | | | | |
0.669% | | | 06/01/2016 | | | # | | | 5,347,000 | | | | 5,341,605 | |
HSBC USA, Inc. | | | | | |
2.375% | | | 02/13/2015 | | | | | | 595,000 | | | | 607,286 | |
1.128% | | | 09/24/2018 | | | # | | | 900,000 | | | | 902,285 | |
International Lease Finance Corp. | | | | | |
4.875% | | | 04/01/2015 | | | | | | 690,000 | | | | 716,738 | |
2.193% | | | 06/15/2016 | | | # | | | 1,295,000 | | | | 1,307,950 | |
John Deere Capital Corp. | | | | | |
1.050% | | | 10/11/2016 | | | | | | 560,000 | | | | 561,994 | |
John Deere Capital Corp. MTN | | | | | |
2.950% | | | 03/09/2015 | | | | | | 1,210,000 | | | | 1,245,236 | |
PACCAR Financial Corp. MTN | | | | | |
1.050% | | | 06/05/2015 | | | | | | 280,000 | | | | 282,384 | |
0.842% | | | 12/06/2018 | | | # | | | 290,000 | | | | 290,766 | |
0.800% | | | 02/08/2016 | | | | | | 300,000 | | | | 299,699 | |
Volkswagen International Finance NV (Netherlands) | |
1.625% | | | 03/22/2015 | | | ^ | | | 1,400,000 | | | | 1,416,226 | |
| | | | | | | | | | | | | | |
| | | | | | | | | | | | | 33,147,502 | |
| | | | | | | | | | | | | | |
| Diversified Financial Services—8.6% | | | | | |
Bank of America Corp. | | | | | |
6.500% | | | 08/01/2016 | | | | | | 6,600,000 | | | | 7,456,476 | |
3.700% | | | 09/01/2015 | | | | | | 635,000 | | | | 664,041 | |
Bank of America Corp. MTN | | | | | |
1.316% | | | 03/22/2018 | | | # | | | 1,480,000 | | | | 1,501,194 | |
1.250% | | | 01/11/2016 | | | | | | 790,000 | | | | 793,951 | |
See accompanying notes to financial statements
202
SCHEDULE OF INVESTMENTS—(Continued)
December 31, 2013
| | | | | | | | | | | | | | |
Vantagepoint Low
Duration Bond Fund | | | | | | |
| | | | |
Coupon
Rate | | Maturity
Date | | | | | Face | | | Value | |
| | | | | | | | | | | | | | |
| CORPORATE OBLIGATIONS—(Continued) | |
Bank of America Corp., Series L MTN | | | | | |
5.650% | | | 05/01/2018 | | | | | $ | 1,650,000 | | | $ | 1,879,972 | |
Bank of America Corp., Series 1 | | | | | |
3.750% | | | 07/12/2016 | | | | | | 520,000 | | | | 553,156 | |
Citigroup, Inc. | | | | | |
6.125% | | | 11/21/2017 | | | | | | 2,750,000 | | | | 3,172,733 | |
6.010% | | | 01/15/2015 | | | | | | 1,596,000 | | | | 1,681,083 | |
4.450% | | | 01/10/2017 | | | | | | 1,545,000 | | | | 1,675,659 | |
1.300% | | | 04/01/2016 | | | | | | 2,189,000 | | | | 2,195,300 | |
1.037% | | | 04/01/2016 | | | # | | | 1,320,000 | | | | 1,329,353 | |
ERAC USA Finance LLC | | | | | |
2.250% | | | 01/10/2014 | | | ^ | | | 550,000 | | | | 550,225 | |
1.400% | | | 04/15/2016 | | | ^ | | | 230,000 | | | | 230,311 | |
GE Capital UK Funding MTN (Ireland) | | | | | |
0.674% | | | 03/20/2017 | | | #GBP | | | 700,000 | | | | 1,138,130 | |
General Electric Capital Corp. | | | | | |
2.150% | | | 01/09/2015 | | | | | | 1,290,000 | | | | 1,313,958 | |
1.625% | | | 07/02/2015 | | | | | | 1,350,000 | | | | 1,372,446 | |
General Electric Capital Corp. MTN | | | | | |
0.894% | | | 07/12/2016 | | | # | | | 9,027,000 | | | | 9,096,002 | |
General Electric Capital Corp., Series A | | | | | |
3.750% | | | 11/14/2014 | | | | | | 1,130,000 | | | | 1,164,061 | |
Hyundai Capital America | | | | | |
1.625% | | | 10/02/2015 | | | ^ | | | 580,000 | | | | 583,154 | |
JPMorgan Chase & Co. | | | | | |
3.150% | | | 07/05/2016 | | | | | | 8,090,000 | | | | 8,486,531 | |
1.138% | | | 01/25/2018 | | | # | | | 750,000 | | | | 758,245 | |
JPMorgan Chase & Co. MTN | | | | | |
1.875% | | | 03/20/2015 | | | | | | 1,230,000 | | | | 1,247,002 | |
NASDAQ OMX Group, Inc. (The) | | | | | |
4.000% | | | 01/15/2015 | | | | | | 1,040,000 | | | | 1,067,464 | |
RCI Banque SA (France) | | | | | |
2.116% | | | 04/11/2014 | | | #^ | | | 1,900,000 | | | | 1,905,928 | |
| | | | | | | | | | | | | | |
| | | | | | | | | | | | | 51,816,375 | |
| | | | | | | | | | | | | | |
| Diversified Telecommunication Services—4.6% | |
AT&T, Inc. | | | | | |
0.900% | | | 02/12/2016 | | | | | | 7,869,000 | | | | 7,833,094 | |
0.875% | | | 02/13/2015 | | | | | | 620,000 | | | | 621,480 | |
British Telecommunications plc (United Kingdom) | | | | | |
1.625% | | | 06/28/2016 | | | | | | 320,000 | | | | 323,016 | |
CC Holdings GS V LLC/Crown Castle GS III Corp. | | | | | |
2.381% | | | 12/15/2017 | | | | | | 370,000 | | | | 366,821 | |
Deutsche Telekom International Finance BV (Netherlands) | |
3.125% | | | 04/11/2016 | | | ^ | | | 5,195,000 | | | | 5,413,736 | |
Verizon Communications, Inc. | | | | | |
3.650% | | | 09/14/2018 | | | | | | 4,881,000 | | | | 5,172,435 | |
1.993% | | | 09/14/2018 | | | # | | | 4,134,000 | | | | 4,351,775 | |
1.773% | | | 09/15/2016 | | | # | | | 280,000 | | | | 288,654 | |
1.250% | | | 11/03/2014 | | | | | | 1,680,000 | | | | 1,690,139 | |
0.700% | | | 11/02/2015 | | | | | | 580,000 | | | | 578,645 | |
Windstream Corp. | | | | | |
7.875% | | | 11/01/2017 | | | | | | 880,000 | | | | 1,009,800 | |
| | | | | | | | | | | | | | |
| | | | | | | | | | | | | 27,649,595 | |
| | | | | | | | | | | | | | |
| Electric Utilities—1.6% | | | | | |
Enel Finance International NV (Netherlands) | | | | | |
3.875% | | | 10/07/2014 | | | ^ | | | 6,034,000 | | | | 6,166,006 | |
Georgia Power Co. | | | | | |
0.563% | | | 03/15/2016 | | | # | | | 1,394,000 | | | | 1,394,856 | |
| | | | | | | | | | | | | | |
| | | | | |
Coupon
Rate | |
| Maturity
Date |
| | | | | Face | | | | Value | |
NextEra Energy Capital Holdings, Inc. | | | | | |
1.611% | | | 06/01/2014 | | | | | $ | 520,000 | | | $ | 522,373 | |
1.339% | | | 09/01/2015 | | | | | | 1,100,000 | | | | 1,107,780 | |
1.200% | | | 06/01/2015 | | | | | | 210,000 | | | | 211,150 | |
| | | | | | | | | | | | | | |
| | | | | | | | | | | | | 9,402,165 | |
| | | | | | | | | | | | | | |
| Electrical Equipment—0.1% | | | | | |
Eaton Corp. | | | | | |
0.950% | | | 11/02/2015 | | | | | | 560,000 | | | | 562,349 | |
| | | | | | | | | | | | | | |
| Energy Equipment & Services—0.3% | | | | | |
Nabors Industries, Inc. | | | | | |
2.350% | | | 09/15/2016 | | | ^ | | | 1,200,000 | | | | 1,212,881 | |
National Oilwell Varco, Inc. | | | | | |
1.350% | | | 12/01/2017 | | | | | | 830,000 | | | | 816,226 | |
| | | | | | | | | | | | | | |
| | | | | | | | | | | | | 2,029,107 | |
| | | | | | | | | | | | | | |
| Food & Staples Retailing—0.6% | | | | | |
CVS Caremark Corp. | | | | | |
1.200% | | | 12/05/2016 | | | | | | 290,000 | | | | 290,502 | |
Kroger Co. (The) | | | | | |
2.200% | | | 01/15/2017 | | | | | | 650,000 | | | | 658,388 | |
0.804% | | | 10/17/2016 | | | # | | | 910,000 | | | | 912,626 | |
Tesco plc (United Kingdom) | | | | | |
2.000% | | | 12/05/2014 | | | ^ | | | 1,300,000 | | | | 1,316,674 | |
Walgreen Co. | | | | | |
1.000% | | | 03/13/2015 | | | | | | 570,000 | | | | 572,512 | |
Woolworths Ltd. (Australia) | | | | | |
2.550% | | | 09/22/2015 | | | ^ | | | 58,000 | | | | 59,660 | |
| | | | | | | | | | | | | | |
| | | | | | | | | | | | | 3,810,362 | |
| | | | | | | | | | | | | | |
| Food Products—0.8% | | | | | |
ConAgra Foods, Inc. | | | | | |
1.350% | | | 09/10/2015 | | | | | | 200,000 | | | | 201,473 | |
1.300% | | | 01/25/2016 | | | | | | 300,000 | | | | 300,672 | |
Ingredion, Inc. | | | | | |
3.200% | | | 11/01/2015 | | | | | | 310,000 | | | | 321,122 | |
Kraft Foods Group, Inc. | | | | | |
1.625% | | | 06/04/2015 | | | | | | 440,000 | | | | 445,745 | |
Want Want China Finance Ltd. (Cayman Islands) | | | | | |
1.875% | | | 05/14/2018 | | | ^ | | | 680,000 | | | | 649,378 | |
Wm. Wrigley Jr. Co. | | | | | |
3.700% | | | 06/30/2014 | | | ^ | | | 2,190,000 | | | | 2,223,947 | |
2.000% | | | 10/20/2017 | | | ^ | | | 200,000 | | | | 199,626 | |
1.400% | | | 10/21/2016 | | | ^ | | | 200,000 | | | | 200,440 | |
| | | | | | | | | | | | | | |
| | | | | | | | | | | | | 4,542,403 | |
| | | | | | | | | | | | | | |
| Health Care Equipment & Supplies—0.2% | | | | | |
Baxter International, Inc. | | | | | |
0.950% | | | 06/01/2016 | | | | | | 260,000 | | | | 260,126 | |
Covidien International Finance SA (Luxembourg) | | | | | |
1.350% | | | 05/29/2015 | | | | | | 350,000 | | | | 352,690 | |
Stryker Corp. | | | | | |
3.000% | | | 01/15/2015 | | | | | | 680,000 | | | | 698,150 | |
| | | | | | | | | | | | | | |
| | | | | | | | | | | | | 1,310,966 | |
| | | | | | | | | | | | | | |
| Health Care Providers & Services—1.9% | | | | | |
Express Scripts Holding Co. | | | | | |
2.750% | | | 11/21/2014 | | | | | | 1,300,000 | | | | 1,325,360 | |
UnitedHealth Group, Inc. | | | | | |
1.400% | | | 10/15/2017 | | | | | | 270,000 | | | | 266,835 | |
0.850% | | | 10/15/2015 | | | | | | 1,358,000 | | | | 1,364,039 | |
Ventas Realty LP | | | | | |
1.550% | | | 09/26/2016 | | | | | | 481,000 | | | | 484,737 | |
See accompanying notes to financial statements
203
SCHEDULE OF INVESTMENTS—(Continued)
December 31, 2013
| | | | | | | | | | | | | | |
Vantagepoint Low
Duration Bond Fund | | | | | | |
| | | | |
Coupon
Rate | | Maturity
Date | | | | | Face | | | Value | |
| | | | | | | | | | | | | | |
| CORPORATE OBLIGATIONS—(Continued) | |
WellPoint, Inc. | | | | | |
5.000% | | | 12/15/2014 | | | | | $ | 2,000,000 | | | $ | 2,086,186 | |
2.375% | | | 02/15/2017 | | | | | | 5,430,000 | | | | 5,500,862 | |
1.250% | | | 09/10/2015 | | | | | | 550,000 | | | | 554,054 | |
| | | | | | | | | | | | | | |
| | | | | | | | | | | | | 11,582,073 | |
| | | | | | | | | | | | | | |
| Hotels, Restaurants & Leisure—0.1% | |
Carnival Corp. (Panama) | | | | | |
1.875% | | | 12/15/2017 | | | | | | 280,000 | | | | 278,453 | |
Starbucks Corp. | | | | | |
0.875% | | | 12/05/2016 | | | | | | 530,000 | | | | 527,042 | |
| | | | | | | | | | | | | | |
| | | | | | | | | | | | | 805,495 | |
| | | | | | | | | | | | | | |
| Household Durables—0.1% | |
Toll Brothers Finance Corp. | | | | | |
4.000% | | | 12/31/2018 | | | | | | 460,000 | | | | 469,200 | |
| | | | | | | | | | | | | | |
| Independent Power Producers & Energy Traders—0.9% | |
Exelon Generation Co. LLC | | | | | |
5.350% | | | 01/15/2014 | | | | | | 5,345,000 | | | | 5,354,567 | |
| | | | | | | | | | | | | | |
| Industrial Conglomerates—0.1% | |
Tyco Electronics Group SA (Luxembourg) | | | | | |
1.600% | | | 02/03/2015 | | | | | | 270,000 | | | | 272,730 | |
| | | | | | | | | | | | | | |
| Insurance—3.4% | |
Aflac, Inc. | | | | | |
3.450% | | | 08/15/2015 | | | † | | | 2,937,000 | | | | 3,068,111 | |
Allstate Corp. (The) | | | | | |
6.200% | | | 05/16/2014 | | | | | | 800,000 | | | | 816,954 | |
American International Group, Inc. | | | | | |
3.000% | | | 03/20/2015 | | | | | | 700,000 | | | | 719,174 | |
2.375% | | | 08/24/2015 | | | | | | 400,000 | | | | 408,741 | |
Berkshire Hathaway Finance Corp. | | | | | |
0.950% | | | 08/15/2016 | | | | | | 310,000 | | | | 311,607 | |
Hartford Financial Services Group, Inc. | | | | | |
4.000% | | | 03/30/2015 | | | | | | 510,000 | | | | 529,997 | |
Metropolitan Life Global Funding I | | | | | |
0.774% | | | 07/15/2016 | | | #^ | | | 4,000,000 | | | | 4,024,680 | |
Principal Life Global Funding II | | | | | |
1.000% | | | 12/11/2015 | | | ^ | | | 660,000 | | | | 661,660 | |
Prudential Covered Trust, Series 2012-1 | | | | | |
2.997% | | | 09/30/2015 | | | ^ | | | 1,933,750 | | | | 1,994,503 | |
Prudential Financial, Inc. | | | | | |
1.021% | | | 08/15/2018 | | | # | | | 600,000 | | | | 602,582 | |
Prudential Financial, Inc. MTN | | | | | |
6.100% | | | 06/15/2017 | | | | | | 2,500,000 | | | | 2,848,000 | |
3.875% | | | 01/14/2015 | | | | | | 1,951,000 | | | | 2,017,389 | |
Prudential Financial, Inc., Series C MTN | | | | | |
4.750% | | | 06/13/2015 | | | | | | 2,290,000 | | | | 2,418,313 | |
| | | | | | | | | | | | | | |
| | | | | | | | | | | | | 20,421,711 | |
| | | | | | | | | | | | | | |
| Internet & Catalog Retail—0.2% | |
Amazon.com, Inc. | | | | | |
0.650% | | | 11/27/2015 | | | | | | 1,150,000 | | | | 1,150,024 | |
| | | | | | | | | | | | | | |
| Internet Software & Services—0.1% | |
Baidu, Inc. (Cayman Islands) | | | | | |
2.250% | | | 11/28/2017 | | | | | | 500,000 | | | | 497,800 | |
IAC/InterActiveCorp | | | | | |
4.875% | | | 11/30/2018 | | | ^ | | | 350,000 | | | | 359,625 | |
| | | | | | | | | | | | | | |
| | | | | | | | | | | | | 857,425 | |
| | | | | | | | | | | | | | |
| | | | | | | | | | | | | | |
| | | | | |
Coupon
Rate | |
| Maturity
Date |
| | | | | Face | | | | Value | |
| IT Services—0.3% | |
Computer Sciences Corp. | | | | | |
2.500% | | | 09/15/2015 | | | | | $ | 270,000 | | | $ | 275,708 | |
Fidelity National Information Services, Inc. | | | | | |
2.000% | | | 04/15/2018 | | | | | | 380,000 | | | | 369,887 | |
Total System Services, Inc. | | | | | |
2.375% | | | 06/01/2018 | | | | | | 1,320,000 | | | | 1,285,540 | |
| | | | | | | | | | | | | | |
| | | | | | | | | | | | | 1,931,135 | |
| | | | | | | | | | | | | | |
| Life Sciences Tools & Services—0.3% | |
Life Technologies Corp. | | | | | |
3.500% | | | 01/15/2016 | | | | | | 1,300,000 | | | | 1,354,815 | |
Thermo Fisher Scientific, Inc. | | | | | |
1.300% | | | 02/01/2017 | | | | | | 400,000 | | | | 398,561 | |
| | | | | | | | | | | | | | |
| | | | | | | | | | | | | 1,753,376 | |
| | | | | | | | | | | | | | |
| Machinery—0.2% | |
CNH Capital LLC | | | | | |
3.875% | | | 11/01/2015 | | | | | | 1,035,000 | | | | 1,073,813 | |
| | | | | | | | | | | | | | |
| Marine—0.1% | |
Far East Capital Ltd. SA (Luxembourg) | | | | | |
8.000% | | | 05/02/2018 | | | ^ | | | 600,000 | | | | 538,500 | |
| | | | | | | | | | | | | | |
| Media—0.7% | |
DirecTV Holdings LLC/DirecTV Financing Co., Inc. | |
4.750% | | | 10/01/2014 | | | | | | 560,000 | | | | 576,768 | |
3.125% | | | 02/15/2016 | | | | | | 500,000 | | | | 520,379 | |
DISH DBS Corp. | | | | | |
4.625% | | | 07/15/2017 | | | | | | 1,000,000 | | | | 1,050,000 | |
NBCUniversal Enterprise, Inc. | | | | | |
0.929% | | | 04/15/2018 | | | #^ | | | 500,000 | | | | 502,357 | |
Thomson Reuters Corp. (Canada) | | | | | |
1.300% | | | 02/23/2017 | | | | | | 400,000 | | | | 398,541 | |
Time Warner, Inc. | | | | | |
3.150% | | | 07/15/2015 | | | | | | 440,000 | | | | 456,008 | |
Viacom, Inc. | | | | | |
4.375% | | | 09/15/2014 | | | | | | 700,000 | | | | 718,381 | |
| | | | | | | | | | | | | | |
| | | | | | | | | | | | | 4,222,434 | |
| | | | | | | | | | | | | | |
| Metals & Mining—4.8% | |
Anglo American Capital plc (United Kingdom) | | | | | |
2.625% | | | 09/27/2017 | | | ^ | | | 2,150,000 | | | | 2,161,176 | |
ArcelorMittal (Luxembourg) | | | | | |
4.250% | | | 08/05/2015 | | | | | | 1,000,000 | | | | 1,038,750 | |
Barrick North America Finance LLC | | | | | |
6.800% | | | 09/15/2018 | | | | | | 4,056,000 | | | | 4,666,988 | |
BHP Billiton Finance USA Ltd. (Australia) | | | | | |
0.508% | | | 02/18/2014 | | | # | | | 2,704,000 | | | | 2,704,975 | |
FMG Resources August 2006 Pty Ltd. (Australia) | | | | | |
6.000% | | | 04/01/2017 | | | ^† | | | 720,000 | | | | 768,600 | |
Freeport-McMoRan Copper & Gold, Inc. | | | | | |
2.150% | | | 03/01/2017 | | | | | | 270,000 | | | | 271,967 | |
1.400% | | | 02/13/2015 | | | | | | 300,000 | | | | 301,757 | |
Glencore Funding LLC | | | | | |
2.500% | | | 01/15/2019 | | | ^ | | | 2,636,000 | | | | 2,555,475 | |
1.604% | | | 01/15/2019 | | | #^ | | | 1,230,000 | | | | 1,207,961 | |
Rio Tinto Finance USA Ltd. (Australia) | | | | | |
8.950% | | | 05/01/2014 | | | | | | 2,875,000 | | | | 2,953,338 | |
1.875% | | | 11/02/2015 | | | | | | 3,435,000 | | | | 3,504,555 | |
Rio Tinto Finance USA plc (United Kingdom) | | | | | |
1.125% | | | 03/20/2015 | | | | | | 700,000 | | | | 704,107 | |
Xstrata Finance Canada Ltd. (Canada) | | | | | |
2.700% | | | 10/25/2017 | | | ^ | | | 5,735,000 | | | | 5,805,328 | |
| | | | | | | | | | | | | | |
| | | | | | | | | | | | | 28,644,977 | |
| | | | | | | | | | | | | | |
See accompanying notes to financial statements
204
SCHEDULE OF INVESTMENTS—(Continued)
December 31, 2013
| | | | | | | | | | | | | | |
Vantagepoint Low
Duration Bond Fund | | | | | | |
| | | | |
Coupon
Rate | | Maturity
Date | | | | | Face | | | Value | |
| | | | | | | | | | | | | | |
| CORPORATE OBLIGATIONS—(Continued) | |
| Multi-Utilities—0.4% | |
Sempra Energy | | | | | |
1.003% | | | 03/15/2014 | | | # | | $ | 2,661,000 | | | $ | 2,664,970 | |
| | | | | | | | | | | | | | |
| Oil, Gas & Consumable Fuels—2.9% | | | | | |
Boardwalk Pipelines LP | |
5.875% | | | 11/15/2016 | | | | | | 640,000 | | | | 708,751 | |
BP Capital Markets plc (United Kingdom) | |
0.749% | | | 05/10/2018 | | | # | | | 240,000 | | | | 240,059 | |
CNOOC Finance 2013 Ltd. (Virgin Islands, British) | |
1.125% | | | 05/09/2016 | | | | | | 620,000 | | | | 618,073 | |
ConocoPhillips | |
4.600% | | | 01/15/2015 | | | | | | 455,000 | | | | 474,401 | |
CONSOL Energy, Inc. | |
8.000% | | | 04/01/2017 | | | | | | 200,000 | | | | 211,500 | |
Devon Energy Corp. | |
1.200% | | | 12/15/2016 | | | | | | 660,000 | | | | 660,200 | |
Enterprise Products Operating LLC | |
1.250% | | | 08/13/2015 | | | | | | 280,000 | | | | 281,973 | |
Marathon Oil Corp. | |
0.900% | | | 11/01/2015 | | | | | | 630,000 | | | | 630,810 | |
Murphy Oil Corp. | |
2.500% | | | 12/01/2017 | | | | | | 430,000 | | | | 433,016 | |
Petrohawk Energy Corp. | |
7.875% | | | 06/01/2015 | | | | | | 1,000,000 | | | | 1,026,500 | |
Phillips 66 | |
2.950% | | | 05/01/2017 | | | | | | 270,000 | | | | 281,128 | |
1.950% | | | 03/05/2015 | | | | | | 270,000 | | | | 273,841 | |
Plains Exploration & Production Co. | |
6.500% | | | 11/15/2020 | | | | | | 615,000 | | | | 679,494 | |
Rockies Express Pipeline LLC | |
3.900% | | | 04/15/2015 | | | ^ | | | 680,000 | | | | 681,700 | |
Sabine Pass LNG LP | |
7.500% | | | 11/30/2016 | | | | | | 1,010,000 | | | | 1,146,350 | |
Sinopec Capital 2013 Ltd. (Virgin Islands, British) | |
1.250% | | | 04/24/2016 | | | ^ | | | 630,000 | | | | 627,912 | |
Statoil ASA (Norway) | |
0.699% | | | 11/08/2018 | | | # | | | 800,000 | | | | 804,771 | |
0.531% | | | 05/15/2018 | | | # | | | 2,285,000 | | | | 2,287,555 | |
Tesoro Corp. | |
4.250% | | | 10/01/2017 | | | | | | 700,000 | | | | 733,250 | |
Total Capital International SA (France) | |
0.809% | | | 08/10/2018 | | | # | | | 780,000 | | | | 785,142 | |
TransCanada PipeLines Ltd. (Canada) | |
3.400% | | | 06/01/2015 | | | | | | 550,000 | | | | 571,615 | |
0.927% | | | 06/30/2016 | | | # | | | 1,960,000 | | | | 1,979,637 | |
WPX Energy, Inc. | |
5.250% | | | 01/15/2017 | | | | | | 990,000 | | | | 1,061,775 | |
| | | | | | | | | | | | | | |
| | | | | | | | | | | | | 17,199,453 | |
| | | | | | | | | | | | | | |
| Pharmaceuticals—1.4% | | | | | |
AbbVie, Inc. | |
1.750% | | | 11/06/2017 | | | | | | 1,450,000 | | | | 1,448,856 | |
0.998% | | | 11/06/2015 | | | # | | | 4,100,000 | | | | 4,144,054 | |
Merck & Co., Inc. | |
0.598% | | | 05/18/2018 | | | # | | | 1,120,000 | | | | 1,124,150 | |
Mylan, Inc. | |
1.800% | | | 06/24/2016 | | | ^ | | | 200,000 | | | | 204,015 | |
1.350% | | | 11/29/2016 | | | | | | 340,000 | | | | 339,618 | |
Perrigo Co. plc (Ireland) | |
1.300% | | | 11/08/2016 | | | ^ | | | 700,000 | | | | 698,060 | |
| | | | | | | | | | | | | | |
| | | | | |
Coupon
Rate | |
| Maturity
Date |
| | | | | Face | | | | Value | |
Salix Pharmaceuticals Ltd. | |
6.000% | | | 01/15/2021 | | | ^ | | $ | 200,000 | | | $ | 205,500 | |
Valeant Pharmaceuticals International | |
6.500% | | | 07/15/2016 | | | ^ | | | 365,000 | | | | 376,862 | |
| | | | | | | | | | | | | | |
| | | | | | | | | | | | | 8,541,115 | |
| | | | | | | | | | | | | | |
| Professional Services—0.0% | | | | | |
Equifax, Inc. | |
4.450% | | | 12/01/2014 | | | | | | 240,000 | | | | 247,576 | |
| | | | | | | | | | | | | | |
| Real Estate Investment Trusts (REITs)—0.7% | |
Digital Realty Trust LP | |
4.500% | | | 07/15/2015 | | | † | | | 1,110,000 | | | | 1,154,948 | |
HCP, Inc. | |
2.700% | | | 02/01/2014 | | | | | | 1,410,000 | | | | 1,412,333 | |
Health Care REIT, Inc. | |
3.625% | | | 03/15/2016 | | | | | | 440,000 | | | | 461,233 | |
Simon Property Group LP | |
4.200% | | | 02/01/2015 | | | | | | 210,000 | | | | 216,218 | |
Vornado Realty LP | |
4.250% | | | 04/01/2015 | | | | | | 1,080,000 | | | | 1,114,004 | |
| | | | | | | | | | | | | | |
| | | | | | | | | | | | | 4,358,736 | |
| | | | | | | | | | | | | | |
| Road & Rail—0.7% | | | | | |
Avis Budget Car Rental LLC/Avis Budget Finance, Inc. | |
4.875% | | | 11/15/2017 | | | † | | | 760,000 | | | | 801,800 | |
JB Hunt Transport Services, Inc. | |
3.375% | | | 09/15/2015 | | | | | | 850,000 | | | | 880,879 | |
Kansas City Southern de Mexico SA de CV (Mexico) | |
2.350% | | | 05/15/2020 | | | | | | 570,000 | | | | 531,799 | |
Penske Truck Leasing Co. Lp/PTL Finance Corp. | |
3.125% | | | 05/11/2015 | | | ^ | | | 800,000 | | | | 823,058 | |
2.500% | | | 03/15/2016 | | | ^ | | | 620,000 | | | | 635,541 | |
Ryder System, Inc. MTN | |
2.500% | | | 03/01/2017 | | | | | | 540,000 | | | | 549,783 | |
| | | | | | | | | | | | | | |
| | | | | | | | | | | | | 4,222,860 | |
| | | | | | | | | | | | | | |
| Semiconductors & Semiconductor Equipment—0.1% | |
NXP BV/NXP Funding LLC (Netherlands) | |
3.500% | | | 09/15/2016 | | | ^† | | | 300,000 | | | | 308,250 | |
TSMC Global Ltd. (Virgin Islands, British) | |
1.625% | | | 04/03/2018 | | | ^ | | | 410,000 | | | | 393,656 | |
| | | | | | | | | | | | | | |
| | | | | | | | | | | | | 701,906 | |
| | | | | | | | | | | | | | |
| Software—0.1% | | | | | |
Autodesk, Inc. | |
1.950% | | | 12/15/2017 | | | | | | 430,000 | | | | 425,773 | |
| | | | | | | | | | | | | | |
| Thrifts & Mortgage Finance—0.3% | | | | | |
Astoria Financial Corp. | |
5.000% | | | 06/19/2017 | | | | | | 690,000 | | | | 740,698 | |
BPCE SA MTN (France) | |
1.488% | | | 04/25/2016 | | | # | | | 800,000 | | | | 810,870 | |
| | | | | | | | | | | | | | |
| | | | | | | | | | | | | 1,551,568 | |
| | | | | | | | | | | | | | |
| Tobacco—1.2% | | | | | |
BAT International Finance plc (United Kingdom) | |
1.400% | | | 06/05/2015 | | | ^ | | | 800,000 | | | | 807,014 | |
Lorillard Tobacco Co. | |
6.875% | | | 05/01/2020 | | | | | | 2,834,000 | | | | 3,274,914 | |
2.300% | | | 08/21/2017 | | | † | | | 2,877,000 | | | | 2,885,844 | |
Reynolds American, Inc. | |
1.050% | | | 10/30/2015 | | | | | | 290,000 | | | | 291,053 | |
| | | | | | | | | | | | | | |
| | | | | | | | | | | | | 7,258,825 | |
| | | | | | | | | | | | | | |
See accompanying notes to financial statements
205
SCHEDULE OF INVESTMENTS—(Continued)
December 31, 2013
| | | | | | | | | | | | | | |
Vantagepoint Low
Duration Bond Fund | | | | | | |
| | | | |
Coupon
Rate | | Maturity
Date | | | | | Face | | | Value | |
| | | | | | | | | | | | | | |
| CORPORATE OBLIGATIONS—(Continued) | |
| Trading Companies & Distributors—0.2% | | | | | |
Aircastle Ltd. (Bermuda) | |
9.750% | | | 08/01/2018 | | | | | $ | 900,000 | | | $ | 985,500 | |
Aviation Capital Group Corp. | |
4.625% | | | 01/31/2018 | | | ^ | | | 430,000 | | | | 445,557 | |
| | | | | | | | | | | | | | |
| | | | | | | | | | | | | 1,431,057 | |
| | | | | | | | | | | | | | |
| Wireless Telecommunication Services—0.5% | |
America Movil SAB de CV (Mexico) | |
3.625% | | | 03/30/2015 | | | | | | 300,000 | | | | 311,252 | |
SBA Communications Corp. | |
5.625% | | | 10/01/2019 | | | | | | 430,000 | | | | 445,050 | |
SoftBank Corp. (Japan) | |
4.500% | | | 04/15/2020 | | | ^ | | | 460,000 | | | | 450,800 | |
T-Mobile USA, Inc. | |
5.250% | | | 09/01/2018 | | | ^† | | | 720,000 | | | | 760,500 | |
Vodafone Group plc (United Kingdom) | |
0.623% | | | 02/19/2016 | | | # | | | 1,210,000 | | | | 1,210,075 | |
| | | | | | | | | | | | | | |
| | | | | | | | | | | | | 3,177,677 | |
| | | | | | | | | | | | | | |
| TOTAL CORPORATE OBLIGATIONS | |
(Cost $363,007,293) | | | | | | | 368,175,459 | |
| | | | | | | | | | | | | | |
| | | | | | | | | | | | | | | |
| FLOATING RATE LOANS—0.7%** | |
ABC Supply Term Loan | |
3.500% | | | 01/15/2014 | | | | | | 1,000,000 | | | | 1,003,470 | |
CDW LLC Term Loan | |
3.250% | | | 03/31/2014 | | | | | | 997,488 | | | | 996,331 | |
Dole Food Co., Inc. Term Loan B | |
4.500% | | | 06/13/2014 | | | | | | 1,000,000 | | | | 1,005,625 | |
H.J. Heinz Co. 1st Lien Term Loan B2 | |
3.500% | | | 03/31/2014 | | | | | | 258,700 | | | | 261,067 | |
Leap Wireless Inc. Term Loan C | |
4.750% | | | 03/31/2014 | | | | | | 1,044,750 | | | | 1,050,517 | |
| | | | | | | | | | | | | | |
| TOTAL FLOATING RATE LOANS | |
(Cost $4,312,545) | | | | | | | 4,317,010 | |
| | | | | | | | | | | | | | |
| | | | | | | | | | | | | | | |
| MORTGAGE-BACKED SECURITIES—5.2% | |
| Non-Agency Mortgage-Backed Securities— 3.6% | |
Banc of America Mortgage Trust, Series 2004-L, Class 1A1 | |
3.040% | | | 01/25/2035 | | | # | | | 452,445 | | | | 447,885 | |
Credit Suisse Mortgage Capital Certificates,
Series 2013-IVR2, Class AD | |
1.550% | | | 04/25/2043 | | | #^ | | | 1,449,045 | | | | 1,399,083 | |
Credit Suisse Mortgage Capital Certificates,
Series 2013-IVR3, Class A3 | |
1.550% | | | 05/25/2043 | | | #^ | | | 733,447 | | | | 678,703 | |
Fosse Master Issuer plc,
Series 2012-1A, Class 2A2 (United Kingdom) | |
1.646% | | | 10/18/2054 | | | #^ | | | 2,102,763 | | | | 2,137,681 | |
GSAMP Trust, Series 2004-SEA2, Class M1 | |
0.815% | | | 03/25/2034 | | | # | | | 1,500,000 | | | | 1,495,127 | |
HarborView Mortgage Loan Trust, Series 2005-14, Class 3A1A | |
2.718% | | | 12/19/2035 | | | # | | | 1,998,855 | | | | 1,765,591 | |
Hilton USA Trust, Series 2013-HLF, Class AFL | |
1.169% | | | 11/05/2030 | | | #^ | | | 1,410,000 | | | | 1,411,552 | |
JP Morgan Mortgage Trust, Series 2013-1, Class 2A2 | |
2.500% | | | 03/25/2043 | | | #^ | | | 919,362 | | | | 892,367 | |
| | | | | | | | | | | | | | |
| | | | | |
Coupon
Rate | |
| Maturity
Date |
| | | | | Face | | | | Value | |
MLCC Mortgage Investors Trust, Series 2004-1, Class 2A2 | |
2.143% | | | 12/25/2034 | | | # | | $ | 1,081,535 | | | $ | 1,109,064 | |
Provident Funding Mortgage Loan Trust,
Series 2004-1, Class 1A1 | |
2.573% | | | 04/25/2034 | | | # | | | 164,305 | | | | 163,684 | |
Sequoia Mortgage Trust, Series 2012-1, Class 1A1 | |
2.865% | | | 01/25/2042 | | | # | | | 1,150,835 | | | | 1,147,161 | |
Sequoia Mortgage Trust, Series 2012-2, Class A2 | |
3.500% | | | 04/25/2042 | | | # | | | 1,027,364 | | | | 1,034,691 | |
Sequoia Mortgage Trust, Series 2013-1, Class 1A1 | |
1.450% | | | 02/25/2043 | | | # | | | 1,089,896 | | | | 1,074,583 | |
Sequoia Mortgage Trust, Series 2013-4, Class A3 | |
1.550% | | | 04/25/2043 | | | # | | | 1,040,548 | | | | 1,005,906 | |
Springleaf Mortgage Loan Trust, Series 2012-3A, Class A | |
1.570% | | | 12/25/2059 | | | #^ | | | 789,723 | | | | 788,588 | |
Springleaf Mortgage Loan Trust, Series 2013-1A, Class A | |
1.270% | | | 06/25/2058 | | | #^ | | | 1,336,242 | | | | 1,336,228 | |
Springleaf Mortgage Loan Trust, Series 2013-2A, Class A | |
1.780% | | | 12/25/2065 | | | #^ | | | 680,762 | | | | 680,552 | |
Structured Agency Credit Risk Debt Notes,
Series 2013-DN2, Class M1 | |
1.618% | | | 11/25/2023 | | | # | | | 1,110,991 | | | | 1,109,086 | |
Structured Asset Mortgage Investments II Trust,
Series 2004-AR5, Class 2A1 | |
2.020% | | | 10/19/2034 | | | # | | | 499,520 | | | | 397,746 | |
Thornburg Mortgage Securities Trust, Series 2004-1, Class II2A | |
1.765% | | | 03/25/2044 | | | # | | | 416,987 | | | | 404,740 | |
Wells Fargo Mortgage Backed Securities Trust,
Series 2004-S, Class B1 | |
2.617% | | | 09/25/2034 | | | # | | | 940,884 | | | | 746,897 | |
| | | | | | | | | | | | | | |
| | | | | | | | | | | | | 21,226,915 | |
| | | | | | | | | | | | | | |
| U.S. Government Agency Mortgage-Backed Securities—1.6% | |
Federal Deposit Insurance Corporation Structured Sale Guaranteed Notes,
Series 2010-S1, Class 2A | |
3.250% | | | 04/25/2038 | | | ^ | | | 977,703 | | | | 1,010,085 | |
Federal National Mortgage Association | |
3.134% | | | 07/01/2041 | | | # | | | 2,471,200 | | | | 2,609,192 | |
3.000% | | | 06/01/2041 | | | # | | | 1,413,185 | | | | 1,491,365 | |
2.113% | | | 10/01/2034 | | | # | | | 949,675 | | | | 1,001,096 | |
2.069% | | | 09/01/2034 | | | # | | | 93,770 | | | | 99,169 | |
2.058% | | | 09/01/2034 | | | # | | | 127,780 | | | | 135,206 | |
1.935% | | | 10/01/2034 | | | # | | | 175,169 | | | | 183,733 | |
National Credit Union Administration Guaranteed Notes,
Series 2010-R1, Class 2A | |
1.840% | | | 10/07/2020 | | | | | | 187,051 | | | | 188,586 | |
National Credit Union Administration Guaranteed Notes,
Series 2010-R3, Class 1A | |
0.729% | | | 12/08/2020 | | | # | | | 2,983,166 | | | | 3,001,065 | |
| | | | | | | | | | | | | | |
| | | | | | | | | | | | | 9,719,497 | |
| | | | | | | | | | | | | | |
| TOTAL MORTGAGE-BACKED SECURITIES | |
(Cost $31,423,739) | | | | | | | 30,946,412 | |
| | | | | | | | | | | | | | |
| | | | | | | | | | | | | | | |
| U.S. TREASURY OBLIGATIONS—16.0% | |
| U.S. Treasury Notes—16.0% | |
U.S. Treasury Note | |
1.250% | | | 10/31/2018 | | | | | | 6,600,000 | | | | 6,471,353 | |
0.875% | | | 11/30/2016 | | | | | | 29,650,000 | | | | 29,748,438 | |
0.750% | | | 10/31/2017 | | | | | | 5,500,000 | | | | 5,401,170 | |
0.625% | |
| 07/15/2016-
10/15/2016 |
| | | | | 8,039,000 | | | | 8,046,315 | |
0.500% | | | 06/15/2016 | | | | | | 10,765,000 | | | | 10,754,483 | |
See accompanying notes to financial statements
206
SCHEDULE OF INVESTMENTS—(Continued)
December 31, 2013
| | | | | | | | | | | | | | |
Vantagepoint Low
Duration Bond Fund | | | | | | |
| | | | | | | | | | | | | | |
| | | | |
Coupon
Rate | | Maturity
Date | | | | | Face | | | Value | |
| U.S. TREASURY OBLIGATIONS—(Continued) | |
0.375% | | | 01/15/2016 | | | | | $ | 8,500,000 | | | $ | 8,497,348 | |
0.375% | | | 03/15/2016 | | | ‡‡ | | | 1,115,000 | | | | 1,113,389 | |
0.250% | |
| 04/30/2014-
05/15/2016 |
| | | | | 26,075,000 | | | | 26,008,418 | |
| | | | | | | | | | | | | | |
| | | | | | | | | | | | | 96,040,914 | |
| | | | | | | | | | | | | | |
| TOTAL U.S. TREASURY OBLIGATIONS | |
(Cost $96,253,382) | | | | | | | 96,040,914 | |
| | | | | | | | | | | | | | |
| | | | | | | | | | | | | | | |
| GOVERNMENT RELATED OBLIGATIONS—4.5% | |
| U.S. Government Agencies—0.6% | |
Federal National Mortgage Association | |
0.500% | | | 03/30/2016 | | | | | | 3,210,000 | | | | 3,208,337 | |
| | | | | | | | | | | | | | |
| Non-U.S. Government Agencies—0.3% | |
IPIC Ltd. MTN (Cayman Islands) | |
3.125% | | | 11/15/2015 | | | ^† | | | 500,000 | | | | 519,375 | |
Petrobras International Finance Co. (Cayman Islands) | |
2.875% | | | 02/06/2015 | | | | | | 410,000 | | | | 417,176 | |
Petroleos Mexicanos (Mexico) | |
2.266% | | | 07/18/2018 | | | # | | | 940,000 | | | | 970,550 | |
| | | | | | | | | | | | | | |
| | | | | | | | | | | | | 1,907,101 | |
| | | | | | | | | | | | | | |
| Sovereign Debt—0.3% | |
Panama Government International Bond (Panama) | |
7.250% | | | 03/15/2015 | | | | | | 60,000 | | | | 64,650 | |
Qatar Government International Bond (Qatar) | |
3.125% | | | 01/20/2017 | | | ^† | | | 780,000 | | | | 819,000 | |
South Africa Government International Bond (South Africa) | |
6.500% | | | 06/02/2014 | | | | | | 880,000 | | | | 902,000 | |
| | | | | | | | | | | | | | |
| | | | | | | | | | | | | 1,785,650 | |
| | | | | | | | | | | | | | |
| Supranational—0.9% | |
European Investment Bank | |
1.125% | | | 04/15/2015 | | | | | | 5,555,000 | | | | 5,613,839 | |
| | | | | | | | | | | | | | |
| U.S. Municipal Bonds—2.4% | |
California General Obligation Bonds (California) | |
5.450% | | | 04/01/2015 | | | | | | 3,635,000 | | | | 3,858,771 | |
5.250% | | | 04/01/2014 | | | | | | 1,655,000 | | | | 1,674,744 | |
1.050% | | | 02/01/2016 | | | | | | 755,000 | | | | 758,571 | |
Florida Hurricane Catastrophe Fund Finance Corp. Revenue Bonds (Florida) | |
2.995% | | | 07/01/2020 | | | | | | 3,125,000 | | | | 2,960,843 | |
1.298% | | | 07/01/2016 | | | | | | 2,765,000 | | | | 2,774,954 | |
Illinois State Toll Highway Authority, Series B (Illinois) | |
5.000% | | | 12/01/2018 | | | | | | 2,230,000 | | | | 2,567,912 | |
| | | | | | | | | | | | | | |
| | | | | | | | | | | | | 14,595,795 | |
| | | | | | | | | | | | | | |
| TOTAL GOVERNMENT RELATED OBLIGATIONS | |
(Cost $26,689,621) | | | | | | | 27,110,722 | |
| | | | | | | | | | | | | | |
| | | | | | | | | | | | | | | |
| ASSET-BACKED SECURITIES—9.2% | |
| Automobiles—2.2% | |
Ally Master Owner Trust
Series 2013-2, Class A | |
0.617% | | | 04/15/2018 | | | # | | | 1,600,000 | | | | 1,597,617 | |
| | | | | | | | | | | | | | |
| | | | | |
Coupon
Rate | |
| Maturity
Date |
| | | | | Face | | | | Value | |
Ally Master Owner Trust
Series 2013-1, Class A1 | |
0.617% | | | 02/15/2018 | | | # | | $ | 1,300,000 | | | $ | 1,299,307 | |
Capital Auto Receivables Asset Trust
Series 2013-1, Class C | |
1.740% | | | 10/22/2018 | | | | | | 330,000 | | | | 326,124 | |
Capital Auto Receivables Asset Trust
Series 2013-1, Class B | |
1.290% | | | 04/20/2018 | | | | | | 330,000 | | | | 326,806 | |
Enterprise Fleet Financing LLC
Series 2012-1, Class A2 | |
1.140% | | | 11/20/2017 | | | ^ | | | 1,597,263 | | | | 1,600,786 | |
Ford Credit Auto Owner Trust
Series 2013-A, Class A3 | |
0.550% | | | 07/15/2017 | | | | | | 3,500,000 | | | | 3,501,170 | |
Nissan Auto Receivables Owner Trust
Series 2011-A, Class A4 | |
1.940% | | | 09/15/2017 | | | | | | 1,491,000 | | | | 1,509,466 | |
Nissan Master Owner Trust Receivables
Series 2013-A, Class A | |
0.467% | | | 02/15/2018 | | | # | | | 2,150,000 | | | | 2,150,575 | |
World Omni Master Owner Trust
Series 2013-1, Class A | |
0.517% | | | 02/15/2018 | | | #^ | | | 950,000 | | | | 950,867 | |
| | | | | | | | | | | | | | |
| | | | | | | | | | | | | 13,262,718 | |
| | | | | | | | | | | | | | |
| Credit Card—6.1% | |
Capital One Multi-Asset Execution Trust
Series 2007-A7, Class A7 | |
5.750% | | | 07/15/2020 | | | | | | 2,100,000 | | | | 2,414,725 | |
Capital One Multi-Asset Execution Trust
Series 2007-A5, Class A5 | |
0.207% | | | 07/15/2020 | | | # | | | 4,900,000 | | | | 4,844,510 | |
Chase Issuance Trust
Series 2013-A9, Class A | |
0.589% | | | 11/16/2020 | | | # | | | 5,500,000 | | | | 5,506,826 | |
Chase Issuance Trust
Series 2006-A2, Class A2 | |
5.160% | | | 04/16/2018 | | | | | | 2,114,000 | | | | 2,312,260 | |
Citibank Credit Card Issuance Trust
Series 2013-A6, Class A6 | |
1.320% | | | 09/07/2018 | | | | | | 3,897,000 | | | | 3,925,933 | |
Citibank Credit Card Issuance Trust
Series 2006-A3, Class A3 | |
5.300% | | | 03/15/2018 | | | | | | 960,000 | | | | 1,054,030 | |
Citibank Credit Card Issuance Trust
Series 2008-A2, Class A2 | |
1.315% | | | 01/23/2020 | | | # | | | 3,300,000 | | | | 3,405,265 | |
Discover Card Execution Note Trust
Series 2012-A1, Class A1 | |
0.810% | | | 08/15/2017 | | | | | | 1,450,000 | | | | 1,455,380 | |
GE Capital Credit Card Master Note Trust
Series 2012-3, Class A | |
0.617% | | | 03/15/2020 | | | # | | | 5,720,000 | | | | 5,699,142 | |
GE Capital Credit Card Master Note Trust
Series 2012-5, Class A | |
0.950% | | | 06/15/2018 | | | | | | 1,390,000 | | | | 1,395,649 | |
GE Capital Credit Card Master Note Trust
Series 2012-1, Class A | |
1.030% | | | 01/15/2018 | | | | | | 2,000,000 | | | | 2,006,097 | |
Gracechurch Card Funding plc (United Kingdom)
Series 2012-1A, Class A1 | |
0.867% | | | 02/15/2017 | | | #^ | | | 2,700,000 | | | | 2,717,075 | |
| | | | | | | | | | | | | | |
| | | | | | | | | | | | | 36,736,892 | |
| | | | | | | | | | | | | | |
See accompanying notes to financial statements
207
SCHEDULE OF INVESTMENTS—(Continued)
December 31, 2013
| | | | | | | | | | | | | | |
Vantagepoint Low
Duration Bond Fund | | | | | | |
| | | | | | | | | | | | | | |
| | | | |
Coupon
Rate | | Maturity
Date | | | | | Face | | | Value | |
| ASSET-BACKED SECURITIES—(Continued) | |
| Other—0.9% | |
CenterPoint Energy Transition Bond Co. IV LLC
Series 2012-1, Class A1 | |
0.901% | | | 04/15/2018 | | | | | $ | 1,807,628 | | | $ | 1,808,654 | |
GreatAmerica Leasing Receivables Funding LLC
Series 2013-1, Class C | |
1.830% | | | 06/17/2019 | | | ^ | | | 250,000 | | | | 247,899 | |
Invitation Homes Trust
Series 2013-SFR1, Class A | |
1.314% | | | 12/17/2030 | | | #^ | | | 940,000 | | | | 942,186 | |
MMAF Equipment Finance LLC
Series 2011-AA, Class A3 | |
1.270% | | | 09/15/2015 | | | ^ | | | 749,647 | | | | 750,562 | |
Trade MAPS 1 Ltd. (Ireland)
Series 2013-1A, Class A | |
0.870% | | | 12/10/2018 | | | #^ | | | 1,800,000 | | | | 1,803,312 | |
| | | | | | | | | | | | | | |
| | | | | | | | | | | | | 5,552,613 | |
| | | | | | | | | | | | | | |
| TOTAL ASSET-BACKED SECURITIES | |
(Cost $55,635,472) | | | | | | | | | | 55,552,223 | |
| | | | | | | | | | | | | | |
| | | | | | | | | | | | | | | |
| | | | |
| | | | | | | | | | Shares | | | | Value | |
| MONEY MARKET FUNDS—5.3% | |
| Institutional Money Market Funds—5.3% | |
Dreyfus Institutional Cash Advantage Fund, 0.06% | | | ††¥ | | | 1,600,000 | | | | 1,600,000 | |
Fidelity Institutional Money Market: Money Market Portfolio—Institutional Class, 0.07% | | | ¥ | | | 21,733,162 | | | | 21,733,162 | |
Fidelity Institutional Money Market: Money Market Portfolio—Institutional Class, 0.07% | | | ††¥ | | | 2,332,748 | | | | 2,332,748 | |
Fidelity Institutional Money Market: Prime Money Market Portfolio—Institutional Class, 0.04% | | | ††¥ | | | 1,600,000 | | | | 1,600,000 | |
Short-Term Investments Trust Liquid Assets Portfolio—Institutional Class, 0.07% | | | ††¥ | | | 1,600,000 | | | | 1,600,000 | |
Wells Fargo Advantage Cash Investment Money Market Fund—Select Class, 0.06% | | | ††¥ | | | 1,600,000 | | | | 1,600,000 | |
| | | | | | | | | | | | |
| | | | | |
| | | | | | | | Shares | | | | Value | |
Wells Fargo Advantage Heritage Money Market Fund—Select Class, 0.06% | | ††¥ | | | 1,600,000 | | | $ | 1,600,000 | |
| | | | | | | | | | | | |
| TOTAL MONEY MARKET FUNDS | |
(Cost $32,065,910) | | | | | | | 32,065,910 | |
| | | | | | | | | | | | |
| TOTAL INVESTMENTS—102.0% | |
(Cost $609,387,962) | | | | | | | 614,208,650 | |
Other assets less liabilities—(2.0%) | | | | (11,952,309 | ) |
| | | | | | | | | | | | |
| NET ASSETS—100.0% | | | | | | $ | 602,256,341 | |
| | | | | | | | | | | | |
Notes to the Schedule of Investments:
| | |
| GBP | | British Pound Sterling |
| MTN | | Medium Term Note |
| REIT | | Real Estate Investment Trust |
| # | | Rate is subject to change. Rate shown reflects current rate. |
| ^ | | Securities are not registered under the Securities Act of 1933. These securities may be resold only in transactions exempt from registration, generally to qualified institutional buyers under Securities Act Rule 144A. Such securities are considered illiquid unless deemed liquid by a subadviser under the liquidity procedures adopted by the Board of Directors. The total market value of 144A securities was $105,723,329, which represents 17.6% of Net Assets. The illiquid 144A securities represented 0.0% of Net Assets, and 0.0% of total 144A securities held. |
| † | | Denotes all or a portion of the security on loan. |
| ** | | Floating Rate Loan positions may involve multiple underlying tranches. In those instances, the position presented reflects the aggregate of those respective underlying tranches and the rate presented reflects their weighted average rate. |
| ‡‡ | | Security or a portion of the security has been pledged as collateral for futures contracts and/or options contracts. |
| †† | | Represents reinvestment of collateral received in conjunction with securities lending. |
| ¥ | | The rate quoted is the annualized seven-day yield of the fund at period end. |
See accompanying notes to financial statements
208
SCHEDULE OF INVESTMENTS
December 31, 2013
| | | | | | | | | | | | | | |
Vantagepoint Inflation Protected Securities Fund | | | | |
| | | | |
Coupon
Rate | | Maturity
Date | | | | | Face | | | Value | |
| | | | | | | | | | | | | | |
| CORPORATE OBLIGATIONS—1.4% | | | | | |
| Consumer Finance—1.4% | | | | | |
HSBC Finance Corp. | | | | | |
0.494% | | | 01/15/2014 | | | # | | $ | 4,900,000 | | | $ | 4,900,117 | |
SLM Corp. MTN | | | | | |
6.250% | | | 01/25/2016 | | | | | | 2,400,000 | | | | 2,601,000 | |
5.050% | | | 11/14/2014 | | | | | | 500,000 | | | | 517,500 | |
| | | | | | | | | | | | | | |
| | | | | | | | | | | | | 8,018,617 | |
| | | | | | | | | | | | | | |
| Diversified Financial Services—0.0% | | | | | |
Bear Stearns Cos. LLC (The), Series CPI MTN | |
2.980% | | | 03/10/2014 | | | # | | | 380,000 | | | | 378,917 | |
| | | | | | | | | | | | | | |
| TOTAL CORPORATE OBLIGATIONS | | | | | |
(Cost $8,159,126) | | | | 8,397,534 | |
| | | | | | | | | | | | | | |
| | | | | | | | | | | | | | | |
| MORTGAGE-BACKED SECURITIES—0.5% | |
| U.S. Government Agency Mortgage-Backed Securities—0.5% | |
Federal National Mortgage Association | | | | | |
3.000% | | | 08/01/2043 | | | | | | | | | | | |
(Cost $2,838,024) | | | 2,963,026 | | | | 2,821,777 | |
| | | | | | | | | | | | | | |
| | | | | | | | | | | | | | | |
| U.S. TREASURY OBLIGATIONS—94.9% | |
| U.S. Treasury Inflation Protected Securities Bonds—31.5% | |
U.S. Treasury Bond | | | | | |
3.875% | | | 04/15/2029 | | | ‡‡ | | | 6,915,000 | | | | 13,484,308 | |
3.625% | | | 04/15/2028 | | | | | | 8,395,000 | | | | 16,057,926 | |
3.375% | | | 04/15/2032 | | | | | | 869,100 | | | | 1,524,095 | |
2.500% | | | 01/15/2029 | | | | | | 13,715,000 | | | | 17,555,356 | |
2.375% | |
| 01/15/2025-
01/15/2027 |
| | | | | 49,902,400 | | | | 69,746,859 | |
2.125% | |
| 02/15/2040-
02/15/2041 |
| | | | | 9,175,100 | | | | 11,088,178 | |
2.000% | | | 01/15/2026 | | | | | | 17,585,000 | | | | 22,939,131 | |
1.750% | | | 01/15/2028 | | | | | | 15,820,000 | | | | 18,915,443 | |
0.750% | | | 02/15/2042 | | | | | | 8,824,500 | | | | 7,351,817 | |
0.625% | | | 02/15/2043 | | | | | | 6,795,000 | | | | 5,321,345 | |
| | | | | | | | | | | | | | |
| | | | | | | | | | | | | 183,984,458 | |
| | | | | | | | | | | | | | |
| U.S. Treasury Inflation Protected Securities Notes—63.3% | |
U.S. Treasury Note | | | | | |
2.625% | | | 07/15/2017 | | | | | | 19,000,000 | | | | 24,099,800 | |
2.500% | | | 07/15/2016 | | | | | | 7,124,800 | | | | 9,046,367 | |
2.375% | | | 01/15/2017 | | | | | | 10,000 | | | | 12,753 | |
2.125% | | | 01/15/2019 | | | | | | 1,992,600 | | | | 2,422,193 | |
2.000% | |
| 07/15/2014-
01/15/2016 |
| | | | | 8,575,000 | | | | 10,775,177 | |
1.875% | |
| 07/15/2015-
07/15/2019 |
| | | | | 17,891,900 | | | | 22,148,737 | |
1.625% | |
| 01/15/2015-
01/15/2018 |
| | | | | 3,800,000 | | | | 4,786,218 | |
1.375% | |
| 07/15/2018-
01/15/2020 |
| | | | | 7,889,800 | | | | 9,186,259 | |
1.250% | | | 07/15/2020 | | | | | | 21,650,000 | | | | 24,827,618 | |
1.125% | | | 01/15/2021 | | | | | | 26,390,000 | | | | 29,639,618 | |
| | | | | | | | | | | | | | |
| | | | | |
Coupon
Rate | |
| Maturity
Date |
| | | | | Face | | | | Value | |
| | | | | | | | | | | | | | |
0.625% | | | 07/15/2021 | | | | | $ | 22,099,500 | | | $ | 23,267,378 | |
0.500% | | | 04/15/2015 | | | | | | 5,726,700 | | | | 6,311,613 | |
0.375% | | | 07/15/2023 | | | | | | 39,345,000 | | | | 38,110,790 | |
0.125% | |
| 04/15/2016-
01/15/2023 |
| | | | | 160,647,300 | | | | 164,332,259 | |
| | | | | | | | | | | | | | |
| | | | | | | | | | | | | 368,966,780 | |
| | | | | | | | | | | | | | |
| U.S. Treasury Notes—0.1% | | | | | |
U.S. Treasury Note | | | | | |
0.375% | | | 11/15/2014 | | | | | | 400,000 | | | | 400,789 | |
| | | | | | | | | | | | | | |
| TOTAL U.S. TREASURY OBLIGATIONS | |
(Cost $563,611,120) | | | | 553,352,027 | |
| | | | | | | | | | | | | | |
| | | | | | | | | | | | | | | |
| GOVERNMENT RELATED OBLIGATIONS—0.3% | |
| U.S. Government Agencies—0.1% | | | | | |
New Valley Generation I, Series 2000-1 | | | | | |
7.299% | | | 03/15/2019 | | | | | | 661,818 | | | | 763,963 | |
| | | | | | | | | | | | | | |
| Non-U.S. Government Agencies—0.2% | | | | | |
Export-Import Bank of Korea (Korea, Republic of) | |
4.000% | | | 01/29/2021 | | | | | | 1,200,000 | | | | 1,236,784 | |
| | | | | | | | | | | | | | |
| TOTAL GOVERNMENT RELATED OBLIGATIONS | |
(Cost $1,966,202) | | | | 2,000,747 | |
| | | | | | | | | | | | | | |
| | | | | | | | | | | | | | | |
| ASSET-BACKED SECURITIES—0.4% | | | | | |
| Home Equity—0.2% | | | | | |
Argent Securities, Inc.
Series 2005-W2, Class A2B1 | | | | | |
0.365% | | | 10/25/2035 | | | # | | | 98,629 | | | | 97,215 | |
First Franklin Mortgage Loan Asset Backed Certificates
Series 2005-FF11, Class A2D | |
0.505% | | | 11/25/2035 | | | # | | | 982,386 | | | | 954,038 | |
Saxon Asset Securities Trust SUB
Series 2003-1, Class AF7 | | | | | |
4.034% | | | 06/25/2033 | | | | | | 102,760 | | | | 104,413 | |
| | | | | | | | | | | | | | |
| | | | | | | | | | | | | 1,155,666 | |
| | | | | | | | | | | | | | |
| Manufactured Housing—0.1% | | | | | |
Conseco Finance Securitizations Corp.
Series 2002-1, Class A | | | | | |
6.681% | | | 12/01/2033 | | | # | | | 298,184 | | | | 302,961 | |
| | | | | | | | | | | | | | |
| Other—0.0% | | | | | |
Park Place Securities, Inc.
Series 2004-WWF1, Class M2 | | | | | |
1.185% | | | 12/25/2034 | | | # | | | 140,336 | | | | 140,380 | |
| | | | | | | | | | | | | | |
| Student Loan—0.1% | | | | | |
North Carolina State Education Assistance Authority
Series 2011-2, Class A1 | |
1.010% | | | 10/26/2020 | | | # | | | 207,897 | | | | 207,859 | |
South Carolina Student Loan Corp.
Series 2010-1, Class A1 | | | | | |
0.688% | | | 01/25/2021 | | | # | | | 240,705 | | | | 240,447 | |
| | | | | | | | | | | | | | |
| | | | | | | | | | | | | 448,306 | |
| | | | | | | | | | | | | | |
| TOTAL ASSET-BACKED SECURITIES | | | | | |
(Cost $1,912,196) | | | | 2,047,313 | |
| | | | | | | | | | | | | | |
See accompanying notes to financial statements
209
SCHEDULE OF INVESTMENTS—(Continued)
December 31, 2013
| | | | | | | | | | | | |
Vantagepoint Inflation Protected Securities Fund | | | | |
| | | | |
| | | | | | | | Shares | | | | Value | |
| | | | | | | | | | | | |
| MONEY MARKET FUNDS—2.4% | | | | | |
| Institutional Money Market Fund—2.4% | |
Fidelity Institutional Money Market: Money Market Portfolio—Institutional Class, 0.07% | | | | | | | | | | |
(Cost $13,784,447) | | ¥ | | | 13,784,447 | | | $ | 13,784,447 | |
| | | | | | | | | | | | |
| TOTAL INVESTMENTS—99.9% | | | | | |
(Cost $592,271,115) | | | | 582,403,845 | |
Other assets less liabilities—0.1% | | | | 414,697 | |
| | | | | | | | | | | | |
| NET ASSETS—100.0% | | | | | | $ | 582,818,542 | |
| | | | | | | | | | | | |
Notes to the Schedule of Investments:
| | |
| MTN | | Medium Term Note |
| # | | Rate is subject to change. Rate shown reflects current rate. |
| ‡‡ | | Security or a portion of the security has been pledged as collateral for futures contracts and/or options contracts. |
| ¥ | | The rate quoted is the annualized seven-day yield of the fund at period end. |
See accompanying notes to financial statements
210
SCHEDULE OF INVESTMENTS
December 31, 2013
| | | | | | | | | | | | |
Vantagepoint Equity
Income Fund | | | | | | Shares | | | Value | |
| COMMON STOCKS—93.3% | |
| Aerospace & Defense—3.0% | |
Boeing Co. (The) | | | | | 71,100 | | | $ | 9,704,439 | |
General Dynamics Corp. | | | | | 125,600 | | | | 12,001,080 | |
Honeywell International, Inc. | | | | | 381,700 | | | | 34,875,929 | |
Raytheon Co. | | | | | 183,700 | | | | 16,661,590 | |
| | | | | | | | | | | | |
| | | | | | | | | | | 73,243,038 | |
| | | | | | | | | | | | |
| Air Freight & Logistics—2.7% | |
FedEx Corp. | | | | | 400,200 | | | | 57,536,754 | |
United Parcel Service, Inc., Class B | | | | | 90,100 | | | | 9,467,708 | |
| | | | | | | | | | | | |
| | | | | | | | | | | 67,004,462 | |
| | | | | | | | | | | | |
| Airlines—0.3% | |
United Continental Holdings, Inc. | | * | | | 215,700 | | | | 8,159,931 | |
| | | | | | | | | | | | |
| Auto Components—1.2% | |
Delphi Automotive plc (United Kingdom) | | | | | 414,400 | | | | 24,917,872 | |
Johnson Controls, Inc. | | | | | 114,900 | | | | 5,894,370 | |
| | | | | | | | | | | | |
| | | | | | | | | | | 30,812,242 | |
| | | | | | | | | | | | |
| Automobiles—0.4% | |
Ford Motor Co. | | | | | 284,400 | | | | 4,388,292 | |
General Motors Co. | | * | | | 133,972 | | | | 5,475,436 | |
| | | | | | | | | | | | |
| | | | | | | | | | | 9,863,728 | |
| | | | | | | | | | | | |
| Beverages—0.3% | |
Coca-Cola Co. (The) | | | | | 17,000 | | | | 702,270 | |
PepsiCo, Inc. | | | | | 86,200 | | | | 7,149,428 | |
| | | | | | | | | | | | |
| | | | | | | | | | | 7,851,698 | |
| | | | | | | | | | | | |
| Building Products—0.3% | |
Masco Corp. | | | | | 207,700 | | | | 4,729,329 | |
USG Corp. | | * | | | 111,900 | | | | 3,175,722 | |
| | | | | | | | | | | | |
| | | | | | | | | | | 7,905,051 | |
| | | | | | | | | | | | |
| Capital Markets—3.6% | |
Bank of New York Mellon Corp. (The) | | | | | 1,397,000 | | | | 48,811,180 | |
Legg Mason, Inc. | | | | | 179,100 | | | | 7,787,268 | |
Northern Trust Corp. | | | | | 129,400 | | | | 8,008,566 | |
Och-Ziff Capital Management Group LLC, Class A | | | | | 38,300 | | | | 566,840 | |
State Street Corp. | | | | | 326,000 | | | | 23,925,140 | |
| | | | | | | | | | | | |
| | | | | | | | | | | 89,098,994 | |
| | | | | | | | | | | | |
| Chemicals—0.3% | |
E.I. Du Pont de Nemours & Co. | | | | | 74,846 | | | | 4,862,745 | |
Potash Corp. of Saskatchewan, Inc. (Canada) | | | | | 107,700 | | | | 3,549,792 | |
| | | | | | | | | | | | |
| | | | | | | | | | | 8,412,537 | |
| | | | | | | | | | | | |
| Commercial Banks—4.2% | |
PNC Financial Services Group, Inc. (The) | | | | | 462,800 | | | | 35,904,024 | |
Regions Financial Corp. | | | | | 316,700 | | | | 3,132,163 | |
SunTrust Banks, Inc. | | | | | 219,000 | | | | 8,061,390 | |
U.S. Bancorp/Minnesota | | | | | 352,100 | | | | 14,224,840 | |
Wells Fargo & Co. | | | | | 941,400 | | | | 42,739,560 | |
| | | | | | | | | | | | |
| | | | | | | | | | | 104,061,977 | |
| | | | | | | | | | | | |
| | | | | | | | | | | | |
| | | | | |
| | | | | | | Shares | | | Value | |
| Communications Equipment—0.6% | |
Cisco Systems, Inc. | | | | | 300,500 | | | $ | 6,746,225 | |
Harris Corp. | | | | | 117,400 | | | | 8,195,694 | |
| | | | | | | | | | | | |
| | | | | | | | | | | 14,941,919 | |
| | | | | | | | | | | | |
| Computers & Peripherals—0.4% | |
Apple, Inc. | | | | | 18,700 | | | | 10,492,757 | |
| | | | | | | | | | | | |
| Construction Materials—0.8% | |
CRH plc ADR (Ireland) | | | | | 2,000 | | | | 50,433 | |
Vulcan Materials Co. | | | | | 324,867 | | | | 19,303,597 | |
| | | | | | | | | | | | |
| | | | | | | | | | | 19,354,030 | |
| | | | | | | | | | | | |
| Consumer Finance—3.1% | |
American Express Co. | | | | | 395,400 | | | | 35,874,642 | |
Capital One Financial Corp. | | | | | 321,700 | | | | 24,645,437 | |
SLM Corp. | | | | | 631,700 | | | | 16,601,076 | |
| | | | | | | | | | | | |
| | | | | | | | | | | 77,121,155 | |
| | | | | | | | | | | | |
| Containers & Packaging—0.2% | |
MeadWestvaco Corp. | | | | | 113,200 | | | | 4,180,476 | |
| | | | | | | | | | | | |
| Distributors—0.2% | |
Genuine Parts Co. | | | | | 55,652 | | | | 4,629,690 | |
| | | | | | | | | | | | |
| Diversified Financial Services—4.1% | |
Bank of America Corp. | | | | | 1,862,706 | | | | 29,002,332 | |
Citigroup, Inc. | | | | | 393,399 | | | | 20,500,022 | |
JPMorgan Chase & Co. | | | | | 780,100 | | | | 45,620,248 | |
McGraw Hill Financial, Inc. | | | | | 79,100 | | | | 6,185,620 | |
| | | | | | | | | | | | |
| | | | | | | | | | | 101,308,222 | |
| | | | | | | | | | | | |
| Diversified Telecommunication Services—5.1% | |
AT&T, Inc. | | | | | 691,442 | | | | 24,311,100 | |
CenturyLink, Inc. | | | | | 116,290 | | | | 3,703,836 | |
Level 3 Communications, Inc. | | * | | | 1,097,599 | | | | 36,407,359 | |
Telefonica SA (Spain) | | | | | 161,958 | | | | 2,648,138 | |
tw telecom inc. | | * | | | 1,062,800 | | | | 32,383,516 | |
Verizon Communications, Inc. | | | | | 559,441 | | | | 27,490,931 | |
| | | | | | | | | | | | |
| | | | | | | | | | | 126,944,880 | |
| | | | | | | | | | | | |
| Electric Utilities—1.2% | |
Duke Energy Corp. | | | | | 134,623 | | | | 9,290,333 | |
Entergy Corp. | | | | | 113,700 | | | | 7,193,799 | |
Exelon Corp. | | | | | 199,300 | | | | 5,458,827 | |
FirstEnergy Corp. | | | | | 118,000 | | | | 3,891,640 | |
Xcel Energy, Inc. | | | | | 166,800 | | | | 4,660,392 | |
| | | | | | | | | | | | |
| | | | | | | | | | | 30,494,991 | |
| | | | | | | | | | | | |
| Electrical Equipment—1.5% | |
Eaton Corp. plc (Ireland) | | | | | 63,375 | | | | 4,824,105 | |
Emerson Electric Co. | | | | | 470,100 | | | | 32,991,618 | |
| | | | | | | | | | | | |
| | | | | | | | | | | 37,815,723 | |
| | | | | | | | | | | | |
Electronic Equipment, Instruments &
Components—0.3% | |
Corning, Inc. | | | | | 431,400 | | | | 7,687,548 | |
| | | | | | | | | | | | |
| Energy Equipment & Services—1.4% | |
Diamond Offshore Drilling, Inc. | | | | | 93,500 | | | | 5,322,020 | |
National Oilwell Varco, Inc. | | | | | 199,500 | | | | 15,866,235 | |
Schlumberger Ltd. | | | | | 94,200 | | | | 8,488,362 | |
Seadrill Ltd. (Bermuda) | | | | | 100,300 | | | | 4,120,324 | |
| | | | | | | | | | | | |
| | | | | | | | | | | 33,796,941 | |
| | | | | | | | | | | | |
See accompanying notes to financial statements
211
SCHEDULE OF INVESTMENTS—(Continued)
December 31, 2013
| | | | | | | | | | | | |
Vantagepoint Equity
Income Fund | | | | | | Shares | | | Value | |
| COMMON STOCKS—(Continued) | |
| Food & Staples Retailing—0.9% | |
Walgreen Co. | | | | | 409,000 | | | $ | 23,492,960 | |
| | | | | | | | | | | | |
| Food Products—2.7% | |
Archer-Daniels-Midland Co. | | | | | 215,200 | | | | 9,339,680 | |
Campbell Soup Co. | | | | | 168,700 | | | | 7,301,336 | |
McCormick & Co., Inc. (Non-Voting Shares) | | | | | 47,100 | | | | 3,246,132 | |
Mondelez International, Inc., Class A | | | | | 1,326,600 | | | | 46,828,980 | |
| | | | | | | | | | | | |
| | | | | | | | | | | 66,716,128 | |
| | | | | | | | | | | | |
| Health Care Equipment & Supplies—1.9% | |
Abbott Laboratories | | | | | 644,262 | | | | 24,694,562 | |
Medtronic, Inc. | | | | | 408,400 | | | | 23,438,076 | |
| | | | | | | | | | | | |
| | | | | | | | | | | 48,132,638 | |
| | | | | | | | | | | | |
| Health Care Providers & Services—1.9% | |
Quest Diagnostics, Inc. | | † | | | 79,000 | | | | 4,229,660 | |
UnitedHealth Group, Inc. | | | | | 276,900 | | | | 20,850,570 | |
WellPoint, Inc. | | | | | 248,900 | | | | 22,995,871 | |
| | | | | | | | | | | | |
| | | | | | | | | | | 48,076,101 | |
| | | | | | | | | | | | |
| Hotels, Restaurants & Leisure—0.8% | |
Carnival Corp. | | | | | 501,700 | | | | 20,153,289 | |
| | | | | | | | | | | | |
| Household Durables—0.0% | |
Whirlpool Corp. | | | | | 5,500 | | | | 862,730 | |
| | | | | | | | | | | | |
| Household Products—0.4% | |
Clorox Co. (The) | | | | | 93,200 | | | | 8,645,232 | |
| | | | | | | | | | | | |
| Independent Power Producers & Energy Traders—0.1% | |
AES Corp. (The) | | | | | 222,900 | | | | 3,234,279 | |
| | | | | | | | | | | | |
| Industrial Conglomerates—2.8% | |
General Electric Co. | | | | | 899,800 | | | | 25,221,394 | |
Koninklijke Philips NV NYRS (Netherlands) | | | | | 1,165,400 | | | | 43,084,838 | |
| | | | | | | | | | | | |
| | | | | | | | | | | 68,306,232 | |
| | | | | | | | | | | | |
| Insurance—8.4% | |
Allstate Corp. (The) | | | | | 373,900 | | | | 20,392,506 | |
Aon plc (United Kingdom) | | | | | 474,441 | | | | 39,800,855 | |
Chubb Corp. (The) | | | | | 41,700 | | | | 4,029,471 | |
Fairfax Financial Holdings Ltd. (Canada) | | | | | 91,500 | | | | 36,605,490 | |
Lincoln National Corp. | | | | | 86,190 | | | | 4,449,128 | |
Loews Corp. | | | | | 1,169,100 | | | | 56,397,384 | |
Marsh & McLennan Cos., Inc. | | | | | 219,200 | | | | 10,600,512 | |
Sun Life Financial, Inc. (Canada) | | | | | 95,300 | | | | 3,366,949 | |
Travelers Cos., Inc. (The) | | | | | 344,000 | | | | 31,145,760 | |
Willis Group Holdings plc (United Kingdom) | | | | | 59,600 | | | | 2,670,676 | |
| | | | | | | | | | | | |
| | | | | | | | | | | 209,458,731 | |
| | | | | | | | | | | | |
| IT Services—1.1% | |
Computer Sciences Corp. | | | | | | | 105,800 | | | | 5,912,104 | |
International Business Machines Corp. | | | | | | | 96,400 | | | | 18,081,748 | |
Western Union Co. (The) | | | | | | | 168,800 | | | | 2,911,800 | |
| | | | | | | | | | | | |
| | | | | | | | | | | 26,905,652 | |
| | | | | | | | | | | | |
| | | | | | | | | | | | |
| | | | | |
| | | | | | | Shares | | | Value | |
| Leisure Equipment & Products—0.4% | |
Mattel, Inc. | | | | | 190,000 | | | $ | 9,040,200 | |
| | | | | | | | | | | | |
| Life Sciences Tools & Services—0.1% | |
Agilent Technologies, Inc. | | | | | 43,600 | | | | 2,493,484 | |
| | | | | | | | | | | | |
| Machinery—2.9% | |
Deere & Co. | | | | | 57,500 | | | | 5,251,475 | |
Illinois Tool Works, Inc. | | | | | 396,700 | | | | 33,354,536 | |
Joy Global, Inc. | | † | | | 78,200 | | | | 4,573,918 | |
Stanley Black & Decker, Inc. | | | | | 300,000 | | | | 24,207,000 | |
Xylem, Inc. | | | | | 147,600 | | | | 5,106,960 | |
| | | | | | | | | | | | |
| | | | | | | | | | | 72,493,889 | |
| | | | | | | | | | | | |
| Media—4.7% | |
Cablevision Systems Corp., Class A | | | | | 210,900 | | | | 3,781,437 | |
Comcast Corp., Class A | | | | | 81,000 | | | | 4,209,165 | |
DIRECTV | | * | | | 656,900 | | | | 45,385,221 | |
Madison Square Garden Co. (The), Class A | | * | | | 60,500 | | | | 3,483,590 | |
New York Times Co. (The), Class A | | † | | | 191,200 | | | | 3,034,344 | |
News Corp., Class A | | * | | | 2,344,800 | | | | 42,253,296 | |
Time Warner, Inc. | | | | | 143,833 | | | | 10,028,037 | |
Walt Disney Co. (The) | | | | | 60,600 | | | | 4,629,840 | |
| | | | | | | | | | | | |
| | | | | | | | | | | 116,804,930 | |
| | | | | | | | | | | | |
| Metals & Mining—0.4% | |
Newmont Mining Corp. | | | | | 120,800 | | | | 2,782,024 | |
Nucor Corp. | | | | | 144,100 | | | | 7,692,058 | |
| | | | | | | | | | | | |
| | | | | | | | | | | 10,474,082 | |
| | | | | | | | | | | | |
| Multiline Retail—1.5% | |
Kohl’s Corp. | | | | | 165,400 | | | | 9,386,450 | |
Macy’s, Inc. | | | | | 105,900 | | | | 5,655,060 | |
Target Corp. | | | | | 366,900 | | | | 23,213,763 | |
| | | | | | | | | | | | |
| | | | | | | | | | | 38,255,273 | |
| | | | | | | | | | | | |
| Multi-Utilities—0.4% | |
NiSource, Inc. | | | | | 280,700 | | | | 9,229,416 | |
| | | | | | | | | | | | |
| Oil, Gas & Consumable Fuels—13.9% | |
Anadarko Petroleum Corp. | | | | | 91,500 | | | | 7,257,780 | |
Apache Corp. | | | | | 172,600 | | | | 14,833,244 | |
BP plc ADR (United Kingdom) | | | | | 574,898 | | | | 27,945,792 | |
Chesapeake Energy Corp. | | | | | 2,120,500 | | | | 57,550,370 | |
Chevron Corp. | | | | | 154,358 | | | | 19,280,858 | |
ConocoPhillips | | | | | 320,200 | | | | 22,622,130 | |
CONSOL Energy, Inc. | | | | | 1,318,400 | | | | 50,151,936 | |
Eni SpA (Italy) | | | | | 69,569 | | | | 1,681,042 | |
Exxon Mobil Corp. | | | | | 160,060 | | | | 16,198,072 | |
Hess Corp. | | | | | 115,000 | | | | 9,545,000 | |
Marathon Oil Corp. | | | | | 590,200 | | | | 20,834,060 | |
Murphy Oil Corp. | | | | | 849,414 | | | | 55,109,980 | |
Occidental Petroleum Corp. | | | | | 201,300 | | | | 19,143,630 | |
Phillips 66 | | | | | 127,300 | | | | 9,818,649 | |
Royal Dutch Shell plc ADR (Netherlands) | | | | | 167,381 | | | | 11,929,244 | |
Talisman Energy, Inc. (Canada) | | | | | 154,700 | | | | 1,802,255 | |
| | | | | | | | | | | | |
| | | | | | | | | | | 345,704,042 | |
| | | | | | | | | | | | |
See accompanying notes to financial statements
212
SCHEDULE OF INVESTMENTS—(Continued)
December 31, 2013
| | | | | | | | | | | | |
Vantagepoint Equity
Income Fund | | | | | | Shares | | | Value | |
| COMMON STOCKS—(Continued) | |
| Paper & Forest Products—0.5% | |
International Paper Co. | | | | | 231,200 | | | $ | 11,335,736 | |
| | | | | | | | | | | | |
| Personal Products—0.2% | |
Avon Products, Inc. | | | | | 288,200 | | | | 4,962,804 | |
| | | | | | | | | | | | |
| Pharmaceuticals—5.3% | |
Bristol-Myers Squibb Co. | | | | | 168,700 | | | | 8,966,405 | |
GlaxoSmithKline plc (United Kingdom) | | | | | 165,144 | | | | 4,412,233 | |
Hospira, Inc. | | * | | | 71,100 | | | | 2,935,008 | |
Johnson & Johnson | | | | | 354,000 | | | | 32,422,860 | |
Merck & Co., Inc. | | | | | 597,100 | | | | 29,884,855 | |
Pfizer, Inc. | | | | | 1,116,687 | | | | 34,204,123 | |
Teva Pharmaceutical Industries Ltd. ADR (Israel) | | | | | 489,600 | | | | 19,623,168 | |
| | | | | | | | | | | | |
| | | | | | | | | | | 132,448,652 | |
| | | | | | | | | | | | |
| Real Estate Investment Trusts (REITs)—0.3% | |
Weyerhaeuser Co. REIT | | | | | 194,737 | | | | 6,147,847 | |
| | | | | | | | | | | | |
| Real Estate Management & Development—0.5% | |
Cheung Kong Holdings Ltd. ADR (Hong Kong) | | | | | 755,000 | | | | 11,936,550 | |
| | | | | | | | | | | | |
| Road & Rail—0.4% | |
Norfolk Southern Corp. | | | | | 97,800 | | | | 9,078,774 | |
| | | | | | | | | | | | |
| Semiconductors & Semiconductor Equipment—2.0% | |
Analog Devices, Inc. | | | | | 118,900 | | | | 6,055,577 | |
Applied Materials, Inc. | | | | | 362,200 | | | | 6,407,318 | |
Intel Corp. | | | | | 488,400 | | | | 12,678,864 | |
Texas Instruments, Inc. | | | | | 585,300 | | | | 25,700,523 | |
| | | | | | | | | | | | |
| | | | | | | | | | | 50,842,282 | |
| | | | | | | | | | | | |
| Software—1.5% | |
CA, Inc. | | | | | 71,900 | | | | 2,419,435 | |
Microsoft Corp. | | | | | 923,300 | | | | 34,559,119 | |
| | | | | | | | | | | | |
| | | | | | | | | | | 36,978,554 | |
| | | | | | | | | | | | |
| Specialty Retail—0.3% | |
Staples, Inc. | | | | | 381,100 | | | | 6,055,679 | |
Tiffany & Co. | | | | | 5,500 | | | | 510,290 | |
| | | | | | | | | | | | |
| | | | | | | | | | | 6,565,969 | |
| | | | | | | | | | | | |
| Tobacco—1.0% | |
Altria Group, Inc. | | | | | 218,100 | | | | 8,372,859 | |
Philip Morris International, Inc. | | | | | 192,800 | | | | 16,798,664 | |
| | | | | | | | | | | | |
| | | | | | | | | | | 25,171,523 | |
| | | | | | | | | | | | |
| Wireless Telecommunication Services—0.8% | |
Vodafone Group plc (United Kingdom) | | | | | | | 900,233 | | | | 3,544,391 | |
Vodafone Group plc ADR (United Kingdom) | | | | | | | 428,000 | | | | 16,824,680 | |
| | | | | | | | | | | | |
| | | | | | | | | | | 20,369,071 | |
| | | | | | | | | | | | |
| TOTAL COMMON STOCKS | |
(Cost $1,626,053,512) | | | | | | | | | 2,319,499,040 | |
| | | | | | | | | | | | |
| | | | | | | | | | | | |
| | | | | |
| | | | | | | Shares | | | Value | |
| CONVERTIBLE PREFERRED STOCKS—0.0% | |
| Real Estate Investment Trusts (REITs)—0.0% | |
Weyerhaeuser Co., Series A 6.375% | |
(Cost $357,500) | | * | | | 7,150 | | | $ | 400,686 | |
| | | | | | | | | | | | |
| | | | | | | | | | | | | |
| MONEY MARKET FUNDS—6.9% | |
| Institutional Money Market Funds—6.9% | |
Dreyfus Institutional Cash Advantage Fund, 0.06% | | ††¥ | | | 750,000 | | | | 750,000 | |
Fidelity Institutional Money Market: Money Market Portfolio—Institutional Class, 0.07% | | ¥ | | | 167,411,083 | | | | 167,411,083 | |
Fidelity Institutional Money Market: Money Market Portfolio—Institutional Class, 0.07% | | ††¥ | | | 987,432 | | | | 987,432 | |
Fidelity Institutional Money Market: Prime Money Market Portfolio—Institutional Class, 0.04% | | ††¥ | | | 750,000 | | | | 750,000 | |
Short-Term Investments Trust Liquid Assets Portfolio—Institutional Class, 0.07% | | ††¥ | | | 750,000 | | | | 750,000 | |
Wells Fargo Advantage Cash Investment Money Market Fund—Select Class, 0.06% | | ††¥ | | | 750,000 | | | | 750,000 | |
Wells Fargo Advantage Heritage Money Market Fund—Select Class, 0.06% | | ††¥ | | | 750,000 | | | | 750,000 | |
| | | | | | | | | | | | |
| TOTAL MONEY MARKET FUNDS | | | | | |
(Cost $172,148,515) | | | | 172,148,515 | |
| | | | | | | | | | | | |
| TOTAL INVESTMENTS—100.2% | |
(Cost $1,798,559,527) | | | | | | | | | 2,492,048,241 | |
Other assets less liabilities—(0.2%) | | | | (4,605,887 | ) |
| | | | | | | | | | | | |
| NET ASSETS—100.0% | | | | | | $ | 2,487,442,354 | |
| | | | | | | | | | | | |
Notes to the Schedule of Investments:
| | |
| ADR | | American Depositary Receipt |
| NYRS | | New York Registry Shares |
| REIT | | Real Estate Investment Trust |
| * | | Non-income producing. |
| † | | Denotes all or a portion of the security on loan. |
| †† | | Represents reinvestment of collateral received in conjunction with securities lending. |
| ¥ | | The rate quoted is the annualized seven-day yield of the fund at period end. |
See accompanying notes to financial statements
213
SCHEDULE OF INVESTMENTS
December 31, 2013
| | | | | | | | | | | | |
Vantagepoint Growth &
Income Fund | | Shares | | | Value | |
| COMMON STOCKS—95.5% | | | | | |
| Aerospace & Defense—2.9% | | | | | | | | |
Boeing Co. (The) | | | | | 53,500 | | | $ | 7,302,215 | |
Honeywell International, Inc. | | | | | 27,900 | | | | 2,549,223 | |
Precision Castparts Corp. | | | | | 35,400 | | | | 9,533,220 | |
Spirit Aerosystems Holdings, Inc., Class A | | * | | | 495,500 | | | | 16,886,640 | |
United Technologies Corp. | | | | | 122,300 | | | | 13,917,740 | |
| | | | | | | | | | | | |
| | | | | | | | | | | 50,189,038 | |
| | | | | | | | | | | | |
| Air Freight & Logistics—1.2% | |
Expeditors International of Washington, Inc. | | | | | 407,000 | | | | 18,009,750 | |
FedEx Corp. | | | | | 23,200 | | | | 3,335,464 | |
| | | | | | | | | | | | |
| | | | | | | | | | | 21,345,214 | |
| | | | | | | | | | | | |
| Airlines—0.2% | | | | | | | | | | |
Delta Air Lines, Inc. | | | | | 62,400 | | | | 1,714,128 | |
United Continental Holdings, Inc. | | * | | | 68,100 | | | | 2,576,223 | |
| | | | | | | | | | | | |
| | | | | | | | | | | 4,290,351 | |
| | | | | | | | | | | | |
| Auto Components—0.0% | | | | | | | | |
Johnson Controls, Inc. | | | 7,100 | | | | 364,230 | |
| | | | | | | | | | | | |
| Automobiles—0.2% | | | | | | | | | | |
Harley-Davidson, Inc. | | | | | 42,200 | | | | 2,921,928 | |
Tesla Motors, Inc. | | *† | | | 6,200 | | | | 932,356 | |
| | | | | | | | | | | | |
| | | | | | | | | | | 3,854,284 | |
| | | | | | | | | | | | |
| Beverages—1.1% | | | | | | | | | | |
Anheuser-Busch InBev NV ADR (Belgium) | | | | | 101,100 | | | | 10,763,106 | |
Constellation Brands, Inc., Class A | | * | | | 6,900 | | | | 485,622 | |
Diageo plc ADR (United Kingdom) | | | | | 52,800 | | | | 6,991,776 | |
Monster Beverage Corp. | | * | | | 9,100 | | | | 616,707 | |
PepsiCo, Inc. | | | | | 12,500 | | | | 1,036,750 | |
| | | | | | | | | | | | |
| | | | | | | | | | | 19,893,961 | |
| | | | | | | | | | | | |
| Biotechnology—3.2% | | | | | | | | | | |
Alexion Pharmaceuticals, Inc. | | * | | | 32,100 | | | | 4,271,226 | |
Amgen, Inc. | | | | | 78,500 | | | | 8,961,560 | |
Biogen Idec, Inc. | | * | | | 32,000 | | | | 8,952,000 | |
Celgene Corp. | | * | | | 48,700 | | | | 8,228,352 | |
Gilead Sciences, Inc. | | * | | | 184,900 | | | | 13,895,235 | |
Pharmacyclics, Inc. | | * | | | 2,400 | | | | 253,872 | |
Regeneron Pharmaceuticals, Inc. | | * | | | 11,600 | | | | 3,192,784 | |
Vertex Pharmaceuticals, Inc. | | * | | | 111,500 | | | | 8,284,450 | |
| | | | | | | | | | | | |
| | | | | | | | | | | 56,039,479 | |
| | | | | | | | | | | | |
| Capital Markets—5.1% | | | | | | | | |
Ameriprise Financial, Inc. | | | | | 21,000 | | | | 2,416,050 | |
Bank of New York Mellon Corp. (The) | | | | | 797,300 | | | | 27,857,662 | |
BlackRock, Inc. | | | | | 33,700 | | | | 10,665,039 | |
Credit Suisse Group AG ADR (Switzerland) | | * | | | 313,801 | | | | 9,740,383 | |
Franklin Resources, Inc. | | | | | 71,300 | | | | 4,116,149 | |
Goldman Sachs Group, Inc. (The) | | | | | 49,400 | | | | 8,756,644 | |
Invesco Ltd. | | | | | 416,500 | | | | 15,160,600 | |
Morgan Stanley | | | | | 94,100 | | | | 2,950,976 | |
Northern Trust Corp. | | | | | 15,000 | | | | 928,350 | |
State Street Corp. | | | | | 47,900 | | | | 3,515,381 | |
| | | | | | | | | | | | |
| | | | | |
| | | | | | | Shares | | | Value | |
TD Ameritrade Holding Corp. | | | | | 76,200 | | | $ | 2,334,768 | |
| | | | | | | | | | | | |
| | | | | | | | | | | 88,442,002 | |
| | | | | | | | | | | | |
| Chemicals—3.5% | | | | | | | | | | |
Airgas, Inc. | | | | | 800 | | | | 89,480 | |
Dow Chemical Co. (The) | | | | | 210,400 | | | | 9,341,760 | |
Ecolab, Inc. | | | | | 50,400 | | | | 5,255,208 | |
FMC Corp. | | | | | 14,700 | | | | 1,109,262 | |
Monsanto Co. | | | | | 20,300 | | | | 2,365,965 | |
Potash Corp. of Saskatchewan, Inc. (Canada) | | | | | 1,004,325 | | | | 33,102,552 | |
Praxair, Inc. | | | | | 35,300 | | | | 4,590,059 | |
Sherwin-Williams Co. (The) | | | | | 27,100 | | | | 4,972,850 | |
| | | | | | | | | | | | |
| | | | | | | | | | | 60,827,136 | |
| | | | | | | | | | | | |
| Commercial Banks—3.9% | | | | | | | | |
BB&T Corp. | | | | | 235,400 | | | | 8,785,128 | |
Comerica, Inc. | | | | | 464,250 | | | | 22,070,445 | |
PNC Financial Services Group, Inc. (The) | | | | | 185,500 | | | | 14,391,090 | |
U.S. Bancorp/Minnesota | | | | | 29,200 | | | | 1,179,680 | |
Wells Fargo & Co. | | | | | 454,800 | | | | 20,647,920 | |
| | | | | | | | | | | | |
| | | | | | | | | | | 67,074,263 | |
| | | | | | | | | | | | |
| Commercial Services & Supplies—1.0% | | | | | |
Cintas Corp. | | | 302,650 | | | | 18,034,913 | |
| | | | | | | | | | | | |
| Communications Equipment—1.3% | | | | | |
Cisco Systems, Inc. | | | | | 778,200 | | | | 17,470,590 | |
Juniper Networks, Inc. | | * | | | 1,800 | | | | 40,626 | |
QUALCOMM, Inc. | | | | | 68,700 | | | | 5,100,975 | |
| | | | | | | | | | | | |
| | | | | | | | | | | 22,612,191 | |
| | | | | | | | | | | | |
| Computers & Peripherals—1.7% | | | | | |
Apple, Inc. | | | | | 22,800 | | | | 12,793,308 | |
EMC Corp. | | | | | 650,000 | | | | 16,347,500 | |
| | | | | | | | | | | | |
| | | | | | | | | | | 29,140,808 | |
| | | | | | | | | | | | |
| Consumer Finance—1.7% | | | | | |
American Express Co. | | | 318,925 | | | | 28,936,065 | |
| | | | | | | | | | | | |
| Diversified Financial Services—5.3% | | | | | |
Berkshire Hathaway, Inc., Class B | | * | | | 224,825 | | | | 26,655,252 | |
Citigroup, Inc. | | | | | 449,900 | | | | 23,444,289 | |
IntercontinentalExchange Group, Inc. | | | | | 53,300 | | | | 11,988,236 | |
JPMorgan Chase & Co. | | | | | 504,008 | | | | 29,474,388 | |
| | | | | | | | | | | | |
| | | | | | | | | | | 91,562,165 | |
| | | | | | | | | | | | |
| Diversified Telecommunication Services—0.8% | |
AT&T, Inc. | | | | | 186,406 | | | | 6,554,035 | |
Verizon Communications, Inc. | | | | | 133,700 | | | | 6,570,018 | |
| | | | | | | | | | | | |
| | | | | | | | | | | 13,124,053 | |
| | | | | | | | | | | | |
| Electric Utilities—0.3% | |
Edison International | | | 115,000 | | | | 5,324,500 | |
| | | | | | | | | | | | |
| Electrical Equipment—0.8% | |
Eaton Corp. plc (Ireland) | | | | | 150,400 | | | | 11,448,448 | |
Roper Industries, Inc. | | | | | 16,200 | | | | 2,246,616 | |
| | | | | | | | | | | | |
| | | | | | | | | | | 13,695,064 | |
| | | | | | | | | | | | |
See accompanying notes to financial statements
214
SCHEDULE OF INVESTMENTS—(Continued)
December 31, 2013
| | | | | | | | | | | | |
Vantagepoint Growth &
Income Fund | | Shares | | | Value | |
| COMMON STOCKS—(Continued) | | | | | |
| Electronic Equipment, Instruments & Components—1.0% | |
TE Connectivity Ltd. (Switzerland) | | | | | 307,775 | | | $ | 16,961,480 | |
Trimble Navigation Ltd. | | * | | | 12,400 | | | | 430,280 | |
| | | | | | | | | | | | |
| | | | | | | | | | | 17,391,760 | |
| | | | | | | | | | | | |
| Energy Equipment & Services—2.2% | |
Cameron International Corp. | | * | | | 1,100 | | | | 65,483 | |
FMC Technologies, Inc. | | * | | | 1,400 | | | | 73,094 | |
Halliburton Co. | | | | | 209,500 | | | | 10,632,125 | |
Schlumberger Ltd. | | | | | 296,075 | | | | 26,679,318 | |
| | | | | | | | | | | | |
| | | | | | | | | | | 37,450,020 | |
| | | | | | | | | | | | |
| Food & Staples Retailing—1.5% | |
Costco Wholesale Corp. | | | | | 10,100 | | | | 1,202,001 | |
CVS Caremark Corp. | | | | | 30,600 | | | | 2,190,042 | |
Wal-Mart Stores, Inc. | | | | | 261,700 | | | | 20,593,173 | |
Whole Foods Market, Inc. | | | | | 50,700 | | | | 2,931,981 | |
| | | | | | | | | | | | |
| | | | | | | | | | | 26,917,197 | |
| | | | | | | | | | | | |
| Food Products—3.7% | | | | | | | | | | |
Danone SA ADR (France) | | | | | 1,401,600 | | | | 20,351,232 | |
Green Mountain Coffee Roasters, Inc. | | *† | | | 17,000 | | | | 1,284,860 | |
Kraft Foods Group, Inc. | | | | | 162,100 | | | | 8,740,432 | |
Nestle SA ADR (Switzerland) | | | | | 273,000 | | | | 20,090,070 | |
Unilever plc ADR (United Kingdom) | | † | | | 351,900 | | | | 14,498,280 | |
| | | | | | | | | | | | |
| | | | | | | | | | | 64,964,874 | |
| | | | | | | | | | | | |
| Health Care Equipment & Supplies—2.6% | |
Baxter International, Inc. | | | | | 124,800 | | | | 8,679,840 | |
Becton Dickinson and Co. | | | | | 3,700 | | | | 408,813 | |
Covidien plc (Ireland) | | | | | 508,950 | | | | 34,659,495 | |
Stryker Corp. | | | | | 16,600 | | | | 1,247,324 | |
| | | | | | | | | | | | |
| | | | | | | | | | | 44,995,472 | |
| | | | | | | | | | | | |
| Health Care Providers & Services—2.7% | |
Aetna, Inc. | | | | | 600 | | | | 41,154 | |
AmerisourceBergen Corp. | | | | | 288,450 | | | | 20,280,919 | |
Cardinal Health, Inc. | | | | | 7,200 | | | | 481,032 | |
Express Scripts Holding Co. | | * | | | 8,800 | | | | 618,112 | |
Henry Schein, Inc. | | * | | | 1,000 | | | | 114,260 | |
McKesson Corp. | | | | | 58,300 | | | | 9,409,620 | |
UnitedHealth Group, Inc. | | | | | 206,425 | | | | 15,543,803 | |
| | | | | | | | | | | | |
| | | | | | | | | | | 46,488,900 | |
| | | | | | | | | | | | |
| Hotels, Restaurants & Leisure—1.8% | |
Carnival Corp. | | | | | 5,400 | | | | 216,918 | |
Chipotle Mexican Grill, Inc. | | * | | | 9,200 | | | | 4,901,576 | |
Hilton Worldwide Holdings, Inc. | | * | | | 20,400 | | | | 453,900 | |
Las Vegas Sands Corp. | | | | | 93,300 | | | | 7,358,571 | |
Marriott International, Inc., Class A | | | | | 24,871 | | | | 1,227,633 | |
Starbucks Corp. | | | | | 99,300 | | | | 7,784,127 | |
Starwood Hotels & Resorts Worldwide, Inc. | | | | | 52,000 | | | | 4,131,400 | |
Wynn Macau Ltd. (Macau) | | | | | 306,000 | | | | 1,390,966 | |
Wynn Resorts Ltd. | | | | | 16,200 | | | | 3,146,202 | |
| | | | | | | | | | | | |
| | | | | | | | | | | 30,611,293 | |
| | | | | | | | | | | | |
| | | | | | | | | | | | |
| | | | | |
| | | | | | | Shares | | | Value | |
| Household Durables—1.1% | |
Lennar Corp., Class A | | | | | 4,000 | | | $ | 158,240 | |
Newell Rubbermaid, Inc. | | | | | 277,000 | | | | 8,977,570 | |
PulteGroup, Inc. | | | | | 500,000 | | | | 10,185,000 | |
| | | | | | | | | | | | |
| | | | | | | | | | | 19,320,810 | |
| | | | | | | | | | | | |
| Household Products—0.1% | |
Procter & Gamble Co. (The) | | | 15,800 | | | | 1,286,278 | |
| | | | | | | | | | | | |
| Industrial Conglomerates—4.4% | |
3M Co. | | | | | 228,700 | | | | 32,075,175 | |
Danaher Corp. | | | | | 157,000 | | | | 12,120,400 | |
General Electric Co. | | | | | 678,700 | | | | 19,023,961 | |
Koninklijke Philips NV NYRS (Netherlands) | | | | | 362,300 | | | | 13,394,231 | |
| | | | | | | | | | | | |
| | | | | | | | | | | 76,613,767 | |
| | | | | | | | | | | | |
| Insurance—2.5% | | | | | | | | | | |
ACE Ltd. (Switzerland) | | | | | 86,500 | | | | 8,955,345 | |
Marsh & McLennan Cos., Inc. | | | | | 250,900 | | | | 12,133,524 | |
Principal Financial Group, Inc. | | | | | 190,000 | | | | 9,368,900 | |
Willis Group Holdings plc (United Kingdom) | | | | | 274,700 | | | | 12,309,307 | |
| | | | | | | | | | | | |
| | | | | | | | | | | 42,767,076 | |
| | | | | | | | | | | | |
| Internet & Catalog Retail—2.4% | |
Amazon.com, Inc. | | * | | | 57,500 | | | | 22,930,425 | |
Ctrip.com International Ltd. ADR (China) | | * | | | 30,100 | | | | 1,493,562 | |
Netflix, Inc. | | * | | | 8,000 | | | | 2,945,360 | |
priceline.com, Inc. | | * | | | 12,300 | | | | 14,297,520 | |
TripAdvisor, Inc. | | * | | | 6,900 | | | | 571,527 | |
| | | | | | | | | | | | |
| | | | | | | | | | | 42,238,394 | |
| | | | | | | | | | | | |
| Internet Software & Services—3.1% | |
Akamai Technologies, Inc. | | * | | | 35,600 | | | | 1,679,608 | |
Baidu, Inc. ADR (China) | | * | | | 36,600 | | | | 6,510,408 | |
eBay, Inc. | | * | | | 84,100 | | | | 4,616,249 | |
Facebook, Inc., Class A | | * | | | 128,400 | | | | 7,018,344 | |
Google, Inc., Class A | | * | | | 22,400 | | | | 25,103,904 | |
LinkedIn Corp., Class A | | * | | | 13,700 | | | | 2,970,571 | |
NAVER Corp. (Korea, Republic of) | | * | | | 1,531 | | | | 1,055,054 | |
Tencent Holdings Ltd. (China) | | | | | 55,000 | | | | 3,521,511 | |
Twitter, Inc. | | *† | | | 9,000 | | | | 572,850 | |
| | | | | | | | | | | | |
| | | | | | | | | | | 53,048,499 | |
| | | | | | | | | | | | |
| IT Services—3.5% | | | | | | | | | | |
Accenture plc, Class A (Ireland) | | | | | 344,450 | | | | 28,320,679 | |
Alliance Data Systems Corp. | | * | | | 6,600 | | | | 1,735,338 | |
Cognizant Technology Solutions Corp., Class A | | * | | | 42,000 | | | | 4,241,160 | |
Fiserv, Inc. | | * | | | 40,900 | | | | 2,415,145 | |
MasterCard, Inc., Class A | | | | | 17,700 | | | | 14,787,642 | |
Visa, Inc., Class A | | | | | 41,700 | | | | 9,285,756 | |
| | | | | | | | | | | | |
| | | | | | | | | | | 60,785,720 | |
| | | | | | | | | | | | |
| Life Sciences Tools & Services—0.3% | |
Thermo Fisher Scientific, Inc. | | | 43,900 | | | | 4,888,265 | |
| | | | | | | | | | | | |
Machinery—3.0% | | | | | | | | | | |
Flowserve Corp. | | | | | 21,300 | | | | 1,679,079 | |
Illinois Tool Works, Inc. | | | | | 336,275 | | | | 28,274,002 | |
Ingersoll-Rand plc (Ireland) | | | | | 104,200 | | | | 6,418,720 | |
PACCAR, Inc. | | | | | 265,500 | | | | 15,709,635 | |
See accompanying notes to financial statements
215
SCHEDULE OF INVESTMENTS—(Continued)
December 31, 2013
| | | | | | | | | | | | |
Vantagepoint Growth &
Income Fund | | Shares | | | Value | |
| COMMON STOCKS—(Continued) | | | | | |
Wabtec Corp. | | | | | 11,100 | | | $ | 824,397 | |
| | | | | | | | | | | | |
| | | | | | | | | | | 52,905,833 | |
| | | | | | | | | | | | |
| Media—3.5% | | | | | | | | | | |
CBS Corp. (Non-Voting Shares), Class B | | | | | 114,300 | | | | 7,285,482 | |
Discovery Communications, Inc., Class C | | * | | | 68,650 | | | | 5,756,989 | |
Interpublic Group of Cos., Inc. (The) | | | | | 504,000 | | | | 8,920,800 | |
Liberty Global plc, Series A (United Kingdom) | | * | | | 3,900 | | | | 347,061 | |
Thomson Reuters Corp. | | | | | 231,100 | | | | 8,740,202 | |
Time Warner Cable, Inc. | | | | | 84,300 | | | | 11,422,650 | |
Time Warner, Inc. | | | | | 207,850 | | | | 14,491,302 | |
Twenty-First Century Fox, Inc., Class A | | | | | 54,000 | | | | 1,899,720 | |
Walt Disney Co. (The) | | | | | 18,600 | | | | 1,421,040 | |
| | | | | | | | | | | | |
| | | | | | | | | | | 60,285,246 | |
| | | | | | | | | | | | |
| Metals & Mining—0.7% | |
Barrick Gold Corp. (Canada) | | | | | 194,500 | | | | 3,429,035 | |
Steel Dynamics, Inc. | | | | | 420,900 | | | | 8,224,386 | |
| | | | | | | | | | | | |
| | | | | | | | | | | 11,653,421 | |
| | | | | | | | | | | | |
| Multiline Retail—1.2% | |
Dollar General Corp. | | * | | | 163,800 | | | | 9,880,416 | |
Dollar Tree, Inc. | | * | | | 20,100 | | | | 1,134,042 | |
Nordstrom, Inc. | | | | | 148,700 | | | | 9,189,660 | |
| | | | | | | | | | | | |
| | | | | | | | | | | 20,204,118 | |
| | | | | | | | | | | | |
| Multi-Utilities—0.6% | |
National Grid plc ADR (United Kingdom) | | † | | | 162,400 | | | | 10,607,968 | |
| | | | | | | | | | | | |
| Oil, Gas & Consumable Fuels—6.5% | |
Anadarko Petroleum Corp. | | | | | 105,000 | | | | 8,328,600 | |
BG Group plc (United Kingdom) | | | | | 549,899 | | | | 11,832,927 | |
Cabot Oil & Gas Corp. | | | | | 8,900 | | | | 344,964 | |
Chevron Corp. | | | | | 157,400 | | | | 19,660,834 | |
Concho Resources, Inc. | | * | | | 15,700 | | | | 1,695,600 | |
Devon Energy Corp. | | | | | 388,950 | | | | 24,064,336 | |
EOG Resources, Inc. | | | | | 78,900 | | | | 13,242,576 | |
EQT Corp. | | | | | 29,700 | | | | 2,666,466 | |
Marathon Oil Corp. | | | | | 315,000 | | | | 11,119,500 | |
Pioneer Natural Resources Co. | | | | | 29,600 | | | | 5,448,472 | |
Range Resources Corp. | | | | | 41,235 | | | | 3,476,523 | |
Southwestern Energy Co. | | * | | | 300,300 | | | | 11,810,799 | |
| | | | | | | | | | | | |
| | | | | | | | | | | 113,691,597 | |
| | | | | | | | | | | | |
| Paper & Forest Products—0.6% | |
International Paper Co. | | | 228,500 | | | | 11,203,355 | |
| | | | | | | | | | | | |
| Pharmaceuticals—2.2% | |
Allergan, Inc. | | | | | 6,900 | | | | 766,452 | |
GlaxoSmithKline plc ADR (United Kingdom) | | | | | 208,750 | | | | 11,145,163 | |
Merck & Co., Inc. | | | | | 257,440 | | | | 12,884,872 | |
Perrigo Co. plc | | † | | | 7,700 | | | | 1,181,642 | |
Roche Holding AG ADR (Switzerland) | | | | | 153,400 | | | | 10,768,680 | |
Valeant Pharmaceuticals International, Inc. | | * | | | 14,300 | | | | 1,678,820 | |
| | | | | | | | | | | | |
| | | | | | | | | | | 38,425,629 | |
| | | | | | | | | | | | |
| | | | | | | | | | | | |
| | | | | |
| | | | | | | Shares | | | Value | |
| Professional Services—0.0% | |
IHS, Inc., Class A | | * | | | 5,200 | | | $ | 622,440 | |
| | | | | | | | | | | | |
| Real Estate Investment Trusts (REITs)—0.9% | |
American Tower Corp. REIT | | | | | 97,600 | | | | 7,790,432 | |
Host Hotels & Resorts, Inc. REIT | | | | | 369,800 | | | | 7,188,912 | |
| | | | | | | | | | | | |
| | | | | | | | | | | 14,979,344 | |
| | | | | | | | | | | | |
| Road & Rail—0.5% | |
Canadian Pacific Railway Ltd. (Canada) | | | | | 4,800 | | | | 726,336 | |
J.B. Hunt Transport Services, Inc. | | | | | 8,300 | | | | 641,590 | |
Kansas City Southern | | | | | 28,600 | | | | 3,541,538 | |
Union Pacific Corp. | | | | | 23,100 | | | | 3,880,800 | |
| | | | | | | | | | | | |
| | | | | | | | | | | 8,790,264 | |
| | | | | | | | | | | | |
| Semiconductors & Semiconductor Equipment—1.1% | |
Intel Corp. | | | | | 444,500 | | | | 11,539,220 | |
Maxim Integrated Products, Inc. | | | | | 259,900 | | | | 7,253,809 | |
| | | | | | | | | | | | |
| | | | | | | | | | | 18,793,029 | |
| | | | | | | | | | | | |
| Software—2.7% | |
Autodesk, Inc. | | * | | | 2,100 | | | | 105,693 | |
Citrix Systems, Inc. | | * | | | 1,400 | | | | 88,550 | |
Intuit, Inc. | | | | | 1,100 | | | | 83,952 | |
Microsoft Corp. | | | | | 805,750 | | | | 30,159,223 | |
Red Hat, Inc. | | * | | | 29,000 | | | | 1,625,160 | |
Salesforce.com, Inc. | | * | | | 88,900 | | | | 4,906,391 | |
Symantec Corp. | | | | | 430,200 | | | | 10,144,116 | |
| | | | | | | | | | | | |
| | | | | | | | | | | 47,113,085 | |
| | | | | | | | | | | | |
| Specialty Retail—2.4% | |
AutoZone, Inc. | | * | | | 24,400 | | | | 11,661,736 | |
Home Depot, Inc. (The) | | | | | 168,600 | | | | 13,882,524 | |
L Brands, Inc. | | | | | 38,700 | | | | 2,393,595 | |
Lowe’s Cos., Inc. | | | | | 83,100 | | | | 4,117,605 | |
O’Reilly Automotive, Inc. | | * | | | 28,700 | | | | 3,693,977 | |
Ross Stores, Inc. | | | | | 26,600 | | | | 1,993,138 | |
Tiffany & Co. | | | | | 7,200 | | | | 668,016 | |
Tractor Supply Co. | | | | | 32,300 | | | | 2,505,834 | |
| | | | | | | | | | | | |
| | | | | | | | | | | 40,916,425 | |
| | | | | | | | | | | | |
| Textiles, Apparel & Luxury Goods—1.2% | |
Fossil Group, Inc. | | * | | | 18,300 | | | | 2,194,902 | |
Lululemon Athletica, Inc. (Canada) | | *† | | | 10,300 | | | | 608,009 | |
Michael Kors Holdings Ltd. (Hong Kong) | | * | | | 4,500 | | | | 365,355 | |
NIKE, Inc., Class B | | | | | 27,700 | | | | 2,178,328 | |
PVH Corp. | | | | | 95,300 | | | | 12,962,706 | |
Ralph Lauren Corp. | | | | | 9,600 | | | | 1,695,072 | |
V.F. Corp. | | | | | 7,600 | | | | 473,784 | |
| | | | | | | | | | | | |
| | | | | | | | | | | 20,478,156 | |
| | | | | | | | | | | | |
| Tobacco—0.5% | |
Imperial Tobacco Group plc ADR (United Kingdom) | | † | | | 123,400 | | | | 9,598,052 | |
| | | | | | | | | | | | |
| Trading Companies & Distributors—0.1% | |
Fastenal Co. | | | | | 31,600 | | | | 1,501,316 | |
W.W. Grainger, Inc. | | | | | 3,100 | | | | 791,802 | |
| | | | | | | | | | | | |
| | | | | | | | | | | 2,293,118 | |
| | | | | | | | | | | | |
See accompanying notes to financial statements
216
SCHEDULE OF INVESTMENTS—(Continued)
December 31, 2013
| | | | | | | | | | | | |
Vantagepoint Growth &
Income Fund | | Shares | | | Value | |
| COMMON STOCKS—(Continued) | | | | | |
| Wireless Telecommunication Services—0.7% | |
SoftBank Corp. (Japan) | | | | | 13,200 | | | $ | 1,158,310 | |
Vodafone Group plc ADR (United Kingdom) | | | | | 258,900 | | | | 10,177,359 | |
| | | | | | | | | | | | |
| | | | | | | | | | | 11,335,669 | |
| | | | | | | | | | | | |
| TOTAL COMMON STOCKS | | | | | | | | |
(Cost $1,141,343,490) | | | | | | | 1,658,414,791 | |
| | | | | | | | | | | | |
| | | | | | | | | | | | | |
| MONEY MARKET FUNDS—5.9% | |
| Institutional Money Market Funds—5.9% | |
Dreyfus Institutional Cash Advantage Fund, 0.06% | | ††¥ | | | 4,000,000 | | | | 4,000,000 | |
Fidelity Institutional Money Market: Money Market Portfolio—Institutional Class, 0.07% | | ¥ | | | 77,580,906 | | | | 77,580,906 | |
Fidelity Institutional Money Market: Money Market Portfolio—Institutional Class, 0.07% | | ††¥ | | | 5,057,093 | | | | 5,057,093 | |
Fidelity Institutional Money Market: Prime Money Market Portfolio—Institutional Class, 0.04% | | ††¥ | | | 4,000,000 | | | | 4,000,000 | |
Short-Term Investments Trust Liquid Assets Portfolio—Institutional Class, 0.07% | | ††¥ | | | 4,000,000 | | | | 4,000,000 | |
Wells Fargo Advantage Cash Investment Money Market Fund—Select Class, 0.06% | | ††¥ | | | 4,000,000 | | | | 4,000,000 | |
Wells Fargo Advantage Heritage Money Market Fund—Select Class, 0.06% | | ††¥ | | | 4,000,000 | | | | 4,000,000 | |
| | | | | | | | | | | | |
| TOTAL MONEY MARKET FUNDS | |
(Cost $102,637,999) | | | | | | | | | 102,637,999 | |
| | | | | | | | | | | | |
| TOTAL INVESTMENTS—101.4% | |
(Cost $1,243,981,489) | | | | | | | | | 1,761,052,790 | |
Other assets less liabilities—(1.4%) | | | | (24,986,754 | ) |
| | | | | | | | | | | | |
| NET ASSETS—100.0% | | | | | | $ | 1,736,066,036 | |
| | | | | | | | | | | | |
Notes to the Schedule of Investments:
| | |
| ADR | | American Depositary Receipt |
| NYRS | | New York Registry Shares |
| REIT | | Real Estate Investment Trust |
| * | | Non-income producing. |
| † | | Denotes all or a portion of the security on loan. |
| †† | | Represents reinvestment of collateral received in conjunction with securities lending. |
| ¥ | | The rate quoted is the annualized seven-day yield of the fund at period end. |
See accompanying notes to financial statements
217
SCHEDULE OF INVESTMENTS
December 31, 2013
| | | | | | | | | | | | |
Vantagepoint
Growth Fund | | | | | | Shares | | | Value | |
| COMMON STOCKS—97.5% | |
| Aerospace & Defense—2.6% | |
Boeing Co. (The) | | | | | 83,200 | | | $ | 11,355,968 | |
Honeywell International, Inc. | | | | | 105,343 | | | | 9,625,190 | |
Precision Castparts Corp. | | | | | 83,388 | | | | 22,456,388 | |
United Technologies Corp. | | | | | 146,730 | | | | 16,697,874 | |
| | | | | | | | | | | | |
| | | | | | | | | 60,135,420 | |
| | | | | | | | | | | | |
| Airlines—0.5% | |
Delta Air Lines, Inc. | | | | | 401,142 | | | | 11,019,371 | |
| | | | | | | | | | | | |
| Auto Components—1.2% | |
BorgWarner, Inc. | | | | | 178,860 | | | | 10,000,063 | |
Johnson Controls, Inc. | | | | | 357,468 | | | | 18,338,108 | |
| | | | | | | | | | | | |
| | | | | | | | | 28,338,171 | |
| | | | | | | | | | | | |
| Automobiles—0.5% | |
General Motors Co. | | * | | | 289,600 | | | | 11,835,952 | |
| | | | | | | | | | | | |
| Beverages—0.5% | |
Coca-Cola Co. (The) | | | | | 289,983 | | | | 11,979,198 | |
| | | | | | | | | | | | |
| Biotechnology—7.9% | |
Alexion Pharmaceuticals, Inc. | | * | | | 111,400 | | | | 14,822,884 | |
Amgen, Inc. | | | | | 79,875 | | | | 9,118,530 | |
Biogen Idec, Inc. | | * | | | 141,064 | | | | 39,462,654 | |
Celgene Corp. | | * | | | 287,555 | | | | 48,585,293 | |
Gilead Sciences, Inc. | | * | | | 797,848 | | | | 59,958,277 | |
Pharmacyclics, Inc. | | * | | | 44,572 | | | | 4,714,826 | |
Regeneron Pharmaceuticals, Inc. | | * | | | 23,900 | | | | 6,578,236 | |
| | | | | | | | | | | | |
| | | | | | | | | 183,240,700 | |
| | | | | | | | | | | | |
| Building Products—0.4% | |
Masco Corp. | | | | | 373,265 | | | | 8,499,244 | |
| | | | | | | | | | | | |
| Capital Markets—2.6% | |
Affiliated Managers Group, Inc. | | * | | | 92,000 | | | | 19,952,960 | |
Charles Schwab Corp. (The) | | | | | 663,000 | | | | 17,238,000 | |
Morgan Stanley | | | | | 183,200 | | | | 5,745,152 | |
State Street Corp. | | | | | 148,110 | | | | 10,869,793 | |
T. Rowe Price Group, Inc. | | | | | 65,950 | | | | 5,524,631 | |
| | | | | | | | | | | | |
| | | | | | | | | 59,330,536 | |
| | | | | | | | | | | | |
| Chemicals—5.3% | |
Ecolab, Inc. | | | | | 257,099 | | | | 26,807,713 | |
FMC Corp. | | | | | 154,400 | | | | 11,651,024 | |
LyondellBasell Industries NV, Class A | | | | | 73,665 | | | | 5,913,826 | |
Monsanto Co. | | | | | 486,059 | | | | 56,650,177 | |
PPG Industries, Inc. | | | | | 120,040 | | | | 22,766,786 | |
| | | | | | | | | | | | |
| | | | | | | | | 123,789,526 | |
| | | | | | | | | | | | |
| Commercial Banks—0.4% | |
Wells Fargo & Co. | | | | | 222,854 | | | | 10,117,572 | |
| | | | | | | | | | | | |
| Commercial Services & Supplies—0.6% | |
Tyco International Ltd. (Switzerland) | | | | | 339,090 | | | | 13,916,254 | |
| | | | | | | | | | | | |
| Communications Equipment—2.5% | |
Juniper Networks, Inc. | | * | | | 288,861 | | | | 6,519,593 | |
QUALCOMM, Inc. | | | | | 680,934 | | | | 50,559,349 | |
| | | | | | | | | | | | |
| | | | | | | | | 57,078,942 | |
| | | | | | | | | | | | |
| Computers & Peripherals—4.3% | |
Apple, Inc. | | | | | 177,942 | | | | 99,845,036 | |
| | | | | | | | | | | | |
| | | | | | | | | | | | |
| | | | | |
| | | | | | |
|
Shares |
| | | Value | |
| Consumer Finance—1.5% | |
American Express Co. | | | | | 154,356 | | | $ | 14,004,720 | |
Discover Financial Services | | | | | 241,791 | | | | 13,528,207 | |
SLM Corp. | | | | | 314,073 | | | | 8,253,838 | |
| | | | | | | | | | | | |
| | | | | | | | | 35,786,765 | |
| | | | | | | | | | | | |
| Diversified Financial Services—1.6% | |
CME Group, Inc. | | | | | 210,200 | | | | 16,492,292 | |
IntercontinentalExchange Group, Inc. | | | | | 48,936 | | | | 11,006,685 | |
JPMorgan Chase & Co. | | | | | 174,340 | | | | 10,195,403 | |
| | | | | | | | | | | | |
| | | | | | | | | 37,694,380 | |
| | | | | | | | | | | | |
| Electrical Equipment—0.9% | |
AMETEK, Inc. | | | | | 244,710 | | | | 12,888,876 | |
Eaton Corp. plc (Ireland) | | | | | 60,509 | | | | 4,605,945 | |
Rockwell Automation, Inc. | | | | | 20,445 | | | | 2,415,781 | |
| | | | | | | | | | | | |
| | | | | | | | | 19,910,602 | |
| | | | | | | | | | | | |
| Energy Equipment & Services—3.0% | |
Cameron International Corp. | | * | | | 87,819 | | | | 5,227,865 | |
FMC Technologies, Inc. | | * | | | 264,500 | | | | 13,809,545 | |
Halliburton Co. | | | | | 441,170 | | | | 22,389,377 | |
National Oilwell Varco, Inc. | | | | | 173,140 | | | | 13,769,824 | |
Schlumberger Ltd. | | | | | 152,815 | | | | 13,770,160 | |
| | | | | | | | | | | | |
| | | | | | | | | 68,966,771 | |
| | | | | | | | | | | | |
| Food & Staples Retailing—2.1% | |
Costco Wholesale Corp. | | | | | 184,925 | | | | 22,007,924 | |
CVS Caremark Corp. | | | | | 194,685 | | | | 13,933,605 | |
Safeway, Inc. | | | | | 163,500 | | | | 5,325,195 | |
Whole Foods Market, Inc. | | | | | 131,320 | | | | 7,594,236 | |
| | | | | | | | | | | | |
| | | | | | | | | 48,860,960 | |
| | | | | | | | | | | | |
| Food Products—1.1% | |
Hershey Co. (The) | | | | | 129,500 | | | | 12,591,285 | |
Mondelez International, Inc., Class A | | | | | 367,290 | | | | 12,965,337 | |
| | | | | | | | | | | | |
| | | | | | | | | 25,556,622 | |
| | | | | | | | | | | | |
| Health Care Equipment & Supplies—1.0% | |
Boston Scientific Corp. | | * | | | 456,000 | | | | 5,481,120 | |
Cooper Cos., Inc. (The) | | | | | 95,790 | | | | 11,862,634 | |
St. Jude Medical, Inc. | | | | | 97,900 | | | | 6,064,905 | |
| | | | | | | | | | | | |
| | | | | | | | | 23,408,659 | |
| | | | | | | | | | | | |
| Health Care Providers & Services—2.6% | |
Cardinal Health, Inc. | | | | | 178,930 | | | | 11,954,313 | |
Catamaran Corp. | | * | | | 353,700 | | | | 16,793,676 | |
DaVita HealthCare Partners, Inc. | | * | | | 66,643 | | | | 4,223,167 | |
Express Scripts Holding Co. | | * | | | 185,215 | | | | 13,009,502 | |
McKesson Corp. | | | | | 38,958 | | | | 6,287,821 | |
UnitedHealth Group, Inc. | | | | | 120,738 | | | | 9,091,571 | |
| | | | | | | | | | | | |
| | | | | | | | | 61,360,050 | |
| | | | | | | | | | | | |
| Health Care Technology—0.6% | |
Cerner Corp. | | * | | | 268,300 | | | | 14,955,042 | |
| | | | | | | | | | | | |
| Hotels, Restaurants & Leisure—4.2% | |
Chipotle Mexican Grill, Inc. | | * | | | 21,100 | | | | 11,241,658 | |
Las Vegas Sands Corp. | | | | | 294,263 | | | | 23,208,523 | |
McDonald’s Corp. | | | | | 83,123 | | | | 8,065,425 | |
Panera Bread Co., Class A | | * | | | 18,382 | | | | 3,247,916 | |
See accompanying notes to financial statements
218
SCHEDULE OF INVESTMENTS—(Continued)
December 31, 2013
| | | | | | | | | | | | |
Vantagepoint
Growth Fund | | | | | | Shares | | | Value | |
| COMMON STOCKS—(Continued) | |
Starbucks Corp. | | | | | 655,704 | | | $ | 51,400,636 | |
| | | | | | | | | | | | |
| | | | | | | | | 97,164,158 | |
| | | | | | | | | | | | |
| Household Durables—1.1% | |
Lennar Corp., Class A | | | | | 201,950 | | | | 7,989,142 | |
Mohawk Industries, Inc. | | * | | | 83,300 | | | | 12,403,370 | |
Whirlpool Corp. | | | | | 38,184 | | | | 5,989,542 | |
| | | | | | | | | | | | |
| | | | | | | | | 26,382,054 | |
| | | | | | | | | | | | |
| Household Products—0.4% | |
Procter & Gamble Co. (The) | | | | | 125,743 | | | | 10,236,738 | |
| | | | | | | | | | | | |
| Industrial Conglomerates—1.4% | |
Danaher Corp. | | | | | 267,499 | | | | 20,650,923 | |
General Electric Co. | | | | | 406,076 | | | | 11,382,310 | |
| | | | | | | | | | | | |
| | | | | | | | | 32,033,233 | |
| | | | | | | | | | | | |
| Insurance—0.8% | |
American International Group, Inc. | | | | | 251,190 | | | | 12,823,249 | |
Marsh & McLennan Cos., Inc. | | | | | 126,138 | | | | 6,100,034 | |
| | | | | | | | | | | | |
| | | | | | | | | 18,923,283 | |
| | | | | | | | | | | | |
| Internet & Catalog Retail—5.2% | |
Amazon.com, Inc. | | * | | | 159,480 | | | | 63,599,029 | |
priceline.com, Inc. | | * | | | 48,684 | | | | 56,590,282 | |
| | | | | | | | | | | | |
| | | | | | | | | 120,189,311 | |
| | | | | | | | | | | | |
| Internet Software & Services—7.3% | |
eBay, Inc. | | * | | | 248,375 | | | | 13,633,304 | |
Facebook, Inc., Class A | | * | | | 675,077 | | | | 36,899,709 | |
Google, Inc., Class A | | * | | | 85,662 | | | | 96,002,260 | |
LinkedIn Corp., Class A | | * | | | 86,294 | | | | 18,711,128 | |
Yelp, Inc. | | * | | | 63,600 | | | | 4,385,220 | |
| | | | | | | | | | | | |
| | | | | | | | | 169,631,621 | |
| | | | | | | | | | | | |
| IT Services—4.5% | |
Alliance Data Systems Corp. | | * | | | 84,946 | | | | 22,334,852 | |
FleetCor Technologies, Inc. | | * | | | 60,775 | | | | 7,121,007 | |
MasterCard, Inc., Class A | | | | | 18,368 | | | | 15,345,729 | |
Visa, Inc., Class A | | | | | 271,173 | | | | 60,384,803 | |
| | | | | | | | | | | | |
| | | | | | | | | 105,186,391 | |
| | | | | | | | | | | | |
| Life Sciences Tools & Services—0.8% | |
Thermo Fisher Scientific, Inc. | | | | | 172,330 | | | | 19,188,946 | |
| | | | | | | | | | | | |
| Machinery—1.4% | |
Caterpillar, Inc. | | | | | 118,680 | | | | 10,777,331 | |
Cummins, Inc. | | | | | 110,400 | | | | 15,563,088 | |
PACCAR, Inc. | | | | | 115,220 | | | | 6,817,567 | |
| | | | | | | | | | | | |
| | | | | | | | | 33,157,986 | |
| | | | | | | | | | | | |
| Media—3.7% | |
Comcast Corp., Class A | | | | | 621,570 | | | | 32,299,885 | |
Sirius XM Holdings, Inc. | | * | | | 1,218,234 | | | | 4,251,637 | |
Twenty-First Century Fox, Inc., Class A | | | | | 388,352 | | | | 13,662,223 | |
Viacom, Inc., Class B | | | | | 141,190 | | | | 12,331,534 | |
Walt Disney Co. (The) | | | | | 312,842 | | | | 23,901,129 | |
| | | | | | | | | | | | |
| | | | | | | | | 86,446,408 | |
| | | | | | | | | | | | |
| Multiline Retail—0.2% | |
Nordstrom, Inc. | | | | | 71,052 | | | | 4,391,014 | |
| | | | | | | | | | | | |
| | | | | | | | | | | | |
| | | | | |
| | | | | | |
|
Shares |
| | | Value | |
| Oil, Gas & Consumable Fuels—2.6% | |
Noble Energy, Inc. | | | | | 160,160 | | | $ | 10,908,498 | |
Occidental Petroleum Corp. | | | | | 168,235 | | | | 15,999,148 | |
Pioneer Natural Resources Co. | | | | | 77,171 | | | | 14,204,866 | |
Suncor Energy, Inc. (Canada) | | | | | 230,440 | | | | 8,076,922 | |
Valero Energy Corp. | | | | | 217,390 | | | | 10,956,456 | |
| | | | | | | | | | | | |
| | | | | | | | | 60,145,890 | |
| | | | | | | | | | | | |
| Personal Products—0.4% | |
Estee Lauder Cos., Inc. (The), Class A | | | | | 123,323 | | | | 9,288,688 | |
| | | | | | | | | | | | |
| Pharmaceuticals—5.5% | |
AbbVie, Inc. | | | | | 270,880 | | | | 14,305,173 | |
Actavis plc | | * | | | 162,411 | | | | 27,285,048 | |
Allergan, Inc. | | | | | 75,994 | | | | 8,441,414 | |
Bristol-Myers Squibb Co. | | | | | 505,381 | | | | 26,861,000 | |
Perrigo Co. plc | | | | | 54,301 | | | | 8,333,032 | |
Pfizer, Inc. | | | | | 352,424 | | | | 10,794,747 | |
Teva Pharmaceutical Industries Ltd. ADR (Israel) | | | | | 500,540 | | | | 20,061,643 | |
Valeant Pharmaceuticals International, Inc. | | * | | | 105,656 | | | | 12,404,014 | |
| | | | | | | | | | | | |
| | | | | | | | | | | 128,486,071 | |
| | | | | | | | | | | | |
| Professional Services—0.5% | |
Nielsen Holdings NV | | | | | 246,160 | | | | 11,296,282 | |
| | | | | | | | | | | | |
| Real Estate Investment Trusts (REITs)—0.3% | |
American Tower Corp. REIT | | | | | 78,989 | | | | 6,304,902 | |
| | | | | | | | | | | | |
| Road & Rail—3.0% | |
Canadian Pacific Railway Ltd. (Canada) | | | | | 174,080 | | | | 26,341,785 | |
CSX Corp. | | | | | 343,270 | | | | 9,875,878 | |
Genesee & Wyoming, Inc., Class A | | * | | | 21,796 | | | | 2,093,506 | |
Hertz Global Holdings, Inc. | | * | | | 281,150 | | | | 8,046,513 | |
J.B. Hunt Transport Services, Inc. | | | | | 197,300 | | | | 15,251,290 | |
Union Pacific Corp. | | | | | 47,863 | | | | 8,040,984 | |
| | | | | | | | | | | | |
| | | | | | | | | | | 69,649,956 | |
| | | | | | | | | | | | |
| Semiconductors & Semiconductor Equipment—0.7% | |
Cree, Inc. | | * | | | 91,382 | | | | 5,717,772 | |
Lam Research Corp. | | * | | | 77,189 | | | | 4,202,941 | |
Texas Instruments, Inc. | | | | | 142,710 | | | | 6,266,396 | |
| | | | | | | | | | | | |
| | | | | | | | | | | 16,187,109 | |
| | | | | | | | | | | | |
| Software—3.1% | |
Adobe Systems, Inc. | | * | | | 197,300 | | | | 11,814,324 | |
Citrix Systems, Inc. | | * | | | 188,500 | | | | 11,922,625 | |
Informatica Corp. | | * | | | 105,020 | | | | 4,358,330 | |
Microsoft Corp. | | | | | 198,865 | | | | 7,443,517 | |
Oracle Corp. | | | | | 177,089 | | | | 6,775,425 | |
Salesforce.com, Inc. | | * | | | 260,810 | | | | 14,394,104 | |
ServiceNow, Inc. | | * | | | 67,646 | | | | 3,788,853 | |
Splunk, Inc. | | * | | | 56,593 | | | | 3,886,241 | |
VMware, Inc., Class A | | * | | | 51,364 | | | | 4,607,864 | |
Workday, Inc., Class A | | * | | | 50,100 | | | | 4,166,316 | |
| | | | | | | | | | | | |
| | | | | | | | | | | 73,157,599 | |
| | | | | | | | | | | | |
| Specialty Retail—2.7% | |
Bed Bath & Beyond, Inc. | | * | | | 76,833 | | | | 6,169,690 | |
Home Depot, Inc. (The) | | | | | 294,357 | | | | 24,237,355 | |
See accompanying notes to financial statements
219
SCHEDULE OF INVESTMENTS—(Continued)
December 31, 2013
| | | | | | | | | | | | |
Vantagepoint
Growth Fund | | | | | | Shares | | | Value | |
| COMMON STOCKS—(Continued) | |
Lowe’s Cos., Inc. | | | | | 213,503 | | | $ | 10,579,074 | |
Ross Stores, Inc. | | | | | 69,906 | | | | 5,238,057 | |
Tractor Supply Co. | | | | | 227,600 | | | | 17,657,208 | |
| | | | | | | | | | | | |
| | | | | | | | | | | 63,881,384 | |
| | | | | | | | | | | | |
| Textiles, Apparel & Luxury Goods—2.6% | |
Michael Kors Holdings Ltd. (Hong Kong) | | * | | | 393,128 | | | | 31,918,062 | |
NIKE, Inc., Class B | | | | | 266,148 | | | | 20,929,879 | |
V.F. Corp. | | | | | 118,612 | | | | 7,394,272 | |
| | | | | | | | | | | | |
| | | | | | | | | | | 60,242,213 | |
| | | | | | | | | | | | |
| Thrifts & Mortgage Finance—0.2% | |
Ocwen Financial Corp. | | * | | | 61,800 | | | | 3,426,810 | |
| | | | | | | | | | | | |
| Tobacco—0.6% | |
Philip Morris International, Inc. | | | | | 150,913 | | | | 13,149,050 | |
| | | | | | | | | | | | |
| Trading Companies & Distributors—0.3% | |
Fastenal Co. | | | | | 145,277 | | | | 6,902,110 | |
| | | | | | | | | | | | |
| Wireless Telecommunication Services—0.3% | |
Crown Castle International Corp. | | * | | | 104,600 | | | | 7,680,778 | |
| | | | | | | | | | | | |
| TOTAL COMMON STOCKS | | | | | | | | |
(Cost $1,609,370,365) | | | | | | | | | 2,268,355,758 | |
| | | | | | | | | | | | |
| | | | | | | | | | | | | |
| MONEY MARKET FUNDS—2.7% | |
| Institutional Money Market Fund—2.7% | |
Fidelity Institutional Money Market: Money Market Portfolio—Institutional Class, 0.07% | | | | | | | | | | |
(Cost $62,416,519) | | ¥ | | | 62,416,519 | | | | 62,416,519 | |
| | | | | | | | | | | | |
| TOTAL INVESTMENTS—100.2% | |
(Cost $1,671,786,884) | | | | | | | | | 2,330,772,277 | |
Other assets less liabilities—(0.2%) | | | | (5,292,547 | ) |
| | | | | | | | | | | | |
| NET ASSETS—100.0% | | | $ | 2,325,479,730 | |
| | | | | |
Notes to the Schedule of Investments:
| | |
| ADR | | American Depositary Receipt |
| REIT | | Real Estate Investment Trust |
| * | | Non-income producing. |
| ¥ | | The rate quoted is the annualized seven-day yield of the fund at period end. |
See accompanying notes to financial statements
220
SCHEDULE OF INVESTMENTS
December 31, 2013
| | | | | | | | | | | | |
Vantagepoint Select
Value Fund | | | | Shares | | | Value | |
| COMMON STOCKS—94.5% | |
| Aerospace & Defense—4.2% | |
Alliant Techsystems, Inc. | | | | | 15,210 | | | $ | 1,850,753 | |
Huntington Ingalls Industries, Inc. | | | | | 65,790 | | | | 5,921,758 | |
L-3 Communications Holdings, Inc. | | | | | 14,615 | | | | 1,561,759 | |
Northrop Grumman Corp. | | | | | 15,100 | | | | 1,730,611 | |
Rockwell Collins, Inc. | | | | | 31,704 | | | | 2,343,560 | |
TransDigm Group, Inc. | | | | | 39,819 | | | | 6,411,655 | |
| | | | | | | | | | | | |
| | | | | | | | | | | 19,820,096 | |
| | | | | | | | | | | | |
| Airlines—0.8% | |
American Airlines Group, Inc. | | *† | | | 65,325 | | | | 1,649,456 | |
Delta Air Lines, Inc. | | | | | 78,450 | | | | 2,155,022 | |
| | | | | | | | | | | | |
| | | | | | | | | | | 3,804,478 | |
| | | | | | | | | | | | |
| Auto Components—1.6% | |
Dana Holding Corp. | | | | | 69,500 | | | | 1,363,590 | |
Delphi Automotive plc (United Kingdom) | | | | | 53,800 | | | | 3,234,994 | |
Lear Corp. | | | | | 13,050 | | | | 1,056,658 | |
Magna International, Inc. (Canada) | | | | | 24,360 | | | | 1,998,982 | |
| | | | | | | | | | | | |
| | | | | | | | | | | 7,654,224 | |
| | | | | | | | | | | | |
| Capital Markets—1.1% | |
Invesco Ltd. | | | | | 103,950 | | | | 3,783,780 | |
Northern Trust Corp. | | | | | 22,787 | | | | 1,410,287 | |
| | | | | | | | | | | | |
| | | | | | | | | | | 5,194,067 | |
| | | | | | | | | | | | |
| Chemicals—1.5% | |
Ashland, Inc. | | | | | 49,900 | | | | 4,842,296 | |
Huntsman Corp. | | | | | 69,475 | | | | 1,709,085 | |
Methanex Corp. (Canada) | | | | | 11,700 | | | | 693,108 | |
| | | | | | | | | | | | |
| | | | | | | | | | | 7,244,489 | |
| | | | | | | | | | | | |
| Commercial Banks—4.4% | |
CIT Group, Inc. | | | | | 15,000 | | | | 781,950 | |
City National Corp./California | | | | | 41,111 | | | | 3,256,813 | |
Fifth Third Bancorp | | | | | 41,400 | | | | 870,642 | |
Huntington Bancshares, Inc./Ohio | | | | | 351,125 | | | | 3,388,356 | |
M&T Bank Corp. | | † | | | 51,183 | | | | 5,958,725 | |
Regions Financial Corp. | | | | | 357,875 | | | | 3,539,384 | |
TCF Financial Corp. | | | | | 95,502 | | | | 1,551,908 | |
Webster Financial Corp. | | | | | 51,525 | | | | 1,606,549 | |
| | | | | | | | | | | | |
| | | | | | | | | | | 20,954,327 | |
| | | | | | | | | | | | |
| Commercial Services & Supplies—1.6% | |
R.R. Donnelley & Sons Co. | | † | | | 48,750 | | | | 988,650 | |
Republic Services, Inc. | | | | | 90,004 | | | | 2,988,133 | |
Steelcase, Inc., Class A | | | | | 229,500 | | | | 3,639,870 | |
| | | | | | | | | | | | |
| | | | | | | | | | | 7,616,653 | |
| | | | | | | | | | | | |
| Communications Equipment—0.5% | |
Finisar Corp. | | * | | | 107,075 | | | | 2,561,234 | |
| | | | | | | | | | | | |
| Computers & Peripherals—0.5% | |
Lexmark International, Inc., Class A | | † | | | 44,748 | | | | 1,589,449 | |
SanDisk Corp. | | | | | 11,500 | | | | 811,210 | |
| | | | | | | | | | | | |
| | | | | | | | | | | 2,400,659 | |
| | | | | | | | | | | | |
| | | | | | | | | | | | |
| | | | | |
| | | | | | | Shares | | | Value | |
| Construction & Engineering—1.5% | |
Jacobs Engineering Group, Inc. | | * | | | 35,541 | | | $ | 2,238,728 | |
URS Corp. | | | | | 89,700 | | | | 4,753,203 | |
| | | | | | | | | | | | |
| | | | | | | | | | | 6,991,931 | |
| | | | | | | | | | | | |
| Consumer Finance—0.3% | |
Discover Financial Services | | | | | 21,975 | | | | 1,229,501 | |
| | | | | | | | | | | | |
| Containers & Packaging—2.3% | |
Bemis Co., Inc. | | | | | 77,500 | | | | 3,174,400 | |
Graphic Packaging Holding Co. | | * | | | 166,825 | | | | 1,601,520 | |
Owens-Illinois, Inc. | | * | | | 71,050 | | | | 2,542,169 | |
Sonoco Products Co. | | | | | 92,317 | | | | 3,851,465 | |
| | | | | | | | | | | | |
| | | | | | | | | | | 11,169,554 | |
| | | | | | | | | | | | |
| Diversified Consumer Services—0.6% | |
H&R Block, Inc. | | | | | 98,389 | | | | 2,857,217 | |
| | | | | | | | | | | | |
| Diversified Financial Services—1.7% | |
ING US, Inc. | | | | | 100,200 | | | | 3,522,030 | |
IntercontinentalExchange Group, Inc. | | | | | 14,809 | | | | 3,330,840 | |
PHH Corp. | | * | | | 57,500 | | | | 1,400,125 | |
| | | | | | | | | | | | |
| | | | | | | | | | | 8,252,995 | |
| | | | | | | | | | | | |
| Electric Utilities—2.6% | |
Cleco Corp. | | | | | 42,175 | | | | 1,966,198 | |
Edison International | | | | | 64,480 | | | | 2,985,424 | |
Great Plains Energy, Inc. | | | | | 121,100 | | | | 2,935,464 | |
Pinnacle West Capital Corp. | | | | | 85,800 | | | | 4,540,536 | |
| | | | | | | | | | | | |
| | | | | | | | | | | 12,427,622 | |
| | | | | | | | | | | | |
| Electrical Equipment—0.9% | |
Generac Holdings, Inc. | | | | | 37,575 | | | | 2,128,248 | |
Hubbell, Inc., Class B | | | | | 20,475 | | | | 2,229,727 | |
| | | | | | | | | | | | |
| | | | | | | | | | | 4,357,975 | |
| | | | | | | | | | | | |
| Electronic Equipment, Instruments & Components—3.1% | |
Arrow Electronics, Inc. | | * | | | 73,645 | | | | 3,995,241 | |
Avnet, Inc. | | | | | 111,487 | | | | 4,917,692 | |
FLIR Systems, Inc. | | | | | 110,467 | | | | 3,325,057 | |
Ingram Micro, Inc., Class A | | * | | | 115,372 | | | | 2,706,627 | |
| | | | | | | | | | | | |
| | | | | | | | | | | 14,944,617 | |
| | | | | | | | | | | | |
| Energy Equipment & Services—2.1% | |
Ensco plc, Class A (United Kingdom) | | | | | 43,784 | | | | 2,503,569 | |
McDermott International, Inc. | | * | | | 185,764 | | | | 1,701,598 | |
Patterson-UTI Energy, Inc. | | | | | 115,751 | | | | 2,930,815 | |
SEACOR Holdings, Inc. | | * | | | 31,900 | | | | 2,909,280 | |
Tidewater, Inc. | | | | | 2,950 | | | | 174,847 | |
| | | | | | | | | | | | |
| | | | | | | | | | | 10,220,109 | |
| | | | | | | | | | | | |
| Food & Staples Retailing—1.3% | |
Kroger Co. (The) | | | | | 95,441 | | | | 3,772,783 | |
Rite Aid Corp. | | * | | | 199,275 | | | | 1,008,331 | |
SUPERVALU, Inc. | | *† | | | 172,300 | | | | 1,256,067 | |
| | | | | | | | | | | | |
| | | | | | | | | | | 6,037,181 | |
| | | | | | | | | | | | |
| Food Products—0.5% | |
Hillshire Brands Co. | | | | | 42,770 | | | | 1,430,229 | |
Tyson Foods, Inc., Class A | | | | | 22,950 | | | | 767,907 | |
| | | | | | | | | | | | |
| | | | | | | | | | | 2,198,136 | |
| | | | | | | | | | | | |
See accompanying notes to financial statements
221
SCHEDULE OF INVESTMENTS—(Continued)
December 31, 2013
| | | | | | | | | | | | |
Vantagepoint Select
Value Fund | | | | Shares | | | Value | |
| COMMON STOCKS—(Continued) | |
| Gas Utilities—0.9% | |
Atmos Energy Corp. | | | | | 59,800 | | | $ | 2,716,116 | |
UGI Corp. | | | | | 33,500 | | | | 1,388,910 | |
| | | | | | | | | | | | |
| | | | | | | | | | | 4,105,026 | |
| | | | | | | | | | | | |
| Health Care Equipment & Supplies—1.6% | |
Becton Dickinson and Co. | | | | | 13,870 | | | | 1,532,496 | |
Boston Scientific Corp. | | * | | | 110,225 | | | | 1,324,905 | |
CareFusion Corp. | | * | | | 89,520 | | | | 3,564,686 | |
St. Jude Medical, Inc. | | | | | 17,225 | | | | 1,067,089 | |
| | | | | | | | | | | | |
| | | | | | | | | | | 7,489,176 | |
| | | | | | | | | | | | |
| Health Care Providers & Services—3.4% | |
Aetna, Inc. | | | | | 37,050 | | | | 2,541,260 | |
Cardinal Health, Inc. | | | | | 44,625 | | | | 2,981,396 | |
Cigna Corp. | | | | | 53,516 | | | | 4,681,580 | |
HCA Holdings, Inc. | | * | | | 62,900 | | | | 3,000,959 | |
Omnicare, Inc. | | | | | 23,425 | | | | 1,413,933 | |
Universal Health Services, Inc., Class B | | | | | 20,970 | | | | 1,704,022 | |
| | | | | | | | | | | | |
| | | | | | | | | | | 16,323,150 | |
| | | | | | | | | | | | |
| Hotels, Restaurants & Leisure—2.7% | |
Darden Restaurants, Inc. | | | | | 85,300 | | | | 4,637,761 | |
MGM Resorts International | | * | | | 64,625 | | | | 1,519,980 | |
Starwood Hotels & Resorts Worldwide, Inc. | | | | | 10,160 | | | | 807,212 | |
Wendy’s Co. (The) | | | | | 90,725 | | | | 791,122 | |
Wyndham Worldwide Corp. | | | | | 66,800 | | | | 4,922,492 | |
| | | | | | | | | | | | |
| | | | | | | | | | | 12,678,567 | |
| | | | | | | | | | | | |
| Household Durables—0.6% | |
Mohawk Industries, Inc. | | * | | | 8,300 | | | | 1,235,870 | |
Whirlpool Corp. | | | | | 9,000 | | | | 1,411,740 | |
| | | | | | | | | | | | |
| | | | | | | | | | | 2,647,610 | |
| | | | | | | | | | | | |
| Household Products—0.5% | |
Energizer Holdings, Inc. | | | | | 21,130 | | | | 2,287,111 | |
| | | | | | | | | | | | |
| Independent Power Producers & Energy Traders—0.6% | |
AES Corp. (The) | | | | | 185,000 | | | | 2,684,350 | |
| | | | | | | | | | | | |
| Industrial Conglomerates—0.8% | |
Carlisle Cos., Inc. | | | | | 50,700 | | | | 4,025,580 | |
| | | | | | | | | | | | |
| Insurance—10.4% | |
Alleghany Corp. | | * | | | 8,725 | | | | 3,489,651 | |
Allied World Assurance Co. Holdings AG (Switzerland) | | | | | 17,008 | | | | 1,918,672 | |
Allstate Corp. (The) | | | | | 192,219 | | | | 10,483,624 | |
Aon plc (United Kingdom) | | | | | 34,199 | | | | 2,868,954 | |
Arch Capital Group Ltd. (Bermuda) | | * | | | 53,236 | | | | 3,177,657 | |
Endurance Specialty Holdings Ltd. (Bermuda) | | | | | 54,600 | | | | 3,203,382 | |
Everest Re Group Ltd. (Bermuda) | | | | | 4,925 | | | | 767,660 | |
HCC Insurance Holdings, Inc. | | | | | 105,975 | | | | 4,889,687 | |
Lincoln National Corp. | | | | | 162,562 | | | | 8,391,450 | |
Loews Corp. | | | | | 52,179 | | | | 2,517,115 | |
Progressive Corp. (The) | | | | | 103,862 | | | | 2,832,317 | |
Torchmark Corp. | | | | | 33,300 | | | | 2,602,395 | |
Unum Group | | | | | 22,925 | | | | 804,209 | |
| | | | | | | | | | | | |
| | | | | |
| | | | | | | Shares | | | Value | |
Validus Holdings Ltd. (Bermuda) | | | | | 42,284 | | | $ | 1,703,622 | |
| | | | | | | | | | | | |
| | | | | | | | | | | 49,650,395 | |
| | | | | | | | | | | | |
| Internet & Catalog Retail—0.4% | |
Liberty Interactive Corp., Series A | | * | | | 69,692 | | | | 2,045,460 | |
| | | | | | | | | | | | |
| Internet Software & Services—0.5% | |
Web.com Group, Inc. | | * | | | 74,950 | | | | 2,382,661 | |
| | | | | | | | | | | | |
IT Services—3.6% | | | | | | | | | | |
Broadridge Financial Solutions, Inc. | | | | | 25,773 | | | | 1,018,549 | |
Computer Sciences Corp. | | | | | 112,667 | | | | 6,295,832 | |
Convergys Corp. | | | | | 145,700 | | | | 3,066,985 | |
NeuStar, Inc., Class A | | * | | | 38,829 | | | | 1,936,014 | |
Teradata Corp. | | * | | | 42,375 | | | | 1,927,639 | |
Western Union Co. (The) | | | | | 172,021 | | | | 2,967,362 | |
| | | | | | | | | | | | |
| | | | | | | | | | | 17,212,381 | |
| | | | | | | | | | | | |
| Leisure Equipment & Products—1.9% | |
Brunswick Corp. | | | | | 137,419 | | | | 6,329,519 | |
Mattel, Inc. | | | | | 60,270 | | | | 2,867,647 | |
| | | | | | | | | | | | |
| | | | | | | | | | | 9,197,166 | |
| | | | | | | | | | | | |
| Life Sciences Tools & Services—0.5% | |
Agilent Technologies, Inc. | | | | | 38,275 | | | | 2,188,947 | |
| | | | | | | | | | | | |
| Machinery—1.9% | |
Dover Corp. | | | | | 23,290 | | | | 2,248,417 | |
ITT Corp. | | | | | 32,000 | | | | 1,389,440 | |
Joy Global, Inc. | | † | | | 39,100 | | | | 2,286,959 | |
Parker Hannifin Corp. | | | | | 16,005 | | | | 2,058,883 | |
Terex Corp. | | | | | 23,900 | | | | 1,003,561 | |
| | | | | | | | | | | | |
| | | | | | | | | | | 8,987,260 | |
| | | | | | | | | | | | |
| Media—1.0% | |
Gannett Co., Inc. | | | | | 56,225 | | | | 1,663,135 | |
Omnicom Group, Inc. | | | | | 39,134 | | | | 2,910,396 | |
| | | | | | | | | | | | |
| | | | | | | | | | | 4,573,531 | |
| | | | | | | | | | | | |
| Metals & Mining—1.2% | |
Barrick Gold Corp. (Canada) | | | | | 77,025 | | | | 1,357,951 | |
Gerdau SA ADR (Brazil) | | | | | 367,275 | | | | 2,879,436 | |
Kinross Gold Corp. (Canada) | | | | | 377,480 | | | | 1,653,362 | |
| | | | | | | | | | | | |
| | | | | | | | | | | 5,890,749 | |
| | | | | | | | | | | | |
| Multiline Retail—1.7% | |
Dillard’s, Inc., Class A | | | | | 11,500 | | | | 1,117,915 | |
Nordstrom, Inc. | | | | | 112,597 | | | | 6,958,495 | |
| | | | | | | | | | | | |
| | | | | | | | | | | 8,076,410 | |
| | | | | | | | | | | | |
| Multi-Utilities—2.3% | |
Ameren Corp. | | | | | 69,250 | | | | 2,504,080 | |
CMS Energy Corp. | | | | | 111,350 | | | | 2,980,840 | |
PG&E Corp. | | | | | 114,100 | | | | 4,595,948 | |
SCANA Corp. | | | | | 17,626 | | | | 827,188 | |
| | | | | | | | | | | | |
| | | | | | | | | | | 10,908,056 | |
| | | | | | | | | | | | |
| Office Electronics—0.2% | |
Xerox Corp. | | | | | 88,125 | | | | 1,072,481 | |
| | | | | | | | | | | | |
| Oil, Gas & Consumable Fuels—6.7% | |
Chesapeake Energy Corp. | | | | | 112,075 | | | | 3,041,716 | |
Cimarex Energy Co. | | | | | 65,967 | | | | 6,920,598 | |
Energen Corp. | | | | | 22,700 | | | | 1,606,025 | |
Hess Corp. | | | | | 36,327 | | | | 3,015,141 | |
See accompanying notes to financial statements
222
SCHEDULE OF INVESTMENTS—(Continued)
December 31, 2013
| | | | | | | | | | | | |
Vantagepoint Select
Value Fund | | | | Shares | | | Value | |
| COMMON STOCKS—(Continued) | |
Murphy Oil Corp. | | | | | 47,900 | | | $ | 3,107,752 | |
Peabody Energy Corp. | | | | | 107,925 | | | | 2,107,775 | |
QEP Resources, Inc. | | | | | 101,000 | | | | 3,095,650 | |
SM Energy Co. | | | | | 30,548 | | | | 2,538,844 | |
Southwestern Energy Co. | | * | | | 72,073 | | | | 2,834,631 | |
Western Refining, Inc. | | † | | | 39,500 | | | | 1,675,195 | |
Whiting Petroleum Corp. | | * | | | 35,625 | | | | 2,204,119 | |
| | | | | | | | | | | | |
| | | | | | | | | | | 32,147,446 | |
| | | | | | | | | | | | |
| Professional Services—1.8% | |
Manpowergroup, Inc. | | | | | 71,106 | | | | 6,105,161 | |
Towers Watson & Co., Class A | | | | | 18,651 | | | | 2,380,054 | |
| | | | | | | | | | | | |
| | | | | | | | | | | 8,485,215 | |
| | | | | | | | | | | | |
| Real Estate Investment Trusts (REITs)—5.8% | |
Annaly Capital Management, Inc. REIT | | | | | 84,708 | | | | 844,539 | |
BioMed Realty Trust, Inc. REIT | | | | | 126,600 | | | | 2,293,992 | |
Brandywine Realty Trust REIT | | | | | 135,525 | | | | 1,909,547 | |
Capstead Mortgage Corp. REIT | | | | | 116,900 | | | | 1,412,152 | |
CBL & Associates Properties, Inc. REIT | | | | | 303,850 | | | | 5,457,146 | |
Duke Realty Corp. REIT | | | | | 319,454 | | | | 4,804,588 | |
DuPont Fabros Technology, Inc. REIT | | | | | 56,075 | | | | 1,385,613 | |
EPR Properties REIT | | | | | 30,300 | | | | 1,489,548 | |
Hatteras Financial Corp. REIT | | | | | 100,725 | | | | 1,645,847 | |
Liberty Property Trust REIT | | | | | 71,050 | | | | 2,406,464 | |
MFA Financial, Inc. REIT | | | | | 202,200 | | | | 1,427,532 | |
Weyerhaeuser Co. REIT | | | | | 89,725 | | | | 2,832,618 | |
| | | | | | | | | | | | |
| | | | | | | | | | | 27,909,586 | |
| | | | | | | | | | | | |
| Real Estate Management & Development—0.2% | |
CBRE Group, Inc., Class A | | * | | | 35,050 | | | | 921,815 | |
| | | | | | | | | | | | |
| Road & Rail—1.7% | |
Ryder System, Inc. | | | | | 23,778 | | | | 1,754,341 | |
Swift Transportation Co. | | *† | | | 70,275 | | | | 1,560,808 | |
Werner Enterprises, Inc. | | | | | 185,500 | | | | 4,587,415 | |
| | | | | | | | | | | | |
| | | | | | | | | | | 7,902,564 | |
| | | | | | | | | | | | |
| Semiconductors & Semiconductor Equipment—3.9% | |
Analog Devices, Inc. | | | | | 75,246 | | | | 3,832,279 | |
First Solar, Inc. | | * | | | 26,475 | | | | 1,446,594 | |
KLA-Tencor Corp. | | | | | 41,281 | | | | 2,660,973 | |
Lam Research Corp. | | * | | | 110,117 | | | | 5,995,871 | |
Marvell Technology Group Ltd. (Bermuda) | | | | | 55,675 | | | | 800,606 | |
Micron Technology, Inc. | | * | | | 74,075 | | | | 1,611,872 | |
NXP Semiconductor NV (Netherlands) | | * | | | 35,750 | | | | 1,641,998 | |
Skyworks Solutions, Inc. | | * | | | 28,225 | | | | 806,106 | |
| | | | | | | | | | | | |
| | | | | | | | | | | 18,796,299 | |
| | | | | | | | | | | | |
| Software—1.2% | |
Autodesk, Inc. | | * | | | 3,335 | | | | 167,851 | |
Electronic Arts, Inc. | | * | | | 43,225 | | | | 991,581 | |
Open Text Corp. (Canada) | | | | | 15,760 | | | | 1,449,290 | |
Synopsys, Inc. | | * | | | 36,162 | | | | 1,467,092 | |
TiVo, Inc. | | * | | | 114,275 | | | | 1,499,288 | |
| | | | | | | | | | | | |
| | | | | | | | | | | 5,575,102 | |
| | | | | | | | | | | | |
| | | | | | | | | | | | |
| | | | | |
| | | | | | | Shares | | | Value | |
| Specialty Retail—1.3% | |
Bed Bath & Beyond, Inc. | | * | | | 36,657 | | | $ | 2,943,557 | |
Best Buy Co., Inc. | | | | | 67,175 | | | | 2,678,939 | |
Guess?, Inc. | | | | | 18,375 | | | | 570,911 | |
| | | | | | | | | | | | |
| | | | | | | | | | | 6,193,407 | |
| | | | | | | | | | | | |
| Textiles, Apparel & Luxury Goods—0.9% | |
Coach, Inc. | | | | | 45,244 | | | | 2,539,546 | |
Hanesbrands, Inc. | | | | | 23,250 | | | | 1,633,777 | |
| | | | | | | | | | | | |
| | | | | | | | | | | 4,173,323 | |
| | | | | | | | | | | | |
| Thrifts & Mortgage Finance—0.2% | |
Nationstar Mortgage Holdings, Inc. | | *† | | | 31,350 | | | | 1,158,696 | |
| | | | | | | | | | | | |
| Tobacco—0.5% | |
Lorillard, Inc. | | | | | 44,550 | | | | 2,257,794 | |
| | | | | | | | | | | | |
| Trading Companies & Distributors—0.5% | |
MRC Global, Inc. | | * | | | 72,200 | | | | 2,329,172 | |
| | | | | | | | | | | | |
| TOTAL COMMON STOCKS | |
(Cost $345,398,317) | | | | | | | | | 450,213,551 | |
| | | | | | | | | | | | |
| | | | | | | | | | | | | |
| MONEY MARKET FUNDS—9.2% | |
| Institutional Money Market Funds—9.2% | |
Dreyfus Institutional Cash Advantage Fund, 0.06% | | ††¥ | | | 3,000,000 | | | | 3,000,000 | |
Fidelity Institutional Money Market: Money Market Portfolio—Institutional Class, 0.07% | | ¥ | | | 26,846,418 | | | | 26,846,418 | |
Fidelity Institutional Money Market: Money Market Portfolio—Institutional Class, 0.07% | | ††¥ | | | 2,144,545 | | | | 2,144,545 | |
Fidelity Institutional Money Market: Prime Money Market Portfolio—Institutional Class, 0.04% | | ††¥ | | | 3,000,000 | | | | 3,000,000 | |
Short-Term Investments Trust Liquid Assets Portfolio—Institutional Class, 0.07% | | ††¥ | | | 3,000,000 | | | | 3,000,000 | |
Wells Fargo Advantage Cash Investment Money Market Fund—Select Class, 0.06% | | ††¥ | | | 3,000,000 | | | | 3,000,000 | |
Wells Fargo Advantage Heritage Money Market Fund—Select Class, 0.06% | | ††¥ | | | 3,000,000 | | | | 3,000,000 | |
| | | | | | | | | | | | |
| TOTAL MONEY MARKET FUNDS | |
(Cost $43,990,963) | | | | | | | 43,990,963 | |
| | | | | | | | | | | | |
| TOTAL INVESTMENTS—103.7% | |
(Cost $389,389,280) | | | | | | | 494,204,514 | |
Other assets less liabilities—(3.7%) | | | | (17,468,955 | ) |
| | | | | | | | | | | | |
| NET ASSETS—100.0% | | | | | | $ | 476,735,559 | |
| | | | | | | | | | | | |
See accompanying notes to financial statements
223
SCHEDULE OF INVESTMENTS—(Continued)
December 31, 2013
Notes to the Schedule of Investments:
| | |
| ADR | | American Depositary Receipt |
| REIT | | Real Estate Investment Trust |
| † | | Denotes all or a portion of the security on loan. |
| * | | Non-income producing. |
| †† | | Represents reinvestment of collateral received in conjunction with securities lending. |
| ¥ | | The rate quoted is the annualized seven-day yield of the fund at period end. |
See accompanying notes to financial statements
224
SCHEDULE OF INVESTMENTS
December 31, 2013
| | | | | | | | | | | | |
Vantagepoint Aggressive Opportunities Fund | | | | | | Shares | | | Value | |
| COMMON STOCKS—96.0% | |
| Aerospace & Defense—2.3% | |
B/E Aerospace, Inc. | | * | | | 75,477 | | | $ | 6,568,763 | |
DigitalGlobe, Inc. | | * | | | 148,966 | | | | 6,129,951 | |
Hexcel Corp. | | * | | | 16,600 | | | | 741,854 | |
Huntington Ingalls Industries, Inc. | | | | | 8,300 | | | | 747,083 | |
L-3 Communications Holdings, Inc. | | | | | 34,100 | | | | 3,643,926 | |
Rockwell Collins, Inc. | | | | | 64,746 | | | | 4,786,024 | |
Spirit Aerosystems Holdings, Inc., Class A | | * | | | 21,531 | | | | 733,777 | |
TransDigm Group, Inc. | | | | | 26,844 | | | | 4,322,421 | |
Triumph Group, Inc. | | | | | 10,133 | | | | 770,817 | |
| | | | | | | | | | | | |
| | | | | | | | | | | 28,444,616 | |
| | | | | | | | | | | | |
| Air Freight & Logistics—1.2% | |
C.H. Robinson Worldwide, Inc. | | | | | 12,822 | | | | 748,035 | |
Expeditors International of Washington, Inc. | | | | | 16,059 | | | | 710,611 | |
FedEx Corp. | | | | | 91,200 | | | | 13,111,824 | |
| | | | | | | | | | | | |
| | | | | | | | | | | 14,570,470 | |
| | | | | | | | | | | | |
| Airlines—1.3% | |
Alaska Air Group, Inc. | | | | | 10,100 | | | | 741,037 | |
Allegiant Travel Co. | | | | | 34,592 | | | | 3,647,381 | |
American Airlines Group, Inc. | | * | | | 27,900 | | | | 704,475 | |
Copa Holdings SA, Class A (Panama) | | | | | 37,804 | | | | 6,052,798 | |
Delta Air Lines, Inc. | | | | | 26,492 | | | | 727,735 | |
Ryanair Holdings plc ADR (Ireland) | | * | | | 64,200 | | | | 3,012,906 | |
Southwest Airlines Co. | | | | | 38,560 | | | | 726,470 | |
United Continental Holdings, Inc. | | * | | | 19,707 | | | | 745,516 | |
| | | | | | | | | | | | |
| | | | | | | | | | | 16,358,318 | |
| | | | | | | | | | | | |
| Auto Components—1.3% | |
Allison Transmission Holdings, Inc. | | | | | 26,542 | | | | 732,825 | |
BorgWarner, Inc. | | | | | 200,232 | | | | 11,194,971 | |
Delphi Automotive plc (United Kingdom) | | | | | 12,166 | | | | 731,542 | |
Gentex Corp. | | | | | 22,144 | | | | 730,530 | |
Goodyear Tire & Rubber Co. (The) | | | | | 31,513 | | | | 751,585 | |
Lear Corp. | | | | | 9,100 | | | | 736,827 | |
Visteon Corp. | | * | | | 9,355 | | | | 766,081 | |
| | | | | | | | | | | | |
| | | | | | | | | | | 15,644,361 | |
| | | | | | | | | | | | |
| Automobiles—0.2% | |
Harley-Davidson, Inc. | | | | | 10,839 | | | | 750,492 | |
Tesla Motors, Inc. | | *† | | | 5,101 | | | | 767,089 | |
Thor Industries, Inc. | | | | | 13,718 | | | | 757,645 | |
| | | | | | | | | | | | |
| | | | | | | | | | | 2,275,226 | |
| | | | | | | | | | | | |
| Beverages—0.8% | |
Brown-Forman Corp., Class B | | | | | 9,712 | | | | 733,936 | |
Coca-Cola Enterprises, Inc. | | | | | 17,366 | | | | 766,361 | |
Constellation Brands, Inc., Class A | | * | | | 100,000 | | | | 7,038,000 | |
Dr. Pepper Snapple Group, Inc. | | | | | 15,730 | | | | 766,366 | |
Monster Beverage Corp. | | * | | | 10,880 | | | | 737,338 | |
| | | | | | | | | | | | |
| | | | | | | | | | | 10,042,001 | |
| | | | | | | | | | | | |
| | | | | | | | | | | | |
| | | | | |
| | | | | | | Shares | | | Value | |
| Biotechnology—2.5% | |
Alexion Pharmaceuticals, Inc. | | * | | | 5,591 | | | $ | 743,938 | |
Alkermes plc (Ireland) | | * | | | 85,800 | | | | 3,488,628 | |
Alnylam Pharmaceuticals, Inc. | | * | | | 41,000 | | | | 2,637,530 | |
Ariad Pharmaceuticals, Inc. | | *† | | | 104,182 | | | | 710,521 | |
BioMarin Pharmaceutical, Inc. | | * | | | 57,290 | | | | 4,025,768 | |
Cepheid, Inc. | | * | | | 85,317 | | | | 3,986,010 | |
Cubist Pharmaceuticals, Inc. | | * | | | 37,762 | | | | 2,600,669 | |
Incyte Corp. Ltd. | | * | | | 14,220 | | | | 719,959 | |
Insmed, Inc. | | * | | | 104,000 | | | | 1,769,040 | |
Isis Pharmaceuticals, Inc. | | * | | | 18,900 | | | | 752,976 | |
Keryx Biopharmaceuticals, Inc. | | *† | | | 89,300 | | | | 1,156,435 | |
Medivation, Inc. | | * | | | 11,814 | | | | 753,970 | |
Myriad Genetics, Inc. | | *† | | | 30,555 | | | | 641,044 | |
NPS Pharmaceuticals, Inc. | | * | | | 48,239 | | | | 1,464,536 | |
Pharmacyclics, Inc. | | * | | | 6,700 | | | | 708,726 | |
Puma Biotechnology, Inc. | | * | | | 14,800 | | | | 1,532,244 | |
Seattle Genetics, Inc. | | * | | | 18,200 | | | | 725,998 | |
Theravance, Inc. | | * | | | 21,400 | | | | 762,910 | |
United Therapeutics Corp. | | * | | | 6,406 | | | | 724,390 | |
Vanda Pharmaceuticals, Inc. | | * | | | 35,161 | | | | 436,348 | |
Vertex Pharmaceuticals, Inc. | | * | | | 9,909 | | | | 736,239 | |
| | | | | | | | | | | | |
| | | | | | | | | | | 31,077,879 | |
| | | | | | | | | | | | |
| Building Products—0.8% | |
A.O. Smith Corp. | | | | | 13,500 | | | | 728,190 | |
Allegion plc (Ireland) | | * | | | 16,286 | | | | 719,678 | |
Armstrong World Industries, Inc. | | * | | | 12,859 | | | | 740,807 | |
Fortune Brands Home & Security, Inc. | | | | | 127,942 | | | | 5,846,950 | |
Lennox International, Inc. | | | | | 8,672 | | | | 737,640 | |
Masco Corp. | | | | | 33,358 | | | | 759,562 | |
| | | | | | | | | | | | |
| | | | | | | | | | | 9,532,827 | |
| | | | | | | | | | | | |
| Capital Markets—2.2% | |
Affiliated Managers Group, Inc. | | * | | | 26,309 | | | | 5,705,896 | |
Ameriprise Financial, Inc. | | | | | 6,500 | | | | 747,825 | |
Artisan Partners Asset Management, Inc., Class A | | | | | 11,300 | | | | 736,647 | |
Bank of New York Mellon Corp. (The) | | | | | 320,000 | | | | 11,180,800 | |
Carlyle Group LP (The) | | | | | 103,100 | | | | 3,672,422 | |
Eaton Vance Corp. | | | | | 17,510 | | | | 749,253 | |
Federated Investors, Inc., Class B | | † | | | 25,906 | | | | 746,093 | |
Lazard Ltd., Class A (Bermuda) | | | | | 16,260 | | | | 736,903 | |
LPL Financial Holdings, Inc. | | | | | 15,633 | | | | 735,220 | |
SEI Investments Co. | | | | | 21,011 | | | | 729,712 | |
T. Rowe Price Group, Inc. | | | | | 8,766 | | | | 734,328 | |
Waddell & Reed Financial, Inc., Class A | | | | | 11,203 | | | | 729,539 | |
| | | | | | | | | | | | |
| | | | | | | | | | | 27,204,638 | |
| | | | | | | | | | | | |
| Chemicals—2.0% | |
Airgas, Inc. | | | | | 34,603 | | | | 3,870,346 | |
Albemarle Corp. | | | | | 11,301 | | | | 716,370 | |
Celanese Corp., Series A | | | | | 13,521 | | | | 747,846 | |
Eastman Chemical Co. | | | | | 9,114 | | | | 735,500 | |
Ecolab, Inc. | | | | | 56,400 | | | | 5,880,828 | |
FMC Corp. | | | | | 9,777 | | | | 737,772 | |
International Flavors & Fragrances, Inc. | | | | | 8,641 | | | | 742,953 | |
NewMarket Corp. | | | | | 2,249 | | | | 751,503 | |
Rockwood Holdings, Inc. | | | | | 10,267 | | | | 738,403 | |
RPM International, Inc. | | | | | 17,854 | | | | 741,120 | |
See accompanying notes to financial statements
225
SCHEDULE OF INVESTMENTS—(Continued)
December 31, 2013
| | | | | | | | | | | | |
Vantagepoint Aggressive Opportunities Fund | | | | Shares | | | Value | |
| COMMON STOCKS—(Continued) | |
Scotts Miracle-Gro Co. (The), Class A | | | | | 11,828 | | | $ | 735,938 | |
Sherwin-Williams Co. (The) | | | | | 3,934 | | | | 721,889 | |
Sigma-Aldrich Corp. | | | | | 7,967 | | | | 748,978 | |
Valspar Corp. (The) | | | | | 10,306 | | | | 734,715 | |
W.R. Grace & Co. | | * | | | 50,290 | | | | 4,972,172 | |
Westlake Chemical Corp. | | | | | 6,190 | | | | 755,613 | |
| | | | | | | | | | | | |
| | | | | | | | | | | 24,331,946 | |
| | | | | | | | | | | | |
| Commercial Banks—0.4% | |
Signature Bank/New York | | * | | | 6,701 | | | | 719,822 | |
Texas Capital Bancshares, Inc. | | * | | | 73,306 | | | | 4,559,633 | |
| | | | | | | | | | | | |
| | | | | | | | | | | 5,279,455 | |
| | | | | | | | | | | | |
| Commercial Services & Supplies—1.7% | |
Cintas Corp. | | | | | 12,323 | | | | 734,328 | |
Clean Harbors, Inc. | | * | | | 97,958 | | | | 5,873,562 | |
Copart, Inc. | | * | | | 143,822 | | | | 5,271,076 | |
Iron Mountain, Inc. | | | | | 25,310 | | | | 768,158 | |
KAR Auction Services, Inc. | | | | | 25,600 | | | | 756,480 | |
Pitney Bowes, Inc. | | | | | 31,760 | | | | 740,008 | |
R.R. Donnelley & Sons Co. | | | | | 38,100 | | | | 772,668 | |
Rollins, Inc. | | | | | 24,355 | | | | 737,713 | |
Stericycle, Inc. | | * | | | 40,706 | | | | 4,728,816 | |
Waste Connections, Inc. | | | | | 16,928 | | | | 738,569 | |
| | | | | | | | | | | | |
| | | | | | | | | | | 21,121,378 | |
| | | | | | | | | | | | |
| Communications Equipment—0.6% | |
CommScope Holding Co., Inc. | | * | | | 40,400 | | | | 764,368 | |
F5 Networks, Inc. | | * | | | 8,075 | | | | 733,694 | |
Harris Corp. | | | | | 10,522 | | | | 734,541 | |
JDS Uniphase Corp. | | * | | | 57,800 | | | | 750,244 | |
Juniper Networks, Inc. | | * | | | 34,100 | | | | 769,637 | |
Motorola Solutions, Inc. | | | | | 10,900 | | | | 735,750 | |
Palo Alto Networks, Inc. | | * | | | 12,860 | | | | 739,064 | |
Riverbed Technology, Inc. | | * | | | 41,648 | | | | 752,996 | |
Ubiquiti Networks, Inc. | | *† | | | 41,700 | | | | 1,916,532 | |
| | | | | | | | | | | | |
| | | | | | | | | | | 7,896,826 | |
| | | | | | | | | | | | |
| Computers & Peripherals—0.6% | |
3D Systems Corp. | | *† | | | 8,000 | | | | 743,440 | |
NCR Corp. | | * | | | 21,760 | | | | 741,146 | |
NetApp, Inc. | | | | | 18,064 | | | | 743,153 | |
SanDisk Corp. | | | | | 10,400 | | | | 733,616 | |
Stratasys Ltd. | | * | | | 36,865 | | | | 4,965,715 | |
| | | | | | | | | | | | |
| | | | | | | | | | | 7,927,070 | |
| | | | | | | | | | | | |
| Construction & Engineering—0.9% | |
ACS Actividades de Construccion y Servicios SA (Spain) | | | | | 127,111 | | | | 4,381,703 | |
AECOM Technology Corp. | | * | | | 24,900 | | | | 732,807 | |
Chicago Bridge & Iron Co. NV (Netherlands) | | | | | 8,922 | | | | 741,775 | |
Fluor Corp. | | | | | 9,237 | | | | 741,639 | |
Quanta Services, Inc. | | * | | | 142,100 | | | | 4,484,676 | |
| | | | | | | | | | | | |
| | | | | | | | | | | 11,082,600 | |
| | | | | | | | | | | | |
| Construction Materials—0.1% | |
Eagle Materials, Inc. | | | | | 9,600 | | | | 743,328 | |
Martin Marietta Materials, Inc. | | | | | 7,540 | | | | 753,548 | |
| | | | | | | | | | | | |
| | | | | | | | | | | 1,496,876 | |
| | | | | | | | | | | | |
| | | | | | | | | | | | |
| | | | | |
| | | | | | | Shares | | | Value | |
| Containers & Packaging—0.6% | |
AptarGroup, Inc. | | | | | 11,032 | | | $ | 748,080 | |
Avery Dennison Corp. | | | | | 14,700 | | | | 737,793 | |
Ball Corp. | | | | | 14,349 | | | | 741,269 | |
Bemis Co., Inc. | | | | | 17,900 | | | | 733,184 | |
Crown Holdings, Inc. | | * | | | 16,453 | | | | 733,310 | |
Greif, Inc., Class A | | | | | 14,300 | | | | 749,320 | |
Owens-Illinois, Inc.* | | | | | 20,788 | | | | 743,795 | |
Packaging Corp. of America | | | | | 12,051 | | | | 762,587 | |
Rock-Tenn Co., Class A | | | | | 7,091 | | | | 744,626 | |
Sealed Air Corp. | | | | | 22,000 | | | | 749,100 | |
Silgan Holdings, Inc. | | | | | 14,738 | | | | 707,719 | |
| | | | | | | | | | | | |
| | | | | | | | | | | 8,150,783 | |
| | | | | | | | | | | | |
| Distributors—0.9% | |
Genuine Parts Co. | | | | | 8,822 | | | | 733,902 | |
LKQ Corp. | | * | | | 190,469 | | | | 6,266,430 | |
Pool Corp. | | | | | 68,100 | | | | 3,959,334 | |
| | | | | | | | | | | | |
| | | | | | | | | | | 10,959,666 | |
| | | | | | | | | | | | |
| Diversified Consumer Services—0.2% | |
H&R Block, Inc. | | | | | 25,250 | | | | 733,260 | |
Service Corp. International | | | | | 41,800 | | | | 757,834 | |
Weight Watchers International, Inc. | | † | | | 22,463 | | | | 739,707 | |
| | | | | | | | | | | | |
| | | | | | | | | | | 2,230,801 | |
| | | | | | | | | | | | |
| Diversified Financial Services—1.3% | |
CBOE Holdings, Inc. | | | | | 13,691 | | | | 711,384 | |
IntercontinentalExchange Group, Inc. | | | | | 35,335 | | | | 7,947,548 | |
Leucadia National Corp. | | | | | 25,113 | | | | 711,703 | |
McGraw Hill Financial, Inc. | | | | | 71,822 | | | | 5,616,480 | |
Moody’s Corp. | | | | | 9,434 | | | | 740,286 | |
MSCI, Inc. | | * | | | 17,432 | | | | 762,127 | |
| | | | | | | | | | | | |
| | | | | | | | | | | 16,489,528 | |
| | | | | | | | | | | | |
| Diversified Telecommunication Services—1.7% | |
Intelsat SA (Luxembourg) | | * | | | 33,500 | | | | 755,090 | |
Level 3 Communications, Inc. | | * | | | 423,601 | | | | 14,050,845 | |
tw telecom inc. | | * | | | 197,233 | | | | 6,009,690 | |
Windstream Holdings, Inc. | | † | | | 85,193 | | | | 679,840 | |
| | | | | | | | | | | | |
| | | | | | | | | | | 21,495,465 | |
| | | | | | | | | | | | |
| Electric Utilities—0.1% | |
ITC Holdings Corp. | | | | | 7,477 | | | | 716,446 | |
| | | | | | | | | | | | |
| Electrical Equipment—0.9% | |
AMETEK, Inc. | | | | | 80,190 | | | | 4,223,607 | |
Babcock & Wilcox Co. (The) | | | | | 20,767 | | | | 710,024 | |
Hubbell, Inc., Class B | | | | | 6,607 | | | | 719,502 | |
Rockwell Automation, Inc. | | | | | 36,083 | | | | 4,263,567 | |
Roper Industries, Inc. | | | | | 5,280 | | | | 732,231 | |
SolarCity Corp. | | * | | | 12,900 | | | | 732,978 | |
| | | | | | | | | | | | |
| | | | | | | | | | | 11,381,909 | |
| | | | | | | | | | | | |
| Electronic Equipment, Instruments & Components—1.1% | |
Amphenol Corp., Class A | | | | | 8,328 | | | | 742,691 | |
CDW Corp. | | | | | 32,700 | | | | 763,872 | |
Cognex Corp. | | * | | | 65,100 | | | | 2,485,518 | |
Dolby Laboratories, Inc., Class A | | *† | | | 18,914 | | | | 729,324 | |
FEI Co. | | | | | 41,024 | | | | 3,665,905 | |
FLIR Systems, Inc. | | | | | 24,682 | | | | 742,928 | |
IPG Photonics Corp. | | *† | | | 45,220 | | | | 3,509,524 | |
See accompanying notes to financial statements
226
SCHEDULE OF INVESTMENTS—(Continued)
December 31, 2013
| | | | | | | | | | | | |
Vantagepoint Aggressive Opportunities Fund | | | | Shares | | | Value | |
| COMMON STOCKS—(Continued) | |
National Instruments Corp. | | | | | 22,555 | | | $ | 722,211 | |
Trimble Navigation Ltd. | | * | | | 21,416 | | | | 743,135 | |
| | | | | | | | | | | | |
| | | | | | | | | | | 14,105,108 | |
| | | | | | | | | | | | |
| Energy Equipment & Services—1.1% | |
Atwood Oceanics, Inc. | | * | | | 14,236 | | | | 760,060 | |
Cameron International Corp. | | * | | | 78,132 | | | | 4,651,198 | |
Dresser-Rand Group, Inc.* | | | | | 12,605 | | | | 751,636 | |
Dril-Quip, Inc.* | | | | | 6,700 | | | | 736,531 | |
Ensco plc, Class A (United Kingdom) | | | | | 54,100 | | | | 3,093,438 | |
FMC Technologies, Inc. | | * | | | 14,108 | | | | 736,579 | |
Frank’s International NV (Netherlands) | | | | | 27,500 | | | | 742,500 | |
Oceaneering International, Inc. | | | | | 9,299 | | | | 733,505 | |
RPC, Inc. | | † | | | 40,848 | | | | 729,137 | |
Seadrill Ltd. (Bermuda) | | | | | 18,600 | | | | 764,088 | |
| | | | | | | | | | | | |
| | | | | | | | | | | 13,698,672 | |
| | | | | | | | | | | | |
| Food & Staples Retailing—0.9% | |
Fresh Market, Inc. (The) | | * | | | 18,260 | | | | 739,530 | |
Kroger Co. (The) | | | | | 18,280 | | | | 722,608 | |
Rite Aid Corp. | | * | | | 446,000 | | | | 2,256,760 | |
Safeway, Inc. | | | | | 21,936 | | | | 714,456 | |
Sprouts Farmers Market, Inc. | | * | | | 87,400 | | | | 3,358,782 | |
United Natural Foods, Inc. | | * | | | 39,800 | | | | 3,000,522 | |
Whole Foods Market, Inc. | | | | | 12,166 | | | | 703,560 | |
| | | | | | | | | | | | |
| | | | | | | | | | | 11,496,218 | |
| | | | | | | | | | | | |
| Food Products—2.5% | |
Annie’s, Inc. | | * | | | 73,975 | | | | 3,183,884 | |
Campbell Soup Co. | | | | | 17,206 | | | | 744,676 | |
ConAgra Foods, Inc. | | | | | 21,900 | | | | 738,030 | |
Flowers Foods, Inc. | | | | | 34,514 | | | | 741,015 | |
Green Mountain Coffee Roasters, Inc. | | *† | | | 9,334 | | | | 705,464 | |
Hershey Co. (The) | | | | | 45,237 | | | | 4,398,393 | |
Hillshire Brands Co. | | | | | 22,989 | | | | 768,752 | |
Hormel Foods Corp. | | | | | 16,577 | | | | 748,783 | |
Ingredion, Inc. | | | | | 10,447 | | | | 715,202 | |
J.M. Smucker Co. (The) | | | | | 7,200 | | | | 746,064 | |
McCormick & Co., Inc. (Non-Voting Shares) | | | | | 10,752 | | | | 741,028 | |
Mead Johnson Nutrition Co. | | | | | 8,814 | | | | 738,261 | |
Mondelez International, Inc., Class A | | | | | 298,300 | | | | 10,529,990 | |
Pinnacle Foods, Inc. | | | | | 27,200 | | | | 746,912 | |
WhiteWave Foods Co., Class A | | * | | | 200,977 | | | | 4,610,412 | |
| | | | | | | | | | | | |
| | | | | | | | | | | 30,856,866 | |
| | | | | | | | | | | | |
| Gas Utilities—0.1% | |
ONEOK, Inc. | | | | | 12,251 | | | | 761,767 | |
Questar Corp. | | | | | 31,519 | | | | 724,622 | |
| | | | | | | | | | | | |
| | | | | | | | | | | 1,486,389 | |
| | | | | | | | | | | | |
| Health Care Equipment & Supplies—1.7% | |
Boston Scientific Corp. | | * | | | 337,700 | | | | 4,059,154 | |
C.R. Bard, Inc. | | | | | 5,501 | | | | 736,804 | |
Cooper Cos., Inc. (The) | | | | | 35,561 | | | | 4,403,874 | |
DENTSPLY International, Inc. | | | | | 14,930 | | | | 723,806 | |
Edwards Lifesciences Corp. | | * | | | 11,182 | | | | 735,328 | |
Hologic, Inc. | | * | | | 32,400 | | | | 724,140 | |
IDEXX Laboratories, Inc. | | * | | | 7,184 | | | | 764,162 | |
| | | | | | | | | | | | |
| | | | | |
| | | | | | | Shares | | | Value | |
Intuitive Surgical, Inc. | | * | | | 6,100 | | | $ | 2,342,888 | |
ResMed, Inc. | | † | | | 15,645 | | | | 736,567 | |
Sirona Dental Systems, Inc. | | * | | | 10,468 | | | | 734,854 | |
St. Jude Medical, Inc. | | | | | 11,715 | | | | 725,744 | |
Varian Medical Systems, Inc. | | * | | | 9,540 | | | | 741,163 | |
Wright Medical Group, Inc. | | * | | | 106,229 | | | | 3,262,293 | |
Zimmer Holdings, Inc. | | | | | 7,792 | | | | 726,136 | |
| | | | | | | | | | | | |
| | | | | | | | | | | 21,416,913 | |
| | | | | | | | | | | | |
| Health Care Providers & Services—3.5% | |
AmerisourceBergen Corp. | | | | | 10,462 | | | | 735,583 | |
Brookdale Senior Living, Inc. | | * | | | 26,600 | | | | 722,988 | |
Catamaran Corp. | | * | | | 121,486 | | | | 5,768,155 | |
Cigna Corp. | | | | | 8,500 | | | | 743,580 | |
Community Health Systems, Inc. | | * | | | 19,200 | | | | 753,984 | |
DaVita HealthCare Partners, Inc. | | * | | | 211,724 | | | | 13,416,950 | |
Envision Healthcare Holdings, Inc. | | * | | | 236,703 | | | | 8,407,690 | |
HCA Holdings, Inc. | | * | | | 15,872 | | | | 757,253 | |
Health Management Associates, Inc., Class A | | * | | | 56,200 | | | | 736,220 | |
Henry Schein, Inc. | | * | | | 6,383 | | | | 729,322 | |
Laboratory Corp. of America Holdings | | * | | | 8,072 | | | | 737,539 | |
MEDNAX, Inc. | | * | | | 14,000 | | | | 747,320 | |
Patterson Cos., Inc. | | | | | 17,425 | | | | 717,910 | |
Premier, Inc., Class A | | * | | | 88,700 | | | | 3,260,612 | |
Quest Diagnostics, Inc. | | | | | 13,502 | | | | 722,897 | |
Team Health Holdings, Inc. | | * | | | 56,960 | | | | 2,594,528 | |
Tenet Healthcare Corp. | | * | | | 17,540 | | | | 738,785 | |
Universal Health Services, Inc., Class B | | | | | 9,522 | | | | 773,758 | |
| | | | | | | | | | | | |
| | | | | | | | | | | 43,065,074 | |
| | | | | | | | | | | | |
| Health Care Technology—0.3% | |
athenahealth, Inc. | | * | | | 21,500 | | | | 2,891,750 | |
Cerner Corp. | | * | | | 13,386 | | | | 746,136 | |
Veeva Systems, Inc., Class A | | * | | | 22,300 | | | | 715,830 | |
| | | | | | | | | | | | |
| | | | | | | | | | | 4,353,716 | |
| | | | | | | | | | | | |
| Hotels, Restaurants & Leisure—2.0% | |
Apollo Global Management LLC, Class A | | | | | 145,000 | | | | 4,583,450 | |
Bally Technologies, Inc. | | * | | | 9,639 | | | | 756,179 | |
Brinker International, Inc. | | | | | 16,160 | | | | 748,854 | |
Burger King Worldwide, Inc. | | | | | 35,100 | | | | 802,386 | |
Chipotle Mexican Grill, Inc. | | * | | | 1,338 | | | | 712,860 | |
Choice Hotels International, Inc. | | | | | 14,896 | | | | 731,542 | |
Darden Restaurants, Inc. | | | | | 13,457 | | | | 731,657 | |
Domino’s Pizza, Inc. | | | | | 10,500 | | | | 731,325 | |
Dunkin’ Brands Group, Inc. | | | | | 15,313 | | | | 738,087 | |
International Game Technology | | | | | 41,194 | | | | 748,083 | |
Krispy Kreme Doughnuts, Inc. | | * | | | 108,300 | | | | 2,089,107 | |
Marriott International, Inc., Class A | | | | | 15,071 | | | | 743,905 | |
Norwegian Cruise Line Holdings Ltd. | | * | | | 21,000 | | | | 744,870 | |
Panera Bread Co., Class A | | * | | | 4,241 | | | | 749,342 | |
SeaWorld Entertainment, Inc. | | | | | 25,300 | | | | 727,881 | |
Six Flags Entertainment Corp. | | | | | 20,400 | | | | 751,128 | |
Starwood Hotels & Resorts Worldwide, Inc. | | | | | 9,238 | | | | 733,959 | |
Wyndham Worldwide Corp. | | | | | 84,075 | | | | 6,195,487 | |
Wynn Resorts Ltd. | | | | | 3,942 | | | | 765,576 | |
| | | | | | | | | | | | |
| | | | | | | | | | | 24,785,678 | |
| | | | | | | | | | | | |
See accompanying notes to financial statements
227
SCHEDULE OF INVESTMENTS—(Continued)
December 31, 2013
| | | | | | | | | | | | |
Vantagepoint Aggressive Opportunities Fund | | | | Shares | | | Value | |
| COMMON STOCKS—(Continued) | |
| Household Durables—0.5% | |
Jarden Corp. | | * | | | 12,134 | | | $ | 744,421 | |
Newell Rubbermaid, Inc. | | | | | 22,900 | | | | 742,189 | |
NVR, Inc. | | * | | | 733 | | | | 752,066 | |
PulteGroup, Inc. | | | | | 37,000 | | | | 753,690 | |
Taylor Morrison Home Corp., Class A | | * | | | 33,100 | | | | 743,095 | |
Tempur Sealy International, Inc. | | * | | | 13,793 | | | | 744,270 | |
Tupperware Brands Corp. | | | | | 7,557 | | | | 714,363 | |
Whirlpool Corp. | | | | | 4,800 | | | | 752,928 | |
| | | | | | | | | | | | |
| | | | | | | | | | | 5,947,022 | |
| | | | | | | | | | | | |
| Household Products—0.4% | |
Church & Dwight Co., Inc. | | | | | 72,298 | | | | 4,791,912 | |
Clorox Co. (The) | | | | | 7,840 | | | | 727,238 | |
| | | | | | | | | | | | |
| | | | | | | | | | | 5,519,150 | |
| | | | | | | | | | | | |
| Independent Power Producers & Energy Traders—0.1% | |
Calpine Corp. | | * | | | 38,200 | | | | 745,282 | |
| | | | | | | | | | | | |
| Industrial Conglomerates—0.8% | |
Carlisle Cos., Inc. | | | | | 9,250 | | | | 734,450 | |
Koninklijke Philips NV NYRS (Netherlands) | | | | | 256,200 | | | | 9,471,714 | |
| | | | | | | | | | | | |
| | | | | | | | | | | 10,206,164 | |
| | | | | | | | | | | | |
| Insurance—4.8% | |
Allied World Assurance Co. Holdings AG (Switzerland) | | | | | 6,632 | | | | 748,156 | |
American Financial Group, Inc. | | | | | 13,000 | | | | 750,360 | |
Aon plc (United Kingdom) | | | | | 117,669 | | | | 9,871,252 | |
Arch Capital Group Ltd. (Bermuda) | | * | | | 12,946 | | | | 772,747 | |
Arthur J. Gallagher & Co. | | | | | 16,154 | | | | 758,107 | |
Assured Guaranty Ltd. (Bermuda) | | | | | 188,800 | | | | 4,453,792 | |
Axis Capital Holdings Ltd. (Bermuda) | | | | | 16,400 | | | | 780,148 | |
Brown & Brown, Inc. | | | | | 23,730 | | | | 744,885 | |
eHealth, Inc. | | * | | | 43,000 | | | | 1,999,070 | |
Endurance Specialty Holdings Ltd. (Bermuda) | | | | | 12,755 | | | | 748,336 | |
Erie Indemnity Co., Class A | | | | | 10,144 | | | | 741,729 | |
Fairfax Financial Holdings Ltd. (Canada) | | | | | 19,400 | | | | 7,761,164 | |
Hanover Insurance Group, Inc. (The) | | | | | 12,705 | | | | 758,616 | |
Loews Corp. | | | | | 258,800 | | | | 12,484,512 | |
Progressive Corp. (The) | | | | | 27,200 | | | | 741,744 | |
RenaissanceRe Holdings Ltd. (Bermuda) | | | | | 96,400 | | | | 9,383,576 | |
Travelers Cos., Inc. (The) | | | | | 59,000 | | | | 5,341,860 | |
Validus Holdings Ltd. (Bermuda) | | | | | 19,066 | | | | 768,169 | |
| | | | | | | | | | | | |
| | | | | | | | | | | 59,608,223 | |
| | | | | | | | | | | | |
| Internet & Catalog Retail—1.0% | |
Expedia, Inc. | | | | | 10,653 | | | | 742,088 | |
Groupon, Inc. | | * | | | 338,085 | | | | 3,979,260 | |
HomeAway, Inc. | | * | | | 111,918 | | | | 4,575,208 | |
Liberty Interactive Corp., Series A | | * | | | 25,253 | | | | 741,176 | |
Liberty Ventures, Series A | | * | | | 6,033 | | | | 739,586 | |
Netflix, Inc. | | * | | | 1,873 | | | | 689,582 | |
TripAdvisor, Inc. | | * | | | 8,771 | | | | 726,502 | |
| | | | | | | | | | | | |
| | | | | |
| | | | | | | Shares | | | Value | |
zulily, Inc., Class A | | * | | | 16,400 | | | $ | 679,452 | |
| | | | | | | | | | | | |
| | | | | | | | | | | 12,872,854 | |
| | | | | | | | | | | | |
| Internet Software & Services—1.5% | |
Akamai Technologies, Inc. | | * | | | 15,328 | | | | 723,175 | |
Cornerstone OnDemand, Inc. | | * | | | 85,600 | | | | 4,565,904 | |
CoStar Group, Inc. | | * | | | 33,054 | | | | 6,101,107 | |
Equinix, Inc. | | * | | | 4,179 | | | | 741,564 | |
IAC/InterActiveCorp | | | | | 10,562 | | | | 725,504 | |
LinkedIn Corp., Class A | | * | | | 3,333 | | | | 722,694 | |
Pandora Media, Inc. | | * | | | 24,673 | | | | 656,302 | |
Rackspace Hosting, Inc. | | * | | | 19,133 | | | | 748,674 | |
Shutterstock, Inc. | | * | | | 29,557 | | | | 2,471,852 | |
VeriSign, Inc. | | * | | | 12,231 | | | | 731,169 | |
| | | | | | | | | | | | |
| | | | | | | | | | | 18,187,945 | |
| | | | | | | | | | | | |
| IT Services—5.7% | |
Alliance Data Systems Corp. | | * | | | 76,711 | | | | 20,169,623 | |
Amdocs Ltd. | | | | | 152,800 | | | | 6,301,472 | |
Booz Allen Hamilton Holding Corp. | | | | | 39,300 | | | | 752,595 | |
Broadridge Financial Solutions, Inc. | | | | | 18,431 | | | | 728,393 | |
DST Systems, Inc. | | | | | 8,039 | | | | 729,459 | |
Fidelity National Information Services, Inc. | | | | | 13,900 | | | | 746,152 | |
Fiserv, Inc. | | * | | | 12,470 | | | | 736,353 | |
FleetCor Technologies, Inc. | | * | | | 39,456 | | | | 4,623,060 | |
Gartner, Inc. | | * | | | 92,556 | | | | 6,576,104 | |
Genpact Ltd. (Bermuda) | | * | | | 40,979 | | | | 752,784 | |
Global Payments, Inc. | | | | | 77,618 | | | | 5,044,394 | |
Jack Henry & Associates, Inc. | | | | | 12,480 | | | | 738,941 | |
Lender Processing Services, Inc. | | | | | 19,655 | | | | 734,704 | |
NeuStar, Inc., Class A | | * | | | 129,040 | | | | 6,433,934 | |
Paychex, Inc. | | | | | 16,012 | | | | 729,026 | |
Teradata Corp. | | * | | | 16,432 | | | | 747,492 | |
Total System Services, Inc. | | | | | 22,058 | | | | 734,090 | |
Vantiv, Inc., Class A | | * | | | 380,656 | | | | 12,413,192 | |
Western Union Co. (The) | | | | | 42,703 | | | | 736,627 | |
| | | | | | | | | | | | |
| | | | | | | | | | | 70,428,395 | |
| | | | | | | | | | | | |
| Leisure Equipment & Products—0.2% | |
Hasbro, Inc. | | | | | 13,757 | | | | 756,772 | |
Mattel, Inc. | | | | | 16,620 | | | | 790,780 | |
Polaris Industries, Inc. | | | | | 5,114 | | | | 744,803 | |
| | | | | | | | | | | | |
| | | | | | | | | | | 2,292,355 | |
| | | | | | | | | | | | |
| Life Sciences Tools & Services—1.1% | |
Agilent Technologies, Inc. | | | | | 12,661 | | | | 724,083 | |
Bruker Corp. | | * | | | 174,687 | | | | 3,453,562 | |
Charles River Laboratories International, Inc. | | * | | | 13,799 | | | | 731,899 | |
Covance, Inc. | | * | | | 8,121 | | | | 715,135 | |
Illumina, Inc. | | *† | | | 39,903 | | | | 4,414,070 | |
Life Technologies Corp. | | * | | | 9,345 | | | | 708,351 | |
Mettler-Toledo International, Inc. | | * | | | 2,913 | | | | 706,665 | |
Quintiles Transnational Holdings, Inc. | | * | | | 15,400 | | | | 713,636 | |
Techne Corp. | | | | | 7,872 | | | | 745,242 | |
Waters Corp. | | * | | | 7,317 | | | | 731,700 | |
| | | | | | | | | | | | |
| | | | | | | | | | | 13,644,343 | |
| | | | | | | | | | | | |
See accompanying notes to financial statements
228
SCHEDULE OF INVESTMENTS—(Continued)
December 31, 2013
| | | | | | | | | | | | |
Vantagepoint Aggressive Opportunities Fund | | | | Shares | | | Value | |
| COMMON STOCKS—(Continued) | |
| Machinery—4.1% | |
Chart Industries, Inc. | | * | | | 39,065 | | | $ | 3,736,177 | |
Colfax Corp. | | * | | | 63,327 | | | | 4,033,297 | |
Crane Co. | | | | | 11,400 | | | | 766,650 | |
Donaldson Co., Inc. | | | | | 16,869 | | | | 733,127 | |
Dover Corp. | | | | | 7,900 | | | | 762,666 | |
Flowserve Corp. | | | | | 9,538 | | | | 751,880 | |
Graco, Inc. | | | | | 66,987 | | | | 5,233,024 | |
Harsco Corp. | | | | | 26,200 | | | | 734,386 | |
IDEX Corp. | | | | | 9,959 | | | | 735,472 | |
Ingersoll-Rand plc (Ireland) | | | | | 11,958 | | | | 736,613 | |
ITT Corp. | | | | | 16,900 | | | | 733,798 | |
Lincoln Electric Holdings, Inc. | | | | | 10,592 | | | | 755,633 | |
Manitowoc Co., Inc. (The) | | | | | 31,678 | | | | 738,731 | |
Navistar International Corp. | | *† | | | 19,300 | | | | 737,067 | |
Nordson Corp. | | | | | 48,998 | | | | 3,640,551 | |
PACCAR, Inc. | | | | | 12,351 | | | | 730,809 | |
Pall Corp. | | | | | 45,013 | | | | 3,841,860 | |
Proto Labs, Inc. | | *† | | | 47,900 | | | | 3,409,522 | |
Snap-on, Inc. | | | | | 6,718 | | | | 735,755 | |
Stanley Black & Decker, Inc. | | | | | 9,000 | | | | 726,210 | |
Toro Co. (The) | | | | | 11,714 | | | | 745,010 | |
Valmont Industries, Inc. | | | | | 4,910 | | | | 732,179 | |
WABCO Holdings, Inc. | | * | | | 91,595 | | | | 8,555,889 | |
Wabtec Corp. | | | | | 87,206 | | | | 6,476,790 | |
Xylem, Inc. | | | | | 21,381 | | | | 739,783 | |
| | | | | | | | | | | | |
| | | | | | | | | | | 51,522,879 | |
| | | | | | | | | | | | |
| Marine—0.1% | |
Kirby Corp. | | * | | | 7,431 | | | | 737,527 | |
| | | | | | | | | | | | |
| Media—3.5% | |
AMC Networks, Inc., Class A | | * | | | 86,143 | | | | 5,867,200 | |
Cablevision Systems Corp., Class A | | | | | 41,586 | | | | 745,637 | |
Charter Communications, Inc., Class A | | * | | | 5,315 | | | | 726,879 | |
Cinemark Holdings, Inc. | | | | | 22,404 | | | | 746,725 | |
Clear Channel Outdoor Holdings, Inc., Class A | | | | | 72,958 | | | | 739,794 | |
DIRECTV | | * | | | 148,570 | | | | 10,264,701 | |
Discovery Communications, Inc., Class A | | * | | | 8,295 | | | | 750,034 | |
Discovery Communications, Inc., Class C | | * | | | 71,000 | | | | 5,954,060 | |
DISH Network Corp., Class A | | * | | | 12,879 | | | | 745,952 | |
Interpublic Group of Cos., Inc. (The) | | | | | 41,191 | | | | 729,081 | |
Lamar Advertising Co., Class A | | * | | | 14,195 | | | | 741,689 | |
Lions Gate Entertainment Corp. | | † | | | 23,500 | | | | 744,010 | |
Madison Square Garden Co. (The), Class A | | * | | | 13,136 | | | | 756,371 | |
Morningstar, Inc. | | | | | 8,988 | | | | 701,873 | |
News Corp., Class A | | * | | | 547,800 | | | | 9,871,356 | |
Omnicom Group, Inc. | | | | | 10,289 | | | | 765,193 | |
Regal Entertainment Group, Class A | | † | | | 36,516 | | | | 710,236 | |
Scripps Networks Interactive, Inc., Class A | | | | | 8,945 | | | | 772,937 | |
Starz, Class A | | * | | | 25,213 | | | | 737,228 | |
| | | | | | | | | | | | |
| | | | | | | | | | | 43,070,956 | |
| | | | | | | | | | | | |
| | | | | | | | | | | | |
| | | | | |
| | | | | | | Shares | | | Value | |
| Metals & Mining—0.5% | |
Compass Minerals International, Inc. | | | | | 9,312 | | | $ | 745,426 | |
Reliance Steel & Aluminum Co. | | | | | 51,700 | | | | 3,920,928 | |
Royal Gold, Inc. | | | | | 16,512 | | | | 760,708 | |
Tahoe Resources, Inc. | | * | | | 46,208 | | | | 768,901 | |
| | | | | | | | | | | | |
| | | | | | | | | | | 6,195,963 | |
| | | | | | | | | | | | |
| Multiline Retail—0.4% | |
Big Lots, Inc. | | * | | | 23,171 | | | | 748,192 | |
Dillard’s, Inc., Class A | | | | | 7,600 | | | | 738,796 | |
Dollar General Corp. | | * | | | 11,820 | | | | 712,982 | |
Dollar Tree, Inc. | | * | | | 13,053 | | | | 736,450 | |
Family Dollar Stores, Inc. | | | | | 11,184 | | | | 726,624 | |
Macy’s, Inc. | | | | | 13,807 | | | | 737,294 | |
Nordstrom, Inc. | | | | | 11,887 | | | | 734,617 | |
| | | | | | | | | | | | |
| | | | | | | | | | | 5,134,955 | |
| | | | | | | | | | | | |
| Office Electronics—0.1% | |
Zebra Technologies Corp., Class A | | * | | | 13,481 | | | | 729,052 | |
| | | | | | | | | | | | |
| Oil, Gas & Consumable Fuels—5.8% | |
Antero Resources Corp. | | * | | | 39,700 | | | | 2,518,568 | |
Bonanza Creek Energy, Inc. | | * | | | 30,900 | | | | 1,343,223 | |
Cabot Oil & Gas Corp. | | | | | 18,422 | | | | 714,037 | |
Cheniere Energy, Inc. | | * | | | 16,696 | | | | 719,932 | |
Chesapeake Energy Corp. | | | | | 488,200 | | | | 13,249,748 | |
Cobalt International Energy, Inc. | | * | | | 45,416 | | | | 747,093 | |
Concho Resources, Inc. | | * | | | 6,568 | | | | 709,344 | |
CONSOL Energy, Inc. | | | | | 250,300 | | | | 9,521,412 | |
Continental Resources, Inc. | | *† | | | 6,613 | | | | 744,095 | |
CVR Energy, Inc. | | | | | 18,300 | | | | 794,769 | |
Delek US Holdings, Inc. | | | | | 55,184 | | | | 1,898,881 | |
Denbury Resources, Inc. | | * | | | 272,300 | | | | 4,473,889 | |
Diamondback Energy, Inc. | | * | | | 26,500 | | | | 1,400,790 | |
EQT Corp. | | | | | 7,800 | | | | 700,284 | |
Gulfport Energy Corp. | | * | | | 62,422 | | | �� | 3,941,949 | |
Kosmos Energy Ltd. (Bermuda) | | * | | | 67,212 | | | | 751,430 | |
Laredo Petroleum Holdings, Inc. | | * | | | 26,744 | | | | 740,541 | |
Murphy Oil Corp. | | | | | 129,400 | | | | 8,395,472 | |
Noble Energy, Inc. | | | | | 10,580 | | | | 720,604 | |
Oasis Petroleum, Inc. | | * | | | 78,200 | | | | 3,673,054 | |
Pioneer Natural Resources Co. | | | | | 3,977 | | | | 732,046 | |
QEP Resources, Inc. | | | | | 23,900 | | | | 732,535 | |
Range Resources Corp. | | | | | 9,137 | | | | 770,341 | |
SM Energy Co. | | | | | 9,134 | | | | 759,127 | |
Southwestern Energy Co. | | * | | | 128,165 | | | | 5,040,729 | |
Whiting Petroleum Corp. | | * | | | 83,735 | | | | 5,180,684 | |
World Fuel Services Corp. | | | | | 17,030 | | | | 735,015 | |
| | | | | | | | | | | | |
| | | | | | | | | | | 71,709,592 | |
| | | | | | | | | | | | |
| Paper & Forest Products—0.1% | |
International Paper Co. | | | | | 15,400 | | | | 755,062 | |
| | | | | | | | | | | | |
| Personal Products—0.2% | |
Avon Products, Inc. | | | | | 42,358 | | | | 729,405 | |
Coty, Inc., Class A | | | | | 48,400 | | | | 738,100 | |
Herbalife Ltd. (Cayman Islands) | | † | | | 9,002 | | | | 708,457 | |
Nu Skin Enterprises, Inc., Class A | | | | | 5,259 | | | | 726,899 | |
| | | | | | | | | | | | |
| | | | | | | | | | | 2,902,861 | |
| | | | | | | | | | | | |
See accompanying notes to financial statements
229
SCHEDULE OF INVESTMENTS—(Continued)
December 31, 2013
| | | | | | | | | | | | |
Vantagepoint Aggressive Opportunities Fund | | | | Shares | | | Value | |
| COMMON STOCKS—(Continued) | |
| Pharmaceuticals—1.1% | |
Actavis plc | | * | | | 4,415 | | | $ | 741,720 | |
Endo Health Solutions, Inc. | | * | | | 10,879 | | | | 733,897 | |
Jazz Pharmaceuticals plc (Ireland) | | * | | | 5,800 | | | | 734,048 | |
Mylan, Inc. | | * | | | 17,119 | | | | 742,965 | |
Perrigo Co. plc | | | | | 4,813 | | | | 738,603 | |
Salix Pharmaceuticals Ltd. | | * | | | 109,859 | | | | 9,880,718 | |
Zoetis, Inc. | | | | | 22,600 | | | | 738,794 | |
| | | | | | | | | | | | |
| | | | | | | | | | | 14,310,745 | |
| | | | | | | | | | | | |
| Professional Services—3.0% | |
Advisory Board Co. (The) | | * | | | 63,030 | | | | 4,013,120 | |
Dun & Bradstreet Corp. (The) | | | | | 5,938 | | | | 728,890 | |
Equifax, Inc. | | | | | 92,457 | | | | 6,387,854 | |
IHS, Inc., Class A | | * | | | 32,430 | | | | 3,881,871 | |
Nielsen Holdings NV | | | | | 204,807 | | | | 9,398,593 | |
Robert Half International, Inc. | | | | | 18,212 | | | | 764,722 | |
Towers Watson & Co., Class A | | | | | 37,600 | | | | 4,798,136 | |
Verisk Analytics, Inc., Class A | | * | | | 107,092 | | | | 7,038,086 | |
| | | | | | | | | | | | |
| | | | | | | | | | | 37,011,272 | |
| | | | | | | | | | | | |
| Real Estate Investment Trusts (REITs)—1.2% | |
American Homes 4 Rent, Class A REIT | | | | | 45,300 | | | | 733,860 | |
Apartment Investment & Management Co., Class A REIT | | | | | 28,257 | | | | 732,139 | |
Boston Properties, Inc. REIT | | | | | 7,023 | | | | 704,898 | |
Brixmor Property Group, Inc. REIT | | * | | | 36,100 | | | | 733,913 | |
CBL & Associates Properties, Inc. REIT | | | | | 40,200 | | | | 721,992 | |
Corrections Corp. of America REIT | | | | | 22,400 | | | | 718,368 | |
Digital Realty Trust, Inc. REIT | | † | | | 15,073 | | | | 740,386 | |
Equity Lifestyle Properties, Inc. REIT | | | | | 20,360 | | | | 737,643 | |
Extra Space Storage, Inc. REIT | | | | | 17,281 | | | | 728,049 | |
Federal Realty Investment Trust REIT | | | | | 6,925 | | | | 702,264 | |
Omega Healthcare Investors, Inc. REIT | | † | | | 23,400 | | | | 697,320 | |
Plum Creek Timber Co., Inc. REIT | | | | | 15,120 | | | | 703,231 | |
Rayonier, Inc. REIT | | | | | 17,148 | | | | 721,931 | |
Regency Centers Corp. REIT | | | | | 15,679 | | | | 725,938 | |
Senior Housing Properties Trust REIT | | | | | 32,800 | | | | 729,144 | |
Spirit Realty Capital, Inc. REIT | | | | | 76,000 | | | | 747,080 | |
Tanger Factory Outlet Centers, Inc. REIT | | | | | 21,733 | | | | 695,891 | |
Taubman Centers, Inc. REIT | | | | | 11,434 | | | | 730,861 | |
Ventas, Inc. REIT | | | | | 12,800 | | | | 733,184 | |
Vornado Realty Trust REIT | | | | | 8,400 | | | | 745,836 | |
Weyerhaeuser Co. REIT | | | | | 24,404 | | | | 770,434 | |
| | | | | | | | | | | | |
| | | | | | | | | | | 15,254,362 | |
| | | | | | | | | | | | |
| Real Estate Management & Development—0.8% | |
CBRE Group, Inc., Class A | | * | | | 92,191 | | | | 2,424,624 | |
Cheung Kong Holdings Ltd. ADR (Hong Kong) | | | | | 353,000 | | | | 5,580,930 | |
Realogy Holdings Corp. | | * | | | 14,900 | | | | 737,103 | |
| | | | | | | | | | | | |
| | | | | |
| | | | | | | Shares | | | Value | |
St. Joe Co. (The) | | *† | | | 39,770 | | | $ | 763,186 | |
| | | | | | | | | | | | |
| | | | | | | | | | | 9,505,843 | |
| | | | | | | | | | | | |
| Road & Rail—2.7% | |
AMERCO | | * | | | 3,100 | | | | 737,304 | |
Avis Budget Group, Inc. | | * | | | 111,400 | | | | 4,502,788 | |
Con-way, Inc. | | | | | 18,715 | | | | 743,173 | |
Genesee & Wyoming, Inc., Class A | | * | | | 50,100 | | | | 4,812,105 | |
Hertz Global Holdings, Inc. | | * | | | 255,674 | | | | 7,317,390 | |
J.B. Hunt Transport Services, Inc. | | | | | 54,504 | | | | 4,213,159 | |
Kansas City Southern | | | | | 47,723 | | | | 5,909,539 | |
Landstar System, Inc. | | | | | 12,527 | | | | 719,676 | |
Old Dominion Freight Line, Inc. | | * | | | 91,600 | | | | 4,856,632 | |
| | | | | | | | | | | | |
| | | | | | | | | | | 33,811,766 | |
| | | | | | | | | | | | |
| Semiconductors & Semiconductor Equipment—1.8% | |
Advanced Micro Devices, Inc. | | *† | | | 194,505 | | | | 752,734 | |
Altera Corp. | | | | | 22,843 | | | | 743,083 | |
Analog Devices, Inc. | | | | | 14,545 | | | | 740,777 | |
Applied Materials, Inc. | | | | | 40,100 | | | | 709,369 | |
Atmel Corp. | | * | | | 95,509 | | | | 747,836 | |
Avago Technologies Ltd. (Singapore) | | | | | 13,989 | | | | 739,878 | |
Cavium, Inc. | | * | | | 76,700 | | | | 2,646,917 | |
Cree, Inc. | | * | | | 56,800 | | | | 3,553,976 | |
Freescale Semiconductor Ltd. | | * | | | 47,162 | | | | 756,950 | |
Lam Research Corp. | | * | | | 13,774 | | | | 749,994 | |
Linear Technology Corp. | | | | | 16,138 | | | | 735,086 | |
LSI Corp. | | | | | 66,242 | | | | 729,987 | |
Maxim Integrated Products, Inc. | | | | | 25,879 | | | | 722,283 | |
Microchip Technology, Inc. | | † | | | 16,571 | | | | 741,552 | |
NXP Semiconductor NV (Netherlands) | | * | | | 92,500 | | | | 4,248,525 | |
ON Semiconductor Corp. | | * | | | 91,700 | | | | 755,608 | |
Silicon Laboratories, Inc. | | * | | | 16,774 | | | | 726,482 | |
Skyworks Solutions, Inc. | | * | | | 26,197 | | | | 748,186 | |
Xilinx, Inc. | | | | | 16,166 | | | | 742,343 | |
| | | | | | | | | | | | |
| | | | | | | | | | | 22,291,566 | |
| | | | | | | | | | | | |
| Software—4.7% | |
ACI Worldwide, Inc. | | * | | | 49,263 | | | | 3,202,095 | |
ANSYS, Inc. | | * | | | 8,107 | | | | 706,930 | |
Aspen Technology, Inc. | | * | | | 121,699 | | | | 5,087,018 | |
Autodesk, Inc. | | * | | | 14,748 | | | | 742,267 | |
Cadence Design Systems, Inc. | | * | | | 53,154 | | | | 745,219 | |
Citrix Systems, Inc. | | * | | | 74,203 | | | | 4,693,340 | |
CommVault Systems, Inc. | | * | | | 67,745 | | | | 5,072,746 | |
Concur Technologies, Inc. | | * | | | 7,289 | | | | 752,079 | |
Electronic Arts, Inc. | | * | | | 30,600 | | | | 701,964 | |
FactSet Research Systems, Inc. | | † | | | 6,452 | | | | 700,558 | |
FireEye, Inc. | | * | | | 18,300 | | | | 798,063 | |
FleetMatics Group plc (Ireland) | | * | | | 80,537 | | | | 3,483,225 | |
Fortinet, Inc. | | * | | | 38,447 | | | | 735,491 | |
Guidewire Software, Inc. | | * | | | 68,300 | | | | 3,351,481 | |
Informatica Corp. | | * | | | 95,001 | | | | 3,942,542 | |
Intuit, Inc. | | | | | 9,590 | | | | 731,909 | |
MICROS Systems, Inc. | | * | | | 12,874 | | | | 738,581 | |
NetSuite, Inc. | | * | | | 7,501 | | | | 772,753 | |
Red Hat, Inc. | | * | | | 12,966 | | | | 726,615 | |
Rovi Corp. | | * | | | 37,182 | | | | 732,114 | |
ServiceNow, Inc. | | * | | | 84,690 | | | | 4,743,487 | |
SolarWinds, Inc. | | * | | | 84,781 | | | | 3,207,265 | |
See accompanying notes to financial statements
230
SCHEDULE OF INVESTMENTS—(Continued)
December 31, 2013
| | | | | | | | | | | | |
Vantagepoint Aggressive Opportunities Fund | | | | Shares | | | Value | |
| COMMON STOCKS—(Continued) | |
Solera Holdings, Inc. | | | | | 76,691 | | | $ | 5,426,655 | |
Splunk, Inc. | | * | | | 31,806 | | | | 2,184,118 | |
Symantec Corp. | | | | | 31,847 | | | | 750,952 | |
Tableau Software, Inc., Class A | | * | | | 37,825 | | | | 2,607,277 | |
TIBCO Software, Inc. | | * | | | 32,901 | | | | 739,615 | |
Workday, Inc., Class A | | * | | | 8,700 | | | | 723,492 | |
| | | | | | | | | | | | |
| | | | | | | | | | | 58,799,851 | |
| | | | | | | | | | | | |
| Specialty Retail—6.4% | |
Aaron’s, Inc. | | | | | 25,425 | | | | 747,495 | |
Abercrombie & Fitch Co., Class A | | † | | | 21,900 | | | | 720,729 | |
Advance Auto Parts, Inc. | | | | | 6,634 | | | | 734,251 | |
American Eagle Outfitters, Inc. | | | | | 50,008 | | | | 720,115 | |
Ascena Retail Group, Inc. | | * | | | 35,231 | | | | 745,488 | |
AutoNation, Inc. | | * | | | 14,697 | | | | 730,294 | |
AutoZone, Inc. | | * | | | 1,570 | | | | 750,366 | |
Bed Bath & Beyond, Inc. | | * | | | 9,215 | | | | 739,965 | |
Best Buy Co., Inc. | | | | | 18,600 | | | | 741,768 | |
Cabela’s, Inc. | | * | | | 10,900 | | | | 726,594 | |
CarMax, Inc. | | * | | | 15,374 | | | | 722,886 | |
Chico’s FAS, Inc. | | | | | 39,047 | | | | 735,646 | |
Conn’s, Inc. | | * | | | 35,500 | | | | 2,797,045 | |
Dick’s Sporting Goods, Inc. | | | | | 13,003 | | | | 755,474 | |
DSW, Inc., Class A | | | | | 105,882 | | | | 4,524,338 | |
Finish Line, Inc. (The), Class A | | | | | 92,400 | | | | 2,602,908 | |
Foot Locker, Inc. | | | | | 138,500 | | | | 5,739,440 | |
Gap, Inc. (The) | | | | | 18,950 | | | | 740,566 | |
GNC Holdings, Inc., Class A | | | | | 201,901 | | | | 11,801,113 | |
L Brands, Inc. | | | | | 11,527 | | | | 712,945 | |
Lithia Motors, Inc., Class A | | | | | 43,100 | | | | 2,992,002 | |
Lumber Liquidators Holdings, Inc. | | * | | | 34,500 | | | | 3,549,705 | |
O’Reilly Automotive, Inc. | | * | | | 70,735 | | | | 9,104,302 | |
PetSmart, Inc. | | | | | 10,050 | | | | 731,138 | |
Restoration Hardware Holdings, Inc. | | * | | | 50,176 | | | | 3,376,845 | |
Ross Stores, Inc. | | | | | 69,125 | | | | 5,179,536 | |
Sally Beauty Holdings, Inc. | | * | | | 161,054 | | | | 4,868,662 | |
Signet Jewelers Ltd. (Bermuda) | | | | | 9,700 | | | | 763,390 | |
Tiffany & Co. | | | | | 44,094 | | | | 4,091,041 | |
Tractor Supply Co. | | | | | 58,274 | | | | 4,520,897 | |
Ulta Salon Cosmetics & Fragrance, Inc. | | * | | | 7,806 | | | | 753,435 | |
Urban Outfitters, Inc. | | * | | | 19,023 | | | | 705,753 | |
Williams-Sonoma, Inc. | | | | | 12,612 | | | | 735,027 | |
| | | | | | | | | | | | |
| | | | | | | | | | | 79,861,159 | |
| | | | | | | | | | | | |
| Textiles, Apparel & Luxury Goods—2.5% | |
Carter’s, Inc. | | | | | 10,275 | | | | 737,642 | |
Coach, Inc. | | | | | 13,100 | | | | 735,303 | |
Deckers Outdoor Corp. | | * | | | 8,625 | | | | 728,467 | |
Fossil Group, Inc. | | * | | | 6,022 | | | | 722,279 | |
Hanesbrands, Inc. | | | | | 79,516 | | | | 5,587,589 | |
Michael Kors Holdings Ltd. (Hong Kong) | | * | | | 9,023 | | | | 732,577 | |
Movado Group, Inc. | | | | | 77,500 | | | | 3,410,775 | |
PVH Corp. | | | | | 67,589 | | | | 9,193,456 | |
Ralph Lauren Corp. | | | | | 4,240 | | | | 748,657 | |
Skechers U.S.A., Inc., Class A | | * | | | 80,787 | | | | 2,676,473 | |
Under Armour, Inc., Class A | | * | | | 59,652 | | | | 5,207,620 | |
V.F. Corp. | | | | | 11,952 | | | | 745,088 | |
| | | | | | | | | | | | |
| | | | | | | | | | | 31,225,926 | |
| | | | | | | | | | | | |
| | | | | | | | | | | | |
| | | | | |
| | | | | | | Shares | | | Value | |
| Thrifts & Mortgage Finance—0.1% | |
Nationstar Mortgage Holdings, Inc. | | *† | | | 20,000 | | | $ | 739,200 | |
Ocwen Financial Corp. | | * | | | 13,300 | | | | 737,485 | |
| | | | | | | | | | | | |
| | | | | | | | | | | 1,476,685 | |
| | | | | | | | | | | | |
| Tobacco—0.1% | |
Lorillard, Inc. | | | | | 14,555 | | | | 737,647 | |
| | | | | | | | | | | | |
| Trading Companies & Distributors—1.2% | |
AerCap Holdings NV (Netherlands) | | * | | | 56,600 | | | | 2,170,610 | |
Fastenal Co. | | | | | 15,813 | | | | 751,276 | |
HD Supply Holdings, Inc. | | * | | | 29,700 | | | | 713,097 | |
MRC Global, Inc. | | * | | | 23,177 | | | | 747,690 | |
MSC Industrial Direct Co., Inc., Class A | | | | | 8,892 | | | | 719,096 | |
United Rentals, Inc. | | * | | | 74,468 | | | | 5,804,781 | |
W.W. Grainger, Inc. | | | | | 2,882 | | | | 736,120 | |
WESCO International, Inc. | | * | | | 37,100 | | | | 3,378,697 | |
| | | | | | | | | | | | |
| | | | | | | | | | | 15,021,367 | |
| | | | | | | | | | | | |
| Water Utilities—0.1% | |
Aqua America, Inc. | | | | | 30,645 | | | | 722,915 | |
| | | | | | | | | | | | |
| Wireless Telecommunication Services—1.6% | |
Crown Castle International Corp. | | * | | | 9,808 | | | | 720,201 | |
SBA Communications Corp., Class A | | * | | | 216,140 | | | | 19,418,018 | |
| | | | | | | | | | | | |
| | | | | | | | | | | 20,138,219 | |
| | | | | | | | | | | | |
| TOTAL COMMON STOCKS | |
(Cost $874,793,651) | | | | | | | | | 1,193,355,622 | |
| | | | | | | | | | | | |
| | | | | | | | | | | | | |
| MONEY MARKET FUNDS—6.2% | |
| Institutional Money Market Funds—6.2% | |
Dreyfus Institutional Cash Advantage Fund, 0.06% | | ††¥ | | | 4,000,000 | | | | 4,000,000 | |
Fidelity Institutional Money Market: Money Market Portfolio—Institutional Class, 0.07% | | ¥ | | | 52,242,195 | | | | 52,242,195 | |
Fidelity Institutional Money Market: Money Market Portfolio—Institutional Class, 0.07% | | ††¥ | | | 4,403,679 | | | | 4,403,679 | |
Fidelity Institutional Money Market: Prime Money Market Portfolio—Institutional Class, 0.04% | | ††¥ | | | 4,000,000 | | | | 4,000,000 | |
Short-Term Investments Trust Liquid Assets Portfolio—Institutional Class, 0.07% | | ††¥ | | | 4,000,000 | | | | 4,000,000 | |
See accompanying notes to financial statements
231
SCHEDULE OF INVESTMENTS—(Continued)
December 31, 2013
| | | | | | | | | | | | |
Vantagepoint Aggressive Opportunities Fund | | Shares | | | Value | |
| MONEY MARKET FUNDS—(Continued) | |
Wells Fargo Advantage Cash Investment Money Market Fund—Select Class, 0.06% | | ††¥ | | | 4,000,000 | | | $ | 4,000,000 | |
Wells Fargo Advantage Heritage Money Market Fund—Select Class, 0.06% | | ††¥ | | | 4,000,000 | | | | 4,000,000 | |
| | | | | | | | | | | | |
| TOTAL MONEY MARKET FUNDS | |
(Cost $76,645,874) | | | | | | | | | 76,645,874 | |
| | | | | | | | | | | | |
| TOTAL INVESTMENTS—102.2% | |
(Cost $951,439,525) | | | | | | | | | 1,270,001,496 | |
Other assets less liabilities—(2.2%) | | | | (27,285,895 | ) |
| | | | | | | | | | | | |
| NET ASSETS—100.0% | | | $ | 1,242,715,601 | |
| | | | | |
Notes to the Schedule of Investments:
| | |
| ADR | | American Depositary Receipt |
| NYRS | | New York Registry Shares |
| REIT | | Real Estate Investment Trust |
| * | | Non-income producing. |
| † | | Denotes all or a portion of the security on loan. |
| †† | | Represents reinvestment of collateral received in conjunction with securities lending. |
| ¥ | | The rate quoted is the annualized seven-day yield of the fund at period end. |
See accompanying notes to financial statements
232
SCHEDULE OF INVESTMENTS
December 31, 2013
| | | | | | | | | | | | |
Vantagepoint
Discovery Fund | | | | | | Shares | | | Value | |
| | | | | | | | | | | | |
| COMMON STOCKS—49.3% | | | | | |
| Aerospace & Defense—1.2% | |
Astronics Corp. | | | | * | | | 20,100 | | | $ | 1,025,100 | |
Astronics Corp., Class B | | | | * | | | 12,550 | | | | 636,913 | |
DigitalGlobe, Inc. | | | | * | | | 40,495 | | | | 1,666,369 | |
| | | | | | | | | | | | |
| | | | | | | | | | | 3,328,382 | |
| | | | | | | | | | | | |
| Air Freight & Logistics—0.6% | |
Park-Ohio Holdings Corp. | | | | * | | | 32,500 | | | | 1,703,000 | |
| | | | | | | | | | | | |
| Auto Components—0.6% | |
Standard Motor Products, Inc. | | | | | 42,377 | | | | 1,559,474 | |
| | | | | | | | | | | | |
| Biotechnology—2.9% | |
Agios Pharmaceuticals, Inc. | | | | *† | | | 81,300 | | | | 1,947,135 | |
Arena Pharmaceuticals, Inc. | | | | *† | | | 331,658 | | | | 1,940,199 | |
Exelixis, Inc. | | | | *† | | | 293,400 | | | | 1,798,542 | |
Foundation Medicine, Inc. | | | | *† | | | 47,000 | | | | 1,119,540 | |
Ironwood Pharmaceuticals, Inc. | | *† | | | 106,000 | | | | 1,230,660 | |
| | | | | | | | | | | | |
| | | | | | | | | | | 8,036,076 | |
| | | | | | | | | | | | |
| Capital Markets—1.2% | |
Fifth Street Finance Corp. | | | | | | | 166,200 | | | | 1,537,350 | |
Marcus & Millichap, Inc. | | | | * | | | 116,200 | | | | 1,731,380 | |
| | | | | | | | | | | | |
| | | | | | | | | | | 3,268,730 | |
| | | | | | | | | | | | |
| Chemicals—1.3% | |
Advanced Emissions Solutions, Inc. | | | | * | | | 31,700 | | | | 1,719,091 | |
LSB Industries, Inc. | | | | * | | | 46,900 | | | | 1,923,838 | |
| | | | | | | | | | | | |
| | | | | | | | | | | 3,642,929 | |
| | | | | | | | | | | | |
| Commercial Banks—1.2% | |
Bank of Marin Bancorp | | | | | | | 38,800 | | | | 1,683,532 | |
Flushing Financial Corp. | | | | | | | 79,217 | | | | 1,639,792 | |
| | | | | | | | | | | | |
| | | | | | | | | | | 3,323,324 | |
| | | | | | | | | | | | |
| Commercial Services & Supplies—0.4% | |
Performant Financial Corp. | | | | * | | | 114,600 | | | | 1,180,380 | |
| | | | | | | | | | | | |
| Communications Equipment—4.0% | |
ARRIS Group, Inc. | | | | * | | | 87,400 | | | | 2,129,501 | |
Emulex Corp. | | | | * | | | 163,900 | | | | 1,173,524 | |
Mitel Networks Corp. (Canada) | | *† | | | 174,270 | | | | 1,758,384 | |
NETGEAR, Inc. | | | | * | | | 51,500 | | | | 1,696,410 | |
Parkervision, Inc. | | | | *† | | | 618,477 | | | | 2,814,071 | |
Polycom, Inc. | | | | * | | | 138,100 | | | | 1,550,863 | |
| | | | | | | | | | | | |
| | | | | | | | | | | 11,122,753 | |
| | | | | | | | | | | | |
| Construction & Engineering—0.6% | |
EMCOR Group, Inc. | | | | | | | 39,100 | | | | 1,659,404 | |
| | | | | | | | | | | | |
| Consumer Finance—0.7% | |
Regional Management Corp. | | | | * | | | 56,599 | | | | 1,920,404 | |
| | | | | | | | | | | | |
| Containers & Packaging—0.6% | |
Myers Industries, Inc. | | | | | | | 73,343 | | | | 1,549,004 | |
| | | | | | | | | | | | |
| Diversified Consumer Services—0.1% | |
Steiner Leisure Ltd. (Bahamas) | | * | | | 6,600 | | | | 324,654 | |
| | | | | | | | | | | | |
| Electric Utilities—0.8% | |
ALLETE, Inc. | | | | | | | 26,400 | | | | 1,316,832 | |
Westar Energy, Inc. | | | | | | | 32,000 | | | | 1,029,440 | |
| | | | | | | | | | | | |
| | | | | | | | | | | 2,346,272 | |
| | | | | | | | | | | | |
| | | | | | | | | | | | |
| | | | | |
| | | | | | | Shares | | | Value | |
| | | | | | | | | | | | |
| Electronic Equipment, Instruments & Components—0.7% | |
Speed Commerce, Inc. | | | | * | | | 407,800 | | | $ | 1,904,426 | |
| | | | | | | | | | | | |
| Energy Equipment & Services—0.6% | |
C&J Energy Services, Inc. | | | | *^‡ | | | 74,600 | | | | 1,723,260 | |
| | | | | | | | | | | | |
| Food Products—0.9% | |
Alliance Grain Traders, Inc. (Canada) | | | | | 66,000 | | | | 1,023,940 | |
Darling International, Inc. | | | | * | | | 66,700 | | | | 1,392,696 | |
| | | | | | | | | | | | |
| | | | | | | | | | | 2,416,636 | |
| | | | | | | | | | | | |
| Health Care Equipment & Supplies—2.6% | |
Globus Medical, Inc., Class A | | *† | | | 89,743 | | | | 1,811,013 | |
Greatbatch, Inc. | | | | * | | | 42,000 | | | | 1,858,080 | |
ICU Medical, Inc. | | | | * | | | 23,000 | | | | 1,465,330 | |
Natus Medical, Inc. | | | | * | | | 75,932 | | | | 1,708,470 | |
PhotoMedex, Inc. | | | | *† | | | 25,744 | | | | 333,385 | |
| | | | | | | | | | | | |
| | | | | | | | | | | 7,176,278 | |
| | | | | | | | | | | | |
| Health Care Providers & Services—1.1% | |
Amsurg Corp. | | | | * | | | 28,600 | | | | 1,313,312 | |
Ensign Group, Inc. (The) | | | | | | | 37,500 | | | | 1,660,125 | |
| | | | | | | | | | | | |
| | | | | | | | | | | 2,973,437 | |
| | | | | | | | | | | | |
| Hotels, Restaurants & Leisure—1.2% | |
Del Frisco’s Restaurant Group, Inc. | | * | | | 91,500 | | | | 2,156,655 | |
Ignite Restaurant Group, Inc. | | *† | | | 96,300 | | | | 1,203,750 | |
| | | | | | | | | | | | |
| | | | | | | | | | | 3,360,405 | |
| | | | | | | | | | | | |
| Household Durables—1.2% | |
LGI Homes, Inc. | | | | * | | | 94,500 | | | | 1,681,155 | |
M/I Homes, Inc. | | | | * | | | 68,700 | | | | 1,748,415 | |
| | | | | | | | | | | | |
| | | | | | | | | | | 3,429,570 | |
| | | | | | | | | | | | |
| Independent Power Producers & Energy Traders—0.5% | |
Pattern Energy Group, Inc. | | | | | | | 49,600 | | | | 1,503,376 | |
| | | | | | | | | | | | |
| Industrial Conglomerates—0.5% | |
Carlisle Cos., Inc. | | | | | | | 18,600 | | | | 1,476,840 | |
| | | | | | | | | | | | |
| Internet Software & Services—1.1% | |
Constant Contact, Inc. | | | | * | | | 63,000 | | | | 1,957,410 | |
Digital River, Inc. | | | | * | | | 66,200 | | | | 1,224,700 | |
| | | | | | | | | | | | |
| | | | | | | | | | | 3,182,110 | |
| | | | | | | | | | | | |
| IT Services—0.4% | |
ExlService Holdings, Inc. | | | | * | | | 37,000 | | | | 1,021,940 | |
| | | | | | | | | | | | |
| Leisure Equipment & Products—0.1% | |
LeapFrog Enterprises, Inc. | | | | *† | | | 39,900 | | | | 316,806 | |
| | | | | | | | | | | | |
| Life Sciences Tools & Services—0.6% | |
Albany Molecular Research, Inc. | | * | | | 165,500 | | | | 1,668,240 | |
| | | | | | | | | | | | |
| Machinery—2.6% | |
Altra Industrial Motion Corp. | | | | | 59,700 | | | | 2,042,934 | |
John Bean Technologies Corp. | | | | | 53,700 | | | | 1,575,021 | |
Luxfer Holdings plc ADR (United Kingdom) | | | | | | | 85,592 | | | | 1,785,449 | |
Titan International, Inc. | | | | | | | 103,800 | | | | 1,866,324 | |
| | | | | | | | | | | | |
| | | | | | | | | | | 7,269,728 | |
| | | | | | | | | | | | |
See accompanying notes to financial statements
233
SCHEDULE OF INVESTMENTS—(Continued)
December 31, 2013
| | | | | | | | | | | | |
Vantagepoint
Discovery Fund | | | | | | Shares | | | Value | |
| | | | | | | | | | | | |
| COMMON STOCKS—(Continued) | | | | | |
| Metals & Mining—0.5% | |
New Gold, Inc. (Canada) | | * | | | 210,400 | | | $ | 1,102,496 | |
Romarco Minerals, Inc. (Canada) | | * | | | 796,150 | | | | 281,060 | |
| | | | | | | | | | | | |
| | | | | | | | | | | 1,383,556 | |
| | | | | | | | | | | | |
| Oil, Gas & Consumable Fuels—3.1% | |
BPZ Resources, Inc. | | *† | | | 1,081,600 | | | | 1,968,512 | |
Diamondback Energy, Inc. | | * | | | 20,300 | | | | 1,073,058 | |
EPL Oil & Gas, Inc. | | * | | | 45,500 | | | | 1,296,750 | |
Jones Energy, Inc., Class A | | * | | | 113,100 | | | | 1,637,688 | |
Karoon Gas Australia Ltd. (Australia) | | * | | | 328,927 | | | | 1,280,625 | |
Synergy Resources Corp. | | * | | | 150,600 | | | | 1,394,556 | |
| | | | | | | | | | | | |
| | | | | | | | | | | 8,651,189 | |
| | | | | | | | | | | | |
| Pharmaceuticals—0.9% | |
Medicines Co. (The) | | * | | | 41,700 | | | | 1,610,454 | |
XenoPort, Inc. | | * | | | 160,200 | | | | 921,150 | |
| | | | | | | | | | | | |
| | | | | | | | | | | 2,531,604 | |
| | | | | | | | | | | | |
| Professional Services—0.8% | |
RPX Corp. | | * | | | 125,800 | | | | 2,126,020 | |
| | | | | | | | | | | | |
| Real Estate Investment Trusts (REITs)—3.7% | |
Arbor Realty Trust, Inc. REIT | | | | | 178,347 | | | | 1,187,791 | |
Armada Hoffler Properties, Inc. REIT | | | | | 127,300 | | | | 1,181,344 | |
Capstead Mortgage Corp. REIT | | | | | 96,600 | | | | 1,166,928 | |
Gladstone Commercial Corp. REIT | | | | | 76,000 | | | | 1,365,720 | |
Medical Properties Trust, Inc. REIT | | | | | 105,800 | | | | 1,292,876 | |
Pebblebrook Hotel Trust REIT | | | | | 45,500 | | | | 1,399,580 | |
STAG Industrial, Inc. REIT | | | | | 64,800 | | | | 1,321,272 | |
Summit Hotel Properties, Inc. REIT | | | | | 153,100 | | | | 1,377,900 | |
| | | | | | | | | | | | |
| | | | | | | | | | | 10,293,411 | |
| | | | | | | | | | | | |
| Road & Rail—0.6% | |
Celadon Group, Inc. | | | | | 87,100 | | | | 1,696,708 | |
| | | | | | | | | | | | |
| Semiconductors & Semiconductor Equipment—0.8% | |
Inphi Corp. | | * | | | 124,900 | | | | 1,611,210 | |
Integrated Silicon Solution, Inc. | | * | | | 47,712 | | | | 576,838 | |
| | | | | | | | | | | | |
| | | | | | | | | | | 2,188,048 | |
| | | | | | | | | | | | |
| Software—2.1% | |
Actuate Corp. | | * | | | 218,400 | | | | 1,683,864 | |
ePlus, Inc. | | * | | | 34,700 | | | | 1,972,348 | |
Kofax Ltd. | | * | | | 134,800 | | | | 1,002,912 | |
SeaChange International, Inc. | | * | | | 107,093 | | | | 1,302,251 | |
| | | | | | | | | | | | |
| | | | | | | | | | | 5,961,375 | |
| | | | | | | | | | | | |
| Specialty Retail—2.5% | |
Cato Corp. (The), Class A | | | | | | | 56,900 | | | | 1,809,420 | |
Destination Maternity Corp. | | | | | 53,125 | | | | 1,587,375 | |
Finish Line, Inc. (The), Class A | | | | | 62,700 | | | | 1,766,259 | |
Shoe Carnival, Inc. | | | | | 59,350 | | | | 1,721,743 | |
| | | | | | | | | | | | |
| | | | | | | | | | | 6,884,797 | |
| | | | | | | | | | | | |
| | | | | | | | | | | | | | |
| | | | | |
| | | | | | | | Shares | | | Value | |
| | | | | | | | | | | | | | |
| Thrifts & Mortgage Finance—2.0% | |
EverBank Financial Corp. | | | | | | 105,500 | | | $ | 1,934,870 | |
Home Loan Servicing Solutions Ltd. (Cayman Islands) | | | | | | 73,400 | | | | 1,685,998 | |
WSFS Financial Corp. | | | | | | 27,000 | | | | 2,093,310 | |
| | | | | | | | | | | | | | |
| | | | | | | | | | | | | 5,714,178 | |
| | | | | | | | | | | | | | |
| Trading Companies & Distributors—2.0% | |
CAI International, Inc. | | | * | | | 72,300 | | | | 1,704,111 | |
Cervus Equipment Corp. (Canada) | | | | | | 28,200 | | | | 634,749 | |
H&E Equipment Services, Inc. | | | * | | | 56,645 | | | | 1,678,391 | |
Textainer Group Holdings Ltd. (Bermuda) | | | † | | | 39,300 | | | | 1,580,646 | |
| | | | | | | | | | | | | | |
| | | | | | | | | | | | | 5,597,897 | |
| | | | | | | | | | | | | | |
| TOTAL COMMON STOCKS | |
(Cost $105,503,143) | | | | | | | | | | 137,416,621 | |
| | | | | | | | | | | | | | |
| | | | | | | | | | | | | | | |
| | | | |
Coupon
Rate | |
| Maturity
Date |
| | | | | Face | | | | Value | |
| | | | | | | | | | | | | | |
| CORPORATE OBLIGATIONS—22.6% | |
| Aerospace & Defense—0.2% | |
United Technologies Corp. | | | | | | | | | | | |
0.739% | | | 06/01/2015 | | | # | | $ | 545,000 | | | | 548,610 | |
| | | | | | | | | | | | | | |
| Automobiles—0.1% | |
Jaguar Land Rover Automotive plc (United Kingdom) | | | | | |
4.125% | | | 12/15/2018 | | | ^ | | | 300,000 | | | | 303,375 | |
| | | | | | | | | | | | | | |
| Beverages—0.4% | |
PepsiCo, Inc. | | | | | | | | | | | |
0.700% | | | 08/13/2015 | | | | | | 1,000,000 | | | | 1,001,459 | |
| | | | | | | | | | | | | | |
| Biotechnology—0.2% | |
Amgen, Inc. | | | | | | | | | | | |
1.875% | | | 11/15/2014 | | | | | | 330,000 | | | | 333,749 | |
Gilead Sciences, Inc. | | | | | | | | | | | |
2.400% | | | 12/01/2014 | | | | | | 140,000 | | | | 142,339 | |
| | | | | | | | | | | | | | |
| | | | | | | | | | | | | 476,088 | |
| | | | | | | | | | | | | | |
| Building Products—0.1% | |
Masco Corp. | | | | | | | | | | | |
4.800% | | | 06/15/2015 | | | | | | 165,000 | | | | 172,838 | |
| | | | | | | | | | | | | | |
| Capital Markets—1.7% | |
Bank of New York Mellon Corp. (The) MTN | | | | | |
2.500% | | | 01/15/2016 | | | | | | 525,000 | | | | 541,892 | |
1.200% | | | 02/20/2015 | | | | | | 100,000 | | | | 100,794 | |
E*TRADE Financial Corp. | | | | | | | | | | | |
6.000% | | | 11/15/2017 | | | | | | 190,000 | | | | 202,825 | |
Goldman Sachs Group, Inc. (The) | | | | | | | | |
3.625% | | | 02/07/2016 | | �� | | | | 1,225,000 | | | | 1,286,265 | |
ING Bank NV (Netherlands) | | | | | | | | | | | |
3.750% | | | 03/07/2017 | | | ^ | | | 500,000 | | | | 527,005 | |
Morgan Stanley | | | | | | | | | | | |
1.488% | | | 02/25/2016 | | | # | | | 450,000 | | | | 456,093 | |
Morgan Stanley MTN | | | | | | | | | | | |
1.518% | | | 04/25/2018 | | | # | | | 620,000 | | | | 629,515 | |
Nomura Holdings, Inc. MTN (Japan) | | | | | |
1.694% | | | 09/13/2016 | | | # | | | 500,000 | | | | 509,394 | |
See accompanying notes to financial statements
234
SCHEDULE OF INVESTMENTS—(Continued)
December 31, 2013
| | | | | | | | | | | | | | |
Vantagepoint
Discovery Fund | | | | | | | | | |
| | | | |
Coupon
Rate | | Maturity
Date | | | | | Face | | | Value | |
| | | | | | | | | | | | | | |
| CORPORATE OBLIGATIONS—(Continued) | |
TD Ameritrade Holding Corp. | | | | | | | | |
4.150% | | | 12/01/2014 | | | | | $ | 410,000 | | | $ | 423,404 | |
| | | | | | | | | | | | | | |
| | | | | | | | | | | | | 4,677,187 | |
| | | | | | | | | | | | | | |
| Chemicals—0.2% | |
Ashland, Inc. | | | | | | | | | | | |
3.000% | | | 03/15/2016 | | | | | | 400,000 | | | | 410,000 | |
Ecolab, Inc. | | | | | | | | | | | |
2.375% | | | 12/08/2014 | | | | | | 110,000 | | | | 111,748 | |
| | | | | | | | | | | | | | |
| | | | | | | | | | | | | 521,748 | |
| | | | | | | | | | | | | | |
| Commercial Banks—3.1% | |
ABN AMRO Bank NV (Netherlands) | | | | | |
1.036% | | | 10/28/2016 | | | #^ | | | 200,000 | | | | 200,360 | |
Australia & New Zealand Banking Group Ltd. (Australia) | |
0.801% | | | 05/15/2018 | | | # | | | 580,000 | | | | 580,140 | |
Banco Nacional de Costa Rica (Costa Rica) | | | | | |
4.875% | | | 11/01/2018 | | | ^ | | | 200,000 | | | | 196,500 | |
Banque Federative du Credit Mutuel SA (France) | |
1.089% | | | 10/28/2016 | | | #^ | | | 600,000 | | | | 602,248 | |
BB&T Corp. MTN | | | | | | | | | | | |
1.600% | | | 08/15/2017 | | | | | | 150,000 | | | | 148,791 | |
Capital One Financial Corp. | | | | | | | | | | | |
2.125% | | | 07/15/2014 | | | | | | 340,000 | | | | 342,740 | |
CIT Group, Inc. | | | | | | | | | | | |
4.750% | | | 02/15/2015 | | | ^ | | | 270,000 | | | | 280,462 | |
Credit Agricole SA (France) | | | | | | | | | | | |
1.404% | | | 04/15/2016 | | | #^ | | | 440,000 | | | | 445,722 | |
Discover Bank | | | | | | | | | | | |
2.000% | | | 02/21/2018 | | | | | | 650,000 | | | | 639,036 | |
Fifth Third Bank/Ohio, Bank Note | |
1.150% | | | 11/18/2016 | | | | | | 400,000 | | | | 400,005 | |
HSBC Bank plc (United Kingdom) | |
0.881% | | | 05/15/2018 | | | #^ | | | 560,000 | | | | 561,816 | |
Huntington National Bank (The), Bank Note | |
1.300% | | | 11/20/2016 | | | | | | 260,000 | | | | 260,223 | |
KeyBank NA, Bank Note | |
4.950% | | | 09/15/2015 | | | | | | 200,000 | | | | 212,829 | |
KeyCorp MTN | |
3.750% | | | 08/13/2015 | | | | | | 230,000 | | | | 240,615 | |
Macquarie Bank Ltd. (Australia) | |
2.000% | | | 08/15/2016 | | | ^ | | | 600,000 | | | | 607,208 | |
PNC Bank NA, Bank Note | |
1.150% | | | 11/01/2016 | | | | | | 250,000 | | | | 250,475 | |
Regions Financial Corp. | |
2.000% | | | 05/15/2018 | | | | | | 370,000 | | | | 358,647 | |
Royal Bank of Scotland Group plc (United Kingdom) | |
2.550% | | | 09/18/2015 | | | | | | 695,000 | | | | 711,114 | |
US Bancorp | |
4.200% | | | 05/15/2014 | | | | | | 500,000 | | | | 507,090 | |
US Bank NA, Bank Note | |
0.524% | | | 10/14/2014 | | | # | | | 400,000 | | | | 400,543 | |
Wachovia Bank NA, Bank Note | |
4.800% | | | 11/01/2014 | | | | | | 545,000 | | | | 565,354 | |
Wells Fargo & Co. | |
0.869% | | | 04/23/2018 | | | # | | | 170,000 | | | | 171,119 | |
| | | | | | | | | | | | | | |
| | | | | | | | | | | | | 8,683,037 | |
| | | | | | | | | | | | | | |
| | | | | | | | | | | | | | |
| | | | | |
Coupon
Rate | |
| Maturity
Date |
| | | | | Face | | | | Value | |
| | | | | | | | | | | | | | |
| Computers & Peripherals—0.6% | | | | | |
Apple, Inc. | |
1.000% | | | 05/03/2018 | | | | | $ | 280,000 | | | $ | 271,030 | |
0.492% | | | 05/03/2018 | | | # | | | 575,000 | | | | 574,642 | |
0.450% | | | 05/03/2016 | | | | | | 250,000 | | | | 248,329 | |
Hewlett-Packard Co. | |
1.794% | | | 09/19/2014 | | | # | | | 300,000 | | | | 302,602 | |
Seagate HDD Cayman (Cayman Islands) | |
3.750% | | | 11/15/2018 | | | ^ | | | 350,000 | | | | 354,812 | |
| | | | | | | | | | | | | | |
| | | | | | | | | | | | | 1,751,415 | |
| | | | | | | | | | | | | | |
| Consumer Finance—2.4% | | | | | |
Ally Financial, Inc. | |
3.500% | | | 07/18/2016 | | | | | | 610,000 | | | | 630,950 | |
American Express Co. | |
0.828% | | | 05/22/2018 | | | # | | | 590,000 | | | | 590,226 | |
American Express Credit Corp. | |
0.747% | | | 07/29/2016 | | | # | | | 550,000 | | | | 553,024 | |
American Express Credit Corp. MTN | |
5.125% | | | 08/25/2014 | | | | | | 300,000 | | | | 309,184 | |
1.750% | | | 06/12/2015 | | | | | | 100,000 | | | | 101,650 | |
Caterpillar Financial Services Corp. | |
0.700% | | | 11/06/2015 | | | | | | 150,000 | | | | 150,250 | |
Caterpillar Financial Services Corp. MTN | |
1.000% | | | 11/25/2016 | | | | | | 130,000 | | | | 129,338 | |
Ford Motor Credit Co. LLC | |
3.875% | | | 01/15/2015 | | | | | | 470,000 | | | | 485,095 | |
1.489% | | | 05/09/2016 | | | # | | | 280,000 | | | | 284,273 | |
General Motors Financial Co., Inc. | |
4.750% | | | 08/15/2017 | | | ^ | | | 350,000 | | | | 373,187 | |
2.750% | | | 05/15/2016 | | | ^ | | | 200,000 | | | | 203,000 | |
Harley-Davidson Financial Services, Inc. | |
1.150% | | | 09/15/2015 | | | ^ | | | 160,000 | | | | 160,595 | |
HSBC USA, Inc. | |
1.128% | | | 09/24/2018 | | | # | | | 400,000 | | | | 401,016 | |
International Lease Finance Corp. | |
6.500% | | | 09/01/2014 | | | ^ | | | 200,000 | | | | 207,500 | |
4.875% | | | 04/01/2015 | | | | | | 210,000 | | | | 218,137 | |
2.193% | | | 06/15/2016 | | | # | | | 560,000 | | | | 565,600 | |
John Deere Capital Corp. | |
1.050% | | | 10/11/2016 | | | | | | 240,000 | | | | 240,855 | |
0.700% | | | 09/04/2015 | | | | | | 280,000 | | | | 281,215 | |
John Deere Capital Corp. MTN | |
1.600% | | | 03/03/2014 | | | | | | 270,000 | | | | 270,592 | |
PACCAR Financial Corp. MTN | |
1.550% | | | 09/29/2014 | | | | | | 210,000 | | | | 211,801 | |
1.050% | | | 06/05/2015 | | | | | | 90,000 | | | | 90,766 | |
0.842% | | | 12/06/2018 | | | # | | | 130,000 | | | | 130,344 | |
| | | | | | | | | | | | | | |
| | | | | | | | | | | | | 6,588,598 | |
| | | | | | | | | | | | | | |
| Diversified Financial Services—2.7% | | | | | |
Bank of America Corp. | |
3.700% | | | 09/01/2015 | | | | | | 425,000 | | | | 444,437 | |
Bank of America Corp. MTN | |
1.316% | | | 03/22/2018 | | | # | | | 590,000 | | | | 598,449 | |
1.250% | | | 01/11/2016 | | | | | | 190,000 | | | | 190,950 | |
Bank of America Corp., Series 1 | |
3.750% | | | 07/12/2016 | | | | | | 130,000 | | | | 138,289 | |
Citigroup, Inc. | |
4.450% | | | 01/10/2017 | | | | | | 225,000 | | | | 244,028 | |
2.250% | | | 08/07/2015 | | | | | | 500,000 | | | | 510,590 | |
1.037% | | | 04/01/2016 | | | # | | | 540,000 | | | | 543,826 | |
ERAC USA Finance LLC | |
2.250% | | | 01/10/2014 | | | ^ | | | 400,000 | | | | 400,164 | |
See accompanying notes to financial statements
235
SCHEDULE OF INVESTMENTS—(Continued)
December 31, 2013
| | | | | | | | | | | | | | |
Vantagepoint
Discovery Fund | | | | | | | | | |
| | | | |
Coupon
Rate | | Maturity Date | | | | | Face | | | Value | |
| �� | | | | | | | | | | | | | |
| CORPORATE OBLIGATIONS—(Continued) | |
General Electric Capital Corp. | |
5.900% | | | 05/13/2014 | | | | | $ | 260,000 | | | $ | 265,284 | |
2.150% | | | 01/09/2015 | | | | | | 240,000 | | | | 244,457 | |
1.625% | | | 07/02/2015 | | | | | | 400,000 | | | | 406,651 | |
General Electric Capital Corp. MTN | |
0.894% | | | 07/12/2016 | | | # | | | 670,000 | | | | 675,121 | |
0.873% | | | 04/07/2014 | | | # | | | 300,000 | | | | 300,499 | |
General Electric Capital Corp., Series A | |
3.750% | | | 11/14/2014 | | | | | | 390,000 | | | | 401,755 | |
JPMorgan Chase & Co. | |
1.138% | | | 01/25/2018 | | | # | | | 280,000 | | | | 283,078 | |
JPMorgan Chase & Co. MTN | |
1.875% | | | 03/20/2015 | | | | | | 105,000 | | | | 106,451 | |
1.100% | | | 10/15/2015 | | | | | | 250,000 | | | | 251,064 | |
NASDAQ OMX Group, Inc. (The) | |
4.000% | | | 01/15/2015 | | | | | | 460,000 | | | | 472,148 | |
National Rural Utilities Cooperative Finance Corp. | |
1.000% | | | 02/02/2015 | | | | | | 200,000 | | | | 201,230 | |
RCI Banque SA (France) | |
2.116% | | | 04/11/2014 | | | #^ | | | 800,000 | | | | 802,496 | |
| | | | | | | | | | | | | | |
| | | | | | | | | | | | | 7,480,967 | |
| | | | | | | | | | | | | | |
| Diversified Telecommunication Services—0.8% | |
AT&T, Inc. | |
0.875% | | | 02/13/2015 | | | | | | 780,000 | | | | 781,863 | |
CC Holdings GS V LLC/Crown Castle GS III Corp. | |
2.381% | | | 12/15/2017 | | | | | | 130,000 | | | | 128,883 | |
Verizon Communications, Inc. | |
1.993% | | | 09/14/2018 | | | # | | | 280,000 | | | | 294,750 | |
1.773% | | | 09/15/2016 | | | # | | | 120,000 | | | | 123,709 | |
0.700% | | | 11/02/2015 | | | | | | 210,000 | | | | 209,509 | |
0.442% | | | 03/06/2015 | | | #^ | | | 300,000 | | | | 299,579 | |
Windstream Corp. | |
7.875% | | | 11/01/2017 | | | | | | 340,000 | | | | 390,150 | |
| | | | | | | | | | | | | | |
| | | | | | | | | | | | | 2,228,443 | |
| | | | | | | | | | | | | | |
| Electric Utilities—0.4% | | | | | |
Georgia Power Co. | | | | | | | | | | | |
0.750% | | | 08/10/2015 | | | | | | 500,000 | | | | 501,123 | |
NextEra Energy Capital Holdings, Inc. | | | | | |
1.611% | | | 06/01/2014 | | | | | | 180,000 | | | | 180,821 | |
1.339% | | | 09/01/2015 | | | | | | 500,000 | | | | 503,537 | |
1.200% | | | 06/01/2015 | | | | | | 80,000 | | | | 80,438 | |
| | | | | | | | | | | | | | |
| | | | | | | | | | | | | 1,265,919 | |
| | | | | | | | | | | | | | |
| Energy Equipment & Services—0.3% | | | | | |
Cameron International Corp. | | | | | | | | |
1.150% | | | 12/15/2016 | | | | | | 300,000 | | | | 299,224 | |
Nabors Industries, Inc. | | | | | | | | |
2.350% | | | 09/15/2016 | | | ^ | | | 500,000 | | | | 505,367 | |
| | | | | | | | | | | | | | |
| | | | | | | | | | | | | 804,591 | |
| | | | | | | | | | | | | | |
| Food & Staples Retailing—0.5% | | | | | |
CVS Caremark Corp. | | | | | | | | |
1.200% | | | 12/05/2016 | | | | | | 130,000 | | | | 130,225 | |
Kroger Co. (The) | | | | | | | | |
2.200% | | | 01/15/2017 | | | | | | 500,000 | | | | 506,452 | |
0.804% | | | 10/17/2016 | | | # | | | 400,000 | | | | 401,154 | |
Walgreen Co. | | | | | | | | |
1.000% | | | 03/13/2015 | | | | | | 210,000 | | | | 210,926 | |
| | | | | | | | | | | | | | |
| | | | | |
Coupon
Rate | |
| Maturity
Date |
| | | | | Face | | | | Value | |
| | | | | | | | | | | | | | |
Wal-Mart Stores, Inc. | | | | | | | | |
0.600% | | | 04/11/2016 | | | | | $ | 120,000 | | | $ | 119,893 | |
| | | | | | | | | | | | | | |
| | | | | | | | | | | | | 1,368,650 | |
| | | | | | | | | | | | | | |
| Food Products—0.6% | | | | | |
BRF SA (Brazil) | | | | | | | | |
7.750% | | | 05/22/2018 | | | ^ BRL | | | 1,200,000 | | | | 423,694 | |
ConAgra Foods, Inc. | | | | | | | | |
1.350% | | | 09/10/2015 | | | | | | 70,000 | | | | 70,515 | |
1.300% | | | 01/25/2016 | | | | | | 110,000 | | | | 110,247 | |
General Mills, Inc. | | | | | | | | |
0.875% | | | 01/29/2016 | | | | | | 90,000 | | | | 89,789 | |
Kellogg Co. | | | | | | | | |
1.125% | | | 05/15/2015 | | | | | | 350,000 | | | | 352,502 | |
Kraft Foods Group, Inc. | | | | | | | | |
1.625% | | | 06/04/2015 | | | | | | 150,000 | | | | 151,958 | |
Want Want China Finance Ltd. (Cayman Islands) | | | | | | | | |
1.875% | | | 05/14/2018 | | | ^ | | | 290,000 | | | | 276,941 | |
Wm. Wrigley Jr. Co. | | | | | | | | |
2.000% | | | 10/20/2017 | | | ^ | | | 100,000 | | | | 99,813 | |
1.400% | | | 10/21/2016 | | | ^ | | | 100,000 | | | | 100,220 | |
| | | | | | | | | | | | | | |
| | | | | | | | | | | | | 1,675,679 | |
| | | | | | | | | | | | | | |
| Health Care Equipment & Supplies—0.1% | | | | | |
Baxter International, Inc. | | | | | | | | |
0.950% | | | 06/01/2016 | | | | | | 110,000 | | | | 110,054 | |
Stryker Corp. | | | | | | | | |
3.000% | | | 01/15/2015 | | | | | | 300,000 | | | | 308,007 | |
| | | | | | | | | | | | | | |
| | | | | | | | | | | | | 418,061 | |
| | | | | | | | | | | | | | |
| Health Care Providers & Services—0.6% | | | | | |
Express Scripts Holding Co. | | | | | | | | |
2.750% | | | 11/21/2014 | | | | | | 500,000 | | | | 509,754 | |
Quest Diagnostics, Inc. | | | | | | | | |
1.098% | | | 03/24/2014 | | | # | | | 160,000 | | | | 160,211 | |
UnitedHealth Group, Inc. | | | | | | | | |
1.400% | | | 10/15/2017 | | | | | | 100,000 | | | | 98,828 | |
Ventas Realty LP | | | | | | | | |
1.550% | | | 09/26/2016 | | | | | | 211,000 | | | | 212,639 | |
WellPoint, Inc. | | | | | | | | |
2.375% | | | 02/15/2017 | | | | | | 465,000 | | | | 471,068 | |
1.250% | | | 09/10/2015 | | | | | | 190,000 | | | | 191,401 | |
| | | | | | | | | | | | | | |
| | | | | | | | | | | | | 1,643,901 | |
| | | | | | | | | | | | | | |
| Hotels, Restaurants & Leisure—0.2% | | | | | |
McDonald’s Corp. MTN | | | | | | | | |
0.750% | | | 05/29/2015 | | | | | | 190,000 | | | | 191,175 | |
Starbucks Corp. | | | | | | | | |
0.875% | | | 12/05/2016 | | | | | | 240,000 | | | | 238,660 | |
| | | | | | | | | | | | | | |
| | | | | | | | | | | | | 429,835 | |
| | | | | | | | | | | | | | |
| Household Durables—0.1% | | | | | |
Toll Brothers Finance Corp. | | | | | | | | |
4.000% | | | 12/31/2018 | | | | | | 200,000 | | | | 204,000 | |
| | | | | | | | | | | | | | |
| Insurance—0.9% | | | | | |
Allstate Corp. (The) | | | | | | | | |
6.200% | | | 05/16/2014 | | | | | | 300,000 | | | | 306,357 | |
American International Group, Inc. | | | | | | | | |
2.375% | | | 08/24/2015 | | | | | | 150,000 | | | | 153,278 | |
Berkshire Hathaway Finance Corp. | | | | | | | | |
0.950% | | | 08/15/2016 | | | | | | 130,000 | | | | 130,674 | |
See accompanying notes to financial statements
236
SCHEDULE OF INVESTMENTS—(Continued)
December 31, 2013
| | | | | | | | | | | | | | |
Vantagepoint
Discovery Fund | | | | | | | | | |
| | | | |
Coupon
Rate | | Maturity Date | | | | | Face | | | Value | |
| | | | | | | | | | | | | | |
| CORPORATE OBLIGATIONS—(Continued) | |
Metropolitan Life Global Funding I | | | | | | | | |
0.994% | | | 01/10/2014 | | | #^ | | $ | 700,000 | | | $ | 700,147 | |
0.774% | | | 07/15/2016 | | | #^ | | | 320,000 | | | | 321,975 | |
New York Life Global Funding | | | | | | | | |
0.504% | | | 04/04/2014 | | | #^ | | | 500,000 | | | | 500,424 | |
Principal Life Global Funding II | | | | | | | | |
1.000% | | | 12/11/2015 | | | ^ | | | 230,000 | | | | 230,579 | |
Prudential Financial, Inc. | | | | | | | | |
1.021% | | | 08/15/2018 | | | # | | | 300,000 | | | | 301,291 | |
| | | | | | | | | | | | | | |
| | | | | | | | | | | | | 2,644,725 | |
| | | | | | | | | | | | | | |
| Internet & Catalog Retail—0.1% | | | | | |
Amazon.com, Inc. | | | | | | | | |
0.650% | | | 11/27/2015 | | | | | | 400,000 | | | | 400,008 | |
| | | | | | | | | | | | | | |
| Internet Software & Services—0.2% | | | | | |
Baidu, Inc. (Cayman Islands) | | | | | | | | |
2.250% | | | 11/28/2017 | | | | | | 200,000 | | | | 199,120 | |
eBay, Inc. | | | | | | | | |
0.700% | | | 07/15/2015 | | | | | | 220,000 | | | | 220,675 | |
IAC/InterActiveCorp | | | | | | | | |
4.875% | | | 11/30/2018 | | | ^ | | | 150,000 | | | | 154,125 | |
| | | | | | | | | | | | | | |
| | | | | | | | | | | | | 573,920 | |
| | | | | | | | | | | | | | |
| IT Services—0.5% | | | | | |
Computer Sciences Corp. | | | | | | | | |
2.500% | | | 09/15/2015 | | | | | | 100,000 | | | | 102,114 | |
Fidelity National Information Services, Inc. | | | | | |
2.000% | | | 04/15/2018 | | | | | | 150,000 | | | | 146,008 | |
International Business Machines Corp. | | | | | |
0.550% | | | 02/06/2015 | | | | | | 610,000 | | | | 611,070 | |
Total System Services, Inc. | | | | | | | | |
2.375% | | | 06/01/2018 | | | | | | 530,000 | | | | 516,164 | |
| | | | | | | | | | | | | | |
| | | | | | | | | | | | | 1,375,356 | |
| | | | | | | | | | | | | | |
| Life Sciences Tools & Services—0.1% | | | | | |
Thermo Fisher Scientific, Inc. | | | | | | | | |
1.300% | | | 02/01/2017 | | | | | | 180,000 | | | | 179,353 | |
| | | | | | | | | | | | | | |
| Marine—0.1% | | | | | |
Far East Capital Ltd. SA (Luxembourg) | | | | | |
8.000% | | | 05/02/2018 | | | ^ | | | 250,000 | | | | 224,375 | |
| | | | | | | | | | | | | | |
| Media—0.2% | | | | | |
DISH DBS Corp. | | | | | | | | |
4.625% | | | 07/15/2017 | | | | | | 245,000 | | | | 257,250 | |
NBCUniversal Enterprise, Inc. | | | | | | | | |
0.929% | | | 04/15/2018 | | | #^ | | | 240,000 | | | | 241,131 | |
Viacom, Inc. | | | | | | | | |
4.375% | | | 09/15/2014 | | | | | | 200,000 | | | | 205,252 | |
| | | | | | | | | | | | | | |
| | | | | | | | | | | | | 703,633 | |
| | | | | | | | | | | | | | |
| Metals & Mining—0.8% | | | | | |
ArcelorMittal (Luxembourg) | | | | | |
4.250% | | | 08/05/2015 | | | | | | 350,000 | | | | 363,563 | |
FMG Resources August 2006 Pty Ltd. (Australia) | | | | | |
6.000% | | | 04/01/2017 | | | ^† | | | 280,000 | | | | 298,900 | |
Freeport-McMoRan Copper & Gold, Inc. | | | | | |
1.400% | | | 02/13/2015 | | | | | | 100,000 | | | | 100,586 | |
Glencore Funding LLC | | | | | |
1.604% | | | 01/15/2019 | | | #^ | | | 600,000 | | | | 589,249 | |
Xstrata Finance Canada Ltd. (Canada) | | | | | |
2.700% | | | 10/25/2017 | | | ^ | | | 800,000 | | | | 809,810 | |
| | | | | | | | | | | | | | |
| | | | | | | | | | | | | 2,162,108 | |
| | | | | | | | | | | | | | |
| | | | | | | | | | | | | | |
| | | | | |
Coupon
Rate | |
| Maturity
Date |
| | | | | Face | | | | Value | |
| | | | | | | | | | | | | | |
| Oil, Gas & Consumable Fuels—1.3% | | | | | |
Boardwalk Pipelines LP | | | | | |
5.875% | | | 11/15/2016 | | | | | $ | 575,000 | | | $ | 636,769 | |
ConocoPhillips | | | | | |
4.750% | | | 02/01/2014 | | | | | | 53,000 | | | | 53,190 | |
CONSOL Energy, Inc. | | | | | |
8.000% | | | 04/01/2017 | | | | | | 100,000 | | | | 105,750 | |
Devon Energy Corp. | | | | | |
1.200% | | | 12/15/2016 | | | | | | 300,000 | | | | 300,091 | |
Enterprise Products Operating LLC | | | | | |
1.250% | | | 08/13/2015 | | | | | | 100,000 | | | | 100,704 | |
Marathon Oil Corp. | | | | | |
0.900% | | | 11/01/2015 | | | | | | 220,000 | | | | 220,283 | |
Murphy Oil Corp. | | | | | |
2.500% | | | 12/01/2017 | | | | | | 250,000 | | | | 251,753 | |
Phillips 66 | | | | | |
1.950% | | | 03/05/2015 | | | | | | 230,000 | | | | 233,272 | |
Plains Exploration & Production Co. | | | | | |
6.500% | | | 11/15/2020 | | | | | | 260,000 | | | | 287,266 | |
Rockies Express Pipeline LLC | | | | | |
3.900% | | | 04/15/2015 | | | ^ | | | 290,000 | | | | 290,725 | |
Sabine Pass LNG LP | | | | | |
7.500% | | | 11/30/2016 | | | | | | 370,000 | | | | 419,950 | |
Tesoro Corp. | | | | | |
4.250% | | | 10/01/2017 | | | | | | 260,000 | | | | 272,350 | |
WPX Energy, Inc. | | | | | |
5.250% | | | 01/15/2017 | | | | | | 355,000 | | | | 380,737 | |
| | | | | | | | | | | | | | |
| | | | | | | | | | | | | 3,552,840 | |
| | | | | | | | | | | | | | |
| Pharmaceuticals—0.8% | | | | | |
AbbVie, Inc. | | | | | |
1.750% | | | 11/06/2017 | | | | | | 520,000 | | | | 519,590 | |
1.200% | | | 11/06/2015 | | | | | | 520,000 | | | | 525,524 | |
Merck & Co., Inc. | | | | | |
0.598% | | | 05/18/2018 | | | # | | | 470,000 | | | | 471,741 | |
Mylan, Inc. | | | | | |
1.800% | | | 06/24/2016 | | | ^ | | | 80,000 | | | | 81,606 | |
1.350% | | | 11/29/2016 | | | | | | 150,000 | | | | 149,831 | |
Perrigo Co. plc (Ireland) | | | | | |
1.300% | | | 11/08/2016 | | | ^ | | | 300,000 | | | | 299,169 | |
Valeant Pharmaceuticals International | | | | | |
6.500% | | | 07/15/2016 | | | ^ | | | 203,000 | | | | 209,598 | |
| | | | | | | | | | | | | | |
| | | | | | | | | | | | | 2,257,059 | |
| | | | | | | | | | | | | | |
| Professional Services—0.0% | | | | | |
Equifax, Inc. | | | | | |
4.450% | | | 12/01/2014 | | | | | | 80,000 | | | | 82,525 | |
| | | | | | | | | | | | | | |
| Real Estate Investment Trusts (REITs)—0.8% | |
Digital Realty Trust LP | | | | | |
4.500% | | | 07/15/2015 | | | † | | | 550,000 | | | | 572,272 | |
HCP, Inc. | | | | | |
2.700% | | | 02/01/2014 | | | | | | 570,000 | | | | 570,943 | |
Health Care REIT, Inc. | | | | | |
3.625% | | | 03/15/2016 | | | | | | 375,000 | | | | 393,096 | |
Simon Property Group LP | | | | | |
4.200% | | | 02/01/2015 | | | | | | 90,000 | | | | 92,665 | |
Vornado Realty LP | | | | | |
4.250% | | | 04/01/2015 | | | | | | 470,000 | | | | 484,798 | |
| | | | | | | | | | | | | | |
| | | | | | | | | | | | | 2,113,774 | |
| | | | | | | | | | | | | | |
| Road & Rail—0.4% | | | | | |
Avis Budget Car Rental LLC/Avis Budget Finance, Inc. | |
4.875% | | | 11/15/2017 | | | † | | | 270,000 | | | | 284,850 | |
See accompanying notes to financial statements
237
SCHEDULE OF INVESTMENTS—(Continued)
December 31, 2013
| | | | | | | | | | | | | | |
Vantagepoint
Discovery Fund | | | | | | | | | |
| | | | |
Coupon
Rate | | Maturity Date | | | | | Face | | | Value | |
| | | | | | | | | | | | | | |
| CORPORATE OBLIGATIONS—(Continued) | |
Kansas City Southern de Mexico SA de CV (Mexico) | |
2.350% | | | 05/15/2020 | | | | | $ | 230,000 | | | $ | 214,586 | |
Penske Truck Leasing Co. Lp/PTL Finance Corp. | |
3.125% | | | 05/11/2015 | | | ^ | | | 300,000 | | | | 308,647 | |
2.500% | | | 03/15/2016 | | | ^ | | | 230,000 | | | | 235,765 | |
| | | | | | | | | | | | | | |
| | | | | | | | | | | | | 1,043,848 | |
| | | | | | | | | | | | | | |
| Semiconductors & Semiconductor Equipment—0.2% | |
Texas Instruments, Inc. | | | | | |
0.450% | | | 08/03/2015 | | | | | | 420,000 | | | | 419,876 | |
TSMC Global Ltd. (Virgin Islands, British) | | | | | |
1.625% | | | 04/03/2018 | | | ^ | | | 200,000 | | | | 192,027 | |
| | | | | | | | | | | | | | |
| | | | | | | | | | | | | 611,903 | |
| | | | | | | | | | | | | | |
| Software—0.4% | | | | | |
Autodesk, Inc. | | | | | |
1.950% | | | 12/15/2017 | | | | | | 150,000 | | | | 148,525 | |
Microsoft Corp. | | | | | |
2.950% | | | 06/01/2014 | | | | | | 500,000 | | | | 505,296 | |
Oracle Corp. | | | | | |
3.750% | | | 07/08/2014 | | | | | | 480,000 | | | | 488,350 | |
| | | | | | | | | | | | | | |
| | | | | | | | | | | | | 1,142,171 | |
| | | | | | | | | | | | | | |
| Thrifts & Mortgage Finance—0.2% | | | | | |
Astoria Financial Corp. | | | | | |
5.000% | | | 06/19/2017 | | | | | | 240,000 | | | | 257,634 | |
BPCE SA MTN (France) | | | | | |
1.488% | | | 04/25/2016 | | | # | | | 350,000 | | | | 354,756 | |
| | | | | | | | | | | | | | |
| | | | | | | | | | | | | 612,390 | |
| | | | | | | | | | | | | | |
| Tobacco—0.0% | | | | | |
Reynolds American, Inc. | | | | | |
1.050% | | | 10/30/2015 | | | | | | 100,000 | | | | 100,363 | |
| | | | | | | | | | | | | | |
| Trading Companies & Distributors—0.2% | | | | | |
Aircastle Ltd. (Bermuda) | | | | | |
9.750% | | | 08/01/2018 | | | | | | 390,000 | | | | 427,050 | |
Aviation Capital Group Corp. | | | | | |
4.625% | | | 01/31/2018 | | | ^ | | | 160,000 | | | | 165,789 | |
| | | | | | | | | | | | | | |
| | | | | | | | | | | | | 592,839 | |
| | | | | | | | | | | | | | |
| Wireless Telecommunication Services—0.1% | |
SBA Communications Corp. | | | | | |
5.625% | | | 10/01/2019 | | | | | | 150,000 | | | | 155,250 | |
SoftBank Corp. (Japan) | | | | | |
4.500% | | | 04/15/2020 | | | ^ | | | 200,000 | | | | 196,000 | |
| | | | | | | | | | | | | | |
| | | | | | | | | | | | | 351,250 | |
| | | | | | | | | | | | | | |
| TOTAL CORPORATE OBLIGATIONS | |
(Cost $62,476,554) | | | | 62,968,841 | |
| | | | | | | | | | | | | | |
| | | | | | | | | | | | | | | |
| MORTGAGE-BACKED SECURITIES—2.7% | |
| Commercial Mortgage-Backed Securities— 0.3% | |
Hilton USA Trust, Series 2013-HLF, Class AFL | |
1.169% | | | 11/05/2030 | | | #^ | | | 610,000 | | | | 610,671 | |
National Credit Union Administration Guaranteed Notes,
Series 2010-C1, Class A1 | |
1.600% | | | 10/29/2020 | | | | | | 284,505 | | | | 286,865 | |
| | | | | | | | | | | | | | |
| | | | | | | | | | | | | 897,536 | |
| | | | | | | | | | | | | | |
| | | | | | | | | | | | | | |
| | | | | |
Coupon
Rate | |
| Maturity
Date |
| | | | | Face | | | | Value | |
| | | | | | | | | | | | | | |
| Non-Agency Mortgage-Backed Securities— 2.0% | |
Credit Suisse Mortgage Capital Certificates,
Series 2013-IVR2, Class AD | |
1.550% | | | 04/25/2043 | | | #^ | | $ | 568,253 | | | $ | 548,660 | |
Credit Suisse Mortgage Capital Certificates,
Series 2013-IVR3, Class A3 | |
1.550% | | | 05/25/2043 | | | #^ | | | 283,600 | | | | 262,432 | |
GSAMP Trust, Series 2004-SEA2, Class M1 | |
0.815% | | | 03/25/2034 | | | # | | | 600,000 | | | | 598,051 | |
HarborView Mortgage Loan Trust, Series 2005-14, Class 3A1A | |
2.718% | | | 12/19/2035 | | | # | | | 584,461 | | | | 516,255 | |
Sequoia Mortgage Trust, Series 2012-2, Class A2 | |
3.500% | | | 04/25/2042 | | | # | | | 395,140 | | | | 397,958 | |
Sequoia Mortgage Trust, Series 2013-1, Class 1A1 | |
1.450% | | | 02/25/2043 | | | # | | | 363,299 | | | | 358,194 | |
Sequoia Mortgage Trust, Series 2013-4, Class A3 | |
1.550% | | | 04/25/2043 | | | # | | | 420,038 | | | | 406,054 | |
Springleaf Mortgage Loan Trust, Series 2012-3A, Class A | |
1.570% | | | 12/25/2059 | | | #^ | | | 287,172 | | | | 286,759 | |
Springleaf Mortgage Loan Trust, Series 2013-1A, Class A | |
1.270% | | | 06/25/2058 | | | #^ | | | 545,904 | | | | 545,898 | |
Springleaf Mortgage Loan Trust, Series 2013-2A, Class A | |
1.780% | | | 12/25/2065 | | | #^ | | | 272,305 | | | | 272,221 | |
Structured Agency Credit Risk Debt Notes,
Series 2013-DN2, Class M1 | |
1.618% | | | 11/25/2023 | | | # | | | 487,277 | | | | 486,441 | |
Thornburg Mortgage Securities Trust, Series 2004-1, Class II2A | |
1.765% | | | 03/25/2044 | | | # | | | 805,543 | | | | 781,884 | |
WaMu Mortgage Pass Through Certificates,
Series 2006-AR12, Class 1A1 | |
2.420% | | | 10/25/2036 | | | # | | | 84,208 | | | | 72,445 | |
| | | | | | | | | | | | | | |
| | | | | | | | | | | | | 5,533,252 | |
| | | | | | | | | | | | | | |
| U.S. Government Agency Mortgage-Backed Securities—0.4% | |
National Credit Union Administration Guaranteed Notes,
Series 2010-R1, Class 1A | |
0.619% | | | 10/07/2020 | | | # | | | 480,825 | | | | 483,412 | |
National Credit Union Administration Guaranteed Notes, Series 2011-R6, Class 1A | |
0.549% | | | 05/07/2020 | | | # | | | 484,489 | | | | 484,962 | |
| | | | | | | | | | | | | | |
| | | | | | | | | | | | | 968,374 | |
| | | | | | | | | | | | | | |
| TOTAL MORTGAGE-BACKED SECURITIES | |
(Cost $7,508,242) | | | | 7,399,162 | |
| | | | | | | | | | | | | | |
| | | | | | | | | | | | | | | |
| U.S. TREASURY OBLIGATIONS—18.3% | |
| U.S. Treasury Notes—18.3% | |
U.S. Treasury Note | | | | | |
0.625% | | | 07/15/2016 | | | | | | 6,730,000 | | | | 6,738,675 | |
0.500% | | | 06/15/2016 | | | | | | 3,825,000 | | | | 3,821,263 | |
0.375% | | | 11/15/2014 | | | ‡‡ | | | 6,590,000 | | | | 6,603,002 | |
0.375% | |
| 06/30/2015-
03/15/2016 |
| | | | | 19,375,000 | | | | 19,368,927 | |
0.250% | | | 03/31/2015 | | | ‡‡ | | | 2,000,000 | | | | 2,001,250 | |
0.250% | |
| 07/31/2015-
05/15/2016 |
| | | | | 12,590,000 | | | | 12,569,469 | |
| | | | | | | | | | | | | | |
| | | | | | | | | | | | | 51,102,586 | |
| | | | | | | | | | | | | | |
| TOTAL U.S. TREASURY OBLIGATIONS | |
(Cost $51,074,786) | | | | 51,102,586 | |
| | | | | | | | | | | | | | |
See accompanying notes to financial statements
238
SCHEDULE OF INVESTMENTS—(Continued)
December 31, 2013
| | | | | | | | | | | | | | |
Vantagepoint
Discovery Fund | | | | | | | | | |
| | | | | | | | | | | | | | |
| | | | |
Coupon
Rate | | Maturity Date | | | | | Face | | | Value | |
| GOVERNMENT RELATED OBLIGATIONS—1.2% | |
| U.S. Government Agencies—0.5% | |
Federal National Mortgage Association | |
0.500% | | | 03/30/2016 | | | | | $ | 1,140,000 | | | $ | 1,139,410 | |
National Credit Union Administration Guaranteed Notes, Series A2 | |
1.400% | | | 06/12/2015 | | | | | | 180,000 | | | | 182,777 | |
| | | | | | | | | | | | | | |
| | | | | | | | | | | | | 1,322,187 | |
| | | | | | | | | | | | | | |
| Non-U.S. Government Agencies—0.3% | |
IPIC Ltd. MTN (Cayman Islands) | |
3.125% | | | 11/15/2015 | | | ^† | | | 250,000 | | | | 259,688 | |
Petrobras International Finance Co. (Cayman Islands) | |
2.875% | | | 02/06/2015 | | | | | | 160,000 | | | | 162,800 | |
Petroleos Mexicanos (Mexico) | |
2.266% | | | 07/18/2018 | | | # | | | 410,000 | | | | 423,325 | |
| | | | | | | | | | | | | | |
| | | | | | | | | | | | | 845,813 | |
| | | | | | | | | | | | | | |
| Sovereign Debt—0.0% | |
Panama Government International Bond (Panama) | |
7.250% | | | 03/15/2015 | | | | | | 23,000 | | | | 24,782 | |
| | | | | | | | | | | | | | |
| U.S. Municipal Bonds—0.4% | |
Florida Hurricane Catastrophe Fund Finance Corp. Revenue Bonds (Florida) | |
1.298% | | | 07/01/2016 | | | | | | 330,000 | | | | 331,188 | |
Missouri Higher Education Loan Authority,
Series 2012-1, Class A1 (Missouri) | |
0.995% | | | 01/26/2026 | | | # | | | 562,999 | | | | 563,017 | |
South Carolina State Public Service Authority,
Series D (South Carolina) | |
1.044% | | | 06/01/2015 | | | # | | | 260,000 | | | | 260,811 | |
| | | | | | | | | | | | | | |
| | | | | | | | | | | | | 1,155,016 | |
| | | | | | | | | | | | | | |
| TOTAL GOVERNMENT RELATED OBLIGATIONS | |
(Cost $3,314,149) | | | | 3,347,798 | |
| | | | | | | | | | | | | | |
| | | | | | | | | | | | | | | |
| ASSET-BACKED SECURITIES—2.5% | |
| Automobiles—1.2% | |
Ally Master Owner Trust
Series 2013-2, Class A | |
0.617% | | | 04/15/2018 | | | # | | | 600,000 | | | | 599,106 | |
Ally Master Owner Trust
Series 2013-1, Class A1 | |
0.617% | | | 02/15/2018 | | | # | | | 500,000 | | | | 499,734 | |
Capital Auto Receivables Asset Trust
Series 2013-1, Class C | |
1.740% | | | 10/22/2018 | | | | | | 120,000 | | | | 118,591 | |
Capital Auto Receivables Asset Trust
Series 2013-1, Class B | |
1.290% | | | 04/20/2018 | | | | | | 120,000 | | | | 118,838 | |
Enterprise Fleet Financing LLC
Series 2012-1, Class A2 | |
1.140% | | | 11/20/2017 | | | ^ | | | 570,451 | | | | 571,709 | |
Nissan Master Owner Trust Receivables
Series 2013-A, Class A | | | | | |
0.467% | | | 02/15/2018 | | | # | | | 1,250,000 | | | | 1,250,334 | |
World Omni Master Owner Trust
Series 2013-1, Class A | | | | | |
0.517% | | | 02/15/2018 | | | #^ | | | 325,000 | | | | 325,297 | |
| | | | | | | | | | | | | | |
| | | | | | | | | | | | | 3,483,609 | |
| | | | | | | | | | | | | | |
| | | | | | | | | | | | | | |
| | | | | |
Coupon
Rate | |
| Maturity
Date |
| | | | | Face | | | | Value | |
| | | | | | | | | | | | | | |
| Credit Card—0.5% | |
Discover Card Execution Note Trust
Series 2012-A1, Class A1 | | | | | |
0.810% | | | 08/15/2017 | | | | | $ | 600,000 | | | $ | 602,226 | |
GE Capital Credit Card Master Note Trust
Series 2012-1, Class A | | | | | |
1.030% | | | 01/15/2018 | | | | | | 750,000 | | | | 752,287 | |
| | | | | | | | | | | | | | |
| | | | | | | | | | | | | 1,354,513 | |
| | | | | | | | | | | | | | |
| Other—0.5% | |
CenterPoint Energy Transition Bond Co. IV LLC
Series 2012-1, Class A1 | |
0.901% | | | 04/15/2018 | | | | | | 668,189 | | | | 668,569 | |
GreatAmerica Leasing Receivables Funding LLC
Series 2013-1, Class C | | | | | |
1.830% | | | 06/17/2019 | | | ^ | | | 100,000 | | | | 99,159 | |
Invitation Homes Trust
Series 2013-SFR1, Class A | | | | | |
1.314% | | | 12/17/2030 | | | #^ | | | 400,000 | | | | 400,930 | |
MMAF Equipment Finance LLC
Series 2011-AA, Class A3 | | | | | |
1.270% | | | 09/15/2015 | | | ^ | | | 278,715 | | | | 279,055 | |
| | | | | | | | | | | | | | |
| | | | | | | | | | | | | 1,447,713 | |
| | | | | | | | | | | | | | |
| Student Loan—0.3% | |
National Credit Union Administration Guaranteed Notes
Series 2010-A1, Class A | |
0.517% | | | 12/07/2020 | | | # | | | 751,290 | | | | 752,086 | |
| | | | | | | | | | | | | | |
| TOTAL ASSET-BACKED SECURITIES | |
(Cost $7,033,340) | | | | | | | | | | 7,037,921 | |
| | | | | | | | | | | | | | |
| | | | | | | | | | | | | | | |
| | | | |
| | | | | | | | | | Shares | | | | Value | |
| WARRANTS—0.0% | |
| Food Products—0.0% | |
Kulim Malaysia Berhad (Malaysia), Expires 02/27/2016, Strike MYR 3.85 | | | * | | | | | | | | |
(Cost $—) | | | | | | 60,350 | | | | 12,713 | |
| | | | | | | | | | | | | | |
| | | | | | | | | | | | | | | |
| MONEY MARKET FUNDS—10.4% | |
| Institutional Money Market Funds—10.4% | |
Dreyfus Institutional Cash Advantage Fund, 0.06% | | | ††¥ | | | 2,900,000 | | | | 2,900,000 | |
Fidelity Institutional Money Market: Money Market Portfolio—Institutional Class, 0.07% | | | ¥ | | | 10,474,352 | | | | 10,474,352 | |
Fidelity Institutional Money Market: Money Market Portfolio—Institutional Class, 0.07% | | | ††¥ | | | 4,078,865 | | | | 4,078,865 | |
Fidelity Institutional Money Market: Prime Money Market Portfolio—Institutional Class, 0.04% | | | ††¥ | | | 2,900,000 | | | | 2,900,000 | |
See accompanying notes to financial statements
239
SCHEDULE OF INVESTMENTS—(Continued)
December 31, 2013
| | | | | | | | | | | | |
Vantagepoint
Discovery Fund | | | | Shares | | | Value | |
| | | | | | | | | | | | |
| MONEY MARKET FUNDS—(Continued) | |
Short-Term Investments Trust Liquid Assets Portfolio—Institutional Class, 0.07% | | ††¥ | | $ | 2,900,000 | | | $ | 2,900,000 | |
Wells Fargo Advantage Cash Investment Money Market Fund—Select Class, 0.06% | | ††¥ | | | 2,900,000 | | | | 2,900,000 | |
Wells Fargo Advantage Heritage Money Market Fund—Select Class, 0.06% | | ††¥ | | | 2,900,000 | | | | 2,900,000 | |
| | | | | | | | | | | | |
| TOTAL MONEY MARKET FUNDS | |
(Cost $29,053,217) | | | | | | | 29,053,217 | |
| | | | | | | | | | | | |
| TOTAL INVESTMENTS—107.0% | |
(Cost $265,963,431) | | | | | | | 298,338,859 | |
Other assets less liabilities—(7.0%) | | | | (19,488,882 | ) |
| | | | | | | | | | | | |
| NET ASSETS—100.0% | | | | | | $ | 278,849,977 | |
| | | | | | | | | | | | |
Notes to the Schedule of Investments:
| | |
| ADR | | American Depositary Receipt |
| BRL | | Brazilian Real |
| MTN | | Medium Term Note |
| MYR | | Malaysian Ringgit |
| REIT | | Real Estate Investment Trust |
| # | | Rate is subject to change. Rate shown reflects current rate. |
| * | | Non-income producing. |
| ^ | | Securities are not registered under the Securities Act of 1933. These securities may be resold only in transactions exempt from registration, generally to qualified institutional buyers under Securities Act Rule 144A. Such securities are considered illiquid unless deemed liquid by a subadviser under the liquidity procedures adopted by the Board of Directors. The total market value of 144A securities was $20,167,844, which represents 7.2% of Net Assets. The illiquid 144A securities represented 0.6% of Net Assets, and 8.5% of total 144A securities held. |
| † | | Denotes all or a portion of the security on loan. |
| †† | | Represents reinvestment of collateral received in conjunction with securities lending. |
| ‡ | | Security valued at fair value as determined by policies approved by the Board of Directors. (Total Market Value $1,723,260) |
| ‡‡ | | Security or a portion of the security has been pledged as collateral for futures contracts and/or options contracts. |
| ¥ | | The rate quoted is the annualized seven-day yield of the fund at period end. |
See accompanying notes to financial statements
240
SCHEDULE OF INVESTMENTS
December 31, 2013
| | | | | | | | | | | | |
Vantagepoint
International Fund | | | | | | Shares | | | Value | |
| COMMON STOCKS—97.3% | |
| Australia—3.9% | | | | | | | | | | |
AMP Ltd. | | | | | 824,771 | | | $ | 3,241,704 | |
Beach Energy Ltd. | | † | | | 1,298,300 | | | | 1,662,314 | |
BHP Billiton Ltd. | | | | | 80,000 | | | | 2,727,436 | |
Brambles Ltd. | | | | | 218,200 | | | | 1,787,701 | |
Coca-Cola Amatil Ltd. | | | | | 345,000 | | | | 3,711,368 | |
Cochlear Ltd. | | | | | 29,000 | | | | 1,527,931 | |
CSL Ltd. | | | | | 127,700 | | | | 7,872,305 | |
Fortescue Metals Group Ltd. | | | | | 465,900 | | | | 2,433,781 | |
Insurance Australia Group Ltd. | | | | | 531,700 | | | | 2,768,370 | |
Oil Search Ltd. | | | | | 122,107 | | | | 887,092 | |
QBE Insurance Group Ltd. | | | | | 600,887 | | | | 6,198,574 | |
REA Group Ltd. | | | | | 85,300 | | | | 2,881,232 | |
Recall Holdings Ltd. | | * | | | 43,640 | | | | 158,203 | |
Suncorp Group Ltd. | | | | | 198,100 | | | | 2,325,270 | |
Telstra Corp. Ltd. | | | | | 514,700 | | | | 2,415,799 | |
Westpac Banking Corp. | | | | | 85,100 | | | | 2,466,937 | |
Woodside Petroleum Ltd. | | | | | 122,000 | | | | 4,249,079 | |
Woolworths Ltd. | | | | | 226,900 | | | | 6,870,841 | |
| | | | | | | | | | | | |
| | | | | | | | | | | 56,185,937 | |
| | | | | | | | | | | | |
| Austria—0.3% | | | | | | | | | | |
OMV AG | | | | | 42,800 | | | | 2,049,323 | |
Zumtobel AG | | | | | 148,900 | | | | 2,325,372 | |
| | | | | | | | | | | | |
| | | | | | | | | | | 4,374,695 | |
| | | | | | | | | | | | |
| Belgium—1.3% | | | | | | | | | | |
Ageas | | | | | 78,100 | | | | 3,330,462 | |
Anheuser-Busch InBev NV | | | | | 59,516 | | | | 6,328,709 | |
Colruyt SA | | | | | 87,200 | | | | 4,872,158 | |
Telenet Group Holding NV | | | | | 36,071 | | | | 2,153,632 | |
UCB SA | | | | | 31,851 | | | | 2,372,955 | |
| | | | | | | | | | | | |
| | | | | | | | | | | 19,057,916 | |
| | | | | | | | | | | | |
| Brazil—1.6% | | | | | | | | | | |
AMBEV SA ADR | | | | | 23,500 | | | | 172,725 | |
AMBEV SA ADR | | | | | 187,500 | | | | 1,378,125 | |
Banco do Brasil SA | | | | | 76,700 | | | | 793,252 | |
CCR SA | | | | | 251,000 | | | | 1,890,546 | |
Cia Brasileira de Distribuicao Grupo Pao de Acucar (Preference) ADR | | | | | 19,400 | | | | 866,598 | |
Cia Hering | | | | | 62,900 | | | | 797,164 | |
Cielo SA | | | | | 83,340 | | | | 2,319,072 | |
CPFL Energia SA ADR | | | | | 105,800 | | | | 1,693,858 | |
EcoRodovias Infraestrutura e Logistica SA | | | | | 241,200 | | | | 1,513,091 | |
Natura Cosmeticos SA | | | | | 50,500 | | | | 885,529 | |
Petroleo Brasileiro SA | | | | | 173,700 | | | | 1,257,517 | |
Petroleo Brasileiro SA ADR | | | | | 65,800 | | | | 966,602 | |
Petroleo Brasileiro SA ADR | | | | | 186,400 | | | | 2,738,216 | |
Souza Cruz SA | | | | | 69,600 | | | | 711,267 | |
Vale SA ADR | | | | | 18,700 | | | | 285,175 | |
Vale SA ADR | | | | | 23,100 | | | | 352,275 | |
Vale SA (Preference) ADR | | | | | 261,700 | | | | 3,666,417 | |
| | | | | | | | | | | | |
| | | | | | | | | | | 22,287,429 | |
| | | | | | | | | | | | |
| Canada—2.4% | | | | | | | | | | |
BCE, Inc. | | | | | 135,400 | | | | 5,863,403 | |
Canadian Natural Resources Ltd. | | | | | 62,300 | | | | 2,107,848 | |
Canadian Pacific Railway Ltd. | | | | | 12,636 | | | | 1,912,080 | |
| | | | | | | | | | | | |
| | | | | |
| | | | | | |
|
Shares |
| | | Value | |
Canfor Corp. | | * | | | 110,700 | | | $ | 2,778,312 | |
CGI Group, Inc., Class A | | * | | | 79,400 | | | | 2,656,508 | |
Genworth MI Canada, Inc. | | | | | 75,400 | | | | 2,600,049 | |
Husky Energy, Inc. | | | | | 70,200 | | | | 2,227,103 | |
Norbord, Inc. | | | | | 63,400 | | | | 2,020,922 | |
Stantec, Inc. | | | | | 42,100 | | | | 2,610,220 | |
Suncor Energy, Inc. | | | | | 203,900 | | | | 7,148,257 | |
Westjet Airlines Ltd. | | | | | 97,700 | | | | 2,561,492 | |
| | | | | | | | | | | | |
| | | | | | | | | | | 34,486,194 | |
| | | | | | | | | | | | |
| Chile—0.2% | | | | | | | | | | |
Enersis SA ADR | | | | | 156,400 | | | | 2,344,436 | |
| | | | | | | | | | | | |
| China—2.5% | | | | | | | | | | |
AAC Technologies Holdings, Inc. | | | | | 222,000 | | | | 1,080,205 | |
Baidu, Inc. ADR | | * | | | 72,624 | | | | 12,918,357 | |
China Shenhua Energy Co. Ltd., H Shares | | | | | 1,565,866 | | | | 4,955,595 | |
CNOOC Ltd. | | | | | 3,027,000 | | | | 5,629,548 | |
ENN Energy Holdings Ltd. | | | | | 166,000 | | | | 1,230,289 | |
Hengan International Group Co. Ltd. | | | | | 214,500 | | | | 2,537,815 | |
Mindray Medical International Ltd. ADR | | | | | 76,800 | | | | 2,792,448 | |
Tencent Holdings Ltd. | | | | | 77,200 | | | | 4,942,921 | |
| | | | | | | | | | | | |
| | | | | | | | | | | 36,087,178 | |
| | | | | | | | | | | | |
| Denmark—1.2% | | | | | | | | | | |
Chr Hansen Holding A/S | | | | | 61,081 | | | | 2,421,282 | |
Coloplast A/S, Class B | | | | | 57,176 | | | | 3,790,517 | |
Novo Nordisk A/S, Class B | | | | | 40,831 | | | | 7,486,574 | |
Rockwool International A/S, Class B | | | | | 5,950 | | | | 1,053,665 | |
Topdanmark A/S | | * | | | 116,676 | | | | 3,074,790 | |
| | | | | | | | | | | | |
| | | | | | | | | | | 17,826,828 | |
| | | | | | | | | | | | |
| Finland—0.7% | | | | | | | | | | |
Huhtamaki Oyj | | | | | 113,800 | | | | 2,927,193 | |
Kone Oyj, Class B | | | | | 82,000 | | | | 3,698,086 | |
Pohjola Bank plc, Class A | | | | | 141,500 | | | | 2,837,174 | |
| | | | | | | | | | | | |
| | | | | | | | | | | 9,462,453 | |
| | | | | | | | | | | | |
| France—8.3% | | | | | | | | | | |
Air Liquide SA | | | | | 34,100 | | | | 4,826,303 | |
AXA SA | | | | | 171,700 | | | | 4,781,438 | |
Carrefour SA | | | | | 145,227 | | | | 5,764,544 | |
Casino Guichard Perrachon SA | | | | | 23,200 | | | | 2,676,956 | |
Cie de Saint-Gobain | | | | | 193,559 | | | | 10,662,603 | |
Danone SA | | | | | 69,500 | | | | 5,013,864 | |
Essilor International SA | | | | | 46,600 | | | | 4,958,586 | |
Etablissements Maurel et Prom | | | | | 147,800 | | | | 2,472,315 | |
L’Oreal SA | | | | | 28,800 | | | | 5,057,654 | |
LVMH Moet Hennessy Louis Vuitton SA | | | | | 6,234 | | | | 1,138,915 | |
Mercialys SA REIT | | | | | 248,600 | | | | 5,217,846 | |
Orange SA | | | | | 816,711 | | | | 10,139,575 | |
Pernod Ricard SA | | | | | 19,591 | | | | 2,232,027 | |
Plastic Omnium SA | | | | | 95,600 | | | | 2,674,454 | |
Rallye SA | | | | | 58,400 | | | | 2,450,318 | |
Safran SA | | | | | 54,200 | | | | 3,768,444 | |
Sanofi | | | | | 117,038 | | | | 12,499,066 | |
Schneider Electric SA | | | | | 61,116 | | | | 5,331,855 | |
Technip SA | | | | | 15,300 | | | | 1,472,789 | |
Total SA | | | | | 243,830 | | | | 14,966,156 | |
See accompanying notes to financial statements
241
SCHEDULE OF INVESTMENTS—(Continued)
December 31, 2013
| | | | | | | | | | | | |
Vantagepoint
International Fund | | | | | | Shares | | | Value | |
| COMMON STOCKS—(Continued) | |
Unibail-Rodamco SE (Paris Exchange) REIT | | | | | 12,173 | | | $ | 3,119,446 | |
Valeo SA | | | | | 28,100 | | | | 3,114,081 | |
Zodiac Aerospace | | † | | | 27,917 | | | | 4,947,176 | |
| | | | | | | | | | | | |
| | | | | | | | | | | 119,286,411 | |
| | | | | | | | | | | | |
| Germany—7.2% | | | | | | | | | | |
Adidas AG | | | | | 41,900 | | | | 5,343,001 | |
Axel Springer SE | | | | | 4,121 | | | | 265,313 | |
BASF SE | | | | | 27,107 | | | | 2,893,237 | |
Bayer AG (Registered) | | | | | 96,969 | | | | 13,615,482 | |
Beiersdorf AG | | | | | 38,843 | | | | 3,938,084 | |
Continental AG | | | | | 17,535 | | | | 3,852,255 | |
Daimler AG (Registered) | | | | | 89,168 | | | | 7,738,401 | |
Deutsche Post AG (Registered) | | | | | 196,441 | | | | 7,175,009 | |
Deutsche Telekom AG (Registered) | | | | | 817,719 | | | | 14,089,459 | |
Duerr AG | | | | | 38,500 | | | | 3,440,357 | |
Hannover Rueck SE | | | | | 24,410 | | | | 2,098,548 | |
HeidelbergCement AG | | | | | 32,869 | | | | 2,495,916 | |
Linde AG | | | | | 47,303 | | | | 9,904,591 | |
Merck KGaA | | | | | 15,500 | | | | 2,781,134 | |
MTU Aero Engines AG | | | | | 34,156 | | | | 3,356,545 | |
Muenchener Rueckversicherungs AG (Registered) | | | | | 19,580 | | | | 4,318,761 | |
RWE AG | | | | | 167,112 | | | | 6,122,822 | |
SAP AG | | | | | 58,900 | | | | 5,107,906 | |
Volkswagen AG | | | | | 15,563 | | | | 4,225,634 | |
| | | | | | | | | | | | |
| | | | | | | | | | | 102,762,455 | |
| | | | | | | | | | | | |
| Hong Kong—4.2% | | | | | | | | | | |
AIA Group Ltd. | | | | | 2,721,000 | | | | 13,696,120 | |
ASM Pacific Technology Ltd. | | | | | 119,800 | | | | 1,003,420 | |
Beijing Enterprises Holdings Ltd. | | | | | 709,000 | | | | 7,042,695 | |
Belle International Holdings Ltd. | | † | | | 1,604,837 | | | | 1,864,439 | |
China Mobile Ltd. | | | | | 960,734 | | | | 10,007,319 | |
China Resources Land Ltd. | | † | | | 822,000 | | | | 2,045,098 | |
China Resources Power Holdings Co. Ltd. | | | | | 1,004,000 | | | | 2,382,950 | |
CLP Holdings Ltd. | | | | | 372,500 | | | | 2,946,235 | |
Galaxy Entertainment Group Ltd. | | * | | | 665,000 | | | | 5,987,169 | |
Hang Lung Properties Ltd. | | | | | 743,000 | | | | 2,355,227 | |
Hong Kong & China Gas Co. Ltd. | | | | | 2,452,893 | | | | 5,631,809 | |
Hongkong Land Holdings Ltd. | | | | | 188,970 | | | | 1,116,548 | |
Hopewell Holdings Ltd. | | | | | 269,000 | | | | 912,127 | |
SJM Holdings Ltd. | | | | | 953,000 | | | | 3,203,479 | |
| | | | | | | | | | | | |
| | | | | | | | | | | 60,194,635 | |
| | | | | | | | | | | | |
| India—0.6% | | | | | | | | | | |
Axis Bank Ltd. GDR | | | | | 77,553 | | | | 1,626,736 | |
ICICI Bank Ltd. ADR | | | | | 28,800 | | | | 1,070,496 | |
Infosys Ltd. ADR | | | | | 38,500 | | | | 2,179,100 | |
Larsen & Toubro Ltd. GDR | | † | | | 127,968 | | | | 2,307,494 | |
Tata Motors Ltd. ADR | | | | | 51,300 | | | | 1,580,040 | |
| | | | | | | | | | | | |
| | | | | | | | | | | 8,763,866 | |
| | | | | | | | | | | | |
| | | | | | | | | | | | |
| | | | | |
| | | | | | |
|
Shares |
| | | Value | |
| Indonesia—0.8% | | | | | | | | | | |
Astra International Tbk PT | | | | | 2,848,500 | | | $ | 1,595,313 | |
Bank Mandiri Persero Tbk PT | | | | | 2,805,500 | | | | 1,815,751 | |
Bank Rakyat Indonesia Persero Tbk PT | | | | | 5,022,500 | | | | 3,002,052 | |
Bumitama Agri Ltd. | | | | | 472,000 | | | | 352,139 | |
Global Mediacom Tbk PT | | | | | 4,581,500 | | | | 716,020 | |
Perusahaan Gas Negara Persero Tbk PT | | | | | 5,396,000 | | | | 1,989,035 | |
Semen Indonesia Persero Tbk PT | | | | | 839,000 | | | | 978,362 | |
Telekomunikasi Indonesia Persero Tbk PT ADR | | | | | 23,000 | | | | 824,550 | |
| | | | | | | | | | | | |
| | | | | | | | | | | 11,273,222 | |
| | | | | | | | | | | | |
| Ireland—1.0% | | | | | | | | | | |
Beazley plc | | | | | 620,100 | | | | 2,799,322 | |
Covidien plc | | | | | 73,338 | | | | 4,994,318 | |
Shire plc | | | | | 74,159 | | | | 3,494,906 | |
Smurfit Kappa Group plc | | | | | 123,900 | | | | 3,048,406 | |
| | | | | | | | | | | | |
| | | | | | | | | | | 14,336,952 | |
| | | | | | | | | | | | |
| Israel—1.4% | | | | | | | | | | |
Bank Hapoalim BM | | | | | 512,393 | | | | 2,870,987 | |
Delek Group Ltd. | | | | | 10,669 | | | | 4,075,406 | |
Teva Pharmaceutical Industries Ltd. ADR | | | | | 319,100 | | | | 12,789,528 | |
Teva Pharmaceutical Industries Ltd. ADR | | | | | 6,000 | | | | 240,480 | |
| | | | | | | | | | | | |
| | | | | | | | | | | 19,976,401 | |
| | | | | | | | | | | | |
| Italy—1.8% | | | | | | | | | | |
ACEA SpA | | | | | 190,239 | | | | 2,159,092 | |
Eni SpA | | | | | 436,717 | | | | 10,552,683 | |
Exor SpA | | | | | 86,200 | | | | 3,426,103 | |
Industria Macchine Automatiche SpA | | | | | 90,400 | | | | 3,490,633 | |
Mediolanum SpA | | | | | 441,400 | | | | 3,824,942 | |
Recordati SpA | | | | | 194,600 | | | | 2,801,997 | |
| | | | | | | | | | | | |
| | | | | | | | | | | 26,255,450 | |
| | | | | | | | | | | | |
| Japan—16.3% | | | | | | | | | | |
Aeon Mall Co. Ltd. | | | | | 125,510 | | | | 3,515,956 | |
Aiful Corp. | | * | | | 859,200 | | | | 3,599,273 | |
Aisin Seiki Co. Ltd. | | | | | 59,900 | | | | 2,435,299 | |
Aoyama Trading Co. Ltd. | | | | | 84,500 | | | | 2,285,242 | |
Autobacs Seven Co. Ltd. | | † | | | 135,800 | | | | 2,115,255 | |
Canon, Inc. | | † | | | 364,300 | | | | 11,624,228 | |
Chugai Pharmaceutical Co. Ltd. | | | | | 167,200 | | | | 3,700,983 | |
Dai Nippon Printing Co. Ltd. | | | | | 254,200 | | | | 2,700,154 | |
Daihatsu Motor Co. Ltd. | | | | | 122,900 | | | | 2,084,723 | |
Daikin Industries Ltd. | | | | | 85,100 | | | | 5,310,473 | |
Daito Trust Construction Co. Ltd. | | | | | 78,400 | | | | 7,329,457 | |
Denso Corp. | | | | | 137,200 | | | | 7,248,097 | |
FANUC Corp. | | | | | 29,700 | | | | 5,442,248 | |
FUJIFILM Holdings Corp. | | | | | 105,400 | | | | 2,991,783 | |
Honda Motor Co. Ltd. | | | | | 282,300 | | | | 11,652,533 | |
IHI Corp. | | | | | 888,000 | | | | 3,840,281 | |
INPEX Corp. | | | | | 392,000 | | | | 5,027,859 | |
Japan Exchange Group, Inc. | | | | | 112,400 | | | | 3,194,845 | |
Japan Tobacco, Inc. | | | | | 59,400 | | | | 1,932,802 | |
JX Holdings, Inc. | | | | | 203,700 | | | | 1,048,943 | |
See accompanying notes to financial statements
242
SCHEDULE OF INVESTMENTS—(Continued)
December 31, 2013
| | | | | | | | | | | | |
Vantagepoint
International Fund | | | | | | Shares | | | Value | |
| COMMON STOCKS—(Continued) | |
Kao Corp. | | | | | 318,700 | | | $ | 10,033,260 | |
KDDI Corp. | | | | | 54,700 | | | | 3,370,355 | |
Keyence Corp. | | | | | 13,892 | | | | 5,948,351 | |
Komatsu Ltd. | | | | | 243,700 | | | | 5,003,475 | |
Komori Corp. | | | | | 235,700 | | | | 4,019,031 | |
Kuroda Electric Co. Ltd. | | † | | | 179,800 | | | | 2,698,128 | |
Kyowa Exeo Corp. | | | | | 189,200 | | | | 2,502,033 | |
Lintec Corp. | | | | | 106,200 | | | | 1,968,926 | |
Matsumotokiyoshi Holdings Co. Ltd. | | | | | 83,900 | | | | 2,925,346 | |
Medipal Holdings Corp. | | | | | 204,900 | | | | 2,704,980 | |
Mitsubishi Estate Co. Ltd. | | | | | 74,000 | | | | 2,214,527 | |
MS&AD Insurance Group Holdings | | | | | 103,200 | | | | 2,773,910 | |
NGK Insulators Ltd. | | | | | 282,000 | | | | 5,366,709 | |
Nippon Telegraph & Telephone Corp. | | | | | 65,727 | | | | 3,540,083 | |
NKSJ Holdings, Inc. | | | | | 98,600 | | | | 2,744,395 | |
NTT DOCOMO, Inc. | | | | | 93,000 | | | | 1,531,365 | |
Olympus Corp. | | * | | | 23,500 | | | | 745,343 | |
Ono Pharmaceutical Co. Ltd. | | | | | 28,400 | | | | 2,489,416 | |
ORIX Corp. | | | | | 85,500 | | | | 1,502,395 | |
Paltac Corp. | | | | | 178,300 | | | | 2,310,470 | |
Seiko Epson Corp. | | | | | 135,600 | | | | 3,650,966 | |
Seven & I Holdings Co. Ltd. | | | | | 285,500 | | | | 11,367,590 | |
Shimamura Co. Ltd. | | | | | 27,000 | | | | 2,530,888 | |
Shin-Etsu Chemical Co. Ltd. | | | | | 79,400 | | | | 4,644,049 | |
Showa Corp. | | | | | 191,400 | | | | 3,087,713 | |
Suzuken Co. Ltd. | | | | | 80,400 | | | | 2,604,395 | |
T&D Holdings, Inc. | | | | | 221,500 | | | | 3,100,245 | |
Takeda Pharmaceutical Co. Ltd. | | | | | 206,600 | | | | 9,475,719 | |
Tokai Rika Co. Ltd. | | | | | 119,200 | | | | 2,373,363 | |
Tokio Marine Holdings, Inc. | | | | | 477,800 | | | | 15,991,816 | |
Tokyo Electron Ltd. | | | | | 102,300 | | | | 5,637,008 | |
Tokyo Gas Co. Ltd. | | | | | 415,000 | | | | 2,045,413 | |
Toyoda Gosei Co. Ltd. | | | | | 124,200 | | | | 2,893,314 | |
Toyota Motor Corp. | | | | | 97,500 | | | | 5,945,071 | |
Warabeya Nichiyo Co. Ltd. | | | | | 135,500 | | | | 2,453,599 | |
| | | | | | | | | | | | |
| | | | | | | | | | | 233,274,081 | |
| | | | | | | | | | | | |
| Jersey, Channel Islands—0.1% | | | | | |
Phoenix Group Holdings | | | | | 149,600 | | | | 1,807,015 | |
| | | | | | | | | | | | |
| Kazakhstan—0.1% | | | | | | | | | | | | |
KazMunaiGas Exploration Production JSC GDR | | | | | 79,138 | | | | 1,242,114 | |
| | | | | | | | | | | | |
| Korea, Republic of—2.2% | | | | | | | | |
Dongbu Insurance Co. Ltd. | | | | | 43,610 | | | | 2,323,589 | |
Hanwha Corp. | | * | | | 152,100 | | | | 5,659,213 | |
Hyundai Marine & Fire Insurance Co. Ltd. | | | | | 71,640 | | | | 2,207,164 | |
Hyundai Mobis | | * | | | 15,215 | | | | 4,235,916 | |
Hyundai Motor Co. | | | | | 7,980 | | | | 1,791,244 | |
Korea Gas Corp. | | * | | | 28,190 | | | | 1,781,881 | |
LG Display Co. Ltd. | | * | | | 104,350 | | | | 2,519,879 | |
Samsung Electronics Co. Ltd. | | | | | 5,786 | | | | 7,539,432 | |
Samsung Electronics Co. Ltd. GDR | | | | | 1,400 | | | | 916,078 | |
SK Holdings Co. Ltd. | | | | | 12,150 | | | | 2,202,847 | |
| | | | | | | | | | | | |
| | | | | | | | | | | 31,177,243 | |
| | | | | | | | | | | | |
| | | | | | | | | | | | |
| | | | | |
| | | | | | | | Shares | | | | Value | |
| Luxembourg—0.1% | | | | | | | | | | | | |
Millicom International Cellular SA SDR | | | | | 10,000 | | | $ | 996,458 | |
Tenaris SA ADR | | | | | 18,300 | | | | 799,527 | |
| | | | | | | | | | | | |
| | | | | | | | | | | 1,795,985 | |
| | | | | | | | | | | | |
| Macau—0.5% | | | | | | | | | | | | |
MGM China Holdings Ltd. | | | | | 859,000 | | | | 3,676,408 | |
Sands China Ltd. | | | | | 476,400 | | | | 3,904,258 | |
| | | | | | | | | | | | |
| | | | | | | | | | | 7,580,666 | |
| | | | | | | | | | | | |
| Malaysia—0.4% | | | | | | | | | | | | |
AMMB Holdings Bhd | | | | | 1,112,500 | | | | 2,461,893 | |
Genting Malaysia Bhd | | | | | 985,800 | | | | 1,319,756 | |
Guinness Anchor Bhd | | | | | 164,700 | | | | 805,107 | |
Top Glove Corp. Bhd | | | | | 472,700 | | | | 813,059 | |
| | | | | | | | | | | | |
| | | | | | | | | | | 5,399,815 | |
| | | | | | | | | | | | |
| Mexico—1.0% | | | | | | | | | | | | |
America Movil SAB de CV, Series L ADR | | | | | 86,600 | | | | 2,023,842 | |
Coca-Cola Femsa SAB de CV ADR | | | | | 8,700 | | | | 1,059,399 | |
Fibra Uno Administracion SA de CV REIT | | | | | 1,060,700 | | | | 3,397,425 | |
Grupo Financiero Santander Mexico SAB de CV, Class B ADR | | | | | 140,400 | | | | 1,915,056 | |
Grupo Financiero Santander Mexico SAB de CV, Class B ADR | | | | | 18,100 | | | | 246,884 | |
Grupo Televisa SAB ADR | | | | | 123,471 | | | | 3,736,232 | |
Kimberly-Clark de Mexico SAB de CV, Class A | | | | | 234,600 | | | | 666,256 | |
Wal-Mart de Mexico SAB de CV, Series V | | | | | 383,600 | | | | 1,006,559 | |
| | | | | | | | | | | | |
| | | | | | | | | | | 14,051,653 | |
| | | | | | | | | | | | |
| Netherlands—4.0% | | | | | | | | | | | | |
ASML Holding NV | | | | | 32,485 | | | | 3,042,601 | |
Koninklijke Ahold NV | | | | | 735,792 | | | | 13,223,023 | |
Randstad Holding NV | | | | | 43,800 | | | | 2,842,320 | |
Reed Elsevier NV | | | | | 505,983 | | | | 10,754,047 | |
Royal Dutch Shell plc, Class A | | † | | | 367,606 | | | | 13,124,556 | |
Royal Dutch Shell plc, Class A | | | | | 76,200 | | | | 2,730,877 | |
Royal Dutch Shell plc, Class B | | | | | 69,000 | | | | 2,602,693 | |
Unilever NV CVA | | | | | 174,131 | | | | 7,000,990 | |
Ziggo NV | | | | | 58,566 | | | | 2,678,110 | |
| | | | | | | | | | | | |
| | | | | | | | | | | 57,999,217 | |
| | | | | | | | | | | | |
| Norway—0.3% | | | | | | | | | | | | |
Statoil ASA | | | | | 98,400 | | | | 2,392,745 | |
TGS Nopec Geophysical Co. ASA | | | | | 67,700 | | | | 1,798,903 | |
| | | | | | | | | | | | |
| | | | | | | | | | | 4,191,648 | |
| | | | | | | | | | | | |
| Peru—0.2% | | | | | | | | | | | | |
Credicorp Ltd. | | | | | 17,056 | | | | 2,263,843 | |
| | | | | | | | | | | | |
| Philippines—0.2% | | | | | | | | | | |
Jollibee Foods Corp. | | | | | 103,490 | | | | 404,448 | |
Philippine Long Distance Telephone Co. ADR | | | | | 44,300 | | | | 2,661,544 | |
| | | | | | | | | | | | |
| | | | | | | | | | | 3,065,992 | |
| | | | | | | | | | | | |
See accompanying notes to financial statements
243
SCHEDULE OF INVESTMENTS—(Continued)
December 31, 2013
| | | | | | | | | | | | |
Vantagepoint
International Fund | | | | | | Shares | | | Value | |
| COMMON STOCKS—(Continued) | |
| Russia—0.3% | | | | | | | | | | |
Gazprom OAO ADR | | | | | 280,921 | | | $ | 2,409,559 | |
Sberbank of Russia ADR | | | | | 168,721 | | | | 2,120,823 | |
| | | | | | | | | | | | |
| | | | | | | | | | | 4,530,382 | |
| | | | | | | | | | | | |
| Singapore—1.6% | | | | | | | | | | |
DBS Group Holdings Ltd. | | | | | 360,605 | | | | 4,900,538 | |
Flextronics International Ltd. | | * | | | 210,700 | | | | 1,637,139 | |
Global Logistic Properties Ltd. | | | | | 341,000 | | | | 782,233 | |
Singapore Telecommunications Ltd. | | | | | 1,668,000 | | | | 4,850,737 | |
SunVic Chemical Holdings Ltd. | | * | | | 5,957,900 | | | | 2,011,121 | |
United Overseas Bank Ltd. | | | | | 471,236 | | | | 7,957,787 | |
Wing Tai Holdings Ltd. | | | | | 829,600 | | | | 1,295,889 | |
| | | | | | | | | | | | |
| | | | | | | | | | | 23,435,444 | |
| | | | | | | | | | | | |
| South Africa—0.2% | | | | | | | | | | |
Bidvest Group Ltd. | | | | | 63,496 | | | | 1,626,662 | |
Shoprite Holdings Ltd. | | | | | 39,900 | | | | 624,809 | |
| | | | | | | | | | | | |
| | | | | | | | | | | 2,251,471 | |
| | | | | | | | | | | | |
| Spain—2.6% | | | | | | | | | | |
Grifols SA | | | | | 32,149 | | | | 1,538,439 | |
Grifols SA ADR | | † | | | 6,206 | | | | 224,161 | |
Grifols SA, Class B | | | | | 2,427 | | | | 86,822 | |
Grupo Catalana Occidente SA | | | | | 94,300 | | | | 3,380,476 | |
Iberdrola SA | | | | | 2,195,297 | | | | 14,009,867 | |
Inditex SA | | | | | 32,600 | | | | 5,382,625 | |
Telefonica SA | | | | | 808,945 | | | | 13,226,872 | |
| | | | | | | | | | | | |
| | | | | | | | | | | 37,849,262 | |
| | | | | | | | | | | | |
| Sweden—1.1% | | | | | | | | | | |
Hennes & Mauritz AB, Class B | | | | | 130,300 | | | | 6,001,159 | |
Hexpol AB | | | | | 38,900 | | | | 2,916,417 | |
ICA Gruppen AB | | * | | | 64,100 | | | | 2,004,921 | |
Investor AB, Class A | | | | | 82,500 | | | | 2,764,589 | |
Svenska Cellulosa AB SCA, Class B | | | | | 91,900 | | | | 2,831,243 | |
| | | | | | | | | | | | |
| | | | | | | | | | | 16,518,329 | |
| | | | | | | | | | | | |
| Switzerland—7.7% | | | | | | | | | | |
ABB Ltd. (Registered) | | * | | | 502,360 | | | | 13,282,406 | |
Actelion Ltd. (Registered) | | * | | | 12,868 | | | | 1,091,474 | |
Nestle SA (Registered) | | | | | 277,748 | | | | 20,356,168 | |
Novartis AG (Registered) | | | | | 258,148 | | | | 20,690,402 | |
Roche Holding AG (Genusschein) | | | | | 52,995 | | | | 14,845,292 | |
SGS SA (Registered) | | | | | 2,150 | | | | 4,949,843 | |
Swatch Group AG (The) (Bearer) | | | | | 8,692 | | | | 5,761,091 | |
Swiss Life Holding AG (Registered) | | * | | | 17,196 | | | | 3,575,045 | |
Swiss Re AG | | * | | | 64,271 | | | | 5,925,044 | |
Syngenta AG (Registered) | | | | | 12,500 | | | | 4,983,714 | |
UBS AG (Registered) | | * | | | 150,276 | | | | 2,877,388 | |
Zurich Insurance Group AG | | * | | | 41,832 | | | | 12,133,962 | |
| | | | | | | | | | | | |
| | | | | | | | | | | 110,471,829 | |
| | | | | | | | | | | | |
| | | | | | | | | | | | |
| | | | | |
| | | | | | |
|
Shares |
| | | Value | |
| Taiwan—0.8% | | | | | | | | | | |
Taiwan Mobile Co. Ltd. | | | | | 720,000 | | | $ | 2,327,193 | |
Taiwan Semiconductor Manufacturing Co. Ltd. | | | | | 1,029,000 | | | | 3,633,358 | |
Taiwan Semiconductor Manufacturing Co. Ltd. ADR | | | | | 330,100 | | | | 5,756,944 | |
| | | | | | | | | | | | |
| | | | | | | | | | | 11,717,495 | |
| | | | | | | | | | | | |
| Thailand—0.3% | | | | | | | | | | |
BEC World PCL | | ‡ | | | 475,600 | | | | 733,163 | |
PTT Exploration & Production PCL | | ‡ | | | 183,200 | | | | 930,546 | |
PTT PCL | | ‡ | | | 309,900 | | | | 2,702,972 | |
| | | | | | | | | | | | |
| | | | | | | | | | | 4,366,681 | |
| | | | | | | | | | | | |
| Turkey—0.3% | | | | | | | | | | |
Tupras Turkiye Petrol Rafinerileri AS | | | | | 117,936 | | | | 2,354,977 | |
Turk Telekomunikasyon AS | | | | | 788,423 | | | | 2,186,862 | |
| | | | | | | | | | | | |
| | | | | | | | | | | 4,541,839 | |
| | | | | | | | | | | | |
| United Arab Emirates—0.2% | | | | | |
Dragon Oil plc | | | | | 235,400 | | | | 2,214,030 | |
| | | | | | | | | | | | |
| United Kingdom—16.6% | | | | | | | | |
3i Group plc | | | | | 395,600 | | | | 2,527,860 | |
AstraZeneca plc (London Exchange) | | | | | 72,299 | | | | 4,289,280 | |
Babcock International Group plc | | | | | 107,300 | | | | 2,411,035 | |
BAE Systems plc | | | | | 376,900 | | | | 2,719,256 | |
BG Group plc | | | | | 240,600 | | | | 5,177,318 | |
BP plc | | | | | 1,949,971 | | | | 15,802,789 | |
British American Tobacco plc | | | | | 16,900 | | | | 907,093 | |
British Sky Broadcasting Group plc | | | | | 205,500 | | | | 2,874,771 | |
BT Group plc | | | | | 456,280 | | | | 2,877,275 | |
Centrica plc | | | | | 1,396,300 | | | | 8,051,939 | |
Compass Group plc | | | | | 523,200 | | | | 8,399,913 | |
easyJet plc | | | | | 203,400 | | | | 5,184,059 | |
EnQuest plc | | * | | | 1,093,000 | | | | 2,437,738 | |
GlaxoSmithKline plc | | | | | 490,556 | | | | 13,106,424 | |
Hammerson plc REIT | | | | | 255,000 | | | | 2,122,920 | |
Home Retail Group plc | | | | | 1,094,800 | | | | 3,487,093 | |
HSBC Holdings plc (London Exchange) | | | | | 751,079 | | | | 8,242,457 | |
Imperial Tobacco Group plc | | | | | 140,776 | | | | 5,457,620 | |
InterContinental Hotels Group plc | | | | | 59,936 | | | | 1,999,248 | |
Johnson Matthey plc | | | | | 62,106 | | | | 3,379,368 | |
Land Securities Group plc REIT | | | | | 216,637 | | | | 3,460,667 | |
Legal & General Group plc | | | | | 1,132,600 | | | | 4,186,610 | |
Liberty Global plc, Series A | | * | | | 52,260 | | | | 4,650,617 | |
Liberty Global plc, Series C | | * | | | 3,896 | | | | 328,511 | |
Meggitt plc | | | | | 263,965 | | | | 2,311,130 | |
Mondi plc | | | | | 116,300 | | | | 2,018,795 | |
National Grid plc | | | | | 1,165,215 | | | | 15,240,094 | |
Pace plc | | | | | 738,599 | | | | 3,899,930 | |
Prudential plc | | | | | 93,186 | | | | 2,082,149 | |
Reckitt Benckiser Group plc | | | | | 87,600 | | | | 6,958,584 | |
Rolls-Royce Holdings plc | | * | | | 529,253 | | | | 11,194,434 | |
Royal Mail plc | | * | | | 183,773 | | | | 1,734,618 | |
See accompanying notes to financial statements
244
SCHEDULE OF INVESTMENTS—(Continued)
December 31, 2013
| | | | | | | | | | | | |
Vantagepoint
International Fund | | | | | | Shares | | | Value | |
| COMMON STOCKS—(Continued) | |
SABMiller plc | | | | | 70,336 | | | $ | 3,575,472 | |
SABMiller plc | | | | | 120,324 | | | | 6,193,688 | |
Schroders plc (Non-Voting Shares) | | | | | 64,500 | | | | 2,158,341 | |
Smith & Nephew plc | | | | | 394,900 | | | | 5,640,234 | |
Standard Chartered plc (Hong Kong Exchange) | | | | | 40,000 | | | | 897,987 | |
Standard Chartered plc (London Exchange) | | | | | 197,400 | | | | 4,458,665 | |
Tesco plc | | | | | 3,263,838 | | | | 18,125,195 | |
TUI Travel plc | | | | | 516,100 | | | | 3,537,563 | |
Unilever plc | | | | | 370,105 | | | | 15,228,269 | |
Vodafone Group plc | | | | | 3,917,241 | | | | 15,422,935 | |
WPP plc | | | | | 161,223 | | | | 3,692,644 | |
| | | | | | | | | | | | |
| | | | | | | | | | | 238,452,588 | |
| | | | | | | | | | | | |
| United States—0.8% | | | | | | | | | | |
Catamaran Corp. | | * | | | 34,400 | | | | 1,633,777 | |
Nielsen Holdings NV | | | | | 11,430 | | | | 524,523 | |
Schlumberger Ltd. | | | | | 21,620 | | | | 1,948,178 | |
Valeant Pharmaceuticals International, Inc. | | * | | | 30,200 | | | | 3,542,974 | |
Yum! Brands, Inc. | | | | | 47,100 | | | | 3,561,231 | |
| | | | | | | | | | | | |
| | | | | | | | | | | 11,210,683 | |
| | | | | | | | | | | | |
| TOTAL COMMON STOCKS | | | | | |
(Cost $1,156,826,600) | | | | | | | | | 1,396,371,763 | |
| | | | | | | | | | | | |
| | | | | | | | | | | | | |
| PREFERRED STOCKS—0.7% | |
| Germany—0.7% | |
Draegerwerk AG & Co. KGaA | | † | | | 15,506 | | | | 2,028,150 | |
Henkel AG & Co. KGaA | | | | | 62,150 | | | | 7,223,981 | |
| | | | | | | | | | | | |
| | | | | | | | | | | 9,252,131 | |
| | | | | | | | | | | | |
| United Kingdom—0.0% | |
Rolls-Royce Holdings plc, Class C | | *‡ | | | 35,336,368 | | | | 58,515 | |
| | | | | | | | | | | | |
| TOTAL PREFERRED STOCKS | | | | | |
(Cost $7,350,850) | | | | | | | 9,310,646 | |
| | | | | | | | | | | | |
| | | | | | | | | | | | | |
| MONEY MARKET FUNDS—3.7% | |
| Institutional Money Market Funds—3.7% | |
Dreyfus Institutional Cash Advantage Fund, 0.06% | | ††¥ | | | 4,200,000 | | | | 4,200,000 | |
Fidelity Institutional Money Market: Money Market Portfolio—Institutional Class, 0.07% | | ¥ | | | 30,261,066 | | | | 30,261,066 | |
Fidelity Institutional Money Market: Money Market Portfolio—Institutional Class, 0.07% | | ††¥ | | | 2,247,526 | | | | 2,247,526 | |
Fidelity Institutional Money Market: Prime Money Market Portfolio—Institutional Class, 0.04% | | ††¥ | | | 4,200,000 | | | | 4,200,000 | |
| | | | | | | | | | | | |
| | | | | |
| | | | | | | | Shares | | | | Value | |
Short-Term Investments Trust Liquid Assets Portfolio—Institutional Class, 0.07% | | ††¥ | | $ | 4,200,000 | | | $ | 4,200,000 | |
Wells Fargo Advantage Cash Investment Money Market Fund—Select Class, 0.06% | | ††¥ | | | 4,200,000 | | | | 4,200,000 | |
Wells Fargo Advantage Heritage Money Market Fund—Select Class, 0.06% | | ††¥ | | | 4,200,000 | | | | 4,200,000 | |
| | | | | | | | | | | | |
| TOTAL MONEY MARKET FUNDS | |
(Cost $53,508,592) | | | | | | | | | 53,508,592 | |
| | | | | | | | | | | | |
| TOTAL INVESTMENTS—101.7% | |
(Cost $1,217,686,042) | | | | | | | | | 1,459,191,001 | |
Other assets less liabilities—(1.7%) | | | | (23,755,566 | ) |
| | | | | | | | | | | | |
| NET ASSETS—100.0% | | | | | | $ | 1,435,435,435 | |
| | | | | | | | | | | | |
Notes to the Schedule of Investments:
| | |
| ADR | | American Depositary Receipt |
| CVA | | Dutch Certificate of Shares |
| GDR | | Global Depositary Receipt |
| REIT | | Real Estate Investment Trust |
| SDR | | Swedish Depository Receipt |
| † | | Denotes all or a portion of the security on loan. |
| * | | Non-income producing. |
| ‡ | | Security valued at fair value as determined by policies approved by the Board of Directors. (Total Market Value $58,517) |
| †† | | Represents reinvestment of collateral received in conjunction with securities lending. |
| ¥ | | The rate quoted is the annualized seven-day yield of the fund at period end. |
See accompanying notes to financial statements
245
SCHEDULE OF INVESTMENTS—(Continued)
December 31, 2013
| | | | |
Vantagepoint
International Fund | | | |
| Percentage of Portfolio by Industry (unaudited): | | | | |
| |
| COMMON STOCKS | | | | |
Pharmaceuticals | | | 9.1% | |
Oil, Gas & Consumable Fuels | | | 9.1% | |
Insurance | | | 8.0% | |
Food & Staples Retailing | | | 5.1% | |
Diversified Telecommunication Services | | | 4.4% | |
Food Products | | | 3.5% | |
Chemicals | | | 3.2% | |
Commercial Banks | | | 3.2% | |
Wireless Telecommunication Services | | | 2.7% | |
Hotels, Restaurants & Leisure | | | 2.5% | |
Automobiles | | | 2.5% | |
Machinery | | | 2.4% | |
Media | | | 2.3% | |
Auto Components | | | 2.2% | |
Multi-Utilities | | | 2.2% | |
Aerospace & Defense | | | 2.0% | |
Semiconductors & Semiconductor Equipment | | | 1.9% | |
Health Care Equipment & Supplies | | | 1.8% | |
Beverages | | | 1.8% | |
Personal Products | | | 1.6% | |
Electrical Equipment | | | 1.5% | |
Specialty Retail | | | 1.5% | |
Electric Utilities | | | 1.5% | |
Real Estate Management & Development | | | 1.4% | |
Internet Software & Services | | | 1.2% | |
Building Products | | | 1.2% | |
Real Estate Investment Trusts (REITs) | | | 1.2% | |
Diversified Financial Services | | | 1.1% | |
Electronic Equipment, Instruments & Components | | | 0.9% | |
Gas Utilities | | | 0.9% | |
Textiles, Apparel & Luxury Goods | | | 0.8% | |
Professional Services | | | 0.8% | |
Biotechnology | | | 0.8% | |
Office Electronics | | | 0.8% | |
Industrial Conglomerates | | | 0.8% | |
Metals & Mining | | | 0.7% | |
Household Products | | | 0.7% | |
Air Freight & Logistics | | | 0.6% | |
Tobacco | | | 0.6% | |
Capital Markets | | | 0.5% | |
Commercial Services & Supplies | | | 0.5% | |
IT Services | | | 0.5% | |
Paper & Forest Products | | | 0.5% | |
Airlines | | | 0.5% | |
Health Care Providers & Services | | | 0.5% | |
Containers & Packaging | | | 0.4% | |
Energy Equipment & Services | | | 0.4% | |
Software | | | 0.4% | |
Communications Equipment | | | 0.3% | |
Computers & Peripherals | | | 0.3% | |
Construction & Engineering | | | 0.3% | |
Independent Power Producers & Energy Traders | | | 0.2% | |
Consumer Finance | | | 0.2% | |
Trading Companies & Distributors | | | 0.2% | |
Distributors | | | 0.2% | |
Transportation Infrastructure | | | 0.2% | |
| | | | |
| | | | | |
Construction Materials | | | 0.2% | |
Thrifts & Mortgage Finance | | | 0.2% | |
Internet & Catalog Retail | | | 0.2% | |
Road & Rail | | | 0.1% | |
| | | | |
| TOTAL COMMON STOCKS | | | 97.3% | |
| | | | |
| PREFERRED STOCKS | | | | |
Household Products | | | 0.5% | |
Health Care Equipment & Supplies | | | 0.2% | |
Aerospace & Defense | | | 0.0% | |
| | | | |
| TOTAL PREFERRED STOCKS | | | 0.7% | |
| | | | |
| MONEY MARKET FUNDS | | | | |
Institutional Money Market Funds | | | 3.7% | |
| | | | |
| TOTAL INVESTMENTS | | | 101.7% | |
Other assets less liabilities | | | (1.7)% | |
| | | | |
| TOTAL NET ASSETS | | | 100.0% | |
| | | | |
See accompanying notes to financial statements
246
SCHEDULE OF INVESTMENTS
December 31, 2013
| | | | | | | | | | | | |
Vantagepoint Diversifying
Strategies Fund | | | | | | Shares | | | Value | |
| COMMON STOCKS—2.9% | |
| Automobiles—0.2% | |
Hyundai Motor Co. (Korea, Republic of) | | * | | | 4,435 | | | $ | 995,510 | |
Toyota Motor Corp. (Japan) | | | | | 31,000 | | | | 1,890,228 | |
| | | | | | | | | | | | |
| | | | | | | | | | | 2,885,738 | |
| | | | | | | | | | | | |
| Beverages—0.1% | |
AMBEV SA ADR (Brazil) | | | | | 136,900 | | | | 1,006,215 | |
| | | | | | | | | | | | |
| Capital Markets—0.3% | |
Credit Suisse Group AG (Registered) (Switzerland) | | * | | | 35,000 | | | | 1,080,218 | |
Franklin Resources, Inc. | | | | | 20,400 | | | | 1,177,692 | |
T. Rowe Price Group, Inc. | | | | | 12,000 | | | | 1,005,240 | |
| | | | | | | | | | | | |
| | | | | | | | | | | 3,263,150 | |
| | | | | | | | | | | | |
| Commercial Banks—0.1% | |
HSBC Holdings plc (London Exchange) (United Kingdom) | | | | | 86,000 | | | | 943,777 | |
| | | | | | | | | | | | |
| Communications Equipment—0.1% | | | | | |
Telefonaktiebolaget LM Ericsson, Class B (Sweden) | | | | | 70,000 | | | | 854,665 | |
| | | | | | | | | | | | |
| Computers & Peripherals—0.3% | | | | | |
Apple, Inc. | | | | | 3,500 | | | | 1,963,885 | |
Catcher Technology Co. Ltd. (Taiwan) | | | | | 185,000 | | | | 1,204,665 | |
| | | | | | | | | | | | |
| | | | | | | | | | | 3,168,550 | |
| | | | | | | | | | | | |
| Diversified Financial Services—0.3% | | | | | |
Citigroup, Inc. | | | | | 18,800 | | | | 979,668 | |
JPMorgan Chase & Co. | | | | | 36,600 | | | | 2,140,368 | |
| | | | | | | | | | | | |
| | | | | | | | | | | 3,120,036 | |
| | | | | | | | | | | | |
| Electrical Equipment—0.1% | | | | | |
ABB Ltd. (Registered) (Switzerland) | | * | | | 30,000 | | | | 793,200 | |
| | | | | | | | | | | | |
| Energy Equipment & Services—0.2% | | | | | |
Schlumberger Ltd. | | | | | 25,936 | | | | 2,337,093 | |
| | | | | | | | | | | | |
| IT Services—0.1% | | | | | |
Accenture plc, Class A (Ireland) | | | | | 12,850 | | | | 1,056,527 | |
| | | | | | | | | | | | |
| Semiconductors & Semiconductor Equipment—0.5% | |
MediaTek, Inc. (Taiwan) | | | | | 82,000 | | | | 1,222,201 | |
Samsung Electronics Co. Ltd. (Korea, Republic of) | | | | | 2,100 | | | | 2,736,399 | |
Taiwan Semiconductor Manufacturing Co. Ltd. ADR (Taiwan) | | | | | 106,235 | | | | 1,852,739 | |
| | | | | | | | | | | | |
| | | | | | | | | | | 5,811,339 | |
| | | | | | | | | | | | |
| Software—0.1% | | | | | | | | | | |
SAP AG (Germany) | | | | | 12,950 | | | | 1,123,046 | |
| | | | | | | | | | | | |
| | | | | | | | | | | | | | |
| | | | | |
| | | | | | | |
Shares | | | Value | |
| Textiles, Apparel & Luxury Goods—0.5% | |
Cie Financiere Richemont SA (Registered) (Switzerland) | | | | | | 10,500 | | | $ | 1,048,923 | |
Swatch Group AG (The) (Bearer) (Switzerland) | | | | | | 6,300 | | | | 4,175,664 | |
| | | | | | | | | | | | | | |
| | | | | | | | | | | | | 5,224,587 | |
| | | | | | | | | | | | | | |
| TOTAL COMMON STOCKS | | | | | |
(Cost $27,057,410) | | | | | | | | | | 31,587,923 | |
| | | | | | | | | | | | | | |
| | | | | | | | | | | | | | | |
| CONVERTIBLE PREFERRED STOCKS—2.9% | |
| Aerospace & Defense—0.5% | | | | | | | | |
United Technologies Corp. 7.500% | | | | | | 78,300 | | | | 5,126,301 | |
| | | | | | | | | | | | | | |
| Commercial Banks—0.2% | | | | | | | | |
KeyCorp, Perpetual, Series A 7.750% | | | * | | | 16,125 | | | | 2,080,125 | |
| | | | | | | | | | | | | | |
| Electric Utilities—0.7% | | | | | |
NextEra Energy, Inc. 5.889% | | | * | | | 17,000 | | | | 962,710 | |
NextEra Energy, Inc. 5.599% | | | * | | | 70,500 | | | | 4,053,750 | |
PPL Corp. 8.750% | | | * | | | 59,250 | | | | 3,133,140 | |
| | | | | | | | | | | | | | |
| | | | | | | | | | | | | 8,149,600 | |
| | | | | | | | | | | | | | |
| Insurance—0.7% | | | | | | | | | | | |
Maiden Holdings Ltd., Series B (Bermuda) 7.250% | | | * | | | 20,350 | | | | 927,350 | |
MetLife, Inc. 5.000% | | | * | | | 216,400 | | | | 6,825,256 | |
| | | | | | | | | | | | | | |
| | | | | | | | | | | | | 7,752,606 | |
| | | | | | | | | | | | | | |
| Metals & Mining—0.2% | | | | | |
Cliffs Natural Resources, Inc. 7.000% | | | * | | | 88,490 | | | | 2,031,730 | |
| | | | | | | | | | | | | | |
| Oil, Gas & Consumable Fuels—0.3% | | | | | |
Chesapeake Energy Corp., Perpetual 5.750% | | | ^ | | | 2,776 | | | | 3,246,185 | |
| | | | | | | | | | | | | | |
| Wireless Telecommunication Services—0.3% | |
Crown Castle International Corp., Series A 4.500% | | | * | | | 30,775 | | | | 3,078,731 | |
| | | | | | | | | | | | | | |
| TOTAL CONVERTIBLE PREFERRED STOCKS | |
(Cost $30,126,782) | | | | | | | | | | 31,465,278 | |
| | | | | | | | | | | | | | |
| | | | | | | | | | | | | | | |
| | | | |
Coupon
Rate | |
| Maturity
Date |
| | | | | Face | | | | Value | |
| CORPORATE OBLIGATIONS—32.4% | | | | | |
| Aerospace & Defense—0.1% | | | | | |
United Technologies Corp. | | | | | |
0.739% | | | 06/01/2015 | | | #§ | | $ | 1,055,000 | | | | 1,061,988 | |
| | | | | | | | | | | | | | |
| Auto Components—0.2% | | | | | |
Goodyear Tire & Rubber Co. (The) | | | | | |
7.000% | | | 05/15/2022 | | | | | | 825,000 | | | | 892,031 | |
Icahn Enterprises LP/Icahn Enterprises Finance Corp. | |
7.750% | | | 01/15/2016 | | | § | | | 1,035,000 | | | | 1,056,994 | |
| | | | | | | | | | | | | | |
| | | | | | | | | | | | | 1,949,025 | |
| | | | | | | | | | | | | | |
See accompanying notes to financial statements
247
SCHEDULE OF INVESTMENTS—(Continued)
December 31, 2013
| | | | | | | | | | | | | | |
Vantagepoint Diversifying
Strategies Fund | | | | | | | | | |
| | | | |
Coupon
Rate | | Maturity
Date | | | | | Face | | | Value | |
| CORPORATE OBLIGATIONS—(Continued) | |
| Automobiles—0.7% | | | | | |
Daimler Finance North America LLC | | | | | |
2.300% | | | 01/09/2015 | | | ^§ | | $ | 1,480,000 | | | $ | 1,500,939 | |
1.875% | | | 09/15/2014 | | | ^ | | | 870,000 | | | | 877,680 | |
1.300% | | | 07/31/2015 | | | ^ | | | 910,000 | | | | 915,695 | |
1.250% | | | 01/11/2016 | | | ^ | | | 740,000 | | | | 740,892 | |
0.922% | | | 08/01/2016 | | | #^ | | | 580,000 | | | | 581,562 | |
0.843% | | | 01/09/2015 | | | #^ | | | 780,000 | | | | 782,810 | |
Nissan Motor Acceptance Corp. | | | | | |
1.000% | | | 03/15/2016 | | | ^§ | | | 1,920,000 | | | | 1,911,702 | |
| | | | | | | | | | | | | | |
| | | | | | | | | | | | | 7,311,280 | |
| | | | | | | | | | | | | | |
| Beverages—0.9% | | | | | |
Anheuser-Busch InBev Finance, Inc. | | | | | |
0.800% | | | 01/15/2016 | | | § | | | 1,700,000 | | | | 1,699,674 | |
Anheuser-Busch InBev Worldwide, Inc. | | | | | |
0.800% | | | 07/15/2015 | | | § | | | 820,000 | | | | 824,395 | |
Coca-Cola Co. (The) | | | | | |
0.342% | | | 11/01/2016 | | | #§ | | | 840,000 | | | | 841,297 | |
Heineken NV (Netherlands) | | | | | |
0.800% | | | 10/01/2015 | | | ^ | | | 440,000 | | | | 440,312 | |
PepsiCo, Inc. | | | | | |
0.700% | | | 08/13/2015 | | | § | | | 1,810,000 | | | | 1,812,641 | |
0.447% | | | 02/26/2016 | | | # | | | 980,000 | | | | 981,172 | |
SABMiller Holdings, Inc. | | | | | |
2.450% | | | 01/15/2017 | | | ^ | | | 810,000 | | | | 830,035 | |
1.850% | | | 01/15/2015 | | | ^§ | | | 1,870,000 | | | | 1,892,900 | |
0.932% | | | 08/01/2018 | | | #^ | | | 550,000 | | | | 553,342 | |
| | | | | | | | | | | | | | |
| | | | | | | | | | | | | 9,875,768 | |
| | | | | | | | | | | | | | |
| Biotechnology—0.1% | | | | | |
Amgen, Inc. | | | | | | | | | | | |
1.875% | | | 11/15/2014 | | | § | | | 970,000 | | | | 981,020 | |
Gilead Sciences, Inc. | | | | | |
2.400% | | | 12/01/2014 | | | | | | 420,000 | | | | 427,017 | |
| | | | | | | | | | | | | | |
| | | | | | | | | | | | | 1,408,037 | |
| | | | | | | | | | | | | | |
| Capital Markets—1.7% | | | | | |
Bank of New York Mellon Corp. (The) | | | | | |
0.802% | | | 08/01/2018 | | | #§ | | | 980,000 | | | | 983,765 | |
Bank of New York Mellon Corp. (The) MTN | | | | | |
1.200% | | | 02/20/2015 | | | | | | 300,000 | | | | 302,383 | |
0.522% | | | 01/31/2014 | | | #§ | | | 1,000,000 | | | | 1,000,254 | |
Credit Suisse (Switzerland) | | | | | |
1.204% | | | 01/14/2014 | | | #§ | | | 1,000,000 | | | | 1,000,334 | |
E*TRADE Financial Corp. | | | | | |
6.000% | | | 11/15/2017 | | | § | | | 585,000 | | | | 624,488 | |
Goldman Sachs Group, Inc. (The) | | | | | |
3.625% | | | 02/07/2016 | | | § | | | 1,575,000 | | | | 1,653,769 | |
Goldman Sachs Group, Inc. (The) MTN | | | | | |
1.341% | | | 11/15/2018 | | | #§ | | | 2,750,000 | | | | 2,759,697 | |
Hutchison Whampoa International 12 II Ltd. (Cayman Islands) | |
2.000% | | | 11/08/2017 | | | ^ | | | 530,000 | | | | 524,415 | |
ING Bank NV (Netherlands) | |
3.750% | | | 03/07/2017 | | | ^ | | | 1,500,000 | | | | 1,581,016 | |
1.886% | | | 09/25/2015 | | | #^ | | | 980,000 | | | | 1,001,564 | |
Morgan Stanley | |
1.488% | | | 02/25/2016 | | | #§ | | | 1,990,000 | | | | 2,016,945 | |
Morgan Stanley MTN | |
1.518% | | | 04/25/2018 | | | #§ | | | 3,090,000 | | | | 3,137,419 | |
| | | | | | | | | | | | | | |
| | | | | |
Coupon
Rate | |
| Maturity
Date |
| | | | | Face | | | | Value | |
Nomura Holdings, Inc. MTN (Japan) | |
1.694% | | | 09/13/2016 | | | #§ | | $ | 1,510,000 | | | $ | 1,538,368 | |
TD Ameritrade Holding Corp. | |
4.150% | | | 12/01/2014 | | | § | | | 760,000 | | | | 784,847 | |
| | | | | | | | | | | | | | |
| | | | | | | | | | | | | 18,909,264 | |
| | | | | | | | | | | | | | |
| Chemicals—0.2% | | | | | |
Ashland, Inc. | |
3.000% | | | 03/15/2016 | | | | | | 400,000 | | | | 410,000 | |
Ecolab, Inc. | |
2.375% | | | 12/08/2014 | | | § | | | 600,000 | | | | 609,536 | |
1.000% | | | 08/09/2015 | | | | | | 230,000 | | | | 230,807 | |
EI du Pont de Nemours & Co. | |
0.666% | | | 03/25/2014 | | | #§ | | | 620,000 | | | | 620,690 | |
| | | | | | | | | | | | | | |
| | | | | | | | | | | | | 1,871,033 | |
| | | | | | | | | | | | | | |
| Commercial Banks—8.4% | | | | | |
ABN AMRO Bank NV (Netherlands) | |
1.036% | | | 10/28/2016 | | | #^§ | | | 2,580,000 | | | | 2,584,644 | |
ANZ New Zealand Int’l Ltd. (New Zealand) | |
1.125% | | | 03/24/2016 | | | ^ | | | 1,220,000 | | | | 1,218,321 | |
Australia & New Zealand Banking Group Ltd. (Australia) | |
0.801% | | | 05/15/2018 | | | #§ | | | 2,570,000 | | | | 2,570,622 | |
Banco do Nordeste do Brasil SA (Brazil) | |
3.625% | | | 11/09/2015 | | | ^§ | | | 1,320,000 | | | | 1,331,550 | |
Bancolombia SA (Colombia) | |
4.250% | | | 01/12/2016 | | | § | | | 300,000 | | | | 312,750 | |
Bank of Montreal MTN (Canada) | |
0.843% | | | 04/09/2018 | | | #§ | | | 1,260,000 | | | | 1,267,680 | |
0.800% | | | 11/06/2015 | | | § | | | 1,140,000 | | | | 1,146,704 | |
0.764% | | | 07/15/2016 | | | # | | | 980,000 | | | | 984,564 | |
0.713% | | | 09/11/2015 | | | #§ | | | 930,000 | | | | 934,728 | |
Bank of Nova Scotia (Canada) | |
1.850% | | | 01/12/2015 | | | § | | | 2,000,000 | | | | 2,030,812 | |
0.750% | | | 10/09/2015 | | | § | | | 1,780,000 | | | | 1,786,598 | |
Bank of Tokyo-Mitsubishi UFJ Ltd. (The) (Japan) | |
0.687% | | | 02/26/2016 | | | #^§ | | | 2,150,000 | | | | 2,153,085 | |
Banque Federative du Credit Mutuel SA (France) | |
1.089% | | | 10/28/2016 | | | #^§ | | | 2,730,000 | | | | 2,740,227 | |
Barclays Bank plc (United Kingdom) | |
3.900% | | | 04/07/2015 | | | § | | | 925,000 | | | | 963,061 | |
1.284% | | | 01/13/2014 | | | #§ | | | 880,000 | | | | 880,303 | |
BB&T Corp. | |
0.938% | | | 04/28/2014 | | | # | | | 850,000 | | | | 851,575 | |
BB&T Corp. MTN | | | | | |
1.600% | | | 08/15/2017 | | | | | | 480,000 | | | | 476,132 | |
BBVA Banco Continental SA (Peru) | | | | | |
2.250% | | | 07/29/2016 | | | ^§ | | | 770,000 | | | | 770,000 | |
BNP Paribas SA (France) | | | | | |
0.832% | | | 12/12/2016 | | | #§ | | | 2,860,000 | | | | 2,866,255 | |
BNP Paribas SA MTN (France) | | | | | |
3.600% | | | 02/23/2016 | | | | | | 930,000 | | | | 979,625 | |
Canadian Imperial Bank of Commerce (Canada) | |
0.900% | | | 10/01/2015 | | | § | | | 2,280,000 | | | | 2,293,482 | |
Capital One Bank USA NA, Bank Note | | | | | |
1.150% | | | 11/21/2016 | | | | | | 570,000 | | | | 567,916 | |
Capital One Financial Corp. | | | | | |
2.125% | | | 07/15/2014 | | | § | | | 1,780,000 | | | | 1,794,347 | |
CBQ Finance Ltd. (Bermuda) | | | | | |
5.000% | | | 11/18/2014 | | | ^ | | | 750,000 | | | | 775,292 | |
Commonwealth Bank of Australia (Australia) | | | | | |
0.745% | | | 09/20/2016 | | | #^§ | | | 830,000 | | | | 832,573 | |
Credit Agricole SA (France) | | | | | |
1.404% | | | 04/15/2016 | | | #^ | | | 1,350,000 | | | | 1,367,557 | |
1.096% | | | 10/03/2016 | | | #^§ | | | 2,050,000 | | | | 2,056,945 | |
See accompanying notes to financial statements
248
SCHEDULE OF INVESTMENTS—(Continued)
December 31, 2013
| | | | | | | | | | | | | | |
Vantagepoint Diversifying
Strategies Fund | | | | | | | | | |
| | | | |
Coupon
Rate | | Maturity
Date | | | | | Face | | | Value | |
| CORPORATE OBLIGATIONS—(Continued) | |
Discover Bank | | | | | |
2.000% | | | 02/21/2018 | | | § | | $ | 1,980,000 | | | $ | 1,946,601 | |
Fifth Third Bank/Ohio, Bank Note | | | | | |
1.150% | | | 11/18/2016 | | | § | | | 1,100,000 | | | | 1,100,013 | |
0.748% | | | 11/18/2016 | | | # | | | 300,000 | | | | 301,007 | |
Hana Bank (Korea, Republic of) | | | | | |
1.375% | | | 02/05/2016 | | | ^ | | | 255,000 | | | | 253,708 | |
HSBC Bank plc (United Kingdom) | | | | | |
0.881% | | | 05/15/2018 | | | #^§ | | | 2,500,000 | | | | 2,508,105 | |
Huntington National Bank (The) | | | | | |
1.350% | | | 08/02/2016 | | | | | | 400,000 | | | | 400,105 | |
Huntington National Bank (The), Bank Note | | | | | |
1.300% | | | 11/20/2016 | | | | | | 1,100,000 | | | | 1,100,943 | |
KeyBank NA | | | | | |
0.727% | | | 11/25/2016 | | | #§ | | | 380,000 | | | | 380,922 | |
KeyBank NA, Bank Note | | | | | |
4.950% | | | 09/15/2015 | | | | | | 600,000 | | | | 638,487 | |
1.100% | | | 11/25/2016 | | | | | | 610,000 | | | | 609,142 | |
KeyCorp MTN | | | | | |
3.750% | | | 08/13/2015 | | | | | | 630,000 | | | | 659,077 | |
Lloyds Bank plc (United Kingdom) | | | | | |
2.300% | | | 11/27/2018 | | | | | | 420,000 | | | | 419,394 | |
Macquarie Bank Ltd. (Australia) | | | | | |
3.450% | | | 07/27/2015 | | | ^§ | | | 1,210,000 | | | | 1,251,801 | |
2.000% | | | 08/15/2016 | | | ^ | | | 4,740,000 | | | | 4,796,946 | |
Manufacturers & Traders Trust Co., Bank Note | |
0.542% | | | 03/07/2016 | | | #§ | | | 800,000 | | | | 798,737 | |
National Australia Bank Ltd. (Australia) | | | | | |
0.900% | | | 01/20/2016 | | | | | | 1,720,000 | | | | 1,720,674 | |
0.788% | | | 07/25/2016 | | | # | | | 1,800,000 | | | | 1,807,555 | |
0.541% | | | 01/22/2015 | | | #^ | | | 870,000 | | | | 872,447 | |
National Bank of Canada (Canada) | | | | | |
1.500% | | | 06/26/2015 | | | § | | | 600,000 | | | | 607,958 | |
Nordea Bank AB (Sweden) | | | | | |
0.875% | | | 05/13/2016 | | | ^ | | | 1,850,000 | | | | 1,841,869 | |
0.699% | | | 05/13/2016 | | | #^ | | | 840,000 | | | | 842,888 | |
Oversea-Chinese Banking Corp. Ltd. (Singapore) | |
1.625% | | | 03/13/2015 | | | ^ | | | 800,000 | | | | 811,226 | |
PNC Bank NA, Bank Note | | | | | |
1.150% | | | 11/01/2016 | | | § | | | 750,000 | | | | 751,424 | |
Regions Financial Corp. | | | | | |
2.000% | | | 05/15/2018 | | | § | | | 1,150,000 | | | | 1,114,712 | |
Royal Bank of Canada MTN (Canada) | | | | | |
0.850% | | | 03/08/2016 | | | § | | | 2,300,000 | | | | 2,298,038 | |
Royal Bank of Scotland Group plc (United Kingdom) | |
2.550% | | | 09/18/2015 | | | | | | 2,400,000 | | | | 2,455,644 | |
Societe Generale SA (France) | | | | | |
1.327% | | | 10/01/2018 | | | #§ | | | 2,590,000 | | | | 2,607,863 | |
Sumitomo Mitsui Banking Corp. (Japan) | | | | | |
0.912% | | | 07/19/2016 | | | # | | | 450,000 | | | | 452,784 | |
0.900% | | | 01/18/2016 | | | | | | 1,070,000 | | | | 1,068,500 | |
SunTrust Bank | | | | | |
0.528% | | | 08/24/2015 | | | #§ | | | 450,000 | | | | 446,469 | |
Svenska Handelsbanken AB (Sweden) | | | | | |
0.696% | | | 03/21/2016 | | | #§ | | | 2,580,000 | | | | 2,587,288 | |
Toronto-Dominion Bank (The) MTN (Canada) | |
2.500% | | | 07/14/2016 | | | § | | | 1,000,000 | | | | 1,037,911 | |
0.702% | | | 09/09/2016 | | | #§ | | | 830,000 | | | | 833,003 | |
Union Bank NA | | | | | |
1.192% | | | 06/06/2014 | | | #§ | | | 1,360,000 | | | | 1,365,024 | |
| | | | | | | | | | | | | | |
| | | | | |
Coupon
Rate | | Maturity
Date | | | | | Face | | | Value | |
US Bank NA, Bank Note | | | | | |
0.524% | | | 10/14/2014 | | | #§ | | $ | 1,500,000 | | | $ | 1,502,035 | |
Wachovia Bank NA, Bank Note | | | | | |
4.800% | | | 11/01/2014 | | | § | | | 1,390,000 | | | | 1,441,911 | |
Wells Fargo & Co. | | | | | |
1.166% | | | 06/26/2015 | | | #§ | | | 1,000,000 | | | | 1,011,512 | |
0.869% | | | 04/23/2018 | | | #§ | | | 1,040,000 | | | | 1,046,847 | |
Westpac Banking Corp. (Australia) | | | | | |
1.006% | | | 09/25/2015 | | | #§ | | | 2,540,000 | | | | 2,568,042 | |
Westpac Banking Corp. MTN (Australia) | | | | | |
0.950% | | | 01/12/2016 | | | § | | | 2,520,000 | | | | 2,525,579 | |
| | | | | | | | | | | | | | |
| | | | 91,321,539 | |
| | | | | | | | | | | | | | |
| Computers & Peripherals—0.4% | | | | | |
Apple, Inc. | | | | | |
0.492% | | | 05/03/2018 | | | # | | | 850,000 | | | | 849,471 | |
0.450% | | | 05/03/2016 | | | § | | | 1,170,000 | | | | 1,162,177 | |
0.292% | | | 05/03/2016 | | | #§ | | | 715,000 | | | | 715,264 | |
Hewlett-Packard Co. | | | | | |
2.350% | | | 03/15/2015 | | | § | | | 1,200,000 | | | | 1,219,140 | |
1.794% | | | 09/19/2014 | | | #§ | | | 900,000 | | | | 907,805 | |
| | | | | | | | | | | | | | |
| | | | 4,853,857 | |
| | | | | | | | | | | | | | |
| Consumer Finance—3.3% | | | | | |
American Express Centurion Bank | | | | | |
0.689% | | | 11/13/2015 | | | #§ | | | 890,000 | | | | 894,434 | |
American Express Co. | | | | | |
0.828% | | | 05/22/2018 | | | #§ | | | 1,770,000 | | | | 1,770,678 | |
American Express Credit Corp. | | | | | |
0.747% | | | 07/29/2016 | | | #§ | | | 1,600,000 | | | | 1,608,797 | |
American Express Credit Corp. MTN | | | | | |
1.750% | | | 06/12/2015 | | | | | | 530,000 | | | | 538,744 | |
American Honda Finance Corp. | | | | | |
1.450% | | | 02/27/2015 | | | ^§ | | | 2,410,000 | | | | 2,433,191 | |
1.125% | | | 10/07/2016 | | | | | | 700,000 | | | | 703,338 | |
0.743% | | | 10/07/2016 | | | #§ | | | 330,000 | | | | 331,943 | |
0.612% | | | 05/26/2016 | | | #^§ | | | 1,120,000 | | | | 1,123,244 | |
Banque PSA Finance SA (France) | | | | | |
2.143% | | | 04/04/2014 | | | #^§ | | | 1,360,000 | | | | 1,359,524 | |
Caterpillar Financial Services Corp. MTN | | | | | |
1.000% | | | 11/25/2016 | | | | | | 200,000 | | | | 198,981 | |
0.589% | | | 02/09/2015 | | | #§ | | | 1,200,000 | | | | 1,203,677 | |
0.477% | | | 02/26/2016 | | | #§ | | | 800,000 | | | | 801,166 | |
Ford Motor Credit Co. LLC | | | | | |
3.875% | | | 01/15/2015 | | | § | | | 2,620,000 | | | | 2,704,147 | |
3.000% | | | 06/12/2017 | | | § | | | 1,275,000 | | | | 1,326,214 | |
1.489% | | | 05/09/2016 | | | #§ | | | 1,270,000 | | | | 1,289,379 | |
General Motors Financial Co., Inc. | | | | | |
4.750% | | | 08/15/2017 | | | ^§ | | | 1,130,000 | | | | 1,204,863 | |
2.750% | | | 05/15/2016 | | | ^ | | | 620,000 | | | | 629,300 | |
Harley-Davidson Financial Services, Inc. | | | | | |
1.150% | | | 09/15/2015 | | | ^ | | | 915,000 | | | | 918,403 | |
HSBC USA, Inc. | | | | | |
2.375% | | | 02/13/2015 | | | § | | | 680,000 | | | | 694,041 | |
1.128% | | | 09/24/2018 | | | #§ | | | 1,750,000 | | | | 1,754,443 | |
International Lease Finance Corp. | | | | | |
6.500% | | | 09/01/2014 | | | ^ | | | 600,000 | | | | 622,500 | |
John Deere Capital Corp. | | | | | |
1.050% | | | 10/11/2016 | | | | | | 720,000 | | | | 722,564 | |
0.536% | | | 10/11/2016 | | | #§ | | | 360,000 | | | | 360,644 | |
John Deere Capital Corp. MTN | | | | | |
1.600% | | | 03/03/2014 | | | § | | | 2,720,000 | | | | 2,725,968 | |
1.400% | | | 03/15/2017 | | | | | | 433,000 | | | | 432,173 | |
0.413% | | | 06/16/2014 | | | #§ | | | 850,000 | | | | 850,647 | |
See accompanying notes to financial statements
249
SCHEDULE OF INVESTMENTS—(Continued)
December 31, 2013
| | | | | | | | | | | | | | |
Vantagepoint Diversifying
Strategies Fund | | | | | | | | | |
| | | | |
Coupon
Rate | | Maturity
Date | | | | | Face | | | Value | |
| CORPORATE OBLIGATIONS—(Continued) | |
PACCAR Financial Corp. MTN | | | | | |
1.050% | | | 06/05/2015 | | | | | $ | 320,000 | | | $ | 322,724 | |
0.842% | | | 12/06/2018 | | | # | | | 560,000 | | | | 561,480 | |
0.750% | | | 05/16/2016 | | | | | | 380,000 | | | | 378,405 | |
0.700% | | | 11/16/2015 | | | § | | | 910,000 | | | | 912,385 | |
0.491% | | | 06/05/2014 | | | #§ | | | 380,000 | | | | 380,434 | |
Toyota Motor Credit Corp. | | | | | |
0.875% | | | 07/17/2015 | | | § | | | 810,000 | | | | 815,288 | |
Volkswagen International Finance NV (Netherlands) | |
1.625% | | | 03/22/2015 | | | ^ | | | 1,600,000 | | | | 1,618,544 | |
0.996% | | | 03/21/2014 | | | #^ | | | 1,250,000 | | | | 1,252,172 | |
0.675% | | | 11/18/2016 | | | #^ | | | 830,000 | | | | 832,476 | |
| | | | | | | | | | | | | | |
| | | | 36,276,911 | |
| | | | | | | | | | | | | | |
| Containers & Packaging—0.0% | | | | | |
Bemis Co., Inc. | |
5.650% | | | 08/01/2014 | | | | | | 290,000 | | | | 298,143 | |
| | | | | | | | | | | | | | |
| Diversified Financial Services—2.6% | | | | | |
Bank of America Corp. | |
4.500% | | | 04/01/2015 | | | § | | | 600,000 | | | | 627,897 | |
3.700% | | | 09/01/2015 | | | | | | 1,370,000 | | | | 1,432,656 | |
1.500% | | | 10/09/2015 | | | § | | | 360,000 | | | | 363,783 | |
Bank of America Corp. MTN | |
1.316% | | | 03/22/2018 | | | #§ | | | 1,700,000 | | | | 1,724,344 | |
1.250% | | | 01/11/2016 | | | | | | 570,000 | | | | 572,851 | |
1.066% | | | 03/22/2016 | | | #§ | | | 840,000 | | | | 846,438 | |
Bank of America Corp., Series 1 | |
3.750% | | | 07/12/2016 | | | | | | 385,000 | | | | 409,548 | |
Citigroup, Inc. | |
4.450% | | | 01/10/2017 | | | | | | 675,000 | | | | 732,084 | |
2.250% | | | 08/07/2015 | | | § | | | 1,540,000 | | | | 1,572,616 | |
1.037% | | | 04/01/2016 | | | #§ | | | 2,420,000 | | | | 2,437,148 | |
CME Group, Inc. | |
5.750% | | | 02/15/2014 | | | | | | 1,000,000 | | | | 1,006,055 | |
ERAC USA Finance LLC | |
1.400% | | | 04/15/2016 | | | ^ | | | 260,000 | | | | 260,351 | |
General Electric Capital Corp. | |
5.900% | | | 05/13/2014 | | | | | | 430,000 | | | | 438,738 | |
2.150% | | | 01/09/2015 | | | § | | | 1,740,000 | | | | 1,772,315 | |
1.625% | | | 07/02/2015 | | | § | | | 1,100,000 | | | | 1,118,290 | |
1.000% | | | 12/11/2015 | | | § | | | 1,310,000 | | | | 1,321,128 | |
General Electric Capital Corp. MTN | |
0.894% | | | 07/12/2016 | | | #§ | | | 2,100,000 | | | | 2,116,052 | |
General Electric Capital Corp., Series A | |
3.750% | | | 11/14/2014 | | | § | | | 750,000 | | | | 772,606 | |
Hyundai Capital America | |
1.625% | | | 10/02/2015 | | | ^ | | | 1,010,000 | | | | 1,015,491 | |
JPMorgan Chase & Co. | |
5.250% | | | 05/01/2015 | | | § | | | 1,335,000 | | | | 1,409,502 | |
1.138% | | | 01/25/2018 | | | #§ | | | 1,300,000 | | | | 1,314,291 | |
JPMorgan Chase & Co. MTN | |
1.100% | | | 10/15/2015 | | | § | | | 780,000 | | | | 783,320 | |
0.857% | | | 02/26/2016 | | | #§ | | | 870,000 | | | | 874,041 | |
MPH Intermediate Holding Co. 2 | |
8.375% | | | 08/01/2018 | | | ^ | | | 1,250,000 | | | | 1,304,688 | |
NASDAQ OMX Group, Inc. (The) | |
4.000% | | | 01/15/2015 | | | § | | | 1,210,000 | | | | 1,241,954 | |
National Rural Utilities Cooperative Finance Corp. | |
1.000% | | | 02/02/2015 | | | | | | 470,000 | | | | 472,891 | |
| | | | | | | | | | | | | | |
| | | | | |
Coupon
Rate | | Maturity
Date | | | | | Face | | | Value | |
National Rural Utilities Cooperative Finance Corp. MTN | |
0.493% | | | 04/04/2014 | | | #§ | | $ | 420,000 | | | $ | 420,276 | |
| | | | | | | | | | | | | | |
| | | | | | | | | | | | | 28,361,354 | |
| | | | | | | | | | | | | | |
| Diversified Telecommunication Services—0.9% | |
AT&T, Inc. | |
0.875% | | | 02/13/2015 | | | § | | | 3,410,000 | | | | 3,418,143 | |
British Telecommunications plc (United Kingdom) | |
1.625% | | | 06/28/2016 | | | | | | 430,000 | | | | 434,053 | |
CC Holdings GS V LLC/Crown Castle GS III Corp. | |
2.381% | | | 12/15/2017 | | | | | | 430,000 | | | | 426,306 | |
Frontier Communications Corp. | |
8.500% | | | 04/15/2020 | | | | | | 1,080,000 | | | | 1,215,000 | |
Verizon Communications, Inc. | |
1.993% | | | 09/14/2018 | | | # | | | 860,000 | | | | 905,304 | |
1.773% | | | 09/15/2016 | | | #§ | | | 900,000 | | | | 927,818 | |
0.442% | | | 03/06/2015 | | | #^ | | | 1,500,000 | | | | 1,497,895 | |
Windstream Corp. | |
7.875% | | | 11/01/2017 | | | § | | | 990,000 | | | | 1,136,025 | |
| | | | | | | | | | | | | | |
| | | | | | | | | | | | | 9,960,544 | |
| | | | | | | | | | | | | | |
| Electric Utilities—0.6% | |
Duke Energy Corp. | |
3.950% | | | 09/15/2014 | | | | | | 290,000 | | | | 296,935 | |
Georgia Power Co. | |
0.563% | | | 03/15/2016 | | | #§ | | | 470,000 | | | | 470,289 | |
NextEra Energy Capital Holdings, Inc. | |
2.600% | | | 09/01/2015 | | | § | | | 2,000,000 | | | | 2,053,950 | |
1.611% | | | 06/01/2014 | | | § | | | 340,000 | | | | 341,551 | |
1.339% | | | 09/01/2015 | | | § | | | 2,040,000 | | | | 2,054,429 | |
1.200% | | | 06/01/2015 | | | § | | | 130,000 | | | | 130,712 | |
NSTAR Electric Co. | |
0.478% | | | 05/17/2016 | | | #§ | | | 720,000 | | | | 719,427 | |
Xcel Energy, Inc. | |
0.750% | | | 05/09/2016 | | | | | | 860,000 | | | | 853,242 | |
| | | | | | | | | | | | | | |
| | | | | | | | | | | | | 6,920,535 | |
| | | | | | | | | | | | | | |
| Electrical Equipment—0.1% | |
Eaton Corp. | |
0.950% | | | 11/02/2015 | | | § | | | 980,000 | | | | 984,111 | |
| | | | | | | | | | | | | | |
| Energy Equipment & Services—0.3% | �� |
Cameron International Corp. | |
1.169% | | | 06/02/2014 | | | #§ | | | 1,010,000 | | | | 1,013,080 | |
Nabors Industries, Inc. | |
2.350% | | | 09/15/2016 | | | ^ | | | 1,550,000 | | | | 1,566,638 | |
National Oilwell Varco, Inc. | |
1.350% | | | 12/01/2017 | | | | | | 930,000 | | | | 914,567 | |
| | | | | | | | | | | | | | |
| | | | | | | | | | | | | 3,494,285 | |
| | | | | | | | | | | | | | |
| Food & Staples Retailing—0.4% | |
CVS Caremark Corp. | |
1.200% | | | 12/05/2016 | | | | | | 390,000 | | | | 390,675 | |
Kroger Co. (The) | |
2.200% | | | 01/15/2017 | | | | | | 750,000 | | | | 759,679 | |
0.804% | | | 10/17/2016 | | | #§ | | | 1,700,000 | | | | 1,704,904 | |
Walgreen Co. | |
1.000% | | | 03/13/2015 | | | § | | | 650,000 | | | | 652,865 | |
0.744% | | | 03/13/2014 | | | #§ | | | 910,000 | | | | 910,953 | |
Wal-Mart Stores, Inc. | |
0.600% | | | 04/11/2016 | | | | | | 180,000 | | | | 179,840 | |
| | | | | | | | | | | | | | |
| | | | | | | | | | | | | 4,598,916 | |
| | | | | | | | | | | | | | |
See accompanying notes to financial statements
250
SCHEDULE OF INVESTMENTS—(Continued)
December 31, 2013
| | | | | | | | | | | | | | |
Vantagepoint Diversifying
Strategies Fund | | | | | | | | | |
| | | | |
Coupon
Rate | | Maturity
Date | | | | | Face | | | Value | |
| CORPORATE OBLIGATIONS—(Continued) | |
| Food Products—0.9% | |
ARAMARK Corp. | |
5.750% | | | 03/15/2020 | | | ^§ | | $ | 720,000 | | | $ | 756,000 | |
Campbell Soup Co. | |
0.542% | | | 08/01/2014 | | | #§ | | | 560,000 | | | | 560,816 | |
ConAgra Foods, Inc. | |
1.350% | | | 09/10/2015 | | | | | | 220,000 | | | | 221,620 | |
1.300% | | | 01/25/2016 | | | | | | 510,000 | | | | 511,143 | |
General Mills, Inc. | |
0.537% | | | 01/29/2016 | | | # | | | 240,000 | | | | 240,331 | |
Hawk Acquisition Sub, Inc. | |
4.250% | | | 10/15/2020 | | | ^§ | | | 1,200,000 | | | | 1,164,000 | |
Ingredion, Inc. | |
3.200% | | | 11/01/2015 | | | | | | 350,000 | | | | 362,557 | |
Kellogg Co. | |
1.125% | | | 05/15/2015 | | | § | | | 1,100,000 | | | | 1,107,864 | |
0.469% | | | 02/13/2015 | | | # | | | 270,000 | | | | 270,388 | |
Kraft Foods Group, Inc. | |
1.625% | | | 06/04/2015 | | | | | | 500,000 | | | | 506,528 | |
Unilever Capital Corp. | |
0.450% | | | 07/30/2015 | | | | | | 680,000 | | | | 680,439 | |
Want Want China Finance Ltd. (Cayman Islands) | |
1.875% | | | 05/14/2018 | | | ^§ | | | 850,000 | | | | 811,723 | |
Wm. Wrigley Jr. Co. | |
3.700% | | | 06/30/2014 | | | ^ | | | 2,510,000 | | | | 2,548,908 | |
2.000% | | | 10/20/2017 | | | ^ | | | 300,000 | | | | 299,439 | |
1.400% | | | 10/21/2016 | | | ^ | | | 300,000 | | | | 300,660 | |
| | | | | | | | | | | | | | |
| | | | | | | | | | | | | 10,342,416 | |
| | | | | | | | | | | | | | |
| Gas Utilities—0.1% | |
AmeriGas Partners LP/AmeriGas Finance Corp. | |
6.250% | | | 08/20/2019 | | | | | | 800,000 | | | | 864,000 | |
| | | | | | | | | | | | | | |
| Health Care Equipment & Supplies—0.1% | |
Baxter International, Inc. | |
0.950% | | | 06/01/2016 | | | | | | 350,000 | | | | 350,170 | |
Covidien International Finance SA (Luxembourg) | |
1.350% | | | 05/29/2015 | | | | | | 400,000 | | | | 403,074 | |
Stryker Corp. | |
3.000% | | | 01/15/2015 | | | § | | | 790,000 | | | | 811,086 | |
| | | | | | | | | | | | | | |
| | | | | | | | | | | | | 1,564,330 | |
| | | | | | | | | | | | | | |
| Health Care Providers & Services—0.7% | |
Express Scripts Holding Co. | |
2.750% | | | 11/21/2014 | | | § | | | 1,500,000 | | | | 1,529,262 | |
2.100% | | | 02/12/2015 | | | | | | 330,000 | | | | 334,874 | |
HCA Holdings, Inc. | |
7.750% | | | 05/15/2021 | | | | | | 600,000 | | | | 657,000 | |
Quest Diagnostics, Inc. | |
1.098% | | | 03/24/2014 | | | #§ | | | 890,000 | | | | 891,176 | |
UnitedHealth Group, Inc. | |
0.850% | | | 10/15/2015 | | | | | | 180,000 | | | | 180,800 | |
Ventas Realty LP | |
1.550% | | | 09/26/2016 | | | § | | | 906,000 | | | | 913,038 | |
WellPoint, Inc. | |
2.375% | | | 02/15/2017 | | | § | | | 1,645,000 | | | | 1,666,467 | |
1.250% | | | 09/10/2015 | | | § | | | 1,060,000 | | | | 1,067,814 | |
| | | | | | | | | | | | | | |
| | | | | | | | | | | | | 7,240,431 | |
| | | | | | | | | | | | | | |
| | | | | | | | | | | | | | |
| | | | | |
Coupon
Rate | |
| Maturity
Date |
| | | | | Face | | | | Value | |
| Hotels, Restaurants & Leisure—0.1% | |
Carnival Corp. (Panama) | |
1.875% | | | 12/15/2017 | | | | | $ | 320,000 | | | $ | 318,232 | |
1.200% | | | 02/05/2016 | | | | | | 450,000 | | | | 448,986 | |
Starbucks Corp. | |
0.875% | | | 12/05/2016 | | | | | | 700,000 | | | | 696,093 | |
| | | | | | | | | | | | | | |
| | | | | | | | | | | | | 1,463,311 | |
| | | | | | | | | | | | | | |
| Household Products—0.1% | |
Reynolds Group Issuer, Inc./Reynolds Group Issuer LLC | |
9.875% | | | 08/15/2019 | | | | | | 1,000,000 | | | | 1,117,500 | |
| | | | | | | | | | | | | | |
| Industrial Conglomerates—0.0% | |
Tyco Electronics Group SA (Luxembourg) | |
1.600% | | | 02/03/2015 | | | | | | 310,000 | | | | 313,134 | |
| | | | | | | | | | | | | | |
| Insurance—0.7% | |
Allstate Corp. (The) | |
6.200% | | | 05/16/2014 | | | § | | | 510,000 | | | | 520,808 | |
American International Group, Inc. | |
2.375% | | | 08/24/2015 | | | | | | 460,000 | | | | 470,052 | |
Berkshire Hathaway Finance Corp. | |
0.950% | | | 08/15/2016 | | | | | | 580,000 | | | | 583,007 | |
Hartford Financial Services Group, Inc. | |
4.000% | | | 03/30/2015 | | | | | | 570,000 | | | | 592,350 | |
MetLife Institutional Funding II | |
0.613% | | | 01/06/2015 | | | #^ | | | 500,000 | | | | 501,692 | |
MetLife, Inc. | |
2.375% | | | 02/06/2014 | | | § | | | 470,000 | | | | 470,924 | |
Metropolitan Life Global Funding I | |
0.774% | | | 07/15/2016 | | | #^ | | | 980,000 | | | | 986,047 | |
Pricoa Global Funding I | |
0.508% | | | 08/19/2015 | | | #^ | | | 490,000 | | | | 490,844 | |
Principal Life Global Funding II | |
1.000% | | | 12/11/2015 | | | ^ | | | 1,150,000 | | | | 1,152,893 | |
Prudential Financial, Inc. | |
1.021% | | | 08/15/2018 | | | # | | | 800,000 | | | | 803,443 | |
Prudential Financial, Inc., Series B MTN | |
4.750% | | | 04/01/2014 | | | § | | | 600,000 | | | | 606,394 | |
QBE Insurance Group Ltd. (Australia) | |
2.400% | | | 05/01/2018 | | | ^ | | | 460,000 | | | | 442,371 | |
| | | | | | | | | | | | | | |
| | | | | | | | | | | | | 7,620,825 | |
| | | | | | | | | | | | | | |
| Internet & Catalog Retail—0.2% | |
Amazon.com, Inc. | |
0.650% | | | 11/27/2015 | | | § | | | 2,020,000 | | | | 2,020,042 | |
| | | | | | | | | | | | | | |
| Internet Software & Services—0.1% | |
Baidu, Inc. (Cayman Islands) | |
2.250% | | | 11/28/2017 | | | § | | | 560,000 | | | | 557,536 | |
| | | | | | | | | | | | | | |
| IT Services—0.5% | |
Alliance Data Systems Corp. | |
5.250% | | | 12/01/2017 | | | ^ | | | 1,000,000 | | | | 1,042,500 | |
Computer Sciences Corp. | |
2.500% | | | 09/15/2015 | | | | | | 300,000 | | | | 306,343 | |
Fidelity National Information Services, Inc. | |
2.000% | | | 04/15/2018 | | | | | | 470,000 | | | | 457,492 | |
Total System Services, Inc. | |
2.375% | | | 06/01/2018 | | | | | | 1,640,000 | | | | 1,597,186 | |
Western Union Co. (The) | |
1.239% | | | 08/21/2015 | | | #§ | | | 1,800,000 | | | | 1,806,876 | |
| | | | | | | | | | | | | | |
| | | | | | | | | | | | | 5,210,397 | |
| | | | | | | | | | | | | | |
See accompanying notes to financial statements
251
SCHEDULE OF INVESTMENTS—(Continued)
December 31, 2013
| | | | | | | | | | | | | | |
Vantagepoint Diversifying
Strategies Fund | | | | | | | | | |
| | | | |
Coupon
Rate | | Maturity
Date | | | | | Face | | | Value | |
| CORPORATE OBLIGATIONS—(Continued) | |
| Life Sciences Tools & Services—0.2% | |
Life Technologies Corp. | |
3.500% | | | 01/15/2016 | | | § | | $ | 1,500,000 | | | $ | 1,563,247 | |
Thermo Fisher Scientific, Inc. | |
1.300% | | | 02/01/2017 | | | | | | 520,000 | | | | 518,130 | |
| | | | | | | | | | | | | | |
| | | | | | | | | | | | | 2,081,377 | |
| | | | | | | | | | | | | | |
| Marine—0.1% | |
Far East Capital Ltd. SA (Luxembourg) | |
8.000% | | | 05/02/2018 | | | ^§ | | | 750,000 | | | | 673,125 | |
| | | | | | | | | | | | | | |
| Media—0.8% | |
CCO Holdings LLC/CCO Holdings Capital Corp. | |
5.250% | | | 09/30/2022 | | | | | | 925,000 | | | | 868,344 | |
COX Communications, Inc. | |
5.450% | | | 12/15/2014 | | | | | | 160,000 | | | | 167,247 | |
DirecTV Holdings LLC/DirecTV Financing Co., Inc. | |
4.750% | | | 10/01/2014 | | | | | | 630,000 | | | | 648,864 | |
3.125% | | | 02/15/2016 | | | § | | | 570,000 | | | | 593,232 | |
DISH DBS Corp. | |
6.625% | | | 10/01/2014 | | | § | | | 850,000 | | | | 886,125 | |
4.625% | | | 07/15/2017 | | | § | | | 1,120,000 | | | | 1,176,000 | |
Mediacom LLC/Mediacom Capital Corp. | |
7.250% | | | 02/15/2022 | | | | | | 800,000 | | | | 852,000 | |
NBCUniversal Enterprise, Inc. | |
0.929% | | | 04/15/2018 | | | #^ | | | 570,000 | | | | 572,688 | |
NBCUniversal Media LLC | |
2.100% | | | 04/01/2014 | | | § | | | 1,600,000 | | | | 1,606,926 | |
Thomson Reuters Corp. (Canada) | |
1.300% | | | 02/23/2017 | | | | | | 700,000 | | | | 697,446 | |
Time Warner, Inc. | |
3.150% | | | 07/15/2015 | | | § | | | 500,000 | | | | 518,191 | |
Viacom, Inc. | |
4.375% | | | 09/15/2014 | | | § | | | 500,000 | | | | 513,130 | |
| | | | | | | | | | | | | | |
| | | | | | | | | | | | | 9,100,193 | |
| | | | | | | | | | | | | | |
| Metals & Mining—1.0% | |
ArcelorMittal (Luxembourg) | |
4.250% | | | 08/05/2015 | | | § | | | 1,100,000 | | | | 1,142,625 | |
BHP Billiton Finance USA Ltd. (Australia) | |
1.000% | | | 02/24/2015 | | | § | | | 1,840,000 | | | | 1,850,613 | |
FMG Resources August 2006 Pty Ltd. (Australia) | |
6.000% | | | 04/01/2017 | | | ^§ | | | 835,000 | | | | 891,363 | |
Freeport-McMoRan Copper & Gold, Inc. | |
2.150% | | | 03/01/2017 | | | | | | 310,000 | | | | 312,258 | |
1.400% | | | 02/13/2015 | | | | | | 700,000 | | | | 704,100 | |
Glencore Funding LLC | |
1.604% | | | 01/15/2019 | | | #^ | | | 1,880,000 | | | | 1,846,314 | |
Rio Tinto Finance USA plc (United Kingdom) | |
1.125% | | | 03/20/2015 | | | § | | | 800,000 | | | | 804,694 | |
Xstrata Finance Canada Ltd. (Canada) | |
2.700% | | | 10/25/2017 | | | ^ | | | 2,480,000 | | | | 2,510,412 | |
2.050% | | | 10/23/2015 | | | ^ | | | 630,000 | | | | 638,300 | |
| | | | | | | | | | | | | | |
| | | | | | | | | | | | | 10,700,679 | |
| | | | | | | | | | | | | | |
| Multiline Retail—0.1% | |
Target Corp. | |
1.125% | | | 07/18/2014 | | | § | | | 600,000 | | | | 602,485 | |
| | | | | | | | | | | | | | |
| | | | | | | | | | | | | | |
| | | | | |
Coupon
Rate | |
| Maturity
Date |
| | | | | Face | | | | Value | |
| Oil, Gas & Consumable Fuels—2.2% | |
Boardwalk Pipelines LP | |
5.875% | | | 11/15/2016 | | | | | $ | 800,000 | | | $ | 885,939 | |
BP Capital Markets plc (United Kingdom) | |
3.875% | | | 03/10/2015 | | | | | | 805,000 | | | | 837,684 | |
0.749% | | | 05/10/2018 | | | #§ | | | 440,000 | | | | 440,109 | |
0.700% | | | 11/06/2015 | | | § | | | 1,850,000 | | | | 1,855,456 | |
CNOOC Finance 2013 Ltd. (Virgin Islands, British) | |
1.125% | | | 05/09/2016 | | | | | | 340,000 | | | | 338,943 | |
ConocoPhillips | |
4.750% | | | 02/01/2014 | | | | | | 199,000 | | | | 199,712 | |
CONSOL Energy, Inc. | |
8.000% | | | 04/01/2017 | | | | | | 230,000 | | | | 243,225 | |
Devon Energy Corp. | |
1.200% | | | 12/15/2016 | | | | | | 870,000 | | | | 870,264 | |
0.784% | | | 12/15/2016 | | | #§ | | | 630,000 | | | | 631,554 | |
Enbridge, Inc. (Canada) | |
0.897% | | | 10/01/2016 | | | #§ | | | 1,310,000 | | | | 1,315,867 | |
Enterprise Products Operating LLC | |
1.250% | | | 08/13/2015 | | | | | | 320,000 | | | | 322,254 | |
Husky Energy, Inc. (Canada) | |
5.900% | | | 06/15/2014 | | | § | | | 550,000 | | | | 563,012 | |
Marathon Oil Corp. | |
0.900% | | | 11/01/2015 | | | § | | | 1,080,000 | | | | 1,081,389 | |
Murphy Oil Corp. | |
2.500% | | | 12/01/2017 | | | | | | 500,000 | | | | 503,507 | |
Petrobras Global Finance BV (Netherlands) | |
2.000% | | | 05/20/2016 | | | § | | | 1,170,000 | | | | 1,172,000 | |
Petrohawk Energy Corp. | |
7.875% | | | 06/01/2015 | | | § | | | 1,000,000 | | | | 1,026,500 | |
Phillips 66 | |
2.950% | | | 05/01/2017 | | | | | | 310,000 | | | | 322,777 | |
1.950% | | | 03/05/2015 | | | | | | 310,000 | | | | 314,409 | |
Plains Exploration & Production Co. | |
6.500% | | | 11/15/2020 | | | § | | | 1,120,000 | | | | 1,237,452 | |
Rockies Express Pipeline LLC | |
3.900% | | | 04/15/2015 | | | ^§ | | | 770,000 | | | | 771,925 | |
Sabine Pass LNG LP | |
7.500% | | | 11/30/2016 | | | § | | | 1,140,000 | | | | 1,293,900 | |
Statoil ASA (Norway) | |
0.699% | | | 11/08/2018 | | | #§ | | | 1,450,000 | | | | 1,458,648 | |
Tesoro Corp. | |
4.250% | | | 10/01/2017 | | | § | | | 780,000 | | | | 817,050 | |
Total Capital Canada Ltd. (Canada) | |
0.624% | | | 01/15/2016 | | | #§ | | | 760,000 | | | | 764,403 | |
Total Capital International SA (France) | |
0.809% | | | 08/10/2018 | | | #§ | | | 1,470,000 | | | | 1,479,690 | |
TransCanada PipeLines Ltd. (Canada) | |
3.400% | | | 06/01/2015 | | | § | | | 630,000 | | | | 654,758 | |
0.927% | | | 06/30/2016 | | | #§ | | | 890,000 | | | | 898,917 | |
0.750% | | | 01/15/2016 | | | | | | 300,000 | | | | 299,400 | |
WPX Energy, Inc. | |
5.250% | | | 01/15/2017 | | | | | | 1,145,000 | | | | 1,228,013 | |
| | | | | | | | | | | | | | |
| | | | | | | | | | | | | 23,828,757 | |
| | | | | | | | | | | | | | |
| Pharmaceuticals—0.9% | |
AbbVie, Inc. | |
1.750% | | | 11/06/2017 | | | § | | | 1,620,000 | | | | 1,618,722 | |
0.998% | | | 11/06/2015 | | | #§ | | | 1,800,000 | | | | 1,819,341 | |
Merck & Co., Inc. | |
0.598% | | | 05/18/2018 | | | #§ | | | 1,400,000 | | | | 1,405,187 | |
Mylan, Inc. | |
1.800% | | | 06/24/2016 | | | ^ | | | 270,000 | | | | 275,420 | |
1.350% | | | 11/29/2016 | | | | | | 440,000 | | | | 439,505 | |
See accompanying notes to financial statements
252
SCHEDULE OF INVESTMENTS—(Continued)
December 31, 2013
| | | | | | | | | | | | | | |
Vantagepoint Diversifying
Strategies Fund | | | | | | | | | |
| | | | |
Coupon
Rate | | Maturity
Date | | | | | Face | | | Value | |
| CORPORATE OBLIGATIONS—(Continued) | |
Perrigo Co. plc (Ireland) | |
1.300% | | | 11/08/2016 | | | ^ | | $ | 1,100,000 | | | $ | 1,096,951 | |
Takeda Pharmaceutical Co. Ltd. (Japan) | |
1.031% | | | 03/17/2015 | | | ^§ | | | 2,500,000 | | | | 2,513,255 | |
Teva Pharmaceutical Finance III BV (Curacao) | |
0.746% | | | 03/21/2014 | | | #§ | | | 470,000 | | | | 470,374 | |
Zoetis, Inc. | |
1.150% | | | 02/01/2016 | | | | | | 170,000 | | | | 170,280 | |
| | | | | | | | | | | | | | |
| | | | | | | | | | | | | 9,809,035 | |
| | | | | | | | | | | | | | |
| Professional Services—0.0% | |
Equifax, Inc. | |
4.450% | | | 12/01/2014 | | | | | | 160,000 | | | | 165,051 | |
| | | | | | | | | | | | | | |
| Real Estate Investment Trusts (REITs)—0.5% | |
Digital Realty Trust LP | |
4.500% | | | 07/15/2015 | | | § | | | 1,680,000 | | | | 1,748,030 | |
HCP, Inc. | |
2.700% | | | 02/01/2014 | | | § | | | 1,610,000 | | | | 1,612,664 | |
Health Care REIT, Inc. | |
3.625% | | | 03/15/2016 | | | | | | 564,000 | | | | 591,217 | |
Simon Property Group LP | |
4.200% | | | 02/01/2015 | | | | | | 250,000 | | | | 257,403 | |
Vornado Realty LP | |
4.250% | | | 04/01/2015 | | | § | | | 1,240,000 | | | | 1,279,041 | |
| | | | | | | | | | | | | | |
| | | | | | | | | | | | | 5,488,355 | |
| | | | | | | | | | | | | | |
| Road & Rail—0.7% | |
Avis Budget Car Rental LLC/Avis Budget Finance, Inc. | |
4.875% | | | 11/15/2017 | | | | | | 840,000 | | | | 886,200 | |
Canadian National Railway Co. (Canada) | |
0.438% | | | 11/06/2015 | | | #§ | | | 760,000 | | | | 760,902 | |
JB Hunt Transport Services, Inc. | |
3.375% | | | 09/15/2015 | | | § | | | 970,000 | | | | 1,005,238 | |
Kansas City Southern de Mexico SA de CV (Mexico) | |
2.350% | | | 05/15/2020 | | | | | | 710,000 | | | | 662,416 | |
0.937% | | | 10/28/2016 | | | # | | | 630,000 | | | | 630,608 | |
Penske Truck Leasing Co. Lp/PTL Finance Corp. | |
3.125% | | | 05/11/2015 | | | ^§ | | | 1,400,000 | | | | 1,440,352 | |
2.500% | | | 03/15/2016 | | | ^ | | | 1,100,000 | | | | 1,127,573 | |
Ryder System, Inc. MTN | |
2.500% | | | 03/01/2017 | | | § | | | 620,000 | | | | 631,233 | |
| | | | | | | | | | | | | | |
| | | | | | | | | | | | | 7,144,522 | |
| | | | | | | | | | | | | | |
| Semiconductors & Semiconductor Equipment—0.2% | |
Texas Instruments, Inc. | |
0.450% | | | 08/03/2015 | | | § | | | 1,380,000 | | | | 1,379,590 | |
TSMC Global Ltd. (Virgin Islands, British) | |
1.625% | | | 04/03/2018 | | | ^ | | | 510,000 | | | | 489,670 | |
0.950% | | | 04/03/2016 | | | ^ | | | 260,000 | | | | 258,577 | |
| | | | | | | | | | | | | | |
| | | | | | | | | | | | | 2,127,837 | |
| | | | | | | | | | | | | | |
| Software—0.1% | |
Autodesk, Inc. | |
1.950% | | | 12/15/2017 | | | | | | 490,000 | | | | 485,184 | |
Oracle Corp. | |
3.750% | | | 07/08/2014 | | | § | | | 750,000 | | | | 763,046 | |
| | | | | | | | | | | | | | |
| | | | | | | | | | | | | 1,248,230 | |
| | | | | | | | | | | | | | |
| | | | | | | | | | | | | | |
| | | | | |
Coupon
Rate | |
| Maturity
Date |
| | | | | Face | | | | Value | |
| Specialty Retail—0.1% | |
Michaels FinCo Holdings LLC/Michaels FinCo, Inc. | |
7.500% | | | 08/01/2018 | | | ^ | | $ | 1,250,000 | | | $ | 1,306,250 | |
| | | | | | | | | | | | | | |
| Thrifts & Mortgage Finance—0.3% | |
Astoria Financial Corp. | |
5.000% | | | 06/19/2017 | | | § | | | 1,120,000 | | | | 1,202,292 | |
BPCE SA MTN (France) | |
1.488% | | | 04/25/2016 | | | #§ | | | 1,500,000 | | | | 1,520,382 | |
| | | | | | | | | | | | | | |
| | | | | | | | | | | | | 2,722,674 | |
| | | | | | | | | | | | | | |
| Tobacco—0.2% | |
BAT International Finance plc (United Kingdom) | |
1.400% | | | 06/05/2015 | | | ^ | | | 1,460,000 | | | | 1,472,800 | |
Reynolds American, Inc. | |
1.050% | | | 10/30/2015 | | | | | | 510,000 | | | | 511,853 | |
| | | | | | | | | | | | | | |
| | | | | | | | | | | | | 1,984,653 | |
| | | | | | | | | | | | | | |
| Trading Companies & Distributors—0.0% | |
Aviation Capital Group Corp. | |
4.625% | | | 01/31/2018 | | | ^§ | | | 490,000 | | | | 507,728 | |
| | | | | | | | | | | | | | |
| Wireless Telecommunication Services—0.6% | |
Rogers Communications, Inc. (Canada) | |
6.375% | | | 03/01/2014 | | | § | | | 1,390,000 | | | | 1,403,323 | |
SBA Communications Corp. | |
5.625% | | | 10/01/2019 | | | § | | | 500,000 | | | | 517,500 | |
SoftBank Corp. (Japan) | |
4.500% | | | 04/15/2020 | | | ^ | | | 200,000 | | | | 196,000 | |
Sprint Corp. | |
7.125% | | | 06/15/2024 | | | ^ | | | 250,000 | | | | 254,375 | |
T-Mobile USA, Inc. | |
6.125% | | | 01/15/2022 | | | | | | 1,000,000 | | | | 1,020,000 | |
Vodafone Group plc (United Kingdom) | |
4.150% | | | 06/10/2014 | | | § | | | 1,090,000 | | | | 1,107,510 | |
0.900% | | | 02/19/2016 | | | § | | | 2,580,000 | | | | 2,590,395 | |
| | | | | | | | | | | | | | |
| | | | | | | | | | | | | 7,089,103 | |
| | | | | | | | | | | | | | |
| TOTAL CORPORATE OBLIGATIONS | |
(Cost $350,607,337) | | | | | | | 354,350,566 | |
| | | | | | | | | | | | | | |
| | | | | | | | | | | | | | | |
| MORTGAGE-BACKED SECURITIES—4.4% | |
| Commercial Mortgage-Backed Securities—0.5% | |
Del Coronado Trust, Series 2013-HDC, Class A | |
0.967% | | | 03/15/2026 | | | #^ | | | 1,040,000 | | | | 1,035,842 | |
Hilton USA Trust, Series 2013-HLF, Class AFL | |
1.169% | | | 11/05/2030 | | | #^ | | | 2,670,000 | | | | 2,672,940 | |
LA Arena Funding LLC, Series 1, Class A | |
7.656% | | | 12/15/2026 | | | ^ | | | 502,825 | | | | 572,770 | |
Motel 6 Trust, Series 2012-MTL6, Class A1 | |
1.500% | | | 10/05/2025 | | | ^ | | | 959,454 | | | | 952,530 | |
National Credit Union Administration Guaranteed Notes,
Series 2010-C1, Class A1 | |
1.600% | | | 10/29/2020 | | | § | | | 675,700 | | | | 681,304 | |
| | | | | | | | | | | | | | |
| | | | | | | | | | | | | 5,915,386 | |
| | | | | | | | | | | | | | |
| Non-Agency Mortgage-Backed Securities—2.6% | |
Argent Securities, Inc., Series 2006-W3, Class A2B | |
0.285% | | | 04/25/2036 | | | # | | | 68,165 | | | | 26,566 | |
Bank of America Mortgage Securities, Inc.,
Series 2002-K, Class 1A4 | |
2.747% | | | 10/20/2032 | | | # | | | 510,907 | | | | 516,839 | |
Credit Suisse First Boston Mortgage Securities Corp.,
Series 2004-3, Class 2A1 | |
5.000% | | | 04/25/2019 | | | | | | 67,225 | | | | 69,180 | |
See accompanying notes to financial statements
253
SCHEDULE OF INVESTMENTS—(Continued)
December 31, 2013
| | | | | | | | | | | | | | |
Vantagepoint Diversifying
Strategies Fund | | | | | | | | | |
| | | | |
Coupon
Rate | | Maturity
Date | | | | | Face | | | Value | |
| MORTGAGE-BACKED SECURITIES—(Continued) | |
Credit Suisse Mortgage Capital Certificates,
Series 2011-1R, Class A1 | |
1.164% | | | 02/27/2047 | | | #^ | | $ | 1,841,904 | | | $ | 1,837,808 | |
Credit Suisse Mortgage Capital Certificates,
Series 2013-IVR2, Class AD | |
1.550% | | | 04/25/2043 | | | #^ | | | 2,661,317 | | | | 2,569,558 | |
Credit Suisse Mortgage Capital Certificates,
Series 2013-IVR3, Class A3 | |
1.550% | | | 05/25/2043 | | | #^ | | | 1,349,542 | | | | 1,248,814 | |
Fosse Master Issuer plc,
Series 2012-1A, Class 2A2 (United Kingdom) | |
1.646% | | | 10/18/2054 | | | #^ | | | 3,775,627 | | | | 3,838,325 | |
GSAMP Trust, Series 2004-SEA2, Class M1 | |
0.815% | | | 03/25/2034 | | | # | | | 1,700,000 | | | | 1,694,477 | |
JP Morgan Mortgage Trust, Series 2013-1, Class 2A2 | |
2.500% | | | 03/25/2043 | | | #^ | | | 1,053,087 | | | | 1,022,166 | |
Option One Mortgage Loan Trust, Series 2005-4, Class A3 | |
0.425% | | | 11/25/2035 | | | # | | | 474,710 | | | | 467,565 | |
Saxon Asset Securities Trust, Series 2005-4, Class A2C | |
0.415% | | | 11/25/2037 | | | # | | | 99,892 | | | | 99,907 | |
Sequoia Mortgage Trust, Series 2012-1, Class 1A1 | |
2.865% | | | 01/25/2042 | | | # | | | 1,193,458 | | | | 1,189,649 | |
Sequoia Mortgage Trust, Series 2012-2, Class A2 | |
3.500% | | | 04/25/2042 | | | # | | | 1,185,420 | | | | 1,193,874 | |
Sequoia Mortgage Trust, Series 2013-1, Class 1A1 | |
1.450% | | | 02/25/2043 | | | # | | | 1,235,215 | | | | 1,217,861 | |
Sequoia Mortgage Trust, Series 2013-4, Class A3 | |
1.550% | | | 04/25/2043 | | | #§ | | | 1,794,706 | | | | 1,734,958 | |
Springleaf Mortgage Loan Trust, Series 2012-2A, Class A | |
2.220% | | | 10/25/2057 | | | #^ | | | 672,566 | | | | 687,574 | |
Springleaf Mortgage Loan Trust, Series 2012-3A, Class A | |
1.570% | | | 12/25/2059 | | | #^ | | | 861,516 | | | | 860,278 | |
Springleaf Mortgage Loan Trust, Series 2013-1A, Class A | |
1.270% | | | 06/25/2058 | | | #^ | | | 2,452,492 | | | | 2,452,468 | |
Springleaf Mortgage Loan Trust, Series 2013-2A, Class A | |
1.780% | | | 12/25/2065 | | | #^ | | | 907,682 | | | | 907,402 | |
Structured Agency Credit Risk Debt Notes,
Series 2013-DN2, Class M1 | |
1.618% | | | 11/25/2023 | | | #§ | | | 2,075,799 | | | | 2,072,239 | |
Structured Asset Investment Loan Trust,
Series 2003-BC1, Class A2 | |
0.845% | | | 01/25/2033 | | | # | | | 1,599,769 | | | | 1,559,558 | |
Thornburg Mortgage Securities Trust, Series 2004-1, Class II2A | |
1.765% | | | 03/25/2044 | | | # | | | 710,395 | | | | 689,530 | |
| | | | | | | | | | | | | | |
| | | | | | | | | | | | | 27,956,596 | |
| | | | | | | | | | | | | | |
| U.S. Government Agency Mortgage-Backed Securities—1.3% | |
Federal Home Loan Mortgage Corp. | |
3.913% | | | 12/01/2039 | | | # | | | 195,356 | | | | 209,219 | |
2.375% | | | 09/01/2035 | | | # | | | 3,559,068 | | | | 3,761,887 | |
Federal National Mortgage Association | |
5.000% | | | 01/01/2018 | | | | | | 495,351 | | | | 528,585 | |
3.134% | | | 07/01/2041 | | | # | | | 2,831,583 | | | | 2,989,700 | |
3.000% | | | 06/01/2041 | | | # | | | 1,589,833 | | | | 1,677,785 | |
2.616% | | | 03/01/2036 | | | #§ | | | 134,150 | | | | 143,458 | |
2.378% | | | 03/01/2036 | | | # | | | 1,418,677 | | | | 1,515,281 | |
Federal National Mortgage Association,
Series 2013-C01, Class M1 | |
2.165% | | | 10/25/2023 | | | #§ | | | 370,566 | | | | 372,387 | |
| | | | | | | | | | | | | | |
| | | | | |
Coupon
Rate | |
| Maturity
Date |
| | | | | Face | | | | Value | |
FHLMC Multifamily Structured Pass Through Certificates,
Series KF01, Class A | |
0.518% | | | 04/25/2019 | | | # | | $ | 682,002 | | | $ | 681,349 | |
Government National Mortgage Association,
Series 2004-19, Class FC | |
0.467% | | | 03/20/2034 | | | # | | | 22,128 | | | | 22,130 | |
National Credit Union Administration Guaranteed Notes,
Series 2010-R1, Class 1A | |
0.619% | | | 10/07/2020 | | | #§ | | | 1,149,558 | | | | 1,155,742 | |
National Credit Union Administration Guaranteed Notes,
Series 2010-R1, Class 2A | |
1.840% | | | 10/07/2020 | | | | | | 213,030 | | | | 214,779 | |
National Credit Union Administration Guaranteed Notes,
Series 2011-R4, Class 1A | |
0.549% | | | 03/06/2020 | | | #§ | | | 968,393 | | | | 971,782 | |
| | | | | | | | | | | | | | |
| | | | | | | | | | | | | 14,244,084 | |
| | | | | | | | | | | | | | |
| TOTAL MORTGAGE-BACKED SECURITIES | |
(Cost $48,124,247) | | | | | | | 48,116,066 | |
| | | | | | | | | | | | | | |
| | | | | | | | | | | | | | | |
| CONVERTIBLE DEBT OBLIGATIONS—36.7% | |
| Aerospace & Defense—0.5% | |
Alliant Techsystems, Inc. | |
3.000% | | | 08/15/2024 | | | | | | 430,000 | | | | 689,344 | |
L-3 Communications Holdings, Inc. | |
3.000% | | | 08/01/2035 | | | | | | 3,705,000 | | | | 4,480,734 | |
| | | | | | | | | | | | | | |
| | | | | | | | | | | | | 5,170,078 | |
| | | | | | | | | | | | | | |
| Beverages—0.5% | |
Asahi Group Holdings Ltd. (Japan) | |
0.000% | | | 05/26/2028 | | | JPY | | | 360,000,000 | | | | 4,952,521 | |
| | | | | | | | | | | | | | |
| Biotechnology—0.2% | |
Gilead Sciences, Inc., Series D | |
1.625% | | | 05/01/2016 | | | | | | 565,000 | | | | 1,864,503 | |
| | | | | | | | | | | | | | |
| Building Products—0.2% | |
Griffon Corp. | |
4.000% | | | 01/15/2017 | | | ^ | | | 1,745,000 | | | | 2,055,828 | |
| | | | | | | | | | | | | | |
| Capital Markets—2.1% | |
Ares Capital Corp. | |
5.750% | | | 02/01/2016 | | | | | | 867,000 | | | | 936,902 | |
4.750% | | | 01/15/2018 | | | | | | 3,900,000 | | | | 4,136,437 | |
Azimut Holding SpA (Italy) | |
2.125% | | | 11/25/2020 | | | EUR | | | 1,500,000 | | | | 2,082,741 | |
Jefferies Group LLC | |
3.875% | | | 11/01/2029 | | | | | | 226,000 | | | | 239,984 | |
Misarte (France) | |
3.250% | | | 01/01/2016 | | | EUR | | | 312,500 | | | | 752,558 | |
Prospect Capital Corp. | |
5.875% | | | 01/15/2019 | | | | | | 1,960,000 | | | | 2,037,175 | |
5.375% | | | 10/15/2017 | | | | | | 1,750,000 | | | | 1,836,032 | |
Temasek Financial III Pte Ltd. (Singapore) | |
0.000% | | | 10/24/2014 | | | SGD | | | 7,750,000 | | | | 6,165,854 | |
Walter Investment Management Corp. | |
4.500% | | | 11/01/2019 | | | | | | 5,200,000 | | | | 5,219,500 | |
| | | | | | | | | | | | | | |
| | | | | | | | | | | | | 23,407,183 | |
| | | | | | | | | | | | | | |
| Commercial Services & Supplies—0.1% | |
Covanta Holding Corp. | |
3.250% | | | 06/01/2014 | | | | | | 1,175,000 | | | | 1,379,891 | |
| | | | | | | | | | | | | | |
See accompanying notes to financial statements
254
SCHEDULE OF INVESTMENTS—(Continued)
December 31, 2013
| | | | | | | | | | | | | | |
Vantagepoint Diversifying
Strategies Fund | | | | | | | | | |
| | | | |
Coupon
Rate | | Maturity
Date | | | | | Face | | | Value | |
| CONVERTIBLE DEBT OBLIGATIONS—(Continued) | |
| Communications Equipment—0.5% | |
Ciena Corp. | |
0.875% | | | 06/15/2017 | | | | | $ | 5,575,000 | | | $ | 5,728,312 | |
| | | | | | | | | | | | | | |
| Computers & Peripherals—0.5% | |
Pegatron Corp., Series 4938 (Taiwan) | |
0.000% | | | 02/06/2017 | | | | | | 600,000 | | | | 674,850 | |
SanDisk Corp. | |
1.500% | | | 08/15/2017 | | | | | | 3,225,000 | | | | 4,768,969 | |
| | | | | | | | | | | | | | |
| | | | | | | | | | | | | 5,443,819 | |
| | | | | | | | | | | | | | |
| Construction Materials—0.4% | |
Buzzi Unicem SpA, Series BZU (Italy) | |
1.375% | | | 07/17/2019 | | | EUR | | | 1,500,000 | | | | 2,253,603 | |
Cemex SAB de CV (Mexico) | |
4.875% | | | 03/15/2015 | | | | | | 1,800,000 | | | | 2,137,500 | |
| | | | | | | | | | | | | | |
| | | | | | | | | | | | | 4,391,103 | |
| | | | | | | | | | | | | | |
| Containers & Packaging—0.2% | |
Owens-Brockway Glass Container, Inc. | |
3.000% | | | 06/01/2015 | | | ^ | | | 2,505,000 | | | | 2,622,422 | |
| | | | | | | | | | | | | | |
| Diversified Financial Services—0.8% | |
Industrivarden AB, Series INDU (Sweden) | |
2.500% | | | 02/27/2015 | | | EUR | | | 4,750,000 | | | | 8,423,067 | |
| | | | | | | | | | | | | | |
| Diversified Telecommunication Services—0.2% | |
Inmarsat plc, Series ISAT (United Kingdom) | |
1.750% | | | 11/16/2017 | | | | | | 1,900,000 | | | | 2,584,950 | |
| | | | | | | | | | | | | | |
| Energy Equipment & Services—1.1% | |
Bristow Group, Inc. | |
3.000% | | | 06/15/2038 | | | | | | 2,265,000 | | | | 2,788,781 | |
Exterran Holdings, Inc. | |
4.250% | | | 06/15/2014 | | | | | | 630,000 | | | | 941,456 | |
SEACOR Holdings, Inc. | |
2.500% | | | 12/15/2027 | | | | | | 3,200,000 | | | | 3,938,000 | |
Technip SA (France) | |
0.500% | | | 01/01/2016 | | | EUR | | | 1,032,800 | | | | 1,291,992 | |
0.250% | | | 01/01/2017 | | | EUR | | | 2,240,000 | | | | 3,156,137 | |
| | | | | | | | | | | | | | |
| | | | | | | | | | | | | 12,116,366 | |
| | | | | | | | | | | | | | |
| Food Products—0.3% | |
Archer-Daniels-Midland Co. | |
0.875% | | | 02/15/2014 | | | | | | 3,580,000 | | | | 3,792,562 | |
| | | | | | | | | | | | | | |
| Health Care Equipment & Supplies—2.4% | |
Alere, Inc. | |
3.000% | | | 05/15/2016 | | | | | | 3,075,000 | | | | 3,470,906 | |
Hologic, Inc. | |
0.000% | | | 12/15/2043 | | | | | | 415,000 | | | | 436,788 | |
Hologic, Inc., Series 2010 | |
2.000% | | | 12/15/2037 | | | | | | 2,410,000 | | | | 2,815,181 | |
Hologic, Inc., Series 2012 | |
2.000% | | | 03/01/2042 | | | | | | 5,360,000 | | | | 5,487,300 | |
Integra LifeSciences Holdings Corp. | |
1.625% | | | 12/15/2016 | | | | | | 3,850,000 | | | | 4,153,188 | |
NuVasive, Inc. | |
2.750% | | | 07/01/2017 | | | | | | 5,435,000 | | | | 5,913,959 | |
Volcano Corp. | |
1.750% | | | 12/01/2017 | | | | | | 3,925,000 | | | | 3,871,031 | |
| | | | | | | | | | | | | | |
| | | | | | | | | | | | | 26,148,353 | |
| | | | | | | | | | | | | | |
| | | | | | | | | | | | | | |
| | | | | |
Coupon
Rate | |
| Maturity
Date |
| | | | | Face | | | | Value | |
| Health Care Providers & Services—1.3% | |
LifePoint Hospitals, Inc. | |
3.500% | | | 05/15/2014 | | | | | $ | 2,720,000 | | | $ | 2,969,900 | |
Omnicare, Inc., Series OCR | |
3.250% | | | 12/15/2035 | | | | | | 5,775,000 | | | | 6,200,906 | |
WellPoint, Inc. | |
2.750% | | | 10/15/2042 | | | | | | 3,860,000 | | | | 5,244,775 | |
| | | | | | | | | | | | | | |
| | | | | | | | | | | | | 14,415,581 | |
| | | | | | | | | | | | | | |
| Hotels, Restaurants & Leisure—1.7% | |
International Game Technology | |
3.250% | | | 05/01/2014 | | | | | | 10,404,000 | | | | 11,041,245 | |
MGM Resorts International | |
4.250% | | | 04/15/2015 | | | | | | 5,610,000 | | | | 7,727,775 | |
| | | | | | | | | | | | | | |
| | | | | | | | | | | | | 18,769,020 | |
| | | | | | | | | | | | | | |
| Household Durables—1.1% | |
Jarden Corp. | |
1.875% | | | 09/15/2018 | | | | | | 2,130,000 | | | | 3,019,275 | |
Ryland Group, Inc. (The) | |
0.250% | | | 06/01/2019 | | | | | | 5,425,000 | | | | 5,089,328 | |
Toll Brothers Finance Corp. | |
0.500% | | | 09/15/2032 | | | | | | 3,705,000 | | | | 3,871,725 | |
| | | | | | | | | | | | | | |
| | | | | | | | | | | | | 11,980,328 | |
| | | | | | | | | | | | | | |
| Industrial Conglomerates—1.5% | |
Danaher Corp. | |
0.000% | | | 01/22/2021 | | | | | | 865,000 | | | | 1,942,466 | |
Siemens Financieringsmaatschappij NV (Netherlands) | |
1.050% | | | 08/16/2017 | | | | | | 12,250,000 | | | | 14,160,510 | |
| | | | | | | | | | | | | | |
| | | | | | | | | | | | | 16,102,976 | |
| | | | | | | | | | | | | | |
| Insurance—0.5% | |
Old Republic International Corp. | |
3.750% | | | 03/15/2018 | | | | | | 4,600,000 | | | | 5,744,250 | |
| | | | | | | | | | | | | | |
| Internet & Catalog Retail—1.6% | |
Ctrip.com International Ltd. (Cayman Islands) | |
1.250% | | | 10/15/2018 | | | ^ | | | 6,200,000 | | | | 6,145,750 | |
priceline.com, Inc. | |
1.000% | | | 03/15/2018 | | | | | | 3,960,000 | | | | 5,479,650 | |
0.350% | | | 06/15/2020 | | | ^ | | | 4,050,000 | | | | 4,634,719 | |
Shutterfly, Inc. | |
0.250% | | | 05/15/2018 | | | ^ | | | 870,000 | | | | 934,706 | |
| | | | | | | | | | | | | | |
| | | | | | | | | | | | | 17,194,825 | |
| | | | | | | | | | | | | | |
| Internet Software & Services—0.9% | |
Dealertrack Technologies, Inc. | |
1.500% | | | 03/15/2017 | | | | | | 1,020,000 | | | | 1,415,250 | |
SINA Corp. (Cayman Islands) | |
1.000% | | | 12/01/2018 | | | ^ | | | 1,600,000 | | | | 1,633,000 | |
WebMD Health Corp. | |
2.500% | | | 01/31/2018 | | | | | | 5,575,000 | | | | 5,505,312 | |
Yandex NV (Netherlands) | |
1.125% | | | 12/15/2018 | | | ^ | | | 1,050,000 | | | | 1,151,719 | |
| | | | | | | | | | | | | | |
| | | | | | | | | | | | | 9,705,281 | |
| | | | | | | | | | | | | | |
| IT Services—0.4% | |
Cap Gemini SA (France) | |
0.000% | | | 01/01/2019 | | | EUR | | | 3,740,000 | | | | 3,730,211 | |
Cardtronics, Inc. | |
1.000% | | | 12/01/2020 | | | ^ | | | 1,050,000 | | | | 1,049,349 | |
| | | | | | | | | | | | | | |
| | | | | | | | | | | | | 4,779,560 | |
| | | | | | | | | | | | | | |
See accompanying notes to financial statements
255
SCHEDULE OF INVESTMENTS—(Continued)
December 31, 2013
| | | | | | | | | | | | | | |
Vantagepoint Diversifying
Strategies Fund | | | | | | | | | |
| | | | |
Coupon
Rate | | Maturity
Date | | | | | Face | | | Value | |
| CONVERTIBLE DEBT OBLIGATIONS—(Continued) | |
| Life Sciences Tools & Services—0.8% | |
Illumina, Inc. | |
0.250% | | | 03/15/2016 | | | ^ | | $ | 5,950,000 | | | $ | 8,281,656 | |
| | | | | | | | | | | | | | |
| Machinery—1.8% | |
Greenbrier Cos., Inc. (The) | |
3.500% | | | 04/01/2018 | | | | | | 3,755,000 | | | | 4,459,063 | |
Meritor, Inc. | |
7.875% | | | 03/01/2026 | | | ^ | | | 2,650,000 | | | | 3,817,656 | |
Navistar International Corp. | |
3.000% | | | 10/15/2014 | | | | | | 5,310,000 | | | | 5,456,025 | |
Trinity Industries, Inc. | |
3.875% | | | 06/01/2036 | | | | | | 4,495,000 | | | | 5,941,828 | |
| | | | | | | | | | | | | | |
| | | | | | | | | | | | | 19,674,572 | |
| | | | | | | | | | | | | | |
| Media—1.6% | |
Liberty Interactive LLC | |
1.000% | | | 09/30/2043 | | | ^ | | | 5,990,000 | | | | 6,334,425 | |
0.750% | | | 03/30/2043 | | | ^ | | | 960,000 | | | | 1,201,200 | |
Live Nation Entertainment, Inc. | |
2.875% | | | 07/15/2027 | | | | | | 2,725,000 | | | | 2,776,094 | |
Omnicom Group, Inc. | |
0.000% | | | 07/31/2032 | | | | | | 5,025,000 | | | | 6,629,859 | |
XM Satellite Radio, Inc. | |
7.000% | | | 12/01/2014 | | | ^ | | | 145,000 | | | | 282,388 | |
| | | | | | | | | | | | | | |
| | | | | | | | | | | | | 17,223,966 | |
| | | | | | | | | | | | | | |
| Metals & Mining—2.0% | |
ArcelorMittal (Luxembourg) | |
5.000% | | | 05/15/2014 | | | | | | 2,595,000 | | | | 2,632,303 | |
Glencore Finance Europe SA (Luxembourg) | |
5.000% | | | 12/31/2014 | | | | | | 5,000,000 | | | | 5,612,500 | |
Goldcorp, Inc. (Canada) | |
2.000% | | | 08/01/2014 | | | | | | 4,220,000 | | | | 4,241,100 | |
Newmont Mining Corp., Series A | |
1.250% | | | 07/15/2014 | | | | | | 1,065,000 | | | | 1,066,997 | |
Royal Gold, Inc. | |
2.875% | | | 06/15/2019 | | | | | | 5,040,000 | | | | 4,869,900 | |
RTI International Metals, Inc. | |
3.000% | | | 12/01/2015 | | | | | | 1,700,000 | | | | 1,934,813 | |
Steel Dynamics, Inc. | |
5.125% | | | 06/15/2014 | | | | | | 1,725,000 | | | | 2,036,578 | |
| | | | | | | | | | | | | | |
| | | | | | | | | | | | | 22,394,191 | |
| | | | | | | | | | | | | | |
| Oil, Gas & Consumable Fuels—0.9% | |
Beach Energy Ltd. (Australia) | |
3.950% | | | 04/03/2017 | | | AUD | | | 3,500,000 | | | | 3,269,688 | |
Chesapeake Energy Corp. | |
2.500% | | | 05/15/2037 | | | | | | 6,125,000 | | | | 6,247,500 | |
| | | | | | | | | | | | | | |
| | | | | | | | | | | | | 9,517,188 | |
| | | | | | | | | | | | | | |
| Pharmaceuticals—0.9% | |
ALZA Corp. | |
0.000% | | | 07/28/2020 | | | | | | 1,853,000 | | | | 2,341,729 | |
Magyar Nemzeti Vagyonkezelo Zrt (Hungary) | |
3.375% | | | 04/02/2019 | | | EUR | | | 700,000 | | | | 999,319 | |
Salix Pharmaceuticals Ltd. | |
1.500% | | | 03/15/2019 | | | | | | 1,200,000 | | | | 1,794,750 | |
Teva Pharmaceutical Finance Co. LLC, Series C | |
0.250% | | | 02/01/2026 | | | | | | 4,020,000 | | | | 4,288,837 | |
| | | | | | | | | | | | | | |
| | | | | | | | | | | | | 9,424,635 | |
| | | | | | | | | | | | | | |
| | | | | | | | | | | | | | |
| | | | | |
Coupon
Rate | |
| Maturity
Date |
| | | | | Face | | | | Value | |
| Real Estate Investment Trusts (REITs)—2.5% | |
American Realty Capital Properties, Inc. | |
3.750% | | | 12/15/2020 | | | | | $ | 3,660,000 | | | $ | 3,714,918 | |
3.000% | | | 08/01/2018 | | | | | | 2,840,000 | | | | 2,841,775 | |
Boston Properties LP | |
3.625% | | | 02/15/2014 | | | ^ | | | 5,030,000 | | | | 5,053,495 | |
Extra Space Storage LP | |
2.375% | | | 07/01/2033 | | | ^ | | | 6,525,000 | | | | 6,553,547 | |
Health Care REIT, Inc. | |
3.000% | | | 12/01/2029 | | | | | | 3,940,000 | | | | 4,400,487 | |
ProLogis LP | |
3.250% | | | 03/15/2015 | | | | | | 4,625,000 | | | | 5,174,219 | |
| | | | | | | | | | | | | | |
| | | | | | | | | | | | | 27,738,441 | |
| | | | | | | | | | | | | | |
| Real Estate Management & Development—0.0% | |
Forest City Enterprises, Inc. | |
3.625% | | | 08/15/2020 | | | ^ | | | 100,000 | | | | 102,375 | |
| | | | | | | | | | | | | | |
| Semiconductors & Semiconductor Equipment—2.7% | |
Advanced Semiconductor Engineering, Inc. (Taiwan) | |
0.000% | | | 09/05/2018 | | | | | | 2,000,000 | | | | 2,124,500 | |
Disco Corp. (Japan) | |
0.000% | | | 12/16/2014 | | | JPY | | | 140,000,000 | | | | 1,632,846 | |
Lam Research Corp. | |
0.500% | | | 05/15/2016 | | | | | | 6,035,000 | | | | 6,902,531 | |
Linear Technology Corp., Series A | |
3.000% | | | 05/01/2027 | | | | | | 8,380,000 | | | | 9,574,150 | |
NVIDIA Corp. | |
1.000% | | | 12/01/2018 | | | ^ | | | 4,600,000 | | | | 4,732,250 | |
SK Hynix, Inc. (Korea, Republic of) | |
2.650% | | | 05/14/2015 | | | | | | 3,400,000 | | | | 4,199,000 | |
| | | | | | | | | | | | | | |
| | | | | | | | | | | �� | | 29,165,277 | |
| | | | | | | | | | | | | | |
| Software—3.0% | |
Electronic Arts, Inc. | |
0.750% | | | 07/15/2016 | | | | | | 6,090,000 | | | | 6,508,688 | |
Mentor Graphics Corp. | |
4.000% | | | 04/01/2031 | | | | | | 1,300,000 | | | | 1,734,687 | |
Nuance Communications, Inc. | |
2.750% | | | 11/01/2031 | | | | | | 4,650,000 | | | | 4,565,719 | |
Proofpoint, Inc. | |
1.250% | | | 12/15/2018 | | | ^ | | | 1,000,000 | | | | 1,083,125 | |
Rovi Corp. | |
2.625% | | | 02/15/2040 | | | | | | 2,000,000 | | | | 2,025,000 | |
Salesforce.com, Inc. | |
0.250% | | | 04/01/2018 | | | ^ | | | 7,250,000 | | | | 7,888,906 | |
ServiceNow, Inc. | |
0.000% | | | 11/01/2018 | | | ^ | | | 1,050,000 | | | | 1,067,719 | |
Take-Two Interactive Software, Inc. | |
1.000% | | | 07/01/2018 | | | | | | 950,000 | | | | 1,018,281 | |
TIBCO Software, Inc. | |
2.250% | | | 05/01/2032 | | | | | | 5,580,000 | | | | 5,618,363 | |
Workday, Inc. | |
1.500% | | | 07/15/2020 | | | ^ | | | 950,000 | | | | 1,150,687 | |
| | | | | | | | | | | | | | |
| | | | | | | | | | | | | 32,661,175 | |
| | | | | | | | | | | | | | |
| Specialty Retail—0.4% | |
Group 1 Automotive, Inc. | |
2.250% | | | 06/15/2036 | | | | | | 3,025,000 | | | | 3,836,078 | |
| | | | | | | | | | | | | | |
| Textiles, Apparel & Luxury Goods—0.5% | |
Iconix Brand Group, Inc. | |
2.500% | | | 06/01/2016 | | | | | | 3,880,000 | | | | 5,347,125 | |
| | | | | | | | | | | | | | |
See accompanying notes to financial statements
256
SCHEDULE OF INVESTMENTS—(Continued)
December 31, 2013
| | | | | | | | | | | | | | |
Vantagepoint Diversifying
Strategies Fund | | | | | | | | | |
| | | | |
Coupon
Rate | | Maturity
Date | | | | | Face | | | Value | |
| CONVERTIBLE DEBT OBLIGATIONS—(Continued) | |
| Trading Companies & Distributors—0.2% | |
Titan Machinery, Inc. | |
3.750% | | | 05/01/2019 | | | | | $ | 2,450,000 | | | $ | 2,094,750 | |
| | | | | | | | | | | | | | |
| Wireless Telecommunication Services—0.4% | |
Leap Wireless International, Inc. | |
4.500% | | | 07/15/2014 | | | | | | 4,655,000 | | | | 4,736,463 | |
| | | | | | | | | | | | | | |
| TOTAL CONVERTIBLE DEBT OBLIGATIONS | |
(Cost $373,902,396) | | | | 400,970,671 | |
| | | | | | | | | | | | | | |
| | | | | | | | | | | | | | | |
| U.S. TREASURY OBLIGATIONS—11.7% | |
| U.S. Treasury Bills—2.1% | |
U.S. Treasury Bill | |
0.075% | | | 06/26/2014 | | | | | | 7,640,000 | | | | 7,637,028 | |
0.066% | | | 03/27/2014 | | | | | | 1,850,000 | | | | 1,849,730 | |
0.062% | | | 03/20/2014 | | | | | | 10,700,000 | | | | 10,698,737 | |
0.042% | | | 01/23/2014 | | | | | | 2,000,000 | | | | 1,999,969 | |
0.023% | | | 01/30/2014 | | | | | | 1,000,000 | | | | 999,987 | |
| | | | | | | | | | | | | | |
| | | | | | | | | | | | | 23,185,451 | |
| | | | | | | | | | | | | | |
| U.S. Treasury Notes—9.6% | |
U.S. Treasury Note | |
0.625% | | | 07/15/2016- | | | | | | | | | | | |
| | | 10/15/2016 | | | | | | 15,689,000 | | | | 15,703,129 | |
0.500% | | | 06/15/2016 | | | | | | 14,585,000 | | | | 14,570,751 | |
0.375% | | | 03/15/2016 | | | ‡‡ | | | 2,510,000 | | | | 2,506,373 | |
0.375% | | | 11/15/2014- | | | | | | | | | | | |
| | | 02/15/2016 | | | | | | 17,250,000 | | | | 17,269,804 | |
0.250% | | | 04/30/2014- | | | | | | | | | | | |
| | | 05/15/2016 | | | | | | 55,075,000 | | | | 54,922,795 | |
| | | | | | | | | | | | | | |
| | | | | | | | | | | | | 104,972,852 | |
| | | | | | | | | | | | | | |
| TOTAL U.S. TREASURY OBLIGATIONS | |
(Cost $128,128,530) | | | | 128,158,303 | |
| | | | | | | | | | | | | | |
| | | | | | | | | | | | | | | |
| GOVERNMENT RELATED OBLIGATIONS—0.9% | |
| U.S. Government Agencies—0.3% | |
Federal National Mortgage Association | |
0.500% | | | 03/30/2016 | | | | | | 3,650,000 | | | | 3,648,109 | |
| | | | | | | | | | | | | | |
| Non-U.S. Government Agencies—0.1% | |
IPIC Ltd. MTN (Cayman Islands) | |
3.125% | | | 11/15/2015 | | | ^ | | | 600,000 | | | | 623,250 | |
Petrobras International Finance Co. (Cayman Islands) | |
2.875% | | | 02/06/2015 | | | § | | | 470,000 | | | | 478,226 | |
| | | | | | | | | | | | | | |
| | | | | | | | | | | | | 1,101,476 | |
| | | | | | | | | | | | | | |
| U.S. Municipal Bonds—0.5% | |
Florida Hurricane Catastrophe Fund Finance Corp. Revenue Bonds (Florida) | |
1.298% | | | 07/01/2016 | | | | | | 1,500,000 | | | | 1,505,400 | |
Jobsohio Beverage Systems Ohio Statewide Liquor Profits,
Series B (Ohio) | |
0.872% | | | 01/01/2015 | | | | | | 510,000 | | | | 510,770 | |
Massachusetts State Development Finance Agency () | |
5.500% | | | 05/01/2027 | | | | | | 1,000,000 | | | | 1,015,280 | |
| | | | | | | | | | | | | | |
| | | | | |
Coupon
Rate | |
| Maturity
Date |
| | | | | Face | | | | Value | |
South Carolina State Public Service Authority,
Series D (South Carolina) | |
1.044% | | | 06/01/2015 | | | # | | $ | 1,140,000 | | | $ | 1,143,557 | |
University of California Revenue Bonds, Series Y-1 (California) | |
0.749% | | | 07/01/2041 | | | # | | | 1,000,000 | | | | 1,000,180 | |
| | | | | | | | | | | | | | |
| | | | | | | | | | | | | 5,175,187 | |
| | | | | | | | | | | | | | |
| TOTAL GOVERNMENT RELATED OBLIGATIONS | |
(Cost $9,883,627) | | | | 9,924,772 | |
| | | | | | | | | | | | | | |
| | | | | | | | | | | | | | | |
| ASSET-BACKED SECURITIES—4.3% | |
| Automobiles—1.9% | |
Ally Auto Receivables Trust
Series 2012-SN1, Class A2 | |
0.510% | | | 12/22/2014 | | | | | | 236,267 | | | | 236,301 | |
Ally Master Owner Trust
Series 2013-1, Class A1 | |
0.617% | | | 02/15/2018 | | | # | | | 2,200,000 | | | | 2,198,827 | |
Ally Master Owner Trust
Series 2013-2, Class A | |
0.617% | | | 04/15/2018 | | | # | | | 1,900,000 | | | | 1,897,170 | |
AmeriCredit Automobile Receivables Trust
Series 2012-1, Class A2 | |
0.910% | | | 10/08/2015 | | | | | | 68,331 | | | | 68,336 | |
Capital Auto Receivables Asset Trust
Series 2013-1, Class A2 | |
0.620% | | | 07/20/2016 | | | | | | 1,800,000 | | | | 1,800,026 | |
Capital Auto Receivables Asset Trust
Series 2013-1, Class C | |
1.740% | | | 10/22/2018 | | | | | | 380,000 | | | | 375,537 | |
Capital Auto Receivables Asset Trust
Series 2013-1, Class B | |
1.290% | | | 04/20/2018 | | | | | | 370,000 | | | | 366,419 | |
Enterprise Fleet Financing LLC
Series 2012-1, Class A2 | |
1.140% | | | 11/20/2017 | | | ^ | | | 1,825,444 | | | | 1,829,470 | |
First Investors Auto Owner Trust
Series 2011-1, Class C | |
3.400% | | | 03/15/2016 | | | ^ | | | 821,188 | | | | 824,990 | |
Ford Credit Auto Lease Trust
Series 2013-B, Class A3 | |
0.760% | | | 09/15/2016 | | | | | | 410,000 | | | | 410,709 | |
Hertz Fleet Lease Funding LP
Series 2013-3, Class A | |
0.716% | | | 12/10/2027 | | | #^ | | | 820,000 | | | | 820,415 | |
Hyundai Auto Receivables Trust
Series 2012-A, Class A3 | |
0.720% | | | 03/15/2016 | | | | | | 1,478,938 | | | | 1,481,330 | |
Nissan Master Owner Trust Receivables
Series 2013-A, Class A | |
0.467% | | | 02/15/2018 | | | # | | | 5,450,000 | | | | 5,451,458 | |
Santander Drive Auto Receivables Trust
Series 2013-1, Class A2 | |
0.480% | | | 02/16/2016 | | | | | | 471,185 | | | | 471,190 | |
World Omni Automobile Lease Securitization Trust
Series 2013-A, Class A2A | |
0.730% | | | 05/16/2016 | | | | | | 750,000 | | | | 750,907 | |
World Omni Master Owner Trust
Series 2013-1, Class A | |
0.517% | | | 02/15/2018 | | | #^ | | | 1,575,000 | | | | 1,576,437 | |
| | | | | | | | | | | | | | |
| | | | | | | | | | | | | 20,559,522 | |
| | | | | | | | | | | | | | |
See accompanying notes to financial statements
257
SCHEDULE OF INVESTMENTS—(Continued)
December 31, 2013
| | | | | | | | | | | | | | |
Vantagepoint Diversifying
Strategies Fund | | | | | | | | | |
| | | | |
Coupon
Rate | | Maturity
Date | | | | | Face | | | Value | |
| ASSET-BACKED SECURITIES—(Continued) | |
| Credit Card—1.6% | |
Cards II Trust (Canada)
Series 2012-4A, Class A | |
0.617% | | | 09/15/2017 | | | #^ | | $ | 1,000,000 | | | $ | 1,001,614 | |
Chester Asset Receivables Dealings plc (United Kingdom)
Series 2004-1, Class A | |
0.714% | | | 04/15/2016 | | | # GBP | | | 1,040,000 | | | | 1,722,028 | |
Citibank Credit Card Issuance Trust
Series 2003-A7, Class A7 | |
4.150% | | | 07/07/2017 | | | | | | 2,700,000 | | | | 2,846,282 | |
Discover Card Execution Note Trust
Series 2012-A1, Class A1 | |
0.810% | | | 08/15/2017 | | | | | | 3,000,000 | | | | 3,011,131 | |
GE Capital Credit Card Master Note Trust
Series 2012-1, Class A | |
1.030% | | | 01/15/2018 | | | | | | 2,200,000 | | | | 2,206,707 | |
Golden Credit Card Trust (Canada)
Series 2012-3A, Class A | |
0.617% | | | 07/17/2017 | | | #^ | | | 1,900,000 | | | | 1,904,636 | |
Gracechurch Card Funding plc (United Kingdom)
Series 2012-1A, Class A1 | |
0.867% | | | 02/15/2017 | | | #^ | | | 3,950,000 | | | | 3,974,980 | |
Gracechurch Card Funding plc (United Kingdom)
Series 2012-1A, Class A2 | |
1.019% | | | 02/15/2017 | | | #^EUR | | | 1,200,000 | | | | 1,659,685 | |
| | | | | | | | | | | | | | |
| | | | | | | | | | | | | 18,327,063 | |
| | | | | | | | | | | | | | |
| Other—0.6% | |
CenterPoint Energy Transition Bond Co. IV LLC
Series 2012-1, Class A1 | |
0.901% | | | 04/15/2018 | | | | | | 1,863,897 | | | | 1,864,954 | |
GreatAmerica Leasing Receivables Funding LLC
Series 2013-1, Class A2 | |
0.610% | | | 05/15/2015 | | | ^ | | | 883,540 | | | | 883,622 | |
GreatAmerica Leasing Receivables Funding LLC
Series 2013-1, Class C | |
1.830% | | | 06/17/2019 | | | ^ | | | 270,000 | | | | 267,731 | |
Invitation Homes Trust
Series 2013-SFR1, Class A | |
1.314% | | | 12/17/2030 | | | #^ | | | 1,220,000 | | | | 1,222,837 | |
Trade MAPS 1 Ltd. (Ireland)
Series 2013-1A, Class A | |
0.870% | | | 12/10/2018 | | | #^ | | | 2,300,000 | | | | 2,304,232 | |
| | | | | | | | | | | | | | |
| | | | | | | | | | | | | 6,543,376 | |
| | | | | | | | | | | | | | |
| Student Loan—0.2% | |
National Credit Union Administration Guaranteed Notes
Series 2010-A1, Class A | |
0.521% | | | 12/07/2020 | | | #§ | | | 1,928,310 | | | | 1,930,354 | |
| | | | | | | | | | | | | | |
| TOTAL ASSET-BACKED SECURITIES | |
(Cost $47,181,927) | | | | 47,360,315 | |
| | | | | | | | | | | | | | |
| | | | | | | | | | | | | | |
| | | | | |
| | | | | | | | | | Contracts | | | | Value | |
| PURCHASED OPTIONS—0.0% | |
Put—Swiss Market Index, Expires 03/21/2014, Strike CHF 7,800.00 | | | 910 | | | $ | 89,404 | |
Call—U.S. 10 Year Treasury Note, Expires 02/21/2014, Strike $105.00 | | | 2 | | | | 36,094 | |
| | | | | | | | | | | | | | |
| TOTAL PURCHASED OPTIONS | |
(Cost $219,506) | | | | | | | | | | 125,498 | |
| | | | | | | | | | | | | | |
| | | | | | | | | | | | | | | |
| | | | |
Coupon
Rate | |
| Maturity
Date |
| | | | | Face | | | | Value | |
| COMMERCIAL PAPER—0.1% | |
Biotechnology—0.1% | | | | | | | | | | | | | | |
Celgene Corp. | |
0.280% | | | 02/19/2014 | | | ^ | | | | | | | | |
(Cost $1,599,390) | | | | | $ | 1,600,000 | | | | 1,599,397 | |
| | | | | | | | | | | | | | |
| | | | | | | | | | | | | | | |
| | | | |
| | | | | | | | | | Shares | | | | Value | |
| MONEY MARKET FUNDS—4.1% | |
| Institutional Money Market Fund—4.1% | |
Fidelity Institutional Money Market: Money Market Portfolio—Institutional Class, 0.07%
(Cost $44,385,873) | | | ¥ | | | 44,385,873 | | | | 44,385,873 | |
| | | | | | | | | | | | | | |
| TOTAL INVESTMENTS—100.4% | |
(Cost $1,061,217,025) | | | | | | | | | | 1,098,044,662 | |
Other assets less liabilities—(0.4%) | | | | (4,455,290 | ) |
| | | | | | | | | | | | | | |
| NET ASSETS—100.0% | | | $ | 1,093,589,372 | |
| | | | | |
Notes to the Schedule of Investments:
| | |
| ADR | | American Depositary Receipt |
| AUD | | Australian Dollar |
| CHF | | Swiss Franc |
| EUR | | European Monetary Unit |
| GBP | | British Pound Sterling |
| JPY | | Japanese Yen |
| MTN | | Medium Term Note |
| REIT | | Real Estate Investment Trust |
| SGD | | Singapore Dollar |
| * | | Non-income producing. |
| ^ | | Securities are not registered under the Securities Act of 1933. These securities may be resold only in transactions exempt from registration, generally to qualified institutional buyers under Securities Act Rule 144A. Such securities are considered illiquid unless deemed liquid by a subadviser under the liquidity procedures adopted by the Board of Directors. The total market value of 144A securities was $202,298,361, which represents 18.5% of Net Assets. The illiquid 144A securities represented 1.0% of Net Assets, and 5.2% of total 144A securities held. |
| # | | Rate is subject to change. Rate shown reflects current rate. |
| § | | Security has been segregated to cover economic leverage under certain derivatives contracts which may include, but are not limited to, futures, swaps, forwards, options and TBA’s, a security that is subject to delayed delivery. |
| ‡‡ | | Security or a portion of the security has been pledged as collateral for futures contracts and/or options contracts. |
| ¥ | | The rate quoted is the annualized seven-day yield of the fund at period end. |
See accompanying notes to financial statements
258
SCHEDULE OF INVESTMENTS
December 31, 2013
| | | | | | | | | | | | | | |
Vantagepoint Core
Bond Index Fund | | | | | | |
| | | | |
Coupon
Rate | | Maturity
Date | | | | | Face | | | Value | |
| CORPORATE OBLIGATIONS—22.7% | | | | | |
| Aerospace & Defense—0.4% | | | | | |
Boeing Co. (The) | | | | | |
6.125% | | | 02/15/2033 | | | | | $ | 100,000 | | | $ | 118,966 | |
4.875% | | | 02/15/2020 | | | | | | 200,000 | | | | 223,285 | |
Honeywell International, Inc. | | | | | |
5.700% | | | 03/15/2036 | | | | | | 300,000 | | | | 339,265 | |
3.350% | | | 12/01/2023 | | | | | | 300,000 | | | | 294,256 | |
L-3 Communications Corp. | | | | | |
4.950% | | | 02/15/2021 | | | | | | 300,000 | | | | 314,254 | |
Lockheed Martin Corp. | | | | | |
4.070% | | | 12/15/2042 | | | | | | 285,000 | | | | 250,209 | |
Northrop Grumman Corp. | | | | | |
3.500% | | | 03/15/2021 | | | | | | 300,000 | | | | 298,651 | |
Precision Castparts Corp. | | | | | |
2.500% | | | 01/15/2023 | | | | | | 200,000 | | | | 181,557 | |
0.700% | | | 12/20/2015 | | | | | | 300,000 | | | | 300,182 | |
Raytheon Co. | | | | | |
6.750% | | | 03/15/2018 | | | | | | 1,150,000 | | | | 1,362,779 | |
United Technologies Corp. | | | | | |
6.700% | | | 08/01/2028 | | | | | | 150,000 | | | | 183,891 | |
4.875% | | | 05/01/2015 | | | | | | 500,000 | | | | 528,574 | |
4.500% | | | 06/01/2042 | | | | | | 200,000 | | | | 194,984 | |
3.100% | | | 06/01/2022 | | | | | | 200,000 | | | | 195,915 | |
1.800% | | | 06/01/2017 | | | | | | 300,000 | | | | 304,876 | |
| | | | | | | | | | | | | | |
| | | | | | | | | | | | | 5,091,644 | |
| | | | | | | | | | | | | | |
| Air Freight & Logistics—0.1% | | | | | |
FedEx Corp. | | | | | |
3.875% | | | 08/01/2042 | | | | | | 200,000 | | | | 164,914 | |
2.625% | | | 08/01/2022 | | | | | | 200,000 | | | | 181,136 | |
United Parcel Service, Inc. | | | | | |
6.200% | | | 01/15/2038 | | | | | | 300,000 | | | | 365,877 | |
2.450% | | | 10/01/2022 | | | | | | 400,000 | | | | 368,278 | |
| | | | | | | | | | | | | | |
| | | | | | | | | | | | | 1,080,205 | |
| | | | | | | | | | | | | | |
| Airlines—0.0% | | | | | |
American Airlines, Inc., Series 2011-1 A | | | | | |
5.250% | | | 01/31/2021 | | | | | | 256,903 | | | | 271,675 | |
Continental Airlines, Inc., Series 2010-1 A | | | | | |
4.750% | | | 01/12/2021 | | | † | | | 267,628 | | | | 284,356 | |
| | | | | | | | | | | | | | |
| | | | | | | | | | | | | 556,031 | |
| | | | | | | | | | | | | | |
| Auto Components—0.0% | | | | | |
Johnson Controls, Inc. | | | | | |
5.500% | | | 01/15/2016 | | | | | | 250,000 | | | | 271,690 | |
4.250% | | | 03/01/2021 | | | | | | 300,000 | | | | 312,186 | |
| | | | | | | | | | | | | | |
| | | | | | | | | | | | | 583,876 | |
| | | | | | | | | | | | | | |
| Automobiles—0.0% | | | | | |
Ford Motor Co. | | | | | |
7.450% | | | 07/16/2031 | | | | | | 200,000 | | | | 245,579 | |
4.750% | | | 01/15/2043 | | | | | | 200,000 | | | | 181,050 | |
| | | | | | | | | | | | | | |
| | | | | | | | | | | | | 426,629 | |
| | | | | | | | | | | | | | |
| Beverages—0.7% | | | | | |
Anheuser-Busch InBev Finance, Inc. | | | | | |
2.625% | | | 01/17/2023 | | | | | | 200,000 | | | | 184,033 | |
0.800% | | | 01/15/2016 | | | | | | 200,000 | | | | 199,961 | |
Anheuser-Busch InBev Worldwide, Inc. | | | | | |
8.200% | | | 01/15/2039 | | | | | | 300,000 | | | | 440,189 | |
| | | | | | | | | | | | | | |
| | | | | |
Coupon
Rate | |
| Maturity
Date |
| | | | | Face | | | | Value | |
7.750% | | | 01/15/2019 | | | | | $ | 500,000 | | | $ | 625,002 | |
6.875% | | | 11/15/2019 | | | | | | 300,000 | | | | 368,233 | |
5.375% | | | 01/15/2020 | | | | | | 500,000 | | | | 574,579 | |
3.750% | | | 07/15/2042 | | | | | | 200,000 | | | | 170,314 | |
0.800% | | | 07/15/2015 | | | | | | 500,000 | | | | 502,680 | |
Beam, Inc. | | | | | |
5.375% | | | 01/15/2016 | | | | | | 90,000 | | | | 97,450 | |
Bottling Group LLC | | | | | |
5.500% | | | 04/01/2016 | | | | | | 500,000 | | | | 551,107 | |
Coca-Cola Co. (The) | | | | | |
5.350% | | | 11/15/2017 | | | | | | 500,000 | | | | 569,797 | |
4.875% | | | 03/15/2019 | | | | | | 300,000 | | | | 336,691 | |
3.150% | | | 11/15/2020 | | | | | | 200,000 | | | | 203,204 | |
0.750% | | | 03/13/2015 | | | | | | 300,000 | | | | 301,039 | |
Coca-Cola Enterprises, Inc. | | | | | |
4.500% | | | 09/01/2021 | | | | | | 300,000 | | | | 312,196 | |
Coca-Cola Femsa SAB de CV (Mexico) | | | | | |
2.375% | | | 11/26/2018 | | | | | | 350,000 | | | | 348,289 | |
Diageo Capital plc (United Kingdom) | | | | | |
1.125% | | | 04/29/2018 | | | | | | 750,000 | | | | 723,826 | |
Diageo Finance BV (Netherlands) | | | | | |
5.300% | | | 10/28/2015 | | | | | | 750,000 | | | | 812,273 | |
Dr Pepper Snapple Group, Inc. | | | | | |
2.600% | | | 01/15/2019 | | | | | | 300,000 | | | | 301,960 | |
PepsiCo, Inc. | | | | | |
5.000% | | | 06/01/2018 | | | | | | 400,000 | | | | 449,138 | |
3.000% | | | 08/25/2021 | | | | | | 500,000 | | | | 493,897 | |
2.750% | | | 03/01/2023 | | | | | | 400,000 | | | | 370,963 | |
| | | | | | | | | | | | | | |
| | | | | | | | | | | | | 8,936,821 | |
| | | | | | | | | | | | | | |
| Biotechnology—0.2% | | | | | |
Amgen, Inc. | | | | | |
6.900% | | | 06/01/2038 | | | | | | 267,000 | | | | 324,274 | |
6.150% | | | 06/01/2018 | | | | | | 500,000 | | | | 584,391 | |
5.850% | | | 06/01/2017 | | | | | | 250,000 | | | | 283,872 | |
5.150% | | | 11/15/2041 | | | | | | 300,000 | | | | 299,986 | |
3.875% | | | 11/15/2021 | | | | | | 300,000 | | | | 308,664 | |
Genentech, Inc. | | | | | |
5.250% | | | 07/15/2035 | | | | | | 100,000 | | | | 105,722 | |
Gilead Sciences, Inc. | | | | | |
4.400% | | | 12/01/2021 | | | | | | 300,000 | | | | 320,907 | |
| | | | | | | | | | | | | | |
| | | | | | | | | | | | | 2,227,816 | |
| | | | | | | | | | | | | | |
| Capital Markets—1.5% | | | | | |
Bank of New York Mellon Corp. (The) | | | | | |
3.550% | | | 09/23/2021 | | | | | | 300,000 | | | | 307,454 | |
Bank of New York Mellon Corp. (The) MTN | | | | | |
2.300% | | | 07/28/2016 | | | | | | 100,000 | | | | 103,342 | |
Bank of New York Mellon Corp. (The), Series 1 | |
2.950% | | | 06/18/2015 | | | † | | | 500,000 | | | | 517,786 | |
BlackRock, Inc. | | | | | |
4.250% | | | 05/24/2021 | | | | | | 500,000 | | | | 529,881 | |
3.375% | | | 06/01/2022 | | | | | | 500,000 | | | | 495,442 | |
Credit Suisse (Switzerland) | | | | | |
5.400% | | | 01/14/2020 | | | | | | 200,000 | | | | 222,555 | |
Credit Suisse USA, Inc. | | | | | |
5.125% | | | 08/15/2015 | | | | | | 500,000 | | | | 536,016 | |
Deutsche Bank AG (Germany) | | | | | |
6.000% | | | 09/01/2017 | | | | | | 650,000 | | | | 743,031 | |
Deutsche Bank Financial LLC MTN | | | | | |
5.375% | | | 03/02/2015 | | | | | | 250,000 | | | | 261,760 | |
Goldman Sachs Group, Inc. (The) | | | | | |
6.250% | | | 09/01/2017 | | | | | | 500,000 | | | | 572,906 | |
6.250% | | | 02/01/2041 | | | | | | 500,000 | | | | 578,211 | |
See accompanying notes to financial statements
259
SCHEDULE OF INVESTMENTS—(Continued)
December 31, 2013
| | | | | | | | | | | | | | |
Vantagepoint Core
Bond Index Fund | | | | | | |
| | | | |
Coupon
Rate | | Maturity
Date | | | | | Face | | | Value | |
| CORPORATE OBLIGATIONS—(Continued) | |
6.150% | | | 04/01/2018 | | | | | $ | 500,000 | | | $ | 573,882 | |
6.125% | | | 02/15/2033 | | | | | | 600,000 | | | | 676,878 | |
5.950% | | | 01/15/2027 | | | | | | 300,000 | | | | 319,321 | |
5.750% | | | 01/24/2022 | | | | | | 300,000 | | | | 338,259 | |
5.250% | | | 07/27/2021 | | | | | | 300,000 | | | | 328,969 | |
5.125% | | | 01/15/2015 | | | | | | 500,000 | | | | 522,426 | |
3.625% | | | 02/07/2016 | | | | | | 500,000 | | | | 525,006 | |
Goldman Sachs Group, Inc. (The) MTN | | | | | |
7.500% | | | 02/15/2019 | | | | | | 300,000 | | | | 365,790 | |
5.375% | | | 03/15/2020 | | | | | | 300,000 | | | | 334,083 | |
1.600% | | | 11/23/2015 | | | | | | 300,000 | | | | 303,365 | |
Jefferies Group LLC | | | | | |
6.250% | | | 01/15/2036 | | | | | | 230,000 | | | | 223,100 | |
5.125% | | | 04/13/2018 | | | | | | 300,000 | | | | 325,629 | |
Lazard Group LLC | | | | | |
4.250% | | | 11/14/2020 | | | | | | 400,000 | | | | 399,721 | |
Merrill Lynch & Co., Inc. | | | | | |
6.875% | | | 11/15/2018 | | | | | | 250,000 | | | | 297,528 | |
6.110% | | | 01/29/2037 | | | | | | 300,000 | | | | 324,571 | |
6.050% | | | 05/16/2016 | | | | | | 890,000 | | | | 979,746 | |
Merrill Lynch & Co., Inc. MTN | | | | | |
6.875% | | | 04/25/2018 | | | | | | 500,000 | | | | 591,747 | |
Morgan Stanley | | | | | |
7.250% | | | 04/01/2032 | | | | | | 100,000 | | | | 124,096 | |
5.750% | | | 01/25/2021 | | | | | | 600,000 | | | | 679,757 | |
4.750% | | | 03/22/2017 | | | | | | 300,000 | | | | 327,642 | |
3.750% | | | 02/25/2023 | | | | | | 300,000 | | | | 292,478 | |
1.750% | | | 02/25/2016 | | | | | | 300,000 | | | | 304,187 | |
Morgan Stanley MTN | | | | | |
5.450% | | | 01/09/2017 | | | | | | 500,000 | | | | 554,890 | |
Morgan Stanley, Series F MTN | | | | | |
6.625% | | | 04/01/2018 | | | | | | 500,000 | | | | 585,599 | |
6.000% | | | 04/28/2015 | | | | | | 1,000,000 | | | | 1,065,376 | |
5.950% | | | 12/28/2017 | | | | | | 500,000 | | | | 571,773 | |
Nomura Holdings, Inc. (Japan) | | | | | |
6.700% | | | 03/04/2020 | | | | | | 300,000 | | | | 344,446 | |
Northern Trust Corp. | | | | | |
3.375% | | | 08/23/2021 | | | | | | 500,000 | | | | 508,227 | |
State Street Corp. | | | | | |
3.700% | | | 11/20/2023 | | | | | | 400,000 | | | | 397,670 | |
3.100% | | | 05/15/2023 | | | | | | 200,000 | | | | 186,333 | |
UBS AG (Switzerland) | | | | | |
7.000% | | | 10/15/2015 | | | | | | 100,000 | | | | 110,410 | |
UBS AG MTN (Switzerland) | | | | | |
7.375% | | | 06/15/2017 | | | | | | 100,000 | | | | 113,844 | |
UBS Preferred Funding Trust V, Perpetual Bond | |
6.243% | | | 05/29/2049 | | | # | | | 300,000 | | | | 321,000 | |
| | | | | | | | | | | | | | |
| | | | | | | | | | | | | 18,786,133 | |
| | | | | | | | | | | | | | |
| Chemicals—0.5% | | | | | |
Agrium, Inc. (Canada) | | | | | |
6.125% | | | 01/15/2041 | | | | | | 400,000 | | | | 432,004 | |
Airgas, Inc. | | | | | |
2.950% | | | 06/15/2016 | | | | | | 200,000 | | | | 207,393 | |
2.375% | | | 02/15/2020 | | | | | | 300,000 | | | | 283,762 | |
CF Industries, Inc. | | | | | |
3.450% | | | 06/01/2023 | | | | | | 400,000 | | | | 366,010 | |
Dow Chemical Co. (The) | | | | | |
8.550% | | | 05/15/2019 | | | | | | 629,000 | | | | 813,073 | |
| | | | | | | | | | | | | | |
| | | | | |
Coupon
Rate | |
| Maturity
Date |
| | | | | Face | | | | Value | |
5.250% | | | 11/15/2041 | | | | | $ | 300,000 | | | $ | 299,985 | |
4.125% | | | 11/15/2021 | | | | | | 150,000 | | | | 155,198 | |
E.I. du Pont de Nemours & Co. | | | | | |
4.900% | | | 01/15/2041 | | | | | | 200,000 | | | | 197,930 | |
4.250% | | | 04/01/2021 | | | | | | 300,000 | | | | 317,806 | |
2.800% | | | 02/15/2023 | | | | | | 300,000 | | | | 275,296 | |
2.750% | | | 04/01/2016 | | | | | | 300,000 | | | | 312,852 | |
Ecolab, Inc. | | | | | |
5.500% | | | 12/08/2041 | | | | | | 300,000 | | | | 322,441 | |
LyondellBasell Industries NV (Netherlands) | | | | | |
5.000% | | | 04/15/2019 | | | | | | 500,000 | | | | 555,961 | |
Monsanto Co. | | | | | |
5.500% | | | 08/15/2025 | | | | | | 200,000 | | | | 226,043 | |
Mosaic Co. (The) | | | | | |
5.625% | | | 11/15/2043 | | | | | | 400,000 | | | | 407,268 | |
PPG Industries, Inc. | | | | | |
3.600% | | | 11/15/2020 | | | | | | 400,000 | | | | 406,550 | |
Praxair, Inc. | | | | | |
3.250% | | | 09/15/2015 | | | | | | 500,000 | | | | 522,558 | |
2.200% | | | 08/15/2022 | | | | | | 400,000 | | | | 356,596 | |
| | | | | | | | | | | | | | |
| | | | | | | | | | | | | 6,458,726 | |
| | | | | | | | | | | | | | |
| Commercial Banks—1.8% | | | | | |
Bank of Montreal MTN (Canada) | | | | | |
2.500% | | | 01/11/2017 | | | | | | 400,000 | | | | 412,336 | |
Bank of Nova Scotia (Canada) | | | | | |
3.400% | | | 01/22/2015 | | | | | | 500,000 | | | | 515,963 | |
2.050% | | | 10/07/2015 | | | | | | 400,000 | | | | 410,509 | |
1.450% | | | 04/25/2018 | | | | | | 300,000 | | | | 291,865 | |
Barclays Bank plc (United Kingdom) | | | | | |
5.125% | | | 01/08/2020 | | | | | | 500,000 | | | | 555,139 | |
3.900% | | | 04/07/2015 | | | | | | 700,000 | | | | 728,803 | |
2.750% | | | 02/23/2015 | | | | | | 300,000 | | | | 306,863 | |
BB&T Corp. | | | | | |
5.250% | | | 11/01/2019 | | | | | | 500,000 | | | | 561,109 | |
5.200% | | | 12/23/2015 | | | | | | 300,000 | | | | 324,306 | |
BB&T Corp. MTN | | | | | |
1.600% | | | 08/15/2017 | | | | | | 400,000 | | | | 396,776 | |
BBVA US Senior SAU (Spain) | | | | | |
4.664% | | | 10/09/2015 | | | | | | 400,000 | | | | 420,690 | |
BNP Paribas SA MTN (France) | | | | | |
2.400% | | | 12/12/2018 | | | | | | 600,000 | | | | 601,078 | |
BNP Paribas SA, Bank Note (France) | | | | | |
5.000% | | | 01/15/2021 | | | | | | 400,000 | | | | 439,450 | |
BNP Paribas SA, Series 0212 (France) | | | | | |
3.250% | | | 03/11/2015 | | | | | | 500,000 | | | | 515,433 | |
Capital One Bank USA NA | | | | | |
8.800% | | | 07/15/2019 | | | | | | 500,000 | | | | 636,261 | |
Commonwealth Bank of Australia (Australia) | | | | | |
1.250% | | | 09/18/2015 | | | | | | 300,000 | | | | 303,421 | |
Discover Bank | | | | | |
7.000% | | | 04/15/2020 | | | | | | 200,000 | | | | 232,899 | |
HSBC Bank USA NA | | | | | |
4.875% | | | 08/24/2020 | | | | | | 400,000 | | | | 432,308 | |
HSBC Finance Capital Trust IX | | | | | |
5.911% | | | 11/30/2035 | | | # | | | 500,000 | | | | 517,500 | |
HSBC Holdings plc (United Kingdom) | | | | | |
6.100% | | | 01/14/2042 | | | | | | 500,000 | | | | 597,839 | |
4.000% | | | 03/30/2022 | | | | | | 500,000 | | | | 514,824 | |
Intesa Sanpaolo SpA (Italy) | | | | | |
3.875% | | | 01/15/2019 | | | | | | 400,000 | | | | 398,137 | |
3.125% | | | 01/15/2016 | | | | | | 300,000 | | | | 305,869 | |
KeyCorp MTN | | | | | |
5.100% | | | 03/24/2021 | | | | | | 500,000 | | | | 547,288 | |
See accompanying notes to financial statements
260
SCHEDULE OF INVESTMENTS—(Continued)
December 31, 2013
| | | | | | | | | | | | | | |
Vantagepoint Core
Bond Index Fund | | | | | | |
| | | | |
Coupon
Rate | | Maturity
Date | | | | | Face | | | Value | |
| CORPORATE OBLIGATIONS—(Continued) | |
LBBW (Germany) | | | | | |
7.625% | | | 02/01/2023 | | | | | $ | 200,000 | | | $ | 240,490 | |
National Australia Bank Ltd. (Australia) | | | | | |
1.600% | | | 08/07/2015 | | | | | | 500,000 | | | | 508,171 | |
National City Corp. | | | | | |
6.875% | | | 05/15/2019 | | | | | | 500,000 | | | | 593,147 | |
PNC Bank NA, Bank Note | | | | | |
1.300% | | | 10/03/2016 | | | | | | 250,000 | | | | 251,509 | |
1.150% | | | 11/01/2016 | | | | | | 500,000 | | | | 500,950 | |
PNC Funding Corp. | | | | | |
2.700% | | | 09/19/2016 | | | | | | 400,000 | | | | 417,490 | |
Royal Bank of Canada MTN (Canada) | | | | | |
2.875% | | | 04/19/2016 | | | | | | 300,000 | | | | 312,868 | |
2.625% | | | 12/15/2015 | | | | | | 300,000 | | | | 311,172 | |
Royal Bank of Scotland plc (The) (United Kingdom) | |
6.125% | | | 01/11/2021 | | | | | | 300,000 | | | | 340,050 | |
4.375% | | | 03/16/2016 | | | † | | | 500,000 | | | | 533,877 | |
Sumitomo Mitsui Banking Corp. (Japan) | | | | | |
3.200% | | | 07/18/2022 | | | | | | 200,000 | | | | 190,460 | |
1.350% | | | 07/18/2015 | | | | | | 300,000 | | | | 302,528 | |
SunTrust Banks, Inc. | | | | | |
3.600% | | | 04/15/2016 | | | | | | 500,000 | | | | 526,947 | |
U.S. Bank NA, Bank Note | | | | | |
4.800% | | | 04/15/2015 | | | | | | 250,000 | | | | 263,041 | |
UBS AG MTN (Switzerland) | | | | | |
5.875% | | | 07/15/2016 | | | | | | 700,000 | | | | 778,817 | |
Union Bank NA | | | | | |
2.625% | | | 09/26/2018 | | | | | | 500,000 | | | | 509,531 | |
US Bancorp MTN | | | | | |
2.950% | | | 07/15/2022 | | | | | | 200,000 | | | | 186,170 | |
1.650% | | | 05/15/2017 | | | | | | 500,000 | | | | 501,451 | |
Wachovia Bank NA, Bank Note | | | | | |
6.600% | | | 01/15/2038 | | | | | | 300,000 | | | | 374,525 | |
Wells Fargo & Co. | �� | | | | |
4.480% | | | 01/16/2024 | | | ^ | | | 784,000 | | | | 781,991 | |
3.676% | | | 06/15/2016 | | | | | | 400,000 | | | | 426,149 | |
3.625% | | | 04/15/2015 | | | | | | 300,000 | | | | 312,139 | |
1.500% | | | 01/16/2018 | | | | | | 500,000 | | | | 497,254 | |
1.250% | | | 07/20/2016 | | | | | | 560,000 | | | | 564,507 | |
Wells Fargo & Co. MTN | | | | | |
4.600% | | | 04/01/2021 | | | | | | 500,000 | | | | 548,964 | |
3.500% | | | 03/08/2022 | | | | | | 300,000 | | | | 300,610 | |
2.100% | | | 05/08/2017 | | | | | | 300,000 | | | | 305,841 | |
Wells Fargo & Co., Series M | | | | | |
3.450% | | | 02/13/2023 | | | | | | 300,000 | | | | 284,177 | |
Wells Fargo Bank NA | | | | | |
5.950% | | | 08/26/2036 | | | | | | 100,000 | | | | 114,115 | |
Westpac Banking Corp. (Australia) | | | | | |
4.200% | | | 02/27/2015 | | | | | | 400,000 | | | | 417,143 | |
3.000% | | | 08/04/2015 | | | | | | 400,000 | | | | 415,720 | |
| | | | | | | | | | | | | | |
| | | | | | | | | | | | | 23,578,470 | |
| | | | | | | | | | | | | | |
| Commercial Services & Supplies—0.1% | | | | | |
Republic Services, Inc. | | | | | |
5.700% | | | 05/15/2041 | | | | | | 200,000 | | | | 214,807 | |
5.500% | | | 09/15/2019 | | | | | | 300,000 | | | | 337,989 | |
Waste Management, Inc. | | | | | |
7.000% | | | 07/15/2028 | | | | | | 50,000 | | | | 60,644 | |
6.375% | | | 03/11/2015 | | | | | | 400,000 | | | | 426,136 | |
| | | | | | | | | | | | | | |
| | | | | | | | | | | | | 1,039,576 | |
| | | | | | | | | | | | | | |
| | | | | | | | | | | | | | |
| | | | | |
Coupon
Rate | |
| Maturity
Date |
| | | | | Face | | | | Value | |
| Communications Equipment—0.2% | | | | | |
Cisco Systems, Inc. | | | | | |
5.500% | | | 02/22/2016 | | | | | $ | 500,000 | | | $ | 550,348 | |
4.950% | | | 02/15/2019 | | | | | | 500,000 | | | | 563,059 | |
Harris Corp. | | | | | |
6.150% | | | 12/15/2040 | | | | | | 250,000 | | | | 267,914 | |
Juniper Networks, Inc. | | | | | |
3.100% | | | 03/15/2016 | | | | | | 400,000 | | | | 412,128 | |
Motorola Solutions, Inc. | | | | | |
7.500% | | | 05/15/2025 | | | | | | 340,000 | | | | 404,163 | |
| | | | | | | | | | | | | | |
| | | | | | | | | | | | | 2,197,612 | |
| | | | | | | | | | | | | | |
| Computers & Peripherals—0.2% | | | | | |
Apple, Inc. | | | | | |
3.850% | | | 05/04/2043 | | | | | | 300,000 | | | | 251,650 | |
2.400% | | | 05/03/2023 | | | | | | 300,000 | | | | 270,317 | |
1.000% | | | 05/03/2018 | | | | | | 200,000 | | | | 193,593 | |
0.450% | | | 05/03/2016 | | | | | | 200,000 | | | | 198,663 | |
Hewlett-Packard Co. | | | | | |
4.650% | | | 12/09/2021 | | | † | | | 300,000 | | | | 309,414 | |
3.300% | | | 12/09/2016 | | | | | | 300,000 | | | | 314,208 | |
2.200% | | | 12/01/2015 | | | | | | 250,000 | | | | 255,622 | |
2.125% | | | 09/13/2015 | | | | | | 500,000 | | | | 509,349 | |
Seagate HDD Cayman (Cayman Islands) | | | | | |
4.750% | | | 06/01/2023 | | | ^ | | | 400,000 | | | | 376,000 | |
Seagate Technology HDD Holdings (Cayman Islands) | |
6.800% | | | 10/01/2016 | | | | | | 75,000 | | | | 85,125 | |
| | | | | | | | | | | | | | |
| | | | | | | | | | | | | 2,763,941 | |
| | | | | | | | | | | | | | |
| Construction Materials—0.0% | | | | | |
CRH America, Inc. | | | | | |
6.000% | | | 09/30/2016 | | | | | | 250,000 | | | | 279,459 | |
| | | | | | | | | | | | | | |
| Consumer Finance—0.7% | | | | | |
American Express Centurion Bank | | | | | |
0.875% | | | 11/13/2015 | | | | | | 400,000 | | | | 401,078 | |
American Express Co. | | | | | |
4.050% | | | 12/03/2042 | | | | | | 472,000 | | | | 416,953 | |
American Express Credit Corp. MTN | | | | | |
2.800% | | | 09/19/2016 | | | | | | 400,000 | | | | 418,226 | |
2.750% | | | 09/15/2015 | | | | | | 400,000 | | | | 414,115 | |
American Honda Finance Corp. | | | | | |
2.125% | | | 10/10/2018 | | | | | | 500,000 | | | | 498,503 | |
Capital One Financial Corp. | | | | | |
6.150% | | | 09/01/2016 | | | | | | 200,000 | | | | 223,836 | |
Caterpillar Financial Services Corp. MTN | | | | | |
2.850% | | | 06/01/2022 | | | | | | 300,000 | | | | 285,877 | |
2.750% | | | 06/24/2015 | | | | | | 200,000 | | | | 206,368 | |
2.650% | | | 04/01/2016 | | | | | | 400,000 | | | | 414,976 | |
1.625% | | | 06/01/2017 | | | | | | 300,000 | | | | 302,128 | |
Ford Motor Credit Co. LLC | | | | | |
5.875% | | | 08/02/2021 | | | | | | 500,000 | | | | 567,735 | |
5.000% | | | 05/15/2018 | | | | | | 200,000 | | | | 223,002 | |
4.250% | | | 02/03/2017 | | | | | | 200,000 | | | | 215,310 | |
4.250% | | | 09/20/2022 | | | | | | 200,000 | | | | 201,283 | |
3.984% | | | 06/15/2016 | | | | | | 300,000 | | | | 319,207 | |
3.000% | | | 06/12/2017 | | | | | | 300,000 | | | | 312,050 | |
2.750% | | | 05/15/2015 | | | | | | 500,000 | | | | 513,094 | |
HSBC USA, Inc. | | | | | |
2.375% | | | 02/13/2015 | | | | | | 400,000 | | | | 408,259 | |
John Deere Capital Corp. | | | | | |
1.200% | | | 10/10/2017 | | | | | | 300,000 | | | | 292,810 | |
1.050% | | | 10/11/2016 | | | | | | 750,000 | | | | 752,671 | |
See accompanying notes to financial statements
261
SCHEDULE OF INVESTMENTS—(Continued)
December 31, 2013
| | | | | | | | | | | | | | |
Vantagepoint Core
Bond Index Fund | | | | | | |
| | | | |
Coupon
Rate | | Maturity
Date | | | | | Face | | | Value | |
| CORPORATE OBLIGATIONS—(Continued) | |
John Deere Capital Corp. MTN | | | | | |
3.900% | | | 07/12/2021 | | | | | $ | 300,000 | | | $ | 311,282 | |
2.250% | | | 06/07/2016 | | | | | | 200,000 | | | | 206,569 | |
Toyota Motor Credit Corp. | | | | | |
0.875% | | | 07/17/2015 | | | | | | 500,000 | | | | 503,264 | |
Toyota Motor Credit Corp. MTN | | | | | |
4.500% | | | 06/17/2020 | | | | | | 300,000 | | | | 325,847 | |
2.625% | | | 01/10/2023 | | | | | | 300,000 | | | | 278,724 | |
1.250% | | | 10/05/2017 | | | | | | 400,000 | | | | 393,029 | |
| | | | | | | | | | | | | | |
| | | | | | | | | | | | | 9,406,196 | |
| | | | | | | | | | | | | | |
| Containers & Packaging—0.0% | | | | | |
MeadWestvaco Corp. | | | | | |
7.375% | | | 09/01/2019 | | | | | | 300,000 | | | | 356,481 | |
Packaging Corp. of America | | | | | |
4.500% | | | 11/01/2023 | | | | | | 250,000 | | | | 251,137 | |
| | | | | | | | | | | | | | |
| | | | | | | | | | | | | 607,618 | |
| | | | | | | | | | | | | | |
| Diversified Financial Services—2.2% | | | | | |
Bank of America Corp. | | | | | |
7.750% | | | 08/15/2015 | | | | | | 250,000 | | | | 275,160 | |
5.875% | | | 01/05/2021 | | | | | | 400,000 | | | | 460,426 | |
5.625% | | | 07/01/2020 | | | | | | 500,000 | | | | 572,145 | |
4.500% | | | 04/01/2015 | | | | | | 700,000 | | | | 732,546 | |
3.875% | | | 03/22/2017 | | | | | | 700,000 | | | | 747,690 | |
1.500% | | | 10/09/2015 | | | | | | 400,000 | | | | 404,204 | |
Bank of America Corp. MTN | | | | | |
5.875% | | | 02/07/2042 | | | | | | 300,000 | | | | 344,363 | |
5.000% | | | 05/13/2021 | | | | | | 300,000 | | | | 328,341 | |
3.625% | | | 03/17/2016 | | | | | | 500,000 | | | | 526,313 | |
3.300% | | | 01/11/2023 | | | | | | 500,000 | | | | 474,043 | |
Bank of America Corp., Series L MTN | | | | | |
5.650% | | | 05/01/2018 | | | | | | 500,000 | | | | 569,689 | |
Bank One Corp. | | | | | |
8.000% | | | 04/29/2027 | | | | | | 300,000 | | | | 383,992 | |
7.625% | | | 10/15/2026 | | | | | | 300,000 | | | | 371,409 | |
Bear Stearns Cos. LLC (The) | | | | | |
7.250% | | | 02/01/2018 | | | | | | 350,000 | | | | 419,458 | |
6.400% | | | 10/02/2017 | | | | | | 400,000 | | | | 464,618 | |
4.650% | | | 07/02/2018 | | | | | | 400,000 | | | | 435,991 | |
Citigroup, Inc. | | | | | |
8.500% | | | 05/22/2019 | | | | | | 300,000 | | | | 384,909 | |
8.125% | | | 07/15/2039 | | | | | | 500,000 | | | | 703,602 | |
6.625% | | | 06/15/2032 | | | | | | 350,000 | | | | 390,499 | |
6.125% | | | 11/21/2017 | | | | | | 750,000 | | | | 865,291 | |
6.125% | | | 08/25/2036 | | | | | | 300,000 | | | | 320,854 | |
6.010% | | | 01/15/2015 | | | | | | 121,000 | | | | 127,451 | |
6.000% | | | 08/15/2017 | | | | | | 600,000 | | | | 684,420 | |
5.375% | | | 08/09/2020 | | | | | | 400,000 | | | | 455,698 | |
4.500% | | | 01/14/2022 | | | | | | 500,000 | | | | 530,750 | |
4.050% | | | 07/30/2022 | | | | | | 300,000 | | | | 297,189 | |
3.953% | | | 06/15/2016 | | | | | | 200,000 | | | | 212,905 | |
3.875% | | | 10/25/2023 | | | | | | 200,000 | | | | 197,009 | |
2.650% | | | 03/02/2015 | | | | | | 400,000 | | | | 408,230 | |
Cooperatieve Centrale Raiffeisen-Boerenleenbank BA (Netherlands) | |
3.875% | | | 02/08/2022 | | | | | | 400,000 | | | | 402,875 | |
3.375% | | | 01/19/2017 | | | | | | 300,000 | | | | 316,096 | |
2.125% | | | 10/13/2015 | | | | | | 200,000 | | | | 205,245 | |
| | | | | | | | | | | | | | |
| | | | | |
Coupon
Rate | |
| Maturity
Date |
| | | | | Face | | | | Value | |
General Electric Capital Corp. | | | | | |
2.950% | | | 05/09/2016 | | | | | $ | 400,000 | | | $ | 419,028 | |
General Electric Capital Corp. MTN | | | | | |
6.375% | | | 11/15/2067 | | | # | | | 600,000 | | | | 653,250 | |
5.875% | | | 01/14/2038 | | | | | | 700,000 | | | | 800,083 | |
5.400% | | | 02/15/2017 | | | | | | 650,000 | | | | 723,926 | |
General Electric Capital Corp., Series A MTN | | | | | |
6.875% | | | 01/10/2039 | | | | | | 300,000 | | | | 386,974 | |
6.750% | | | 03/15/2032 | | | | | | 750,000 | | | | 931,349 | |
5.625% | | | 09/15/2017 | | | | | | 300,000 | | | | 341,568 | |
5.500% | | | 01/08/2020 | | | | | | 500,000 | | | | 573,325 | |
4.625% | | | 01/07/2021 | | | | | | 300,000 | | | | 327,627 | |
ING US, Inc. | | | | | |
5.500% | | | 07/15/2022 | | | | | | 500,000 | | | | 544,679 | |
IntercontinentalExchange Group, Inc. | | | | | |
2.500% | | | 10/15/2018 | | | | | | 300,000 | | | | 302,546 | |
JPMorgan Chase & Co. | | | | | |
6.400% | | | 05/15/2038 | | | | | | 300,000 | | | | 359,245 | |
6.300% | | | 04/23/2019 | | | | | | 500,000 | | | | 590,806 | |
5.600% | | | 07/15/2041 | | | | | | 200,000 | | | | 217,838 | |
4.750% | | | 03/01/2015 | | | | | | 500,000 | | | | 523,259 | |
4.625% | | | 05/10/2021 | | | | | | 300,000 | | | | 323,907 | |
4.500% | | | 01/24/2022 | | | | | | 400,000 | | | | 423,809 | |
3.450% | | | 03/01/2016 | | | | | | 500,000 | | | | 524,696 | |
3.200% | | | 01/25/2023 | | | | | | 500,000 | | | | 474,933 | |
JPMorgan Chase & Co. MTN | | | | | |
1.875% | | | 03/20/2015 | | | | | | 500,000 | | | | 506,912 | |
0.800% | | | 04/23/2015 | | | | | | 350,000 | | | | 350,186 | |
JPMorgan Chase Bank NA, Bank Note | | | | | |
6.000% | | | 10/01/2017 | | | | | | 500,000 | | | | 572,546 | |
Leucadia National Corp. | | | | | |
6.625% | | | 10/23/2043 | | | | | | 200,000 | | | | 196,283 | |
National Rural Utilities Cooperative Finance Corp. | |
10.375% | | | 11/01/2018 | | | | | | 281,000 | | | | 380,401 | |
3.050% | | | 03/01/2016 | | | | | | 250,000 | | | | 260,329 | |
Shell International Finance BV (Netherlands) | | | | | |
5.200% | | | 03/22/2017 | | | | | | 500,000 | | | | 558,951 | |
3.625% | | | 08/21/2042 | | | | | | 300,000 | | | | 251,956 | |
3.100% | | | 06/28/2015 | | | | | | 500,000 | | | | 519,081 | |
2.375% | | | 08/21/2022 | | | | | | 500,000 | | | | 458,714 | |
| | | | | | | | | | | | | | |
| | | | | | | | | | | | | 27,511,618 | |
| | | | | | | | | | | | | | |
| Diversified Telecommunication Services—1.0% | |
AT&T, Inc. | | | | | |
6.150% | | | 09/15/2034 | | | | | | 500,000 | | | | 545,042 | |
5.800% | | | 02/15/2019 | | | | | | 550,000 | | | | 631,205 | |
5.550% | | | 08/15/2041 | | | | | | 300,000 | | | | 305,538 | |
5.500% | | | 02/01/2018 | | | | | | 510,000 | | | | 574,627 | |
5.350% | | | 09/01/2040 | | | | | | 307,000 | | | | 304,825 | |
4.350% | | | 06/15/2045 | | | | | | 758,000 | | | | 644,254 | |
1.600% | | | 02/15/2017 | | | | | | 400,000 | | | | 399,742 | |
British Telecommunications plc (United Kingdom) | |
9.625% | | | 12/15/2030 | | | | | | 250,000 | | | | 373,985 | |
Cellco Partnership/Verizon Wireless Capital LLC | |
8.500% | | | 11/15/2018 | | | | | | 250,000 | | | | 316,860 | |
Deutsche Telekom International Finance BV (Netherlands) | |
8.750% | | | 06/15/2030 | | | | | | 300,000 | | | | 424,290 | |
Embarq Corp. | | | | | |
7.082% | | | 06/01/2016 | | | | | | 250,000 | | | | 279,507 | |
Orange SA (France) | | | | | |
8.750% | | | 03/01/2031 | | | | | | 500,000 | | | | 692,084 | |
Qwest Corp. | | | | | |
6.500% | | | 06/01/2017 | | | | | | 250,000 | | | | 282,738 | |
See accompanying notes to financial statements
262
SCHEDULE OF INVESTMENTS—(Continued)
December 31, 2013
| | | | | | | | | | | | | | |
Vantagepoint Core
Bond Index Fund | | | | | | |
| | | | |
Coupon
Rate | | Maturity
Date | | | | | Face | | | Value | |
| CORPORATE OBLIGATIONS—(Continued) | |
Telefonica Emisiones SAU (Spain) | | | | | |
5.134% | | | 04/27/2020 | | | | | $ | 600,000 | | | $ | 638,915 | |
3.729% | | | 04/27/2015 | | | | | | 200,000 | | | | 207,129 | |
Verizon Communications, Inc. | | | | | |
7.750% | | | 12/01/2030 | | | | | | 130,000 | | | | 166,469 | |
6.550% | | | 09/15/2043 | | | | | | 1,150,000 | | | | 1,350,239 | |
6.400% | | | 02/15/2038 | | | | | | 500,000 | | | | 563,296 | |
6.350% | | | 04/01/2019 | | | | | | 500,000 | | | | 588,363 | |
6.000% | | | 04/01/2041 | | | | | | 300,000 | | | | 330,532 | |
5.850% | | | 09/15/2035 | | | | | | 250,000 | | | | 266,249 | |
5.150% | | | 09/15/2023 | | | | | | 750,000 | | | | 806,816 | |
4.500% | | | 09/15/2020 | | | | | | 150,000 | | | | 160,818 | |
3.650% | | | 09/14/2018 | | | | | | 200,000 | | | | 211,942 | |
3.500% | | | 11/01/2021 | | | | | | 400,000 | | | | 397,798 | |
3.000% | | | 04/01/2016 | | | | | | 400,000 | | | | 417,349 | |
2.450% | | | 11/01/2022 | | | | | | 300,000 | | | | 266,090 | |
0.700% | | | 11/02/2015 | | | | | | 400,000 | | | | 399,065 | |
| | | | | | | | | | | | | | |
| | | | | | | | | | | | | 12,545,767 | |
| | | | | | | | | | | | | | |
| Electric Utilities—1.4% | | | | | |
Alabama Power Co., Series Q | | | | | |
5.500% | | | 10/15/2017 | | | | | | 150,000 | | | | 169,553 | |
Arizona Public Service Co. | | | | | |
4.500% | | | 04/01/2042 | | | | | | 300,000 | | | | 288,389 | |
Commonwealth Edison Co. | | | | | |
5.900% | | | 03/15/2036 | | | | | | 300,000 | | | | 343,849 | |
5.875% | | | 02/01/2033 | | | | | | 200,000 | | | | 227,476 | |
5.800% | | | 03/15/2018 | | | | | | 100,000 | | | | 114,966 | |
Connecticut Light & Power Co. (The), Series 09-A | |
5.500% | | | 02/01/2019 | | | | | | 300,000 | | | | 344,032 | |
Constellation Energy Group, Inc. | | | | | |
5.150% | | | 12/01/2020 | | | | | | 400,000 | | | | 426,260 | |
Dominion Gas Holdings LLC | | | | | |
3.550% | | | 11/01/2023 | | | ^ | | | 250,000 | | | | 241,299 | |
Duke Energy Carolinas LLC | | | | | |
6.450% | | | 10/15/2032 | | | | | | 330,000 | | | | 389,164 | |
4.300% | | | 06/15/2020 | | | | | | 100,000 | | | | 107,384 | |
4.000% | | | 09/30/2042 | | | | | | 300,000 | | | | 271,890 | |
Duke Energy Corp. | | | | | |
2.150% | | | 11/15/2016 | | | | | | 200,000 | | | | 205,112 | |
Duke Energy Florida, Inc. | | | | | |
6.400% | | | 06/15/2038 | | | | | | 350,000 | | | | 432,993 | |
0.650% | | | 11/15/2015 | | | | | | 300,000 | | | | 300,229 | |
Duke Energy Indiana, Inc. | | | | | |
3.750% | | | 07/15/2020 | | | | | | 300,000 | | | | 311,437 | |
Entergy Corp. | | | | | |
4.700% | | | 01/15/2017 | | | | | | 500,000 | | | | 537,990 | |
Exelon Corp. | | | | | |
4.900% | | | 06/15/2015 | | | | | | 350,000 | | | | 369,136 | |
Florida Power & Light Co. | | | | | |
5.625% | | | 04/01/2034 | | | | | | 50,000 | | | | 56,915 | |
5.125% | | | 06/01/2041 | | | | | | 200,000 | | | | 215,606 | |
4.950% | | | 06/01/2035 | | | | | | 100,000 | | | | 105,153 | |
Georgia Power Co., Series 07-A | | | | | |
5.650% | | | 03/01/2037 | | | | | | 200,000 | | | | 215,693 | |
Great Plains Energy, Inc. | | | | | |
4.850% | | | 06/01/2021 | | | | | | 400,000 | | | | 422,112 | |
Indiana Michigan Power Co. | | | | | |
7.000% | | | 03/15/2019 | | | | | | 250,000 | | | | 297,653 | |
Jersey Central Power & Light | | | | | |
5.625% | | | 05/01/2016 | | | | | | 500,000 | | | | 543,519 | |
| | | | | | | | | | | | | | |
| | | | | |
Coupon
Rate | |
| Maturity
Date |
| | | | | Face | | | | Value | |
Kentucky Utilities Co. | | | | | |
5.125% | | | 11/01/2040 | | | | | $ | 500,000 | | | $ | 530,605 | |
MidAmerican Energy Co. | | | | | |
3.700% | | | 09/15/2023 | | | | | | 500,000 | | | | 498,739 | |
MidAmerican Energy Co. MTN | | | | | |
5.800% | | | 10/15/2036 | | | | | | 500,000 | | | | 567,305 | |
Mississippi Power Co., Series 2012-A | | | | | |
4.250% | | | 03/15/2042 | | | | | | 300,000 | | | | 261,261 | |
NextEra Energy Capital Holdings, Inc. | | | | | |
6.000% | | | 03/01/2019 | | | | | | 250,000 | | | | 283,541 | |
4.500% | | | 06/01/2021 | | | | | | 200,000 | | | | 206,602 | |
1.200% | | | 06/01/2015 | | | | | | 500,000 | | | | 502,738 | |
Northern States Power Co. | | | | | |
5.250% | | | 03/01/2018 | | | | | | 500,000 | | | | 565,388 | |
Ohio Power Co., Series K | | | | | |
6.000% | | | 06/01/2016 | | | | | | 500,000 | | | | 553,839 | |
Pacific Gas & Electric Co. | | | | | |
6.050% | | | 03/01/2034 | | | | | | 500,000 | | | | 574,495 | |
4.450% | | | 04/15/2042 | | | | | | 300,000 | | | | 282,503 | |
Peco Energy Co. | | | | | |
2.375% | | | 09/15/2022 | | | | | | 200,000 | | | | 182,104 | |
Potomac Electric Power Co. | | | | | |
7.900% | | | 12/15/2038 | | | | | | 200,000 | | | | 283,262 | |
PPL Capital Funding, Inc. | | | | | |
4.700% | | | 06/01/2043 | | | | | | 200,000 | | | | 180,838 | |
3.400% | | | 06/01/2023 | | | | | | 200,000 | | | | 186,467 | |
Progress Energy, Inc. | | | | | |
7.050% | | | 03/15/2019 | | | | | | 400,000 | | | | 479,973 | |
4.400% | | | 01/15/2021 | | | | | | 300,000 | | | | 317,070 | |
PSEG Power LLC | | | | | |
8.625% | | | 04/15/2031 | | | | | | 300,000 | | | | 409,038 | |
2.750% | | | 09/15/2016 | | | | | | 200,000 | | | | 207,238 | |
Public Service Electric & Gas Co. MTN | | | | | |
3.650% | | | 09/01/2042 | | | | | | 200,000 | | | | 169,343 | |
Sierra Pacific Power Co., Series T | | | | | |
3.375% | | | 08/15/2023 | | | | | | 350,000 | | | | 338,629 | |
South Carolina Electric & Gas Co. | | | | | |
5.300% | | | 05/15/2033 | | | | | | 150,000 | | | | 160,958 | |
Southern California Edison Co. | | | | | |
6.650% | | | 04/01/2029 | | | | | | 500,000 | | | | 594,948 | |
4.050% | | | 03/15/2042 | | | | | | 300,000 | | | | 272,744 | |
Southern Power Co., Series D | | | | | |
4.875% | | | 07/15/2015 | | | | | | 350,000 | | | | 371,476 | |
Union Electric Co. | | | | | |
6.400% | | | 06/15/2017 | | | | | | 250,000 | | | | 286,841 | |
Virginia Electric and Power Co. | | | | | |
5.400% | | | 04/30/2018 | | | | | | 250,000 | | | | 284,030 | |
1.200% | | | 01/15/2018 | | | | | | 300,000 | | | | 291,528 | |
Westar Energy, Inc. | | | | | |
4.625% | | | 09/01/2043 | | | | | | 350,000 | | | | 345,805 | |
Wisconsin Electric Power | | | | | |
5.625% | | | 05/15/2033 | | | | | | 150,000 | | | | 167,101 | |
Xcel Energy, Inc. | | | | | |
4.800% | | | 09/15/2041 | | | | | | 200,000 | | | | 195,493 | |
| | | | | | | | | | | | | | |
| | | | | | | | | | | | | 17,489,712 | |
| | | | | | | | | | | | | | |
| Electrical Equipment—0.1% | | | | | |
Eaton Corp. | | | | | |
4.150% | | | 11/02/2042 | | | | | | 100,000 | | | | 89,188 | |
2.750% | | | 11/02/2022 | | | | | | 100,000 | | | | 93,466 | |
1.500% | | | 11/02/2017 | | | | | | 300,000 | | | | 294,372 | |
0.950% | | | 11/02/2015 | | | | | | 100,000 | | | | 100,420 | |
Emerson Electric Co. | | | | | |
5.000% | | | 12/15/2014 | | | | | | 150,000 | | | | 156,523 | |
5.000% | | | 04/15/2019 | | | | | | 500,000 | | | | 561,985 | |
2.625% | | | 02/15/2023 | | | | | | 270,000 | | | | 252,682 | |
See accompanying notes to financial statements
263
SCHEDULE OF INVESTMENTS—(Continued)
December 31, 2013
| | | | | | | | | | | | | | |
Vantagepoint Core
Bond Index Fund | | | | | | |
| | | | |
Coupon
Rate | | Maturity
Date | | | | | Face | | | Value | |
| CORPORATE OBLIGATIONS—(Continued) | |
Roper Industries, Inc. | | | | | |
1.850% | | | 11/15/2017 | | | | | $ | 200,000 | | | $ | 198,437 | |
| | | | | | | | | | | | | | |
| | | | | | | | | | | | | 1,747,073 | |
| | | | | | | | | | | | | | |
| Electronic Equipment, Instruments & Components—0.1% | |
Arrow Electronics, Inc. | | | | | |
4.500% | | | 03/01/2023 | | | | | | 300,000 | | | | 289,048 | |
3.000% | | | 03/01/2018 | | | | | | 400,000 | | | | 400,595 | |
Corning, Inc. | | | | | |
4.750% | | | 03/15/2042 | | | | | | 400,000 | | | | 386,708 | |
Jabil Circuit, Inc. | | | | | |
4.700% | | | 09/15/2022 | | | | | | 200,000 | | | | 193,000 | |
| | | | | | | | | | | | | | |
| | | | | | | | | | | | | 1,269,351 | |
| | | | | | | | | | | | | | |
| Energy Equipment & Services—0.3% | | | | | |
Cameron International Corp. | | | | | |
1.150% | | | 12/15/2016 | | | | | | 250,000 | | | | 249,354 | |
Diamond Offshore Drilling, Inc. | | | | | |
4.875% | | | 11/01/2043 | | | | | | 300,000 | | | | 295,580 | |
Halliburton Co. | | | | | |
7.450% | | | 09/15/2039 | | | | | | 400,000 | | | | 540,159 | |
Nabors Industries, Inc. | | | | | |
2.350% | | | 09/15/2016 | | | ^ | | | 150,000 | | | | 151,610 | |
Noble Holding International Ltd. (Cayman Islands) | |
6.200% | | | 08/01/2040 | | | | | | 200,000 | | | | 209,541 | |
3.450% | | | 08/01/2015 | | | | | | 200,000 | | | | 207,462 | |
2.500% | | | 03/15/2017 | | | | | | 300,000 | | | | 301,179 | |
Pride International, Inc. | | | | | |
6.875% | | | 08/15/2020 | | | | | | 200,000 | | | | 239,802 | |
Rowan Cos., Inc. | | | | | |
4.875% | | | 06/01/2022 | | | | | | 250,000 | | | | 254,112 | |
Transocean, Inc. (Cayman Islands) | | | | | |
6.800% | | | 03/15/2038 | | | | | | 500,000 | | | | 558,240 | |
Weatherford International Ltd. (Bermuda) | | | | | |
9.625% | | | 03/01/2019 | | | | | | 400,000 | | | | 514,491 | |
6.750% | | | 09/15/2040 | | | | | | 300,000 | | | | 325,510 | |
4.500% | | | 04/15/2022 | | | | | | 300,000 | | | | 302,395 | |
| | | | | | | | | | | | | | |
| | | | | | | | | | | | | 4,149,435 | |
| | | | | | | | | | | | | | |
| Food & Staples Retailing—0.4% | | | | | |
Costco Wholesale Corp. | | | | | |
0.650% | | | 12/07/2015 | | | | | | 300,000 | | | | 300,696 | |
CVS Caremark Corp. | | | | | |
4.125% | | | 05/15/2021 | | | | | | 200,000 | | | | 207,643 | |
2.250% | | | 12/05/2018 | | | | | | 750,000 | | | | 750,651 | |
Kroger Co. (The) | | | | | |
7.500% | | | 04/01/2031 | | | | | | 200,000 | | | | 243,413 | |
5.400% | | | 07/15/2040 | | | | | | 200,000 | | | | 198,604 | |
4.950% | | | 01/15/2015 | | | | | | 300,000 | | | | 313,076 | |
Walgreen Co. | | | | | |
4.400% | | | 09/15/2042 | | | | | | 200,000 | | | | 178,456 | |
1.000% | | | 03/13/2015 | | | | | | 300,000 | | | | 301,322 | |
Wal-Mart Stores, Inc. | | | | | |
7.550% | | | 02/15/2030 | | | | | | 250,000 | | | | 337,417 | |
5.250% | | | 09/01/2035 | | | | | | 750,000 | | | | 817,454 | |
4.875% | | | 07/08/2040 | | | | | | 300,000 | | | | 306,995 | |
4.250% | | | 04/15/2021 | | | | | | 300,000 | | | | 323,529 | |
3.625% | | | 07/08/2020 | | | | | | 300,000 | | | | 314,812 | |
2.550% | | | 04/11/2023 | | | | | | 500,000 | | | | 457,764 | |
| | | | | | | | | | | | | | |
| | | | | | | | | | | | | 5,051,832 | |
| | | | | | | | | | | | | | |
| | | | | | | | | | | | | | |
| | | | | |
Coupon
Rate | |
| Maturity
Date |
| | | | | Face | | | | Value | |
| Food Products—0.4% | | | | | |
Archer-Daniels Midland Co. | | | | | |
5.450% | | | 03/15/2018 | | | | | $ | 500,000 | | | $ | 565,668 | |
ConAgra Foods, Inc. | | | | | |
4.650% | | | 01/25/2043 | | | | | | 300,000 | | | | 276,667 | |
3.250% | | | 09/15/2022 | | | | | | 200,000 | | | | 187,927 | |
2.100% | | | 03/15/2018 | | | | | | 200,000 | | | | 198,000 | |
1.300% | | | 01/25/2016 | | | | | | 400,000 | | | | 400,896 | |
General Mills, Inc. | | | | | |
5.400% | | | 06/15/2040 | | | | | | 300,000 | | | | 318,868 | |
3.150% | | | 12/15/2021 | | | | | | 200,000 | | | | 196,119 | |
Hillshire Brands Co. | | | | | |
2.750% | | | 09/15/2015 | | | | | | 300,000 | | | | 308,626 | |
Kellogg Co. | | | | | |
4.000% | | | 12/15/2020 | | | | | | 300,000 | | | | 311,794 | |
Kraft Foods Group, Inc. | | | | | |
6.875% | | | 01/26/2039 | | | | | | 380,000 | | | | 464,297 | |
6.500% | | | 02/09/2040 | | | | | | 200,000 | | | | 234,028 | |
5.375% | | | 02/10/2020 | | | | | | 209,000 | | | | 236,104 | |
1.625% | | | 06/04/2015 | | | | | | 300,000 | | | | 303,917 | |
Mondelez International, Inc. | | | | | |
6.500% | | | 02/09/2040 | | | | | | 200,000 | | | | 239,817 | |
4.125% | | | 02/09/2016 | | | | | | 100,000 | | | | 106,069 | |
Unilever Capital Corp. | | | | | |
4.250% | | | 02/10/2021 | | | | | | 300,000 | | | | 322,217 | |
| | | | | | | | | | | | | | |
| | | | | | | | | | | | | 4,671,014 | |
| | | | | | | | | | | | | | |
| Gas Utilities—0.0% | | | | | |
Southern California Gas Co. | | | | | |
5.125% | | | 11/15/2040 | | | | | | 400,000 | | | | 429,603 | |
| | | | | | | | | | | | | | |
| Health Care Equipment & Supplies—0.3% | |
Baxter International, Inc. | | | | | |
5.900% | | | 09/01/2016 | | | | | | 400,000 | | | | 451,004 | |
3.200% | | | 06/15/2023 | | | | | | 300,000 | | | | 287,182 | |
2.400% | | | 08/15/2022 | | | | | | 300,000 | | | | 272,467 | |
Becton Dickinson and Co. | | | | | |
5.000% | | | 11/12/2040 | | | | | | 300,000 | | | | 310,375 | |
Boston Scientific Corp. | | | | | |
7.375% | | | 01/15/2040 | | | | | | 200,000 | | | | 249,303 | |
6.250% | | | 11/15/2015 | | | | | | 200,000 | | | | 218,550 | |
6.000% | | | 01/15/2020 | | | | | | 200,000 | | | | 229,901 | |
CareFusion Corp. | | | | | |
6.375% | | | 08/01/2019 | | | | | | 250,000 | | | | 283,267 | |
Covidien International Finance SA (Luxembourg) | |
6.000% | | | 10/15/2017 | | | | | | 250,000 | | | | 286,637 | |
Medtronic, Inc. | | | | | |
4.450% | | | 03/15/2020 | | | | | | 300,000 | | | | 329,223 | |
3.000% | | | 03/15/2015 | | | | | | 380,000 | | | | 392,192 | |
2.750% | | | 04/01/2023 | | | | | | 100,000 | | | | 92,685 | |
Stryker Corp. | | | | | |
4.100% | | | 04/01/2043 | | | | | | 200,000 | | | | 177,823 | |
| | | | | | | | | | | | | | |
| | | | | | | | | | | | | 3,580,609 | |
| | | | | | | | | | | | | | |
| Health Care Providers & Services—0.4% | | | | | |
Aetna, Inc. | | | | | |
6.625% | | | 06/15/2036 | | | | | | 250,000 | | | | 299,861 | |
4.125% | | | 11/15/2042 | | | | | | 200,000 | | | | 175,622 | |
1.500% | | | 11/15/2017 | | | | | | 200,000 | | | | 197,242 | |
Cardinal Health, Inc. | | | | | |
4.600% | | | 03/15/2043 | | | | | | 200,000 | | | | 187,481 | |
3.200% | | | 03/15/2023 | | | | | | 300,000 | | | | 281,429 | |
1.700% | | | 03/15/2018 | | | | | | 300,000 | | | | 293,879 | |
See accompanying notes to financial statements
264
SCHEDULE OF INVESTMENTS—(Continued)
December 31, 2013
| | | | | | | | | | | | | | |
Vantagepoint Core
Bond Index Fund | | | | | | |
| | | | |
Coupon
Rate | | Maturity
Date | | | | | Face | | | Value | |
| CORPORATE OBLIGATIONS—(Continued) | |
Cigna Corp. | | | | | |
5.125% | | | 06/15/2020 | | | | | $ | 300,000 | | | $ | 333,205 | |
Express Scripts Holding Co. | | | | | |
6.125% | | | 11/15/2041 | | | | | | 200,000 | | | | 225,775 | |
4.750% | | | 11/15/2021 | | | | | | 200,000 | | | | 211,680 | |
McKesson Corp. | | | | | |
2.850% | | | 03/15/2023 | | | | | | 300,000 | | | | 271,904 | |
Quest Diagnostics, Inc. | | | | | |
6.950% | | | 07/01/2037 | | | | | | 300,000 | | | | 332,019 | |
4.700% | | | 04/01/2021 | | | | | | 300,000 | | | | 308,121 | |
UnitedHealth Group, Inc. | | | | | |
6.000% | | | 02/15/2018 | | | | | | 500,000 | | | | 578,193 | |
5.950% | | | 02/15/2041 | | | | | | 200,000 | | | | 227,384 | |
5.375% | | | 03/15/2016 | | | | | | 200,000 | | | | 219,038 | |
1.625% | | | 03/15/2019 | | | | | | 400,000 | | | | 385,666 | |
WellPoint, Inc. | |
5.250% | | | 01/15/2016 | | | | | | 500,000 | | | | 540,875 | |
4.650% | | | 01/15/2043 | | | | | | 200,000 | | | | 185,871 | |
3.300% | | | 01/15/2023 | | | | | | 300,000 | | | | 280,502 | |
| | | | | | | | | | | | | | |
| | | | | | | | | | | | | 5,535,747 | |
| | | | | | | | | | | | | | |
| Hotels, Restaurants & Leisure—0.2% | | | | | |
Carnival Corp. (Panama) | | | | | |
3.950% | | | 10/15/2020 | | | | | | 400,000 | | | | 400,900 | |
McDonald’s Corp., Series I MTN | | | | | |
5.350% | | | 03/01/2018 | | | | | | 500,000 | | | | 568,664 | |
Starbucks Corp. | | | | | |
2.000% | | | 12/05/2018 | | | | | | 400,000 | | | | 397,003 | |
Wyndham Worldwide Corp. | | | | | |
3.900% | | | 03/01/2023 | | | | | | 300,000 | | | | 283,125 | |
Yum! Brands, Inc. | |
6.875% | | | 11/15/2037 | | | | | | 52,000 | | | | 59,392 | |
5.350% | | | 11/01/2043 | | | | | | 250,000 | | | | 243,802 | |
| | | | | | | | | | | | | | |
| | | | | | | | | | | | | 1,952,886 | |
| | | | | | | | | | | | | | |
| Household Durables—0.0% | | | | | |
Whirlpool Corp. MTN | | | | | |
4.850% | | | 06/15/2021 | | | | | | 200,000 | | | | 210,450 | |
| | | | | | | | | | | | | | |
| Household Products—0.1% | | | | | |
Clorox Co. (The) | | | | | |
3.800% | | | 11/15/2021 | | | | | | 400,000 | | | | 403,219 | |
Kimberly-Clark Corp. | | | | | |
6.125% | | | 08/01/2017 | | | | | | 500,000 | | | | 577,208 | |
Procter & Gamble Co. (The) | |
5.800% | | | 08/15/2034 | | | | | | 250,000 | | | | 289,305 | |
4.700% | | | 02/15/2019 | | | | | | 500,000 | | | | 559,110 | |
| | | | | | | | | | | | | | |
| | | | | | | | | | | | | 1,828,842 | |
| | | | | | | | | | | | | | |
| Industrial Conglomerates—0.2% | | | | | |
3M Co. MTN | |
5.700% | | | 03/15/2037 | | | | | | 100,000 | | | | 115,739 | |
2.000% | | | 06/26/2022 | | | | | | 300,000 | | | | 274,271 | |
GE Capital Trust I | |
6.375% | | | 11/15/2067 | | | # | | | 130,000 | | | | 140,725 | |
General Electric Co. | |
5.250% | | | 12/06/2017 | | | | | | 500,000 | | | | 566,480 | |
4.125% | | | 10/09/2042 | | | | | | 300,000 | | | | 278,285 | |
2.700% | | | 10/09/2022 | | | | | | 300,000 | | | | 281,340 | |
0.850% | | | 10/09/2015 | | | | | | 300,000 | | | | 301,533 | |
| | | | | | | | | | | | | | |
| | | | | | | | | | | | | 1,958,373 | |
| | | | | | | | | | | | | | |
| | | | | | | | | | | | | | |
| | | | | |
Coupon
Rate | |
| Maturity
Date |
| | | | | Face | | | | Value | |
| Insurance—1.0% | | | | | |
AEGON Funding Co. LLC | |
5.750% | | | 12/15/2020 | | | | | $ | 290,000 | | | $ | 326,166 | |
Aflac, Inc. | |
3.625% | | | 06/15/2023 | | | | | | 400,000 | | | | 387,956 | |
American International Group, Inc. | |
8.175% | | | 05/15/2058 | | | # | | | 300,000 | | | | 364,500 | |
6.400% | | | 12/15/2020 | | | | | | 400,000 | | | | 473,423 | |
3.800% | | | 03/22/2017 | | | | | | 500,000 | | | | 534,356 | |
3.000% | | | 03/20/2015 | | | | | | 400,000 | | | | 410,957 | |
American International Group, Inc. MTN | |
5.850% | | | 01/16/2018 | | | | | | 500,000 | | | | 574,572 | |
Aon plc (United Kingdom) | |
4.450% | | | 05/24/2043 | | | | | | 400,000 | | | | 356,708 | |
Arch Capital Group US, Inc. | |
5.144% | | | 11/01/2043 | | | | | | 150,000 | | | | 150,554 | |
AXA SA (France) | |
8.600% | | | 12/15/2030 | | | | | | 250,000 | | | | 308,438 | |
Berkshire Hathaway Finance Corp. | |
4.300% | | | 05/15/2043 | | | | | | 300,000 | | | | 271,256 | |
4.250% | | | 01/15/2021 | | | | | | 300,000 | | | | 319,292 | |
3.200% | | | 02/11/2015 | | | | | | 400,000 | | | | 412,392 | |
2.000% | | | 08/15/2018 | | | | | | 500,000 | | | | 500,849 | |
1.600% | | | 05/15/2017 | | | | | | 400,000 | | | | 404,188 | |
Chubb Corp. (The) | |
6.375% | | | 03/29/2067 | | | # | | | 200,000 | | | | 217,500 | |
CNA Financial Corp. | |
5.850% | | | 12/15/2014 | | | | | | 430,000 | | | | 450,481 | |
5.750% | | | 08/15/2021 | | | | | | 300,000 | | | | 336,659 | |
Fidelity National Financial, Inc. | |
6.600% | | | 05/15/2017 | | | | | | 300,000 | | | | 335,233 | |
Genworth Financial, Inc. | |
7.700% | | | 06/15/2020 | | | † | | | 200,000 | | | | 238,741 | |
Genworth Holdings, Inc. | |
4.900% | | | 08/15/2023 | | | | | | 250,000 | | | | 250,351 | |
Hartford Financial Services Group, Inc. | |
6.100% | | | 10/01/2041 | | | | | | 150,000 | | | | 172,127 | |
4.000% | | | 10/15/2017 | | | | | | 300,000 | | | | 319,367 | |
Hartford Financial Services Group, Inc. MTN | |
6.000% | | | 01/15/2019 | | | | | | 500,000 | | | | 574,089 | |
Lincoln National Corp. | |
6.150% | | | 04/07/2036 | | | | | | 250,000 | | | | 283,952 | |
Markel Corp. | |
5.000% | | | 03/30/2043 | | | | | | 300,000 | | | | 281,599 | |
MetLife, Inc. | |
6.750% | | | 06/01/2016 | | | | | | 600,000 | | | | 682,605 | |
5.700% | | | 06/15/2035 | | | | | | 250,000 | | | | 273,906 | |
Progressive Corp. (The) | |
6.625% | | | 03/01/2029 | | | | | | 150,000 | | | | 180,685 | |
Prudential Financial, Inc. MTN | |
6.625% | | | 06/21/2040 | | | | | | 100,000 | | | | 121,682 | |
5.800% | | | 11/16/2041 | | | | | | 200,000 | | | | 222,294 | |
5.375% | | | 06/21/2020 | | | | | | 300,000 | | | | 339,503 | |
Prudential Financial, Inc., Series D MTN | |
5.700% | | | 12/14/2036 | | | | | | 250,000 | | | | 269,439 | |
4.750% | | | 09/17/2015 | | | | | | 300,000 | | | | 319,825 | |
Trinity Acquisition plc (United Kingdom) | |
4.625% | | | 08/15/2023 | | | | | | 500,000 | | | | 492,135 | |
Validus Holdings Ltd. (Bermuda) | |
8.875% | | | 01/26/2040 | | | | | | 200,000 | | | | 264,870 | |
XLIT Ltd. (Cayman Islands) | |
2.300% | | | 12/15/2018 | | | | | | 400,000 | | | | 393,332 | |
| | | | | | | | | | | | | | |
| | | | | | | | | | | | | 12,815,982 | |
| | | | | | | | | | | | | | |
See accompanying notes to financial statements
265
SCHEDULE OF INVESTMENTS—(Continued)
December 31, 2013
| | | | | | | | | | | | | | |
Vantagepoint Core
Bond Index Fund | | | | | | |
| | | | |
Coupon
Rate | | Maturity
Date | | | | | Face | | | Value | |
| CORPORATE OBLIGATIONS—(Continued) | |
| Internet & Catalog Retail—0.1% | | | | | |
Amazon.com, Inc. | |
2.500% | | | 11/29/2022 | | | † | | $ | 200,000 | | | $ | 180,639 | |
1.200% | | | 11/29/2017 | | | | | | 200,000 | | | | 196,004 | |
0.650% | | | 11/27/2015 | | | | | | 400,000 | | | | 400,008 | |
Expedia, Inc. | |
7.456% | | | 08/15/2018 | | | | | | 500,000 | | | | 582,667 | |
| | | | | | | | | | | | | | |
| | | | | | | | | | | | | 1,359,318 | |
| | | | | | | | | | | | | | |
| Internet Software & Services—0.1% | |
eBay, Inc. | |
4.000% | | | 07/15/2042 | | | | | | 100,000 | | | | 85,022 | |
2.600% | | | 07/15/2022 | | | | | | 100,000 | | | | 92,146 | |
1.350% | | | 07/15/2017 | | | | | | 100,000 | | | | 99,516 | |
0.700% | | | 07/15/2015 | | | | | | 200,000 | | | | 200,613 | |
Google, Inc. | |
3.625% | | | 05/19/2021 | | | | | | 300,000 | | | | 313,316 | |
2.125% | | | 05/19/2016 | | | | | | 300,000 | | | | 310,138 | |
| | | | | | | | | | | | | | |
| | | | | | | | | | | | | 1,100,751 | |
| | | | | | | | | | | | | | |
| IT Services—0.2% | |
Computer Sciences Corp. | |
4.450% | | | 09/15/2022 | | | | | | 200,000 | | | | 193,251 | |
2.500% | | | 09/15/2015 | | | | | | 300,000 | | | | 306,342 | |
Fiserv, Inc. | |
3.500% | | | 10/01/2022 | | | | | | 200,000 | | | | 186,065 | |
International Business Machines Corp. | |
7.000% | | | 10/30/2025 | | | | | | 300,000 | | | | 377,290 | |
5.700% | | | 09/14/2017 | | | | | | 500,000 | | | | 574,635 | |
1.625% | | | 05/15/2020 | | | | | | 400,000 | | | | 375,654 | |
Western Union Co. (The) | |
5.253% | | | 04/01/2020 | | | | | | 502,000 | | | | 535,543 | |
| | | | | | | | | | | | | | |
| | | | | | | | | | | | | 2,548,780 | |
| | | | | | | | | | | | | | |
| Life Sciences Tools & Services—0.1% | |
Agilent Technologies, Inc. | |
5.000% | | | 07/15/2020 | | | | | | 100,000 | | | | 107,959 | |
Thermo Fisher Scientific, Inc. | |
2.400% | | | 02/01/2019 | | | | | | 750,000 | | | | 743,901 | |
| | | | | | | | | | | | | | |
| | | | | | | | | | | | | 851,860 | |
| | | | | | | | | | | | | | |
| Machinery—0.1% | |
Caterpillar, Inc. | |
3.803% | | | 08/15/2042 | | | | | | 685,000 | | | | 578,376 | |
Dover Corp. | |
5.375% | | | 03/01/2041 | | | | | | 300,000 | | | | 322,674 | |
Parker Hannifin Corp. MTN | |
3.500% | | | 09/15/2022 | | | | | | 100,000 | | | | 97,931 | |
| | | | | | | | | | | | | | |
| | | | | | | | | | | | | 998,981 | |
| | | | | | | | | | | | | | |
| Media—1.1% | |
21st Century Fox America, Inc. | |
8.000% | | | 10/17/2016 | | | | | | 150,000 | | | | 176,666 | |
7.750% | | | 12/01/2045 | | | | | | 200,000 | | | | 253,585 | |
6.150% | | | 02/15/2041 | | | | | | 300,000 | | | | 335,518 | |
5.650% | | | 08/15/2020 | | | | | | 500,000 | | | | 561,077 | |
CBS Corp. | |
7.875% | | | 07/30/2030 | | | | | | 250,000 | | | | 311,824 | |
5.750% | | | 04/15/2020 | | | | | | 200,000 | | �� | | 224,804 | |
4.850% | | | 07/01/2042 | | | | | | 250,000 | | | | 226,089 | |
1.950% | | | 07/01/2017 | | | | | | 300,000 | | | | 300,797 | |
| | | | | | | | | | | | | | |
| | | | | |
Coupon
Rate | |
| Maturity
Date |
| | | | | Face | | | | Value | |
Comcast Corp. | |
6.450% | | | 03/15/2037 | | | | | $ | 500,000 | | | $ | 582,130 | |
6.300% | | | 11/15/2017 | | | | | | 700,000 | | | | 815,957 | |
5.850% | | | 11/15/2015 | | | | | | 400,000 | | | | 437,828 | |
5.650% | | | 06/15/2035 | | | | | | 200,000 | | | | 213,700 | |
4.500% | | | 01/15/2043 | | | | | | 200,000 | | | | 181,362 | |
2.850% | | | 01/15/2023 | | | † | | | 500,000 | | | | 463,210 | |
COX Communications, Inc. | |
5.500% | | | 10/01/2015 | | | | | | 75,000 | | | | 80,537 | |
DIRECTV Holdings LLC/DIRECTV Financing Co., Inc. | |
6.375% | | | 03/01/2041 | | | | | | 500,000 | | | | 520,128 | |
5.200% | | | 03/15/2020 | | | | | | 200,000 | | | | 218,085 | |
3.800% | | | 03/15/2022 | | | | | | 300,000 | | | | 288,692 | |
3.550% | | | 03/15/2015 | | | | | | 200,000 | | | | 206,654 | |
3.500% | | | 03/01/2016 | | | | | | 400,000 | | | | 420,095 | |
Discovery Communications LLC | |
5.625% | | | 08/15/2019 | | | | | | 400,000 | | | | 449,684 | |
Historic TW, Inc. | |
9.150% | | | 02/01/2023 | | | | | | 300,000 | | | | 398,481 | |
NBCUniversal Media LLC | |
6.400% | | | 04/30/2040 | | | | | | 200,000 | | | | 230,707 | |
5.950% | | | 04/01/2041 | | | | | | 250,000 | | | | 274,419 | |
4.375% | | | 04/01/2021 | | | | | | 250,000 | | | | 265,017 | |
Omnicom Group, Inc. | |
5.900% | | | 04/15/2016 | | | | | | 500,000 | | | | 553,008 | |
Thomson Reuters Corp. (Canada) | |
6.500% | | | 07/15/2018 | | | | | | 300,000 | | | | 348,178 | |
Time Warner Cable, Inc. | |
6.750% | | | 06/15/2039 | | | | | | 200,000 | | | | 188,892 | |
5.850% | | | 05/01/2017 | | | | | | 400,000 | | | | 436,611 | |
Time Warner Entertainment Co. LP | |
8.375% | | | 03/15/2023 | | | | | | 250,000 | | | | 288,019 | |
8.375% | | | 07/15/2033 | | | | | | 250,000 | | | | 273,050 | |
Time Warner, Inc. | |
5.875% | | | 11/15/2016 | | | | | | 700,000 | | | | 790,250 | |
5.375% | | | 10/15/2041 | | | | | | 250,000 | | | | 253,790 | |
4.050% | | | 12/15/2023 | | | | | | 750,000 | | | | 749,332 | |
Viacom, Inc. | |
6.875% | | | 04/30/2036 | | | | | | 300,000 | | | | 347,528 | |
4.500% | | | 03/01/2021 | | | | | | 200,000 | | | | 209,581 | |
4.375% | | | 03/15/2043 | | | | | | 200,000 | | | | 169,518 | |
2.500% | | | 12/15/2016 | | | | | | 300,000 | | | | 310,478 | |
Walt Disney Co. (The) MTN | |
3.700% | | | 12/01/2042 | | | | | | 200,000 | | | | 167,718 | |
2.350% | | | 12/01/2022 | | | | | | 200,000 | | | | 182,076 | |
1.100% | | | 12/01/2017 | | | | | | 250,000 | | | | 246,580 | |
0.450% | | | 12/01/2015 | | | | | | 350,000 | | | | 349,808 | |
Walt Disney Co. (The), Series B MTN | |
7.000% | | | 03/01/2032 | | | | | | 210,000 | | | | 269,454 | |
| | | | | | | | | | | | | | |
| | | | | | | | | | | | | 14,570,917 | |
| | | | | | | | | | | | | | |
| Metals & Mining—0.6% | |
Alcoa, Inc. | |
5.550% | | | 02/01/2017 | | | | | | 290,000 | | | | 312,366 | |
5.400% | | | 04/15/2021 | | | † | | | 300,000 | | | | 306,845 | |
Barrick PD Australia Finance Pty Ltd. (Australia) | |
5.950% | | | 10/15/2039 | | | | | | 400,000 | | | | 347,153 | |
BHP Billiton Finance USA Ltd. (Australia) | |
6.500% | | | 04/01/2019 | | | | | | 500,000 | | | | 600,128 | |
4.125% | | | 02/24/2042 | | | | | | 400,000 | | | | 356,843 | |
1.625% | | | 02/24/2017 | | | | | | 400,000 | | | | 401,390 | |
Freeport-McMoRan Copper & Gold, Inc. | |
3.875% | | | 03/15/2023 | | | | | | 800,000 | | | | 757,956 | |
3.550% | | | 03/01/2022 | | | | | | 400,000 | | | | 380,824 | |
1.400% | | | 02/13/2015 | | | | | | 400,000 | | | | 402,343 | |
See accompanying notes to financial statements
266
SCHEDULE OF INVESTMENTS—(Continued)
December 31, 2013
| | | | | | | | | | | | | | |
Vantagepoint Core
Bond Index Fund | | | | | | |
| | | | |
Coupon
Rate | | Maturity
Date | | | | | Face | | | Value | |
| CORPORATE OBLIGATIONS—(Continued) | |
Newmont Mining Corp. | |
6.250% | | | 10/01/2039 | | | | | $ | 200,000 | | | $ | 177,432 | |
3.500% | | | 03/15/2022 | | | | | | 400,000 | | | | 341,062 | |
Rio Tinto Alcan, Inc. (Canada) | |
6.125% | | | 12/15/2033 | | | | | | 150,000 | | | | 169,308 | |
Rio Tinto Finance USA plc (United Kingdom) | |
4.750% | | | 03/22/2042 | | | | | | 300,000 | | | | 292,695 | |
2.250% | | | 12/14/2018 | | | | | | 400,000 | | | | 398,490 | |
2.000% | | | 03/22/2017 | | | | | | 500,000 | | | | 502,817 | |
Southern Copper Corp. | |
7.500% | | | 07/27/2035 | | | | | | 250,000 | | | | 263,017 | |
Teck Resources Ltd. (Canada) | |
5.200% | | | 03/01/2042 | | | | | | 300,000 | | | | 265,698 | |
3.000% | | | 03/01/2019 | | | | | | 300,000 | | | | 301,297 | |
Vale Overseas Ltd. (Cayman Islands) | |
6.875% | | | 11/21/2036 | | | | | | 400,000 | | | | 415,101 | |
6.250% | | | 01/23/2017 | | | | | | 500,000 | | | | 557,068 | |
4.625% | | | 09/15/2020 | | | | | | 500,000 | | | | 514,601 | |
| | | | | | | | | | | | | | |
| | | | | | | | | | | | | 8,064,434 | |
| | | | | | | | | | | | | | |
| Multiline Retail—0.2% | |
Dollar General Corp. | |
1.875% | | | 04/15/2018 | | | | | | 500,000 | | | | 484,179 | |
Kohl’s Corp. | |
4.000% | | | 11/01/2021 | | | | | | 300,000 | | | | 300,372 | |
Macy’s Retail Holdings, Inc. | |
6.900% | | | 04/01/2029 | | | | | | 100,000 | | | | 113,755 | |
6.650% | | | 07/15/2024 | | | | | | 100,000 | | | | 115,775 | |
5.900% | | | 12/01/2016 | | | | | | 500,000 | | | | 561,219 | |
4.300% | | | 02/15/2043 | | | | | | 200,000 | | | | 169,439 | |
Nordstrom, Inc. | |
4.000% | | | 10/15/2021 | | | | | | 100,000 | | | | 103,885 | |
Target Corp. | |
6.000% | | | 01/15/2018 | | | | | | 500,000 | | | | 577,941 | |
4.000% | | | 07/01/2042 | | | | | | 200,000 | | | | 174,177 | |
| | | | | | | | | | | | | | |
| | | | | | | | | | | | | 2,600,742 | |
| | | | | | | | | | | | | | |
| Multi-Utilities—0.3% | |
Ameren Illinois Co. | |
2.700% | | | 09/01/2022 | | | | | | 400,000 | | | | 375,092 | |
Consolidated Edison Co. of New York, Inc., Series 06-C | |
5.500% | | | 09/15/2016 | | | | | | 500,000 | | | | 558,509 | |
Consumers Energy Co., Series P | |
5.500% | | | 08/15/2016 | | | | | | 150,000 | | | | 167,350 | |
Dominion Resources, Inc., Series A | |
5.600% | | | 11/15/2016 | | | | | | 300,000 | | | | 334,206 | |
Dominion Resources, Inc., Series C | |
4.900% | | | 08/01/2041 | | | | | | 300,000 | | | | 289,013 | |
MidAmerican Energy Holdings Co. | |
6.125% | | | 04/01/2036 | | | | | | 200,000 | | | | 227,937 | |
Nisource Finance Corp. | |
5.450% | | | 09/15/2020 | | | | | | 500,000 | | | | 556,784 | |
5.250% | | | 02/15/2043 | | | | | | 300,000 | | | | 292,613 | |
Puget Sound Energy, Inc. | |
4.434% | | | 11/15/2041 | | | | | | 300,000 | | | | 286,766 | |
Sempra Energy | |
6.150% | | | 06/15/2018 | | | | | | 250,000 | | | | 287,278 | |
| | | | | | | | | | | | | | |
| | | | | | | | | | | | | 3,375,548 | |
| | | | | | | | | | | | | | |
| | | | | | | | | | | | | | |
| | | | | |
Coupon
Rate | |
| Maturity
Date |
| | | | | Face | | | | Value | |
| Office Electronics—0.1% | |
Xerox Corp. | |
6.350% | | | 05/15/2018 | | | † | | $ | 500,000 | | | $ | 571,992 | |
4.500% | | | 05/15/2021 | | | | | | 200,000 | | | | 206,179 | |
4.250% | | | 02/15/2015 | | | | | | 300,000 | | | | 311,314 | |
| | | | | | | | | | | | | | |
| | | | | | | | | | | | | 1,089,485 | |
| | | | | | | | | | | | | | |
| Oil, Gas & Consumable Fuels—2.2% | |
Alberta Energy Co. Ltd. (Canada) | |
7.375% | | | 11/01/2031 | | | | | | 400,000 | | | | 470,865 | |
Anadarko Petroleum Corp. | |
8.700% | | | 03/15/2019 | | | | | | 500,000 | | | | 633,723 | |
Apache Corp. | |
5.250% | | | 02/01/2042 | | | | | | 500,000 | | | | 521,059 | |
Apache Finance Canada Corp. (Canada) | |
7.750% | | | 12/15/2029 | | | | | | 150,000 | | | | 199,524 | |
Boardwalk Pipelines LP | |
3.375% | | | 02/01/2023 | | | | | | 200,000 | | | | 180,171 | |
BP Capital Markets plc (United Kingdom) | |
4.500% | | | 10/01/2020 | | | | | | 300,000 | | | | 324,598 | |
3.245% | | | 05/06/2022 | | | | | | 200,000 | | | | 194,203 | |
3.200% | | | 03/11/2016 | | | | | | 400,000 | | | | 420,255 | |
2.750% | | | 05/10/2023 | | | | | | 500,000 | | | | 457,473 | |
1.846% | | | 05/05/2017 | | | | | | 200,000 | | | | 202,171 | |
Buckeye Partners LP | |
2.650% | | | 11/15/2018 | | | | | | 250,000 | | | | 246,605 | |
Canadian Natural Resources Ltd. (Canada) | |
5.850% | | | 02/01/2035 | | | | | | 500,000 | | | | 532,011 | |
3.450% | | | 11/15/2021 | | | | | | 200,000 | | | | 196,866 | |
Cenovus Energy, Inc. (Canada) | |
5.700% | | | 10/15/2019 | | | | | | 200,000 | | | | 228,111 | |
CenterPoint Energy Resources Corp. | |
4.500% | | | 01/15/2021 | | | | | | 434,000 | | | | 463,615 | |
Chevron Corp. | |
3.191% | | | 06/24/2023 | | | | | | 400,000 | | | | 384,756 | |
2.355% | | | 12/05/2022 | | | | | | 400,000 | | | | 364,556 | |
CNOOC Finance 2013 Ltd. (Virgin Islands, British) | |
4.250% | | | 05/09/2043 | | | | | | 200,000 | | | | 169,165 | |
3.000% | | | 05/09/2023 | | | | | | 200,000 | | | | 178,993 | |
1.750% | | | 05/09/2018 | | | | | | 200,000 | | | | 195,704 | |
1.125% | | | 05/09/2016 | | | | | | 200,000 | | | | 199,378 | |
ConocoPhillips Canada Funding Co. I (Canada) | |
5.950% | | | 10/15/2036 | | | | | | 500,000 | | | | 585,251 | |
5.625% | | | 10/15/2016 | | | | | | 500,000 | | | | 559,798 | |
ConocoPhillips Holding Co. | |
6.950% | | | 04/15/2029 | | | | | | 500,000 | | | | 634,287 | |
Devon Energy Corp. | |
5.600% | | | 07/15/2041 | | | | | | 100,000 | | | | 104,579 | |
2.400% | | | 07/15/2016 | | | † | | | 300,000 | | | | 308,670 | |
1.875% | | | 05/15/2017 | | | | | | 300,000 | | | | 302,425 | |
Ecopetrol SA (Colombia) | |
4.250% | | | 09/18/2018 | | | | | | 500,000 | | | | 528,750 | |
El Paso Pipeline Partners Operating Co. LLC | |
4.700% | | | 11/01/2042 | | | | | | 200,000 | | | | 172,216 | |
Enbridge Energy Partners LP | |
9.875% | | | 03/01/2019 | | | | | | 300,000 | | | | 388,574 | |
Encana Corp. (Canada) | |
5.150% | | | 11/15/2041 | | | | | | 300,000 | | | | 282,257 | |
3.900% | | | 11/15/2021 | | | | | | 300,000 | | | | 298,366 | |
Energy Transfer Partners LP | |
6.500% | | | 02/01/2042 | | | | | | 400,000 | | | | 431,329 | |
5.950% | | | 02/01/2015 | | | | | | 500,000 | | | | 526,913 | |
5.200% | | | 02/01/2022 | | | | | | 300,000 | | | | 316,346 | |
See accompanying notes to financial statements
267
SCHEDULE OF INVESTMENTS—(Continued)
December 31, 2013
| | | | | | | | | | | | | | |
Vantagepoint Core
Bond Index Fund | | | | | | |
| | | | |
Coupon
Rate | | Maturity
Date | | | | | Face | | | Value | |
| CORPORATE OBLIGATIONS—(Continued) | |
Enterprise Products Operating LLC | |
5.950% | | | 02/01/2041 | | | | | $ | 200,000 | | | $ | 218,572 | |
4.450% | | | 02/15/2043 | | | | | | 200,000 | | | | 177,344 | |
3.700% | | | 06/01/2015 | | | | | | 100,000 | | | | 104,149 | |
3.200% | | | 02/01/2016 | | | | | | 200,000 | | | | 208,731 | |
Enterprise Products Operating LLC, Series D | |
6.875% | | | 03/01/2033 | | | | | | 150,000 | | | | 179,828 | |
EOG Resources, Inc. | |
4.100% | | | 02/01/2021 | | | | | | 300,000 | | | | 313,860 | |
Hess Corp. | |
7.300% | | | 08/15/2031 | | | | | | 250,000 | | | | 306,131 | |
Kinder Morgan Energy Partners LP | |
6.550% | | | 09/15/2040 | | | | | | 300,000 | | | | 332,524 | |
6.500% | | | 02/01/2037 | | | | | | 300,000 | | | | 329,764 | |
5.950% | | | 02/15/2018 | | | | | | 300,000 | | | | 341,234 | |
5.000% | | | 03/01/2043 | | | | | | 200,000 | | | | 185,270 | |
4.150% | | | 03/01/2022 | | | | | | 500,000 | | | | 497,214 | |
3.500% | | | 09/01/2023 | | | | | | 400,000 | | | | 368,011 | |
Magellan Midstream Partners LP | |
4.200% | | | 12/01/2042 | | | | | | 200,000 | | | | 169,724 | |
Marathon Oil Corp. | |
5.900% | | | 03/15/2018 | | | | | | 455,000 | | | | 518,223 | |
Nexen Energy ULC (Canada) | |
6.400% | | | 05/15/2037 | | | | | | 500,000 | | | | 570,978 | |
Noble Energy, Inc. | |
5.250% | | | 11/15/2043 | | | | | | 300,000 | | | | 300,882 | |
Occidental Petroleum Corp. | |
2.700% | | | 02/15/2023 | | | | | | 300,000 | | | | 275,186 | |
ONEOK Partners LP | |
6.150% | | | 10/01/2016 | | | | | | 160,000 | | | | 179,791 | |
3.375% | | | 10/01/2022 | | | | | | 300,000 | | | | 280,965 | |
Petrobras Global Finance BV (Netherlands) | |
4.375% | | | 05/20/2023 | | | | | | 400,000 | | | | 360,357 | |
Petro-Canada (Canada) | |
5.950% | | | 05/15/2035 | | | | | | 100,000 | | | | 108,651 | |
Phillips 66 | |
4.300% | | | 04/01/2022 | | | | | | 400,000 | | | | 407,188 | |
1.950% | | | 03/05/2015 | | | | | | 500,000 | | | | 507,112 | |
Pioneer Natural Resources Co. | |
3.950% | | | 07/15/2022 | | | | | | 200,000 | | | | 201,119 | |
Plains All American Pipeline LP/PAA Finance Corp. | |
4.300% | | | 01/31/2043 | | | | | | 200,000 | | | | 173,971 | |
3.950% | | | 09/15/2015 | | | | | | 300,000 | | | | 315,614 | |
2.850% | | | 01/31/2023 | | | | | | 400,000 | | | | 364,392 | |
Southern Natural Gas Co./Southern Natural Issuing Corp. | |
4.400% | | | 06/15/2021 | | | | | | 200,000 | | | | 205,894 | |
Statoil ASA (Norway) | |
5.100% | | | 08/17/2040 | | | | | | 300,000 | | | | 312,512 | |
3.150% | | | 01/23/2022 | | | | | | 500,000 | | | | 489,151 | |
2.650% | | | 01/15/2024 | | | | | | 300,000 | | | | 271,185 | |
1.150% | | | 05/15/2018 | | | | | | 300,000 | | | | 290,108 | |
Suncor Energy, Inc. (Canada) | |
7.150% | | | 02/01/2032 | | | | | | 500,000 | | | | 639,506 | |
Sunoco Logistics Partners Operations LP | |
4.950% | | | 01/15/2043 | | | | | | 200,000 | | | | 178,571 | |
3.450% | | | 01/15/2023 | | | | | | 200,000 | | | | 184,119 | |
Talisman Energy, Inc. (Canada) | |
6.250% | | | 02/01/2038 | | | | | | 300,000 | | | | 306,009 | |
Tennessee Gas Pipeline Co. LLC | |
7.000% | | | 10/15/2028 | | | | | | 350,000 | | | | 413,920 | |
| | | | | | | | | | | | | | |
| | | | | |
Coupon
Rate | |
| Maturity
Date |
| | | | | Face | | | | Value | |
Texas Eastern Transmission LP | |
7.000% | | | 07/15/2032 | | | | | $ | 150,000 | | | $ | 179,465 | |
Total Capital International SA (France) | |
3.700% | | | 01/15/2024 | | | | | | 250,000 | | | | 247,707 | |
2.875% | | | 02/17/2022 | | | | | | 400,000 | | | | 381,063 | |
Total Capital SA (France) | |
4.450% | | | 06/24/2020 | | | | | | 300,000 | | | | 327,255 | |
3.000% | | | 06/24/2015 | | | | | | 300,000 | | | | 310,857 | |
TransCanada PipeLines Ltd. (Canada) | |
5.850% | | | 03/15/2036 | | | | | | 500,000 | | | | 545,946 | |
3.750% | | | 10/16/2023 | | | | | | 400,000 | | | | 390,653 | |
Valero Energy Corp. | |
6.125% | | | 06/15/2017 | | | | | | 250,000 | | | | 285,273 | |
Western Gas Partners LP | |
2.600% | | | 08/15/2018 | | | | | | 250,000 | | | | 247,237 | |
Williams Cos., Inc. (The) | |
7.875% | | | 09/01/2021 | | | | | | 230,000 | | | | 265,606 | |
Williams Partners LP | |
6.300% | | | 04/15/2040 | | | | | | 100,000 | | | | 107,828 | |
5.250% | | | 03/15/2020 | | | | | | 100,000 | | | | 109,493 | |
4.500% | | | 11/15/2023 | | | | | | 350,000 | | | | 348,308 | |
3.800% | | | 02/15/2015 | | | | | | 100,000 | | | | 103,340 | |
| | | | | | | | | | | | | | |
| | | | | | | | | | | | | 27,641,354 | |
| | | | | | | | | | | | | | |
| Paper & Forest Products—0.0% | |
International Paper Co. | |
7.500% | | | 08/15/2021 | | | | | | 500,000 | | | | 613,869 | |
| | | | | | | | | | | | | | |
| Pharmaceuticals—0.9% | |
AbbVie, Inc. | |
4.400% | | | 11/06/2042 | | | | | | 300,000 | | | | 280,909 | |
2.900% | | | 11/06/2022 | | | | | | 300,000 | | | | 280,935 | |
2.000% | | | 11/06/2018 | | | | | | 300,000 | | | | 297,104 | |
1.750% | | | 11/06/2017 | | | | | | 300,000 | | | | 299,763 | |
1.200% | | | 11/06/2015 | | | | | | 300,000 | | | | 303,187 | |
AstraZeneca plc (United Kingdom) | |
5.900% | | | 09/15/2017 | | | | | | 250,000 | | | | 286,108 | |
4.000% | | | 09/18/2042 | | | | | | 300,000 | | | | 261,954 | |
Bristol-Myers Squibb Co. | |
5.875% | | | 11/15/2036 | | | | | | 155,000 | | | | 177,972 | |
5.450% | | | 05/01/2018 | | | | | | 250,000 | | | | 286,461 | |
3.250% | | | 08/01/2042 | | | | | | 200,000 | | | | 155,971 | |
Eli Lilly & Co. | |
6.770% | | | 01/01/2036 | | | | | | 250,000 | | | | 314,478 | |
GlaxoSmithKline Capital plc (United Kingdom) | |
2.850% | | | 05/08/2022 | | | | | | 300,000 | | | | 283,462 | |
0.750% | | | 05/08/2015 | | | | | | 300,000 | | | | 301,293 | |
GlaxoSmithKline Capital, Inc. | |
2.800% | | | 03/18/2023 | | | | | | 200,000 | | | | 185,599 | |
Johnson & Johnson | |
4.950% | | | 05/15/2033 | | | | | | 200,000 | | | | 215,864 | |
4.850% | | | 05/15/2041 | | | | | | 200,000 | | | | 210,298 | |
3.550% | | | 05/15/2021 | | | | | | 200,000 | | | | 208,417 | |
2.150% | | | 05/15/2016 | | | | | | 200,000 | | | | 206,845 | |
Merck & Co., Inc. | |
6.550% | | | 09/15/2037 | | | | | | 200,000 | | | | 250,199 | |
6.500% | | | 12/01/2033 | | | | | | 250,000 | | | | 312,632 | |
3.600% | | | 09/15/2042 | | | | | | 200,000 | | | | 166,351 | |
2.400% | | | 09/15/2022 | | | | | | 200,000 | | | | 183,040 | |
1.100% | | | 01/31/2018 | | | | | | 200,000 | | | | 194,591 | |
Merck Sharp & Dohme Corp. | |
4.750% | | | 03/01/2015 | | | | | | 350,000 | | | | 367,454 | |
Mylan, Inc. | |
5.400% | | | 11/29/2043 | | | | | | 250,000 | | | | 252,948 | |
1.350% | | | 11/29/2016 | | | | | | 250,000 | | | | 249,719 | |
See accompanying notes to financial statements
268
SCHEDULE OF INVESTMENTS—(Continued)
December 31, 2013
| | | | | | | | | | | | | | |
Vantagepoint Core
Bond Index Fund | | | | | | |
| | | | |
Coupon
Rate | | Maturity
Date | | | | | Face | | | Value | |
| CORPORATE OBLIGATIONS—(Continued) | |
Novartis Capital Corp. | |
2.900% | | | 04/24/2015 | | | | | $ | 200,000 | | | $ | 206,734 | |
Novartis Securities Investment Ltd. (Bermuda) | |
5.125% | | | 02/10/2019 | | | | | | 500,000 | | | | 566,828 | |
Perrigo Co. plc (Ireland) | |
2.300% | | | 11/08/2018 | | | ^ | | | 300,000 | | | | 296,446 | |
Pfizer, Inc. | |
5.350% | | | 03/15/2015 | | | | | | 500,000 | | | | 528,482 | |
3.000% | | | 06/15/2023 | | | | | | 1,000,000 | | | | 941,476 | |
Pharmacia Corp. | |
6.500% | | | 12/01/2018 | | | | | | 350,000 | | | | 421,114 | |
Sanofi (France) | |
2.625% | | | 03/29/2016 | | | | | | 400,000 | | | | 416,168 | |
Teva Pharmaceutical Finance Co. LLC | |
6.150% | | | 02/01/2036 | | | | | | 250,000 | | | | 274,690 | |
Teva Pharmaceutical Finance II BV / Teva Pharmaceutical Finance III LLC (Curacao) | |
3.000% | | | 06/15/2015 | | | | | | 300,000 | | | | 309,721 | |
Wyeth LLC | |
6.500% | | | 02/01/2034 | | | | | | 250,000 | | | | 306,950 | |
Zoetis, Inc. | |
4.700% | | | 02/01/2043 | | | | | | 200,000 | | | | 187,649 | |
3.250% | | | 02/01/2023 | | | | | | 300,000 | | | | 281,244 | |
1.150% | | | 02/01/2016 | | | | | | 300,000 | | | | 300,494 | |
| | | | | | | | | | | | | | |
| | | | | | | | | | | | | 11,571,550 | |
| | | | | | | | | | | | | | |
| Real Estate Investment Trusts (REITs)—0.7% | |
American Tower Corp. | |
4.500% | | | 01/15/2018 | | | | | | 500,000 | | | | 536,127 | |
3.500% | | | 01/31/2023 | | | | | | 400,000 | | | | 365,392 | |
AvalonBay Communities, Inc. MTN | |
2.850% | | | 03/15/2023 | | | | | | 300,000 | | | | 270,828 | |
Boston Properties LP | |
4.125% | | | 05/15/2021 | | | | | | 300,000 | | | | 307,448 | |
3.125% | | | 09/01/2023 | | | | | | 450,000 | | | | 411,866 | |
Brandywine Operating Partnership LP | |
3.950% | | | 02/15/2023 | | | | | | 300,000 | | | | 281,744 | |
Camden Property Trust | |
5.000% | | | 06/15/2015 | | | | | | 200,000 | | | | 211,460 | |
CubeSmart LP | |
4.375% | | | 12/15/2023 | | | | | | 300,000 | | | | 293,699 | |
DDR Corp. | |
4.625% | | | 07/15/2022 | | | | | | 200,000 | | | | 204,345 | |
Duke Realty LP | |
7.375% | | | 02/15/2015 | | | | | | 150,000 | | | | 160,487 | |
3.875% | | | 10/15/2022 | | | | | | 200,000 | | | | 190,433 | |
ERP Operating LP | |
5.375% | | | 08/01/2016 | | | | | | 500,000 | | | | 551,623 | |
3.000% | | | 04/15/2023 | | | | | | 200,000 | | | | 182,991 | |
Federal Realty Investment Trust | |
2.750% | | | 06/01/2023 | | | | | | 200,000 | | | | 180,099 | |
HCP, Inc. | |
4.250% | | | 11/15/2023 | | | | | | 400,000 | | | | 392,058 | |
HCP, Inc. MTN | |
6.700% | | | 01/30/2018 | | | | | | 250,000 | | | | 290,844 | |
Health Care REIT, Inc. | |
6.125% | | | 04/15/2020 | | | | | | 300,000 | | | | 338,092 | |
4.500% | | | 01/15/2024 | | | | | | 200,000 | | | | 197,865 | |
Hospitality Properties Trust | |
5.000% | | | 08/15/2022 | | | | | | 300,000 | | | | 305,376 | |
| | | | | | | | | | | | | | |
| | | | | |
Coupon
Rate | |
| Maturity
Date |
| | | | | Face | | | | Value | |
Host Hotels & Resorts LP | |
6.000% | | | 10/01/2021 | | | | | $ | 300,000 | | | $ | 327,142 | |
Kimco Realty Corp. | |
3.125% | | | 06/01/2023 | | | | | | 200,000 | | | | 182,243 | |
Liberty Property LP | |
3.375% | | | 06/15/2023 | | | | | | 300,000 | | | | 273,580 | |
Realty Income Corp. | |
5.875% | | | 03/15/2035 | | | | | | 200,000 | | | | 208,791 | |
Simon Property Group LP | |
4.750% | | | 03/15/2042 | | | | | | 400,000 | | | | 388,480 | |
4.375% | | | 03/01/2021 | | | | | | 400,000 | | | | 423,568 | |
2.800% | | | 01/30/2017 | | | | | | 500,000 | | | | 517,505 | |
Ventas Realty LP/Ventas Capital Corp. | |
4.250% | | | 03/01/2022 | | | | | | 400,000 | | | | 403,188 | |
Weyerhaeuser Co. | |
7.375% | | | 03/15/2032 | | | | | | 300,000 | | | | 368,088 | |
| | | | | | | | | | | | | | |
| | | | | | | | | | | | | 8,765,362 | |
| | | | | | | | | | | | | | |
| Road & Rail—0.4% | |
Burlington Northern Santa Fe LLC | |
5.650% | | | 05/01/2017 | | | | | | 500,000 | | | | 561,186 | |
5.150% | | | 09/01/2043 | | | | | | 350,000 | | | | 356,907 | |
3.450% | | | 09/15/2021 | | | | | | 200,000 | | | | 197,848 | |
Canadian National Railway Co. (Canada) | |
2.250% | | | 11/15/2022 | | | | | | 300,000 | | | | 269,468 | |
Canadian Pacific Railway Co. (Canada) | |
7.250% | | | 05/15/2019 | | | | | | 300,000 | | | | 363,728 | |
CSX Corp. | |
7.375% | | | 02/01/2019 | | | | | | 300,000 | | | | 364,359 | |
6.250% | | | 04/01/2015 | | | | | | 20,000 | | | | 21,383 | |
6.000% | | | 10/01/2036 | | | | | | 334,000 | | | | 367,007 | |
Norfolk Southern Corp. | |
5.900% | | | 06/15/2019 | | | | | | 300,000 | | | | 347,338 | |
4.800% | | | 08/15/2043 | | | | | | 350,000 | | | | 340,284 | |
3.250% | | | 12/01/2021 | | | | | | 200,000 | | | | 194,129 | |
Ryder System, Inc. MTN | |
3.150% | | | 03/02/2015 | | | | | | 300,000 | | | | 307,412 | |
2.350% | | | 02/26/2019 | | | | | | 400,000 | | | | 392,153 | |
Union Pacific Corp. | |
4.821% | | | 02/01/2044 | | | ^ | | | 557,000 | | | | 541,568 | |
| | | | | | | | | | | | | | |
| | | | | | | | | | | | | 4,624,770 | |
| | | | | | | | | | | | | | |
| Semiconductors & Semiconductor Equipment—0.1% | |
Intel Corp. | |
4.800% | | | 10/01/2041 | | | | | | 300,000 | | | | 293,677 | |
4.250% | | | 12/15/2042 | | | | | | 200,000 | | | | 177,459 | |
3.300% | | | 10/01/2021 | | | | | | 300,000 | | | | 298,554 | |
1.350% | | | 12/15/2017 | | | | | | 400,000 | | | | 395,714 | |
| | | | | | | | | | | | | | |
| | | | | | | | | | | | | 1,165,404 | |
| | | | | | | | | | | | | | |
| Software—0.3% | |
Microsoft Corp. | |
4.500% | | | 10/01/2040 | | | | | | 300,000 | | | | 286,074 | |
3.625% | | | 12/15/2023 | | | | | | 750,000 | | | | 752,698 | |
1.625% | | | 09/25/2015 | | | | | | 400,000 | | | | 408,506 | |
Oracle Corp. | |
5.750% | | | 04/15/2018 | | | | | | 500,000 | | | | 578,341 | |
5.375% | | | 07/15/2040 | | | | | | 500,000 | | | | 535,828 | |
5.250% | | | 01/15/2016 | | | | | | 500,000 | | | | 546,068 | |
2.500% | | | 10/15/2022 | | | | | | 400,000 | | | | 367,086 | |
| | | | | | | | | | | | | | |
| | | | | | | | | | | | | 3,474,601 | |
| | | | | | | | | | | | | | |
See accompanying notes to financial statements
269
SCHEDULE OF INVESTMENTS—(Continued)
December 31, 2013
| | | | | | | | | | | | | | |
Vantagepoint Core
Bond Index Fund | | | | | | |
| | | | |
Coupon
Rate | | Maturity
Date | | | | | Face | | | Value | |
| CORPORATE OBLIGATIONS—(Continued) | |
| Specialty Retail—0.2% | |
Gap, Inc. (The) | |
5.950% | | | 04/12/2021 | | | | | $ | 200,000 | | | $ | 221,324 | |
Home Depot, Inc. (The) | |
5.875% | | | 12/16/2036 | | | | | | 550,000 | | | | 636,756 | |
5.400% | | | 03/01/2016 | | | | | | 400,000 | | | | 438,982 | |
Lowe’s Cos., Inc. | |
5.800% | | | 04/15/2040 | | | | | | 300,000 | | | | 338,202 | |
5.400% | | | 10/15/2016 | | | | | | 400,000 | | | | 448,309 | |
| | | | | | | | | | | | | | |
| | | | | | | | | | | | | 2,083,573 | |
| | | | | | | | | | | | | | |
| Textiles, Apparel & Luxury Goods—0.0% | |
NIKE, Inc. | |
3.625% | | | 05/01/2043 | | | | | | 300,000 | | | | 252,732 | |
2.250% | | | 05/01/2023 | | | | | | 300,000 | | | | 268,793 | |
| | | | | | | | | | | | | | |
| | | | | | | | | | | | | 521,525 | |
| | | | | | | | | | | | | | |
| Thrifts & Mortgage Finance—0.0% | |
Abbey National Treasury Services plc (United Kingdom) | |
3.050% | | | 08/23/2018 | | | | | | 350,000 | | | | 360,024 | |
| | | | | | | | | | | | | | |
| Tobacco—0.2% | |
Altria Group, Inc. | |
9.950% | | | 11/10/2038 | | | | | | 97,000 | | | | 148,401 | |
9.250% | | | 08/06/2019 | | | | | | 524,000 | | | | 691,061 | |
Lorillard Tobacco Co. | |
6.875% | | | 05/01/2020 | | | | | | 300,000 | | | | 346,674 | |
Philip Morris International, Inc. | |
5.650% | | | 05/16/2018 | | | | | | 500,000 | | | | 574,825 | |
4.375% | | | 11/15/2041 | | | | | | 200,000 | | | | 182,990 | |
2.900% | | | 11/15/2021 | | | | | | 200,000 | | | | 191,263 | |
1.125% | | | 08/21/2017 | | | | | | 300,000 | | | | 294,350 | |
| | | | | | | | | | | | | | |
| | | | | | | | | | | | | 2,429,564 | |
| | | | | | | | | | | | | | |
| Trading Companies & Distributors—0.0% | |
Air Lease Corp. | |
3.375% | | | 01/15/2019 | | | | | | 200,000 | | | | 201,000 | |
GATX Corp. | |
4.750% | | | 06/15/2022 | | | | | | 300,000 | | | | 305,623 | |
| | | | | | | | | | | | | | |
| | | | | | | | | | | | | 506,623 | |
| | | | | | | | | | | | | | |
| Wireless Telecommunication Services—0.3% | |
America Movil SAB de CV (Mexico) | |
6.125% | | | 03/30/2040 | | | | | | 300,000 | | | | 320,435 | |
5.000% | | | 03/30/2020 | | | | | | 400,000 | | | | 435,225 | |
Rogers Communications, Inc. (Canada) | |
6.800% | | | 08/15/2018 | | | | | | 500,000 | | | | 596,521 | |
Telefonica Europe BV (Netherlands) | |
8.250% | | | 09/15/2030 | | | | | | 350,000 | | | | 418,547 | |
Vodafone Group plc (United Kingdom) | |
7.875% | | | 02/15/2030 | | | | | | 250,000 | | | | 313,835 | |
6.150% | | | 02/27/2037 | | | | | | 200,000 | | | | 217,443 | |
5.625% | | | 02/27/2017 | | | | | | 500,000 | | | | 559,751 | |
5.375% | | | 01/30/2015 | | | | | | 250,000 | | | | 262,367 | |
1.500% | | | 02/19/2018 | | | | | | 300,000 | | | | 292,787 | |
| | | | | | | | | | | | | | |
| | | | | | | | | | | | | 3,416,911 | |
| | | | | | | | | | | | | | |
| TOTAL CORPORATE OBLIGATIONS | |
(Cost $275,929,212) | | | | 290,504,993 | |
| | | | | | | | | | | | | | |
| | | | | | | | | | | | | | |
| | | | | |
Coupon
Rate | |
| Maturity
Date |
| | | | | Face | | | | Value | |
| MORTGAGE-BACKED SECURITIES—31.5% | |
| Commercial Mortgage-Backed Securities— 1.6% | |
Banc of America Commercial Mortgage Trust,
Series 2006-3, Class A4 | |
5.889% | | | 07/10/2044 | | | # | | $ | 497,212 | | | $ | 541,588 | |
Banc of America Commercial Mortgage Trust,
Series 2007-2, Class A2 | |
5.633% | | | 04/10/2049 | | | # | | | 121,186 | | | | 121,644 | |
Banc of America Commercial Mortgage Trust,
Series 2007-5, Class A4 | |
5.492% | | | 02/10/2051 | | | | | | 2,000,000 | | | | 2,188,406 | |
Banc of America Merrill Lynch Commercial Mortgage, Inc.,
Series 2005-6, Class A4 | |
5.184% | | | 09/10/2047 | | | # | | | 800,000 | | | | 852,169 | |
Banc of America Merrill Lynch Commercial Mortgage, Inc.,
Series 2005-6, Class AM | |
5.184% | | | 09/10/2047 | | | # | | | 1,000,000 | | | | 1,075,214 | |
Bear Stearns Commercial Mortgage Securities,
Series 2005-PWR8, Class A4 | |
4.674% | | | 06/11/2041 | | | | | | 718,308 | | | | 747,456 | |
Bear Stearns Commercial Mortgage Securities,
Series 2005-T20, Class A4A | |
5.138% | | | 10/12/2042 | | | # | | | 921,000 | | | | 978,585 | |
Bear Stearns Commercial Mortgage Securities,
Series 2006-T24, Class A4 | |
5.537% | | | 10/12/2041 | | | | | | 1,000,000 | | | | 1,094,119 | |
Citigroup/Deutsche Bank Commercial Mortgage Trust,
Series 2005-CD1, Class A4 | |
5.218% | | | 07/15/2044 | | | # | | | 900,000 | | | | 954,908 | |
Citigroup/Deutsche Bank Commercial Mortgage Trust,
Series 2007-CD4, Class A4 | |
5.322% | | | 12/11/2049 | | | | | | 1,000,000 | | | | 1,096,680 | |
GMAC Commercial Mortgage Securities, Inc.,
Series 2006-C1, Class AM | |
5.290% | | | 11/10/2045 | | | # | | | 750,000 | | | | 795,149 | |
Greenwich Capital Commercial Funding Corp.,
Series 2007-GG11, Class A4 | |
5.736% | | | 12/10/2049 | | | | | | 1,000,000 | | | | 1,118,643 | |
Greenwich Capital Commercial Funding Corp.,
Series 2007-GG9, Class A4 | |
5.444% | | | 03/10/2039 | | | | | | 1,000,000 | | | | 1,100,013 | |
GS Mortgage Securities Corp. II, Series 2006-GG6, Class A4 | |
5.553% | | | 04/10/2038 | | | # | | | 800,000 | | | | 862,134 | |
GS Mortgage Securities Corp. II, Series 2006-GG8, Class A4 | |
5.560% | | | 11/10/2039 | | | | | | 1,200,000 | | | | 1,317,113 | |
GS Mortgage Securities Corp. II, Series 2012-GCJ7, Class A4 | |
3.377% | | | 05/10/2045 | | | | | | 1,000,000 | | | | 995,635 | |
JP Morgan Chase Commercial Mortgage Securities Corp.,
Series 2005-LDP2, Class A4 | |
4.738% | | | 07/15/2042 | | | | | | 935,000 | | | | 974,596 | |
JP Morgan Chase Commercial Mortgage Securities Corp., Series 2007-CB20, Class A4 | |
5.794% | | | 02/12/2051 | | | # | | | 500,000 | | | | 561,391 | |
JP Morgan Chase Commercial Mortgage Securities Corp.,
Series 2007-LDPX, Class A3 | |
5.420% | | | 01/15/2049 | | | | | | 500,000 | | | | 549,326 | |
Merrill Lynch/Countrywide Commercial Mortgage Trust,
Series 2006-3, Class A4 | |
5.414% | | | 07/12/2046 | | | # | | | 749,135 | | | | 813,028 | |
Morgan Stanley Bank of America Merrill Lynch Trust,
Series 2012-C6, Class A4 | |
2.858% | | | 11/15/2045 | | | | | | 500,000 | | | | 471,673 | |
See accompanying notes to financial statements
270
SCHEDULE OF INVESTMENTS—(Continued)
December 31, 2013
| | | | | | | | | | | | | | |
Vantagepoint Core
Bond Index Fund | | | | | | |
| | | | |
Coupon
Rate | | Maturity
Date | | | | | Face | | | Value | |
| MORTGAGE-BACKED SECURITIES—(Continued) | |
UBS-Barclays Commercial Mortgage Trust,
Series 2012-C4, Class A5 | |
2.850% | | | 12/10/2045 | | | | | $ | 500,000 | | | $ | 467,663 | |
Wachovia Bank Commercial Mortgage Trust,
Series 2006-C27, Class AM | |
5.795% | | | 07/15/2045 | | | # | | | 1,000,000 | | | | 1,091,071 | |
| | | | | | | | | | | | | | |
| | | | | | | | | | | | | 20,768,204 | |
| | | | | | | | | | | | | | |
| U.S. Government Agency Mortgage-Backed Securities—29.9% | |
Federal Home Loan Mortgage Corp. | |
7.500% | | | 06/01/2027- | | | | | | | | | | | |
| | | 10/01/2029 | | | | | | 182,770 | | | | 209,222 | |
7.000% | | | 02/01/2016- | | | | | | | | | | | |
| | | 09/01/2036 | | | | | | 337,542 | | | | 368,325 | |
6.500% | | | 07/01/2014- | | | | | | | | | | | |
| | | 01/01/2039 | | | | | | 1,414,886 | | | | 1,577,986 | |
6.201% | | | 01/01/2037 | | | # | | | 76,891 | | | | 79,755 | |
6.000% | | | 11/01/2016- | | | | | | | | | | | |
| | | 10/01/2038 | | | | | | 3,870,489 | | | | 4,299,516 | |
5.711% | | | 01/01/2037 | | | # | | | 43,886 | | | | 46,387 | |
5.669% | | | 02/01/2037 | | | # | | | 142,798 | | | | 149,573 | |
5.500% | | | 02/01/2018- | | | | | | | | | | | |
| | | 08/01/2039 | | | | | | 6,552,678 | | | | 7,167,894 | |
5.000% | | | 08/01/2017- | | | | | | | | | | | |
| | | 04/01/2041 | | | | | | 9,634,039 | | | | 10,408,599 | |
4.500% | | | 08/01/2018- | | | | | | | | | | | |
| | | 08/01/2041 | | | | | | 13,407,579 | | | | 14,242,510 | |
4.000% | | | 05/01/2019- | | | | | | | | | | | |
| | | 03/01/2042 | | | | | | 11,966,987 | | | | 12,404,616 | |
3.500% | | | 10/01/2025- | | | | | | | | | | | |
| | | 12/01/2043 | | | | | | 10,446,706 | | | | 10,574,034 | |
3.441% | | | 06/01/2041 | | | # | | | 111,167 | | | | 117,578 | |
3.000% | | | 03/01/2027- | | | | | | | | | | | |
| | | 10/01/2043 | | | | | | 12,165,011 | | | | 11,819,612 | |
2.662% | | | 01/01/2042 | | | # | | | 274,583 | | | | 287,552 | |
2.500% | | | 08/01/2027- | | | | | | | | | | | |
| | | 01/15/2044 | | | | | | 5,162,780 | | | | 5,112,470 | |
2.463% | | | 10/01/2043 | | | # | | | 793,735 | | | | 800,814 | |
2.138% | | | 08/01/2043 | | | # | | | 892,636 | | | | 888,945 | |
Federal Home Loan Mortgage Corp. TBA | |
5.000% | | | 01/15/2044 | | | | | | 400,000 | | | | 431,438 | |
4.500% | | | 01/15/2029- | | | | | | | | | | | |
| | | 01/15/2044 | | | | | | 400,000 | | | | 423,152 | |
4.000% | | | 01/15/2029- | | | | | | | | | | | |
| | | 01/15/2044 | | | | | | 2,900,000 | | | | 2,987,672 | |
3.500% | | | 01/15/2029- | | | | | | | | | | | |
| | | 01/15/2044 | | | | | | 7,100,000 | | | | 7,026,625 | |
3.000% | | | 01/15/2029- | | | | | | | | | | | |
| | | 01/15/2044 | | | | | | 8,500,000 | | | | 8,182,140 | |
2.500% | | | 01/15/2029 | | | | | | 3,600,000 | | | | 3,567,797 | |
Federal National Mortgage Association | |
7.500% | | | 06/01/2030- | | | | | | | | | | | |
| | | 07/01/2031 | | | | | | 20,347 | | | | 22,224 | |
7.000% | | | 03/01/2030- | | | | | | | | | | | |
| | | 04/01/2038 | | | | | | 741,362 | | | | 819,075 | |
6.500% | | | 02/01/2017- | | | | | | | | | | | |
| | | 10/01/2039 | | | | | | 1,665,802 | | | | 1,869,837 | |
6.000% | | | 04/01/2014- | | | | | | | | | | | |
| | | 11/01/2039 | | | | | | 5,250,019 | | | | 5,844,470 | |
| | | | | | | | | | | | | | |
| | | | | |
Coupon
Rate | |
| Maturity
Date |
| | | | | Face | | | | Value | |
5.500% | | | 01/01/2018- | | | | | | | | | | | |
| | | 05/01/2040 | | | | | $ | 10,472,858 | | | $ | 11,531,114 | |
5.000% | | | 03/01/2018- | | | | | | | | | | | |
| | | 05/01/2041 | | | | | | 11,476,324 | | | | 12,480,763 | |
4.970% | | | 01/01/2037 | | | # | | | 324,438 | | | | 347,216 | |
4.500% | | | 03/01/2018- | | | | | | | | | | | |
| | | 11/01/2041 | | | | | | 20,128,050 | | | | 21,396,494 | |
4.000% | | | 08/01/2018- | | | | | | | | | | | |
| | | 03/01/2042 | | | | | | 21,309,067 | | | | 22,117,763 | |
3.605% | | | 08/01/2040 | | | # | | | 163,368 | | | | 172,264 | |
3.581% | | | 05/01/2041 | | | # | | | 234,075 | | | | 246,618 | |
3.500% | | | 10/01/2025- | | | | | | | | | | | |
| | | 12/01/2043 | | | | | | 23,193,061 | | | | 23,373,378 | |
3.476% | | | 02/01/2041 | | | # | | | 108,609 | | | | 112,719 | |
3.260% | | | 07/01/2040 | | | # | | | 337,982 | | | | 360,153 | |
3.143% | | | 06/01/2040 | | | # | | | 142,037 | | | | 150,626 | |
3.000% | | | 07/01/2027- | | | | | | | | | | | |
| | | 09/01/2043 | | | | | | 16,700,179 | | | | 16,121,702 | |
2.832% | | | 01/01/2042 | | | # | | | 524,735 | | | | 542,045 | |
2.722% | | | 12/01/2043 | | | # | | | 98,652 | | | | 101,335 | |
2.705% | | | 05/01/2035 | | | # | | | 192,356 | | | | 206,316 | |
2.701% | | | 02/01/2037 | | | # | | | 80,091 | | | | 85,494 | |
2.500% | | | 08/01/2027- | | | | | | | | | | | |
| | | 07/01/2033 | | | | | | 4,820,808 | | | | 4,771,325 | |
2.442% | | | 05/01/2035 | | | # | | | 335,624 | | | | 356,793 | |
2.392% | | | 10/01/2035 | | | # | | | 434,324 | | | | 459,477 | |
2.354% | | | 03/01/2037 | | | # | | | 1,479,534 | | | | 1,570,440 | |
Federal National Mortgage Association TBA | |
5.000% | | | 01/25/2029- | | | | | | | | | | | |
| | | 01/25/2044 | | | | | | 1,500,000 | | | | 1,617,149 | |
4.500% | | | 01/25/2029- | | | | | | | | | | | |
| | | 01/25/2044 | | | | | | 1,200,000 | | | | 1,271,414 | |
4.000% | | | 01/25/2044 | | | | | | 8,690,000 | | | | 8,947,984 | |
3.500% | | | 01/25/2029- | | | | | | | | | | | |
| | | 01/25/2044 | | | | | | 10,400,000 | | | | 10,370,856 | |
3.000% | | | 01/25/2029- | | | | | | | | | | | |
| | | 01/25/2044 | | | | | | 20,100,000 | | | | 19,485,930 | |
2.500% | | | 01/25/2029- | | | | | | | | | | | |
| | | 01/25/2044 | | | | | | 9,000,000 | | | | 8,825,235 | |
Government National Mortgage Association | |
7.500% | | | 12/15/2029- | | | | | | | | | | | |
| | | 05/15/2032 | | | | | | 278,246 | | | | 332,529 | |
6.500% | | | 03/15/2026- | | | | | | | | | | | |
| | | 01/15/2039 | | | | | | 1,054,651 | | | | 1,178,362 | |
6.000% | | | 02/15/2033- | | | | | | | | | | | |
| | | 12/15/2039 | | | | | | 2,367,729 | | | | 2,648,137 | |
5.500% | | | 01/15/2024- | | | | | | | | | | | |
| | | 07/20/2040 | | | | | | 4,105,361 | | | | 4,543,139 | |
5.000% | | | 05/15/2033- | | | | | | | | | | | |
| | | 11/20/2043 | | | | | | 10,079,448 | | | | 11,008,144 | |
4.500% | | | 04/20/2026- | | | | | | | | | | | |
| | | 05/20/2043 | | | | | | 15,166,235 | | | | 16,275,244 | |
4.000% | | | 08/15/2024- | | | | | | | | | | | |
| | | 03/20/2042 | | | | | | 10,565,256 | | | | 11,040,649 | |
3.500% | | | 12/15/2025- | | | | | | | | | | | |
| | | 04/20/2043 | | | | | | 13,197,923 | | | | 13,360,511 | |
3.500% | | | 12/20/2040- | | | | | | | | | | | |
| | | 05/20/2041 | | | # | | | 1,226,367 | | | | 1,289,800 | |
3.000% | | | 02/20/2041- | | | | | | | | | | | |
| | | 07/20/2042 | | | # | | | 1,660,397 | | | | 1,734,547 | |
3.000% | | | 04/15/2027- | | | | | | | | | | | |
| | | 10/20/2043 | | | | | | 7,619,615 | | | | 7,453,486 | |
2.500% | | | 12/20/2027- | | | | | | | | | | | |
| | | 07/20/2043 | | | | | | 898,833 | | | | 883,599 | |
See accompanying notes to financial statements
271
SCHEDULE OF INVESTMENTS—(Continued)
December 31, 2013
| | | | | | | | | | | | | | |
Vantagepoint Core
Bond Index Fund | | | | | | |
| | | | |
Coupon
Rate | | Maturity
Date | | | | | Face | | | Value | |
| MORTGAGE-BACKED SECURITIES—(Continued) | |
2.500% | | | 11/20/2040- | | | | | | | | | | | |
| | | 11/20/2043 | | | # | | $ | 1,072,143 | | | $ | 1,111,745 | |
2.000% | | | 10/20/2042- | | | | | | | | | | | |
| | | 06/20/2043 | | | # | | | 743,376 | | | | 770,685 | |
Government National Mortgage Association TBA | |
5.000% | | | 01/15/2044 | | | | | | 100,000 | | | | 108,371 | |
4.500% | | | 01/15/2044 | | | | | | 1,900,000 | | | | 2,031,961 | |
4.000% | | | 01/15/2044 | | | | | | 5,300,000 | | | | 5,512,207 | |
3.500% | | | 01/15/2044 | | | | | | 9,800,000 | | | | 9,888,633 | |
3.000% | | | 01/15/2044 | | | | | | 12,200,000 | | | | 11,789,985 | |
2.500% | | | 01/15/2044 | | | | | | 500,000 | | | | 459,121 | |
| | | | | | | | | | | | | | |
| | | | | | | | | | | | | 382,173,276 | |
| | | | | | | | | | | | | | |
| TOTAL MORTGAGE-BACKED SECURITIES | |
(Cost $398,837,427) | | | | 402,941,480 | |
| | | | | | | | | | | | | | |
| | | | | | | | | | | | | | | |
| U.S. TREASURY OBLIGATIONS—35.2% | |
| U.S. Treasury Bonds—4.7% | |
U.S. Treasury Bond | | | | | |
11.250% | | | 02/15/2015 | | | | | | 1,300,000 | | | | 1,460,875 | |
9.875% | | | 11/15/2015 | | | | | | 2,470,000 | | | | 2,908,183 | |
9.125% | | | 05/15/2018 | | | | | | 1,060,000 | | | | 1,406,819 | |
8.750% | | | 05/15/2017- | | | | | | | | | | | |
| | | 08/15/2020 | | | | | | 795,000 | | | | 1,094,736 | |
8.500% | | | 02/15/2020 | | | | | | 991,000 | | | | 1,359,258 | |
8.125% | | | 08/15/2019- | | | | | | | | | | | |
| | | 08/15/2021 | | | | | | 575,000 | | | | 779,537 | |
8.000% | | | 11/15/2021 | | | | | | 920,000 | | | | 1,278,369 | |
7.625% | | | 11/15/2022 | | | | | | 250,000 | | | | 346,592 | |
7.500% | | | 11/15/2016 | | | | | | 800,000 | | | | 953,750 | |
7.250% | | | 05/15/2016 | | | | | | 577,000 | | | | 668,419 | |
6.875% | | | 08/15/2025 | | | | | | 370,000 | | | | 503,951 | |
6.625% | | | 02/15/2027 | | | | | | 300,000 | | | | 405,492 | |
6.500% | | | 11/15/2026 | | | | | | 920,000 | | | | 1,229,207 | |
6.375% | | | 08/15/2027 | | | | | | 300,000 | | | | 398,461 | |
6.250% | | | 08/15/2023 | | | | | | 738,000 | | | | 948,330 | |
6.125% | | | 11/15/2027- | | | | | | | | | | | |
| | | 08/15/2029 | | | | | | 1,710,000 | | | | 2,228,244 | |
6.000% | | | 02/15/2026 | | | | | | 265,000 | | | | 338,434 | |
5.500% | | | 08/15/2028 | | | | | | 1,160,000 | | | | 1,430,335 | |
5.375% | | | 02/15/2031 | | | | | | 1,400,000 | | | | 1,716,313 | |
5.250% | | | 11/15/2028 | | | † | | | 860,000 | | | | 1,035,763 | |
4.750% | | | 02/15/2041 | | | | | | 2,120,000 | | | | 2,439,989 | |
4.625% | | | 02/15/2040 | | | | | | 1,470,000 | | | | 1,660,641 | |
4.500% | | | 02/15/2036 | | | | | | 1,250,000 | | | | 1,391,406 | |
4.375% | | | 11/15/2039- | | | | | | | | | | | |
| | | 05/15/2041 | | | | | | 5,560,000 | | | | 6,040,010 | |
4.250% | | | 05/15/2039- | | | | | | | | | | | |
| | | 11/15/2040 | | | | | | 3,330,000 | | | | 3,547,053 | |
3.875% | | | 08/15/2040 | | | | | | 1,730,000 | | | | 1,731,081 | |
3.750% | | | 08/15/2041- | | | | | | | | | | | |
| | | 11/15/2043 | | | | | | 4,540,000 | | | | 4,408,647 | |
3.500% | | | 02/15/2039 | | | | | | 1,540,000 | | | | 1,450,728 | |
3.125% | | | 11/15/2041- | | | | | | | | | | | |
| | | 02/15/2043 | | | | | | 7,980,000 | | | | 6,873,302 | |
3.000% | | | 05/15/2042 | | | | | | 1,581,000 | | | | 1,326,310 | |
2.875% | | | 05/15/2043 | | | | | | 3,175,000 | | | | 2,573,982 | |
2.750% | | | 08/15/2042- | | | | | | | | | | | |
| | | 11/15/2042 | | | | | | 5,573,000 | | | | 4,411,717 | |
| | | | | | | | | | | | | | |
| | | | | | | | | | | | | 60,345,934 | |
| | | | | | | | | | | | | | |
| | | | | | | | | | | | | | |
| | | | | |
Coupon
Rate | |
| Maturity
Date |
| | | | | Face | | | | Value | |
| U.S. Treasury Notes—30.5% | |
U.S. Treasury Note | | | | | |
5.125% | | | 05/15/2016 | | | | | $ | 330,000 | | | $ | 365,785 | |
4.875% | | | 08/15/2016 | | | | | | 1,050,000 | | | | 1,166,772 | |
4.750% | | | 08/15/2017 | | | | | | 529,000 | | | | 597,791 | |
4.625% | | | 11/15/2016 | | | | | | 1,520,000 | | | | 1,687,496 | |
4.500% | | | 02/15/2016 | | | | | | 1,360,000 | | | | 1,477,885 | |
4.250% | | | 08/15/2015- | | | | | | | | | | | |
| | | 11/15/2017 | | | | | | 2,530,000 | | | | 2,723,271 | |
4.125% | | | 05/15/2015 | | | | | | 1,070,000 | | | | 1,127,136 | |
4.000% | | | 02/15/2015 | | | | | | 1,626,000 | | | | 1,695,295 | |
3.875% | | | 05/15/2018 | | | | | | 500,000 | | | | 551,250 | |
3.625% | | | 08/15/2019- | | | | | | | | | | | |
| | | 02/15/2021 | | | | | | 11,000,000 | | | | 11,939,509 | |
3.500% | | | 02/15/2018- | | | | | | | | | | | |
| | | 05/15/2020 | | | | | | 4,891,000 | | | | 5,294,402 | |
3.375% | | | 11/15/2019 | | | | | | 1,495,000 | | | | 1,608,527 | |
3.250% | | | 05/31/2016- | | | | | | | | | | | |
| | | 03/31/2017 | | | | | | 8,990,000 | | | | 9,624,163 | |
3.125% | | | 10/31/2016- | | | | | | | | | | | |
| | | 05/15/2021 | | | | | | 10,015,000 | | | | 10,611,323 | |
3.000% | | | 08/31/2016- | | | | | | | | | | | |
| | | 02/28/2017 | | | | | | 4,947,000 | | | | 5,263,331 | |
2.875% | | | 03/31/2018 | | | | | | 1,060,000 | | | | 1,123,724 | |
2.750% | | | 11/30/2016- | | | | | | | | | | | |
| | | 02/28/2018 | | | | | | 4,830,000 | | | | 5,106,893 | |
2.750% | | | 11/15/2023 | | | † | | | 2,780,000 | | | | 2,719,838 | |
2.625% | | | 02/29/2016- | | | | | | | | | | | |
| | | 11/15/2020 | | | | | | 9,052,000 | | | | 9,343,043 | |
2.500% | | | 03/31/2015- | | | | | | | | | | | |
| | | 08/15/2023 | | | | | | 9,566,000 | | | | 9,504,722 | |
2.375% | | | 02/28/2015- | | | | | | | | | | | |
| | | 12/31/2020 | | | | | | 10,789,000 | | | | 11,088,890 | |
2.250% | | | 01/31/2015- | | | | | | | | | | | |
| | | 11/30/2017 | | | | | | 5,510,000 | | | | 5,680,818 | |
2.125% | | | 05/31/2015- | | | | | | | | | | | |
| | | 08/15/2021 | | | | | | 8,750,000 | | | | 8,869,944 | |
2.000% | | | 01/31/2016- | | | | | | | | | | | |
| | | 02/15/2023 | | | | | | 23,555,000 | | | | 22,870,087 | |
1.875% | | | 06/30/2015- | | | | | | | | | | | |
| | | 06/30/2020 | | | | | | 9,471,000 | | | | 9,561,775 | |
1.750% | | | 07/31/2015- | | | | | | | | | | | |
| | | 05/15/2023 | | | | | | 14,020,000 | | | | 13,315,667 | |
1.625% | | | 08/15/2022- | | | | | | | | | | | |
| | | 11/15/2022 | | | | | | 4,075,000 | | | | 3,681,749 | |
1.500% | | | 06/30/2016- | | | | | | | | | | | |
| | | 03/31/2019 | | | | | | 12,557,000 | | | | 12,557,792 | |
1.375% | | | 11/30/2015- | | | | | | | | | | | |
| | | 05/31/2020 | | | | | | 20,807,000 | | | | 20,381,023 | |
1.250% | | | 08/31/2015- | | | | | | | | | | | |
| | | 10/31/2019 | | | | | | 17,790,000 | | | | 17,637,860 | |
1.125% | | | 05/31/2019- | | | | | | | | | | | |
| | | 04/30/2020 | | | | | | 8,320,000 | | | | 7,843,070 | |
1.000% | | | 08/31/2016- | | | | | | | | | | | |
| | | 09/30/2019 | | | | | | 26,248,000 | | | | 25,747,464 | |
0.875% | | | 09/15/2016- | | | | | | | | | | | |
| | | 07/31/2019 | | | | | | 21,897,000 | | | | 21,774,583 | |
0.750% | | | 06/30/2017- | | | | | | | | | | | |
| | | 03/31/2018 | | | | | | 14,510,000 | | | | 14,201,010 | |
0.625% | | | 07/15/2016- | | | | | | | | | | | |
| | | 04/30/2018 | | | | | | 26,550,000 | | | | 26,179,498 | |
0.500% | | | 06/15/2016- | | | | | | | | | | | |
| | | 07/31/2017 | | | | | | 5,500,000 | | | | 5,444,922 | |
0.375% | | | 03/15/2015- | | | | | | | | | | | |
| | | 03/15/2016 | | | | | | 26,160,000 | | | | 26,181,566 | |
See accompanying notes to financial statements
272
SCHEDULE OF INVESTMENTS—(Continued)
December 31, 2013
| | | | | | | | | | | | | | |
Vantagepoint Core
Bond Index Fund | | | | | | |
| | | | |
Coupon
Rate | | Maturity
Date | | | | | Face | | | Value | |
| U.S. TREASURY OBLIGATIONS—(Continued) | |
0.250% | | | 01/15/2015- | | | | | | | | | | | |
| | | 05/15/2016 | | | | | $ | 50,448,000 | | | $ | 50,404,505 | |
0.125% | | | 04/30/2015 | | | | | | 3,000,000 | | | | 2,996,718 | |
| | | | | | | | | | | | | | |
| | | | | | | | | | | | | 389,951,097 | |
| | | | | | | | | | | | | | |
| TOTAL U.S. TREASURY OBLIGATIONS | |
(Cost $459,249,522) | | | | 450,297,031 | |
| | | | | | | | | | | | | | |
| | | | | | | | | | | | | | | |
| GOVERNMENT RELATED OBLIGATIONS—9.4% | |
| U.S. Government Agencies—3.8% | |
Federal Farm Credit Bank | | | | | |
4.875% | | | 12/16/2015 | | | | | | 1,245,000 | | | | 1,353,930 | |
0.730% | | | 08/15/2016 | | | | | | 100,000 | | | | 100,005 | |
0.540% | | | 11/07/2016 | | | | | | 300,000 | | | | 298,251 | |
Federal Home Loan Bank | | | | | |
5.500% | | | 07/15/2036 | | | | | | 500,000 | | | | 580,385 | |
4.875% | | | 09/08/2017 | | | | | | 1,250,000 | | | | 1,409,395 | |
4.750% | | | 12/16/2016 | | | | | | 1,000,000 | | | | 1,117,648 | |
2.875% | | | 06/12/2015 | | | | | | 900,000 | | | | 933,394 | |
1.625% | | | 06/14/2019 | | | | | | 1,000,000 | | | | 975,283 | |
1.250% | | | 02/28/2018 | | | | | | 300,000 | | | | 294,148 | |
0.450% | | | 12/28/2015 | | | | | | 250,000 | | | | 249,856 | |
0.375% | | | 06/24/2016 | | | | | | 500,000 | | | | 498,611 | |
Federal Home Loan Bank, Series 1 | | | | | |
1.000% | | | 06/21/2017 | | | | | | 1,500,000 | | | | 1,496,594 | |
Federal Home Loan Bank, Series 656 | | | | | |
5.375% | | | 05/18/2016 | | | | | | 900,000 | | | | 1,002,583 | |
Federal Home Loan Mortgage Corp. | | | | | |
6.250% | | | 07/15/2032 | | | | | | 650,000 | | | | 824,695 | |
5.500% | | | 07/18/2016 | | | | | | 1,000,000 | | | | 1,122,662 | |
5.125% | | | 11/17/2017 | | | | | | 800,000 | | | | 913,609 | |
4.875% | | | 06/13/2018 | | | | | | 1,000,000 | | | | 1,137,453 | |
4.750% | | | 11/17/2015 | | | | | | 1,000,000 | | | | 1,081,351 | |
4.500% | | | 01/15/2015 | | | | | | 350,000 | | | | 365,661 | |
4.375% | | | 07/17/2015 | | | | | | 1,400,000 | | | | 1,488,655 | |
3.750% | | | 03/27/2019 | | | | | | 500,000 | | | | 545,636 | |
2.875% | | | 02/09/2015 | | | | | | 1,000,000 | | | | 1,029,526 | |
2.375% | | | 01/13/2022 | | | | | | 1,000,000 | | | | 957,695 | |
2.250% | | | 03/13/2020 | | | | | | 450,000 | | | | 442,867 | |
2.000% | | | 08/25/2016 | | | | | | 1,500,000 | | | | 1,552,170 | |
1.250% | | | 05/12/2017- | | | | | | | | | | | |
| | | 08/01/2019 | | | | | | 2,000,000 | | | | 1,960,861 | |
1.200% | | | 06/12/2018 | | | | | | 200,000 | | | | 196,610 | |
0.950% | | | 10/17/2016 | �� | | | | | 500,000 | | | | 500,146 | |
0.700% | | | 09/27/2016 | | | | | | 280,000 | | | | 279,263 | |
0.500% | | | 04/17/2015- | | | | | | | | | | | |
| | | 01/28/2016 | | | | | | 1,300,000 | | | | 1,303,392 | |
0.420% | | | 09/18/2015 | | | | | | 700,000 | | | | 700,640 | |
0.320% | | | 04/29/2015 | | | | | | 510,000 | | | | 510,064 | |
Federal Home Loan Mortgage Corp. MTN | |
5.050% | | | 01/26/2015 | | | | | | 300,000 | | | | 315,550 | |
Federal National Mortgage Association | |
7.250% | | | 05/15/2030 | | | | | | 400,000 | | | | 550,549 | |
6.625% | | | 11/15/2030 | | | | | | 500,000 | | | | 652,185 | |
6.250% | | | 05/15/2029 | | | | | | 740,000 | | | | 930,136 | |
6.000% | | | 04/18/2036 | | | | | | 250,000 | | | | 273,965 | |
5.000% | | | 04/15/2015- | | | | | | | | | | | |
| | | 05/11/2017 | | | | | | 2,550,000 | | | | 2,785,463 | |
4.375% | | | 10/15/2015 | | | | | | 1,000,000 | | | | 1,070,965 | |
2.500% | | | 02/22/2023 | | | | | | 300,000 | | | | 274,436 | |
| | | | | | | | | | | | | | |
| | | | | |
Coupon
Rate | |
| Maturity
Date |
| | | | | Face | | | | Value | |
2.375% | | | 07/28/2015 | | | | | $ | 1,000,000 | | | $ | 1,032,006 | |
1.250% | | | 09/28/2016- | | | | | | | | | | | |
| | | 01/30/2017 | | | | | | 1,000,000 | | | | 1,013,878 | |
1.125% | | | 04/27/2017 | | | | | | 1,000,000 | | | | 1,004,707 | |
1.070% | | | 09/27/2017 | | | | | | 500,000 | | | | 494,564 | |
1.000% | | | 12/28/2017- | | | | | | | | | | | |
| | | 04/30/2018 | | | | | | 1,470,000 | | | | 1,433,715 | |
0.950% | | | 08/23/2017 | | | | | | 750,000 | | | | 742,099 | |
0.550% | | | 02/27/2015 | | | | | | 650,000 | | | | 650,409 | |
0.520% | | | 05/27/2016 | | | | | | 500,000 | | | | 498,978 | |
0.500% | | | 07/02/2015- | | | | | | | | | | | |
| | | 04/29/2016 | | | | | | 1,985,000 | | | | 1,985,483 | |
0.375% | | | 07/05/2016 | | | | | | 1,000,000 | | | | 993,688 | |
0.000% | | | 06/01/2017 | | | | | | 400,000 | | | | 381,957 | |
Federal National Mortgage Association, Series 1 | |
0.500% | | | 09/28/2015 | | | | | | 1,000,000 | | | | 1,002,200 | |
Financing Corp. Fico | |
8.600% | | | 09/26/2019 | | | | | | 500,000 | | | | 661,943 | |
Financing Corp. Fico, Series E | |
9.650% | | | 11/02/2018 | | | | | | 500,000 | | | | 676,220 | |
Israel Government AID Bond (Israel) | |
5.500% | | | 04/26/2024 | | | | | | 350,000 | | | | 405,193 | |
Tennessee Valley Authority | |
5.250% | | | 09/15/2039 | | | | | | 500,000 | | | | 535,585 | |
Tennessee Valley Authority, Series E | |
6.250% | | | 12/15/2017 | | | | | | 1,200,000 | | | | 1,421,298 | |
| | | | | | | | | | | | | | |
| | | | | | | | | | | | | 49,010,211 | |
| | | | | | | | | | | | | | |
| Non-U.S. Government Agencies—1.4% | |
Export Development Canada (Canada) | |
2.250% | | | 05/28/2015 | | | | | | 300,000 | | | | 308,195 | |
0.625% | | | 12/15/2016 | | | † | | | 350,000 | | | | 347,817 | |
Export-Import Bank of Korea (Korea, Republic of) | |
5.125% | | | 03/16/2015 | | | | | | 500,000 | | | | 526,009 | |
5.000% | | | 04/11/2022 | | | | | | 400,000 | | | | 436,197 | |
FMS Wertmanagement AoeR (Germany) | |
1.625% | | | 11/20/2018 | | | | | | 350,000 | | | | 345,853 | |
0.625% | | | 04/18/2016 | | | | | | 400,000 | | | | 396,078 | |
Japan Bank for International Cooperation (Japan) | |
2.500% | | | 05/18/2016 | | | | | | 400,000 | | | | 416,258 | |
1.750% | | | 07/31/2018 | | | | | | 500,000 | | | | 496,484 | |
Japan Bank for International Cooperation, Series DTC (Japan) | |
1.125% | | | 07/19/2017 | | | † | | | 500,000 | | | | 497,465 | |
KFW (Germany) | |
4.875% | | | 01/17/2017 | | | | | | 500,000 | | | | 559,600 | |
4.500% | | | 07/16/2018 | | | | | | 500,000 | | | | 560,481 | |
4.000% | | | 01/27/2020 | | | | | | 300,000 | | | | 327,104 | |
2.625% | | | 03/03/2015 | | | | | | 1,050,000 | | | | 1,078,819 | |
2.125% | | | 01/17/2023 | | | | | | 500,000 | | | | 460,031 | |
2.000% | | | 10/04/2022 | | | | | | 500,000 | | | | 458,823 | |
1.250% | | | 02/15/2017 | | | | | | 400,000 | | | | 404,176 | |
0.625% | | | 04/24/2015- | | | | | | | | | | | |
| | | 12/15/2016 | | | | | | 1,350,000 | | | | 1,352,581 | |
KFW MTN (Germany) | |
4.375% | | | 03/15/2018 | | | | | | 500,000 | | | | 556,683 | |
2.750% | | | 09/08/2020- | | | | | | | | | | | |
| | | 10/01/2020 | | | | | | 1,000,000 | | | | 1,009,488 | |
0.500% | | | 04/19/2016 | | | | | | 500,000 | | | | 494,465 | |
Korea Development Bank (The) (Korea, Republic of) | |
3.875% | | | 05/04/2017 | | | | | | 300,000 | | | | 316,959 | |
Korea Finance Corp. (Korea, Republic of) | |
2.875% | | | 08/22/2018 | | | | | | 350,000 | | | | 352,971 | |
Landwirtschaftliche Rentenbank (Germany) | |
5.125% | | | 02/01/2017 | | | | | | 300,000 | | | | 337,762 | |
See accompanying notes to financial statements
273
SCHEDULE OF INVESTMENTS—(Continued)
December 31, 2013
| | | | | | | | | | | | | | |
Vantagepoint Core
Bond Index Fund | | | | | | |
| | | | |
Coupon
Rate | | Maturity
Date | | | | | Face | | | Value | |
| GOVERNMENT RELATED OBLIGATIONS—(Continued) | |
Landwirtschaftliche Rentenbank, Series G13 (Germany) | |
4.875% | | | 11/16/2015 | | | | | $ | 750,000 | | | $ | 811,117 | |
Oesterreichische Kontrollbank AG (Austria) | |
2.000% | | | 06/03/2016 | | | | | | 300,000 | | | | 309,087 | |
Pemex Project Funding Master Trust | |
6.625% | | | 06/15/2035 | | | | | | 500,000 | | | | 528,750 | |
Petrobras International Finance Co. (Cayman Islands) | |
8.375% | | | 12/10/2018 | | | | | | 250,000 | | | | 294,463 | |
6.750% | | | 01/27/2041 | | | | | | 300,000 | | | | 280,630 | |
6.125% | | | 10/06/2016 | | | | | | 500,000 | | | | 544,031 | |
5.375% | | | 01/27/2021 | | | | | | 600,000 | | | | 598,433 | |
2.875% | | | 02/06/2015 | | | | | | 500,000 | | | | 508,751 | |
Petroleos Mexicanos (Mexico) | |
8.000% | | | 05/03/2019 | | | | | | 250,000 | | | | 303,750 | |
5.500% | | | 01/21/2021- | | | | | | | | | | | |
| | | 06/27/2044 | | | | | | 900,000 | | | | 907,000 | |
4.875% | | | 03/15/2015 | | | | | | 400,000 | | | | 420,800 | |
Svensk Exportkredit AB (Sweden) | |
5.125% | | | 03/01/2017 | | | | | | 500,000 | | | | 562,360 | |
| | | | | | | | | | | | | | |
| | | | | | | | | | | | | 18,109,471 | |
| | | | | | | | | | | | | | |
| Sovereign Debt—1.5% | |
Brazilian Government International Bond (Brazil) | |
11.000% | | | 08/17/2040 | | | | | | 260,000 | | | | 295,750 | |
10.125% | | | 05/15/2027 | | | | | | 435,000 | | | | 643,800 | |
8.875% | | | 04/15/2024 | | | | | | 400,000 | | | | 534,800 | |
7.875% | | | 03/07/2015 | | | | | | 455,000 | | | | 491,173 | |
7.125% | | | 01/20/2037 | | | | | | 460,000 | | | | 529,000 | |
5.875% | | | 01/15/2019 | | | | | | 500,000 | | | | 562,500 | |
4.875% | | | 01/22/2021 | | | | | | 200,000 | | | | 212,000 | |
Chile Government International Bond (Chile) | |
3.875% | | | 08/05/2020 | | | | | | 500,000 | | | | 522,500 | |
Colombia Government International Bond (Colombia) | |
11.750% | | | 02/25/2020 | | | | | | 200,000 | | | | 288,000 | |
8.125% | | | 05/21/2024 | | | | | | 200,000 | | | | 258,000 | |
7.375% | | | 09/18/2037 | | | | | | 200,000 | | | | 247,000 | |
Israel Government International Bond (Israel) | |
4.000% | | | 06/30/2022 | | | | | | 400,000 | | | | 416,748 | |
Mexico Government International Bond (Mexico) | |
6.050% | | | 01/11/2040 | | | | | | 500,000 | | | | 546,250 | |
3.625% | | | 03/15/2022 | | | † | | | 300,000 | | | | 300,750 | |
Mexico Government International Bond MTN (Mexico) | |
4.750% | | | 03/08/2044 | | | | | | 200,000 | | | | 181,250 | |
Panama Government International Bond (Panama) | |
6.700% | | | 01/26/2036 | | | | | | 288,000 | | | | 323,280 | |
5.200% | | | 01/30/2020 | | | | | | 300,000 | | | | 328,125 | |
Peruvian Government International Bond (Peru) | |
7.350% | | | 07/21/2025 | | | | | | 400,000 | | | | 506,000 | |
6.550% | | | 03/14/2037 | | | | | | 500,000 | | | | 577,500 | |
Philippine Government International Bond (Philippines) | |
10.625% | | | 03/16/2025 | | | | | | 600,000 | | | | 923,250 | |
9.500% | | | 02/02/2030 | | | | | | 600,000 | | | | 900,000 | |
9.375% | | | 01/18/2017 | | | | | | 200,000 | | | | 245,250 | |
8.875% | | | 03/17/2015 | | | | | | 200,000 | | | | 218,650 | |
6.500% | | | 01/20/2020 | | | | | | 300,000 | | | | 353,625 | |
5.000% | | | 01/13/2037 | | | | | | 500,000 | | | | 521,250 | |
Poland Government International Bond (Poland) | |
6.375% | | | 07/15/2019 | | | | | | 500,000 | | | | 585,625 | |
5.125% | | | 04/21/2021 | | | | | | 300,000 | | | | 326,625 | |
3.875% | | | 07/16/2015 | | | | | | 300,000 | | | | 314,640 | |
| | | | | | | | | | | | | | |
| | | | | |
Coupon
Rate | |
| Maturity
Date |
| | | | | Face | | | | Value | |
Republic of Finland (Finland) | |
6.950% | | | 02/15/2026 | | | | | $ | 150,000 | | | $ | 192,042 | |
Republic of Italy (Italy) | |
6.875% | | | 09/27/2023 | | | | | | 450,000 | | | | 537,923 | |
5.375% | | | 06/15/2033 | | | † | | | 500,000 | | | | 522,083 | |
Republic of Korea (Korea, Republic of) | |
3.875% | | | 09/11/2023 | | | | | | 250,000 | | | | 254,753 | |
South Africa Government International Bond (South Africa) | |
6.875% | | | 05/27/2019 | | | | | | 500,000 | | | | 574,375 | |
State of Israel (Israel) | |
5.500% | | | 11/09/2016 | | | | | | 300,000 | | | | 335,864 | |
Turkey Government International Bond (Turkey) | |
8.000% | | | 02/14/2034 | | | | | | 600,000 | | | | 669,000 | |
7.250% | | | 03/15/2015 | | | | | | 300,000 | | | | 317,970 | |
7.000% | | | 09/26/2016 | | | | | | 200,000 | | | | 220,000 | |
4.875% | | | 04/16/2043 | | | | | | 1,000,000 | | | | 770,500 | |
3.250% | | | 03/23/2023 | | | | | | 800,000 | | | | 662,000 | |
United Mexican States (Mexico) | |
8.125% | | | 12/30/2019 | | | † | | | 750,000 | | | | 1,000,125 | |
United Mexican States MTN (Mexico) | |
8.300% | | | 08/15/2031 | | | | | | 200,000 | | | | 271,000 | |
Uruguay Government International Bond (Uruguay) | |
8.000% | | | 11/18/2022 | | | | | | 330,815 | | | | 410,211 | |
6.875% | | | 09/28/2025 | | | | | | 100,000 | | | | 114,750 | |
4.125% | | | 11/20/2045 | | | | | | 200,000 | | | | 155,500 | |
| | | | | | | | | | | | | | |
| | | | | | | | | | | | | 19,161,437 | |
| | | | | | | | | | | | | | |
| Supranational—1.3% | |
African Development Bank | |
0.750% | | | 10/18/2016 | | | | | | 830,000 | | | | 832,357 | |
African Development Bank, Series GDIF | |
1.250% | | | 09/02/2016 | | | | | | 400,000 | | | | 404,865 | |
Asian Development Bank MTN | |
2.500% | | | 03/15/2016 | | | | | | 400,000 | | | | 416,575 | |
1.750% | | | 09/11/2018 | | | | | | 500,000 | | | | 500,643 | |
1.375% | | | 03/23/2020 | | | † | | | 300,000 | | | | 283,064 | |
1.125% | | | 03/15/2017 | | | | | | 500,000 | | | | 502,744 | |
Corp. Andina de Fomento | |
3.750% | | | 01/15/2016 | | | | | | 300,000 | | | | 313,409 | |
Council Of Europe Development Bank MTN | |
1.500% | | | 02/22/2017 | | | | | | 400,000 | | | | 405,390 | |
European Bank for Reconstruction & Development MTN | |
2.500% | | | 03/15/2016 | | | | | | 500,000 | | | | 520,816 | |
1.000% | | | 02/16/2017 | | | | | | 500,000 | | | | 501,565 | |
European Investment Bank | |
5.125% | | | 09/13/2016- | | | | | | | | | | | |
| | | 05/30/2017 | | | | | | 1,000,000 | | | | 1,124,204 | |
4.875% | | | 02/16/2016- | | | | | | | | | | | |
| | | 01/17/2017 | | | | | | 800,000 | | | | 882,025 | |
2.875% | | | 09/15/2020 | | | | | | 500,000 | | | | 504,992 | |
1.750% | | | 03/15/2017 | | | | | | 500,000 | | | | 511,683 | |
1.125% | | | 04/15/2015- | | | | | | | | | | | |
| | | 09/15/2017 | | | | | | 1,200,000 | | | | 1,204,963 | |
1.000% | | | 03/15/2018- | | | | | | | | | | | |
| | | 06/15/2018 | | | | | | 900,000 | | | | 876,837 | |
European Investment Bank MTN | |
1.625% | | | 09/01/2015 | | | † | | | 700,000 | | | | 714,853 | |
Inter-American Development Bank | |
2.250% | | | 07/15/2015 | | | | | | 200,000 | | | | 205,774 | |
1.750% | | | 08/24/2018 | | | | | | 400,000 | | | | 399,488 | |
1.375% | | | 10/18/2016 | | | | | | 300,000 | | | | 304,970 | |
1.125% | | | 03/15/2017 | | | | | | 500,000 | | | | 503,397 | |
Inter-American Development Bank MTN | |
3.875% | | | 02/14/2020 | | | | | | 400,000 | | | | 434,267 | |
0.875% | | | 11/15/2016 | | | | | | 500,000 | | | | 501,949 | |
See accompanying notes to financial statements
274
SCHEDULE OF INVESTMENTS—(Continued)
December 31, 2013
| | | | | | | | | | | | | | |
Vantagepoint Core
Bond Index Fund | | | | | | |
| | | | |
Coupon
Rate | | Maturity
Date | | | | | Face | | | Value | |
| GOVERNMENT RELATED OBLIGATIONS—(Continued) | |
International Bank for Reconstruction & Development | |
2.375% | | | 05/26/2015 | | | | | $ | 200,000 | | | $ | 205,837 | |
2.125% | | | 03/15/2016 | | | † | | | 500,000 | | | | 517,636 | |
1.125% | | | 07/18/2017 | | | † | | | 750,000 | | | | 750,730 | |
0.875% | | | 04/17/2017 | | | † | | | 700,000 | | | | 698,741 | |
International Finance Corp. | |
0.625% | | | 11/15/2016 | | | | | | 650,000 | | | | 646,357 | |
International Finance Corp. MTN | |
2.125% | | | 11/17/2017 | | | | | | 500,000 | | | | 514,095 | |
Nordic Investment Bank | |
2.500% | | | 07/15/2015 | | | | | | 500,000 | | | | 516,543 | |
| | | | | | | | | | | | | | |
| | | | | | | | | | | | | 16,700,769 | |
| | | | | | | | | | | | | | |
| U.S. Municipal Bonds—1.0% | |
American Municipal Power-Ohio, Inc. Revenue Bonds, Series 2010 B (Ohio) | |
7.499% | | | 02/15/2050 | | | | | | 200,000 | | | | 244,416 | |
Bay Area Toll Authority Revenue Bonds,
Series 2009 F-2 (California) | |
6.263% | | | 04/01/2049 | | | | | | 400,000 | | | | 480,124 | |
California General Obligation Bonds (California) | |
7.550% | | | 04/01/2039 | | | | | | 500,000 | | | | 647,235 | |
California State Public Works Board Revenue Bonds,
Series 2009 G-2 (California) | |
8.361% | | | 10/01/2034 | | | | | | 400,000 | | | | 489,084 | |
City of New York General Obligation Bonds (New York) | |
5.846% | | | 06/01/2040 | | | | | | 200,000 | | | | 218,818 | |
City of New York General Obligation Bonds,
Series 2010 C-1 (New York) | |
5.517% | | | 10/01/2037 | | | | | | 100,000 | | | | 104,676 | |
County of Cook Illinois General Obligation Bonds,
Series 2010 D (Illinois) | |
6.229% | | | 11/15/2034 | | | | | | 400,000 | | | | 401,564 | |
Dallas Area Rapid Transit Revenue Bonds, Series 2010 B (Texas) | |
5.022% | | | 12/01/2048 | | | | | | 300,000 | | | | 305,097 | |
Dallas Convention Center Hotel Development Corp. Revenue Bonds, Series 2009 B (Texas) | |
7.088% | | | 01/01/2042 | | | | | | 200,000 | | | | 226,370 | |
Dallas County Hospital District General Obligation Bonds,
Series 2009 C (Texas) | |
5.621% | | | 08/15/2044 | | | | | | 300,000 | | | | 328,773 | |
Dallas Independent School District General Obligation Bonds,
Series 2010 C (Texas) | |
6.450% | | | 02/15/2035 | | | | | | 300,000 | | | | 334,014 | |
Florida Hurricane Catastrophe Fund Finance Corp. Revenue Bonds, Series 2013 A (Florida) | |
2.107% | | | 07/01/2018 | | | | | | 200,000 | | | | 195,418 | |
Government Development Bank for Puerto Rico Revenue Bonds, Series 2011 B (Puerto Rico) | |
4.704% | | | 05/01/2016 | | | | | | 400,000 | | | | 328,192 | |
Illinois General Obligation Bonds (Illinois) | |
5.100% | | | 06/01/2033 | | | | | | 500,000 | | | | 464,970 | |
Los Angeles Unified School District General Obligation Bonds,
Series 2009 KRY (California) | |
5.755% | | | 07/01/2029 | | | | | | 200,000 | | | | 222,242 | |
5.750% | | | 07/01/2034 | | | | | | 300,000 | | | | 332,421 | |
Metropolitan Government of Nashville & Davidson County Authority General Obligation Bonds,
Series 2010 B (Tennessee) | |
5.707% | | | 07/01/2034 | | | | | | 300,000 | | | | 318,360 | |
| | | | | | | | | | | | | | |
| | | | | |
Coupon
Rate | |
| Maturity
Date |
| | | | | Face | | | | Value | |
Metropolitan Transportation Authority Revenue Bonds,
Series 2010 B-1 (New York) | |
6.648% | | | 11/15/2039 | | | | | $ | 300,000 | | | $ | 350,346 | |
6.548% | | | 11/15/2031 | | | | | | 200,000 | | | | 228,966 | |
Municipal Electric Authority of Georgia Revenue Bonds,
Series 2010 A (Georgia) | |
6.637% | | | 04/01/2057 | | | | | | 300,000 | | | | 315,642 | |
New Jersey Economic Development Authority Revenue Bonds,
Series 1997 A (New Jersey) | |
7.425% | | | 02/15/2029 | | | | | | 200,000 | | | | 241,480 | |
New Jersey State Turnpike Authority Revenue Bonds,
Series 2003 B (New Jersey) | |
4.252% | | | 01/01/2016 | | | | | | 25,000 | | | | 25,911 | |
New Jersey State Turnpike Authority Revenue Bonds,
Series 2010 A (New Jersey) | |
7.102% | | | 01/01/2041 | | | | | | 500,000 | | | | 637,220 | |
New York City Municipal Water Finance Authority Revenue Bonds, Series 2010 GG (New York) | |
5.724% | | | 06/15/2042 | | | | | | 300,000 | | | | 334,587 | |
New York State Dormitory Authority Revenue Bonds,
Series 2010 D (New York) | |
5.600% | | | 03/15/2040 | | | | | | 200,000 | | | | 219,820 | |
North Texas Tollway Authority Revenue Bonds,
Series 2010 B-2 (Texas) | |
8.910% | | | 02/01/2030 | | | | | | 200,000 | | | | 225,308 | |
Ohio State University General Obligation Bonds,
Series 2010 C (Ohio) | |
4.910% | | | 06/01/2040 | | | | | | 300,000 | | | | 300,870 | |
Oregon General Obligation Bonds (Oregon) | |
5.762% | | | 06/01/2023 | | | | | | 200,000 | | | | 232,042 | |
Oregon State Department of Transportation Revenue Bonds,
Series 2010 A (Oregon) | |
5.834% | | | 11/15/2034 | | | | | | 300,000 | | | | 339,717 | |
Port Authority of New York & New Jersey Revenue Bonds (New York) | |
6.040% | | | 12/01/2029 | | | | | | 255,000 | | | | 289,892 | |
4.458% | | | 10/01/2062 | | | | | | 200,000 | | | | 170,576 | |
San Francisco California City & County General Obligation Bonds (California) | |
6.000% | | | 11/01/2040 | | | | | | 200,000 | | | | 228,138 | |
State of California General Obligation Bonds (California) | |
7.625% | | | 03/01/2040 | | | | | | 600,000 | | | | 785,322 | |
State of Connecticut General Obligation Bonds,
Series 2008 A (Connecticut) | |
5.850% | | | 03/15/2032 | | | | | | 200,000 | | | | 223,272 | |
State of Georgia General Obligation Bonds,
Series 2009 H (Georgia) | |
4.503% | | | 11/01/2025 | | | | | | 300,000 | | | | 317,760 | |
State of Illinois General Obligation Bonds (Illinois) | |
4.961% | | | 03/01/2016 | | | | | | 300,000 | | | | 320,004 | |
State of Texas General Obligation Bonds, Series 2010 A (Texas) | |
4.681% | | | 04/01/2040 | | | | | | 300,000 | | | | 296,079 | |
State of Utah, Series 2010 B (Utah) | |
3.539% | | | 07/01/2025 | | | | | | 300,000 | | | | 294,288 | |
University of California Revenue Bonds,
Series 2009 R (California) | |
1.796% | | | 07/01/2019 | | | | | | 300,000 | | | | 288,651 | |
University of California Revenue Bonds,
Series 2010 H (California) | |
6.548% | | | 05/15/2048 | | | | | | 300,000 | | | | 350,220 | |
University of California Revenue Bonds,
Series 2013 AH (California) | |
5.770% | | | 05/15/2043 | | | | | | 200,000 | | | | 220,602 | |
| | | | | | | | | | | | | | |
| | | | | | | | | | | | | 12,878,487 | |
| | | | | | | | | | | | | | |
See accompanying notes to financial statements
275
SCHEDULE OF INVESTMENTS—(Continued)
December 31, 2013
| | | | | | | | | | | | | | |
Vantagepoint Core
Bond Index Fund | | | | | | |
| | | | |
Coupon
Rate | | Maturity
Date | | | | | Face | | | Value | |
| GOVERNMENT RELATED OBLIGATIONS—(Continued) | |
| Non-U.S. Regional Authority Bonds—0.4% | |
Hydro-Quebec, Series IO (Canada) | |
8.050% | | | 07/07/2024 | | | | | $ | 250,000 | | | $ | 333,621 | |
Province of British Columbia (Canada) | |
2.850% | | | 06/15/2015 | | | | | | 200,000 | | | | 207,264 | |
Province of Manitoba, Series FH (Canada) | |
4.900% | | | 12/06/2016 | | | | | | 500,000 | | | | 558,065 | |
Province of Nova Scotia (Canada) | |
2.375% | | | 07/21/2015 | | | | | | 300,000 | | | | 308,545 | |
Province of Ontario (Canada) | |
5.450% | | | 04/27/2016 | | | | | | 1,000,000 | | | | 1,107,111 | |
4.500% | | | 02/03/2015 | | | | | | 650,000 | | | | 679,308 | |
4.400% | | | 04/14/2020 | | | | | | 200,000 | | | | 219,743 | |
2.700% | | | 06/16/2015 | | | | | �� | 200,000 | | | | 206,652 | |
1.200% | | | 02/14/2018 | | | | | | 400,000 | | | | 392,672 | |
Province of Quebec (Canada) | |
4.600% | | | 05/26/2015 | | | | | | 500,000 | | | | 529,570 | |
2.750% | | | 08/25/2021 | | | | | | 300,000 | | | | 289,919 | |
Region of Lombardy (Italy) | |
5.804% | | | 10/25/2032 | | | | | | 100,000 | | | | 93,318 | |
| | | | | | | | | | | | | | |
| | | | | | | | | | | | | 4,925,788 | |
| | | | | | | | | | | | | | |
| TOTAL GOVERNMENT RELATED OBLIGATIONS | |
(Cost $120,358,229) | | | | 120,786,163 | |
| | | | | | | | | | | | | | |
| | | | | | | | | | | | | | | |
| ASSET-BACKED SECURITIES—0.4% | |
| Automobiles—0.1% | |
Ally Auto Receivables Trust
Series 2012-4, Class A3 | |
0.590% | | | 01/17/2017 | | | | | | 450,000 | | | | 450,491 | |
Ford Credit Auto Owner Trust
Series 2012-A, Class A4 | |
1.150% | | | 06/15/2017 | | | | | | 500,000 | | | | 503,823 | |
Honda Auto Receivables Owner Trust
Series 2012-4, Class A3 | |
0.520% | | | 08/18/2016 | | | | | | 250,000 | | | | 250,289 | |
Nissan Auto Receivables Owner Trust
Series 2012-A, Class A4 | |
1.000% | | | 07/16/2018 | | | | | | 450,000 | | | | 453,243 | |
| | | | | | | | | | | | | | |
| | | | | | | | | | | | | 1,657,846 | |
| | | | | | | | | | | | | | |
| Credit Card—0.2% | |
Capital One Multi-Asset Execution Trust
Series 2007-A7, Class A7 | |
5.750% | | | 07/15/2020 | | | | | | 1,500,000 | | | | 1,724,804 | |
Chase Issuance Trust
Series 2012-A8, Class A8 | |
0.540% | | | 10/16/2017 | | | | | | 200,000 | | | | 199,804 | |
Citibank Credit Card Issuance Trust
Series 2005-A5, Class A5 | |
4.550% | | | 06/20/2017 | | | | | | 500,000 | | | | 529,387 | |
| | | | | | | | | | | | | | |
| | | | | | | | | | | | | 2,453,995 | |
| | | | | | | | | | | | | | |
| Other—0.1% | |
CenterPoint Energy Restoration Bond Co. LLC
Series 2009-1, Class A2 | |
3.460% | | | 08/15/2019 | | | | | | 400,000 | | | | 425,618 | |
| | | | | | | | | | | | | | |
| TOTAL ASSET-BACKED SECURITIES | |
(Cost $4,528,457) | | | | | | | | | | 4,537,459 | |
| | | | | | | | | | | | | | |
| | | | | | | | | | | | |
| | | | | |
| | | | | | | | Shares | | | | Value | |
| MONEY MARKET FUNDS—9.3% | |
| Institutional Money Market Funds—9.3% | |
Dreyfus Institutional Cash Advantage Fund, 0.06% | | ††¥ | | | 1,500,000 | | | $ | 1,500,000 | |
Fidelity Institutional Money Market: Money Market Portfolio—Institutional Class, 0.07% | | ¥ | | | 110,471,922 | | | | 110,471,922 | |
Fidelity Institutional Money Market: Money Market Portfolio—Institutional Class, 0.07% | | ††¥ | | | 1,523,177 | | | | 1,523,177 | |
Fidelity Institutional Money Market: Prime Money Market Portfolio—Institutional Class, 0.04% | | ††¥ | | | 1,500,000 | | | | 1,500,000 | |
Short-Term Investments Trust Liquid Assets Portfolio—Institutional Class, 0.07% | | ††¥ | | | 1,500,000 | | | | 1,500,000 | |
Wells Fargo Advantage Cash Investment Money Market Fund—Select Class, 0.06% | | ††¥ | | | 1,500,000 | | | | 1,500,000 | |
Wells Fargo Advantage Heritage Money Market Fund—Select Class, 0.06% | | ††¥ | | | 1,500,000 | | | | 1,500,000 | |
| | | | | | | | | | | | |
| TOTAL MONEY MARKET FUNDS | |
(Cost $119,495,099) | | | | | | | 119,495,099 | |
| | | | | | | | | | | | |
| TOTAL INVESTMENTS—108.5% | |
(Cost $1,378,397,946) | | | | | | | 1,388,562,225 | |
Other assets less liabilities—(8.5%) | | | | (109,017,367 | ) |
| | | | | | | | | | | | |
| NET ASSETS—100.0% | | | | | | $ | 1,279,544,858 | |
| | | | | | | | | | | | |
Notes to the Schedule of Investments:
| | |
| MTN | | Medium Term Note |
| REIT | | Real Estate Investment Trust |
| TBA | | Security is subject to delayed delivery. |
| † | | Denotes all or a portion of the security on loan. |
| # | | Rate is subject to change. Rate shown reflects current rate. |
| ^ | | Securities are not registered under the Securities Act of 1933. These securities may be resold only in transactions exempt from registration, generally to qualified institutional buyers under Securities Act Rule 144A. Such securities are considered illiquid unless deemed liquid by a subadviser under the liquidity procedures adopted by the Board of Directors. The total market value of 144A securities was $2,388,914, which represents 0.2% of Net Assets. The illiquid 144A securities represented 0.2% of Net Assets, and 100.0% of total 144A securities held. |
| †† | | Represents reinvestment of collateral received in conjunction with securities lending. |
| ¥ | | The rate quoted is the annualized seven-day yield of the fund at period end. |
See accompanying notes to financial statements
276
SCHEDULE OF INVESTMENTS
December 31, 2013
| | | | | | | | | | | | |
Vantagepoint 500 Stock
Index Fund | | | | | | Shares | | | Value | |
| COMMON STOCKS—98.0% | |
| Aerospace & Defense—2.7% | |
Boeing Co. (The) | | | | | 27,158 | | | $ | 3,706,795 | |
General Dynamics Corp. | | | | | 13,151 | | | | 1,256,578 | |
Honeywell International, Inc. | | | | | 30,685 | | | | 2,803,689 | |
L-3 Communications Holdings, Inc. | | | | | 3,483 | | | | 372,193 | |
Lockheed Martin Corp. | | | | | 10,679 | | | | 1,587,540 | |
Northrop Grumman Corp. | | | | | 8,834 | | | | 1,012,465 | |
Precision Castparts Corp. | | | | | 5,670 | | | | 1,526,931 | |
Raytheon Co. | | | | | 12,693 | | | | 1,151,255 | |
Rockwell Collins, Inc. | | | | | 5,306 | | | | 392,220 | |
Textron, Inc. | | | | | 10,583 | | | | 389,031 | |
United Technologies Corp. | | | | | 33,035 | | | | 3,759,383 | |
| | | | | | | | | | | | |
| | | | | | | | | | | 17,958,080 | |
| | | | | | | | | | | | |
| Air Freight & Logistics—0.8% | |
C.H. Robinson Worldwide, Inc. | | | | | 6,138 | | | | 358,091 | |
Expeditors International of Washington, Inc. | | | | | 8,169 | | | | 361,478 | |
FedEx Corp. | | | | | 11,576 | | | | 1,664,282 | |
United Parcel Service, Inc., Class B | | | | | 28,202 | | | | 2,963,466 | |
| | | | | | | | | | | | |
| | | | | | | | | | | 5,347,317 | |
| | | | | | | | | | | | |
| Airlines—0.2% | |
Delta Air Lines, Inc. | | | | | 34,070 | | | | 935,903 | |
Southwest Airlines Co. | | | | | 27,222 | | | | 512,862 | |
| | | | | | | | | | | | |
| | | | | | | | | | | 1,448,765 | |
| | | | | | | | | | | | |
| Auto Components—0.4% | |
BorgWarner, Inc. | | | | | 9,040 | | | | 505,426 | |
Delphi Automotive plc (United Kingdom) | | | | | 10,907 | | | | 655,838 | |
Goodyear Tire & Rubber Co. (The) | | | | | 9,204 | | | | 219,515 | |
Johnson Controls, Inc. | | | | | 26,609 | | | | 1,365,042 | |
| | | | | | | | | | | | |
| | | | | | | | | | | 2,745,821 | |
| | | | | | | | | | | | |
| Automobiles—0.7% | |
Ford Motor Co. | | | | | 154,039 | | | | 2,376,822 | |
General Motors Co. | | * | | | 43,988 | | | | 1,797,789 | |
Harley-Davidson, Inc. | | | | | 8,600 | | | | 595,464 | |
| | | | | | | | | | | | |
| | | | | | | | | | | 4,770,075 | |
| | | | | | | | | | | | |
| Beverages—2.1% | |
Beam, Inc. | | | | | 6,449 | | | | 438,919 | |
Brown-Forman Corp., Class B | | | | | 6,560 | | | | 495,739 | |
Coca-Cola Co. (The) | | | | | 149,372 | | | | 6,170,557 | |
Coca-Cola Enterprises, Inc. | | | | | 9,508 | | | | 419,588 | |
Constellation Brands, Inc., Class A | | * | | | 6,689 | | | | 470,772 | |
Dr. Pepper Snapple Group, Inc. | | | | | 7,761 | | | | 378,116 | |
Molson Coors Brewing Co., Class B | | | | | 6,443 | | | | 361,774 | |
Monster Beverage Corp. | | * | | | 5,550 | | | | 376,124 | |
PepsiCo, Inc. | | | | | 60,405 | | | | 5,009,991 | |
| | | | | | | | | | | | |
| | | | | | | | | | | 14,121,580 | |
| | | | | | | | | | | | |
| Biotechnology—2.4% | |
Alexion Pharmaceuticals, Inc. | | * | | | 7,719 | | | | 1,027,090 | |
Amgen, Inc. | | | | | 29,479 | | | | 3,365,323 | |
Biogen Idec, Inc. | | * | | | 9,287 | | | | 2,598,038 | |
| | | | | | | | | | | | |
| | | | | |
| | | | | | | Shares | | | Value | |
Celgene Corp. | | * | | | 16,077 | | | $ | 2,716,370 | |
Gilead Sciences, Inc. | | * | | | 59,916 | | | | 4,502,687 | |
Regeneron Pharmaceuticals, Inc. | | * | | | 3,029 | | | | 833,702 | |
Vertex Pharmaceuticals, Inc. | | * | | | 9,259 | | | | 687,944 | |
| | | | | | | | | | | | |
| | | | | | | | | | | 15,731,154 | |
| | | | | | | | | | | | |
| Building Products—0.1% | |
Allegion plc (Ireland) | | * | | | 3,566 | | | | 157,582 | |
Masco Corp. | | | | | 13,673 | | | | 311,334 | |
| | | | | | | | | | | | |
| | | | | | | | | | | 468,916 | |
| | | | | | | | | | | | |
| Capital Markets—2.2% | |
Ameriprise Financial, Inc. | | | | | 7,757 | | | | 892,443 | |
Bank of New York Mellon Corp. (The) | | | | | 45,578 | | | | 1,592,495 | |
BlackRock, Inc. | | | | | 4,990 | | | | 1,579,185 | |
Charles Schwab Corp. (The) | | | | | 44,917 | | | | 1,167,842 | |
E*TRADE Financial Corp. | | * | | | 10,643 | | | | 209,029 | |
Franklin Resources, Inc. | | | | | 16,039 | | | | 925,931 | |
Goldman Sachs Group, Inc. (The) | | | | | 16,329 | | | | 2,894,479 | |
Invesco Ltd. | | | | | 17,068 | | | | 621,275 | |
Legg Mason, Inc. | | | | | 3,941 | | | | 171,355 | |
Morgan Stanley | | | | | 54,208 | | | | 1,699,963 | |
Northern Trust Corp. | | | | | 8,909 | | | | 551,378 | |
State Street Corp. | | | | | 17,424 | | | | 1,278,747 | |
T. Rowe Price Group, Inc. | | | | | 10,071 | | | | 843,648 | |
| | | | | | | | | | | | |
| | | | | | | | | | | 14,427,770 | |
| | | | | | | | | | | | |
| Chemicals—2.5% | |
Air Products & Chemicals, Inc. | | | | | 8,133 | | | | 909,107 | |
Airgas, Inc. | | | | | 2,476 | | | | 276,941 | |
CF Industries Holdings, Inc. | | | | | 2,202 | | | | 513,154 | |
Dow Chemical Co. (The) | | | | | 47,247 | | | | 2,097,767 | |
E.I. Du Pont de Nemours & Co. | | | | | 36,073 | | | | 2,343,663 | |
Eastman Chemical Co. | | | | | 6,152 | | | | 496,466 | |
Ecolab, Inc. | | | | | 10,774 | | | | 1,123,405 | |
FMC Corp. | | | | | 5,406 | | | | 407,937 | |
International Flavors & Fragrances, Inc. | | | | | 3,351 | | | | 288,119 | |
LyondellBasell Industries NV, Class A | | | | | 17,321 | | | | 1,390,530 | |
Monsanto Co. | | | | | 20,767 | | | | 2,420,394 | |
Mosaic Co. (The) | | | | | 13,601 | | | | 642,919 | |
PPG Industries, Inc. | | | | | 5,550 | | | | 1,052,613 | |
Praxair, Inc. | | | | | 11,681 | | | | 1,518,880 | |
Sherwin-Williams Co. (The) | | | | | 3,430 | | | | 629,405 | |
Sigma-Aldrich Corp. | | | | | 4,802 | | | | 451,436 | |
| | | | | | | | | | | | |
| | | | | | | | | | | 16,562,736 | |
| | | | | | | | | | | | |
| Commercial Banks—2.7% | |
BB&T Corp. | | | | | 27,897 | | | | 1,041,116 | |
Comerica, Inc. | | | | | 7,037 | | | | 334,539 | |
Fifth Third Bancorp | | | | | 34,254 | | | | 720,361 | |
Huntington Bancshares, Inc./Ohio | | | | | 31,006 | | | | 299,208 | |
KeyCorp | | | | | 35,171 | | | | 471,995 | |
M&T Bank Corp. | | | | | 5,252 | | | | 611,438 | |
PNC Financial Services Group, Inc. (The) | | | | | 20,724 | | | | 1,607,768 | |
Regions Financial Corp. | | | | | 54,720 | | | | 541,181 | |
SunTrust Banks, Inc. | | | | | 21,380 | | | | 786,998 | |
U.S. Bancorp/Minnesota | | | | | 71,916 | | | | 2,905,406 | |
Wells Fargo & Co. | | | | | 188,582 | | | | 8,561,623 | |
See accompanying notes to financial statements
277
SCHEDULE OF INVESTMENTS—(Continued)
December 31, 2013
| | | | | | | | | | | | |
Vantagepoint 500 Stock
Index Fund | | | | | | Shares | | | Value | |
| COMMON STOCKS—(Continued) | |
Zions Bancorporation | | | | | 6,864 | | | $ | 205,645 | |
| | | | | | | | | | | | |
| | | | | | | | | | | 18,087,278 | |
| | | | | | | | | | | | |
| Commercial Services & Supplies—0.5% | |
ADT Corp. (The) | | † | | | 8,210 | | | | 332,259 | |
Cintas Corp. | | | | | 4,181 | | | | 249,146 | |
Iron Mountain, Inc. | | | | | 6,801 | | | | 206,410 | |
Pitney Bowes, Inc. | | † | | | 8,116 | | | | 189,103 | |
Republic Services, Inc. | | | | | 10,984 | | | | 364,669 | |
Stericycle, Inc. | | * | | | 3,415 | | | | 396,720 | |
Tyco International Ltd. (Switzerland) | | | | | 18,500 | | | | 759,240 | |
Waste Management, Inc. | | | | | 17,174 | | | | 770,597 | |
| | | | | | | | | | | | |
| | | | | | | | | | | 3,268,144 | |
| | | | | | | | | | | | |
| Communications Equipment—1.7% | |
Cisco Systems, Inc. | | | | | 210,004 | | | | 4,714,590 | |
F5 Networks, Inc. | | * | | | 3,153 | | | | 286,482 | |
Harris Corp. | | | | | 4,033 | | | | 281,544 | |
Juniper Networks, Inc. | | * | | | 19,565 | | | | 441,582 | |
Motorola Solutions, Inc. | | | | | 9,124 | | | | 615,870 | |
QUALCOMM, Inc. | | | | | 66,534 | | | | 4,940,149 | |
| | | | | | | | | | | | |
| | | | | | | | | | | 11,280,217 | |
| | | | | | | | | | | | |
| Computers & Peripherals—4.0% | |
Apple, Inc. | | | | | 35,365 | | | | 19,843,655 | |
EMC Corp. | | | | | 81,280 | | | | 2,044,192 | |
Hewlett-Packard Co. | | | | | 75,947 | | | | 2,124,997 | |
NetApp, Inc. | | | | | 13,112 | | | | 539,428 | |
SanDisk Corp. | | | | | 9,056 | | | | 638,810 | |
Seagate Technology plc (Ireland) | | | | | 11,964 | | | | 671,898 | |
Western Digital Corp. | | | | | 8,419 | | | | 706,354 | |
| | | | | | | | | | | | |
| | | | | | | | | | | 26,569,334 | |
| | | | | | | | | | | | |
| Construction & Engineering—0.2% | |
Fluor Corp. | | | | | 6,454 | | | | 518,192 | |
Jacobs Engineering Group, Inc. | | * | | | 5,135 | | | | 323,454 | |
Quanta Services, Inc. | | * | | | 8,631 | | | | 272,394 | |
| | | | | | | | | | | | |
| | | | | | | | | | | 1,114,040 | |
| | | | | | | | | | | | |
| Construction Materials—0.0% | |
Vulcan Materials Co. | | | | | 5,181 | | | | 307,855 | |
| | | | | | | | | | | | |
| Consumer Finance—1.0% | |
American Express Co. | | | | | 36,281 | | | | 3,291,775 | |
Capital One Financial Corp. | | | | | 22,822 | | | | 1,748,393 | |
Discover Financial Services | | | | | 18,788 | | | | 1,051,189 | |
SLM Corp. | | | | | 17,698 | | | | 465,104 | |
| | | | | | | | | | | | |
| | | | | | | | | | | 6,556,461 | |
| | | | | | | | | | | | |
| Containers & Packaging—0.2% | |
Avery Dennison Corp. | | | | | 3,890 | | | | 195,239 | |
Ball Corp. | | | | | 5,864 | | | | 302,934 | |
Bemis Co., Inc. | | | | | 3,884 | | | | 159,089 | |
MeadWestvaco Corp. | | | | | 6,883 | | | | 254,189 | |
Owens-Illinois, Inc. | | * | | | 6,064 | | | | 216,970 | |
Sealed Air Corp. | | | | | 7,825 | | | | 266,441 | |
| | | | | | | | | | | | |
| | | | | | | | | | | 1,394,862 | |
| | | | | | | | | | | | |
| Distributors—0.1% | |
Genuine Parts Co. | | | | | 6,184 | | | | 514,447 | |
| | | | | | | | | | | | |
| | | | | | | | | | | | |
| | | | | |
| | | | | | | Shares | | | Value | |
| Diversified Consumer Services—0.1% | |
Graham Holdings Co., Class B | | * | | | 183 | | | $ | 121,388 | |
H&R Block, Inc. | | | | | 10,285 | | | | 298,676 | |
| | | | | | | | | | | | |
| | | | | | | | | | | 420,064 | |
| | | | | | | | | | | | |
| Diversified Financial Services—5.1% | |
Bank of America Corp. | | | | | 419,802 | | | | 6,536,317 | |
Berkshire Hathaway, Inc., Class B | | * | | | 70,558 | | | | 8,365,357 | |
Citigroup, Inc. | | | | | 119,153 | | | | 6,209,063 | |
CME Group, Inc. | | | | | 12,529 | | | | 983,025 | |
IntercontinentalExchange Group, Inc. | | | | | 4,546 | | | | 1,022,486 | |
JPMorgan Chase & Co. | | | | | 147,551 | | | | 8,628,783 | |
Leucadia National Corp. | | | | | 12,642 | | | | 358,274 | |
McGraw Hill Financial, Inc. | | | | | 10,839 | | | | 847,610 | |
Moody’s Corp. | | | | | 7,605 | | | | 596,764 | |
NASDAQ OMX Group, Inc. (The) | | | | | 4,812 | | | | 191,518 | |
| | | | | | | | | | | | |
| | | | | | | | | | | 33,739,197 | |
| | | | | | | | | | | | |
| Diversified Telecommunication Services—2.1% | |
AT&T, Inc. | | | 207,303 | | | | 7,288,773 | |
CenturyLink, Inc. | | | 23,678 | | | | 754,144 | |
Frontier Communications Corp. | | † | | | 37,781 | | | | 175,682 | |
Verizon Communications, Inc. | | | | | 112,109 | | | | 5,509,036 | |
Windstream Holdings, Inc. | | † | | | 24,372 | | | | 194,489 | |
| | | | | | | | | | | | |
| | | | | | | | | | | 13,922,124 | |
| | | | | | | | | | | | |
| Electric Utilities—1.6% | |
American Electric Power Co., Inc. | | | 19,414 | | | | 907,410 | |
Duke Energy Corp. | | | 27,557 | | | | 1,901,709 | |
Edison International | | | 13,140 | | | | 608,382 | |
Entergy Corp. | | | 7,068 | | | | 447,192 | |
Exelon Corp. | | | 34,157 | | | | 935,560 | |
FirstEnergy Corp. | | | 16,698 | | | | 550,700 | |
NextEra Energy, Inc. | | | 16,543 | | | | 1,416,412 | |
Northeast Utilities | | | 12,648 | | | | 536,149 | |
Pepco Holdings, Inc. | | | 10,620 | | | | 203,161 | |
Pinnacle West Capital Corp. | | | 4,394 | | | | 232,530 | |
PPL Corp. | | | 24,462 | | | | 736,062 | |
Southern Co. (The) | | | 34,054 | | | | 1,399,960 | |
Xcel Energy, Inc. | | | 19,996 | | | | 558,688 | |
| | | | | | | | | | | | |
| | | | | | | | | | | 10,433,915 | |
| | | | | | | | | | | | |
| Electrical Equipment—0.8% | |
AMETEK, Inc. | | | 9,582 | | | | 504,684 | |
Eaton Corp. plc (Ireland) | | | 18,452 | | | | 1,404,566 | |
Emerson Electric Co. | | | 27,841 | | | | 1,953,882 | |
Rockwell Automation, Inc. | | | 5,483 | | | | 647,871 | |
Roper Industries, Inc. | | | 3,816 | | | | 529,203 | |
| | | | | | | | | | | | |
| | | | | | | | | | | 5,040,206 | |
| | | | | | | | | | | | |
| Electronic Equipment, Instruments & Components—0.4% | |
Amphenol Corp., Class A | | | 6,116 | | | | 545,425 | |
Corning, Inc. | | | 57,573 | | | | 1,025,951 | |
FLIR Systems, Inc. | | | 5,744 | | | | 172,894 | |
Jabil Circuit, Inc. | | | 7,681 | | | | 133,957 | |
TE Connectivity Ltd. (Switzerland) | | | 16,300 | | | | 898,293 | |
| | | | | | | | | | | | |
| | | | | | | | | | | 2,776,520 | |
| | | | | | | | | | | | |
| Energy Equipment & Services—1.8% | |
Baker Hughes, Inc. | | | | | 17,648 | | | | 975,228 | |
Cameron International Corp. | | * | | | 9,557 | | | | 568,928 | |
See accompanying notes to financial statements
278
SCHEDULE OF INVESTMENTS—(Continued)
December 31, 2013
| | | | | | | | | | | | |
Vantagepoint 500 Stock
Index Fund | | | | | | Shares | | | Value | |
| COMMON STOCKS—(Continued) | |
Diamond Offshore Drilling, Inc. | | | | | 2,523 | | | $ | 143,609 | |
Ensco plc, Class A (United Kingdom) | | | | | 9,255 | | | | 529,201 | |
FMC Technologies, Inc. | | * | | | 9,425 | | | | 492,079 | |
Halliburton Co. | | | | | 33,530 | | | | 1,701,648 | |
Helmerich & Payne, Inc. | | | | | 4,270 | | | | 359,022 | |
Nabors Industries Ltd. (Bermuda) | | | | | 11,142 | | | | 189,303 | |
National Oilwell Varco, Inc. | | | | | 16,931 | | | | 1,346,522 | |
Noble Corp. plc (United Kingdom) | | | | | 10,355 | | | | 388,002 | |
Rowan Cos. plc, Class A | | * | | | 4,737 | | | | 167,500 | |
Schlumberger Ltd. | | | | | 51,823 | | | | 4,669,771 | |
Transocean Ltd. (Switzerland) | | | | | 13,175 | | | | 651,108 | |
| | | | | | | | | | | | |
| | | | | | | | | | | 12,181,921 | |
| | | | | | | | | | | | |
| Food & Staples Retailing—2.3% | |
Costco Wholesale Corp. | | | | | 17,052 | | | | 2,029,359 | |
CVS Caremark Corp. | | | | | 46,942 | | | | 3,359,639 | |
Kroger Co. (The) | | | | | 20,092 | | | | 794,237 | |
Safeway, Inc. | | | | | 9,150 | | | | 298,015 | |
Sysco Corp. | | | | | 23,192 | | | | 837,231 | |
Walgreen Co. | | | | | 33,944 | | | | 1,949,743 | |
Wal-Mart Stores, Inc. | | | | | 63,750 | | | | 5,016,488 | |
Whole Foods Market, Inc. | | | | | 14,453 | | | | 835,817 | |
| | | | | | | | | | | | |
| | | | | | | | | | | 15,120,529 | |
| | | | | | | | | | | | |
| Food Products—1.5% | |
Archer-Daniels-Midland Co. | | | | | 25,600 | | | | 1,111,040 | |
Campbell Soup Co. | | † | | | 7,028 | | | | 304,172 | |
ConAgra Foods, Inc. | | | | | 16,444 | | | | 554,163 | |
General Mills, Inc. | | | | | 24,983 | | | | 1,246,901 | |
Hershey Co. (The) | | | | | 5,760 | | | | 560,045 | |
Hormel Foods Corp. | | | | | 5,329 | | | | 240,711 | |
J.M. Smucker Co. (The) | | | | | 4,032 | | | | 417,796 | |
Kellogg Co. | | | | | 10,054 | | | | 613,998 | |
Kraft Foods Group, Inc. | | | | | 23,191 | | | | 1,250,459 | |
McCormick & Co., Inc. (Non-Voting Shares) | | | | | 5,067 | | | | 349,217 | |
Mead Johnson Nutrition Co. | | | | | 8,085 | | | | 677,199 | |
Mondelez International, Inc., Class A | | | | | 69,259 | | | | 2,444,843 | |
Tyson Foods, Inc., Class A | | | | | 11,046 | | | | 369,599 | |
| | | | | | | | | | | | |
| | | | | | | | | | | 10,140,143 | |
| | | | | | | | | | | | |
| Gas Utilities—0.1% | |
AGL Resources, Inc. | | | | | 4,393 | | | | 207,481 | |
ONEOK, Inc. | | | | | 7,967 | | | | 495,388 | |
| | | | | | | | | | | | |
| | | | | | | | | | | 702,869 | |
| | | | | | | | | | | | |
| Health Care Equipment & Supplies—2.0% | |
Abbott Laboratories | | | | | 60,702 | | | | 2,326,708 | |
Baxter International, Inc. | | | | | 21,515 | | | | 1,496,368 | |
Becton Dickinson and Co. | | | | | 7,523 | | | | 831,216 | |
Boston Scientific Corp. | | * | | | 52,793 | | | | 634,572 | |
C.R. Bard, Inc. | | | | | 3,176 | | | | 425,393 | |
CareFusion Corp. | | * | | | 8,194 | | | | 326,285 | |
Covidien plc (Ireland) | | | | | 18,199 | | | | 1,239,352 | |
DENTSPLY International, Inc. | | | | | 5,867 | | | | 284,432 | |
Edwards Lifesciences Corp. | | * | | | 4,230 | | | | 278,165 | |
Intuitive Surgical, Inc. | | * | | | 1,533 | | | | 588,795 | |
Medtronic, Inc. | | | | | 38,961 | | | | 2,235,972 | |
St. Jude Medical, Inc. | | | | | 11,316 | | | | 701,026 | |
| | | | | | | | | | | | |
| | | | | |
| | | | | | | Shares | | | Value | |
Stryker Corp. | | | | | 11,769 | | | $ | 884,323 | |
Varian Medical Systems, Inc. | | * | | | 4,052 | | | | 314,800 | |
Zimmer Holdings, Inc. | | | | | 6,717 | | | | 625,957 | |
| | | | | | | | | | | | |
| | | | | | | | | | | 13,193,364 | |
| | | | | | | | | | | | |
| Health Care Providers & Services—2.0% | |
Aetna, Inc. | | | | | 14,626 | | | | 1,003,197 | |
AmerisourceBergen Corp. | | | | | 9,001 | | | | 632,860 | |
Cardinal Health, Inc. | | | | | 13,371 | | | | 893,317 | |
Cigna Corp. | | | | | 11,007 | | | | 962,892 | |
DaVita HealthCare Partners, Inc. | | * | | | 7,118 | | | | 451,068 | |
Express Scripts Holding Co. | | * | | | 31,798 | | | | 2,233,492 | |
Humana, Inc. | | | | | 6,147 | | | | 634,493 | |
Laboratory Corp. of America Holdings | | * | | | 3,573 | | | | 326,465 | |
McKesson Corp. | | | | | 9,047 | | | | 1,460,186 | |
Patterson Cos., Inc. | | | | | 3,274 | | | | 134,889 | |
Quest Diagnostics, Inc. | | † | | | 5,946 | | | | 318,349 | |
Tenet Healthcare Corp. | | * | | | 4,228 | | | | 178,083 | |
UnitedHealth Group, Inc. | | | | | 39,767 | | | | 2,994,455 | |
WellPoint, Inc. | | | | | 11,748 | | | | 1,085,398 | |
| | | | | | | | | | | | |
| | | | | | | | | | | 13,309,144 | |
| | | | | | | | | | | | |
| Health Care Technology—0.1% | |
Cerner Corp. | | * | | | 11,559 | | | | 644,299 | |
| | | | | | | | | | | | |
| Hotels, Restaurants & Leisure—1.7% | |
Carnival Corp. | | | | | 17,489 | | | | 702,533 | |
Chipotle Mexican Grill, Inc. | | * | | | 1,236 | | | | 658,516 | |
Darden Restaurants, Inc. | | | | | 5,316 | | | | 289,031 | |
International Game Technology | | | | | 9,854 | | | | 178,949 | |
Marriott International, Inc., Class A | | | | | 8,867 | | | | 437,675 | |
McDonald’s Corp. | | | | | 39,131 | | | | 3,796,881 | |
Starbucks Corp. | | | | | 29,363 | | | | 2,301,765 | |
Starwood Hotels & Resorts Worldwide, Inc. | | | | | 7,688 | | | | 610,812 | |
Wyndham Worldwide Corp. | | | | | 5,296 | | | | 390,262 | |
Wynn Resorts Ltd. | | | | | 3,249 | | | | 630,988 | |
Yum! Brands, Inc. | | | | | 17,667 | | | | 1,335,802 | |
| | | | | | | | | | | | |
| | | | | | | | | | | 11,333,214 | |
| | | | | | | | | | | | |
| Household Durables—0.4% | |
D.R. Horton, Inc. | | * | | | 11,310 | | | | 252,439 | |
Garmin Ltd. (Switzerland) | | † | | | 4,380 | | | | 202,444 | |
Harman International Industries, Inc. | | | | | 2,804 | | | | 229,507 | |
Leggett & Platt, Inc. | | | | | 5,707 | | | | 176,575 | |
Lennar Corp., Class A | | | | | 6,984 | | | | 276,287 | |
Mohawk Industries, Inc. | | * | | | 2,173 | | | | 323,560 | |
Newell Rubbermaid, Inc. | | | | | 11,694 | | | | 379,002 | |
PulteGroup, Inc. | | | | | 13,136 | | | | 267,580 | |
Whirlpool Corp. | | | | | 3,145 | | | | 493,325 | |
| | | | | | | | | | | | |
| | | | | | | | | | | 2,600,719 | |
| | | | | | | | | | | | |
| Household Products—2.0% | |
Clorox Co. (The) | | | | | 5,204 | | | | 482,723 | |
Colgate-Palmolive Co. | | | | | 34,422 | | | | 2,244,659 | |
Kimberly-Clark Corp. | | | | | 15,113 | | | | 1,578,704 | |
Procter & Gamble Co. (The) | | | | | 106,930 | | | | 8,705,171 | |
| | | | | | | | | | | | |
| | | | | | | | | | | 13,011,257 | |
| | | | | | | | | | | | |
See accompanying notes to financial statements
279
SCHEDULE OF INVESTMENTS—(Continued)
December 31, 2013
| | | | | | | | | | | | |
Vantagepoint 500 Stock
Index Fund | | | | | | Shares | | | Value | |
| COMMON STOCKS—(Continued) | |
| Independent Power Producers & Energy Traders—0.1% | |
AES Corp. (The) | | | | | 24,364 | | | $ | 353,522 | |
NRG Energy, Inc. | | | | | 12,918 | | | | 371,005 | |
| | | | | | | | | | | | |
| | | | | | | | | | | 724,527 | |
| | | | | | | | | | | | |
| Industrial Conglomerates—2.5% | |
3M Co. | | | | | 25,220 | | | | 3,537,105 | |
Danaher Corp. | | | | | 23,719 | | | | 1,831,107 | |
General Electric Co. | | | | | 397,885 | | | | 11,152,716 | |
| | | | | | | | | | | | |
| | | | | | | | | | | 16,520,928 | |
| | | | | | | | | | | | |
| Insurance—3.0% | |
ACE Ltd. (Switzerland) | | | | | 13,500 | | | | 1,397,655 | |
Aflac, Inc. | | | | | 18,097 | | | | 1,208,880 | |
Allstate Corp. (The) | | | | | 18,106 | | | | 987,501 | |
American International Group, Inc. | | | | | 57,742 | | | | 2,947,729 | |
Aon plc (United Kingdom) | | | | | 11,930 | | | | 1,000,808 | |
Assurant, Inc. | | | | | 2,740 | | | | 181,854 | |
Chubb Corp. (The) | | | | | 10,024 | | | | 968,619 | |
Cincinnati Financial Corp. | | | | | 5,603 | | | | 293,429 | |
Genworth Financial, Inc., Class A | | * | | | 18,819 | | | | 292,259 | |
Hartford Financial Services Group, Inc. | | | | | 17,919 | | | | 649,205 | |
Lincoln National Corp. | | | | | 10,227 | | | | 527,918 | |
Loews Corp. | | | | | 11,798 | | | | 569,136 | |
Marsh & McLennan Cos., Inc. | | | | | 21,341 | | | | 1,032,051 | |
MetLife, Inc. | | | | | 43,741 | | | | 2,358,515 | |
Principal Financial Group, Inc. | | | | | 10,602 | | | | 522,785 | |
Progressive Corp. (The) | | | | | 21,341 | | | | 581,969 | |
Prudential Financial, Inc. | | | | | 18,329 | | | | 1,690,300 | |
Torchmark Corp. | | | | | 3,582 | | | | 279,933 | |
Travelers Cos., Inc. (The) | | | | | 14,445 | | | | 1,307,850 | |
Unum Group | | | | | 10,478 | | | | 367,568 | |
XL Group plc (Ireland) | | | | | 10,982 | | | | 349,667 | |
| | | | | | | | | | | | |
| | | | | | | | | | | 19,515,631 | |
| | | | | | | | | | | | |
| Internet & Catalog Retail—1.5% | |
Amazon.com, Inc. | | * | | | 14,493 | | | | 5,779,664 | |
Expedia, Inc. | | | | | 4,233 | | | | 294,871 | |
Netflix, Inc. | | * | | | 2,282 | | | | 840,164 | |
priceline.com, Inc. | | * | | | 2,011 | | | | 2,337,586 | |
TripAdvisor, Inc. | | * | | | 4,434 | | | | 367,268 | |
| | | | | | | | | | | | |
| | | | | | | | | | | 9,619,553 | |
| | | | | | | | | | | | |
| Internet Software & Services—3.1% | |
Akamai Technologies, Inc. | | * | | | 7,177 | | | | 338,611 | |
eBay, Inc. | | * | | | 45,547 | | | | 2,500,075 | |
Facebook, Inc., Class A | | * | | | 64,639 | | | | 3,533,168 | |
Google, Inc., Class A | | * | | | 10,969 | | | | 12,293,068 | |
VeriSign, Inc. | | * | | | 5,121 | | | | 306,133 | |
Yahoo!, Inc. | | * | | | 37,375 | | | | 1,511,445 | |
| | | | | | | | | | | | |
| | | | | | | | | | | 20,482,500 | |
| | | | | | | | | | | | |
| IT Services—3.6% | |
Accenture plc, Class A (Ireland) | | | | | 25,173 | | | | 2,069,724 | |
Alliance Data Systems Corp. | | * | | | 1,787 | | | | 469,856 | |
Automatic Data Processing, Inc. | | | | | 19,073 | | | | 1,541,289 | |
Cognizant Technology Solutions Corp., Class A | | * | | | 11,908 | | | | 1,202,470 | |
Computer Sciences Corp. | | | | | 5,934 | | | | 331,592 | |
| | | | | | | | | | | | |
| | | | | |
| | | | | | | Shares | | | Value | |
Fidelity National Information Services, Inc. | | | | | 11,570 | | | $ | 621,078 | |
Fiserv, Inc. | | * | | | 10,204 | | | | 602,546 | |
International Business Machines Corp. | | | | | 40,165 | | | | 7,533,749 | |
MasterCard, Inc., Class A | | | | | 4,057 | | | | 3,389,461 | |
Paychex, Inc. | | | | | 12,817 | | | | 583,558 | |
Teradata Corp. | | * | | | 6,621 | | | | 301,189 | |
Total System Services, Inc. | | | | | 6,301 | | | | 209,697 | |
Visa, Inc., Class A | | | | | 20,062 | | | | 4,467,406 | |
Western Union Co. (The) | | | | | 21,283 | | | | 367,132 | |
| | | | | | | | | | | | |
| | | | | | | | | | | 23,690,747 | |
| | | | | | | | | | | | |
| Leisure Equipment & Products—0.1% | |
Hasbro, Inc. | | | 4,823 | | | | 265,313 | |
Mattel, Inc. | | | 13,573 | | | | 645,804 | |
| | | | | | | | | | | | |
| | | | | | | | | | | 911,117 | |
| | | | | | | | | | | | |
| Life Sciences Tools & Services—0.5% | |
Agilent Technologies, Inc. | | | 13,021 | | | | 744,671 | |
Life Technologies Corp. | | * | | | 6,644 | | | | 503,615 | |
PerkinElmer, Inc. | | | 4,587 | | | | 189,122 | |
Thermo Fisher Scientific, Inc. | | | 14,042 | | | | 1,563,577 | |
Waters Corp. | | * | | | 3,407 | | | | 340,700 | |
| | | | | | | | | | | | |
| | | | | | | | | | | 3,341,685 | |
| | | | | | | | | | | | |
| Machinery—1.7% | |
Caterpillar, Inc. | | | | | 24,852 | | | | 2,256,810 | |
Cummins, Inc. | | | | | 6,877 | | | | 969,451 | |
Deere & Co. | | | | | 15,158 | | | | 1,384,380 | |
Dover Corp. | | | | | 6,829 | | | | 659,272 | |
Flowserve Corp. | | | | | 5,649 | | | | 445,311 | |
Illinois Tool Works, Inc. | | | | | 16,040 | | | | 1,348,643 | |
Ingersoll-Rand plc (Ireland) | | | | | 10,700 | | | | 659,120 | |
Joy Global, Inc. | | † | | | 4,192 | | | | 245,190 | |
PACCAR, Inc. | | | | | 13,712 | | | | 811,339 | |
Pall Corp. | | | | | 4,519 | | | | 385,697 | |
Parker Hannifin Corp. | | | | | 5,761 | | | | 741,095 | |
Pentair Ltd. (Registered) (Switzerland) | | | | | 7,664 | | | | 595,263 | |
Snap-on, Inc. | | | | | 2,151 | | | | 235,577 | |
Stanley Black & Decker, Inc. | | | | | 6,173 | | | | 498,099 | |
Xylem, Inc. | | | | | 6,916 | | | | 239,294 | |
| | | | | | | | | | | | |
| | | | | | | | | | | 11,474,541 | |
| | | | | | | | | | | | |
| Media—3.6% | |
Cablevision Systems Corp., Class A | | | | | 8,537 | | | | 153,068 | |
CBS Corp. (Non-Voting Shares), Class B | | | | | 22,135 | | | | 1,410,885 | |
Comcast Corp., Class A | | | | | 102,435 | | | | 5,323,035 | |
DIRECTV | | * | | | 19,386 | | | | 1,339,379 | |
Discovery Communications, Inc., Class A | | * | | | 9,039 | | | | 817,306 | |
Gannett Co., Inc. | | | | | 8,486 | | | | 251,016 | |
Interpublic Group of Cos., Inc. (The) | | | | | 15,943 | | | | 282,191 | |
News Corp., Class A | | * | | | 20,291 | | | | 365,644 | |
Omnicom Group, Inc. | | | | | 10,121 | | | | 752,699 | |
Scripps Networks Interactive, Inc., Class A | | | | | 4,374 | | | | 377,957 | |
Time Warner Cable, Inc. | | | | | 11,167 | | | | 1,513,128 | |
Time Warner, Inc. | | | | | 35,729 | | | | 2,491,026 | |
Twenty-First Century Fox, Inc., Class A | | | | | 77,464 | | | | 2,725,184 | |
See accompanying notes to financial statements
280
SCHEDULE OF INVESTMENTS—(Continued)
December 31, 2013
| | | | | | | | | | | | |
Vantagepoint 500 Stock
Index Fund | | | | | | Shares | | | Value | |
| COMMON STOCKS—(Continued) | |
Viacom, Inc., Class B | | | | | 15,931 | | | $ | 1,391,414 | |
Walt Disney Co. (The) | | | | | 64,373 | | | | 4,918,097 | |
| | | | | | | | | | | | |
| | | | | | | | | | | 24,112,029 | |
| | | | | | | | | | | | |
| Metals & Mining—0.5% | |
Alcoa, Inc. | | | | | 42,231 | | | | 448,916 | |
Allegheny Technologies, Inc. | | | | | 4,521 | | | | 161,083 | |
Cliffs Natural Resources, Inc. | | † | | | 5,496 | | | | 144,050 | |
Freeport-McMoRan Copper & Gold, Inc. | | | | | 41,116 | | | | 1,551,718 | |
Newmont Mining Corp. | | | | | 19,894 | | | | 458,159 | |
Nucor Corp. | | | | | 12,284 | | | | 655,720 | |
United States Steel Corp. | | † | | | 5,205 | | | | 153,547 | |
| | | | | | | | | | | | |
| | | | | | | | | | | 3,573,193 | |
| | | | | | | | | | | | |
| Multiline Retail—0.7% | |
Dollar General Corp. | | * | | | 11,785 | | | | 710,871 | |
Dollar Tree, Inc. | | * | | | 8,398 | | | | 473,815 | |
Family Dollar Stores, Inc. | | | | | 3,966 | | | | 257,671 | |
Kohl’s Corp. | | | | | 7,884 | | | | 447,417 | |
Macy’s, Inc. | | | | | 14,536 | | | | 776,223 | |
Nordstrom, Inc. | | | | | 5,484 | | | | 338,911 | |
Target Corp. | | | | | 25,023 | | | | 1,583,205 | |
| | | | | | | | | | | | |
| | | | | | | | | | | 4,588,113 | |
| | | | | | | | | | | | |
| Multi-Utilities—1.1% | |
Ameren Corp. | | | | | 9,760 | | | | 352,922 | |
CenterPoint Energy, Inc. | | | | | 17,012 | | | | 394,338 | |
CMS Energy Corp. | | | | | 10,742 | | | | 287,563 | |
Consolidated Edison, Inc. | | | | | 11,733 | | | | 648,600 | |
Dominion Resources, Inc. | | | | | 22,942 | | | | 1,484,118 | |
DTE Energy Co. | | | | | 6,968 | | | | 462,606 | |
Integrys Energy Group, Inc. | | | | | 2,985 | | | | 162,414 | |
NiSource, Inc. | | | | | 12,358 | | | | 406,331 | |
PG&E Corp. | | | | | 17,937 | | | | 722,502 | |
Public Service Enterprise Group, Inc. | | | | | 20,262 | | | | 649,195 | |
SCANA Corp. | | | | | 5,312 | | | | 249,292 | |
Sempra Energy | | | | | 8,800 | | | | 789,888 | |
TECO Energy, Inc. | | | | | 8,085 | | | | 139,385 | |
Wisconsin Energy Corp. | | | | | 8,687 | | | | 359,121 | |
| | | | | | | | | | | | |
| | | | | | | | | | | 7,108,275 | |
| | | | | | | | | | | | |
| Office Electronics—0.1% | |
Xerox Corp. | | | | | 44,862 | | | | 545,970 | |
| | | | | | | | | | | | |
| Oil, Gas & Consumable Fuels—8.2% | |
Anadarko Petroleum Corp. | | | | | 19,625 | | | | 1,556,655 | |
Apache Corp. | | | | | 15,829 | | | | 1,360,344 | |
Cabot Oil & Gas Corp. | | | | | 16,648 | | | | 645,276 | |
Chesapeake Energy Corp. | | | | | 19,874 | | | | 539,380 | |
Chevron Corp. | | | | | 75,650 | | | | 9,449,441 | |
ConocoPhillips | | | | | 47,863 | | | | 3,381,521 | |
CONSOL Energy, Inc. | | | | | 9,227 | | | | 350,995 | |
Denbury Resources, Inc. | | * | | | 14,441 | | | | 237,266 | |
Devon Energy Corp. | | | | | 14,809 | | | | 916,233 | |
EOG Resources, Inc. | | | | | 10,808 | | | | 1,814,015 | |
EQT Corp. | | | | | 5,795 | | | | 520,275 | |
Exxon Mobil Corp. | | | | | 171,730 | | | | 17,379,076 | |
Hess Corp. | | | | | 11,197 | | | | 929,351 | |
Kinder Morgan, Inc. | | | | | 26,143 | | | | 941,148 | |
Marathon Oil Corp. | | | | | 27,568 | | | | 973,150 | |
Marathon Petroleum Corp. | | | | | 11,970 | | | | 1,098,008 | |
| | | | | | | | | | | | |
| | | | | |
| | | | | | | Shares | | | Value | |
Murphy Oil Corp. | | | | | 7,132 | | | $ | 462,724 | |
Newfield Exploration Co. | | * | | | 5,063 | | | | 124,702 | |
Noble Energy, Inc. | | | | | 14,298 | | | | 973,837 | |
Occidental Petroleum Corp. | | | | | 31,522 | | | | 2,997,742 | |
Peabody Energy Corp. | | | | | 11,203 | | | | 218,795 | |
Phillips 66 | | | | | 23,722 | | | | 1,829,678 | |
Pioneer Natural Resources Co. | | | | | 5,379 | | | | 990,113 | |
QEP Resources, Inc. | | | | | 6,758 | | | | 207,133 | |
Range Resources Corp. | | | | | 6,462 | | | | 544,811 | |
Southwestern Energy Co. | | * | | | 14,099 | | | | 554,514 | |
Spectra Energy Corp. | | | | | 25,980 | | | | 925,408 | |
Tesoro Corp. | | | | | 5,437 | | | | 318,064 | |
Valero Energy Corp. | | | | | 20,987 | | | | 1,057,745 | |
Williams Cos., Inc. (The) | | | | | 27,048 | | | | 1,043,241 | |
WPX Energy, Inc. | | * | | | 7,464 | | | | 152,116 | |
| | | | | | | | | | | | |
| | | | | | | | | | | 54,492,757 | |
| | | | | | | | | | | | |
| Paper & Forest Products—0.1% | |
International Paper Co. | | | | | 17,645 | | | | 865,134 | |
| | | | | | | | | | | | |
| Personal Products—0.2% | |
Avon Products, Inc. | | | | | 17,240 | | | | 296,873 | |
Estee Lauder Cos., Inc. (The), Class A | | | | | 9,892 | | | | 745,065 | |
| | | | | | | | | | | | |
| | | | | | | | | | | 1,041,938 | |
| | | | | | | | | | | | |
| Pharmaceuticals—5.7% | |
AbbVie, Inc. | | | | | 62,012 | | | | 3,274,854 | |
Actavis plc | | * | | | 6,906 | | | | 1,160,208 | |
Allergan, Inc. | | | | | 11,540 | | | | 1,281,863 | |
Bristol-Myers Squibb Co. | | | | | 64,406 | | | | 3,423,179 | |
Eli Lilly & Co. | | | | | 38,705 | | | | 1,973,955 | |
Forest Laboratories, Inc. | | * | | | 9,553 | | | | 573,467 | |
Hospira, Inc. | | * | | | 6,375 | | | | 263,160 | |
Johnson & Johnson | | | | | 110,493 | | | | 10,120,054 | |
Merck & Co., Inc. | | | | | 114,651 | | | | 5,738,283 | |
Mylan, Inc. | | * | | | 14,738 | | | | 639,629 | |
Perrigo Co. plc | | † | | | 5,220 | | | | 801,061 | |
Pfizer, Inc. | | | | | 254,999 | | | | 7,810,619 | |
Zoetis, Inc. | | | | | 19,313 | | | | 631,342 | |
| | | | | | | | | | | | |
| | | | | | | | | | | 37,691,674 | |
| | | | | | | | | | | | |
| Professional Services—0.2% | |
Dun & Bradstreet Corp. (The) | | | | | 1,418 | | | | 174,059 | |
Equifax, Inc. | | | | | 4,544 | | | | 313,945 | |
Nielsen Holdings NV | | | | | 9,249 | | | | 424,437 | |
Robert Half International, Inc. | | | | | 5,337 | | | | 224,101 | |
| | | | | | | | | | | | |
| | | | | | | | | | | 1,136,542 | |
| | | | | | | | | | | | |
| Real Estate Investment Trusts (REITs)—1.8% | |
American Tower Corp. REIT | | | | | 15,367 | | | | 1,226,594 | |
Apartment Investment & Management Co., Class A REIT | | | | | 5,887 | | | | 152,532 | |
AvalonBay Communities, Inc. REIT | | | | | 4,694 | | | | 554,972 | |
Boston Properties, Inc. REIT | | | | | 6,026 | | | | 604,830 | |
Equity Residential REIT | | | | | 12,965 | | | | 672,495 | |
General Growth Properties, Inc. REIT | | | | | 21,732 | | | | 436,161 | |
HCP, Inc. REIT | | | | | 18,114 | | | | 657,900 | |
Health Care REIT, Inc. REIT | | | | | 11,533 | | | | 617,823 | |
Host Hotels & Resorts, Inc. REIT | | | | | 29,186 | | | | 567,376 | |
Kimco Realty Corp. REIT | | | | | 16,772 | | | | 331,247 | |
See accompanying notes to financial statements
281
SCHEDULE OF INVESTMENTS—(Continued)
December 31, 2013
| | | | | | | | | | | | |
Vantagepoint 500 Stock
Index Fund | | | | | | Shares | | | Value | |
| COMMON STOCKS—(Continued) | |
Macerich Co. (The) REIT | | | | | 5,462 | | | $ | 321,657 | |
Plum Creek Timber Co., Inc. REIT | | | | | 6,721 | | | | 312,594 | |
Prologis, Inc. REIT | | | | | 19,306 | | | | 713,357 | |
Public Storage REIT | | | | | 5,610 | | | | 844,417 | |
Simon Property Group, Inc. REIT | | | | | 12,114 | | | | 1,843,266 | |
Ventas, Inc. REIT | | | | | 11,718 | | | | 671,207 | |
Vornado Realty Trust REIT | | | | | 6,875 | | | | 610,431 | |
Weyerhaeuser Co. REIT | | | | | 23,306 | | | | 735,770 | |
| | | | | | | | | | | | |
| | | | | | | | | | | 11,874,629 | |
| | | | | | | | | | | | |
| Real Estate Management & Development—0.0% | |
CBRE Group, Inc., Class A | | * | | | 10,491 | | | | 275,913 | |
| | | | | | | | | | | | |
| Road & Rail—0.9% | |
CSX Corp. | | | | | 40,270 | | | | 1,158,568 | |
Kansas City Southern | | | | | 4,378 | | | | 542,128 | |
Norfolk Southern Corp. | | | | | 12,274 | | | | 1,139,395 | |
Ryder System, Inc. | | | | | 2,024 | | | | 149,331 | |
Union Pacific Corp. | | | | | 18,141 | | | | 3,047,688 | |
| | | | | | | | | | | | |
| | | | | | | | | | | 6,037,110 | |
| | | | | | | | | | | | |
| Semiconductors & Semiconductor Equipment—2.0% | |
Altera Corp. | | | | | 12,379 | | | | 402,689 | |
Analog Devices, Inc. | | | | | 12,190 | | | | 620,837 | |
Applied Materials, Inc. | | | | | 48,064 | | | | 850,252 | |
Broadcom Corp., Class A | | | | | 21,636 | | | | 641,507 | |
First Solar, Inc. | | *† | | | 2,927 | | | | 159,931 | |
Intel Corp. | | | | | 195,106 | | | | 5,064,952 | |
KLA-Tencor Corp. | | | | | 6,657 | | | | 429,110 | |
Lam Research Corp. | | * | | | 6,211 | | | | 338,189 | |
Linear Technology Corp. | | | | | 9,266 | | | | 422,066 | |
LSI Corp. | | | | | 22,124 | | | | 243,807 | |
Microchip Technology, Inc. | | † | | | 7,642 | | | | 341,980 | |
Micron Technology, Inc. | | * | | | 41,167 | | | | 895,794 | |
NVIDIA Corp. | | | | | 22,217 | | | | 355,916 | |
Texas Instruments, Inc. | | | | | 43,290 | | | | 1,900,864 | |
Xilinx, Inc. | | | | | 10,440 | | | | 479,405 | |
| | | | | | | | | | | | |
| | | | | | | | | | | 13,147,299 | |
| | | | | | | | | | | | |
| Software—3.4% | |
Adobe Systems, Inc. | | * | | | 18,455 | | | | 1,105,085 | |
Autodesk, Inc. | | * | | | 8,514 | | | | 428,510 | |
CA, Inc. | | | | | 13,070 | | | | 439,805 | |
Citrix Systems, Inc. | | * | | | 7,537 | | | | 476,715 | |
Electronic Arts, Inc. | | * | | | 12,404 | | | | 284,548 | |
Intuit, Inc. | | | | | 11,356 | | | | 866,690 | |
Microsoft Corp. | | | | | 297,225 | | | | 11,125,132 | |
Oracle Corp. | | | | | 138,219 | | | | 5,288,259 | |
Red Hat, Inc. | | * | | | 7,147 | | | | 400,518 | |
Salesforce.com, Inc. | | * | | | 21,330 | | | | 1,177,203 | |
Symantec Corp. | | | | | 27,973 | | | | 659,603 | |
| | | | | | | | | | | | |
| | | | | | | | | | | 22,252,068 | |
| | | | | | | | | | | | |
| Specialty Retail—2.2% | |
AutoNation, Inc. | | * | | | 2,537 | | | | 126,063 | |
AutoZone, Inc. | | * | | | 1,370 | | | | 654,778 | |
Bed Bath & Beyond, Inc. | | * | | | 8,417 | | | | 675,885 | |
Best Buy Co., Inc. | | | | | 10,320 | | | | 411,562 | |
CarMax, Inc. | | * | | | 9,072 | | | | 426,565 | |
GameStop Corp., Class A | | | | | 4,389 | | | | 216,202 | |
Gap, Inc. (The) | | | | | 10,732 | | | | 419,406 | |
| | | | | | | | | | | | | | |
| | | | | |
| | | | | | | | Shares | | | Value | |
Home Depot, Inc. (The) | | | | | | 55,476 | | | $ | 4,567,894 | |
L Brands, Inc. | | | | | | 9,527 | | | | 589,245 | |
Lowe’s Cos., Inc. | | | | | | 41,072 | | | | 2,035,118 | |
O’Reilly Automotive, Inc. | | | * | | | 4,183 | | | | 538,394 | |
PetSmart, Inc. | | | | | | 3,907 | | | | 284,234 | |
Ross Stores, Inc. | | | | | | 8,518 | | | | 638,254 | |
Staples, Inc. | | | | | | 25,425 | | | | 404,003 | |
Tiffany & Co. | | | | | | 4,464 | | | | 414,170 | |
TJX Cos., Inc. | | | | | | 28,140 | | | | 1,793,362 | |
Urban Outfitters, Inc. | | | * | | | 4,636 | | | | 171,996 | |
| | | | | | | | | | | | | | |
| | | | | | | | | | | | | 14,367,131 | |
| | | | | | | | | | | | | | |
| Textiles, Apparel & Luxury Goods—0.8% | |
Coach, Inc. | | | | | | 11,243 | | | | 631,070 | |
Fossil Group, Inc. | | | * | | | 1,891 | | | | 226,807 | |
Michael Kors Holdings Ltd. (Hong Kong) | | | * | | | 7,008 | | | | 568,979 | |
NIKE, Inc., Class B | | | | | | 29,216 | | | | 2,297,546 | |
PVH Corp. | | | | | | 3,149 | | | | 428,327 | |
Ralph Lauren Corp. | | | | | | 2,414 | | | | 426,240 | |
V.F. Corp. | | | | | | 14,048 | | | | 875,752 | |
| | | | | | | | | | | | | | |
| | | | | | | | | | | | | 5,454,721 | |
| | | | | | | | | | | | | | |
| Thrifts & Mortgage Finance—0.1% | |
Hudson City Bancorp, Inc. | | | | | | 17,847 | | | | 168,297 | |
People’s United Financial, Inc. | | | | | | 11,867 | | | | 179,429 | |
| | | | | | | | | | | | | | |
| | | | | | | | | | | | | 347,726 | |
| | | | | | | | | | | | | | |
| Tobacco—1.5% | |
Altria Group, Inc. | | | | | | 78,386 | | | | 3,009,239 | |
Lorillard, Inc. | | | | | | 14,722 | | | | 746,111 | |
Philip Morris International, Inc. | | | | | | 63,083 | | | | 5,496,422 | |
Reynolds American, Inc. | | | | | | 12,448 | | | | 622,275 | |
| | | | | | | | | | | | | | |
| | | | | | | | | | | | | 9,874,047 | |
| | | | | | | | | | | | | | |
| Trading Companies & Distributors—0.2% | |
Fastenal Co. | | | | | | 10,523 | | | | 499,948 | |
W.W. Grainger, Inc. | | | | | | 2,477 | | | | 632,675 | |
| | | | | | | | | | | | | | |
| | | | | | | | | | | | | 1,132,623 | |
| | | | | | | | | | | | | | |
| Wireless Telecommunication Services—0.1% | |
Crown Castle International Corp. | | | * | | | 12,917 | | | | 948,495 | |
| | | | | | | | | | | | | | |
| TOTAL COMMON STOCKS | |
(Cost $369,403,530) | | | | | | | | | | 648,392,953 | |
| | | | | | | | | | | | | | |
| | | | | | | | | | | | | | | |
| | | | |
Coupon
Rate | |
| Maturity
Date |
| | | | | Face | | | | Value | |
| U.S. TREASURY OBLIGATIONS—0.1% | |
| U.S. Treasury Bills—0.1% | |
U.S. Treasury Bill | | | | | | | | | | | |
0.072% | | | 06/26/2014 | | | ‡‡ | | $ | 20,000 | | | | 19,992 | |
0.072% | | | 03/27/2014 | | | ‡‡ | | | 705,000 | | | | 704,897 | |
| | | | | | | | | | | | | | |
| | | | | | | | | | | | | 724,889 | |
| | | | | | | | | | | | | | |
| TOTAL U.S. TREASURY OBLIGATIONS | |
(Cost $724,874) | | | | | | | | | | 724,889 | |
| | | | | | | | | | | | | | |
See accompanying notes to financial statements
282
SCHEDULE OF INVESTMENTS—(Continued)
December 31, 2013
| | | | | | | | | | | | |
Vantagepoint 500 Stock
Index Fund | | | | Shares | | | Value | |
| | | | | | | | | | | | |
| MONEY MARKET FUNDS—2.3% | |
| Institutional Money Market Funds—2.3% | |
Dreyfus Institutional Cash Advantage Fund, 0.06% | | ††¥ | | | 550,000 | | | $ | 550,000 | |
Fidelity Institutional Money Market: Money Market Portfolio—Institutional Class, 0.07% | | ¥ | | | 11,839,668 | | | | 11,839,668 | |
Fidelity Institutional Money Market: Money Market Portfolio—Institutional Class, 0.07% | | ††¥ | | | 429,674 | | | | 429,674 | |
Fidelity Institutional Money Market: Prime Money Market Portfolio—Institutional Class, 0.04% | | ††¥ | | | 550,000 | | | | 550,000 | |
Short-Term Investments Trust Liquid Assets Portfolio—Institutional Class, 0.07% | | ††¥ | | | 550,000 | | | | 550,000 | |
Wells Fargo Advantage Cash Investment Money Market Fund—Select Class, 0.06% | | ††¥ | | | 550,000 | | | | 550,000 | |
Wells Fargo Advantage Heritage Money Market Fund—Select Class, 0.06% | | ††¥ | | | 550,000 | | | | 550,000 | |
| | | | | | | | | | | | |
| TOTAL MONEY MARKET FUNDS | |
(Cost $15,019,342) | | | | | | | | | 15,019,342 | |
| | | | | | | | | | | | |
| TOTAL INVESTMENTS—100.4% | |
(Cost $385,147,746) | | | | | | | | | 664,137,184 | |
Other assets less liabilities—(0.4%) | | | | (2,349,753 | ) |
| | | | | | | | | | | | |
| NET ASSETS—100.0% | | | $ | 661,787,431 | |
| | | | | |
Notes to the Schedule of Investments:
| | |
| REIT | | Real Estate Investment Trust |
| * | | Non-income producing. |
| † | | Denotes all or a portion of the security on loan. |
| ‡‡ | | Security or a portion of the security has been pledged as collateral for futures contracts and/or options contracts. |
| †† | | Represents reinvestment of collateral received in conjunction with securities lending. |
| ¥ | | The rate quoted is the annualized seven-day yield of the fund at period end. |
See accompanying notes to financial statements
283
SCHEDULE OF INVESTMENTS
December 31, 2013
| | | | | | | | | | | | |
Vantagepoint Broad
Market Index Fund | | | | Shares | | | Value | |
| COMMON STOCKS—98.3% | | | | | |
| Aerospace & Defense—2.6% | |
AAR Corp. | | | | | 1,489 | | | $ | 41,707 | |
Alliant Techsystems, Inc. | | | | | 1,550 | | | | 188,604 | |
American Science & Engineering, Inc. | | | | | 435 | | | | 31,281 | |
B/E Aerospace, Inc. | | * | | | 4,159 | | | | 361,958 | |
Boeing Co. (The) | | | | | 27,728 | | | | 3,784,595 | |
Cubic Corp. | | | | | 476 | | | | 25,066 | |
Curtiss-Wright Corp. | | | | | 2,112 | | | | 131,430 | |
DigitalGlobe, Inc. | | * | | | 1,249 | | | | 51,396 | |
Engility Holdings, Inc. | | * | | | 622 | | | | 20,775 | |
Esterline Technologies Corp. | | * | | | 1,049 | | | | 106,956 | |
Exelis, Inc. | | | | | 4,977 | | | | 94,862 | |
GenCorp, Inc. | | *† | | | 1,629 | | | | 29,354 | |
General Dynamics Corp. | | | | | 11,394 | | | | 1,088,697 | |
HEICO Corp. | | | | | 3,163 | | | | 183,296 | |
Hexcel Corp. | | * | | | 4,757 | | | | 212,590 | |
Honeywell International, Inc. | | | | | 28,740 | | | | 2,625,974 | |
Huntington Ingalls Industries, Inc. | | | | | 1,577 | | | | 141,946 | |
Kratos Defense & Security Solutions, Inc. | | * | | | 832 | | | | 6,390 | |
L-3 Communications Holdings, Inc. | | | | | 2,864 | | | | 306,047 | |
Lockheed Martin Corp. | | | | | 9,381 | | | | 1,394,579 | |
Moog, Inc., Class A | | * | | | 1,446 | | | | 98,241 | |
National Presto Industries, Inc. | | *† | | | 535 | | | | 43,067 | |
Northrop Grumman Corp. | | | | | 7,805 | | | | 894,531 | |
Orbital Sciences Corp. | | * | | | 2,123 | | | | 49,466 | |
Precision Castparts Corp. | | | | | 5,732 | | | | 1,543,627 | |
Raytheon Co. | | | | | 12,251 | | | | 1,111,166 | |
Rockwell Collins, Inc. | | | | | 5,705 | | | | 421,714 | |
Spirit Aerosystems Holdings, Inc., Class A | | * | | | 7,021 | | | | 239,276 | |
Taser International, Inc. | | * | | | 2,292 | | | | 36,397 | |
Teledyne Technologies, Inc. | | * | | | 1,228 | | | | 112,804 | |
Textron, Inc. | | | | | 12,971 | | | | 476,814 | |
TransDigm Group, Inc. | | | | | 2,305 | | | | 371,151 | |
Triumph Group, Inc. | | | | | 1,644 | | | | 125,059 | |
United Technologies Corp. | | | | | 33,445 | | | | 3,806,041 | |
| | | | | | | | | | | | |
| | | | | | | | | | | 20,156,857 | |
| | | | | | | | | | | | |
| Air Freight & Logistics—0.7% | |
Atlas Air Worldwide Holdings, Inc. | | * | | | 600 | | | | 24,690 | |
C.H. Robinson Worldwide, Inc. | | | | | 6,357 | | | | 370,867 | |
Expeditors International of Washington, Inc. | | | | | 7,178 | | | | 317,627 | |
FedEx Corp. | | | | | 11,246 | | | | 1,616,837 | |
Forward Air Corp. | | | | | 1,431 | | | | 62,835 | |
Hub Group, Inc., Class A | | * | | | 2,400 | | | | 95,712 | |
Pacer International, Inc. | | * | | | 1,664 | | | | 13,745 | |
United Parcel Service, Inc., Class B | | | | | 26,404 | | | | 2,774,532 | |
UTi Worldwide, Inc. | | | | | 2,208 | | | | 38,773 | |
| | | | | | | | | | | | |
| | | | | | | | | | | 5,315,618 | |
| | | | | | | | | | | | |
| | | | | | | | | | | | |
| | | | |
| | | | |
|
Shares |
| | | Value | |
| Airlines—0.4% | |
Alaska Air Group, Inc. | | | | | 2,686 | | | $ | 197,072 | |
American Airlines Group, Inc. | | * | | | 8,660 | | | | 218,665 | |
Copa Holdings SA, Class A (Panama) | | | | | 1,841 | | | | 294,762 | |
Delta Air Lines, Inc. | | | | | 32,014 | | | | 879,424 | |
JetBlue Airways Corp. | | * | | | 6,414 | | | | 54,840 | |
SkyWest, Inc. | | | | | 2,390 | | | | 35,444 | |
Southwest Airlines Co. | | | | | 26,758 | | | | 504,121 | |
Spirit Airlines, Inc. | | * | | | 3,308 | | | | 150,216 | |
United Continental Holdings, Inc. | | * | | | 12,259 | | | | 463,758 | |
| | | | | | | | | | | | |
| | | | | | | | | | | 2,798,302 | |
| | | | | | | | | | | | |
| Auto Components—0.5% | |
American Axle & Manufacturing Holdings, Inc. | | * | | | 2,113 | | | | 43,211 | |
BorgWarner, Inc. | | | | | 8,218 | | | | 459,468 | |
Cooper Tire & Rubber Co. | | | | | 3,066 | | | | 73,707 | |
Dana Holding Corp. | | | | | 5,645 | | | | 110,755 | |
Delphi Automotive plc (United Kingdom) | | | | | 12,145 | | | | 730,279 | |
Drew Industries, Inc. | | | | | 2,820 | | | | 144,384 | |
Fuel Systems Solutions, Inc. | | * | | | 769 | | | | 10,666 | |
Gentex Corp. | | | | | 6,594 | | | | 217,536 | |
Gentherm, Inc. | | * | | | 2,107 | | | | 56,489 | |
Goodyear Tire & Rubber Co. (The) | | | | | 7,281 | | | | 173,652 | |
Johnson Controls, Inc. | | | | | 24,673 | | | | 1,265,725 | |
Lear Corp. | | | | | 3,353 | | | | 271,492 | |
Modine Manufacturing Co. | | * | | | 1,208 | | | | 15,487 | |
Shiloh Industries, Inc. | | * | | | 1,441 | | | | 28,099 | |
Superior Industries International, Inc. | | | | | 1,102 | | | | 22,734 | |
Tenneco, Inc. | | * | | | 1,600 | | | | 90,512 | |
TRW Automotive Holdings Corp. | | * | | | 3,548 | | | | 263,936 | |
Visteon Corp. | | * | | | 3,044 | | | | 249,273 | |
| | | | | | | | | | | | |
| | | | | | | | | | | 4,227,405 | |
| | | | | | | | | | | | |
| Automobiles—0.6% | |
Ford Motor Co. | | | | | 142,848 | | | | 2,204,145 | |
General Motors Co. | | * | | | 30,714 | | | | 1,255,281 | |
Harley-Davidson, Inc. | | | | | 7,622 | | | | 527,747 | |
Tesla Motors, Inc. | | *† | | | 3,137 | | | | 471,742 | |
Thor Industries, Inc. | | | | | 1,221 | | | | 67,436 | |
Winnebago Industries, Inc. | | * | | | 1,432 | | | | 39,308 | |
| | | | | | | | | | | | |
| | | | | | | | | | | 4,565,659 | |
| | | | | | | | | | | | |
| Beverages—1.7% | |
Beam, Inc. | | | | | 4,803 | | | | 326,892 | |
Boston Beer Co., Inc. (The), Class A | | *† | | | 609 | | | | 147,250 | |
Brown-Forman Corp., Class B | | | | | 5,077 | | | | 383,669 | |
Coca-Cola Bottling Co. Consolidated | | | | | 437 | | | | 31,984 | |
Coca-Cola Co. (The) | | | | | 144,066 | | | | 5,951,366 | |
Coca-Cola Enterprises, Inc. | | | | | 8,850 | | | | 390,551 | |
Constellation Brands, Inc., Class A | | * | | | 6,550 | | | | 460,989 | |
See accompanying notes to financial statements
284
SCHEDULE OF INVESTMENTS—(Continued)
December 31, 2013
| | | | | | | | | | | | |
Vantagepoint Broad
Market Index Fund | | | | Shares | | | Value | |
| COMMON STOCKS—(Continued) | | | | | |
Dr. Pepper Snapple Group, Inc. | | | | | 7,323 | | | $ | 356,777 | |
Molson Coors Brewing Co., Class B | | | | | 6,229 | | | | 349,758 | |
Monster Beverage Corp. | | * | | | 5,360 | | | | 363,247 | |
PepsiCo, Inc. | | | | | 58,219 | | | | 4,828,684 | |
| | | | | | | | | | | | |
| | | | | | | | | | | 13,591,167 | |
| | | | | | | | | | | | |
| Biotechnology—2.4% | |
ACADIA Pharmaceuticals, Inc. | | *† | | | 1,825 | | | | 45,607 | |
Acorda Therapeutics, Inc. | | * | | | 674 | | | | 19,681 | |
Aegerion Pharmaceuticals, Inc. | | *† | | | 1,499 | | | | 106,369 | |
Alexion Pharmaceuticals, Inc. | | * | | | 6,664 | | | | 886,712 | |
Alkermes plc (Ireland) | | * | | | 3,579 | | | | 145,522 | |
Alnylam Pharmaceuticals, Inc. | | * | | | 2,390 | | | | 153,749 | |
AMAG Pharmaceuticals, Inc. | | * | | | 834 | | | | 20,241 | |
Amgen, Inc. | | | | | 27,538 | | | | 3,143,738 | |
Arena Pharmaceuticals, Inc. | | *† | | | 9,689 | | | | 56,681 | |
Ariad Pharmaceuticals, Inc. | | *† | | | 5,175 | | | | 35,293 | |
Arqule, Inc. | | * | | | 864 | | | | 1,858 | |
Array BioPharma, Inc. | | * | | | 4,333 | | | | 21,708 | |
Biogen Idec, Inc. | | * | | | 8,798 | | | | 2,461,240 | |
BioMarin Pharmaceutical, Inc. | | * | | | 4,531 | | | | 318,393 | |
Celgene Corp. | | * | | | 15,744 | | | | 2,660,106 | |
Celldex Therapeutics, Inc. | | * | | | 6,204 | | | | 150,199 | |
Cepheid, Inc. | | *† | | | 1,692 | | | | 79,050 | |
Chelsea Therapeutics International Ltd. | | *† | | | 14,392 | | | | 63,757 | |
Clovis Oncology, Inc. | | * | | | 478 | | | | 28,809 | |
Cubist Pharmaceuticals, Inc. | | * | | | 1,762 | | | | 121,349 | |
Dendreon Corp. | | *† | | | 4,737 | | | | 14,164 | |
Dynavax Technologies Corp. | | * | | | 29,475 | | | | 57,771 | |
Emergent Biosolutions, Inc. | | * | | | 1,319 | | | | 30,324 | |
Enzon Pharmaceuticals, Inc. | | | | | 1,765 | | | | 2,047 | |
Exact Sciences Corp. | | * | | | 1,250 | | | | 14,612 | |
Exelixis, Inc. | | *† | | | 2,695 | | | | 16,520 | |
Galena Biopharma, Inc. | | * | | | 15,289 | | | | 75,833 | |
Genomic Health, Inc. | | * | | | 1,284 | | | | 37,583 | |
Geron Corp. | | * | | | 4,719 | | | | 22,368 | |
Gilead Sciences, Inc. | | * | | | 56,275 | | | | 4,229,066 | |
GTx, Inc. | | *† | | | 200 | | | | 330 | |
Halozyme Therapeutics, Inc. | | *† | | | 6,362 | | | | 95,366 | |
ImmunoGen, Inc. | | *† | | | 1,323 | | | | 19,408 | |
Immunomedics, Inc. | | *† | | | 2,141 | | | | 9,849 | |
Incyte Corp. Ltd. | | * | | | 3,102 | | | | 157,054 | |
Insmed, Inc. | | * | | | 2,696 | | | | 45,859 | |
InterMune, Inc. | | * | | | 1,586 | | | | 23,362 | |
Ironwood Pharmaceuticals, Inc. | | *† | | | 7,019 | | | | 81,491 | |
Isis Pharmaceuticals, Inc. | | * | | | 6,737 | | | | 268,402 | |
Keryx Biopharmaceuticals, Inc. | | *† | | | 5,221 | | | | 67,612 | |
Lexicon Pharmaceuticals, Inc. | | * | | | 2,343 | | | | 4,217 | |
Ligand Pharmaceuticals, Inc., Class B | | *† | | | 815 | | | | 42,869 | |
| | | | | | | | | | | | |
| | | | |
| | | | | | Shares | | | | Value | |
MannKind Corp. | | *† | | | 4,492 | | | $ | 23,403 | |
Medivation, Inc. | | * | | | 3,462 | | | | 220,945 | |
Momenta Pharmaceuticals, Inc. | | * | | | 2,618 | | | | 46,286 | |
Myriad Genetics, Inc. | | *† | | | 4,124 | | | | 86,522 | |
Neurocrine Biosciences, Inc. | | * | | | 1,479 | | | | 13,814 | |
NewLink Genetics Corp. | | *† | | | 3,326 | | | | 73,205 | |
Novavax, Inc. | | *† | | | 1,550 | | | | 7,936 | |
NPS Pharmaceuticals, Inc. | | * | | | 1,660 | | | | 50,398 | |
Opko Health, Inc. | | *† | | | 14,466 | | | | 122,093 | |
Osiris Therapeutics, Inc. | | *† | | | 1,402 | | | | 22,544 | |
PDL BioPharma, Inc. | | † | | | 3,841 | | | | 32,418 | |
Peregrine Pharmaceuticals, Inc. | | *† | | | 20,036 | | | | 27,850 | |
Pharmacyclics, Inc. | | * | | | 1,782 | | | | 188,500 | |
Progenics Pharmaceuticals, Inc. | | * | | | 793 | | | | 4,227 | |
Raptor Pharmaceutical Corp. | | *† | | | 3,794 | | | | 49,398 | |
Regeneron Pharmaceuticals, Inc. | | * | | | 3,165 | | | | 871,135 | |
Rigel Pharmaceuticals, Inc. | | * | | | 1,882 | | | | 5,364 | |
Sarepta Therapeutics, Inc. | | *† | | | 787 | | | | 16,031 | |
Seattle Genetics, Inc. | | *† | | | 3,191 | | | | 127,289 | |
SIGA Technologies, Inc. | | *† | | | 4,649 | | | | 15,202 | |
Synageva BioPharma Corp. | | *† | | | 242 | | | | 15,662 | |
Synergy Pharmaceuticals, Inc. | | * | | | 6,708 | | | | 37,766 | |
Theravance, Inc. | | *† | | | 3,224 | | | | 114,936 | |
Threshold Pharmaceuticals, Inc. | | * | | | 6,119 | | | | 28,576 | |
United Therapeutics Corp. | | * | | | 1,828 | | | | 206,710 | |
Vanda Pharmaceuticals, Inc. | | * | | | 2,680 | | | | 33,259 | |
Vertex Pharmaceuticals, Inc. | | * | | | 9,991 | | | | 742,331 | |
XOMA Corp. | | *† | | | 331 | | | | 2,228 | |
ZIOPHARM Oncology, Inc. | | *† | | | 16,393 | | | | 71,146 | |
| | | | | | | | | | | | |
| | | | | | | | | | | 19,093,343 | |
| | | | | | | | | | | | |
| Building Products—0.2% | |
A.O. Smith Corp. | | | | | 4,024 | | | | 217,055 | |
Allegion plc (Ireland) | | * | | | 3,761 | | | | 166,199 | |
American Woodmark Corp. | | * | | | 800 | | | | 31,624 | |
Apogee Enterprises, Inc. | | | | | 1,250 | | | | 44,888 | |
Fortune Brands Home & Security, Inc. | | | | | 3,861 | | | | 176,448 | |
Gibraltar Industries, Inc. | | * | | | 1,188 | | | | 22,085 | |
Griffon Corp. | | | | | 1,288 | | | | 17,014 | |
Lennox International, Inc. | | | | | 2,437 | | | | 207,291 | |
Masco Corp. | | | | | 16,508 | | | | 375,887 | |
NCI Building Systems, Inc. | | * | | | 246 | | | | 4,315 | |
Owens Corning, Inc. | | * | | | 3,682 | | | | 149,931 | |
Quanex Building Products Corp. | | | | | 1,671 | | | | 33,286 | |
Simpson Manufacturing Co., Inc. | | | | | 2,084 | | | | 76,545 | |
Trex Co., Inc. | | * | | | 731 | | | | 58,136 | |
Universal Forest Products, Inc. | | | | | 1,121 | | | | 58,449 | |
USG Corp. | | * | | | 3,348 | | | | 95,016 | |
| | | | | | | | | | | | |
| | | | | | | | | | | 1,734,169 | |
| | | | | | | | | | | | |
See accompanying notes to financial statements
285
SCHEDULE OF INVESTMENTS—(Continued)
December 31, 2013
| | | | | | | | | | | | |
Vantagepoint Broad
Market Index Fund | | | | Shares | | | Value | |
| COMMON STOCKS—(Continued) | | | | | |
| Capital Markets—2.4% | |
Affiliated Managers Group, Inc. | | * | | | 2,083 | | | $ | 451,761 | |
American Capital Ltd. | | * | | | 10,947 | | | | 171,211 | |
Ameriprise Financial, Inc. | | | | | 7,046 | | | | 810,642 | |
Apollo Investment Corp. | | | | | 17,052 | | | | 144,601 | |
Ares Capital Corp. | | | | | 14,456 | | | | 256,883 | |
Arlington Asset Investment Corp., Class A | | | | | 304 | | | | 8,023 | |
Bank of New York Mellon Corp. (The) | | | | | 41,637 | | | | 1,454,797 | |
BGC Partners, Inc., Class A | | | | | 7,270 | | | | 44,056 | |
BlackRock, Inc. | | | | | 5,053 | | | | 1,599,123 | |
Calamos Asset Management, Inc., Class A | | | | | 1,800 | | | | 21,312 | |
Charles Schwab Corp. (The) | | | | | 39,829 | | | | 1,035,554 | |
CIFC Corp. | | | | | 4,547 | | | | 35,376 | |
Cowen Group, Inc., Class A | | * | | | 2,582 | | | | 10,096 | |
Diamond Hill Investment Group, Inc. | | | | | 331 | | | | 39,171 | |
E*TRADE Financial Corp. | | * | | | 13,474 | | | | 264,629 | |
Eaton Vance Corp. | | | | | 5,282 | | | | 226,017 | |
Evercore Partners, Inc., Class A | | | | | 2,789 | | | | 166,726 | |
Federated Investors, Inc., Class B | | † | | | 3,745 | | | | 107,856 | |
Fifth Street Finance Corp. | | | | | 14,566 | | | | 134,735 | |
Financial Engines, Inc. | | | | | 1,762 | | | | 122,424 | |
Franklin Resources, Inc. | | | | | 15,516 | | | | 895,739 | |
GAMCO Investors, Inc., Class A | | | | | 558 | | | | 48,529 | |
GFI Group, Inc. | | | | | 2,520 | | | | 9,853 | |
Goldman Sachs Group, Inc. (The) | | | | | 17,015 | | | | 3,016,079 | |
Greenhill & Co., Inc. | | | | | 495 | | | | 28,680 | |
ICG Group, Inc. | | * | | | 4,779 | | | | 89,033 | |
INTL FCStone, Inc. | | * | | | 507 | | | | 9,400 | |
Invesco Ltd. | | | | | 16,610 | | | | 604,604 | |
Investment Technology Group, Inc. | | * | | | 2,078 | | | | 42,724 | |
Janus Capital Group, Inc. | | | | | 6,411 | | | | 79,304 | |
JMP Group, Inc. | | | | | 4,495 | | | | 33,263 | |
KCG Holdings, Inc., Class A | | * | | | 444 | | | | 5,310 | |
Ladenburg Thalmann Financial Services, Inc. | | * | | | 18,032 | | | | 56,440 | |
Lazard Ltd., Class A (Bermuda) | | | | | 6,921 | | | | 313,660 | |
Legg Mason, Inc. | | | | | 3,981 | | | | 173,094 | |
Main Street Capital Corp. | | † | | | 4,799 | | | | 156,879 | |
Medallion Financial Corp. | | | | | 958 | | | | 13,747 | |
Morgan Stanley | | | | | 57,026 | | | | 1,788,335 | |
Northern Trust Corp. | | | | | 8,495 | | | | 525,756 | |
PennantPark Investment Corp. | | | | | 8,005 | | | | 92,858 | |
Piper Jaffray Cos. | | * | | | 963 | | | | 38,087 | |
Prospect Capital Corp. | | | | | 18,643 | | | | 209,174 | |
Pzena Investment Management, Inc., Class A | | | | | 6,659 | | | | 78,310 | |
Raymond James Financial, Inc. | | | | | 3,472 | | | | 181,204 | |
Safeguard Scientifics, Inc. | | * | | | 678 | | | | 13,621 | |
SEI Investments Co. | | | | | 5,918 | | | | 205,532 | |
| | | | | | | | | | | | |
| | | | |
| | | | |
|
Shares |
| | | Value | |
Solar Senior Capital Ltd. | | | | | 3,820 | | | $ | 69,600 | |
State Street Corp. | | | | | 15,937 | | | | 1,169,616 | |
Stifel Financial Corp. | | * | | | 2,724 | | | | 130,534 | |
SWS Group, Inc. | | * | | | 1,323 | | | | 8,044 | |
T. Rowe Price Group, Inc. | | | | | 9,852 | | | | 825,302 | |
TD Ameritrade Holding Corp. | | | | | 8,355 | | | | 255,997 | |
THL Credit, Inc. | | | | | 5,201 | | | | 85,764 | |
Virtus Investment Partners, Inc. | | * | | | 210 | | | | 42,010 | |
Waddell & Reed Financial, Inc., Class A | | | | | 3,971 | | | | 258,592 | |
Walter Investment Management Corp. | | * | | | 1,972 | | | | 69,730 | |
Westwood Holdings Group, Inc. | | | | | 1,027 | | | | 63,582 | |
WisdomTree Investments, Inc. | | * | | | 3,701 | | | | 65,545 | |
| | | | | | | | | | | | |
| | | | | | | | | | | 18,858,524 | |
| | | | | | | | | | | | |
| Chemicals—2.5% | |
A. Schulman, Inc. | | | | | 1,444 | | | | 50,915 | |
Air Products & Chemicals, Inc. | | | | | 8,124 | | | | 908,101 | |
Airgas, Inc. | | | | | 2,915 | | | | 326,043 | |
Albemarle Corp. | | | | | 3,712 | | | | 235,304 | |
Ashland, Inc. | | | | | 2,794 | | | | 271,130 | |
Axiall Corp. | | | | | 2,616 | | | | 124,103 | |
Cabot Corp. | | | | | 2,693 | | | | 138,420 | |
Calgon Carbon Corp. | | * | | | 3,184 | | | | 65,495 | |
Celanese Corp., Series A | | | | | 5,277 | | | | 291,871 | |
CF Industries Holdings, Inc. | | | | | 2,079 | | | | 484,490 | |
Chemtura Corp. | | * | | | 5,201 | | | | 145,212 | |
Cytec Industries, Inc. | | | | | 1,644 | | | | 153,155 | |
Dow Chemical Co. (The) | | | | | 44,682 | | | | 1,983,881 | |
E.I. Du Pont de Nemours & Co. | | | | | 34,621 | | | | 2,249,326 | |
Eastman Chemical Co. | | | | | 6,221 | | | | 502,035 | |
Ecolab, Inc. | | | | | 9,129 | | | | 951,881 | |
Ferro Corp. | | * | | | 1,818 | | | | 23,325 | |
FMC Corp. | | | | | 5,510 | | | | 415,785 | |
H.B. Fuller Co. | | | | | 2,570 | | | | 133,743 | |
Huntsman Corp. | | | | | 5,470 | | | | 134,562 | |
International Flavors & Fragrances, Inc. | | | | | 3,643 | | | | 313,225 | |
Intrepid Potash, Inc. | | *† | | | 1,172 | | | | 18,564 | |
Koppers Holdings, Inc. | | | | | 1,582 | | | | 72,376 | |
Kronos Worldwide, Inc. | | † | | | 2,262 | | | | 43,091 | |
Landec Corp. | | * | | | 986 | | | | 11,950 | |
LSB Industries, Inc. | | * | | | 1,411 | | | | 57,879 | |
LyondellBasell Industries NV, Class A | | | | | 14,648 | | | | 1,175,941 | |
Minerals Technologies, Inc. | | | | | 1,736 | | | | 104,281 | |
Monsanto Co. | | | | | 19,538 | | | | 2,277,154 | |
Mosaic Co. (The) | | | | | 10,146 | | | | 479,601 | |
NewMarket Corp. | | | | | 378 | | | | 126,309 | |
Olin Corp. | | † | | | 2,796 | | | | 80,665 | |
OM Group, Inc. | | * | | | 1,147 | | | | 41,762 | |
OMNOVA Solutions, Inc. | | * | | | 6,478 | | | | 59,015 | |
PolyOne Corp. | | | | | 3,321 | | | | 117,397 | |
PPG Industries, Inc. | | | | | 4,963 | | | | 941,283 | |
Praxair, Inc. | | | | | 11,160 | | | | 1,451,135 | |
Quaker Chemical Corp. | | | | | 483 | | | | 37,225 | |
Rockwood Holdings, Inc. | | | | | 2,347 | | | | 168,796 | |
See accompanying notes to financial statements
286
SCHEDULE OF INVESTMENTS—(Continued)
December 31, 2013
| | | | | | | | | | | | |
Vantagepoint Broad
Market Index Fund | | | | Shares | | | Value | |
| COMMON STOCKS—(Continued) | | | | | |
RPM International, Inc. | | | | | 4,832 | | | $ | 200,576 | |
Scotts Miracle-Gro Co. (The), Class A | | | | | 1,662 | | | | 103,410 | |
Sensient Technologies Corp. | | | | | 2,027 | | | | 98,350 | |
Sherwin-Williams Co. (The) | | | | | 3,473 | | | | 637,295 | |
Sigma-Aldrich Corp. | | | | | 3,395 | | | | 319,164 | |
Stepan Co. | | | | | 1,112 | | | | 72,981 | |
Tredegar Corp. | | | | | 1,606 | | | | 46,269 | |
Valspar Corp. (The) | | | | | 4,361 | | | | 310,896 | |
W.R. Grace & Co. | | * | | | 3,427 | | | | 338,827 | |
Westlake Chemical Corp. | | | | | 1,279 | | | | 156,128 | |
Zep, Inc. | | | | | 936 | | | | 16,998 | |
| | | | | | | | | | | | |
| | | | | | | | | | | 19,467,320 | |
| | | | | | | | | | | | |
| Commercial Banks—3.1% | |
1st Source Corp. | | | | | 1,180 | | | | 37,689 | |
Associated Banc-Corp | | | | | 5,110 | | | | 88,914 | |
BancFirst Corp. | | | | | 642 | | | | 35,991 | |
BancorpSouth, Inc. | | | | | 3,611 | | | | 91,792 | |
Bank of Hawaii Corp. | | | | | 1,898 | | | | 112,248 | |
BankUnited, Inc. | | | | | 4,777 | | | | 157,259 | |
BB&T Corp. | | | | | 24,485 | | | | 913,780 | |
BBCN Bancorp, Inc./California | | | | | 9,619 | | | | 159,579 | |
BOK Financial Corp. | | | | | 801 | | | | 53,122 | |
Boston Private Financial Holdings, Inc. | | | | | 1,297 | | | | 16,368 | |
Bridge Bancorp, Inc. | | | | | 3,091 | | | | 80,366 | |
Bryn Mawr Bank Corp. | | | | | 1,058 | | | | 31,930 | |
Capital City Bank Group, Inc. | | * | | | 1,113 | | | | 13,100 | |
CapitalSource, Inc. | | | | | 7,766 | | | | 111,597 | |
Cardinal Financial Corp. | | | | | 1,142 | | | | 20,556 | |
Cascade Bancorp | | *† | | | 219 | | | | 1,145 | |
Cathay General Bancorp | | | | | 2,082 | | | | 55,652 | |
Catskill Litigation Trust | | *‡d | | | 582 | | | | — | |
Central Pacific Financial Corp. | | | | | 103 | | | | 2,068 | |
Chemical Financial Corp. | | | | | 1,552 | | | | 49,152 | |
CIT Group, Inc. | | | | | 7,587 | | | | 395,510 | |
Citizens & Northern Corp. | | | | | 3,618 | | | | 74,639 | |
City Holding Co. | | | | | 250 | | | | 11,582 | |
City National Corp./California | | | | | 1,548 | | | | 122,633 | |
CNB Financial Corp./Pennsylvania | | | | | 4,147 | | | | 78,793 | |
CoBiz Financial, Inc. | | | | | 1,063 | | | | 12,713 | |
Comerica, Inc. | | | | | 7,542 | | | | 358,547 | |
Commerce Bancshares, Inc./Missouri | | | | | 3,001 | | | | 134,775 | |
Community Bank System, Inc. | | | | | 1,402 | | | | 55,631 | |
Community Trust Bancorp, Inc. | | | | | 665 | | | | 30,031 | |
Cullen/Frost Bankers, Inc. | | | | | 2,502 | | | | 186,224 | |
CVB Financial Corp. | | | | | 4,084 | | | | 69,714 | |
East West Bancorp, Inc. | | | | | 6,997 | | | | 244,685 | |
Fidelity Southern Corp. | | | | | 1,586 | | | | 26,343 | |
Fifth Third Bancorp | | | | | 32,850 | | | | 690,835 | |
Financial Institutions, Inc. | | | | | 749 | | | | 18,508 | |
| | | | | | | | | | | | |
| | | | |
| | | | |
|
Shares |
| | | Value | |
First BanCorp. (Puerto Rico) | | * | | | 322 | | | $ | 1,993 | |
First Bancorp/North Carolina | | | | | 643 | | | | 10,687 | |
First Busey Corp. | | | | | 2,407 | | | | 13,961 | |
First Citizens BancShares, Inc./North Carolina, Class A | | | | | 254 | | | | 56,548 | |
First Commonwealth Financial Corp. | | | | | 2,619 | | | | 23,100 | |
First Connecticut Bancorp, Inc./Farmington CT | | | | | 5,036 | | | | 81,180 | |
First Financial Bancorp | | | | | 1,895 | | | | 33,030 | |
First Financial Bankshares, Inc. | | † | | | 500 | | | | 33,160 | |
First Financial Holdings, Inc. | | | | | 2,377 | | | | 158,094 | |
First Horizon National Corp. | | | | | 8,735 | | | | 101,763 | |
First Merchants Corp. | | | | | 874 | | | | 19,892 | |
First Midwest Bancorp, Inc./Illinois | | | | | 2,002 | | | | 35,095 | |
First Niagara Financial Group, Inc. | | | | | 10,034 | | | | 106,561 | |
First of Long Island Corp. (The) | | | | | 986 | | | | 42,270 | |
First Republic Bank/California | | | | | 4,803 | | | | 251,437 | |
First Security Group, Inc./Tennesse | | * | | | 14,959 | | | | 34,406 | |
FirstMerit Corp. | | | | | 8,833 | | | | 196,358 | |
FNB Corp./Pennsylvania | | | | | 4,685 | | | | 59,125 | |
Fulton Financial Corp. | | | | | 6,533 | | | | 85,452 | |
Glacier Bancorp, Inc. | | | | | 1,771 | | | | 52,758 | |
Guaranty Bancorp | | | | | 1,060 | | | | 14,893 | |
Hancock Holding Co. | | | | | 2,032 | | | | 74,534 | |
Hanmi Financial Corp. | | | | | 900 | | | | 19,701 | |
Heritage Financial Corp./Washington | | | | | 332 | | | | 5,681 | |
Home Bancshares, Inc./Arkansas | | | | | 2,340 | | | | 87,399 | |
Huntington Bancshares, Inc./Ohio | | | | | 26,837 | | | | 258,977 | |
IBERIABANK Corp. | | | | | 966 | | | | 60,713 | |
Independent Bank Corp./Massachusetts | | | | | 874 | | | | 34,252 | |
International Bancshares Corp. | | | | | 3,248 | | | | 85,715 | |
KeyCorp | | | | | 27,431 | | | | 368,124 | |
M&T Bank Corp. | | † | | | 5,079 | | | | 591,297 | |
MB Financial, Inc. | | | | | 931 | | | | 29,876 | |
Merchants Bancshares, Inc. | | | | | 571 | | | | 19,129 | |
MidSouth Bancorp, Inc. | | | | | 522 | | | | 9,323 | |
MidWestOne Financial Group, Inc. | | | | | 552 | | | | 15,014 | |
National Penn Bancshares, Inc. | | | | | 2,758 | | | | 31,248 | |
NBT Bancorp, Inc. | | | | | 1,000 | | | | 25,900 | |
Old National Bancorp/Indiana | | | | | 3,552 | | | | 54,594 | |
PacWest Bancorp | | † | | | 894 | | | | 37,745 | |
Park National Corp. | | † | | | 728 | | | | 61,931 | |
Peoples Bancorp, Inc./Ohio | | | | | 814 | | | | 18,323 | |
Pinnacle Financial Partners, Inc. | | | | | 1,818 | | | | 59,140 | |
PNC Financial Services Group, Inc. (The) | | | | | 19,925 | | | | 1,545,782 | |
Popular, Inc. (Puerto Rico) | | * | | | 5,380 | | | | 154,567 | |
See accompanying notes to financial statements
287
SCHEDULE OF INVESTMENTS—(Continued)
December 31, 2013
| | | | | | | | | | | | |
Vantagepoint Broad
Market Index Fund | | | | Shares | | | Value | |
| COMMON STOCKS—(Continued) | | | | | |
PrivateBancorp, Inc. | | | | | 1,200 | | | $ | 34,716 | |
Prosperity Bancshares, Inc. | | | | | 2,300 | | | | 145,797 | |
Regions Financial Corp. | | | | | 41,501 | | | | 410,445 | |
Republic Bancorp, Inc./Kentucky, Class A | | | | | 1,603 | | | | 39,338 | |
S&T Bancorp, Inc. | | | | | 955 | | | | 24,171 | |
Sandy Spring Bancorp, Inc. | | | | | 344 | | | | 9,697 | |
Signature Bank/New York | | * | | | 1,900 | | | | 204,098 | |
Simmons First National Corp., Class A | | | | | 911 | | | | 33,844 | |
State Bank Financial Corp. | | | | | 4,194 | | | | 76,289 | |
Sterling Bancorp/New York | | | | | 5,533 | | | | 73,976 | |
Sterling Financial Corp./Washington | | | | | 38 | | | | 1,295 | |
Suffolk Bancorp | | * | | | 1,100 | | | | 22,880 | |
SunTrust Banks, Inc. | | | | | 19,144 | | | | 704,691 | |
Susquehanna Bancshares, Inc. | | | | | 15,304 | | | | 196,503 | |
SVB Financial Group | | * | | | 1,437 | | | | 150,684 | |
Synovus Financial Corp. | | | | | 41,667 | | | | 150,001 | |
TCF Financial Corp. | | | | | 6,104 | | | | 99,190 | |
Texas Capital Bancshares, Inc. | | * | | | 2,821 | | | | 175,466 | |
Tompkins Financial Corp. | | | | | 730 | | | | 37,515 | |
TowneBank/Virginia | | † | | | 1,448 | | | | 22,285 | |
Trustmark Corp. | | | | | 2,635 | | | | 70,723 | |
U.S. Bancorp/Minnesota | | | | | 68,636 | | | | 2,772,894 | |
UMB Financial Corp. | | | | | 1,211 | | | | 77,843 | |
Umpqua Holdings Corp. | | † | | | 9,658 | | | | 184,854 | |
United Bankshares, Inc./West Virginia | | † | | | 2,134 | | | | 67,114 | |
United Community Banks, Inc./Georgia | | * | | | 454 | | | | 8,059 | |
Valley National Bancorp | | † | | | 6,899 | | | | 69,818 | |
Washington Banking Co. | | | | | 4,949 | | | | 87,746 | |
Washington Trust Bancorp, Inc. | | | | | 500 | | | | 18,610 | |
Webster Financial Corp. | | | | | 2,393 | | | | 74,614 | |
Wells Fargo & Co. | | | | | 180,372 | | | | 8,188,889 | |
WesBanco, Inc. | | | | | 1,699 | | | | 54,368 | |
Westamerica Bancorporation | | † | | | 288 | | | | 16,260 | |
Western Alliance Bancorp | | * | | | 1,400 | | | | 33,404 | |
Wintrust Financial Corp. | | | | | 1,017 | | | | 46,904 | |
Zions Bancorporation | | | | | 10,153 | | | | 304,184 | |
| | | | | | | | | | | | |
| | | | | | | | | | | 24,293,364 | |
| | | | | | | | | | | | |
| Commercial Services & Supplies—0.6% | |
ABM Industries, Inc. | | | | | 2,291 | | | | 65,500 | |
ACCO Brands Corp. | | * | | | 2,302 | | | | 15,469 | |
ADT Corp. (The) | | † | | | 7,488 | | | | 303,039 | |
Brink’s Co. (The) | | | | | 2,084 | | | | 71,148 | |
Cenveo, Inc. | | *† | | | 4,741 | | | | 16,309 | |
Cintas Corp. | | | | | 2,017 | | | | 120,193 | |
Clean Harbors, Inc. | | * | | | 2,414 | | | | 144,743 | |
Consolidated Graphics, Inc. | | * | | | 776 | | | | 52,333 | |
Copart, Inc. | | * | | | 2,852 | | | | 104,526 | |
Courier Corp. | | | | | 424 | | | | 7,670 | |
Covanta Holding Corp. | | | | | 4,185 | | | | 74,284 | |
Deluxe Corp. | | | | | 2,098 | | | | 109,495 | |
Ennis, Inc. | | | | | 695 | | | | 12,302 | |
G&K Services, Inc., Class A | | | | | 1,008 | | | | 62,728 | |
Healthcare Services Group, Inc. | | | | | 4,963 | | | | 140,800 | |
| | | | | | | | | | | | |
| | | | |
| | | | |
|
Shares |
| | | Value | |
Herman Miller, Inc. | | | | | 3,155 | | | $ | 93,136 | |
HNI Corp. | | | | | 2,512 | | | | 97,541 | |
Interface, Inc. | | | | | 3,357 | | | | 73,720 | |
Iron Mountain, Inc. | | | | | 7,780 | | | | 236,123 | |
Kimball International, Inc., Class B | | | | | 1,500 | | | | 22,545 | |
Knoll, Inc. | | | | | 2,701 | | | | 49,455 | |
McGrath RentCorp | | | | | 916 | | | | 36,457 | |
Mine Safety Appliances Co. | | | | | 1,444 | | | | 73,947 | |
Mobile Mini, Inc. | | * | | | 2,000 | | | | 82,360 | |
NL Industries, Inc. | | | | | 2,111 | | | | 23,601 | |
Pitney Bowes, Inc. | | | | | 5,918 | | | | 137,889 | |
R.R. Donnelley & Sons Co. | | † | | | 8,887 | | | | 180,228 | |
Republic Services, Inc. | | | | | 11,229 | | | | 372,803 | |
Rollins, Inc. | | | | | 1,486 | | | | 45,011 | |
Steelcase, Inc., Class A | | | | | 1,992 | | | | 31,593 | |
Stericycle, Inc. | | * | | | 3,138 | | | | 364,541 | |
Tetra Tech, Inc. | | * | | | 2,114 | | | | 59,150 | |
TRC Cos., Inc. | | * | | | 327 | | | | 2,335 | |
United Stationers, Inc. | | | | | 2,556 | | | | 117,295 | |
Viad Corp. | | | | | 937 | | | | 26,030 | |
Waste Connections, Inc. | | | | | 3,543 | | | | 154,581 | |
Waste Management, Inc. | | | | | 17,744 | | | | 796,173 | |
| | | | | | | | | | | | |
| | | | | | | | | | | 4,377,053 | |
| | | | | | | | | | | | |
| Communications Equipment—1.6% | |
ADTRAN, Inc. | | | | | 3,197 | | | | 86,351 | |
Anaren, Inc. | | * | | | 813 | | | | 22,756 | |
ARRIS Group, Inc. | | * | | | 3,613 | | | | 88,031 | |
Aruba Networks, Inc. | | * | | | 2,125 | | | | 38,038 | |
Aviat Networks, Inc. | | * | | | 2,182 | | | | 4,931 | |
Black Box Corp. | | | | | 865 | | | | 25,777 | |
Brocade Communications Systems, Inc. | | * | | | 14,008 | | | | 124,251 | |
CalAmp Corp. | | * | | | 550 | | | | 15,384 | |
Ciena Corp. | | * | | | 5,950 | | | | 142,384 | |
Cisco Systems, Inc. | | | | | 196,805 | | | | 4,418,272 | |
Comtech Telecommunications Corp. | | | | | 1,350 | | | | 42,552 | |
Digi International, Inc. | | * | | | 1,976 | | | | 23,949 | |
EchoStar Corp., Class A | | * | | | 1,877 | | | | 93,324 | |
Emulex Corp. | | * | | | 3,408 | | | | 24,401 | |
Extreme Networks, Inc. | | * | | | 4,491 | | | | 31,437 | |
F5 Networks, Inc. | | * | | | 2,664 | | | | 242,051 | |
Finisar Corp. | | * | | | 7,171 | | | | 171,530 | |
Harmonic, Inc. | | * | | | 2,820 | | | | 20,812 | |
Harris Corp. | | | | | 3,891 | | | | 271,631 | |
Infinera Corp. | | *† | | | 4,191 | | | | 40,988 | |
InterDigital, Inc. | | † | | | 2,803 | | | | 82,660 | |
Ixia | | * | | | 2,330 | | | | 31,012 | |
JDS Uniphase Corp. | | * | | | 7,444 | | | | 96,623 | |
Juniper Networks, Inc. | | * | | | 17,553 | | | | 396,171 | |
KVH Industries, Inc. | | * | | | 375 | | | | 4,886 | |
Motorola Solutions, Inc. | | | | | 8,298 | | | | 560,115 | |
NETGEAR, Inc. | | * | | | 1,206 | | | | 39,726 | |
Numerex Corp., Class A | | * | | | 1,800 | | | | 23,310 | |
Oplink Communications, Inc. | | * | | | 758 | | | | 14,099 | |
Palo Alto Networks, Inc. | | * | | | 3,567 | | | | 204,995 | |
Parkervision, Inc. | | *† | | | 1,052 | | | | 4,787 | |
Plantronics, Inc. | | | | | 1,826 | | | | 84,818 | |
Polycom, Inc. | | * | | | 8,354 | | | | 93,815 | |
QUALCOMM, Inc. | | | | | 63,584 | | | | 4,721,112 | |
See accompanying notes to financial statements
288
SCHEDULE OF INVESTMENTS—(Continued)
December 31, 2013
| | | | | | | | | | | | |
Vantagepoint Broad
Market Index Fund | | | | Shares | | | Value | |
| COMMON STOCKS—(Continued) | | | | | |
Riverbed Technology, Inc. | | * | | | 3,698 | | | $ | 66,860 | |
Sonus Networks, Inc. | | * | | | 10,700 | | | | 33,705 | |
ViaSat, Inc. | | * | | | 1,190 | | | | 74,554 | |
Westell Technologies, Inc., Class A | | * | | | 1,821 | | | | 7,375 | |
| | | | | | | | | | | | |
| | | | | | | | | | | 12,469,473 | |
| | | | | | | | | | | | |
| Computers & Peripherals—3.4% | |
3D Systems Corp. | | *† | | | 3,474 | | | | 322,839 | |
Apple, Inc. | | | | | 34,859 | | | | 19,559,734 | |
Avid Technology, Inc. | | * | | | 1,448 | | | | 11,801 | |
Cray, Inc. | | * | | | 714 | | | | 19,606 | |
Diebold, Inc. | | † | | | 3,079 | | | | 101,638 | |
Electronics For Imaging, Inc. | | * | | | 2,638 | | | | 102,170 | |
EMC Corp. | | | | | 80,313 | | | | 2,019,872 | |
Fusion-io, Inc. | | *† | | | 5,678 | | | | 50,591 | |
Hewlett-Packard Co. | | | | | 71,885 | | | | 2,011,342 | |
Hutchinson Technology, Inc. | | * | | | 6,180 | | | | 19,776 | |
Imation Corp. | | * | | | 1,564 | | | | 7,320 | |
Lexmark International, Inc., Class A | | † | | | 1,492 | | | | 52,996 | |
NCR Corp. | | * | | | 6,904 | | | | 235,150 | |
NetApp, Inc. | | | | | 11,382 | | | | 468,255 | |
QLogic Corp. | | * | | | 3,731 | | | | 44,138 | |
Quantum Corp. | | * | | | 6,681 | | | | 8,017 | |
SanDisk Corp. | | | | | 8,969 | | | | 632,673 | |
Silicon Graphics International Corp. | | * | | | 1,843 | | | | 24,715 | |
Stratasys Ltd. | | * | | | 1,440 | | | | 193,968 | |
Western Digital Corp. | | | | | 8,356 | | | | 701,068 | |
| | | | | | | | | | | | |
| | | | | | | | | | | 26,587,669 | |
| | | | | | | | | | | | |
| Construction & Engineering—0.3% | |
AECOM Technology Corp. | | * | | | 3,236 | | | | 95,236 | |
Aegion Corp. | | * | | | 1,223 | | | | 26,771 | |
Chicago Bridge & Iron Co. NV (Netherlands) | | | | | 3,194 | | | | 265,549 | |
Comfort Systems USA, Inc. | | | | | 2,179 | | | | 42,251 | |
Dycom Industries, Inc. | | * | | | 2,076 | | | | 57,692 | |
EMCOR Group, Inc. | | | | | 2,908 | | | | 123,416 | |
Fluor Corp. | | | | | 6,816 | | | | 547,257 | |
Furmanite Corp. | | * | | | 1,100 | | | | 11,682 | |
Granite Construction, Inc. | | | | | 1,889 | | | | 66,077 | |
Jacobs Engineering Group, Inc. | | * | | | 4,968 | | | | 312,934 | |
KBR, Inc. | | | | | 6,464 | | | | 206,137 | |
Layne Christensen Co. | | *† | | | 510 | | | | 8,711 | |
MasTec, Inc. | | * | | | 2,049 | | | | 67,043 | |
Quanta Services, Inc. | | * | | | 8,861 | | | | 279,653 | |
Tutor Perini Corp. | | * | | | 960 | | | | 25,248 | |
URS Corp. | | | | | 2,934 | | | | 155,473 | |
| | | | | | | | | | | | |
| | | | | | | | | | | 2,291,130 | |
| | | | | | | | | | | | |
| Construction Materials—0.1% | |
Eagle Materials, Inc. | | | | | 2,083 | | | | 161,287 | |
Headwaters, Inc. | | * | | | 2,095 | | | | 20,510 | |
Martin Marietta Materials, Inc. | | | | | 801 | | | | 80,052 | |
Texas Industries, Inc. | | *† | | | 1,116 | | | | 76,758 | |
Vulcan Materials Co. | | | | | 6,242 | | | | 370,900 | |
| | | | | | | | | | | | |
| | | | | | | | | | | 709,507 | |
| | | | | | | | | | | | |
| | | | | | | | | | | | |
| | | | |
| | | | |
|
Shares |
| | | Value | |
| Consumer Finance—0.9% | |
American Express Co. | | | | | 35,120 | | | $ | 3,186,438 | |
Capital One Financial Corp. | | | | | 22,188 | | | | 1,699,823 | |
Cash America International, Inc. | | | | | 685 | | | | 26,235 | |
Consumer Portfolio Services, Inc. | | * | | | 5,110 | | | | 47,983 | |
Discover Financial Services | | | | | 18,027 | | | | 1,008,611 | |
Ezcorp, Inc., Class A | | * | | | 2,031 | | | | 23,742 | |
First Cash Financial Services, Inc. | | * | | | 2,461 | | | | 152,188 | |
First Marblehead Corp. (The) | | * | | | 3,218 | | | | 23,781 | |
Imperial Holdings, Inc. | | * | | | 8,933 | | | | 58,422 | |
Nelnet, Inc., Class A | | | | | 481 | | | | 20,269 | |
Portfolio Recovery Associates, Inc. | | * | | | 1,512 | | | | 79,894 | |
SLM Corp. | | | | | 18,104 | | | | 475,773 | |
World Acceptance Corp. | | *† | | | 639 | | | | 55,932 | |
| | | | | | | | | | | | |
| | | | | | | | | | | 6,859,091 | |
| | | | | | | | | | | | |
| Containers & Packaging—0.3% | |
AEP Industries, Inc. | | * | | | 372 | | | | 19,653 | |
AptarGroup, Inc. | | | | | 3,130 | | | | 212,245 | |
Avery Dennison Corp. | | | | | 3,924 | | | | 196,946 | |
Ball Corp. | | | | | 6,557 | | | | 338,735 | |
Bemis Co., Inc. | | | | | 1,316 | | | | 53,903 | |
Crown Holdings, Inc. | | * | | | 3,283 | | | | 146,323 | |
Greif, Inc., Class A | | | | | 852 | | | | 44,645 | |
MeadWestvaco Corp. | | | | | 6,183 | | | | 228,338 | |
Myers Industries, Inc. | | | | | 1,716 | | | | 36,242 | |
Owens-Illinois, Inc. | | * | | | 6,064 | | | | 216,970 | |
Packaging Corp. of America | | | | | 4,339 | | | | 274,572 | |
Rock-Tenn Co., Class A | | | | | 2,588 | | | | 271,766 | |
Sealed Air Corp. | | | | | 7,726 | | | | 263,070 | |
Silgan Holdings, Inc. | | | | | 820 | | | | 39,376 | |
Sonoco Products Co. | | | | | 3,353 | | | | 139,887 | |
| | | | | | | | | | | | |
| | | | | | | | | | | 2,482,671 | |
| | | | | | | | | | | | |
| Distributors—0.1% | |
Genuine Parts Co. | | | | | 6,041 | | | | 502,551 | |
LKQ Corp. | | * | | | 11,438 | | | | 376,310 | |
Pool Corp. | | | | | 2,434 | | | | 141,513 | |
VOXX International Corp. | | * | | | 1,218 | | | | 20,340 | |
| | | | | | | | | | | | |
| | | | | | | | | | | 1,040,714 | |
| | | | | | | | | | | | |
| Diversified Consumer Services—0.2% | |
American Public Education, Inc. | | * | | | 698 | | | | 30,342 | |
Apollo Education Group, Inc. | | * | | | 3,118 | | | | 85,184 | |
Ascent Capital Group, Inc., Class A | | * | | | 545 | | | | 46,630 | |
Career Education Corp. | | * | | | 4,167 | | | | 23,752 | |
Corinthian Colleges, Inc. | | *† | | | 3,624 | | | | 6,451 | |
DeVry Education Group, Inc. | | | | | 2,980 | | | | 105,790 | |
Graham Holdings Co., Class B | | * | | | 258 | | | | 171,137 | |
Grand Canyon Education, Inc. | | * | | | 3,129 | | | | 136,424 | |
H&R Block, Inc. | | | | | 11,402 | | | | 331,114 | |
Hillenbrand, Inc. | | | | | 1,576 | | | | 46,366 | |
ITT Educational Services, Inc. | | *† | | | 335 | | | | 11,249 | |
See accompanying notes to financial statements
289
SCHEDULE OF INVESTMENTS—(Continued)
December 31, 2013
| | | | | | | | | | | | |
Vantagepoint Broad
Market Index Fund | | | | Shares | | | Value | |
| COMMON STOCKS—(Continued) | | | | | |
Matthews International Corp., Class A | | | | | 1,052 | | | $ | 44,826 | |
Regis Corp. | | | | | 1,818 | | | | 26,379 | |
Service Corp. International | | | | | 10,864 | | | | 196,964 | |
Sotheby’s | | | | | 2,623 | | | | 139,544 | |
Steiner Leisure Ltd. (Bahamas) | | * | | | 1,503 | | | | 73,933 | |
Strayer Education, Inc. | | *† | | | 551 | | | | 18,993 | |
Universal Technical Institute, Inc. | | | | | 418 | | | | 5,814 | |
Weight Watchers International, Inc. | | † | | | 1,826 | | | | 60,130 | |
| | | | | | | | | | | | |
| | | | | | | | | | | 1,561,022 | |
| | | | | | | | | | | | |
| Diversified Financial Services—4.2% | |
Bank of America Corp. | | | | | 397,605 | | | | 6,190,710 | |
Berkshire Hathaway, Inc., Class B | | * | | | 66,657 | | | | 7,902,854 | |
CBOE Holdings, Inc. | | | | | 3,873 | | | | 201,241 | |
Citigroup, Inc. | | | | | 112,846 | | | | 5,880,405 | |
CME Group, Inc. | | | | | 11,807 | | | | 926,377 | |
ING US, Inc. | | | | | 4,191 | | | | 147,314 | |
Interactive Brokers Group, Inc., Class A | | | | | 1,570 | | | | 38,214 | |
IntercontinentalExchange Group, Inc. | | | | | 4,413 | | | | 992,572 | |
JPMorgan Chase & Co. | | | | | 139,421 | | | | 8,153,340 | |
Leucadia National Corp. | | | | | 9,873 | | | | 279,801 | |
McGraw Hill Financial, Inc. | | | | | 9,601 | | | | 750,798 | |
Moody’s Corp. | | | | | 8,073 | | | | 633,488 | |
MSCI, Inc. | | * | | | 3,439 | | | | 150,353 | |
NASDAQ OMX Group, Inc. (The) | | | | | 5,431 | | | | 216,154 | |
PHH Corp. | | * | | | 2,212 | | | | 53,862 | |
PICO Holdings, Inc. | | * | | | 1,150 | | | | 26,577 | |
Resource America, Inc., Class A | | | | | 1,287 | | | | 12,046 | |
| | | | | | | | | | | | |
| | | | | | | | | | | 32,556,106 | |
| | | | | | | | | | | | |
| Diversified Telecommunication Services—1.8% | |
8x8, Inc. | | * | | | 3,048 | | | | 30,968 | |
AT&T, Inc. | | | | | 199,454 | | | | 7,012,803 | |
CenturyLink, Inc. | | | | | 22,585 | | | | 719,332 | |
Cincinnati Bell, Inc. | | * | | | 8,448 | | | | 30,075 | |
Cogent Communications Group, Inc. | | | | | 2,886 | | | | 116,623 | |
Consolidated Communications Holdings, Inc. | | | | | 80 | | | | 1,571 | |
Frontier Communications Corp. | | † | | | 39,354 | | | | 182,996 | |
General Communication, Inc., Class A | | * | | | 2,516 | | | | 28,053 | |
HickoryTech Corp. | | | | | 651 | | | | 8,352 | |
IDT Corp., Class B | | | | | 1,600 | | | | 28,592 | |
Level 3 Communications, Inc. | | * | | | 8,634 | | | | 286,390 | |
Lumos Networks Corp. | | | | | 1,350 | | | | 28,350 | |
Premiere Global Services, Inc. | | * | | | 2,174 | | | | 25,197 | |
Straight Path Communications, Inc., Class B | | * | | | 800 | | | | 6,552 | |
| | | | | | | | | | | | |
| | | | |
| | | | |
|
Shares |
| | | Value | |
Towerstream Corp. | | *† | | | 27,749 | | | $ | 82,137 | |
tw telecom inc. | | * | | | 4,305 | | | | 131,173 | |
Verizon Communications, Inc. | | | | | 105,428 | | | | 5,180,732 | |
Windstream Holdings, Inc. | | † | | | 21,003 | | | | 167,604 | |
| | | | | | | | | | | | |
| | | | | | | | | | | 14,067,500 | |
| | | | | | | | | | | | |
| Electric Utilities—1.4% | |
ALLETE, Inc. | | | | | 1,243 | | | | 62,001 | |
American Electric Power Co., Inc. | | | | | 17,879 | | | | 835,665 | |
Cleco Corp. | | | | | 2,109 | | | | 98,322 | |
Duke Energy Corp. | | | | | 27,217 | | | | 1,878,245 | |
Edison International | | | | | 12,222 | | | | 565,879 | |
El Paso Electric Co. | | | | | 1,748 | | | | 61,372 | |
Empire District Electric Co. (The) | | | | | 1,197 | | | | 27,160 | |
Entergy Corp. | | | | | 5,375 | | | | 340,076 | |
Exelon Corp. | | | | | 31,805 | | | | 871,139 | |
FirstEnergy Corp. | | | | | 16,831 | | | | 555,086 | |
Great Plains Energy, Inc. | | | | | 3,450 | | | | 83,628 | |
Hawaiian Electric Industries, Inc. | | † | | | 3,066 | | | | 79,900 | |
IDACORP, Inc. | | | | | 1,515 | | | | 78,538 | |
ITC Holdings Corp. | | | | | 1,539 | | | | 147,467 | |
MGE Energy, Inc. | | | | | 1,559 | | | | 90,266 | |
NextEra Energy, Inc. | | | | | 16,412 | | | | 1,405,196 | |
Northeast Utilities | | | | | 10,939 | | | | 463,704 | |
OGE Energy Corp. | | | | | 6,716 | | | | 227,672 | |
Otter Tail Corp. | | | | | 1,095 | | | | 32,051 | |
Pepco Holdings, Inc. | | | | | 7,066 | | | | 135,173 | |
Pinnacle West Capital Corp. | | | | | 3,789 | | | | 200,514 | |
PNM Resources, Inc. | | | | | 2,169 | | | | 52,316 | |
Portland General Electric Co. | | | | | 1,100 | | | | 33,220 | |
PPL Corp. | | | | | 22,170 | | | | 667,095 | |
Southern Co. (The) | | | | | 33,220 | | | | 1,365,674 | |
UIL Holdings Corp. | | | | | 1,496 | | | | 57,970 | |
Unitil Corp. | | | | | 2,609 | | | | 79,548 | |
UNS Energy Corp. | | | | | 1,571 | | | | 94,024 | |
Westar Energy, Inc. | | | | | 4,032 | | | | 129,709 | |
Xcel Energy, Inc. | | | | | 16,552 | | | | 462,463 | |
| | | | | | | | | | | | |
| | | | | | | | | | | 11,181,073 | |
| | | | | | | | | | | | |
| Electrical Equipment—0.8% | |
Acuity Brands, Inc. | | | | | 1,873 | | | | 204,756 | |
American Superconductor Corp. | | *† | | | 1,147 | | | | 1,881 | |
AMETEK, Inc. | | | | | 9,526 | | | | 501,734 | |
AZZ, Inc. | | | | | 2,357 | | | | 115,163 | |
Babcock & Wilcox Co. (The) | | | | | 5,852 | | | | 200,080 | |
Brady Corp., Class A | | | | | 2,402 | | | | 74,294 | |
Capstone Turbine Corp. | | *† | | | 34,249 | | | | 44,181 | |
Eaton Corp. plc (Ireland) | | | | | 17,125 | | | | 1,303,555 | |
Emerson Electric Co. | | | | | 27,226 | | | | 1,910,721 | |
Encore Wire Corp. | | | | | 1,400 | | | | 75,880 | |
EnerSys, Inc. | | | | | 2,156 | | | | 151,114 | |
Enphase Energy, Inc. | | *† | | | 4,495 | | | | 28,498 | |
Franklin Electric Co., Inc. | | | | | 1,804 | | | | 80,531 | |
FuelCell Energy, Inc. | | *† | | | 56,398 | | | | 79,521 | |
Generac Holdings, Inc. | | | | | 3,020 | | | | 171,053 | |
General Cable Corp. | | | | | 1,732 | | | | 50,938 | |
GrafTech International Ltd. | | *† | | | 3,487 | | | | 39,159 | |
See accompanying notes to financial statements
290
SCHEDULE OF INVESTMENTS—(Continued)
December 31, 2013
| | | | | | | | | | | | |
Vantagepoint Broad
Market Index Fund | | | | Shares | | | Value | |
| COMMON STOCKS—(Continued) | | | | | |
Hubbell, Inc., Class B | | | | | 2,078 | | | $ | 226,294 | |
II-VI, Inc. | | * | | | 1,364 | | | | 24,006 | |
LSI Industries, Inc. | | | | | 1,083 | | | | 9,390 | |
Polypore International, Inc. | | *† | | | 2,675 | | | | 104,058 | |
Powell Industries, Inc. | | | | | 1,045 | | | | 70,005 | |
Regal-Beloit Corp. | | | | | 1,272 | | | | 93,772 | |
Revolution Lighting Technologies, Inc. | | *† | | | 8,587 | | | | 29,410 | |
Rockwell Automation, Inc. | | | | | 4,331 | | | | 511,751 | |
Roper Industries, Inc. | | | | | 2,980 | | | | 413,266 | |
SolarCity Corp. | | * | | | 851 | | | | 48,354 | |
Vicor Corp. | | * | | | 1,380 | | | | 18,520 | |
| | | | | | | | | | | | |
| | | | | | | | | | | 6,581,885 | |
| | | | | | | | | | | | |
| Electronic Equipment, Instruments & Components—0.7% | |
Agilysys, Inc. | | * | | | 1,335 | | | | 18,583 | |
Amphenol Corp., Class A | | | | | 5,423 | | | | 483,623 | |
Anixter International, Inc. | | | | | 1,723 | | | | 154,794 | |
Arrow Electronics, Inc. | | * | | | 4,585 | | | | 248,736 | |
Avnet, Inc. | | | | | 5,129 | | | | 226,240 | |
AVX Corp. | | | | | 2,270 | | | | 31,621 | |
Badger Meter, Inc. | | | | | 1,134 | | | | 61,803 | |
Belden, Inc. | | | | | 1,894 | | | | 133,432 | |
Benchmark Electronics, Inc. | | * | | | 2,520 | | | | 58,162 | |
Checkpoint Systems, Inc. | | * | | | 1,441 | | | | 22,725 | |
Cognex Corp. | | * | | | 4,046 | | | | 154,476 | |
Coherent, Inc. | | * | | | 1,348 | | | | 100,278 | |
Corning, Inc. | | | | | 57,318 | | | | 1,021,407 | |
CTS Corp. | | | | | 1,580 | | | | 31,458 | |
Daktronics, Inc. | | | | | 927 | | | | 14,535 | |
Dolby Laboratories, Inc., Class A | | *† | | | 1,370 | | | | 52,827 | |
DTS, Inc. | | * | | | 755 | | | | 18,105 | |
Electro Rent Corp. | | | | | 950 | | | | 17,594 | |
Electro Scientific Industries, Inc. | | | | | 1,421 | | | | 14,864 | |
FARO Technologies, Inc. | | * | | | 453 | | | | 26,410 | |
FEI Co. | | | | | 1,368 | | | | 122,245 | |
FLIR Systems, Inc. | | | | | 5,608 | | | | 168,801 | |
Ingram Micro, Inc., Class A | | * | | | 7,190 | | | | 168,677 | |
Insight Enterprises, Inc. | | * | | | 2,054 | | | | 46,646 | |
IPG Photonics Corp. | | *† | | | 2,130 | | | | 165,309 | |
Itron, Inc. | | * | | | 955 | | | | 39,566 | |
Jabil Circuit, Inc. | | | | | 8,287 | | | | 144,525 | |
Littelfuse, Inc. | | | | | 909 | | | | 84,473 | |
Maxwell Technologies, Inc. | | * | | | 370 | | | | 2,875 | |
Mercury Systems, Inc. | | * | | | 963 | | | | 10,545 | |
Mesa Laboratories, Inc. | | | | | 1,200 | | | | 94,296 | |
Methode Electronics, Inc. | | | | | 1,383 | | | | 47,285 | |
MTS Systems Corp. | | | | | 1,342 | | | | 95,618 | |
National Instruments Corp. | | | | | 5,121 | | | | 163,974 | |
Newport Corp. | | * | | | 1,614 | | | | 29,165 | |
OSI Systems, Inc. | | * | | | 867 | | | | 46,046 | |
Park Electrochemical Corp. | | | | | 1,086 | | | | 31,190 | |
PC Connection, Inc. | | | | | 854 | | | | 21,222 | |
Plexus Corp. | | * | | | 1,884 | | | | 81,558 | |
Radisys Corp. | | * | | | 961 | | | | 2,201 | |
Rofin-Sinar Technologies, Inc. | | * | | | 2,200 | | | | 59,444 | |
Rogers Corp. | | * | | | 803 | | | | 49,385 | |
Sanmina Corp. | | * | | | 3,577 | | | | 59,736 | |
ScanSource, Inc. | | * | | | 1,126 | | | | 47,776 | |
SYNNEX Corp. | | * | | | 104 | | | | 7,010 | |
| | | | | | | | | | | | |
| | | | |
| | | | |
|
Shares |
| | | Value | |
Tech Data Corp. | | * | | | 2,057 | | | $ | 106,141 | |
Trimble Navigation Ltd. | | * | | | 8,636 | | | | 299,669 | |
TTM Technologies, Inc. | | * | | | 1,639 | | | | 14,063 | |
Uni-Pixel, Inc. | | *† | | | 2,120 | | | | 21,221 | |
Universal Display Corp. | | *† | | | 1,350 | | | | 46,386 | |
Vishay Intertechnology, Inc. | | * | | | 6,172 | | | | 81,841 | |
Vishay Precision Group, Inc. | | * | | | 440 | | | | 6,552 | |
Zygo Corp. | | * | | | 967 | | | | 14,292 | |
| | | | | | | | | | | | |
| | | | | | | | | | | 5,271,406 | |
| | | | | | | | | | | | |
| Energy Equipment & Services—1.7% | |
Atwood Oceanics, Inc. | | * | | | 1,298 | | | | 69,300 | |
Baker Hughes, Inc. | | | | | 17,431 | | | | 963,237 | |
Basic Energy Services, Inc. | | * | | | 1,600 | | | | 25,248 | |
Bristow Group, Inc. | | | | | 982 | | | | 73,709 | |
Cal Dive International, Inc. | | *† | | | 4,816 | | | | 9,680 | |
Cameron International Corp. | | * | | | 9,319 | | | | 554,760 | |
CARBO Ceramics, Inc. | | † | | | 1,137 | | | | 132,495 | |
Dawson Geophysical Co. | | * | | | 924 | | | | 31,250 | |
Diamond Offshore Drilling, Inc. | | | | | 1,577 | | | | 89,763 | |
Dresser-Rand Group, Inc. | | * | | | 2,924 | | | | 174,358 | |
Dril-Quip, Inc. | | * | | | 880 | | | | 96,738 | |
Era Group, Inc. | | * | | | 713 | | | | 22,003 | |
Exterran Holdings, Inc. | | * | | | 2,465 | | | | 84,303 | |
FMC Technologies, Inc. | | * | | | 8,237 | | | | 430,054 | |
Geospace Technologies Corp. | | * | | | 1,100 | | | | 104,313 | |
Gulfmark Offshore, Inc., Class A | | | | | 1,000 | | | | 47,130 | |
Halliburton Co. | | | | | 33,840 | | | | 1,717,380 | |
Helix Energy Solutions Group, Inc. | | * | | | 3,853 | | | | 89,313 | |
Helmerich & Payne, Inc. | | | | | 3,926 | | | | 330,098 | |
Hercules Offshore, Inc. | | * | | | 5,226 | | | | 34,126 | |
Hornbeck Offshore Services, Inc. | | * | | | 1,800 | | | | 88,614 | |
ION Geophysical Corp. | | * | | | 6,136 | | | | 20,249 | |
Key Energy Services, Inc. | | * | | | 7,257 | | | | 57,330 | |
Matrix Service Co. | | * | | | 468 | | | | 11,452 | |
McDermott International, Inc. | | * | | | 11,704 | | | | 107,209 | |
Mitcham Industries, Inc. | | * | | | 1,100 | | | | 19,481 | |
Nabors Industries Ltd. (Bermuda) | | | | | 10,988 | | | | 186,686 | |
National Oilwell Varco, Inc. | | | | | 14,826 | | | | 1,179,112 | |
Newpark Resources, Inc. | | * | | | 3,484 | | | | 42,818 | |
Oceaneering International, Inc. | | | | | 4,464 | | | | 352,120 | |
Oil States International, Inc. | | * | | | 2,026 | | | | 206,085 | |
Parker Drilling Co. | | * | | | 3,755 | | | | 30,528 | |
Patterson-UTI Energy, Inc. | | | | | 6,712 | | | | 169,948 | |
PHI, Inc. | | * | | | 774 | | | | 33,592 | |
Pioneer Energy Services Corp. | | * | | | 2,700 | | | | 21,627 | |
Rowan Cos. plc, Class A | | * | | | 3,918 | | | | 138,540 | |
Schlumberger Ltd. | | | | | 49,959 | | | | 4,501,805 | |
SEACOR Holdings, Inc. | | * | | | 713 | | | | 65,026 | |
Seadrill Ltd. (Bermuda) | | | | | 15,030 | | | | 617,432 | |
Superior Energy Services, Inc. | | * | | | 9,385 | | | | 249,735 | |
Tesco Corp. | | * | | | 3,185 | | | | 62,999 | |
TETRA Technologies, Inc. | | * | | | 2,352 | | | | 29,071 | |
See accompanying notes to financial statements
291
SCHEDULE OF INVESTMENTS—(Continued)
December 31, 2013
| | | | | | | | | | | | |
Vantagepoint Broad
Market Index Fund | | | | Shares | | | Value | |
| COMMON STOCKS—(Continued) | | | | | |
Tidewater, Inc. | | | | | 2,250 | | | $ | 133,358 | |
Unit Corp. | | * | | | 1,702 | | | | 87,857 | |
| | | | | | | | | | | | |
| | | | | | | | | | | 13,491,932 | |
| | | | | | | | | | | | |
| Food & Staples Retailing—2.0% | |
Andersons, Inc. (The) | | | | | 700 | | | | 62,419 | |
Arden Group, Inc., Class A | | | | | 260 | | | | 32,893 | |
Casey’s General Stores, Inc. | | | | | 1,608 | | | | 112,962 | |
Costco Wholesale Corp. | | | | | 15,557 | | | | 1,851,439 | |
CVS Caremark Corp. | | | | | 44,969 | | | | 3,218,431 | |
Fresh Market, Inc. (The) | | * | | | 1,489 | | | | 60,304 | |
Harris Teeter Supermarkets, Inc. | | | | | 1,967 | | | | 97,071 | |
Kroger Co. (The) | | | | | 20,480 | | | | 809,574 | |
Pantry, Inc. (The) | | * | | | 1,200 | | | | 20,136 | |
PriceSmart, Inc. | | | | | 1,212 | | | | 140,034 | |
Rite Aid Corp. | | * | | | 25,982 | | | | 131,469 | |
Safeway, Inc. | | | | | 8,825 | | | | 287,430 | |
Spartan Stores, Inc. | | | | | 808 | | | | 19,618 | |
SUPERVALU, Inc. | | * | | | 8,154 | | | | 59,443 | |
Sysco Corp. | | | | | 20,649 | | | | 745,429 | |
United Natural Foods, Inc. | | * | | | 1,912 | | | | 144,146 | |
Walgreen Co. | | | | | 34,513 | | | | 1,982,427 | |
Wal-Mart Stores, Inc. | | | | | 59,717 | | | | 4,699,131 | |
Weis Markets, Inc. | | | | | 382 | | | | 20,078 | |
Whole Foods Market, Inc. | | | | | 14,831 | | | | 857,677 | |
| | | | | | | | | | | | |
| | | | | | | | | | | 15,352,111 | |
| | | | | | | | | | | | |
| Food Products—1.6% | |
Archer-Daniels-Midland Co. | | | | | 23,265 | | | | 1,009,701 | |
B&G Foods, Inc. | | | | | 4,432 | | | | 150,289 | |
Bunge Ltd. | | | | | 4,700 | | | | 385,917 | |
Campbell Soup Co. | | | | | 5,629 | | | | 243,623 | |
Chiquita Brands International, Inc. | | * | | | 2,150 | | | | 25,155 | |
ConAgra Foods, Inc. | | | | | 14,190 | | | | 478,203 | |
Darling International, Inc. | | * | | | 3,150 | | | | 65,772 | |
Dean Foods Co. | | * | | | 3,140 | | | | 53,977 | |
Farmer Bros. Co. | | * | | | 930 | | | | 21,632 | |
Flowers Foods, Inc. | | | | | 7,909 | | | | 169,806 | |
Fresh Del Monte Produce, Inc. | | | | | 567 | | | | 16,046 | |
General Mills, Inc. | | | | | 24,219 | | | | 1,208,770 | |
Green Mountain Coffee Roasters, Inc. | | *† | | | 6,872 | | | | 519,386 | |
Griffin Land & Nurseries, Inc. | | | | | 650 | | | | 21,697 | |
Hain Celestial Group, Inc. (The) | | * | | | 1,426 | | | | 129,452 | |
Hershey Co. (The) | | | | | 5,148 | | | | 500,540 | |
Hillshire Brands Co. | | | | | 4,327 | | | | 144,695 | |
Hormel Foods Corp. | | | | | 6,390 | | | | 288,636 | |
Ingredion, Inc. | | | | | 3,164 | | | | 216,607 | |
Inventure Foods, Inc. | | * | | | 5,272 | | | | 69,907 | |
J&J Snack Foods Corp. | | | | | 761 | | | | 67,417 | |
J.M. Smucker Co. (The) | | | | | 4,332 | | | | 448,882 | |
Kellogg Co. | | | | | 11,040 | | | | 674,213 | |
Kraft Foods Group, Inc. | | | | | 22,510 | | | | 1,213,739 | |
Lancaster Colony Corp. | | | | | 1,389 | | | | 122,440 | |
McCormick & Co., Inc. (Non-Voting Shares) | | | | | 4,101 | | | | 282,641 | |
Mead Johnson Nutrition Co. | | | | | 7,038 | | | | 589,503 | |
| | | | | | | | | | | | |
| | | | |
| | | | |
|
Shares |
| | | Value | |
Mondelez International, Inc., Class A | | | | | 66,427 | | | $ | 2,344,873 | |
Post Holdings, Inc. | | * | | | 1,156 | | | | 56,956 | |
Sanderson Farms, Inc. | | | | | 864 | | | | 62,493 | |
Seaboard Corp. | | * | | | 18 | | | | 50,310 | |
Snyders-Lance, Inc. | | | | | 1,370 | | | | 39,346 | |
Tootsie Roll Industries, Inc. | | † | | | 681 | | | | 22,160 | |
TreeHouse Foods, Inc. | | * | | | 1,256 | | | | 86,564 | |
Tyson Foods, Inc., Class A | | | | | 10,231 | | | | 342,329 | |
WhiteWave Foods Co., Class A | | * | | | 1,604 | | | | 36,796 | |
| | | | | | | | | | | | |
| | | | | | | | | 12,160,473 | |
| | | | | | | | | | | | |
| Gas Utilities—0.2% | |
AGL Resources, Inc. | | | | | 3,698 | | | | 174,657 | |
Atmos Energy Corp. | | | | | 2,732 | | | | 124,087 | |
Chesapeake Utilities Corp. | | | | | 949 | | | | 56,959 | |
Delta Natural Gas Co., Inc. | | | | | 760 | | | | 17,009 | |
Laclede Group, Inc. (The) | | | | | 1,025 | | | | 46,679 | |
National Fuel Gas Co. | | | | | 3,639 | | | | 259,825 | |
New Jersey Resources Corp. | | | | | 1,681 | | | | 77,729 | |
Northwest Natural Gas Co. | | | | | 1,183 | | | | 50,656 | |
ONEOK, Inc. | | | | | 7,816 | | | | 485,999 | |
Piedmont Natural Gas Co., Inc. | | | | | 2,740 | | | | 90,858 | |
Questar Corp. | | | | | 7,412 | | | | 170,402 | |
South Jersey Industries, Inc. | | | | | 2,014 | | | | 112,703 | |
Southwest Gas Corp. | | | | | 1,252 | | | | 69,999 | |
UGI Corp. | | | | | 2,720 | | | | 112,771 | |
WGL Holdings, Inc. | | | | | 2,315 | | | | 92,739 | |
| | | | | | | | | | | | |
| | | | | | | | | | | 1,943,072 | |
| | | | | | | | | | | | |
| Health Care Equipment & Supplies—2.0% | |
Abaxis, Inc. | | * | | | 749 | | | | 29,975 | |
Abbott Laboratories | | | | | 57,095 | | | | 2,188,451 | |
ABIOMED, Inc. | | * | | | 886 | | | | 23,692 | |
Alere, Inc. | | * | | | 3,011 | | | | 108,998 | |
Align Technology, Inc. | | * | | | 2,449 | | | | 139,960 | |
Analogic Corp. | | | | | 593 | | | | 52,516 | |
Baxter International, Inc. | | | | | 21,536 | | | | 1,497,829 | |
Becton Dickinson and Co. | | | | | 7,370 | | | | 814,311 | |
Boston Scientific Corp. | | * | | | 47,653 | | | | 572,789 | |
C.R. Bard, Inc. | | | | | 2,876 | | | | 385,211 | |
CareFusion Corp. | | * | | | 10,625 | | | | 423,087 | |
Cerus Corp. | | *† | | | 1,010 | | | | 6,514 | |
CONMED Corp. | | | | | 1,362 | | | | 57,885 | |
Cooper Cos., Inc. (The) | | | | | 1,627 | | | | 201,488 | |
Covidien plc (Ireland) | | | | | 17,848 | | | | 1,215,449 | |
CryoLife, Inc. | | | | | 937 | | | | 10,391 | |
Cyberonics, Inc. | | * | | | 956 | | | | 62,628 | |
Cynosure, Inc., Class A | | * | | | 314 | | | | 8,378 | |
DENTSPLY International, Inc. | | | | | 5,668 | | | | 274,785 | |
DexCom, Inc. | | * | | | 4,391 | | | | 155,485 | |
Edwards Lifesciences Corp. | | * | | | 3,593 | | | | 236,276 | |
Greatbatch, Inc. | | * | | | 942 | | | | 41,674 | |
Haemonetics Corp. | | * | | | 2,314 | | | | 97,489 | |
HeartWare International, Inc. | | * | | | 664 | | | | 62,389 | |
Hill-Rom Holdings, Inc. | | | | | 1,576 | | | | 65,152 | |
Hologic, Inc. | | * | | | 9,792 | | | | 218,851 | |
ICU Medical, Inc. | | * | | | 605 | | | | 38,545 | |
IDEXX Laboratories, Inc. | | * | | | 1,985 | | | | 211,144 | |
Insulet Corp. | | * | | | 2,469 | | | | 91,600 | |
See accompanying notes to financial statements
292
SCHEDULE OF INVESTMENTS—(Continued)
December 31, 2013
| | | | | | | | | | | | |
Vantagepoint Broad
Market Index Fund | | | | Shares | | | Value | |
| COMMON STOCKS—(Continued) | | | | | |
Integra LifeSciences Holdings Corp. | | * | | | 1,190 | | | $ | 56,775 | |
Intuitive Surgical, Inc. | | * | | | 1,385 | | | | 531,951 | |
Invacare Corp. | | | | | 1,333 | | | | 30,939 | |
Masimo Corp. | | * | | | 1,500 | | | | 43,845 | |
Medtronic, Inc. | | | | | 35,844 | | | | 2,057,087 | |
Meridian Bioscience, Inc. | | † | | | 1,158 | | | | 30,722 | |
Merit Medical Systems, Inc. | | * | | | 3,149 | | | | 49,565 | |
Neogen Corp. | | * | | | 3,150 | | | | 143,955 | |
NuVasive, Inc. | | * | | | 990 | | | | 32,007 | |
OraSure Technologies, Inc. | | * | | | 1,687 | | | | 10,611 | |
ResMed, Inc. | | † | | | 6,068 | | | | 285,681 | |
RTI Surgical, Inc. | | * | | | 807 | | | | 2,857 | |
Sirona Dental Systems, Inc. | | * | | | 1,664 | | | | 116,813 | |
Spectranetics Corp. | | * | | | 1,045 | | | | 26,125 | |
St. Jude Medical, Inc. | | | | | 10,767 | | | | 667,016 | |
Staar Surgical Co. | | * | | | 848 | | | | 13,729 | |
STERIS Corp. | | | | | 2,777 | | | | 133,435 | |
Stryker Corp. | | | | | 12,580 | | | | 945,261 | |
SurModics, Inc. | | * | | | 9 | | | | 220 | |
Teleflex, Inc. | | | | | 1,322 | | | | 124,083 | |
Thoratec Corp. | | * | | | 2,306 | | | | 84,400 | |
Varian Medical Systems, Inc. | | * | | | 4,761 | | | | 369,882 | |
Volcano Corp. | | * | | | 1,970 | | | | 43,045 | |
West Pharmaceutical Services, Inc. | | | | | 3,408 | | | | 167,196 | |
Wright Medical Group, Inc. | | * | | | 1,309 | | | | 40,199 | |
Zimmer Holdings, Inc. | | | | | 5,894 | | | | 549,262 | |
| | | | | | | | | | | | |
| | | | | | | | | | | 15,849,603 | |
| | | | | | | | | | | | |
| Health Care Providers & Services—2.2% | |
Aetna, Inc. | | | | | 14,039 | | | | 962,935 | |
Air Methods Corp. | | * | | | 2,900 | | | | 169,157 | |
Almost Family, Inc. | | * | | | 422 | | | | 13,643 | |
Amedisys, Inc. | | * | | | 1,698 | | | | 24,842 | |
AmerisourceBergen Corp. | | | | | 9,159 | | | | 643,969 | |
AMN Healthcare Services, Inc. | | * | | | 1,507 | | | | 22,153 | |
Amsurg Corp. | | * | | | 1,423 | | | | 65,344 | |
BioScrip, Inc. | | * | | | 1,095 | | | | 8,103 | |
Brookdale Senior Living, Inc. | | * | | | 2,200 | | | | 59,796 | |
Cardinal Health, Inc. | | | | | 13,757 | | | | 919,105 | |
Catamaran Corp. | | * | | | 7,215 | | | | 342,568 | |
Centene Corp. | | * | | | 1,972 | | | | 116,249 | |
Chemed Corp. | | † | | | 1,162 | | | | 89,033 | |
Chindex International, Inc. | | * | | | 822 | | | | 14,328 | |
Cigna Corp. | | | | | 11,100 | | | | 971,028 | |
Community Health Systems, Inc. | | * | | | 4,282 | | | | 168,154 | |
Cross Country Healthcare, Inc. | | * | | | 1,339 | | | | 13,363 | |
DaVita HealthCare Partners, Inc. | | * | | | 7,014 | | | | 444,477 | |
Express Scripts Holding Co. | | * | | | 31,121 | | | | 2,185,939 | |
Gentiva Health Services, Inc. | | * | | | 1,474 | | | | 18,292 | |
Hanger, Inc. | | * | | | 1,083 | | | | 42,605 | |
HCA Holdings, Inc. | | * | | | 10,023 | | | | 478,197 | |
Health Management Associates, Inc., Class A | | * | | | 9,953 | | | | 130,384 | |
Health Net, Inc. | | * | | | 3,209 | | | | 95,211 | |
HealthSouth Corp. | | | | | 2,220 | | | | 73,970 | |
Healthways, Inc. | | * | | | 1,362 | | | | 20,907 | |
Henry Schein, Inc. | | * | | | 3,652 | | | | 417,278 | |
| | | | | | | | | | | | |
| | | | |
| | | | |
|
Shares |
| | | Value | |
Humana, Inc. | | | | | 6,153 | | | $ | 635,113 | |
Kindred Healthcare, Inc. | | | | | 2,148 | | | | 42,402 | |
Laboratory Corp. of America Holdings | | * | | | 3,138 | | | | 286,719 | |
Landauer, Inc. | | | | | 598 | | | | 31,461 | |
LifePoint Hospitals, Inc. | | * | | | 2,149 | | | | 113,553 | |
Magellan Health Services, Inc. | | * | | | 1,400 | | | | 83,874 | |
McKesson Corp. | | | | | 8,824 | | | | 1,424,194 | |
MEDNAX, Inc. | | * | | | 4,364 | | | | 232,950 | |
MWI Veterinary Supply, Inc. | | * | | | 519 | | | | 88,536 | |
National Healthcare Corp. | | | | | 431 | | | | 23,235 | |
National Research Corp., Class A | | * | | | 3,750 | | | | 70,575 | |
Omnicare, Inc. | | | | | 4,277 | | | | 258,160 | |
Owens & Minor, Inc. | | | | | 2,434 | | | | 88,987 | |
Patterson Cos., Inc. | | | | | 4,679 | | | | 192,775 | |
PharMerica Corp. | | * | | | 1,365 | | | | 29,348 | |
Quest Diagnostics, Inc. | | | | | 6,754 | | | | 361,609 | |
Team Health Holdings, Inc. | | * | | | 3,999 | | | | 182,155 | |
Tenet Healthcare Corp. | | * | | | 4,822 | | | | 203,103 | |
U.S. Physical Therapy, Inc. | | | | | 1,300 | | | | 45,838 | |
UnitedHealth Group, Inc. | | | | | 37,671 | | | | 2,836,626 | |
Universal American Corp. | | | | | 1,812 | | | | 13,228 | |
Universal Health Services, Inc., Class B | | | | | 2,466 | | | | 200,387 | |
VCA Antech, Inc. | | * | | | 3,442 | | | | 107,941 | |
WellCare Health Plans, Inc. | | * | | | 1,500 | | | | 105,630 | |
WellPoint, Inc. | | | | | 10,501 | | | | 970,187 | |
| | | | | | | | | | | | |
| | | | | | | | | | | 17,139,616 | |
| | | | | | | | | | | | |
| Health Care Technology—0.2% | |
Allscripts Healthcare Solutions, Inc. | | * | | | 4,515 | | | | 69,802 | |
athenahealth, Inc. | | * | | | 1,151 | | | | 154,810 | |
Cerner Corp. | | * | | | 11,584 | | | | 645,692 | |
HMS Holdings Corp. | | * | | | 4,230 | | | | 96,148 | |
Medidata Solutions, Inc. | | * | | | 2,616 | | | | 158,451 | |
Omnicell, Inc. | | * | | | 783 | | | | 19,990 | |
Quality Systems, Inc. | | | | | 1,536 | | | | 32,348 | |
| | | | | | | | | | | | |
| | | | | | | | | | | 1,177,241 | |
| | | | | | | | | | | | |
| Hotels, Restaurants & Leisure—2.0% | |
Bally Technologies, Inc. | | * | | | 1,971 | | | | 154,625 | |
Biglari Holdings, Inc. | | * | | | 75 | | | | 37,998 | |
Bob Evans Farms, Inc. | | | | | 1,465 | | | | 74,114 | |
Boyd Gaming Corp. | | * | | | 2,619 | | | | 29,490 | |
Brinker International, Inc. | | | | | 2,003 | | | | 92,819 | |
Buffalo Wild Wings, Inc. | | * | | | 867 | | | | 127,622 | |
Carnival Corp. | | | | | 17,391 | | | | 698,596 | |
CEC Entertainment, Inc. | | | | | 1,614 | | | | 71,468 | |
Cheesecake Factory, Inc. (The) | | | | | 3,444 | | | | 166,242 | |
Chipotle Mexican Grill, Inc. | | * | | | 1,003 | | | | 534,378 | |
Choice Hotels International, Inc. | | | | | 1,616 | | | | 79,362 | |
Churchill Downs, Inc. | | | | | 638 | | | | 57,197 | |
Cracker Barrel Old Country Store, Inc. | | | | | 919 | | | | 101,154 | |
Darden Restaurants, Inc. | | | | | 3,930 | | | | 213,674 | |
DineEquity, Inc. | | | | | 1,079 | | | | 90,150 | |
Domino’s Pizza, Inc. | | | | | 532 | | | | 37,054 | |
Dunkin’ Brands Group, Inc. | | | | | 4,613 | | | | 222,347 | |
International Game Technology | | | | | 7,153 | | | | 129,898 | |
See accompanying notes to financial statements
293
SCHEDULE OF INVESTMENTS—(Continued)
December 31, 2013
| | | | | | | | | | | | |
Vantagepoint Broad
Market Index Fund | | | | Shares | | | Value | |
| COMMON STOCKS—(Continued) | | | | | |
International Speedway Corp., Class A | | | | | 1,190 | | | $ | 42,233 | |
Interval Leisure Group, Inc. | | | | | 1,886 | | | | 58,277 | |
Isle of Capri Casinos, Inc. | | * | | | 1,250 | | | | 11,250 | |
Jack in the Box, Inc. | | * | | | 2,874 | | | | 143,757 | |
Krispy Kreme Doughnuts, Inc. | | * | | | 2,573 | | | | 49,633 | |
Las Vegas Sands Corp. | | | | | 15,680 | | | | 1,236,682 | |
Life Time Fitness, Inc. | | *† | | | 1,774 | | | | 83,378 | |
Marcus Corp. (The) | | | | | 1,505 | | | | 20,227 | |
Marriott International, Inc., Class A | | | | | 9,639 | | | | 475,781 | |
Marriott Vacations Worldwide Corp. | | * | | | 1,075 | | | | 56,717 | |
McDonald’s Corp. | | | | | 37,192 | | | | 3,608,740 | |
MGM Resorts International | | * | | | 16,457 | | | | 387,069 | |
Morgans Hotel Group Co. | | * | | | 2,300 | | | | 18,699 | |
Multimedia Games Holding Co., Inc. | | * | | | 1,202 | | | | 37,695 | |
Panera Bread Co., Class A | | * | | | 1,250 | | | | 220,863 | |
Papa John’s International, Inc. | | | | | 3,220 | | | | 146,188 | |
Penn National Gaming, Inc. | | * | | | 2,586 | | | | 37,057 | |
Pinnacle Entertainment, Inc. | | * | | | 1,629 | | | | 42,338 | |
Red Robin Gourmet Burgers, Inc. | | * | | | 692 | | | | 50,890 | |
Royal Caribbean Cruises Ltd. | | | | | 5,925 | | | | 280,964 | |
Ruby Tuesday, Inc. | | * | | | 2,816 | | | | 19,515 | |
Scientific Games Corp., Class A | | * | | | 2,517 | | | | 42,613 | |
Six Flags Entertainment Corp. | | | | | 2,984 | | | | 109,871 | |
Sonic Corp. | | * | | | 3,730 | | | | 75,309 | |
Speedway Motorsports, Inc. | | | | | 149 | | | | 2,958 | |
Starbucks Corp. | | | | | 28,124 | | | | 2,204,640 | |
Starwood Hotels & Resorts Worldwide, Inc. | | | | | 7,446 | | | | 591,585 | |
Texas Roadhouse, Inc. | | | | | 3,070 | | | | 85,346 | |
Vail Resorts, Inc. | | | | | 1,491 | | | | 112,168 | |
Wendy’s Co. (The) | | | | | 11,481 | | | | 100,114 | |
Wyndham Worldwide Corp. | | | | | 5,799 | | | | 427,328 | |
Wynn Resorts Ltd. | | | | | 3,423 | | | | 664,781 | |
Yum! Brands, Inc. | | | | | 16,971 | | | | 1,283,177 | |
| | | | | | | | | | | | |
| | | | | | | | | | | 15,646,031 | |
| | | | | | | | | | | | |
| Household Durables—0.5% | |
Bassett Furniture Industries, Inc. | | | | | 1,139 | | | | 17,404 | |
Beazer Homes USA, Inc. | | *† | | | 4,467 | | | | 109,084 | |
Blyth, Inc. | | † | | | 920 | | | | 10,010 | |
CSS Industries, Inc. | | | | | 2,711 | | | | 77,752 | |
D.R. Horton, Inc. | | * | | | 8,007 | | | | 178,716 | |
Ethan Allen Interiors, Inc. | | | | | 1,551 | | | | 47,181 | |
Garmin Ltd. (Switzerland) | | † | | | 3,151 | | | | 145,639 | |
Harman International Industries, Inc. | | | | | 2,728 | | | | 223,287 | |
Helen of Troy Ltd. (Bermuda) | | * | | | 1,333 | | | | 65,997 | |
Hooker Furniture Corp. | | | | | 4,293 | | | | 71,607 | |
Hovnanian Enterprises, Inc., Class A | | *† | | | 13,407 | | | | 88,754 | |
Jarden Corp. | | * | | | 3,082 | | | | 189,081 | |
| | | | | | | | | | | | |
| | | | |
| | | | |
|
Shares |
| | | Value | |
KB Home | | † | | | 3,248 | | | $ | 59,374 | |
La-Z-Boy, Inc. | | | | | 2,404 | | | | 74,524 | |
Leggett & Platt, Inc. | | | | | 2,928 | | | | 90,592 | |
Lennar Corp., Class A | | | | | 5,675 | | | | 224,503 | |
M/I Homes, Inc. | | * | | | 610 | | | | 15,525 | |
MDC Holdings, Inc. | | * | | | 1,091 | | | | 35,174 | |
Meritage Homes Corp. | | * | | | 1,300 | | | | 62,387 | |
Mohawk Industries, Inc. | | * | | | 1,833 | | | | 272,934 | |
NACCO Industries, Inc., Class A | | | | | 309 | | | | 19,217 | |
Newell Rubbermaid, Inc. | | | | | 7,929 | | | | 256,979 | |
NVR, Inc. | | * | | | 112 | | | | 114,913 | |
PulteGroup, Inc. | | | | | 13,539 | | | | 275,789 | |
Ryland Group, Inc. (The) | | | | | 1,852 | | | | 80,395 | |
Standard Pacific Corp. | | *† | | | 2,568 | | | | 23,240 | |
Tempur Sealy International, Inc. | | * | | | 1,346 | | | | 72,630 | |
Toll Brothers, Inc. | | * | | | 4,132 | | | | 152,884 | |
Tupperware Brands Corp. | | | | | 2,427 | | | | 229,424 | |
Universal Electronics, Inc. | | * | | | 639 | | | | 24,352 | |
Whirlpool Corp. | | | | | 2,800 | | | | 439,208 | |
| | | | | | | | | | | | |
| | | | | | | | | | | 3,748,556 | |
| | | | | | | | | | | | |
| Household Products—1.7% | |
Central Garden and Pet Co., Class A | | * | | | 1,230 | | | | 8,303 | |
Church & Dwight Co., Inc. | | | | | 5,138 | | | | 340,547 | |
Clorox Co. (The) | | | | | 4,503 | | | | 417,698 | |
Colgate-Palmolive Co. | | | | | 34,209 | | | | 2,230,769 | |
Energizer Holdings, Inc. | | | | | 1,856 | | | | 200,893 | |
Kimberly-Clark Corp. | | | | | 14,543 | | | | 1,519,162 | |
Procter & Gamble Co. (The) | | | | | 102,031 | | | | 8,306,344 | |
WD-40 Co. | | | | | 949 | | | | 70,871 | |
| | | | | | | | | | | | |
| | | | | | | | | | | 13,094,587 | |
| | | | | | | | | | | | |
| Independent Power Producers & Energy Traders—0.2% | |
AES Corp. (The) | | | | | 26,935 | | | | 390,827 | |
Calpine Corp. | | * | | | 16,000 | | | | 312,160 | |
Dynegy, Inc. | | *† | | | 7,118 | | | | 153,179 | |
Genie Energy Ltd., Class B | | * | | | 1,600 | | | | 16,336 | |
NRG Energy, Inc. | | | | | 15,295 | | | | 439,273 | |
| | | | | | | | | | | | |
| | | | | | | | | | | 1,311,775 | |
| | | | | | | | | | | | |
| Industrial Conglomerates—2.1% | |
3M Co. | | | | | 25,190 | | | | 3,532,898 | |
Carlisle Cos., Inc. | | | | | 2,452 | | | | 194,689 | |
Danaher Corp. | | | | | 23,171 | | | | 1,788,801 | |
General Electric Co. | | | | | 382,675 | | | | 10,726,380 | |
| | | | | | | | | | | | |
| | | | | | | | | | | 16,242,768 | |
| | | | | | | | | | | | |
| Insurance—3.1% | |
ACE Ltd. (Switzerland) | | | | | 12,470 | | | | 1,291,019 | |
Aflac, Inc. | | | | | 18,456 | | | | 1,232,861 | |
Alleghany Corp. | | * | | | 614 | | | | 245,576 | |
Allied World Assurance Co. Holdings AG (Switzerland) | | | | | 1,675 | | | | 188,957 | |
Allstate Corp. (The) | | | | | 16,311 | | | | 889,602 | |
American Equity Investment Life Holding Co. | | | | | 4,302 | | | | 113,487 | |
American Financial Group, Inc. | | | | | 2,657 | | | | 153,362 | |
American International Group, Inc. | | | | | 54,063 | | | | 2,759,916 | |
See accompanying notes to financial statements
294
SCHEDULE OF INVESTMENTS—(Continued)
December 31, 2013
| | | | | | | | | | | | |
Vantagepoint Broad
Market Index Fund | | | | Shares | | | Value | |
| COMMON STOCKS—(Continued) | | | | | |
American National Insurance Co. | | | | | 374 | | | $ | 42,838 | |
Aon plc (United Kingdom) | | | | | 12,144 | | | | 1,018,760 | |
Arch Capital Group Ltd. (Bermuda) | | * | | | 4,284 | | | | 255,712 | |
Argo Group International Holdings Ltd. (Bermuda) | | | | | 988 | | | | 45,932 | |
Arthur J. Gallagher & Co. | | | | | 3,230 | | | | 151,584 | |
Aspen Insurance Holdings Ltd. (Bermuda) | | | | | 3,512 | | | | 145,081 | |
Assurant, Inc. | | | | | 1,358 | | | | 90,131 | |
Assured Guaranty Ltd. (Bermuda) | | | | | 7,538 | | | | 177,821 | |
Axis Capital Holdings Ltd. (Bermuda) | | | | | 5,691 | | | | 270,721 | |
Baldwin & Lyons, Inc., Class B | | | | | 945 | | | | 25,817 | |
Brown & Brown, Inc. | | | | | 5,036 | | | | 158,080 | |
Chubb Corp. (The) | | | | | 8,832 | | | | 853,436 | |
Cincinnati Financial Corp. | | | | | 6,036 | | | | 316,105 | |
CNA Financial Corp. | | | | | 1,422 | | | | 60,990 | |
CNO Financial Group, Inc. | | | | | 6,600 | | | | 116,754 | |
Crawford & Co., Class B | | | | | 1,891 | | | | 17,473 | |
EMC Insurance Group, Inc. | | | | | 341 | | | | 10,441 | |
Employers Holdings, Inc. | | | | | 2,770 | | | | 87,671 | |
Endurance Specialty Holdings Ltd. (Bermuda) | | | | | 2,698 | | | | 158,292 | |
Enstar Group Ltd. (Bermuda) | | * | | | 1,080 | | | | 150,023 | |
Erie Indemnity Co., Class A | | | | | 1,023 | | | | 74,802 | |
Everest Re Group Ltd. (Bermuda) | | | | | 2,228 | | | | 347,278 | |
FBL Financial Group, Inc., Class A | | | | | 1,275 | | | | 57,107 | |
Fidelity National Financial, Inc., Class A | | | | | 8,236 | | | | 267,258 | |
First American Financial Corp. | | | | | 3,159 | | | | 89,084 | |
Genworth Financial, Inc., Class A | | * | | | 16,181 | | | | 251,291 | |
Hanover Insurance Group, Inc. (The) | | | | | 2,346 | | | | 140,080 | |
Hartford Financial Services Group, Inc. | | | | | 15,915 | | | | 576,601 | |
HCC Insurance Holdings, Inc. | | | | | 3,999 | | | | 184,514 | |
Health Insurance Innovations, Inc., Class A | | * | | | 3,279 | | | | 33,151 | |
Hilltop Holdings, Inc. | | * | | | 1,180 | | | | 27,293 | |
Horace Mann Educators Corp. | | | | | 2,000 | | | | 63,080 | |
Independence Holding Co. | | | | | 1,056 | | | | 14,245 | |
Infinity Property & Casualty Corp. | | | | | 810 | | | | 58,118 | |
Kansas City Life Insurance Co. | | | | | 902 | | | | 43,062 | |
Kemper Corp. | | | | | 1,906 | | | | 77,917 | |
Lincoln National Corp. | | | | | 10,899 | | | | 562,606 | |
Loews Corp. | | | | | 11,788 | | | | 568,653 | |
Markel Corp. | | * | | | 352 | | | | 204,283 | |
Marsh & McLennan Cos., Inc. | | | | | 18,811 | | | | 909,700 | |
MBIA, Inc. | | * | | | 5,212 | | | | 62,231 | |
Mercury General Corp. | | | | | 1,109 | | | | 55,128 | |
| | | | | | | | | | | | |
| | | | |
| | | | |
|
Shares |
| | | Value | |
MetLife, Inc. | | | | | 31,039 | | | $ | 1,673,623 | |
Montpelier Re Holdings Ltd. (Bermuda) | | | | | 3,734 | | | | 108,659 | |
Navigators Group, Inc. (The) | | * | | | 938 | | | | 59,244 | |
Old Republic International Corp. | | | | | 10,195 | | | | 176,068 | |
PartnerRe Ltd. (Bermuda) | | | | | 2,300 | | | | 242,489 | |
Phoenix Cos., Inc. (The) | | * | | | 210 | | | | 12,894 | |
Platinum Underwriters Holdings Ltd. (Bermuda) | | | | | 2,206 | | | | 135,184 | |
Principal Financial Group, Inc. | | | | | 10,891 | | | | 537,035 | |
ProAssurance Corp. | | | | | 2,054 | | | | 99,578 | |
Progressive Corp. (The) | | | | | 23,937 | | | | 652,762 | |
Protective Life Corp. | | | | | 3,130 | | | | 158,566 | |
Prudential Financial, Inc. | | | | | 16,151 | | | | 1,489,445 | |
Reinsurance Group of America, Inc. | | | | | 1,440 | | | | 111,470 | |
RenaissanceRe Holdings Ltd. (Bermuda) | | | | | 2,164 | | | | 210,644 | |
RLI Corp. | | | | | 1,164 | | | | 113,350 | |
Safety Insurance Group, Inc. | | | | | 850 | | | | 47,855 | |
Selective Insurance Group, Inc. | | | | | 2,122 | | | | 57,421 | |
StanCorp Financial Group, Inc. | | | | | 2,460 | | | | 162,975 | |
State Auto Financial Corp. | | | | | 488 | | | | 10,365 | |
Stewart Information Services Corp. | | | | | 1,239 | | | | 39,983 | |
Torchmark Corp. | | | | | 4,030 | | | | 314,945 | |
Travelers Cos., Inc. (The) | | | | | 13,074 | | | | 1,183,720 | |
United Fire Group, Inc. | | | | | 1,250 | | | | 35,825 | |
Unum Group | | | | | 12,054 | | | | 422,854 | |
Validus Holdings Ltd. (Bermuda) | | | | | 3,553 | | | | 143,150 | |
W.R. Berkley Corp. | | | | | 2,501 | | | | 108,518 | |
White Mountains Insurance Group Ltd. | | | | | 300 | | | | 180,924 | |
XL Group plc (Ireland) | | | | | 7,279 | | | | 231,763 | |
| | | | | | | | | | | | |
| | | | | | | | | | | 24,417,233 | |
| | | | | | | | | | | | |
| Internet & Catalog Retail—1.3% | |
1-800-Flowers.com, Inc., Class A | | * | | | 793 | | | | 4,290 | |
Amazon.com, Inc. | | * | | | 13,601 | | | | 5,423,943 | |
Expedia, Inc. | | | | | 3,588 | | | | 249,940 | |
FTD Cos., Inc. | | * | | | 501 | | | | 16,323 | |
Groupon, Inc. | | * | | | 10,416 | | | | 122,596 | |
HomeAway, Inc. | | * | | | 4,242 | | | | 173,413 | |
HSN, Inc. | | | | | 1,886 | | | | 117,498 | |
Liberty Interactive Corp., Series A | | * | | | 21,689 | | | | 636,572 | |
Liberty Ventures, Series A | | * | | | 1,648 | | | | 202,028 | |
Netflix, Inc. | | * | | | 1,859 | | | | 684,428 | |
Orbitz Worldwide, Inc. | | * | | | 4,023 | | | | 28,885 | |
Overstock.com, Inc. | | *† | | | 770 | | | | 23,708 | |
priceline.com, Inc. | | * | | | 1,880 | | | | 2,185,312 | |
Shutterfly, Inc. | | * | | | 2,976 | | | | 151,568 | |
TripAdvisor, Inc. | | * | | | 3,588 | | | | 297,194 | |
| | | | | | | | | | | | |
| | | | | | | | | | | 10,317,698 | |
| | | | | | | | | | | | |
See accompanying notes to financial statements
295
SCHEDULE OF INVESTMENTS—(Continued)
December 31, 2013
| | | | | | | | | | | | |
Vantagepoint Broad
Market Index Fund | | | | Shares | | | Value | |
| COMMON STOCKS—(Continued) | | | | | |
| Internet Software & Services—2.9% | |
Akamai Technologies, Inc. | | * | | | 7,479 | | | $ | 352,859 | |
Angie’s List, Inc. | | *† | | | 1,166 | | | | 17,665 | |
AOL, Inc. | | * | | | 3,989 | | | | 185,967 | |
Blucora, Inc. | | * | | | 1,323 | | | | 38,579 | |
Brightcove, Inc. | | * | | | 3,636 | | | | 51,413 | |
CoStar Group, Inc. | | * | | | 770 | | | | 142,127 | |
Dealertrack Technologies, Inc. | | * | | | 1,800 | | | | 86,544 | |
Digital River, Inc. | | * | | | 1,627 | | | | 30,099 | |
EarthLink, Inc. | | | | | 5,814 | | | | 29,477 | |
eBay, Inc. | | * | | | 47,745 | | | | 2,620,723 | |
Equinix, Inc. | | * | | | 1,616 | | | | 286,759 | |
Facebook, Inc., Class A | | * | | | 62,983 | | | | 3,442,651 | |
Google, Inc., Class A | | * | | | 10,004 | | | | 11,211,583 | |
IAC/InterActiveCorp | | | | | 2,481 | | | | 170,420 | |
Internap Network Services Corp. | | * | | | 1,297 | | | | 9,753 | |
j2 Global, Inc. | | | | | 1,614 | | | | 80,716 | |
LinkedIn Corp., Class A | | * | | | 3,488 | | | | 756,303 | |
LivePerson, Inc. | | * | | | 3,333 | | | | 49,395 | |
Marin Software, Inc. | | *† | | | 3,014 | | | | 30,863 | |
Monster Worldwide, Inc. | | * | | | 4,681 | | | | 33,376 | |
Move, Inc. | | * | | | 1,840 | | | | 29,422 | |
Net Element International, Inc. | | *† | | | 5,378 | | | | 23,502 | |
NIC, Inc. | | | | | 2,450 | | | | 60,932 | |
OpenTable, Inc. | | * | | | 1,772 | | | | 140,644 | |
Pandora Media, Inc. | | * | | | 5,054 | | | | 134,436 | |
Rackspace Hosting, Inc. | | * | | | 6,130 | | | | 239,867 | |
RealNetworks, Inc. | | * | | | 1,461 | | | | 11,031 | |
Stamps.com, Inc. | | * | | | 1,050 | | | | 44,205 | |
support.com, Inc. | | * | | | 1,562 | | | | 5,920 | |
Trulia, Inc. | | *† | | | 998 | | | | 35,199 | |
Twitter, Inc. | | *† | | | 1,758 | | | | 111,897 | |
United Online, Inc. | | | | | 358 | | | | 4,926 | |
Unwired Planet, Inc. | | * | | | 2,763 | | | | 3,813 | |
ValueClick, Inc. | | * | | | 4,058 | | | | 94,835 | |
VeriSign, Inc. | | * | | | 4,905 | | | | 293,221 | |
VistaPrint NV (Netherlands) | | *† | | | 2,666 | | | | 151,562 | |
Web.com Group, Inc. | | * | | | 308 | | | | 9,791 | |
WebMD Health Corp. | | * | | | 2,106 | | | | 83,187 | |
XO Group, Inc. | | * | | | 2,304 | | | | 34,237 | |
Yahoo!, Inc. | | * | | | 33,133 | | | | 1,339,899 | |
Yelp, Inc. | | * | | | 985 | | | | 67,916 | |
Zillow, Inc., Class A | | *† | | | 1,791 | | | | 146,378 | |
Zix Corp. | | * | | | 1,015 | | | | 4,628 | |
| | | | | | | | | | | | |
| | | | | | | | | | | 22,698,720 | |
| | | | | | | | | | | | |
| IT Services—3.5% | |
Accenture plc, Class A (Ireland) | | | | | 23,994 | | | | 1,972,787 | |
Acxiom Corp. | | * | | | 3,451 | | | | 127,618 | |
Alliance Data Systems Corp. | | * | | | 1,955 | | | | 514,028 | |
Amdocs Ltd. | | | | | 6,782 | | | | 279,690 | |
Automatic Data Processing, Inc. | | | | | 17,041 | | | | 1,377,083 | |
Broadridge Financial Solutions, Inc. | | | | | 5,748 | | | | 227,161 | |
CACI International, Inc., Class A | | * | | | 1,198 | | | | 87,718 | |
Cardtronics, Inc. | | * | | | 3,545 | | | | 154,030 | |
| | | | | | | | | | | | |
| | | | |
| | | | |
|
Shares |
| | | Value | |
CIBER, Inc. | | * | | | 2,444 | | | $ | 10,118 | |
Cognizant Technology Solutions Corp., Class A | | * | | | 11,127 | | | | 1,123,605 | |
Computer Sciences Corp. | | | | | 5,963 | | | | 333,212 | |
Convergys Corp. | | | | | 5,933 | | | | 124,890 | |
CoreLogic, Inc. | | * | | | 3,159 | | | | 112,239 | |
CSG Systems International, Inc. | | | | | 2,153 | | | | 63,298 | |
DST Systems, Inc. | | | | | 2,122 | | | | 192,550 | |
Euronet Worldwide, Inc. | | * | | | 1,056 | | | | 50,530 | |
Fidelity National Information Services, Inc. | | | | | 9,512 | | | | 510,604 | |
Fiserv, Inc. | | * | | | 10,252 | | | | 605,381 | |
FleetCor Technologies, Inc. | | * | | | 2,714 | | | | 317,999 | |
Forrester Research, Inc. | | | | | 963 | | | | 36,844 | |
Gartner, Inc. | | * | | | 3,107 | | | | 220,752 | |
Genpact Ltd. (Bermuda) | | * | | | 6,727 | | | | 123,575 | |
Global Payments, Inc. | | | | | 3,238 | | | | 210,438 | |
Hackett Group, Inc. (The) | | | | | 1,140 | | | | 7,079 | |
Heartland Payment Systems, Inc. | | † | | | 3,370 | | | | 167,961 | |
iGATE Corp. | | * | | | 1,397 | | | | 56,104 | |
International Business Machines Corp. | | | | | 38,599 | | | | 7,240,014 | |
Jack Henry & Associates, Inc. | | | | | 3,591 | | | | 212,623 | |
Leidos Holdings, Inc. | | | | | 2,132 | | | | 99,117 | |
Lender Processing Services, Inc. | | | | | 4,048 | | | | 151,314 | |
Lionbridge Technologies, Inc. | | * | | | 1,165 | | | | 6,943 | |
ManTech International Corp., Class A | | † | | | 1,217 | | | | 36,425 | |
MasterCard, Inc., Class A | | | | | 4,327 | | | | 3,615,035 | |
MAXIMUS, Inc. | | | | | 4,208 | | | | 185,110 | |
ModusLink Global Solutions, Inc. | | * | | | 1,007 | | | | 5,770 | |
MoneyGram International, Inc. | | * | | | 468 | | | | 9,725 | |
NeuStar, Inc., Class A | | * | | | 3,140 | | | | 156,560 | |
Paychex, Inc. | | | | | 9,849 | | | | 448,425 | |
Sapient Corp. | | * | | | 4,150 | | | | 72,044 | |
Science Applications International Corp. | | | | | 1,218 | | | | 40,279 | |
Sykes Enterprises, Inc. | | * | | | 1,423 | | | | 31,036 | |
Syntel, Inc. | | * | | | 1,554 | | | | 141,336 | |
TeleTech Holdings, Inc. | | * | | | 2,738 | | | | 65,548 | |
Teradata Corp. | | * | | | 5,364 | | | | 244,008 | |
Total System Services, Inc. | | | | | 6,935 | | | | 230,797 | |
Unisys Corp. | | * | | | 1,371 | | | | 46,025 | |
VeriFone Systems, Inc. | | * | | | 3,103 | | | | 83,222 | |
Visa, Inc., Class A | | | | | 19,386 | | | | 4,316,875 | |
Western Union Co. (The) | | | | | 23,068 | | | | 397,923 | |
WEX, Inc. | | * | | | 1,750 | | | | 173,303 | |
| | | | | | | | | | | | |
| | | | | | | | | | | 27,016,751 | |
| | | | | | | | | | | | |
| Leisure Equipment & Products—0.2% | |
Arctic Cat, Inc. | | | | | 689 | | | | 39,259 | |
Brunswick Corp. | | | | | 3,797 | | | | 174,890 | |
Callaway Golf Co. | | | | | 2,881 | | | | 24,287 | |
Hasbro, Inc. | | | | | 4,899 | | | | 269,494 | |
JAKKS Pacific, Inc. | | † | | | 765 | | | | 5,148 | |
LeapFrog Enterprises, Inc. | | *† | | | 1,261 | | | | 10,012 | |
Mattel, Inc. | | | | | 10,938 | | | | 520,430 | |
See accompanying notes to financial statements
296
SCHEDULE OF INVESTMENTS—(Continued)
December 31, 2013
| | | | | | | | | | | | |
Vantagepoint Broad
Market Index Fund | | | | Shares | | | Value | |
| COMMON STOCKS—(Continued) | | | | | |
Polaris Industries, Inc. | | | | | 2,406 | | | $ | 350,410 | |
Sturm Ruger & Co., Inc. | | † | | | 1,052 | | | | 76,891 | |
| | | | | | | | | | | | |
| | | | | | | | | | | 1,470,821 | |
| | | | | | | | | | | | |
| Life Sciences Tools & Services—0.7% | |
Affymetrix, Inc. | | * | | | 2,525 | | | | 21,639 | |
Agilent Technologies, Inc. | | | | | 13,260 | | | | 758,339 | |
Bio-Rad Laboratories, Inc., Class A | | * | | | 623 | | | | 77,009 | |
Bruker Corp. | | * | | | 1,667 | | | | 32,957 | |
Cambrex Corp. | | * | | | 1,258 | | | | 22,430 | |
Charles River Laboratories International, Inc. | | * | | | 2,755 | | | | 146,125 | |
Covance, Inc. | | * | | | 2,839 | | | | 250,002 | |
Furiex Pharmaceuticals, Inc. | | * | | | 394 | | | | 16,552 | |
Illumina, Inc. | | * | | | 4,535 | | | | 501,662 | |
Life Technologies Corp. | | * | | | 6,618 | | | | 501,644 | |
Luminex Corp. | | * | | | 1,070 | | | | 20,758 | |
Mettler-Toledo International, Inc. | | * | | | 913 | | | | 221,485 | |
PAREXEL International Corp. | | * | | | 2,306 | | | | 104,185 | |
PerkinElmer, Inc. | | | | | 5,266 | | | | 217,117 | |
QIAGEN NV (Netherlands) | | * | | | 6,882 | | | | 163,861 | |
Sequenom, Inc. | | *† | | | 19,756 | | | | 46,229 | |
Techne Corp. | | | | | 1,736 | | | | 164,347 | |
Thermo Fisher Scientific, Inc. | | | | | 13,988 | | | | 1,557,564 | |
Waters Corp. | | * | | | 3,591 | | | | 359,100 | |
| | | | | | | | | | | | |
| | | | | | | | | | | 5,183,005 | |
| | | | | | | | | | | | |
| Machinery—2.2% | |
Actuant Corp., Class A | | | | | 2,022 | | | | 74,086 | |
AGCO Corp. | | | | | 3,068 | | | | 181,595 | |
Albany International Corp., Class A | | | | | 1,437 | | | | 51,631 | |
American Railcar Industries, Inc. | | † | | | 1,200 | | | | 54,900 | |
Ampco-Pittsburgh Corp. | | | | | 613 | | | | 11,923 | |
Astec Industries, Inc. | | | | | 821 | | | | 31,715 | |
Barnes Group, Inc. | | | | | 2,018 | | | | 77,310 | |
Blount International, Inc. | | * | | | 1,532 | | | | 22,168 | |
Briggs & Stratton Corp. | | | | | 1,822 | | | | 39,647 | |
Caterpillar, Inc. | | | | | 24,443 | | | | 2,219,669 | |
Chart Industries, Inc. | | * | | | 1,070 | | | | 102,335 | |
CIRCOR International, Inc. | | | | | 711 | | | | 57,435 | |
CLARCOR, Inc. | | | | | 2,354 | | | | 151,480 | |
Colfax Corp. | | * | | | 3,666 | | | | 233,488 | |
Crane Co. | | | | | 2,467 | | | | 165,906 | |
Cummins, Inc. | | | | | 7,207 | | | | 1,015,971 | |
Deere & Co. | | | | | 14,974 | | | | 1,367,575 | |
Donaldson Co., Inc. | | | | | 4,058 | | | | 176,361 | |
Dover Corp. | | | | | 5,761 | | | | 556,167 | |
EnPro Industries, Inc. | | * | | | 981 | | | | 56,555 | |
ESCO Technologies, Inc. | | | | | 1,222 | | | | 41,866 | |
Federal Signal Corp. | | * | | | 2,159 | | | | 31,629 | |
Flow International Corp. | | * | | | 2,200 | | | | 8,888 | |
Flowserve Corp. | | | | | 5,994 | | | | 472,507 | |
FreightCar America, Inc. | | | | | 900 | | | | 23,958 | |
Graco, Inc. | | | | | 2,883 | | | | 225,220 | |
Harsco Corp. | | | | | 3,646 | | | | 102,197 | |
Hurco Cos., Inc. | | | | | 300 | | | | 7,503 | |
| | | | | | | | | | | | |
| | | | |
| | | | |
|
Shares |
| | | Value | |
Hyster-Yale Materials Handling, Inc. | | | | | 618 | | | $ | 57,573 | |
IDEX Corp. | | | | | 3,304 | | | | 244,000 | |
Illinois Tool Works, Inc. | | | | | 13,130 | | | | 1,103,970 | |
Ingersoll-Rand plc (Ireland) | | | | | 11,284 | | | | 695,094 | |
ITT Corp. | | | | | 2,488 | | | | 108,029 | |
John Bean Technologies Corp. | | | | | 1,164 | | | | 34,140 | |
Joy Global, Inc. | | † | | | 4,237 | | | | 247,822 | |
Kadant, Inc. | | | | | 721 | | | | 29,215 | |
Kennametal, Inc. | | | | | 3,196 | | | | 166,416 | |
Lincoln Electric Holdings, Inc. | | | | | 3,754 | | | | 267,810 | |
Lindsay Corp. | | † | | | 808 | | | | 66,862 | |
Manitowoc Co., Inc. (The) | | | | | 5,044 | | | | 117,626 | |
Meritor, Inc. | | * | | | 2,791 | | | | 29,110 | |
Middleby Corp. (The) | | * | | | 984 | | | | 236,130 | |
Mueller Industries, Inc. | | | | | 1,592 | | | | 100,312 | |
Mueller Water Products, Inc., Class A | | | | | 3,000 | | | | 28,110 | |
Navistar International Corp. | | *† | | | 2,436 | | | | 93,031 | |
Nordson Corp. | | | | | 3,044 | | | | 226,169 | |
Oshkosh Corp. | | | | | 2,868 | | | | 144,490 | |
PACCAR, Inc. | | | | | 13,455 | | | | 796,132 | |
Pall Corp. | | | | | 3,831 | | | | 326,976 | |
Parker Hannifin Corp. | | | | | 5,068 | | | | 651,948 | |
Pentair Ltd. (Registered) (Switzerland) | | | | | 6,813 | | | | 529,166 | |
Snap-on, Inc. | | | | | 2,419 | | | | 264,929 | |
SPX Corp. | | | | | 2,157 | | | | 214,859 | |
Standex International Corp. | | | | | 724 | | | | 45,525 | |
Stanley Black & Decker, Inc. | | | | | 5,209 | | | | 420,314 | |
Tennant Co. | | | | | 1,280 | | | | 86,797 | |
Terex Corp. | | | | | 4,124 | | | | 173,167 | |
Timken Co. | | | | | 3,702 | | | | 203,869 | |
Titan International, Inc. | | | | | 1,356 | | | | 24,381 | |
Toro Co. (The) | | | | | 2,040 | | | | 129,744 | |
Trimas Corp. | | * | | | 3,917 | | | | 156,249 | |
Trinity Industries, Inc. | | | | | 3,051 | | | | 166,341 | |
Valmont Industries, Inc. | | | | | 1,162 | | | | 173,277 | |
Wabash National Corp. | | * | | | 6,441 | | | | 79,546 | |
WABCO Holdings, Inc. | | * | | | 2,354 | | | | 219,887 | |
Wabtec Corp. | | | | | 3,474 | | | | 258,014 | |
Watts Water Technologies, Inc., Class A | | | | | 1,225 | | | | 75,791 | |
Woodward, Inc. | | | | | 2,448 | | | | 111,653 | |
Xylem, Inc. | | | | | 4,977 | | | | 172,204 | |
| | | | | | | | | | | | |
| | | | | | | | | | | 16,838,363 | |
| | | | | | | | | | | | |
| Marine—0.0% | |
Kirby Corp. | | * | | | 2,358 | | | | 234,032 | |
Matson, Inc. | | | | | 1,466 | | | | 38,277 | |
| | | | | | | | | | | | |
| | | | | | | | | | | 272,309 | |
| | | | | | | | | | | | |
| Media—3.8% | |
AMC Networks, Inc., Class A | | * | | | 2,261 | | | | 153,997 | |
Cablevision Systems Corp., Class A | | | | | 9,044 | | | | 162,159 | |
CBS Corp. (Non-Voting Shares), Class B | | | | | 23,813 | | | | 1,517,841 | |
Charter Communications, Inc., Class A | | * | | | 2,812 | | | | 384,569 | |
Cinemark Holdings, Inc. | | | | | 3,727 | | | | 124,221 | |
See accompanying notes to financial statements
297
SCHEDULE OF INVESTMENTS—(Continued)
December 31, 2013
| | | | | | | | | | | | |
Vantagepoint Broad
Market Index Fund | | | | Shares | | | Value | |
| COMMON STOCKS—(Continued) | | | | | |
Clear Channel Outdoor Holdings, Inc., Class A | | | | | 2,500 | | | $ | 25,350 | |
Comcast Corp., Class A | | | | | 96,980 | | | | 5,039,566 | |
Crown Media Holdings, Inc., Class A | | * | | | 5,899 | | | | 20,824 | |
Cumulus Media, Inc., Class A | | * | | | 2,174 | | | | 16,805 | |
DIRECTV | | * | | | 18,126 | | | | 1,252,325 | |
Discovery Communications, Inc., Class A | | * | | | 8,104 | | | | 732,764 | |
DISH Network Corp., Class A | | * | | | 9,231 | | | | 534,660 | |
DreamWorks Animation SKG, Inc., Class A | | * | | | 1,300 | | | | 46,150 | |
Entercom Communications Corp., Class A | | * | | | 2,183 | | | | 22,943 | |
Entravision Communications Corp., Class A | | | | | 2,852 | | | | 17,369 | |
EW Scripps Co. (The), Class A | | * | | | 1,204 | | | | 26,151 | |
Gannett Co., Inc. | | | | | 7,301 | | | | 215,964 | |
Harte-Hanks, Inc. | | | | | 3,119 | | | | 24,391 | |
Interpublic Group of Cos., Inc. (The) | | | | | 17,203 | | | | 304,493 | |
John Wiley & Sons, Inc., Class A | | | | | 2,491 | | | | 137,503 | |
Journal Communications, Inc., Class A | | * | | | 3,900 | | | | 36,309 | |
Lamar Advertising Co., Class A | | * | | | 3,479 | | | | 181,778 | |
Liberty Global plc, Series A (United Kingdom) | | * | | | 13,767 | | | | 1,225,125 | |
Liberty Global plc, Series C (United Kingdom) | | * | | | 988 | | | | 83,308 | |
Liberty Media Corp., Series A | | * | | | 3,556 | | | | 520,776 | |
Lions Gate Entertainment Corp. | | † | | | 5,038 | | | | 159,503 | |
Live Nation Entertainment, Inc. | | * | | | 5,485 | | | | 108,384 | |
Madison Square Garden Co. (The), Class A | | * | | | 2,261 | | | | 130,188 | |
McClatchy Co. (The), Class A | | *† | | | 2,444 | | | | 8,310 | |
Meredith Corp. | | | | | 2,083 | | | | 107,899 | |
National CineMedia, Inc. | | | | | 2,226 | | | | 44,431 | |
New York Times Co. (The), Class A | | | | | 5,682 | | | | 90,173 | |
News Corp., Class A | | * | | | 17,563 | | | | 316,485 | |
Nexstar Broadcasting Group, Inc., Class A | | | | | 902 | | | | 50,268 | |
Omnicom Group, Inc. | | | | | 9,924 | | | | 738,048 | |
Radio Unica Communications Corp. | | *‡d | | | 1,900 | | | | — | |
Regal Entertainment Group, Class A | | † | | | 2,743 | | | | 53,351 | |
Salem Communications Corp., Class A | | | | | 850 | | | | 7,395 | |
Scholastic Corp. | | | | | 1,845 | | | | 62,748 | |
| | | | | | | | | | | | |
| | | | |
| | | | |
|
Shares |
| | | Value | |
Scripps Networks Interactive, Inc., Class A | | | | | 3,612 | | | $ | 312,113 | |
Sinclair Broadcast Group, Inc., Class A | | | | | 2,049 | | | | 73,211 | |
Sirius XM Holdings, Inc. | | * | | | 109,168 | | | | 380,996 | |
Starz, Class A | | * | | | 4,301 | | | | 125,761 | |
Thomson Reuters Corp. | | | | | 13,044 | | | | 493,324 | |
Time Warner Cable, Inc. | | | | | 10,238 | | | | 1,387,249 | |
Time Warner, Inc. | | | | | 35,102 | | | | 2,447,311 | |
Twenty-First Century Fox, Inc., Class A | | | | | 74,643 | | | | 2,625,941 | |
Valassis Communications, Inc. | | † | | | 2,236 | | | | 76,583 | |
Viacom, Inc., Class B | | | | | 17,970 | | | | 1,569,500 | |
Walt Disney Co. (The) | | | | | 66,428 | | | | 5,075,099 | |
World Wrestling Entertainment, Inc., Class A | | | | | 1,030 | | | | 17,077 | |
| | | | | | | | | | | | |
| | | | | | | | | | | 29,268,689 | |
| | | | | | | | | | | | |
| Metals & Mining—0.7% | |
AK Steel Holding Corp. | | *† | | | 5,009 | | | | 41,074 | |
Alcoa, Inc. | | | | | 35,958 | | | | 382,234 | |
Allegheny Technologies, Inc. | | | | | 3,760 | | | | 133,969 | |
Allied Nevada Gold Corp. | | *† | | | 3,041 | | | | 10,796 | |
AMCOL International Corp. | | | | | 1,186 | | | | 40,300 | |
Carpenter Technology Corp. | | | | | 1,882 | | | | 117,060 | |
Century Aluminum Co. | | * | | | 865 | | | | 9,048 | |
Cliffs Natural Resources, Inc. | | † | | | 4,448 | | | | 116,582 | |
Coeur Mining, Inc. | | * | | | 7,315 | | | | 79,368 | |
Commercial Metals Co. | | | | | 4,080 | | | | 82,946 | |
Compass Minerals International, Inc. | | | | | 1,915 | | | | 153,296 | |
Freeport-McMoRan Copper & Gold, Inc. | | | | | 40,638 | | | | 1,533,678 | |
Hecla Mining Co. | | † | | | 20,609 | | | | 63,476 | |
Kaiser Aluminum Corp. | | | | | 2,266 | | | | 159,164 | |
Materion Corp. | | | | | 1,122 | | | | 34,614 | |
Molycorp, Inc. | | *† | | | 7,253 | | | | 40,762 | |
Newmont Mining Corp. | | | | | 16,854 | | | | 388,148 | |
Nucor Corp. | | | | | 10,963 | | | | 585,205 | |
Paramount Gold and Silver Corp. | | *† | | | 26,200 | | | | 24,413 | |
Reliance Steel & Aluminum Co. | | | | | 2,966 | | | | 224,941 | |
Royal Gold, Inc. | | | | | 1,153 | | | | 53,119 | |
RTI International Metals, Inc. | | * | | | 1,363 | | | | 46,628 | |
Schnitzer Steel Industries, Inc., Class A | | | | | 693 | | | | 22,640 | |
Southern Copper Corp. | | | | | 7,739 | | | | 222,187 | |
Steel Dynamics, Inc. | | | | | 8,080 | | | | 157,883 | |
Stillwater Mining Co. | | * | | | 3,727 | | | | 45,991 | |
SunCoke Energy, Inc. | | * | | | 1,473 | | | | 33,599 | |
Tahoe Resources, Inc. | | * | | | 5,318 | | | | 88,491 | |
United States Steel Corp. | | † | | | 5,607 | | | | 165,406 | |
Walter Energy, Inc. | | † | | | 1,840 | | | | 30,599 | |
Worthington Industries, Inc. | | | | | 3,575 | | | | 150,436 | |
| | | | | | | | | | | | |
| | | | | | | | | | | 5,238,053 | |
| | | | | | | | | | | | |
See accompanying notes to financial statements
298
SCHEDULE OF INVESTMENTS—(Continued)
December 31, 2013
| | | | | | | | | | | | |
Vantagepoint Broad
Market Index Fund | | | | Shares | | | Value | |
| COMMON STOCKS—(Continued) | | | | | |
| Multiline Retail—0.6% | |
Big Lots, Inc. | | * | | | 1,874 | | | $ | 60,512 | |
Dillard’s, Inc., Class A | | | | | 1,535 | | | | 149,217 | |
Dollar General Corp. | | * | | | 12,040 | | | | 726,253 | |
Dollar Tree, Inc. | | * | | | 8,356 | | | | 471,446 | |
Family Dollar Stores, Inc. | | | | | 3,743 | | | | 243,183 | |
Fred’s, Inc., Class A | | | | | 1,781 | | | | 32,984 | |
J.C. Penney Co., Inc. | | *† | | | 7,928 | | | | 72,541 | |
Kohl’s Corp. | | | | | 7,696 | | | | 436,748 | |
Macy’s, Inc. | | | | | 14,423 | | | | 770,188 | |
Nordstrom, Inc. | | | | | 6,080 | | | | 375,744 | |
Sears Holdings Corp. | | *† | | | 2,729 | | | | 133,830 | |
Target Corp. | | | | | 23,009 | | | | 1,455,779 | |
Tuesday Morning Corp. | | * | | | 1,816 | | | | 28,983 | |
| | | | | | | | | | | | |
| | | | | | | | | | | 4,957,408 | |
| | | | | | | | | | | | |
| Multi-Utilities—0.9% | |
Alliant Energy Corp. | | | | | 4,491 | | | | 231,736 | |
Ameren Corp. | | | | | 8,429 | | | | 304,793 | |
Avista Corp. | | | | | 1,759 | | | | 49,586 | |
Black Hills Corp. | | | | | 2,041 | | | | 107,173 | |
CenterPoint Energy, Inc. | | | | | 12,705 | | | | 294,502 | |
CMS Energy Corp. | | | | | 11,539 | | | | 308,899 | |
Consolidated Edison, Inc. | | | | | 9,508 | | | | 525,602 | |
Dominion Resources, Inc. | | | | | 21,301 | | | | 1,377,962 | |
DTE Energy Co. | | | | | 5,654 | | | | 375,369 | |
Integrys Energy Group, Inc. | | | | | 3,108 | | | | 169,106 | |
MDU Resources Group, Inc. | | | | | 7,657 | | | | 233,921 | |
NiSource, Inc. | | | | | 10,893 | | | | 358,162 | |
NorthWestern Corp. | | | | | 1,449 | | | | 62,771 | |
PG&E Corp. | | | | | 17,518 | | | | 705,625 | |
Public Service Enterprise Group, Inc. | | | | | 17,215 | | | | 551,569 | |
SCANA Corp. | | | | | 4,791 | | | | 224,842 | |
Sempra Energy | | | | | 9,100 | | | | 816,816 | |
TECO Energy, Inc. | | | | | 7,797 | | | | 134,420 | |
Vectren Corp. | | | | | 3,706 | | | | 131,563 | |
Wisconsin Energy Corp. | | | | | 9,128 | | | | 377,351 | |
| | | | | | | | | | | | |
| | | | | | | | | | | 7,341,768 | |
| | | | | | | | | | | | |
| Office Electronics—0.1% | |
Xerox Corp. | | | | | 37,010 | | | | 450,412 | |
Zebra Technologies Corp., Class A | | * | | | 2,988 | | | | 161,591 | |
| | | | | | | | | | | | |
| | | | | | | | | | | 612,003 | |
| | | | | | | | | | | | |
| Oil, Gas & Consumable Fuels—7.4% | |
Adams Resources & Energy, Inc. | | | | | 1,006 | | | | 68,911 | |
Alpha Natural Resources, Inc. | | * | | | 8,351 | | | | 59,626 | |
Anadarko Petroleum Corp. | | | | | 17,995 | | | | 1,427,363 | |
Apache Corp. | | | | | 15,202 | | | | 1,306,460 | |
Apco Oil and Gas International, Inc. | | * | | | 1,181 | | | | 18,412 | |
Arch Coal, Inc. | | † | | | 7,214 | | | | 32,102 | |
Bill Barrett Corp. | | *† | | | 5,171 | | | | 138,479 | |
Bonanza Creek Energy, Inc. | | * | | | 2,837 | | | | 123,324 | |
BPZ Resources, Inc. | | *† | | | 4,003 | | | | 7,286 | |
Cabot Oil & Gas Corp. | | | | | 16,664 | | | | 645,897 | |
Callon Petroleum Co. | | * | | | 779 | | | | 5,087 | |
Carrizo Oil & Gas, Inc. | | * | | | 1,800 | | | | 80,586 | |
Cheniere Energy, Inc. | | * | | | 6,673 | | | | 287,740 | |
| | | | | | | | | | | | |
| | | | |
| | | | |
|
Shares |
| | | Value | |
Chesapeake Energy Corp. | | | | | 20,459 | | | $ | 555,257 | |
Chevron Corp. | | | | | 72,329 | | | | 9,034,615 | |
Cimarex Energy Co. | | | | | 2,681 | | | | 281,264 | |
Clayton Williams Energy, Inc. | | * | | | 550 | | | | 45,073 | |
Cobalt International Energy, Inc. | | * | | | 13,233 | | | | 217,683 | |
Comstock Resources, Inc. | | | | | 1,735 | | | | 31,733 | |
Concho Resources, Inc. | | * | | | 3,943 | | | | 425,844 | |
ConocoPhillips | | | | | 45,189 | | | | 3,192,603 | |
CONSOL Energy, Inc. | | | | | 7,662 | | | | 291,463 | |
Contango Oil & Gas Co. | | * | | | 400 | | | | 18,904 | |
Continental Resources, Inc. | | *† | | | 2,212 | | | | 248,894 | |
Crosstex Energy, Inc. | | | | | 2,100 | | | | 75,936 | |
Denbury Resources, Inc. | | * | | | 16,015 | | | | 263,126 | |
Devon Energy Corp. | | | | | 14,461 | | | | 894,702 | |
Emerald Oil, Inc. | | * | | | 4,541 | | | | 34,784 | |
Energen Corp. | | | | | 2,644 | | | | 187,063 | |
Energy XXI Bermuda Ltd. (Bermuda) | | | | | 3,270 | | | | 88,486 | |
EOG Resources, Inc. | | | | | 10,198 | | | | 1,711,632 | |
EQT Corp. | | | | | 5,288 | | | | 474,757 | |
EXCO Resources, Inc. | | † | | | 8,720 | | | | 46,303 | |
Exxon Mobil Corp. | | | | | 166,083 | | | | 16,807,600 | |
Forest Oil Corp. | | * | | | 3,820 | | | | 13,790 | |
FX Energy, Inc. | | *† | | | 3,496 | | | | 12,795 | |
Gastar Exploration Ltd. | | * | | | 11,611 | | | | 80,348 | |
Golar LNG Ltd. (Bermuda) | | † | | | 3,300 | | | | 119,757 | |
Goodrich Petroleum Corp. | | *† | | | 1,566 | | | | 26,653 | |
Gulfport Energy Corp. | | * | | | 3,188 | | | | 201,322 | |
Halcon Resources Corp. | | *† | | | 5,474 | | | | 21,130 | |
Hess Corp. | | | | | 10,275 | | | | 852,825 | |
HollyFrontier Corp. | | | | | 7,651 | | | | 380,178 | |
Kinder Morgan, Inc. | | | | | 25,064 | | | | 902,304 | |
Kodiak Oil & Gas Corp. | | * | | | 13,664 | | | | 153,173 | |
L&L Energy, Inc. | | *†‡ | | | 8,563 | | | | 10,789 | |
Magnum Hunter Resources Corp. | | *† | | | 8,937 | | | | 65,330 | |
Marathon Oil Corp. | | | | | 25,577 | | | | 902,868 | |
Marathon Petroleum Corp. | | | | | 12,128 | | | | 1,112,501 | |
Murphy Oil Corp. | | | | | 8,206 | | | | 532,405 | |
Newfield Exploration Co. | | * | | | 3,712 | | | | 91,427 | |
Noble Energy, Inc. | | | | | 11,892 | | | | 809,964 | |
Oasis Petroleum, Inc. | | * | | | 3,200 | | | | 150,304 | |
Occidental Petroleum Corp. | | | | | 29,608 | | | | 2,815,721 | |
PDC Energy, Inc. | | * | | | 1,250 | | | | 66,525 | |
Peabody Energy Corp. | | | | | 10,624 | | | | 207,487 | |
Penn Virginia Corp. | | * | | | 13,955 | | | | 131,596 | |
PetroQuest Energy, Inc. | | * | | | 3,346 | | | | 14,455 | |
Phillips 66 | | | | | 23,728 | | | | 1,830,141 | |
Pioneer Natural Resources Co. | | | | | 5,081 | | | | 935,260 | |
QEP Resources, Inc. | | | | | 7,412 | | | | 227,178 | |
Quicksilver Resources, Inc. | | *† | | | 3,960 | | | | 12,157 | |
Range Resources Corp. | | | | | 5,516 | | | | 465,054 | |
Rentech, Inc. | | * | | | 38,127 | | | | 66,722 | |
Rosetta Resources, Inc. | | * | | | 3,400 | | | | 163,336 | |
SandRidge Energy, Inc. | | *† | | | 26,990 | | | | 163,829 | |
Scorpio Tankers, Inc. (Monaco) | | | | | 12,382 | | | | 145,984 | |
SemGroup Corp., Class A | | | | | 2,433 | | | | 158,705 | |
Ship Finance International Ltd. (Norway) | | † | | | 3,352 | | | | 54,906 | |
See accompanying notes to financial statements
299
SCHEDULE OF INVESTMENTS—(Continued)
December 31, 2013
| | | | | | | | | | | | |
Vantagepoint Broad
Market Index Fund | | | | Shares | | | Value | |
| COMMON STOCKS—(Continued) | | | | | |
SM Energy Co. | | | | | 2,262 | | | $ | 187,995 | |
Southwestern Energy Co. | | * | | | 12,344 | | | | 485,490 | |
Spectra Energy Corp. | | | | | 23,691 | | | | 843,873 | |
Stone Energy Corp. | | * | | | 1,208 | | | | 41,785 | |
Swift Energy Co. | | *† | | | 1,142 | | | | 15,417 | |
Targa Resources Corp. | | | | | 1,879 | | | | 165,671 | |
Teekay Corp. (Bermuda) | | | | | 1,691 | | | | 81,185 | |
Tesoro Corp. | | | | | 6,597 | | | | 385,925 | |
Ultra Petroleum Corp. | | *† | | | 7,839 | | | | 169,714 | |
Uranium Energy Corp. (Canada) | | *† | | | 16,570 | | | | 33,140 | |
Vaalco Energy, Inc. | | * | | | 3,800 | | | | 26,182 | |
Valero Energy Corp. | | | | | 20,375 | | | | 1,026,900 | |
Warren Resources, Inc. | | * | | | 3,600 | | | | 11,304 | |
Western Refining, Inc. | | † | | | 2,500 | | | | 106,025 | |
Whiting Petroleum Corp. | | * | | | 4,736 | | | | 293,016 | |
Williams Cos., Inc. (The) | | | | | 24,207 | | | | 933,664 | |
World Fuel Services Corp. | | | | | 1,920 | | | | 82,867 | |
WPX Energy, Inc. | | * | | | 8,069 | | | | 164,446 | |
| | | | | | | | | | | | |
| | | | | | | | | | | 58,082,513 | |
| | | | | | | | | | | | |
| Paper & Forest Products—0.2% | |
Clearwater Paper Corp. | | * | | | 924 | | | | 48,510 | |
Deltic Timber Corp. | | | | | 724 | | | | 49,188 | |
Domtar Corp. (Canada) | | | | | 1,388 | | | | 130,944 | |
International Paper Co. | | | | | 17,689 | | | | 867,292 | |
KapStone Paper and Packaging Corp. | | * | | | 2,858 | | | | 159,648 | |
Louisiana-Pacific Corp. | | * | | | 4,396 | | | | 81,370 | |
Neenah Paper, Inc. | | | | | 652 | | | | 27,886 | |
P.H. Glatfelter Co. | | | | | 1,740 | | | | 48,094 | |
Schweitzer-Mauduit International, Inc. | | | | | 1,448 | | | | 74,528 | |
Wausau Paper Corp. | | | | | 1,903 | | | | 24,130 | |
| | | | | | | | | | | | |
| | | | | | | | | | | 1,511,590 | |
| | | | | | | | | | | | |
| Personal Products—0.2% | |
Avon Products, Inc. | | | | | 14,351 | | | | 247,124 | |
Elizabeth Arden, Inc. | | * | | | 1,017 | | | | 36,053 | |
Estee Lauder Cos., Inc. (The), Class A | | | | | 9,518 | | | | 716,896 | |
Herbalife Ltd. (Cayman Islands) | | † | | | 3,985 | | | | 313,619 | |
Medifast, Inc. | | * | | | 734 | | | | 19,179 | |
Nu Skin Enterprises, Inc., Class A | | | | | 2,249 | | | | 310,857 | |
USANA Health Sciences, Inc. | | *† | | | 593 | | | | 44,819 | |
| | | | | | | | | | | | |
| | | | | | | | | | | 1,688,547 | |
| | | | | | | | | | | | |
| Pharmaceuticals—4.9% | |
AbbVie, Inc. | | | | | 58,793 | | | | 3,104,858 | |
AcelRx Pharmaceuticals, Inc. | | *† | | | 3,645 | | | | 41,225 | |
Actavis plc | | * | | | 5,902 | | | | 991,536 | |
Alimera Sciences, Inc. | | *† | | | 6,205 | | | | 29,226 | |
Allergan, Inc. | | | | | 11,483 | | | | 1,275,532 | |
AVANIR Pharmaceuticals, Inc., Class A | | * | | | 19,069 | | | | 64,072 | |
Bristol-Myers Squibb Co. | | | | | 60,619 | | | | 3,221,900 | |
Eli Lilly & Co. | | | | | 37,950 | | | | 1,935,450 | |
Endo Health Solutions, Inc. | | * | | | 4,151 | | | | 280,027 | |
Forest Laboratories, Inc. | | * | | | 9,208 | | | | 552,756 | |
Hi-Tech Pharmacal Co., Inc. | | * | | | 862 | | | | 37,402 | |
| | | | | | | | | | | | |
| | | | |
| | | | |
|
Shares |
| | | Value | |
Hospira, Inc. | | * | | | 5,415 | | | $ | 223,531 | |
Impax Laboratories, Inc. | | * | | | 6,278 | | | | 157,829 | |
Jazz Pharmaceuticals plc (Ireland) | | * | | | 1,945 | | | | 246,159 | |
Johnson & Johnson | | | | | 104,783 | | | | 9,597,075 | |
Mallinckrodt plc (Ireland) | | * | | | 1,947 | | | | 101,750 | |
Medicines Co. (The) | | * | | | 2,018 | | | | 77,935 | |
Merck & Co., Inc. | | | | | 112,101 | | | | 5,610,655 | |
Mylan, Inc. | | * | | | 13,150 | | | | 570,710 | |
Nektar Therapeutics | | * | | | 2,368 | | | | 26,877 | |
Pacira Pharmaceuticals, Inc. | | * | | | 2,705 | | | | 155,510 | |
Perrigo Co. plc | | | | | 4,089 | | | | 627,498 | |
Pfizer, Inc. | | | | | 248,312 | | | | 7,605,797 | |
Pozen, Inc. | | * | | | 1,014 | | | | 8,153 | |
Questcor Pharmaceuticals, Inc. | | † | | | 2,231 | | | | 121,478 | |
Salix Pharmaceuticals Ltd. | | * | | | 2,346 | | | | 210,999 | |
Santarus, Inc. | | * | | | 4,624 | | | | 147,783 | |
Sciclone Pharmaceuticals, Inc. | | * | | | 1,700 | | | | 8,568 | |
ViroPharma, Inc. | | * | | | 4,061 | | | | 202,441 | |
Vivus, Inc. | | *† | | | 1,630 | | | | 14,800 | |
XenoPort, Inc. | | * | | | 1,939 | | | | 11,149 | |
Zoetis, Inc. | | | | | 19,148 | | | | 625,948 | |
| | | | | | | | | | | | |
| | | | | | | | | | | 37,886,629 | |
| | | | | | | | | | | | |
| Professional Services—0.4% | |
Acacia Research Corp. | | † | | | 2,593 | | | | 37,702 | |
Advisory Board Co. (The) | | * | | | 1,900 | | | | 120,973 | |
Barrett Business Services, Inc. | | | | | 1,310 | | | | 121,489 | |
CDI Corp. | | | | | 1,131 | | | | 20,957 | |
Corporate Executive Board Co. (The) | | | | | 1,507 | | | | 116,687 | |
CRA International, Inc. | | * | | | 986 | | | | 19,523 | |
Dun & Bradstreet Corp. (The) | | | | | 1,546 | | | | 189,771 | |
Equifax, Inc. | | | | | 3,044 | | | | 210,310 | |
FTI Consulting, Inc. | | * | | | 1,735 | | | | 71,378 | |
Heidrick & Struggles International, Inc. | | | | | 865 | | | | 17,421 | |
Huron Consulting Group, Inc. | | * | | | 988 | | | | 61,967 | |
IHS, Inc., Class A | | * | | | 2,723 | | | | 325,943 | |
Insperity, Inc. | | | | | 1,143 | | | | 41,297 | |
Kelly Services, Inc., Class A | | | | | 1,173 | | | | 29,255 | |
Kforce, Inc. | | | | | 297 | | | | 6,077 | |
Korn/Ferry International | | * | | | 1,624 | | | | 42,419 | |
Manpowergroup, Inc. | | | | | 3,593 | | | | 308,495 | |
Navigant Consulting, Inc. | | * | | | 2,313 | | | | 44,410 | |
Nielsen Holdings NV | | | | | 8,545 | | | | 392,130 | |
On Assignment, Inc. | | * | | | 1,243 | | | | 43,405 | |
Resources Connection, Inc. | | | | | 2,060 | | | | 29,520 | |
Robert Half International, Inc. | | | | | 3,922 | | | | 164,685 | |
Towers Watson & Co., Class A | | | | | 2,923 | | | | 373,004 | |
TrueBlue, Inc. | | * | | | 2,485 | | | | 64,063 | |
Verisk Analytics, Inc., Class A | | * | | | 4,073 | | | | 267,678 | |
| | | | | | | | | | | | |
| | | | | | | | | | | 3,120,559 | |
| | | | | | | | | | | | |
| Real Estate Investment Trusts (REITs)—3.0% | |
Acadia Realty Trust REIT | | | | | 1,368 | | | | 33,967 | |
Agree Realty Corp. REIT | | | | | 814 | | | | 23,622 | |
See accompanying notes to financial statements
300
SCHEDULE OF INVESTMENTS—(Continued)
December 31, 2013
| | | | | | | | | | | | |
Vantagepoint Broad
Market Index Fund | | | | Shares | | | Value | |
| COMMON STOCKS—(Continued) | | | | | |
Alexander’s, Inc. REIT | | | | | 78 | | | $ | 25,740 | |
Alexandria Real Estate Equities, Inc. REIT | | | | | 3,569 | | | | 227,060 | |
American Campus Communities, Inc. REIT | | | | | 5,228 | | | | 168,394 | |
American Capital Agency Corp. REIT | | | | | 11,950 | | | | 230,515 | |
American Realty Capital Properties, Inc. REIT | | † | | | 11,217 | | | | 144,251 | |
American Tower Corp. REIT | | | | | 15,051 | | | | 1,201,371 | |
AmREIT, Inc. REIT | | | | | 1,682 | | | | 28,258 | |
Annaly Capital Management, Inc. REIT | | | | | 37,828 | | | | 377,145 | |
Anworth Mortgage Asset Corp. REIT | | | | | 12,920 | | | | 54,393 | |
Apartment Investment & Management Co., Class A REIT | | | | | 5,659 | | | | 146,625 | |
Armada Hoffler Properties, Inc. REIT | | | | | 2,694 | | | | 25,000 | |
ARMOUR Residential REIT, Inc. REIT | | | | | 15,586 | | | | 62,500 | |
Ashford Hospitality Prime, Inc. REIT | | | | | 840 | | | | 15,288 | |
Ashford Hospitality Trust, Inc. REIT | | | | | 4,200 | | | | 34,776 | |
Associated Estates Realty Corp. REIT | | | | | 5,662 | | | | 90,875 | |
AvalonBay Communities, Inc. REIT | | | | | 5,028 | | | | 594,460 | |
BioMed Realty Trust, Inc. REIT | | | | | 6,210 | | | | 112,525 | |
Boston Properties, Inc. REIT | | | | | 4,757 | | | | 477,460 | |
Brandywine Realty Trust REIT | | | | | 6,105 | | | | 86,019 | |
BRE Properties, Inc. REIT | | | | | 2,433 | | | | 133,109 | |
Camden Property Trust REIT | | | | | 4,497 | | | | 255,789 | |
Capstead Mortgage Corp. REIT | | | | | 2,400 | | | | 28,992 | |
CBL & Associates Properties, Inc. REIT | | | | | 7,509 | | | | 134,862 | |
Cedar Realty Trust, Inc. REIT | | | | | 10,942 | | | | 68,497 | |
Chambers Street Properties REIT | | † | | | 6,657 | | | | 50,926 | |
Chatham Lodging Trust REIT | | | | | 3,723 | | | | 76,135 | |
Chimera Investment Corp. REIT | | | | | 42,645 | | | | 132,199 | |
Colony Financial, Inc. REIT | | | | | 7,422 | | | | 150,592 | |
CommonWealth REIT REIT | | | | | 2,285 | | | | 53,263 | |
Corporate Office Properties Trust REIT | | | | | 1,904 | | | | 45,106 | |
Corrections Corp. of America REIT | | | | | 5,829 | | | | 186,936 | |
Cousins Properties, Inc. REIT | | | | | 2,489 | | | | 25,637 | |
CubeSmart REIT | | | | | 8,821 | | | | 140,607 | |
DCT Industrial Trust, Inc. REIT | | | | | 6,576 | | | | 46,887 | |
DDR Corp. REIT | | | | | 5,227 | | | | 80,339 | |
DiamondRock Hospitality Co. REIT | | | | | 4,047 | | | | 46,743 | |
Digital Realty Trust, Inc. REIT | | † | | | 5,165 | | | | 253,705 | |
| | | | | | | | | | | | |
| | | | |
| | | | |
|
Shares |
| | | Value | |
Douglas Emmett, Inc. REIT | | | | | 4,212 | | | $ | 98,097 | |
Duke Realty Corp. REIT | | | | | 14,966 | | | | 225,089 | |
DuPont Fabros Technology, Inc. REIT | | | | | 4,666 | | | | 115,297 | |
EastGroup Properties, Inc. REIT | | | | | 1,538 | | | | 89,096 | |
Ellington Residential Mortgage REIT REIT | | | | | 2,341 | | | | 36,005 | |
EPR Properties REIT | | | | | 2,733 | | | | 134,354 | |
Equity Lifestyle Properties, Inc. REIT | | | | | 2,280 | | | | 82,604 | |
Equity One, Inc. REIT | | | | | 2,619 | | | | 58,770 | |
Equity Residential REIT | | | | | 14,255 | | | | 739,407 | |
Essex Property Trust, Inc. REIT | | | | | 1,723 | | | | 247,268 | |
Excel Trust, Inc. REIT | | | | | 2,765 | | | | 31,493 | |
Extra Space Storage, Inc. REIT | | | | | 3,500 | | | | 147,455 | |
Federal Realty Investment Trust REIT | | | | | 2,295 | | | | 232,736 | |
FelCor Lodging Trust, Inc. REIT | | * | | | 14,860 | | | | 121,258 | |
First Industrial Realty Trust, Inc. REIT | | | | | 6,729 | | | | 117,421 | |
First Potomac Realty Trust REIT | | | | | 1,628 | | | | 18,934 | |
Franklin Street Properties Corp. REIT | | | | | 2,200 | | | | 26,290 | |
Gaming and Leisure Properties, Inc. REIT | | * | | | 2,586 | | | | 131,395 | |
General Growth Properties, Inc. REIT | | | | | 21,432 | | | | 430,140 | |
Geo Group, Inc. (The) REIT | | | | | 2,829 | | | | 91,150 | |
Getty Realty Corp. REIT | | | | | 1,747 | | | | 32,092 | |
Glimcher Realty Trust REIT | | | | | 9,231 | | | | 86,402 | |
Government Properties Income Trust REIT | | † | | | 3,576 | | | | 88,864 | |
Gramercy Property Trust, Inc. REIT | | * | | | 10,832 | | | | 62,284 | |
Hatteras Financial Corp. REIT | | | | | 1,935 | | | | 31,618 | |
HCP, Inc. REIT | | | | | 16,845 | | | | 611,810 | |
Health Care REIT, Inc. REIT | | | | | 9,130 | | | | 489,094 | |
Healthcare Realty Trust, Inc. REIT | | | | | 1,881 | | | | 40,084 | |
Highwoods Properties, Inc. REIT | | | | | 2,393 | | | | 86,555 | |
Home Properties, Inc. REIT | | | | | 1,390 | | | | 74,532 | |
Hospitality Properties Trust REIT | | | | | 2,923 | | | | 79,009 | |
Host Hotels & Resorts, Inc. REIT | | | | | 29,698 | | | | 577,329 | |
Inland Real Estate Corp. REIT | | | | | 2,302 | | | | 24,217 | |
Invesco Mortgage Capital, Inc. REIT | | | | | 3,087 | | | | 45,317 | |
Investors Real Estate Trust REIT | | † | | | 2,989 | | | | 25,646 | |
iStar Financial, Inc. REIT | | * | | | 7,235 | | | | 103,243 | |
Kilroy Realty Corp. REIT | | | | | 3,732 | | | | 187,272 | |
Kimco Realty Corp. REIT | | | | | 15,341 | | | | 302,985 | |
Kite Realty Group Trust REIT | | | | | 2,654 | | | | 17,437 | |
LaSalle Hotel Properties REIT | | | | | 6,253 | | | | 192,968 | |
See accompanying notes to financial statements
301
SCHEDULE OF INVESTMENTS—(Continued)
December 31, 2013
| | | | | | | | | | | | |
Vantagepoint Broad
Market Index Fund | | | | Shares | | | Value | |
| COMMON STOCKS—(Continued) | | | | | |
Lexington Realty Trust REIT | | | | | 9,308 | | | $ | 95,035 | |
Liberty Property Trust REIT | | | | | 3,372 | | | | 114,210 | |
LTC Properties, Inc. REIT | | | | | 2,385 | | | | 84,405 | |
Macerich Co. (The) REIT | | | | | 5,275 | | | | 310,645 | |
Mack-Cali Realty Corp. REIT | | | | | 2,488 | | | | 53,442 | |
Medical Properties Trust, Inc. REIT | | | | | 9,571 | | | | 116,958 | |
MFA Financial, Inc. REIT | | | | | 10,801 | | | | 76,255 | |
Mid-America Apartment Communities, Inc. REIT | | | | | 1,946 | | | | 118,200 | |
Monmouth Real Estate Investment Corp., Class A REIT | | | | | 3,275 | | | | 29,770 | |
National Health Investors, Inc. REIT | | | | | 979 | | | | 54,922 | |
National Retail Properties, Inc. REIT | | † | | | 2,356 | | | | 71,457 | |
New York Mortgage Trust, Inc. REIT | | | | | 8,120 | | | | 56,759 | |
NorthStar Realty Finance Corp. REIT | | | | | 9,319 | | | | 125,341 | |
Omega Healthcare Investors, Inc. REIT | | † | | | 4,100 | | | | 122,180 | |
Parkway Properties, Inc. REIT | | | | | 5,570 | | | | 107,445 | |
Pebblebrook Hotel Trust REIT | | | | | 4,976 | | | | 153,062 | |
Pennsylvania Real Estate Investment Trust REIT | | | | | 1,510 | | | | 28,660 | |
PennyMac Mortgage Investment Trust REIT | | | | | 6,735 | | | | 154,636 | |
Piedmont Office Realty Trust, Inc., Class A REIT | | † | | | 3,057 | | | | 50,502 | |
Plum Creek Timber Co., Inc. REIT | | | | | 6,990 | | | | 325,105 | |
Post Properties, Inc. REIT | | | | | 2,078 | | | | 93,988 | |
Potlatch Corp. REIT | | | | | 1,618 | | | | 67,535 | |
Prologis, Inc. REIT | | | | | 18,429 | | | | 680,952 | |
PS Business Parks, Inc. REIT | | | | | 599 | | | | 45,776 | |
Public Storage REIT | | | | | 5,376 | | | | 809,196 | |
RAIT Financial Trust REIT | | † | | | 7,882 | | | | 70,702 | |
Ramco-Gershenson Properties Trust REIT | | | | | 1,275 | | | | 20,068 | |
Rayonier, Inc. REIT | | | | | 5,004 | | | | 210,668 | |
Realty Income Corp. REIT | | † | | | 6,943 | | | | 259,182 | |
Redwood Trust, Inc. REIT | | † | | | 1,008 | | | | 19,525 | |
Regency Centers Corp. REIT | | | | | 2,745 | | | | 127,093 | |
Retail Opportunity Investments Corp. REIT | | | | | 7,505 | | | | 110,474 | |
RLJ Lodging Trust REIT | | | | | 1,393 | | | | 33,878 | |
Rouse Properties, Inc. REIT | | † | | | 579 | | | | 12,848 | |
Ryman Hospitality Properties, Inc. REIT | | † | | | 2,005 | | | | 83,769 | |
Sabra Health Care REIT, Inc. REIT | | | | | 694 | | | | 18,141 | |
Saul Centers, Inc. REIT | | | | | 987 | | | | 47,109 | |
Senior Housing Properties Trust REIT | | | | | 3,680 | | | | 81,806 | |
Silver Bay Realty Trust Corp. REIT | | † | | | 489 | | | | 7,819 | |
Simon Property Group, Inc. REIT | | | | | 11,684 | | | | 1,777,837 | |
| | | | | | | | | | | | |
| | | | |
| | | | |
|
Shares |
| | | Value | |
SL Green Realty Corp. REIT | | | | | 3,603 | | | $ | 332,845 | |
Sovran Self Storage, Inc. REIT | | | | | 1,269 | | | | 82,701 | |
Spirit Realty Capital, Inc. REIT | | | | | 14,667 | | | | 144,177 | |
Starwood Property Trust, Inc. REIT | | | | | 8,338 | | | | 230,963 | |
Strategic Hotels & Resorts, Inc. REIT | | * | | | 13,392 | | | | 126,554 | |
Sun Communities, Inc. REIT | | | | | 1,061 | | | | 45,241 | |
Sunstone Hotel Investors, Inc. REIT | | | | | 5,275 | | | | 70,685 | |
Tanger Factory Outlet Centers, Inc. REIT | | | | | 2,442 | | | | 78,193 | |
Taubman Centers, Inc. REIT | | | | | 2,083 | | | | 133,145 | |
Terreno Realty Corp. REIT | | | | | 4,464 | | | | 79,013 | |
Two Harbors Investment Corp. REIT | | | | | 10,028 | | | | 93,060 | |
UDR, Inc. REIT | | | | | 12,278 | | | | 286,691 | |
Universal Health Realty Income Trust REIT | | | | | 1,333 | | | | 53,400 | |
Ventas, Inc. REIT | | | | | 10,699 | | | | 612,839 | |
Vornado Realty Trust REIT | | | | | 7,263 | | | | 644,882 | |
Washington Real Estate Investment Trust REIT | | | | | 1,834 | | | | 42,842 | |
Weingarten Realty Investors REIT | | | | | 3,474 | | | | 95,257 | |
Weyerhaeuser Co. REIT | | | | | 21,444 | | | | 676,987 | |
WP Carey, Inc. REIT | | | | | 562 | | | | 34,479 | |
ZAIS Financial Corp. REIT | | | | | 1,699 | | | | 27,235 | |
| | | | | | | | | | | | |
| | | | | | | | | | | 23,122,129 | |
| | | | | | | | | | | | |
| Real Estate Management & Development—0.1% | |
Alexander & Baldwin, Inc. | | | | | 1,466 | | | | 61,176 | |
CBRE Group, Inc., Class A | | * | | | 9,507 | | | | 250,034 | |
Forest City Enterprises, Inc., Class A | | * | | | 9,240 | | | | 176,484 | |
Forestar Group, Inc. | | * | | | 1,502 | | | | 31,948 | |
Howard Hughes Corp. (The) | | * | | | 1,160 | | | | 139,316 | |
Jones Lang LaSalle, Inc. | | | | | 1,311 | | | | 134,233 | |
Realogy Holdings Corp. | | * | | | 5,690 | | | | 281,484 | |
St. Joe Co. (The) | | *† | | | 3,582 | | | | 68,739 | |
Tejon Ranch Co. | | * | | | 858 | | | | 31,540 | |
| | | | | | | | | | | | |
| | | | | | | | | | | 1,174,954 | |
| | | | | | | | | | | | |
| Road & Rail—1.0% | |
AMERCO | | * | | | 434 | | | | 103,223 | |
Arkansas Best Corp. | | | | | 903 | | | | 30,413 | |
Avis Budget Group, Inc. | | * | | | 4,424 | | | | 178,818 | |
Con-way, Inc. | | | | | 2,160 | | | | 85,774 | |
CSX Corp. | | | | | 34,403 | | | | 989,774 | |
Genesee & Wyoming, Inc., Class A | | * | | | 1,576 | | | | 151,375 | |
Heartland Express, Inc. | | | | | 4,220 | | | | 82,796 | |
Hertz Global Holdings, Inc. | | * | | | 15,313 | | | | 438,258 | |
J.B. Hunt Transport Services, Inc. | | | | | 2,208 | | | | 170,678 | |
Kansas City Southern | | | | | 4,402 | | | | 545,100 | |
Knight Transportation, Inc. | | | | | 3,879 | | | | 71,141 | |
Landstar System, Inc. | | | | | 2,256 | | | | 129,607 | |
Norfolk Southern Corp. | | | | | 11,527 | | | | 1,070,051 | |
See accompanying notes to financial statements
302
SCHEDULE OF INVESTMENTS—(Continued)
December 31, 2013
| | | | | | | | | | | | |
Vantagepoint Broad
Market Index Fund | | | | Shares | | | Value | |
| COMMON STOCKS—(Continued) | | | | | |
Old Dominion Freight Line, Inc. | | * | | | 4,011 | | | $ | 212,663 | |
Ryder System, Inc. | | | | | 2,947 | | | | 217,430 | |
Saia, Inc. | | * | | | 2,493 | | | | 79,901 | |
Swift Transportation Co. | | *† | | | 6,729 | | | | 149,451 | |
Union Pacific Corp. | | | | | 17,233 | | | | 2,895,144 | |
Werner Enterprises, Inc. | | | | | 2,915 | | | | 72,088 | |
YRC Worldwide, Inc. | | *† | | | 1,193 | | | | 20,722 | |
| | | | | | | | | | | | |
| | | | | | | | | | | 7,694,407 | |
| | | | | | | | | | | | |
| Semiconductors & Semiconductor Equipment—2.1% | |
Advanced Energy Industries, Inc. | | * | | | 1,428 | | | | 32,644 | |
Advanced Micro Devices, Inc. | | *† | | | 21,447 | | | | 83,000 | |
Alpha & Omega Semiconductor Ltd. | | * | | | 8,591 | | | | 66,237 | |
Altera Corp. | | | | | 11,427 | | | | 371,720 | |
Amkor Technology, Inc. | | *† | | | 7,211 | | | | 44,203 | |
ANADIGICS, Inc. | | * | | | 9,445 | | | | 17,379 | |
Analog Devices, Inc. | | | | | 11,925 | | | | 607,340 | |
Applied Materials, Inc. | | | | | 43,119 | | | | 762,775 | |
Applied Micro Circuits Corp. | | * | | | 3,186 | | | | 42,629 | |
Atmel Corp. | | * | | | 18,733 | | | | 146,679 | |
ATMI, Inc. | | * | | | 1,559 | | | | 47,097 | |
Avago Technologies Ltd. (Singapore) | | | | | 8,310 | | | | 439,516 | |
Axcelis Technologies, Inc. | | * | | | 4,095 | | | | 9,992 | |
Broadcom Corp., Class A | | | | | 23,587 | | | | 699,355 | |
Brooks Automation, Inc. | | | | | 3,103 | | | | 32,550 | |
Cabot Microelectronics Corp. | | * | | | 1,049 | | | | 47,939 | |
Cavium, Inc. | | * | | | 1,864 | | | | 64,327 | |
Ceva, Inc. | | * | | | 692 | | | | 10,532 | |
Cirrus Logic, Inc. | | *† | | | 2,946 | | | | 60,187 | |
Cohu, Inc. | | | | | 859 | | | | 9,019 | |
Cree, Inc. | | * | | | 5,646 | | | | 353,270 | |
Cypress Semiconductor Corp. | | *† | | | 4,876 | | | | 51,198 | |
Diodes, Inc. | | * | | | 2,400 | | | | 56,544 | |
DSP Group, Inc. | | * | | | 1,194 | | | | 11,594 | |
Entegris, Inc. | | * | | | 5,738 | | | | 66,561 | |
Exar Corp. | | * | | | 1,758 | | | | 20,727 | |
Fairchild Semiconductor International, Inc. | | * | | | 4,903 | | | | 65,455 | |
First Solar, Inc. | | * | | | 2,540 | | | | 138,786 | |
FormFactor, Inc. | | * | | | 1,417 | | | | 8,530 | |
Hittite Microwave Corp. | | * | | | 1,112 | | | | 68,644 | |
Integrated Device Technology, Inc. | | * | | | 8,168 | | | | 83,232 | |
Integrated Silicon Solution, Inc. | | * | | | 1,269 | | | | 15,342 | |
Intel Corp. | | | | | 183,911 | | | | 4,774,330 | |
International Rectifier Corp. | | * | | | 2,631 | | | | 68,590 | |
Intersil Corp., Class A | | | | | 5,757 | | | | 66,033 | |
IXYS Corp. | | | | | 1,329 | | | | 17,237 | |
KLA-Tencor Corp. | | | | | 5,600 | | | | 360,976 | |
Kopin Corp. | | * | | | 2,431 | | | | 10,259 | |
Lam Research Corp. | | * | | | 6,125 | | | | 333,506 | |
Lattice Semiconductor Corp. | | * | | | 4,395 | | | | 24,216 | |
Linear Technology Corp. | | | | | 6,084 | | | | 277,126 | |
LSI Corp. | | | | | 28,032 | | | | 308,913 | |
| | | | | | | | | | | | |
| | | | |
| | | | |
|
Shares |
| | | Value | |
LTX-Credence Corp. | | * | | | 1,358 | | | $ | 10,850 | |
Marvell Technology Group Ltd. (Bermuda) | | | | | 18,500 | | | | 266,030 | |
Maxim Integrated Products, Inc. | | | | | 9,481 | | | | 264,615 | |
Micrel, Inc. | | | | | 3,731 | | | | 36,825 | |
Microchip Technology, Inc. | | † | | | 6,639 | | | | 297,095 | |
Micron Technology, Inc. | | * | | | 35,271 | | | | 767,497 | |
Microsemi Corp. | | * | | | 2,474 | | | | 61,726 | |
MKS Instruments, Inc. | | | | | 2,455 | | | | 73,503 | |
MoSys, Inc. | | * | | | 1,251 | | | | 6,905 | |
NVE Corp. | | * | | | 348 | | | | 20,281 | |
NVIDIA Corp. | | | | | 20,184 | | | | 323,348 | |
OmniVision Technologies, Inc. | | * | | | 2,354 | | | | 40,489 | |
ON Semiconductor Corp. | | * | | | 30,400 | | | | 250,496 | |
PDF Solutions, Inc. | | * | | | 974 | | | | 24,954 | |
Pericom Semiconductor Corp. | | * | | | 1,023 | | | | 9,064 | |
Photronics, Inc. | | * | | | 1,388 | | | | 12,534 | |
PLX Technology, Inc. | | * | | | 1,050 | | | | 6,909 | |
PMC—Sierra, Inc. | | * | | | 7,045 | | | | 45,299 | |
Power Integrations, Inc. | | | | | 1,952 | | | | 108,961 | |
Rambus, Inc. | | * | | | 4,071 | | | | 38,552 | |
RF Micro Devices, Inc. | | * | | | 8,143 | | | | 42,018 | |
Rudolph Technologies, Inc. | | * | | | 1,247 | | | | 14,640 | |
Semtech Corp. | | * | | | 2,970 | | | | 75,082 | |
Sigma Designs, Inc. | | * | | | 1,320 | | | | 6,230 | |
Silicon Image, Inc. | | * | | | 2,948 | | | | 18,130 | |
Silicon Laboratories, Inc. | | * | | | 2,124 | | | | 91,990 | |
Skyworks Solutions, Inc. | | * | | | 5,822 | | | | 166,276 | |
SunEdison, Inc. | | * | | | 8,113 | | | | 105,875 | |
SunPower Corp. | | *† | | | 1,759 | | | | 52,436 | |
Synaptics, Inc. | | *† | | | 1,586 | | | | 82,171 | |
Teradyne, Inc. | | * | | | 7,938 | | | | 139,868 | |
Tessera Technologies, Inc. | | | | | 1,560 | | | | 30,748 | |
Texas Instruments, Inc. | | | | | 39,030 | | | | 1,713,807 | |
TriQuint Semiconductor, Inc. | | * | | | 4,918 | | | | 41,016 | |
Ultratech, Inc. | | * | | | 971 | | | | 28,159 | |
Veeco Instruments, Inc. | | * | | | 1,294 | | | | 42,586 | |
Xilinx, Inc. | | | | | 7,420 | | | | 340,726 | |
| | | | | | | | | | | | |
| | | | | | | | | | | 16,433,880 | |
| | | | | | | | | | | | |
| Software—3.6% | |
Accelrys, Inc. | | * | | | 2,216 | | | | 21,141 | |
ACI Worldwide, Inc. | | * | | | 1,653 | | | | 107,445 | |
Activision Blizzard, Inc. | | | | | 17,758 | | | | 316,625 | |
Actuate Corp. | | * | | | 2,084 | | | | 16,068 | |
Adobe Systems, Inc. | | * | | | 17,358 | | | | 1,039,397 | |
Advent Software, Inc. | | | | | 2,902 | | | | 101,541 | |
American Software, Inc., Class A | | | | | 1,950 | | | | 19,246 | |
ANSYS, Inc. | | * | | | 2,396 | | | | 208,931 | |
Aspen Technology, Inc. | | * | | | 3,661 | | | | 153,030 | |
Autodesk, Inc. | | * | | | 9,258 | | | | 465,955 | |
Blackbaud, Inc. | | | | | 2,650 | | | | 99,773 | |
CA, Inc. | | | | | 11,593 | | | | 390,104 | |
Cadence Design Systems, Inc. | | * | | | 10,745 | | | | 150,645 | |
Callidus Software, Inc. | | * | | | 172 | | | | 2,362 | |
Citrix Systems, Inc. | | * | | | 7,179 | | | | 454,072 | |
CommVault Systems, Inc. | | * | | | 1,510 | | | | 113,069 | |
Compuware Corp. | | | | | 7,505 | | | | 84,131 | |
Concur Technologies, Inc. | | *† | | | 2,083 | | | | 214,924 | |
See accompanying notes to financial statements
303
SCHEDULE OF INVESTMENTS—(Continued)
December 31, 2013
| | | | | | | | | | | | |
Vantagepoint Broad
Market Index Fund | | | | Shares | | | Value | |
| COMMON STOCKS—(Continued) | | | | | |
Ebix, Inc. | | † | | | 2,802 | | | $ | 41,245 | |
Electronic Arts, Inc. | | * | | | 12,060 | | | | 276,656 | |
Epiq Systems, Inc. | | | | | 1,087 | | | | 17,620 | |
FactSet Research Systems, Inc. | | † | | | 1,490 | | | | 161,784 | |
Fair Isaac Corp. | | | | | 2,628 | | | | 165,144 | |
Fortinet, Inc. | | * | | | 5,654 | | | | 108,161 | |
Guidewire Software, Inc. | | * | | | 3,146 | | | | 154,374 | |
Informatica Corp. | | * | | | 3,171 | | | | 131,597 | |
Interactive Intelligence Group, Inc. | | * | | | 950 | | | | 63,992 | |
Intuit, Inc. | | | | | 11,315 | | | | 863,561 | |
Manhattan Associates, Inc. | | * | | | 1,346 | | | | 158,128 | |
Mentor Graphics Corp. | | | | | 2,745 | | | | 66,072 | |
MICROS Systems, Inc. | | * | | | 3,428 | | | | 196,664 | |
Microsoft Corp. | | | | | 309,545 | | | | 11,586,269 | |
MicroStrategy, Inc., Class A | | * | | | 513 | | | | 63,735 | |
Mitek Systems, Inc. | | *† | | | 5,828 | | | | 34,618 | |
Netscout Systems, Inc. | | * | | | 1,250 | | | | 36,988 | |
NetSuite, Inc. | | * | | | 1,276 | | | | 131,454 | |
Nuance Communications, Inc. | | *† | | | 9,517 | | | | 144,658 | |
Oracle Corp. | | | | | 130,442 | | | | 4,990,711 | |
Pegasystems, Inc. | | | | | 2,141 | | | | 105,294 | |
Progress Software Corp. | | * | | | 1,983 | | | | 51,221 | |
PTC, Inc. | | * | | | 4,423 | | | | 156,530 | |
Qlik Technologies, Inc. | | * | | | 5,245 | | | | 139,674 | |
Red Hat, Inc. | | * | | | 7,251 | | | | 406,346 | |
Rovi Corp. | | * | | | 3,917 | | | | 77,126 | |
Salesforce.com, Inc. | | * | | | 20,430 | | | | 1,127,532 | |
SeaChange International, Inc. | | * | | | 958 | | | | 11,649 | |
ServiceNow, Inc. | | * | | | 3,535 | | | | 197,995 | |
SolarWinds, Inc. | | * | | | 1,876 | | | | 70,969 | |
Solera Holdings, Inc. | | | | | 3,377 | | | | 238,957 | |
Splunk, Inc. | | * | | | 3,859 | | | | 264,998 | |
SS&C Technologies Holdings, Inc. | | * | | | 3,677 | | | | 162,744 | |
Symantec Corp. | | | | | 26,135 | | | | 616,263 | |
Synopsys, Inc. | | * | | | 6,501 | | | | 263,746 | |
Take-Two Interactive Software, Inc. | | * | | | 2,643 | | | | 45,909 | |
TIBCO Software, Inc. | | * | | | 4,452 | | | | 100,081 | |
TiVo, Inc. | | * | | | 2,696 | | | | 35,372 | |
Tyler Technologies, Inc. | | * | | | 1,886 | | | | 192,617 | |
Ultimate Software Group, Inc. (The) | | * | | | 1,242 | | | | 190,299 | |
VASCO Data Security International, Inc. | | * | | | 3,804 | | | | 29,405 | |
Verint Systems, Inc. | | * | | | 4,064 | | | | 174,508 | |
VMware, Inc., Class A | | * | | | 3,264 | | | | 292,813 | |
Vringo, Inc. | | *† | | | 10,252 | | | | 30,346 | |
Workday, Inc., Class A | | * | | | 987 | | | | 82,079 | |
Zynga, Inc., Class A | | * | | | 11,188 | | | | 42,514 | |
| | | | | | | | | | | | |
| | | | | | | | | | | 28,458,877 | |
| | | | | | | | | | | | |
| Specialty Retail—2.4% | |
Aaron’s, Inc. | | | | | 2,908 | | | | 85,495 | |
Abercrombie & Fitch Co., Class A | | † | | | 3,072 | | | | 101,100 | |
Advance Auto Parts, Inc. | | | | | 3,235 | | | | 358,050 | |
Aeropostale, Inc. | | *† | | | 2,075 | | | | 18,862 | |
| | | | | | | | | | | | |
| | | | |
| | | | |
|
Shares |
| | | Value | |
American Eagle Outfitters, Inc. | | | | | 12,752 | | | $ | 183,629 | |
America’s Car-Mart, Inc. | | * | | | 354 | | | | 14,949 | |
ANN, Inc. | | * | | | 2,733 | | | | 99,918 | |
Asbury Automotive Group, Inc. | | * | | | 1,342 | | | | 72,119 | |
Ascena Retail Group, Inc. | | * | | | 5,194 | | | | 109,905 | |
AutoNation, Inc. | | * | | | 2,555 | | | | 126,958 | |
AutoZone, Inc. | | * | | | 1,308 | | | | 625,146 | |
Barnes & Noble, Inc. | | * | | | 828 | | | | 12,379 | |
bebe stores, Inc. | | | | | 790 | | | | 4,203 | |
Bed Bath & Beyond, Inc. | | * | | | 7,504 | | | | 602,571 | |
Best Buy Co., Inc. | | | | | 9,299 | | | | 370,844 | |
Big 5 Sporting Goods Corp. | | | | | 1,071 | | | | 21,227 | |
Brown Shoe Co., Inc. | | | | | 1,791 | | | | 50,399 | |
Buckle, Inc. (The) | | † | | | 1,236 | | | | 64,964 | |
Cabela’s, Inc. | | * | | | 1,696 | | | | 113,055 | |
CarMax, Inc. | | * | | | 7,970 | | | | 374,749 | |
Cato Corp. (The), Class A | | | | | 1,761 | | | | 56,000 | |
Chico’s FAS, Inc. | | | | | 7,236 | | | | 136,326 | |
Children’s Place Retail Stores, Inc. (The) | | * | | | 1,144 | | | | 65,174 | |
CST Brands, Inc. | | | | | 2,444 | | | | 89,744 | |
Destination Maternity Corp. | | | | | 1,200 | | | | 35,856 | |
Destination XL Group, Inc. | | * | | | 1,930 | | | | 12,680 | |
Dick’s Sporting Goods, Inc. | | | | | 2,480 | | | | 144,088 | |
DSW, Inc., Class A | | | | | 1,192 | | | | 50,934 | |
Express, Inc. | | * | | | 6,015 | | | | 112,300 | |
Finish Line, Inc. (The), Class A | | | | | 1,917 | | | | 54,002 | |
Foot Locker, Inc. | | | | | 5,840 | | | | 242,010 | |
GameStop Corp., Class A | | | | | 4,171 | | | | 205,463 | |
Gap, Inc. (The) | | | | | 11,079 | | | | 432,967 | |
Genesco, Inc. | | * | | | 921 | | | | 67,288 | |
GNC Holdings, Inc., Class A | | | | | 2,440 | | | | 142,618 | |
Group 1 Automotive, Inc. | | | | | 1,068 | | | | 75,849 | |
Guess?, Inc. | | | | | 1,639 | | | | 50,924 | |
Haverty Furniture Cos., Inc. | | | | | 1,111 | | | | 34,774 | |
Hibbett Sports, Inc. | | *† | | | 1,396 | | | | 93,825 | |
Home Depot, Inc. (The) | | | | | 53,787 | | | | 4,428,822 | |
Jos A. Bank Clothiers, Inc. | | * | | | 865 | | | | 47,341 | |
Kirkland’s, Inc. | | * | | | 833 | | | | 19,717 | |
L Brands, Inc. | | | | | 9,309 | | | | 575,762 | |
Lithia Motors, Inc., Class A | | | | | 862 | | | | 59,840 | |
Lowe’s Cos., Inc. | | | | | 41,485 | | | | 2,055,582 | |
Lumber Liquidators Holdings, Inc. | | * | | | 769 | | | | 79,122 | |
MarineMax, Inc. | | * | | | 800 | | | | 12,864 | |
Men’s Wearhouse, Inc. (The) | | | | | 2,437 | | | | 124,482 | |
Monro Muffler Brake, Inc. | | | | | 1,487 | | | | 83,807 | |
Murphy USA, Inc. | | * | | | 1,451 | | | | 60,304 | |
Office Depot, Inc. | | * | | | 21,441 | | | | 113,423 | |
O’Reilly Automotive, Inc. | | * | | | 3,911 | | | | 503,385 | |
Outerwall, Inc. | | *† | | | 1,075 | | | | 72,315 | |
Penske Automotive Group, Inc. | | | | | 1,654 | | | | 78,003 | |
Pep Boys-Manny, Moe & Jack (The) | | * | | | 2,200 | | | | 26,708 | |
PetSmart, Inc. | | | | | 3,546 | | | | 257,972 | |
Pier 1 Imports, Inc. | | | | | 3,712 | | | | 85,673 | |
RadioShack Corp. | | *† | | | 2,569 | | | | 6,679 | |
Rent-A-Center, Inc. | | | | | 1,769 | | | | 58,978 | |
See accompanying notes to financial statements
304
SCHEDULE OF INVESTMENTS—(Continued)
December 31, 2013
| | | | | | | | | | | | |
Vantagepoint Broad
Market Index Fund | | | | Shares | | | Value | |
| COMMON STOCKS—(Continued) | | | | | |
Ross Stores, Inc. | | | | | 6,787 | | | $ | 508,550 | |
Sally Beauty Holdings, Inc. | | * | | | 9,008 | | | | 272,312 | |
Select Comfort Corp. | | * | | | 2,104 | | | | 44,373 | |
Signet Jewelers Ltd. (Bermuda) | | | | | 3,344 | | | | 263,173 | |
Sonic Automotive, Inc., Class A | | | | | 1,649 | | | | 40,368 | |
Stage Stores, Inc. | | | | | 2,236 | | | | 49,684 | |
Staples, Inc. | | | | | 22,960 | | | | 364,834 | |
Stein Mart, Inc. | | | | | 1,261 | | | | 16,960 | |
Systemax, Inc. | | * | | | 1,358 | | | | 15,278 | |
Tiffany & Co. | | | | | 4,057 | | | | 376,408 | |
TJX Cos., Inc. | | | | | 25,282 | | | | 1,611,222 | |
Tractor Supply Co. | | | | | 5,080 | | | | 394,106 | |
Ulta Salon Cosmetics & Fragrance, Inc. | | * | | | 2,434 | | | | 234,930 | |
Urban Outfitters, Inc. | | * | | | 5,012 | | | | 185,945 | |
Vitamin Shoppe, Inc. | | * | | | 2,795 | | | | 145,368 | |
West Marine, Inc. | | * | | | 803 | | | | 11,427 | |
Wet Seal, Inc. (The), Class A | | * | | | 1,246 | | | | 3,402 | |
Williams-Sonoma, Inc. | | | | | 3,877 | | | | 225,952 | |
| | | | | | | | | | | | |
| | | | | | | | | | | 19,028,415 | |
| | | | | | | | | | | | |
| Textiles, Apparel & Luxury Goods—0.9% | |
Carter’s, Inc. | | | | | 1,476 | | | | 105,962 | |
Coach, Inc. | | | | | 10,479 | | | | 588,186 | |
Columbia Sportswear Co. | | † | | | 652 | | | | 51,345 | |
Crocs, Inc. | | * | | | 3,600 | | | | 57,312 | |
Culp, Inc. | | | | | 888 | | | | 18,160 | |
Deckers Outdoor Corp. | | * | | | 1,935 | | | | 163,430 | |
Fifth & Pacific Cos., Inc. | | * | | | 4,930 | | | | 158,105 | |
Fossil Group, Inc. | | * | | | 1,614 | | | | 193,583 | |
Hanesbrands, Inc. | | | | | 4,099 | | | | 288,037 | |
Iconix Brand Group, Inc. | | * | | | 2,737 | | | | 108,659 | |
Jones Group, Inc. (The) | | | | | 4,641 | | | | 69,429 | |
Michael Kors Holdings Ltd. (Hong Kong) | | * | | | 7,314 | | | | 593,824 | |
Movado Group, Inc. | | | | | 1,678 | | | | 73,849 | |
NIKE, Inc., Class B | | | | | 25,176 | | | | 1,979,841 | |
Oxford Industries, Inc. | | | | | 936 | | | | 75,507 | |
PVH Corp. | | | | | 2,525 | | | | 343,450 | |
Quiksilver, Inc. | | * | | | 4,288 | | | | 37,606 | |
Ralph Lauren Corp. | | | | | 1,773 | | | | 313,059 | |
Skechers U.S.A., Inc., Class A | | * | | | 1,935 | | | | 64,107 | |
Steven Madden Ltd. | | * | | | 2,533 | | | | 92,682 | |
Under Armour, Inc., Class A | | * | | | 3,874 | | | | 338,200 | |
Unifi, Inc. | | * | | | 876 | | | | 23,862 | |
V.F. Corp. | | | | | 12,436 | | | | 775,260 | |
Wolverine World Wide, Inc. | | | | | 5,178 | | | | 175,845 | |
| | | | | | | | | | | | |
| | | | | | | | | | | 6,689,300 | |
| | | | | | | | | | | | |
| Thrifts & Mortgage Finance—0.3% | |
Astoria Financial Corp. | | | | | 3,465 | | | | 47,921 | |
Bank Mutual Corp. | | | | | 3,756 | | | | 26,330 | |
Beneficial Mutual Bancorp, Inc. | | * | | | 969 | | | | 10,581 | |
Brookline Bancorp, Inc. | | | | | 3,765 | | | | 36,031 | |
Capitol Federal Financial, Inc. | | | | | 4,787 | | | | 57,971 | |
Dime Community Bancshares, Inc. | | | | | 1,638 | | | | 27,715 | |
Doral Financial Corp. (Puerto Rico) | | * | | | 2,222 | | | | 34,797 | |
| | | | | | | | | | | | |
| | | | |
| | | | |
|
Shares |
| | | Value | |
ESB Financial Corp. | | | | | 5,450 | | | $ | 77,390 | |
EverBank Financial Corp. | | | | | 9,739 | | | | 178,613 | |
Home Loan Servicing Solutions Ltd. (Cayman Islands) | | | | | 6,384 | | | | 146,640 | |
Hudson City Bancorp, Inc. | | | | | 30,824 | | | | 290,670 | |
MGIC Investment Corp. | | * | | | 16,751 | | | | 141,378 | |
NASB Financial, Inc. | | † | | | 528 | | | | 15,946 | |
New York Community Bancorp, Inc. | | † | | | 12,640 | | | | 212,984 | |
Northwest Bancshares, Inc. | | | | | 4,608 | | | | 68,106 | |
Ocwen Financial Corp. | | * | | | 3,358 | | | | 186,201 | |
People’s United Financial, Inc. | | | | | 15,654 | | | | 236,688 | |
Provident Financial Services, Inc. | | | | | 943 | | | | 18,219 | |
Radian Group, Inc. | | | | | 8,446 | | | | 119,258 | |
Territorial Bancorp, Inc. | | | | | 2,649 | | | | 61,457 | |
TFS Financial Corp. | | * | | | 3,398 | | | | 41,167 | |
Tree.com, Inc. | | * | | | 314 | | | | 10,312 | |
TrustCo Bank Corp. NY | | | | | 3,435 | | | | 24,663 | |
Washington Federal, Inc. | | | | | 3,379 | | | | 78,697 | |
Westfield Financial, Inc. | | | | | 4,068 | | | | 30,347 | |
| | | | | | | | | | | | |
| | | | | | | | | | | 2,180,082 | |
| | | | | | | | | | | | |
| Tobacco—1.2% | |
Alliance One International, Inc. | | * | | | 2,000 | | | | 6,100 | |
Altria Group, Inc. | | | | | 74,463 | | | | 2,858,635 | |
Lorillard, Inc. | | | | | 13,374 | | | | 677,794 | |
Philip Morris International, Inc. | | | | | 61,517 | | | | 5,359,976 | |
Reynolds American, Inc. | | | | | 11,115 | | | | 555,639 | |
Universal Corp. | | † | | | 1,078 | | | | 58,859 | |
Vector Group Ltd. | | † | | | 3,197 | | | | 52,335 | |
| | | | | | | | | | | | |
| | | | | | | | | | | 9,569,338 | |
| | | | | | | | | | | | |
| Trading Companies & Distributors—0.3% | |
Air Lease Corp. | | | | | 2,229 | | | | 69,277 | |
Aircastle Ltd. | | | | | 7,818 | | | | 149,793 | |
Applied Industrial Technologies, Inc. | | | | | 2,056 | | | | 100,929 | |
Beacon Roofing Supply, Inc. | | * | | | 2,570 | | | | 103,520 | |
Fastenal Co. | | | | | 11,276 | | | | 535,723 | |
GATX Corp. | | | | | 1,766 | | | | 92,132 | |
H&E Equipment Services, Inc. | | * | | | 1,600 | | | | 47,408 | |
MSC Industrial Direct Co., Inc., Class A | | | | | 1,782 | | | | 144,110 | |
TAL International Group, Inc. | | † | | | 2,773 | | | | 159,032 | |
United Rentals, Inc. | | * | | | 2,798 | | | | 218,104 | |
W.W. Grainger, Inc. | | | | | 2,301 | | | | 587,721 | |
Watsco, Inc. | | | | | 553 | | | | 53,121 | |
WESCO International, Inc. | | * | | | 1,550 | | | | 141,159 | |
| | | | | | | | | | | | |
| | | | | | | | | | | 2,402,029 | |
| | | | | | | | | | | | |
| Water Utilities—0.1% | |
American States Water Co. | | | | | 2,522 | | | | 72,457 | |
American Water Works Co., Inc. | | | | | 8,019 | | | | 338,883 | |
Aqua America, Inc. | | | | | 5,411 | | | | 127,646 | |
California Water Service Group | | | | | 1,930 | | | | 44,525 | |
See accompanying notes to financial statements
305
SCHEDULE OF INVESTMENTS—(Continued)
December 31, 2013
| | | | | | | | | | | | | | |
Vantagepoint
Broad Market Index
Fund | | | | | Shares | | | Value | |
| COMMON STOCKS—(Continued) | | | | | |
Connecticut Water Service, Inc. | | | | | | 500 | | | $ | 17,755 | |
SJW Corp. | | | | | | 1,010 | | | | 30,088 | |
| | | | | | | | | | | | | | |
| | | | | | | | | | | | | 631,354 | |
| | | | | | | | | | | | | | |
| Wireless Telecommunication Services—0.3% | |
Crown Castle International Corp. | | | * | | | 12,722 | | | | 934,176 | |
Leap Wireless International, Inc. | | | * | | | 3,300 | | | | 57,420 | |
NII Holdings, Inc. | | | *† | | | 5,995 | | | | 16,486 | |
NTELOS Holdings Corp. | | | | | | 1,350 | | | | 27,311 | |
SBA Communications Corp., Class A | | | * | | | 5,704 | | | | 512,447 | |
Shenandoah Telecommunications Co. | | | | | | 1,200 | | | | 30,804 | |
Sprint Corp. | | | * | | | 24,376 | | | | 262,042 | |
Telephone & Data Systems, Inc. | | | | | | 3,217 | | | | 82,934 | |
T-Mobile US, Inc. | | | * | | | 9,242 | | | | 310,901 | |
United States Cellular Corp. | | | | | | 680 | | | | 28,438 | |
| | | | | | | | | | | | | | |
| | | | | | | | | | | | | 2,262,959 | |
| | | | | | | | | | | | | | |
| TOTAL COMMON STOCKS | |
(Cost $422,922,429) | | | | | | | | | | 766,866,176 | |
| | | | | | | | | | | | | | |
| | | | | | | | | | | | | | | |
| | | | |
Coupon
Rate | |
| Maturity
Date |
| | | | | Face | | | | Value | |
| U.S. TREASURY OBLIGATIONS—0.1% | |
| U.S. Treasury Bills—0.1% | |
U.S. Treasury Bill | | | | | | | | | | | |
0.075% | | | 06/26/2014 | | | ‡‡ | | $ | 335,000 | | | | 334,870 | |
0.070% | | | 03/27/2014 | | | ‡‡ | | | 205,000 | | | | 204,970 | |
0.046% | | | 03/13/2014 | | | ‡‡ | | | 55,000 | | | | 54,996 | |
| | | | | | | | | | | | | | |
| | | | | | | | | | | | | 594,836 | |
| | | | | | | | | | | | | | |
| TOTAL U.S. TREASURY OBLIGATIONS | |
(Cost $594,834) | | | | | | | | | | 594,836 | |
| | | | | | | | | | | | | | |
| | | | | | | | | | | | | | | |
| | | | |
| | | | | | | | | | Shares | | | | Value | |
| RIGHTS—0.0% | |
| Machinery—0.0% | |
Gerber Scientific, Inc. | | | *†‡d | | | 1,608 | | | | — | |
| | | | | | | | | | | | | | |
| Oil, Gas & Consumable Fuels—0.0% | |
EXCO Resources, Inc., Expires 01/09/2014 | | | *† | | | 8,720 | | | | 1,395 | |
| | | | | | | | | | | | | | |
| Pharmaceuticals—0.0% | |
Forest Laboratories, Inc. | | | *‡ | | | 1,998 | | | | 1,099 | |
| | | | | | | | | | | | | | |
| Textiles, Apparel & Luxury Goods—0.0% | |
Mossimo, Inc. | | | *‡d | | | 2,806 | | | | — | |
| | | | | | | | | | | | | | |
| TOTAL RIGHTS | |
(Cost $–) | | | | | | | | | | 2,494 | |
| | | | | | | | | | | | | | |
| | | | | | | | | | | | |
| | | | | |
| | | | | | |
|
Shares |
| | | Value | |
| WARRANTS—0.0% | |
| Communications Equipment—0.0% | |
Pegasus Wireless Corp. | | | | *‡d | | | 540 | | | $ | — | |
| | | | | | | | | | | | |
| Oil, Gas & Consumable Fuels—0.0% | |
Magnum Hunter Resources Corp., Expires 04/15/2016, Strike $1.00 | | | | *†‡ | | | 893 | | | | 1,045 | |
| | | | | | | | | | | | |
| TOTAL WARRANTS | |
(Cost $–) | | | | | | | | | 1,045 | |
| | | | | | | | | | | | |
| | | | | | | | | | | | | |
| MONEY MARKET FUNDS—3.2% | |
| Institutional Money Market Funds—3.2% | |
Dreyfus Institutional Cash Advantage Fund, 0.06% | | ††¥ | | | 2,200,000 | | | | 2,200,000 | |
Fidelity Institutional Money Market: Money Market Portfolio—Institutional Class, 0.07% | | ¥ | | | 12,009,773 | | | | 12,009,773 | |
Fidelity Institutional Money Market: Money Market Portfolio—Institutional Class, 0.07% | | ††¥ | | | 2,336,357 | | | | 2,336,357 | |
Fidelity Institutional Money Market: Prime Money Market Portfolio—Institutional Class, 0.04% | | ††¥ | | | 2,200,000 | | | | 2,200,000 | |
Short-Term Investments Trust Liquid Assets Portfolio—Institutional Class, 0.07% | | ††¥ | | | 2,200,000 | | | | 2,200,000 | |
Wells Fargo Advantage Cash Investment Money Market Fund—Select Class, 0.06% | | ††¥ | | | 2,200,000 | | | | 2,200,000 | |
Wells Fargo Advantage Heritage Money Market Fund—Select Class, 0.06% | | ††¥ | | | 2,200,000 | | | | 2,200,000 | |
| | | | | | | | | | | | |
| TOTAL MONEY MARKET FUNDS | |
(Cost $25,346,130) | | | | | | | | | 25,346,130 | |
| | | | | | | | | | | | |
| TOTAL INVESTMENTS—101.6% | |
(Cost $448,863,393) | | | | | | | | | 792,810,681 | |
Other assets less liabilities—(1.6%) | | | | (12,729,530 | ) |
| | | | | | | | | | | | |
| NET ASSETS—100.0% | | | $ | 780,081,151 | |
| | | | | | | | | | | | |
Notes to the Schedule of Investments:
| | |
| REIT | | Real Estate Investment Trust |
| * | | Non-income producing. |
| † | | Denotes all or a portion of the security on loan. |
| d | | Security has no market value at December 31, 2013. |
| ‡ | | Security valued at fair value as determined by policies approved by the Board of Directors. (Total Market Value $12,933) |
| ‡‡ | | Security or a portion of the security has been pledged as collateral for futures contracts and/or options contracts. |
| †† | | Represents reinvestment of collateral received in conjunction with securities lending. |
| ¥ | | The rate quoted is the annualized seven-day yield of the fund at period end. |
See accompanying notes to financial statements
306
SCHEDULE OF INVESTMENTS
December 31, 2013
| | | | | | | | | | | | |
Vantagepoint Mid/Small
Company Index Fund | | | | Shares | | | Value | |
| | | | | | | | | | | | |
| COMMON STOCKS—97.8% | |
| Aerospace & Defense—1.8% | |
AAR Corp. | | | | | 6,897 | | | $ | 193,185 | |
Aerovironment, Inc. | | * | | | 3,832 | | | | 111,626 | |
Alliant Techsystems, Inc. | | | | | 6,101 | | | | 742,370 | |
American Science & Engineering, Inc. | | | | | 1,394 | | | | 100,243 | |
API Technologies Corp. | | * | | | 5,462 | | | | 18,625 | |
Astronics Corp. | | * | | | 3,084 | | | | 157,284 | |
B/E Aerospace, Inc. | | * | | | 18,257 | | | | 1,588,907 | |
Cubic Corp. | | | | | 3,920 | | | | 206,427 | |
Curtiss-Wright Corp. | | | | | 8,952 | | | | 557,083 | |
DigitalGlobe, Inc. | | * | | | 13,689 | | | | 563,302 | |
Ducommun, Inc. | | * | | | 1,702 | | | | 50,737 | |
Engility Holdings, Inc. | | * | | | 3,630 | | | | 121,242 | |
Erickson Air-Crane, Inc. | | *† | | | 603 | | | | 12,536 | |
Esterline Technologies Corp. | | * | | | 5,743 | | | | 585,556 | |
Exelis, Inc. | | | | | 35,218 | | | | 671,255 | |
GenCorp, Inc. | | *† | | | 11,785 | | | | 212,366 | |
HEICO Corp. | | | | | 12,141 | | | | 703,571 | |
Hexcel Corp. | | * | | | 18,978 | | | | 848,127 | |
Huntington Ingalls Industries, Inc. | | | | | 9,498 | | | | 854,915 | |
Innovative Solutions & Support, Inc. | | * | | | 2,046 | | | | 14,915 | |
KEYW Holding Corp. (The) | | *† | | | 5,318 | | | | 71,474 | |
Kratos Defense & Security Solutions, Inc. | | * | | | 9,324 | | | | 71,608 | |
LMI Aerospace, Inc. | | *† | | | 1,056 | | | | 15,565 | |
Moog, Inc., Class A | | * | | | 8,506 | | | | 577,898 | |
National Presto Industries, Inc. | | *† | | | 975 | | | | 78,488 | |
Orbital Sciences Corp. | | * | | | 11,370 | | | | 264,921 | |
Sparton Corp. | | * | | | 1,633 | | | | 45,642 | |
Spirit Aerosystems Holdings, Inc., Class A | | * | | | 21,856 | | | | 744,853 | |
Taser International, Inc. | | * | | | 9,624 | | | | 152,829 | |
Teledyne Technologies, Inc. | | * | | | 6,838 | | | | 628,139 | |
TransDigm Group, Inc. | | | | | 9,693 | | | | 1,560,767 | |
Triumph Group, Inc. | | | | | 9,630 | | | | 732,554 | |
| | | | | | | | | | | | |
| | | | | | | | | | | 13,259,010 | |
| | | | | | | | | | | | |
| Air Freight & Logistics—0.2% | |
Air Transport Services Group, Inc. | | * | | | 10,717 | | | | 86,700 | |
Atlas Air Worldwide Holdings, Inc. | | * | | | 4,497 | | | | 185,051 | |
Echo Global Logistics, Inc. | | * | | | 3,023 | | | | 64,934 | |
Forward Air Corp. | | | | | 5,836 | | | | 256,259 | |
Hub Group, Inc., Class A | | * | | | 7,193 | | | | 286,857 | |
Pacer International, Inc. | | * | | | 8,126 | | | | 67,121 | |
Park-Ohio Holdings Corp. | | * | | | 1,449 | | | | 75,928 | |
UTi Worldwide, Inc. | | | | | 16,303 | | | | 286,281 | |
XPO Logistics, Inc. | | *† | | | 5,038 | | | | 132,449 | |
| | | | | | | | | | | | |
| | | | | | | | | | | 1,441,580 | |
| | | | | | | | | | | | |
| Airlines—0.5% | | | | | | | | | | | | |
Alaska Air Group, Inc. | | | | | 13,065 | | | | 958,579 | |
Allegiant Travel Co. | | | | | 2,901 | | | | 305,882 | |
Copa Holdings SA, Class A (Panama) | | | | | 6,294 | | | | 1,007,732 | |
Hawaiian Holdings, Inc. | | * | | | 10,774 | | | | 103,754 | |
JetBlue Airways Corp. | | * | | | 42,091 | | | | 359,878 | |
| | | | | | | | | | | | |
| | | | |
| | | | | | Shares | | | | Value | |
| | | | | | | | | | | | |
Republic Airways Holdings, Inc. | | * | | | 9,724 | | | $ | 103,950 | |
SkyWest, Inc. | | | | | 8,900 | | | | 131,987 | |
Spirit Airlines, Inc. | | * | | | 11,040 | | | | 501,326 | |
| | | | | | | | | | | | |
| | | | | | | | | | | 3,473,088 | |
| | | | | | | | | | | | |
| Auto Components—1.2% | | | | | | | | | | |
Allison Transmission Holdings, Inc. | | | | | 5,794 | | | | 159,972 | |
American Axle & Manufacturing Holdings, Inc. | | * | | | 11,716 | | | | 239,592 | |
Cooper Tire & Rubber Co. | | | | | 12,290 | | | | 295,452 | |
Dana Holding Corp. | | | | | 27,984 | | | | 549,046 | |
Dorman Products, Inc. | | * | | | 4,696 | | | | 263,305 | |
Drew Industries, Inc. | | | | | 4,435 | | | | 227,072 | |
Federal-Mogul Corp. | | * | | | 4,327 | | | | 85,155 | |
Fox Factory Holding Corp. | | * | | | 1,589 | | | | 27,998 | |
Fuel Systems Solutions, Inc. | | * | | | 2,164 | | | | 30,015 | |
Gentex Corp. | | | | | 26,752 | | | | 882,549 | |
Gentherm, Inc. | | * | | | 6,384 | | | | 171,155 | |
Goodyear Tire & Rubber Co. (The) | | | | | 46,366 | | | | 1,105,829 | |
Lear Corp. | | | | | 15,191 | | | | 1,230,015 | |
Modine Manufacturing Co. | | * | | | 9,793 | | | | 125,546 | |
Remy International, Inc. | | | | | 2,247 | | | | 52,400 | |
Shiloh Industries, Inc. | | * | | | 1,469 | | | | 28,646 | |
Spartan Motors, Inc. | | | | | 7,093 | | | | 47,523 | |
Standard Motor Products, Inc. | | | | | 3,701 | | | | 136,197 | |
Stoneridge, Inc. | | * | | | 4,564 | | | | 58,191 | |
Superior Industries International, Inc. | | | | | 3,960 | | | | 81,695 | |
Tenneco, Inc. | | * | | | 11,055 | | | | 625,381 | |
Tower International, Inc. | | * | | | 1,272 | | | | 27,221 | |
TRW Automotive Holdings Corp. | | * | | | 19,904 | | | | 1,480,659 | |
Visteon Corp. | | * | | | 9,432 | | | | 772,386 | |
| | | | | | | | | | | | |
| | | | | | | | | | | 8,703,000 | |
| | | | | | | | | | | | |
| Automobiles—0.1% | | | | | | | | | | | | |
Thor Industries, Inc. | | | | | 8,062 | | | | 445,264 | |
Winnebago Industries, Inc. | | * | | | 5,233 | | | | 143,646 | |
| | | | | | | | | | | | |
| | | | | | | | | | | 588,910 | |
| | | | | | | | | | | | |
| Beverages—0.1% | | | | | | | | | | | | |
Boston Beer Co., Inc. (The), Class A | | * | | | 1,496 | | | | 361,718 | |
Coca-Cola Bottling Co. Consolidated | | | | | 798 | | | | 58,405 | |
Craft Brew Alliance, Inc. | | * | | | 1,788 | | | | 29,359 | |
National Beverage Corp. | | * | | | 1,873 | | | | 37,760 | |
| | | | | | | | | | | | |
| | | | | | | | | | | 487,242 | |
| | | | | | | | | | | | |
| Biotechnology—2.8% | | | | | | | | | | | | |
ACADIA Pharmaceuticals, Inc. | | *† | | | 13,001 | | | | 324,895 | |
Acceleron Pharma, Inc. | | *† | | | 1,076 | | | | 42,610 | |
Achillion Pharmaceuticals, Inc. | | *† | | | 15,783 | | | | 52,400 | |
Acorda Therapeutics, Inc. | | * | | | 7,064 | | | | 206,269 | |
Aegerion Pharmaceuticals, Inc. | | * | | | 5,288 | | | | 375,236 | |
See accompanying notes to financial statements
307
SCHEDULE OF INVESTMENTS—(Continued)
December 31, 2013
| | | | | | | | | | | | |
Vantagepoint Mid/Small
Company Index Fund | | | | Shares | | | Value | |
| | | | | | | | | | | | |
| COMMON STOCKS—(Continued) | |
Agios Pharmaceuticals, Inc. | | *† | | | 1,102 | | | $ | 26,393 | |
Alkermes plc (Ireland) | | * | | | 23,879 | | | | 970,920 | |
Alnylam Pharmaceuticals, Inc. | | * | | | 10,660 | | | | 685,758 | |
AMAG Pharmaceuticals, Inc. | | * | | | 3,480 | | | | 84,460 | |
Amicus Therapeutics, Inc. | | *† | | | 5,087 | | | | 11,954 | |
Anacor Pharmaceuticals, Inc. | | *† | | | 5,844 | | | | 98,062 | |
Arena Pharmaceuticals, Inc. | | *† | | | 39,027 | | | | 228,308 | |
Ariad Pharmaceuticals, Inc. | | *† | | | 32,716 | | | | 223,123 | |
Arqule, Inc. | | * | | | 6,240 | | | | 13,416 | |
Array BioPharma, Inc. | | * | | | 23,016 | | | | 115,310 | |
AVEO Pharmaceuticals, Inc. | | * | | | 10,510 | | | | 19,338 | |
BIND Therapeutics, Inc. | | *† | | | 887 | | | | 13,385 | |
Biotime, Inc. | | *† | | | 5,653 | | | | 20,351 | |
Bluebird Bio, Inc. | | *† | | | 1,101 | | | | 23,099 | |
Cell Therapeutics, Inc. | | *† | | | 17,863 | | | | 34,297 | |
Celldex Therapeutics, Inc. | | * | | | 15,390 | | | | 372,592 | |
Cellular Dynamics International, Inc. | | *† | | | 620 | | | | 10,236 | |
Cepheid, Inc. | | *† | | | 12,602 | | | | 588,765 | |
Chelsea Therapeutics International Ltd. | | *† | | | 10,821 | | | | 47,937 | |
ChemoCentryx, Inc. | | *† | | | 4,080 | | | | 23,623 | |
Chimerix, Inc. | | * | | | 1,348 | | | | 20,368 | |
Clovis Oncology, Inc. | | * | | | 3,164 | | | | 190,694 | |
Conatus Pharmaceuticals, Inc. | | * | | | 967 | | | | 6,237 | |
Coronado Biosciences, Inc. | | *† | | | 3,351 | | | | 8,813 | |
Cubist Pharmaceuticals, Inc. | | * | | | 12,346 | | | | 850,269 | |
Curis, Inc. | | *† | | | 13,154 | | | | 37,094 | |
Cytokinetics, Inc. | | * | | | 3,923 | | | | 25,499 | |
Cytori Therapeutics, Inc. | | *† | | | 10,004 | | | | 25,710 | |
Dendreon Corp. | | *† | | | 30,192 | | | | 90,274 | |
Durata Therapeutics, Inc. | | *† | | | 2,219 | | | | 28,381 | |
Dyax Corp. | | * | | | 22,226 | | | | 167,362 | |
Dynavax Technologies Corp. | | * | | | 40,913 | | | | 80,189 | |
Emergent Biosolutions, Inc. | | * | | | 4,839 | | | | 111,249 | |
Enanta Pharmaceuticals, Inc. | | * | | | 579 | | | | 15,795 | |
Enzon Pharmaceuticals, Inc. | | | | | 7,159 | | | | 8,304 | |
Epizyme, Inc. | | *† | | | 936 | | | | 19,469 | |
Esperion Therapeutics, Inc. | | * | | | 738 | | | | 10,140 | |
Exact Sciences Corp. | | * | | | 11,760 | | | | 137,474 | |
Exelixis, Inc. | | *† | | | 35,337 | | | | 216,616 | |
Fibrocell Science, Inc. | | * | | | 2,671 | | | | 10,844 | |
Five Prime Therapeutics, Inc. | | *† | | | 941 | | | | 15,799 | |
Foundation Medicine, Inc. | | * | | | 1,152 | | | | 27,441 | |
Galena Biopharma, Inc. | | * | | | 22,766 | | | | 112,919 | |
Genomic Health, Inc. | | * | | | 3,336 | | | | 97,645 | |
Geron Corp. | | * | | | 36,667 | | | | 173,802 | |
GTx, Inc. | | *† | | | 4,210 | | | | 6,947 | |
Halozyme Therapeutics, Inc. | | *† | | | 17,334 | | | | 259,837 | |
Harvard Apparatus Regenerative Technology, Inc. | | * | | | 1,009 | | | | 4,793 | |
Hyperion Therapeutics, Inc. | | *† | | | 1,530 | | | | 30,937 | |
Idenix Pharmaceuticals, Inc. | | *† | | | 16,973 | | | | 101,499 | |
ImmunoGen, Inc. | | *† | | | 16,516 | | | | 242,290 | |
Immunomedics, Inc. | | *† | | | 12,320 | | | | 56,672 | |
Incyte Corp. Ltd. | | * | | | 18,893 | | | | 956,553 | |
Infinity Pharmaceuticals, Inc. | | * | | | 7,990 | | | | 110,342 | |
Insmed, Inc. | | * | | | 7,258 | | | | 123,459 | |
Insys Therapeutics, Inc. | | * | | | 803 | | | | 31,084 | |
Intercept Pharmaceuticals, Inc. | | * | | | 1,187 | | | | 81,048 | |
InterMune, Inc. | | * | | | 15,347 | | | | 226,061 | |
| | | | | | | | | | | | |
| | | | |
| | | | | | Shares | | | | Value | |
| | | | | | | | | | | | |
Intrexon Corp. | | *† | | | 1,853 | | | $ | 44,101 | |
Ironwood Pharmaceuticals, Inc. | | *† | | | 16,020 | | | | 185,992 | |
Isis Pharmaceuticals, Inc. | | * | | | 21,257 | | | | 846,879 | |
Karyopharm Therapeutics, Inc. | | * | | | 1,310 | | | | 30,025 | |
Keryx Biopharmaceuticals, Inc. | | *† | | | 16,251 | | | | 210,450 | |
KYTHERA Biopharmaceuticals, Inc. | | *† | | | 2,509 | | | | 93,460 | |
Lexicon Pharmaceuticals, Inc. | | * | | | 45,225 | | | | 81,405 | |
Ligand Pharmaceuticals, Inc., Class B | | *† | | | 3,489 | | | | 183,521 | |
MacroGenics, Inc. | | | | | 964 | | | | 26,443 | |
MannKind Corp. | | *† | | | 25,750 | | | | 134,158 | |
Medivation, Inc. | | * | | | 14,178 | | | | 904,840 | |
MEI Pharma, Inc. | | *† | | | 1,537 | | | | 12,311 | |
Merrimack Pharmaceuticals, Inc. | | *† | | | 21,566 | | | | 115,162 | |
MiMedx Group, Inc. | | * | | | 13,338 | | | | 116,574 | |
Momenta Pharmaceuticals, Inc. | | * | | | 9,022 | | | | 159,509 | |
Myriad Genetics, Inc. | | *† | | | 14,360 | | | | 301,273 | |
Nanosphere, Inc. | | * | | | 6,754 | | | | 15,467 | |
Navidea Biopharmaceuticals, Inc. | | *† | | | 24,451 | | | | 50,614 | |
Neurocrine Biosciences, Inc. | | * | | | 11,394 | | | | 106,420 | |
NewLink Genetics Corp. | | *† | | | 2,675 | | | | 58,877 | |
Novavax, Inc. | | *† | | | 39,570 | | | | 202,598 | |
NPS Pharmaceuticals, Inc. | | * | | | 18,616 | | | | 565,182 | |
OncoGenex Pharmaceutical, Inc. | | * | | | 4,342 | | | | 36,212 | |
OncoMed Pharmaceuticals, Inc. | | *† | | | 758 | | | | 22,376 | |
Onconova Therapeutics, Inc. | | *† | | | 958 | | | | 10,998 | |
Ophthotech Corp. | | * | | | 1,485 | | | | 48,040 | |
Opko Health, Inc. | | *† | | | 35,792 | | | | 302,084 | |
Orexigen Therapeutics, Inc. | | * | | | 15,768 | | | | 88,774 | |
Osiris Therapeutics, Inc. | | * | | | 4,513 | | | | 72,569 | |
OvaScience, Inc. | | * | | | 1,458 | | | | 13,326 | |
PDL BioPharma, Inc. | | † | | | 26,041 | | | | 219,786 | |
Peregrine Pharmaceuticals, Inc. | | *† | | | 21,962 | | | | 30,527 | |
Pharmacyclics, Inc. | | * | | | 11,006 | | | | 1,164,215 | |
Portola Pharmaceuticals, Inc. | | * | | | 1,551 | | | | 39,938 | |
Progenics Pharmaceuticals, Inc. | | * | | | 12,608 | | | | 67,201 | |
Prothena Corp. plc (Ireland) | | * | | | 3,249 | | | | 86,163 | |
PTC Therapeutics, Inc. | | *† | | | 1,549 | | | | 26,287 | |
Puma Biotechnology, Inc. | | *† | | | 4,141 | | | | 428,718 | |
Raptor Pharmaceutical Corp. | | *† | | | 12,085 | | | | 157,347 | |
Receptos, Inc. | | * | | | 934 | | | | 27,077 | |
Regulus Therapeutics, Inc. | | * | | | 3,193 | | | | 23,596 | |
Repligen Corp. | | * | | | 4,933 | | | | 67,286 | |
Rigel Pharmaceuticals, Inc. | | * | | | 12,762 | | | | 36,372 | |
Sangamo Biosciences, Inc. | | *† | | | 10,702 | | | | 148,651 | |
Sarepta Therapeutics, Inc. | | *† | | | 5,928 | | | | 120,753 | |
Seattle Genetics, Inc. | | * | | | 19,013 | | | | 758,429 | |
SIGA Technologies, Inc. | | *† | | | 7,831 | | | | 25,607 | |
Spectrum Pharmaceuticals, Inc. | | *† | | | 11,842 | | | | 104,802 | |
Stemline Therapeutics, Inc. | | * | | | 1,454 | | | | 28,498 | |
Sunesis Pharmaceuticals, Inc. | | *† | | | 8,964 | | | | 42,489 | |
Synageva BioPharma Corp. | | *† | | | 3,787 | | | | 245,095 | |
See accompanying notes to financial statements
308
SCHEDULE OF INVESTMENTS—(Continued)
December 31, 2013
| | | | | | | | | | | | |
Vantagepoint Mid/Small
Company Index Fund | | | | Shares | | | Value | |
| | | | | | | | | | | | |
| COMMON STOCKS—(Continued) | |
Synergy Pharmaceuticals, Inc. | | *† | | | 13,464 | | | $ | 75,802 | |
Synta Pharmaceuticals Corp. | | *† | | | 9,125 | | | | 47,815 | |
Targacept, Inc. | | * | | | 4,421 | | | | 18,347 | |
TESARO, Inc. | | * | | | 2,274 | | | | 64,218 | |
Tetraphase Pharmaceuticals, Inc. | | * | | | 1,882 | | | | 25,445 | |
TG Therapeutics, Inc. | | *† | | | 2,066 | | | | 8,057 | |
Theravance, Inc. | | * | | | 15,003 | | | | 534,857 | |
Threshold Pharmaceuticals, Inc. | | * | | | 7,764 | | | | 36,258 | |
United Therapeutics Corp. | | * | | | 8,807 | | | | 995,896 | |
Vanda Pharmaceuticals, Inc. | | *† | | | 6,002 | | | | 74,485 | |
Verastem, Inc. | | *† | | | 2,285 | | | | 26,049 | |
Vical, Inc. | | * | | | 16,264 | | | | 19,192 | |
XOMA Corp. | | *† | | | 17,238 | | | | 116,012 | |
ZIOPHARM Oncology, Inc. | | *† | | | 10,632 | | | | 46,143 | |
| | | | | | | | | | | | |
| | | | | | | | | | | 20,309,699 | |
| | | | | | | | | | | | |
| Building Products—0.9% | |
A.O. Smith Corp. | | | | | 14,650 | | | | 790,221 | |
AAON, Inc. | | | | | 5,633 | | | | 179,974 | |
American Woodmark Corp. | | * | | | 1,937 | | | | 76,570 | |
Apogee Enterprises, Inc. | | | | | 5,631 | | | | 202,209 | |
Armstrong World Industries, Inc. | | * | | | 4,751 | | | | 273,705 | |
Builders FirstSource, Inc. | | * | | | 9,415 | | | | 67,223 | |
Fortune Brands Home & Security, Inc. | | | | | 30,557 | | | | 1,396,455 | |
Gibraltar Industries, Inc. | | * | | | 5,228 | | | | 97,189 | |
Griffon Corp. | | | | | 8,735 | | | | 115,389 | |
Insteel Industries, Inc. | | | | | 2,829 | | | | 64,303 | |
Lennox International, Inc. | | | | | 9,543 | | | | 811,728 | |
NCI Building Systems, Inc. | | * | | | 4,108 | | | | 72,054 | |
Norcraft Cos., Inc. | | * | | | 1,233 | | | | 24,192 | |
Nortek, Inc. | | * | | | 1,847 | | | | 137,786 | |
Owens Corning, Inc. | | * | | | 22,481 | | | | 915,426 | |
Patrick Industries, Inc. | | * | | | 1,056 | | | | 30,550 | |
PGT, Inc. | | * | | | 5,599 | | | | 56,662 | |
Ply Gem Holdings, Inc. | | * | | | 2,526 | | | | 45,544 | |
Quanex Building Products Corp. | | | | | 6,170 | | | | 122,906 | |
Simpson Manufacturing Co., Inc. | | | | | 7,310 | | | | 268,496 | |
Trex Co., Inc. | | * | | | 3,364 | | | | 267,539 | |
Universal Forest Products, Inc. | | | | | 3,904 | | | | 203,555 | |
USG Corp. | | * | | | 14,490 | | | | 411,226 | |
| | | | | | | | | | | | |
| | | | | | | | | | | 6,630,902 | |
| | | | | | | | | | | | |
| Capital Markets—2.6% | |
American Capital Ltd. | | * | | | 55,009 | | | | 860,341 | |
Apollo Investment Corp. | | | | | 40,588 | | | | 344,186 | |
Ares Capital Corp. | | | | | 54,687 | | | | 971,788 | |
Arlington Asset Investment Corp., Class A | | | | | 3,155 | | | | 83,261 | |
Artisan Partners Asset Management, Inc., Class A | | | | | 2,528 | | | | 164,800 | |
BGC Partners, Inc., Class A | | | | | 21,607 | | | | 130,938 | |
BlackRock Kelso Capital Corp. | | | | | 14,156 | | | | 132,076 | |
Calamos Asset Management, Inc., Class A | | | | | 3,748 | | | | 44,376 | |
| | | | | | | | | | | | |
| | | | |
| | | | | | Shares | | | | Value | |
| | | | | | | | | | | | |
Capital Southwest Corp. | | | | | 2,132 | | | $ | 74,343 | |
Capitala Finance Corp. | | † | | | 671 | | | | 13,353 | |
CIFC Corp. | | | | | 2,540 | | | | 19,761 | |
Cohen & Steers, Inc. | | † | | | 3,785 | | | | 151,627 | |
Cowen Group, Inc., Class A | | * | | | 18,898 | | | | 73,891 | |
Diamond Hill Investment Group, Inc. | | | | | 582 | | | | 68,874 | |
E*TRADE Financial Corp. | | * | | | 54,162 | | | | 1,063,742 | |
Eaton Vance Corp. | | | | | 22,674 | | | | 970,221 | |
Evercore Partners, Inc., Class A | | | | | 5,811 | | | | 347,382 | |
FBR & Co. | | * | | | 2,187 | | | | 57,693 | |
Federated Investors, Inc., Class B | | † | | | 16,888 | | | | 486,374 | |
Fidus Investment Corp. | | † | | | 2,264 | | | | 49,219 | |
Fifth Street Finance Corp. | | | | | 26,255 | | | | 242,859 | |
Financial Engines, Inc. | | | | | 9,169 | | | | 637,062 | |
Firsthand Technology Value Fund, Inc. | | | | | 1,355 | | | | 31,395 | |
FXCM, Inc., Class A | | | | | 7,654 | | | | 136,547 | |
GAMCO Investors, Inc., Class A | | | | | 1,052 | | | | 91,492 | |
Garrison Capital, Inc. | | | | | 981 | | | | 13,616 | |
GFI Group, Inc. | | | | | 14,329 | | | | 56,026 | |
Gladstone Capital Corp. | | | | | 3,326 | | | | 31,930 | |
Gladstone Investment Corp. | | | | | 4,193 | | | | 33,796 | |
Golub Capital BDC, Inc. | | † | | | 7,712 | | | | 147,376 | |
Greenhill & Co., Inc. | | | | | 5,109 | | | | 296,016 | |
GSV Capital Corp. | | *† | | | 3,060 | | | | 36,995 | |
Hercules Technology Growth Capital, Inc. | | | | | 10,586 | | | | 173,610 | |
HFF, Inc., Class A | | * | | | 6,615 | | | | 177,613 | |
Horizon Technology Finance Corp. | | | | | 1,405 | | | | 19,965 | |
ICG Group, Inc. | | * | | | 7,645 | | | | 142,426 | |
INTL FCStone, Inc. | | * | | | 2,698 | | | | 50,021 | |
Investment Technology Group, Inc. | | * | | | 7,705 | | | | 158,415 | |
Janus Capital Group, Inc. | | | | | 28,857 | | | | 356,961 | |
JMP Group, Inc. | | | | | 2,681 | | | | 19,839 | |
KCAP Financial, Inc. | | † | | | 4,478 | | | | 36,138 | |
KCG Holdings, Inc., Class A | | * | | | 12,692 | | | | 151,796 | |
Ladenburg Thalmann Financial Services, Inc. | | * | | | 25,346 | | | | 79,333 | |
Lazard Ltd., Class A (Bermuda) | | | | | 24,149 | | | | 1,094,433 | |
Legg Mason, Inc. | | | | | 20,691 | | | | 899,645 | |
LPL Financial Holdings, Inc. | | | | | 10,346 | | | | 486,572 | |
Main Street Capital Corp. | | † | | | 7,553 | | | | 246,908 | |
Manning & Napier, Inc. | | | | | 2,151 | | | | 37,965 | |
MCG Capital Corp. | | | | | 11,279 | | | | 49,628 | |
Medallion Financial Corp. | | | | | 4,381 | | | | 62,867 | |
Medley Capital Corp. | | | | | 6,922 | | | | 95,870 | |
MVC Capital, Inc. | | | | | 4,303 | | | | 58,091 | |
New Mountain Finance Corp. | | | | | 7,475 | | | | 112,424 | |
NGP Capital Resources Co. | | | | | 3,329 | | | | 24,868 | |
Oppenheimer Holdings, Inc., Class A | | | | | 2,362 | | | | 58,530 | |
PennantPark Floating Rate Capital Ltd. | | | | | 3,849 | | | | 52,847 | |
PennantPark Investment Corp. | | | | | 13,532 | | | | 156,971 | |
Piper Jaffray Cos. | | * | | | 2,965 | | | | 117,266 | |
Prospect Capital Corp. | | | | | 52,122 | | | | 584,809 | |
See accompanying notes to financial statements
309
SCHEDULE OF INVESTMENTS—(Continued)
December 31, 2013
| | | | | | | | | | | | |
Vantagepoint Mid/Small
Company Index Fund | | | | Shares | | | Value | |
| | | | | | | | | | | | |
| COMMON STOCKS—(Continued) | |
Pzena Investment Management, Inc., Class A | | | | | 1,908 | | | $ | 22,438 | |
Raymond James Financial, Inc. | | | | | 22,989 | | | | 1,199,796 | |
Safeguard Scientifics, Inc. | | * | | | 3,658 | | | | 73,489 | |
SEI Investments Co. | | | | | 26,803 | | | | 930,868 | |
Silvercrest Asset Management Group, Inc., Class A | | | | | 887 | | | | 15,123 | |
Solar Capital Ltd. | | | | | 8,719 | | | | 196,613 | |
Solar Senior Capital Ltd. | | | | | 1,823 | | | | 33,215 | |
Stellus Capital Investment Corp. | | | | | 1,909 | | | | 28,540 | |
Stifel Financial Corp. | | * | | | 11,543 | | | | 553,141 | |
SWS Group, Inc. | | * | | | 6,080 | | | | 36,966 | |
TCP Capital Corp. | | | | | 5,177 | | | | 86,870 | |
THL Credit, Inc. | | | | | 7,161 | | | | 118,085 | |
TICC Capital Corp. | | | | | 10,963 | | | | 113,357 | |
Triangle Capital Corp. | | † | | | 4,766 | | | | 131,780 | |
Virtus Investment Partners, Inc. | | * | | | 1,297 | | | | 259,465 | |
Waddell & Reed Financial, Inc., Class A | | | | | 16,218 | | | | 1,056,116 | |
Walter Investment Management Corp. | | * | | | 7,174 | | | | 253,673 | |
Westwood Holdings Group, Inc. | | | | | 1,390 | | | | 86,055 | |
WhiteHorse Finance, Inc. | | † | | | 1,426 | | | | 21,547 | |
WisdomTree Investments, Inc. | | * | | | 18,871 | | | | 334,205 | |
| | | | | | | | | | | | |
| | | | | | | | | | | 18,920,509 | |
| | | | | | | | | | | | |
| Chemicals—2.7% | | | | | | | | | | | | |
A. Schulman, Inc. | | | | | 5,791 | | | | 204,191 | |
Advanced Emissions Solutions, Inc. | | * | | | 1,650 | | | | 89,480 | |
Albemarle Corp. | | | | | 15,106 | | | | 957,569 | |
American Pacific Corp. | | * | | | 939 | | | | 34,987 | |
American Vanguard Corp. | | | | | 5,182 | | | | 125,871 | |
Arabian American Development Co. | | * | | | 3,148 | | | | 39,507 | |
Ashland, Inc. | | | | | 14,632 | | | | 1,419,889 | |
Axiall Corp. | | | | | 13,090 | | | | 620,990 | |
Balchem Corp. | | | | | 5,542 | | | | 325,315 | |
Cabot Corp. | | | | | 11,960 | | | | 614,744 | |
Calgon Carbon Corp. | | * | | | 10,032 | | | | 206,358 | |
Chase Corp. | | | | | 1,020 | | | | 36,006 | |
Chemtura Corp. | | | | * | | | 18,538 | | | | 517,581 | |
Cytec Industries, Inc. | | | | | 6,632 | | | | 617,837 | |
Ferro Corp. | | * | | | 13,500 | | | | 173,205 | |
Flotek Industries, Inc. | | * | | | 8,704 | | | | 174,689 | |
FutureFuel Corp. | | | | | 3,443 | | | | 54,399 | |
H.B. Fuller Co. | | | | | 9,608 | | | | 500,000 | |
Hawkins, Inc. | | | | | 1,492 | | | | 55,487 | |
Huntsman Corp. | | | | | 36,546 | | | | 899,032 | |
Innophos Holdings, Inc. | | | | | 3,822 | | | | 185,749 | |
Innospec, Inc. | | | | | 4,218 | | | | 194,956 | |
International Flavors & Fragrances, Inc. | | | | | 15,088 | | | | 1,297,266 | |
Intrepid Potash, Inc. | | *† | | | 10,243 | | | | 162,249 | |
KMG Chemicals, Inc. | | | | | 1,157 | | | | 19,542 | |
Koppers Holdings, Inc. | | | | | 4,084 | | | | 186,843 | |
Kraton Performance Polymers, Inc. | | * | | | 6,464 | | | | 148,995 | |
| | | | | | | | | | | | |
| | | | |
| | | | | | Shares | | | | Value | |
| | | | | | | | | | | | |
Kronos Worldwide, Inc. | | † | | | 3,735 | | | $ | 71,152 | |
Landec Corp. | | * | | | 4,989 | | | | 60,467 | |
LSB Industries, Inc. | | * | | | 3,576 | | | | 146,688 | |
Marrone Bio Innovations, Inc. | | * | | | 880 | | | | 15,646 | |
Minerals Technologies, Inc. | | | | | 6,508 | | | | 390,936 | |
NewMarket Corp. | | | | | 1,777 | | | | 593,785 | |
Olin Corp. | | † | | | 14,705 | | | | 424,239 | |
OM Group, Inc. | | * | | | 5,836 | | | | 212,489 | |
OMNOVA Solutions, Inc. | | * | | | 9,679 | | | | 88,176 | |
Penford Corp. | | * | | | 1,563 | | | | 20,085 | |
PolyOne Corp. | | | | | 18,618 | | | | 658,146 | |
Quaker Chemical Corp. | | | | | 2,270 | | | | 174,949 | |
Rockwood Holdings, Inc. | | | | | 14,153 | | | | 1,017,884 | |
RPM International, Inc. | | | | | 25,017 | | | | 1,038,456 | |
Scotts Miracle-Gro Co. (The), Class A | | | | | 7,921 | | | | 492,845 | |
Sensient Technologies Corp. | | | | | 9,570 | | | | 464,336 | |
Stepan Co. | | | | | 3,691 | | | | 242,240 | |
Taminco Corp. | | * | | | 2,528 | | | | 51,091 | |
Tredegar Corp. | | | | | 4,146 | | | | 119,446 | |
Valspar Corp. (The) | | | | | 16,794 | | | | 1,197,244 | |
W.R. Grace & Co. | | * | | | 14,292 | | | | 1,413,050 | |
Westlake Chemical Corp. | | | | | 3,659 | | | | 446,654 | |
Zep, Inc. | | | | | 4,143 | | | | 75,237 | |
Zoltek Cos., Inc. | | * | | | 6,079 | | | | 101,823 | |
| | | | | | | | | | | | |
| | | | | | | | | | | 19,379,801 | |
| | | | | | | | | | | | |
| Commercial Banks—5.2% | |
1st Source Corp. | | | | | 3,248 | | | | 103,741 | |
1st United Bancorp, Inc./Boca Raton | | | | | 6,773 | | | | 51,543 | |
Access National Corp. | | | | | 1,241 | | | | 18,553 | |
American National Bankshares, Inc. | | | | | 1,246 | | | | 32,707 | |
Ameris Bancorp | | * | | | 4,403 | | | | 92,947 | |
Ames National Corp. | | † | | | 1,475 | | | | 33,025 | |
Arrow Financial Corp. | | | | | 2,129 | | | | 56,546 | |
Associated Banc-Corp | | | | | 31,950 | | | | 555,930 | |
BancFirst Corp. | | | | | 1,092 | | | | 61,218 | |
Banco Latinoamericano de Comercio Exterior SA, Class E (Panama) | | | | | 5,927 | | | | 166,075 | |
Bancorp, Inc. (The)/Delaware | | * | | | 6,092 | | | | 109,108 | |
BancorpSouth, Inc. | | | | | 18,226 | | | | 463,305 | |
Bank of Hawaii Corp. | | | | | 8,560 | | | | 506,238 | |
Bank of Kentucky Financial Corp. | | | | | 972 | | | | 35,867 | |
Bank of Marin Bancorp | | | | | 862 | | | | 37,402 | |
Bank of the Ozarks, Inc. | | | | | 5,690 | | | | 321,997 | |
BankUnited, Inc. | | | | | 11,828 | | | | 389,378 | |
Banner Corp. | | | | | 3,350 | | | | 150,147 | |
Bar Harbor Bankshares | | | | | 622 | | | | 24,874 | |
BBCN Bancorp, Inc./California | | | | | 14,858 | | | | 246,494 | |
BNC Bancorp | | | | | 2,917 | | | | 49,997 | |
BOK Financial Corp. | | | | | 4,915 | | | | 325,963 | |
Boston Private Financial Holdings, Inc. | | | | | 15,034 | | | | 189,729 | |
Bridge Bancorp, Inc. | | | | | 2,704 | | | | 70,304 | |
Bridge Capital Holdings | | * | | | 1,525 | | | | 31,324 | |
Bryn Mawr Bank Corp. | | | | | 2,581 | | | | 77,895 | |
C&F Financial Corp. | | | | | 518 | | | | 23,657 | |
Camden National Corp. | | | | | 1,411 | | | | 59,572 | |
Capital Bank Financial Corp., Class A | | * | | | 5,231 | | | | 119,005 | |
See accompanying notes to financial statements
310
SCHEDULE OF INVESTMENTS—(Continued)
December 31, 2013
| | | | | | | | | | | | |
Vantagepoint Mid/Small
Company Index Fund | | | | Shares | | | Value | |
| | | | | | | | | | | | |
| COMMON STOCKS—(Continued) | |
Capital City Bank Group, Inc. | | * | | | 1,724 | | | $ | 20,291 | |
CapitalSource, Inc. | | | | | 35,892 | | | | 515,768 | |
Cardinal Financial Corp. | | | | | 5,568 | | | | 100,224 | |
Cascade Bancorp | | *† | | | 479 | | | | 2,505 | |
Cathay General Bancorp | | | | | 14,388 | | | | 384,591 | |
Catskill Litigation Trust | | *‡d | | | 583 | | | | — | |
Center Bancorp, Inc. | | | | | 3,097 | | | | 58,100 | |
Centerstate Banks, Inc. | | | | | 4,967 | | | | 50,415 | |
Central Pacific Financial Corp. | | | | | 4,653 | | | | 93,432 | |
Century Bancorp, Inc./Massachussetts, Class A | | | | | 582 | | | | 19,352 | |
Chemical Financial Corp. | | | | | 5,880 | | | | 186,220 | |
Chemung Financial Corp. | | | | | 584 | | | | 19,955 | |
Citizens & Northern Corp. | | | | | 1,953 | | | | 40,290 | |
City Holding Co. | | | | | 2,691 | | | | 124,674 | |
City National Corp./California | | | | | 8,859 | | | | 701,810 | |
CNB Financial Corp./Pennsylvania | | | | | 3,476 | | | | 66,044 | |
CoBiz Financial, Inc. | | | | | 6,918 | | | | 82,739 | |
Columbia Banking System, Inc. | | | | | 9,330 | | | | 256,668 | |
Commerce Bancshares, Inc./Missouri | | | | | 14,739 | | | | 661,928 | |
Community Bank System, Inc. | | | | | 7,504 | | | | 297,759 | |
Community Trust Bancorp, Inc. | | | | | 2,928 | | | | 132,228 | |
CommunityOne Bancorp | | * | | | 4,390 | | | | 55,973 | |
CU Bancorp | | * | | | 1,509 | | | | 26,377 | |
Cullen/Frost Bankers, Inc. | | | | | 9,868 | | | | 734,475 | |
Customers Bancorp, Inc. | | * | | | 3,163 | | | | 64,715 | |
CVB Financial Corp. | | | | | 17,733 | | | | 302,702 | |
Eagle Bancorp, Inc. | | * | | | 3,732 | | | | 114,311 | |
East West Bancorp, Inc. | | | | | 25,746 | | | | 900,338 | |
Enterprise Bancorp, Inc./Massachussetts | | | | | 1,147 | | | | 24,282 | |
Enterprise Financial Services Corp. | | | | | 2,867 | | | | 58,544 | |
Farmers Capital Bank Corp. | | * | | | 1,187 | | | | 25,817 | |
Fidelity Southern Corp. | | | | | 2,398 | | | | 39,831 | |
Financial Institutions, Inc. | | | | | 2,448 | | | | 60,490 | |
First Bancorp, Inc./Maine | | | | | 1,513 | | | | 26,356 | |
First BanCorp. (Puerto Rico) | | * | | | 13,990 | | | | 86,598 | |
First Bancorp/North Carolina | | | | | 5,052 | | | | 83,964 | |
First Busey Corp. | | | | | 14,438 | | | | 83,740 | |
First Citizens BancShares, Inc./North Carolina, Class A | | | | | 1,460 | | | | 325,040 | |
First Commonwealth Financial Corp. | | | | | 18,567 | | | | 163,761 | |
First Community Bancshares, Inc./Virginia | | | | | 2,951 | | | | 49,282 | |
First Connecticut Bancorp, Inc./Farmington CT | | | | | 2,809 | | | | 45,281 | |
First Financial Bancorp | | | | | 9,825 | | | | 171,250 | |
First Financial Bankshares, Inc. | | † | | | 6,057 | | | | 401,700 | |
First Financial Corp./Indiana | | | | | 1,835 | | | | 67,088 | |
| | | | | | | | | | | | |
| | | | |
| | | | | | Shares | | | | Value | |
| | | | | | | | | | | | |
First Financial Holdings, Inc. | | | | | 4,489 | | | $ | 298,563 | |
First Horizon National Corp. | | | | | 45,336 | | | | 528,164 | |
First Interstate BancSystem, Inc. | | | | | 3,848 | | | | 109,168 | |
First Merchants Corp. | | | | | 7,037 | | | | 160,162 | |
First Midwest Bancorp, Inc./Illinois | | | | | 14,625 | | | | 256,376 | |
First NBC Bank Holding Co. | | * | | | 667 | | | | 21,544 | |
First Niagara Financial Group, Inc. | | | | | 67,092 | | | | 712,517 | |
First of Long Island Corp. (The) | | | | | 1,432 | | | | 61,390 | |
First Republic Bank/California | | | | | 21,951 | | | | 1,149,135 | |
First Security Group, Inc./Tennesse | | * | | | 9,923 | | | | 22,823 | |
FirstMerit Corp. | | | | | 30,214 | | | | 671,657 | |
Flushing Financial Corp. | | | | | 5,182 | | | | 107,267 | |
FNB Corp./Pennsylvania | | | | | 28,506 | | | | 359,746 | |
Fulton Financial Corp. | | | | | 35,195 | | | | 460,351 | |
German American Bancorp, Inc. | | | | | 2,006 | | | | 57,171 | |
Glacier Bancorp, Inc. | | | | | 13,371 | | | | 398,322 | |
Great Southern Bancorp, Inc. | | | | | 1,938 | | | | 58,935 | |
Guaranty Bancorp | | | | | 3,103 | | | | 43,597 | |
Hampton Roads Bankshares, Inc. | | * | | | 5,516 | | | | 9,653 | |
Hancock Holding Co. | | | | | 15,930 | | | | 584,312 | |
Hanmi Financial Corp. | | | | | 5,822 | | | | 127,444 | |
Heartland Financial USA, Inc. | | | | | 2,967 | | | | 85,420 | |
Heritage Commerce Corp. | | | | | 4,197 | | | | 34,583 | |
Heritage Financial Corp./Washington | | | | | 2,948 | | | | 50,440 | |
Heritage Oaks Bancorp | | * | | | 3,455 | | | | 25,913 | |
Home Bancshares, Inc./Arkansas | | | | | 8,643 | | | | 322,816 | |
Home Federal Bancorp, Inc./Idaho | | | | | 2,295 | | | | 34,196 | |
HomeTrust Bancshares, Inc. | | * | | | 3,407 | | | | 54,478 | |
Horizon Bancorp/Indiana | | | | | 1,400 | | | | 35,462 | |
Hudson Valley Holding Corp. | | | | | 2,708 | | | | 55,108 | |
Huntington Bancshares, Inc./Ohio | | | | | 155,218 | | | | 1,497,854 | |
IBERIABANK Corp. | | | | | 5,329 | | | | 334,928 | |
Independent Bank Corp./Massachusetts | | | | | 4,722 | | | | 185,055 | |
Independent Bank Group, Inc. | | | | | 611 | | | | 30,342 | |
International Bancshares Corp. | | | | | 10,389 | | | | 274,166 | |
Intervest Bancshares Corp. | | * | | | 2,892 | | | | 21,719 | |
Investors Bancorp, Inc. | | | | | 9,582 | | | | 245,108 | |
Lakeland Bancorp, Inc. | | | | | 7,890 | | | | 97,599 | |
Lakeland Financial Corp. | | | | | 3,085 | | | | 120,315 | |
LCNB Corp. | | | | | 959 | | | | 17,137 | |
Macatawa Bank Corp. | | *† | | | 3,843 | | | | 19,215 | |
MainSource Financial Group, Inc. | | | | | 4,454 | | | | 80,306 | |
MB Financial, Inc. | | | | | 10,454 | | | | 335,469 | |
Mercantile Bank Corp. | | | | | 1,379 | | | | 29,759 | |
Merchants Bancshares, Inc. | | | | | 1,246 | | | | 41,741 | |
Metro Bancorp, Inc. | | * | | | 2,334 | | | | 50,274 | |
MetroCorp Bancshares, Inc. | | | | | 2,525 | | | | 38,052 | |
See accompanying notes to financial statements
311
SCHEDULE OF INVESTMENTS—(Continued)
December 31, 2013
| | | | | | | | | | | | |
Vantagepoint Mid/Small
Company Index Fund | | | | Shares | | | Value | |
| | | | | | | | | | | | |
| COMMON STOCKS—(Continued) | |
Middleburg Financial Corp. | | | | | 906 | | | $ | 16,344 | |
MidSouth Bancorp, Inc. | | | | | 1,585 | | | | 28,308 | |
MidWestOne Financial Group, Inc. | | | | | 1,528 | | | | 41,562 | |
National Bank Holdings Corp., Class A | | | | | 9,798 | | | | 209,677 | |
National Bankshares, Inc. | | | | | 1,101 | | | | 40,616 | |
National Penn Bancshares, Inc. | | | | | 22,622 | | | | 256,307 | |
NBT Bancorp, Inc. | | | | | 8,605 | | | | 222,870 | |
NewBridge Bancorp | | * | | | 4,001 | | | | 30,008 | |
Northrim BanCorp, Inc. | | | | | 1,031 | | | | 27,053 | |
OFG Bancorp (Puerto Rico) | | | | | 8,948 | | | | 155,158 | |
Old National Bancorp/Indiana | | | | | 19,139 | | | | 294,166 | |
OmniAmerican Bancorp, Inc. | | * | | | 1,885 | | | | 40,301 | |
Pacific Continental Corp. | | | | | 2,833 | | | | 45,158 | |
Pacific Premier Bancorp, Inc. | | * | | | 2,487 | | | | 39,145 | |
PacWest Bancorp | | † | | | 7,111 | | | | 300,226 | |
Palmetto Bancshares, Inc. | | * | | | 743 | | | | 9,629 | |
Park National Corp. | | † | | | 1,966 | | | | 167,248 | |
Park Sterling Corp. | | | | | 7,082 | | | | 50,565 | |
Peapack Gladstone Financial Corp. | | | | | 1,381 | | | | 26,377 | |
Penns Woods Bancorp, Inc. | | | | | 1,191 | | | | 60,741 | |
Peoples Bancorp, Inc./Ohio | | | | | 2,337 | | | | 52,606 | |
Pinnacle Financial Partners, Inc. | | | | | 6,115 | | | | 198,921 | |
Popular, Inc. (Puerto Rico) | | * | | | 19,386 | | | | 556,960 | |
Preferred Bank/California | | * | | | 2,248 | | | | 45,072 | |
PrivateBancorp, Inc. | | | | | 12,103 | | | | 350,140 | |
Prosperity Bancshares, Inc. | | | | | 11,247 | | | | 712,947 | |
Renasant Corp. | | | | | 6,084 | | | | 191,403 | |
Republic Bancorp, Inc./Kentucky, Class A | | | | | 2,055 | | | | 50,430 | |
S&T Bancorp, Inc. | | | | | 5,786 | | | | 146,444 | |
Sandy Spring Bancorp, Inc. | | | | | 4,178 | | | | 117,778 | |
Seacoast Banking Corp of Florida | | * | | | 3,384 | | | | 41,285 | |
Sierra Bancorp | | | | | 2,504 | | | | 40,289 | |
Signature Bank/New York | | * | | | 8,930 | | | | 959,261 | |
Simmons First National Corp., Class A | | | | | 3,697 | | | | 137,344 | |
Southside Bancshares, Inc. | | | | | 3,011 | | | | 82,321 | |
Southwest Bancorp, Inc./Oklahoma | | * | | | 4,075 | | | | 64,874 | |
State Bank Financial Corp. | | | | | 5,308 | | | | 96,553 | |
StellarOne Corp. | | | | | 3,710 | | | | 89,300 | |
Sterling Bancorp/New York | | | | | 14,340 | | | | 191,726 | |
Sterling Financial Corp./Washington | | | | | 6,680 | | | | 227,654 | |
Suffolk Bancorp | | * | | | 2,229 | | | | 46,363 | |
Sun Bancorp, Inc./New Jersey | | * | | | 6,405 | | | | 22,546 | |
Susquehanna Bancshares, Inc. | | | | | 35,211 | | | | 452,109 | |
SVB Financial Group | | * | | | 8,525 | | | | 893,932 | |
SY Bancorp, Inc. | | | | | 2,661 | | | | 84,939 | |
Synovus Financial Corp. | | | | | 183,113 | | | | 659,207 | |
Taylor Capital Group, Inc. | | * | | | 2,736 | | | | 72,723 | |
TCF Financial Corp. | | | | | 30,121 | | | | 489,466 | |
Texas Capital Bancshares, Inc. | | * | | | 7,710 | | | | 479,562 | |
Tompkins Financial Corp. | | | | | 2,487 | | | | 127,807 | |
TowneBank/Virginia | | † | | | 4,995 | | | | 76,873 | |
Trico Bancshares | | | | | 2,628 | | | | 74,556 | |
Tristate Capital Holdings, Inc. | | * | | | 1,067 | | | | 12,655 | |
Trustmark Corp. | | | | | 12,758 | | | | 342,425 | |
| | | | | | | | | | | | |
| | | | |
| | | | | | Shares | | | | Value | |
| | | | | | | | | | | | |
UMB Financial Corp. | | | | | 6,835 | | | $ | 439,354 | |
Umpqua Holdings Corp. | | † | | | 21,252 | | | | 406,763 | |
Union First Market Bankshares Corp. | | | | | 4,226 | | | | 104,847 | |
United Bankshares, Inc./West Virginia | | † | | | 9,635 | | | | 303,021 | |
United Community Banks, Inc./Georgia | | * | | | 8,268 | | | | 146,757 | |
Univest Corp of Pennsylvania | | | | | 2,741 | | | | 56,684 | |
Valley National Bancorp | | † | | | 36,283 | | | | 367,184 | |
VantageSouth Bancshares, Inc. | | * | | | 2,017 | | | | 10,630 | |
ViewPoint Financial Group, Inc. | | | | | 7,553 | | | | 207,330 | |
Virginia Commerce Bancorp, Inc. | | * | | | 5,289 | | | | 89,860 | |
Washington Banking Co. | | | | | 2,583 | | | | 45,797 | |
Washington Trust Bancorp, Inc. | | | | | 3,111 | | | | 115,791 | |
Webster Financial Corp. | | | | | 16,461 | | | | 513,254 | |
WesBanco, Inc. | | | | | 4,384 | | | | 140,288 | |
West Bancorporation, Inc. | | | | | 2,473 | | | | 39,123 | |
Westamerica Bancorporation | | † | | | 4,848 | | | | 273,718 | |
Western Alliance Bancorp | | * | | | 13,905 | | | | 331,773 | |
Wilshire Bancorp, Inc. | | | | | 11,523 | | | | 125,946 | |
Wintrust Financial Corp. | | | | | 7,068 | | | | 325,976 | |
Yadkin Financial Corp. | | * | | | 2,278 | | | | 38,817 | |
Zions Bancorporation | | | | | 34,774 | | | | 1,041,829 | |
| | | | | | | | | | | | |
| | | | | | | | | | | 37,821,873 | |
| | | | | | | | | | | | |
Commercial Services & Supplies—1.8% | |
ABM Industries, Inc. | | | | | 9,730 | | | | 278,181 | |
ACCO Brands Corp. | | * | | | 19,480 | | | | 130,906 | |
Acorn Energy, Inc. | | † | | | 2,865 | | | | 11,661 | |
ARC Document Solutions, Inc. | | * | | | 7,490 | | | | 61,568 | |
Brink’s Co. (The) | | | | | 9,284 | | | | 316,956 | |
Casella Waste Systems, Inc., Class A | | * | | | 5,820 | | | | 33,756 | |
Ceco Environmental Corp. | | | | | 3,330 | | | | 53,846 | |
Cenveo, Inc. | | * | | | 10,269 | | | | 35,325 | |
Cintas Corp. | | | | | 19,125 | | | | 1,139,659 | |
Clean Harbors, Inc. | | * | | | 11,311 | | | | 678,208 | |
Consolidated Graphics, Inc. | | * | | | 1,217 | | | | 82,074 | |
Copart, Inc. | | * | | | 20,371 | | | | 746,597 | |
Costa, Inc. | | * | | | 1,508 | | | | 32,769 | |
Courier Corp. | | | | | 1,904 | | | | 34,443 | |
Covanta Holding Corp. | | | | | 19,254 | | | | 341,758 | |
Deluxe Corp. | | | | | 9,388 | | | | 489,960 | |
EnerNOC, Inc. | | * | | | 4,402 | | | | 75,758 | |
Ennis, Inc. | | | | | 4,365 | | | | 77,260 | |
G&K Services, Inc., Class A | | | | | 3,785 | | | | 235,541 | |
Healthcare Services Group, Inc. | | | | | 12,994 | | | | 368,640 | |
Heritage-Crystal Clean, Inc. | | * | | | 1,400 | | | | 28,686 | |
Herman Miller, Inc. | | | | | 10,436 | | | | 308,071 | |
HNI Corp. | | | | | 8,770 | | | | 340,539 | |
InnerWorkings, Inc. | | * | | | 7,289 | | | | 56,781 | |
Interface, Inc. | | | | | 11,468 | | | | 251,837 | |
Intersections, Inc. | | | | | 4,413 | | | | 34,377 | |
KAR Auction Services, Inc. | | | | | 13,936 | | | | 411,809 | |
Kimball International, Inc., Class B | | | | | 6,806 | | | | 102,294 | |
Knoll, Inc. | | | | | 8,621 | | | | 157,851 | |
McGrath RentCorp | | | | | 4,288 | | | | 170,662 | |
See accompanying notes to financial statements
312
SCHEDULE OF INVESTMENTS—(Continued)
December 31, 2013
| | | | | | | | | | | | |
Vantagepoint Mid/Small
Company Index Fund | | | | Shares | | | Value | |
| | | | | | | | | | | | |
| COMMON STOCKS—(Continued) | |
Mine Safety Appliances Co. | | | | | 5,239 | | | $ | 268,289 | |
Mobile Mini, Inc. | | * | | | 7,349 | | | | 302,632 | |
Multi-Color Corp. | | | | | 2,526 | | | | 95,331 | |
NL Industries, Inc. | | | | | 412 | | | | 4,606 | |
Performant Financial Corp. | | * | | | 3,538 | | | | 36,441 | |
Pitney Bowes, Inc. | | | | | 38,114 | | | | 888,056 | |
Quad/Graphics, Inc. | | † | | | 4,134 | | | | 112,569 | |
R.R. Donnelley & Sons Co. | | | | | 33,026 | | | | 669,767 | |
Rollins, Inc. | | | | | 11,788 | | | | 357,059 | |
Schawk, Inc. | | | | | 3,488 | | | | 51,867 | |
SP Plus Corp. | | * | | | 3,417 | | | | 88,979 | |
Steelcase, Inc., Class A | | | | | 15,256 | | | | 241,960 | |
Swisher Hygiene, Inc. | | *† | | | 19,333 | | | | 9,939 | |
Team, Inc. | | * | | | 4,053 | | | | 171,604 | |
Tetra Tech, Inc. | | * | | | 12,362 | | | | 345,889 | |
TRC Cos., Inc. | | * | | | 3,666 | | | | 26,175 | |
Unifirst Corp. | | | | | 2,842 | | | | 304,094 | |
United Stationers, Inc. | | | | | 7,455 | | | | 342,110 | |
US Ecology, Inc. | | | | | 3,604 | | | | 134,033 | |
Viad Corp. | | | | | 3,417 | | | | 94,924 | |
Waste Connections, Inc. | | | | | 22,926 | | | | 1,000,261 | |
West Corp. | | | | | 3,374 | | | | 86,746 | |
| | | | | | | | | | | | |
| | | | | | | | | | | 12,721,104 | |
| | | | | | | | | | | | |
| Communications Equipment—1.2% | |
ADTRAN, Inc. | | | | | 10,673 | | | | 288,278 | |
Alliance Fiber Optic Products, Inc. | | † | | | 1,860 | | | | 27,993 | |
Anaren, Inc. | | * | | | 2,003 | | | | 56,064 | |
Applied Optoelectronics, Inc. | | * | | | 694 | | | | 10,417 | |
ARRIS Group, Inc. | | * | | | 22,065 | | | | 537,614 | |
Aruba Networks, Inc. | | * | | | 21,903 | | | | 392,064 | |
Aviat Networks, Inc. | | * | | | 11,965 | | | | 27,041 | |
Bel Fuse, Inc., Class B | | | | | 1,562 | | | | 33,286 | |
Black Box Corp. | | | | | 2,697 | | | | 80,370 | |
Brocade Communications Systems, Inc. | | * | | | 82,900 | | | | 735,323 | |
CalAmp Corp. | | * | | | 6,551 | | | | 183,231 | |
Calix, Inc. | | * | | | 6,802 | | | | 65,571 | |
Ciena Corp. | | * | | | 18,562 | | | | 444,189 | |
CommScope Holding Co., Inc. | | * | | | 6,987 | | | | 132,194 | |
Comtech Telecommunications Corp. | | | | | 3,106 | | | | 97,901 | |
Digi International, Inc. | | * | | | 4,346 | | | | 52,673 | |
EchoStar Corp., Class A | | * | | | 7,521 | | | | 373,944 | |
Emulex Corp. | | * | | | 15,840 | | | | 113,414 | |
Extreme Networks, Inc. | | * | | | 15,723 | | | | 110,061 | |
Finisar Corp. | | * | | | 17,651 | | | | 422,212 | |
Harmonic, Inc. | | * | | | 19,391 | | | | 143,105 | |
Infinera Corp. | | *† | | | 22,813 | | | | 223,111 | |
InterDigital, Inc. | | | | | 7,655 | | | | 225,746 | |
Ixia | | * | | | 9,680 | | | | 128,841 | |
JDS Uniphase Corp. | | * | | | 42,458 | | | | 551,105 | |
KVH Industries, Inc. | | * | | | 3,755 | | | | 48,928 | |
NETGEAR, Inc. | | * | | | 7,470 | | | | 246,062 | |
Numerex Corp., Class A | | * | | | 1,800 | | | | 23,310 | |
Oplink Communications, Inc. | | * | | | 3,197 | | | | 59,464 | |
Palo Alto Networks, Inc. | | * | | | 6,163 | | | | 354,188 | |
Parkervision, Inc. | | *† | | | 17,722 | | | | 80,635 | |
PC-Tel, Inc. | | | | | 2,924 | | | | 27,983 | |
Plantronics, Inc. | | | | | 7,822 | | | | 363,332 | |
Polycom, Inc. | | * | | | 33,242 | | | | 373,308 | |
| | | | | | | | | | | | |
| | | | |
| | | | | | Shares | | | | Value | |
| | | | | | | | | | | | |
Procera Networks, Inc. | | * | | | 3,968 | | | $ | 59,599 | |
Riverbed Technology, Inc. | | * | | | 30,760 | | | | 556,141 | |
Ruckus Wireless, Inc. | | * | | | 7,098 | | | | 100,792 | |
ShoreTel, Inc. | | * | | | 9,728 | | | | 90,276 | |
Sonus Networks, Inc. | | * | | | 42,907 | | | | 135,157 | |
Tessco Technologies, Inc. | | | | | 867 | | | | 34,957 | |
Ubiquiti Networks, Inc. | | *† | | | 2,651 | | | | 121,840 | |
ViaSat, Inc. | | * | | | 7,192 | | | | 450,579 | |
Westell Technologies, Inc., Class A | | * | | | 13,644 | | | | 55,258 | |
| | | | | | | | | | | | |
| | | | | | | | | | | 8,637,557 | |
| | | | | | | | | | | | |
| Computers & Peripherals—0.8% | |
3D Systems Corp. | | *† | | | 18,626 | | | | 1,730,914 | |
Avid Technology, Inc. | | * | | | 7,519 | | | | 61,280 | |
Cray, Inc. | | * | | | 6,853 | | | | 188,183 | |
Datalink Corp. | | * | | | 4,947 | | | | 53,922 | |
Diebold, Inc. | | | | | 11,573 | | | | 382,025 | |
Electronics For Imaging, Inc. | | * | | | 8,854 | | | | 342,916 | |
Fusion-io, Inc. | | *† | | | 12,959 | | | | 115,465 | |
Hutchinson Technology, Inc. | | * | | | 3,764 | | | | 12,045 | |
Imation Corp. | | * | | | 7,222 | | | | 33,799 | |
Immersion Corp. | | * | | | 5,977 | | | | 62,041 | |
Lexmark International, Inc., Class A | | | | | 11,893 | | | | 422,439 | |
NCR Corp. | | * | | | 31,036 | | | | 1,057,086 | |
QLogic Corp. | | * | | | 16,769 | | | | 198,377 | |
Quantum Corp. | | * | | | 33,664 | | | | 40,397 | |
Silicon Graphics International Corp. | | * | | | 6,293 | | | | 84,389 | |
Stratasys Ltd. | | * | | | 6,516 | | | | 877,705 | |
Super Micro Computer, Inc. | | * | | | 5,215 | | | | 89,490 | |
Violin Memory, Inc. | | *† | | | 3,125 | | | | 12,375 | |
| | | | | | | | | | | | |
| | | | | | | | | | | 5,764,848 | |
| | | | | | | | | | | | |
| Construction & Engineering—1.1% | |
AECOM Technology Corp. | | * | | | 18,809 | | | | 553,549 | |
Aegion Corp. | | * | | | 6,611 | | | | 144,715 | |
Ameresco, Inc., Class A | | * | | | 5,077 | | | | 49,044 | |
Argan, Inc. | | | | | 2,317 | | | | 63,856 | |
Chicago Bridge & Iron Co. NV (Netherlands) | | | | | 18,611 | | | | 1,547,319 | |
Comfort Systems USA, Inc. | | | | | 6,272 | | | | 121,614 | |
Dycom Industries, Inc. | | * | | | 6,558 | | | | 182,247 | |
EMCOR Group, Inc. | | | | | 12,302 | | | | 522,097 | |
Furmanite Corp. | | * | | | 7,017 | | | | 74,521 | |
Granite Construction, Inc. | | | | | 6,711 | | | | 234,751 | |
Great Lakes Dredge & Dock Corp. | | * | | | 9,800 | | | | 90,160 | |
KBR, Inc. | | | | | 27,461 | | | | 875,731 | |
Layne Christensen Co. | | * | | | 3,389 | | | | 57,884 | |
MasTec, Inc. | | * | | | 10,983 | | | | 359,364 | |
MYR Group, Inc. | | * | | | 3,419 | | | | 85,748 | |
Northwest Pipe Co. | | * | | | 2,458 | | | | 92,814 | |
Orion Marine Group, Inc. | | * | | | 6,042 | | | | 72,685 | |
Pike Corp. | | * | | | 4,864 | | | | 51,412 | |
Primoris Services Corp. | | | | | 6,986 | | | | 217,474 | |
Quanta Services, Inc. | | * | | | 38,741 | | | | 1,222,666 | |
Sterling Construction Co., Inc. | | * | | | 5,331 | | | | 62,533 | |
Tutor Perini Corp. | | * | | | 7,347 | | | | 193,226 | |
URS Corp. | | | | | 14,378 | | | | 761,890 | |
| | | | | | | | | | | | |
| | | | | | | | | | | 7,637,300 | |
| | | | | | | | | | | | |
See accompanying notes to financial statements
313
SCHEDULE OF INVESTMENTS—(Continued)
December 31, 2013
| | | | | | | | | | | | |
Vantagepoint Mid/Small
Company Index Fund | | | | Shares | | | Value | |
| | | | | | | | | | | | |
| COMMON STOCKS—(Continued) | |
| Construction Materials—0.3% | |
Eagle Materials, Inc. | | | | | 9,389 | | | $ | 726,990 | |
Headwaters, Inc. | | * | | | 14,630 | | | | 143,228 | |
Martin Marietta Materials, Inc. | | | | | 8,712 | | | | 870,677 | |
Texas Industries, Inc. | | * | | | 4,254 | | | | 292,590 | |
United States Lime & Minerals, Inc. | | * | | | 481 | | | | 29,423 | |
US Concrete, Inc. | | * | | | 2,151 | | | | 48,677 | |
| | | | | | | | | | | | |
| | | | | | | | | | | 2,111,585 | |
| | | | | | | | | | | | |
| Consumer Finance—0.3% | |
Cash America International, Inc. | | | | | 5,250 | | | | 201,075 | |
Consumer Portfolio Services, Inc. | | * | | | 2,748 | | | | 25,804 | |
Credit Acceptance Corp. | | * | | | 1,300 | | | | 168,987 | |
DFC Global Corp. | | * | | | 7,457 | | | | 85,383 | |
Encore Capital Group, Inc. | | * | | | 4,850 | | | | 243,761 | |
Ezcorp, Inc., Class A | | * | | | 8,825 | | | | 103,164 | |
First Cash Financial Services, Inc. | | * | | | 5,377 | | | | 332,514 | |
First Marblehead Corp. (The) | | * | | | 1,233 | | | | 9,112 | |
Green Dot Corp., Class A | | *† | | | 4,362 | | | | 109,704 | |
Imperial Holdings, Inc. | | * | | | 2,792 | | | | 18,260 | |
JGWPT Holdings, Inc., Class A | | * | | | 1,635 | | | | 28,433 | |
Nelnet, Inc., Class A | | | | | 4,517 | | | | 190,346 | |
Nicholas Financial, Inc. | | | | | 1,628 | | | | 25,625 | |
Portfolio Recovery Associates, Inc. | | * | | | 9,315 | | | | 492,204 | |
Regional Management Corp. | | * | | | 850 | | | | 28,840 | |
Springleaf Holdings, Inc. | | * | | | 4,063 | | | | 102,712 | |
World Acceptance Corp. | | *† | | | 1,607 | | | | 140,661 | |
| | | | | | | | | | | | |
| | | | | | | | | | | 2,306,585 | |
| | | | | | | | | | | | |
| Containers & Packaging—1.7% | |
AEP Industries, Inc. | | * | | | 838 | | | | 44,272 | |
AptarGroup, Inc. | | | | | 12,624 | | | | 856,033 | |
Avery Dennison Corp. | | | | | 18,817 | | | | 944,425 | |
Ball Corp. | | | | | 27,529 | | | | 1,422,148 | |
Bemis Co., Inc. | | | | | 19,180 | | | | 785,613 | |
Berry Plastics Group, Inc. | | * | | | 10,277 | | | | 244,490 | |
Crown Holdings, Inc. | | * | | | 26,663 | | | | 1,188,370 | |
Graphic Packaging Holding Co. | | * | | | 37,441 | | | | 359,434 | |
Greif, Inc., Class A | | | | | 5,997 | | | | 314,243 | |
Myers Industries, Inc. | | | | | 4,506 | | | | 95,167 | |
Owens-Illinois, Inc. | | * | | | 31,038 | | | | 1,110,540 | |
Packaging Corp. of America | | | | | 18,185 | | | | 1,150,747 | |
Rock-Tenn Co., Class A | | | | | 13,318 | | | | 1,398,523 | |
Sealed Air Corp. | | | | | 36,910 | | | | 1,256,785 | |
Silgan Holdings, Inc. | | | | | 7,880 | | | | 378,398 | |
Sonoco Products Co. | | | | | 18,866 | | | | 787,089 | |
UFP Technologies, Inc. | | * | | | 952 | | | | 24,009 | |
| | | | | | | | | | | | |
| | | | | | | | | | | 12,360,286 | |
| | | | | | | | | | | | |
| Distributors—0.4% | |
Core-Mark Holding Co., Inc. | | | | | 2,291 | | | | 173,956 | |
LKQ Corp. | | * | | | 56,084 | | | | 1,845,164 | |
Pool Corp. | | | | | 8,766 | | | | 509,655 | |
VOXX International Corp. | | * | | | 2,945 | | | | 49,181 | |
| | | | | | | | | | | | |
| | | | |
| | | | | | Shares | | | | Value | |
| | | | | | | | | | | | |
Weyco Group, Inc. | | | | | 1,031 | | | $ | 30,342 | |
| | | | | | | | | | | | |
| | | | | | | | | | | 2,608,298 | |
| | | | | | | | | | | | |
| Diversified Consumer Services—0.8% | |
American Public Education, Inc. | | * | | | 3,033 | | | | 131,845 | |
Apollo Education Group, Inc. | | * | | | 18,344 | | | | 501,158 | |
Ascent Capital Group, Inc., Class A | | * | | | 2,543 | | | | 217,579 | |
Bridgepoint Education, Inc. | | *† | | | 3,328 | | | | 58,939 | |
Bright Horizons Family Solutions, Inc. | | * | | | 1,996 | | | | 73,333 | |
Capella Education Co. | | | | | 2,073 | | | | 137,730 | |
Career Education Corp. | | * | | | 11,632 | | | | 66,302 | |
Carriage Services, Inc. | | | | | 2,616 | | | | 51,090 | |
Corinthian Colleges, Inc. | | *† | | | 17,447 | | | | 31,056 | |
DeVry Education Group, Inc. | | | | | 11,303 | | | | 401,257 | |
Education Management Corp. | | *† | | | 5,027 | | | | 50,722 | |
Graham Holdings Co., Class B | | * | | | 803 | | | | 532,646 | |
Grand Canyon Education, Inc. | | * | | | 8,434 | | | | 367,722 | |
Hillenbrand, Inc. | | | | | 10,140 | | | | 298,319 | |
Houghton Mifflin Harcourt Co. | | * | | | 3,517 | | | | 59,648 | |
ITT Educational Services, Inc. | | *† | | | 4,643 | | | | 155,912 | |
JTH Holding, Inc., Class A | | *† | | | 737 | | | | 17,909 | |
K12, Inc. | | * | | | 5,107 | | | | 111,077 | |
LifeLock, Inc. | | * | | | 11,972 | | | | 196,461 | |
Lincoln Educational Services Corp. | | | | | 3,801 | | | | 18,929 | |
Mac-Gray Corp. | | | | | 1,917 | | | | 40,698 | |
Matthews International Corp., Class A | | | | | 5,159 | | | | 219,825 | |
Regis Corp. | | | | | 8,692 | | | | 126,121 | |
Service Corp. International | | | | | 40,123 | | | | 727,430 | |
Sotheby’s | | | | | 12,498 | | | | 664,894 | |
Steiner Leisure Ltd. (Bahamas) | | * | | | 2,781 | | | | 136,797 | |
Strayer Education, Inc. | | * | | | 1,807 | | | | 62,287 | |
Universal Technical Institute, Inc. | | | | | 4,524 | | | | 62,929 | |
Weight Watchers International, Inc. | | † | | | 5,074 | | | | 167,087 | |
| | | | | | | | | | | | |
| | | | | | | | | | | 5,687,702 | |
| | | | | | | | | | | | |
| Diversified Financial Services—0.5% | |
CBOE Holdings, Inc. | | | | | 16,510 | | | | 857,860 | |
Gain Capital Holdings, Inc. | | | | | 1,849 | | | | 13,886 | |
MarketAxess Holdings, Inc. | | | | | 6,806 | | | | 455,117 | |
Marlin Business Services Corp. | | | | | 1,306 | | | | 32,911 | |
MSCI, Inc. | | * | | | 22,434 | | | | 980,814 | |
NASDAQ OMX Group, Inc. (The) | | | | | 20,778 | | | | 826,964 | |
NewStar Financial, Inc. | | * | | | 5,723 | | | | 101,698 | |
PHH Corp. | | * | | | 10,225 | | | | 248,979 | |
PICO Holdings, Inc. | | * | | | 3,754 | | | | 86,755 | |
Resource America, Inc., Class A | | | | | 3,696 | | | | 34,595 | |
| | | | | | | | | | | | |
| | | | | | | | | | | 3,639,579 | |
| | | | | | | | | | | | |
| Diversified Telecommunication Services—0.7% | |
8x8, Inc. | | * | | | 14,799 | | | | 150,358 | |
Atlantic Tele-Network, Inc. | | | | | 1,558 | | | | 88,136 | |
See accompanying notes to financial statements
314
SCHEDULE OF INVESTMENTS—(Continued)
December 31, 2013
| | | | | | | | | | | | |
Vantagepoint Mid/Small
Company Index Fund | | | | Shares | | | Value | |
| | | | | | | | | | | | |
| COMMON STOCKS—(Continued) | |
Cbeyond, Inc. | | * | | | 5,638 | | | $ | 38,902 | |
Cincinnati Bell, Inc. | | * | | | 38,778 | | | | 138,050 | |
Cogent Communications Group, Inc. | | | | | 8,853 | | | | 357,750 | |
Consolidated Communications Holdings, Inc. | | | | | 7,943 | | | | 155,921 | |
Fairpoint Communications, Inc. | | *† | | | 2,675 | | | | 30,254 | |
Frontier Communications Corp. | | † | | | 188,706 | | | | 877,483 | |
General Communication, Inc., Class A | | * | | | 6,831 | | | | 76,166 | |
Hawaiian Telcom Holdco, Inc. | | * | | | 1,637 | | | | 48,079 | |
HickoryTech Corp. | | | | | 2,808 | | | | 36,026 | |
IDT Corp., Class B | | | | | 2,274 | | | | 40,636 | |
inContact, Inc. | | * | | | 8,949 | | | | 69,892 | |
Inteliquent, Inc. | | | | | 6,478 | | | | 73,979 | |
Intelsat SA (Luxembourg) | | * | | | 3,546 | | | | 79,927 | |
Iridium Communications, Inc. | | *† | | | 10,823 | | | | 67,752 | |
Level 3 Communications, Inc. | | * | | | 30,170 | | | | 1,000,739 | |
Lumos Networks Corp. | | | | | 2,601 | | | | 54,621 | |
magicJack VocalTec Ltd. (Israel) | | * | | | 3,040 | | | | 36,237 | |
ORBCOMM, Inc. | | * | | | 7,135 | | | | 45,236 | |
Premiere Global Services, Inc. | | * | | | 8,185 | | | | 94,864 | |
Straight Path Communications, Inc., Class B | | * | | | 1,137 | | | | 9,312 | |
Towerstream Corp. | | *† | | | 9,781 | | | | 28,952 | |
tw telecom inc. | | * | | | 28,448 | | | | 866,810 | |
Vonage Holdings Corp. | | * | | | 26,128 | | | | 87,006 | |
Windstream Holdings, Inc. | | † | | | 112,048 | | | | 894,143 | |
| | | | | | | | | | | | |
| | | | | | | | | | | 5,447,231 | |
| | | | | | | | | | | | |
| Electric Utilities—1.4% | | | | | | | | | | | | |
ALLETE, Inc. | | | | | 7,371 | | | | 367,666 | |
Cleco Corp. | | | | | 11,068 | | | | 515,990 | |
El Paso Electric Co. | | | | | 7,508 | | | | 263,606 | |
Empire District Electric Co. (The) | | | | | 7,796 | | | | 176,891 | |
Great Plains Energy, Inc. | | | | | 29,161 | | | | 706,863 | |
Hawaiian Electric Industries, Inc. | | † | | | 18,088 | | | | 471,373 | |
IDACORP, Inc. | | | | | 9,449 | | | | 489,836 | |
ITC Holdings Corp. | | | | | 9,715 | | | | 930,891 | |
MGE Energy, Inc. | | | | | 4,136 | | | | 239,475 | |
NRG Yield, Inc., Class A | | | | | 4,569 | | | | 182,806 | |
OGE Energy Corp. | | | | | 36,680 | | | | 1,243,452 | |
Otter Tail Corp. | | | | | 6,778 | | | | 198,392 | |
Pepco Holdings, Inc. | | | | | 46,995 | | | | 899,014 | |
Pinnacle West Capital Corp. | | | | | 20,383 | | | | 1,078,668 | |
PNM Resources, Inc. | | | | | 15,338 | | | | 369,953 | |
Portland General Electric Co. | | | | | 13,925 | | | | 420,535 | |
UIL Holdings Corp. | | | | | 10,668 | | | | 413,385 | |
Unitil Corp. | | | | | 2,617 | | | | 79,792 | |
UNS Energy Corp. | | | | | 7,848 | | | | 469,703 | |
Westar Energy, Inc. | | | | | 25,129 | | | | 808,400 | |
| | | | | | | | | | | | |
| | | | | | | | | | | 10,326,691 | |
| | | | | | | | | | | | |
| | | | | | | | | | | | |
| | | | |
| | | | | | Shares | | | | Value | |
| | | | | | | | | | | | |
| Electrical Equipment—1.1% | |
Acuity Brands, Inc. | | | | | 8,105 | | | $ | 886,039 | |
American Superconductor Corp. | | *† | | | 6,746 | | | | 11,063 | |
AZZ, Inc. | | | | | 4,607 | | | | 225,098 | |
Babcock & Wilcox Co. (The) | | | | | 21,289 | | | | 727,871 | |
Brady Corp., Class A | | | | | 8,619 | | | | 266,586 | |
Capstone Turbine Corp. | | *† | | | 49,493 | | | | 63,846 | |
Coleman Cable, Inc. | | | | | 2,304 | | | | 60,411 | |
Encore Wire Corp. | | | | | 4,068 | | | | 220,486 | |
EnerSys, Inc. | | | | | 8,778 | | | | 615,250 | |
Enphase Energy, Inc. | | *† | | | 4,304 | | | | 27,287 | |
Franklin Electric Co., Inc. | | | | | 8,722 | | | | 389,350 | |
FuelCell Energy, Inc. | | *† | | | 23,381 | | | | 32,967 | |
Generac Holdings, Inc. | | | | | 9,432 | | | | 534,229 | |
General Cable Corp. | | | | | 9,667 | | | | 284,306 | |
Global Power Equipment Group, Inc. | | | | | 2,804 | | | | 54,874 | |
GrafTech International Ltd. | | *† | | | 22,518 | | | | 252,877 | |
Hubbell, Inc., Class B | | | | | 11,185 | | | | 1,218,047 | |
II-VI, Inc. | | * | | | 8,787 | | | | 154,651 | |
LSI Industries, Inc. | | | | | 3,003 | | | | 26,036 | |
Polypore International, Inc. | | *† | | | 8,493 | | | | 330,378 | |
Powell Industries, Inc. | | | | | 1,563 | | | | 104,705 | |
Power Solutions International, Inc. | | * | | | 305 | | | | 22,906 | |
PowerSecure International, Inc. | | * | | | 4,744 | | | | 81,454 | |
Preformed Line Products Co. | | | | | 638 | | | | 46,676 | |
Regal-Beloit Corp. | | | | | 8,416 | | | | 620,428 | |
Revolution Lighting Technologies, Inc. | | *† | | | 4,765 | | | | 16,320 | |
SolarCity Corp. | | * | | | 4,497 | | | | 255,520 | |
Thermon Group Holdings, Inc. | | * | | | 4,483 | | | | 122,520 | |
Vicor Corp. | | * | | | 3,481 | | | | 46,715 | |
| | | | | | | | | | | | |
| | | | | | | | | | | 7,698,896 | |
| | | | | | | | | | | | |
| Electronic Equipment, Instruments & Components—2.3% | |
Aeroflex Holding Corp. | | * | | | 2,268 | | | | 14,742 | |
Agilysys, Inc. | | * | | | 4,188 | | | | 58,297 | |
Anixter International, Inc. | | | | | 4,879 | | | | 438,329 | |
Arrow Electronics, Inc. | | * | | | 19,442 | | | | 1,054,728 | |
Audience, Inc. | | * | | | 1,525 | | | | 17,751 | |
Avnet, Inc. | | | | | 25,442 | | | | 1,122,247 | |
AVX Corp. | | | | | 9,165 | | | | 127,668 | |
Badger Meter, Inc. | | | | | 2,704 | | | | 147,368 | |
Belden, Inc. | | | | | 8,256 | | | | 581,635 | |
Benchmark Electronics, Inc. | | * | | | 10,071 | | | | 232,439 | |
CDW Corp. | | | | | 4,309 | | | | 100,658 | |
Checkpoint Systems, Inc. | | * | | | 8,101 | | | | 127,753 | |
Cognex Corp. | | * | | | 16,331 | | | | 623,518 | |
Coherent, Inc. | | * | | | 4,645 | | | | 345,542 | |
Control4 Corp. | | *† | | | 742 | | | | 13,133 | |
CTS Corp. | | | | | 6,621 | | | | 131,824 | |
Daktronics, Inc. | | | | | 7,523 | | | | 117,961 | |
Dolby Laboratories, Inc., Class A | | *† | | | 8,312 | | | | 320,511 | |
DTS, Inc. | | * | | | 3,053 | | | | 73,211 | |
Electro Rent Corp. | | | | | 4,267 | | | | 79,025 | |
Electro Scientific Industries, Inc. | | | | | 3,685 | | | | 38,545 | |
Fabrinet (Cayman Islands) | | * | | | 4,614 | | | | 94,864 | |
FARO Technologies, Inc. | | * | | | 3,399 | | | | 198,162 | |
See accompanying notes to financial statements
315
SCHEDULE OF INVESTMENTS—(Continued)
December 31, 2013
| | | | | | | | | | | | |
Vantagepoint Mid/Small
Company Index Fund | | | | Shares | | | Value | |
| | | | | | | | | | | | |
| COMMON STOCKS—(Continued) | |
FEI Co. | | | | | 7,793 | | | $ | 696,382 | |
FLIR Systems, Inc. | | | | | 26,450 | | | | 796,145 | |
GSI Group, Inc. | | * | | | 5,025 | | | | 56,481 | |
Ingram Micro, Inc., Class A | | * | | | 28,453 | | | | 667,507 | |
Insight Enterprises, Inc. | | * | | | 8,626 | | | | 195,896 | |
InvenSense Inc. | | *† | | | 11,228 | | | | 233,318 | |
IPG Photonics Corp. | | *† | | | 6,135 | | | | 476,137 | |
Itron, Inc. | | * | | | 7,053 | | | | 292,206 | |
Jabil Circuit, Inc. | | | | | 38,372 | | | | 669,208 | |
Kemet Corp. | | * | | | 8,699 | | | | 49,062 | |
Littelfuse, Inc. | | | | | 4,198 | | | | 390,120 | |
Maxwell Technologies, Inc. | | * | | | 5,615 | | | | 43,629 | |
Measurement Specialties, Inc. | | * | | | 3,063 | | | | 185,893 | |
Mercury Systems, Inc. | | * | | | 6,981 | | | | 76,442 | |
Mesa Laboratories, Inc. | | | | | 539 | | | | 42,355 | |
Methode Electronics, Inc. | | | | | 7,481 | | | | 255,775 | |
MTS Systems Corp. | | | | | 2,686 | | | | 191,377 | |
Multi-Fineline Electronix, Inc. | | * | | | 1,120 | | | | 15,557 | |
National Instruments Corp. | | | | | 18,032 | | | | 577,385 | |
Neonode, Inc. (Sweden) | | *† | | | 3,979 | | | | 25,147 | |
Newport Corp. | | * | | | 6,603 | | | | 119,316 | |
OSI Systems, Inc. | | * | | | 3,433 | | | | 182,327 | |
Park Electrochemical Corp. | | | | | 3,495 | | | | 100,376 | |
PC Connection, Inc. | | | | | 2,755 | | | | 68,462 | |
Plexus Corp. | | * | | | 6,633 | | | | 287,143 | |
Radisys Corp. | | * | | | 4,878 | | | | 11,171 | |
RealD, Inc. | | * | | | 6,791 | | | | 57,995 | |
Richardson Electronics Ltd./United States | | | | | 1,926 | | | | 21,879 | |
Rofin-Sinar Technologies, Inc. | | * | | | 4,789 | | | | 129,399 | |
Rogers Corp. | | * | | | 3,354 | | | | 206,271 | |
Sanmina Corp. | | * | | | 15,958 | | | | 266,499 | |
ScanSource, Inc. | | * | | | 5,403 | | | | 229,249 | |
Speed Commerce, Inc. | | * | | | 6,434 | | | | 30,047 | |
SYNNEX Corp. | | * | | | 4,962 | | | | 334,439 | |
Tech Data Corp. | | * | | | 7,261 | | | | 374,668 | |
Trimble Navigation Ltd. | | * | | | 47,299 | | | | 1,641,275 | |
TTM Technologies, Inc. | | * | | | 9,730 | | | | 83,483 | |
Uni-Pixel, Inc. | | *† | | | 1,630 | | | | 16,316 | |
Universal Display Corp. | | * | | | 7,843 | | | | 269,485 | |
Vishay Intertechnology, Inc. | | * | | | 25,419 | | | | 337,056 | |
Vishay Precision Group, Inc. | | * | | | 2,712 | | | | 40,382 | |
Zygo Corp. | | * | | | 2,997 | | | | 44,296 | |
| | | | | | | | | | | | |
| | | | | | | | | | | 16,847,467 | |
| | | | | | | | | | | | |
| Energy Equipment & Services—2.4% | |
Atwood Oceanics, Inc. | | * | | | 10,471 | | | | 559,047 | |
Basic Energy Services, Inc. | | * | | | 5,491 | | | | 86,648 | |
Bolt Technology Corp. | | | | | 1,856 | | | | 40,851 | |
Bristow Group, Inc. | | | | | 6,783 | | | | 509,132 | |
C&J Energy Services, Inc. | | * | | | 8,503 | | | | 196,419 | |
Cal Dive International, Inc. | | *† | | | 20,032 | | | | 40,264 | |
CARBO Ceramics, Inc. | | | | | 3,679 | | | | 428,714 | |
Dawson Geophysical Co. | | * | | | 1,539 | | | | 52,049 | |
Dresser-Rand Group, Inc. | | * | | | 14,411 | | | | 859,328 | |
Dril-Quip, Inc. | | * | | | 7,679 | | | | 844,153 | |
Era Group, Inc. | | * | | | 3,470 | | | | 107,084 | |
Exterran Holdings, Inc. | | * | | | 10,606 | | | | 362,725 | |
Forum Energy Technologies, Inc. | | * | | | 7,619 | | | | 215,313 | |
Frank’s International NV (Netherlands) | | | | | 6,714 | | | | 181,278 | |
| | | | | | | | | | | | |
| | | | |
| | | | | | Shares | | | | Value | |
| | | | | | | | | | | | |
Geospace Technologies Corp. | | * | | | 2,532 | | | $ | 240,110 | |
Global Geophysical Services, Inc. | | * | | | 3,880 | | | | 6,247 | |
Gulf Island Fabrication, Inc. | | | | | 2,377 | | | | 55,194 | |
Gulfmark Offshore, Inc., Class A | | | | | 5,207 | | | | 245,406 | |
Helix Energy Solutions Group, Inc. | | * | | | 19,957 | | | | 462,603 | |
Helmerich & Payne, Inc. | | | | | 17,852 | | | | 1,500,996 | |
Hercules Offshore, Inc. | | * | | | 29,491 | | | | 192,576 | |
Hornbeck Offshore Services, Inc. | | * | | | 6,789 | | | | 334,223 | |
ION Geophysical Corp. | | * | | | 22,870 | | | | 75,471 | |
Key Energy Services, Inc. | | * | | | 29,567 | | | | 233,579 | |
Matrix Service Co. | | * | | | 4,454 | | | | 108,989 | |
McDermott International, Inc. | | * | | | 45,471 | | | | 416,514 | |
Mitcham Industries, Inc. | | * | | | 1,935 | | | | 34,269 | |
Nabors Industries Ltd. (Bermuda) | | | | | 55,669 | | | | 945,816 | |
Natural Gas Services Group, Inc. | | * | | | 2,483 | | | | 68,456 | |
Newpark Resources, Inc. | | * | | | 16,681 | | | | 205,010 | |
Nuverra Environmental Solutions, Inc. | | *† | | | 2,403 | | | | 40,346 | |
Oceaneering International, Inc. | | | | | 19,988 | | | | 1,576,653 | |
Oil States International, Inc. | | * | | | 10,194 | | | | 1,036,934 | |
Parker Drilling Co. | | * | | | 23,214 | | | | 188,730 | |
Patterson-UTI Energy, Inc. | | | | | 27,432 | | | | 694,578 | |
PHI, Inc. | | * | | | 2,638 | | | | 114,489 | |
Pioneer Energy Services Corp. | | * | | | 11,528 | | | | 92,339 | |
RigNet, Inc. | | * | | | 1,876 | | | | 89,917 | |
Rowan Cos. plc, Class A | | * | | | 23,107 | | | | 817,064 | |
RPC, Inc. | | † | | | 12,219 | | | | 218,109 | |
SEACOR Holdings, Inc. | | * | | | 3,616 | | | | 329,779 | |
Superior Energy Services, Inc. | | * | | | 30,226 | | | | 804,314 | |
Tesco Corp. | | * | | | 6,389 | | | | 126,374 | |
TETRA Technologies, Inc. | | * | | | 13,294 | | | | 164,314 | |
TGC Industries, Inc. | | * | | | 2,392 | | | | 17,462 | |
Tidewater, Inc. | | | | | 9,431 | | | | 558,975 | |
Unit Corp. | | * | | | 9,048 | | | | 467,058 | |
Vantage Drilling Co. | | *† | | | 44,721 | | | | 82,287 | |
Willbros Group, Inc. | | * | | | 6,569 | | | | 61,880 | |
| | | | | | | | | | | | |
| | | | | | | | | | | 17,090,066 | |
| | | | | | | | | | | | |
| Food & Staples Retailing—0.7% | |
Andersons, Inc. (The) | | | | | 3,587 | | | | 319,853 | |
Arden Group, Inc., Class A | | | | | 241 | | | | 30,489 | |
Casey’s General Stores, Inc. | | | | | 7,187 | | | | 504,887 | |
Chefs’ Warehouse, Inc. (The) | | * | | | 3,665 | | | | 106,871 | |
Fairway Group Holdings Corp. | | *† | | | 2,487 | | | | 45,064 | |
Fresh Market, Inc. (The) | | * | | | 7,516 | | | | 304,398 | |
Harris Teeter Supermarkets, Inc. | | | | | 9,315 | | | | 459,695 | |
Ingles Markets, Inc., Class A | | | | | 1,996 | | | | 54,092 | |
Natural Grocers by Vitamin Cottage, Inc. | | *† | | | 1,404 | | | | 59,600 | |
Pantry, Inc. (The) | | * | | | 3,943 | | | | 66,163 | |
PriceSmart, Inc. | | | | | 3,563 | | | | 411,669 | |
Rite Aid Corp. | | * | | | 134,552 | | | | 680,833 | |
Roundy’s, Inc. | | | | | 3,989 | | | | 39,332 | |
Spartan Stores, Inc. | | | | | 7,304 | | | | 177,341 | |
Sprouts Farmers Market, Inc. | | * | | | 3,981 | | | | 152,990 | |
See accompanying notes to financial statements
316
SCHEDULE OF INVESTMENTS—(Continued)
December 31, 2013
| | | | | | | | | | | | |
Vantagepoint Mid/Small
Company Index Fund | | | | Shares | | | Value | |
| | | | | | | | | | | | |
| COMMON STOCKS—(Continued) | |
SUPERVALU, Inc. | | * | | | 39,641 | | | $ | 288,983 | |
Susser Holdings Corp. | | *† | | | 3,451 | | | | 226,006 | |
United Natural Foods, Inc. | | * | | | 9,033 | | | | 680,998 | |
Village Super Market, Inc., Class A | | | | | 1,280 | | | | 39,693 | |
Weis Markets, Inc. | | | | | 2,120 | | | | 111,427 | |
| | | | | | | | | | | | |
| | | | | | | | | | | 4,760,384 | |
| | | | | | | | | | | | |
| Food Products—1.2% | |
Alico, Inc. | | | | | 494 | | | | 19,202 | |
Annie’s, Inc. | | *† | | | 2,802 | | | | 120,598 | |
B&G Foods, Inc. | | | | | 9,578 | | | | 324,790 | |
Boulder Brands, Inc. | | * | | | 11,006 | | | | 174,555 | |
Calavo Growers, Inc. | | | | | 2,244 | | | | 67,903 | |
Cal-Maine Foods, Inc. | | | | | 2,754 | | | | 165,873 | |
Chiquita Brands International, Inc. | | * | | | 10,131 | | | | 118,533 | |
Darling International, Inc. | | * | | | 28,785 | | | | 601,031 | |
Dean Foods Co. | | * | | | 17,722 | | | | 304,641 | |
Diamond Foods, Inc. | | *† | | | 4,466 | | | | 115,401 | |
Farmer Bros. Co. | | * | | | 930 | | | | 21,632 | |
Flowers Foods, Inc. | | | | | 32,424 | | | | 696,143 | |
Fresh Del Monte Produce, Inc. | | | | | 7,228 | | | | 204,552 | |
Griffin Land & Nurseries, Inc. | | | | | 620 | | | | 20,696 | |
Hain Celestial Group, Inc. (The) | | * | | | 7,301 | | | | 662,785 | |
Hillshire Brands Co. | | | | | 23,311 | | | | 779,520 | |
Ingredion, Inc. | | | | | 14,626 | | | | 1,001,296 | |
Inventure Foods, Inc. | | * | | | 3,145 | | | | 41,703 | |
J&J Snack Foods Corp. | | | | | 2,916 | | | | 258,328 | |
John B. Sanfilippo & Son, Inc. | | | | | 1,899 | | | | 46,867 | |
Lancaster Colony Corp. | | | | | 3,541 | | | | 312,139 | |
Lifeway Foods, Inc. | | † | | | 778 | | | | 12,432 | |
Limoneira Co. | | | | | 1,586 | | | | 42,172 | |
Omega Protein Corp. | | * | | | 4,824 | | | | 59,287 | |
Pilgrim’s Pride Corp. | | * | | | 11,995 | | | | 194,919 | |
Pinnacle Foods, Inc. | | | | | 6,337 | | | | 174,014 | |
Post Holdings, Inc. | | * | | | 6,309 | | | | 310,844 | |
Sanderson Farms, Inc. | | | | | 4,402 | | | | 318,397 | |
Seaboard Corp. | | * | | | 51 | | | | 142,544 | |
Seneca Foods Corp., Class A | | * | | | 1,290 | | | | 41,138 | |
Snyders-Lance, Inc. | | | | | 8,591 | | | | 246,734 | |
Tootsie Roll Industries, Inc. | | † | | | 3,351 | | | | 109,042 | |
TreeHouse Foods, Inc. | | * | | | 6,813 | | | | 469,552 | |
WhiteWave Foods Co., Class A | | * | | | 28,001 | | | | 642,343 | |
| | | | | | | | | | | | |
| | | | | | | | | | | 8,821,606 | |
| | | | | | | | | | | | |
| Gas Utilities—1.0% | |
AGL Resources, Inc. | | | | | 22,309 | | | | 1,053,654 | |
Atmos Energy Corp. | | | | | 17,152 | | | | 779,044 | |
Chesapeake Utilities Corp. | | | | | 1,819 | | | | 109,176 | |
Delta Natural Gas Co., Inc. | | | | | 1,837 | | | | 41,112 | |
Laclede Group, Inc. (The) | | | | | 6,241 | | | | 284,215 | |
National Fuel Gas Co. | | | | | 13,663 | | | | 975,538 | |
New Jersey Resources Corp. | | | | | 7,441 | | | | 344,072 | |
Northwest Natural Gas Co. | | | | | 4,635 | | | | 198,471 | |
Piedmont Natural Gas Co., Inc. | | | | | 14,437 | | | | 478,731 | |
Questar Corp. | | | | | 33,167 | | | | 762,509 | |
| | | | | | | | | | | | |
| | | | |
| | | | | | Shares | | | | Value | |
| | | | | | | | | | | | |
South Jersey Industries, Inc. | | | | | 6,062 | | | $ | 339,230 | |
Southwest Gas Corp. | | | | | 8,465 | | | | 473,278 | |
UGI Corp. | | | | | 21,525 | | | | 892,427 | |
WGL Holdings, Inc. | | | | | 9,748 | | | | 390,505 | |
| | | | | | | | | | | | |
| | | | | | | | | | | 7,121,962 | |
| | | | | | | | | | | | |
| Health Care Equipment & Supplies—2.5% | |
Abaxis, Inc. | | * | | | 3,746 | | | | 149,915 | |
ABIOMED, Inc. | | * | | | 6,733 | | | | 180,040 | |
Accuray, Inc. | | *† | | | 15,070 | | | | 131,260 | |
Alere, Inc. | | * | | | 14,908 | | | | 539,670 | |
Align Technology, Inc. | | * | | | 13,372 | | | | 764,210 | |
Alphatec Holdings, Inc. | | * | | | 9,819 | | | | 19,736 | |
Analogic Corp. | | | | | 2,120 | | | | 187,747 | |
AngioDynamics, Inc. | | * | | | 5,314 | | | | 91,348 | |
Anika Therapeutics, Inc. | | * | | | 1,903 | | | | 72,619 | |
Antares Pharma, Inc. | | *† | | | 19,090 | | | | 85,523 | |
ArthroCare Corp. | | * | | | 5,452 | | | | 219,389 | |
AtriCure, Inc. | | * | | | 3,315 | | | | 61,924 | |
Atrion Corp. | | | | | 291 | | | | 86,209 | |
Biolase, Inc. | | *† | | | 5,185 | | | | 14,674 | |
Cantel Medical Corp. | | | | | 6,207 | | | | 210,479 | |
Cardiovascular Systems, Inc. | | * | | | 3,524 | | | | 120,838 | |
Cerus Corp. | | *† | | | 16,123 | | | | 103,993 | |
CONMED Corp. | | | | | 5,352 | | | | 227,460 | |
Cooper Cos., Inc. (The) | | | | | 9,109 | | | | 1,128,059 | |
CryoLife, Inc. | | | | | 6,833 | | | | 75,778 | |
Cutera, Inc. | | * | | | 2,327 | | | | 23,689 | |
Cyberonics, Inc. | | * | | | 5,278 | | | | 345,762 | |
Cynosure, Inc., Class A | | * | | | 2,936 | | | | 78,333 | |
Derma Sciences, Inc. | | *† | | | 2,171 | | | | 23,490 | |
DexCom, Inc. | | * | | | 13,408 | | | | 474,777 | |
Endologix, Inc. | | * | | | 11,389 | | | | 198,624 | |
Exactech, Inc. | | * | | | 1,480 | | | | 35,165 | |
GenMark Diagnostics, Inc. | | * | | | 7,868 | | | | 104,723 | |
Globus Medical, Inc., Class A | | *† | | | 10,657 | | | | 215,058 | |
Greatbatch, Inc. | | * | | | 4,737 | | | | 209,565 | |
Haemonetics Corp. | | * | | | 9,672 | | | | 407,481 | |
HeartWare International, Inc. | | * | | | 3,167 | | | | 297,571 | |
Hill-Rom Holdings, Inc. | | | | | 11,018 | | | | 455,484 | |
Hologic, Inc. | | * | | | 50,782 | | | | 1,134,978 | |
ICU Medical, Inc. | | * | | | 2,188 | | | | 139,397 | |
IDEXX Laboratories, Inc. | | * | | | 10,035 | | | | 1,067,423 | |
Insulet Corp. | | * | | | 10,118 | | | | 375,378 | |
Integra LifeSciences Holdings Corp. | | * | | | 4,183 | | | | 199,571 | |
Invacare Corp. | | | | | 6,320 | | | | 146,687 | |
LDR Holding Corp. | | * | | | 964 | | | | 22,750 | |
Masimo Corp. | | * | | | 9,466 | | | | 276,691 | |
Medical Action Industries, Inc. | | * | | | 2,332 | | | | 19,962 | |
Meridian Bioscience, Inc. | | | | | 7,174 | | | | 190,326 | |
Merit Medical Systems, Inc. | | * | | | 7,183 | | | | 113,060 | |
Natus Medical, Inc. | | * | | | 6,365 | | | | 143,213 | |
Neogen Corp. | | * | | | 6,836 | | | | 312,405 | |
NuVasive, Inc. | | * | | | 8,592 | | | | 277,779 | |
NxStage Medical, Inc. | | * | | | 11,835 | | | | 118,350 | |
OraSure Technologies, Inc. | | * | | | 12,739 | | | | 80,128 | |
Orthofix International NV (Curacao) | | * | | | 3,796 | | | | 86,625 | |
Oxford Immunotec Global plc (United Kingdom) | | * | | | 1,033 | | | | 20,020 | |
PhotoMedex, Inc. | | *† | | | 2,664 | | | | 34,499 | |
Quidel Corp. | | *† | | | 5,467 | | | | 168,876 | |
ResMed, Inc. | | † | | | 26,374 | | | | 1,241,688 | |
See accompanying notes to financial statements
317
SCHEDULE OF INVESTMENTS—(Continued)
December 31, 2013
| | | | | | | | | | | | |
Vantagepoint Mid/Small
Company Index Fund | | | | Shares | | | Value | |
| | | | | | | | | | | | |
| COMMON STOCKS—(Continued) | |
Rockwell Medical, Inc. | | *† | | | 6,217 | | | $ | 64,905 | |
RTI Surgical, Inc. | | * | | | 13,504 | | | | 47,804 | |
Sirona Dental Systems, Inc. | | * | | | 10,243 | | | | 719,059 | |
Solta Medical, Inc. | | * | | | 11,237 | | | | 33,149 | |
Spectranetics Corp. | | * | | | 8,093 | | | | 202,325 | |
Staar Surgical Co. | | * | | | 7,139 | | | | 115,580 | |
STERIS Corp. | | | | | 10,645 | | | | 511,492 | |
SurModics, Inc. | | * | | | 3,217 | | | | 78,463 | |
Symmetry Medical, Inc. | | * | | | 5,904 | | | | 59,512 | |
Tandem Diabetes Care, Inc. | | * | | | 1,542 | | | | 39,737 | |
TearLab Corp. | | *† | | | 4,055 | | | | 37,874 | |
Teleflex, Inc. | | | | | 7,670 | | | | 719,906 | |
Thoratec Corp. | | * | | | 10,517 | | | | 384,922 | |
Tornier NV (Netherlands) | | * | | | 4,118 | | | | 77,377 | |
Unilife Corp. | | *† | | | 15,695 | | | | 69,058 | |
Utah Medical Products, Inc. | | | | | 525 | | | | 30,009 | |
Vascular Solutions, Inc. | | * | | | 2,721 | | | | 62,991 | |
Veracyte, Inc. | | * | | | 845 | | | | 12,253 | |
Volcano Corp. | | * | | | 10,713 | | | | 234,079 | |
West Pharmaceutical Services, Inc. | | | | | 12,945 | | | | 635,082 | |
Wright Medical Group, Inc. | | * | | | 7,473 | | | | 229,496 | |
Zeltiq Aesthetics, Inc. | | * | | | 3,019 | | | | 57,089 | |
| | | | | | | | | | | | |
| | | | | | | | | | | 17,932,561 | |
| | | | | | | | | | | | |
| Health Care Providers & Services—2.3% | |
Acadia Healthcare Co., Inc. | | * | | | 6,649 | | | | 314,697 | |
Accretive Health, Inc. | | *† | | | 9,701 | | | | 88,861 | |
Addus HomeCare Corp. | | * | | | 874 | | | | 19,621 | |
Air Methods Corp. | | * | | | 7,403 | | | | 431,817 | |
Alliance HealthCare Services, Inc. | | * | | | 806 | | | | 19,940 | |
Almost Family, Inc. | | * | | | 2,502 | | | | 80,890 | |
Amedisys, Inc. | | * | | | 5,275 | | | | 77,173 | |
AMN Healthcare Services, Inc. | | * | | | 7,678 | | | | 112,867 | |
Amsurg Corp. | | * | | | 6,144 | | | | 282,132 | |
Bio-Reference Labs, Inc. | | *† | | | 4,688 | | | | 119,732 | |
BioScrip, Inc. | | * | | | 9,835 | | | | 72,779 | |
Brookdale Senior Living, Inc. | | * | | | 17,941 | | | | 487,636 | |
Capital Senior Living Corp. | | * | | | 5,534 | | | | 132,761 | |
Centene Corp. | | * | | | 9,888 | | | | 582,898 | |
Chemed Corp. | | † | | | 3,466 | | | | 265,565 | |
Chindex International, Inc. | | * | | | 2,406 | | | | 41,937 | |
Community Health Systems, Inc. | | * | | | 17,866 | | | | 701,598 | |
Corvel Corp. | | * | | | 2,370 | | | | 110,679 | |
Cross Country Healthcare, Inc. | | * | | | 7,318 | | | | 73,034 | |
Emeritus Corp. | | * | | | 6,981 | | | | 150,999 | |
Ensign Group, Inc. (The) | | | | | 3,393 | | | | 150,208 | |
Envision Healthcare Holdings, Inc. | | * | | | 9,272 | | | | 329,341 | |
ExamWorks Group, Inc. | | * | | | 6,025 | | | | 179,967 | |
Five Star Quality Care, Inc. | | * | | | 9,106 | | | | 49,992 | |
Gentiva Health Services, Inc. | | * | | | 5,336 | | | | 66,220 | |
Hanger, Inc. | | * | | | 6,290 | | | | 247,449 | |
Health Management Associates, Inc., Class A | | * | | | 49,261 | | | | 645,319 | |
Health Net, Inc. | | * | | | 15,182 | | | | 450,450 | |
HealthSouth Corp. | | | | | 16,598 | | | | 553,045 | |
Healthways, Inc. | | * | | | 5,769 | | | | 88,554 | |
IPC The Hospitalist Co., Inc. | | * | | | 3,142 | | | | 186,603 | |
| | | | | | | | | | | | |
| | | | |
| | | | | | Shares | | | | Value | |
| | | | | | | | | | | | |
Kindred Healthcare, Inc. | | | | | 9,246 | | | $ | 182,516 | |
Landauer, Inc. | | | | | 1,882 | | | | 99,012 | |
LHC Group, Inc. | | * | | | 2,770 | | | | 66,591 | |
LifePoint Hospitals, Inc. | | * | | | 8,646 | | | | 456,855 | |
Magellan Health Services, Inc. | | * | | | 4,963 | | | | 297,333 | |
MEDNAX, Inc. | | * | | | 18,646 | | | | 995,323 | |
Molina Healthcare, Inc. | | * | | | 4,825 | | | | 167,669 | |
MWI Veterinary Supply, Inc. | | * | | | 2,422 | | | | 413,169 | |
National Healthcare Corp. | | | | | 1,812 | | | | 97,685 | |
National Research Corp., Class A | | * | | | 1,929 | | | | 36,304 | |
Omnicare, Inc. | | | | | 19,462 | | | | 1,174,726 | |
Owens & Minor, Inc. | | | | | 11,941 | | | | 436,563 | |
Patterson Cos., Inc. | | | | | 16,316 | | | | 672,219 | |
PharMerica Corp. | | * | | | 5,445 | | | | 117,067 | |
Premier, Inc., Class A | | * | | | 5,426 | | | | 199,460 | |
Providence Service Corp. (The) | | * | | | 2,069 | | | | 53,215 | |
Select Medical Holdings Corp. | | | | | 8,061 | | | | 93,588 | |
Skilled Healthcare Group, Inc., Class A | | * | | | 4,230 | | | | 20,346 | |
Surgical Care Affiliates, Inc. | | * | | | 1,885 | | | | 65,673 | |
Team Health Holdings, Inc. | | * | | | 12,486 | | | | 568,737 | |
Tenet Healthcare Corp. | | * | | | 19,583 | | | | 824,836 | |
Triple-S Management Corp., Class B (Puerto Rico) | | * | | | 4,524 | | | | 87,947 | |
U.S. Physical Therapy, Inc. | | | | | 2,234 | | | | 78,771 | |
Universal American Corp. | | | | | 7,130 | | | | 52,049 | |
Universal Health Services, Inc., Class B | | | | | 16,792 | | | | 1,364,518 | |
USMD Holdings, Inc. | | * | | | 174 | | | | 3,499 | |
VCA Antech, Inc. | | * | | | 16,891 | | | | 529,702 | |
WellCare Health Plans, Inc. | | * | | | 8,148 | | | | 573,782 | |
| | | | | | | | | | | | |
| | | | | | | | | | | 16,843,919 | |
| | | | | | | | | | | | |
| Health Care Technology—0.5% | |
Allscripts Healthcare Solutions, Inc. | | * | | | 32,155 | | | | 497,116 | |
athenahealth, Inc. | | * | | | 6,943 | | | | 933,834 | |
Computer Programs & Systems, Inc. | | | | | 2,114 | | | | 130,666 | |
HealthStream, Inc. | | * | | | 3,356 | | | | 109,976 | |
HMS Holdings Corp. | | * | | | 16,863 | | | | 383,296 | |
MedAssets, Inc. | | * | | | 11,090 | | | | 219,915 | |
Medidata Solutions, Inc. | | * | | | 9,732 | | | | 589,467 | |
Merge Healthcare, Inc. | | * | | | 9,619 | | | | 22,316 | |
Omnicell, Inc. | | * | | | 6,227 | | | | 158,975 | |
Quality Systems, Inc. | | | | | 6,901 | | | | 145,335 | |
Veeva Systems, Inc., Class A | | * | | | 2,515 | | | | 80,732 | |
Vocera Communications, Inc. | | * | | | 3,339 | | | | 52,122 | |
| | | | | | | | | | | | |
| | | | | | | | | | | 3,323,750 | |
| | | | | | | | | | | | |
| Hotels, Restaurants & Leisure—2.1% | |
AFC Enterprises, Inc. | | * | | | 4,381 | | | | 168,668 | |
Bally Technologies, Inc. | | * | | | 7,358 | | | | 577,235 | |
Biglari Holdings, Inc. | | * | | | 243 | | | | 123,114 | |
BJ’s Restaurants, Inc. | | * | | | 4,349 | | | | 135,080 | |
Bloomin’ Brands, Inc. | | * | | | 10,231 | | | | 245,646 | |
Bob Evans Farms, Inc. | | | | | 5,219 | | | | 264,029 | |
Boyd Gaming Corp. | | * | | | 12,175 | | | | 137,090 | |
Bravo Brio Restaurant Group, Inc. | | * | | | 3,101 | | | | 50,453 | |
Brinker International, Inc. | | | | | 12,927 | | | | 599,037 | |
Buffalo Wild Wings, Inc. | | * | | | 3,576 | | | | 526,387 | |
Burger King Worldwide, Inc. | | † | | | 18,369 | | | | 419,915 | |
See accompanying notes to financial statements
318
SCHEDULE OF INVESTMENTS—(Continued)
December 31, 2013
| | | | | | | | | | | | |
Vantagepoint Mid/Small
Company Index Fund | | | | Shares | | | Value | |
| | | | | | | | | | | | |
| COMMON STOCKS—(Continued) | |
Caesars Entertainment Corp. | | *† | | | 8,076 | | | $ | 173,957 | |
Carrols Restaurant Group, Inc. | | * | | | 3,749 | | | | 24,781 | |
CEC Entertainment, Inc. | | | | | 3,600 | | | | 159,408 | |
Cheesecake Factory, Inc. (The) | | | | | 10,028 | | | | 484,052 | |
Choice Hotels International, Inc. | | | | | 5,105 | | | | 250,707 | |
Churchill Downs, Inc. | | | | | 2,690 | | | | 241,158 | |
Chuy’s Holdings, Inc. | | * | | | 3,373 | | | | 121,495 | |
ClubCorp Holdings, Inc. | | | | | 3,469 | | | | 61,540 | |
Cracker Barrel Old Country Store, Inc. | | | | | 3,710 | | | | 408,360 | |
Del Frisco’s Restaurant Group, Inc. | | * | | | 1,694 | | | | 39,928 | |
Denny’s Corp. | | * | | | 15,003 | | | | 107,872 | |
Diamond Resorts International, Inc. | | * | | | 2,873 | | | | 53,036 | |
DineEquity, Inc. | | | | | 3,180 | | | | 265,689 | |
Diversified Restaurant Holdings, Inc. | | * | | | 1,746 | | | | 8,328 | |
Domino’s Pizza, Inc. | | | | | 10,659 | | | | 742,399 | |
Dunkin’ Brands Group, Inc. | | | | | 20,134 | | | | 970,459 | |
Einstein Noah Restaurant Group, Inc. | | | | | 1,279 | | | | 18,546 | |
Fiesta Restaurant Group, Inc. | | * | | | 3,950 | | | | 206,348 | |
Ignite Restaurant Group, Inc. | | *† | | | 1,280 | | | | 16,000 | |
International Game Technology | | | | | 49,229 | | | | 893,999 | |
International Speedway Corp., Class A | | | | | 5,069 | | | | 179,899 | |
Interval Leisure Group, Inc. | | | | | 6,806 | | | | 210,305 | |
Isle of Capri Casinos, Inc. | | * | | | 5,204 | | | | 46,836 | |
Jack in the Box, Inc. | | * | | | 8,142 | | | | 407,263 | |
Jamba, Inc. | | * | | | 3,273 | | | | 40,683 | |
Krispy Kreme Doughnuts, Inc. | | * | | | 12,266 | | | | 236,611 | |
Life Time Fitness, Inc. | | * | | | 7,740 | | | | 363,780 | |
Luby’s, Inc. | | * | | | 4,603 | | | | 35,535 | |
Marcus Corp. (The) | | | | | 4,188 | | | | 56,287 | |
Marriott Vacations Worldwide Corp. | | * | | | 5,657 | | | | 298,463 | |
Monarch Casino & Resort, Inc. | | * | | | 2,050 | | | | 41,164 | |
Morgans Hotel Group Co. | | * | | | 5,643 | | | | 45,878 | |
Multimedia Games Holding Co., Inc. | | * | | | 4,998 | | | | 156,737 | |
Nathan’s Famous, Inc. | | * | | | 431 | | | | 21,727 | |
Noodles & Co. | | *† | | | 993 | | | | 35,669 | |
Orient-Express Hotels Ltd., Class A (Bermuda) | | * | | | 18,365 | | | | 277,495 | |
Panera Bread Co., Class A | | * | | | 5,310 | | | | 938,224 | |
Papa John’s International, Inc. | | | | | 6,232 | | | | 282,933 | |
Penn National Gaming, Inc. | | * | | | 12,185 | | | | 174,611 | |
Pinnacle Entertainment, Inc. | | * | | | 10,729 | | | | 278,847 | |
Potbelly Corp. | | | | | 1,446 | | | | 35,109 | |
Red Robin Gourmet Burgers, Inc. | | * | | | 2,741 | | | | 201,573 | |
Ruby Tuesday, Inc. | | * | | | 11,736 | | | | 81,330 | |
Ruth’s Hospitality Group, Inc. | | | | | 7,796 | | | | 110,781 | |
Scientific Games Corp., Class A | | * | | | 8,925 | | | | 151,100 | |
| | | | | | | | | | | | |
| | | | |
| | | | | | Shares | | | | Value | |
| | | | | | | | | | | | |
SeaWorld Entertainment, Inc. | | | | | 5,684 | | | $ | 163,529 | |
Six Flags Entertainment Corp. | | | | | 12,629 | | | | 465,000 | |
Sonic Corp. | | * | | | 10,276 | | | | 207,472 | |
Speedway Motorsports, Inc. | | | | | 1,680 | | | | 33,348 | |
Texas Roadhouse, Inc. | | | | | 11,362 | | | | 315,864 | |
Town Sports International Holdings, Inc. | | | | | 4,025 | | | | 59,409 | |
Vail Resorts, Inc. | | | | | 6,756 | | | | 508,254 | |
Wendy’s Co. (The) | | | | | 51,279 | | | | 447,153 | |
| | | | | | | | | | | | |
| | | | | | | | | | | 15,403,585 | |
| | | | | | | | | | | | |
| Household Durables—2.0% | |
Bassett Furniture Industries, Inc. | | | | | 1,779 | | | | 27,183 | |
Beazer Homes USA, Inc. | | *† | | | 4,831 | | | | 117,973 | |
Blyth, Inc. | | † | | | 1,754 | | | | 19,084 | |
Cavco Industries, Inc. | | * | | | 1,216 | | | | 83,539 | |
CSS Industries, Inc. | | | | | 1,140 | | | | 32,695 | |
D.R. Horton, Inc. | | * | | | 52,371 | | | | 1,168,921 | |
Ethan Allen Interiors, Inc. | | | | | 4,278 | | | | 130,137 | |
EveryWare Global, Inc. | | * | | | 1,582 | | | | 13,099 | |
Flexsteel Industries, Inc. | | | | | 839 | | | | 25,782 | |
Harman International Industries, Inc. | | | | | 12,614 | | | | 1,032,456 | |
Helen of Troy Ltd. (Bermuda) | | * | | | 6,111 | | | | 302,556 | |
Hooker Furniture Corp. | | | | | 2,097 | | | | 34,978 | |
Hovnanian Enterprises, Inc., Class A | | *† | | | 21,157 | | | | 140,059 | |
iRobot Corp. | | * | | | 5,589 | | | | 194,330 | |
Jarden Corp. | | * | | | 23,538 | | | | 1,444,056 | |
KB Home | | | | | 16,227 | | | | 296,630 | |
La-Z-Boy, Inc. | | | | | 9,601 | | | | 297,631 | |
Leggett & Platt, Inc. | | | | | 27,050 | | | | 836,927 | |
Lennar Corp., Class A | | | | | 31,185 | | | | 1,233,679 | |
LGI Homes, Inc. | | * | | | 1,508 | | | | 26,827 | |
Libbey, Inc. | | * | | | 3,551 | | | | 74,571 | |
Lifetime Brands, Inc. | | | | | 1,617 | | | | 25,435 | |
M/I Homes, Inc. | | * | | | 4,003 | | | | 101,876 | |
MDC Holdings, Inc. | | * | | | 6,746 | | | | 217,491 | |
Meritage Homes Corp. | | * | | | 6,902 | | | | 331,227 | |
Mohawk Industries, Inc. | | * | | | 11,214 | | | | 1,669,765 | |
NACCO Industries, Inc., Class A | | | | | 829 | | | | 51,555 | |
NVR, Inc. | | * | | | 882 | | | | 904,941 | |
Ryland Group, Inc. (The) | | | | | 8,272 | | | | 359,088 | |
Skullcandy, Inc. | | * | | | 3,066 | | | | 22,106 | |
Standard Pacific Corp. | | * | | | 28,766 | | | | 260,332 | |
Taylor Morrison Home Corp., Class A | | * | | | 6,556 | | | | 147,182 | |
Tempur Sealy International, Inc. | | * | | | 11,368 | | | | 613,417 | |
Toll Brothers, Inc. | | * | | | 31,914 | | | | 1,180,818 | |
TRI Pointe Homes, Inc. | | *† | | | 2,341 | | | | 46,656 | |
Tupperware Brands Corp. | | | | | 9,837 | | | | 929,892 | |
UCP, Inc., Class A | | * | | | 1,249 | | | | 18,285 | |
Universal Electronics, Inc. | | * | | | 3,125 | | | | 119,094 | |
WCI Communities, Inc. | | * | | | 1,099 | | | | 20,980 | |
William Lyon Homes, Class A | | * | | | 2,179 | | | | 48,243 | |
Zagg, Inc. | | *† | | | 4,869 | | | | 21,180 | |
| | | | | | | | | | | | |
| | | | | | | | | | | 14,622,676 | |
| | | | | | | | | | | | |
| Household Products—0.3% | |
Central Garden and Pet Co., Class A | | * | | | 6,906 | | | | 46,615 | |
Energizer Holdings, Inc. | | | | | 11,719 | | | | 1,268,465 | |
See accompanying notes to financial statements
319
SCHEDULE OF INVESTMENTS—(Continued)
December 31, 2013
| | | | | | | | | | | | |
Vantagepoint Mid/Small
Company Index Fund | | | | Shares | | | Value | |
| | | | | | | | | | | | |
| COMMON STOCKS—(Continued) | |
Harbinger Group, Inc. | | * | | | 7,514 | | | $ | 89,041 | |
Oil-Dri Corp of America | | | | | 764 | | | | 28,910 | |
Orchids Paper Products Co. | | | | | 947 | | | | 31,099 | |
Spectrum Brands Holdings, Inc. | | | | | 4,173 | | | | 294,405 | |
WD-40 Co. | | | | | 2,756 | | | | 205,818 | |
| | | | | | | | | | | | |
| | | | | | | | | | | 1,964,353 | |
| | | | | | | | | | | | |
| Independent Power Producers & Energy Traders—0.1% | |
Atlantic Power Corp. | | † | | | 20,459 | | | | 71,197 | |
Dynegy, Inc. | | *† | | | 18,273 | | | | 393,235 | |
Genie Energy Ltd., Class B | | * | | | 1,703 | | | | 17,388 | |
Ormat Technologies, Inc. | | † | | | 3,707 | | | | 100,867 | |
Pattern Energy Group, Inc. | | | | | 3,084 | | | | 93,476 | |
| | | | | | | | | | | | |
| | | | | | | | | | | 676,163 | |
| | | | | | | | | | | | |
| Industrial Conglomerates—0.2% | |
Carlisle Cos., Inc. | | | | | 12,019 | | | | 954,308 | |
Raven Industries, Inc. | | | | | 6,841 | | | | 281,439 | |
| | | | | | | | | | | | |
| | | | | | | | | | | 1,235,747 | |
| | | | | | | | | | | | |
| Insurance—4.7% | |
Alleghany Corp. | | * | | | 3,162 | | | | 1,264,674 | |
Allied World Assurance Co. Holdings AG (Switzerland) | | | | | 6,453 | | | | 727,963 | |
Ambac Financial Group, Inc. | | * | | | 8,936 | | | | 219,468 | |
American Equity Investment Life Holding Co. | | | | | 12,306 | | | | 324,632 | |
American Financial Group, Inc. | | | | | 14,468 | | | | 835,093 | |
American National Insurance Co. | | | | | 1,400 | | | | 160,356 | |
AMERISAFE, Inc. | | | | | 3,489 | | | | 147,375 | |
Amtrust Financial Services, Inc. | | † | | | 5,869 | | | | 191,858 | |
Arch Capital Group Ltd. (Bermuda) | | * | | | 24,618 | | | | 1,469,448 | |
Argo Group International Holdings Ltd. (Bermuda) | | | | | 5,302 | | | | 246,490 | |
Arthur J. Gallagher & Co. | | | | | 23,902 | | | | 1,121,721 | |
Aspen Insurance Holdings Ltd. (Bermuda) | | | | | 12,105 | | | | 500,058 | |
Assurant, Inc. | | | | | 14,324 | | | | 950,684 | |
Assured Guaranty Ltd. (Bermuda) | | | | | 31,937 | | | | 753,394 | |
Axis Capital Holdings Ltd. (Bermuda) | | | | | 22,487 | | | | 1,069,707 | |
Baldwin & Lyons, Inc., Class B | | | | | 1,792 | | | | 48,957 | |
Blue Capital Reinsurance Holdings Ltd. (Bermuda) | | * | | | 1,048 | | | | 19,252 | |
Brown & Brown, Inc. | | | | | 22,011 | | | | 690,925 | |
Citizens, Inc. | | * | | | 8,606 | | | | 75,302 | |
CNO Financial Group, Inc. | | | | | 40,617 | | | | 718,515 | |
Crawford & Co., Class B | | | | | 6,546 | | | | 60,485 | |
Donegal Group, Inc., Class A | | | | | 1,264 | | | | 20,098 | |
Eastern Insurance Holdings, Inc. | | | | | 1,019 | | | | 24,955 | |
eHealth, Inc. | | * | | | 3,998 | | | | 185,867 | |
EMC Insurance Group, Inc. | | | | | 1,041 | | | | 31,875 | |
Employers Holdings, Inc. | | | | | 5,724 | | | | 181,165 | |
Endurance Specialty Holdings Ltd. (Bermuda) | | | | | 8,239 | | | | 483,382 | |
| | | | | | | | | | | | |
| | | | |
| | | | | | Shares | | | | Value | |
| | | | | | | | | | | | |
Enstar Group Ltd. (Bermuda) | | * | | | 1,836 | | | $ | 255,039 | |
Erie Indemnity Co., Class A | | | | | 4,544 | | | | 332,257 | |
Everest Re Group Ltd. (Bermuda) | | | | | 9,230 | | | | 1,438,680 | |
FBL Financial Group, Inc., Class A | | | | | 1,304 | | | | 58,406 | |
Fidelity National Financial, Inc., Class A | | | | | 46,215 | | | | 1,499,677 | |
First American Financial Corp. | | | | | 20,314 | | | | 572,855 | |
Genworth Financial, Inc., Class A | | * | | | 92,797 | | | | 1,441,137 | |
Global Indemnity plc (Ireland) | | * | | | 1,488 | | | | 37,646 | |
Greenlight Capital Re Ltd., Class A (Cayman Islands) | | * | | | 5,625 | | | | 189,619 | |
Hallmark Financial Services, Inc. | | * | | | 2,249 | | | | 19,982 | |
Hanover Insurance Group, Inc. (The) | | | | | 8,274 | | | | 494,041 | |
HCC Insurance Holdings, Inc. | | | | | 18,680 | | | | 861,895 | |
HCI Group, Inc. | | † | | | 1,471 | | | | 78,698 | |
Hilltop Holdings, Inc. | | * | | | 11,655 | | | | 269,580 | |
Horace Mann Educators Corp. | | | | | 7,441 | | | | 234,689 | |
Independence Holding Co. | | | | | 1,901 | | | | 25,644 | |
Infinity Property & Casualty Corp. | | | | | 1,953 | | | | 140,128 | |
Investors Title Co. | | | | | 224 | | | | 18,140 | |
Kansas City Life Insurance Co. | | | | | 1,203 | | | | 57,431 | |
Kemper Corp. | | | | | 8,711 | | | | 356,106 | |
Maiden Holdings Ltd. (Bermuda) | | | | | 8,262 | | | | 90,304 | |
Markel Corp. | | * | | | 2,551 | | | | 1,480,473 | |
MBIA, Inc. | | * | | | 27,028 | | | | 322,714 | |
Meadowbrook Insurance Group, Inc. | | | | | 10,981 | | | | 76,428 | |
Mercury General Corp. | | | | | 5,177 | | | | 257,349 | |
Montpelier Re Holdings Ltd. (Bermuda) | | | | | 8,461 | | | | 246,215 | |
National Interstate Corp. | | | | | 1,051 | | | | 24,173 | |
National Western Life Insurance Co., Class A | | | | | 368 | | | | 82,266 | |
Navigators Group, Inc. (The) | | * | | | 1,745 | | | | 110,214 | |
Old Republic International Corp. | | | | | 49,114 | | | | 848,199 | |
OneBeacon Insurance Group Ltd., Class A | | | | | 4,581 | | | | 72,471 | |
PartnerRe Ltd. (Bermuda) | | | | | 10,210 | | | | 1,076,440 | |
Phoenix Cos., Inc. (The) | | * | | | 1,471 | | | | 90,319 | |
Platinum Underwriters Holdings Ltd. (Bermuda) | | | | | 5,531 | | | | 338,940 | |
Primerica, Inc. | | | | | 10,411 | | | | 446,736 | |
ProAssurance Corp. | | | | | 11,295 | | | | 547,582 | |
Protective Life Corp. | | | | | 14,319 | | | | 725,401 | |
Reinsurance Group of America, Inc. | | | | | 13,683 | | | | 1,059,201 | |
RenaissanceRe Holdings Ltd. (Bermuda) | | | | | 8,290 | | | | 806,949 | |
RLI Corp. | | | | | 4,029 | | | | 392,344 | |
Safety Insurance Group, Inc. | | | | | 2,194 | | | | 123,522 | |
Selective Insurance Group, Inc. | | | | | 10,774 | | | | 291,544 | |
StanCorp Financial Group, Inc. | | | | | 8,100 | | | | 536,625 | |
State Auto Financial Corp. | | | | | 2,585 | | | | 54,905 | |
Stewart Information Services Corp. | | | | | 3,543 | | | | 114,333 | |
See accompanying notes to financial statements
320
SCHEDULE OF INVESTMENTS—(Continued)
December 31, 2013
| | | | | | | | | | | | |
Vantagepoint Mid/Small
Company Index Fund | | | | Shares | | | Value | |
| | | | | | | | | | | | |
| COMMON STOCKS—(Continued) | |
Symetra Financial Corp. | | | | | 15,274 | | | $ | 289,595 | |
Third Point Reinsurance Ltd. (Bermuda) | | * | | | 4,088 | | | | 75,751 | |
Tower Group International Ltd. (Bermuda) | | † | | | 9,683 | | | | 32,729 | |
United Fire Group, Inc. | | | | | 3,518 | | | | 100,826 | |
Universal Insurance Holdings, Inc. | | | | | 4,648 | | | | 67,303 | |
Validus Holdings Ltd. (Bermuda) | | | | | 19,760 | | | | 796,130 | |
W.R. Berkley Corp. | | | | | 20,500 | | | | 889,495 | |
White Mountains Insurance Group Ltd. | | | | | 1,171 | | | | 706,207 | |
| | | | | | | | | | | | |
| | | | | | | | | | | 34,079,032 | |
| | | | | | | | | | | | |
| Internet & Catalog Retail—0.5% | |
1-800-Flowers.com, Inc., Class A | | * | | | 6,281 | | | | 33,980 | |
Blue Nile, Inc. | | * | | | 2,444 | | | | 115,088 | |
FTD Cos., Inc. | | * | | | 2,967 | | | | 96,665 | |
Groupon, Inc. | | * | | | 79,534 | | | | 936,115 | |
HomeAway, Inc. | | * | | | 10,363 | | | | 423,639 | |
HSN, Inc. | | | | | 6,425 | | | | 400,278 | |
Liberty Ventures, Series A | | * | | | 6,963 | | | | 853,594 | |
Nutrisystem, Inc. | | | | | 5,029 | | | | 82,677 | |
Orbitz Worldwide, Inc. | | * | | | 5,907 | | | | 42,412 | |
Overstock.com, Inc. | | *† | | | 2,104 | | | | 64,782 | |
PetMed Express, Inc. | | † | | | 3,185 | | | | 52,967 | |
RetailMeNot, Inc. | | * | | | 1,514 | | | | 43,588 | |
Shutterfly, Inc. | | * | | | 7,318 | | | | 372,706 | |
ValueVision Media, Inc., Class A | | * | | | 6,239 | | | | 43,611 | |
Vitacost.com, Inc. | | * | | | 5,941 | | | | 34,398 | |
zulily, Inc., Class A | | * | | | 2,217 | | | | 91,850 | |
| | | | | | | | | | | | |
| | | | | | | | | | | 3,688,350 | |
| | | | | | | | | | | | |
| Internet Software & Services—1.7% | |
Angie’s List, Inc. | | *† | | | 7,000 | | | | 106,050 | |
AOL, Inc. | | * | | | 14,126 | | | | 658,554 | |
Bankrate, Inc. | | * | | | 9,244 | | | | 165,837 | |
Bazaarvoice, Inc. | | *† | | | 8,939 | | | | 70,797 | |
Benefitfocus, Inc. | | * | | | 852 | | | | 49,195 | |
Blucora, Inc. | | * | | | 7,679 | | | | 223,920 | |
Brightcove, Inc. | | * | | | 6,369 | | | | 90,058 | |
Carbonite, Inc. | | * | | | 1,699 | | | | 20,099 | |
ChannelAdvisor Corp. | | * | | | 978 | | | | 40,792 | |
Chegg, Inc. | | * | | | 2,514 | | | | 21,394 | |
comScore, Inc. | | * | | | 6,023 | | | | 172,318 | |
Constant Contact, Inc. | | * | | | 5,890 | | | | 183,002 | |
Cornerstone OnDemand, Inc. | | * | | | 7,409 | | | | 395,196 | |
CoStar Group, Inc. | | * | | | 5,388 | | | | 994,517 | |
Cvent, Inc. | | * | | | 1,038 | | | | 37,773 | |
Dealertrack Technologies, Inc. | | * | | | 8,039 | | | | 386,515 | |
Demand Media, Inc. | | * | | | 4,535 | | | | 26,167 | |
Demandware, Inc. | | * | | | 3,369 | | | | 216,020 | |
Dice Holdings, Inc. | | * | | | 6,835 | | | | 49,554 | |
Digital River, Inc. | | * | | | 5,786 | | | | 107,041 | |
E2open, Inc. | | * | | | 2,458 | | | | 58,771 | |
EarthLink, Inc. | | | | | 20,557 | | | | 104,224 | |
eGain Corp. | | * | | | 2,108 | | | | 21,586 | |
Endurance International Group Holdings, Inc. | | *† | | | 3,650 | | | | 51,757 | |
| | | | | | | | | | | | |
| | | | |
| | | | | | Shares | | | | Value | |
| | | | | | | | | | | | |
Envestnet, Inc. | | * | | | 4,359 | | | $ | 175,668 | |
Global Eagle Entertainment, Inc. | | * | | | 3,438 | | | | 51,123 | |
Gogo, Inc. | | * | | | 1,773 | | | | 43,988 | |
IAC/InterActiveCorp | | | | | 14,134 | | | | 970,864 | |
Internap Network Services Corp. | | * | | | 12,196 | | | | 91,714 | |
IntraLinks Holdings, Inc. | | * | | | 8,511 | | | | 103,068 | |
j2 Global, Inc. | | † | | | 8,665 | | | | 433,337 | |
Limelight Networks, Inc. | | * | | | 6,937 | | | | 13,735 | |
Liquidity Services, Inc. | | *† | | | 4,692 | | | | 106,321 | |
LivePerson, Inc. | | * | | | 11,777 | | | | 174,535 | |
LogMeIn, Inc. | | * | | | 4,468 | | | | 149,901 | |
Marchex, Inc., Class B | | * | | | 5,699 | | | | 49,296 | |
Marin Software, Inc. | | *† | | | 1,504 | | | | 15,401 | |
Marketo, Inc. | | *† | | | 1,125 | | | | 41,704 | |
Millennial Media, Inc. | | *† | | | 8,132 | | | | 59,120 | |
Monster Worldwide, Inc. | | * | | | 21,639 | | | | 154,286 | |
Move, Inc. | | * | | | 7,747 | | | | 123,875 | |
Net Element International, Inc. | | *† | | | 362 | | | | 1,582 | |
NIC, Inc. | | | | | 12,220 | | | | 303,911 | |
OpenTable, Inc. | | * | | | 4,249 | | | | 337,243 | |
Pandora Media, Inc. | | * | | | 26,455 | | | | 703,703 | |
Perficient, Inc. | | * | | | 5,746 | | | | 134,571 | |
QuinStreet, Inc. | | * | | | 5,214 | | | | 45,310 | |
Rackspace Hosting, Inc. | | * | | | 21,423 | | | | 838,282 | |
RealNetworks, Inc. | | * | | | 4,328 | | | | 32,676 | |
Reis, Inc. | | * | | | 1,345 | | | | 25,864 | |
Responsys, Inc. | | * | | | 6,331 | | | | 173,533 | |
Rocket Fuel, Inc. | | *† | | | 825 | | | | 50,729 | |
SciQuest, Inc. | | * | | | 3,675 | | | | 104,664 | |
Shutterstock, Inc. | | * | | | 1,263 | | | | 105,625 | |
Spark Networks, Inc. | | * | | | 1,965 | | | | 12,104 | |
SPS Commerce, Inc. | | * | | | 2,907 | | | | 189,827 | |
Stamps.com, Inc. | | * | | | 2,445 | | | | 102,935 | |
support.com, Inc. | | * | | | 10,899 | | | | 41,307 | |
TechTarget, Inc. | | * | | | 2,374 | | | | 16,286 | |
Textura Corp. | | *† | | | 846 | | | | 25,329 | |
Travelzoo, Inc. | | * | | | 1,808 | | | | 38,547 | |
Tremor Video, Inc. | | *† | | | 1,209 | | | | 7,012 | |
Trulia, Inc. | | *† | | | 5,165 | | | | 182,170 | |
United Online, Inc. | | | | | 2,119 | | | | 29,157 | |
Unwired Planet, Inc. | | * | | | 23,320 | | | | 32,182 | |
ValueClick, Inc. | | * | | | 13,525 | | | | 316,079 | |
VistaPrint NV (Netherlands) | | *† | | | 6,206 | | | | 352,811 | |
Vocus, Inc. | | * | | | 4,079 | | | | 46,460 | |
Web.com Group, Inc. | | * | | | 7,545 | | | | 239,856 | |
WebMD Health Corp. | | *† | | | 5,809 | | | | 229,456 | |
Wix.com Ltd. (Israel) | | * | | | 1,393 | | | | 37,402 | |
XO Group, Inc. | | * | | | 5,737 | | | | 85,252 | |
Xoom Corp. | | * | | | 1,855 | | | | 50,771 | |
Yelp, Inc. | | * | | | 5,557 | | | | 383,155 | |
Zillow, Inc., Class A | | * | | | 4,130 | | | | 337,545 | |
Zix Corp. | | * | | | 9,536 | | | | 43,484 | |
| | | | | | | | | | | | |
| | | | | | | | | | | 12,665,893 | |
| | | | | | | | | | | | |
| IT Services—2.6% | |
Acxiom Corp. | | * | | | 13,925 | | | | 514,947 | |
Blackhawk Network Holdings, Inc. | | * | | | 1,822 | | | | 46,024 | |
Booz Allen Hamilton Holding Corp. | | | | | 5,188 | | | | 99,350 | |
Broadridge Financial Solutions, Inc. | | | | | 22,585 | | | | 892,559 | |
See accompanying notes to financial statements
321
SCHEDULE OF INVESTMENTS—(Continued)
December 31, 2013
| | | | | | | | | | | | |
Vantagepoint Mid/Small
Company Index Fund | | | | Shares | | | Value | |
| | | | | | | | | | | | |
| COMMON STOCKS—(Continued) | |
CACI International, Inc., Class A | | | | * | | | 4,457 | | | $ | 326,342 | |
Cardtronics, Inc. | | | | * | | | 8,528 | | | | 370,542 | |
Cass Information Systems, Inc. | | | | | | | 2,024 | | | | 136,316 | |
CIBER, Inc. | | | | * | | | 14,012 | | | | 58,010 | |
Computer Task Group, Inc. | | | | | | | 2,532 | | | | 47,855 | |
Convergys Corp. | | | | | | | 20,160 | | | | 424,368 | |
CoreLogic, Inc. | | | | * | | | 17,877 | | | | 635,170 | |
CSG Systems International, Inc. | | | | | | | 5,860 | | | | 172,284 | |
DST Systems, Inc. | | | | | | | 6,148 | | | | 557,870 | |
EPAM Systems, Inc. | | | | * | | | 3,695 | | | | 129,103 | |
Euronet Worldwide, Inc. | | | | * | | | 9,421 | | | | 450,795 | |
EVERTEC, Inc. (Puerto Rico) | | | | | | | 5,923 | | | | 146,061 | |
ExlService Holdings, Inc. | | | | * | | | 5,435 | | | | 150,115 | |
FleetCor Technologies, Inc. | | | | * | | | 12,560 | | | | 1,471,655 | |
Forrester Research, Inc. | | | | | | | 2,455 | | | | 93,928 | |
Gartner, Inc. | | | | * | | | 17,403 | | | | 1,236,483 | |
Genpact Ltd. (Bermuda) | | | | * | | | 32,012 | | | | 588,060 | |
Global Cash Access Holdings, Inc. | | | | * | | | 13,203 | | | | 131,898 | |
Global Payments, Inc. | | | | | | | 14,182 | | | | 921,688 | |
Hackett Group, Inc. (The) | | | | | | | 7,902 | | | | 49,071 | |
Heartland Payment Systems, Inc. | | | | | | | 6,660 | | | | 331,934 | |
Higher One Holdings, Inc. | | | | * | | | 7,479 | | | | 72,995 | |
iGATE Corp. | | | | * | | | 6,743 | | | | 270,799 | |
Jack Henry & Associates, Inc. | | | | | | | 16,013 | | | | 948,130 | |
Leidos Holdings, Inc. | | | | | | | 13,906 | | | | 646,490 | |
Lender Processing Services, Inc. | | | | | | | 15,945 | | | | 596,024 | |
Lionbridge Technologies, Inc. | | | | * | | | 13,699 | | | | 81,646 | |
Luxoft Holding, Inc. (Virgin Islands, British) | | | | * | | | 758 | | | | 28,789 | |
ManTech International Corp., Class A | | | | † | | | 4,079 | | | | 122,084 | |
MAXIMUS, Inc. | | | | | | | 13,002 | | | | 571,958 | |
ModusLink Global Solutions, Inc. | | | | * | | | 10,739 | | | | 61,534 | |
MoneyGram International, Inc. | | | | * | | | 4,578 | | | | 95,131 | |
NeuStar, Inc., Class A | | | | * | | | 12,510 | | | | 623,749 | |
Planet Payment, Inc. | | | | *† | | | 6,859 | | | | 19,068 | |
PRGX Global, Inc. | | | | * | | | 4,569 | | | | 30,704 | |
Sapient Corp. | | | | * | | | 20,009 | | | | 347,356 | |
Science Applications International Corp. | | | | | | | 7,547 | | | | 249,579 | |
ServiceSource International, Inc. | | | | * | | | 9,931 | | | | 83,222 | |
Sykes Enterprises, Inc. | | | | * | | | 6,572 | | | | 143,335 | |
Syntel, Inc. | | * | | | 2,923 | | | | 265,847 | |
TeleTech Holdings, Inc. | | * | | | 3,025 | | | | 72,419 | |
Total System Services, Inc. | | | | | 30,369 | | | | 1,010,680 | |
Unisys Corp. | | * | | | 8,649 | | | | 290,347 | |
Vantiv, Inc., Class A | | * | | | 15,940 | | | | 519,803 | |
VeriFone Systems, Inc. | | * | | | 19,931 | | | | 534,549 | |
Virtusa Corp. | | * | | | 3,400 | | | | 129,506 | |
| | | | | | | | | | | | |
| | | | |
| | | | | | Shares | | | | Value | |
| | | | | | | | | | | | |
WEX, Inc. | | * | | | 7,357 | | | $ | 728,564 | |
| | | | | | | | | | | | |
| | | | | | | | | | | 18,526,736 | |
| | | | | | | | | | | | |
| Leisure Equipment & Products—0.5% | |
Arctic Cat, Inc. | | | | | 2,262 | | | | 128,889 | |
Black Diamond, Inc. | | * | | | 3,789 | | | | 50,507 | |
Brunswick Corp. | | | | | 17,127 | | | | 788,870 | |
Callaway Golf Co. | | | | | 13,092 | | | | 110,366 | |
JAKKS Pacific, Inc. | | † | | | 3,244 | | | | 21,832 | |
Johnson Outdoors, Inc., Class A | | | | | 785 | | | | 21,156 | |
LeapFrog Enterprises, Inc. | | *† | | | 12,080 | | | | 95,915 | |
Marine Products Corp. | | | | | 3,091 | | | | 31,064 | |
Nautilus, Inc. | | * | | | 4,916 | | | | 41,442 | |
Polaris Industries, Inc. | | | | | 11,973 | | | | 1,743,748 | |
Smith & Wesson Holding Corp. | | *† | | | 12,690 | | | | 171,188 | |
Sturm Ruger & Co., Inc. | | † | | | 3,706 | | | | 270,871 | |
| | | | | | | | | | | | |
| | | | | | | | | | | 3,475,848 | |
| | | | | | | | | | | | |
| Life Sciences Tools & Services—1.1% | |
Accelerate Diagnostics, Inc. | | *† | | | 1,793 | | | | 21,875 | |
Affymetrix, Inc. | | * | | | 13,418 | | | | 114,992 | |
Albany Molecular Research, Inc. | | * | | | 3,704 | | | | 37,336 | |
Bio-Rad Laboratories, Inc., Class A | | * | | | 3,744 | | | | 462,796 | |
Bruker Corp. | | * | | | 19,689 | | | | 389,251 | |
Cambrex Corp. | | * | | | 6,259 | | | | 111,598 | |
Charles River Laboratories International, Inc. | | * | | | 9,037 | | | | 479,322 | |
Covance, Inc. | | * | | | 10,559 | | | | 929,826 | |
Fluidigm Corp. | | * | | | 5,173 | | | | 198,229 | |
Furiex Pharmaceuticals, Inc. | | * | | | 1,264 | | | | 53,101 | |
Harvard Bioscience, Inc. | | * | | | 4,039 | | | | 18,983 | |
Luminex Corp. | | * | | | 7,419 | | | | 143,929 | |
Mettler-Toledo International, Inc. | | * | | | 5,586 | | | | 1,355,108 | |
NeoGenomics, Inc. | | * | | | 5,221 | | | | 18,900 | |
Pacific Biosciences of California, Inc. | | * | | | 7,617 | | | | 39,837 | |
PAREXEL International Corp. | | * | | | 10,419 | | | | 470,730 | |
PerkinElmer, Inc. | | | | | 21,185 | | | | 873,458 | |
QIAGEN NV (Netherlands) | | * | | | 44,171 | | | | 1,051,711 | |
Quintiles Transnational Holdings, Inc. | | * | | | 5,268 | | | | 244,119 | |
Sequenom, Inc. | | *† | | | 20,997 | | | | 49,133 | |
Techne Corp. | | | | | 6,895 | | | | 652,750 | |
| | | | | | | | | | | | |
| | | | | | | | | | | 7,716,984 | |
| | | | | | | | | | | | |
| Machinery—4.4% | |
Accuride Corp. | | * | | | 5,687 | | | | 21,213 | |
Actuant Corp., Class A | | | | | 13,737 | | | | 503,324 | |
AGCO Corp. | | | | | 18,353 | | | | 1,086,314 | |
Alamo Group, Inc. | | | | | 1,174 | | | | 71,250 | |
Albany International Corp., Class A | | | | | 5,205 | | | | 187,016 | |
Altra Industrial Motion Corp. | | | | | 5,386 | | | | 184,309 | |
American Railcar Industries, Inc. | | † | | | 2,078 | | | | 95,068 | |
Ampco-Pittsburgh Corp. | | | | | 986 | | | | 19,178 | |
Astec Industries, Inc. | | | | | 3,451 | | | | 133,312 | |
Barnes Group, Inc. | | | | | 10,180 | | | | 389,996 | |
See accompanying notes to financial statements
322
SCHEDULE OF INVESTMENTS—(Continued)
December 31, 2013
| | | | | | | | | | | | |
Vantagepoint Mid/Small
Company Index Fund | | | | Shares | | | Value | |
| | | | | | | | | | | | |
| COMMON STOCKS—(Continued) | |
Blount International, Inc. | | * | | | 9,180 | | | $ | 132,835 | |
Briggs & Stratton Corp. | | | | | 9,174 | | | | 199,626 | |
Chart Industries, Inc. | | * | | | 5,535 | | | | 529,367 | |
CIRCOR International, Inc. | | | | | 3,375 | | | | 272,632 | |
CLARCOR, Inc. | | | | | 9,456 | | | | 608,494 | |
Colfax Corp. | | * | | | 16,171 | | | | 1,029,931 | |
Columbus McKinnon Corp. | | * | | | 3,189 | | | | 86,549 | |
Commercial Vehicle Group, Inc. | | * | | | 6,660 | | | | 48,418 | |
Crane Co. | | | | | 9,084 | | | | 610,899 | |
Donaldson Co., Inc. | | | | | 27,667 | | | | 1,202,408 | |
Douglas Dynamics, Inc. | | | | | 3,681 | | | | 61,914 | |
Dynamic Materials Corp. | | | | | 3,125 | | | | 67,937 | |
Energy Recovery, Inc. | | *† | | | 6,998 | | | | 38,909 | |
EnPro Industries, Inc. | | * | | | 3,892 | | | | 224,374 | |
ESCO Technologies, Inc. | | | | | 4,458 | | | | 152,731 | |
ExOne Co. (The) | | *† | | | 966 | | | | 58,404 | |
Federal Signal Corp. | | * | | | 11,860 | | | | 173,749 | |
Flow International Corp. | | * | | | 9,896 | | | | 39,980 | |
FreightCar America, Inc. | | | | | 2,798 | | | | 74,483 | |
Global Brass & Copper Holdings, Inc. | | | | | 1,289 | | | | 21,333 | |
Gorman-Rupp Co. (The) | | | | | 3,896 | | | | 130,243 | |
Graco, Inc. | | | | | 11,581 | | | | 904,708 | |
Graham Corp. | | | | | 1,617 | | | | 58,681 | |
Greenbrier Cos., Inc. (The) | | * | | | 4,956 | | | | 162,755 | |
Hardinge, Inc. | | | | | 1,862 | | | | 26,943 | |
Harsco Corp. | | | | | 14,896 | | | | 417,535 | |
Hurco Cos., Inc. | | | | | 1,248 | | | | 31,212 | |
Hyster-Yale Materials Handling, Inc. | | | | | 2,095 | | | | 195,170 | |
IDEX Corp. | | | | | 15,255 | | | | 1,126,582 | |
ITT Corp. | | | | | 16,791 | | | | 729,065 | |
John Bean Technologies Corp. | | | | | 5,724 | | | | 167,885 | |
Kadant, Inc. | | | | | 2,468 | | | | 100,003 | |
Kennametal, Inc. | | | | | 14,370 | | | | 748,246 | |
L.B. Foster Co., Class A | | | | | 1,705 | | | | 80,629 | |
Lincoln Electric Holdings, Inc. | | | | | 15,664 | | | | 1,117,470 | |
Lindsay Corp. | | | | | 2,395 | | | | 198,186 | |
Lydall, Inc. | | * | | | 2,982 | | | | 52,543 | |
Manitex International, Inc. | | * | | | 1,949 | | | | 30,950 | |
Manitowoc Co., Inc. (The) | | | | | 25,441 | | | | 593,284 | |
Meritor, Inc. | | * | | | 19,272 | | | | 201,007 | |
Middleby Corp. (The) | | * | | | 3,558 | | | | 853,813 | |
Miller Industries, Inc. | | | | | 1,779 | | | | 33,143 | |
Mueller Industries, Inc. | | | | | 5,028 | | | | 316,814 | |
Mueller Water Products, Inc., Class A | | | | | 30,046 | | | | 281,531 | |
Navistar International Corp. | | *† | | | 10,261 | | | | 391,868 | |
NN, Inc. | | | | | 3,390 | | | | 68,444 | |
Nordson Corp. | | | | | 12,138 | | | | 901,853 | |
Oshkosh Corp. | | | | | 16,649 | | | | 838,777 | |
PMFG, Inc. | | * | | | 3,313 | | | | 29,983 | |
Proto Labs, Inc. | | * | | | 3,182 | | | | 226,495 | |
RBC Bearings, Inc. | | * | | | 4,314 | | | | 305,216 | |
Rexnord Corp. | | * | | | 5,002 | | | | 135,104 | |
Snap-on, Inc. | | | | | 10,984 | | | | 1,202,968 | |
SPX Corp. | | | | | 8,853 | | | | 881,847 | |
Standex International Corp. | | | | | 2,170 | | | | 136,450 | |
Sun Hydraulics Corp. | | | | | 4,279 | | | | 174,712 | |
| | | | | | | | | | | | |
| | | | |
| | | | | | Shares | | | | Value | |
| | | | | | | | | | | | |
| COMMON STOCKS—(Continued) | |
Tecumseh Products Co., Class A | | * | | | 2,932 | | | $ | 26,535 | |
Tennant Co. | | | | | 3,185 | | | | 215,975 | |
Terex Corp. | | | | | 21,047 | | | | 883,764 | |
Timken Co. | | | | | 16,064 | | | | 884,644 | |
Titan International, Inc. | | | | | 9,793 | | | | 176,078 | |
Toro Co. (The) | | | | | 10,819 | | | | 688,088 | |
Trimas Corp. | | * | | | 8,555 | | | | 341,259 | |
Trinity Industries, Inc. | | | | | 15,009 | | | | 818,291 | |
Twin Disc, Inc. | | | | | 1,926 | | | | 49,864 | |
Valmont Industries, Inc. | | | | | 5,071 | | | | 756,188 | |
Wabash National Corp. | | * | | | 12,487 | | | | 154,214 | |
WABCO Holdings, Inc. | | * | | | 10,844 | | | | 1,012,938 | |
Wabtec Corp. | | | | | 17,829 | | | | 1,324,160 | |
Watts Water Technologies, Inc., Class A | | | | | 5,244 | | | | 324,446 | |
Woodward, Inc. | | | | | 12,597 | | | | 574,549 | |
Xerium Technologies, Inc. | | * | | | 1,744 | | | | 28,759 | |
Xylem, Inc. | | | | | 34,925 | | | | 1,208,405 | |
| | | | | | | | | | | | |
| | | | | | | | | | | 31,646,225 | |
| | | | | | | | | | | | |
| Marine—0.2% | |
International Shipholding Corp. | | | | | 724 | | | | 21,358 | |
Kirby Corp. | | * | | | 10,715 | | | | 1,063,464 | |
Matson, Inc. | | | | | 7,328 | | | | 191,334 | |
Ultrapetrol Bahamas Ltd. (Bahamas) | | * | | | 3,567 | | | | 13,340 | |
| | | | | | | | | | | | |
| | | | | | | | | | | 1,289,496 | |
| | | | | | | | | | | | |
| Media—1.9% | |
A.H. Belo Corp., Class A | | | | | 2,998 | | | | 22,395 | |
AMC Networks, Inc., Class A | | * | | | 11,185 | | | | 761,810 | |
Cablevision Systems Corp., Class A | | | | | 35,534 | | | | 637,125 | |
Carmike Cinemas, Inc. | | * | | | 4,840 | | | | 134,746 | |
Central European Media Enterprises Ltd., Class A (Bermuda) | | *† | | | 20,704 | | | | 79,503 | |
Cinemark Holdings, Inc. | | | | | 21,864 | | | | 728,727 | |
Clear Channel Outdoor Holdings, Inc., Class A | | | | | 8,401 | | | | 85,186 | |
Crown Media Holdings, Inc., Class A | | * | | | 4,399 | | | | 15,529 | |
Cumulus Media, Inc., Class A | | * | | | 17,734 | | | | 137,084 | |
Daily Journal Corp. | | * | | | 156 | | | | 28,858 | |
Dex Media, Inc. | | *† | | | 2,722 | | | | 18,455 | |
Digital Generation, Inc. | | * | | | 5,674 | | | | 72,344 | |
DreamWorks Animation SKG, Inc., Class A | | * | | | 13,912 | | | | 493,876 | |
Entercom Communications Corp., Class A | | * | | | 3,975 | | | | 41,777 | |
Entravision Communications Corp., Class A | | | | | 9,227 | | | | 56,192 | |
EW Scripps Co. (The), Class A | | * | | | 5,253 | | | | 114,095 | |
Gannett Co., Inc. | | | | | 43,175 | | | | 1,277,117 | |
Global Sources Ltd. (Bermuda) | | * | | | 3,330 | | | | 27,073 | |
Gray Television, Inc. | | * | | | 10,278 | | | | 152,937 | |
Harte-Hanks, Inc. | | | | | 7,272 | | | | 56,867 | |
Hemisphere Media Group, Inc. | | *† | | | 1,387 | | | | 16,464 | |
See accompanying notes to financial statements
323
SCHEDULE OF INVESTMENTS—(Continued)
December 31, 2013
| | | | | | | | | | | | |
Vantagepoint Mid/Small
Company Index Fund | | | | Shares | | | Value | |
| | | | | | | | | | | | |
| COMMON STOCKS—(Continued) | |
Interpublic Group of Cos., Inc. (The) | | | | | 79,292 | | | $ | 1,403,468 | |
John Wiley & Sons, Inc., Class A | | | | | 8,182 | | | | 451,646 | |
Journal Communications, Inc., Class A | | * | | | 9,165 | | | | 85,326 | |
Lamar Advertising Co., Class A | | * | | | 14,385 | | | | 751,616 | |
Lions Gate Entertainment Corp. | | † | | | 14,824 | | | | 469,328 | |
Live Nation Entertainment, Inc. | | * | | | 26,867 | | | | 530,892 | |
Loral Space & Communications, Inc. | | * | | | 2,438 | | | | 197,429 | |
Madison Square Garden Co. (The), Class A | | * | | | 11,610 | | | | 668,504 | |
Martha Stewart Living Omnimedia, Inc., Class A | | *† | | | 6,601 | | | | 27,724 | |
McClatchy Co. (The), Class A | | *† | | | 14,513 | | | | 49,344 | |
MDC Partners, Inc., Class A | | | | | 7,656 | | | | 195,305 | |
Media General, Inc. | | *† | | | 3,104 | | | | 70,150 | |
Meredith Corp. | | | | | 6,486 | | | | 335,975 | |
Morningstar, Inc. | | | | | 3,829 | | | | 299,007 | |
National CineMedia, Inc. | | | | | 10,391 | | | | 207,404 | |
New York Times Co. (The), Class A | | | | | 24,566 | | | | 389,862 | |
Nexstar Broadcasting Group, Inc., Class A | | | | | 5,657 | | | | 315,265 | |
Radio Unica Communications Corp. | | *‡d | | | 1,900 | | | | — | |
ReachLocal, Inc. | | * | | | 2,912 | | | | 37,012 | |
Reading International, Inc., Class A | | * | | | 2,976 | | | | 22,290 | |
Regal Entertainment Group, Class A | | † | | | 15,242 | | | | 296,457 | |
Rentrak Corp. | | * | | | 1,647 | | | | 62,405 | |
Saga Communications, Inc., Class A | | | | | 1,196 | | | | 60,159 | |
Salem Communications Corp., Class A | | | | | 3,266 | | | | 28,414 | |
Scholastic Corp. | | | | | 4,805 | | | | 163,418 | |
SFX Entertainment, Inc. | | *† | | | 3,352 | | | | 40,224 | |
Sinclair Broadcast Group, Inc., Class A | | | | | 12,521 | | | | 447,375 | |
Starz, Class A | | * | | | 21,150 | | | | 618,426 | |
Valassis Communications, Inc. | | † | | | 6,961 | | | | 238,414 | |
World Wrestling Entertainment, Inc., Class A | | | | | 6,474 | | | | 107,339 | |
| | | | | | | | | | | | |
| | | | | | | | | | | 13,528,338 | |
| | | | | | | | | | | | |
| Metals & Mining—1.4% | |
AK Steel Holding Corp. | | *† | | | 22,896 | | | | 187,747 | |
Allegheny Technologies, Inc. | | | | | 20,156 | | | | 718,158 | |
Allied Nevada Gold Corp. | | *† | | | 17,040 | | | | 60,492 | |
AM Castle & Co. | | * | | | 3,161 | | | | 46,688 | |
AMCOL International Corp. | | | | | 4,673 | | | | 158,788 | |
Carpenter Technology Corp. | | | | | 8,458 | | | | 526,088 | |
Century Aluminum Co. | | * | | | 9,652 | | | | 100,960 | |
Cliffs Natural Resources, Inc. | | † | | | 29,026 | | | | 760,771 | |
| | | | | | | | | | | | |
| | | | |
| | | | | | Shares | | | | Value | |
| | | | | | | | | | | | |
Coeur Mining, Inc. | | * | | | 19,056 | | | $ | 206,758 | |
Commercial Metals Co. | | | | | 22,078 | | | | 448,846 | |
Compass Minerals International, Inc. | | | | | 6,051 | | | | 484,382 | |
General Moly, Inc. | | * | | | 9,796 | | | | 13,127 | |
Globe Specialty Metals, Inc. | | | | | 11,348 | | | | 204,377 | |
Gold Resource Corp. | | † | | | 6,352 | | | | 28,774 | |
Handy & Harman Ltd. | | * | | | 1,465 | | | | 35,468 | |
Haynes International, Inc. | | | | | 2,542 | | | | 140,420 | |
Hecla Mining Co. | | † | | | 57,658 | | | | 177,587 | |
Horsehead Holding Corp. | | * | | | 8,375 | | | | 135,759 | |
Kaiser Aluminum Corp. | | | | | 3,645 | | | | 256,025 | |
Materion Corp. | | | | | 3,982 | | | | 122,845 | |
Midway Gold Corp. | | *† | | | 19,115 | | | | 15,483 | |
Molycorp, Inc. | | *† | | | 29,774 | | | | 167,330 | |
Noranda Aluminum Holding Corp. | | | | | 4,196 | | | | 13,805 | |
Olympic Steel, Inc. | | | | | 1,772 | | | | 51,353 | |
Paramount Gold and Silver Corp. | | *† | | | 21,835 | | | | 20,346 | |
Reliance Steel & Aluminum Co. | | | | | 14,229 | | | | 1,079,127 | |
Royal Gold, Inc. | | | | | 12,232 | | | | 563,528 | |
RTI International Metals, Inc. | | * | | | 6,083 | | | | 208,099 | |
Schnitzer Steel Industries, Inc., Class A | | | | | 4,380 | | | | 143,095 | |
Steel Dynamics, Inc. | | | | | 41,022 | | | | 801,570 | |
Stillwater Mining Co. | | * | | | 20,578 | | | | 253,932 | |
SunCoke Energy, Inc. | | * | | | 13,564 | | | | 309,395 | |
Tahoe Resources, Inc. | | * | | | 15,705 | | | | 261,331 | |
United States Steel Corp. | | † | | | 27,350 | | | | 806,825 | |
Universal Stainless & Alloy Products, Inc. | | * | | | 2,058 | | | | 74,211 | |
US Silica Holdings, Inc. | | | | | 3,654 | | | | 124,638 | |
Walter Energy, Inc. | | † | | | 10,993 | | | | 182,814 | |
Worthington Industries, Inc. | | | | | 9,711 | | | | 408,639 | |
| | | | | | | | | | | | |
| | | | | | | | | | | 10,299,581 | |
| | | | | | | | | | | | |
| Multiline Retail—0.3% | |
Big Lots, Inc. | | * | | | 10,372 | | | | 334,912 | |
Bon-Ton Stores, Inc. (The) | | | | | 2,140 | | | | 34,839 | |
Burlington Stores, Inc. | | * | | | 2,570 | | | | 82,240 | |
Dillard’s, Inc., Class A | | | | | 5,159 | | | | 501,507 | |
Fred’s, Inc., Class A | | | | | 5,995 | | | | 111,028 | |
Gordmans Stores, Inc. | | | | | 1,503 | | | | 11,528 | |
J.C. Penney Co., Inc. | | *† | | | 45,529 | | | | 416,590 | |
Sears Holdings Corp. | | *† | | | 7,950 | | | | 389,868 | |
Tuesday Morning Corp. | | * | | | 6,966 | | | | 111,177 | |
| | | | | | | | | | | | |
| | | | | | | | | | | 1,993,689 | |
| | | | | | | | | | | | |
| Multi-Utilities—1.1% | |
Alliant Energy Corp. | | | | | 20,577 | | | | 1,061,773 | |
Avista Corp. | | | | | 11,016 | | | | 310,541 | |
Black Hills Corp. | | | | | 8,511 | | | | 446,913 | |
CMS Energy Corp. | | | | | 49,383 | | | | 1,321,983 | |
Integrys Energy Group, Inc. | | | | | 14,719 | | | | 800,861 | |
MDU Resources Group, Inc. | | | | | 35,630 | | | | 1,088,496 | |
NorthWestern Corp. | | | | | 7,207 | | | | 312,207 | |
SCANA Corp. | | | | | 25,840 | | | | 1,212,671 | |
TECO Energy, Inc. | | † | | | 39,656 | | | | 683,669 | |
Vectren Corp. | | | | | 15,433 | | | | 547,872 | |
| | | | | | | | | | | | |
| | | | | | | | | | | 7,786,986 | |
| | | | | | | | | | | | |
See accompanying notes to financial statements
324
SCHEDULE OF INVESTMENTS—(Continued)
December 31, 2013
| | | | | | | | | | | | |
Vantagepoint Mid/Small
Company Index Fund | | | | Shares | | | Value | |
| | | | | | | | | | | | |
| COMMON STOCKS—(Continued) | |
| Office Electronics—0.1% | |
Zebra Technologies Corp., Class A | | * | | | 9,296 | | | $ | 502,728 | |
| | | | | | | | | | | | |
| Oil, Gas & Consumable Fuels—3.3% | |
Abraxas Petroleum Corp. | | * | | | 16,099 | | | | 52,805 | |
Adams Resources & Energy, Inc. | | | | | 479 | | | | 32,811 | |
Alon USA Energy, Inc. | | | | | 3,922 | | | | 64,870 | |
Alpha Natural Resources, Inc. | | * | | | 42,685 | | | | 304,771 | |
Amyris, Inc. | | *† | | | 6,091 | | | | 32,221 | |
Apco Oil and Gas International, Inc. | | * | | | 2,488 | | | | 38,788 | |
Approach Resources, Inc. | | *† | | | 6,656 | | | | 128,394 | |
Arch Coal, Inc. | | † | | | 37,708 | | | | 167,801 | |
Athlon Energy, Inc. | | * | | | 2,927 | | | | 88,542 | |
Bill Barrett Corp. | | * | | | 9,354 | | | | 250,500 | |
Bonanza Creek Energy, Inc. | | * | | | 5,506 | | | | 239,346 | |
BPZ Resources, Inc. | | *† | | | 27,149 | | | | 49,411 | |
Callon Petroleum Co. | | * | | | 8,345 | | | | 54,493 | |
Carrizo Oil & Gas, Inc. | | * | | | 7,586 | | | | 339,625 | |
Cheniere Energy, Inc. | | * | | | 45,307 | | | | 1,953,638 | |
Clayton Williams Energy, Inc. | | * | | | 1,241 | | | | 101,700 | |
Clean Energy Fuels Corp. | | *† | | | 11,637 | | | | 149,885 | |
Cloud Peak Energy, Inc. | | * | | | 11,802 | | | | 212,436 | |
Comstock Resources, Inc. | | | | | 8,808 | | | | 161,098 | |
Contango Oil & Gas Co. | | * | | | 3,036 | | | | 143,481 | |
Crosstex Energy, Inc. | | | | | 8,856 | | | | 320,233 | |
CVR Energy, Inc. | | | | | 2,695 | | | | 117,044 | |
Delek US Holdings, Inc. | | | | | 6,946 | | | | 239,012 | |
Diamondback Energy, Inc. | | * | | | 3,805 | | | | 201,132 | |
Emerald Oil, Inc. | | * | | | 9,095 | | | | 69,668 | |
Endeavour International Corp. | | *† | | | 7,460 | | | | 39,165 | |
Energen Corp. | | | | | 13,647 | | | | 965,525 | |
Energy XXI Bermuda Ltd. (Bermuda) | | | | | 14,643 | | | | 396,240 | |
EPL Oil & Gas, Inc. | | * | | | 5,691 | | | | 162,193 | |
Equal Energy Ltd. | | | | | 5,695 | | | | 30,411 | |
Evolution Petroleum Corp. | | | | | 2,183 | | | | 26,938 | |
EXCO Resources, Inc. | | † | | | 25,463 | | | | 135,209 | |
Forest Oil Corp. | | * | | | 19,596 | | | | 70,742 | |
Frontline Ltd. (Bermuda) | | *† | | | 8,754 | | | | 32,740 | |
FX Energy, Inc. | | *† | | | 10,537 | | | | 38,565 | |
GasLog Ltd. (Monaco) | | | | | 4,325 | | | | 73,914 | |
Gastar Exploration Ltd. | | * | | | 9,755 | | | | 67,505 | |
Golar LNG Ltd. (Bermuda) | | † | | | 8,340 | | | | 302,659 | |
Goodrich Petroleum Corp. | | * | | | 5,095 | | | | 86,717 | |
Green Plains Renewable Energy, Inc. | | † | | | 4,187 | | | | 81,186 | |
Gulfport Energy Corp. | | * | | | 15,745 | | | | 994,297 | |
Halcon Resources Corp. | | *† | | | 45,027 | | | | 173,804 | |
Hallador Energy Co. | | | | | 3,197 | | | | 25,768 | |
Isramco, Inc. | | * | | | 156 | | | | 19,820 | |
Jones Energy, Inc., Class A | | * | | | 1,795 | | | | 25,992 | |
KiOR, Inc., Class A | | *† | | | 11,289 | | | | 18,966 | |
Knightsbridge Tankers Ltd. (Bermuda) | | | | | 7,348 | | | | 67,528 | |
Kodiak Oil & Gas Corp. | | * | | | 50,572 | | | | 566,912 | |
Kosmos Energy Ltd. (Bermuda) | | * | | | 19,857 | | | | 222,001 | |
L&L Energy, Inc. | | *†‡ | | | 4,777 | | | | 6,019 | |
| | | | | | | | | | | | |
| | | | |
| | | | | | Shares | | | | Value | |
| | | | | | | | | | | | |
Laredo Petroleum Holdings, Inc. | | * | | | 7,513 | | | $ | 208,035 | |
Magnum Hunter Resources Corp. | | *† | | | 33,259 | | | | 243,123 | |
Matador Resources Co. | | * | | | 11,333 | | | | 211,247 | |
Midstates Petroleum Co., Inc. | | * | | | 5,381 | | | | 35,622 | |
Miller Energy Resources, Inc. | | *† | | | 4,833 | | | | 34,024 | |
Newfield Exploration Co. | | * | | | 25,244 | | | | 621,760 | |
Nordic American Tankers Ltd. (Norway) | | † | | | 12,057 | | | | 116,953 | |
Northern Oil and Gas, Inc. | | * | | | 12,515 | | | | 188,601 | |
Oasis Petroleum, Inc. | | * | | | 18,680 | | | | 877,400 | |
Panhandle Oil and Gas, Inc., Class A | | | | | 1,620 | | | | 54,124 | |
PBF Energy, Inc., Class A | | † | | | 4,025 | | | | 126,626 | |
PDC Energy, Inc. | | * | | | 6,839 | | | | 363,972 | |
Peabody Energy Corp. | | | | | 50,922 | | | | 994,507 | |
Penn Virginia Corp. | | * | | | 9,218 | | | | 86,926 | |
PetroQuest Energy, Inc. | | * | | | 13,685 | | | | 59,119 | |
QEP Resources, Inc. | | | | | 33,828 | | | | 1,036,828 | |
Quicksilver Resources, Inc. | | *† | | | 22,131 | | | | 67,942 | |
Renewable Energy Group, Inc. | | * | | | 5,520 | | | | 63,259 | |
Rentech, Inc. | | * | | | 43,798 | | | | 76,646 | |
Resolute Energy Corp. | | * | | | 11,308 | | | | 102,111 | |
REX American Resources Corp. | | * | | | 1,034 | | | | 46,230 | |
Rex Energy Corp. | | * | | | 9,028 | | | | 177,942 | |
Rosetta Resources, Inc. | | * | | | 11,412 | | | | 548,232 | |
Sanchez Energy Corp. | | *† | | | 6,613 | | | | 162,085 | |
SandRidge Energy, Inc. | | *† | | | 92,657 | | | | 562,428 | |
Scorpio Tankers, Inc. (Monaco) | | | | | 34,877 | | | | 411,200 | |
SemGroup Corp., Class A | | | | | 7,738 | | | | 504,750 | |
Ship Finance International Ltd. (Norway) | | † | | | 10,743 | | | | 175,970 | |
SM Energy Co. | | | | | 12,507 | | | | 1,039,457 | |
Solazyme, Inc. | | *† | | | 7,574 | | | | 82,481 | |
Stone Energy Corp. | | * | | | 9,408 | | | | 325,423 | |
Swift Energy Co. | | *† | | | 7,371 | | | | 99,508 | |
Synergy Resources Corp. | | * | | | 10,554 | | | | 97,730 | |
Targa Resources Corp. | | | | | 6,062 | | | | 534,487 | |
Teekay Corp. (Bermuda) | | | | | 6,856 | | | | 329,157 | |
Teekay Tankers Ltd., Class A (Bermuda) | | | | | 9,900 | | | | 38,907 | |
Triangle Petroleum Corp. | | * | | | 11,688 | | | | 97,244 | |
Ultra Petroleum Corp. | | *† | | | 29,073 | | | | 629,430 | |
Uranium Energy Corp. (Canada) | | *† | | | 13,541 | | | | 27,082 | |
Ur-Energy, Inc. | | *† | | | 19,514 | | | | 26,929 | |
Vaalco Energy, Inc. | | * | | | 12,065 | | | | 83,128 | |
W&T Offshore, Inc. | | | | | 5,802 | | | | 92,832 | |
Warren Resources, Inc. | | * | | | 10,845 | | | | 34,053 | |
Western Refining, Inc. | | † | | | 10,072 | | | | 427,154 | |
Westmoreland Coal Co. | | * | | | 1,584 | | | | 30,555 | |
World Fuel Services Corp. | | | | | 13,335 | | | | 575,539 | |
WPX Energy, Inc. | | * | | | 36,507 | | | | 744,013 | |
ZaZa Energy Corp. | | *† | | | 22,201 | | | | 21,215 | |
| | | | | | | | | | | | |
| | | | | | | | | | | 23,638,507 | |
| | | | | | | | | | | | |
| Paper & Forest Products—0.4% | |
Boise Cascade Co. | | * | | | 2,264 | | | | 66,743 | |
Clearwater Paper Corp. | | * | | | 3,863 | | | | 202,807 | |
Deltic Timber Corp. | | | | | 1,869 | | | | 126,980 | |
Domtar Corp. (Canada) | | | | | 6,286 | | | | 593,021 | |
See accompanying notes to financial statements
325
SCHEDULE OF INVESTMENTS—(Continued)
December 31, 2013
| | | | | | | | | | | | |
Vantagepoint Mid/Small
Company Index Fund | | | | Shares | | | Value | |
| | | | | | | | | | | | |
| COMMON STOCKS—(Continued) | |
KapStone Paper and Packaging Corp. | | * | | | 7,731 | | | $ | 431,854 | |
Louisiana-Pacific Corp. | | * | | | 25,478 | | | | 471,598 | |
Neenah Paper, Inc. | | | | | 2,742 | | | | 117,275 | |
P.H. Glatfelter Co. | | | | | 8,163 | | | | 225,625 | |
Resolute Forest Products, Inc. (Canada) | | * | | | 13,110 | | | | 210,022 | |
Schweitzer-Mauduit International, Inc. | | | | | 5,613 | | | | 288,901 | |
Wausau Paper Corp. | | | | | 7,879 | | | | 99,906 | |
| | | | | | | | | | | | |
| | | | | | | | | | | 2,834,732 | |
| | | | | | | | | | | | |
| Personal Products—0.5% | |
Coty, Inc., Class A | | † | | | 11,258 | | | | 171,684 | |
Elizabeth Arden, Inc. | | * | | | 4,409 | | | | 156,299 | |
Female Health Co. (The) | | | | | 5,170 | | | | 43,945 | |
Herbalife Ltd. (Cayman Islands) | | † | | | 15,830 | | | | 1,245,821 | |
Inter Parfums, Inc. | | | | | 2,745 | | | | 98,298 | |
Lifevantage Corp. | | *† | | | 18,012 | | | | 29,720 | |
Medifast, Inc. | | * | | | 2,861 | | | | 74,758 | |
Nature’s Sunshine Products, Inc. | | | | | 1,727 | | | | 29,912 | |
Nu Skin Enterprises, Inc., Class A | | | | | 10,817 | | | | 1,495,126 | |
Nutraceutical International Corp. | | * | | | 1,355 | | | | 36,287 | |
Revlon, Inc., Class A | | * | | | 1,782 | | | | 44,479 | |
Star Scientific, Inc. | | *† | | | 39,623 | | | | 45,963 | |
Synutra International, Inc. | | * | | | 2,931 | | | | 26,027 | |
USANA Health Sciences, Inc. | | * | | | 1,221 | | | | 92,283 | |
| | | | | | | | | | | | |
| | | | | | | | | | | 3,590,602 | |
| | | | | | | | | | | | |
| Pharmaceuticals—1.3% | |
AcelRx Pharmaceuticals, Inc. | | *† | | | 3,351 | | | | 37,900 | |
Aerie Pharmaceuticals, Inc. | | * | | | 1,295 | | | | 23,258 | |
Akorn, Inc. | | * | | | 11,298 | | | | 278,270 | |
Alimera Sciences, Inc. | | *† | | | 2,748 | | | | 12,943 | |
Ampio Pharmaceuticals, Inc. | | *† | | | 7,534 | | | | 53,717 | |
Aratana Therapeutics, Inc. | | * | | | 1,066 | | | | 20,361 | |
Auxilium Pharmaceuticals, Inc. | | * | | | 9,100 | | | | 188,734 | |
AVANIR Pharmaceuticals, Inc., Class A | | * | | | 28,713 | | | | 96,476 | |
BioDelivery Sciences International, Inc. | | *† | | | 3,972 | | | | 23,395 | |
Cadence Pharmaceuticals, Inc. | | * | | | 9,924 | | | | 89,812 | |
Cempra, Inc. | | * | | | 4,933 | | | | 61,120 | |
Corcept Therapeutics, Inc. | | * | | | 20,997 | | | | 67,610 | |
Cornerstone Therapeutics, Inc. | | * | | | 1,926 | | | | 18,278 | |
Depomed, Inc. | | * | | | 11,672 | | | | 123,490 | |
Endo Health Solutions, Inc. | | * | | | 21,125 | | | | 1,425,092 | |
Endocyte, Inc. | | *† | | | 5,585 | | | | 59,704 | |
Hi-Tech Pharmacal Co., Inc. | | * | | | 2,404 | | | | 104,310 | |
Horizon Pharma, Inc. | | *† | | | 8,159 | | | | 62,172 | |
Impax Laboratories, Inc. | | * | | | 13,250 | | | | 333,105 | |
Jazz Pharmaceuticals plc (Ireland) | | * | | | 9,777 | | | | 1,237,377 | |
Lannett Co., Inc. | | * | | | 4,735 | | | | 156,728 | |
Medicines Co. (The) | | * | | | 12,102 | | | | 467,379 | |
Nektar Therapeutics | | * | | | 21,602 | | | | 245,183 | |
Omeros Corp. | | *† | | | 4,721 | | | | 53,300 | |
| | | | | | | | | | | | |
| | | | |
| | | | | | Shares | | | | Value | |
| | | | | | | | | | | | |
Pacira Pharmaceuticals, Inc. | | * | | | 5,292 | | | $ | 304,237 | |
Pernix Therapeutics Holdings | | *† | | | 2,943 | | | | 7,416 | |
Pozen, Inc. | | * | | | 5,088 | | | | 40,908 | |
Prestige Brands Holdings, Inc. | | * | | | 9,444 | | | | 338,095 | |
Questcor Pharmaceuticals, Inc. | | † | | | 9,466 | | | | 515,424 | |
Relypsa, Inc. | | * | | | 1,017 | | | | 25,425 | |
Repros Therapeutics, Inc. | | *† | | | 4,662 | | | | 85,315 | |
Sagent Pharmaceuticals, Inc. | | * | | | 4,122 | | | | 104,616 | |
Salix Pharmaceuticals Ltd. | | * | | | 11,576 | | | | 1,041,145 | |
Santarus, Inc. | | * | | | 9,954 | | | | 318,130 | |
Sciclone Pharmaceuticals, Inc. | | * | | | 10,639 | | | | 53,621 | |
Sucampo Pharmaceuticals, Inc., Class A | | * | | | 1,783 | | | | 16,760 | |
Supernus Pharmaceuticals, Inc. | | *† | | | 3,172 | | | | 23,917 | |
TherapeuticsMD, Inc. | | *† | | | 18,397 | | | | 95,848 | |
ViroPharma, Inc. | | * | | | 12,065 | | | | 601,440 | |
Vivus, Inc. | | *† | | | 18,805 | | | | 170,749 | |
XenoPort, Inc. | | * | | | 8,506 | | | | 48,910 | |
Zogenix, Inc. | | *† | | | 22,351 | | | | 76,887 | |
| | | | | | | | | | | | |
| | | | | | | | | | | 9,108,557 | |
| | | | | | | | | | | | |
| Professional Services—1.5% | |
Acacia Research Corp. | | † | | | 8,726 | | | | 126,876 | |
Advisory Board Co. (The) | | * | | | 6,712 | | | | 427,353 | |
Barrett Business Services, Inc. | | | | | 1,514 | | | | 140,408 | |
CBIZ, Inc. | | * | | | 9,278 | | | | 84,615 | |
CDI Corp. | | | | | 2,129 | | | | 39,450 | |
Corporate Executive Board Co. (The) | | | | | 6,042 | | | | 467,832 | |
CRA International, Inc. | | * | | | 1,427 | | | | 28,255 | |
Dun & Bradstreet Corp. (The) | | | | | 7,438 | | | | 913,015 | |
Equifax, Inc. | | | | | 22,298 | | | | 1,540,569 | |
Exponent, Inc. | | | | | 2,267 | | | | 175,556 | |
Franklin Covey Co. | | * | | | 1,232 | | | | 24,492 | |
FTI Consulting, Inc. | | * | | | 7,311 | | | | 300,775 | |
GP Strategies Corp. | | * | | | 2,402 | | | | 71,556 | |
Heidrick & Struggles International, Inc. | | | | | 3,000 | | | | 60,420 | |
Huron Consulting Group, Inc. | | * | | | 4,527 | | | | 283,933 | |
ICF International, Inc. | | * | | | 3,982 | | | | 138,215 | |
Insperity, Inc. | | | | | 3,965 | | | | 143,255 | |
Kelly Services, Inc., Class A | | | | | 4,508 | | | | 112,430 | |
Kforce, Inc. | | | | | 5,728 | | | | 117,195 | |
Korn/Ferry International | | * | | | 8,421 | | | | 219,957 | |
Manpowergroup, Inc. | | | | | 14,538 | | | | 1,248,233 | |
Mistras Group, Inc. | | * | | | 3,345 | | | | 69,844 | |
Navigant Consulting, Inc. | | * | | | 10,052 | | | | 192,998 | |
Odyssey Marine Exploration, Inc. | | *† | | | 14,969 | | | | 30,237 | |
On Assignment, Inc. | | * | | | 8,870 | | | | 309,740 | |
Pendrell Corp. | | * | | | 26,471 | | | | 53,207 | |
Resources Connection, Inc. | | | | | 6,845 | | | | 98,089 | |
Robert Half International, Inc. | | | | | 26,329 | | | | 1,105,555 | |
RPX Corp. | | * | | | 5,414 | | | | 91,497 | |
Towers Watson & Co., Class A | | | | | 12,068 | | | | 1,539,997 | |
TrueBlue, Inc. | | * | | | 7,816 | | | | 201,496 | |
VSE Corp. | | | | | 653 | | | | 31,351 | |
WageWorks, Inc. | | * | | | 4,709 | | | | 279,903 | |
| | | | | | | | | | | | |
| | | | | | | | | | | 10,668,304 | |
| | | | | | | | | | | | |
See accompanying notes to financial statements
326
SCHEDULE OF INVESTMENTS—(Continued)
December 31, 2013
| | | | | | | | | | | | |
Vantagepoint Mid/Small
Company Index Fund | | | | Shares | | | Value | |
| | | | | | | | | | | | |
| COMMON STOCKS—(Continued) | |
| Real Estate Investment Trusts (REITs)—7.2% | |
Acadia Realty Trust REIT | | | | | 10,332 | | | $ | 256,544 | |
AG Mortgage Investment Trust, Inc. REIT | | | | | 4,573 | | | | 71,522 | |
Agree Realty Corp. REIT | | | | | 2,737 | | | | 79,428 | |
Alexander’s, Inc. REIT | | | | | 383 | | | | 126,390 | |
Alexandria Real Estate Equities, Inc. REIT | | | | | 13,510 | | | | 859,506 | |
American Assets Trust, Inc. REIT | | | | | 6,527 | | | | 205,144 | |
American Campus Communities, Inc. REIT | | | | | 19,568 | | | | 630,285 | |
American Capital Mortgage Investment Corp. REIT | | | | | 11,522 | | | | 201,174 | |
American Homes 4 Rent, Class A REIT | | | | | 10,050 | | | | 162,810 | |
American Realty Capital Properties, Inc. REIT | | † | | | 28,107 | | | | 361,456 | |
American Residential Properties, Inc. REIT | | * | | | 2,190 | | | | 37,580 | |
AmREIT, Inc. REIT | | | | | 4,135 | | | | 69,468 | |
Anworth Mortgage Asset Corp. REIT | | | | | 27,380 | | | | 115,270 | |
Apartment Investment & Management Co., Class A REIT | | | | | 27,666 | | | | 716,826 | |
Apollo Commercial Real Estate Finance, Inc. REIT | | | | | 6,767 | | | | 109,964 | |
Apollo Residential Mortgage, Inc. REIT | | | | | 5,862 | | | | 86,640 | |
Ares Commercial Real Estate Corp. REIT | | | | | 4,696 | | | | 61,518 | |
Armada Hoffler Properties, Inc. REIT | | | | | 3,047 | | | | 28,276 | |
ARMOUR Residential REIT, Inc. REIT | | | | | 65,367 | | | | 262,122 | |
Ashford Hospitality Prime, Inc. REIT | | | | | 2,145 | | | | 39,039 | |
Ashford Hospitality Trust, Inc. REIT | | | | | 10,729 | | | | 88,836 | |
Associated Estates Realty Corp. REIT | | | | | 11,260 | | | | 180,723 | |
Aviv REIT, Inc. REIT | | | | | 1,842 | | | | 43,655 | |
BioMed Realty Trust, Inc. REIT | | | | | 33,948 | | | | 615,138 | |
Brandywine Realty Trust REIT | | | | | 29,584 | | | | 416,839 | |
BRE Properties, Inc. REIT | | | | | 14,359 | | | | 785,581 | |
Brixmor Property Group, Inc. REIT | | *† | | | 7,652 | | | | 155,565 | |
Camden Property Trust REIT | | | | | 16,026 | | | | 911,559 | |
Campus Crest Communities, Inc. REIT | | | | | 10,695 | | | | 100,640 | |
Capstead Mortgage Corp. REIT | | | | | 17,141 | | | | 207,063 | |
CBL & Associates Properties, Inc. REIT | | | | | 31,054 | | | | 557,730 | |
Cedar Realty Trust, Inc. REIT | | | | | 13,395 | | | | 83,853 | |
Chambers Street Properties REIT | | † | | | 45,393 | | | | 347,256 | |
Chatham Lodging Trust REIT | | | | | 5,559 | | | | 113,682 | |
| | | | | | | | | | | | |
| | | | |
| | | | | | Shares | | | | Value | |
| | | | | | | | | | | | |
Chesapeake Lodging Trust REIT | | | | | 9,527 | | | $ | 240,938 | |
Chimera Investment Corp. REIT | | | | | 195,394 | | | | 605,721 | |
Colony Financial, Inc. REIT | | | | | 12,611 | | | | 255,877 | |
CommonWealth REIT REIT | | | | | 22,203 | | | | 517,552 | |
CoreSite Realty Corp. REIT | | | | | 3,409 | | | | 109,736 | |
Corporate Office Properties Trust REIT | | | | | 16,231 | | | | 384,512 | |
Corrections Corp. of America REIT | | | | | 21,829 | | | | 700,056 | |
Cousins Properties, Inc. REIT | | | | | 31,920 | | | | 328,776 | |
CubeSmart REIT | | | | | 24,215 | | | | 385,987 | |
CyrusOne, Inc. REIT | | | | | 3,038 | | | | 67,839 | |
CYS Investments, Inc. REIT | | | | | 31,116 | | | | 230,570 | |
DCT Industrial Trust, Inc. REIT | | | | | 54,868 | | | | 391,209 | |
DDR Corp. REIT | | | | | 55,099 | | | | 846,872 | |
DiamondRock Hospitality Co. REIT | | | | | 37,464 | | | | 432,709 | |
Douglas Emmett, Inc. REIT | | | | | 27,097 | | | | 631,089 | |
Duke Realty Corp. REIT | | | | | 59,744 | | | | 898,550 | |
DuPont Fabros Technology, Inc. REIT | | | | | 11,161 | | | | 275,788 | |
Dynex Capital, Inc. REIT | | | | | 9,171 | | | | 73,368 | |
EastGroup Properties, Inc. REIT | | | | | 5,650 | | | | 327,304 | |
Education Realty Trust, Inc. REIT | | | | | 21,399 | | | | 188,739 | |
Ellington Residential Mortgage REIT REIT | | | | | 1,039 | | | | 15,980 | |
Empire State Realty Trust, Inc., Class A REIT | | | | | 13,808 | | | | 211,262 | |
EPR Properties REIT | | | | | 9,704 | | | | 477,049 | |
Equity Lifestyle Properties, Inc. REIT | | | | | 15,607 | | | | 565,442 | |
Equity One, Inc. REIT | | | | | 10,911 | | | | 244,843 | |
Essex Property Trust, Inc. REIT | | | | | 7,166 | | | | 1,028,393 | |
Excel Trust, Inc. REIT | | | | | 10,056 | | | | 114,538 | |
Extra Space Storage, Inc. REIT | | | | | 20,982 | | | | 883,972 | |
Federal Realty Investment Trust REIT | | | | | 12,081 | | | | 1,225,134 | |
FelCor Lodging Trust, Inc. REIT | | * | | | 23,021 | | | | 187,851 | |
First Industrial Realty Trust, Inc. REIT | | | | | 20,382 | | | | 355,666 | |
First Potomac Realty Trust REIT | | | | | 11,442 | | | | 133,070 | |
Franklin Street Properties Corp. REIT | | | | | 16,006 | | | | 191,272 | |
Gaming and Leisure Properties, Inc. REIT | | * | | | 14,211 | | | | 722,061 | |
Geo Group, Inc. (The) REIT | | | | | 13,484 | | | | 434,454 | |
Getty Realty Corp. REIT | | | | | 4,999 | | | | 91,832 | |
Gladstone Commercial Corp. REIT | | | | | 2,393 | | | | 43,002 | |
Glimcher Realty Trust REIT | | | | | 28,107 | | | | 263,082 | |
Government Properties Income Trust REIT | | | | | 10,092 | | | | 250,786 | |
Gramercy Property Trust, Inc. REIT | | * | | | 11,512 | | | | 66,194 | |
Hannon Armstrong Sustainable Infrastructure Capital, Inc. REIT | | | | | 2,349 | | | | 32,792 | |
See accompanying notes to financial statements
327
SCHEDULE OF INVESTMENTS—(Continued)
December 31, 2013
| | | | | | | | | | | | |
Vantagepoint Mid/Small
Company Index Fund | | | | Shares | | | Value | |
| | | | | | | | | | | | |
| COMMON STOCKS—(Continued) | |
Hatteras Financial Corp. REIT | | | | | 17,493 | | | $ | 285,836 | |
Healthcare Realty Trust, Inc. REIT | | | | | 18,090 | | | | 385,498 | |
Healthcare Trust of America, Inc., Class A REIT | | | | | 20,683 | | | | 203,521 | |
Hersha Hospitality Trust REIT | | | | | 37,283 | | | | 207,666 | |
Highwoods Properties, Inc. REIT | | | | | 16,801 | | | | 607,692 | |
Home Properties, Inc. REIT | | | | | 10,370 | | | | 556,039 | |
Hospitality Properties Trust REIT | | | | | 27,769 | | | | 750,596 | |
Hudson Pacific Properties, Inc. REIT | | | | | 8,157 | | | | 178,394 | |
Inland Real Estate Corp. REIT | | | | | 16,167 | | | | 170,077 | |
Invesco Mortgage Capital, Inc. REIT | | | | | 24,680 | | | | 362,302 | |
Investors Real Estate Trust REIT | | | | | 18,364 | | | | 157,563 | |
iStar Financial, Inc. REIT | | * | | | 16,514 | | | | 235,655 | |
JAVELIN Mortgage Investment Corp. REIT | | † | | | 2,138 | | | | 29,782 | |
Kilroy Realty Corp. REIT | | | | | 15,169 | | | | 761,180 | |
Kite Realty Group Trust REIT | | | | | 23,613 | | | | 155,137 | |
LaSalle Hotel Properties REIT | | | | | 19,449 | | | | 600,196 | |
Lexington Realty Trust REIT | | | | | 34,030 | | | | 347,446 | |
Liberty Property Trust REIT | | | | | 24,092 | | | | 815,996 | |
LTC Properties, Inc. REIT | | | | | 6,423 | | | | 227,310 | |
Mack-Cali Realty Corp. REIT | | | | | 16,724 | | | | 359,232 | |
Medical Properties Trust, Inc. REIT | | | | | 30,549 | | | | 373,309 | |
MFA Financial, Inc. REIT | | | | | 66,233 | | | | 467,605 | |
Mid-America Apartment Communities, Inc. REIT | | | | | 13,876 | | | | 842,828 | |
Monmouth Real Estate Investment Corp., Class A REIT | | | | | 7,811 | | | | 71,002 | |
National Health Investors, Inc. REIT | | | | | 5,376 | | | | 301,594 | |
National Retail Properties, Inc. REIT | | † | | | 22,451 | | | | 680,939 | |
New Residential Investment Corp. REIT | | | | | 46,548 | | | | 310,941 | |
New York Mortgage Trust, Inc. REIT | | | | | 10,634 | | | | 74,332 | |
NorthStar Realty Finance Corp. REIT | | | | | 53,173 | | | | 715,177 | |
Omega Healthcare Investors, Inc. REIT | | † | | | 22,771 | | | | 678,576 | |
One Liberty Properties, Inc. REIT | | | | | 1,927 | | | | 38,790 | |
Parkway Properties, Inc. REIT | | | | | 10,778 | | | | 207,908 | |
Pebblebrook Hotel Trust REIT | | | | | 11,832 | | | | 363,952 | |
Pennsylvania Real Estate Investment Trust REIT | | | | | 13,304 | | | | 252,510 | |
PennyMac Mortgage Investment Trust REIT | | | | | 13,445 | | | | 308,697 | |
Physicians Realty Trust REIT | | | | | 1,894 | | | | 24,130 | |
Piedmont Office Realty Trust, Inc., Class A REIT | | | | | 31,422 | | | | 519,091 | |
Post Properties, Inc. REIT | | | | | 10,280 | | | | 464,964 | |
Potlatch Corp. REIT | | | | | 7,237 | | | | 302,072 | |
PS Business Parks, Inc. REIT | | | | | 3,550 | | | | 271,291 | |
| | | | | | | | | | | | |
| | | | |
| | | | | | Shares | | | | Value | |
| | | | | | | | | | | | |
QTS Realty Trust, Inc., Class A REIT | | | | | 2,361 | | | $ | 58,506 | |
RAIT Financial Trust REIT | | | | | 13,669 | | | | 122,611 | |
Ramco-Gershenson Properties Trust REIT | | | | | 11,310 | | | | 178,019 | |
Rayonier, Inc. REIT | | | | | 23,783 | | | | 1,001,264 | |
Redwood Trust, Inc. REIT | | † | | | 14,817 | | | | 287,005 | |
Regency Centers Corp. REIT | | | | | 17,331 | | | | 802,425 | |
Resource Capital Corp. REIT | | | | | 25,000 | | | | 148,250 | |
Retail Opportunity Investments Corp. REIT | | | | | 14,126 | | | | 207,935 | |
Retail Properties of America, Inc., Class A REIT | | | | | 24,528 | | | | 311,996 | |
Rexford Industrial Realty, Inc. REIT | | | | | 2,728 | | | | 36,010 | |
RLJ Lodging Trust REIT | | | | | 22,647 | | | | 550,775 | |
Rouse Properties, Inc. REIT | | † | | | 4,591 | | | | 101,874 | |
Ryman Hospitality Properties, Inc. REIT | | † | | | 8,002 | | | | 334,324 | |
Sabra Health Care REIT, Inc. REIT | | | | | 6,872 | | | | 179,634 | |
Saul Centers, Inc. REIT | | | | | 1,580 | | | | 75,413 | |
Select Income REIT REIT | | | | | 4,354 | | | | 116,426 | |
Senior Housing Properties Trust REIT | | | | | 35,598 | | | | 791,344 | |
Silver Bay Realty Trust Corp. REIT | | † | | | 3,004 | | | | 48,034 | |
Sovran Self Storage, Inc. REIT | | | | | 5,793 | | | | 377,530 | |
Spirit Realty Capital, Inc. REIT | | | | | 69,068 | | | | 678,938 | |
STAG Industrial, Inc. REIT | | | | | 8,311 | | | | 169,461 | |
Starwood Property Trust, Inc. REIT | | | | | 36,249 | | | | 1,004,097 | |
Strategic Hotels & Resorts, Inc. REIT | | * | | | 33,776 | | | | 319,183 | |
Summit Hotel Properties, Inc. REIT | | | | | 16,339 | | | | 147,051 | |
Sun Communities, Inc. REIT | | | | | 6,851 | | | | 292,127 | |
Sunstone Hotel Investors, Inc. REIT | | | | | 33,780 | | | | 452,652 | |
Tanger Factory Outlet Centers, Inc. REIT | | | | | 17,965 | | | | 575,239 | |
Taubman Centers, Inc. REIT | | | | | 12,070 | | | | 771,514 | |
Terreno Realty Corp. REIT | | | | | 5,103 | | | | 90,323 | |
Two Harbors Investment Corp. REIT | | | | | 68,265 | | | | 633,499 | |
UMH Properties, Inc. REIT | | | | | 3,071 | | | | 28,929 | |
Universal Health Realty Income Trust REIT | | | | | 2,317 | | | | 92,819 | |
Urstadt Biddle Properties, Inc., Class A REIT | | | | | 4,932 | | | | 90,995 | |
Washington Real Estate Investment Trust REIT | | | | | 12,190 | | | | 284,758 | |
Weingarten Realty Investors REIT | | | | | 23,123 | | | | 634,033 | |
Western Asset Mortgage Capital Corp. REIT | | † | | | 4,020 | | | | 59,818 | |
Whitestone REIT | | | | | 5,035 | | | | 67,318 | |
Winthrop Realty Trust REIT | | | | | 5,324 | | | | 58,830 | |
WP Carey, Inc. REIT | | | | | 10,899 | | | | 668,654 | |
ZAIS Financial Corp. REIT | | | | | 962 | | | | 15,421 | |
| | | | | | | | | | | | |
| | | | | | | | | | | 52,052,809 | |
| | | | | | | | | | | | |
See accompanying notes to financial statements
328
SCHEDULE OF INVESTMENTS—(Continued)
December 31, 2013
| | | | | | | | | | | | |
Vantagepoint Mid/Small
Company Index Fund | | | | Shares | | | Value | |
| | | | | | | | | | | | |
| COMMON STOCKS—(Continued) | |
| Real Estate Management & Development—0.7% | |
Alexander & Baldwin, Inc. | | | | | 8,319 | | | $ | 347,152 | |
Altisource Residential Corp. (Virgin Islands, U.S.) | | | | | 8,250 | | | | 248,408 | |
AV Homes, Inc. | | * | | | 1,495 | | | | 27,164 | |
Consolidated-Tomoka Land Co. | | | | | 1,195 | | | | 43,367 | |
Forest City Enterprises, Inc., Class A | | * | | | 30,060 | | | | 574,146 | |
Forestar Group, Inc. | | * | | | 6,325 | | | | 134,533 | |
Howard Hughes Corp. (The) | | * | | | 7,474 | | | | 897,627 | |
Jones Lang LaSalle, Inc. | | | | | 8,344 | | | | 854,342 | |
Kennedy-Wilson Holdings, Inc. | | | | | 10,976 | | | | 244,216 | |
RE/MAX Holdings, Inc., Class A | | * | | | 1,946 | | | | 62,408 | |
Realogy Holdings Corp. | | * | | | 22,657 | | | | 1,120,842 | |
St. Joe Co. (The) | | *† | | | 11,522 | | | | 221,107 | |
Tejon Ranch Co. | | * | | | 2,591 | | | | 95,245 | |
| | | | | | | | | | | | |
| | | | | | | | | | | 4,870,557 | |
| | | | | | | | | | | | |
| Road & Rail—0.8% | | | | | | | | | | | | |
AMERCO | | * | | | 1,307 | | | | 310,857 | |
Arkansas Best Corp. | | | | | 4,354 | | | | 146,643 | |
Avis Budget Group, Inc. | | * | | | 20,414 | | | | 825,134 | |
Celadon Group, Inc. | | | | | 4,371 | | | | 85,147 | |
Con-way, Inc. | | | | | 10,630 | | | | 422,117 | |
Genesee & Wyoming, Inc., Class A | | * | | | 8,061 | | | | 774,259 | |
Heartland Express, Inc. | | | | | 8,826 | | | | 173,166 | |
Knight Transportation, Inc. | | | | | 10,752 | | | | 197,192 | |
Landstar System, Inc. | | | | | 8,890 | | | | 510,730 | |
Marten Transport Ltd. | | | | | 3,709 | | | | 74,885 | |
Old Dominion Freight Line, Inc. | | * | | | 13,469 | | | | 714,126 | |
Patriot Transportation Holding, Inc. | | * | | | 1,038 | | | | 43,087 | |
Quality Distribution, Inc. | | * | | | 5,838 | | | | 74,902 | |
Roadrunner Transportation Systems, Inc. | | * | | | 2,955 | | | | 79,637 | |
Ryder System, Inc. | | | | | 9,486 | | | | 699,877 | |
Saia, Inc. | | * | | | 4,169 | | | | 133,616 | |
Swift Transportation Co. | | *† | | | 15,398 | | | | 341,990 | |
Universal Truckload Services, Inc. | | | | | 1,615 | | | | 49,274 | |
Werner Enterprises, Inc. | | | | | 8,408 | | | | 207,930 | |
YRC Worldwide, Inc. | | *† | | | 1,506 | | | | 26,159 | |
| | | | | | | | | | | | |
| | | | | | | | | | | 5,890,728 | |
| | | | | | | | | | | | |
| Semiconductors & Semiconductor Equipment—2.4% | |
Advanced Energy Industries, Inc. | | * | | | 7,214 | | | | 164,912 | |
Advanced Micro Devices, Inc. | | *† | | | 110,379 | | | | 427,167 | |
Alpha & Omega Semiconductor Ltd. | | * | | | 2,749 | | | | 21,195 | |
Ambarella, Inc. | | * | | | 3,046 | | | | 103,351 | |
Amkor Technology, Inc. | | * | | | 12,795 | | | | 78,433 | |
ANADIGICS, Inc. | | * | | | 15,184 | | | | 27,939 | |
Applied Micro Circuits Corp. | | * | | | 14,794 | | | | 197,944 | |
Atmel Corp. | | * | | | 81,517 | | | | 638,278 | |
ATMI, Inc. | | * | | | 5,396 | | | | 163,013 | |
Axcelis Technologies, Inc. | | * | | | 20,883 | | | | 50,954 | |
| | | | | | | | | | | | |
| | | | |
| | | | | | Shares | | | | Value | |
| | | | | | | | | | | | |
Brooks Automation, Inc. | | | | | 11,493 | | | $ | 120,562 | |
Cabot Microelectronics Corp. | | * | | | 4,276 | | | | 195,413 | |
Cavium, Inc. | | * | | | 9,259 | | | | 319,528 | |
Ceva, Inc. | | * | | | 3,801 | | | | 57,851 | |
Cirrus Logic, Inc. | | *† | | | 11,941 | | | | 243,955 | |
Cohu, Inc. | | | | | 4,103 | | | | 43,081 | |
Cree, Inc. | | * | | | 21,835 | | | | 1,366,216 | |
Cypress Semiconductor Corp. | | * | | | 28,584 | | | | 300,132 | |
Diodes, Inc. | | * | | | 6,017 | | | | 141,760 | |
DSP Group, Inc. | | * | | | 4,251 | | | | 41,277 | |
Entegris, Inc. | | * | | | 25,104 | | | | 291,206 | |
Entropic Communications, Inc. | | * | | | 14,187 | | | | 66,821 | |
Exar Corp. | | * | | | 7,230 | | | | 85,242 | |
Fairchild Semiconductor International, Inc. | | * | | | 22,826 | | | | 304,727 | |
First Solar, Inc. | | * | | | 12,628 | | | | 689,994 | |
FormFactor, Inc. | | * | | | 11,437 | | | | 68,851 | |
Freescale Semiconductor Ltd. | | * | | | 11,271 | | | | 180,899 | |
GSI Technology, Inc. | | * | | | 3,251 | | | | 21,587 | |
GT Advanced Technologies, Inc. | | *† | | | 23,592 | | | | 205,722 | |
Hittite Microwave Corp. | | * | | | 5,664 | | | | 349,639 | |
Inphi Corp. | | * | | | 4,292 | | | | 55,367 | |
Integrated Device Technology, Inc. | | * | | | 24,178 | | | | 246,374 | |
Integrated Silicon Solution, Inc. | | * | | | 4,746 | | | | 57,379 | |
Intermolecular, Inc. | | * | | | 2,026 | | | | 9,968 | |
International Rectifier Corp. | | * | | | 12,910 | | | | 336,564 | |
Intersil Corp., Class A | | | | | 24,427 | | | | 280,178 | |
IXYS Corp. | | | | | 5,795 | | | | 75,161 | |
Kopin Corp. | | * | | | 10,484 | | | | 44,242 | |
Lattice Semiconductor Corp. | | * | | | 22,371 | | | | 123,264 | |
LSI Corp. | | | | | 103,971 | | | | 1,145,760 | |
LTX-Credence Corp. | | * | | | 8,847 | | | | 70,687 | |
M/A-COM Technology Solutions Holdings, Inc. | | * | | | 1,263 | | | | 21,458 | |
MaxLinear, Inc., Class A | | * | | | 3,663 | | | | 38,205 | |
Micrel, Inc. | | | | | 7,091 | | | | 69,988 | |
Microsemi Corp. | | * | | | 17,114 | | | | 426,994 | |
MKS Instruments, Inc. | | | | | 10,273 | | | | 307,574 | |
Monolithic Power Systems, Inc. | | * | | | 7,140 | | | | 247,472 | |
MoSys, Inc. | | * | | | 9,117 | | | | 50,326 | |
Nanometrics, Inc. | | * | | | 3,660 | | | | 69,723 | |
NeoPhotonics Corp. | | * | | | 2,624 | | | | 18,525 | |
NVE Corp. | | * | | | 771 | | | | 44,934 | |
OmniVision Technologies, Inc. | | * | | | 9,688 | | | | 166,634 | |
ON Semiconductor Corp. | | * | | | 84,344 | | | | 694,995 | |
PDF Solutions, Inc. | | * | | | 4,882 | | | | 125,077 | |
Peregrine Semiconductor Corp. | | * | | | 4,359 | | | | 32,300 | |
Pericom Semiconductor Corp. | | * | | | 5,204 | | | | 46,107 | |
Photronics, Inc. | | * | | | 11,167 | | | | 100,838 | |
PLX Technology, Inc. | | * | | | 8,946 | | | | 58,865 | |
PMC—Sierra, Inc. | | * | | | 37,964 | | | | 244,108 | |
Power Integrations, Inc. | | | | | 5,526 | | | | 308,461 | |
Rambus, Inc. | | * | | | 19,057 | | | | 180,470 | |
RF Micro Devices, Inc. | | * | | | 51,143 | | | | 263,898 | |
Rubicon Technology, Inc. | | *† | | | 2,802 | | | | 27,880 | |
Rudolph Technologies, Inc. | | * | | | 5,424 | | | | 63,678 | |
Semtech Corp. | | * | | | 12,745 | | | | 322,194 | |
See accompanying notes to financial statements
329
SCHEDULE OF INVESTMENTS—(Continued)
December 31, 2013
| | | | | | | | | | | | |
Vantagepoint Mid/Small
Company Index Fund | | | | Shares | | | Value | |
| | | | | | | | | | | | |
| COMMON STOCKS—(Continued) | |
Sigma Designs, Inc. | | * | | | 8,818 | | | $ | 41,621 | |
Silicon Image, Inc. | | * | | | 13,062 | | | | 80,331 | |
Silicon Laboratories, Inc. | | * | | | 7,560 | | | | 327,424 | |
Skyworks Solutions, Inc. | | * | | | 35,530 | | | | 1,014,737 | |
Spansion, Inc., Class A | | * | | | 9,327 | | | | 129,552 | |
SunEdison, Inc. | | * | | | 49,945 | | | | 651,782 | |
SunPower Corp. | | *† | | | 7,788 | | | | 232,160 | |
Supertex, Inc. | | * | | | 1,876 | | | | 46,994 | |
Synaptics, Inc. | | * | | | 6,286 | | | | 325,678 | |
Teradyne, Inc. | | * | | | 35,663 | | | | 628,382 | |
Tessera Technologies, Inc. | | | | | 9,035 | | | | 178,080 | |
TriQuint Semiconductor, Inc. | | * | | | 29,317 | | | | 244,504 | |
Ultra Clean Holdings, Inc. | | * | | | 6,562 | | | | 65,817 | |
Ultratech, Inc. | | * | | | 4,638 | | | | 134,502 | |
Veeco Instruments, Inc. | | * | | | 7,670 | | | | 252,420 | |
| | | | | | | | | | | | |
| | | | | | | | | | | 17,697,281 | |
| | | | | | | | | | | | |
| Software—3.8% | |
Accelrys, Inc. | | * | | | 9,479 | | | | 90,430 | |
ACI Worldwide, Inc. | | * | | | 7,536 | | | | 489,840 | |
Actuate Corp. | | * | | | 9,173 | | | | 70,724 | |
Advent Software, Inc. | | | | | 6,076 | | | | 212,599 | |
American Software, Inc., Class A | | | | | 3,570 | | | | 35,236 | |
ANSYS, Inc. | | * | | | 17,233 | | | | 1,502,718 | |
Aspen Technology, Inc. | | * | | | 17,503 | | | | 731,625 | |
AVG Technologies NV (Netherlands) | | * | | | 3,792 | | | | 65,260 | |
Barracuda Networks, Inc. | | * | | | 698 | | | | 27,697 | |
Blackbaud, Inc. | | | | | 8,708 | | | | 327,856 | |
Bottomline Technologies de, Inc. | | * | | | 7,299 | | | | 263,932 | |
BroadSoft, Inc. | | * | | | 4,735 | | | | 129,455 | |
Cadence Design Systems, Inc. | | * | | | 52,820 | | | | 740,536 | |
Callidus Software, Inc. | | * | | | 7,373 | | | | 101,231 | |
CommVault Systems, Inc. | | * | | | 8,682 | | | | 650,108 | |
Compuware Corp. | | | | | 40,292 | | | | 451,673 | |
Comverse, Inc. | | * | | | 3,789 | | | | 147,013 | |
Concur Technologies, Inc. | | * | | | 8,829 | | | | 910,976 | |
Covisint Corp. | | * | | | 1,233 | | | | 15,474 | |
Cyan, Inc. | | *† | | | 1,292 | | | | 6,835 | |
Digimarc Corp. | | | | | 993 | | | | 19,125 | |
Ebix, Inc. | | † | | | 6,537 | | | | 96,225 | |
Ellie Mae, Inc. | | *† | | | 4,322 | | | | 116,132 | |
Epiq Systems, Inc. | | | | | 6,758 | | | | 109,547 | |
ePlus, Inc. | | * | | | 596 | | | | 33,877 | |
FactSet Research Systems, Inc. | | † | | | 8,178 | | | | 887,967 | |
Fair Isaac Corp. | | | | | 6,796 | | | | 427,061 | |
FireEye, Inc. | | * | | | 2,925 | | | | 127,559 | |
FleetMatics Group plc (Ireland) | | * | | | 2,761 | | | | 119,413 | |
Fortinet, Inc. | | * | | | 25,484 | | | | 487,509 | |
Gigamon, Inc. | | * | | | 1,252 | | | | 35,156 | |
Glu Mobile, Inc. | | *† | | | 8,971 | | | | 34,897 | |
Guidance Software, Inc. | | * | | | 2,669 | | | | 26,957 | |
Guidewire Software, Inc. | | * | | | 9,348 | | | | 458,706 | |
Imperva, Inc. | | * | | | 3,842 | | | | 184,915 | |
Infoblox, Inc. | | * | | | 9,240 | | | | 305,105 | |
Informatica Corp. | | * | | | 20,453 | | | | 848,800 | |
Interactive Intelligence Group, Inc. | | * | | | 2,618 | | | | 176,349 | |
Jive Software, Inc. | | * | | | 6,532 | | | | 73,485 | |
Manhattan Associates, Inc. | | * | | | 3,680 | | | | 432,326 | |
| | | | | | | | | | | | |
| | | | |
| | | | | | Shares | | | | Value | |
| | | | | | | | | | | | |
Mavenir Systems, Inc. | | * | | | 940 | | | $ | 10,490 | |
Mentor Graphics Corp. | | | | | 17,566 | | | | 422,814 | |
MICROS Systems, Inc. | | * | | | 14,652 | | | | 840,585 | |
MicroStrategy, Inc., Class A | | * | | | 1,777 | | | | 220,775 | |
Mitek Systems, Inc. | | *† | | | 3,615 | | | | 21,473 | |
Model N, Inc. | | *† | | | 1,301 | | | | 15,339 | |
Monotype Imaging Holdings, Inc. | | | | | 7,430 | | | | 236,720 | |
Netscout Systems, Inc. | | * | | | 6,836 | | | | 202,277 | |
NetSuite, Inc. | | * | | | 6,549 | | | | 674,678 | |
Nuance Communications, Inc. | | * | | | 48,708 | | | | 740,362 | |
Pegasystems, Inc. | | | | | 2,969 | | | | 146,015 | |
Progress Software Corp. | | * | | | 9,932 | | | | 256,544 | |
Proofpoint, Inc. | | * | | | 3,579 | | | | 118,715 | |
PROS Holdings, Inc. | | * | | | 3,855 | | | | 153,815 | |
PTC, Inc. | | * | | | 22,668 | | | | 802,221 | |
QAD, Inc., Class A | | | | | 986 | | | | 17,413 | |
Qlik Technologies, Inc. | | * | | | 16,686 | | | | 444,348 | |
Qualys, Inc. | | * | | | 3,457 | | | | 79,891 | |
Rally Software Development Corp. | | * | | | 1,100 | | | | 21,395 | |
RealPage, Inc. | | * | | | 8,084 | | | | 189,004 | |
Rosetta Stone, Inc. | | * | | | 2,755 | | | | 33,666 | |
Rovi Corp. | | * | | | 19,697 | | | | 387,834 | |
Sapiens International Corp. NV (Israel) | | | | | 3,979 | | | | 30,678 | |
SeaChange International, Inc. | | * | | | 5,522 | | | | 67,148 | |
ServiceNow, Inc. | | * | | | 14,954 | | | | 837,574 | |
Silver Spring Networks, Inc. | | *† | | | 944 | | | | 19,824 | |
SolarWinds, Inc. | | * | | | 12,044 | | | | 455,625 | |
Solera Holdings, Inc. | | | | | 12,842 | | | | 908,700 | |
Splunk, Inc. | | * | | | 19,013 | | | | 1,305,623 | |
SS&C Technologies Holdings, Inc. | | * | | | 10,671 | | | | 472,298 | |
Synchronoss Technologies, Inc. | | * | | | 5,012 | | | | 155,723 | |
Synopsys, Inc. | | * | | | 29,002 | | | | 1,176,611 | |
Tableau Software, Inc., Class A | | * | | | 1,964 | | | | 135,379 | |
Take-Two Interactive Software, Inc. | | * | | | 15,130 | | | | 262,808 | |
Tangoe, Inc. | | *† | | | 4,906 | | | | 88,357 | |
TeleCommunication Systems, Inc., Class A | | * | | | 7,640 | | | | 17,725 | |
TeleNav, Inc. | | * | | | 4,267 | | | | 28,120 | |
TIBCO Software, Inc. | | * | | | 31,097 | | | | 699,061 | |
TiVo, Inc. | | * | | | 22,968 | | | | 301,340 | |
Tyler Technologies, Inc. | | * | | | 5,903 | | | | 602,873 | |
Ultimate Software Group, Inc. (The) | | * | | | 5,233 | | | | 801,800 | |
VASCO Data Security International, Inc. | | * | | | 4,225 | | | | 32,659 | |
Verint Systems, Inc. | | * | | | 9,660 | | | | 414,800 | |
VirnetX Holding Corp. | | *† | | | 7,740 | | | | 150,233 | |
Vringo, Inc. | | *† | | | 10,670 | | | | 31,583 | |
Zynga, Inc., Class A | | * | | | 107,050 | | | | 406,790 | |
| | | | | | | | | | | | |
| | | | | | | | | | | 27,412,035 | |
| | | | | | | | | | | | |
| Specialty Retail—3.5% | |
Aaron’s, Inc. | | | | | 13,685 | | | | 402,339 | |
Abercrombie & Fitch Co., Class A | | † | | | 14,262 | | | | 469,362 | |
Aeropostale, Inc. | | *† | | | 13,291 | | | | 120,815 | |
See accompanying notes to financial statements
330
SCHEDULE OF INVESTMENTS—(Continued)
December 31, 2013
| | | | | | | | | | | | |
Vantagepoint Mid/Small
Company Index Fund | | | | Shares | | | Value | |
| | | | | | | | | | | | |
| COMMON STOCKS—(Continued) | |
American Eagle Outfitters, Inc. | | | | | 36,160 | | | $ | 520,704 | |
America’s Car-Mart, Inc. | | * | | | 1,569 | | | | 66,259 | |
ANN, Inc. | | * | | | 8,527 | | | | 311,747 | |
Asbury Automotive Group, Inc. | | * | | | 5,664 | | | | 304,383 | |
Ascena Retail Group, Inc. | | * | | | 24,015 | | | | 508,157 | |
AutoNation, Inc. | | * | | | 9,272 | | | | 460,726 | |
Barnes & Noble, Inc. | | * | | | 6,505 | | | | 97,250 | |
bebe stores, Inc. | | | | | 4,090 | | | | 21,759 | |
Big 5 Sporting Goods Corp. | | | | | 4,027 | | | | 79,815 | |
Body Central Corp. | | *† | | | 2,618 | | | | 10,315 | |
Brown Shoe Co., Inc. | | | | | 8,500 | | | | 239,190 | |
Buckle, Inc. (The) | | † | | | 5,434 | | | | 285,611 | |
Cabela’s, Inc. | | * | | | 9,046 | | | | 603,006 | |
Cato Corp. (The), Class A | | | | | 4,713 | | | | 149,873 | |
Chico’s FAS, Inc. | | | | | 29,738 | | | | 560,264 | |
Children’s Place Retail Stores, Inc. (The) | | * | | | 4,359 | | | | 248,332 | |
Christopher & Banks Corp. | | * | | | 5,820 | | | | 49,703 | |
Citi Trends, Inc. | | * | | | 3,282 | | | | 55,794 | |
Conn’s, Inc. | | * | | | 4,337 | | | | 341,712 | |
Container Store Group, Inc.(The) | | *† | | | 2,409 | | | | 112,283 | |
CST Brands, Inc. | | | | | 11,057 | | | | 406,013 | |
Destination Maternity Corp. | | | | | 2,707 | | | | 80,885 | |
Destination XL Group, Inc. | | * | | | 8,855 | | | | 58,177 | |
Dick’s Sporting Goods, Inc. | | | | | 18,646 | | | | 1,083,333 | |
DSW, Inc., Class A | | | | | 13,331 | | | | 569,634 | |
Express, Inc. | | * | | | 16,183 | | | | 302,137 | |
Finish Line, Inc. (The), Class A | | | | | 9,621 | | | | 271,024 | |
Five Below, Inc. | | * | | | 6,097 | | | | 263,390 | |
Foot Locker, Inc. | | | | | 27,877 | | | | 1,155,223 | |
Francesca’s Holdings Corp. | | *† | | | 7,474 | | | | 137,596 | |
GameStop Corp., Class A | | | | | 22,017 | | | | 1,084,557 | |
Genesco, Inc. | | * | | | 4,586 | | | | 335,053 | |
GNC Holdings, Inc., Class A | | | | | 18,547 | | | | 1,084,072 | |
Group 1 Automotive, Inc. | | | | | 4,050 | | | | 287,631 | |
Guess?, Inc. | | | | | 10,555 | | | | 327,944 | |
Haverty Furniture Cos., Inc. | | | | | 3,359 | | | | 105,137 | |
hhgregg, Inc. | | * | | | 2,033 | | | | 28,401 | |
Hibbett Sports, Inc. | | *† | | | 4,967 | | | | 333,832 | |
Jos A. Bank Clothiers, Inc. | | * | | | 5,414 | | | | 296,308 | |
Kirkland’s, Inc. | | * | | | 2,193 | | | | 51,908 | |
Lithia Motors, Inc., Class A | | | | | 4,128 | | | | 286,566 | |
Lumber Liquidators Holdings, Inc. | | * | | | 5,235 | | | | 538,629 | |
MarineMax, Inc. | | * | | | 5,242 | | | | 84,291 | |
Mattress Firm Holding Corp. | | *† | | | 2,112 | | | | 90,900 | |
Men’s Wearhouse, Inc. (The) | | | | | 9,504 | | | | 485,464 | |
Monro Muffler Brake, Inc. | | † | | | 5,979 | | | | 336,976 | |
New York & Co., Inc. | | * | | | 3,724 | | | | 16,274 | |
Office Depot, Inc. | | * | | | 89,117 | | | | 471,429 | |
Outerwall, Inc. | | *† | | | 5,002 | | | | 336,485 | |
Pacific Sunwear of California, Inc. | | * | | | 7,414 | | | | 24,763 | |
Penske Automotive Group, Inc. | | | | | 7,830 | | | | 369,263 | |
Pep Boys-Manny, Moe & Jack (The) | | * | | | 10,379 | | | | 126,001 | |
Pier 1 Imports, Inc. | | | | | 18,214 | | | | 420,379 | |
RadioShack Corp. | | *† | | | 19,631 | | | | 51,041 | |
| | | | | | | | | | | | |
| | | | |
| | | | | | Shares | | | | Value | |
| | | | | | | | | | | | |
Rent-A-Center, Inc. | | | | | 10,379 | | | $ | 346,036 | |
Restoration Hardware Holdings, Inc. | | * | | | 3,414 | | | | 229,762 | |
Sally Beauty Holdings, Inc. | | * | | | 32,098 | | | | 970,323 | |
Sears Hometown and Outlet Stores, Inc. | | * | | | 1,371 | | | | 34,961 | |
Select Comfort Corp. | | * | | | 10,963 | | | | 231,210 | |
Shoe Carnival, Inc. | | | | | 3,350 | | | | 97,184 | |
Signet Jewelers Ltd. (Bermuda) | | | | | 14,992 | | | | 1,179,870 | |
Sonic Automotive, Inc., Class A | | | | | 7,614 | | | | 186,391 | |
Stage Stores, Inc. | | | | | 6,014 | | | | 133,631 | |
Stein Mart, Inc. | | | | | 5,811 | | | | 78,158 | |
Systemax, Inc. | | * | | | 1,358 | | | | 15,278 | |
Tile Shop Holdings, Inc. | | *† | | | 2,923 | | | | 52,819 | |
Tilly’s, Inc., Class A | | * | | | 1,567 | | | | 17,942 | |
Trans World Entertainment Corp. | | * | | | 1,749 | | | | 7,731 | |
Ulta Salon Cosmetics & Fragrance, Inc. | | * | | | 11,771 | | | | 1,136,137 | |
Urban Outfitters, Inc. | | * | | | 20,403 | | | | 756,951 | |
Vitamin Shoppe, Inc. | | * | | | 5,873 | | | | 305,455 | |
West Marine, Inc. | | * | | | 3,373 | | | | 47,998 | |
Wet Seal, Inc. (The), Class A | | * | | | 18,979 | | | | 51,813 | |
Williams-Sonoma, Inc. | | | | | 18,433 | | | | 1,074,275 | |
Winmark Corp. | | | | | 356 | | | | 32,973 | |
Zale Corp. | | * | | | 5,195 | | | | 81,925 | |
Zumiez, Inc. | | * | | | 3,482 | | | | 90,532 | |
| | | | | | | | | | | | |
| | | | | | | | | | | 25,079,470 | |
| | | | | | | | | | | | |
| Textiles, Apparel & Luxury Goods—1.3% | |
American Apparel, Inc. | | *† | | | 9,346 | | | | 11,496 | |
Carter’s, Inc. | | | | | 10,696 | | | | 767,866 | |
Columbia Sportswear Co. | | † | | | 2,546 | | | | 200,497 | |
Crocs, Inc. | | * | | | 15,828 | | | | 251,982 | |
Culp, Inc. | | | | | 1,780 | | | | 36,401 | |
Deckers Outdoor Corp. | | * | | | 6,235 | | | | 526,608 | |
Fifth & Pacific Cos., Inc. | | * | | | 21,977 | | | | 704,802 | |
Fossil Group, Inc. | | * | | | 9,528 | | | | 1,142,788 | |
G-III Apparel Group Ltd. | | * | | | 3,293 | | | | 242,990 | |
Hanesbrands, Inc. | | | | | 18,560 | | | | 1,304,211 | |
Iconix Brand Group, Inc. | | * | | | 10,387 | | | | 412,364 | |
Jones Group, Inc. (The) | | | | | 15,747 | | | | 235,575 | |
Movado Group, Inc. | | | | | 2,952 | | | | 129,917 | |
Oxford Industries, Inc. | | | | | 2,482 | | | | 200,223 | |
Perry Ellis International, Inc. | | * | | | 2,045 | | | | 32,291 | |
Quiksilver, Inc. | | * | | | 22,620 | | | | 198,377 | |
RG Barry Corp. | | | | | 1,580 | | | | 30,494 | |
Skechers U.S.A., Inc., Class A | | * | | | 7,438 | | | | 246,421 | |
Steven Madden Ltd. | | * | | | 11,537 | | | | 422,139 | |
Tumi Holdings, Inc. | | * | | | 8,914 | | | | 201,011 | |
Under Armour, Inc., Class A | | * | | | 15,512 | | | | 1,354,198 | |
Unifi, Inc. | | * | | | 3,223 | | | | 87,794 | |
Vera Bradley, Inc. | | *† | | | 3,595 | | | | 86,424 | |
Vince Holding Corp. | | * | | | 1,928 | | | | 59,132 | |
Wolverine World Wide, Inc. | | | | | 18,384 | | | | 624,321 | |
| | | | | | | | | | | | |
| | | | | | | | | | | 9,510,322 | |
| | | | | | | | | | | | |
| Thrifts & Mortgage Finance—1.2% | |
Astoria Financial Corp. | | | | | 17,289 | | | | 239,107 | |
Banc of California, Inc. | | | | | 3,678 | | | | 49,322 | |
Bank Mutual Corp. | | | | | 9,174 | | | | 64,310 | |
BankFinancial Corp. | | | | | 3,338 | | | | 30,576 | |
BBX Capital Corp., Class A | | * | | | 1,182 | | | | 18,439 | |
See accompanying notes to financial statements
331
SCHEDULE OF INVESTMENTS—(Continued)
December 31, 2013
| | | | | | | | | | | | |
Vantagepoint Mid/Small
Company Index Fund | | | | Shares | | | Value | |
| | | | | | | | | | | | |
| COMMON STOCKS—(Continued) | |
Beneficial Mutual Bancorp, Inc. | | * | | | 7,279 | | | $ | 79,487 | |
Berkshire Hills Bancorp, Inc. | | | | | 4,121 | | | | 112,380 | |
BofI Holding, Inc. | | * | | | 2,398 | | | | 188,075 | |
Brookline Bancorp, Inc. | | | | | 13,692 | | | | 131,032 | |
Capitol Federal Financial, Inc. | | | | | 26,548 | | | | 321,496 | |
Charter Financial Corp. | | | | | 5,539 | | | | 59,655 | |
Clifton Savings Bancorp, Inc. | | | | | 1,464 | | | | 18,739 | |
Dime Community Bancshares, Inc. | | | | | 5,399 | | | | 91,351 | |
Doral Financial Corp. (Puerto Rico) | | * | | | 1,389 | | | | 21,752 | |
ESB Financial Corp. | | | | | 2,032 | | | | 28,854 | |
ESSA Bancorp, Inc. | | | | | 2,018 | | | | 23,328 | |
Essent Group Ltd. (Bermuda) | | * | | | 3,799 | | | | 91,404 | |
EverBank Financial Corp. | | | | | 14,911 | | | | 273,468 | |
Federal Agricultural Mortgage Corp., Class C | | | | | 2,090 | | | | 71,583 | |
First Defiance Financial Corp. | | | | | 1,548 | | | | 40,202 | |
First Financial Northwest, Inc. | | | | | 4,938 | | | | 51,207 | |
Flagstar Bancorp, Inc. | | * | | | 3,160 | | | | 61,999 | |
Fox Chase Bancorp, Inc. | | | | | 2,827 | | | | 49,133 | |
Franklin Financial Corp. | | * | | | 2,537 | | | | 50,182 | |
Hingham Institution for Savings | | | | | 216 | | | | 16,954 | |
Home Bancorp, Inc. | | * | | | 1,026 | | | | 19,340 | |
Home Loan Servicing Solutions Ltd. (Cayman Islands) | | | | | 13,537 | | | | 310,945 | |
HomeStreet, Inc. | | | | | 1,829 | | | | 36,580 | |
Hudson City Bancorp, Inc. | | | | | 99,851 | | | | 941,595 | |
Kearny Financial Corp. | | * | | | 3,008 | | | | 34,983 | |
Meridian Interstate Bancorp, Inc. | | * | | | 2,252 | | | | 50,850 | |
Meta Financial Group, Inc. | | | | | 883 | | | | 35,611 | |
MGIC Investment Corp. | | * | | | 59,562 | | | | 502,703 | |
NASB Financial, Inc. | | | | | 529 | | | | 15,976 | |
Nationstar Mortgage Holdings, Inc. | | *† | | | 4,170 | | | | 154,123 | |
Northfield Bancorp, Inc. | | | | | 11,875 | | | | 156,750 | |
Northwest Bancshares, Inc. | | | | | 16,950 | | | | 250,521 | |
OceanFirst Financial Corp. | | | | | 3,947 | | | | 67,612 | |
Ocwen Financial Corp. | | * | | | 19,245 | | | | 1,067,135 | |
Oritani Financial Corp. | | | | | 8,540 | | | | 137,067 | |
PennyMac Financial Services, Inc., Class A | | * | | | 2,032 | | | | 35,662 | |
People’s United Financial, Inc. | | | | | 57,625 | | | | 871,290 | |
Provident Financial Holdings, Inc. | | | | | 1,454 | | | | 21,810 | |
Provident Financial Services, Inc. | | | | | 11,086 | | | | 214,182 | |
Radian Group, Inc. | | | | | 31,780 | | | | 448,734 | |
Rockville Financial, Inc. | | | | | 4,636 | | | | 65,878 | |
Stonegate Mortgage Corp. | | *† | | | 1,368 | | | | 22,613 | |
Territorial Bancorp, Inc. | | | | | 1,756 | | | | 40,739 | |
TFS Financial Corp. | | * | | | 13,499 | | | | 163,540 | |
Tree.com, Inc. | | * | | | 1,518 | | | | 49,851 | |
TrustCo Bank Corp. NY | | | | | 15,928 | | | | 114,363 | |
United Community Financial Corp./OH | | * | | | 6,335 | | | | 22,616 | |
| | | | | | | | | | | | |
| | | | |
| | | | | | Shares | | | | Value | |
| | | | | | | | | | | | |
United Financial Bancorp, Inc. | | | | | 3,096 | | | $ | 58,483 | |
Walker & Dunlop, Inc. | | * | | | 2,337 | | | | 37,789 | |
Washington Federal, Inc. | | | | | 19,186 | | | | 446,842 | |
Waterstone Financial, Inc. | | * | | | 1,236 | | | | 13,720 | |
Westfield Financial, Inc. | | | | | 3,887 | | | | 28,997 | |
WSFS Financial Corp. | | | | | 1,658 | | | | 128,545 | |
| | | | | | | | | | | | |
| | | | | | | | | | | 8,751,480 | |
| | | | | | | | | | | | |
| Tobacco—0.1% | | | | | | | | | | | | |
Alliance One International, Inc. | | * | | | 16,723 | | | | 51,005 | |
Universal Corp. | | † | | | 4,071 | | | | 222,277 | |
Vector Group Ltd. | | † | | | 12,325 | | | | 201,760 | |
| | | | | | | | | | | | |
| | | | | | | | | | | 475,042 | |
| | | | | | | | | | | | |
| Trading Companies & Distributors—1.0% | | | | | | | | | | | | |
Aceto Corp. | | | | | 4,950 | | | | 123,799 | |
Air Lease Corp. | | | | | 13,434 | | | | 417,529 | |
Aircastle Ltd. | | | | | 12,914 | | | | 247,432 | |
Applied Industrial Technologies, Inc. | | | | | 8,098 | | | | 397,531 | |
Beacon Roofing Supply, Inc. | | * | | | 8,899 | | | | 358,452 | |
BlueLinx Holdings, Inc. | | * | | | 7,803 | | | | 15,216 | |
CAI International, Inc. | | * | | | 2,855 | | | | 67,292 | |
DXP Enterprises, Inc. | | * | | | 1,862 | | | | 214,502 | |
GATX Corp. | | | | | 8,813 | | | | 459,774 | |
H&E Equipment Services, Inc. | | * | | | 5,923 | | | | 175,498 | |
HD Supply Holdings, Inc. | | * | | | 11,871 | | | | 285,023 | |
Houston Wire & Cable Co. | | | | | 3,458 | | | | 46,268 | |
Kaman Corp. | | | | | 5,326 | | | | 211,602 | |
MRC Global, Inc. | | * | | | 15,142 | | | | 488,481 | |
MSC Industrial Direct Co., Inc., Class A | | | | | 8,612 | | | | 696,452 | |
Rush Enterprises, Inc., Class A | | * | | | 5,884 | | | | 174,461 | |
Stock Building Supply Holdings, Inc. | | * | | | 2,416 | | | | 44,020 | |
TAL International Group, Inc. | | † | | | 6,450 | | | | 369,908 | |
Textainer Group Holdings Ltd. (Bermuda) | | † | | | 4,142 | | | | 166,591 | |
Titan Machinery, Inc. | | *† | | | 2,896 | | | | 51,607 | |
United Rentals, Inc. | | * | | | 17,467 | | | | 1,361,553 | |
Watsco, Inc. | | | | | 4,911 | | | | 471,751 | |
WESCO International, Inc. | | * | | | 8,362 | | | | 761,527 | |
| | | | | | | | | | | | |
| | | | | | | | | | | 7,606,269 | |
| | | | | | | | | | | | |
| Transportation Infrastructure—0.0% | |
Wesco Aircraft Holdings, Inc. | | * | | | 6,864 | | | | 150,459 | |
| | | | | | | | | | | | |
| Water Utilities—0.4% | |
American States Water Co. | | | | | 7,394 | | | | 212,430 | |
American Water Works Co., Inc. | | | | | 32,873 | | | | 1,389,213 | |
Aqua America, Inc. | | | | | 32,739 | | | | 772,313 | |
Artesian Resources Corp., Class A | | | | | 1,201 | | | | 27,563 | |
California Water Service Group | | | | | 9,216 | | | | 212,613 | |
Connecticut Water Service, Inc. | | | | | 2,093 | | | | 74,322 | |
See accompanying notes to financial statements
332
SCHEDULE OF INVESTMENTS—(Continued)
December 31, 2013
| | | | | | | | | | | | | | |
Vantagepoint Mid/Small
Company Index Fund | | | | | Shares | | | Value | |
| | | | | | | | | | | | | | |
| COMMON STOCKS—(Continued) | |
Consolidated Water Co. Ltd. (Cayman Islands) | | | | | | 2,318 | | | $ | 32,684 | |
Middlesex Water Co. | | | | | | 2,518 | | | | 52,727 | |
Pure Cycle Corp. | | | *† | | | 2,739 | | | | 17,338 | |
SJW Corp. | | | | | | 2,960 | | | | 88,178 | |
York Water Co. | | | | | | 2,142 | | | | 44,832 | |
| | | | | | | | | | | | | | |
| | | | | | | | | | | | | 2,924,213 | |
| | | | | | | | | | | | | | |
| Wireless Telecommunication Services—0.1% | |
Boingo Wireless, Inc. | | | * | | | 3,174 | | | | 20,345 | |
Leap Wireless International, Inc. | | | * | | | 10,198 | | | | 177,445 | |
NII Holdings, Inc. | | | *† | | | 29,822 | | | | 82,011 | |
NTELOS Holdings Corp. | | | | | | 2,906 | | | | 58,788 | |
RingCentral, Inc., Class A | | | * | | | 1,445 | | | | 26,545 | |
Shenandoah Telecommunications Co. | | | | | | 4,013 | | | | 103,014 | |
Telephone & Data Systems, Inc. | | | | | | 17,675 | | | | 455,662 | |
United States Cellular Corp. | | | | | | 2,164 | | | | 90,498 | |
USA Mobility, Inc. | | | | | | 3,582 | | | | 51,151 | |
| | | | | | | | | | | | | | |
| | | | | | | | | | | | | 1,065,459 | |
| | | | | | | | | | | | | | |
| TOTAL COMMON STOCKS | | | | | | | | |
(Cost $500,109,721) | | | | | | | 705,134,227 | |
| | | | | | | | | | | | | | |
| | | | | | | | | | | | | | | |
| | | | |
Coupon
Rate | |
| Maturity
Date |
| | | | | Face | | | | Value | |
| U.S. TREASURY OBLIGATIONS—0.1% | |
| U.S. Treasury Bills—0.1% | |
U.S. Treasury Bill | | | | | | | | | | | |
0.075% | | | 06/26/2014 | | | ‡‡ | | $ | 620,000 | | | | 619,759 | |
0.044% | | | 03/13/2014 | | | ‡‡ | | | 165,000 | | | | 164,988 | |
| | | | | | | | | | | | | | |
| | | | | | | | | | | | | 784,747 | |
| | | | | | | | | | | | | | |
| TOTAL U.S. TREASURY OBLIGATIONS | |
(Cost $784,761) | | | | | | | | | | 784,747 | |
| | | | | | | | | | | | | | |
| | | | | | | | | | | | | | | |
| | | | |
| | | | | | | | | | Shares | | | | Value | |
| RIGHTS—0.0% | |
| Machinery—0.0% | |
Gerber Scientific, Inc. | | | *‡d | | | 3,478 | | | | — | |
| | | | | | | | | | | | | | |
| Oil, Gas & Consumable Fuels—0.0% | |
EXCO Resources, Inc., Expires 01/09/2014 | | | *† | | | 25,463 | | | | 4,074 | |
| | | | | | | | | | | | | | |
| Pharmaceuticals—0.0% | |
Forest Laboratories, Inc. | | | *‡ | | | 2,916 | | | | 1,604 | |
| | | | | | | | | | | | | | |
| Textiles, Apparel & Luxury Goods—0.0% | |
Mossimo, Inc. | | | *‡d | | | 2,807 | | | | — | |
| | | | | | | | | | | | | | |
| TOTAL RIGHTS | | | | | |
(Cost $—) | | | | | | | 5,678 | |
| | | | | | | | | | | | | | |
| | | | | | | | | | | | |
| | | | |
| | | | | | Shares | | | | Value | |
| | | | | | | | | | | | |
| WARRANTS—0.0% | | | | | | | | | | | | |
| Communications Equipment—0.0% | |
Pegasus Wireless Corp. | | *‡d | | | 200 | | | $ | — | |
| | | | | | | | | | | | |
| Oil, Gas & Consumable Fuels—0.0% | |
Magnum Hunter Resources Corp., Expires 04/15/2016, Strike $1.00 | | *†‡ | | | 2,734 | | | | 3,199 | |
| | | | | | | | | | | | |
| TOTAL WARRANTS | | | | | | | | |
(Cost $—) | | | | | | | 3,199 | |
| | | | | | | | | | | | |
| | | | | | | | | | | | | |
| MONEY MARKET FUNDS—8.2% | |
| Institutional Money Market Funds—8.2% | |
Dreyfus Institutional Cash Advantage Fund, 0.06% | | ††¥ | | | 7,350,000 | | | | 7,350,000 | |
Fidelity Institutional Money Market: Money Market Portfolio—Institutional Class, 0.07% | | ¥ | | | 13,705,295 | | | | 13,705,296 | |
Fidelity Institutional Money Market: Money Market Portfolio—Institutional Class, 0.07% | | ††¥ | | | 8,440,289 | | | | 8,440,289 | |
Fidelity Institutional Money Market: Prime Money Market Portfolio—Institutional Class, 0.04% | | ††¥ | | | 7,350,000 | | | | 7,350,000 | |
Short-Term Investments Trust Liquid Assets Portfolio—Institutional Class, 0.07% | | ††¥ | | | 7,350,000 | | | | 7,350,000 | |
Wells Fargo Advantage Cash Investment Money Market Fund—Select Class, 0.06% | | ††¥ | | | 7,350,000 | | | | 7,350,000 | |
Wells Fargo Advantage Heritage Money Market Fund—Select Class, 0.06% | | ††¥ | | | 7,350,000 | | | | 7,350,000 | |
| | | | | | | | | | | | |
| TOTAL MONEY MARKET FUNDS | |
(Cost $58,895,585) | | | | | | | | | 58,895,585 | |
| | | | | | | | | | | | |
| TOTAL INVESTMENTS—106.1% | |
(Cost $559,790,067) | | | | | | | | | 764,823,436 | |
Other assets less liabilities—(6.1%) | | | | (43,976,895 | ) |
| | | | | | | | | | | | |
| NET ASSETS—100.0% | | | | | | | | $ | 720,846,541 | |
| | | | | | | | | | | | |
Notes to the Schedule of Investments:
| | |
| REIT | | Real Estate Investment Trust |
| * | | Non-income producing. |
| † | | Denotes all or a portion of the security on loan. |
| d | | Security has no market value at December 31, 2013. |
| ‡ | | Security valued at fair value as determined by policies approved by the Board of Directors. (Total Market Value $10,822) |
| ‡‡ | | Security or a portion of the security has been pledged as collateral for futures contracts and/or options contracts. |
| †† | | Represents reinvestment of collateral received in conjunction with securities lending. |
| ¥ | | The rate quoted is the annualized seven-day yield of the fund at period end. |
See accompanying notes to financial statements
333
SCHEDULE OF INVESTMENTS
December 31, 2013
| | | | | | | | | | | | |
Vantagepoint Overseas
Equity Index Fund | | | | Shares | | | Value | |
| COMMON STOCKS—98.2% | | | | | |
| Australia—7.3% | | | | | | | | | | |
AGL Energy Ltd. | | | | | 12,177 | | | $ | 163,693 | |
ALS Ltd. | | | | | 9,199 | | | | 72,575 | |
Alumina Ltd. | | * | | | 55,712 | | | | 55,312 | |
Amcor Ltd. | | | | | 27,599 | | | | 260,694 | |
AMP Ltd. | | | | | 64,050 | | | | 251,744 | |
APA Group | | | | | 20,321 | | | | 109,066 | |
Asciano Ltd. | | | | | 20,252 | | | | 104,408 | |
ASX Ltd. | | | | | 4,313 | | | | 141,833 | |
Aurizon Holdings Ltd. | | | | | 43,743 | | | | 191,049 | |
Australia & New Zealand Banking Group Ltd. | | | | | 60,507 | | | | 1,746,730 | |
Bank of Queensland Ltd. | | | | | 6,134 | | | | 66,781 | |
Bendigo and Adelaide Bank Ltd. | | † | | | 9,416 | | | | 98,982 | |
BHP Billiton Ltd. | | | | | 70,875 | | | | 2,416,337 | |
Boral Ltd. | | † | | | 17,810 | | | | 76,167 | |
Brambles Ltd. | | | | | 33,965 | | | | 278,274 | |
Caltex Australia Ltd. | | | | | 2,894 | | | | 52,008 | |
CFS Retail Property Trust Group REIT | | | | | 47,514 | | | | 82,707 | |
Coca-Cola Amatil Ltd. | | | | | 11,996 | | | | 129,048 | |
Cochlear Ltd. | | † | | | 1,448 | | | | 76,291 | |
Commonwealth Bank of Australia | | | | | 35,574 | | | | 2,478,694 | |
Computershare Ltd. | | | | | 10,442 | | | | 106,408 | |
Crown Resorts Ltd. | | | | | 9,289 | | | | 140,150 | |
CSL Ltd. | | | | | 10,699 | | | | 659,560 | |
Dexus Property Group REIT | | | | | 114,468 | | | | 102,951 | |
Echo Entertainment Group Ltd. | | | | | 19,164 | | | | 42,214 | |
Federation Centres Ltd. REIT | | | | | 29,361 | | | | 61,547 | |
Flight Centre Travel Group Ltd. | | † | | | 1,102 | | | | 46,933 | |
Fortescue Metals Group Ltd. | | † | | | 34,217 | | | | 178,744 | |
Goodman Group REIT | | | | | 36,901 | | | | 156,341 | |
GPT Group REIT | | | | | 38,412 | | | | 116,817 | |
Harvey Norman Holdings Ltd. | | † | | | 10,998 | | | | 31,123 | |
Iluka Resources Ltd. | | † | | | 8,956 | | | | 69,400 | |
Incitec Pivot Ltd. | | | | | 36,840 | | | | 88,377 | |
Insurance Australia Group Ltd. | | | | | 47,574 | | | | 247,701 | |
Leighton Holdings Ltd. | | | | | 3,887 | | | | 56,135 | |
Lend Lease Group | | | | | 12,847 | | | | 128,209 | |
Macquarie Group Ltd. | | | | | 6,287 | | | | 308,583 | |
Metcash Ltd. | | | | | 22,706 | | | | 64,122 | |
Mirvac Group REIT | | | | | 80,365 | | | | 120,846 | |
National Australia Bank Ltd. | | | | | 51,791 | | | | 1,616,503 | |
Newcrest Mining Ltd. | | | | | 17,344 | | | | 121,795 | |
Orica Ltd. | | | | | 8,537 | | | | 182,553 | |
Origin Energy Ltd. | | | | | 23,882 | | | | 300,976 | |
Orora Ltd. | | * | | | 27,599 | | | | 28,586 | |
Qantas Airways Ltd. | | * | | | 24,422 | | | | 23,956 | |
QBE Insurance Group Ltd. | | | | | 27,279 | | | | 281,402 | |
Ramsay Health Care Ltd. | | | | | 3,118 | | | | 120,671 | |
REA Group Ltd. | | | | | 1,010 | | | | 34,115 | |
Rio Tinto Ltd. | | | | | 9,669 | | | | 591,812 | |
Santos Ltd. | | | | | 21,571 | | | | 282,707 | |
Seek Ltd. | | | | | 7,951 | | | | 95,590 | |
Sonic Healthcare Ltd. | | | | | 7,976 | | | | 118,368 | |
| | | | | | | | | | | | |
| | | | |
| | | | | Shares | | | Value | |
SP AusNet | | | | | 35,545 | | | $ | 39,582 | |
Stockland REIT | | † | | | 53,247 | | | | 172,154 | |
Suncorp Group Ltd. | | | | | 28,036 | | | | 329,083 | |
Sydney Airport | | | | | 23,555 | | | | 80,055 | |
Tabcorp Holdings Ltd. | | | | | 17,824 | | | | 57,871 | |
Tatts Group Ltd. | | | | | 29,615 | | | | 82,106 | |
Telstra Corp. Ltd. | | | | | 96,860 | | | | 454,623 | |
Toll Holdings Ltd. | | | | | 13,967 | | | | 71,038 | |
Transurban Group | | | | | 30,231 | | | | 184,875 | |
Treasury Wine Estates Ltd. | | | | | 12,953 | | | | 55,866 | |
Wesfarmers Ltd. | | | | | 21,974 | | | | 865,181 | |
Westfield Group REIT | | | | | 45,074 | | | | 406,898 | |
Westfield Retail Trust REIT | | | | | 65,659 | | | | 174,432 | |
Westpac Banking Corp. | | | | | 68,468 | | | | 1,984,797 | |
Woodside Petroleum Ltd. | | | | | 14,636 | | | | 509,750 | |
Woolworths Ltd. | | | | | 28,029 | | | | 848,756 | |
WorleyParsons Ltd. | | | | | 4,768 | | | | 70,927 | |
| | | | | | | | | | |
| | | | | | | | | | | 21,765,582 | |
| | | | | | | | | | | | |
| Austria—0.3% | | | | | | | | | | |
Andritz AG | | † | | | 1,731 | | | | 108,480 | |
Erste Group Bank AG | | | | | 5,834 | | | | 203,376 | |
IMMOFINANZ AG | | * | | | 22,198 | | | | 102,861 | |
OMV AG | | | | | 3,271 | | | | 156,620 | |
Raiffeisen Bank International AG | | | | | 930 | | | | 32,839 | |
Telekom Austria AG | | | | | 4,876 | | | | 36,940 | |
Vienna Insurance Group AG Wiener Versicherung Gruppe | | | | | 952 | | | | 47,579 | |
Voestalpine AG | | | | | 2,547 | | | | 122,394 | |
| | | | | | | | | | |
| | | | | | | | | | | 811,089 | |
| | | | | | | | | | | | |
| Belgium—1.2% | | | | | | | | | | |
Ageas | | | | | 5,094 | | | | 217,226 | |
Anheuser-Busch InBev NV | | | | | 17,725 | | | | 1,884,810 | |
Belgacom SA | | | | | 3,304 | | | | 97,773 | |
Colruyt SA | | | | | 1,560 | | | | 87,163 | |
Delhaize Group SA | | | | | 2,269 | | | | 134,987 | |
Groupe Bruxelles Lambert SA | | | | | 1,702 | | | | 156,348 | |
Groupe Bruxelles Lambert SA STRIP VVPR | | *‡d | | | 127 | | | | — | |
KBC Groep NV | | | | | 5,505 | | | | 312,990 | |
Solvay SA | | | | | 1,276 | | | | 201,952 | |
Telenet Group Holding NV | | | | | 1,140 | | | | 68,064 | |
UCB SA | | | | | 2,456 | | | | 182,976 | |
Umicore SA | | | | | 2,564 | | | | 119,802 | |
| | | | | | | | | | |
| | | | | | | | | | | 3,464,091 | |
| | | | | | | | | | | | |
| Bermuda—0.1% | | | | | | | | | | |
Seadrill Ltd. | | | | | 8,376 | | | | 343,286 | |
| | | | | | | | | | |
| China—0.0% | | | | | | | | | | |
Yangzijiang Shipbuilding Holdings Ltd. | | | | | 53,000 | | | | 49,882 | |
| | | | | | | | | | |
| Denmark—1.2% | | | | | | | | | | |
A.P. Moller-Maersk A/S, Class A | | | | | 12 | | | | 123,612 | |
A.P. Moller-Maersk A/S, Class B | | | | | 29 | | | | 313,837 | |
Carlsberg A/S, Class B | | | | | 2,349 | | | | 259,926 | |
Coloplast A/S, Class B | | | | | 2,584 | | | | 171,308 | |
Danske Bank A/S | | * | | | 14,344 | | | | 329,506 | |
See accompanying notes to financial statements
334
SCHEDULE OF INVESTMENTS—(Continued)
December 31, 2013
| | | | | | | | | | | | |
Vantagepoint Overseas
Equity Index Fund | | | | Shares | | | Value | |
| COMMON STOCKS—(Continued) | | | | | |
DSV A/S | | | | | 3,830 | | | $ | 125,748 | |
Novo Nordisk A/S, Class B | | | | | 8,781 | | | | 1,610,042 | |
Novozymes A/S, Class B | | | | | 5,104 | | | | 215,594 | |
TDC A/S | | | | | 16,300 | | | | 158,185 | |
Tryg A/S | | | | | 491 | | | | 47,480 | |
William Demant Holding A/S | | * | | | 482 | | | | 46,824 | |
| | | | | | | | | | |
| | | | | | | | | | | 3,402,062 | |
| | | | | | | | | | | | |
| Finland—0.9% | | | | | | | | | | |
Elisa Oyj | | | | | 3,556 | | | | 94,300 | |
Fortum Oyj | | | | | 10,216 | | | | 233,504 | |
Kone Oyj, Class B | | † | | | 6,800 | | | | 306,671 | |
Metso Oyj | | † | | | 3,020 | | | | 129,141 | |
Neste Oil Oyj | | | | | 3,215 | | | | 63,581 | |
Nokia Oyj | | * | | | 82,247 | | | | 664,556 | |
Nokian Renkaat Oyj | | | | | 2,497 | | | | 119,742 | |
Orion Oyj, Class B | | | | | 2,366 | | | | 66,501 | |
Pohjola Bank plc, Class A | | | | | 3,375 | | | | 67,671 | |
Sampo, Class A | | | | | 9,333 | | | | 458,742 | |
Stora Enso Oyj, Class R | | | | | 12,981 | | | | 130,443 | |
UPM-Kymmene Oyj | | | | | 12,193 | | | | 206,794 | |
Wartsila Oyj Abp | | | | | 3,825 | | | | 188,577 | |
| | | | | | | | | | |
| | | | | | | | | | | 2,730,223 | |
| | | | | | | | | | | | |
| France—9.6% | | | | | | | | | | |
Accor SA | | | | | 3,556 | | | | 167,950 | |
Aeroports de Paris | | | | | 710 | | | | 80,621 | |
Air Liquide SA | | | | | 6,899 | | | | 976,442 | |
Alcatel-Lucent | | * | | | 54,619 | | | | 242,384 | |
Alstom SA | | | | | 4,650 | | | | 169,569 | |
Arkema SA | | | | | 1,446 | | | | 168,832 | |
AtoS | | | | | 1,515 | | | | 137,265 | |
AXA SA | | | | | 39,507 | | | | 1,100,176 | |
BNP Paribas SA | | | | | 21,953 | | | | 1,712,494 | |
Bouygues SA | | | | | 4,268 | | | | 161,398 | |
Bureau Veritas SA | | † | | | 4,918 | | | | 143,580 | |
Cap Gemini SA | | | | | 3,325 | | | | 225,054 | |
Carrefour SA | | | | | 13,646 | | | | 541,655 | |
Casino Guichard Perrachon SA | | | | | 1,263 | | | | 145,733 | |
CGG SA | | *† | | | 3,682 | | | | 63,901 | |
Christian Dior SA | | | | | 1,168 | | | | 221,080 | |
Cie de Saint-Gobain | | | | | 9,023 | | | | 497,051 | |
Cie Generale des Etablissements Michelin | | | | | 4,066 | | | | 432,625 | |
CNP Assurances | | | | | 3,589 | | | | 73,597 | |
Credit Agricole SA | | * | | | 22,015 | | | | 282,209 | |
Danone SA | | | | | 12,494 | | | | 901,341 | |
Dassault Systemes SA | | | | | 1,458 | | | | 181,042 | |
Edenred | | | | | 4,650 | | | | 155,693 | |
Electricite de France SA | | | | | 5,483 | | | | 193,973 | |
Essilor International SA | | | | | 4,528 | | | | 481,813 | |
Eurazeo SA | | | | | 672 | | | | 52,704 | |
European Aeronautic Defence and Space Co. NV | | | | | 13,125 | | | | 1,007,609 | |
Eutelsat Communications SA | | | | | 3,163 | | | | 98,693 | |
Fonciere Des Regions REIT | | | | | 530 | | | | 45,752 | |
GDF Suez | | | | | 29,154 | | | | 685,686 | |
Gecina SA REIT | | | | | 463 | | | | 61,304 | |
Groupe Eurotunnel SA (Registered) | | | | | 12,467 | | | | 131,069 | |
| | | | | | | | | | | | |
| | | | |
| | | | | Shares | | | Value | |
ICADE REIT | | | | | 860 | | | $ | 80,058 | |
Iliad SA | | | | | 568 | | | | 116,378 | |
Imerys SA | | | | | 759 | | | | 66,069 | |
JCDecaux SA | | | | | 1,658 | | | | 68,448 | |
Kering | | | | | 1,685 | | | | 356,176 | |
Klepierre REIT | | | | | 2,095 | | | | 97,108 | |
Lafarge SA | | | | | 4,083 | | | | 306,470 | |
Lagardere SCA | | | | | 2,409 | | | | 89,551 | |
Legrand SA | | | | | 5,801 | | | | 319,708 | |
L’Oreal SA | | | | | 5,321 | | | | 934,437 | |
LVMH Moet Hennessy Louis Vuitton SA | | | | | 5,589 | | | | 1,021,077 | |
Natixis | | | | | 19,877 | | | | 116,941 | |
Orange SA | | | | | 41,287 | | | | 512,584 | |
Pernod Ricard SA | | | | | 4,707 | | | | 536,274 | |
Publicis Groupe SA | | | | | 3,953 | | | | 362,195 | |
Remy Cointreau SA | | † | | | 585 | | | | 49,140 | |
Renault SA | | | | | 4,294 | | | | 345,566 | |
Rexel SA | | | | | 4,637 | | | | 121,692 | |
Safran SA | | | | | 5,996 | | | | 416,893 | |
Sanofi | | | | | 26,357 | | | | 2,814,794 | |
Schneider Electric SA | | | | | 11,866 | | | | 1,035,208 | |
SCOR SE | | | | | 3,478 | | | | 127,213 | |
Societe BIC SA | | | | | 579 | | | | 70,959 | |
Societe Generale SA | | | | | 15,960 | | | | 928,082 | |
Sodexo | | | | | 2,173 | | | | 220,359 | |
Suez Environnement Co. | | | | | 6,656 | | | | 119,363 | |
Technip SA | | | | | 2,285 | | | | 219,956 | |
Thales SA | | | | | 2,014 | | | | 129,789 | |
Total SA | | | | | 47,219 | | | | 2,898,277 | |
Unibail-Rodamco SE (Paris Exchange) REIT | | | | | 2,183 | | | | 559,414 | |
Valeo SA | | | | | 1,403 | | | | 155,482 | |
Vallourec SA | | | | | 2,319 | | | | 126,516 | |
Veolia Environnement SA | | | | | 7,983 | | | | 130,382 | |
Vinci SA | | | | | 10,629 | | | | 698,658 | |
Vivendi SA | | | | | 26,419 | | | | 696,865 | |
Wendel SA | | | | | 697 | | | | 101,596 | |
Zodiac Aerospace | | † | | | 770 | | | | 136,452 | |
| | | | | | | | | | |
| | | | | | | | | | | 28,626,425 | |
| | | | | | | | | | | | |
| Germany—8.7% | | | | | | | | | | |
Adidas AG | | | | | 4,645 | | | | 592,321 | |
Allianz SE (Registered) | | | | | 10,056 | | | | 1,809,333 | |
Axel Springer SE | | | | | 720 | | | | 46,354 | |
BASF SE | | | | | 20,265 | | | | 2,162,963 | |
Bayer AG (Registered) | | | | | 18,251 | | | | 2,562,635 | |
Bayerische Motoren Werke AG | | | | | 7,328 | | | | 860,547 | |
Beiersdorf AG | | | | | 2,318 | | | | 235,010 | |
Brenntag AG | | | | | 1,169 | | | | 216,962 | |
Celesio AG | | † | | | 2,112 | | | | 66,965 | |
Commerzbank AG | | * | | | 21,269 | | | | 343,354 | |
Continental AG | | | | | 2,412 | | | | 529,891 | |
Daimler AG (Registered) | | | | | 21,229 | | | | 1,842,349 | |
Deutsche Bank AG (Registered) | | | | | 22,447 | | | | 1,078,386 | |
Deutsche Boerse AG | | | | | 4,217 | | | | 349,480 | |
Deutsche Lufthansa AG (Registered) | | * | | | 5,181 | | | | 109,819 | |
Deutsche Post AG (Registered) | | | | | 19,928 | | | | 727,870 | |
Deutsche Telekom AG (Registered) | | | | | 64,329 | | | | 1,108,401 | |
See accompanying notes to financial statements
335
SCHEDULE OF INVESTMENTS—(Continued)
December 31, 2013
| | | | | | | | | | | | |
Vantagepoint Overseas
Equity Index Fund | | | | Shares | | | Value | |
| COMMON STOCKS—(Continued) | | | | | |
Deutsche Wohnen AG | | | | | 6,646 | | | $ | 128,329 | |
E.ON SE | | | | | 39,578 | | | | 731,715 | |
Fraport AG Frankfurt Airport Services Worldwide | | | | | 826 | | | | 61,897 | |
Fresenius Medical Care AG & Co. KGaA | | | | | 4,912 | | | | 350,352 | |
Fresenius SE & Co. KGaA | | | | | 2,785 | | | | 428,262 | |
GEA Group AG | | | | | 3,970 | | | | 189,311 | |
Hannover Rueck SE | | | | | 1,362 | | | | 117,092 | |
HeidelbergCement AG | | | | | 3,165 | | | | 240,335 | |
Henkel AG & Co. KGaA | | | | | 2,922 | | | | 304,645 | |
Hochtief AG | | | | | 766 | | | | 65,556 | |
Hugo Boss AG | | | | | 710 | | | | 101,123 | |
Infineon Technologies AG | | | | | 23,785 | | | | 254,060 | |
K+S AG (Registered) | | † | | | 3,611 | | | | 111,265 | |
Kabel Deutschland Holding AG | | | | | 485 | | | | 62,969 | |
Lanxess AG | | | | | 1,821 | | | | 121,678 | |
Linde AG | | | | | 4,096 | | | | 857,646 | |
MAN SE | | | | | 786 | | | | 96,520 | |
Merck KGaA | | | | | 1,385 | | | | 248,508 | |
Metro AG | | | | | 2,787 | | | | 135,113 | |
Muenchener Rueckversicherungs AG (Registered) | | | | | 3,967 | | | | 875,001 | |
OSRAM Licht AG | | * | | | 1,704 | | | | 96,201 | |
ProSiebenSat.1 Media AG (Registered) | | | | | 3,911 | | | | 194,204 | |
RWE AG | | | | | 11,109 | | | | 407,023 | |
SAP AG | | | | | 20,319 | | | | 1,762,097 | |
Siemens AG (Registered) | | | | | 17,498 | | | | 2,399,302 | |
Sky Deutschland AG | | * | | | 8,411 | | | | 92,967 | |
Suedzucker AG | | | | | 1,523 | | | | 41,144 | |
Telefonica Deutschland Holding AG | | | | | 5,613 | | | | 46,389 | |
ThyssenKrupp AG | | * | | | 10,097 | | | | 246,216 | |
United Internet AG (Registered) | | | | | 2,133 | | | | 90,930 | |
Volkswagen AG | | † | | | 642 | | | | 174,315 | |
| | | | | | | | | | |
| | | | | | | | | | | 25,674,805 | |
| | | | | | | | | | | | |
| Guernsey, Channel Islands—0.1% | | | | | |
Resolution Ltd. | | | | | 32,337 | | | | 189,811 | |
| | | | | | | | | | |
| Hong Kong—2.6% | | | | | | | | | | |
AIA Group Ltd. | | | | | 265,400 | | | | 1,335,888 | |
ASM Pacific Technology Ltd. | | | | | 5,500 | | | | 46,067 | |
Bank of East Asia Ltd. | | | | | 27,720 | | | | 117,672 | |
BOC Hong Kong Holdings Ltd. | | | | | 84,500 | | | | 271,385 | |
Cathay Pacific Airways Ltd. | | | | | 23,000 | | | | 48,734 | |
Cheung Kong Holdings Ltd. | | | | | 31,000 | | | | 490,444 | |
Cheung Kong Infrastructure Holdings Ltd. | | | | | 14,000 | | | | 88,496 | |
CLP Holdings Ltd. | | | | | 38,500 | | | | 304,510 | |
First Pacific Co. Ltd. | | | | | 47,250 | | | | 53,874 | |
Galaxy Entertainment Group Ltd. | | * | | | 46,000 | | | | 414,150 | |
Hang Lung Properties Ltd. | | | | | 49,000 | | | | 155,325 | |
Hang Seng Bank Ltd. | | | | | 16,700 | | | | 271,234 | |
Henderson Land Development Co. Ltd. | | | | | 23,900 | | | | 136,635 | |
| | | | | | | | | | | | |
| | | | |
| | | | | Shares | | | Value | |
HKT Trust/HKT Ltd. | | | | | 45,000 | | | $ | 44,526 | |
Hong Kong & China Gas Co. Ltd. | | | | | 128,514 | | | | 295,066 | |
Hong Kong Exchanges and Clearing Ltd. | | | | | 24,900 | | | | 416,212 | |
Hopewell Holdings Ltd. | | | | | 11,000 | | | | 37,299 | |
Hutchison Whampoa Ltd. | | | | | 47,000 | | | | 640,411 | |
Hysan Development Co. Ltd. | | | | | 16,000 | | | | 69,068 | |
Kerry Properties Ltd. | | | | | 15,500 | | | | 53,970 | |
Li & Fung Ltd. | | † | | | 125,200 | | | | 161,836 | |
Link (The) REIT | | | | | 51,500 | | | | 249,778 | |
MTR Corp. Ltd. | | | | | 30,000 | | | | 113,706 | |
New World Development Co. Ltd. | | | | | 86,900 | | | | 110,038 | |
Noble Group Ltd. | | | | | 95,309 | | | | 81,169 | |
NWS Holdings Ltd. | | | | | 26,500 | | | | 40,448 | |
PCCW Ltd. | | | | | 84,000 | | | | 37,623 | |
Power Assets Holdings Ltd. | | | | | 30,500 | | | | 242,794 | |
Shangri-La Asia Ltd. | | | | | 34,000 | | | | 66,386 | |
Sino Land Co. Ltd. | | | | | 67,000 | | | | 91,883 | |
SJM Holdings Ltd. | | | | | 43,000 | | | | 144,543 | |
Sun Hung Kai Properties Ltd. | | | | | 36,000 | | | | 457,537 | |
Swire Pacific Ltd., Class A | | | | | 15,000 | | | | 176,245 | |
Swire Properties Ltd. | | | | | 23,400 | | | | 59,257 | |
Wharf Holdings Ltd. | | | | | 33,637 | | | | 257,664 | |
Wheelock & Co. Ltd. | | | | | 19,000 | | | | 87,531 | |
Yue Yuen Industrial Holdings Ltd. | | | | | 14,000 | | | | 46,812 | |
| | | | | | | | | | |
| | | | | | | | | | | 7,716,216 | |
| | | | | | | | | | | | |
| Ireland—0.6% | | | | | | | | | | |
Bank of Ireland | | * | | | 424,026 | | | | 147,784 | |
CRH plc | | | | | 16,213 | | | | 410,868 | |
Experian plc | | | | | 22,488 | | | | 415,407 | |
Irish Bank Resolution Corp. Ltd. | | *‡d | | | 11,206 | | | | — | |
James Hardie Industries plc CDI | | | | | 9,395 | | | | 109,036 | |
Kerry Group plc, Class A | | | | | 3,295 | | | | 229,084 | |
Shire plc | | | | | 12,394 | | | | 584,095 | |
| | | | | | | | | | |
| | | | | | | | | | | 1,896,274 | |
| | | | | | | | | | | | |
| Israel—0.4% | | | | | | | | | | |
Bank Hapoalim BM | | | | | 22,018 | | | | 123,369 | |
Bank Leumi Le-Israel BM | | * | | | 25,559 | | | | 104,373 | |
Bezeq Israeli Telecommunication Corp. Ltd. | | | | | 45,959 | | | | 77,940 | |
Delek Group Ltd. | | | | | 117 | | | | 44,692 | |
Israel Chemicals Ltd. | | | | | 9,457 | | | | 78,882 | |
Israel Corp. Ltd. (The) | | * | | | 66 | �� | | | 34,755 | |
Mizrahi Tefahot Bank Ltd. | | | | | 3,622 | | | | 47,409 | |
NICE Systems Ltd. | | | | | 1,431 | | | | 58,518 | |
Teva Pharmaceutical Industries Ltd. | | | | | 18,791 | | | | 751,854 | |
| | | | | | | | | | |
| | | | | | | | | | | 1,321,792 | |
| | | | | | | | | | | | |
| Italy—2.0% | | | | | | | | | | |
Assicurazioni Generali SpA | | | | | 25,923 | | | | 609,042 | |
Atlantia SpA | | † | | | 7,578 | | | | 169,746 | |
Banca Monte dei Paschi di Siena SpA | | *† | | | 100,790 | | | | 24,258 | |
See accompanying notes to financial statements
336
SCHEDULE OF INVESTMENTS—(Continued)
December 31, 2013
| | | | | | | | | | | | |
Vantagepoint Overseas
Equity Index Fund | | | | Shares | | | Value | |
| COMMON STOCKS—(Continued) | | | | | |
Enel Green Power SpA | | | | | 39,986 | | | $ | 100,598 | |
Enel SpA | | | | | 144,508 | | | | 630,546 | |
Eni SpA | | | | | 56,060 | | | | 1,354,615 | |
Exor SpA | | | | | 2,150 | | | | 85,454 | |
Fiat SpA | | * | | | 18,972 | | | | 155,285 | |
Finmeccanica SpA | | * | | | 10,305 | | | | 78,220 | |
Intesa Sanpaolo SpA | | | | | 258,184 | | | | 635,056 | |
Luxottica Group SpA | | | | | 3,654 | | | | 195,823 | |
Mediobanca SpA | | * | | | 12,327 | | | | 107,797 | |
Pirelli & C. SpA | | | | | 4,877 | | | | 84,373 | |
Prysmian SpA | | | | | 4,169 | | | | 107,340 | |
Saipem SpA | | | | | 6,092 | | | | 130,647 | |
Snam SpA | | | | | 44,592 | | | | 249,241 | |
Telecom Italia SpA | | | | | 217,256 | | | | 216,638 | |
Telecom Italia SpA RSP | | | | | 146,457 | | | | 114,916 | |
Terna Rete Elettrica Nazionale SpA | | | | | 32,722 | | | | 163,416 | |
UniCredit SpA | | | | | 96,215 | | | | 709,744 | |
Unione di Banche Italiane ScpA | | | | | 20,529 | | | | 139,172 | |
| | | | | | | | | | |
| | | | | | | | | | | 6,061,927 | |
| | | | | | | | | | | | |
| Japan—20.7% | | | | | | | | | | |
ABC-Mart, Inc. | | | | | 600 | | | | 26,213 | |
Acom Co. Ltd. | | * | | | 8,000 | | | | 27,258 | |
Advantest Corp. | | | | | 2,800 | | | | 34,889 | |
Aeon Co. Ltd. | | | | | 13,000 | | | | 176,237 | |
Aeon Credit Service Co. Ltd. | | | | | 1,400 | | | | 37,542 | |
Aeon Mall Co. Ltd. | | | | | 2,640 | | | | 73,955 | |
Air Water, Inc. | | | | | 3,000 | | | | 40,659 | |
Aisin Seiki Co. Ltd. | | | | | 4,400 | | | | 178,887 | |
Ajinomoto Co., Inc. | | | | | 13,000 | | | | 188,197 | |
Alfresa Holdings Corp. | | | | | 900 | | | | 44,671 | |
Amada Co. Ltd. | | | | | 9,000 | | | | 79,482 | |
ANA Holdings, Inc. | | | | | 26,000 | | | | 51,945 | |
Aozora Bank Ltd. | | | | | 27,000 | | | | 76,515 | |
Asahi Glass Co. Ltd. | | | | | 22,000 | | | | 136,989 | |
Asahi Group Holdings Ltd. | | | | | 8,700 | | | | 245,511 | |
Asahi Kasei Corp. | | | | | 27,000 | | | | 211,783 | |
Asics Corp. | | | | | 3,900 | | | | 66,660 | |
Astellas Pharma, Inc. | | | | | 9,675 | | | | 573,600 | |
Bank of Kyoto Ltd. (The) | | | | | 8,000 | | | | 66,878 | |
Bank of Yokohama Ltd. (The) | | | | | 27,000 | | | | 150,639 | |
Benesse Holdings, Inc. | | | | | 1,700 | | | | 68,296 | |
Bridgestone Corp. | | | | | 14,700 | | | | 556,937 | |
Brother Industries Ltd. | | | | | 4,600 | | | | 62,921 | |
Calbee, Inc. | | | | | 2,000 | | | | 48,571 | |
Canon, Inc. | | † | | | 25,100 | | | | 800,901 | |
Casio Computer Co. Ltd. | | | | | 4,500 | | | | 55,142 | |
Central Japan Railway Co. | | | | | 3,300 | | | | 388,912 | |
Chiba Bank Ltd. (The) | | | | | 16,000 | | | | 107,978 | |
Chiyoda Corp. | | | | | 3,000 | | | | 43,550 | |
Chubu Electric Power Co., Inc. | | | | | 14,200 | | | | 183,575 | |
Chugai Pharmaceutical Co. Ltd. | | | | | 5,200 | | | | 115,102 | |
Chugoku Bank Ltd. (The) | | | | | 4,000 | | | | 50,841 | |
Chugoku Electric Power Co., Inc. (The) | | | | | 6,000 | | | | 93,422 | |
Citizen Holdings Co. Ltd. | | | | | 5,200 | | | | 43,873 | |
Coca-Cola West Holdings Co. Ltd. | | | | | 1,200 | | | | 25,416 | |
| | | | | | | | | | | | |
| | | | |
| | | | | Shares | | | Value | |
Credit Saison Co. Ltd. | | | | | 3,800 | | | $ | 100,176 | |
Dai Nippon Printing Co. Ltd. | | | | | 13,000 | | | | 138,088 | |
Daicel Corp. | | | | | 7,000 | | | | 57,049 | |
Daido Steel Co. Ltd. | | | | | 6,000 | | | | 29,860 | |
Daihatsu Motor Co. Ltd. | | | | | 4,000 | | | | 67,851 | |
Dai-ichi Life Insurance Co. Ltd. (The) | | | | | 18,600 | | | | 311,234 | |
Daiichi Sankyo Co. Ltd. | | | | | 14,702 | | | | 268,826 | |
Daikin Industries Ltd. | | | | | 5,100 | | | | 318,254 | |
Dainippon Sumitomo Pharma Co. Ltd. | | | | | 3,000 | | | | 46,989 | |
Daito Trust Construction Co. Ltd. | | | | | 1,700 | | | | 158,930 | |
Daiwa House Industry Co. Ltd. | | | | | 13,000 | | | | 251,878 | |
Daiwa Securities Group, Inc. | | | | | 37,000 | | | | 370,575 | |
Dena Co. Ltd. | | † | | | 2,100 | | | | 44,269 | |
Denso Corp. | | | | | 10,700 | | | | 565,267 | |
Dentsu, Inc. | | | | | 4,900 | | | | 200,403 | |
Don Quijote Holdings Co. Ltd. | | | | | 1,100 | | | | 66,682 | |
East Japan Railway Co. | | | | | 7,400 | | | | 589,468 | |
Eisai Co. Ltd. | | | | | 5,400 | | | | 209,288 | |
Electric Power Development Co. Ltd. | | | | | 2,440 | | | | 71,143 | |
FamilyMart Co. Ltd. | | † | | | 1,200 | | | | 54,824 | |
FANUC Corp. | | | | | 4,300 | | | | 787,935 | |
Fast Retailing Co. Ltd. | | | | | 1,200 | | | | 495,627 | |
Fuji Electric Co. Ltd. | | | | | 14,000 | | | | 65,596 | |
Fuji Heavy Industries Ltd. | | | | | 13,000 | | | | 373,606 | |
FUJIFILM Holdings Corp. | | | | | 10,200 | | | | 289,527 | |
Fujitsu Ltd. | | * | | | 41,000 | | | | 212,490 | |
Fukuoka Financial Group, Inc. | | | | | 17,000 | | | | 74,621 | |
Gree, Inc. | | † | | | 1,800 | | | | 17,747 | |
GungHo Online Entertainment, Inc. | | *† | | | 7,000 | | | | 50,421 | |
Gunma Bank Ltd. (The) | | | | | 8,000 | | | | 44,699 | |
Hachijuni Bank Ltd. (The) | | | | | 11,000 | | | | 64,215 | |
Hakuhodo DY Holdings, Inc. | | | | | 4,800 | | | | 37,213 | |
Hamamatsu Photonics KK | | | | | 1,400 | | | | 56,021 | |
Hankyu Hanshin Holdings, Inc. | | | | | 25,000 | | | | 135,087 | |
Hino Motors Ltd. | | | | | 6,000 | | | | 94,516 | |
Hirose Electric Co. Ltd. | | | | | 630 | | | | 89,807 | |
Hiroshima Bank Ltd. (The) | | | | | 10,000 | | | | 41,437 | |
Hisamitsu Pharmaceutical Co., Inc. | | | | | 1,200 | | | | 60,471 | |
Hitachi Chemical Co. Ltd. | | | | | 2,300 | | | | 36,681 | |
Hitachi Construction Machinery Co. Ltd. | | † | | | 2,300 | | | | 49,216 | |
Hitachi High-Technologies Corp. | | | | | 1,100 | | | | 27,695 | |
Hitachi Ltd. | | | | | 107,000 | | | | 811,290 | |
Hitachi Metals Ltd. | | | | | 5,000 | | | | 70,746 | |
Hokkaido Electric Power Co., Inc. | | * | | | 4,400 | | | | 50,634 | |
Hokuhoku Financial Group, Inc. | | | | | 24,007 | | | | 47,998 | |
Hokuriku Electric Power Co. | | | | | 4,400 | | | | 59,754 | |
Honda Motor Co. Ltd. | | | | | 35,900 | | | | 1,481,849 | |
HOYA Corp. | | | | | 9,400 | | | | 261,432 | |
See accompanying notes to financial statements
337
SCHEDULE OF INVESTMENTS—(Continued)
December 31, 2013
| | | | | | | | | | | | |
Vantagepoint Overseas
Equity Index Fund | | | | Shares | | | Value | |
| COMMON STOCKS—(Continued) | | | | | |
Hulic Co. Ltd. | | | | | 6,400 | | | $ | 94,715 | |
Ibiden Co. Ltd. | | † | | | 2,200 | | | | 41,195 | |
Idemitsu Kosan Co. Ltd. | | | | | 2,400 | | | | 54,638 | |
IHI Corp. | | | | | 30,000 | | | | 129,739 | |
Iida Group Holdings Co. Ltd. | | * | | | 2,900 | | | | 57,884 | |
INPEX Corp. | | | | | 20,200 | | | | 259,089 | |
Isetan Mitsukoshi Holdings Ltd. | | | | | 7,540 | | | | 107,337 | |
Isuzu Motors Ltd. | | | | | 25,000 | | | | 155,924 | |
ITOCHU Corp. | | | | | 33,500 | | | | 414,148 | |
Itochu Techno-Solutions Corp. | | | | | 600 | | | | 24,320 | |
Iyo Bank Ltd. (The) | | | | | 5,100 | | | | 50,036 | |
J. Front Retailing Co. Ltd. | | | | | 10,600 | | | | 80,415 | |
Japan Airlines Co. Ltd. | | | | | 1,200 | | | | 59,198 | |
Japan Exchange Group, Inc. | | | | | 5,800 | | | | 164,859 | |
Japan Petroleum Exploration Co. | | | | | 500 | | | | 18,963 | |
Japan Prime Realty Investment Corp. REIT | | | | | 16 | | | | 51,206 | |
Japan Real Estate Investment Corp. REIT | | | | | 28 | | | | 149,802 | |
Japan Retail Fund Investment Corp. REIT | | | | | 50 | | | | 101,735 | |
Japan Steel Works Ltd. (The) | | | | | 6,000 | | | | 33,621 | |
Japan Tobacco, Inc. | | | | | 24,300 | | | | 790,692 | |
JFE Holdings, Inc. | | | | | 10,800 | | | | 257,365 | |
JGC Corp. | | | | | 4,000 | | | | 156,975 | |
Joyo Bank Ltd. (The) | | | | | 16,000 | | | | 81,811 | |
JSR Corp. | | | | | 4,300 | | | | 83,347 | |
JTEKT Corp. | | | | | 4,700 | | | | 80,196 | |
JX Holdings, Inc. | | | | | 51,410 | | | | 264,733 | |
Kajima Corp. | | | | | 21,000 | | | | 78,981 | |
Kakaku.com, Inc. | | | | | 2,800 | | | | 49,186 | |
Kamigumi Co. Ltd. | | | | | 5,000 | | | | 45,877 | |
Kaneka Corp. | | | | | 6,000 | | | | 39,397 | |
Kansai Electric Power Co., Inc. (The) | | * | | | 14,900 | | | | 171,489 | |
Kansai Paint Co. Ltd. | | | | | 5,000 | | | | 73,940 | |
Kao Corp. | | | | | 11,700 | | | | 368,337 | |
Kawasaki Heavy Industries Ltd. | | | | | 33,000 | | | | 138,593 | |
KDDI Corp. | | | | | 11,900 | | | | 733,222 | |
Keikyu Corp. | | | | | 11,000 | | | | 90,696 | |
Keio Corp. | | | | | 13,000 | | | | 86,632 | |
Keisei Electric Railway Co. Ltd. | | | | | 7,000 | | | | 64,410 | |
Keyence Corp. | | | | | 972 | | | | 416,196 | |
Kikkoman Corp. | | | | | 4,000 | | | | 75,633 | |
Kinden Corp. | | | | | 2,000 | | | | 20,939 | |
Kintetsu Corp. | | | | | 42,000 | | | | 147,372 | |
Kirin Holdings Co. Ltd. | | | | | 19,000 | | | | 273,628 | |
Kobe Steel Ltd. | | * | | | 54,000 | | | | 92,577 | |
Koito Manufacturing Co. Ltd. | | | | | 2,000 | | | | 38,215 | |
Komatsu Ltd. | | | | | 20,800 | | | | 427,051 | |
Konami Corp. | | | | | 2,000 | | | | 46,248 | |
Konica Minolta, Inc. | | | | | 10,500 | | | | 104,930 | |
Kubota Corp. | | | | | 24,000 | | | | 398,094 | |
Kuraray Co. Ltd. | | | | | 8,100 | | | | 96,688 | |
Kurita Water Industries Ltd. | | | | | 2,700 | | | | 56,012 | |
Kyocera Corp. | | | | | 7,400 | | | | 369,938 | |
| | | | | | | | | | | | |
| | | | |
| | | | | Shares | | | Value | |
Kyowa Hakko Kirin Co. Ltd. | | | | | 5,000 | | | $ | 55,175 | |
Kyushu Electric Power Co., Inc. | | * | | | 9,300 | | | | 118,778 | |
Lawson, Inc. | | | | | 1,500 | | | | 112,254 | |
LIXIL Group Corp. | | | | | 5,900 | | | | 161,969 | |
M3, Inc. | | | | | 18 | | | | 45,079 | |
Mabuchi Motor Co. Ltd. | | | | | 700 | | | | 41,655 | |
Makita Corp. | | | | | 2,600 | | | | 136,741 | |
Marubeni Corp. | | | | | 38,000 | | | | 273,565 | |
Marui Group Co. Ltd. | | | | | 5,400 | | | | 54,925 | |
Maruichi Steel Tube Ltd. | | | | | 1,000 | | | | 25,259 | |
Mazda Motor Corp. | | * | | | 59,000 | | | | 305,742 | |
McDonald’s Holdings Co. Japan Ltd. | | † | | | 1,400 | | | | 35,751 | |
Medipal Holdings Corp. | | | | | 2,800 | | | | 36,964 | |
MEIJI Holdings Co. Ltd. | | | | | 1,502 | | | | 96,544 | |
Miraca Holdings, Inc. | | | | | 1,300 | | | | 61,329 | |
Mitsubishi Chemical Holdings Corp. | | | | | 28,500 | | | | 131,890 | |
Mitsubishi Corp. | | | | | 31,100 | | | | 597,055 | |
Mitsubishi Electric Corp. | | | | | 43,000 | | | | 540,702 | |
Mitsubishi Estate Co. Ltd. | | | | | 27,411 | | | | 820,303 | |
Mitsubishi Gas Chemical Co., Inc. | | | | | 9,000 | | | | 66,346 | |
Mitsubishi Heavy Industries Ltd. | | | | | 69,000 | | | | 427,356 | |
Mitsubishi Logistics Corp. | | | | | 3,000 | | | | 47,491 | |
Mitsubishi Materials Corp. | | | | | 26,000 | | | | 96,108 | |
Mitsubishi Motors Corp. | | * | | | 9,400 | | | | 101,128 | |
Mitsubishi Tanabe Pharma Corp. | | | | | 4,600 | | | | 64,156 | |
Mitsubishi UFJ Financial Group, Inc. | | | | | 281,140 | | | | 1,866,600 | |
Mitsubishi UFJ Lease & Finance Co. Ltd. | | | | | 11,800 | | | | 72,545 | |
Mitsui & Co. Ltd. | | | | | 38,600 | | | | 538,128 | |
Mitsui Chemicals, Inc. | | | | | 21,000 | | | | 50,778 | |
Mitsui Fudosan Co. Ltd. | | | | | 18,000 | | | | 649,272 | |
Mitsui OSK Lines Ltd. | | | | | 23,000 | | | | 103,803 | |
Mizuho Financial Group, Inc. | | | | | 505,980 | | | | 1,098,499 | |
MS&AD Insurance Group Holdings | | | | | 11,074 | | | | 297,658 | |
Murata Manufacturing Co. Ltd. | | | | | 4,500 | | | | 400,200 | |
Nabtesco Corp. | | | | | 2,600 | | | | 60,005 | |
Namco Bandai Holdings, Inc. | | | | | 3,850 | | | | 85,480 | |
NEC Corp. | | | | | 54,000 | | | | 121,889 | |
Nexon Co. Ltd. | | | | | 2,100 | | | | 19,404 | |
NGK Insulators Ltd. | | | | | 6,000 | | | | 114,185 | |
NGK Spark Plug Co. Ltd. | | | | | 4,000 | | | | 94,803 | |
NHK Spring Co. Ltd. | | | | | 3,000 | | | | 33,896 | |
Nidec Corp. | | | | | 2,200 | | | | 216,732 | |
Nikon Corp. | | | | | 7,100 | | | | 135,686 | |
Nintendo Co. Ltd. | | | | | 2,300 | | | | 307,863 | |
Nippon Building Fund, Inc. REIT | | | | | 30 | | | | 174,306 | |
Nippon Electric Glass Co. Ltd. | | | | | 7,500 | | | | 39,399 | |
Nippon Express Co. Ltd. | | | | | 16,000 | | | | 77,450 | |
Nippon Meat Packers, Inc. | | | | | 4,000 | | | | 68,750 | |
Nippon Paint Co. Ltd. | | | | | 3,000 | | | | 49,914 | |
Nippon Prologis REIT, Inc. REIT | | | | | 5 | | | | 47,895 | |
See accompanying notes to financial statements
338
SCHEDULE OF INVESTMENTS—(Continued)
December 31, 2013
| | | | | | | | | | | | |
Vantagepoint Overseas
Equity Index Fund | | | | Shares | | | Value | |
| COMMON STOCKS—(Continued) | | | | | |
Nippon Steel & Sumitomo Metal Corp. | | | | | 167,245 | | | $ | 560,907 | |
Nippon Telegraph & Telephone Corp. | | | | | 8,200 | | | | 441,655 | |
Nippon Yusen K.K. | | | | | 38,000 | | | | 121,502 | |
Nishi-Nippon City Bank Ltd. (The) | | | | | 15,000 | | | | 40,409 | |
Nissan Motor Co. Ltd. | | | | | 56,300 | | | | 471,794 | |
Nisshin Seifun Group, Inc. | | | | | 4,620 | | | | 47,781 | |
Nissin Foods Holdings Co. Ltd. | | | | | 1,500 | | | | 63,302 | |
Nitori Holdings Co. Ltd. | | | | | 700 | | | | 66,274 | |
Nitto Denko Corp. | | | | | 3,600 | | | | 152,225 | |
NKSJ Holdings, Inc. | | | | | 7,775 | | | | 216,406 | |
NOK Corp. | | | | | 2,000 | | | | 32,758 | |
Nomura Holdings, Inc. | | | | | 79,700 | | | | 615,907 | |
Nomura Real Estate Holdings, Inc. | | | | | 2,500 | | | | 56,332 | |
Nomura Real Estate Office Fund, Inc. REIT | | | | | 10 | | | | 46,476 | |
Nomura Research Institute Ltd. | | | | | 2,150 | | | | 67,946 | |
NSK Ltd. | | | | | 10,000 | | | | 124,623 | |
NTT Data Corp. | | | | | 2,600 | | | | 96,053 | |
NTT DOCOMO, Inc. | | | | | 33,900 | | | | 558,207 | |
NTT Urban Development Corp. | | | | | 2,400 | | | | 27,665 | |
Obayashi Corp. | | | | | 16,000 | | | | 91,260 | |
Odakyu Electric Railway Co. Ltd. | | | | | 13,000 | | | | 117,570 | |
Oji Holdings Corp. | | | | | 18,000 | | | | 92,329 | |
Olympus Corp. | | * | | | 5,100 | | | | 161,755 | |
Omron Corp. | | | | | 4,700 | | | | 207,708 | |
Ono Pharmaceutical Co. Ltd. | | | | | 1,900 | | | | 166,545 | |
Oracle Corp. Japan | | | | | 900 | | | | 32,899 | |
Oriental Land Co. Ltd. | | | | | 1,100 | | | | 158,635 | |
ORIX Corp. | | | | | 27,400 | | | | 481,469 | |
Osaka Gas Co. Ltd. | | | | | 41,000 | | | | 161,032 | |
Otsuka Corp. | | | | | 300 | | | | 38,326 | |
Otsuka Holdings Co. Ltd. | | | | | 7,900 | | | | 228,104 | |
Panasonic Corp. | | | | | 49,100 | | | | 572,369 | |
Park24 Co. Ltd. | | | | | 2,000 | | | | 37,718 | |
Rakuten, Inc. | | | | | 16,400 | | | | 244,744 | |
Resona Holdings, Inc. | | | | | 41,500 | | | | 211,752 | |
Ricoh Co. Ltd. | | | | | 14,000 | | | | 148,887 | |
Rinnai Corp. | | | | | 800 | | | | 62,327 | |
Rohm Co. Ltd. | | | | | 2,100 | | | | 102,432 | |
Sankyo Co. Ltd. | | | | | 1,300 | | | | 59,957 | |
Sanrio Co. Ltd. | | | | | 900 | | | | 37,897 | |
Santen Pharmaceutical Co. Ltd. | | | | | 1,700 | | | | 79,207 | |
SBI Holdings, Inc. | | | | | 4,710 | | | | 71,518 | |
Secom Co. Ltd. | | | | | 4,700 | | | | 283,574 | |
Sega Sammy Holdings, Inc. | | | | | 4,048 | | | | 103,164 | |
Sekisui Chemical Co. Ltd. | | | | | 9,000 | | | | 110,444 | |
Sekisui House Ltd. | | | | | 12,000 | | | | 167,918 | |
Seven & I Holdings Co. Ltd. | | | | | 16,740 | | | | 666,527 | |
Seven Bank Ltd. | | | | | 12,200 | | | | 47,715 | |
Sharp Corp. | | * | | | 35,000 | | | | 111,437 | |
Shikoku Electric Power Co., Inc. | | * | | | 3,600 | | | | 53,987 | |
Shimadzu Corp. | | | | | 5,000 | | | | 43,530 | |
| | | | | | | | | | | | |
| | | | |
| | | | | Shares | | | Value | |
Shimamura Co. Ltd. | | | | | 500 | | | $ | 46,868 | |
Shimano, Inc. | | | | | 1,700 | | | | 145,944 | |
Shimizu Corp. | | | | | 13,000 | | | | 65,690 | |
Shin-Etsu Chemical Co. Ltd. | | | | | 9,100 | | | | 532,253 | |
Shinsei Bank Ltd. | | | | | 37,000 | | | | 90,572 | |
Shionogi & Co. Ltd. | | | | | 7,000 | | | | 151,968 | |
Shiseido Co. Ltd. | | | | | 8,000 | | | | 128,651 | |
Shizuoka Bank Ltd. (The) | | | | | 13,000 | | | | 138,858 | |
Showa Denko K.K. | | | | | 32,000 | | | | 45,386 | |
Showa Shell Sekiyu K.K. | | | | | 4,400 | | | | 44,726 | |
SMC Corp. | | | | | 1,100 | | | | 277,627 | |
SoftBank Corp. | | | | | 21,200 | | | | 1,860,316 | |
Sojitz Corp. | | | | | 26,800 | | | | 47,715 | |
Sony Corp. | | | | | 22,500 | | | | 387,862 | |
Sony Financial Holdings, Inc. | | | | | 3,400 | | | | 61,933 | |
Stanley Electric Co. Ltd. | | | | | 3,200 | | | | 73,362 | |
Sumco Corp. | | | | | 1,900 | | | | 16,762 | |
Sumitomo Chemical Co. Ltd. | | | | | 32,000 | | | | 125,595 | |
Sumitomo Corp. | | | | | 25,100 | | | | 315,460 | |
Sumitomo Electric Industries Ltd. | | | | | 16,600 | | | | 277,486 | |
Sumitomo Heavy Industries Ltd. | | | | | 12,000 | | | | 55,294 | |
Sumitomo Metal Mining Co. Ltd. | | | | | 11,000 | | | | 144,136 | |
Sumitomo Mitsui Financial Group, Inc. | | | | | 28,000 | | | | 1,456,095 | |
Sumitomo Mitsui Trust Holdings, Inc. | | | | | 72,740 | | | | 384,883 | |
Sumitomo Realty & Development Co. Ltd. | | | | | 7,500 | | | | 373,706 | |
Sumitomo Rubber Industries Ltd. | | | | | 3,600 | | | | 51,245 | |
Suntory Beverage & Food Ltd. | | † | | | 2,600 | | | | 82,945 | |
Suruga Bank Ltd. | | | | | 4,000 | | | | 71,829 | |
Suzuken Co. Ltd. | | | | | 1,460 | | | | 47,294 | |
Suzuki Motor Corp. | | | | | 7,800 | | | | 210,184 | |
Sysmex Corp. | | | | | 1,500 | | | | 88,598 | |
T&D Holdings, Inc. | | | | | 12,500 | | | | 174,957 | |
Taiheiyo Cement Corp. | | | | | 27,000 | | | | 103,835 | |
Taisei Corp. | | | | | 20,000 | | | | 91,018 | |
Taisho Pharmaceutical Holdings Co. Ltd. | | | | | 690 | | | | 47,430 | |
Taiyo Nippon Sanso Corp. | | | | | 5,000 | | | | 35,603 | |
Takashimaya Co. Ltd. | | | | | 7,000 | | | | 69,844 | |
Takeda Pharmaceutical Co. Ltd. | | | | | 17,320 | | | | 794,383 | |
TDK Corp. | | | | | 2,600 | | | | 124,732 | |
Teijin Ltd. | | | | | 19,000 | | | | 42,321 | |
Terumo Corp. | | | | | 3,500 | | | | 168,979 | |
THK Co. Ltd. | | | | | 2,500 | | | | 62,439 | |
Tobu Railway Co. Ltd. | | | | | 22,000 | | | | 106,677 | |
Toho Co. Ltd. | | | | | 2,400 | | | | 52,799 | |
Toho Gas Co. Ltd. | | | | | 9,000 | | | | 43,811 | |
Tohoku Electric Power Co., Inc. | | * | | | 10,100 | | | | 113,778 | |
Tokio Marine Holdings, Inc. | | | | | 15,400 | | | | 515,433 | |
Tokyo Electric Power Co., Inc. | | * | | | 31,900 | | | | 157,174 | |
Tokyo Electron Ltd. | | | | | 3,700 | | | | 203,880 | |
Tokyo Gas Co. Ltd. | | | | | 55,000 | | | | 271,079 | |
Tokyo Tatemono Co. Ltd. | | † | | | 8,351 | | | | 92,863 | |
See accompanying notes to financial statements
339
SCHEDULE OF INVESTMENTS—(Continued)
December 31, 2013
| | | | | | | | | | | | |
Vantagepoint Overseas
Equity Index Fund | | | | Shares | | | Value | |
| COMMON STOCKS—(Continued) | | | | | |
Tokyu Corp. | | | | | 24,000 | | | $ | 155,499 | |
Tokyu Fudosan Holdings Corp. | | * | | | 12,400 | | | | 116,570 | |
TonenGeneral Sekiyu K.K. | | † | | | 7,000 | | | | 64,232 | |
Toppan Printing Co. Ltd. | | | | | 12,000 | | | | 96,055 | |
Toray Industries, Inc. | | | | | 32,000 | | | | 221,664 | |
Toshiba Corp. | | | | | 92,000 | | | | 387,303 | |
TOTO Ltd. | | | | | 6,000 | | | | 95,167 | |
Toyo Seikan Group Holdings Ltd. | | | | | 3,400 | | | | 73,196 | |
Toyo Suisan Kaisha Ltd. | | | | | 2,000 | | | | 60,082 | |
Toyoda Gosei Co. Ltd. | | | | | 1,200 | | | | 27,955 | |
Toyota Boshoku Corp. | | | | | 1,400 | | | | 17,505 | |
Toyota Industries Corp. | | | | | 3,700 | | | | 167,257 | |
Toyota Motor Corp. | | | | | 60,900 | | | | 3,713,383 | |
Toyota Tsusho Corp. | | | | | 5,000 | | | | 123,994 | |
Trend Micro, Inc. | | | | | 2,200 | | | | 77,095 | |
Tsumura & Co. | | | | | 1,500 | | | | 39,750 | |
Ube Industries Ltd. | | | | | 21,000 | | | | 44,978 | |
Unicharm Corp. | | | | | 2,600 | | | | 148,352 | |
United Urban Investment Corp. REIT | | | | | 57 | | | | 81,928 | |
USS Co. Ltd. | | | | | 4,600 | | | | 63,096 | |
West Japan Railway Co. | | | | | 3,700 | | | | 160,315 | |
Yahoo! Japan Corp. | | | | | 33,100 | | | | 184,579 | |
Yakult Honsha Co. Ltd. | | | | | 1,900 | | | | 96,004 | |
Yamada Denki Co. Ltd. | | | | | 21,200 | | | | 69,345 | |
Yamaguchi Financial Group, Inc. | | | | | 4,000 | | | | 37,093 | |
Yamaha Corp. | | | | | 3,900 | | | | 62,004 | |
Yamaha Motor Co. Ltd. | | † | | | 6,600 | | | | 99,227 | |
Yamato Holdings Co. Ltd. | | | | | 8,100 | | | | 163,809 | |
Yamato Kogyo Co. Ltd. | | | | | 1,200 | | | | 38,378 | |
Yamazaki Baking Co. Ltd. | | | | | 2,000 | | | | 20,516 | |
Yaskawa Electric Corp. | | | | | 5,000 | | | | 79,228 | |
Yokogawa Electric Corp. | | | | | 4,300 | | | | 66,112 | |
Yokohama Rubber Co. Ltd. (The) | | | | | 4,000 | | | | 39,334 | |
| | | | | | | | | | |
| | | | | | | | | | | 61,319,202 | |
| | | | | | | | | | | | |
| Jersey, Channel Islands—0.0% | | | | | | | | |
Randgold Resources Ltd. | | | | | 2,012 | | | | 126,520 | |
| | | | | | | | | | |
| Luxembourg—0.4% | | | | | | | | | | |
ArcelorMittal | | | | | 21,868 | | | | 390,610 | |
Millicom International Cellular SA SDR | | | | | 1,447 | | | | 144,187 | |
RTL Group SA | | | | | 742 | | | | 96,040 | |
SES SA FDR | | | | | 6,694 | | | | 216,861 | |
Tenaris SA | | | | | 10,124 | | | | 220,607 | |
| | | | | | | | | | |
| | | | | | | | | | | 1,068,305 | |
| | | | | | | | | | | | |
| Macau—0.2% | | | | | | | | | | |
MGM China Holdings Ltd. | | | | | 18,400 | | | | 78,750 | |
Sands China Ltd. | | | | | 52,894 | | | | 433,484 | |
Wynn Macau Ltd. | | | | | 36,456 | | | | 165,716 | |
| | | | | | | | | | |
| | | | | | | | | | | 677,950 | |
| | | | | | | | | | | | |
| Malta—0.0% | | | | | | | | | | |
BGP Holdings plc | | *‡d | | | 142,647 | | | | — | |
| | | | | | | | | | |
| Mexico—0.0% | | | | | | | | | | |
Fresnillo plc | | | | | 4,532 | | | | 56,351 | |
| | | | | | | | | | |
| | | | | | | | | | | | |
| | | | |
| | | | | Shares | | | Value | |
| Netherlands—4.5% | | | | | | | | | | |
Aegon NV | | | | | 40,579 | | | $ | 384,548 | |
Akzo Nobel NV | | | | | 5,446 | | | | 422,315 | |
ASML Holding NV | | | | | 7,908 | | | | 740,677 | |
Corio NV REIT | | | | | 1,472 | | | | 66,059 | |
Delta Lloyd NV | | | | | 3,918 | | | | 97,299 | |
Fugro NV CVA | | | | | 1,491 | | | | 88,940 | |
Gemalto NV | | | | | 1,831 | | | | 201,512 | |
Heineken Holding NV | | | | | 2,357 | | | | 149,198 | |
Heineken NV | | | | | 5,139 | | | | 347,328 | |
ING Groep NV CVA | | * | | | 84,541 | | | | 1,180,914 | |
Koninklijke Ahold NV | | | | | 22,480 | | | | 403,991 | |
Koninklijke Boskalis Westminster NV | | | | | 1,837 | | | | 97,166 | |
Koninklijke DSM NV | | | | | 3,384 | | | | 266,315 | |
Koninklijke KPN NV | | * | | | 72,649 | | | | 234,736 | |
Koninklijke Philips NV | | | | | 21,568 | | | | 794,160 | |
Koninklijke Vopak NV | | | | | 1,683 | | | | 98,527 | |
OCI | | * | | | 1,944 | | | | 87,607 | |
Qiagen NV | | * | | | 5,577 | | | | 130,201 | |
Randstad Holding NV | | | | | 2,875 | | | | 186,568 | |
Reed Elsevier NV | | | | | 15,462 | | | | 328,626 | |
Royal Dutch Shell plc, Class A | | | | | 84,368 | | | | 3,023,604 | |
Royal Dutch Shell plc, Class B | | | | | 55,429 | | | | 2,090,792 | |
TNT Express NV | | | | | 8,743 | | | | 81,323 | |
Unilever NV CVA | | | | | 35,904 | | | | 1,443,531 | |
Wolters Kluwer NV | | | | | 6,716 | | | | 191,771 | |
Ziggo NV | | | | | 3,347 | | | | 153,052 | |
| | | | | | | | | | |
| | | | | | | | | | | 13,290,760 | |
| | | | | | | | | | | | |
| New Zealand—0.1% | | | | | | | | | | |
Auckland International Airport Ltd. | | | | | 26,856 | | | | 77,995 | |
Contact Energy Ltd. | | | | | 7,698 | | | | 32,503 | |
Fletcher Building Ltd. | | | | | 16,159 | | | | 113,236 | |
Ryman Healthcare Ltd. | | | | | 7,157 | | | | 46,237 | |
Telecom Corp of New Zealand Ltd. | | | | | 37,893 | | | | 71,928 | |
| | | | | | | | | | |
| | | | | | | | | | | 341,899 | |
| | | | | | | | | | | | |
| Norway—0.7% | | | | | | | | | | |
Aker Solutions ASA | | † | | | 3,966 | | | | 71,006 | |
DnB ASA | | | | | 21,797 | | | | 391,216 | |
Gjensidige Forsikring ASA | | | | | 4,268 | | | | 81,629 | |
Norsk Hydro ASA | | † | | | 28,905 | | | | 129,308 | |
Orkla ASA | | | | | 16,610 | | | | 129,830 | |
Statoil ASA | | | | | 24,770 | | | | 602,320 | |
Telenor ASA | | | | | 14,906 | | | | 356,158 | |
Yara International ASA | | | | | 4,276 | | | | 184,416 | |
| | | | | | | | | | |
| | | | | | | | | | | 1,945,883 | |
| | | | | | | | | | | | |
| Portugal—0.2% | | | | | | | | | | |
Banco Espirito Santo SA (Registered) | | * | | | 36,677 | | | | 52,379 | |
EDP—Energias de Portugal SA | | | | | 44,604 | | | | 163,835 | |
Galp Energia SGPS SA | | | | | 7,587 | | | | 124,346 | |
Jeronimo Martins SGPS SA | | | | | 5,514 | | | | 107,819 | |
Portugal Telecom SGPS SA (Registered) | | | | | 15,686 | | | | 68,288 | |
| | | | | | | | | | |
| | | | | | | | | | | 516,667 | |
| | | | | | | | | | | | |
See accompanying notes to financial statements
340
SCHEDULE OF INVESTMENTS—(Continued)
December 31, 2013
| | | | | | | | | | | | |
Vantagepoint Overseas
Equity Index Fund | | | | Shares | | | Value | |
| COMMON STOCKS—(Continued) | | | | | |
| Singapore—1.4% | | | | | | | | | | |
Ascendas Real Estate Investment Trust REIT | | | | | 41,786 | | | $ | 73,131 | |
CapitaCommercial Trust REIT | | | | | 40,000 | | | | 46,066 | |
CapitaLand Ltd. | | | | | 58,500 | | | | 141,009 | |
CapitaMall Trust REIT | | | | | 54,000 | | | | 81,720 | |
CapitaMalls Asia Ltd. | | | | | 25,000 | | | | 38,965 | |
City Developments Ltd. | | | | | 10,000 | | | | 76,410 | |
ComfortDelGro Corp. Ltd. | | | | | 47,000 | | | | 75,153 | |
DBS Group Holdings Ltd. | | | | | 37,730 | | | | 512,742 | |
Genting Singapore plc | | | | | 132,000 | | | | 156,973 | |
Global Logistic Properties Ltd. | | | | | 70,779 | | | | 162,363 | |
Golden Agri-Resources Ltd. | | | | | 136,320 | | | | 59,013 | |
Hutchison Port Holdings Trust | | | | | 119,000 | | | | 80,423 | |
Jardine Cycle & Carriage Ltd. | | | | | 2,349 | | | | 67,113 | |
Keppel Corp. Ltd. | | | | | 31,400 | | | | 278,915 | |
Keppel Land Ltd. | | | | | 16,000 | | | | 42,470 | |
Olam International Ltd. | | | | | 30,672 | | | | 37,415 | |
Oversea-Chinese Banking Corp. Ltd. | | | | | 57,600 | | | | 466,862 | |
SembCorp Industries Ltd. | | | | | 22,340 | | | | 97,462 | |
Sembcorp Marine Ltd. | | | | | 17,000 | | | | 60,107 | |
Singapore Airlines Ltd. | | | | | 12,400 | | | | 102,420 | |
Singapore Exchange Ltd. | | | | | 20,000 | | | | 115,332 | |
Singapore Press Holdings Ltd. | | | | | 35,500 | | | | 116,005 | |
Singapore Technologies Engineering Ltd. | | | | | 35,000 | | | | 110,156 | |
Singapore Telecommunications Ltd. | | | | | 177,159 | | | | 515,199 | |
StarHub Ltd. | | | | | 12,730 | | | | 43,394 | |
United Overseas Bank Ltd. | | | | | 28,000 | | | | 472,837 | |
UOL Group Ltd. | | | | | 9,000 | | | | 44,297 | |
Wilmar International Ltd. | | | | | 40,000 | | | | 108,651 | |
| | | | | | | | | | |
| | | | | | | | | | | 4,182,603 | |
| | | | | | | | | | | | |
| Spain—3.3% | | | | | | | | | | |
Abertis Infraestructuras SA | | | | | 8,558 | | | | 190,355 | |
ACS Actividades de Construccion y Servicios SA | | | | | 3,542 | | | | 122,098 | |
Amadeus IT Holding SA, Class A | | | | | 8,318 | | | | 356,304 | |
Banco Bilbao Vizcaya Argentaria SA | | | | | 128,711 | | | | 1,592,225 | |
Banco de Sabadell SA | | | | | 78,549 | | | | 205,108 | |
Banco Popular Espanol SA | | * | | | 27,652 | | | | 167,022 | |
Banco Santander SA | | | | | 250,720 | | | | 2,254,600 | |
Bankia SA | | * | | | 86,411 | | | | 146,815 | |
CaixaBank SA | | | | | 37,132 | | | | 193,413 | |
Distribuidora Internacional de Alimentacion SA | | | | | 12,771 | | | | 114,351 | |
Enagas SA | | | | | 4,452 | | | | 116,294 | |
Ferrovial SA | | | | | 8,975 | | | | 173,862 | |
Gas Natural SDG SA | | | | | 7,760 | | | | 199,737 | |
Grifols SA | | | | | 3,344 | | | | 160,022 | |
Iberdrola SA | | | | | 104,756 | | | | 668,528 | |
Inditex SA | | | | | 4,796 | | | | 791,873 | |
| | | | | | | | | | | | |
| | | | |
| | | | | Shares | | | Value | |
Mapfre SA | | | | | 23,259 | | | $ | 99,767 | |
Red Electrica Corp. SA | | | | | 2,484 | | | | 165,831 | |
Repsol SA | | † | | | 19,360 | | | | 488,513 | |
Telefonica SA | | | | | 90,286 | | | | 1,476,246 | |
Zardoya Otis SA | | | | | 3,986 | | | | 72,166 | |
| | | | | | | | | | |
| | | | | | | | | | | 9,755,130 | |
| | | | | | | | | | | | |
| Sweden—3.2% | | | | | | | | | | |
Alfa Laval AB | | | | | 7,040 | | | | 180,880 | |
Assa Abloy AB, Class B | | | | | 7,296 | | | | 386,280 | |
Atlas Copco AB, Class A | | | | | 15,237 | | | | 423,071 | |
Atlas Copco AB, Class B | | | | | 8,814 | | | | 224,063 | |
Boliden AB | | | | | 6,529 | | | | 100,100 | |
Electrolux AB, Series B | | | | | 5,643 | | | | 147,466 | |
Elekta AB, Class B | | † | | | 8,106 | | | | 124,047 | |
Getinge AB, Class B | | | | | 4,683 | | | | 160,524 | |
Hennes & Mauritz AB, Class B | | | | | 20,996 | | | | 967,002 | |
Hexagon AB, Class B | | | | | 5,503 | | | | 174,072 | |
Husqvarna AB, Class B | | | | | 10,183 | | | | 61,316 | |
Industrivarden AB, Class C | | | | | 2,912 | | | | 55,408 | |
Investment AB Kinnevik, Class B | | | | | 5,173 | | | | 239,826 | |
Investor AB, Class B | | | | | 9,958 | | | | 343,188 | |
Lundin Petroleum AB | | * | | | 5,158 | | | | 100,377 | |
Nordea Bank AB | | | | | 67,191 | | | | 905,923 | |
Sandvik AB | | | | | 23,844 | | | | 336,527 | |
Scania AB, Class B | | | | | 7,479 | | | | 146,584 | |
Securitas AB, Class B | | | | | 6,530 | | | | 69,482 | |
Skandinaviska Enskilda Banken AB, Class A | | | | | 33,873 | | | | 447,505 | |
Skanska AB, Class B | | | | | 7,994 | | | | 163,542 | |
SKF AB, Class B | | | | | 8,416 | | | | 220,713 | |
Svenska Cellulosa AB SCA, Class B | | | | | 12,709 | | | | 391,537 | |
Svenska Handelsbanken AB, Class A | | | | | 11,040 | | | | 542,802 | |
Swedbank AB, Class A | | | | | 20,120 | | | | 566,767 | |
Swedish Match AB | | | | | 4,560 | | | | 146,609 | |
Tele2 AB, Class B | | | | | 7,906 | | | | 89,794 | |
Telefonaktiebolaget LM Ericsson, Class B | | | | | 67,274 | | | | 821,382 | |
TeliaSonera AB | | | | | 53,094 | | | | 442,826 | |
Volvo AB, Class B | | | | | 33,419 | | | | 439,740 | |
| | | | | | | | | | |
| | | | | | | | | | | 9,419,353 | |
| | | | | | | | | | | | |
| Switzerland—9.4% | | | | | | | | | | |
ABB Ltd. (Registered) | | * | | | 48,450 | | | | 1,281,019 | |
Actelion Ltd. (Registered) | | * | | | 2,209 | | | | 187,369 | |
Adecco SA (Registered) | | * | | | 3,048 | | | | 241,971 | |
Aryzta AG | | * | | | 2,023 | | | | 155,445 | |
Baloise Holding AG (Registered) | | | | | 1,105 | | | | 140,903 | |
Barry Callebaut AG (Registered) | | * | | | 42 | | | | 52,778 | |
Cie Financiere Richemont SA (Registered) | | | | | 11,497 | | | | 1,148,521 | |
Coca-Cola HBC AG CDI | | * | | | 4,538 | | | | 132,817 | |
Credit Suisse Group AG (Registered) | | * | | | 33,696 | | | | 1,039,972 | |
EMS-Chemie Holding AG (Registered) | | | | | 163 | | | | 58,122 | |
Geberit AG (Registered) | | | | | 833 | | | | 252,716 | |
Givaudan SA (Registered) | | * | | | 191 | | | | 273,238 | |
See accompanying notes to financial statements
341
SCHEDULE OF INVESTMENTS—(Continued)
December 31, 2013
| | | | | | | | | | | | |
Vantagepoint Overseas
Equity Index Fund | | | | Shares | | | Value | |
| COMMON STOCKS—(Continued) | | | | | |
Glencore Xstrata plc | | * | | | 233,731 | | | $ | 1,215,999 | |
Holcim Ltd. (Registered) | | * | | | 4,981 | | | | 372,403 | |
Julius Baer Group Ltd. | | * | | | 4,814 | | | | 231,342 | |
Kuehne + Nagel International AG (Registered) | | | | | 1,232 | | | | 161,933 | |
Lindt & Spruengli AG (Participation Certificates) | | | | | 21 | | | | 94,714 | |
Lindt & Spruengli AG (Registered) | | | | | 2 | | | | 107,945 | |
Lonza Group AG (Registered) | | * | | | 1,286 | | | | 122,213 | |
Nestle SA (Registered) | | | | | 71,235 | | | | 5,220,818 | |
Novartis AG (Registered) | | | | | 50,800 | | | | 4,071,588 | |
Pargesa Holding SA (Bearer) | | | | | 689 | | | | 55,495 | |
Partners Group Holding AG | | | | | 354 | | | | 94,312 | |
Roche Holding AG (Genusschein) | | | | | 15,517 | | | | 4,346,719 | |
Schindler Holding AG (Participation Certificates) | | | | | 1,021 | | | | 150,305 | |
Schindler Holding AG (Registered) | | † | | | 416 | | | | 61,370 | |
SGS SA (Registered) | | | | | 119 | | | | 273,968 | |
Sika AG (Bearer) | | | | | 47 | | | | 167,482 | |
Sonova Holding AG (Registered) | | * | | | 1,063 | | | | 143,340 | |
STMicroelectronics NV | | | | | 13,478 | | | | 108,197 | |
Sulzer AG (Registered) | | | | | 491 | | | | 79,336 | |
Swatch Group AG (The) (Bearer) | | | | | 700 | | | | 463,963 | |
Swatch Group AG (The) (Registered) | | | | | 1,011 | | | | 113,963 | |
Swiss Life Holding AG (Registered) | | * | | | 719 | | | | 149,480 | |
Swiss Prime Site AG (Registered) | | * | | | 1,132 | | | | 87,661 | |
Swiss Re AG | | * | | | 7,738 | | | | 713,354 | |
Swisscom AG (Registered) | | | | | 512 | | | | 270,589 | |
Syngenta AG (Registered) | | | | | 2,059 | | | | 820,917 | |
Transocean Ltd. | | | | | 8,018 | | | | 392,398 | |
UBS AG (Registered) | | * | | | 80,408 | | | | 1,539,600 | |
Wolseley plc | | | | | 5,790 | | | | 329,180 | |
Zurich Insurance Group AG | | * | | | 3,277 | | | | 950,540 | |
| | | | | | | | | | |
| | | | | | | | | | | 27,875,995 | |
| | | | | | | | | | | | |
| United Kingdom—19.1% | | | | | | | | | | |
3i Group plc | | | | | 20,647 | | | | 131,933 | |
Aberdeen Asset Management plc | | | | | 21,473 | | | | 178,562 | |
Admiral Group plc | | | | | 3,873 | | | | 84,188 | |
Aggreko plc | | | | | 5,953 | | | | 168,831 | |
AMEC plc | | | | | 6,987 | | | | 126,149 | |
Anglo American plc | | | | | 30,822 | | | | 674,549 | |
Antofagasta plc | | | | | 8,361 | | | | 114,625 | |
ARM Holdings plc | | | | | 31,088 | | | | 565,269 | |
Associated British Foods plc | | | | | 8,140 | | | | 330,123 | |
AstraZeneca plc (London Exchange) | | | | | 27,619 | | | | 1,638,551 | |
Aviva plc | | | | | 66,758 | | | | 499,447 | |
Babcock International Group plc | | | | | 7,618 | | | | 171,177 | |
BAE Systems plc | | | | | 72,157 | | | | 520,598 | |
Barclays plc | | | | | 336,857 | | | | 1,523,228 | |
BG Group plc | | | | | 75,066 | | | | 1,615,297 | |
| | | | | | | | | | | | |
| | | | |
| | | | | Shares | | | Value | |
BHP Billiton plc | | | | | 46,550 | | | $ | 1,444,443 | |
BP plc | | | | | 416,191 | | | | 3,372,860 | |
British American Tobacco plc | | | | | 41,987 | | | | 2,253,615 | |
British Land Co. plc REIT | | | | | 21,737 | | | | 226,619 | |
British Sky Broadcasting Group plc | | | | | 22,960 | | | | 321,191 | |
BT Group plc | | | | | 174,144 | | | | 1,098,142 | |
Bunzl plc | | | | | 6,996 | | | | 168,121 | |
Burberry Group plc | | | | | 9,954 | | | | 250,794 | |
Capita plc | | | | | 14,771 | | | | 254,257 | |
Carnival plc | | | | | 4,082 | | | | 168,987 | |
Centrica plc | | | | | 115,056 | | | | 663,485 | |
CNH Industrial NV | | * | | | 21,683 | | | | 247,763 | |
Cobham plc | | | | | 26,184 | | | | 119,193 | |
Compass Group plc | | | | | 39,700 | | | | 637,379 | |
Croda International plc | | | | | 3,042 | | | | 124,001 | |
Diageo plc | | | | | 55,378 | | | | 1,835,148 | |
Direct Line Insurance Group plc | | | | | 23,843 | | | | 98,637 | |
easyJet plc | | | | | 3,777 | | | | 96,264 | |
G4S plc | | | | | 36,265 | | | | 157,795 | |
GKN plc | | | | | 37,669 | | | | 233,424 | |
GlaxoSmithKline plc | | | | | 108,138 | | | | 2,889,176 | |
Hammerson plc REIT | | | | | 15,069 | | | | 125,452 | |
Hargreaves Lansdown plc | | | | | 4,746 | | | | 106,604 | |
HSBC Holdings plc (London Exchange) | | | | | 412,053 | | | | 4,521,933 | |
ICAP plc | | | | | 12,886 | | | | 96,515 | |
IMI plc | | | | | 7,162 | | | | 181,370 | |
Imperial Tobacco Group plc | | | | | 21,702 | | | | 841,346 | |
Inmarsat plc | | | | | 9,544 | | | | 119,665 | |
InterContinental Hotels Group plc | | | | | 6,091 | | | | 203,174 | |
International Consolidated Airlines Group SA | | * | | | 19,566 | | | | 130,334 | |
Intertek Group plc | | | | | 3,732 | | | | 194,778 | |
Intu Properties plc REIT | | | | | 13,800 | | | | 70,840 | |
Invensys plc | | | | | 15,216 | | | | 128,615 | |
Investec plc | | | | | 13,127 | | | | 95,338 | |
ITV plc | | | | | 85,574 | | | | 275,390 | |
J. Sainsbury plc | | | | | 27,239 | | | | 164,857 | |
Johnson Matthey plc | | | | | 4,522 | | | | 246,055 | |
Kingfisher plc | | | | | 51,823 | | | | 330,840 | |
Land Securities Group plc REIT | | | | | 17,922 | | | | 286,295 | |
Legal & General Group plc | | | | | 134,094 | | | | 495,673 | |
Lloyds Banking Group plc | | * | | | 1,103,402 | | | | 1,447,871 | |
London Stock Exchange Group plc | | | | | 3,970 | | | | 114,203 | |
Marks & Spencer Group plc | | | | | 36,242 | | | | 260,250 | |
Meggitt plc | | | | | 16,572 | | | | 145,095 | |
Melrose Industries plc | | | | | 29,387 | | | | 149,090 | |
National Grid plc | | | | | 82,456 | | | | 1,078,460 | |
Next plc | | | | | 3,430 | | | | 310,043 | |
Old Mutual plc | | | | | 106,780 | | | | 335,034 | |
Pearson plc | | | | | 18,231 | | | | 406,475 | |
Persimmon plc | | * | | | 6,790 | | | | 139,597 | |
Petrofac Ltd. | | | | | 5,685 | | | | 115,280 | |
Prudential plc | | | | | 56,385 | | | | 1,259,867 | |
Reckitt Benckiser Group plc | | | | | 14,243 | | | | 1,131,405 | |
Reed Elsevier plc | | | | | 26,043 | | | | 388,395 | |
Rexam plc | | | | | 17,291 | | | | 152,130 | |
Rio Tinto plc | | | | | 28,029 | | | | 1,583,909 | |
See accompanying notes to financial statements
342
SCHEDULE OF INVESTMENTS—(Continued)
December 31, 2013
| | | | | | | | | | | | |
Vantagepoint Overseas
Equity Index Fund | | | | Shares | | | Value | |
| COMMON STOCKS—(Continued) | | | | | |
Rolls-Royce Holdings plc | | * | | | 41,595 | | | $ | 879,792 | |
Royal Bank of Scotland Group plc | | * | | | 49,109 | | | | 276,573 | |
RSA Insurance Group plc | | | | | 79,868 | | | | 120,944 | |
SABMiller plc | | | | | 21,181 | | | | 1,090,294 | |
Sage Group plc (The) | | | | | 25,181 | | | | 168,566 | |
Schroders plc | | | | | 2,378 | | | | 102,561 | |
Segro plc REIT | | | | | 15,885 | | | | 87,927 | |
Serco Group plc | | | | | 10,407 | | | | 86,114 | |
Severn Trent plc | | | | | 5,019 | | | | 141,902 | |
Smith & Nephew plc | | | | | 20,726 | | | | 296,023 | |
Smiths Group plc | | | | | 8,690 | | | | 213,388 | |
SSE plc | | | | | 21,838 | | | | 496,252 | |
Standard Chartered plc (London Exchange) | | | | | 53,387 | | | | 1,205,850 | |
Standard Life plc | | | | | 51,488 | | | | 307,481 | |
Subsea 7 SA | | | | | 5,664 | | | | 108,584 | |
Tate & Lyle plc | | | | | 9,844 | | | | 132,051 | |
Tesco plc | | | | | 177,887 | | | | 987,867 | |
Travis Perkins plc | | | | | 5,478 | | | | 170,169 | |
TUI Travel plc | | | | | 9,107 | | | | 62,423 | |
Tullow Oil plc | | | | | 19,781 | | | | 280,744 | |
Unilever plc | | | | | 28,267 | | | | 1,163,069 | |
United Utilities Group plc | | | | | 14,722 | | | | 163,908 | |
Vodafone Group plc | | | | | 1,070,045 | | | | 4,212,974 | |
Weir Group plc (The) | | | | | 4,948 | | | | 175,189 | |
Whitbread plc | | | | | 4,060 | | | | 252,672 | |
William Hill plc | | | | | 19,270 | | | | 128,460 | |
Wm Morrison Supermarkets plc | | | | | 49,809 | | | | 215,614 | |
WPP plc | | | | | 29,726 | | | | 680,843 | |
| | | | | | | | | | |
| | | | | | | | | | | 56,844,233 | |
| | | | | | | | | | | | |
| TOTAL COMMON STOCKS | | | | | | | | |
(Cost $254,625,352) | | | | | | | 291,474,316 | |
| | | | | | | | | | | | |
| | | | | | | | | | | | | |
| PREFERRED STOCKS—0.6% | |
| Germany—0.6% | |
Bayerische Motoren Werke AG | | | | | 1,318 | | | | 112,706 | |
Fuchs Petrolub SE | | | | | 720 | | | | 70,536 | |
Henkel AG & Co. KGaA | | | | | 3,969 | | | | 461,335 | |
Porsche Automobil Holding SE | | | | | 3,428 | | | | 357,854 | |
Volkswagen AG | | | | | 3,198 | | | | 899,977 | |
| | | | | | | | | | |
| | | | | | | | | | | 1,902,408 | |
| | | | | | | | | | | | |
| United Kingdom—0.0% | |
Rolls-Royce Holdings plc, Class C | | *‡ | | | 4,366,229 | | | | 7,230 | |
Rolls-Royce Holdings plc, Class C | | *‡ | | | 3,577,170 | | | | 5,924 | |
| | | | | | | | | | |
| | | | | | | | | | | 13,154 | |
| | | | | | | | | | | | |
| TOTAL PREFERRED STOCKS | | | | | |
(Cost $1,069,283) | | | | | | | 1,915,562 | |
| | | | | | | | | | | | |
| | | | | | | | | | | | | | |
| | | | | |
Coupon
Rate | |
| Maturity
Date |
| | | | | Face | | | | Value | |
| U.S. TREASURY OBLIGATIONS—0.1% | |
| U.S. Treasury Bills—0.1% | |
U.S. Treasury Bill | | | | | | | | | | | |
0.076% | | | 06/26/2014 | | | | | | | | | | | |
(Cost $249,908) | | | ‡‡ | | $ | 250,000 | | | $ | 249,903 | |
| | | | | | | | | | | | | | |
| | | | | | | | | | | | | | | |
| | | | |
| | | | | | | | | | Shares | | | | Value | |
| RIGHTS—0.0% | |
| Spain—0.0% | |
Repsol SA,
Expires 01/09/14 | | | *† | | | | | | | | |
(Cost $—) | | | | | | 19,360 | | | | 13,210 | |
| | | | | | | | | | | | | | |
| | | | | | | | | | | | | | | |
| MONEY MARKET FUNDS—1.3% | |
| Institutional Money Market Funds—1.3% | |
Dreyfus Institutional Cash Advantage Fund, 0.06% | | | ††¥ | | | 600,000 | | | | 600,000 | |
Fidelity Institutional Money Market: Money Market Portfolio—Institutional Class, 0.07% | | | ††¥ | | | 724,169 | | | | 724,169 | |
Fidelity Institutional Money Market: Prime Money Market Portfolio—Institutional Class, 0.04% | | | ††¥ | | | 600,000 | | | | 600,000 | |
Short-Term Investments Trust Liquid Assets Portfolio—Institutional Class, 0.07% | | | ††¥ | | | 600,000 | | | | 600,000 | |
Wells Fargo Advantage Cash Investment Money Market Fund—Select Class, 0.06% | | | ††¥ | | | 600,000 | | | | 600,000 | |
Wells Fargo Advantage Heritage Money Market Fund—Select Class, 0.06% | | | ††¥ | | | 600,000 | | | | 600,000 | |
| | | | | | | | | | | | | | |
| TOTAL MONEY MARKET FUNDS | |
(Cost $3,724,169) | | | | | | | | | | 3,724,169 | |
| | | | | | | | | | | | | | |
| TOTAL INVESTMENTS—100.2% | |
(Cost $259,668,712) | | | | | | | | | | 297,377,160 | |
Other assets less liabilities—(0.2%) | | | | (465,597 | ) |
| | | | | | | | | | | | | | |
| NET ASSETS—100.0% | | | | | | | | | $ | 296,911,563 | |
| | | | | | | | | | | | | | |
See accompanying notes to financial statements
343
SCHEDULE OF INVESTMENTS—(Continued)
December 31, 2013
Notes to the Schedule of Investments:
| | |
| CDI | | Chess Depository Interest |
| CVA | | Dutch Certificate of Shares |
| FDR | | Fiduciary Depository Receipt |
| REIT | | Real Estate Investment Trust |
| RSP | | Risparmio (Italian Savings Shares) |
| SDR | | Swedish Depository Receipt |
| VVPR | | Verlaagde Vooheffing Precompte Reduit (Belgian dividend coupon) |
| * | | Non-income producing. |
| † | | Denotes all or a portion of the security on loan. |
| d | | Security has no market value at December 31, 2013. |
| ‡ | | Security valued at fair value as determined by policies approved by the Board of Directors. (Total Market Value $13,154) |
| ‡‡ | | Security or a portion of the security has been pledged as collateral for futures contracts and/or options contracts. |
| †† | | Represents reinvestment of collateral received in conjunction with securities lending. |
| ¥ | | The rate quoted is the annualized seven-day yield of the fund at period end. |
See accompanying notes to financial statements
344
SCHEDULE OF INVESTMENTS—(Continued)
December 31, 2013
| | | | |
Vantagepoint Overseas
Equity Index Fund | | | |
| Percentage of Portfolio by Industry (unaudited): | | | | |
| |
| COMMON STOCKS | | | | |
Commercial Banks | | | 13.1% | |
Pharmaceuticals | | | 8.3% | |
Oil, Gas & Consumable Fuels | | | 6.1% | |
Insurance | | | 5.2% | |
Metals & Mining | | | 3.7% | |
Food Products | | | 3.7% | |
Automobiles | | | 3.5% | |
Chemicals | | | 3.3% | |
Diversified Telecommunication Services | | | 3.1% | |
Machinery | | | 2.7% | |
Wireless Telecommunication Services | | | 2.6% | |
Beverages | | | 2.4% | |
Capital Markets | | | 2.1% | |
Real Estate Management & Development | | | 2.0% | |
Food & Staples Retailing | | | 2.0% | |
Industrial Conglomerates | | | 1.6% | |
Textiles, Apparel & Luxury Goods | | | 1.6% | |
Media | | | 1.5% | |
Electric Utilities | | | 1.5% | |
Real Estate Investment Trusts (REITs) | | | 1.4% | |
Tobacco | | | 1.4% | |
Diversified Financial Services | | | 1.4% | |
Electrical Equipment | | | 1.4% | |
Multi-Utilities | | | 1.3% | |
Hotels, Restaurants & Leisure | | | 1.3% | |
Electronic Equipment, Instruments & Components | | | 1.2% | |
Auto Components | | | 1.2% | |
Aerospace & Defense | | | 1.2% | |
Trading Companies & Distributors | | | 1.1% | |
Software | | | 1.0% | |
Specialty Retail | | | 1.0% | |
Road & Rail | | | 0.9% | |
Semiconductors & Semiconductor Equipment | | | 0.7% | |
Energy Equipment & Services | | | 0.7% | |
Construction & Engineering | | | 0.7% | |
Household Products | | | 0.7% | |
Personal Products | | | 0.6% | |
Communications Equipment | | | 0.6% | |
Building Products | | | 0.6% | |
Construction Materials | | | 0.6% | |
Commercial Services & Supplies | | | 0.6% | |
Health Care Equipment & Supplies | | | 0.6% | |
Professional Services | | | 0.6% | |
Household Durables | | | 0.6% | |
Gas Utilities | | | 0.5% | |
Office Electronics | | | 0.4% | |
IT Services | | | 0.4% | |
Air Freight & Logistics | | | 0.4% | |
Biotechnology | | | 0.4% | |
Health Care Providers & Services | | | 0.4% | |
Transportation Infrastructure | | | 0.4% | |
Multiline Retail | | | 0.3% | |
Marine | | | 0.3% | |
Airlines | | | 0.2% | |
Containers & Packaging | | | 0.2% | |
Leisure Equipment & Products | | | 0.2% | |
Internet & Catalog Retail | | | 0.1% | |
Life Sciences Tools & Services | | | 0.1% | |
| | | | |
| | | | | |
Consumer Finance | | | 0.1% | |
Internet Software & Services | | | 0.1% | |
Independent Power Producers & Energy Traders | | | 0.1% | |
Paper & Forest Products | | | 0.1% | |
Water Utilities | | | 0.1% | |
Distributors | | | 0.0% | |
Computers & Peripherals | | | 0.0% | |
Diversified Consumer Services | | | 0.0% | |
Health Care Technology | | | 0.0% | |
| | | | |
| | | 98.2% | |
| | | | |
| PREFERRED STOCKS | | | | |
Automobiles | | | 0.5% | |
Household Products | | | 0.1% | |
Aerospace & Defense | | | 0.0% | |
Chemicals | | | 0.0% | |
| | | | |
| | | 0.6% | |
| | | | |
| RIGHTS | | | | |
Oil, Gas & Consumable Fuels | | | 0.0% | |
| | | | |
| TOTAL COMMON STOCKS/PREFERRED STOCKS | | | 98.8% | |
| | | | |
| U.S. TREASURY OBLIGATIONS | | | | |
U.S. Treasury Bills | | | 0.1% | |
| | | | |
| MONEY MARKET FUNDS | | | | |
Institutional Money Market Funds | | | 1.3% | |
| | | | |
| TOTAL INVESTMENTS | | | 100.2% | |
Other assets less liabilities | | | (0.2)% | |
| | | | |
| TOTAL NET ASSETS | | | 100.0% | |
| | | | |
See accompanying notes to financial statements
345
SCHEDULE OF INVESTMENTS
December 31, 2013
| | | | | | | | | | |
Vantagepoint Model
Portfolio Conservative
Growth Fund | | | Shares | | Value | |
| AFFILIATED MUTUAL FUNDS—99.0% | |
Vantagepoint Aggressive Opportunities Fund Class T | | | 1,603,133 | | $ | 20,600,254 | |
Vantagepoint Core Bond Index Fund Class T | | | 7,758,340 | | | 77,583,397 | |
Vantagepoint Diversifying Strategies Fund | | | 11,970,867 | | | 124,856,141 | |
Vantagepoint Equity Income Fund Class T | | | 6,708,046 | | | 74,459,315 | |
Vantagepoint Growth & Income Fund Class T | | | 4,658,910 | | | 61,590,785 | |
Vantagepoint Growth Fund Class T | | | 3,234,573 | | | 41,111,417 | |
Vantagepoint Inflation Protected Securities Fund Class T | | | 6,094,369 | | | 63,990,872 | |
Vantagepoint International Fund Class T | | | 4,236,447 | | | 46,982,198 | |
Vantagepoint Low Duration Bond Fund Class T | | | 12,173,108 | | | 123,191,855 | |
Vantagepoint Select Value Fund Class T | | | 1,581,873 | | | 20,358,708 | |
| | | | | | | | | | |
TOTAL AFFILIATED MUTUAL FUNDS (Cost $567,762,315) | | | 654,724,942 | |
| | | | | | | | | | |
| | | | | | | | | | | |
| EXCHANGE TRADED FUND—0.9% | |
Vanguard FTSE Emerging Markets ETF (Cost $6,313,545) | | | | | | 147,650 | | | 6,074,321 | |
| | | | | | | | | | |
| | | | | | | | | | | |
| MONEY MARKET FUND—0.1% | |
Fidelity Institutional Money Market: Money Market Portfolio—Institutional Class, 0.07% | | | | | | | | | | |
(Cost $729,580) | | ¥ | | | | 729,580 | | | 729,580 | |
| | | | | | | | | | |
| TOTAL INVESTMENTS—100.0% | | | | |
(Cost $574,805,440) | | | | | | | | | 661,528,843 | |
Other assets less liabilities—(0.0%) | | | (97,985 | ) |
| | | | | | | | | | |
| NET ASSETS—100.0% | | | | | | | | $ | 661,430,858 | |
| | | | | | | | | | |
Notes to the Schedule of Investments:
| | |
| ¥ | | The rate quoted is the annualized seven-day yield of the fund at period end. |
See accompanying notes to financial statements
346
SCHEDULE OF INVESTMENTS
December 31, 2013
| | | | | | | | | | |
Vantagepoint Model
Portfolio Traditional
Growth Fund | | | Shares | | Value | |
| AFFILIATED MUTUAL FUNDS—99.0% | |
Vantagepoint Aggressive Opportunities Fund Class T | | | 7,594,846 | | $ | 97,593,776 | |
Vantagepoint Core Bond Index Fund Class T | | | 20,662,265 | | | 206,622,649 | |
Vantagepoint Discovery Fund Class T | | | 4,962,580 | | | 53,893,622 | |
Vantagepoint Diversifying Strategies Fund | | | 23,543,036 | | | 245,553,860 | |
Vantagepoint Equity Income Fund Class T | | | 18,741,178 | | | 208,027,070 | |
Vantagepoint Growth & Income Fund Class T | | | 15,987,238 | | | 211,351,290 | |
Vantagepoint Growth Fund Class T | | | 14,012,167 | | | 178,094,644 | |
Vantagepoint Inflation Protected Securities Fund Class T | | | 5,885,600 | | | 61,798,800 | |
Vantagepoint International Fund Class T | | | 16,908,289 | | | 187,512,923 | |
Vantagepoint Low Duration Bond Fund Class T | | | 12,573,833 | | | 127,247,186 | |
Vantagepoint Select Value Fund Class T | | | 7,435,554 | | | 95,695,586 | |
| | | | | | | | | | |
TOTAL AFFILIATED MUTUAL FUNDS (Cost $1,398,983,071) | | | 1,673,391,406 | |
| | | | | | | | | | |
| | | | | | | | | | | |
| EXCHANGE TRADED FUND—0.9% | |
Vanguard FTSE Emerging Markets ETF | | | | | | | | | | |
(Cost $16,085,068) | | | | | | 374,800 | | | 15,419,272 | |
| | | | | | | | | | |
| | | | | | | | | | | |
| MONEY MARKET FUND—0.1% | |
Fidelity Institutional Money Market: Money Market Portfolio—Institutional Class, 0.07% | | | | | | | | | | |
(Cost $1,471,078) | | ¥ | | | | 1,471,078 | | | 1,471,078 | |
| | | | | | | | | | |
| TOTAL INVESTMENTS—100.0% | | | | |
(Cost $1,416,539,217) | | | | | | | | | 1,690,281,756 | |
Other assets less liabilities—(0.0%) | | | (195,625 | ) |
| | | | | | | | | | |
| NET ASSETS—100.0% | | $ | 1,690,086,131 | |
| | | | | | | | | | |
Notes to the Schedule of Investments:
| | |
| ¥ | | The rate quoted is the annualized seven-day yield of the fund at period end. |
See accompanying notes to financial statements
347
SCHEDULE OF INVESTMENTS
December 31, 2013
| | | | | | | | | | | | |
Vantagepoint Model
Portfolio Long-Term
Growth Fund | | | Shares | | | Value | |
| AFFILIATED MUTUAL FUNDS—98.1% | |
Vantagepoint Aggressive Opportunities Fund Class T | | | | 15,156,292 | | | $ | 194,758,356 | |
Vantagepoint Core Bond Index Fund Class T | | | | 26,555,750 | | | | 265,557,503 | |
Vantagepoint Discovery Fund Class T | | | | 9,594,698 | | | | 104,198,421 | |
Vantagepoint Diversifying Strategies Fund | | | | 24,296,681 | | | | 253,414,381 | |
Vantagepoint Equity Income Fund Class T | | | | 26,258,793 | | | | 291,472,604 | |
Vantagepoint Growth & Income Fund Class T | | | | 22,366,916 | | | | 295,690,624 | |
Vantagepoint Growth Fund Class T | | | | 20,683,906 | | | | 262,892,449 | |
Vantagepoint International Fund Class T | | | | 27,931,296 | | | | 309,758,076 | |
Vantagepoint Select Value Fund Class T | | | | 14,850,541 | | | | 191,126,460 | |
| | | | | | | | | | | | |
TOTAL AFFILIATED MUTUAL FUNDS (Cost $1,767,597,231) | | | | 2,168,868,874 | |
| | | | | | | | | | | | |
| | | | | | | | | | | | | |
| EXCHANGE TRADED FUND—1.9% | |
Vanguard FTSE Emerging Markets ETF | | | | | | | | | |
(Cost $44,629,849) | | | | 1,034,450 | | | | 42,557,273 | |
| | | | | | | | | | | | |
| | | | | | | | | | | | | |
| MONEY MARKET FUND—0.0% | |
Fidelity Institutional Money Market: Money Market Portfolio—Institutional Class, 0.07% | | | | | | | | | | | | |
(Cost $960,799) | | ¥ | | | | | 960,799 | | | | 960,799 | |
| | | | | | | | | | | | |
| TOTAL INVESTMENTS—100.0% | | | | | |
(Cost $1,813,187,879) | | | | | | | | | | | 2,212,386,946 | |
Other assets less liabilities—(0.0%) | | | | (247,073 | ) |
| | | | | | | | | | | | |
| NET ASSETS—100.0% | | | $ | 2,212,139,873 | |
| | | | | | | | | | | | |
Notes to the Schedule of Investments:
| | |
| ¥ | | The rate quoted is the annualized seven-day yield of the fund at period end. |
See accompanying notes to financial statements
348
SCHEDULE OF INVESTMENTS
December 31, 2013
| | | | | | | | | | | | |
Vantagepoint
Model Portfolio
All-Equity Growth Fund | | | Shares | | | Value | |
| AFFILIATED MUTUAL FUNDS—97.0% | |
Vantagepoint Aggressive Opportunities Fund Class T | | | | 6,891,937 | | | $ | 88,561,386 | |
Vantagepoint Discovery Fund Class T | | | | 7,786,977 | | | | 84,566,571 | |
Vantagepoint Equity Income Fund Class T | | | | 14,939,269 | | | | 165,825,887 | |
Vantagepoint Growth & Income Fund Class T | | | | 11,938,525 | | | | 157,827,300 | |
Vantagepoint Growth Fund Class T | | | | 12,401,391 | | | | 157,621,682 | |
Vantagepoint International Fund Class T | | | | 14,115,153 | | | | 156,537,048 | |
Vantagepoint Select Value Fund Class T | | | | 6,807,758 | | | | 87,615,840 | |
| | | | | | | | | | | | |
TOTAL AFFILIATED MUTUAL FUNDS (Cost $694,384,900) | | | | 898,555,714 | |
| | | | | | | | | | | | |
| | | | | | | | | | | | | |
| EXCHANGE TRADED FUND—2.9% | |
Vanguard FTSE Emerging Markets ETF | | | | | | | | | | | | |
(Cost $28,230,682) | | | | | | | 655,650 | | | | 26,973,441 | |
| | | | | | | | | | | | |
| | | | | | | | | | | | | |
| MONEY MARKET FUND—0.1% | |
Fidelity Institutional Money Market: Money Market Portfolio—Institutional Class, 0.07% | | | | | | | | | | | | |
(Cost $656,711) | | ¥ | | | | | 656,711 | | | | 656,711 | |
| | | | | | | | | | | | |
| TOTAL INVESTMENTS—100.0% | | | | | |
(Cost $723,272,293) | | | | | | | | | | | 926,185,866 | |
Other assets less liabilities—(0.0%) | | | | (118,314 | ) |
| | | | | | | | | | | | |
| NET ASSETS—100.0% | | | $ | 926,067,552 | |
| | | | | | | | | | | | |
Notes to the Schedule of Investments:
| | |
| ¥ | | The rate quoted is the annualized seven-day yield of the fund at period end. |
See accompanying notes to financial statements
349
SCHEDULE OF INVESTMENTS
December 31, 2013
| | | | | | | | | | | | |
Vantagepoint Milestone Retirement
Income Fund | | | Shares | | | Value | |
| AFFILIATED MUTUAL FUNDS—99.0% | |
Vantagepoint Core Bond Index Fund Class T | | | | 2,890,093 | | | $ | 28,900,932 | |
Vantagepoint Diversifying Strategies Fund | | | | 6,210,387 | | | | 64,774,340 | |
Vantagepoint Equity Income Fund Class T | | | | 2,955,875 | | | | 32,810,213 | |
Vantagepoint Growth & Income Fund Class T | | | | 2,493,470 | | | | 32,963,673 | |
Vantagepoint Inflation Protected Securities Fund Class T | | | | 4,586,895 | | | | 48,162,401 | |
Vantagepoint International Fund Class T | | | | 1,187,806 | | | | 13,172,769 | |
Vantagepoint Low Duration Bond Fund Class T | | | | 9,838,056 | | | | 99,561,129 | |
| | | | | | | | | | | | |
TOTAL AFFILIATED MUTUAL FUNDS (Cost $308,548,704) | | | | 320,345,457 | |
| | | | | | | | | | | | |
| | | | | | | | | | | | | |
| EXCHANGE TRADED FUND—0.9% | |
Vanguard FTSE Emerging Markets ETF | | | | | | | | | | | | |
(Cost $3,109,468) | | | | | | | 72,600 | | | | 2,986,764 | |
| | | | | | | | | | | | |
| | | | | | | | | | | | | |
| MONEY MARKET FUND—0.1% | |
Fidelity Institutional Money Market: Money Market Portfolio—Institutional Class, 0.07% | | | | | | | | | | | | |
(Cost $327,764) | | ¥ | | | | | 327,764 | | | | 327,764 | |
| | | | | | | | | | | | |
| TOTAL INVESTMENTS—100.0% | | | | | |
(Cost $311,985,936) | | | | | | | | | | | 323,659,985 | |
Other assets less liabilities—(0.0%) | | | | (27,724 | ) |
| | | | | | | | | | | | |
| NET ASSETS—100.0% | | | $ | 323,632,261 | |
| | | | | | | | | | | | |
Notes to the Schedule of Investments:
| | |
| ¥ | | The rate quoted is the annualized seven-day yield of the fund at period end. |
See accompanying notes to financial statements
350
SCHEDULE OF INVESTMENTS
December 31, 2013
| | | | | | | | | | | | |
Vantagepoint
Milestone 2010 Fund | | | | Shares | | | Value | |
| AFFILIATED MUTUAL FUNDS—98.9% | | | | | |
Vantagepoint Core Bond Index Fund Class T | | | | | 1,891,230 | | | $ | 18,912,298 | |
Vantagepoint Diversifying Strategies Fund | | | | | 5,048,287 | | | | 52,653,631 | |
Vantagepoint Equity Income Fund Class T | | | | | 4,493,981 | | | | 49,883,190 | |
Vantagepoint Growth & Income Fund Class T | | | | | 2,450,990 | | | | 32,402,089 | |
Vantagepoint Growth Fund Class T | | | | | 1,456,291 | | | | 18,509,460 | |
Vantagepoint Inflation Protected Securities Fund Class T | | | | | 4,084,869 | | | | 42,891,121 | |
Vantagepoint International Fund Class T | | | | | 2,026,423 | | | | 22,473,034 | |
Vantagepoint Low Duration Bond Fund Class T | | | | | 4,870,314 | | | | 49,287,580 | |
| | | | | | | | | | | | |
| TOTAL AFFILIATED MUTUAL FUNDS | | | | | |
(Cost $263,698,752) | | | | | | | | | 287,012,403 | |
| | | | | | | | | | | | |
| | | | | | | | | | | | | |
| EXCHANGE TRADED FUND—0.9% | |
Vanguard FTSE Emerging Markets ETF | | | | | | | | | | |
(Cost $2,771,933) | | | | | 64,600 | | | | 2,657,644 | |
| | | | | | | | | | | | |
| | | | | | | | | | | | | |
| MONEY MARKET FUND—0.2% | |
Fidelity Institutional Money Market: Money Market Portfolio—Institutional Class, 0.07% | | | | | | | | | | |
(Cost $439,157) | | ¥ | | | 439,157 | | | | 439,157 | |
| | | | | | | | | | | | |
| TOTAL INVESTMENTS—100.0% | |
(Cost $266,909,842) | | | | | | | | | 290,109,204 | |
Other assets less liabilities—(0.0%) | | | | (56,643 | ) |
| | | | | | | | | | | | |
| NET ASSETS—100.0% | | | | | | | | $ | 290,052,561 | |
| | | | | | | | | | | | |
Notes to the Schedule of Investments:
| | |
| ¥ | | The rate quoted is the annualized seven-day yield of the fund at period end. |
See accompanying notes to financial statements
351
SCHEDULE OF INVESTMENTS
December 31, 2013
| | | | | | | | | | | | |
Vantagepoint
Milestone 2015 Fund | | Shares | | | Value | |
| AFFILIATED MUTUAL FUNDS—98.6% | | | | | |
Vantagepoint Core Bond Index Fund Class T | | | | | 4,459,879 | | | $ | 44,598,787 | |
Vantagepoint Diversifying Strategies Fund | | | | | 8,975,425 | | | | 93,613,681 | |
Vantagepoint Equity Income Fund Class T | | | | | 9,654,362 | | | | 107,163,416 | |
Vantagepoint Growth & Income Fund Class T | | | | | 4,721,906 | | | | 62,423,602 | |
Vantagepoint Growth Fund Class T | | | | | 3,334,565 | | | | 42,382,319 | |
Vantagepoint Inflation Protected Securities Fund Class T | | | | | 6,234,574 | | | | 65,463,027 | |
Vantagepoint International Fund Class T | | | | | 4,447,337 | | | | 49,320,972 | |
Vantagepoint Low Duration Bond Fund Class T | | | | | 6,713,013 | | | | 67,935,696 | |
Vantagepoint Mid/Small Company Index Fund Class T | | | | | 776,692 | | | | 15,347,425 | |
| | | | | | | | | | | | |
| TOTAL AFFILIATED MUTUAL FUNDS | | | | | |
(Cost $480,315,776) | | | | | | | | | 548,248,925 | |
| | | | | | | | | | | | |
| | | | | | | | | | | | | |
| EXCHANGE TRADED FUND—1.3% | |
Vanguard FTSE Emerging Markets ETF | | | | | | | | | | |
(Cost $7,679,215) | | | | | 178,450 | | | | 7,341,433 | |
| | | | | | | | | | | | |
| | | | | | | | | | | | | |
| MONEY MARKET FUND—0.1% | |
Fidelity Institutional Money Market: Money Market Portfolio—Institutional Class, 0.07% | | | | | | | | | | |
(Cost $632,658) | | ¥ | | | 632,658 | | | | 632,658 | |
| | | | | | | | | | | | |
| TOTAL INVESTMENTS—100.0% | |
(Cost $488,627,649) | | | | | | | | | 556,223,016 | |
Other assets less liabilities—(0.0%) | | | | (66,507 | ) |
| | | | | | | | | | | | |
| NET ASSETS—100.0% | | | | | | | | $ | 556,156,509 | |
| | | | | | | | | | | | |
Notes to the Schedule of Investments:
| | |
| ¥ | | The rate quoted is the annualized seven-day yield of the fund at period end. |
See accompanying notes to financial statements
352
SCHEDULE OF INVESTMENTS
December 31, 2013
| | | | | | | | | | | | |
Vantagepoint
Milestone 2020 Fund | | | | Shares | | | Value | |
| AFFILIATED MUTUAL FUNDS—97.9% | | | | | |
Vantagepoint Core Bond Index Fund Class T | | | | | 7,991,667 | | | $ | 79,916,673 | |
Vantagepoint Diversifying Strategies Fund | | | | | 9,711,000 | | | | 101,285,734 | |
Vantagepoint Equity Income Fund Class T | | | | | 11,801,033 | | | | 130,991,462 | |
Vantagepoint Growth & Income Fund Class T | | | | | 5,607,845 | | | | 74,135,709 | |
Vantagepoint Growth Fund Class T | | | | | 4,064,022 | | | | 51,653,713 | |
Vantagepoint Inflation Protected Securities Fund Class T | | | | | 2,752,045 | | | | 28,896,469 | |
Vantagepoint International Fund Class T | | | | | 5,777,099 | | | | 64,068,033 | |
Vantagepoint Low Duration Bond Fund Class T | | | | | 5,309,518 | | | | 53,732,319 | |
Vantagepoint Mid/Small Company Index Fund Class T | | | | | 2,566,015 | | | | 50,704,466 | |
| | | | | | | | | | | | |
| TOTAL AFFILIATED MUTUAL FUNDS | | | | | |
(Cost $542,404,026) | | | | | | | | | 635,384,578 | |
| | | | | | | | | | | | |
| | | | | | | | | | | | | |
| EXCHANGE TRADED FUND—1.9% | |
Vanguard FTSE Emerging Markets ETF | | | | | | | | | | |
(Cost $12,996,527) | | | | | 303,900 | | | | 12,502,446 | |
| | | | | | | | | | | | |
| | | | | | | | | | | | | |
| MONEY MARKET FUND—0.2% | |
Fidelity Institutional Money Market: Money Market Portfolio—Institutional Class, 0.07% | | | | | | | | | | |
(Cost $1,223,811) | | ¥ | | | 1,223,811 | | | | 1,223,811 | |
| | | | | | | | | | | | |
| TOTAL INVESTMENTS—100.0% | |
(Cost $556,624,364) | | | | | | | | | 649,110,835 | |
Other assets less liabilities—(0.0%) | | | | (4,293 | ) |
| | | | | | | | | | | | |
| NET ASSETS—100.0% | | | | | | | | $ | 649,106,542 | |
| | | | | | | | | | | | |
Notes to the Schedule of Investments:
| | |
| ¥ | | The rate quoted is the annualized seven-day yield of the fund at period end. |
See accompanying notes to financial statements
353
SCHEDULE OF INVESTMENTS
December 31, 2013
| | | | | | | | | | | | |
Vantagepoint
Milestone 2025 Fund | | | | Shares | | | Value | |
| AFFILIATED MUTUAL FUNDS—98.0% | | | | | |
Vantagepoint Core Bond Index Fund Class T | | | | | 7,544,358 | | | $ | 75,443,583 | |
Vantagepoint Diversifying Strategies Fund | | | | | 7,175,672 | | | | 74,842,257 | |
Vantagepoint Equity Income Fund Class T | | | | | 10,903,007 | | | | 121,023,372 | |
Vantagepoint Growth & Income Fund Class T | | | | | 5,098,850 | | | | 67,406,793 | |
Vantagepoint Growth Fund Class T | | | | | 3,800,250 | | | | 48,301,178 | |
Vantagepoint International Fund Class T | | | | | 5,664,910 | | | | 62,823,854 | |
Vantagepoint Low Duration Bond Fund Class T | | | | | 2,378,102 | | | | 24,066,394 | |
Vantagepoint Mid/Small Company Index Fund Class T | | | | | 2,834,462 | | | | 56,008,973 | |
| | | | | | | | | | | | |
| TOTAL AFFILIATED MUTUAL FUNDS | | | | | |
(Cost $440,581,922) | | | | | | | | | 529,916,404 | |
| | | | | | | | | | | | |
| | | | | | | | | | | | | |
| EXCHANGE TRADED FUND—1.9% | |
Vanguard FTSE Emerging Markets ETF | | | | | | | | | | |
(Cost $10,788,869) | | | | | 252,750 | | | | 10,398,135 | |
| | | | | | | | | | | | |
| | | | | | | | | | | | | |
| MONEY MARKET FUND—0.1% | |
Fidelity Institutional Money Market: Money Market Portfolio—Institutional Class, 0.07% | | | | | | | | | | |
(Cost $737,641) | | ¥ | | | 737,641 | | | | 737,641 | |
| | | | | | | | | | | | |
| TOTAL INVESTMENTS—100.0% | |
(Cost $452,108,432) | | | | | | | | | 541,052,180 | |
Other assets less liabilities—(0.0%) | | | | (19,343 | ) |
| | | | | | | | | | | | |
| NET ASSETS—100.0% | | | | | | | | $ | 541,032,837 | |
| | | | | | | | | | | | |
Notes to the Schedule of Investments:
| | |
| ¥ | | The rate quoted is the annualized seven-day yield of the fund at period end. |
See accompanying notes to financial statements
354
SCHEDULE OF INVESTMENTS
December 31, 2013
| | | | | | | | | | | | |
Vantagepoint
Milestone 2030 Fund | | Shares | | | Value | |
| AFFILIATED MUTUAL FUNDS—97.9% | | | | | |
Vantagepoint Core Bond Index Fund Class T | | | | | 4,789,902 | | | $ | 47,899,023 | |
Vantagepoint Diversifying Strategies Fund | | | | | 4,784,559 | | | | 49,902,951 | |
Vantagepoint Equity Income Fund Class T | | | | | 9,414,762 | | | | 104,503,857 | |
Vantagepoint Growth & Income Fund Class T | | | | | 4,578,339 | | | | 60,525,641 | |
Vantagepoint Growth Fund Class T | | | | | 3,449,824 | | | | 43,847,267 | |
Vantagepoint International Fund Class T | | | | | 5,271,972 | | | | 58,466,165 | |
Vantagepoint Low Duration Bond Fund Class T | | | | | 739,224 | | | | 7,480,946 | |
Vantagepoint Mid/Small Company Index Fund Class T | | | | | 2,911,136 | | | | 57,524,045 | |
| | | | | | | | | | | | |
| TOTAL AFFILIATED MUTUAL FUNDS | | | | | |
(Cost $348,614,377) | | | | | | | | | 430,149,895 | |
| | | | | | | | | | | | |
| | | | | | | | | | | | | |
| EXCHANGE TRADED FUND—1.9% | |
Vanguard FTSE Emerging Markets ETF | | | | | | | | | | |
(Cost $8,768,664) | | | | | 205,450 | | | | 8,452,213 | |
| | | | | | | | | | | | |
| | | | | | | | | | | | | |
| MONEY MARKET FUND—0.2% | |
Fidelity Institutional Money Market: Money Market Portfolio—Institutional Class, 0.07% | | | | | | | | | | |
(Cost $729,825) | | ¥ | | | 729,825 | | | | 729,825 | |
| | | | | | | | | | | | |
| TOTAL INVESTMENTS—100.0% | |
(Cost $358,112,866) | | | | | | | | | 439,331,933 | |
Other assets less liabilities—(0.0%) | | | | (31,838 | ) |
| | | | | | | | | | | | |
| NET ASSETS—100.0% | | | | | | | | $ | 439,300,095 | |
| | | | | | | | | | | | |
Notes to the Schedule of Investments:
| | |
| ¥ | | The rate quoted is the annualized seven-day yield of the fund at period end. |
See accompanying notes to financial statements
355
SCHEDULE OF INVESTMENTS
December 31, 2013
| | | | | | | | | | | | |
Vantagepoint
Milestone 2035 Fund | | Shares | | | Value | |
| AFFILIATED MUTUAL FUNDS—97.1% | | | | | |
Vantagepoint Core Bond Index Fund Class T | | | | | 2,066,076 | | | $ | 20,660,759 | |
Vantagepoint Diversifying Strategies Fund | | | | | 2,301,512 | | | | 24,004,775 | |
Vantagepoint Equity Income Fund Class T | | | | | 6,861,893 | | | | 76,167,009 | |
Vantagepoint Growth & Income Fund Class T | | | | | 3,371,225 | | | | 44,567,599 | |
Vantagepoint Growth Fund Class T | | | | | 2,668,121 | | | | 33,911,812 | |
Vantagepoint International Fund Class T | | | | | 3,848,433 | | | | 42,679,127 | |
Vantagepoint Low Duration Bond Fund Class T | | | | | 198,180 | | | | 2,005,577 | |
Vantagepoint Mid/Small Company Index Fund Class T | | | | | 2,543,797 | | | | 50,265,427 | |
| | | | | | | | | | | | |
| TOTAL AFFILIATED MUTUAL FUNDS | | | | | |
(Cost $233,979,850) | | | | | | | | | 294,262,085 | |
| | | | | | | | | | | | |
| | | | | | | | | | | | | |
| EXCHANGE TRADED FUND—2.8% | |
Vanguard FTSE Emerging Markets ETF | | | | | | | | | | |
(Cost $8,901,269) | | | | | 208,100 | | | | 8,561,234 | |
| | | | | | | | | | | | |
| | | | | | | | | | | | | |
| MONEY MARKET FUND—0.1% | |
Fidelity Institutional Money Market: Money Market Portfolio—Institutional Class, 0.07% | | | | | | | | | | |
(Cost $443,974) | | ¥ | | | 443,974 | | | | 443,974 | |
| | | | | | | | | | | | |
| TOTAL INVESTMENTS—100.0% | |
(Cost $243,325,093) | | | | | | | | | 303,267,293 | |
Other assets less liabilities—(0.0%) | | | | (25,129 | ) |
| | | | | | | | | | | | |
| NET ASSETS—100.0% | | | | | | | | $ | 303,242,164 | |
| | | | | | | | | | | | |
Notes to the Schedule of Investments:
| | |
| ¥ | | The rate quoted is the annualized seven-day yield of the fund at period end. |
See accompanying notes to financial statements
356
SCHEDULE OF INVESTMENTS
December 31, 2013
| | | | | | | | | | | | |
Vantagepoint
Milestone 2040 Fund | | Shares | | | Value | |
| AFFILIATED MUTUAL FUNDS—97.0% | | | | | |
Vantagepoint Core Bond Index Fund Class T | | | | | 1,452,907 | | | $ | 14,529,074 | |
Vantagepoint Diversifying Strategies Fund | | | | | 838,752 | | | | 8,748,188 | |
Vantagepoint Equity Income Fund Class T | | | | | 7,040,631 | | | | 78,151,008 | |
Vantagepoint Growth & Income Fund Class T | | | | | 3,447,777 | | | | 45,579,614 | |
Vantagepoint Growth Fund Class T | | | | | 2,835,561 | | | | 36,039,976 | |
Vantagepoint International Fund Class T | | | | | 4,092,069 | | | | 45,381,044 | |
Vantagepoint Mid/Small Company Index Fund Class T | | | | | 2,906,729 | | | | 57,436,964 | |
| | | | | | | | | | | | |
| TOTAL AFFILIATED MUTUAL FUNDS | | | | | |
(Cost $220,493,901) | | | | | | | | | 285,865,868 | |
| | | | | | | | | | | | |
| | | | | | | | | | | | | |
| EXCHANGE TRADED FUND—2.9% | |
Vanguard FTSE Emerging Markets ETF | | | | | | | | | | |
(Cost $8,924,689) | | | | | 208,950 | | | | 8,596,203 | |
| | | | | | | | | | | | |
| | | | | | | | | | | | | |
| MONEY MARKET FUND—0.1% | |
Fidelity Institutional Money Market: Money Market Portfolio—Institutional Class, 0.07% | | | | | | | | | | |
(Cost $316,850) | | ¥ | | | 316,850 | | | | 316,850 | |
| | | | | | | | | | | | |
| TOTAL INVESTMENTS—100.0% | |
(Cost $229,735,440) | | | | | | | | | 294,778,921 | |
Other assets less liabilities—0.0% | | | | 3,835 | |
| | | | | | | | | | | | |
| NET ASSETS—100.0% | | | | | | | | $ | 294,782,756 | |
| | | | | | | | | | | | |
Notes to the Schedule of Investments:
| | |
| ¥ | | The rate quoted is the annualized seven-day yield of the fund at period end. |
See accompanying notes to financial statements
357
SCHEDULE OF INVESTMENTS
December 31, 2013
| | | | | | | | | | | | |
Vantagepoint
Milestone 2045 Fund | | Shares | | | Value | |
| AFFILIATED MUTUAL FUNDS—96.6% | | | | | |
Vantagepoint Core Bond Index Fund Class T | | | | | 488,493 | | | $ | 4,884,926 | |
Vantagepoint Equity Income Fund Class T | | | | | 2,412,523 | | | | 26,779,003 | |
Vantagepoint Growth & Income Fund Class T | | | | | 1,184,558 | | | | 15,659,852 | |
Vantagepoint Growth Fund Class T | | | | | 971,503 | | | | 12,347,804 | |
Vantagepoint International Fund Class T | | | | | 1,410,280 | | | | 15,640,001 | |
Vantagepoint Mid/Small Company Index Fund Class T | | | | | 989,638 | | | | 19,555,247 | |
| | | | | | | | | | | | |
| TOTAL AFFILIATED MUTUAL FUNDS | | | | | |
(Cost $80,312,546) | | | | | | | | | 94,866,833 | |
| | | | | | | | | | | | |
| | | | | | | | | | | | | |
| EXCHANGE TRADED FUND—2.9% | |
Vanguard FTSE Emerging Markets ETF | | | | | | | | | | |
(Cost $2,902,661) | | | | | 68,850 | | | | 2,832,489 | |
| | | | | | | | | | | | |
| | | | | | | | | | | | | |
| MONEY MARKET FUND—0.5% | |
Fidelity Institutional Money Market: Money Market Portfolio—Institutional Class, 0.07% | | | | | | | | | | |
(Cost $492,423) | | ¥ | | | 492,423 | | | | 492,423 | |
| | | | | | | | | | | | |
| TOTAL INVESTMENTS—100.0% | |
(Cost $83,707,630) | | | | | | | | | 98,191,745 | |
Other assets less liabilities—0.0% | | | | 3,941 | |
| | | | | | | | | | | | |
| NET ASSETS—100.0% | | | | | | | | $ | 98,195,686 | |
| | | | | | | | | | | | |
Notes to the Schedule of Investments:
| | |
| ¥ | | The rate quoted is the annualized seven-day yield of the fund at period end. |
See accompanying notes to financial statements
358
SCHEDULE OF INVESTMENTS
December 31, 2013
| | | | | | | | | | | | |
Vantagepoint
Milestone 2050 Fund | | | | Shares | | | Value | |
| AFFILIATED MUTUAL FUNDS—96.9% | |
Vantagepoint Core Bond Index Fund Class T | | | | | 110,204 | | | $ | 1,102,044 | |
Vantagepoint Equity Income Fund Class T | | | | | 547,934 | | | | 6,082,067 | |
Vantagepoint Growth & Income Fund Class T | | | | | 271,488 | | | | 3,589,074 | |
Vantagepoint Growth Fund Class T | | | | | 219,620 | | | | 2,791,367 | |
Vantagepoint International Fund Class T | | | | | 320,154 | | | | 3,550,504 | |
Vantagepoint Mid/Small Company Index Fund Class T | | | | | 227,576 | | | | 4,496,904 | |
| | | | | | | | | | | | |
| TOTAL AFFILIATED MUTUAL FUNDS | |
(Cost $19,910,983) | | | | | | | | | | | 21,611,960 | |
| | | | | | | | | | | | |
| | | | | | | | | | | | | |
| EXCHANGE TRADED FUND—2.9% | |
Vanguard FTSE Emerging Markets ETF | | | | | | | | | | | | |
(Cost $650,857) | | | | | | | 15,750 | | | | 647,955 | |
| | | | | | | | | | | | |
| | | | | | | | | | | | | |
| MONEY MARKET FUND—0.4% | |
Fidelity Institutional Money Market: Money Market Portfolio—Institutional Class, 0.07% | | | | | | | | | | | | |
(Cost $81,235) | | | | ¥ | | | 81,235 | | | | 81,235 | |
| | | | | | | | | | | | |
| TOTAL INVESTMENTS—100.2% | |
(Cost $20,643,075) | | | | | | | | | 22,341,150 | |
Other assets less liabilities—(0.2%) | | | | (51,255 | ) |
| | | | | | | | | | | | |
| NET ASSETS—100.0% | | | $ | 22,289,895 | |
| | | | | |
Notes to the Schedule of Investments:
| | |
| ¥ | | The rate quoted is the annualized seven-day yield of the fund at period end. |
See accompanying notes to financial statements
359
THE VANTAGEPOINT FUNDS
Additional Information (Unaudited)
For corporate shareholder, a portion of the ordinary dividends paid during the fund’s year ended December 31, 2013, qualified for the dividends received deduction as follows:
| | | | |
Fund | | Corporate Dividend
Received Deduction | |
Equity Income | | | 83.88 | % |
Growth & Income | | | 71.87 | % |
Growth | | | 100.00 | % |
Select Value | | | 28.70 | % |
Aggressive Opportunities | | | 15.46 | % |
Discovery | | | 4.30 | % |
International | | | 0.21 | % |
Diversifying Strategies | | | 5.37 | % |
500 Stock Index | | | 100.00 | % |
Broad Market Index | | | 89.31 | % |
Mid/Small Company Index | | | 44.79 | % |
Model Portfolio Conservative Growth | | | 22.98 | % |
Model Portfolio Traditional Growth | | | 28.79 | % |
Model Portfolio Long-Term Growth | | | 25.73 | % |
Model Portfolio All-Equity Growth | | | 27.38 | % |
Milestone Retirement Income | | | 19.97 | % |
Milestone 2010 | | | 31.00 | % |
Milestone 2015 | | | 33.84 | % |
Milestone 2020 | | | 35.91 | % |
Milestone 2025 | | | 39.73 | % |
Milestone 2030 | | | 43.83 | % |
Milestone 2035 | | | 49.01 | % |
Milestone 2040 | | | 52.96 | % |
Milestone 2045 | | | 57.11 | % |
Milestone 2050 | | | 35.18 | % |
Pursuant to Section 852 of the Internal Revenue Code, the Company designated the following capital gain dividends for the year ended December 31, 2013:
| | | | |
Fund | | Long Term
Capital Gain
Dividend | |
Low Duration Bond | | $ | 1,509,632 | |
Inflation Protected Securities | | | 8,974,277 | |
Equity Income | | | 106,020,635 | |
Growth & Income | | | 111,699,235 | |
Select Value | | | 39,536,586 | |
Aggressive Opportunities | | | 66,939,790 | |
Discovery | | | 25,798,289 | |
Diversifying Strategies | | | 11,992,223 | |
500 Stock Index | | | 1,698,318 | |
Broad Market Index | | | 8,981,718 | |
Mid/Small Company Index | | | 44,613,956 | |
Model Conservative Growth | | | 9,507,066 | |
Model Traditional Growth | | | 28,932,875 | |
Model Long-Term Growth | | | 44,573,892 | |
Model All-Equity Growth | | | 7,618,002 | |
Milestone Retirement Income | | | 5,062,522 | |
Milestone 2010 | | | 8,502,311 | |
360
THE VANTAGEPOINT FUNDS
Additional Information (Unaudited) — (Continued)
| | | | |
Fund | | Long Term
Capital Gain
Dividend | |
Milestone 2015 | | | 12,336,153 | |
Milestone 2020 | | | 13,428,042 | |
Milestone 2025 | | | 9,863,758 | |
Milestone 2030 | | | 8,871,634 | |
Milestone 2035 | | | 7,072,377 | |
Milestone 2040 | | | 10,019,247 | |
Milestone 2045 | | | 3,721,269 | |
Milestone 2050 | | | 7,977 | |
The Company received updated information concerning the tax character of distributions made by certain issuers during 2012, and as a result, pursuant to Section 852 of the Internal Revenue Code, has modified its reported designation of capital gain dividends for the year ended December 31, 2012, as follows:
| | | | |
Fund | | Long Term
Capital Gain
Dividend | |
Growth & Income | | $ | 21,592,950 | |
Diversifying Strategies | | | 2,847,974 | |
Mid/Small Company Index | | | 16,455,322 | |
Model Portfolio Conservative Growth | | | 3,646,788 | |
Model Portfolio Traditional Growth | | | 16,923,609 | |
Model Portfolio Long-Term Growth | | | 30,487,806 | |
Milestone Retirement Income | | | 2,904,601 | |
Milestone 2010 | | | 4,514,649 | |
Milestone 2015 | | | 5,042,114 | |
Milestone 2020 | | | 3,974,669 | |
Milestone 2025 | | | 3,154,682 | |
Milestone 2030 | | | 2,741,511 | |
Milestone 2035 | | | 1,914,115 | |
Milestone 2040 | | | 342,369 | |
Milestone 2045 | | | 701,884 | |
Milestone 2050 | | | 812 | |
For the year ended December 31, 2013, dividends from foreign countries and taxes paid to foreign countries that qualify for foreign tax credits are as follows:
| | | | | | | | |
Fund | | Net Foreign
Source Income | | | Foreign Tax
Credit | |
International | | $ | 37,001,061 | | | $ | 1,627,899 | |
Overseas Equity Index | | | 7,287,580 | | | | 151,086 | |
Model Portfolio Conservative Growth | | | 1,227,972 | | | | 53,444 | |
Model Portfolio Traditional Growth | | | 4,897,109 | | | | 213,059 | |
Model Portfolio Long-Term Growth | | | 8,089,249 | | | | 351,921 | |
Model Portfolio All-Equity Growth | | | 4,077,999 | | | | 177,112 | |
Milestone Retirement Income | | | 345,208 | | | | 15,071 | |
Milestone 2010 | | | 587,378 | | | | 25,576 | |
Milestone 2015 | | | 1,288,454 | | | | 56,058 | |
Milestone 2020 | | | 1,673,218 | | | | 72,797 | |
Milestone 2025 | | | 1,640,512 | | | | 71,365 | |
Milestone 2030 | | | 1,526,254 | | | | 66,343 | |
361
THE VANTAGEPOINT FUNDS
Additional Information (Unaudited) — (Continued)
| | | | | | | | |
Fund | | Net Foreign
Source
Income | | | Foreign
Tax
Credit | |
Milestone 2035 | | | 1,112,967 | | | | 48,351 | |
Milestone 2040 | | | 1,184,277 | | | | 51,486 | |
Milestone 2045 | | | 405,785 | | | | 17,560 | |
Milestone 2050 | | | 91,619 | | | | 3,956 | |
All other funds treat foreign taxes paid as reductions of net investment company taxable income by these amounts.
The following table summarizes the percentage of income received by the Company in 2013 from various obligors:
| | | | | | | | | | | | | | | | | | | | | | | | | | | | |
Fund | | U.S. Treasury
Obligations | | | GNMA | | | FNMA | | | FHL Bank | | | FHLMC | | | Tennessee
Valley
Authority | | | Other U.S.
Government
Agency | |
Low Duration Bond | | | 3.29 | % | | | 0.00 | % | | | 2.55 | % | | | 0.00 | % | | | 0.00 | % | | | 0.00 | % | | | 0.00 | % |
Inflation Protected Securities | | | 34.85 | % | | | 0.00 | % | | | 0.23 | % | | | 0.08 | % | | | 0.00 | % | | | 0.00 | % | | | 1.21 | % |
Discovery | | | 0.29 | % | | | 0.00 | % | | | 0.11 | % | | | 0.00 | % | | | 0.03 | % | | | 0.00 | % | | | 0.00 | % |
Diversifying Strategies | | | 0.68 | % | | | 0.01 | % | | | 1.15 | % | | | 0.00 | % | | | 0.34 | % | | | 0.00 | % | | | 0.00 | % |
Core Bond Index | | | 23.56 | % | | | 7.87 | % | | | 14.44 | % | | | 1.03 | % | | | 9.98 | % | | | 0.26 | % | | | 0.20 | % |
500 Stock Index | | | 0.00 | % | | | 0.00 | % | | | 0.00 | % | | | 0.00 | % | | | 0.00 | % | | | 0.00 | % | | | 0.00 | % |
Broad Market Index | | | 0.00 | % | | | 0.00 | % | | | 0.00 | % | | | 0.00 | % | | | 0.00 | % | | | 0.00 | % | | | 0.00 | % |
Mid/Small Company Index | | | 0.00 | % | | | 0.00 | % | | | 0.00 | % | | | 0.00 | % | | | 0.00 | % | | | 0.00 | % | | | 0.00 | % |
Overseas Equity Index | | | 0.00 | % | | | 0.00 | % | | | 0.00 | % | | | 0.00 | % | | | 0.00 | % | | | 0.00 | % | | | 0.00 | % |
| D. | | Qualified Dividend Income |
The following are estimates of qualified dividend income received by the Company through December 31, 2013 that qualify for a reduced tax rate pursuant to the Jobs and Growth Tax Relief Reconciliation Act of 2003 as extended by the Tax Relief, Unemployment Insurance Reauthorization and Job Creation Act of 2010:
| | | | |
Fund | | Qualified
Dividend Income | |
Equity Income | | | 95.19 | % |
Growth & Income | | | 95.35 | % |
Growth | | | 100.00 | % |
Select Value | | | 31.41 | % |
Aggressive Opportunities | | | 17.71 | % |
Discovery | | | 4.65 | % |
International | | | 86.22 | % |
Diversifying Strategies | | | 7.95 | % |
500 Stock Index | | | 100.00 | % |
Broad Market Index | | | 90.51 | % |
Mid/Small Company Index | | | 46.91 | % |
Overseas Equity Index | | | 68.52 | % |
Model Portfolio Conservative Growth | | | 35.02 | % |
Model Portfolio Traditional Growth | | | 39.26 | % |
Model Portfolio Long-Term Growth | | | 41.03 | % |
Model Portfolio All-Equity Growth | | | 42.87 | % |
Milestone Retirement Income | | | 29.66 | % |
Milestone 2010 | | | 46.77 | % |
Milestone 2015 | | | 50.69 | % |
Milestone 2020 | | | 53.31 | % |
362
THE VANTAGEPOINT FUNDS
Additional Information (Unaudited) — (Continued)
| | | | |
Fund | | Qualified
Dividend Income | |
Milestone 2025 | | | 58.79 | % |
Milestone 2030 | | | 65.98 | % |
Milestone 2035 | | | 73.00 | % |
Milestone 2040 | | | 78.98 | % |
Milestone 2045 | | | 85.34 | % |
Milestone 2050 | | | 52.61 | % |
Independent Directors
| | | | | | | | |
Name, Address*
and Age | | Positions
Held with
the Company | | Term/Service
Expiration
and Length of
Time Served† | | Principal Occupation(s)
During the Past Five Years | | Directorship(s) of
Public Companies
and Other Registered
Investment
Companies During
the Past Five Years |
| George M. Chamberlain, Jr. (66) | | Director, Audit Committee Member, Investment Committee Member, and Nominating and Governance Committee Member | | October 31, 2014; Director since January 2012 | | Director and Vice President, Legal and Business Affairs—SCM Advantage LLC (supply chain consulting) (October 2009–present); Principal—GMC Consulting (corporate consulting) (May 1999–present); Board member—Alzheimer’s Association Delaware Valley Chapter (January 2008–present); Board member—Trapp Family Lodge Cooperative (non-profit) (April 2008–present); Board member and Vice Chair—Walnut Street Theater (January 2000–June 2010) | | N/A |
Dorothy D. Hayes (63) | | Director, Audit Committee Member and Chair, Investment Committee Member, and Nominating and Governance Committee Member | | October 31, 2014; Director since April 2013 | | Director, Chair of the Enterprise Risk Committee, and member of Executive Committee—First Tech Federal Credit Union (2011–present); Director and Chair of the Finance Committee— American Leadership Forum—Silicon Valley (2011–present); Director (2010–present), Chair of the Audit Committee (2010–2013) and Chair of the Board of Directors and member of Executive and Fund Development Committees (2012– present)—Silicon Valley FACES; Trustee, chair of the finance committee, member of the executive committee, and member of the investment committee— Computer History Museum (2006– present); Director and Chair of the Audit Committee—Range Fuels (development-stage biofuels company) (2008–2012); Director and Chair of the Finance Committee—Addison Avenue Federal Credit Union (2002–2010); Trustee—Foothills Foundation, Foothills Congregational Church (church foundation) (2004–present); Vice President, Internal Audit—Intuit, Inc. (financial software and services company) (2005–2008) | | N/A |
363
THE VANTAGEPOINT FUNDS
Additional Information (Unaudited) — (Continued)
| | | | | | | | |
Name, Address*
and Age | | Positions
Held with
the Company | | Term/Service
Expiration
and Length of
Time Served† | | Principal Occupation(s)
During the Past Five Years | | Directorship(s) of
Public Companies
and Other Registered
Investment
Companies During
the Past Five Years |
JoAnn H. Price (64) | | Director, Investment Committee Member | | October 31, 2016; Director since October 2013 | | President—Fairview Capital Partners, Inc. (private equity advisory firm) (October 1994–present); Treasurer (2011–present) and Director (October 2001–present)—Apollo Theater Foundation; Director—Hartford Foundation for Public Giving (January 2010–present); Vice Chair (2009–present) and Director (January 2003– present);—YMCA of Greater Hartford; Trustee (January 2002–present) and Former President (2004–2010)—The Amistad Center for Art and Culture; Director—Hartford Communities that Care, Inc. (January 2012–present); Member—Howard University School of Business Board of Visitors (January 2002–present); Trustee—Connecticut Women’s Hall of Fame (January 2012–present). | | N/A |
| Timothy M. O’Brien (64) | | Chair of the Board and Director, Audit Committee Member, Investment Committee Member and Chair, and Nominating and Governance Committee Member | | October 31, 2014; Director since September 2005 | | Independent Consultant (pension consulting) (2003–present); Trustee, Chair of Audit Committee and member of Investment and Benefits Committees— Public Employees Retirement Association of Colorado (July 2011–present) | | N/A |
| Harold Singleton, III (51) | | Director, Investment Committee Member | | October 31, 2016; Director since October 2013 | | Managing Director (January 2007–May 2012), Head of Asset Management Companies and Global Head of Retail and Intermediary Sales (December 2010–May 2012), Global Head of Equities and Fixed Income Product Specialists (June 2009–December 2010), Equity Product Specialist (January 2007–June 2009)—PineBridge Investments, LLC (investment management firm); Chair of the Board—PineBridge Investments East Africa Limited (January 2011–May 2012); Chair of the Board—PineBridge Investments Taiwan Limited (January 2011–May 2012); Director—PineBridge Investments Ireland Limited (December 2010–May 2012); Director—PineBridge Investments India Limited (April 2011–May 2012); Trustee—Illinois Institute of Technology (May 2012–present). | | N/A |
364
THE VANTAGEPOINT FUNDS
Additional Information (Unaudited) — (Continued)
Interested Director and Officers
| | | | | | | | |
| Name and Age | | Positions
Held with
the Company | | Term/Service
Expiration
and Length of
Time Served† | | Principal Occupation(s)
During the Past Five Years | | Directorship(s) of
Public Companies
and Other Registered
Investment
Companies During
the Past Five Years |
| David R. Mora (68)* | | Director | | October 31, 2014; Director since November 2011 | | Board member (January 2005–present) and former Chair of the Board of Directors (January 2010–December 2013)–ICMA Retirement Corporation; West Coast Regional Director—International City/County Management Association (February 2009–April 2011); City Manager—City of Salinas, CA (September 1990–September 2008); Board member—Public Entity Risk Institute (non-profit) (January 2000–December 2008) | | N/A |
| Joan W. McCallen (61)*** | | President and Principal Executive Officer | | Since September 2003 | | Chief Executive Officer—ICMA Retirement Corporation (Aug. 2003–present); President and Manager—Vantagepoint Investment Advisers, LLC, and ICMA-RC Services, LLC (broker-dealer); President and Manager—Vantagepoint Transfer Agents, LLC (2003–present); Director and President, VantageTrust Company, LLC (2003–present) | | N/A |
| Bruce James Rohrbacher (61)*** | | Vice President and Chief Compliance Officer | | Since September 2004 | | Senior Vice President and Chief Compliance Officer—ICMA Retirement Corporation (2004–present); Chief Compliance Officer, Vantagepoint Investment Advisers, LLC (2004–present) and Chief Compliance Officer, ICMA-RC Services, LLC (broker-dealer) (2004–present); Chief Compliance Officer—VantageTrust Company, LLC (2004–present) | | N/A |
| Elizabeth S. Glista (49)*** | | Treasurer and Principal Financial Officer | | Since March 2009 | | Senior Vice President and Chief Financial Officer—ICMA Retirement Corporation (April 2009–present); Treasurer–Vantagepoint Investment Advisers, LLC, and Vantagepoint Transfer Agents, LLC (April 2009– present); Treasurer–ICMA-RC Services, LLC (broker-dealer) (April 2009–present); Treasurer—VantageTrust Company, LLC (April 2009–present); Managing Vice President, Financial Operations, Analysis & Treasury—ICMA Retirement Corporation (January 2009–April 2009); Vice President, Financial Planning & Analysis and Treasury—ICMA-RC (January 2000–September 2007 and March 2008–January 2009) | | N/A |
365
THE VANTAGEPOINT FUNDS
Additional Information (Unaudited) — (Continued)
| | | | | | | | |
| Name and Age | | Positions
Held with
the Company | | Term/Service
Expiration
and Length of
Time Served† | | Principal Occupation(s)
During the Past Five Years | | Directorship(s) of
Public Companies
and Other Registered
Investment
Companies During
the Past Five Years |
| Angela C. Montez (46)*** | | Secretary | | Since December 2006 | | Managing Vice President, Deputy General Counsel and Assistant Secretary—ICMA Retirement Corporation (2006–present); Assistant Secretary—Vantagepoint Investment Advisers, LLC, Vantagepoint Transfer Agents, LLP and ICMA-RC Services, LLC(broker dealer) (2011–present); Assistant Secretary—VantageTrust Company, LLC (February 2008– present); Secretary—Vantagepoint Investment Advisers, LLC, Vantagepoint Transfer Agents, LLC and ICMA-RC Services, LLC (broker-dealer) (2006–2007); Corporate Counsel—ICMA Retirement Corporation (2000–2006) | | N/A |
| Kathryn B. McGrath (69)*** | | Assistant Secretary | | Since March 2008 | | Senior Vice President, General Counsel and Secretary—ICMA Retirement Corporation (2007–Present); Secretary—Vantagepoint Investment Advisers, LLC, Vantagepoint Transfer Agents, LLP and ICMA-RC Services, LLC(broker dealer) (2007–present); Secretary—VantageTrust Company, LLC (February 2008–present) | | N/A |
NOTES:
| | * | The business mailing address for the Directors and officers of the Trust is 777 North Capitol Street, N.E., Suite 600, Washington, DC 20002. |
| | † | The Company has three classes of directors: Class 1, Class 2 and Class 3. The Declaration of Trust sets forth the length of the Directors’ terms (five years for Class 1 and Class 2; one year for Class 3), limits each Class 1 and Class 2 Director’s length of service to 12 consecutive years, and prohibits each Director from serving a term that begins after he or she has reached age 72. The date shown in this column reflects the expiration date of the Director’s current term, the end of the Class 1 or Class 2 Director’s 12th year of service, or the Director’s retirement date, whichever occurs first. |
| | ** | Mr. Mora is considered to be an “interested person” of the Trust (as that term is defined under the 1940 Act), and thus an “interested director,” because he is a director of ICMA Retirement Corporation (“ICMA-RC”), the parent company of VIA and of ICMA-RC Services, LLC (“RC Services”), the distributor of the Company’s shares. |
| | *** | Mses. McCallen, Glista, Montez, and McGrath and Mr. Rohrbacher are considered to be “interested persons” of the Trust, as that term is defined under the 1940 Act, due to their positions as officers of the following entities: VIA; RC Services, the distributor of the funds; ICMA-RC, the parent company of VIA and RC Services; and the Trust Company. |
Presented below are the fees paid by each fund to subadvisers during the year ended December 31, 2013. Fees are shown as an annual percentage of average net assets under management except that the subadvisory fees for Mellon Capital Management Corporation for the Diversifying Strategies Fund are calculated based on the average net asset
366
THE VANTAGEPOINT FUNDS
Additional Information (Unaudited) — (Continued)
value of the assets allocated and assigned to it by VIA. The total dollars below represent amounts paid to subadvisers for services performed during the period July 1, 2012 through September 30, 2013.
| | | | | | | | | | |
Fund | | Subadviser | | Actual Fee
as a Percentage of
Average Daily
Net Assets (net of any
subadviser fee waivers) | | | Dollars Paid | |
| Low Duration Bond | | Payden & Rygel | | | 0.10% | | | $ | 278,539 | |
| | Schroder Investment Management North America Inc. (1) | | | 0.18% | | | | 521,704 | |
| | | |
| Inflation Protected Securities | | Pacific Investment Management Company, LLC | | | 0.20% | | | | 625,014 | |
| | BlackRock Financial Management, Inc. | | | 0.10% | | | | 390,324 | |
| | | |
| Equity Income | | Barrow, Hanley, Mewhinney & Strauss, LLC | | | 0.21% | | | | 1,532,858 | |
| | T. Rowe Price Associates, Inc. | | | 0.30% | | | | 2,196,501 | |
| | Southeastern Asset Management, Inc. | | | 0.52% | | | | 3,600,462 | |
| | | |
| Growth & Income | | Fiduciary Management, Inc. | | | 0.29% | | | | 1,390,395 | |
| | T. Rowe Price Associates, Inc. | | | 0.38% | | | | 1,319,509 | |
| | Wellington Management Company, LLP | | | 0.27% | | | | 1,501,509 | |
| | | |
| Growth | | Atlanta Capital Management Company, LLC | | | 0.30% | | | | 1,470,891 | |
| | Columbus Circle Investors | | | 0.33% | | | | 1,650,863 | |
| | Victory Capital Management Inc. (2) | | | 0.26% | | | | 1,284,665 | |
| | Westfield Capital Management Company, L.P. | | | 0.33% | | | | 1,953,151 | |
| | | |
| Select Value | | Artisan Partners Limited Partnership | | | 0.55% | | | | 716,935 | |
| | Systematic Financial Management, L.P. | | | 0.41% | | | | 533,293 | |
| | WEDGE Capital Management LLP | | | 0.51% | | | | 672,139 | |
| | | |
| Aggressive Opportunities | | Southeastern Asset Management, Inc. | | | 0.58% | | | | 907,888 | |
| | SSgA Funds Management, Inc. | | | 0.03% | | | | 113,056 | |
| | TimesSquare Capital Management, LLC | | | 0.50% | | | | 1,574,156 | |
| | Wells Capital Management Inc. | | | 0.43% | | | | 1,146,995 | |
| | | |
| Discovery | | Payden & Rygel | | | 0.15% | | | | 170,598 | |
| | Wellington Management Company, LLP | | | 0.73% | | | | 825,428 | |
| | | |
| International | | Artisan Partners Limited Partnership | | | 0.64% | | | | 1,468,527 | |
| | GlobeFlex Capital, LP | | | 0.40% | | | | 1,532,680 | |
| | Mondrian Investment Partners Limited | | | 0.43% | | | | 1,939,144 | |
| | Walter Scott & Partners Limited | | | 0.54% | | | | 1,316,207 | |
| | | |
| Diversifying Strategies | | Calamos Advisors LLC | | | 0.53% | | | | 1,203,912 | |
| | Mellon Capital Management Corporation (3) | | | 0.33% | | | | 658,014 | |
| | Payden & Rygel (Enhanced Cash Management) | | | 0.10% | | | | 169,926 | |
| | Payden & Rygel (Low Duration-Plus Fixed Income) | | | 0.09% | | | | 330,162 | |
| | Shenkman Capital Management, Inc. | | | 0.38% | | | | 912,476 | |
| | | |
| Core Bond Index | | Mellon Capital Management Corporation (4) | | | 0.01% | | | | 162,518 | |
| | | |
| 500 Stock Index | | Mellon Capital Management Corporation (4) | | | 0.01% | | | | 64,593 | |
| | | |
| Broad Market Index | | Mellon Capital Management Corporation (4) | | | 0.01% | | | | 102,264 | |
| | | |
| Mid/Small Company Index | | Mellon Capital Management Corporation (4) | | | 0.02% | | | | 103,915 | |
| | | |
| Overseas Equity Index | | Mellon Capital Management Corporation (4) | | | 0.04% | | | | 118,936 | |
| | (1) | Effective October 11, 2013, STW Fixed Income Management, LLC (“STW”) was integrated into the operations of Schroeder Investment Management North American Inc.(“SIMNA”). On that date, SIMNA replaced STW as subadviser to the Low Duration Bond Fund. |
367
THE VANTAGEPOINT FUNDS
Additional Information (Unaudited) — (Continued)
| | (2) | Effective August 1, 2013, the fee schedule charged by Victory Capital Management, Inc. (“Victory”) to the Growth Fund was amended and the percentage shown above represents a blended rate of the previous fee schedule and the new fee schedule |
| | (3) | Mellon Capital Management Corporation has contractually agreed to reduce its subadvisory fee through February 4, 2014. |
| | (4) | Effective January 18, 2013, the fee schedule charged by Mellon Capital Management Corporation for each Index Fund was amended and the percentages shown above represent a blended rate of the previous fee schedules and the new fee schedules. |
| G. | | Directors’ Considerations of Investment Subadvisory Agreements |
The following relates to the consideration by the Board of Directors (“Directors” or “Board”) of The Vantagepoint Funds (“Company”), during the period beginning July 1, 2013 through December 31, 2013, of the approval of certain investment subadvisory agreements and an amendment to an existing investment subadvisory agreement.
Vantagepoint Low Duration Bond Fund
At a meeting held on July 1, 2013 (“July Meeting”), Vantagepoint Investment Advisers, LLC (“VIA”) recommended, and the Board of the Company, including a majority of the Directors who are not “interested persons” as defined in the Investment Company Act of 1940, as amended (“Independent Directors”), approved a new investment subadvisory agreement among the Company, on behalf of the Vantagepoint Low Duration Bond Fund (“Low Duration Bond Fund”), VIA and Schroder Investment Management North America Inc. (“SIMNA”), which became effective on October 11, 2013 (“New SIMNA Subadvisory Agreement”). SIMNA replaced STW Fixed Income Management LLC (“STW”) as a subadviser to the Low Duration Bond Fund due to the integration of STW’s operations into the existing business of SIMNA (the “Integration”), following the previous acquisition of STW by Schroder U.S. Holdings Inc. (“SUSHI”). SIMNA is a wholly owned subsidiary of SUSHI. The Integration took place on October 11, 2013 and, subsequently, STW ceased being a registered investment adviser. As a result, the Integration terminated STW’s existing investment subadvisory agreement with the Low Duration Bond Fund (“STW Subadvisory Agreement”) and necessitated the execution of the New SIMNA Subadvisory Agreement, which became effective on the date of the Integration. Prior to the Integration, the Board was asked by VIA to consider the selection of SIMNA as a new subadviser to the Low Duration Bond Fund and approve the New SIMNA Subadvisory Agreement. Before approving the appointment of SIMNA as a subadviser to the Low Duration Bond Fund, the Board considered the recommendations of, and supporting analyses and data presented by, VIA.
With respect to the Board’s consideration of the New SIMNA Subadvisory Agreement, the Directors received written information in advance of the July Meeting from VIA, which included: (1) the conclusions reached by VIA as a result of the due diligence it conducted relating to the Integration and in recommending the Board approve the New SIMNA Subadvisory Agreement; (2) the nature, extent and quality of services that STW currently provided, and that SIMNA was expected to provide after the Integration, to the Low Duration Bond Fund; (3) SIMNA’s experience, investment management business, personnel and operations; (4) SIMNA’s brokerage and trading policies and practices; (5) the level of the subadvisory fees to be charged to the Low Duration Bond Fund by SIMNA and a comparison of those fees to: (a) SIMNA’s fee schedule for managing other advisory accounts with an investment strategy similar to the one it is to employ for the Low Duration Bond Fund; and (b) the fees charged to accounts with assets comparable to the amount of assets to be allocated to SIMNA by a group of U.S. separate account investment managers that utilize a short duration fixed income mandate; (6) SIMNA’s compliance program; (7) STW’s investment performance as a subadviser of the Low Duration Bond Fund and as compared to a relevant benchmark and peer group; (8) SIMNA’s representation that the Integration is not expected to affect the nature, scope or quality of the investment advisory services provided to the Low Duration Bond Fund; and (9) certain financial information for SIMNA.
In considering the information and materials described above, the Independent Directors received assistance from, and met separately with, their independent counsel and were provided with a written description of their statutory responsibilities and the legal standards that are applicable to approvals of advisory agreements.
In determining whether to approve the New SIMNA Subadvisory Agreement, the Directors considered the information received in advance of the July Meeting, and the presentations made by, and discussions held with,
368
THE VANTAGEPOINT FUNDS
Additional Information (Unaudited) — (Continued)
representatives of STW and SIMNA and the personnel of VIA, and discussions with the Company’s Chief Compliance Officer (“CCO”), as well as a variety of factors. Although not meant to be all-inclusive, the following discusses some of the factors relevant to the Board’s decision to approve the New SIMNA Subadvisory Agreement.
Nature, Extent and Quality of Services. With respect to the nature, extent and quality of the investment advisory services to be provided by SIMNA to the Low Duration Bond Fund following the Integration, the Directors considered SIMNA’s investment management process with respect to managing the portion of the Low Duration Bond Fund’s assets to be allocated to it, including the personnel responsible for the portfolio management of the Fund. The Directors noted that VIA concluded that the Integration would not have a negative impact on the services being provided to the Low Duration Bond Fund. The Directors took into account that, based on discussions with SIMNA, VIA was confident that the current services provided to the Low Duration Bond Fund, primarily performed by the former STW portfolio management team, will remain intact following the Integration. The Directors considered that key management personnel of STW have accepted economic incentives for their continued portfolio management services at SIMNA for several years after the Integration. The Directors considered SIMNA’s representations that it does not expect the Integration to affect the nature, scope or quality of the investment advisory services provided to the Low Duration Bond Fund, and that the investment advisory services to be provided by SIMNA are expected to be substantially similar to those currently provided by STW, and may even be enhanced as the portfolio managers will have access to additional research and other support resources from the Schroder’s group of companies. In addition, the Directors considered that the fee schedule under the New SIMNA Subadvisory Agreement is the same as the fee schedule under the STW Subadvisory Agreement. Based on the information considered, the Directors concluded that, after the Integration, SIMNA would likely have the ability to continue to provide the nature, extent and quality of services that the Low Duration Bond Fund had received from STW.
Investment Performance. The Directors considered the historical data provided regarding STW’s investment performance with respect to managing the assets of the Low Duration Bond Fund and such performance versus a relevant benchmark and peer group, and VIA’s favorable assessment of such performance. The Directors concluded that the investment performance record of the former STW investment team that would continue to manage the portion of the assets of the Low Duration Bond Fund allocated to SIMNA following the Integration supported approval of the New SIMNA Subadvisory Agreement.
Subadvisory Fees and Economies of Scale. In evaluating the subadvisory fee, the Directors considered that the subadvisory fee payable under the New SIMNA Subadvisory Agreement is the same as the subadvisory fee payable under the STW Subadvisory Agreement. The Directors considered a comparison of the subadvisory fee to be charged by SIMNA to the Low Duration Bond Fund with its fee schedule for managing other accounts (which were not pooled investment vehicles or other investment companies) with an investment strategy similar to the strategy SIMNA is to employ on behalf of the Low Duration Bond Fund. The Directors considered that, according to the information provided by VIA, the effective fee rate to be paid by the Low Duration Bond Fund under the New SIMNA Subadvisory Agreement, based on the amount of assets to be allocated to SIMNA, was competitive. The Directors further considered that, based on the statements provided by SIMNA, the services that SIMNA was to provide to the Low Duration Bond Fund following the Integration appeared to be generally similar to those SIMNA expects to provide to other accounts it manages in the same strategy. The Directors also considered VIA’s assessment that SIMNA’s subadvisory fee schedule for the Low Duration Bond Fund is competitive and reasonable given STW’s performance for the Fund and VIA’s expectations for SIMNA.
The Directors reviewed information provided by VIA (which was based on an independent third-party source) on the fees charged to accounts with assets comparable to the amount of assets to be allocated to SIMNA by a group of U.S. separate account investment managers that utilize a short duration fixed income mandate. According to the information provided, the effective fee rate to be paid by the Low Duration Bond Fund to SIMNA at asset levels as of May 31, 2013 (0.1835%) is slightly higher than the median fee charged by such managers (0.18%). The Directors considered VIA’s assessment that it believed SIMNA’s subadvisory fee to be appropriate given the nature and quality of the services to be provided by SIMNA and the nature of the strategy SIMNA is to employ for the Low Duration Bond Fund. The foregoing comparisons assisted the Directors in considering the New SIMNA Subadvisory Agreement by providing them with a basis for evaluating SIMNA’s fee on a relative basis. Based on this information, the Directors concluded that the subadvisory fee to be charged under the New SIMNA Subadvisory Agreement appeared to be within a reasonable range for the services to be provided.
369
THE VANTAGEPOINT FUNDS
Additional Information (Unaudited) — (Continued)
The Directors also reviewed the information provided regarding the estimated profits to be realized with respect to SIMNA’s relationship with the Low Duration Bond Fund. In considering the extent to which economies of scale may be realized by SIMNA as the assets of the Low Duration Bond Fund to be managed by SIMNA grow, and whether the proposed fee levels reflect these economies, the Directors noted that the proposed fee schedule under the New SIMNA Subadvisory Agreement includes breakpoints, whereby the Low Duration Bond Fund and its shareholders will benefit from reduced subadvisory fee rates as the assets managed by SIMNA increase.
Other Considerations. The Directors considered the conclusions reached by VIA as a result of its evaluation of SIMNA and the due diligence it conducted in deciding to recommend that the Board approve the New SIMNA Subadvisory Agreement. The Directors also considered VIA’s assessment that the proposed fee to be paid to SIMNA for its services to the Low Duration Bond Fund is competitive and reasonable given STW’s performance for the Fund and VIA’s expectations for SIMNA. The Directors concluded that VIA’s recommendations and conclusions supported approval of the New SIMNA Subadvisory Agreement.
In considering the potential “fall-out” or ancillary benefits that may accrue to SIMNA due to its relationship with the Low Duration Bond Fund, the Directors noted that SIMNA does not anticipate “fall-out” or ancillary benefits of any significance due to its relationship with the Fund, other than providing exposure to broker-dealers or investment advisers who may offer SIMNA the opportunity to participate in other lines of business such as subadvisory, separate account wrap programs or model manager programs.
Conclusion. After full consideration of the foregoing factors, with no single factor identified as being of paramount importance, the Directors, including a majority of the Independent Directors, concluded that the approval of the New SIMNA Subadvisory Agreement was in the best interests of the Low Duration Bond Fund and its shareholders.
Vantagepoint Growth Fund
Also at the July Meeting, VIA recommended, and the Board of the Company, including a majority of the Independent Directors, approved a new investment subadvisory agreement with Victory Capital Management Inc. (“Victory”), one of the subadvisers of the Vantagepoint Growth Fund (“Growth Fund”), due to the sale of the interests held in Victory by KeyBank National Association to Victory’s employees and Crestview Partners, a private equity firm, which occurred on August 1, 2013 (the “Transaction”). The Transaction resulted in a “change of control” of Victory under applicable provisions of the Investment Company Act of 1940 (“1940 Act”). The 1940 Act provides that a “change of control” of a fund’s adviser or subadviser results in an “assignment,” and a consequent automatic termination, of the investment advisory agreement between the fund and the adviser or subadviser, as the case may be. Accordingly, as a result of the Transaction, the investment subadvisory agreement previously in effect among the Company, on behalf of the Growth Fund, VIA and Victory (“Current Victory Subadvisory Agreement”) terminated on August 1, 2013. At the July Meeting, in anticipation of the Transaction and consequent immediate termination of the Current Victory Subadvisory Agreement, the Board, including a majority of the Independent Directors, approved a new investment subadvisory agreement among the Company, on behalf of the Growth Fund, VIA and Victory (“New Victory Subadvisory Agreement”), which became effective August 1, 2013. Before approving the New Victory Subadvisory Agreement, the Board considered the recommendations of, and supporting analyses and data presented by, VIA.
With respect to the Board’s consideration of the New Victory Subadvisory Agreement, the Directors received written information in advance of the Meeting from VIA, which included: (1) the conclusions reached by VIA as a result of the due diligence it conducted relating to the Transaction and in recommending the Board approve the New Victory Subadvisory Agreement; (2) the nature, extent and quality of services that Victory currently provides, and is expected to continue to provide after the Transaction, to the Growth Fund; (3) Victory’s experience, investment management business, personnel and operations; (4) Victory’s brokerage and trading policies and practices; (5) the level of the subadvisory fees to be charged to the Growth Fund by Victory and a comparison of that fee to: (a) Victory’s fee schedule for managing other advisory accounts with an investment objective similar to that of the Growth Fund; and (b) the fees charged to accounts with assets comparable to the amount of assets to be allocated to Victory by a group of U.S. separate account investment managers that utilize a large capitalization growth mandate; (6) Victory’s compliance program; (7) Victory’s historical investment performance and its performance as a subadviser to the Growth Fund and such performance as compared to a relevant benchmark and peer group; (8) Victory’s
370
THE VANTAGEPOINT FUNDS
Additional Information (Unaudited) — (Continued)
representation that the pending change of control is not expected to affect the nature, scope or quality of the services Victory provides to the Growth Fund; and (9) certain financial information for Victory.
In considering the information and materials described above, the Independent Directors received assistance from, and met separately with, their independent legal counsel and were provided with a written description of their statutory responsibilities and the legal standards that are applicable to approvals of advisory agreements.
In determining whether to approve the New Victory Subadvisory Agreement, the Directors considered the information received in advance of the July Meeting, and the presentations made by, and discussions held with, representatives of Victory and the personnel of VIA, and discussions with the Company’s CCO, as well as a variety of factors. Although not meant to be all-inclusive, the following discusses some of the factors relevant to the Board’s decision to approve the New Victory Subadvisory Agreement.
Nature, Extent and Quality of Services. With respect to the nature, extent and quality of the investment advisory services to be provided by Victory to the Growth Fund following the Transaction, the Directors considered Victory’s investment management process in managing the portion of the Growth Fund’s assets allocated to it, including the personnel responsible for the portfolio management of the Growth Fund. The Directors considered VIA’s and Victory’s statements that there will be no changes to Victory’s chief investment officers, investment teams or their investment process as a result of the Transaction, and that the investment teams will not experience any change in the resources received from Victory. In addition, the Directors considered VIA’s and Victory’s statements that there will be no change to Victory’s current operating model as a result of the Transaction, and that Victory’s management team will continue to be responsible for developing the firm’s overall strategy and run the day-to-day operations of the business. The Directors considered Victory’s representation that the Transaction is not expected to affect the nature, scope or quality of services it provides to the Growth Fund. The Directors also considered that the fee schedule under the New Victory Subadvisory Agreement was slightly more favorable to the Growth Fund than the fee schedule under the Current Victory Subadvisory Agreement. Based on the information considered, the Directors concluded that, after the Transaction, Victory would likely have the ability to continue to provide the nature, extent and quality of services it currently provides to the Growth Fund.
Investment Performance. The Directors considered the historical data provided regarding Victory’s investment performance with respect to the Growth Fund since it began managing the assets of the Fund in January 2012 through March 31, 2013, and for the one-year period ended March 31, 2013, as well as Victory’s composite performance for longer periods, and such performance versus a relevant benchmark and peer group. The Directors took into account VIA’s explanation that, despite recent underperformance, it believes Victory serves an important complementary role in the multi-managed Growth Fund, and that the combination of the complimentary styles and underlying characteristics of the existing subadvisers enhances the overall risk/return profile of the Growth Fund. The Directors concluded that Victory’s role in the Growth Fund supported approval of the New Victory Subadvisory Agreement.
Subadvisory Fees and Economies of Scale. In evaluating the subadvisory fee, the Directors considered that the subadvisory fee schedule under the New Victory Subadvisory Agreement is slightly more favorable to the Growth Fund than the subadvisory fee schedule under the Current Victory Subadvisory Agreement. The Directors noted Victory’s representation to VIA that the nature, quality and scope of the services it provides to the Growth Fund will not be affected by the lower subadvisory fee. The Directors considered comparisons of the subadvisory fee to be charged by Victory to the Growth Fund with its fee schedule for managing other accounts (including investment companies and pooled investment vehicles) with an investment objective similar to that of the Growth Fund. The Directors considered that, according to the information provided by VIA, based on the amount of assets to be allocated to Victory under the New Victory Subadvisory Agreement, the Growth Fund would be paying the lowest average basis point fee of any of Victory’s accounts with an investment objective similar to that of the Growth Fund. In addition, the Directors took into account Victory’s statement that the services to be rendered to the Growth Fund are similar to its other investment company relationships. The Directors also considered VIA’s assessment that Victory’s subadvisory fee schedule for the Growth Fund under the New Victory Subadvisory Agreement reflects the lowest available fee schedule offered by Victory to “like accounts.” For this purpose, the term “like accounts” was used by VIA generally to describe accounts of similar size and mandate to the Growth Fund.
371
THE VANTAGEPOINT FUNDS
Additional Information (Unaudited) — (Continued)
The Directors reviewed information provided by VIA (which was based on an independent third-party source) on the fees charged to accounts with assets comparable to the amount of assets allocated to Victory by a group of U.S. separate account investment managers that utilize a large capitalization growth mandate. According to the information provided, the effective fee rate to be paid by the Growth Fund to Victory at asset levels as of March 31, 2013 was below the median fee charged by such managers. The Directors considered that VIA deemed the proposed fee schedule under the New Victory Subadvisory Agreement appropriate given the nature and quality of the services to be provided by Victory and the nature of the strategy Victory is to employ for the Growth Fund. The foregoing comparisons assisted the Directors in considering the New Victory Subadvisory Agreement by providing them with a basis for evaluating Victory’s subadvisory fee on a relative basis. Based on this information, the Directors concluded that Victory’s subadvisory fee appeared to be within a reasonable range for the services to be provided.
The Directors also reviewed the information provided regarding the estimated profits to be realized with respect to Victory’s relationship with the Growth Fund. In considering the extent to which economies of scale may be realized by Victory as the assets of the Growth Fund to be managed by Victory grow, and whether the proposed fee levels reflect these economies, the Directors noted that the proposed fee schedule under the New Victory Subadvisory Agreement includes breakpoints, whereby the Growth Fund and its shareholders will benefit from reduced subadvisory fee rates as the assets managed by Victory increase.
Other Considerations. The Directors considered the conclusions reached by VIA as a result of its evaluation of Victory and the due diligence it conducted in deciding to recommend that the Board approve the New Victory Subadvisory Agreement. The Directors also considered VIA’s assessment that the proposed fee to be paid to Victory for its services to the Growth Fund is competitive and reasonable and appropriate given the nature and quality of the services to be provided by Victory. The Directors concluded that VIA’s recommendations and conclusions supported approval of the New Victory Subadvisory Agreement.
In considering the potential “fall-out” or ancillary benefits that may accrue to Victory due to its relationship with the Growth Fund, the Directors noted Victory’s statement that, as the assets under Victory’s management increase so will the commissions generated by Victory, which will improve Victory’s ability to access research services available from its brokers. However, the Directors noted that all subadvisers are required to select brokers who meet the Growth Fund’s requirements for seeking best execution, and that VIA monitors and evaluates the subadvisers’ trade execution with respect to the Growth Fund’s brokerage transactions on a regular basis and provides reports to the Board in this regard. The Directors concluded that the potential benefits accruing to Victory by virtue of its relationship to the Growth Fund appeared to be reasonable.
Conclusion. After full consideration of the foregoing factors, with no single factor identified as being of paramount importance, the Directors, including a majority of the Independent Directors, concluded that the approval of the New Victory Subadvisory Agreement was in the best interests of the Growth Fund and its shareholders.
Vantagepoint Diversifying Strategies Fund
At a meeting held on December 3, 2013 (“December Meeting”), VIA recommended, and the Board of the Company approved, the following changes to the Vantagepoint Diversifying Strategies Fund (“Diversifying Strategies Fund”), which became effective on or about February 4, 2014 (“February Changes”): (i) the termination of Calamos Advisors LLC (“Calamos”) as a subadviser to the Diversifying Strategies Fund; (ii) the hiring of Oaktree Capital Management, L.P. (“Oaktree”) as a subadviser to replace Calamos; and (iii) a change in the Diversifying Strategies Fund’s principal investment strategies to reflect an increase in the Diversifying Strategies Fund’s exposure to below investment grade convertible securities in light of Oaktree’s convertible securities strategy. Also at the December Meeting, VIA recommended, and the Board of the Company approved, the following additional changes to the principal investment strategies of the Diversifying Strategies Fund, as well as related subadviser changes, to become effective on or about May 1, 2014 (“May Changes”): (i) the elimination of the global tactical asset allocation strategy (“GTAA strategy”) and the termination of the subadviser for that strategy, Mellon Capital Management Corporation (“Mellon”); (ii) the elimination of the collateral portfolio associated with the GTAA strategy (“collateral portfolio”), which is subadvised by Payden & Rygel (“Payden”); (iii) a reduction in the assets of the Diversifying Strategies Fund allocated to the low duration plus fixed income strategy, which is subadvised by Payden; (iv) the addition of an enhanced equity strategy (“Enhanced Equity strategy”) and the hiring of Payden to serve as a subadviser for that new strategy; (v) a reduction in
372
THE VANTAGEPOINT FUNDS
Additional Information (Unaudited) — (Continued)
the assets of the Diversifying Strategies Fund allocated to the convertible securities strategy subadvised by Shenkman Capital Management, Inc. (“Shenkman”); and (vi) the addition of a real estate investment trust (“REIT”) strategy to be implemented on a passive basis (“passive U.S. REIT strategy”) and the hiring of SSgA Funds Management, Inc. (“SSgA FM”) to serve as a subadviser for that new strategy. In connection with the foregoing changes, the Board of the Company, including a majority of the Independent Directors, approved: (i) initial investment subadvisory agreements among the Company, on behalf of the Diversifying Strategies Fund, VIA and each of Oaktree and SSgA FM (each, a “New Subadvisory Agreement” and, collectively, the “New Subadvisory Agreements”); and (ii) an amendment to the fee schedule of the current investment subadvisory agreement among the Company, on behalf of the Diversifying Strategies Fund, VIA and Payden to reflect the fee relating to Payden serving as a subadviser for the Enhanced Equity strategy and to remove references to the fee for Payden’s services as a subadviser to the collateral portfolio (“Payden Amendment”). Oaktree and SSgA FM may each be referred to below as a “New Subadviser” and collectively as the “New Subadvisers.” Before approving the New Subadvisory Agreements and the Payden Amendment and the changes described above, the Board considered the recommendations of, and supporting analyses and data presented by, VIA.
With respect to the Board’s consideration of the New Subadvisory Agreements with Oaktree and SSgA FM and the Payden Amendment, the Directors received written information in advance of the December Meeting from VIA, which included: (1) VIA’s rationale for recommending the February Changes and May Changes; (2) the process by which VIA selected and recommended for Board approval Oaktree and SSgA FM as subadvisers of the Diversifying Strategies Fund to implement the U.S. convertible securities strategy and passive U.S. REIT strategy, respectively, and Payden to implement the Enhanced Equity strategy; (3) the nature, extent and quality of the services that the New Subadvisers and Payden would provide to the Diversifying Strategies Fund; (4) the experience, investment management business, personnel and operations of each New Subadviser and Payden; (5) the brokerage and trading policies and practices of each New Subadviser and Payden; (6) the level of the subadvisory fees to be charged to the Diversifying Strategies Fund by each New Subadviser and Payden and a comparison of those fees to the: (a) fees charged by each New Subadviser and Payden for managing other comparable accounts; and (b) fees charged by a group of U.S. separate account investment managers utilizing a U.S. convertible securities mandate with respect to Oaktree, a U.S. REIT mandate with respect to SSgA FM and a small capitalization core mandate with respect to Payden; (7) the compliance programs of the New Subadvisers and information on Payden’s compliance program; (8) performance information for each New Subadviser and Payden utilizing: (i) a U.S. convertible securities mandate with respect to Oaktree; (ii) a passive U.S. REIT mandate with respect to SSgA FM, and (iii) an Enhanced Equity mandate with respect to Payden, and such performance compared to a relevant benchmark and peer group; (9) the Diversifying Strategies Fund’s expected overall investment advisory fee and projected total expense ratio, taking into account the February Changes and May Changes, respectively, compared to a group of multialternative mutual funds; and (10) the financial condition of each New Subadviser and Payden.
In considering the information and materials described above, the Independent Directors received assistance from, and met separately with, their independent legal counsel and were provided with a written description of their statutory responsibilities and the legal standards that are applicable to approvals of advisory agreements.
In determining whether to approve each New Subadvisory Agreement and the Payden Amendment, the Directors considered the information received in advance of the December Meeting, and the presentations made by, and discussions held with, representatives of Oaktree and SSgA FM and the personnel of VIA, and discussions with the Company’s CCO, as well as a variety of factors. Although not meant to be all-inclusive, the following discusses some of the factors relevant to the Board’s decision to approve the New Subadvisory Agreements and the Payden Amendment. The discussion below with respect to Payden specifically relates to its services as a subadviser for the Enhanced Equity strategy.
Nature, Extent and Quality of Services. With respect to the nature, extent and quality of the services expected to be provided by each New Subadviser under the New Subadvisory Agreements and Payden under the Payden Amendment, the Directors considered the specific investment process to be employed by each New Subadviser and Payden in managing the assets of the Diversifying Strategies Fund to be allocated to them; the qualifications of Oaktree’s, SSgA FM’s and Payden’s respective investment management personnel with regard to implementing a U.S. convertible securities strategy with respect to Oaktree, a passive U.S. REIT strategy with respect to SSgA FM and an
373
THE VANTAGEPOINT FUNDS
Additional Information (Unaudited) — (Continued)
Enhanced Equity strategy with respect to Payden; performance information provided for each New Subadviser and Payden as compared to a relevant benchmark and peer group; each New Subadviser’s and Payden’s infrastructure and whether it appeared to adequately support a U.S. convertible securities strategy with respect to Oaktree, a passive U.S. REIT strategy with respect to SSgA FM and an Enhanced Equity strategy with respect to Payden; and VIA’s review process and favorable assessment as to the nature, quality and extent of the subadvisory services expected to be provided to the Diversifying Strategies Fund by each New Subadviser and Payden. The Directors acknowledged that Oaktree, SSgA FM and Payden each has experienced portfolio management personnel; and appeared to have adequate infrastructure and support staff to seek to achieve favorable results implementing their respective proposed strategies for the Diversifying Strategies Fund. The Directors concluded that the nature, extent and quality of the subadvisory services expected to be provided by each New Subadviser and Payden were appropriate in light of the investment strategies that each such subadviser is to implement on behalf of the Diversifying Strategies Fund, and, thus, supported a decision to approve each New Subadvisory Agreement and the Payden Amendment.
Investment Performance. The Directors reviewed the investment performance information provided by VIA for Oaktree, SSgA FM and Payden with respect to the proposed mandate each is to employ for the Diversifying Strategies Fund, and considered such performance information versus a relevant benchmark and peer group (based on information provided by an independent third-party source) and VIA’s favorable assessment of such performance. Based on the information provided, the Directors concluded that the performance information supported a decision to approve each New Subadvisory Agreement and the Payden Amendment.
Subadvisory Fees, Expense Ratio Impact and Economies of Scale. In evaluating each proposed subadvisory fee, the Directors reviewed the subadvisory fee schedules for each New Subadviser and Payden. The Directors considered comparisons of the subadvisory fee to be charged by each New Subadviser and Payden to the Diversifying Strategies Fund with its respective fee schedule for managing other accounts with an investment mandate similar to the mandate the subadviser is to employ on behalf of the Diversifying Strategies Fund. The Directors also considered that, according to the information provided by VIA: (i) the proposed fee schedule for Oaktree is equal to the fee schedule Oaktree charges to all of its clients in its U.S. and Non-U.S. convertible securities strategy with assets comparable to the amount of assets of the Diversifying Strategies Fund to be allocated to Oaktree; and (ii) the proposed fee schedule for SSgA FM reflected the lowest fee rate currently charged by the subadviser to other accounts for which it provides advisory services utilizing a mandate similar to the mandate it is to employ for the Diversifying Strategies Fund and is lower than its standard fee schedule for managing accounts with a mandate similar to the mandate it is to employ for the Diversifying Strategies Fund. With regard to the proposed fee schedule for Payden relating to the Enhanced Equity strategy, the Directors also considered that the proposed fee schedule under the Payden Amendment is the same as the fee schedule Payden charges to the Vantagepoint Discovery Fund (“Discovery Fund”). According to the information provided by VIA, the Discovery Fund is the only other comparable SEC-registered mutual fund that Payden manages with a mandate similar to the Enhanced Equity strategy it is to employ for the Diversifying Strategies Fund and both fee schedules are lower than Payden’s standard fee schedule for managing accounts with a mandate similar to the mandate it is to employ for the Fund. Additionally, the nature of the subadvisory services that each New Subadviser and Payden is to provide to the Diversifying Strategies Fund appeared to be comparable to those each subadviser currently provides to its other subadvisory relationships.
The Directors reviewed information provided by VIA (which was based on an independent third-party source) on the fees charged by a group of U.S. separate account investment managers to accounts with assets comparable to the amount of assets to be allocated initially to each New Subadviser and Payden (with respect to the Enhanced Equity strategy) and that employ a U.S. convertibles strategy (for comparison to Oaktree), a U.S. REIT strategy (for comparison to SSgA FM) and a small capitalization core strategy (for comparison to Payden). According to the information provided, the proposed effective fee rate to be paid by the Diversifying Strategies Fund to each New Subadviser, and Payden with respect to the Enhanced Equity strategy, at the proposed initial asset allocation levels would be below the median fee charged by such managers.
The Directors also considered information provided by VIA showing that there would be a decrease in the overall subadvisory fees and, therefore, a decrease in the total expense ratio of the Diversifying Strategies Fund as a result of the appointment of Oaktree effective February 2014 and also as a result of the May Changes. In each case, referring to data provided by VIA and compiled by Morningstar, Inc. (“Morningstar”), a provider of independent investment
374
THE VANTAGEPOINT FUNDS
Additional Information (Unaudited) — (Continued)
company data, the Directors noted that the expected total investment advisory fee for the Diversifying Strategies Fund, taking into account the appointment of Oaktree effective February 2014 and taking into account the May Changes, respectively, was lower than the average and median investment advisory fee of a group of mutual funds in Morningstar’s multialternative funds category. The Directors also considered information provided by VIA and compiled by Morningstar on the total expense ratios of this same group of mutual funds in Morningstar’s multialternative funds category, which showed that, if Oaktree served as a subadviser to the Diversifying Strategies Fund at the proposed subadvisory fee rate and initial asset allocation level, along with the Diversifying Strategies Fund’s other existing subadvisers at their current subadvisory fee rates and asset allocation levels, the Diversifying Strategies Fund’s expected total expense ratio would be below the average and median expense ratios of such funds. In addition, the Directors also considered information provided by VIA on the total expense ratios of this same group of mutual funds in Morningstar’s multialternative funds category, which showed that, if Oaktree, SSgA FM and Payden (with respect to the Enhanced Equity strategy) each served as a subadviser to the Diversifying Strategies Fund at the proposed subadvisory fee rates and proposed asset allocation levels effective May 1, 2014, along with the Diversifying Strategies Fund’s other existing subadvisers, Shenkman and Payden (with respect to the low duration plus fixed income strategy), at their current subadvisory fee rates and proposed asset allocation levels effective May 1, 2014, the Diversifying Strategies Fund’s expected total expense ratio would be below the average and median expense ratios of such funds.
The foregoing comparisons assisted the Directors in considering each New Subadvisory Agreement and the Payden Amendment by providing them with a basis for evaluating each New Subadviser’s fee, and Payden’s fee with respect to the Enhanced Equity strategy, including in light of the Diversifying Strategies Fund’s expected overall investment advisory fee and total expense ratio, on a relative basis. Based on this information, the Directors concluded that the subadvisory fees of each New Subadviser and Payden appeared to be within a reasonable range for the services to be provided.
The Directors also reviewed the information provided regarding the estimated profits to be realized with respect to each New Subadviser’s and Payden’s respective relationships with the Diversifying Strategies Fund. In considering the extent to which economies of scale may be realized by each New Subadviser, and Payden with respect to the Enhanced Equity strategy, as the assets of the Diversifying Strategies Fund to be managed by each New Subadviser and Payden grow and whether the proposed fee levels reflect these economies, the Directors considered that, although the proposed fee schedule for each New Subadviser does not include breakpoints, each New Subadvisory Agreement was the product of arm’s-length negotiation. The Directors further considered the appropriateness of each subadvisory fee structure in light of VIA’s assessment that the subadvisory fee schedule of each of Oaktree and SSgA FM reflects the lowest fee schedule available or offered by Oaktree and SSgA FM, respectively, for like accounts (accounts of similar size and mandate) and the proposed effective fee rate to be paid to each New Subadviser would be below the median fee charged by a group of U.S. separate account investment managers to accounts with assets comparable to the amount of assets proposed to be allocated initially to each New Subadviser and that employ a U.S. convertibles strategy (for comparison to Oaktree) and a U.S. REIT strategy (for comparison to SSgA FM). With regard to Payden, the Directors considered that the Payden subadvisory fee for the Enhanced Equity strategy included breakpoints, which indicates that the proposed subadvisory fee rate is intended to capture certain anticipated economies of scale for the benefit of the Diversifying Strategies Fund and its shareholders, and that the subadvisory fee schedule of Payden reflects the lowest fee schedule offered by Payden for like accounts (accounts of similar size and mandate). The Directors concluded that the proposed fee schedules with respect to each New Subadviser, and Payden for the Enhanced Equity strategy, were appropriate at this time.
Other Considerations. The Directors considered VIA’s judgment that the hiring of Oaktree as a subadviser to implement the U.S. convertible securities strategy creates a well-diversified fund with attractive risk/return attributes. The Directors also considered VIA’s judgment that the addition of a passive U.S. REIT strategy and an Enhanced Equity strategy and the hiring of SSgA FM and Payden, respectively, to implement such strategies, as well as the other May Changes to the Diversifying Strategies Fund, should enhance the Diversifying Strategies Fund’s growth potential while preserving downside protection.
The Directors considered the selection and due diligence process employed by VIA in deciding to recommend Oaktree and SSgA FM as subadvisers to the Diversifying Strategies Fund to implement a U.S. convertible securities
375
THE VANTAGEPOINT FUNDS
Additional Information (Unaudited) — (Continued)
strategy and a passive U.S. REIT strategy, respectively, and in deciding to recommend that Payden provide subadvisory services to the Diversifying Strategies Fund with respect to the Enhanced Equity strategy. The Directors also considered VIA’s conclusion that the fee to be paid to each New Subadviser and to Payden as it relates to the Enhanced Equity strategy for their respective services to the Diversifying Strategies Fund is competitive, reasonable and appropriate in light of the nature and quality of services to be provided by each subadviser and the reasons supporting that conclusion. The Directors concluded that VIA’s recommendations and conclusions supported approval of each New Subadvisory Agreement and the Payden Amendment.
The Directors also considered the potential “fall-out” or ancillary benefits that may accrue to Oaktree, SSgA FM and Payden due to their relationship with the Diversifying Strategies Fund. With respect to Oaktree, the Board considered that Oaktree indicated that the relationship would enhance a favorable channel through which Oaktree’s investment strategies may reach a clientele as yet relatively underserved by Oaktree. With respect to SSgA FM, the Board considered that SSgA FM indicated that, by serving as subadviser to the Diversifying Strategies Fund, it may indirectly receive “fall-out” benefits from its relationship due to the value derived in the marketplace from the association. With respect to SSgA FM, the Directors also considered that SSgA FM may receive research or other services from certain brokers in connection with the execution of the Diversifying Strategies Fund’s brokerage transactions. However, the Directors noted that all subadvisers are required to select brokers who meet the Diversifying Strategies Fund’s requirements for seeking best execution, and that VIA monitors and evaluates the subadvisers’ trade execution with respect to the Diversifying Strategies Fund’s brokerage transactions on a regular basis and provides reports to the Board in this regard. The Directors concluded that the potential benefits that may accrue to Oaktree and SSgA FM by virtue of their relationships with the Diversifying Strategies Fund appeared to be reasonable. The Directors considered that Payden does not anticipate any “fall-out” or ancillary benefits due to its relationship with the Diversifying Strategies Fund.
Conclusion. After full consideration of the foregoing factors, with no single factor identified as being of paramount importance, the Directors, including a majority of the Independent Directors, concluded that the initial approval of each New Subadvisory Agreement and the Payden Amendment was in the best interests of the Diversifying Strategies Fund and its shareholders, and approved the New Subadvisory Agreement with each of Oaktree and SSgA FM, and also approved the Payden Amendment.
Vantagepoint Equity Income Fund
Also at the December Meeting, VIA recommended, and the Board of the Company, including a majority of the Independent Directors, approved initial investment subadvisory agreements (each, a “New Equity Income Subadvisory Agreement” and, collectively, the “New Equity Income Subadvisory Agreements”) among the Company, on behalf of the Vantagepoint Equity Income Fund (“Equity Income Fund”), VIA and each of Wellington Management Company, LLP (“Wellington”) and SSgA FM. Wellington and SSgA FM may each be referred to below as a “New Equity Income Subadviser” and collectively as the “New Equity Income Subadvisers.” At the December Meeting, VIA also recommended, and the Board of the Company approved: (i) changes to the Equity Income Fund’s principal investment strategies that would allow SSgA FM to manage the portion of the Equity Income Fund’s assets allocated to it by investing in a portfolio that approximates an equal-weighted custom version of the Russell 1000 Value Index (“passively managed U.S. equity strategy”); (ii) a reduction in the assets allocated to two of the Equity Income Fund’s existing subadvisers, Southeastern Asset Management, Inc. (“Southeastern”) and T. Rowe Price Associates, Inc. (“T. Rowe Price”); and (iii) the termination of Barrow, Hanley, Mewhinney & Strauss, LLC (“Barrow Hanley”) as a subadviser to the Equity Income Fund. The changes described above became effective in February 2014 and may be collectively referred to below as the “New Subadviser Structure.” Before approving the New Subadviser Structure, including the New Equity Income Fund Subadvisory Agreements, the Board considered the recommendations of, and supporting analyses and data presented by, VIA.
With respect to the Board’s consideration of each New Equity Income Subadvisory Agreement, the Directors received written information in advance of the December Meeting from VIA, which included: (1) VIA’s rationale for recommending the New Subadviser Structure; (2) the process by which VIA selected and recommended for Board approval Wellington as a subadviser to the Equity Income Fund to implement a strategy of investing in large capitalization value equity securities (“large cap value equity strategy”) and SSgA FM as a subadviser to the Equity
376
THE VANTAGEPOINT FUNDS
Additional Information (Unaudited) — (Continued)
Income Fund to implement a passively managed U.S. equity strategy; (3) the nature, extent and quality of the services that Wellington and SSgA FM would provide to the Equity Income Fund; (4) the experience, investment management business, personnel and operations of each of Wellington and SSgA FM; (5) the brokerage and trading policies and practices of each of Wellington and SSgA FM; (6) the level of the subadvisory fees to be charged to the Equity Income Fund by Wellington and SSgA FM and a comparison of those fees to the: (a) fees charged by each of Wellington and SSgA FM for managing other generally comparable accounts; and (b) fees charged by a group of U.S. separate account investment managers utilizing a large cap value equity style with respect to Wellington and a U.S. passively managed equity style with respect to SSgA FM; (7) the compliance programs of Wellington and SSgA FM; (8) the performance information for each of Wellington and SSgA FM with respect to a large cap value equity strategy and a passively managed U.S. equity strategy, respectively, and such performance compared to a relevant benchmark and a large cap value peer group; (9) the Equity Income Fund’s expected overall investment advisory fee and projected total expense ratio compared to a group of large cap value mutual funds, taking into account: (a) the proposed changes in subadvisers; and (b) the proposed amount of the Equity Income Fund’s assets to be allocated to each of Wellington and SSgA FM, Southeastern and T. Rowe Price (“proposed target allocation levels”); and (10) the financial condition of each of Wellington and SSgA FM.
In considering the information and materials described above, the Independent Directors received assistance from, and met separately with, their independent legal counsel and were provided with a written description of their statutory responsibilities and the legal standards that are applicable to approvals of advisory agreements.
In determining whether to approve each New Equity Income Subadvisory Agreement, the Directors considered the information received in advance of the December Meeting, and the presentations made by, and discussions held with, representatives of Wellington and SSgA FM and the personnel of VIA, and discussions with the Company’s CCO, as well as a variety of factors. Although not meant to be all-inclusive, the following discusses some of the factors relevant to the Board’s decision to approve the New Equity Income Subadvisory Agreements.
Nature, Extent and Quality of Services. With respect to the nature, extent and quality of the services expected to be provided by Wellington and SSgA FM under their respective New Equity Income Subadvisory Agreements, the Directors considered the specific investment process to be employed by each of Wellington and SSgA FM in managing the assets of the Equity Income Fund to be allocated to them; the qualifications of Wellington’s and SSgA FM’s investment management personnel with regard to implementing a large cap value equity strategy and a passively managed U.S. equity strategy, respectively; the performance information provided for each of Wellington and SSgA FM as compared to a relevant benchmark and a large cap value peer group; each of Wellington’s and SSgA FM’s infrastructure and whether it appeared to adequately support the investment strategies to be implemented by each of Wellington and SSgA FM; and VIA’s review process and favorable assessment as to the nature, quality and extent of the subadvisory services expected to be provided by each of Wellington and SSgA FM to the Equity Income Fund. The Directors acknowledged that Wellington and SSgA FM each has experienced portfolio management personnel; and appeared to have adequate infrastructure and support staff to seek to achieve favorable results implementing their respective proposed mandates for the Equity Income Fund. The Directors concluded that the nature, extent and quality of the subadvisory services expected to be provided by each of Wellington and SSgA FM were appropriate in light of the investment strategies each such subadviser is to implement on behalf of the Equity Income Fund, and, thus, supported a decision to approve each New Equity Income Subadvisory Agreement.
Investment Performance. The Directors reviewed the investment performance information provided by VIA for Wellington and SSgA FM with respect to the proposed mandate each is to employ for the Equity Income Fund, and considered such performance information versus a relevant benchmark and a large cap value peer group (based on information provided by an independent third-party source) and VIA’s favorable assessment of such performance. Based on the information provided, the Directors concluded that the performance information supported a decision to approve each New Equity Income Subadvisory Agreement.
Subadvisory Fees, Expense Ratio Impact and Economies of Scale. In evaluating each proposed subadvisory fee, the Directors reviewed the subadvisory fee schedules for Wellington and SSgA FM. The Directors considered comparisons of the subadvisory fee to be charged by Wellington to the Equity Income Fund with Wellington’s fee schedule for managing other accounts with an investment mandate similar to the mandate it is to employ on behalf of
377
THE VANTAGEPOINT FUNDS
Additional Information (Unaudited) — (Continued)
the Equity Income Fund. The Directors also considered that, according to the information provided by VIA, Wellington’s proposed fee schedule for the Equity Income Fund reflected the lowest fee rate currently charged by Wellington to other accounts for which it provides advisory services utilizing a similar mandate, other than for one client for which Wellington collectively manages a significantly greater amount of assets. The Directors noted that SSgA FM indicated it does not currently manage any other accounts with an investment mandate directly comparable to the mandate SSgA FM is to employ on behalf of the Equity Income Fund. The Directors, however, considered that, according to the information provided by VIA, SSgA FM’s proposed fee schedule for the Equity Income Fund was lower than the standard fee schedule charged by an affiliate of SSgA FM to other accounts for which it provides advisory services utilizing a standard equal weighted S&P 500 Index mandate and is the same as the fee SSgA FM charges to the Vantagepoint Aggressive Opportunities Fund for which it provides subadvisory services utilizing an equal weighted customized version of a different index, except that SSgA FM’s fee for the Equity Income Fund is subject to a minimum dollar amount. Additionally, the nature of the subadvisory services each of Wellington and SSgA FM is to provide to the Equity Income Fund appeared to be comparable to those each subadviser currently provides to its other subadvisory relationships.
The Directors reviewed information provided by VIA (which was based on an independent third-party source) on the fees charged by a group of U.S. separate account investment managers to accounts with assets comparable to the amount of assets to be allocated initially to each of Wellington and SSgA FM and that employ a large cap value equity style (for comparison to Wellington) and a U.S. passively managed equity style (for comparison to SSgA FM). According to the information provided, the proposed effective fee rate to be paid by the Equity Income Fund to each of Wellington and SSgA FM at the proposed initial asset allocation levels would be below the median fee charged by such managers.
The Directors also considered information provided by VIA showing that there would be a decrease in the overall subadvisory fees and, therefore, a decrease in the total expense ratio of the Equity Income Fund as a result of the New Subadviser Structure. Referring to data provided by VIA and compiled by Morningstar, a provider of independent investment company data, the Directors noted that the expected total investment advisory fee for the Equity Income Fund, taking into account the proposed subadviser changes and proposed target allocation levels of the Fund, was lower than the average and median investment advisory fee of a group of mutual funds in Morningstar’s large cap value funds category. The Directors also considered information provided by VIA and compiled by Morningstar on the total expense ratios of this same group of mutual funds in Morningstar’s large cap value funds category, which showed that, if Wellington and SSgA FM each served as a subadviser to the Equity Income Fund at the proposed subadvisory fee rates, along with the Equity Income Fund’s two other existing subadvisers at their current subadvisory fee rates and proposed asset allocation levels, the Equity Income Fund’s expected total expense ratio would be below the average and median expense ratios of such funds.
The foregoing comparisons assisted the Directors in considering each New Equity Income Subadvisory Agreement by providing them with a basis for evaluating Wellington’s and SSgA FM’s fees, including in light of the Equity Income Fund’s expected overall investment advisory fee and total expense ratio, on a relative basis. Based on this information, the Directors concluded that the subadvisory fees of Wellington and SSgA FM appeared to be within a reasonable range for the services to be provided.
The Directors reviewed the information provided in response to a request regarding the estimated profits to be realized by Wellington and SSgA FM from their respective relationships with the Equity Income Fund. In considering the extent to which economies of scale may be realized by Wellington and SSgA FM as the assets of the Equity Income Fund to be managed by each subadviser grow and whether the proposed fee levels reflect these economies, the Directors considered that, although the proposed fee schedule for each subadviser does not include breakpoints, each New Equity Income Fund Subadvisory Agreement was the product of arm’s-length negotiation. The Directors further considered the appropriateness of each subadvisory fee structure in light of VIA’s assessment that the subadvisory fee schedule of each of Wellington and SSgA FM reflects the lowest fee schedule available from Wellington and SSgA FM, respectively, for like accounts (accounts of similar size and mandate) and the proposed effective fee rate to be paid to Wellington and SSgA FM, respectively, would be below the median fee charged by a group of U.S. separate account investment managers to accounts with assets comparable to the amount of assets proposed to be allocated initially to each subadviser and that employ a large cap value equity style (for comparison to Wellington) and a
378
THE VANTAGEPOINT FUNDS
Additional Information (Unaudited) — (Continued)
U.S. passively managed equity style (for comparison to SSgA FM). The Directors concluded that each proposed fee schedule with respect to Wellington and SSgA FM was appropriate at this time.
Other Considerations. The Directors considered VIA’s judgment that the hiring of Wellington as a subadviser to implement a large cap value equity strategy and addition of a passively managed U.S. equity strategy, and the hiring of SSgA FM as a subadviser to implement the new passively managed U.S. equity strategy, would add value by complementing the investment approach of the Equity Income Fund’s current investment subadvisers, T. Rowe Price and Southeastern. In this regard, the Directors considered VIA’s belief that the New Subadviser Structure, including the addition of each of Wellington and SSgA FM as a subadviser, should serve to improve the Equity Income Fund’s risk/return profile, reduce exposure to the growing asset size of any single subadviser and improve manager diversification.
The Directors considered the selection and due diligence process employed by VIA in deciding to recommend Wellington and SSgA FM as subadvisers to the Equity Income Fund to implement a large cap value equity and passively managed U.S. equity strategy, respectively. The Directors also considered VIA’s conclusion that the fee to be paid to each of Wellington and SSgA FM for their respective services to the Equity Income Fund is competitive, reasonable and appropriate in light of the nature and quality of services to be provided by each subadviser and the reasons supporting that conclusion. The Directors concluded that VIA’s recommendations and conclusions supported approval of each New Equity Income Subadvisory Agreement.
The Directors also considered the potential “fall-out” or ancillary benefits that may accrue to Wellington and SSgA FM due to each subadviser’s relationship with the Equity Income Fund. With respect to Wellington, the Board considered that Wellington indicated that the only potential “fall-out” benefit was the reputational benefit that may accrue from the relationship. With respect to SSgA FM, the Board also considered that SSgA FM indicated that, by serving as subadviser to the Equity Income Fund, it may indirectly receive “fall-out” benefits from its relationship due to the value derived in the marketplace from the association. The Directors also considered that Wellington and SSgA FM may receive research or other services from certain brokers in connection with the execution of the Equity Income Fund’s brokerage transactions. However, the Directors noted that all subadvisers are required to select brokers who meet the Equity Income Fund’s requirements for seeking best execution, and that VIA monitors and evaluates the subadvisers’ trade execution with respect to the Equity Income Fund’s brokerage transactions on a regular basis and provides reports to the Board in this regard. The Directors concluded that the potential benefits that may accrue to Wellington and SSgA FM by virtue of their relationships with the Equity Income Fund appeared to be reasonable.
Conclusion. After full consideration of the foregoing factors, with no single factor identified as being of paramount importance, the Directors, including a majority of the Independent Directors, concluded that the initial approval of each New Equity Income Subadvisory Agreement was in the best interests of the Equity Income Fund and its shareholders, and approved the New Equity Income Subadvisory Agreement with each of Wellington and SSgA FM.
Only one copy of this Annual Report may be mailed to households, even if more than one person in a household is a shareholder of record, unless the Company has received instructions to the contrary. If you need additional copies of this Annual Report, please contact the Company toll free at 800-669-7400 or in writing at 777 North Capitol Street, NE, Suite 600, Washington, D.C. 20002. If you do not want this mailing of this Annual Report to be combined with those for other members of your household, contact the Company in writing at 777 North Capitol Street, NE, Suite 600, Washington, D.C. 20002 or toll free at 800-669-7400.
| I. | | Other Available Information |
A description of the Company’s proxy voting policies and procedures and the proxy voting record for the period ended June 30, 2013 are available without charge, upon request by calling 800-669-7400, online at www.icmarc.org, or by accessing the Securities and Exchange Commission’s website at www.sec.gov.
The Company files its complete schedule of portfolio holdings with the SEC for the first and third quarters of each fiscal year on Form N-Q; the Company’s Forms N-Q are available on the SEC’s website at www.sec.gov and may be
379
THE VANTAGEPOINT FUNDS
Additional Information (Unaudited) — (Continued)
reviewed and copied at the SEC’s Public Reference Room in Washington, D.C. Information on the operation of the Public Reference Room may be obtained by calling 800-SEC-0330.
Standard & Poor’s Marks and Indexes. “Standard & Poor’s,” “S&P,” “S&P 500,” “Standard & Poor’s 500,” and “500” are trademarks of The McGraw-Hill Companies, Inc. and have been licensed for use by The Vantagepoint Funds for the Vantagepoint 500 Stock Index Fund. The Fund is not sponsored, endorsed, sold or promoted by Standard & Poor’s, a division of The McGraw-Hill Companies, Inc., and makes no representation regarding the advisability of investing in the Fund.
Russell Investment Group Marks and Indexes. Russell Investment Group is the source and owner of the trademarks, service marks and copyrights related to the Russell Indexes. Russell® is a trademark of Russell Investment Group.
1) The Vantagepoint Equity Income Fund, Vantagepoint Aggressive Opportunities Fund, Vantagepoint Broad Market Index Fund, and Vantagepoint Mid/Small Company Index Fund are not promoted, sponsored or endorsed by, nor in any way affiliated with Russell Investments (“Russell”). Russell is not responsible for and has not reviewed these Funds nor any associated literature or publications and Russell makes no representation or warranty, express or implied, as to their accuracy, or completeness, or otherwise.
2)Russell reserves the right, at any time and without notice, to alter, amend, terminate or in any way change the Russell Indexes. Russell has no obligation to take the needs of any particular fund or its participants or any other product or person into consideration in determining, composing or calculating any of the Russell Indexes.
3)Russell’s publication of the Russell Indexes in no way suggests or implies an opinion by Russell as to the attractiveness or appropriateness of investment in any or all securities upon which the Russell Indexes are based. RUSSELL MAKES NO REPRESENTATION, WARRANTY, OR GUARANTEE AS TO THE ACCURACY, COMPLETENESS, RELIABILITY, OR OTHERWISE OF THE RUSSELL INDEXES OR ANY DATA INCLUDED IN THE RUSSELL INDEXES. RUSSELL MAKES
NO REPRESENTATION, WARRANTY OR GUARANTEE REGARDING THE USE, OR THE RESULTS OF USE, OF THE RUSSELL INDEXES OR ANY DATA INCLUDED THEREIN, OR ANY SECURITY (OR COMBINATION THEREOF) COMPRISING THE RUSSELL INDEXES. RUSSELL MAKES NO OTHER EXPRESS OR IMPLIED WARRANTY, AND EXPRESSLY DISCLAIMS ANY WARRANTY, OF ANY KIND, INCLUDING WITHOUT LIMITATION, ANY WARRANTY OF MERCHANTABILITY OR FITNESS FOR A PARTICULAR PURPOSE WITH RESPECT TO THE RUSSELL INDEXES OR ANY DATA OR ANY SECURITY (OR COMBINATION THEREOF) INCLUDED THEREIN.
380
Item 2 (Code of Ethics):
Sub-item 2a. The board of directors of the registrant has adopted a code of ethics that applies to the registrant’s principal executive officer, principal financial officer, principal accounting officer or controller, and to persons performing similar functions.
Sub-item 2c. Not applicable.
Sub-item 2d. Not applicable.
Sub-item 2e. Not applicable.
Sub-item 2f. Not applicable.
Item 3 (Audit Committee Financial Expert): Two members of the audit committee of the registrant have been determined by its board of directors to be audit committee financial experts. The audit committee financial experts of the registrant are Dorothy Hayes and Timothy O’Brien, both of whom are independent under the applicable rules.
Item 4 (Principal Accountant Fees and Services):
Sub-item 4a (Audit Fees). The aggregate fees billed for professional services rendered by the registrant’s principal accountant, PricewaterhouseCoopers LLP, for audits of the registrant’s financial statements were $565,244 and $470,042 in 2013 and 2012, respectively.
Sub-item 4b (Audit Related Fees). Not applicable.
Sub-item 4c (Tax Fees). The aggregate fees billed for professional services rendered by PricewaterhouseCoopers LLP for tax compliance, tax advice and tax planning were $78,877 and $186,186 in 2013 and 2012, respectively. These services covered preparation of the registrant’s income tax and excise tax returns, and also included related consulting and tax provision work.
Sub-item 4d (All Other Fees). Not applicable.
Sub-item 4e (1). The registrant’s audit committee pre-approves all audit and non-audit services to be performed by the registrant’s accountant before they are engaged to perform such services.
Sub-item 4e (2). The registrant’s audit committee approved 100% of the services described in Sub-item 4c.
Sub-item 4f. Not applicable.
Sub-item 4g. Not applicable.
Sub-item 4h. Not applicable.
Item 5 (Audit Committee of Listed Registrants): Not applicable to this registrant.
Item 6 (Investments):
Sub-item 6a. Not applicable; included under Item 1 above.
Sub-item 6b. Not applicable; the registrant did not divest itself of securities in accordance with Section 13(c) of the Investment Company Act of 1940.
Item 7 (Disclosure of Proxy Voting Policies & Procedures for Closed-end Management
Investment Companies): Not applicable to this registrant.
Item 8 (Portfolio Managers of Closed-End Management Investment Companies): Not applicable to
this registrant.
Item 9 (Purchases of Equity Securities by Closed-End Management Investment Company and
Affiliated Purchasers): Not applicable to this registrant.
Item 10 (Submission of Matters to a Vote of Security Holders): Not applicable.
Item 11 (Controls and Procedures):
Sub-item 11a. The principal executive and principal financial officers have concluded that the registrant’s disclosure controls and procedures are effective based on their evaluation of the disclosure controls and procedures as of a date within 90 days of the filing of this report.
Sub-item 11b. There was no change in the registrant’s internal control over financial reporting that occurred during the most recent fiscal quarter of the period covered by this report that has materially affected, or is reasonably likely to affect, the registrant’s internal control over financial reporting.
Item 12 (Exhibits):
Sub-item 12a(1). The code of ethics exhibit is attached.
Sub-item 12a(2). The certification exhibits are attached.
Pursuant to the requirements of the Securities Exchange Act of 1934 and the Investment Company Act of 1940, the registrant has duly caused this report to be signed on its behalf by the undersigned, thereunto duly authorized.
| | | | | | | | |
The Vantagepoint Funds | | | | |
| | | | |
By: | | /s/ Joan McCallen | | | | | | |
| | Joan McCallen, Principal Executive Officer | | | | | | |
| | | | |
Date: | | March 5, 2014 | | | | | | |
Pursuant to the requirements of the Securities Exchange Act of 1934 and the Investment Company Act of 1940, this report has been signed below by the following persons on behalf of the registrant and in the capacities, and on the dates indicated.
| | | | | | | | |
By: | | /s/ Joan McCallen | | | | | | |
| | Joan McCallen, Principal Executive Officer | | | | | | |
| | | | |
Date: | | March 5, 2014 | | | | | | |
By: | | /s/ Elizabeth Glista | | | | | | |
| | Elizabeth Glista, Principal Financial Officer | | | | | | |
| | | | |
Date: | | March 5, 2014 | | | | | | |