| | | | |
OMB APPROVAL |
| OMB Number: | | 3235-0570 |
| Expires: | | January 31, 2014 |
| Estimated average burden |
| hours per response | | 20.6 |
UNITED STATES
SECURITIES AND EXCHANGE COMMISSION
Washington, D.C. 20549
FORM N-CSR
CERTIFIED SHAREHOLDER REPORT OF REGISTERED
MANAGEMENT INVESTMENT COMPANIES
Investment Company Act file number 811-08941
The Vantagepoint Funds
(Exact name of registrant as specified in charter)
777 North Capitol Street, NE, Suite 600, Washington D.C. 20002-4240
(Address of principal executive offices) (Zip code)
Angela Montez, Secretary of the Registrant
777 North Capitol Street, NE, Suite 600, Washington D.C. 20002-4240
(Name and address of agent for service)
Registrant’s telephone number, including area code: 202-962-4600
Date of fiscal year end: 12/31/11
Date of reporting period: 01/01/11 - 12/31/11
Item 1 (Report to Shareholders): The annual report is set forth below.
Shareholder Expenses
As a shareholder of a Vantagepoint Fund, you incur ongoing expenses, such as advisory fees and other fund expenses. The following example is intended to help you understand your ongoing expenses (in dollars and cents) of investing in a fund and to compare these expenses with the ongoing expenses of investing in other mutual funds. The example is based on an investment of $1,000 invested at the beginning of the period and held for the entire period from July 1, 2011 to December 31, 2011.
Actual Expenses
The first section in the example below provides information about the actual account values and actual expenses. You may use the information in this section, together with the amount you invested, to estimate the expenses that you paid over the period. Simply divide your account value by $1,000 (for example, an $8,600 account value divided by $1,000 = 8.6), then multiply the result by the number for your fund under the heading entitled “Expenses Paid During Period” to estimate the expenses you paid on your account during this period.
Hypothetical Example for Comparison Purposes
The second section in the example below provides information about the hypothetical account values and hypothetical expenses based on each fund’s actual expense ratio and an assumed rate of return of 5% per year before expenses, which is not the fund’s actual return. The hypothetical account values and expenses may not be used to estimate the actual ending account balance or expenses you paid for the period. You may use this information to compare the ongoing costs of investing in your fund and other funds. To do so, compare this 5% hypothetical example with the 5% hypothetical examples that appear in the shareholder reports of the other funds.
| | | | | | | | | | | | | | | | | | | | | | | | | | | | | | |
| ACTUAL | | | | | HYPOTHETICAL | |
Beginning
Account
Value
7/01/11 | | Ending
Account
Value
12/31/11 | | | 2011
Annualized
Expense
Ratio | | | Expenses
Paid
During
Period* | | | Vantagepoint Funds | | Beginning
Account
Value
7/01/11 | | | Ending
Account
Value
12/31/11 | | | 2011
Annualized
Expense
Ratio | | | Expenses
Paid
During
Period* | |
| $1,000.00 | | $ | 999.30 | | | | 0.62% | | | $ | 3.12 | | | Low Duration Bond | | $ | 1,000.00 | | | $ | 1,022.08 | | | | 0.62% | | | $ | 3.16 | |
| $1,000.00 | | $ | 1,064.70 | | | | 0.63% | | | $ | 3.28 | | | Inflation Protected Securities | | $ | 1,000.00 | | | $ | 1,022.03 | | | | 0.63% | | | $ | 3.21 | |
| $1,000.00 | | $ | 926.40 | | | | 0.81% | | | $ | 3.93 | | | Equity Income | | $ | 1,000.00 | | | $ | 1,021.12 | | | | 0.81% | | | $ | 4.13 | |
| $1,000.00 | | $ | 941.50 | | | | 0.77% | | | $ | 3.77 | | | Growth & Income | | $ | 1,000.00 | | | $ | 1,021.32 | | | | 0.77% | | | $ | 3.92 | |
| $1,000.00 | | $ | 926.70 | | | | 0.80% | | | $ | 3.89 | | | Growth | | $ | 1,000.00 | | | $ | 1,021.17 | | | | 0.80% | | | $ | 4.08 | |
| $1,000.00 | | $ | 918.10 | | | | 0.99% | | | $ | 4.79 | | | Select Value | | $ | 1,000.00 | | | $ | 1,020.21 | | | | 0.99% | | | $ | 5.04 | |
| $1,000.00 | | $ | 855.10 | | | | 0.91% | | | $ | 4.26 | | | Aggressive Opportunities | | $ | 1,000.00 | | | $ | 1,020.62 | | | | 0.91% | | | $ | 4.63 | |
| $1,000.00 | | $ | 899.30 | | | | 0.95% | | | $ | 4.55 | | | Discovery | | $ | 1,000.00 | | | $ | 1,020.42 | | | | 0.95% | | | $ | 4.84 | |
| $1,000.00 | | $ | 855.70 | | | | 0.95% | | | $ | 4.44 | | | International | | $ | 1,000.00 | | | $ | 1,020.42 | | | | 0.95% | | | $ | 4.84 | |
| $1,000.00 | | $ | 987.40 | | | | 0.81% | | | $ | 4.06 | | | Diversifying Strategies | | $ | 1,000.00 | | | $ | 1,021.12 | | | | 0.81% | | | $ | 4.13 | |
| $1,000.00 | | $ | 1,047.70 | | | | 0.41% | | | $ | 2.12 | | | Core Bond Index Class I | | $ | 1,000.00 | | | $ | 1,023.14 | | | | 0.41% | | | $ | 2.09 | |
| $1,000.00 | | $ | 1,048.50 | | | | 0.21% | | | $ | 1.08 | | | Core Bond Index Class II | | $ | 1,000.00 | | | $ | 1,024.15 | | | | 0.21% | | | $ | 1.07 | |
| $1,000.00 | | $ | 961.20 | | | | 0.41% | | | $ | 2.03 | | | 500 Stock Index Class I | | $ | 1,000.00 | | | $ | 1,023.14 | | | | 0.41% | | | $ | 2.09 | |
| $1,000.00 | | $ | 962.30 | | | | 0.21% | | | $ | 1.04 | | | 500 Stock Index Class II | | $ | 1,000.00 | | | $ | 1,024.15 | | | | 0.21% | | | $ | 1.07 | |
| $1,000.00 | | $ | 952.70 | | | | 0.41% | | | $ | 2.02 | | | Broad Market Index Class I | | $ | 1,000.00 | | | $ | 1,023.14 | | | | 0.41% | | | $ | 2.09 | |
| $1,000.00 | | $ | 953.10 | | | | 0.21% | | | $ | 1.03 | | | Broad Market Index Class II | | $ | 1,000.00 | | | $ | 1,024.15 | | | | 0.21% | | | $ | 1.07 | |
| $1,000.00 | | $ | 897.40 | | | | 0.42% | | | $ | 2.01 | | | Mid/Small Company Index Class I | | $ | 1,000.00 | | | $ | 1,023.09 | | | | 0.42% | | | $ | 2.14 | |
| $1,000.00 | | $ | 898.40 | | | | 0.22% | | | $ | 1.05 | | | Mid/Small Company Index Class II | | $ | 1,000.00 | | | $ | 1,024.10 | | | | 0.22% | | | $ | 1.12 | |
| $1,000.00 | | $ | 830.50 | | | | 0.55% | | | $ | 2.54 | | | Overseas Equity Index Class I | | $ | 1,000.00 | | | $ | 1,022.43 | | | | 0.55% | | | $ | 2.80 | |
| $1,000.00 | | $ | 831.30 | | | | 0.35% | | | $ | 1.62 | | | Overseas Equity Index Class II | | $ | 1,000.00 | | | $ | 1,023.44 | | | | 0.35% | | | $ | 1.79 | |
| $1,000.00 | | $ | 991.60 | | | | 0.82% | | | $ | 4.12 | | | Model Portfolio Savings Oriented** | | $ | 1,000.00 | | | $ | 1,021.07 | | | | 0.82% | | | $ | 4.18 | |
| $1,000.00 | | $ | 974.70 | | | | 0.84% | | | $ | 4.18 | | | Model Portfolio Conservative Growth** | | $ | 1,000.00 | | | $ | 1,020.97 | | | | 0.84% | | | $ | 4.28 | |
| $1,000.00 | | $ | 952.30 | | | | 0.88% | | | $ | 4.33 | | | Model Portfolio Traditional Growth** | | $ | 1,000.00 | | | $ | 1,020.77 | | | | 0.88% | | | $ | 4.48 | |
| $1,000.00 | | $ | 932.80 | | | | 0.91% | | | $ | 4.43 | | | Model Portfolio Long-Term Growth** | | $ | 1,000.00 | | | $ | 1,020.62 | | | | 0.91% | | | $ | 4.63 | |
| $1,000.00 | | $ | 904.30 | | | | 0.99% | | | $ | 4.75 | | | Model Portfolio All-Equity Growth** | | $ | 1,000.00 | | | $ | 1,020.21 | | | | 0.99% | | | $ | 5.04 | |
(continued)
1
| | | | | | | | | | | | | | | | | | | | | | | | | | | | | | |
| ACTUAL | | | | | HYPOTHETICAL | |
Beginning
Account
Value
7/01/11 | | Ending
Account
Value
12/31/11 | | | 2011
Annualized
Expense
Ratio | | | Expenses
Paid
During
Period* | | | Vantagepoint Funds | | Beginning
Account
Value
7/01/11 | | | Ending
Account
Value
12/31/11 | | | 2011
Annualized
Expense
Ratio | | | Expenses
Paid
During
Period* | |
| $1,000.00 | | $ | 992.10 | | | | 0.83% | | | $ | 4.17 | | | Milestone Retirement Income** | | $ | 1,000.00 | | | $ | 1,021.02 | | | | 0.83% | | | $ | 4.23 | |
| $1,000.00 | | $ | 973.30 | | | | 0.88% | | | $ | 4.38 | | | Milestone 2010** | | $ | 1,000.00 | | | $ | 1,020.77 | | | | 0.88% | | | $ | 4.48 | |
| $1,000.00 | | $ | 963.30 | | | | 0.85% | | | $ | 4.21 | | | Milestone 2015** | | $ | 1,000.00 | | | $ | 1,020.92 | | | | 0.85% | | | $ | 4.33 | |
| $1,000.00 | | $ | 951.40 | | | | 0.85% | | | $ | 4.18 | | | Milestone 2020** | | $ | 1,000.00 | | | $ | 1,020.92 | | | | 0.85% | | | $ | 4.33 | |
| $1,000.00 | | $ | 942.80 | | | | 0.85% | | | $ | 4.16 | | | Milestone 2025** | | $ | 1,000.00 | | | $ | 1,020.92 | | | | 0.85% | | | $ | 4.33 | |
| $1,000.00 | | $ | 933.00 | | | | 0.87% | | | $ | 4.24 | | | Milestone 2030** | | $ | 1,000.00 | | | $ | 1,020.82 | | | | 0.87% | | | $ | 4.43 | |
| $1,000.00 | | $ | 922.00 | | | | 0.90% | | | $ | 4.36 | | | Milestone 2035** | | $ | 1,000.00 | | | $ | 1,020.67 | | | | 0.90% | | | $ | 4.58 | |
| $1,000.00 | | $ | 917.00 | | | | 0.90% | | | $ | 4.35 | | | Milestone 2040** | | $ | 1,000.00 | | | $ | 1,020.67 | | | | 0.90% | | | $ | 4.58 | |
| $1,000.00 | | $ | 914.60 | | | | 1.08% | | | $ | 5.21 | | | Milestone 2045** | | $ | 1,000.00 | | | $ | 1,019.76 | | | | 1.08% | | | $ | 5.50 | |
| * | | Expenses are calculated using each fund’s annualized expense ratio (as disclosed in the table), multiplied by the average account value over the period, multiplied by [number of days in most recent fiscal half year divided by total number of days in fiscal year e.g. 184/365] (to reflect the one-half year period). |
| ** | | This fund invests in one or more other mutual funds. The annualized expense ratio includes this fund’s proportionate share of the expense ratio of such other mutual fund(s). |
2
MANAGEMENT’S DISCUSSION OF MARKET CONDITIONS FOR THE YEAR ENDED DECEMBER 31, 2011
The following represents Vantagepoint Investment Advisers, LLC’s (“VIA”) views of the major market conditions that prevailed in 2011. This commentary should not be considered a complete discussion of all markets, but a brief discussion so that a fund’s performance can be read in context with the performance of those markets in which it invests. The Management’s Discussion of Fund Performance for each fund should be read together with this commentary.
Equity and fixed income securities markets offered mixed returns for 2011, with fixed income securities generally outperforming equity securities. These securities markets generally performed well in the opening months of 2011, with equity markets peaking in late April and then pulling back. Market volatility generally increased across the equity and fixed income markets in the third quarter due to significant economic concerns in the U.S., the Eurozone and Asia. As the year progressed, several major economies, most notably in Europe, remained in an uncertain state. However, the U.S. economy showed signs of improvement in the fourth quarter as corporate earnings began to strengthen, unemployment started to decline, the housing market began to show signs of stabilization and consumer confidence began to rise. Also in the fourth quarter, the U.S. Federal Reserve and major foreign central banks took coordinated measures to improve liquidity in the Eurozone.
U.S. and foreign fixed income markets generally produced positive returns in 2011. U.S. Government bonds outperformed credit-related sectors as risk-averse investors drove up U.S. Government bond prices. Higher credit quality sectors outperformed those with lower credit quality. Longer maturity bonds outperformed shorter maturity bonds as the Federal Reserve worked to maintain already low short-term interest rates and to lower longer term rates. The ten-year U.S. Treasury bond yield declined from 3.30% at the beginning of the year to 1.88% at the end of the year. Treasury inflation-protected securities (“TIPS”) outperformed shorter duration securities for the year and reflected the general outperformance of U.S. Treasury issued securities.
The U.S. equity market produced varying results during 2011. After rising through late April coincident with indications of an improving U.S. economy, the market then fell back. Notable losses suffered in the third quarter were followed by a positive reversal for the U.S. equity market in the fourth quarter, which helped to mitigate steep losses for the year as a whole. Returns across the ten sectors of the U.S. equity market varied greatly in 2011. Defensive sectors, including Utilities, Consumer Staples, and Healthcare, were notable outperformers, while the economically sensitive Financials and Materials sectors had the worst performance. Large-capitalization stocks, particularly blue chips, generally outperformed small- and mid-capitalization stocks; and, at a broad market level, growth-oriented strategies generally outperformed value-oriented strategies.
The equity markets of countries outside the U.S. generally peaked in April, and then pulled back for most of the following months, resulting in negative returns for the year. The equity markets of developed countries outside the U.S. generally underperformed the U.S. equity market. Emerging market countries underperformed their developed market counterparts, generally reflecting investor risk aversion. The U.S. Dollar declined against the Japanese Yen, but advanced against most other major currencies, notably the European currencies.
3
Vantagepoint Low Duration Bond Fund
The Vantagepoint Low Duration Bond Fund’s objective is to seek total return that is consistent with preservation of capital. The Fund invests, under normal circumstances, at least 80% of its net assets in bonds and other fixed income securities of varying maturities, and the Fund also normally invests at least 65% of its net assets in bonds and other fixed income securities with more than one year to maturity. The Fund seeks to maintain a portfolio effective duration of no greater than three years. The Fund’s investments may include securities issued or guaranteed by the U.S. Government or foreign governments and their agencies and instrumentalities, or supra-national organizations (such as the World Bank); securities issued by U.S. or foreign companies; U.S. and foreign mortgage-backed and asset-backed securities; and municipal securities. Investments in foreign securities are limited to 30% of the Fund’s net assets. Investments in (i) derivative instruments and (ii) securities rated below investment grade or unrated securities that the Fund’s subadvisers determine are of comparable quality, are each limited to 10% of the Fund’s net assets.
Performance
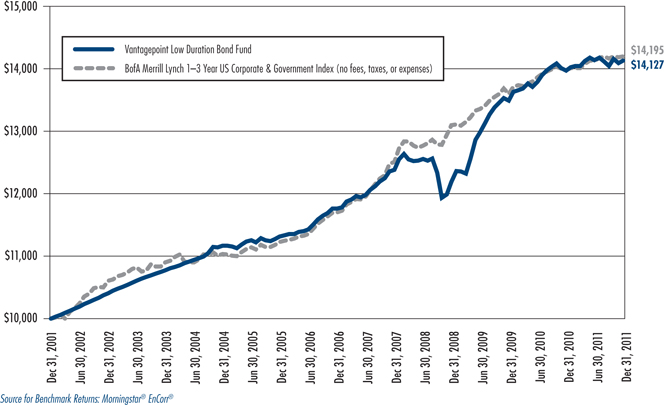
The Vantagepoint Low Duration Bond Fund gained 1.14% in 2011. The Fund’s market benchmark, the BofA Merrill Lynch 1–3 Year US Corporate & Government Index, gained 1.56% while the Fund’s peer group benchmark, the Morningstar Short-Term Bond Funds Average, a group of mutual funds with similar investment objectives, gained 1.66%.
The Fund’s absolute performance in 2011 benefited from positive returns in all fixed income sectors included in the Fund, led by the performance of the asset-backed securities sector. In addition, the Fund benefited from changes throughout the year to the duration of the holdings in response to changes in interest rate expectations.
The Fund underperformed its market benchmark primarily due to its overweight allocation to credit sector bonds, including high yield bonds and emerging market debt, which generally underperformed similar maturity U.S. Treasury securities. Performance relative to the market benchmark benefited from an overweight exposure to asset-backed securities, as well as changes to the duration of the holdings throughout the year as interest rate expectations changed.
The Fund’s underperformance relative to its peer group benchmark primarily resulted from a higher exposure to corporate bonds, which underperformed U.S. Treasuries, and the Fund’s shorter duration. An overweight exposure to asset-backed securities partially offset this underperformance.
The Fund used forward currency contracts to manage foreign currency risk associated with the Fund’s foreign bond exposure. Their use did not materially impact performance or risk. The Fund used interest rate futures during the year which added modestly to performance and did not materially impact risk. The Fund used these futures to seek to manage interest rate risk and to seek to obtain investment exposure based on the Fund subadvisers’ views on interest rates and yield curves.
VIA uses more than one subadviser to manage the Fund’s assets. This multi-management strategy seeks to improve consistency of returns over time by eliminating reliance on the results of a single subadviser. The Fund’s subadvisers are as follows:
Subadviser Data
| | |
Payden & Rygel |
Founded: | | 1983 |
| Investment Style: | | Low duration |
|
STW Fixed Income Management LLC |
Founded: | | 1977 |
| Investment Style: | | Low duration |
4
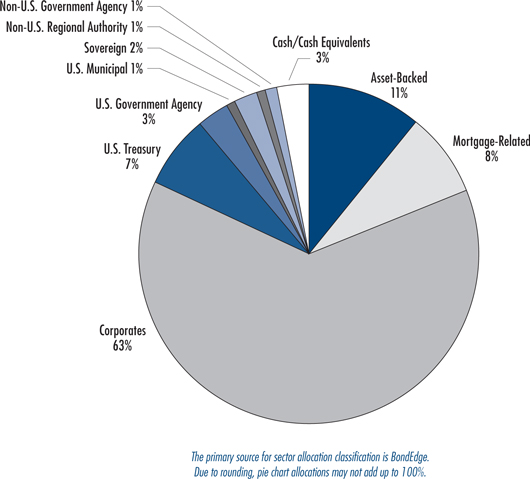
Vantagepoint Low Duration Bond Fund
Sector Allocation as of December 31, 2011 (% of Net Assets)
5
Vantagepoint Low Duration Bond Fund vs. BofA Merrill Lynch 1–3 Year US Corporate & Government
Index: Growth of $10,000 Invested December 31, 2001*
Vantagepoint Low Duration Bond Fund
Average Annual Total Returns for the periods ended December 31, 2011*
| | | | |
| |
One Year | | | 1.14 | % |
| |
Three Years | | | 5.04 | % |
| |
Five Years | | | 3.73 | % |
| |
Ten Years | | | 3.52 | % |
| |
Fund Inception Date | | | December 4, 2000 | |
| * | Current performance may be higher or lower than the past performance presented in this report. Past performance is no guarantee of future performance. Investment returns and principal value will fluctuate so that shares, when redeemed, may be worth more or less than their original cost. The graph and the table do not reflect the deduction of taxes that a shareholder would pay on fund distributions or the redemption of fund shares. Current performance is available by calling 1-800-669-7400 or at www.icmarc.org/vpperformance. |
The Fund’s market benchmark, the BofA Merrill Lynch 1–3 Year US Corporate & Government Index, tracks the performance of U.S. dollar-denominated investment grade Government and corporate public debt securities issued in the U.S. domestic bond market with maturities between 1 and 3 years. An index is not available for direct investment, is unmanaged, and does not reflect the costs of portfolio management or trading. The Fund’s portfolio may differ significantly from the securities in the index.
6
Vantagepoint Inflation Protected Securities Fund
The Vantagepoint Inflation Protected Securities Fund’s objective is to offer current income. The principal investment strategy is to invest, under normal circumstances, at least 80% of its net assets in inflation-adjusted U.S. and foreign fixed income securities. The Fund will, under normal circumstances, invest at least 50% of its net assets in U.S. Treasury inflation-protected securities (“TIPS”). The Fund’s investments may include fixed income securities issued or guaranteed by the U.S. government, foreign governments, their agencies or instrumentalities, or supra-national organizations (such as the World Bank); U.S. and foreign corporate fixed income securities; and municipal securities. Investments in derivative instruments and U.S. and foreign fixed income securities whose values are not linked to adjustments in interest rates are each limited to 20% of the Fund’s net assets. The Fund’s portfolio turnover rate typically exceeds 100% because of the small size of the TIPS market and the subadvisers’ active trading in that market to seek attractive return opportunities.
Performance
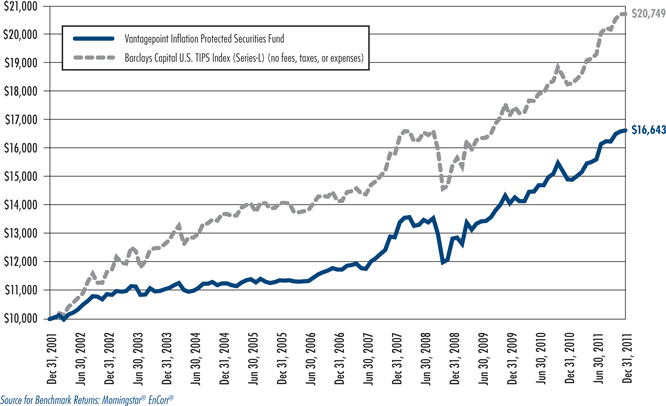
The Vantagepoint Inflation Protected Securities Fund gained 11.53% in 2011. The Fund’s market benchmark, the Barclays Capital U.S. Treasury Inflation Protected Securities (TIPS) Index (Series-L), gained 13.56%, while the Fund’s peer group benchmark, the Morningstar Inflation-Protected Bond Funds Average, a group of mutual funds with similar investment objectives, gained 10.93%.
The Fund’s positive absolute return in 2011 was primarily the result of favorable market conditions, with inflation-protected securities benefiting from the general decline in interest rates and investors’ aversion to credit risk.
The Fund’s underperformance relative to its market benchmark primarily resulted from below benchmark duration positioning when yields fell, as well as from exposure to bonds issued by financial services companies which underperformed TIPS. This was somewhat offset by a bias towards longer-maturity rather than shorter-maturity bonds and exposure to non-inflation adjusted U.S. Treasury securities, which outperformed TIPS.
The Fund outperformed its peer group average primarily due to lower than peer average exposure to credit sectors, which underperformed TIPS. The outperformance was partially offset by shorter duration positioning relative to peers during periods of the year in which yields fell.
The Fund used derivative instruments during the year, which included interest rate and bond futures, options, swaps and swaptions. These derivative instruments had a modest effect on performance. The Fund used these derivatives to seek to manage interest rate risk and to seek to obtain investment exposure based on the Fund subadvisers’ views on interest rates and yield curves. Use of interest rate and bond futures and options detracted from performance, while interest rate swaps and swaptions partially offset the negative performance.
VIA uses more than one subadviser to manage the Fund’s assets. This multi-management strategy seeks to improve consistency of returns over time by eliminating reliance on the results of a single subadviser. The Fund’s subadvisers are as follows:
Subadviser Data
BlackRock Financial Management, Inc.
| | |
Founded: | | 1988 |
Investment Style: | | Broad-based inflation-linked |
Pacific Investment Management Company, LLC
| | |
Founded: | | 1971 |
Investment Style: | | Broad-based inflation-linked |
7
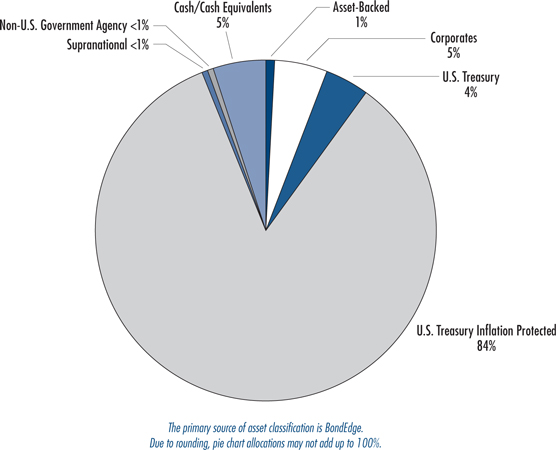
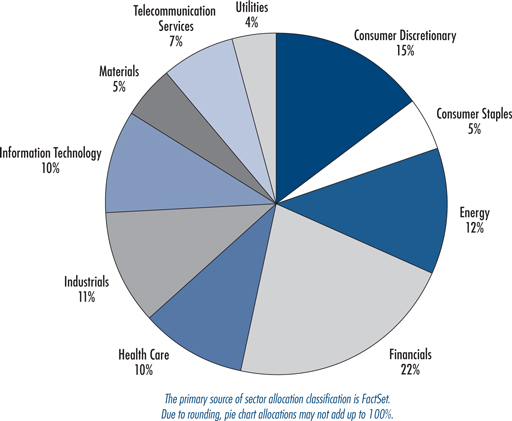
Vantagepoint Inflation Protected Securities Fund
Sector Allocation as of December 31, 2011 (% of Net Assets)
8
Vantagepoint Inflation Protected Securities Fund vs. Barclays Capital U.S. TIPS Index (Series-L):
Growth of $10,000 Invested December 31, 2001*
Vantagepoint Inflation Protected Securities Fund
Average Annual Total Returns for the periods ended December 31, 2011*
| | | | |
One Year | | | 11.53 | % |
| |
Three Years | | | 9.05 | % |
| |
Five Years | | | 7.21 | % |
| |
Ten Years | | | 5.23 | % |
| |
Fund Inception Date | | | July 1, 1992 | |
| * | Current performance may be higher or lower than the past performance presented in this report. Past performance is no guarantee of future performance. Investment returns and principal value will fluctuate so that shares, when redeemed, may be worth more or less than their original cost. The graph and the table do not reflect the deduction of taxes that a shareholder would pay on fund distributions or the redemption of fund shares. Current performance is available by calling 1-800-669-7400 or at www.icmarc.org/vpperformance. |
The Fund’s market benchmark, the Barclays Capital U.S. Treasury Inflation Protected Securities Index (Series-L), consists of all U.S. Treasury inflation protected securities rated investment grade or better, having at least one year to final maturity and at least $250 million par amount outstanding. The Series-L reference identifies this index as the former Lehman Brothers U.S. TIPS Index. An index is not available for direct investment, is unmanaged, and does not reflect the costs of portfolio management or trading. The Fund’s portfolio may differ significantly from the securities held in the index.
9
Vantagepoint Equity Income Fund
The Vantagepoint Equity Income Fund’s objective is to offer long-term capital growth with consistency derived from dividend yield. The principal investment strategy is to invest, under normal circumstances, at least 80% of its net assets in equity securities (common and preferred stock). The Fund seeks to invest primarily in the common stocks of U.S. companies that the Fund’s subadvisers believe will pay dividends at above-market levels. As a result of the Fund’s income focus, certain sectors or industries may be emphasized. The Fund may exhibit greater sensitivity to certain economic factors, such as changing interest rates, than will the general stock market. The Fund may invest across companies of all sizes but generally focuses on larger capitalization companies, which tend to have stable long-term earnings and dividend-paying records. The Fund also may invest in foreign equity securities, U.S. and foreign convertible securities, and U.S. preferred stock.
Performance
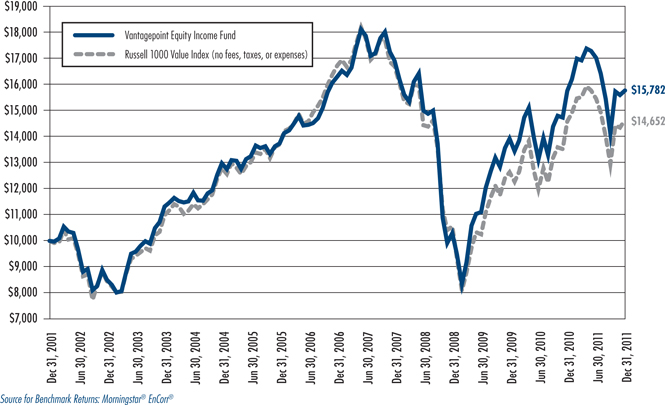
The Vantagepoint Equity Income Fund gained 0.04% in 2011. The Fund’s market benchmark, the Russell 1000 Value Index, gained 0.39%, while the Fund’s peer group benchmark, the Morningstar Large Value Funds Average, a group of mutual funds with similar investment objectives, declined 0.75%.
The Fund’s absolute performance reflected the volatility and returns of the U.S. equity market in 2011. The positive absolute performance is primarily attributable to favorable returns from certain stocks held in the Telecommunication Services, Utilities, and Healthcare sectors, which was partially offset by returns from certain stocks held in the Financials, Materials, and Information Technology sectors.
The Fund’s underperformance relative to its market benchmark primarily resulted from underweight allocations to the Utilities and Healthcare sectors, and the performance of certain stocks held in the Consumer Staples, Materials, Consumer Discretionary and Energy sectors. The Fund’s overweight allocation to the Consumer Discretionary sector, and underweight position in the Financials sector, as well as favorable performance from certain stocks held in the Financials sector partially offset the underperformance.
The Fund’s outperformance relative to its peer group benchmark primarily was driven by overweight allocations to the Consumer Discretionary and Telecommunication Services sectors, as well as the performance of certain stocks held in the Financials sector. The outperformance was partially offset by the cumulative effect of underweight allocations to the Consumer Staples and Healthcare sectors, an overweight allocation to the Financials sector, and certain stocks held in the Consumer Staples, Consumer Discretionary and Materials sectors.
VIA uses more than one subadviser to manage the Fund’s assets. This multi-management strategy seeks to improve consistency of returns over time by eliminating reliance on the results of a single subadviser. The Fund’s subadvisers are as follows:
Subadviser Data
Barrow, Hanley, Mewhinney & Strauss, LLC
| | |
Founded: | | 1979 |
Investment Style: | | Contrarian value |
T. Rowe Price Associates, Inc.
| | |
Founded: | | 1937 |
Investment Style: | | Relative yield value |
Southeastern Asset Management, Inc.
| | |
Founded: | | 1975 |
Investment Style: | | Special situations |
10
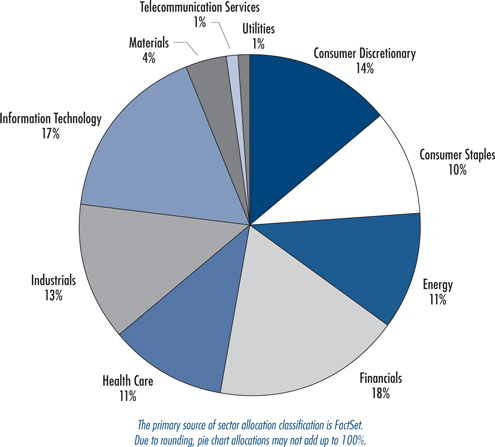
Vantagepoint Equity Income Fund
Sector Allocation as of December 31, 2011 (% of Total Investments)
11
Vantagepoint Equity Income Fund vs. Russell 1000 Value Index:
Growth of $10,000 Invested December 31, 2001*
Vantagepoint Equity Income Fund
Average Annual Total Returns for the periods ended December 31, 2011*
| | | | |
One Year | | | 0.04 | % |
| |
Three Years | | | 15.31 | % |
| |
Five Years | | | –0.66 | % |
| |
Ten Years | | | 4.67 | % |
| |
Fund Inception Date | | | April 1, 1994 | |
| * | Current performance may be higher or lower than the past performance presented in this report. Past performance is no guarantee of future performance. Investment returns and principal value will fluctuate so that shares, when redeemed, may be worth more or less than their original cost. The graph and the table do not reflect the deduction of taxes that a shareholder would pay on fund distributions or the redemption of fund shares. Current performance is available by calling 1-800-669-7400 or at www.icmarc.org/vpperformance. |
The Fund’s market benchmark, the Russell 1000 Value Index, is a subset of the Russell 1000 Index that measures the performance of the large-cap value segment of the U.S. equity universe, and includes companies with lower price-to-book ratios and lower expected growth values. An index is not available for direct investment, is unmanaged, and does not reflect the costs of portfolio management or trading. The Fund’s portfolio may differ significantly from the securities in the index.
12
Vantagepoint Growth & Income Fund
The Vantagepoint Growth & Income Fund’s objective is to offer long-term capital growth and current income. The principal investment strategy is to invest, under normal circumstances, primarily in U.S. common stocks that the Fund’s subadvisers believe offer the potential for capital appreciation or that may provide current income by paying dividends. Strategies used by the Fund’s subadvisers include: 1) focusing on large-capitalization U.S. companies whose stocks are believed to offer potential for price appreciation because of undervaluation, earnings growth or both; and 2) emphasizing U.S. stocks that may pay dividends. The Fund also may invest in foreign equity securities (common and preferred stock), mid-capitalization equity securities, U.S. preferred stock, and U.S. convertible securities.
Performance
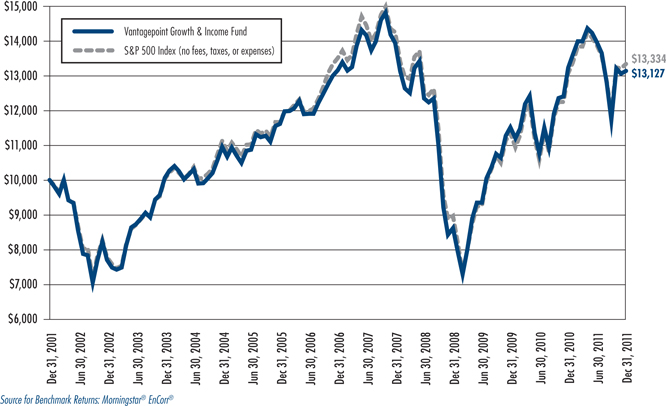
The Vantagepoint Growth & Income Fund lost 0.69% in 2011. The Fund’s market benchmark, the S&P 500 Index, gained 2.11%, while the Fund’s peer group benchmark, the Morningstar Large Blend Funds Average, a group of mutual funds with similar investment objectives, lost 1.27%.
The Fund’s absolute performance reflected the volatility and returns of the U.S. equity market in 2011. The Fund’s negative absolute performance primarily resulted from exposure to the Financials and Materials sectors, as well as certain stocks held in the Energy and Consumer Discretionary sectors. The negative absolute performance was partially offset by favorable exposure to certain sectors, primarily the Utilities, Consumer Staples, Healthcare and Information Technology sectors.
The Fund’s underperformance relative to its market benchmark primarily resulted from the weak performance of certain stocks held in the Consumer Discretionary, Energy and Healthcare sectors, as well as overweight allocations to the Financials and Materials sectors. Underweight allocations to the Consumer Staples and Utilities sectors, as well as certain stocks held in the Utilities sector, also contributed to the underperformance. Favorable performance of certain stocks held in the Information Technology, Industrials, and Materials sectors partially offset this underperformance.
The Fund’s outperformance relative to its peer group benchmark primarily resulted from the favorable performance of certain stocks held in the Materials, Consumer Staples, Information Technology, Industrials and Telecommunication Services sectors, as well as an overweight exposure to the Consumer Discretionary, Information Technology and Industrials sectors. Certain stocks held in the Consumer Discretionary, Energy and Healthcare sectors, an overweight exposure to the Financials and Materials sectors and an underweight exposure to the Consumer Staples sector partially offset this outperformance.
VIA uses more than one subadviser to manage the Fund’s assets. This multi-management strategy seeks to improve consistency of returns over time by eliminating reliance on the results of a single subadviser. The Fund’s subadvisers are as follows:
Subadviser Data
Fiduciary Management, Inc.
| | |
| Founded: | | 1980 |
| Investment Style: | | Large-cap blend |
T. Rowe Price Associates, Inc.
| | |
| Founded: | | 1937 |
| Investment Style: | | Blue chip growth |
Wellington Management Company, LLP
| | |
| Founded: | | 1928 |
| Investment Style: | | Yield focused |
13
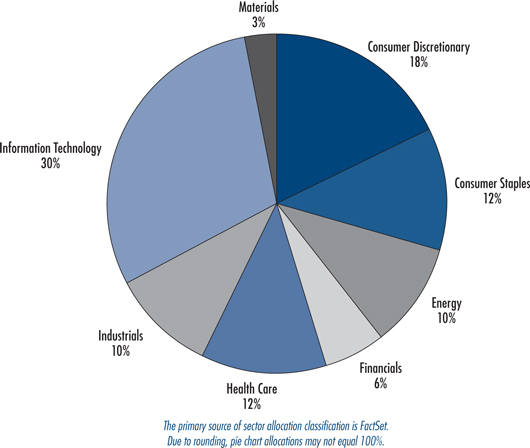
Vantagepoint Growth & Income Fund
Sector Allocation as of December 31, 2011 (% of Total Investments)
14
Vantagepoint Growth & Income Fund vs. S&P 500 Index:
Growth of $10,000 Invested December 31, 2001*
Vantagepoint Growth & Income Fund
Average Annual Total Returns for the periods ended December 31, 2011*
| | | | |
One Year | | | –0.69 | % |
| |
Three Years | | | 15.06 | % |
| |
Five Years | | | –0.03 | % |
| |
Ten Years | | | 2.76 | % |
| |
Fund Inception Date | | | October 2, 1998 | |
| * | Current performance may be higher or lower than the past performance presented in this report. Past performance is no guarantee of future performance. Investment returns and principal value will fluctuate so that shares, when redeemed, may be worth more or less than their original cost. The graph and the table do not reflect the deduction of taxes that a shareholder would pay on fund distributions or the redemption of fund shares. Current performance is available by calling 1-800-669-7400 or at www.icmarc.org/vpperformance. |
The Fund’s market benchmark, the S&P 500 Index, consists of 500 companies representing larger capitalization stocks traded in the U.S. An index is not available for direct investment, is unmanaged, and does not reflect the costs of portfolio management or trading. The Fund’s portfolio may differ significantly from the securities in the index.
15
Vantagepoint Growth Fund
The Vantagepoint Growth Fund’s objective is to offer long-term capital growth. The principal investment strategy is to invest primarily, under normal circumstances, in U.S. common stocks that are considered by the Fund’s subadvisers to have above-average potential for growth, with emphasis on stocks of seasoned medium- and large-capitalization firms. The Fund also may invest in foreign equity securities (common and preferred stock), small-capitalization equity securities, U.S. preferred stock, and U.S. convertible securities.
Performance
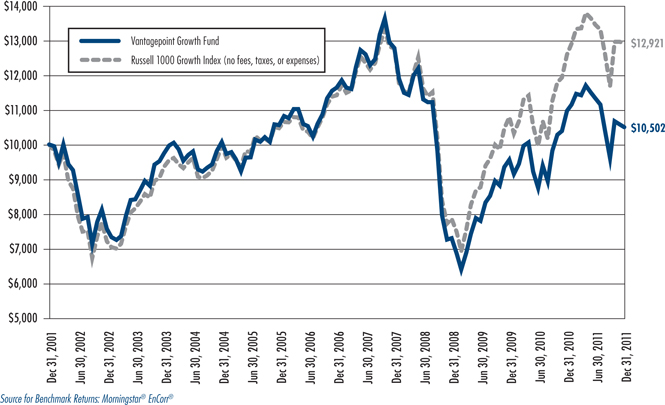
The Vantagepoint Growth Fund lost 4.27% in 2011. The Fund’s market benchmark, the Russell 1000 Growth Index, gained 2.64% for the year. The Fund’s peer group benchmark, the Morningstar Large Growth Funds Average, a group of mutual funds with similar investment objectives, lost 2.46%.
The Fund’s absolute performance was negatively impacted by the volatility and returns of the U.S. equity market in 2011. The Fund’s negative absolute return is primarily attributable to certain stocks in the Financials, Materials and Energy sectors. The negative performance was partially offset by positive returns in the Consumer Staples, Consumer Discretionary, and Healthcare sectors.
The Fund’s underperformance relative to its market benchmark primarily reflected the weak performance of certain stocks held in the Energy and Financials sectors. Certain stocks held in the Materials and Information Technology sectors also detracted from relative performance. Positive results from certain stocks held in the Industrials sector partially offset the underperformance.
The Fund’s underperformance relative to its peer group benchmark primarily resulted from the performance of certain stocks held in the Energy, Healthcare, and Information Technology sectors. An overweight to the Consumer Staples sector and returns from certain stocks held in the Consumer Staples sector, and to a lesser extent, certain stocks held in the Consumer Discretionary and Industrials sectors partially offset this underperformance.
VIA uses more than one subadviser to manage the Fund’s assets. This multi-management strategy seeks to improve consistency of returns over time by eliminating reliance on the results of a single subadviser. The Fund’s subadvisers are as follows:
Subadviser Data
Columbus Circle Investors
| | |
| Founded: | | 1975 |
| Investment Style: | | Large-cap growth |
D.G. Capital Management Trust*
| | |
| Founded: | | 1996 |
| Investment Style: | | Opportunistic growth |
Legg Mason Capital Management, LLC.*
| | |
| Founded: | | 1982 |
| Investment Style: | | Opportunistic growth |
Tukman Grossman Capital Management, Inc.*
| | |
| Founded: | | 1980 |
| Investment Style: | | Contrarian growth |
16
Westfield Capital Management Company, L.P.
| | |
| Founded: | | 1989 |
| Investment Style: | | Large-cap growth |
| * | At a meeting held on December 13, 2011, VIA recommended and The Vantagepoint Funds’ Board of Directors approved the termination of Legg Mason Capital Management, LLC, D.G. Capital Management Trust, and Tukman Grossman Capital Management, Inc. and the appointment of Victory Capital Management Inc. and Atlanta Capital Management Company, LLC as subadvisers to the Growth Fund. These changes were effective on January 23, 2012. |
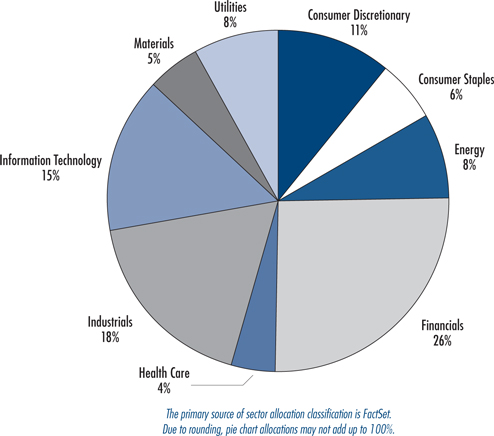
Vantagepoint Growth Fund
Sector Allocation as of December 31, 2011 (% of Total Investments)
17
Vantagepoint Growth Fund vs. Russell 1000 Growth Index:
Growth of $10,000 Invested December 31, 2001*
Vantagepoint Growth Fund
Average Annual Total Returns for the periods ended December 31, 2011*
| | | | |
| |
One Year | | | –4.27 | % |
| |
Three Years | | | 12.91 | % |
| |
Five Years | | | –2.03 | % |
| |
Ten Years | | | 0.49 | % |
| |
Fund Inception Date | | | April 1, 1983 | |
| * | Current performance may be higher or lower than the past performance presented in this report. Past performance is no guarantee of future performance. Investment returns and principal value will fluctuate so that shares, when redeemed, may be worth more or less than their original cost. The graph and the table do not reflect the deduction of taxes that a shareholder would pay on fund distributions or the redemption of fund shares. Current performance is available by calling 1-800-669-7400 or at www.icmarc.org/vpperformance. |
The Fund’s market benchmark, the Russell 1000 Growth Index, is a subset of the Russell 1000 Index that measures the performance of the large-cap growth segment of the U.S. equity universe and includes companies with higher price-to-book ratios and higher expected growth values. An index is not available for direct investment, is unmanaged, and does not reflect the costs of portfolio management or trading. The Fund’s portfolio may differ significantly from the securities in the index.
18
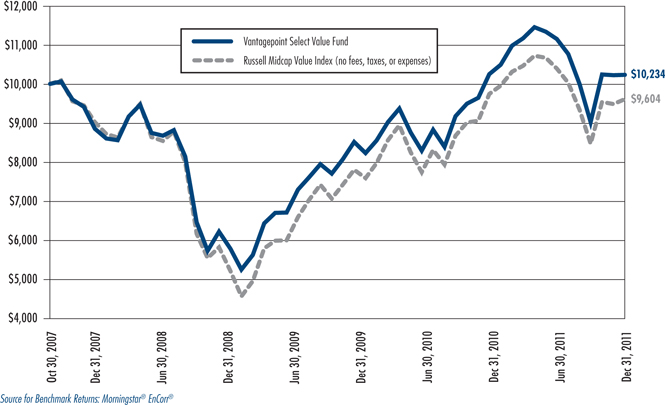
Vantagepoint Select Value Fund
The Vantagepoint Select Value Fund’s objective is to offer long-term growth from dividend income and capital appreciation. The principal investment strategy is to invest, under normal circumstances, primarily in common stocks of mid-capitalization U.S. companies that the Fund’s subadvisers believe present attractive investment opportunities at favorable prices in relation to the intrinsic worth of the issuer and may also offer the possibility for growth through reinvestment of dividends. The Fund generally seeks to invest in common stocks of companies with market capitalizations that fall within the range of companies in the Russel Midcap Value Index. The Fund also may invest in real estate investment trusts (up to 10% of the Fund’s net assets), and in foreign equity securities (common and preferred stock), U.S. preferred stocks, U.S. convertible securities, and small-capitalization equity securities.
Performance
The Vantagepoint Select Value Fund lost 0.16% in 2011. The Fund’s market benchmark, the Russell Midcap Value Index, lost 1.38%, while the Fund’s peer group benchmark, the Morningstar Mid-Cap Value Funds Average, a group of mutual funds with similar investment objectives, lost 3.96%.
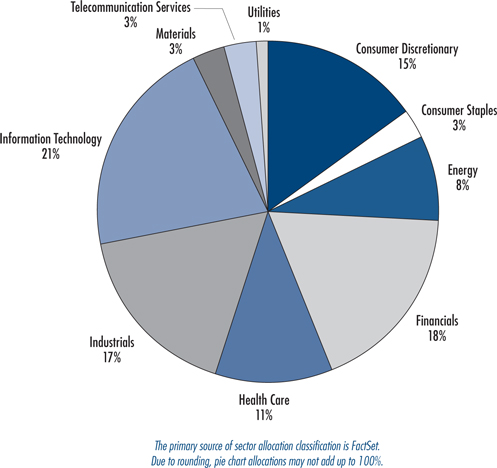
The Fund’s negative absolute performance generally reflected the volatility and returns of the U.S. equity market in 2011, and the primarily negative returns for mid-capitalization stocks in the U.S. equity market. The performance of certain stocks held by the Fund in the Telecommunication Services, Materials, and Information Technology sectors contributed to the Fund’s negative performance while returns from certain stocks held in the Consumer Discretionary and Utilities sectors partially offset this negative performance.
The Fund’s outperformance relative to its market benchmark primarily resulted from the favorable performance of certain stocks held in the Consumer Discretionary, Industrials and Financials sectors, and underweight allocations in the Financials and Telecommunication Services sectors. The outperformance was partially offset by returns from certain stocks held in the Materials, Healthcare and Energy sectors, as well as the Fund’s underweight allocation in the Utilities sector and its overweight position in the Information Technology sector.
The Fund’s outperformance relative to its peer group benchmark primarily resulted from the favorable performance of certain stocks held in the Financials, Consumer Discretionary and Industrials sectors. The outperformance was partially offset by returns from certain stocks held in the Materials, Information Technology, and Healthcare sectors, and the Fund’s underweight allocation to the Healthcare and Consumer Staples sectors.
VIA uses more than one subadviser to manage the Fund’s assets. This multi-management strategy seeks to improve consistency of returns over time by eliminating reliance on the results of a single subadviser. The Fund’s subadvisers are as follows:
Subadviser Data
Artisan Partners Limited Partnership
| | |
Founded: | | 1995 |
Investment Style: | | Contrarian value |
Systematic Financial Management, L.P.
| | |
Founded: | | 1982 |
Investment Style: | | Relative value |
WEDGE Capital Management, LLP
| | |
Founded: | | 1984 |
Investment Style: | | Concentrated traditional value |
19
Vantagepoint Select Value Fund
Sector Allocation as of December 31, 2011 (% of Total Investments)
.
20
Vantagepoint Select Value Fund vs. Russell Midcap Value Index:
Growth of $10,000 Invested October 30, 2007*
Vantagepoint Select Value Fund
Average Annual Total Returns for the periods ended December 31, 2011*
| | | | |
One Year | | | –0.16 | % |
| |
Three Years | | | 18.07 | % |
| |
Since Inception | | | 0.55 | % |
| |
Fund Inception Date | | | October 30, 2007 | |
| * | Current performance may be higher or lower than the past performance presented in this report. Past performance is no guarantee of future performance. Investment returns and principal value will fluctuate so that shares, when redeemed, may be worth more or less than their original cost. The graph and the table do not reflect the deduction of taxes that a shareholder would pay on fund distributions or the redemption of fund shares. Current performance is available by calling 1-800-669-7400 or at www.icmarc.org/vpperformance. |
The Fund’s market benchmark, the Russell Midcap Value Index, measures the performance of the mid-cap value segment of the U.S. equity universe. It includes those Russell Midcap Index companies with lower price-to-book ratios and lower forecasted growth values. An index is not available for direct investment, is unmanaged, and does not reflect the costs of portfolio management or trading. The Fund’s portfolio may differ significantly from the securities in the index.
21
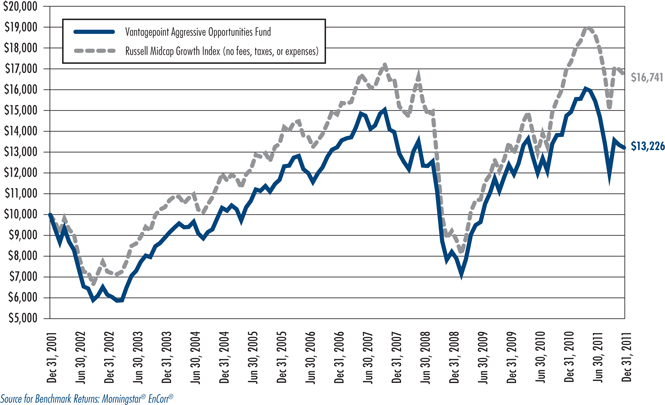
Vantagepoint Aggressive Opportunities Fund
The Vantagepoint Aggressive Opportunities Fund’s objective is to offer high long-term capital appreciation. The principal investment strategy is to invest, under normal circumstances, primarily in common stocks of small- to mid-capitalization U.S. and foreign companies that the Fund’s subadvisers believe offer the opportunity for high capital appreciation. The range of the mid-capitalization stocks in which the Fund normally invests is expected to be that of the Russell Midcap Index. The Fund also may invest in foreign equity securities (common and preferred stock, including those of issuers located in emerging market countries), U.S. preferred stock, and U.S. and foreign convertible securities. Investments in derivatives are limited to 10% of the Fund’s net assets but normally will not exceed 5% of the Fund’s net assets.
Performance
The Vantagepoint Aggressive Opportunities Fund lost 10.42% in 2011. The Fund’s market benchmark, the Russell Midcap Growth Index, lost 1.65%, while its peer group benchmark, the Morningstar Mid-Cap Growth Funds Average, a group of mutual funds with similar investment objectives, lost 3.96%.
The Fund’s absolute performance generally reflected the volatility of the U.S. equity market in 2011, and the primarily negative returns for mid- and small- capitalization stocks in the U.S. equity market. The Fund’s negative return was primarily attributable to the returns on certain stocks held in the Financials, Information Technology and Energy sectors. Favorable returns from stocks held in the Telecommunication Services and Consumer Staples sectors, as well as exposure to certain larger capitalization stocks, partially offset this underperformance.
The Fund’s underperformance relative to its market benchmark primarily reflected the performance of certain stocks held in the Financials, Consumer Discretionary and Healthcare sectors. The underperformance was partially offset by an overweight exposure to, and favorable performance from, certain stocks held in the Telecommunication Services sector and an underweight exposure to, and favorable performance from, certain stocks held in the Information Technology sector.
The Fund’s underperformance relative to its peer group benchmark primarily reflected the weak performance of certain stocks held in the Healthcare, Consumer Discretionary and Industrials sectors, as well as exposure to certain small-capitalization stocks. This underperformance was partly offset by favorable performance from certain stocks held in the Telecommunication Services sector.
VIA uses more than one subadviser to manage the Fund’s assets. This multi-management strategy seeks to improve consistency of returns over time by eliminating reliance on the results of a single subadviser. The Fund’s subadvisers are as follows:
Subadviser Data
Legg Mason Capital Management, LLC
| | |
Founded: | | 1982 |
Investment Style: | | Opportunistic growth |
Southeastern Asset Management, Inc.
| | |
Founded: | | 1975 |
Investment Style: | | Special situations |
TimesSquare Capital Management, LLC
| | |
Founded: | | 2004 |
Investment Style: | | Growth opportunities |
Wellington Management Company, LLP
| | |
Founded: | | 1928 |
Investment Style: | | Select mid cap growth |
22
Vantagepoint Aggressive Opportunities Fund
Sector Allocation as of December 31, 2011 (% of Total Investments)
23
Vantagepoint Aggressive Opportunities Fund vs. Russell Midcap Growth Index:
Growth of $10,000 Invested December 31, 2001*
Vantagepoint Aggressive Opportunities Fund
Average Annual Total Returns for the periods ended December 31, 2011*
| | | | |
One Year | | | –10.42 | % |
| |
Three Years | | | 17.22 | % |
| |
Five Years | | | –0.04 | % |
| |
Ten Years | | | 2.83 | % |
| |
Fund Inception Date | | | October 1, 1994 | |
| * | Current performance may be higher or lower than the past performance presented in this report. Past performance is no guarantee of future performance. Investment returns and principal value will fluctuate so that shares, when redeemed, may be worth more or less than their original cost. The graph and the table do not reflect the deduction of taxes that a shareholder would pay on fund distributions or the redemption of fund shares. Current performance is available by calling 1-800-669-7400 or at www.icmarc.org/vpperformance. |
The Fund’s market benchmark, the Russell Midcap Growth Index, measures the performance of the mid-cap growth segment of the U.S. equity universe. It includes those Russell Midcap Index companies with higher price-to-book ratios and higher forecasted growth values. An index is not available for direct investment, is unmanaged, and does not reflect the costs of portfolio management or trading. The Fund’s portfolio may differ significantly from the securities in the index.
24
Vantagepoint Discovery Fund
The Vantagepoint Discovery Fund’s objective is to offer long-term capital growth. The principal investment strategy is to invest, under normal circumstances, primarily in a combination of common stocks of U.S. small-capitalization companies, Russell 2000 Index futures contracts, and U.S. and foreign fixed income securities held, in part, as collateral in connection with the Fund’s use of futures contracts and which, at all times, have a portfolio effective duration no greater than three years. The Fund’s subadvisers select stocks that they believe have above-average potential for growth and that generally have market capitalizations that fall within the range of companies in the Russell 2000 Index. The Fund also may invest in foreign equity securities (common and preferred stock, including those of issuers located in emerging market countries), U.S. preferred stock, and U.S. and foreign convertible securities. The Fund’s fixed income securities are generally investment grade securities. The Fund’s investments in derivative instruments are limited to 15% of the Fund’s net assets.
Performance
The Vantagepoint Discovery Fund lost 6.15% in 2011. The Fund’s market benchmark, the Russell 2000 Index, lost 4.18%, while its peer group benchmark, the Morningstar Small Blend Funds Average, a group of mutual funds with similar investment objectives, lost 4.07%.
The Fund’s absolute performance primarily reflected the generally negative returns for small-capitalization stocks in the U.S. equity market in 2011. The Fund’s negative absolute return primarily resulted from the performance of certain stocks held in the Energy, Financials, Information Technology, and Consumer Staples sectors. Favorable returns from certain stocks held in the Utilities, Healthcare, and Materials sectors partially offset the negative results.
The Fund’s underperformance relative to its market benchmark primarily resulted from returns from certain stocks held in the Financials, Energy, and Consumer Staples sectors. Favorable returns from certain stocks held in the Industrials and Materials sectors partially offset this underperformance.
The Fund’s underperformance relative to its peer group benchmark primarily reflected returns from certain stocks held in the Energy, Consumer Discretionary and Technology sectors. Favorable performance from certain stocks held in the Materials sector partially offset the underperformance.
The Fund used derivative instruments during the year. Consistent with the Fund’s principal investment strategy, the Fund invested in Russell 2000 Index futures to seek to gain market exposure to U.S. small-capitalization stocks. The use of Russell 2000 Index futures did not have a material impact on Fund risk. The Fund also used fixed income futures to manage interest rate exposure in the fixed income portion of the Fund, and used forward currency contracts to manage currency risk from the Fund’s foreign bond exposure. The use of fixed income futures and forward currency contracts did not have a material impact on Fund performance or risk.
VIA uses more than one subadviser to manage the Fund’s assets. This multi-management strategy seeks to improve consistency of returns over time by eliminating reliance on the results of a single subadviser. The Fund’s subadvisers are as follows:
Subadviser Data
Payden & Rygel
| | |
Founded: | | 1983 |
Investment Style: | | Enhanced index |
Wellington Management Company, LLP
| | |
Founded: | | 1928 |
Investment Style: | | Diversified small-blend |
25
Vantagepoint Discovery Fund Asset Class Exposure
as of December 31, 2011* (% of Net Assets)
| * | For the Vantagepoint Discovery Fund, portfolio exposures represent the market value of physical securities and a measurement of the exposure through the derivative instruments held by the fund as a percent of the Fund’s net assets. For the purpose of displaying this allocation information, exposure through derivatives is measured based on the value of the underlying assets, rate or index represented by the derivative. This measurement is different from the valuation used for the purposes of calculating the fund’s net asset value, is intended to reflect the “economic exposure” of the derivative, and results in a total percentage reflected in the chart that exceeds 100%. |
26
Vantagepoint Discovery Fund
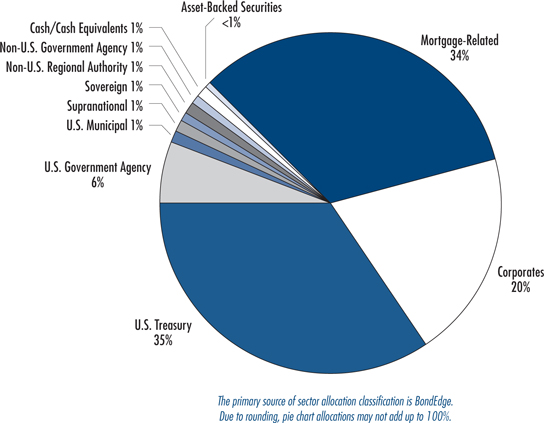
Fixed Income Sector Allocation as of December 31, 2011 (% of Net Assets excluding Equities)
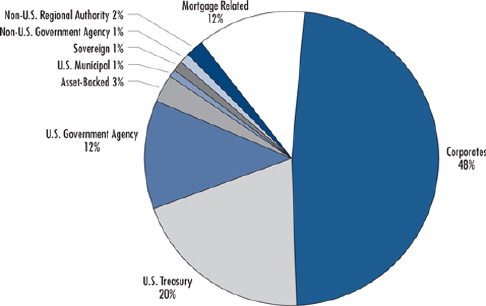
The Fixed Income Sector Allocation reflected in this pie chart was calculated using the actual fixed income securities held by the Fund. This pie chart represents the portion of the Fund classified as Bonds in the Asset Class Exposure Table. The primary source of fixed income sector classification is BondEdge. Due to rounding, pie chart allocations may not equal 100%.
Vantagepoint Discovery Fund
Equity Sector Allocation as of December 31, 2011 (% of Total Investments excluding Bonds and Cash)
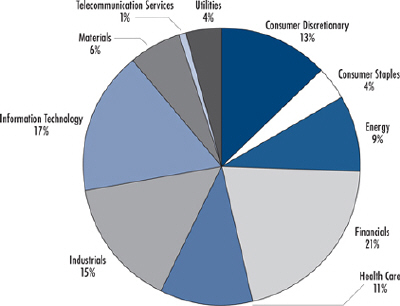
The Equity Sector Allocation reflected in this pie chart was calculated using the actual equity securities held by the Fund and blending them with the sectors represented in the Russell 2000 Index futures held by this Fund. This pie chart represents the portion of the Fund classified as Stocks in the Asset Class Exposure Table. The primary source of equity sector classification is FactSet. Due to rounding, pie chart allocations may not equal 100%.
27
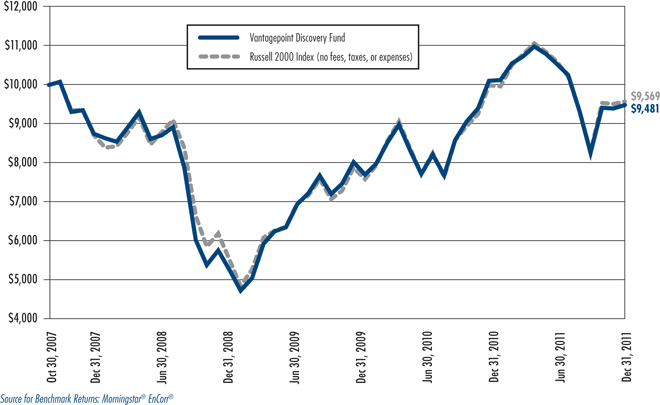
Vantagepoint Discovery Fund vs. Russell 2000 Index:
Growth of $10,000 Invested October 30, 2007*
Vantagepoint Discovery Fund
Average Annual Total Returns for the periods ended December 31, 2011*
| | | | |
One Year | | | ��6.15 | % |
| |
Three Years | | | 18.13 | % |
| |
Since Inception | | | –1.27 | % |
| |
Fund Inception Date | | | October 30, 2007 | |
| * | Current performance may be higher or lower than the past performance presented in this report. Past performance is no guarantee of future performance. Investment returns and principal value will fluctuate so that shares, when redeemed, may be worth more or less than their original cost. The graph and the table do not reflect the deduction of taxes that a shareholder would pay on fund distributions or the redemption of fund shares. Current performance is available by calling 1-800-669-7400 or at www.icmarc.org/vpperformance. |
The Fund’s market benchmark, the Russell 2000 Index, measures the performance of the small-cap segment of the U.S. equity universe. The Russell 2000 Index is a subset of the Russell 3000 Index, and includes approximately 2,000 of the smallest securities based on a combination of their market cap and current index membership. An index is not available for direct investment, is unmanaged, and does not reflect the costs of portfolio management or trading. The Fund’s portfolio may differ significantly from the securities in the index.
28
Vantagepoint International Fund
The Vantagepoint International Fund’s objective is to offer long-term capital growth and diversification by country. The principal investment strategy is to invest primarily in the common stocks of companies headquartered outside of the United States. The Fund will invest, under normal circumstances, at least 80% of its net assets in foreign equity securities (common and preferred stock), including those of issuers located in emerging market countries. Strategies used by the Fund’s subadvisers include: 1) investing in equity securities believed to have above average potential for growth across multiple capitalization sizes; and 2) investing in equity securities believed to be priced below fair market value at the time of purchase. The Fund also may invest in U.S. or foreign fixed income securities, U.S. equity securities, and U.S. or foreign convertible securities. Investments in derivatives are limited to 10% of the Fund’s net assets but normally will not exceed 5% of the Fund’s net assets.
Performance
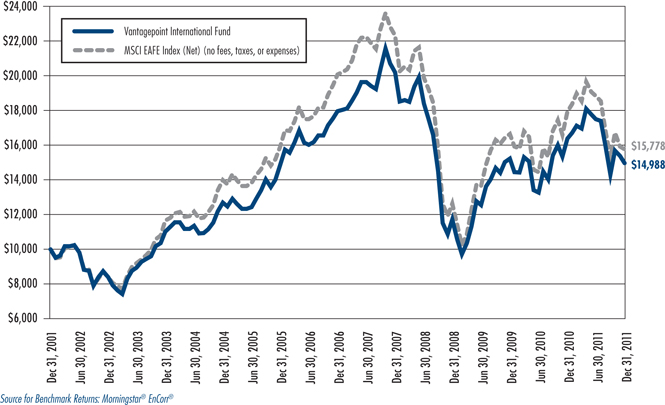
The Vantagepoint International Fund lost 8.57% in 2011. The Fund’s market benchmark, the MSCI Europe Australasia and Far East (EAFE) Index (Net), lost 12.14%, while its peer group benchmark, the Morningstar Foreign Large Blend Funds Average, a group of mutual funds with similar investment objectives, lost 13.97%.
The Fund’s absolute return reflected generally negative returns to U.S. investors from foreign stocks. The Fund experienced losses in most geographic regions, particularly in continental Europe and developed Asian countries excluding Japan. The Fund’s negative absolute return was primarily attributable to the performance of certain stocks held in the Financials, Materials, Utilities and Industrials sectors. Favorable returns from certain stocks held in the Healthcare, Consumer Staples and Telecommunication Services sectors, as well as positive currency returns partially offset this underperformance.
The Fund’s outperformance relative to its market benchmark primarily reflected favorable returns from certain stock holdings in companies from all major geographic regions. Underweight exposures to Europe and Japan, as well as returns from certain stocks held in those regions, enhanced relative performance. Performance also benefited from an overweight allocation to the Telecommunication Services sector and underweight allocations to the Materials and Financials sectors as well as performance from certain stocks held in those sectors. An underweight exposure to the United Kingdom detracted from relative performance.
The Fund’s outperformance relative to its peer group benchmark primarily reflected the performance of certain stocks of companies in developed countries within the Asia and Eurozone regions. Performance benefited from an overweight allocation to, and certain stocks held in, the Telecommunication Services and certain stocks held in the Consumer Discretionary sector. An underweight exposure to companies in the United Kingdom and United States detracted from relative performance, as did an overweight exposure to and unfavorable performance by certain stocks held in the Utilities sector.
The Fund used forward foreign currency contracts during the year to manage foreign currency risk, which also enhanced the Fund’s return as the U.S. dollar strengthened against the hedged currencies.
VIA uses more than one subadviser to manage the Fund’s assets. This multi-management strategy seeks to improve consistency of returns over time by eliminating reliance on the results of a single subadviser. The Fund’s subadvisers are as follows:
Subadviser Data
Artisan Partners Limited Partnership
| | |
Founded: | | 1995 |
Investment Style: | | International growth opportunities |
GlobeFlex Capital, LP
| | |
Founded: | | 1994 |
Investment Style: | | Diversified all-cap |
29
Mondrian Investment Partners Limited
| | |
Founded: | | 1990 |
Investment Style: | | Value-oriented international |
Walter Scott & Partners Limited
| | |
Founded: | | 1983 |
Investment Style: | | Concentrated growth |
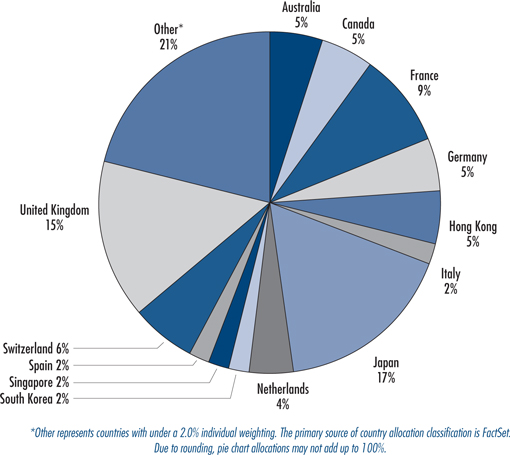
Vantagepoint International Fund
Country Allocation as of December 31, 2011 (% of Net Assets)
30
Vantagepoint International Fund vs. MSCI EAFE Index (Net):
Growth of $10,000 Invested December 31, 2001*
Vantagepoint International Fund
Average Annual Total Returns for the periods ended December 31, 2011*
| | | | |
One Year | | | –8.57 | % |
| |
Three Years | | | 8.54 | % |
| |
Five Years | | | –3.57 | % |
| |
Ten Years | | | 4.13 | % |
| |
Fund Inception Date | | | October 1, 1994 | |
| * | Current performance may be higher or lower than the past performance presented in this report. Past performance is no guarantee of future performance. Investment returns and principal value will fluctuate so that shares, when redeemed, may be worth more or less than their original cost. The graph and the table do not reflect the deduction of taxes that a shareholder would pay on fund distributions or the redemption of fund shares. Current performance is available by calling 1-800-669-7400 or at www.icmarc.org/vpperformance. |
The Fund’s market benchmark, the MSCI EAFE Index (Net), is a free float-adjusted market capitalization index of equity securities that is designed to measure the equity market performance of developed markets, excluding the U.S. and Canada, and approximates the minimum possible dividend reinvestment after deduction of withholding tax according to MSCI Barra’s methodology. An index is not available for direct investment, is unmanaged, and does not reflect the costs of portfolio management or trading. The Fund’s portfolio may differ significantly from the securities in the index.
31
Vantagepoint Diversifying Strategies Fund
The Vantagepoint Diversifying Strategies Fund’s objective is to offer long-term capital growth. The Fund employs multiple investment strategies to seek long-term growth of capital, with lower volatility over time than that of stocks in general and a risk/return profile different from that of traditional asset classes, such as stocks and fixed income securities (i.e., a “low correlation” to such asset classes). In combination, the Fund’s investment strategies seek to provide investment exposure to U.S. and foreign stocks and fixed income securities (including convertible securities) and foreign currencies through direct investments or through the use of derivative instruments. The Fund employed three strategies in 2011 — a global tactical asset allocation strategy, a low duration-plus fixed income strategy, and a convertible securities strategy. The Fund’s assets allocated to the global tactical asset allocation strategy are invested in derivative instruments that provide investment exposure to the global equity, investment grade fixed income and currency markets. The Fund’s assets allocated to the convertible securities strategy are invested in U.S. and foreign convertible securities, and also may be invested in a combination of either convertible or non-convertible bonds, and common stocks or equity options, to seek to replicate the investment exposure of convertible securities or to seek to manage risk. In addition, the Fund may invest in non-convertible bonds, common stocks as well as restricted securities. The Fund’s assets allocated to the low duration-plus fixed income strategy are invested in core short and intermediate maturity U.S. and foreign fixed income securities that combined generally have a portfolio effective duration of no greater than three years.
Performance
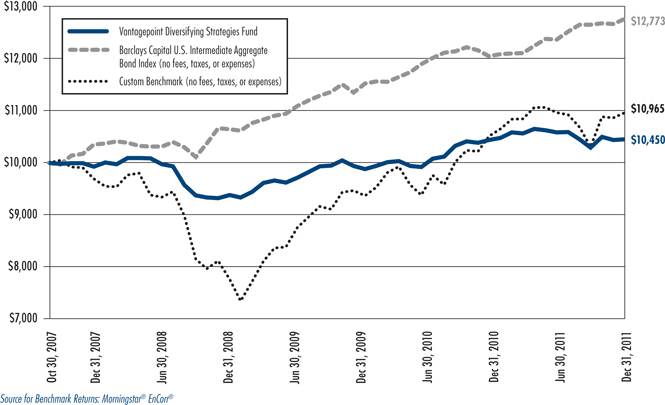
The Vantagepoint Diversifying Strategies Fund gained 0.10% during 2011. The Fund’s market benchmark, the Barclays Capital U.S. Intermediate Aggregate Bond Index, gained 5.97%. The Fund’s custom benchmark, which is an equal-weighted blend of the S&P 500 Index and the Barclays Capital U.S. Intermediate Aggregate Bond Index, gained 4.33%.
The Fund’s positive absolute performance in 2011 primarily reflected favorable performance from the low duration bond and global tactical asset allocation strategies.
The Fund’s underperformance relative to its market benchmark resulted from all strategies. The convertible securities strategy was the largest detractor due to equity-like returns in a year when bonds generally outperformed stocks. The low duration-plus fixed income strategy also trailed the market, primarily due to its lower yield as compared to the market benchmark.
The Fund used derivatives extensively in 2011, primarily in executing its global tactical asset allocation strategy. This strategy tactically allocated assets, on a long and short basis, across global equity markets, fixed income markets and currencies based on the Fund subadvisers’ perceived prospects for returns. The Fund used exchange-traded interest rate futures and over-the-counter total return swaps and options to take long and short positions in sovereign bonds. It also used exchange-traded equity futures, and to a lesser extent, over-the-counter options to gain long and short exposure to global equity markets. Additionally, the Fund utilized forward currency contracts to gain or alter exposure to currencies of developed countries and to a lesser extent, emerging market countries. In combination, the Fund used derivatives positions to seek to provide flexibility and efficiency in implementing the Fund’s strategy and the Fund’s use of derivatives generally produced positive returns. The risks resulting from the utilization of derivatives were generally consistent with risks of the underlying markets, and the combination of offsetting long and short positions within each asset class generally resulted in a small amount of net exposure.
VIA uses more than one subadviser to manage the Fund’s assets. This multi management strategy seeks to improve consistency of returns over time by eliminating reliance on the results of a single subadviser. The Fund’s subadvisers are as follows:
Subadviser Data
| | |
Calamos Advisors, LLC |
| |
Founded: | | 1977 |
Investment Style: | | Global convertible securities |
32
Mellon Capital Management Corporation
| | |
| |
Founded: | | 1983 |
Investment Style: | | Global tactical asset allocation |
Payden & Rygel
| | |
| |
Founded: | | 1983 |
Investment Style: | | Low duration-plus fixed income |
Payden & Rygel
| | |
| |
Founded: | | 1983 |
Investment Style: | | Enhanced cash |
Shenkman Capital Management, Inc.
| | |
| |
Founded: | | 1985 |
Investment Style: | | Convertible securities |
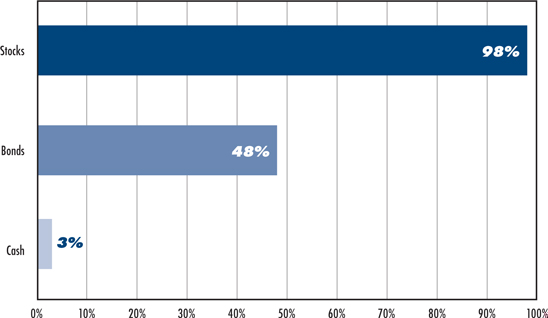
Vantagepoint Diversifying Strategies Fund Asset Class Exposure
as of December 31, 2011* (% of Net Assets)
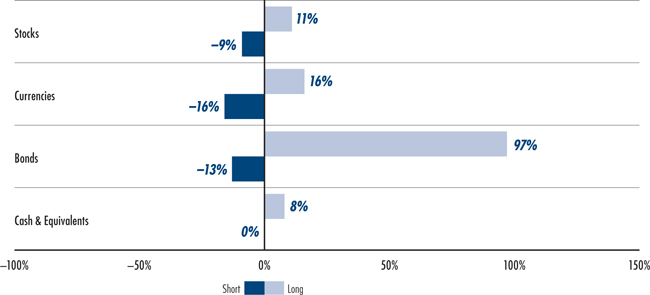
| * | For the Vantagepoint Diversifying Strategies Fund, portfolio exposures represent the market value of physical securities and a measurement of exposure to asset classes through the derivative instruments held by the fund as a percent of the fund’s net assets. For the purpose of displaying this allocation information, exposure through derivatives is measured based on the value of the underlying assets, rate, or index represented by the derivative. This measurement is different from the valuation used for the purposes of calculating the fund’s net asset value, is intended to reflect the “economic exposure” of the derivative, and results in a total percentage reflected in the chart that exceeds 100%. In its use of derivative instruments, the fund may take both long positions (the values of which move in the same direction as the prices of the underlying investments, pools of investments, indexes or currencies) and short positions (the values of which move in the opposite direction as the prices of the underlying investments, pools of investments, indexes or currencies). These long and short positions are reflected above. |
33
Vantagepoint Diversifying Strategies Fund vs. Barclays Capital U.S. Intermediate Aggregate Bond Index and Custom Benchmark: Growth of $10,000 Invested October 30, 2007**
Vantagepoint Diversifying Strategies Fund
Average Annual Total Returns for the periods ended December 31, 2011**
| | | | |
One Year | | | 0.10 | % |
| |
Three Years | | | 3.89 | % |
| |
Since Inception | | | 1.06 | % |
| |
Fund Inception Date | | | October 30, 2007 | |
| ** | Current performance may be higher or lower than the past performance presented in this report. Past performance is no guarantee of future performance. Investment returns and principal value will fluctuate so that shares, when redeemed, may be worth more or less than their original cost. The graph and the table do not reflect the deduction of taxes that a shareholder would pay on fund distributions or the redemption of fund shares. Current performance is available by calling 1-800-669-7400 or at www.icmarc.org/vpperformance. |
The Fund’s market benchmark, the Barclays Capital U.S. Intermediate Aggregate Bond Index, consists of investment-grade U.S. fixed income securities with maturities of 1 to 10 years. The Fund’s custom benchmark is an equal-blend of the Barclays Capital U.S. Intermediate Aggregate Bond Index and the S&P 500 Index, which consists of 500 companies representing larger capitalization stocks traded in the U.S. An index is not available for direct investment, is unmanaged, and does not reflect the costs of portfolio management or trading. The Fund’s portfolio may differ significantly from the securities in the indexes.
34
Vantagepoint Index Funds
The Vantagepoint Index Funds follow an indexed or “passively managed” approach to investing. The Funds invest in securities that are selected to try to approximate the investment characteristics and performance of their respective benchmarks. To minimize transaction costs, the Index Funds, with the exception of the 500 Stock Index and Overseas Equity Index Funds, use sampling techniques to approximate their benchmarks’ characteristics using fewer securities than are contained in the market benchmark index.
| | 1. | The Vantagepoint Core Bond Index Fund’s objective is to offer current income by approximating the performance of the Barclays Capital U.S. Aggregate Bond Index. |
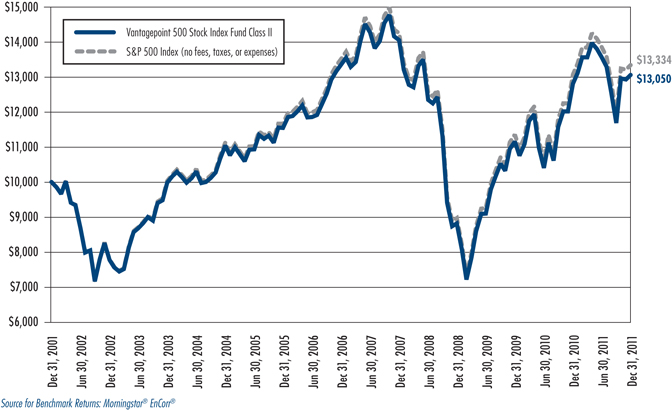
| | 2. | The Vantagepoint 500 Stock Index Fund’s objective is to offer long-term capital growth by approximating the performance of the S&P 500 Index. |
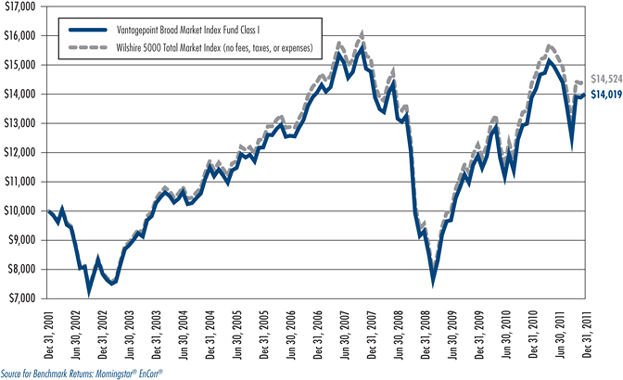
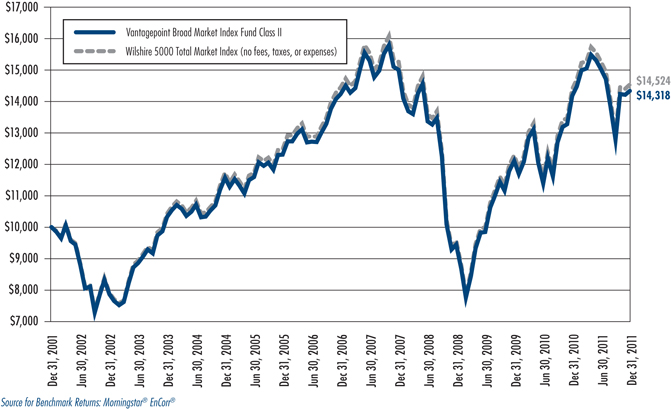
| | 3. | The Vantagepoint Broad Market Index Fund’s objective is to offer long-term capital growth by approximating the performance of the Wilshire 5000 Total Market Index. |
| | 4. | The Vantagepoint Mid/Small Company Index Fund’s objective is to offer long-term capital growth by approximating the performance of the Wilshire 4500 Completion Index. |
| | 5. | The Vantagepoint Overseas Equity Index Fund’s objective is to offer long-term capital growth and diversification by approximating the performance of the MSCI Europe Australasia Far East (EAFE) Index (Net). |
Performance
Performance of the Index Funds will differ from the underlying indexes for several reasons. First, fund fees and expenses reduce Fund performance, while the indexes themselves bear no management fees, transaction costs or other expenses. Second, due to sampling techniques used by the Core Bond, Broad Market, and Mid/Small Company Index Funds, there will be tracking error, which may impact Fund performance positively or negatively. Third, changes to the indexes, such as additions or deletions in the securities contained in an index and rebalancing, can cause tracking error which may impact the Fund’s performance positively or negatively as compared to its benchmark index. Fourth, the timing of cash flows into and out of a Fund will affect its ability to precisely track its underlying index. Fifth, there may be pricing differences if the underlying index and the Fund use different pricing sources. This is more common in the Overseas Equity Index Fund and the Core Bond Index Fund.
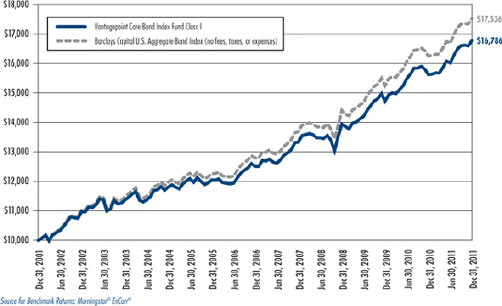
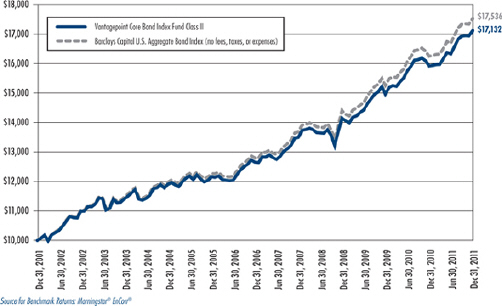
The Vantagepoint Core Bond Index Fund gained 7.41% (Class I shares) and 7.57% (Class II shares). The Fund’s market benchmark, the Barclays Capital U.S. Aggregate Bond Index, gained 7.84%.
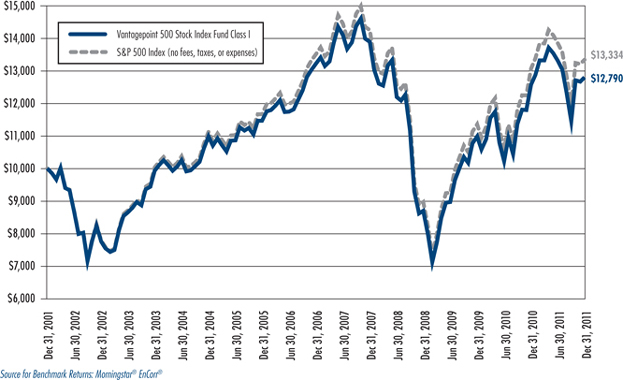
The Vantagepoint 500 Stock Index Fund gained 1.72% (Class I shares) and 1.97% (Class II shares). The Fund’s market benchmark, the S&P 500 Index, gained 2.11%.
The Vantagepoint Broad Market Index Fund gained 0.85% (Class I shares) and 1.07% (Class II shares). The Fund’s market benchmark, the Wilshire 5000 Total Market Index, gained 0.98%.
The Vantagepoint Mid/Small Company Index Fund lost 3.91% (Class I shares) and 3.70% (Class II shares). The Fund’s market benchmark, the Wilshire 4500 Completion Index, lost 4.10%.
The Vantagepoint Overseas Equity Index Fund lost 12.42% (Class I shares) and 12.28% (Class II shares). The Fund’s market benchmark, the MSCI EAFE Index (Net), lost 12.14%.
The 500 Stock Index Fund, Broad Market Index Fund, Mid\Small Company Index Fund, and Overseas Equity Index Fund used futures to obtain or adjust investment exposure to equity issues when it was believed that using futures would be more efficient or cost effective than trading in the securities directly. The Overseas Equity Fund also used forward currency contracts to manage currency risks.
As of December 31, 2011, each Index Fund was managed by Mellon Capital Management Corporation.
Subadviser Data
| | |
Mellon Capital Management Corporation |
Founded: | | 1983 |
Investment Style: | | Index portfolio |
35
Vantagepoint Core Bond Index Fund
Sector Allocation as of December 31, 2011 (% of Net Assets)
36
Vantagepoint Core Bond Index Fund Class I vs. Barclays Capital U.S. Aggregate Bond Index:
Growth of $10,000 Invested December 31, 2001*
Vantagepoint Core Bond Index Fund Class II vs. Barclays Capital U.S. Aggregate Bond Index:
Growth of $10,000 Invested December 31, 2001*
37
Vantagepoint Core Bond Index Fund
Average Annual Total Returns for the periods ended December 31, 2011*
| | | | | | | | |
| | | Class I Shares | | | Class II Shares | |
| One Year | | | 7.41 | % | | | 7.57 | % |
| Three Years | | | 6.36 | % | | | 6.57 | % |
| Five Years | | | 6.05 | % | | | 6.25 | % |
| Ten Years | | | 5.32 | % | | | 5.53 | % |
| | |
| Fund Inception Date | | | June 2, 1997 | | | | April 5, 1999 | |
| * | Current performance may be higher or lower than the past performance presented in this report. Past performance is no guarantee of future performance. Investment returns and principal value will fluctuate so that shares, when redeemed, may be worth more or less than their original cost. The graph and the table do not reflect the deduction of taxes that a shareholder would pay on fund distributions or the redemption of fund shares. Current performance is available by calling 1-800-669-7400 or at www.icmarc.org/vpperformance. |
The Fund’s market benchmark, the Barclays Capital U.S. Aggregate Bond Index, consists of investment-grade U.S. fixed income securities. An index is not available for direct investment, is unmanaged, and does not reflect the costs of portfolio management or trading.
38
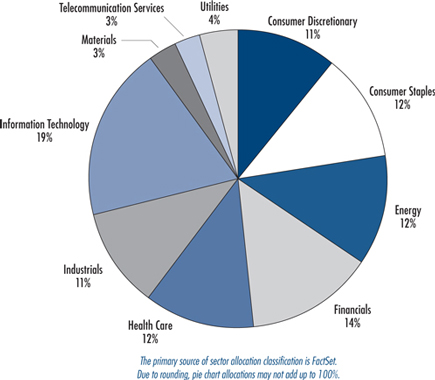
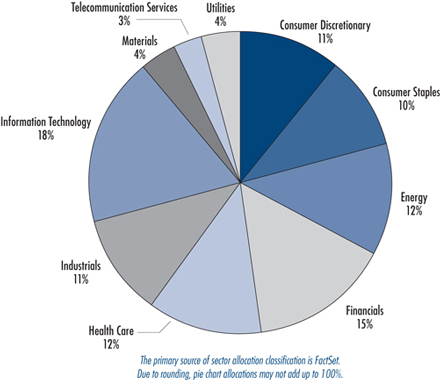
Vantagepoint 500 Stock Index Fund
Sector Allocation as of December 31, 2011 (% of Total Investments)
Vantagepoint 500 Stock Index Fund Class I vs. S&P 500 Index:
Growth of $10,000 Invested December 31, 2001*
39
Vantagepoint 500 Stock Index Fund Class II vs. S&P 500 Index:
Growth of $10,000 Invested December 31, 2001*
Vantagepoint 500 Stock Index Fund
Average Annual Total Returns for the periods ended December 31, 2011*
| | | | | | | | |
| | | Class I Shares | | | Class II Shares | |
One Year | | | 1.72 | % | | | 1.97 | % |
Three Years | | | 13.70 | % | | | 13.93 | % |
Five Years | | | –0.65 | % | | | –0.44 | % |
Ten Years | | | 2.49 | % | | | 2.70 | % |
| | |
Fund Inception Date | | | June 2, 1997 | | | | April 5, 1999 | |
| * | Current performance may be higher or lower than the past performance presented in this report. Past performance is no guarantee of future performance. Investment returns and principal value will fluctuate so that shares, when redeemed, may be worth more or less than their original cost.The graph and the table do not reflect the deduction of taxes that a shareholder would pay on fund distributions or the redemption of fund shares. Current performance is available by calling 1-800-669-7400 or at www.icmarc.org/vpperformance. |
The Fund’s market benchmark, the S&P 500 Index, consists of 500 companies representing larger capitalization stocks traded in the U.S. An index is not available for direct investment, is unmanaged, and does not reflect the costs of portfolio management or trading.
40
Vantagepoint Broad Market Index Fund
Sector Allocation as of December 31, 2011 (% of Total Investments)
Vantagepoint Broad Market Index Fund Class I vs. Wilshire 5000 Total Market Index:
Growth of $10,000 Invested December 31, 2001*
41
Vantagepoint Broad Market Index Fund Class II vs. Wilshire 5000 Total Market Index:
Growth of $10,000 Invested December 31, 2001*
Vantagepoint Broad Market Index Fund
Average Annual Total Returns for the periods ended December 31, 2011*
| | | | | | | | |
| | | Class I Shares | | | Class II Shares | |
One Year | | | 0.85 | % | | | 1.07 | % |
Three Years | | | 14.62 | % | | | 14.87 | % |
Five Years | | | –0.07 | % | | | 0.13 | % |
Ten Years | | | 3.44 | % | | | 3.65 | % |
| | |
Fund Inception Date | | | October 1, 1994 | | | | April 5, 1999 | |
| * | Current performance may be higher or lower than the past performance presented in this report. Past performance is no guarantee of future performance. Investment returns and principal value will fluctuate so that shares, when redeemed, may be worth more or less than their original cost. The graph and the table do not reflect the deduction of taxes that a shareholder would pay on fund distributions or the redemption of fund shares. Current performance is available by calling 1-800-669-7400 or at www.icmarc.org/vpperformance. |
The Fund’s market benchmark, the Wilshire 5000 Total Market Index, consists of all U.S. equity securities with readily available price data (which includes common stocks, interests in real estate investment trusts and limited partnership interests of U.S. companies, that have their primary market listing in the U.S.) and is calculated using a float-adjusted market capitalization weighting. The float-adjusted methodology adjusts an individual stock’s market capitalization to account for (by excluding) shares that may be restricted or otherwise unavailable for purchase. An index is not available for direct investment, is unmanaged, and does not reflect the costs of portfolio management or trading.
42
Vantagepoint Mid/Small Company Index Fund
Sector Allocation as of December 31, 2011 (% of Total Investments)
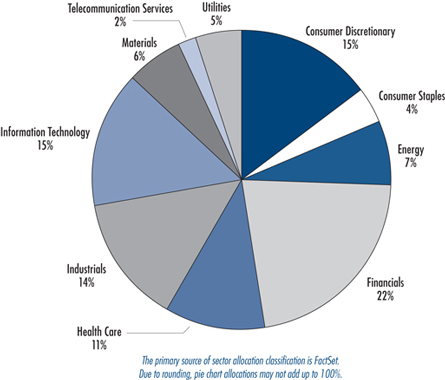
Vantagepoint Mid/Small Company Index Fund Class I vs. Wilshire 4500 Completion Index:
Growth of $10,000 Invested December 31, 2001*
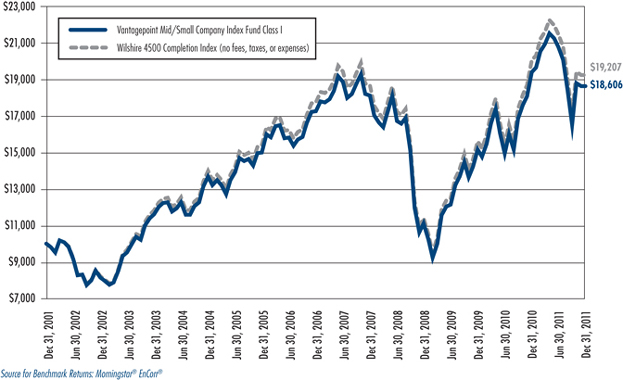
43
Vantagepoint Mid/Small Company Index Fund Class II vs. Wilshire 4500 Completion Index:
Growth of $10,000 Invested December 31, 2001*
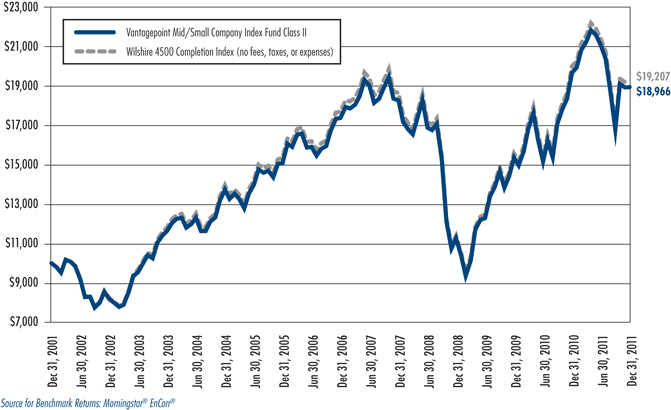
Vantagepoint Mid/Small Company Index Fund
Average Annual Total Returns for the periods ended December 31, 2011*
| | | | | | | | |
| | | Class I Shares | | | Class II Shares | |
One Year | | | –3.91 | % | | | –3.70 | % |
Three Years | | | 18.74 | % | | | 18.97 | % |
Five Years | | | 1.54 | % | | | 1.75 | % |
Ten Years | | | 6.41 | % | | | 6.61 | % |
| | |
Fund Inception Date | | | June 2, 1997 | | | | April 5, 1999 | |
| * | Current performance may be higher or lower than the past performance presented in this report. Past performance is no guarantee of future performance. Investment returns and principal value will fluctuate so that shares, when redeemed, may be worth more or less than their original cost. The graph and the table do not reflect the deduction of taxes that a shareholder would pay on fund distributions or the redemption of fund shares. Current performance is available by calling 1-800-669-7400 or at www.icmarc.org/vpperformance. |
The Fund’s market benchmark, the Wilshire 4500 Completion Index, consists of all U.S. equity securities included in the Wilshire 5000 Total Market Index, excluding the companies in the S&P 500 Index. As such, it consists of small- and mid-capitalization U.S. equity securities. It is calculated using a float adjusted market capitalization weighting, which adjusts an individual stock’s market capitalization to account for (by excluding) shares that may be restricted or otherwise unavailable for purchase. An index is not available for direct investment, is unmanaged, and does not reflect the costs of portfolio management or trading.
44
Vantagepoint Overseas Equity Index Fund
Country Allocation as of December 31, 2011 (% of Net Assets)
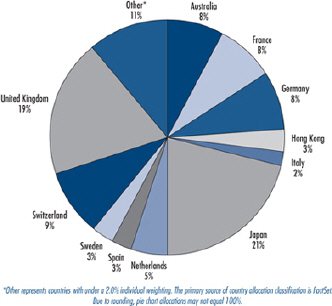
Vantagepoint Overseas Equity Index Fund Class I vs. MSCI EAFE Index (Net):
Growth of $10,000 Invested December 31, 2001*
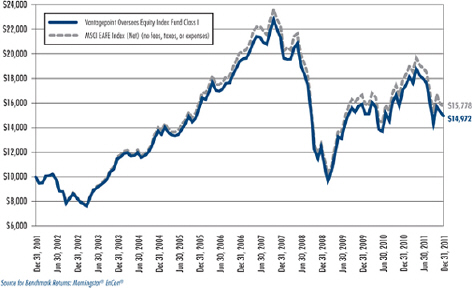
45
Vantagepoint Overseas Equity Index Fund Class II vs. MSCI EAFE Index (Net):
Growth of $10,000 Invested December 31, 2001*
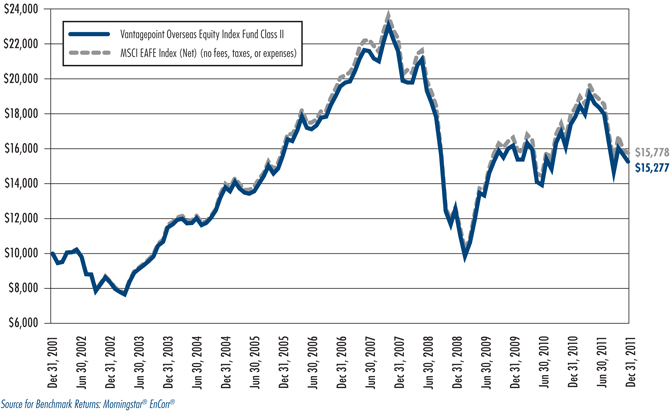
Vantagepoint Overseas Equity Index Fund
Average Annual Total Returns for the periods ended December 31, 2011*
| | | | | | | | |
| | | Class I Shares | | | Class II Shares | |
One Year | | | –12.42 | % | | | –12.28 | % |
Three Years | | | 6.55 | % | | | 6.74 | % |
Five Years | | | –5.04 | % | | | –4.86 | % |
Ten Years | | | 4.12 | % | | | 4.33 | % |
| | |
Fund Inception Date | | | June 2, 1997 | | | | April 5, 1999 | |
| * | Current performance may be higher or lower than the past performance presented in this report. Past performance is no guarantee of future performance. Investment returns and principal value will fluctuate so that shares, when redeemed, may be worth more or less than their original cost. The graph and the table do not reflect the deduction of taxes that a shareholder would pay on fund distributions or the redemption of fund shares. Current performance is available by calling 1-800-669-7400 or at www.icmarc.org/vpperformance. |
The Fund’s market benchmark, the MSCI Europe Australasia Far East (EAFE) Index (Net), is a free float-adjusted market capitalization index that is designed to measure the equity market performance of developed markets, excluding the U.S. and Canada and approximates the minimum possible dividend reinvestment after deduction of withholding tax according to MSCI Barra’s methodology. An index is not available for direct investment, is unmanaged, and does not reflect the costs of portfolio management or trading.
46
Vantagepoint Model Portfolio Savings Oriented Fund
The Vantagepoint Model Portfolio Savings Oriented Fund’s objective is to offer capital preservation, reasonable current income, and some capital growth while seeking to limit risk. The principal investment strategy is to invest in a combination of underlying Vantagepoint Funds to seek to obtain exposure to approximately 55% fixed income investments, 25% equity investments, and 20% investments in asset classes and strategies that have historically exhibited a low correlation to traditional fixed income and equity investments (a “multi-strategy” Fund) by investing in the following Vantagepoint Funds at target allocations within the percentage ranges indicated:
| | | | |
FIXED INCOME | | | |
Low Duration Bond Fund | | | 26%–36% | |
Core Bond Index Fund (Class I) | | | 4%–14% | |
Inflation Protected Securities Fund | | | 10%–20% | |
| |
EQUITY | | | |
Equity Income Fund | | | 5%–15% | |
Growth & Income Fund | | | 5%–15% | |
International Fund | | | 0%–10% | |
| |
MULTI-STRATEGY | | | |
Diversifying Strategies Fund | | | 18%–22% | |
Performance
The Vantagepoint Model Portfolio Savings Oriented Fund gained 2.38% in 2011. The Fund’s market benchmark, the Barclays Capital U.S. Intermediate Aggregate Bond Index, gained 5.97%, while the Fund’s peer group benchmark, the Morningstar Conservative Allocation Funds Average, a group of mutual funds with similar investment objectives, gained 1.70%. The Fund’s custom benchmark gained 5.22%. The Fund’s custom benchmark is composed of market indexes that reflect the general performance of the asset classes in which the Fund invests, in weighted percentages, corresponding to the historical target allocation to those asset classes for the Fund.
The Model Portfolio Savings Oriented Fund produced a positive absolute return in 2011 primarily due to the performance of the underlying fixed income funds, led by the Inflation Protected Securities Fund. The exposure to equities generally detracted from the Fund’s absolute performance, with the exposure to funds invested in foreign equities providing the least favorable performance. The Fund’s three underlying fixed income funds all produced positive returns, as the Low Duration Bond Fund gained 1.14%, the Core Bond Index Fund (Class I) rose 7.41% and the Inflation Protected Securities Fund increased 11.53%. The Fund’s three underlying equity funds produced mixed returns, as the Equity Income Fund returned 0.04%, the Growth & Income Fund lost 0.69% and the International Fund lost 8.57%. The Diversifying Strategies Fund gained 0.10%. Please refer to each underlying fund’s commentary within this report for more information.
The Fund’s underperformance relative to its fixed income market benchmark primarily resulted from its allocation to equity funds, which underperformed the fixed income funds. The allocation to the Core Bond Index Fund (Class I) and the Inflation Protected Securities Fund partially offset this underperformance as these funds outperformed the Fund’s market benchmark.
The Fund’s outperformance relative to its peer group benchmark primarily reflected its lower than peer average allocation to equity funds, which underperformed funds invested in fixed income securities. The Fund’s relative performance also benefited from an underweight allocation to funds invested in smaller-capitalization stocks, which trailed funds invested in large-capitalization stocks, and an overweight allocation to funds invested in inflation protected securities, which were among the stronger performers in the financial markets for the year. Additionally, the underlying fixed income funds’ allocation to higher-quality securities aided relative performance. The shorter duration focus of the underlying fixed income investments detracted from relative performance during periods of the year in which yields fell.
The Fund’s underperformance relative to its custom benchmark primarily resulted from its allocation to equity funds, the Low Duration Bond Fund and the Diversifying Strategies Fund, which trailed the performance of their respective broad market indices in the custom benchmark. The allocation to the Inflation Protected Securities Fund and Core Bond Index Fund partially offset this underperformance as they outperformed the fixed income index in the custom benchmark.
47
Vantagepoint Model Portfolio Savings Oriented Fund
Underlying Fund Allocation as of December 31, 2011 (% of Net Assets)
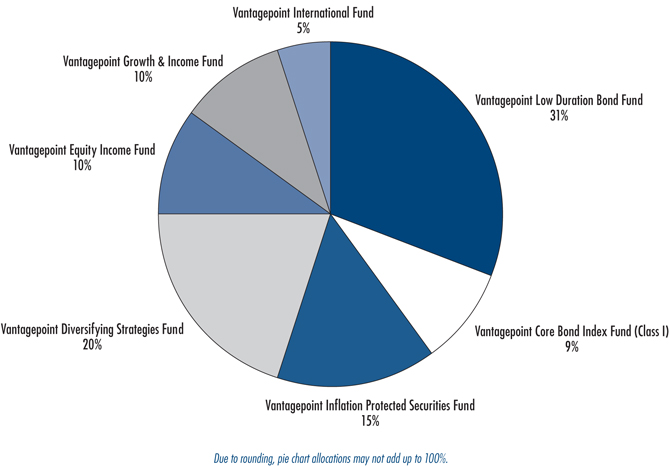
48
Vantagepoint Model Portfolio Savings Oriented Fund vs. Barclays Capital U.S. Intermediate Aggregate
Bond Index and Custom Benchmark: Growth of $10,000 Invested December 31, 2001*
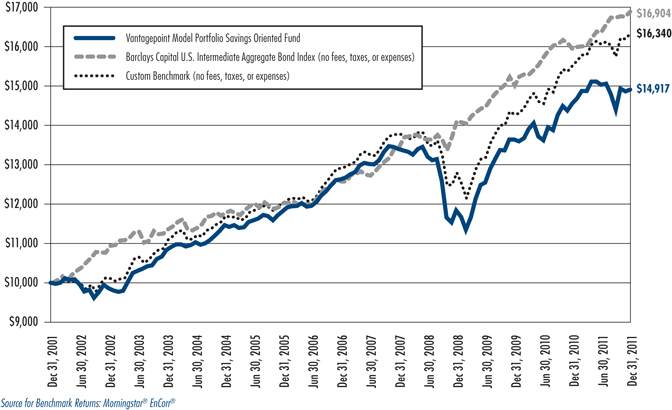
Vantagepoint Model Portfolio Savings Oriented Fund
Average Annual Total Returns for the periods ended December 31, 2011*
| | | | |
One Year | | | 2.38 | % |
| |
Three Years | | | 7.98 | % |
| |
Five Years | | | 3.38 | % |
| |
Ten Years | | | 4.08 | % |
| |
Fund Inception Date | | | February 9, 1995 | |
| * | Current performance may be higher or lower than the past performance presented in this report. Past performance is no guarantee of future performance. Investment returns and principal value will fluctuate so that shares, when redeemed, may be worth more or less than their original cost. The graph and the table do not reflect the deduction of taxes that a shareholder would pay on fund distributions or the redemption of fund shares. Current performance is available by calling 1-800-669-7400 or at www.icmarc.org/vpperformance. |
The Fund’s market benchmark, the Barclays Capital U.S. Intermediate Aggregate Bond Index, consists of investment-grade U.S. fixed income securities with maturities of 1 to 10 years. The custom benchmark is composed of market indexes that reflect the general performance of the primary asset classes in which the Fund invests, in weighted percentages that correspond to the historical target allocations to those asset classes for the Fund. Those asset class benchmarks are the Barclays Capital U.S. Intermediate Aggregate Bond Index for the fixed income asset class and the S&P 500 Index for the equity asset class. The S&P 500 Index is an index consisting of 500 companies representing larger capitalization stocks traded in the U.S. Should the target allocations for the Fund between those asset classes change, the percentage allocations to the corresponding indexes will also change when calculating the custom benchmark. An index is not available for direct investment, is unmanaged, and does not reflect the costs of portfolio management or trading. A fund’s portfolio may differ significantly from the securities held in the indexes.
49
Vantagepoint Model Portfolio Conservative Growth Fund
The Vantagepoint Model Portfolio Conservative Growth Fund’s objective is to offer reasonable current income and capital preservation, with modest potential for capital growth. The principal investment strategy is to invest in a combination of underlying Vantagepoint Funds to seek to obtain exposure to approximately 41% fixed income investments, 40% equity investments, and 19% investments in asset classes and strategies that have historically exhibited a low correlation to traditional fixed income and equity investments (a “multi-strategy” Fund) by investing in the following Vantagepoint Funds at target allocations within the percentage ranges indicated:
| | | | |
FIXED INCOME | | | |
Low Duration Bond Fund | | | 14%–24% | |
Core Bond Index Fund (Class I) | | | 7%–17% | |
Inflation Protected Securities Fund | | | 5%–15% | |
| |
EQUITY | | | |
Equity Income Fund | | | 6%–16% | |
Growth & Income Fund | | | 4%–14% | |
Growth Fund | | | 1%–11% | |
Select Value Fund | | | 0%–8% | |
Aggressive Opportunities Fund | | | 0%–8% | |
International Fund | | | 3%–13% | |
| |
MULTI-STRATEGY | | | |
Diversifying Strategies Fund | | | 17%–21% | |
Performance
The Vantagepoint Model Portfolio Conservative Growth Fund gained 1.15% in 2011. The Fund’s market benchmark, the Barclays Capital U.S. Intermediate Aggregate Bond Index, gained 5.97%, while the Fund’s peer group benchmark, the Morningstar Conservative Allocation Funds Average, a group of mutual funds with similar investment objectives, gained 1.70%. The Fund’s custom benchmark gained 4.70%. The Fund’s custom benchmark is composed of market indexes that reflect the general performance of the asset classes in which the Fund invests, in weighted percentages, corresponding to the historical target allocation to those asset classes for the Fund.
The Model Portfolio Conservative Growth Fund produced a positive absolute return in 2011 primarily due to the performance of the underlying fixed income funds, led by the Inflation Protected Securities Fund. The exposure to equities generally detracted from the Fund’s absolute performance, with the funds invested in smaller-capitalization and international securities generally providing the least favorable performance. The Fund’s three underlying fixed income funds all produced positive returns, as the Low Duration Bond Fund gained 1.14%, the Core Bond Index Fund (Class I) rose 7.41% and the Inflation Protected Securities Fund increased 11.53%. The Fund’s six underlying equity funds produced mixed results, with returns ranging between 0.04% for the Equity Income Fund and negative 10.42% for the Aggressive Opportunities Fund. The Diversifying Strategies Fund gained 0.10%. Please refer to each underlying fund’s commentary within this report for more information.
The Fund’s underperformance relative to its fixed income market benchmark primarily resulted from its allocation to equity funds, which underperformed the fixed income funds. The allocation to the Core Bond Index Fund (Class I) and the Inflation Protected Securities Fund partially offset this underperformance as these funds outperformed the Fund’s market benchmark.
The Fund’s underperformance relative to its peer group benchmark primarily resulted from an overweight allocation to equities, with the exposure to funds invested in foreign equities generally providing the least favorable performance. Additionally, the shorter duration focus of fixed income investments detracted from relative performance during periods of the year in which yields fell. The Fund’s underweight allocation to funds invested in smaller-capitalization securities, which generally trailed funds invested in large-capitalization securities, and an overweight allocation to funds invested in inflation protected securities, which were among the stronger performers in financial markets for the year, partially offset the underperformance. Additionally, the underlying fixed income funds’ allocation to higher-quality securities added to relative performance.
The Fund’s underperformance relative to its custom benchmark primarily resulted from its allocation to equity funds, the Low Duration Bond Fund and the Diversifying Strategies Fund, which trailed the performance of their respective broad market indices in the custom benchmark. The allocation to the Inflation Protected Securities Fund and Core Bond Index Fund partially offset this underperformance as they outperformed the fixed income index in the custom benchmark.
50
Vantagepoint Model Portfolio Conservative Growth Fund
Underlying Fund Allocation as of December 31, 2011 (% of Net Assets)
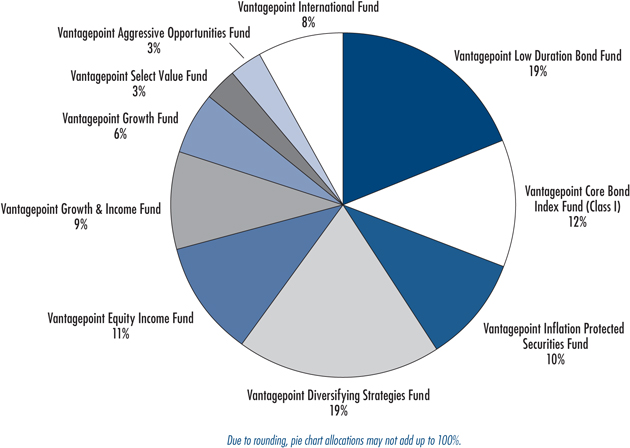
51
Vantagepoint Model Portfolio Conservative Growth Fund vs. Barclays Capital U.S. Intermediate Aggregate
Bond Index and Custom Benchmark: Growth of $10,000 Invested December 31, 2001*

Vantagepoint Model Portfolio Conservative Growth Fund
Average Annual Total Returns for the periods ended December 31, 2011*
| | | | |
One Year | | | 1.15 | % |
| |
Three Years | | | 9.18 | % |
| |
Five Years | | | 2.72 | % |
| |
Ten Years | | | 3.97 | % |
| |
Fund Inception Date | | | April 1, 1996 | |
| * | Current performance may be higher or lower than the past performance presented in this report. Past performance is no guarantee of future performance. Investment returns and principal value will fluctuate so that shares, when redeemed, may be worth more or less than their original cost. The graph and the table do not reflect the deduction of taxes that a shareholder would pay on fund distributions or the redemption of fund shares. Current performance is available by calling 1-800-669-7400 or at www.icmarc.org/vpperformance. |
The Fund’s market benchmark, the Barclays Capital U.S. Intermediate Aggregate Bond Index, consists of investment-grade U.S. fixed income securities with maturities of 1 to 10 years. The custom benchmark is composed of market indexes that reflect the general performance of the primary asset classes in which the Fund invests, in weighted percentages that correspond to the historical target allocations to those asset classes for the Fund. Those asset class benchmarks are the Barclays Capital U.S. Intermediate Aggregate Bond Index for the fixed income asset class and the S&P 500 Index for the equity asset class. The S&P 500 Index is an index consisting of 500 companies representing larger capitalization stocks traded in the U.S. Should the target allocations for the Fund between those asset classes change, the percentage allocations to the corresponding indexes will also change when calculating the custom benchmark. An index is not available for direct investment, is unmanaged, and does not reflect the costs of portfolio management or trading. A fund’s portfolio may differ significantly from the securities held in the indexes.
52
Vantagepoint Model Portfolio Traditional Growth Fund
The Vantagepoint Model Portfolio Traditional Growth Fund’s objective is to offer moderate capital growth and reasonable current income. The principal investment strategy of the Fund is to invest in a combination of underlying Vantagepoint Funds to seek to obtain exposure to approximately 25% fixed income investments, 60% equity investments, and 15% investments in asset classes and strategies that have historically exhibited a low correlation to traditional fixed income and equity investments (a “multi-strategy” Fund) by investing in the following Vantagepoint Funds at target allocations within the percentage ranges indicated:
| | | | |
FIXED INCOME | | | |
Low Duration Bond Fund | | | 3%–13% | |
Core Bond Index Fund (Class I) | | | 8%–18% | |
Inflation Protected Securities Fund | | | 0%–9% | |
| |
EQUITY | | | |
Equity Income Fund | | | 7%–17% | |
Growth & Income Fund | | | 7%–17% | |
Growth Fund | | | 5%–15% | |
Select Value Fund | | | 1%–11% | |
Aggressive Opportunities Fund | | | 1%–11% | |
Discovery Fund | | | 0%–8% | |
International Fund | | | 7%–17% | |
| |
MULTI-STRATEGY | | | |
Diversifying Strategies Fund | | | 13%–17% | |
Performance
The Vantagepoint Model Portfolio Traditional Growth Fund lost 0.56% in 2011. The Fund’s market benchmark, the S&P 500 Index, gained 2.11%, while the Fund’s peer group benchmark, the Morningstar Moderate Allocation Funds Average, a group of mutual funds with similar investment objectives, lost 0.11%. The Fund’s custom benchmark gained 3.93%. The Fund’s custom benchmark is composed of market indexes that reflect the general performance of the asset classes in which the Fund invests, in weighted percentages, corresponding to the historical target allocation to those asset classes for the Fund.
The Model Portfolio Traditional Growth Fund produced a negative absolute return in 2011 primarily due to the underlying equity funds, which mostly generated negative returns for the year. Generally, the funds invested in smaller-capitalization and international securities were the primary detractors. The Fund’s seven underlying equity funds produced mixed returns ranging from 0.04% for the Equity Income Fund and negative 10.42% for the Aggressive Opportunities Fund. The Fund’s three underlying fixed income funds all produced positive returns, as the Low Duration Bond Fund gained 1.14%, the Core Bond Index Fund (Class I) rose 7.41% and the Inflation Protected Securities Fund increased 11.53%. Also, the Diversifying Strategies Fund gained 0.10%. Please refer to each underlying fund’s commentary within this report for more information.
The Fund’s underperformance relative to its market benchmark primarily reflected performance of the underlying equity funds, which trailed the benchmark, with the funds invested in smaller-capitalization securities and the International Fund generally underperforming U.S. large-capitalization funds. The underlying fixed income funds, which generally outperformed the Fund’s market benchmark, partially offset this under performance.
The Fund’s underperformance relative to its peer group benchmark primarily reflected an overweight allocation to funds invested in smaller-capitalization equities, which underperformed funds invested in larger-capitalization equities, as well as an overweight allocation to funds invested in foreign equities which underperformed funds invested in U.S. equities. Additionally, the short duration focus of fixed income investments detracted from relative performance during periods of the year in which yields fell. The underlying fixed income funds’ allocation to higher-quality securities aided relative performance.
The Fund’s underperformance relative to its custom benchmark primarily resulted from its allocation to equity funds, the Low Duration Bond Fund and the Diversifying Strategies Fund, which trailed the performance of their respective broad market indices in the custom benchmark. The allocation to the Inflation Protected Securities Fund and Core Bond Index Fund partially offset this underperformance as they outperformed the fixed income index in the custom benchmark.
53
Vantagepoint Model Portfolio Traditional Growth Fund
Underlying Fund Allocation as of December 31, 2011 (% of Net Assets)
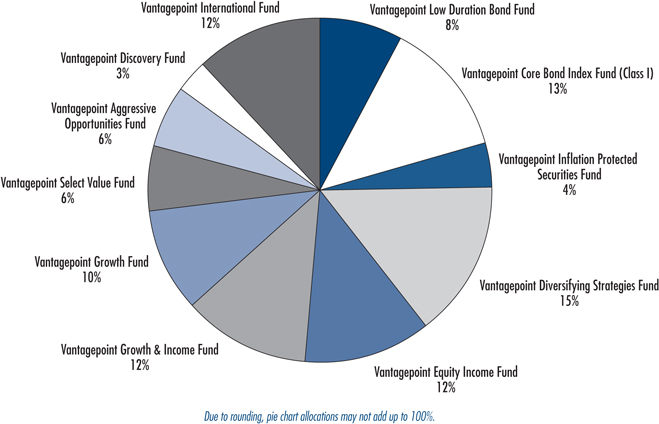
54
Vantagepoint Model Portfolio Traditional Growth Fund vs. S&P 500 Index and Custom Benchmark:
Growth of $10,000 Invested December 31, 2001*
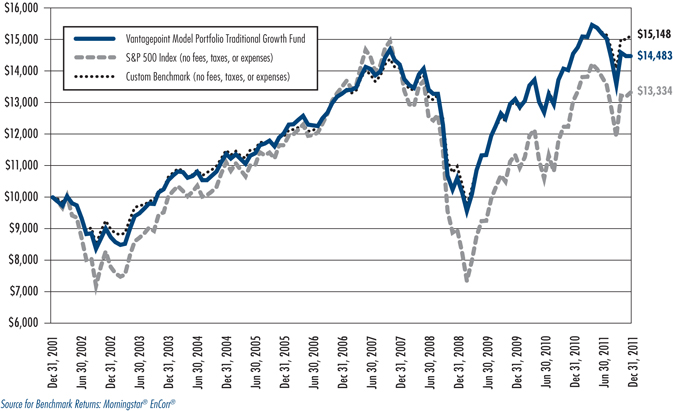
Vantagepoint Model Portfolio Traditional Growth Fund
Average Annual Total Returns for the periods ended December 31, 2011*
| | | | |
One Year | | | –0.56 | % |
| |
Three Years | | | 10.93 | % |
| |
Five Years | | | 1.74 | % |
| |
Ten Years | | | 3.77 | % |
| |
Fund Inception Date | | | April 1, 1996 | |
| * | Current performance may be higher or lower than the past performance presented in this report. Past performance is no guarantee of future performance. Investment returns and principal value will fluctuate so that shares, when redeemed, may be worth more or less than their original cost. The graph and the table do not reflect the deduction of taxes that a shareholder would pay on fund distributions or the redemption of fund shares. Current performance is available by calling 1-800-669-7400 or at www.icmarc.org/vpperformance. |
The Fund’s market benchmark, the S&P 500 Index, is an index consisting of 500 companies representing larger capitalization stocks traded in the U.S. The custom benchmark is composed of market indexes that reflect the general performance of the primary asset classes in which the Fund invests, in weighted percentages that correspond to the historical target allocations to those asset classes for the Fund. Those asset class benchmarks are the Barclays Capital U.S. Intermediate Aggregate Bond Index for the fixed income asset class and the S&P 500 Index for the equity asset class. The Barclays Capital U.S. Intermediate Aggregate Bond Index consists of investment-grade U.S. fixed income securities with maturities of 1 to 10 years. Should the target allocations for the Fund between those asset classes change, the percentage allocations to the corresponding indexes will also change when calculating the custom benchmark. An index is not available for direct investment, is unmanaged, and does not reflect the costs of portfolio management or trading. A fund’s portfolio may differ significantly from the securities held in the indexes.
55
Vantagepoint Model Portfolio Long-Term Growth Fund
The Vantagepoint Model Portfolio Long-Term Growth Fund’s objective is to offer high long-term capital growth and modest current income. The principal investment strategy of the Fund is to invest in a combination of underlying Vantagepoint Funds to seek to obtain exposure to approximately 13% fixed income investments, 75% equity investments, and 12% investments in asset classes and strategies that have historically exhibited a low correlation to traditional fixed income and equity investments (a “multi strategy” Fund) in the following Vantagepoint Funds at target allocations within the percentage ranges indicated:
| | | | |
FIXED INCOME | | | |
Core Bond Index Fund (Class I) | | | 8 | %–18% |
| |
EQUITY | | | |
Equity Income Fund | | | 8 | %–18% |
Growth & Income Fund | | | 8 | %–18% |
Growth Fund | | | 7 | %–17% |
Select Value Fund | | | 4 | %–14% |
Aggressive Opportunities Fund | | | 4 | %–14% |
Discovery Fund | | | 0 | %–10% |
International Fund | | | 11 | %–21% |
| |
MULTI-STRATEGY | | | |
Diversifying Strategies Fund | | | 10 | %–14% |
Performance
The Vantagepoint Model Portfolio Long-Term Growth Fund lost 1.98% in 2011. The Fund’s market benchmark, the S&P 500 Index, gained 2.11%, while the Fund’s peer group benchmark, the Morningstar Aggressive Allocation Funds Average, a group of mutual funds with similar investment objectives, lost 3.80%. The Fund’s custom benchmark gained 3.29%. The Fund’s custom benchmark is composed of market indexes that reflect the general performance of the asset classes in which the Fund invests, in weighted percentages, corresponding to the historical target allocation to those asset classes for the Fund.
The Model Portfolio Long-Term Growth Fund produced a negative absolute return in 2011 primarily due to the underlying equity funds, which mostly generated negative returns for the year. Generally, the funds invested in smaller-capitalization and foreign equities were primary detractors. Exposure to the Core Bond Index Fund (Class I) partially offset the negative return as fixed income securities generally outperformed equities. The Fund’s seven underlying equity funds produced returns ranging from 0.04% for the Equity Income Fund to negative 10.42% for the Aggressive Opportunities Fund. The Fund’s single fixed income fund, the Core Bond Index Fund (Class I), rose 7.41%. Also, the Diversifying Strategies Fund gained 0.10%. Please refer to each underlying fund’s commentary within this report for more information.
The Fund’s underperformance relative to its market benchmark primarily reflected the performance of the underlying equity funds, which trailed this benchmark. Generally, funds invested in smaller-capitalization and foreign funds were primary detractors. The underlying Core Bond Index Fund (Class I) outperformed the Fund’s market benchmark and partially offset this underperformance.
The Fund’s outperformance relative to its peer group benchmark primarily resulted from an underweight allocation to funds invested in foreign equities, which trailed funds invested in U.S. equities. An overweight allocation to funds invested in smaller-capitalization stocks, which trailed funds invested in large-capitalization stocks, was a primary detractor and partially offset the outperformance.
The Fund’s underperformance relative to its custom benchmark primarily resulted from its allocation to equity funds and to the Diversifying Strategies Fund, which trailed the performance of their respective broad market indices in the custom benchmark. The allocation to the Core Bond Index Fund partially offset this underperformance as it outperformed the fixed income index in the custom benchmark.
56
Vantagepoint Model Portfolio Long-Term Growth Fund
Underlying Fund Allocation as of December 31, 2011 (% of Net Assets)
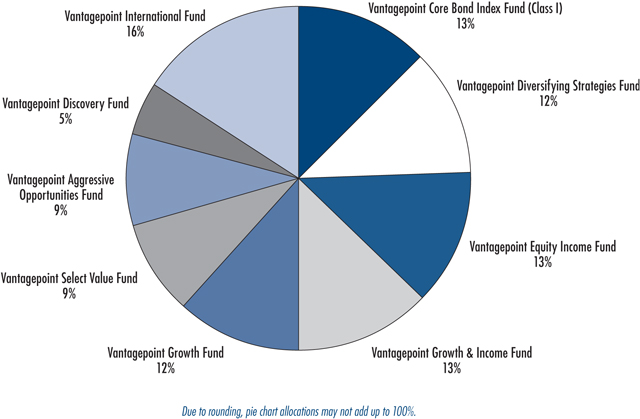
57
Vantagepoint Model Portfolio Long-Term Growth Fund vs. S&P 500 Index and Custom Benchmark:
Growth of $10,000 Invested December 31, 2001*
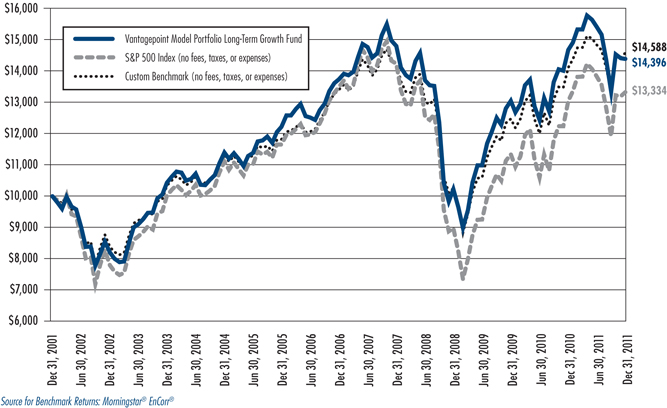
Vantagepoint Model Portfolio Long-Term Growth Fund
Average Annual Total Returns for the periods ended December 31, 2011*
| | | | |
One Year | | | –1.98 | % |
| |
Three Years | | | 12.09 | % |
| |
Five Years | | | 0.93 | % |
| |
Ten Years | | | 3.71 | % |
| |
Fund Inception Date | | | April 1, 1996 | |
| * | Current performance may be higher or lower than the past performance presented in this report. Past performance is no guarantee of future performance. Investment returns and principal value will fluctuate so that shares, when redeemed, may be worth more or less than their original cost. The graph and the table do not reflect the deduction of taxes that a shareholder would pay on fund distributions or the redemption of fund shares. Current performance is available by calling 1-800-669-7400 or at www.icmarc.org/vpperformance. |
The Fund’s market benchmark, the S&P 500 Index, is an index consisting of 500 companies representing larger capitalization stocks traded in the U.S. The custom benchmark is composed of market indexes that reflect the general performance of the primary asset classes in which the Fund invests, in weighted percentages that correspond to the historical target allocations to those asset classes for the Fund. Those asset class benchmarks are the Barclays Capital U.S. Intermediate Aggregate Bond Index for the fixed income asset class and the S&P 500 Index for the equity asset class. The Barclays Capital U.S. Intermediate Aggregate Bond Index consists of investment-grade U.S. fixed income securities with maturities of 1 to 10 years. Should the target allocations for the Fund between those asset classes change, the percentage allocations to the corresponding indexes will also change when calculating the custom benchmark. An index is not available for direct investment, is unmanaged, and does not reflect the costs of portfolio management or trading. A fund’s portfolio may differ significantly from the securities held in the indexes.
58
Vantagepoint Model Portfolio All-Equity Growth Fund
The Vantagepoint Model Portfolio All-Equity Growth Fund’s objective is to offer high long-term capital growth. The principal investment strategy of the Fund is to invest, under normal circumstances, 100% of its net assets in equity Funds by investing in a combination of other Vantagepoint Funds whose assets are invested, under normal circumstances, at least 80% in equity securities (common and preferred stock) or instruments that provide equity exposure. The investment strategy is implemented by investing in the following Vantagepoint Funds at target allocations within the percentage ranges indicated:
| | | | |
EQUITY | | | |
Equity Income Fund | | | 13 | %–23% |
Growth & Income Fund | | | 12 | %–22% |
Growth Fund | | | 12 | %–22% |
Select Value Fund | | | 5 | %–15% |
Aggressive Opportunities Fund | | | 5 | %–15% |
Discovery Fund | | | 4 | %–14% |
International Fund | | | 15 | %–25% |
Performance
The Vantagepoint Model Portfolio All-Equity Growth Fund lost 4.23% in 2011. The Fund’s market benchmark, the S&P 500 Index, gained 2.11%, while the Fund’s peer group benchmark, the Morningstar Large Blend Funds Average, a group of mutual funds with similar investment objectives, lost 1.27%. The Fund’s custom benchmark lost 0.86%. The Fund’s custom benchmark is composed of market indexes that reflect the general performance of the asset classes in which the Fund invests, in weighted percentages, corresponding to the historical target allocation to those asset classes for the Fund.
The Model Portfolio All-Equity Growth Fund produced a negative absolute return in 2011 due to the mostly negative performance in the Fund’s underlying equity funds. Generally, funds invested in foreign and smaller-capitalization equities were primary detractors from performance. The Fund’s seven underlying equity funds produced returns ranging from 0.04% for the Equity Income Fund to negative 10.42% for the Aggressive Opportunities Fund. Please refer to each underlying fund’s commentary within this report for more information.
The Fund’s underperformance relative to its market benchmark primarily reflected the performance of the underlying equity funds, which trailed the Fund’s market benchmark.
The Fund’s underperformance relative to its peer group benchmark primarily reflected an overweight allocation to funds invested in smaller-capitalization equities, which generally underperformed funds invested in large-capitalization equities, as well as an overweight allocation to funds invested in foreign equities, which underperformed funds invested in U.S. equities. Additionally, the Fund’s overweight allocation to funds invested in emerging market equities detracted from relative performance as funds invested in developed markets generally produced higher returns.
The Fund’s underperformance relative to its custom benchmark resulted from the Fund’s allocation to U.S. equity funds, which trailed the performance of the U.S. equity portion of the custom benchmark. The allocation to the International Fund partially offset this underperformance as it outperformed the international equity index in the custom benchmark.
59
Vantagepoint Model Portfolio All-Equity Growth Fund
Underlying Fund Allocation as of December 31, 2011 (% of Net Assets)
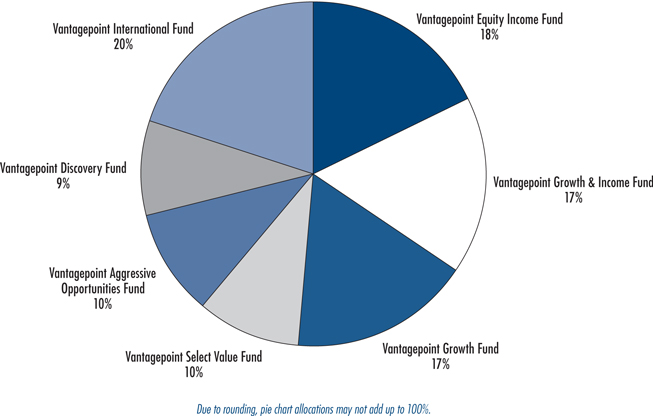
60
Vantagepoint Model Portfolio All-Equity Growth Fund vs. S&P 500 Index and Custom Benchmark:
Growth of $10,000 Invested December 31, 2001*
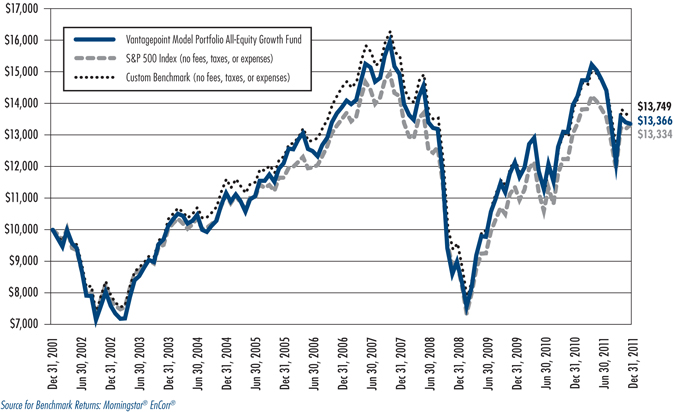
Vantagepoint Model Portfolio All-Equity Growth Fund
Average Annual Total Returns for the periods ended December 31, 2011*
| | | | |
One Year | | | –4.23 | % |
| |
Three Years | | | 14.13 | % |
| |
Five Years | | | –0.74 | % |
| |
Ten Years | | | 2.94 | % |
| |
Fund Inception Date | | | October 1, 2000 | |
| * | Current performance may be higher or lower than the past performance presented in this report. Past performance is no guarantee of future performance. Investment returns and principal value will fluctuate so that shares, when redeemed, may be worth more or less than their original cost. The graph and the table do not reflect the deduction of taxes that a shareholder would pay on fund distributions or the redemption of fund shares. Current performance is available by calling 1-800-669-7400 or at www.icmarc.org/vpperformance. |
The Fund’s market benchmark, the S&P 500 Index, is an index consisting of 500 companies representing larger capitalization stocks traded in the U.S. The custom benchmark is composed of market indexes that reflect the general performance of the primary asset classes in which the Fund invests, in weighted percentages that correspond to the historical target allocations to those asset classes. Those asset class benchmarks are the S&P 500 Index and the MSCI EAFE Index (Net). The MSCI Europe Australasia Far East (EAFE) Index (Net) is a free float-adjusted market capitalization index that is designed to measure the equity market performance of developed markets, excluding the U.S. and Canada, and approximates the minimum possible dividend reinvestment after deduction of withholding tax according to MSCI Barra’s methodology. Should the percentage allocations to those asset classes change, the percentage allocations to the corresponding indexes will also change when calculating the custom benchmark. An index is not available for direct investment, is unmanaged, and does not reflect the costs of portfolio management or trading. A fund’s portfolio may differ significantly from the securities held in the indexes.
61
Vantagepoint Milestone Retirement Income Fund
The Vantagepoint Milestone Retirement Income Fund’s objective is to seek to offer current income and opportunities for capital growth that have limited risk.
The principal investment strategy is to invest in a combination of underlying Vantagepoint Funds to seek to obtain exposure to approximately 55% fixed income investments, approximately 25% equity investments, and 20% investments in asset classes and strategies that have historically exhibited a low correlation to traditional fixed income and equity investments (a “multi-strategy” Fund) by investing in the following Vantagepoint Funds at target allocations within the percentage ranges indicated:
| | | | |
FIXED INCOME | | | |
Low Duration Bond Fund | | | 26 | %–36% |
Core Bond Index Fund (Class I) | | | 4 | %–14% |
Inflation Protected Securities Fund | | | 10 | %–20% |
| |
EQUITY | | | |
Equity Income Fund | | | 5 | %–15% |
Growth & Income Fund | | | 5 | %–15% |
International Fund | | | 0 | %–10% |
| |
MULTI-STRATEGY | | | |
Diversifying Strategies Fund | | | 15 | %–25% |
Performance
The Vantagepoint Milestone Retirement Income Fund gained 2.37% in 2011. The Fund’s market benchmark, the Barclays Capital U.S. Intermediate Aggregate Bond Index, gained 5.97%, while the Fund’s peer group benchmark, the Morningstar Retirement Income Funds Average, a group of mutual funds with similar investment objectives, gained 1.60%. The Fund’s custom benchmark gained 5.22%. The Fund’s custom benchmark is composed of market indexes that reflect the general performance of the asset classes in which the Fund invests, in weighted percentages, corresponding to the historical target allocation to those asset classes for the Fund.
The Milestone Retirement Income Fund produced a positive absolute return as the three underlying fixed income funds and the multi-strategy fund provided positive returns, while the three underlying equity funds provided mixed returns. The Inflation Protected Securities Fund increased 11.53%, the Core Bond Index Fund (Class I) rose 7.41% and the Low Duration Bond Fund gained 1.14%. The Equity Income Fund returned 0.04%, Growth & Income Fund lost 0.69% and the International Fund lost 8.57%. The Diversifying Strategies Fund gained 0.10%. Please refer to each underlying fund’s commentary within this report for more information.
The Fund’s underperformance relative to its market benchmark primarily resulted from its allocation to equity funds, which generally underperformed funds invested in fixed income securities as represented by the Fund’s market benchmark. The allocations to the Inflation Protected Securities Fund and Core Bond Index Fund (Class I) partially offset the underperformance as both outperformed the Fund’s market benchmark.
The Fund’s outperformance relative to its peer group benchmark primarily reflected its underweight allocation to U.S. and foreign equities. The Fund also benefited from an underweight allocation to funds invested in smaller-capitalization equities, whose performance generally trailed large-capitalization equities. Additionally, the Fund’s exposure to funds investing in higher-quality fixed income securities aided relative performance. The Fund’s overweight exposure to funds invested in value style equities and the shorter duration of the underlying funds’ fixed income securities detracted from relative performance.
The Fund’s underperformance relative to its custom benchmark primarily resulted from its allocation to equity funds, the Low Duration Bond Fund and the Diversifying Strategies Fund, which trailed the performance of their respective broad market indexes in the custom benchmark. The allocation to the Inflation Protected Securities Fund and Core Bond Index Fund partially offset this underperformance as they outperformed the fixed income index in the custom benchmark.
62
Vantagepoint Milestone Retirement Income Fund
Underlying Fund Allocation as of December 31, 2011 (% of Net Assets)
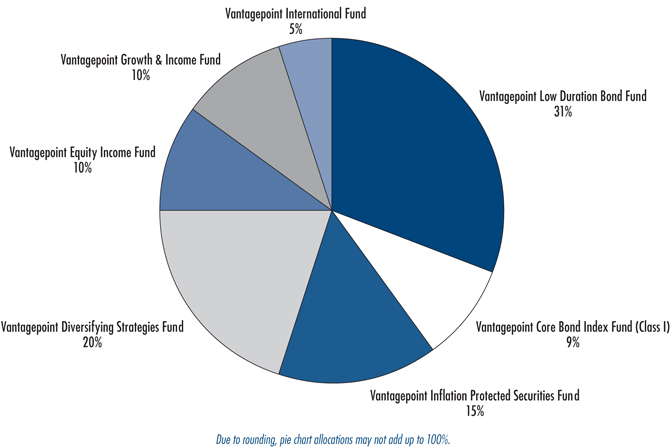
63
Vantagepoint Milestone Retirement Income Fund vs. Barclays Capital U.S. Intermediate Aggregate
Bond Index and Custom Benchmark: Growth of $10,000 Invested January 3, 2005*
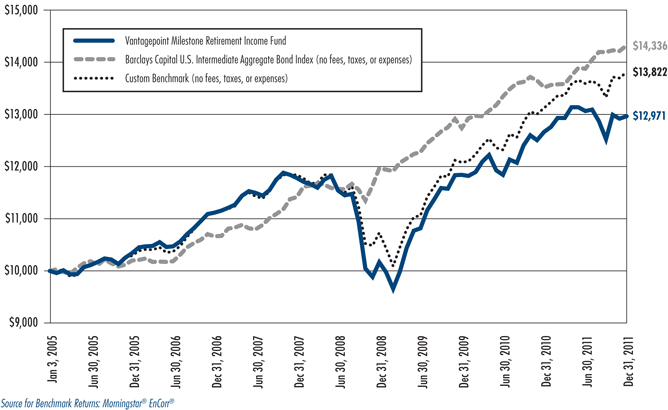
Vantagepoint Milestone Retirement Income Fund
Average Annual Total Returns for the periods ended December 31, 2011*
| | | | |
One Year | | | 2.37 | % |
| |
Three Years | | | 8.45 | % |
| |
Five Years | | | 3.13 | % |
| |
Since Inception | | | 3.78 | % |
| |
Fund Inception Date | | | January 3, 2005 | |
| * | Current performance may be higher or lower than the past performance presented in this report. Past performance is no guarantee of future performance. Investment returns and principal value will fluctuate so that shares, when redeemed, may be worth more or less than their original cost. The graph and the table do not reflect the deduction of taxes that a shareholder would pay on fund distributions or the redemption of fund shares. Current performance is available by calling 1-800-669-7400 or at www.icmarc.org/vpperformance. |
The Fund’s market benchmark, the Barclays Capital U.S. Intermediate Aggregate Bond Index, consists of investment-grade U.S. fixed income securities with maturities of 1 to 10 years. The custom benchmark is composed of market indexes that reflect the general performance of the primary asset classes in which the Fund invests, in weighted percentages that correspond to the historical target allocations to those asset classes for the Fund. Those asset class benchmarks are the Barclays Capital U.S. Intermediate Aggregate Bond Index for the fixed income asset class and the S&P 500 Index for the equity asset class. The S&P 500 Index is an index consisting of 500 companies representing larger capitalization stocks traded in the U.S. Should the target allocations for the Fund between those asset classes change, the percentage allocations to the corresponding indexes will also change when calculating the custom benchmark. A fund’s portfolio may differ significantly from the securities held in the indexes.
64
Vantagepoint Milestone 2010 Fund
The Vantagepoint Milestone 2010 Fund’s objective is to offer high total return consistent with the Fund’s current asset allocation. The Fund’s principal investment strategy is to invest in a combination of underlying Vantagepoint Funds using an asset allocation strategy designed for investors expecting to begin gradual withdrawals from the Fund, typically at or after retirement (assumed to occur at age 60), in or around the year 2010.
At year-end, the Fund was invested in the following Vantagepoint Funds at target allocations within the percentage ranges indicated:
| | | | |
FIXED INCOME | | | |
Low Duration Bond Fund | | | 10 | %–20% |
Core Bond Index Fund (Class I) | | | 1 | %–11% |
Inflation Protected Securities Fund | | | 10 | %–20% |
| |
EQUITY | | | |
Equity Income Fund | | | 13 | %–23% |
Growth & Income Fund | | | 6 | %–16% |
Growth Fund | | | 2 | %–12% |
International Fund | | | 4 | %–14% |
| |
MULTI-STRATEGY | | | |
Diversifying Strategies Fund | | | 13 | %–23% |
In 2011, the Fund followed a strategy that as time elapses, the Fund’s allocation to equity investments will periodically decrease and the Fund’s allocation to fixed income and multi-strategy investments will correspondingly increase so that by June 30 of the year 2020 (ten years after the year indicated in the Fund name), the Fund’s net assets will be invested approximately 25% in equity Funds, 55% in fixed income Funds, and 20% in the multi-strategy Fund.
Performance
The Vantagepoint Milestone 2010 Fund gained 1.41% in 2011. The Fund’s market benchmark, the Barclays Capital U.S. Intermediate Aggregate Bond Index, gained 5.97%, while the Fund’s peer group benchmark, the Morningstar Target Date 2000-2010 Funds Average, a group of mutual funds with similar investment objectives, gained 0.91%. The Fund’s custom benchmark gained 4.52%. The Fund’s custom benchmark is composed of market indexes that reflect the general performance of the asset classes in which the Fund invests, in weighted percentages, corresponding to the historical target allocation to those asset classes for the Fund.
The Milestone 2010 Fund produced a positive absolute return as the three underlying fixed income funds and the multi-strategy fund provided positive returns, while the four underlying equity funds provided mixed returns. The Inflation Protected Securities Fund increased 11.53%, the Core Bond Index Fund (Class I) rose 7.41% and the Low Duration Bond Fund gained 1.14%. The Fund’s underlying equity funds produced returns ranging from 0.04% for the Equity Income Fund to negative 8.57% for the International Fund. The Diversifying Strategies Fund gained 0.10%. Please refer to each underlying fund’s commentary within this report for more information.
The Fund’s underperformance relative to its market benchmark primarily resulted from its allocation to equity funds, which generally underperformed funds invested in fixed income securities as represented by the Fund’s market benchmark. The allocations to the Inflation Protected Securities Fund and Core Bond Index Fund (Class I) partially offset the underperformance as both outperformed the Fund’s market benchmark.
The Fund’s outperformance relative to its peer group benchmark primarily reflected its underweight allocation to funds invested in smaller-capitalization equities, whose performance generally trailed funds invested in large-capitalization equities, as well as an underweight allocation to funds invested in foreign equities, which generally underperformed funds invested in U.S. equities. Additionally, the Fund’s exposure to funds invested in higher-quality fixed income securities aided relative performance. The Fund’s overweight exposure to funds invested in value style equities and the shorter duration of the underlying funds’ fixed income securities detracted from the Fund’s relative performance.
The Fund’s underperformance relative to its custom benchmark primarily resulted from its allocation to equity funds, the Low Duration Bond Fund and the Diversifying Strategies Fund, which trailed the performance of their respective broad market indexes in the custom benchmark. The allocation to the Inflation Protected Securities Fund and Core Bond Index Fund partially offset this underperformance as they outperformed the fixed income index in the custom benchmark.
65
Vantagepoint Milestone 2010 Fund
Underlying Fund Allocation as of December 31, 2011 (% of Net Assets)
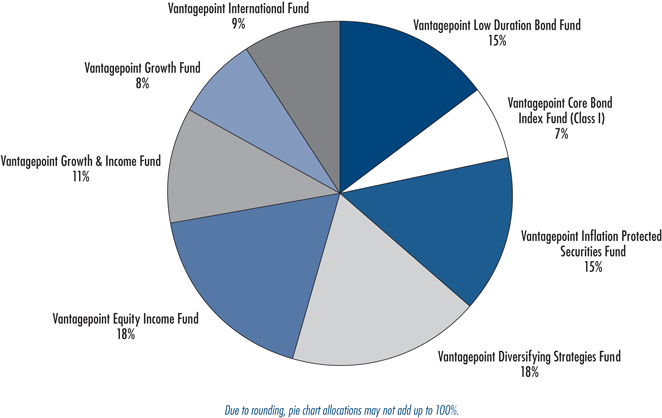
66
Vantagepoint Milestone 2010 Fund vs. Barclays Capital U.S. Intermediate Aggregate Bond Index and
Custom Benchmark: Growth of $10,000 Invested January 3, 2005*
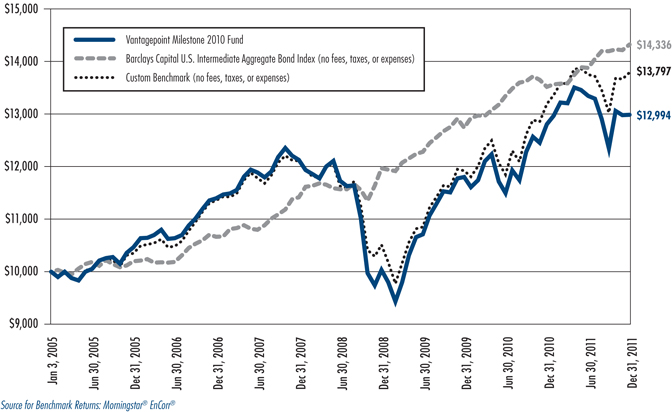
Vantagepoint Milestone 2010 Fund
Average Annual Total Returns for the periods ended December 31, 2011*
| | | | |
One Year | | | 1.41 | % |
| |
Three Years | | | 9.01 | % |
| |
Five Years | | | 2.65 | % |
| |
Since Inception | | | 3.81 | % |
| |
Fund Inception Date | | | January 3, 2005 | |
| * | Current performance may be higher or lower than the past performance presented in this report. Past performance is no guarantee of future performance. Investment returns and principal value will fluctuate so that shares, when redeemed, may be worth more or less than their original cost. The graph and the table do not reflect the deduction of taxes that a shareholder would pay on fund distributions or the redemption of fund shares. Current performance is available by calling 1-800-669-7400 or at www.icmarc.org/vpperformance. |
The Fund’s market benchmark, the Barclays Capital U.S. Intermediate Aggregate Bond Index, consists of investment-grade U.S. fixed income securities with maturities of 1 to 10 years. The custom benchmark is composed of market indexes that reflect the general performance of the primary asset classes in which the Fund invests, in weighted percentages that correspond to the historical target allocations to those asset classes for the Fund. Those asset class benchmarks are the Barclays Capital U.S. Intermediate Aggregate Bond Index for the fixed income asset class and the S&P 500 Index for the equity asset class. The S&P 500 Index is an index consisting of 500 companies representing larger capitalization stocks traded in the U.S. Should the target allocations for the Fund between those asset classes change, the percentage allocations to the corresponding indexes will also change when calculating the custom benchmark. An index is not available for direct investment, is unmanaged, and does not reflect the costs of portfolio management or trading. A fund’s portfolio may differ significantly from the securities held in the indexes.
67
Vantagepoint Milestone 2015 Fund
The Vantagepoint Milestone 2015 Fund’s objective is to offer high total return consistent with the Fund’s current asset allocation. The Fund’s principal investment strategy is to invest in a combination of underlying Vantagepoint Funds using an asset allocation strategy designed for investors expecting to begin gradual withdrawals from the Fund, typically at or after retirement (assumed to occur at age 60), around the year 2015.
At year-end, the Fund was invested in the following Vantagepoint Funds at target allocations within the percentage ranges indicated:
| | | | |
FIXED INCOME | | | |
Low Duration Bond Fund | | | 6 | %–16% |
Core Bond Index Fund (Class I) | | | 5 | %–15% |
Inflation Protected Securities Fund | | | 4 | %–14% |
| |
EQUITY | | | |
Equity Income Fund | | | 14 | %–24% |
Growth & Income Fund | | | 6 | %–16% |
Growth Fund | | | 3 | %–13% |
Mid/Small Company Index Fund (Class I) | | | 0 | %–10% |
International Fund | | | 6 | %–16% |
| |
MULTI-STRATEGY | | | |
Diversifying Strategies Fund | | | 12 | %–22% |
In 2011, the Fund followed a strategy that as time elapses, the Fund’s allocation to equity Funds would periodically decrease and the Fund’s allocation to fixed income and multi-strategy Funds would correspondingly increase so that by June 30 of the year 2025 (ten years after the year indicated in the Fund name), the Fund’s asset allocation would be approximately 25% equity Funds, 55% fixed income Funds, and 20% in a multi-strategy Fund.
Performance
The Vantagepoint Milestone 2015 Fund gained 0.70% in 2011. The Fund’s market benchmark, the S&P 500 Index, gained 2.11%, while the Fund’s peer group benchmark, the Morningstar Target Date 2011–2015 Funds Average, a group of mutual funds with similar investment objectives, lost 0.27%. The Fund’s custom benchmark gained 4.21%. The Fund’s custom benchmark is composed of market indexes that reflect the general performance of the asset classes in which the Fund invests, in weighted percentages, corresponding to the historical target allocation to those asset classes for the Fund.
The Milestone 2015 Fund produced a positive absolute return as the three underlying fixed income funds and the multi-strategy fund provided positive returns, while the five underlying equity funds provided mixed returns. The Inflation Protected Securities Fund increased 11.53%, the Core Bond Index Fund (Class I) rose 7.41% and the Low Duration Bond Fund gained 1.14%. The five underlying equity funds produced returns ranging from 0.04% for the Equity Income Fund to negative 8.57% for the International Fund. The Diversifying Strategies Fund gained 0.10%. Please refer to each underlying fund’s commentary within this report for more information.
The Fund’s underperformance relative to its market benchmark primarily reflected the mostly negative performance of the underlying equity funds. Generally, the funds invested in smaller-capitalization and foreign equity securities were primary detractors. The allocation to the fixed income funds partially offset the underperformance as the Inflation Protected Securities Fund and the Core Bond Index Fund (Class I) outperformed the Fund’s market benchmark.
The Fund’s outperformance relative to its peer group benchmark primarily reflected its underweight allocation to funds invested in smaller-capitalization equities, whose performance generally trailed funds invested in large-capitalization equities, as well as an underweight allocation to funds invested in foreign equities, which generally underperformed funds invested in U.S. equities. Additionally, the Fund’s exposure to funds invested in higher-quality fixed income securities aided relative performance. The Fund’s overweight to funds invested in value style equities and the shorter duration of the underlying funds’ fixed income securities detracted from the Fund’s relative performance.
The Fund’s underperformance relative to its custom benchmark primarily resulted from its allocation to equity funds, the Low Duration Bond Fund and the Diversifying Strategies Fund, which trailed the performance of their respective broad market indexes in the custom benchmark. The allocation to the Inflation Protected Securities Fund and Core Bond Index Fund partially offset this underperformance as they outperformed the fixed income index in the custom benchmark.
68
Vantagepoint Milestone 2015 Fund
Underlying Fund Allocation as of December 31, 2011 (% of Net Assets)
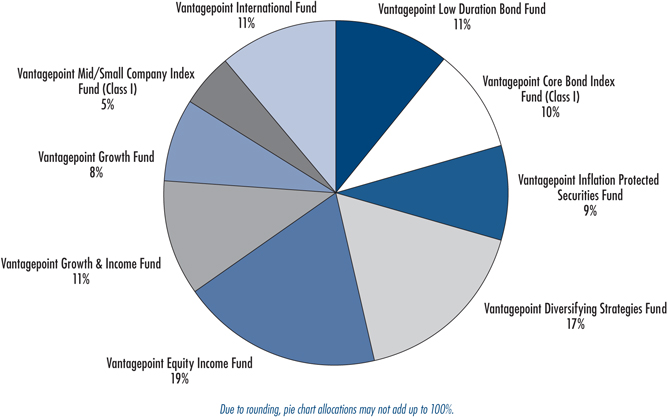
69
Vantagepoint Milestone 2015 Fund vs. S&P 500 Index and Custom Benchmark:
Growth of $10,000 Invested January 3, 2005*
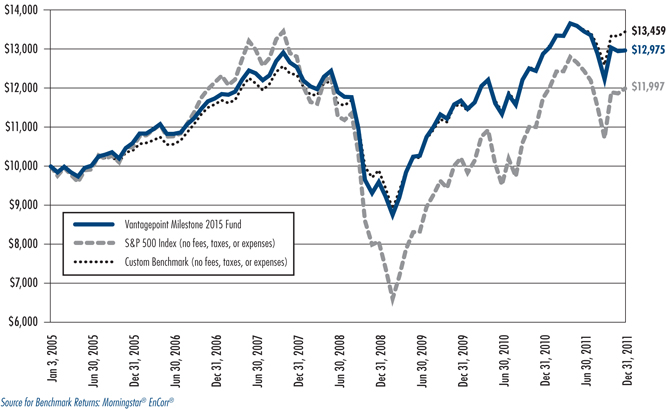
Vantagepoint Milestone 2015 Fund
Average Annual Total Returns for the periods ended December 31, 2011*
| | | | |
One Year | | | 0.70 | % |
| |
Three Years | | | 10.58 | % |
| |
Five Years | | | 2.01 | % |
| |
Since Inception | | | 3.79 | % |
| |
Fund Inception Date | | | January 3, 2005 | |
| * | Current performance may be higher or lower than the past performance presented in this report. Past performance is no guarantee of future performance. Investment returns and principal value will fluctuate so that shares, when redeemed, may be worth more or less than their original cost. The graph and the table do not reflect the deduction of taxes that a shareholder would pay on fund distributions or the redemption of fund shares. Current performance is available by calling 1-800-669-7400 or at www.icmarc.org/vpperformance. |
The Fund’s market benchmark, the S&P 500 Index, is an index consisting of 500 companies representing larger capitalization stocks traded in the U.S. The custom benchmark is composed of market indexes that reflect the general performance of the primary asset classes in which the Fund invests, in weighted percentages that correspond to the historical target allocations to those asset classes for the Fund. Those asset class benchmarks are the Barclays Capital U.S. Intermediate Aggregate Bond Index for the fixed income asset class and the S&P 500 Index for the equity asset class. The Barclays Capital U.S. Intermediate Aggregate Bond Index consists of investment-grade U.S. fixed income securities with maturities of 1 to 10 years. Should the target allocations for the Fund between those asset classes change, the percentage allocations to the corresponding indexes will also change when calculating the custom benchmark. An index is not available for direct investment, is unmanaged, and does not reflect the costs of portfolio management or trading. A fund’s portfolio may differ significantly from the securities held in the indexes.
70
Vantagepoint Milestone 2020 Fund
The Vantagepoint Milestone 2020 Fund’s objective is to offer high total return consistent with the Fund’s current asset allocation. The Fund’s principal investment strategy is to invest in a combination of underlying Vantagepoint Funds using an asset allocation strategy designed for investors expecting to begin gradual withdrawals from the Fund, typically at or after retirement (assumed to occur at age 60), in or around the year 2020.
At year-end, the Fund was invested in the following Vantagepoint Funds at target allocations within the percentage ranges indicated:
| | | | |
FIXED INCOME | | | |
Low Duration Bond Fund | | | 2%–12% | |
Core Bond Index Fund (Class I) | | | 9%–19% | |
Inflation Protected Securities Fund | | | 0%–7% | |
| |
EQUITY | | | |
Equity Income Fund | | | 16%–26% | |
Growth & Income Fund | | | 7%–17% | |
Growth Fund | | | 3%–13% | |
Mid/Small Company Index Fund (Class I) | | | 4%–14% | |
International Fund | | | 7%–17% | |
| |
MULTI-STRATEGY | | | |
Diversifying Strategies Fund | | | 10%–20% | |
In 2011, the Fund followed a strategy that as time elapses, the Fund’s allocation to equity investments will periodically decrease and the Fund’s allocation to fixed income and multi-strategy investments will correspondingly increase so that by June 30 of the year 2030 (ten years after the year indicated in the Fund name), the Fund’s net assets will be invested approximately 25% in equity Funds, 55% in fixed income Funds, and 20% in the multi-strategy Fund.
Performance
The Vantagepoint Milestone 2020 Fund lost 0.26% in 2011. The Fund’s market benchmark, the S&P 500 Index, gained 2.11%, while the Fund’s peer group benchmark, the Morningstar Target Date 2016-2020 Funds Average, a group of mutual funds with similar investment objectives, lost 0.22%. The Fund’s custom benchmark gained 3.87%. The Fund’s custom benchmark is composed of market indexes that reflect the general performance of the asset classes in which the Fund invests, in weighted percentages, corresponding to the historical target allocation to those asset classes for the Fund.
The Milestone 2020 Fund produced a negative absolute return, as four of the five underlying equity funds declined, while the three fixed income funds and the multi-strategy fund provided positive returns. The five underlying equity funds produced returns ranging from 0.04% for the Equity Income Fund to negative 8.57% for the International Fund. The Inflation Protected Securities Fund increased 11.53%, the Core Bond Index Fund (Class I) rose 7.41% and the Low Duration Bond Fund gained 1.14%. The Diversifying Strategies Fund gained 0.10%. Please refer to each underlying fund’s commentary within this report for more information.
The Fund’s underperformance relative to its market benchmark primarily reflected the mostly negative performance of the underlying equity funds. Generally, the funds invested in smaller-capitalization and foreign equity securities were primary detractors. The allocation to the Inflation Protected Securities Fund and the Core Bond Index Fund (Class I) partially offset the underperformance as these funds outperformed the Fund’s market benchmark.
The Fund’s slight underperformance relative to its peer group benchmark primarily reflected its overweight allocation to equities. The Fund’s overweight to funds invested in value style equities and the shorter duration of the underlying funds’ investments in fixed income securities also detracted from relative performance. The Fund’s underweight allocation to funds invested in foreign equities, which generally underperformed funds invested in U.S. equities, partially offset the underperformance. The Fund’s underweight allocation to funds invested in smaller-capitalization equities, whose performance generally trailed the funds invested in large-capitalization equities, as well as the Fund’s allocation to funds invested in higher-quality fixed income securities also aided relative performance.
The Fund’s underperformance relative to its custom benchmark primarily resulted from its allocation to equity funds, the Low Duration Bond Fund and the Diversifying Strategies Fund, which trailed the performance of their respective broad market indexes in the custom benchmark. The allocation to the Inflation Protected Securities Fund and Core Bond Index Fund partially offset this underperformance as they outperformed the fixed income index in the custom benchmark.
71
Vantagepoint Milestone 2020 Fund
Underlying Fund Allocation as of December 31, 2011 (% of Net Assets)
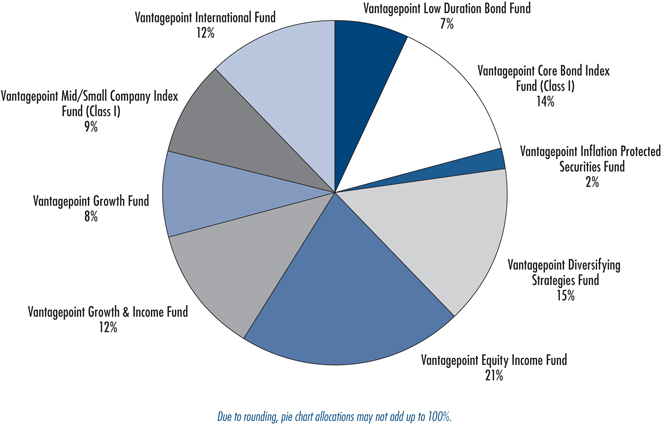
72
Vantagepoint Milestone 2020 Fund vs. S&P 500 Index and Custom Benchmark:
Growth of $10,000 Invested January 3, 2005*
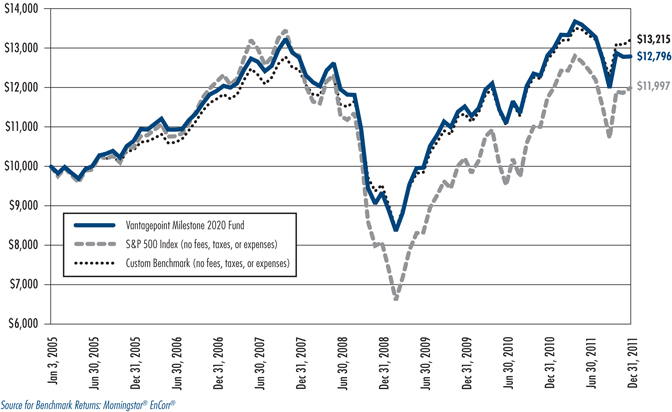
Vantagepoint Milestone 2020 Fund
Average Annual Total Returns for the periods ended December 31, 2011*
| | | | |
One Year | | | –0.26 | % |
| |
Three Years | | | 11.06 | % |
| |
Five Years | | | 1.43 | % |
| |
Since Inception | | | 3.58 | % |
| |
Fund Inception Date | | | January 3, 2005 | |
| * | Current performance may be higher or lower than the past performance presented in this report. Past performance is no guarantee of future performance. Investment returns and principal value will fluctuate so that shares, when redeemed, may be worth more or less than their original cost. The graph and the table do not reflect the deduction of taxes that a shareholder would pay on fund distributions or the redemption of fund shares. Current performance is available by calling 1-800-669-7400 or at www.icmarc.org/vpperformance. |
The Fund’s market benchmark, the S&P 500 Index, is an index consisting of 500 companies representing larger capitalization stocks traded in the U.S. The custom benchmark is composed of market indexes that reflect the general performance of the primary asset classes in which the Fund invests, in weighted percentages that correspond to the historical target allocations to those asset classes for the Fund. Those asset class benchmarks are the Barclays Capital U.S. Intermediate Aggregate Bond Index for the fixed income asset class and the S&P 500 Index for the equity asset class. The Barclays Capital U.S. Intermediate Aggregate Bond Index consists of investment-grade U.S. fixed income securities with maturities of 1 to 10 years. Should the target allocations for the Fund between those asset classes change, the percentage allocations to the corresponding indexes will also change when calculating the custom benchmark. An index is not available for direct investment, is unmanaged, and does not reflect the costs of portfolio management or trading. A fund’s portfolio may differ significantly from the securities held in the indexes.
73
Vantagepoint Milestone 2025 Fund
The Vantagepoint Milestone 2025 Fund’s objective is to offer high total return consistent with the Fund’s current asset allocation. The Fund’s principal investment strategy is to invest in a combination of underlying Vantagepoint Funds using an asset allocation strategy designed for investors expecting to begin gradual withdrawals from the Fund, typically at or after retirement (assumed to occur at age 60), in or around the year 2025.
At year-end, the Fund was invested in the following Vantagepoint Funds at target allocations within the percentage ranges indicated:
| | | | |
FIXED INCOME | | | |
Low Duration Bond Fund | | | 0%–8% | |
Core Bond Index Fund (Class I) | | | 8%–18% | |
| |
EQUITY | | | |
Equity Income Fund | | | 18%–28% | |
Growth & Income Fund | | | 8%–18% | |
Growth Fund | | | 4%–14% | |
Mid/Small Company Index Fund (Class I) | | | 6%–16% | |
International Fund | | | 9%–19% | |
| |
MULTI-STRATEGY | | | |
Diversifying Strategies Fund | | | 8%–18% | |
In 2011, the Fund followed a strategy that as time elapses, the Fund’s allocation to equity investments will periodically decrease and the Fund’s allocation to fixed income and multi-strategy investments will correspondingly increase so that by June 30 of the year 2035 (ten years after the year indicated in the Fund name), the Fund’s net assets will be invested approximately 25% in equity Funds, 55% in fixed income Funds, and 20% in the multi-strategy Fund.
Performance
The Vantagepoint Milestone 2025 Fund lost 0.85% in 2011. The Fund’s market benchmark, the S&P 500 Index, gained 2.11%, while the Fund’s peer group benchmark, the Morningstar Target Date 2021–2025 Funds Average, a group of mutual funds with similar investment objectives, lost 2.06%. The Fund’s custom benchmark gained 3.51%. The Fund’s custom benchmark is composed of market indexes that reflect the general performance of the asset classes in which the Fund invests, in weighted percentages, corresponding to the historical target allocation to those asset classes for the Fund.
The Milestone 2025 Fund produced a negative absolute return as four of the five underlying equity funds declined, while the two underlying fixed income funds and the multi-strategy fund provided positive returns. The Core Bond Index Fund (Class I) rose 7.41% and the Low Duration Bond Fund gained 1.14%. The five underlying equity funds produced returns ranging from 0.04% for the Equity Income Fund to negative 8.57% for the International Fund. The Diversifying Strategies Fund gained 0.10%. Please refer to each underlying fund’s commentary within this report for more information.
The Fund’s underperformance relative to its market benchmark primarily reflected the mostly negative performance of the underlying equity funds. Generally, the funds invested in smaller-capitalization and foreign equity securities were primary detractors. The allocation to the Core Bond Index Fund (Class I) partially offset this underperformance as it outperformed the Fund’s market benchmark.
The Fund’s outperformance relative to its peer group benchmark primarily reflected its underweight allocation to funds invested in smaller-capitalization equities, whose performance generally trailed funds invested in large-capitalization equities, as well as an underweight allocation to funds invested in foreign equities, which generally underperformed funds invested in U.S. equities. Additionally, the Fund’s allocation to funds invested in higher-quality fixed income securities aided relative performance.
The Fund’s overweight to funds invested in value style equities detracted from its relative performance. The Fund’s underperformance relative to its custom benchmark primarily resulted from its allocation to equity funds, the Low Duration Bond Fund and the Diversifying Strategies Fund, which trailed the performance of their respective broad market indexes in the custom benchmark. The allocation to the Core Bond Index Fund partially offset this underperformance as it outperformed the fixed income index in the custom benchmark.
74
Vantagepoint Milestone 2025 Fund
Underlying Fund Allocation as of December 31, 2011 (% of Net Assets)
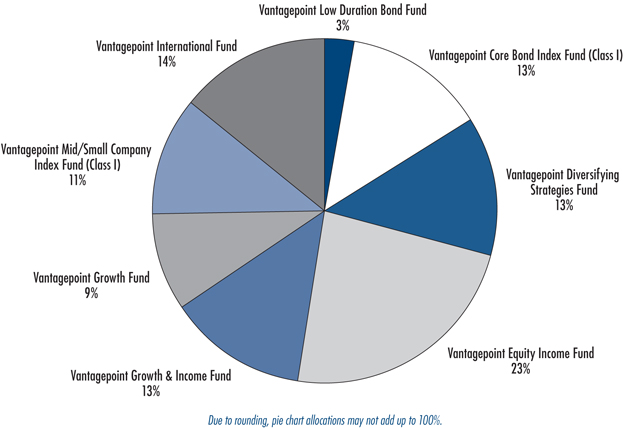
75
Vantagepoint Milestone 2025 Fund vs. S&P 500 Index and Custom Benchmark:
Growth of $10,000 Invested January 3, 2005*
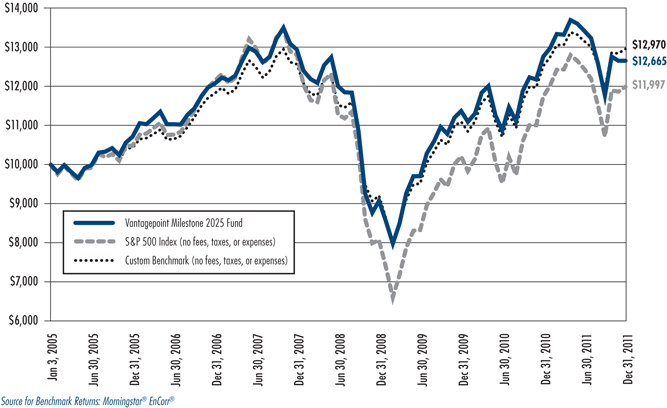
Vantagepoint Milestone 2025 Fund
Average Annual Total Returns for the periods ended December 31, 2011*
| | | | |
One Year | | | –0.85 | % |
| |
Three Years | | | 11.75 | % |
| |
Five Years | | | 0.95 | % |
| |
Since Inception | | | 3.43 | % |
| |
Fund Inception Date | | | January 3, 2005 | |
| * | Current performance may be higher or lower than the past performance presented in this report. Past performance is no guarantee of future performance. Investment returns and principal value will fluctuate so that shares, when redeemed, may be worth more or less than their original cost. The graph and the table do not reflect the deduction of taxes that a shareholder would pay on fund distributions or the redemption of fund shares. Current performance is available by calling 1-800-669-7400 or at www.icmarc.org/vpperformance. |
The Fund’s market benchmark, the S&P 500 Index, is an index consisting of 500 companies representing larger capitalization stocks traded in the U.S. The custom benchmark is composed of market indexes that reflect the general performance of the primary asset classes in which the Fund invests, in weighted percentages that correspond to the historical target allocations to those asset classes for the Fund. Those asset class benchmarks are the Barclays Capital U.S. Intermediate Aggregate Bond Index for the fixed income asset class and the S&P 500 Index for the equity asset class. The Barclays Capital U.S. Intermediate Aggregate Bond Index consists of investment-grade U.S. fixed income securities with maturities of 1 to 10 years. Should the target allocations for the Fund between those asset classes change, the percentage allocations to the corresponding indexes will also change when calculating the custom benchmark. An index is not available for direct investment, is unmanaged, and does not reflect the costs of portfolio management or trading. A fund’s portfolio may differ significantly from the securities held in the indexes.
76
Vantagepoint Milestone 2030 Fund
The Vantagepoint Milestone 2030 Fund’s objective is to offer high total return consistent with the Fund’s current asset allocation. The Fund’s principal investment strategy is to invest in a combination of underlying Vantagepoint Funds using an asset allocation strategy designed for investors expecting to begin gradual withdrawals from the Fund, typically at or after retirement (assumed to occur at age 60), in or around the year 2030.
At year-end the Fund was invested in the following Vantagepoint Funds at target allocations within the percentage ranges indicated:
| | | | |
FIXED INCOME | | | |
Low Duration Bond Fund | | | 0%–6% | |
Core Bond Index Fund (Class I) | | | 4%–14% | |
| |
EQUITY | | | |
Equity Income Fund | | | 19%–29% | |
Growth & Income Fund | | | 9%–19% | |
Growth Fund | | | 5%–15% | |
Mid/Small Company Index Fund (Class I) | | | 9%–19% | |
International Fund | | | 11%–21% | |
| |
MULTI-STRATEGY | | | |
Diversifying Strategies Fund | | | 6%–16% | |
In 2011, the Fund followed a strategy that as time elapses, the Fund’s allocation to equity investments will periodically decrease and the Fund’s allocation to fixed income and multi-strategy investments will correspondingly increase so that by June 30 of the year 2040 (ten years after the year indicated in the Fund name), the Fund’s net assets will be invested approximately 25% in equity Funds, 55% in fixed income Funds, and 20% in the multi-strategy Fund.
Performance
The Vantagepoint Milestone 2030 Fund lost 1.46% in 2011. The Fund’s market benchmark, the S&P 500 Index, gained 2.11%, while the Fund’s peer group benchmark, the Morningstar Target Date 2026-2030 Funds Average, a group of mutual funds with similar investment objectives, lost 2.26%. The Fund’s custom benchmark gained 3.14%. The Fund’s custom benchmark is composed of market indexes that reflect the general performance of the asset classes in which the Fund invests, in weighted percentages, corresponding to the historical target allocation to those asset classes for the Fund.
The Milestone 2030 Fund produced a negative absolute return as four of the five underlying equity funds declined, while the two underlying fixed income funds and the multi-strategy fund provided positive returns. The Core Bond Index Fund (Class I) rose 7.41% and the Low Duration Bond Fund gained 1.14%. The five underlying equity funds produced returns ranging from 0.04% for the Equity Income Fund to negative 8.57% for the International Fund. The Diversifying Strategies Fund gained 0.10%. Please refer to each underlying fund’s commentary within this report for more information.
The Fund’s underperformance relative to its market benchmark primarily reflected the mostly negative performance of the underlying equity funds. Generally, the funds invested in smaller-capitalization and foreign equity securities were primary detractors. The allocation to the Core Bond Index Fund (Class I) partially offset this underperformance as it outperformed the Fund’s market benchmark.
The Fund’s outperformance relative to its peer group benchmark primarily reflected its underweight allocation to funds invested in foreign equities, which generally underperformed funds invested in U.S. equities. Additionally, the Fund’s allocation to funds invested in higher-quality fixed income securities aided relative performance. The Fund’s overweight allocation to equities, particularly funds invested in smaller-capitalization equities, whose performance generally trailed funds invested in large-capitalization equities, detracted from performance. Additionally, the Fund’s overweight to funds invested in value style equities detracted from its relative performance.
The Fund’s underperformance relative to its custom benchmark primarily resulted from its allocation to equity funds, the Low Duration Bond Fund and the Diversifying Strategies Fund, which trailed the performance of their respective broad market indexes in the custom benchmark. The allocation to the Core Bond Index Fund partially offset this underperformance as it outperformed the fixed income index in the custom benchmark.
77
Vantagepoint Milestone 2030 Fund
Underlying Fund Allocation as of December 31, 2011 (% of Net Assets)
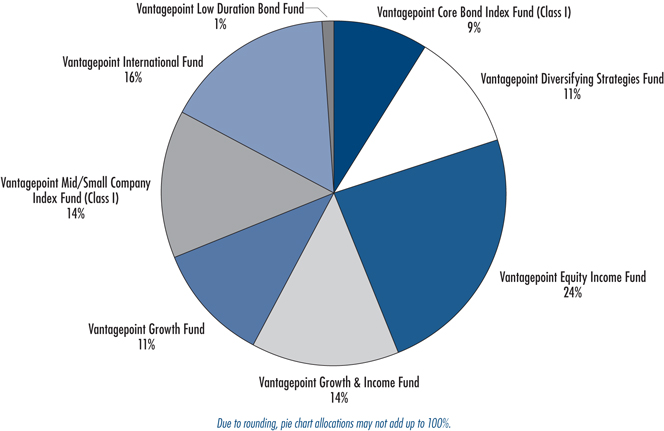
78
Vantagepoint Milestone 2030 Fund vs. S&P 500 Index and Custom Benchmark:
Growth of $10,000 Invested January 3, 2005*
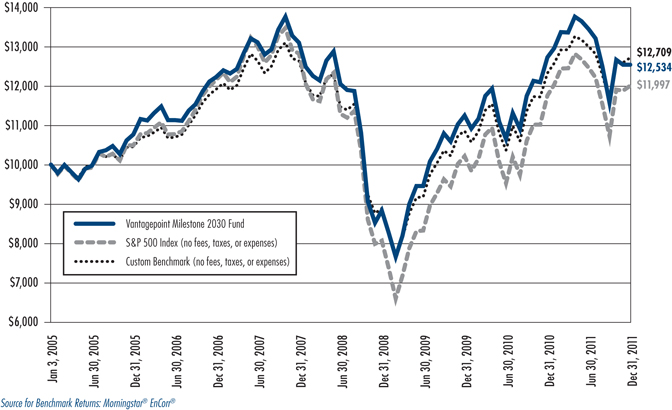
Vantagepoint Milestone 2030 Fund
Average Annual Total Returns for the periods ended December 31, 2011*
| | | | |
One Year | | | –1.46 | % |
| |
Three Years | | | 12.38 | % |
| |
Five Years | | | 0.50 | % |
| |
Since Inception | | | 3.28 | % |
| |
Fund Inception Date | | | January 3, 2005 | |
| * | Current performance may be higher or lower than the past performance presented in this report. Past performance is no guarantee of future performance. Investment returns and principal value will fluctuate so that shares, when redeemed, may be worth more or less than their original cost. The graph and the table do not reflect the deduction of taxes that a shareholder would pay on fund distributions or the redemption of fund shares. Current performance is available by calling 1-800-669-7400 or at www.icmarc.org/vpperformance. |
The Fund’s market benchmark, the S&P 500 Index, is an index consisting of 500 companies representing larger capitalization stocks traded in the U.S. The custom benchmark is composed of market indexes that reflect the general performance of the primary asset classes in which the Fund invests, in weighted percentages that correspond to the historical target allocations to those asset classes for the Fund. Those asset class benchmarks are the Barclays Capital U.S. Intermediate Aggregate Bond Index for the fixed income asset class and the S&P 500 Index for the equity asset class. The Barclays Capital U.S. Intermediate Aggregate Bond Index consists of investment-grade U.S. fixed income securities with maturities of 1 to 10 years. Should the target allocations for the Fund between those asset classes change, the percentage allocations to the corresponding indexes will also change when calculating the custom benchmark. A fund’s portfolio may differ significantly from the securities held in the indexes.
79
Vantagepoint Milestone 2035 Fund
The Vantagepoint Milestone 2035 Fund’s objective is to offer high total return consistent with the Fund’s current asset allocation. The Fund’s principal investment strategy is to invest in a combination of underlying Vantagepoint Funds using an asset allocation strategy designed for investors expecting to begin gradual withdrawals from the Fund, typically at or after retirement (assumed to occur at age 60), in or around the year 2035. At year-end the Fund was invested in the following Vantagepoint Funds at target allocations within the percentage ranges indicated:
| | | | |
FIXED INCOME | | | |
Low Duration Bond Fund | | | 0%–5% | |
Core Bond Index Fund (Class I) | | | 1%–11% | |
| |
EQUITY | | | |
Equity Income Fund | | | 21%–31% | |
Growth & Income Fund | | | 10%–20% | |
Growth Fund | | | 7%–17% | |
Mid/Small Company Index Fund (Class I) | | | 13%–23% | |
International Fund | | | 13%–23% | |
| |
MULTI-STRATEGY | | | |
Diversifying Strategies Fund | | | 1%–11% | |
In 2011, the Fund followed a strategy that as time elapses, the Fund’s allocation to equity investments will periodically decrease and the Fund’s allocation to fixed income and multi-strategy investments will correspondingly increase so that by June 30 of the year 2045 (ten years after the year indicated in the Fund name), the Fund’s net assets will be invested approximately in 25% equity Funds, 55% in fixed income Funds, and 20% in the multi-strategy Fund.
Performance
The Vantagepoint Milestone 2035 Fund lost 2.24% in 2011. The Fund’s market benchmark, the S&P 500 Index, gained 2.11%, while the Fund’s peer group benchmark, the Morningstar Target Date 2031-2035 Funds Average, a group of mutual funds with similar investment objectives, lost 3.51%. The Fund’s custom benchmark gained 2.72%. The Fund’s custom benchmark is composed of market indexes that reflect the general performance of the asset classes in which the Fund invests, in weighted percentages, corresponding to the historical target allocation to those asset classes for the Fund.
The Milestone 2035 Fund produced a negative absolute return as four of the five underlying equity funds declined, while the two underlying fixed income funds and the multi-strategy fund provided positive returns. The Core Bond Index Fund (Class I) rose 7.41% and the Low Duration Bond Fund gained 1.14%. The five underlying equity funds produced returns ranging from 0.04% for the Equity Income Fund to negative 8.57% for the International Fund. The Diversifying Strategies Fund gained 0.10%. Please refer to each underlying fund’s commentary within this report for more information.
The Fund’s underperformance relative to its market benchmark primarily reflected the mostly negative performance of the underlying equity funds. Generally, the underlying funds invested in smaller-capitalization and foreign equity securities were primary detractors. The allocation to the Core Bond Index Fund (Class I) partially offset this underperformance as it outperformed the Fund’s market benchmark.
The Fund’s outperformance relative to its peer group benchmark primarily reflected its underweight allocation to funds invested in foreign securities, which generally underperformed funds invested in U.S. equities. The Fund’s overweight allocation to equities, particularly funds invested in smaller-capitalization equities, whose performance generally trailed fund’s invested in large-capitalization equities, detracted from performance. Additionally, the Fund’s overweight to funds invested in value style equities detracted from its relative performance.
The Fund’s underperformance relative to its custom benchmark primarily resulted from its allocation to equity funds, the Low Duration Bond Fund and the Diversifying Strategies Fund, which trailed the performance of their respective broad market indexes in the custom benchmark. The allocation to the Core Bond Index Fund partially offset this underperformance as it outperformed the fixed income index in the custom benchmark.
80
Vantagepoint Milestone 2035 Fund
Underlying Fund Allocation as of December 31, 2011 (% of Net Assets)
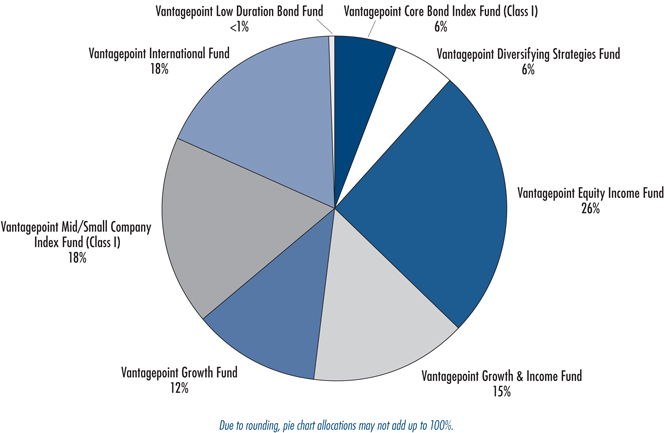
81
Vantagepoint Milestone 2035 Fund vs. S&P 500 Index and Custom Benchmark:
Growth of $10,000 Invested January 3, 2005*
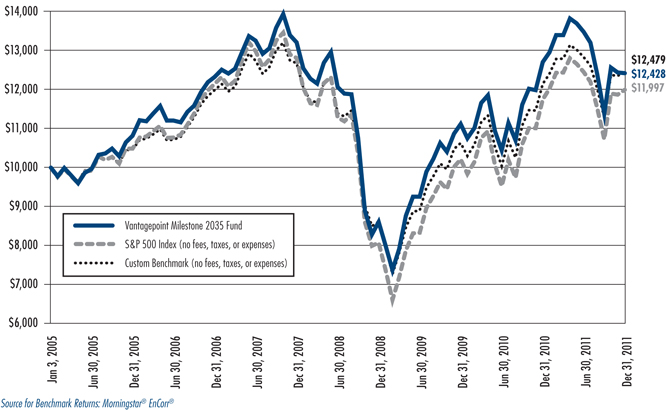
Vantagepoint Milestone 2035 Fund
Average Annual Total Returns for the periods ended December 31, 2011*
| | | | |
One Year | | | –2.24 | % |
| |
Three Years | | | 13.04 | % |
| |
Five Years | | | 0.16 | % |
| |
Since Inception | | | 3.15 | % |
| |
Fund Inception Date | | | January 3, 2005 | |
| * | Current performance may be higher or lower than the past performance presented in this report. Past performance is no guarantee of future performance. Investment returns and principal value will fluctuate so that shares, when redeemed, may be worth more or less than their original cost. The graph and the table do not reflect the deduction of taxes that a shareholder would pay on fund distributions or the redemption of fund shares. Current performance is available by calling 1-800-669-7400 or at www.icmarc.org/vpperformance. |
The Fund’s market benchmark, the S&P 500 Index, is an index consisting of 500 companies representing larger capitalization stocks traded in the U.S. The custom benchmark is composed of market indexes that reflect the general performance of the primary asset classes in which the Fund invests, in weighted percentages that correspond to the historical target allocations to those asset classes for the Fund. Those asset class benchmarks are the Barclays Capital U.S. Intermediate Aggregate Bond Index for the fixed income asset class and the S&P 500 Index for the equity asset class. The Barclays Capital U.S. Intermediate Aggregate Bond Index consists of investment-grade U.S. fixed income securities with maturities of 1 to 10 years. Should the target allocations for the Fund between those asset classes change, the percentage allocations to the corresponding indexes will also change when calculating the custom benchmark. An index is not available for direct investment, is unmanaged, and does not reflect the costs of portfolio management or trading. A fund’s portfolio may differ significantly from the securities held in the indexes.
82
Vantagepoint Milestone 2040 Fund
The Vantagepoint Milestone 2040 Fund’s objective is to offer high total return consistent with the Fund’s current asset allocation. The Fund’s principal investment strategy is to invest in a combination of underlying Vantagepoint Funds using an asset allocation strategy designed for investors expecting to begin gradual withdrawals from the Fund, typically at or after retirement (assumed to occur at age 60), in or around the year 2040.
At year-end the Fund was invested in the following Vantagepoint Funds at target allocations within the percentage ranges indicated:
| | | | |
FIXED INCOME | | | |
Core Bond Index Fund (Class I) | | | 0%–10% | |
| |
EQUITY | | | |
Equity Income Fund | | | 22%–32% | |
Growth & Income Fund | | | 11%–21% | |
Growth Fund | | | 7%–17% | |
Mid/Small Company Index Fund (Class I) | | | 15%–25% | |
International Fund | | | 14%–24% | |
| |
MULTI-STRATEGY | | | |
Diversifying Strategies Fund | | | 0%–6% | |
In 2011, the Fund followed a strategy that as time elapses, the Fund’s allocation to equity investments will periodically decrease and the Fund’s allocation to fixed income and multi-strategy investments will increase so that by June 30 of the year 2050 (ten years after the year indicated in the Fund name), the Fund’s net assets will be invested approximately 25% in equity Funds, 55% in fixed income Funds, and 20% in the multi-strategy Fund.
Performance
The Vantagepoint Milestone 2040 Fund lost 2.61% in 2011. The Fund’s market benchmark, the S&P 500 Index, gained 2.11%, while the Fund’s peer group benchmark, the Morningstar Target Date 2036-2040 Funds Average, a group of mutual funds with similar investment objectives, lost 3.49%. The Fund’s custom benchmark lost 0.68%. The Fund’s custom benchmark is composed of market indexes that reflect the general performance of the asset classes in which the Fund invests, in weighted percentages, corresponding to the historical target allocation to those asset classes for the Fund.
The Milestone 2040 Fund produced a negative absolute return as four of the five underlying equity funds declined, while the underlying fixed income fund and the multi-strategy fund provided positive returns. The Core Bond Index Fund (Class I) rose 7.41%. The five underlying equity funds produced returns ranging from 0.04% for the Equity Income Fund to negative 8.57% for the International Fund. The Diversifying Strategies Fund gained 0.10%. Please refer to each underlying fund’s commentary within this report for more information.
The Fund’s underperformance relative to its market benchmark primarily reflected the mostly negative performance of the underlying equity funds. The underlying funds invested in smaller-capitalization and foreign equity securities were primary detractors. The allocation to the Core Bond Index Fund (Class I) partially offset this underperformance as it outperformed the Fund’s market benchmark.
The Fund’s outperformance relative to its peer group benchmark primarily reflected its underweight allocation to funds invested in foreign equities, which generally underperformed funds invested in U.S. equities. The Fund’s overweight allocation to equities, particularly funds invested in smaller-capitalization equities, whose performance generally trailed funds invested in large-capitalization equities, detracted from performance. Additionally, the Fund’s overweight to funds invested in value style equities detracted from its relative performance.
The Fund’s underperformance relative to its custom benchmark primarily resulted from its allocation to U.S. equity funds and to the Diversifying Strategies Fund, which trailed the performance of the U.S. equity portion of the custom benchmark. The allocation to the International Fund partially offset this underperformance as it outperformed the international equity index in the custom benchmark. The Core Bond Index Fund also outperformed the custom benchmark.
83
Vantagepoint Milestone 2040 Fund
Underlying Fund Allocation as of December 31, 2011 (% of Net Assets)
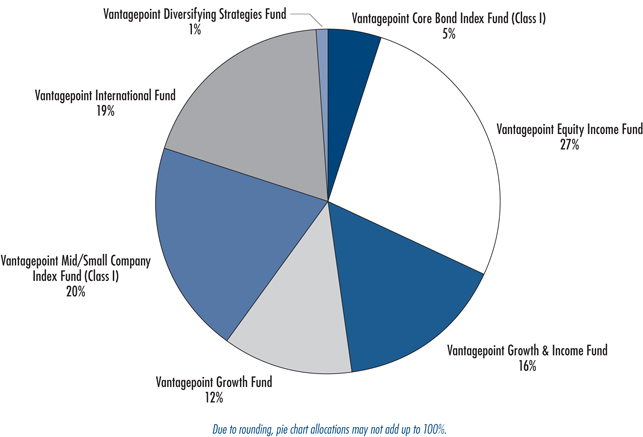
84
Vantagepoint Milestone 2040 Fund vs. S&P 500 Index and Custom Benchmark:
Growth of $10,000 Invested January 3, 2005*
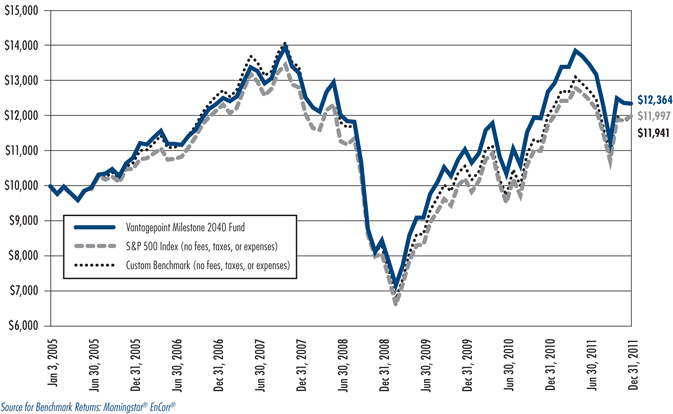
Vantagepoint Milestone 2040 Fund
Average Annual Total Returns for the periods ended December 31, 2011*
| | | | |
One Year | | | –2.61 | % |
| |
Three Years | | | 13.51 | % |
| |
Five Years | | | 0.03 | % |
| |
Since Inception | | | 3.08 | % |
| |
Fund Inception Date | | | January 3, 2005 | |
| * | Current performance may be higher or lower than the past performance presented in this report. Past performance is no guarantee of future performance. Investment returns and principal value will fluctuate so that shares, when redeemed, may be worth more or less than their original cost. The graph and the table do not reflect the deduction of taxes that a shareholder would pay on fund distributions or the redemption of fund shares. Current performance is available by calling 1-800-669-7400 or at www.icmarc.org/vpperformance. |
The Fund’s market benchmark, the S&P 500 Index, is an index consisting of 500 companies representing larger capitalization stocks traded in the U.S. The custom benchmark is composed of market indexes that reflect the general performance of the primary asset classes in which the Fund invests, in weighted percentages that correspond to the historical target allocations to those asset classes for the Fund. Those asset class benchmarks are the S&P 500 Index and the MSCI EAFE Index (Net). The MSCI Europe Australasia Far East (EAFE) Index (Net) is a free float-adjusted market capitalization index that is designed to measure the equity market performance of developed markets, excluding the U.S. and Canada, and approximates the minimum possible dividend reinvestment after deduction of withholding tax according to MSCI Barra’s methodology. Should the target allocations for the Fund between those asset classes change, the percentage allocations to the corresponding indexes will also change when calculating the custom benchmark. An index is not available for direct investment, is unmanaged, and does not reflect the costs of portfolio management or trading. A fund’s portfolio may differ significantly from the securities held in the indexes.
85
Vantagepoint Milestone 2045 Fund
The Vantagepoint Milestone 2045 Fund’s objective is to offer high total return consistent with the Fund’s current asset allocation. The Fund’s principal investment strategy is to invest in a combination of underlying Vantagepoint Funds using an asset allocation strategy designed for investors expecting to begin gradual withdrawals from the Fund, typically at or after retirement (assumed to occur at age 60), in or around the year 2045.
At year-end, the Fund was invested in the following Vantagepoint Funds at target allocations within the percentage ranges indicated:
| | | | |
FIXED INCOME | | | |
Core Bond Index Fund (Class I) | | | 0 | %–10% |
| |
EQUITY | | | |
Equity Income Fund | | | 22 | %–32% |
Growth & Income Fund | | | 11 | %–21% |
Growth Fund | | | 8 | %–18% |
Mid/Small Company Index Fund (Class I) | | | 15 | %–25% |
International Fund | | | 14 | %–24% |
The Fund follows a strategy that as time elapses, the Fund’s allocation to equity investments will periodically decrease, the Fund’s allocation to fixed income investments will increase and an allocation will be added (and increased) to investments in asset classes and strategies that have historically exhibited a low correlation to traditional fixed income and equity investments (through the “multi-strategy” Fund) so that by June 30 of the year 2055 (ten years after the year indicated in the Fund name), the Fund’s net assets will be invested approximately 25% in equity Funds, 55% in fixed income Funds, and 20% in the multi-strategy Fund.
Performance
The Vantagepoint Milestone 2045 Fund lost 2.81% in 2011. The Fund’s market benchmark, the S&P 500 Index, gained 2.11%, while the Fund’s peer group benchmark, the Morningstar Target Date 2041-2045 Funds Average, a group of mutual funds with similar investment objectives, lost 4.10%. The Fund’s custom benchmark lost 0.71%. The Fund’s custom benchmark is composed of market indexes that reflect the general performance of the asset classes in which the Fund invests, in weighted percentages, corresponding to the historical target allocation to those asset classes for the Fund.
The Milestone 2045 Fund produced a negative absolute return as four of the five underlying equity funds declined, while the underlying fixed income fund provided positive returns. The Core Bond Index Fund (Class I) rose 7.41%. The five underlying equity funds produced returns ranging from 0.04% for the Equity Income Fund to negative 8.57% for the International Fund. Please refer to each underlying fund’s commentary within this report for more information.
The Fund’s underperformance relative to its market benchmark primarily reflected the mostly negative performance of the underlying equity funds. The underlying funds invested in smaller-capitalization and foreign equity securities were primary detractors. Generally, the allocation to the Core Bond Index Fund (Class I) partially offset the underperformance as it outperformed the Fund’s market benchmark.
The Fund’s outperformance relative to its peer group benchmark primarily reflected its underweight allocation to funds invested in foreign equities, which generally underperformed funds invested in U.S. equities. The Fund’s overweight allocation to equities, particularly funds invested in smaller-capitalization equities, whose performance generally trailed funds invested in large-capitalization equities, detracted from performance. Additionally, the Fund’s overweight to funds invested in value style equities detracted from its relative performance.
The Fund’s underperformance relative to its custom benchmark resulted from the Fund’s allocation to U.S. equity funds, which trailed the performance of the U.S. equity portion of the custom benchmark. The allocation to the International Fund partially offset this underperformance as it outperformed the international equity index in the custom benchmark. The Core Bond Index Fund also outperformed the custom benchmark
86
Vantagepoint Milestone 2045 Fund
Underlying Fund Allocation as of December 31, 2011 (% of Net Assets)
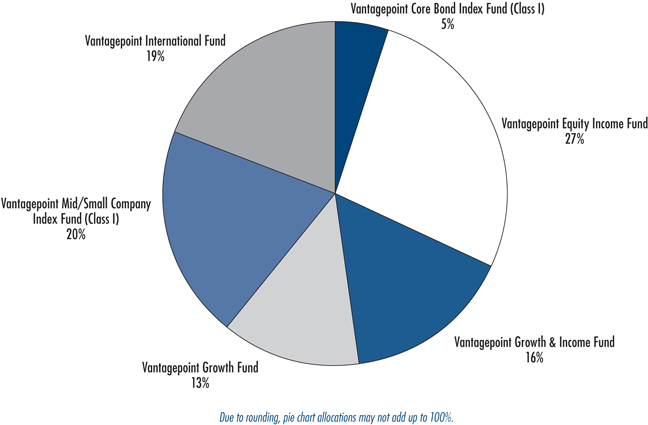
87
Vantagepoint Milestone 2045 Fund vs. S&P 500 Index and Custom Benchmark:
Growth of $10,000 Invested January 4, 2010*
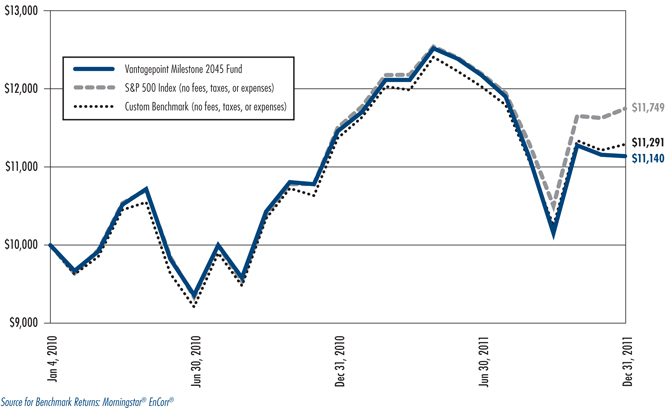
Vantagepoint Milestone 2045 Fund
Average Annual Total Returns for the periods ended December 31, 2011*
| | | | |
One Year | | | –2.81 | % |
| |
Since Inception | | | 5.55 | % |
| |
Fund Inception Date | | | January 4, 2010 | |
| * | Current performance may be higher or lower than the past performance presented in this report. Past performance is no guarantee of future performance. Investment returns and principal value will fluctuate so that shares, when redeemed, may be worth more or less than their original cost. The graph and the table do not reflect the deduction of taxes that a shareholder would pay on fund distributions or the redemption of fund shares. Current performance is available by calling 1-800-669-7400 or at www.icmarc.org/vpperformance. |
The Fund’s market benchmark, the S&P 500 Index, is an index consisting of 500 companies representing larger capitalization stocks traded in the U.S. The custom benchmark is composed of market indexes that reflect the general performance of the primary asset classes in which the Fund invests, in weighted percentages that correspond to the historical target allocations to those asset classes for the Fund. Those asset class benchmarks are the S&P 500 Index and the MSCI EAFE Index (Net). The MSCI Europe Australasia Far East (EAFE) Index (Net) is a free float-adjusted market capitalization index that is designed to measure the equity market performance of developed markets, excluding the U.S. and Canada, and approximates the minimum possible dividend reinvestment after deduction of withholding tax according to MSCI Barra’s methodology. Should the target allocations for the Fund between those asset classes change, the percentage allocations to the corresponding indexes will also change when calculating the custom benchmark. An index is not available for direct investment, is unmanaged, and does not reflect the costs of portfolio management or trading. A fund’s portfolio may differ significantly from the securities held in the indexes.
88
[THIS PAGE INTENTIONALLY LEFT BLANK]
89
Report of Independent Registered Public Accounting Firm
To the Shareholders and Board of Directors of The Vantagepoint Funds:
In our opinion, the accompanying statements of assets and liabilities, including the schedules of investments and the related statements of operations and changes in net assets and the financial highlights present fairly, in all material respects, the financial position of the Low Duration Bond Fund, Inflation Protected Securities Fund, Equity Income Fund, Growth & Income Fund, Growth Fund, Select Value Fund, Aggressive Opportunities Fund, Discovery Fund, International Fund, Diversifying Strategies Fund, Core Bond Index Fund, 500 Stock Index Fund, Broad Market Index Fund, Mid/Small Company Index Fund, Overseas Equity Index Fund, Model Portfolio Savings Oriented Fund, Model Portfolio Conservative Growth Fund, Model Portfolio Traditional Growth Fund, Model Portfolio Long-Term Growth Fund, Model Portfolio All-Equity Growth Fund, Milestone Retirement Income Fund, Milestone 2010 Fund, Milestone 2015 Fund, Milestone 2020 Fund, Milestone 2025 Fund, Milestone 2030 Fund, Milestone 2035 Fund, Milestone 2040 Fund and Milestone 2045 Fund comprising The Vantagepoint Funds (hereafter referred to as the “Funds”) at December 31, 2011, and the results of each of their operations for the year then ended and changes in each of their net assets for each of the fiscal periods presented, and the financial highlights for each of the fiscal periods presented, in conformity with accounting principles generally accepted in the United States of America. These financial statements and financial highlights (hereafter referred to as “financial statements”) are the responsibility of the Funds’ management; our responsibility is to express an opinion on these financial statements based on our audits. We conducted our audits of these financial statements in accordance with the standards of the Public Company Accounting Oversight Board (United States). Those standards require that we plan and perform the audits to obtain reasonable assurance about whether the financial statements are free of material misstatement. An audit includes examining, on a test basis, evidence supporting the amounts and disclosures in the financial statements, assessing the accounting principles used and significant estimates made by management, and evaluating the overall financial statement presentation. We believe that our audits, which included confirmation of securities at December 31, 2011 by correspondence with the custodian and brokers, and confirmation of the underlying funds by correspondence with the transfer agent, provide a reasonable basis for our opinion.
PricewaterhouseCoopers LLP
Baltimore, Maryland
February 29, 2012
90
THE VANTAGEPOINT FUNDS
Statements of Assets and Liabilities
December 31, 2011
| | | | | | | | | | | | |
| �� | | Low
Duration
Bond | | | Inflation
Protected
Securities | | | Equity
Income | |
ASSETS: | | | | | | | | | | | | |
Investment in securities, at value† | | $ | 547,148,015 | | | $ | 592,546,328 | | | $ | 1,923,050,899 | |
Cash | | | 21,397 | | | | — | | | | 10,266 | |
Cash denominated in foreign currencies | | | — | | | | 207,620 | | | | — | |
Receivables: | | | | | | | | | | | | |
Dividends | | | 3,655 | | | | 6,744 | | | | 3,140,334 | |
Interest | | | 3,726,638 | | | | 3,390,736 | | | | — | |
Security lending income | | | 1,040 | | | | 923 | | | | 26,753 | |
Investments sold | | | — | | | | 34,360 | | | | 30,571 | |
Fund shares sold | | | 562,997 | | | | 10,609,625 | | | | 426,609 | |
Variation margin on futures contracts | | | 6,016 | | | | — | | | | — | |
Unrealized appreciation on swap agreements | | | — | | | | 390,113 | | | | — | |
Unrealized appreciation on forward foreign currency exchange contracts | | | 149,544 | | | | — | | | | — | |
Due from broker | | | — | | | | 1,223,080 | | | | — | |
| | | | | | | | | | | | |
Total Assets | | | 551,619,302 | | | | 608,409,529 | | | | 1,926,685,432 | |
| | | | | | | | | | | | |
LIABILITIES: | | | | | | | | | | | | |
Payables: | | | | | | | | | | | | |
Investments purchased | | | — | | | | 895,048 | | | | — | |
Distributions | | | 476,888 | | | | 9,659,966 | | | | — | |
Fund shares redeemed | | | 65,082 | | | | 6,909 | | | | 313,802 | |
Variation margin on futures contracts | | | — | | | | 15,354 | | | | — | |
Collateral for securities loaned | | | 26,135,756 | | | | 12,985,716 | | | | 106,321,976 | |
Options written, at value (Premium $0, $344,660 and $0, respectively) | | | — | | | | 55,581 | | | | — | |
Unrealized depreciation on forward foreign currency exchange contracts | | | 525 | | | | — | | | | — | |
Accrued Expenses: | | | | | | | | | | | | |
Advisory fees | | | 44,459 | | | | 49,039 | | | | 152,489 | |
Subadviser fees | | | 182,181 | | | | 277,567 | | | | 1,596,429 | |
Fund services fees | | | 155,608 | | | | 171,639 | | | | 533,718 | |
Administration fees | | | 5,877 | | | | 5,877 | | | | 5,876 | |
Directors’ fees and expenses | | | 5,542 | | | | 5,035 | | | | 19,185 | |
Other accrued expenses | | | 84,507 | | | | 90,305 | | | | 184,667 | |
| | | | | | | | | | | | |
Total Liabilities | | | 27,156,425 | | | | 24,218,036 | | | | 109,128,142 | |
| | | | | | | | | | | | |
NET ASSETS | | $ | 524,462,877 | | | $ | 584,191,493 | | | $ | 1,817,557,290 | |
| | | | | | | | | | | | |
NET ASSETS REPRESENTED BY: | | | | | | | | | | | | |
Paid-in capital | | $ | 527,935,769 | | | $ | 536,097,398 | | | $ | 1,753,656,037 | |
Undistributed net investment income | | | 54,940 | | | | — | | | | 434,949 | |
Accumulated net realized gain (loss) on investments, futures contracts, foreign currency transactions, written options and swap agreements | | | (2,191,325 | ) | | | 7,213,503 | | | | (27,536,238 | ) |
Net unrealized appreciation (depreciation) on investments, futures contracts, foreign currency transactions, written options, and swap agreements | | | (1,336,507 | ) | | | 40,880,592 | | | | 91,002,542 | |
| | | | | | | | | | | | |
NET ASSETS | | $ | 524,462,877 | | | $ | 584,191,493 | | | $ | 1,817,557,290 | |
| | | | | | | | | | | | |
CAPITAL SHARES: | | | | | | | | | | | | |
Net Assets | | $ | 524,462,877 | | | $ | 584,191,493 | | | $ | 1,817,557,290 | |
Shares Outstanding | | | 52,674,986 | | | | 50,026,155 | | | | 219,761,207 | |
Net Asset Value offering and redemption price per share
(net assets divided by shares outstanding) | | $ | 9.96 | | | $ | 11.68 | | | $ | 8.27 | |
Cost of investments | | $ | 548,641,112 | | | $ | 552,062,243 | | | $ | 1,832,047,078 | |
Cost of cash denominated in foreign currencies | | $ | — | | | $ | 213,339 | | | $ | — | |
| | | | | | | | | | | | |
† Includes securities on loan with values of (Note 7): | | $ | 25,619,130 | | | $ | 12,756,491 | | | $ | 105,050,315 | |
See Notes to Financial Statements.
91
THE VANTAGEPOINT FUNDS
Statements of Assets and Liabilities
December 31, 2011
| | | | | | | | | | | | | | | | |
| | | Growth &
Income | | | Growth | | | Select Value | | | Aggressive
Opportunities | |
ASSETS: | | | | | | | | | | | | | | | | |
Investment in securities, at value† | | $ | 1,181,812,365 | | | $ | 1,784,119,803 | | | $ | 329,727,881 | | | $ | 1,037,780,468 | |
Cash | | | — | | | | 19,570 | | | | — | | | | 18,380 | |
Cash denominated in foreign currencies | | | 10,976 | | | | — | | | | — | | | | 15 | |
Receivables: | | | | | | | | | | | | | | | | |
Dividends | | | 1,732,176 | | | | 1,807,058 | | | | 674,021 | | | | 901,383 | |
Security lending income | | | 12,560 | | | | 88,103 | | | | 2,473 | | | | 17,576 | |
Investments sold | | | 37,560 | | | | 2,204,004 | | | | 698,181 | | | | 1,628,220 | |
Fund shares sold | | | 240,484 | | | | 911,132 | | | | 86,566 | | | | 134,883 | |
Recoverable foreign taxes | | | 5,845 | | | | — | | | | 1,327 | | | | 14,069 | |
| | | | | | | | | | | | | | | | |
Total Assets | | | 1,183,851,966 | | | | 1,789,149,670 | | | | 331,190,449 | | | | 1,040,494,994 | |
| | | | | | | | | | | | | | | | |
LIABILITIES: | | | | | | | | | | | | | | | | |
Payables: | | | | | | | | | | | | | | | | |
Investments purchased | | | — | | | | 3,597,755 | | | | 994,168 | | | | 4,630,737 | |
Fund shares redeemed | | | 494,443 | | | | 366,164 | | | | 41,989 | | | | 24,544 | |
Collateral for securities loaned | | | 19,398,507 | | | | 31,704,220 | | | | 9,537,261 | | | | 77,024,271 | |
Accrued Expenses: | | | | | | | | | | | | | | | | |
Advisory fees | | | 97,970 | | | | 148,515 | | | | 26,971 | | | | 80,440 | |
Subadviser fees | | | 870,903 | | | | 1,465,940 | | | | 389,496 | | | | 1,045,923 | |
Fund services fees | | | 342,901 | | | | 519,812 | | | | 94,402 | | | | 281,543 | |
Administration fees | | | 5,877 | | | | 5,868 | | | | 5,877 | | | | 5,877 | |
Directors’ fees and expenses | | | 12,439 | | | | 19,691 | | | | 3,443 | | | | 11,450 | |
Other accrued expenses | | | 146,878 | | | | 246,259 | | | | 77,653 | | | | 119,450 | |
| | | | | | | | | | | | | | | | |
Total Liabilities | | | 21,369,918 | | | | 38,074,224 | | | | 11,171,260 | | | | 83,224,235 | |
| | | | | | | | | | | | | | | | |
NET ASSETS | | $ | 1,162,482,048 | | | $ | 1,751,075,446 | | | $ | 320,019,189 | | | $ | 957,270,759 | |
| | | | | | | | | | | | | | | | |
NET ASSETS REPRESENTED BY: | | | | | | | | | | | | | | | | |
Paid-in capital | | $ | 1,081,414,590 | | | $ | 2,117,600,571 | | | $ | 309,802,793 | | | $ | 963,593,986 | |
Undistributed net investment income | | | 3,483,488 | | | | 488,273 | | | | 396,382 | | | | 3,845,757 | |
Accumulated net realized loss on investments and foreign currency transactions | | | (38,823,476 | ) | | | (526,162,680 | ) | | | (16,250,758 | ) | | | (34,407,190 | ) |
Net unrealized appreciation on investments and foreign currency transactions | | | 116,407,446 | | | | 159,149,282 | | | | 26,070,772 | | | | 24,238,206 | |
| | | | | | | | | | | | | | | | |
NET ASSETS | | $ | 1,162,482,048 | | | $ | 1,751,075,446 | | | $ | 320,019,189 | | | $ | 957,270,759 | |
| | | | | | | | | | | | | | | | |
CAPITAL SHARES: | | | | | | | | | | | | | | | | |
Net Assets | | $ | 1,162,482,048 | | | $ | 1,751,075,446 | | | $ | 320,019,189 | | | $ | 957,270,759 | |
Shares Outstanding | | | 122,449,138 | | | | 209,434,183 | | | | 32,882,003 | | | | 103,406,547 | |
Net Asset Value offering and redemption price per share
(net assets divided by shares outstanding) | | $ | 9.49 | | | $ | 8.36 | | | $ | 9.73 | | | $ | 9.26 | |
Cost of investments | | $ | 1,065,405,339 | | | $ | 1,624,970,521 | | | $ | 303,657,109 | | | $ | 1,013,541,092 | |
Cost of cash denominated in foreign currencies | | $ | 11,448 | | | $ | — | | | $ | — | | | $ | 16 | |
| | | | | | | | | | | | | | | | |
† Includes securities on loan with values of (Note 7): | | $ | 18,975,438 | | | $ | 30,726,352 | | | $ | 9,307,327 | | | $ | 73,139,684 | |
See Notes to Financial Statements.
92
THE VANTAGEPOINT FUNDS
Statements of Assets and Liabilities
December 31, 2011
| | | | | | | | | | | | |
| | | Discovery | | | International | | | Diversifying
Strategies(1) | |
ASSETS: | | | | | | | | | | | | |
Investment in securities, at value† | | $ | 213,727,104 | | | $ | 1,177,830,940 | | | $ | 842,487,957 | |
Cash | | | — | | | | 31,533 | | | | 44,934 | |
Cash denominated in foreign currencies | | | 37 | | | | 5,080,073 | | | | 103,194 | |
Receivables: | | | | | | | | | | | | |
Dividends | | | 160,090 | | | | 2,097,679 | | | | 9,032 | |
Interest | | | 458,865 | | | | — | | | | 4,195,709 | |
Security lending income | | | 34,618 | | | | 39,331 | | | | — | |
Investments sold | | | 505 | | | | 165,313 | | | | 238,048 | |
Fund shares sold | | | 74,179 | | | | 1,724,666 | | | | 423,134 | |
Variation margin on futures contracts | | | — | | | | — | | | | 50,223 | |
Variation margin on purchased options on Euro-Bund futures contracts | | | — | | | | — | | | | 52,495 | |
Recoverable foreign taxes | | | — | | | | 780,238 | | | | 29,932 | |
Due from broker—options contracts collateral | | | — | | | | — | | | | 307,863 | |
Unrealized appreciation on forward foreign currency exchange contracts | | | 33,429 | | | | 834,869 | | | | 4,900,403 | |
| | | | | | | | | | | | |
Total Assets | | | 214,488,827 | | | | 1,188,584,642 | | | | 852,842,924 | |
| | | | | | | | | | | | |
LIABILITIES: | | | | | | | | | | | | |
Payables: | | | | | | | | | | | | |
Investments purchased | | | 1,788,196 | | | | 3,689,473 | | | | 217,881 | |
Distributions | | | 60,013 | | | | — | | | | — | |
Fund shares redeemed | | | 120,431 | | | | 37,370 | | | | 14,871 | |
Variation margin on futures contracts | | | 363,878 | | | | — | | | | — | |
Foreign taxes | | | — | | | | 63,308 | | | | — | |
Collateral for securities loaned | | | 17,935,954 | | | | 42,926,698 | | | | — | |
Written options, at value (Premium $0, $0 and $554,178, respectively) | | | — | | | | — | | | | 819,341 | |
Unrealized depreciation on forward foreign currency exchange contracts | | | — | | | | — | | | | 836,610 | |
Accrued Expenses: | | | | | | | | | | | | |
Advisory fees | | | 16,392 | | | | 95,751 | | | | 71,694 | |
Subadviser fees | | | 209,762 | | | | 1,214,611 | | | | 716,795 | |
Fund services fees | | | 57,374 | | | | 335,135 | | | | 250,931 | |
Administration fees | | | 5,876 | | | | 5,877 | | | | 5,877 | |
Directors’ fees and expenses | | | 2,143 | | | | 12,380 | | | | 8,965 | |
Other accrued expenses | | | 57,126 | | | | 240,380 | | | | 123,193 | |
| | | | | | | | | | | | |
Total Liabilities | | | 20,617,145 | | | | 48,620,983 | | | | 3,066,158 | |
| | | | | | | | | | | | |
NET ASSETS | | $ | 193,871,682 | | | $ | 1,139,963,659 | | | $ | 849,776,766 | |
| | | | | | | | | | | | |
NET ASSETS REPRESENTED BY: | | | | | | | | | | | | |
Paid-in capital | | $ | 198,123,921 | | | $ | 1,322,655,342 | | | $ | 845,925,242 | |
Undistributed net investment income (loss) | | | (1,388 | ) | | | 13,859,239 | | | | (5,792,855 | ) |
Accumulated net realized gain (loss) on investments, futures contracts, foreign currency transactions, purchased options on Euro-Bund futures, written options and swap agreements | | | (8,851,652 | ) | | | (173,692,272 | ) | | | 882,011 | |
Net unrealized appreciation (depreciation) on investments, futures contracts, foreign currency transactions, purchased options on Euro-Bund futures, written options, and swap agreements | | | 4,600,801 | | | | (22,858,650 | ) | | | 8,762,368 | |
| | | | | | | | | | | | |
NET ASSETS | | $ | 193,871,682 | | | $ | 1,139,963,659 | | | $ | 849,776,766 | |
| | | | | | | | | | | | |
CAPITAL SHARES: | | | | | | | | | | | | |
Net Assets | | $ | 193,871,682 | | | $ | 1,139,963,659 | | | $ | 849,776,766 | |
Shares Outstanding | | | 22,180,697 | | | | 136,997,403 | | | | 84,883,903 | |
Net Asset Value offering and redemption price per share
(net assets divided by shares outstanding) | | $ | 8.74 | | | $ | 8.32 | | | $ | 10.01 | |
Cost of investments | | $ | 211,971,993 | | | $ | 1,201,477,074 | | | $ | 839,721,762 | |
Cost of cash denominated in foreign currencies | | $ | 36 | | | $ | 5,097,087 | | | $ | 104,162 | |
†Includes securities on loan with values of (Note 7): | | $ | 16,788,326 | | | $ | 41,512,238 | | | $ | — | |
| (1) | Formerly Diversified Assets Fund. |
See Notes to Financial Statements.
93
THE VANTAGEPOINT FUNDS
Statements of Assets and Liabilities
December 31, 2011
| | | | | | | | | | | | | | | | | | | | |
| | | Core Bond
Index | | | 500 Stock
Index | | | Broad Market
Index | | | Mid/Small
Company
Index | | | Overseas
Equity
Index | |
ASSETS: | | | | | | | | | | | | | | | | | | | | |
Investment in securities, at value† | | $ | 1,222,061,046 | | | $ | 388,609,880 | | | $ | 516,821,220 | | | $ | 442,310,407 | | | $ | 181,054,824 | |
Cash | | | 258,939 | | | | 1,141 | | | | 2,881 | | | | 7,667 | | | | 785 | |
Cash denominated in foreign currencies | | | — | | | | — | | | | — | | | | — | | | | 2,826,140 | |
Receivables: | | | | | | | | | | | | | | | | | | | | |
Dividends | | | 6,250 | | | | 564,691 | | | | 724,758 | | | | 585,633 | | | | 280,265 | |
Interest | | | 7,919,985 | | | | — | | | | — | | | | — | | | | — | |
Security lending income | | | 4,079 | | | | 2,288 | | | | 11,685 | | | | 63,915 | | | | 7,783 | |
Investments sold | | | 17,608,235 | | | | 61,750 | | | | 235 | | | | 634 | | | | — | |
Fund shares sold | | | 5,811,873 | | | | 462,742 | | | | 475,383 | | | | 310,822 | | | | 163,581 | |
Recoverable foreign taxes | | | — | | | | — | | | | 142 | | | | 549 | | | | 222,894 | |
Variation margin on futures contracts | | | — | | | | — | | | | — | | | | — | | | | 38,655 | |
Unrealized appreciation on forward foreign currency exchange contracts | | | — | | | | — | | | | — | | | | — | | | | 10,818 | |
| | | | | | | | | | | | | | | | | | | | |
Total Assets | | | 1,253,670,407 | | | | 389,702,492 | | | | 518,036,304 | | | | 443,279,627 | | | | 184,605,745 | |
| | | | | | | | | | | | | | | | | | | | |
LIABILITIES: | | | | | | | | | | | | | | | | | | | | |
Payables: | | | | | | | | | | | | | | | | | | | | |
Investments purchased | | | 47,738,240 | | | | — | | | | — | | | | 197,998 | | | | — | |
Distributions | | | 3,561,747 | | | | — | | | | — | | | | — | | | | — | |
Fund shares redeemed | | | 4,192 | | | | — | | | | 205,553 | | | | 730,227 | | | | 28,423 | |
Variation margin on futures contracts | | | — | | | | 28,560 | | | | 53,554 | | | | 15,475 | | | | — | |
Collateral for securities loaned | | | 67,598,878 | | | | 8,219,745 | | | | 13,848,786 | | | | 33,680,955 | | | | 6,602,718 | |
Unrealized depreciation on forward foreign currency exchange contracts | | | — | | | | — | | | | — | | | | — | | | | 17,520 | |
Accrued Expenses: | | | | | | | | | | | | | | | | | | | | |
Advisory fees | | | 47,672 | | | | 15,987 | | | | 21,111 | | | | 17,143 | | | | 7,492 | |
Subadviser fees | | | 58,579 | | | | 18,815 | | | | 31,690 | | | | 31,325 | | | | 31,851 | |
Fund services fees | | | 232,575 | | | | 47,792 | | | | 61,432 | | | | 75,857 | | | | 22,534 | |
Administration fees | | | 5,877 | | | | 5,876 | | | | 5,877 | | | | 5,876 | | | | 5,877 | |
Directors’ fees and expenses | | | 11,233 | | | | 3,969 | | | | 5,394 | | | | 4,260 | | | | 2,099 | |
Other accrued expenses | | | 171,336 | | | | 92,293 | | | | 97,452 | | | | 79,085 | | | | 103,252 | |
| | | | | | | | | | | | | | | | | | | | |
Total Liabilities | | | 119,430,329 | | | | 8,433,037 | | | | 14,330,849 | | | | 34,838,201 | | | | 6,821,766 | |
| | | | | | | | | | | | | | | | | | | | |
NET ASSETS | | $ | 1,134,240,078 | | | $ | 381,269,455 | | | $ | 503,705,455 | | | $ | 408,441,426 | | | $ | 177,783,979 | |
| | | | | | | | | | | | | | | | | | | | |
NET ASSETS REPRESENTED BY: | | | | | | | | | | | | | | | | | | | | |
Paid-in capital | | $ | 1,089,978,586 | | | $ | 280,376,193 | | | $ | 367,796,505 | | | $ | 372,557,315 | | | $ | 217,251,139 | |
Undistributed net investment income (loss) | | | 9,575 | | | | 234,960 | | | | 6,064,305 | | | | 1,125,658 | | | | (465,915 | ) |
Accumulated net realized gain (loss) on investments, futures contracts and foreign currency transactions | | | (22,101,196 | ) | | | (12,859,309 | ) | | | (1,480,878 | ) | | | 954,793 | | | | (5,680,601 | ) |
Net unrealized appreciation (depreciation) on investments, futures contracts and foreign currency transactions | | | 66,353,113 | | | | 113,517,611 | | | | 131,325,523 | | | | 33,803,660 | | | | (33,320,644 | ) |
| | | | | | | | | | | | | | | | | | | | |
NET ASSETS | | $ | 1,134,240,078 | | | $ | 381,269,455 | | | $ | 503,705,455 | | | $ | 408,441,426 | | | $ | 177,783,979 | |
| | | | | | | | | | | | | | | | | | | | |
CAPITAL SHARES: | | | | | | | | | | | | | | | | | | | | |
Net Assets—Class I | | $ | 813,430,671 | | | $ | 94,196,994 | | | $ | 114,674,213 | | | $ | 247,731,818 | | | $ | 44,910,706 | |
Shares Outstanding—Class I | | | 77,713,886 | | | | 9,456,750 | | | | 10,569,557 | | | | 17,665,707 | | | | 4,888,145 | |
Net Asset Value—Class I, offering and redemption price per share (net assets divided by shares outstanding) | | $ | 10.47 | | | $ | 9.96 | | | $ | 10.85 | | | $ | 14.02 | | | $ | 9.19 | |
Net Assets—Class II | | $ | 320,809,407 | | | $ | 287,072,461 | | | $ | 389,031,242 | | | $ | 160,709,608 | | | $ | 132,873,273 | |
Shares Outstanding—Class II | | | 30,474,234 | | | | 30,573,119 | | | | 38,180,520 | | | | 12,116,778 | | | | 15,446,879 | |
Net Asset Value—Class II, offering and redemption price per share (net assets divided by shares outstanding) | | $ | 10.53 | | | $ | 9.39 | | | $ | 10.19 | | | $ | 13.26 | | | $ | 8.60 | |
Cost of investments | | $ | 1,155,707,933 | | | $ | 275,119,110 | | | $ | 385,546,941 | | | $ | 408,552,465 | | | $ | 214,402,455 | |
Cost of cash denominated in foreign currencies | | $ | — | | | $ | — | | | $ | — | | | $ | — | | | $ | 2,833,026 | |
| | | | | | | | | | | | | | | | | | | | |
† Includes securities on loan with values of (Note 7): | | $ | 65,318,202 | | | $ | 7,883,342 | | | $ | 13,383,315 | | | $ | 32,423,689 | | | $ | 6,316,643 | |
See Notes to Financial Statements.
94
THE VANTAGEPOINT FUNDS
Statements of Assets and Liabilities
December 31, 2011
| | | | | | | | | | | | | | | | | | | | |
| | | Model Portfolio Funds | |
| | | Savings
Oriented | | | Conservative
Growth | | | Traditional
Growth | | | Long-Term
Growth | | | All-Equity
Growth | |
ASSETS: | | | | | | | | | | | | | | | | | | | | |
Investment in securities of affiliated Mutual Funds, at value(a) | | $ | 288,528,239 | | | $ | 556,247,434 | | | $ | 1,366,272,141 | | | $ | 1,712,421,212 | | | $ | 649,916,761 | |
Receivables: | | | | | | | | | | | | | | | | | | | | |
Dividends | | | 874,948 | | | | 1,217,226 | | | | 1,557,352 | | | | 711,149 | | | | 18,332 | |
Investments sold | | | 47,158 | | | | 45,006 | | | | 101,644 | | | | 124,224 | | | | 51,831 | |
Fund shares sold | | | 5,844,013 | | | | 10,192,639 | | | | 33,353,083 | | | | 55,091,310 | | | | 10,172,415 | |
| | | | | | | | | | | | | | | | | | | | |
Total Assets | | | 295,294,358 | | | | 567,702,305 | | | | 1,401,284,220 | | | | 1,768,347,895 | | | | 660,159,339 | |
| | | | | | | | | | | | | | | | | | | | |
LIABILITIES: | | | | | | | | | | | | | | | | | | | | |
Payables: | | | | | | | | | | | | | | | | | | | | |
Investments purchased | | | 876,995 | | | | 1,389,181 | | | | 2,309,487 | | | | 1,385,684 | | | | 568,466 | |
Distributions | | | 5,782,341 | | | | 10,020,684 | | | | 32,605,404 | | | | 54,399,874 | | | | 9,622,281 | |
Fund shares redeemed | | | 84,172 | | | | — | | | | — | | | | 16,901 | | | | — | |
Accrued Expenses: | | | | | | | | | | | | | | | | | | | | |
Advisory fees | | | 25,220 | | | | 48,023 | | | | 108,454 | | | | 132,553 | | | | 55,313 | |
Administration fees | | | 4,893 | | | | 4,893 | | | | 4,893 | | | | 4,893 | | | | 4,893 | |
Directors’ fees and expenses | | | 3,400 | | | | 5,903 | | | | 14,953 | | | | 18,685 | | | | 7,307 | |
Other accrued expenses | | | 50,330 | | | | 69,678 | | | | 133,266 | | | | 161,191 | | | | 75,570 | |
| | | | | | | | | | | | | | | | | | | | |
Total Liabilities | | | 6,827,351 | | | | 11,538,362 | | | | 35,176,457 | | | | 56,119,781 | | | | 10,333,830 | |
| | | | | | | | | | | | | | | | | | | | |
NET ASSETS | | $ | 288,467,007 | | | $ | 556,163,943 | | | $ | 1,366,107,763 | | | $ | 1,712,228,114 | | | $ | 649,825,509 | |
| | | | | | | | | | | | | | | | | | | | |
NET ASSETS REPRESENTED BY: | | | | | | | | | | | | | | | | | | | | |
Paid-in capital | | $ | 282,209,921 | | | $ | 550,364,401 | | | $ | 1,384,580,886 | | | $ | 1,739,654,665 | | | $ | 696,981,884 | |
Undistributed net investment income | | | 357,959 | | | | 953,889 | | | | 269,550 | | | | 328,469 | | | | 1,284,933 | |
Accumulated net realized loss on investments | | | (8,571,659 | ) | | | (8,420,516 | ) | | | (19,205,377 | ) | | | (6,277,507 | ) | | | (7,057,957 | ) |
Net unrealized appreciation (depreciation) on investments | | | 14,470,786 | | | | 13,266,169 | | | | 462,704 | | | | (21,477,513 | ) | | | (41,383,351 | ) |
| | | | | | | | | | | | | | | | | | | | |
NET ASSETS | | $ | 288,467,007 | | | $ | 556,163,943 | | | $ | 1,366,107,763 | | | $ | 1,712,228,114 | | | $ | 649,825,509 | |
| | | | | | | | | | | | | | | | | | | | |
CAPITAL SHARES: | | | | | | | | | | | | | | | | | | | | |
Net Assets | | $ | 288,467,007 | | | $ | 556,163,943 | | | $ | 1,366,107,763 | | | $ | 1,712,228,114 | | | $ | 649,825,509 | |
Shares Outstanding | | | 11,823,082 | | | | 23,707,374 | | | | 63,494,929 | | | | 84,275,500 | | | | 34,764,368 | |
Net Asset Value offering and redemption price per share
(net assets divided by shares outstanding) | | $ | 24.40 | | | $ | 23.46 | | | $ | 21.52 | | | $ | 20.32 | | | $ | 18.69 | |
Cost of investments | | $ | 274,057,453 | | | $ | 542,981,265 | | | $ | 1,365,809,437 | | | $ | 1,733,898,725 | | | $ | 691,300,112 | |
| (a) | Investment in other Vantagepoint Funds (Note 1). |
See Notes to Financial Statements.
95
THE VANTAGEPOINT FUNDS
Statements of Assets and Liabilities
December 31, 2011
| | | | | | | | | | | | | | | | | | | | |
| | | Milestone Funds | |
| | | Milestone
Retirement
Income | | | Milestone
2010 | | | Milestone
2015 | | | Milestone
2020 | | | Milestone
2025 | |
ASSETS: | | | | | | | | | | | | | | | | | | | | |
Investment in securities of affiliated Mutual Funds, at value(a) | | $ | 220,116,455 | | | $ | 222,325,346 | | | $ | 381,911,839 | | | $ | 386,381,155 | | | $ | 301,326,348 | |
Receivables: | | | | | | | | | | | | | | | | | | | | |
Dividends | | | 667,904 | | | | 626,284 | | | | 722,369 | | | | 289,260 | | | | 133,520 | |
Investments sold | | | 37,542 | | | | 58,816 | | | | 31,152 | | | | 31,355 | | | | 24,433 | |
Fund shares sold | | | 8,246,893 | | | | 6,128,733 | | | | 9,818,795 | | | | 8,251,757 | | | | 6,627,578 | |
| | | | | | | | | | | | | | | | | | | | |
Total Assets | | | 229,068,794 | | | | 229,139,179 | | | | 392,484,155 | | | | 394,953,527 | | | | 308,111,879 | |
| | | | | | | | | | | | | | | | | | | | |
LIABILITIES: | | | | | | | | | | | | | | | | | | | | |
Payables: | | | | | | | | | | | | | | | | | | | | |
Investments purchased | | | 668,692 | | | | 627,615 | | | | 927,154 | | | | 583,203 | | | | 483,982 | |
Distributions | | | 8,226,455 | | | | 6,091,196 | | | | 9,614,010 | | | | 7,957,814 | | | | 6,277,116 | |
Fund shares redeemed | | | 39,164 | | | | 76,803 | | | | — | | | | — | | | | — | |
Accrued Expenses: | | | | | | | | | | | | | | | | | | | | |
Advisory fees | | | 19,233 | | | | 19,438 | | | | 33,244 | | | | 33,472 | | | | 26,083 | |
Administration fees | | | 4,893 | | | | 4,893 | | | | 4,893 | | | | 4,893 | | | | 4,893 | |
Directors’ fees and expenses | | | 2,224 | | | | 2,247 | | | | 3,801 | | | | 3,668 | | | | 2,850 | |
Other accrued expenses | | | 45,585 | | | | 42,326 | | | | 45,593 | | | | 43,490 | | | | 42,326 | |
| | | | | | | | | | | | | | | | | | | | |
Total Liabilities | | | 9,006,246 | | | | 6,864,518 | | | | 10,628,695 | | | | 8,626,540 | | | | 6,837,250 | |
| | | | | | | | | | | | | | | | | | | | |
NET ASSETS | | $ | 220,062,548 | | | $ | 222,274,661 | | | $ | 381,855,460 | | | $ | 386,326,987 | | | $ | 301,274,629 | |
| | | | | | | | | | | | | | | | | | | | |
NET ASSETS REPRESENTED BY: | | | | | | | | | | | | | | | | | | | | |
Paid-in capital | | $ | 221,485,676 | | | $ | 222,788,022 | | | $ | 383,780,741 | | | $ | 387,076,415 | | | $ | 301,121,870 | |
Undistributed net investment income | | | — | | | | — | | | | — | | | | 6,793 | | | | 8,340 | |
Accumulated net realized loss on investments | | | (2,310,727 | ) | | | (2,563,258 | ) | | | (8,620,057 | ) | | | (6,967,836 | ) | | | (4,001,720 | ) |
Net unrealized appreciation on investments | | | 887,599 | | | | 2,049,897 | | | | 6,694,776 | | | | 6,211,615 | | | | 4,146,139 | |
| | | | | | | | | | | | | | | | | | | | |
NET ASSETS | | $ | 220,062,548 | | | $ | 222,274,661 | | | $ | 381,855,460 | | | $ | 386,326,987 | | | $ | 301,274,629 | |
| | | | | | | | | | | | | | | | | | | | |
CAPITAL SHARES: | | | | | | | | | | | | | | | | | | | | |
Net Assets | | $ | 220,062,548 | | | $ | 222,274,661 | | | $ | 381,855,460 | | | $ | 386,326,987 | | | $ | 301,274,629 | |
Shares Outstanding | | | 21,618,502 | | | | 21,997,421 | | | | 37,600,428 | | | | 38,237,540 | | | | 30,216,917 | |
Net Asset Value offering and redemption price per share
(net assets divided by shares outstanding) | | $ | 10.18 | | | $ | 10.10 | | | $ | 10.16 | | | $ | 10.10 | | | $ | 9.97 | |
Cost of investments | | $ | 219,228,856 | | | $ | 220,275,449 | | | $ | 375,217,063 | | | $ | 380,169,540 | | | $ | 297,180,209 | |
| (a) | Investment in other Vantagepoint Funds (Note 1). |
See Notes to Financial Statements.
96
THE VANTAGEPOINT FUNDS
Statements of Assets and Liabilities
December 31, 2011
| | | | | | | | | | | | | | | | |
| | | Milestone Funds | |
| | | Milestone
2030 | | | Milestone
2035 | | | Milestone
2040 | | | Milestone
2045 | |
ASSETS: | | | | | | | | | | | | | | | | |
Investment in securities of affiliated Mutual Funds, at value(a) | | $ | 236,502,085 | | | $ | 150,518,411 | | | $ | 146,081,366 | | | $ | 33,475,142 | |
Receivables: | | | | | | | | | | | | | | | | |
Dividends | | | 69,940 | | | | 26,714 | | | | 22,519 | | | | 5,237 | |
Investments sold | | | 19,163 | | | | 12,144 | | | | 11,825 | | | | 2,707 | |
Fund shares sold | | | 4,729,211 | | | | 3,098,702 | | | | 2,828,986 | | | | 982,106 | |
| | | | | | | | | | | | | | | | |
Total Assets | | | 241,320,399 | | | | 153,655,971 | | | | 148,944,696 | | | | 34,465,192 | |
| | | | | | | | | | | | | | | | |
LIABILITIES: | | | | | | | | | | | | | | | | |
Payables: | | | | | | | | | | | | | | | | |
Investments purchased | | | 429,273 | | | | 288,704 | | | | 360,491 | | | | 71,655 | |
Distributions | | | 4,369,878 | | | | 2,836,713 | | | | 2,491,014 | | | | 915,688 | |
Accrued Expenses: | | | | | | | | | | | | | | | | |
Advisory fees | | | 20,458 | | | | 12,969 | | | | 12,625 | | | | 2,890 | |
Administration fees | | | 4,893 | | | | 4,893 | | | | 4,893 | | | | 5,002 | |
Directors’ fees and expenses | | | 2,240 | | | | 1,414 | | | | 1,400 | | | | 223 | |
Other accrued expenses | | | 41,177 | | | | 39,660 | | | | 41,901 | | | | 36,081 | |
| | | | | | | | | | | | | | | | |
Total Liabilities | | | 4,867,919 | | | | 3,184,353 | | | | 2,912,324 | | | | 1,031,539 | |
| | | | | | | | | | | | | | | | |
NET ASSETS | | $ | 236,452,480 | | | $ | 150,471,618 | | | $ | 146,032,372 | | | $ | 33,433,653 | |
| | | | | | | | | | | | | | | | |
NET ASSETS REPRESENTED BY: | | | | | | | | | | | | | | | | |
Paid-in capital | | $ | 233,899,907 | | | $ | 148,104,096 | | | $ | 141,141,901 | | | $ | 32,840,026 | |
Undistributed net investment income | | | 8,932 | | | | 5,054 | | | | 2,990 | | | | — | |
Accumulated net realized gain (loss) on investments | | | (2,828,290 | ) | | | (2,218,754 | ) | | | (6,909,128 | ) | | | 502,024 | |
Net unrealized appreciation on investments | | | 5,371,931 | | | | 4,581,222 | | | | 11,796,609 | | | | 91,603 | |
| | | | | | | | | | | | | | | | |
NET ASSETS | | $ | 236,452,480 | | | $ | 150,471,618 | | | $ | 146,032,372 | | | $ | 33,433,653 | |
| | | | | | | | | | | | | | | | |
CAPITAL SHARES: | | | | | | | | | | | | | | | | |
Net Assets | | $ | 236,452,480 | | | $ | 150,471,618 | | | $ | 146,032,372 | | | $ | 33,433,653 | |
Shares Outstanding | | | 23,651,239 | | | | 15,264,320 | | | | 14,817,707 | | | | 3,121,914 | |
Net Asset Value offering and redemption price per share
(net assets divided by shares outstanding) | | $ | 10.00 | | | $ | 9.86 | | | $ | 9.86 | | | $ | 10.71 | |
Cost of investments | | $ | 231,130,154 | | | $ | 145,937,189 | | | $ | 134,284,757 | | | $ | 33,383,539 | |
| (a) | Investment in other Vantagepoint Funds (Note 1). |
See Notes to Financial Statements.
97
THE VANTAGEPOINT FUNDS
Statements of Operations
For the Year Ended December 31, 2011
| | | | | | | | | | | | |
| | | Low
Duration
Bond | | | Inflation
Protected
Securities | | | Equity
Income | |
INVESTMENT INCOME: | | | | | | | | | | | | |
Dividends | | $ | 37,986 | | | $ | 60,102 | | | $ | 39,882,165 | |
Interest | | | 13,846,799 | | | | 18,616,321 | | | | — | |
Security lending income | | | 11,756 | | | | 32,722 | | | | 468,956 | |
Foreign taxes withheld on dividends | | | — | | | | (2,675 | ) | | | (187,885 | ) |
| | | | | | | | | | | | |
Total investment income | | | 13,896,541 | | | | 18,706,470 | | | | 40,163,236 | |
| | | | | | | | | | | | |
EXPENSES: | | | | | | | | | | | | |
Advisory (Note 4) | | | 544,108 | | | | 521,400 | | | | 1,862,685 | |
Subadviser | | | 750,488 | | | | 777,814 | | | | 6,734,963 | |
Fund services | | | 1,904,409 | | | | 1,824,929 | | | | 6,519,499 | |
Custodian | | | 43,820 | | | | 59,259 | | | | 42,894 | |
Administration | | | 17,951 | | | | 17,951 | | | | 17,951 | |
Fund accounting | | | 22,499 | | | | 22,499 | | | | 72,606 | |
Legal | | | 29,943 | | | | 27,538 | | | | 102,722 | |
Audit | | | 23,244 | | | | 23,180 | | | | 23,014 | |
Directors | | | 9,309 | | | | 8,437 | | | | 32,289 | |
State license fees and memberships | | | 23,725 | | | | 37,975 | | | | 45,582 | |
Other expenses | | | 27,423 | | | | 41,518 | | | | 109,763 | |
| | | | | | | | | | | | |
Total expenses | | | 3,396,919 | | | | 3,362,500 | | | | 15,563,968 | |
Less waivers (Note 4) | | | — | | | | — | | | | (76,072 | ) |
| | | | | | | | | | | | |
Net Expenses | | | 3,396,919 | | | | 3,362,500 | | | | 15,487,896 | |
| | | | | | | | | | | | |
NET INVESTMENT INCOME | | | 10,499,622 | | | | 15,343,970 | | | | 24,675,340 | |
| | | | | | | | | | | | |
NET REALIZED AND UNREALIZED GAIN (LOSS) (Note 2): | | | | | | | | | | | | |
Net realized gain (loss) on: | | | | | | | | | | | | |
Investments | | | 2,753,773 | | | | 18,842,962 | | | | 82,080,509 | |
Forward contracts and foreign currency transactions | | | (251,249 | ) | | | 13,041 | | | | (6,181 | ) |
Futures contracts | | | (579,024 | ) | | | (3,963,927 | ) | | | — | |
Options written | | | — | | | | 422,566 | | | | — | |
Swap agreements | | | — | | | | (407,271 | ) | | | — | |
| | | | | | | | | | | | |
Net realized gain | | | 1,923,500 | | | | 14,907,371 | | | | 82,074,328 | |
| | | | | | | | | | | | |
Net change in unrealized appreciation (depreciation) on: | | | | | | | | | | | | |
Investments | | | (6,308,739 | ) | | | 26,527,872 | | | | (102,159,957 | ) |
Forward contracts and foreign currency transactions | | | 127,754 | | | | (12,535 | ) | | | (460 | ) |
Futures contracts | | | 19,017 | | | | (271,062 | ) | | | — | |
Options written | | | — | | | | 499,864 | | | | — | |
Swap agreements | | | — | | | | 202,684 | | | | — | |
| | | | | | | | | | | | |
Net change in unrealized appreciation (depreciation) | | | (6,161,968 | ) | | | 26,946,823 | | | | (102,160,417 | ) |
| | | | | | | | | | | | |
NET GAIN (LOSS) | | | (4,238,468 | ) | | | 41,854,194 | | | | (20,086,089 | ) |
| | | | | | | | | | | | |
NET INCREASE IN NET ASSETS RESULTING FROM OPERATIONS | | $ | 6,261,154 | | | $ | 57,198,164 | | | $ | 4,589,251 | |
| | | | | | | | | | | | |
See Notes to Financial Statements.
98
THE VANTAGEPOINT FUNDS
Statements of Operations
For the Year Ended December 31, 2011
| | | | | | | | | | | | | | | | |
| | | Growth &
Income | | | Growth | | | Select Value | | | Aggressive
Opportunities | |
INVESTMENT INCOME: | | | | | | | | | | | | | | | | |
Dividends | | $ | 22,689,817 | | | $ | 24,078,535 | | | $ | 6,446,450 | | | $ | 11,897,521 | |
Security lending income | | | 137,477 | | | | 257,910 | | | | 31,845 | | | | 374,573 | |
Foreign taxes withheld on dividends | | | (656 | ) | | | (70,862 | ) | | | (1,611 | ) | | | (252,284 | ) |
| | | | | | | | | | | | | | | | |
Total investment income | | | 22,826,638 | | | | 24,265,583 | | | | 6,476,684 | | | | 12,019,810 | |
| | | | | | | | | | | | | | | | |
EXPENSES: | | | | | | | | | | | | | | | | |
Advisory (Note 4) | | | 1,203,665 | | | | 1,876,402 | | | | 332,606 | | | | 1,068,607 | |
Subadviser | | | 3,665,519 | | | | 6,625,024 | | | | 1,643,615 | | | | 4,658,070 | |
Fund services | | | 4,212,894 | | | | 6,567,510 | | | | 1,164,139 | | | | 3,740,185 | |
Custodian | | | 32,901 | | | | 17,148 | | | | 18,185 | | | | 37,632 | |
Administration | | | 17,951 | | | | 17,951 | | | | 17,951 | | | | 17,951 | |
Fund accounting | | | 47,281 | | | | 87,283 | | | | 34,368 | | | | 46,078 | |
Legal | | | 68,208 | | | | 103,291 | | | | 18,995 | | | | 63,816 | |
Audit | | | 23,141 | | | | 22,984 | | | | 23,243 | | | | 23,244 | |
Directors | | | 20,984 | | | | 33,345 | | | | 5,802 | | | | 19,409 | |
State license fees and memberships | | | 37,122 | | | | 44,380 | | | | 18,980 | | | | 30,912 | |
Other expenses | | | 65,766 | | | | 88,091 | | | | 14,491 | | | | 50,424 | |
| | | | | | | | | | | | | | | | |
Total expenses | | | 9,395,432 | | | | 15,483,409 | | | | 3,292,375 | | | | 9,756,328 | |
Less waivers (Note 4) | | | (41,831 | ) | | | (339,560 | ) | | | — | | | | — | |
| | | | | | | | | | | | | | | | |
Net Expenses | | | 9,353,601 | | | | 15,143,849 | | | | 3,292,375 | | | | 9,756,328 | |
| | | | | | | | | | | | | | | | |
NET INVESTMENT INCOME | | | 13,473,037 | | | | 9,121,734 | | | | 3,184,309 | | | | 2,263,482 | |
| | | | | | | | | | | | | | | | |
NET REALIZED AND UNREALIZED (LOSS) (Note 2): | | | | | | | | | | | | | | | | |
Net realized gain (loss) on: | | | | | | | | | | | | | | | | |
Investments | | | 93,695,272 | | | | 109,646,065 | | | | 34,844,389 | | | | 58,474,759 | |
Forward contracts and foreign currency transactions | | | (50,156 | ) | | | — | | | | — | | | | (657 | ) |
| | | | | | | | | | | | | | | | |
Net realized gain | | | 93,645,116 | | | | 109,646,065 | | | | 34,844,389 | | | | 58,474,102 | |
| | | | | | | | | | | | | | | | |
Net change in unrealized appreciation (depreciation) on: | | | | | | | | | | | | | | | | |
Investments | | | (112,362,003 | ) | | | (194,568,063 | ) | | | (36,822,309 | ) | | | (168,765,390 | ) |
Forward contracts and foreign currency transactions | | | (1,375 | ) | | | — | | | | — | | | | (362 | ) |
| | | | | | | | | | | | | | | | |
Net change in unrealized depreciation | | | (112,363,378 | ) | | | (194,568,063 | ) | | | (36,822,309 | ) | | | (168,765,752 | ) |
| | | | | | | | | | | | | | | | |
NET LOSS | | | (18,718,262 | ) | | | (84,921,998 | ) | | | (1,977,920 | ) | | | (110,291,650 | ) |
| | | | | | | | | | | | | | | | |
NET INCREASE (DECREASE) IN NET ASSETS RESULTING FROM OPERATIONS | | $ | (5,245,225 | ) | | $ | (75,800,264 | ) | | $ | 1,206,389 | | | $ | (108,028,168 | ) |
| | | | | | | | | | | | | | | | |
See Notes to Financial Statements.
99
THE VANTAGEPOINT FUNDS
Statements of Operations
For the Year Ended December 31, 2011
| | | | | | | | | | | | |
| | | Discovery | | | International | | | Diversifying
Strategies(1) | |
INVESTMENT INCOME: | | | | | | | | | | | | |
Dividends | | $ | 1,647,127 | | | $ | 40,486,625 | | | $ | 1,203,879 | |
Interest | | | 2,023,263 | | | | 7,916 | | | | 14,988,998 | |
Security lending income | | | 435,069 | | | | 1,489,124 | | | | — | |
Foreign taxes withheld on dividends | | | (13,759 | ) | | | (3,537,022 | ) | | | (18,085 | ) |
| | | | | | | | | | | | |
Total investment income | | | 4,091,700 | | | | 38,446,643 | | | | 16,174,792 | |
| | | | | | | | | | | | |
EXPENSES: | | | | | | | | | | | | |
Advisory (Note 4) | | | 204,046 | | | | 1,195,439 | | | | 878,041 | |
Subadviser | | | 888,796 | | | | 5,671,129 | | | | 3,607,948 | |
Fund services | | | 714,173 | | | | 4,184,103 | | | | 3,073,190 | |
Custodian | | | 38,334 | | | | 210,825 | | | | 112,455 | |
Administration | | | 17,951 | | | | 17,951 | | | | 17,951 | |
Fund accounting | | | 18,648 | | | | 58,534 | | | | 41,174 | |
Legal | | | 11,889 | | | | 67,802 | | | | 148,148 | |
Audit | | | 23,244 | | | | 23,122 | | | | 23,244 | |
Directors | | | 3,620 | | | | 20,843 | | | | 15,059 | |
State license fees and memberships | | | 17,885 | | | | 37,257 | | | | 7,519 | |
Other expenses | | | 9,803 | | | | 83,512 | | | | 90,521 | |
| | | | | | | | | | | | |
Total expenses | | | 1,948,389 | | | | 11,570,517 | | | | 8,015,250 | |
Less waivers (Note 4) | | | — | | | | (158,991 | ) | | | (594,582 | ) |
| | | | | | | | | | | | |
Net Expenses | | | 1,948,389 | | | | 11,411,526 | | | | 7,420,668 | |
| | | | | | | | | | | | |
NET INVESTMENT INCOME | | | 2,143,311 | | | | 27,035,117 | | | | 8,754,124 | |
| | | | | | | | | | | | |
NET REALIZED AND UNREALIZED (LOSS) (Note 2): | | | | | | | | | | | | |
Net realized gain (loss) on: | | | | | | | | | | | | |
Investments | | | 8,872,967 | | | | 14,450,774 | | | | 17,499,596 | |
Forward contracts and foreign currency transactions | | | (104,104 | ) | | | (309,539 | ) | | | (4,798,215 | ) |
Futures contracts | | | (3,505,283 | ) | | | — | | | | (3,420,220 | ) |
Written options | | | — | | | | — | | | | 247,986 | |
Purchased options on Euro-Bund futures contracts | | | — | | | | — | | | | (6,297,919 | ) |
Swap agreements | | | — | | | | — | | | | (101,348 | ) |
| | | | | | | | | | | | |
Net realized gain | | | 5,263,580 | | | | 14,141,235 | | | | 3,129,880 | |
| | | | | | | | | | | | |
Net change in unrealized appreciation (depreciation) on: | | | | | | | | | | | | |
Investments | | | (19,235,698 | ) | | | (138,572,330 | )(a) | | | (19,508,229 | ) |
Forward contracts and foreign currency transactions | | | 33,156 | | | | 716,501 | | | | 3,149,463 | |
Futures contracts | | | 440,364 | | | | — | | | | (219,469 | ) |
Written options | | | — | | | | — | | | | (282,401 | ) |
Purchased options on Euro-Bund futures contracts | | | — | | | | — | | | | 2,475,721 | |
Swap agreements | | | — | | | | — | | | | 1,853,545 | |
| | | | | | | | | | | | |
Net change in unrealized depreciation | | | (18,762,178 | ) | | | (137,855,829 | ) | | | (12,531,370 | ) |
| | | | | | | | | | | | |
NET LOSS | | | (13,498,598 | ) | | | (123,714,594 | ) | | | (9,401,490 | ) |
| | | | | | | | | | | | |
NET DECREASE IN NET ASSETS RESULTING FROM OPERATIONS | | $ | (11,355,287 | ) | | $ | (96,679,477 | ) | | $ | (647,366 | ) |
| | | | | | | | | | | | |
| (a) | Net of decrease in deferred foreign tax of $60,606. |
| (1) | Formerly Diversified Assets Fund. |
See Notes to Financial Statements.
100
THE VANTAGEPOINT FUNDS
Statements of Operations
For the Year Ended December 31, 2011
| | | | | | | | | | | | | | | | | | | | |
| | | Core Bond
Index | | | 500 Stock
Index | | | Broad
Market
Index | | | Mid/Small
Company
Index | | | Overseas
Equity
Index | |
INVESTMENT INCOME: | | | | | | | | | | | | | | | | | | | | |
Dividends | | $ | 33,345 | | | $ | 7,960,535 | | | $ | 10,070,585 | | | $ | 5,925,591 | | | $ | 7,241,216 | |
Interest | | | 37,811,648 | | | | 443 | | | | 229 | | | | 243 | | | | 1,669 | |
Security lending income | | | 71,417 | | | | 44,068 | | | | 156,906 | | | | 497,144 | | | | 229,627 | |
Foreign taxes withheld on dividends | | | (1,377 | ) | | | — | | | | (1,187 | ) | | | (3,923 | ) | | | (596,633 | ) |
| | | | | | | | | | | | | | | | | | | | |
Total investment income | | | 37,915,033 | | | | 8,005,046 | | | | 10,226,533 | | | | 6,419,055 | | | | 6,875,879 | |
| | | | | | | | | | | | | | | | | | | | |
EXPENSES: | | | | | | | | | | | | | | | | | | | | |
Advisory (Note 4) | | | 558,165 | | | | 192,842 | | | | 258,362 | | | | 209,324 | | | | 99,511 | |
Subadviser | | | 236,621 | | | | 77,859 | | | | 120,020 | | | | 128,721 | | | | 139,410 | |
Fund services Class I | | | 2,478,890 | | | | 297,449 | | | | 370,009 | | | | 748,539 | | | | 160,533 | |
Fund services Class II | | | 290,014 | | | | 286,533 | | | | 393,384 | | | | 169,129 | | | | 145,510 | |
Custodian | | | 133,339 | | | | 22,165 | | | | 40,192 | | | | 38,777 | | | | 44,880 | |
Administration | | | 17,951 | | | | 17,951 | | | | 17,951 | | | | 17,951 | | | | 17,951 | |
Fund accounting | | | 40,429 | | | | 22,499 | | | | 22,498 | | | | 22,499 | | | | 22,499 | |
Legal | | | 61,562 | | | | 21,356 | | | | 30,271 | | | | 22,521 | | | | 10,418 | |
Audit | | | 23,245 | | | | 23,246 | | | | 23,246 | | | | 23,243 | | | | 23,243 | |
Directors | | | 18,861 | | | | 6,681 | | | | 9,122 | | | | 7,141 | | | | 3,543 | |
State license fees and memberships | | | 43,889 | | | | 64,187 | | | | 42,675 | | | | 40,904 | | | | 55,053 | |
Other expenses | | | 48,556 | | | | 21,760 | | | | 25,680 | | | | 34,347 | | | | 63,063 | |
| | | | | | | | | | | | | | | | | | | | |
Total expenses | | | 3,951,522 | | | | 1,054,528 | | | | 1,353,410 | | | | 1,463,096 | | | | 785,614 | |
| | | | | | | | | | | | | | | | | | | | |
NET INVESTMENT INCOME | | | 33,963,511 | | | | 6,950,518 | | | | 8,873,123 | | | | 4,955,959 | | | | 6,090,265 | |
| | | | | | | | | | | | | | | | | | | | |
NET REALIZED AND UNREALIZED GAIN (LOSS) (Note 2): | | | | | | | | | | | | | | | | | | | | |
Net realized gain (loss) on: | | | | | | | | | | | | | | | | | | | | |
Investments | | | 13,157,942 | | | | 4,828,842 | | | | 16,504,617 | | | | 17,603,556 | | | | (1,221,463 | ) |
Forward contracts and foreign currency transactions | | | — | | | | — | | | | — | | | | — | | | | 56,349 | |
Futures contracts | | | — | | | | 1,018,891 | | | | 742,739 | | | | (778,542 | ) | | | (306,178 | ) |
| | | | | | | | | | | | | | | | | | | | |
Net realized gain (loss) | | | 13,157,942 | | | | 5,847,733 | | | | 17,247,356 | | | | 16,825,014 | | | | (1,471,292 | ) |
| | | | | | | | | | | | | | | | | | | | |
Net change in unrealized appreciation (depreciation) on: | | | | | | | | | | | | | | | | | | | | |
Investments | | | 34,307,648 | | | | (4,795,590 | ) | | | (19,054,951 | ) | | | (36,497,049 | ) | | | (29,359,699 | ) |
Forward contracts and foreign currency transactions | | | — | | | | — | | | | — | | | | — | | | | (7,827 | ) |
Futures contracts | | | — | | | | (162,717 | ) | | | (46,596 | ) | | | 51,515 | | | | 45,105 | |
| | | | | | | | | | | | | | | | | | | | |
Net change in unrealized appreciation (depreciation) | | | 34,307,648 | | | | (4,958,307 | ) | | | (19,101,547 | ) | | | (36,445,534 | ) | | | (29,322,421 | ) |
| | | | | | | | | | | | | | | | | | | | |
NET GAIN (LOSS) | | | 47,465,590 | | | | 889,426 | | | | (1,854,191 | ) | | | (19,620,520 | ) | | | (30,793,713 | ) |
| | | | | | | | | | | | | | | | | | | | |
NET INCREASE (DECREASE) IN NET ASSETS RESULTING FROM OPERATIONS | | $ | 81,429,101 | | | $ | 7,839,944 | | | $ | 7,018,932 | | | $ | (14,664,561 | ) | | $ | (24,703,448 | ) |
| | | | | | | | | | | | | | | | | | | | |
See Notes to Financial Statements.
101
THE VANTAGEPOINT FUNDS
Statements of Operations
For the Year Ended December 31, 2011
| | | | | | | | | | | | | | | | | | | | |
| | | Model Portfolio Funds | |
| | | Savings
Oriented | | | Conservative
Growth | | | Traditional
Growth | | | Long-Term
Growth | | | All-Equity
Growth | |
INVESTMENT INCOME: | | | | | | | | | | | | | | | | | | | | |
Dividend income from affiliated mutual funds(a) | | $ | 6,085,881 | | | $ | 10,307,657 | | | $ | 23,508,287 | | | $ | 27,569,033 | | | $ | 9,503,904 | |
| | | | | | | | | | | | | | | | | | | | |
Total investment income | | | 6,085,881 | | | | 10,307,657 | | | | 23,508,287 | | | | 27,569,033 | | | | 9,503,904 | |
| | | | | | | | | | | | | | | | | | | | |
EXPENSES: | | | | | | | | | | | | | | | | | | | | |
Advisory (Note 4) | | | 320,867 | | | | 567,588 | | | | 1,301,301 | | | | 1,590,047 | | | | 677,215 | |
Custodian | | | 2,190 | | | | 2,190 | | | | 2,190 | | | | 2,190 | | | | 2,190 | |
Administration | | | 14,958 | | | | 14,957 | | | | 14,958 | | | | 14,958 | | | | 14,958 | |
Fund accounting | | | 12,465 | | | | 17,885 | | | | 46,132 | | | | 62,118 | | | | 25,708 | |
Legal | | | 18,888 | | | | 32,573 | | | | 83,573 | | | | 103,090 | | | | 39,891 | |
Audit | | | 17,498 | | | | 17,435 | | | | 17,337 | | | | 17,498 | | | | 17,498 | |
Directors | | | 5,723 | | | | 9,946 | | | | 25,242 | | | | 31,506 | | | | 12,326 | |
State license fees and memberships | | | 22,995 | | | | 23,360 | | | | 23,589 | | | | 27,360 | | | | 22,265 | |
Other expenses | | | 17,654 | | | | 29,683 | | | | 70,631 | | | | 93,059 | | | | 40,608 | |
| | | | | | | | | | | | | | | | | | | | |
Total expenses | | | 433,238 | | | | 715,617 | | | | 1,584,953 | | | | 1,941,826 | | | | 852,659 | |
| | | | | | | | | | | | | | | | | | | | |
NET INVESTMENT INCOME | | | 5,652,643 | | | | 9,592,040 | | | | 21,923,334 | | | | 25,627,207 | | | | 8,651,245 | |
| | | | | | | | | | | | | | | | | | | | |
NET REALIZED AND UNREALIZED GAIN (LOSS) (Note 2): | | | | | | | | | | | | | | | | | | | | |
Net realized gain (loss) on investments | | | (2,447,541 | ) | | | 930,730 | | | | 28,813,215 | | | | 29,198,347 | | | | (2,373,384 | ) |
Realized gain distributions from affiliated mutual funds | | | 1,970,756 | | | | 4,722,605 | | | | 12,558,825 | | | | 18,442,349 | | | | 7,041,702 | |
Net change in unrealized appreciation (depreciation) on investments | | | 1,450,544 | | | | (8,573,402 | ) | | | (70,336,673 | ) | | | (108,133,801 | ) | | | (41,317,903 | ) |
| | | | | | | | | | | | | | | | | | | | |
NET GAIN (LOSS) | | | 973,759 | | | | (2,920,067 | ) | | | (28,964,633 | ) | | | (60,493,105 | ) | | | (36,649,585 | ) |
| | | | | | | | | | | | | | | | | | | | |
NET INCREASE (DECREASE) IN NET ASSETS RESULTING FROM OPERATIONS | | $ | 6,626,402 | | | $ | 6,671,973 | | | $ | (7,041,299 | ) | | $ | (34,865,898 | ) | | $ | (27,998,340 | ) |
| | | | | | | | | | | | | | | | | | | | |
| (a) | Received from other Vantagepoint Funds (Note 1). |
See Notes to Financial Statements.
102
THE VANTAGEPOINT FUNDS
Statements of Operations
For the Year Ended December 31, 2011
| | | | | | | | | | | | | | | | | | | | |
| | | Milestone Funds | |
| | | Milestone
Retirement
Income | | | Milestone
2010 | | | Milestone
2015 | | | Milestone
2020 | | | Milestone
2025 | |
INVESTMENT INCOME: | | | | | | | | | | | | | | | | | | | | |
Dividend income from affiliated mutual funds(a) | | $ | 4,314,231 | | | $ | 4,274,463 | | | $ | 7,062,337 | | | $ | 6,930,965 | | | $ | 5,358,367 | |
| | | | | | | | | | | | | | | | | | | | |
Total investment income | | | 4,314,231 | | | | 4,274,463 | | | | 7,062,337 | | | | 6,930,965 | | | | 5,358,367 | |
| | | | | | | | | | | | | | | | | | | | |
EXPENSES: | | | | | | | | | | | | | | | | | | | | |
Advisory (Note 4) | | | 222,500 | | | | 224,613 | | | | 381,084 | | | | 372,578 | | | | 289,219 | |
Custodian | | | 365 | | | | 365 | | | | 365 | | | | 365 | | | | 365 | |
Administration | | | 14,958 | | | | 14,958 | | | | 14,958 | | | | 14,958 | | | | 14,957 | |
Fund accounting | | | 12,465 | | | | 12,465 | | | | 12,465 | | | | 12,465 | | | | 12,465 | |
Legal | | | 12,170 | | | | 12,230 | | | | 20,148 | | | | 19,026 | | | | 14,743 | |
Audit | | | 17,517 | | | | 17,517 | | | | 17,517 | | | | 17,517 | | | | 17,517 | |
Directors | | | 3,738 | | | | 3,778 | | | | 6,370 | | | | 6,128 | | | | 4,755 | |
State license fees and memberships | | | 23,725 | | | | 24,820 | | | | 24,090 | | | | 22,630 | | | | 21,170 | |
Other expenses | | | 33,180 | | | | 28,243 | | | | 37,813 | | | | 34,679 | | | | 29,879 | |
| | | | | | | | | | | | | | | | | | | | |
Total expenses | | | 340,618 | | | | 338,989 | | | | 514,810 | | | | 500,346 | | | | 405,070 | |
| | | | | | | | | | | | | | | | | | | | |
NET INVESTMENT INCOME | | | 3,973,613 | | | | 3,935,474 | | | | 6,547,527 | | | | 6,430,619 | | | | 4,953,297 | |
| | | | | | | | | | | | | | | | | | | | |
NET REALIZED AND UNREALIZED GAIN (LOSS) (Note 2): | | | | | | | | | | | | | | | | | | | | |
Net realized gain (loss) on investments | | | 5,778,814 | | | | 6,018,751 | | | | (3,234,976 | ) | | | (5,100,777 | ) | | | (3,464,558 | ) |
Realized gain distributions from affiliated mutual funds | | | 1,498,687 | | | | 1,768,873 | | | | 3,474,810 | | | | 3,622,008 | | | | 3,050,416 | |
Net change in unrealized appreciation (depreciation) on investments | | | (6,109,472 | ) | | | (8,706,661 | ) | | | (4,786,269 | ) | | | (6,768,227 | ) | | | (7,766,396 | ) |
| | | | | | | | | | | | | | | | | | | | |
NET GAIN (LOSS) | | | 1,168,029 | | | | (919,037 | ) | | | (4,546,435 | ) | | | (8,246,996 | ) | | | (8,180,538 | ) |
| | | | | | | | | | | | | | | | | | | | |
NET INCREASE (DECREASE) IN NET ASSETS RESULTING FROM OPERATIONS | | $ | 5,141,642 | | | $ | 3,016,437 | | | $ | 2,001,092 | | | $ | (1,816,377 | ) | | $ | (3,227,241 | ) |
| | | | | | | | | | | | | | | | | | | | |
| (a) | Received from other Vantagepoint Funds (Note 1). |
See Notes to Financial Statements.
103
THE VANTAGEPOINT FUNDS
Statements of Operations
For the Year Ended December 31, 2011
| | | | | | | | | | | | | | | | |
| | | Milestone Funds | |
| | | Milestone
2030 | | | Milestone
2035 | | | Milestone
2040 | | | Milestone
2045 | |
INVESTMENT INCOME: | | | | | | | | | | | | | | | | |
Dividend income from affiliated mutual funds(a) | | $ | 4,069,395 | | | $ | 2,551,667 | | | $ | 2,579,451 | | | $ | 590,037 | |
| | | | | | | | | | | | | | | | |
Total investment income | | | 4,069,395 | | | | 2,551,667 | | | | 2,579,451 | | | | 590,037 | |
| | | | | | | | | | | | | | | | |
EXPENSES: | | | | | | | | | | | | | | | | |
Advisory (Note 4) | | | 226,919 | | | | 143,193 | | | | 140,322 | | | | 28,982 | |
Custodian | | | 365 | | | | 365 | | | | 365 | | | | 704 | |
Administration | | | 14,957 | | | | 14,958 | | | | 14,957 | | | | 15,002 | |
Fund accounting | | | 12,465 | | | | 12,465 | | | | 12,465 | | | | 12,479 | |
Legal | | | 11,709 | | | | 7,325 | | | | 7,329 | | | | 2,617 | |
Audit | | | 17,517 | | | | 17,517 | | | | 17,517 | | | | 17,468 | |
Directors | | | 3,746 | | | | 2,357 | | | | 2,337 | | | | 364 | |
State license fees and memberships | | | 19,710 | | | | 18,980 | | | | 19,710 | | | | 19,445 | |
Other expenses | | | 25,777 | | | | 20,604 | | | | 19,280 | | | | 5,463 | |
| | | | | | | | | | | | | | | | |
Total expenses | | | 333,165 | | | | 237,764 | | | | 234,282 | | | | 102,524 | |
Less reimbursements/waivers (Note 4) | | | — | | | | — | | | | — | | | | (1,479 | ) |
| | | | | | | | | | | | | | | | |
Net Expenses | | | 333,165 | | | | 237,764 | | | | 234,282 | | | | 101,045 | |
| | | | | | | | | | | | | | | | |
NET INVESTMENT INCOME | | | 3,736,230 | | | | 2,313,903 | | | | 2,345,169 | | | | 488,992 | |
| | | | | | | | | | | | | | | | |
NET REALIZED AND UNREALIZED (LOSS) (Note 2): | | | | | | | | | | | | | | | | |
Net realized gain (loss) on investments | | | (3,053,478 | ) | | | (2,481,276 | ) | | | (793,665 | ) | | | 436,915 | |
Realized gain distributions from affiliated mutual funds | | | 2,659,702 | | | | 1,866,697 | | | | 1,857,828 | | | | 425,290 | |
Net change in unrealized appreciation (depreciation) on investments | | | (7,385,447 | ) | | | (5,353,565 | ) | | | (7,456,184 | ) | | | (2,482,770 | ) |
| | | | | | | | | | | | | | | | |
NET LOSS | | | (7,779,223 | ) | | | (5,968,144 | ) | | | (6,392,021 | ) | | | (1,620,565 | ) |
| | | | | | | | | | | | | | | | |
NET DECREASE IN NET ASSETS RESULTING FROM OPERATIONS | | $ | (4,042,993 | ) | | $ | (3,654,241 | ) | | $ | (4,046,852 | ) | | $ | (1,131,573 | ) |
| | | | | | | | | | | | | | | | |
| (a) | Received from other Vantagepoint Funds (Note 1). |
See Notes to Financial Statements.
104
THE VANTAGEPOINT FUNDS
Statements of Changes in Net Assets
| | | | | | | | | | | | | | | | |
| | | Low Duration Bond | | | Inflation Protected Securities | |
| | | For the
Year Ended
December 31,
2011 | | | For the
Year Ended
December 31,
2010 | | | For the
Year Ended
December 31,
2011 | | | For the
Year Ended
December 31,
2010 | |
Increase (decrease) in net assets resulting from operations: | | | | | | | | | | | | | | | | |
Net investment income | | $ | 10,499,622 | | | $ | 11,368,342 | | | $ | 15,343,970 | | | $ | 7,493,347 | |
Net realized gain | | | 1,923,500 | | | | 7,891,404 | | | | 14,907,371 | | | | 13,341,834 | |
Net change in unrealized appreciation (depreciation) | | | (6,161,968 | ) | | | (4,644,205 | ) | | | 26,946,823 | | | | 2,863,005 | |
| | | | | | | | | | | | | | | | |
Net increase in net assets resulting from operations | | | 6,261,154 | | | | 14,615,541 | | | | 57,198,164 | | | | 23,698,186 | |
| | | | | | | | | | | | | | | | |
Distributions to shareholders from: | | | | | | | | | | | | | | | | |
Net investment income | | | (10,532,013 | ) | | | (11,819,982 | ) | | | (16,239,280 | ) | | | (7,562,392 | ) |
Net realized gain | | | — | | | | — | | | | (9,659,966 | ) | | | (7,414,344 | ) |
| | | | | | | | | | | | | | | | |
Total distributions | | | (10,532,013 | ) | | | (11,819,982 | ) | | | (25,899,246 | ) | | | (14,976,736 | ) |
| | | | | | | | | | | | | | | | |
Capital share transactions: | | | | | | | | | | | | | | | | |
Proceeds from sale of shares | | | 89,913,269 | | | | 153,859,333 | | | | 143,708,312 | | | | 176,197,701 | |
Reinvestment of distributions | | | 10,532,013 | | | | 11,819,982 | | | | 25,899,246 | | | | 14,976,736 | |
Value of shares redeemed | | | (109,420,716 | ) | | | (148,424,550 | ) | | | (108,716,628 | ) | | | (46,683,849 | ) |
| | | | | | | | | | | | | | | | |
Net increase (decrease) from capital share transactions | | | (8,975,434 | ) | | | 17,254,765 | | | | 60,890,930 | | | | 144,490,588 | |
| | | | | | | | | | | | | | | | |
Total increase (decrease) in net assets | | | (13,246,293 | ) | | | 20,050,324 | | | | 92,189,848 | | | | 153,212,038 | |
| | | | | | | | | | | | | | | | |
NET ASSETS at beginning of year | | | 537,709,170 | | | | 517,658,846 | | | | 492,001,645 | | | | 338,789,607 | |
| | | | | | | | | | | | | | | | |
NET ASSETS at end of year | | $ | 524,462,877 | | | $ | 537,709,170 | | | $ | 584,191,493 | | | $ | 492,001,645 | |
| | | | | | | | | | | | | | | | |
Accumulated net investment income included in net assets at end of year | | $ | 54,940 | | | $ | 268,741 | | | $ | — | | | $ | — | |
| | | | | | | | | | | | | | | | |
SHARE TRANSACTIONS: | | | | | | | | | | | | | | | | |
Number of shares sold | | | 8,967,929 | | | | 15,262,796 | | | | 12,432,838 | | | | 16,047,775 | |
Number of shares issued through reinvestment of dividends and distributions | | | 1,050,169 | | | | 1,174,377 | | | | 2,259,024 | | | | 1,363,298 | |
Number of shares redeemed | | | (10,914,618 | ) | | | (14,867,466 | ) | | | (9,446,370 | ) | | | (4,244,002 | ) |
| | | | | | | | | | | | | | | | |
Net increase (decrease) in shares outstanding | | | (896,520 | ) | | | 1,569,707 | | | | 5,245,492 | | | | 13,167,071 | |
| | | | | | | | | | | | | | | | |
See Notes to Financial Statements.
105
THE VANTAGEPOINT FUNDS
Statements of Changes in Net Assets
| | | | | | | | | | | | | | | | |
| | | Equity Income | | | Growth & Income | |
| | | For the
Year Ended
December 31,
2011 | | | For the
Year Ended
December 31,
2010 | | | For the
Year Ended
December 31,
2011 | | | For the
Year Ended
December 31,
2010 | |
Increase (decrease) in net assets resulting from operations: | | | | | | | | | | | | | | | | |
Net investment income | | $ | 24,675,340 | | | $ | 19,287,303 | | | $ | 13,473,037 | | | $ | 9,774,009 | |
Net realized gain | | | 82,074,328 | | | | 68,128,714 | | | | 93,645,116 | | | | 80,869,349 | |
Net change in unrealized appreciation (depreciation) | | | (102,160,417 | ) | | | 126,234,519 | | | | (112,363,378 | ) | | | 65,787,259 | |
| | | | | | | | | | | | | | | | |
Net increase (decrease) in net assets resulting from operations | | | 4,589,251 | | | | 213,650,536 | | | | (5,245,225 | ) | | | 156,430,617 | |
| | | | | | | | | | | | | | | | |
Distributions to shareholders from: | | | | | | | | | | | | | | | | |
Net investment income | | | (46,144,465 | ) | | | (17,413,710 | ) | | | (13,366,132 | ) | | | (9,595,362 | ) |
Net realized gain | | | (30,409,530 | ) | | | — | | | | — | | | | — | |
| | | | | | | | | | | | | | | | |
Total distributions | | | (76,553,995 | ) | | | (17,413,710 | ) | | | (13,366,132 | ) | | | (9,595,362 | ) |
| | | | | | | | | | | | | | | | |
Capital share transactions: | | | | | | | | | | | | | | | | |
Proceeds from sale of shares | | | 165,692,872 | | | | 258,561,722 | | | | 111,888,165 | | | | 156,434,244 | |
Reinvestment of distributions | | | 76,552,827 | | | | 17,413,211 | | | | 13,365,853 | | | | 9,595,165 | |
Value of shares redeemed | | | (220,228,833 | ) | | | (120,905,222 | ) | | | (172,282,535 | ) | | | (108,378,342 | ) |
| | | | | | | | | | | | | | | | |
Net increase (decrease) from capital share transactions | | | 22,016,866 | | | | 155,069,711 | | | | (47,028,517 | ) | | | 57,651,067 | |
| | | | | | | | | | | | | | | | |
Total increase (decrease) in net assets | | | (49,947,878 | ) | | | 351,306,537 | | | | (65,639,874 | ) | | | 204,486,322 | |
| | | | | | | | | | | | | | | | |
NET ASSETS at beginning of year | | | 1,867,505,168 | | | | 1,516,198,631 | | | | 1,228,121,922 | | | | 1,023,635,600 | |
| | | | | | | | | | | | | | | | |
NET ASSETS at end of year | | $ | 1,817,557,290 | | | $ | 1,867,505,168 | | | $ | 1,162,482,048 | | | $ | 1,228,121,922 | |
| | | | | | | | | | | | | | | | |
Accumulated net investment income included in net assets at end of year | | $ | 434,949 | | | $ | 19,713,747 | | | $ | 3,483,488 | | | $ | 3,389,224 | |
| | | | | | | | | | | | | | | | |
SHARE TRANSACTIONS: | | | | | | | | | | | | | | | | |
Number of shares sold | | | 19,316,926 | | | | 32,408,118 | | | | 11,824,262 | | | | 17,780,947 | |
Number of shares issued through reinvestment of dividends and distributions | | | 9,509,668 | | | | 2,051,026 | | | | 1,451,233 | | | | 1,002,630 | |
Number of shares redeemed | | | (25,142,453 | ) | | | (15,260,016 | ) | | | (17,795,739 | ) | | | (12,392,060 | ) |
| | | | | | | | | | | | | | | | |
Net increase (decrease) in shares outstanding | | | 3,684,141 | | | | 19,199,128 | | | | (4,520,244 | ) | | | 6,391,517 | |
| | | | | | | | | | | | | | | | |
See Notes to Financial Statements.
106
THE VANTAGEPOINT FUNDS
Statements of Changes in Net Assets
| | | | | | | | | | | | | | | | |
| | | Growth | | | Select Value | |
| | | For the
Year Ended
December 31,
2011 | | | For the
Year Ended
December 31,
2010 | | | For the
Year Ended
December 31,
2011 | | | For the
Year Ended
December 31,
2010 | |
Increase (decrease) in net assets resulting from operations: | | | | | | | | | | | | | | | | |
Net investment income | | $ | 9,121,734 | | | $ | 11,957,271 | | | $ | 3,184,309 | | | $ | 3,055,195 | |
Net realized gain | | | 109,646,065 | | | | 132,859,679 | | | | 34,844,389 | | | | 29,416,353 | |
Net change in unrealized appreciation (depreciation) | | | (194,568,063 | ) | | | 112,223,450 | | | | (36,822,309 | ) | | | 26,343,846 | |
| | | | | | | | | | | | | | | | |
Net increase (decrease) in net assets resulting from operations | | | (75,800,264 | ) | | | 257,040,400 | | | | 1,206,389 | | | | 58,815,394 | |
| | | | | | | | | | | | | | | | |
Distributions to shareholders from: | | | | | | | | | | | | | | | | |
Net investment income | | | (9,226,338 | ) | | | (12,440,966 | ) | | | (2,974,231 | ) | | | (2,972,119 | ) |
| | | | | | | | | | | | | | | | |
Total distributions | | | (9,226,338 | ) | | | (12,440,966 | ) | | | (2,974,231 | ) | | | (2,972,119 | ) |
| | | | | | | | | | | | | | | | |
Capital share transactions: | | | | | | | | | | | | | | | | |
Proceeds from sale of shares | | | 88,778,128 | | | | 118,629,311 | | | | 40,187,068 | | | | 18,344,078 | |
Reinvestment of distributions | | | 9,226,338 | | | | 12,440,966 | | | | 2,974,231 | | | | 2,972,119 | |
Value of shares redeemed | | | (233,709,687 | ) | | | (218,394,942 | ) | | | (59,710,708 | ) | | | (34,623,221 | ) |
| | | | | | | | | | | | | | | | |
Net decrease from capital share transactions | | | (135,705,221 | ) | | | (87,324,665 | ) | | | (16,549,409 | ) | | | (13,307,024 | ) |
| | | | | | | | | | | | | | | | |
Total increase (decrease) in net assets | | | (220,731,823 | ) | | | 157,274,769 | | | | (18,317,251 | ) | | | 42,536,251 | |
| | | | | | | | | | | | | | | | |
NET ASSETS at beginning of year | | | 1,971,807,269 | | | | 1,814,532,500 | | | | 338,336,440 | | | | 295,800,189 | |
| | | | | | | | | | | | | | | | |
NET ASSETS at end of year | | $ | 1,751,075,446 | | | $ | 1,971,807,269 | | | $ | 320,019,189 | | | $ | 338,336,440 | |
| | | | | | | | | | | | | | | | |
Accumulated net investment income included in net assets at end of year | | $ | 488,273 | | | $ | 404,263 | | | $ | 396,382 | | | $ | 296,258 | |
| | | | | | | | | | | | | | | | |
SHARE TRANSACTIONS: | | | | | | | | | | | | | | | | |
Number of shares sold | | | 10,466,360 | | | | 15,096,886 | | | | 4,179,747 | | | | 2,148,934 | |
Number of shares issued through reinvestment of dividends and distributions | | | 1,127,914 | | | | 1,429,996 | | | | 314,401 | | | | 304,833 | |
Number of shares redeemed | | | (26,864,686 | ) | | | (27,614,863 | ) | | | (5,991,582 | ) | | | (3,932,125 | ) |
| | | | | | | | | | | | | | | | |
Net decrease in shares outstanding | | | (15,270,412 | ) | | | (11,087,981 | ) | | | (1,497,434 | ) | | | (1,478,358 | ) |
| | | | | | | | | | | | | | | | |
See Notes to Financial Statements.
107
THE VANTAGEPOINT FUNDS
Statements of Changes in Net Assets
| | | | | | | | | | | | | | | | |
| | | Aggressive Opportunities | | | Discovery | |
| | | For the
Year Ended
December 31,
2011 | | | For the
Year Ended
December 31,
2010 | | | For the
Year Ended
December 31,
2011 | | | For the
Year Ended
December 31,
2010 | |
Increase (decrease) in net assets resulting from operations: | | | | | | | | | | | | | | | | |
Net investment income | | $ | 2,263,482 | | | $ | 505,137 | | | $ | 2,143,311 | | | $ | 1,783,425 | |
Net realized gain | | | 58,474,102 | | | | 150,445,498 | | | | 5,263,580 | | | | 41,836,563 | |
Net change in unrealized appreciation (depreciation) | | | (168,765,752 | ) | | | 34,516,017 | | | | (18,762,178 | ) | | | 2,640,839 | |
| | | | | | | | | | | | | | | | |
Net increase (decrease) in net assets resulting from operations | | | (108,028,168 | ) | | | 185,466,652 | | | | (11,355,287 | ) | | | 46,260,827 | |
| | | | | | | | | | | | | | | | |
Distributions to shareholders from: | | | | | | | | | | | | | | | | |
Net investment income | | | (3,492,614 | ) | | | — | | | | (2,156,271 | ) | | | (1,907,086 | ) |
Net realized gain | | | (78,909,119 | ) | | | — | | | | — | | | | — | |
| | | | | | | | | | | | | | | | |
Total distributions | | | (82,401,733 | ) | | | — | | | | (2,156,271 | ) | | | (1,907,086 | ) |
| | | | | | | | | | | | | | | | |
Capital share transactions: | | | | | | | | | | | | | | | | |
Proceeds from sale of shares | | | 59,715,009 | | | | 66,682,250 | | | | 34,078,276 | | | | 24,685,115 | |
Reinvestment of distributions | | | 82,401,733 | | | | — | | | | 2,156,271 | | | | 1,907,086 | |
Value of shares redeemed | | | (141,985,872 | ) | | | (114,677,378 | ) | | | (41,621,265 | ) | | | (36,350,248 | ) |
| | | | | | | | | | | | | | | | |
Net increase (decrease) from capital share transactions | | | 130,870 | | | | (47,995,128 | ) | | | (5,386,718 | ) | | | (9,758,047 | ) |
| | | | | | | | | | | | | | | | |
Total increase (decrease) in net assets | | | (190,299,031 | ) | | | 137,471,524 | | | | (18,898,276 | ) | | | 34,595,694 | |
| | | | | | | | | | | | | | | | |
NET ASSETS at beginning of year | | | 1,147,569,790 | | | | 1,010,098,266 | | | | 212,769,958 | | | | 178,174,264 | |
| | | | | | | | | | | | | | | | |
NET ASSETS at end of year | | $ | 957,270,759 | | | $ | 1,147,569,790 | | | $ | 193,871,682 | | | $ | 212,769,958 | |
| | | | | | | | | | | | | | | | |
Accumulated net investment income (loss) included in net assets at end of year | | $ | 3,845,757 | | | $ | 623,831 | | | $ | (1,388 | ) | | $ | (49,562 | ) |
| | | | | | | | | | | | | | | | |
SHARE TRANSACTIONS: | | | | | | | | | | | | | | | | |
Number of shares sold | | | 5,873,382 | | | | 6,533,411 | | | | 3,935,791 | | | | 3,105,575 | |
Number of shares issued through reinvestment of dividends and distributions | | | 9,145,586 | | | | — | | | | 253,195 | | | | 205,015 | |
Number of shares redeemed | | | (12,840,586 | ) | | | (11,440,999 | ) | | | (4,583,506 | ) | | | (4,380,347 | ) |
| | | | | | | | | | | | | | | | |
Net increase (decrease) in shares outstanding | | | 2,178,382 | | | | (4,907,588 | ) | | | (394,520 | ) | | | (1,069,757 | ) |
| | | | | | | | | | | | | | | | |
See Notes to Financial Statements.
108
THE VANTAGEPOINT FUNDS
Statements of Changes in Net Assets
| | | | | | | | | | | | | | | | |
| | | International | | | Diversifying Strategies(1) | |
| | | For the
Year Ended
December 31,
2011 | | | For the
Year Ended
December 31,
2010 | | | For the
Year Ended
December 31,
2011 | | | For the
Year Ended
December 31,
2010 | |
Increase (decrease) in net assets resulting from operations: | | | | | | | | | | | | | | | | |
Net investment income | | $ | 27,035,117 | | | $ | 20,744,447 | | | $ | 8,754,124 | | | $ | 7,806,302 | |
Net realized gain | | | 14,141,235 | | | | 20,637,444 | | | | 3,129,880 | | | | 6,694,400 | |
Net change in unrealized appreciation (depreciation) | | | (137,855,829 | ) | | | 47,499,370 | | | | (12,531,370 | ) | | | 20,775,645 | |
| | | | | | | | | | | | | | | | |
Net increase (decrease) in net assets resulting from operations | | | (96,679,477 | ) | | | 88,881,261 | | | | (647,366 | ) | | | 35,276,347 | |
| | | | | | | | | | | | | | | | |
Distributions to shareholders from: | | | | | | | | | | | | | | | | |
Net investment income | | | (28,267,374 | ) | | | (22,937,847 | ) | | | (2,003,574 | ) | | | (15,514,149 | ) |
Net realized gain | | | — | | | | — | | | | (11,262,657 | ) | | | — | |
| | | | | | | | | | | | | | | | |
Total distributions | | | (28,267,374 | ) | | | (22,937,847 | ) | | | (13,266,231 | ) | | | (15,514,149 | ) |
| | | | | | | | | | | | | | | | |
Capital share transactions: | | | | | | | | | | | | | | | | |
Proceeds from sale of shares | | | 180,804,130 | | | | 221,751,601 | | | | 125,684,627 | | | | 431,006,703 | |
Reinvestment of distributions | | | 28,267,374 | | | | 22,937,847 | | | | 13,266,231 | | | | 15,514,149 | |
Value of shares redeemed | | | (162,924,179 | ) | | | (107,496,325 | ) | | | (145,851,609 | ) | | | (48,887,751 | ) |
| | | | | | | | | | | | | | | | |
Net increase (decrease) from capital share transactions | | | 46,147,325 | | | | 137,193,123 | | | | (6,900,751 | ) | | | 397,633,101 | |
| | | | | | | | | | | | | | | | |
Total increase (decrease) in net assets | | | (78,799,526 | ) | | | 203,136,537 | | | | (20,814,348 | ) | | | 417,395,299 | |
| | | | | | | | | | | | | | | | |
NET ASSETS at beginning of year | | | 1,218,763,185 | | | | 1,015,626,648 | | | | 870,591,114 | | | | 453,195,815 | |
| | | | | | | | | | | | | | | | |
NET ASSETS at end of year | | $ | 1,139,963,659 | | | $ | 1,218,763,185 | | | $ | 849,776,766 | | | $ | 870,591,114 | |
| | | | | | | | | | | | | | | | |
Accumulated net investment income (loss) included in net assets at end of year | | $ | 13,859,239 | | | $ | 11,574,953 | | | $ | (5,792,855 | ) | | $ | (1,755,777 | ) |
| | | | | | | | | | | | | | | | |
SHARE TRANSACTIONS: | | | | | | | | | | | | | | | | |
Number of shares sold | | | 20,269,574 | | | | 25,357,736 | | | | 12,311,251 | | | | 43,063,258 | |
Number of shares issued through reinvestment of dividends and distributions | | | 3,494,113 | | | | 2,493,244 | | | | 1,334,631 | | | | 1,531,505 | |
Number of shares redeemed | | | (17,194,310 | ) | | | (12,161,106 | ) | | | (14,437,106 | ) | | | (4,948,332 | ) |
| | | | | | | | | | | | | | | | |
Net increase (decrease) in shares outstanding | | | 6,569,377 | | | | 15,689,874 | | | | (791,224 | ) | | | 39,646,431 | |
| | | | | | | | | | | | | | | | |
| (1) | Formerly Diversified Assets Fund. |
See Notes to Financial Statements.
109
THE VANTAGEPOINT FUNDS
Statements of Changes in Net Assets
| | | | | | | | | | | | | | | | |
| | | Core Bond Index | | | 500 Stock Index | |
| | | For the
Year Ended
December 31,
2011 | | | For the
Year Ended
December 31,
2010 | | | For the
Year Ended
December 31,
2011 | | | For the
Year Ended
December 31,
2010 | |
Increase (decrease) in net assets resulting from operations: | | | | | | | | | | | | | | | | |
Net investment income | | $ | 33,963,511 | | | $ | 33,435,459 | | | $ | 6,950,518 | | | $ | 6,035,497 | |
Net realized gain | | | 13,157,942 | | | | 7,955,159 | | | | 5,847,733 | | | | 4,234,237 | |
Net change in unrealized appreciation (depreciation) | | | 34,307,648 | | | | 16,038,999 | | | | (4,958,307 | ) | | | 38,084,448 | |
| | | | | | | | | | | | | | | | |
Net increase in net assets resulting from operations | | | 81,429,101 | | | | 57,429,617 | | | | 7,839,944 | | | | 48,354,182 | |
| | | | | | | | | | | | | | | | |
Distributions to shareholders from: | | | | | | | | | | | | | | | | |
Net investment income—Class I | | | (29,321,806 | ) | | | (28,430,963 | ) | | | (1,457,030 | ) | | | (1,428,297 | ) |
Net investment income—Class II | | | (10,828,719 | ) | | | (10,420,610 | ) | | | (5,368,593 | ) | | | (4,640,755 | ) |
| | | | | | | | | | | | | | | | |
Total distributions | | | (40,150,525 | ) | | | (38,851,573 | ) | | | (6,825,623 | ) | | | (6,069,052 | ) |
| | | | | | | | | | | | | | | | |
Capital share transactions: | | | | | | | | | | | | | | | | |
Proceeds from sale of shares—Class I | | | 154,830,581 | | | | 203,777,877 | | | | 15,004,449 | | | | 14,588,594 | |
Proceeds from sale of shares—Class II | | | 55,189,411 | | | | 50,001,904 | | | | 42,704,327 | | | | 37,573,481 | |
Reinvestment of distributions—Class I | | | 29,321,806 | | | | 28,430,963 | | | | 1,456,429 | | | | 1,427,754 | |
Reinvestment of distributions—Class II | | | 10,828,719 | | | | 10,420,610 | | | | 5,368,593 | | | | 4,640,755 | |
Value of shares redeemed—Class I | | | (226,620,000 | ) | | | (278,819,887 | ) | | | (25,473,968 | ) | | | (10,331,582 | ) |
Value of shares redeemed—Class II | | | (37,910,366 | ) | | | (20,765,381 | ) | | | (42,890,111 | ) | | | (29,614,247 | ) |
| | | | | | | | | | | | | | | | |
Net increase (decrease) from capital share transactions | | | (14,359,849 | ) | | | (6,953,914 | ) | | | (3,830,281 | ) | | | 18,284,755 | |
| | | | | | | | | | | | | | | | |
Total increase (decrease) in net assets | | | 26,918,727 | | | | 11,624,130 | | | | (2,815,960 | ) | | | 60,569,885 | |
| | | | | | | | | | | | | | | | |
NET ASSETS at beginning of year | | | 1,107,321,351 | | | | 1,095,697,221 | | | | 384,085,415 | | | | 323,515,530 | |
| | | | | | | | | | | | | | | | |
NET ASSETS at end of year | | $ | 1,134,240,078 | | | $ | 1,107,321,351 | | | $ | 381,269,455 | | | $ | 384,085,415 | |
| | | | | | | | | | | | | | | | |
Accumulated net investment income included in net assets at end of year | | $ | 9,575 | | | $ | 14,310 | | | $ | 234,960 | | | $ | 139,469 | |
| | | | | | | | | | | | | | | | |
SHARE TRANSACTIONS: | | | | | | | | | | | | | | | | |
Number of shares sold—Class I | | | 15,075,414 | | | | 19,999,683 | | | | 1,487,565 | | | | 1,592,115 | |
Number of shares issued through reinvestment of dividends and distributions—Class I | | | 2,857,923 | | | | 2,799,424 | | | | 150,925 | | | | 145,097 | |
Number of shares redeemed—Class I | | | (21,873,215 | ) | | | (27,859,444 | ) | | | (2,498,225 | ) | | | (1,159,827 | ) |
| | | | | | | | | | | | | | | | |
Net increase (decrease) in shares outstanding—Class I | | | (3,939,878 | ) | | | (5,060,337 | ) | | | (859,735 | ) | | | 577,385 | |
| | | | | | | | | | | | | | | | |
| | | | | | | | | | | | | | | | |
Number of shares sold—Class II | | | 5,322,939 | | | | 4,856,998 | | | | 4,508,609 | | | | 4,346,334 | |
Number of shares issued through reinvestment of dividends and distributions—Class II | | | 1,048,508 | | | | 1,020,016 | | | | 589,955 | | | | 499,543 | |
Number of shares redeemed—Class II | | | (3,690,535 | ) | | | (2,041,422 | ) | | | (4,489,530 | ) | | | (3,458,473 | ) |
| | | | | | | | | | | | | | | | |
Net increase in shares outstanding—Class II | | | 2,680,912 | | | | 3,835,592 | | | | 609,034 | | | | 1,387,404 | |
| | | | | | | | | | | | | | | | |
See Notes to Financial Statements.
110
THE VANTAGEPOINT FUNDS
Statements of Changes in Net Assets
| | | | | | | | | | | | | | | | |
| | | Broad Market Index | | | Mid/Small Company Index | |
| | | For the
Year Ended
December 31,
2011 | | | For the
Year Ended
December 31,
2010 | | | For the
Year Ended
December 31,
2011 | | | For the
Year Ended
December 31,
2010 | |
Increase (decrease) in net assets resulting from operations: | | | | | | | | | | | | | | | | |
Net investment income | | $ | 8,873,123 | | | $ | 8,214,664 | | | $ | 4,955,959 | | | $ | 3,699,440 | |
Net realized gain | | | 17,247,356 | | | | 10,774,722 | | | | 16,825,014 | | | | 10,490,951 | |
Net change in unrealized appreciation (depreciation) | | | (19,101,547 | ) | | | 61,434,056 | | | | (36,445,534 | ) | | | 65,038,295 | |
| | | | | | | | | | | | | | | | |
Net increase (decrease) in net assets resulting from operations | | | 7,018,932 | | | | 80,423,442 | | | | (14,664,561 | ) | | | 79,228,686 | |
| | | | | | | | | | | | | | | | |
Distributions to shareholders from: | | | | | | | | | | | | | | | | |
Net investment income—Class I | | | (1,639,619 | ) | | | (1,698,268 | ) | | | (2,428,025 | ) | | | (1,856,518 | ) |
Net investment income—Class II | | | (6,889,586 | ) | | | (6,388,942 | ) | | | (2,001,727 | ) | | | (1,502,952 | ) |
Net realized gain—Class I | | | — | | | | — | | | | (10,097,260 | ) | | | (4,324,029 | ) |
Net realized gain—Class II | | | — | | | | — | | | | (6,898,716 | ) | | | (2,957,241 | ) |
| | | | | | | | | | | | | | | | |
Total distributions | | | (8,529,205 | ) | | | (8,087,210 | ) | | | (21,425,728 | ) | | | (10,640,740 | ) |
| | | | | | | | | | | | | | | | |
Capital share transactions: | | | | | | | | | | | | | | | | |
Proceeds from sale of shares—Class I | | | 11,415,454 | | | | 8,161,973 | | | | 61,546,128 | | | | 78,493,509 | |
Proceeds from sale of shares—Class II | | | 36,872,748 | | | | 40,387,637 | | | | 37,937,915 | | | | 45,105,812 | |
Reinvestment of distributions—Class I | | | 1,639,619 | | | | 1,698,268 | | | | 12,524,481 | | | | 6,179,653 | |
Reinvestment of distributions—Class II | | | 6,889,586 | | | | 6,388,942 | | | | 8,900,443 | | | | 4,460,193 | |
Value of shares redeemed—Class I | | | (30,043,681 | ) | | | (15,130,889 | ) | | | (49,925,329 | ) | | | (15,906,098 | ) |
Value of shares redeemed—Class II | | | (59,260,258 | ) | | | (54,166,831 | ) | | | (31,424,662 | ) | | | (13,566,570 | ) |
| | | | | | | | | | | | | | | | |
Net increase (decrease) from capital share transactions | | | (32,486,532 | ) | | | (12,660,900 | ) | | | 39,558,976 | | | | 104,766,499 | |
| | | | | | | | | | | | | | | | |
Total increase (decrease) in net assets | | | (33,996,805 | ) | | | 59,675,332 | | | | 3,468,687 | | | | 173,354,445 | |
| | | | | | | | | | | | | | | | |
NET ASSETS at beginning of year | | | 537,702,260 | | | | 478,026,928 | | | | 404,972,739 | | | | 231,618,294 | |
| | | | | | | | | | | | | | | | |
NET ASSETS at end of year | | $ | 503,705,455 | | | $ | 537,702,260 | | | $ | 408,441,426 | | | $ | 404,972,739 | |
| | | | | | | | | | | | | | | | |
Accumulated net investment income included in net assets at end of year | | $ | 6,064,305 | | | $ | 5,871,309 | | | $ | 1,125,658 | | | $ | 684,655 | |
| | | | | | | | | | | | | | | | |
SHARE TRANSACTIONS: | | | | | | | | | | | | | | | | |
Number of shares sold—Class I | | | 1,031,697 | | | | 823,042 | | | | 4,144,118 | | | | 5,770,721 | |
Number of shares issued through reinvestment of dividends and distributions—Class I | | | 155,857 | | | | 157,393 | | | | 918,217 | | | | 406,557 | |
Number of shares redeemed—Class I | | | (2,681,236 | ) | | | (1,566,504 | ) | | | (3,234,606 | ) | | | (1,203,680 | ) |
| | | | | | | | | | | | | | | | |
Net increase (decrease) in shares outstanding—Class I | | | (1,493,682 | ) | | | (586,069 | ) | | | 1,827,729 | | | | 4,973,598 | |
| | | | | | | | | | | | | | | | |
| | | | | | | | | | | | | | | | |
Number of shares sold—Class II | | | 3,538,800 | | | | 4,472,508 | | | | 2,563,731 | | | | 3,480,050 | |
Number of shares issued through reinvestment of dividends and distributions—Class II | | | 697,326 | | | | 629,452 | | | | 689,957 | | | | 309,306 | |
Number of shares redeemed—Class II | | | (5,602,099 | ) | | | (5,751,688 | ) | | | (2,173,431 | ) | | | (1,063,592 | ) |
| | | | | | | | | | | | | | | | |
Net increase (decrease) in shares outstanding—Class II | | | (1,365,973 | ) | | | (649,728 | ) | | | 1,080,257 | | | | 2,725,764 | |
| | | | | | | | | | | | | | | | |
See Notes to Financial Statements.
111
THE VANTAGEPOINT FUNDS
Statements of Changes in Net Assets
| | | | | | | | |
| | | Overseas Equity Index | |
| | | For the
Year Ended
December 31,
2011 | | | For the
Year Ended
December 31,
2010 | |
Increase (decrease) in net assets resulting from operations: | | | | | | | | |
Net investment income | | $ | 6,090,265 | | | $ | 4,377,431 | |
Net realized loss | | | (1,471,292 | ) | | | (311,721 | ) |
Net change in unrealized appreciation (depreciation) | | | (29,322,421 | ) | | | 10,232,532 | |
| | | | | | | | |
Net increase (decrease) in net assets resulting from operations | | | (24,703,448 | ) | | | 14,298,242 | |
| | | | | | | | |
Distributions to shareholders from: | | | | | | | | |
Net investment income—Class I | | | (1,300,170 | ) | | | (1,217,868 | ) |
Net investment income—Class II | | | (4,495,031 | ) | | | (3,668,751 | ) |
| | | | | | | | |
Total distributions | | | (5,795,201 | ) | | | (4,886,619 | ) |
| | | | | | | | |
Capital share transactions: | | | | | | | | |
Proceeds from sale of shares—Class I | | | 5,355,854 | | | | 8,123,045 | |
Proceeds from sale of shares—Class II | | | 20,846,747 | | | | 23,326,692 | |
Reinvestment of distributions—Class I | | | 1,300,170 | | | | 1,217,868 | |
Reinvestment of distributions—Class II | | | 4,495,031 | | | | 3,668,751 | |
Value of shares redeemed—Class I | | | (11,561,711 | ) | | | (7,089,014 | ) |
Value of shares redeemed—Class II | | | (19,010,679 | ) | | | (12,740,308 | ) |
| | | | | | | | |
Net increase from capital share transactions | | | 1,425,412 | | | | 16,507,034 | |
| | | | | | | | |
Total increase (decrease) in net assets | | | (29,073,237 | ) | | | 25,918,657 | |
| | | | | | | | |
NET ASSETS at beginning of year | | | 206,857,216 | | | | 180,938,559 | |
| | | | | | | | |
NET ASSETS at end of year | | $ | 177,783,979 | | | $ | 206,857,216 | |
| | | | | | | | |
Accumulated net investment loss included in net assets at end of year | | $ | (465,915 | ) | | $ | (832,919 | ) |
| | | | | | | | |
SHARE TRANSACTIONS: | | | | | | | | |
Number of shares sold—Class I | | | 497,952 | | | | 794,858 | |
Number of shares issued through reinvestment of dividends and distributions—Class I | | | 145,923 | | | | 114,307 | |
Number of shares redeemed—Class I | | | (1,083,214 | ) | | | (719,758 | ) |
| | | | | | | | |
Net increase (decrease) in shares outstanding—Class I | | | (439,339 | ) | | | 189,407 | |
| | | | | | | | |
| | | | | | | | |
Number of shares sold—Class II | | | 2,110,621 | | | | 2,446,773 | |
Number of shares issued through reinvestment of dividends and distributions—Class II | | | 538,972 | | | | 366,711 | |
Number of shares redeemed—Class II | | | (1,885,576 | ) | | | (1,341,339 | ) |
| | | | | | | | |
Net increase in shares outstanding—Class II | | | 764,017 | | | | 1,472,145 | |
| | | | | | | | |
See Notes to Financial Statements.
112
THE VANTAGEPOINT FUNDS
Statements of Changes in Net Assets
| | | | | | | | | | | | | | | | |
| | | Model Portfolio Funds | |
| | | Savings Oriented | | | Conservative Growth | |
| | | For the
Year Ended
December 31,
2011 | | | For the
Year Ended
December 31,
2010 | | | For the
Year Ended
December 31,
2011 | | | For the
Year Ended
December 31,
2010 | |
Increase (decrease) in net assets resulting from operations: | | | | | | | | | | | | | | | | |
Net investment income | | $ | 5,652,643 | | | $ | 6,337,201 | | | $ | 9,592,040 | | | $ | 9,904,540 | |
Net realized gain (loss) | | | (476,785 | ) | | | (2,640,382 | ) | | | 5,653,335 | | | | 2,312,457 | |
Net change in unrealized appreciation (depreciation) | | | 1,450,544 | | | | 17,590,586 | | | | (8,573,402 | ) | | | 33,658,884 | |
| | | | | | | | | | | | | | | | |
Net increase in net assets resulting from operations | | | 6,626,402 | | | | 21,287,405 | | | | 6,671,973 | | | | 45,875,881 | |
| | | | | | | | | | | | | | | | |
Distributions to shareholders from: | | | | | | | | | | | | | | | | |
Net investment income | | | (5,656,447 | ) | | | (6,476,782 | ) | | | (9,593,725 | ) | | | (10,064,194 | ) |
Net realized gain | | | (125,894 | ) | | | — | | | | (426,959 | ) | | | — | |
| | | | | | | | | | | | | | | | |
Total distributions | | | (5,782,341 | ) | | | (6,476,782 | ) | | | (10,020,684 | ) | | | (10,064,194 | ) |
| | | | | | | | | | | | | | | | |
Capital share transactions: | | | | | | | | | | | | | | | | |
Proceeds from sale of shares | | | 34,730,309 | | | | 39,888,620 | | | | 40,299,829 | | | | 59,902,564 | |
Reinvestment of distributions | | | 5,781,314 | | | | 6,475,804 | | | | 10,020,684 | | | | 10,063,438 | |
Value of shares redeemed | | | (91,421,580 | ) | | | (29,938,691 | ) | | | (77,719,720 | ) | | | (47,048,924 | ) |
| | | | | | | | | | | | | | | | |
Net increase (decrease) from capital share transactions | | | (50,909,957 | ) | | | 16,425,733 | | | | (27,399,207 | ) | | | 22,917,078 | |
| | | | | | | | | | | | | | | | |
Total increase (decrease) in net assets | | | (50,065,896 | ) | | | 31,236,356 | | | | (30,747,918 | ) | | | 58,728,765 | |
| | | | | | | | | | | | | | | | |
NET ASSETS at beginning of year | | | 338,532,903 | | | | 307,296,547 | | | | 586,911,861 | | | | 528,183,096 | |
| | | | | | | | | | | | | | | | |
NET ASSETS at end of year | | $ | 288,467,007 | | | $ | 338,532,903 | | | $ | 556,163,943 | | | $ | 586,911,861 | |
| | | | | | | | | | | | | | | | |
Accumulated net investment income included in net assets at end of year | | $ | 357,959 | | | $ | 628,890 | | | $ | 953,889 | | | $ | 1,371,379 | |
| | | | | | | | | | | | | | | | |
SHARE TRANSACTIONS: | | | | | | | | | | | | | | | | |
Number of shares sold | | | 1,400,880 | | | | 1,671,899 | | | | 1,682,331 | | | | 2,629,989 | |
Number of shares issued through reinvestment of dividends and distributions | | | 236,939 | | | | 266,165 | | | | 427,139 | | | | 425,875 | |
Number of shares redeemed | | | (3,733,716 | ) | | | (1,255,126 | ) | | | (3,250,086 | ) | | | (2,071,257 | ) |
| | | | | | | | | | | | | | | | |
Net increase (decrease) in shares outstanding | | | (2,095,897 | ) | | | 682,938 | | | | (1,140,616 | ) | | | 984,607 | |
| | | | | | | | | | | | | | | | |
See Notes to Financial Statements.
113
THE VANTAGEPOINT FUNDS
Statements of Changes in Net Assets
| | | | | | | | | | | | | | | | |
| | | Model Portfolio Funds | |
| | | Traditional Growth | | | Long-Term Growth | |
| | | For the
Year Ended
December 31,
2011 | | | For the
Year Ended
December 31,
2010 | | | For the
Year Ended
December 31,
2011 | | | For the
Year Ended
December 31,
2010 | |
Increase (decrease) in net assets resulting from operations: | | | | | | | | | | | | | | | | |
Net investment income | | $ | 21,923,334 | | | $ | 21,820,282 | | | $ | 25,627,207 | | | $ | 23,528,585 | |
Net realized gain | | | 41,372,040 | | | | 13,171,964 | | | | 47,640,696 | | | | 12,496,051 | |
Net change in unrealized appreciation (depreciation) | | | (70,336,673 | ) | | | 112,016,099 | | | | (108,133,801 | ) | | | 169,636,223 | |
| | | | | | | | | | | | | | | | |
Net increase (decrease) in net assets resulting from operations | | | (7,041,299 | ) | | | 147,008,345 | | | | (34,865,898 | ) | | | 205,660,859 | |
| | | | | | | | | | | | | | | | |
Distributions to shareholders from: | | | | | | | | | | | | | | | | |
Net investment income | | | (28,313,249 | ) | | | (21,975,154 | ) | | | (30,098,534 | ) | | | (26,389,015 | )�� |
Net realized gain | | | (4,292,155 | ) | | | — | | | | (24,301,340 | ) | | | — | |
| | | | | | | | | | | | | | | | |
Total distributions | | | (32,605,404 | ) | | | (21,975,154 | ) | | | (54,399,874 | ) | | | (26,389,015 | ) |
| | | | | | | | | | | | | | | | |
Capital share transactions: | | | | | | | | | | | | | | | | |
Proceeds from sale of shares | | | 73,296,341 | | | | 81,013,767 | | | | 86,481,553 | | | | 100,667,167 | |
Reinvestment of distributions | | | 32,600,948 | | | | 21,972,001 | | | | 54,399,874 | | | | 26,389,015 | |
Value of shares redeemed | | | (195,900,060 | ) | | | (85,311,246 | ) | | | (187,817,488 | ) | | | (79,000,421 | ) |
| | | | | | | | | | | | | | | | |
Net increase (decrease) from capital share transactions | | | (90,002,771 | ) | | | 17,674,522 | | | | (46,936,061 | ) | | | 48,055,761 | |
| | | | | | | | | | | | | | | | |
Total increase (decrease) in net assets | | | (129,649,474 | ) | | | 142,707,713 | | | | (136,201,833 | ) | | | 227,327,605 | |
| | | | | | | | | | | | | | | | |
NET ASSETS at beginning of year | | | 1,495,757,237 | | | | 1,353,049,524 | | | | 1,848,429,947 | | | | 1,621,102,342 | |
| | | | | | | | | | | | | | | | |
NET ASSETS at end of year | | $ | 1,366,107,763 | | | $ | 1,495,757,237 | | | $ | 1,712,228,114 | | | $ | 1,848,429,947 | |
| | | | | | | | | | | | | | | | |
Accumulated net investment income included in net assets at end of year | | $ | 269,550 | | | $ | 6,688,019 | | | $ | 328,469 | | | $ | 4,819,192 | |
| | | | | | | | | | | | | | | | |
SHARE TRANSACTIONS: | | | | | | | | | | | | | | | | |
Number of shares sold | | | 3,284,198 | | | | 3,873,208 | | | | 4,030,628 | | | | 5,065,938 | |
Number of shares issued through reinvestment of dividends and distributions | | | 1,514,914 | | | | 991,069 | | | | 2,677,159 | | | | 1,231,405 | |
Number of shares redeemed | | | (8,786,410 | ) | | | (4,101,587 | ) | | | (8,747,060 | ) | | | (3,983,899 | ) |
| | | | | | | | | | | | | | | | |
Net increase (decrease) in shares outstanding | | | (3,987,298 | ) | | | 762,690 | | | | (2,039,273 | ) | | | 2,313,444 | |
| | | | | | | | | | | | | | | | |
See Notes to Financial Statements.
114
THE VANTAGEPOINT FUNDS
Statements of Changes in Net Assets
| | | | | | | | |
| | | Model Portfolio | |
| | | All-Equity Growth | |
| | | For the
Year Ended
December 31,
2011 | | | For the
Year Ended
December 31,
2010 | |
Increase (decrease) in net assets resulting from operations: | | | | | | | | |
Net investment income | | $ | 8,651,245 | | | $ | 5,917,143 | |
Net realized gain (loss) | | | 4,668,318 | | | | (3,536,219 | ) |
Net change in unrealized appreciation (depreciation) | | | (41,317,903 | ) | | | 89,034,048 | |
| | | | | | | | |
Net increase (decrease) in net assets resulting from operations | | | (27,998,340 | ) | | | 91,414,972 | |
| | | | | | | | |
Distributions to shareholders from: | | | | | | | | |
Net investment income | | | (8,642,925 | ) | | | (5,906,426 | ) |
Net realized gain | | | (979,356 | ) | | | — | |
| | | | | | | | |
Total distributions | | | (9,622,281 | ) | | | (5,906,426 | ) |
| | | | | | | | |
Capital share transactions: | | | | | | | | |
Proceeds from sale of shares | | | 55,069,364 | | | | 67,871,936 | |
Reinvestment of distributions | | | 9,622,281 | | | | 5,906,426 | |
Value of shares redeemed | | | (92,335,125 | ) | | | (35,730,366 | ) |
| | | | | | | | |
Net increase (decrease) from capital share transactions | | | (27,643,480 | ) | | | 38,047,996 | |
| | | | | | | | |
Total increase (decrease) in net assets | | | (65,264,101 | ) | | | 123,556,542 | |
| | | | | | | | |
NET ASSETS at beginning of year | | | 715,089,610 | | | | 591,533,068 | |
| | | | | | | | |
NET ASSETS at end of year | | $ | 649,825,509 | | | $ | 715,089,610 | |
| | | | | | | | |
Accumulated net investment income included in net assets at end of year | | $ | 1,284,933 | | | $ | 1,367,944 | |
| | | | | | | | |
SHARE TRANSACTIONS: | | | | | | | | |
Number of shares sold | | | 2,782,327 | | | | 3,779,376 | |
Number of shares issued through reinvestment of dividends and distributions | | | 514,836 | | | | 298,003 | |
Number of shares redeemed | | | (4,635,666 | ) | | | (2,004,125 | ) |
| | | | | | | | |
Net increase (decrease) in shares outstanding | | | (1,338,503 | ) | | | 2,073,254 | |
| | | | | | | | |
See Notes to Financial Statements.
115
THE VANTAGEPOINT FUNDS
Statements of Changes in Net Assets
| | | | | | | | | | | | | | | | |
| | | Milestone Funds | |
| | | Milestone Retirement Income | | | Milestone 2010 | |
| | | For the
Year Ended
December 31,
2011 | | | For the
Year Ended
December 31,
2010 | | | For the
Year Ended
December 31,
2011 | | | For the
Year Ended
December 31,
2010 | |
Increase (decrease) in net assets resulting from operations: | | | | | | | | | | | | | | | | |
Net investment income | | $ | 3,973,613 | | | $ | 2,833,920 | | | $ | 3,935,474 | | | $ | 2,721,503 | |
Net realized gain (loss) | | | 7,277,501 | | | | (390,853 | ) | | | 7,787,624 | | | | (890,949 | ) |
Net change in unrealized appreciation (depreciation) | | | (6,109,472 | ) | | | 5,225,970 | | | | (8,706,661 | ) | | | 9,515,183 | |
| | | | | | | | | | | | | | | | |
Net increase in net assets resulting from operations | | | 5,141,642 | | | | 7,669,037 | | | | 3,016,437 | | | | 11,345,737 | |
| | | | | | | | | | | | | | | | |
Distributions to shareholders from: | | | | | | | | | | | | | | | | |
Net investment income | | | (3,975,718 | ) | | | (3,104,436 | ) | | | (4,335,853 | ) | | | (2,813,079 | ) |
Net realized gain | | | (4,250,737 | ) | | | (188,938 | ) | | | (1,755,343 | ) | | | — | |
| | | | | | | | | | | | | | | | |
Total distributions | | | (8,226,455 | ) | | | (3,293,374 | ) | | | (6,091,196 | ) | | | (2,813,079 | ) |
| | | | | | | | | | | | | | | | |
Capital share transactions: | | | | | | | | | | | | | | | | |
Proceeds from sale of shares | | | 40,604,046 | | | | 157,374,875 | | | | 38,705,399 | | | | 135,480,402 | |
Reinvestment of distributions | | | 8,226,455 | | | | 3,293,374 | | | | 6,091,196 | | | | 2,813,079 | |
Value of shares redeemed | | | (41,644,586 | ) | | | (25,765,656 | ) | | | (37,217,191 | ) | | | (19,845,672 | ) |
| | | | | | | | | | | | | | | | |
Net increase from capital share transactions | | | 7,185,915 | | | | 134,902,593 | | | | 7,579,404 | | | | 118,447,809 | |
| | | | | | | | | | | | | | | | |
Total increase in net assets | | | 4,101,102 | | | | 139,278,256 | | | | 4,504,645 | | | | 126,980,467 | |
| | | | | | | | | | | | | | | | |
NET ASSETS at beginning of year | | | 215,961,446 | | | | 76,683,190 | | | | 217,770,016 | | | | 90,789,549 | |
| | | | | | | | | | | | | | | | |
NET ASSETS at end of year | | $ | 220,062,548 | | | $ | 215,961,446 | | | $ | 222,274,661 | | | $ | 217,770,016 | |
| | | | | | | | | | | | | | | | |
Accumulated net investment income included in net assets at end of year | | $ | — | | | $ | 3,234 | | | $ | — | | | $ | 410,722 | |
| | | | | | | | | | | | | | | | |
SHARE TRANSACTIONS: | | | | | | | | | | | | | | | | |
Number of shares sold | | | 3,856,537 | | | | 15,330,569 | | | | 3,692,226 | | | | 13,531,505 | |
Number of shares issued through reinvestment of dividends and distributions | | | 808,100 | | | | 318,816 | | | | 603,089 | | | | 274,715 | |
Number of shares redeemed | | | (3,957,807 | ) | | | (2,551,535 | ) | | | (3,569,346 | ) | | | (2,030,717 | ) |
| | | | | | | | | | | | | | | | |
Net increase in shares outstanding | | | 706,830 | | | | 13,097,850 | | | | 725,969 | | | | 11,775,503 | |
| | | | | | | | | | | | | | | | |
See Notes to Financial Statements.
116
THE VANTAGEPOINT FUNDS
Statements of Changes in Net Assets
| | | | | | | | | | | | | | | | |
| | | Milestone Funds | |
| | | Milestone 2015 | | | Milestone 2020 | |
| | | For the
Year Ended
December 31,
2011 | | | For the
Year Ended
December 31,
2010 | | | For the
Year Ended
December 31,
2011 | | | For the
Year Ended
December 31,
2010 | |
Increase (decrease) in net assets resulting from operations: | | | | | | | | | | | | | | | | |
Net investment income | | $ | 6,547,527 | | | $ | 4,778,662 | | | $ | 6,430,619 | | | $ | 4,574,916 | |
Net realized gain (loss) | | | 239,834 | | | | (309,614 | ) | | | (1,478,769 | ) | | | (16,066 | ) |
Net change in unrealized appreciation (depreciation) | | | (4,786,269 | ) | | | 20,894,329 | | | | (6,768,227 | ) | | | 22,997,020 | |
| | | | | | | | | | | | | | | | |
Net increase (decrease) in net assets resulting from operations | | | 2,001,092 | | | | 25,363,377 | | | | (1,816,377 | ) | | | 27,555,870 | |
| | | | | | | | | | | | | | | | |
Distributions to shareholders from: | | | | | | | | | | | | | | | | |
Net investment income | | | (7,384,621 | ) | | | (4,947,542 | ) | | | (6,433,834 | ) | | | (4,666,602 | ) |
Net realized gain | | | (2,229,389 | ) | | | (307,240 | ) | | | (1,523,980 | ) | | | (327,355 | ) |
| | | | | | | | | | | | | | | | |
Total distributions | | | (9,614,010 | ) | | | (5,254,782 | ) | | | (7,957,814 | ) | | | (4,993,957 | ) |
| | | | | | | | | | | | | | | | |
Capital share transactions: | | | | | | | | | | | | | | | | |
Proceeds from sale of shares | | | 66,950,595 | | | | 171,311,494 | | | | 79,151,031 | | | | 141,895,139 | |
Reinvestment of distributions | | | 9,614,010 | | | | 5,254,782 | | | | 7,957,814 | | | | 4,993,957 | |
Value of shares redeemed | | | (50,239,931 | ) | | | (19,520,195 | ) | | | (35,040,309 | ) | | | (11,566,427 | ) |
| | | | | | | | | | | | | | | | |
Net increase from capital share transactions | | | 26,324,674 | | | | 157,046,081 | | | | 52,068,536 | | | | 135,322,669 | |
| | | | | | | | | | | | | | | | |
Total increase in net assets | | | 18,711,756 | | | | 177,154,676 | | | | 42,294,345 | | | | 157,884,582 | |
| | | | | | | | | | | | | | | | |
NET ASSETS at beginning of year | | | 363,143,704 | | | | 185,989,028 | | | | 344,032,642 | | | | 186,148,060 | |
| | | | | | | | | | | | | | | | |
NET ASSETS at end of year | | $ | 381,855,460 | | | $ | 363,143,704 | | | $ | 386,326,987 | | | $ | 344,032,642 | |
| | | | | | | | | | | | | | | | |
Accumulated net investment income included in net assets at end of year | | $ | — | | | $ | 853,089 | | | $ | 6,793 | | | $ | 12,743 | |
| | | | | | | | | | | | | | | | |
SHARE TRANSACTIONS: | | | | | | | | | | | | | | | | |
Number of shares sold | | | 6,323,761 | | | | 17,080,020 | | | | 7,514,993 | | | | 14,257,125 | |
Number of shares issued through reinvestment of dividends and distributions | | | 946,261 | | | | 507,708 | | | | 787,902 | | | | 482,975 | |
Number of shares redeemed | | | (4,768,534 | ) | | | (2,014,504 | ) | | | (3,347,269 | ) | | | (1,195,001 | ) |
| | | | | | | | | | | | | | | | |
Net increase in shares outstanding | | | 2,501,488 | | | | 15,573,224 | | | | 4,955,626 | | | | 13,545,099 | |
| | | | | | | | | | | | | | | | |
See Notes to Financial Statements.
117
THE VANTAGEPOINT FUNDS
Statements of Changes in Net Assets
| | | | | | | | | | | | | | | | |
| | | Milestone Funds | |
| | | Milestone 2025 | | | Milestone 2030 | |
| | | For the
Year Ended
December 31,
2011 | | | For the
Year Ended
December 31,
2010 | | | For the
Year Ended
December 31,
2011 | | | For the
Year Ended
December 31,
2010 | |
Increase (decrease) in net assets resulting from operations: | | | | | | | | | | | | | | | | |
Net investment income | | $ | 4,953,297 | | | $ | 3,341,394 | | | $ | 3,736,230 | | | $ | 2,403,843 | |
Net realized gain (loss) | | | (414,142 | ) | | | 184,088 | | | | (393,776 | ) | | | 69,648 | |
Net change in unrealized appreciation (depreciation) | | | (7,766,396 | ) | | | 20,567,704 | | | | (7,385,447 | ) | | | 18,981,329 | |
| | | | | | | | | | | | | | | | |
Net increase (decrease) in net assets resulting from operations | | | (3,227,241 | ) | | | 24,093,186 | | | | (4,042,993 | ) | | | 21,454,820 | |
| | | | | | | | | | | | | | | | |
Distributions to shareholders from: | | | | | | | | | | | | | | | | |
Net investment income | | | (4,955,325 | ) | | | (3,355,439 | ) | | | (3,737,605 | ) | | | (2,417,766 | ) |
Net realized gain | | | (1,321,791 | ) | | | (409,547 | ) | | | (632,273 | ) | | | (293,847 | ) |
| | | | | | | | | | | | | | | | |
Total distributions | | | (6,277,116 | ) | | | (3,764,986 | ) | | | (4,369,878 | ) | | | (2,711,613 | ) |
| | | | | | | | | | | | | | | | |
Capital share transactions: | | | | | | | | | | | | | | | | |
Proceeds from sale of shares | | | 62,102,070 | | | | 102,735,105 | | | | 50,648,092 | | | | 73,730,416 | |
Reinvestment of distributions | | | 6,277,116 | | | | 3,764,986 | | | | 4,369,878 | | | | 2,711,613 | |
Value of shares redeemed | | | (24,755,453 | ) | | | (6,069,787 | ) | | | (21,307,635 | ) | | | (5,248,816 | ) |
| | | | | | | | | | | | | | | | |
Net increase from capital share transactions | | | 43,623,733 | | | | 100,430,304 | | | | 33,710,335 | | | | 71,193,213 | |
| | | | | | | | | | | | | | | | |
Total increase in net assets | | | 34,119,376 | | | | 120,758,504 | | | | 25,297,464 | | | | 89,936,420 | |
| | | | | | | | | | | | | | | | |
NET ASSETS at beginning of year | | | 267,155,253 | | | | 146,396,749 | | | | 211,155,016 | | | | 121,218,596 | |
| | | | | | | | | | | | | | | | |
NET ASSETS at end of year | | $ | 301,274,629 | | | $ | 267,155,253 | | | $ | 236,452,480 | | | $ | 211,155,016 | |
| | | | | | | | | | | | | | | | |
Accumulated net investment income included in net assets at end of year | | $ | 8,340 | | | $ | 12,925 | | | $ | 8,932 | | | $ | 13,369 | |
| | | | | | | | | | | | | | | | |
SHARE TRANSACTIONS: | | | | | | | | | | | | | | | | |
Number of shares sold | | | 5,946,639 | | | | 10,522,334 | | | | 4,830,598 | | | | 7,614,799 | |
Number of shares issued through reinvestment of dividends and distributions | | | 629,600 | | | | 366,601 | | | | 436,988 | | | | 261,991 | |
Number of shares redeemed | | | (2,382,418 | ) | | | (637,062 | ) | | | (2,028,739 | ) | | | (556,779 | ) |
| | | | | | | | | | | | | | | | |
Net increase in shares outstanding | | | 4,193,821 | | | | 10,251,873 | | | | 3,238,847 | | | | 7,320,011 | |
| | | | | | | | | | | | | | | | |
See Notes to Financial Statements.
118
THE VANTAGEPOINT FUNDS
Statements of Changes in Net Assets
| | | | | | | | | | | | | | | | |
| | | Milestone Funds | |
| | | Milestone 2035 | | | Milestone 2040 | |
| | | For the
Year Ended
December 31,
2011 | | | For the
Year Ended
December 31,
2010 | | | For the
Year Ended
December 31,
2011 | | | For the
Year Ended
December 31,
2010 | |
Increase (decrease) in net assets resulting from operations: | | | | | | | | | | | | | | | | |
Net investment income | | $ | 2,313,903 | | | $ | 1,339,037 | | | $ | 2,345,169 | | | $ | 1,288,163 | |
Net realized gain (loss) | | | (614,579 | ) | | | 73,403 | | | | 1,064,163 | | | | (6,410,788 | ) |
Net change in unrealized appreciation (depreciation) | | | (5,353,565 | ) | | | 13,530,798 | | | | (7,456,184 | ) | | | 20,391,750 | |
| | | | | | | | | | | | | | | | |
Net increase (decrease) in net assets resulting from operations | | | (3,654,241 | ) | | | 14,943,238 | | | | (4,046,852 | ) | | | 15,269,125 | |
| | | | | | | | | | | | | | | | |
Distributions to shareholders from: | | | | | | | | | | | | | | | | |
Net investment income | | | (2,314,189 | ) | | | (1,350,089 | ) | | | (2,345,175 | ) | | | (1,299,828 | ) |
Net realized gain | | | (522,524 | ) | | | (234,623 | ) | | | (145,839 | ) | | | (247,741 | ) |
| | | | | | | | | | | | | | | | |
Total distributions | | | (2,836,713 | ) | | | (1,584,712 | ) | | | (2,491,014 | ) | | | (1,547,569 | ) |
| | | | | | | | | | | | | | | | |
Capital share transactions: | | | | | | | | | | | | | | | | |
Proceeds from sale of shares | | | 37,042,100 | | | | 44,879,846 | | | | 36,820,049 | | | | 45,741,486 | |
Reinvestment of distributions | | | 2,836,713 | | | | 1,584,712 | | | | 2,491,014 | | | | 1,547,569 | |
Value of shares redeemed | | | (16,036,919 | ) | | | (3,577,372 | ) | | | (19,047,271 | ) | | | (20,051,937 | ) |
| | | | | | | | | | | | | | | | |
Net increase from capital share transactions | | | 23,841,894 | | | | 42,887,186 | | | | 20,263,792 | | | | 27,237,118 | |
| | | | | | | | | | | | | | | | |
Total increase in net assets | | | 17,350,940 | | | | 56,245,712 | | | | 13,725,926 | | | | 40,958,674 | |
| | | | | | | | | | | | | | | | |
NET ASSETS at beginning of year | | | 133,120,678 | | | | 76,874,966 | | | | 132,306,446 | | | | 91,347,772 | |
| | | | | | | | | | | | | | | | |
NET ASSETS at end of year | | $ | 150,471,618 | | | $ | 133,120,678 | | | $ | 146,032,372 | | | $ | 132,306,446 | |
| | | | | | | | | | | | | | | | |
Accumulated net investment income included in net assets at end of year | | $ | 5,054 | | | $ | 8,810 | | | $ | 2,990 | | | $ | 6,607 | |
| | | | | | | | | | | | | | | | |
SHARE TRANSACTIONS: | | | | | | | | | | | | | | | | |
Number of shares sold | | | 3,571,504 | | | | 4,732,919 | | | | 3,544,151 | | | | 4,848,744 | |
Number of shares issued through reinvestment of dividends and distributions | | | 287,699 | | | | 154,005 | | | | 252,638 | | | | 150,249 | |
Number of shares redeemed | | | (1,543,867 | ) | | | (384,845 | ) | | | (1,830,534 | ) | | | (2,223,674 | ) |
| | | | | | | | | | | | | | | | |
Net increase in shares outstanding | | | 2,315,336 | | | | 4,502,079 | | | | 1,966,255 | | | | 2,775,319 | |
| | | | | | | | | | | | | | | | |
See Notes to Financial Statements.
119
THE VANTAGEPOINT FUNDS
Statements of Changes in Net Assets
| | | | | | | | |
| | | Milestone Fund | |
| | | Milestone 2045 | |
| | | For the
Year Ended
December 31,
2011 | | | For the Period
from January 4,
2010* to
December 31,
2010 | |
Increase (decrease) in net assets resulting from operations: | | | | | | | | |
Net investment income | | $ | 488,992 | | | $ | 203,346 | |
Net realized gain | | | 862,205 | | | | 121,282 | |
Net change in unrealized appreciation (depreciation) | | | (2,482,770 | ) | | | 2,574,373 | |
| | | | | | | | |
Net increase (decrease) in net assets resulting from operations | | | (1,131,573 | ) | | | 2,899,001 | |
| | | | | | | | |
Distributions to shareholders from: | | | | | | | | |
Net investment income | | | (490,728 | ) | | | (206,583 | ) |
Net realized gain | | | (424,960 | ) | | | (51,530 | ) |
| | | | | | | | |
Total distributions | | | (915,688 | ) | | | (258,113 | ) |
| | | | | | | | |
Capital share transactions: | | | | | | | | |
Proceeds from sale of shares | | | 17,424,814 | | | | 20,506,639 | |
Reinvestment of distributions | | | 915,688 | | | | 258,113 | |
Value of shares redeemed | | | (5,222,933 | ) | | | (1,042,295 | ) |
| | | | | | | | |
Net increase from capital share transactions | | | 13,117,569 | | | | 19,722,457 | |
| | | | | | | | |
Total increase in net assets | | | 11,070,308 | | | | 22,363,345 | |
| | | | | | | | |
NET ASSETS at beginning of year | | | 22,363,345 | | | | — | |
| | | | | | | | |
NET ASSETS at end of year | | $ | 33,433,653 | | | $ | 22,363,345 | |
| | | | | | | | |
Accumulated net investment income included in net assets at end of year | | $ | — | | | $ | — | |
| | | | | | | | |
SHARE TRANSACTIONS: | | | | | | | | |
Number of shares sold | | | 1,534,720 | | | | 2,049,774 | |
Number of shares issued through reinvestment of dividends and distributions | | | 85,498 | | | | 22,761 | |
Number of shares redeemed | | | (471,317 | ) | | | (99,522 | ) |
| | | | | | | | |
Net increase in shares outstanding | | | 1,148,901 | | | | 1,973,013 | |
| | | | | | | | |
��
| * | Commencement of operations |
See Notes to Financial Statements.
120
THE VANTAGEPOINT FUNDS
Financial Highlights
(For a share outstanding throughout each period)
| | | | | | | | | | | | | | | | | | | | |
| | | Low Duration Bond(1) | |
| | | For the Year Ended December 31, | |
| | | 2011 | | | 2010 | | | 2009 | | | 2008 | | | 2007 | |
Net Asset Value, beginning of year | | $ | 10.04 | | | $ | 9.95 | | | $ | 9.28 | | | $ | 9.83 | | | $ | 9.76 | |
Income from investment operations: | | | | | | | | | | | | | | | | | | | | |
Net investment income | | | 0.19 | | | | 0.25 | | | | 0.32 | | | | 0.37 | | | | 0.41 | |
Net realized and unrealized gain (loss) | | | (0.08 | ) | | | 0.10 | | | | 0.65 | | | | (0.51 | ) | | | 0.09 | |
| | | | | | | | | | | | | | | | | | | | |
Total from investment operations | | | 0.11 | | | | 0.35 | | | | 0.97 | | | | (0.14 | ) | | | 0.50 | |
| | | | | | | | | | | | | | | | | | | | |
Less distributions: | | | | | | | | | | | | | | | | | | | | |
From net investment income | | | (0.19 | ) | | | (0.26 | ) | | | (0.30 | ) | | | (0.41 | ) | | | (0.43 | ) |
| | | | | | | | | | | | | | | | | | | | |
Total distributions | | | (0.19 | ) | | | (0.26 | ) | | | (0.30 | ) | | | (0.41 | ) | | | (0.43 | ) |
| | | | | | | | | | | | | | | | | | | | |
Net Asset Value, end of year | | $ | 9.96 | | | $ | 10.04 | | | $ | 9.95 | | | $ | 9.28 | | | $ | 9.83 | |
| | | | | | | | | | | | | | | | | | | | |
Total return | | | 1.14 | % | | | 3.58 | % | | | 10.63 | % | | | (1.52 | )% | | | 5.24 | % |
Ratios to Average Net Assets: | | | | | | | | | | | | | | | | | | | | |
Expenses | | | 0.62 | % | | | 0.64 | % | | | 0.66 | % | | | 0.66 | % | | | 0.65 | % |
Net investment income | | | 1.93 | % | | | 2.51 | % | | | 3.27 | % | | | 3.82 | % | | | 4.15 | % |
Supplemental Data: | | | | | | | | | | | | | | | | | | | | |
Net assets, end of year (in thousands) | | $ | 524,463 | | | $ | 537,709 | | | $ | 517,659 | | | $ | 394,704 | | | $ | 507,120 | |
Portfolio turnover | | | 66 | % | | | 70 | % | | | 63 | % | | | 91 | % | | | 149 | % |
| | | | | | | | | | | | | | | | | | | | |
| | | Inflation Protected Securities(2) | |
| | | For the Year Ended December 31, | |
| | | 2011 | | | 2010 | | | 2009 | | | 2008 | | | 2007 | |
Net Asset Value, beginning of year | | $ | 10.99 | | | $ | 10.72 | | | $ | 9.88 | | | $ | 10.46 | | | $ | 10.03 | |
Income from investment operations: | | | | | | | | | | | | | | | | | | | | |
Net investment income | | | 0.34 | | | | 0.19 | | | | 0.11 | | | | 0.57 | | | | 0.50 | |
Net realized and unrealized gain (loss) | | | 0.91 | | | | 0.44 | | | | 0.85 | | | | (0.59 | ) | | | 0.43 | |
| | | | | | | | | | | | | | | | | | | | |
Total from investment operations | | | 1.25 | | | | 0.63 | | | | 0.96 | | | | (0.02 | ) | | | 0.93 | |
| | | | | | | | | | | | | | | | | | | | |
Less distributions: | | | | | | | | | | | | | | | | | | | | |
From net investment income | | | (0.36 | ) | | | (0.19 | ) | | | (0.12 | ) | | | (0.46 | ) | | | (0.50 | ) |
From net realized gain | | | (0.20 | ) | | | (0.17 | ) | | | — | | | | — | | | | — | |
Return of capital | | | — | | | | — | | | | — | | | | (0.10 | ) | | | — | |
| | | | | | | | | | | | | | | | | | | | |
Total distributions | | | (0.56 | ) | | | (0.36 | ) | | | (0.12 | ) | | | (0.56 | ) | | | (0.50 | ) |
| | | | | | | | | | | | | | | | | | | | |
Net Asset Value, end of year | | $ | 11.68 | | | $ | 10.99 | | | $ | 10.72 | | | $ | 9.88 | | | $ | 10.46 | |
| | | | | | | | | | | | | | | | | | | | |
Total return | | | 11.53 | % | | | 5.95 | % | | | 9.75 | % | | | (0.40 | )% | | | 9.64 | % |
Ratios to Average Net Assets: | | | | | | | | | | | | | | | | | | | | |
Expenses | | | 0.64 | % | | | 0.65 | % | | | 0.67 | % | | | 0.67 | % | | | 0.68 | % |
Net investment income | | | 2.94 | % | | | 1.73 | % | | | 1.13 | % | | | 4.64 | % | | | 4.86 | % |
Supplemental Data: | | | | | | | | | | | | | | | | | | | | |
Net assets, end of year (in thousands) | | $ | 584,191 | | | $ | 492,002 | | | $ | 338,790 | | | $ | 300,148 | | | $ | 274,209 | |
Portfolio turnover | | | 109 | % | | | 97 | % | | | 105 | % | | | 149 | % | | | 174 | % |
| (1) | Formerly Short-Term Bond Fund. |
| (2) | Formerly US Government Securities Fund. |
See Notes to Financial Statements.
121
THE VANTAGEPOINT FUNDS
Financial Highlights
(For a share outstanding throughout each period)
| | | | | | | | | | | | | | | | | | | | |
| | | Equity Income | |
| | | For the Year Ended December 31, | |
| | | 2011 | | | 2010 | | | 2009 | | | 2008 | | | 2007 | |
Net Asset Value, beginning of year | | $ | 8.64 | | | $ | 7.70 | | | $ | 5.79 | | | $ | 9.78 | | | $ | 9.90 | |
Income from investment operations: | | | | | | | | | | | | | | | | | | | | |
Net investment income | | | 0.12 | | | | 0.08 | | | | 0.09 | | | | 0.13 | | | | 0.13 | |
Net realized and unrealized gain (loss) | | | (0.13 | ) | | | 0.94 | | | | 1.95 | | | | (3.96 | ) | | | 0.25 | |
| | | | | | | | | | | | | | | | | | | | |
Total from investment operations | | | (0.01 | ) | | | 1.02 | | | | 2.04 | | | | (3.83 | ) | | | 0.38 | |
| | | | | | | | | | | | | | | | | | | | |
Less distributions: | | | | | | | | | | | | | | | | | | | | |
From net investment income | | | (0.22 | ) | | | (0.08 | ) | | | (0.13 | ) | | | — | | | | (0.14 | ) |
From net realized gain | | | (0.14 | ) | | | — | | | | — | | | | (0.16 | ) | | | (0.36 | ) |
| | | | | | | | | | | | | | | | | | | | |
Total distributions | | | (0.36 | ) | | | (0.08 | ) | | | (0.13 | ) | | | (0.16 | ) | | | (0.50 | ) |
| | | | | | | | | | | | | | | | | | | | |
Net Asset Value, end of year | | $ | 8.27 | | | $ | 8.64 | | | $ | 7.70 | | | $ | 5.79 | | | $ | 9.78 | |
| | | | | | | | | | | | | | | | | | | | |
Total return | | | 0.04 | % | | | 13.28 | % | | | 35.28 | % | | | (39.19 | )% | | | 3.76 | % |
Ratios to Average Net Assets: | | | | | | | | | | | | | | | | | | | | |
Expenses before reimbursements/waivers | | | 0.84 | % | | | 0.85 | % | | | 0.88 | % | | | 0.88 | % | | | 0.88 | % |
Expenses net of reimbursements/waivers, if any | | | 0.83 | % | | | 0.85 | % | | | 0.88 | % | | | 0.88 | % | | | 0.88 | % |
Net investment income before reimbursements/waivers | | | 1.32 | % | | | 1.19 | % | | | 1.49 | % | | | 1.74 | % | | | 1.22 | % |
Net investment income net of reimbursements/waivers, if any | | | 1.32 | % | | | 1.19 | % | | | 1.49 | % | | | 1.74 | % | | | 1.23 | % |
Supplemental Data: | | | | | | | | | | | | | | | | | | | | |
Net assets, end of year (in thousands) | | $ | 1,817,557 | | | $ | 1,867,505 | | | $ | 1,516,199 | | | $ | 1,102,032 | | | $ | 1,734,750 | |
Portfolio turnover | | | 18 | % | | | 18 | % | | | 22 | % | | | 29 | % | | | 18 | % |
| | | | | | | | | | | | | | | | | | | | |
| | | Growth & Income | |
| | | For the Year Ended December 31, | |
| | | 2011 | | | 2010 | | | 2009 | | | 2008 | | | 2007 | |
Net Asset Value, beginning of year | | $ | 9.67 | | | $ | 8.49 | | | $ | 6.43 | | | $ | 10.56 | | | $ | 11.49 | |
Income from investment operations: | | | | | | | | | | | | | | | | | | | | |
Net investment income | | | 0.11 | | | | 0.08 | | | | 0.10 | | | | 0.10 | | | | 0.12 | |
Net realized and unrealized gain (loss) | | | (0.18 | ) | | | 1.18 | | | | 2.06 | | | | (4.13 | ) | | | 0.58 | |
| | | | | | | | | | | | | | | | | | | | |
Total from investment operations | | | (0.07 | ) | | | 1.26 | | | | 2.16 | | | | (4.03 | ) | | | 0.70 | |
| | | | | | | | | | | | | | | | | | | | |
Less distributions: | | | | | | | | | | | | | | | | | | | | |
From net investment income | | | (0.11 | ) | | | (0.08 | ) | | | (0.10 | ) | | | (0.07 | ) | | | (0.15 | ) |
From net realized gain | | | — | | | | — | | | | — | | | | (0.03 | ) | | | (1.48 | ) |
| | | | | | | | | | | | | | | | | | | | |
Total distributions | | | (0.11 | ) | | | (0.08 | ) | | | (0.10 | ) | | | (0.10 | ) | | | (1.63 | ) |
| | | | | | | | | | | | | | | | | | | | |
Net Asset Value, end of year | | $ | 9.49 | | | $ | 9.67 | | | $ | 8.49 | | | $ | 6.43 | | | $ | 10.56 | |
| | | | | | | | | | | | | | | | | | | | |
Total return | | | (0.69 | )% | | | 14.81 | % | | | 33.61 | % | | | (38.16 | )% | | | 5.98 | % |
Ratios to Average Net Assets: | | | | | | | | | | | | | | | | | | | | |
Expenses before reimbursements/waivers | | | 0.78 | % | | | 0.79 | % | | | 0.82 | % | | | 0.81 | % | | | 0.81 | % |
Expenses net of reimbursements/waivers, if any | | | 0.78 | % | | | 0.79 | % | | | 0.81 | % | | | 0.80 | % | | | 0.80 | % |
Net investment income before reimbursements/waivers | | | 1.12 | % | | | 0.91 | % | | | 1.39 | % | | | 1.20 | % | | | 0.90 | % |
Net investment income net of reimbursements/waivers, if any | | | 1.12 | % | | | 0.91 | % | | | 1.39 | % | | | 1.21 | % | | | 0.90 | % |
Supplemental Data: | | | | | | | | | | | | | | | | | | | | |
Net assets, end of year (in thousands) | | $ | 1,162,482 | | | $ | 1,228,122 | | | $ | 1,023,636 | | | $ | 747,032 | | | $ | 1,101,700 | |
Portfolio turnover | | | 40 | % | | | 46 | % | | | 111 | % | | | 58 | % | | | 41 | % |
See Notes to Financial Statements.
122
THE VANTAGEPOINT FUNDS
Financial Highlights
(For a share outstanding throughout each period)
| | | | | | | | | | | | | | | | | | | | |
| | | Growth | |
| | | For the Year Ended December 31, | |
| | | 2011 | | | 2010 | | | 2009 | | | 2008 | | | 2007 | |
Net Asset Value, beginning of year | | $ | 8.78 | | | $ | 7.70 | | | $ | 5.91 | | | $ | 10.45 | | | $ | 9.56 | |
Income from investment operations: | | | | | | | | | | | | | | | | | | | | |
Net investment income | | | 0.04 | | | | 0.05 | | | | 0.04 | | | | 0.06 | | | | 0.05 | |
Net realized and unrealized gain (loss) | | | (0.42 | ) | | | 1.09 | | | | 1.79 | | | | (4.54 | ) | | | 0.89 | |
| | | | | | | | | | | | | | | | | | | | |
Total from investment operations | | | (0.38 | ) | | | 1.14 | | | | 1.83 | | | | (4.48 | ) | | | 0.94 | |
| | | | | | | | | | | | | | | | | | | | |
Less distributions: | | | | | | | | | | | | | | | | | | | | |
From net investment income | | | (0.04 | ) | | | (0.06 | ) | | | (0.04 | ) | | | (0.06 | ) | | | (0.05 | ) |
| | | | | | | | | | | | | | | | | | | | |
Total distributions | | | (0.04 | ) | | | (0.06 | ) | | | (0.04 | ) | | | (0.06 | ) | | | (0.05 | ) |
| | | | | | | | | | | | | | | | | | | | |
Net Asset Value, end of year | | $ | 8.36 | | | $ | 8.78 | | | $ | 7.70 | | | $ | 5.91 | | | $ | 10.45 | |
| | | | | | | | | | | | | | | | | | | | |
Total return | | | (4.27 | )% | | | 14.76 | % | | | 31.02 | % | | | (42.89 | )% | | | 9.81 | % |
Ratios to Average Net Assets: | | | | | | | | | | | | | | | | | | | | |
Expenses before reimbursements/waivers | | | 0.83 | % | | | 0.86 | % | | | 0.86 | % | | | 0.88 | % | | | 0.87 | % |
Expenses net of reimbursements/waivers, if any | | | 0.81 | % | | | 0.84 | % | | | 0.84 | % | | | 0.87 | % | | | 0.87 | % |
Net investment income before reimbursements/waivers | | | 0.47 | % | | | 0.64 | % | | | 0.64 | % | | | 0.63 | % | | | 0.41 | % |
Net investment income net of reimbursements/waivers, if any | | | 0.49 | % | | | 0.66 | % | | | 0.66 | % | | | 0.64 | % | | | 0.41 | % |
Supplemental Data: | | | | | | | | | | | | | | | | | | | | |
Net assets, end of year (in thousands) | | $ | 1,751,075 | | | $ | 1,971,807 | | | $ | 1,814,533 | | | $ | 1,427,675 | | | $ | 2,567,845 | |
Portfolio turnover | | | 70 | % | | | 117 | % | | | 89 | % | | | 175 | % | | | 50 | % |
| | | | | | | | | | | | | | | | | | | | |
| | | Select Value | |
| | |
For the Year Ended December 31, | | | For the Period
from October 30,
2007* to
December 31,
2007 | |
| | | 2011 | | | 2010 | | | 2009 | | | 2008 | | |
Net Asset Value, beginning of year | | $ | 9.84 | | | $ | 8.25 | | | $ | 6.07 | | | $ | 9.38 | | | $ | 10.00 | |
Income from investment operations: | | | | | | | | | | | | | | | | | | | | |
Net investment income | | | 0.10 | | | | 0.09 | | | | 0.10 | | | | 0.12 | | | | 0.04 | |
Net realized and unrealized gain (loss) | | | (0.12 | ) | | | 1.59 | | | | 2.14 | | | | (3.31 | ) | | | (0.62 | ) |
| | | | | | | | | | | | | | | | | | | | |
Total from investment operations | | | (0.02 | ) | | | 1.68 | | | | 2.24 | | | | (3.19 | ) | | | (0.58 | ) |
| | | | | | | | | | | | | | | | | | | | |
Less distributions: | | | | | | | | | | | | | | | | | | | | |
From net investment income | | | (0.09 | ) | | | (0.09 | ) | | | (0.06 | ) | | | (0.12 | ) | | | (0.04 | ) |
| | | | | | | | | | | | | | | | | | | | |
Total distributions | | | (0.09 | ) | | | (0.09 | ) | | | (0.06 | ) | | | (0.12 | ) | | | (0.04 | ) |
| | | | | | | | | | | | | | | | | | | | |
Net Asset Value, end of year | | $ | 9.73 | | | $ | 9.84 | | | $ | 8.25 | | | $ | 6.07 | | | $ | 9.38 | |
| | | | | | | | | | | | | | | | | | | | |
Total return | | | (0.16 | )% | | | 20.34 | % | | | 36.99 | % | | | (33.96 | )% | | | (5.85 | )%†† |
Ratios to Average Net Assets: | | | | | | | | | | | | | | | | | | | | |
Expenses before reimbursements/waivers | | | 0.99 | % | | | 1.00 | % | | | 1.04 | % | | | 1.01 | % | | | 1.04 | %† |
Expenses net of reimbursements/waivers, if any | | | 0.99 | % | | | 1.00 | % | | | 1.04 | % | | | 0.98 | % | | | 1.00 | %† |
Net investment income before reimbursements/waivers | | | 0.96 | % | | | 1.01 | % | | | 1.42 | % | | | 1.65 | % | | | 2.02 | %† |
Net investment income net of reimbursements/waivers, if any | | | 0.96 | % | | | 1.01 | % | | | 1.42 | % | | | 1.68 | % | | | 2.06 | %† |
Supplemental Data: | | | | | | | | | | | | | | | | | | | | |
Net assets, end of year (in thousands) | | $ | 320,019 | | | $ | 338,336 | | | $ | 295,800 | | | $ | 220,955 | | | $ | 294,157 | |
Portfolio turnover | | | 60 | % | | | 68 | % | | | 85 | % | | | 211 | % | | | 11 | %†† |
| * | Commencement of operations |
See Notes to Financial Statements.
123
THE VANTAGEPOINT FUNDS
Financial Highlights
(For a share outstanding throughout each period)
| | | | | | | | | | | | | | | | | | | | |
| | | Aggressive Opportunities | |
| | | For the Year Ended December 31, | |
| | | 2011 | | | 2010 | | | 2009 | | | 2008 | | | 2007 | |
Net Asset Value, beginning of year | | $ | 11.34 | | | $ | 9.52 | | | $ | 6.32 | | | $ | 11.26 | | | $ | 12.85 | |
Income from investment operations: | | | | | | | | | | | | | | | | | | | | |
Net investment income | | | 0.03 | | | | 0.01 | | | | (0.00 | )# | | | 0.03 | | | | 0.01 | |
Net realized and unrealized gain (loss) | | | (1.23 | ) | | | 1.81 | | | | 3.22 | | | | (4.68 | ) | | | 0.72 | |
| | | | | | | | | | | | | | | | | | | | |
Total from investment operations | | | (1.20 | ) | | | 1.82 | | | | 3.22 | | | | (4.65 | ) | | | 0.73 | |
| | | | | | | | | | | | | | | | | | | | |
Less distributions: | | | | | | | | | | | | | | | | | | | | |
From net investment income | | | (0.04 | ) | | | — | | | | (0.02 | ) | | | (0.01 | ) | | | — | |
From net realized gain | | | (0.84 | ) | | | — | | | | — | | | | (0.28 | ) | | | (2.32 | ) |
| | | | | | | | | | | | | | | | | | | | |
Total distributions | | | (0.88 | ) | | | — | | | | (0.02 | ) | | | (0.29 | ) | | | (2.32 | ) |
| | | | | | | | | | | | | | | | | | | | |
Net Asset Value, end of year | | $ | 9.26 | | | $ | 11.34 | | | $ | 9.52 | | | $ | 6.32 | | | $ | 11.26 | |
| | | | | | | | | | | | | | | | | | | | |
Total return | | | (10.42 | )% | | | 19.12 | % | | | 50.95 | % | | | (41.29 | )% | | | 5.53 | % |
Ratios to Average Net Assets: | | | | | | | | | | | | | | | | | | | | |
Expenses before reimbursements/waivers | | | 0.91 | % | | | 0.93 | % | | | 0.99 | % | | | 1.01 | % | | | 1.02 | % |
Expenses net of reimbursements/waivers, if any | | | 0.91 | % | | | 0.93 | % | | | 0.98 | % | | | 0.96 | % | | | 1.02 | % |
Net investment income (loss) before reimbursements/waivers | | | 0.21 | % | | | 0.05 | % | | | (0.02 | )% | | | 0.25 | % | | | 0.07 | % |
Net investment income (loss) net of reimbursements/waivers, if any | | | 0.21 | % | | | 0.05 | % | | | (0.02 | )% | | | 0.30 | % | | | 0.08 | % |
Supplemental Data: | | | | | | | | | | | | | | | | | | | | |
Net assets, end of year (in thousands) | | $ | 957,271 | | | $ | 1,147,570 | | | $ | 1,010,098 | | | $ | 668,403 | | | $ | 1,154,745 | |
Portfolio turnover | | | 53 | % | | | 96 | % | | | 53 | % | | | 57 | % | | | 45 | % |
| | | | | | | | | | | | | | | | | | | | |
| | | Discovery | |
| | |
For the Year Ended December 31, | | | For the Period
from October 30,
2007* to
December 31,
2007 | |
| | | 2011 | | | 2010 | | | 2009 | | | 2008 | | |
Net Asset Value, beginning of year | | $ | 9.42 | | | $ | 7.54 | | | $ | 5.46 | | | $ | 9.25 | | | $ | 10.00 | |
Income from investment operations: | | | | | | | | | | | | | | | | | | | | |
Net investment income | | | 0.10 | | | | 0.08 | | | | 0.08 | | | | 0.20 | | | | 0.03 | |
Net realized and unrealized gain (loss) | | | (0.68 | ) | | | 1.89 | | | | 2.07 | | | | (3.77 | ) | | | (0.68 | ) |
| | | | | | | | | | | | | | | | | | | | |
Total from investment operations | | | (0.58 | ) | | | 1.97 | | | | 2.15 | | | | (3.57 | ) | | | (0.65 | ) |
| | | | | | | | | | | | | | | | | | | | |
Less distributions: | | | | | | | | | | | | | | | | | | | | |
From net investment income | | | (0.10 | ) | | | (0.09 | ) | | | (0.07 | ) | | | (0.17 | ) | | | (0.03 | ) |
From net realized gain | | | — | | | | — | | | | — | | | | — | | | | (0.07 | ) |
Return of capital | | | — | | | | — | | | | — | | | | (0.05 | ) | | | — | |
| | | | | | | | | | | | | | | | | | | | |
Total distributions | | | (0.10 | ) | | | (0.09 | ) | | | (0.07 | ) | | | (0.22 | ) | | | (0.10 | ) |
| | | | | | | | | | | | | | | | | | | | |
Net Asset Value, end of year | | $ | 8.74 | | | $ | 9.42 | | | $ | 7.54 | | | $ | 5.46 | | | $ | 9.25 | |
| | | | | | | | | | | | | | | | | | | | |
Total return | | | (6.15 | )% | | | 26.08 | % | | | 39.32 | % | | | (38.51 | )% | | | (6.46 | )%†† |
Ratios to Average Net Assets: | | | | | | | | | | | | | | | | | | | | |
Expenses | | | 0.95 | % | | | 0.98 | % | | | 0.99 | % | | | 0.99 | % | | | 1.07 | %† |
Net investment income | | | 1.05 | % | | | 0.97 | % | | | 1.35 | % | | | 2.12 | % | | | 2.08 | %† |
Supplemental Data: | | | | | | | | | | | | | | | | | | | | |
Net assets, end of year (in thousands) | | $ | 193,872 | | | $ | 212,770 | | | $ | 178,174 | | | $ | 126,382 | | | $ | 173,510 | |
Portfolio turnover | | | 86 | % | | | 73 | % | | | 85 | % | | | 111 | % | | | 36 | %†† |
| # | Rounds to less than $0.01 |
| * | Commencement of operations |
See Notes to Financial Statements.
124
THE VANTAGEPOINT FUNDS
Financial Highlights
(For a share outstanding throughout each period)
| | | | | | | | | | | | | | | | | | | | |
| | | International | |
| | | For the Year Ended December 31, | |
| | | 2011 | | | 2010 | | | 2009 | | | 2008 | | | 2007 | |
Net Asset Value, beginning of year | | $ | 9.34 | | | $ | 8.85 | | | $ | 6.94 | | | $ | 12.19 | | | $ | 12.57 | |
Income from investment operations: | | | | | | | | | | | | | | | | | | | | |
Net investment income | | | 0.20 | | | | 0.15 | | | | 0.12 | | | | 0.17 | | | | 0.18 | |
Net realized and unrealized gain (loss) | | | (1.01 | ) | | | 0.52 | | | | 1.96 | | | | (5.29 | ) | | | 1.37 | |
| | | | | | | | | | | | | | | | | | | | |
Total from investment operations | | | (0.81 | ) | | | 0.67 | | | | 2.08 | | | | (5.12 | ) | | | 1.55 | |
| | | | | | | | | | | | | | | | | | | | |
Less distributions: | | | | | | | | | | | | | | | | | | | | |
From net investment income | | | (0.21 | ) | | | (0.18 | ) | | | (0.17 | ) | | | (0.02 | ) | | | (0.21 | ) |
From net realized gain | | | — | | | | — | | | | — | | | | (0.11 | ) | | | (1.72 | ) |
| | | | | | | | | | | | | | | | | | | | |
Total distributions | | | (0.21 | ) | | | (0.18 | ) | | | (0.17 | ) | | | (0.13 | ) | | | (1.93 | ) |
| | | | | | | | | | | | | | | | | | | | |
Net Asset Value, end of year | | $ | 8.32 | | | $ | 9.34 | | | $ | 8.85 | | | $ | 6.94 | | | $ | 12.19 | |
| | | | | | | | | | | | | | | | | | | | |
Total return | | | (8.57 | )% | | | 7.61 | % | | | 29.97 | % | | | (42.03 | )% | | | 12.46 | % |
Ratios to Average Net Assets: | | | | | | | | | | | | | | | | | | | | |
Expenses before reimbursements/waivers | | | 0.97 | % | | | 0.98 | % | | | 1.05 | % | | | 1.07 | % | | | 1.10 | % |
Expenses net of reimbursements/waivers, if any | | | 0.95 | % | | | 0.98 | % | | | 1.05 | % | | | 1.07 | % | | | 1.10 | % |
Net investment income before reimbursements/waivers | | | 2.25 | % | | | 1.95 | % | | | 1.70 | % | | | 1.95 | % | | | 1.15 | % |
Net investment income net of reimbursements/waivers, if any | | | 2.26 | % | | | 1.95 | % | | | 1.70 | % | | | 1.95 | % | | | 1.15 | % |
Supplemental Data: | | | | | | | | | | | | | | | | | | | | |
Net assets, end of year (in thousands) | | $ | 1,139,964 | | | $ | 1,218,763 | | | $ | 1,015,627 | | | $ | 766,210 | | | $ | 1,145,029 | |
Portfolio turnover | | | 50 | % | | | 53 | % | | | 164 | % | | | 59 | % | | | 60 | % |
| | | | | | | | | | | | | | | | | | | | |
| | | Diversifying Strategies(1) | |
| | |
For the Year Ended December 31, | | | For the Period
from October 30,
2007* to
December 31,
2007 | |
| | | 2011 | | | 2010 | | | 2009 | | | 2008 | | |
Net Asset Value, beginning of year | | $ | 10.16 | | | $ | 9.85 | | | $ | 9.28 | | | $ | 9.95 | | | $ | 10.00 | |
Income from investment operations: | | | | | | | | | | | | | | | | | | | | |
Net investment income | | | 0.10 | | | | 0.06 | | | | 0.09 | | | | 0.28 | | | | 0.06 | |
Net realized and unrealized gain (loss) | | | (0.09 | ) | | | 0.44 | | | | 0.53 | | | | (0.95 | ) | | | (0.07 | ) |
| | | | | | | | | | | | | | | | | | | | |
Total from investment operations | | | 0.01 | | | | 0.50 | | | | 0.62 | | | | (0.67 | ) | | | (0.01 | ) |
| | | | | | | | | | | | | | | | | | | | |
Less distributions: | | | | | | | | | | | | | | | | | | | | |
From net investment income | | | (0.02 | ) | | | (0.19 | ) | | | (0.05 | ) | | | — | | | | (0.04 | ) |
From net realized gain | | | (0.14 | ) | | | — | | | | — | | | | (0.00 | )# | | | — | |
| | | | | | | | | | | | | | | | | | | | |
Total distributions | | | (0.16 | ) | | | (0.19 | ) | | | (0.05 | ) | | | (0.00 | )# | | | (0.04 | ) |
| | | | | | | | | | | | | | | | | | | | |
Net Asset Value, end of year | | $ | 10.01 | | | $ | 10.16 | | | $ | 9.85 | | | $ | 9.28 | | | $ | 9.95 | |
| | | | | | | | | | | | | | | | | | | | |
Total return | | | 0.10 | % | | | 5.04 | % | | | 6.64 | % | | | (6.73 | )% | | | (0.07 | )%†† |
Ratios to Average Net Assets: | | | | | | | | | | | | | | | | | | | | |
Expenses before reimbursements/waivers | | | 0.91 | % | | | 0.91 | % | | | 0.96 | % | | | 1.00 | % | | | 1.02 | %† |
Expenses net of reimbursements/waivers, if any | | | 0.85 | % | | | 0.91 | % | | | 0.95 | % | | | 0.99 | % | | | 1.01 | %† |
Net investment income before reimbursements/waivers | | | 0.93 | % | | | 1.06 | % | | | 1.05 | % | | | 2.30 | % | | | 3.52 | %† |
Net investment income net of reimbursements/waivers, if any | | | 1.00 | % | | | 1.06 | % | | | 1.06 | % | | | 2.31 | % | | | 3.53 | %† |
Supplemental Data: | | | | | | | | | | | | | | | | | | | | |
Net assets, end of year (in thousands) | | $ | 849,777 | | | $ | 870,591 | | | $ | 453,196 | | | $ | 338,090 | | | $ | 465,175 | |
Portfolio turnover | | | 73 | % | | | 63 | % | | | 129 | % | | | 89 | % | | | 16 | %†† |
| (1) | Formerly Diversified Assets Fund. |
| * | Commencement of operations |
| # | Rounds to less than $0.01 |
See Notes to Financial Statements.
125
THE VANTAGEPOINT FUNDS
Financial Highlights
(For a share outstanding throughout each period)
| | | | | | | | | | | | | | | | | | | | |
| | | Core Bond Index Class I | |
| | | For the Year Ended December 31, | |
| | | 2011 | | | 2010 | | | 2009 | | | 2008 | | | 2007 | |
Net Asset Value, beginning of year | | $ | 10.10 | | | $ | 9.89 | | | $ | 9.81 | | | $ | 9.87 | | | $ | 9.75 | |
Income from investment operations: | | | | | | | | | | | | | | | | | | | | |
Net investment income | | | 0.31 | | | | 0.34 | | | | 0.40 | | | | 0.46 | | | | 0.47 | |
Net realized and unrealized gain (loss) | | | 0.42 | | | | 0.26 | | | | 0.13 | | | | (0.02 | ) | | | 0.15 | |
| | | | | | | | | | | | | | | | | | | | |
Total from investment operations | | | 0.73 | | | | 0.60 | | | | 0.53 | | | | 0.44 | | | | 0.62 | |
| | | | | | | | | | | | | | | | | | | | |
Less distributions: | | | | | | | | | | | | | | | | | | | | |
From net investment income | | | (0.36 | ) | | | (0.39 | ) | | | (0.45 | ) | | | (0.50 | ) | | | (0.50 | ) |
| | | | | | | | | | | | | | | | | | | | |
Total distributions | | | (0.36 | ) | | | (0.39 | ) | | | (0.45 | ) | | | (0.50 | ) | | | (0.50 | ) |
| | | | | | | | | | | | | | | | | | | | |
Net Asset Value, end of year | | $ | 10.47 | | | $ | 10.10 | | | $ | 9.89 | | | $ | 9.81 | | | $ | 9.87 | |
| | | | | | | | | | | | | | | | | | | | |
Total return | | | 7.41 | % | | | 6.13 | % | | | 5.57 | % | | | 4.63 | % | | | 6.52 | % |
Ratios to Average Net Assets: | | | | | | | | | | | | | | | | | | | | |
Expenses | | | 0.41 | % | | | 0.42 | % | | | 0.42 | % | | | 0.44 | % | | | 0.44 | % |
Net investment income | | | 3.00 | % | | | 3.31 | % | | | 3.99 | % | | | 4.70 | % | | | 4.71 | % |
Supplemental Data: | | | | | | | | | | | | | | | | | | | | |
Net assets, end of year (in thousands) | | $ | 813,431 | | | $ | 824,963 | | | $ | 857,504 | | | $ | 656,279 | | | $ | 888,541 | |
Portfolio turnover | | | 57 | % | | | 85 | % | | | 60 | % | | | 49 | % | | | 76 | % |
| | | | | | | | | | | | | | | | | | | | |
| | | Core Bond Index Class II | |
| | | For the Year Ended December 31, | |
| | | 2011 | | | 2010 | | | 2009 | | | 2008 | | | 2007 | |
Net Asset Value, beginning of year | | $ | 10.16 | | | $ | 9.94 | | | $ | 9.86 | | | $ | 9.92 | | | $ | 9.80 | |
Income from investment operations: | | | | | | | | | | | | | | | | | | | | |
Net investment income | | | 0.33 | | | | 0.36 | | | | 0.42 | | | | 0.48 | | | | 0.49 | |
Net realized and unrealized gain (loss) | | | 0.43 | | | | 0.27 | | | | 0.13 | | | | (0.02 | ) | | | 0.15 | |
| | | | | | | | | | | | | | | | | | | | |
Total from investment operations | | | 0.76 | | | | 0.63 | | | | 0.55 | | | | 0.46 | | | | 0.64 | |
| | | | | | | | | | | | | | | | | | | | |
Less distributions: | | | | | | | | | | | | | | | | | | | | |
From net investment income | | | (0.39 | ) | | | (0.41 | ) | | | (0.47 | ) | | | (0.52 | ) | | | (0.52 | ) |
| | | | | | | | | | | | | | | | | | | | |
Total distributions | | | (0.39 | ) | | | (0.41 | ) | | | (0.47 | ) | | | (0.52 | ) | | | (0.52 | ) |
| | | | | | | | | | | | | | | | | | | | |
Net Asset Value, end of year | | $ | 10.53 | | | $ | 10.16 | | | $ | 9.94 | | | $ | 9.86 | | | $ | 9.92 | |
| | | | | | | | | | | | | | | | | | | | |
Total return | | | 7.57 | % | | | 6.41 | % | | | 5.74 | % | | | 4.82 | % | | | 6.71 | % |
Ratios to Average Net Assets: | | | | | | | | | | | | | | | | | | | | |
Expenses | | | 0.21 | % | | | 0.22 | % | | | 0.22 | % | | | 0.24 | % | | | 0.24 | % |
Net investment income | | | 3.15 | % | | | 3.51 | % | | | 4.21 | % | | | 4.90 | % | | | 4.91 | % |
Supplemental Data: | | | | | | | | | | | | | | | | | | | | |
Net assets, end of year (in thousands) | | $ | 320,809 | | | $ | 282,359 | | | $ | 238,193 | | | $ | 220,355 | | | $ | 201,573 | |
Portfolio turnover | | | 57 | % | | | 85 | % | | | 60 | % | | | 49 | % | | | 76 | % |
See Notes to Financial Statements.
126
THE VANTAGEPOINT FUNDS
Financial Highlights
(For a share outstanding throughout each period)
| | | | | | | | | | | | | | | | | | | | |
| | | 500 Stock Index Class I | |
| | | For the Year Ended December 31, | |
| | | 2011 | | | 2010 | | | 2009 | | | 2008 | | | 2007 | |
Net Asset Value, beginning of year | | $ | 9.95 | | | $ | 8.81 | | | $ | 7.12 | | | $ | 11.63 | | | $ | 11.23 | |
Income from investment operations: | | | | | | | | | | | | | | | | | | | | |
Net investment income | | | 0.17 | | | | 0.15 | | | | 0.16 | | | | 0.18 | | | | 0.22 | |
Net realized and unrealized gain (loss) | | | 0.00 | # | | | 1.13 | | | | 1.70 | | | | (4.52 | ) | | | 0.35 | |
| | | | | | | | | | | | | | | | | | | | |
Total from investment operations | | | 0.17 | | | | 1.28 | | | | 1.86 | | | | (4.34 | ) | | | 0.57 | |
| | | | | | | | | | | | | | | | | | | | |
Less distributions: | | | | | | | | | | | | | | | | | | | | |
From net investment income | | | (0.16 | ) | | | (0.14 | ) | | | (0.17 | ) | | | (0.17 | ) | | | (0.17 | ) |
| | | | | | | | | | | | | | | | | | | | |
Total distributions | | | (0.16 | ) | | | (0.14 | ) | | | (0.17 | ) | | | (0.17 | ) | | | (0.17 | ) |
| | | | | | | | | | | | | | | | | | | | |
Net Asset Value, end of year | | $ | 9.96 | | | $ | 9.95 | | | $ | 8.81 | | | $ | 7.12 | | | $ | 11.63 | |
| | | | | | | | | | | | | | | | | | | | |
Total return | | | 1.72 | % | | | 14.56 | % | | | 26.13 | % | | | (37.31 | )% | | | 5.06 | % |
Ratios to Average Net Assets: | | | | | | | | | | | | | | | | | | | | |
Expenses | | | 0.42 | % | | | 0.43 | % | | | 0.44 | % | | | 0.46 | % | | | 0.45 | % |
Net investment income | | | 1.65 | % | | | 1.63 | % | | | 2.19 | % | | | 1.92 | % | | | 1.55 | % |
Supplemental Data: | | | | | | | | | | | | | | | | | | | | |
Net assets, end of year (in thousands) | | $ | 94,197 | | | $ | 102,642 | | | $ | 85,772 | | | $ | 59,748 | | | $ | 95,694 | |
Portfolio turnover | | | 3 | % | | | 3 | % | | | 15 | % | | | 7 | % | | | 5 | % |
| | | | | | | | | | | | | | | | | | | | |
| | | 500 Stock Index Class II | |
| | | For the Year Ended December 31, | |
| | | 2011 | | | 2010 | | | 2009 | | | 2008 | | | 2007 | |
Net Asset Value, beginning of year | | $ | 9.39 | | | $ | 8.32 | | | $ | 6.73 | | | $ | 11.01 | | | $ | 10.65 | |
Income from investment operations: | | | | | | | | | | | | | | | | | | | | |
Net investment income | | | 0.18 | | | | 0.16 | | | | 0.19 | | | | 0.19 | | | | 0.20 | |
Net realized and unrealized gain (loss) | | | 0.00 | # | | | 1.07 | | | | 1.58 | | | | (4.28 | ) | | | 0.36 | |
| | | | | | | | | | | | | | | | | | | | |
Total from investment operations | | | 0.18 | | | | 1.23 | | | | 1.77 | | | | (4.09 | ) | | | 0.56 | |
| | | | | | | | | | | | | | | | | | | | |
Less distributions: | | | | | | | | | | | | | | | | | | | | |
From net investment income | | | (0.18 | ) | | | (0.16 | ) | | | (0.18 | ) | | | (0.19 | ) | | | (0.20 | ) |
| | | | | | | | | | | | | | | | | | | | |
Total distributions | | | (0.18 | ) | | | (0.16 | ) | | | (0.18 | ) | | | (0.19 | ) | | | (0.20 | ) |
| | | | | | | | | | | | | | | | | | | | |
Net Asset Value, end of year | | $ | 9.39 | | | $ | 9.39 | | | $ | 8.32 | | | $ | 6.73 | | | $ | 11.01 | |
| | | | | | | | | | | | | | | | | | | | |
Total return | | | 1.97 | % | | | 14.78 | % | | | 26.35 | % | | | (37.15 | )% | | | 5.22 | % |
Ratios to Average Net Assets: | | | | | | | | | | | | | | | | | | | | |
Expenses | | | 0.22 | % | | | 0.23 | % | | | 0.24 | % | | | 0.26 | % | | | 0.25 | % |
Net investment income | | | 1.86 | % | | | 1.84 | % | | | 2.40 | % | | | 2.13 | % | | | 1.75 | % |
Supplemental Data: | | | | | | | | | | | | | | | | | | | | |
Net assets, end of year (in thousands) | | $ | 287,072 | | | $ | 281,443 | | | $ | 237,743 | | | $ | 200,989 | | | $ | 316,248 | |
Portfolio turnover | | | 3 | % | | | 3 | % | | | 15 | % | | | 7 | % | | | 5 | % |
| # | Rounds to less than $0.01 |
See Notes to Financial Statements.
127
THE VANTAGEPOINT FUNDS
Financial Highlights
(For a share outstanding throughout each period)
| | | | | | | | | | | | | | | | | | | | |
| | | Broad Market Index Class I | |
| | | For the Year Ended December 31, | |
| | | 2011 | | | 2010 | | | 2009 | | | 2008 | | | 2007 | |
Net Asset Value, beginning of year | | $ | 10.92 | | | $ | 9.47 | | | $ | 7.53 | | | $ | 12.25 | | | $ | 11.81 | |
Income from investment operations: | | | | | | | | | | | | | | | | | | | | |
Net investment income | | | 0.20 | | | | 0.16 | | | | 0.17 | | | | 0.21 | | | | 0.26 | |
Net realized and unrealized gain (loss) | | | (0.11 | ) | | | 1.43 | | | | 1.92 | | | | (4.75 | ) | | | 0.35 | |
| | | | | | | | | | | | | | | | | | | | |
Total from investment operations | | | 0.09 | | | | 1.59 | | | | 2.09 | | | | (4.54 | ) | | | 0.61 | |
| | | | | | | | | | | | | | | | | | | | |
Less distributions: | | | | | | | | | | | | | | | | | | | | |
From net investment income | | | (0.16 | ) | | | (0.14 | ) | | | (0.15 | ) | | | (0.18 | ) | | | (0.17 | ) |
| | | | | | | | | | | | | | | | | | | | |
Total distributions | | | (0.16 | ) | | | (0.14 | ) | | | (0.15 | ) | | | (0.18 | ) | | | (0.17 | ) |
| | | | | | | | | | | | | | | | | | | | |
Net Asset Value, end of year | | $ | 10.85 | | | $ | 10.92 | | | $ | 9.47 | | | $ | 7.53 | | | $ | 12.25 | |
| | | | | | | | | | | | | | | | | | | | |
Total return | | | 0.85 | % | | | 16.84 | % | | | 27.78 | % | | | (37.06 | )% | | | 5.15 | % |
Ratios to Average Net Assets: | | | | | | | | | | | | | | | | | | | | |
Expenses | | | 0.41 | % | | | 0.42 | % | | | 0.43 | % | | | 0.44 | % | | | 0.44 | % |
Net investment income | | | 1.56 | % | | | 1.55 | % | | | 2.05 | % | | | 1.81 | % | | | 1.48 | % |
Supplemental Data: | | | | | | | | | | | | | | | | | | | | |
Net assets, end of year (in thousands) | | $ | 114,674 | | | $ | 131,673 | | | $ | 119,777 | | | $ | 94,710 | | | $ | 170,584 | |
Portfolio turnover | | | 1 | % | | | 6 | % | | | 7 | % | | | 4 | % | | | 2 | % |
| | | | | | | | | | | | | | | | | | | | |
| | | Broad Market Index Class II | |
| | | For the Year Ended December 31, | |
| | | 2011 | | | 2010 | | | 2009 | | | 2008 | | | 2007 | |
Net Asset Value, beginning of year | | $ | 10.27 | | | $ | 8.91 | | | $ | 7.09 | | | $ | 11.57 | | | $ | 11.17 | |
Income from investment operations: | | | | | | | | | | | | | | | | | | | | |
Net investment income | | | 0.19 | | | | 0.16 | | | | 0.18 | | | | 0.20 | | | | 0.20 | |
Net realized and unrealized gain (loss) | | | (0.09 | ) | | | 1.36 | | | | 1.81 | | | | (4.48 | ) | | | 0.40 | |
| | | | | | | | | | | | | | | | | | | | |
Total from investment operations | | | 0.10 | | | | 1.52 | | | | 1.99 | | | | (4.28 | ) | | | 0.60 | |
| | | | | | | | | | | | | | | | | | | | |
Less distributions: | | | | | | | | | | | | | | | | | | | | |
From net investment income | | | (0.18 | ) | | | (0.16 | ) | | | (0.17 | ) | | | (0.20 | ) | | | (0.20 | ) |
| | | | | | | | | | | | | | | | | | | | |
Total distributions | | | (0.18 | ) | | | (0.16 | ) | | | (0.17 | ) | | | (0.20 | ) | | | (0.20 | ) |
| | | | | | | | | | | | | | | | | | | | |
Net Asset Value, end of year | | $ | 10.19 | | | $ | 10.27 | | | $ | 8.91 | | | $ | 7.09 | | | $ | 11.57 | |
| | | | | | | | | | | | | | | | | | | | |
Total return | | | 1.07 | % | | | 17.12 | % | | | 28.04 | % | | | (36.97 | )% | | | 5.35 | % |
Ratios to Average Net Assets: | | | | | | | | | | | | | | | | | | | | |
Expenses | | | 0.21 | % | | | 0.22 | % | | | 0.23 | % | | | 0.24 | % | | | 0.24 | % |
Net investment income | | | 1.77 | % | | | 1.75 | % | | | 2.26 | % | | | 2.03 | % | | | 1.68 | % |
Supplemental Data: | | | | | | | | | | | | | | | | | | | | |
Net assets, end of year (in thousands) | | $ | 389,031 | | | $ | 406,029 | | | $ | 358,250 | | | $ | 295,297 | | | $ | 484,534 | |
Portfolio turnover | | | 1 | % | | | 6 | % | | | 7 | % | | | 4 | % | | | 2 | % |
See Notes to Financial Statements.
128
THE VANTAGEPOINT FUNDS
Financial Highlights
(For a share outstanding throughout each period)
| | | | | | | | | | | | | | | | | | | | |
| | | Mid/Small Company Index Class I | |
| | | For the Year Ended December 31, | |
| | | 2011 | | | 2010 | | | 2009 | | | 2008 | | | 2007 | |
Net Asset Value, beginning of year | | $ | 15.39 | | | $ | 12.35 | | | $ | 9.17 | | | $ | 16.23 | | | $ | 16.52 | |
Income from investment operations: | | | | | | | | | | | | | | | | | | | | |
Net investment income | | | 0.16 | | | | 0.13 | | | | 0.13 | | | | 0.18 | | | | 0.16 | |
Net realized and unrealized gain (loss) | | | (0.78 | ) | | | 3.31 | | | | 3.19 | | | | (6.46 | ) | | | 0.68 | |
| | | | | | | | | | | | | | | | | | | | |
Total from investment operations | | | (0.62 | ) | | | 3.44 | | | | 3.32 | | | | (6.28 | ) | | | 0.84 | |
| | | | | | | | | | | | | | | | | | | | |
Less distributions: | | | | | | | | | | | | | | | | | | | | |
From net investment income | | | (0.15 | ) | | | (0.12 | ) | | | (0.14 | ) | | | (0.18 | ) | | | (0.20 | ) |
From net realized gain | | | (0.60 | ) | | | (0.28 | ) | | | — | | | | (0.59 | ) | | | (0.93 | ) |
Return of capital | | | — | | | | — | | | | — | | | | (0.01 | ) | | | — | |
| | | | | | | | | | | | | | | | | | | | |
Total distributions | | | (0.75 | ) | | | (0.40 | ) | | | (0.14 | ) | | | (0.78 | ) | | | (1.13 | ) |
| | | | | | | | | | | | | | | | | | | | |
Net Asset Value, end of year | | $ | 14.02 | | | $ | 15.39 | | | $ | 12.35 | | | $ | 9.17 | | | $ | 16.23 | |
| | | | | | | | | | | | | | | | | | | | |
Total return | | | (3.91 | )% | | | 27.93 | % | | | 36.19 | % | | | (38.57 | )% | | | 4.98 | % |
Ratios to Average Net Assets: | | | | | | | | | | | | | | | | | | | | |
Expenses | | | 0.43 | % | | | 0.45 | % | | | 0.48 | % | | | 0.50 | % | | | 0.50 | % |
Net investment income | | | 1.11 | % | | | 1.16 | % | | | 1.46 | % | | | 1.47 | % | | | 1.16 | % |
Supplemental Data: | | | | | | | | | | | | | | | | | | | | |
Net assets, end of year (in thousands) | | $ | 247,732 | | | $ | 243,794 | | | $ | 134,165 | | | $ | 82,628 | | | $ | 105,496 | |
Portfolio turnover | | | 15 | % | | | 14 | % | | | 25 | % | | | 15 | % | | | 18 | % |
| | | | | | | | | | | | | | | | | | | | |
| | | Mid/Small Company Index Class II | |
| | | For the Year Ended December 31, | |
| | | 2011 | | | 2010 | | | 2009 | | | 2008 | | | 2007 | |
Net Asset Value, beginning of year | | $ | 14.60 | | | $ | 11.73 | | | $ | 8.71 | | | $ | 15.48 | | | $ | 15.80 | |
Income from investment operations: | | | | | | | | | | | | | | | | | | | | |
Net investment income | | | 0.19 | | | | 0.15 | | | | 0.17 | | | | 0.23 | | | | 0.22 | |
Net realized and unrealized gain (loss) | | | (0.76 | ) | | | 3.14 | | | | 3.00 | | | | (6.20 | ) | | | 0.61 | |
| | | | | | | | | | | | | | | | | | | | |
Total from investment operations | | | (0.57 | ) | | | 3.29 | | | | 3.17 | | | | (5.97 | ) | | | 0.83 | |
| | | | | | | | | | | | | | | | | | | | |
Less distributions: | | | | | | | | | | | | | | | | | | | | |
From net investment income | | | (0.17 | ) | | | (0.14 | ) | | | (0.15 | ) | | | (0.20 | ) | | | (0.22 | ) |
From net realized gain | | | (0.60 | ) | | | (0.28 | ) | | | — | | | | (0.59 | ) | | | (0.93 | ) |
Return of capital | | | — | | | | — | | | | — | | | | (0.01 | ) | | | — | |
| | | | | | | | | | | | | | | | | | | | |
Total distributions | | | (0.77 | ) | | | (0.42 | ) | | | (0.15 | ) | | | (0.80 | ) | | | (1.15 | ) |
| | | | | | | | | | | | | | | | | | | | |
Net Asset Value, end of year | | $ | 13.26 | | | $ | 14.60 | | | $ | 11.73 | | | $ | 8.71 | | | $ | 15.48 | |
| | | | | | | | | | | | | | | | | | | | |
Total return | | | (3.70 | )% | | | 28.15 | % | | | 36.47 | % | | | (38.44 | )% | | | 5.20 | % |
Ratios to Average Net Assets: | | | | | | | | | | | | | | | | | | | | |
Expenses | | | 0.23 | % | | | 0.25 | % | | | 0.28 | % | | | 0.30 | % | | | 0.30 | % |
Net investment income | | | 1.30 | % | | | 1.35 | % | | | 1.66 | % | | | 1.63 | % | | | 1.36 | % |
Supplemental Data: | | | | | | | | | | | | | | | | | | | | |
Net assets, end of year (in thousands) | | $ | 160,710 | | | $ | 161,178 | | | $ | 97,453 | | | $ | 71,965 | | | $ | 121,950 | |
Portfolio turnover | | | 15 | % | | | 14 | % | | | 25 | % | | | 15 | % | | | 18 | % |
See Notes to Financial Statements.
129
THE VANTAGEPOINT FUNDS
Financial Highlights
(For a share outstanding throughout each period)
| | | | | | | | | | | | | | | | | | | | |
| | | Overseas Equity Index Class I | |
| | | For the Year Ended December 31, | |
| | | 2011 | | | 2010 | | | 2009 | | | 2008 | | | 2007 | |
Net Asset Value, beginning of year | | $ | 10.82 | | | $ | 10.30 | | | $ | 8.20 | | | $ | 14.80 | | | $ | 13.79 | |
Income from investment operations: | | | | | | | | | | | | | | | | | | | | |
Net investment income | | | 0.33 | | | | 0.23 | | | | 0.22 | | | | 0.39 | | | | 0.35 | |
Net realized and unrealized gain (loss) | | | (1.68 | ) | | | 0.52 | | | | 2.12 | | | | (6.61 | ) | | | 1.05 | |
| | | | | | | | | | | | | | | | | | | | |
Total from investment operations | | | (1.35 | ) | | | 0.75 | | | | 2.34 | | | | (6.22 | ) | | | 1.40 | |
| | | | | | | | | | | | | | | | | | | | |
Less distributions: | | | | | | | | | | | | | | | | | | | | |
From net investment income | | | (0.28 | ) | | | (0.23 | ) | | | (0.24 | ) | | | (0.32 | ) | | | (0.38 | ) |
From net realized gain | | | — | | | | — | | | | — | | | | (0.06 | ) | | | (0.01 | ) |
| | | | | | | | | | | | | | | | | | | | |
Total distributions | | | (0.28 | ) | | | (0.23 | ) | | | (0.24 | ) | | | (0.38 | ) | | | (0.39 | ) |
| | | | | | | | | | | | | | | | | | | | |
Net Asset Value, end of year | | $ | 9.19 | | | $ | 10.82 | | | $ | 10.30 | | | $ | 8.20 | | | $ | 14.80 | �� |
| | | | | | | | | | | | | | | | | | | | |
Total return | | | (12.42 | )% | | | 7.37 | % | | | 28.63 | % | | | (42.05 | )% | | | 10.17 | % |
Ratios to Average Net Assets: | | | | | | | | | | | | | | | | | | | | |
Expenses | | | 0.54 | % | | | 0.56 | % | | | 0.59 | % | | | 0.63 | % | | | 0.63 | % |
Net investment income | | | 2.93 | % | | | 2.27 | % | | | 2.61 | % | | | 3.07 | % | | | 2.36 | % |
Supplemental Data: | | | | | | | | | | | | | | | | | | | | |
Net assets, end of year (in thousands) | | $ | 44,911 | | | $ | 57,649 | | | $ | 52,937 | | | $ | 36,021 | | | $ | 70,723 | |
Portfolio turnover | | | 2 | % | | | 2 | % | | | 5 | % | | | 6 | % | | | 5 | % |
| | | | | | | | | | | | | | | | | | | | |
| | | Overseas Equity Index Class II | |
| | | For the Year Ended December 31, | |
| | | 2011 | | | 2010 | | | 2009 | | | 2008 | | | 2007 | |
Net Asset Value, beginning of year | | $ | 10.16 | | | $ | 9.69 | | | $ | 7.72 | | | $ | 13.98 | | | $ | 13.06 | |
Income from investment operations: | | | | | | | | | | | | | | | | | | | | |
Net investment income | | | 0.31 | | | | 0.23 | | | | 0.23 | | | | 0.39 | | | | 0.35 | |
Net realized and unrealized gain (loss) | | | (1.57 | ) | | | 0.50 | | | | 2.00 | | | | (6.25 | ) | | | 0.99 | |
| | | | | | | | | | | | | | | | | | | | |
Total from investment operations | | | (1.26 | ) | | | 0.73 | | | | 2.23 | | | | (5.86 | ) | | | 1.34 | |
| | | | | | | | | | | | | | | | | | | | |
Less distributions: | | | | | | | | | | | | | | | | | | | | |
From net investment income | | | (0.30 | ) | | | (0.26 | ) | | | (0.26 | ) | | | (0.34 | ) | | | (0.41 | ) |
From net realized gain | | | — | | | | — | | | | — | | | | (0.06 | ) | | | (0.01 | ) |
| | | | | | | | | | | | | | | | | | | | |
Total distributions | | | (0.30 | ) | | | (0.26 | ) | | | (0.26 | ) | | | (0.40 | ) | | | (0.42 | ) |
| | | | | | | | | | | | | | | | | | | | |
Net Asset Value, end of year | | $ | 8.60 | | | $ | 10.16 | | | $ | 9.69 | | | $ | 7.72 | | | $ | 13.98 | |
| | | | | | | | | | | | | | | | | | | | |
Total return | | | (12.28 | )% | | | 7.54 | % | | | 28.94 | % | | | (41.90 | )% | | | 10.30 | % |
Ratios to Average Net Assets: | | | | | | | | | | | | | | | | | | | | |
Expenses | | | 0.34 | % | | | 0.36 | % | | | 0.39 | % | | | 0.43 | % | | | 0.43 | % |
Net investment income | | | 3.11 | % | | | 2.45 | % | | | 2.83 | % | | | 3.27 | % | | | 2.56 | % |
Supplemental Data: | | | | | | | | | | | | | | | | | | | | |
Net assets, end of year (in thousands) | | $ | 132,873 | | | $ | 149,208 | | | $ | 128,002 | | | $ | 92,719 | | | $ | 178,661 | |
Portfolio turnover | | | 2 | % | | | 2 | % | | | 5 | % | | | 6 | % | | | 5 | % |
See Notes to Financial Statements.
130
THE VANTAGEPOINT FUNDS
Financial Highlights
(For a share outstanding throughout each period)
| | | | | | | | | | | | | | | | | | | | |
| | | Model Portfolio Savings Oriented | |
| | | For the Year Ended December 31, | |
| | | 2011 | | | 2010 | | | 2009 | | | 2008 | | | 2007 | |
Net Asset Value, beginning of year | | $ | 24.32 | | | $ | 23.22 | | | $ | 20.58 | | | $ | 24.70 | | | $ | 24.70 | |
Income from investment operations: | | | | | | | | | | | | | | | | | | | | |
Net investment income | | | 0.51 | | | | 0.46 | | | | 0.49 | | | | 0.73 | | | | 0.88 | |
Net realized and unrealized gain (loss) | | | 0.07 | | | | 1.11 | | | | 2.64 | | | | (3.63 | ) | | | 0.63 | |
| | | | | | | | | | | | | | | | | | | | |
Total from investment operations | | | 0.58 | | | | 1.57 | | | | 3.13 | | | | (2.90 | ) | | | 1.51 | |
| | | | | | | | | | | | | | | | | | | | |
Less distributions: | | | | | | | | | | | | | | | | | | | | |
From net investment income | | | (0.50 | ) | | | (0.47 | ) | | | (0.48 | ) | | | (0.70 | ) | | | (0.96 | ) |
From net realized gain | | | — | | | | — | | | | (0.01 | ) | | | (0.52 | ) | | | (0.55 | ) |
| | | | | | | | | | | | | | | | | | | | |
Total distributions | | | (0.50 | ) | | | (0.47 | ) | | | (0.49 | ) | | | (1.22 | ) | | | (1.51 | ) |
| | | | | | | | | | | | | | | | | | | | |
Net Asset Value, end of year | | $ | 24.40 | | | $ | 24.32 | | | $ | 23.22 | | | $ | 20.58 | | | $ | 24.70 | |
| | | | | | | | | | | | | | | | | | | | |
Total return | | | 2.38 | % | | | 6.78 | % | | | 15.18 | % | | | (11.67 | )% | | | 6.15 | % |
Ratios to Average Net Assets: | | | | | | | | | | | | | | | | | | | | |
Expenses | | | 0.14 | % | | | 0.14 | % | | | 0.16 | % | | | 0.16 | % | | | 0.15 | % |
Net investment income | | | 1.76 | % | | | 1.97 | % | | | 2.36 | % | | | 2.88 | % | | | 3.66 | % |
Supplemental Data: | | | | | | | | | | | | | | | | | | | | |
Net assets, end of year (in thousands) | | $ | 288,467 | | | $ | 338,533 | | | $ | 307,297 | | | $ | 255,970 | | | $ | 311,455 | |
Portfolio turnover | | | 15 | % | | | 25 | % | | | 7 | % | | | 18 | % | | | 27 | % |
| | | | | | | | | | | | | | | | | | | | |
| | | Model Portfolio Conservative Growth | |
| | | For the Year Ended December 31, | |
| | | 2011 | | | 2010 | | | 2009 | | | 2008 | | | 2007 | |
Net Asset Value, beginning of year | | $ | 23.62 | | | $ | 22.13 | | | $ | 19.04 | | | $ | 24.62 | | | $ | 24.48 | |
Income from investment operations: | | | | | | | | | | | | | | | | | | | | |
Net investment income | | | 0.43 | | | | 0.40 | | | | 0.44 | | | | 0.58 | | | | 0.68 | |
Net realized and unrealized gain (loss) | | | (0.16 | ) | | | 1.50 | | | | 3.08 | | | | (4.92 | ) | | | 0.92 | |
| | | | | | | | | | | | | | | | | | | | |
Total from investment operations | | | 0.27 | | | | 1.90 | | | | 3.52 | | | | (4.34 | ) | | | 1.60 | |
| | | | | | | | | | | | | | | | | | | | |
Less distributions: | | | | | | | | | | | | | | | | | | | | |
From net investment income | | | (0.43 | ) | | | (0.41 | ) | | | (0.43 | ) | | | (0.53 | ) | | | (0.75 | ) |
From net realized gain | | | — | | | | — | | | | — | | | | (0.71 | ) | | | (0.71 | ) |
| | | | | | | | | | | | | | | | | | | | |
Total distributions | | | (0.43 | ) | | | (0.41 | ) | | | (0.43 | ) | | | (1.24 | ) | | | (1.46 | ) |
| | | | | | | | | | | | | | | | | | | | |
Net Asset Value, end of year | | $ | 23.46 | | | $ | 23.62 | | | $ | 22.13 | | | $ | 19.04 | | | $ | 24.62 | |
| | | | | | | | | | | | | | | | | | | | |
Total return | | | 1.15 | % | | | 8.60 | % | | | 18.50 | % | | | (17.56 | )% | | | 6.57 | % |
Ratios to Average Net Assets: | | | | | | | | | | | | | | | | | | | | |
Expenses | | | 0.12 | % | | | 0.13 | % | | | 0.15 | % | | | 0.15 | % | | | 0.14 | % |
Net investment income | | | 1.67 | % | | | 1.80 | % | | | 2.20 | % | | | 2.40 | % | | | 2.99 | % |
Supplemental Data: | | | | | | | | | | | | | | | | | | | | |
Net assets, end of year (in thousands) | | $ | 556,164 | | | $ | 586,912 | | | $ | 528,183 | | | $ | 449,433 | | | $ | 597,775 | |
Portfolio turnover | | | 14 | % | | | 23 | % | | | 13 | % | | | 19 | % | | | 27 | % |
See Notes to Financial Statements.
131
THE VANTAGEPOINT FUNDS
Financial Highlights
(For a share outstanding throughout each period)
| | | | | | | | | | | | | | | | | | | | |
| | | Model Portfolio Traditional Growth | |
| | | For the Year Ended December 31, | |
| | | 2011 | | | 2010 | | | 2009 | | | 2008 | | | 2007 | |
Net Asset Value, beginning of year | | $ | 22.17 | | | $ | 20.28 | | | $ | 16.65 | | | $ | 24.04 | | | $ | 24.26 | |
Income from investment operations: | | | | | | | | | | | | | | | | | | | | |
Net investment income | | | 0.38 | | | | 0.33 | | | | 0.33 | | | | 0.38 | | | | 0.46 | |
Net realized and unrealized gain (loss) | | | (0.50 | ) | | | 1.89 | | | | 3.62 | | | | (6.53 | ) | | | 1.25 | |
| | | | | | | | | | | | | | | | | | | | |
Total from investment operations | | | (0.12 | ) | | | 2.22 | | | | 3.95 | | | | (6.15 | ) | | | 1.71 | |
| | | | | | | | | | | | | | | | | | | | |
Less distributions: | | | | | | | | | | | | | | | | | | | | |
From net investment income | | | (0.48 | ) | | | (0.33 | ) | | | (0.30 | ) | | | (0.30 | ) | | | (0.56 | ) |
From net realized gain | | | (0.05 | ) | | | — | | | | (0.02 | ) | | | (0.94 | ) | | | (1.37 | ) |
| | | | | | | | | | | | | | | | | | | | |
Total distributions | | | (0.53 | ) | | | (0.33 | ) | | | (0.32 | ) | | | (1.24 | ) | | | (1.93 | ) |
| | | | | | | | | | | | | | | | | | | | |
Net Asset Value, end of year | | $ | 21.52 | | | $ | 22.17 | | | $ | 20.28 | | | $ | 16.65 | | | $ | 24.04 | |
| | | | | | | | | | | | | | | | | | | | |
Total return | | | (0.56 | )% | | | 10.95 | % | | | 23.72 | % | | | (25.39 | )% | | | 7.03 | % |
Ratios to Average Net Assets: | | | | | | | | | | | | | | | | | | | | |
Expenses | | | 0.11 | % | | | 0.12 | % | | | 0.13 | % | | | 0.13 | % | | | 0.13 | % |
Net investment income | | | 1.52 | % | | | 1.57 | % | | | 1.86 | % | | | 1.74 | % | | | 2.23 | % |
Supplemental Data: | | | | | | | | | | | | | | | | | | | | |
Net assets, end of year (in thousands) | | $ | 1,366,108 | | | $ | 1,495,757 | | | $ | 1,353,050 | | | $ | 1,072,076 | | | $ | 1,487,224 | |
Portfolio turnover | | | 13 | % | | | 15 | % | | | 8 | % | | | 20 | % | | | 28 | % |
| | | | | | | | | | | | | | | | | | | | |
| | | Model Portfolio Long-Term Growth | |
| | | For the Year Ended December 31, | |
| | | 2011 | | | 2010 | | | 2009 | | | 2008 | | | 2007 | |
Net Asset Value, beginning of year | | $ | 21.41 | | | $ | 19.30 | | | $ | 15.35 | | | $ | 24.26 | | | $ | 24.56 | |
Income from investment operations: | | | | | | | | | | | | | | | | | | | | |
Net investment income | | | 0.35 | | | | 0.27 | | | | 0.26 | | | | 0.24 | | | | 0.26 | |
Net realized and unrealized gain (loss) | | | (0.77 | ) | | | 2.15 | | | | 3.99 | | | | (7.81 | ) | | | 1.64 | |
| | | | | | | | | | | | | | | | | | | | |
Total from investment operations | | | (0.42 | ) | | | 2.42 | | | | 4.25 | | | | (7.57 | ) | | | 1.90 | |
| | | | | | | | | | | | | | | | | | | | |
Less distributions: | | | | | | | | | | | | | | | | | | | | |
From net investment income | | | (0.40 | ) | | | (0.31 | ) | | | (0.21 | ) | | | (0.21 | ) | | | (0.43 | ) |
From net realized gain | | | (0.27 | ) | | | — | | | | (0.09 | ) | | | (1.13 | ) | | | (1.77 | ) |
| | | | | | | | | | | | | | | | | | | | |
Total distributions | | | (0.67 | ) | | | (0.31 | ) | | | (0.30 | ) | | | (1.34 | ) | | | (2.20 | ) |
| | | | | | | | | | | | | | | | | | | | |
Net Asset Value, end of year | | $ | 20.32 | | | $ | 21.41 | | | $ | 19.30 | | | $ | 15.35 | | | $ | 24.26 | |
| | | | | | | | | | | | | | | | | | | | |
Total return | | | (1.98 | )% | | | 12.54 | % | | | 27.67 | % | | | (30.99 | )% | | | 7.74 | % |
Ratios to Average Net Assets: | | | | | | | | | | | | | | | | | | | | |
Expenses | | | 0.11 | % | | | 0.12 | % | | | 0.13 | % | | | 0.13 | % | | | 0.12 | % |
Net investment income | | | 1.42 | % | | | 1.40 | % | | | 1.63 | % | | | 1.16 | % | | | 1.57 | % |
Supplemental Data: | | | | | | | | | | | | | | | | | | | | |
Net assets, end of year (in thousands) | | $ | 1,712,228 | | | $ | 1,848,430 | | | $ | 1,621,102 | | | $ | 1,203,596 | | | $ | 1,677,987 | |
Portfolio turnover | | | 11 | % | | | 10 | % | | | 5 | % | | | 14 | % | | | 27 | % |
See Notes to Financial Statements.
132
THE VANTAGEPOINT FUNDS
Financial Highlights
(For a share outstanding throughout each period)
| | | | | | | | | | | | | | | | | | | | |
| | | Model Portfolio All-Equity Growth | |
| | | For the Year Ended December 31, | |
| | | 2011 | | | 2010 | | | 2009 | | | 2008 | | | 2007 | |
Net Asset Value, beginning of year | | $ | 19.81 | | | $ | 17.38 | | | $ | 13.07 | | | $ | 24.63 | | | $ | 25.88 | |
Income from investment operations: | | | | | | | | | | | | | | | | | | | | |
Net investment income | | | 0.28 | | | | 0.16 | | | | 0.18 | | | | 0.11 | | | | 0.04 | |
Net realized and unrealized gain (loss) | | | (1.12 | ) | | | 2.43 | | | | 4.41 | | | | (10.01 | ) | | | 1.98 | |
| | | | | | | | | | | | | | | | | | | | |
Total from investment operations | | | (0.84 | ) | | | 2.59 | | | | 4.59 | | | | (9.90 | ) | | | 2.02 | |
| | | | | | | | | | | | | | | | | | | | |
Less distributions: | | | | | | | | | | | | | | | | | | | | |
From net investment income | | | (0.28 | ) | | | (0.16 | ) | | | (0.15 | ) | | | (0.12 | ) | | | (0.21 | ) |
From net realized gain | | | — | | | | — | | | | (0.13 | ) | | | (1.54 | ) | | | (3.06 | ) |
| | | | | | | | | | | | | | | | | | | | |
Total distributions | | | (0.28 | ) | | | (0.16 | ) | | | (0.28 | ) | | | (1.66 | ) | | | (3.27 | ) |
| | | | | | | | | | | | | | | | | | | | |
Net Asset Value, end of year | | $ | 18.69 | | | $ | 19.81 | | | $ | 17.38 | | | $ | 13.07 | | | $ | 24.63 | |
| | | | | | | | | | | | | | | | | | | | |
Total return | | | (4.23 | )% | | | 14.93 | % | | | 35.07 | % | | | (39.86 | )% | | | 7.75 | % |
Ratios to Average Net Assets: | | | | | | | | | | | | | | | | | | | | |
Expenses | | | 0.12 | % | | | 0.13 | % | | | 0.14 | % | | | 0.15 | % | | | 0.14 | % |
Net investment income | | | 1.24 | % | | | 0.95 | % | | | 1.30 | % | | | 0.57 | % | | | 0.82 | % |
Supplemental Data: | | | | | | | | | | | | | | | | | | | | |
Net assets, end of year (in thousands) | | $ | 649,826 | | | $ | 715,090 | | | $ | 591,533 | | | $ | 385,657 | | | $ | 597,973 | |
Portfolio turnover | | | 9 | % | | | 6 | % | | | 3 | % | | | 7 | % | | | 23 | % |
| | | | | | | | | | | | | | | | | | | | |
| | | Milestone Retirement Income | |
| | | For the Year Ended December 31, | |
| | | 2011 | | | 2010 | | | 2009 | | | 2008 | | | 2007 | |
Net Asset Value, beginning of year | | $ | 10.33 | | | $ | 9.81 | | | $ | 8.56 | | | $ | 10.61 | | | $ | 10.51 | |
Income from investment operations: | | | | | | | | | | | | | | | | | | | | |
Net investment income | | | 0.20 | | | | 0.12 | | | | 0.16 | | | | 0.29 | | | | 0.27 | |
Net realized and unrealized gain (loss) | | | 0.05 | | | | 0.56 | | | | 1.26 | | | | (1.76 | ) | | | 0.36 | |
| | | | | | | | | | | | | | | | | | | | |
Total from investment operations | | | 0.25 | | | | 0.68 | | | | 1.42 | | | | (1.47 | ) | | | 0.63 | |
| | | | | | | | | | | | | | | | | | | | |
Less distributions: | | | | | | | | | | | | | | | | | | | | |
From net investment income | | | (0.20 | ) | | | (0.15 | ) | | | (0.15 | ) | | | (0.29 | ) | | | (0.29 | ) |
From net realized gain | | | (0.20 | ) | | | (0.01 | ) | | | (0.02 | ) | | | (0.29 | ) | | | (0.24 | ) |
| | | | | | | | | | | | | | | | | | | | |
Total distributions | | | (0.40 | ) | | | (0.16 | ) | | | (0.17 | ) | | | (0.58 | ) | | | (0.53 | ) |
| | | | | | | | | | | | | | | | | | | | |
Net Asset Value, end of year | | $ | 10.18 | | | $ | 10.33 | | | $ | 9.81 | | | $ | 8.56 | | | $ | 10.61 | |
| | | | | | | | | | | | | | | | | | | | |
Total return | | | 2.37 | % | | | 6.93 | % | | | 16.53 | % | | | (13.76 | )% | | | 6.05 | % |
Ratios to Average Net Assets: | | | | | | | | | | | | | | | | | | | | |
Expenses before reimbursements/waivers | | | 0.15 | % | | | 0.18 | % | | | 0.25 | % | | | 0.27 | % | | | 0.30 | % |
Expenses net of reimbursements/waivers, if any | | | 0.15 | % | | | 0.18 | % | | | 0.20 | % | | | 0.07 | % | | | 0.14 | % |
Net investment income before reimbursements/waivers | | | 1.79 | % | | | 2.49 | % | | | 2.29 | % | | | 2.55 | % | | | 3.48 | % |
Net investment income net of reimbursements/waivers, if any | | | 1.79 | % | | | 2.49 | % | | | 2.34 | % | | | 2.74 | % | | | 3.63 | % |
Supplemental Data: | | | | | | | | | | | | | | | | | | | | |
Net assets, end of year (in thousands) | | $ | 220,063 | | | $ | 215,961 | | | $ | 76,683 | | | $ | 43,323 | | | $ | 54,573 | |
Portfolio turnover | | | 19 | % | | | 25 | % | | | 14 | % | | | 36 | % | | | 63 | % |
See Notes to Financial Statements.
133
THE VANTAGEPOINT FUNDS
Financial Highlights
(For a share outstanding throughout each period)
| | | | | | | | | | | | | | | | | | | | |
| | | Milestone 2010 | |
| | | For the Year Ended December 31, | |
| | | 2011 | | | 2010 | | | 2009 | | | 2008 | | | 2007 | |
Net Asset Value, beginning of year | | $ | 10.24 | | | $ | 9.56 | | | $ | 8.27 | | | $ | 10.65 | | | $ | 10.85 | |
Income from investment operations: | | | | | | | | | | | | | | | | | | | | |
Net investment income | | | 0.19 | | | | 0.10 | | | | 0.18 | | | | 0.23 | | | | 0.27 | |
Net realized and unrealized gain (loss) | | | (0.04 | ) | | | 0.71 | | | | 1.29 | | | | (2.09 | ) | | | 0.42 | |
| | | | | | | | | | | | | | | | | | | | |
Total from investment operations | | | 0.15 | | | | 0.81 | | | | 1.47 | | | | (1.86 | ) | | | 0.69 | |
| | | | | | | | | | | | | | | | | | | | |
Less distributions: | | | | | | | | | | | | | | | | | | | | |
From net investment income | | | (0.21 | ) | | | (0.13 | ) | | | (0.14 | ) | | | (0.23 | ) | | | (0.30 | ) |
From net realized gain | | | (0.08 | ) | | | — | | | | (0.04 | ) | | | (0.29 | ) | | | (0.59 | ) |
| | | | | | | | | | | | | | | | | | | | |
Total distributions | | | (0.29 | ) | | | (0.13 | ) | | | (0.18 | ) | | | (0.52 | ) | | | (0.89 | ) |
| | | | | | | | | | | | | | | | | | | | |
Net Asset Value, end of year | | $ | 10.10 | | | $ | 10.24 | | | $ | 9.56 | | | $ | 8.27 | | | $ | 10.65 | |
| | | | | | | | | | | | | | | | | | | | |
Total return | | | 1.41 | % | | | 8.51 | % | | | 17.71 | % | | | (17.34 | )% | | | 6.43 | % |
Ratios to Average Net Assets: | | | | | | | | | | | | | | | | | | | | |
Expenses before reimbursements/waivers | | | 0.15 | % | | | 0.18 | % | | | 0.22 | % | | | 0.23 | % | | | 0.24 | % |
Expenses net of reimbursements/waivers, if any | | | 0.15 | % | | | 0.18 | % | | | 0.19 | % | | | 0.13 | % | | | 0.18 | % |
Net investment income before reimbursements/waivers | | | 1.75 | % | | | 2.11 | % | | | 2.15 | % | | | 2.31 | % | | | 2.97 | % |
Net investment income net of reimbursements/waivers, if any | | | 1.75 | % | | | 2.11 | % | | | 2.17 | % | | | 2.41 | % | | | 3.02 | % |
Supplemental Data: | | | | | | | | | | | | | | | | | | | | |
Net assets, end of year (in thousands) | | $ | 222,275 | | | $ | 217,770 | | | $ | 90,790 | | | $ | 65,043 | | | $ | 70,403 | |
Portfolio turnover | | | 22 | % | | | 33 | % | | | 20 | % | | | 27 | % | | | 58 | % |
| | | | | | | | | | | | | | | | | | | | |
| | | Milestone 2015 | |
| | | For the Year Ended December 31, | |
| | | 2011 | | | 2010 | | | 2009 | | | 2008 | | | 2007 | |
Net Asset Value, beginning of year | | $ | 10.35 | | | $ | 9.53 | | | $ | 7.96 | | | $ | 11.13 | | | $ | 11.29 | |
Income from investment operations: | | | | | | | | | | | | | | | | | | | | |
Net investment income | | | 0.18 | | | | 0.12 | | | | 0.16 | | | | 0.17 | | | | 0.22 | |
Net realized and unrealized gain (loss) | | | (0.10 | ) | | | 0.85 | | | | 1.58 | | | | (2.80 | ) | | | 0.56 | |
| | | | | | | | | | | | | | | | | | | | |
Total from investment operations | | | 0.08 | | | | 0.97 | | | | 1.74 | | | | (2.63 | ) | | | 0.78 | |
| | | | | | | | | | | | | | | | | | | | |
Less distributions: | | | | | | | | | | | | | | | | | | | | |
From net investment income | | | (0.21 | ) | | | (0.14 | ) | | | (0.11 | ) | | | (0.18 | ) | | | (0.25 | ) |
From net realized gain | | | (0.06 | ) | | | (0.01 | ) | | | (0.06 | ) | | | (0.36 | ) | | | (0.69 | ) |
| | | | | | | | | | | | | | | | | | | | |
Total distributions | | | (0.27 | ) | | | (0.15 | ) | | | (0.17 | ) | | | (0.54 | ) | | | (0.94 | ) |
| | | | | | | | | | | | | | | | | | | | |
Net Asset Value, end of year | | $ | 10.16 | | | $ | 10.35 | | | $ | 9.53 | | | $ | 7.96 | | | $ | 11.13 | |
| | | | | | | | | | | | | | | | | | | | |
Total return | | | 0.70 | % | | | 10.20 | % | | | 21.84 | % | | | (23.54 | )% | | | 6.88 | % |
Ratios to Average Net Assets: | | | | | | | | | | | | | | | | | | | | |
Expenses before reimbursements/waivers | | | 0.14 | % | | | 0.15 | % | | | 0.18 | % | | | 0.19 | % | | | 0.18 | % |
Expenses net of reimbursements/waivers, if any | | | 0.14 | % | | | 0.15 | % | | | 0.17 | % | | | 0.14 | % | | | 0.18 | % |
Net investment income before reimbursements/waivers | | | 1.72 | % | | | 1.96 | % | | | 2.06 | % | | | 1.81 | % | | | 2.57 | % |
Net investment income net of reimbursements/waivers, if any | | | 1.72 | % | | | 1.96 | % | | | 2.07 | % | | | 1.85 | % | | | 2.57 | % |
Supplemental Data: | | | | | | | | | | | | | | | | | | | | |
Net assets, end of year (in thousands) | | $ | 381,855 | | | $ | 363,144 | | | $ | 185,989 | | | $ | 120,249 | | | $ | 138,535 | |
Portfolio turnover | | | 20 | % | | | 15 | % | | | 12 | % | | | 21 | % | | | 40 | % |
See Notes to Financial Statements.
134
THE VANTAGEPOINT FUNDS
Financial Highlights
(For a share outstanding throughout each period)
| | | | | | | | | | | | | | | | | | | | |
| | | Milestone 2020 | |
| | | For the Year Ended December 31, | |
| | | 2011 | | | 2010 | | | 2009 | | | 2008 | | | 2007 | |
Net Asset Value, beginning of year | | $ | 10.34 | | | $ | 9.43 | | | $ | 7.83 | | | $ | 11.38 | | | $ | 11.52 | |
Income from investment operations: | | | | | | | | | | | | | | | | | | | | |
Net investment income | | | 0.18 | | | | 0.14 | | | | 0.16 | | | | 0.13 | | | | 0.20 | |
Net realized and unrealized gain (loss) | | | (0.20 | ) | | | 0.92 | | | | 1.68 | | | | (3.20 | ) | | | 0.63 | |
| | | | | | | | | | | | | | | | | | | | |
Total from investment operations | | | (0.02 | ) | | | 1.06 | | | | 1.84 | | | | (3.07 | ) | | | 0.83 | |
| | | | | | | | | | | | | | | | | | | | |
Less distributions: | | | | | | | | | | | | | | | | | | | | |
From net investment income | | | (0.18 | ) | | | (0.14 | ) | | | (0.16 | ) | | | (0.14 | ) | | | (0.23 | ) |
From net realized gain | | | (0.04 | ) | | | (0.01 | ) | | | (0.08 | ) | | | (0.34 | ) | | | (0.74 | ) |
| | | | | | | | | | | | | | | | | | | | |
Total distributions | | | (0.22 | ) | | | (0.15 | ) | | | (0.24 | ) | | | (0.48 | ) | | | (0.97 | ) |
| | | | | | | | | | | | | | | | | | | | |
Net Asset Value, end of year | | $ | 10.10 | | | $ | 10.34 | | | $ | 9.43 | | | $ | 7.83 | | | $ | 11.38 | |
| | | | | | | | | | | | | | | | | | | | |
Total return | | | (0.26 | )% | | | 11.27 | % | | | 23.43 | % | | | (26.86 | )% | | | 7.17 | % |
Ratios to Average Net Assets: | | | | | | | | | | | | | | | | | | | | |
Expenses before reimbursements/waivers | | | 0.13 | % | | | 0.15 | % | | | 0.18 | % | | | 0.19 | % | | | 0.20 | % |
Expenses net of reimbursements/waivers, if any | | | 0.13 | % | | | 0.15 | % | | | 0.17 | % | | | 0.15 | % | | | 0.19 | % |
Net investment income before reimbursements/waivers | | | 1.73 | % | | | 1.93 | % | | | 2.16 | % | | | 1.50 | % | | | 2.23 | % |
Net investment income net of reimbursements/waivers, if any | | | 1.73 | % | | | 1.93 | % | | | 2.17 | % | | | 1.54 | % | | | 2.24 | % |
Supplemental Data: | | | | | | | | | | | | | | | | | | | | |
Net assets, end of year (in thousands) | | $ | 386,327 | | | $ | 344,033 | | | $ | 186,148 | | | $ | 112,440 | | | $ | 112,064 | |
Portfolio turnover | | | 16 | % | | | 10 | % | | | 7 | % | | | 12 | % | | | 40 | % |
| | | | | | | | | | | | | | | | | | | | |
| | | Milestone 2025 | |
| | | For the Year Ended December 31, | |
| | | 2011 | | | 2010 | | | 2009 | | | 2008 | | | 2007 | |
Net Asset Value, beginning of year | | $ | 10.27 | | | $ | 9.28 | | | $ | 7.58 | | | $ | 11.55 | | | $ | 11.72 | |
Income from investment operations: | | | | | | | | | | | | | | | | | | | | |
Net investment income | | | 0.17 | | | | 0.13 | | | | 0.14 | | | | 0.10 | | | | 0.16 | |
Net realized and unrealized gain (loss) | | | (0.26 | ) | | | 1.00 | | | | 1.78 | | | | (3.57 | ) | | | 0.68 | |
| | | | | | | | | | | | | | | | | | | | |
Total from investment operations | | | (0.09 | ) | | | 1.13 | | | | 1.92 | | | | (3.47 | ) | | | 0.84 | |
| | | | | | | | | | | | | | | | | | | | |
Less distributions: | | | | | | | | | | | | | | | | | | | | |
From net investment income | | | (0.17 | ) | | | (0.12 | ) | | | (0.14 | ) | | | (0.11 | ) | | | (0.20 | ) |
From net realized gain | | | (0.04 | ) | | | (0.02 | ) | | | (0.08 | ) | | | (0.39 | ) | | | (0.81 | ) |
| | | | | | | | | | | | | | | | | | | | |
Total distributions | | | (0.21 | ) | | | (0.14 | ) | | | (0.22 | ) | | | (0.50 | ) | | | (1.01 | ) |
| | | | | | | | | | | | | | | | | | | | |
Net Asset Value, end of year | | $ | 9.97 | | | $ | 10.27 | | | $ | 9.28 | | | $ | 7.58 | | | $ | 11.55 | |
| | | | | | | | | | | | | | | | | | | | |
Total return | | | (0.85 | )% | | | 12.25 | % | | | 25.40 | % | | | (29.90 | )% | | | 7.17 | % |
Ratios to Average Net Assets: | | | | | | | | | | | | | | | | | | | | |
Expenses before reimbursements/waivers | | | 0.14 | % | | | 0.16 | % | | | 0.19 | % | | | 0.21 | % | | | 0.22 | % |
Expenses net of reimbursements/waivers, if any | | | 0.14 | % | | | 0.16 | % | | | 0.18 | % | | | 0.15 | % | | | 0.18 | % |
Net investment income before reimbursements/waivers | | | 1.71 | % | | | 1.77 | % | | | 2.03 | % | | | 1.17 | % | | | 1.98 | % |
Net investment income net of reimbursements/waivers, if any | | | 1.71 | % | | | 1.77 | % | | | 2.04 | % | | | 1.22 | % | | | 2.02 | % |
Supplemental Data: | | | | | | | | | | | | | | | | | | | | |
Net assets, end of year (in thousands) | | $ | 301,275 | | | $ | 267,155 | | | $ | 146,397 | | | $ | 81,317 | | | $ | 83,891 | |
Portfolio turnover | | | 15 | % | | | 7 | % | | | 5 | % | | | 11 | % | | | 38 | % |
See Notes to Financial Statements.
135
THE VANTAGEPOINT FUNDS
Financial Highlights
(For a share outstanding throughout each period)
| | | | | | | | | | | | | | | | | | | | |
| | | Milestone 2030 | |
| | | For the Year Ended December 31, | |
| | | 2011 | | | 2010 | | | 2009 | | | 2008 | | | 2007 | |
Net Asset Value, beginning of year | | $ | 10.34 | | | $ | 9.26 | | | $ | 7.45 | | | $ | 11.75 | | | $ | 11.88 | |
Income from investment operations: | | | | | | | | | | | | | | | | | | | | |
Net investment income | | | 0.17 | | | | 0.12 | | | | 0.13 | | | | 0.08 | | | | 0.14 | |
Net realized and unrealized gain (loss) | | | (0.32 | ) | | | 1.09 | | | | 1.90 | | | | (3.92 | ) | | | 0.70 | |
| | | | | | | | | | | | | | | | | | | | |
Total from investment operations | | | (0.15 | ) | | | 1.21 | | | | 2.03 | | | | (3.84 | ) | | | 0.84 | |
| | | | | | | | | | | | | | | | | | | | |
Less distributions: | | | | | | | | | | | | | | | | | | | | |
From net investment income | | | (0.17 | ) | | | (0.12 | ) | | | (0.13 | ) | | | (0.09 | ) | | | (0.18 | ) |
From net realized gain | | | (0.02 | ) | | | (0.01 | ) | | | (0.09 | ) | | | (0.37 | ) | | | (0.79 | ) |
| | | | | | | | | | | | | | | | | | | | |
Total distributions | | | (0.19 | ) | | | (0.13 | ) | | | (0.22 | ) | | | (0.46 | ) | | | (0.97 | ) |
| | | | | | | | | | | | | | | | | | | | |
Net Asset Value, end of year | | $ | 10.00 | | | $ | 10.34 | | | $ | 9.26 | | | $ | 7.45 | | | $ | 11.75 | |
| | | | | | | | | | | | | | | | | | | | |
Total return | | | (1.46 | )% | | | 13.11 | % | | | 27.33 | % | | | (32.54 | )% | | | 7.11 | % |
Ratios to Average Net Assets: | | | | | | | | | | | | | | | | | | | | |
Expenses before reimbursements/waivers | | | 0.15 | % | | | 0.16 | % | | | 0.20 | % | | | 0.23 | % | | | 0.26 | % |
Expenses net of reimbursements/waivers, if any | | | 0.15 | % | | | 0.16 | % | | | 0.19 | % | | | 0.16 | % | | | 0.20 | % |
Net investment income before reimbursements/waivers | | | 1.65 | % | | | 1.53 | % | | | 1.89 | % | | | 1.01 | % | | | 1.78 | % |
Net investment income net of reimbursements/waivers, if any | | | 1.65 | % | | | 1.53 | % | | | 1.90 | % | | | 1.07 | % | | | 1.85 | % |
Supplemental Data: | | | | | | | | | | | | | | | | | | | | |
Net assets, end of year (in thousands) | | $ | 236,452 | | | $ | 211,155 | | | $ | 121,219 | | | $ | 66,183 | | | $ | 61,465 | |
Portfolio turnover | | | 14 | % | | | 7 | % | | | 4 | % | | | 10 | % | | | 43 | % |
| | | | | | | | | | | | | | | | | | | | |
| | | Milestone 2035 | |
| | | For the Year Ended December 31, | |
| | | 2011 | | | 2010 | | | 2009 | | | 2008 | | | 2007 | |
Net Asset Value, beginning of year | | $ | 10.28 | | | $ | 9.10 | | | $ | 7.21 | | | $ | 11.83 | | | $ | 11.98 | |
Income from investment operations: | | | | | | | | | | | | | | | | | | | | |
Net investment income | | | 0.16 | | | | 0.10 | | | | 0.13 | | | | 0.08 | | | | 0.12 | |
Net realized and unrealized gain (loss) | | | (0.39 | ) | | | 1.20 | | | | 1.98 | | | | (4.23 | ) | | | 0.75 | |
| | | | | | | | | | | | | | | | | | | | |
Total from investment operations | | | (0.23 | ) | | | 1.30 | | | | 2.11 | | | | (4.15 | ) | | | 0.87 | |
| | | | | | | | | | | | | | | | | | | | |
Less distributions: | | | | | | | | | | | | | | | | | | | | |
From net investment income | | | (0.16 | ) | | | (0.10 | ) | | | (0.13 | ) | | | (0.08 | ) | | | (0.17 | ) |
From net realized gain | | | (0.03 | ) | | | (0.02 | ) | | | (0.09 | ) | | | (0.39 | ) | | | (0.85 | ) |
| | | | | | | | | | | | | | | | | | | | |
Total distributions | | | (0.19 | ) | | | (0.12 | ) | | | (0.22 | ) | | | (0.47 | ) | | | (1.02 | ) |
| | | | | | | | | | | | | | | | | | | | |
Net Asset Value, end of year | | $ | 9.86 | | | $ | 10.28 | | | $ | 9.10 | | | $ | 7.21 | | | $ | 11.83 | |
| | | | | | | | | | | | | | | | | | | | |
Total return | | | (2.24 | )% | | | 14.33 | % | | | 29.22 | % | | | (34.91 | )% | | | 7.25 | % |
Ratios to Average Net Assets: | | | | | | | | | | | | | | | | | | | | |
Expenses before reimbursements/waivers | | | 0.17 | % | | | 0.19 | % | | | 0.25 | % | | | 0.31 | % | | | 0.40 | % |
Expenses net of reimbursements/waivers, if any | | | 0.17 | % | | | 0.19 | % | | | 0.22 | % | | | 0.19 | % | | | 0.20 | % |
Net investment income before reimbursements/waivers | | | 1.62 | % | | | 1.35 | % | | | 1.92 | % | | | 0.90 | % | | | 1.60 | % |
Net investment income net of reimbursements/waivers, if any | | | 1.62 | % | | | 1.35 | % | | | 1.95 | % | | | 1.03 | % | | | 1.80 | % |
Supplemental Data: | | | | | | | | | | | | | | | | | | | | |
Net assets, end of year (in thousands) | | $ | 150,472 | | | $ | 133,121 | | | $ | 76,875 | | | $ | 37,375 | | | $ | 34,831 | |
Portfolio turnover | | | 13 | % | | | 7 | % | | | 4 | % | | | 9 | % | | | 40 | % |
See Notes to Financial Statements.
136
THE VANTAGEPOINT FUNDS
Financial Highlights
(For a share outstanding throughout each period)
| | | | | | | | | | | | | | | | | | | | |
| | | Milestone 2040 | |
| | | For the Year Ended December 31, | |
| | | 2011 | | | 2010 | | | 2009 | | | 2008 | | | 2007 | |
Net Asset Value, beginning of year | | $ | 10.30 | | | $ | 9.07 | | | $ | 7.10 | | | $ | 11.85 | | | $ | 11.91 | |
Income from investment operations: | | | | | | | | | | | | | | | | | | | | |
Net investment income | | | 0.17 | | | | 0.10 | | | | 0.13 | | | | 0.08 | | | | 0.11 | |
Net realized and unrealized gain (loss) | | | (0.44 | ) | | | 1.25 | | | | 2.05 | | | | (4.38 | ) | | | 0.75 | |
| | | | | | | | | | | | | | | | | | | | |
Total from investment operations | | | (0.27 | ) | | | 1.35 | | | | 2.18 | | | | (4.30 | ) | | | 0.86 | |
| | | | | | | | | | | | | | | | | | | | |
Less distributions: | | | | | | | | | | | | | | | | | | | | |
From net investment income | | | (0.17 | ) | | | (0.10 | ) | | | (0.13 | ) | | | (0.08 | ) | | | (0.16 | ) |
From net realized gain | | | — | | | | (0.02 | ) | | | (0.08 | ) | | | (0.37 | ) | | | (0.76 | ) |
| | | | | | | | | | | | | | | | | | | | |
Total distributions | | | (0.17 | ) | | | (0.12 | ) | | | (0.21 | ) | | | (0.45 | ) | | | (0.92 | ) |
| | | | | | | | | | | | | | | | | | | | |
Net Asset Value, end of year | | $ | 9.86 | | | $ | 10.30 | | | $ | 9.07 | | | $ | 7.10 | | | $ | 11.85 | |
| | | | | | | | | | | | | | | | | | | | |
Total return | | | (2.61 | )% | | | 14.91 | % | | | 30.70 | % | | | (36.13 | )% | | | 7.23 | % |
Ratios to Average Net Assets: | | | | | | | | | | | | | | | | | | | | |
Expenses before reimbursements/waivers | | | 0.17 | % | | | 0.18 | % | | | 0.23 | % | | | 0.32 | % | | | 0.43 | % |
Expenses net of reimbursements/waivers, if any | | | 0.17 | % | | | 0.18 | % | | | 0.21 | % | | | 0.19 | % | | | 0.19 | % |
Net investment income before reimbursements/waivers | | | 1.67 | % | | | 1.20 | % | | | 2.05 | % | | | 0.92 | % | | | 1.61 | % |
Net investment income net of reimbursements/waivers, if any | | | 1.67 | % | | | 1.20 | % | | | 2.06 | % | | | 1.05 | % | | | 1.85 | % |
Supplemental Data: | | | | | | | | | | | | | | | | | | | | |
Net assets, end of year (in thousands) | | $ | 146,032 | | | $ | 132,306 | | | $ | 91,348 | | | $ | 38,001 | | | $ | 32,882 | |
Portfolio turnover | | | 14 | % | | | 21 | % | | | 4 | % | | | 11 | % | | | 47 | % |
| | | | | | | | |
| | | Milestone 2045 | |
| | | For the
Year Ended
December 31, | | | For the Period
from January 4,
2010* to
December 31, | |
| | | 2011 | | | 2010 | |
Net Asset Value, beginning of year | | $ | 11.33 | | | $ | 10.00 | |
Income from investment operations: | | | | | | | | |
Net investment income | | | 0.17 | | | | 0.10 | |
Net realized and unrealized gain (loss) | | | (0.49 | ) | | | 1.36 | |
| | | | | | | | |
Total from investment operations | | | (0.32 | ) | | | 1.46 | |
| | | | | | | | |
Less distributions: | | | | | | | | |
From net investment income | | | (0.17 | ) | | | (0.10 | ) |
From net realized gain | | | (0.13 | ) | | | (0.03 | ) |
| | | | | | | | |
Total distributions | | | (0.30 | ) | | | (0.13 | ) |
| | | | | | | | |
Net Asset Value, end of year | | $ | 10.71 | | | $ | 11.33 | |
| | | | | | | | |
Total return | | | (2.81 | )% | | | 14.62 | %†† |
Ratios to Average Net Assets: | | | | | | | | |
Expenses before reimbursements/waivers | | | 0.36 | % | | | 0.87 | %† |
Expenses net of reimbursements/waivers, if any | | | 0.35 | % | | | 0.34 | %† |
Net investment income before reimbursements/waivers | | | 1.68 | % | | | 1.67 | %† |
Net investment income net of reimbursements/waivers, if any | | | 1.69 | % | | | 2.19 | %† |
Supplemental Data: | | | | | | | | |
Net assets, end of year (in thousands) | | $ | 33,434 | | | $ | 22,363 | |
Portfolio turnover | | | 14 | % | | | 8 | %†† |
| * | Commencement of operations |
See Notes to Financial Statements.
137
THE VANTAGEPOINT FUNDS
NOTES TO FINANCIAL STATEMENTS
The Vantagepoint Funds (the “Company”) was organized as a Delaware statutory trust on July 28, 1998 and is registered under the Investment Company Act of 1940, as amended (the “1940 Act”), as an open-end management investment company. The Company consisted of the following series on December 31, 2011:
| | |
| |
| The “Actively Managed Funds”: | | The “Index Funds”: |
Low Duration Bond Fund | | Core Bond Index Fund |
Inflation Protected Securities Fund | | 500 Stock Index Fund |
Equity Income Fund | | Broad Market Index Fund |
Growth & Income Fund | | Mid/Small Company Index Fund |
Growth Fund | | Overseas Equity Index Fund |
Select Value Fund | | |
Aggressive Opportunities Fund | | |
Discovery Fund | | |
International Fund | | |
Diversifying Strategies Fund | | |
| |
| The “Milestone Funds”: | | The “Model Portfolio Funds”: |
Milestone Retirement Income Fund | | Model Portfolio Savings Oriented Fund |
Milestone 2010 Fund | | Model Portfolio Conservative Growth Fund |
Milestone 2015 Fund | | Model Portfolio Traditional Growth Fund |
Milestone 2020 Fund | | Model Portfolio Long-Term Growth Fund |
Milestone 2025 Fund | | Model Portfolio All-Equity Growth Fund |
Milestone 2030 Fund | | |
Milestone 2035 Fund | | |
Milestone 2040 Fund | | |
Milestone 2045 Fund | | |
The Actively Managed, Model Portfolio and Milestone Funds each offer a single class of shares. The Index Funds offer two classes of shares: Class I Shares and Class II Shares. The two classes of shares differ principally in their respective level of account-based services and the fees associated with such services. Ordinary dividends to shareholders are allocated to each class, based upon shares outstanding on the record date of distribution. Neither class has preferential dividend rights. Differences in per share dividend rates are generally due to differences in separate class expenses.
The Model Portfolio Funds Structure
The Model Portfolio Funds invest entirely in other series of the Company (“underlying funds”). Subject to the supervision of the Board, Vantagepoint Investment Advisers, LLC (“VIA” or the “Adviser”) may make allocation changes to the underlying funds based on its periodic analysis to identify the allocation of assets among the different underlying funds that it believes is optimum for each Model Portfolio Fund. Each Model Portfolio Fund has a different degree of potential risk and reward and is diversified among various underlying funds in differing allocations. The underlying funds of each Model Portfolio Fund and the target investment allocation to each underlying fund as of December 31, 2011 were as follows:
| | | | | | | | | | | | | | | | | | | | |
| | | Model Portfolio Funds | |
Fund | | Savings
Oriented | | | Conservative
Growth | | | Traditional
Growth | | | Long-
Term
Growth | | | All-Equity
Growth | |
Fixed Income—% | | | | | | | | | | | | | | | | | | | | |
Low Duration Bond | | | 31.00% | | | | 19.00% | | | | 8.00% | | | | 0.00% | | | | 0.00% | |
Core Bond Index, Class I | | | 9.00% | | | | 12.00% | | | | 13.00% | | | | 13.00% | | | | 0.00% | |
Inflation Protected Securities | | | 15.00% | | | | 10.00% | | | | 4.00% | | | | 0.00% | | | | 0.00% | |
| | | | | | | | | | | | | | | | | | | | |
Total Fixed Income—% | | | 55.00% | | | | 41.00% | | | | 25.00% | | | | 13.00% | | | | 0.00% | |
| | | | | | | | | | | | | | | | | | | | |
138
THE VANTAGEPOINT FUNDS
NOTES TO FINANCIAL STATEMENTS — (Continued)
| | | | | | | | | | | | | | | | | | | | |
| | | Model Portfolio Funds | |
Fund | | Savings
Oriented | | | Conservative
Growth | | | Traditional
Growth | | | Long-
Term
Growth | | | All-Equity
Growth | |
Equity—% | | | | | | | | | | | | | | | | | | | | |
Equity Income | | | 10.00% | | | | 11.00% | | | | 12.00% | | | | 13.00% | | | | 18.00% | |
Growth & Income | | | 10.00% | | | | 9.00% | | | | 12.00% | | | | 13.00% | | | | 17.00% | |
Growth | | | 0.00% | | | | 6.00% | | | | 10.00% | | | | 11.50% | | | | 17.00% | |
Select Value | | | 0.00% | | | | 3.00% | | | | 5.50% | | | | 8.50% | | | | 9.50% | |
Aggressive Opportunities | | | 0.00% | | | | 3.00% | | | | 5.50% | | | | 8.50% | | | | 9.50% | |
Discovery | | | 0.00% | | | | 0.00% | | | | 3.00% | | | | 4.50% | | | | 9.00% | |
International | | | 5.00% | | | | 8.00% | | | | 12.00% | | | | 16.00% | | | | 20.00% | |
| | | | | | | | | | | | | | | | | | | | |
Total Equity—% | | | 25.00% | | | | 40.00% | | | | 60.00% | | | | 75.00% | | | | 100.00% | |
| | | | | | | | | | | | | | | | | | | | |
| | | | | |
Multi-Strategy—% | | | | | | | | | | | | | | | | | | | | |
Diversifying Strategies | | | 20.00% | | | | 19.00% | | | | 15.00% | | | | 12.00% | | | | 0.00% | |
| | | | | | | | | | | | | | | | | | | | |
Total Multi-Strategy—% | | | 20.00% | | | | 19.00% | | | | 15.00% | | | | 12.00% | | | | 0.00% | |
| | | | | | | | | | | | | | | | | | | | |
| | | | | |
Total—% | | | 100.00% | | | | 100.00% | | | | 100.00% | | | | 100.00% | | | | 100.00% | |
| | | | | | | | | | | | | | | | | | | | |
The Milestone Funds Structure
The Milestone Funds invest entirely in underlying funds. Subject to the supervision of the Board, VIA may make allocation changes to the underlying funds based on its periodic analysis to identify the allocation of assets among the different underlying funds that it believes is optimum for each Milestone Fund. Each Milestone Fund invests in a combination of underlying funds that is believed to be appropriate for investors who expect to begin making gradual withdrawals from the Milestone Fund, typically at or after retirement, in or around the year stated in the Milestone Fund’s name, except for the Milestone Retirement Income Fund. VIA adjusts the asset allocation of each “dated” Milestone Fund to become more conservative over time until the Milestone Fund achieves a constant asset allocation approximately ten years after the year designated in its name. The Milestone 2045 Fund has not yet been adjusted because of its long remaining time horizon. Each Milestone Fund has a different degree of potential risk and reward and is diversified among various underlying funds in differing allocations. The underlying funds of each Milestone Fund and the target investment allocation to each underlying fund as of December 31, 2011, were as follows:
| | | | | | | | | | | | | | | | | | | | |
| | | Milestone Funds | |
Fund | | Retirement
Income | | | 2010 | | | 2015 | | | 2020 | | | 2025 | |
Fixed Income—% | | | | | | | | | | | | | | | | | | | | |
Low Duration Bond | | | 31.00% | | | | 15.13% | | | | 10.74% | | | | 6.87% | | | | 2.94% | |
Core Bond Index, Class I | | | 9.00% | | | | 6.47% | | | | 9.94% | | | | 14.14% | | | | 13.42% | |
Inflation Protected Securities | | | 15.00% | | | | 15.00% | | | | 9.00% | | | | 1.50% | | | | 0.00% | |
| | | | | | | | | | | | | | | | | | | | |
Total Fixed Income—% | | | 55.00% | | | | 36.60% | | | | 29.68% | | | | 22.51% | | | | 16.36% | |
| | | | | | | | | | | | | | | | | | | | |
| | | | | |
Equity—% | | | | | | | | | | | | | | | | | | | | |
Equity Income | | | 10.00% | | | | 18.34% | | | | 19.09% | | | | 21.16% | | | | 22.91% | |
Growth & Income | | | 10.00% | | | | 11.00% | | | | 11.04% | | | | 11.59% | | | | 12.94% | |
Growth | | | 0.00% | | | | 7.10% | | | | 7.52% | | | | 8.28% | | | | 9.29% | |
Mid/Small Company Index, Class I | | | 0.00% | | | | 0.00% | | | | 5.39% | | | | 8.72% | | | | 11.24% | |
International | | | 5.00% | | | | 9.21% | | | | 10.78% | | | | 12.49% | | | | 14.26% | |
| | | | | | | | | | | | | | | | | | | | |
Total Equity—% | | | 25.00% | | | | 45.65% | | | | 53.82% | | | | 62.24% | | | | 70.64% | |
| | | | | | | | | | | | | | | | | | | | |
139
THE VANTAGEPOINT FUNDS
NOTES TO FINANCIAL STATEMENTS — (Continued)
| | | | | | | | | | | | | | | | | | | | |
| | | Milestone Funds | |
Fund | | Retirement
Income | | | 2010 | | | 2015 | | | 2020 | | | 2025 | |
Multi-Strategy—% | | | | | | | | | | | | | | | | | | | | |
Diversifying Strategies | | | 20.00% | | | | 17.75% | | | | 16.50% | | | | 15.25% | | | | 13.00% | |
| | | | | | | | | | | | | | | | | | | | |
Total Multi-Strategy—% | | | 20.00% | | | | 17.75% | | | | 16.50% | | | | 15.25% | | | | 13.00% | |
| | | | | | | | | | | | | | | | | | | | |
| | | | | |
Total—% | | | 100.00% | | | | 100.00% | | | | 100.00% | | | | 100.00% | | | | 100.00% | |
| | | | | | | | | | | | | | | | | | | | |
| | |
| | | Milestone Funds | | | | |
Fund | | 2030 | | | 2035 | | | 2040 | | | 2045 | | | | |
Fixed Income—% | | | | | | | | | | | | | | | | | | | | |
Low Duration Bond | | | 1.32% | | | | 0.22% | | | | 0.00% | | | | 0.00% | | | | | |
Core Bond Index, Class I | | | 9.15% | | | | 5.64% | | | | 5.00% | | | | 5.00% | | | | | |
Inflation Protected Securities | | | 0.00% | | | | 0.00% | | | | 0.00% | | | | 0.00% | | | | | |
| | | | | | | | | | | | | | | | | | | | |
Total Fixed Income—% | | | 10.47% | | | | 5.86% | | | | 5.00% | | | | 5.00% | | | | | |
| | | | | | | | | | | | | | | | | | | | |
| | | | | |
Equity—% | | | | | | | | | | | | | | | | | | | | |
Equity Income | | | 24.35% | | | | 25.76% | | | | 27.13% | | | | 27.40% | | | | | |
Growth & Income | | | 14.09% | | | | 14.88% | | | | 15.81% | | | | 16.00% | | | | | |
Growth | | | 10.43% | | | | 11.75% | | | | 12.48% | | | | 12.60% | | | | | |
Mid/Small Company Index, Class I | | | 14.21% | | | | 18.09% | | | | 19.78% | | | | 20.00% | | | | | |
International | | | 15.95% | | | | 17.66% | | | | 18.80% | | | | 19.00% | | | | | |
| | | | | | | | | | | | | | | | | | | | |
Total Equity—% | | | 79.03% | | | | 88.14% | | | | 94.00% | | | | 95.00% | | | | | |
| | | | | | | | | | | | | | | | | | | | |
| | | | | |
Multi-Strategy—% | | | | | | | | | | | | | | | | | | | | |
Diversifying Strategies | | | 10.50% | | | | 6.00% | | | | 1.00% | | | | 0.00% | | | | | |
| | | | | | | | | | | | | | | | | | | | |
Total Multi-Strategy—% | | | 10.50% | | | | 6.00% | | | | 1.00% | | | | 0.00% | | | | | |
| | | | | | | | | | | | | | | | | | | | |
| | | | | |
Total —% | | | 100.00% | | | | 100.00% | | | | 100.00% | | | | 100.00% | | | | | |
| | | | | | | | | | | | | | | | | | | | |
Since the Model Portfolio Funds and Milestone Funds invest entirely in underlying funds, investment earnings are composed of:
| | 1. | ordinary and capital gain dividends from the underlying funds, |
| | 2. | unrealized appreciation/depreciation on investments in the underlying funds, and |
| | 3. | realized gain/loss from sales of the shares of the underlying funds triggered by net outflows associated with normal capital stock activity and rebalancing of the Model Portfolio Funds and Milestone Funds. |
Subadviser Changes from January 1, 2011 to December 31, 2011
At a Board meeting held on June 17, 2011 VIA recommended, and the Board approved, the termination of Analytic Investors, LLC as a subadviser to the Diversifying Strategies Fund. At a Board meeting held on December 13, 2011, VIA recommended, and the Board approved, the termination of D.G. Capital Management Trust, Legg Mason Capital Management, LLC and Tukman Grossman Capital Management, Inc. as subadvisers to the Growth Fund and the appointment of Atlanta Capital Management Company, LLC and Victory Capital Management Inc. as subadvisers of the Growth Fund to be effective in January 2012.
| 2. | | Significant Accounting Policies |
The Company’s significant accounting policies are consistently applied in the preparation of its financial statements in accordance with accounting principles generally accepted in the United States of America (“GAAP”). Management makes estimates and assumptions in the preparation of financial statements that affect the reported amounts of assets
140
THE VANTAGEPOINT FUNDS
NOTES TO FINANCIAL STATEMENTS — (Continued)
and liabilities, including the disclosure of contingent assets and liabilities at the date of the financial statements as well as the revenue and expense amounts during the reporting period. Actual results could differ from those estimates and those differences could be material.
New Accounting Pronouncements
In May 2011, the Financial Accounting Standards Board issued Accounting Standard Update No. 2011-04, Fair Value Measurement (Topic 820)—Amendments to Achieve Common Fair Value Measurement and Disclosure Requirements in U.S. GAAP and IFRSs (International Financial Reporting Standards). The update establishes common requirements for measuring fair value and for disclosing information about fair value measurements. The update is effective during interim and annual periods beginning after December 15, 2011. Management is currently evaluating the impact of the update’s adoption on the Company’s financial statement disclosures.
In December 2011, the Financial Accounting Standards Board issued amended guidance to enhance disclosures for offsetting assets and liabilities. The guidance is effective for fiscal years and interim periods beginning on or after January 1, 2013; the adoption of such guidance will have no effect on the funds’ net assets or results of operations.
Fair Value Measurements
The Company adopted FASB ASC 820, Fair Value Measurements and Disclosures, effective January 1, 2008. In accordance with ASC 820, fair value is defined as the price that the fund would receive upon selling an investment in an orderly transaction to an independent buyer in the principal or most advantageous market for the investment. ASC 820 established a three-tier hierarchy, which maximizes the use of observable market data and minimizes the use of unobservable inputs to establish classification of fair value measurements for disclosure purposes. Inputs refer broadly to the assumptions that market participants would use in pricing the asset or liability, including assumptions about risk, for example, the risk inherent in a particular valuation technique used to measure fair value including a pricing model and/or the risk inherent in the inputs to the valuation technique. Inputs may be observable or unobservable.
Observable inputs are inputs that reflect the assumptions market participants would use in pricing the asset or liability, developed based on market data obtained from sources independent of the reporting entity. Unobservable inputs are inputs that reflect the reporting entity’s own assumptions about the assumptions market participants would use in pricing the asset or liability based on the best information available in the circumstances. The three-tier hierarchy of inputs is summarized in the three broad levels listed below.
Level 1—quoted prices in active markets for identical investments
Level 2—other significant observable inputs (including quoted prices for similar investments in active markets, interest rates and yield curves, prepayment speeds, credit risks, etc.)
Level 3—significant unobservable inputs (including the fund’s own assumptions about the assumptions that market participants would use in determining the fair value of investments)
Investment Policy and Security Valuation
All equity securities that are traded on a national securities exchange (other than NASDAQ Global/Global Select and Capital Market securities traded primarily on the Nasdaq Stock Market, Inc. exchange (“NASDAQ”)) held by each fund normally will be valued at the last reported sale price or official close price (if available) on the exchange on which the security is primarily traded, and are categorized as Level 1 in the hierarchy. If, on a particular day, an exchange-traded security does not trade on its primary exchange, then the price normally will be the mean between the closing bid and closing offer reported to the primary exchange and made available to quotation vendors or disseminated through an automated quotation system, or obtained by a pricing service from other quotation sources believed to be reliable and is generally categorized as Level 2 in the hierarchy. NASDAQ Global/Global Select and Capital Market securities traded primarily on NASDAQ will be valued at the NASDAQ Official Closing Price (“NOCP”). If, on any given day, no NOCP is available, the price of such securities normally will be the mean between the closing bid and closing offer reported on NASDAQ prior to the calculation of the net asset value (“NAV”) of a fund and are generally categorized as Level 1 in the hierarchy. All equity securities not traded on a national securities exchange (“OTC Equities”) normally will be priced at the last reported sale price in the
141
THE VANTAGEPOINT FUNDS
NOTES TO FINANCIAL STATEMENTS — (Continued)
over-the-counter market and are generally categorized as Level 1 in the hierarchy. If an OTC Equity does not trade in an over-the-counter market on a particular day, then the price normally will be the mean between the closing bid and closing offer obtained from a quotation service or other source believed to be reliable and is generally categorized as Level 1 in the hierarchy. Short-term debt instruments, such as commercial paper, banker’s acceptances, and U.S. Treasury Bills, with a remaining maturity of less than 60 days may be valued at amortized cost and are generally categorized as Level 2 in the hierarchy. Prices for debt instruments normally will be obtained from a pricing service. In determining prices, the pricing service may employ methodologies designed to identify the market value of debt instruments, which may include reference to actual market transactions, broker-dealer supplied quotations or valuations, matrix pricing, or other valuation techniques. These techniques generally consider such factors as securities’ prices, yields, maturities, call features, ratings and developments relating to specific securities in arriving at valuations and are generally categorized as Level 2 in the hierarchy. In the event a pricing service is unable to provide a price for a particular security, the security may be priced based on the average of two or more independent broker-dealer quotations and is generally categorized as Level 2 in the hierarchy. Any security for which market value as described above is not readily available is valued at fair value as determined in good faith in accordance with policies approved by the Board (“Valuation Procedures”) and is generally categorized as Level 2 or Level 3 in the hierarchy depending on the observability of market inputs. Except for certain foreign equity securities described later in this note, foreign exchange traded securities are valued in the same manner as domestic exchange traded equity securities and are generally categorized as Level 1 in the hierarchy.
Shares of the underlying funds in which the Model Portfolio and Milestone Funds invest are valued by using the underlying funds’ current NAVs for purchase and/or redemption orders that day and are categorized as Level 1 in the hierarchy.
Valuation of Certain Foreign Equity Securities
For foreign equity securities that are primarily traded in markets outside North and South America, the Board has approved the use of a third party fair valuation service. The service uses a multifactor model to calculate a factor that is then applied to adjust the market price for each such security, which are generally categorized as Level 2 in the hierarchy. Additionally, the Board has approved the use of the fair value prices provided by this service on a daily basis without a market trigger or confidence interval filter for all foreign equity securities held by the funds that are primarily traded in markets outside North and South America which are generally categorized as Level 2 in the hierarchy. In the event prices for such foreign securities are not available through the service or another fair value pricing service approved by the Board, the securities may be priced at the average of two or more independent broker-dealer quotations or at the fair value of the security in accordance with the Company’s Valuation Procedures and are generally categorized as Level 2 or Level 3 in the hierarchy.
The valuation techniques used by the funds to measure fair value during the year ended December 31, 2011 maximized the use of observable inputs and minimized the use of unobservable inputs. The funds utilized fair value techniques such as a multi-dimensional relational pricing model and option adjusted spread pricing to estimate prices that would have prevailed in a liquid market given information available at the time of evaluation.
The following is a summary of the inputs used as of December 31, 2011, in valuing each fund’s investment carried at value:
| | | | | | | | | | | | | | | | |
Investment Type | | Level 1 | | | Level 2 | | | Level 3 | | | Total | |
Low Duration Bond Fund | | | | | | | | | | | | | | | | |
Investments in Securities: | | | | | | | | | | | | | | | | |
Corporate Obligations | | $ | — | | | $ | 329,599,952 | | | $ | — | | | $ | 329,599,952 | |
Mortgage-Related Securities | | | — | | | | 42,271,471 | | | | — | | | | 42,271,471 | |
U.S. Treasury Obligations | | | — | | | | 35,541,505 | | | | — | | | | 35,541,505 | |
Government Related Obligations | | | — | | | | 39,135,014 | | | | — | | | | 39,135,014 | |
Asset-Backed Securities | | | — | | | | 59,954,953 | | | | — | | | | 59,954,953 | |
Money Market Funds | | | 40,645,120 | | | | — | | | | — | | | | 40,645,120 | |
| | | | | | | | | | | | | | | | |
Total Investments in Securities | | $ | 40,645,120 | | | $ | 506,502,895 | | | $ | — | | | $ | 547,148,015 | |
| | | | | | | | | | | | | | | | |
142
THE VANTAGEPOINT FUNDS
NOTES TO FINANCIAL STATEMENTS — (Continued)
| | | | | | | | | | | | | | | | |
Investment Type | | Level 1 | | | Level 2 | | | Level 3 | | | Total | |
Derivative Instruments: | | | | | | | | | | | | | | | | |
Assets: | | | | | | | | | | | | | | | | |
Futures | | $ | 19,017 | | | $ | — | | | $ | — | | | $ | 19,017 | |
Forward Currency Contracts | | | — | | | | 149,544 | | | | — | | | | 149,544 | |
| | | | | | | | | | | | | | | | |
Total Assets | | $ | 19,017 | | | $ | 149,544 | | | $ | — | | | $ | 168,561 | |
| | | | | | | | | | | | | | | | |
Liabilities: | | | | | | | | | | | | | | | | |
Forward Currency Contracts | | | — | | | | (525 | ) | | | — | | | | (525 | ) |
| | | | | | | | | | | | | | | | |
Total Liabilities | | | — | | | | (525 | ) | | | — | | | | (525 | ) |
| | | | | | | | | | | | | | | | |
Total Derivative Instruments | | $ | 19,017 | | | $ | 149,019 | | | $ | — | | | $ | 168,036 | |
| | | | | | | | | | | | | | | | |
| | | | |
Inflation Protected Securities Fund | | | | | | | | | | | | | | | | |
Investments in Securities: | | | | | | | | | | | | | | | | |
Corporate Obligations | | $ | — | | | $ | 27,360,275 | | | $ | — | | | $ | 27,360,275 | |
U.S. Treasury Obligations | | | — | | | | 510,271,472 | | | | — | | | | 510,271,472 | |
Government Related Obligations | | | — | | | | 2,687,489 | | | | — | | | | 2,687,489 | |
Asset-Backed Securities | | | — | | | | 7,338,241 | | | | — | | | | 7,338,241 | |
Purchased Options | | | — | | | | 25,384 | | | | — | | | | 25,384 | |
Certificates of Deposit | | | — | | | | 3,795,018 | | | | — | | | | 3,795,018 | |
Money Market Funds | | | 41,068,449 | | | | — | | | | — | | | | 41,068,449 | |
| | | | | | | | | | | | | | | | |
Total Investments in Securities | | $ | 41,068,449 | | | $ | 551,477,879 | | | $ | — | | | $ | 592,546,328 | |
| | | | | | | | | | | | | | | | |
Derivative Instruments: | | | | | | | | | | | | | | | | |
Assets: | | | | | | | | | | | | | | | | |
Swap Agreements | | | — | | | | 390,113 | | | | — | | | | 390,113 | |
Futures | | | 103,303 | | | | — | | | | — | | | | 103,303 | |
| | | | | | | | | | | | | | | | |
Total Assets | | $ | 103,303 | | | $ | 390,113 | | | $ | — | | | $ | 493,416 | |
| | | | | | | | | | | | | | | | |
Liabilities: | | | | | | | | | | | | | | | | |
Written Options | | | (15,031 | ) | | | (40,550 | ) | | | — | | | | (55,581 | ) |
Futures | | | (380,269 | ) | | | — | | | | — | | | | (380,269 | ) |
| | | | | | | | | | | | | | | | |
Total Liabilities | | | (395,300 | ) | | | (40,550 | ) | | | — | | | | (435,850 | ) |
| | | | | | | | | | | | | | | | |
Total Derivative Instruments | | $ | (291,997 | ) | | $ | 349,563 | | | $ | — | | | $ | 57,566 | |
| | | | | | | | | | | | | | | | |
| | | | |
Equity Income Fund | | | | | | | | | | | | | | | | |
Investments in Securities: | | | | | | | | | | | | | | | | |
Common Stocks | | $ | 1,733,794,702 | | | $ | 6,610,748 | | | $ | — | | | $ | 1,740,405,450 | |
Convertible Preferred Stocks | | | 3,123,600 | | | | — | | | | — | | | | 3,123,600 | |
Money Market Funds | | | 179,521,849 | | | | — | | | | — | | | | 179,521,849 | |
| | | | | | | | | | | | | | | | |
Total Investments in Securities | | $ | 1,916,440,151 | | | $ | 6,610,748 | | | $ | — | | | $ | 1,923,050,899 | |
| | | | | | | | | | | | | | | | |
| | | | |
Growth & Income Fund | | | | | | | | | | | | | | | | |
Investments in Securities: | | | | | | | | | | | | | | | | |
Common Stocks | | $ | 1,129,242,901 | | | $ | 2,464,877 | | | $ | — | | | $ | 1,131,707,778 | |
Money Market Funds | | | 50,104,587 | | | | — | | | | — | | | | 50,104,587 | |
| | | | | | | | | | | | | | | | |
Total Investments in Securities | | $ | 1,179,347,488 | | | $ | 2,464,877 | | | $ | — | | | $ | 1,181,812,365 | |
| | | | | | | | | | | | | | | | |
143
THE VANTAGEPOINT FUNDS
NOTES TO FINANCIAL STATEMENTS — (Continued)
| | | | | | | | | | | | | | | | |
Investment Type | | Level 1 | | | Level 2 | | | Level 3 | | | Total | |
Growth Fund | | | | | | | | | | | | | | | | |
Investments in Securities: | | | | | | | | | | | | | | | | |
Common Stocks | | $ | 1,667,556,052 | | | $ | — | | | $ | — | | | $ | 1,667,556,052 | |
Money Market Funds | | | 116,563,751 | | | | — | | | | — | | | | 116,563,751 | |
| | | | | | | | | | | | | | | | |
Total Investments in Securities | | $ | 1,784,119,803 | | | $ | — | | | $ | — | | | $ | 1,784,119,803 | |
| | | | | | | | | | | | | | | | |
| | | | |
Select Value Fund | | | | | | | | | | | | | | | | |
Investments in Securities: | | | | | | | | | | | | | | | | |
Common Stocks | | $ | 308,359,854 | | | $ | — | | | $ | — | | | $ | 308,359,854 | |
Money Market Funds | | | 21,368,027 | | | | — | | | | — | | | | 21,368,027 | |
| | | | | | | | | | | | | | | | |
Total Investments in Securities | | $ | 329,727,881 | | | $ | — | | | $ | — | | | $ | 329,727,881 | |
| | | | | | | | | | | | | | | | |
| | | | |
Aggressive Opportunities Fund | | | | | | | | | | | | | | | | |
Investments in Securities: | | | | | | | | | | | | | | | | |
Common Stocks | | $ | 920,691,161 | | | $ | 12,875,344 | | | $ | — | | | $ | 933,566,505 | |
Money Market Funds | | | 104,213,963 | | | | — | | | | — | | | | 104,213,963 | |
| | | | | | | | | | | | | | | | |
Total Investments in Securities | | $ | 1,024,905,124 | | | $ | 12,875,344 | | | $ | — | | | $ | 1,037,780,468 | |
| | | | | | | | | | | | | | | | |
| | | | |
Discovery Fund | | | | | | | | | | | | | | | | |
Investments in Securities: | | | | | | | | | | | | | | | | |
Common Stocks | | $ | 88,566,485 | | | $ | 3,080,243 | | | $ | 183,980 | | | $ | 91,830,708 | |
Convertible Preferred Stocks | | | — | | | | 1,124,574 | | | | — | | | | 1,124,574 | |
Corporate Obligations | | | — | | | | 46,334,930 | | | | — | | | | 46,334,930 | |
Mortgage-Related Securities | | | — | | | | 11,863,880 | | | | — | | | | 11,863,880 | |
Convertible Debt Obligations | | | — | | | | 337,895 | | | | — | | | | 337,895 | |
U.S. Treasury Obligations | | | — | | | | 19,203,943 | | | | — | | | | 19,203,943 | |
Government Related Obligations | | | — | | | | 15,411,046 | | | | — | | | | 15,411,046 | |
Asset-Backed Securities | | | — | | | | 2,730,985 | | | | — | | | | 2,730,985 | |
Warrants | | | 107,745 | | | | 20,561 | | | | — | | | | 128,306 | |
Money Market Funds | | | 24,760,837 | | | | — | | | | — | | | | 24,760,837 | |
| | | | | | | | | | | | | | | | |
Total Investments in Securities | | $ | 113,435,067 | | | $ | 100,108,057 | | | $ | 183,980 | | | $ | 213,727,104 | |
| | | | | | | | | | | | | | | | |
Derivative Instruments: | | | | | | | | | | | | | | | | |
Assets: | | | | | | | | | | | | | | | | |
Futures | | | 2,811,932 | | | | — | | | | — | | | | 2,811,932 | |
Forward Currency Contracts | | | — | | | | 33,429 | | | | — | | | | 33,429 | |
| | | | | | | | | | | | | | | | |
Total Assets | | $ | 2,811,932 | | | $ | 33,429 | | | $ | — | | | $ | 2,845,361 | |
| | | | | | | | | | | | | | | | |
Total Derivative Instruments | | $ | 2,811,932 | | | $ | 33,429 | | | $ | — | | | $ | 2,845,361 | |
| | | | | | | | | | | | | | | | |
| | | | |
International Fund | | | | | | | | | | | | | | | | |
Investments in Securities: | | | | | | | | | | | | | | | | |
Common Stocks | | $ | 113,400,682 | | | $ | 988,296,155 | | | $ | — | | | $ | 1,101,696,837 | |
Money Market Funds | | | 76,134,103 | | | | — | | | | — | | | | 76,134,103 | |
| | | | | | | | | | | | | | | | |
Total Investments in Securities | | $ | 189,534,785 | | | $ | 988,296,155 | | | $ | — | | | $ | 1,177,830,940 | |
| | | | | | | | | | | | | | | | |
Derivative Instruments: | | | | | | | | | | | | | | | | |
Assets: | | | | | | | | | | | | | | | | |
Forward Currency Contracts | | | — | | | | 834,869 | | | | — | | | | 834,869 | |
| | | | | | | | | | | | | | | | |
Total Assets | | $ | — | | | $ | 834,869 | | | $ | — | | | $ | 834,869 | |
| | | | | | | | | | | | | | | | |
Total Derivative Instruments | | $ | — | | | $ | 834,869 | | | $ | — | | | $ | 834,869 | |
| | | | | | | | | | | | | | | | |
144
THE VANTAGEPOINT FUNDS
NOTES TO FINANCIAL STATEMENTS — (Continued)
| | | | | | | | | | | | | | | | |
Investment Type | | Level 1 | | | Level 2 | | | Level 3 | | | Total | |
Diversifying Strategies Fund | | | | | | | | | | | | | | | | |
Investments in Securities: | | | | | | | | | | | | | | | | |
Common Stocks | | $ | 7,361,294 | | | $ | 13,729,362 | | | $ | — | | | $ | 21,090,656 | |
Convertible Preferred Stocks | | | 8,775,202 | | | | 236,234 | | | | — | | | | 9,011,436 | |
Corporate Obligations | | | — | | | | 293,597,329 | | | | — | | | | 293,597,329 | |
Mortgage-Related Securities | | | — | | | | 53,982,249 | | | | — | | | | 53,982,249 | |
Convertible Debt Obligations | | | — | | | | 204,650,574 | | | | — | | | | 204,650,574 | |
U.S. Treasury Obligations | | | — | | | | 75,972,424 | | | | — | | | | 75,972,424 | |
Government Related Obligations | | | — | | | | 82,316,584 | | | | — | | | | 82,316,584 | |
Asset-Backed Securities | | | — | | | | 36,742,629 | | | | — | | | | 36,742,629 | |
Purchased Options | | | 8,385,375 | | | | 390,993 | | | | — | | | | 8,776,368 | |
Certificates of Deposit | | | — | | | | 14,266,989 | | | | — | | | | 14,266,989 | |
Money Market Funds | | | 42,080,719 | | | | — | | | | — | | | | 42,080,719 | |
| | | | | | | | | | | | | | | | |
Total Investments in Securities | | $ | 66,602,590 | | | $ | 775,885,367 | | | $ | — | | | $ | 842,487,957 | |
| | | | | | | | | | | | | | | | |
Derivative Instruments: | | | | | | | | | | | | | | | | |
Assets: | | | | | | | | | | | | | | | | |
Purchased options on Euro-Bund futures | | | 2,475,721 | | | | — | | | | — | | | | 2,475,721 | |
Futures | | | 1,962,211 | | | | — | | | | — | | | | 1,962,211 | |
Forward Currency Contracts | | | — | | | | 4,900,403 | | | | — | | | | 4,900,403 | |
| | | | | | | | | | | | | | | | |
Total Assets | | $ | 4,437,932 | | | $ | 4,900,403 | | | $ | — | | | $ | 9,338,335 | |
| | | | | | | | | | | | | | | | |
Liabilities: | | | | | | | | | | | | | | | | |
Written Options | | | — | | | | (819,341 | ) | | | — | | | | (819,341 | ) |
Futures | | | (2,203,621 | ) | | | — | | | | — | | | | (2,203,621 | ) |
Forward Currency Contracts | | | — | | | | (836,610 | ) | | | — | | | | (836,610 | ) |
| | | | | | | | | | | | | | | | |
Total Liabilities | | | (2,203,621 | ) | | | (1,655,951 | ) | | | — | | | | (3,859,572 | ) |
| | | | | | | | | | | | | | | | |
Total Derivative Instruments | | $ | 2,234,311 | | | $ | 3,244,452 | | | $ | — | | | $ | 5,478,763 | |
| | | | | | | | | | | | | | | | |
| | | | |
Core Bond Index Fund | | | | | | | | | | | | | | | | |
Investments in Securities: | | | | | | | | | | | | | | | | |
Corporate Obligations | | $ | — | | | $ | 224,671,992 | | | $ | — | | | $ | 224,671,992 | |
Mortgage-Related Securities | | | — | | | | 382,777,345 | | | | — | | | | 382,777,345 | |
U.S. Treasury Obligations | | | — | | | | 394,317,255 | | | | — | | | | 394,317,255 | |
Government Related Obligations | | | — | | | | 118,212,087 | | | | — | | | | 118,212,087 | |
Asset-Backed Securities | | | — | | | | 2,965,580 | | | | — | | | | 2,965,580 | |
Certificates of Deposit | | | — | | | | 507,112 | | | | — | | | | 507,112 | |
Money Market Funds | | | 98,609,675 | | | | — | | | | — | | | | 98,609,675 | |
| | | | | | | | | | | | | | | | |
Total Investments in Securities | | $ | 98,609,675 | | | $ | 1,123,451,371 | | | $ | — | | | $ | 1,222,061,046 | |
| | | | | | | | | | | | | | | | |
| | | | |
500 Stock Index Fund | | | | | | | | | | | | | | | | |
Investments in Securities: | | | | | | | | | | | | | | | | |
Common Stocks | | $ | 373,473,082 | | | $ | 1 | | | $ | — | | | $ | 373,473,083 | |
Convertible Preferred Stocks | | | — | | | | 1 | | | | — | | | | 1 | |
U.S. Treasury Obligations | | | — | | | | 524,981 | | | | — | | | | 524,981 | |
Money Market Funds | | | 14,611,815 | | | | — | | | | — | | | | 14,611,815 | |
| | | | | | | | | | | | | | | | |
Total Investments in Securities | | $ | 388,084,897 | | | $ | 524,983 | | | $ | — | | | $ | 388,609,880 | |
| | | | | | | | | | | | | | | | |
Derivative Instruments: | | | | | | | | | | | | | | | | |
Assets: | | | | | | | | | | | | | | | | |
Futures | | | 26,841 | | | | — | | | | — | | | | 26,841 | |
| | | | | | | | | | | | | | | | |
Total Assets | | $ | 26,841 | | | $ | — | | | $ | — | | | $ | 26,841 | |
| | | | | | | | | | | | | | | | |
Total Derivative Instruments | | $ | 26,841 | | | $ | — | | | $ | — | | | $ | 26,841 | |
| | | | | | | | | | | | | | | | |
145
THE VANTAGEPOINT FUNDS
NOTES TO FINANCIAL STATEMENTS — (Continued)
| | | | | | | | | | | | | | | | |
Investment Type | | Level 1 | | | Level 2 | | | Level 3 | | | Total | |
Broad Market Index Fund | | | | | | | | | | | | | | | | |
Investments in Securities: | | | | | | | | | | | | | | | | |
Common Stocks | | $ | 489,582,929 | | | $ | 2 | | | $ | — | | | $ | 489,582,931 | |
Convertible Preferred Stocks | | | — | | | | 2 | | | | — | | | | 2 | |
U.S. Treasury Obligations | | | — | | | | 979,956 | | | | — | | | | 979,956 | |
Rights | | | — | | | | — | | | | — | | | | — | |
Warrants | | | — | | | | — | | | | — | | | | — | |
Money Market Funds | | | 26,258,331 | | | | — | | | | — | | | | 26,258,331 | |
| | | | | | | | | | | | | | | | |
Total Investments in Securities | | $ | 515,841,260 | | | $ | 979,960 | | | $ | — | | | $ | 516,821,220 | |
| | | | | | | | | | | | | | | | |
Derivative Instruments: | | | | | | | | | | | | | | | | |
Assets: | | | | | | | | | | | | | | | | |
Futures | | | 51,582 | | | | — | | | | — | | | | 51,582 | |
| | | | | | | | | | | | | | | | |
Total Assets | | $ | 51,582 | | | $ | — | | | $ | — | | | $ | 51,582 | |
| | | | | | | | | | | | | | | | |
Liabilities: | | | | | | | | | | | | | | | | |
Futures | | | (338 | ) | | | — | | | | — | | | | (338 | ) |
| | | | | | | | | | | | | | | | |
Total Liabilities | | | (338 | ) | | | — | | | | — | | | | (338 | ) |
| | | | | | | | | | | | | | | | |
Total Derivative Instruments | | $ | 51,244 | | | $ | — | | | $ | — | | | $ | 51,244 | |
| | | | | | | | | | | | | | | | |
| | | | |
Mid/Small Company Index Fund | | | | | | | | | | | | | | | | |
Investments in Securities: | | | | | | | | | | | | | | | | |
Common Stocks | | $ | 405,066,552 | | | $ | — | | | $ | — | | | $ | 405,066,552 | |
U.S. Treasury Obligations | | | — | | | | 359,974 | | | | — | | | | 359,974 | |
Rights | | | — | | | | — | | | | — | | | | — | |
Warrants | | | — | | | | — | | | | — | | | | — | |
Money Market Funds | | | 36, 883,881 | | | | — | | | | — | | | | 36,883,881 | |
| | | | | | | | | | | | | | | | |
Total Investments in Securities | | $ | 441,950,433 | | | $ | 359,974 | | | $ | — | | | $ | 442,310,407 | |
| | | | | | | | | | | | | | | | |
Derivative Instruments: | | | | | | | | | | | | | | | | |
Assets: | | | | | | | | | | | | | | | | |
Futures | | | 45,718 | | | | — | | | | — | | | | 45,718 | |
| | | | | | | | | | | | | | | | |
Total Assets | | $ | 45,718 | | | $ | — | | | $ | — | | | $ | 45,718 | |
| | | | | | | | | | | | | | | | |
Total Derivative Instruments | | $ | 45,718 | | | $ | — | | | $ | — | | | $ | 45,718 | |
| | | | | | | | | | | | | | | | |
| | | | |
Overseas Equity Index Fund | | | | | | | | | | | | | | | | |
Investments in Securities: | | | | | | | | | | | | | | | | |
Common Stocks | | $ | — | | | $ | 171,554,799 | | | $ | — | | | $ | 171,554,799 | |
Preferred Stocks | | | — | | | | 834,917 | | | | — | | | | 834,917 | |
U.S. Treasury Obligations | | | — | | | | 359,987 | | | | — | | | | 359,987 | |
Rights | | | — | | | | 3,033 | | | | — | | | | 3,033 | |
Money Market Funds | | | 8,302,088 | | | | — | | | | — | | | | 8,302,088 | |
| | | | | | | | | | | | | | | | |
Total Investments in Securities | | $ | 8,302,088 | | | $ | 172,752,736 | | | $ | — | | | $ | 181,054,824 | |
| | | | | | | | | | | | | | | | |
Derivative Instruments: | | | | | | | | | | | | | | | | |
Assets: | | | | | | | | | | | | | | | | |
Futures | | | 65,141 | | | | — | | | | — | | | | 65,141 | |
Forward Currency Contracts | | | — | | | | 10,818 | | | | — | | | | 10,818 | |
| | | | | | | | | | | | | | | | |
Total Assets | | $ | 65,141 | | | $ | 10,818 | | | $ | — | | | $ | 75,959 | |
| | | | | | | | | | | | | | | | |
Liabilities: | | | | | | | | | | | | | | | | |
Futures | | | (31,062 | ) | | | — | | | | — | | | | (31,062 | ) |
Forward Currency Contracts | | | — | | | | (17,520 | ) | | | — | | | | (17,520 | ) |
| | | | | | | | | | | | | | | | |
Total Liabilities | | | (31,062 | ) | | | (17,520 | ) | | | — | | | | (48,582 | ) |
| | | | | | | | | | | | | | | | |
Total Derivative Instruments | | $ | 34,079 | | | $ | (6,702 | ) | | $ | — | | | $ | 27,377 | |
| | | | | | | | | | | | | | | | |
146
THE VANTAGEPOINT FUNDS
NOTES TO FINANCIAL STATEMENTS — (Continued)
See Schedule of Investments for identification of securities by industry classification.
All investments held by the Model Portfolio Funds and Milestone Funds are categorized as Level 1.
As of December 31, 2011, with the exception of the Discovery Fund, the funds did not hold any significant investments in Level 3. Additionally, there were no significant transfers in and out of Levels 1 and 2.
The following is a reconciliation of assets in which significant unobservable inputs (Level 3) were used in determining fair value:
| | | | |
Discovery Fund | | Commons Stocks | |
Balance as of December 31, 2010 | | $ | — | |
Accrued discounts/(premiums) | | | — | |
Realized gain/(loss) | | | — | |
Change in unrealized appreciation/(depreciation) | | | — | |
Purchases | | | — | |
Sales | | | — | |
Transfers in to Level 3 | | | 183,980 | |
Transfers out of Level 3 | | | — | |
| | | | |
Balance as of December 31, 2011 | | $ | 183,980 | |
| | | | |
When Issued Securities
When issued securities or “To Be Announced” securities are sometimes held by the funds. The funds maintain security positions and cash positions such that sufficient liquid assets will be available to make payments for such securities purchased.
Foreign Currency
The accounting records of the funds are maintained in U.S. dollars. Investment securities and other assets and liabilities denominated in foreign currencies will be translated (but not actually converted) into U.S. dollars daily at the closing spot rates supplied by the WM/Reuters Intraday Spot exchange rates provided as of 4:00 pm Eastern Time. Purchases and sales of securities, income receipts and expense payments are translated (but not actually converted) into U.S. dollars at the prevailing exchange rates on the respective dates of such transactions. Unrealized gains and losses, not relating to securities, that result from changes in foreign currency exchange rates, have been included in unrealized appreciation/(depreciation) of securities. Net realized foreign currency gains and losses include foreign currency gains and losses resulting from changes in exchange rates between trade date and settlement date on investment securities transactions, gains and losses on foreign currency transactions, and the difference between the amounts of interest and dividends recorded on the books of the funds and the amounts actually received. The portion of foreign currency gains and losses related to fluctuations in exchange rates between the initial purchase trade date and subsequent sale trade date is included in realized gains/(losses) from security transactions.
Currency symbols utilized throughout the notes to these financial statements are defined as follows:
| | | | | | |
| AUD | | — Australian Dollar | | JPY | | — Japanese Yen |
| BRL | | — Brazilian Real | | MXN | | — Mexican Peso |
| CAD | | — Canadian Dollar | | NOK | | — Norwegian Krona |
| CHF | | — Swiss Franc | | NZD | | — New Zealand Dollar |
| EUR | | — European Monetary Unit | | SEK | | — Swedish Krona |
| GBP | | — British Pound | | USD | | — U.S. Dollar |
Options (other than Swaptions)
Exchange traded options normally will be priced based on the last reported sale price or official closing price (if available) on the exchange on which the option is primarily traded, as provided by a pricing service. If on a particular
147
THE VANTAGEPOINT FUNDS
NOTES TO FINANCIAL STATEMENTS — (Continued)
day, an option does not trade on its primary exchange, the fund’s custodian will calculate and use the mean between the closing bid and closing offer reported to the exchange and obtained from a pricing service and such options are generally categorized as Level 1 in the hierarchy.
Purchased options on Euro-Bund futures trade on foreign exchanges and are marked to market daily with variation margin payments received or made by the funds daily based on fluctuation in value. There is no premium paid at the time of purchase. These options are generally categorized as Level 1 in the hierarchy.
Non-exchange traded (i.e., over-the-counter) options normally will be priced using an option valuation model, which incorporates relevant parameters (e.g., implied volatility; current value of underlier). Such prices will be provided by a pricing service and these options are generally categorized as Level 2 in the hierarchy.
In the event a pricing service is unable to provide a price for a particular option, the option may be priced based on the average of two or more independent broker-dealer quotations, pursuant to the Valuation Procedures, or at its fair value determined in accordance with the Valuation Procedures and is generally categorized as Level 2 in the hierarchy.
Futures
Futures contracts normally will be priced at their settlement prices established and reported each day on the exchange on which they are traded, as provided by a pricing service and are generally categorized as Level 1 in the hierarchy. In the event a pricing service is unable to provide a price for a particular futures contract, the value of the contract will be priced at its fair value in accordance with the Valuation Procedures and generally such futures are categorized as Level 2 in the hierarchy.
Futures exchange abbreviations utilized throughout the notes to these financial statements are defined as follows:
| | | | | | |
| CBT | | — Chicago Board of Trade Exchange | | MSE | | — Montreal Exchange |
| CME | | — Chicago Mercantile Exchange | | NYF | | — New York Futures Exchange |
| EOE | | — Dutch Options Exchange | | SFE | | — Sydney Futures Exchange |
| EUX | | — Eurex Deutschland Exchange | | SGX | | — Singapore Exchange |
| HKG | | — Hong Kong Futures Exchange | | TSE | | — Tokyo Stock Exchange |
| LIF | | — Liffe Exchange | | | | |
Forward Currency Contracts
Forward currency contracts normally will be priced using the WM/Reuters Intraday Forwards rates provided as of 4:00 pm Eastern Time. In the event WM/Reuters (or a designated pricing service) is unable to provide a rate for a particular contract, the fair value of the contract will be determined in accordance with the Valuation Procedures and generally such contracts are categorized as Level 2 in the hierarchy.
Interest Rate Swaps and Inflation Swaps
Interest rate and inflation swaps normally will be priced based on the applicable swap valuation model (i.e., interest rate or inflation) which incorporates a snapshot of the relevant swap curve (interest rate curve or inflation rate curve, as applicable). Such prices will be provided by a pricing service. In the event a pricing service is unable to provide a price for a particular swap, the swap will be priced at its fair value in accordance with the Valuation Procedures and generally such swaps are categorized as Level 2 in the hierarchy.
Interest Rate Swaptions
Interest rate swaptions normally will be priced based on a snapshot taken of the relevant swap curve, deriving an implied volatility surface from actual and/or indicative broker-dealer swaption prices, and combining them in a swaption valuation model. Such prices will be provided by a pricing service. In the event a pricing service is unable to provide a price for a particular swaption, the swaption will be priced at its fair value in accordance with the Valuation Procedures and generally such swaptions are categorized as Level 2 in the hierarchy.
Total Return Swaps
Total return swaps are normally priced based on a valuation model that incorporates cash flow forecasts for the reference asset and a snapshot of the relevant interest rate swap curve. Such prices will be provided by a pricing
148
THE VANTAGEPOINT FUNDS
NOTES TO FINANCIAL STATEMENTS — (Continued)
service. In the event a pricing service is unable to provide a price for a particular total return swap, the total return swap will be priced at its fair value in accordance with the Valuation Procedures and generally such swaps are categorized as Level 2 in the hierarchy.
Security Transactions and Income Recognition
Security transactions are accounted for on the date the securities are purchased or sold (trade date). Dividend income is recognized on the ex-dividend date and interest income is accrued daily. Realized gains or losses are reported on the basis of identified cost of securities delivered. Bond discounts and premiums are amortized for both financial reporting and tax purposes, except for the Core Bond Index Fund, which does not amortize bond premium for tax purposes.
Dividends and Distributions to Shareholders
Dividends received from mutual fund investments are reflected as dividend income; capital gain distributions are reflected as realized gain/loss. Dividends from net investment income, if any, are declared and paid monthly to shareholders of the Core Bond Index, Low Duration Bond, and Inflation Protected Securities Funds. For the remaining funds, dividends from net investment income, if any, are declared and paid annually to shareholders. Distributions from net realized capital gains, if any, are generally declared and paid annually to shareholders. Income and capital gain distributions are determined in accordance with income tax regulations which may differ from GAAP. These differences are primarily due to differing treatments of income and gains on investment securities, and differing characterizations of distributions being made by each fund.
Certain differences are permanent, and result in reclassifications among paid-in capital, net investment income or realized gains. These include net operating losses not utilized during the current year, commission adjustments, pay-down gains and losses, bond premium amortization, foreign currency gains and losses, treasury inflation-protected securities adjustments, taxable over-distributions or returns of capital, and adjustments relating to income received from, or dispositions of, real estate investment trust, passive foreign investment company, publicly traded partnership, contingent payment debt instruments, and mutual fund company securities. The following reclassifications were made in the financial statements to present the components of fund net assets and distributions on a tax basis for the year ended December 31, 2011. These reclassifications have no effect on net assets or net asset values per share, and they do not affect the net investment income per share calculations presented in the Financial Highlights.
| | | | | | | | | | | | |
Fund | | Paid-in Capital
Increase/(Decrease) | | | Undistributed Net
Investment Income
Increase/(Decrease) | | | Accumulated Net
Realized Gain/(Loss)
Increase/(Decrease) | |
Low Duration Bond | | $ | — | | | $ | (181,410 | ) | | $ | 181,410 | |
Inflation Protected Securities | | | — | | | | 895,310 | | | | (895,310 | ) |
Equity Income | | | — | | | | 2,190,327 | | | | (2,190,327 | ) |
Growth & Income | | | — | | | | (12,641 | ) | | | 12,641 | |
Growth | | | (23,280,910 | ) | | | 188,614 | | | | 23,092,296 | |
Select Value | | | (372,340 | ) | | | (109,954 | ) | | | 482,294 | |
Aggressive Opportunities | | | 517,178 | | | | 4,451,058 | | | | (4,968,236 | ) |
Discovery | | | — | | | | 61,134 | | | | (61,134 | ) |
International | | | — | | | | 3,516,543 | | | | (3,516,543 | ) |
Diversifying Strategies | | | (177,475 | ) | | | (10,787,628 | ) | | | 10,965,103 | |
Core Bond Index | | | — | | | | 6,182,279 | | | | (6,182,279 | ) |
500 Stock Index | | | 3,282,586 | | | | (29,404 | ) | | | (3,253,182 | ) |
Broad Market Index | | | 3,759,898 | | | | (150,922 | ) | | | (3,608,976 | ) |
Mid/Small Company Index | | | 2,421,503 | | | | (85,204 | ) | | | (2,336,299 | ) |
Overseas Equity Index | | | (2,078 | ) | | | 71,940 | | | | (69,862 | ) |
Model Portfolio Savings Oriented | | | — | | | | (267,127 | ) | | | 267,127 | |
Model Portfolio Conservative Growth | | | — | | | | (415,805 | ) | | | 415,805 | |
Model Portfolio Traditional Growth | | | — | | | | (28,554 | ) | | | 28,554 | |
149
THE VANTAGEPOINT FUNDS
NOTES TO FINANCIAL STATEMENTS — (Continued)
| | | | | | | | | | | | |
Fund | | Paid-in Capital
Increase/(Decrease) | | | Undistributed Net
Investment Income
Increase/(Decrease) | | | Accumulated Net
Realized Gain/(Loss)
Increase/(Decrease) | |
Model Portfolio Long-Term Growth | | $ | — | | | $ | (19,396 | ) | | $ | 19,396 | |
Model Portfolio All-Equity Growth | | | — | | | | (91,331 | ) | | | 91,331 | |
Milestone Retirement Income | | | — | | | | (1,129 | ) | | | 1,129 | |
Milestone 2010 | | | — | | | | (10,343 | ) | | | 10,343 | |
Milestone 2015 | | | — | | | | (15,995 | ) | | | 15,995 | |
Milestone 2020 | | | — | | | | (2,735 | ) | | | 2,735 | |
Milestone 2025 | | | — | | | | (2,557 | ) | | | 2,557 | |
Milestone 2030 | | | — | | | | (3,062 | ) | | | 3,062 | |
Milestone 2035 | | | — | | | | (3,470 | ) | | | 3,470 | |
Milestone 2040 | | | (53,941 | ) | | | (3,611 | ) | | | 57,552 | |
Milestone 2045 | | | — | | | | 1,736 | | | | (1,736 | ) |
Federal Income Taxes
Each fund intends to qualify as a regulated investment company under Subchapter M of the Internal Revenue Code for federal tax purposes. Accordingly, each fund intends to make distributions of substantially all of its net investment company taxable income and any net realized capital gains (after reduction for capital loss carry forwards) sufficient to relieve it from all, or substantially all, federal income and excise taxes. Any taxable income or gains remaining at fiscal year-end are distributed in the following year. Therefore, no provision for federal income or excise taxes was required.
The FASB issued Interpretation ASC 740, “Income Taxes,” which establishes guidelines for recognizing, measuring, and disclosing tax return positions in financial statements. Management has evaluated the Company’s tax positions and determined that the application of ASC 740 had no material impact on the Company’s financial statements. Accordingly, no adjustments for unrecognized tax benefits or related interest or penalties were required as of December 31, 2011. If applicable, the Company recognizes interest accrued related to unrecognized tax benefits in interest expense and penalties in “Other Expenses” in the Statement of Operations. The Company is not aware of any tax positions for which it is reasonably possible that the total amounts of unrecognized tax benefits will significantly increase or decrease in the next twelve months.
The Regulated Investment Company Modernization Act of 2010 (the “Act”) was enacted on December 22, 2010. The Act changed various technical rules governing the tax treatment of regulated investment companies, which are generally effective beginning with the Company’s taxable year ending December 31, 2011. Under the Act, the funds are permitted to carry forward capital losses incurred in taxable years beginning after the enactment date indefinitely. However, any losses incurred during post-enactment taxable years are required to be utilized prior to the losses incurred in pre-enactment taxable years, which expires according to their original schedule. As a result of this ordering rule, pre-enactment capital loss carry forwards may be more likely to expire unused.
Additionally, post-enactment capital loss carryforwards will retain their character as either short-term or long-term capital losses rather than being considered entirely short-term as required under prior law.
At December 31, 2011, the components of distributable earnings on a tax basis were as follows:
| | | | | | | | | | | | |
Fund | | Undistributed
Ordinary Income | | | Undistributed
Long-Term Gains | | | Total Distributable
Earnings | |
Low Duration Bond | | $ | 203,959 | | | $ | — | | | $ | 203,959 | |
Inflation Protected Securities | | | 1,556,083 | | | | 6,002,630 | | | | 7,558,713 | |
Equity Income | | | — | | | | 3,919,923 | | �� | | 3,919,923 | |
Growth & Income | | | 3,258,284 | | | | — | | | | 3,258,284 | |
Growth | | | 488,273 | | | | — | | | | 488,273 | |
Select Value | | | 10,617 | | | | — | | | | 10,617 | |
Aggressive Opportunities | | | 5,210,766 | | | | — | | | | 5,210,766 | |
Discovery | | | 224,327 | | | | — | | | | 224,327 | |
150
THE VANTAGEPOINT FUNDS
NOTES TO FINANCIAL STATEMENTS — (Continued)
| | | | | | | | | | | | |
Fund | | Undistributed
Ordinary Income | | | Undistributed
Long-Term Gains | | | Total Distributable
Earnings | |
International | | $ | 14,972,826 | | | $ | — | | | $ | 14,972,826 | |
Diversifying Strategies | | | — | | | | — | | | | — | |
Core Bond Index | | | 9,575 | | | | — | | | | 9,575 | |
500 Stock Index | | | 29,426 | | | | — | | | | 29,426 | |
Broad Market Index | | | 5,388,128 | | | | — | | | | 5,388,128 | |
Mid/Small Company Index | | | 202,634 | | | | 2,185,455 | | | | 2,388,089 | |
Overseas Equity Index | | | 62,617 | | | | — | | | | 62,617 | |
Model Portfolio Savings Oriented | | | 343,827 | | | | 387,843 | | | | 731,670 | |
Model Portfolio Conservative Growth | | | 907,123 | | | | 3,383,218 | | | | 4,290,341 | |
Model Portfolio Traditional Growth | | | — | | | | 12,384,344 | | | | 12,384,344 | |
Model Portfolio Long-Term Growth | | | — | | | | 17,718,513 | | | | 17,718,513 | |
Model Portfolio All-Equity Growth | | | 1,071,551 | | | | 3,884,797 | | | | 4,956,348 | |
Milestone Retirement Income | | | — | | | | 1,593,295 | | | | 1,593,295 | |
Milestone 2010 | | | — | | | | 2,125,735 | | | | 2,125,735 | |
Milestone 2015 | | | — | | | | 3,262,456 | | | | 3,262,456 | |
Milestone 2020 | | | — | | | | 3,467,749 | | | | 3,467,749 | |
Milestone 2025 | | | — | | | | 2,898,533 | | | | 2,898,533 | |
Milestone 2030 | | | — | | | | 2,502,317 | | | | 2,502,317 | |
Milestone 2035 | | | — | | | | 1,749,283 | | | | 1,749,283 | |
Milestone 2040 | | | — | | | | — | | | | — | |
Milestone 2045 | | | — | | | | 507,403 | | | | 507,403 | |
The tax character of distributions during 2011 was as follows:
| | | | | | | | | | | | |
Fund | | Distributions Paid
from Ordinary
Income | | | Distributions Paid
from Long-Term
Gains | | | Total
Distributions | |
Low Duration Bond | | $ | 10,532,013 | | | $ | — | | | $ | 10,532,013 | |
Inflation Protected Securities | | | 17,944,572 | | | | 7,954,674 | | | | 25,899,246 | |
Equity Income | | | 43,691,700 | | | | 32,862,295 | | | | 76,553,995 | |
Growth & Income | | | 13,366,132 | | | | — | | | | 13,366,132 | |
Growth | | | 9,226,338 | | | | — | | | | 9,226,338 | |
Select Value | | | 2,974,231 | | | | — | | | | 2,974,231 | |
Aggressive Opportunities | | | 18,772,215 | | | | 63,629,518 | | | | 82,401,733 | |
Discovery | | | 2,156,271 | | | | — | | | | 2,156,271 | |
International | | | 28,267,374 | | | | — | | | | 28,267,374 | |
Diversifying Strategies | | | 1,880,043 | | | | 11,386,188 | | | | 13,266,231 | |
Core Bond Index | | | 40,150,525 | | | | — | | | | 40,150,525 | |
500 Stock Index | | | 6,825,623 | | | | — | | | | 6,825,623 | |
Broad Market Index | | | 8,529,205 | | | | — | | | | 8,529,205 | |
Mid/Small Company Index | | | 6,542,637 | | | | 14,883,091 | | | | 21,425,728 | |
Overseas Equity Index | | | 5,795,201 | | | | — | | | | 5,795,201 | |
Model Portfolio Savings Oriented | | | 5,782,341 | | | | — | | | | 5,782,341 | |
Model Portfolio Conservative Growth | | | 10,020,684 | | | | — | | | | 10,020,684 | |
Model Portfolio Traditional Growth | | | 29,272,914 | | | | 3,332,490 | | | | 32,605,404 | |
Model Portfolio Long-Term Growth | | | 32,241,740 | | | | 22,158,134 | | | | 54,399,874 | |
Model Portfolio All-Equity Growth | | | 9,622,281 | | | | — | | | | 9,622,281 | |
Milestone Retirement Income | | | 4,033,272 | | | | 4,193,183 | | | | 8,226,455 | |
Milestone 2010 | | | 4,370,084 | | | | 1,721,112 | | | | 6,091,196 | |
Milestone 2015 | | | 7,477,460 | | | | 2,136,550 | | | | 9,614,010 | |
Milestone 2020 | | | 6,588,924 | | | | 1,368,890 | | | | 7,957,814 | |
Milestone 2025 | | | 5,025,002 | | | | 1,252,114 | | | | 6,277,116 | |
151
THE VANTAGEPOINT FUNDS
NOTES TO FINANCIAL STATEMENTS — (Continued)
| | | | | | | | | | | | |
Fund | | Distributions Paid
from Ordinary
Income | | | Distributions Paid
from Long-Term
Gains | | | Total
Distributions | |
Milestone 2030 | | $ | 3,824,527 | | | $ | 545,351 | | | $ | 4,369,878 | |
Milestone 2035 | | | 2,407,747 | | | | 428,966 | | | | 2,836,713 | |
Milestone 2040 | | | 2,491,014 | | | | — | | | | 2,491,014 | |
Milestone 2045 | | | 613,903 | | | | 301,785 | | | | 915,688 | |
The tax character of distributions during 2010 was as follows:
| | | | | | | | | | | | |
Fund | | Distributions Paid
from Ordinary
Income | | | Distributions Paid
from Long-Term
Gains | | | Total
Distributions | |
Low Duration Bond | | $ | 11,819,982 | | | $ | — | | | $ | 11,819,982 | |
Inflation Protected Securities | | | 10,073,687 | | | | 4,903,049 | | | | 14,976,736 | |
Equity Income | | | 17,413,710 | | | | — | | | | 17,413,710 | |
Growth & Income | | | 9,595,362 | | | | — | | | | 9,595,362 | |
Growth | | | 12,440,966 | | | | — | | | | 12,440,966 | |
Select Value | | | 2,972,119 | | | | — | | | | 2,972,119 | |
Discovery | | | 1,907,086 | | | | — | | | | 1,907,086 | |
International | | | 22,937,847 | | | | — | | | | 22,937,847 | |
Diversifying Strategies | | | 15,514,149 | | | | — | | | | 15,514,149 | |
Core Bond Index | | | 38,851,573 | | | | — | | | | 38,851,573 | |
500 Stock Index | | | 6,069,052 | | | | — | | | | 6,069,052 | |
Broad Market Index | | | 8,087,210 | | | | — | | | | 8,087,210 | |
Mid/Small Company Index | | | 7,194,179 | | | | 3,446,561 | | | | 10,640,740 | |
Overseas Equity Index | | | 4,886,619 | | | | — | | | | 4,886,619 | |
Model Portfolio Savings Oriented | | | 6,476,782 | | | | — | | | | 6,476,782 | |
Model Portfolio Conservative Growth | | | 10,064,194 | | | | — | | | | 10,064,194 | |
Model Portfolio Traditional Growth | | | 21,975,154 | | | | — | | | | 21,975,154 | |
Model Portfolio Long-Term Growth | | | 26,389,015 | | | | — | | | | 26,389,015 | |
Model Portfolio All-Equity Growth | | | 5,906,426 | | | | — | | | | 5,906,426 | |
Milestone Retirement Income | | | 3,101,763 | | | | 191,611 | | | | 3,293,374 | |
Milestone 2010 | | | 2,813,079 | | | | — | | | | 2,813,079 | |
Milestone 2015 | | | 5,254,782 | | | | — | | | | 5,254,782 | |
Milestone 2020 | | | 4,951,090 | | | | 42,867 | | | | 4,993,957 | |
Milestone 2025 | | | 3,659,576 | | | | 105,410 | | | | 3,764,986 | |
Milestone 2030 | | | 2,698,541 | | | | 13,072 | | | | 2,711,613 | |
Milestone 2035 | | | 1,584,712 | | | | — | | | | 1,584,712 | |
Milestone 2040 | | | 1,547,569 | | | | — | | | | 1,547,569 | |
Milestone 2045 | | | 258,113 | | | | — | | | | 258,113 | |
At December 31, 2011, the following funds had net capital loss carryovers:
Post-enactment losses incurred that will be carried forward under the provisions of the Act are as follows:
| | | | | | | | |
| | | Loss Carryforward Character | |
Fund | | Short Term | | | Long Term | |
Overseas Equity Index | | $ | 224,805 | | | $ | 618,340 | |
152
THE VANTAGEPOINT FUNDS
NOTES TO FINANCIAL STATEMENTS — (Continued)
At December 31, 2011, the following Funds had pre-enactment capital loss carryforwards for federal income tax purposes available to offset future capital gains through the indicated expiration dates:
| | | | | | | | | | | | |
| | | Expiring December 31 | |
Fund | | 2014 | | | 2015 | | | 2016 | |
Low Duration Bond | | $ | — | | | $ | — | | | $ | — | |
Growth & Income | | | — | | | | — | | | | — | |
Growth | | | — | | | | — | | | | 174,724,570 | |
Select Value | | | — | | | | — | | | | — | |
Discovery | | | — | | | | — | | | | — | |
International | | | — | | | | — | | | | — | |
Core Bond Index | | | 3,320,661 | | | | 4,299,528 | | | | 2,798,291 | |
500 Stock Index | | | — | | | | — | | | | 7,028,727 | |
Broad Market Index | | | — | | | | — | | | | 265,032 | |
Overseas Equity Index | | | — | | | | — | | | | — | |
Milestone 2040 | | | — | | | | — | | | | — | |
| | |
| | | Expiring December 31 | | | | |
Fund | | 2017 | | | 2018 | | | | |
Low Duration Bond | | $ | 2,168,088 | | | $ | — | | | | | |
Growth & Income | | | 27,596,672 | | | | — | | | | | |
Growth | | | 326,415,305 | | | | — | | | | | |
Select Value | | | 11,578,240 | | | | — | | | | | |
Discovery | | | 3,715,529 | | | | — | | | | | |
International | | | 144,731,133 | | | | — | | | | | |
Core Bond Index | | | 4,404,280 | | | | — | | | | | |
500 Stock Index | | | 1,199,321 | | | | — | | | | | |
Broad Market Index | | | — | | | | — | | | | | |
Overseas Equity Index | | | 2,991,434 | | | | 444,126 | | | | | |
Milestone 2040 | | | 397,316 | | | | — | | | | | |
At December 31, 2011, the following funds elected to defer post-October net capital losses and specified losses of:
| | | | | | | | | | |
Fund | | Capital Losses | | | Specified Losses | | | |
Low Duration Bond | | $ | 5,718 | | | $ | — | | | |
Equity Income | | | — | | | | 242 | | | |
Growth & Income | | | — | | | | 522 | | | |
Aggressive Opportunities | | | 16,381,283 | | | | — | | | |
International | | | 21,222,069 | | | | — | | | |
500 Stock Index | | | 378,656 | | | | — | | | |
Broad Market Index | | | 106,236 | | | | — | | | |
Overseas Equity Index | | | 920,763 | | | | 155,502 | | | |
| 3. | | Investments in Derivative Instruments |
Some of the funds use derivative instruments in pursuing their investment objectives. The following table and discussion provides more detailed information about a fund’s derivative usage. The table below shows the average monthly notional balance, settlement value, or market value (as applicable) of the derivative instruments held by each fund during the reporting period.
153
THE VANTAGEPOINT FUNDS
NOTES TO FINANCIAL STATEMENTS — (Continued)
| | | | | | | | | | | | | | | | |
| | | Low Duration
Bond Fund | | | Inflation
Protected
Securities Fund | | | Discovery Fund | | | Diversifying
Strategies
Fund | |
Futures Contracts: | | | | | | | | | | | | | | | | |
Average Notional Balance Long | | $ | 1,708,396 | | | $ | 10,925,113 | | | $ | 102,663,050 | | | $ | 134,112,566 | |
Average Notional Balance Short | | | 4,544,529 | | | | 31,716,036 | | | | — | | | | 217,807,292 | |
Forward Foreign Currency Exchange Contracts: | | | | | | | | | | | | | | | | |
Average Settlement Value Purchased | | $ | 272,237 | | | $ | — | | | $ | 67,263 | | | $ | 407,049,076 | |
Average Settlement Value Sold | | | 5,763,562 | | | | — | | | | 1,055,083 | | | | 392,510,888 | |
Exchange-Traded Options: | | | | | | | | | | | | | | | | |
Average Market Value Purchased | | $ | — | | | $ | 25,547 | | | $ | — | | | $ | 7,964,476 | |
Average Market Value Written | | | — | | | | 40,761 | | | | — | | | | — | |
Average Market Value Purchased Options on Euro-Bund futures | | | — | | | | — | | | | — | | | | 4,153,859 | |
Over the Counter Options: | | | | | | | | | | | | | | | | |
Average Market Value Purchased | | $ | — | | | $ | — | | | $ | — | | | $ | 123,712 | |
Average Market Value Written | | | — | | | | — | | | | — | | | | 197,554 | |
Swaptions: | | | | | | | | | | | | | | | | |
Average Notional Balance Purchased | | $ | — | | | $ | 7,615,692 | | | $ | — | | | $ | — | |
Average Notional Balance Written | | | — | | | | 55,176,923 | | | | — | | | | — | |
| | | | |
| | | Low Duration
Bond Fund | | | Inflation
Protected
Securities Fund | | | Discovery Fund | | | Diversifying
Strategies
Fund | |
Total Return Swaps: | | | | | | | | | | | | | | | | |
Average Notional Balance Long | | $ | — | | | $ | — | | | $ | — | | | $ | 38,723,077 | |
Average Notional Balance Short | | | — | | | | — | | | | — | | | | 8,046,154 | |
Interest Rate Swaps: | | | | | | | | | | | | | | | | |
Average Notional Balance—Pays Fixed Rate | | $ | — | | | $ | 123,077 | | | $ | — | | | $ | — | |
Average Notional Balance—Receives Fixed Rate | | | — | | | | 12,823,077 | | | | — | | | | — | |
| | | | |
| | | 500 Stock
Index Fund | | | Broad Market
Index Fund | | | Mid/Small
Company Index
Fund | | | Overseas
Equity Index
Fund | |
Futures Contracts: | | | | | | | | | | | | | | | | |
Average Notional Balance Long | | $ | 8,609,414 | | | $ | 6,870,523 | | | $ | 6,141,312 | | | $ | 3,660,542 | |
Average Notional Balance Short | | | — | | | | — | | | | — | | | | — | |
Forward Foreign Currency Exchange Contracts: | | | | | | | | | | | | | | | | |
Average Settlement Value Purchased | | $ | — | | | $ | — | | | $ | — | | | $ | 5,172,574 | |
Average Settlement Value Sold | | | — | | | | — | | | | — | | | | 2,723,981 | |
| | | | |
| | | International
Fund | | | | | | | | | | |
Forward Foreign Currency Exchange Contracts: | | | | | | | | | | | | | | | | |
Average Settlement Value Purchased | | $ | 11,037 | | | | | | | | | | | | | |
Average Settlement Value Sold | | | 17,044,314 | | | | | | | | | | | | | |
Futures Contracts (“Futures”)
A futures contract is an agreement to buy or sell a specific amount of a commodity or financial instrument at a particular price on a stipulated future date.
154
THE VANTAGEPOINT FUNDS
NOTES TO FINANCIAL STATEMENTS — (Continued)
Certain funds may enter into futures to manage certain risks. These risks may include interest rate risk (the risk that interest rates will rise, causing fixed income securities prices to fall), credit risk (the risk that the issuer of a fixed income security will default on its obligation to pay interest and/or principal in a timely manner on the instrument), stock market risk (the risk that stock prices overall will decline over short or extended periods), or foreign currency risk (the risk that foreign currency values will decline relative to the U.S. dollar). Certain funds may use futures to seek to increase portfolio value, by increasing or decreasing their exposure to changes in the market value of the specific underlying security, foreign currency, or index.
Futures may be used by the following funds for the following purposes:
| | | | | | | | | | | | |
| | | Manage Risk: | | Obtain or Adjust Investment
Exposure: |
Fund | | Interest Rate
Risk | | Credit Risk | | Stock Market
Risk | | Foreign
Currency
Risk | | To Certain
Assets or
Asset Classes | | To
Foreign
Currencies |
Low Duration Bond | | * | | | | | | * | | * | | * |
Inflation Protected Securities | | * | | | | | | * | | * | | * |
Equity Income | | | | | | | | * | | * | | |
Growth & Income | | | | | | | | * | | * | | |
Growth | | | | | | | | * | | * | | |
Select Value | | | | | | | | * | | * | | |
Aggressive Opportunities | | | | | | | | * | | * | | |
Discovery | | * | | | | | | * | | * | | |
International | | | | | | * | | * | | * | | * |
Diversifying Strategies | | * | | * | | * | | * | | * | | * |
Core Bond Index | | * | | | | | | | | * | | |
500 Stock Index | | | | | | | | | | * | | |
Broad Market Index | | | | | | | | | | * | | |
Mid/Small Company Index | | | | | | | | | | * | | |
Overseas Equity Index | | | | | | | | * | | * | | |
Upon entering into the futures contract, the fund agrees to deposit an amount equal to a certain percentage of the contract notional value (initial margin). The fund agrees to subsequently receive or pay an amount of cash equal to the daily fluctuation in the value of the contract. Such receipts or payments are known as “variation margin” and are recorded by the fund as unrealized gains or losses. When the contract is closed, the fund records a realized gain or loss equal to the difference between the value of the contract at the time it was opened and the value at the time it was closed. Realized gains and losses are a component of net realized gain (loss) on futures in the Statement of Operations.
Use of futures may involve risks different from, or possibly greater than, the risks associated with more traditional investments, and may involve a small amount of investment relative to the amount of risk assumed. Risks associated with futures include: the risk that a particular future may be difficult to purchase or sell (liquidity risk); the risk that certain futures may be more sensitive than traditional investments to interest rate changes and market price fluctuations (interest rate and market risks); the risk of mispricing or improper valuation of the future, and the
155
THE VANTAGEPOINT FUNDS
NOTES TO FINANCIAL STATEMENTS — (Continued)
inability of the future to correlate perfectly, or at all, with the value of the underlying asset, reference rate, or index it is designed to closely track (valuation risk); the risk that the fund may lose substantially more than the amount invested and that the fund may be forced to liquidate portfolio positions when it may not be advantageous to do so (leverage risk).
During the year ended December 31, 2011, the following funds purchased and/or sold futures contracts: Low Duration Bond Fund, Inflation Protected Securities Fund, Discovery Fund, Diversifying Strategies Fund, 500 Stock Index Fund, Broad Market Index Fund, Mid/Small Company Index Fund, and Overseas Equity Index Fund.
As of December 31, 2011, the following funds had open futures contracts outstanding:
Low Duration Bond Fund
| | | | | | | | | | | | | | | | |
Number of
Contracts | | | Exchange | | Contract | | Expiration
Date | | Contract
Value | | | Net
Unrealized
Appreciation | |
| | Purchased | | | | | | | | | | | | | | | |
| | 35 | | | CBT | | U.S. 5 Year Treasury Note | | March 2012 | | $ | 4,314,023 | | | $ | 19,017 | |
| | | | | | | | | | | | | | | | |
Inflation Protected Securities Fund
| | | | | | | | | | | | | | | | |
Number of
Contracts | | | Exchange | | Contract | | Expiration
Date | | Contract
Value | | | Net
Unrealized
Appreciation/
(Depreciation) | |
| | Purchased | | | | | | | | | | | | | | | |
| | 81 | | | CBT | | U.S. 10 Year Treasury Note | | March 2012 | | $ | 10,621,125 | | | $ | 44,689 | |
| | 168 | | | CBT | | U.S. 5 Year Treasury Note | | March 2012 | | | 20,707,312 | | | | 58,614 | |
| | | | | | | | | | | | | | | | |
| | | | | | | | | | | | | | $ | 103,303 | |
| | | | | | | | | | | | | | | | |
| | Sold | | | | | | | | | | | | | | | |
| | 14 | | | CBT | | U.S. 2 Year Treasury Note | | March 2012 | | $ | 3,087,656 | | | $ | (2,652 | ) |
| | 44 | | | CBT | | U.S. 20 Year Treasury Bond | | March 2012 | | | 6,371,750 | | | | (94,018 | ) |
| | 112 | | | CBT | | U.S. 30 Year Treasury Bond | | March 2012 | | | 17,941,000 | | | | (283,599 | ) |
| | | | | | | | | | | | | | | | |
| | | | | | | | | | | | | | $ | (380,269 | ) |
| | | | | | | | | | | | | | | | |
| | | | | | | | | | | | | | $ | (276,966 | ) |
| | | | | | | | | | | | | | | | |
Discovery Fund
| | | | | | | | | | | | | | | | |
Number of
Contracts | | | Exchange | | Contract | | Expiration
Date | | Contract
Value | | | Net
Unrealized
Appreciation | |
| | Purchased | | | | | | | | | | | | | | | |
| | 1,307 | | | NYF | | E-MINI Russell 2000 Index | | March 2012 | | $ | 96,561,160 | | | $ | 2,811,932 | |
| | | | | | | | | | | | | | | | |
156
THE VANTAGEPOINT FUNDS
NOTES TO FINANCIAL STATEMENTS — (Continued)
Diversifying Strategies Fund
| | | | | | | | | | | | | | | | |
Number of
Contracts | | | Exchange | | Contract | | Expiration
Date | | Contract
Value | | | Net
Unrealized
Appreciation/
(Depreciation) | |
| | Purchased | | | | | | | | | | | | | | | |
| | 203 | | | EOE | | Amsterdam Index | | January 2012 | | $ | 16,460,207 | | | $ | 765,012 | |
| | 134 | | | EUX | | DAX Index | | March 2012 | | | 25,580,851 | | | | 720,908 | |
| | 99 | | | LIF | | FTSE 100 Index | | March 2012 | | | 8,511,434 | | | | 177,531 | |
| | 113 | | | SFE | | SPI 200 Index | | March 2012 | | | 11,612,538 | | | | (409,363 | ) |
| | | | | | | | | | | | | | | | |
| | | | | | | | | | | | | | $ | 1,254,088 | |
| | | | | | | | | | | | | | | | |
| | Sold | | | | | | | | | | | | | | | |
| | 100 | | | SGX | | 10 Year Mini-JGB | | March 2012 | | $ | 18,515,006 | | | $ | (114,417 | ) |
| | 83 | | | SFE | | Australian Government 10 Year Bond | | March 2012 | | | 10,093,277 | | | | (86,108 | ) |
| | 169 | | | MSE | | Canadian Government 10 Year Bond | | March 2012 | | | 22,202,660 | | | | (79,494 | ) |
| | 58 | | | CME | | E-MINI S&P 500 Index | | March 2012 | | | 3,632,540 | | | | 15,976 | |
| | 100 | | | HKG | | Hang Seng Index | | January 2012 | | | 11,881,647 | | | | (19,816 | ) |
| | 51 | | | MSE | | S&P/TSX 60 Index | | March 2012 | | | 6,797,330 | | | | 17,137 | |
| | 212 | | | TSE | | TOPIX Index | | March 2012 | | | 20,051,449 | | | | 265,647 | |
| | 324 | | | LIF | | UK Gilt Long Bond | | March 2012 | | | 58,845,964 | | | | (1,494,423 | ) |
| | | | | | | | | | | | | | | | |
| | | | | | | | | | | | | | $ | (1,495,498 | ) |
| | | | | | | | | | | | | | | | |
| | | | | | | | | | | | | | $ | (241,410 | ) |
| | | | | | | | | | | | | | | | |
500 Stock Index Fund
| | | | | | | | | | | | | | | | |
Number of
Contracts | | | Exchange | | Contract | | Expiration
Date | | Contract
Value | | | Net
Unrealized
Appreciation | |
| | Purchased | | | | | | | | | | | | | | | |
| | 119 | | | CME | | E-MINI S&P 500 Index | | March 2012 | | $ | 7,452,970 | | | $ | 26,841 | |
| | | | | | | | | | | | | | | | |
Broad Market Index Fund
| | | | | | | | | | | | | | | | |
Number of
Contracts | | | Exchange | | Contract | | Expiration
Date | | Contract
Value | | | Net
Unrealized
Appreciation/
(Depreciation) | |
| | Purchased | | | | | | | | | | | | | | | |
| | 31 | | | NYF | | E-MINI Russell 2000 Index | | March 2012 | | $ | 2,290,280 | | | $ | (338 | ) |
| | 187 | | | CME | | E-MINI S&P 500 Index | | March 2012 | | | 11,711,810 | | | | 51,582 | |
| | | | | | | | | | | | | | | | |
| | | | | | | | | | | | | | $ | 51,244 | |
| | | | | | | | | | | | | | | | |
157
THE VANTAGEPOINT FUNDS
NOTES TO FINANCIAL STATEMENTS — (Continued)
Mid/Small Company Index Fund
| | | | | | | | | | | | | | | | |
Number of
Contracts | | | Exchange | | Contract | | Expiration
Date | | Contract
Value | | | Net
Unrealized
Appreciation | |
| | Purchased | | | | | | | | | | | | | | | |
| | 26 | | | NYF | | E-MINI Russell 2000 Index | | March 2012 | | $ | 1,920,880 | | | $ | 25,989 | |
| | 22 | | | CME | | E-MINI S&P MidCap 400 Index | | March 2012 | | | 1,930,060 | | | | 19,729 | |
| | | | | | | | | | | | | | | | |
| | | | | | | | | | | | | | $ | 45,718 | |
| | | | | | | | | | | | | | | | |
Overseas Equity Index Fund
| | | | | | | | | | | | | | | | |
Number of
Contracts | | | Exchange | | Contract | | Expiration
Date | | Contract
Value | | | Net
Unrealized
Appreciation/
(Depreciation) | |
| | Purchased | | | | | | | | | | | | | | | |
| | 61 | | | EUX | | DJ Euro STOXX 50 Index | | March 2012 | | $ | 1,822,149 | | | $ | 37,384 | |
| | 17 | | | LIF | | FTSE 100 Index | | March 2012 | | | 1,461,559 | | | | 27,757 | |
| | 5 | | | SFE | | SPI 200 Index | | March 2012 | | | 513,829 | | | | (17,367 | ) |
| | 13 | | | TSE | | TOPIX Index | | March 2012 | | | 1,229,570 | | | | (13,695 | ) |
| | | | | | | | | | | | | | | | |
| | | | | | | | | | | | | | $ | 34,079 | |
| | | | | | | | | | | | | | | | |
Forward Currency Contracts
A forward currency contract involves a privately negotiated obligation to purchase or sell a specific currency at a future date at a price set in the contract.
Certain funds may enter into forward currency contracts to manage foreign currency risk. Foreign currency risk is the risk that a fund’s investment in or exposure to foreign currencies or securities denominated in foreign currencies may cause the fund to experience gains or losses solely based on changes in the exchange rate between foreign currencies and the U.S. dollar, or, in the case of hedged positions, the risk that the U.S. dollar will decline relative to the currency being hedged. Currency rates in foreign countries may fluctuate significantly over short periods of time. A decline in the value of foreign currencies relative to the U.S. dollar will reduce the value of securities held by a fund denominated in those currencies. Certain funds also may enter into forward currency contracts to obtain or adjust investment exposure to a foreign currency.
Forward currency contracts may be used by the following funds for the following purposes:
| | | | | | | | |
Fund | | Manage Foreign
Currency Risk | | | Obtain or Adjust Investment
Exposure to Foreign
Currencies | |
Low Duration Bond | | | * | | | | * | |
Inflation Protected Securities | | | * | | | | * | |
Equity Income | | | * | | | | | |
Growth & Income | | | * | | | | | |
Growth | | | * | | | | | |
Select Value | | | * | | | | | |
Aggressive Opportunities | | | * | | | | | |
Discovery | | | * | | | | | |
International | | | * | | | | * | |
Diversifying Strategies | | | * | | | | * | |
Overseas Equity Index | | | * | | | | | |
158
THE VANTAGEPOINT FUNDS
NOTES TO FINANCIAL STATEMENTS — (Continued)
Risks of entering into forward currency contracts include the possibility that a fund may lose money. For example, foreign currency values may change unfavorably relative to the U.S. dollar, there may be an illiquid market or a change in the value of the contracts may not correlate with changes in the value of the underlying currency. The use of over-the-counter forward currency contracts includes counterparty risk, which is the risk that the other party to a contract may not fulfill its obligations.
The net U.S. dollar value of foreign currency underlying all contractual commitments held by a fund and the resulting unrealized appreciation or depreciation are determined daily using prevailing exchange rates. Realized gain or loss is recorded upon the termination of the contract. Net realized and unrealized gains or losses occurring during the holding period of forward currency contracts are components of net realized gain (loss) on foreign currency transactions and change in net unrealized appreciation (depreciation) on forward currency contracts and foreign currency transactions in the Statement of Operations, respectively.
The amount at risk for such forward currency contracts may exceed the amount reflected in the financial statements.
During the year ended December 31, 2011, the following funds purchased and/or sold forward foreign currency exchange contracts: Low Duration Bond Fund, Discovery Fund, International Fund, Diversifying Strategies Fund, and Overseas Equity Index Fund.
As of December 31, 2011, the following funds had open forward currency contracts outstanding:
Low Duration Bond Fund
| | | | | | | | | | | | | | | | | | | | | | | | |
Contract
Type | | Counterparty | | Currency
to Deliver | | In Exchange
For | | | Exchange
Date | | | Foreign Currency
Cost/Proceeds
(U.S.$) | | | U.S. Dollar Value at
December 31, 2011 | | | Net
Unrealized
Appreciation/
(Depreciation) | |
| Purchase | | Citibank NA | | USD | | | EUR | | | | 01/10/2012 | | | $ | 63,946 | | | $ | 63,421 | | | $ | (525 | ) |
| | | | | | | | | | | | | | | | | | | | | | | | |
| Sale | | Citibank NA | | EUR | | | USD | | | | 01/10/2012 | | | $ | 3,573,080 | | | $ | 3,435,065 | | | $ | 138,015 | |
| Sale | | HSBC Bank plc | | GBP | | | USD | | | | 01/10/2012 | | | | 1,326,851 | | | | 1,315,322 | | | | 11,529 | |
| | | | | | | | | | | | | | | | | | | | | | | | |
| | | | | | | | | | | | | | | | | | | | | | $ | 149,544 | |
| | | | | | | | | | | | | | | | | | | | | | | | |
| | | | | | | | | | | | | | | | | | | | | | $ | 149,019 | |
| | | | | | | | | | | | | | | | | | | | | | | | |
|
Discovery Fund | |
Contract
Type | | Counterparty | | Currency
to Deliver | | In Exchange
For | | | Exchange
Date | | | Foreign Currency
Cost/Proceeds
(U.S.$) | | | U.S. Dollar Value at
December 31, 2011 | | | Net
Unrealized
Appreciation | |
| Sale | | HSBC Bank plc | | BRL | | | USD | | | | 02/27/2012 | | | $ | 860,916 | | | $ | 831,965 | | | $ | 28,951 | |
| Sale | | HSBC Bank plc | | GBP | | | USD | | | | 01/10/2012 | | | | 515,388 | | | | 510,910 | | | | 4,478 | |
| | | | | | | | | | | | | | | | | | | | | | | | |
| | | | | | | | | | | | | | | | | | | | | | $ | 33,429 | |
| | | | | | | | | | | | | | | | | | | | | | | | |
|
International Fund | |
Contract
Type | | Counterparty | | Currency
to Deliver | | In Exchange
For | | | Exchange
Date | | | Foreign Currency
Cost/Proceeds
(U.S.$) | | | U.S. Dollar Value at
December 31, 2011 | | | Net
Unrealized
Appreciation | |
| Sale | | JPMorgan Chase Bank NA | | AUD | | | USD | | | | 01/31/2012 | | | $ | 14,477,937 | | | $ | 14,121,429 | | | $ | 356,508 | |
| Sale | | JPMorgan Chase Bank NA | | CHF | | | USD | | | | 01/31/2012 | | | | 9,762,667 | | | | 9,284,306 | | | | 478,361 | |
| | | | | | | | | | | | | | | | | | | | | | | | |
| | | | | | | | | | | | | | | | | | | | | | $ | 834,869 | |
| | | | | | | | | | | | | | | | | | | | | | | | |
159
THE VANTAGEPOINT FUNDS
NOTES TO FINANCIAL STATEMENTS — (Continued)
| | | | | | | | | | | | | | | | | | | | | | | | |
Diversifying Strategies Fund | | | | | | | | | |
Contract
Type | | Counterparty | | Currency
to Deliver | | In Exchange
For | | | Exchange
Date | | | Foreign Currency
Cost/Proceeds
(U.S.$) | | | U.S. Dollar Value at
December 31, 2011 | | | Net
Unrealized
Appreciation/
(Depreciation) | |
| Purchase | | Deutsche Bank AG | | USD | | | AUD | | | | 03/21/2012 | | | $ | 20,008,284 | | | $ | 20,321,622 | | | $ | 313,338 | |
| Purchase | | Goldman Sachs International | | USD | | | AUD | | | | 03/21/2012 | | | | 16,242,226 | | | | 16,323,370 | | | | 81,144 | |
| Purchase | | Deutsche Bank AG | | USD | | | CAD | | | | 03/21/2012 | | | | 7,772,114 | | | | 7,807,505 | | | | 35,391 | |
| Purchase | | Goldman Sachs International | | USD | | | CAD | | | | 03/21/2012 | | | | 21,814,157 | | | | 21,992,131 | | | | 177,974 | |
| Purchase | | Deutsche Bank AG | | USD | | | CHF | | | | 03/21/2012 | | | | 10,476,563 | | | | 10,506,195 | | | | 29,632 | |
| Purchase | | Deutsche Bank AG | | USD | | | GBP | | | | 03/21/2012 | | | | 52,817,066 | | | | 52,946,869 | | | | 129,803 | |
| Purchase | | Deutsche Bank AG | | USD | | | JPY | | | | 03/21/2012 | | | | 25,638,588 | | | | 25,925,174 | | | | 286,586 | |
| Purchase | | Goldman Sachs International | | USD | | | JPY | | | | 03/21/2012 | | | | 19,555,561 | | | | 19,693,301 | | | | 137,740 | |
| Purchase | | Deutsche Bank AG | | USD | | | NOK | | | | 03/21/2012 | | | | 13,259,076 | | | | 13,075,531 | | | | (183,545 | ) |
| Purchase | | Deutsche Bank AG | | USD | | | NZD | | | | 03/21/2012 | | | | 3,150,078 | | | | 3,253,387 | | | | 103,309 | |
| Purchase | | Morgan Stanley Co., Inc. | | USD | | | NZD | | | | 03/21/2012 | | | | 2,216,412 | | | | 2,266,802 | | | | 50,390 | |
| Purchase | | Goldman Sachs International | | USD | | | SEK | | | | 03/21/2012 | | | | 29,619,953 | | | | 29,677,614 | | | | 57,661 | |
| | | | | | | | | | | | | | | | | | | | | | | | |
| | | | | | | | | | | | | | | | | | | | | | $ | 1,219,423 | |
| | | | | | | | | | | | | | | | | | | | | | | | |
| Sale | | JPMorgan Chase Bank NA | | BRL | | | USD | | | | 02/27/2012 | | | $ | 2,155,324 | | | $ | 2,079,648 | | | $ | 75,676 | |
| Sale | | Deutsche Bank AG | | CAD | | | USD | | | | 03/21/2012 | | | | 13,790,849 | | | | 13,987,205 | | | | (196,356 | ) |
| Sale | | Deutsche Bank AG | | CHF | | | USD | | | | 03/21/2012 | | | | 10,163,175 | | | | 10,294,880 | | | | (131,705 | ) |
| Sale | | Morgan Stanley Co., Inc. | | CHF | | | USD | | | | 03/21/2012 | | | | 188,927 | | | | 188,317 | | | | 610 | |
| Sale | | Deutsche Bank AG | | EUR | | | USD | | | | 03/21/2012 | | | | 87,615,906 | | | | 84,852,211 | | | | 2,763,695 | |
| Sale | | Deutsche Bank AG | | GBP | | | USD | | | | 03/21/2012 | | | | 4,498,405 | | | | 4,484,043 | | | | 14,362 | |
| Sale | | Goldman Sachs International | | GBP | | | USD | | | | 03/21/2012 | | | | 7,348,073 | | | | 7,316,069 | | | | 32,004 | |
| Sale | | Morgan Stanley Co., Inc. | | GBP | | | USD | | | | 03/21/2012 | | | | 16,991,549 | | | | 16,920,560 | | | | 70,989 | |
| Sale | | Deutsche Bank AG | | JPY | | | USD | | | | 03/21/2012 | | | | 2,747,119 | | | | 2,779,941 | | | | (32,822 | ) |
| Sale | | JPMorgan Chase Bank NA | | MXN | | | USD | | | | 01/18/2012 | | | | 2,829,764 | | | | 2,748,222 | | | | 81,542 | |
| Sale | | JPMorgan Chase Bank NA | | NOK | | | USD | | | | 01/10/2012 | | | | 1,577,890 | | | | 1,518,453 | | | | 59,437 | |
| Sale | | Goldman Sachs International | | NOK | | | USD | | | | 03/21/2012 | | | | 9,322,222 | | | | 8,970,922 | | | | 351,300 | |
| Sale | | Deutsche Bank AG | | NOK | | | USD | | | | 03/21/2012 | | | | 4,878,316 | | | | 4,830,496 | | | | 47,820 | |
| Sale | | Deutsche Bank AG | | NZD | | | USD | | | | 03/21/2012 | | | | 7,552,971 | | | | 7,741,578 | | | | (188,607 | ) |
| Sale | | Deutsche Bank AG | | SEK | | | USD | | | | 03/21/2012 | | | | 14,945,969 | | | | 15,049,544 | | | | (103,575 | ) |
| | | | | | | | | | | | | | | | | | | | | | | | |
| | | | | | | | | | | | | | | | | | | | | | $ | 2,844,370 | |
| | | | | | | | | | | | | | | | | | | | | | | | |
| | | | | | | | | | | | | | | | | | | | | | $ | 4,063,793 | |
| | | | | | | | | | | | | | | | | | | | | | | | |
160
THE VANTAGEPOINT FUNDS
NOTES TO FINANCIAL STATEMENTS — (Continued)
| | | | | | | | | | | | | | | | | | | | | | | | |
Overseas Equity Index Fund | | | | | |
Contract
Type | | Counterparty | | Currency
to Deliver | | In Exchange
For | | | Exchange
Date | | | Foreign Currency
Cost/Proceeds
(U.S.$) | | | U.S. Dollar Value at
December 31, 2011 | | | Net
Unrealized
Appreciation/
(Depreciation) | |
| Purchase | | Bank of America NA | | USD | | | AUD | | | | 03/21/2012 | | | $ | 122,806 | | | $ | 124,446 | | | $ | 1,640 | |
| Purchase | | Credit Suisse International | | USD | | | AUD | | | | 03/21/2012 | | | | 100,986 | | | | 102,413 | | | | 1,427 | |
| Purchase | | Barclays Bank plc | | USD | | | EUR | | | | 03/21/2012 | | | | 495,942 | | | | 485,848 | | | | (10,094 | ) |
| Purchase | | Citibank NA | | USD | | | EUR | | | | 03/21/2012 | | | | 207,676 | | | | 205,929 | | | | (1,747 | ) |
| Purchase | | Credit Suisse International | | USD | | | EUR | | | | 03/21/2012 | | | | 288,889 | | | | 286,746 | | | | (2,143 | ) |
| Purchase | | Citibank NA | | USD | | | GBP | | | | 03/21/2012 | | | | 473,788 | | | | 473,612 | | | | (176 | ) |
| Purchase | | Credit Suisse International | | USD | | | GBP | | | | 03/21/2012 | | | | 250,097 | | | | 248,603 | | | | (1,494 | ) |
| Purchase | | Citibank NA | | USD | | | JPY | | | | 03/21/2012 | | | | 188,160 | | | | 190,345 | | | | 2,185 | |
| Purchase | | Credit Suisse International | | USD | | | JPY | | | | 03/21/2012 | | | | 278,652 | | | | 281,028 | | | | 2,376 | |
| Purchase | | JPMorgan Chase Bank NA | | USD | | | JPY | | | | 03/21/2012 | | | | 346,810 | | | | 350,000 | | | | 3,190 | |
| | | | | | | | | | | | | | | | | | | | | | | | |
| | | | | | | | | | | | | | | | | | | | | | $ | (4,836 | ) |
| | | | | | | | | | | | | | | | | | | | | | | | |
| Sale | | Credit Suisse International | | EUR | | | USD | | | | 03/21/2012 | | | $ | 116,457 | | | $ | 116,823 | | | $ | (366 | ) |
| Sale | | Credit Suisse International | | GBP | | | USD | | | | 03/21/2012 | | | | 84,486 | | | | 85,040 | | | | (554 | ) |
| Sale | | Credit Suisse International | | JPY | | | USD | | | | 03/21/2012 | | | | 92,730 | | | | 93,676 | | | | (946 | ) |
| | | | | | | | | | | | | | | | | | | | | | | | |
| | | | | | | | | | | | | | | | | | | | | | $ | (1,866 | ) |
| | | | | | | | | | | | | | | | | | | | | | | | |
| | | | | | | | | | | | | | | | | | | | | | $ | (6,702 | ) |
| | | | | | | | | | | | | | | | | | | | | | | | |
Option Contracts (“Options”)
An option gives the holder the right but not the obligation to enter into a transaction (e.g., the purchase or sale of a security, an index of securities or another instrument, such as a futures contract) with another party on or before a specific date at a specified price (called the strike price). The counterparty is obligated to enter into the transaction if the holder elects to exercise the option. A call option gives the holder the right to purchase the underlying security or instrument from the other party; a put option gives the holder the right to sell the underlying security or instrument to the other party.
Certain funds may enter into options to manage certain risks. These risks may include interest rate risk (the risk that interest rates will rise, causing prices of fixed income securities to fall), credit risk (the risk that the issuer of a fixed income security will default on its obligation to pay interest and/or principal on the instrument in a timely manner), stock market risk (the risk that stock prices overall will decline over short or extended periods), and foreign currency risk (the risk that foreign currency values will decline relative to the U.S. dollar). Some funds also may use options, including options on Euro-Bund futures contracts, to obtain or adjust investment exposure to certain assets, asset classes, or foreign currencies.
161
THE VANTAGEPOINT FUNDS
NOTES TO FINANCIAL STATEMENTS — (Continued)
Option contracts may be used by the following funds for the following purposes:
| | | | | | | | | | | | | | | | | | | | | | | | |
| | | Manage Risk: | | | Obtain or Adjust Investment
Exposure: | |
Fund | | Interest
Rate
Risk | | | Credit
Risk | | | Stock
Market
Risk | | | Foreign
Currency
Risk | | | To Certain
Assets or Asset
Classes | | | To Foreign
Currencies | |
Low Duration Bond | | | * | | | | * | | | | | | | | * | | | | * | | | | * | |
Inflation Protected Securities | | | * | | | | * | | | | | | | | * | | | | * | | | | * | |
Equity Income | | | | | | | | | | | * | | | | | | | | | | | | | |
Growth & Income | | | | | | | | | | | * | | | | | | | | | | | | | |
Growth | | | | | | | | | | | | | | | | | | | * | | | | | |
Select Value | | | | | | | | | | | * | | | | | | | | * | | | | | |
Aggressive Opportunities | | | | | | | | | | | * | | | | | | | | * | | | | | |
Discovery | | | | | | | * | | | | * | | | | | | | | * | | | | | |
International | | | | | | | | | | | * | | | | * | | | | * | | | | | |
Diversifying Strategies | | | * | | | | * | | | | * | | | | * | | | | * | | | | * | |
Purchases of put and call options are recorded as an investment, the value of which is marked to market at each valuation date. When a purchased option expires, the fund will realize a loss equal to the premium paid. When a fund enters into a closing sale transaction, the fund will realize a gain or loss depending on whether the sales proceeds from the closing sale transaction are greater or less than the cost of the option. When a fund exercises a put option, it will realize a gain or loss from the sale of the underlying security and the proceeds from such sale will be decreased by the premium originally paid. When a fund exercises a call option, the cost of the security that the fund purchases upon exercise will be increased by the premium originally paid. When a fund writes (sells) a call or put option, an amount equal to the premium received by the fund is recorded as a liability, and the value of each option is marked to market at each valuation date. When a written option expires, the fund realizes a gain equal to the amount of the premium originally received. When a fund enters into a closing purchase transaction, the fund realizes a gain (or loss if the cost of the closing purchase transaction exceeds the premium originally received when the option was sold/written) without regard to any unrealized gain or loss on the underlying security, and the liability related to such option is eliminated. When a written call option is exercised, the fund realizes a gain or loss from the sale of the underlying security and the proceeds from such sale are increased by the amount of the premium originally received. When a written put option is exercised, the amount of the premium originally received will reduce the cost of the security that the fund purchased upon exercise. Option contract transactions may incur a commission, in addition to the premium paid or received. Options written are reported as a liability in a fund’s Statement of Assets and Liabilities.
Purchased options on Euro-Bund futures are recorded, accounted for and reported in the financial statements very much like futures contracts. There is no premium paid at the time of purchase and they are marked to market daily with variation margin payments received or made by the funds daily based on fluctuation in value and recorded as unrealized gain or loss. At the expiration of the option, the accumulated variation margin received or paid is recorded as realized gain or loss. If the option is exercised, the transaction is recorded as a normal purchase or sale of a futures contract.
A risk in writing (selling) a call option is that the fund gives up the opportunity for profit if the market price of the security increases to or above the strike price and the option is exercised. A risk in writing (selling) a call option on a futures contract, including a Euro-Bund futures contract, is that the fund may incur a loss if the market value of the underlying futures contract increases and the option is exercised. A risk in writing a put option is that the fund may incur a loss if the market price of the security, or futures contract including a Euro-Bund futures contract, decreases and the option is exercised. A risk in buying an option, including an option on a Euro-Bund futures contract, is that the fund pays a premium whether or not the option is exercised. The use of over-the-counter option contracts may also include counterparty risk, which is the risk that the other party to the contract may not fulfill its obligations.
During the year ended December 31, 2011, the following funds purchased and/or sold put and/or call options: Inflation Protected Securities Fund and Diversifying Strategies Fund.
162
THE VANTAGEPOINT FUNDS
NOTES TO FINANCIAL STATEMENTS — (Continued)
Written option activity for the year ended December 31, 2011 was as follows:
Inflation Protected Securities Fund
| | | | | | | | | | | | | | | | | | | | | | | | |
| | | Call Options | | | Put Options | | | Total | |
| | | Number of
Contracts | | | Premium | | | Number of
Contracts | | | Premium | | | Number of
Contracts | | | Premium | |
Beginning balance as of 12/31/2010 | | | — | | | $ | — | | | | — | | | $ | — | | | | — | | | $ | — | |
| | | | | | | | | | | | | | | | | | | | | | | | |
Written | | | 125 | | | | 67,472 | | | | 576 | | | | 169,132 | | | | 701 | | | | 236,604 | |
Closed | | | (40 | ) | | | (20,457 | ) | | | (329 | ) | | | (114,345 | ) | | | (369 | ) | | | (134,802 | ) |
Expired | | | (48 | ) | | | (26,005 | ) | | | (247 | ) | | | (54,787 | ) | | | (295 | ) | | | (80,792 | ) |
| | | | | | | | | | | | | | | | | | | | | | | | |
Ending balance as of 12/31/2011 | | | 37 | | | $ | 21,010 | | | | — | | | $ | — | | | | 37 | | | $ | 21,010 | |
| | | | | | | | | | | | | | | | | | | | | | | | |
Diversifying Strategies Fund
| | | | | | | | | | | | | | | | | | | | | | | | |
| | | Call Options | | | Put Options | | | Total | |
| | | Number of
Contracts | | | Premium | | | Number of
Contracts | | | Premium | | | Number of
Contracts | | | Premium | |
Beginning balance as of 12/31/2010 | | | 470 | | | $ | 88,257 | | | | — | | | $ | — | | | | 470 | | | $ | 88,257 | |
| | | | | | | | | | | | | | | | | | | | | | | | |
Written | | | 6,110 | | | | 1,048,964 | | | | — | | | | — | | | | 6,110 | | | | 1,048,964 | |
Closed | | | (3,880 | ) | | | (583,043 | ) | | | — | | | | — | | | | (3,880 | ) | | | (583,043 | ) |
Expired | | | — | | | | — | | | | — | | | | — | | | | — | | | | — | |
| | | | | | | | | | | | | | | | | | | | | | | | |
Ending balance as of 12/31/2011 | | | 2,700 | | | $ | 554,178 | | | | — | | | $ | — | | | | 2,700 | | | $ | 554,178 | |
| | | | | | | | | | | | | | | | | | | | | | | | |
As of December 31, 2011, the following funds had open written option contracts or open purchased option contracts on Euro-Bund futures:
Inflation Protected Securities Fund
| | | | | | | | | | | | | | | | | | |
Option Type | | Description | | # Contracts | | | Strike Price | | | Expiration
Date | | | Unrealized
Gain/(Loss) | |
Written Call | | U.S. 10 Year Treasury Note | | | 37 | | | | 132.00 | | | | 1/27/2012 | | | $ | 5,979 | |
| | | | | | | | | | | | | | | | | | |
Diversifying Strategies Fund
| | | | | | | | | | | | | | | | | | |
Option Type | | Description | | # Contracts | | | Strike Price | | | Expiration
Date | | | Unrealized
Gain/(Loss) | |
Written Call | | Swiss Market Index | | | 500 | | | | 5,808.91 | | | | 3/16/2012 | | | $ | (8,864 | ) |
Written Call | | Swiss Market Index | | | 410 | | | | 5,692.36 | | | | 3/16/2012 | | | $ | (8,561 | ) |
Written Call | | Swiss Market Index | | | 1,790 | | | | 5,686.50 | | | | 3/16/2012 | | | $ | (247,738 | ) |
| | | | | | | | | | | | | | | | | | |
| | | | | | | | | | | | | | | | $ | (265,163 | ) |
| | | | | | | | | | | | | | | | | | |
| | | | | |
Option Type | | Description | | # Contracts | | | Strike Price | | | Expiration
Date | | | Unrealized
Gain/(Loss) | |
Purchased Call | | Euro-Bund | | | 339 | | | | EUR 114.00 | | | | 2/24/2012 | | | $ | 2,482,798 | |
Purchased Put | | Euro-Bund | | | 1 | | | | EUR 155.00 | | | | 2/24/2012 | | | | (7,077 | ) |
| | | | | | | | | | | | | | | | | | |
| | | | | | | | | | | | | | | | $ | 2,475,721 | |
| | | | | | | | | | | | | | | | | | |
163
THE VANTAGEPOINT FUNDS
NOTES TO FINANCIAL STATEMENTS — (Continued)
Swap Agreements (“Swaps”)
Swaps are two-party contracts entered into primarily by institutional investors for periods typically ranging from a few weeks to more than one year. In a typical “swap” transaction, two parties agree to exchange the returns (or differentials in rates of return) earned or realized on particular predetermined investments or instruments, such as specified interest rates, a particular foreign currency, or a “basket” of securities or commodities as represented by a particular index. The gross returns to be exchanged or “swapped” between the parties are generally calculated based on the return on or increase in value of a “notional amount”, i.e. the predetermined dollar amount on which the dollar amount of gross returns are calculated.
Swap contract provisions and underlying assets are varied and customized to the specifications of the swap parties. Total return swaps are contracts in which one party agrees to make periodic payments to another party based on the change in market value of the assets underlying the contract, which may include a specified security, basket of securities or securities indexes during the specified period, in return for periodic payments based on a fixed or variable interest rate or the total return from other underlying assets. Total return swaps may be used to obtain exposure to a security or market without owning or taking physical custody of such security or investing directly in such market. Credit default swaps are contracts whereby one party makes periodic payments to a counterparty in exchange for the right to receive from the counterparty a payment equal to the par (or other agreed-upon) value of a referenced fixed income security in the event of a default or other agreed upon credit related event by the issuer of the debt obligation. Interest rate swaps involve the exchange by a fund with another party of their respective commitments to pay or receive interest, e.g., an exchange of floating rate payments for fixed rate payments with respect to a notional amount of principal. Inflation rate swaps involve the exchange by a fund with another party of their respective commitments to pay or receive a fixed rate in exchange for the rate of change of an inflation index with respect to a notional amount of principal.
Certain funds may enter into swaps to manage certain risks (e.g. interest rate risk, which is the risk that interest rates will rise, causing prices of fixed income securities to fall, and credit risk, which is the risk that the issuer of a fixed income security will default on its obligation to pay interest and/or principal on the instrument in a timely manner). Some funds also may use swaps to manage foreign currency risk or to obtain or adjust investment exposure to certain assets or asset classes.
Swaps may be used by the following funds for the following purposes:
| | | | | | | | | | | | | | | | |
| | | Manage Risk: | | | Obtain or Adjust Investment
Exposure: | |
Fund | | Interest Rate
Risk | | | Credit Risk | | | Foreign
Currency
Risk | | | To Certain Assets or
Asset Classes | |
Low Duration Bond | | | * | | | | * | | | | * | | | | * | |
Inflation Protected Securities | | | * | | | | * | | | | | | | | * | |
Discovery | | | * | | | | * | | | | | | | | * | |
Diversifying Strategies | | | * | | | | * | | | | | | | | * | |
Core Bond Index | | | * | | | | * | | | | | | | | * | |
The risks of entering into swaps include the possible lack of liquidity and unfavorable changes in the underlying investments or instruments. The use of swaps may also include counterparty risk, which is the risk that the other party to a swap may not fulfill its obligations.
In certain types of swap transactions, the risk of loss is increased because the fund may be required to make additional or higher payments to the counterparty as a result of market volatility. In addition, swaps are not traded on exchanges or other organized markets and are generally illiquid.
Swap value changes, including the periodic amounts of interest to be paid or received on swaps, are recorded as unrealized appreciation (depreciation) on swaps. A realized gain or loss is recorded upon receipt or payment of a periodic settlement or termination of a swap. Net realized and unrealized gains and losses occurring during the holding period of swaps are a component of net realized gain (loss) on swaps and change in net unrealized appreciation (depreciation) on swaps in the Statement of Operations, respectively.
164
THE VANTAGEPOINT FUNDS
NOTES TO FINANCIAL STATEMENTS — (Continued)
During the year ended December 31, 2011, the Inflation Protected Securities Fund participated in interest rate swaps and the Diversifying Strategies Fund participated in total return swaps.
As of December 31, 2011, the following swaps were outstanding:
Inflation Protected Securities Fund
| | | | | | | | | | | | | | | | |
| Interest Rate Swaps | | | | | | | | | | | | | |
| | | Rates Exchanged | | | | | | | | | |
Swap Counterparty | | Payments Made
By The Fund | | Payments Received
By The Fund | | Termination
Date | | | Notional Amount | | | Net Unrealized
Appreciation/
(Depreciation) | |
| Citibank NA | | 4.00% | | 3-month LIBOR | | | 12/21/2041 | | | | USD 1,400,000 | | | $ | (94,762 | ) |
| Deutsche Bank AG | | 4.00% | | 3-month LIBOR | | | 12/21/2041 | | | | USD 200,000 | | | | (18,028 | ) |
| Morgan Stanley Capital Services | | 3-month LIBOR | | 3.25% | | | 12/21/2021 | | | | USD 18,500,000 | | | | 502,903 | |
| | | | | | | | | | | | | | | | |
| | | | | | | | | | | | | | $ | 390,113 | |
| | | | | | | | | | | | | | | | |
Swap Options (“Swaptions”)
A swaption is a contract that gives the holder the right (but not the obligation), in return for the payment of a premium, to enter into a new swap agreement, or shorten, extend, cancel or otherwise modify an existing swap agreement, at some designated future time on specified terms.
Certain funds may enter into swaptions to manage certain risks (e.g., interest rate risk, which is the risk that interest rates will rise, causing bond prices to fall, and credit risk, which is the risk that the issuer of a debt instrument will default on its obligation to pay interest and/or principal on the instrument in a timely manner). Some funds also may use swaptions to manage foreign currency risk or to obtain or adjust investment exposure to certain assets or asset classes.
Swaptions may be used by the following funds for the following purposes:
| | | | | | | | | | | | | | | | |
| | | Manage Risk: | | | Obtain or Adjust
Investment Exposure: | |
Fund | | Interest Rate
Risk | | | Credit Risk | | | Foreign
Currency
Risk | | | To Certain Assets or
Asset Classes | |
Low Duration Bond | | | * | | | | * | | | | * | | | | * | |
Inflation Protected Securities | | | * | | | | * | | | | | | | | * | |
Discovery | | | * | | | | * | | | | | | | | | |
Diversifying Strategies | | | * | | | | * | | | | | | | | * | |
Core Bond Index | | | * | | | | * | | | | | | | | * | |
When a fund purchases a swaption, it risks losing the amount of the premium it has paid should it decide to let the option expire unexercised. However, when a fund writes a swaption, upon exercise of the option the fund will become obligated according to the terms of the underlying agreement (i.e., the fund may be required to enter into a new swap agreement, or to shorten, extend, cancel, or otherwise modify an existing swap agreement, even when there has been an unfavorable change in the value of the underlying swap). The use of swaptions includes counterparty risk, which is the risk that the other party to a swaption may not fulfill its obligations.
When a fund writes a call or put swaption, an amount equal to the premium received is recorded as a liability and subsequently marked to market to reflect the current value of the swaption written. These liabilities are reflected as written swaptions outstanding on the Statement of Assets and Liabilities. Certain swaptions may be written with premiums to be determined on a future date. Premiums received from writing swaptions that expire are treated as realized gains. Premiums received from writing swaptions that are exercised or closed are added to the proceeds or offset against amounts paid on the underlying swap to determine the realized gain or loss.
165
THE VANTAGEPOINT FUNDS
NOTES TO FINANCIAL STATEMENTS — (Continued)
Funds may also purchase put and call swaptions. Purchasing put or call swaptions tends to increase the fund’s potential opportunity to benefit from favorable market value changes in the underlying swap without obligating the fund to participate in unfavorable market changes that may occur. The fund pays a premium that is included on the fund’s Statement of Assets and Liabilities as an investment and subsequently marked to market to reflect the current value of the swaption. Premiums paid for purchasing swaptions which expire are treated as realized losses. Certain swaptions may be purchased with premiums to be determined on a future date. The premiums for these swaptions are based upon implied volatility parameters at specified terms. When a fund enters into a closing sale transaction, the fund will realize a gain or loss depending on whether the sales proceeds from the closing sale transaction are greater or less than the cost of the swaption. When a fund exercises a put swaption, it will realize a gain or loss from the underlying swap and the proceeds will be decreased by the premium originally paid. When a fund exercises a call swaption, the cost of the swap that the fund purchases upon exercise will be increased by the premium originally paid. Swaptions written are reported as a liability in a fund’s Statement of Assets and Liabilities. Gains and losses are reported in a fund’s Statement of Operations.
During the year ended December 31, 2011, the Inflation Protected Securities Fund participated in interest rate swaptions.
Written swaption activity for the year ended December 31, 2011 was as follows:
Inflation Protected Securities Fund
| | | | | | | | | | | | | | | | | | | | | | | | |
| | | Call Swaptions | | | Put Swaptions | | | Total | |
| | | Notional
Amount | | | Premium | | | Notional
Amount | | | Premium | | | Notional
Amount | | | Premium | |
Beginning balance as of 12/31/2010 | | $ | 3,600,000 | | | $ | 7,371 | | | $ | 34,200,000 | | | $ | 267,038 | | | $ | 37,800,000 | | | $ | 274,409 | |
| | | | | | | | | | | | | | | | | | | | | | | | |
Written | | | 28,000,000 | | | | 127,656 | | | | 67,000,000 | | | | 349,557 | | | | 95,000,000 | | | | 477,213 | |
Closed | | | (4,800,000 | ) | | | (9,120 | ) | | | (35,900,000 | ) | | | (143,272 | ) | | | (40,700,000 | ) | | | (152,392 | ) |
Expired | | | (26,800,000 | ) | | | (125,907 | ) | | | (23,200,000 | ) | | | (149,673 | ) | | | (50,000,000 | ) | | | (275,580 | ) |
| | | | | | | | | | | | | | | | | | | | | | | | |
Ending balance as of 12/31/2011 | | $ | — | | | $ | — | | | $ | 42,100,000 | | | $ | 323,650 | | | $ | 42,100,000 | | | $ | 323,650 | |
| | | | | | | | | | | | | | | | | | | | | | | | |
As of December 31, 2011, the following fund had open written swaption contracts outstanding:
Inflation Protected Securities Fund
| | | | | | | | | | | | | | | | | | | | | | |
Exchange | | Counterparty | | Contract | | | Notional
Amount | | | Strike
Rate | | | Expiration
Date | | | Net
Unrealized
Appreciation | |
OTC | | Royal Bank of Scotland plc | | | Put—Interest Rate Swaption | | | $ | 15,800,000 | | | | 2.25% | | | | 9/24/2012 | | | $ | 120,415 | |
OTC | | Royal Bank of Scotland plc | | | Put—Interest Rate Swaption | | | | 7,300,000 | | | | 2.25% | | | | 9/24/2012 | | | | 30,300 | |
OTC | | Citibank NA | | | Put—Interest Rate Swaption | | | | 6,900,000 | | | | 3.00% | | | | 6/18/2012 | | | | 62,122 | |
OTC | | Deutsche Bank AG | | | Put—Interest Rate Swaption | | | | 4,200,000 | | | | 1.75% | | | | 7/11/2013 | | | | 14,883 | |
OTC | | Goldman Sachs | | | Put—Interest Rate Swaption | | | | 3,400,000 | | | | 1.00% | | | | 11/19/2012 | | | | 14,779 | |
OTC | | Deutsche Bank AG | | | Put—Interest Rate Swaption | | | | 3,000,000 | | | | 3.00% | | | | 6/18/2012 | | | | 30,175 | |
OTC | | Citibank NA | | | Put—Interest Rate Swaption | | | | 800,000 | | | | 2.25% | | | | 9/24/2012 | | | | 5,126 | |
OTC | | Barclays Bank plc | | | Put—Interest Rate Swaption | | | | 400,000 | | | | 3.00% | | | | 6/18/2012 | | | | 3,501 | |
OTC | | Morgan Stanley Capital Services | | | Put—Interest Rate Swaption | | | | 300,000 | | | | 2.25% | | | | 9/24/2012 | | | | 1,799 | |
| | | | | | | | | | | | | | | | | | | | | | |
| | | | | | | | | | | | | | | | | | | | $ | 283,100 | |
| | | | | | | | | | | | | | | | | | | | | | |
Derivative Risk Exposure
In April 2009, the Company adopted FASB ASC 815 “Disclosure about Derivative Instruments and Hedging Activities” (“ASC 815”), which requires enhanced disclosures about the funds’ derivatives and hedging activities. The following tables reflect the value of the funds’ derivative contracts by certain risk exposure types (risks to which a fund is exposed as a result of holding the derivative contract) as of December 31, 2011.
166
THE VANTAGEPOINT FUNDS
NOTES TO FINANCIAL STATEMENTS — (Continued)
| | | | | | | | | | | | |
| | | Asset Derivatives | | | Liability Derivatives | |
Risk Exposure | | Statement of Assets and Liabilities
Location | | Value | | | Statement of Assets and Liabilities
Location | | Value | |
Low Duration Bond Fund | |
| Interest rate | | Receivable for variation margin on futures contracts | | $ | 19,017 | * | | Payable for variation margin on futures contracts | | $ | — | |
| Foreign currency | | Unrealized appreciation on forward foreign currency exchange contracts | | | 149,544 | | | Unrealized depreciation on forward foreign currency exchange contracts | | | 525 | |
| | | | | | | | | | | | |
| Total | | | | $ | 168,561 | | | | | $ | 525 | |
| | | | | | | | | | | | |
Inflation Protected Securities Fund | |
| Interest rate | | Investment in Securities, at value — purchased options, unrealized appreciation on swap agreements and receivable for variation margin on futures contracts | | $ | 518,800 | * | | Payable for variation margin on futures contracts and written options at value | | $ | 435,850 | * |
| | | | | | | | | | | | |
| Total | | | | $ | 518,800 | | | | | $ | 435,850 | |
| | | | | | | | | | | | |
Discovery Fund | |
| Foreign currency | | Unrealized appreciation on forward foreign currency exchange contracts | | $ | 33,429 | | | Unrealized depreciation on forward foreign currency exchange contracts | | $ | — | |
| Stock market | | Receivable for variation margin on futures contracts | | | 2,811,932 | * | | Payable for variation margin on futures contracts | | | — | |
| | | | | | | | | | | | |
| Total | | | | $ | 2,845,361 | | | | | $ | — | |
| | | | | | | | | | | | |
International Fund | |
| Foreign currency | | Unrealized appreciation on forward foreign currency exchange contracts | | $ | 834,869 | | | Unrealized depreciation on forward foreign currency exchange contracts | | $ | — | |
| | | | | | | | | | | | |
| Total | | | | $ | 834,869 | | | | | $ | — | |
| | | | | | | | | | | | |
Diversifying Strategies Fund | |
| Interest rate | | Investment in Securities, at value — purchased options and receivable for variation margin for options on Euro-Bund futures contracts | | $ | 10,861,096^ | | | Payable for variation margin on futures contracts | | $ | 1,774,442 | * |
| Foreign currency | | Unrealized appreciation on forward foreign currency exchange contracts | | | 4,900,403 | | | Unrealized depreciation on forward foreign currency exchange contracts | | | 836,610 | |
| Stock market | | Investments in Securities, at value — purchased options and receivable for variation margin on futures contracts | | | 2,353,204 | * | | Payable for variation margin on futures contracts and written options at value | | | 1,248,520 | * |
| | | | | | | | | | | | |
| Total | | | | $ | 18,114,703 | | | | | $ | 3,859,572 | |
| | | | | | | | | | | | |
167
THE VANTAGEPOINT FUNDS
NOTES TO FINANCIAL STATEMENTS — (Continued)
| | | | | | | | | | | | |
| | | Asset Derivatives | | | Liability Derivatives | |
Risk Exposure | | Statement of Assets and Liabilities
Location | | Value | | | Statement of Assets and Liabilities
Location | | Value | |
500 Stock Index Fund | |
| Stock market | | Receivable for variation margin on futures contracts | | $ | 26,841 | * | | Payable for variation margin on futures contracts | | $ | — | |
| | | | | | | | | | | | |
| Total | | | | $ | 26,841 | | | | | $ | — | |
| | | | | | | | | | | | |
Broad Market Index Fund | | | | | | | |
| Stock market | | Receivable for variation margin on futures contracts | | $ | 51,582 | * | | Payable for variation margin on futures contracts | | $ | 338 | * |
| | | | | | | | | | | | |
| Total | | | | $ | 51,582 | | | | | $ | 338 | |
| | | | | | | | | | | | |
Mid/Small Company Index Fund | | | | | | | |
| Stock market | | Receivable for variation margin on futures contracts | | $ | 45,718 | * | | Payable for variation margin on futures contracts | | $ | — | |
| | | | | | | | | | | | |
| Total | | | | $ | 45,718 | | | | | $ | — | |
| | | | | | | | | | | | |
Overseas Equity Index Fund | | | | | | | |
| Foreign currency | | Unrealized appreciation on forward foreign currency exchange contracts | | $ | 10,818 | | | Unrealized depreciation on forward foreign currency exchange contracts | | $ | 17,520 | |
| Stock market | | Receivable for variation margin on futures contracts | | | 65,141 | * | | Payable for variation margin on futures contracts | | | 31,062 | * |
| | | | | | | | | | | | |
| Total | | | | $ | 75,959 | | | | | $ | 48,582 | |
| | | | | | | | | | | | |
| * | | Includes cumulative appreciation (depreciation) of futures contracts as reported in the Notes to Financial Statements. Only the current day’s variation margin is reported within the asset and liability sections of the Statements of Assets and Liabilities. |
| ^ | | Includes cumulative appreciation (depreciation) of options on Euro-Bund futures and options contracts at value as reported in the Notes to Financial Statements and Schedule of Investments. Only the current day’s variation margin is reported within the asset and liability sections of the Statements of Assets and Liabilities for the options on Euro-Bund futures. |
168
THE VANTAGEPOINT FUNDS
NOTES TO FINANCIAL STATEMENTS — (Continued)
The following tables reflect the funds’ gains (losses) related to derivative activities by risk exposure types (risks to which a fund is exposed as a result of holding the derivative contract) for the year ended December 31, 2011, in accordance with ASC 815. These gains (losses) are included in net realized gain (loss) or net change in unrealized appreciation (depreciation) in the Statements of Operations.
| | | | | | | | | | | | | | | | | | | | |
| | | | | |
Low Duration Bond Fund1 | | | | | | | | | | | | | | | | | | | | |
| Realized Gain (Loss) | |
Risk Exposure | | Options | | | Futures | | | Forward Currency
Contracts | | | Swap Agreements | | | Total | |
Interest rate | | $ | — | | | $ | (579,024 | ) | | $ | — | | | $ | — | | | $ | (579,024 | ) |
Foreign currency | | | — | | | | — | | | | 113,895 | | | | — | | | | 113,895 | |
| | | | | | | | | | | | | | | | | | | | |
Total | | $ | — | | | $ | (579,024 | ) | | $ | 113,895 | | | $ | — | | | $ | (465,129 | ) |
| | | | | | | | | | | | | | | | | | | | |
| | | | | | | | | | | | | | | | | | | | | |
| Change in Unrealized Appreciation (Depreciation) | |
Risk Exposure | | Options | | | Futures | | | Forward Currency
Contracts | | | Swap Agreements | | | Total | |
Interest rate | | $ | — | | | $ | 19,017 | | | $ | — | | | $ | — | | | $ | 19,017 | |
Foreign currency | | | — | | | | — | | | | 141,530 | | | | — | | | | 141,530 | |
| | | | | | | | | | | | | | | | | | | | |
Total | | $ | — | | | $ | 19,017 | | | $ | 141,530 | | | $ | — | | | $ | 160,547 | |
| | | | | | | | | | | | | | | | | | | | |
|
Inflation Protected Securities Fund2 | |
| Realized Gain (Loss) | |
Risk Exposure | | Options | | | Futures | | | Forward Currency
Contracts | | | Swap Agreements | | | Total | |
Interest rate | | $ | 381,791 | ** | | $ | (3,963,927 | ) | | $ | — | | | $ | (407,271 | ) | | $ | (3,989,407 | ) |
| Change in Unrealized Appreciation (Depreciation) | |
Risk Exposure | | Options | | | Futures | | | Forward Currency
Contracts | | | Swap Agreements | | | Total | |
Interest rate | | $ | 449,605 | ** | | $ | (271,062 | ) | | $ | — | | | $ | 202,684 | | | $ | 381,227 | |
| | | | | |
Discovery Fund3 | | | | | | | | | | | | | | | | | | | | |
| Realized Gain (Loss) | |
Risk Exposure | | Options | | | Futures | | | Forward Currency
Contracts | | | Swap Agreements | | | Total | |
Foreign currency | | $ | — | | | $ | — | | | $ | (44,802 | ) | | $ | — | | | $ | (44,802 | ) |
Stock market | | | — | | | | (3,505,283 | ) | | | — | | | | — | | | | (3,505,283 | ) |
| | | | | | | | | | | | | | | | | | | | |
Total | | $ | — | | | $ | (3,505,283 | ) | | $ | (44,802 | ) | | $ | — | | | $ | (3,550,085 | ) |
| | | | | | | | | | | | | | | | | | | | |
| | | | | | | | | | | | | | | | | | | | | |
| Change in Unrealized Appreciation (Depreciation) | |
Risk Exposure | | Options | | | Futures | | | Forward Currency
Contracts | | | Swap Agreements | | | Total | |
Foreign currency | | $ | — | | | $ | — | | | $ | 32,769 | | | $ | — | | | $ | 32,769 | |
Stock market | | | — | | | | 440,364 | | | | — | | | | — | | | | 440,364 | |
| | | | | | | | | | | | | | | | | | | | |
Total | | $ | — | | | $ | 440,364 | | | $ | 32,769 | | | $ | — | | | $ | 473,133 | |
| | | | | | | | | | | | | | | | | | | | |
169
THE VANTAGEPOINT FUNDS
NOTES TO FINANCIAL STATEMENTS — (Continued)
| | | | | | | | | | | | | | | | | | | | |
|
International Fund4 | |
| Realized Gain (Loss) | |
Risk Exposure | | Options | | | Futures | | | Forward Currency
Contracts | | | Swap Agreements | | | Total | |
Foreign currency | | $ | — | | | $ | — | | | $ | (577,438 | ) | | $ | — | | | $ | (577,438 | ) |
| Change In Unrealized Appreciation (Depreciation) | |
Risk Exposure | | Options | | | Futures | | | Forward Currency
Contracts | | | Swap Agreements | | | Total | |
Foreign currency | | $ | — | | | $ | — | | | $ | 834,869 | | | $ | — | | | $ | 834,869 | |
| | | | |
Diversifying Strategies Fund5 | | | | | | | | | | | | | | | | | |
| Realized Gain (Loss) | |
Risk Exposure | | Options | | | Futures | | | Forward Currency
Contracts | | | Swap Agreements | | | Total | |
Interest rate | | $ | (369,963 | )** | | $ | (4,218,758 | ) | | $ | — | | | $ | (101,348 | ) | | $ | (4,690,069 | ) |
Foreign currency | | | — | | | | — | | | | (4,448,455 | ) | | | — | | | | (4,448,455 | ) |
Stock market | | | 333,800 | | | | 798,538 | | | | — | | | | — | | | | 1,132,338 | |
| | | | | | | | | | | | | | | | | | | | |
Total | | $ | (36,163 | )** | | $ | (3,420,220 | ) | | $ | (4,448,455 | ) | | $ | (101,348 | ) | | $ | (8,006,186 | ) |
| | | | | | | | | | | | | | | | | | | | |
| | | | | | | | | | | | | | | | | | | | | |
| Change in Unrealized Appreciation (Depreciation) | |
Risk Exposure | | Options | | | Futures | | | Forward Currency
Contracts | | | Swap Agreements | | | Total | |
Interest rate | | $ | 4,070,113 | ** | | $ | (1,005,623 | ) | | $ | — | | | $ | 1,853,545 | | | $ | 4,918,035 | |
Foreign currency | | | — | | | | — | | | | 3,171,073 | | | | — | | | | 3,171,073 | |
Stock market | | | (476,622 | )** | | | 786,154 | | | | — | | | | — | | | | 309,532 | |
| | | | | | | | | | | | | | | | | | | | |
Total | | $ | 3,593,491 | ** | | $ | (219,469 | ) | | $ | 3,171,073 | | | $ | 1,853,545 | | | $ | 8,398,640 | |
| | | | | | | | | | | | | | | | | | | | |
| | | | | |
500 Stock Index Fund6 | | | | | | | | | | | | | | | | | | | | |
| Realized Gain (Loss) | |
Risk Exposure | | Options | | | Futures | | | Forward Currency
Contracts | | | Swap Agreements | | | Total | |
Stock market | | $ | — | | | $ | 1,018,891 | | | $ | — | | | $ | — | | | $ | 1,018,891 | |
| Change in Unrealized Appreciation (Depreciation) | |
Risk Exposure | | Options | | | Futures | | | Forward Currency
Contracts | | | Swap Agreements | | | Total | |
Stock market | | $ | — | | | $ | (162,717 | ) | | $ | — | | | $ | — | | | $ | (162,717 | ) |
| | | | |
Broad Market Index Fund7 | | | | | | | | | | | | | | | | | |
| Realized Gain (Loss) | |
Risk Exposure | | Options | | | Futures | | | Forward Currency
Contracts | | | Swap Agreements | | | Total | |
Stock market | | $ | — | | | $ | 742,739 | | | $ | — | | | $ | — | | | $ | 742,739 | |
| Change in Unrealized Appreciation (Depreciation) | |
Risk Exposure | | Options | | | Futures | | | Forward Currency
Contracts | | | Swap Agreements | | | Total | |
Stock market | | $ | — | | | $ | (46,596 | ) | | $ | — | | | $ | — | | | $ | (46,596 | ) |
170
THE VANTAGEPOINT FUNDS
NOTES TO FINANCIAL STATEMENTS — (Continued)
| | | | | | | | | | | | | | | | | | | | |
| |
Mid/Small Company Index Fund8 | | | | | |
| Realized Gain (Loss) | |
Risk Exposure | | Options | | | Futures | | | Forward Currency
Contracts | | | Swap Agreements | | | Total | |
Stock market | | $ | — | | | $ | (778,542 | ) | | $ | — | | | $ | — | | | $ | (778,542 | ) |
| Change in Unrealized Appreciation (Depreciation) | |
Risk Exposure | | Options | | | Futures | | | Forward Currency
Contracts | | | Swap Agreements | | | Total | |
Stock market | | $ | — | | | $ | 51,515 | | | $ | — | | | $ | — | | | $ | 51,515 | |
| | | | | |
Overseas Equity Index Fund9 | | | | | | | | | | | | | | | | | | | | |
| Realized Gain (Loss) | |
Risk Exposure | | Options | | | Futures | | | Forward Currency
Contracts | | | Swap Agreements | | | Total | |
Foreign currency | | $ | — | | | $ | — | | | $ | 134,514 | | | $ | — | | | $ | 134,514 | |
Stock market | | | — | | | | (306,178 | ) | | | — | | | | — | | | | (306,178 | ) |
| | | | | | | | | | | | | | | | | | | | |
Total | | $ | — | | | $ | (306,178 | ) | | $ | 134,514 | | | $ | — | | | $ | (171,664 | ) |
| | | | | | | | | | | | | | | | | | | | |
| | | | | | | | | | | | | | | | | | | | | |
| Change in Unrealized Appreciation (Depreciation) | |
Risk Exposure | | Options | | | Futures | | | Forward Currency
Contracts | | | Swap Agreements | | | Total | |
Foreign currency | | $ | — | | | $ | — | | | $ | (93,427 | ) | | $ | — | | | $ | (93,427 | ) |
Stock market | | | — | | | | 45,105 | | | | — | | | | — | | | | 45,105 | |
| | | | | | | | | | | | | | | | | | | | |
Total | | $ | — | | | $ | 45,105 | | | $ | (93,427 | ) | | $ | — | | | $ | (48,322 | ) |
| | | | | | | | | | | | | | | | | | | | |
| ** | The realized gain (loss) and unrealized appreciation (depreciation) for purchased options is reported in the Statements of Operations within realized gains (losses) on investments and net change in unrealized appreciation (depreciation) on investments. The realized gain (loss) and unrealized appreciation (depreciation) for purchased options on Euro-Bund futures is reported in the Statements of Operations within realized gains (losses) on purchased options on Euro-Bund futures contracts and net change in unrealized appreciation (depreciation) on purchased options on Euro-Bund futures contracts. |
| (1) | The Low Duration Bond Fund used futures to manage interest rate risk inherent in its fixed income securities, consistent with its principal investment strategies. The fund used forward currency contracts to manage currency risk. |
| (2) | The Inflation Protected Securities Fund used futures, options (including swaptions), and swaps to manage interest rate risk inherent in its fixed income securities, consistent with its principal investment strategies. The fund used futures, options (including swaptions), and swaps to obtain or adjust investment exposure to segments of the fixed income market in pursuit of its investment objective. |
| (3) | The Discovery Fund used Russell 2000 Index futures to obtain or adjust investment exposure to U.S. common stocks consistent with its principal investment strategies. The fund used forward currency contracts to manage foreign currency risk inherent in its foreign fixed income holdings. |
| (4) | The International Fund used forward currency contracts to obtain or adjust investment exposure to foreign currencies to facilitate the trading of the foreign securities in which the fund invested consistent with its principal investment strategies and in pursuit of its investment objective. |
| (5) | The Diversifying Strategies Fund used futures to manage interest rate risk inherent in its fixed income securities, consistent with its principal investment strategies. The fund also used futures and options on Euro-Bund futures to obtain or adjust investment exposure to stocks and fixed income securities in pursuit of its investment objective. Also, in pursuit of its investment objective, the fund used (1) options and swaps to obtain or adjust investment exposure to fixed income securities, (2) foreign currency contracts to obtain or adjust investment exposure to foreign currencies, and (3) options to obtain or adjust investment exposure to equity securities. |
171
THE VANTAGEPOINT FUNDS
NOTES TO FINANCIAL STATEMENTS — (Continued)
| (6) | The 500 Stock Index Fund used futures to obtain or adjust investment exposure to equity issues in pursuit of its investment objective, when it was believed that using futures would be more efficient or cost effective than trading in the securities directly. |
| (7) | The Broad Market Index Fund used futures to obtain or adjust investment exposure to equity issues in pursuit of its investment objective, when it was believed that using futures would be more efficient or cost effective than trading in the securities directly. |
| (8) | The Mid/Small Company Index Fund used futures to obtain or adjust investment exposure to equity issues in pursuit of its investment objective, when it was believed that using futures would be more efficient or cost effective than trading in the securities directly. |
| (9) | The Overseas Equity Index Fund used forward currency contracts to manage currency risks inherent in the fund’s equity securities in pursuit of its investment objective. The fund used futures to obtain or adjust investment exposure to equity securities, which were in support of the fund’s investment objective, when it was believed that using futures would be more efficient or cost effective than trading in the securities directly. |
| 4. | | Agreements and Other Transactions with Affiliates |
VIA, a wholly owned subsidiary of ICMA Retirement Corporation (“ICMA-RC”), provides investment advisory services to each of the funds. Pursuant to Master Advisory Agreements, VIA is entitled to receive 0.10% of the average daily net assets of each Actively Managed and Milestone Fund and 0.05% of the average daily net assets of the Index Funds. Effective July 1, 2005, VIA is entitled to receive 0.10% on the first $500 million of net assets, 0.09% on the next $500 million of net assets, and 0.08% on net assets over $1 billion for each Model Portfolio Fund. For these services, VIA earned $17,534,419 in the aggregate for the year ended December 31, 2011.
Vantagepoint Transfer Agents, LLC (“VTA”), a wholly owned subsidiary of ICMA-RC, provides certain transfer agency and administrative shareholder support services for the funds related to the retirement plans investing in the funds. Pursuant to a Transfer Agency and Administrative Services Agreement with the Company, VTA is entitled to receive a fee for fund services. VTA receives 0.35% of the average daily net assets of each Actively Managed Fund, 0.30% of the average daily net assets of the Class I shares of the Index Funds and 0.10% of the average daily net assets of the Class II shares of the Index Funds. For these services, VTA earned $39,544,120 in the aggregate for the year ended December 31, 2011.
VIA and the Company contract with one or more subadvisers (“Subadvisers”) for the day-to-day management of each of the funds other than the Model Portfolio Funds and Milestone Funds. Each Subadviser is paid a fee by the funds during the year based on average net assets under management, except that the subadvisory fees for Analytic Investors, LLC was calculated and Mellon Capital Management Corporation for the Diversifying Strategies Fund is calculated, based on the average net asset value of the fund’s assets allocated and assigned to each of them by VIA. The fee structure for many of the Subadvisers provides for a range of fees so that as average net assets under management increases the rate of fee paid to the Subadviser decreases. Other Subadvisers charge one fee no matter what amount of assets they have under management. Additional information about each Subadviser’s fee is presented in the Company’s prospectus and statement of additional information. Fees paid by each fund to Subadvisers during the year ended December 31, 2011 are presented in the “Additional Information” section of these Notes. The Subadviser’s fees during the year ended December 31, 2011 are shown here as an annual percentage of average net assets under management, except the subadvisory fees for Analytic Investors, LLC and Mellon Capital Management Corporation for the Diversifying Strategies Fund which were calculated based on the average net asset value of the assets allocated and assigned to each of them by VIA.
| | | | | | |
Fund | | Subadviser | | Actual Fee as a Percentage of
Average Daily Net Assets (net of
any subadviser fee waivers) | |
| Low Duration Bond | | Payden & Rygel | | | 0.10 | % |
| | STW Fixed Income Management LLC | | | 0.19 | % |
| | |
| Inflation Protected Securities | | Pacific Investment Management Company, LLC | | | 0.20 | % |
| | BlackRock Financial Management, Inc. | | | 0.10 | % |
172
THE VANTAGEPOINT FUNDS
NOTES TO FINANCIAL STATEMENTS — (Continued)
| | | | | | |
Fund | | Subadviser | | Actual Fee as a Percentage of
Average Daily Net Assets (net of
any subadviser fee waivers) | |
| Equity Income | | Barrow, Hanley, Mewhinney & Strauss, LLC 1 | | | 0.22 | % |
| | T. Rowe Price Associates, Inc. 1 | | | 0.33 | % |
| | Southeastern Asset Management, Inc. | | | 0.52 | % |
| | |
| Growth & Income | | Fiduciary Management, Inc. | | | 0.29 | % |
| | T. Rowe Price Associates, Inc. | | | 0.38 | % |
| | Wellington Management Company, LLP | | | 0.27 | % |
| | |
| Growth | | Columbus Circle Investors | | | 0.33 | % |
| | D.G. Capital Management Trust 2,3 | | | 0.35 | % |
| | Legg Mason Capital Management, LLC 3 | | | 0.32 | % |
| | Tukman Grossman Capital Management, Inc. 3 | | | 0.40 | % |
| | Westfield Capital Management Company, L.P. | | | 0.33 | % |
| | |
| Select Value | | Artisan Partners Limited Partnership | | | 0.55 | % |
| | WEDGE Capital Management LLP | | | 0.53 | % |
| | Systematic Financial Management, L.P. | | | 0.42 | % |
| | |
| Aggressive Opportunities | | Legg Mason Capital Management, LLC | | | 0.32 | % |
| | Southeastern Asset Management, Inc. | | | 0.56 | % |
| | TimesSquare Capital Management, LLC | | | 0.50 | % |
| | Wellington Management Company, LLP | | | 0.41 | % |
| | |
| Discovery | | Payden & Rygel | | | 0.15 | % |
| | Wellington Management Company, LLP | | | 0.73 | % |
| | |
| International | | Artisan Partners Limited Partnership | | | 0.65 | % |
| | GlobeFlex Capital, LP | | | 0.40 | % |
| | Mondrian Investment Partners Limited | | | 0.43 | % |
| | Walter Scott & Partners Limited | | | 0.55 | % |
| | |
| Diversifying Strategies | | Analytic Investors, LLC 4 | | | 0.45 | % |
| | Calamos Advisors LLC | | | 0.54 | % |
| | Mellon Capital Management Corporation 5 | | | 0.46 | % |
| | Payden & Rygel (Enhanced Cash Strategy) | | | 0.10 | % |
| | Payden & Rygel (Low Duration Strategy) | | | 0.10 | % |
| | Shenkman Capital Management, Inc. | | | 0.39 | % |
| | |
| Core Bond Index | | Mellon Capital Management Corporation | | | 0.02 | % |
| | |
| 500 Stock Index | | Mellon Capital Management Corporation | | | 0.02 | % |
| | |
| Broad Market Index | | Mellon Capital Management Corporation | | | 0.02 | % |
| | |
| Mid/Small Company Index | | Mellon Capital Management Corporation | | | 0.03 | % |
| | |
| Overseas Equity Index | | Mellon Capital Management Corporation | | | 0.07 | % |
| | (1) | Effective May 1, 2011, the fee schedules charged by Barrow, Hanley, Mewhinney & Strauss, LLC and T. Rowe Price & Associates, Inc. were amended and the percentages shown above represent a blended rate of the previous fee schedules and the new fee schedules. |
| | (2) | Effective March 1, 2011, D.G. Capital Management Trust amended its fee schedule to a flat 0.35%. |
| | (3) | On December 13, 2011, the Board approved the termination of D.G. Capital Management Trust, Legg Mason Capital Management, LLC and Tukman Grossman Capital Management, Inc. effective January 2012. |
| | (4) | On June 17, 2011, the Board approved the termination of Analytic Investors, LLC. |
| | (5) | Effective May 1, 2011, Mellon Capital Management Corporation contractually agreed to waive a portion of its subadvisory fee through April 30, 2014. |
173
THE VANTAGEPOINT FUNDS
NOTES TO FINANCIAL STATEMENTS — (Continued)
Expenses
The Model Portfolio Funds and Milestone Funds incur fees and expenses indirectly as shareholders in their respective underlying funds. Because the underlying funds have varied expense and fee levels and the Model Portfolio and Milestone Funds may own different proportions of such funds at different times, the amount of fees and expenses indirectly incurred by the Model Portfolio and Milestone Funds will vary.
Fee Waivers
VIA will waive its management fee or reimburse expenses to the extent necessary as a result of any increase in subadvisory fees payable by the Growth Fund that would cause the aggregate management and subadvisory fees of the Growth Fund to exceed 0.54% as a result of subadvisory changes. This commitment will continue until such time as shareholders approve an increase in this limit. For the year ended December 31, 2011, no waiver or reimbursement was required.
From January 4, 2010 through April 30, 2011, and from May 1, 2011 through April 30, 2012, VIA contractually agreed to limit the Milestone 2045 Fund expense ratio to 1.10%. The waived amount during the year ended December 31, 2011 was $1,479.
T. Rowe Price Associates, Inc. (“T. Rowe Price”) voluntarily waives a portion of its aggregate subadvisory fees for the Growth & Income and Equity Income Funds. These voluntary fee waivers were first implemented on May 1, 2003. The fee for each fund managed by T. Rowe Price is voluntarily reduced by the following percentages, which are determined based on the total amount of assets managed by T. Rowe Price for the Company: a 2.5% waiver on the first $500 million in total assets provided the total amount of assets managed by T. Rowe Price is between $250 and $500 million and a 5% waiver on total assets above $500 million. For the year ended December 31, 2011, the fee waiver for the Growth & Income Fund totaled $41,831 and the fee waiver for the Equity Income Fund totaled $76,072. Effective October 1, 2008, Tukman Grossman Capital Management, Inc. (“Tukman Grossman”) voluntarily agreed to waive a portion of its subadvisory fee in an amount equal to 0.10% of the average daily market value of the assets managed in the Growth Fund. This waiver totaled $284,214 for the year ended December 31, 2011. Effective October 1, 2010 through February 28, 2011 D.G. Capital Management Trust (“D.G. Capital”) voluntarily agreed to waive its subadvisory fee for assets managed in the Growth Fund so that its fee would not exceed a flat rate of 0.35%. The waiver totaled $55,346 for the year ended December 31, 2011. Effective May 1, 2011, Mellon Capital Management Corporation (“Mellon Capital Management”) agreed to waive a portion of its subadvisory fee through April 30, 2014 so that its fee for the Diversifying Strategies Fund does not exceed 0.325% of the average daily market value of the assets managed in the Diversifying Strategies Fund. This waiver totaled $594,582 for the year ended December 31, 2011. Mondrian Investment Partners Limited (“Mondrian”) voluntarily waived its subadviser fee for the month of July 2011 and the total fee waiver was $158,991 for the International Fund.
| 5. | | Investment Portfolio Transactions |
Purchases and sales of investments, exclusive of short-term securities, for each fund for the year ended December 31, 2011 were as follows:
| | | | | | | | | | | | | | | | |
| | | U.S. Government Obligations | | | Other Securities | |
Fund | | Purchases at Cost | | | Sales Proceeds | | | Purchases at Cost | | | Sales Proceeds | |
Low Duration Bond | | $ | 90,120,608 | | | $ | 95,620,936 | | | $ | 273,537,663 | | | $ | 244,571,381 | |
Inflation Protected Securities | | | 486,698,457 | | | | 486,156,899 | | | | 79,571,227 | | | | 47,801,318 | |
Equity Income | | | — | | | | — | | | | 332,877,252 | | | | 370,068,695 | |
Growth & Income | | | — | | | | — | | | | 475,582,605 | | | | 506,768,415 | |
Growth | | | — | | | | — | | | | 1,286,749,102 | | | | 1,437,573,429 | |
Select Value | | | — | | | | — | | | | 196,084,424 | | | | 214,495,585 | |
Aggressive Opportunities | | | — | | | | — | | | | 568,877,584 | | | | 636,981,637 | |
Discovery | | | 60,180,715 | | | | 50,643,592 | | | | 116,379,782 | | | | 117,936,613 | |
International | | | — | | | | — | | | | 653,174,699 | | | | 596,462,529 | |
Diversifying Strategies | | | 108,729,041 | | | | 101,039,869 | | | | 499,038,591 | | | | 441,113,311 | |
Core Bond Index | | | 264,054,989 | | | | 262,495,503 | | | | 366,197,642 | | | | 382,806,695 | |
500 Stock Index | | | — | | | | — | | | | 13,103,121 | | | | 12,514,921 | |
174
THE VANTAGEPOINT FUNDS
NOTES TO FINANCIAL STATEMENTS — (Continued)
| | | | | | | | | | | | | | | | |
| | | U.S. Government Obligations | | | Other Securities | |
Fund | | Purchases at Cost | | | Sales Proceeds | | | Purchases at Cost | | | Sales Proceeds | |
Broad Market Index | | $ | — | | | $ | — | | | $ | 4,692,685 | | | $ | 44,942,612 | |
Mid/Small Company Index | | | — | | | | — | | | | 93,571,631 | | | | 65,658,788 | |
Overseas Equity Index | | | — | | | | — | | | | 4,652,760 | | | | 4,514,469 | |
Model Portfolio Savings Oriented | | | — | | | | — | | | | 46,744,940 | | | | 95,812,861 | |
Model Portfolio Conservative Growth | | | — | | | | — | | | | 79,622,883 | | | | 102,724,574 | |
Model Portfolio Traditional Growth | | | — | | | | — | | | | 185,825,416 | | | | 273,938,101 | |
Model Portfolio Long-Term Growth | | | — | | | | — | | | | 202,793,016 | | | | 260,031,625 | |
Model Portfolio All-Equity Growth | | | — | | | | — | | | | 63,883,981 | | | | 85,443,498 | |
Milestone Retirement Income | | | — | | | | — | | | | 47,157,193 | | | | 42,715,105 | |
Milestone 2010 | | | — | | | | — | | | | 56,562,126 | | | | 49,363,973 | |
Milestone 2015 | | | — | | | | — | | | | 103,391,063 | | | | 76,652,631 | |
Milestone 2020 | | | — | | | | — | | | | 115,319,832 | | | | 61,151,827 | |
Milestone 2025 | | | — | | | | — | | | | 87,852,128 | | | | 42,495,880 | |
Milestone 2030 | | | — | | | | — | | | | 67,381,552 | | | | 31,638,908 | |
Milestone 2035 | | | — | | | | — | | | | 43,843,429 | | | | 18,650,815 | |
Milestone 2040 | | | — | | | | — | | | | 41,259,974 | | | | 19,276,000 | |
Milestone 2045 | | | — | | | | — | | | | 17,217,125 | | | | 4,097,166 | |
| 6. | | Tax Basis Unrealized Appreciation (Depreciation) |
As of December 31, 2011, net unrealized appreciation (depreciation) on investments was as follows:
| | | | | | | | | | | | | | | | |
Fund | | Federal Income
Tax Cost | | | Gross
Unrealized
Appreciation | | | Gross
Unrealized
Depreciation | | | Tax Basis Net
Unrealized
Appreciation/
(Depreciation) | |
Low Duration Bond | | $ | 548,639,614 | | | $ | 6,033,732 | | | $ | 7,525,331 | | | | $(1,491,599 | ) |
Inflation Protected Securities | | | 552,678,440 | | | | 41,437,743 | | | | 1,569,855 | | | | 39,867,888 | |
Equity Income | | | 1,863,085,647 | | | | 256,853,534 | | | | 196,888,282 | | | | 59,965,252 | |
Growth & Income | | | 1,076,406,413 | | | | 171,659,757 | | | | 66,253,805 | | | | 105,405,952 | |
Growth | | | 1,649,993,326 | | | | 208,253,796 | | | | 74,127,319 | | | | 134,126,477 | |
Select Value | | | 307,943,861 | | | | 34,177,305 | | | | 12,393,285 | | | | 21,784,020 | |
Aggressive Opportunities | | | 1,032,932,008 | | | | 118,408,440 | | | | 113,559,980 | | | | 4,848,460 | |
Discovery | | | 214,487,965 | | | | 14,628,213 | | | | 15,389,074 | | | | (760,861 | ) |
International | | | 1,209,490,564 | | | | 89,564,228 | | | | 121,223,852 | | | | (31,659,624 | ) |
Diversifying Strategies | | | 841,531,946 | | | | 12,292,982 | | | | 11,336,971 | | | | 956,011 | |
Core Bond Index | | | 1,162,986,370 | | | | 63,236,835 | | | | 4,162,159 | | | | 59,074,676 | |
500 Stock Index | | | 279,139,340 | | | | 162,969,176 | | | | 53,498,636 | | | | 109,470,540 | |
Broad Market Index | | | 385,929,130 | | | | 219,020,614 | | | | 88,128,524 | | | | 130,892,090 | |
Mid/Small Company Index | | | 408,814,383 | | | | 87,126,215 | | | | 53,630,191 | | | | 33,496,024 | |
Overseas Equity Index | | | 215,233,671 | | | | 21,440,791 | | | | 55,619,638 | | | | (34,178,847 | ) |
Model Portfolio Savings Oriented | | | 283,002,823 | | | | 5,525,416 | | | | — | | | | 5,525,416 | |
Model Portfolio Conservative Growth | | | 554,738,232 | | | | 9,148,000 | | | | 7,638,798 | | | | 1,509,202 | |
Model Portfolio Traditional Growth | | | 1,397,129,610 | | | | 25,570,430 | | | | 56,427,899 | | | | (30,857,469 | ) |
Model Portfolio Long-Term Growth | | | 1,757,566,273 | | | | 32,047,640 | | | | 77,192,701 | | | | (45,145,061 | ) |
Model Portfolio All-Equity Growth | | | 702,029,485 | | | | 6,266,618 | | | | 58,379,342 | | | | (52,112,724 | ) |
Milestone Retirement Income | | | 223,132,881 | | | | 556,715 | | | | 3,573,141 | | | | (3,016,426 | ) |
Milestone 2010 | | | 224,964,444 | | | | 1,274,368 | | | | 3,913,466 | | | | (2,639,098 | ) |
Milestone 2015 | | | 387,099,577 | | | | — | | | | 5,187,738 | | | | (5,187,738 | ) |
Milestone 2020 | | | 390,598,332 | | | | 1,495,311 | | | | 5,712,488 | | | | (4,217,177 | ) |
Milestone 2025 | | | 304,072,123 | | | | 2,398,937 | | | | 5,144,712 | | | | (2,745,775 | ) |
Milestone 2030 | | | 236,451,826 | | | | 3,786,753 | | | | 3,736,494 | | | | 50,259 | |
175
THE VANTAGEPOINT FUNDS
NOTES TO FINANCIAL STATEMENTS — (Continued)
| | | | | | | | | | | | | | | | |
Fund | | Federal Income
Tax Cost | | | Gross
Unrealized
Appreciation | | | Gross
Unrealized
Depreciation | | | Tax Basis Net
Unrealized
Appreciation/
(Depreciation) | |
Milestone 2035 | | $ | 149,900,173 | | | $ | 3,152,082 | | | $ | 2,533,844 | | | $ | 618,238 | |
Milestone 2040 | | | 140,793,580 | | | | 5,796,825 | | | | 509,039 | | | | 5,287,786 | |
Milestone 2045 | | | 33,388,918 | | | | 430,395 | | | | 344,171 | | | | 86,224 | |
| 7. | | Portfolio Securities Loaned |
Certain funds lend securities to approved borrowers to seek to earn additional income. As of December 31, 2011, certain funds had loaned securities, which were collateralized by cash or other forms of collateral as provided for in the Company’s Securities Lending Agency Agreement with JPMorgan Chase Bank, N.A. at least equal to the market value of the securities loaned. The funds receive dividends and interest on the loaned securities and a portion of interest earned on reinvested collateral. All securities loaned are marked to market daily in U.S. dollars and collateral is received and released accordingly on the following day to achieve the required collateralization for the previous day’s market value. The fund may terminate a loan at any time and generally expects to receive the securities loaned within the normal settlement period for the security involved. As with other extensions of credit, there are risks of delay in recovery or even loss of rights in collateral in the event of default or insolvency of the borrower. The fund may not retain voting rights on securities while they are on loan. Voting rights on the loaned securities may pass to the borrower. The funds, however, are entitled to terminate or recall the loans to vote proxies or otherwise obtain rights to vote or consent with respect to a material event.
The funds will be indemnified by its custodian for securities lending programs conducted through the custodian if, at the time of a default by a borrower, some or all of the loaned securities have not been returned by the borrower. The custodian, as soon as practicable after the time of default, shall deposit in the funds’ accounts securities of the same number, issue, type, class and series of the unreturned loaned securities. If the custodian is unable to purchase replacement securities, it will credit to the funds’ accounts an amount equal to the market value of the unreturned loaned securities. For purposes of calculating the amount of credit to a fund’s account, the market value of U.S. securities will be determined as of the date on which the custodian posts the credit to the fund and the market value of the U.S. securities may be more or less than it was on the date the securities were due to be returned to the fund. For non-U.S. securities, the market value of the securities to be credited to a fund is determined as of the date the securities were due to be returned to the fund.
The market value of the securities on loan and the value of the related collateral as of December 31, 2011, were as follows:
| | | | | | | | | | | | |
Fund | | Securities on
Loan | | | Collateral | | | Collateralization | |
Low Duration Bond | | $ | 25,619,130 | | | $ | 26,135,756 | | | | 102 | % |
Inflation Protected Securities | | | 12,756,491 | | | | 12,985,716 | | | | 102 | % |
Equity Income | | | 105,050,315 | | | | 106,321,976 | | | | 101 | % |
Growth & Income | | | 18,975,438 | | | | 19,398,507 | | | | 102 | % |
Growth | | | 30,726,352 | | | | 31,704,220 | | | | 103 | % |
Select Value | | | 9,307,327 | | | | 9,537,261 | | | | 102 | % |
Aggressive Opportunities | | | 73,139,684 | | | | 77,024,271 | | | | 105 | % |
Discovery | | | 16,788,326 | | | | 17,935,954 | | | | 107 | % |
International | | | 41,512,238 | | | | 42,926,698 | | | | 103 | % |
Core Bond Index | | | 65,318,202 | | | | 67,598,878 | | | | 103 | % |
500 Stock Index | | | 7,883,342 | | | | 8,219,745 | | | | 104 | % |
Broad Market Index | | | 13,383,315 | | | | 13,848,786 | | | | 103 | % |
Mid/Small Company Index | | | 32,423,689 | | | | 33,680,955 | | | | 104 | % |
Overseas Equity Index | | | 6,316,643 | | | | 6,602,718 | | | | 105 | % |
176
THE VANTAGEPOINT FUNDS
NOTES TO FINANCIAL STATEMENTS — (Continued)
| 8. | | Transactions with Affiliated Funds |
As of December 31, 2011, the Model Portfolio Funds and Milestone Funds held investments in a number of the underlying funds. The figures presented below represent the percentages of shares outstanding in each of the underlying funds owned by the Model Portfolio and Milestone Funds on that date:
| | | | | | | | | | | | | | | | | | | | |
Underlying Fund | | Model Portfolio
Savings
Oriented | | | Model Portfolio
Conservative
Growth | | | Model Portfolio
Traditional
Growth | | | Model Portfolio
Long-Term
Growth | | | Model Portfolio
All-Equity
Growth | |
Low Duration Bond | | | 17.01 | % | | | 20.00 | % | | | 20.62 | % | | | — | | | | — | |
Inflation Protected Securities | | | 7.37 | % | | | 9.47 | % | | | 9.29 | % | | | — | | | | — | |
Equity Income | | | 1.60 | % | | | 3.43 | % | | | 9.19 | % | | | 12.47 | % | | | 6.51 | % |
Growth & Income | | | 2.50 | % | | | 4.35 | % | | | 14.26 | % | | | 19.35 | % | | | 9.55 | % |
Growth | | | — | | | | 1.90 | % | | | 7.77 | % | | | 11.17 | % | | | 6.27 | % |
Select Value | | | — | | | | 5.28 | % | | | 23.84 | % | | | 46.06 | % | | | 19.40 | % |
Aggressive Opportunities | | | — | | | | 1.76 | % | | | 7.84 | % | | | 15.20 | % | | | 6.44 | % |
Discovery | | | — | | | | — | | | | 21.60 | % | | | 40.57 | % | | | 30.56 | % |
International | | | 1.26 | % | | | 3.87 | % | | | 14.14 | % | | | 23.57 | % | | | 11.23 | % |
Core Bond Index Class I | | | 3.20 | % | | | 8.20 | % | | | 21.77 | % | | | 27.23 | % | | | — | |
Diversifying Strategies | | | 6.79 | % | | | 12.39 | % | | | 23.97 | % | | | 23.97 | % | | | — | |
| | | | | | | | | | | | | | | | | | | | |
Underlying Fund | | Milestone
Retirement
Income | | | Milestone
2010 | | | Milestone
2015 | | | Milestone
2020 | | | Milestone
2025 | |
Low Duration Bond | | | 12.99 | % | | | 6.40 | % | | | 7.79 | % | | | 5.05 | % | | | 1.69 | % |
Inflation Protected Securities | | | 5.63 | % | | | 5.69 | % | | | 5.88 | % | | | 0.99 | % | | | — | |
Equity Income | | | 1.22 | % | | | 2.26 | % | | | 4.05 | % | | | 4.53 | % | | | 3.82 | % |
Growth & Income | | | 1.90 | % | | | 2.11 | % | | | 3.64 | % | | | 3.85 | % | | | 3.35 | % |
Growth | | | — | | | | 0.90 | % | | | 1.63 | % | | | 1.81 | % | | | 1.59 | % |
International | | | 0.97 | % | | | 1.78 | % | | | 3.57 | % | | | 4.20 | % | | | 3.76 | % |
Core Bond Index Class I | | | 2.44 | % | | | 1.77 | % | | | 4.67 | % | | | 6.72 | % | | | 4.98 | % |
Mid/Small Company Index Class I | | | — | | | | — | | | | 8.36 | % | | | 13.67 | % | | | 13.69 | % |
Diversifying Strategies | | | 5.18 | % | | | 4.64 | % | | | 7.39 | % | | | 6.91 | % | | | 4.60 | % |
| | | | | |
Underlying Fund | | Milestone
2030 | | | Milestone
2035 | | | Milestone
2040 | | | Milestone
2045 | | | | |
Low Duration Bond | | | 0.59 | % | | | 0.06 | % | | | — | | | | — | | | | | |
Equity Income | | | 3.18 | % | | | 2.13 | % | | | 2.19 | % | | | 0.50 | % | | | | |
Growth & Income | | | 2.87 | % | | | 1.93 | % | | | 1.99 | % | | | 0.46 | % | | | | |
Growth | | | 1.40 | % | | | 1.01 | % | | | 1.04 | % | | | 0.24 | % | | | | |
International | | | 3.30 | % | | | 2.33 | % | | | 2.41 | % | | | 0.56 | % | | | | |
Core Bond Index Class I | | | 2.66 | % | | | 1.05 | % | | | 0.90 | % | | | 0.21 | % | | | | |
Mid/Small Company Index Class I | | | 13.58 | % | | | 10.99 | % | | | 11.66 | % | | | 2.70 | % | | | | |
Diversifying Strategies | | | 2.92 | % | | | 1.06 | % | | | 0.17 | % | | | — | | | | | |
| 9. | | Control Persons and Principal Holders of Securities |
A majority of the voting shares of each Fund are held either directly, or indirectly through the Model Portfolio Funds and the Milestone Funds, by VantageTrust, a group trust sponsored and maintained by VantageTrust Company (“Trust Company”), 777 N. Capitol N.E. Street, Washington, DC 20002. VantageTrust was established for the purpose of holding and investing the assets of public sector retirement and deferred compensation plans. The Trust Company, a New Hampshire non-depository banking corporation, has the power to vote the shares of the Funds directly held by VantageTrust and has the power to direct the vote of the shares of the underlying Funds held by the Model Portfolio Funds and the Milestone Funds under the proxy voting policy adopted by VIA and is therefore considered a “control” person of the Funds for purposes of the 1940 Act. Both the Trust Company and VIA are
177
THE VANTAGEPOINT FUNDS
NOTES TO FINANCIAL STATEMENTS — (Continued)
wholly owned subsidiaries of ICMA-RC. As a control person of each Fund, the Trust Company may possess the ability to control the outcome of matters submitted to the vote of shareholders. The following represents the percentage of shares outstanding in each of the Funds held, directly or indirectly, by VantageTrust as of a December 31, 2011:
| | | | |
Fund | | % Owned by
VantageTrust | |
Low Duration Bond | | | 78.04 | % |
Inflation Protected Securities | | | 85.79 | % |
Equity Income | | | 90.71 | % |
Growth & Income | | | 90.12 | % |
Growth | | | 95.31 | % |
Select Value | | | 93.41 | % |
Aggressive Opportunities | | | 95.79 | % |
Discovery | | | 62.95 | % |
International | | | 91.24 | % |
Diversifying Strategies | | | 88.44 | % |
Core Bond Index Class I | | | 88.27 | % |
Core Bond Index Class II | | | 89.64 | % |
500 Stock Index Class I | | | 82.96 | % |
500 Stock Index Class II | | | 99.86 | % |
Broad Market Index Class I | | | 83.13 | % |
Broad Market Index Class II | | | 98.23 | % |
Mid/Small Company Index Class I | | | 81.41 | % |
Mid/Small Company Index Class II | | | 98.85 | % |
Overseas Equity Index Class I | | | 83.35 | % |
Overseas Equity Index Class II | | | 98.99 | % |
Model Portfolio Savings Oriented | | | 81.20 | % |
Model Portfolio Conservative Growth | | | 88.15 | % |
Model Portfolio Traditional Growth | | | 94.04 | % |
Model Portfolio Long-Term Growth | | | 95.78 | % |
Model Portfolio All-Equity Growth | | | 90.76 | % |
Milestone Retirement Income | | | 76.14 | % |
Milestone 2010 | | | 74.44 | % |
Milestone 2015 | | | 80.78 | % |
Milestone 2020 | | | 83.60 | % |
Milestone 2025 | | | 84.51 | % |
Milestone 2030 | | | 84.35 | % |
Milestone 2035 | | | 81.57 | % |
Milestone 2040 | | | 83.44 | % |
Milestone 2045 | | | 67.91 | % |
178
THE VANTAGEPOINT FUNDS
NOTES TO FINANCIAL STATEMENTS — (Continued)
| 10. | | Rebates of Brokerage Commissions |
VIA has entered into agreements with brokers whereby the brokers will rebate a portion of the funds’ brokerage commissions on behalf of certain funds. Such amounts, under such agreements, are included in net realized gain (loss) on the sale of investments presented in the Statements of Operations. For the year ended December 31, 2011, the funds recaptured the following amounts of brokerage commissions:
| | | | |
Fund | | Recaptured Brokerage
Commissions | |
Equity Income | | $ | 41,875 | |
Growth & Income | | | 49,339 | |
Growth | | | 312,818 | |
Select Value | | | 82,634 | |
Aggressive Opportunities | | | 232,152 | |
Discovery | | | 12,976 | |
International | | | 204,591 | |
Management has evaluated events or transactions that may have occurred since December 31, 2011, that would merit recognition or disclosure in the financial statements. Subsequent events occurring after the date of this report have been evaluated for potential impact to this report through the date the financial statements were issued. There were no subsequent events that required disclosure.
| 12. | | Capital Stock Authorization |
The Company’s Amended Declaration of Trust permits it to issue an unlimited number of full and fractional shares of beneficial interest of each fund, without par value, and to divide or combine the shares of any series into a greater or lesser number of shares of that fund without thereby changing the proportionate beneficial interests in that fund and to divide such shares into classes. Each share of a class of a fund represents an equal proportional interest in the fund with each other share in the same class.
179
THE VANTAGEPOINT FUNDS
Additional Information (Unaudited)
For corporate shareholders, a portion of the ordinary dividends paid during the fund’s year ended December 31, 2011, qualified for the dividends received deduction as follows:
| | | | |
Fund | | Corporate Dividend
Received Deduction | |
Equity Income | | | 74.51 | % |
Growth & Income | | | 100.00 | % |
Growth Fund | | | 100.00 | % |
Select Value | | | 100.00 | % |
Aggressive Opportunities | | | 32.96 | % |
Discovery | | | 29.82 | % |
International | | | 0.19 | % |
Diversifying Strategies | | | 28.89 | % |
500 Stock Index | | | 100.00 | % |
Broad Market Index | | | 100.00 | % |
Mid/Small Company Index | | | 43.92 | % |
Overseas Equity Index | | | 0.04 | % |
Model Portfolio Savings Oriented | | | 15.56 | % |
Model Portfolio Conservative | | | 22.00 | % |
Model Portfolio Traditional Growth | | | 24.18 | % |
Model Portfolio Long-Term Growth | | | 32.24 | % |
Model Portfolio All-Equity Growth | | | 53.57 | % |
Milestone Retirement Income | | | 16.79 | % |
Milestone 2010 | | | 25.99 | % |
Milestone 2015 | | | 28.50 | % |
Milestone 2020 | | | 36.61 | % |
Milestone 2025 | | | 41.35 | % |
Milestone 2030 | | | 46.52 | % |
Milestone 2035 | | | 50.77 | % |
Milestone 2040 | | | 50.65 | % |
Milestone 2045 | | | 47.37 | % |
Pursuant to Section 852 of the Internal Revenue Code, the Company designated the following capital gain dividends for the year ended December 31, 2011:
| | | | |
Fund | | Long Term
Capital Gain
Dividend | |
Inflation Protected Securities | | $ | 7,954,674 | |
Equity Income | | | 32,862,295 | |
Aggressive Opportunities | | | 63,629,518 | |
Diversifying Strategies | | | 11,386,188 | |
Mid/Small Company Index | | | 14,883,091 | |
Model Traditional Growth | | | 3,332,490 | |
Model Long-Term Growth Fund | | | 22,158,134 | |
Milestone Retirement Income | | | 4,193,183 | |
Milestone 2010 | | | 1,721,112 | |
Milestone 2015 | | | 2,136,550 | |
Milestone 2020 | | | 1,368,890 | |
Milestone 2025 | | | 1,252,114 | |
Milestone 2030 | | | 545,351 | |
Milestone 2035 | | | 428,966 | |
Milestone 2045 | | | 301,785 | |
180
THE VANTAGEPOINT FUNDS
Additional Information (Unaudited) — (Continued)
For the year ended December 31, 2011, dividends from foreign countries and taxes paid to foreign countries that qualify for foreign tax credit are as follows:
| | | | | | | | |
Fund | | Net Foreign
Source Income | | | Foreign
Tax Credit | |
International | | $ | 36,844,404 | | | $ | 3,543,445 | |
Overseas Equity Index | | | 6,641,650 | | | | 217,512 | |
Model Portfolio Savings Oriented | | | 465,634 | | | | 44,781 | |
Model Portfolio Conservative Growth | | | 1,421,375 | | | | 136,698 | |
Model Portfolio Traditional Growth | | | 5,219,580 | | | | 501,983 | |
Model Portfolio Long-Term Growth | | | 8,686,236 | | | | 835,383 | |
Model Portfolio All-Equity Growth | | | 4,144,702 | | | | 398,609 | |
Milestone Retirement Income | | | 352,319 | | | | 33,884 | |
Milestone 2010 | | | 660,245 | | | | 63,498 | |
Milestone 2015 | | | 1,309,833 | | | | 125,971 | |
Milestone 2020 | | | 1,538,279 | | | | 147,941 | |
Milestone 2025 | | | 1,372,047 | | | | 131,954 | |
Milestone 2030 | | | 1,206,323 | | | | 116,016 | |
Milestone 2035 | | | 846,591 | | | | 81,419 | |
Milestone 2040 | | | 876,030 | | | | 84,251 | |
Milestone 2045 | | | 203,937 | | | | 19,613 | |
All other funds treat foreign taxes paid as a reduction of net investment company taxable income by these amounts.
The following table summarizes the percentage of income received by the Company in 2011 from various obligors:
| | | | | | | | | | | | | | | | | | | | | | | | |
Fund | | U.S. Treasury
Obligations | | | GNMA | | | FNMA | | | FHL Bank | | | FHLMC | | | Other U.S.
Government
Agency | |
Low Duration Bond | | | 2.23 | % | | | 0.26 | % | | | 2.07 | % | | | 0.00 | % | | | 0.42 | % | | | 0.30 | % |
Inflation Protected Securities | | | 79.97 | % | | | 0.00 | % | | | 0.03 | % | | | 0.00 | % | | | 0.00 | % | | | 1.31 | % |
Discovery | | | 2.07 | % | | | 0.29 | % | | | 1.62 | % | | | 1.77 | % | | | 0.57 | % | | | 0.29 | % |
Diversifying Strategies | | | 11.08 | % | | | 0.33 | % | | | 12.20 | % | | | 1.45 | % | | | 7.63 | % | | | 1.69 | % |
Core Bond Index | | | 23.50 | % | | | 7.53 | % | | | 19.09 | % | | | 1.19 | % | | | 13.01 | % | | | 0.34 | % |
500 Stock Index | | | 0.01 | % | | | 0.00 | % | | | 0.00 | % | | | 0.00 | % | | | 0.00 | % | | | 0.00 | % |
Broad Market Index | | | 0.00 | % | | | 0.00 | % | | | 0.00 | % | | | 0.00 | % | | | 0.00 | % | | | 0.00 | % |
Mid/Small Company Index | | | 0.00 | % | | | 0.00 | % | | | 0.00 | % | | | 0.00 | % | | | 0.00 | % | | | 0.00 | % |
Overseas Equity Index | | | 0.00 | % | | | 0.00 | % | | | 0.00 | % | | | 0.00 | % | | | 0.00 | % | | | 0.00 | % |
181
THE VANTAGEPOINT FUNDS
Additional Information (Unaudited) — (Continued)
| D. | | Qualified Dividend Income |
The following are estimates of qualified dividend income received by the Company through December 31, 2011 that qualify for a reduced tax rate pursuant to the Jobs and Growth Tax Relief Reconciliation Act of 2003 as extended by the Tax Relief, Unemployment Insurance Reauthorization, and Job Creation Act of 2010:
| | | | |
Fund | | Qualified
Dividend Income | |
Equity Income | | | 83.43 | % |
Growth & Income | | | 100.00 | % |
Growth | | | 100.00 | % |
Select Value | | | 100.00 | % |
Aggressive Opportunities | | | 41.76 | % |
Discovery | | | 36.09 | % |
International | | | 75.31 | % |
Diversifying Strategies | | | 51.66 | % |
500 Stock Index | | | 100.00 | % |
Broad Market Index | | | 100.00 | % |
Mid/Small Company Index | | | 46.46 | % |
Overseas Equity Index | | | 68.04 | % |
Model Portfolio Savings Oriented | | | 21.79 | % |
Model Portfolio Conservative | | | 32.32 | % |
Model Portfolio Traditional Growth | | | 36.57 | % |
Model Portfolio Long-Term Growth | | | 50.54 | % |
Model Portfolio All-Equity Growth | | | 82.56 | % |
Milestone Retirement Income | | | 23.55 | % |
Milestone 2010 | | | 37.19 | % |
Milestone 2015 | | | 41.23 | % |
Milestone 2020 | | | 53.38 | % |
Milestone 2025 | | | 60.68 | % |
Milestone 2030 | | | 68.59 | % |
Milestone 2035 | | | 75.09 | % |
Milestone 2040 | | | 74.81 | % |
Milestone 2045 | | | 70.13 | % |
182
THE VANTAGEPOINT FUNDS
Additional Information (Unaudited) — (Continued)
Independent Directors
| | | | | | | | |
Name, Address,*
and Age | | Positions
Held with
the Company | | Term of Office
and Length of
Time Served | | Principal Occupation(s)
During Past Five Years | | Other
Directorships
Held By Director |
| N. Anthony Calhoun (64) | | Director, Audit Committee Member and Chair, Investment Committee and Nominating Committee Member | | Term expires October 2013 Director since November 1998 | | Independent Consultant (financial) (April 2009–present); Executive Deputy State Treasurer—Commonwealth of Pennsylvania (August 2007–March 2009); Secretary to Senate Finance Committee/Minority—State of New York Legislature (January 2007–August 2007); Retired (October 2005–January 2007); and Deputy Chief Financial Officer and Treasurer—District of Columbia (2001–2005) | | N/A |
Donna K. Gilding (72) | | Director, Investment Committee Member and Chair, and Nominating Committee Member | | Term expires October 2013 Director since November 1998 | | Chief Investment Officer—Lowenhaupt Global Advisors, LLC (Sept. 2006–present); Chief Investment Officer—Lowenhaupt & Chasnoff (2005–Sept. 2006) (wealth management law firm); and Chief Investment Officer—Progress Investment Management Company (2000–2005) | | N/A |
Arthur R. Lynch (57) | | Director, Audit Committee Member, Investment Committee Member, and Nominating Committee Member | | Term expires October 2013 Director since November 1998 | | President and Chief Executive Officer - SRJ Government Consultants, LLC (October 2009–present); Deputy City Manager—City of Glendale, Arizona (2005–October 2009); Chief Financial Officer—City of Glendale, Arizona (1985–2005) | | N/A |
| Timothy M. O’Brien (62) | | Director, Audit Committee Member, Investment Committee Member, and Nominating Committee Member | | Term expires October 2014 Director since September 2005 | | Independent Consultant (pension consulting) (2003–present); Board Member and Chair of Audit Committee—Colorado Public Employees Retirement Association (July 2011–present) President and Chief Executive Officer—American Humane Association (1999–2003) | | N/A |
| Robin L. Wiessmann (58) | | Chair of the Board, Director, Investment Committee Member, and Nominating Committee Member | | Term expires October 2013 Director since November 1998 | | State Treasurer—Commonwealth of Pennsylvania (April 2007–January 2009); Director—Merrill, Lynch, Pierce, Fenner & Smith Incorporated, (2006– April 2007); and Consultant—Brown Wiessmann Group (financial services consulting) (2002–2006) | | Director—Met-Pro Corporation (December 2009–present) |
| George M. Chamberlain, Jr. (64) | | Director, Investment Committee and Nominating Committee Member | | Term expires October 2014 Director since January 2012 | | Vice President, Legal Affairs—SCM Advantage LLC (supply chain consulting) (October 2009–present); Principal—GMC Consulting (corporate consulting) (May 1999–present); Vice President and General Counsel—Citco Mutual Fund Services, Inc. (November 2004–April 2007); Board member—Alzheimer’s Association Delaware Valley Chapter (January 2008–present); Board member—Trapp Family Housing Cooperative (non-profit) (April 2008–present); Board member and Vice Chair—Walnut Street Theater (January 2000–June 2010) | | N/A |
183
THE VANTAGEPOINT FUNDS
Additional Information (Unaudited) — (Continued)
Interested Director and Officers
| | | | | | | | |
Name, Address,*
and Age | | Positions
Held with
the Company | | Term of Office
and Length of
Time Served | | Principal Occupation(s)
During Past Five Years | | Other
Directorships
Held By Director |
| David R. Mora (66)** | | Director | | Term expires October 2012 Director since November 2011 | | Board member (January 2005–present) and Chair of the Board of Directors (January 2010–present)—ICMA Retirement Corporation; West Coast Regional Director—International City County Management Association (February 2009–April 2011); City Manager—City of Salinas, CA (September 1990–September 2008); Board member—Public Entity Risk Institute (non-profit) (January 2000–December 2008) | | N/A |
| Joan W. McCallen (59)** | | President and Principal Executive Officer | | Since September 2003 | | Chief Executive Officer—ICMA Retirement Corporation (Aug. 2003–present); President and Manager—Vantagepoint Investment Advisers, LLC; ICMA-RC Services, LLC (broker-dealer); President and Manager—Vantagepoint Transfer Agents, LLC (2003–present); and Director and President, VantageTrust Company, LLC (2003–present) | | N/A |
| Bruce James Rohrbacher (59)** | | Vice President and Chief Compliance Officer | | Since September 2004 | | Senior Vice President and Chief Compliance Officer—ICMA Retirement Corporation (2004–present); Senior Vice President and Chief Compliance Officer, Vantagepoint Investment Advisers, LLC (2004–present); Chief Compliance Officer, ICMA-RC Services, LLC (broker-dealer) (2004–present); and Chief Compliance Officer VantageTrust Company, LLC (2004–present) | | N/A |
| Elizabeth S. Glista (47)** | | Treasurer and Principal Financial Officer | | Since March 2009 | | Senior Vice President and Chief Financial Officer—ICMA Retirement Corporation (April 2009–present); Treasurer—Vantagepoint Investment Advisers, LLC, and Vantagepoint Transfer Agents, LLC (April 2009–present); Treasurer—ICMA-RC Services, LLC (broker-dealer) (April 2009–present); Treasurer—VantageTrust Company, LLC (April 2009–present); Managing Vice President, Financial Operations, Analysis & Treasury—ICMA Retirement Corporation (January 2009–April 2009); Vice President Financial Planning & Analysis and Treasury—ICMA-RC (January 2000–September 2007) and (March 2008–January 2009); Acting Vice President, Internal Audit—ICMA-RC (September 2007–March 2008) | | N/A |
184
THE VANTAGEPOINT FUNDS
Additional Information (Unaudited) — (Continued)
| | | | | | | | |
Name, Address,*
and Age | | Positions
Held with
the Company | | Term of Office
and Length of
Time Served | | Principal Occupation(s)
During Past Five Years | | Other
Directorships
Held By Director |
| Angela C. Montez (44)** | | Secretary | | Since December 2006 | | Managing Vice President, Deputy General Counsel and Assistant Secretary—ICMA Retirement Corporation (2006–present) Corporate Counsel—ICMA Retirement Corporation (2000–2006); Secretary—Vantagepoint Investment Advisers, LLC, Vantagepoint Transfer Agents, LLC and ICMA-RC Services, LLC (broker-dealer) (2006–2007); and Assistant Secretary—VantageTrust Company, LLC (February 2008–present) | | N/A |
Kathryn B. McGrath (67)** | | Assistant Secretary | | Since March 2008 | | Senior Vice President and General Counsel—ICMA Retirement Corporation (October 2007–present); Secretary—Vantagepoint Investment Advisers, LLC, Vantagepoint Transfer Agents, LLC and ICMA-RC Services, LLC (broker-dealer) (December 2007–present); Secretary—VantageTrust Company, LLC (February 2008–present); and Partner—Mayer Brown LLP (law firm) (2005–October 2007) | | N/A |
| | * | The business address for each Director and Officer is 777 N. Capitol Street N.E., Washington, D.C. 20002. |
| | ** | Mr. Mora is considered an Interested Director because he is a director of ICMA Retirement Corporation, the parent corporation of VIA and ICMA-RC Services. Mses. McCallen, Glista, Montez, and McGrath and Mr. Rohrbacher are considered to be “interested persons” of the Company, as that term is defined under the 1940 Act, due to their positions as officers of the following entities: VIA; ICMA-RC Services, the distributor of the Company; ICMA Retirement Corporation, the parent company of VIA and ICMA-RC Services; and VantageTrust Company. |
Aggregate compensation that was paid to the directors during the fiscal year ended December 31, 2011 totaled $111,195. Executive officers do not receive any compensation from the Company. However, the Company pays a portion of the compensation of the Chief Compliance Officer of the Company. The amount paid by the Company during the year ended December 31, 2011 totaled $249,110.
The Statement of Additional Information includes additional information about the Company’s Board and is available, without charge, upon request, by calling 1-800-669-7400 and on ICMA-RC’s website at www.icmarc.org.
Presented below are the fees paid by each fund to subadvisers during the year ended December 31, 2011. Fees are shown as an annual percentage of average net assets under management except that the subadvisory fees for Analytic Investors, LLC and Mellon Capital Management Corporation for the Diversifying Strategies Fund are calculated based on the average net asset value of the assets allocated and assigned to each of them by VIA. The total dollars below represent amounts paid to subadvisers for services performed during the period October 1, 2010 through September 30, 2011.
| | | | | | | | | | |
Fund | | Subadviser | | Actual Fee
as a Percentage of
Average Daily
Net Assets (net of any
subadviser fee waivers) | | | Dollars Paid | |
| Low Duration Bond | | Payden & Rygel | | | 0.10% | | | $ | 257,253 | |
| | STW Fixed Income Management LLC | | | 0.19% | | | | 491,982 | |
| | | |
| Inflation Protected Securities | | Pacific Investment Management Company, LLC | | | 0.20% | | | | 492,808 | |
| | BlackRock Financial Management, Inc. | | | 0.10% | | | | 190,117 | |
185
THE VANTAGEPOINT FUNDS
Additional Information (Unaudited) — (Continued)
| | | | | | | | | | |
Fund | | Subadviser | | Actual Fee
as a Percentage of
Average Daily
Net Assets (net of any
subadviser fee waivers) | | | Dollars Paid | |
| Equity Income | | Barrow, Hanley, Mewhinney & Strauss, LLC 1 | | | 0.22% | | | $ | 1,374,904 | |
| | T. Rowe Price Associates, Inc. 1 | | | 0.33% | | | | 2,091,992 | |
| | Southeastern Asset Management, Inc. | | | 0.52% | | | | 3,231,145 | |
| | | |
| Growth & Income | | Fiduciary Management, Inc. | | | 0.29% | | | | 1,199,831 | |
| | T. Rowe Price Associates, Inc. | | | 0.38% | | | | 1,120,140 | |
| | Wellington Management Company, LLP | | | 0.27% | | | | 1,332.280 | |
| | | |
| Growth | | Columbus Circle Investors | | | 0.33% | | | | 1,721,324 | |
| | D.G. Capital Management Trust 2,3 | | | 0.35% | | | | 780,250 | |
| | Legg Mason Capital Management, LLC 3 | | | 0.32% | | | | 929,842 | |
| | Tukman Grossman Capital Management, Inc. 3 | | | 0.40% | | | | 1,153,699 | |
| | Westfield Capital Management Company, L.P. | | | 0.33% | | | | 1,847,948 | |
| | | |
| Select Value | | Artisan Partners Limited Partnership | | | 0.55% | | | | 607,136 | |
| | WEDGE Capital Management LLP | | | 0.53% | | | | 591,268 | |
| | Systematic Financial Management, L.P. | | | 0.42% | | | | 467,513 | |
| | | |
| Aggressive Opportunities | | Legg Mason Capital Management, LLC | | | 0.32% | | | | 1,054,313 | |
| | Southeastern Asset Management, Inc. | | | 0.56% | | | | 1,225,264 | |
| | TimesSquare Capital Management, LLC | | | 0.50% | | | | 1,649,080 | |
| | Wellington Management Company, LLP | | | 0.41% | | | | 890,948 | |
| | | |
| Discovery | | Payden & Rygel | | | 0.15% | | | | 154,512 | |
| | Wellington Management Company, LLP | | | 0.73% | | | | 745,155 | |
| | | |
| International | | Artisan Partners Limited Partnership | | | 0.65% | | | | 1,353,026 | |
| | GlobeFlex Capital, LP | | | 0.40% | | | | 1,439,971 | |
| | Mondrian Investment Partners Limited | | | 0.43% | | | | 1,812,385 | |
| | Walter Scott & Partners Limited | | | 0.55% | | | | 1,147,143 | |
| | | |
| Diversifying Strategies | | Analytic Investors, LLC 4 | | | 0.45% | | | | 545,605 | |
| | Calamos Advisors LLC | | | 0.54% | | | | 631,457 | |
| | Mellon Capital Management Corporation 5 | | | 0.46% | | | | 991,247 | |
| | Payden & Rygel (Enhanced Cash Strategy) | | | 0.10% | | | | 256,724 | |
| | Payden & Rygel (Low Duration Strategy) | | | 0.10% | | | | 290,146 | |
| | Shenkman Capital Management, Inc. | | | 0.39% | | | | 441,381 | |
| | | |
| Core Bond Index | | Mellon Capital Management Corporation | | | 0.02% | | | | 235,504 | |
| | | |
| 500 Stock Index | | Mellon Capital Management Corporation | | | 0.02% | | | | 77,564 | |
| | | |
| Broad Market Index | | Mellon Capital Management Corporation | | | 0.02% | | | | 119,039 | |
| | | |
| Mid/Small Company Index | | Mellon Capital Management Corporation | | | 0.03% | | | | 126,496 | |
| | | |
| Overseas Equity Index | | Mellon Capital Management Corporation | | | 0.07% | | | | 142,635 | |
| | (1) | Effective May 1, 2011, the fee schedules charged by Barrow, Hanley, Mewhinney & Strauss, LLC and T. Rowe Price & Associates, Inc. were amended and the percentages shown above represent a blended rate of the previous fee schedules and the new fee schedules. |
| | (2) | Effective March 1, 2011, D.G. Capital Management Trust amended its fee schedule to a flat 0.35%. |
| | (3) | On December 13, 2011, the Board approved the termination of D.G. Capital Management Trust, Legg Mason Capital Management, LLC and Tukman Grossman Capital Management, Inc. |
186
THE VANTAGEPOINT FUNDS
Additional Information (Unaudited) — (Continued)
| | (4) | On June 17, 2011, the Board approved the termination of Analytic Investors, LLC. |
| | (5) | Effective May 1, 2011, Mellon Capital Management Corporation has contractually agreed to waive a portion of its subadvisory fee through April 30, 2014. |
| G. | | Directors’ Considerations of Investment Advisory and Subadvisory Agreements |
The following relates to the consideration by the Board of Directors of the Company (“Directors” or “Board”), during the period beginning July 1, 2011 through December 31, 2011, of the approval of certain Investment Subadvisory Agreements (“Subadvisory Agreement” or “Subadvisory Agreements”) for the International and Growth Funds.
Directors’ Consideration of Subadvisory Agreements
Vantagepoint International Fund
At a meeting held on July 1, 2011 (“July Meeting”), the Board of the Company, including a majority of the Directors who are not “interested persons” (“Independent Directors”) as defined in the 1940 Act, approved a new subadvisory agreement (“Mondrian Subadvisory Agreement”) with Mondrian Investment Partners Limited (“Mondrian”), one of the subadvisers of the International Fund. On July 12, 2011, a group of private equity funds controlled by Hellman & Friedman LLC sold a minority interest in Mondrian to the management of Mondrian (“Buyout”). Upon completion of the Buyout, Mondrian became 100% owned by its employees. The Buyout resulted in a “change of control” of Mondrian under applicable provisions of the 1940 Act. The 1940 Act provides that a “change of control” of a fund’s adviser or subadviser results in an “assignment,” and a consequent automatic termination, of the investment advisory agreement between the fund and the adviser or subadviser, as the case may be. Accordingly, as a result of the Buyout, the prior investment subadvisory agreement dated October 12, 2009, among VIA, the Company and Mondrian (“Prior Subadvisory Agreement”) terminated on July 12, 2011. At the July Meeting, in anticipation of the Buyout and consequent immediate termination of the Prior Subadvisory Agreement, the Board, including a majority of the Independent Directors, approved the Mondrian Subadvisory Agreement, with terms substantially similar to the terms of the Prior Subadvisory Agreement. Before approving the Mondrian Subadvisory Agreement, the Board considered the recommendations of, and supporting analyses and data presented by, VIA.
With respect to the Board’s consideration of the Mondrian Subadvisory Agreement, the Directors received written information in advance of the July Meeting from VIA, which included: (1) the conclusions reached by VIA as a result of the due diligence it conducted relating to the Buyout; (2) the nature, extent and quality of services that Mondrian currently provides, and would continue to provide, to the International Fund; (3) Mondrian’s experience, investment management business, personnel and operations; (4) Mondrian’s brokerage and trading policies and practices; (5) the level of the subadvisory fee to be charged to the International Fund by Mondrian and a comparison of that fee to the: (a) fees charged by Mondrian for managing other foreign large-cap value equity accounts; and (b) fees charged by a group of U.S. investment managers utilizing a non-U.S. diversified value mandate; (6) Mondrian’s compliance program; (7) Mondrian’s investment performance as a subadviser to the International Fund as compared to relevant benchmarks; and (8) Mondrian’s financial condition, including its anticipated financial condition after the Buyout.
In considering the information and materials described above, the Independent Directors received assistance from their independent legal counsel and were provided with a written description of their statutory responsibilities and the legal standards that are applicable to approvals of advisory agreements.
In determining whether to approve the Mondrian Subadvisory Agreement, the Directors considered the information received in advance of the July Meeting, the presentations made by, and discussions held with, the personnel of VIA and Mondrian, as well as a variety of factors. Although not meant to be all-inclusive, the following discusses some of the factors relevant to the Board’s decision to approve the Mondrian Subadvisory Agreement.
Nature, Extent and Quality of Services. With respect to the nature, extent and quality of services to be provided by Mondrian to the International Fund following the Buyout, the Directors considered Mondrian’s investment management process in managing the International Fund’s assets allocated to it, including the experience and capability of Mondrian’s management and other personnel responsible for the portfolio management of the International Fund. The Directors also considered VIA’s assessment that it does not anticipate the Buyout to result in
187
THE VANTAGEPOINT FUNDS
Additional Information (Unaudited) — (Continued)
significant changes in Mondrian’s investment philosophy, process or team. In addition, the Directors considered Mondrian’s representations that it does not plan to make any changes in its key personnel, day-to-day operations or compliance policies and procedures as a result of the Buyout and that Mondrian intends to continue managing the International Fund in the same manner as it currently does. The Directors considered Mondrian’s representations that it does not expect the nature, quality or scope of services to be provided to the International Fund to be impacted as a result of the Buyout and that there would be no changes to the fee charged by Mondrian to the International Fund as a result of the Buyout. The Directors also considered that VIA did not have concerns at the time with respect to Mondrian’s ability to service the debt associated with the Buyout. Based on the information considered, the Directors concluded that the International Fund was likely to continue to benefit from the nature, extent and quality of Mondrian’s services and that Mondrian has the ability to continue to provide these services after the Buyout.
Investment Performance. The Directors considered the data provided regarding Mondrian’s investment performance with respect to managing the assets of the International Fund versus relevant benchmarks and VIA’s favorable assessment of such performance. The Directors concluded that the investment performance record of Mondrian supported approval of the Mondrian Subadvisory Agreement.
Subadvisory Fee, Expense Ratio Impact and Economies of Scale. In evaluating the subadvisory fee, the Directors considered that the subadvisory fee payable under the Mondrian Subadvisory Agreement is the same as the subadvisory fee payable under the Prior Subadvisory Agreement. The Directors also considered comparisons of the subadvisory fee charged by Mondrian to the International Fund with the fees charged by Mondrian for managing other accounts according to an investment mandate similar to the mandate the subadviser employs on behalf of the International Fund. The Directors also considered VIA’s assessment that the International Fund’s fee schedule at the current level of assets allocated to Mondrian is the lowest fee schedule offered by Mondrian for managing focused All Countries World Index (ACWI) ex-U.S. equity accounts of similar size. Additionally, the nature of the subadvisory services Mondrian is to provide to the International Fund appeared to be comparable to those Mondrian currently provides to its other subadvisory clients. The Directors reviewed information provided by VIA (which was based on an independent third-party source) on the fees charged by a group of U.S. investment managers utilizing a non-U.S. diversified value mandate. According to the information provided, the effective fee rate to be paid by the International Fund to Mondrian at current asset levels is below the median fee charged by such managers. The foregoing comparisons assisted the Directors in considering the Mondrian Subadvisory Agreement by providing them with a basis for evaluating Mondrian’s fee on a relative basis. Based on this information, the Directors concluded that Mondrian’s subadvisory fee appeared to be within a reasonable range for the services provided.
The Directors also reviewed the information provided regarding the estimated profits to be realized with respect to Mondrian’s relationship with the International Fund. In reviewing the extent to which economies of scale may be realized by Mondrian as the assets of the International Fund to be managed by Mondrian grow, and whether the proposed fee levels reflect these economies, the Directors considered that Mondrian’s fee schedule includes breakpoints, which indicated that the subadvisory fee rate is intended to capture certain anticipated economies of scale for the benefit of the International Fund’s shareholders in connection with the services to be provided.
Other Considerations. The Directors considered the due diligence process engaged in by VIA in connection with the Buyout and in deciding to recommend that the Board approve the Mondrian Subadvisory Agreement. The Directors also considered VIA’s conclusion that the fee to be paid by Mondrian for its services to the International Fund continues to be reasonable and appropriate in light of the nature and quality of services to be provided by Mondrian. The Directors concluded that VIA’s recommendations and conclusions supported approval of the Mondrian Subadvisory Agreement.
The Directors also considered the potential “fall-out” or ancillary benefits that may accrue to Mondrian due to its relationship with the International Fund. The Directors considered that Mondrian may direct the International Fund’s brokerage transactions to certain brokers to obtain research and other services. However, the Directors noted that all subadvisers are required to select brokers who meet the International Fund’s requirements for seeking best execution, and that VIA monitors and evaluates the subadvisers’ trade execution with respect to Fund brokerage transactions on a regular basis and provides reports to the Board in this regard. The Directors concluded that the potential benefits accruing to Mondrian by virtue of its relationship to the International Fund appeared to be reasonable.
188
THE VANTAGEPOINT FUNDS
Additional Information (Unaudited) — (Continued)
Conclusion. After full consideration of the foregoing factors, with no single factor identified as being of paramount importance, the Directors, including a majority of the Independent Directors, concluded that the approval of the Mondrian Subadvisory Agreement was in the best interests of the International Fund and its shareholders, and approved the Mondrian Subadvisory Agreement with, and the fee to be paid to, Mondrian.
Vantagepoint Growth Fund
At a meeting held on December 13, 2011 (“December Meeting”), the Board, including a majority of the Independent Directors, approved initial Investment Subadvisory Agreements (each a “New Subadvisory Agreement”) among the Company, VIA and each of Victory Capital Management, Inc. (“Victory”) and Atlanta Capital Management Company, LLC (“Atlanta Capital”), relating to the Growth Fund. Also at the December Meeting, VIA recommended and the Board approved: the termination of Legg Mason Capital Management, LLC (“Legg Mason”), D.G. Capital Management Trust (“D.G. Capital”) and Tukman Grossman Capital Management, Inc. (“Tukman Grossman”) as subadvisers to the Growth Fund, among other matters. Before approving the appointment of Victory and Atlanta Capital as subadvisers to the Growth Fund, the Board of the Company considered the recommendations of, and supporting analyses and data presented by, VIA.
With respect to the Board’s consideration of each New Subadvisory Agreement, the Directors received written information in advance of the December Meeting from VIA, which included: (1) the process by which VIA selected and recommended for Board approval Victory and Atlanta Capital as subadvisers to the Growth Fund; (2) the nature, extent and quality of the services that Victory and Atlanta Capital would provide to the Growth Fund; (3) each of Victory’s and Atlanta Capital’s experience, investment management business, personnel and operations; (4) each of Victory’s and Atlanta Capital’s brokerage and trading policies and practices; (5) the level of the subadvisory fees to be charged to the Growth Fund by Victory and Atlanta Capital and a comparison of those fees to the: (a) fees charged by each of Victory and Atlanta Capital to manage other large-cap growth accounts; and (b) fees charged by a group of U.S. separate account investment managers utilizing an active large-cap growth equity style; (6) Victory’s and Atlanta Capital’s compliance programs; (7) each of Victory’s and Atlanta Capital’s performance returns utilizing a large-cap growth mandate, and such performance compared to a relevant benchmark and peer group; (8) the Growth Fund’s expected overall investment advisory fee and projected total expense ratio, taking into account the change in subadvisers and the proposed allocation of the Growth Fund’s assets to each subadviser, compared to a group of large-cap growth funds; and (9) each of Victory’s and Atlanta Capital’s financial condition.
In considering the information and materials described above, the Independent Directors received assistance from, and met separately with, their independent legal counsel and were provided with a written description of their statutory responsibilities and the legal standards that are applicable to approvals of advisory agreements.
In determining whether to approve each New Subadvisory Agreement, the Directors considered the information received in advance of the December Meeting, the presentations made by, and discussions held with, representatives of Victory and Atlanta Capital, VIA’s personnel and the Company’s Chief Compliance Officer prior to the December Meeting and at the December Meeting, as applicable, as well as a variety of factors. Although not meant to be all-inclusive, the following discusses some of the factors relevant to the Board’s decision to approve the New Subadvisory Agreements.
Nature, Extent and Quality of Services. With respect to the nature, extent and quality of the services expected to be provided by Victory and Atlanta Capital under their respective New Subadvisory Agreements, the Directors considered the specific investment process to be employed by each of Victory and Atlanta Capital in managing the assets of the Growth Fund to be allocated to them; the qualifications of Victory’s and Atlanta Capital’s respective investment management personnel with regard to implementing a large-cap growth mandate; each of Victory’s and Atlanta Capital’s performance record as compared to a relevant benchmark and peer group; each of Victory’s and Atlanta Capital’s infrastructure and whether it appeared to adequately support a large-cap growth strategy; and VIA’s review process and favorable assessment as to the nature, quality and extent of the subadvisory services expected to be provided by each of Victory and Atlanta Capital to the Growth Fund. The Directors acknowledged that Victory and Atlanta Capital have experienced portfolio management personnel; and appeared to have adequate infrastructure and support staff to seek to achieve favorable results implementing large-cap growth mandates for the Growth Fund. The Directors concluded that the nature, extent and quality of the subadvisory services expected to be provided by each of
189
THE VANTAGEPOINT FUNDS
Additional Information (Unaudited) — (Continued)
Victory and Atlanta Capital were appropriate for the Growth Fund in light of its investment strategy and, thus, supported a decision to approve each New Subadvisory Agreement.
Investment Performance. The Directors evaluated Victory’s and Atlanta Capital’s historical investment performance records in managing their clients’ assets utilizing large-cap growth mandates and considered each performance record versus a relevant benchmark and peer group (based on information provided by an independent third-party source). The Directors concluded that each of Victory’s and Atlanta Capital’s overall historical investment performance record supported approval of each New Subadvisory Agreement.
Subadvisory Fees, Expense Ratio Impact and Economies of Scale. In evaluating each proposed subadvisory fee, the Directors reviewed Victory’s and Atlanta Capital’s subadvisory fee schedules. The Directors considered comparisons of the subadvisory fee to be charged by each of Victory and Atlanta Capital to the Growth Fund with its respective fee schedule for managing other accounts with an investment mandate similar to the mandate the subadviser is to employ on behalf of the Growth Fund. The Directors considered that, based on the information provided by VIA, the proposed fee schedule for each of Victory and Atlanta Capital is lower than each subadviser’s respective standard fee schedule for managing accounts with a similar mandate. The Directors also considered that, according to the information provided by VIA, the proposed effective fee rate to be paid to each of Victory and Atlanta Capital by the Growth Fund, based on the initial amount of assets to be allocated to each subadviser, reflected the lowest effective fee charged by the subadviser to other accounts of similar size (based on current assets) for which the subadviser provides advisory services utilizing a similar mandate. Additionally, the nature of the subadvisory services each of Victory and Atlanta Capital is to provide to the Growth Fund appeared to be comparable to those each subadviser currently provides to its other subadvisory clients.
The Directors reviewed information provided by VIA (which was based on an independent third-party source) on the fees charged to accounts with assets comparable to the amount of assets to be allocated initially to each of Victory and Atlanta Capital to a group of U.S. separate account investment managers that employ a similar investment style to the investment style each subadviser is to employ for the Growth Fund. According to the information provided, the effective fee rate to be paid by the Growth Fund to each of Victory and Atlanta Capital at the proposed initial asset allocation levels would be below the median fee charged by such managers.
The Directors also considered information from VIA showing that there would be no increase in the overall subadvisory fees and, therefore, no increase in the total expense ratio of the Growth Fund as a result of the changes in subadvisory arrangements. Referring to data provided by VIA and compiled by Morningstar, the Directors also noted that the expected total investment advisory fee for the Growth Fund, taking into account the proposed subadviser changes and the proposed allocation of the Fund’s assets to each of the Fund’s subadvisers, was lower than the average and median investment advisory fee of a group of mutual funds in Morningstar’s large-cap growth funds category. The Directors also considered information provided by VIA and compiled by Morningstar on the total expense ratios of a group of mutual funds in Morningstar’s large-cap growth funds category, which showed that, if Victory and Atlanta Capital served as a subadvisers to the Growth Fund at the proposed subadvisory fee rates and initial asset allocation levels, along with the Growth Fund’s two other existing subadvisers at their current subadvisory fee rates and based on the current asset allocation level with respect to Westfield Capital Management, L.P. (“Westfield”), and the proposed asset allocation level with respect to Columbus Circle Investors (“CCI”), the Fund’s expected total expense ratio would be below the average and median expense ratios of such funds.
The foregoing comparisons assisted the Directors in considering the New Subadvisory Agreements by providing them with a basis for evaluating Victory’s and Atlanta Capital’s respective fees, including in light of the Growth Fund’s expected overall investment advisory fee and total expense ratio, on a relative basis. Based on this information, the Directors concluded that Victory’s and Atlanta Capital’s subadvisory fees appeared to be within a reasonable range for the services to be provided.
The Directors also reviewed the information provided by Victory and Atlanta Capital regarding the estimated profits to be realized from their respective relationships with the Growth Fund. In reviewing the extent to which economies of scale may be realized by Victory as the assets of the Growth Fund to be managed by it grow, and whether the proposed fee levels reflect these economies, the Directors considered that Victory’s proposed fee schedule included breakpoints, which indicates that the proposed subadvisory fee rate is intended to capture certain anticipated
190
THE VANTAGEPOINT FUNDS
Additional Information (Unaudited) — (Continued)
economies of scale for the benefit of the Growth Fund’s shareholders in connection with the services to be provided. With respect to Atlanta Capital, the Directors considered that, although the proposed subadvisory fee schedule does not include breakpoints, the fee schedule is lower than Atlanta Capital’s standard fee schedule for a large-cap growth mandate and is the lowest fee schedule available for accounts of similar size for which Atlanta Capital provides advisory services utilizing a similar mandate. The Directors concluded that each proposed fee schedule with respect to Victory and Atlanta Capital was appropriate at this time.
Other Considerations. The Directors considered VIA’s judgment that the addition of Victory and Atlanta Capital as subadvisers to the Growth Fund would add value by complementing the investment approach of two of the current subadvisers to the Growth Fund, Westfield and CCI. In this regard, the Directors considered VIA’s belief that the addition of Victory and Atlanta Capital as subadvisers, along with VIA’s recommendation to terminate Legg Mason, D.G. Capital and Tukman Grossman and the proposed allocation of the Growth Fund’s assets to each subadviser. should serve to enhance the Growth Fund’s risk/return attributes.
The Directors considered the selection and due diligence process employed by VIA in deciding to recommend Victory and Atlanta Capital as subadvisers to the Growth Fund and also considered VIA’s conclusion that the fee to be paid to each of Victory and Atlanta Capital for their respective services to the Fund is reasonable and appropriate in light of the nature and quality of services to be provided by each subadviser and the reasons supporting that conclusion. The Directors also considered information from VIA concerning its strategy to efficiently implement the subadviser transitions. The Directors concluded that VIA’s recommendations and conclusions supported approval of each New Subadvisory Agreement.
The Directors also considered the potential “fall-out” or ancillary benefits that may accrue to Victory and Atlanta Capital due to each subadviser’s relationship with the Growth Fund. The Directors considered that Victory and Atlanta Capital may direct the Growth Fund’s brokerage transactions to certain brokers to obtain research and other services. However, the Directors noted that all subadvisers are required to select brokers who meet the Growth Fund’s requirements for seeking best execution, and that VIA monitors and evaluates the subadvisers’ trade execution with respect to Growth Fund brokerage transactions on a regular basis and provides reports to the Board in this regard. The Directors concluded that the potential benefits that may accrue to Victory and Atlanta Capital by virtue of their relationships with the Growth Fund appeared to be reasonable.
Conclusion. After full consideration of the foregoing factors, with no single factor identified as being of paramount importance, the Directors, including a majority of the Independent Directors, concluded that the initial approval of each New Subadvisory Agreement was in the best interests of the Growth Fund and its shareholders, and approved the New Subadvisory Agreement with, and the fee to be paid to, each of Victory and Atlanta Capital.
Only one copy of this Annual Report may be mailed to households, even if more than one person in a household is a shareholder of record, unless the Company has received instructions to the contrary. If you need additional copies of this Annual Report, please contact the Company toll free at 800-669-7400 or in writing at 777 North Capitol Street, NE, Suite 600, Washington, D.C. 20002. If you do not want this mailing of this Annual Report to be combined with those for other members of your household, contact the Company in writing at 777 North Capitol Street, NE, Suite 600, Washington, D.C. 20002 or toll free at 800-669-7400.
| I. | | Other Available Information |
A description of the Company’s proxy voting policies and procedures and the proxy voting record for the 12-month period ended June 30, 2011 are available without charge, upon request by calling 800-669-7400, on the Company’s website at www.icmarc.org, or by accessing the Securities and Exchange Commission’s website at www.sec.gov.
The Company files its complete schedule of portfolio holdings with the SEC for the first and third quarters of each fiscal year on Form N-Q; the Company’s Forms N-Q are available on the SEC’s website at www.sec.gov and may be reviewed and copied at the SEC’s Public Reference Room in Washington, D.C. Information on the operation of the Public Reference Room may be obtained by calling 800-SEC-0330.
191
THE VANTAGEPOINT FUNDS
Additional Information (Unaudited) — (Continued)
Wilshire®, the Wilshire IndexesSM, Wilshire 5000 Total Market IndexSM, and Wilshire 4500 Completion IndexSM are service marks of Wilshire Associates Incorporated (“Wilshire”) and have been licensed for use by The Vantagepoint Funds (the “Funds”), on behalf of the Broad Market Index Fund and the Mid/Small Company Index Fund, respectively. All content of the Wilshire Indexes and the aforementioned indexes is ©2012 Wilshire Associates Incorporated, all rights reserved. The Funds are not sponsored, endorsed, sold or promoted by Wilshire, and Wilshire makes no representations or warranties with respect to the Funds. Wilshire has no relationship with The Vantagepoint Funds, other than the licensing of the aforementioned indexes and its service marks for use in connection with these two Funds. Wilshire does not:
| | • | | Sponsor, endorse, sell or promote the Funds. |
| | • | | Recommend that any person invest in the Funds or any other securities. |
| | • | | Have any responsibility or liability for or make any decisions about the timing, amount or pricing of the Funds. |
| | • | | Have any responsibility or liability for the administration, management or marketing of the Funds. |
| | • | | Consider the needs of the Funds or their shareholders in determining, composing or calculating the above indexes or have any obligation to do so. |
Wilshire shall have no liability in connection with the Funds. Specifically, Wilshire makes no representation or warranty, express or implied, regarding:
| | • | | The results to be obtained by the Funds, their shareholders or any other person in connection with the use of the above indexes and the data included in those indexes; |
| | • | | The accuracy or completeness of these indexes and any related data; or |
| | • | | The merchantability or the fitness for a particular purpose or use of these indexes and/or its related data. |
Wilshire shall not have any liability for any errors, omissions or interruptions in the above indexes or related data. Under no circumstances will Wilshire be liable for any lost profits or indirect, punitive, special or consequential damages or losses, even if Wilshire knows that they might occur. The licensing agreement between The Vantagepoint Funds, on behalf of the Broad Market Index Fund and the Mid/Small Company Index Fund, and Wilshire is solely for the Funds’ benefit and not for the benefit of Fund shareholders or any other third parties.
“Standard & Poor’s”, “S&P”, “S&P 500”, “Standard & Poor’s 500”, and “500” are trademarks of The McGraw-Hill Companies, Inc. and have been licensed for use by The Vantagepoint Funds for the Vantagepoint 500 Stock Index Fund. The Fund is not sponsored, endorsed, sold or promoted by Standard & Poor’s, a division of The McGraw-Hill Companies, Inc., and makes no representation regarding the advisability of investing in the Fund.
192
SCHEDULE OF INVESTMENTS
December 31, 2011
| | | | | | | | | | | | | | |
| Vantagepoint Low Duration Bond Fund | | | | | | | | |
| | | | |
Coupon
Rate | | Maturity
Date | | | | | Face | | | Value | |
| | | | | | | | | | | | | | |
| CORPORATE OBLIGATIONS—62.8% | |
| Aerospace & Defense—0.5% | |
Boeing Co. (The) | |
1.875% | | | 11/20/2012 | | | | | $ | 1,280,000 | | | $ | 1,293,631 | |
Lockheed Martin Corp. | |
2.125% | | | 09/15/2016 | | | | | | 760,000 | | | | 762,088 | |
Raytheon Co. | |
1.400% | | | 12/15/2014 | | | | | | 430,000 | | | | 432,394 | |
| | | | | | | | | | | | | | |
| | | | | | | | | | | | | 2,488,113 | |
| | | | | | | | | | | | | | |
| Auto Components—0.6% | |
Johnson Controls, Inc. | |
1.750% | | | 03/01/2014 | | | | | | 3,000,000 | | | | 3,027,534 | |
| | | | | | | | | | | | | | |
| Beverages—1.3% | |
Anheuser-Busch InBev Worldwide, Inc. | |
2.500% | | | 03/26/2013 | | | | | | 3,335,000 | | | | 3,397,678 | |
1.500% | | | 07/14/2014 | | | | | | 2,750,000 | | | | 2,771,370 | |
Coca-Cola Co. (The) | |
1.800% | | | 09/01/2016 | | | | | | 730,000 | | | | 743,350 | |
| | | | | | | | | | | | | | |
| | | | | | | | | | | | | 6,912,398 | |
| | | | | | | | | | | | | | |
| Biotechnology—0.6% | |
Amgen, Inc. | |
2.300% | | | 06/15/2016 | | | | | | 700,000 | | | | 705,525 | |
1.875% | | | 11/15/2014 | | | | | | 860,000 | | | | 871,737 | |
Gilead Sciences, Inc. | |
2.400% | | | 12/01/2014 | | | | | | 370,000 | | | | 376,927 | |
Life Technologies Corp. | |
3.500% | | | 01/15/2016 | | | | | | 1,300,000 | | | | 1,306,649 | |
| | | | | | | | | | | | | | |
| | | | | | | | | | | | | 3,260,838 | |
| | | | | | | | | | | | | | |
| Capital Markets—2.8% | |
Bear Stearns Cos. LLC (The) | |
5.700% | | | 11/15/2014 | | | | | | 7,340,000 | | | | 7,987,777 | |
Goldman Sachs Group, Inc. (The) | |
1.435% | | | 02/07/2014 | | | # | | | 1,430,000 | | | | 1,337,438 | |
Merrill Lynch & Co., Inc., Series C MTN | |
6.050% | | | 08/15/2012 | | | | | | 550,000 | | | | 558,026 | |
Morgan Stanley | |
1.408% | | | 04/29/2013 | | | # | | | 1,530,000 | | | | 1,442,401 | |
TD Ameritrade Holding Corp. | |
4.150% | | | 12/01/2014 | | | | | | 1,140,000 | | | | 1,205,681 | |
WCI Finance LLC/WEA Finance LLC | |
5.400% | | | 10/01/2012 | | | ^ | | | 1,000,000 | | | | 1,024,761 | |
WT Finance Aust Pty Ltd./Westfield Capital/WEA Finance LLC (Australia) | |
5.125% | | | 11/15/2014 | | | ^ | | | 1,170,000 | | | | 1,226,640 | |
| | | | | | | | | | | | | | |
| | | | | | | | | | | | | 14,782,724 | |
| | | | | | | | | | | | | | |
| Chemicals—1.8% | |
Airgas, Inc. | |
2.850% | | | 10/01/2013 | | | | | | 460,000 | | | | 468,827 | |
Dow Chemical Co. (The) | |
7.600% | | | 05/15/2014 | | | | | | 4,385,000 | | | | 4,961,364 | |
4.850% | | | 08/15/2012 | | | | | | 2,300,000 | | | | 2,353,434 | |
2.500% | | | 02/15/2016 | | | | | | 690,000 | | | | 694,351 | |
Ecolab, Inc. | |
2.375% | | | 12/08/2014 | | | | | | 290,000 | | | | 295,841 | |
Praxair, Inc. | |
1.750% | | | 11/15/2012 | | | | | | 570,000 | | | | 574,985 | |
| | | | | | | | | | | | | | |
| | | | | | | | | | | | | 9,348,802 | |
| | | | | | | | | | | | | | |
| | | | | | | | | | | | | | |
| | | | | |
Coupon
Rate | |
| Maturity
Date |
| | | | | Face | | | | Value | |
| | | | | | | | | | | | | | |
| Commercial Banks—11.2% | |
Banco Bradesco SA (Brazil) | |
2.561% | | | 05/16/2014 | | | #^ | | $ | 300,000 | | | $ | 294,661 | |
Banco de Credito del Peru (Peru) | |
4.750% | | | 03/16/2016 | | | ^ | | | 1,110,000 | | | | 1,118,325 | |
Banco do Brasil SA (Brazil) | |
4.500% | | | 01/22/2015 | | | ^ | | | 1,180,000 | | | | 1,226,020 | |
Bank of Nova Scotia (Canada) | |
2.250% | | | 01/22/2013 | | | | | | 950,000 | | | | 963,232 | |
Barclays Bank plc (United Kingdom) | |
3.900% | | | 04/07/2015 | | | | | | 2,590,000 | | | | 2,603,038 | |
2.700% | | | 03/05/2012 | | | ^ | | | 500,000 | | | | 501,973 | |
1.438% | | | 01/13/2014 | | | # | | | 970,000 | | | | 940,742 | |
BB&T Corp. | |
1.125% | | | 04/28/2014 | | | # | | | 350,000 | | | | 345,886 | |
BB&T Corp. MTN | |
3.850% | | | 07/27/2012 | | | | | | 518,000 | | | | 526,525 | |
BB&T Corp., Series A MTN | |
3.375% | | | 09/25/2013 | | | | | | 700,000 | | | | 724,371 | |
Capital One Financial Corp. | |
7.375% | | | 05/23/2014 | | | | | | 3,630,000 | | | | 3,990,524 | |
2.125% | | | 07/15/2014 | | | | | | 860,000 | | | | 849,494 | |
CIT Group, Inc. | |
5.250% | | | 04/01/2014 | | | ^ | | | 735,000 | | | | 735,919 | |
Commonwealth Bank of Australia (Australia) | |
2.125% | | | 03/17/2014 | | | ^ | | | 1,360,000 | | | | 1,356,724 | |
Credit Suisse (Switzerland) | |
1.361% | | | 01/14/2014 | | | # | | | 2,020,000 | | | | 1,956,198 | |
Danske Bank A/S (Denmark) | |
1.451% | | | 04/14/2014 | | | #^† | | | 1,450,000 | | | | 1,398,508 | |
HSBC Bank plc (United Kingdom) | |
1.625% | | | 07/07/2014 | | | ^† | | | 970,000 | | | | 959,333 | |
ING Bank NV (Netherlands) | |
2.625% | | | 02/09/2012 | | | ^ | | | 1,400,000 | | | | 1,402,673 | |
1.596% | | | 03/15/2013 | | | #^ | | | 1,400,000 | | | | 1,367,881 | |
KeyCorp MTN | |
3.750% | | | 08/13/2015 | | | | | | 560,000 | | | | 581,190 | |
M&T Bank Corp. | |
5.375% | | | 05/24/2012 | | | | | | 4,000,000 | | | | 4,056,364 | |
Royal Bank of Scotland plc (The) (United Kingdom) | |
3.950% | | | 09/21/2015 | | | | | | 5,990,000 | | | | 5,621,603 | |
3.250% | | | 01/11/2014 | | | | | | 1,320,000 | | | | 1,265,476 | |
Royal Bank of Scotland plc (The), Series 2 (United Kingdom) | |
3.400% | | | 08/23/2013 | | | | | | 1,250,000 | | | | 1,216,552 | |
Santander US Debt SA Unipersonal (Spain) | |
3.781% | | | 10/07/2015 | | | ^ | | | 5,200,000 | | | | 4,716,551 | |
Sparebank 1 Boligkreditt AS (Norway) | |
1.250% | | | 10/25/2013 | | | ^ | | | 570,000 | | | | 566,196 | |
Standard Chartered plc (United Kingdom) | |
3.200% | | | 05/12/2016 | | | ^† | | | 3,800,000 | | | | 3,722,149 | |
SunTrust Bank | |
1.195% | | | 06/22/2012 | | | # | | | GBP 850,000 | | | | 1,306,636 | |
Toronto-Dominion Bank (The) (Canada) | |
2.500% | | | 07/14/2016 | | | | | | 5,050,000 | | | | 5,155,904 | |
Union Bank NA, Bank Note | |
2.125% | | | 12/16/2013 | | | | | | 1,380,000 | | | | 1,396,349 | |
US Bancorp | |
4.200% | | | 05/15/2014 | | | | | | 1,300,000 | | | | 1,392,599 | |
US Bancorp MTN | |
1.375% | | | 09/13/2013 | | | | | | 1,000,000 | | | | 1,006,506 | |
Wachovia Bank NA, Bank Note | |
4.800% | | | 11/01/2014 | | | | | | 660,000 | | | | 693,991 | |
See accompanying notes to financial statements.
193
SCHEDULE OF INVESTMENTS—(Continued)
December 31, 2011
| | | | | | | | | | | | | | |
| Vantagepoint Low Duration Bond Fund | | | | | | | | |
| | | | |
Coupon
Rate | | Maturity
Date | | | | | Face | | | Value | |
| | | | | | | | | | | | | | |
| CORPORATE OBLIGATIONS—(Continued) | |
Westpac Banking Corp. (Australia) | |
2.250% | | | 11/19/2012 | | | | | $ | 1,600,000 | | | $ | 1,616,254 | |
1.133% | | | 04/08/2013 | | | #^ | | | 1,000,000 | | | | 1,001,595 | |
| | | | | | | | | | | | | | |
| | | | | | | | | | | | | 58,577,942 | |
| | | | | | | | | | | | | | |
| Communications Equipment—0.2% | |
Cisco Systems, Inc. | |
1.625% | | | 03/14/2014 | | | | | | 1,265,000 | | | | 1,289,403 | |
| | | | | | | | | | | | | | |
| Computers & Peripherals—1.8% | |
Hewlett-Packard Co. | |
4.750% | | | 06/02/2014 | | | | | | 540,000 | | | | 570,596 | |
4.250% | | | 02/24/2012 | | | | | | 730,000 | | | | 733,266 | |
3.000% | | | 09/15/2016 | | | | | | 3,536,000 | | | | 3,564,822 | |
2.350% | | | 03/15/2015 | | | | | | 1,100,000 | | | | 1,095,512 | |
1.550% | | | 05/30/2014 | | | | | | 3,660,000 | | | | 3,601,407 | |
| | | | | | | | | | | | | | |
| | | | | | | | | | | | | 9,565,603 | |
| | | | | | | | | | | | | | |
| Consumer Finance—4.4% | |
Ally Financial, Inc. | |
4.500% | | | 02/11/2014 | | | | | | 900,000 | | | | 870,750 | |
American Express Credit Corp. MTN | |
2.750% | | | 09/15/2015 | | | | | | 2,500,000 | | | | 2,515,457 | |
American Express Credit Corp., Series D MTN | |
5.125% | | | 08/25/2014 | | | | | | 3,177,000 | | | | 3,415,234 | |
American Honda Finance Corp. | |
2.375% | | | 03/18/2013 | | | ^ | | | 470,000 | | | | 476,722 | |
Banque PSA Finance MTN (France) | |
3.500% | | | 01/17/2014 | | | EUR | | | 850,000 | | | | 1,067,749 | |
Caterpillar Financial Services Corp. | |
2.050% | | | 08/01/2016 | | | | | | 2,766,000 | | | | 2,842,541 | |
1.125% | | | 12/15/2014 | | | | | | 200,000 | | | | 200,393 | |
Caterpillar Financial Services Corp. MTN | |
5.750% | | | 02/15/2012 | | | | | | 900,000 | | | | 905,619 | |
Ford Motor Credit Co. LLC | |
3.875% | | | 01/15/2015 | | | | | | 1,280,000 | | | | 1,276,127 | |
HSBC Finance Corp. | |
0.957% | | | 06/01/2016 | | | # | | | 4,347,000 | | | | 3,640,160 | |
John Deere Capital Corp. MTN | |
2.950% | | | 03/09/2015 | | | | | | 1,210,000 | | | | 1,275,756 | |
1.600% | | | 03/03/2014 | | | | | | 1,160,000 | | | | 1,179,689 | |
PACCAR Financial Corp. | |
1.550% | | | 09/29/2014 | | | | | | 620,000 | | | | 627,715 | |
PACCAR Financial Corp. MTN | |
0.745% | | | 04/05/2013 | | | # | | | 840,000 | | | | 839,474 | |
RCI Banque SA (France) | |
2.261% | | | 04/11/2014 | | | #^ | | | 1,900,000 | | | | 1,811,924 | |
| | | | | | | | | | | | | | |
| | | | | | | | | | | | | 22,945,310 | |
| | | | | | | | | | | | | | |
| Diversified Financial Services—7.1% | |
Bank of America Corp. | |
4.875% | | | 01/15/2013 | | | † | | | 3,850,000 | | | | 3,866,555 | |
Bank of America Corp. MTN | |
4.900% | | | 05/01/2013 | | | | | | 550,000 | | | | 550,620 | |
Bank of America Corp., Series L MTN | |
7.375% | | | 05/15/2014 | | | † | | | 2,680,000 | | | | 2,780,280 | |
Caisse Centrale Desjardins du Quebec (Canada) | |
1.700% | | | 09/16/2013 | | | ^ | | | 350,000 | | | | 350,722 | |
Citigroup, Inc. | |
6.375% | | | 08/12/2014 | | | | | | 2,000,000 | | | | 2,100,300 | |
6.010% | | | 01/15/2015 | | | | | | 2,660,000 | | | | 2,780,833 | |
| | | | | | | | | | | | | | |
| | | | | |
Coupon
Rate | |
| Maturity
Date |
| | | | | Face | | | | Value | |
| | | | | | | | | | | | | | |
6.000% | | | 12/13/2013 | | | | | $ | 2,800,000 | | | $ | 2,898,650 | |
5.300% | | | 10/17/2012 | | | | | | 425,000 | | | | 431,988 | |
Equifax, Inc. | |
4.450% | | | 12/01/2014 | | | | | | 240,000 | | | | 253,134 | |
ERAC USA Finance LLC | |
2.250% | | | 01/10/2014 | | | ^ | | | 550,000 | | | | 547,987 | |
General Electric Capital Corp. | |
5.900% | | | 05/13/2014 | | | | | | 680,000 | | | | 745,117 | |
General Electric Capital Corp. MTN | |
1.875% | | | 09/16/2013 | | | | | | 300,000 | | | | 303,822 | |
1.253% | | | 01/15/2013 | | | # | | | 1,000,000 | | | | 1,006,788 | |
General Electric Capital Corp., Series A MTN | |
3.750% | | | 11/14/2014 | | | | | | 1,130,000 | | | | 1,191,907 | |
0.806% | | | 09/15/2014 | | | # | | | 2,075,000 | | | | 1,991,915 | |
General Electric Capital Corp., Series G MTN | |
1.311% | | | 05/09/2016 | | | # | | | 5,675,000 | | | | 5,358,471 | |
JPMorgan Chase & Co. | |
5.375% | | | 10/01/2012 | | | | | | 400,000 | | | | 413,624 | |
4.750% | | | 05/01/2013 | | | | | | 500,000 | | | | 522,877 | |
Lloyds TSB Bank plc (United Kingdom) | |
4.875% | | | 01/21/2016 | | | | | | 7,280,000 | | | | 7,101,393 | |
NASDAQ OMX Group, Inc. (The) | |
4.000% | | | 01/15/2015 | | | | | | 1,040,000 | | | | 1,066,424 | |
Susser Holdings LLC/Susser Finance Corp. | |
8.500% | | | 05/15/2016 | | | | | | 950,000 | | | | 1,029,563 | |
| | | | | | | | | | | | | | |
| | | | | | | | | | | | | 37,292,970 | |
| | | | | | | | | | | | | | |
| Diversified Telecommunication Services—5.3% | |
AT&T, Inc. | |
6.700% | | | 11/15/2013 | | | | | | 3,700,000 | | | | 4,080,726 | |
4.850% | | | 02/15/2014 | | | | | | 600,000 | | | | 647,050 | |
2.400% | | | 08/15/2016 | | | | | | 620,000 | | | | 633,268 | |
Cellco Partnership/Verizon Wireless Capital LLC | |
5.550% | | | 02/01/2014 | | | | | | 400,000 | | | | 434,799 | |
Deutsche Telekom International Finance BV (Netherlands) | |
3.125% | | | 04/11/2016 | | | ^ | | | 7,945,000 | | | | 8,011,937 | |
Frontier Communications Corp. | |
6.250% | | | 01/15/2013 | | | † | | | 700,000 | | | | 717,500 | |
Telecom Italia Capital SA (Luxembourg) | |
5.250% | | | 11/15/2013 | | | | | | 280,000 | | | | 269,080 | |
5.250% | | | 10/01/2015 | | | | | | 1,986,000 | | | | 1,823,323 | |
Telefonica Emisiones SAU (Spain) | |
4.949% | | | 01/15/2015 | | | | | | 4,000,000 | | | | 3,981,724 | |
2.582% | | | 04/26/2013 | | | | | | 1,090,000 | | | | 1,063,957 | |
Verizon Communications, Inc. | |
4.350% | | | 02/15/2013 | | | | | | 750,000 | | | | 779,581 | |
1.250% | | | 11/03/2014 | | | | | | 1,680,000 | | | | 1,689,482 | |
1.184% | | | 03/28/2014 | | | # | | | 3,595,000 | | | | 3,592,724 | |
| | | | | | | | | | | | | | |
| | | | | | | | | | | | | 27,725,151 | |
| | | | | | | | | | | | | | |
| Electric Utilities—2.2% | |
Consumers Energy Co., Series D | |
5.375% | | | 04/15/2013 | | | | | | 850,000 | | | | 894,655 | |
Duke Energy Carolinas LLC | |
6.250% | | | 01/15/2012 | | | | | | 1,165,000 | | | | 1,167,402 | |
Enel Finance International NV (Luxembourg) | |
3.875% | | | 10/07/2014 | | | ^ | | | 6,034,000 | | | | 5,877,840 | |
Exelon Generation Co. LLC | |
5.350% | | | 01/15/2014 | | | | | | 1,500,000 | | | | 1,602,994 | |
Georgia Power Co. | |
1.300% | | | 09/15/2013 | | | | | | 1,100,000 | | | | 1,110,628 | |
Midamerican Energy Holdings Co. | | | | | |
3.150% | | | 07/15/2012 | | | | | | 1,000,000 | | | | 1,011,848 | |
| | | | | | | | | | | | | | |
| | | | | | | | | | | | | 11,665,367 | |
| | | | | | | | | | | | | | |
See accompanying notes to financial statements.
194
SCHEDULE OF INVESTMENTS—(Continued)
December 31, 2011
| | | | | | | | | | | | | | |
| Vantagepoint Low Duration Bond Fund | | | | | | | | |
| | | | |
Coupon
Rate | | Maturity
Date | | | | | Face | | | Value | |
| | | | | | | | | | | | | | |
| CORPORATE OBLIGATIONS—(Continued) | |
| Electronic Equipment, Instruments & Components—0.2% | |
Agilent Technologies, Inc. | | | | | |
2.500% | | | 07/15/2013 | | | | | $ | 470,000 | | | $ | 474,616 | |
Thermo Fisher Scientific, Inc. | | | | | |
2.150% | | | 12/28/2012 | | | | | | 640,000 | | | | 647,840 | |
| | | | | | | | | | | | | | |
| | | | | | | | | | | | | 1,122,456 | |
| | | | | | | | | | | | | | |
| Energy Equipment & Services—0.2% | |
Complete Production Services, Inc. | | | | | |
8.000% | | | 12/15/2016 | | | | | | 900,000 | | | | 940,500 | |
| | | | | | | | | | | | | | |
| Food & Staples Retailing—1.2% | |
Safeway, Inc. | | | | | |
5.800% | | | 08/15/2012 | | | | | | 1,000,000 | | | | 1,027,006 | |
3.400% | | | 12/01/2016 | | | | | | 650,000 | | | | 667,370 | |
TESCO plc (United Kingdom) | | | | | |
2.000% | | | 12/05/2014 | | | ^ | | | 4,200,000 | | | | 4,246,868 | |
Woolworths Ltd. (Australia) | | | | | |
2.550% | | | 09/22/2015 | | | ^ | | | 220,000 | | | | 224,956 | |
| | | | | | | | | | | | | | |
| | | | | | | | | | | | | 6,166,200 | |
| | | | | | | | | | | | | | |
| Food Products—1.1% | |
Corn Products International, Inc. | | | | | |
3.200% | | | 11/01/2015 | | | | | | 310,000 | | | | 320,580 | |
General Mills, Inc. | | | | | |
6.000% | | | 02/15/2012 | | | | | | 1,500,000 | | | | 1,508,621 | |
Kellogg Co. | | | | | |
5.125% | | | 12/03/2012 | | | | | | 1,000,000 | | | | 1,039,521 | |
Kraft Foods, Inc. | | | | | |
5.250% | | | 10/01/2013 | | | | | | 340,000 | | | | 362,827 | |
2.625% | | | 05/08/2013 | | | | | | 340,000 | | | | 347,468 | |
Wm. Wrigley Jr. Co. | | | | | |
3.700% | | | 06/30/2014 | | | ^ | | | 2,190,000 | | | | 2,259,079 | |
| | | | | | | | | | | | | | |
| | | | | | | | | | | | | 5,838,096 | |
| | | | | | | | | | | | | | |
| Health Care Equipment & Supplies—0.7% | |
Covidien International Finance SA (Luxembourg) | |
1.875% | | | 06/15/2013 | | | | | | 880,000 | | | | 888,672 | |
DENTSPLY International, Inc. | | | | | |
1.957% | | | 08/15/2013 | | | # | | | 800,000 | | | | 805,799 | |
Stryker Corp. | | | | | |
3.000% | | | 01/15/2015 | | | | | | 680,000 | | | | 717,089 | |
2.000% | | | 09/30/2016 | | | | | | 1,120,000 | | | | 1,147,426 | |
| | | | | | | | | | | | | | |
| | | | | | | | | | | | | 3,558,986 | |
| | | | | | | | | | | | | | |
| Health Care Providers & Services—2.0% | |
Aristotle Holding, Inc. | | | | | |
2.750% | | | 11/21/2014 | | | ^ | | | 1,300,000 | | | | 1,316,669 | |
Quest Diagnostics, Inc. | | | | | |
1.424% | | | 03/24/2014 | | | # | | | 410,000 | | | | 412,358 | |
UnitedHealth Group, Inc. | | | | | |
4.875% | | | 02/15/2013 | | | | | | 3,000,000 | | | | 3,124,803 | |
WellPoint, Inc. | | | | | |
6.800% | | | 08/01/2012 | | | | | | 1,790,000 | | | | 1,851,202 | |
5.000% | | | 12/15/2014 | | | | | | 2,000,000 | | | | 2,186,686 | |
2.375% | | | 02/15/2017 | | | | | | 1,445,000 | | | | 1,442,355 | |
| | | | | | | | | | | | | | |
| | | | | | | | | | | | | 10,334,073 | |
| | | | | | | | | | | | | | |
| | | | | | | | | | | | | | |
| | | | | |
Coupon
Rate | |
| Maturity
Date |
| | | | | Face | | | | Value | |
| | | | | | | | | | | | | | |
| Independent Power Producers & Energy Traders—0.1% | |
AES Corp. (The) | | | | | |
7.750% | | | 03/01/2014 | | | | | $ | 565,000 | | | $ | 613,025 | |
| | | | | | | | | | | | | | |
| Industrial Conglomerates—0.3% | |
3M Co. | | | | | |
1.375% | | | 09/29/2016 | | | | | | 920,000 | | | | 928,958 | |
Danaher Corp. | | | | | |
1.300% | | | 06/23/2014 | | | | | | 400,000 | | | | 405,994 | |
| | | | | | | | | | | | | | |
| | | | | | | | | | | | | 1,334,952 | |
| | | | | | | | | | | | | | |
| Insurance—2.9% | |
Aflac, Inc. | | | | | |
3.450% | | | 08/15/2015 | | | † | | | 2,937,000 | | | | 3,033,504 | |
Allstate Corp. (The) | | | | | |
6.200% | | | 05/16/2014 | | | | | | 800,000 | | | | 892,706 | |
Berkshire Hathaway Finance Corp. | | | | | |
4.000% | | | 04/15/2012 | | | | | | 700,000 | | | | 707,069 | |
Berkshire Hathaway, Inc. | | | | | |
3.750% | | | 08/15/2021 | | | | | | 3,100,000 | | | | 3,227,543 | |
Hartford Financial Services Group, Inc. | | | | | |
4.000% | | | 03/30/2015 | | | | | | 510,000 | | | | 512,856 | |
MetLife, Inc. | | | | | |
2.375% | | | 02/06/2014 | | | | | | 450,000 | | | | 456,511 | |
Metropolitan Life Global Funding I | | | | | |
5.125% | | | 04/10/2013 | | | ^ | | | 2,000,000 | | | | 2,089,912 | |
1.141% | | | 01/10/2014 | | | #^ | | | 2,100,000 | | | | 2,099,051 | |
Prudential Financial, Inc., Series D MTN | | | | | |
5.150% | | | 01/15/2013 | | | | | | 1,000,000 | | | | 1,035,557 | |
3.625% | | | 09/17/2012 | | | | | | 1,100,000 | | | | 1,117,247 | |
| | | | | | | | | | | | | | |
| | | | | | | | | | | | | 15,171,956 | |
| | | | | | | | | | | | | | |
| Internet & Catalog Retail—0.1% | |
eBay, Inc. | | | | | | | | | | | | | | |
0.875% | | | 10/15/2013 | | | | | | 500,000 | | | | 501,757 | |
| | | | | | | | | | | | | | |
| IT Services—0.6% | |
International Business Machines Corp. | | | | | |
2.100% | | | 05/06/2013 | | | | | | 2,170,000 | | | | 2,215,505 | |
1.000% | | | 08/05/2013 | | | | | | 1,100,000 | | | | 1,109,096 | |
| | | | | | | | | | | | | | |
| | | | | | | | | | | | | 3,324,601 | |
| | | | | | | | | | | | | | |
| Life Sciences Tools & Services—0.2% | |
Howard Hughes Medical Institute | | | | | |
3.450% | | | 09/01/2014 | | | | | | 1,100,000 | | | | 1,173,899 | |
| | | | | | | | | | | | | | |
| Machinery—0.4% | |
Tyco International Finance SA (Luxembourg) | | | | | |
6.000% | | | 11/15/2013 | | | | | | 2,100,000 | | | | 2,276,014 | |
| | | | | | | | | | | | | | |
| Media—2.2% | |
DirecTV Holdings LLC/DirecTV Financing Co., Inc. | |
4.750% | | | 10/01/2014 | | | | | | 1,060,000 | | | | 1,145,716 | |
NBCUniversal Media LLC | | | | | |
3.650% | | | 04/30/2015 | | | | | | 850,000 | | | | 897,852 | |
Time Warner Cable, Inc. | | | | | |
8.250% | | | 02/14/2014 | | | | | | 2,200,000 | | | | 2,480,964 | |
6.200% | | | 07/01/2013 | | | | | | 5,500,000 | | | | 5,903,986 | |
Time Warner, Inc. | | | | | |
3.150% | | | 07/15/2015 | | | | | | 440,000 | | | | 458,035 | |
Viacom, Inc. | | | | | |
4.375% | | | 09/15/2014 | | | | | | 700,000 | | | | 750,354 | |
| | | | | | | | | | | | | | |
| | | | | | | | | | | | | 11,636,907 | |
| | | | | | | | | | | | | | |
See accompanying notes to financial statements.
195
SCHEDULE OF INVESTMENTS—(Continued)
December 31, 2011
| | | | | | | | | | | | | | |
| Vantagepoint Low Duration Bond Fund | | | | | | | | |
| | | | |
Coupon
Rate | | Maturity
Date | | | | | Face | | | Value | |
| | | | | | | | | | | | | | |
| CORPORATE OBLIGATIONS—(Continued) | |
| Metals & Mining—2.9% | |
Alcoa, Inc. | |
6.000% | | | 07/15/2013 | | | † | | $ | 5,000,000 | | | $ | 5,321,395 | |
ArcelorMittal (Luxembourg) | |
5.375% | | | 06/01/2013 | | | | | | 1,910,000 | | | | 1,955,926 | |
Barrick Gold Corp. (Canada) | |
1.750% | | | 05/30/2014 | | | | | | 510,000 | | | | 515,331 | |
Barrick Gold Financeco LLC (Canada) | |
6.125% | | | 09/15/2013 | | | | | | 795,000 | | | | 859,502 | |
Rio Tinto Finance USA Ltd. (Australia) | |
8.950% | | | 05/01/2014 | | | | | | 2,875,000 | | | | 3,364,161 | |
Steel Dynamics, Inc. | |
7.375% | | | 11/01/2012 | | | | | | 880,000 | | | | 918,500 | |
Vedanta Resources plc (United Kingdom) | |
6.750% | | | 06/07/2016 | | | ^ | | | 450,000 | | | | 387,000 | |
Xstrata Canada Financial Corp. (Canada) | |
2.850% | | | 11/10/2014 | | | ^ | | | 1,765,000 | | | | 1,775,223 | |
| | | | | | | | | | | | | | |
| | | | | | | | | | | | | 15,097,038 | |
| | | | | | | | | | | | | | |
| Multiline Retail—0.4% | |
Target Corp. | |
1.125% | | | 07/18/2014 | | | | | | 500,000 | | | | 503,988 | |
0.575% | | | 07/18/2014 | | | # | | | 1,800,000 | | | | 1,801,125 | |
| | | | | | | | | | | | | | |
| | | | | | | | | | | | | 2,305,113 | |
| | | | | | | | | | | | | | |
| Multi-Utilities—0.7% | |
DTE Energy Co. | |
1.227% | | | 06/03/2013 | | | # | | | 950,000 | | | | 949,427 | |
Sempra Energy | |
1.306% | | | 03/15/2014 | | | # | | | 2,661,000 | | | | 2,651,969 | |
| | | | | | | | | | | | | | |
| | | | | | | | | | | | | 3,601,396 | |
| | | | | | | | | | | | | | |
| Oil, Gas & Consumable Fuels—1.2% | |
ConocoPhillips | | | | | | | | | | | | | | |
4.750% | | | 02/01/2014 | | | | | | 600,000 | | | | 648,335 | |
4.600% | | | 01/15/2015 | | | | | | 455,000 | | | | 503,587 | |
Petrohawk Energy Corp. | |
7.875% | | | 06/01/2015 | | | | | | 1,000,000 | | | | 1,070,000 | |
Rockies Express Pipeline LLC | |
3.900% | | | 04/15/2015 | | | ^ | | | 680,000 | | | | 672,483 | |
Shell International Finance BV (Netherlands) | |
1.875% | | | 03/25/2013 | | | | | | 620,000 | | | | 631,730 | |
Tesoro Corp. | |
6.625% | | | 11/01/2015 | | | | | | 355,000 | | | | 362,987 | |
TransCanada PipeLines Ltd. (Canada) | |
3.400% | | | 06/01/2015 | | | | | | 550,000 | | | | 583,026 | |
Valero Energy Corp. | |
6.875% | | | 04/15/2012 | | | | | | 550,000 | | | | 558,980 | |
XTO Energy, Inc. | |
7.500% | | | 04/15/2012 | | | | | | 990,000 | | | | 1,009,893 | |
| | | | | | | | | | | | | | |
| | | | | | | | | | | | | 6,041,021 | |
| | | | | | | | | | | | | | |
| Personal Products—0.2% | |
Revlon Consumer Products Corp. | |
9.750% | | | 11/15/2015 | | | | | | 950,000 | | | | 1,015,313 | |
| | | | | | | | | | | | | | |
| Pharmaceuticals—1.4% | |
Novartis Capital Corp. | |
4.125% | | | 02/10/2014 | | | | | | 1,170,000 | | | | 1,252,444 | |
| | | | | | | | | | | | | | |
| | | | | |
Coupon
Rate | |
| Maturity
Date |
| | | | | Face | | | | Value | |
| | | | | | | | | | | | | | |
Pfizer, Inc. | |
3.625% | | | 06/03/2013 | | | EUR | | | 200,000 | | | $ | 266,991 | |
Sanofi (France) | |
1.625% | | | 03/28/2014 | | | | | $ | 800,000 | | | | 814,452 | |
0.774% | | | 03/28/2013 | | | # | | | 1,580,000 | | | | 1,582,087 | |
Teva Pharmaceutical Finance III BV (Netherlands Antilles) | |
1.700% | | | 03/21/2014 | | | | | | 500,000 | | | | 502,852 | |
Teva Pharmaceutical Finance III LLC | |
1.500% | | | 06/15/2012 | | | | | | 1,230,000 | | | | 1,234,805 | |
Teva Pharmaceutical Finance IV LLC | |
1.700% | | | 11/10/2014 | | | | | | 1,040,000 | | | | 1,048,768 | |
Valeant Pharmaceuticals International | |
6.500% | | | 07/15/2016 | | | ^ | | | 720,000 | | | | 722,700 | |
| | | | | | | | | | | | | | |
| | | | | | | | | | | | | 7,425,099 | |
| | | | | | | | | | | | | | |
| Real Estate Investment Trusts (REITs)—0.8% | |
China Resources Land Ltd. (Hong Kong) | |
4.625% | | | 05/19/2016 | | | ^ | | | 525,000 | | | | 516,460 | |
HCP, Inc. | |
2.700% | | | 02/01/2014 | | | | | | 1,410,000 | | | | 1,408,656 | |
Health Care REIT, Inc. | |
6.000% | | | 11/15/2013 | | | | | | 810,000 | | | | 850,293 | |
Simon Property Group LP | |
4.200% | | | 02/01/2015 | | | | | | 210,000 | | | | 222,850 | |
Vornado Realty LP | |
4.250% | | | 04/01/2015 | | | | | | 1,080,000 | | | | 1,118,555 | |
| | | | | | | | | | | | | | |
| | | | | | | | | | | | | 4,116,814 | |
| | | | | | | | | | | | | | |
| Road & Rail—0.2% | |
JB Hunt Transport Services, Inc. | |
3.375% | | | 09/15/2015 | | | | | | 850,000 | | | | 862,153 | |
| | | | | | | | | | | | | | |
| Semiconductors & Semiconductor Equipment—0.3% | |
Intel Corp. | |
1.950% | | | 10/01/2016 | | | | | | 730,000 | | | | 751,302 | |
Texas Instruments, Inc. | |
0.875% | | | 05/15/2013 | | | | | | 1,030,000 | | | | 1,033,056 | |
| | | | | | | | | | | | | | |
| | | | | | | | | | | | | 1,784,358 | |
| | | | | | | | | | | | | | |
| Software—0.4% | |
Microsoft Corp. | |
2.950% | | | 06/01/2014 | | | | | | 1,400,000 | | | | 1,488,052 | |
Oracle Corp. | |
3.750% | | | 07/08/2014 | | | | | | 700,000 | | | | 753,287 | |
| | | | | | | | | | | | | | |
| | | | | | | | | | | | | 2,241,339 | |
| | | | | | | | | | | | | | |
| Textiles, Apparel & Luxury Goods—0.2% | |
Levi Strauss & Co. | |
8.875% | | | 04/01/2016 | | | † | | | 850,000 | | | | 888,250 | |
| | | | | | | | | | | | | | |
| Tobacco—1.3% | |
Altria Group, Inc. | |
8.500% | | | 11/10/2013 | | | | | | 5,319,000 | | | | 6,007,491 | |
Lorillard Tobacco Co. | |
3.500% | | | 08/04/2016 | | | | | | 1,060,000 | | | | 1,073,301 | |
| | | | | | | | | | | | | | |
| | | | | | | | | | | | | 7,080,792 | |
| | | | | | | | | | | | | | |
| Trading Companies & Distributors—0.1% | |
AmeriGas Partners LP/AmeriGas Finance Corp. | |
6.250% | | | 08/20/2019 | | | | | | 695,000 | | | | 695,000 | |
| | | | | | | | | | | | | | |
| Water Utilities—0.4% | |
Thames Water Utilities Cayman Finance Ltd. MTN (Cayman Islands) | |
6.125% | | | 02/04/2013 | | | EUR | | | 1,400,000 | | | | 1,896,836 | |
| | | | | | | | | | | | | | |
See accompanying notes to financial statements.
196
SCHEDULE OF INVESTMENTS—(Continued)
December 31, 2011
| | | | | | | | | | | | | | |
| Vantagepoint Low Duration Bond Fund | | | | | | | | |
| | | | |
Coupon
Rate | | Maturity
Date | | | | | Face | | | Value | |
| | | | | | | | | | | | | | |
| CORPORATE OBLIGATIONS—(Continued) | |
| Wireless Telecommunication Services—0.3% | |
America Movil SAB de CV (Mexico) | |
3.625% | | | 03/30/2015 | | | | | $ | 300,000 | | | $ | 315,861 | |
Vodafone Group plc (United Kingdom) | |
4.150% | | | 06/10/2014 | | | | | | 1,280,000 | | | | 1,357,992 | |
| | | | | | | | | | | | | | |
| | | | | | | | | | | | | 1,673,853 | |
| | | | | | | | | | | | | | |
| TOTAL CORPORATE OBLIGATIONS | |
(Cost $329,431,019) | | | | | | | | | | 329,599,952 | |
| | | | | | | | | | | | | | |
| | | | | | | | | | | | | | | |
| MORTGAGE-RELATED SECURITIES—8.1% | |
| Commercial Mortgage-Backed Securities—0.5% | |
Extended Stay America Trust,
Series 2010-ESHA, Class A | |
2.951% | | | 11/05/2027 | | | ^ | | | 1,166,169 | | | | 1,172,002 | |
National Credit Union Administration Guaranteed Notes, Series 2010-C1, Class A2 | |
2.900% | | | 10/29/2020 | | | | | | 1,100,000 | | | | 1,163,026 | |
| | | | | | | | | | | | | | |
| | | | | | | | | | | | | 2,335,028 | |
| | | | | | | | | | | | | | |
| U.S. Government Agency Mortgage-Backed Securities—6.2% | |
Federal Deposit Insurance Corporation Structured Sale Guaranteed Notes,
Series 2010-S1, Class 2A | |
3.250% | | | 04/25/2038 | | | ^ | | | 1,475,700 | | | | 1,514,914 | |
Federal National Mortgage Association | |
5.000% | | | 07/01/2035 | | | | | | 4,761,001 | | | | 5,149,489 | |
4.000% | | | 11/01/2040- | | | | | | | | | | | |
| | | 09/01/2041 | | | | | | 4,035,770 | | | | 4,245,415 | |
3.500% | |
| 05/01/2020-
12/01/2020 |
| | | | | 2,295,933 | | | | 2,404,926 | |
3.138% | | | 07/01/2041 | | | # | | | 4,402,254 | | | | 4,591,158 | |
3.092% | | | 06/01/2041 | | | # | | | 2,919,951 | | | | 3,045,335 | |
2.240% | | | 10/01/2034 | | | # | | | 1,633,937 | | | | 1,712,408 | |
2.191% | | | 09/01/2034 | | | # | | | 139,653 | | | | 145,151 | |
2.165% | | | 09/01/2034 | | | # | | | 198,304 | | | | 206,126 | |
2.060% | | | 10/01/2034 | | | # | | | 246,664 | | | | 256,959 | |
0.595% | | | 07/01/2016 | | | # | | | 2,800,000 | | | | 2,827,296 | |
Government National Mortgage Association,
Series 2005-58, Class NJ | |
4.500% | | | 08/20/2035 | | | | | | 413,655 | | | | 417,335 | |
National Credit Union Administration Guaranteed Notes, Series 2010-R1, Class 2A | |
1.840% | | | 10/07/2020 | | | | | | 431,457 | | | | 434,153 | |
National Credit Union Administration Guaranteed Notes, Series 2010-R2, Class 1A | |
0.644% | | | 11/06/2017 | | | # | | | 1,753,436 | | | | 1,753,436 | |
National Credit Union Administration Guaranteed Notes, Series 2010-R3, Class 1A | |
0.834% | | | 12/08/2020 | | | # | | | 3,648,727 | | | | 3,662,409 | |
| | | | | | | | | | | | | | |
| | | | | | | | | | | | | 32,366,510 | |
| | | | | | | | | | | | | | |
| U.S. Non-Agency Mortgage-Backed Securities—1.4% | |
Banc of America Mortgage Securities, Inc.,
Series 2004-L, Class 1A1 | |
2.888% | | | 01/25/2035 | | | # | | | 731,109 | | | | 552,311 | |
GSR Mortgage Loan Trust,
Series 2005-AR6, Class 2A1 | |
2.685% | | | 09/25/2035 | | | # | | | 2,242,164 | | | | 1,961,787 | |
Harborview Mortgage Loan Trust,
Series 2005-14, Class 3A1A | |
2.750% | | | 12/19/2035 | | | # | | | 2,678,703 | | | | 1,662,355 | |
| | | | | | | | | | | | | | |
| | | | | |
Coupon
Rate | |
| Maturity
Date |
| | | | | Face | | | | Value | |
| | | | | | | | | | | | | | |
MLCC Mortgage Investors, Inc.,
Series 2004-1, Class 2A2 | |
2.079% | | | 12/25/2034 | | | # | | $ | 1,516,429 | | | $ | 1,435,158 | |
Provident Funding Mortgage Loan Trust,
Series 2004-1, Class 1A1 | |
2.619% | | | 04/25/2034 | | | # | | | 231,018 | | | | 216,695 | |
Structured Asset Mortgage Investments, Inc.,
Series 2004-AR5, Class 2A1 | |
2.169% | | | 10/19/2034 | | | # | | | 717,314 | | | | 388,584 | |
Thornburg Mortgage Securities Trust,
Series 2004-1, Class II2A | |
1.744% | | | 03/25/2044 | | | # | | | 540,334 | | | | 458,476 | |
Wells Fargo Mortgage Backed Securities Trust,
Series 2004-S, Class B1 | |
2.701% | | | 09/25/2034 | | | # | | | 1,502,245 | | | | 894,567 | |
| | | | | | | | | | | | | | |
| | | | | | | | | | | | | 7,569,933 | |
| | | | | | | | | | | | | | |
| TOTAL MORTGAGE-RELATED SECURITIES | |
(Cost $44,512,793) | | | | | | | | | | 42,271,471 | |
| | | | | | | | | | | | | | |
| | | | | | | | | | | | | | | |
| U.S. TREASURY OBLIGATIONS—6.8% | |
| U.S. Treasury Notes—6.8% | |
U.S. Treasury Note | |
3.000% | | | 09/30/2016 | | | | | | 2,700,000 | | | | 2,976,961 | |
2.375% | | | 08/31/2014 | | | | | | 330,000 | | | | 347,686 | |
1.250% | | | 02/15/2014 | | | ‡‡ | | | 288,000 | | | | 293,962 | |
1.000% | | | 07/15/2013- | | | | | | | | | | | |
| | | 08/31/2016 | | | | | | 5,850,000 | | | | 5,919,980 | |
0.875% | | | 11/30/2016 | | | | | | 9,500,000 | | | | 9,530,429 | |
0.750% | | | 09/15/2013 | | | | | | 1,820,000 | | | | 1,835,854 | |
0.375% | | | 06/30/2013 | | | | | | 9,280,000 | | | | 9,303,562 | |
0.250% | | | 10/31/2013 | | | † | | | 2,055,000 | | | | 2,055,643 | |
0.249% | | | 11/30/2013 | | | † | | | 1,635,000 | | | | 1,635,448 | |
0.125% | | | 09/30/2013 | | | | | | 1,645,000 | | | | 1,641,980 | |
| | | | | | | | | | | | | | |
| TOTAL U.S. TREASURY OBLIGATIONS | |
(Cost $35,335,128) | | | | | | | | | | 35,541,505 | |
| | | | | | | | | | | | | | |
| | | | | | | | | | | | | | | |
| GOVERNMENT RELATED OBLIGATIONS—7.5% | |
| U.S. Government Agencies—3.2% | |
Federal Farm Credit Bank | |
1.375% | | | 06/25/2013 | | | | | | 1,830,000 | | | | 1,860,543 | |
Federal Home Loan Mortgage Corp. | |
0.625% | | | 12/29/2014 | | | † | | | 7,800,000 | | | | 7,800,047 | |
0.550% | | | 09/09/2013 | | | | | | 5,000,000 | | | | 4,995,970 | |
National Credit Union Administration Guaranteed Notes, Series A2 | |
1.400% | | | 06/12/2015 | | | | | | 1,770,000 | | | | 1,792,992 | |
| | | | | | | | | | | | | | |
| | | | | | | | | | | | | 16,449,552 | |
| | | | | | | | | | | | | | |
| U.S. Government Agencies-U.S. Government Guaranteed Bank Debt—0.2% | |
Western Corporate Federal Credit Union | |
1.750% | | | 11/02/2012 | | | | | | 980,000 | | | | 992,479 | |
| | | | | | | | | | | | | | |
| Non-U.S. Government Agencies—0.6% | |
IPIC Ltd. MTN (Cayman Islands) | |
3.125% | | | 11/15/2015 | | | ^ | | | 500,000 | | | | 501,250 | |
Korea National Oil Corp. (Korea, Republic of) | |
2.875% | | | 11/09/2015 | | | ^ | | | 1,160,000 | | | | 1,163,134 | |
Kreditanstalt fuer Wiederaufbau (Germany) | |
1.375% | | | 01/13/2014 | | | | | | 1,500,000 | | | | 1,514,471 | |
| | | | | | | | | | | | | | |
| | | | | | | | | | | | | 3,178,855 | |
| | | | | | | | | | | | | | |
See accompanying notes to financial statements.
197
SCHEDULE OF INVESTMENTS—(Continued)
December 31, 2011
| | | | | | | | | | | | | | |
| Vantagepoint Low Duration Bond Fund | | | | | | | | |
| | | | |
Coupon
Rate | | Maturity
Date | | | | | Face | | | Value | |
| | | | | | | | | | | | | | |
| GOVERNMENT RELATED OBLIGATIONS—(Continued) | |
| Sovereign Debt—1.7% | |
Irish Life & Permanent plc (Ireland) | |
3.600% | | | 01/14/2013 | | | ^ | | $ | 4,617,000 | | | $ | 4,084,087 | |
Korea Finance Corp. (Korea, Republic of) | |
3.250% | | | 09/20/2016 | | | | | | 1,660,000 | | | | 1,640,585 | |
Panama Government International Bond (Panama) | |
9.375% | | | 07/23/2012 | | | | | | 500,000 | | | | 522,000 | |
7.250% | | | 03/15/2015 | | | | | | 785,000 | | | | 908,637 | |
Qatar Government International Bond (Qatar) | |
3.125% | | | 01/20/2017 | | | ^ | | | 780,000 | | | | 788,736 | |
Republic of South Africa (South Africa) | |
7.375% | | | 04/25/2012 | | | | | | 1,000,000 | | | | 1,018,800 | |
| | | | | | | | | | | | | | |
| | | | | | | | | | | | | 8,962,845 | |
| | | | | | | | | | | | | | |
| U.S. Municipal Bonds—1.3% | |
California General Obligation Bonds (California) | |
5.450% | | | 04/01/2015 | | | | | | 3,635,000 | | | | 3,977,163 | |
5.250% | | | 04/01/2014 | | | | | | 1,200,000 | | | | 1,284,396 | |
Kentucky Asset Liability Commission Revenue Bonds (Kentucky) | |
3.165% | | | 04/01/2018 | | | | | | 1,100,000 | | | | 1,131,966 | |
University of California Revenue Bonds (California) | |
1.988% | | | 05/15/2050 | | | # | | | 460,000 | | | | 468,027 | |
| | | | | | | | | | | | | | |
| | | | | | | | | | | | | 6,861,552 | |
| | | | | | | | | | | | | | |
| Non-U.S. Regional Authority Bonds—0.5% | |
Province of British Columbia (Canada) | |
2.650% | | | 09/22/2021 | | | | | | 700,000 | | | | 715,196 | |
Province of Manitoba (Canada) | |
1.375% | | | 04/28/2014 | | | | | | 1,500,000 | | | | 1,525,413 | |
Province of Ontario (Canada) | |
1.600% | | | 09/21/2016 | | | | | | 450,000 | | | | 449,122 | |
| | | | | | | | | | | | | | |
| | | | | | | | | | | | | 2,689,731 | |
| | | | | | | | | | | | | | |
| TOTAL GOVERNMENT RELATED OBLIGATIONS | |
(Cost $38,966,401) | | | | | | | | | | 39,135,014 | |
| | | | | | | | | | | | | | |
| | | | | | | | | | | | | | | |
| ASSET-BACKED SECURITIES—11.4% | |
| Automobile—2.7% | |
Capital Auto Receivables Asset Trust
Series 2008-1, Class A4B | |
1.628% | | | 07/15/2014 | | | # | | | 1,974,866 | | | | 1,980,871 | |
Capital Auto Receivables Asset Trust
Series 2007-4A, Class A4 | |
5.300% | | | 05/15/2014 | | | | | | 202,712 | | | | 204,462 | |
Daimler Chrysler Auto Trust
Series 2008-B, Class A4A | |
5.320% | | | 11/10/2014 | | | | | | 692,931 | | | | 697,510 | |
Daimler Chrysler Auto Trust
Series 2007-A, Class A4 | |
5.280% | | | 03/08/2013 | | | | | | 330,661 | | | | 330,986 | |
Ford Credit Auto Owner Trust
Series 2009-A, Class A4 | |
6.070% | | | 05/15/2014 | | | | | | 1,600,000 | | | | 1,654,415 | |
Harley-Davidson Motorcycle Trust
Series 2008-1, Class A4 | |
4.900% | | | 12/15/2013 | | | | | | 955,052 | | | | 966,730 | |
| | | | | | | | | | | | | | |
| | | | | |
Coupon
Rate | |
| Maturity
Date |
| | | | | Face | | | | Value | |
| | | | | | | | | | | | | | |
Harley-Davidson Motorcycle Trust
Series 2007-2, Class A4 | |
5.120% | | | 08/15/2013 | | | | | $ | 372,242 | | | $ | 374,479 | |
Harley-Davidson Motorcycle Trust
Series 2009-3, Class A4 | |
2.540% | | | 04/15/2017 | | | | | | 2,000,000 | | | | 2,017,338 | |
Honda Auto Receivables Owner Trust
Series 2011-1, Class A3 | |
1.130% | | | 10/15/2014 | | | | | | 2,000,000 | | | | 2,008,574 | |
Honda Auto Receivables Owner Trust
Series 2009-2, Class A4 | |
4.430% | | | 07/15/2015 | | | | | | 1,175,000 | | | | 1,197,482 | |
Honda Auto Receivables Owner Trust
Series 2009-2, Class A3 | |
2.790% | | | 01/15/2013 | | | | | | 633,291 | | | | 634,489 | |
Hyundai Capital Auto Funding Ltd. (Cayman Islands)
Series 2010-8A, Class A | |
1.285% | | | 09/20/2016 | | | #^ | | | 2,200,000 | | | | 2,212,078 | |
| | | | | | | | | | | | | | |
| | | | | | | | | | | | | 14,279,414 | |
| | | | | | | | | | | | | | |
| Credit Card—8.1% | |
American Express Credit Account Master Trust
Series 2008-5, Class A | |
1.078% | | | 03/15/2016 | | | # | | | 4,550,000 | | | | 4,602,865 | |
American Express Credit Account Master Trust
Series 2005-4, Class A | |
0.348% | | | 01/15/2015 | | | # | | | 1,268,000 | | | | 1,268,113 | |
Capital One Multi-Asset Execution Trust
Series 2006-A5, Class A5 | |
0.338% | | | 01/15/2016 | | | # | | | 6,750,000 | | | | 6,739,085 | |
Capital One Multi-Asset Execution Trust
Series 2005-A10, Class A | |
0.358% | | | 09/15/2015 | | | # | | | 2,095,000 | | | | 2,092,435 | |
Chase Issuance Trust
Series 2007-A17, Class A | |
5.120% | | | 10/15/2014 | | | † | | | 5,050,000 | | �� | | 5,228,254 | |
Citibank Credit Card Issuance Trust
Series 2009-A5, Class A5 | |
2.250% | | | 12/23/2014 | | | | | | 4,230,000 | | | | 4,293,542 | |
Citibank Credit Card Issuance Trust
Series 2009-A2, Class A2 | |
1.828% | | | 05/15/2014 | | | # | | | 2,211,000 | | | | 2,223,524 | |
Discover Card Master Trust
Series 2009-A2, Class A | |
1.578% | | | 02/17/2015 | | | # | | | 2,200,000 | | | | 2,216,961 | |
Discover Card Master Trust
Series 2009-A1, Class A1 | |
1.578% | | | 12/15/2014 | | | # | | | 5,383,000 | | | | 5,415,080 | |
GE Capital Credit Card Master Note Trust
Series 2010-3, Class A | |
2.210% | | | 06/15/2016 | | | | | | 6,300,000 | | | | 6,426,909 | |
GE Capital Credit Card Master Note Trust
Series 2007-4, Class A | |
0.328% | | | 06/15/2015 | | | # | | | 1,886,000 | | | | 1,884,841 | |
Penarth Master Issuer plc (United Kingdom)
Series 2011-1A, Class A1 | |
0.935% | | | 05/18/2015 | | | #^ | | | 300,000 | | | | 300,124 | |
| | | | | | | | | | | | | | |
| | | | | | | | | | | | | 42,691,733 | |
| | | | | | | | | | | | | | |
| Other—0.6% | |
CNH Equipment Trust
Series 2011-A, Class A2 | |
0.620% | | | 06/16/2014 | | | | | | 1,425,000 | | | | 1,423,930 | |
See accompanying notes to financial statements.
198
SCHEDULE OF INVESTMENTS—(Continued)
December 31, 2011
| | | | | | | | | | | | | | |
| Vantagepoint Low Duration Bond Fund | | | | | | | | |
| | | | |
Coupon
Rate | | Maturity
Date | | | | | Face | | | Value | |
| | | | | | | | | | | | | | |
| ASSET-BACKED SECURITIES—(Continued) | |
MMAF Equipment Finance LLC
Series 2011-AA, Class A3 | |
1.270% | | | 09/15/2015 | | | ^ | | $ | 1,560,000 | | | $ | 1,559,876 | |
| | | | | | | | | | | | | | |
| | | | | | | | | | | | | 2,983,806 | |
| | | | | | | | | | | | | | |
| TOTAL ASSET-BACKED SECURITIES | |
(Cost $59,750,651) | | | | | | | | | | 59,954,953 | |
| | | | | | | | | | | | | | |
| | | | | | | | | | | | | | | |
| | | | |
| | | | | | | | | | Shares | | | | Value | |
| MONEY MARKET FUNDS—7.7% | |
| Institutional Money Market Funds—7.7% | |
Dreyfus Institutional Cash Advantage Fund, 0.06% | | | ††¥ | | | 4,300,000 | | | $ | 4,300,000 | |
Fidelity Institutional Money Market: Money Market Portfolio—Institutional Class, 0.23% | | | ¥ | | | 14,509,364 | | | | 14,509,364 | |
Fidelity Institutional Money Market: Money Market Portfolio—Institutional Class, 0.23% | | | ††¥ | | | 4,435,756 | | | | 4,435,756 | |
Fidelity Institutional Money Market: Prime Money Market Portfolio—Institutional Class, 0.17% | | | ††¥ | | | 4,300,000 | | | | 4,300,000 | |
Short-Term Investments Trust Liquid Assets Portfolio, 0.16% | | | ††¥ | | | 4,500,000 | | | | 4,500,000 | |
Wells Fargo Advantage Cash Investment Money Market Fund—Select Class, 0.11% | | | ††¥ | | | 4,300,000 | | | | 4,300,000 | |
Wells Fargo Advantage Heritage Money Market Fund—Select Class, 0.08% | | | ††¥ | | | 4,300,000 | | | | 4,300,000 | |
| | | | | | | | | | | | | | |
| TOTAL MONEY MARKET FUNDS | |
(Cost $40,645,120) | | | | | | | 40,645,120 | |
| | | | | | | | | | | | | | |
| TOTAL INVESTMENTS—104.3% | |
(Cost $548,641,112) | | | | | | | 547,148,015 | |
Other assets less liabilities—(4.3%) | | | | (22,685,138 | ) |
| | | | | | | | | | | | | | |
| NET ASSETS—100.0% | | | $ | 524,462,877 | |
| | | | | | | | | | | | | | |
Notes to the Schedule of Investments:
| | |
| EUR | | European Monetary Unit |
| GBP | | British Pound Sterling |
| MTN | | Medium Term Note |
| REIT | | Real Estate Investment Trust |
| # | | Rate is subject to change. Rate shown reflects current rate. |
| ^ | | Securities are not registered under the Securities Act of 1933. These securities may be resold only in transactions exempt from registration, generally to qualified institutional buyers under Securities Act Rule 144A. Such securities are considered illiquid unless deemed liquid by a subadviser under the liquidity procedures adopted by the Board of Directors. The total market value of 144A securities was $69,303,643, which represented 13.2% of Net Assets. The illiquid 144A securities represented 6.7% of Net Assets, and 51.0% of total 144A securities held. |
| † | | Denotes all or a portion of the security on loan. |
| ‡‡ | | Security or a portion of the security has been pledged as collateral for futures contracts and/or options contracts. |
| †† | | Represents reinvestment of collateral received in conjunction with securities lending. |
| ¥ | | The rate quoted is the annualized seven-day yield of the fund at period end. |
See accompanying notes to financial statements.
199
SCHEDULE OF INVESTMENTS
December 31, 2011
| | | | | | | | | | | | | | |
| Vantagepoint Inflation Protected Securities Fund | | | | | | | | |
| | | | |
Coupon
Rate | | Maturity
Date | | | | | Face | | | Value | |
| | | | | | | | | | | | | | |
| CORPORATE OBLIGATIONS—4.7% | | | | | |
| Capital Markets—0.7% | | | | | |
Bear Stearns Cos. LLC (The), Series CPI MTN | |
5.670% | | | 03/10/2014 | | | # | | $ | 380,000 | | | $ | 385,358 | |
Morgan Stanley MTN | |
2.953% | | | 05/14/2013 | | | # | | | 4,000,000 | | | | 3,842,408 | |
| | | | | | | | | | | | | | |
| | | | | | | | | | | | | 4,227,766 | |
| | | | | | | | | | | | | | |
| Commercial Banks—1.6% | | | | | |
Barclays Bank plc MTN (United Kingdom) | |
0.740% | | | 09/11/2017 | | | # | | | 1,500,000 | | | | 1,316,355 | |
Barclays Bank plc, Series E MTN (United Kingdom) | |
0.746% | | | 03/23/2017 | | | # | | | 3,600,000 | | | | 3,294,198 | |
BNP Paribas/BNP Paribas LLC MTN (France) | |
5.340% | | | 03/23/2012 | | | # | | | 2,000,000 | | | | 2,015,060 | |
JPMorgan Chase Bank NA | |
0.872% | | | 06/13/2016 | | | # | | | 2,100,000 | | | | 1,881,464 | |
Royal Bank of Scotland plc (The) (United Kingdom) | |
4.875% | | | 03/16/2015 | | | † | | | 600,000 | | | | 574,126 | |
| | | | | | | | | | | | | | |
| | | | | | | | | | | | | 9,081,203 | |
| | | | | | | | | | | | | | |
| Consumer Finance—1.3% | | | | | |
HSBC Finance Corp. | |
0.653% | | | 01/15/2014 | | | #† | | | 4,900,000 | | | | 4,516,100 | |
SLM Corp. MTN | |
6.250% | | | 01/25/2016 | | | | | | 2,400,000 | | | | 2,336,002 | |
5.050% | | | 11/14/2014 | | | | | | 500,000 | | | | 493,473 | |
SLM Corp., Series CPI MTN | |
6.118% | | | 03/15/2013 | | | # | | | 120,000 | | | | 118,552 | |
| | | | | | | | | | | | | | |
| | | | | | | | | | | | | 7,464,127 | |
| | | | | | | | | | | | | | |
| Diversified Financial Services—0.8% | | | | | |
Bank of America Corp., Series K MTN | |
0.876% | | | 09/15/2014 | | | # | | | 2,000,000 | | | | 1,719,586 | |
Citigroup, Inc. | |
2.453% | | | 08/13/2013 | | | # | | | 700,000 | | | | 687,391 | |
Lloyds TSB Bank plc (United Kingdom) | |
2.766% | | | 01/24/2014 | | | # | | | 2,500,000 | | | | 2,366,312 | |
| | | | | | | | | | | | | | |
| | | | | | | | | | | | | 4,773,289 | |
| | | | | | | | | | | | | | |
| Energy Equipment & Services—0.1% | | | | | |
Transocean, Inc. (Cayman Islands) | |
4.950% | | | 11/15/2015 | | | | | | 500,000 | | | | 511,020 | |
| | | | | | | | | | | | | | |
| Thrifts & Mortgage Finance—0.2% | | | | | |
Countrywide Financial Corp. MTN | |
5.800% | | | 06/07/2012 | | | † | | | 1,300,000 | | | | 1,302,870 | |
| | | | | | | | | | | | | | |
| TOTAL CORPORATE OBLIGATIONS | |
(Cost $28,691,956) | | | | | | | | | | 27,360,275 | |
| | | | | | | | | | | | | | |
| | | | | | | | | | | | | | | |
| U.S. TREASURY OBLIGATIONS—87.3% | |
| U.S. Treasury Bills—1.6% | | | | | |
U.S. Treasury Bill | |
0.106% | | | 12/13/2012 | | | † | | | 3,200,000 | | | | 3,196,784 | |
0.058% | | | 06/28/2012 | | | | | | 3,600,000 | | | | 3,598,981 | |
0.040% | | | 06/07/2012 | | | † | | | 2,500,000 | | | | 2,499,540 | |
| | | | | | | | | | | | | | |
| | | | | | | | | | | | | 9,295,305 | |
| | | | | | | | | | | | | | |
| | | | | | | | | | | | | | |
| | | | | |
Coupon
Rate | |
| Maturity
Date |
| | | | | Face | | | | Value | |
| | | | | | | | | | | | | | |
| U.S. Treasury Bonds—0.3% | | | | | |
U.S. Treasury Bond | |
3.750% | | | 08/15/2041 | | | † | | $ | 1,572,500 | | | $ | 1,849,653 | |
| | | | | | | | | | | | | | |
| U.S. Treasury Inflation Protected Securities Bonds—38.0% | |
U.S. Treasury Bond | |
3.875% | | | 04/15/2029 | | | | | | 14,315,000 | | | | 30,777,292 | |
3.625% | | | 04/15/2028 | | | | | | 13,300,000 | | | | 27,707,106 | |
3.375% | | | 04/15/2032 | | | | | | 449,100 | | | | 883,975 | |
2.500% | | | 01/15/2029 | | | | | | 11,600,000 | | | | 16,347,627 | |
2.375% | | | 01/15/2025- | | | | | | | | | | | |
| | | 01/15/2027 | | | | | | 34,852,400 | | | | 52,629,067 | |
2.125% | | | 02/15/2041 | | | | | | 21,940,300 | | | | 30,697,051 | |
2.125% | | | 02/15/2040 | | | ‡‡ | | | 12,009,800 | | | | 16,914,706 | |
2.000% | | | 01/15/2026 | | | | | | 17,705,000 | | | | 24,852,628 | |
1.750% | | | 01/15/2028 | | | | | | 16,470,000 | | | | 21,428,874 | |
| | | | | | | | | | | | | | |
| | | | | | | | | | | | | 222,238,326 | |
| | | | | | | | | | | | | | |
| U.S. Treasury Inflation Protected Securities Notes—45.8% | |
U.S. Treasury Note | |
3.000% | | | 07/15/2012 | | | | | | 4,850,000 | | | | 6,242,588 | |
2.625% | | | 07/15/2017 | | | | | | 21,335,000 | | | | 27,760,019 | |
2.500% | | | 07/15/2016 | | | | | | 9,719,800 | | | | 12,610,399 | |
2.375% | | | 01/15/2017 | | | | | | 11,315,300 | | | | 14,754,927 | |
2.125% | | | 01/15/2019 | | | | | | 3,107,600 | | | | 3,898,898 | |
2.000% | | | 04/15/2012- | | | | | | | | | | | |
| | | 01/15/2016 | | | | | | 24,071,100 | | | | 29,737,912 | |
1.875% | | | 07/15/2013- | | | | | | | | | | | |
| | | 07/15/2019 | | | | | | 36,221,900 | | | | 46,396,467 | |
1.625% | | | 01/15/2015- | | | | | | | | | | | |
| | | 01/15/2018 | | | | | | 3,690,000 | | | | 4,584,230 | |
1.375% | | | 07/15/2018- | | | | | | | | | | | |
| | | 01/15/2020 | | | | | | 10,009,800 | | | | 11,940,303 | |
1.250% | | | 04/15/2014- | | | | | | | | | | | |
| | | 07/15/2020 | | | | | | 15,120,000 | | | | 17,346,687 | |
1.125% | | | 01/15/2021 | | | | | | 2,970,000 | | | | 3,431,256 | |
0.625% | | | 04/15/2013- | | | | | | | | | | | |
| | | 07/15/2021 | | | | | | 37,834,500 | | | | 40,784,601 | |
0.500% | | | 04/15/2015 | | | | | | 16,356,700 | | | | 17,891,883 | |
0.125% | | | 04/15/2016 | | | | | | 28,078,500 | | | | 30,044,466 | |
| | | | | | | | | | | | | | |
| | | | | | | | | | | | | 267,424,636 | |
| | | | | | | | | | | | | | |
| U.S. Treasury Notes—1.6% | | | | | |
U.S. Treasury Note | |
3.625% | | | 02/15/2021 | | | ‡‡ | | | 8,150,000 | | | | 9,463,552 | |
| | | | | | | | | | | | | | |
| TOTAL U.S. TREASURY OBLIGATIONS | |
(Cost $468,396,645) | | | | | | | | | | 510,271,472 | |
| | | | | | | | | | | | | | |
| | | | | | | | | | | | | | | |
| GOVERNMENT RELATED OBLIGATIONS—0.5% | |
| Non-U.S. Government Agencies—0.4% | | | | | |
Export-Import Bank of Korea (Korea, Republic of) | |
4.000% | | | 01/29/2021 | | | † | | | 1,200,000 | | | | 1,164,031 | |
Petrobras International Finance Co. (Cayman Islands) | |
3.875% | | | 01/27/2016 | | | | | | 1,200,000 | | | | 1,242,254 | |
| | | | | | | | | | | | | | |
| | | | | | | | | | | | | 2,406,285 | |
| | | | | | | | | | | | | | |
| Supranational—0.1% | | | | | |
International Bank for Reconstruction & Development, Series CPI | |
5.416% | | | 12/10/2013 | | | # | | | 275,000 | | | | 281,204 | |
| | | | | | | | | | | | | | |
| TOTAL GOVERNMENT RELATED OBLIGATIONS | |
(Cost $2,660,855) | | | | | | | | | | 2,687,489 | |
| | | | | | | | | | | | | | |
See accompanying notes to financial statements.
200
SCHEDULE OF INVESTMENTS—(Continued)
December 31, 2011
| | | | | | | | | | | | | | |
| Vantagepoint Inflation Protected Securities Fund | | | | | | | | |
| | | | |
Coupon
Rate | | Maturity
Date | | | | | Face | | | Value | |
| | | | | | | | | | | | | | |
| ASSET-BACKED SECURITIES—1.3% | |
| Home Equity—0.3% | |
Argent Securities, Inc.
Series 2005-W2, Class A2B1 | |
0.494% | | | 10/25/2035 | | | # | | $ | 242,819 | | | $ | 220,013 | |
First Franklin Mortgage Loan Asset Backed Certificates
Series 2005-FF11, Class A2D | |
0.634% | | | 11/25/2035 | | | # | | | 1,568,651 | | | | 1,300,324 | |
Saxon Asset Securities Trust
Series 2003-1, Class AF7 | |
4.034% | | | 06/25/2033 | | | | | | 135,474 | | | | 123,863 | |
| | | | | | | | | | | | | | |
| | | | | | | | | | | | | 1,644,200 | |
| | | | | | | | | | | | | | |
| Manufactured Housing—0.2% | |
Conseco Finance Securitizations Corp.
Series 2002-1, Class A | |
6.681% | | | 12/01/2033 | | | # | | | 1,024,022 | | | | 1,082,506 | |
| | | | | | | | | | | | | | |
| Other—0.1% | |
Park Place Securities, Inc.
Series 2004-WWF1, Class M2 | |
0.974% | | | 12/25/2034 | | | # | | | 301,827 | | | | 287,148 | |
| | | | | | | | | | | | | | |
| Student Loan—0.7% | |
Illinois Student Assistance Commission
Series 2010-1, Class A1 | |
0.898% | | | 04/25/2017 | | | # | | | 2,023,558 | | | | 2,012,024 | |
North Carolina State Education Assistance Authority
Series 2011-2, Class A1 | |
0.868% | | | 10/26/2020 | | | # | | | 548,024 | | | | 544,391 | |
South Carolina Student Loan Corp.
Series 2010-1, Class A1 | |
0.872% | | | 01/25/2021 | | | # | | | 1,786,318 | | | | 1,767,972 | |
| | | | | | | | | | | | | | |
| | | | | | | | | | | | | 4,324,387 | |
| | | | | | | | | | | | | | |
| TOTAL ASSET-BACKED SECURITIES | |
(Cost $7,382,594) | | | | | | | | | | 7,338,241 | |
| | | | | | | | | | | | | | |
| | | | | | | | | | | | | | | |
| PURCHASED OPTIONS—0.0% | |
| | | | |
| | | | | | | | Notional | | | Value | |
Put—U.S. 1 Year Swaption, Expires 11/19/2012, Strike 2.00% | | | 3,400,000 | | | | 1,473 | |
Put—U.S. 30 Year Swaption, Expires 09/24/2012, Strike 3.75% | | | 1,600,000 | | | | 23,911 | |
| | | | | | | | | | | | | | |
| TOTAL PURCHASED OPTIONS | |
(Cost $61,744) | | | | | | | | | | 25,384 | |
| | | | | | | | | | | | | | |
| | | | | | | | | | | | | | | |
| | | | |
| Coupon Rate | | Maturity
Date | | | | | Face | | | Value | |
| CERTIFICATES OF DEPOSIT—0.6% | |
| Commercial Banks—0.6% | |
Abbey National Treasury Services plc (United Kingdom) | |
1.916% | | | 06/10/2013 | | | | | | | | | | | |
(Cost $3,800,000) | | | | | | 3,800,000 | | | | 3,795,018 | |
| | | | | | | | | | | | | | |
| | | | | | | | | | | | |
| | | | | |
Coupon
Rate | | Maturity
Date | | | | | Shares | | | | Value | |
| | | | | | | | | | | | |
| MONEY MARKET FUNDS—7.0% | |
| Institutional Money Market Funds—7.0% | |
Dreyfus Institutional Cash Advantage Fund, 0.06% | | ††¥ | | $ | 2,100,000 | | | $ | 2,100,000 | |
Fidelity Institutional Money Market: Money Market Portfolio—Institutional Class, 0.23% | | ¥ | | | 28,082,733 | | | | 28,082,733 | |
Fidelity Institutional Money Market: Money Market Portfolio—Institutional Class, 0.23% | | ††¥ | | | 2,485,716 | | | | 2,485,716 | |
Fidelity Institutional Money Market: Prime Money Market Portfolio—Institutional Class, 0.17% | | ††¥ | | | 2,100,000 | | | | 2,100,000 | |
Short-Term Investments Trust Liquid Assets Portfolio, 0.16% | | ††¥ | | | 2,100,000 | | | | 2,100,000 | |
Wells Fargo Advantage Cash Investment Money Market Fund—Select Class, 0.11% | | ††¥ | | | 2,100,000 | | | | 2,100,000 | |
Wells Fargo Advantage Heritage Money Market Fund—Select Class, 0.08% | | ††¥ | | | 2,100,000 | | | | 2,100,000 | |
| | | | | | | | | | | | |
| TOTAL MONEY MARKET FUNDS | | | | | |
(Cost $41,068,449) | | | | | | | | | 41,068,449 | |
| | | | | | | | | | | | |
| TOTAL INVESTMENTS—101.4% | | | | | |
(Cost $552,062,243) | | | | | | | | | 592,546,328 | |
Other assets less liabilities—(1.4%) | | | | (8,354,835 | ) |
| | | | | | | | | | | | |
| NET ASSETS—100.0% | | | $ | 584,191,493 | |
| | | | | | | | | | | | |
Notes to the Schedule of Investments:
| | |
| MTN | | Medium Term Note |
| # | | Rate is subject to change. Rate shown reflects current rate. |
| † | | Denotes all or a portion of the security on loan. |
| ‡‡ | | Security or a portion of the security has been pledged as collateral for futures contracts and/or options contracts. |
| †† | | Represents reinvestment of collateral received in conjunction with securities lending. |
| ¥ | | The rate quoted is the annualized seven-day yield of the fund at period end. |
See accompanying notes to financial statements.
201
SCHEDULE OF INVESTMENTS
December 31, 2011
| | | | | | | | | | | | |
| Vantagepoint Equity Income Fund | | | Shares | | | | Value | |
| | | | | | | | | | |
| COMMON STOCKS—95.7% | |
| Aerospace & Defense—2.4% | |
Boeing Co. (The) | | | | | 76,000 | | | $ | 5,574,600 | |
Exelis, Inc. | | | | | 73,800 | | | | 667,890 | |
Honeywell International, Inc. | | | | | 393,200 | | | | 21,370,420 | |
L-3 Communications Holdings, Inc. | | | | | 60,200 | | | | 4,014,136 | |
Lockheed Martin Corp. | | | | | 40,800 | | | | 3,300,720 | |
Raytheon Co. | | | | | 187,900 | | | | 9,090,602 | |
| | | | | | | | | | |
| | | | | | | | | 44,018,368 | |
| | | | | | | | | | |
| Air Freight & Logistics—2.1% | |
FedEx Corp. | | | | | 393,600 | | | | 32,869,536 | |
United Parcel Service, Inc., Class B | | | | | 86,100 | | | | 6,301,659 | |
| | | | | | | | | | |
| | | | | | | | | 39,171,195 | |
| | | | | | | | | | |
| Automobiles—0.2% | |
General Motors Co. | | * | | | 68,800 | | | | 1,394,576 | |
Harley-Davidson, Inc. | | | | | 75,400 | | | | 2,930,798 | |
| | | | | | | | | | |
| | | | | | | | | 4,325,374 | |
| | | | | | | | | | |
| Beverages—0.7% | |
Beam, Inc. | | | | | 101,900 | | | | 5,220,337 | |
Molson Coors Brewing Co., Class B | | | | | 55,300 | | | | 2,407,762 | |
PepsiCo, Inc. | | | | | 85,000 | | | | 5,639,750 | |
| | | | | | | | | | |
| | | | | | | | | 13,267,849 | |
| | | | | | | | | | |
| Biotechnology—0.3% | |
Amgen, Inc. | | | | | 81,100 | | | | 5,207,431 | |
| | | | | | | | | | |
| Building Products—0.3% | |
Fortune Brands Home & Security, Inc. | | * | | | 99,500 | | | | 1,694,485 | |
Masco Corp. | | | | | 212,500 | | | | 2,227,000 | |
USG Corp. | | *† | | | 85,900 | | | | 872,744 | |
| | | | | | | | | | |
| | | | | | | | | 4,794,229 | |
| | | | | | | | | | |
| Capital Markets—3.1% | |
Bank of New York Mellon Corp. (The) | | | | | 1,581,500 | | | | 31,487,665 | |
Legg Mason, Inc. | | | | | 161,100 | | | | 3,874,455 | |
Morgan Stanley | | | | | 105,500 | | | | 1,596,215 | |
Northern Trust Corp. | | | | | 130,200 | | | | 5,163,732 | |
Och-Ziff Capital Management Group LLC, Class A | | | | | 38,300 | | | | 322,103 | |
State Street Corp. | | | | | 333,500 | | | | 13,443,385 | |
| | | | | | | | | | |
| | | | | | | | | 55,887,555 | |
| | | | | | | | | | |
| Chemicals—0.7% | |
E.I. Du Pont de Nemours & Co. | | | | | 65,446 | | | | 2,996,118 | |
International Flavors & Fragrances, Inc. | | | | | 57,000 | | | | 2,987,940 | |
Monsanto Co. | | | | | 90,000 | | | | 6,306,300 | |
| | | | | | | | | | |
| | | | | | | | | 12,290,358 | |
| | | | | | | | | | |
| Commercial Banks—3.2% | |
PNC Financial Services Group, Inc. | | | | | 345,600 | | | | 19,930,752 | |
Regions Financial Corp. | | | | | 319,100 | | | | 1,372,130 | |
| | | | | | | | | | | | |
| | | | |
| | | | | | Shares | | | | Value | |
| | | | | | | | | | |
SunTrust Banks, Inc. | | | | | 206,200 | | | $ | 3,649,740 | |
U.S. Bancorp | | | | | 347,400 | | | | 9,397,170 | |
Wells Fargo & Co. | | | | | 846,700 | | | | 23,335,052 | |
| | | | | | | | | | |
| | | | | | | | | 57,684,844 | |
| | | | | | | | | | |
| Commercial Services & Supplies—0.1% | |
Avery Dennison Corp. | | | | | 77,600 | | | | 2,225,568 | |
| | | | | | | | | | |
| Communications Equipment—0.6% | |
Cisco Systems, Inc. | | | | | 284,600 | | | | 5,145,568 | |
Harris Corp. | | | | | 150,100 | | | | 5,409,604 | |
| | | | | | | | | | |
| | | | | | | | | 10,555,172 | |
| | | | | | | | | | |
| Computers & Peripherals—3.5% | |
Dell, Inc. | | * | | | 3,512,500 | | | | 51,387,875 | |
Hewlett-Packard Co. | | | | | 490,300 | | | | 12,630,128 | |
| | | | | | | | | | |
| | | | | | | | | 64,018,003 | |
| | | | | | | | | | |
| Construction Materials—3.2% | |
Cemex SAB de CV ADR (Mexico) | | *† | | | 2,314,539 | | | | 12,475,365 | |
Martin Marietta Materials, Inc. | | † | | | 221,000 | | | | 16,665,610 | |
Vulcan Materials Co. | | † | | | 719,800 | | | | 28,324,130 | |
| | | | | | | | | | |
| | | | | | | | | 57,465,105 | |
| | | | | | | | | | |
| Consumer Finance—3.0% | |
American Express Co. | | | | | 582,400 | | | | 27,471,808 | |
Capital One Financial Corp. | | | | | 336,000 | | | | 14,209,440 | |
SLM Corp. | | | | | 926,700 | | | | 12,417,780 | |
| | | | | | | | | | |
| | | | | | | | | 54,099,028 | |
| | | | | | | | | | |
| Distributors—0.2% | |
Genuine Parts Co. | | | | | 57,052 | | | | 3,491,582 | |
| | | | | | | | | | |
| Diversified Consumer Services—0.1% | |
H&R Block, Inc. | | | | | 77,300 | | | | 1,262,309 | |
| | | | | | | | | | |
| Diversified Financial Services—2.6% | |
Bank of America Corp. | | | | | 1,744,106 | | | | 9,697,229 | |
Citigroup, Inc. | | | | | 388,199 | | | | 10,213,516 | |
JPMorgan Chase & Co. | | | | | 725,300 | | | | 24,116,225 | |
NYSE Euronext | | | | | 110,200 | | | | 2,876,220 | |
| | | | | | | | | | |
| | | | | | | | | 46,903,190 | |
| | | | | | | | | | |
| Diversified Telecommunication Services—5.8% | |
AT&T, Inc. | | | | | 782,542 | | | | 23,664,070 | |
CenturyLink, Inc. | | | | | 103,490 | | | | 3,849,828 | |
Level 3 Communications, Inc. | | * | | | 1,097,599 | | | | 18,648,207 | |
Telefonica SA (Spain) | | | | | 142,134 | | | | 2,448,707 | |
tw telecom inc. | | * | | | 1,783,991 | | | | 34,573,745 | |
Verizon Communications, Inc. | | | | | 554,841 | | | | 22,260,221 | |
| | | | | | | | | | |
| | | | | | | | | 105,444,778 | |
| | | | | | | | | | |
| Electric Utilities—2.3% | |
Duke Energy Corp. | | | | | 176,800 | | | | 3,889,600 | |
Entergy Corp. | | | | | 240,600 | | | | 17,575,830 | |
Exelon Corp. | | | | | 164,800 | | | | 7,147,376 | |
FirstEnergy Corp. | | | | | 64,100 | | | | 2,839,630 | |
Pinnacle West Capital Corp. | | | | | 69,400 | | | | 3,343,692 | |
PPL Corp. | | | | | 89,100 | | | | 2,621,322 | |
See accompanying notes to financial statements.
202
SCHEDULE OF INVESTMENTS—(Continued)
December 31, 2011
| | | | | | | | | | | | |
| Vantagepoint Equity Income Fund | | | | | | | Shares | | | | Value | |
| | | | | | | | | | | | |
| COMMON STOCKS—(Continued) | |
Progress Energy, Inc. | | | | | | | 91,800 | | | $ | 5,142,636 | |
| | | | | | | | | | | | |
| | | | | | | | | | | 42,560,086 | |
| | | | | | | | | | | | |
| Electrical Equipment—1.1% | |
Cooper Industries plc | | | | † | | | 103,000 | | | | 5,577,450 | |
Emerson Electric Co. | | | | | | | 312,400 | | | | 14,554,716 | |
| | | | | | | | | | | | |
| | | | | | | | | | | 20,132,166 | |
| | | | | | | | | | | | |
| Electronic Equipment, Instruments & Components—0.4% | |
Corning, Inc. | | | | | | | 558,600 | | | | 7,250,628 | |
| | | | | | | | | | | | |
| Energy Equipment & Services—0.5% | |
Diamond Offshore Drilling, Inc. | | † | | | 80,000 | | | | 4,420,800 | |
Schlumberger Ltd. | | | | | | | 79,600 | | | | 5,437,476 | |
| | | | | | | | | | | | |
| | | | | | | | | | | 9,858,276 | |
| | | | | | | | | | | | |
| Food & Staples Retailing—0.9% | |
Walgreen Co. | | | | | | | 470,900 | | | | 15,567,954 | |
| | | | | | | | | | | | |
| Food Products—0.9% | |
Archer-Daniels-Midland Co. | | | | | 164,700 | | | | 4,710,420 | |
Campbell Soup Co. | | | | | | | 111,800 | | | | 3,716,232 | |
ConAgra Foods, Inc. | | | | | | | 153,900 | | | | 4,062,960 | |
Hershey Co. (The) | | | | | | | 10,600 | | | | 654,868 | |
McCormick & Co., Inc. | | | | | | | 52,600 | | | | 2,652,092 | |
| | | | | | | | | | | | |
| | | | | | | | | | | 15,796,572 | |
| | | | | | | | | | | | |
| Health Care Equipment & Supplies—1.5% | |
Baxter International, Inc. | | | | | | | 214,900 | | | | 10,633,252 | |
Medtronic, Inc. | | | | | | | 417,900 | | | | 15,984,675 | |
| | | | | | | | | | | | |
| | | | | | | | | | | 26,617,927 | |
| | | | | | | | | | | | |
| Health Care Providers & Services—2.1% | |
Quest Diagnostics, Inc. | | | | | | | 63,700 | | | | 3,698,422 | |
UnitedHealth Group, Inc. | | | | | | | 342,000 | | | | 17,332,560 | |
WellPoint, Inc. | | | | † | | | 254,600 | | | | 16,867,250 | |
| | | | | | | | | | | | |
| | | | | | | | | | | 37,898,232 | |
| | | | | | | | | | | | |
| Hotels, Restaurants & Leisure—2.5% | |
Carnival Corp. | | | | | | | 322,100 | | | | 10,513,344 | |
Intercontinental Hotels Group plc ADR (United Kingdom) | | † | | | 673,000 | | | | 12,107,270 | |
Marriott International, Inc., Class A | | | | | 82,988 | | | | 2,420,760 | |
Yum! Brands, Inc. | | | | | | | 350,000 | | | | 20,653,500 | |
| | | | | | | | | | | | |
| | | | | | | | | | | 45,694,874 | |
| | | | | | | | | | | | |
| Household Durables—0.3% | |
Whirlpool Corp. | | | | | | | 98,500 | | | | 4,673,825 | |
| | | | | | | | | | | | |
| Household Products—0.7% | |
Clorox Co. (The) | | | | | | | 91,100 | | | | 6,063,616 | |
Kimberly-Clark Corp. | | | | | | | 100,659 | | | | 7,404,476 | |
| | | | | | | | | | | | |
| | | | | | | | | | | 13,468,092 | |
| | | | | | | | | | | | |
| Industrial Conglomerates—3.7% | |
3M Co. | | | | | | | 104,000 | | | | 8,499,920 | |
General Electric Co. | | | | | | | 1,418,400 | | | | 25,403,544 | |
| | | | | | | | | | | | |
| | | | | |
| | | | | | | | Shares | | | | Value | |
| | | | | | | | | | | | |
Koninklijke Philips Electronics NV NYRS (Netherlands) | | | | | 1,599,000 | | | $ | 33,499,050 | |
| | | | | | | | | | | | |
| | | | | | | | | | | 67,402,514 | |
| | | | | | | | | | | | |
| Insurance—8.9% | |
Allstate Corp. (The) | | | | | | | 431,100 | | | | 11,816,451 | |
Aon Corp. | | | | | | | 721,141 | | | | 33,749,398 | |
Chubb Corp. (The) | | | | | | | 42,800 | | | | 2,962,616 | |
Fairfax Financial Holdings Ltd. (Canada) | | † | | | 93,600 | | | | 40,360,320 | |
Lincoln National Corp. | | | | | | | 143,990 | | | | 2,796,286 | |
Loews Corp. | | | | | | | 772,200 | | | | 29,073,330 | |
Marsh & McLennan Cos., Inc. | | | | | 222,200 | | | | 7,025,964 | |
Sun Life Financial, Inc. (Canada) | | | | | | | 110,500 | | | | 2,046,460 | |
Travelers Cos., Inc. (The) | | | | | | | 554,000 | | | | 32,780,180 | |
| | | | | | | | | | | | |
| | | | | | | | | | | 162,611,005 | |
| | | | | | | | | | | | |
| Internet & Catalog Retail—1.3% | |
Liberty Interactive Corp., Series A | | | | * | | | 1,462,500 | | | | 23,714,437 | |
| | | | | | | | | | | | |
| Internet Software & Services—0.1% | |
Yahoo! Inc. | | | | * | | | 78,000 | | | | 1,258,140 | |
| | | | | | | | | | | | |
| IT Services—1.2% | |
Computer Sciences Corp. | | | | | | | 171,600 | | | | 4,066,920 | |
International Business Machines Corp. | | | | | | | 98,600 | | | | 18,130,568 | |
| | | | | | | | | | | | |
| | | | | | | | | | | 22,197,488 | |
| | | | | | | | | | | | |
| Leisure Equipment & Products—0.3% | |
Mattel, Inc. | | | | | | | 200,200 | | | | 5,557,552 | |
| | | | | | | | | | | | |
| Life Sciences Tools & Services—0.3% | |
Thermo Fisher Scientific, Inc. | | | | * | | | 120,900 | | | | 5,436,873 | |
| | | | | | | | | | | | |
| Machinery—2.4% | |
Illinois Tool Works, Inc. | | | | | | | 471,700 | | | | 22,033,107 | |
Ingersoll-Rand plc (Ireland) | | | | | | | 91,000 | | | | 2,772,770 | |
ITT Corp. | | | | | | | 36,900 | | | | 713,277 | |
Stanley Black & Decker, Inc. | | | | | 251,200 | | | | 16,981,120 | |
Xylem, Inc. | | | | | | | 73,800 | | | | 1,895,922 | |
| | | | | | | | | | | | |
| | | | | | | | | | | 44,396,196 | |
| | | | | | | | | | | | |
| Media—5.2% | |
Cablevision Systems Corp., Class A | | | | | | | 162,400 | | | | 2,309,328 | |
Comcast Corp., Class A | | | | | | | 153,500 | | | | 3,639,485 | |
DIRECTV, Class A | | | | * | | | 674,000 | | | | 28,820,240 | |
Madison Square Garden Co. (The), Class A | | | | * | | | 60,400 | | | | 1,729,856 | |
McGraw-Hill Cos., Inc. (The) | | | | | 128,600 | | | | 5,783,142 | |
New York Times Co. (The), Class A | | | | *† | | | 183,800 | | | | 1,420,774 | |
Time Warner, Inc. | | | | | | | 242,733 | | | | 8,772,371 | |
Walt Disney Co. (The) | | | | | | | 1,082,200 | | | | 40,582,500 | |
WPP plc (Ireland) | | | | | | | 162,700 | | | | 1,706,276 | |
| | | | | | | | | | | | |
| | | | | | | | | | | 94,763,972 | |
| | | | | | | | | | | | |
See accompanying notes to financial statements.
203
SCHEDULE OF INVESTMENTS—(Continued)
December 31, 2011
| | | | | | | | | | | | |
| Vantagepoint Equity Income Fund | | | | | | | Shares | | | | Value | |
| | | | | | | | | | | | |
| COMMON STOCKS—(Continued) | |
| Metals & Mining—0.3% | |
Nucor Corp. | | | | | | | 159,500 | | | $ | 6,311,415 | |
| | | | | | | | | | | | |
| Multiline Retail—0.7% | |
Kohl’s Corp. | | | | | | | 68,300 | | | | 3,370,605 | |
Macy’s, Inc. | | | | | | | 105,700 | | | | 3,401,426 | |
Target Corp. | | | | | | | 111,000 | | | | 5,685,420 | |
| | | | | | | | | | | | |
| | | | | | | | | | | 12,457,451 | |
| | | | | | | | | | | | |
| Multi-Utilities—1.3% | |
Dominion Resources, Inc. | | | | | | | 208,600 | | | | 11,072,488 | |
NiSource, Inc. | | | | † | | | 284,100 | | | | 6,764,421 | |
TECO Energy, Inc. | | | | | | | 68,800 | | | | 1,316,832 | |
Xcel Energy, Inc. | | | | | | | 163,400 | | | | 4,516,376 | |
| | | | | | | | | | | | |
| | | | | | | | | | | 23,670,117 | |
| | | | | | | | | | | | |
| Oil, Gas & Consumable Fuels—10.9% | |
Anadarko Petroleum Corp. | | | | | | | 91,500 | | | | 6,984,195 | |
BP plc ADR (United Kingdom) | | | | | 375,398 | | | | 16,044,511 | |
Chesapeake Energy Corp. | | | | | | | 1,961,000 | | | | 43,710,690 | |
Chevron Corp. | | | | | | | 233,058 | | | | 24,797,371 | |
ConocoPhillips | | | | | | | 325,400 | | | | 23,711,898 | |
Exxon Mobil Corp. | | | | | | | 172,060 | | | | 14,583,806 | |
Marathon Oil Corp. | | | | | | | 568,800 | | | | 16,648,776 | |
Murphy Oil Corp. | | | | | | | 134,000 | | | | 7,469,160 | |
Occidental Petroleum Corp. | | | | | 220,400 | | | | 20,651,480 | |
Royal Dutch Shell plc ADR (Netherlands) | | | | | 165,081 | | | | 12,065,770 | |
Spectra Energy Corp. | | | | † | | | 347,212 | | | | 10,676,769 | |
| | | | | | | | | | | | |
| | | | | | | | | | | 197,344,426 | |
| | | | | | | | | | | | |
| Paper & Forest Products—0.6% | |
International Paper Co. | | | | | 246,600 | | | | 7,299,360 | |
MeadWestvaco Corp. | | | | | 116,000 | | | | 3,474,200 | |
| | | | | | | | | | | | |
| | | | | | | | | | | 10,773,560 | |
| | | | | | | | | | | | |
| Personal Products—0.2% | |
Avon Products, Inc. | | | | | 244,100 | | | | 4,264,427 | |
| | | | | | | | | | | | |
| Pharmaceuticals—5.4% | |
Abbott Laboratories | | | | | 300,000 | | | | 16,869,000 | |
Bristol-Myers Squibb Co. | | | | | 414,000 | | | | 14,589,360 | |
Johnson & Johnson | | | | | 396,200 | | | | 25,982,796 | |
Merck & Co., Inc. | | | | | 188,000 | | | | 7,087,600 | |
Pfizer, Inc. | | | | | 1,129,787 | | | | 24,448,591 | |
Teva Pharmaceutical Industries Ltd. ADR (Israel) | | | | | 209,300 | | | | 8,447,348 | |
| | | | | | | | | | | | |
| | | | | | | | | | | 97,424,695 | |
| | | | | | | | | | | | |
| Real Estate Investment Trusts (REITs)—0.1% | |
Weyerhaeuser Co. REIT | | | | | 137,437 | | | | 2,565,949 | |
| | | | | | | | | | | | |
| Road & Rail—0.1% | |
Canadian Pacific Railway Ltd. (Canada) | | † | | | 21,700 | | | | 1,468,439 | |
| | | | | | | | | | | | |
| Semiconductors & Semiconductor Equipment—2.1% | |
Analog Devices, Inc. | | | | | 120,500 | | | | 4,311,490 | |
Applied Materials, Inc. | | | | | 784,700 | | | | 8,404,137 | |
First Solar, Inc. | | *† | | | 14,200 | | | | 479,392 | |
| | | | | | | | | | | | |
| | | | | |
| | | | | | | | Shares | | | | Value | |
| | | | | | | | | | | | |
Intel Corp. | | | | | 499,600 | | | $ | 12,115,300 | |
Texas Instruments, Inc. | | | | | 450,100 | | | | 13,102,411 | |
| | | | | | | | | | | | |
| | | | | | | | | 38,412,730 | |
| | | | | | | | | | | | |
| Software—1.4% | |
Microsoft Corp. | | | | | 977,900 | | | | 25,386,284 | |
| | | | | | | | | | | | |
| Specialty Retail—1.4% | |
Home Depot, Inc. (The) | | | | | 522,700 | | | | 21,974,308 | |
Staples, Inc. | | | | | 276,700 | | | | 3,843,363 | |
Tiffany & Co. | | | | | 7,300 | | | | 483,698 | |
| | | | | | | | | | | | |
| | | | | | | | | 26,301,369 | |
| | | | | | | | | | | | |
| Tobacco—1.7% | |
Altria Group, Inc. | | | | | 243,300 | | | | 7,213,845 | |
Imperial Tobacco Group plc ADR (United Kingdom) | | | 106,900 | | | | 8,053,846 | |
Philip Morris International, Inc. | | | | | 197,300 | | | | 15,484,104 | |
| | | | | | | | | | | | |
| | | | | | | | | 30,751,795 | |
| | | | | | | | | | | | |
| Wireless Telecommunication Services—0.8% | |
Vodafone Group plc (United Kingdom) | | | | | 880,800 | | | | 2,455,765 | |
Vodafone Group plc ADR (United Kingdom) | | † | | | 422,700 | | | | 11,848,281 | |
| | | | | | | | | | | | |
| | | | | | | | | 14,304,046 | |
| | | | | | | | | | | | |
| TOTAL COMMON STOCKS | |
(Cost $1,647,970,217) | | | | | | | 1,740,405,450 | |
| | | | | | | | | | | | |
| | | | | | | | | | | | | |
| CONVERTIBLE PREFERRED STOCKS—0.2% | |
| Automobiles—0.2% | |
General Motors Co., Series B 4.750% | | | | | | | | | | |
(Cost $4,555,012) | | | 91,200 | | | | 3,123,600 | |
| | | | | | | | | | | | |
| | | | | | | | | | | | | |
| MONEY MARKET FUNDS—9.9% | |
| Institutional Money Market Funds—9.9% | |
Dreyfus Institutional Cash Advantage Fund, 0.06% | | ††¥ | | | 17,500,000 | | | | 17,500,000 | |
Fidelity Institutional Money Market: Money Market Portfolio—Institutional Class, 0.23% | | ¥ | | | 73,199,873 | | | | 73,199,873 | |
Fidelity Institutional Money Market: Money Market Portfolio—Institutional Class, 0.23% | | ††¥ | | | 18,821,976 | | | | 18,821,976 | |
Fidelity Institutional Money Market: Prime Money Market Portfolio—Institutional Class, 0.17% | | ††¥ | | | 17,500,000 | | | | 17,500,000 | |
See accompanying notes to financial statements.
204
SCHEDULE OF INVESTMENTS—(Continued)
December 31, 2011
| | | | | | | | | | | | |
| Vantagepoint Equity Income Fund | | | Shares | | | | Value | |
| | | | | | | | | | | | |
| MONEY MARKET FUNDS—(Continued) | |
Short-Term Investments Trust Liquid Assets Portfolio, 0.16% | | ††¥ | | | 17,500,000 | | | $ | 17,500,000 | |
Wells Fargo Advantage Cash Investment Money Market Fund—Select Class, 0.11% | | ††¥ | | | 17,500,000 | | | | 17,500,000 | |
Wells Fargo Advantage Heritage Money Market Fund—Select Class, 0.08% | | ††¥ | | | 17,500,000 | | | | 17,500,000 | |
| | | | | | | | | | | | |
| TOTAL MONEY MARKET FUNDS | |
(Cost $179,521,849) | | | | | | | | | 179,521,849 | |
| | | | | | | | | | | | |
| TOTAL INVESTMENTS—105.8% | |
(Cost $1,832,047,078) | | | | | | | 1,923,050,899 | |
Other assets less liabilities—(5.8%) | | | | (105,493,609 | ) |
| | | | | | | | | | | | |
| NET ASSETS—100.0% | | | $ | 1,817,557,290 | |
| | | | | | | | | | | | |
Notes to the Schedule of Investments:
| | |
| ADR | | American Depositary Receipt |
| NYRS | | New York Registry Shares |
| REIT | | Real Estate Investment Trust |
| * | | Non-income producing. |
| † | | Denotes all or a portion of the security on loan. |
| †† | | Represents reinvestment of collateral received in conjunction with securities lending. |
| ¥ | | The rate quoted is the annualized seven-day yield of the fund at period end. |
See accompanying notes to financial statements.
205
SCHEDULE OF INVESTMENTS
December 31, 2011
| | | | | | | | | | | | |
| Vantagepoint Growth & Income Fund | | | | | | | Shares | | | | Value | |
| | | | | | | | | | | | |
| COMMON STOCKS—97.4% | |
| Aerospace & Defense—1.0% | |
Boeing Co. (The) | | | | | 32,200 | | | $ | 2,361,870 | |
Honeywell International, Inc. | | | | | 33,800 | | | | 1,837,030 | |
Precision Castparts Corp. | | | | | 28,800 | | | | 4,745,952 | |
United Technologies Corp. | | | | | 37,600 | | | | 2,748,184 | |
| | | | | | | | | | | | |
| | | | | | | | | | | 11,693,036 | |
| | | | | | | | | | | | |
| Air Freight & Logistics—2.0% | |
C.H. Robinson Worldwide, Inc. | | | | | 400 | | | | 27,912 | |
Expeditors International of Washington, Inc. | | | | | 28,900 | | | | 1,183,744 | |
FedEx Corp. | | | | | 53,300 | | | | 4,451,083 | |
United Parcel Service, Inc., Class B | | | | | 238,775 | | | | 17,475,942 | |
| | | | | | | | | | | | |
| | | | | | | | | | | 23,138,681 | |
| | | | | | | | | | | | |
| Auto Components—0.7% | |
Goodyear Tire & Rubber Co. (The) | | * | | | 414,100 | | | | 5,867,797 | |
Johnson Controls, Inc. | | | | | 54,100 | | | | 1,691,166 | |
| | | | | | | | | | | | |
| | | | | | | | | | | 7,558,963 | |
| | | | | | | | | | | | |
| Automobiles—0.3% | |
General Motors Co. | | * | | | 186,700 | | | | 3,784,409 | |
| | | | | | | | | | | | |
| Beverages—1.8% | |
Anheuser-Busch InBev NV ADR (Belgium) | | | | | 121,460 | | | | 7,407,845 | |
Coca-Cola Co. (The) | | | | | 400 | | | | 27,988 | |
Diageo plc ADR (United Kingdom) | | | | | 151,175 | | | | 13,215,719 | |
Hansen Natural Corp. | | * | | | 6,000 | | | | 552,840 | |
| | | | | | | | | | | | |
| | | | | | | | | | | 21,204,392 | |
| | | | | | | | | | | | |
| Biotechnology—1.5% | |
Alexion Pharmaceuticals, Inc. | | * | | | 15,700 | | | | 1,122,550 | |
Amgen, Inc. | | | | | 147,100 | | | | 9,445,291 | |
Biogen Idec, Inc. | | * | | | 25,800 | | | | 2,839,290 | |
Celgene Corp. | | * | | | 57,200 | | | | 3,866,720 | |
Gilead Sciences, Inc. | | * | | | 3,200 | | | | 130,976 | |
| | | | | | | | | | | | |
| | | | | | | | | | | 17,404,827 | |
| | | | | | | | | | | | |
| Capital Markets—4.2% | |
Ameriprise Financial, Inc. | | | | | 25,700 | | | | 1,275,748 | |
Bank of New York Mellon Corp. (The) | | | | | 756,000 | | | | 15,051,960 | |
BlackRock, Inc. | | | | | 41,000 | | | | 7,307,840 | |
Charles Schwab Corp. (The) | | | | | 2,700 | | | | 30,402 | |
Credit Suisse Group AG ADR (Switzerland) | | † | | | 207,000 | | | | 4,860,360 | |
Franklin Resources, Inc. | | | | | 48,500 | | | | 4,658,910 | |
Goldman Sachs Group, Inc. (The) | | | | | 57,700 | | | | 5,217,811 | |
Invesco Ltd. | | | | | 435,500 | | | | 8,749,195 | |
Northern Trust Corp. | | | | | 17,100 | | | | 678,186 | |
State Street Corp. | | | | | 29,300 | | | | 1,181,083 | |
TD Ameritrade Holding Corp. | | | | | 14,300 | | | | 223,795 | |
| | | | | | | | | | | | |
| | | | | | | | | | | 49,235,290 | |
| | | | | | | | | | | | |
| Chemicals—2.9% | |
Air Products & Chemicals, Inc. | | | | | 13,700 | | | | 1,167,103 | |
CF Industries Holdings, Inc. | | | | | 13,500 | | | | 1,957,230 | |
| | | | | | | | | | | | |
| | | | | |
| | | | | | | | Shares | | | | Value | |
| | | | | | | | | | | | |
Dow Chemical Co. (The) | | | | | 256,700 | | | $ | 7,382,692 | |
Ecolab, Inc. | | † | | | 5,900 | | | | 341,079 | |
Monsanto Co. | | | | | 149,600 | | | | 10,482,472 | |
Mosaic Co. (The) | | | | | 115,000 | | | | 5,799,450 | |
Potash Corp. of Saskatchewan, Inc. (Canada) | | | | | 2,800 | | | | 115,584 | |
Praxair, Inc. | | | | | 63,400 | | | | 6,777,460 | |
Sherwin-Williams Co. (The) | | | | | 2,000 | | | | 178,540 | |
| | | | | | | | | | | | |
| | | | | | | | | | | 34,201,610 | |
| | | | | | | | | | | | |
| Commercial Banks—4.6% | |
BB&T Corp. | | | | | 358,100 | | | | 9,013,377 | |
Comerica, Inc. | | | | | 490,150 | | | | 12,645,870 | |
PNC Financial Services Group, Inc. | | | | | 203,900 | | | | 11,758,913 | |
U.S. Bancorp | | | | | 65,200 | | | | 1,763,660 | |
Wells Fargo & Co. | | | | | 642,500 | | | | 17,707,300 | |
| | | | | | | | | | | | |
| | | | | | | | | | | 52,889,120 | |
| | | | | | | | | | | | |
| Commercial Services & Supplies—1.0% | |
Cintas Corp. | | | | | 321,500 | | | | 11,191,415 | |
| | | | | | | | | | | | |
| Communications Equipment—1.4% | |
Cisco Systems, Inc. | | | | | 455,400 | | | | 8,233,632 | |
Juniper Networks, Inc. | | * | | | 82,800 | | | | 1,689,948 | |
QUALCOMM, Inc. | | | | | 121,600 | | | | 6,651,520 | |
| | | | | | | | | | | | |
| | | | | | | | | | | 16,575,100 | |
| | | | | | | | | | | | |
| Computers & Peripherals—3.2% | |
Apple, Inc. | | * | | | 74,400 | | | | 30,132,000 | |
EMC Corp. | | * | | | 121,200 | | | | 2,610,648 | |
Hewlett-Packard Co. | | | | | 181,900 | | | | 4,685,744 | |
| | | | | | | | | | | | |
| | | | | | | | | | | 37,428,392 | |
| | | | | | | | | | | | |
| Consumer Finance—1.3% | |
American Express Co. | | | | | 323,000 | | | | 15,235,910 | |
| | | | | | | | | | | | |
| Containers & Packaging—0.4% | |
Rexam plc ADR (United Kingdom) | | † | | | 181,600 | | | | 4,948,600 | |
| | | | | | | | | | | | |
| Diversified Consumer Services—0.0% | |
Weight Watchers International, Inc. | | † | | | 3,700 | | | | 203,537 | |
| | | | | | | | | | | | |
| Diversified Financial Services—2.3% | |
Bank of America Corp. | | | | | 1,290,800 | | | | 7,176,848 | |
CME Group, Inc. | | | | | 600 | | | | 146,202 | |
IntercontinentalExchange, Inc. | | * | | | 18,400 | | | | 2,218,120 | |
JPMorgan Chase & Co. | | | | | 513,908 | | | | 17,087,441 | |
| | | | | | | | | | | | |
| | | | | | | | | 26,628,611 | |
| | | | | | | | | | | | |
| Diversified Telecommunication Services—0.9% | |
AT&T, Inc. | | | | | 363,606 | | | | 10,995,445 | |
| | | | | | | | | | | | |
| Electric Utilities—1.2% | |
Edison International | | | | | 144,700 | | | | 5,990,580 | |
Entergy Corp. | | | | | 79,000 | | | | 5,770,950 | |
PPL Corp. | | | | | 77,600 | | | | 2,282,992 | |
| | | | | | | | | | | | |
| | | | | | | | | 14,044,522 | |
| | | | | | | | | | | | |
| Electrical Equipment—0.1% | |
Emerson Electric Co. | | | | | 13,100 | | | | 610,329 | |
Roper Industries, Inc. | | | | | 10,600 | | | | 920,822 | |
| | | | | | | | | | | | |
| | | | | | | | | 1,531,151 | |
| | | | | | | | | | | | |
See accompanying notes to financial statements.
206
SCHEDULE OF INVESTMENTS—(Continued)
December 31, 2011
| | | | | | | | | | | | |
| Vantagepoint Growth & Income Fund | | | | | | | Shares | | | | Value | |
| | | | | | | | | | | | |
| COMMON STOCKS—(Continued) | |
Electronic Equipment, Instruments &
Components—1.2% | |
TE Connectivity Ltd. (Switzerland) | | | | | 438,375 | | | $ | 13,506,334 | |
| | | | | | | | | | | | |
| Energy Equipment & Services—2.8% | |
Baker Hughes, Inc. | | | | | 146,500 | | | | 7,125,760 | |
Cameron International Corp. | | * | | | 43,000 | | | | 2,115,170 | |
FMC Technologies, Inc. | | *† | | | 31,300 | | | | 1,634,799 | |
Halliburton Co. | | | | | 5,000 | | | | 172,550 | |
Noble Corp. (Switzerland) | | * | | | 230,800 | | | | 6,974,776 | |
Schlumberger Ltd. | | | | | 212,975 | | | | 14,548,322 | |
| | | | | | | | | | | | |
| | | | | | | | | | | 32,571,377 | |
| | | | | | | | | | | | |
| Food & Staples Retailing—3.5% | |
Costco Wholesale Corp. | | | | | 100 | | | | 8,332 | |
Sysco Corp. | | | | | 664,175 | | | | 19,480,253 | |
Wal-Mart Stores, Inc. | | | | | 322,075 | | | | 19,247,202 | |
Whole Foods Market, Inc. | | | | | 23,400 | | | | 1,628,172 | |
| | | | | | | | | | | | |
| | | | | | | | | | | 40,363,959 | |
| | | | | | | | | | | | |
| Food Products—2.3% | |
Archer-Daniels-Midland Co. | | | | | 183,100 | | | | 5,236,660 | |
General Mills, Inc. | | | | | 144,900 | | | | 5,855,409 | |
Nestle SA ADR (Switzerland) | | † | | | 270,850 | | | | 15,630,754 | |
| | | | | | | | | | | | |
| | | | | | | | | | | 26,722,823 | |
| | | | | | | | | | | | |
| Health Care Equipment & Supplies—2.2% | |
Baxter International, Inc. | | | | | 131,500 | | | | 6,506,620 | |
Covidien plc (Ireland) | | | | | 397,200 | | | | 17,877,972 | |
Edwards Lifesciences Corp. | | * | | | 1,400 | | | | 98,980 | |
Intuitive Surgical, Inc. | | * | | | 100 | | | | 46,301 | |
Stryker Corp. | | † | | | 29,700 | | | | 1,476,387 | |
| | | | | | | | | | | | |
| | | | | | | | | | | 26,006,260 | |
| | | | | | | | | | | | |
| Health Care Providers & Services—2.7% | |
AmerisourceBergen Corp. | | | | | 373,550 | | | | 13,892,325 | |
Cardinal Health, Inc. | | | | | 52,400 | | | | 2,127,964 | |
Express Scripts, Inc. | | * | | | 69,400 | | | | 3,101,486 | |
McKesson Corp. | | | | | 67,500 | | | | 5,258,925 | |
UnitedHealth Group, Inc. | | | | | 132,900 | | | | 6,735,372 | |
| | | | | | | | | | | | |
| | | | | | | | | | | 31,116,072 | |
| | | | | | | | | | | | |
| Health Care Technology—0.0% | |
Cerner Corp. | | * | | | 100 | | | | 6,125 | |
| | | | | | | | | | | | |
| Hotels, Restaurants & Leisure—2.0% | |
Carnival Corp. | | | | | 72,000 | | | | 2,350,080 | |
Chipotle Mexican Grill, Inc. | | * | | | 5,300 | | | | 1,790,022 | |
Las Vegas Sands Corp. | | * | | | 74,200 | | | | 3,170,566 | |
Marriott International, Inc., Class A | | | | | 84,471 | | | | 2,464,019 | |
McDonald’s Corp. | | | | | 30,200 | | | | 3,029,966 | |
Starbucks Corp. | | | | | 133,600 | | | | 6,146,936 | |
Starwood Hotels & Resorts Worldwide, Inc. | | | | | 50,100 | | | | 2,403,297 | |
Wynn Resorts Ltd. | | | | | 5,900 | | | | 651,891 | |
Yum! Brands, Inc. | | | | | 29,800 | | | | 1,758,498 | |
| | | | | | | | | | | | |
| | | | | | | | | | | 23,765,275 | |
| | | | | | | | | | | | |
| Household Durables—0.5% | |
Newell Rubbermaid, Inc. | | | | | 353,900 | | | | 5,715,485 | |
| | | | | | | | | | | | |
| | | | | | | | | | | | |
| | | | | |
| | | | | | | | Shares | | | | Value | |
| | | | | | | | | | | | |
| Household Products—1.3% | |
Kimberly-Clark Corp. | | | | | 209,000 | | | $ | 15,374,040 | |
Procter & Gamble Co. (The) | | | | | 1,175 | | | | 78,384 | |
| | | | | | | | | | | | |
| | | | | | | | | | | 15,452,424 | |
| | | | | | | | | | | | |
| Industrial Conglomerates—5.2% | |
3M Co. | | | | | 259,925 | | | | 21,243,670 | |
Danaher Corp. | | | | | 199,200 | | | | 9,370,368 | |
General Electric Co. | | | | | 865,900 | | | | 15,508,269 | |
Koninklijke Philips Electronics NV NYRS (Netherlands) | | | | | 297,800 | | | | 6,238,910 | |
Tyco International Ltd. (Switzerland) | | | | | 185,400 | | | | 8,660,034 | |
| | | | | | | | | | | | |
| | | | | | | | | | | 61,021,251 | |
| | | | | | | | | | | | |
| Insurance—4.3% | |
ACE Ltd. (Switzerland) | | | | | 87,500 | | | | 6,135,500 | |
Berkshire Hathaway, Inc., Class B | | * | | | 207,800 | | | | 15,855,140 | |
Marsh & McLennan Cos., Inc. | | | | | 230,100 | | | | 7,275,762 | |
Principal Financial Group, Inc. | | | | | 194,200 | | | | 4,777,320 | |
Prudential Financial, Inc. | | | | | 26,300 | | | | 1,318,156 | |
Unum Group | | | | | 172,600 | | | | 3,636,682 | |
Willis Group Holdings plc (United Kingdom) | | | | | 273,550 | | | | 10,613,740 | |
| | | | | | | | | | | | |
| | | | | | | | | | | 49,612,300 | |
| | | | | | | | | | | | |
| Internet & Catalog Retail—1.6% | |
Amazon.com, Inc. | | * | | | 61,900 | | | | 10,714,890 | |
Groupon, Inc., Class A | | *† | | | 23,600 | | | | 486,868 | |
Liberty Interactive Corp., Series A | | * | | | 68,400 | | | | 1,109,106 | |
priceline.com, Inc. | | * | | | 13,600 | | | | 6,360,856 | |
| | | | | | | | | | | | |
| | | | | | | | | | | 18,671,720 | |
| | | | | | | | | | | | |
| Internet Software & Services—3.1% | |
Baidu, Inc. ADR (China) | | * | | | 55,500 | | | | 6,464,085 | |
eBay, Inc. | | * | | | 97,500 | | | | 2,957,175 | |
Google, Inc., Class A | | * | | | 36,700 | | | | 23,704,530 | |
LinkedIn Corp., Class A | | * | | | 4,900 | | | | 308,749 | |
Tencent Holdings Ltd. (China) | | | | | 123,100 | | | | 2,464,877 | |
| | | | | | | | | | | | |
| | | | | | | | | | | 35,899,416 | |
| | | | | | | | | | | | |
| IT Services—3.6% | |
Accenture plc, Class A (Ireland) | | | | | 309,300 | | | | 16,464,039 | |
Automatic Data Processing, Inc. | | | | | 230,350 | | | | 12,441,203 | |
Fiserv, Inc. | | * | | | 3,400 | | | | 199,716 | |
International Business Machines Corp. | | | | | 2,500 | | | | 459,700 | |
Mastercard, Inc., Class A | | | | | 21,200 | | | | 7,903,784 | |
Visa, Inc., Class A | | | | | 39,700 | | | | 4,030,741 | |
Western Union Co. (The) | | | | | 100 | | | | 1,826 | |
| | | | | | | | | | | | |
| | | | | | | | | | | 41,501,009 | |
| | | | | | | | | | | | |
| Leisure Equipment & Products—0.0% | |
Mattel, Inc. | | | | | 100 | | | | 2,776 | |
| | | | | | | | | | | | |
| Life Sciences Tools & Services—0.1% | |
Thermo Fisher Scientific, Inc. | | * | | | 15,900 | | | | 715,023 | |
| | | | | | | | | | | | |
See accompanying notes to financial statements.
207
SCHEDULE OF INVESTMENTS—(Continued)
December 31, 2011
| | | | | | | | | | | | |
| Vantagepoint Growth & Income Fund | | | | | | | Shares | | | | Value | |
| | | | | | | | | | | | |
| COMMON STOCKS—(Continued) | |
| Machinery—3.1% | |
Caterpillar, Inc. | | | | | 10,500 | | | $ | 951,300 | |
Cummins, Inc. | | | | | 4,500 | | | | 396,090 | |
Deere & Co. | | | | | 3,400 | | | | 262,990 | |
Illinois Tool Works, Inc. | | | | | 257,400 | | | | 12,023,154 | |
Ingersoll-Rand plc (Ireland) | | | | | 489,675 | | | | 14,920,397 | |
Joy Global, Inc. | | | | | 16,000 | | | | 1,199,520 | |
Stanley Black & Decker, Inc. | | | | | 90,600 | | | | 6,124,560 | |
| | | | | | | | | | | | |
| | | | | | | | | | | 35,878,011 | |
| | | | | | | | | | | | |
| Media—3.9% | |
CBS Corp., Class B | | | | | 202,100 | | | | 5,484,994 | |
Comcast Corp., Class A | | | | | 300,100 | | | | 7,115,371 | |
Discovery Communications, Inc., Class C | | * | | | 51,750 | | | | 1,950,975 | |
Omnicom Group, Inc. | | | | | 328,900 | | | | 14,662,362 | |
Time Warner, Inc. | | | | | 402,433 | | | | 14,543,929 | |
Walt Disney Co. (The) | | | | | 40,900 | | | | 1,533,750 | |
| | | | | | | | | | | | |
| | | | | | | | | | | 45,291,381 | |
| | | | | | | | | | | | |
| Metals & Mining—0.8% | |
Barrick Gold Corp. (Canada) | | | | | 91,200 | | | | 4,126,800 | |
Freeport-McMoRan Copper & Gold, Inc. | | | | | 100 | | | | 3,679 | |
Steel Dynamics, Inc. | | | | | 394,200 | | | | 5,183,730 | |
| | | | | | | | | | | | |
| | | | | | | | | | | 9,314,209 | |
| | | | | | | | | | | | |
| Multiline Retail—0.9% | |
Dollar Tree, Inc. | | * | | | 2,050 | | | | 170,376 | |
Kohl’s Corp. | | | | | 104,500 | | | | 5,157,075 | |
Nordstrom, Inc. | | | | | 94,900 | | | | 4,717,479 | |
| | | | | | | | | | | | |
| | | | | | | | | | | 10,044,930 | |
| | | | | | | | | | | | |
| Oil, Gas & Consumable Fuels—8.1% | |
Chevron Corp. | | | | | 213,300 | | | | 22,695,120 | |
Concho Resources, Inc. | | * | | | 22,000 | | | | 2,062,500 | |
Devon Energy Corp. | | | | | 248,700 | | | | 15,419,400 | |
EOG Resources, Inc. | | | | | 86,490 | | | | 8,520,130 | |
EQT Corp. | | | | | 19,500 | | | | 1,068,405 | |
Exxon Mobil Corp. | | | | | 100 | | | | 8,476 | |
Marathon Oil Corp. | | | | | 297,200 | | | | 8,699,044 | |
Occidental Petroleum Corp. | | | | | 107,400 | | | | 10,063,380 | |
Peabody Energy Corp. | | | | | 38,500 | | | | 1,274,735 | |
Petroleo Brasileiro SA ADR (Brazil) | | | | | 284,400 | | | | 7,067,340 | |
Pioneer Natural Resources Co. | | | | | 7,900 | | | | 706,892 | |
Range Resources Corp. | | | | | 21,300 | | | | 1,319,322 | |
Royal Dutch Shell plc ADR (Netherlands) | | | | | 145,200 | | | | 10,612,668 | |
Southwestern Energy Co. | | * | | | 132,300 | | | | 4,225,662 | |
| | | | | | | | | | | | |
| | | | | | | | | | | 93,743,074 | |
| | | | | | | | | | | | |
| Pharmaceuticals—3.8% | |
Allergan, Inc. | | | | | 28,300 | | | | 2,483,042 | |
GlaxoSmithKline plc ADR (United Kingdom) | | | | | 328,500 | | | | 14,989,455 | |
Merck & Co., Inc. | | | | | 227,240 | | | | 8,566,948 | |
Pfizer, Inc. | | | | | 448,600 | | | | 9,707,704 | |
Shire plc ADR (Ireland) | | | | | 600 | | | | 62,340 | |
Teva Pharmaceutical Industries Ltd. ADR (Israel) | | | | | 195,200 | | | | 7,878,272 | |
| | | | | | | | | | | | |
| | | | | | | | | | | 43,687,761 | |
| | | | | | | | | | | | |
| | | | | | | | | | | | |
| | | | | |
| | | | | | | | Shares | | | | Value | |
| | | | | | | | | | | | |
| Real Estate Management & Development—0.0% | |
CBRE Group, Inc. | | * | | | 4,000 | | | $ | 60,880 | |
| | | | | | | | | | | | |
| Road & Rail—0.5% | |
Kansas City Southern | | * | | | 9,700 | | | | 659,697 | |
Union Pacific Corp. | | | | | 44,200 | | | | 4,682,548 | |
| | | | | | | | | | | | |
| | | | | | | | | | | 5,342,245 | |
| | | | | | | | | | | | |
| Semiconductors & Semiconductor Equipment—2.4% | |
Altera Corp. | | | | | 18,300 | | | | 678,930 | |
Broadcom Corp., Class A | | * | | | 101,700 | | | | 2,985,912 | |
Freescale Semiconductor Holdings I Ltd. | | *† | | | 195,600 | | | | 2,474,340 | |
Intel Corp. | | | | | 326,700 | | | | 7,922,475 | |
Maxim Integrated Products, Inc. | | | | | 217,800 | | | | 5,671,512 | |
Xilinx, Inc. | | | | | 252,100 | | | | 8,082,326 | |
| | | | | | | | | | | | |
| | | | | | | | | | | 27,815,495 | |
| | | | | | | | | | | | |
| Software—1.7% | |
Autodesk, Inc. | | * | | | 35,700 | | | | 1,082,781 | |
Intuit, Inc. | | | | | 13,800 | | | | 725,742 | |
Microsoft Corp. | | | | | 677,450 | | | | 17,586,602 | |
Salesforce.com, Inc. | | * | | | 4,300 | | | | 436,278 | |
| | | | | | | | | | | | |
| | | | | | | | | | | 19,831,403 | |
| | | | | | | | | | | | |
| Specialty Retail—2.4% | |
Bed Bath & Beyond, Inc. | | * | | | 30,900 | | | | 1,791,273 | |
Home Depot, Inc. (The) | | | | | 8,300 | | | | 348,932 | |
Limited Brands, Inc. | | | | | 6,500 | | | | 262,275 | |
Lowe’s Cos., Inc. | | | | | 264,000 | | | | 6,700,320 | |
O’Reilly Automotive, Inc. | | * | | | 33,000 | | | | 2,638,350 | |
Staples, Inc. | | | | | 1,127,025 | | | | 15,654,377 | |
Tiffany & Co. | | | | | 8,300 | | | | 549,958 | |
| | | | | | | | | | | | |
| | | | | | | | | | | 27,945,485 | |
| | | | | | | | | | | | |
| Textiles, Apparel & Luxury Goods—0.8% | |
Coach, Inc. | | | | | 26,300 | | | | 1,605,352 | |
Fossil, Inc. | | * | | | 19,200 | | | | 1,523,712 | |
NIKE, Inc., Class B | | | | | 34,200 | | | | 3,295,854 | |
Ralph Lauren Corp. | | | | | 20,500 | | | | 2,830,640 | |
| | | | | | | | | | | | |
| | | | | | | | | 9,255,558 | |
| | | | | | | | | | | | |
| Tobacco—0.7% | |
Imperial Tobacco Group plc ADR (United Kingdom) | | | | | 106,900 | | | | 8,053,846 | |
| | | | | | | | | | | | |
| Trading Companies & Distributors—0.6% | |
Fastenal Co. | | † | | | 101,100 | | | | 4,408,971 | |
W.W. Grainger, Inc. | | | | | 11,800 | | | | 2,208,842 | |
| | | | | | | | | | | | |
| | | | | | | | | | | 6,617,813 | |
| | | | | | | | | | | | |
| Wireless Telecommunication Services—0.5% | |
American Tower Corp., Class A | | | | | 104,700 | | | | 6,283,047 | |
| | | | | | | | | | | | |
| TOTAL COMMON STOCKS | |
(Cost $1,015,300,752) | | | | | | | | | 1,131,707,778 | |
| | | | | | | | | | | | |
See accompanying notes to financial statements.
208
SCHEDULE OF INVESTMENTS—(Continued)
December 31, 2011
| | | | | | | | | | | | |
| Vantagepoint Growth & Income Fund | | | | | Shares | | | | Value | |
| | | | | | | | | | | | |
| MONEY MARKET FUNDS—4.3% | |
| Institutional Money Market Funds—4.3% | |
Dreyfus Institutional Cash Advantage Fund, 0.06% | | ††¥ | | | 3,600,000 | | | $ | 3,600,000 | |
Fidelity Institutional Money Market: Money Market Portfolio—Institutional Class, 0.23% | | ¥ | | | 30,706,080 | | | | 30,706,080 | |
Fidelity Institutional Money Market: Money Market Portfolio—Institutional Class, 0.23% | | ††¥ | | | 1,398,507 | | | | 1,398,507 | |
Fidelity Institutional Money Market: Prime Money Market Portfolio—Institutional Class, 0.17% | | ††¥ | | | 3,600,000 | | | | 3,600,000 | |
Short-Term Investments Trust Liquid Assets Portfolio, 0.16% | | ††¥ | | | 3,600,000 | | | | 3,600,000 | |
Wells Fargo Advantage Cash Investment Money Market Fund—Select Class, 0.11% | | ††¥ | | | 3,600,000 | | | | 3,600,000 | |
Wells Fargo Advantage Heritage Money Market Fund—Select Class, 0.08% | | ††¥ | | | 3,600,000 | | | | 3,600,000 | |
| | | | | | | | | | | | |
| TOTAL MONEY MARKET FUNDS | |
(Cost $50,104,587) | | | | | | | | | 50,104,587 | |
| | | | | | | | | | | | |
| TOTAL INVESTMENTS—101.7% | |
(Cost $1,065,405,339) | | | | | | | 1,181,812,365 | |
Other assets less liabilities—(1.7%) | | | | (19,330,317 | ) |
| | | | | | | | | | | | |
| NET ASSETS—100.0% | | | $ | 1,162,482,048 | |
| | | | | |
Notes to the Schedule of Investments:
| | |
| ADR | | American Depositary Receipt |
| NYRS | | New York Registry Shares |
| * | | Non-income producing. |
| † | | Denotes all or a portion of the security on loan. |
| †† | | Represents reinvestment of collateral received in conjunction with securities lending. |
| ¥ | | The rate quoted is the annualized seven-day yield of the fund at period end. |
See accompanying notes to financial statements.
209
SCHEDULE OF INVESTMENTS
December 31, 2011
| | | | | | | | | | | | |
| Vantagepoint Growth Fund | | | | | | | Shares | | | | Value | |
| | | | | | | | | | | | |
| COMMON STOCKS—95.2% | |
| Aerospace & Defense—1.3% | |
Exelis, Inc. | | | | | 104,290 | | | $ | 943,825 | |
Precision Castparts Corp. | | | | | 55,775 | | | | 9,191,162 | |
United Technologies Corp. | | | | | 173,660 | | | | 12,692,809 | |
| | | | | | | | | | | | |
| | | | | | | | | 22,827,796 | |
| | | | | | | | | | | | |
| Air Freight & Logistics—0.6% | |
Expeditors International of Washington, Inc. | | | | | 69,900 | | | | 2,863,104 | |
FedEx Corp. | | | | | 85,300 | | | | 7,123,403 | |
| | | | | | | | | | |
| | | | | | | | | 9,986,507 | |
| | | | | | | | | | | | |
| Airlines—0.3% | |
Southwest Airlines Co. | | | | | 516,800 | | | | 4,423,808 | |
| | | | | | | | | | | | |
Automobiles—0.8% | |
Ford Motor Co. | | * | | | 1,339,042 | | | | 14,408,092 | |
| | | | | | | | | | | | |
| Beverages—4.0% | |
Anheuser-Busch InBev NV ADR (Belgium) | | | | | 103,210 | | | | 6,294,778 | |
Coca-Cola Co. (The) | | | | | 397,000 | | | | 27,778,090 | |
Diageo plc ADR (United Kingdom) | | | | | 118,338 | | | | 10,345,108 | |
PepsiCo, Inc. | | | | | 381,370 | | | | 25,303,899 | |
| | | | | | | | | | | | |
| | | | | | | | | 69,721,875 | |
| | | | | | | | | | | | |
| Biotechnology—3.5% | |
Alexion Pharmaceuticals, Inc. | | * | | | 38,200 | | | | 2,731,300 | |
Biogen Idec, Inc. | | * | | | 19,500 | | | | 2,145,975 | |
Celgene Corp. | | * | | | 514,540 | | | | 34,782,904 | |
Gilead Sciences, Inc. | | * | | | 124,000 | | | | 5,075,320 | |
Myriad Genetics, Inc. | | * | | | 303,416 | | | | 6,353,531 | |
Vertex Pharmaceuticals, Inc. | | * | | | 312,390 | | | | 10,374,472 | |
| | | | | | | | | | |
| | | | | | | | | 61,463,502 | |
| | | | | | | | | | | | |
| Capital Markets—1.3% | |
BlackRock, Inc. | | | | | 67,300 | | | | 11,995,552 | |
Charles Schwab Corp. (The) | | | | | 415,900 | | | | 4,683,034 | |
Goldman Sachs Group, Inc. (The) | | | | | 71,800 | | | | 6,492,874 | |
| | | | | | | | | | | | |
| | | | | | | | | 23,171,460 | |
| | | | | | | | | | | | |
| Chemicals—2.2% | |
Chemtura Corp. | | * | | | 160,960 | | | | 1,825,286 | |
Dow Chemical Co. (The) | | | | | 293,640 | | | | 8,445,087 | |
Monsanto Co. | | | | | 282,530 | | | | 19,796,877 | |
Mosaic Co. (The) | | | | | 35,830 | | | | 1,806,907 | |
Potash Corp. of Saskatchewan, Inc. (Canada) | | | | | 170,310 | | | | 7,030,397 | |
| | | | | | | | | | | | |
| | | | | | | | | 38,904,554 | |
| | | | | | | | | | | | |
| Commercial Banks—1.4% | |
Wells Fargo & Co. | | | | | 894,200 | | | | 24,644,152 | |
| | | | | | | | | | | | |
| Communications Equipment—4.4% | |
Cisco Systems, Inc. | | | | | 1,153,710 | | | | 20,859,077 | |
F5 Networks, Inc. | | * | | | 97,500 | | | | 10,346,700 | |
QUALCOMM, Inc. | | | | | 780,360 | | | | 42,685,692 | |
Riverbed Technology, Inc. | | * | | | 125,100 | | | | 2,939,850 | |
| | | | | | | | | | |
| | | | | | | | | 76,831,319 | |
| | | | | | | | | | | | |
| Computers & Peripherals—6.4% | |
Apple, Inc. | | * | | | 195,705 | | | | 79,260,525 | |
| | | | | | | | | | | | |
| | | | | |
| | | | | | | | Shares | | | | Value | |
| | | | | | | | | | | | |
EMC Corp. | | * | | | 1,105,390 | | | $ | 23,810,101 | |
NetApp, Inc. | | * | | | 120,419 | | | | 4,367,597 | |
SanDisk Corp. | | * | | | 111,066 | | | | 5,465,558 | |
| | | | | | | | | | | | |
| | | | | | | | | | | 112,903,781 | |
| | | | | | | | | | | | |
| Construction & Engineering—0.3% | |
Quanta Services, Inc. | | * | | | 272,554 | | | | 5,870,813 | |
| | | | | | | | | | | | |
| Consumer Finance—1.3% | |
American Express Co. | | | | | 202,400 | | | | 9,547,208 | |
Capital One Financial Corp. | | | | | 108,814 | | | | 4,601,744 | |
Discover Financial Services | | | | | 373,063 | | | | 8,953,512 | |
| | | | | | | | | | | | |
| | | | | | | | | | | 23,102,464 | |
| | | | | | | | | | | | |
| Containers & Packaging—0.1% | |
Owens-Illinois, Inc. | | * | | | 71,600 | | | | 1,387,608 | |
| | | | | | | | | | | | |
| Diversified Consumer Services—0.3% | |
Apollo Group, Inc., Class A | | * | | | 104,870 | | | | 5,649,347 | |
| | | | | | | | | | | | |
| Diversified Financial Services—0.4% | |
Citigroup, Inc. | | | | | 294,030 | | | | 7,735,929 | |
| | | | | | | | | | | | |
| Energy Equipment & Services—4.8% | |
Cameron International Corp. | | * | | | 57,420 | | | | 2,824,490 | |
Ensco plc ADR (United Kingdom) | | | | | 224,690 | | | | 10,542,455 | |
Halliburton Co. | | | | | 296,360 | | | | 10,227,384 | |
Nabors Industries Ltd. (Bermuda) | | * | | | 383,700 | | | | 6,653,358 | |
National Oilwell Varco, Inc. | | | | | 282,460 | | | | 19,204,455 | |
Schlumberger Ltd. | | | | | 425,670 | | | | 29,077,518 | |
Weatherford International Ltd. (Switzerland) | | * | | | 400,230 | | | | 5,859,367 | |
| | | | | | | | | | | | |
| | | | | | | | | | | 84,389,027 | |
| | | | | | | | | | | | |
| Food & Staples Retailing—1.5% | |
Walgreen Co. | | | | | 40,000 | | | | 1,322,400 | |
Wal-Mart Stores, Inc. | | | | | 241,400 | | | | 14,426,064 | |
Whole Foods Market, Inc. | | | | | 144,200 | | | | 10,033,436 | |
| | | | | | | | | | | | |
| | | | | | | | | | | 25,781,900 | |
| | | | | | | | | | | | |
| Food Products—2.5% | |
General Mills, Inc. | | | | | 288,730 | | | | 11,667,579 | |
Hershey Co. (The) | | | | | 363,265 | | | | 22,442,512 | |
Mead Johnson Nutrition Co. | | | | | 91,200 | | | | 6,268,176 | |
Unilever NV NYRS (Netherlands) | | † | | | 94,200 | | | | 3,237,654 | |
| | | | | | | | | | | | |
| | | | | | | | | | | 43,615,921 | |
| | | | | | | | | | | | |
| Health Care Equipment & Supplies—0.9% | |
Medtronic, Inc. | | | | | 257,700 | | | | 9,857,025 | |
Stryker Corp. | | | | | 124,700 | | | | 6,198,837 | |
| | | | | | | | | | | | |
| | | | | | | | | | | 16,055,862 | |
| | | | | | | | | | | | |
| Health Care Providers & Services—0.2% | |
Humana, Inc. | | | | | 40,430 | | | | 3,542,072 | |
| | | | | | | | | | | | |
| Hotels, Restaurants & Leisure—3.4% | |
Las Vegas Sands Corp. | | * | | | 389,605 | | | | 16,647,822 | |
McDonald’s Corp. | | | | | 135,200 | | | | 13,564,616 | |
Starbucks Corp. | | | | | 557,240 | | | | 25,638,612 | |
Yum! Brands, Inc. | | | | | 60,120 | | | | 3,547,681 | |
| | | | | | | | | | | | |
| | | | | | | | | | | 59,398,731 | |
| | | | | | | | | | | | |
See accompanying notes to financial statements.
210
SCHEDULE OF INVESTMENTS—(Continued)
December 31, 2011
| | | | | | | | | | | | |
Vantagepoint
Growth Fund | | | | | | | Shares | | | | Value | |
| | | | | | | | | | | | |
| COMMON STOCKS—(Continued) | |
| Household Products—1.8% | |
Colgate-Palmolive Co. | | | | | 30,400 | | | $ | 2,808,656 | |
Procter & Gamble Co. (The) | | | | | 440,300 | | | | 29,372,413 | |
| | | | | | | | | | | | |
| | | | | | | | | | | 32,181,069 | |
| | | | | | | | | | | | |
| Industrial Conglomerates—3.6% | |
3M Co. | | | | | 295,000 | | | | 24,110,350 | |
Danaher Corp. | | † | | | 242,110 | | | | 11,388,854 | |
General Electric Co. | | | | | 862,250 | | | | 15,442,898 | |
Tyco International Ltd. (Switzerland) | | | | | 276,290 | | | | 12,905,506 | |
| | | | | | | | | | | | |
| | | | | | | | | | | 63,847,608 | |
| | | | | | | | | | | | |
| Insurance—1.2% | |
ACE Ltd. (Switzerland) | | | | | 78,330 | | | | 5,492,500 | |
Arch Capital Group Ltd. (Bermuda) | | * | | | 85,050 | | | | 3,166,411 | |
Berkshire Hathaway, Inc., Class B | | * | | | 103,900 | | | | 7,927,570 | |
Marsh & McLennan Cos., Inc. | | | | | 113,600 | | | | 3,592,032 | |
| | | | | | | | | | | | |
| | | | | | | | | | | 20,178,513 | |
| | | | | | | | | | | | |
| Internet & Catalog Retail—2.1% | |
Amazon.com, Inc. | | * | | | 126,070 | | | | 21,822,717 | |
Groupon, Inc., Class A | | *† | | | 152,848 | | | | 3,153,254 | |
priceline.com, Inc. | | * | | | 23,420 | | | | 10,953,768 | |
| | | | | | | | | | | | |
| | | | | | | | | | | 35,929,739 | |
| | | | | | | | | | | | |
| Internet Software & Services—3.5% | |
eBay, Inc. | | * | | | 491,000 | | | | 14,892,030 | |
Google, Inc., Class A | | * | | | 61,700 | | | | 39,852,030 | |
Rackspace Hosting, Inc. | | *† | | | 138,554 | | | | 5,959,208 | |
| | | | | | | | | | | | |
| | | | | | | | | | | 60,703,268 | |
| | | | | | | | | | | | |
| IT Services—8.0% | |
Accenture plc, Class A (Ireland) | | | | | 232,630 | | | | 12,382,895 | |
Automatic Data Processing, Inc. | | | | | 428,500 | | | | 23,143,285 | |
Cognizant Technology Solutions Corp., Class A | | * | | | 322,855 | | | | 20,762,805 | |
International Business Machines Corp. | | | | | 196,560 | | | | 36,143,453 | |
Mastercard, Inc., Class A | | | | | 73,340 | | | | 27,342,618 | |
Teradata Corp. | | * | | | 88,000 | | | | 4,268,880 | |
Visa, Inc., Class A | | | | | 149,930 | | | | 15,222,393 | |
| | | | | | | | | | | | |
| | | | | | | | | | | 139,266,329 | |
| | | | | | | | | | | | |
| Machinery—2.8% | |
Caterpillar, Inc. | | | | | 148,600 | | | | 13,463,160 | |
Cummins, Inc. | | | | | 64,800 | | | | 5,703,696 | |
Deere & Co. | | † | | | 136,434 | | | | 10,553,170 | |
Dover Corp. | | | | | 135,400 | | | | 7,859,970 | |
Stanley Black & Decker, Inc. | | | | | 118,170 | | | | 7,988,292 | |
Xylem, Inc. | | | | | 119,190 | | | | 3,061,991 | |
| | | | | | | | | | | | |
| | | | | | | | | | | 48,630,279 | |
| | | | | | | | | | | | |
| Media—2.7% | |
Comcast Corp., Class A | | | | | 586,870 | | | | 13,914,688 | |
DIRECTV, Class A | | * | | | 106,700 | | | | 4,562,492 | |
Viacom, Inc., Class B | | | | | 231,190 | | | | 10,498,338 | |
| | | | | | | | | | | | |
| | | | | |
| | | | | | | | Shares | | | | Value | |
| | | | | | | | | | | | |
Walt Disney Co. (The) | | | | | 476,200 | | | $ | 17,857,500 | |
| | | | | | | | | | | | |
| | | | | | | | | | | 46,833,018 | |
| | | | | | | | | | | | |
| Metals & Mining—1.0% | |
Barrick Gold Corp. (Canada) | | | | | 77,990 | | | | 3,529,048 | |
Freeport-McMoRan Copper & Gold, Inc. | | | | | 99,360 | | | | 3,655,454 | |
Newmont Mining Corp. | | | | | 164,360 | | | | 9,863,244 | |
| | | | | | | | | | | | |
| | | | | | | | | | | 17,047,746 | |
| | | | | | | | | | | | |
| Multiline Retail—1.3% | |
Macy’s, Inc. | | | | | 343,310 | | | | 11,047,716 | |
Target Corp. | | | | | 238,370 | | | | 12,209,311 | |
| | | | | | | | | | | | |
| | | | | | | | | | | 23,257,027 | |
| | | | | | | | | | | | |
| Oil, Gas & Consumable Fuels—5.0% | |
Anadarko Petroleum Corp. | | | | | 47,920 | | | | 3,657,734 | |
Apache Corp. | | | | | 83,800 | | | | 7,590,604 | |
Cabot Oil & Gas Corp. | | | | | 115,783 | | | | 8,787,930 | |
Cenovus Energy, Inc. (Canada) | | | | | 202,400 | | | | 6,719,680 | |
ConocoPhillips | | | | | 89,400 | | | | 6,514,578 | |
CONSOL Energy, Inc. | | | | | 246,500 | | | | 9,046,550 | |
Occidental Petroleum Corp. | | | | | 240,220 | | | | 22,508,614 | |
Southwestern Energy Co. | | * | | | 80,290 | | | | 2,564,463 | |
Suncor Energy, Inc. (Canada) | | | | | 354,810 | | | | 10,229,172 | |
Valero Energy Corp. | | | | | 466,810 | | | | 9,826,350 | |
| | | | | | | | | | | | |
| | | | | | | | | | | 87,445,675 | |
| | | | | | | | | | | | |
| Personal Products—0.4% | |
Estee Lauder Cos., Inc. (The), Class A | | | | | 69,344 | | | | 7,788,718 | |
| | | | | | | | | | | | |
| Pharmaceuticals—6.6% | |
Abbott Laboratories | | | | | 305,800 | | | | 17,195,134 | |
Allergan, Inc. | | | | | 147,795 | | | | 12,967,533 | |
Eli Lilly & Co. | | | | | 341,490 | | | | 14,192,324 | |
Johnson & Johnson | | | | | 404,268 | | | | 26,511,896 | |
Pfizer, Inc. | | | | | 564,100 | | | | 12,207,124 | |
Questcor Pharmaceuticals, Inc. | | * | | | 21,300 | | | | 885,654 | |
Roche Holding AG ADR (Switzerland) | | | | | 150,800 | | | | 6,416,540 | |
Valeant Pharmaceuticals International, Inc. (Canada) | | * | | | 66,900 | | | | 3,123,561 | |
Warner Chilcott plc, Class A (Ireland) | | * | | | 752,447 | | | | 11,384,523 | |
Watson Pharmaceuticals, Inc. | | * | | | 173,400 | | | | 10,462,956 | |
| | | | | | | | | | | | |
| | | | | | | | | | | 115,347,245 | |
| | | | | | | | | | | | |
| Professional Services—0.3% | |
Verisk Analytics, Inc., Class A | | * | | | 123,030 | | | | 4,937,194 | |
| | | | | | | | | | | | |
| Semiconductors & Semiconductor Equipment—0.5% | |
Avago Technologies Ltd. (Singapore) | | | | | 93,000 | | | | 2,683,980 | |
Broadcom Corp., Class A | | * | | | 216,930 | | | | 6,369,065 | |
| | | | | | | | | | | | |
| | | | | | | | | | | 9,053,045 | |
| | | | | | | | | | | | |
| Software—5.7% | |
Adobe Systems, Inc. | | * | | | 439,554 | | | | 12,426,192 | |
Autodesk, Inc. | | * | | | 138,500 | | | | 4,200,705 | |
Check Point Software Technologies Ltd. (Israel) | | *† | | | 198,565 | | | | 10,432,605 | |
See accompanying notes to financial statements.
211
SCHEDULE OF INVESTMENTS—(Continued)
December 31, 2011
| | | | | | | | | | | | |
Vantagepoint
Growth Fund | | | | | | | Shares | | | | Value | |
| | | | | | | | | | | | |
| COMMON STOCKS—(Continued) | |
Citrix Systems, Inc. | | * | | | 171,340 | | | $ | 10,403,765 | |
Electronic Arts, Inc. | | * | | | 217,600 | | | | 4,482,560 | |
Microsoft Corp. | | | | | 856,300 | | | | 22,229,548 | |
Oracle Corp. | | | | | 760,370 | | | | 19,503,490 | |
QLIK Technologies, Inc. | | * | | | 66,500 | | | | 1,609,300 | |
Red Hat, Inc. | | * | | | 84,631 | | | | 3,494,414 | |
Salesforce.com, Inc. | | *† | | | 65,700 | | | | 6,665,922 | |
VMware, Inc., Class A | | * | | | 51,700 | | | | 4,300,923 | |
Zynga, Inc., Class A | | *† | | | 19,275 | | | | 181,378 | |
| | | | | | | | | | | | |
| | | | | | | | | | | 99,930,802 | |
| | | | | | | | | | | | |
| Specialty Retail—4.9% | |
Bed Bath & Beyond, Inc. | | * | | | 184,816 | | | | 10,713,783 | |
Home Depot, Inc. (The) | | | | | 524,090 | | | | 22,032,744 | |
Limited Brands, Inc. | | | | | 125,400 | | | | 5,059,890 | |
Lowe’s Cos., Inc. | | | | | 1,568,040 | | | | 39,796,855 | |
Tractor Supply Co. | | † | | | 30,900 | | | | 2,167,635 | |
Ulta Salon Cosmetics & Fragrance, Inc. | | * | | | 37,000 | | | | 2,402,040 | |
Williams-Sonoma, Inc. | | | | | 70,830 | | | | 2,726,955 | |
| | | | | | | | | | | | |
| | | | | | | | | | | 84,899,902 | |
| | | | | | | | | | | | |
| Textiles, Apparel & Luxury Goods—1.2% | |
Adidas AG ADR (Germany) | | | | | 84,260 | | | | 2,747,719 | |
Michael Kors Holdings Ltd. (Hong Kong) | | *† | | | 4,753 | | | | 129,519 | |
NIKE, Inc., Class B | | | | | 195,260 | | | | 18,817,206 | |
| | | | | | | | | | | | |
| | | | | | | | | 21,694,444 | |
| | | | | | | | | | | | |
| Tobacco—0.7% | |
Philip Morris International, Inc. | | | | | 162,690 | | | | 12,767,911 | |
| | | | | | | | | | | | |
| TOTAL COMMON STOCKS | | | | | |
(Cost $1,508,406,770) | | | | | | | | | 1,667,556,052 | |
| | | | | | | | | | | | |
| | | | | | | | | | | | | |
| MONEY MARKET FUNDS—6.7% | |
| Institutional Money Market Funds—6.7% | |
Dreyfus Institutional Cash Advantage Fund, 0.06% | | ††¥ | | | 5,200,000 | | | | 5,200,000 | |
Fidelity Institutional Money Market: Money Market Portfolio—Institutional Class, 0.23% | | ¥ | | | 84,859,531 | | | | 84,859,531 | |
Fidelity Institutional Money Market: Money Market Portfolio—Institutional Class, 0.23% | | ††¥ | | | 5,704,220 | | | | 5,704,220 | |
Fidelity Institutional Money Market: Prime Money Market Portfolio—Institutional Class, 0.17% | | ††¥ | | | 5,200,000 | | | | 5,200,000 | |
| | | | | | | | | | | | |
| | | | | |
| | | | | | | | Shares | | | | Value | |
| | | | | | | | | | | | |
Short-Term Investments Trust Liquid Assets Portfolio, 0.16% | | ††¥ | | | 5,200,000 | | | $ | 5,200,000 | |
Wells Fargo Advantage Cash Investment Money Market Fund—Select Class, 0.11% | | ††¥ | | | 5,200,000 | | | | 5,200,000 | |
Wells Fargo Advantage Heritage Money Market Fund—Select Class, 0.08% | | ††¥ | | | 5,200,000 | | | | 5,200,000 | |
| | | | | | | | | | | | |
| TOTAL MONEY MARKET FUNDS | |
(Cost $116,563,751) | | | | | | | | | 116,563,751 | |
| | | | | | | | | | | | |
| TOTAL INVESTMENTS—101.9% | |
(Cost $1,624,970,521) | | | | | | | 1,784,119,803 | |
Other assets less liabilities—(1.9%) | | | | (33,044,357 | ) |
| | | | | | | | | | | | |
| NET ASSETS—100.0% | | | $ | 1,751,075,446 | |
| | | | | | | | | | | | |
Notes to the Schedule of Investments:
| | |
| ADR | | American Depositary Receipt |
| NYRS | | New York Registry Shares |
| * | | Non-income producing. |
| † | | Denotes all or a portion of the security on loan. |
| †† | | Represents reinvestment of collateral received in conjunction with securities lending. |
| ¥ | | The rate quoted is the annualized seven-day yield of the fund at period end. |
See accompanying notes to financial statements.
212
SCHEDULE OF INVESTMENTS
December 31, 2011
| | | | | | | | | | | | |
| Vantagepoint Select Value Fund | | | | | | | Shares | | | | Value | |
| | | | | | | | | | | | |
| COMMON STOCKS—96.3% | | | | | | | | |
| Aerospace & Defense—4.1% | | | | | | | | | | |
L-3 Communications Holdings, Inc. | | | | | 28,100 | | | $ | 1,873,708 | |
Northrop Grumman Corp. | | | | | 17,900 | | | | 1,046,792 | |
Rockwell Collins, Inc. | | | | | 42,800 | | | | 2,369,836 | |
Spirit Aerosystems Holdings, Inc., Class A | | * | | | 88,400 | | | | 1,836,952 | |
TransDigm Group, Inc. | | * | | | 46,519 | | | | 4,450,938 | |
Triumph Group, Inc. | | | | | 25,425 | | | | 1,486,091 | |
| | | | | | | | | | | | |
| | | | | | | | | 13,064,317 | |
| | | | | | | | | | | | |
| Auto Components—0.5% | | | | | | | | | | |
Lear Corp. | | | | | 38,883 | | | | 1,547,543 | |
| | | | | | | | | | | | |
| Automobiles—0.3% | | | | | | | | | | |
Harley-Davidson, Inc. | | | | | 24,275 | | | | 943,569 | |
| | | | | | | | | | | | |
| Beverages—0.4% | | | | | | | | | | |
Constellation Brands, Inc., Class A | | * | | | 57,075 | | | | 1,179,740 | |
| | | | | | | | | | | | |
| Building Products—0.3% | | | | | | | | | | |
Owens Corning, Inc. | | * | | | 37,325 | | | | 1,071,974 | |
| | | | | | | | | | | | |
| Capital Markets—2.3% | | | | | | | | | | |
Invesco Ltd. | | | | | 96,500 | | | | 1,938,685 | |
Northern Trust Corp. | | | | | 43,300 | | | | 1,717,278 | |
Raymond James Financial, Inc. | | | | | 64,525 | | | | 1,997,694 | |
State Street Corp. | | | | | 44,625 | | | | 1,798,834 | |
| | | | | | | | | | | | |
| | | | | | | | | 7,452,491 | |
| | | | | | | | | | | | |
| Chemicals—1.3% | | | | | | | | | | |
Agrium, Inc. (Canada) | | † | | | 15,500 | | | | 1,040,205 | |
Albemarle Corp. | | | | | 8,500 | | | | 437,835 | |
Ashland, Inc. | | | | | 13,975 | | | | 798,811 | |
Huntsman Corp. | | | | | 58,300 | | | | 583,000 | |
Solutia, Inc. | | * | | | 70,700 | | | | 1,221,696 | |
| | | | | | | | | | | | |
| | | | | | | | | 4,081,547 | |
| | | | | | | | | | | | |
| Commercial Banks—3.9% | | | | | | | | | | |
Bank of Hawaii Corp. | | | | | 50,993 | | | | 2,268,678 | |
Fifth Third Bancorp | | | | | 220,200 | | | | 2,800,944 | |
First Niagara Financial Group, Inc. | | | | | 109,300 | | | | 943,259 | |
KeyCorp | | | | | 313,600 | | | | 2,411,584 | |
M&T Bank Corp. | | | | | 26,500 | | | | 2,023,010 | |
TCF Financial Corp. | | | | | 195,202 | | | | 2,014,485 | |
| | | | | | | | | | | | |
| | | | | | | | | 12,461,960 | |
| | | | | | | | | | | | |
| Commercial Services & Supplies—1.8% | | | | | |
R.R. Donnelley & Sons Co. | | † | | | 248,013 | | | | 3,578,828 | |
Steelcase, Inc., Class A | | † | | | 275,400 | | | | 2,054,484 | |
| | | | | | | | | | | | |
| | | | | | | | | 5,633,312 | |
| | | | | | | | | | | | |
| Communications Equipment—0.6% | | | | | |
Comtech Telecommunications Corp. | | | | | 64,200 | | | | 1,837,404 | |
| | | | | | | | | | | | |
| Computers & Peripherals—1.7% | | | | | |
Lexmark International, Inc., Class A | | | | | 62,800 | | | | 2,076,796 | |
SanDisk Corp. | | * | | | 21,550 | | | | 1,060,475 | |
Seagate Technology plc (Ireland) | | | | | 98,275 | | | | 1,611,710 | |
Western Digital Corp. | | * | | | 17,000 | | | | 526,150 | |
| | | | | | | | | | | | |
| | | | | | | | | 5,275,131 | |
| | | | | | | | | | | | |
| | | | | | | | | | | | |
| | | | | |
| | | | | | | | Shares | | | | Value | |
| | | | | | | | | | | | |
| Construction & Engineering—2.3% | | | | | |
Jacobs Engineering Group, Inc. | | * | | | 60,300 | | | $ | 2,446,974 | |
KBR, Inc. | | | | | 58,710 | | | | 1,636,248 | |
URS Corp. | | * | | | 91,700 | | | | 3,220,504 | |
| | | | | | | | | | | | |
| | | | | | | | | 7,303,726 | |
| | | | | | | | | | | | |
| Consumer Finance—1.5% | | | | | |
Discover Financial Services | | | | | 101,050 | | | | 2,425,200 | |
SLM Corp. | | | | | 174,000 | | | | 2,331,600 | |
| | | | | | | | | | | | |
| | | | | | | | | 4,756,800 | |
| | | | | | | | | | | | |
| Containers & Packaging—2.6% | | | | | |
AptarGroup, Inc. | | | | | 24,508 | | | | 1,278,582 | |
Bemis Co., Inc. | | | | | 98,300 | | | | 2,956,864 | |
Sonoco Products Co. | | | | | 124,700 | | | | 4,110,112 | |
| | | | | | | | | | | | |
| | | | | | | | | 8,345,558 | |
| | | | | | | | | | | | |
| Diversified Consumer Services—0.7% | | | | | |
H&R Block, Inc. | | | | | 136,100 | | | | 2,222,513 | |
| | | | | | | | | | | | |
| Diversified Financial Services—0.2% | | | | | |
PHH Corp. | | * | | | 63,200 | | | | 676,240 | |
| | | | | | | | | | | | |
Electric Utilities—2.9% | | | | | | | | | | |
FirstEnergy Corp. | | | | | 56,800 | | | | 2,516,240 | |
Pinnacle West Capital Corp. | | | | | 68,400 | | | | 3,295,512 | |
PPL Corp. | | | | | 96,400 | | | | 2,836,088 | |
Westar Energy, Inc. | | | | | 20,700 | | | | 595,746 | |
| | | | | | | | | | | | |
| | | | | | | | | 9,243,586 | |
| | | | | | | | | | | | |
| Electrical Equipment—0.7% | | | | | |
Hubbell, Inc., Class B | | | | | 33,200 | | | | 2,219,752 | |
| | | | | | | | | | | | |
| Electronic Equipment, Instruments & Components—3.2% | |
Arrow Electronics, Inc. | | * | | | 76,000 | | | | 2,843,160 | |
Avnet, Inc. | | * | | | 96,500 | | | | 3,000,185 | |
FLIR Systems, Inc. | | | | | 62,800 | | | | 1,574,396 | |
Ingram Micro, Inc., Class A | | * | | | 148,300 | | | | 2,697,577 | |
| | | | | | | | | | | | |
| | | | | | | | | 10,115,318 | |
| | | | | | | | | | | | |
| Energy Equipment & Services—3.3% | | | | | |
Ensco plc ADR (United Kingdom) | | | | | 45,057 | | | | 2,114,075 | |
McDermott International, Inc. | | * | | | 142,700 | | | | 1,642,477 | |
Oil States International, Inc. | | * | | | 28,125 | | | | 2,147,906 | |
Patterson-UTI Energy, Inc. | | | | | 27,600 | | | | 551,448 | |
SEACOR Holdings, Inc. | | * | | | 23,800 | | | | 2,117,248 | |
Superior Energy Services, Inc. | | *† | | | 69,200 | | | | 1,968,048 | |
| | | | | | | | | | | | |
| | | | | | | | | 10,541,202 | |
| | | | | | | | | | | | |
| Food & Staples Retailing—1.9% | | | | | |
Kroger Co. (The) | | | | | 109,500 | | | | 2,652,090 | |
Ruddick Corp. | | † | | | 45,765 | | | | 1,951,420 | |
Sysco Corp. | | | | | 53,300 | | | | 1,563,289 | |
| | | | | | | | | | | | |
| | | | | | | | | 6,166,799 | |
| | | | | | | | | | | | |
| Food Products—2.2% | | | | | |
Campbell Soup Co. | | † | | | 42,700 | | | | 1,419,348 | |
Hain Celestial Group, Inc. (The) | | * | | | 46,850 | | | | 1,717,521 | |
Sara Lee Corp. | | | | | 118,351 | | | | 2,239,201 | |
Smithfield Foods, Inc. | | * | | | 70,050 | | | | 1,700,814 | |
| | | | | | | | | | | | |
| | | | | | | | | 7,076,884 | |
| | | | | | | | | | | | |
| Gas Utilities—0.3% | | | | | |
UGI Corp. | | | | | 37,500 | | | | 1,102,500 | |
| | | | | | | | | | | | |
See accompanying notes to financial statements.
213
SCHEDULE OF INVESTMENTS—(Continued)
December 31, 2011
| | | | | | | | | | | | |
| Vantagepoint Select Value Fund | | | | | | | Shares | | | | Value | |
| | | | | | | | | | | | |
| COMMON STOCKS—(Continued) | | | | | |
| Health Care Providers & Services—3.0% | | | | | |
Cardinal Health, Inc. | | | | | 52,225 | | | $ | 2,120,857 | |
CIGNA Corp. | | | | | 95,125 | | | | 3,995,250 | |
Health Management Associates, Inc., Class A | | * | | | 206,950 | | | | 1,525,221 | |
Health Net, Inc. | | * | | | 46,825 | | | | 1,424,417 | |
Quest Diagnostics, Inc. | | | | | 11,000 | | | | 638,660 | |
| | | | | | | | | | | | |
| | | | | | | | | | | 9,704,405 | |
| | | | | | | | | | | | |
| Hotels, Restaurants & Leisure—2.0% | | | | | |
Brinker International, Inc. | | | | | 28,050 | | | | 750,618 | |
Darden Restaurants, Inc. | | | | | 50,100 | | | | 2,283,558 | |
Wyndham Worldwide Corp. | | | | | 84,500 | | | | 3,196,635 | |
| | | | | | | | | | | | |
| | | | | | | | | 6,230,811 | |
| | | | | | | | | | | | |
| Household Durables—0.5% | | | | | |
Mohawk Industries, Inc. | | * | | | 28,600 | | | | 1,711,710 | |
| | | | | | | | | | | | |
| Industrial Conglomerates—1.1% | | | | | |
Carlisle Cos., Inc. | | | | | 81,500 | | | | 3,610,450 | |
| | | | | | | | | | | | |
| Insurance—10.7% | | | | | |
Alleghany Corp. | | *† | | | 9,170 | | | | 2,616,110 | |
Allied World Assurance Co. Holdings AG (Switzerland) | | | | | 17,700 | | | | 1,113,861 | |
Allstate Corp. (The) | | | | | 236,300 | | | | 6,476,982 | |
Aon Corp. | | | | | 45,349 | | | | 2,122,333 | |
Arch Capital Group Ltd. (Bermuda) | | * | | | 55,000 | | | | 2,047,650 | |
Fidelity National Financial, Inc., Class A | | | | | 104,500 | | | | 1,664,685 | |
HCC Insurance Holdings, Inc. | | | | | 111,300 | | | | 3,060,750 | |
Lincoln National Corp. | | | | | 320,810 | | | | 6,230,130 | |
Loews Corp. | | | | | 47,400 | | | | 1,784,610 | |
Marsh & McLennan Cos., Inc. | | | | | 48,600 | | | | 1,536,732 | |
Progressive Corp. (The) | | | | | 139,500 | | | | 2,721,645 | |
Validus Holdings Ltd. (Bermuda) | | | | | 21,700 | | | | 683,550 | |
XL Group plc (Ireland) | | | | | 109,500 | | | | 2,164,815 | |
| | | | | | | | | | | | |
| | | | | | | | | 34,223,853 | |
| | | | | | | | | | | | |
| Internet Software & Services—0.7% | | | | | |
Open Text Corp. (Canada) | | * | | | 14,300 | | | | 731,302 | |
ValueClick, Inc. | | * | | | 98,450 | | | | 1,603,751 | |
| | | | | | | | | | | | |
| | | | | | | | | 2,335,053 | |
| | | | | | | | | | | | |
IT Services—4.6% | | | | | | | | | | |
Broadridge Financial Solutions, Inc. | | | | | 80,500 | | | | 1,815,275 | |
Computer Sciences Corp. | | | | | 164,867 | | | | 3,907,348 | |
Convergys Corp. | | * | | | 202,100 | | | | 2,580,817 | |
SAIC, Inc. | | * | | | 135,300 | | | | 1,662,837 | |
Total System Services, Inc. | | | | | 117,800 | | | | 2,304,168 | |
Western Union Co. (The) | | | | | 136,800 | | | | 2,497,968 | |
| | | | | | | | | | | | |
| | | | | | | | | 14,768,413 | |
| | | | | | | | | | | | |
| Leisure Equipment & Products—1.6% | | | | | |
Brunswick Corp. | | | | | 172,500 | | | | 3,115,350 | |
Mattel, Inc. | | | | | 77,000 | | | | 2,137,520 | |
| | | | | | | | | | | | |
| | | | | | | | | 5,252,870 | |
| | | | | | | | | | | | |
| Life Sciences Tools & Services—0.6% | | | | | |
Life Technologies Corp. | | * | | | 50,400 | | | | 1,961,064 | |
| | | | | | | | | | | | |
| | | | | | | | | | | | |
| | | | | |
| | | | | | | | Shares | | | | Value | |
| | | | | | | | | | | | |
| Machinery—2.5% | | | | | |
Dover Corp. | | | | | 56,100 | | | $ | 3,256,605 | |
Eaton Corp. | | | | | 32,900 | | | | 1,432,137 | |
Flowserve Corp. | | | | | 15,600 | | | | 1,549,392 | |
Timken Co. | | | | | 47,900 | | | | 1,854,209 | |
| | | | | | | | | | | | |
| | | | | | | | | 8,092,343 | |
| | | | | | | | | | | | |
| Media—1.1% | | | | | |
CBS Corp., Class B | | | | | 33,350 | | | | 905,119 | |
Omnicom Group, Inc. | | | | | 45,500 | | | | 2,028,390 | |
Scripps Networks Interactive, Inc., Class A | | | | | 12,750 | | | | 540,855 | |
| | | | | | | | | | | | |
| | | | | | | | | 3,474,364 | |
| | | | | | | | | | | | |
| Metals & Mining—0.4% | | | | | |
Nucor Corp. | | | | | 33,125 | | | | 1,310,756 | |
| | | | | | | | | | | | |
| Multiline Retail—0.6% | | | | | |
Macy’s, Inc. | | | | | 61,150 | | | | 1,967,807 | |
| | | | | | | | | | | | |
| Multi-Utilities—3.5% | | | | | |
CMS Energy Corp. | | | | | 94,700 | | | | 2,090,976 | |
DTE Energy Co. | | | | | 9,300 | | | | 506,385 | |
NiSource, Inc. | | | | | 83,575 | | | | 1,989,921 | |
OGE Energy Corp. | | | | | 20,200 | | | | 1,145,542 | |
PG&E Corp. | | | | | 73,800 | | | | 3,042,036 | |
SCANA Corp. | | | | | 25,000 | | | | 1,126,500 | |
Xcel Energy, Inc. | | | | | 41,000 | | | | 1,133,240 | |
| | | | | | | | | | | | |
| | | | | | | | | 11,034,600 | |
| | | | | | | | | | | | |
| Oil, Gas & Consumable Fuels—4.4% | | | | | |
Cimarex Energy Co. | | | | | 43,800 | | | | 2,711,220 | |
Energen Corp. | | | | | 67,925 | | | | 3,396,250 | |
Murphy Oil Corp. | | | | | 39,400 | | | | 2,196,156 | |
QEP Resources, Inc. | | | | | 65,500 | | | | 1,919,150 | |
Southwestern Energy Co. | | * | | | 63,600 | | | | 2,031,384 | |
Spectra Energy Corp. | | | | | 27,425 | | | | 843,319 | |
Valero Energy Corp. | | | | | 17,625 | | | | 371,006 | |
Western Refining, Inc. | | * | | | 53,875 | | | | 715,999 | |
| | | | | | | | | | | | |
| | | | | | | | | 14,184,484 | |
| | | | | | | | | | | | |
| Paper & Forest Products—0.5% | | | | | |
MeadWestvaco Corp. | | | | | 54,625 | | | | 1,636,019 | |
| | | | | | | | | | | | |
| Personal Products—0.7% | | | | | |
Herbalife Ltd. (Cayman Islands) | | | | | 28,050 | | | | 1,449,344 | |
Nu Skin Enterprises, Inc., Class A | | | | | 16,225 | | | | 788,048 | |
| | | | | | | | | | | | |
| | | | | | | | | 2,237,392 | |
| | | | | | | | | | | | |
| Professional Services—2.3% | | | | | |
Dun & Bradstreet Corp. (The) | | | | | 27,300 | | | | 2,042,859 | |
Equifax, Inc. | | | | | 52,700 | | | | 2,041,598 | |
Manpower, Inc. | | | | | 37,800 | | | | 1,351,350 | |
Towers Watson & Co., Class A | | | | | 33,400 | | | | 2,001,662 | |
| | | | | | | | | | | | |
| | | | | | | | | 7,437,469 | |
| | | | | | | | | | | | |
| Real Estate Investment Trusts (REITs)—6.4% | |
Annaly Capital Management, Inc. REIT | | | | | 144,875 | | | | 2,312,205 | |
BioMed Realty Trust, Inc. REIT | | | | | 84,675 | | | | 1,530,924 | |
Brandywine Realty Trust REIT | | | | | 169,725 | | | | 1,612,387 | |
Capstead Mortgage Corp. REIT | | | | | 78,400 | | | | 975,296 | |
CBL & Associates Properties, Inc. REIT | | | | | 134,075 | | | | 2,104,977 | |
See accompanying notes to financial statements.
214
SCHEDULE OF INVESTMENTS—(Continued)
December 31, 2011
| | | | | | | | | | | | |
Vantagepoint Select
Value Fund | | | | | | | Shares | | | | Value | |
| | | | | | | | | | | | |
| COMMON STOCKS—(Continued) | | | | | |
Duke Realty Corp. REIT | | | | | 363,732 | | | $ | 4,382,971 | |
DuPont Fabros Technology, Inc. REIT | | † | | | 36,625 | | | | 887,058 | |
Entertainment Properties Trust REIT | | | | | 24,400 | | | | 1,066,524 | |
Hatteras Financial Corp. REIT | | | | | 46,600 | | | | 1,228,842 | |
Health Care REIT, Inc. REIT | | | | | 44,250 | | | | 2,412,953 | |
Home Properties, Inc. REIT | | | | | 34,520 | | | | 1,987,316 | |
| | | | | | | | | | | | |
| | | | | | | | | 20,501,453 | |
| | | | | | | | | | | | |
| Road & Rail—2.7% | | | | | |
Hertz Global Holdings, Inc. | | * | | | 158,225 | | | | 1,854,397 | |
Ryder System, Inc. | | | | | 64,875 | | | | 3,447,457 | |
Werner Enterprises, Inc. | | † | | | 131,200 | | | | 3,161,920 | |
| | | | | | | | | | | | |
| | | | | | | | | 8,463,774 | |
| | | | | | | | | | | | |
| Semiconductors & Semiconductor Equipment—1.4% | |
Analog Devices, Inc. | | | | | 67,600 | | | | 2,418,728 | |
Applied Materials, Inc. | | | | | 189,800 | | | | 2,032,758 | |
| | | | | | | | | | | | |
| | | | | | | | | | | 4,451,486 | |
| | | | | | | | | | | | |
| Software—2.0% | |
BMC Software, Inc. | | * | | | 14,400 | | | | 472,032 | |
Cadence Design Systems, Inc. | | * | | | 152,475 | | | | 1,585,740 | |
Electronic Arts, Inc. | | * | | | 73,725 | | | | 1,518,735 | |
Symantec Corp. | | * | | | 56,350 | | | | 881,877 | |
Synopsys, Inc. | | * | | | 73,600 | | | | 2,001,920 | |
| | | | | | | | | | | | |
| | | | | | | | | | | 6,460,304 | |
| | | | | | | | | | | | |
| Specialty Retail—1.7% | |
Express, Inc. | | * | | | 26,550 | | | | 529,407 | |
Foot Locker, Inc. | | | | | 81,100 | | | | 1,933,424 | |
Pier 1 Imports, Inc. | | * | | | 141,000 | | | | 1,964,130 | |
Signet Jewelers Ltd. (Bermuda) | | | | | 26,175 | | | | 1,150,653 | |
| | | | | | | | | | | | |
| | | | | | | | | | | 5,577,614 | |
| | | | | | | | | | | | |
| Textiles, Apparel & Luxury Goods—1.1% | |
PVH Corp. | | | | | 10,700 | | | | 754,243 | |
V.F. Corp. | | | | | 22,900 | | | | 2,908,071 | |
| | | | | | | | | | | | |
| | | | | | | | | | | 3,662,314 | |
| | | | | | | | | | | | |
| Tobacco—0.2% | | | | | | | | | | | | |
Lorillard, Inc. | | | | | 4,500 | | | | 513,000 | |
| | | | | | | | | | | | |
| Water Utilities—1.0% | |
American Water Works Co., Inc. | | | | | 101,575 | | | | 3,236,180 | |
| | | | | | | | | | | | |
| TOTAL COMMON STOCKS | | | | | | | | |
(Cost $282,289,082) | | | | | | | | | 308,359,854 | |
| | | | | | | | | | | | |
| | | | | | | | | | | | | |
| MONEY MARKET FUNDS—6.7% | |
| Institutional Money Market Funds—6.7% | |
Dreyfus Institutional Cash Advantage Fund, 0.06% | | ††¥ | | | 1,700,000 | | | | 1,700,000 | |
| | | | | | | | | | | | |
| | | | | |
| | | | | | | | Shares | | | | Value | |
| | | | | | | | | | | | |
Fidelity Institutional Money Market: Money Market Portfolio—Institutional Class, 0.23% | | ¥ | | | 11,831,089 | | | $ | 11,830,766 | |
Fidelity Institutional Money Market: Money Market Portfolio—Institutional Class, 0.23% | | ††¥ | | | 1,037,261 | | | | 1,037,261 | |
Fidelity Institutional Money Market: Prime Money Market Portfolio—Institutional Class, 0.17% | | ††¥ | | | 1,700,000 | | | | 1,700,000 | |
Short-Term Investments Trust Liquid Assets Portfolio, 0.16% | | ††¥ | | | 1,700,000 | | | | 1,700,000 | |
Wells Fargo Advantage Cash Investment Money Market Fund—Select Class, 0.11% | | ††¥ | | | 1,700,000 | | | | 1,700,000 | |
Wells Fargo Advantage Heritage Money Market Fund—Select Class, 0.08% | | ††¥ | | | 1,700,000 | | | | 1,700,000 | |
| | | | | | | | | | | | |
| TOTAL MONEY MARKET FUNDS | |
(Cost $21,368,027) | | | | | | | | | | | 21,368,027 | |
| | | | | | | | | | | | |
| TOTAL INVESTMENTS—103.0% | |
(Cost $303,657,109) | | | | | | | | | | | 329,727,881 | |
Other assets less liabilities—(3.0%) | | | | (9,708,692 | ) |
| | | | | | | | | | | | |
| NET ASSETS—100.0% | | | $ | 320,019,189 | |
| | | | | | | | | | | | |
Notes to the Schedule of Investments:
| | |
| ADR | | American Depositary Receipt |
| REIT | | Real Estate Investment Trust |
| * | | Non-income producing. |
| † | | Denotes all or a portion of the security on loan. |
| †† | | Represents reinvestment of collateral received in conjunction with securities lending. |
| ¥ | | The rate quoted is the annualized seven-day yield of the fund at period end. |
See accompanying notes to financial statements.
215
SCHEDULE OF INVESTMENTS
December 31, 2011
| | | | | | | | | | | | |
Vantagepoint Aggressive
Opportunities Fund | | | Shares | | | | Value | |
| | | | | | | | | | | | |
| COMMON STOCKS—97.5% | |
| Aerospace & Defense—0.2% | |
Rockwell Collins, Inc. | | | | | 39,000 | | | $ | 2,159,430 | |
| | | | | | | | | | | | |
| Air Freight & Logistics—2.6% | |
C.H. Robinson Worldwide, Inc. | | | | | 143,145 | | | | 9,988,658 | |
Expeditors International of Washington, Inc. | | | | | 124,405 | | | | 5,095,629 | |
FedEx Corp. | | | | | 118,100 | | | | 9,862,531 | |
| | | | | | | | | | | | |
| | | | | | | | | | | 24,946,818 | |
| | | | | | | | | | | | |
| Airlines—0.8% | |
United Continental Holdings, Inc. | | * | | | 422,395 | | | | 7,970,594 | |
| | | | | | | | | | | | |
| Auto Components—0.3% | |
Autoliv, Inc. (Sweden) | | † | | | 62,100 | | | | 3,321,729 | |
| | | | | | | | | | | | |
| Biotechnology—1.3% | |
Amylin Pharmaceuticals, Inc. | | * | | | 535,410 | | | | 6,092,966 | |
Dendreon Corp. | | *† | | | 86,800 | | | | 659,680 | |
Human Genome Sciences, Inc. | | *† | | | 365,200 | | | | 2,698,828 | |
Myriad Genetics, Inc. | | * | | | 127,800 | | | | 2,676,132 | |
| | | | | | | | | | | | |
| | | | | | | | | | | 12,127,606 | |
| | | | | | | | | | | | |
| Building Products—1.0% | |
Masco Corp. | | | | | 483,400 | | | | 5,066,032 | |
Owens Corning, Inc. | | * | | | 171,705 | | | | 4,931,368 | |
| | | | | | | | | | | | |
| | | | | | | | | | | 9,997,400 | |
| | | | | | | | | | | | |
| Capital Markets—3.6% | |
Bank of New York Mellon Corp. (The) | | | | | 484,000 | | | | 9,636,440 | |
Fortress Investment Group LLC, Class A | | * | | | 1,460,100 | | | | 4,935,138 | |
Greenhill & Co., Inc. | | † | | | 147,305 | | | | 5,357,483 | |
Lazard Ltd., Class A (Bermuda) | | | | | 83,400 | | | | 2,177,574 | |
SEI Investments Co. | | | | | 424,575 | | | | 7,366,376 | |
TD Ameritrade Holding Corp. | | | | | 343,100 | | | | 5,369,515 | |
| | | | | | | | | | | | |
| | | | | | | | | | | 34,842,526 | |
| | | | | | | | | | | | |
| Chemicals—1.8% | |
Airgas, Inc. | | | | | 55,400 | | | | 4,325,632 | |
Ecolab, Inc. | | † | | | 105,100 | | | | 6,075,831 | |
FMC Corp. | | | | | 74,390 | | | | 6,400,516 | |
| | | | | | | | | | | | |
| | | | | | | | | | | 16,801,979 | |
| | | | | | | | | | | | |
| Commercial Banks—1.3% | |
Fifth Third Bancorp | | | | | 460,400 | | | | 5,856,288 | |
First Interstate BancSystem, Inc. | | † | | | 247,300 | | | | 3,222,319 | |
Synovus Financial Corp. | | † | | | 2,461,900 | | | | 3,471,279 | |
| | | | | | | | | | | | |
| | | | | | | | | | | 12,549,886 | |
| | | | | | | | | | | | |
| Commercial Services & Supplies—0.5% | |
Copart, Inc. | | * | | | 92,400 | | | | 4,425,036 | |
| | | | | | | | | | | | |
| Communications Equipment—1.5% | |
Acme Packet, Inc. | | * | | | 72,450 | | | | 2,239,430 | |
| | | | | | | | | | | | |
| | | | | |
| | | | | | | | Shares | | | | Value | |
| | | | | | | | | | | | |
ADTRAN, Inc. | | | | | 212,665 | | | $ | 6,413,976 | |
F5 Networks, Inc. | | * | | | 53,100 | | | | 5,634,972 | |
| | | | | | | | | | | | |
| | | | | | | | | | | 14,288,378 | |
| | | | | | | | | | | | |
| Computers & Peripherals—2.2% | |
Dell, Inc. | | * | | | 1,257,000 | | | | 18,389,910 | |
NetApp, Inc. | | * | | | 68,700 | | | | 2,491,749 | |
| | | | | | | | | | | | |
| | | | | | | | | | | 20,881,659 | |
| | | | | | | | | | | | |
| Construction & Engineering—2.3% | |
ACS Actividades de Construccion y Servicios SA (Spain) | | † | | | 304,000 | | | | 8,975,821 | |
AECOM Technology Corp. | | * | | | 191,200 | | | | 3,932,984 | |
Jacobs Engineering Group, Inc. | | * | | | 133,580 | | | | 5,420,676 | |
URS Corp. | | | | * | | | 98,200 | | | | 3,448,784 | |
| | | | | | | | | | | | |
| | | | | | | | | | | 21,778,265 | |
| | | | | | | | | | | | |
| Construction Materials—1.3% | |
Cemex SAB de CV ADR (Mexico) | | *† | | | 1,090,534 | | | | 5,877,978 | |
Vulcan Materials Co. | | † | | | 160,924 | | | | 6,332,360 | |
| | | | | | | | | | | | |
| | | | | | | | | | | 12,210,338 | |
| | | | | | | | | | | | |
| Distributors—0.4% | |
Pool Corp. | | | | | 133,500 | | | | 4,018,350 | |
| | | | | | | | | | | | |
| Diversified Consumer Services—0.2% | |
DeVry, Inc. | | | | | 41,800 | | | | 1,607,628 | |
| | | | | | | | | | | | |
| Diversified Financial Services—1.6% | |
KKR Financial Holdings LLC | | † | | | 1,271,900 | | | | 11,103,687 | |
NASDAQ OMX Group, Inc. (The) | | * | | | 178,100 | | | | 4,365,231 | |
| | | | | | | | | | | | |
| | | | | | | | | | | 15,468,918 | |
| | | | | | | | | | | | |
| Diversified Telecommunication Services—2.0% | |
Level 3 Communications, Inc. | | *† | | | 401,133 | | | | 6,815,250 | |
tw telecom inc. | | * | | | 640,000 | | | | 12,403,200 | |
| | | | | | | | | | | | |
| | | | | | | | | | | 19,218,450 | |
| | | | | | | | | | | | |
| Electrical Equipment—2.4% | |
AMETEK, Inc. | | | | | 254,020 | | | | 10,694,242 | |
Babcock & Wilcox Co. (The) | | * | | | 160,575 | | | | 3,876,280 | |
Cooper Industries plc | | | | | 95,900 | | | | 5,192,985 | |
Polypore International, Inc. | | * | | | 67,700 | | | | 2,978,123 | |
| | | | | | | | | | | | |
| | | | | | | | | | | 22,741,630 | |
| | | | | | | | | | | | |
| Electronic Equipment, Instruments & Components—0.6% | |
FLIR Systems, Inc. | | | | | 77,900 | | | | 1,952,953 | |
Trimble Navigation Ltd. | | * | | | 83,298 | | | | 3,615,133 | |
| | | | | | | | | | | | |
| | | | | | | | | | | 5,568,086 | |
| | | | | | | | | | | | |
| Energy Equipment & Services—1.2% | |
Cameron International Corp. | | * | | | 89,900 | | | | 4,422,181 | |
Core Laboratories NV (Netherlands) | | † | | | 25,100 | | | | 2,860,145 | |
��
See accompanying notes to financial statements.
216
SCHEDULE OF INVESTMENTS—(Continued)
December 31, 2011
| | | | | | | | | | | | |
| Vantagepoint Aggressive Opportunities Fund | | | Shares | | | | Value | |
| | | | | | | | | | | | |
| COMMON STOCKS—(Continued) | |
Oil States International, Inc. | | * | | | 54,700 | | | $ | 4,177,439 | |
| | | | | | | | | | | | |
| | | | | | | | | | | 11,459,765 | |
| | | | | | | | | | | | |
| Food & Staples Retailing—1.1% | |
Safeway, Inc. | | | | | 275,100 | | | | 5,788,104 | |
Whole Foods Market, Inc. | | | | | 73,055 | | | | 5,083,167 | |
| | | | | | | | | | | | |
| | | | | | | | | | | 10,871,271 | |
| | | | | | | | | | | | |
| Food Products—0.4% | |
Hershey Co. (The) | | | | | 67,400 | | | | 4,163,972 | |
| | | | | | | | | | | | |
| Health Care Equipment & Supplies—2.2% | |
Boston Scientific Corp. | | * | | | 1,040,300 | | | | 5,555,202 | |
Gen-Probe, Inc. | | * | | | 126,500 | | | | 7,478,680 | |
Hologic, Inc. | | * | | | 180,400 | | | | 3,158,804 | |
ResMed, Inc. | | * | | | 182,970 | | | | 4,647,438 | |
| | | | | | | | | | | | |
| | | | | | | | | | | 20,840,124 | |
| | | | | | | | | | | | |
| Health Care Providers & Services—3.1% | |
DaVita, Inc. | | * | | | 188,400 | | | | 14,282,604 | |
Health Management Associates, Inc., Class A | | * | | | 353,900 | | | | 2,608,243 | |
Lincare Holdings, Inc. | | | | | 253,850 | | | | 6,526,483 | |
WellPoint, Inc. | | | | | 94,400 | | | | 6,254,000 | |
| | | | | | | | | | | | |
| | | | | | | | | | | 29,671,330 | |
| | | | | | | | | | | | |
| Health Care Technology—0.4% | |
SXC Health Solutions Corp. | | * | | | 73,340 | | | | 4,142,243 | |
| | | | | | | | | | | | |
| Hotels, Restaurants & Leisure—2.4% | |
Bwin.Party Digital Entertainment plc (Gibraltar) | | | | | 1,534,000 | | | | 3,899,523 | |
Intercontinental Hotels Group plc ADR (United Kingdom) | | † | | | 462,000 | | | | 8,311,380 | |
P.F. Chang’s China Bistro, Inc. | | † | | | 128,000 | | | | 3,956,480 | |
Yum! Brands, Inc. | | | | | 117,000 | | | | 6,904,170 | |
| | | | | | | | | | | | |
| | | | | | | | | | | 23,071,553 | |
| | | | | | | | | | | | |
| Household Durables—1.7% | |
Lennar Corp., Class A | | † | | | 324,600 | | | | 6,378,390 | |
NVR, Inc. | | * | | | 10,550 | | | | 7,237,300 | |
Tempur-Pedic International, Inc. | | *† | | | 48,200 | | | | 2,531,946 | |
| | | | | | | | | | | | |
| | | | | | | | | | | 16,147,636 | |
| | | | | | | | | | | | |
| Household Products—1.1% | |
Church & Dwight Co., Inc. | | | | | 62,200 | | | | 2,846,272 | |
Energizer Holdings, Inc. | | * | | | 100,700 | | | | 7,802,236 | |
| | | | | | | | | | | | |
| | | | | | | | | | | 10,648,508 | |
| | | | | | | | | | | | |
| Independent Power Producers & Energy Traders—0.6% | |
Calpine Corp. | | * | | | 357,900 | | | | 5,844,507 | |
| | | | | | | | | | | | |
| Industrial Conglomerates—1.2% | |
Koninklijke Philips Electronics NV NYRS (Netherlands) | | | | | 528,000 | | | | 11,061,600 | |
| | | | | | | | | | | | |
| Insurance—8.1% | |
Aflac, Inc. | | | | | 68,000 | | | | 2,941,680 | |
Aon Corp. | | | | | 238,000 | | | | 11,138,400 | |
| | | | | | | | | | | | |
| | | | | |
| | | | | | | | Shares | | | | Value | |
| | | | | | | | | | | | |
Assured Guaranty Ltd. (Bermuda) | | | | | 840,000 | | | $ | 11,037,600 | |
Axis Capital Holdings Ltd. (Bermuda) | | | | | 115,300 | | | | 3,684,988 | |
Fairfax Financial Holdings Ltd. (Canada) | | † | | | 36,900 | | | | 15,911,280 | |
Genworth Financial, Inc., Class A | | * | | | 741,400 | | | | 4,856,170 | |
Hartford Financial Services Group, Inc. | | | | | 284,600 | | | | 4,624,750 | |
Loews Corp. | | | | | 273,000 | | | | 10,278,450 | |
RenaissanceRe Holdings Ltd. (Bermuda) | | | | | 112,300 | | | | 8,351,751 | |
Syncora Holdings Ltd. (Bermuda) | | *† | | | 626,661 | | | | 144,759 | |
XL Group plc (Ireland) | | | | | 238,900 | | | | 4,723,053 | |
| | | | | | | | | | | | |
| | | | | | | | | | | 77,692,881 | |
| | | | | | | | | | | | |
| Internet & Catalog Retail—1.5% | |
Expedia, Inc. | | † | | | 79,800 | | | | 2,315,781 | |
Liberty Interactive Corp., Series A | | * | | | 589,575 | | | | 9,559,959 | |
TripAdvisor, Inc. | | *† | | | 79,800 | | | | 2,011,745 | |
| | | | | | | | | | | | |
| | | | | | | | | | | 13,887,485 | |
| | | | | | | | | | | | |
| Internet Software & Services—2.7% | |
Active Network, Inc. (The) | | * | | | 117,400 | | | | 1,596,640 | |
eBay, Inc. | | * | | | 263,600 | | | | 7,994,988 | |
Rackspace Hosting, Inc. | | *† | | | 112,900 | | | | 4,855,829 | |
VeriSign, Inc. | | | | | 318,855 | | | | 11,389,501 | |
| | | | | | | | | | | | |
| | | | | | | | | | | 25,836,958 | |
| | | | | | | | | | | | |
| IT Services—4.9% | |
Alliance Data Systems Corp. | | *† | | | 78,800 | | | | 8,182,592 | |
Amdocs Ltd. | | * | | | 316,100 | | | | 9,018,333 | |
FleetCor Technologies, Inc. | | * | | | 70,900 | | | | 2,117,783 | |
Gartner, Inc. | | * | | | 99,300 | | | | 3,452,661 | |
Genpact Ltd. (Bermuda) | | * | | | 398,720 | | | | 5,960,864 | |
Global Payments, Inc. | | | | | 101,600 | | | | 4,813,808 | |
NeuStar, Inc., Class A | | * | | | 167,800 | | | | 5,733,726 | |
Teradata Corp. | | * | | | 51,400 | | | | 2,493,414 | |
VeriFone Systems, Inc. | | * | | | 63,000 | | | | 2,237,760 | |
Western Union Co. (The) | | | | | 174,700 | | | | 3,190,022 | |
| | | | | | | | | | | | |
| | | | | | | | | | | 47,200,963 | |
| | | | | | | | | | | | |
| Life Sciences Tools & Services—1.1% | |
BG Medicine, Inc. | | *† | | | 353,500 | | | | 1,668,520 | |
Mettler-Toledo International, Inc. | | *† | | | 20,600 | | | | 3,042,826 | |
Waters Corp. | | * | | | 84,645 | | | | 6,267,962 | |
| | | | | | | | | | | | |
| | | | | | | | | | | 10,979,308 | |
| | | | | | | | | | | | |
| Machinery—3.2% | |
Navistar International Corp. | | * | | | 98,800 | | | | 3,742,544 | |
PACCAR, Inc. | | | | | 165,510 | | | | 6,201,660 | |
Pall Corp. | | | | | 58,100 | | | | 3,320,415 | |
Parker Hannifin Corp. | | | | | 29,700 | | | | 2,264,625 | |
SPX Corp. | | | | | 60,200 | | | | 3,628,254 | |
Stanley Black & Decker, Inc. | | | | | 128,400 | | | | 8,679,840 | |
WABCO Holdings, Inc. | | * | | | 66,300 | | | | 2,877,420 | |
| | | | | | | | | | | | |
| | | | | | | | | | | 30,714,758 | |
| | | | | | | | | | | | |
| Media—3.9% | |
AMC Networks, Inc., Class A | | * | | | 18,325 | | | | 688,653 | |
DIRECTV, Class A | | * | | | 234,000 | | | | 10,005,840 | |
See accompanying notes to financial statements.
217
SCHEDULE OF INVESTMENTS—(Continued)
December 31, 2011
| | | | | | | | | | | | |
| Vantagepoint Aggressive Opportunities Fund | | | Shares | | | | Value | |
| | | | | | | | | | | | |
| COMMON STOCKS—(Continued) | |
Discovery Communications, Inc., Class C | | * | | | 178,100 | | | $ | 6,714,370 | |
National CineMedia, Inc. | | | | | 146,300 | | | | 1,814,120 | |
Virgin Media, Inc. | | † | | | 430,600 | | | | 9,206,228 | |
Walt Disney Co. (The) | | | | | 237,000 | | | | 8,887,500 | |
| | | | | | | | | | | | |
| | | | | | | | | | | 37,316,711 | |
| | | | | | | | | | | | |
| Multiline Retail—0.4% | |
Big Lots, Inc. | | * | | | 112,650 | | | | 4,253,664 | |
| | | | | | | | | | | | |
| Oil, Gas & Consumable Fuels—6.6% | |
Chesapeake Energy Corp. | | | | | 695,000 | | | | 15,491,550 | |
Concho Resources, Inc. | | * | | | 43,200 | | | | 4,050,000 | |
CONSOL Energy, Inc. | | | | | 288,095 | | | | 10,573,086 | |
Denbury Resources, Inc. | | * | | | 180,700 | | | | 2,728,570 | |
EXCO Resources, Inc. | | | | | 293,000 | | | | 3,061,850 | |
Newfield Exploration Co. | | * | | | 170,905 | | | | 6,448,246 | |
Pioneer Natural Resources Co. | | | | | 74,760 | | | | 6,689,525 | |
QEP Resources, Inc. | | | | | 133,300 | | | | 3,905,690 | |
Southwestern Energy Co. | | * | | | 84,300 | | | | 2,692,542 | |
Whiting Petroleum Corp. | | * | | | 160,200 | | | | 7,479,738 | |
| | | | | | | | | | | | |
| | | | | | | | | | | 63,120,797 | |
| | | | | | | | | | | | |
| Personal Products—0.4% | |
Herbalife Ltd. (Cayman Islands) | | | | | 71,600 | | | | 3,699,572 | |
| | | | | | | | | | | | |
| Pharmaceuticals—2.2% | |
Forest Laboratories, Inc. | | * | | | 173,000 | | | | 5,234,980 | |
Medicis Pharmaceutical Corp., Class A | | | | | 102,500 | | | | 3,408,125 | |
Nektar Therapeutics | | *† | | | 283,200 | | | | 1,584,504 | |
Shire plc ADR (Ireland) | | | | | 44,800 | | | | 4,654,720 | |
Watson Pharmaceuticals, Inc. | | * | | | 101,350 | | | | 6,115,459 | |
| | | | | | | | | | | | |
| | | | | | | | | 20,997,788 | |
| | | | | | | | | | | | |
| Professional Services—1.7% | |
Equifax, Inc. | | | | | 78,340 | | | | 3,034,892 | |
IHS, Inc., Class A | | * | | | 52,500 | | | | 4,523,400 | |
Manpower, Inc. | | | | | 50,800 | | | | 1,816,100 | |
Nielsen Holdings NV | | * | | | 134,900 | | | | 4,005,181 | |
Robert Half International, Inc. | | | | | 98,685 | | | | 2,808,575 | |
| | | | | | | | | | | | |
| | | | | | | | | | | 16,188,148 | |
| | | | | | | | | | | | |
| Real Estate Investment Trusts (REITs)—0.9% | |
American Capital Agency Corp. REIT | | | | | 143,600 | | | | 4,032,288 | |
PennyMac Mortgage Investment Trust REIT | | † | | | 300,000 | | | | 4,986,000 | |
| | | | | | | | | | | | |
| | | | | | | | | | | 9,018,288 | |
| | | | | | | | | | | | |
| Real Estate Management & Development—0.3% | |
Jones Lang LaSalle, Inc. | | | | | 46,900 | | | | 2,873,094 | |
| | | | | | | | | | | | |
| Road & Rail—1.0% | |
Kansas City Southern | | * | | | 89,000 | | | | 6,052,890 | |
Old Dominion Freight Line, Inc. | | * | | | 92,100 | | | | 3,732,813 | |
| | | | | | | | | | | | |
| | | | | | | | | | | 9,785,703 | |
| | | | | | | | | | | | |
| | | | | | | | | | | | |
| | | | | |
| | | | | | | | Shares | | | | Value | |
| | | | | | | | | | | | |
| Semiconductors & Semiconductor Equipment—4.5% | |
Altera Corp. | | | | | 65,100 | | | $ | 2,415,210 | |
Analog Devices, Inc. | | | | | 61,600 | | | | 2,204,048 | |
ASML Holding NV, Class G NYRS (Netherlands) | | | | | 63,600 | | | | 2,657,844 | |
Broadcom Corp., Class A | | * | | | 92,500 | | | | 2,715,800 | |
Integrated Device Technology, Inc. | | * | | | 1,309,100 | | | | 7,147,686 | |
Linear Technology Corp. | | | | | 47,600 | | | | 1,429,428 | |
Marvell Technology Group Ltd. (Bermuda) | | * | | | 541,100 | | | | 7,494,235 | |
Micron Technology, Inc. | | * | | | 595,400 | | | | 3,745,066 | |
NVIDIA Corp. | | * | | | 439,310 | | | | 6,088,837 | |
Skyworks Solutions, Inc. | | * | | | 419,715 | | | | 6,807,777 | |
| | | | | | | | | | | | |
| | | | | | | | | 42,705,931 | |
| | | | | | | | | | | | |
| Software—4.5% | |
Adobe Systems, Inc. | | * | | | 198,600 | | | | 5,614,422 | |
Citrix Systems, Inc. | | * | | | 89,635 | | | | 5,442,637 | |
Factset Research Systems, Inc. | | | | | 75,925 | | | | 6,626,734 | |
Informatica Corp. | | * | | | 40,300 | | | | 1,488,279 | |
MICROS Systems, Inc. | | * | | | 137,113 | | | | 6,386,724 | |
Red Hat, Inc. | | * | | | 155,275 | | | | 6,411,305 | |
Rovi Corp. | | * | | | 232,035 | | | | 5,703,420 | |
Solera Holdings, Inc. | | | | | 69,500 | | | | 3,095,530 | |
TIBCO Software, Inc. | | * | | | 82,700 | | | | 1,977,357 | |
| | | | | | | | | | | | |
| | | | | | | | | 42,746,408 | |
| | | | | | | | | | | | |
| Specialty Retail—1.4% | |
CarMax, Inc. | | * | | | 148,390 | | | | 4,522,927 | |
O’Reilly Automotive, Inc. | | * | | | 49,100 | | | | 3,925,545 | |
Tiffany & Co. | | | | | 49,100 | | | | 3,253,366 | |
Tractor Supply Co. | | | | | 23,000 | | | | 1,613,450 | |
| | | | | | | | | | |
| | | | | | | | | 13,315,288 | |
| | | | | | | | | | | | |
| Textiles, Apparel & Luxury Goods—0.8% | |
Coach, Inc. | | | | | 73,900 | | | | 4,510,856 | |
Hanesbrands, Inc. | | * | | | 105,000 | | | | 2,295,300 | |
Michael Kors Holdings Ltd. (Hong Kong) | | *† | | | 36,130 | | | | 984,542 | |
| | | | | | | | | | | | |
| | | | | | | | | 7,790,698 | |
| | | | | | | | | | | | |
| Thrifts & Mortgage Finance—0.5% | |
People’s United Financial, Inc. | | | | | 353,300 | | | | 4,539,905 | |
| | | | | | | | | | | | |
| Trading Companies & Distributors—1.3% | |
Aircastle Ltd. | | | | | 441,400 | | | | 5,614,608 | |
MSC Industrial Direct Co., Inc., Class A | | | | | 92,045 | | | | 6,585,820 | |
| | | | | | | | | | | | |
| | | | | | | | | 12,200,428 | |
| | | | | | | | | | | | |
| Wireless Telecommunication Services—2.3% | |
American Tower Corp., Class A | | | | | 174,190 | | | | 10,453,142 | |
NII Holdings, Inc. | | * | | | 113,945 | | | | 2,427,028 | |
SBA Communications Corp., Class A | | * | | | 208,900 | | | | 8,974,344 | |
| | | | | | | | | | | | |
| | | | | | | | | 21,854,514 | |
| | | | | | | | | | | | |
| TOTAL COMMON STOCKS | | | | | | | | |
(Cost $909,327,129) | | | | | | | 933,566,505 | |
| | | | | | | | | | | | |
See accompanying notes to financial statements.
218
SCHEDULE OF INVESTMENTS—(Continued)
December 31, 2011
| | | | | | | | | | | | |
| Vantagepoint Aggressive Opportunities Fund | | | Shares | | | | Value | |
| | | | | | | | | | | | |
| MONEY MARKET FUNDS—10.9% | |
| Institutional Money Market Funds—10.9% | |
Dreyfus Institutional Cash Advantage Fund, 0.06% | | ††¥ | | | 13,000,000 | | | $ | 13,000,000 | |
Fidelity Institutional Money Market: Money Market Portfolio—Institutional Class, 0.23% | | ¥ | | | 27,189,692 | | | | 27,189,692 | |
Fidelity Institutional Money Market: Money Market Portfolio—Institutional Class, 0.23% | | ††¥ | | | 12,024,271 | | | | 12,024,271 | |
Fidelity Institutional Money Market: Prime Money Market Portfolio—Institutional Class, 0.17% | | ††¥ | | | 13,000,000 | | | | 13,000,000 | |
Short-Term Investments Trust Liquid Assets Portfolio, 0.16% | | ††¥ | | | 13,000,000 | | | | 13,000,000 | |
Wells Fargo Advantage Cash Investment Money Market Fund—Select Class, 0.11% | | ††¥ | | | 13,000,000 | | | | 13,000,000 | |
Wells Fargo Advantage Heritage Money Market Fund—Select Class, 0.08% | | ††¥ | | | 13,000,000 | | | | 13,000,000 | |
| | | | | | | | | | | | |
| TOTAL MONEY MARKET FUNDS | |
(Cost $104,213,963) | | | | | | | 104,213,963 | |
| | | | | | | | | | | | |
| TOTAL INVESTMENTS—108.4% | |
(Cost $1,013,541,092) | | | | | | | 1,037,780,468 | |
Other assets less liabilities—(8.4%) | | | | (80,509,709 | ) |
| | | | | | | | | | | | |
| NET ASSETS—100.0% | | | $ | 957,270,759 | |
| | | | | | | | | | | | |
Notes to the Schedule of Investments:
| | |
| ADR | | American Depositary Receipt |
| NYRS | | New York Registry Shares |
| REIT | | Real Estate Investment Trust |
| * | | Non-income producing. |
| † | | Denotes all or a portion of the security on loan. |
| †† | | Represents reinvestment of collateral received in conjunction with securities lending. |
| ¥ | | The rate quoted is the annualized seven-day yield of the fund at period end. |
See accompanying notes to financial statements.
219
SCHEDULE OF INVESTMENTS
December 31, 2011
| | | | | | | | | | | | |
| Vantagepoint Discovery Fund | | | | | | | Shares | | | | Value | |
| | | | | | | | | | | | |
| COMMON STOCKS—47.4% | |
| Aerospace & Defense—0.5% | |
Kratos Defense & Security Solutions, Inc. | | *† | | | 157,300 | | | $ | 939,081 | |
| | | | | | | | | | | | |
| Automobiles—0.5% | |
Tesla Motors, Inc. | | *† | | | 36,400 | | | | 1,039,584 | |
| | | | | | | | | | | | |
| Biotechnology—1.5% | |
Arena Pharmaceuticals, Inc. | | *† | | | 516,758 | | | | 966,337 | |
Incyte Corp. Ltd. | | *† | | | 76,800 | | | | 1,152,768 | |
Rigel Pharmaceuticals, Inc. | | * | | | 110,200 | | | | 869,478 | |
| | | | | | | | | | | | |
| | | | | | | | | | | 2,988,583 | |
| | | | | | | | | | | | |
| Capital Markets—2.1% | |
BGC Partners, Inc., Class A | | | | | 175,900 | | | | 1,044,846 | |
Cowen Group, Inc., Class A | | * | | | 138,663 | | | | 359,137 | |
Duff & Phelps Corp., Class A | | † | | | 39,400 | | | | 571,300 | |
Gluskin Sheff + Associates, Inc. (Canada) | | | | | 14,100 | | | | 206,362 | |
Knight Capital Group, Inc., Class A | | * | | | 80,500 | | | | 951,510 | |
Uranium Participation Corp. (Canada) | | * | | | 151,978 | | | | 838,396 | |
| | | | | | | | | | | | |
| | | | | | | | | | | 3,971,551 | |
| | | | | | | | | | | | |
| Chemicals—0.2% | |
EcoSynthetix, Inc.—Legend Shares (Canada) | | *‡ | | | 24,500 | | | | 120,245 | |
EcoSynthetix, Inc. (Canada) | | * | | | 59,900 | | | | 293,988 | |
| | | | | | | | | | | | |
| | | | | | | | | | | 414,233 | |
| | | | | | | | | | | | |
| Commercial Banks—1.0% | |
First Midwest Bancorp, Inc./Illinois | | | | | 33,675 | | | | 341,128 | |
Hudson Valley Holding Corp. | | † | | | 44,989 | | | | 954,666 | |
MB Financial, Inc. | | | | | 40,000 | | | | 684,000 | |
| | | | | | | | | | | | |
| | | | | | | | | | | 1,979,794 | |
| | | | | | | | | | | | |
| Commercial Services & Supplies—0.5% | |
United Stationers, Inc. | | | | | 30,500 | | | | 993,080 | |
| | | | | | | | | | | | |
| Communications Equipment—2.6% | |
Arris Group, Inc. | | * | | | 90,800 | | | | 982,456 | |
Comverse Technology, Inc. | | * | | | 108,100 | | | | 741,566 | |
Emulex Corp. | | * | | | 121,300 | | | | 832,118 | |
Mitel Networks Corp. (Canada) | | *† | | | 325,870 | | | | 1,036,267 | |
NETGEAR, Inc. | | * | | | 29,800 | | | | 1,000,386 | |
Parkervision, Inc. | | *† | | | 534,972 | | | | 454,726 | |
| | | | | | | | | | | | |
| | | | | | | | | | | 5,047,519 | |
| | | | | | | | | | | | |
| Construction & Engineering—1.8% | |
EMCOR Group, Inc. | | | | | 40,300 | | | | 1,080,443 | |
Great Lakes Dredge & Dock Corp. | | | | | 82,500 | | | | 458,700 | |
Michael Baker Corp. | | * | | | 48,845 | | | | 957,850 | |
Orion Marine Group, Inc. | | * | | | 141,000 | | | | 937,650 | |
| | | | | | | | | | | | |
| | | | | | | | | | | 3,434,643 | |
| | | | | | | | | | | | |
| Consumer Finance—0.5% | |
DFC Global Corp. | | * | | | 54,000 | | | | 975,240 | |
| | | | | | | | | | | | |
| Containers & Packaging—0.5% | |
AptarGroup, Inc. | | | | | 17,800 | | | | 928,626 | |
| | | | | | | | | | | | |
| | | | | | | | | | | | |
| | | | | |
| | | | | | | | Shares | | | | Value | |
| | | | | | | | | | | | |
| Diversified Consumer Services—0.5% | |
Steiner Leisure Ltd. (Bahamas) | | *† | | | 21,500 | | | $ | 975,885 | |
| | | | | | | | | | | | |
| Diversified Financial Services—0.6% | |
Gain Capital Holdings, Inc. | | † | | | 162,000 | | | | 1,085,400 | |
| | | | | | | | | | | | |
| Diversified Telecommunication Services—0.3% | |
Neutral Tandem, Inc. | | * | | | 49,800 | | | | 532,362 | |
| | | | | | | | | | | | |
| Electric Utilities—1.4% | |
Portland General Electric Co. | | | | | 36,800 | | | | 930,672 | |
Unisource Energy Corp. | | | | | 23,900 | | | | 882,388 | |
Westar Energy, Inc. | | | | | 32,400 | | | | 932,472 | |
| | | | | | | | | | | | |
| | | | | | | | | | | 2,745,532 | |
| | | | | | | | | | | | |
| Electronic Equipment, Instruments & Components—1.7% | |
Fabrinet (Cayman Islands) | | *† | | | 73,400 | | | | 1,004,112 | |
InvenSense Inc. | | * | | | 36,100 | | | | 359,556 | |
OSI Systems, Inc. | | * | | | 19,400 | | | | 946,332 | |
Park Electrochemical Corp. | | | | | 38,500 | | | | 986,370 | |
| | | | | | | | | | | | |
| | | | | | | | | | | 3,296,370 | |
| | | | | | | | | | | | |
| Energy Equipment & Services—1.1% | |
C&J Energy Services, Inc. | | *^‡ | | | 94,000 | | | | 1,967,420 | |
Vantage Drilling Co. | | *† | | | 167,700 | | | | 194,532 | |
| | | | | | | | | | | | |
| | | | | | | | | | | 2,161,952 | |
| | | | | | | | | | | | |
| Food Products—1.8% | |
Cosan SA Industria e Comercio (Brazil) | | | | | 64,100 | | | | 927,865 | |
Darling International, Inc. | | * | | | 63,000 | | | | 837,270 | |
Omega Protein Corp. | | * | | | 114,000 | | | | 812,820 | |
Viterra, Inc. (Canada) | | | | | 82,600 | | | | 870,797 | |
| | | | | | | | | | | | |
| | | | | | | | | | | 3,448,752 | |
| | | | | | | | | | | | |
| Health Care Equipment & Supplies—1.1% | |
Greatbatch, Inc. | | * | | | 47,500 | | | | 1,049,750 | |
ICU Medical, Inc. | | *† | | | 23,200 | | | | 1,044,000 | |
| | | | | | | | | | | | |
| | | | | | | | | | | 2,093,750 | |
| | | | | | | | | | | | |
| Health Care Providers & Services—1.7% | |
Amsurg Corp. | | * | | | 32,300 | | | | 841,092 | |
Ensign Group, Inc. (The) | | | | | 32,500 | | | | 796,250 | |
LHC Group, Inc. | | *† | | | 59,500 | | | | 763,385 | |
Mednax, Inc. | | * | | | 12,400 | | | | 892,924 | |
| | | | | | | | | | | | |
| | | | | | | | | | | 3,293,651 | |
| | | | | | | | | | | | |
| Hotels, Restaurants & Leisure—1.1% | |
Gaylord Entertainment Co. | | * | | | 42,500 | | | | 1,025,950 | |
Whistler Blackcomb Holdings, Inc. (Canada) | | | | | 69,700 | | | | 732,064 | |
Whistler Blackcomb Holdings, Inc. (Canada) | | ‡ | | | 30,100 | | | | 316,142 | |
| | | | | | | | | | | | |
| | | | | | | | | | | 2,074,156 | |
| | | | | | | | | | | | |
| Industrial Conglomerates—0.5% | |
Carlisle Cos., Inc. | | | | | 23,500 | | | | 1,041,050 | |
| | | | | | | | | | | | |
| Insurance—0.5% | |
Platinum Underwriters Holdings Ltd. (Bermuda) | | | | | 28,200 | | | | 961,902 | |
| | | | | | | | | | | | |
| Internet & Catalog Retail—0.5% | |
PetMed Express, Inc. | | † | | | 91,000 | | | | 944,580 | |
| | | | | | | | | | | | |
See accompanying notes to financial statements.
220
SCHEDULE OF INVESTMENTS—(Continued)
December 31, 2011
| | | | | | | | | | | | |
| Vantagepoint Discovery Fund | | | | | | | Shares | | | | Value | |
| | | | | | | | | | | | |
| COMMON STOCKS—(Continued) | |
| Internet Software & Services—1.1% | |
KIT Digital, Inc. | | *† | | | 118,652 | | | $ | 1,002,609 | |
XO Group, Inc. | | * | | | 127,700 | | | | 1,065,018 | |
| | | | | | | | | | | | |
| | | | | | | | | | | 2,067,627 | |
| | | | | | | | | | | | |
| Machinery—1.1% | |
Altra Holdings, Inc. | | * | | | 50,000 | | | | 941,500 | |
Wabash National Corp. | | *† | | | 160,800 | | | | 1,260,672 | |
| | | | | | | | | | | | |
| | | | | | | | | | | 2,202,172 | |
| | | | | | | | | | | | |
| Marine—0.4% | |
Kirby Corp. | | * | | | 12,500 | | | | 823,000 | |
| | | | | | | | | | | | |
| Metals & Mining—2.5% | |
Allied Nevada Gold Corp. | | * | | | 25,400 | | | | 769,112 | |
Carpenter Technology Corp. | | | | | 17,200 | | | | 885,456 | |
New Gold, Inc. (Canada) | | * | | | 75,600 | | | | 762,048 | |
Romarco Minerals, Inc. (Canada) | | * | | | 797,900 | | | | 845,872 | |
Sandstorm Gold Ltd. (Canada) | | *W | | | 484,700 | | | | 570,935 | |
Universal Stainless & Alloy Products, Inc. | | * | | | 26,600 | | | | 993,776 | |
| | | | | | | | | | | | |
| | | | | | | | | | | 4,827,199 | |
| | | | | | | | | | | | |
| Oil, Gas & Consumable Fuels—3.7% | |
Alberta Oilsands, Inc. (Canada) | | * | | | 1,498,600 | | | | 272,138 | |
Berry Petroleum Co., Class A | | | | | 21,700 | | | | 911,834 | |
BPZ Resources, Inc. | | *† | | | 324,100 | | | | 920,444 | |
Karoon Gas Australia Ltd. (Australia) | | * | | | 146,888 | | | | 676,436 | |
Oilsands Quest, Inc. (Canada) | | *†‡ | | | 2,055,636 | | | | 183,980 | |
Porto Energy Corp. | | * | | | 1,634,900 | | | | 192,577 | |
Swift Energy Co. | | * | | | 36,300 | | | | 1,078,836 | |
Synergy Resources Corp. | | * | | | 330,000 | | | | 933,900 | |
Triangle Petroleum Corp. | | *† | | | 161,900 | | | | 966,543 | |
Warren Resources, Inc. | | * | | | 321,800 | | | | 1,049,068 | |
| | | | | | | | | | | | |
| | | | | | | | | | | 7,185,756 | |
| | | | | | | | | | | | |
| Pharmaceuticals—0.6% | |
Medicines Co. (The) | | * | | | 58,700 | | | | 1,094,168 | |
| | | | | | | | | | | | |
| Real Estate Investment Trusts (REITs)—2.9% | |
Anworth Mortgage Asset Corp. REIT | | | | | 108,700 | | | | 682,636 | |
Capstead Mortgage Corp. REIT | | | | | 59,400 | | | | 738,936 | |
CreXus Investment Corp. REIT | | | | | 80,318 | | | | 833,701 | |
Gladstone Commercial Corp. REIT | | † | | | 55,500 | | | | 974,025 | |
Medical Properties Trust, Inc. REIT | | | | | 83,900 | | | | 828,093 | |
MFA Financial, Inc. REIT | | | | | 110,700 | | | | 743,904 | |
Summit Hotel Properties, Inc. REIT | | | | | 87,500 | | | | 826,000 | |
| | | | | | | | | | | | |
| | | | | | | | | | | 5,627,295 | |
| | | | | | | | | | | | |
| Real Estate Management & Development—0.4% | |
Brasil Brokers Participacoes SA (Brazil) | | | | | 256,100 | | | | 766,138 | |
| | | | | | | | | | | | |
| | | | | | | | | | | | |
| | | | | |
| | | | | | | | Shares | | | | Value | |
| | | | | | | | | | | | |
| Road & Rail—0.3% | |
Zipcar, Inc. | | *† | | | 36,600 | | | $ | 491,172 | |
| | | | | | | | | | | | |
| Semiconductors & Semiconductor Equipment—1.4% | |
Cymer, Inc. | | * | | | 20,100 | | | | 1,000,176 | |
Microsemi Corp. | | * | | | 58,000 | | | | 971,500 | |
PMC—Sierra, Inc. | | * | | | 147,400 | | | | 812,174 | |
| | | | | | | | | | | | |
| | | | | | | | | | | 2,783,850 | |
| | | | | | | | | | | | |
| Software—0.9% | |
JDA Software Group, Inc. | | * | | | 33,400 | | | | 1,081,826 | |
SeaChange International, Inc. | | * | | | 107,243 | | | | 753,918 | |
| | | | | | | | | | | | |
| | | | | | | | | | | 1,835,744 | |
| | | | | | | | | | | | |
| Specialty Retail—1.9% | |
Cato Corp. (The), Class A | | | | | 40,300 | | | | 975,260 | |
Children’s Place Retail Stores, Inc. (The) | | * | | | 14,900 | | | | 791,488 | |
Destination Maternity Corp. | | | | | 69,600 | | | | 1,163,712 | |
Hot Topic, Inc. | | | | | 125,300 | | | | 828,233 | |
| | | | | | | | | | | | |
| | | | | | | | | | | 3,758,693 | |
| | | | | | | | | | | | |
| Textiles, Apparel & Luxury Goods—1.0% | |
G-III Apparel Group Ltd. | | | | * | | | 39,500 | | | | 983,945 | |
Skechers U.S.A., Inc., Class A | | | | * | | | 85,200 | | | | 1,032,624 | |
| | | | | | | | | | | | |
| | | | | | | | | | | 2,016,569 | |
| | | | | | | | | | | | |
| Thrifts & Mortgage Finance—0.9% | |
Flushing Financial Corp. | | | | | 75,117 | | | | 948,728 | |
Northwest Bancshares, Inc. | | | | | 71,000 | | | | 883,240 | |
| | | | | | | | | | | | |
| | | | | | | | | | | 1,831,968 | |
| | | | | | | | | | | | |
| Trading Companies & Distributors—2.8% | |
Applied Industrial Technologies, Inc. | | | | | 28,200 | | | | 991,794 | |
H&E Equipment Services, Inc. | | * | | | 86,400 | | | | 1,159,488 | |
SeaCube Container Leasing Ltd. | | | | | 69,800 | | | | 1,033,738 | |
TAL International Group, Inc. | | † | | | 34,453 | | | | 991,902 | |
Textainer Group Holdings Ltd. | | † | | | 39,600 | | | | 1,153,152 | |
| | | | | | | | | | | | |
| | | | | | | | | | | 5,330,074 | |
| | | | | | | | | | | | |
| Water Utilities—0.5% | |
Companhia de Saneamento de Minas Gerais—Copasa MG (Brazil) | | | | | 49,300 | | | | 882,788 | |
| | | | | | | | | | | | |
| Wireless Telecommunication Services—0.5% | |
Leap Wireless International, Inc. | | *† | | | 101,100 | | | | 939,219 | |
| | | | | | | | | | | | |
| TOTAL COMMON STOCKS | |
(Cost $89,007,302) | | | | | | | | | 91,830,708 | |
| | | | | | | | | | | | |
| | | | | | | | | | | | | |
| CONVERTIBLE PREFERRED STOCKS—0.6% | |
| Leisure Equipment & Products—0.6% | |
Callaway Golf Co., Perpetual,
Series B 7.500% | | | | | 11,000 | | | | 1,050,324 | |
| | | | | | | | | | | | |
| Real Estate Management & Development—0.0% | |
Grubb & Ellis Co. 12.000% | | * | | | 5,800 | | | | 39,150 | |
Grubb & Ellis Co., Perpetual
12.000% | | *^ | | | 5,200 | | | | 35,100 | |
| | | | | | | | | | | | |
| | | | | | | | | | | 74,250 | |
| | | | | | | | | | | | |
| TOTAL CONVERTIBLE PREFERRED STOCKS | |
(Cost $2,112,130) | | | | | | | | | 1,124,574 | |
| | | | | | | | | | | | |
See accompanying notes to financial statements.
221
SCHEDULE OF INVESTMENTS—(Continued)
December 31, 2011
| | | | | | | | | | | | | | |
Vantagepoint Discovery Fund | | | | | | | | |
| | | | |
Coupon
Rate | | Maturity
Date | | | | | Face | | | Value | |
| | | | | | | | | | | | | | |
| CORPORATE OBLIGATIONS—23.9% | |
| Aerospace & Defense—0.3% | |
Boeing Co. (The) | |
1.875% | | | 11/20/2012 | | | | | | $ 450,000 | | | $ | 454,792 | |
Raytheon Co. | |
1.400% | | | 12/15/2014 | | | | | | 145,000 | | | | 145,807 | |
| | | | | | | | | | | | | | |
| | | | | | | | | | | | | 600,599 | |
| | | | | | | | | | | | | | |
| Auto Components—0.1% | |
Johnson Controls, Inc. | |
0.843% | | | 02/04/2014 | | | # | | | 290,000 | | | | 289,994 | |
| | | | | | | | | | | | | | |
| Beverages—0.8% | |
Anheuser-Busch InBev Worldwide, Inc. | |
9.750% | | | 11/17/2015 | | | † | | | BRL 1,030,000 | | | | 579,815 | |
2.500% | | | 03/26/2013 | | | | | | 470,000 | | | | 478,833 | |
Coca-Cola Enterprises, Inc. | |
1.125% | | | 11/12/2013 | | | | | | 530,000 | | | | 531,935 | |
| | | | | | | | | | | | | | |
| | | | | | | | | | | | | 1,590,583 | |
| | | | | | | | | | | | | | |
| Biotechnology—0.2% | |
Amgen, Inc. | |
1.875% | | | 11/15/2014 | | | | | | 330,000 | | | | 334,504 | |
Gilead Sciences, Inc. | |
2.400% | | | 12/01/2014 | | | | | | 140,000 | | | | 142,621 | |
| | | | | | | | | | | | | | |
| | | | | | | | | | | | | 477,125 | |
| | | | | | | | | | | | | | |
| Capital Markets—1.2% | |
Goldman Sachs Group, Inc. (The) | |
1.435% | | | 02/07/2014 | | | # | | | 570,000 | | | | 533,105 | |
Merrill Lynch & Co., Inc., Series C MTN | |
6.050% | | | 08/15/2012 | | | | | | 225,000 | | | | 228,283 | |
Morgan Stanley | |
1.408% | | | 04/29/2013 | | | # | | | 610,000 | | | | 575,075 | |
TD Ameritrade Holding Corp. | |
4.150% | | | 12/01/2014 | | | | | | 410,000 | | | | 433,622 | |
WCI Finance LLC/WEA Finance LLC | |
5.400% | | | 10/01/2012 | | | ^ | | | 450,000 | | | | 461,143 | |
| | | | | | | | | | | | | | |
| | | | | | | | | | | | | 2,231,228 | |
| | | | | | | | | | | | | | |
| Chemicals—0.2% | |
Ecolab, Inc. | |
2.375% | | | 12/08/2014 | | | | | | 110,000 | | | | 112,216 | |
Praxair, Inc. | |
1.750% | | | 11/15/2012 | | | | | | 200,000 | | | | 201,749 | |
| | | | | | | | | | | | | | |
| | | | | | | | | | | | | 313,965 | |
| | | | | | | | | | | | | | |
| Commercial Banks—3.1% | |
Banco Bradesco SA (Brazil) | |
2.561% | | | 05/16/2014 | | | #^ | | | 300,000 | | | | 294,661 | |
Banco de Credito del Peru (Peru) | |
4.750% | | | 03/16/2016 | | | ^ | | | 420,000 | | | | 423,150 | |
Barclays Bank plc (United Kingdom) | |
1.438% | | | 01/13/2014 | | | # | | | 520,000 | | | | 504,315 | |
BB&T Corp., Series A MTN | |
3.375% | | | 09/25/2013 | | | | | | 200,000 | | | | 206,963 | |
Capital One Financial Corp. | |
2.125% | | | 07/15/2014 | | | | | | 340,000 | | | | 335,846 | |
CIT Group, Inc. | |
5.250% | | | 04/01/2014 | | | ^ | | | 285,000 | | | | 285,356 | |
HSBC Bank plc (United Kingdom) | |
1.625% | | | 07/07/2014 | | | ^† | | | 360,000 | | | | 356,041 | |
| | | | | | | | | | | | | | |
| | | | | |
Coupon
Rate | |
| Maturity
Date |
| | | | | Face | | | | Value | |
| | | | | | | | | | | | | | |
ING Bank NV (Netherlands) | |
1.596% | | | 03/15/2013 | | | #^ | | | $ 570,000 | | | $ | 556,923 | |
KeyCorp MTN | |
3.750% | | | 08/13/2015 | | | | | | 230,000 | | | | 238,703 | |
Nordea Bank AB (Sweden) | |
1.301% | | | 01/14/2014 | | | #^ | | | 500,000 | | | | 484,390 | |
Royal Bank of Scotland plc (The) (United Kingdom) | |
3.250% | | | 01/11/2014 | | | | | | 520,000 | | | | 498,521 | |
SunTrust Bank | |
1.195% | | | 06/22/2012 | | | # | | | GBP 330,000 | | | | 507,282 | |
Union Bank NA, Bank Note | |
2.125% | | | 12/16/2013 | | | | | | 530,000 | | | | 536,279 | |
US Bancorp | |
4.200% | | | 05/15/2014 | | | | | | 500,000 | | | | 535,615 | |
Wachovia Bank NA, Bank Note | |
4.800% | | | 11/01/2014 | | | | | | 250,000 | | | | 262,876 | |
| | | | | | | | | | | | | | |
| | | | | | | | | | | | | 6,026,921 | |
| | | | | | | | | | | | | | |
| Communications Equipment—0.4% | |
Cisco Systems, Inc. | |
0.794% | | | 03/14/2014 | | | # | | | 680,000 | | | | 679,927 | |
| | | | | | | | | | | | | | |
| Computers & Peripherals—0.2% | |
Hewlett-Packard Co. | |
2.109% | | | 09/19/2014 | | | # | | | 300,000 | | | | 298,756 | |
| | | | | | | | | | | | | | |
| Consumer Finance—2.1% | |
Ally Financial, Inc. | |
4.500% | | | 02/11/2014 | | | | | | 400,000 | | | | 387,000 | |
American Express Credit Corp., Series D MTN | |
5.125% | | | 08/25/2014 | | | | | | 300,000 | | | | 322,496 | |
American Honda Finance Corp. | |
2.375% | | | 03/18/2013 | | | ^ | | | 200,000 | | | | 202,860 | |
Banque PSA Finance (France) | |
2.481% | | | 04/04/2014 | | | #^ | | | 540,000 | | | | 500,379 | |
Caterpillar Financial Services Corp., Series G MTN | |
1.375% | | | 05/20/2014 | | | | | | 360,000 | | | | 364,720 | |
Ford Motor Credit Co. LLC | |
3.875% | | | 01/15/2015 | | | | | | 470,000 | | | | 468,578 | |
International Lease Finance Corp. | |
6.500% | | | 09/01/2014 | | | ^ | | | 200,000 | | | | 205,500 | |
John Deere Capital Corp. MTN | |
1.600% | | | 03/03/2014 | | | | | | 270,000 | | | | 274,583 | |
PACCAR Financial Corp. | |
1.550% | | | 09/29/2014 | | | | | | 210,000 | | | | 212,613 | |
PACCAR Financial Corp. MTN | |
0.745% | | | 04/05/2013 | | | # | | | 360,000 | | | | 359,775 | |
RCI Banque SA (France) | |
2.261% | | | 04/11/2014 | | | #^ | | | 800,000 | | | | 762,915 | |
| | | | | | | | | | | | | | |
| | | | | | | | | | | | | 4,061,419 | |
| | | | | | | | | | | | | | |
| Diversified Financial Services—3.4% | |
Bank of America Corp. MTN | |
4.900% | | | 05/01/2013 | | | | | | 225,000 | | | | 225,254 | |
Caisse Centrale Desjardins du Quebec (Canada) | |
1.700% | | | 09/16/2013 | | | ^ | | | 450,000 | | | | 450,929 | |
Citigroup, Inc. | |
6.000% | | | 12/13/2013 | | | | | | 175,000 | | | | 181,166 | |
5.300% | | | 10/17/2012 | | | | | | 175,000 | | | | 177,878 | |
1.307% | | | 02/15/2013 | | | # | | | 470,000 | | | | 461,392 | |
CME Group, Inc. | |
5.400% | | | 08/01/2013 | | | | | | 200,000 | | | | 213,208 | |
Equifax, Inc. | |
4.450% | | | 12/01/2014 | | | | | | 80,000 | | | | 84,378 | |
See accompanying notes to financial statements.
222
SCHEDULE OF INVESTMENTS—(Continued)
December 31, 2011
| | | | | | | | | | | | | | |
Vantagepoint Discovery Fund | | | | | | | | |
| | | | |
Coupon
Rate | | Maturity
Date | | | | | Face | | | Value | |
| | | | | | | | | | | | | | |
| CORPORATE OBLIGATIONS—(Continued) | |
ERAC USA Finance LLC | |
2.250% | | | 01/10/2014 | | | ^ | | | $ 400,000 | | | $ | 398,536 | |
General Electric Capital Corp. | |
5.900% | | | 05/13/2014 | | | | | | 260,000 | | | | 284,898 | |
2.800% | | | 01/08/2013 | | | | | | 400,000 | | | | 407,702 | |
General Electric Capital Corp. MTN | |
2.125% | | | 12/21/2012 | | | | | | 1,000,000 | | | | 1,018,847 | |
1.253% | | | 01/15/2013 | | | # | | | 300,000 | | | | 302,036 | |
General Electric Capital Corp., Series A MTN | |
3.750% | | | 11/14/2014 | | | | | | 390,000 | | | | 411,366 | |
JPMorgan Chase & Co. | |
4.750% | | | 05/01/2013 | | | | | | 350,000 | | | | 366,013 | |
JPMorgan Chase & Co. MTN | |
1.216% | | | 01/24/2014 | | | # | | | 540,000 | | | | 532,148 | |
NASDAQ OMX Group, Inc. (The) | |
4.000% | | | 01/15/2015 | | | | | | 460,000 | | | | 471,688 | |
National Rural Utilities Cooperative Finance Corp. | |
1.125% | | | 11/01/2013 | | | | | | 215,000 | | | | 215,189 | |
Western Union Co. (The) | |
1.114% | | | 03/07/2013 | | | # | | | 390,000 | | | | 390,087 | |
| | | | | | | | | | | | | | |
| | | | | | | | | | | | | 6,592,715 | |
| | | | | | | | | | | | | | |
| Diversified Telecommunication Services—0.8% | |
BellSouth Corp. | |
4.750% | | | 11/15/2012 | | | | | | 630,000 | | | | 651,230 | |
Cellco Partnership/Verizon Wireless Capital LLC | |
5.550% | | | 02/01/2014 | | | | | | 100,000 | | | | 108,700 | |
Telecom Italia Capital SA (Luxembourg) | |
5.250% | | | 11/15/2013 | | | | | | 105,000 | | | | 100,905 | |
Telefonica Emisiones SAU (Spain) | |
2.582% | | | 04/26/2013 | | | | | | 490,000 | | | | 478,293 | |
Verizon Communications, Inc. | |
1.184% | | | 03/28/2014 | | | # | | | 300,000 | | | | 299,810 | |
| | | | | | | | | | | | | | |
| | | | | | | | | | | | | 1,638,938 | |
| | | | | | | | | | | | | | |
| Electric Utilities—1.5% | |
Cia de Eletricidade do Estado da Bahia (Brazil) | |
11.750% | | | 04/27/2016 | | | ^ | | | BRL 450,000 | | | | 253,317 | |
Consumers Energy Co., Series D | |
5.375% | | | 04/15/2013 | | | | | | 275,000 | | | | 289,447 | |
Duke Energy Carolinas LLC | |
6.250% | | | 01/15/2012 | | | | | | 400,000 | | | | 400,639 | |
Georgia Power Co. | |
1.300% | | | 09/15/2013 | | | | | | 460,000 | | | | 464,445 | |
0.673% | | | 01/15/2013 | | | # | | | 500,000 | | | | 500,352 | |
Midamerican Energy Holdings Co. | |
3.150% | | | 07/15/2012 | | | | | | 300,000 | | | | 303,555 | |
Public Service Electric & Gas Co., Series B MTN | |
5.125% | | | 09/01/2012 | | | | | | 700,000 | | | | 719,709 | |
| | | | | | | | | | | | | | |
| | | | | | | | | | | | | 2,931,464 | |
| | | | | | | | | | | | | | |
| Electronic Equipment, Instruments & Components—0.1% | |
Thermo Fisher Scientific, Inc. | |
2.150% | | | 12/28/2012 | | | | | | 220,000 | | | | 222,695 | |
| | | | | | | | | | | | | | |
| Food & Staples Retailing—0.3% | |
Safeway, Inc. | |
5.800% | | | 08/15/2012 | | | | | | 350,000 | | | | 359,452 | |
| | | | | | | | | | | | | | |
| | | | | |
Coupon
Rate | |
| Maturity
Date |
| | | | | Face | | | | Value | |
| | | | | | | | | | | | | | |
3.400% | | | 12/01/2016 | | | | | $ | 200,000 | | | $ | 205,345 | |
| | | | | | | | | | | | | | |
| | | | | | | | | | | | | 564,797 | |
| | | | | | | | | | | | | | |
| Food Products—0.6% | |
General Mills, Inc. | |
5.250% | | | 08/15/2013 | | | | | | 750,000 | | | | 801,822 | |
Kraft Foods, Inc. | |
5.250% | | | 10/01/2013 | | | | | | 140,000 | | | | 149,400 | |
2.625% | | | 05/08/2013 | | | | | | 140,000 | | | | 143,075 | |
| | | | | | | | | | | | | | |
| | | | | | | | | | | | | 1,094,297 | |
| | | | | | | | | | | | | | |
| Health Care Equipment & Supplies—0.5% | |
DENTSPLY International, Inc. | |
1.957% | | | 08/15/2013 | | | # | | | 280,000 | | | | 282,030 | |
Stryker Corp. | |
3.000% | | | 01/15/2015 | | | | | | 300,000 | | | | 316,363 | |
2.000% | | | 09/30/2016 | | | | | | 400,000 | | | | 409,794 | |
| | | | | | | | | | | | | | |
| | | | | | | | | | | | | 1,008,187 | |
| | | | | | | | | | | | | | |
| Health Care Providers & Services—0.6% | |
Aristotle Holding, Inc. | |
2.750% | | | 11/21/2014 | | | ^ | | | 500,000 | | | | 506,411 | |
Quest Diagnostics, Inc. | |
1.424% | | | 03/24/2014 | | | # | | | 160,000 | | | | 160,920 | |
WellPoint, Inc. | |
2.375% | | | 02/15/2017 | | | | | | 465,000 | | | | 464,149 | |
| | | | | | | | | | | | | | |
| | | | | | | | | | | | | 1,131,480 | |
| | | | | | | | | | | | | | |
| Independent Power Producers & Energy Traders—0.1% | |
AES Corp. (The) | |
7.750% | | | 03/01/2014 | | | | | | 225,000 | | | | 244,125 | |
| | | | | | | | | | | | | | |
| Industrial Conglomerates—0.3% | |
Danaher Corp. | |
0.817% | | | 06/21/2013 | | | # | | | 500,000 | | | | 500,947 | |
| | | | | | | | | | | | | | |
| Insurance—1.6% | |
Allstate Corp. (The) | |
6.200% | | | 05/16/2014 | | | | | | 300,000 | | | | 334,765 | |
Berkshire Hathaway, Inc. | |
3.750% | | | 08/15/2021 | | | † | | | 1,000,000 | | | | 1,041,143 | |
MetLife, Inc. | |
2.375% | | | 02/06/2014 | | | | | | 190,000 | | | | 192,749 | |
Metropolitan Life Global Funding I | |
1.141% | | | 01/10/2014 | | | #^ | | | 700,000 | | | | 699,683 | |
New York Life Global Funding | |
0.841% | | | 04/04/2014 | | | #^ | | | 500,000 | | | | 493,809 | |
Prudential Financial, Inc., Series D MTN | |
3.625% | | | 09/17/2012 | | | | | | 355,000 | | | | 360,566 | |
| | | | | | | | | | | | | | |
| | | | | | | | | | | | | 3,122,715 | |
| | | | | | | | | | | | | | |
| IT Services—0.4% | |
International Business Machines Corp. | |
1.000% | | | 08/05/2013 | | | | | | 750,000 | | | | 756,202 | |
| | | | | | | | | | | | | | |
| Life Sciences Tools & Services—0.2% | |
Howard Hughes Medical Institute | |
3.450% | | | 09/01/2014 | | | | | | 400,000 | | | | 426,872 | |
| | | | | | | | | | | | | | |
| Machinery—0.1% | |
Case New Holland, Inc. | |
7.750% | | | 09/01/2013 | | | | | | 200,000 | | | | 213,500 | |
| | | | | | | | | | | | | | |
| Media—0.1% | |
Viacom, Inc. | |
4.375% | | | 09/15/2014 | | | | | | 200,000 | | | | 214,387 | |
| | | | | | | | | | | | | | |
See accompanying notes to financial statements.
223
SCHEDULE OF INVESTMENTS—(Continued)
December 31, 2011
| | | | | | | | | | | | | | |
Vantagepoint Discovery Fund | | | | | | | | |
| | | | |
Coupon
Rate | | Maturity
Date | | | | | Face | | | Value | |
| | | | | | | | | | | | | | |
| CORPORATE OBLIGATIONS—(Continued) | |
| Metals & Mining—0.3% | |
Steel Dynamics, Inc. | |
7.375% | | | 11/01/2012 | | | | | $ | 375,000 | | | $ | 391,406 | |
Vedanta Resources plc (United Kingdom) | |
6.750% | | | 06/07/2016 | | | ^ | | | 200,000 | | | | 172,000 | |
| | | | | | | | | | | | | | |
| | | | | | | | | | | | | 563,406 | |
| | | | | | | | | | | | | | |
| Multiline Retail—0.4% | |
Target Corp. | |
0.575% | | | 07/18/2014 | | | # | | | 700,000 | | | | 700,438 | |
| | | | | | | | | | | | | | |
| Multi-Utilities—0.2% | |
DTE Energy Co. | |
1.227% | | | 06/03/2013 | | | # | | | 370,000 | | | | 369,777 | |
| | | | | | | | | | | | | | |
| Oil, Gas & Consumable Fuels—1.0% | |
ConocoPhillips | |
4.750% | | | 02/01/2014 | | | | | | 200,000 | | | | 216,111 | |
Kinder Morgan Energy Partners LP | | | | | |
5.850% | | | 09/15/2012 | | | | | | 370,000 | | | | 381,995 | |
Kinder Morgan Kansas, Inc. | | | | | |
6.500% | | | 09/01/2012 | | | | | | 460,000 | | | | 471,500 | |
Rockies Express Pipeline LLC | | | | | |
3.900% | | | 04/15/2015 | | | ^ | | | 290,000 | | | | 286,794 | |
Tesoro Corp. | | | | | |
6.625% | | | 11/01/2015 | | | | | | 140,000 | | | | 143,150 | |
XTO Energy, Inc. | | | | | |
7.500% | | | 04/15/2012 | | | | | | 390,000 | | | | 397,837 | |
| | | | | | | | | | | | | | |
| | | | | | | | | | | | | 1,897,387 | |
| | | | | | | | | | | | | | |
| Personal Products—0.2% | |
Revlon Consumer Products Corp. | | | | | |
9.750% | | | 11/15/2015 | | | | | | 380,000 | | | | 406,125 | |
| | | | | | | | | | | | | | |
| Pharmaceuticals—0.6% | |
Eli Lilly & Co. | | | | | |
3.550% | | | 03/06/2012 | | | | | | 100,000 | | | | 100,526 | |
Novartis Capital Corp. | | | | | |
4.125% | | | 02/10/2014 | | | | | | 100,000 | | | | 107,046 | |
Teva Pharmaceutical Finance Co. BV (Netherlands Antilles) | |
1.344% | | | 11/08/2013 | | | # | | | 490,000 | | | | 492,253 | |
Valeant Pharmaceuticals International | | | | | |
6.500% | | | 07/15/2016 | | | ^ | | | 400,000 | | | | 401,500 | |
| | | | | | | | | | | | | | |
| | | | | | | | | | | | | 1,101,325 | |
| | | | | | | | | | | | | | |
| Real Estate Investment Trusts (REITs)—0.8% | |
HCP, Inc. | | | | | |
2.700% | | | 02/01/2014 | | | | | | 570,000 | | | | 569,457 | |
Health Care REIT, Inc. | | | | | |
6.000% | | | 11/15/2013 | | | | | | 370,000 | | | | 388,405 | |
Simon Property Group LP | | | | | |
4.200% | | | 02/01/2015 | | | | | | 90,000 | | | | 95,507 | |
Vornado Realty LP | | | | | |
4.250% | | | 04/01/2015 | | | | | | 470,000 | | | | 486,779 | |
| | | | | | | | | | | | | | |
| | | | | | | | | | | | | 1,540,148 | |
| | | | | | | | | | | | | | |
| Semiconductors & Semiconductor Equipment—0.2% | |
Texas Instruments, Inc. | | | | | |
0.875% | | | 05/15/2013 | | | | | | 410,000 | | | | 411,216 | |
| | | | | | | | | | | | | | |
| | | | | | | | | | | | | | |
| | | | | |
Coupon
Rate | |
| Maturity
Date |
| | | | | Face | | | | Value | |
| | | | | | | | | | | | | | |
| Software—0.5% | |
Microsoft Corp. | | | | | |
2.950% | | | 06/01/2014 | | | | | $ | 500,000 | | | $ | 531,447 | |
Oracle Corp. | | | | | |
3.750% | | | 07/08/2014 | | | | | | 480,000 | | | | 516,540 | |
| | | | | | | | | | | | | | |
| | | | | | | | | | | | | 1,047,987 | |
| | | | | | | | | | | | | | |
| Textiles, Apparel & Luxury Goods—0.3% | |
Levi Strauss & Co. | | | | | |
8.875% | | | 04/01/2016 | | | † | | | 350,000 | | | | 365,750 | |
VF Corp. | | | | | |
1.245% | | | 08/23/2013 | | | # | | | 300,000 | | | | 300,660 | |
| | | | | | | | | | | | | | |
| | | | | | | | | | | | | 666,410 | |
| | | | | | | | | | | | | | |
| Trading Companies & Distributors—0.1% | |
AmeriGas Partners LP/AmeriGas Finance Corp. | | | | | |
6.250% | | | 08/20/2019 | | | | | | 260,000 | | | | 260,000 | |
| | | | | | | | | | | | | | |
| Wireless Telecommunication Services—0.1% | |
America Movil SAB de CV (Mexico) | | | | | |
3.625% | | | 03/30/2015 | | | | | | 130,000 | | | | 136,873 | |
| | | | | | | | | | | | | | |
| TOTAL CORPORATE OBLIGATIONS | |
(Cost $46,185,014) | | | | 46,334,930 | |
| | | | | | | | | | | | | | |
| | | | | | | | | | | | | | | |
| MORTGAGE-RELATED SECURITIES—6.1% | |
| Commercial Mortgage-Backed Securities—0.5% | |
Extended Stay America Trust,
Series 2010-ESHA, Class A | | | | | |
2.951% | | | 11/05/2027 | | | ^ | | | 499,787 | | | | 502,287 | |
National Credit Union Administration Guaranteed Notes,
Series 2010-C1, Class A1 | |
1.600% | | | 10/29/2020 | | | | | | 430,001 | | | | 435,816 | |
| | | | | | | | | | | | | | |
| | | | | | | | | | | | | 938,103 | |
| | | | | | | | | | | | | | |
U.S. Government Agency Mortgage-Backed
Securities—4.9% | |
Federal National Mortgage Association | | | | | |
5.000% | | | 07/01/2035 | | | | | | 1,682,251 | | | | 1,819,519 | |
4.000% | |
| 11/01/2040-
09/01/2041 |
| | | | | 1,255,546 | | | | 1,320,747 | |
3.500% | | | 12/01/2020 | | | | | | 596,082 | | | | 624,380 | |
0.595% | | | 07/01/2016 | | | # | | | 1,500,000 | | | | 1,514,623 | |
Government National Mortgage Association,
Series 2005-58, Class NJ | |
4.500% | | | 08/20/2035 | | | | | | 138,217 | | | | 139,446 | |
National Credit Union Administration Guaranteed Notes, Series 2010-R1, Class 1A | |
0.724% | | | 10/07/2020 | | | # | | | 708,950 | | | | 709,722 | |
National Credit Union Administration Guaranteed Notes, Series 2010-R2, Class 1A | |
0.644% | | | 11/06/2017 | | | # | | | 1,537,971 | | | | 1,537,971 | |
National Credit Union Administration Guaranteed Notes, Series 2011-R6, Class 1A | |
0.654% | | | 05/07/2020 | | | # | | | 1,803,911 | | | | 1,803,911 | |
| | | | | | | | | | | | | | |
| | | | | | | | | | | | | 9,470,319 | |
| | | | | | | | | | | | | | |
| U.S. Non-Agency Mortgage-Backed Securities—0.7% | |
Harborview Mortgage Loan Trust,
Series 2005-14, Class 3A1A | | | | | |
2.750% | | | 12/19/2035 | | | # | | | 783,246 | | | | 486,069 | |
See accompanying notes to financial statements.
224
SCHEDULE OF INVESTMENTS—(Continued)
December 31, 2011
| | | | | | | | | | | | | | |
Vantagepoint Discovery Fund | | | | | | | | |
| | | | |
Coupon
Rate | | Maturity
Date | | | | | Face | | | Value | |
| | | | | | | | | | | | | | |
| MORTGAGE-RELATED SECURITIES—(Continued) | |
Thornburg Mortgage Securities Trust,
Series 2004-1, Class II2A | | | | | |
1.744% | | | 03/25/2044 | | | # | | $ | 1,043,828 | | | $ | 885,693 | |
WaMu Mortgage Pass Through Certificates,
Series 2006-AR12, Class 1A1 | | | | | |
5.933% | | | 10/25/2036 | | | # | | | 121,838 | | | | 83,696 | |
| | | | | | | | | | | | | | |
| | | | | | | | | | | | | 1,455,458 | |
| | | | | | | | | | | | | | |
| TOTAL MORTGAGE-RELATED SECURITIES | |
(Cost $12,261,966) | | | | 11,863,880 | |
| | | | | | | | | | | | | | |
| | | | | | | | | | | | | | | |
| CONVERTIBLE DEBT OBLIGATIONS—0.2% | |
| Capital Markets—0.1% | |
Grubb & Ellis Co. | | | | | |
7.950% | | | 05/01/2015 | | | ^ | | | 299,000 | | | | 192,855 | |
| | | | | | | | | | | | | | |
| Oil, Gas & Consumable Fuels—0.1% | |
Rentech, Inc. | | | | | |
4.000% | | | 04/15/2013 | | | | | | 148,000 | | | | 145,040 | |
| | | | | | | | | | | | | | |
| TOTAL CONVERTIBLE DEBT OBLIGATIONS | |
(Cost $400,620) | | | | 337,895 | |
| | | | | | | | | | | | | | |
| | | | | | | | | | | | | | | |
| | | | | | | | | | | | | | |
| U.S. TREASURY OBLIGATIONS—9.9% | |
| U.S. Treasury Notes—9.9% | |
U.S. Treasury Note | | | | | |
0.376% | | | 11/15/2014 | | | †‡‡ | | | 6,590,000 | | | | 6,595,147 | |
0.250% | |
| 09/15/2014-
12/15/2014 |
| | | | | 5,580,000 | | | | 5,563,016 | |
0.249% | | | 11/30/2013 | | | | | | 6,500,000 | | | | 6,501,781 | |
0.125% | | | 09/30/2013 | | | ‡‡ | | | 545,000 | | | | 543,999 | |
| | | | | | | | | | | | | | |
| TOTAL U.S. TREASURY OBLIGATIONS | |
(Cost $19,179,734) | | | | 19,203,943 | |
| | | | | | | | | | | | | | |
| | | | | | | | | | | | | | | |
| GOVERNMENT RELATED OBLIGATIONS—7.9% | |
| U.S. Government Agencies—4.7% | |
Federal Home Loan Banks | | | | | |
0.375% | | | 11/27/2013 | | | † | | | 2,650,000 | | | | 2,648,296 | |
Federal Home Loan Mortgage Corp. | | | | | |
1.000% | | | 07/30/2014 | | | ‡‡ | | | 2,000,000 | | | | 2,022,730 | |
0.375% | | | 11/27/2013 | | | † | | | 1,800,000 | | | | 1,797,943 | |
Federal National Mortgage Association | | | | | |
1.125% | | | 06/27/2014 | | | ‡‡ | | | 2,000,000 | | | | 2,027,194 | |
National Credit Union Administration Guaranteed Notes, Series A1 | |
0.296% | | | 06/12/2013 | | | # | | | 570,000 | | | | 569,475 | |
National Credit Union Administration Guaranteed Notes, Series A2 | |
1.400% | | | 06/12/2015 | | | | | | 180,000 | | | | 182,338 | |
| | | | | | | | | | | | | | |
| | | | | | | | | | | | | 9,247,976 | |
| | | | | | | | | | | | | | |
| U.S. Government Agencies-U.S. Government Guaranteed Bank Debt—1.6% | |
Ally Financial, Inc. | | | | | |
2.200% | | | 12/19/2012 | | | | | | 1,000,000 | | | | 1,019,570 | |
US Central Federal Credit Union | | | | | |
1.900% | | | 10/19/2012 | | | | | | 1,000,000 | | | | 1,014,151 | |
| | | | | | | | | | | | | | |
| | | | | |
Coupon
Rate | |
| Maturity
Date |
| | | | | Face | | | | Value | |
| | | | | | | | | | | | | | |
Western Corporate Federal Credit Union | | | | | |
1.750% | | | 11/02/2012 | | | | | $ | 1,000,000 | | | $ | 1,012,734 | |
| | | | | | | | | | | | | | |
| | | | | | | | | | | | | 3,046,455 | |
| | | | | | | | | | | | | | |
| Non-U.S. Government Agencies—0.4% | |
IPIC Ltd. MTN (Cayman Islands) | | | | | |
3.125% | | | 11/15/2015 | | | ^ | | | 250,000 | | | | 250,625 | |
Korea National Oil Corp. (Korea, Republic of) | | | | | |
2.875% | | | 11/09/2015 | | | ^ | | | 500,000 | | | | 501,351 | |
| | | | | | | | | | | | | | |
| | | | | | | | | | | | | 751,976 | |
| | | | | | | | | | | | | | |
| Sovereign Debt—0.7% | |
Panama Government International Bond (Panama) | |
7.250% | | | 03/15/2015 | | | | | | 300,000 | | | | 347,250 | |
Province of Nova Scotia (Canada) | | | | | |
5.750% | | | 02/27/2012 | | | | | | 1,000,000 | | | | 1,006,872 | |
| | | | | | | | | | | | | | |
| | | | | | | | | | | | | 1,354,122 | |
| | | | | | | | | | | | | | |
| U.S. Municipal Bonds—0.5% | |
Citizens Property Insurance Corp. Revenue Bonds,
Series 2007-A (Florida) | |
5.000% | | | 03/01/2013 | | | | | | 150,000 | | | | 156,626 | |
State of Louisiana General Obligation Bonds, Series 2011-B (Louisiana) | | | | | |
1.007% | | | 07/15/2014 | | | # | | | 670,000 | | | | 670,750 | |
University of California Revenue Bonds (California) | |
1.988% | | | 05/15/2050 | | | # | | | 180,000 | | | | 183,141 | |
| | | | | | | | | | | | | | |
| | | | | | | | | | | | | 1,010,517 | |
| | | | | | | | | | | | | | |
| TOTAL GOVERNMENT RELATED OBLIGATIONS | |
(Cost $15,346,236) | | | | 15,411,046 | |
| | | | | | | | | | | | | | |
| | | | | | | | | | | | | | | |
| ASSET-BACKED SECURITIES—1.4% | |
| Automobile—0.5% | |
Hyundai Capital Auto Funding Ltd. (Cayman Islands)
Series 2010-8A, Class A | |
1.285% | | | 09/20/2016 | | | #^ | | | 950,000 | | | | 955,216 | |
| | | | | | | | | | | | | | |
| Other—0.3% | |
MMAF Equipment Finance LLC
Series 2011-AA, Class A3 | | | | | |
1.270% | | | 09/15/2015 | | | ^ | | | 580,000 | | | | 579,954 | |
| | | | | | | | | | | | | | |
| Student Loan—0.6% | |
National Credit Union Administration Guaranteed Notes
Series 2010-A1, Class A | |
0.624% | | | 12/07/2020 | | | # | | | 1,192,346 | | | | 1,195,815 | |
| | | | | | | | | | | | | | |
| TOTAL ASSET-BACKED SECURITIES | |
(Cost $2,718,154) | | | | 2,730,985 | |
| | | | | | | | | | | | | | |
| | | | | | | | | | | | | | | |
| | | | |
| | | | | | | | Shares | | | Value | |
| WARRANTS—0.0% | |
| Food Products—0.0% | |
Kulim Malaysia BHD (Malaysia), Expires 02/27/2016,
Strike MYR 3.85 | | | * | | | 60,350 | | | | 20,561 | |
| | | | | | | | | | | | | | |
See accompanying notes to financial statements.
225
SCHEDULE OF INVESTMENTS—(Continued)
December 31, 2011
| | | | | | | | | | | | |
Vantagepoint Discovery Fund | | | | | Shares | | | | Value | |
| | | | | | | | | | | | |
| WARRANTS—(Continued) | |
| Metals & Mining—0.0% | |
Sandstorm Gold Ltd. (Canada), Expires 10/19/2015,
Strike CAD 1.00 | | *W | | | 189,250 | | | $ | 107,745 | |
| | | | | | | | | | | | |
| TOTAL WARRANTS | |
(Cost $—) | | | | 128,306 | |
| | | | | | | | | | | | |
| | | | | | | | | | | | | |
| MONEY MARKET FUNDS—12.8% | |
| Institutional Money Market Funds—12.8% | |
Dreyfus Institutional Cash Advantage Fund, 0.06% | | ††¥ | | | 3,000,000 | | | | 3,000,000 | |
Fidelity Institutional Money Market: Money Market Portfolio—Institutional Class, 0.23% | | ¥ | | | 6,824,883 | | | | 6,824,883 | |
Fidelity Institutional Money Market: Money Market Portfolio—Institutional Class, 0.23% | | ††¥ | | | 2,935,954 | | | | 2,935,954 | |
Fidelity Institutional Money Market: Prime Money Market Portfolio—Institutional Class, 0.17% | | ††¥ | | | 3,000,000 | | | | 3,000,000 | |
Short-Term Investments Trust Liquid Assets Portfolio, 0.16% | | ††¥ | | | 3,000,000 | | | | 3,000,000 | |
Wells Fargo Advantage Cash Investment Money Market Fund—Select Class, 0.11% | | ††¥ | | | 3,000,000 | | | | 3,000,000 | |
Wells Fargo Advantage
Heritage Money Market
Fund—Select Class, 0.08% | | ††¥ | | | 3,000,000 | | | | 3,000,000 | |
| | | | | | | | | | | | |
| TOTAL MONEY MARKET FUNDS | |
(Cost $24,760,837) | | | | | | | 24,760,837 | |
| | | | | | | | | | | | |
| TOTAL INVESTMENTS—110.2% | |
(Cost $211,971,993) | | | | | | | 213,727,104 | |
Other assets less liabilities—(10.2%) | | | | (19,855,422 | ) |
| | | | | | | | | | | | |
| NET ASSETS—100.0% | | | | | | | | $ | 193,871,682 | |
| | | | | | | | | | | | |
Notes to the Schedule of Investments:
| | |
| BRL | | Brazilian Real |
| CAD | | Canadian Dollar |
| GBP | | British Pound Sterling |
| MTN | | Medium Term Note |
| MYR | | Malaysian Ringgit |
| REIT | | Real Estate Investment Trust |
| # | | Rate is subject to change. Rate shown reflects current rate. |
| * | | Non-income producing. |
| ^ | | Securities are not registered under the Securities Act of 1933. These securities may be resold only in transactions exempt from registration, generally to qualified institutional buyers under Securities Act Rule 144A. Such securities are considered illiquid unless deemed liquid by a subadviser under the liquidity procedures adopted by the Board of Directors. The total market value of 144A securities was $13,181,105, which represented 6.8% of Net Assets. The illiquid 144A securities represented 1.3% of Net Assets, and 18.6% of total 144A securities held. |
| † | | Denotes all or a portion of the security on loan. |
| †† | | Represents reinvestment of collateral received in conjunction with securities lending. |
| ‡ | | Security valued at fair value as determined by policies approved by the Board of Directors. |
| ‡‡ | | Security or a portion of the security has been pledged as collateral for futures contracts and/or options contracts. |
| ¥ | | The rate quoted is the annualized seven-day yield of the fund at period end. |
| W | | The aggregate value of restricted securities (excluding 144A issues) at period end amounted to $678,680, which represents 0.35% of Net Assets. |
Additional information on each holding is as follows.
| | | | | | |
| Security | | Acquisition
Date | | Acquisition
Cost | |
Sandstorm Gold Ltd. | | 10/15/2010 -
12/06/2010 | | $ | 346,434 | |
Sandstorm Gold Ltd. | | 10/19/2010 | | $ | — | |
See accompanying notes to financial statements.
226
SCHEDULE OF INVESTMENTS
December 31, 2011
| | | | | | | | | | | | |
| Vantagepoint International Fund | | | | | | | Shares | | | | Value | |
| | | | | | | | | | | | |
| COMMON STOCKS—96.6% | | | | | | | | |
| Australia—5.1% | | | | | | | | |
AMP Ltd. | | | | | | | 896,104 | | | $ | 3,723,855 | |
Coca-Cola Amatil Ltd. | | † | | | 376,382 | | | | 4,422,303 | |
Cochlear Ltd. | | † | | | 29,000 | | | | 1,841,822 | |
CSL Ltd. | | † | | | 179,300 | | | | 5,845,685 | |
Iluka Resources Ltd. | | † | | | 356,000 | | | | 5,638,696 | |
Lend Lease Group | | | | | 213,600 | | | | 1,564,189 | |
Newcrest Mining Ltd. | | | | | 55,800 | | | | 1,700,511 | |
QBE Insurance Group Ltd. | | † | | | 582,880 | | | | 7,714,063 | |
Regis Resources Ltd. | | *† | | | 692,600 | | | | 2,407,204 | |
Sigma Pharmaceuticals Ltd. | | † | | | 3,920,100 | | | | 2,207,542 | |
Suncorp Group Ltd. | | | | | 410,300 | | | | 3,506,888 | |
Telstra Corp. Ltd. | | | | | 2,892,684 | | | | 9,838,084 | |
Treasury Wine Estates Ltd. | | | | | 199,083 | | | | 750,559 | |
Wesfarmers Ltd. | | | | | 39,548 | | | | 1,191,334 | |
Woodside Petroleum Ltd. | | | | | 101,701 | | | | 3,183,555 | |
Woolworths Ltd. | | | | | 110,500 | | | | 2,836,355 | |
| | | | | | | | | | | | |
| | | | | | | | | 58,372,645 | |
| | | | | | | | | | | | |
| Belgium—1.3% | | | | | | | | |
Anheuser-Busch InBev NV | | | | | 161,005 | | | | 9,826,661 | |
Colruyt SA | | | | | 80,000 | | | | 3,022,313 | |
Tessenderlo Chemie NV | | | | | 55,000 | | | | 1,457,729 | |
| | | | | | | | | | | | |
| | | | | | | | | 14,306,703 | |
| | | | | | | | | | | | |
| Brazil—1.8% | | | | | | | | |
CCR SA | | | | | 260,000 | | | | 1,703,364 | |
Cia de Bebidas das Americas ADR | | | | | 50,800 | | | | 1,833,372 | |
Cia Siderurgica Nacional SA ADR | | | | | 117,600 | | | | 961,968 | |
CPFL Energia SA ADR | | | | | 67,000 | | | | 1,890,070 | |
Itau Unibanco Holding SA ADR | | | | | 24,900 | | | | 462,144 | |
Itausa—Investimentos Itau SA | | | | | 387,560 | | | | 2,343,749 | |
Petroleo Brasileiro SA ADR | | | | | 177,000 | | | | 4,157,730 | |
Petroleo Brasileiro SA | | | | | 149,800 | | | | 1,725,882 | |
Redecard SA | | | | | 157,200 | | | | 2,460,082 | |
Vale SA ADR | | | | | 19,400 | | | | 416,130 | |
Vale SA ADR | | | | | 125,300 | | | | 2,581,180 | |
| | | | | | | | | | | | |
| | | | | | | | | 20,535,671 | |
| | | | | | | | | | | | |
| Canada—5.1% | | | | | | | | |
Aecon Group, Inc. | | | | | 204,200 | | | | 2,096,620 | |
AuRico Gold, Inc. | | * | | | 245,500 | | | | 1,973,639 | |
Barrick Gold Corp. | | | | | 53,400 | | | | 2,419,053 | |
BCE, Inc. | | | | | 212,100 | | | | 8,842,098 | |
Canadian National Railway Co. | | | | | 508 | | | | 39,909 | |
Canadian Pacific Railway Ltd. | | † | | | 114,035 | | | | 7,716,748 | |
Centerra Gold, Inc. | | | | | 71,400 | | | | 1,261,546 | |
Dundee Corp., Class A | | * | | | 100,200 | | | | 2,320,214 | |
Enbridge, Inc. | | | | | 59,700 | | | | 2,232,121 | |
Endeavour Silver Corp. | | * | | | 239,800 | | | | 2,327,973 | |
Gibson Energy, Inc. | | | | | 127,200 | | | | 2,374,816 | |
Goldcorp, Inc. | | | | | 40,500 | | | | 1,797,306 | |
Husky Energy, Inc. | | | | | 82,400 | | | | 1,985,688 | |
Metro, Inc., Class A | | | | | 33,800 | | | | 1,791,607 | |
National Bank of Canada | | | | | 35,100 | | | | 2,485,511 | |
Neo Material Technologies, Inc. | | * | | | 371,000 | | | | 2,669,379 | |
| | | | | | | | | | | | |
| | | | | |
| | | | | | | | Shares | | | | Value | |
| | | | | | | | | | | | |
Rogers Communications, Inc., Class B | | | | | 70,300 | | | $ | 2,708,491 | |
Suncor Energy, Inc. | | | | | 184,800 | | | | 5,329,496 | |
Trinidad Drilling Ltd. | | | | | 226,800 | | | | 1,729,802 | |
Wajax Corp. | | | | | 60,000 | | | | 2,271,018 | |
Yamana Gold, Inc. | | | | | 118,100 | | | | 1,741,214 | |
| | | | | | | | | | | | |
| | | | | | | | | 58,114,249 | |
| | | | | | | | | | | | |
| Chile—0.2% | | | | | | | | |
Enersis SA ADR | | | | | 131,700 | | | | 2,321,871 | |
| | | | | | | | | | | | |
| China—1.8% | | | | | | | | |
Baidu, Inc. ADR | | * | | | 50,804 | | | | 5,917,142 | |
China Construction Bank Corp., H Shares | | | | | 4,410,600 | | | | 3,063,650 | |
China Shenhua Energy Co. Ltd., H Shares | | † | | | 977,866 | | | | 4,228,556 | |
China Shipping Development Co. Ltd., H Shares | | | | | 168,000 | | | | 104,498 | |
Hengan International Group Co. Ltd. | | | | | 142,500 | | | | 1,328,563 | |
Industrial & Commercial Bank of China, H Shares | | | | | 4,597,715 | | | | 2,715,672 | |
Tencent Holdings Ltd. | | | | | 47,000 | | | | 941,098 | |
Want Want China Holdings Ltd. | | † | | | 1,999,000 | | | | 1,991,167 | |
| | | | | | | | | | | | |
| | | | | | | | | 20,290,346 | |
| | | | | | | | | | | | |
| Denmark—1.2% | | | | | | | | | | |
Coloplast A/S, Class B | | | 13,300 | | | | 1,908,539 | |
Novo Nordisk A/S, Class B | | | | | 65,600 | | | | 7,536,339 | |
Topdanmark A/S | | * | | | 14,050 | | | | 2,185,657 | |
Tryg A/S | | | | | 36,100 | | | | 1,999,719 | |
| | | | | | | | | | | | |
| | | | | | | | | 13,630,254 | |
| | | | | | | | | | | | |
| Finland—0.3% | | | | | | | | |
Kesko Oyj, Class B | | | | | 42,600 | | | | 1,428,048 | |
Kone Oyj, Class B | | | | | 36,000 | | | | 1,863,734 | |
| | | | | | | | | | | | |
| | | | | | | | | 3,291,782 | |
| | | | | | | | | | | | |
| France—8.9% | | | | | | | | |
Accor SA | | | | | 7,986 | | | | 201,259 | |
Air Liquide SA | | | | | 10,570 | | | | 1,305,158 | |
Carrefour SA | | | | | 381,527 | | | | 8,680,418 | |
Cie de Saint-Gobain | | | | | 192,804 | | | | 7,370,074 | |
Cie Generale d’Optique Essilor International SA | | | | | 62,000 | | | | 4,370,478 | |
Danone SA | | | | | 111,249 | | | | 6,981,147 | |
Dassault Systemes SA | | | | | 25,500 | | | | 2,037,007 | |
France Telecom SA | | | | | 608,566 | | | | 9,525,061 | |
L’Oreal SA | | | | | 37,000 | | | | 3,853,541 | |
LVMH Moet Hennessy Louis Vuitton SA | | | | | 9,408 | | | | 1,325,255 | |
Pernod-Ricard SA | | | | | 47,470 | | | | 4,393,771 | |
Rallye SA | | | | | 67,900 | | | | 1,892,765 | |
Sanofi | | | | | 229,882 | | | | 16,803,843 | |
Schneider Electric SA | | | | | 56,315 | | | | 2,944,224 | |
Societe Generale SA | | | | | 170,549 | | | | 3,764,975 | |
Technip SA | | | | | 37,342 | | | | 3,500,810 | |
Total SA | | | | | 216,369 | | | | 11,040,852 | |
Unibail-Rodamco SE (Paris Exchange) REIT | | | | | 31,222 | | | | 5,587,902 | |
Valeo SA | | | | | 44,200 | | | | 1,749,260 | |
Vallourec SA | | | | | 20,000 | | | | 1,291,938 | |
Vivendi SA | | | | | 86,300 | | | | 1,883,888 | |
See accompanying notes to financial statements.
227
SCHEDULE OF INVESTMENTS—(Continued)
December 31, 2011
| | | | | | | | | | | | |
| Vantagepoint International Fund | | | | | | | Shares | | | | Value | |
| | | | | | | | | | | | |
| COMMON STOCKS—(Continued) | | | | | |
Zodiac Aerospace | | | | | 9,438 | | | $ | 797,308 | |
| | | | | | | | | | | | |
| | | | | | | | | 101,300,934 | |
| | | | | | | | | | | | |
| Germany—4.8% | | | | | | | | |
Adidas AG | | | | | 55,600 | | | | 3,612,503 | |
Allianz SE (Registered) | | | | | 15,412 | | | | 1,471,910 | |
Bayer AG | | | | | | | 74,112 | | | | 4,733,046 | |
Bayerische Motoren Werke AG | | | | | 37,400 | | | | 2,500,120 | |
Beiersdorf AG | | | | | 50,861 | | | | 2,882,240 | |
Brenntag AG | | | | | 31,475 | | | | 2,926,926 | |
Daimler AG (Registered) | | | | | 40,698 | | | | 1,782,919 | |
Delticom AG | | | | | 19,200 | | | | 1,653,967 | |
Duerr AG | | | | | 59,900 | | | | 2,632,327 | |
Linde AG | | | | | 55,674 | | | | 8,273,850 | |
Muenchener Rueckversicherungs AG (Registered) | | | | | 12,441 | | | | 1,524,554 | |
RWE AG | | | | | 300,483 | | | | 10,547,972 | |
SAP AG | | | | | 69,100 | | | | 3,654,812 | |
Suedzucker AG | | | | | 66,000 | | | | 2,102,478 | |
TAG Immobilien AG | | * | | | 250,900 | | | | 1,998,859 | |
Volkswagen AG | | | | | 21,000 | | | | 2,811,382 | |
| | | | | | | | | | | | |
| | | | | | | | | 55,109,865 | |
| | | | | | | | | | | | |
| Greece—0.2% | | | | | | | | |
Hellenic Petroleum SA | | | | | 231,638 | | | | 1,905,994 | |
Motor Oil Hellas Corinth Refineries SA | | | | | 63,400 | | | | 484,410 | |
| | | | | | | | | | | | |
| | | | | | | | | 2,390,404 | |
| | | | | | | | | | | | |
| Hong Kong—5.0% | | | | | | | | |
AIA Group Ltd. | | | | | 1,929,400 | | | | 6,006,072 | |
Beijing Enterprises Holdings Ltd. | | † | | | 485,399 | | | | 2,906,113 | |
Belle International Holdings Ltd. | | | | | 809,837 | | | | 1,406,905 | |
BOC Hong Kong Holdings Ltd. | | | | | 394,745 | | | | 931,459 | |
China Merchants Holdings International Co. Ltd. | | † | | | 598,000 | | | | 1,729,610 | |
China Mobile Ltd. | | | | | 796,634 | | | | 7,739,768 | |
China Resources Land Ltd. | | † | | | 806,000 | | | | 1,289,235 | |
China Resources Power Holdings Co. Ltd. | | | | | 900,000 | | | | 1,732,859 | |
CLP Holdings Ltd. | | | | | 480,000 | | | | 4,078,020 | |
CNOOC Ltd. | | | | | 2,511,000 | | | | 4,378,543 | |
Galaxy Entertainment Group Ltd. | | *† | | | 1,586,642 | | | | 2,884,193 | |
Hang Seng Bank Ltd. | | † | | | 151,194 | | | | 1,790,955 | |
Henderson Land Development Co. Ltd. | | † | | | 294,999 | | | | 1,461,352 | |
Hong Kong & China Gas Co. Ltd. | | | | | 894,300 | | | | 2,070,637 | |
Hongkong Land Holdings Ltd. | | | | | 242,970 | | | | 1,101,235 | |
Jardine Matheson Holdings Ltd. | | | | | 45,200 | | | | 2,123,623 | |
Link (The) REIT | | | | | 596,000 | | | | 2,191,906 | |
MGM China Holdings Ltd. | | * | | | 415,100 | | | | 540,008 | |
NWS Holdings Ltd. | | | | | 723,596 | | | | 1,063,931 | |
Sino Land Co. Ltd. | | | | | 1,839,838 | | | | 2,614,464 | |
| | | | | | | | | | | | |
| | | | | |
| | | | | | | | Shares | | | | Value | |
| | | | | | | | | | | | |
SmarTone Telecommunications Holding Ltd. | | † | | | 1,284,500 | | | $ | 2,214,803 | |
Sun Hung Kai Properties Ltd. | | | | | 381,954 | | | | 4,773,247 | |
| | | | | | | | | | | | |
| | | | | | | | | 57,028,938 | |
| | | | | | | | | | | | |
| India—0.7% | | | | | | | | |
Axis Bank Ltd., Reg S GDR | | | | | 129,309 | | | | 1,951,375 | |
ICICI Bank Ltd. ADR | | | | | 47,400 | | | | 1,252,782 | |
Larsen & Toubro Ltd. GDR | | | | | 23,728 | | | | 446,561 | |
Larsen & Toubro Ltd. GDR | | | | | 79,960 | | | | 1,496,858 | |
Larsen & Toubro Ltd. GDR | | | | | 3,057 | | | | 58,421 | |
Tata Motors Ltd. ADR | | | | | 144,300 | | | | 2,438,670 | |
| | | | | | | | | | | | |
| | | | | | | | | 7,644,667 | |
| | | | | | | | | | | | |
| Indonesia—0.3% | | | | | | | | |
Astra International Tbk PT | | | | | 221,000 | | | | 1,800,950 | |
Perusahaan Gas Negara PT | | | | | 5,990,500 | | | | 2,095,373 | |
| | | | | | | | | | | | |
| | | | | | | | | 3,896,323 | |
| | | | | | | | | | | | |
| Ireland—0.6% | | | | | | | | |
Accenture plc, Class A | | | | | 23,318 | | | | 1,241,217 | |
Shire plc | | | | | 84,359 | | | | 2,931,821 | |
WPP plc | | | | | 236,773 | | | | 2,483,098 | |
| | | | | | | | | | | | |
| | | | | | | | | 6,656,136 | |
| | | | | | | | | | | | |
| Israel—0.8% | | | | | | | | |
Bank Hapoalim BM | | | | | 605,730 | | | | 1,980,735 | |
Rami Levi Chain Stores Hashikma Marketing 2006 Ltd. | | | | | 66,215 | | | | 2,054,219 | |
Teva Pharmaceutical Industries Ltd. ADR | | | | | 136,400 | | | | 5,505,104 | |
| | | | | | | | | | | | |
| | | | | | | | | 9,540,058 | |
| | | | | | | | | | | | |
| Italy—2.3% | | | | | | | | |
Banca Generali SpA | | | | | 81,223 | | | | 755,084 | |
Enel SpA | | | | | 706,518 | | | | 2,866,156 | |
ENI SpA | | | | | 434,069 | | | | 8,949,476 | |
Fiat Industrial SpA | | * | | | 265,393 | | | | 2,260,994 | |
Intesa Sanpaolo SpA | | | | | 2,594,370 | | | | 4,320,965 | |
Saipem SpA | | | | | 141,644 | | | | 5,992,076 | |
Sorin SpA | | * | | | 505,648 | | | | 774,413 | |
| | | | | | | | | | | | |
| | | | | | | | | 25,919,164 | |
| | | | | | | | | | | | |
| Japan—17.4% | | | | | | | | |
Aeon Mall Co. Ltd. | | | | | 116,500 | | | | 2,471,516 | |
Aisin Seiki Co. Ltd. | | | | | 72,100 | | | | 2,043,323 | |
AOC Holdings, Inc. | | | | | 216,900 | | | | 1,313,325 | |
Canon, Inc. | | † | | | 341,000 | | | | 15,006,500 | |
Central Japan Railway Co. | | | | | 273 | | | | 2,303,924 | |
Chugai Pharmaceutical Co. Ltd. | | † | | | 167,200 | | | | 2,756,035 | |
Daikin Industries Ltd. | | | | | 98,000 | | | | 2,675,118 | |
Daito Trust Construction Co. Ltd. | | | | | 50,200 | | | | 4,298,458 | |
Denso Corp. | | | | | 103,000 | | | | 2,829,497 | |
FANUC Corp. | | | | | 32,500 | | | | 4,957,298 | |
Geo Holdings Corp. | | † | | | 1,145 | | | | 1,185,052 | |
Hokuetsu Kishu Paper Co. Ltd. | | | | | 341,000 | | | | 2,289,941 | |
Honda Motor Co. Ltd. | | | | | 295,100 | | | | 8,989,012 | |
HOYA Corp. | | | | | 164,900 | | | | 3,545,205 | |
INPEX Corp. | | | | | 590 | | | | 3,714,775 | |
See accompanying notes to financial statements.
228
SCHEDULE OF INVESTMENTS—(Continued)
December 31, 2011
| | | | | | | | | | | | |
| Vantagepoint International Fund | | | | | | | Shares | | | | Value | |
| | | | | | | | | | | | |
| COMMON STOCKS—(Continued) | | | | | |
ITOCHU Corp. | | | | | 226,000 | | | $ | 2,291,518 | |
Japan Tobacco, Inc. | | | | | 1,589 | | | | 7,472,295 | |
JX Holdings, Inc. | | | | | 270,000 | | | | 1,629,341 | |
Kao Corp. | | | | | 550,700 | | | | 15,026,409 | |
KDDI Corp. | | | | | 309 | | | | 1,984,492 | |
Keyence Corp. | | | | | 14,720 | | | | 3,548,105 | |
Komatsu Ltd. | | | | | 188,300 | | | | 4,390,762 | |
Mitsubishi Estate Co. Ltd. | | | | | 208,000 | | | | 3,101,573 | |
Mitsubishi UFJ Financial Group, Inc. | | | | | 637,000 | | | | 2,696,728 | |
Nippon Shokubai Co. Ltd. | | | | | 116,000 | | | | 1,242,788 | |
Nippon Telegraph & Telephone Corp. | | | | | 128,427 | | | | 6,538,209 | |
Nissan Motor Co. Ltd. | | | | | 300,000 | | | | 2,686,528 | |
Okinawa Electric Power Co., Inc. (The) | | | | | 24,400 | | | | 1,040,029 | |
Seven & I Holdings Co. Ltd. | | | | | 451,200 | | | | 12,574,818 | |
Shimamura Co. Ltd. | | | | | 27,000 | | | | 2,758,723 | |
Shin-Etsu Chemical Co. Ltd. | | | | | 126,800 | | | | 6,228,391 | |
Ship Healthcare Holdings, Inc. | | | | | 78,700 | | | | 1,717,375 | |
Siix Corp. | | | | | 233,900 | | | | 2,965,948 | |
Softbank Corp. | | | | | 146,400 | | | | 4,299,486 | |
Sumitomo Corp. | | | | | 415,700 | | | | 5,619,074 | |
Sumitomo Mitsui Financial Group, Inc. | | | | | 108,291 | | | | 3,003,211 | |
Sumitomo Osaka Cement Co. Ltd. | | | | | 641,000 | | | | 1,746,000 | |
Sumitomo Precision Products Co. Ltd. | | † | | | 328,000 | | | | 2,014,114 | |
Takeda Pharmaceutical Co. Ltd. | | | | | 237,000 | | | | 10,410,341 | |
Tokio Marine Holdings, Inc. | | | | | 521,200 | | | | 11,541,369 | |
Tosoh Corp. | | | | | 823,000 | | | | 2,187,026 | |
Toyota Motor Corp. | | | | | 269,200 | | | | 8,901,668 | |
Unipres Corp. | | | | | 167,200 | | | | 4,779,347 | |
Universal Entertainment Corp. | | † | | | 82,600 | | | | 2,266,082 | |
Yorozu Corp. | | † | | | 68,000 | | | | 1,545,889 | |
| | | | | | | | | | | | |
| | | | | | | | | 198,586,618 | |
| | | | | | | | | | | | |
| Kazakhstan—0.1% | |
KazMunaiGas Exploration Production GDR | | | | | 82,959 | | | | 1,237,212 | |
| | | | | | | | | | | | |
| Korea, Republic of—2.2% | |
Dongbu Insurance Co. Ltd. | | | | | 49,100 | | | | 2,281,690 | |
Hyundai Motor Co. | | | | | 31,800 | | | | 5,890,240 | |
Hyundai Wia Corp. | | * | | | 16,900 | | | | 2,094,714 | |
KB Financial Group, Inc. | | * | | | 53,159 | | | | 1,675,062 | |
Kia Motors Corp. | | | | | 110,400 | | | | 6,406,262 | |
NHN Corp. | | * | | | 9,304 | | | | 1,705,193 | |
Samsung Electronics Co., Ltd. | | | | | 3,654 | | | | 3,361,088 | |
SK Holdings Co. Ltd. | | * | | | 15,000 | | | | 1,576,631 | |
| | | | | | | | | | | | |
| | | | | | | | | | | 24,990,880 | |
| | | | | | | | | | | | |
| Macau—1.1% | |
Sands China Ltd. | | * | | | 3,291,921 | | | | 9,235,779 | |
| | | | | | | | | | | | |
| | | | | |
| | | | | | | | Shares | | | | Value | |
| | | | | | | | | | | | |
Wynn Macau Ltd. | | | | | 1,403,077 | | | $ | 3,502,589 | |
| | | | | | | | | | | | |
| | | | | | | | | | | 12,738,368 | |
| | | | | | | | | | | | |
| Malaysia—0.1% | |
Maxis Bhd | | | | | 880,500 | | | | 1,521,468 | |
| | | | | | | | | | | | |
| Mexico—0.3% | |
Fresnillo plc | | | | | 69,500 | | | | 1,646,781 | |
Grupo Mexico SAB de CV | | | | | 826,696 | | | | 2,173,567 | |
| | | | | | | | | | | | |
| | | | | | | | | | | 3,820,348 | |
| | | | | | | | | | | | |
| Netherlands—4.3% | |
Akzo Nobel NV | | | | | 47,854 | | | | 2,306,064 | |
European Aeronautic Defence and Space Co. NV | | | | | 69,800 | | | | 2,173,505 | |
Koninklijke Ahold NV | | | | | 886,261 | | | | 11,911,877 | |
Koninklijke Vopak NV | | | | | 26,010 | | | | 1,371,583 | |
Reed Elsevier NV | | | | | 534,806 | | | | 6,222,687 | |
Royal Dutch Shell plc, Class A | | | | | 354,995 | | | | 12,939,866 | |
Royal Dutch Shell plc, Class B | | | | | 67,900 | | | | 2,582,772 | |
Unilever NV CVA | | | | | 288,868 | | | | 9,932,307 | |
| | | | | | | | | | | | |
| | | | | | | | | | | 49,440,661 | |
| | | | | | | | | | | | |
| Norway—0.4% | |
Statoil ASA | | | | | 92,700 | | | | 2,374,074 | |
Yara International ASA | | | | | 50,400 | | | | 2,011,951 | |
| | | | | | | | | | | | |
| | | | | | | | | | | 4,386,025 | |
| | | | | | | | | | | | |
| Peru—0.2% | |
Credicorp Ltd. | | | | | 23,556 | | | | 2,578,675 | |
| | | | | | | | | | | | |
| Philippines—0.2% | |
Philippine Long Distance Telephone Co. ADR | | | | | 40,700 | | | | 2,345,134 | |
| | | | | | | | | | | | |
| Portugal—0.3% | |
Jeronimo Martins SGPS SA | | * | | | 190,200 | | | | 3,141,609 | |
| | | | | | | | | | | | |
| Russia—0.4% | |
Gazprom OAO ADR | | | | | 308,410 | | | | 3,285,781 | |
Lukoil OAO ADR | | | | | 27,100 | | | | 1,441,720 | |
| | | | | | | | | | | | |
| | | | | | | | | | | 4,727,501 | |
| | | | | | | | | | | | |
| Singapore—2.2% | |
Biosensors International Group Ltd. | | * | | | 3,929,800 | | | | 4,325,728 | |
City Developments Ltd. | | | | | 86,049 | | | | 589,709 | |
DBS Group Holdings Ltd. | | | | | 410,697 | | | | 3,645,462 | |
Genting Singapore plc | | * | | | 1,235,658 | | | | 1,437,806 | |
Singapore Telecommunications Ltd. | | | | | 1,787,000 | | | | 4,256,186 | |
United Overseas Bank Ltd. | | | | | 686,236 | | | | 8,075,999 | |
Wilmar International Ltd. | | | | | 562,000 | | | | 2,166,508 | |
| | | | | | | | | | | | |
| | | | | | | | | | | 24,497,398 | |
| | | | | | | | | | | | |
| South Africa—0.3% | |
Sasol Ltd. | | | | | 37,270 | | | | 1,774,164 | |
Tiger Brands Ltd. | | | | | 68,127 | | | | 2,116,609 | |
| | | | | | | | | | | | |
| | | | | | | | | | | 3,890,773 | |
| | | | | | | | | | | | |
See accompanying notes to financial statements.
229
SCHEDULE OF INVESTMENTS—(Continued)
December 31, 2011
| | | | | | | | | | | | |
Vantagepoint International Fund | | | Shares | | | | Value | |
| | | | | | | | | | | | |
| COMMON STOCKS—(Continued) | | | | | |
| Spain—2.4% | |
ACS Actividades de Construccion y Servicios SA | | † | | | 63,700 | | | $ | 1,880,789 | |
Gas Natural SDG SA | | † | | | 126,500 | | | | 2,168,067 | |
Grifols SA | | *† | | | 52,150 | | | | 873,813 | |
Iberdrola SA | | | | | 1,214,440 | | | | 7,585,919 | |
Inditex SA | | | | | 77,800 | | | | 6,351,194 | |
Telefonica SA | | | | | 505,627 | | | | 8,711,022 | |
| | | | | | | | | | | | |
| | | | | | | | | | | 27,570,804 | |
| | | | | | | | | | | | |
| Sweden—1.4% | |
Castellum AB | | | | | 197,600 | | | | 2,445,190 | |
Hennes & Mauritz AB, Class B | | | | | 130,300 | | | | 4,180,018 | |
Investor AB, Class B | | | | | 106,500 | | | | 1,980,766 | |
Kinnevik Investment AB, Class B | | | | | 99,200 | | | | 1,928,100 | |
Kungsleden AB | | | | | 288,700 | | | | 1,924,550 | |
NCC AB, Class B | | | | | 61,788 | | | | 1,082,355 | |
Sandvik AB | | | | | 76,324 | | | | 933,096 | |
Skanska AB, Class B | | | | | 62,985 | | | | 1,039,555 | |
| | | | | | | | | | | | |
| | | | | | | | | | | 15,513,630 | |
| | | | | | | | | | | | |
| Switzerland—6.3% | |
Adecco SA (Registered) | | * | | | 46,116 | | | | 1,921,943 | |
Compagnie Financiere Richemont SA (A Bearer Shares) | | | | | 80,994 | | | | 4,074,218 | |
Givaudan SA (Registered) | | * | | | 2,097 | | | | 1,992,629 | |
Nestle SA (Registered) | | | | | 213,277 | | | | 12,247,117 | |
Novartis AG (Registered) | | | | | 395,334 | | | | 22,570,836 | |
Roche Holding AG (Genusschein) | | | | | 13,000 | | | | 2,198,539 | |
SGS SA (Registered) | | | | | 3,743 | | | | 6,173,486 | |
Swatch Group AG (The) (Bearer) | | | | | 11,817 | | | | 4,398,491 | |
Swiss Life Holding AG (Registered) | | * | | | 23,040 | | | | 2,110,198 | |
Swiss Re AG | | * | | | 47,700 | | | | 2,425,055 | |
Xstrata plc | | | | | 139,600 | | | | 2,125,432 | |
Zurich Financial Services AG (Registered) | | * | | | 40,699 | | | | 9,169,784 | |
| | | | | | | | | | | | |
| | | | | | | | | | | 71,407,728 | |
| | | | | | | | | | | | |
| Taiwan—0.8% | |
Chunghwa Telecom Co. Ltd. | | | | | 425,290 | | | | 1,404,971 | |
HTC Corp. | | | | | 76,800 | | | | 1,258,810 | |
Taiwan Semiconductor Manufacturing Co. Ltd. ADR | | | | | 320,300 | | | | 4,135,073 | |
Taiwan Semiconductor Manufacturing Co. Ltd. | | | | | 1,059,000 | | | | 2,646,017 | |
| | | | | | | | | | | | |
| | | | | | | | | | | 9,444,871 | |
| | | | | | | | | | | | |
| Thailand—0.3% | |
Kasikornbank PCL | | | | | 402,000 | | | | 1,551,335 | |
PTT PCL | | ‡ | | | 234,800 | | | | 2,362,303 | |
| | | | | | | | | | | | |
| | | | | | | | | | | 3,913,638 | |
| | | | | | | | | | | | |
| | | | | | | | | | | | |
| | | | | |
| | | | | | | | Shares | | | | Value | |
| | | | | | | | | | | | |
| Turkey—0.3% | |
Tupras Turkiye Petrol Rafinerileri AS | | | | | 69,145 | | | $ | 1,456,362 | |
Turkiye Garanti Bankasi AS | | | | | 487,042 | | | | 1,514,148 | |
| | | | | | | | | | | | |
| | | | | | | | | | | 2,970,510 | |
| | | | | | | | | | | | |
| United Kingdom—14.5% | |
Anglo American plc | | | | | 122,654 | | | | 4,530,860 | |
AstraZeneca plc (London Exchange) | | | | | 147,099 | | | | 6,794,800 | |
BAE Systems plc | | | | | 472,200 | | | | 2,086,568 | |
BG Group plc | | | | | 310,431 | | | | 6,631,936 | |
BHP Billiton plc | | | | | 84,300 | | | | 2,464,568 | |
BP plc | | | | | 2,424,836 | | | | 17,272,808 | |
BT Group plc | | | | | 868,480 | | | | 2,574,335 | |
Cairn Energy plc | | * | | | 615,660 | | | | 2,531,164 | |
Centrica plc | | | | | 849,000 | | | | 3,813,284 | |
Debenhams plc | | | | | 4,077,263 | | | | 3,700,649 | |
Diageo plc | | | | | 36,032 | | | | 787,303 | |
Drax Group plc | | | | | 156,000 | | | | 1,319,386 | |
Enterprise Inns plc | | * | | | 1,017,399 | | | | 442,281 | |
GlaxoSmithKline plc | | | | | 601,041 | | | | 13,695,277 | |
Hochschild Mining plc | | | | | 268,900 | | | | 1,612,657 | |
HSBC Holdings plc (London Exchange) | | | | | 852,914 | | | | 6,511,186 | |
Imperial Tobacco Group plc | | | | | 203,916 | | | | 7,716,289 | |
Intermediate Capital Group plc | | | | | 1,220,132 | | | | 4,331,854 | |
Johnson Matthey plc | | | | | 34,728 | | | | 989,472 | |
Land Securities Group plc REIT | | | | | 180,949 | | | | 1,784,696 | |
Legal & General Group plc | | | | | 1,263,863 | | | | 2,019,749 | |
Old Mutual plc | | | | | 1,196,200 | | | | 2,516,006 | |
Petropavlovsk plc | | | | | 210,378 | | | | 2,013,242 | |
Prudential plc | | | | | 59,655 | | | | 590,237 | |
Reckitt Benckiser Group plc | | | | | 87,881 | | | | 4,334,293 | |
Rio Tinto plc | | | | | 47,852 | | | | 2,337,405 | |
SABMiller plc | | | | | 88,745 | | | | 3,119,970 | |
Smith & Nephew plc | | | | | 394,900 | | | | 3,832,456 | |
Standard Chartered plc (London Exchange) | | | | | 228,444 | | | | 4,996,647 | |
Tate & Lyle plc | | | | | 113,588 | | | | 1,241,803 | |
Tesco plc | | | | | 2,443,142 | | | | 15,286,348 | |
Unilever plc | | | | | 358,295 | | | | 12,015,100 | |
Vodafone Group plc | | | | | 5,368,230 | | | | 14,967,200 | |
Wm Morrison Supermarkets plc | | | | | 850,000 | | | | 4,299,292 | |
| | | | | | | | | | | | |
| | | | | | | | | | | 165,161,121 | |
| | | | | | | | | | | | |
| United States—0.7% | |
Boart Longyear Ltd. | | | | | 831,759 | | | | 2,366,149 | |
Schlumberger Ltd. | | | | | 43,233 | | | | 2,953,246 | |
Synthes, Inc. | | ^ | | | 12,800 | | | | 2,142,460 | |
| | | | | | | | | | | | |
| | | | | | | | | | | 7,461,855 | |
| | | | | | | | | | | | |
| TOTAL COMMON STOCKS | |
(Cost $1,125,342,971) | | | | | | | | | 1,101,696,837 | |
| | | | | | | | | | | | |
See accompanying notes to financial statements.
230
SCHEDULE OF INVESTMENTS—(Continued)
December 31, 2011
| | | | | | | | | | | | |
Vantagepoint International Fund | | | Shares | | | | Value | |
| | | | | | | | | | | | |
| MONEY MARKET FUNDS—6.7% | |
| Institutional Money Market Funds—6.7% | |
Dreyfus Institutional Cash Advantage Fund, 0.06% | | ††¥ | | | 7,000,000 | | | $ | 7,000,000 | |
Fidelity Institutional Money Market: Money Market Portfolio—Institutional Class, 0.23% | | ¥ | | | 33,207,405 | | | | 33,207,405 | |
Fidelity Institutional Money Market: Money Market Portfolio—Institutional Class, 0.23% | | ††¥ | | | 7,926,698 | | | | 7,926,698 | |
Fidelity Institutional Money Market: Prime Money Market Portfolio—Institutional Class, 0.17% | | ††¥ | | | 7,000,000 | | | | 7,000,000 | |
Short-Term Investments Trust Liquid Assets Portfolio, 0.16% | | ††¥ | | | 7,000,000 | | | | 7,000,000 | |
Wells Fargo Advantage Cash Investment Money Market Fund—Select Class, 0.11% | | ††¥ | | | 7,000,000 | | | | 7,000,000 | |
Wells Fargo Advantage Heritage Money Market Fund—Select Class, 0.08% | | ††¥ | | | 7,000,000 | | | | 7,000,000 | |
| | | | | | | | | | | | |
| TOTAL MONEY MARKET FUNDS | |
(Cost $76,134,103) | | | | | | | | | 76,134,103 | |
| | | | | | | | | | | | |
| TOTAL INVESTMENTS—103.3% | |
(Cost $1,201,477,074) | | | | | | | | | 1,177,830,940 | |
Other assets less liabilities—(3.3%) | | | | (37,867,281 | ) |
| | | | | | | | | | | | |
| NET ASSETS—100.0% | | | $ | 1,139,963,659 | |
| | | | | |
Notes to the Schedule of Investments:
| | |
| ADR | | American Depositary Receipt |
| CVA | | Dutch Certificate of Shares |
| GDR | | Global Depositary Receipt |
| Reg S | | Security purchased outside the United States and is not registered under the Securities Act of 1933. This security may be resold in the United States only if the offer and sale are made pursuant to such registration or are exempt from registration. |
| REIT | | Real Estate Investment Trust |
| † | | Denotes all or a portion of the security on loan. |
| * | | Non-income producing. |
| ‡ | | Security valued at fair value as determined by policies approved by the Board of Directors. |
| ^ | | Securities are not registered under the Securities Act of 1933. These securities may be resold only in transactions exempt from registration, generally to qualified institutional buyers under Securities Act Rule 144A. Such securities are considered illiquid unless deemed liquid by a subadviser under the liquidity procedures adopted by the Board of Directors. The total market value of illiquid 144A securities was $2,142,460, which represented 0.2% of Net Assets. |
| †† | | Represents reinvestment of collateral received in conjunction with securities lending. |
| ¥ | | The rate quoted is the annualized seven-day yield of the fund at period end. |
See accompanying notes to financial statements.
231
SCHEDULE OF INVESTMENTS—(Continued)
December 31, 2011
| | | | |
Vantagepoint
International Fund | | | | �� |
| Percentage of Portfolio by Industry (unaudited): | |
| |
| COMMON STOCKS | | | | |
Oil, Gas & Consumable Fuels | | | 10.0% | |
Pharmaceuticals | | | 8.4% | |
Food & Staples Retailing | | | 6.2% | |
Commercial Banks | | | 5.6% | |
Insurance | | | 5.3% | |
Diversified Telecommunication Services | | | 4.7% | |
Food Products | | | 4.5% | |
Automobiles | | | 3.9% | |
Metals & Mining | | | 3.9% | |
Wireless Telecommunication Services | | | 3.3% | |
Chemicals | | | 2.7% | |
Real Estate Management & Development | | | 2.6% | |
Beverages | | | 2.2% | |
Personal Products | | | 2.0% | |
Electric Utilities | | | 1.7% | |
Health Care Equipment & Supplies | | | 1.7% | |
Machinery | | | 1.6% | |
Hotels, Restaurants & Leisure | | | 1.6% | |
Specialty Retail | | | 1.5% | |
Multi-Utilities | | | 1.3% | |
Auto Components | | | 1.3% | |
Tobacco | | | 1.3% | |
Office Electronics | | | 1.3% | |
Energy Equipment & Services | | | 1.2% | |
Textiles, Apparel & Luxury Goods | | | 1.2% | |
Trading Companies & Distributors | | | 1.1% | |
Road & Rail | | | 0.9% | |
Electronic Equipment, Instruments & Components | | | 0.9% | |
Semiconductors & Semiconductor Equipment | | | 0.9% | |
Building Products | | | 0.9% | |
Construction & Engineering | | | 0.9% | |
Real Estate Investment Trusts (REITs) | | | 0.8% | |
Internet Software & Services | | | 0.8% | |
Media | | | 0.8% | |
Industrial Conglomerates | | | 0.7% | |
Professional Services | | | 0.7% | |
Biotechnology | | | 0.6% | |
Aerospace & Defense | | | 0.6% | |
Gas Utilities | | | 0.6% | |
Capital Markets | | | 0.6% | |
Software | | | 0.5% | |
Household Products | | | 0.4% | |
Transportation Infrastructure | | | 0.4% | |
Multiline Retail | | | 0.3% | |
Independent Power Producers & Energy Traders | | | 0.3% | |
Health Care Providers & Services | | | 0.3% | |
| | | | |
| | | | | |
Diversified Financial Services | | | 0.3% | |
IT Services | | | 0.3% | |
Electrical Equipment | | | 0.3% | |
Construction Materials | | | 0.2% | |
Leisure Equipment & Products | | | 0.2% | |
Paper & Forest Products | | | 0.2% | |
Communications Equipment | | | 0.1% | |
Marine | | | 0.0% | |
| | | | |
| TOTAL COMMON STOCKS | | | 96.6% | |
| | | | |
| MONEY MARKET FUNDS | | | | |
Institutional Money Market Funds | | | 6.7% | |
| | | | |
| TOTAL INVESTMENTS | | | 103.3% | |
Other assets less liabilities | | | (3.3)% | |
| | | | |
| TOTAL NET ASSETS | | | 100.0% | |
| | | | |
See accompanying notes to financial statements.
232
SCHEDULE OF INVESTMENTS
December 31, 2011
| | | | | | | | | | | | |
| Vantagepoint Diversifying Strategies Fund | | | Shares | | | | Value | |
| | | | | | | | | | | | |
| COMMON STOCKS—2.5% | |
| Capital Markets—0.2% | |
Franklin Resources, Inc. | | | | | 10,800 | | | $ | 1,037,448 | |
T. Rowe Price Group, Inc. | | | | | 12,000 | | | | 683,400 | |
| | | | | | | | | | | | |
| | | | | | | | | 1,720,848 | |
| | | | | | | | | | | | |
| Electrical Equipment—0.1% | |
ABB Ltd. (Registered) (Switzerland) | | * | | | 30,000 | | | | 563,588 | |
| | | | | | | | | | | | |
| Energy Equipment & Services—0.3% | |
National Oilwell Varco, Inc. | | | | | 37,000 | | | | 2,515,630 | |
| | | | | | | | | | | | |
| Food Products—0.1% | |
Nestle SA (Registered) (Switzerland) | | | | | 10,200 | | | | 585,720 | |
| | | | | | | | | | | | |
| Household Products—0.1% | |
Unicharm Corp. (Japan) | | | | | 15,000 | | | | 739,563 | |
| | | | | | | | | | | | |
| Metals & Mining—0.1% | |
Barrick Gold Corp. (Canada) | | | | | 26,000 | | | | 1,177,816 | |
| | | | | | | | | | | | |
| Pharmaceuticals—0.6% | |
Novo Nordisk A/S, Class B (Denmark) | | | | | 34,600 | | | | 3,974,960 | |
Sawai Pharmaceutical Co. Ltd. (Japan) | | | | | 9,900 | | | | 1,027,052 | |
| | | | | | | | | | | | |
| | | | | | | | | 5,002,012 | |
| | | | | | | | | | | | |
| Semiconductors & Semiconductor Equipment—0.1% | |
ARM Holdings plc (United Kingdom) | | | | | 67,823 | | | | 626,038 | |
| | | | | | | | | | | | |
| Software—0.6% | |
Microsoft Corp. | | | | | 75,000 | | | | 1,947,000 | |
SAP AG (Germany) | | | | | 65,600 | | | | 3,469,692 | |
| | | | | | | | | | | | |
| | | | | | | | | 5,416,692 | |
| | | | | | | | | | | | |
| Textiles, Apparel & Luxury Goods—0.3% | |
Swatch Group AG (The) (Bearer) (Switzerland) | | | | | 718 | | | | 267,252 | |
Swatch Group AG (The) (Registered) (Switzerland) | | | | | 37,330 | | | | 2,475,497 | |
| | | | | | | | | | | | |
| | | | | | | | | 2,742,749 | |
| | | | | | | | | | | | |
| TOTAL COMMON STOCKS | |
(Cost $20,571,819) | | | | | | | | | 21,090,656 | |
| | | | | | | | | | | | |
| | | | | | | | | | | | | |
| CONVERTIBLE PREFERRED STOCKS—1.1% | |
| Communications Equipment—0.2% | |
Lucent Technologies Capital Trust I 7.750% | | | | | 3,000 | | | | 1,842,000 | |
| | | | | | | | | | | | |
| Electric Utilities—0.2% | |
NextEra Energy, Inc. 7.000% | | | | | 35,000 | | | | 1,865,500 | |
| | | | | | | | | | | | |
| Food Products—0.2% | |
Bunge Ltd., Perpetual (Bermuda) 4.875% | | | | | 11,195 | | | | 1,052,330 | |
| | | | | | | | | | | | |
| Oil, Gas & Consumable Fuels—0.4% | |
Apache Corp., Series D 6.000% | | | | | 54,900 | | | | 2,979,972 | |
| | | | | | | | | | | | | | |
| | | |
| | | | Shares | | | | Value | |
| | | | | | | | | | | | | | |
Chesapeake Energy Corp., Perpetual 5.750% | | | ^ | | | 235 | | | $ | 236,234 | |
| | | | | | | | | | | | | | |
| | | | | | | | | | | | | 3,216,206 | |
| | | | | | | | | | | | | | |
| Wireless Telecommunication Services—0.1% | |
Crown Castle International Corp. 6.250% | | | | | | 16,700 | | | | 1,035,400 | |
| | | | | | | | | | | | | | |
| TOTAL CONVERTIBLE PREFERRED STOCKS | |
(Cost $10,273,783) | | | | | | | | | | 9,011,436 | |
| | | | | | | | | | | | | | |
| | | | | | | | | | | | | | | |
| | | | |
Coupon
Rate | | Maturity
Date | | | | | Face | | | Value | |
| CORPORATE OBLIGATIONS—34.5% | |
| Aerospace & Defense—0.3% | |
General Dynamics Corp. | |
4.250% | | | 05/15/2013 | | | § | | $ | 980,000 | | | | 1,028,151 | |
Lockheed Martin Corp. | |
2.125% | | | 09/15/2016 | | | | | | 870,000 | | | | 872,391 | |
Raytheon Co. | |
1.400% | | | 12/15/2014 | | | § | | | 875,000 | | | | 879,872 | |
| | | | | | | | | | | | | | |
| | | | | | | | | | | | | 2,780,414 | |
| | | | | | | | | | | | | | |
| Auto Components—0.1% | |
Johnson Controls, Inc. | |
0.843% | | | 02/04/2014 | | | #§ | | | 770,000 | | | | 769,985 | |
| | | | | | | | | | | | | | |
| Beverages—1.1% | |
Anheuser-Busch InBev Worldwide, Inc. | |
9.750% | | | 11/17/2015 | | | BRL | | | 2,600,000 | | | | 1,463,611 | |
3.000% | | | 10/15/2012 | | | § | | | 910,000 | | | | 924,423 | |
2.500% | | | 03/26/2013 | | | | | | 1,240,000 | | | | 1,263,304 | |
1.304% | | | 03/26/2013 | | | #§ | | | 1,900,000 | | | | 1,909,842 | |
Coca-Cola Enterprises, Inc. | |
1.125% | | | 11/12/2013 | | | § | | | 1,220,000 | | | | 1,224,453 | |
Diageo Capital plc (United Kingdom) | |
5.125% | | | 01/30/2012 | | | § | | | 2,700,000 | | | | 2,706,427 | |
| | | | | | | | | | | | | | |
| | | | | | | | | | | | | 9,492,060 | |
| | | | | | | | | | | | | | |
| Biotechnology—0.5% | |
Amgen, Inc. | |
2.300% | | | 06/15/2016 | | | | | | 750,000 | | | | 755,919 | |
1.875% | | | 11/15/2014 | | | | | | 970,000 | | | | 983,239 | |
Genzyme Corp. | |
3.625% | | | 06/15/2015 | | | | | | 730,000 | | | | 780,055 | |
Gilead Sciences, Inc. | |
2.400% | | | 12/01/2014 | | | | | | 420,000 | | | | 427,863 | |
Life Technologies Corp. | |
3.500% | | | 01/15/2016 | | | § | | | 1,500,000 | | | | 1,507,672 | |
| | | | | | | | | | | | | | |
| | | | | | | | | | | | | 4,454,748 | |
| | | | | | | | | | | | | | |
| Capital Markets—1.2% | |
Bank of New York Mellon Corp. (The) MTN | |
0.709% | | | 01/31/2014 | | | #§ | | | 2,750,000 | | | | 2,741,544 | |
Bear Stearns Cos. LLC (The), Series B MTN | |
6.950% | | | 08/10/2012 | | | | | | 2,000,000 | | | | 2,074,364 | |
Merrill Lynch & Co., Inc., Series C MTN | |
6.050% | | | 08/15/2012 | | | | | | 650,000 | | | | 659,485 | |
Morgan Stanley | |
1.408% | | | 04/29/2013 | | | #§ | | | 3,300,000 | | | | 3,111,062 | |
TD Ameritrade Holding Corp. | |
4.150% | | | 12/01/2014 | | | | | | 760,000 | | | | 803,787 | |
See accompanying notes to financial statements.
233
SCHEDULE OF INVESTMENTS—(Continued)
December 31, 2011
| | | | | | | | | | | | | | |
| Vantagepoint Diversifying Strategies Fund | | | | | | | | |
| | | | |
Coupon
Rate | | Maturity
Date | | | | | Face | | | Value | |
| | | | | | | | | | | | | | |
| CORPORATE OBLIGATIONS—(Continued) | |
WT Finance Aust Pty Ltd./Westfield Capital/WEA Finance LLC (Australia) | |
5.125% | | | 11/15/2014 | | | ^ | | $ | 400,000 | | | $ | 419,364 | |
| | | | | | | | | | | | | | |
| | | | | | | | | | | | | 9,809,606 | |
| | | | | | | | | | | | | | |
| Chemicals—0.7% | |
Airgas, Inc. | |
2.850% | | | 10/01/2013 | | | § | | | 1,270,000 | | | | 1,294,369 | |
Dow Chemical Co. (The) | |
4.850% | | | 08/15/2012 | | | | | | 3,100,000 | | | | 3,172,019 | |
Ecolab, Inc. | |
2.375% | | | 12/08/2014 | | | § | | | 600,000 | | | | 612,086 | |
Ferro Corp. | |
7.875% | | | 08/15/2018 | | | | | | 650,000 | | | | 656,500 | |
| | | | | | | | | | | | | | |
| | | | | | | | | | | | | 5,734,974 | |
| | | | | | | | | | | | | | |
| Commercial Banks—5.0% | |
Banco Bradesco SA (Brazil) | |
2.561% | | | 05/16/2014 | | | #^§ | | | 1,000,000 | | | | 982,203 | |
Banco de Credito del Peru (Peru) | |
4.750% | | | 03/16/2016 | | | ^ | | | 1,390,000 | | | | 1,400,425 | |
Banco do Brasil SA (Brazil) | |
4.500% | | | 01/22/2015 | | | ^§ | | | 1,200,000 | | | | 1,246,800 | |
Banco do Nordeste do Brasil SA (Brazil) | |
3.625% | | | 11/09/2015 | | | ^ | | | 1,320,000 | | | | 1,323,300 | |
Bank of Nova Scotia (Canada) | |
2.250% | | | 01/22/2013 | | | | | | 2,000,000 | | | | 2,027,856 | |
Barclays Bank plc (United Kingdom) | |
3.900% | | | 04/07/2015 | | | | | | 925,000 | | | | 929,656 | |
1.438% | | | 01/13/2014 | | | #§ | | | 2,510,000 | | | | 2,434,291 | |
BB&T Corp. | |
1.125% | | | 04/28/2014 | | | # | | | 850,000 | | | | 840,009 | |
BB&T Corp., Series A MTN | |
3.375% | | | 09/25/2013 | | | | | | 400,000 | | | | 413,926 | |
Capital One Financial Corp. | |
2.125% | | | 07/15/2014 | | | § | | | 1,780,000 | | | | 1,758,254 | |
CBQ Finance Ltd. (Bermuda) | |
5.000% | | | 11/18/2014 | | | ^ | | | 750,000 | | | | 787,106 | |
CIT Group, Inc. | |
7.000% | | | 05/01/2015 | | | | | | 950,000 | | | | 953,087 | |
5.250% | | | 04/01/2014 | | | ^ | | | 350,000 | | | | 350,438 | |
Credit Suisse (Switzerland) | |
1.361% | | | 01/14/2014 | | | #§ | | | 4,440,000 | | | | 4,299,763 | |
ICICI Bank Ltd. (India) | |
5.500% | | | 03/25/2015 | | | ^ | | | 450,000 | | | | 450,445 | |
KeyCorp MTN | |
3.750% | | | 08/13/2015 | | | | | | 630,000 | | | | 653,839 | |
Royal Bank of Canada (Canada) | |
1.125% | | | 01/15/2014 | | | | | | 2,330,000 | | | | 2,336,447 | |
Royal Bank of Scotland plc (The) (United Kingdom) | |
3.250% | | | 01/11/2014 | | | § | | | 2,860,000 | | | | 2,741,865 | |
Societe Generale SA (France) | |
1.862% | | | 12/13/2013 | | | #^§ | | | 1,000,000 | | | | 923,881 | |
SunTrust Bank GA, Bank Note | |
0.589% | | | 05/21/2012 | | | #§ | | | 1,250,000 | | | | 1,247,040 | |
Toronto-Dominion Bank (The) (Canada) | |
2.500% | | | 07/14/2016 | | | | | | 2,100,000 | | | | 2,144,039 | |
0.701% | | | 07/14/2014 | | | #§ | | | 1,320,000 | | | | 1,319,549 | |
Union Bank NA | |
1.478% | | | 06/06/2014 | | | #§ | | | 1,360,000 | | | | 1,340,970 | |
| | | | | | | | | | | | | | |
| | | | | |
| Coupon Rate | |
| Maturity
Date |
| | | | | Face | | | | Value | |
| | | | | | | | | | | | | | |
Union Bank NA, Bank Note | |
2.125% | | | 12/16/2013 | | | § | | $ | 1,560,000 | | | $ | 1,578,481 | |
US Bancorp | |
4.200% | | | 05/15/2014 | | | | | | 800,000 | | | | 856,984 | |
2.000% | | | 06/14/2013 | | | § | | | 1,500,000 | | | | 1,525,014 | |
US Bancorp MTN | |
1.375% | | | 09/13/2013 | | | | | | 1,000,000 | | | | 1,006,506 | |
Wachovia Bank NA, Bank Note | |
4.800% | | | 11/01/2014 | | | § | | | 1,390,000 | | | | 1,461,588 | |
Wachovia Corp. MTN | |
0.619% | | | 08/01/2013 | | | #§ | | | 2,250,000 | | | | 2,227,610 | |
Westpac Banking Corp. (Australia) | |
2.250% | | | 11/19/2012 | | | | | | 700,000 | | | | 707,111 | |
| | | | | | | | | | | | | | |
| | | | | | | | | | | | | 42,268,483 | |
| | | | | | | | | | | | | | |
| Commercial Services & Supplies—0.1% | |
Corrections Corp. of America | |
6.250% | | | 03/15/2013 | | | | | | 815,000 | | | | 817,038 | |
| | | | | | | | | | | | | | |
| Communications Equipment—1.0% | |
Cisco Systems, Inc. | |
1.625% | | | 03/14/2014 | | | | | | 3,560,000 | | | | 3,628,676 | |
0.794% | | | 03/14/2014 | | | # | | | 4,500,000 | | | | 4,499,518 | |
| | | | | | | | | | | | | | |
| | | | | | | | | | | | | 8,128,194 | |
| | | | | | | | | | | | | | |
| Computers & Peripherals—0.5% | |
Hewlett-Packard Co. | |
4.250% | | | 02/24/2012 | | | | | | 1,929,000 | | | | 1,937,630 | |
2.350% | | | 03/15/2015 | | | § | | | 1,200,000 | | | | 1,195,104 | |
2.109% | | | 09/19/2014 | | | #§ | | | 900,000 | | | | 896,267 | |
| | | | | | | | | | | | | | |
| | | | | | | | | | | | | 4,029,001 | |
| | | | | | | | | | | | | | |
| Construction Materials—0.2% | |
CRH America, Inc. | |
6.950% | | | 03/15/2012 | | | § | | | 1,400,000 | | | | 1,414,046 | |
| | | | | | | | | | | | | | |
| Consumer Finance—2.1% | |
Ally Financial, Inc. | |
4.500% | | | 02/11/2014 | | | § | | | 1,000,000 | | | | 967,500 | |
American Express Credit Corp. | |
1.424% | | | 06/24/2014 | | | #§ | | | 1,570,000 | | | | 1,540,958 | |
American Express Credit Corp. MTN | |
1.985% | | | 06/19/2013 | | | #§ | | | 1,400,000 | | | | 1,403,192 | |
Banque PSA Finance (France) | |
2.481% | | | 04/04/2014 | | | #^§ | | | 1,360,000 | | | | 1,260,214 | |
Caterpillar Financial Services Corp., Series G MTN | |
1.375% | | | 05/20/2014 | | | § | | | 3,200,000 | | | | 3,241,955 | |
Ford Motor Credit Co. LLC | |
3.875% | | | 01/15/2015 | | | § | | | 1,460,000 | | | | 1,455,582 | |
HSBC Finance Corp. | |
0.653% | | | 01/15/2014 | | | #§ | | | 1,500,000 | | | | 1,382,479 | |
International Lease Finance Corp. | |
6.500% | | | 09/01/2014 | | | ^ | | | 600,000 | | | | 616,500 | |
John Deere Capital Corp. MTN | |
1.600% | | | 03/03/2014 | | | | | | 2,720,000 | | | | 2,766,167 | |
0.747% | | | 03/03/2014 | | | #§ | | | 680,000 | | | | 678,532 | |
John Deere Capital Corp., Series D MTN | |
5.350% | | | 01/17/2012 | | | § | | | 2,150,000 | | | | 2,154,855 | |
PACCAR Financial Corp. | |
1.550% | | | 09/29/2014 | | | | | | 710,000 | | | | 718,835 | |
| | | | | | | | | | | | | | |
| | | | | | | | | | | | | 18,186,769 | |
| | | | | | | | | | | | | | |
| Containers & Packaging—0.0% | |
Bemis Co., Inc. | |
5.650% | | | 08/01/2014 | | | | | | 290,000 | | | | 314,020 | |
| | | | | | | | | | | | | | |
See accompanying notes to financial statements.
234
SCHEDULE OF INVESTMENTS—(Continued)
December 31, 2011
| | | | | | | | | | | | | | |
| Vantagepoint Diversifying Strategies Fund | | | | | | | | |
| | | | |
Coupon
Rate | | Maturity
Date | | | | | Face | | | Value | |
| | | | | | | | | | | | | | |
| CORPORATE OBLIGATIONS—(Continued) | |
| Diversified Financial Services—2.3% | |
Bank of America Corp. | |
1.040% | | | 09/11/2012 | | | #§ | | $ | 1,300,000 | | | $ | 1,263,024 | |
Bank of America Corp. MTN | |
4.900% | | | 05/01/2013 | | | | | | 650,000 | | | | 650,733 | |
Citigroup, Inc. | |
6.000% | | | 12/13/2013 | | | | | | 475,000 | | | | 491,735 | |
5.300% | | | 10/17/2012 | | | | | | 475,000 | | | | 482,811 | |
2.453% | | | 08/13/2013 | | | #§ | | | 1,530,000 | | | | 1,502,440 | |
1.307% | | | 02/15/2013 | | | #§ | | | 1,210,000 | | | | 1,187,840 | |
CME Group, Inc. | |
5.750% | | | 02/15/2014 | | | § | | | 1,000,000 | | | | 1,090,563 | |
Equifax, Inc. | |
4.450% | | | 12/01/2014 | | | | | | 160,000 | | | | 168,756 | |
ERAC USA Finance LLC | |
2.250% | | | 01/10/2014 | | | ^ | | | 630,000 | | | | 627,694 | |
General Electric Capital Corp. | |
5.900% | | | 05/13/2014 | | | | | | 430,000 | | | | 471,177 | |
2.800% | | | 01/08/2013 | | | | | | 1,100,000 | | | | 1,121,181 | |
General Electric Capital Corp. MTN | |
1.875% | | | 09/16/2013 | | | | | | 1,400,000 | | | | 1,417,836 | |
General Electric Capital Corp., Series A MTN | |
6.000% | | | 06/15/2012 | | | § | | | 2,700,000 | | | | 2,761,004 | |
3.750% | | | 11/14/2014 | | | § | | | 750,000 | | | | 791,089 | |
Icahn Enterprises LP/Icahn Enterprises Finance Corp. | |
7.750% | | | 01/15/2016 | | | § | | | 1,035,000 | | | | 1,078,987 | |
JPMorgan Chase & Co. MTN | |
1.216% | | | 01/24/2014 | | | #§ | | | 1,300,000 | | | | 1,281,097 | |
NASDAQ OMX Group, Inc. (The) | |
4.000% | | | 01/15/2015 | | | § | | | 1,210,000 | | | | 1,240,744 | |
Noble Group Ltd. (Bermuda) | |
8.500% | | | 05/30/2013 | | | ^ | | | 530,000 | | | | 540,600 | |
Pinnacle Foods Finance LLC/Pinnacle Foods Finance Corp. | |
8.250% | | | 09/01/2017 | | | | | | 550,000 | | | | 574,750 | |
Susser Holdings LLC/Susser Finance Corp. | |
8.500% | | | 05/15/2016 | | | § | | | 1,090,000 | | | | 1,181,287 | |
| | | | | | | | | | | | | | |
| | | | | | | | | | | | | 19,925,348 | |
| | | | | | | | | | | | | | |
| Diversified Telecommunication Services—1.8% | |
AT&T, Inc. | |
5.875% | | | 08/15/2012 | | | § | | | 3,210,000 | | | | 3,314,287 | |
4.850% | | | 02/15/2014 | | | | | | 600,000 | | | | 647,050 | |
2.400% | | | 08/15/2016 | | | | | | 690,000 | | | | 704,765 | |
Cellco Partnership/Verizon Wireless Capital LLC | |
5.550% | | | 02/01/2014 | | | | | | 500,000 | | | | 543,499 | |
Cincinnati Bell, Inc. | |
8.250% | | | 10/15/2017 | | | | | | 500,000 | | | | 505,000 | |
Frontier Communications Corp. | |
8.500% | | | 04/15/2020 | | | | | | 850,000 | | | | 874,437 | |
7.875% | | | 04/15/2015 | | | | | | 50,000 | | | | 50,938 | |
6.250% | | | 01/15/2013 | | | | | | 820,000 | | | | 840,500 | |
PAETEC Holding Corp. | |
8.875% | | | 06/30/2017 | | | | | | 500,000 | | | | 542,500 | |
Qtel International Finance Ltd. (Bermuda) | |
6.500% | | | 06/10/2014 | | | ^ | | | 1,170,000 | | | | 1,279,395 | |
Telecom Italia Capital SA (Luxembourg) | |
5.250% | | | 11/15/2013 | | | | | | 280,000 | | | | 269,080 | |
Telefonica Emisiones SAU (Spain) | |
2.582% | | | 04/26/2013 | | | | | | 1,260,000 | | | | 1,229,895 | |
| | | | | | | | | | | | | | |
| | | | | |
| Coupon Rate | |
| Maturity
Date |
| | | | | Face | | | | Value | |
| | | | | | | | | | | | | | |
Verizon Communications, Inc. | |
1.184% | | | 03/28/2014 | | | #§ | | | $ 4,800,000 | | | $ | 4,796,962 | |
| | | | | | | | | | | | | | |
| | | | | | | | | | | | | 15,598,308 | |
| | | | | | | | | | | | | | |
| Electric Utilities—1.9% | |
Cia de Eletricidade do Estado da Bahia (Brazil) | |
11.750% | | | 04/27/2016 | | | ^ | | | BRL 1,100,000 | | | | 619,220 | |
Columbus Southern Power Co. | |
0.955% | | | 03/16/2012 | | | #§ | | | 1,490,000 | | | | 1,488,565 | |
Columbus Southern Power Co., Series C | |
5.500% | | | 03/01/2013 | | | | | | 750,000 | | | | 785,407 | |
Consolidated Edison Co. of New York, Inc., Series 2002-B | |
4.875% | | | 02/01/2013 | | | § | | | 1,000,000 | | | | 1,040,158 | |
Consumers Energy Co., Series D | |
5.375% | | | 04/15/2013 | | | | | | 575,000 | | | | 605,208 | |
Dominion Resources, Inc. | |
5.700% | | | 09/17/2012 | | | § | | | 700,000 | | | | 723,596 | |
Duke Energy Carolinas LLC | |
6.250% | | | 01/15/2012 | | | § | | | 2,625,000 | | | | 2,630,412 | |
Duke Energy Corp. | |
3.950% | | | 09/15/2014 | | | § | | | 290,000 | | | | 309,606 | |
Georgia Power Co. | |
1.300% | | | 09/15/2013 | | | | | | 1,260,000 | | | | 1,272,174 | |
0.866% | | | 03/15/2013 | | | #§ | | | 1,700,000 | | | | 1,700,899 | |
0.673% | | | 01/15/2013 | | | #§ | | | 1,000,000 | | | | 1,000,705 | |
NextEra Energy Capital Holdings, Inc. | |
2.600% | | | 09/01/2015 | | | § | | | 2,000,000 | | | | 2,019,992 | |
Northern States Power Co., Series B | |
8.000% | | | 08/28/2012 | | | § | | | 1,039,000 | | | | 1,087,554 | |
Pacific Gas & Electric Co. | |
0.938% | | | 11/20/2012 | | | #§ | | | 590,000 | | | | 590,815 | |
Southern Co., Series A | |
5.300% | | | 01/15/2012 | | | § | | | 350,000 | | | | 350,624 | |
| | | | | | | | | | | | | | |
| | | | | | | | | | | | | 16,224,935 | |
| | | | | | | | | | | | | | |
| Electronic Equipment, Instruments & Components—0.4% | |
Agilent Technologies, Inc. | |
2.500% | | | 07/15/2013 | | | | | | 520,000 | | | | 525,108 | |
Koninklijke Philips Electronics NV (Netherlands) | |
4.625% | | | 03/11/2013 | | | § | | | 1,000,000 | | | | 1,044,129 | |
Thermo Fisher Scientific, Inc. | |
2.150% | | | 12/28/2012 | | | § | | | 1,620,000 | | | | 1,639,843 | |
| | | | | | | | | | | | | | |
| | | | | | | | | | | | | 3,209,080 | |
| | | | | | | | | | | | | | |
| Energy Equipment & Services—0.2% | |
Cameron International Corp. | |
1.459% | | | 06/02/2014 | | | #§ | | | 1,010,000 | | | | 1,014,735 | |
Complete Production Services, Inc. | |
8.000% | | | 12/15/2016 | | | § | | | 1,000,000 | | | | 1,045,000 | |
| | | | | | | | | | | | | | |
| | | | | | | | | | | | | 2,059,735 | |
| | | | | | | | | | | | | | |
| Food & Staples Retailing—0.7% | |
Costco Wholesale Corp. | |
5.300% | | | 03/15/2012 | | | § | | | 2,000,000 | | | | 2,018,628 | |
Kroger Co. (The) | |
6.200% | | | 06/15/2012 | | | § | | | 1,500,000 | | | | 1,535,907 | |
Safeway, Inc. | |
5.800% | | | 08/15/2012 | | | § | | | 1,786,000 | | | | 1,834,233 | |
3.400% | | | 12/01/2016 | | | | | | 750,000 | | | | 770,042 | |
| | | | | | | | | | | | | | |
| | | | | | | | | | | | | 6,158,810 | |
| | | | | | | | | | | | | | |
| Food Products—1.3% | |
Archer-Daniels-Midland Co. | | | | | |
0.613% | | | 08/13/2012 | | | #§ | | | 2,470,000 | | | | 2,474,416 | |
See accompanying notes to financial statements.
235
SCHEDULE OF INVESTMENTS—(Continued)
December 31, 2011
| | | | | | | | | | | | | | |
Vantagepoint Diversifying
Strategies Fund | | | | | |
| | | | |
Coupon
Rate | | Maturity
Date | | | | | Face | | | Value | |
| | | | | | | | | | | | | | |
| CORPORATE OBLIGATIONS—(Continued) | |
Corn Products International, Inc. | | | | | |
3.200% | | | 11/01/2015 | | | | | $ | 350,000 | | | $ | 361,945 | |
General Mills, Inc. | | | | | |
6.000% | | | 02/15/2012 | | | § | | | 2,500,000 | | | | 2,514,368 | |
5.250% | | | 08/15/2013 | | | | | | 1,500,000 | | | | 1,603,644 | |
Kraft Foods, Inc. | | | | | |
6.250% | | | 06/01/2012 | | | § | | | 425,000 | | | | 434,302 | |
5.250% | | | 10/01/2013 | | | | | | 390,000 | | | | 416,184 | |
2.625% | | | 05/08/2013 | | | | | | 390,000 | | | | 398,566 | |
Wm. Wrigley Jr. Co. | | | | | |
3.700% | | | 06/30/2014 | | | ^ | | | 2,510,000 | | | | 2,589,173 | |
| | | | | | | | | | | | | | |
| | | | | | | | | | | | | 10,792,598 | |
| | | | | | | | | | | | | | |
| Health Care Equipment & Supplies—0.6% | |
Covidien International Finance SA (Luxembourg) | |
1.875% | | | 06/15/2013 | | | | | | 1,250,000 | | | | 1,262,319 | |
DENTSPLY International, Inc. | | | | | |
1.957% | | | 08/15/2013 | | | #§ | | | 1,640,000 | | | | 1,651,888 | |
Stryker Corp. | | | | | |
3.000% | | | 01/15/2015 | | | | | | 790,000 | | | | 833,089 | |
2.000% | | | 09/30/2016 | | | § | | | 1,280,000 | | | | 1,311,343 | |
| | | | | | | | | | | | | | |
| | | | | | | | | | | | | 5,058,639 | |
| | | | | | | | | | | | | | |
| Health Care Providers & Services—0.6% | | | | | |
Aristotle Holding, Inc. | | | | | |
2.750% | | | 11/21/2014 | | | ^§ | | | 1,500,000 | | | | 1,519,233 | |
DaVita, Inc. | | | | | |
6.625% | | | 11/01/2020 | | | | | | 800,000 | | | | 826,000 | |
Quest Diagnostics, Inc. | | | | | |
1.424% | | | 03/24/2014 | | | #§ | | | 890,000 | | | | 895,118 | |
WellPoint, Inc. | | | | | |
2.375% | | | 02/15/2017 | | | § | | | 1,645,000 | | | | 1,641,990 | |
| | | | | | | | | | | | | | |
| | | | | | | | | | | | | 4,882,341 | |
| | | | | | | | | | | | | | |
| Hotels, Restaurants & Leisure—0.1% | |
McDonald’s Corp., Series G MTN | | | | | |
5.750% | | | 03/01/2012 | | | | | | 750,000 | | | | 756,138 | |
| | | | | | | | | | | | | | |
| Household Durables—0.2% | |
Clorox Co. (The) | | | | | |
5.000% | | | 03/01/2013 | | | § | | | 1,000,000 | | | | 1,043,258 | |
Kimberly-Clark Corp. | | | | | |
5.625% | | | 02/15/2012 | | | § | | | 1,000,000 | | | | 1,005,357 | |
| | | | | | | | | | | | | | |
| | | | | | | | | | | | | 2,048,615 | |
| | | | | | | | | | | | | | |
| Household Products—0.1% | |
Procter & Gamble Co. (The) | | | | | |
0.700% | | | 08/15/2014 | | | § | | | 910,000 | | | | 915,028 | |
| | | | | | | | | | | | | | |
| Independent Power Producers & Energy Traders—0.2% | |
AES Corp. (The) | | | | | |
7.750% | | | 03/01/2014 | | | | | | 650,000 | | | | 705,250 | |
Calpine Corp. | | | | | |
7.250% | | | 10/15/2017 | | | ^ | | | 750,000 | | | | 791,250 | |
| | | | | | | | | | | | | | |
| | | | | | | | | | | | | 1,496,500 | |
| | | | | | | | | | | | | | |
| Industrial Conglomerates—0.5% | |
3M Co. | | | | | |
1.375% | | | 09/29/2016 | | | § | | | 1,040,000 | | | | 1,050,127 | |
3M Co., Series E MTN | | | | | |
4.375% | | | 08/15/2013 | | | | | | 750,000 | | | | 797,546 | |
| | | | | | | | | | | | | | |
| | | | | |
Coupon
Rate | |
| Maturity
Date |
| | | | | Face | | | | Value | |
| | | | | | | | | | | | | | |
Danaher Corp. | | | | | |
1.300% | | | 06/23/2014 | | | | | $ | 500,000 | | | $ | 507,492 | |
0.817% | | | 06/21/2013 | | | #§ | | | 1,000,000 | | | | 1,001,895 | |
Siemens Financieringsmaatschappij NV MTN (Netherlands) | |
0.705% | | | 03/16/2012 | | | # | | | 1,100,000 | | | | 1,099,725 | |
| | | | | | | | | | | | | | |
| | | | | | | | | | | | | 4,456,785 | |
| | | | | | | | | | | | | | |
| Insurance—1.1% | |
Allstate Corp. (The) | | | | | |
6.200% | | | 05/16/2014 | | | | | | 510,000 | | | | 569,100 | |
Berkshire Hathaway Finance Corp. | | | | | |
4.000% | | | 04/15/2012 | | | | | | 750,000 | | | | 757,574 | |
Berkshire Hathaway, Inc. | | | | | |
3.750% | | | 08/15/2021 | | | | | | 3,300,000 | | | | 3,435,772 | |
Hartford Financial Services Group, Inc. | | | | | |
4.000% | | | 03/30/2015 | | | | | | 570,000 | | | | 573,192 | |
MetLife, Inc. | | | | | |
2.375% | | | 02/06/2014 | | | § | | | 980,000 | | | | 994,179 | |
Prudential Financial, Inc., Series D MTN | | | | | |
5.150% | | | 01/15/2013 | | | § | | | 2,000,000 | | | | 2,071,114 | |
3.625% | | | 09/17/2012 | | | | | | 710,000 | | | | 721,132 | |
2.750% | | | 01/14/2013 | | | | | | 600,000 | | | | 605,323 | |
| | | | | | | | | | | | | | |
| | | | | | | | | | | | | 9,727,386 | |
| | | | | | | | | | | | | | |
| Internet & Catalog Retail—0.1% | |
eBay, Inc. | | | | | | | | | | | |
0.875% | | | 10/15/2013 | | | | | | 570,000 | | | | 572,003 | |
| | | | | | | | | | | | | | |
| IT Services—0.4% | |
International Business Machines Corp. | | | | | |
2.100% | | | 05/06/2013 | | | | | | 630,000 | | | | 643,211 | |
1.000% | | | 08/05/2013 | | | | | | 1,250,000 | | | | 1,260,336 | |
0.875% | | | 10/31/2014 | | | § | | | 1,180,000 | | | | 1,181,246 | |
| | | | | | | | | | | | | | |
| | | | | | | | | | | | | 3,084,793 | |
| | | | | | | | | | | | | | |
| Life Sciences Tools & Services—0.1% | |
Howard Hughes Medical Institute | | | | | |
3.450% | | | 09/01/2014 | | | | | | 700,000 | | | | 747,027 | |
| | | | | | | | | | | | | | |
| Machinery—0.4% | |
Case New Holland, Inc. | | | | | |
7.750% | | | 09/01/2013 | | | § | | | 1,450,000 | | | | 1,547,875 | |
Caterpillar, Inc. | | | | | |
0.649% | | | 05/21/2013 | | | #§ | | | 1,200,000 | | | | 1,202,060 | |
Terex Corp. | | | | | |
8.000% | | | 11/15/2017 | | | | | | 500,000 | | | | 492,500 | |
| | | | | | | | | | | | | | |
| | | | | | | | | | | | | 3,242,435 | |
| | | | | | | | | | | | | | |
| Media—0.9% | |
CCO Holdings LLC/CCO Holdings Capital Corp. | |
8.125% | | | 04/30/2020 | | | | | | 250,000 | | | | 275,000 | |
COX Communications, Inc. | |
5.450% | | | 12/15/2014 | | | | | | 500,000 | | | | 555,396 | |
DirecTV Holdings LLC/DirecTV Financing Co., Inc. | |
4.750% | | | 10/01/2014 | | | | | | 1,200,000 | | | | 1,297,037 | |
DISH DBS Corp. | | | | | |
6.625% | | | 10/01/2014 | | | | | | 850,000 | | | | 911,625 | |
Mediacom Broadband LLC/Mediacom Broadband Corp. | |
8.500% | | | 10/15/2015 | | | | | | 500,000 | | | | 517,500 | |
NBCUniversal Media LLC | |
2.100% | | | 04/01/2014 | | | § | | | 2,300,000 | | | | 2,339,171 | |
Time Warner, Inc. | |
3.150% | | | 07/15/2015 | | | | | | 500,000 | | | | 520,494 | |
Viacom, Inc. | |
4.375% | | | 09/15/2014 | | | | | | 500,000 | | | | 535,967 | |
See accompanying notes to financial statements.
236
SCHEDULE OF INVESTMENTS—(Continued)
December 31, 2011
| | | | | | | | | | | | | | |
Vantagepoint Diversifying
Strategies Fund | | | | | |
| | | | |
Coupon
Rate | | Maturity
Date | | | | | Face | | | Value | |
| | | | | | | | | | | | | | |
| CORPORATE OBLIGATIONS—(Continued) | |
Walt Disney Co. (The), Series B MTN | |
6.375% | | | 03/01/2012 | | | | | $ | 375,000 | | | $ | 378,393 | |
| | | | | | | | | | | | | | |
| | | | | | | | | | | | | 7,330,583 | |
| | | | | | | | | | | | | | |
| Metals & Mining—0.3% | |
BHP Billiton Finance USA Ltd. (Australia) | |
5.125% | | | 03/29/2012 | | | | | | 1,400,000 | | | | 1,415,522 | |
Steel Dynamics, Inc. | |
7.375% | | | 11/01/2012 | | | | | | 1,065,000 | | | | 1,111,594 | |
Vedanta Resources plc (United Kingdom) | |
6.750% | | | 06/07/2016 | | | ^ | | | 550,000 | | | | 473,000 | |
| | | | | | | | | | | | | | |
| | | | | | | | | | | | | 3,000,116 | |
| | | | | | | | | | | | | | |
| Multiline Retail—0.3% | |
Target Corp. | |
8.600% | | | 01/15/2012 | | | § | | | 1,600,000 | | | | 1,604,980 | |
1.125% | | | 07/18/2014 | | | | | | 600,000 | | | | 604,785 | |
| | | | | | | | | | | | | | |
| | | | | | | | | | | | | 2,209,765 | |
| | | | | | | | | | | | | | |
| Multi-Utilities—0.2% | |
DTE Energy Co. | |
1.227% | | | 06/03/2013 | | | #§ | | | 2,070,000 | | | | 2,068,752 | |
| | | | | | | | | | | | | | |
| Oil, Gas & Consumable Fuels—2.3% | |
Alpha Natural Resources, Inc. | |
6.000% | | | 06/01/2019 | | | | | | 175,000 | | | | 170,625 | |
Canadian Natural Resources Ltd. (Canada) | |
5.450% | | | 10/01/2012 | | | § | | | 1,200,000 | | | | 1,239,991 | |
Chevron Corp. | |
3.950% | | | 03/03/2014 | | | § | | | 1,000,000 | | | | 1,069,959 | |
ConocoPhillips | |
4.750% | | | 02/01/2014 | | | | | | 750,000 | | | | 810,418 | |
Husky Energy, Inc. (Canada) | |
6.250% | | | 06/15/2012 | | | § | | | 1,670,000 | | | | 1,709,938 | |
5.900% | | | 06/15/2014 | | | § | | | 550,000 | | | | 598,122 | |
Kinder Morgan Energy Partners LP | |
7.125% | | | 03/15/2012 | | | | | | 900,000 | | | | 910,331 | |
5.850% | | | 09/15/2012 | | | § | | | 980,000 | | | | 1,011,770 | |
Kinder Morgan Kansas, Inc. | |
6.500% | | | 09/01/2012 | | | | | | 1,300,000 | | | | 1,332,500 | |
Petrohawk Energy Corp. | |
7.875% | | | 06/01/2015 | | | | | | 1,000,000 | | | | 1,070,000 | |
Petroleos Mexicanos (Mexico) | |
4.875% | | | 03/15/2015 | | | § | | | 1,400,000 | | | | 1,496,250 | |
Rockies Express Pipeline LLC | |
3.900% | | | 04/15/2015 | | | ^ | | | 770,000 | | | | 761,488 | |
Shell International Finance BV (Netherlands) | |
1.875% | | | 03/25/2013 | | | | | | 710,000 | | | | 723,433 | |
Tesoro Corp. | |
6.625% | | | 11/01/2015 | | | | | | 390,000 | | | | 398,775 | |
Total Capital Canada Ltd. (Canada) | |
0.543% | | | 05/13/2013 | | | #§ | | | 2,000,000 | | | | 2,004,250 | |
TransCanada PipeLines Ltd. (Canada) | |
3.400% | | | 06/01/2015 | | | | | | 630,000 | | | | 667,830 | |
Valero Energy Corp. | |
6.875% | | | 04/15/2012 | | | | | | 1,200,000 | | | | 1,219,592 | |
XTO Energy, Inc. | |
7.500% | | | 04/15/2012 | | | § | | | 2,190,000 | | | | 2,234,006 | |
| | | | | | | | | | | | | | |
| | | | | | | | | | | | | 19,429,278 | |
| | | | | | | | | | | | | | |
| | | | | | | | | | | | | | |
| | | | | |
Coupon
Rate | |
| Maturity
Date |
| | | | | Face | | | | Value | |
| | | | | | | | | | | | | | |
| Personal Products—0.1% | |
Revlon Consumer Products Corp. | |
9.750% | | | 11/15/2015 | | | § | | $ | 1,090,000 | | | $ | 1,164,938 | |
| | | | | | | | | | | | | | |
| Pharmaceuticals—1.6% | |
AstraZeneca plc (United Kingdom) | |
5.400% | | | 09/15/2012 | | | § | | | 1,000,000 | | | | 1,034,722 | |
GlaxoSmithKline Capital, Inc. | |
4.850% | | | 05/15/2013 | | | | | | 1,700,000 | | | | 1,799,756 | |
Merck & Co., Inc. | |
4.375% | | | 02/15/2013 | | | § | | | 1,816,000 | | | | 1,894,560 | |
Novartis Capital Corp. | |
4.125% | | | 02/10/2014 | | | | | | 1,580,000 | | | | 1,691,335 | |
Sanofi (France) | |
1.625% | | | 03/28/2014 | | | § | | | 1,720,000 | | | | 1,751,072 | |
1.200% | | | 09/30/2014 | | | | | | 350,000 | | | | 352,954 | |
Teva Pharmaceutical Finance III BV (Netherlands Antilles) | |
1.700% | | | 03/21/2014 | | | | | | 580,000 | | | | 583,308 | |
1.067% | | | 03/21/2014 | | | #§ | | | 470,000 | | | | 467,576 | |
Teva Pharmaceutical Finance III LLC | |
1.500% | | | 06/15/2012 | | | § | | | 1,846,000 | | | | 1,853,210 | |
Teva Pharmaceutical Finance IV LLC | |
1.700% | | | 11/10/2014 | | | | | | 1,180,000 | | | | 1,189,949 | |
Valeant Pharmaceuticals International | |
6.500% | | | 07/15/2016 | | | ^§ | | | 820,000 | | | | 823,075 | |
| | | | | | | | | | | | | | |
| | | | | | | | | | | | | 13,441,517 | |
| | | | | | | | | | | | | | |
| Real Estate Investment Trusts (REITs)—0.6% | |
China Resources Land Ltd. (Hong Kong) | |
4.625% | | | 05/19/2016 | | | ^ | | | 600,000 | | | | 590,240 | |
HCP, Inc. | |
2.700% | | | 02/01/2014 | | | | | | 1,610,000 | | | | 1,608,465 | |
Health Care REIT, Inc. | |
6.000% | | | 11/15/2013 | | | | | | 930,000 | | | | 976,262 | |
Host Hotels & Resorts LP, Series Q | |
3.250% | | | 04/15/2024 | | | ^ | | | 450,000 | | | | 488,250 | |
Simon Property Group LP | |
4.200% | | | 02/01/2015 | | | | | | 250,000 | | | | 265,298 | |
Vornado Realty LP | |
4.250% | | | 04/01/2015 | | | § | | | 1,240,000 | | | | 1,284,267 | |
| | | | | | | | | | | | | | |
| | | | | | | | | | | | | 5,212,782 | |
| | | | | | | | | | | | | | |
| Road & Rail—0.1% | |
JB Hunt Transport Services, Inc. | |
3.375% | | | 09/15/2015 | | | | | | 970,000 | | | | 983,869 | |
| | | | | | | | | | | | | | |
| Semiconductors & Semiconductor Equipment—0.5% | |
Intel Corp. | |
1.950% | | | 10/01/2016 | | | § | | | 840,000 | | | | 864,512 | |
Texas Instruments, Inc. | |
0.875% | | | 05/15/2013 | | | § | | | 2,230,000 | | | | 2,236,616 | |
0.637% | | | 05/15/2013 | | | #§ | | | 1,000,000 | | | | 1,002,415 | |
| | | | | | | | | | | | | | |
| | | | | | | | | | | | | 4,103,543 | |
| | | | | | | | | | | | | | |
| Software—0.2% | |
Microsoft Corp. | |
2.950% | | | 06/01/2014 | | | | | | 900,000 | | | | 956,604 | |
Oracle Corp. | |
3.750% | | | 07/08/2014 | | | | | | 750,000 | | | | 807,094 | |
| | | | | | | | | | | | | | |
| | | | | | | | | | | | | 1,763,698 | |
| | | | | | | | | | | | | | |
| Specialty Retail—0.0% | |
Toys “R” Us, Inc. | |
7.375% | | | 09/01/2016 | | | ^ | | | 250,000 | | | | 251,875 | |
7.375% | | | 10/15/2018 | | | | | | 150,000 | | | | 135,375 | |
| | | | | | | | | | | | | | |
| | | | | | | | | | | | | 387,250 | |
| | | | | | | | | | | | | | |
See accompanying notes to financial statements.
237
SCHEDULE OF INVESTMENTS—(Continued)
December 31, 2011
| | | | | | | | | | | | | | |
| Vantagepoint Diversifying Strategies Fund | | | | | |
| | | | |
Coupon
Rate | | Maturity
Date | | | | | Face | | | Value | |
| | | | | | | | | | | | | | |
| CORPORATE OBLIGATIONS—(Continued) | |
| Textiles, Apparel & Luxury Goods—0.3% | |
Hanesbrands, Inc. | |
6.375% | | | 12/15/2020 | | | | | $ | 950,000 | | | $ | 969,000 | |
Levi Strauss & Co. | |
8.875% | | | 04/01/2016 | | | § | | | 1,000,000 | | | | 1,045,000 | |
VF Corp. | |
1.245% | | | 08/23/2013 | | | #§ | | | 700,000 | | | | 701,539 | |
| | | | | | | | | | | | | | |
| | | | | | | | | | | | | 2,715,539 | |
| | | | | | | | | | | | | | |
| Tobacco—0.5% | |
Lorillard Tobacco Co. | |
3.500% | | | 08/04/2016 | | | | | | 1,200,000 | | | | 1,215,058 | |
Philip Morris International, Inc. | |
4.875% | | | 05/16/2013 | | | § | | | 2,500,000 | | | | 2,639,017 | |
| | | | | | | | | | | | | | |
| | | | | | | | | | | | | 3,854,075 | |
| | | | | | | | | | | | | | |
| Trading Companies & Distributors—0.1% | |
AmeriGas Partners LP/AmeriGas Finance Corp. | |
6.250% | | | 08/20/2019 | | | | | | 800,000 | | | | 800,000 | |
| | | | | | | | | | | | | | |
| Water Utilities—0.1% | |
Veolia Environnement SA (France) | |
5.250% | | | 06/03/2013 | | | | | | 910,000 | | | | 957,868 | |
| | | | | | | | | | | | | | |
| Wireless Telecommunication Services—0.6% | |
America Movil SAB de CV (Mexico) | |
3.625% | | | 03/30/2015 | | | | | | 350,000 | | | | 368,505 | |
Rogers Communications, Inc. (Canada) | |
6.375% | | | 03/01/2014 | | | § | | | 1,390,000 | | | | 1,533,441 | |
6.250% | | | 06/15/2013 | | | § | | | 1,100,000 | | | | 1,177,870 | |
Syniverse Holdings, Inc. | |
9.125% | | | 01/15/2019 | | | | | | 500,000 | | | | 530,000 | |
Vodafone Group plc (United Kingdom) | |
5.350% | | | 02/27/2012 | | | | | | 250,000 | | | | 251,683 | |
4.150% | | | 06/10/2014 | | | § | | | 1,090,000 | | | | 1,156,415 | |
| | | | | | | | | | | | | | |
| | | | | | | | | | | | | 5,017,914 | |
| | | | | | | | | | | | | | |
| TOTAL CORPORATE OBLIGATIONS | |
(Cost $291,743,736) | | | | | | | 293,597,329 | |
| | | | | | | | | | | | | | |
| | | | | | | | | | | | | | | |
| MORTGAGE-RELATED SECURITIES—6.3% | |
| Commercial Mortgage-Backed Securities—0.5% | |
Extended Stay America Trust, Series 2010-ESHA, Class A | |
2.951% | | | 11/05/2027 | | | ^§ | | | 1,342,564 | | | | 1,349,280 | |
LA Arena Funding LLC, Series 1, Class A | |
7.656% | | | 12/15/2026 | | | ^ | | | 636,857 | | | | 639,619 | |
National Credit Union Administration Guaranteed Notes, Series 2010-C1, Class A1 | |
1.600% | | | 10/29/2020 | | | § | | | 1,021,251 | | | | 1,035,064 | |
National Credit Union Administration Guaranteed Notes, Series 2010-C1, Class A2 | |
2.900% | | | 10/29/2020 | | | | | | 1,260,000 | | | | 1,332,193 | |
| | | | | | | | | | | | | | |
| | | | | | | | | | | | | 4,356,156 | |
| | | | | | | | | | | | | | |
U.S. Government Agency Mortgage-Backed
Securities—5.6% | |
Federal Home Loan Mortgage Corp. | |
3.906% | | | 12/01/2039 | | | # | | | 487,462 | | | | 513,685 | |
2.448% | | | 09/01/2035 | | | # | | | 6,209,435 | | | | 6,547,840 | |
| | | | | | | | | | | | | | |
| | | | | |
| Coupon Rate | |
| Maturity
Date |
| | | | | Face | | | | Value | |
| | | | | | | | | | | | | | |
Federal Home Loan Mortgage Corp. REMICS, Series 2929, Class AC | |
4.500% | | | 12/15/2022 | | | | | $ | 254,903 | | | $ | 257,270 | |
Federal National Mortgage Association | |
5.000% | | | 01/01/2018- | | | | | | | | | | | |
| | | 07/01/2035 | | | | | | 6,776,514 | | | | 7,327,626 | |
4.000% | | | 11/01/2040- | | | | | | | | | | | |
| | | 09/01/2041 | | | | | | 2,854,510 | | | | 3,002,600 | |
3.500% | | | 05/01/2020- | | | | | | | | | | | |
| | | 12/01/2020 | | | | | | 2,494,627 | | | | 2,613,053 | |
3.138% | | | 07/01/2041 | | | # | | | 5,044,249 | | | | 5,260,701 | |
3.092% | | | 06/01/2041 | | | # | | | 3,284,945 | | | | 3,426,002 | |
0.595% | | | 07/01/2016 | | | # | | | 6,600,000 | | | | 6,664,340 | |
Federal National Mortgage Association REMICS,
Series 2005-38, Class CD | |
5.000% | | | 06/25/2019 | | | § | | | 616,423 | | | | 635,050 | |
Government National Mortgage Association,
Series 2004-19, Class FC | |
0.585% | | | 03/20/2034 | | | #§ | | | 2,003,260 | | | | 2,007,263 | |
National Credit Union Administration Guaranteed Notes,
Series 2010-R1, Class 1A | |
0.724% | | | 10/07/2020 | | | #§ | | | 1,694,960 | | | | 1,696,807 | |
National Credit Union Administration Guaranteed Notes,
Series 2010-R1, Class 2A | |
1.840% | | | 10/07/2020 | | | | | | 491,381 | | | | 494,452 | |
National Credit Union Administration Guaranteed Notes,
Series 2010-R2, Class 1A | |
0.644% | | | 11/06/2017 | | | #§ | | | 5,535,211 | | | | 5,535,211 | |
National Credit Union Administration Guaranteed Notes,
Series 2011-R4, Class 1A | |
0.654% | | | 03/06/2020 | | | #§ | | | 1,775,699 | | | | 1,775,699 | |
| | | | | | | | | | | | | | |
| | | | | | | | | | | | | 47,757,599 | |
| | | | | | | | | | | | | | |
| U.S. Non-Agency Mortgage-Backed Securities—0.2% | |
Banc of America Mortgage Securities, Inc.,
Series 2002-K, Class 1A4 | |
2.765% | | | 10/20/2032 | | | # | | | 657,839 | | | | 619,261 | |
Credit Suisse First Boston Mortgage Securities Corp.,
Series 2004-3, Class 2A1 | |
5.000% | | | 04/25/2019 | | | | | | 230,404 | | | | 237,992 | |
Thornburg Mortgage Securities Trust,
Series 2004-1, Class II2A | |
1.744% | | | 03/25/2044 | | | #§ | | | 920,533 | | | | 781,077 | |
Wells Fargo Mortgage Backed Securities Trust,
Series 2004-6, Class A13 | |
0.744% | | | 06/25/2034 | | | #§ | | | 232,059 | | | | 230,164 | |
| | | | | | | | | | | | | | |
| | | | | | | | | | | | | 1,868,494 | |
| | | | | | | | | | | | | | |
| TOTAL MORTGAGE-RELATED SECURITIES | |
(Cost $53,792,800) | | | | | | | 53,982,249 | |
| | | | | | | | | | | | | | |
| | | | | | | | | | | | | | | |
| CONVERTIBLE DEBT OBLIGATIONS—24.1% | |
| Beverages—0.7% | |
Asahi Group Holdings Ltd. (Japan) | |
0.000% | | | 05/26/2028 | | | JPY | | | 215,000,000 | | | | 2,859,385 | |
Molson Coors Brewing Co. | |
2.500% | | | 07/30/2013 | | | | | $ | 3,300,000 | | | | 3,510,375 | |
| | | | | | | | | | | | | | |
| | | | | | | | | | | | | 6,369,760 | |
| | | | | | | | | | | | | | |
| Biotechnology—0.9% | |
Amgen, Inc., Series B | |
0.375% | | | 02/01/2013 | | | | | | 2,300,000 | | | | 2,320,125 | |
See accompanying notes to financial statements.
238
SCHEDULE OF INVESTMENTS—(Continued)
December 31, 2011
| | | | | | | | | | | | | | |
Vantagepoint Diversifying
Strategies Fund | | | | | |
| | | | |
Coupon
Rate | | Maturity
Date | | | | | Face | | | Value | |
| | | | | | | | | | | | | | |
| CONVERTIBLE DEBT OBLIGATIONS—(Continued) | |
Gilead Sciences, Inc. | |
1.625% | | | 05/01/2016 | | | | | $ | 3,300,000 | | | $ | 3,774,375 | |
1.000% | | | 05/01/2014 | | | | | | 1,500,000 | | | | 1,650,000 | |
| | | | | | | | | | | | | | |
| | | | | | | | | | | | | 7,744,500 | |
| | | | | | | | | | | | | | |
| Building Products—0.1% | |
Griffon Corp. | |
4.000% | | | 01/15/2017 | | | ^ | | | 500,000 | | | | 475,000 | |
| | | | | | | | | | | | | | |
| Capital Markets—1.5% | |
Affiliated Managers Group, Inc. | |
3.950% | | | 08/15/2038 | | | | | | 3,750,000 | | | | 4,087,500 | |
Billion Express Investments Ltd. (Virgin Islands, British) | |
0.750% | | | 10/18/2015 | | | | | | 3,400,000 | | | | 3,947,400 | |
ProLogis LP | |
3.250% | | | 03/15/2015 | | | | | | 1,750,000 | | | | 1,813,438 | |
Temasek Financial III Pte Ltd., Reg S (Singapore) | |
0.000% | | | 10/24/2014 | | | SGD | | | 3,750,000 | | | | 2,985,486 | |
| | | | | | | | | | | | | | |
| | | | | | | | | | | | | 12,833,824 | |
| | | | | | | | | | | | | | |
| Commercial Services & Supplies—0.1% | |
Covanta Holding Corp. | |
3.250% | | | 06/01/2014 | | | | | | 600,000 | | | | 628,500 | |
| | | | | | | | | | | | | | |
| Communications Equipment—0.2% | |
Arris Group, Inc. | |
2.000% | | | 11/15/2026 | | | | | | 1,500,000 | | | | 1,511,250 | |
| | | | | | | | | | | | | | |
| Computers & Peripherals—1.0% | |
EMC Corp., Series B | |
1.750% | | | 12/01/2013 | | | | | | 2,600,000 | | | | 3,744,000 | |
SanDisk Corp. | |
1.500% | | | 08/15/2017 | | | | | | 3,000,000 | | | | 3,547,500 | |
1.000% | | | 05/15/2013 | | | | | | 1,600,000 | | | | 1,566,000 | |
| | | | | | | | | | | | | | |
| | | | | | | | | | | | | 8,857,500 | |
| | | | | | | | | | | | | | |
| Containers & Packaging—0.2% | |
Owens-Brockway Glass Container, Inc. | |
3.000% | | | 06/01/2015 | | | ^ | | | 1,990,000 | | | | 1,860,650 | |
| | | | | | | | | | | | | | |
| Diversified Consumer Services—0.2% | |
Stewart Enterprises, Inc. | |
3.125% | | | 07/15/2014 | | | | | | 2,000,000 | | | | 1,912,500 | |
| | | | | | | | | | | | | | |
| Diversified Telecommunication Services—0.5% | |
Alaska Communications Systems Group, Inc. | |
6.250% | | | 05/01/2018 | | | ^ | | | 1,800,000 | | | | 1,154,250 | |
Inmarsat plc, Series ISAT (United Kingdom) | |
1.750% | | | 11/16/2017 | | | | | | 1,600,000 | | | | 1,856,000 | |
tw telecom inc. | |
2.375% | | | 04/01/2026 | | | | | | 800,000 | | | | 946,000 | |
| | | | | | | | | | | | | | |
| | | | | | | | | | | | | 3,956,250 | |
| | | | | | | | | | | | | | |
| Electric Utilities—0.0% | |
Unisource Energy Corp. | |
4.500% | | | 03/01/2035 | | | | | | 300,000 | | | | 324,375 | |
| | | | | | | | | | | | | | |
| Electrical Equipment—0.3% | |
EnerSys | | | | | | | | | | | | | | |
3.375% | | | 06/01/2038 | | | | | | 450,000 | | | | 456,750 | |
General Cable Corp. | |
0.875% | | | 11/15/2013 | | | | | | 2,500,000 | | | | 2,312,500 | |
| | | | | | | | | | | | | | |
| | | | | | | | | | | | | 2,769,250 | |
| | | | | | | | | | | | | | |
| | | | | | | | | | | | | | |
| | | | | |
Coupon
Rate | |
| Maturity
Date |
| | | | | Face | | | | Value | |
| | | | | | | | | | | | | | |
| Energy Equipment & Services—2.2% | |
Bristow Group, Inc. | |
3.000% | | | 06/15/2038 | | | | | $ | 2,500,000 | | | $ | 2,565,625 | |
Exterran Energy Corp. | |
4.750% | | | 01/15/2014 | | | | | | 1,870,000 | | | | 1,720,400 | |
Exterran Holdings, Inc. | |
4.250% | | | 06/15/2014 | | | | | | 1,130,000 | | | | 1,008,525 | |
Helix Energy Solutions Group, Inc. | |
3.250% | | | 12/15/2025 | | | | | | 2,150,000 | | | | 2,166,125 | |
Hercules Offshore, Inc. | |
3.375% | | | 06/01/2038 | | | | | | 900,000 | | | | 811,125 | |
Hornbeck Offshore Services, Inc. | |
1.625% | | | 11/15/2026 | | | | | | 2,500,000 | | | | 2,512,500 | |
Subsea 7 SA (Luxembourg) | |
2.250% | | | 10/11/2013 | | | | | | 4,500,000 | | | | 4,810,500 | |
Technip SA (France) | |
0.500% | | | 01/01/2016 | | | EUR | | | 2,160,600 | | | | 3,082,985 | |
0.250% | | | 01/01/2017 | | | EUR | | | 111,657 | | | | 148,795 | |
| | | | | | | | | | | | | | |
| | | | | | | | | | | | | 18,826,580 | |
| | | | | | | | | | | | | | |
| Food & Staples Retailing—0.1% | |
Pantry, Inc. (The) | |
3.000% | | | 11/15/2012 | | | | | | 500,000 | | | | 491,250 | |
| | | | | | | | | | | | | | |
| Food Products—0.1% | |
Archer-Daniels-Midland Co. | |
0.875% | | | 02/15/2014 | | | | | | 1,250,000 | | | | 1,262,500 | |
| | | | | | | | | | | | | | |
| Health Care Equipment & Supplies—1.1% | |
Alere, Inc. | |
3.000% | | | 05/15/2016 | | | | | | 1,600,000 | | | | 1,524,000 | |
Hologic, Inc. | |
2.000% | | | 12/15/2037 | | | | | | 2,500,000 | | | | 2,396,875 | |
Integra LifeSciences Holdings Corp. | |
2.375% | | | 06/01/2012 | | | ^ | | | 350,000 | | | | 348,250 | |
1.625% | | | 12/15/2016 | | | ^ | | | 1,550,000 | | | | 1,333,000 | |
Medtronic, Inc., Series B | |
1.625% | | | 04/15/2013 | | | | | | 1,950,000 | | | | 1,974,375 | |
NuVasive, Inc. | |
2.750% | | | 07/01/2017 | | | | | | 1,600,000 | | | | 1,174,000 | |
Teleflex, Inc. | |
3.875% | | | 08/01/2017 | | | | | | 600,000 | | | | 724,500 | |
| | | | | | | | | | | | | | |
| | | | | | | | | | | | | 9,475,000 | |
| | | | | | | | | | | | | | |
| Health Care Providers & Services—0.5% | |
LifePoint Hospitals, Inc. | |
3.500% | | | 05/15/2014 | | | | | | 3,550,000 | | | | 3,647,625 | |
Omnicare, Inc. | |
3.250% | | | 12/15/2035 | | | | | | 390,000 | | | | 359,775 | |
| | | | | | | | | | | | | | |
| | | | | | | | | | | | | 4,007,400 | |
| | | | | | | | | | | | | | |
| Hotels, Restaurants & Leisure—0.6% | |
Gaylord Entertainment Co. | |
3.750% | | | 10/01/2014 | | | ^ | | | 1,500,000 | | | | 1,676,250 | |
International Game Technology | |
3.250% | | | 05/01/2014 | | | | | | 1,665,000 | | | | 1,979,269 | |
MGM Resorts International | |
4.250% | | | 04/15/2015 | | | | | | 1,550,000 | | | | 1,474,437 | |
| | | | | | | | | | | | | | |
| | | | | | | | | | | | | 5,129,956 | |
| | | | | | | | | | | | | | |
| Household Durables—0.5% | |
Lennar Corp. | |
2.000% | | | 12/01/2020 | | | ^ | | | 3,000,000 | | | | 3,030,000 | |
Stanley Black & Decker, Inc. | |
0.000% | | | 05/17/2012 | | | # | | | 1,180,000 | | | | 1,312,013 | |
| | | | | | | | | | | | | | |
| | | | | | | | | | | | | 4,342,013 | |
| | | | | | | | | | | | | | |
See accompanying notes to financial statements.
239
SCHEDULE OF INVESTMENTS—(Continued)
December 31, 2011
| | | | | | | | | | | | | | |
Vantagepoint Diversifying
Strategies Fund | | | | | |
| | | | |
Coupon
Rate | | Maturity
Date | | | | | Face | | | Value | |
| | | | | | | | | | | | | | |
| CONVERTIBLE DEBT OBLIGATIONS—(Continued) | |
| Household Products—0.5% | |
Unicharm Corp. (Japan) | |
0.000% | | | 09/24/2013 | | | JPY | | | 120,000,000 | | | $ | 1,677,981 | |
0.000% | | | 09/24/2015 | | | JPY | | | 150,000,000 | | | | 2,153,201 | |
| | | | | | | | | | | | | | |
| | | | | | | | | | | | | 3,831,182 | |
| | | | | | | | | | | | | | |
| Industrial Conglomerates—0.2% | |
Danaher Corp. | |
0.000% | | | 01/22/2021 | | | | | $ | 1,500,000 | | | | 2,055,000 | |
| | | | | | | | | | | | | | |
| Internet Software & Services—0.5% | |
Equinix, Inc. | |
2.500% | | | 04/15/2012 | | | | | | 2,000,000 | | | | 2,075,000 | |
WebMD Health Corp. | |
2.500% | | | 01/31/2018 | | | ^ | | | 900,000 | | | | 842,625 | |
2.250% | | | 03/31/2016 | | | ^ | | | 1,150,000 | | | | 1,109,750 | |
| | | | | | | | | | | | | | |
| | | | | | | | | | | | | 4,027,375 | |
| | | | | | | | | | | | | | |
| IT Services—0.4% | |
Alliance Data Systems Corp. | |
1.750% | | | 08/01/2013 | | | | | | 750,000 | | | | 1,032,187 | |
Cap Gemini SA (France) | |
3.500% | | | 01/01/2014 | | | EUR | | | 850,000 | | | | 1,198,880 | |
Euronet Worldwide, Inc. | |
3.500% | | | 10/15/2025 | | | | | | 1,050,000 | | | | 1,044,750 | |
| | | | | | | | | | | | | | |
| | | | | | | | | | | | | 3,275,817 | |
| | | | | | | | | | | | | | |
| Life Sciences Tools & Services—0.2% | |
Charles River Laboratories International, Inc. | |
2.250% | | | 06/15/2013 | | | | | | 1,750,000 | | | | 1,704,063 | |
| | | | | | | | | | | | | | |
| Machinery—0.8% | |
AGCO Corp. | |
1.250% | | | 12/15/2036 | | | | | | 600,000 | | | | 755,250 | |
Greenbrier Cos., Inc. | |
3.500% | | | 04/01/2018 | | | ^ | | | 1,000,000 | | | | 973,750 | |
Meritor, Inc. | |
4.625% | | | 03/01/2026 | | | | | | 2,290,000 | | | | 1,700,325 | |
Trinity Industries, Inc. | |
3.875% | | | 06/01/2036 | | | | | | 3,000,000 | | | | 2,947,500 | |
| | | | | | | | | | | | | | |
| | | | | | | | | | | | | 6,376,825 | |
| | | | | | | | | | | | | | |
| Media—1.4% | |
Central European Media Enterprises Ltd. (Bermuda) | |
5.000% | | | 11/15/2015 | | | | | | 1,600,000 | | | | 1,012,000 | |
3.500% | | | 03/15/2013 | | | ^ | | | 900,000 | | | | 830,250 | |
Interpublic Group of Cos., Inc. (The) | |
4.250% | | | 03/15/2023 | | | | | | 2,000,000 | | | | 2,032,500 | |
Liberty Interactive LLC | |
3.250% | | | 03/15/2031 | | | | | | 1,625,000 | | | | 1,306,094 | |
3.125% | | | 03/30/2023 | | | | | | 1,600,000 | | | | 1,798,000 | |
Live Nation Entertainment, Inc. | |
2.875% | | | 07/15/2027 | | | | | | 1,000,000 | | | | 888,750 | |
Omnicom Group, Inc. | |
0.000% | | | 07/01/2038 | | | | | | 2,425,000 | | | | 2,570,500 | |
Publicis Groupe SA (France) | |
3.125% | | | 07/30/2014 | | | EUR | | | 251,100 | | | | 429,912 | |
XM Satellite Radio, Inc. | |
7.000% | | | 12/01/2014 | | | ^ | | | 550,000 | | | | 713,625 | |
| | | | | | | | | | | | | | |
| | | | | | | | | | | | | 11,581,631 | |
| | | | | | | | | | | | | | |
| | | | | | | | | | | | | | |
| | | | | |
| Coupon Rate | |
| Maturity
Date |
| | | | | Face | | | | Value | |
| | | | | | | | | | | | | | |
| Metals & Mining—1.4% | |
Anglo American plc (United Kingdom) | |
4.000% | | | 05/07/2014 | | | | | $ | 1,700,000 | | | $ | 2,410,600 | |
AngloGold Ashanti Holdings Finance plc, Reg S (Isle of Man) | |
3.500% | | | 05/22/2014 | | | * | | | 1,700,000 | | | | 1,893,375 | |
Goldcorp, Inc. (Canada) | |
2.000% | | | 08/01/2014 | | | | | | 3,500,000 | | | | 4,300,625 | |
Kaiser Aluminum Corp. | |
4.500% | | | 04/01/2015 | | | ^ | | | 725,000 | | | | 842,377 | |
Newmont Mining Corp. | |
3.000% | | | 02/15/2012 | | | | | | 1,400,000 | | | | 1,846,250 | |
Newmont Mining Corp., Series A | |
1.250% | | | 07/15/2014 | | | | | | 725,000 | | | | 1,011,375 | |
| | | | | | | | | | | | | | |
| | | | | | | | | | | | | 12,304,602 | |
| | | | | | | | | | | | | | |
| Oil, Gas & Consumable Fuels—1.2% | |
Bill Barrett Corp. | |
5.000% | | | 03/15/2028 | | | | | | 2,000,000 | | | | 2,012,500 | |
Chesapeake Energy Corp. | |
2.750% | | | 11/15/2035 | | | | | | 1,250,000 | | | | 1,228,125 | |
2.500% | | | 05/15/2037 | | | | | | 2,780,000 | | | | 2,491,575 | |
Goodrich Petroleum Corp. | |
5.000% | | | 10/01/2029 | | | | | | 2,000,000 | | | | 1,862,500 | |
Patriot Coal Corp. | |
3.250% | | | 05/31/2013 | | | | | | 2,000,000 | | | | 1,835,000 | |
Pioneer Natural Resources Co. | |
2.875% | | | 01/15/2038 | | | | | | 55,000 | | | | 84,631 | |
SM Energy Co. | |
3.500% | | | 04/01/2027 | | | | | | 500,000 | | | | 685,000 | |
| | | | | | | | | | | | | | |
| | | | | | | | | | | | | 10,199,331 | |
| | | | | | | | | | | | | | |
| Pharmaceuticals—1.6% | |
Endo Pharmaceuticals Holdings, Inc. | |
1.750% | | | 04/15/2015 | | | | | | 700,000 | | | | 919,625 | |
Mylan, Inc. | |
1.250% | | | 03/15/2012 | | | | | | 2,000,000 | | | | 2,015,000 | |
Salix Pharmaceuticals Ltd. | |
2.750% | | | 05/15/2015 | | | | | | 512,000 | | | | 664,960 | |
Sawai Pharmaceutical Co. Ltd. (Japan) | |
0.000% | | | 09/17/2015 | | | JPY | | | 145,000,000 | | | | 1,998,575 | |
Shire plc, Reg S (Jersey, Channel Islands) | |
2.750% | | | 05/09/2014 | | | | | | 4,200,000 | | | | 4,991,700 | |
Teva Pharmaceutical Finance Co. LLC, Series C | |
0.250% | | | 02/01/2026 | | | | | | 1,450,000 | | | | 1,506,188 | |
UCB SA (Belgium) | |
4.500% | | | 10/22/2015 | | | EUR | | | 850,000 | | | | 1,256,053 | |
| | | | | | | | | | | | | | |
| | | | | | | | | | | | | 13,352,101 | |
| | | | | | | | | | | | | | |
| Real Estate Investment Trusts (REITs)—0.7% | |
Alexandria Real Estate Equities, Inc. | |
3.700% | | | 01/15/2027 | | | ^ | | | 1,750,000 | | | | 1,756,563 | |
Boston Properties LP | |
3.625% | | | 02/15/2014 | | | ^ | | | 750,000 | | | | 812,813 | |
Health Care REIT, Inc. | |
3.000% | | | 12/01/2029 | | | | | | 1,500,000 | | | | 1,723,125 | |
Host Hotels & Resorts LP | |
2.625% | | | 04/15/2027 | | | ^ | | | 1,815,000 | | | | 1,828,612 | |
| | | | | | | | | | | | | | |
| | | | | | | | | | | | | 6,121,113 | |
| | | | | | | | | | | | | | |
| Road & Rail—0.2% | |
Avis Budget Group, Inc. | |
3.500% | | | 10/01/2014 | | | | | | 1,600,000 | | | | 1,640,000 | |
| | | | | | | | | | | | | | |
See accompanying notes to financial statements.
240
SCHEDULE OF INVESTMENTS—(Continued)
December 31, 2011
| | | | | | | | | | | | | | |
| Vantagepoint Diversifying Strategies Fund | | | | | |
| | | | |
Coupon
Rate | | Maturity
Date | | | | | Face | | | Value | |
| | | | | | | | | | | | | | |
| CONVERTIBLE DEBT OBLIGATIONS—(Continued) | |
| Semiconductors & Semiconductor Equipment—1.5% | |
Advanced Micro Devices, Inc. | |
6.000% | | | 05/01/2015 | | | | | $ | 2,850,000 | | | $ | 2,796,563 | |
Intel Corp. | |
3.250% | | | 08/01/2039 | | | | | | 3,250,000 | | | | 4,086,875 | |
Linear Technology Corp., Series A | |
3.000% | | | 05/01/2027 | | | | | | 1,000,000 | | | | 1,026,250 | |
Micron Technology, Inc. | |
1.875% | | | 06/01/2014 | | | | | | 2,000,000 | | | | 1,920,000 | |
Xilinx, Inc. | |
2.625% | | | 06/15/2017 | | | | | | 2,150,000 | | | | 2,741,250 | |
| | | | | | | | | | | | | | |
| | | | | | | | | | | | | 12,570,938 | |
| | | | | | | | | | | | | | |
| Software—1.2% | |
Electronic Arts, Inc. | |
0.750% | | | 07/15/2016 | | | ^ | | | 1,380,000 | | | | 1,347,225 | |
Microsoft Corp. | |
0.000% | | | 06/15/2013 | | | ^ | | | 3,025,000 | | | | 3,077,937 | |
Nuance Communications, Inc. | |
2.750% | | | 11/01/2031 | | | ^ | | | 1,525,000 | | | | 1,645,094 | |
Symantec Corp., Series B | | | | | | | | |
1.000% | | | 06/15/2013 | | | | | | 3,785,000 | | | | 4,234,469 | |
| | | | | | | | | | | | | | |
| | | | | | | | | | | | | 10,304,725 | |
| | | | | | | | | | | | | | |
| Specialty Retail—0.7% | |
Group 1 Automotive, Inc. | |
2.250% | | | 06/15/2036 | | | | | | 2,750,000 | | | | 2,904,688 | |
RadioShack Corp. | |
2.500% | | | 08/01/2013 | | | ^ | | | 1,500,000 | | | | 1,441,875 | |
Sonic Automotive, Inc. | |
5.000% | | | 10/01/2029 | | | | | | 1,000,000 | | | | 1,328,750 | |
| | | | | | | | | | | | | | |
| | | | | | | | | | | | | 5,675,313 | |
| | | | | | | | | | | | | | |
| Textiles, Apparel & Luxury Goods—0.3% | |
Iconix Brand Group, Inc. | |
2.500% | | | 06/01/2016 | | | ^ | | | 2,000,000 | | | | 1,902,500 | |
1.875% | | | 06/30/2012 | | | | | | 500,000 | | | | 495,000 | |
| | | | | | | | | | | | | | |
| | | | | | | | | | | | | 2,397,500 | |
| | | | | | | | | | | | | | |
| Wireless Telecommunication Services—0.5% | |
Leap Wireless International, Inc. | |
4.500% | | | 07/15/2014 | | | | | | 2,500,000 | | | | 2,187,500 | |
SBA Communications Corp. | |
1.875% | | | 05/01/2013 | | | | | | 2,000,000 | | | | 2,267,500 | |
| | | | | | | | | | | | | | |
| | | | | | | | | | | | | 4,455,000 | |
| | | | | | | | | | | | | | |
| TOTAL CONVERTIBLE DEBT OBLIGATIONS | |
(Cost $202,848,687) | | | | 204,650,574 | |
| | | | | | | | | | | | | | |
| | | | | | | | | | | | | | | |
| U.S. TREASURY OBLIGATIONS—8.9% | |
| U.S. Treasury Bills—3.5% | |
U.S. Treasury Bill | |
0.047% | | | 12/13/2012 | | | | | | 4,500,000 | | | | 4,495,477 | |
0.027% | | | 01/19/2012 | | | | | | 5,000,000 | | | | 4,999,994 | |
0.025% | | | 03/22/2012 | | | ‡‡ | | | 1,825,000 | | | | 1,824,940 | |
0.020% | | | 02/23/2012 | | | | | | 2,000,000 | | | | 1,999,979 | |
0.015% | | | 01/12/2012 | | | | | | 5,700,000 | | | | 5,699,978 | |
0.012% | | | 03/01/2012 | | | | | | 1,000,000 | | | | 999,975 | |
| | | | | | | | | | | | | | |
| | | | | |
Coupon
Rate | |
| Maturity
Date |
| | | | | Face | | | | Value | |
| | | | | | | | | | | | | | |
0.008% | | | 03/08/2012 | | | ‡‡ | | $ | 10,270,000 | | | $ | 10,269,671 | |
| | | | | | | | | | | | | | |
| | | | | | | | | | | | | 30,290,014 | |
| | | | | | | | | | | | | | |
| U.S. Treasury Notes—5.4% | |
U.S. Treasury Note | |
2.375% | | | 10/31/2014 | | | | | | 4,200,000 | | | | 4,437,237 | |
1.750% | | | 01/31/2014 | | | | | | 4,500,000 | | | | 4,638,164 | |
1.000% | | | 08/31/2016 | | | | | | 280,000 | | | | 283,106 | |
0.625% | | | 12/31/2012 | | | | | | 300,000 | | | | 301,453 | |
0.500% | | | 11/30/2012 | | | | | | 8,500,000 | | | | 8,528,560 | |
0.375% | | | 06/30/2013- | | | | | | | | | | | |
| | | 07/31/2013 | | | | | | 4,400,000 | | | | 4,411,172 | |
0.250% | | | 10/31/2013- | | | | | | | | | | | |
| | | 12/15/2014 | | | § | | | 21,300,000 | | | | 21,286,023 | |
0.125% | | | 09/30/2013 | | | | | | 1,800,000 | | | | 1,796,695 | |
| | | | | | | | | | | | | | |
| | | | | | | | | | | | | 45,682,410 | |
| | | | | | | | | | | | | | |
| TOTAL U.S. TREASURY OBLIGATIONS | |
(Cost $75,921,916) | | | | 75,972,424 | |
| | | | | | | | | | | | | | |
| | | | | | | | | | | | | | | |
| GOVERNMENT RELATED OBLIGATIONS—9.7% | |
| U.S. Government Agencies—5.9% | |
Federal Farm Credit Bank | |
1.375% | | | 06/25/2013 | | | | | | 3,850,000 | | | | 3,914,257 | |
Federal Home Loan Banks | |
0.375% | | | 11/27/2013 | | | | | | 2,000,000 | | | | 1,998,714 | |
Federal Home Loan Banks, Series 1 | |
0.500% | | | 08/28/2013 | | | | | | 4,280,000 | | | | 4,289,570 | |
Federal Home Loan Mortgage Corp. | |
1.750% | | | 06/15/2012 | | | | | | 6,000,000 | | | | 6,045,048 | |
1.000% | | | 08/28/2012 | | | | | | 4,000,000 | | | | 4,021,532 | |
0.625% | | | 12/29/2014 | | | | | | 8,800,000 | | | | 8,800,053 | |
Federal National Mortgage Association | |
0.750% | | | 12/18/2013 | | | | | | 4,000,000 | | | | 4,017,220 | |
0.625% | | | 10/30/2014 | | | | | | 3,000,000 | | | | 2,996,637 | |
0.500% | | | 10/30/2012 | | | | | | 7,000,000 | | | | 7,018,158 | |
0.375% | | | 12/28/2012 | | | | | | 3,604,000 | | | | 3,612,534 | |
National Credit Union Administration Guaranteed Notes, Series A1 | |
0.296% | | | 06/12/2013 | | | #§ | | | 1,510,000 | | | | 1,508,611 | |
National Credit Union Administration Guaranteed Notes, Series A2 | |
1.400% | | | 06/12/2015 | | | | | | 2,050,000 | | | | 2,076,629 | |
| | | | | | | | | | | | | | |
| | | | | | | | | | | | | 50,298,963 | |
| | | | | | | | | | | | | | |
| U.S. Government Agencies-U.S. Government Guaranteed Bank Debt—0.8% | |
Ally Financial, Inc. | |
2.200% | | | 12/19/2012 | | | § | | | 2,350,000 | | | | 2,395,989 | |
Citibank NA | |
1.750% | | | 12/28/2012 | | | § | | | 2,000,000 | | | | 2,031,064 | |
General Electric Capital Corp., Series G MTN | |
2.625% | | | 12/28/2012 | | | § | | | 1,546,000 | | | | 1,583,390 | |
Western Corporate Federal Credit Union | |
1.750% | | | 11/02/2012 | | | | | | 640,000 | | | | 648,150 | |
| | | | | | | | | | | | | | |
| | | | | | | | | | | | | 6,658,593 | |
| | | | | | | | | | | | | | |
| Non-U.S. Government Agencies—0.3% | |
Export-Import Bank of Korea (Korea, Republic of) | |
5.500% | | | 10/17/2012 | | | | | | 500,000 | | | | 512,830 | |
IPIC Ltd. MTN (Cayman Islands) | |
3.125% | | | 11/15/2015 | | | ^ | | | 600,000 | | | | 601,500 | |
See accompanying notes to financial statements.
241
SCHEDULE OF INVESTMENTS—(Continued)
December 31, 2011
| | | | | | | | | | | | | | |
Vantagepoint Diversifying
Strategies Fund | | | | | |
| | | | |
Coupon
Rate | | Maturity
Date | | | | | Face | | | Value | |
| | | | | | | | | | | | | | |
GOVERNMENT RELATED
OBLIGATIONS—(Continued) | |
Korea National Oil Corp. (Korea, Republic of) | |
2.875% | | | 11/09/2015 | | | ^§ | | $ | 1,330,000 | | | $ | 1,333,594 | |
| | | | | | | | | | | | | | |
| | | | | | | | | | | | | 2,447,924 | |
| | | | | | | | | | | | | | |
| Sovereign Debt—1.1% | |
Canadian Government International Bond (Canada) | |
2.000% | | | 12/01/2014 | | | CAD | | | 500,000 | | | | 504,417 | |
Korea Finance Corp. (Korea, Republic of) | |
3.250% | | | 09/20/2016 | | | § | | | 1,890,000 | | | | 1,867,895 | |
Mexican Bonos (Mexico) | |
8.000% | | | 12/19/2013 | | | MXN | | | 34,800,000 | | | | 2,640,328 | |
Norway Government International Bond (Norway) | |
5.000% | | | 05/15/2015 | | | NOK | | | 2,500,000 | | | | 464,715 | |
Panama Government International Bond (Panama) | |
9.375% | | | 07/23/2012 | | | | | | 740,000 | | | | 772,560 | |
7.250% | | | 03/15/2015 | | | § | | | 900,000 | | | | 1,041,750 | |
Peruvian Government International Bond (Peru) | |
9.125% | | | 02/21/2012 | | | | | | 460,000 | | | | 463,921 | |
Qatar Government International Bond (Qatar) | |
3.125% | | | 01/20/2017 | | | ^ | | | 900,000 | | | | 910,080 | |
Republic of South Africa (South Africa) | |
7.375% | | | 04/25/2012 | | | | | | 1,080,000 | | | | 1,100,304 | |
| | | | | | | | | | | | | | |
| | | | | | | | | | | | | 9,765,970 | |
| | | | | | | | | | | | | | |
| Supranational—0.2% | |
Asian Development Bank, Series G MTN (Philippines) | |
3.375% | | | 05/20/2014 | | | NOK | | | 8,700,000 | | | | 1,496,624 | |
| | | | | | | | | | | | | | |
| U.S. Municipal Bonds—0.9% | |
Citizens Property Insurance Corp. Revenue Bonds,
Series 2007-A (Florida) | |
5.000% | | | 03/01/2013 | | | | | | 290,000 | | | | 302,809 | |
Kentucky Asset Liability Commission Revenue Bonds (Kentucky) | |
3.165% | | | 04/01/2018 | | | § | | | 1,300,000 | | | | 1,337,778 | |
Minnesota School District Capital Equipment Borrowing Program, Series 2011-B (Minnesota) | |
2.000% | | | 09/09/2012 | | | § | | | 1,660,000 | | | | 1,680,020 | |
South Carolina State Public Service Authority Revenue Bonds,
Series 2011-A (South Carolina) | |
0.995% | | | 06/02/2014 | | | #§ | | | 1,500,000 | | | | 1,501,770 | |
State of Louisiana General Obligation Bonds,
Series 2011-B (Louisiana) | |
1.007% | | | 07/15/2014 | | | #§ | | | 1,780,000 | | | | 1,781,993 | |
University of California Revenue Bonds (California) | |
1.988% | | | 05/15/2050 | | | #§ | | | 1,000,000 | | | | 1,017,450 | |
| | | | | | | | | | | | | | |
| | | | | | | | | | | | | 7,621,820 | |
| | | | | | | | | | | | | | |
| Non-U.S. Regional Authority Bonds—0.5% | |
Province of British Columbia (Canada) | |
2.650% | | | 09/22/2021 | | | § | | | 800,000 | | | | 817,366 | |
Province of Ontario (Canada) | |
2.950% | | | 02/05/2015 | | | § | | | 1,530,000 | | | | 1,612,446 | |
1.600% | | | 09/21/2016 | | | § | | | 1,600,000 | | | | 1,596,878 | |
| | | | | | | | | | | | | | |
| | | | | | | | | | | | | 4,026,690 | |
| | | | | | | | | | | | | | |
| TOTAL GOVERNMENT RELATED OBLIGATIONS | |
(Cost $82,528,794) | | | | 82,316,584 | |
| | | | | | | | | | | | | | |
| | | | | | | | | | | | | | |
| | | | | |
Coupon
Rate | |
| Maturity
Date |
| | | | | Face | | | | Value | |
| | | | | | | | | | | | | | |
| ASSET-BACKED SECURITIES—4.3% | |
| Automobile—2.1% | |
Ally Auto Receivables Trust
Series 2011-1, Class A2 | |
0.810% | | | 10/15/2013 | | | § | | $ | 1,234,857 | | | $ | 1,235,607 | |
AmeriCredit Automobile Receivables Trust
Series 2010-3, Class A2 | |
0.770% | | | 12/09/2013 | | | § | | | 1,067,126 | | | | 1,067,005 | |
BMW Vehicle Lease Trust
Series 2010-1, Class A2 | |
0.580% | | | 09/17/2012 | | | § | | | 780,614 | | | | 780,537 | |
CarMax Auto Owner Trust
Series 2011-1, Class A2 | |
0.720% | | | 11/15/2013 | | | | | | 4,127,654 | | | | 4,128,450 | |
First Investors Auto Owner Trust
Series 2011-1, Class C | |
3.400% | | | 03/15/2016 | | | ^ | | | 1,400,000 | | | | 1,396,201 | |
Hyundai Capital Auto Funding Ltd. (Cayman Islands)
Series 2010-8A, Class A | |
1.285% | | | 09/20/2016 | | | #^ | | | 1,100,000 | | | | 1,106,039 | |
Nissan Auto Receivables Owner Trust
Series 2010-A, Class A2 | |
0.550% | | | 03/15/2013 | | | § | | | 1,815,447 | | | | 1,815,355 | |
Volkswagen Auto Loan Enhanced Trust
Series 2011-1, Class A2 | |
0.670% | | | 12/20/2013 | | | § | | | 2,922,777 | | | | 2,923,162 | |
World Omni Auto Receivables Trust
Series 2011-A, Class A2 | |
0.640% | | | 11/15/2013 | | | | | | 3,428,429 | | | | 3,426,972 | |
| | | | | | | | | | | | | | |
| | | | | | | | | | | | | 17,879,328 | |
| | | | | | | | | | | | | | |
| Credit Card—1.2% | |
Capital One Multi-Asset Execution Trust
Series 2008-A3, Class A3 | |
5.050% | | | 02/15/2016 | | | | | | 3,050,000 | | | | 3,212,237 | |
Chase Issuance Trust
Series 2011-A2, Class A2 | |
0.368% | | | 05/15/2015 | | | #§ | | | 2,500,000 | | | | 2,499,525 | |
Citibank Credit Card Issuance Trust
Series 2009-A5, Class A5 | |
2.250% | | | 12/23/2014 | | | | | | 4,700,000 | | | | 4,770,602 | |
| | | | | | | | | | | | | | |
| | | | | | | | | | | | | 10,482,364 | |
| | | | | | | | | | | | | | |
| Home Equity—0.5% | |
Ameriquest Mortgage Securities, Inc.
Series 2003-AR3, Class M2 | |
3.369% | | | 10/25/2033 | | | # | | | 230,364 | | | | 226,607 | |
Argent Securities, Inc.
Series 2006-W3, Class A2B | |
0.414% | | | 04/25/2036 | | | # | | | 74,395 | | | | 20,421 | |
Countrywide Asset-Backed Certificates
Series 2004-AB1, Class 2A3 | |
1.334% | | | 02/25/2035 | | | # | | | 250,766 | | | | 245,044 | |
Countrywide Asset-Backed Certificates
Series 2005-12, Class 2A3 | |
5.069% | | | 02/25/2036 | | | # | | | 606,470 | | | | 548,450 | |
Countrywide Asset-Backed Certificates
Series 2005-11, Class 3AV2 | |
0.584% | | | 02/25/2036 | | | # | | | 65,383 | | | | 64,979 | |
Option One Mortgage Loan Trust
Series 2005-4, Class A3 | |
0.554% | | | 11/25/2035 | | | # | | | 814,708 | | | | 744,802 | |
See accompanying notes to financial statements.
242
SCHEDULE OF INVESTMENTS—(Continued)
December 31, 2011
| | | | | | | | | | | | | | |
Vantagepoint Diversifying
Strategies Fund | | | | | |
| | | | |
Coupon
Rate | | Maturity
Date | | | | | Face | | | Value | |
| | | | | | | | | | | | | | |
| ASSET-BACKED SECURITIES—(Continued) | |
Saxon Asset Securities Trust
Series 2005-4, Class A2C | |
0.544% | | | 11/25/2037 | | | # | | $ | 528,576 | | | $ | 503,958 | |
Structured Asset Investment Loan Trust
Series 2003-BC1, Class A2 | |
0.974% | | | 01/25/2033 | | | # | | | 2,057,130 | | | | 1,705,247 | |
| | | | | | | | | | | | | | |
| | | | | | | | | | | | | 4,059,508 | |
| | | | | | | | | | | | | | |
| Other—0.1% | |
CNH Equipment Trust
Series 2011-A, Class A2 | |
0.620% | | | 06/16/2014 | | | § | | | 1,100,000 | | | | 1,099,174 | |
PG&E Energy Recovery Funding LLC
Series 2005-1, Class A4 | |
4.370% | | | 06/25/2014 | | | § | | | 151,243 | | | | 152,996 | |
| | | | | | | | | | | | | | |
| | | | | | | | | | | | | 1,252,170 | |
| | | | | | | | | | | | | | |
| Student Loan—0.4% | |
National Credit Union Administration Guaranteed Notes
Series 2010-A1, Class A | |
0.624% | | | 12/07/2020 | | | # | | | 3,060,354 | | | | 3,069,259 | |
| | | | | | | | | | | | | | |
| TOTAL ASSET-BACKED SECURITIES | |
(Cost $37,089,183) | | | | | | | | | | 36,742,629 | |
| | | | | | | | | | | | | | |
| | | | | | | | | | | | | | | |
| PURCHASED OPTIONS—1.0% | |
| | | | |
| | | | | | | | | | Contracts | | | | Value | |
Put—Swiss Market Index, Expires 03/16/2012, Strike CHF 5,686.50 | | | 1,790 | | | | 246,771 | |
Put—Swiss Market Index, Expires 03/16/2012, Strike CHF 5,692.36 | | | 410 | | | | 55,823 | |
Put—Swiss Market Index, Expires 03/16/2012, Strike CHF 5,808.91 | | | 500 | | | | 88,399 | |
Call—U.S. 10 Year Treasury, Expires 02/24/2012, Strike $109.00 | | | 379 | | | | 8,385,375 | |
| | | | | | | | | | | | | | |
| TOTAL PURCHASED OPTIONS | |
(Cost $8,601,793) | | | | | | | 8,776,368 | |
| | | | | | | | | | | | | | |
| | | | | | | | | | | | | | | |
| | | | |
Coupon
Rate | | Maturity
Date | | | | | Face | | | Value | |
| CERTIFICATES OF DEPOSIT—1.7% | |
| Commercial Banks—1.7% | |
Bank of Nova Scotia | |
0.622% | | | 07/27/2012 | | | | | | 3,000,000 | | | | 3,002,523 | |
Canadian Imperial Bank of Commerce | |
0.633% | | | 05/04/2012 | | | § | | | 500,000 | | | | 500,099 | |
0.603% | | | 07/17/2012 | | | § | | | 2,250,000 | | | | 2,250,284 | |
| | | | | | | | | | | | | | |
| | | | | |
Coupon
Rate | |
| Maturity
Date |
| | | | | Face | | | | Value | |
| | | | | | | | | | | | | | |
Cooperatieve Centrale Raiffeisen-Boerenleenbank BA | |
0.340% | | | 01/06/2012 | | | § | | $ | 2,400,000 | | | $ | 2,400,011 | |
Nordea Bank Finland plc | |
0.915% | | | 02/07/2013 | | | § | | | 900,000 | | | | 895,013 | |
0.698% | | | 04/13/2012 | | | § | | | 1,100,000 | | | | 1,099,108 | |
Royal Bank of Canada | |
0.700% | | | 03/11/2013 | | | § | | | 1,390,000 | | | | 1,390,855 | |
Svenska Handelsbanken, Inc. (Sweden) | |
0.855% | | | 01/18/2013 | | | § | | | 2,730,000 | | | | 2,729,096 | |
| | | | | | | | | | | | | | |
| TOTAL CERTIFICATES OF DEPOSIT | |
(Cost $14,268,532) | | | | | | | | | | 14,266,989 | |
| | | | | | | | | | | | | | |
| | | | | | | | | | | | | | | |
| | |
| | | | Shares | | | | Value | |
| MONEY MARKET FUNDS—5.0% | |
| Institutional Money Market Fund—5.0% | |
Fidelity Institutional Money Market: Money Market Portfolio—Institutional Class, 0.23% | | | | | | | | | | | |
(Cost $42,080,719) | | | ¥ | | | 42,080,719 | | | | 42,080,719 | |
| | | | | | | | | | | | | | |
| TOTAL INVESTMENTS—99.1% | |
(Cost $839,721,762) | | | | | | | | | | 842,487,957 | |
Other assets less liabilities—0.9% | | | | 7,288,809 | |
| | | | | | | | | | | | | | |
| NET ASSETS—100.0% | | | $ | 849,776,766 | |
| | | | | | | | | | | | | | |
Notes to the Schedule of Investments:
| | |
| BRL | | Brazilian Real |
| CAD | | Canadian Dollar |
| CHF | | Swiss Franc |
| EUR | | European Monetary Unit |
| JPY | | Japanese Yen |
| MTN | | Medium Term Note |
| MXN | | Mexican Peso |
| NOK | | Norwegian Krone |
| Reg S | | Security purchased outside the United States and is not registered under the Securities Act of 1933. This security may be resold in the United States only if the offer and sale are made pursuant to such registration or are exempt from registration. |
| REIT | | Real Estate Investment Trust |
| SGD | | Singapore Dollar |
| * | | Non-income producing. |
| ^ | | Securities are not registered under the Securities Act of 1933. These securities may be resold only in transactions exempt from registration, generally to qualified institutional buyers under Securities Act Rule 144A. Such securities are considered illiquid unless deemed liquid by a subadviser under the liquidity procedures adopted by the Board of Directors. The total market value of 144A securities was $57,690,112, which represented 6.8% of Net Assets. The illiquid 144A securities represented 3.8% of Net Assets, and 56.0% of total 144A securities held. |
| § | | Security has been segregated to cover economic leverage under certain derivatives contracts which may include, but are not limited to, futures, swaps, forwards, options and TBA’s, a security that is subject to delayed delivery. |
| # | | Rate is subject to change. Rate shown reflects current rate. |
| ‡‡ | | Security or a portion of the security has been pledged as collateral for futures contracts and/or options contracts. |
| ¥ | | The rate quoted is the annualized seven-day yield of the fund at period end. |
See accompanying notes to financial statements.
243
SCHEDULE OF INVESTMENTS
December 31, 2011
| | | | | | | | | | | | | | |
| Vantagepoint Core Bond Index Fund | | | | | | | | |
| | | | |
Coupon
Rate | | Maturity
Date | | | | | Face | | | Value | |
| | | | | | | | | | | | | | |
| CORPORATE OBLIGATIONS—19.8% | | | | | |
| Aerospace & Defense—0.2% | |
Boeing Co. (The) | | | | | |
6.125% | | | 02/15/2033 | | | | | $ | 100,000 | | | $ | 126,461 | |
5.125% | | | 02/15/2013 | | | | | | 250,000 | | | | 262,176 | |
4.875% | | | 02/15/2020 | | | | | | 200,000 | | | | 233,915 | |
L-3 Communications Corp. | | | | | |
4.950% | | | 02/15/2021 | | | | | | 300,000 | | | | 297,857 | |
Lockheed Martin Corp., Series B | | | | | |
6.150% | | | 09/01/2036 | | | | | | 250,000 | | | | 287,005 | |
Northrop Grumman Corp. | | | | | |
3.500% | | | 03/15/2021 | | | | | | 300,000 | | | | 304,049 | |
United Technologies Corp. | | | | | |
6.700% | | | 08/01/2028 | | | | | | 150,000 | | | | 195,103 | |
4.875% | | | 05/01/2015 | | | | | | 500,000 | | | | 562,099 | |
| | | | | | | | | | | | | | |
| | | | | | | | | | | | | 2,268,665 | |
| | | | | | | | | | | | | | |
| Airlines—0.0% | |
Continental Airlines, Inc.,
Series 2010-1 A, Class A | |
4.750% | | | 01/12/2021 | | | | | | 300,000 | | | | 304,500 | |
| | | | | | | | | | | | | | |
| Auto Components—0.1% | |
Johnson Controls, Inc. | | | | | |
5.500% | | | 01/15/2016 | | | | | | 250,000 | | | | 279,980 | |
4.250% | | | 03/01/2021 | | | | | | 300,000 | | | | 321,181 | |
| | | | | | | | | | | | | | |
| | | | | | | | | | | | | 601,161 | |
| | | | | | | | | | | | | | |
| Beverages—0.5% | |
Anheuser-Busch Cos. LLC | | | | | |
6.800% | | | 01/15/2031 | | | | | | 350,000 | | | | 455,958 | |
Anheuser-Busch InBev Worldwide, Inc. | | | | | |
8.200% | | | 01/15/2039 | | | | | | 300,000 | | | | 474,613 | |
6.875% | | | 11/15/2019 | | | | | | 300,000 | | | | 377,337 | |
5.375% | | | 01/15/2020 | | | | | | 500,000 | | | | 587,379 | |
1.500% | | | 07/14/2014 | | | | | | 200,000 | | | | 201,554 | |
Beam, Inc. | | | | | |
5.375% | | | 01/15/2016 | | | | | | 90,000 | | | | 98,907 | |
Bottling Group LLC | | | | | |
5.500% | | | 04/01/2016 | | | | | | 500,000 | | | | 579,803 | |
Coca-Cola Co. (The) | | | | | |
4.875% | | | 03/15/2019 | | | | | | 300,000 | | | | 351,874 | |
3.150% | | | 11/15/2020 | | | | | | 200,000 | | | | 210,307 | |
0.750% | | | 11/15/2013 | | | | | | 200,000 | | | | 200,459 | |
Coca-Cola Enterprises, Inc. | | | | | |
4.500% | | | 09/01/2021 | | | | | | 300,000 | | | | 333,542 | |
Diageo Finance BV (Netherlands) | | | | | |
5.300% | | | 10/28/2015 | | | | | | 750,000 | | | | 854,032 | |
PepsiCo, Inc. | | | | | |
3.750% | | | 03/01/2014 | | | | | | 500,000 | | | | 531,905 | |
3.000% | | | 08/25/2021 | | | | | | 500,000 | | | | 517,036 | |
2.500% | | | 05/10/2016 | | | | | | 200,000 | | | | 208,278 | |
| | | | | | | | | | | | | | |
| | | | | | | | | | | | | 5,982,984 | |
| | | | | | | | | | | | | | |
| Biotechnology—0.2% | |
Amgen, Inc. | | | | | |
6.900% | | | 06/01/2038 | | | | | | 267,000 | | | | 330,031 | |
6.150% | | | 06/01/2018 | | | | | | 500,000 | | | | 582,377 | |
5.850% | | | 06/01/2017 | | | | | | 250,000 | | | | 287,838 | |
5.150% | | | 11/15/2041 | | | | | | 300,000 | | | | 312,208 | |
3.875% | | | 11/15/2021 | | | | | | 300,000 | | | | 303,352 | |
| | | | | | | | | | | | | | |
| | | | | |
Coupon
Rate | |
| Maturity
Date |
| | | | | Face | | | | Value | |
| | | | | | | | | | | | | | |
Genentech, Inc. | | | | | |
5.250% | | | 07/15/2035 | | | | | $ | 100,000 | | | $ | 118,619 | |
Gilead Sciences, Inc. | | | | | |
4.400% | | | 12/01/2021 | | | | | | 300,000 | | | | 318,234 | |
| | | | | | | | | | | | | | |
| | | | | | | | | | | | | 2,252,659 | |
| | | | | | | | | | | | | | |
| Capital Markets—1.2% | |
Bank of New York Mellon Corp. (The) | | | | | |
3.550% | | | 09/23/2021 | | | | | | 300,000 | | | | 304,950 | |
2.950% | | | 06/18/2015 | | | | | | 500,000 | | | | 518,957 | |
2.300% | | | 07/28/2016 | | | | | | 100,000 | | | | 100,418 | |
Bear Stearns Cos. LLC (The) | | | | | |
7.250% | | | 02/01/2018 | | | | | | 250,000 | | | | 293,455 | |
6.400% | | | 10/02/2017 | | | | | | 400,000 | | | | 447,434 | |
5.700% | | | 11/15/2014 | | �� | | | | 50,000 | | | | 54,413 | |
4.650% | | | 07/02/2018 | | | | | | 400,000 | | | | 409,498 | |
BlackRock, Inc. | | | | | |
4.250% | | | 05/24/2021 | | | | | | 500,000 | | | | 523,731 | |
Credit Suisse USA, Inc. | | | | | |
5.500% | | | 08/15/2013 | | | | | | 300,000 | | | | 313,091 | |
5.125% | | | 01/15/2014 | | | | | | 500,000 | | | | 521,408 | |
5.125% | | | 08/15/2015 | | | | | | 500,000 | | | | 527,112 | |
Goldman Sachs Group, Inc. (The) | | | | | |
6.250% | | | 09/01/2017 | | | | | | 500,000 | | | | 523,340 | |
6.150% | | | 04/01/2018 | | | | | | 500,000 | | | | 516,710 | |
6.125% | | | 02/15/2033 | | | | | | 600,000 | | | | 583,080 | |
5.375% | | | 03/15/2020 | | | | | | 300,000 | | | | 296,592 | |
5.150% | | | 01/15/2014 | | | | | | 500,000 | | | | 509,760 | |
5.125% | | | 01/15/2015 | | | | | | 500,000 | | | | 511,411 | |
5.000% | | | 10/01/2014 | | | | | | 553,000 | | | | 560,917 | |
3.625% | | | 02/07/2016 | | | | | | 300,000 | | | | 290,139 | |
Jefferies Group, Inc. | | | | | |
6.250% | | | 01/15/2036 | | | | | | 230,000 | | | | 190,370 | |
5.125% | | | 04/13/2018 | | | | | | 300,000 | | | | 267,000 | |
JP Morgan Chase Capital XXV, Series Y | | | | | |
6.800% | | | 10/01/2037 | | | | | | 500,000 | | | | 506,875 | |
Mellon Funding Corp. | | | | | |
5.200% | | | 05/15/2014 | | | | | | 400,000 | | | | 431,412 | |
Merrill Lynch & Co., Inc. | | | | | |
6.875% | | | 11/15/2018 | | | | | | 250,000 | | | | 241,341 | |
Morgan Stanley | | | | | |
7.250% | | | 04/01/2032 | | | | | | 100,000 | | | | 102,243 | |
6.000% | | | 05/13/2014 | | | | | | 500,000 | | | | 505,133 | |
5.750% | | | 01/25/2021 | | | | | | 300,000 | | | | 280,323 | |
2.875% | | | 01/24/2014 | | | | | | 300,000 | | | | 287,478 | |
Morgan Stanley MTN | | | | | |
5.450% | | | 01/09/2017 | | | | | | 500,000 | | | | 481,901 | |
Morgan Stanley, Series F MTN | | | | | |
6.625% | | | 04/01/2018 | | | | | | 500,000 | | | | 494,343 | |
6.000% | | | 04/28/2015 | | | | | | 1,000,000 | | | | 1,002,484 | |
5.950% | | | 12/28/2017 | | | | | | 500,000 | | | | 476,955 | |
Nomura Holdings, Inc. (Japan) | | | | | |
6.700% | | | 03/04/2020 | | | | | | 300,000 | | | | 316,378 | |
Northern Trust Corp. | | | | | |
3.375% | | | 08/23/2021 | | | | | | 500,000 | | | | 513,551 | |
| | | | | | | | | | | | | | |
| | | | | | | | | | | | | 13,904,203 | |
| | | | | | | | | | | | | | |
| Chemicals—0.4% | |
Agrium, Inc. (Canada) | | | | | |
6.125% | | | 01/15/2041 | | | | | | 400,000 | | | | 498,010 | |
Airgas, Inc. | | | | | |
2.950% | | | 06/15/2016 | | | | | | 200,000 | | | | 204,501 | |
Dow Chemical Co. (The) | | | | | |
8.550% | | | 05/15/2019 | | | | | | 629,000 | | | | 824,123 | |
See accompanying notes to financial statements.
244
SCHEDULE OF INVESTMENTS—(Continued)
December 31, 2011
| | | | | | | | | | | | | | |
| Vantagepoint Core Bond Index Fund | | | | | | | | |
| | | | |
Coupon
Rate | | Maturity
Date | | | | | Face | | | Value | |
| | | | | | | | | | | | | | |
| CORPORATE OBLIGATIONS—(Continued) | |
5.250% | | | 11/15/2041 | | | | | $ | 300,000 | | | $ | 316,769 | |
4.125% | | | 11/15/2021 | | | | | | 150,000 | | | | 154,163 | |
E.I. du Pont de Nemours & Co. | |
4.900% | | | 01/15/2041 | | | | | | 200,000 | | | | 227,046 | |
4.250% | | | 04/01/2021 | | | | | | 300,000 | | | | 339,685 | |
2.750% | | | 04/01/2016 | | | | | | 300,000 | | | | 317,344 | |
1.750% | | | 03/25/2014 | | | | | | 300,000 | | | | 305,757 | |
Monsanto Co. | |
5.500% | | | 08/15/2025 | | | | | | 200,000 | | | | 239,457 | |
Potash Corp. of Saskatchewan, Inc. (Canada) | |
4.875% | | | 03/01/2013 | | | | | | 500,000 | | | | 522,988 | |
PPG Industries, Inc. | |
3.600% | | | 11/15/2020 | | | | | | 400,000 | | | | 418,929 | |
Praxair, Inc. | |
3.950% | | | 06/01/2013 | | | | | | 150,000 | | | | 157,001 | |
3.250% | | | 09/15/2015 | | | | | | 500,000 | | | | 535,331 | |
| | | | | | | | | | | | | | |
| | | | | | | | | | | | | 5,061,104 | |
| | | | | | | | | | | | | | |
| Commercial Banks—1.7% | |
Bank of Nova Scotia (Canada) | |
2.375% | | | 12/17/2013 | | | | | | 300,000 | | | | 308,157 | |
2.050% | | | 10/07/2015 | | | | | | 400,000 | | | | 401,973 | |
Barclays Bank plc (United Kingdom) | |
3.900% | | | 04/07/2015 | | | | | | 1,000,000 | | | | 1,005,034 | |
2.375% | | | 01/13/2014 | | | | | | 300,000 | | | | 293,776 | |
BB&T Corp. | |
5.250% | | | 11/01/2019 | | | | | | 500,000 | | | | 546,597 | |
BNP Paribas SA, Bank Note (France) | |
5.000% | | | 01/15/2021 | | | | | | 400,000 | | | | 385,686 | |
Capital One Financial Corp. | |
6.150% | | | 09/01/2016 | | | | | | 500,000 | | | | 520,790 | |
2.125% | | | 07/15/2014 | | | | | | 200,000 | | | | 197,557 | |
Citigroup, Inc. | |
8.500% | | | 05/22/2019 | | | | | | 300,000 | | | | 353,623 | |
Cooperatieve Centrale Raiffeisen-Boerenleenbank BA (Netherlands) | |
2.125% | | | 10/13/2015 | | | | | | 200,000 | | | | 196,156 | |
Credit Suisse (Switzerland) | |
5.300% | | | 08/13/2019 | | | | | | 400,000 | | | | 413,168 | |
Credit Suisse MTN (Switzerland) | |
4.375% | | | 08/05/2020 | | | | | | 200,000 | | | | 196,441 | |
Deutsche Bank AG (Germany) | |
2.375% | | | 01/11/2013 | | | | | | 500,000 | | | | 496,418 | |
Discover Bank | |
7.000% | | | 04/15/2020 | | | | | | 200,000 | | | | 209,582 | |
Fifth Third Capital Trust IV | |
6.500% | | | 04/15/2037 | | | # | | | 580,000 | | | | 571,300 | |
FleetBoston Financial Corp. | |
6.875% | | | 01/15/2028 | | | | | | 150,000 | | | | 135,036 | |
Goldman Sachs Group, Inc. (The) | |
7.500% | | | 02/15/2019 | | | | | | 300,000 | | | | 331,784 | |
6.250% | | | 02/01/2041 | | | | | | 300,000 | | | | 295,282 | |
HSBC Bank USA NA | |
4.875% | | | 08/24/2020 | | | | | | 400,000 | | | | 371,814 | |
HSBC Holdings plc (United Kingdom) | |
6.100% | | | 01/14/2042 | | | | | | 200,000 | | | | 227,525 | |
JP Morgan Chase Bank NA, Bank Note | |
6.000% | | | 10/01/2017 | | | | | | 500,000 | | | | 538,508 | |
JPMorgan Chase & Co. | |
5.600% | | | 07/15/2041 | | | | | | 200,000 | | | | 210,165 | |
| | | | | | | | | | | | | | |
| | | | | |
Coupon
Rate | |
| Maturity
Date |
| | | | | Face | | | | Value | |
| | | | | | | | | | | | | | |
KeyBank NA, Bank Note | |
5.800% | | | 07/01/2014 | | | | | $ | 100,000 | | | $ | 106,830 | |
KeyCorp MTN | |
5.100% | | | 03/24/2021 | | | | | | 500,000 | | | | 520,184 | |
Landesbank Baden-Wuerttemberg (Germany) | |
7.625% | | | 02/01/2023 | | | | | | 200,000 | | | | 260,958 | |
National City Bank | |
4.625% | | | 05/01/2013 | | | | | | 500,000 | | | | 519,231 | |
National City Corp. | |
6.875% | | | 05/15/2019 | | | | | | 500,000 | | | | 562,758 | |
PNC Funding Corp. | |
2.700% | | | 09/19/2016 | | | | | | 200,000 | | | | 203,816 | |
Royal Bank of Canada MTN (Canada) | |
2.875% | | | 04/19/2016 | | | | | | 300,000 | | | | 311,329 | |
Royal Bank of Scotland plc (The) (United Kingdom) | |
6.125% | | | 01/11/2021 | | | | | | 300,000 | | | | 296,464 | |
4.875% | | | 03/16/2015 | | | | | | 100,000 | | | | 95,688 | |
4.375% | | | 03/16/2016 | | | | | | 500,000 | | | | 477,446 | |
SunTrust Banks, Inc. | |
3.600% | | | 04/15/2016 | | | | | | 500,000 | | | | 509,671 | |
Toronto-Dominion Bank (The) (Canada) | |
1.375% | | | 07/14/2014 | | | | | | 300,000 | | | | 303,727 | |
U.S. Bank NA, Bank Note | |
4.800% | | | 04/15/2015 | | | | | | 250,000 | | | | 273,171 | |
UBS AG (Switzerland) | |
7.000% | | | 10/15/2015 | | | | | | 100,000 | | | | 103,417 | |
5.875% | | | 07/15/2016 | | | | | | 1,000,000 | | | | 996,917 | |
UBS AG MTN (Switzerland) | |
7.375% | | | 06/15/2017 | | | | | | 100,000 | | | | 106,959 | |
US Bancorp | |
2.000% | | | 06/14/2013 | | | | | | 300,000 | | | | 305,003 | |
USB Capital XIII Trust | |
6.625% | | | 12/15/2039 | | | | | | 300,000 | | | | 305,763 | |
Wachovia Bank NA, Bank Note | |
6.600% | | | 01/15/2038 | | | | | | 300,000 | | | | 341,336 | |
4.875% | | | 02/01/2015 | | | | | | 500,000 | | | | 530,158 | |
Wachovia Corp., Series G MTN | |
5.500% | | | 05/01/2013 | | | | | | 1,000,000 | | | | 1,055,439 | |
Wells Fargo & Co. | |
5.000% | | | 11/15/2014 | | | | | | 750,000 | | | | 803,056 | |
3.676% | | | 06/15/2016 | | | | | | 400,000 | | | | 418,428 | |
Wells Fargo & Co. MTN | |
4.600% | | | 04/01/2021 | | | | | | 500,000 | | | | 549,383 | |
Wells Fargo Bank NA | |
5.950% | | | 08/26/2036 | | | | | | 100,000 | | | | 103,293 | |
Westpac Banking Corp. (Australia) | |
3.000% | | | 08/04/2015 | | | | | | 400,000 | | | | 404,983 | |
1.850% | | | 12/09/2013 | | | | | | 600,000 | | | | 600,836 | |
| | | | | | | | | | | | | | |
| | | | | | | | | | | | | 19,272,616 | |
| | | | | | | | | | | | | | |
| Commercial Services & Supplies—0.1% | |
Republic Services, Inc. | |
5.700% | | | 05/15/2041 | | | | | | 200,000 | | | | 230,293 | |
5.500% | | | 09/15/2019 | | | | | | 300,000 | | | | 346,775 | |
Waste Management, Inc. | |
7.000% | | | 07/15/2028 | | | | | | 50,000 | | | | 62,855 | |
6.375% | | | 03/11/2015 | | | | | | 400,000 | | | | 456,704 | |
| | | | | | | | | | | | | | |
| | | | | | | | | | | | | 1,096,627 | |
| | | | | | | | | | | | | | |
| Communications Equipment—0.2% | |
Cisco Systems, Inc. | |
5.500% | | | 02/22/2016 | | | | | | 500,000 | | | | 582,413 | |
4.950% | | | 02/15/2019 | | | | | | 500,000 | | | | 580,501 | |
1.625% | | | 03/14/2014 | | | | | | 400,000 | | | | 407,716 | |
See accompanying notes to financial statements.
245
SCHEDULE OF INVESTMENTS—(Continued)
December 31, 2011
| | | | | | | | | | | | | | |
| Vantagepoint Core Bond Index Fund | | | | | | | | |
| | | | |
Coupon
Rate | | Maturity
Date | | | | | Face | | | Value | |
| | | | | | | | | | | | | | |
| CORPORATE OBLIGATIONS—(Continued) | |
Harris Corp. | |
6.150% | | | 12/15/2040 | | | | | $ | 250,000 | | | $ | 283,734 | |
Juniper Networks, Inc. | |
3.100% | | | 03/15/2016 | | | | | | 400,000 | | | | 414,138 | |
Motorola Solutions, Inc. | |
7.500% | | | 05/15/2025 | | | | | | 340,000 | | | | 402,019 | |
| | | | | | | | | | | | | | |
| | | | | | | | | | | | | 2,670,521 | |
| | | | | | | | | | | | | | |
| Computers & Peripherals—0.2% | |
Dell, Inc. | |
5.400% | | | 09/10/2040 | | | | | | 300,000 | | | | 338,568 | |
1.400% | | | 09/10/2013 | | | | | | 300,000 | | | | 302,117 | |
Hewlett-Packard Co. | |
4.650% | | | 12/09/2021 | | | | | | 300,000 | | | | 317,155 | |
3.300% | | | 12/09/2016 | | | | | | 300,000 | | | | 306,679 | |
2.125% | | | 09/13/2015 | | | | | | 500,000 | | | | 491,631 | |
1.250% | | | 09/13/2013 | | | | | | 200,000 | | | | 197,529 | |
| | | | | | | | | | | | | | |
| | | | | | | | | | | | | 1,953,679 | |
| | | | | | | | | | | | | | |
| Construction Materials—0.1% | |
CRH America, Inc. | |
6.000% | | | 09/30/2016 | | | | | | 750,000 | | | | 801,991 | |
| | | | | | | | | | | | | | |
| Consumer Finance—0.5% | |
American Express Co. | |
8.150% | | | 03/19/2038 | | | | | | 350,000 | | | | 521,041 | |
4.875% | | | 07/15/2013 | | | | | | 1,000,000 | | | | 1,046,118 | |
American Express Credit Corp. | |
2.800% | | | 09/19/2016 | | | | | | 200,000 | | | | 201,200 | |
American Express Credit Corp. MTN | |
2.750% | | | 09/15/2015 | | | | | | 400,000 | | | | 402,473 | |
Capital One Bank USA NA | |
8.800% | | | 07/15/2019 | | | | | | 500,000 | | | | 572,800 | |
Caterpillar Financial Services Corp. | |
1.550% | | | 12/20/2013 | | | | | | 400,000 | | | | 405,622 | |
Caterpillar Financial Services Corp. MTN | |
2.750% | | | 06/24/2015 | | | | | | 200,000 | | | | 207,855 | |
Caterpillar Financial Services Corp., Series F MTN | |
2.650% | | | 04/01/2016 | | | | | | 400,000 | | | | 416,935 | |
HSBC Finance Capital Trust IX | |
5.911% | | | 11/30/2035 | | | # | | | 500,000 | | | | 417,500 | |
John Deere Capital Corp. MTN | |
3.900% | | | 07/12/2021 | | | | | | 300,000 | | | | 327,205 | |
2.250% | | | 06/07/2016 | | | | | | 200,000 | | | | 205,678 | |
1.875% | | | 06/17/2013 | | | | | | 200,000 | | | | 203,694 | |
SLM Corp., Series A MTN | |
5.000% | | | 10/01/2013 | | | | | | 500,000 | | | | 501,250 | |
Toyota Motor Credit Corp. MTN | |
4.500% | | | 06/17/2020 | | | | | | 300,000 | | | | 328,029 | |
1.375% | | | 08/12/2013 | | | | | | 500,000 | | | | 504,848 | |
| | | | | | | | | | | | | | |
| | | | | | | | | | | | | 6,262,248 | |
| | | | | | | | | | | | | | |
| Diversified Financial Services—1.8% | |
Bank of America Corp. | |
7.750% | | | 08/15/2015 | | | | | | 250,000 | | | | 253,384 | |
6.800% | | | 03/15/2028 | | | | | | 200,000 | | | | 173,202 | |
6.500% | | | 09/15/2037 | | | | | | 500,000 | | | | 410,613 | |
5.875% | | | 01/05/2021 | | | | | | 400,000 | | | | 381,382 | |
5.625% | | | 07/01/2020 | | | | | | 500,000 | | | | 462,625 | |
5.420% | | | 03/15/2017 | | | | | | 700,000 | | | | 632,241 | |
| | | | | | | | | | | | | | |
| | | | | |
Coupon
Rate | |
| Maturity
Date |
| | | | | Face | | | | Value | |
| | | | | | | | | | | | | | |
4.875% | | | 01/15/2013 | | | † | | $ | 200,000 | | | $ | 200,860 | |
4.500% | | | 04/01/2015 | | | | | | 700,000 | | | | 675,991 | |
Bank of America Corp. MTN | |
5.000% | | | 05/13/2021 | | | | | | 300,000 | | | | 273,747 | |
4.900% | | | 05/01/2013 | | | | | | 200,000 | | | | 200,225 | |
3.625% | | | 03/17/2016 | | | | | | 500,000 | | | | 461,330 | |
Bank of America Corp., Series L MTN | |
7.375% | | | 05/15/2014 | | | | | | 200,000 | | | | 207,484 | |
5.650% | | | 05/01/2018 | | | | | | 500,000 | | | | 476,997 | |
Citigroup, Inc. | |
8.125% | | | 07/15/2039 | | | | | | 500,000 | | | | 614,060 | |
6.625% | | | 06/15/2032 | | | | | | 150,000 | | | | 139,488 | |
6.375% | | | 08/12/2014 | | | | | | 500,000 | | | | 525,075 | |
6.125% | | | 11/21/2017 | | | | | | 750,000 | | | | 801,413 | |
6.010% | | | 01/15/2015 | | | | | | 200,000 | | | | 209,085 | |
6.000% | | | 08/15/2017 | | | | | | 600,000 | | | | 629,525 | |
5.850% | | | 12/11/2034 | | | | | | 100,000 | | | | 98,888 | |
5.500% | | | 04/11/2013 | | | | | | 1,320,000 | | | | 1,348,030 | |
3.953% | | | 06/15/2016 | | | | | | 200,000 | | | | 199,512 | |
Deutsche Bank AG (Germany) | |
6.000% | | | 09/01/2017 | | | | | | 650,000 | | | | 726,794 | |
Deutsche Bank Financial LLC MTN | |
5.375% | | | 03/02/2015 | | | | | | 250,000 | | | | 245,455 | |
General Electric Capital Corp. | |
5.500% | | | 01/08/2020 | | | | | | 500,000 | | | | 551,046 | |
4.800% | | | 05/01/2013 | | | | | | 500,000 | | | | 523,610 | |
4.625% | | | 01/07/2021 | | | | | | 300,000 | | | | 311,808 | |
2.950% | | | 05/09/2016 | | | † | | | 400,000 | | | | 411,812 | |
2.800% | | | 01/08/2013 | | | | | | 300,000 | | | | 305,777 | |
2.100% | | | 01/07/2014 | | | | | | 400,000 | | | | 406,187 | |
General Electric Capital Corp. MTN | |
5.875% | | | 01/14/2038 | | | | | | 700,000 | | | | 744,242 | |
5.400% | | | 02/15/2017 | | | | | | 250,000 | | | | 278,078 | |
General Electric Capital Corp., Series A MTN | |
6.875% | | | 01/10/2039 | | | | | | 300,000 | | | | 360,618 | |
6.750% | | | 03/15/2032 | | | | | | 750,000 | | | | 880,777 | |
3.750% | | | 11/14/2014 | | | | | | 500,000 | | | | 527,393 | |
JPMorgan Chase & Co. | |
6.400% | | | 05/15/2038 | | | | | | 300,000 | | | | 349,453 | |
5.750% | | | 01/02/2013 | | | | | | 750,000 | | | | 778,194 | |
5.125% | | | 09/15/2014 | | | | | | 500,000 | | | | 527,483 | |
4.750% | | | 03/01/2015 | | | | | | 500,000 | | | | 532,174 | |
4.625% | | | 05/10/2021 | | | | | | 300,000 | | | | 310,982 | |
3.450% | | | 03/01/2016 | | | | | | 500,000 | | | | 508,466 | |
JPMorgan Chase & Co. MTN | |
2.050% | | | 01/24/2014 | | | | | | 300,000 | | | | 300,377 | |
MUFG Capital Finance 1 Ltd., Perpetual Bond (Cayman Islands) | |
6.346% | | | 07/29/2049 | | | # | | | 600,000 | | | | 609,982 | |
National Rural Utilities Cooperative Finance Corp. | |
10.375% | | | 11/01/2018 | | | | | | 281,000 | | | | 404,826 | |
5.500% | | | 07/01/2013 | | | | | | 75,000 | | | | 80,244 | |
3.050% | | | 03/01/2016 | | | | | | 250,000 | | | | 262,843 | |
Western Union Co. (The) | |
5.253% | | | 04/01/2020 | | | | | | 502,000 | | | | 566,498 | |
| | | | | | | | | | | | | | |
| | | | | | | | | | | | | 20,880,276 | |
| | | | | | | | | | | | | | |
| Diversified Telecommunication Services—1.0% | |
AT&T, Inc. | |
6.550% | | | 02/15/2039 | | | | | | 200,000 | | | | 255,314 | |
6.300% | | | 01/15/2038 | | | | | | 250,000 | | | | 308,012 | |
6.150% | | | 09/15/2034 | | | | | | 500,000 | | | | 595,069 | |
5.800% | | | 02/15/2019 | | | | | | 500,000 | | | | 590,893 | |
5.625% | | | 06/15/2016 | | | | | | 150,000 | | | | 172,247 | |
See accompanying notes to financial statements.
246
SCHEDULE OF INVESTMENTS—(Continued)
December 31, 2011
| | | | | | | | | | | | | | |
| Vantagepoint Core Bond Index Fund | | | | | | | | |
| | | | |
Coupon
Rate | | Maturity
Date | | | | | Face | | | Value | |
| | | | | | | | | | | | | | |
| CORPORATE OBLIGATIONS—(Continued) | |
5.550% | | | 08/15/2041 | | | | | $ | 300,000 | | | $ | 354,610 | |
5.350% | | | 09/01/2040 | | | | | | 307,000 | | | | 346,677 | |
BellSouth Capital Funding Corp. | |
7.875% | | | 02/15/2030 | | | | | | 400,000 | | | | 539,492 | |
BellSouth Corp. | |
6.875% | | | 10/15/2031 | | | | | | 350,000 | | | | 437,453 | |
5.200% | | | 09/15/2014 | | | | | | 500,000 | | | | 553,099 | |
British Telecommunications plc (United Kingdom) | |
9.625% | | | 12/15/2030 | | | | | | 150,000 | | | | 211,937 | |
Cellco Partnership/Verizon Wireless Capital LLC | |
5.550% | | | 02/01/2014 | | | | | | 300,000 | | | | 326,100 | |
Deutsche Telekom International Finance BV (Netherlands) | |
8.750% | | | 06/15/2030 | | | | | | 300,000 | | | | 419,578 | |
Embarq Corp. | |
7.082% | | | 06/01/2016 | | | | | | 250,000 | | | | 271,244 | |
France Telecom SA (France) | |
8.500% | | | 03/01/2031 | | | | | | 500,000 | | | | 714,925 | |
Qwest Capital Funding, Inc. | |
6.875% | | | 07/15/2028 | | | | | | 200,000 | | | | 188,794 | |
Qwest Communications International, Inc. | |
8.000% | | | 10/01/2015 | | | | | | 200,000 | | | | 214,079 | |
Qwest Corp. | |
6.500% | | | 06/01/2017 | | | | | | 500,000 | | | | 548,750 | |
Telecom Italia Capital SA (Luxembourg) | |
6.999% | | | 06/04/2018 | | | | | | 500,000 | | | | 468,036 | |
6.000% | | | 09/30/2034 | | | | | | 250,000 | | | | 185,737 | |
5.250% | | | 11/15/2013 | | | | | | 350,000 | | | | 336,350 | |
Telefonica Emisiones SAU (Spain) | |
5.134% | | | 04/27/2020 | | | | | | 200,000 | | | | 188,174 | |
3.729% | | | 04/27/2015 | | | | | | 200,000 | | | | 191,943 | |
Telefonica Europe BV (Netherlands) | |
8.250% | | | 09/15/2030 | | | | | | 350,000 | | | | 385,886 | |
Verizon Communications, Inc. | |
6.400% | | | 02/15/2038 | | | | | | 500,000 | | | | 636,947 | |
6.350% | | | 04/01/2019 | | | | | | 500,000 | | | | 610,164 | |
5.850% | | | 09/15/2035 | | | | | | 250,000 | | | | 299,717 | |
3.000% | | | 04/01/2016 | | | | | | 400,000 | | | | 419,294 | |
1.950% | | | 03/28/2014 | | | | | | 400,000 | | | | 408,486 | |
Verizon Global Funding Corp. | |
7.750% | | | 12/01/2030 | | | | | | 130,000 | | | | 181,566 | |
Verizon Virginia, Inc., Series A | |
4.625% | | | 03/15/2013 | | | | | | 250,000 | | | | 260,369 | |
| | | | | | | | | | | | | | |
| | | | | | | | | | | | | 11,620,942 | |
| | | | | | | | | | | | | | |
| Electric Utilities—1.6% | |
Alabama Power Co., Series Q | |
5.500% | | | 10/15/2017 | | | | | | 150,000 | | | | 177,953 | |
Columbus Southern Power Co., Series C | |
5.500% | | | 03/01/2013 | | | | | | 150,000 | | | | 157,082 | |
Commonwealth Edison Co. | |
5.900% | | | 03/15/2036 | | | | | | 300,000 | | | | 369,191 | |
5.800% | | | 03/15/2018 | | | | | | 100,000 | | | | 118,215 | |
1.625% | | | 01/15/2014 | | | | | | 400,000 | | | | 403,102 | |
Consolidated Edison Co. of New York, Inc., Series 06-C | |
5.500% | | | 09/15/2016 | | | | | | 500,000 | | | | 588,805 | |
Constellation Energy Group, Inc. | |
5.150% | | | 12/01/2020 | | | | | | 400,000 | | | | 434,236 | |
Consumers Energy Co., Series P | |
5.500% | | | 08/15/2016 | | | | | | 150,000 | | | | 172,575 | |
| | | | | | | | | | | | | | |
| | | | | |
Coupon
Rate | |
| Maturity
Date |
| | | | | Face | | | | Value | |
| | | | | | | | | | | | | | |
Dominion Resources, Inc. | |
1.800% | | | 03/15/2014 | | | | | $ | 400,000 | | | $ | 407,488 | |
Dominion Resources, Inc., Series A | |
5.600% | | | 11/15/2016 | | | | | | 300,000 | | | | 348,858 | |
Duke Energy Carolinas LLC | |
6.450% | | | 10/15/2032 | | | | | | 330,000 | | | | 424,725 | |
4.300% | | | 06/15/2020 | | | | | | 100,000 | | | | 112,833 | |
Duke Energy Corp. | |
2.150% | | | 11/15/2016 | | | | | | 200,000 | | | | 200,799 | |
Duke Energy Indiana, Inc. | |
3.750% | | | 07/15/2020 | | | | | | 300,000 | | | | 322,719 | |
Exelon Corp. | |
4.900% | | | 06/15/2015 | | | | | | 350,000 | | | | 377,418 | |
FirstEnergy Corp., Series C | |
7.375% | | | 11/15/2031 | | | | | | 150,000 | | | | 184,989 | |
FirstEnergy Solutions Corp. | |
6.050% | | | 08/15/2021 | | | | | | 250,000 | | | | 277,937 | |
Florida Power & Light Co. | |
5.625% | | | 04/01/2034 | | | | | | 50,000 | | | | 61,984 | |
5.125% | | | 06/01/2041 | | | | | | 200,000 | | | | 239,122 | |
4.950% | | | 06/01/2035 | | | | | | 100,000 | | | | 115,363 | |
4.850% | | | 02/01/2013 | | | | | | 150,000 | | | | 156,529 | |
Florida Power Corp. | |
6.400% | | | 06/15/2038 | | | | | | 350,000 | | | | 476,480 | |
Georgia Power Co., Series 07-A | |
5.650% | | | 03/01/2037 | | | | | | 200,000 | | | | 248,761 | |
Georgia Power Co., Series AMBC | |
6.000% | | | 09/01/2040 | | | | | | 141,000 | | | | 142,819 | |
Great Plains Energy, Inc. | |
4.850% | | | 06/01/2021 | | | | | | 400,000 | | | | 420,084 | |
Indiana Michigan Power Co. | |
7.000% | | | 03/15/2019 | | | | | | 250,000 | | | | 307,948 | |
Jersey Central Power & Light | |
5.625% | | | 05/01/2016 | | | | | | 500,000 | | | | 565,564 | |
Kentucky Utilities Co. | |
5.125% | | | 11/01/2040 | | | | | | 500,000 | | | | 601,612 | |
MidAmerican Energy Co. | |
5.800% | | | 10/15/2036 | | | | | | 500,000 | | | | 597,405 | |
MidAmerican Energy Holdings Co. | |
6.125% | | | 04/01/2036 | | | | | | 200,000 | | | | 239,682 | |
MidAmerican Energy Holdings Co., Series D | |
5.000% | | | 02/15/2014 | | | | | | 150,000 | | | | 161,249 | |
NextEra Energy Capital Holdings, Inc. | |
6.000% | | | 03/01/2019 | | | | | | 250,000 | | | | 291,878 | |
4.500% | | | 06/01/2021 | | | | | | 200,000 | | | | 213,461 | |
Nisource Finance Corp. | |
5.450% | | | 09/15/2020 | | | | | | 500,000 | | | | 554,799 | |
Northern States Power Co. | |
5.250% | | | 03/01/2018 | | | | | | 500,000 | | | | 595,362 | |
Ohio Power Co., Series K | |
6.000% | | | 06/01/2016 | | | | | | 500,000 | | | | 577,963 | |
Pacific Gas & Electric Co. | |
6.050% | | | 03/01/2034 | | | | | | 500,000 | | | | 620,968 | |
Potomac Electric Power Co. | |
7.900% | | | 12/15/2038 | | | | | | 200,000 | | | | 310,323 | |
Progress Energy, Inc. | |
7.050% | | | 03/15/2019 | | | | | | 400,000 | | | | 495,430 | |
4.400% | | | 01/15/2021 | | | | | | 300,000 | | | | 331,308 | |
PSEG Power LLC | |
8.625% | | | 04/15/2031 | | | | | | 300,000 | | | | 443,774 | |
2.750% | | | 09/15/2016 | | | | | | 200,000 | | | | 201,200 | |
2.500% | | | 04/15/2013 | | | | | | 500,000 | | | | 508,064 | |
Puget Sound Energy, Inc. | |
4.434% | | | 11/15/2041 | | | | | | 300,000 | | | | 312,446 | |
See accompanying notes to financial statements.
247
SCHEDULE OF INVESTMENTS—(Continued)
December 31, 2011
| | | | | | | | | | | | | | |
| Vantagepoint Core Bond Index Fund | | | | | | | | |
| | | | |
Coupon
Rate | | Maturity
Date | | | | | Face | | | Value | |
| | | | | | | | | | | | | | |
| CORPORATE OBLIGATIONS—(Continued) | |
South Carolina Electric & Gas Co. | | | | | |
5.300% | | | 05/15/2033 | | | | | $ | 150,000 | | | $ | 175,707 | |
Southern California Edison Co. | | | | | |
6.650% | | | 04/01/2029 | | | | | | 500,000 | | | | 660,972 | |
Southern Power Co., Series D | | | | | |
4.875% | | | 07/15/2015 | | | | | | 350,000 | | | | 383,344 | |
Union Electric Co. | | | | | |
6.400% | | | 06/15/2017 | | | | | | 250,000 | | | | 299,178 | |
Virginia Electric and Power Co. | | | | | |
5.950% | | | 09/15/2017 | | | | | | 250,000 | | | | 301,226 | |
5.400% | | | 04/30/2018 | | | | | | 250,000 | | | | 298,630 | |
Virginia Electric and Power Co., Series B | | | | | |
6.000% | | | 01/15/2036 | | | | | | 380,000 | | | | 483,612 | |
Wisconsin Electric Power | | | | | |
5.625% | | | 05/15/2033 | | | | | | 150,000 | | | | 188,806 | |
Xcel Energy, Inc. | | | | | |
4.800% | | | 09/15/2041 | | | | | | 200,000 | | | | 218,840 | |
| | | | | | | | | | | | | | |
| | | | | | | | | | | | | 17,880,818 | |
| | | | | | | | | | | | | | |
| Electrical Equipment—0.1% | |
Emerson Electric Co. | | | | | |
5.000% | | | 12/15/2014 | | | | | | 150,000 | | | | 166,285 | |
5.000% | | | 04/15/2019 | | | | | | 500,000 | | | | 588,247 | |
| | | | | | | | | | | | | | |
| | | | | | | | | | | | | 754,532 | |
| | | | | | | | | | | | | | |
Electronic Equipment, Instruments &
Components—0.1% | |
Agilent Technologies, Inc. | | | | | |
5.000% | | | 07/15/2020 | | | | | | 100,000 | | | | 112,170 | |
Arrow Electronics, Inc. | | | | | |
6.875% | | | 07/01/2013 | | | | | | 250,000 | | | | 268,875 | |
Thermo Fisher Scientific, Inc. | | | | | |
2.050% | | | 02/21/2014 | | | | | | 300,000 | | | | 307,410 | |
| | | | | | | | | | | | | | |
| | | | | | | | | | | | | 688,455 | |
| | | | | | | | | | | | | | |
| Energy Equipment & Services—0.2% | |
Halliburton Co. | | | | | |
7.450% | | | 09/15/2039 | | | | | | 400,000 | | | | 580,009 | |
Noble Holding International Ltd. (Cayman Islands) | |
6.200% | | | 08/01/2040 | | | | | | 200,000 | | | | 226,045 | |
3.450% | | | 08/01/2015 | | | | | | 200,000 | | | | 208,247 | |
Pride International, Inc. | | | | | |
6.875% | | | 08/15/2020 | | | | | | 200,000 | | | | 234,877 | |
Transocean, Inc. (Cayman Islands) | | | | | |
6.800% | | | 03/15/2038 | | | | | | 500,000 | | | | 505,511 | |
Weatherford International Ltd. (Bermuda) | | | | | |
9.625% | | | 03/01/2019 | | | | | | 400,000 | | | | 518,022 | |
6.750% | | | 09/15/2040 | | | | | | 300,000 | | | | 341,468 | |
| | | | | | | | | | | | | | |
| | | | | | | | | | | | | 2,614,179 | |
| | | | | | | | | | | | | | |
| Food & Staples Retailing—0.1% | |
CVS Caremark Corp. | | | | | |
6.600% | | | 03/15/2019 | | | | | | 250,000 | | | | 305,177 | |
4.875% | | | 09/15/2014 | | | | | | 230,000 | | | | 251,675 | |
4.125% | | | 05/15/2021 | | | | | | 200,000 | | | | 215,734 | |
Kroger Co. (The) | | | | | |
7.500% | | | 04/01/2031 | | | | | | 200,000 | | | | 261,638 | |
5.400% | | | 07/15/2040 | | | | | | 200,000 | | | | 216,279 | |
4.950% | | | 01/15/2015 | | | | | | 300,000 | | | | 331,369 | |
| | | | | | | | | | | | | | |
| | | | | | | | | | | | | 1,581,872 | |
| | | | | | | | | | | | | | |
| | | | | | | | | | | | | | |
| | | | | |
Coupon
Rate | |
| Maturity
Date |
| | | | | Face | | | | Value | |
| | | | | | | | | | | | | | |
| Food Products—0.5% | |
Archer-Daniels Midland Co. | | | | | |
5.450% | | | 03/15/2018 | | | | | $ | 500,000 | | | $ | 593,707 | |
Bunge Ltd. Finance Corp. | | | | | |
5.350% | | | 04/15/2014 | | | | | | 500,000 | | | | 524,708 | |
Campbell Soup Co. | | | | | |
4.875% | | | 10/01/2013 | | | | | | 250,000 | | | | 267,691 | |
ConAgra Foods, Inc. | | | | | |
5.875% | | | 04/15/2014 | | | | | | 500,000 | | | | 549,004 | |
General Mills, Inc. | | | | | |
5.400% | | | 06/15/2040 | | | | | | 300,000 | | | | 351,717 | |
3.150% | | | 12/15/2021 | | | | | | 200,000 | | | | 203,046 | |
Kellogg Co. | | | | | |
4.000% | | | 12/15/2020 | | | | | | 300,000 | | | | 318,109 | |
Kraft Foods, Inc. | | | | | |
6.875% | | | 02/01/2038 | | | | | | 380,000 | | | | 504,931 | |
6.500% | | | 02/09/2040 | | | | | | 200,000 | | | | 261,144 | |
5.375% | | | 02/10/2020 | | | | | | 400,000 | | | | 462,312 | |
5.250% | | | 10/01/2013 | | | | | | 600,000 | | | | 640,283 | |
4.125% | | | 02/09/2016 | | | | | | 100,000 | | | | 108,676 | |
Sara Lee Corp. | | | | | |
2.750% | | | 09/15/2015 | | | | | | 300,000 | | | | 302,489 | |
Unilever Capital Corp. | | | | | |
4.250% | | | 02/10/2021 | | | | | | 300,000 | | | | 342,541 | |
| | | | | | | | | | | | | | |
| | | | | | | | | | | | | 5,430,358 | |
| | | | | | | | | | | | | | |
| Gas Utilities—0.0% | |
Southern California Gas Co. | | | | | |
5.125% | | | 11/15/2040 | | | | | | 400,000 | | | | 485,285 | |
| | | | | | | | | | | | | | |
| Health Care Equipment & Supplies—0.2% | |
Baxter International, Inc. | | | | | |
5.900% | | | 09/01/2016 | | | | | | 400,000 | | | | 476,646 | |
Becton Dickinson and Co. | | | | | |
5.000% | | | 11/12/2040 | | | | | | 300,000 | | | | 335,100 | |
Boston Scientific Corp. | | | | | |
7.375% | | | 01/15/2040 | | | | | | 200,000 | | | | 255,367 | |
6.250% | | | 11/15/2015 | | | | | | 200,000 | | | | 221,896 | |
6.000% | | | 01/15/2020 | | | | | | 200,000 | | | | 223,628 | |
CareFusion Corp. | | | | | |
6.375% | | | 08/01/2019 | | | | | | 250,000 | | | | 295,666 | |
Covidien International Finance SA (Luxembourg) | |
6.000% | | | 10/15/2017 | | | | | | 250,000 | | | | 296,620 | |
Medtronic, Inc. | | | | | |
4.450% | | | 03/15/2020 | | | | | | 300,000 | | | | 339,118 | |
| | | | | | | | | | | | | | |
| | | | | | | | | | | | | 2,444,041 | |
| | | | | | | | | | | | | | |
| Health Care Providers & Services—0.3% | |
Aetna, Inc. | | | | | |
6.625% | | | 06/15/2036 | | | | | | 250,000 | | | | 311,507 | |
Aristotle Holding, Inc. | | | | | |
6.125% | | | 11/15/2041 | | | ^ | | | 200,000 | | | | 217,008 | |
4.750% | | | 11/15/2021 | | | ^ | | | 200,000 | | | | 207,361 | |
Cigna Corp. | | | | | |
5.125% | | | 06/15/2020 | | | | | | 300,000 | | | | 324,029 | |
Express Scripts, Inc. | | | | | |
6.250% | | | 06/15/2014 | | | | | | 300,000 | | | | 327,168 | |
Quest Diagnostics, Inc. | | | | | |
6.950% | | | 07/01/2037 | | | | | | 300,000 | | | | 374,225 | |
UnitedHealth Group, Inc. | | | | | |
6.000% | | | 02/15/2018 | | | | | | 500,000 | | | | 595,258 | |
5.950% | | | 02/15/2041 | | | | | | 200,000 | | | | 246,830 | |
5.375% | | | 03/15/2016 | | | | | | 200,000 | | | | 229,622 | |
WellPoint, Inc. | | | | | |
5.250% | | | 01/15/2016 | | | | | | 500,000 | | | | 560,293 | |
| | | | | | | | | | | | | | |
| | | | | | | | | | | | | 3,393,301 | |
| | | | | | | | | | | | | | |
See accompanying notes to financial statements.
248
SCHEDULE OF INVESTMENTS—(Continued)
December 31, 2011
| | | | | | | | | | | | | | |
| Vantagepoint Core Bond Index Fund | | | | | | | | |
| | | | |
Coupon
Rate | | Maturity
Date | | | | | Face | | | Value | |
| | | | | | | | | | | | | | |
| CORPORATE OBLIGATIONS—(Continued) | |
| Hotels, Restaurants & Leisure—0.1% | |
McDonald’s Corp., Series I MTN | |
5.350% | | | 03/01/2018 | | | | | $ | 500,000 | | | $ | 598,250 | |
Yum! Brands, Inc. | |
6.875% | | | 11/15/2037 | | | | | | 200,000 | | | | 256,185 | |
| | | | | | | | | | | | | | |
| | | | | | | | | | | | | 854,435 | |
| | | | | | | | | | | | | | |
| Household Durables—0.1% | |
Kimberly-Clark Corp. | |
6.125% | | | 08/01/2017 | | | | | | 500,000 | | | | 612,337 | |
Whirlpool Corp. MTN | |
4.850% | | | 06/15/2021 | | | | | | 200,000 | | | | 200,025 | |
| | | | | | | | | | | | | | |
| | | | | | | | | | | | | 812,362 | |
| | | | | | | | | | | | | | |
| Household Products—0.1% | |
Procter & Gamble Co. (The) | |
5.800% | | | 08/15/2034 | | | | | | 250,000 | | | | 330,457 | |
4.700% | | | 02/15/2019 | | | | | | 500,000 | | | | 590,985 | |
| | | | | | | | | | | | | | |
| | | | | | | | | | | | | 921,442 | |
| | | | | | | | | | | | | | |
| Industrial Conglomerates—0.1% | |
3M Co. MTN | |
5.700% | | | 03/15/2037 | | | | | | 100,000 | | | | 134,810 | |
GE Capital Trust I | |
6.375% | | | 11/15/2067 | | | # | | | 130,000 | | | | 128,050 | |
General Electric Co. | |
5.000% | | | 02/01/2013 | | | | | | 500,000 | | | | 521,185 | |
| | | | | | | | | | | | | | |
| | | | | | | | | | | | | 784,045 | |
| | | | | | | | | | | | | | |
| Insurance—0.9% | |
ACE INA Holdings, Inc. | |
5.875% | | | 06/15/2014 | | | | | | 300,000 | | | | 331,136 | |
AEGON Funding Co. LLC | |
5.750% | | | 12/15/2020 | | | | | | 290,000 | | | | 302,382 | |
Allstate Corp. (The) | |
5.350% | | | 06/01/2033 | | | | | | 500,000 | | | | 516,873 | |
American International Group, Inc. | |
6.400% | | | 12/15/2020 | | | | | | 400,000 | | | | 404,374 | |
6.250% | | | 03/15/2037 | | | | | | 300,000 | | | | 218,625 | |
4.250% | | | 05/15/2013 | | | | | | 100,000 | | | | 99,963 | |
American International Group, Inc., Series G MTN | |
5.850% | | | 01/16/2018 | | | | | | 500,000 | | | | 490,232 | |
Assurant, Inc. | |
5.625% | | | 02/15/2014 | | | | | | 500,000 | | | | 523,143 | |
AXA SA (France) | |
8.600% | | | 12/15/2030 | | | | | | 250,000 | | | | 246,789 | |
Berkshire Hathaway Finance Corp. | |
5.000% | | | 08/15/2013 | | | | | | 700,000 | | | | 745,688 | |
4.250% | | | 01/15/2021 | | | † | | | 300,000 | | | | 327,534 | |
Chubb Corp. (The) | |
6.375% | | | 03/29/2067 | | | # | | | 200,000 | | | | 198,500 | |
CNA Financial Corp. | |
5.850% | | | 12/15/2014 | | | | | | 430,000 | | | | 453,403 | |
5.750% | | | 08/15/2021 | | | | | | 300,000 | | | | 306,691 | |
Fidelity National Financial, Inc. | |
6.600% | | | 05/15/2017 | | | | | | 300,000 | | | | 318,365 | |
Genworth Financial, Inc. | |
7.700% | | | 06/15/2020 | | | † | | | 200,000 | | | | 190,675 | |
Hartford Financial Services Group, Inc. | |
6.100% | | | 10/01/2041 | | | | | | 150,000 | | | | 140,839 | |
| | | | | | | | | | | | | | |
| | | | | |
Coupon
Rate | |
| Maturity
Date |
| | | | | Face | | | | Value | |
| | | | | | | | | | | | | | |
Jefferson-Pilot Corp. | |
4.750% | | | 01/30/2014 | | | | | $ | 300,000 | | | $ | 310,490 | |
Lincoln National Corp. | |
6.150% | | | 04/07/2036 | | | | | | 250,000 | | | | 251,891 | |
Marsh & McLennan Cos., Inc. | |
5.750% | | | 09/15/2015 | | | | | | 46,000 | | | | 50,986 | |
MetLife, Inc. | |
6.750% | | | 06/01/2016 | | | | | | 600,000 | | | | 691,892 | |
5.700% | | | 06/15/2035 | | | | | | 250,000 | | | | 279,977 | |
2.375% | | | 02/06/2014 | | | | | | 300,000 | | | | 304,340 | |
Progressive Corp. (The) | |
6.625% | | | 03/01/2029 | | | | | | 150,000 | | | | 185,985 | |
Prudential Financial, Inc. | |
6.625% | | | 06/21/2040 | | | | | | 100,000 | | | | 110,842 | |
5.375% | | | 06/21/2020 | | | | | | 300,000 | | | | 321,618 | |
Prudential Financial, Inc. MTN | |
5.800% | | | 11/16/2041 | | | | | | 200,000 | | | | 203,156 | |
Prudential Financial, Inc., Series D MTN | |
5.700% | | | 12/14/2036 | | | | | | 250,000 | | | | 249,034 | |
4.750% | | | 09/17/2015 | | | | | | 300,000 | | | | 317,037 | |
Travelers Property Casualty Corp. | |
5.000% | | | 03/15/2013 | | | | | | 400,000 | | | | 417,390 | |
Validus Holdings Ltd. (Bermuda) | |
8.875% | | | 01/26/2040 | | | | | | 200,000 | | | | 219,097 | |
| | | | | | | | | | | | | | |
| | | | | | | | | | | | | 9,728,947 | |
| | | | | | | | | | | | | | |
| Internet Software & Services—0.1% | |
Google, Inc. | |
3.625% | | | 05/19/2021 | | | | | | 300,000 | | | | 328,622 | |
2.125% | | | 05/19/2016 | | | | | | 300,000 | | | | 312,274 | |
1.250% | | | 05/19/2014 | | | | | | 300,000 | | | | 304,693 | |
| | | | | | | | | | | | | | |
| | | | | | | | | | | | | 945,589 | |
| | | | | | | | | | | | | | |
| IT Services—0.2% | |
HP Enterprise Services LLC, Series B | |
6.000% | | | 08/01/2013 | | | | | | 650,000 | | | | 689,309 | |
International Business Machines Corp. | |
7.000% | | | 10/30/2025 | | | | | | 300,000 | | | | 412,350 | |
2.100% | | | 05/06/2013 | | | | | | 300,000 | | | | 306,291 | |
1.000% | | | 08/05/2013 | | | | | | 300,000 | | | | 302,481 | |
0.875% | | | 10/31/2014 | | | | | | 300,000 | | | | 300,317 | |
| | | | | | | | | | | | | | |
| | | | | | | | | | | | | 2,010,748 | |
| | | | | | | | | | | | | | |
| Machinery—0.3% | |
Caterpillar, Inc. | |
6.050% | | | 08/15/2036 | | | | | | 500,000 | | | | 648,448 | |
Deere & Co. | |
6.950% | | | 04/25/2014 | | | | | | 250,000 | | | | 284,355 | |
Dover Corp. | |
5.375% | | | 03/01/2041 | | | | | | 300,000 | | | | 368,292 | |
Honeywell International, Inc. | |
5.700% | | | 03/15/2036 | | | | | | 300,000 | | | | 372,725 | |
3.875% | | | 02/15/2014 | | | | | | 300,000 | | | | 320,238 | |
Parker Hannifin Corp. MTN | |
3.500% | | | 09/15/2022 | | | | | | 100,000 | | | | 103,634 | |
Tyco International Finance SA (Luxembourg) | |
4.625% | | | 01/15/2023 | | | | | | 300,000 | | | | 325,000 | |
3.750% | | | 01/15/2018 | | | | | | 300,000 | | | | 316,326 | |
3.375% | | | 10/15/2015 | | | | | | 200,000 | | | | 209,492 | |
| | | | | | | | | | | | | | |
| | | | | | | | | | | | | 2,948,510 | |
| | | | | | | | | | | | | | |
| Media—1.1% | |
CBS Corp. | |
7.875% | | | 07/30/2030 | | | | | | 250,000 | | | | 318,904 | |
5.750% | | | 04/15/2020 | | | | | | 200,000 | | | | 225,232 | |
See accompanying notes to financial statements.
249
SCHEDULE OF INVESTMENTS—(Continued)
December 31, 2011
| | | | | | | | | | | | | | |
| Vantagepoint Core Bond Index Fund | | | | | | | | |
| | | | |
Coupon
Rate | | Maturity
Date | | | | | Face | | | Value | |
| | | | | | | | | | | | | | |
| CORPORATE OBLIGATIONS—(Continued) | |
Comcast Corp. | |
6.450% | | | 03/15/2037 | | | | | $ | 500,000 | | | $ | 608,180 | |
6.300% | | | 11/15/2017 | | | | | | 1,000,000 | | | | 1,184,279 | |
5.650% | | | 06/15/2035 | | | | | | 200,000 | | | | 221,690 | |
COX Communications, Inc. | |
5.500% | | | 10/01/2015 | | | | | | 75,000 | | | | 84,465 | |
4.625% | | | 06/01/2013 | | | | | | 250,000 | | | | 263,631 | |
DIRECTV Holdings LLC/DIRECTV Financing Co., Inc. | |
6.375% | | | 03/01/2041 | | | | | | 500,000 | | | | 578,564 | |
5.200% | | | 03/15/2020 | | | | | | 200,000 | | | | 215,925 | |
3.550% | | | 03/15/2015 | | | | | | 200,000 | | | | 208,331 | |
3.500% | | | 03/01/2016 | | | | | | 400,000 | | | | 412,768 | |
Discovery Communications LLC | |
5.625% | | | 08/15/2019 | | | | | | 400,000 | | | | 455,850 | |
Historic TW, Inc. | |
9.150% | | | 02/01/2023 | | | | | | 300,000 | | | | 411,139 | |
NBCUniversal Media LLC | |
5.950% | | | 04/01/2041 | | | | | | 250,000 | | | | 294,955 | |
4.375% | | | 04/01/2021 | | | | | | 250,000 | | | | 264,339 | |
News America, Inc. | |
8.000% | | | 10/17/2016 | | | | | | 150,000 | | | | 185,209 | |
7.750% | | | 12/01/2045 | | | | | | 200,000 | | | | 245,712 | |
6.150% | | | 02/15/2041 | | | | | | 300,000 | | | | 347,035 | |
5.650% | | | 08/15/2020 | | | | | | 500,000 | | | | 559,283 | |
Omnicom Group, Inc. | |
5.900% | | | 04/15/2016 | | | | | | 500,000 | | | | 556,476 | |
Thomson Reuters Corp. (Canada) | |
6.500% | | | 07/15/2018 | | | | | | 500,000 | | | | 599,865 | |
Time Warner Cable, Inc. | |
6.750% | | | 06/15/2039 | | | | | | 200,000 | | | | 237,147 | |
6.200% | | | 07/01/2013 | | | | | | 500,000 | | | | 536,726 | |
5.850% | | | 05/01/2017 | | | | | | 400,000 | | | | 456,059 | |
Time Warner Entertainment Co. LP | |
8.375% | | | 03/15/2023 | | | | | | 250,000 | | | | 326,235 | |
8.375% | | | 07/15/2033 | | | | | | 250,000 | | | | 328,611 | |
Time Warner, Inc. | |
5.875% | | | 11/15/2016 | | | | | | 1,000,000 | | | | 1,155,466 | |
5.375% | | | 10/15/2041 | | | | | | 250,000 | | | | 271,840 | |
Viacom, Inc. | |
6.875% | | | 04/30/2036 | | | | | | 300,000 | | | | 376,696 | |
4.500% | | | 03/01/2021 | | | | | | 200,000 | | | | 211,560 | |
2.500% | | | 12/15/2016 | | | | | | 300,000 | | | | 300,233 | |
Walt Disney Co. (The), Series B MTN | |
7.000% | | | 03/01/2032 | | | | | | 210,000 | | | | 293,374 | |
| | | | | | | | | | | | | | |
| | | | | | | | | | | | | 12,735,779 | |
| | | | | | | | | | | | | | |
| Metals & Mining—0.5% | |
Alcoa, Inc. | |
5.550% | | | 02/01/2017 | | | † | | | 290,000 | | | | 309,587 | |
5.400% | | | 04/15/2021 | | | | | | 300,000 | | | | 301,103 | |
ArcelorMittal (Luxembourg) | |
7.000% | | | 10/15/2039 | | | | | | 400,000 | | | | 372,811 | |
5.250% | | | 08/05/2020 | | | † | | | 400,000 | | | | 363,834 | |
3.750% | | | 08/05/2015 | | | | | | 400,000 | | | | 382,707 | |
Barrick Gold Corp. (Canada) | |
2.900% | | | 05/30/2016 | | | | | | 200,000 | | | | 205,480 | |
Barrick PD Australia Finance Pty Ltd. (Australia) | |
5.950% | | | 10/15/2039 | | | | | | 400,000 | | | | 464,758 | |
BHP Billiton Finance USA Ltd. (Australia) | |
6.500% | | | 04/01/2019 | | | | | | 500,000 | | | | 618,700 | |
1.125% | | | 11/21/2014 | | | | | | 300,000 | | | | 300,917 | �� |
| | | | | | | | | | | | | | |
| | | | | |
Coupon
Rate | |
| Maturity
Date |
| | | | | Face | | | | Value | |
| | | | | | | | | | | | | | |
Newmont Mining Corp. | |
6.250% | | | 10/01/2039 | | | | | $ | 200,000 | | | $ | 237,649 | |
Rio Tinto Alcan, Inc. (Canada) | |
6.125% | | | 12/15/2033 | | | | | | 150,000 | | | | 185,231 | |
Rio Tinto Finance USA Ltd. (Australia) | |
8.950% | | | 05/01/2014 | | | | | | 500,000 | | | | 585,072 | |
Southern Copper Corp. | |
7.500% | | | 07/27/2035 | | | | | | 250,000 | | | | 275,576 | |
Teck Resources Ltd. (Canada) | |
9.750% | | | 05/15/2014 | | | | | | 500,000 | | | | 587,903 | |
Vale Overseas Ltd. (Cayman Islands) | |
6.875% | | | 11/21/2036 | | | | | | 100,000 | | | | 114,355 | |
4.625% | | | 09/15/2020 | | | | | | 500,000 | | | | 519,552 | |
| | | | | | | | | | | | | | |
| | | | | | | | | | | | | 5,825,235 | |
| | | | | | | | | | | | | | |
| Multiline Retail—0.4% | |
Kohl’s Corp. | |
4.000% | | | 11/01/2021 | | | | | | 300,000 | | | | 307,973 | |
Macy’s Retail Holdings, Inc. | |
6.900% | | | 04/01/2029 | | | | | | 100,000 | | | | 110,270 | |
6.650% | | | 07/15/2024 | | | | | | 100,000 | | | | 111,777 | |
5.900% | | | 12/01/2016 | | | | | | 100,000 | | | | 111,867 | |
5.750% | | | 07/15/2014 | | | | | | 300,000 | | | | 319,300 | |
Nordstrom, Inc. | |
4.000% | | | 10/15/2021 | | | | | | 100,000 | | | | 104,450 | |
Target Corp. | |
7.000% | | | 07/15/2031 | | | | | | 150,000 | | | | 202,933 | |
6.000% | | | 01/15/2018 | | | | | | 500,000 | | | | 609,972 | |
Wal-Mart Stores, Inc. | |
7.550% | | | 02/15/2030 | | | | | | 250,000 | | | | 366,103 | |
5.250% | | | 09/01/2035 | | | | | | 750,000 | | | | 900,382 | |
4.875% | | | 07/08/2040 | | | | | | 300,000 | | | | 347,842 | |
4.550% | | | 05/01/2013 | | | | | | 500,000 | | | | 527,899 | |
4.250% | | | 04/15/2021 | | | | | | 300,000 | | | | 347,325 | |
3.625% | | | 07/08/2020 | | | | | | 300,000 | | | | 329,399 | |
1.625% | | | 04/15/2014 | | | | | | 300,000 | | | | 306,768 | |
| | | | | | | | | | | | | | |
| | | | | | | | | | | | | 5,004,260 | |
| | | | | | | | | | | | | | |
| Multi-Utilities—0.0% | |
Sempra Energy | |
6.150% | | | 06/15/2018 | | | | | | 250,000 | | | | 295,077 | |
2.000% | | | 03/15/2014 | | | | | | 250,000 | | | | 253,303 | |
| | | | | | | | | | | | | | |
| | | | | | | | | | | | | 548,380 | |
| | | | | | | | | | | | | | |
| Office Electronics—0.2% | |
Pitney Bowes, Inc. | |
5.000% | | | 03/15/2015 | | | | | | 500,000 | | | | 529,262 | |
Pitney Bowes, Inc. MTN | |
4.750% | | | 01/15/2016 | | | | | | 200,000 | | | | 205,808 | |
Xerox Corp. | |
6.350% | | | 05/15/2018 | | | | | | 500,000 | | | | 563,976 | |
4.500% | | | 05/15/2021 | | | | | | 200,000 | | | | 203,078 | |
4.250% | | | 02/15/2015 | | | | | | 300,000 | | | | 316,430 | |
| | | | | | | | | | | | | | |
| | | | | | | | | | | | | 1,818,554 | |
| | | | | | | | | | | | | | |
| Oil, Gas & Consumable Fuels—1.8% | |
Alberta Energy Co. Ltd. (Canada) | |
7.375% | | | 11/01/2031 | | | | | | 400,000 | | | | 501,672 | |
Anadarko Petroleum Corp. | |
8.700% | | | 03/15/2019 | | | | | | 500,000 | | | | 639,244 | |
Apache Corp. | |
5.250% | | | 02/01/2042 | | | | | | 500,000 | | | | 599,926 | |
Apache Finance Canada Corp. (Canada) | |
7.750% | | | 12/15/2029 | | | | | | 150,000 | | | | 219,589 | |
See accompanying notes to financial statements.
250
SCHEDULE OF INVESTMENTS—(Continued)
December 31, 2011
| | | | | | | | | | | | | | |
| Vantagepoint Core Bond Index Fund | | | | | | | | |
| | | | |
Coupon
Rate | | Maturity
Date | | | | | Face | | | Value | |
| | | | | | | | | | | | | | |
| CORPORATE OBLIGATIONS—(Continued) | |
BP Capital Markets plc (United Kingdom) | |
5.250% | | | 11/07/2013 | | | | | $ | 500,000 | | | $ | 536,520 | |
4.500% | | | 10/01/2020 | | | | | | 300,000 | | | | 331,014 | |
3.200% | | | 03/11/2016 | | | | | | 400,000 | | | | 419,620 | |
Canadian Natural Resources Ltd. (Canada) | |
5.850% | | | 02/01/2035 | | | | | | 500,000 | | | | 597,148 | |
3.450% | | | 11/15/2021 | | | † | | | 200,000 | | | | 208,883 | |
Cenovus Energy, Inc. (Canada) | |
5.700% | | | 10/15/2019 | | | | | | 200,000 | | | | 234,969 | |
CenterPoint Energy Resources Corp. | |
4.500% | | | 01/15/2021 | | | | | | 434,000 | | | | 460,512 | |
Chevron Corp. | |
3.950% | | | 03/03/2014 | | | | | | 300,000 | | | | 320,988 | |
ConocoPhillips Canada Funding Co. I (Canada) | |
5.950% | | | 10/15/2036 | | | | | | 500,000 | | | | 618,021 | |
5.625% | | | 10/15/2016 | | | | | | 500,000 | | | | 584,390 | |
ConocoPhillips Holding Co. | |
6.950% | | | 04/15/2029 | | | | | | 500,000 | | | | 683,551 | |
Devon Energy Corp. | |
5.600% | | | 07/15/2041 | | | | | | 100,000 | | | | 120,701 | |
2.400% | | | 07/15/2016 | | | | | | 300,000 | | | | 307,493 | |
Enbridge Energy Partners LP | |
9.875% | | | 03/01/2019 | | | | | | 300,000 | | | | 398,412 | |
Encana Corp. (Canada) | |
5.150% | | | 11/15/2041 | | | | | | 300,000 | | | | 307,439 | |
3.900% | | | 11/15/2021 | | | | | | 300,000 | | | | 301,995 | |
Energy Transfer Partners LP | |
5.950% | | | 02/01/2015 | | | | | | 500,000 | | | | 540,818 | |
Enterprise Products Operating LLC | |
5.950% | | | 02/01/2041 | | | | | | 200,000 | | | | 224,990 | |
3.700% | | | 06/01/2015 | | | | | | 100,000 | | | | 104,922 | |
3.200% | | | 02/01/2016 | | | | | | 200,000 | | | | 207,253 | |
Enterprise Products Operating LLC, Series D | |
6.875% | | | 03/01/2033 | | | | | | 150,000 | | | | 181,580 | |
Enterprise Products Operating LLC, Series G | |
5.600% | | | 10/15/2014 | | | | | | 150,000 | | | | 164,457 | |
EOG Resources, Inc. | |
4.100% | | | 02/01/2021 | | | | | | 300,000 | | | | 327,337 | |
Hess Corp. | |
7.300% | | | 08/15/2031 | | | | | | 250,000 | | | | 321,733 | |
Kinder Morgan Energy Partners LP | |
6.550% | | | 09/15/2040 | | | | | | 300,000 | | | | 337,216 | |
6.500% | | | 02/01/2037 | | | | | | 300,000 | | | | 331,415 | |
5.950% | | | 02/15/2018 | | | | | | 300,000 | | | | 343,179 | |
Marathon Oil Corp. | |
5.900% | | | 03/15/2018 | | | | | | 455,000 | | | | 533,360 | |
Nexen, Inc. (Canada) | |
6.400% | | | 05/15/2037 | | | | | | 500,000 | | | | 531,332 | |
ONEOK Partners LP | |
6.150% | | | 10/01/2016 | | | | | | 160,000 | | | | 183,921 | |
Pemex Project Funding Master Trust | |
6.625% | | | 06/15/2035 | | | | | | 500,000 | | | | 571,875 | |
Petrobras International Finance Co. (Cayman Islands) | |
8.375% | | | 12/10/2018 | | | | | | 250,000 | | | | 306,250 | |
6.750% | | | 01/27/2041 | | | † | | | 300,000 | | | | 346,240 | |
6.125% | | | 10/06/2016 | | | | | | 500,000 | | | | 556,782 | |
5.375% | | | 01/27/2021 | | | | | | 300,000 | | | | 316,680 | |
Petro-Canada (Canada) | |
5.950% | | | 05/15/2035 | | | | | | 100,000 | | | | 115,439 | |
| | | | | | | | | | | | | | |
| | | | | |
Coupon
Rate | |
| Maturity
Date |
| | | | | Face | | | | Value | |
| | | | | | | | | | | | | | |
Petroleos Mexicanos (Mexico) | |
8.000% | | | 05/03/2019 | | | | | $ | 250,000 | | | $ | 313,125 | |
Plains All American Pipeline LP/PAA Finance Corp. | |
3.950% | | | 09/15/2015 | | | | | | 300,000 | | | | 317,955 | |
Shell International Finance BV (Netherlands) | |
5.200% | | | 03/22/2017 | | | | | | 500,000 | | | | 585,277 | |
3.100% | | | 06/28/2015 | | | | | | 100,000 | | | | 107,303 | |
Southern Natural Gas Co./Southern Natural Issuing Corp. | |
4.400% | | | 06/15/2021 | | | | | | 200,000 | | | | 206,752 | |
Statoil ASA (Norway) | |
5.100% | | | 08/17/2040 | | | | | | 300,000 | | | | 356,561 | |
Suncor Energy, Inc. (Canada) | |
7.150% | | | 02/01/2032 | | | | | | 500,000 | | | | 643,519 | |
Tennessee Gas Pipeline Co. | |
7.000% | | | 10/15/2028 | | | | | | 350,000 | | | | 403,993 | |
Texas Eastern Transmission LP | |
7.000% | | | 07/15/2032 | | | | | | 150,000 | | | | 191,884 | |
Total Capital SA (France) | |
4.450% | | | 06/24/2020 | | | | | | 300,000 | | | | 334,753 | |
3.000% | | | 06/24/2015 | | | | | | 300,000 | | | | 317,333 | |
TransCanada PipeLines Ltd. (Canada) | |
5.850% | | | 03/15/2036 | | | | | | 500,000 | | | | 595,628 | |
4.000% | | | 06/15/2013 | | | | | | 250,000 | | | | 260,262 | |
Valero Energy Corp. | |
6.125% | | | 06/15/2017 | | | | | | 250,000 | | | | 279,485 | |
4.750% | | | 06/15/2013 | | | | | | 500,000 | | | | 523,572 | |
Williams Cos., Inc. | |
7.875% | | | 09/01/2021 | | | | | | 230,000 | | | | 283,568 | |
Williams Partners LP | |
6.300% | | | 04/15/2040 | | | | | | 100,000 | | | | 122,373 | |
5.250% | | | 03/15/2020 | | | | | | 100,000 | | | | 110,883 | |
3.800% | | | 02/15/2015 | | | | | | 100,000 | | | | 105,057 | |
| | | | | | | | | | | | | | |
| | | | | | | | | | | | | 20,998,149 | |
| | | | | | | | | | | | | | |
| Paper & Forest Products—0.1% | |
International Paper Co. | |
7.500% | | | 08/15/2021 | | | | | | 500,000 | | | | 618,284 | |
| | | | | | | | | | | | | | |
| Pharmaceuticals—0.8% | |
Abbott Laboratories | |
5.875% | | | 05/15/2016 | | | | | | 700,000 | | | | 821,982 | |
5.125% | | | 04/01/2019 | | | | | | 300,000 | | | | 348,878 | |
AstraZeneca plc (United Kingdom) | |
5.900% | | | 09/15/2017 | | | | | | 250,000 | | | | 302,350 | |
Bristol-Myers Squibb Co. | |
5.875% | | | 11/15/2036 | | | | | | 155,000 | | | | 197,946 | |
5.450% | | | 05/01/2018 | | | | | | 250,000 | | | | 300,207 | |
Eli Lilly & Co. | |
6.770% | | | 01/01/2036 | | | | | | 250,000 | | | | 351,846 | |
GlaxoSmithKline Capital, Inc. | |
4.850% | | | 05/15/2013 | | | | | | 500,000 | | | | 529,340 | |
4.375% | | | 04/15/2014 | | | | | | 500,000 | | | | 541,412 | |
Johnson & Johnson | |
4.950% | | | 05/15/2033 | | | | | | 200,000 | | | | 240,363 | |
4.850% | | | 05/15/2041 | | | | | | 200,000 | | | | 241,011 | |
3.550% | | | 05/15/2021 | | | | | | 200,000 | | | | 223,306 | |
2.150% | | | 05/15/2016 | | | | | | 200,000 | | | | 208,810 | |
Merck & Co., Inc. | |
6.550% | | | 09/15/2037 | | | | | | 200,000 | | | | 279,825 | |
6.500% | | | 12/01/2033 | | | | | | 250,000 | | | | 345,650 | |
4.750% | | | 03/01/2015 | | | | | | 350,000 | | | | 391,098 | |
4.375% | | | 02/15/2013 | | | | | | 200,000 | | | | 208,652 | |
Novartis Capital Corp. | |
2.900% | | | 04/24/2015 | | | | | | 200,000 | | | | 211,834 | |
1.900% | | | 04/24/2013 | | | | | | 200,000 | | | | 203,992 | |
See accompanying notes to financial statements.
251
SCHEDULE OF INVESTMENTS—(Continued)
December 31, 2011
| | | | | | | | | | | | | | |
| Vantagepoint Core Bond Index Fund | | | | | | | | |
| | | | |
Coupon
Rate | | Maturity
Date | | | | | Face | | | Value | |
| | | | | | | | | | | | | | |
| CORPORATE OBLIGATIONS—(Continued) | |
Novartis Securities Investment Ltd. (Bermuda) | |
5.125% | | | 02/10/2019 | | | | | $ | 500,000 | | | $ | 588,518 | |
Pfizer, Inc. | |
5.350% | | | 03/15/2015 | | | | | | 500,000 | | | | 566,014 | |
Pharmacia Corp. | |
6.500% | | | 12/01/2018 | | | | | | 350,000 | | | | 438,872 | |
Sanofi (France) | |
2.625% | | | 03/29/2016 | | | | | | 400,000 | | | | 417,509 | |
Teva Pharmaceutical Finance Co. LLC | |
6.150% | | | 02/01/2036 | | | | | | 250,000 | | | | 304,891 | |
Wyeth | |
6.500% | | | 02/01/2034 | | | | | | 250,000 | | | | 339,306 | |
5.500% | | | 03/15/2013 | | | | | | 100,000 | | | | 105,742 | |
5.500% | | | 02/01/2014 | | | | | | 250,000 | | | | 274,201 | |
| | | | | | | | | | | | | | |
| | | | | | | | | | | | | 8,983,555 | |
| | | | | | | | | | | | | | |
| Real Estate Investment Trusts (REITs)—0.3% | |
Boston Properties LP | |
4.125% | | | 05/15/2021 | | | | | | 300,000 | | | | 303,056 | |
Camden Property Trust | |
5.000% | | | 06/15/2015 | | | | | | 200,000 | | | | 212,586 | |
Duke Realty LP | |
7.375% | | | 02/15/2015 | | | | | | 150,000 | | | | 164,845 | |
ERP Operating LP | |
5.375% | | | 08/01/2016 | | | | | | 500,000 | | | | 544,529 | |
5.200% | | | 04/01/2013 | | | † | | | 250,000 | | | | 259,360 | |
HCP, Inc. | |
2.700% | | | 02/01/2014 | | | | | | 300,000 | | | | 299,714 | |
HCP, Inc. MTN | |
6.700% | | | 01/30/2018 | | | | | | 250,000 | | | | 278,256 | |
Health Care REIT, Inc. | |
6.125% | | | 04/15/2020 | | | | | | 300,000 | | | | 311,338 | |
ProLogis LP | |
7.375% | | | 10/30/2019 | | | | | | 350,000 | | | | 396,024 | |
Realty Income Corp. | |
5.875% | | | 03/15/2035 | | | | | | 200,000 | | | | 204,740 | |
Simon Property Group LP | |
4.375% | | | 03/01/2021 | | | † | | | 400,000 | | | | 424,051 | |
2.800% | | | 01/30/2017 | | | † | | | 300,000 | | | | 306,791 | |
| | | | | | | | | | | | | | |
| | | | | | | | | | | | | 3,705,290 | |
| | | | | | | | | | | | | | |
| Road & Rail—0.3% | |
Burlington Northern Santa Fe LLC | |
5.650% | | | 05/01/2017 | | | | | | 500,000 | | | | 577,700 | |
3.450% | | | 09/15/2021 | | | | | | 200,000 | | | | 206,553 | |
Canadian National Railway Co. (Canada) | |
4.400% | | | 03/15/2013 | | | | | | 585,000 | | | | 610,066 | |
CSX Corp. | |
7.375% | | | 02/01/2019 | | | | | | 300,000 | | | | 374,462 | |
6.000% | | | 10/01/2036 | | | | | | 334,000 | | | | 394,951 | |
Norfolk Southern Corp. | |
5.900% | | | 06/15/2019 | | | | | | 300,000 | | | | 365,090 | |
3.250% | | | 12/01/2021 | | | | | | 200,000 | | | | 203,356 | |
Ryder System, Inc. MTN | |
3.150% | | | 03/02/2015 | | | | | | 300,000 | | | | 308,531 | |
Union Pacific Corp. | |
6.625% | | | 02/01/2029 | | | | | | 250,000 | | | | 329,188 | |
5.780% | | | 07/15/2040 | | | | | | 300,000 | | | | 364,726 | |
| | | | | | | | | | | | | | |
| | | | | | | | | | | | | 3,734,623 | |
| | | | | | | | | | | | | | |
| | | | | | | | | | | | | | |
| | | | | |
Coupon
Rate | |
| Maturity
Date |
| | | | | Face | | | | Value | |
| | | | | | | | | | | | | | |
| Semiconductors & Semiconductor Equipment—0.1% | |
Intel Corp. | |
4.800% | | | 10/01/2041 | | | | | $ | 300,000 | | | $ | 337,608 | |
3.300% | | | 10/01/2021 | | | | | | 300,000 | | | | 316,688 | |
| | | | | | | | | | | | | | |
| | | | | | | | | | | | | 654,296 | |
| | | | | | | | | | | | | | |
| Software—0.2% | |
Microsoft Corp. | |
4.500% | | | 10/01/2040 | | | | | | 300,000 | | | | 339,989 | |
1.625% | | | 09/25/2015 | | | | | | 400,000 | | | | 411,892 | |
0.875% | | | 09/27/2013 | | | | | | 300,000 | | | | 302,736 | |
Oracle Corp. | |
5.375% | | | 07/15/2040 | | | | | | 500,000 | | | | 611,560 | |
5.250% | | | 01/15/2016 | | | | | | 500,000 | | | | 577,882 | |
| | | | | | | | | | | | | | |
| | | | | | | | | | | | | 2,244,059 | |
| | | | | | | | | | | | | | |
| Specialty Retail—0.2% | |
Gap, Inc. (The) | |
5.950% | | | 04/12/2021 | | | | | | 200,000 | | | | 191,093 | |
Home Depot, Inc. (The) | |
5.875% | | | 12/16/2036 | | | | | | 550,000 | | | | 692,665 | |
5.400% | | | 03/01/2016 | | | | | | 400,000 | | | | 462,424 | |
Lowe’s Cos., Inc. | |
5.400% | | | 10/15/2016 | | | | | | 400,000 | | | | 462,825 | |
| | | | | | | | | | | | | | |
| | | | | | | | | | | | | 1,809,007 | |
| | | | | | | | | | | | | | |
| Thrifts & Mortgage Finance—0.0% | |
Abbey National Treasury Services plc (United Kingdom) | |
2.875% | | | 04/25/2014 | | | | | | 300,000 | | | | 279,828 | |
| | | | | | | | | | | | | | |
| Tobacco—0.3% | |
Altria Group, Inc. | |
9.950% | | | 11/10/2038 | | | | | | 300,000 | | | | 457,680 | |
9.250% | | | 08/06/2019 | | | | | | 800,000 | | | | 1,075,765 | |
Lorillard Tobacco Co. | |
6.875% | | | 05/01/2020 | | | | | | 300,000 | | | | 335,771 | |
Philip Morris International, Inc. | |
5.650% | | | 05/16/2018 | | | | | | 500,000 | | | | 592,219 | |
4.375% | | | 11/15/2041 | | | | | | 200,000 | | | | 208,743 | |
2.900% | | | 11/15/2021 | | | | | | 200,000 | | | | 204,346 | |
| | | | | | | | | | | | | | |
| | | | | | | | | | | | | 2,874,524 | |
| | | | | | | | | | | | | | |
| Transportation Infrastructure—0.0% | |
United Parcel Service, Inc. | |
6.200% | | | 01/15/2038 | | | | | | 300,000 | | | | 405,011 | |
| | | | | | | | | | | | | | |
| Wireless Telecommunication Services—0.3% | |
America Movil SAB de CV (Mexico) | |
6.125% | | | 03/30/2040 | | | † | | | 300,000 | | | | 359,687 | |
5.000% | | | 03/30/2020 | | | † | | | 400,000 | | | | 443,909 | |
Cellco Partnership/Verizon Wireless Capital LLC | |
7.375% | | | 11/15/2013 | | | | | | 300,000 | | | | 334,180 | |
Rogers Communications, Inc. (Canada) | |
6.800% | | | 08/15/2018 | | | | | | 500,000 | | | | 609,907 | |
Vodafone Group plc (United Kingdom) | |
7.875% | | | 02/15/2030 | | | | | | 250,000 | | | | 364,116 | |
6.150% | | | 02/27/2037 | | | | | | 200,000 | | | | 249,756 | |
5.625% | | | 02/27/2017 | | | | | | 500,000 | | | | 581,226 | |
5.375% | | | 01/30/2015 | | | | | | 250,000 | | | | 277,282 | |
| | | | | | | | | | | | | | |
| | | | | | | | | | | | | 3,220,063 | |
| | | | | | | | | | | | | | |
| TOTAL CORPORATE OBLIGATIONS | |
(Cost $211,592,868) | | | | | | | | | | 224,671,992 | |
| | | | | | | | | | | | | | |
See accompanying notes to financial statements.
252
SCHEDULE OF INVESTMENTS—(Continued)
December 31, 2011
| | | | | | | | | | | | | | |
| Vantagepoint Core Bond Index Fund | | | | | | | | |
| | | | |
Coupon
Rate | | Maturity
Date | | | | | Face | | | Value | |
| | | | | | | | | | | | | | |
| MORTGAGE-RELATED SECURITIES—33.7% | |
| Commercial Mortgage-Backed Securities—2.0% | |
Banc of America Commercial Mortgage, Inc.,
Series 2005-1, Class A4 | |
5.066% | | | 11/10/2042 | | | # | | $ | 500,000 | | | $ | 516,023 | |
Banc of America Commercial Mortgage, Inc.,
Series 2005-6, Class AM | |
5.193% | | | 09/10/2047 | | | # | | | 1,000,000 | | | | 1,069,151 | |
Banc of America Commercial Mortgage, Inc.,
Series 2007-5, Class A4 | |
5.492% | | | 02/10/2051 | | | | | | 2,000,000 | | | | 2,167,887 | |
Banc of America Merrill Lynch Commercial Mortgage, Inc.,
Series 2006-3, Class A4 | |
5.889% | | | 07/10/2044 | | | # | | | 500,000 | | | | 549,983 | |
Bear Stearns Commercial Mortgage Securities,
Series 2005-T20, Class A4A | |
5.145% | | | 10/12/2042 | | | # | | | 921,000 | | | | 1,022,872 | |
Bear Stearns Commercial Mortgage Securities,
Series 2006-T24, Class A4 | |
5.537% | | | 10/12/2041 | | | | | | 1,000,000 | | | | 1,128,619 | |
Citigroup Commercial Mortgage Trust,
Series 2004-C1, Class A3 | |
5.251% | | | 04/15/2040 | | | # | | | 415,838 | | | | 429,718 | |
Citigroup/Deutsche Bank Commercial Mortgage Trust,
Series 2005-CD1, Class A4 | |
5.225% | | | 07/15/2044 | | | # | | | 900,000 | | | | 998,816 | |
Greenwich Capital Commercial Funding Corp.,
Series 2007-GG11, Class A4 | |
5.736% | | | 12/10/2049 | | | | | | 1,000,000 | | | | 1,083,272 | |
Greenwich Capital Commercial Funding Corp.,
Series 2007-GG9, Class A4 | |
5.444% | | | 03/10/2039 | | | | | | 1,000,000 | | | | 1,086,497 | |
GS Mortgage Securities Corp. II,
Series 2004-GG2, Class A6 | |
5.396% | | | 08/10/2038 | | | # | | | 600,000 | | | | 643,734 | |
GS Mortgage Securities Corp. II,
Series 2006-GG6, Class A4 | |
5.553% | | | 04/10/2038 | | | # | | | 800,000 | | | | 872,432 | |
GS Mortgage Securities Corp. II,
Series 2006-GG8, Class A4 | |
5.560% | | | 11/10/2039 | | | | | | 1,200,000 | | | | 1,322,124 | |
JP Morgan Chase Commercial Mortgage Securities Corp.,
Series 2005-LDP2, Class A4 | |
4.738% | | | 07/15/2042 | | | | | | 935,000 | | | | 1,011,202 | |
JP Morgan Chase Commercial Mortgage Securities Corp.,
Series 2006-CB17, Class AM | |
5.464% | | | 12/12/2043 | | | | | | 750,000 | | | | 738,297 | |
JP Morgan Chase Commercial Mortgage Securities Corp.,
Series 2007-CB20, Class A4 | |
5.794% | | | 02/12/2051 | | | #† | | | 500,000 | | | | 552,839 | |
LB-UBS Commercial Mortgage Trust,
Series 2007-C2, Class A3 | |
5.430% | | | 02/15/2040 | | | | | | 750,000 | | | | 803,104 | |
Merrill Lynch/Countrywide Commercial Mortgage Trust,
Series 2006-3, Class A4 | |
5.414% | | | 07/12/2046 | | | # | | | 750,000 | | | | 828,949 | |
Merrill Lynch/Countrywide Commercial Mortgage Trust,
Series 2006-3, Class AJ | |
5.485% | | | 07/12/2046 | | | # | | | 500,000 | | | | 378,927 | |
| | | | | | | | | | | | | | |
| | | | | |
Coupon
Rate | |
| Maturity
Date |
| | | | | Face | | | | Value | |
| | | | | | | | | | | | | | |
Morgan Stanley Capital I,
Series 2007-HQ13, Class A2 | |
5.649% | | | 12/15/2044 | | | | | $ | 1,400,000 | | | $ | 1,430,116 | |
Wachovia Bank Commercial Mortgage Trust,
Series 2003-C5, Class A2 | |
3.989% | | | 06/15/2035 | | | | | | 750,000 | | | | 766,723 | |
Wachovia Bank Commercial Mortgage Trust,
Series 2003-C9, Class A4 | |
5.012% | | | 12/15/2035 | | | # | | | 750,000 | | | | 791,161 | |
Wachovia Bank Commercial Mortgage Trust,
Series 2004-C11, Class A5 | |
5.215% | | | 01/15/2041 | | | # | | | 500,000 | | | | 536,527 | |
Wachovia Bank Commercial Mortgage Trust,
Series 2004-C12, Class A4 | |
5.316% | | | 07/15/2041 | | | # | | | 750,000 | | | | 807,109 | |
Wachovia Bank Commercial Mortgage Trust,
Series 2004-C15, Class B | |
4.892% | | | 10/15/2041 | | | | | | 1,000,000 | | | | 997,650 | |
Wachovia Bank Commercial Mortgage Trust,
Series 2006-C26, Class AJ | |
6.000% | | | 06/15/2045 | | | # | | | 1,000,000 | | | | 808,762 | |
| | | | | | | | | | | | | | |
| | | | | | | | | | | | | 23,342,494 | |
| | | | | | | | | | | | | | |
U.S. Government Agency Mortgage-Backed
Securities—31.7% | �� |
Federal Home Loan Mortgage Corp. | |
7.500% | | | 06/01/2027- | | | | | | | | | | | |
| | | 10/01/2029 | | | | | | 282,927 | | | | 335,116 | |
7.000% | | | 02/01/2016- | | | | | | | | | | | |
| | | -09/01/2036 | | | | | | 645,960 | | | | 737,583 | |
6.500% | | | 07/01/2014- | | | | | | | | | | | |
| | | 01/01/2039 | | | | | | 3,138,320 | | | | 3,533,404 | |
6.081% | | | 01/01/2037 | | | # | | | 627,080 | | | | 680,534 | |
6.000% | | | 11/01/2016- | | | | | | | | | | | |
| | | 10/01/2038 | | | | | | 8,390,993 | | | | 9,266,689 | |
5.799% | | | 01/01/2037 | | | # | | | 180,495 | | | | 194,869 | |
5.638% | | | 02/01/2037 | | | # | | | 306,001 | | | | 330,397 | |
5.500% | | | 02/01/2018- | | | | | | | | | | | |
| | | 08/01/2039 | | | | | | 14,198,328 | | | | 15,466,829 | |
5.000% | | | 08/01/2017- | | | | | | | | | | | |
| | | 04/01/2041 | | | | | | 20,459,509 | | | | 22,044,511 | |
4.500% | | | 08/01/2018- | | | | | | | | | | | |
| | | 06/01/2041 | | | | | | 21,285,095 | | | | 22,603,510 | |
4.000% | | | 05/01/2019- | | | | | | | | | | | |
| | | 07/01/2041 | | | | | | 16,917,949 | | | | 17,800,404 | |
3.500% | | | 10/01/2025- | | | | | | | | | | | |
| | | 10/01/2040 | | | | | | 5,696,049 | | | | 5,926,611 | |
3.428% | | | 06/01/2041 | | | # | | | 251,964 | | | | 263,544 | |
Federal Home Loan Mortgage Corp. TBA | |
4.500%- 5.500% | | | 01/15/2042 | | | | | | 4,500,000 | | | | 4,766,766 | |
4.000% | | | 01/15/2042 | | | | | | 500,000 | | | | 524,531 | |
3.500% | | | 01/25/2027- | | | | | | | | | | | |
| | | 01/15/2042 | | | | | | 1,200,000 | | | | 1,249,625 | |
Federal National Mortgage Association | |
7.500% | | | 06/01/2030- | | | | | | | | | | | |
| | | 07/01/2031 | | | | | | 27,048 | | | | 30,804 | |
7.000% | | | 03/01/2030- | | | | | | | | | | | |
| | | 04/01/2038 | | | | | | 1,491,041 | | | | 1,712,740 | |
6.500% | | | 02/01/2017- | | | | | | | | | | | |
| | | 10/01/2039 | | | | | | 3,904,426 | | | | 4,400,962 | |
6.000% | | | 04/01/2014- | | | | | | | | | | | |
| | | 11/01/2039 | | | | | | 14,172,269 | | | | 15,664,669 | |
5.659% | | | 01/01/2037 | | | # | | | 1,230,247 | | | | 1,325,043 | |
See accompanying notes to financial statements.
253
SCHEDULE OF INVESTMENTS—(Continued)
December 31, 2011
| | | | | | | | | | | | | | |
| Vantagepoint Core Bond Index Fund | | | | | | | | |
| | | | |
Coupon
Rate | | Maturity
Date | | | | | Face | | | Value | |
| | | | | | | | | | | | | | |
| MORTGAGE-RELATED SECURITIES—(Continued) | |
5.500% | | | 01/01/2018- | | | | | | | | | | | |
| | | 05/01/2040 | | | | | $ | 23,782,395 | | | $ | 25,989,425 | |
5.255% | | | 02/01/2037 | | | # | | | 109,414 | | | | 115,620 | |
5.000% | | | 03/01/2018- | | | | | | | | | | | |
| | | 05/01/2041 | | | | | | 23,268,276 | | | | 25,187,025 | |
4.500% | | | 03/01/2018- | | | | | | | | | | | |
| | | 07/01/2041 | | | | | | 32,091,986 | | | | 34,238,579 | |
4.000% | | | 08/01/2018- | | | | | | | | | | | |
| | | 09/01/2041 | | | | | | 26,673,346 | | | | 28,112,239 | |
3.750% | | | 03/01/2037 | | | # | | | 2,076,736 | | | | 2,201,628 | |
3.668% | | | 05/01/2041 | | | # | | | 432,014 | | | | 453,233 | |
3.576% | | | 08/01/2040 | | | # | | | 346,628 | | | | 363,358 | |
3.500% | | | 08/01/2025- | | | | | | | | | | | |
| | | 01/01/2041 | | | | | | 7,944,653 | | | | 8,296,746 | |
3.448% | | | 02/01/2041 | | | # | | | 249,210 | | | | 259,432 | |
3.226% | | | 07/01/2040 | | | # | | | 707,219 | | | | 739,946 | |
3.121% | | | 06/01/2040 | | | # | | | 286,917 | | | | 297,848 | |
2.587% | | | 05/01/2035 | | | # | | | 255,978 | | | | 271,297 | |
2.517% | | | 10/01/2035 | | | # | | | 806,849 | | | | 853,541 | |
2.413% | | | 05/01/2035 | | | # | | | 688,865 | | | | 726,364 | |
Federal National Mortgage Association TBA | |
5.000%-6.500% | |
| 01/25/2027-
01/25/2042 |
| | | | | 3,900,000 | | | | 4,187,704 | |
4.500% | | | 01/25/2042 | | | | | | 5,100,000 | | | | 5,428,312 | |
4.000% | |
| 01/25/2027-
01/25/2042 |
| | | | | 4,100,000 | | | | 4,313,891 | |
3.500% | |
| 01/25/2027-
01/25/2042 |
| | | | | 3,700,000 | | | | 3,835,594 | |
Government National Mortgage Association | |
7.500% | |
| 12/15/2029-
05/15/2032 |
| | | | | 386,975 | | | | 455,098 | |
7.000% | | | 09/15/2037 | | | | | | 48,903 | | | | 57,127 | |
6.500% | |
| 03/15/2026-
01/15/2039 |
| | | | | 1,801,155 | | | | 2,068,303 | |
6.000% | |
| 02/15/2033-
12/15/2039 |
| | | | | 4,779,132 | | | | 5,426,815 | |
5.500% | |
| 01/15/2024-
07/20/2040 |
| | | | | 7,386,876 | | | | 8,320,276 | |
5.000% | |
| 05/15/2033-
10/20/2041 |
| | | | | 17,311,074 | | | | 19,239,467 | |
4.500% | |
| 04/20/2026-
07/15/2041 |
| | | | | 25,918,272 | | | | 28,311,616 | |
4.000% | |
| 08/15/2024-
12/15/2041 |
| | | | | 13,151,313 | | | | 14,136,955 | |
3.500% | |
| 12/15/2025-
11/20/2041 |
| | | | | 1,114,220 | | | | 1,167,821 | |
3.500% | | | 12/20/2040 | | | # | | | 460,583 | | | | 486,671 | |
3.000% | |
| 02/20/2041-
11/20/2041 |
| | # | | | 972,988 | | | | 1,016,372 | |
2.500% | |
| 11/20/2040-
12/20/2040 |
| | # | | | 958,466 | | | | 986,532 | |
Government National Mortgage Association TBA | |
5.500% | | | 01/15/2042 | | | | | | 400,000 | | | | 449,000 | |
4.500% | | | 01/15/2042 | | | | | | 400,000 | | | | 435,938 | |
4.000% | | | 01/15/2042 | | | | | | 2,000,000 | | | | 2,145,937 | |
| | | | | | | | | | | | | | |
| | | | | | | | | | | | | 359,434,851 | |
| | | | | | | | | | | | | | |
| TOTAL MORTGAGE-RELATED SECURITIES | |
(Cost $363,611,610) | | | | | | | 382,777,345 | |
| | | | | | | | | | | | | | |
| | | | | | | | | | | | | | |
| | | | | |
Coupon
Rate | |
| Maturity
Date |
| | | | | Face | | | | Value | |
| | | | | | | | | | | | | | |
| U.S. TREASURY OBLIGATIONS—34.8% | |
| U.S. Treasury Bonds—7.5% | |
U.S. Treasury Bond | |
11.250% | | | 02/15/2015 | | | † | | $ | 1,300,000 | | | $ | 1,734,890 | |
9.875% | | | 11/15/2015 | | | † | | | 2,550,000 | | | | 3,458,040 | |
9.125% | | | 05/15/2018 | | | † | | | 1,060,000 | | | | 1,581,637 | |
8.750% | |
| 05/15/2017-
08/15/2020 |
| | | | | 2,910,000 | | | | 4,380,434 | |
8.500% | | | 02/15/2020 | | | † | | | 1,221,000 | | | | 1,878,146 | |
8.125% | | | 05/15/2021 | | | | | | 1,780,000 | | | | 2,769,847 | |
8.125% | |
| 08/15/2019-
08/15/2021 |
| | † | | | 2,660,000 | | | | 3,987,960 | |
8.000% | | | 11/15/2021 | | | | | | 1,320,000 | | | | 2,063,325 | |
7.625% | |
| 11/15/2022-
02/15/2025 |
| | | | | 1,300,000 | | | | 2,060,140 | |
7.500% | | | 11/15/2024 | | | † | | | 475,000 | | | | 758,145 | |
7.250% | |
| 05/15/2016-
08/15/2022 |
| | | | | 2,310,000 | | | | 3,126,887 | |
7.125% | | | 02/15/2023 | | | | | | 723,000 | | | | 1,093,538 | |
6.875% | | | 08/15/2025 | | | | | | 300,000 | | | | 462,047 | |
6.625% | | | 02/15/2027 | | | † | | | 300,000 | | | | 461,672 | |
6.500% | | | 11/15/2026 | | | | | | 800,000 | | | | 1,213,875 | |
6.375% | | | 08/15/2027 | | | | | | 300,000 | | | | 454,781 | |
6.250% | | | 05/15/2030 | | | | | | 800,000 | | | | 1,237,375 | |
6.250% | | | 08/15/2023 | | | † | | | 1,700,000 | | | | 2,433,390 | |
6.125% | |
| 11/15/2027-
08/15/2029 |
| | | | | 1,100,000 | | | | 1,646,609 | |
6.000% | | | 02/15/2026 | | | | | | 565,000 | | | | 814,394 | |
5.375% | | | 02/15/2031 | | | | | | 600,000 | | | | 855,281 | |
5.250% | |
| 11/15/2028-
02/15/2029 |
| | | | | 1,000,000 | | | | 1,380,313 | |
5.000% | | | 05/15/2037 | | | | | | 710,000 | | | | 999,104 | |
4.750% | |
| 02/15/2037-
02/15/2041 |
| | | | | 3,200,000 | | | | 4,396,609 | |
4.625% | | | 02/15/2040 | | | | | | 3,100,000 | | | | 4,181,609 | |
4.500% | |
| 02/15/2036-
08/15/2039 |
| | | | | 4,300,000 | | | | 5,671,361 | |
4.375% | |
| 02/15/2038-
05/15/2041 |
| | | | | 10,070,000 | | | | 13,086,440 | |
4.250% | |
| 05/15/2039-
11/15/2040 |
| | | | | 4,900,000 | | | | 6,243,861 | |
3.875% | | | 08/15/2040 | | | | | | 3,000,000 | | | | 3,596,718 | |
3.750% | | | 08/15/2041 | | | | | | 2,500,000 | | | | 2,940,625 | |
3.500% | | | 02/15/2039 | | | | | | 1,800,000 | | | | 2,025,000 | |
3.125% | | | 11/15/2041 | | | | | | 2,000,000 | | | | 2,095,626 | |
| | | | | | | | | | | | | | |
| | | | | | | | | | | | | 85,089,679 | |
| | | | | | | | | | | | | | |
| U.S. Treasury Notes—27.3% | |
U.S. Treasury Note | |
5.125% | | | 05/15/2016 | | | | | | 1,500,000 | | | | 1,785,117 | |
4.875% | | | 08/15/2016 | | | | | | 1,600,000 | | | | 1,897,875 | |
4.750% | | | 05/15/2014 | | | | | | 1,710,000 | | | | 1,889,016 | |
4.750% | | | 08/15/2017 | | | † | | | 1,300,000 | | | | 1,565,485 | |
4.625% | |
| 11/15/2016-
02/15/2017 |
| | | | | 2,260,000 | | | | 2,672,466 | |
4.500% | |
| 11/15/2015-
02/15/2016 |
| | | | | 2,340,000 | | | | 2,697,378 | |
4.250% | |
| 08/15/2013-
11/15/2017 |
| | | | | 11,335,000 | | | | 12,511,279 | |
4.125% | | | 05/15/2015 | | | | | | 1,530,000 | | | | 1,716,588 | |
4.000% | |
| 02/15/2014-
08/15/2018 |
| | | | | 6,050,000 | | | | 6,757,337 | |
See accompanying notes to financial statements.
254
SCHEDULE OF INVESTMENTS—(Continued)
December 31, 2011
| | | | | | | | | | | | | | |
| Vantagepoint Core Bond Index Fund | | | | | | | | |
| | | | |
Coupon
Rate | | Maturity
Date | | | | | Face | | | Value | |
| | | | | | | | | | | | | | |
| U.S. TREASURY OBLIGATIONS—(Continued) | |
3.875% | |
| 02/15/2013-
05/15/2018 |
| | | | $ | 2,555,000 | | | $ | 2,852,203 | |
3.750% | | | 11/15/2018 | | | † | | | 2,200,000 | | | | 2,559,735 | |
3.625% | |
| 05/15/2013-
02/15/2021 |
| | | | | 11,870,000 | | | | 13,483,408 | |
3.500% | |
| 05/31/2013-
05/15/2020 |
| | | | | 6,835,000 | | | | 7,793,385 | |
3.375% | |
| 06/30/2013-
11/15/2019 |
| | | | | 7,475,000 | | | | 8,085,235 | |
3.250% | |
| 05/31/2016-
06/30/2016 |
| | † | | | 2,400,000 | | | | 2,664,375 | |
3.250% | |
| 07/31/2016-
03/31/2017 |
| | | | | 5,400,000 | | | | 6,029,338 | |
3.125% | |
| 08/31/2013-
05/15/2021 |
| | | | | 15,030,000 | | | | 16,484,462 | |
3.125% | |
| 04/30/2013-
10/31/2016 |
| | † | | | 2,955,000 | | | | 3,143,530 | |
3.000% | |
| 08/31/2016-
02/28/2017 |
| | | | | 5,900,000 | | | | 6,512,595 | |
2.875% | |
| 01/31/2013-
03/31/2018 |
| | | | | 3,100,000 | | | | 3,235,864 | |
2.750% | |
| 02/28/2013-
02/15/2019 |
| | | | | 11,030,000 | | | | 11,909,340 | |
2.750% | | | 02/28/2018 | | | † | | | 1,200,000 | | | | 1,315,876 | |
2.625% | |
| 02/29/2016-
01/31/2018 |
| | † | | | 2,535,000 | | | | 2,751,237 | |
2.625% | |
| 06/30/2014-
11/15/2020 |
| | | | | 21,850,000 | | | | 23,406,577 | |
2.500% | |
| 03/31/2013-
06/30/2017 |
| | | | | 8,900,000 | | | | 9,452,134 | |
2.375% | |
| 08/31/2014-
06/30/2018 |
| | | | | 12,415,000 | | | | 13,163,730 | |
2.250% | |
| 05/31/2014-
07/31/2018 |
| | | | | 7,870,000 | | | | 8,316,202 | |
2.125% | |
| 11/30/2014-
08/15/2021 |
| | | | | 11,600,000 | | | | 12,110,595 | |
2.000% | |
| 11/30/2013-
11/15/2021 |
| | | | | 9,000,000 | | | | 9,301,720 | |
1.875% | |
| 02/28/2014-
10/31/2017 |
| | | | | 13,465,000 | | | | 14,049,457 | |
1.750% | |
| 04/15/2013-
10/31/2018 |
| | | | | 12,000,000 | | | | 12,390,649 | |
1.500% | |
| 12/31/2013-
07/31/2016 |
| | | | | 5,150,000 | | | | 5,313,486 | |
1.375% | |
| 01/15/2013-
12/31/2018 |
| | | | | 10,360,000 | | | | 10,472,258 | |
1.250% | |
| 03/15/2014-
10/31/2015 |
| | | | | 7,050,000 | | | | 7,212,890 | |
1.250% | |
| 08/31/2015-
09/30/2015 |
| | † | | | 5,400,000 | | | | 5,543,033 | |
1.125% | | | 06/15/2013 | | | | | | 1,900,000 | | | | 1,925,310 | |
1.000% | | | 10/31/2016 | | | † | | | 3,000,000 | | | | 3,029,532 | |
1.000% | |
| 07/15/2013-
09/30/2016 |
| | | | | 5,950,000 | | | | 6,022,583 | |
0.875% | | | 11/30/2016 | | | † | | | 2,500,000 | | | | 2,508,007 | |
0.875% | | | 12/31/2016 | | | | | | 2,500,000 | | | | 2,504,882 | |
0.750% | |
| 03/31/2013-
06/15/2014 |
| | | | | 8,600,000 | | | | 8,675,831 | |
0.625% | |
| 01/31/2013-
07/15/2014 |
| | | | | 5,213,000 | | | | 5,246,518 | |
| | | | | | | | | | | | | | |
| | | | | |
Coupon
Rate | |
| Maturity
Date |
| | | | | Face | | | | Value | |
| | | | | | | | | | | | | | |
0.500% | | | 10/15/2014 | | | † | | $ | 1,800,000 | | | $ | 1,807,735 | |
0.500% | |
| 05/31/2013-
08/15/2014 |
| | | | | 5,000,000 | | | | 5,022,422 | |
0.376% | | | 11/15/2014 | | | † | | | 2,500,000 | | | | 2,501,952 | |
0.375% | |
| 06/30/2013-
07/31/2013 |
| | | | | 3,250,000 | | | | 3,258,252 | |
0.250% | |
| 09/15/2014-
12/15/2014 |
| | | | | 4,000,000 | | | | 3,989,062 | |
0.250% | | | 10/31/2013 | | | † | | | 2,200,000 | | | | 2,200,689 | |
0.249% | | | 11/30/2013 | | | † | | | 1,750,000 | | | | 1,750,479 | |
0.125% | |
| 08/31/2013-
12/31/2013 |
| | | | | 5,750,000 | | | | 5,738,467 | |
| | | | | | | | | | | | | | |
| | | | | | | | | | | | | 309,227,576 | |
| | | | | | | | | | | | | | |
| TOTAL U.S. TREASURY OBLIGATIONS | |
(Cost $366,292,530) | | | | | | | 394,317,255 | |
| | | | | | | | | | | | | | |
| | | | | | | | | | | | | | | |
| GOVERNMENT RELATED OBLIGATIONS—10.4% | |
| U.S. Government Agencies—5.5% | |
Federal Farm Credit Bank | |
2.625% | | | 04/17/2014 | | | | | | 500,000 | | | | 524,218 | |
1.125% | | | 02/27/2014 | | | | | | 500,000 | | | | 507,171 | |
0.750% | | | 12/19/2014 | | | | | | 750,000 | | | | 749,603 | |
0.470% | | | 12/19/2013 | | | | | | 750,000 | | | | 749,543 | |
0.350% | | | 03/08/2013 | | | | | | 500,000 | | | | 499,965 | |
Federal Home Loan Bank | |
5.500% | |
| 08/13/2014-
07/15/2036 |
| | | | | 1,400,000 | | | | 1,665,938 | |
4.875% | | | 09/08/2017 | | | | | | 1,250,000 | | | | 1,485,078 | |
4.750% | | | 12/16/2016 | | | † | | | 1,000,000 | | | | 1,176,266 | |
4.000% | | | 01/13/2021 | | | | | | 500,000 | | | | 500,444 | |
3.625% | | | 10/18/2013 | | | | | | 900,000 | | | | 951,607 | |
3.125% | | | 12/13/2013 | | | | | | 500,000 | | | | 524,200 | |
2.875% | | | 06/12/2015 | | | | | | 900,000 | | | | 964,828 | |
1.000% | | | 08/08/2014 | | | | | | 500,000 | | | | 500,233 | |
Federal Home Loan Bank, Series 467 | |
5.250% | | | 06/18/2014 | | | | | | 1,000,000 | | | | 1,113,640 | |
Federal Home Loan Bank, Series 656 | |
5.375% | | | 05/18/2016 | | | | | | 900,000 | | | | 1,068,456 | |
Federal Home Loan Mortgage Corp. | |
6.250% | | | 07/15/2032 | | | | | | 650,000 | | | | 949,147 | |
6.000% | | | 04/16/2037 | | | | | | 600,000 | | | | 609,049 | |
5.500% | | | 07/18/2016 | | | | | | 1,000,000 | | | | 1,193,731 | |
5.125% | | | 11/17/2017 | | | † | | | 800,000 | | | | 964,523 | |
5.000% | |
| 01/30/2014-
07/15/2014 |
| | | | | 1,500,000 | | | | 1,656,142 | |
4.875% | | | 06/13/2018 | | | † | | | 1,000,000 | | | | 1,206,626 | |
4.500% | |
| 01/15/2013-
04/02/2014 |
| | | | | 1,300,000 | | | | 1,396,078 | |
4.500% | |
| 07/15/2013-
01/15/2015 |
| | † | | | 2,200,000 | | | | 2,358,898 | |
4.375% | | | 07/17/2015 | | | † | | | 1,400,000 | | | | 1,575,073 | |
4.125% | | | 09/27/2013 | | | † | | | 1,000,000 | | | | 1,064,658 | |
3.750% | | | 06/28/2013 | | | | | | 1,710,000 | | | | 1,798,368 | |
2.875% | | | 02/09/2015 | | | | | | 1,000,000 | | | | 1,067,252 | |
1.625% | | | 04/15/2013 | | | | | | 500,000 | | | | 508,564 | |
1.000% | | | 08/27/2014 | | | † | | | 500,000 | | | | 505,196 | |
0.950% | | | 11/10/2014 | | | | | | 750,000 | | | | 751,090 | |
0.800% | | | 09/29/2014 | | | | | | 300,000 | | | | 299,738 | |
0.550% | | | 09/23/2013 | | | | | | 750,000 | | | | 749,401 | |
0.500% | |
| 08/23/2013-
10/18/2013 |
| | | | | 1,500,000 | | | | 1,498,361 | |
See accompanying notes to financial statements.
255
SCHEDULE OF INVESTMENTS—(Continued)
December 31, 2011
| | | | | | | | | | | | | | |
| Vantagepoint Core Bond Index Fund | | | | | | | | |
| | | | |
Coupon
Rate | | Maturity
Date | | | | | Face | | | Value | |
| | | | | | | | | | | | | | |
| GOVERNMENT RELATED OBLIGATIONS—(Continued) | |
Federal Home Loan Mortgage Corp. MTN | |
5.050% | | | 01/26/2015 | | | | | $ | 300,000 | | | $ | 340,003 | |
Federal National Mortgage Association | |
7.250% | | | 05/15/2030 | | | | | | 400,000 | | | | 626,548 | |
6.625% | | | 11/15/2030 | | | | | | 500,000 | | | | 742,858 | |
6.250% | | | 05/15/2029 | | | | | | 740,000 | | | | 1,044,888 | |
6.000% | | | 04/18/2036 | | | | | | 250,000 | | | | 290,569 | |
5.375% | | | 04/11/2022 | | | | | | 880,000 | | | | 891,064 | |
5.000% | | | 03/15/2016 | | | | | | 900,000 | | | | 1,049,803 | |
5.000% | | | 05/11/2017 | | | † | | | 650,000 | | | | 772,455 | |
4.625% | | | 10/15/2013 | | | | | | 900,000 | | | | 968,275 | |
4.375% | |
| 03/15/2013-
10/15/2015 |
| | | | | 1,600,000 | | | | 1,760,574 | |
3.625% | | | 02/12/2013 | | | | | | 900,000 | | | | 933,602 | |
2.750% | | | 02/05/2014 | | | † | | | 2,000,000 | | | | 2,092,036 | |
2.750% | | | 03/13/2014 | | | | | | 2,000,000 | | | | 2,096,854 | |
2.625% | | | 11/20/2014 | | | | | | 1,000,000 | | | | 1,058,761 | |
2.375% | | | 07/28/2015 | | | | | | 1,000,000 | | | | 1,055,977 | |
1.750% | | | 05/07/2013 | | | | | | 1,000,000 | | | | 1,019,093 | |
1.500% | | | 09/08/2014 | | | | | | 500,000 | | | | 510,341 | |
1.125% | | | 06/27/2014 | | | † | | | 1,000,000 | | | | 1,013,597 | |
1.000% | | | 09/20/2013 | | | | | | 500,000 | | | | 500,257 | |
0.850% | | | 09/12/2014 | | | | | | 750,000 | | | | 749,410 | |
0.800% | | | 10/17/2014 | | | | | | 750,000 | | | | 750,917 | |
0.750% | | | 02/26/2013 | | | | | | 1,000,000 | | | | 1,005,871 | |
0.750% | | | 12/18/2013 | | | † | | | 1,000,000 | | | | 1,004,305 | |
0.600% | | | 03/06/2014 | | | | | | 750,000 | | | | 749,712 | |
0.500% | | | 08/09/2013 | | | † | | | 1,000,000 | | | | 1,002,759 | |
0.500% | | | 12/27/2013 | | | | | | 750,000 | | | | 750,101 | |
0.000% | | | 06/01/2017 | | | | | | 400,000 | | | | 370,287 | |
Federal National Mortgage Association, Series 1 | |
0.500% | | | 09/06/2013 | | | | | | 500,000 | | | | 500,013 | |
Financing Corp. FICO | |
8.600% | | | 09/26/2019 | | | | | | 500,000 | | | | 731,787 | |
Financing Corp. FICO, Series E | |
9.650% | | | 11/02/2018 | | | | | | 500,000 | | | | 747,482 | |
Israel Government AID Bond (Israel) | |
5.500% | | | 04/26/2024 | | | | | | 350,000 | | | | 450,014 | |
Tennessee Valley Authority | |
5.250% | | | 09/15/2039 | | | | | | 500,000 | | | | 640,830 | |
Tennessee Valley Authority, Series E | |
6.250% | | | 12/15/2017 | | | | | | 1,200,000 | | | | 1,528,393 | |
| | | | | | | | | | | | | | |
| | | | | | | | | | | | | 62,882,521 | |
| | | | | | | | | | | | | | |
| Non-U.S. Government Agencies—1.0% | |
Export Development Canada (Canada) | |
2.250% | | | 05/28/2015 | | | | | | 300,000 | | | | 314,902 | |
1.500% | | | 05/15/2014 | | | † | | | 300,000 | | | | 306,698 | |
Export-Import Bank of Korea (Korea, Republic of) | |
5.125% | | | 03/16/2015 | | | | | | 500,000 | | | | 529,381 | |
Japan Finance Corp. (Japan) | |
2.500% | | | 05/18/2016 | | | | | | 400,000 | | | | 418,710 | |
Korea Development Bank (The) (Korea, Republic of) | |
8.000% | | | 01/23/2014 | | | | | | 500,000 | | | | 550,398 | |
3.875% | | | 05/04/2017 | | | | | | 300,000 | | | | 296,995 | |
Kreditanstalt fuer Wiederaufbau (Germany) | |
4.875% | | | 01/17/2017 | | | † | | | 1,000,000 | | | | 1,166,655 | |
4.500% | | | 07/16/2018 | | | † | | | 500,000 | | | | 582,121 | |
4.125% | | | 10/15/2014 | | | | | | 1,000,000 | | | | 1,084,380 | |
| | | | | | | | | | | | | | |
| | | | | |
Coupon
Rate | |
| Maturity
Date |
| | | | | Face | | | | Value | |
| | | | | | | | | | | | | | |
4.000% | | | 01/27/2020 | | | † | | $ | 300,000 | | | $ | 339,375 | |
3.250% | | | 03/15/2013 | | | | | | 1,050,000 | | | | 1,081,599 | |
2.625% | | | 03/03/2015 | | | | | | 750,000 | | | | 786,970 | |
1.875% | | | 01/14/2013 | | | | | | 200,000 | | | | 202,516 | |
1.375% | | | 01/13/2014 | | | | | | 800,000 | | | | 807,718 | |
Kreditanstalt fuer Wiederaufbau MTN (Germany) | |
2.750% | | | 09/08/2020 | | | | | | 500,000 | | | | 518,403 | |
Landwirtschaftliche Rentenbank (Germany) | |
5.125% | | | 02/01/2017 | | | | | | 300,000 | | | | 350,613 | |
4.125% | | | 07/15/2013 | | | | | | 150,000 | | | | 157,228 | |
Landwirtschaftliche Rentenbank, Series G13 (Germany) | |
4.875% | | | 11/16/2015 | | | | | | 750,000 | | | | 851,906 | |
Oesterreichische Kontrollbank AG (Austria) | |
2.000% | | | 06/03/2016 | | | | | | 300,000 | | | | 299,330 | |
Oesterreichische Kontrollbank AG MTN (Austria) | |
1.750% | | | 03/11/2013 | | | | | | 200,000 | | | | 201,104 | |
Svensk Exportkredit AB (Sweden) | |
5.125% | | | 03/01/2017 | | | | | | 500,000 | | | | 557,671 | |
| | | | | | | | | | | | | | |
| | | | | | | | | | | | | 11,404,673 | |
| | | | | | | | | | | | | | |
| Sovereign Debt—1.2% | |
Brazilian Government International Bond (Brazil) | |
11.000% | | | 08/17/2040 | | | | | | 260,000 | | | | 344,500 | |
10.125% | | | 05/15/2027 | | | | | | 435,000 | | | | 722,100 | |
8.875% | | | 04/15/2024 | | | | | | 400,000 | | | | 598,000 | |
7.875% | | | 03/07/2015 | | | | | | 455,000 | | | | 542,587 | |
7.125% | | | 01/20/2037 | | | | | | 460,000 | | | | 637,100 | |
5.875% | | | 01/15/2019 | | | | | | 500,000 | | | | 593,750 | |
Canada Government International Bond (Canada) | |
2.375% | | | 09/10/2014 | | | | | | 500,000 | | | | 525,408 | |
Chile Government International Bond (Chile) | |
3.875% | | | 08/05/2020 | | | | | | 500,000 | | | | 543,750 | |
Colombia Government International Bond (Colombia) | |
11.750% | | | 02/25/2020 | | | | | | 200,000 | | | | 315,000 | |
10.750% | | | 01/15/2013 | | | | | | 300,000 | | | | 329,250 | |
8.125% | | | 05/21/2024 | | | | | | 200,000 | | | | 279,000 | |
7.375% | | | 09/18/2037 | | | | | | 200,000 | | | | 282,500 | |
Hungary Government International Bond (Hungary) | |
6.250% | | | 01/29/2020 | | | | | | 500,000 | | | | 452,500 | |
Mexico Government International Bond (Mexico) | |
6.050% | | | 01/11/2040 | | | | | | 500,000 | | | | 613,750 | |
5.875% | | | 02/17/2014 | | | | | | 500,000 | | | | 542,500 | |
Panama Government International Bond (Panama) | |
7.250% | | | 03/15/2015 | | | | | | 300,000 | | | | 347,250 | |
Peruvian Government International Bond (Peru) | |
6.550% | | | 03/14/2037 | | | | | | 500,000 | | | | 637,500 | |
Poland Government International Bond (Poland) | |
5.125% | | | 04/21/2021 | | | | | | 300,000 | | | | 306,000 | |
3.875% | | | 07/16/2015 | | | | | | 300,000 | | | | 306,690 | |
Republic of Finland (Finland) | |
6.950% | | | 02/15/2026 | | | | | | 150,000 | | | | 218,458 | |
Republic of Italy (Italy) | |
6.875% | | | 09/27/2023 | | | | | | 250,000 | | | | 243,350 | |
5.375% | | | 06/15/2033 | | | | | | 500,000 | | | | 423,202 | |
4.375% | | | 06/15/2013 | | | † | | | 1,000,000 | | | | 983,900 | |
Republic of Korea (Korea, Republic of) | |
5.750% | | | 04/16/2014 | | | | | | 500,000 | | | | 544,702 | |
South Africa Government International Bond (South Africa) | |
6.875% | | | 05/27/2019 | | | | | | 500,000 | | | | 605,000 | |
State of Israel (Israel) | |
5.500% | | | 11/09/2016 | | | | | | 300,000 | | | | 345,228 | |
United Mexican States (Mexico) | |
8.125% | | | 12/30/2019 | | | | | | 750,000 | | | | 1,076,250 | |
See accompanying notes to financial statements.
256
SCHEDULE OF INVESTMENTS—(Continued)
December 31, 2011
| | | | | | | | | | | | | | |
Vantagepoint Core Bond
Index Fund | | | | | | | | |
| | | | |
Coupon
Rate | | Maturity
Date | | | | | Face | | | Value | |
| | | | | | | | | | | | | | |
| GOVERNMENT RELATED OBLIGATIONS—(Continued) | |
United Mexican States MTN (Mexico) | |
8.300% | | | 08/15/2031 | | | | | $ | 200,000 | | | $ | 300,000 | |
| | | | | | | | | | | | | | |
| | | | | | | | | | | | | 13,659,225 | |
| | | | | | | | | | | | | | |
| Supranational—1.2% | |
Asian Development Bank | |
2.750% | | | 05/21/2014 | | | | | | 100,000 | | | | 105,106 | |
Asian Development Bank MTN | |
4.250% | | | 10/20/2014 | | | | | | 300,000 | | | | 329,265 | |
3.625% | | | 09/05/2013 | | | † | | | 800,000 | | | | 840,160 | |
2.500% | | | 03/15/2016 | | | † | | | 400,000 | | | | 424,859 | |
Corp. Andina de Fomento | |
3.750% | | | 01/15/2016 | | | | | | 300,000 | | | | 306,122 | |
European Bank for Reconstruction & Development MTN | |
2.500% | | | 03/15/2016 | | | | | | 500,000 | | | | 527,332 | |
European Investment Bank | |
5.125% | |
| 09/13/2016-
05/30/2017 |
| | | | | 1,000,000 | | | | 1,157,917 | |
4.625% | | | 05/15/2014 | | | | | | 500,000 | | | | 538,693 | |
3.375% | | | 06/12/2013 | | | | | | 500,000 | | | | 515,640 | |
3.000% | | | 04/08/2014 | | | | | | 500,000 | | | | 518,453 | |
2.875% | | | 09/15/2020 | | | † | | | 500,000 | | | | 501,021 | |
2.125% | | | 07/15/2016 | | | | | | 500,000 | | | | 507,847 | |
1.625% | |
| 03/15/2013-
09/01/2015 |
| | | | | 1,100,000 | | | | 1,103,778 | |
1.500% | | | 05/15/2014 | | | | | | 500,000 | | | | 502,313 | |
1.250% | | | 02/14/2014 | | | † | | | 500,000 | | | | 500,071 | |
1.125% | | | 08/15/2014 | | | † | | | 500,000 | | | | 497,978 | |
Inter-American Development Bank | |
2.250% | | | 07/15/2015 | | | | | | 200,000 | | | | 209,961 | |
1.625% | | | 07/15/2013 | | | | | | 500,000 | | | | 506,690 | |
1.375% | | | 10/18/2016 | | | | | | 300,000 | | | | 304,408 | |
Inter-American Development Bank MTN | |
3.875% | | | 02/14/2020 | | | † | | | 400,000 | | | | 464,874 | |
3.500% | | | 03/15/2013 | | | † | | | 500,000 | | | | 517,172 | |
International Bank for Reconstruction & Development | |
2.375% | | | 05/26/2015 | | | | | | 200,000 | | | | 211,172 | |
2.125% | | | 03/15/2016 | | | | | | 500,000 | | | | 525,540 | |
1.750% | | | 07/15/2013 | | | | | | 500,000 | | | | 509,413 | |
1.125% | | | 08/25/2014 | | | | | | 500,000 | | | | 508,470 | |
0.650% | | | 11/29/2013 | | | | | | 400,000 | | | | 400,050 | |
International Finance Corp. MTN | |
2.125% | | | 11/17/2017 | | | | | | 500,000 | | | | 521,587 | |
Nordic Investment Bank | |
2.500% | | | 07/15/2015 | | | | | | 500,000 | | | | 527,077 | |
| | | | | | | | | | | | | | |
| | | | | | | | | | | | | 14,082,969 | |
| | | | | | | | | | | | | | |
| U.S. Municipal Bonds—1.0% | |
American Municipal Power-Ohio, Inc. Revenue Bonds (Ohio) | |
7.499% | | | 02/15/2050 | | | | | | 200,000 | | | | 261,114 | |
Bay Area Toll Authority Revenue Bonds (California) | |
6.263% | | | 04/01/2049 | | | | | | 400,000 | | | | 522,288 | |
California General Obligation Bonds (California) | |
7.550% | | | 04/01/2039 | | | | | | 500,000 | | | | 611,860 | |
California State Public Works Board Revenue Bonds,
Series 2009 G-2 (California) | |
8.361% | | | 10/01/2034 | | | | | | 400,000 | | | | 463,340 | |
City of New York General Obligation Bonds (New York) | |
5.517% | | | 10/01/2037 | | | | | | 100,000 | | | | 113,439 | |
| | | | | | | | | | | | | | |
| | | | | |
Coupon
Rate | |
| Maturity
Date |
| | | | | Face | | | | Value | |
| | | | | | | | | | | | | | |
County of Cook Illinois General Obligation Bonds,
Series 2010 D (Illinois) | |
6.229% | | | 11/15/2034 | | | | | $ | 200,000 | | | $ | 222,450 | |
Dallas Area Rapid Transit Revenue Bonds (Texas) | |
5.022% | | | 12/01/2048 | | | | | | 300,000 | | | | 339,699 | |
Dallas Convention Center Hotel Development Corp. Revenue Bonds (Texas) | |
7.088% | | | 01/01/2042 | | | | | | 200,000 | | | | 224,780 | |
Dallas County Hospital District General Obligation Bonds, Series 2009 C (Texas) | |
5.621% | | | 08/15/2044 | | | | | | 300,000 | | | | 368,493 | |
Dallas Independent School District General Obligation Bonds,
Series 2010 C (Texas) | |
6.450% | | | 02/15/2035 | | | | | | 300,000 | | | | 354,135 | |
Government Development Bank for Puerto Rico Revenue Bonds, Series 2011 B (Puerto Rico) | |
4.704% | | | 05/01/2016 | | | | | | 400,000 | | | | 414,752 | |
3.670% | | | 05/01/2014 | | | | | | 400,000 | | | | 405,236 | |
Illinois General Obligation Bonds (Illinois) | |
5.100% | | | 06/01/2033 | | | | | | 500,000 | | | | 454,320 | |
Los Angeles Unified School District General Obligation Bonds (California) | |
5.755% | | | 07/01/2029 | | | | | | 200,000 | | | | 218,010 | |
5.750% | | | 07/01/2034 | | | | | | 300,000 | | | | 331,482 | |
Metropolitan Government of Nashville & Davidson County Authority General Obligation Bonds (Tennessee) | |
5.707% | | | 07/01/2034 | | | | | | 300,000 | | | | 352,110 | |
Metropolitan Transportation Authority Revenue Bonds (New York) | |
6.648% | | | 11/15/2039 | | | | | | 100,000 | | | | 121,412 | |
6.548% | | | 11/15/2031 | | | | | | 200,000 | | | | 237,696 | |
Municipal Electric Authority of Georgia Revenue Bonds,
Series 2010 J (Georgia) | |
6.637% | | | 04/01/2057 | | | | | | 300,000 | | | | 312,132 | |
New Jersey Economic Development Authority Revenue Bonds,
Series 1997 A (New Jersey) | |
7.425% | | | 02/15/2029 | | | | | | 200,000 | | | | 243,774 | |
New Jersey State Turnpike Authority Revenue Bonds,
Series 2003 B (New Jersey) | |
4.252% | | | 01/01/2016 | | | | | | 25,000 | | | | 27,349 | |
New Jersey State Turnpike Authority Revenue Bonds,
Series 2010 A (New Jersey) | |
7.102% | | | 01/01/2041 | | | | | | 200,000 | | | | 274,012 | |
New York City Municipal Water Finance Authority Revenue Bonds (New York) | |
5.724% | | | 06/15/2042 | | | | | | 200,000 | | | | 240,358 | |
New York State Dormitory Authority Revenue Bonds (New York) | |
5.600% | | | 03/15/2040 | | | | | | 200,000 | | | | 236,602 | |
North Texas Tollway Authority Revenue Bonds,
Series 2010 B-2 (Texas) | |
8.910% | | | 02/01/2030 | | | | | | 200,000 | | | | 225,206 | |
Ohio State University General Obligation Bonds,
Series 2010 C (Ohio) | |
4.910% | | | 06/01/2040 | | | | | | 300,000 | | | | 339,996 | |
Oregon General Obligation Bonds (Oregon) | |
5.762% | | | 06/01/2023 | | | | | | 200,000 | | | | 238,102 | |
Oregon State Department of Transportation Revenue Bonds,
Series 2010 A (Oregon) | |
5.834% | | | 11/15/2034 | | | | | | 300,000 | | | | 369,207 | |
Port Authority of New York & New Jersey Revenue Bonds (New York) | |
6.040% | | | 12/01/2029 | | | | | | 255,000 | | | | 309,285 | |
State of California General Obligation Bonds (California) | |
7.625% | | | 03/01/2040 | | | | | | 300,000 | | | | 369,405 | |
See accompanying notes to financial statements.
257
SCHEDULE OF INVESTMENTS—(Continued)
December 31, 2011
| | | | | | | | | | | | | | |
Vantagepoint Core Bond
Index Fund | | | | | |
| | | | |
Coupon
Rate | | Maturity
Date | | | | | Face | | | Value | |
| | | | | | | | | | | | | | |
| GOVERNMENT RELATED OBLIGATIONS—(Continued) | |
State of Connecticut General Obligation Bonds,
Series 2008 A (Connecticut) | |
5.850% | | | 03/15/2032 | | | | | $ | 200,000 | | | $ | 245,026 | |
State of Georgia General Obligation Bonds,
Series 2009 H (Georgia) | |
4.503% | | | 11/01/2025 | | | | | | 300,000 | | | | 337,344 | |
State of Illinois General Obligation Bonds (Illinois) | |
4.961% | | | 03/01/2016 | | | | | | 300,000 | | | | 317,157 | |
State of Texas General Obligation Bonds (Texas) | |
4.681% | | | 04/01/2040 | | | | | | 300,000 | | | | 333,375 | |
University of California Revenue Bonds (California) | |
6.548% | | | 05/15/2048 | | | | | | 300,000 | | | | 357,252 | |
| | | | | | | | | | | | | | |
| | | | | | | | | | | | | 10,792,198 | |
| | | | | | | | | | | | | | |
| Non-U.S. Regional Authority Bonds—0.5% | |
Hydro Quebec, Series IO (Canada) | |
8.050% | | | 07/07/2024 | | | | | | 250,000 | | | | 372,596 | |
Ontario Electricity Financial Corp. (Canada) | |
7.450% | | | 03/31/2013 | | | | | | 350,000 | | | | 377,773 | |
Province of British Columbia (Canada) | |
2.850% | | | 06/15/2015 | | | | | | 200,000 | | | | 212,066 | |
Province of Manitoba, Series FH (Canada) | |
4.900% | | | 12/06/2016 | | | | | | 500,000 | | | | 579,517 | |
Province of Nova Scotia (Canada) | |
2.375% | | | 07/21/2015 | | | † | | | 300,000 | | | | 312,999 | |
Province of Ontario (Canada) | |
5.450% | | | 04/27/2016 | | | | | | 1,000,000 | | | | 1,162,322 | |
4.500% | | | 02/03/2015 | | | | | | 400,000 | | | | 439,553 | |
4.400% | | | 04/14/2020 | | | † | | | 200,000 | | | | 228,281 | |
2.700% | | | 06/16/2015 | | | | | | 200,000 | | | | 209,644 | |
1.375% | | | 01/27/2014 | | | | | | 300,000 | | | | 303,295 | |
Province of Quebec (Canada) | |
4.600% | | | 05/26/2015 | | | | | | 500,000 | | | | 556,852 | |
2.750% | | | 08/25/2021 | | | † | | | 300,000 | | | | 300,298 | |
Province of Saskatchewan (Canada) | |
7.375% | | | 07/15/2013 | | | | | | 230,000 | | | | 252,489 | |
Region of Lombardy (Italy) | |
5.804% | | | 10/25/2032 | | | | | | 100,000 | | | | 82,816 | |
| | | | | | | | | | | | | | |
| | | | | | | | | | | | | 5,390,501 | |
| | | | | | | | | | | | | | |
| TOTAL GOVERNMENT RELATED OBLIGATIONS | |
(Cost $112,215,940) | | | | | | | 118,212,087 | |
| | | | | | | | | | | | | | |
| | | | | | | | | | | | | | | |
| ASSET-BACKED SECURITIES—0.3% | |
| Automobile—0.1% | |
Ally Auto Receivables Trust
Series 2010-5, Class A3 | |
1.110% | | | 01/15/2015 | | | | | | 750,000 | | | | 752,839 | |
| | | | | | | | | | | | | | |
| Credit Card—0.2% | |
Capital One Multi-Asset Execution Trust
Series 2007-A7, Class A7 | |
5.750% | | | 07/15/2020 | | | | | | 1,500,000 | | | | 1,776,100 | |
| | | | | | | | | | | | | | |
| | | | | | | | | | | | | | |
| | | | | |
Coupon
Rate | |
| Maturity
Date |
| | | | | Face | | | | Value | |
| | | | | | | | | | | | | | |
| Other—0.0% | |
CenterPoint Energy Transition Bond Co. LLC
Series 2009-1, Class A2 | |
3.460% | | | 08/15/2019 | | | | | $ | 400,000 | | | $ | 436,641 | |
| | | | | | | | | | | | | | |
| TOTAL ASSET-BACKED SECURITIES | |
(Cost $2,869,680) | | | | | | | 2,965,580 | |
| | | | | | | | | | | | | | |
| | | | | | | | | | | | | | | |
| CERTIFICATES OF DEPOSIT—0.0% | |
| Commercial Banks—0.0% | |
Royal Bank of Canada | |
2.250% | | | 03/15/2013 | | | | | | | | | | | |
(Cost $515,630) | | | | | | 500,000 | | | | 507,112 | |
| | | | | | | | | | | | | | |
| | | | | | | | | | | | | | | |
| | | | |
| | | | | | | | | | Shares | | | | Value | |
| MONEY MARKET FUNDS—8.7% | |
| Institutional Money Market Funds—8.7% | |
Dreyfus Institutional Cash Advantage Fund, 0.06% | | | ††¥ | | | 11,100,000 | | | | 11,100,000 | |
Fidelity Institutional Money Market: Money Market Portfolio—Institutional Class, 0.23% | | | ¥ | | | 31,010,798 | | | | 31,010,797 | |
Fidelity Institutional Money Market: Money Market Portfolio—Institutional Class, 0.23% | | | ††¥ | | | 12,098,878 | | | | 12,098,878 | |
Fidelity Institutional Money Market: Prime Money Market Portfolio—Institutional Class, 0.17% | | | ††¥ | | | 11,100,000 | | | | 11,100,000 | |
Short-Term Investments Trust Liquid Assets Portfolio, 0.16% | | | ††¥ | | | 11,100,000 | | | | 11,100,000 | |
Wells Fargo Advantage Cash Investment Money Market Fund—Select Class, 0.11% | | | ††¥ | | | 11,100,000 | | | | 11,100,000 | |
Wells Fargo Advantage Heritage Money Market Fund—Select Class, 0.08% | | | ††¥ | | | 11,100,000 | | | | 11,100,000 | |
| | | | | | | | | | | | | | |
| TOTAL MONEY MARKET FUNDS | |
(Cost $98,609,675) | | | | | | | 98,609,675 | |
| | | | | | | | | | | | | | |
| TOTAL INVESTMENTS—107.7% | |
(Cost $1,155,707,933) | | | | | | | 1,222,061,046 | |
Other assets less liabilities—(7.7%) | | | | (87,820,968 | ) |
| | | | | | | | | | | | | | |
| NET ASSETS—100.0% | | | | | | $ | 1,134,240,078 | |
| | | | | | | | | | | | | | |
See accompanying notes to financial statements.
258
SCHEDULE OF INVESTMENTS—(Continued)
December 31, 2011
Notes to the Schedule of Investments:
| | |
| MTN | | Medium Term Note |
| REIT | | Real Estate Investment Trust |
| TBA | | Security is subject to delayed delivery. |
| # | | Rate is subject to change. Rate shown reflects current rate. |
| † | | Denotes all or a portion of the security on loan. |
| ^ | | Securities are not registered under the Securities Act of 1933. These securities may be resold only in transactions exempt from registration, generally to qualified institutional buyers under Securities Act Rule 144A. Such securities are considered illiquid unless deemed liquid by a subadviser under the liquidity procedures adopted by the Board of Directors. The total market value of illiquid 144A securities was $424,369, which represented 0.0% of Net Assets. |
| †† | | Represents reinvestment of collateral received in conjunction with securities lending. |
| ¥ | | The rate quoted is the annualized seven-day yield of the fund at period end. |
See accompanying notes to financial statements.
259
SCHEDULE OF INVESTMENTS
December 31, 2011
| | | | | | | | | | | | |
Vantagepoint 500
Stock Index Fund | | | Shares | | | | Value | |
| | | | | | | | | | | | |
| COMMON STOCKS—98.0% | |
| Aerospace & Defense—2.6% | |
Boeing Co. (The) | | | | | 24,371 | | | $ | 1,787,613 | |
General Dynamics Corp. | | | | | 11,811 | | | | 784,369 | |
Goodrich Corp. | | | | | 4,185 | | | | 517,685 | |
Honeywell International, Inc. | | | | | 25,326 | | | | 1,376,468 | |
L-3 Communications Holdings, Inc. | | | | | 3,424 | | | | 228,312 | |
Lockheed Martin Corp. | | | | | 8,719 | | | | 705,367 | |
Northrop Grumman Corp. | | | | | 8,606 | | | | 503,279 | |
Precision Castparts Corp. | | | | | 4,725 | | | | 778,633 | |
Raytheon Co. | | | | | 11,346 | | | | 548,919 | |
Rockwell Collins, Inc. | | | | | 5,022 | | | | 278,068 | |
Textron, Inc. | | | | | 9,147 | | | | 169,128 | |
United Technologies Corp. | | | | | 29,537 | | | | 2,158,859 | |
| | | | | | | | | | | | |
| | | | | | | | | 9,836,700 | |
| | | | | | | | | | | | |
| Air Freight & Logistics—1.0% | |
C.H. Robinson Worldwide, Inc. | | | | | 5,367 | | | | 374,509 | |
Expeditors International of Washington, Inc. | | | | | 7,127 | | | | 291,922 | |
FedEx Corp. | | | | | 10,396 | | | | 868,170 | |
United Parcel Service, Inc., Class B | | | | | 31,815 | | | | 2,328,540 | |
| | | | | | | | | | | | |
| | | | | | | | | 3,863,141 | |
| | | | | | | | | | | | |
| Airlines—0.1% | |
Southwest Airlines Co. | | | | | 25,882 | | | | 221,550 | |
| | | | | | | | | | | | |
| Auto Components—0.3% | |
BorgWarner, Inc. | | * | | | 3,571 | | | | 227,616 | |
Goodyear Tire & Rubber Co. (The) | | * | | | 7,170 | | | | 101,599 | |
Johnson Controls, Inc. | | | | | 21,794 | | | | 681,280 | |
| | | | | | | | | | | | |
| | | | | | | | | 1,010,495 | |
| | | | | | | | | | | | |
| Automobiles—0.4% | |
Ford Motor Co. | | * | | | 123,585 | | | | 1,329,775 | |
Harley-Davidson, Inc. | | | | | 7,505 | | | | 291,719 | |
| | | | | | | | | | | | |
| | | | | | | | | 1,621,494 | |
| | | | | | | | | | | | |
| Beverages—2.6% | |
Beam, Inc. | | | | | 5,116 | | | | 262,093 | |
Brown-Forman Corp., Class B | | | | | 3,358 | | | | 270,352 | |
Coca-Cola Co. (The) | | | | | 74,712 | | | | 5,227,599 | |
Coca-Cola Enterprises, Inc. | | | | | 10,815 | | | | 278,811 | |
Constellation Brands, Inc., Class A | | * | | | 5,379 | | | | 111,184 | |
Dr. Pepper Snapple Group, Inc. | | † | | | 7,442 | | | | 293,810 | |
Molson Coors Brewing Co., Class B | | | | | 5,028 | | | | 218,919 | |
PepsiCo, Inc. | | | | | 51,498 | | | | 3,416,892 | |
| | | | | | | | | | | | |
| | | | | | | | | 10,079,660 | |
| | | | | | | | | | | | |
| Biotechnology—1.2% | |
Amgen, Inc. | | | | | 25,848 | | | | 1,659,700 | |
Biogen Idec, Inc. | | * | | | 7,862 | | | | 865,213 | |
Celgene Corp. | | * | | | 14,846 | | | | 1,003,589 | |
Gilead Sciences, Inc. | | * | | | 24,691 | | | | 1,010,603 | |
| | | | | | | | | | | | |
| | | | | | | | | 4,539,105 | |
| | | | | | | | | | | | |
| Building Products—0.0% | |
Masco Corp. | | | | | 10,878 | | | | 114,001 | |
| | | | | | | | | | | | |
| | | | | | | | | | | | |
| | | |
| | | | Shares | | | | Value | |
| | | | | | | | | | | | |
| Capital Markets—1.8% | |
Ameriprise Financial, Inc. | | | | | 7,688 | | | $ | 381,632 | |
Bank of New York Mellon Corp. (The) | | | | | 40,410 | | | | 804,563 | |
BlackRock, Inc. | | | | | 3,258 | | | | 580,706 | |
Charles Schwab Corp. (The) | | | | | 34,953 | | | | 393,571 | |
E*Trade Financial Corp. | | * | | | 8,183 | | | | 65,137 | |
Federated Investors, Inc., Class B | | † | | | 2,838 | | | | 42,996 | |
Franklin Resources, Inc. | | | | | 4,604 | | | | 442,260 | |
Goldman Sachs Group, Inc. (The) | | | | | 16,170 | | | | 1,462,253 | |
Invesco Ltd. | | | | | 14,822 | | | | 297,774 | |
Legg Mason, Inc. | | | | | 4,333 | | | | 104,208 | |
Morgan Stanley | | | | | 47,749 | | | | 722,442 | |
Northern Trust Corp. | | | | | 7,701 | | | | 305,422 | |
State Street Corp. | | | | | 16,251 | | | | 655,078 | |
T. Rowe Price Group, Inc. | | | | | 8,601 | | | | 489,827 | |
| | | | | | | | | | | | |
| | | | | | | | | 6,747,869 | |
| | | | | | | | | | | | |
| Chemicals—2.2% | |
Air Products & Chemicals, Inc. | | | | | 6,874 | | | | 585,596 | |
Airgas, Inc. | | | | | 2,441 | | | | 190,593 | |
CF Industries Holdings, Inc. | | | | | 2,155 | | | | 312,432 | |
Dow Chemical Co. (The) | | | | | 38,147 | | | | 1,097,108 | |
E.I. Du Pont de Nemours & Co. | | | | | 30,102 | | | | 1,378,070 | |
Eastman Chemical Co. | | | | | 4,432 | | | | 173,114 | |
Ecolab, Inc. | | † | | | 9,769 | | | | 564,746 | |
FMC Corp. | | | | | 2,227 | | | | 191,611 | |
International Flavors & Fragrances, Inc. | | | | | 2,537 | | | | 132,989 | |
Monsanto Co. | | | | | 17,439 | | | | 1,221,951 | |
Mosaic Co. (The) | | | | | 9,693 | | | | 488,818 | |
PPG Industries, Inc. | | | | | 5,123 | | | | 427,719 | |
Praxair, Inc. | | | | | 9,974 | | | | 1,066,221 | |
Sherwin-Williams Co. (The) | | | | | 2,752 | | | | 245,671 | |
Sigma-Aldrich Corp. | | | | | 3,803 | | | | 237,535 | |
| | | | | | | | | | | | |
| | | | | | | | | 8,314,174 | |
| | | | | | | | | | | | |
| Commercial Banks—2.6% | |
BB&T Corp. | | | | | 22,869 | | | | 575,613 | |
Comerica, Inc. | | | | | 5,923 | | | | 152,813 | |
Fifth Third Bancorp | | | | | 29,930 | | | | 380,710 | |
First Horizon National Corp. | | | | | 8,525 | | | | 68,200 | |
Huntington Bancshares, Inc./Ohio | | | | | 27,946 | | | | 153,424 | |
KeyCorp | | | | | 31,081 | | | | 239,013 | |
M&T Bank Corp. | | | | | 4,107 | | | | 313,528 | |
PNC Financial Services Group, Inc. | | | | | 17,070 | | | | 984,427 | |
Regions Financial Corp. | | | | | 40,205 | | | | 172,882 | |
SunTrust Banks, Inc. | | | | | 17,569 | | | | 310,971 | |
U.S. Bancorp | | † | | | 62,561 | | | | 1,692,275 | |
Wells Fargo & Co. | | | | | 172,965 | | | | 4,766,915 | |
Zions Bancorporation | | | | | 5,936 | | | | 96,638 | |
| | | | | | | | | | | | |
| | | | | | | | | 9,907,409 | |
| | | | | | | | | | | | |
| Commercial Services & Supplies—0.4% | |
Avery Dennison Corp. | | | | | 3,386 | | | | 97,110 | |
Cintas Corp. | | | | | 3,833 | | | | 133,427 | |
Iron Mountain, Inc. | | † | | | 6,512 | | | | 200,570 | |
Pitney Bowes, Inc. | | † | | | 7,101 | | | | 131,653 | |
R.R. Donnelley & Sons Co. | | † | | | 5,629 | | | | 81,226 | |
Republic Services, Inc. | | | | | 10,271 | | | | 282,966 | |
Stericycle, Inc. | | * | | | 2,698 | | | | 210,228 | |
Waste Management, Inc. | | | | | 15,135 | | | | 495,066 | |
| | | | | | | | | | | | |
| | | | | | | | | 1,632,246 | |
| | | | | | | | | | | | |
See accompanying notes to financial statements.
260
SCHEDULE OF INVESTMENTS—(Continued)
December 31, 2011
| | | | | | | | | | | | |
Vantagepoint 500
Stock Index Fund | | | Shares | | | | Value | |
| | | | | | | | | | | | |
| COMMON STOCKS—(Continued) | |
| Communications Equipment—2.1% | |
Cisco Systems, Inc. | | | | | 176,482 | | | $ | 3,190,795 | |
F5 Networks, Inc. | | * | | | 2,505 | | | | 265,831 | |
Harris Corp. | | † | | | 4,085 | | | | 147,223 | |
JDS Uniphase Corp. | | * | | | 7,658 | | | | 79,949 | |
Juniper Networks, Inc. | | * | | | 17,428 | | | | 355,705 | |
Motorola Mobility Holdings, Inc. | | * | | | 8,587 | | | | 333,176 | |
Motorola Solutions, Inc. | | | | | 9,424 | | | | 436,237 | |
QUALCOMM, Inc. | | | | | 55,126 | | | | 3,015,392 | |
| | | | | | | | | | | | |
| | | | | | | | | 7,824,308 | |
| | | | | | | | | | | | |
| Computers & Peripherals—4.5% | |
Apple, Inc. | | * | | | 30,489 | | | | 12,348,045 | |
Dell, Inc. | | * | | | 50,762 | | | | 742,648 | |
EMC Corp. | | * | | | 67,075 | | | | 1,444,795 | |
Hewlett-Packard Co. | | | | | 65,260 | | | | 1,681,098 | |
Lexmark International, Inc., Class A | | | | | 2,870 | | | | 94,911 | |
NetApp, Inc. | | * | | | 11,768 | | | | 426,825 | |
SanDisk Corp. | | * | | | 7,717 | | | | 379,754 | |
Western Digital Corp. | | * | | | 7,676 | | | | 237,572 | |
| | | | | | | | | | | | |
| | | | | | | | | 17,355,648 | |
| | | | | | | | | | | | |
| Construction & Engineering—0.2% | |
Fluor Corp. | | | | | 5,633 | | | | 283,058 | |
Jacobs Engineering Group, Inc. | | * | | | 3,849 | | | | 156,192 | |
Quanta Services, Inc. | | * | | | 6,807 | | | | 146,623 | |
| | | | | | | | | | | | |
| | | | | | | | | 585,873 | |
| | | | | | | | | | | | |
| Construction Materials—0.0% | |
Vulcan Materials Co. | | † | | | 4,015 | | | | 157,990 | |
| | | | | | | | | | | | |
| Consumer Finance—0.7% | |
American Express Co. | | | | | 33,181 | | | | 1,565,148 | |
Capital One Financial Corp. | | | | | 14,787 | | | | 625,342 | |
Discover Financial Services | | | | | 17,334 | | | | 416,016 | |
SLM Corp. | | | | | 17,168 | | | | 230,051 | |
| | | | | | | | | | | | |
| | | | | | | | | 2,836,557 | |
| | | | | | | | | | | | |
| Containers & Packaging—0.1% | |
Ball Corp. | | | | | 5,788 | | | | 206,690 | |
Bemis Co., Inc. | | | | | 3,365 | | | | 101,219 | |
Owens-Illinois, Inc. | | * | | | 5,235 | | | | 101,454 | |
Sealed Air Corp. | | | | | 5,101 | | | | 87,788 | |
| | | | | | | | | | | | |
| | | | | | | | | 497,151 | |
| | | | | | | | | | | | |
| Distributors—0.1% | |
Genuine Parts Co. | | | | | 4,973 | | | | 304,348 | |
| | | | | | | | | | | | |
| Diversified Consumer Services—0.1% | |
Apollo Group, Inc., Class A | | * | | | 4,113 | | | | 221,567 | |
DeVry, Inc. | | | | | 2,111 | | | | 81,189 | |
H&R Block, Inc. | | | | | 10,479 | | | | 171,122 | |
| | | | | | | | | | | | |
| | | | | | | | | 473,878 | |
| | | | | | | | | | | | |
| Diversified Financial Services—2.6% | |
Bank of America Corp. | | | | | 329,786 | | | | 1,833,610 | |
Citigroup, Inc. | | | | | 95,858 | | | | 2,522,024 | |
CME Group, Inc. | | | | | 2,188 | | | | 533,150 | |
IntercontinentalExchange, Inc. | | * | | | 2,472 | | | | 298,000 | |
JPMorgan Chase & Co. | | | | | 124,727 | | | | 4,147,173 | |
Leucadia National Corp. | | | | | 6,542 | | | | 148,765 | |
| | | | | | | | | | | | |
| | | |
| | | | Shares | | | | Value | |
| | | | | | | | | | | | |
Moody’s Corp. | | † | | | 6,750 | | | $ | 227,340 | |
NASDAQ OMX Group, Inc. (The) | | * | | | 4,218 | | | | 103,383 | |
NYSE Euronext | | | | | 8,746 | | | | 228,270 | |
| | | | | | | | | | | | |
| | | | | | | | | 10,041,715 | |
| | | | | | | | | | | | |
| Diversified Telecommunication Services—2.8% | |
AT&T, Inc. | | | | | 194,369 | | | | 5,877,719 | |
CenturyLink, Inc. | | | | | 20,032 | | | | 745,190 | |
Frontier Communications Corp. | | † | | | 32,749 | | | | 168,657 | |
Verizon Communications, Inc. | | | | | 92,849 | | | | 3,725,102 | |
Windstream Corp. | | † | | | 18,999 | | | | 223,048 | |
| | | | | | | | | | | | |
| | | | | | | | | 10,739,716 | |
| | | | | | | | | | | | |
| Electric Utilities—2.0% | |
American Electric Power Co., Inc. | | | | | 15,506 | | | | 640,553 | |
Duke Energy Corp. | | | | | 43,619 | | | | 959,618 | |
Edison International | | | | | 10,394 | | | | 430,312 | |
Entergy Corp. | | | | | 5,918 | | | | 432,310 | |
Exelon Corp. | | | | | 21,434 | | | | 929,593 | |
FirstEnergy Corp. | | | | | 13,644 | | | | 604,429 | |
NextEra Energy, Inc. | | | | | 13,746 | | | | 836,856 | |
Northeast Utilities | | | | | 5,907 | | | | 213,065 | |
Pepco Holdings, Inc. | | | | | 7,419 | | | | 150,606 | |
Pinnacle West Capital Corp. | | | | | 3,328 | | | | 160,343 | |
PPL Corp. | | | | | 18,447 | | | | 542,711 | |
Progress Energy, Inc. | | | | | 9,523 | | | | 533,478 | |
Southern Co. | | | | | 28,246 | | | | 1,307,507 | |
| | | | | | | | | | | | |
| | | | | | | | | 7,741,381 | |
| | | | | | | | | | | | |
| Electrical Equipment—0.5% | |
Cooper Industries plc | | | | | 5,371 | | | | 290,840 | |
Emerson Electric Co. | | | | | 24,162 | | | | 1,125,708 | |
Rockwell Automation, Inc. | | | | | 4,779 | | | | 350,635 | |
Roper Industries, Inc. | | | | | 3,106 | | | | 269,818 | |
| | | | | | | | | | | | |
| | | | | | | | | 2,037,001 | |
| | | | | | | | | | | | |
| Electronic Equipment, Instruments & Components—0.4% | |
Amphenol Corp., Class A | | | | | 5,737 | | | | 260,402 | |
Corning, Inc. | | | | | 50,629 | | | | 657,164 | |
FLIR Systems, Inc. | | | | | 5,021 | | | | 125,877 | |
Jabil Circuit, Inc. | | | | | 6,753 | | | | 132,764 | |
Molex, Inc. | | | | | 3,928 | | | | 93,722 | |
TE Connectivity Ltd. (Switzerland) | | | | | 14,100 | | | | 434,421 | |
| | | | | | | | | | | | |
| | | | | | | | | 1,704,350 | |
| | | | | | | | | | | | |
| Energy Equipment & Services—1.9% | |
Baker Hughes, Inc. | | | | | 14,181 | | | | 689,764 | |
Cameron International Corp. | | * | | | 8,159 | | | | 401,341 | |
Diamond Offshore Drilling, Inc. | | † | | | 2,210 | | | | 122,125 | |
FMC Technologies, Inc. | | *† | | | 7,656 | | | | 399,873 | |
Halliburton Co. | | | | | 29,836 | | | | 1,029,640 | |
Helmerich & Payne, Inc. | | | | | 3,364 | | | | 196,323 | |
Nabors Industries Ltd. (Bermuda) | | * | | | 9,642 | | | | 167,192 | |
National Oilwell Varco, Inc. | | | | | 13,863 | | | | 942,545 | |
Noble Corp. (Switzerland) | | * | | | 8,339 | | | | 252,005 | |
Rowan Cos., Inc. | | * | | | 4,110 | | | | 124,656 | |
Schlumberger Ltd. | | | | | 43,851 | | | | 2,995,462 | |
| | | | | | | | | | | | |
| | | | | | | | | 7,320,926 | |
| | | | | | | | | | | | |
See accompanying notes to financial statements.
261
SCHEDULE OF INVESTMENTS—(Continued)
December 31, 2011
| | | | | | | | | | | | |
Vantagepoint 500
Stock Index Fund | | | Shares | | | | Value | |
| | | | | | | | | | | | |
| COMMON STOCKS—(Continued) | |
| Food & Staples Retailing—2.4% | |
Costco Wholesale Corp. | | | | | 14,305 | | | $ | 1,191,893 | |
CVS Caremark Corp. | | | | | 42,755 | | | | 1,743,549 | |
Kroger Co. (The) | | | | | 19,656 | | | | 476,068 | |
Safeway, Inc. | | † | | | 11,416 | | | | 240,193 | |
SUPERVALU, Inc. | | † | | | 7,553 | | | | 61,330 | |
Sysco Corp. | | | | | 18,930 | | | | 555,217 | |
Walgreen Co. | | | | | 29,208 | | | | 965,616 | |
Wal-Mart Stores, Inc. | | | | | 57,561 | | | | 3,439,845 | |
Whole Foods Market, Inc. | | | | | 5,117 | | | | 356,041 | |
| | | | | | | | | | | | |
| | | | | | | | | 9,029,752 | |
| | | | | | | | | | | | |
| Food Products—1.9% | |
Archer-Daniels-Midland Co. | | | | | 22,275 | | | | 637,065 | |
Campbell Soup Co. | | † | | | 6,126 | | | | 203,628 | |
ConAgra Foods, Inc. | | | | | 13,490 | | | | 356,136 | |
Dean Foods Co. | | * | | | 6,452 | | | | 72,262 | |
General Mills, Inc. | | | | | 20,967 | | | | 847,276 | |
H.J. Heinz Co. | | | | | 10,469 | | | | 565,745 | |
Hershey Co. (The) | | | | | 5,061 | | | | 312,669 | |
Hormel Foods Corp. | | † | | | 4,650 | | | | 136,198 | |
J.M. Smucker Co. (The) | | | | | 3,807 | | | | 297,593 | |
Kellogg Co. | | † | | | 8,189 | | | | 414,118 | |
Kraft Foods, Inc., Class A | | | | | 57,941 | | | | 2,164,676 | |
McCormick & Co., Inc. | | | | | 4,418 | | | | 222,756 | |
Mead Johnson Nutrition Co. | | | | | 6,505 | | | | 447,089 | |
Sara Lee Corp. | | | | | 19,315 | | | | 365,440 | |
Tyson Foods, Inc., Class A | | | | | 10,014 | | | | 206,689 | |
| | | | | | | | | | | | |
| | | | | | | | | 7,249,340 | |
| | | | | | | | | | | | |
| Gas Utilities—0.1% | |
AGL Resources, Inc. | | | | | 3,798 | | | | 160,504 | |
ONEOK, Inc. | | | | | 3,325 | | | | 288,244 | |
| | | | | | | | | | | | |
| | | | | | | | | 448,748 | |
| | | | | | | | | | | | |
| Health Care Equipment & Supplies—1.7% | |
Baxter International, Inc. | | | | | 18,326 | | | | 906,770 | |
Becton Dickinson and Co. | | | | | 6,981 | | | | 521,620 | |
Boston Scientific Corp. | | * | | | 48,118 | | | | 256,950 | |
C.R. Bard, Inc. | | | | | 2,796 | | | | 239,058 | |
CareFusion Corp. | | * | | | 7,217 | | | | 183,384 | |
Covidien plc (Ireland) | | | | | 15,852 | | | | 713,499 | |
DENTSPLY International, Inc. | | | | | 4,513 | | | | 157,910 | |
Edwards Lifesciences Corp. | | * | | | 3,751 | | | | 265,196 | |
Intuitive Surgical, Inc. | | * | | | 1,297 | | | | 600,524 | |
Medtronic, Inc. | | | | | 34,394 | | | | 1,315,571 | |
St. Jude Medical, Inc. | | | | | 10,668 | | | | 365,912 | |
Stryker Corp. | | † | | | 11,023 | | | | 547,953 | |
Varian Medical Systems, Inc. | | * | | | 3,908 | | | | 262,344 | |
Zimmer Holdings, Inc. | | * | | | 6,212 | | | | 331,845 | |
| | | | | | | | | | | | |
| | | | | | | | | 6,668,536 | |
| | | | | | | | | | | | |
| Health Care Providers & Services—2.1% | |
Aetna, Inc. | | | | | 11,917 | | | | 502,778 | |
AmerisourceBergen Corp. | | | | | 8,861 | | | | 329,541 | |
Cardinal Health, Inc. | | | | | 11,476 | | | | 466,040 | |
CIGNA Corp. | | | | | 9,336 | | | | 392,112 | |
Coventry Health Care, Inc. | | * | | | 4,426 | | | | 134,418 | |
DaVita, Inc. | | * | | | 3,186 | | | | 241,531 | |
Express Scripts, Inc. | | * | | | 15,813 | | | | 706,683 | |
Humana, Inc. | | | | | 5,453 | | | | 477,737 | |
Laboratory Corp. of America Holdings | | * | | | 3,235 | | | | 278,113 | |
| | | | | | | | | | | | |
| | | |
| | | | Shares | | | | Value | |
| | | | | | | | | | | | |
McKesson Corp. | | | | | 8,268 | | | $ | 644,160 | |
Medco Health Solutions, Inc. | | * | | | 12,812 | | | | 716,191 | |
Patterson Cos., Inc. | | | | | 2,852 | | | | 84,191 | |
Quest Diagnostics, Inc. | | | | | 4,972 | | | | 288,674 | |
Tenet Healthcare Corp. | | * | | | 14,819 | | | | 76,021 | |
UnitedHealth Group, Inc. | | | | | 35,275 | | | | 1,787,737 | |
WellPoint, Inc. | | | | | 11,439 | | | | 757,834 | |
| | | | | | | | | | | | |
| | | | | | | | | 7,883,761 | |
| | | | | | | | | | | | |
| Health Care Technology—0.1% | |
Cerner Corp. | | * | | | 4,670 | | | | 286,038 | |
| | | | | | | | | | | | |
| Hotels, Restaurants & Leisure—2.0% | |
Carnival Corp. | | | | | 14,998 | | | | 489,535 | |
Chipotle Mexican Grill, Inc. | | * | | | 1,014 | | | | 342,468 | |
Darden Restaurants, Inc. | | | | | 4,663 | | | | 212,540 | |
International Game Technology | | | | | 9,205 | | | | 158,326 | |
Marriott International, Inc., Class A | | | | | 9,303 | | | | 271,369 | |
McDonald’s Corp. | | | | | 33,504 | | | | 3,361,456 | |
Starbucks Corp. | | | | | 24,135 | | | | 1,110,451 | |
Starwood Hotels & Resorts Worldwide, Inc. | | † | | | 6,332 | | | | 303,746 | |
Wyndham Worldwide Corp. | | | | | 5,452 | | | | 206,249 | |
Wynn Resorts Ltd. | | | | | 2,595 | | | | 286,722 | |
Yum! Brands, Inc. | | | | | 15,149 | | | | 893,942 | |
| | | | | | | | | | | | |
| | | | | | | | | 7,636,804 | |
| | | | | | | | | | | | |
| Household Durables—0.2% | |
D.R. Horton, Inc. | | | | | 7,975 | | | | 100,565 | |
Harman International Industries, Inc. | | | | | 2,000 | | | | 76,080 | |
Leggett & Platt, Inc. | | † | | | 4,242 | | | | 97,736 | |
Lennar Corp., Class A | | † | | | 5,349 | | | | 105,108 | |
Newell Rubbermaid, Inc. | | | | | 9,337 | | | | 150,792 | |
PulteGroup, Inc. | | * | | | 11,419 | | | | 72,054 | |
Whirlpool Corp. | | | | | 2,518 | | | | 119,479 | |
| | | | | | | | | | | | |
| | | | | | | | | 721,814 | |
| | | | | | | | | | | | |
| Household Products—2.3% | |
Clorox Co. (The) | | | | | 4,303 | | | | 286,408 | |
Colgate-Palmolive Co. | | | | | 15,733 | | | | 1,453,572 | |
Kimberly-Clark Corp. | | | | | 12,920 | | | | 950,395 | |
Procter & Gamble Co. (The) | | | | | 90,243 | | | | 6,020,110 | |
| | | | | | | | | | | | |
| | | | | | | | | 8,710,485 | |
| | | | | | | | | | | | |
| Independent Power Producers & Energy Traders—0.2% | |
AES Corp. (The) | | * | | | 21,242 | | | | 251,505 | |
Constellation Energy Group, Inc. | | | | | 6,423 | | | | 254,801 | |
NRG Energy, Inc. | | * | | | 8,174 | | | | 148,113 | |
| | | | | | | | | | | | |
| | | | | | | | | 654,419 | |
| | | | | | | | | | | | |
| Industrial Conglomerates—2.5% | |
3M Co. | | | | | 22,915 | | | | 1,872,843 | |
Danaher Corp. | | | | | 18,490 | | | | 869,770 | |
General Electric Co. | | | | | 346,316 | | | | 6,202,519 | |
Tyco International Ltd. (Switzerland) | | | | | 15,000 | | | | 700,650 | |
| | | | | | | | | | | | |
| | | | | | | | | 9,645,782 | |
| | | | | | | | | | | | |
| Insurance—3.5% | |
ACE Ltd. (Switzerland) | | | | | 11,000 | | | | 771,320 | |
Aflac, Inc. | | | | | 15,227 | | | | 658,720 | |
Allstate Corp. (The) | | | | | 16,951 | | | | 464,627 | |
See accompanying notes to financial statements.
262
SCHEDULE OF INVESTMENTS—(Continued)
December 31, 2011
| | | | | | | | | | | | |
Vantagepoint 500
Stock Index Fund | | | Shares | | | | Value | |
| | | | | | | | | | | | |
| COMMON STOCKS—(Continued) | |
American International Group, Inc. | | * | | | 14,242 | | | $ | 330,414 | |
Aon Corp. | | | | | 10,696 | | | | 500,573 | |
Assurant, Inc. | | | | | 3,058 | | | | 125,561 | |
Berkshire Hathaway, Inc., Class B | | * | | | 57,658 | | | | 4,399,305 | |
Chubb Corp. (The) | | | | | 9,141 | | | | 632,740 | |
Cincinnati Financial Corp. | | | | | 5,643 | | | | 171,886 | |
Genworth Financial, Inc., Class A | | * | | | 16,334 | | | | 106,988 | |
Hartford Financial Services Group, Inc. | | | | | 14,732 | | | | 239,395 | |
Lincoln National Corp. | | | | | 10,294 | | | | 199,909 | |
Loews Corp. | | | | | 9,849 | | | | 370,815 | |
Marsh & McLennan Cos., Inc. | | | | | 17,937 | | | | 567,168 | |
MetLife, Inc. | | | | | 34,354 | | | | 1,071,158 | |
Principal Financial Group, Inc. | | | | | 10,148 | | | | 249,641 | |
Progressive Corp. (The) | | | | | 20,305 | | | | 396,151 | |
Prudential Financial, Inc. | | | | | 15,793 | | | | 791,545 | |
Torchmark Corp. | | | | | 3,646 | | | | 158,200 | |
Travelers Cos., Inc. (The) | | | | | 13,607 | | | | 805,126 | |
Unum Group | | | | | 10,175 | | | | 214,387 | |
XL Group plc (Ireland) | | | | | 10,640 | | | | 210,353 | |
| | | | | | | | | | | | |
| | | | | | | | | 13,435,982 | |
| | | | | | | | | | | | |
| Internet & Catalog Retail—0.8% | |
Amazon.com, Inc. | | * | | | 11,930 | | | | 2,065,083 | |
Expedia, Inc. | | † | | | 3,271 | | | | 94,910 | |
Netflix, Inc. | | *† | | | 1,696 | | | | 117,516 | |
priceline.com, Inc. | | * | | | 1,626 | | | | 760,497 | |
TripAdvisor, Inc. | | *† | | | 3,271 | | | | 82,449 | |
| | | | | | | | | | | | |
| | | | | | | | | 3,120,455 | |
| | | | | | | | | | | | |
| Internet Software & Services—2.0% | |
Akamai Technologies, Inc. | | * | | | 5,766 | | | | 186,126 | |
eBay, Inc. | | * | | | 37,648 | | | | 1,141,864 | |
Google, Inc., Class A | | * | | | 8,286 | | | | 5,351,927 | |
VeriSign, Inc. | | | | | 5,701 | | | | 203,640 | |
Yahoo! Inc. | | * | | | 40,774 | | | | 657,685 | |
| | | | | | | | | | | | |
| | | | | | | | | 7,541,242 | |
| | | | | | | | | | | | |
| IT Services—3.8% | |
Accenture plc, Class A (Ireland) | | | | | 21,228 | | | | 1,129,967 | |
Automatic Data Processing, Inc. | | | | | 16,299 | | | | 880,309 | |
Cognizant Technology Solutions Corp., Class A | | * | | | 9,934 | | | | 638,856 | |
Computer Sciences Corp. | | | | | 5,168 | | | | 122,482 | |
Fidelity National Information Services, Inc. | | | | | 8,254 | | | | 219,474 | |
Fiserv, Inc. | | * | | | 4,834 | | | | 283,949 | |
International Business Machines Corp. | | | | | 38,680 | | | | 7,112,478 | |
Mastercard, Inc., Class A | | | | | 3,454 | | | | 1,287,720 | |
Paychex, Inc. | | | | | 10,243 | | | | 308,417 | |
SAIC, Inc. | | * | | | 9,268 | | | | 113,904 | |
Teradata Corp. | | * | | | 5,336 | | | | 258,849 | |
Total System Services, Inc. | | | | | 5,490 | | | | 107,384 | |
Visa, Inc., Class A | | | | | 16,591 | | | | 1,684,484 | |
Western Union Co. (The) | | | | | 20,457 | | | | 373,545 | |
| | | | | | | | | | | | |
| | | | | | | | | 14,521,818 | |
| | | | | | | | | | | | |
| | | | | | | | | | | | |
| | | |
| | | | Shares | | | | Value | |
| | | | | | | | | | | | |
| Leisure Equipment & Products—0.1% | |
Hasbro, Inc. | | | | | 4,244 | | | $ | 135,341 | |
Mattel, Inc. | | | | | 11,220 | | | | 311,467 | |
| | | | | | | | | | | | |
| | | | | | | | | 446,808 | |
| | | | | | | | | | | | |
| Life Sciences Tools & Services—0.4% | |
Agilent Technologies, Inc. | | * | | | 11,545 | | | | 403,267 | |
Life Technologies Corp. | | * | | | 5,603 | | | | 218,013 | |
PerkinElmer, Inc. | | | | | 4,019 | | | | 80,380 | |
Thermo Fisher Scientific, Inc. | | * | | | 12,450 | | | | 559,876 | |
Waters Corp. | | * | | | 2,974 | | | | 220,225 | |
| | | | | | | | | | | | |
| | | | | | | | | 1,481,761 | |
| | | | | | | | | | | | |
| Machinery—2.0% | |
Caterpillar, Inc. | | | | | 21,020 | | | | 1,904,412 | |
Cummins, Inc. | | | | | 6,431 | | | | 566,057 | |
Deere & Co. | | | | | 13,485 | | | | 1,043,065 | |
Dover Corp. | | | | | 5,924 | | | | 343,888 | |
Eaton Corp. | | | | | 11,110 | | | | 483,618 | |
Flowserve Corp. | | | | | 1,878 | | | | 186,523 | |
Illinois Tool Works, Inc. | | | | | 16,235 | | | | 758,337 | |
Ingersoll-Rand plc (Ireland) | | | | | 10,300 | | | | 313,841 | |
Joy Global, Inc. | | | | | 3,366 | | | | 252,349 | |
PACCAR, Inc. | | | | | 11,811 | | | | 442,558 | |
Pall Corp. | | | | | 3,958 | | | | 226,200 | |
Parker Hannifin Corp. | | | | | 4,975 | | | | 379,344 | |
Snap-On, Inc. | | | | | 1,846 | | | | 93,445 | |
Stanley Black & Decker, Inc. | | | | | 5,362 | | | | 362,471 | |
Xylem, Inc. | | | | | 5,979 | | | | 153,600 | |
| | | | | | | | | | | | |
| | | | | | | | | 7,509,708 | |
| | | | | | | | | | | | |
| Media—3.1% | |
Cablevision Systems Corp., Class A | | | | | 7,437 | | | | 105,754 | |
CBS Corp., Class B | | | | | 21,597 | | | | 586,143 | |
Comcast Corp., Class A | | | | | 90,092 | | | | 2,136,081 | |
DIRECTV, Class A | | * | | | 23,190 | | | | 991,604 | |
Discovery Communications, Inc., Class A | | * | | | 9,025 | | | | 369,754 | |
Gannett Co., Inc. | | | | | 7,093 | | | | 94,833 | |
Interpublic Group of Cos., Inc. (The) | | | | | 16,092 | | | | 156,575 | |
McGraw-Hill Cos., Inc. (The) | | | | | 10,038 | | | | 451,409 | |
News Corp., Class A | | | | | 72,056 | | | | 1,285,479 | |
Omnicom Group, Inc. | | | | | 9,317 | | | | 415,352 | |
Scripps Networks Interactive, Inc., Class A | | † | | | 3,006 | | | | 127,514 | |
Time Warner Cable, Inc. | | | | | 10,624 | | | | 675,368 | |
Time Warner, Inc. | | | | | 32,892 | | | | 1,188,717 | |
Viacom, Inc., Class B | | | | | 18,160 | | | | 824,646 | |
Walt Disney Co. (The) | | | | | 58,994 | | | | 2,212,275 | |
Washington Post Co. (The), Class B | | † | | | 160 | | | | 60,290 | |
| | | | | | | | | | | | |
| | | | | | | | | | | 11,681,794 | |
| | | | | | | | | | | | |
| Metals & Mining—0.9% | |
Alcoa, Inc. | | † | | | 33,865 | | | | 292,932 | |
Allegheny Technologies, Inc. | | | | | 3,302 | | | | 157,836 | |
Cliffs Natural Resources, Inc. | | | | | 4,728 | | | | 294,791 | |
Freeport-McMoRan Copper & Gold, Inc. | | | | | 30,774 | | | | 1,132,175 | |
Newmont Mining Corp. | | | | | 15,946 | | | | 956,919 | |
Nucor Corp. | | | | | 10,440 | | | | 413,111 | |
Titanium Metals Corp. | | | | | 2,725 | | | | 40,821 | |
See accompanying notes to financial statements.
263
SCHEDULE OF INVESTMENTS—(Continued)
December 31, 2011
| | | | | | | | | | | | |
Vantagepoint 500
Stock Index Fund | | | Shares | | | | Value | |
| | | | | | | | | | | | |
| COMMON STOCKS—(Continued) | |
United States Steel Corp. | | † | | | 4,478 | | | $ | 118,488 | |
| | | | | | | | | | | | |
| | | | | | | | | | | 3,407,073 | |
| | | | | | | | | | | | |
| Multiline Retail—0.8% | |
Big Lots, Inc. | | * | | | 2,176 | | | | 82,166 | |
Dollar Tree, Inc. | | * | | | 3,883 | | | | 322,716 | |
Family Dollar Stores, Inc. | | | | | 3,929 | | | | 226,546 | |
J.C. Penney Co., Inc. | | † | | | 4,844 | | | | 170,267 | |
Kohl’s Corp. | | | | | 8,351 | | | | 412,122 | |
Macy’s, Inc. | | | | | 14,108 | | | | 453,995 | |
Nordstrom, Inc. | | | | | 5,299 | | | | 263,413 | |
Sears Holdings Corp. | | *† | | | 1,559 | | | | 49,545 | |
Target Corp. | | | | | 22,017 | | | | 1,127,711 | |
| | | | | | | | | | | | |
| | | | | | | | | | | 3,108,481 | |
| | | | | | | | | | | | |
| Multi-Utilities—1.4% | |
Ameren Corp. | | | | | 8,026 | | | | 265,901 | |
CenterPoint Energy, Inc. | | | | | 13,038 | | | | 261,933 | |
CMS Energy Corp. | | | | | 7,916 | | | | 174,785 | |
Consolidated Edison, Inc. | | | | | 9,344 | | | | 579,608 | |
Dominion Resources, Inc. | | | | | 18,473 | | | | 980,547 | |
DTE Energy Co. | | | | | 5,638 | | | | 306,989 | |
Integrys Energy Group, Inc. | | | | | 2,588 | | | | 140,218 | |
NiSource, Inc. | | | | | 8,838 | | | | 210,433 | |
PG&E Corp. | | | | | 13,286 | | | | 547,649 | |
Public Service Enterprise Group, Inc. | | | | | 16,379 | | | | 540,671 | |
SCANA Corp. | | | | | 3,814 | | | | 171,859 | |
Sempra Energy | | | | | 7,749 | | | | 426,195 | |
TECO Energy, Inc. | | | | | 7,055 | | | | 135,033 | |
Wisconsin Energy Corp. | | | | | 7,552 | | | | 264,018 | |
Xcel Energy, Inc. | | | | | 15,732 | | | | 434,833 | |
| | | | | | | | | | | | |
| | | | | | | | | | | 5,440,672 | |
| | | | | | | | | | | | |
| Office Electronics—0.1% | |
Xerox Corp. | | | | | 45,690 | | | | 363,692 | |
| | | | | | | | | | | | |
| Oil, Gas & Consumable Fuels—10.1% | |
Alpha Natural Resources, Inc. | | * | | | 7,415 | | | | 151,488 | |
Anadarko Petroleum Corp. | | | | | 16,322 | | | | 1,245,858 | |
Apache Corp. | | | | | 12,440 | | | | 1,126,815 | |
Cabot Oil & Gas Corp. | | | | | 3,271 | | | | 248,269 | |
Chesapeake Energy Corp. | | | | | 21,536 | | | | 480,037 | |
Chevron Corp. | | | | | 65,324 | | | | 6,950,474 | |
ConocoPhillips | | | | | 43,589 | | | | 3,176,330 | |
CONSOL Energy, Inc. | | | | | 7,547 | | | | 276,975 | |
Denbury Resources, Inc. | | * | | | 12,602 | | | | 190,290 | |
Devon Energy Corp. | | | | | 13,277 | | | | 823,174 | |
El Paso Corp. | | | | | 25,157 | | | | 668,421 | |
EOG Resources, Inc. | | | | | 8,755 | | | | 862,455 | |
EQT Corp. | | | | | 4,886 | | | | 267,704 | |
Exxon Mobil Corp. | | | | | 157,288 | | | | 13,331,731 | |
Hess Corp. | | | | | 9,907 | | | | 562,718 | |
Marathon Oil Corp. | | | | | 23,004 | | | | 673,327 | |
Marathon Petroleum Corp. | | | | | 11,502 | | | | 382,902 | |
Murphy Oil Corp. | | | | | 6,084 | | | | 339,122 | |
Newfield Exploration Co. | | * | | | 4,380 | | | | 165,257 | |
Noble Energy, Inc. | | | | | 5,791 | | | | 546,613 | |
Occidental Petroleum Corp. | | | | | 26,615 | | | | 2,493,826 | |
Peabody Energy Corp. | | | | | 8,830 | | | | 292,361 | |
Pioneer Natural Resources Co. | | | | | 3,881 | | | | 347,272 | |
QEP Resources, Inc. | | | | | 5,856 | | | | 171,581 | |
Range Resources Corp. | | | | | 5,342 | | | | 330,883 | |
| | | | | | | | | | | | |
| | | |
| | | | Shares | | | | Value | |
| | | | | | | | | | | | |
Southwestern Energy Co. | | * | | | 11,457 | | | $ | 365,937 | |
Spectra Energy Corp. | | | | | 21,457 | | | | 659,803 | |
Sunoco, Inc. | | | | | 3,836 | | | | 157,353 | |
Tesoro Corp. | | *† | | | 4,285 | | | | 100,098 | |
Valero Energy Corp. | | | | | 18,867 | | | | 397,150 | |
Williams Cos., Inc. (The) | | | | | 19,364 | | | | 639,399 | |
| | | | | | | | | | | | |
| | | | | | | | | | | 38,425,623 | |
| | | | | | | | | | | | |
| Paper & Forest Products—0.2% | |
International Paper Co. | | | | | 14,482 | | | | 428,667 | |
MeadWestvaco Corp. | | | | | 5,178 | | | | 155,081 | |
| | | | | | | | | | | | |
| | | | | | | | | | | 583,748 | |
| | | | | | | | | | | | |
| Personal Products—0.2% | |
Avon Products, Inc. | | | | | 13,632 | | | | 238,151 | |
Estee Lauder Cos., Inc. (The), Class A | | | | | 3,737 | | | | 419,740 | |
| | | | | | | | | | | | |
| | | | | | | | | | | 657,891 | |
| | | | | | | | | | | | |
| Pharmaceuticals—6.2% | |
Abbott Laboratories | | | | | 51,088 | | | | 2,872,678 | |
Allergan, Inc. | | | | | 9,964 | | | | 874,241 | |
Bristol-Myers Squibb Co. | | | | | 55,565 | | | | 1,958,111 | |
Eli Lilly & Co. | | | | | 33,106 | | | | 1,375,885 | |
Forest Laboratories, Inc. | | * | | | 9,192 | | | | 278,150 | |
Hospira, Inc. | | * | | | 5,541 | | | | 168,280 | |
Johnson & Johnson | | | | | 89,578 | | | | 5,874,525 | |
Merck & Co., Inc. | | | | | 100,265 | | | | 3,779,991 | |
Mylan, Inc. | | * | | | 14,173 | | | | 304,153 | |
Perrigo Co. | | | | | 3,039 | | | | 295,695 | |
Pfizer, Inc. | | | | | 252,295 | | | | 5,459,664 | |
Watson Pharmaceuticals, Inc. | | * | | | 4,062 | | | | 245,101 | |
| | | | | | | | | | | | |
| | | | | | | | | | | 23,486,474 | |
| | | | | | | | | | | | |
| Professional Services—0.1% | |
Dun & Bradstreet Corp. (The) | | | | | 1,587 | | | | 118,755 | |
Equifax, Inc. | | | | | 3,923 | | | | 151,977 | |
Robert Half International, Inc. | | | | | 4,441 | | | | 126,391 | |
| | | | | | | | | | | | |
| | | | | | | | | | | 397,123 | |
| | | | | | | | | | | | |
| Real Estate Investment Trusts (REITs)—1.8% | |
Apartment Investment & Management Co., Class A REIT | | | | | 3,454 | | | | 79,131 | |
AvalonBay Communities, Inc. REIT | | | | | 3,047 | | | | 397,938 | |
Boston Properties, Inc. REIT | | | | | 4,834 | | | | 481,466 | |
Equity Residential REIT | | | | | 9,714 | | | | 553,990 | |
HCP, Inc. REIT | | | | | 13,264 | | | | 549,528 | |
Health Care REIT, Inc. REIT | | | | | 6,193 | | | | 337,704 | |
Host Hotels & Resorts, Inc. REIT | | | | | 22,178 | | | | 327,569 | |
Kimco Realty Corp. REIT | | | | | 13,174 | | | | 213,946 | |
Plum Creek Timber Co., Inc. REIT | | † | | | 5,220 | | | | 190,843 | |
ProLogis, Inc. REIT | | | | | 14,890 | | | | 425,705 | |
Public Storage REIT | | | | | 4,650 | | | | 625,239 | |
Simon Property Group, Inc. REIT | | | | | 9,628 | | | | 1,241,434 | |
Ventas, Inc. REIT | | | | | 9,422 | | | | 519,435 | |
Vornado Realty Trust REIT | | | | | 5,966 | | | | 458,547 | |
Weyerhaeuser Co. REIT | | | | | 17,506 | | | | 326,837 | |
| | | | | | | | | | | | |
| | | | | | | | | | | 6,729,312 | |
| | | | | | | | | | | | |
See accompanying notes to financial statements.
264
SCHEDULE OF INVESTMENTS—(Continued)
December 31, 2011
| | | | | | | | | | | | |
Vantagepoint 500
Stock Index Fund | | | Shares | | | | Value | |
| | | | | | | | | | | | |
| COMMON STOCKS—(Continued) | |
| Real Estate Management & Development—0.0% | |
CBRE Group, Inc. | | | | * | | | 10,514 | | | $ | 160,023 | |
| | | | | | | | | | | | |
| Road & Rail—0.9% | |
CSX Corp. | | | | | | | 34,519 | | | | 726,970 | |
Norfolk Southern Corp. | | | | | | | 11,044 | | | | 804,666 | |
Ryder System, Inc. | | | | | | | 1,762 | | | | 93,633 | |
Union Pacific Corp. | | | | | | | 15,967 | | | | 1,691,544 | |
| | | | | | | | | | | | |
| | | | | | | | | | | 3,316,813 | |
| | | | | | | | | | | | |
| Semiconductors & Semiconductor Equipment—2.3% | |
Advanced Micro Devices, Inc. | | | | * | | | 17,355 | | | | 93,717 | |
Altera Corp. | | | | | | | 10,550 | | | | 391,405 | |
Analog Devices, Inc. | | | | | | | 9,959 | | | | 356,333 | |
Applied Materials, Inc. | | | | | | | 42,743 | | | | 457,778 | |
Broadcom Corp., Class A | | | | * | | | 15,511 | | | | 455,403 | |
First Solar, Inc. | | | | *† | | | 1,746 | | | | 58,945 | |
Intel Corp. | | | | | | | 167,145 | | | | 4,053,266 | |
KLA-Tencor Corp. | | | | | | | 5,322 | | | | 256,787 | |
Linear Technology Corp. | | | | | | | 7,535 | | | | 226,276 | |
LSI Corp. | | | | *† | | | 19,354 | | | | 115,156 | |
Microchip Technology, Inc. | | | | † | | | 5,876 | | | | 215,238 | |
Micron Technology, Inc. | | | | * | | | 32,473 | | | | 204,255 | |
Novellus Systems, Inc. | | | | * | | | 2,335 | | | | 96,412 | |
NVIDIA Corp. | | | | * | | | 19,212 | | | | 266,278 | |
Teradyne, Inc. | | | | * | | | 6,358 | | | | 86,660 | |
Texas Instruments, Inc. | | | | | | | 37,321 | | | | 1,086,414 | |
Xilinx, Inc. | | | | | | | 8,358 | | | | 267,957 | |
| | | | | | | | | | | | |
| | | | | | | | | | | 8,688,280 | |
| | | | | | | | | | | | |
| Software—3.4% | |
Adobe Systems, Inc. | | | | * | | | 16,632 | | | | 470,187 | |
Autodesk, Inc. | | | | * | | | 7,352 | | | | 222,986 | |
BMC Software, Inc. | | | | * | | | 5,758 | | | | 188,747 | |
CA, Inc. | | | | | | | 12,683 | | | | 256,387 | |
Citrix Systems, Inc. | | | | * | | | 5,998 | | | | 364,199 | |
Electronic Arts, Inc. | | | | * | | | 10,885 | | | | 224,231 | |
Intuit, Inc. | | | | | | | 9,845 | | | | 517,749 | |
Microsoft Corp. | | | | | | | 245,573 | | | | 6,375,075 | |
Oracle Corp. | | | | | | | 129,070 | | | | 3,310,646 | |
Red Hat, Inc. | | | | * | | | 6,356 | | | | 262,439 | |
Salesforce.com, Inc. | | | | * | | | 4,388 | | | | 445,206 | |
Symantec Corp. | | * | | | 24,479 | | | | 383,096 | |
| | | | | | | | | | | | |
| | | | | | | | | 13,020,948 | |
| | | | | | | | | | | | |
| Specialty Retail—2.0% | |
Abercrombie & Fitch Co., Class A | | | | | 2,804 | | | | 136,947 | |
AutoNation, Inc. | | *† | | | 1,994 | | | | 73,519 | |
AutoZone, Inc. | | * | | | 940 | | | | 305,472 | |
Bed Bath & Beyond, Inc. | | * | | | 7,920 | | | | 459,122 | |
Best Buy Co., Inc. | | † | | | 9,936 | | | | 232,204 | |
CarMax, Inc. | | * | | | 7,221 | | | | 220,096 | |
GameStop Corp., Class A | | *† | | | 4,873 | | | | 117,586 | |
Gap, Inc. (The) | | | | | 11,424 | | | | 211,915 | |
Home Depot, Inc. (The) | | | | | 50,616 | | | | 2,127,897 | |
Limited Brands, Inc. | | | | | 8,319 | | | | 335,672 | |
Lowe’s Cos., Inc. | | | | | 41,776 | | | | 1,060,275 | |
Orchard Supply Hardware Stores Corp., Class A | | *‡ | | | 70 | | | | 1 | |
O’Reilly Automotive, Inc. | | * | | | 4,231 | | | | 338,268 | |
Ross Stores, Inc. | | | | | 7,548 | | | | 358,756 | |
| | | | | | | | | | | | | | |
| | | |
| | | | Shares | | | | Value | |
| | | | | | | | | | | | | | |
Staples, Inc. | | | | | | 22,563 | | | $ | 313,400 | |
Tiffany & Co. | | | | | | 4,254 | | | | 281,870 | |
TJX Cos., Inc. | | | | | | 12,536 | | | | 809,199 | |
Urban Outfitters, Inc. | | | * | | | 4,083 | | | | 112,528 | |
| | | | | | | | | | | | | | |
| | | | | | | | | | 7,494,727 | |
| | | | | | | | | | | | | | |
| Textiles, Apparel & Luxury Goods—0.6% | |
Coach, Inc. | | | | | | 9,376 | | | | 572,311 | |
NIKE, Inc., Class B | | | | | | 12,337 | | | | 1,188,917 | |
Ralph Lauren Corp. | | | † | | | 2,129 | | | | 293,972 | |
V.F. Corp. | | | | | | 2,834 | | | | 359,890 | |
| | | | | | | | | | | | | | |
| | | | | | | | | | 2,415,090 | |
| | | | | | | | | | | | | | |
| Thrifts & Mortgage Finance—0.1% | |
Hudson City Bancorp, Inc. | | | | | | 15,948 | | | | 99,675 | |
People’s United Financial, Inc. | | | | | | 12,543 | | | | 161,178 | |
| | | | | | | | | | | | | | |
| | | | | | | | | | 260,853 | |
| | | | | | | | | | | | | | |
| Tobacco—2.0% | |
Altria Group, Inc. | | | | | | 67,986 | | | | 2,015,785 | |
Lorillard, Inc. | | | | | | 4,441 | | | | 506,274 | |
Philip Morris International, Inc. | | | | | | 57,205 | | | | 4,489,448 | |
Reynolds American, Inc. | | | | | | 10,768 | | | | 446,011 | |
| | | | | | | | | | | | | | |
| | | | | | | | | | 7,457,518 | |
| | | | | | | | | | | | | | |
| Trading Companies & Distributors—0.2% | |
Fastenal Co. | | | † | | | 9,572 | | | | 417,435 | |
W.W. Grainger, Inc. | | | | | | 1,952 | | | | 365,395 | |
| | | | | | | | | | | | | | |
| | | | | | | | | | 782,830 | |
| | | | | | | | | | | | | | |
| Wireless Telecommunication Services—0.3% | |
American Tower Corp., Class A | | | | | | 13,071 | | | | 784,391 | |
MetroPCS Communications, Inc. | | | * | | | 8,843 | | | | 76,757 | |
Sprint Nextel Corp. | | | * | | | 98,731 | | | | 231,031 | |
| | | | | | | | | | | | | | |
| | | | | | | | | | 1,092,179 | |
| | | | | | | | | | | | | | |
| TOTAL COMMON STOCKS | | | | | |
(Cost $259,982,312) | | | | | | | | | | 373,473,083 | |
| | | | | | | | | | | | | | |
| | | | | | | | | | | | | | | |
| CONVERTIBLE PREFERRED STOCKS—0.0% | |
| Specialty Retail—0.0% | |
Orchard Supply Hardware Stores Corp., Perpetual, Series A 0.000% | | | | | | | | | | | |
(Cost $—) | | | *‡ | | | 70 | | | | 1 | |
| | | | | | | | | | | | | | |
| | | | | | | | | | | | | | | |
| | | | |
Coupon
Rate | |
| Maturity
Date |
| | | | | Face | | | | Value | |
| | | | | | | | | | | | | | |
| U.S. TREASURY OBLIGATIONS—0.1% | |
| U.S. Treasury Bills—0.1% | |
U.S. Treasury Bill | |
0.018% | | | 05/24/2012 | | | ‡‡ | | $ | 20,000 | | | | 19,997 | |
0.014% | | | 03/22/2012 | | | ‡‡ | | | 505,000 | | | | 504,984 | |
| | | | | | | | | | | | | | |
| TOTAL U.S. TREASURY OBLIGATIONS | |
(Cost $524,983) | | | | 524,981 | |
| | | | | | | | | | | | | | |
See accompanying notes to financial statements.
265
SCHEDULE OF INVESTMENTS—(Continued)
December 31, 2011
| | | | | | | | | | | | |
Vantagepoint 500
Stock Index Fund | | | Shares | | | | Value | |
| | | | | | | | | | | | |
| MONEY MARKET FUNDS—3.8% | |
| Institutional Money Market Funds—3.8% | |
Dreyfus Institutional Cash Advantage Fund, 0.06% | | | | ††¥ | | | 1,500,000 | | | $ | 1,500,000 | |
Fidelity Institutional Money Market: Money Market Portfolio—Institutional Class, 0.23% | | | | ¥ | | | 6,392,070 | | | | 6,392,070 | |
Fidelity Institutional Money Market: Money Market Portfolio—Institutional Class, 0.23% | | | | ††¥ | | | 519,745 | | | | 519,745 | |
Fidelity Institutional Money Market: Prime Money Market Portfolio—Institutional Class, 0.17% | | | | ††¥ | | | 1,500,000 | | | | 1,500,000 | |
Short-Term Investments Trust Liquid Assets Portfolio, 0.16% | | | | ††¥ | | | 1,700,000 | | | | 1,700,000 | |
Wells Fargo Advantage Cash Investment Money Market Fund—Select Class, 0.11% | | | | ††¥ | | | 1,500,000 | | | | 1,500,000 | |
Wells Fargo Advantage Heritage Money Market Fund—Select Class, 0.08% | | | | ††¥ | | | 1,500,000 | | | | 1,500,000 | |
| | | | | | | | | | | | |
| TOTAL MONEY MARKET FUNDS | |
(Cost $14,611,815) | | | | 14,611,815 | |
| | | | | | | | | | | | |
| TOTAL INVESTMENTS—101.9% | |
(Cost $275,119,110) | | | | 388,609,880 | |
Other assets less liabilities—(1.9%) | | | | (7,340,425 | ) |
| | | | | | | | | | | | |
| NET ASSETS—100.0% | | | $ | 381,269,455 | |
| | | | | | | | | | | | |
Notes to the Schedule of Investments:
| | |
| REIT | | Real Estate Investment Trust |
| * | | Non-income producing. |
| † | | Denotes all or a portion of the security on loan. |
| ‡ | | Security valued at fair value as determined by policies approved by the Board of Directors. |
| ‡‡ | | Security or a portion of the security has been pledged as collateral for futures contracts and/or options contracts. |
| †† | | Represents reinvestment of collateral received in conjunction with securities lending. |
| ¥ | | The rate quoted is the annualized seven-day yield of the fund at period end. |
See accompanying notes to financial statements.
266
SCHEDULE OF INVESTMENTS
December 31, 2011
| | | | | | | | | | | | |
| Vantagepoint Broad Market Index Fund | | | | | | | Shares | | | | Value | |
| | | | | | | | | | | | |
| COMMON STOCKS—97.2% | |
| Aerospace & Defense—2.2% | |
AAR Corp. | | | | | 1,489 | | | $ | 28,544 | |
Alliant Techsystems, Inc. | | | | | 1,550 | | | | 88,598 | |
American Science & Engineering, Inc. | | | | | 435 | | | | 29,628 | |
BE Aerospace, Inc. | | * | | | 2,393 | | | | 92,633 | |
Boeing Co. (The) | | | | | 22,743 | | | | 1,668,199 | |
Ceradyne, Inc. | | * | | | 1,867 | | | | 49,998 | |
Cubic Corp. | | | | | 476 | | | | 20,749 | |
Curtiss-Wright Corp. | | | | | 2,112 | | | | 74,617 | |
Esterline Technologies Corp. | | * | | | 1,049 | | | | 58,713 | |
Exelis, Inc. | | | | | 4,977 | | | | 45,042 | |
GenCorp, Inc. | | *† | | | 1,629 | | | | 8,666 | |
General Dynamics Corp. | | | | | 12,337 | | | | 819,300 | |
Goodrich Corp. | | | | | 4,882 | | | | 603,903 | |
HEICO Corp., Class A | | | | | 1,371 | | | | 53,949 | |
Hexcel Corp. | | * | | | 4,757 | | | | 115,167 | |
Honeywell International, Inc. | | | | | 26,085 | | | | 1,417,720 | |
Huntington Ingalls Industries, Inc. | | * | | | 1,577 | | | | 49,329 | |
Kratos Defense & Security Solutions, Inc. | | *† | | | 832 | | | | 4,967 | |
L-3 Communications Holdings, Inc. | | | | | 3,737 | | | | 249,183 | |
Lockheed Martin Corp. | | | | | 9,671 | | | | 782,384 | |
Moog, Inc., Class A | | * | | | 1,446 | | | | 63,523 | |
National Presto Industries, Inc. | | † | | | 535 | | | | 50,076 | |
Northrop Grumman Corp. | | | | | 7,805 | | | | 456,436 | |
Orbital Sciences Corp. | | * | | | 2,123 | | | | 30,847 | |
Precision Castparts Corp. | | | | | 5,136 | | | | 846,362 | |
Raytheon Co. | | | | | 10,521 | | | | 509,006 | |
Rockwell Collins, Inc. | | | | | 6,041 | | | | 334,490 | |
Spirit Aerosystems Holdings, Inc., Class A | | * | | | 2,103 | | | | 43,700 | |
Taser International, Inc. | | *† | | | 2,292 | | | | 11,735 | |
Teledyne Technologies, Inc. | | * | | | 1,228 | | | | 67,356 | |
Textron, Inc. | | | | | 8,214 | | | | 151,877 | |
Triumph Group, Inc. | | | | | 1,644 | | | | 96,092 | |
United Technologies Corp. | | | | | 29,160 | | | | 2,131,304 | |
| | | | | | | | | | | | |
| | | | | | | | | 11,054,093 | |
| | | | | | | | | | | | |
| Air Freight & Logistics—0.7% | |
Air T, Inc. | | | | | 1,352 | | | | 11,479 | |
Atlas Air Worldwide Holdings, Inc. | | * | | | 600 | | | | 23,058 | |
C.H. Robinson Worldwide, Inc. | | | | | 6,357 | | | | 443,591 | |
Expeditors International of Washington, Inc. | | | | | 8,772 | | | | 359,301 | |
FedEx Corp. | | | | | 8,008 | | | | 668,748 | |
Forward Air Corp. | | | | | 1,431 | | | | 45,864 | |
HUB Group, Inc., Class A | | * | | | 2,400 | | | | 77,832 | |
Pacer International, Inc. | | * | | | 1,664 | | | | 8,902 | |
United Parcel Service, Inc., Class B | | | | | 26,935 | | | | 1,971,373 | |
UTi Worldwide, Inc. (Virgin Islands, British) | | | | | 2,208 | | | | 29,344 | |
| | | | | | | | | | | | |
| | | | | | | | | 3,639,492 | |
| | | | | | | | | | | | |
| Airlines—0.2% | |
Alaska Air Group, Inc. | | * | | | 1,343 | | | | 100,846 | |
Delta Air Lines, Inc. | | * | | | 25,505 | | | | 206,336 | |
JetBlue Airways Corp. | | *† | | | 6,414 | | | | 33,353 | |
| | | | | | | | | | | | |
| | | | | |
| | | | | | | | Shares | | | | Value | |
| | | | | | | | | | | | |
SkyWest, Inc. | | | | | 2,390 | | | $ | 30,090 | |
Southwest Airlines Co. | | | | | 18,586 | | | | 159,096 | |
United Continental Holdings, Inc. | | * | | | 12,259 | | | | 231,327 | |
US Airways Group, Inc. | | *† | | | 8,660 | | | | 43,906 | |
| | | | | | | | | | | | |
| | | | | | | | | 804,954 | |
| | | | | | | | | | | | |
| Auto Components—0.4% | |
American Axle & Manufacturing Holdings, Inc. | | * | | | 2,113 | | | | 20,897 | |
Amerigon, Inc. | | * | | | 2,107 | | | | 30,046 | |
Autoliv, Inc. (Sweden) | | † | | | 915 | | | | 48,943 | |
BorgWarner, Inc. | | * | | | 4,109 | | | | 261,908 | |
Cooper Tire & Rubber Co. | | | | | 3,066 | | | | 42,955 | |
Dana Holding Corp. | | * | | | 9,980 | | | | 121,257 | |
Fuel Systems Solutions, Inc. | | * | | | 769 | | | | 12,681 | |
Gentex Corp. | | † | | | 6,594 | | | | 195,116 | |
Goodyear Tire & Rubber Co. (The) | | * | | | 7,281 | | | | 103,172 | |
Johnson Controls, Inc. | | | | | 21,627 | | | | 676,060 | |
Lear Corp. | | | | | 2,719 | | | | 108,216 | |
Modine Manufacturing Co. | | * | | | 1,208 | | | | 11,428 | |
Quantum Fuel Systems Technologies Worldwide, Inc. | | * | | | 141 | | | | 103 | |
Shiloh Industries, Inc. | | * | | | 1,441 | | | | 12,075 | |
Strattec Security Corp. | | | | | 123 | | | | 2,454 | |
Superior Industries International, Inc. | | | | | 1,102 | | | | 18,227 | |
Tenneco, Inc. | | * | | | 1,600 | | | | 47,648 | |
TRW Automotive Holdings Corp. | | * | | | 3,548 | | | | 115,665 | |
| | | | | | | | | | | | |
| | | | | | | | | 1,828,851 | |
| | | | | | | | | | | | |
| Automobiles—0.4% | |
Ford Motor Co. | | * | | | 132,145 | | | | 1,421,880 | |
General Motors Co. | | * | | | 26,868 | | | | 544,614 | |
Harley-Davidson, Inc. | | | | | 5,597 | | | | 217,556 | |
Thor Industries, Inc. | | | | | 1,221 | | | | 33,492 | |
Winnebago Industries, Inc. | | *† | | | 1,432 | | | | 10,568 | |
| | | | | | | | | | | | |
| | | | | | | | | 2,228,110 | |
| | | | | | | | | | | | |
| Beverages—2.2% | |
Beam, Inc. | | | | | 3,861 | | | | 197,799 | |
Brown-Forman Corp., Class B | | | | | 3,385 | | | | 272,527 | |
Central European Distribution Corp. (Poland) | | *† | | | 9,797 | | | | 42,862 | |
Coca-Cola Bottling Co. Consolidated | | † | | | 437 | | | | 25,586 | |
Coca-Cola Co. (The) | | | | | 79,772 | | | | 5,581,647 | |
Coca-Cola Enterprises, Inc. | | | | | 13,572 | | | | 349,886 | |
Constellation Brands, Inc., Class A | | * | | | 8,096 | | | | 167,344 | |
Dr. Pepper Snapple Group, Inc. | | | | | 7,323 | | | | 289,112 | |
Hansen Natural Corp. | | * | | | 2,680 | | | | 246,935 | |
Molson Coors Brewing Co., Class B | | | | | 3,486 | | | | 151,781 | |
PepsiCo, Inc. | | | | | 59,809 | | | | 3,968,327 | |
| | | | | | | | | | | | |
| | | | | | | | | 11,293,806 | |
| | | | | | | | | | | | |
| Biotechnology—1.6% | |
Aastrom Biosciences, Inc. | | *† | | | 411 | | | | 748 | |
Acorda Therapeutics, Inc. | | * | | | 674 | | | | 16,068 | |
See accompanying notes to financial statements.
267
SCHEDULE OF INVESTMENTS—(Continued)
December 31, 2011
| | | | | | | | | | | | |
| Vantagepoint Broad Market Index Fund | | | | | | | Shares | | | | Value | |
| | | | | | | | | | | | |
| COMMON STOCKS—(Continued) | |
Agenus, Inc. | | * | | | 284 | | | $ | 568 | |
Alexion Pharmaceuticals, Inc. | | * | | | 4,700 | | | | 336,050 | |
Alkermes plc (Ireland) | | * | | | 3,579 | | | | 62,131 | |
Allos Therapeutics, Inc. | | * | | | 3,978 | | | | 5,649 | |
Alnylam Pharmaceuticals, Inc. | | * | | | 2,390 | | | | 19,479 | |
AMAG Pharmaceuticals, Inc. | | * | | | 834 | | | | 15,771 | |
Amgen, Inc. | | | | | 33,581 | | | | 2,156,236 | |
Amylin Pharmaceuticals, Inc. | | * | | | 4,036 | | | | 45,930 | |
ARCA Biopharma, Inc. | | * | | | 57 | | | | 56 | |
Arena Pharmaceuticals, Inc. | | *† | | | 1,439 | | | | 2,691 | |
Ariad Pharmaceuticals, Inc. | | * | | | 5,175 | | | | 63,394 | |
Arqule, Inc. | | * | | | 864 | | | | 4,873 | |
Array Biopharma, Inc. | | * | | | 4,333 | | | | 9,359 | |
Astex Pharmaceuticals | | * | | | 1,338 | | | | 2,529 | |
AVI BioPharma, Inc. | | *† | | | 2,400 | | | | 1,788 | |
Avigen, Inc. (Escrow Shares) | | *‡d | | | 1,009 | | | | — | |
Biogen Idec, Inc. | | * | | | 6,544 | | | | 720,167 | |
BioMarin Pharmaceutical, Inc. | | * | | | 3,587 | | | | 123,321 | |
Biosante Pharmaceuticals, Inc. | | * | | | 300 | | | | 151 | |
Celgene Corp. | | * | | | 19,373 | | | | 1,309,615 | |
Cell Therapeutics, Inc. | | *† | | | 15,172 | | | | 17,600 | |
Celldex Therapeutics, Inc. | | * | | | 429 | | | | 1,115 | |
Cepheid, Inc. | | *† | | | 4,930 | | | | 169,641 | |
Codexis, Inc. | | * | | | 230 | | | | 1,219 | |
Cubist Pharmaceuticals, Inc. | | *† | | | 1,762 | | | | 69,810 | |
CytRx Corp. | | * | | | 4,200 | | | | 1,139 | |
Dendreon Corp. | | *† | | | 4,737 | | | | 36,001 | |
Discovery Laboratories, Inc. | | *† | | | 171 | | | | 289 | |
Emergent Biosolutions, Inc. | | * | | | 1,319 | | | | 22,212 | |
Entremed, Inc. | | * | | | 126 | | | | 123 | |
Enzon Pharmaceuticals, Inc. | | *† | | | 1,765 | | | | 11,826 | |
Exact Sciences Corp. | | * | | | 1,250 | | | | 10,150 | |
Exelixis, Inc. | | *† | | | 2,695 | | | | 12,761 | |
Galena Biopharma, Inc. | | *† | | | 209 | | | | 98 | |
Genomic Health, Inc. | | * | | | 1,284 | | | | 32,601 | |
Geron Corp. | | *† | | | 4,719 | | | | 6,984 | |
Gilead Sciences, Inc. | | * | | | 29,798 | | | | 1,219,632 | |
GTx, Inc. | | * | | | 200 | | | | 672 | |
Halozyme Therapeutics, Inc. | | * | | | 6,362 | | | | 60,503 | |
Hemispherx Biopharma, Inc. | | *† | | | 920 | | | | 179 | |
Human Genome Sciences, Inc. | | *† | | | 5,938 | | | | 43,882 | |
Immunogen, Inc. | | *† | | | 1,323 | | | | 15,320 | |
Immunomedics, Inc. | | *† | | | 2,141 | | | | 7,130 | |
Incyte Corp. Ltd. | | *† | | | 3,102 | | | | 46,561 | |
InterMune, Inc. | | * | | | 1,586 | | | | 19,984 | |
Isis Pharmaceuticals, Inc. | | *† | | | 2,216 | | | | 15,977 | |
Keryx Biopharmaceuticals, Inc. | | *† | | | 5,221 | | | | 13,209 | |
Lexicon Pharmaceuticals, Inc. | | *† | | | 2,343 | | | | 3,022 | |
Ligand Pharmaceuticals, Inc., Class B | | * | | | 815 | | | | 9,674 | |
MannKind Corp. | | *† | | | 4,492 | | | | 11,230 | |
Marina Biotech, Inc. | | * | | | 38 | | | | 33 | |
Maxygen, Inc. | | * | | | 1,231 | | | | 6,931 | |
MediciNova, Inc. | | * | | | 91 | | | | 157 | |
Medivation, Inc. | | *† | | | 1,731 | | | | 79,816 | |
Momenta Pharmaceuticals, Inc. | | * | | | 2,618 | | | | 45,527 | |
Myrexis, Inc. | | * | | | 1,031 | | | | 2,763 | |
Myriad Genetics, Inc. | | * | | | 4,124 | | | | 86,357 | |
Nabi Biopharmaceuticals | | * | | | 1,995 | | | | 3,751 | |
Neurocrine Biosciences, Inc. | | *† | | | 1,479 | | | | 12,572 | |
Novavax, Inc. | | *† | | | 1,550 | | | | 1,953 | |
NPS Pharmaceuticals, Inc. | | * | | | 1,660 | | | | 10,939 | |
| | | | | | | | | | | | |
| | | | | |
| | | | | | | | Shares | | | | Value | |
| | | | | | | | | | | | |
Onyx Pharmaceuticals, Inc. | | * | | | 1,361 | | | $ | 59,816 | |
Osiris Therapeutics, Inc. | | *† | | | 1,402 | | | | 7,501 | |
PDL BioPharma, Inc. | | | | | 3,841 | | | | 23,814 | |
Peregrine Pharmaceuticals, Inc. | | *† | | | 1,823 | | | | 1,878 | |
Pharmasset, Inc. | | * | | | 3,525 | | | | 451,905 | |
Poniard Pharmaceuticals, Inc. | | * | | | 9 | | | | 19 | |
Progenics Pharmaceuticals, Inc. | | *† | | | 793 | | | | 6,772 | |
Regeneron Pharmaceuticals, Inc. | | * | | | 2,632 | | | | 145,892 | |
Rigel Pharmaceuticals, Inc. | | * | | | 1,882 | | | | 14,849 | |
Savient Pharmaceuticals, Inc. | | *† | | | 1,538 | | | | 3,430 | |
Sciclone Pharmaceuticals, Inc. | | *† | | | 1,700 | | | | 7,293 | |
SIGA Technologies, Inc. | | *† | | | 4,649 | | | | 11,715 | |
Synageva BioPharma Corp. | | * | | | 242 | | | | 6,444 | |
Telik, Inc. | | * | | | 1,748 | | | | 297 | |
Theravance, Inc. | | *† | | | 3,224 | | | | 71,250 | |
United Therapeutics Corp. | | * | | | 1,828 | | | | 86,373 | |
Vanda Pharmaceuticals, Inc. | | * | | | 2,680 | | | | 12,757 | |
Vertex Pharmaceuticals, Inc. | | * | | | 5,197 | | | | 172,592 | |
XOMA Ltd. | | *† | | | 331 | | | | 381 | |
| | | | | | | | | | | | |
| | | | | | | | | | | 8,092,895 | |
| | | | | | | | | | | | |
| Building Products—0.1% | |
A.O. Smith Corp. | | | | | 2,012 | | | | 80,722 | |
American Woodmark Corp. | | | | | 800 | | | | 10,928 | |
Apogee Enterprises, Inc. | | | | | 1,250 | | | | 15,325 | |
Fortune Brands Home & Security, Inc. | | * | | | 3,861 | | | | 65,753 | |
Gibraltar Industries, Inc. | | * | | | 1,188 | | | | 16,585 | |
Griffon Corp. | | | | | 1,288 | | | | 11,759 | |
Lennox International, Inc. | | | | | 2,437 | | | | 82,249 | |
Masco Corp. | | | | | 9,464 | | | | 99,183 | |
NCI Building Systems, Inc. | | * | | | 246 | | | | 2,674 | |
Owens Corning, Inc. | | * | | | 1,100 | | | | 31,592 | |
Quanex Building Products Corp. | | | | | 1,671 | | | | 25,098 | |
Simpson Manufacturing Co., Inc. | | | | | 2,084 | | | | 70,147 | |
Trex Co., Inc. | | *† | | | 731 | | | | 16,747 | |
U.S. Home Systems, Inc. | | | | | 1,291 | | | | 8,585 | |
Universal Forest Products, Inc. | | † | | | 1,121 | | | | 34,605 | |
USG Corp. | | * | | | 3,348 | | | | 34,016 | |
| | | | | | | | | | | | |
| | | | | | | | | | | 605,968 | |
| | | | | | | | | | | | |
| Capital Markets—1.9% | |
Affiliated Managers Group, Inc. | | * | | | 1,354 | | | | 129,916 | |
Ameriprise Financial, Inc. | | | | | 9,235 | | | | 458,425 | |
Arlington Asset Investment Corp., Class A | | | | | 304 | | | | 6,484 | |
Bank of New York Mellon Corp. (The) | | | | | 46,996 | | | | 935,690 | |
BGC Partners, Inc., Class A | | † | | | 7,270 | | | | 43,184 | |
BlackRock, Inc. | | | | | 4,558 | | | | 812,418 | |
Calamos Asset Management, Inc., Class A | | | | | 1,800 | | | | 22,518 | |
Charles Schwab Corp. (The) | | | | | 39,829 | | | | 448,475 | |
CIFC Corp. | | * | | | 342 | | | | 1,847 | |
Cowen Group, Inc., Class A | | * | | | 2,582 | | | | 6,687 | |
Diamond Hill Investment Group, Inc. | | | | | 331 | | | | 24,487 | |
E*Trade Financial Corp. | | * | | | 13,474 | | | | 107,253 | |
Eaton Vance Corp. | | | | | 5,282 | | | | 124,866 | |
Federated Investors, Inc., Class B | | † | | | 3,745 | | | | 56,737 | |
Franklin Resources, Inc. | | | | | 6,281 | | | | 603,353 | |
GAMCO Investors, Inc., Class A | | | | | 558 | | | | 24,267 | |
GFI Group, Inc. | | | | | 2,520 | | | | 10,382 | |
See accompanying notes to financial statements.
268
SCHEDULE OF INVESTMENTS—(Continued)
December 31, 2011
| | | | | | | | | | | | |
| Vantagepoint Broad Market Index Fund | | | | | | | Shares | | | | Value | |
| | | | | | | | | | | | |
| COMMON STOCKS—(Continued) | |
Goldman Sachs Group, Inc. (The) | | | | | 19,417 | | | $ | 1,755,879 | |
Greenhill & Co., Inc. | | † | | | 495 | | | | 18,003 | |
Institutional Financial Markets, Inc. | | | | | 421 | | | | 594 | |
INTL FCStone, Inc. | | * | | | 507 | | | | 11,950 | |
Invesco Ltd. | | | | | 16,610 | | | | 333,695 | |
Investment Technology Group, Inc. | | * | | | 2,078 | | | | 22,463 | |
Janus Capital Group, Inc. | | | | | 6,411 | | | | 40,453 | |
Jefferies Group, Inc. | | † | | | 4,678 | | | | 64,322 | |
KBW, Inc. | | | | | 1,604 | | | | 24,349 | |
Knight Capital Group, Inc., Class A | | *† | | | 4,630 | | | | 54,727 | |
Legg Mason, Inc. | | | | | 5,850 | | | | 140,693 | |
Medallion Financial Corp. | | | | | 958 | | | | 10,902 | |
Morgan Stanley | | | | | 60,840 | | | | 920,509 | |
Northern Trust Corp. | | | | | 8,495 | | | | 336,912 | |
Piper Jaffray Cos. | | * | | | 963 | | | | 19,453 | |
Raymond James Financial, Inc. | | | | | 3,472 | | | | 107,493 | |
Safeguard Scientifics, Inc. | | * | | | 678 | | | | 10,706 | |
SEI Investments Co. | | | | | 5,918 | | | | 102,677 | |
State Street Corp. | | | | | 19,892 | | | | 801,847 | |
Stifel Financial Corp. | | * | | | 2,381 | | | | 76,311 | |
SWS Group, Inc. | | | | | 1,323 | | | | 9,089 | |
T. Rowe Price Group, Inc. | | | | | 10,248 | | | | 583,624 | |
TD Ameritrade Holding Corp. | | | | | 8,355 | | | | 130,756 | |
Virtus Investment Partners, Inc. | | * | | | 210 | | | | 15,962 | |
Waddell & Reed Financial, Inc., Class A | | | | | 3,971 | | | | 98,362 | |
Walter Investment Management Corp. | | | | | 602 | | | | 12,347 | |
Westwood Holdings Group, Inc. | | † | | | 1,027 | | | | 37,537 | |
| | | | | | | | | | | | |
| | | | | | | | | 9,558,604 | |
| | | | | | | | | | | | |
Chemicals—2.2% | | | | | | | | | | |
A. Schulman, Inc. | | | | | 1,444 | | | | 30,584 | |
Air Products & Chemicals, Inc. | | | | | 6,756 | | | | 575,544 | |
Airgas, Inc. | | | | | 3,075 | | | | 240,096 | |
Albemarle Corp. | | | | | 3,712 | | | | 191,205 | |
Ampal-American Israel Corp., Class A | | * | | | 1,391 | | | | 417 | |
Ashland, Inc. | | | | | 1,520 | | | | 86,883 | |
Cabot Corp. | | | | | 2,693 | | | | 86,553 | |
Calgon Carbon Corp. | | *† | | | 3,184 | | | | 50,021 | |
Celanese Corp., Class A | | | | | 2,979 | | | | 131,880 | |
CF Industries Holdings, Inc. | | | | | 2,571 | | | | 372,744 | |
Cytec Industries, Inc. | | | | | 1,644 | | | | 73,405 | |
Dow Chemical Co. (The) | | | | | 41,287 | | | | 1,187,414 | |
E.I. Du Pont de Nemours & Co. | | | | | 36,166 | | | | 1,655,679 | |
Eastman Chemical Co. | | | | | 4,366 | | | | 170,536 | |
Ecolab, Inc. | | † | | | 10,311 | | | | 596,088 | |
Ferro Corp. | | * | | | 1,818 | | | | 8,890 | |
FMC Corp. | | | | | 3,336 | | | | 287,029 | |
Georgia Gulf Corp. | | * | | | 50 | | | | 974 | |
H.B. Fuller Co. | | | | | 2,570 | | | | 59,393 | |
Huntsman Corp. | | | | | 5,470 | | | | 54,700 | |
International Flavors & Fragrances, Inc. | | | | | 3,885 | | | | 203,652 | |
Intrepid Potash, Inc. | | * | | | 1,172 | | | | 26,522 | |
Koppers Holdings, Inc. | | | | | 1,582 | | | | 54,358 | |
Kronos Worldwide, Inc. | | | | | 2,262 | | | | 40,806 | |
Landec Corp. | | * | | | 986 | | | | 5,443 | |
| | | | | | | | | | | | |
| | | | | |
| | | | | | | | Shares | | | | Value | |
| | | | | | | | | | | | |
LSB Industries, Inc. | | * | | | 1,411 | | | $ | 39,550 | |
Minerals Technologies, Inc. | | | | | 868 | | | | 49,068 | |
Monsanto Co. | | | | | 20,701 | | | | 1,450,519 | |
Mosaic Co. (The) | | | | | 6,742 | | | | 339,999 | |
NewMarket Corp. | | † | | | 378 | | | | 74,886 | |
Olin Corp. | | | | | 2,796 | | | | 54,941 | |
OM Group, Inc. | | * | | | 1,147 | | | | 25,681 | |
Omnova Solutions, Inc. | | * | | | 6,478 | | | | 29,864 | |
Penford Corp. | | * | | | 785 | | | | 3,996 | |
PolyOne Corp. | | † | | | 2,862 | | | | 33,056 | |
PPG Industries, Inc. | | | | | 5,657 | | | | 472,303 | |
Praxair, Inc. | | | | | 10,790 | | | | 1,153,451 | |
Quaker Chemical Corp. | | † | | | 483 | | | | 18,784 | |
RPM International, Inc. | | | | | 4,832 | | | | 118,626 | |
Scotts Miracle-Gro Co. (The), Class A | | † | | | 1,662 | | | | 77,599 | |
Sensient Technologies Corp. | | | | | 2,027 | | | | 76,823 | |
Sherwin-Williams Co. (The) | | | | | 2,340 | | | | 208,892 | |
Sigma-Aldrich Corp. | | | | | 3,395 | | | | 212,052 | |
Spartech Corp. | | * | | | 1,451 | | | | 6,863 | |
Stepan Co. | | | | | 556 | | | | 44,569 | |
Tredegar Corp. | | | | | 1,606 | | | | 35,685 | |
Valhi, Inc. | | | | | 511 | | | | 30,900 | |
Valspar Corp. | | | | | 2,240 | | | | 87,293 | |
W.R. Grace & Co. | | * | | | 4,200 | | | | 192,864 | |
Zep, Inc. | | † | | | 936 | | | | 13,085 | |
| | | | | | | | | | | | |
| | | | | | | | | 11,042,165 | |
| | | | | | | | | | | | |
Commercial Banks—2.9% | | | | | | | | | | |
1st Source Corp. | | | | | 1,180 | | | | 29,889 | |
Associated Banc-Corp | | | | | 5,110 | | | | 57,079 | |
BancFirst Corp. | | | | | 642 | | | | 24,101 | |
BancorpSouth, Inc. | | † | | | 3,611 | | | | 39,793 | |
BancTrust Financial Group, Inc. | | * | | | 1,600 | | | | 1,984 | |
Bank of Hawaii Corp. | | | | | 1,898 | | | | 84,442 | |
BB&T Corp. | | | | | 24,485 | | | | 616,287 | |
BOK Financial Corp. | | | | | 1,765 | | | | 96,951 | |
Boston Private Financial Holdings, Inc. | | † | | | 1,297 | | | | 10,298 | |
Bryn Mawr Bank Corp. | | | | | 1,058 | | | | 20,620 | |
Capital Bank Corp. | | * | | | 1,779 | | | | 3,576 | |
Capital City Bank Group, Inc. | | | | | 1,113 | | | | 10,629 | |
CapitalSource, Inc. | | | | | 19,650 | | | | 131,655 | |
Cardinal Financial Corp. | | | | | 1,142 | | | | 12,265 | |
Cascade Bancorp | | *† | | | 219 | | | | 959 | |
Cathay General Bancorp | | | | | 2,082 | | | | 31,084 | |
Catskill Litigation Trust | | *‡d | | | 582 | | | | — | |
Central Pacific Financial Corp. | | * | | | 103 | | | | 1,331 | |
Chemical Financial Corp. | | | | | 1,552 | | | | 33,089 | |
CIT Group, Inc. | | * | | | 6,132 | | | | 213,823 | |
Citizens Republic Bancorp, Inc. | | * | | | 6,759 | | | | 77,053 | |
City Holding Co. | | † | | | 250 | | | | 8,472 | |
City National Corp./California | | | | | 1,548 | | | | 68,391 | |
CoBiz Financial, Inc. | | | | | 1,063 | | | | 6,134 | |
Comerica, Inc. | | | | | 8,301 | | | | 214,166 | |
Commerce Bancshares, Inc./Missouri | | | | | 2,723 | | | | 103,801 | |
Community Bank System, Inc. | | | | | 1,402 | | | | 38,976 | |
Community Trust Bancorp, Inc. | | † | | | 665 | | | | 19,564 | |
Cullen/Frost Bankers, Inc. | | | | | 2,502 | | | | 132,381 | |
CVB Financial Corp. | | | | | 4,084 | | | | 40,963 | |
East West Bancorp, Inc. | | | | | 7,969 | | | | 157,388 | |
Eastern Virginia Bankshares, Inc. | | * | | | 6,402 | | | | 12,932 | |
See accompanying notes to financial statements.
269
SCHEDULE OF INVESTMENTS—(Continued)
December 31, 2011
| | | | | | | | | | | | |
| Vantagepoint Broad Market Index Fund | | | | | | | Shares | | | | Value | |
| | | | | | | | | | | | |
| COMMON STOCKS—(Continued) | |
Fidelity Southern Corp. | | | | | 1,455 | | | $ | 8,846 | |
Fifth Third Bancorp | | | | | 34,539 | | | | 439,336 | |
Financial Institutions, Inc. | | † | | | 749 | | | | 12,089 | |
First BanCorp. (Puerto Rico) | | *† | | | 322 | | | | 1,124 | |
First Bancorp/North Carolina | | | | | 643 | | | | 7,169 | |
First Busey Corp. | | † | | | 2,407 | | | | 12,035 | |
First Citizens BancShares, Inc./North Carolina, Class A | | | | | 254 | | | | 44,447 | |
First Commonwealth Financial Corp. | | | | | 2,619 | | | | 13,776 | |
First Financial Bancorp | | | | | 1,895 | | | | 31,533 | |
First Financial Bankshares, Inc. | | | | | 500 | | | | 16,715 | |
First Horizon National Corp. | | | | | 8,735 | | | | 69,880 | |
First Merchants Corp. | | | | | 874 | | | | 7,403 | |
First Midwest Bancorp, Inc./Illinois | | | | | 2,002 | | | | 20,280 | |
First Niagara Financial Group, Inc. | | | | | 10,034 | | | | 86,593 | |
First of Long Island Corp. (The) | | | | | 986 | | | | 25,952 | |
FirstMerit Corp. | | | | | 3,950 | | | | 59,764 | |
FNB Corp./Pennsylvania | | † | | | 3,344 | | | | 37,821 | |
Fulton Financial Corp. | | | | | 6,533 | | | | 64,089 | |
Glacier Bancorp, Inc. | | † | | | 1,771 | | | | 21,305 | |
Guaranty Bancorp | | * | | | 5,300 | | | | 7,791 | |
Hancock Holding Co. | | | | | 2,032 | | | | 64,963 | |
Hanmi Financial Corp. | | * | | | 900 | | | | 6,660 | |
Heritage Financial Corp./Washington | | | | | 332 | | | | 4,170 | |
Home Bancshares, Inc./Arkansas | | | | | 1,170 | | | | 30,315 | |
Huntington Bancshares, Inc./Ohio | | | | | 26,837 | | | | 147,335 | |
IBERIABANK Corp. | | † | | | 966 | | | | 47,624 | |
Independent Bank Corp./Massachusetts | | † | | | 874 | | | | 23,851 | |
Independent Bank Corp./Michigan | | *† | | | 208 | | | | 287 | |
International Bancshares Corp. | | | | | 3,248 | | | | 59,552 | |
KeyCorp | | | | | 27,431 | | | | 210,944 | |
M&T Bank Corp. | | | | | 3,469 | | | | 264,823 | |
MB Financial, Inc. | | | | | 931 | | | | 15,920 | |
Merchants Bancshares, Inc. | | | | | 571 | | | | 16,673 | |
MidSouth Bancorp, Inc. | | | | | 522 | | | | 6,791 | |
MidWestOne Financial Group, Inc. | | | | | 552 | | | | 8,070 | |
National Penn Bancshares, Inc. | | | | | 2,758 | | | | 23,278 | |
NBT Bancorp, Inc. | | | | | 1,000 | | | | 22,130 | |
Old National Bancorp/Indiana | | | | | 3,552 | | | | 41,381 | |
Pacific Capital Bancorp NA | | *† | | | 281 | | | | 7,935 | |
Pacific Premier Bancorp, Inc. | | * | | | 976 | | | | 6,188 | |
PacWest Bancorp | | | | | 894 | | | | 16,941 | |
Park National Corp. | | † | | | 728 | | | | 47,364 | |
Peoples Bancorp, Inc./Ohio | | † | | | 814 | | | | 12,055 | |
Peoples Financial Corp./Mississippi | | | | | 883 | | | | 9,104 | |
Pinnacle Financial Partners, Inc. | | *† | | | 1,818 | | | | 29,361 | |
PNC Financial Services Group, Inc. | | | | | 20,071 | | | | 1,157,495 | |
Popular, Inc. (Puerto Rico) | | * | | | 53,808 | | | | 74,793 | |
PrivateBancorp, Inc. | | | | | 1,200 | | | | 13,176 | |
Prosperity Bancshares, Inc. | | † | | | 2,300 | | | | 92,805 | |
Regions Financial Corp. | | | | | 41,501 | | | | 178,454 | |
Republic Bancorp, Inc./Kentucky, Class A | | | | | 1,603 | | | | 36,709 | |
| | | | | | | | | | | | |
| | | | | |
| | | | | | | | Shares | | | | Value | |
| | | | | | | | | | | | |
Royal Bancshares of Pennsylvania, Inc., Class A | | * | | | 882 | | | $ | 1,173 | |
S&T Bancorp, Inc. | | | | | 955 | | | | 18,670 | |
Sandy Spring Bancorp, Inc. | | | | | 344 | | | | 6,037 | |
Shore Bancshares, Inc. | | | | | 826 | | | | 4,254 | |
Signature Bank/New York | | * | | | 1,900 | | | | 113,981 | |
Simmons First National Corp., Class A | | † | | | 911 | | | | 24,770 | |
Sterling Bancorp/New York | | † | | | 1,476 | | | | 12,753 | |
Sterling Financial Corp./Washington | | * | | | 38 | | | | 635 | |
Suffolk Bancorp | | * | | | 1,100 | | | | 11,869 | |
SunTrust Banks, Inc. | | | | | 19,144 | | | | 338,849 | |
Susquehanna Bancshares, Inc. | | | | | 2,932 | | | | 24,570 | |
SVB Financial Group | | * | | | 1,437 | | | | 68,531 | |
Synovus Financial Corp. | | † | | | 41,667 | | | | 58,750 | |
TCF Financial Corp. | | | | | 6,104 | | | | 62,993 | |
Texas Capital Bancshares, Inc. | | * | | | 2,821 | | | | 86,351 | |
Tompkins Financial Corp. | | † | | | 730 | | | | 28,112 | |
TowneBank/Virginia | | † | | | 1,406 | | | | 17,209 | |
Trustmark Corp. | | † | | | 2,435 | | | | 59,146 | |
U.S. Bancorp | | | | | 73,433 | | | | 1,986,363 | |
UMB Financial Corp. | | | | | 1,211 | | | | 45,110 | |
Umpqua Holdings Corp. | | | | | 1,151 | | | | 14,261 | |
United Bankshares, Inc. | | | | | 2,134 | | | | 60,328 | |
United Community Banks, Inc./Georgia | | * | | | 454 | | | | 3,173 | |
Valley National Bancorp | | † | | | 6,571 | | | | 81,283 | |
Washington Trust Bancorp, Inc. | | | | | 500 | | | | 11,930 | |
Webster Financial Corp. | | | | | 2,393 | | | | 48,793 | |
Wells Fargo & Co. | | | | | 188,400 | | | | 5,192,304 | |
WesBanco, Inc. | | | | | 1,699 | | | | 33,080 | |
Westamerica Bancorporation | | † | | | 1,628 | | | | 71,469 | |
Western Alliance Bancorp | | * | | | 1,400 | | | | 8,722 | |
Wintrust Financial Corp. | | | | | 1,017 | | | | 28,527 | |
Zions Bancorporation | | | | | 5,053 | | | | 82,263 | |
| | | | | | | | | | | | |
| | | | | | | | | 14,571,430 | |
| | | | | | | | | | | | |
| Commercial Services & Supplies—0.6% | |
ABM Industries, Inc. | | | | | 2,291 | | | | 47,241 | |
ACCO Brands Corp. | | * | | | 1,319 | | | | 12,728 | |
Avery Dennison Corp. | | | | | 3,924 | | | | 112,540 | |
Brink’s Co. (The) | | | | | 2,084 | | | | 56,018 | |
Cenveo, Inc. | | *† | | | 4,741 | | | | 16,119 | |
Cintas Corp. | | | | | 2,017 | | | | 70,212 | |
Clean Harbors, Inc. | | * | | | 2,414 | | | | 153,844 | |
Consolidated Graphics, Inc. | | * | | | 776 | | | | 37,465 | |
Copart, Inc. | | * | | | 3,582 | | | | 171,542 | |
Corrections Corp. of America | | * | | | 5,700 | | | | 116,109 | |
Courier Corp. | | † | | | 424 | | | | 4,974 | |
Covanta Holding Corp. | | | | | 4,185 | | | | 57,293 | |
Deluxe Corp. | | | | | 2,098 | | | | 47,751 | |
EnergySolutions, Inc. | | * | | | 4,049 | | | | 12,511 | |
Ennis, Inc. | | | | | 695 | | | | 9,264 | |
G&K Services, Inc., Class A | | | | | 1,008 | | | | 29,343 | |
Geo Group, Inc. (The) | | * | | | 2,456 | | | | 41,138 | |
Healthcare Services Group, Inc. | | | | | 5,603 | | | | 99,117 | |
Herman Miller, Inc. | | | | | 3,155 | | | | 58,210 | |
HNI Corp. | | † | | | 2,512 | | | | 65,563 | |
Interface, Inc., Class A | | | | | 3,357 | | | | 38,740 | |
Iron Mountain, Inc. | | | | | 7,146 | | | | 220,097 | |
Kimball International, Inc., Class B | | † | | | 1,500 | | | | 7,605 | |
See accompanying notes to financial statements.
270
SCHEDULE OF INVESTMENTS—(Continued)
December 31, 2011
| | | | | | | | | | | | |
| Vantagepoint Broad Market Index Fund | | | | | | | Shares | | | | Value | |
| | | | | | | | | | | | |
| COMMON STOCKS—(Continued) | |
Knoll, Inc. | | | | | 2,701 | | | $ | 40,110 | |
McGrath Rentcorp | | | | | 916 | | | | 26,555 | |
Mine Safety Appliances Co. | | | | | 1,444 | | | | 47,825 | |
Mobile Mini, Inc. | | * | | | 2,000 | | | | 34,900 | |
NL Industries, Inc. | | † | | | 2,111 | | | | 27,380 | |
Perma-Fix Environmental Services, Inc. | | * | | | 5,502 | | | | 8,528 | |
Pitney Bowes, Inc. | | † | | | 1,828 | | | | 33,891 | |
Portfolio Recovery Associates, Inc. | | * | | | 504 | | | | 34,030 | |
R.R. Donnelley & Sons Co. | | | | | 8,887 | | | | 128,240 | |
Republic Services, Inc. | | | | | 14,202 | | | | 391,265 | |
Rollins, Inc. | | | | | 1,486 | | | | 33,019 | |
Standard Register Co. (The) | | | | | 1,650 | | | | 3,845 | |
Steelcase, Inc., Class A | | † | | | 1,992 | | | | 14,860 | |
Stericycle, Inc. | | * | | | 3,138 | | | | 244,513 | |
Sykes Enterprises, Inc. | | * | | | 1,423 | | | | 22,284 | |
Tetra Tech, Inc. | | * | | | 2,114 | | | | 45,641 | |
TRC Cos., Inc. | | * | | | 327 | | | | 1,965 | |
United Stationers, Inc. | | | | | 2,556 | | | | 83,223 | |
Viad Corp. | | † | | | 937 | | | | 16,379 | |
Virco Mfg. Corp. | | | | | 799 | | | | 1,286 | |
Waste Connections, Inc. | | | | | 3,543 | | | | 117,415 | |
Waste Management, Inc. | | | | | 9,462 | | | | 309,502 | |
| | | | | | | | | | | | |
| | | | | | | | | 3,152,080 | |
| | | | | | | | | | | | |
| Communications Equipment—2.0% | |
ADTRAN, Inc. | | | | | 3,197 | | | | 96,422 | |
Alliance Fiber Optic Products, Inc. | | * | | | 963 | | | | 7,377 | |
Anaren, Inc. | | * | | | 813 | | | | 13,512 | |
Arris Group, Inc. | | * | | | 3,613 | | | | 39,093 | |
Aruba Networks, Inc. | | * | | | 2,125 | | | | 39,355 | |
Aviat Networks, Inc. | | * | | | 2,182 | | | | 3,993 | |
Black Box Corp. | | | | | 865 | | | | 24,255 | |
Blonder Tongue Laboratories, Inc. | | * | | | 2,285 | | | | 2,765 | |
Blue Coat Systems, Inc. | | * | | | 1,072 | | | | 27,282 | |
Brocade Communications Systems, Inc. | | * | | | 14,008 | | | | 72,701 | |
CalAmp Corp. | | * | | | 550 | | | | 2,337 | |
Ciena Corp. | | *† | | | 5,950 | | | | 71,995 | |
Cisco Systems, Inc. | | | | | 206,501 | | | | 3,733,538 | |
Comtech Telecommunications Corp. | | | | | 1,350 | | | | 38,637 | |
Digi International, Inc. | | *† | | | 1,976 | | | | 22,052 | |
Ditech Networks, Inc. | | * | | | 1,360 | | | | 1,278 | |
EchoStar Corp., Class A | | * | | | 1,877 | | | | 39,304 | |
Emcore Corp. | | *† | | | 1,219 | | | | 1,051 | |
Emulex Corp. | | * | | | 3,408 | | | | 23,379 | |
Extreme Networks, Inc. | | * | | | 4,491 | | | | 13,114 | |
F5 Networks, Inc. | | * | | | 2,664 | | | | 282,704 | |
Finisar Corp. | | *† | | | 856 | | | | 14,334 | |
Harmonic, Inc. | | * | | | 2,820 | | | | 14,213 | |
Harris Corp. | | | | | 3,891 | | | | 140,232 | |
Infinera Corp. | | * | | | 4,191 | | | | 26,319 | |
InterDigital, Inc. | | † | | | 2,803 | | | | 122,127 | |
Ixia | | * | | | 2,330 | | | | 24,488 | |
JDS Uniphase Corp. | | * | | | 7,444 | | | | 77,715 | |
Juniper Networks, Inc. | | * | | | 17,553 | | | | 358,257 | |
KVH Industries, Inc. | | *† | | | 375 | | | | 2,917 | |
Motorola Mobility Holdings, Inc. | | * | | | 10,553 | | | | 409,456 | |
| | | | | | | | | | | | |
| | | | | |
| | | | | | | | Shares | | | | Value | |
| | | | | | | | | | | | |
Motorola Solutions, Inc. | | | | | 12,061 | | | $ | 558,304 | |
NETGEAR, Inc. | | * | | | 1,206 | | | | 40,485 | |
Network Engines, Inc. | | * | | | 1,329 | | | | 1,279 | |
Numerex Corp., Class A | | * | | | 1,800 | | | | 14,814 | |
Oclaro, Inc. | | *† | | | 363 | | | | 1,024 | |
Oplink Communications, Inc. | | * | | | 758 | | | | 12,484 | |
Optical Cable Corp. | | | | | 240 | | | | 766 | |
Parkervision, Inc. | | *† | | | 1,052 | | | | 894 | |
Performance Technologies, Inc. | | * | | | 793 | | | | 1,427 | |
Plantronics, Inc. | | † | | | 1,826 | | | | 65,079 | |
Polycom, Inc. | | * | | | 8,354 | | | | 136,170 | |
Powerwave Technologies, Inc. | | *† | | | 486 | | | | 1,011 | |
QUALCOMM, Inc. | | | | | 63,004 | | | | 3,446,319 | |
Riverbed Technology, Inc. | | * | | | 3,698 | | | | 86,903 | |
Sonus Networks, Inc. | | * | | | 10,700 | | | | 25,680 | |
Sycamore Networks, Inc. | | * | | | 991 | | | | 17,739 | |
Tekelec | | * | | | 2,569 | | | | 28,079 | |
Tellabs, Inc. | | | | | 19,143 | | | | 77,338 | |
UTStarcom Holdings Corp. (China) | | * | | | 4,555 | | | | 6,286 | |
Viasat, Inc. | | * | | | 1,190 | | | | 54,883 | |
Westell Technologies, Inc., Class A | | * | | | 1,821 | | | | 4,043 | |
Zoom Technologies, Inc. (China) | | *† | | | 542 | | | | 558 | |
| | | | | | | | | | | | |
| | | | | | | | | | | 10,327,767 | |
| | | | | | | | | | | | |
| Computers & Peripherals—3.9% | |
3D Systems Corp. | | *† | | | 2,316 | | | | 33,350 | |
Apple, Inc. | | * | | | 32,927 | | | | 13,335,435 | |
Avid Technology, Inc. | | * | | | 1,448 | | | | 12,351 | |
Concurrent Computer Corp. | | * | | | 190 | | | | 720 | |
Cray, Inc. | | * | | | 714 | | | | 4,620 | |
Dataram Corp. | | *† | | | 1,175 | | | | 952 | |
Dell, Inc. | | * | | | 58,645 | | | | 857,976 | |
Diebold, Inc. | | | | | 3,079 | | | | 92,586 | |
Dot Hill Systems Corp. | | * | | | 1,396 | | | | 1,857 | |
Electronics for Imaging, Inc. | | * | | | 2,638 | | | | 37,592 | |
EMC Corp. | | * | | | 74,289 | | | | 1,600,185 | |
Hewlett-Packard Co. | | | | | 79,079 | | | | 2,037,075 | |
Hutchinson Technology, Inc. | | *† | | | 1,149 | | | | 1,724 | |
iGO, Inc. | | * | | | 674 | | | | 520 | |
Imation Corp. | | * | | | 1,564 | | | | 8,962 | |
Intermec, Inc. | | *† | | | 2,374 | | | | 16,286 | |
Lexmark International, Inc., Class A | | | | | 1,492 | | | | 49,340 | |
NCR Corp. | | * | | | 7,848 | | | | 129,178 | |
NetApp, Inc. | | * | | | 11,382 | | | | 412,825 | |
Novatel Wireless, Inc. | | * | | | 1,358 | | | | 4,251 | |
Overland Storage, Inc. | | * | | | 160 | | | | 400 | |
Presstek, Inc. | | * | | | 945 | | | | 510 | |
QLogic Corp. | | * | | | 3,731 | | | | 55,965 | |
Quantum Corp. | | * | | | 6,681 | | | | 16,034 | |
SanDisk Corp. | | * | | | 8,969 | | | | 441,364 | |
Silicon Graphics International Corp. | | *† | | | 1,843 | | | | 21,121 | |
STEC, Inc. | | *† | | | 1,255 | | | | 10,780 | |
Stratasys, Inc. | | * | | | 1,782 | | | | 54,191 | |
Synaptics, Inc. | | *† | | | 1,586 | | | | 47,818 | |
TransAct Technologies, Inc. | | * | | | 888 | | | | 6,447 | |
Western Digital Corp. | | * | | | 8,356 | | | | 258,618 | |
| | | | | | | | | | | | |
| | | | | | | | | | | 19,551,033 | |
| | | | | | | | | | | | |
| Construction & Engineering—0.3% | |
AECOM Technology Corp. | | * | | | 3,236 | | | | 66,565 | |
Aegion Corp. | | * | | | 1,223 | | | | 18,761 | |
See accompanying notes to financial statements.
271
SCHEDULE OF INVESTMENTS—(Continued)
December 31, 2011
| | | | | | | | | | | | |
| Vantagepoint Broad Market Index Fund | | | | | | | Shares | | | | Value | |
| | | | | | | | | | | | |
| COMMON STOCKS—(Continued) | |
Comfort Systems USA, Inc. | | † | | | 2,179 | | | $ | 23,359 | |
Dycom Industries, Inc. | | * | | | 2,076 | | | | 43,430 | |
EMCOR Group, Inc. | | | | | 2,908 | | | | 77,963 | |
Fluor Corp. | | | | | 4,946 | | | | 248,537 | |
Furmanite Corp. | | *† | | | 1,100 | | | | 6,941 | |
Granite Construction, Inc. | | | | | 1,889 | | | | 44,807 | |
Jacobs Engineering Group, Inc. | | * | | | 4,968 | | | | 201,601 | |
KBR, Inc. | | | | | 6,464 | | | | 180,152 | |
Layne Christensen Co. | | *† | | | 510 | | | | 12,342 | |
MasTec, Inc. | | * | | | 2,049 | | | | 35,591 | |
Quanta Services, Inc. | | * | | | 8,861 | | | | 190,866 | |
Shaw Group, Inc. (The) | | * | | | 2,182 | | | | 58,696 | |
Tutor Perini Corp. | | * | | | 960 | | | | 11,846 | |
URS Corp. | | * | | | 2,934 | | | | 103,042 | |
| | | | | | | | | | | | |
| | | | | | | | | | | 1,324,499 | |
| | | | | | | | | | | | |
| Construction Materials—0.0% | |
Eagle Materials, Inc. | | | | | 2,083 | | | | 53,450 | |
Headwaters, Inc. | | * | | | 2,095 | | | | 4,651 | |
Martin Marietta Materials, Inc. | | † | | | 494 | | | | 37,252 | |
Texas Industries, Inc. | | † | | | 1,116 | | | | 34,350 | |
Vulcan Materials Co. | | † | | | 3,605 | | | | 141,857 | |
| | | | | | | | | | | | |
| | | | | | | | | | | 271,560 | |
| | | | | | | | | | | | |
| Consumer Finance—0.7% | |
Advance America Cash Advance Centers, Inc. | | | | | 21,480 | | | | 192,246 | |
American Express Co. | | | | | 36,573 | | | | 1,725,148 | |
Capital One Financial Corp. | | | | | 16,201 | | | | 685,140 | |
Cash America International, Inc. | | † | | | 685 | | | | 31,942 | |
CompuCredit Holdings Corp. | | * | | | 38 | | | | 141 | |
Discover Financial Services | | | | | 18,027 | | | | 432,648 | |
Ezcorp, Inc., Class A | | * | | | 2,031 | | | | 53,557 | |
First Marblehead Corp. (The) | | *† | | | 2,764 | | | | 3,234 | |
Nelnet, Inc., Class A | | | | | 481 | | | | 11,770 | |
SLM Corp. | | | | | 20,100 | | | | 269,340 | |
World Acceptance Corp. | | * | | | 639 | | | | 46,967 | |
| | | | | | | | | | | | |
| | | | | | | | | 3,452,133 | |
| | | | | | | | | | | | |
| Containers & Packaging—0.2% | |
AEP Industries, Inc. | | * | | | 372 | | | | 10,472 | |
AptarGroup, Inc. | | | | | 3,130 | | | | 163,292 | |
Ball Corp. | | | | | 6,557 | | | | 234,151 | |
Bemis Co., Inc. | | | | | 1,316 | | | | 39,585 | |
Crown Holdings, Inc. | | * | | | 3,283 | | | | 110,243 | |
Greif, Inc., Class A | | | | | 852 | | | | 38,809 | |
Myers Industries, Inc. | | | | | 1,716 | | | | 21,175 | |
Owens-Illinois, Inc. | | * | | | 6,064 | | | | 117,520 | |
Packaging Corp. of America | | | | | 4,339 | | | | 109,516 | |
Rock-Tenn Co., Class A | | | | | 1,450 | | | | 83,665 | |
Sealed Air Corp. | | | | | 2,704 | | | | 46,536 | |
Silgan Holdings, Inc. | | | | | 908 | | | | 35,085 | |
Sonoco Products Co. | | | | | 3,353 | | | | 110,515 | |
Temple-Inland, Inc. | | | | | 3,169 | | | | 100,489 | |
| | | | | | | | | | | | |
| | | | | | | | | 1,221,053 | |
| | | | | | | | | | | | |
| Distributors—0.1% | |
Genuine Parts Co. | | | | | 3,417 | | | | 209,120 | |
LKQ Corp. | | * | | | 7,000 | | | | 210,560 | |
Pool Corp. | | | | | 2,434 | | | | 73,264 | |
VOXX International Corp. | | * | | | 1,218 | | | | 10,292 | |
| | | | | | | | | | | | |
| | | | | | | | | 503,236 | |
| | | | | | | | | | | | |
| | | | | | | | | | | | |
| | | | | |
| | | | | | | | Shares | | | | Value | |
| | | | | | | | | | | | |
| Diversified Consumer Services—0.3% | |
American Public Education, Inc. | | *† | | | 698 | | | $ | 30,210 | |
Apollo Group, Inc., Class A | | * | | | 5,209 | | | | 280,609 | |
Ascent Capital Group, Inc., Class A | | * | | | 545 | | | | 27,642 | |
Career Education Corp. | | * | | | 4,167 | | | | 33,211 | |
Coinstar, Inc. | | *† | | | 1,075 | | | | 49,063 | |
Corinthian Colleges, Inc. | | *† | | | 3,624 | | | | 7,864 | |
DeVry, Inc. | | | | | 2,980 | | | | 114,611 | |
H&R Block, Inc. | | | | | 11,402 | | | | 186,195 | |
Hillenbrand, Inc. | | | | | 1,576 | | | | 35,176 | |
ITT Educational Services, Inc. | | *† | | | 1,873 | | | | 106,555 | |
Learning Tree International, Inc. | | * | | | 766 | | | | 5,377 | |
Matthews International Corp., Class A | | † | | | 1,052 | | | | 33,064 | |
Regis Corp. | | | | | 1,818 | | | | 30,088 | |
School Specialty, Inc. | | * | | | 854 | | | | 2,135 | |
Service Corp. International | | | | | 11,775 | | | | 125,404 | |
Sotheby’s | | | | | 2,623 | | | | 74,834 | |
Steiner Leisure Ltd. (Bahamas) | | * | | | 1,503 | | | | 68,221 | |
Stewart Enterprises, Inc., Class A | | † | | | 4,115 | | | | 23,702 | |
Strayer Education, Inc. | | † | | | 551 | | | | 53,552 | |
Universal Technical Institute, Inc. | | * | | | 418 | | | | 5,342 | |
Weight Watchers International, Inc. | | † | | | 1,826 | | | | 100,448 | |
| | | | | | | | | | | | |
| | | | | | | | | 1,393,303 | |
| | | | | | | | | | | | |
| Diversified Financial Services—2.4% | |
Bank of America Corp. | | | | | 388,627 | | | | 2,160,766 | |
Citigroup, Inc. | | | | | 111,256 | | | | 2,927,145 | |
CME Group, Inc. | | | | | 2,698 | | | | 657,422 | |
Interactive Brokers Group, Inc., Class A | | | | | 1,570 | | | | 23,456 | |
IntercontinentalExchange, Inc. | | * | | | 2,776 | | | | 334,647 | |
JPMorgan Chase & Co. | | | | | 148,125 | | | | 4,925,156 | |
Leucadia National Corp. | | | | | 6,084 | | | | 138,350 | |
Moody’s Corp. | | | | | 6,057 | | | | 204,000 | |
MSCI, Inc., Class A | | * | | | 3,439 | | | | 113,246 | |
NASDAQ OMX Group, Inc. (The) | | * | | | 5,431 | | | | 133,114 | |
NYSE Euronext | | | | | 9,567 | | | | 249,699 | |
PHH Corp. | | * | | | 2,212 | | | | 23,668 | |
PICO Holdings, Inc. | | * | | | 1,150 | | | | 23,667 | |
Resource America, Inc., Class A | | | | | 1,287 | | | | 6,126 | |
| | | | | | | | | | | | |
| | | | | | | | | 11,920,462 | |
| | | | | | | | | | | | |
| Diversified Telecommunication Services—2.5% | |
8x8, Inc. | | *† | | | 3,048 | | | | 9,662 | |
Alaska Communications Systems Group, Inc. | | † | | | 2,850 | | | | 8,578 | |
AT&T, Inc. | | | | | 223,413 | | | | 6,756,009 | |
CenturyLink, Inc. | | | | | 19,640 | | | | 730,608 | |
Cincinnati Bell, Inc. | | *† | | | 35,531 | | | | 107,659 | |
Cogent Communications Group, Inc. | | * | | | 2,886 | | | | 48,745 | |
Frontier Communications Corp. | | † | | | 39,354 | | | | 202,673 | |
General Communication, Inc., Class A | | * | | | 2,516 | | | | 24,632 | |
HickoryTech Corp. | | | | | 651 | | | | 7,213 | |
See accompanying notes to financial statements.
272
SCHEDULE OF INVESTMENTS—(Continued)
December 31, 2011
| | | | | | | | | | | | |
| Vantagepoint Broad Market Index Fund | | | | | | | Shares | | | | Value | |
| | | | | | | | | | | | |
| COMMON STOCKS—(Continued) | |
IDT Corp., Class B | | | | | 1,600 | | | $ | 15,008 | |
Integrated Telecom Express, Inc. | | *‡d | | | 1,103 | | | | — | |
Level 3 Communications, Inc. | | *† | | | 3,878 | | | | 65,887 | |
Lumos Networks Corp. | | | | | 1,350 | | | | 20,709 | |
Premiere Global Services, Inc. | | *† | | | 2,174 | | | | 18,414 | |
Superior TeleCom, Inc. | | *‡d | | | 2,013 | | | | — | |
SureWest Communications | | | | | 184 | | | | 2,213 | |
tw telecom inc. | | * | | | 1,928 | | | | 37,365 | |
Verizon Communications, Inc. | | | | | 105,621 | | | | 4,237,515 | |
Windstream Corp. | | | | | 21,003 | | | | 246,575 | |
| | | | | | | | | | | | |
| | | | | | | | | 12,539,465 | |
| | | | | | | | | | | | |
| Electric Utilities—1.9% | |
Allete, Inc. | | | | | 1,243 | | | | 52,181 | |
American Electric Power Co., Inc. | | | | | 17,879 | | | | 738,581 | |
Central Vermont Public Service Corp. | | | | | 540 | | | | 18,954 | |
Cleco Corp. | | | | | 2,109 | | | | 80,353 | |
Duke Energy Corp. | | | | | 48,292 | | | | 1,062,424 | |
Edison International | | | | | 12,222 | | | | 505,991 | |
El Paso Electric Co. | | | | | 1,748 | | | | 60,551 | |
Empire District Electric Co. (The) | | | | | 1,197 | | | | 25,245 | |
Entergy Corp. | | | | | 5,441 | | | | 397,465 | |
Exelon Corp. | | | | | 24,553 | | | | 1,064,864 | |
FirstEnergy Corp. | | | | | 12,192 | | | | 540,106 | |
Great Plains Energy, Inc. | | | | | 3,450 | | | | 75,141 | |
Hawaiian Electric Industries, Inc. | | | | | 3,066 | | | | 81,188 | |
IDACORP, Inc. | | | | | 1,515 | | | | 64,251 | |
ITC Holdings Corp. | | | | | 1,539 | | | | 116,779 | |
MGE Energy, Inc. | | | | | 1,559 | | | | 72,914 | |
NextEra Energy, Inc. | | | | | 16,813 | | | | 1,023,575 | |
Northeast Utilities | | | | | 5,201 | | | | 187,600 | |
NV Energy, Inc. | | | | | 7,959 | | | | 130,130 | |
Otter Tail Corp. | | † | | | 1,095 | | | | 24,112 | |
Pepco Holdings, Inc. | | | | | 7,066 | | | | 143,440 | |
Pinnacle West Capital Corp. | | | | | 3,789 | | | | 182,554 | |
PNM Resources, Inc. | | | | | 2,169 | | | | 39,541 | |
Portland General Electric Co. | | | | | 1,100 | | | | 27,819 | |
PPL Corp. | | | | | 16,345 | | | | 480,870 | |
Progress Energy, Inc. | | | | | 10,369 | | | | 580,871 | |
Southern Co. | | | | | 31,134 | | | | 1,441,193 | |
UIL Holdings Corp. | | | | | 1,496 | | | | 52,913 | |
Unisource Energy Corp. | | | | | 1,571 | | | | 58,001 | |
Unitil Corp. | | | | | 420 | | | | 11,920 | |
Westar Energy, Inc. | | | | | 4,032 | | | | 116,041 | |
| | | | | | | | | | | | |
| | | | | | | | | 9,457,568 | |
| | | | | | | | | | | | |
| Electrical Equipment—0.6% | |
Active Power, Inc. | | * | | | 1,093 | | | | 721 | |
Acuity Brands, Inc. | | † | | | 1,873 | | | | 99,269 | |
American Superconductor Corp. | | *† | | | 1,147 | | | | 4,232 | |
AMETEK, Inc. | | | | | 6,351 | | | | 267,377 | |
AZZ, Inc. | | † | | | 1,582 | | | | 71,886 | |
Babcock & Wilcox Co. (The) | | * | | | 5,852 | | | | 141,267 | |
Belden, Inc. | | | | | 1,894 | | | | 63,032 | |
Brady Corp., Class A | | | | | 2,402 | | | | 75,831 | |
Capstone Turbine Corp. | | *† | | | 34,249 | | | | 39,729 | |
Emerson Electric Co. | | | | | 26,374 | | | | 1,228,765 | |
| | | | | | | | | | | | |
| | | | | |
| | | | | | | | Shares | | | | Value | |
| | | | | | | | | | | | |
Encore Wire Corp. | | | | | 1,400 | | | $ | 36,260 | |
Franklin Electric Co., Inc. | | | | | 902 | | | | 39,291 | |
FuelCell Energy, Inc. | | * | | | 1,938 | | | | 1,690 | |
General Cable Corp. | | * | | | 3,772 | | | | 94,338 | |
GrafTech International Ltd. | | * | | | 3,487 | | | | 47,598 | |
Hubbell, Inc., Class B | | | | | 2,078 | | | | 138,935 | |
II-VI, Inc. | | *† | | | 1,364 | | | | 25,043 | |
LSI Industries, Inc. | | | | | 1,083 | | | | 6,498 | |
Magnetek, Inc. | | * | | | 140 | | | | 1,205 | |
Orbit International Corp. | | * | | | 2,812 | | | | 10,039 | |
Plug Power, Inc. | | *† | | | 270 | | | | 551 | |
Powell Industries, Inc. | | * | | | 1,045 | | | | 32,688 | |
Regal-Beloit Corp. | | | | | 1,272 | | | | 64,834 | |
Rockwell Automation, Inc. | | | | | 4,331 | | | | 317,765 | |
Roper Industries, Inc. | | | | | 2,980 | | | | 258,873 | |
Thomas & Betts Corp. | | * | | | 2,428 | | | | 132,569 | |
Ultralife Corp. | | * | | | 416 | | | | 1,672 | |
Universal Security Instruments, Inc. | | * | | | 1,866 | | | | 9,852 | |
Valence Technology, Inc. | | *† | | | 6,972 | | | | 6,833 | |
Vicor Corp. | | | | | 1,380 | | | | 10,985 | |
| | | | | | | | | | | | |
| | | | | | | | | 3,229,628 | |
| | | | | | | | | | | | |
| Electronic Equipment, Instruments & Components—0.7% | |
Agilysys, Inc. | | * | | | 1,335 | | | | 10,613 | |
Amphenol Corp., Class A | | | | | 5,423 | | | | 246,150 | |
Anixter International, Inc. | | * | | | 1,723 | | | | 102,760 | |
Arrow Electronics, Inc. | | * | | | 4,585 | | | | 171,525 | |
Avnet, Inc. | | * | | | 5,129 | | | | 159,461 | |
AVX Corp. | | | | | 2,270 | | | | 28,965 | |
Badger Meter, Inc. | | † | | | 1,134 | | | | 33,374 | |
Benchmark Electronics, Inc. | | * | | | 2,520 | | | | 33,944 | |
Brightpoint, Inc. | | * | | | 2,358 | | | | 25,372 | |
Checkpoint Systems, Inc. | | * | | | 1,441 | | | | 15,765 | |
Cognex Corp. | | | | | 2,023 | | | | 72,403 | |
Coherent, Inc. | | * | | | 1,348 | | | | 70,460 | |
Corning, Inc. | | | | | 52,776 | | | | 685,032 | |
CTS Corp. | | † | | | 1,580 | | | | 14,536 | |
Daktronics, Inc. | | † | | | 927 | | | | 8,871 | |
Dolby Laboratories, Inc., Class A | | * | | | 1,370 | | | | 41,799 | |
DTS, Inc. | | * | | | 755 | | | | 20,566 | |
Echelon Corp. | | *† | | | 1,769 | | | | 8,615 | |
Electro Rent Corp. | | | | | 950 | | | | 16,292 | |
Electro Scientific Industries, Inc. | | * | | | 1,421 | | | | 20,576 | |
FARO Technologies, Inc. | | * | | | 453 | | | | 20,838 | |
FEI Co. | | * | | | 1,368 | | | | 55,787 | |
FLIR Systems, Inc. | | | | | 5,608 | | | | 140,593 | |
Frequency Electronics, Inc. | | * | | | 821 | | | | 6,289 | |
ID Systems, Inc. | | * | | | 2,016 | | | | 9,536 | |
Identive Group, Inc. | | * | | | 1,494 | | | | 3,332 | |
Ingram Micro, Inc., Class A | | * | | | 1,030 | | | | 18,736 | |
Insight Enterprises, Inc. | | * | | | 2,054 | | | | 31,406 | |
Iteris, Inc. | | * | | | 4,263 | | | | 5,542 | |
Itron, Inc. | | * | | | 955 | | | | 34,160 | |
Jabil Circuit, Inc. | | | | | 8,287 | | | | 162,922 | |
Lightpath Technologies, Inc., Class A | | *† | | | 1,526 | | | | 1,633 | |
Littelfuse, Inc. | | † | | | 909 | | | | 39,069 | |
LRAD Corp. | | * | | | 3,686 | | | | 5,492 | |
Maxwell Technologies, Inc. | | *† | | | 370 | | | | 6,009 | |
Mercury Computer Systems, Inc. | | * | | | 963 | | | | 12,798 | |
Mesa Laboratories, Inc. | | | | | 1,200 | | | | 49,728 | |
Methode Electronics, Inc. | | † | | | 1,383 | | | | 11,465 | |
See accompanying notes to financial statements.
273
SCHEDULE OF INVESTMENTS—(Continued)
December 31, 2011
| | | | | | | | | | | | |
| Vantagepoint Broad Market Index Fund | | | | | | | Shares | | | | Value | |
| | | | | | | | | | | | |
| COMMON STOCKS—(Continued) | |
Molex, Inc. | | | | | 1,611 | | | $ | 38,438 | |
MTS Systems Corp. | | | | | 1,342 | | | | 54,686 | |
National Instruments Corp. | | | | | 5,121 | | | | 132,890 | |
Newport Corp. | | * | | | 1,614 | | | | 21,966 | |
OSI Systems, Inc. | | * | | | 867 | | | | 42,292 | |
Park Electrochemical Corp. | | | | | 1,086 | | | | 27,823 | |
PC Connection, Inc. | | | | | 854 | | | | 9,471 | |
Planar Systems, Inc. | | * | | | 785 | | | | 1,523 | |
Plexus Corp. | | * | | | 1,884 | | | | 51,584 | |
Power-One, Inc. | | * | | | 3,459 | | | | 13,525 | |
Pulse Electronics Corp. | | | | | 1,866 | | | | 5,225 | |
Radisys Corp. | | * | | | 961 | | | | 4,863 | |
Research Frontiers, Inc. | | * | | | 752 | | | | 2,542 | |
Rofin-Sinar Technologies, Inc. | | * | | | 2,200 | | | | 50,270 | |
Rogers Corp. | | * | | | 803 | | | | 29,599 | |
Sanmina-SCI Corp. | | * | | | 3,577 | | | | 33,302 | |
ScanSource, Inc. | | * | | | 1,126 | | | | 40,536 | |
Sigmatron International, Inc. | | * | | | 282 | | | | 931 | |
SYNNEX Corp. | | * | | | 104 | | | | 3,168 | |
Tech Data Corp. | | * | | | 2,057 | | | | 101,636 | |
Trimble Navigation Ltd. | | * | | | 4,318 | | | | 187,401 | |
TTM Technologies, Inc. | | * | | | 1,639 | | | | 17,963 | |
Universal Display Corp. | | *† | | | 1,350 | | | | 49,531 | |
Vishay Intertechnology, Inc. | | * | | | 6,172 | | | | 55,486 | |
Vishay Precision Group, Inc. | | * | | | 440 | | | | 7,031 | |
Wayside Technology Group, Inc. | | | | | 1,787 | | | | 21,712 | |
X-Rite, Inc. | | *† | | | 1,890 | | | | 8,770 | |
Zygo Corp. | | * | | | 967 | | | | 17,068 | |
| | | | | | | | | | | | |
| | | | | | | | | 3,433,646 | |
| | | | | | | | | | | | |
| Energy Equipment & Services—2.0% | |
Atwood Oceanics, Inc. | | * | | | 1,298 | | | | 51,647 | |
Baker Hughes, Inc. | | | | | 13,177 | | | | 640,929 | |
Basic Energy Services, Inc. | | * | | | 1,600 | | | | 31,520 | |
Bristow Group, Inc. | | | | | 982 | | | | 46,537 | |
Cal Dive International, Inc. | | * | | | 4,816 | | | | 10,836 | |
Cameron International Corp. | | * | | | 9,319 | | | | 458,402 | |
CARBO Ceramics, Inc. | | | | | 1,137 | | | | 140,226 | |
Complete Production Services, Inc. | | * | | | 1,200 | | | | 40,272 | |
Dawson Geophysical Co. | | * | | | 924 | | | | 36,526 | |
Diamond Offshore Drilling, Inc. | | † | | | 1,577 | | | | 87,145 | |
Dresser-Rand Group, Inc. | | * | | | 2,924 | | | | 145,937 | |
Dril-Quip, Inc. | | * | | | 880 | | | | 57,922 | |
Exterran Holdings, Inc. | | * | | | 2,465 | | | | 22,432 | |
FMC Technologies, Inc. | | *† | | | 8,237 | | | | 430,219 | |
Gulfmark Offshore, Inc., Class A | | * | | | 1,000 | | | | 42,010 | |
Halliburton Co. | | | | | 32,022 | | | | 1,105,079 | |
Helix Energy Solutions Group, Inc. | | * | | | 3,853 | | | | 60,877 | |
Helmerich & Payne, Inc. | | | | | 3,926 | | | | 229,121 | |
Hercules Offshore, Inc. | | * | | | 5,226 | | | | 23,203 | |
Hornbeck Offshore Services, Inc. | | *† | | | 1,800 | | | | 55,836 | |
ION Geophysical Corp. | | * | | | 6,136 | | | | 37,614 | |
Key Energy Services, Inc. | | * | | | 7,257 | | | | 112,266 | |
Lufkin Industries, Inc. | | | | | 2,000 | | | | 134,620 | |
Matrix Service Co. | | * | | | 468 | | | | 4,418 | |
McDermott International, Inc. | | * | | | 11,704 | | | | 134,713 | |
Mitcham Industries, Inc. | | * | | | 1,100 | | | | 24,024 | |
Nabors Industries Ltd. (Bermuda) | | * | | | 10,988 | | | | 190,532 | |
National Oilwell Varco, Inc. | | | | | 16,517 | | | | 1,122,991 | |
Newpark Resources, Inc. | | * | | | 3,484 | | | | 33,098 | |
| | | | | | | | | | | | |
| | | | | |
| | | | | | | | Shares | | | | Value | |
| | | | | | | | | | | | |
Oceaneering International, Inc. | | | | | 4,464 | | | $ | 205,924 | |
Oil States International, Inc. | | * | | | 2,026 | | | | 154,726 | |
OYO Geospace Corp. | | * | | | 550 | | | | 42,532 | |
Parker Drilling Co. | | * | | | 3,755 | | | | 26,923 | |
Patterson-UTI Energy, Inc. | | | | | 6,712 | | | | 134,106 | |
PHI, Inc. | | * | | | 774 | | | | 19,234 | |
Pioneer Drilling Co. | | * | | | 2,700 | | | | 26,136 | |
Rowan Cos., Inc. | | * | | | 3,918 | | | | 118,833 | |
Schlumberger Ltd. | | | | | 52,043 | | | | 3,555,057 | |
SEACOR Holdings, Inc. | | * | | | 713 | | | | 63,428 | |
Superior Energy Services, Inc. | | *† | | | 2,900 | | | | 82,476 | |
Tesco Corp. | | * | | | 3,185 | | | | 40,258 | |
Tetra Technologies, Inc. | | * | | | 2,352 | | | | 21,968 | |
Tidewater, Inc. | | | | | 78 | | | | 3,845 | |
Unit Corp. | | * | | | 1,702 | | | | 78,973 | |
| | | | | | | | | | | | |
| | | | | | | | | | | 10,085,371 | |
| | | | | | | | | | | | |
| Food & Staples Retailing—2.0% | |
Andersons, Inc. (The) | | | | | 700 | | | | 30,562 | |
Arden Group, Inc., Class A | | † | | | 260 | | | | 23,403 | |
Casey’s General Stores, Inc. | | | | | 1,608 | | | | 82,828 | |
Costco Wholesale Corp. | | | | | 14,385 | | | | 1,198,558 | |
CVS Caremark Corp. | | | | | 48,989 | | | | 1,997,771 | |
Kroger Co. (The) | | | | | 19,202 | | | | 465,072 | |
Nash Finch Co. | | | | | 674 | | | | 19,735 | |
Pantry, Inc. (The) | | * | | | 1,200 | | | | 14,364 | |
Rite Aid Corp. | | *† | | | 25,982 | | | | 32,737 | |
Ruddick Corp. | | | | | 1,967 | | | | 83,873 | |
Safeway, Inc. | | | | | 8,825 | | | | 185,678 | |
SUPERVALU, Inc. | | † | | | 8,154 | | | | 66,210 | |
Sysco Corp. | | | | | 22,511 | | | | 660,248 | |
United Natural Foods, Inc. | | * | | | 1,912 | | | | 76,499 | |
Walgreen Co. | | | | | 34,325 | | | | 1,134,785 | |
Wal-Mart Stores, Inc. | | | | | 63,901 | | | | 3,818,724 | |
Weis Markets, Inc. | | † | | | 382 | | | | 15,257 | |
Whole Foods Market, Inc. | | | | | 5,036 | | | | 350,405 | |
Winn-Dixie Stores, Inc. | | * | | | 3,309 | | | | 31,038 | |
| | | | | | | | | | | | |
| | | | | | | | | | | 10,287,747 | |
| | | | | | | | | | | | |
| Food Products—1.8% | |
Archer-Daniels-Midland Co. | | | | | 23,265 | | | | 665,379 | |
Bridgford Foods Corp. | | *† | | | 559 | | | | 5,456 | |
Bunge Ltd. | | | | | 4,700 | | | | 268,840 | |
Campbell Soup Co. | | | | | 5,629 | | | | 187,108 | |
Chiquita Brands International, Inc. | | * | | | 2,150 | | | | 17,931 | |
ConAgra Foods, Inc. | | | | | 14,190 | | | | 374,616 | |
Corn Products International, Inc. | | | | | 3,164 | | | | 166,395 | |
Darling International, Inc. | | * | | | 3,150 | | | | 41,864 | |
Dean Foods Co. | | * | | | 6,281 | | | | 70,347 | |
Farmer Bros. Co. | | † | | | 930 | | | | 7,105 | |
Flowers Foods, Inc. | | | | | 6,210 | | | | 117,866 | |
Fresh Del Monte Produce, Inc. | | | | | 567 | | | | 14,181 | |
General Mills, Inc. | | | | | 21,313 | | | | 861,258 | |
Green Mountain Coffee Roasters, Inc. | | *† | | | 4,435 | | | | 198,910 | |
Griffin Land & Nurseries, Inc. | | † | | | 650 | | | | 17,199 | |
H.J. Heinz Co. | | | | | 10,532 | | | | 569,149 | |
Hain Celestial Group, Inc. (The) | | * | | | 1,426 | | | | 52,277 | |
Hershey Co. (The) | | | | | 6,664 | | | | 411,702 | |
Hormel Foods Corp. | | | | | 6,390 | | | | 187,163 | |
Inventure Foods, Inc. | | * | | | 5,272 | | | | 19,717 | |
J&J Snack Foods Corp. | | | | | 761 | | | | 40,546 | |
J.M. Smucker Co. (The) | | | | | 4,592 | | | | 358,957 | |
See accompanying notes to financial statements.
274
SCHEDULE OF INVESTMENTS—(Continued)
December 31, 2011
| | | | | | | | | | | | |
| Vantagepoint Broad Market Index Fund | | | | | | | Shares | | | | Value | |
| | | | | | | | | | | | |
| COMMON STOCKS—(Continued) | |
Kellogg Co. | | | | | 8,673 | | | $ | 438,594 | |
Kraft Foods, Inc., Class A | | | | | 59,086 | | | | 2,207,453 | |
Lancaster Colony Corp. | | † | | | 1,389 | | | | 96,313 | |
McCormick & Co., Inc. | | | | | 4,101 | | | | 206,772 | |
Mead Johnson Nutrition Co. | | | | | 4,802 | | | | 330,042 | |
Ralcorp Holdings, Inc. | | * | | | 2,312 | | | | 197,676 | |
Sanderson Farms, Inc. | | † | | | 864 | | | | 43,312 | |
Sara Lee Corp. | | | | | 22,459 | | | | 424,924 | |
Smithfield Foods, Inc. | | * | | | 4,682 | | | | 113,679 | |
Snyders-Lance, Inc. | | | | | 1,370 | | | | 30,825 | |
Tootsie Roll Industries, Inc. | | † | | | 643 | | | | 15,220 | |
TreeHouse Foods, Inc. | | * | | | 1,256 | | | | 82,117 | |
Tyson Foods, Inc., Class A | | | | | 10,231 | | | | 211,168 | |
| | | | | | | | | | | | |
| | | | | | | | | | | 9,052,061 | |
| | | | | | | | | | | | |
| Gas Utilities—0.3% | |
AGL Resources, Inc. | | | | | 3,698 | | | | 156,278 | |
Atmos Energy Corp. | | | | | 2,732 | | | | 91,112 | |
Chesapeake Utilities Corp. | | | | | 949 | | | | 41,139 | |
Delta Natural Gas Co., Inc. | | | | | 380 | | | | 13,053 | |
Laclede Group, Inc. (The) | | | | | 1,025 | | | | 41,482 | |
National Fuel Gas Co. | | | | | 3,639 | | | | 202,256 | |
New Jersey Resources Corp. | | | | | 1,681 | | | | 82,705 | |
Northwest Natural Gas Co. | | † | | | 1,183 | | | | 56,701 | |
ONEOK, Inc. | | | | | 3,908 | | | | 338,785 | |
Piedmont Natural Gas Co., Inc. | | † | | | 2,740 | | | | 93,105 | |
Questar Corp. | | | | | 7,412 | | | | 147,202 | |
South Jersey Industries, Inc. | | | | | 2,014 | | | | 114,415 | |
Southwest Gas Corp. | | | | | 1,252 | | | | 53,198 | |
UGI Corp. | | | | | 2,720 | | | | 79,968 | |
WGL Holdings, Inc. | | | | | 2,315 | | | | 102,369 | |
| | | | | | | | | | | | |
| | | | | | | | | | | 1,613,768 | |
| | | | | | | | | | | | |
| Health Care Equipment & Supplies—1.7% | |
Abaxis, Inc. | | * | | | 749 | | | | 20,725 | |
ABIOMED, Inc. | | * | | | 886 | | | | 16,364 | |
Alere, Inc. | | * | | | 3,011 | | | | 69,524 | |
Align Technology, Inc. | | * | | | 2,449 | | | | 58,103 | |
Analogic Corp. | | | | | 593 | | | | 33,991 | |
Baxter International, Inc. | | | | | 19,308 | | | | 955,360 | |
Becton Dickinson and Co. | | | | | 7,370 | | | | 550,686 | |
Biolase Technology, Inc. | | *† | | | 798 | | | | 2,050 | |
Boston Scientific Corp. | | * | | | 53,540 | | | | 285,904 | |
C.R. Bard, Inc. | | | | | 3,904 | | | | 333,792 | |
CareFusion Corp. | | * | | | 6,833 | | | | 173,627 | |
Cerus Corp. | | * | | | 1,010 | | | | 2,828 | |
Conceptus, Inc. | | * | | | 1,047 | | | | 13,234 | |
CONMED Corp. | | * | | | 1,362 | | | | 34,963 | |
Cooper Cos., Inc. (The) | | | | | 1,627 | | | | 114,736 | |
CryoLife, Inc. | | * | | | 937 | | | | 4,498 | |
Cyberonics, Inc. | | * | | | 956 | | | | 32,026 | |
DENTSPLY International, Inc. | | | | | 5,668 | | | | 198,323 | |
Edwards Lifesciences Corp. | | * | | | 4,494 | | | | 317,726 | |
Gen-Probe, Inc. | | * | | | 1,849 | | | | 109,313 | |
Greatbatch, Inc. | | * | | | 942 | | | | 20,818 | |
Haemonetics Corp. | | * | | | 1,157 | | | | 70,832 | |
Hill-Rom Holdings, Inc. | | | | | 1,576 | | | | 53,095 | |
Hologic, Inc. | | * | | | 9,792 | | | | 171,458 | |
ICU Medical, Inc. | | *† | | | 605 | | | | 27,225 | |
IDEXX Laboratories, Inc. | | * | | | 1,985 | | | | 152,766 | |
Integra LifeSciences Holdings Corp. | | * | | | 1,190 | | | | 36,688 | |
Intuitive Surgical, Inc. | | * | | | 1,260 | | | | 583,393 | |
| | | | | | | | | | | | |
| | | | | |
| | | | | | | | Shares | | | | Value | |
| | | | | | | | | | | | |
Invacare Corp. | | | | | 1,333 | | | $ | 20,382 | |
Kensey Nash Corp. | | *† | | | 866 | | | | 16,619 | |
Masimo Corp. | | * | | | 1,500 | | | | 28,027 | |
Medtronic, Inc. | | | | | 39,854 | | | | 1,524,415 | |
Meridian Bioscience, Inc. | | † | | | 1,158 | | | | 21,817 | |
Merit Medical Systems, Inc. | | * | | | 3,149 | | | | 42,134 | |
NuVasive, Inc. | | * | | | 990 | | | | 12,464 | |
OraSure Technologies, Inc. | | * | | | 1,687 | | | | 15,369 | |
Palomar Medical Technologies, Inc. | | * | | | 1,116 | | | | 10,379 | |
ResMed, Inc. | | *† | | | 6,068 | | | | 154,127 | |
RTI Biologics, Inc. | | * | | | 807 | | | | 3,583 | |
SonoSite, Inc. | | * | | | 1,012 | | | | 54,506 | |
Spectranetics Corp. | | * | | | 1,045 | | | | 7,545 | |
St. Jude Medical, Inc. | | | | | 11,448 | | | | 392,666 | |
Staar Surgical Co. | | * | | | 848 | | | | 8,895 | |
STERIS Corp. | | | | | 2,777 | | | | 82,810 | |
Stryker Corp. | | † | | | 10,105 | | | | 502,320 | |
SurModics, Inc. | | * | | | 675 | | | | 9,895 | |
Synovis Life Technologies, Inc. | | * | | | 346 | | | | 9,629 | |
Teleflex, Inc. | | | | | 1,322 | | | | 81,025 | |
Theragenics Corp. | | * | | | 1,492 | | | | 2,507 | |
ThermoGenesis Corp. | | * | | | 1,079 | | | | 766 | |
Thoratec Corp. | | * | | | 2,306 | | | | 77,389 | |
Urologix, Inc. | | * | | | 1,050 | | | | 1,134 | |
Varian Medical Systems, Inc. | | * | | | 4,761 | | | | 319,606 | |
Volcano Corp. | | * | | | 1,970 | | | | 46,866 | |
West Pharmaceutical Services, Inc. | | | | | 1,704 | | | | 64,667 | |
Wright Medical Group, Inc. | | * | | | 1,309 | | | | 21,598 | |
Young Innovations, Inc. | | | | | 677 | | | | 20,059 | |
Zimmer Holdings, Inc. | | * | | | 6,941 | | | | 370,788 | |
Zoll Medical Corp. | | * | | | 850 | | | | 53,703 | |
| | | | | | | | | | | | |
| | | | | | | | | | | 8,421,738 | |
| | | | | | | | | | | | |
| Health Care Providers & Services—2.2% | |
Aetna, Inc. | | | | | 12,020 | | | | 507,124 | |
Alliance HealthCare Services, Inc. | | * | | | 1,429 | | | | 1,801 | |
Almost Family, Inc. | | * | | | 422 | | | | 6,997 | |
Amedisys, Inc. | | * | | | 1,698 | | | | 18,525 | |
AMERIGROUP Corp. | | * | | | 1,157 | | | | 68,356 | |
AmerisourceBergen Corp. | | | | | 11,686 | | | | 434,602 | |
AMN Healthcare Services, Inc. | | * | | | 1,507 | | | | 6,676 | |
Amsurg Corp. | | * | | | 1,423 | | | | 37,055 | |
BioScrip, Inc. | | * | | | 1,095 | | | | 5,979 | |
Brookdale Senior Living, Inc. | | * | | | 2,200 | | | | 38,258 | |
Cardinal Health, Inc. | | | | | 13,667 | | | | 555,017 | |
CardioNet, Inc. | | * | | | 1,151 | | | | 2,728 | |
Catalyst Health Solutions, Inc. | | * | | | 1,864 | | | | 96,928 | |
Centene Corp. | | * | | | 1,972 | | | | 78,071 | |
Chemed Corp. | | | | | 1,162 | | | | 59,506 | |
Chindex International, Inc. | | * | | | 822 | | | | 7,003 | |
CIGNA Corp. | | | | | 7,259 | | | | 304,878 | |
Community Health Systems, Inc. | | * | | | 4,282 | | | | 74,721 | |
Coventry Health Care, Inc. | | * | | | 5,198 | | | | 157,863 | |
Cross Country Healthcare, Inc. | | * | | | 1,339 | | | | 7,431 | |
DaVita, Inc. | | * | | | 3,507 | | | | 265,866 | |
Express Scripts, Inc. | | * | | | 19,149 | | | | 855,769 | |
Gentiva Health Services, Inc. | | * | | | 1,474 | | | | 9,949 | |
Hanger Orthopedic Group, Inc. | | * | | | 1,083 | | | | 20,241 | |
HCA Holdings, Inc. | | * | | | 3,319 | | | | 73,118 | |
Health Management Associates, Inc., Class A | | * | | | 9,953 | | | | 73,354 | |
See accompanying notes to financial statements.
275
SCHEDULE OF INVESTMENTS—(Continued)
December 31, 2011
| | | | | | | | | | | | |
| Vantagepoint Broad Market Index Fund | | | | | | | Shares | | | | Value | |
| | | | | | | | | | | | |
| COMMON STOCKS—(Continued) | |
Health Net, Inc. | | * | | | 3,209 | | | $ | 97,618 | |
Healthspring, Inc. | | * | | | 1,621 | | | | 88,409 | |
Healthways, Inc. | | * | | | 1,362 | | | | 9,343 | |
Henry Schein, Inc. | | *† | | | 3,652 | | | | 235,298 | |
HMS Holdings Corp. | | * | | | 4,230 | | | | 135,275 | |
Humana, Inc. | | | | | 4,622 | | | | 404,933 | |
Kindred Healthcare, Inc. | | * | | | 2,148 | | | | 25,282 | |
Laboratory Corp. of America Holdings | | * | | | 4,321 | | | | 371,476 | |
Landauer, Inc. | | | | | 598 | | | | 30,797 | |
LCA-Vision, Inc. | | * | | | 616 | | | | 1,786 | |
LifePoint Hospitals, Inc. | | * | | | 2,149 | | | | 79,835 | |
Lincare Holdings, Inc. | | | | | 3,193 | | | | 82,092 | |
Magellan Health Services, Inc. | | * | | | 1,400 | | | | 69,258 | |
McKesson Corp. | | | | | 9,930 | | | | 773,646 | |
Medco Health Solutions, Inc. | | * | | | 13,709 | | | | 766,333 | |
Mednax, Inc. | | * | | | 2,182 | | | | 157,126 | |
National Healthcare Corp. | | † | | | 431 | | | | 18,059 | |
National Research Corp. | | | | | 1,250 | | | | 48,512 | |
Omnicare, Inc. | | | | | 4,277 | | | | 147,343 | |
Owens & Minor, Inc. | | † | | | 2,434 | | | | 67,641 | |
Patterson Cos., Inc. | | | | | 5,546 | | | | 163,718 | |
PDI, Inc. | | * | | | 703 | | | | 4,534 | |
PharMerica Corp. | | * | | | 1,365 | | | | 20,721 | |
PSS World Medical, Inc. | | * | | | 3,574 | | | | 86,455 | |
Psychemedics Corp. | | | | | 302 | | | | 2,748 | |
Quest Diagnostics, Inc. | | | | | 3,899 | | | | 226,376 | |
Sun Healthcare Group, Inc. | | *† | | | 694 | | | | 2,693 | |
Sunrise Senior Living, Inc. | | *† | | | 1,950 | | | | 12,636 | |
Tenet Healthcare Corp. | | * | | | 19,289 | | | | 98,953 | |
U.S. Physical Therapy, Inc. | | | | | 1,300 | | | | 25,584 | |
UnitedHealth Group, Inc. | | | | | 39,341 | | | | 1,993,802 | |
Universal American Corp. | | | | | 1,812 | | | | 23,031 | |
Universal Health Services, Inc., Class B | | | | | 2,466 | | | | 95,829 | |
VCA Antech, Inc. | | * | | | 3,442 | | | | 67,980 | |
WellCare Health Plans, Inc. | | * | | | 1,500 | | | | 78,750 | |
WellPoint, Inc. | | | | | 12,343 | | | | 817,724 | |
| | | | | | | | | | | | |
| | | | | | | | | | | 11,099,412 | |
| | | | | | | | | | | | |
| Health Care Technology—0.1% | |
Allscripts Healthcare Solutions, Inc. | | * | | | 4,515 | | | | 85,514 | |
Authentidate Holding Corp. | | * | | | 1,023 | | | | 696 | |
Cerner Corp. | | * | | | 6,088 | | | | 372,890 | |
Mediware Information Systems, Inc. | | * | | | 1,088 | | | | 13,948 | |
Omnicell, Inc. | | * | | | 783 | | | | 12,935 | |
Quality Systems, Inc. | | | | | 1,536 | | | | 56,817 | |
| | | | | | | | | | | | |
| | | | | | | | | | | 542,800 | |
| | | | | | | | | | | | |
| Hotels, Restaurants & Leisure—2.2% | |
Ameristar Casinos, Inc. | | | | | 300 | | | | 5,187 | |
Bally Technologies, Inc. | | * | | | 1,971 | | | | 77,973 | |
Biglari Holdings, Inc. | | * | | | 63 | | | | 23,199 | |
Bob Evans Farms, Inc. | | | | | 1,465 | | | | 49,136 | |
Boyd Gaming Corp. | | *† | | | 2,619 | | | | 19,538 | |
Brinker International, Inc. | | | | | 5,167 | | | | 138,269 | |
Buffalo Wild Wings, Inc. | | *† | | | 867 | | | | 58,531 | |
Carnival Corp. | | | | | 11,468 | | | | 374,316 | |
CEC Entertainment, Inc. | | | | | 1,614 | | | | 55,602 | |
Cheesecake Factory, Inc. (The) | | * | | | 3,444 | | | | 101,081 | |
Chipotle Mexican Grill, Inc. | | * | | | 1,003 | | | | 338,753 | |
| | | | | | | | | | | | |
| | | | | |
| | | | | | | | Shares | | | | Value | |
| | | | | | | | | | | | |
Choice Hotels International, Inc. | | † | | | 1,616 | | | $ | 61,489 | |
Churchill Downs, Inc. | | | | | 638 | | | | 33,259 | |
Cracker Barrel Old Country Store, Inc. | | † | | | 2,120 | | | | 106,869 | |
Darden Restaurants, Inc. | | | | | 3,930 | | | | 179,129 | |
DineEquity, Inc. | | * | | | 1,079 | | | | 45,545 | |
Dover Downs Gaming & Entertainment, Inc. | | | | | 1,710 | | | | 3,659 | |
Dover Motorsports, Inc. | | * | | | 1,645 | | | | 1,711 | |
Gaylord Entertainment Co. | | *† | | | 1,772 | | | | 42,776 | |
International Game Technology | | | | | 7,153 | | | | 123,032 | |
International Speedway Corp., Class A | | | | | 1,190 | | | | 30,167 | |
Interval Leisure Group, Inc. | | * | | | 1,886 | | | | 25,669 | |
Isle of Capri Casinos, Inc. | | * | | | 1,250 | | | | 5,838 | |
Jack in the Box, Inc. | | * | | | 2,874 | | | | 60,067 | |
Krispy Kreme Doughnuts, Inc. | | * | | | 2,573 | | | | 16,827 | |
Las Vegas Sands Corp. | | * | | | 16,217 | | | | 692,952 | |
Life Time Fitness, Inc. | | *† | | | 1,774 | | | | 82,935 | |
Marcus Corp. | | † | | | 1,505 | | | | 18,978 | |
Marriott International, Inc., Class A | | | | | 10,755 | | | | 313,723 | |
Marriott Vacations Worldwide Corp. | | * | | | 1,075 | | | | 18,447 | |
McDonald’s Corp. | | | | | 37,036 | | | | 3,715,822 | |
MGM Resorts International | | * | | | 8,952 | | | | 93,369 | |
Morgans Hotel Group Co. | | *† | | | 2,300 | | | | 13,570 | |
Morton’s Restaurant Group, Inc. | | * | | | 2,200 | | | | 15,136 | |
Multimedia Games Holding Co., Inc. | | * | | | 1,202 | | | | 9,544 | |
O’Charleys, Inc. | | * | | | 1,091 | | | | 5,990 | |
Orient-Express Hotels Ltd., Class A (Bermuda) | | * | | | 1,577 | | | | 11,780 | |
P.F. Chang’s China Bistro, Inc. | | † | | | 1,089 | | | | 33,661 | |
Panera Bread Co., Class A | | * | | | 1,250 | | | | 176,813 | |
Papa John’s International, Inc. | | * | | | 1,610 | | | | 60,665 | |
Peet’s Coffee & Tea, Inc. | | * | | | 637 | | | | 39,927 | |
Penn National Gaming, Inc. | | * | | | 2,586 | | | | 98,449 | |
Pinnacle Entertainment, Inc. | | * | | | 1,629 | | | | 16,551 | |
Red Robin Gourmet Burgers, Inc. | | * | | | 692 | | | | 19,168 | |
Royal Caribbean Cruises Ltd. | | | | | 7,613 | | | | 188,574 | |
Ruby Tuesday, Inc. | | * | | | 2,816 | | | | 19,430 | |
Scientific Games Corp., Class A | | * | | | 2,517 | | | | 24,415 | |
Shuffle Master, Inc. | | * | | | 1,527 | | | | 17,896 | |
Sonic Corp. | | * | | | 3,730 | | | | 25,103 | |
Speedway Motorsports, Inc. | | | | | 149 | | | | 2,284 | |
Starbucks Corp. | | | | | 24,221 | | | | 1,114,408 | |
Starwood Hotels & Resorts Worldwide, Inc. | | | | | 7,939 | | | | 380,834 | |
Texas Roadhouse, Inc. | | | | | 3,070 | | | | 45,743 | |
Vail Resorts, Inc. | | † | | | 1,491 | | | | 63,159 | |
Wendy’s Co. (The) | | | | | 25,109 | | | | 134,584 | |
WMS Industries, Inc. | | * | | | 564 | | | | 11,573 | |
Wyndham Worldwide Corp. | | | | | 6,992 | | | | 264,507 | |
Wynn Resorts Ltd. | | | | | 2,554 | | | | 282,191 | |
Yum! Brands, Inc. | | | | | | | 14,951 | | | | 882,259 | |
| | | | | | | | | | | | |
| | | | | | | | | | | 10,872,062 | |
| | | | | | | | | | | | |
| Household Durables—0.3% | |
American Greetings Corp., Class A | | | | | 2,760 | | | | 34,528 | |
Bassett Furniture Industries, Inc. | | | | | 1,139 | | | | 8,531 | |
Beazer Homes USA, Inc. | | *† | | | 34,087 | | | | 84,536 | |
See accompanying notes to financial statements.
276
SCHEDULE OF INVESTMENTS—(Continued)
December 31, 2011
| | | | | | | | | | | | |
| Vantagepoint Broad Market Index Fund | | | | | | | Shares | | | | Value | |
| | | | | | | | | | | | |
| COMMON STOCKS—(Continued) | |
Blyth, Inc. | | | | | 460 | | | $ | 26,128 | |
D.R. Horton, Inc. | | | | | 3,903 | | | | 49,217 | |
Ethan Allen Interiors, Inc. | | † | | | 1,551 | | | | 36,774 | |
Furniture Brands International, Inc. | | * | | | 2,341 | | | | 2,879 | |
Harman International Industries, Inc. | | | | | 2,728 | | | | 103,773 | |
Helen of Troy Ltd. (Bermuda) | | * | | | 1,333 | | | | 40,923 | |
Hovnanian Enterprises, Inc., Class A | | *† | | | 15,517 | | | | 22,500 | |
Jarden Corp. | | | | | 2,055 | | | | 61,403 | |
KB Home | | † | | | 3,248 | | | | 21,827 | |
Kid Brands, Inc. | | * | | | 1,156 | | | | 3,653 | |
La-Z-Boy, Inc. | | * | | | 2,404 | | | | 28,608 | |
Leggett & Platt, Inc. | | | | | 2,928 | | | | 67,461 | |
Lennar Corp., Class A | | † | | | 5,675 | | | | 111,514 | |
M/I Homes, Inc. | | * | | | 610 | | | | 5,856 | |
MDC Holdings, Inc. | | | | | 1,091 | | | | 19,234 | |
Meritage Homes Corp. | | * | | | 1,300 | | | | 30,147 | |
Mohawk Industries, Inc. | | * | | | 868 | | | | 51,950 | |
Newell Rubbermaid, Inc. | | | | | 3,792 | | | | 61,241 | |
NVR, Inc. | | * | | | 112 | | | | 76,832 | |
PulteGroup, Inc. | | *† | | | 13,539 | | | | 85,431 | |
Ryland Group, Inc. (The) | | | | | 1,852 | | | | 29,188 | |
Skyline Corp. | | † | | | 720 | | | | 3,132 | |
Standard Pacific Corp. | | *† | | | 2,568 | | | | 8,166 | |
Tempur-Pedic International, Inc. | | *† | | | 1,346 | | | | 70,705 | |
Toll Brothers, Inc. | | * | | | 4,132 | | | | 84,375 | |
Tupperware Brands Corp. | | | | | 2,427 | | | | 135,839 | |
Universal Electronics, Inc. | | * | | | 639 | | | | 10,780 | |
Whirlpool Corp. | | | | | 1,858 | | | | 88,162 | |
| | | | | | | | | | | | |
| | | | | | | | | | | 1,465,293 | |
| | | | | | | | | | | | |
| Household Products—2.0% | |
Central Garden and Pet Co., Class A | | * | | | 1,230 | | | | 10,234 | |
Church & Dwight Co., Inc. | | | | | 5,138 | | | | 235,115 | |
Clorox Co. (The) | | | | | 4,503 | | | | 299,720 | |
Colgate-Palmolive Co. | | | | | 16,371 | | | | 1,512,517 | |
Energizer Holdings, Inc. | | * | | | 1,856 | | | | 143,803 | |
Kimberly-Clark Corp. | | | | | 13,185 | | | | 969,888 | |
Procter & Gamble Co. (The) | | | | | 103,995 | | | | 6,937,506 | |
WD-40 Co. | | | | | 949 | | | | 38,349 | |
| | | | | | | | | | | | |
| | | | | | | | | | | 10,147,132 | |
| | | | | | | | | | | | |
| Independent Power Producers & Energy Traders—0.2% | |
AES Corp. (The) | | * | | | 26,935 | | | | 318,910 | |
Calpine Corp. | | * | | | 16,000 | | | | 261,280 | |
Constellation Energy Group, Inc. | | | | | 7,434 | | | | 294,907 | |
Dynegy, Inc. | | * | | | 25,395 | | | | 70,344 | |
Genie Energy Ltd., Class B | | | | | 1,600 | | | | 12,688 | |
GenOn Energy, Inc. | | * | | | 15,396 | | | | 40,184 | |
NRG Energy, Inc. | | * | | | 8,000 | | | | 144,960 | |
Tegal Corp. | | * | | | 62 | | | | 208 | |
| | | | | | | | | | | | |
| | | | | | | | | | | 1,143,481 | |
| | | | | | | | | | | | |
| Industrial Conglomerates—2.0% | |
3M Co. | | | | | 24,174 | | | | 1,975,741 | |
Carlisle Cos., Inc. | | | | | 2,452 | | | | 108,624 | |
Danaher Corp. | | | | | 16,656 | | | | 783,498 | |
General Electric Co. | | | | | 395,685 | | | | 7,086,718 | |
| | | | | | | | | | | | |
| | | | | |
| | | | | | | | Shares | | | | Value | |
| | | | | | | | | | | | |
Seaboard Corp. | | * | | | 18 | | | $ | 36,648 | |
Standex International Corp. | | † | | | 724 | | | | 24,739 | |
| | | | | | | | | | | | |
| | | | | | | | | | | 10,015,968 | |
| | | | | | | | | | | | |
| Insurance—3.5% | |
Aflac, Inc. | | | | | 19,465 | | | | 842,056 | |
Alleghany Corp. | | *† | | | 157 | | | | 44,791 | |
Allied World Assurance Co. Holdings AG (Switzerland) | | | | | 1,889 | | | | 118,875 | |
Allstate Corp. (The) | | | | | 18,288 | | | | 501,274 | |
Alterra Capital Holdings Ltd. (Bermuda) | | | | | 1,915 | | | | 45,251 | |
American Equity Investment Life Holding Co. | | † | | | 4,302 | | | | 44,741 | |
American Financial Group, Inc. | | | | | 2,657 | | | | 98,017 | |
American International Group, Inc. | | * | | | 14,067 | | | | 326,354 | |
American National Insurance Co. | | | | | 945 | | | | 69,013 | |
Aon Corp. | | | | | 9,153 | | | | 428,360 | |
Arch Capital Group Ltd. (Bermuda) | | * | | | 4,284 | | | | 159,493 | |
Argo Group International Holdings Ltd. (Bermuda) | | | | | 899 | | | | 26,035 | |
Arthur J. Gallagher & Co. | | | | | 3,230 | | | | 108,011 | |
Aspen Insurance Holdings Ltd. (Bermuda) | | | | | 3,512 | | | | 93,068 | |
Assurant, Inc. | | | | | 1,358 | | | | 55,759 | |
Assured Guaranty Ltd. (Bermuda) | | | | | 7,538 | | | | 99,049 | |
Axis Capital Holdings Ltd. (Bermuda) | | | | | 5,691 | | | | 181,884 | |
Baldwin & Lyons, Inc., Class B | | | | | 945 | | | | 20,601 | |
Berkshire Hathaway, Inc., Class B | | * | | | 68,409 | | | | 5,219,607 | |
Brown & Brown, Inc. | | | | | 5,036 | | | | 113,965 | |
Chubb Corp. (The) | | | | | 8,118 | | | | 561,928 | |
Cincinnati Financial Corp. | | | | | 6,036 | | | | 183,857 | |
CNA Financial Corp. | | | | | 1,422 | | | | 38,038 | |
CNO Financial Group, Inc. | | * | | | 6,600 | | | | 41,646 | |
Crawford & Co., Class B | | † | | | 1,891 | | | | 11,649 | |
Delphi Financial Group, Inc., Class A | | | | | 1,945 | | | | 86,163 | |
EMC Insurance Group, Inc. | | | | | 341 | | | | 7,014 | |
Employers Holdings, Inc. | | | | | 2,770 | | | | 50,109 | |
Endurance Specialty Holdings Ltd. (Bermuda) | | | | | 2,698 | | | | 103,198 | |
Erie Indemnity Co., Class A | | | | | 1,023 | | | | 79,958 | |
Everest Re Group Ltd. (Bermuda) | | | | | 2,468 | | | | 207,534 | |
FBL Financial Group, Inc., Class A | | | | | 1,275 | | | | 43,375 | |
Fidelity National Financial, Inc., Class A | | | | | 8,236 | | | | 131,199 | |
First American Financial Corp. | | | | | 3,159 | | | | 40,025 | |
Genworth Financial, Inc., Class A | | * | | | 16,181 | | | | 105,986 | |
Greenlight Capital Re Ltd., Class A (Cayman Islands) | | *† | | | 1,797 | | | | 42,535 | |
Hanover Insurance Group, Inc. (The) | | | | | 2,346 | | | | 81,993 | |
Harleysville Group, Inc. | | | | | 1,351 | | | | 76,426 | |
Hartford Financial Services Group, Inc. | | | | | 15,915 | | | | 258,619 | |
HCC Insurance Holdings, Inc. | | | | | 3,999 | | | | 109,972 | |
See accompanying notes to financial statements.
277
SCHEDULE OF INVESTMENTS—(Continued)
December 31, 2011
| | | | | | | | | | | | |
| Vantagepoint Broad Market Index Fund | | | | | | | Shares | | | | Value | |
| | | | | | | | | | | | |
| COMMON STOCKS—(Continued) | |
Hilltop Holdings, Inc. | | * | | | 1,180 | | | $ | 9,971 | |
Horace Mann Educators Corp. | | | | | 2,000 | | | | 27,420 | |
Independence Holding Co. | | † | | | 961 | | | | 7,813 | |
Infinity Property & Casualty Corp. | | | | | 810 | | | | 45,959 | |
Kansas City Life Insurance Co. | | † | | | 902 | | | | 29,604 | |
Kemper Corp. | | | | | 1,906 | | | | 55,674 | |
Lincoln National Corp. | | | | | 10,899 | | | | 211,659 | |
Loews Corp. | | | | | 6,027 | | | | 226,917 | |
Markel Corp. | | * | | | 152 | | | | 63,030 | |
Marsh & McLennan Cos., Inc. | | | | | 15,676 | | | | 495,675 | |
MBIA, Inc. | | *† | | | 5,212 | | | | 60,407 | |
Mercury General Corp. | | | | | 1,109 | | | | 50,593 | |
MetLife, Inc. | | | | | 32,137 | | | | 1,002,032 | |
Montpelier Re Holdings Ltd. (Bermuda) | | | | | 3,734 | | | | 66,279 | |
National Financial Partners Corp. | | * | | | 1,495 | | | | 20,212 | |
Navigators Group, Inc. (The) | | * | | | 938 | | | | 44,724 | |
Old Republic International Corp. | | | | | 10,195 | | | | 94,508 | |
PartnerRe Ltd. (Bermuda) | | | | | 2,300 | | | | 147,683 | |
Phoenix Cos., Inc. (The) | | *† | | | 4,217 | | | | 7,085 | |
Platinum Underwriters Holdings Ltd. (Bermuda) | | | | | 2,734 | | | | 93,257 | |
Presidential Life Corp. | | | | | 1,144 | | | | 11,429 | |
Principal Financial Group, Inc. | | | | | 10,891 | | | | 267,919 | |
ProAssurance Corp. | | | | | 1,647 | | | | 131,464 | |
Progressive Corp. (The) | | | | | 18,475 | | | | 360,447 | |
Protective Life Corp. | | | | | 3,130 | | | | 70,613 | |
Prudential Financial, Inc. | | | | | 17,746 | | | | 889,430 | |
Reinsurance Group of America, Inc. | | | | | 1,440 | | | | 75,240 | |
RenaissanceRe Holdings Ltd. (Bermuda) | | | | | 2,900 | | | | 215,673 | |
RLI Corp. | | † | | | 1,164 | | | | 84,809 | |
Safety Insurance Group, Inc. | | | | | 850 | | | | 34,408 | |
Selective Insurance Group, Inc. | | | | | 2,122 | | | | 37,623 | |
StanCorp Financial Group, Inc. | | | | | 2,460 | | | | 90,405 | |
State Auto Financial Corp. | | | | | 488 | | | | 6,632 | |
Stewart Information Services Corp. | | † | | | 1,239 | | | | 14,310 | |
Torchmark Corp. | | | | | 5,434 | | | | 235,781 | |
Tower Group, Inc. | | | | | 1,736 | | | | 35,015 | |
Transatlantic Holdings, Inc. | | | | | 1,167 | | | | 63,870 | |
Travelers Cos., Inc. (The) | | | | | 12,194 | | | | 721,519 | |
United Fire & Casualty Co. | | | | | 1,250 | | | | 25,225 | |
Unum Group | | | | | 7,547 | | | | 159,015 | |
Validus Holdings Ltd. (Bermuda) | | | | | 3,553 | | | | 111,919 | |
W.R. Berkley Corp. | | | | | 2,501 | | | | 86,009 | |
White Mountains Insurance Group Ltd. | | | | | 300 | | | | 136,038 | |
| | | | | | | | | | | | |
| | | | | | | | | 17,482,723 | |
| | | | | | | | | | | | |
| Internet & Catalog Retail—0.7% | |
1-800-Flowers.com, Inc., Class A | | * | | | 793 | | | | 1,745 | |
Amazon.com, Inc. | | * | | | 13,403 | | | | 2,320,059 | |
dELiA*s, Inc. | | * | | | 925 | | | | 944 | |
Expedia, Inc. | | | | | 3,588 | | | | 104,124 | |
Geeknet, Inc. | | * | | | 201 | | | | 3,427 | |
Hollywood Media Corp. | | * | | | 998 | | | | 1,267 | |
HSN, Inc. | | | | | 1,886 | | | | 68,386 | |
Liberty Interactive Corp., Series A | | * | | | 16,418 | | | | 266,218 | |
| | | | | | | | | | | | |
| | | | | |
| | | | | | | | Shares | | | | Value | |
| | | | | | | | | | | | |
Netflix, Inc. | | * | | | 1,859 | | | $ | 128,810 | |
Overstock.com, Inc. | | * | | | 770 | | | | 6,037 | |
priceline.com, Inc. | | * | | | 1,548 | | | | 724,015 | |
TripAdvisor, Inc. | | *† | | | 3,588 | | | | 90,453 | |
Valuevision Media, Inc., Class A | | * | | | 1,741 | | | | 3,273 | |
| | | | | | | | | | | | |
| | | | | | | | | 3,718,758 | |
| | | | | | | | | | | | |
| Internet Software & Services—1.8% | |
Akamai Technologies, Inc. | | * | | | 7,479 | | | | 241,422 | |
AOL, Inc. | | * | | | 3,989 | | | | 60,234 | |
Autobytel, Inc. | | * | | | 1,384 | | | | 969 | |
DealerTrack Holdings, Inc. | | *† | | | 1,800 | | | | 49,068 | |
Digital River, Inc. | | * | | | 1,627 | | | | 24,438 | |
Earthlink, Inc. | | | | | 5,814 | | | | 37,442 | |
eBay, Inc. | | * | | | 40,546 | | | | 1,229,760 | |
Equinix, Inc. | | * | | | 1,323 | | | | 134,152 | |
Google, Inc., Class A | | * | | | 8,936 | | | | 5,771,762 | |
IAC/InterActiveCorp | | | | | 4,715 | | | | 200,859 | |
InfoSpace, Inc. | | * | | | 1,323 | | | | 14,540 | |
Internap Network Services Corp. | | * | | | 1,297 | | | | 7,704 | |
j2 Global, Inc. | | † | | | 1,614 | | | | 45,418 | |
Keynote Systems, Inc. | | | | | 1,400 | | | | 28,756 | |
LivePerson, Inc. | | * | | | 3,333 | | | | 41,829 | |
Looksmart Ltd. | | * | | | 500 | | | | 645 | |
Monster Worldwide, Inc. | | *† | | | 4,681 | | | | 37,120 | |
Move, Inc. | | * | | | 1,840 | | | | 11,629 | |
NIC, Inc. | | | | | 2,450 | | | | 32,609 | |
Openwave Systems, Inc. | | * | | | 2,570 | | | | 4,061 | |
Rackspace Hosting, Inc. | | * | | | 985 | | | | 42,365 | |
RealNetworks, Inc. | | | | | 1,461 | | | | 10,957 | |
Saba Software, Inc. | | *† | | | 1,576 | | | | 12,435 | |
Stamps.com, Inc. | | * | | | 1,050 | | | | 27,436 | |
support.com, Inc. | | * | | | 1,562 | | | | 3,515 | |
United Online, Inc. | | | | | 2,509 | | | | 13,649 | |
ValueClick, Inc. | | * | | | 4,058 | | | | 66,105 | |
VeriSign, Inc. | | | | | 8,080 | | | | 288,618 | |
Vertro, Inc. | | * | | | 198 | | | | 204 | |
Web.com Group, Inc. | | * | | | 308 | | | | 3,527 | |
WebMD Health Corp. | | * | | | 2,424 | | | | 91,021 | |
WebMediaBrands, Inc. | | * | | | 1,450 | | | | 660 | |
XO Group, Inc. | | * | | | 2,304 | | | | 19,215 | |
Yahoo! Inc. | | * | | | 43,481 | | | | 701,349 | |
Zix Corp. | | * | | | 1,015 | | | | 2,862 | |
| | | | | | | | | | | | |
| | | | | | | | | 9,258,335 | |
| | | | | | | | | | | | |
| IT Services—3.3% | | | | | | | | | | |
Acxiom Corp. | | * | | | 3,451 | | | | 42,137 | |
Alliance Data Systems Corp. | | *† | | | 1,955 | | | | 203,007 | |
Automatic Data Processing, Inc. | | | | | 17,041 | | | | 920,384 | |
Broadridge Financial Solutions, Inc. | | | | | 5,748 | | | | 129,617 | |
CACI International, Inc., Class A | | * | | | 1,198 | | | | 66,992 | |
Ciber, Inc. | | * | | | 2,444 | | | | 9,434 | |
Cognizant Technology Solutions Corp., Class A | | * | | | 11,127 | | | | 715,577 | |
Computer Sciences Corp. | | | | | 3,563 | | | | 84,443 | |
Convergys Corp. | | * | | | 5,933 | | | | 75,764 | |
CoreLogic, Inc. | | * | | | 3,159 | | | | 40,846 | |
CSG Systems International, Inc. | | * | | | 2,153 | | | | 31,671 | |
DST Systems, Inc. | | | | | 2,518 | | | | 114,619 | |
Edgewater Technology, Inc. | | * | | | 1,533 | | | | 4,216 | |
Euronet Worldwide, Inc. | | * | | | 1,056 | | | | 19,515 | |
Fidelity National Information Services, Inc. | | | | | 9,512 | | | | 252,924 | |
See accompanying notes to financial statements.
278
SCHEDULE OF INVESTMENTS—(Continued)
December 31, 2011
| | | | | | | | | | | | |
| Vantagepoint Broad Market Index Fund | | | | | | | Shares | | | | Value | |
| | | | | | | | | | | | |
| COMMON STOCKS—(Continued) | |
Fiserv, Inc. | | * | | | 5,260 | | | $ | 308,972 | |
Forrester Research, Inc. | | * | | | 963 | | | | 32,684 | |
Gartner, Inc. | | * | | | 1,179 | | | | 40,994 | |
Global Payments, Inc. | | | | | 3,238 | | | | 153,416 | |
Hackett Group, Inc. (The) | | * | | | 1,140 | | | | 4,264 | |
iGATE Corp. | | * | | | 1,397 | | | | 21,975 | |
International Business Machines Corp. | | | | | 42,966 | | | | 7,900,588 | |
Jack Henry & Associates, Inc. | | | | | 3,591 | | | | 120,694 | |
Lender Processing Services, Inc. | | | | | 4,048 | | | | 61,003 | |
Lionbridge Technologies, Inc. | | * | | | 1,165 | | | | 2,668 | |
Management Network Group, Inc. | | * | | | 320 | | | | 486 | |
Mantech International Corp., Class A | | † | | | 1,217 | | | | 38,019 | |
Mastercard, Inc., Class A | | | | | 3,819 | | | | 1,423,800 | |
MAXIMUS, Inc. | | | | | 2,104 | | | | 87,000 | |
ModusLink Global Solutions, Inc. | | | | | 1,007 | | | | 5,438 | |
MoneyGram International, Inc. | | * | | | 468 | | | | 8,307 | |
NeuStar, Inc., Class A | | * | | | 3,140 | | | | 107,294 | |
Online Resources Corp. | | * | | | 700 | | | | 1,694 | |
Paychex, Inc. | | | | | 9,849 | | | | 296,553 | |
Pfsweb, Inc. | | * | | | 1,209 | | | | 3,978 | |
SAIC, Inc. | | * | | | 8,529 | | | | 104,821 | |
Sapient Corp. | | | | | 4,150 | | | | 52,290 | |
StarTek, Inc. | | * | | | 994 | | | | 1,908 | |
Syntel, Inc. | | | | | 1,554 | | | | 72,681 | |
TeleTech Holdings, Inc. | | * | | | 2,738 | | | | 44,356 | |
Teradata Corp. | | * | | | 6,451 | | | | 312,938 | |
Total System Services, Inc. | | | | | 6,935 | | | | 135,649 | |
Unisys Corp. | | * | | | 1,371 | | | | 27,022 | |
VeriFone Systems, Inc. | | * | | | 3,103 | | | | 110,219 | |
Visa, Inc., Class A | | | | | 18,001 | | | | 1,827,642 | |
Western Union Co. (The) | | | | | 25,245 | | | | 460,974 | |
Wright Express Corp. | | * | | | 1,750 | | | | 94,990 | |
| | | | | | | | | | | | |
| | | | | | | | | 16,576,463 | |
| | | | | | | | | | | | |
| Leisure Equipment & Products—0.2% | |
Arctic Cat, Inc. | | * | | | 1,857 | | | | 41,875 | |
Brunswick Corp. | | | | | 3,797 | | | | 68,574 | |
Callaway Golf Co. | | † | | | 2,881 | | | | 15,932 | |
Eastman Kodak Co. | | *† | | | 11,893 | | | | 7,725 | |
Hasbro, Inc. | | | | | 2,107 | | | | 67,192 | |
Jakks Pacific, Inc. | | | | | 925 | | | | 13,052 | |
Leapfrog Enterprises, Inc. | | * | | | 1,261 | | | | 7,049 | |
Mattel, Inc. | | | | | 8,487 | | | | 235,599 | |
Nautilus, Inc. | | * | | | 1,359 | | | | 2,378 | |
Polaris Industries, Inc. | | | | | 3,716 | | | | 208,022 | |
Steinway Musical Instruments, Inc. | | * | | | 683 | | | | 17,102 | |
Sturm Ruger & Co., Inc. | | | | | 3,296 | | | | 110,284 | |
| | | | | | | | | | | | |
| | | | | | | | | 794,784 | |
| | | | | | | | | | | | |
| Life Sciences Tools & Services—0.5% | |
Affymetrix, Inc. | | * | | | 2,525 | | | | 10,327 | |
Agilent Technologies, Inc. | | * | | | 10,372 | | | | 362,294 | |
Albany Molecular Research, Inc. | | * | | | 1,371 | | | | 4,017 | |
Bio-Rad Laboratories, Inc., Class A | | * | | | 623 | | | | 59,833 | |
Bruker Corp. | | * | | | 1,667 | | | | 20,704 | |
Cambrex Corp. | | * | | | 1,258 | | | | 9,032 | |
Charles River Laboratories International, Inc. | | * | | | 2,755 | | | | 75,294 | |
| | | | | | | | | | | | |
| | | | | |
| | | | | | | | Shares | | | | Value | |
| | | | | | | | | | | | |
Covance, Inc. | | * | | | 2,839 | | | $ | 129,799 | |
Enzo Biochem, Inc. | | *† | | | 1,353 | | | | 3,031 | |
eResearchTechnology, Inc. | | * | | | 2,056 | | | | 9,643 | |
Furiex Pharmaceuticals, Inc. | | * | | | 394 | | | | 6,584 | |
Illumina, Inc. | | * | | | 4,535 | | | | 138,227 | |
Life Technologies Corp. | | * | | | 7,474 | | | | 290,813 | |
Luminex Corp. | | * | | | 1,070 | | | | 22,716 | |
Mettler-Toledo International, Inc. | | *† | | | 913 | | | | 134,859 | |
PAREXEL International Corp. | | * | | | 2,306 | | | | 47,827 | |
PerkinElmer, Inc. | | | | | 5,266 | | | | 105,320 | |
Sequenom, Inc. | | *† | | | 19,756 | | | | 87,914 | |
Techne Corp. | | | | | 1,736 | | | | 118,499 | |
Thermo Fisher Scientific, Inc. | | * | | | 14,773 | | | | 664,342 | |
Waters Corp. | | * | | | 3,878 | | | | 287,166 | |
| | | | | | | | | | | | |
| | | | | | | | | 2,588,241 | |
| | | | | | | | | | | | |
| Machinery—2.2% | |
Actuant Corp., Class A | | | | | 2,022 | | | | 45,879 | |
AGCO Corp. | | *† | | | 3,068 | | | | 131,832 | |
Albany International Corp., Class A | | | | | 1,437 | | | | 33,223 | |
American Railcar Industries, Inc. | | * | | | 1,200 | | | | 28,716 | |
Ampco-Pittsburgh Corp. | | | | | 613 | | | | 11,855 | |
Astec Industries, Inc. | | * | | | 821 | | | | 26,444 | |
Barnes Group, Inc. | | | | | 2,018 | | | | 48,654 | |
Blount International, Inc. | | * | | | 1,532 | | | | 22,245 | |
Briggs & Stratton Corp. | | | | | 1,822 | | | | 28,223 | |
Caterpillar, Inc. | | | | | 21,496 | | | | 1,947,538 | |
Chart Industries, Inc. | | * | | | 1,070 | | | | 57,855 | |
CIRCOR International, Inc. | | | | | 711 | | | | 25,105 | |
CLARCOR, Inc. | | | | | 2,354 | | | | 117,677 | |
Crane Co. | | | | | 2,467 | | | | 115,234 | |
Cummins, Inc. | | | | | 5,514 | | | | 485,342 | |
Deere & Co. | | | | | 15,887 | | | | 1,228,859 | |
Donaldson Co., Inc. | | | | | 2,029 | | | | 138,134 | |
Dover Corp. | | | | | 5,761 | | | | 334,426 | |
Eaton Corp. | | | | | 11,582 | | | | 504,164 | |
EnPro Industries, Inc. | | *† | | | 981 | | | | 32,353 | |
ESCO Technologies, Inc. | | | | | 1,222 | | | | 35,169 | |
Federal Signal Corp. | | * | | | 2,159 | | | | 8,960 | |
Flow International Corp. | | * | | | 2,200 | | | | 7,700 | |
Flowserve Corp. | | | | | 2,375 | | | | 235,885 | |
FreightCar America, Inc. | | * | | | 900 | | | | 18,855 | |
Gardner Denver, Inc. | | | | | 1,836 | | | | 141,482 | |
Graco, Inc. | | | | | 2,883 | | | | 117,886 | |
Harsco Corp. | | | | | 3,646 | | | | 75,035 | |
Hurco Cos., Inc. | | * | | | 300 | | | | 6,300 | |
IDEX Corp. | | | | | 3,304 | | | | 122,611 | |
Illinois Tool Works, Inc. | | | | | 16,815 | | | | 785,429 | |
ITT Corp. | | | | | 2,488 | | | | 48,093 | |
John Bean Technologies Corp. | | | | | 1,164 | | | | 17,891 | |
Joy Global, Inc. | | | | | 4,237 | | | | 317,648 | |
Kadant, Inc. | | * | | | 721 | | | | 16,302 | |
Kaydon Corp. | | | | | 1,422 | | | | 43,371 | |
Kennametal, Inc. | | | | | 3,196 | | | | 116,718 | |
Lincoln Electric Holdings, Inc. | | | | | 3,754 | | | | 146,857 | |
Lindsay Corp. | | | | | 808 | | | | 44,351 | |
Manitowoc Co., Inc. (The) | | | | | 5,044 | | | | 46,354 | |
Meritor, Inc. | | * | | | 2,791 | | | | 14,848 | |
Middleby Corp. | | * | | | 984 | | | | 92,535 | |
Mueller Industries, Inc. | | | | | 1,592 | | | | 61,165 | |
Mueller Water Products, Inc., Class A | | † | | | 3,000 | | | | 7,320 | |
See accompanying notes to financial statements.
279
SCHEDULE OF INVESTMENTS—(Continued)
December 31, 2011
| | | | | | | | | | | | |
| Vantagepoint Broad Market Index Fund | | | | | | | Shares | | | | Value | |
| | | | | | | | | | | | |
| COMMON STOCKS—(Continued) | |
NACCO Industries, Inc., Class A | | | | | 309 | | | $ | 27,569 | |
Navistar International Corp. | | * | | | 2,436 | | | | 92,276 | |
Nordson Corp. | | | | | 3,044 | | | | 125,352 | |
Oshkosh Corp. | | * | | | 2,868 | | | | 61,318 | |
PACCAR, Inc. | | | | | 14,853 | | | | 556,542 | |
Pall Corp. | | | | | 3,831 | | | | 218,942 | |
Parker Hannifin Corp. | | | | | 5,068 | | | | 386,435 | |
Pentair, Inc. | | | | | 3,618 | | | | 120,443 | |
Robbins & Myers, Inc. | | | | | 2,604 | | | | 126,424 | |
Sauer-Danfoss, Inc. | | * | | | 1,531 | | | | 55,438 | |
Snap-On, Inc. | | | | | 2,419 | | | | 122,450 | |
SPX Corp. | | | | | 2,157 | | | | 130,002 | |
Stanley Black & Decker, Inc. | | | | | 3,191 | | | | 215,712 | |
Tecumseh Products Co., Class A | | *† | | | 712 | | | | 3,346 | |
Tennant Co. | | † | | | 1,280 | | | | 49,754 | |
Terex Corp. | | * | | | 4,124 | | | | 55,715 | |
Timken Co. | | | | | 3,702 | | | | 143,304 | |
Titan International, Inc. | | | | | 1,356 | | | | 26,388 | |
Toro Co. (The) | | | | | 1,020 | | | | 61,873 | |
Trinity Industries, Inc. | | | | | 3,051 | | | | 91,713 | |
Valmont Industries, Inc. | | | | | 1,162 | | | | 105,498 | |
Wabash National Corp. | | * | | | 6,441 | | | | 50,497 | |
WABCO Holdings, Inc. | | * | | | 2,354 | | | | 102,164 | |
Wabtec Corp. | | | | | 1,737 | | | | 121,503 | |
Watts Water Technologies, Inc., Class A | | | | | 1,225 | | | | 41,907 | |
Woodward, Inc. | | | | | 2,448 | | | | 100,197 | |
Xylem, Inc. | | | | | 4,977 | | | | 127,859 | |
| | | | | | | | | | | | |
| | | | | | | | | | | 11,213,144 | |
| | | | | | | | | | | | |
| Marine—0.0% | |
Alexander & Baldwin, Inc. | | | | | 1,466 | | | | 59,842 | |
Eagle Bulk Shipping, Inc. | | *† | | | 3,648 | | | | 3,437 | |
Excel Maritime Carriers Ltd. (Greece) | | *† | | | 2,810 | | | | 4,074 | |
Genco Shipping & Trading Ltd. | | *† | | | 2,042 | | | | 13,804 | |
Kirby Corp. | | * | | | 2,358 | | | | 155,251 | |
| | | | | | | | | | | | |
| | | | | | | | | | | 236,408 | |
| | | | | | | | | | | | |
| Media—2.6% | |
A.H. Belo Corp., Class A | | | | | 944 | | | | 4,484 | |
AMC Networks, Inc., Class A | | * | | | 2,261 | | | | 84,968 | |
Arbitron, Inc. | | | | | 1,298 | | | | 44,664 | |
Belo Corp., Class A | | | | | 4,721 | | | | 29,742 | |
Cablevision Systems Corp., Class A | | | | | 9,044 | | | | 128,606 | |
CBS Corp., Class B | | | | | 23,133 | | | | 627,830 | |
Clear Channel Outdoor Holdings, Inc., Class A | | * | | | 2,500 | | | | 31,375 | |
Comcast Corp., Class A | | | | | 71,429 | | | | 1,693,582 | |
Crown Media Holdings, Inc., Class A | | *† | | | 5,899 | | | | 7,138 | |
Cumulus Media, Inc., Class A | | * | | | 2,174 | | | | 7,261 | |
DIRECTV, Class A | | * | | | 23,720 | | | | 1,014,267 | |
Discovery Communications, Inc., Class A | | * | | | 5,451 | | | | 223,328 | |
DISH Network Corp., Class A | | | | | 4,775 | | | | 135,992 | |
DreamWorks Animation SKG, Inc., Class A | | *† | | | 1,300 | | | | 21,574 | |
E.W. Scripps Co., (The), Class A | | * | | | 1,204 | | | | 9,644 | |
Emmis Communications Corp., Class A | | * | | | 1,175 | | | | 775 | |
| | | | | | | | | | | | |
| | | | | |
| | | | | | | | Shares | | | | Value | |
| | | | | | | | | | | | |
Entercom Communications Corp., Class A | | * | | | 2,183 | | | $ | 13,425 | |
Entravision Communications Corp., Class A | | | | | 2,852 | | | | 4,449 | |
Gannett Co., Inc. | | | | | 7,301 | | | | 97,614 | |
Gray Television, Inc. | | * | | | 1,838 | | | | 2,978 | |
Harris Interactive, Inc. | | * | | | 2,730 | | | | 1,527 | |
Harte-Hanks, Inc. | | | | | 3,119 | | | | 28,352 | |
Interpublic Group of Cos., Inc. (The) | | | | | 17,203 | | | | 167,385 | |
John Wiley & Sons, Inc., Class A | | | | | 2,491 | | | | 110,600 | |
Journal Communications, Inc., Class A | | * | | | 3,900 | | | | 17,160 | |
Lamar Advertising Co., Class A | | * | | | 3,479 | | | | 95,673 | |
Liberty Global, Inc., Series A | | * | | | 4,456 | | | | 182,830 | |
Liberty Media Corp.—Liberty Capital, Class A | | * | | | 4,301 | | | | 335,693 | |
LIN TV Corp., Class A | | * | | | 1,419 | | | | 6,002 | |
Live Nation Entertainment, Inc. | | * | | | 5,485 | | | | 45,580 | |
LodgeNet Interactive Corp. | | * | | | 1,250 | | | | 2,988 | |
Madison Square Garden Co. (The), Class A | | * | | | 2,261 | | | | 64,755 | |
McClatchy Co. (The), Class A | | *† | | | 2,444 | | | | 5,841 | |
McGraw-Hill Cos., Inc. (The) | | | | | 9,601 | | | | 431,757 | |
Media General, Inc., Class A | | *† | | | 952 | | | | 3,875 | |
Meredith Corp. | | † | | | 2,083 | | | | 68,010 | |
National CineMedia, Inc. | | † | | | 2,226 | | | | 27,602 | |
New Frontier Media, Inc. | | * | | | 3,808 | | | | 3,960 | |
New York Times Co. (The), Class A | | *† | | | 5,682 | | | | 43,922 | |
News Corp., Class A | | | | | 55,516 | | | | 990,405 | |
Omnicom Group, Inc. | | | | | 9,924 | | | | 442,412 | |
Radio Unica Communications Corp. | | *‡d | | | 1,900 | | | | — | |
Regal Entertainment Group, Class A | | † | | | 2,743 | | | | 32,751 | |
Salem Communications Corp., Class A | | * | | | 850 | | | | 2,185 | |
Scholastic Corp. | | † | | | 1,845 | | | | 55,295 | |
Scripps Networks Interactive, Inc., Class A | | † | | | 3,612 | | | | 153,221 | |
Sinclair Broadcast Group, Inc., Class A | | | | | 2,049 | | | | 23,215 | |
Sirius XM Radio, Inc. | | *† | | | 169,893 | | | | 309,205 | |
Time Warner Cable, Inc. | | | | | 10,238 | | | | 650,830 | |
Time Warner, Inc. | | | | | 34,296 | | | | 1,239,457 | |
Valassis Communications, Inc. | | * | | | 2,236 | | | | 42,998 | |
Value Line, Inc. | | † | | | 573 | | | | 5,890 | |
Viacom, Inc., Class B | | | | | 19,730 | | | | 895,939 | |
Virgin Media, Inc. | | † | | | 10,479 | | | | 224,041 | |
Walt Disney Co. (The) | | | | | 61,815 | | | | 2,318,063 | |
Washington Post Co. (The), Class B | | † | | | 258 | | | | 97,217 | |
World Wrestling Entertainment, Inc., Class A | | † | | | 1,030 | | | | 9,600 | |
| | | | | | | | | | | | |
| | | | | | | | | | | 13,319,932 | |
| | | | | | | | | | | | |
| Metals & Mining—1.1% | |
AK Steel Holding Corp. | | | | | 5,009 | | | | 41,374 | |
Alcoa, Inc. | | | | | 44,044 | | | | 380,981 | |
Allegheny Technologies, Inc. | | | | | 3,760 | | | | 179,728 | |
See accompanying notes to financial statements.
280
SCHEDULE OF INVESTMENTS—(Continued)
December 31, 2011
| | | | | | | | | | | | |
| Vantagepoint Broad Market Index Fund | | | | | | | Shares | | | | Value | |
| | | | | | | | | | | | |
| COMMON STOCKS—(Continued) | |
AMCOL International Corp. | | | | | 1,186 | | | $ | 31,844 | |
Carpenter Technology Corp. | | | | | 1,882 | | | | 96,885 | |
Century Aluminum Co. | | * | | | 865 | | | | 7,361 | |
Cliffs Natural Resources, Inc. | | | | | 4,448 | | | | 277,333 | |
Coeur d’Alene Mines Corp. | | * | | | 7,315 | | | | 176,584 | |
Commercial Metals Co. | | | | | 4,080 | | | | 56,426 | |
Compass Minerals International, Inc. | | | | | 1,915 | | | | 131,848 | |
Freeport-McMoRan Copper & Gold, Inc. | | | | | 38,302 | | | | 1,409,131 | |
Hecla Mining Co. | | | | | 20,609 | | | | 107,785 | |
Materion Corp. | | * | | | 1,122 | | | | 27,242 | |
Molycorp, Inc. | | *† | | | 1,566 | | | | 37,553 | |
Newmont Mining Corp. | | | | | 16,854 | | | | 1,011,409 | |
Nucor Corp. | | | | | 10,963 | | | | 433,806 | |
Reliance Steel & Aluminum Co. | | | | | 2,966 | | | | 144,415 | |
Royal Gold, Inc. | | † | | | 1,153 | | | | 77,747 | |
RTI International Metals, Inc. | | * | | | 1,363 | | | | 31,635 | |
Schnitzer Steel Industries, Inc., Class A | | | | | 693 | | | | 29,300 | |
Southern Copper Corp. | | | | | 8,700 | | | | 262,566 | |
Steel Dynamics, Inc. | | | | | 8,080 | | | | 106,252 | |
Stillwater Mining Co. | | * | | | 3,727 | | | | 38,984 | |
Titanium Metals Corp. | | | | | 5,344 | | | | 80,053 | |
United States Steel Corp. | | † | | | 5,607 | | | | 148,361 | |
Walter Energy, Inc. | | | | | 1,840 | | | | 111,430 | |
Worthington Industries, Inc. | | | | | 3,575 | | | | 58,559 | |
| | | | | | | | | | | | |
| | | | | | | | | | | 5,496,592 | |
| | | | | | | | | | | | |
| Multiline Retail—0.7% | |
99 Cents Only Stores | | * | | | 3,207 | | | | 70,394 | |
Big Lots, Inc. | | * | | | 1,874 | | | | 70,762 | |
Dillard’s, Inc., Class A | | † | | | 1,535 | | | | 68,891 | |
Dollar Tree, Inc. | | * | | | 4,178 | | | | 347,234 | |
Family Dollar Stores, Inc. | | | | | 3,743 | | | | 215,821 | |
Fred’s, Inc., Class A | | † | | | 1,781 | | | | 25,967 | |
J.C. Penney Co., Inc. | | † | | | 7,928 | | | | 278,669 | |
Kohl’s Corp. | | | | | 8,292 | | | | 409,210 | |
Macy’s, Inc. | | | | | 14,423 | | | | 464,132 | |
Nordstrom, Inc. | | | | | 6,901 | | | | 343,049 | |
Saks, Inc. | | *† | | | 5,811 | | | | 56,657 | |
Sears Holdings Corp. | | *† | | | 3,097 | | | | 98,423 | |
Target Corp. | | | | | 23,232 | | | | 1,189,943 | |
Tuesday Morning Corp. | | * | | | 1,816 | | | | 6,265 | |
| | | | | | | | | | | | |
| | | | | | | | | | | 3,645,417 | |
| | | | | | | | | | | | |
| Multi-Utilities—1.4% | |
Alliant Energy Corp. | | | | | 4,491 | | | | 198,098 | |
Ameren Corp. | | | | | 8,429 | | | | 279,253 | |
Avista Corp. | | | | | 1,759 | | | | 45,294 | |
Black Hills Corp. | | | | | 2,041 | | | | 68,537 | |
CenterPoint Energy, Inc. | | | | | 12,705 | | | | 255,243 | |
CH Energy Group, Inc. | | | | | 694 | | | | 40,516 | |
CMS Energy Corp. | | | | | 15,613 | | | | 344,735 | |
Consolidated Edison, Inc. | | | | | 9,508 | | | | 589,781 | |
Dominion Resources, Inc. | | | | | 18,948 | | | | 1,005,760 | |
DTE Energy Co. | | | | | 5,654 | | | | 307,860 | |
Integrys Energy Group, Inc. | | | | | 5,523 | | | | 299,236 | |
MDU Resources Group, Inc. | | | | | 7,657 | | | | 164,319 | |
NiSource, Inc. | | | | | 10,893 | | | | 259,362 | |
NorthWestern Corp. | | | | | 1,449 | | | | 51,860 | |
NSTAR | | | | | 4,374 | | | | 205,403 | |
OGE Energy Corp. | | | | | 3,358 | | | | 190,432 | |
| | | | | | | | | | | | |
| | | | | |
| | | | | | | | Shares | | | | Value | |
| | | | | | | | | | | | |
PG&E Corp. | | | | | 13,909 | | | $ | 573,329 | |
Public Service Enterprise Group, Inc. | | | | | 19,188 | | | | 633,396 | |
SCANA Corp. | | | | | 4,791 | | | | 215,883 | |
Sempra Energy | | | | | 6,698 | | | | 368,390 | |
TECO Energy, Inc. | | | | | 7,797 | | | | 149,235 | |
Vectren Corp. | | | | | 3,706 | | | | 112,032 | |
Wisconsin Energy Corp. | | | | | 9,128 | | | | 319,115 | |
Xcel Energy, Inc. | | | | | 16,552 | | | | 457,497 | |
| | | | | | | | | | | | |
| | | | | | | | | | | 7,134,566 | |
| | | | | | | | | | | | |
| Office Electronics—0.1% | |
Xerox Corp. | | | | | 37,010 | | | | 294,599 | |
Zebra Technologies Corp., Class A | | * | | | 2,988 | | | | 106,911 | |
| | | | | | | | | | | | |
| | | | | | | | | | | 401,510 | |
| | | | | | | | | | | | |
| Oil, Gas & Consumable Fuels—9.5% | |
Adams Resources & Energy, Inc. | | | | | 1,462 | | | | 42,369 | |
Alpha Natural Resources, Inc. | | * | | | 8,351 | | | | 170,611 | |
Anadarko Petroleum Corp. | | | | | 17,995 | | | | 1,373,558 | |
Apache Corp. | | | | | 13,575 | | | | 1,229,623 | |
Apco Oil and Gas International, Inc. | | † | | | 1,181 | | | | 96,511 | |
Arch Coal, Inc. | | | | | 7,214 | | | | 104,675 | |
ATP Oil & Gas Corp. | | *† | | | 685 | | | | 5,042 | |
Berry Petroleum Co., Class A | | † | | | 2,902 | | | | 121,942 | |
Blue Dolphin Energy Co. | | *† | | | 521 | | | | 2,183 | |
BP Prudhoe Bay Royalty Trust | | | | | 1,105 | | | | 125,926 | |
BPZ Resources, Inc. | | *† | | | 4,003 | | | | 11,369 | |
Cabot Oil & Gas Corp. | | | | | 3,075 | | | | 233,392 | |
Callon Petroleum Co. | | * | | | 779 | | | | 3,872 | |
Carrizo Oil & Gas, Inc. | | * | | | 1,800 | | | | 47,430 | |
Chesapeake Energy Corp. | | | | | 24,112 | | | | 537,456 | |
Chevron Corp. | | | | | 71,520 | | | | 7,609,728 | |
Cimarex Energy Co. | | | | | 2,681 | | | | 165,954 | |
Clayton Williams Energy, Inc. | | * | | | 550 | | | | 41,734 | |
Comstock Resources, Inc. | | *† | | | 1,735 | | | | 26,545 | |
Concho Resources, Inc. | | * | | | 3,943 | | | | 369,656 | |
ConocoPhillips | | | | | 53,110 | | | | 3,870,126 | |
CONSOL Energy, Inc. | | | | | 7,662 | | | | 281,195 | |
Contango Oil & Gas Co. | | * | | | 902 | | | | 52,478 | |
Continental Resources, Inc. | | *† | | | 2,992 | | | | 199,596 | |
Cross Timbers Royalty Trust | | | | | 575 | | | | 28,100 | |
Crosstex Energy, Inc. | | | | | 2,100 | | | | 26,544 | |
CVR Energy, Inc. | | * | | | 2,907 | | | | 54,448 | |
Denbury Resources, Inc. | | * | | | 16,015 | | | | 241,826 | |
Devon Energy Corp. | | | | | 14,461 | | | | 896,582 | |
DHT Holdings, Inc. (Jersey, Channel Islands) | | † | | | 4,173 | | | | 3,088 | |
El Paso Corp. | | | | | 25,233 | | | | 670,441 | |
Energen Corp. | | | | | 2,644 | | | | 132,200 | |
EOG Resources, Inc. | | | | | 7,506 | | | | 739,416 | |
EQT Corp. | | | | | 5,288 | | | | 289,730 | |
EXCO Resources, Inc. | | | | | 8,720 | | | | 91,124 | |
Exxon Mobil Corp. | | | | | 184,167 | | | | 15,609,995 | |
Forest Oil Corp. | | * | | | 3,820 | | | | 51,761 | |
FX Energy, Inc. | | * | | | 3,496 | | | | 16,781 | |
GMX Resources, Inc. | | *† | | | 1,297 | | | | 1,621 | |
Goodrich Petroleum Corp. | | *† | | | 1,566 | | | | 21,501 | |
Hess Corp. | | | | | 10,275 | | | | 583,620 | |
HollyFrontier Corp. | | | | | 5,470 | | | | 127,998 | |
Hugoton Royalty Trust | | | | | 1,669 | | | | 31,477 | |
See accompanying notes to financial statements.
281
SCHEDULE OF INVESTMENTS—(Continued)
December 31, 2011
| | | | | | | | | | | | |
| Vantagepoint Broad Market Index Fund | | | | | | | Shares | | | | Value | |
| | | | | | | | | | | | |
| COMMON STOCKS—(Continued) | |
James River Coal Co. | | *† | | | 1,500 | | | $ | 10,380 | |
Kinder Morgan, Inc. | | † | | | 20,480 | | | | 658,842 | |
Kodiak Oil & Gas Corp. | | *† | | | 5,207 | | | | 49,466 | |
Marathon Oil Corp. | | | | | 25,577 | | | | 748,639 | |
Marathon Petroleum Corp. | | | | | 12,788 | | | | 425,713 | |
McMoRan Exploration Co. | | *† | | | 2,961 | | | | 43,083 | |
Murphy Oil Corp. | | | | | 5,804 | | | | 323,515 | |
Newfield Exploration Co. | | * | | | 3,712 | | | | 140,054 | |
Noble Energy, Inc. | | | | | 4,966 | | | | 468,741 | |
Occidental Petroleum Corp. | | | | | 30,246 | | | | 2,834,050 | |
Overseas Shipholding Group, Inc. | | † | | | 1,587 | | | | 17,346 | |
Patriot Coal Corp. | | * | | | 2,992 | | | | 25,342 | |
Peabody Energy Corp. | | | | | 10,624 | | | | 351,761 | |
Penn Virginia Corp. | | | | | 1,433 | | | | 7,581 | |
Petroleum Development Corp. | | * | | | 1,250 | | | | 43,887 | |
Petroquest Energy, Inc. | | *† | | | 3,346 | | | | 22,084 | |
Pioneer Natural Resources Co. | | | | | 5,081 | | | | 454,648 | |
Plains Exploration & Production Co. | | * | | | 5,227 | | | | 191,935 | |
QEP Resources, Inc. | | | | | 7,412 | | | | 217,172 | |
Quicksilver Resources, Inc. | | *† | | | 3,960 | | | | 26,572 | |
Range Resources Corp. | | | | | 5,516 | | | | 341,661 | |
Rentech, Inc. | | * | | | 49,300 | | | | 64,583 | |
Rosetta Resources, Inc. | | * | | | 3,400 | | | | 147,900 | |
SandRidge Energy, Inc. | | * | | | 8,962 | | | | 73,130 | |
Ship Finance International Ltd. (Bermuda) | | † | | | 3,352 | | | | 31,308 | |
SM Energy Co. | | | | | 2,262 | | | | 165,352 | |
Southern Union Co. | | | | | 3,367 | | | | 141,784 | |
Southwestern Energy Co. | | * | | | 12,344 | | | | 394,267 | |
Spectra Energy Corp. | | | | | 23,691 | | | | 728,498 | |
Stone Energy Corp. | | * | | | 1,208 | | | | 31,867 | |
Sunoco, Inc. | | | | | 2,777 | | | | 113,913 | |
Swift Energy Co. | | * | | | 1,142 | | | | 33,940 | |
Syntroleum Corp. | | * | | | 1,246 | | | | 1,196 | |
Teekay Corp. (Canada) | | † | | | 1,691 | | | | 45,200 | |
Tesoro Corp. | | * | | | 6,846 | | | | 159,923 | |
Ultra Petroleum Corp. | | * | | | 7,839 | | | | 232,270 | |
USEC, Inc. | | * | | | 7,347 | | | | 8,376 | |
Vaalco Energy, Inc. | | * | | | 3,800 | | | | 22,952 | |
Valero Energy Corp. | | | | | 22,004 | | | | 463,184 | |
Verenium Corp. | | *† | | | 149 | | | | 325 | |
Warren Resources, Inc. | | * | | | 3,600 | | | | 11,736 | |
Western Refining, Inc. | | * | | | 2,500 | | | | 33,225 | |
Whiting Petroleum Corp. | | * | | | 2,484 | | | | 115,978 | |
Williams Cos., Inc. (The) | | | | | 24,207 | | | | 799,315 | |
World Fuel Services Corp. | | | | | 1,920 | | | | 80,602 | |
| | | | | | | | | | | | |
| | | | | | | | | | | 47,644,520 | |
| | | | | | | | | | | | |
| Paper & Forest Products—0.2% | |
Buckeye Technologies, Inc. | | | | | 1,251 | | | | 41,833 | |
Clearwater Paper Corp. | | * | | | 924 | | | | 32,904 | |
Deltic Timber Corp. | | | | | 724 | | | | 43,722 | |
Domtar Corp. (Canada) | | | | | 1,388 | | | | 110,984 | |
International Paper Co. | | | | | 14,370 | | | | 425,352 | |
Louisiana-Pacific Corp. | | * | | | 4,396 | | | | 35,476 | |
MeadWestvaco Corp. | | | | | 2,983 | | | | 89,341 | |
Neenah Paper, Inc. | | | | | 652 | | | | 14,553 | |
P.H. Glatfelter Co. | | | | | 1,740 | | | | 24,569 | |
Schweitzer-Mauduit International, Inc. | | | | | 724 | | | | 48,117 | |
| | | | | | | | | | | | |
| | | | | |
| | | | | | | | Shares | | | | Value | |
| | | | | | | | | | | | |
Wausau Paper Corp. | | † | | | 1,903 | | | $ | 15,719 | |
| | | | | | | | | | | | |
| | | | | | | | | | | 882,570 | |
| | | | | | | | | | | | |
| Personal Products—0.2% | |
Avon Products, Inc. | | | | | 14,351 | | | | 250,712 | |
Elizabeth Arden, Inc. | | * | | | 1,017 | | | | 37,670 | |
Estee Lauder Cos., Inc. (The), Class A | | | | | 3,747 | | | | 420,863 | |
Herbalife Ltd. (Cayman Islands) | | | | | 1,696 | | | | 87,632 | |
Medifast, Inc. | | *† | | | 734 | | | | 10,071 | |
Nu Skin Enterprises, Inc., Class A | | | | | 3,018 | | | | 146,584 | |
USANA Health Sciences, Inc. | | *† | | | 593 | | | | 18,009 | |
| | | | | | | | | | | | |
| | | | | | | | | | | 971,541 | |
| | | | | | | | | | | | |
| Pharmaceuticals—5.4% | |
Abbott Laboratories | | | | | 59,451 | | | | 3,342,930 | |
Allergan, Inc. | | | | | 11,119 | | | | 975,581 | |
AVANIR Pharmaceuticals, Inc., Class A | | *† | | | 30,376 | | | | 62,271 | |
Bristol-Myers Squibb Co. | | | | | 62,456 | | | | 2,200,949 | |
Columbia Laboratories, Inc. | | *† | | | 1,819 | | | | 4,547 | |
Durect Corp. | | * | | | 1,900 | | | | 2,242 | |
Eli Lilly & Co. | | | | | 35,287 | | | | 1,466,528 | |
Emisphere Technologies, Inc. | | * | | | 772 | | | | 166 | |
Endo Pharmaceuticals Holdings, Inc. | | * | | | 4,151 | | | | 143,334 | |
Forest Laboratories, Inc. | | * | | | 9,208 | | | | 278,634 | |
Heska Corp. | | * | | | 446 | | | | 3,256 | |
Hi-Tech Pharmacal Co., Inc. | | * | | | 862 | | | | 33,523 | |
Hospira, Inc. | | * | | | 5,415 | | | | 164,454 | |
Johnson & Johnson | | | | | 97,345 | | | | 6,383,885 | |
KV Pharmaceutical Co., Class A | | *† | | | 2,179 | | | | 3,051 | |
Medicines Co. (The) | | * | | | 2,018 | | | | 37,616 | |
Medicis Pharmaceutical Corp., Class A | | | | | 2,564 | | | | 85,253 | |
Merck & Co., Inc. | | | | | 105,830 | | | | 3,989,791 | |
Mylan, Inc. | | * | | | 10,972 | | | | 235,459 | |
Nektar Therapeutics | | *† | | | 2,368 | | | | 13,249 | |
Optimer Pharmaceuticals, Inc. | | *† | | | 2,592 | | | | 31,726 | |
Pain Therapeutics, Inc. | | * | | | 1,318 | | | | 5,008 | |
Par Pharmaceutical Cos., Inc. | | * | | | 1,362 | | | | 44,578 | |
Perrigo Co. | | | | | 3,119 | | | | 303,479 | |
Pfizer, Inc. | | | | | 300,587 | | | | 6,504,703 | |
Pozen, Inc. | | * | | | 1,014 | | | | 4,005 | |
Questcor Pharmaceuticals, Inc. | | * | | | 4,217 | | | | 175,343 | |
Salix Pharmaceuticals Ltd. | | * | | | 2,346 | | | | 112,256 | |
Viropharma, Inc. | | * | | | 4,061 | | | | 111,231 | |
Vivus, Inc. | | *† | | | 1,630 | | | | 15,892 | |
Watson Pharmaceuticals, Inc. | | * | | | 4,630 | | | | 279,374 | |
XenoPort, Inc. | | * | | | 1,939 | | | | 7,388 | |
| | | | | | | | | | | | |
| | | | | | | | | | | 27,021,702 | |
| | | | | | | | | | | | |
| Professional Services—0.3% | |
Advisory Board Co. (The) | | * | | | 950 | | | | 70,500 | |
Barrett Business Services, Inc. | | | | | 2,203 | | | | 43,972 | |
CDI Corp. | | | | | 1,131 | | | | 15,619 | |
Corporate Executive Board Co. (The) | | | | | 1,507 | | | | 57,417 | |
CoStar Group, Inc. | | *† | | | 770 | | | | 51,382 | |
CRA International, Inc. | | * | | | 986 | | | | 19,562 | |
Dun & Bradstreet Corp. (The) | | | | | 1,546 | | | | 115,687 | |
Equifax, Inc. | | | | | 2,521 | | | | 97,664 | |
FTI Consulting, Inc. | | *† | | | 1,735 | | | | 73,599 | |
See accompanying notes to financial statements.
282
SCHEDULE OF INVESTMENTS—(Continued)
December 31, 2011
| | | | | | | | | | | | |
| Vantagepoint Broad Market Index Fund | | | | | | | Shares | | | | Value | |
| | | | | | | | | | | | |
| COMMON STOCKS—(Continued) | |
Heidrick & Struggles International, Inc. | | † | | | 865 | | | $ | 18,632 | |
Huron Consulting Group, Inc. | | * | | | 988 | | | | 38,275 | |
IHS, Inc., Class A | | * | | | 1,414 | | | | 121,830 | |
Insperity, Inc. | | † | | | 1,143 | | | | 28,975 | |
Kelly Services, Inc., Class A | | | | | 1,173 | | | | 16,047 | |
Kforce, Inc. | | *† | | | 297 | | | | 3,662 | |
Korn/Ferry International | | * | | | 1,624 | | | | 27,705 | |
Manpower, Inc. | | | | | 3,593 | | | | 128,450 | |
Mastech Holdings, Inc. | | * | | | 93 | | | | 347 | |
Navigant Consulting, Inc. | | * | | | 2,313 | | | | 26,391 | |
On Assignment, Inc. | | * | | | 1,243 | | | | 13,897 | |
RCM Technologies, Inc. | | * | | | 1,593 | | | | 8,252 | |
Resources Connection, Inc. | | | | | 2,060 | | | | 21,815 | |
Robert Half International, Inc. | | | | | 3,922 | | | | 111,620 | |
Towers Watson & Co., Class A | | | | | 1,600 | | | | 95,888 | |
TrueBlue, Inc. | | * | | | 2,485 | | | | 34,492 | |
Verisk Analytics, Inc., Class A | | * | | | 4,073 | | | | 163,449 | |
| | | | | | | | | | | | |
| | | | | | | | | | | 1,405,129 | |
| | | | | | | | | | | | |
| Real Estate Investment Trusts (REITs)—3.1% | |
Acadia Realty Trust REIT | | | | | 1,368 | | | | 27,552 | |
Agree Realty Corp. REIT | | | | | 814 | | | | 19,845 | |
Alexander’s, Inc. REIT | | | | | 78 | | | | 28,862 | |
Alexandria Real Estate Equities, Inc. REIT | | † | | | 1,245 | | | | 85,868 | |
American Campus Communities, Inc. REIT | | | | | 5,751 | | | | 241,312 | |
American Capital Agency Corp. REIT | | | | | 3,150 | | | | 88,452 | |
Annaly Capital Management, Inc. REIT | | | | | 30,573 | | | | 487,945 | |
Anworth Mortgage Asset Corp. REIT | | | | | 18,790 | | | | 118,001 | |
Apartment Investment & Management Co., Class A REIT | | | | | 5,659 | | | | 129,648 | |
Ashford Hospitality Trust, Inc. REIT | | | | | 4,200 | | | | 33,600 | |
AvalonBay Communities, Inc. REIT | | | | | 3,314 | | | | 432,808 | |
BioMed Realty Trust, Inc. REIT | | | | | 6,210 | | | | 112,277 | |
Boston Properties, Inc. REIT | | | | | 5,737 | | | | 571,405 | |
Brandywine Realty Trust REIT | | | | | 6,105 | | | | 57,998 | |
BRE Properties, Inc. REIT | | | | | 2,433 | | | | 122,818 | |
BRT Realty Trust REIT | | * | | | 421 | | | | 2,669 | |
Camden Property Trust REIT | | | | | 2,058 | | | | 128,090 | |
Capital Trust, Inc., Class A REIT | | * | | | 523 | | | | 1,177 | |
Capstead Mortgage Corp. REIT | | | | | 2,400 | | | | 29,856 | |
CBL & Associates Properties, Inc. REIT | | | | | 10,788 | | | | 169,372 | |
Cedar Realty Trust, Inc. REIT | | | | | 583 | | | | 2,513 | |
Chimera Investment Corp. REIT | | | | | 42,645 | | | | 107,039 | |
Colonial Properties Trust REIT | | † | | | 1,962 | | | | 40,927 | |
CommonWealth REIT REIT | | | | | 2,285 | | | | 38,022 | |
Corporate Office Properties Trust REIT | | | | | 1,904 | | | | 40,479 | |
Cousins Properties, Inc. REIT | | | | | 2,489 | | | | 15,954 | |
CubeSmart REIT | | † | | | 8,821 | | | | 93,855 | |
DCT Industrial Trust, Inc. REIT | | | | | 6,576 | | | | 33,669 | |
DDR Corp. REIT | | | | | 5,227 | | | | 63,613 | |
DiamondRock Hospitality Co. REIT | | | | | 4,047 | | | | 39,013 | |
| | | | | | | | | | | | |
| | | | | |
| | | | | | | | Shares | | | | Value | |
| | | | | | | | | | | | |
Digital Realty Trust, Inc. REIT | | † | | | 5,681 | | | $ | 378,752 | |
Douglas Emmett, Inc. REIT | | | | | 4,212 | | | | 76,827 | |
Duke Realty Corp. REIT | | | | | 5,609 | | | | 67,588 | |
DuPont Fabros Technology, Inc. REIT | | † | | | 4,666 | | | | 113,011 | |
EastGroup Properties, Inc. REIT | | | | | 1,538 | | | | 66,872 | |
Entertainment Properties Trust REIT | | | | | 2,733 | | | | 119,459 | |
Equity Lifestyle Properties, Inc. REIT | | | | | 1,140 | | | | 76,027 | |
Equity One, Inc. REIT | | | | | 2,619 | | | | 44,471 | |
Equity Residential REIT | | | | | 11,387 | | | | 649,401 | |
Essex Property Trust, Inc. REIT | | | | | 807 | | | | 113,392 | |
Extra Space Storage, Inc. REIT | | | | | 3,500 | | | | 84,805 | |
Federal Realty Investment Trust REIT | | | | | 2,295 | | | | 208,271 | |
FelCor Lodging Trust, Inc. REIT | | * | | | 19,456 | | | | 59,341 | |
First Industrial Realty Trust, Inc. REIT | | * | | | 6,729 | | | | 68,838 | |
First Potomac Realty Trust REIT | | | | | 1,628 | | | | 21,245 | |
Franklin Street Properties Corp. REIT | | † | | | 2,200 | | | | 21,890 | |
General Growth Properties, Inc. REIT | | | | | 15,452 | | | | 232,089 | |
Getty Realty Corp. REIT | | † | | | 1,747 | | | | 24,371 | |
Glimcher Realty Trust REIT | | | | | 17,270 | | | | 158,884 | |
Gramercy Capital Corp. REIT | | * | | | 2,182 | | | | 5,455 | |
Hatteras Financial Corp. REIT | | | | | 1,935 | | | | 51,026 | |
HCP, Inc. REIT | | | | | 13,391 | | | | 554,789 | |
Health Care REIT, Inc. REIT | | | | | 4,494 | | | | 245,058 | |
Healthcare Realty Trust, Inc. REIT | | | | | 1,881 | | | | 34,968 | |
Highwoods Properties, Inc. REIT | | † | | | 2,393 | | | | 71,000 | |
Home Properties, Inc. REIT | | | | | 1,390 | | | | 80,022 | |
Hospitality Properties Trust REIT | | | | | 2,923 | | | | 67,171 | |
Host Hotels & Resorts, Inc. REIT | | | | | 21,796 | | | | 321,927 | |
Inland Real Estate Corp. REIT | | | | | 2,302 | | | | 17,518 | |
Investors Real Estate Trust REIT | | † | | | 2,989 | | | | 21,805 | |
iStar Financial, Inc. REIT | | *† | | | 4,331 | | | | 22,911 | |
Kilroy Realty Corp. REIT | | | | | 1,316 | | | | 50,100 | |
Kimco Realty Corp. REIT | | | | | 15,341 | | | | 249,138 | |
Kite Realty Group Trust REIT | | | | | 2,654 | | | | 11,970 | |
LaSalle Hotel Properties REIT | | | | | 1,561 | | | | 37,792 | |
Lexington Realty Trust REIT | | † | | | 9,308 | | | | 69,717 | |
Liberty Property Trust REIT | | | | | 3,372 | | | | 104,127 | |
LTC Properties, Inc. REIT | | | | | 2,385 | | | | 73,601 | |
Macerich Co. (The) REIT | | | | | 5,275 | | | | 266,915 | |
Mack-Cali Realty Corp. REIT | | | | | 2,488 | | | | 66,405 | |
Medical Properties Trust, Inc. REIT | | | | | 11,530 | | | | 113,801 | |
MFA Financial, Inc. REIT | | | | | 10,801 | | | | 72,583 | |
Mid-America Apartment Communities, Inc. REIT | | | | | 1,240 | | | | 77,562 | |
Mission West Properties, Inc. REIT | | | | | 1,417 | | | | 12,781 | |
Monmouth Real Estate Investment Corp., Class A REIT | | | | | 3,275 | | | | 29,966 | |
MPG Office Trust, Inc. REIT | | *† | | | 1,199 | | | | 2,386 | |
National Health Investors, Inc. REIT | | | | | 979 | | | | 43,056 | |
See accompanying notes to financial statements.
283
SCHEDULE OF INVESTMENTS—(Continued)
December 31, 2011
| | | | | | | | | | | | |
| Vantagepoint Broad Market Index Fund | | | | | | | Shares | | | | Value | |
| | | | | | | | | | | | |
| COMMON STOCKS—(Continued) | |
National Retail Properties, Inc. REIT | | | | | 2,356 | | | $ | 62,151 | |
Newcastle Investment Corp. REIT | | | | | 754 | | | | 3,506 | |
NorthStar Realty Finance Corp. REIT | | † | | | 4,388 | | | | 20,931 | |
Omega Healthcare Investors, Inc. REIT | | | | | 4,100 | | | | 79,335 | |
Parkway Properties, Inc. REIT | | † | | | 986 | | | | 9,722 | |
Pennsylvania Real Estate Investment Trust REIT | | | | | 1,510 | | | | 15,764 | |
Plum Creek Timber Co., Inc. REIT | | | | | 7,429 | | | | 271,604 | |
PMC Commercial Trust REIT | | | | | 865 | | | | 6,046 | |
Post Properties, Inc. REIT | | | | | 2,078 | | | | 90,850 | |
Potlatch Corp. REIT | | | | | 1,618 | | | | 50,336 | |
ProLogis, Inc. REIT | | | | | 16,023 | | | | 458,098 | |
PS Business Parks, Inc. REIT | | | | | 599 | | | | 33,203 | |
Public Storage REIT | | | | | 6,057 | | | | 814,424 | |
RAIT Financial Trust REIT | | † | | | 7,882 | | | | 37,440 | |
Ramco-Gershenson Properties Trust REIT | | | | | 1,275 | | | | 12,533 | |
Rayonier, Inc. REIT | | | | | 5,004 | | | | 223,329 | |
Realty Income Corp. REIT | | † | | | 4,138 | | | | 144,664 | |
Redwood Trust, Inc. REIT | | | | | 1,008 | | | | 10,261 | |
Regency Centers Corp. REIT | | | | | 2,745 | | | | 103,267 | |
Sabra Healthcare REIT, Inc. REIT | | | | | 694 | | | | 8,390 | |
Saul Centers, Inc. REIT | | | | | 987 | | | | 34,960 | |
Senior Housing Properties Trust REIT | | | | | 3,680 | | | | 82,579 | |
Simon Property Group, Inc. REIT | | | | | 11,699 | | | | 1,508,469 | |
SL Green Realty Corp. REIT | | | | | 3,603 | | | | 240,104 | |
Sovran Self Storage, Inc. REIT | | | | | 1,269 | | | | 54,148 | |
Strategic Hotels & Resorts, Inc. REIT | | * | | | 22,977 | | | | 123,386 | |
Sun Communities, Inc. REIT | | † | | | 1,061 | | | | 38,758 | |
Sunstone Hotel Investors, Inc. REIT | | * | | | 2,559 | | | | 20,856 | |
Tanger Factory Outlet Centers, Inc. REIT | | | | | 2,442 | | | | 71,599 | |
Taubman Centers, Inc. REIT | | | | | 2,083 | | | | 129,354 | |
UDR, Inc. REIT | | | | | 6,077 | | | | 152,533 | |
Universal Health Realty Income Trust REIT | | † | | | 1,333 | | | | 51,987 | |
Ventas, Inc. REIT | | | | | 12,494 | | | | 688,794 | |
Vornado Realty Trust REIT | | | | | 7,702 | | | | 591,976 | |
Washington Real Estate Investment Trust REIT | | | | | 1,834 | | | | 50,160 | |
Weingarten Realty Investors REIT | | | | | 3,474 | | | | 75,803 | |
Weyerhaeuser Co. REIT | | | | | 16,471 | | | | 307,514 | |
| | | | | | | | | | | | |
| | | | | | | | | 15,404,557 | |
| | | | | | | | | | | | |
| Real Estate Management & Development—0.1% | |
Altisource Portfolio Solutions SA (Luxembourg) | | * | | | 1,119 | | | | 56,151 | |
Brookfield Office Properties, Inc. | | | | | 15,325 | | | | 239,683 | |
CBRE Group, Inc. | | * | | | 6,900 | | | | 105,018 | |
Forest City Enterprises, Inc., Class A | | * | | | 9,240 | | | | 109,217 | |
Forestar Group, Inc. | | * | | | 1,502 | | | | 22,725 | |
Grubb & Ellis Co. | | * | | | 652 | | | | 84 | |
Jones Lang LaSalle, Inc. | | | | | 1,311 | | | | 80,312 | |
| | | | | | | | | | | | |
| | | | | |
| | | | | | | | Shares | | | | Value | |
| | | | | | | | | | | | |
St. Joe Co. (The) | | *† | | | 3,582 | | | $ | 52,512 | |
Tejon Ranch Co. | | * | | | 858 | | | | 21,004 | |
| | | | | | | | | | | | |
| | | | | | | | | 686,706 | |
| | | | | | | | | | | | |
| Road & Rail—0.9% | |
Amerco, Inc. | | † | | | 805 | | | | 71,162 | |
Arkansas Best Corp. | | | | | 903 | | | | 17,401 | |
Avis Budget Group, Inc. | | * | | | 4,424 | | | | 47,425 | |
Con-way, Inc. | | | | | 2,160 | | | | 62,986 | |
CSX Corp. | | | | | 35,751 | | | | 752,916 | |
Dollar Thrifty Automotive Group, Inc. | | * | | | 1,057 | | | | 74,265 | |
Genesee & Wyoming, Inc., Class A | | * | | | 1,576 | | | | 95,474 | |
Heartland Express, Inc. | | † | | | 4,220 | | | | 60,304 | |
J.B. Hunt Transport Services, Inc. | | | | | 1,317 | | | | 59,357 | |
Kansas City Southern | | * | | | 4,745 | | | | 322,707 | |
Knight Transportation, Inc. | | | | | 3,879 | | | | 60,668 | |
Landstar System, Inc. | | | | | 2,256 | | | | 108,108 | |
Norfolk Southern Corp. | | | | | 12,299 | | | | 896,105 | |
Old Dominion Freight Line, Inc. | | * | | | 2,674 | | | | 108,377 | |
PAM Transportation Services, Inc. | | * | | | 338 | | | | 3,211 | |
Ryder System, Inc. | | | | | 707 | | | | 37,570 | |
Saia, Inc. | | * | | | 1,662 | | | | 20,742 | |
Union Pacific Corp. | | | | | 15,516 | | | | 1,643,765 | |
Werner Enterprises, Inc. | | † | | | 2,915 | | | | 70,251 | |
| | | | | | | | | | | | |
| | | | | | | | | 4,512,794 | |
| | | | | | | | | | | | |
| Semiconductors & Semiconductor Equipment—2.4% | |
Advanced Energy Industries, Inc. | | * | | | 1,428 | | | | 15,322 | |
Advanced Micro Devices, Inc. | | * | | | 21,447 | | | | 115,814 | |
Aetrium, Inc. | | * | | | 614 | | | | 448 | |
Altera Corp. | | | | | 9,504 | | | | 352,598 | |
Amkor Technology, Inc. | | *† | | | 7,211 | | | | 31,440 | |
Anadigics, Inc. | | *† | | | 957 | | | | 2,096 | |
Analog Devices, Inc. | | | | | 7,450 | | | | 266,561 | |
Applied Materials, Inc. | | | | | 43,119 | | | | 461,805 | |
Applied Micro Circuits Corp. | | * | | | 3,186 | | | | 21,410 | |
Atmel Corp. | | * | | | 18,733 | | | | 151,737 | |
ATMI, Inc. | | * | | | 1,559 | | | | 31,227 | |
Axcelis Technologies, Inc. | | *† | | | 4,095 | | | | 5,446 | |
AXT, Inc. | | * | | | 946 | | | | 3,945 | |
Broadcom Corp., Class A | | * | | | 18,226 | | | | 535,115 | |
Brooks Automation, Inc. | | | | | 3,103 | | | | 31,868 | |
Cabot Microelectronics Corp. | | * | | | 1,049 | | | | 49,565 | |
Ceva, Inc. | | * | | | 692 | | | | 20,940 | |
Cirrus Logic, Inc. | | * | | | 2,946 | | | | 46,694 | |
Cohu, Inc. | | | | | 859 | | | | 9,750 | |
Cree, Inc. | | *† | | | 3,097 | | | | 68,258 | |
Cymer, Inc. | | * | | | 1,498 | | | | 74,541 | |
Cypress Semiconductor Corp. | | * | | | 4,876 | | | | 82,356 | |
Diodes, Inc. | | * | | | 2,400 | | | | 51,120 | |
DSP Group, Inc. | | * | | | 1,194 | | | | 6,221 | |
Energy Conversion Devices, Inc. | | *† | | | 781 | | | | 158 | |
Entegris, Inc. | | * | | | 5,738 | | | | 50,064 | |
Exar Corp. | | *† | | | 1,758 | | | | 11,427 | |
Fairchild Semiconductor International, Inc. | | * | | | 4,903 | | | | 59,032 | |
First Solar, Inc. | | *† | | | 2,540 | | | | 85,750 | |
Formfactor, Inc. | | * | | | 1,417 | | | | 7,170 | |
FSI International, Inc. | | * | | | 1,479 | | | | 5,413 | |
GigOptix, Inc. | | * | | | 827 | | | | 1,489 | |
See accompanying notes to financial statements.
284
SCHEDULE OF INVESTMENTS—(Continued)
December 31, 2011
| | | | | | | | | | | | |
| Vantagepoint Broad Market Index Fund | | | | | | | Shares | | | | Value | |
| | | | | | | | | | | | |
| COMMON STOCKS—(Continued) | |
Integrated Device Technology, Inc. | | * | | | 8,168 | | | $ | 44,597 | |
Integrated Silicon Solution, Inc. | | *† | | | 1,269 | | | | 11,599 | |
Intel Corp. | | | | | 199,133 | | | | 4,828,975 | |
International Rectifier Corp. | | * | | | 2,631 | | | | 51,094 | |
Intersil Corp., Class A | | | | | 5,757 | | | | 60,103 | |
IXYS Corp. | | * | | | 1,329 | | | | 14,393 | |
KLA-Tencor Corp. | | | | | 4,441 | | | | 214,278 | |
Kopin Corp. | | *† | | | 2,431 | | | | 9,432 | |
Kulicke & Soffa Industries, Inc. | | * | | | 2,008 | | | | 18,574 | |
Lam Research Corp. | | * | | | 2,890 | | | | 106,988 | |
Lattice Semiconductor Corp. | | * | | | 4,395 | | | | 26,106 | |
Linear Technology Corp. | | | | | 5,243 | | | | 157,447 | |
LSI Corp. | | * | | | 30,700 | | | | 182,665 | |
LTX-Credence Corp. | | * | | | 1,358 | | | | 7,265 | |
Marvell Technology Group Ltd. (Bermuda) | | * | | | 18,500 | | | | 256,225 | |
Mattson Technology, Inc. | | * | | | 1,760 | | | | 2,429 | |
Maxim Integrated Products, Inc. | | | | | 5,913 | | | | 153,975 | |
MEMC Electronic Materials, Inc. | | * | | | 8,113 | | | | 31,965 | |
Micrel, Inc. | | | | | 3,731 | | | | 37,720 | |
Microchip Technology, Inc. | | † | | | 3,565 | | | | 130,586 | |
Micron Technology, Inc. | | * | | | 35,271 | | | | 221,855 | |
Microsemi Corp. | | * | | | 2,474 | | | | 41,440 | |
Mindspeed Technologies, Inc. | | *† | | | 801 | | | | 3,669 | |
MIPS Technologies, Inc. | | * | | | 2,228 | | | | 9,937 | |
MKS Instruments, Inc. | | | | | 2,455 | | | | 68,298 | |
MoSys, Inc. | | *† | | | 1,251 | | | | 5,254 | |
Netlogic Microsystems, Inc. | | * | | | 2,136 | | | | 105,882 | |
Novellus Systems, Inc. | | * | | | 2,876 | | | | 118,750 | |
NVE Corp. | | * | | | 348 | | | | 19,324 | |
NVIDIA Corp. | | * | | | 20,184 | | | | 279,750 | |
Omnivision Technologies, Inc. | | * | | | 2,354 | | | | 28,801 | |
ON Semiconductor Corp. | | * | | | 10,008 | | | | 77,262 | |
PDF Solutions, Inc. | | *† | | | 974 | | | | 6,789 | |
Pericom Semiconductor Corp. | | * | | | 1,023 | | | | 7,785 | |
Photronics, Inc. | | * | | | 1,388 | | | | 8,439 | |
PLX Technology, Inc. | | * | | | 1,050 | | | | 3,014 | |
PMC—Sierra, Inc. | | * | | | 7,045 | | | | 38,818 | |
Power Integrations, Inc. | | † | | | 1,952 | | | | 64,728 | |
QuickLogic Corp. | | *† | | | 1,050 | | | | 2,730 | |
Rambus, Inc. | | * | | | 4,071 | | | | 30,736 | |
Ramtron International Corp. | | * | | | 1,920 | | | | 3,744 | |
RF Micro Devices, Inc. | | *† | | | 8,143 | | | | 43,972 | |
Rudolph Technologies, Inc. | | * | | | 1,247 | | | | 11,547 | |
Semtech Corp. | | * | | | 2,970 | | | | 73,715 | |
Sigma Designs, Inc. | | * | | | 1,320 | | | | 7,920 | |
Silicon Image, Inc. | | * | | | 2,948 | | | | 13,856 | |
Silicon Laboratories, Inc. | | *† | | | 2,124 | | | | 92,224 | |
Skyworks Solutions, Inc. | | * | | | 5,822 | | | | 94,433 | |
Spire Corp. | | * | | | 2,500 | | | | 1,550 | |
Standard Microsystems Corp. | | * | | | 806 | | | | 20,771 | |
SunPower Corp. | | *† | | | 141 | | | | 878 | |
Teradyne, Inc. | | * | | | 7,938 | | | | 108,195 | |
Tessera Technologies, Inc. | | * | | | 1,560 | | | | 26,130 | |
Texas Instruments, Inc. | | | | | 38,855 | | | | 1,131,069 | |
Transwitch Corp. | | * | | | 429 | | | | 1,373 | |
Trident Microsystems, Inc. | | * | | | 3,018 | | | | 543 | |
TriQuint Semiconductor, Inc. | | * | | | 4,918 | | | | 23,951 | |
Ultratech, Inc. | | * | | | 971 | | | | 23,857 | |
Veeco Instruments, Inc. | | * | | | 1,294 | | | | 26,915 | |
| | | | | | | | | | | | |
| | | | | |
| | | | | | | | Shares | | | | Value | |
| | | | | | | | | | | | |
Xilinx, Inc. | | | | | 6,637 | | | $ | 212,782 | |
| | | | | | | | | | | | |
| | | | | | | | | 12,065,882 | |
| | | | | | | | | | | | |
| Software—3.6% | |
Accelrys, Inc. | | * | | | 2,216 | | | | 14,892 | |
ACI Worldwide, Inc. | | *† | | | 1,298 | | | | 37,175 | |
Activision Blizzard, Inc. | | | | | 23,814 | | | | 293,388 | |
Actuate Corp. | | * | | | 2,084 | | | | 12,212 | |
Adobe Systems, Inc. | | * | | | 17,358 | | | | 490,711 | |
Advent Software, Inc. | | * | | | 2,902 | | | | 70,693 | |
American Software, Inc., Class A | | | | | 1,950 | | | | 18,428 | |
ANSYS, Inc. | | * | | | 2,396 | | | | 137,243 | |
Ariba, Inc. | | * | | | 2,075 | | | | 58,266 | |
Autodesk, Inc. | | * | | | 9,258 | | | | 280,795 | |
Blackbaud, Inc. | | | | | 2,650 | | | | 73,405 | |
BMC Software, Inc. | | * | | | 2,708 | | | | 88,768 | |
CA, Inc. | | | | | 11,593 | | | | 234,353 | |
Cadence Design Systems, Inc. | | * | | | 10,745 | | | | 111,748 | |
Callidus Software, Inc. | | * | | | 172 | | | | 1,104 | |
Citrix Systems, Inc. | | * | | | 7,179 | | | | 435,909 | |
Compuware Corp. | | * | | | 7,505 | | | | 62,442 | |
Concur Technologies, Inc. | | * | | | 2,083 | | | | 105,796 | |
Datawatch Corp. | | * | | | 3,500 | | | | 19,985 | |
Ebix, Inc. | | † | | | 2,802 | | | | 61,924 | |
Electronic Arts, Inc. | | * | | | 12,060 | | | | 248,436 | |
EPIQ Systems, Inc. | | † | | | 1,087 | | | | 13,066 | |
Evergreen Energy, Inc. | | *† | | | 416 | | | | 25 | |
Evolving Systems, Inc. | | | | | 527 | | | | 3,947 | |
Factset Research Systems, Inc. | | | | | 1,490 | | | | 130,047 | |
Fair Isaac Corp. | | | | | 3,039 | | | | 108,918 | |
FalconStor Software, Inc. | | *† | | | 1,373 | | | | 3,542 | |
Informatica Corp. | | * | | | 3,171 | | | | 117,105 | |
Interactive Intelligence Group, Inc. | | * | | | 950 | | | | 21,774 | |
Intuit, Inc. | | | | | 8,244 | | | | 433,552 | |
JDA Software Group, Inc. | | * | | | 1,256 | | | | 40,682 | |
Kenexa Corp. | | * | | | 1,681 | | | | 44,883 | |
Magma Design Automation, Inc. | | * | | | 1,429 | | | | 10,260 | |
Manhattan Associates, Inc. | | * | | | 1,346 | | | | 54,486 | |
Mentor Graphics Corp. | | * | | | 2,745 | | | | 37,222 | |
MICROS Systems, Inc. | | * | | | 3,428 | | | | 159,676 | |
Microsoft Corp. | | | | | 294,920 | | | | 7,656,123 | |
MicroStrategy, Inc., Class A | | * | | | 513 | | | | 55,568 | |
Netscout Systems, Inc. | | * | | | 1,250 | | | | 22,000 | |
Nuance Communications, Inc. | | * | | | 4,541 | | | | 114,252 | |
Oracle Corp. | | | | | 150,585 | | | | 3,862,505 | |
Parametric Technology Corp. | | * | | | 4,423 | | | | 80,764 | |
Pegasystems, Inc. | | † | | | 2,141 | | | | 62,945 | |
Progress Software Corp. | | * | | | 1,983 | | | | 38,371 | |
QAD, Inc., Class B | | * | | | 136 | | | | 1,408 | |
Quest Software, Inc. | | * | | | 3,847 | | | | 71,554 | |
Red Hat, Inc. | | * | | | 7,251 | | | | 299,394 | |
Rovi Corp. | | * | | | 3,917 | | | | 96,280 | |
S1 Corp. | | * | | | 2,636 | | | | 25,227 | |
Salesforce.com, Inc. | | * | | | 3,783 | | | | 383,823 | |
Scientific Learning Corp. | | * | | | 3,145 | | | | 8,020 | |
SeaChange International, Inc. | | * | | | 958 | | | | 6,735 | |
Solera Holdings, Inc. | | | | | 1,099 | | | | 48,949 | |
Sonic Foundry, Inc. | | * | | | 120 | | | | 908 | |
SuccessFactors, Inc. | | * | | | 1,451 | | | | 57,851 | |
Symantec Corp. | | * | | | 26,135 | | | | 409,013 | |
Synopsys, Inc. | | * | | | 6,501 | | | | 176,827 | |
See accompanying notes to financial statements.
285
SCHEDULE OF INVESTMENTS—(Continued)
December 31, 2011
| | | | | | | | | | | | |
| Vantagepoint Broad Market Index Fund | | | | | | | Shares | | | | Value | |
| | | | | | | | | | | | |
| COMMON STOCKS—(Continued) | |
Take-Two Interactive Software, Inc. | | *† | | | 2,643 | | | $ | 35,813 | |
TeleCommunication Systems, Inc., Class A | | * | | | 1,200 | | | | 2,820 | |
THQ, Inc. | | *† | | | 2,914 | | | | 2,215 | |
TIBCO Software, Inc. | | * | | | 4,452 | | | | 106,447 | |
TiVo, Inc. | | * | | | 2,696 | | | | 24,183 | |
Tyler Technologies, Inc. | | * | | | 1,886 | | | | 56,787 | |
Ultimate Software Group, Inc. | | * | | | 1,242 | | | | 80,879 | |
VASCO Data Security International, Inc. | | * | | | 3,804 | | | | 24,802 | |
Versant Corp. | | * | | | 330 | | | | 3,056 | |
VMware, Inc., Class A | | * | | | 1,733 | | | | 144,168 | |
Websense, Inc. | | * | | | 1,958 | | | | 36,673 | |
| | | | | | | | | | | | |
| | | | | | | | | 18,033,218 | |
| | | | | | | | | | | | |
| Specialty Retail—2.1% | |
Aaron’s, Inc. | | | | | 2,908 | | | | 77,585 | |
Abercrombie & Fitch Co., Class A | | | | | 3,072 | | | | 150,036 | |
Advance Auto Parts, Inc. | | | | | 1,752 | | | | 121,992 | |
Aeropostale, Inc. | | * | | | 2,075 | | | | 31,644 | |
American Eagle Outfitters, Inc. | | | | | 3,552 | | | | 54,310 | |
America’s Car-Mart, Inc. | | *† | | | 354 | | | | 13,870 | |
ANN, Inc. | | * | | | 2,733 | | | | 67,724 | |
Asbury Automotive Group, Inc. | | * | | | 1,342 | | | | 28,934 | |
Ascena Retail Group, Inc. | | * | | | 2,597 | | | | 77,183 | |
AutoNation, Inc. | | *† | | | 5,363 | | | | 197,734 | |
AutoZone, Inc. | | * | | | 1,769 | | | | 574,872 | |
Barnes & Noble, Inc. | | *† | | | 828 | | | | 11,989 | |
Bebe Stores, Inc. | | | | | 790 | | | | 6,581 | |
Bed Bath & Beyond, Inc. | | * | | | 6,586 | | | | 381,790 | |
Best Buy Co., Inc. | | † | | | 9,299 | | | | 217,318 | |
Big 5 Sporting Goods Corp. | | | | | 1,071 | | | | 11,181 | |
Brown Shoe Co., Inc. | | | | | 1,791 | | | | 15,940 | |
Buckle, Inc. (The) | | † | | | 1,236 | | | | 50,515 | |
CarMax, Inc. | | * | | | 6,608 | | | | 201,412 | |
Casual Male Retail Group, Inc. | | *† | | | 1,930 | | | | 6,601 | |
Cato Corp. (The), Class A | | | | | 1,761 | | | | 42,616 | |
Charming Shoppes, Inc. | | * | | | 3,138 | | | | 15,376 | |
Chico’s FAS, Inc. | | | | | 7,236 | | | | 80,609 | |
Children’s Place Retail Stores, Inc. (The) | | * | | | 1,144 | | | | 60,769 | |
Christopher & Banks Corp. | | | | | 1,528 | | | | 3,576 | |
Coldwater Creek, Inc. | | * | | | 1,528 | | | | 1,803 | |
Collective Brands, Inc. | | *† | | | 2,964 | | | | 42,593 | |
Cost Plus, Inc. | | * | | | 1,014 | | | | 9,887 | |
Destination Maternity Corp. | | | | | 1,200 | | | | 20,064 | |
Dick’s Sporting Goods, Inc. | | | | | 2,480 | | | | 91,462 | |
DSW, Inc., Class A | | | | | 596 | | | | 26,349 | |
Finish Line, Inc. (The), Class A | | | | | 1,917 | | | | 36,969 | |
Foot Locker, Inc. | | | | | 5,840 | | | | 139,226 | |
GameStop Corp., Class A | | *† | | | 1,010 | | | | 24,371 | |
Gap, Inc. (The) | | | | | 15,719 | | | | 291,587 | |
Genesco, Inc. | | * | | | 921 | | | | 56,863 | |
Group 1 Automotive, Inc. | | † | | | 1,068 | | | | 55,322 | |
Guess?, Inc. | | | | | 3,548 | | | | 105,801 | |
Haverty Furniture Cos., Inc. | | | | | 1,111 | | | | 12,199 | |
Hibbett Sports, Inc. | | * | | | 1,396 | | | | 63,071 | |
Home Depot, Inc. (The) | | | | | 47,382 | | | | 1,991,939 | |
Hot Topic, Inc. | | | | | 1,824 | | | | 12,057 | |
JOS A. Bank Clothiers, Inc. | | * | | | 865 | | | | 42,177 | |
Kirkland’s, Inc. | | * | | | 833 | | | | 11,079 | |
| | | | | | | | | | | | |
| | | | | |
| | | | | | | | Shares | | | | Value | |
| | | | | | | | | | | | |
Limited Brands, Inc. | | | | | 9,245 | | | $ | 373,036 | |
Lithia Motors, Inc., Class A | | | | | 862 | | | | 18,843 | |
Lowe’s Cos., Inc. | | | | | 47,338 | | | | 1,201,438 | |
MarineMax, Inc. | | * | | | 800 | | | | 5,216 | |
Men’s Wearhouse, Inc. (The) | | | | | 2,437 | | | | 78,983 | |
Midas, Inc. | | * | | | 1,277 | | | | 10,969 | |
Monro Muffler Brake, Inc. | | † | | | 1,487 | | | | 57,681 | |
Office Depot, Inc. | | * | | | 11,792 | | | | 25,353 | |
OfficeMax, Inc. | | * | | | 3,587 | | | | 16,285 | |
Orchard Supply Hardware Stores Corp., Class A | | *‡ | | | 140 | | | | 2 | |
O’Reilly Automotive, Inc. | | * | | | 5,478 | | | | 437,966 | |
Pacific Sunwear of California, Inc. | | * | | | 3,025 | | | | 5,173 | |
Penske Automotive Group, Inc. | | | | | 1,654 | | | | 31,840 | |
Pep Boys-Manny, Moe & Jack (The) | | | | | 2,200 | | | | 24,200 | |
PetSmart, Inc. | | | | | 3,546 | | | | 181,874 | |
Pier 1 Imports, Inc. | | * | | | 3,712 | | | | 51,708 | |
RadioShack Corp. | | † | | | 2,569 | | | | 24,945 | |
Rent-A-Center, Inc. | | | | | 3,377 | | | | 124,949 | |
Ross Stores, Inc. | | | | | 8,400 | | | | 399,252 | |
Sally Beauty Holdings, Inc. | | *† | | | 3,659 | | | | 77,315 | |
Select Comfort Corp. | | * | | | 2,104 | | | | 45,636 | |
Signet Jewelers Ltd. (Bermuda) | | | | | 3,344 | | | | 147,002 | |
Sonic Automotive, Inc., Class A | | | | | 1,649 | | | | 24,422 | |
Stage Stores, Inc. | | | | | 2,236 | | | | 31,058 | |
Staples, Inc. | | | | | 22,960 | | | | 318,914 | |
Stein Mart, Inc. | | * | | | 1,261 | | | | 8,587 | |
Systemax, Inc. | | *† | | | 1,358 | | | | 22,285 | |
Talbots, Inc. | | *† | | | 375 | | | | 998 | |
Tiffany & Co. | | | | | 3,221 | | | | 213,423 | |
TJX Cos., Inc. | | | | | 12,006 | | | | 774,987 | |
Tractor Supply Co. | | | | | 3,098 | | | | 217,325 | |
Trans World Entertainment Corp. | | * | | | 1,932 | | | | 4,869 | |
Urban Outfitters, Inc. | | * | | | 5,012 | | | | 138,131 | |
West Marine, Inc. | | *† | | | 803 | | | | 9,339 | |
Wet Seal, Inc. (The), Class A | | * | | | 1,246 | | | | 4,062 | |
Williams-Sonoma, Inc. | | | | | 3,877 | | | | 149,265 | |
Zale Corp. | | *† | | | 2,300 | | | | 8,763 | |
| | | | | | | | | | | | |
| | | | | | | | | 10,803,070 | |
| | | | | | | | | | | | |
| Textiles, Apparel & Luxury Goods—0.8% | |
Carter’s, Inc. | | * | | | 1,476 | | | | 58,760 | |
Charles & Colvard Ltd. | | * | | | 1,843 | | | | 4,736 | |
Cherokee, Inc. | | † | | | 994 | | | | 11,600 | |
Coach, Inc. | | | | | 10,479 | | | | 639,638 | |
Columbia Sportswear Co. | | | | | 652 | | | | 30,351 | |
Crocs, Inc. | | * | | | 3,600 | | | | 53,172 | |
Culp, Inc. | | * | | | 888 | | | | 7,566 | |
Deckers Outdoor Corp. | | * | | | 1,935 | | | | 146,228 | |
Fossil, Inc. | | * | | | 1,614 | | | | 128,087 | |
Hallwood Group, Inc. (The) | | * | | | 100 | | | | 908 | |
Hanesbrands, Inc. | | * | | | 4,099 | | | | 89,604 | |
Iconix Brand Group, Inc. | | * | | | 2,737 | | | | 44,586 | |
Jones Group, Inc. (The) | | | | | 4,641 | | | | 48,963 | |
Kenneth Cole Productions, Inc., Class A | | * | | | 956 | | | | 10,124 | |
K-Swiss, Inc., Class A | | *† | | | 1,476 | | | | 4,310 | |
Liz Claiborne, Inc. | | *† | | | 4,930 | | | | 42,546 | |
Movado Group, Inc. | | | | | 1,678 | | | | 30,489 | |
NIKE, Inc., Class B | | | | | 12,835 | | | | 1,236,909 | |
Oxford Industries, Inc. | | † | | | 936 | | | | 42,232 | |
See accompanying notes to financial statements.
286
SCHEDULE OF INVESTMENTS—(Continued)
December 31, 2011
| | | | | | | | | | | | |
| Vantagepoint Broad Market Index Fund | | | | | | | Shares | | | | Value | |
| | | | | | | | | | | | |
| COMMON STOCKS—(Continued) | |
PVH Corp. | | | | | 1,267 | | | $ | 89,311 | |
Quiksilver, Inc. | | * | | | 4,288 | | | | 15,480 | |
Ralph Lauren Corp. | | | | | 2,143 | | | | 295,905 | |
Skechers U.S.A., Inc., Class A | | * | | | 1,935 | | | | 23,452 | |
Steven Madden Ltd. | | * | | | 1,689 | | | | 58,270 | |
Under Armour, Inc., Class A | | *† | | | 1,937 | | | | 139,057 | |
Unifi, Inc. | | * | | | 876 | | | | 6,658 | |
V.F. Corp. | | | | | 3,109 | | | | 394,812 | |
Warnaco Group, Inc. (The) | | * | | | 1,527 | | | | 76,411 | |
Wolverine World Wide, Inc. | | | | | 2,589 | | | | 92,272 | |
| | | | | | | | | | | | |
| | | | | | | | | 3,822,437 | |
| | | | | | | | | | | | |
| Thrifts & Mortgage Finance—0.2% | |
Astoria Financial Corp. | | | | | 3,465 | | | | 29,418 | |
Bank Mutual Corp. | | | | | 3,756 | | | | 11,944 | |
BankAtlantic Bancorp, Inc., Class A | | * | | | 639 | | | | 2,160 | |
Beneficial Mutual Bancorp, Inc. | | * | | | 969 | | | | 8,101 | |
Brookline Bancorp, Inc. | | | | | 3,765 | | | | 31,777 | |
Capitol Federal Financial, Inc. | | | | | 4,787 | | | | 55,242 | |
CFS Bancorp, Inc. | | | | | 1,873 | | | | 8,110 | |
Dime Community Bancshares, Inc. | | | | | 1,638 | | | | 20,639 | |
Doral Financial Corp. (Puerto Rico) | | * | | | 221 | | | | 211 | |
Federal Home Loan Mortgage Corp. | | *† | | | 25,235 | | | | 5,350 | |
Federal National Mortgage Association | | *† | | | 37,770 | | | | 7,599 | |
Flagstar Bancorp, Inc. | | *† | | | 211 | | | | 107 | |
Hudson City Bancorp, Inc. | | | | | 14,470 | | | | 90,437 | |
MGIC Investment Corp. | | * | | | 4,084 | | | | 15,233 | |
NASB Financial, Inc. | | * | | | 528 | | | | 5,655 | |
New York Community Bancorp, Inc. | | | | | 12,640 | | | | 156,357 | |
Northwest Bancshares, Inc. | | | | | 4,608 | | | | 57,324 | |
Ocwen Financial Corp. | | * | | | 3,358 | | | | 48,624 | |
Parkvale Financial Corp. | | | | | 616 | | | | 15,141 | |
People’s United Financial, Inc. | | | | | 9,716 | | | | 124,851 | |
Provident Financial Services, Inc. | | † | | | 943 | | | | 12,627 | |
Provident New York Bancorp | | | | | 3,670 | | | | 24,369 | |
Radian Group, Inc. | | † | | | 3,844 | | | | 8,995 | |
Riverview Bancorp, Inc. | | * | | | 2,600 | | | | 6,162 | |
TFS Financial Corp. | | * | | | 3,398 | | | | 30,446 | |
Tree.com, Inc. | | * | | | 314 | | | | 1,755 | |
Triad Guaranty, Inc. | | *† | | | 692 | | | | 76 | |
Trustco Bank Corp. | | | | | 3,435 | | | | 19,270 | |
Washington Federal, Inc. | | | | | 3,379 | | | | 47,272 | |
Westfield Financial, Inc. | | | | | 4,068 | | | | 29,940 | |
| | | | | | | | | | | | |
| | | | | | | | | 875,192 | |
| | | | | | | | | | | | |
| Tobacco—1.7% | |
Alliance One International, Inc. | | *† | | | 2,000 | | | | 5,440 | |
Altria Group, Inc. | | | | | 70,302 | | | | 2,084,454 | |
Lorillard, Inc. | | | | | 5,710 | | | | 650,940 | |
Philip Morris International, Inc. | | | | | 62,767 | | | | 4,925,954 | |
Reynolds American, Inc. | | | | | 15,280 | | | | 632,898 | |
Universal Corp. | | | | | 1,078 | | | | 49,545 | |
Vector Group Ltd. | | † | | | 2,901 | | | | 51,522 | |
| | | | | | | | | | | | |
| | | | | | | | | 8,400,753 | |
| | | | | | | | | | | | |
| | | | | | | | | | | | |
| | | | | |
| | | | | | | | Shares | | | | Value | |
| | | | | | | | | | | | |
| Trading Companies & Distributors—0.3% | |
Applied Industrial Technologies, Inc. | | | | | 2,056 | | | $ | 72,310 | |
Beacon Roofing Supply, Inc. | | *† | | | 2,570 | | | | 51,991 | |
Fastenal Co. | | † | | | 11,276 | | | | 491,746 | |
GATX Corp. | | | | | 1,766 | | | | 77,104 | |
H&E Equipment Services, Inc. | | * | | | 1,600 | | | | 21,472 | |
Interline Brands, Inc. | | * | | | 982 | | | | 15,290 | |
MSC Industrial Direct Co., Inc., Class A | | | | | 1,782 | | | | 127,502 | |
United Rentals, Inc. | | *† | | | 2,798 | | | | 82,681 | |
W.W. Grainger, Inc. | | | | | 2,817 | | | | 527,314 | |
Watsco, Inc. | | | | | 553 | | | | 36,310 | |
WESCO International, Inc. | | * | | | 1,550 | | | | 82,165 | |
Willis Lease Finance Corp. | | * | | | 1,234 | | | | 14,685 | |
| | | | | | | | | | | | |
| | | | | | | | | 1,600,570 | |
| | | | | | | | | | | | |
| Water Utilities—0.1% | |
American States Water Co. | | | | | 1,261 | | | | 44,009 | |
American Water Works Co., Inc. | | | | | 2,266 | | | | 72,195 | |
Aqua America, Inc. | | | | | 4,329 | | | | 95,454 | |
California Water Service Group | | | | | 1,930 | | | | 35,242 | |
Connecticut Water Service, Inc. | | | | | 500 | | | | 13,565 | |
SJW Corp. | | † | | | 1,010 | | | | 23,876 | |
| | | | | | | | | | | | |
| | | | | | | | | 284,341 | |
| | | | | | | | | | | | |
| Wireless Telecommunication Services—0.4% | |
American Tower Corp., Class A | | | | | 13,160 | | | | 789,732 | |
Crown Castle International Corp. | | * | | | 13,031 | | | | 583,789 | |
Leap Wireless International, Inc. | | *† | | | 3,300 | | | | 30,657 | |
MetroPCS Communications, Inc. | | * | | | 7,134 | | | | 61,923 | |
NII Holdings, Inc. | | * | | | 5,995 | | | | 127,693 | |
NTELOS Holdings Corp. | | | | | 1,350 | | | | 27,513 | |
SBA Communications Corp., Class A | | * | | | 4,064 | | | | 174,589 | |
Shenandoah Telecommunications Co. | | † | | | 1,200 | | | | 12,576 | |
Sprint Nextel Corp. | | * | | | 88,755 | | | | 207,687 | |
Telephone & Data Systems, Inc. | | † | | | 410 | | | | 10,615 | |
United States Cellular Corp. | | * | | | 680 | | | | 29,668 | |
| | | | | | | | | | | | |
| | | | | | | | | 2,056,442 | |
| | | | | | | | | | | | |
| TOTAL COMMON STOCKS | |
(Cost $358,308,646) | | | | | | | | | 489,582,931 | |
| | | | | | | | | | | | |
| | | | | | | | | | | | | |
| CONVERTIBLE PREFERRED STOCKS—0.0% | |
| Specialty Retail—0.0% | |
Orchard Supply Hardware Stores Corp., Perpetual, Series A 0.000% | | | | | | | | | | |
(Cost $—) | | *‡ | | | 140 | | | | 2 | |
| | | | | | | | | | | | |
| | | | | | | | | | | | | |
| | | | | | | | | | | | | | |
| | | | |
Coupon
Rate | | Maturity
Date | | | | | Face | | | Value | |
| | | | | | | | | | | | | | |
| U.S. TREASURY OBLIGATIONS—0.2% | |
| U.S. Treasury Bills—0.2% | |
U.S. Treasury Bill | |
0.027% | | | 03/08/2012 | | | ‡‡ | | $ | 105,000 | | | | 104,997 | |
0.016% | | | 03/22/2012 | | | ‡‡ | | | 715,000 | | | | 714,976 | |
See accompanying notes to financial statements.
287
SCHEDULE OF INVESTMENTS—(Continued)
December 31, 2011
| | | | | | | | | | | | | | |
Vantagepoint Broad
Market Index Fund | | | | | |
| | | | |
Coupon
Rate | | Maturity
Date | | | | | Face | | | Value | |
| | | | | | | | | | | | | | |
| U.S. TREASURY OBLIGATIONS—(Continued) | |
0.012% | | | 05/24/2012 | | | ‡‡ | | $ | 120,000 | | | $ | 119,984 | |
0.009% | | | 02/09/2012 | | | ‡‡ | | | 40,000 | | | | 39,999 | |
| | | | | | | | | | | | | | |
| TOTAL U.S. TREASURY OBLIGATIONS | |
(Cost $979,964) | | | | | | | | | | 979,956 | |
| | | | | | | | | | | | | | |
| | | | | | | | | | | | | | | |
| | | |
| | | | | | Shares | | | Value | |
| RIGHTS—0.0% | | | | | | | | | | | |
| Biotechnology—0.0% | |
Ligand Pharmaceuticals, Inc., Expires 12/31/2011 | | | *‡d | | | 572 | | | | — | |
| | | | | | | | | | | | | | |
| Machinery—0.0% | |
Gerber Scientific, Inc. CVR | | | *†‡d | | | 1,608 | | | | — | |
| | | | | | | | | | | | | | |
| Pharmaceuticals—0.0% | |
Forest Laboratories, Inc. | | | *‡d | | | 1,998 | | | | — | |
| | | | | | | | | | | | | | |
| Textiles, Apparel & Luxury Goods—0.0% | |
Mossimo, Inc. | | | *‡d | | | 2,806 | | | | — | |
| | | | | | | | | | | | | | |
| TOTAL RIGHTS | |
(Cost $—) | | | | | | | | | | — | |
| | | | | | | | | | | | | | |
| | | | | | | | | | | | | | | |
| WARRANTS—0.0% | | | | | | | | | | | |
| Diversified Financial Services—0.0% | |
Pegasus Wireless Corp., Strike $1.00 | | | | | | | | | | | |
(Cost $—) | | | *‡d | | | 540 | | | | — | |
| | | | | | | | | | | | | | |
| | | | | | | | | | | | | | | |
| MONEY MARKET FUNDS—5.2% | |
| Institutional Money Market Funds—5.2% | |
Dreyfus Institutional Cash Advantage Fund, 0.06% | | | ††¥ | | | 2,300,000 | | | | 2,300,000 | |
Fidelity Institutional Money Market: Money Market Portfolio—Institutional Class, 0.23% | | | ¥ | | | 12,409,545 | | | | 12,409,545 | |
Fidelity Institutional Money Market: Money Market Portfolio—Institutional Class, 0.23% | | | ††¥ | | | 2,348,786 | | | | 2,348,786 | |
Fidelity Institutional Money Market: Prime Money Market Portfolio—Institutional Class, 0.17% | | | ††¥ | | | 2,300,000 | | | | 2,300,000 | |
| | | | | | | | | | | | |
| | | | | |
| | | | | | | | Shares | | | | Value | |
| | | | | | | | | | | | |
Short-Term Investments Trust Liquid Assets Portfolio, 0.16% | | ††¥ | | | 2,300,000 | | | $ | 2,300,000 | |
Wells Fargo Advantage Cash Investment Money Market Fund—Select Class, 0.11% | | ††¥ | | | 2,300,000 | | | | 2,300,000 | |
Wells Fargo Advantage Heritage Money Market Fund—Select Class, 0.08% | | ††¥ | | | 2,300,000 | | | | 2,300,000 | |
| | | | | | | | | | | | |
| TOTAL MONEY MARKET FUNDS | |
(Cost $26,258,331) | | | | | | | | | 26,258,331 | |
| | | | | | | | | | | | |
| TOTAL INVESTMENTS—102.6% | |
(Cost $385,546,941) | | | | | | | 516,821,220 | |
Other assets less liabilities—(2.6%) | | | | (13,115,765 | ) |
| | | | | | | | | | | | |
| NET ASSETS—100.0% | | | $ | 503,705,455 | |
| | | | | | | | | | | | |
Notes to the Schedule of Investments:
| | |
| CVR | | Contingent Value Rights |
| REIT | | Real Estate Investment Trust |
| * | | Non-income producing. |
| † | | Denotes all or a portion of the security on loan. |
| d | | Security has no market value at December 31, 2011. |
| ‡ | | Security valued at fair value as determined by policies approved by the Board of Directors. |
| ‡‡ | | Security or a portion of the security has been pledged as collateral for futures contracts and/or options contracts. |
| †† | | Represents reinvestment of collateral received in conjunction with securities lending. |
| ¥ | | The rate quoted is the annualized seven-day yield of the fund at period end. |
See accompanying notes to financial statements.
288
SCHEDULE OF INVESTMENTS
December 31, 2011
| | | | | | | | | | | | |
| Vantagepoint Mid/Small Company Index Fund | | | Shares | | | | Value | |
| | | | | | | | | | | | |
| COMMON STOCKS—99.2% | |
| Aerospace & Defense—1.3% | |
AAR Corp. | | | | | 6,897 | | | $ | 132,215 | |
Aerovironment, Inc. | | * | | | 8,991 | | | | 282,947 | |
Alliant Techsystems, Inc. | | | | | 4,487 | | | | 256,477 | |
American Science & Engineering, Inc. | | | | | 1,020 | | | | 69,472 | |
Astronics Corp. | | *† | | | 788 | | | | 28,218 | |
BE Aerospace, Inc. | | * | | | 16,293 | | | | 630,702 | |
Ceradyne, Inc. | | * | | | 2,334 | | | | 62,505 | |
Cubic Corp. | | | | | 1,262 | | | | 55,011 | |
Curtiss-Wright Corp. | | | | | 9,576 | | | | 338,320 | |
DigitalGlobe, Inc. | | * | | | 6,919 | | | | 118,384 | |
Ducommun, Inc. | | | | | 6,327 | | | | 80,669 | |
Esterline Technologies Corp. | | * | | | 2,519 | | | | 140,988 | |
Exelis, Inc. | | | | | 29,631 | | | | 268,161 | |
GenCorp, Inc. | | *† | | | 31,676 | | | | 168,516 | |
GeoEye, Inc. | | * | | | 5,933 | | | | 131,831 | |
HEICO Corp., Class A | | | | | 3,870 | | | | 152,284 | |
Hexcel Corp. | | * | | | 10,517 | | | | 254,617 | |
Huntington Ingalls Industries, Inc. | | * | | | 5,264 | | | | 164,658 | |
Innovative Solutions & Support, Inc. | | * | | | 3,094 | | | | 10,643 | |
Kratos Defense & Security Solutions, Inc. | | *† | | | 2,827 | | | | 16,877 | |
Moog, Inc., Class A | | * | | | 4,645 | | | | 204,055 | |
National Presto Industries, Inc. | | † | | | 656 | | | | 61,402 | |
Orbital Sciences Corp. | | * | | | 15,337 | | | | 222,847 | |
Spirit Aerosystems Holdings, Inc., Class A | | * | | | 6,992 | | | | 145,294 | |
Taser International, Inc. | | *† | | | 15,133 | | | | 77,481 | |
Teledyne Technologies, Inc. | | * | | | 3,528 | | | | 193,511 | |
TransDigm Group, Inc. | | * | | | 10,171 | | | | 973,161 | |
Triumph Group, Inc. | | | | | 4,160 | | | | 243,152 | |
| | | | | | | | | | | | |
| | | | | | | | | 5,484,398 | |
| | | | | | | | | | | | |
| Air Freight & Logistics—0.2% | |
Air T, Inc. | | | | | 1,301 | | | | 11,046 | |
Air Transport Services Group, Inc. | | * | | | 25,035 | | | | 118,165 | |
Atlas Air Worldwide Holdings, Inc. | | * | | | 4,051 | | | | 155,680 | |
Forward Air Corp. | | | | | 2,629 | | | | 84,259 | |
HUB Group, Inc., Class A | | * | | | 5,189 | | | | 168,279 | |
Pacer International, Inc. | | * | | | 3,711 | | | | 19,854 | |
UTi Worldwide, Inc. (Virgin Islands, British) | | | | | 8,709 | | | | 115,743 | |
| | | | | | | | | | | | |
| | | | | | | | | 673,026 | |
| | | | | | | | | | | | |
| Airlines—0.7% | |
Alaska Air Group, Inc. | | * | | | 3,394 | | | | 254,856 | |
Allegiant Travel Co. | | * | | | 2,296 | | | | 122,469 | |
Delta Air Lines, Inc. | | * | | | 127,516 | | | | 1,031,604 | |
JetBlue Airways Corp. | | *† | | | 58,802 | | | | 305,770 | |
Pinnacle Airlines Corp. | | * | | | 7,190 | | | | 5,896 | |
Republic Airways Holdings, Inc. | | * | | | 27,551 | | | | 94,500 | |
SkyWest, Inc. | | | | | 6,829 | | | | 85,977 | |
United Continental Holdings, Inc. | | * | | | 50,408 | | | | 951,199 | |
US Airways Group, Inc. | | * | | | 21,375 | | | | 108,371 | |
| | | | | | | | | | | | |
| | | | | | | | | 2,960,642 | |
| | | | | | | | | | | | |
| | | | | | | | | | | | |
| | | |
| | | | Shares | | | | Value | |
| | | | | | | | | | | | |
| Auto Components—1.1% | |
American Axle & Manufacturing Holdings, Inc. | | * | | | 10,679 | | | $ | 105,615 | |
Amerigon, Inc. | | * | | | 3,475 | | | | 49,554 | |
Autoliv, Inc. (Sweden) | | | | | 12,657 | | | | 677,023 | |
Cooper Tire & Rubber Co. | | | | | 5,679 | | | | 79,563 | |
Dana Holding Corp. | | * | | | 32,442 | | | | 394,170 | |
Drew Industries, Inc. | | * | | | 1,570 | | | | 38,512 | |
Exide Technologies | | * | | | 11,062 | | | | 29,093 | |
Federal-Mogul Corp. | | * | | | 14,982 | | | | 220,985 | |
Fuel Systems Solutions, Inc. | | * | | | 2,117 | | | | 34,909 | |
Gentex Corp. | | | | | 28,535 | | | | 844,351 | |
Lear Corp. | | | | | 14,105 | | | | 561,379 | |
Modine Manufacturing Co. | | *† | | | 5,469 | | | | 51,737 | |
Quantum Fuel Systems Technologies Worldwide, Inc. | | * | | | 552 | | | | 403 | |
Shiloh Industries, Inc. | | * | | | 5,043 | | | | 42,260 | |
Spartan Motors, Inc. | | † | | | 6,140 | | | | 29,533 | |
Standard Motor Products, Inc. | | | | | 2,540 | | | | 50,927 | |
Strattec Security Corp. | | | | | 502 | | | | 10,015 | |
Superior Industries International, Inc. | | | | | 2,013 | | | | 33,295 | |
Tenneco, Inc. | | * | | | 8,885 | | | | 264,595 | |
TRW Automotive Holdings Corp. | | * | | | 16,963 | | | | 552,994 | |
Visteon Corp. | | * | | | 5,463 | | | | 272,822 | |
| | | | | | | | | | | | |
| | | | | | | | | 4,343,735 | |
| | | | | | | | | | | | |
| Automobiles—0.8% | |
General Motors Co. | | * | | | 135,633 | | | | 2,749,281 | |
Tesla Motors, Inc. | | *† | | | 6,833 | | | | 195,150 | |
Thor Industries, Inc. | | | | | 7,449 | | | | 204,326 | |
Winnebago Industries, Inc. | | *† | | | 15,478 | | | | 114,228 | |
| | | | | | | | | | | | |
| | | | | | | | | 3,262,985 | |
| | | | | | | | | | | | |
| Beverages—0.4% | |
Boston Beer Co., Inc. (The), Class A | | *† | | | 1,904 | | | | 206,698 | |
Central European Distribution Corp. (Poland) | | *† | | | 15,916 | | | | 69,633 | |
Coca-Cola Bottling Co. Consolidated | | † | | | 437 | | | | 25,586 | |
Hansen Natural Corp. | | * | | | 13,013 | | | | 1,199,018 | |
Heckmann Corp. | | * | | | 9,838 | | | | 65,423 | |
Jones Soda Co. | | *† | | | 36,928 | | | | 13,663 | |
National Beverage Corp. | | * | | | 766 | | | | 12,310 | |
| | | | | | | | | | | | |
| | | | | | | | | 1,592,331 | |
| | | | | | | | | | | | |
| Biotechnology—3.2% | |
Aastrom Biosciences, Inc. | | *† | | | 9,842 | | | | 17,912 | |
Acorda Therapeutics, Inc. | | * | | | 5,183 | | | | 123,563 | |
Agenus, Inc. | | * | | | 1,535 | | | | 3,070 | |
Alexion Pharmaceuticals, Inc. | | * | | | 29,178 | | | | 2,086,227 | |
Alkermes plc (Ireland) | | * | | | 12,144 | | | | 210,820 | |
Allos Therapeutics, Inc. | | * | | | 18,248 | | | | 25,912 | |
Alnylam Pharmaceuticals, Inc. | | * | | | 5,353 | | | | 43,627 | |
AMAG Pharmaceuticals, Inc. | | * | | | 3,480 | | | | 65,807 | |
Amylin Pharmaceuticals, Inc. | | * | | | 25,467 | | | | 289,814 | |
ARCA Biopharma, Inc. | | * | | | 436 | | | | 432 | |
Arena Pharmaceuticals, Inc. | | *† | | | 8,294 | | | | 15,510 | |
Ariad Pharmaceuticals, Inc. | | * | | | 34,626 | | | | 424,169 | |
Arqule, Inc. | | * | | | 4,724 | | | | 26,643 | |
See accompanying notes to financial statements.
289
SCHEDULE OF INVESTMENTS—(Continued)
December 31, 2011
| | | | | | | | | | | | |
| Vantagepoint Mid/Small Company Index Fund | | | Shares | | | | Value | |
| | | | | | | | | | | | |
| COMMON STOCKS—(Continued) | |
Array Biopharma, Inc. | | * | | | 4,170 | | | $ | 9,007 | |
Astex Pharmaceuticals | | * | | | 3,719 | | | | 7,029 | |
AVEO Pharmaceuticals, Inc. | | * | | | 1,209 | | | | 20,795 | |
AVI BioPharma, Inc. | | *† | | | 51,906 | | | | 38,670 | |
Avigen, Inc. (Escrow Shares) | | *‡d | | | 3,880 | | | | — | |
BioCryst Pharmaceuticals, Inc. | | *† | | | 21,994 | | | | 54,325 | |
BioMarin Pharmaceutical, Inc. | | * | | | 18,240 | | | | 627,091 | |
BioMimetic Therapeutics, Inc. | | * | | | 7,095 | | | | 20,221 | |
Biosante Pharmaceuticals, Inc. | | *† | | | 1,867 | | | | 937 | |
Cell Therapeutics, Inc. | | *† | | | 103,528 | | | | 120,092 | |
Celldex Therapeutics, Inc. | | * | | | 10,060 | | | | 26,156 | |
Cepheid, Inc. | | * | | | 8,077 | | | | 277,930 | |
Codexis, Inc. | | * | | | 559 | | | | 2,963 | |
Cubist Pharmaceuticals, Inc. | | *† | | | 7,593 | | | | 300,835 | |
Cytokinetics, Inc. | | * | | | 69,212 | | | | 66,444 | |
CytRx Corp. | | * | | | 60,806 | | | | 16,485 | |
Dendreon Corp. | | *† | | | 24,041 | | | | 182,712 | |
Discovery Laboratories, Inc. | | *† | | | 686 | | | | 1,159 | |
Dyax Corp. | | * | | | 9,610 | | | | 13,070 | |
Emergent Biosolutions, Inc. | | * | | | 4,839 | | | | 81,489 | |
Entremed, Inc. | | * | | | 126 | | | | 123 | |
Enzon Pharmaceuticals, Inc. | | *† | | | 5,036 | | | | 33,741 | |
Exact Sciences Corp. | | * | | | 7,997 | | | | 64,936 | |
Exelixis, Inc. | | *† | | | 35,337 | | | | 167,321 | |
Galena Biopharma, Inc. | | *† | | | 6,212 | | | | 2,913 | |
Genomic Health, Inc. | | * | | | 6,866 | | | | 174,328 | |
Geron Corp. | | *† | | | 36,667 | | | | 54,267 | |
GTx, Inc. | | * | | | 4,210 | | | | 14,146 | |
Halozyme Therapeutics, Inc. | | * | | | 18,837 | | | | 179,140 | |
Hemispherx Biopharma, Inc. | | *† | | | 54,952 | | | | 10,721 | |
Human Genome Sciences, Inc. | | *† | | | 34,289 | | | | 253,396 | |
Idenix Pharmaceuticals, Inc. | | * | | | 3,110 | | | | 23,154 | |
Idera Pharmaceuticals, Inc. | | * | | | 1,932 | | | | 2,048 | |
Immunogen, Inc. | | *† | | | 9,339 | | | | 108,146 | |
Immunomedics, Inc. | | *† | | | 9,692 | | | | 32,274 | |
Incyte Corp. Ltd. | | *† | | | 29,421 | | | | 441,609 | |
InterMune, Inc. | | * | | | 7,345 | | | | 92,547 | |
Isis Pharmaceuticals, Inc. | | *† | | | 15,742 | | | | 113,500 | |
Keryx Biopharmaceuticals, Inc. | | *† | | | 33,078 | | | | 83,687 | |
Lexicon Pharmaceuticals, Inc. | | *† | | | 20,111 | | | | 25,943 | |
Ligand Pharmaceuticals, Inc., Class B | | * | | | 1,582 | | | | 18,778 | |
MannKind Corp. | | *† | | | 14,906 | | | | 37,265 | |
Marina Biotech, Inc. | | * | | | 84 | | | | 74 | |
Maxygen, Inc. | | *† | | | 2,991 | | | | 16,839 | |
MediciNova, Inc. | | * | | | 349 | | | | 600 | |
Medivation, Inc. | | * | | | 6,781 | | | | 312,672 | |
Metabolix, Inc. | | *† | | | 3,165 | | | | 14,401 | |
Momenta Pharmaceuticals, Inc. | | * | | | 5,148 | | | | 89,524 | |
Myrexis, Inc. | | * | | | 10,114 | | | | 27,106 | |
Myriad Genetics, Inc. | | * | | | 17,432 | | | | 365,026 | |
Nabi Biopharmaceuticals | | * | | | 6,806 | | | | 12,795 | |
Neurocrine Biosciences, Inc. | | *† | | | 8,240 | | | | 70,040 | |
Novavax, Inc. | | *† | | | 21,148 | | | | 26,646 | |
NPS Pharmaceuticals, Inc. | | * | | | 9,432 | | | | 62,157 | |
Onyx Pharmaceuticals, Inc. | | * | | | 13,102 | | | | 575,833 | |
Osiris Therapeutics, Inc. | | *† | | | 2,984 | | | | 15,964 | |
PDL BioPharma, Inc. | | | | | 38,667 | | | | 239,735 | |
Peregrine Pharmaceuticals, Inc. | | *† | | | 14,427 | | | | 14,860 | |
Pharmasset, Inc. | | * | | | 9,439 | | | | 1,210,080 | |
Poniard Pharmaceuticals, Inc. | | * | | | 92 | | | | 197 | |
| | | | | | | | | | | | |
| | | |
| | | | Shares | | | | Value | |
| | | | | | | | | | | | |
Progenics Pharmaceuticals, Inc. | | *† | | | 2,623 | | | $ | 22,400 | |
Regeneron Pharmaceuticals, Inc. | | * | | | 11,886 | | | | 658,841 | |
Repligen Corp. | | * | | | 3,422 | | | | 11,874 | |
Rigel Pharmaceuticals, Inc. | | * | | | 12,762 | | | | 100,692 | |
Sangamo Biosciences, Inc. | | * | | | 10,702 | | | | 30,394 | |
Savient Pharmaceuticals, Inc. | | *† | | | 32,380 | | | | 72,207 | |
Sciclone Pharmaceuticals, Inc. | | *† | | | 4,800 | | | | 20,592 | |
Seattle Genetics, Inc. | | *† | | | 20,977 | | | | 350,631 | |
SIGA Technologies, Inc. | | *† | | | 4,650 | | | | 11,718 | |
Spectrum Pharmaceuticals, Inc. | | * | | | 2,732 | | | | 39,969 | |
StemCells, Inc. | | *† | | | 12,574 | | | | 10,361 | |
Synageva BioPharma Corp. | | * | | | 802 | | | | 21,357 | |
Telik, Inc. | | * | | | 6,069 | | | | 1,032 | |
Theravance, Inc. | | *† | | | 5,928 | | | | 131,009 | |
United Therapeutics Corp. | | * | | | 10,148 | | | | 479,493 | |
Vanda Pharmaceuticals, Inc. | | * | | | 4,137 | | | | 19,692 | |
Vertex Pharmaceuticals, Inc. | | * | | | 32,222 | | | | 1,070,093 | |
XOMA Ltd. | | *† | | | 803 | | | | 923 | |
| | | | | | | | | | | | |
| | | | | | | | | 13,242,726 | |
| | | | | | | | | | | | |
| Building Products—0.6% | |
A.O. Smith Corp. | | | | | 7,252 | | | | 290,950 | |
American Woodmark Corp. | | | | | 800 | | | | 10,928 | |
Apogee Enterprises, Inc. | | | | | 5,631 | | | | 69,036 | |
Armstrong World Industries, Inc. | | * | | | 5,873 | | | | 257,649 | |
Fortune Brands Home & Security, Inc. | | * | | | 26,296 | | | | 447,821 | |
Gibraltar Industries, Inc. | | * | | | 1,868 | | | | 26,077 | |
Griffon Corp. | | | | | 6,441 | | | | 58,806 | |
Insteel Industries, Inc. | | | | | 2,829 | | | | 31,091 | |
Lennox International, Inc. | | | | | 9,822 | | | | 331,492 | |
NCI Building Systems, Inc. | | * | | | 8,291 | | | | 90,123 | |
Owens Corning, Inc. | | * | | | 13,707 | | | | 393,665 | |
Quanex Building Products Corp. | | | | | 8,639 | | | | 129,758 | |
Simpson Manufacturing Co., Inc. | | | | | 8,898 | | | | 299,507 | |
Trex Co., Inc. | | *† | | | 2,108 | | | | 48,294 | |
U.S. Home Systems, Inc. | | | | | 1,624 | | | | 10,800 | |
Universal Forest Products, Inc. | | † | | | 1,649 | | | | 50,905 | |
USG Corp. | | *† | | | 8,613 | | | | 87,508 | |
| | | | | | | | | | | | |
| | | | | | | | | 2,634,410 | |
| | | | | | | | | | | | |
| Capital Markets—1.8% | |
Affiliated Managers Group, Inc. | | * | | | 8,257 | | | | 792,259 | |
American Capital Ltd. | | * | | | 62,297 | | | | 419,259 | |
Apollo Investment Corp. | | | | | 37,127 | | | | 239,098 | |
Arlington Asset Investment Corp., Class A | | | | | 3,155 | | | | 67,296 | |
Artio Global Investors, Inc. | | † | | | 13,209 | | | | 64,460 | |
BGC Partners, Inc., Class A | | | | | 13,921 | | | | 82,691 | |
Calamos Asset Management, Inc., Class A | | | | | 1,520 | | | | 19,015 | |
CIFC Corp. | | * | | | 522 | | | | 2,819 | |
Cowen Group, Inc., Class A | | * | | | 21,336 | | | | 55,260 | |
Diamond Hill Investment Group, Inc. | | | | | 649 | | | | 48,013 | |
Eaton Vance Corp. | | | | | 18,870 | | | | 446,087 | |
Edelman Financial Group, Inc. | | † | | | 2,882 | | | | 18,935 | |
Evercore Partners, Inc., Class A | | | | | 6,219 | | | | 165,550 | |
GAMCO Investors, Inc., Class A | | | | | 639 | | | | 27,790 | |
GFI Group, Inc. | | | | | 33,019 | | | | 136,038 | |
See accompanying notes to financial statements.
290
SCHEDULE OF INVESTMENTS—(Continued)
December 31, 2011
| | | | | | | | | | | | |
| Vantagepoint Mid/Small Company Index Fund | | | Shares | | | | Value | |
| | | | | | | | | | | | |
| COMMON STOCKS—(Continued) | |
Greenhill & Co., Inc. | | † | | | 5,368 | | | $ | 195,234 | |
ICG Group, Inc. | | * | | | 7,645 | | | | 59,019 | |
Institutional Financial Markets, Inc. | | † | | | 4,976 | | | | 7,016 | |
INTL FCStone, Inc. | | *† | | | 1,308 | | | | 30,829 | |
Investment Technology Group, Inc. | | *† | | | 14,744 | | | | 159,383 | |
Janus Capital Group, Inc. | | | | | 25,815 | | | | 162,893 | |
Jefferies Group, Inc. | | † | | | 29,047 | | | | 399,396 | |
KBW, Inc. | | | | | 12,959 | | | | 196,718 | |
Knight Capital Group, Inc., Class A | | *† | | | 25,616 | | | | 302,781 | |
Medallion Financial Corp. | | | | | 2,518 | | | | 28,655 | |
Penson Worldwide, Inc. | | *† | | | 21,060 | | | | 24,430 | |
Piper Jaffray Cos. | | * | | | 2,312 | | | | 46,702 | |
Raymond James Financial, Inc. | | | | | 18,586 | | | | 575,422 | |
Safeguard Scientifics, Inc. | | * | | | 3,658 | | | | 57,760 | |
SEI Investments Co. | | | | | 31,842 | | | | 552,459 | |
Stifel Financial Corp. | | * | | | 12,564 | | | | 402,676 | |
SWS Group, Inc. | | | | | 14,960 | | | | 102,775 | |
TD Ameritrade Holding Corp. | | | | | 50,759 | | | | 794,378 | |
U.S. Global Investors, Inc., Class A | | | | | 6,927 | | | | 41,770 | |
Virtus Investment Partners, Inc. | | * | | | 1,094 | | | | 83,155 | |
Waddell & Reed Financial, Inc., Class A | | | | | 12,604 | | | | 312,201 | |
Walter Investment Management Corp. | | | | | 5,513 | | | | 113,072 | |
Westwood Holdings Group, Inc. | | | | | 1,427 | | | | 52,157 | |
| | | | | | | | | | | | |
| | | | | | | | | | | 7,285,451 | |
| | | | | | | | | | | | |
| Chemicals—2.5% | |
A. Schulman, Inc. | | | | | 5,791 | | | | 122,653 | |
Albemarle Corp. | | | | | 14,830 | | | | 763,893 | |
Ampal-American Israel Corp., Class A | | * | | | 15,776 | | | | 4,734 | |
Ashland, Inc. | | | | | 9,037 | | | | 516,555 | |
Balchem Corp. | | | | | 4,960 | | | | 201,078 | |
Cabot Corp. | | | | | 11,590 | | | | 372,503 | |
Calgon Carbon Corp. | | *† | | | 19,947 | | | | 313,367 | |
Celanese Corp., Class A | | | | | 18,058 | | | | 799,428 | |
Chemtura Corp. | | * | | | 15,439 | | | | 175,078 | |
Cytec Industries, Inc. | | | | | 5,746 | | | | 256,559 | |
Ferro Corp. | | * | | | 20,271 | | | | 99,125 | |
Flotek Industries, Inc. | | *† | | | 11,454 | | | | 114,082 | |
Georgia Gulf Corp. | | * | | | 3,528 | | | | 68,761 | |
H.B. Fuller Co. | | | | | 12,649 | | | | 292,318 | |
Huntsman Corp. | | | | | 27,831 | | | | 278,310 | |
Intrepid Potash, Inc. | | * | | | 4,761 | | | | 107,742 | |
Koppers Holdings, Inc. | | | | | 3,348 | | | | 115,037 | |
Kronos Worldwide, Inc. | | | | | 3,735 | | | | 67,379 | |
Landec Corp. | | *† | | | 8,822 | | | | 48,698 | |
LSB Industries, Inc. | | * | | | 5,477 | | | | 153,520 | |
Material Sciences Corp. | | * | | | 2,565 | | | | 20,930 | |
Minerals Technologies, Inc. | | | | | 1,872 | | | | 105,824 | |
NewMarket Corp. | | | | | 1,651 | | | | 327,080 | |
Olin Corp. | | | | | 8,990 | | | | 176,654 | |
OM Group, Inc. | | * | | | 7,720 | | | | 172,851 | |
Omnova Solutions, Inc. | | * | | | 3,769 | | | | 17,375 | |
Penford Corp. | | * | | | 2,075 | | | | 10,562 | |
PolyOne Corp. | | | | | 16,034 | | | | 185,193 | |
| | | | | | | | | | | | |
| | | |
| | | | Shares | | | | Value | |
| | | | | | | | | | | | |
Quaker Chemical Corp. | | † | | | 1,303 | | | $ | 50,674 | |
Rockwood Holdings, Inc. | | * | | | 11,141 | | | | 438,621 | |
RPM International, Inc. | | | | | 25,982 | | | | 637,858 | |
Scotts Miracle-Gro Co. (The), Class A | | † | | | 7,848 | | | | 366,423 | |
Sensient Technologies Corp. | | | | | 11,108 | | | | 420,993 | |
Solutia, Inc. | | * | | | 16,061 | | | | 277,534 | |
Spartech Corp. | | * | | | 2,131 | | | | 10,080 | |
Stepan Co. | | | | | 1,197 | | | | 95,952 | |
Tredegar Corp. | | | | | 2,467 | | | | 54,817 | |
Valhi, Inc. | | | | | 3,920 | | | | 237,042 | |
Valspar Corp. | | | | | 20,186 | | | | 786,648 | |
W.R. Grace & Co. | | * | | | 13,453 | | | | 617,762 | |
Westlake Chemical Corp. | | | | | 4,325 | | | | 174,038 | |
Zep, Inc. | | | | | 2,287 | | | | 31,972 | |
Zoltek Cos., Inc. | | *† | | | 17,218 | | | | 131,201 | |
| | | | | | | | | | | | |
| | | | | | | | | | | 10,218,904 | |
| | | | | | | | | | | | |
| Commercial Banks—4.3% | |
1st Source Corp. | | | | | 850 | | | | 21,530 | |
Ameris Bancorp | | * | | | 3,095 | | | | 31,817 | |
Arrow Financial Corp. | | † | | | 2,391 | | | | 56,045 | |
Associated Banc-Corp | | | | | 36,019 | | | | 402,332 | |
BancFirst Corp. | | | | | 1,092 | | | | 40,994 | |
Bancorp, Inc. (The)/Delaware | | *† | | | 4,479 | | | | 32,383 | |
BancorpSouth, Inc. | | | | | 19,643 | | | | 216,466 | |
BancTrust Financial Group, Inc. | | * | | | 4,800 | | | | 5,952 | |
Bank of Hawaii Corp. | | | | | 11,079 | | | | 492,905 | |
Bank of the Ozarks, Inc. | | † | | | 10,632 | | | | 315,026 | |
Banner Corp. | | | | | 383 | | | | 6,568 | |
BBCN Bancorp, Inc./California | | * | | | 33,598 | | | | 317,501 | |
BOK Financial Corp. | | | | | 2,311 | | | | 126,943 | |
Boston Private Financial Holdings, Inc. | | | | | 12,410 | | | | 98,535 | |
Bryn Mawr Bank Corp. | | | | | 4,411 | | | | 85,970 | |
Camden National Corp. | | † | | | 1,411 | | | | 45,999 | |
Capital Bank Corp. | | *† | | | 1,781 | | | | 3,580 | |
Capital City Bank Group, Inc. | | | | | 1,576 | | | | 15,051 | |
CapitalSource, Inc. | | | | | 69,445 | | | | 465,282 | |
Cardinal Financial Corp. | | | | | 5,028 | | | | 54,001 | |
Cascade Bancorp | | *† | | | 479 | | | | 2,098 | |
Cathay General Bancorp | | | | | 18,966 | | | | 283,162 | |
Catskill Litigation Trust | | *‡d | | | 583 | | | | — | |
Central Pacific Financial Corp. | | * | | | 336 | | | | 4,341 | |
Chemical Financial Corp. | | | | | 2,317 | | | | 49,398 | |
CIT Group, Inc. | | * | | | 24,906 | | | | 868,472 | |
Citizens Republic Bancorp, Inc. | | * | | | 16,394 | | | | 186,892 | |
City Holding Co. | | † | | | 1,962 | | | | 66,492 | |
City National Corp./California | | | | | 6,918 | | | | 305,637 | |
CoBiz Financial, Inc. | | | | | 3,329 | | | | 19,208 | |
Columbia Banking System, Inc. | | | | | 9,767 | | | | 188,210 | |
Commerce Bancshares, Inc./Missouri | | | | | 12,773 | | | | 486,907 | |
Community Bank System, Inc. | | | | | 8,019 | | | | 222,928 | |
Community Trust Bancorp, Inc. | | † | | | 1,658 | | | | 48,778 | |
Cullen/Frost Bankers, Inc. | | | | | 11,710 | | | | 619,576 | |
CVB Financial Corp. | | | | | 13,723 | | | | 137,642 | |
East West Bancorp, Inc. | | | | | 31,285 | | | | 617,879 | |
See accompanying notes to financial statements.
291
SCHEDULE OF INVESTMENTS—(Continued)
December 31, 2011
| | | | | | | | | | | | |
| Vantagepoint Mid/Small Company Index Fund | | | Shares | | | | Value | |
| | | | | | | | | | | | |
| COMMON STOCKS—(Continued) | |
Eastern Virginia Bankshares, Inc. | | * | | | 701 | | | $ | 1,416 | |
Fidelity Southern Corp. | | | | | 6,861 | | | | 41,715 | |
Financial Institutions, Inc. | | | | | 2,448 | | | | 39,511 | |
First BanCorp. (Puerto Rico) | | *† | | | 1,114 | | | | 3,888 | |
First Bancorp/North Carolina | | | | | 2,459 | | | | 27,418 | |
First Busey Corp. | | | | | 2,491 | | | | 12,455 | |
First Citizens BancShares, Inc./North Carolina, Class A | | | | | 634 | | | | 110,944 | |
First Commonwealth Financial Corp. | | | | | 23,677 | | | | 124,541 | |
First Financial Bancorp | | | | | 6,617 | | | | 110,107 | |
First Financial Bankshares, Inc. | | † | | | 2,590 | | | | 86,584 | |
First Merchants Corp. | | | | | 2,436 | | | | 20,633 | |
First Midwest Bancorp, Inc./Illinois | | | | | 9,549 | | | | 96,731 | |
First Niagara Financial Group, Inc. | | | | | 70,463 | | | | 608,096 | |
First of Long Island Corp. (The) | | | | | 1,432 | | | | 37,690 | |
FirstMerit Corp. | | | | | 18,310 | | | | 277,030 | |
FNB Corp./Pennsylvania | | † | | | 25,897 | | | | 292,895 | |
Fulton Financial Corp. | | | | | 38,381 | | | | 376,518 | |
Glacier Bancorp, Inc. | | † | | | 21,753 | | | | 261,689 | |
Great Southern Bancorp, Inc. | | † | | | 1,809 | | | | 42,674 | |
Green Bankshares, Inc. | | * | | | 2,129 | | | | 2,683 | |
Guaranty Bancorp | | * | | | 20,379 | | | | 29,957 | |
Hancock Holding Co. | | | | | 13,641 | | | | 436,103 | |
Hanmi Financial Corp. | | * | | | 8,189 | | | | 60,599 | |
Heritage Commerce Corp. | | * | | | 5,846 | | | | 27,710 | |
Heritage Financial Corp./Washington | | | | | 972 | | | | 12,208 | |
IBERIABANK Corp. | | | | | 6,270 | | | | 309,111 | |
Independent Bank Corp./Massachusetts | | † | | | 3,125 | | | | 85,281 | |
Independent Bank Corp./Michigan | | *† | | | 389 | | | | 537 | |
International Bancshares Corp. | | | | | 6,833 | | | | 125,283 | |
Investors Bancorp, Inc. | | * | | | 16,332 | | | | 220,155 | |
Lakeland Financial Corp. | | † | | | 4,180 | | | | 108,137 | |
Macatawa Bank Corp. | | * | | | 1,599 | | | | 3,646 | |
MainSource Financial Group, Inc. | | | | | 3,185 | | | | 28,124 | |
MB Financial, Inc. | | | | | 3,847 | | | | 65,784 | |
Merchants Bancshares, Inc. | | | | | 1,298 | | | | 37,902 | |
MidSouth Bancorp, Inc. | | | | | 3,651 | | | | 47,500 | |
MidWestOne Financial Group, Inc. | | | | | 4,566 | | | | 66,755 | |
National Penn Bancshares, Inc. | | | | | 8,522 | | | | 71,926 | |
NBT Bancorp, Inc. | | | | | 4,152 | | | | 91,884 | |
Old National Bancorp/Indiana | | | | | 30,830 | | | | 359,169 | |
Old Second Bancorp, Inc. | | *† | | | 1,975 | | | | 2,627 | |
Oriental Financial Group, Inc. (Puerto Rico) | | | | | 19,202 | | | | 232,536 | |
Pacific Capital Bancorp NA | | * | | | 906 | | | | 25,585 | |
Pacific Premier Bancorp, Inc. | | * | | | 977 | | | | 6,194 | |
PacWest Bancorp | | | | | 2,392 | | | | 45,328 | |
Park National Corp. | | † | | | 1,146 | | | | 74,559 | |
Peapack Gladstone Financial Corp. | | | | | 1,086 | | | | 11,664 | |
Peoples Bancorp, Inc./Ohio | | † | | | 1,235 | | | | 18,290 | |
Peoples Financial Corp./Mississippi | | | | | 3,749 | | | | 38,652 | |
| | | | | | | | | | | | |
| | | |
| | | | Shares | | | | Value | |
| | | | | | | | | | | | |
Pinnacle Financial Partners, Inc. | | * | | | 2,764 | | | $ | 44,639 | |
Popular, Inc. (Puerto Rico) | | * | | | 174,906 | | | | 243,119 | |
Preferred Bank/Los Angeles CA | | * | | | 894 | | | | 6,705 | |
PrivateBancorp, Inc. | | | | | 12,737 | | | | 139,852 | |
Prosperity Bancshares, Inc. | | † | | | 9,550 | | | | 385,343 | |
Renasant Corp. | | † | | | 2,924 | | | | 43,860 | |
Republic Bancorp, Inc./Kentucky, Class A | | † | | | 2,055 | | | | 47,059 | |
Royal Bancshares of Pennsylvania, Inc., Class A | | * | | | 11,522 | | | | 15,324 | |
S&T Bancorp, Inc. | | | | | 2,764 | | | | 54,036 | |
Sandy Spring Bancorp, Inc. | | | | | 2,239 | | | | 39,294 | |
Seacoast Banking Corp. of Florida | | * | | | 2,998 | | | | 4,557 | |
Shore Bancshares, Inc. | | | | | 5,419 | | | | 27,908 | |
Sierra Bancorp | | | | | 5,758 | | | | 50,670 | |
Signature Bank/New York | | * | | | 5,410 | | | | 324,546 | |
Simmons First National Corp., Class A | | | | | 2,377 | | | | 64,631 | |
Southwest Bancorp, Inc./Oklahoma | | * | | | 2,739 | | | | 16,324 | |
State Bancorp, Inc./New York | | | | | 3,354 | | | | 40,919 | |
Sterling Bancorp/New York | | † | | | 3,135 | | | | 27,086 | |
Sterling Financial Corp./Washington | | * | | | 59 | | | | 985 | |
Suffolk Bancorp | | * | | | 1,614 | | | | 17,415 | |
Susquehanna Bancshares, Inc. | | | | | 13,514 | | | | 113,247 | |
SVB Financial Group | | * | | | 6,536 | | | | 311,702 | |
SY Bancorp, Inc. | | | | | 2,543 | | | | 52,208 | |
Synovus Financial Corp. | | | | | 85,830 | | | | 121,020 | |
TCF Financial Corp. | | | | | 16,152 | | | | 166,689 | |
Texas Capital Bancshares, Inc. | | * | | | 6,292 | | | | 192,598 | |
Tompkins Financial Corp. | | † | | | 1,087 | | | | 41,860 | |
TowneBank/Virginia | | † | | | 2,280 | | | | 27,907 | |
Trustmark Corp. | | † | | | 7,243 | | | | 175,932 | |
UMB Financial Corp. | | | | | 5,083 | | | | 189,342 | |
Umpqua Holdings Corp. | | | | | 15,160 | | | | 187,832 | |
Union First Market Bankshares Corp. | | | | | 2,131 | | | | 28,321 | |
United Bankshares, Inc. | | † | | | 5,447 | | | | 153,987 | |
United Community Banks, Inc./Georgia | | *† | | | 5,391 | | | | 37,683 | |
Valley National Bancorp | | † | | | 41,646 | | | | 515,161 | |
Virginia Commerce Bancorp, Inc. | | * | | | 10,179 | | | | 78,684 | |
Washington Trust Bancorp, Inc. | | | | | 2,413 | | | | 57,574 | |
Webster Financial Corp. | | | | | 19,943 | | | | 406,638 | |
WesBanco, Inc. | | | | | 2,340 | | | | 45,560 | |
West Coast Bancorp/Oregon | | * | | | 1,663 | | | | 25,943 | |
Westamerica Bancorporation | | | | | 5,748 | | | | 252,337 | |
Western Alliance Bancorp | | * | | | 35,451 | | | | 220,860 | |
Wilshire Bancorp, Inc. | | * | | | 17,149 | | | | 62,251 | |
Wintrust Financial Corp. | | | | | 5,057 | | | | 141,849 | |
| | | | | | | | | | | | |
| | | | | | | | | | | 17,362,381 | |
| | | | | | | | | | | | |
| Commercial Services & Supplies—1.5% | |
ABM Industries, Inc. | | | | | 7,480 | | | | 154,238 | |
ACCO Brands Corp. | | * | | | 10,589 | | | | 102,184 | |
American Reprographics Co. | | * | | | 15,235 | | | | 69,929 | |
Asset Acceptance Capital Corp. | | * | | | 3,797 | | | | 14,846 | |
Asta Funding, Inc. | | | | | 1,791 | | | | 14,292 | |
Brink’s Co. (The) | | | | | 6,600 | | | | 177,408 | |
Casella Waste Systems, Inc., Class A | | *† | | | 5,820 | | | | 37,248 | |
See accompanying notes to financial statements.
292
SCHEDULE OF INVESTMENTS—(Continued)
December 31, 2011
| | | | | | | | | | | | |
| Vantagepoint Mid/Small Company Index Fund | | | Shares | | | | Value | |
| | | | | | | | | | | | |
| COMMON STOCKS—(Continued) | |
Cenveo, Inc. | | * | | | 10,269 | | | $ | 34,915 | |
Clean Harbors, Inc. | | * | | | 5,992 | | | | 381,870 | |
Consolidated Graphics, Inc. | | * | | | 699 | | | | 33,748 | |
Copart, Inc. | | * | | | 9,938 | | | | 475,931 | |
Corrections Corp. of America | | * | | | 24,625 | | | | 501,611 | |
Courier Corp. | | † | | | 1,904 | | | | 22,334 | |
Covanta Holding Corp. | | | | | 32,749 | | | | 448,334 | |
Deluxe Corp. | | | | | 6,902 | | | | 157,089 | |
EnergySolutions, Inc. | | * | | | 17,158 | | | | 53,018 | |
Ennis, Inc. | | | | | 2,217 | | | | 29,553 | |
G&K Services, Inc., Class A | | | | | 1,576 | | | | 45,877 | |
Geo Group, Inc. (The) | | * | | | 18,885 | | | | 316,324 | |
Healthcare Services Group, Inc. | | | | | 6,684 | | | | 118,240 | |
Herman Miller, Inc. | | | | | 5,018 | | | | 92,582 | |
HNI Corp. | | | | | 4,666 | | | | 121,783 | |
Interface, Inc., Class A | | | | | 5,624 | | | | 64,901 | |
Intersections, Inc. | | | | | 1,900 | | | | 21,071 | |
Kimball International, Inc., Class B | | † | | | 4,445 | | | | 22,536 | |
Knoll, Inc. | | | | | 4,910 | | | | 72,913 | |
McGrath Rentcorp | | | | | 2,460 | | | | 71,315 | |
Metalico, Inc. | | *† | | | 1,513 | | | | 4,978 | |
Mine Safety Appliances Co. | | | | | 2,725 | | | | 90,252 | |
Mobile Mini, Inc. | | * | | | 3,320 | | | | 57,934 | |
Multi-Color Corp. | | | | | 1,912 | | | | 49,196 | |
NL Industries, Inc. | | | | | 412 | | | | 5,344 | |
Perma-Fix Environmental Services, Inc. | | * | | | 25,765 | | | | 39,936 | |
Portfolio Recovery Associates, Inc. | | * | | | 1,413 | | | | 95,406 | |
Rollins, Inc. | | † | | | 17,041 | | | | 378,651 | |
Standard Register Co. (The) | | | | | 1,650 | | | | 3,844 | |
Steelcase, Inc., Class A | | | | | 19,006 | | | | 141,785 | |
Sykes Enterprises, Inc. | | * | | | 3,519 | | | | 55,107 | |
Team, Inc. | | * | | | 1,659 | | | | 49,355 | |
Tetra Tech, Inc. | | * | | | 6,841 | | | | 147,697 | |
TRC Cos., Inc. | | * | | | 11,036 | | | | 66,326 | |
Unifirst Corp. | | | | | 605 | | | | 34,328 | |
United Stationers, Inc. | | | | | 4,110 | | | | 133,822 | |
US Ecology, Inc. | | | | | 11,022 | | | | 206,993 | |
Viad Corp. | | † | | | 1,978 | | | | 34,575 | |
Virco Mfg. Corp. | | | | | 1,859 | | | | 2,993 | |
Waste Connections, Inc. | | | | | 22,161 | | | | 734,416 | |
| | | | | | | | | | | | |
| | | | | | | | | | | 5,989,028 | |
| | | | | | | | | | | | |
| Communications Equipment—1.5% | |
Acme Packet, Inc. | | * | | | 10,066 | | | | 311,140 | |
ADTRAN, Inc. | | | | | 11,372 | | | | 342,979 | |
Alliance Fiber Optic Products, Inc. | | * | | | 963 | | | | 7,377 | |
Anaren, Inc. | | * | | | 2,003 | | | | 33,290 | |
Arris Group, Inc. | | * | | | 18,691 | | | | 202,237 | |
Aruba Networks, Inc. | | * | | | 21,257 | | | | 393,680 | |
Aviat Networks, Inc. | | * | | | 4,485 | | | | 8,207 | |
Black Box Corp. | | | | | 1,414 | | | | 39,648 | |
Blonder Tongue Laboratories, Inc. | | * | | | 2,285 | | | | 2,765 | |
Blue Coat Systems, Inc. | | * | | | 9,599 | | | | 244,294 | |
Brocade Communications Systems, Inc. | | * | | | 59,993 | | | | 311,364 | |
CalAmp Corp. | | * | | | 7,372 | | | | 31,331 | |
Ciena Corp. | | *† | | | 20,644 | | | | 249,792 | |
| | | | | | | | | | | | |
| | | |
| | | | Shares | | | | Value | |
| | | | | | | | | | | | |
Comtech Telecommunications Corp. | | | | | 4,419 | | | $ | 126,472 | |
Digi International, Inc. | | *† | | | 2,517 | | | | 28,090 | |
Ditech Networks, Inc. | | * | | | 3,980 | | | | 3,741 | |
EchoStar Corp., Class A | | * | | | 8,362 | | | | 175,100 | |
Emcore Corp. | | *† | | | 6,178 | | | | 5,327 | |
Emulex Corp. | | * | | | 15,840 | | | | 108,662 | |
Extreme Networks, Inc. | | *† | | | 9,940 | | | | 29,025 | |
Finisar Corp. | | *† | | | 16,126 | | | | 270,030 | |
Globecomm Systems, Inc. | | * | | | 5,067 | | | | 69,317 | |
Harmonic, Inc. | | * | | | 19,391 | | | | 97,731 | |
Infinera Corp. | | *† | | | 10,202 | | | | 64,068 | |
InterDigital, Inc. | | † | | | 7,655 | | | | 333,528 | |
Ixia | | * | | | 5,492 | | | | 57,721 | |
KVH Industries, Inc. | | *† | | | 3,755 | | | | 29,214 | |
Loral Space & Communications, Inc. | | * | | | 1,513 | | | | 98,163 | |
NETGEAR, Inc. | | * | | | 3,773 | | | | 126,660 | |
Network Engines, Inc. | | * | | | 1,330 | | | | 1,280 | |
Network Equipment Technologies, Inc. | | * | | | 20,690 | | | | 24,000 | |
Numerex Corp., Class A | | * | | | 1,800 | | | | 14,814 | |
Oclaro, Inc. | | *† | | | 9,084 | | | | 25,617 | |
Oplink Communications, Inc. | | * | | | 1,808 | | | | 29,778 | |
Optical Cable Corp. | | | | | 241 | | | | 769 | |
ORBCOMM, Inc. | | * | | | 3,512 | | | | 10,501 | |
Parkervision, Inc. | | *† | | | 2,943 | | | | 2,501 | |
Performance Technologies, Inc. | | * | | | 794 | | | | 1,429 | |
Plantronics, Inc. | | † | | | 9,656 | | | | 344,140 | |
Polycom, Inc. | | * | | | 30,575 | | | | 498,372 | |
Powerwave Technologies, Inc. | | * | | | 6,812 | | | | 14,169 | |
Riverbed Technology, Inc. | | * | | | 24,824 | | | | 583,364 | |
Sonus Networks, Inc. | | * | | | 107,679 | | | | 258,430 | |
Sycamore Networks, Inc. | | * | | | 1,477 | | | | 26,438 | |
Symmetricom, Inc. | | * | | | 6,110 | | | | 32,933 | |
Tekelec | | * | | | 12,588 | | | | 137,587 | |
Tellabs, Inc. | | | | | 59,542 | | | | 240,550 | |
UTStarcom Holdings Corp. (China) | | * | | | 76,536 | | | | 105,620 | |
Viasat, Inc. | | * | | | 2,822 | | | | 130,151 | |
Westell Technologies, Inc., Class A | | * | | | 3,671 | | | | 8,150 | |
Zoom Technologies, Inc. (China) | | *† | | | 542 | | | | 558 | |
| | | | | | | | | | | | |
| | | | | | | | | | | 6,292,104 | |
| | | | | | | | | | | | |
| Computers & Peripherals—0.5% | |
3D Systems Corp. | | *† | | | 5,464 | | | | 78,682 | |
Avid Technology, Inc. | | * | | | 2,658 | | | | 22,673 | |
Concurrent Computer Corp. | | * | | | 759 | | | | 2,877 | |
Cray, Inc. | | * | | | 4,598 | | | | 29,749 | |
Dataram Corp. | | *† | | | 1,175 | | | | 952 | |
Diebold, Inc. | | | | | 12,962 | | | | 389,767 | |
Dot Hill Systems Corp. | | * | | | 3,866 | | | | 5,142 | |
Electronics for Imaging, Inc. | | * | | | 3,912 | | | | 55,746 | |
Hutchinson Technology, Inc. | | *† | | | 2,054 | | | | 3,081 | |
iGO, Inc. | | * | | | 2,804 | | | | 2,165 | |
Imation Corp. | | * | | | 18,494 | | | | 105,971 | |
Immersion Corp. | | * | | | 5,977 | | | | 30,961 | |
Intermec, Inc. | | * | | | 5,471 | | | | 37,531 | |
Intevac, Inc. | | *† | | | 3,891 | | | | 28,793 | |
NCR Corp. | | * | | | 20,810 | | | | 342,533 | |
Novatel Wireless, Inc. | | * | | | 10,536 | | | | 32,978 | |
Overland Storage, Inc. | | * | | | 9,851 | | | | 24,627 | |
See accompanying notes to financial statements.
293
SCHEDULE OF INVESTMENTS—(Continued)
December 31, 2011
| | | | | | | | | | | | |
| Vantagepoint Mid/Small Company Index Fund | | | Shares | | | | Value | |
| | | | | | | | | | | | |
| COMMON STOCKS—(Continued) | |
Presstek, Inc. | | * | | | 6,107 | | | $ | 3,298 | |
QLogic Corp. | | * | | | 23,188 | | | | 347,820 | |
Quantum Corp. | | * | | | 58,778 | | | | 141,067 | |
Rimage Corp. | | | | | 924 | | | | 10,395 | |
Silicon Graphics International Corp. | | *† | | | 4,183 | | | | 47,937 | |
STEC, Inc. | | * | | | 14,855 | | | | 127,604 | |
Stratasys, Inc. | | * | | | 1,962 | | | | 59,664 | |
Synaptics, Inc. | | *† | | | 5,067 | | | | 152,770 | |
TransAct Technologies, Inc. | | * | | | 889 | | | | 6,454 | |
| | | | | | | | | | | | |
| | | | | | | | | | | 2,091,237 | |
| | | | | | | | | | | | |
| Construction & Engineering—0.8% | |
AECOM Technology Corp. | | * | | | 23,093 | | | | 475,023 | |
Aegion Corp. | | * | | | 2,980 | | | | 45,713 | |
Comfort Systems USA, Inc. | | † | | | 3,803 | | | | 40,768 | |
Dycom Industries, Inc. | | * | | | 13,213 | | | | 276,416 | |
EMCOR Group, Inc. | | | | | 10,329 | | | | 276,921 | |
Furmanite Corp. | | *† | | | 4,100 | | | | 25,871 | |
Granite Construction, Inc. | | | | | 5,631 | | | | 133,567 | |
KBR, Inc. | | | | | 23,912 | | | | 666,428 | |
Layne Christensen Co. | | * | | | 1,813 | | | | 43,875 | |
MasTec, Inc. | | * | | | 11,328 | | | | 196,767 | |
Northwest Pipe Co. | | * | | | 1,025 | | | | 23,432 | |
Orion Marine Group, Inc. | | * | | | 17,265 | | | | 114,812 | |
Pike Electric Corp. | | *† | | | 1,369 | | | | 9,843 | |
Shaw Group, Inc. (The) | | * | | | 12,959 | | | | 348,597 | |
Sterling Construction Co., Inc. | | * | | | 1,751 | | | | 18,858 | |
Tutor Perini Corp. | | * | | | 5,845 | | | | 72,127 | |
URS Corp. | | * | | | 9,779 | | | | 343,439 | |
| | | | | | | | | | | | |
| | | | | | | | | | | 3,112,457 | |
| | | | | | | | | | | | |
| Construction Materials—0.1% | |
Eagle Materials, Inc. | | | | | | | 6,632 | | | | 170,177 | |
Headwaters, Inc. | | | | * | | | 14,630 | | | | 32,479 | |
Martin Marietta Materials, Inc. | | | | † | | | 3,598 | | | | 271,325 | |
Texas Industries, Inc. | | | | † | | | 3,011 | | | | 92,678 | |
| | | | | | | | | | | | |
| | | | | | | | | | | 566,659 | |
| | | | | | | | | | | | |
| Consumer Finance—0.3% | |
Advance America Cash Advance Centers, Inc. | | | | | 18,116 | | | | 162,138 | |
Cash America International, Inc. | | | | | 6,335 | | | | 295,401 | |
CompuCredit Holdings Corp. | | * | | | 1,291 | | | | 4,777 | |
DFC Global Corp. | | * | | | 10,439 | | | | 188,528 | |
Ezcorp, Inc., Class A | | * | | | 7,391 | | | | 194,901 | |
First Cash Financial Services, Inc. | | * | | | 7,544 | | | | 264,719 | |
First Marblehead Corp. (The) | | * | | | 4,118 | | | | 4,818 | |
Nelnet, Inc., Class A | | | | | 4,517 | | | | 110,531 | |
World Acceptance Corp. | | * | | | 1,219 | | | | 89,596 | |
| | | | | | | | | | | | |
| | | | | | | | | | | 1,315,409 | |
| | | | | | | | | | | | |
| Containers & Packaging—1.1% | |
AEP Industries, Inc. | | * | | | 1,109 | | | | 31,218 | |
AptarGroup, Inc. | | | | | 8,229 | | | | 429,307 | |
Crown Holdings, Inc. | | * | | | 29,102 | | | | 977,245 | |
Graphic Packaging Holding Co. | | * | | | 52,944 | | | | 225,542 | |
Greif, Inc., Class A | | | | | 4,197 | | | | 191,173 | |
Myers Industries, Inc. | | | | | 4,506 | | | | 55,604 | |
| | | | | | | | | | | | |
| | | |
| | | | Shares | | | | Value | |
| | | | | | | | | | | | |
Packaging Corp. of America | | | | | 19,693 | | | $ | 497,051 | |
Rock-Tenn Co., Class A | | | | | 10,108 | | | | 583,232 | |
Silgan Holdings, Inc. | | | | | 9,969 | | | | 385,202 | |
Sonoco Products Co. | | | | | 14,585 | | | | 480,722 | |
Temple-Inland, Inc. | | | | | 17,877 | | | | 566,880 | |
| | | | | | | | | | | | |
| | | | | | | | | | | 4,423,176 | |
| | | | | | | | | | | | |
| Distributors—0.2% | |
LKQ Corp. | | * | | | 22,164 | | | | 666,693 | |
Pool Corp. | | | | | 4,626 | | | | 139,243 | |
VOXX International Corp. | | * | | | 2,945 | | | | 24,885 | |
| | | | | | | | | | | | |
| | | | | | | | | | | 830,821 | |
| | | | | | | | | | | | |
| Diversified Consumer Services—0.9% | |
American Public Education, Inc. | | *† | | | 2,444 | | | | 105,776 | |
Ascent Capital Group, Inc., Class A | | * | | | 2,424 | | | | 122,945 | |
Capella Education Co. | | * | | | 3,229 | | | | 116,405 | |
Career Education Corp. | | * | | | 11,632 | | | | 92,707 | |
Coinstar, Inc. | | *† | | | 3,501 | | | | 159,786 | |
Corinthian Colleges, Inc. | | *† | | | 17,447 | | | | 37,860 | |
Education Management Corp. | | *† | | | 12,017 | | | | 336,356 | |
Grand Canyon Education, Inc. | | *† | | | 8,434 | | | | 134,607 | |
Hillenbrand, Inc. | | | | | 8,605 | | | | 192,064 | |
ITT Educational Services, Inc. | | *† | | | 4,939 | | | | 280,980 | |
K12, Inc. | | * | | | 8,049 | | | | 144,399 | |
Learning Tree International, Inc. | | * | | | 4,044 | | | | 28,389 | |
Matthews International Corp., Class A | | | | | 4,455 | | | | 140,021 | |
Regis Corp. | | † | | | 10,952 | | | | 181,256 | |
School Specialty, Inc. | | * | | | 1,184 | | | | 2,960 | |
Service Corp. International | | | | | 41,199 | | | | 438,769 | |
Sotheby’s | | | | | 8,625 | | | | 246,071 | |
Steiner Leisure Ltd. (Bahamas) | | * | | | 1,645 | | | | 74,666 | |
Stewart Enterprises, Inc., Class A | | † | | | 11,267 | | | | 64,898 | |
Strayer Education, Inc. | | † | | | 944 | | | | 91,747 | |
Universal Technical Institute, Inc. | | *† | | | 4,524 | | | | 57,817 | |
Weight Watchers International, Inc. | | † | | | 7,607 | | | | 418,461 | |
| | | | | | | | | | | | |
| | | | | | | | | | | 3,468,940 | |
| | | | | | | | | | | | |
| Diversified Financial Services—0.3% | |
Interactive Brokers Group, Inc., Class A | | | | | 11,762 | | | | 175,724 | |
MarketAxess Holdings, Inc. | | | | | 8,655 | | | | 260,602 | |
MSCI, Inc., Class A | | * | | | 19,794 | | | | 651,817 | |
PHH Corp. | | * | | | 11,809 | | | | 126,356 | |
PICO Holdings, Inc. | | * | | | 1,955 | | | | 40,234 | |
Resource America, Inc., Class A | | | | | 1,547 | | | | 7,364 | |
| | | | | | | | | | | | |
| | | | | | | | | | | 1,262,097 | |
| | | | | | | | | | | | |
| Diversified Telecommunication Services—0.5% | |
8x8, Inc. | | *† | | | 33,730 | | | | 106,924 | |
AboveNet, Inc. | | * | | | 2,364 | | | | 153,684 | |
Alaska Communications Systems Group, Inc. | | † | | | 8,744 | | | | 26,320 | |
Atlantic Tele-Network, Inc. | | | | | 1,034 | | | | 40,378 | |
Cbeyond, Inc. | | * | | | 5,638 | | | | 45,160 | |
Cincinnati Bell, Inc. | | * | | | 76,144 | | | | 230,716 | |
Cogent Communications Group, Inc. | | * | | | 3,453 | | | | 58,321 | |
See accompanying notes to financial statements.
294
SCHEDULE OF INVESTMENTS—(Continued)
December 31, 2011
| | | | | | | | | | | | |
| Vantagepoint Mid/Small Company Index Fund | | | Shares | | | | Value | |
| | | | | | | | | | | | |
| COMMON STOCKS—(Continued) | |
Consolidated Communications Holdings, Inc. | | | | | 13,175 | | | $ | 250,984 | |
General Communication, Inc., Class A | | *† | | | 3,847 | | | | 37,662 | |
HickoryTech Corp. | | | | | 2,286 | | | | 25,329 | |
IDT Corp., Class B | | | | | 2,274 | | | | 21,330 | |
Integrated Telecom Express, Inc. | | *‡d | | | 1,103 | | | | — | |
Level 3 Communications, Inc. | | * | | | 28,997 | | | | 492,659 | |
Lumos Networks Corp. | | | | | 1,551 | | | | 23,792 | |
Neutral Tandem, Inc. | | * | | | 13,265 | | | | 141,803 | |
Premiere Global Services, Inc. | | * | | | 5,642 | | | | 47,788 | |
Superior TeleCom, Inc. | | *‡d | | | 2,014 | | | | — | |
SureWest Communications | | | | | 6,213 | | | | 74,742 | |
tw telecom inc. | | * | | | 20,524 | | | | 397,755 | |
| | | | | | | | | | | | |
| | | | | | | | | | | 2,175,347 | |
| | | | | | | | | | | | |
| Electric Utilities—1.4% | |
Allete, Inc. | | | | | 5,454 | | | | 228,959 | |
Central Vermont Public Service Corp. | | | | | 6,116 | | | | 214,672 | |
Cleco Corp. | | | | | 9,591 | | | | 365,417 | |
El Paso Electric Co. | | | | | 6,402 | | | | 221,765 | |
Empire District Electric Co. (The) | | | | | 15,918 | | | | 335,711 | |
Great Plains Energy, Inc. | | | | | 19,050 | | | | 414,909 | |
Hawaiian Electric Industries, Inc. | | | | | 19,153 | | | | 507,171 | |
IDACORP, Inc. | | | | | 8,759 | | | | 371,469 | |
ITC Holdings Corp. | | | | | 6,901 | | | | 523,648 | |
MGE Energy, Inc. | | | | | 4,750 | | | | 222,158 | |
NV Energy, Inc. | | | | | 29,607 | | | | 484,074 | |
Otter Tail Corp. | | | | | 2,897 | | | | 63,792 | |
PNM Resources, Inc. | | | | | 13,928 | | | | 253,907 | |
Portland General Electric Co. | | | | | 11,420 | | | | 288,812 | |
UIL Holdings Corp. | | † | | | 7,355 | | | | 260,146 | |
Unisource Energy Corp. | | | | | 10,080 | | | | 372,154 | |
Unitil Corp. | | | | | 1,689 | | | | 47,934 | |
Westar Energy, Inc. | | | | | 13,513 | | | | 388,904 | |
| | | | | | | | | | | | |
| | | | | | | | | | | 5,565,602 | |
| | | | | | | | | | | | |
| Electrical Equipment—1.3% | |
A123 Systems, Inc. | | *† | | | 39,421 | | | | 63,468 | |
Active Power, Inc. | | *† | | | 28,492 | | | | 18,805 | |
Acuity Brands, Inc. | | † | | | 3,756 | | | | 199,068 | |
American Superconductor Corp. | | *† | | | 6,746 | | | | 24,893 | |
AMETEK, Inc. | | | | | 28,325 | | | | 1,192,482 | |
AZZ, Inc. | | † | | | 1,134 | | | | 51,529 | |
Babcock & Wilcox Co. (The) | | * | | | 19,772 | | | | 477,296 | |
Belden, Inc. | | | | | 7,758 | | | | 258,186 | |
Brady Corp., Class A | | | | | 7,763 | | | | 245,078 | |
Capstone Turbine Corp. | | *† | | | 79,299 | | | | 91,987 | |
Encore Wire Corp. | | | | | 1,693 | | | | 43,849 | |
EnerSys | | * | | | 11,416 | | | | 296,474 | |
Franklin Electric Co., Inc. | | | | | 3,929 | | | | 171,147 | |
FuelCell Energy, Inc. | | *† | | | 9,197 | | | | 8,020 | |
General Cable Corp. | | * | | | 7,507 | | | | 187,750 | |
GrafTech International Ltd. | | * | | | 22,518 | | | | 307,371 | |
Hubbell, Inc., Class B | | | | | 6,770 | | | | 452,642 | |
II-VI, Inc. | | * | | | 3,964 | | | | 72,779 | |
| | | | | | | | | | | | |
| | | |
| | | | Shares | | | | Value | |
| | | | | | | | | | | | |
LSI Industries, Inc. | | | | | 3,003 | | | $ | 18,018 | |
Magnetek, Inc. | | * | | | 458 | | | | 3,943 | |
Orbit International Corp. | | * | | | 2,812 | | | | 10,039 | |
Plug Power, Inc. | | *† | | | 893 | | | | 1,822 | |
Polypore International, Inc. | | *† | | | 3,591 | | | | 157,968 | |
Powell Industries, Inc. | | * | | | 1,046 | | | | 32,719 | |
PowerSecure International, Inc. | | * | | | 2,650 | | | | 13,117 | |
Regal-Beloit Corp. | | | | | 5,997 | | | | 305,667 | |
Thomas & Betts Corp. | | * | | | 11,859 | | | | 647,501 | |
Ultralife Corp. | | * | | | 3,672 | | | | 14,761 | |
Universal Security Instruments, Inc. | | * | | | 266 | | | | 1,404 | |
Valence Technology, Inc. | | *† | | | 4,773 | | | | 4,678 | |
Vicor Corp. | | | | | 3,481 | | | | 27,709 | |
| | | | | | | | | | | | |
| | | | | | | | | 5,402,170 | |
| | | | | | | | | | | | |
| Electronic Equipment, Instruments & Components—2.1% | |
Agilysys, Inc. | | * | | | 2,266 | | | | 18,015 | |
Anixter International, Inc. | | * | | | 5,818 | | | | 346,986 | |
Arrow Electronics, Inc. | | * | | | 15,039 | | | | 562,609 | |
Avnet, Inc. | | * | | | 23,170 | | | | 720,355 | |
AVX Corp. | | | | | 13,236 | | | | 168,891 | |
Badger Meter, Inc. | | † | | | 4,287 | | | | 126,166 | |
Benchmark Electronics, Inc. | | * | | | 14,600 | | | | 196,662 | |
Brightpoint, Inc. | | * | | | 13,208 | | | | 142,118 | |
Checkpoint Systems, Inc. | | * | | | 3,624 | | | | 39,647 | |
Cognex Corp. | | | | | 3,335 | | | | 119,360 | |
Coherent, Inc. | | * | | | 3,191 | | | | 166,794 | |
CTS Corp. | | | | | 4,578 | | | | 42,118 | |
Daktronics, Inc. | | † | | | 3,564 | | | | 34,107 | |
Dolby Laboratories, Inc., Class A | | * | | | 6,100 | | | | 186,111 | |
DTS, Inc. | | * | | | 1,605 | | | | 43,720 | |
Echelon Corp. | | *† | | | 3,748 | | | | 18,253 | |
Electro Rent Corp. | | | | | 2,563 | | | | 43,955 | |
Electro Scientific Industries, Inc. | | * | | | 3,685 | | | | 53,359 | |
FARO Technologies, Inc. | | * | | | 1,212 | | | | 55,752 | |
FEI Co. | | * | | | 7,016 | | | | 286,112 | |
Frequency Electronics, Inc. | | * | | | 822 | | | | 6,297 | |
ID Systems, Inc. | | * | | | 2,437 | | | | 11,527 | |
Identive Group, Inc. | | * | | | 1,494 | | | | 3,332 | |
Ingram Micro, Inc., Class A | | * | | | 30,748 | | | | 559,306 | |
Insight Enterprises, Inc. | | * | | | 2,944 | | | | 45,014 | |
IPG Photonics Corp. | | * | | | 6,852 | | | | 232,077 | |
Iteris, Inc. | | * | | | 4,264 | | | | 5,543 | |
Itron, Inc. | | * | | | 9,037 | | | | 323,253 | |
LeCroy Corp. | | * | | | 3,916 | | | | 32,934 | |
Lightpath Technologies, Inc., Class A | | *† | | | 17,646 | | | | 18,881 | |
Littelfuse, Inc. | | † | | | 2,845 | | | | 122,278 | |
LoJack Corp. | | * | | | 1,880 | | | | 5,772 | |
LRAD Corp. | | * | | | 3,686 | | | | 5,492 | |
Maxwell Technologies, Inc. | | *† | | | 3,381 | | | | 54,907 | |
Measurement Specialties, Inc. | | * | | | 3,063 | | | | 85,641 | |
Mercury Computer Systems, Inc. | | * | | | 2,443 | | | | 32,467 | |
Mesa Laboratories, Inc. | | | | | 1,200 | | | | 49,728 | |
Methode Electronics, Inc. | | † | | | 16,111 | | | | 133,560 | |
Microvision, Inc. | | *† | | | 114,459 | | | | 41,217 | |
MTS Systems Corp. | | | | | 1,818 | | | | 74,083 | |
National Instruments Corp. | | | | | 17,107 | | | | 443,927 | |
Newport Corp. | | * | | | 3,015 | | | | 41,034 | |
OSI Systems, Inc. | | * | | | 2,179 | | | | 106,292 | |
Park Electrochemical Corp. | | | | | 1,950 | | | | 49,959 | |
PC Connection, Inc. | | | | | 2,755 | | | | 30,553 | |
See accompanying notes to financial statements.
295
SCHEDULE OF INVESTMENTS—(Continued)
December 31, 2011
| | | | | | | | | | | | |
| Vantagepoint Mid/Small Company Index Fund | | | Shares | | | | Value | |
| | | | | | | | | | | | |
| COMMON STOCKS—(Continued) | |
Planar Systems, Inc. | | * | | | 8,504 | | | $ | 16,498 | |
Plexus Corp. | | * | | | 4,416 | | | | 120,910 | |
Power-One, Inc. | | * | | | 40,825 | | | | 159,626 | |
Pulse Electronics Corp. | | | | | 7,988 | | | | 22,366 | |
Radisys Corp. | | * | | | 2,757 | | | | 13,950 | |
Research Frontiers, Inc. | | * | | | 2,932 | | | | 9,910 | |
Rofin-Sinar Technologies, Inc. | | * | | | 3,102 | | | | 70,881 | |
Rogers Corp. | | * | | | 1,417 | | | | 52,231 | |
Sanmina-SCI Corp. | | * | | | 9,115 | | | | 84,861 | |
ScanSource, Inc. | | * | | | 1,798 | | | | 64,728 | |
Sigmatron International, Inc. | | * | | | 283 | | | | 934 | |
SYNNEX Corp. | | * | | | 4,002 | | | | 121,901 | |
Tech Data Corp. | | * | | | 9,988 | | | | 493,507 | |
Trimble Navigation Ltd. | | * | | | 16,777 | | | | 728,122 | |
TTM Technologies, Inc. | | * | | | 9,216 | | | | 101,007 | |
Universal Display Corp. | | *† | | | 3,507 | | | | 128,672 | |
Vishay Intertechnology, Inc. | | * | | | 19,798 | | | | 177,984 | |
Vishay Precision Group, Inc. | | * | | | 7,543 | | | | 120,537 | |
Wayside Technology Group, Inc. | | | | | 1,787 | | | | 21,712 | |
X-Rite, Inc. | | *† | | | 2,441 | | | | 11,326 | |
Zygo Corp. | | * | | | 2,489 | | | | 43,931 | |
| | | | | | | | | | | | |
| | | | | | | | | 8,451,758 | |
| | | | | | | | | | | | |
| Energy Equipment & Services—2.1% | |
Atwood Oceanics, Inc. | | * | | | 7,768 | | | | 309,089 | |
Basic Energy Services, Inc. | | * | | | 5,491 | | | | 108,173 | |
Bolt Technology Corp. | | | | | 3,477 | | | | 39,777 | |
Bristow Group, Inc. | | | | | 5,164 | | | | 244,722 | |
Cal Dive International, Inc. | | * | | | 45,231 | | | | 101,770 | |
CARBO Ceramics, Inc. | | † | | | 2,127 | | | | 262,323 | |
Complete Production Services, Inc. | | * | | | 15,650 | | | | 525,214 | |
Dawson Geophysical Co. | | * | | | 930 | | | | 36,763 | |
Dresser-Rand Group, Inc. | | * | | | 13,863 | | | | 691,902 | |
Dril-Quip, Inc. | | * | | | 3,953 | | | | 260,186 | |
Exterran Holdings, Inc. | | * | | | 10,606 | | | | 96,515 | |
Gulfmark Offshore, Inc., Class A | | * | | | 3,758 | | | | 157,874 | |
Helix Energy Solutions Group, Inc. | | * | | | 10,795 | | | | 170,561 | |
Hercules Offshore, Inc. | | * | | | 42,310 | | | | 187,856 | |
Hornbeck Offshore Services, Inc. | | *† | | | 4,277 | | | | 132,673 | |
ION Geophysical Corp. | | * | | | 22,870 | | | | 140,193 | |
Key Energy Services, Inc. | | * | | | 31,716 | | | | 490,646 | |
Lufkin Industries, Inc. | | | | | 5,305 | | | | 357,080 | |
Matrix Service Co. | | * | | | 2,410 | | | | 22,750 | |
McDermott International, Inc. | | * | | | 32,280 | | | | 371,543 | |
Mitcham Industries, Inc. | | * | | | 3,707 | | | | 80,961 | |
Natural Gas Services Group, Inc. | | *† | | | 2,837 | | | | 41,023 | |
Newpark Resources, Inc. | | * | | | 17,228 | | | | 163,666 | |
Oceaneering International, Inc. | | | | | 12,244 | | | | 564,816 | |
Oil States International, Inc. | | * | | | 5,243 | | | | 400,408 | |
OYO Geospace Corp. | | * | | | 550 | | | | 42,531 | |
Parker Drilling Co. | | * | | | 15,606 | | | | 111,895 | |
Patterson-UTI Energy, Inc. | | | | | 35,480 | | | | 708,890 | |
PHI, Inc. | | * | | | 1,283 | | | | 31,883 | |
Pioneer Drilling Co. | | * | | | 16,802 | | | | 162,643 | |
RPC, Inc. | | † | | | 16,792 | | | | 306,454 | |
SEACOR Holdings, Inc. | | * | | | 2,817 | | | | 250,600 | |
| | | | | | | | | | | | |
| | | |
| | | | Shares | | | | Value | |
| | | | | | | | | | | | |
Superior Energy Services, Inc. | | * | | | 11,934 | | | $ | 339,403 | |
Tetra Technologies, Inc. | | * | | | 8,961 | | | | 83,696 | |
Tidewater, Inc. | | | | | 5,295 | | | | 261,043 | |
Unit Corp. | | * | | | 6,849 | | | | 317,794 | |
Vantage Drilling Co. | | *† | | | 35,506 | | | | 41,187 | |
| | | | | | | | | | | | |
| | | | | | | | | 8,616,503 | |
| | | | | | | | | | | | |
| Food & Staples Retailing—0.4% | |
Andersons, Inc. (The) | | | | | 1,795 | | | | 78,370 | |
Arden Group, Inc., Class A | | † | | | 391 | | | | 35,194 | |
Casey’s General Stores, Inc. | | | | | 7,327 | | | | 377,414 | |
Nash Finch Co. | | | | | 1,190 | | | | 34,843 | |
Pantry, Inc. (The) | | * | | | 2,139 | | | | 25,604 | |
Pricesmart, Inc. | | | | | 531 | | | | 36,952 | |
Rite Aid Corp. | | * | | | 203,564 | | | | 256,491 | |
Ruddick Corp. | | † | | | 6,610 | | | | 281,850 | |
Spartan Stores, Inc. | | | | | 3,490 | | | | 64,565 | |
United Natural Foods, Inc. | | * | | | 4,444 | | | | 177,804 | |
Village Super Market, Inc., Class A | | | | | 2,777 | | | | 79,006 | |
Weis Markets, Inc. | | | | | 1,103 | | | | 44,054 | |
Winn-Dixie Stores, Inc. | | * | | | 11,232 | | | | 105,356 | |
| | | | | | | | | | | | |
| | | | | | | | | 1,597,503 | |
| | | | | | | | | | | | |
| Food Products—1.8% | |
B&G Foods, Inc. | | | | | 15,178 | | | | 365,334 | |
Bridgford Foods Corp. | | *† | | | 1,169 | | | | 11,409 | |
Bunge Ltd. | | | | | 23,951 | | | | 1,369,997 | |
Calavo Growers, Inc. | | † | | | 2,244 | | | | 57,626 | |
Cal-Maine Foods, Inc. | | | | | 6,514 | | | | 238,217 | |
Chiquita Brands International, Inc. | | * | | | 9,802 | | | | 81,749 | |
Corn Products International, Inc. | | | | | 10,796 | | | | 567,762 | |
Darling International, Inc. | | * | | | 17,587 | | | | 233,731 | |
Diamond Foods, Inc. | | † | | | 4,466 | | | | 144,118 | |
Dole Food Co., Inc. | | *† | | | 12,165 | | | | 105,227 | |
Farmer Bros. Co. | | † | | | 930 | | | | 7,105 | |
Flowers Foods, Inc. | | | | | 29,847 | | | | 566,496 | |
Fresh Del Monte Produce, Inc. | | | | | 9,319 | | | | 233,068 | |
Green Mountain Coffee Roasters, Inc. | | *† | | | 17,672 | | | | 792,589 | |
Griffin Land & Nurseries, Inc. | | † | | | 2,039 | | | | 53,952 | |
Hain Celestial Group, Inc. (The) | | * | | | 9,137 | | | | 334,962 | |
Inventure Foods, Inc. | | * | | | 9,182 | | | | 34,341 | |
J&J Snack Foods Corp. | | | | | 1,866 | | | | 99,421 | |
John B. Sanfilippo & Son, Inc. | | * | | | 1,899 | | | | 14,318 | |
Lancaster Colony Corp. | | † | | | 2,437 | | | | 168,982 | |
Omega Protein Corp. | | * | | | 1,515 | | | | 10,802 | |
Ralcorp Holdings, Inc. | | * | | | 7,841 | | | | 670,406 | |
Sanderson Farms, Inc. | | † | | | 1,537 | | | | 77,050 | |
Smart Balance, Inc. | | * | | | 15,817 | | | | 84,779 | |
Smithfield Foods, Inc. | | * | | | 18,538 | | | | 450,103 | |
Snyders-Lance, Inc. | | | | | 3,688 | | | | 82,980 | |
Tootsie Roll Industries, Inc. | | | | | 3,161 | | | | 74,821 | |
TreeHouse Foods, Inc. | | * | | | 7,389 | | | | 483,093 | |
| | | | | | | | | | | | |
| | | | | | | | | 7,414,438 | |
| | | | | | | | | | | | |
| Gas Utilities—1.1% | |
Atmos Energy Corp. | | | | | 15,421 | | | | 514,290 | |
Chesapeake Utilities Corp. | | † | | | 2,965 | | | | 128,533 | |
Delta Natural Gas Co., Inc. | | | | | 3,757 | | | | 129,053 | |
Laclede Group, Inc. (The) | | | | | 1,902 | | | | 76,974 | |
See accompanying notes to financial statements.
296
SCHEDULE OF INVESTMENTS—(Continued)
December 31, 2011
| | | | | | | | | | | | |
| Vantagepoint Mid/Small Company Index Fund | | | Shares | | | | Value | |
| | | | | | | | | | | | |
| COMMON STOCKS—(Continued) | |
National Fuel Gas Co. | | | | | 11,592 | | | $ | 644,283 | |
New Jersey Resources Corp. | | | | | 6,561 | | | | 322,801 | |
Northwest Natural Gas Co. | | † | | | 3,667 | | | | 175,759 | |
Piedmont Natural Gas Co., Inc. | | † | | | 16,155 | | | | 548,947 | |
Questar Corp. | | | | | 29,569 | | | | 587,240 | |
South Jersey Industries, Inc. | | | | | 3,110 | | | | 176,679 | |
Southwest Gas Corp. | | | | | 7,750 | | | | 329,298 | |
UGI Corp. | | | | | 16,949 | | | | 498,301 | |
WGL Holdings, Inc. | | | | | 6,648 | | | | 293,975 | |
| | | | | | | | | | | | |
| | | | | | | | | 4,426,133 | |
| | | | | | | | | | | | |
| Health Care Equipment & Supplies—2.3% | |
Abaxis, Inc. | | * | | | 1,864 | | | | 51,577 | |
ABIOMED, Inc. | | * | | | 3,940 | | | | 72,772 | |
Accuray, Inc. | | * | | | 3,768 | | | | 15,939 | |
Alere, Inc. | | * | | | 9,884 | | | | 228,221 | |
Align Technology, Inc. | | * | | | 7,897 | | | | 187,356 | |
Analogic Corp. | | | | | 1,287 | | | | 73,771 | |
AngioDynamics, Inc. | | * | | | 14,132 | | | | 209,295 | |
Atrion Corp. | | † | | | 308 | | | | 73,991 | |
Biolase Technology, Inc. | | *† | | | 21,860 | | | | 56,179 | |
Cantel Medical Corp. | | | | | 4,511 | | | | 125,992 | |
Cerus Corp. | | * | | | 16,123 | | | | 45,144 | |
Conceptus, Inc. | | * | | | 2,419 | | | | 30,576 | |
CONMED Corp. | | * | | | 9,592 | | | | 246,227 | |
Cooper Cos., Inc. (The) | | | | | 6,675 | | | | 470,721 | |
CryoLife, Inc. | | * | | | 4,037 | | | | 19,378 | |
Cutera, Inc. | | * | | | 3,098 | | | | 23,080 | |
Cyberonics, Inc. | | * | | | 2,993 | | | | 100,265 | |
Cynosure, Inc., Class A | | * | | | 772 | | | | 9,079 | |
DexCom, Inc. | | * | | | 11,213 | | | | 104,393 | |
Endologix, Inc. | | * | | | 14,422 | | | | 165,564 | |
Gen-Probe, Inc. | | * | | | 7,280 | | | | 430,394 | |
Greatbatch, Inc. | | * | | | 2,283 | | | | 50,454 | |
Haemonetics Corp. | | * | | | 3,839 | | | | 235,024 | |
Hill-Rom Holdings, Inc. | | | | | 8,394 | | | | 282,794 | |
Hologic, Inc. | | * | | | 51,211 | | | | 896,705 | |
ICU Medical, Inc. | | * | | | 1,366 | | | | 61,470 | |
IDEXX Laboratories, Inc. | | * | | | 4,638 | | | | 356,940 | |
Insulet Corp. | | * | | | 2,068 | | | | 38,940 | |
Integra LifeSciences Holdings Corp. | | * | | | 2,236 | | | | 68,936 | |
Invacare Corp. | | | | | 4,378 | | | | 66,940 | |
IRIS International, Inc. | | * | | | 2,570 | | | | 24,029 | |
Kensey Nash Corp. | | * | | | 1,683 | | | | 32,297 | |
MAKO Surgical Corp. | | *† | | | 679 | | | | 17,118 | |
Masimo Corp. | | * | | | 5,620 | | | | 105,010 | |
Medical Action Industries, Inc. | | *† | | | 7,146 | | | | 37,374 | |
Meridian Bioscience, Inc. | | † | | | 4,370 | | | | 82,331 | |
Merit Medical Systems, Inc. | | * | | | 3,136 | | | | 41,960 | |
Natus Medical, Inc. | | * | | | 15,518 | | | | 146,335 | |
Neogen Corp. | | * | | | 2,463 | | | | 75,466 | |
NuVasive, Inc. | | * | | | 6,151 | | | | 77,441 | |
NxStage Medical, Inc. | | * | | | 9,600 | | | | 170,688 | |
OraSure Technologies, Inc. | | * | | | 4,328 | | | | 39,428 | |
Orthofix International NV (Netherlands Antilles) | | * | | | 2,888 | | | | 101,744 | |
Palomar Medical Technologies, Inc. | | * | | | 2,762 | | | | 25,687 | |
Quidel Corp. | | *† | | | 14,799 | | | | 223,909 | |
ResMed, Inc. | | * | | | 25,007 | | | | 635,178 | |
Rochester Medical Corp. | | * | | | 5,305 | | | | 43,978 | |
| | | | | | | | | | | | |
| | | |
| | | | Shares | | | | Value | |
| | | | | | | | | | | | |
RTI Biologics, Inc. | | * | | | 7,464 | | | $ | 33,140 | |
Sirona Dental Systems, Inc. | | * | | | 9,020 | | | | 397,241 | |
SonoSite, Inc. | | * | | | 1,320 | | | | 71,095 | |
Spectranetics Corp. | | * | | | 3,376 | | | | 24,375 | |
Staar Surgical Co. | | * | | | 13,188 | | | | 138,342 | |
STERIS Corp. | | | | | 9,627 | | | | 287,077 | |
SurModics, Inc. | | * | | | 1,932 | | | | 28,323 | |
Synovis Life Technologies, Inc. | | * | | | 4,579 | | | | 127,434 | |
Teleflex, Inc. | | | | | 5,710 | | | | 349,966 | |
Theragenics Corp. | | * | | | 5,822 | | | | 9,781 | |
ThermoGenesis Corp. | | * | | | 1,079 | | | | 766 | |
Thoratec Corp. | | * | | | 9,579 | | | | 321,471 | |
Urologix, Inc. | | * | | | 25,612 | | | | 27,661 | |
Vision-Sciences, Inc. | | * | | | 27,178 | | | | 51,366 | |
Volcano Corp. | | * | | | 5,711 | | | | 135,865 | |
West Pharmaceutical Services, Inc. | | | | | 4,069 | | | | 154,418 | |
Wright Medical Group, Inc. | | * | | | 3,907 | | | | 64,465 | |
Young Innovations, Inc. | | | | | 677 | | | | 20,059 | |
Zoll Medical Corp. | | * | | | 6,431 | | | | 406,311 | |
| | | | | | | | | | | | |
| | | | | | | | | 9,327,246 | |
| | | | | | | | | | | | |
| Health Care Providers & Services—2.7% | |
Alliance HealthCare Services, Inc. | | * | | | 10,817 | | | | 13,629 | |
Almost Family, Inc. | | * | | | 2,502 | | | | 41,483 | |
Amedisys, Inc. | | * | | | 2,921 | | | | 31,868 | |
American Dental Partners, Inc. | | * | | | 4,922 | | | | 92,681 | |
AMERIGROUP Corp. | | * | | | 4,801 | | | | 283,643 | |
AMN Healthcare Services, Inc. | | *† | | | 3,864 | | | | 17,118 | |
Amsurg Corp. | | * | | | 3,079 | | | | 80,177 | |
Bio-Reference Labs, Inc. | | * | | | 11,461 | | | | 186,471 | |
BioScrip, Inc. | | * | | | 3,476 | | | | 18,979 | |
Brookdale Senior Living, Inc. | | * | | | 23,328 | | | | 405,674 | |
Capital Senior Living Corp. | | * | | | 9,966 | | | | 79,130 | |
CardioNet, Inc. | | * | | | 8,331 | | | | 19,744 | |
Catalyst Health Solutions, Inc. | | * | | | 6,266 | | | | 325,832 | |
Centene Corp. | | * | | | 7,045 | | | | 278,912 | |
Chemed Corp. | | | | | 2,102 | | | | 107,643 | |
Chindex International, Inc. | | * | | | 1,527 | | | | 13,010 | |
Community Health Systems, Inc. | | * | | | 12,136 | | | | 211,773 | |
Cross Country Healthcare, Inc. | | * | | | 2,631 | | | | 14,602 | |
Emeritus Corp. | | * | | | 5,975 | | | | 104,622 | |
Ensign Group, Inc. (The) | | † | | | 3,393 | | | | 83,129 | |
Five Star Quality Care, Inc. | | * | | | 23,205 | | | | 69,615 | |
Gentiva Health Services, Inc. | | * | | | 3,767 | | | | 25,427 | |
Hanger Orthopedic Group, Inc. | | * | | | 7,988 | | | | 149,296 | |
HCA Holdings, Inc. | | * | | | 7,601 | | | | 167,450 | |
Health Management Associates, Inc., Class A | | * | | | 38,960 | | | | 287,135 | |
Health Net, Inc. | | * | | | 15,676 | | | | 476,864 | |
HealthSouth Corp. | | * | | | 20,125 | | | | 355,609 | |
Healthspring, Inc. | | * | | | 9,544 | | | | 520,530 | |
Healthways, Inc. | | * | | | 3,517 | | | | 24,127 | |
Henry Schein, Inc. | | * | | | 13,916 | | | | 896,608 | |
HMS Holdings Corp. | | * | | | 13,299 | | | | 425,302 | |
IPC The Hospitalist Co., Inc. | | * | | | 4,870 | | | | 222,656 | |
Kindred Healthcare, Inc. | | * | | | 6,873 | | | | 80,895 | |
Landauer, Inc. | | | | | 923 | | | | 47,535 | |
LHC Group, Inc. | | * | | | 8,598 | | | | 110,312 | |
LifePoint Hospitals, Inc. | | * | | | 8,109 | | | | 301,249 | |
Lincare Holdings, Inc. | | | | | 19,141 | | | | 492,115 | |
Magellan Health Services, Inc. | | * | | | 4,963 | | | | 245,520 | |
See accompanying notes to financial statements.
297
SCHEDULE OF INVESTMENTS—(Continued)
December 31, 2011
| | | | | | | | | | | | |
| Vantagepoint Mid/Small Company Index Fund | | | Shares | | | | Value | |
| | | | | | | | | | | | |
| COMMON STOCKS—(Continued) | |
Mednax, Inc. | | * | | | 8,920 | | | $ | 642,329 | |
Molina Healthcare, Inc. | | * | | | 3,366 | | | | 75,163 | |
MWI Veterinary Supply, Inc. | | * | | | 1,472 | | | | 97,800 | |
National Healthcare Corp. | | † | | | 1,078 | | | | 45,168 | |
National Research Corp. | | | | | 1,250 | | | | 48,513 | |
Omnicare, Inc. | | | | | 15,436 | | | | 531,770 | |
Owens & Minor, Inc. | | † | | | 8,595 | | | | 238,855 | |
PDI, Inc. | | * | | | 864 | | | | 5,573 | |
PharMerica Corp. | | * | | | 5,445 | | | | 82,655 | |
Providence Service Corp. (The) | | * | | | 3,898 | | | | 53,637 | |
PSS World Medical, Inc. | | * | | | 14,310 | | | | 346,159 | |
Psychemedics Corp. | | | | | 902 | | | | 8,208 | |
Skilled Healthcare Group, Inc., Class A | | * | | | 10,902 | | | | 59,525 | |
Sun Healthcare Group, Inc. | | *† | | | 7,309 | | | | 28,359 | |
Sunrise Senior Living, Inc. | | *† | | | 17,453 | | | | 113,095 | |
Team Health Holdings, Inc. | | * | | | 2,035 | | | | 44,912 | |
Triple-S Management Corp., Class B (Puerto Rico) | | * | | | 7,729 | | | | 154,735 | |
U.S. Physical Therapy, Inc. | | | | | 2,083 | | | | 40,993 | |
Universal American Corp. | | | | | 10,462 | | | | 132,972 | |
Universal Health Services, Inc., Class B | | | | | 10,922 | | | | 424,429 | |
Vanguard Health Systems, Inc. | | * | | | 3,023 | | | | 30,895 | |
VCA Antech, Inc. | | * | | | 11,415 | | | | 225,446 | |
WellCare Health Plans, Inc. | | * | | | 5,753 | | | | 302,033 | |
| | | | | | | | | | | | |
| | | | | | | | | 11,041,589 | |
| | | | | | | | | | | | |
| Health Care Technology—0.4% | |
Allscripts Healthcare Solutions, Inc. | | * | | | 35,462 | | | | 671,650 | |
athenahealth, Inc. | | * | | | 3,145 | | | | 154,482 | |
Authentidate Holding Corp. | | * | | | 41,599 | | | | 28,287 | |
Computer Programs & Systems, Inc. | | | | | 3,593 | | | | 183,638 | |
MedAssets, Inc. | | * | | | 10,517 | | | | 97,282 | |
Medidata Solutions, Inc. | | * | | | 11,494 | | | | 249,995 | |
Mediware Information Systems, Inc. | | * | | | 1,191 | | | | 15,269 | |
Merge Healthcare, Inc. | | * | | | 9,619 | | | | 46,652 | |
Omnicell, Inc. | | * | | | 7,892 | | | | 130,376 | |
Quality Systems, Inc. | | | | | 4,710 | | | | 174,223 | |
| | | | | | | | | | | | |
| | | | | | | | | 1,751,854 | |
| | | | | | | | | | | | |
| Hotels, Restaurants & Leisure—3.0% | |
AFC Enterprises, Inc. | | * | | | 5,988 | | | | 88,024 | |
Ambassadors Group, Inc. | | | | | 2,796 | | | | 12,610 | |
Ameristar Casinos, Inc. | | | | | 3,664 | | | | 63,351 | |
Bally Technologies, Inc. | | * | | | 6,636 | | | | 262,520 | |
Benihana, Inc. | | * | | | 680 | | | | 6,956 | |
Biglari Holdings, Inc. | | * | | | 109 | | | | 40,138 | |
Bluegreen Corp. | | * | | | 1,800 | | | | 5,058 | |
Bob Evans Farms, Inc. | | | | | 2,925 | | | | 98,105 | |
Boyd Gaming Corp. | | *† | | | 9,758 | | | | 72,795 | |
Brinker International, Inc. | | | | | 6,508 | | | | 174,154 | |
Buffalo Wild Wings, Inc. | | *† | | | 4,069 | | | | 274,698 | |
CEC Entertainment, Inc. | | | | | 2,926 | | | | 100,801 | |
Cheesecake Factory, Inc. (The) | | * | | | 8,701 | | | | 255,374 | |
Choice Hotels International, Inc. | | | | | 6,229 | | | | 237,014 | |
Churchill Downs, Inc. | | | | | 1,567 | | | | 81,688 | |
Cosi, Inc. | | * | | | 16,495 | | | | 11,629 | |
| | | | | | | | | | | | |
| | | |
| | | | Shares | | | | Value | |
| | | | | | | | | | | | |
Cracker Barrel Old Country Store, Inc. | | † | | | 2,879 | | | $ | 145,130 | |
DineEquity, Inc. | | * | | | 1,467 | | | | 61,922 | |
Domino’s Pizza, Inc. | | * | | | 12,378 | | | | 420,233 | |
Dover Downs Gaming & Entertainment, Inc. | | | | | 1,687 | | | | 3,610 | |
Dover Motorsports, Inc. | | * | | | 1,645 | | | | 1,711 | |
Gaylord Entertainment Co. | | *† | | | 5,614 | | | | 135,522 | |
Great Wolf Resorts, Inc. | | * | | | 3,072 | | | | 8,909 | |
Hyatt Hotels Corp., Class A | | * | | | 8,122 | | | | 305,712 | |
International Speedway Corp., Class A | | | | | 3,250 | | | | 82,388 | |
Interval Leisure Group, Inc. | | *† | | | 2,598 | | | | 35,359 | |
Isle of Capri Casinos, Inc. | | * | | | 1,251 | | | | 5,842 | |
Jack in the Box, Inc. | | * | | | 8,142 | | | | 170,168 | |
Jamba, Inc. | | * | | | 31,424 | | | | 41,165 | |
Krispy Kreme Doughnuts, Inc. | | * | | | 23,022 | | | | 150,564 | |
Las Vegas Sands Corp. | | * | | | 83,691 | | | | 3,576,116 | |
Life Time Fitness, Inc. | | * | | | 4,455 | | | | 208,271 | |
Luby’s, Inc. | | * | | | 14,427 | | | | 65,066 | |
Marcus Corp. | | † | | | 1,805 | | | | 22,761 | |
Marriott Vacations Worldwide Corp. | | * | | | 4,601 | | | | 78,953 | |
McCormick & Schmick’s Seafood Restaurants, Inc. | | * | | | 5,172 | | | | 45,203 | |
MGM Resorts International | | * | | | 59,481 | | | | 620,387 | |
Monarch Casino & Resort, Inc. | | * | | | 6,897 | | | | 70,280 | |
Morgans Hotel Group Co. | | * | | | 7,052 | | | | 41,607 | |
MTR Gaming Group, Inc. | | * | | | 4,525 | | | | 8,462 | |
Multimedia Games Holding Co., Inc. | | * | | | 2,902 | | | | 23,042 | |
O’Charleys, Inc. | | * | | | 3,157 | | | | 17,332 | |
Orient-Express Hotels Ltd., Class A (Bermuda) | | * | | | 13,651 | | | | 101,973 | |
P.F. Chang’s China Bistro, Inc. | | | | | 7,791 | | | | 240,820 | |
Panera Bread Co., Class A | | * | | | 3,669 | | | | 518,980 | |
Papa John’s International, Inc. | | * | | | 2,356 | | | | 88,774 | |
Peet’s Coffee & Tea, Inc. | | *† | | | 2,241 | | | | 140,466 | |
Penn National Gaming, Inc. | | * | | | 13,863 | | | | 527,764 | |
Pinnacle Entertainment, Inc. | | * | | | 22,133 | | | | 224,871 | |
Red Robin Gourmet Burgers, Inc. | | * | | | 1,203 | | | | 33,323 | |
Royal Caribbean Cruises Ltd. | | | �� | | 20,951 | | | | 518,956 | |
Ruby Tuesday, Inc. | | * | | | 20,841 | | | | 143,803 | |
Scientific Games Corp., Class A | | * | | | 13,630 | | | | 132,211 | |
Shuffle Master, Inc. | | * | | | 6,463 | | | | 75,746 | |
Six Flags Entertainment Corp. | | | | | 2,764 | | | | 113,987 | |
Sonic Corp. | | * | | | 13,814 | | | | 92,968 | |
Speedway Motorsports, Inc. | | | | | 1,680 | | | | 25,754 | |
Texas Roadhouse, Inc. | | | | | 22,121 | | | | 329,603 | |
Vail Resorts, Inc. | | † | | | 4,618 | | | | 195,619 | |
Wendy’s Co. (The) | | | | | 64,355 | | | | 344,943 | |
WMS Industries, Inc. | | * | | | 4,326 | | | | 88,770 | |
| | | | | | | | | | | | |
| | | | | | | | | 12,069,961 | |
| | | | | | | | | | | | |
| Household Durables—1.0% | |
American Greetings Corp., Class A | | | | | 7,214 | | | | 90,247 | |
Bassett Furniture Industries, Inc. | | | | | 610 | | | | 4,569 | |
Beazer Homes USA, Inc. | | *† | | | 42,835 | | | | 106,231 | |
Blyth, Inc. | | | | | 877 | | | | 49,814 | |
Cavco Industries, Inc. | | *† | | | 1,216 | | | | 48,713 | |
CSS Industries, Inc. | | † | | | 1,140 | | | | 22,709 | |
See accompanying notes to financial statements.
298
SCHEDULE OF INVESTMENTS—(Continued)
December 31, 2011
| | | | | | | | | | | | |
| Vantagepoint Mid/Small Company Index Fund | | | Shares | | | | Value | |
| | | | | | | | | | | | |
| COMMON STOCKS—(Continued) | |
Ethan Allen Interiors, Inc. | | | | | 3,468 | | | $ | 82,226 | |
Furniture Brands International, Inc. | | * | | | 9,746 | | | | 11,988 | |
Helen of Troy Ltd. (Bermuda) | | * | | | 3,893 | | | | 119,515 | |
Hooker Furniture Corp. | | | | | 3,953 | | | | 45,341 | |
Hovnanian Enterprises, Inc., Class A | | *† | | | 48,421 | | | | 70,210 | |
Jarden Corp. | | | | | 13,859 | | | | 414,107 | |
KB Home | | † | | | 20,796 | | | | 139,749 | |
Kid Brands, Inc. | | * | | | 1,157 | | | | 3,656 | |
La-Z-Boy, Inc. | | * | | | 13,087 | | | | 155,735 | |
M/I Homes, Inc. | | * | | | 1,741 | | | | 16,714 | |
MDC Holdings, Inc. | | | | | 5,581 | | | | 98,393 | |
Meritage Homes Corp. | | * | | | 4,845 | | | | 112,355 | |
Mohawk Industries, Inc. | | * | | | 6,587 | | | | 394,232 | |
NVR, Inc. | | * | | | 724 | | | | 496,664 | |
Ryland Group, Inc. (The) | | | | | 13,131 | | | | 206,945 | |
Sealy Corp. | | *† | | | 6,171 | | | | 10,614 | |
Skyline Corp. | | | | | 918 | | | | 3,993 | |
Standard Pacific Corp. | | *† | | | 29,234 | | | | 92,964 | |
Tempur-Pedic International, Inc. | | *† | | | 7,158 | | | | 376,010 | |
Toll Brothers, Inc. | | * | | | 13,312 | | | | 271,831 | |
Tupperware Brands Corp. | | | | | 8,397 | | | | 469,980 | |
Universal Electronics, Inc. | | * | | | 3,125 | | | | 52,719 | |
| | | | | | | | | | | | |
| | | | | | | | | 3,968,224 | |
| | | | | | | | | | | | |
| Household Products—0.5% | |
Central Garden and Pet Co., Class A | | * | | | 2,770 | | | | 23,047 | |
Church & Dwight Co., Inc. | | | | | 23,288 | | | | 1,065,659 | |
Energizer Holdings, Inc. | | * | | | 10,457 | | | | 810,208 | |
WD-40 Co. | | | | | 2,756 | | | | 111,370 | |
| | | | | | | | | | | | |
| | | | | | | | | 2,010,284 | |
| | | | | | | | | | | | |
| Independent Power Producers & Energy Traders—0.4% | |
Calpine Corp. | | * | | | 75,224 | | | | 1,228,408 | |
Dynegy, Inc. | | * | | | 14,760 | | | | 40,885 | |
Genie Energy Ltd., Class B | | | | | 2,274 | | | | 18,033 | |
GenOn Energy, Inc. | | * | | | 76,798 | | | | 200,443 | |
Ormat Technologies, Inc. | | † | | | 9,093 | | | | 163,947 | |
Tegal Corp. | | * | | | 62 | | | | 207 | |
| | | | | | | | | | | | |
| | | | | | | | | 1,651,923 | |
| | | | | | | | | | | | |
| Industrial Conglomerates—0.2% | |
Carlisle Cos., Inc. | | | | | 9,558 | | | | 423,419 | |
Raven Industries, Inc. | | | | | 5,412 | | | | 335,003 | |
Seaboard Corp. | | * | | | 43 | | | | 87,548 | |
Standex International Corp. | | | | | 1,584 | | | | 54,125 | |
| | | | | | | | | | | | |
| | | | | | | | | 900,095 | |
| | | | | | | | | | | | |
| Insurance—4.5% | |
Alleghany Corp. | | *† | | | 565 | | | | 161,189 | |
Allied World Assurance Co. Holdings AG (Switzerland) | | | | | 7,319 | | | | 460,585 | |
Alterra Capital Holdings Ltd. (Bermuda) | | | | | 13,003 | | | | 307,261 | |
American Financial Group, Inc. | | | | | 19,300 | | | | 711,977 | |
American National Insurance Co. | | | | | 3,374 | | | | 246,403 | |
American Safety Insurance Holdings Ltd. | | * | | | 8,481 | | | | 184,462 | |
| | | | | | | | | | | | |
| | | |
| | | | Shares | | | | Value | |
| | | | | | | | | | | | |
AMERISAFE, Inc. | | * | | | 5,765 | | | $ | 134,036 | |
Amtrust Financial Services, Inc. | | | | | 10,931 | | | | 259,611 | |
Arch Capital Group Ltd. (Bermuda) | | * | | | 21,151 | | | | 787,452 | |
Argo Group International Holdings Ltd. (Bermuda) | | | | | 3,031 | | | | 87,778 | |
Arthur J. Gallagher & Co. | | | | | 19,079 | | | | 638,002 | |
Aspen Insurance Holdings Ltd. (Bermuda) | | | | | 16,805 | | | | 445,332 | |
Assured Guaranty Ltd. (Bermuda) | | | | | 15,420 | | | | 202,619 | |
Axis Capital Holdings Ltd. (Bermuda) | | | | | 23,436 | | | | 749,015 | |
Baldwin & Lyons, Inc., Class B | | | | | 1,316 | | | | 28,689 | |
Brown & Brown, Inc. | | | | | 22,389 | | | | 506,663 | |
Citizens, Inc. | | * | | | 28,808 | | | | 279,150 | |
CNA Financial Corp. | | | | | 8,930 | | | | 238,877 | |
CNO Financial Group, Inc. | | * | | | 33,835 | | | | 213,499 | |
Crawford & Co., Class B | | | | | 3,543 | | | | 21,825 | |
Delphi Financial Group, Inc., Class A | | | | | 5,179 | | | | 229,430 | |
eHealth, Inc. | | * | | | 9,146 | | | | 134,446 | |
EMC Insurance Group, Inc. | | | | | 1,041 | | | | 21,413 | |
Employers Holdings, Inc. | | | | | 8,216 | | | | 148,627 | |
Endurance Specialty Holdings Ltd. (Bermuda) | | | | | 9,153 | | | | 350,102 | |
Enstar Group Ltd. (Bermuda) | | * | | | 626 | | | | 61,473 | |
Erie Indemnity Co., Class A | | | | | 3,864 | | | | 302,010 | |
Everest Re Group Ltd. (Bermuda) | | | | | 7,051 | | | | 592,919 | |
FBL Financial Group, Inc., Class A | | | | | 2,268 | | | | 77,157 | |
Fidelity National Financial, Inc., Class A | | | | | 32,112 | | | | 511,544 | |
First American Financial Corp. | | | | | 13,864 | | | | 175,657 | |
Flagstone Reinsurance Holdings SA (Luxembourg) | | | | | 11,279 | | | | 93,503 | |
Greenlight Capital Re Ltd., Class A (Cayman Islands) | | * | | | 4,754 | | | | 112,527 | |
Hanover Insurance Group, Inc. (The) | | | | | 4,762 | | | | 166,432 | |
Harleysville Group, Inc. | | | | | 1,963 | | | | 111,047 | |
HCC Insurance Holdings, Inc. | | | | | 18,265 | | | | 502,288 | |
Hilltop Holdings, Inc. | | * | | | 18,258 | | | | 154,280 | |
Horace Mann Educators Corp. | | | | | 11,211 | | | | 153,703 | |
Independence Holding Co. | | † | | | 5,932 | | | | 48,227 | |
Infinity Property & Casualty Corp. | | | | | 1,280 | | | | 72,627 | |
Kansas City Life Insurance Co. | | † | | | 1,203 | | | | 39,482 | |
Kemper Corp. | | | | | 11,715 | | | | 342,195 | |
Markel Corp. | | * | | | 1,119 | | | | 464,016 | |
MBIA, Inc. | | *† | | | 12,247 | | | | 141,943 | |
Meadowbrook Insurance Group, Inc. | | | | | 24,397 | | | | 260,560 | |
Mercury General Corp. | | | | | 5,146 | | | | 234,761 | |
Montpelier Re Holdings Ltd. (Bermuda) | | | | | 15,659 | | | | 277,947 | |
National Financial Partners Corp. | | *† | | | 9,598 | | | | 129,765 | |
Navigators Group, Inc. (The) | | * | | | 1,745 | | | | 83,202 | |
Old Republic International Corp. | | | | | 33,631 | | | | 311,759 | |
OneBeacon Insurance Group Ltd., Class A | | | | | 6,290 | | | | 96,803 | |
See accompanying notes to financial statements.
299
SCHEDULE OF INVESTMENTS—(Continued)
December 31, 2011
| | | | | | | | | | | | |
| Vantagepoint Mid/Small Company Index Fund | | | Shares | | | | Value | |
| | | | | | | | | | | | |
| COMMON STOCKS—(Continued) | |
PartnerRe Ltd. (Bermuda) | | | | | 9,324 | | | $ | 598,694 | |
Phoenix Cos., Inc. (The) | | *† | | | 29,424 | | | | 49,432 | |
Platinum Underwriters Holdings Ltd. (Bermuda) | | | | | 10,542 | | | | 359,588 | |
Presidential Life Corp. | | | | | 2,568 | | | | 25,654 | |
ProAssurance Corp. | | | | | 3,102 | | | | 247,602 | |
Protective Life Corp. | | | | | 9,843 | | | | 222,058 | |
Reinsurance Group of America, Inc. | | | | | 11,745 | | | | 613,676 | |
RenaissanceRe Holdings Ltd. (Bermuda) | | | | | 6,822 | | | | 507,352 | |
RLI Corp. | | † | | | 1,980 | | | | 144,263 | |
Safety Insurance Group, Inc. | | | | | 1,536 | | | | 62,177 | |
SeaBright Holdings, Inc. | | | | | 3,141 | | | | 24,029 | |
Selective Insurance Group, Inc. | | | | | 9,573 | | | | 169,729 | |
StanCorp Financial Group, Inc. | | | | | 9,728 | | | | 357,504 | |
State Auto Financial Corp. | | | | | 2,585 | | | | 35,130 | |
Stewart Information Services Corp. | | | | | 1,684 | | | | 19,450 | |
Symetra Financial Corp. | | | | | 15,274 | | | | 138,535 | |
Tower Group, Inc. | | | | | 3,847 | | | | 77,594 | |
Transatlantic Holdings, Inc. | | | | | 4,297 | | | | 235,175 | |
United Fire & Casualty Co. | | | | | 2,592 | | | | 52,307 | |
Validus Holdings Ltd. (Bermuda) | | | | | 14,426 | | | | 454,419 | |
W.R. Berkley Corp. | | | | | 22,306 | | | | 767,103 | |
White Mountains Insurance Group Ltd. | | | | | 706 | | | | 320,143 | |
| | | | | | | | | | | | |
| | | | | | | | | 18,547,884 | |
| | | | | | | | | | | | |
| Internet & Catalog Retail—0.5% | |
1-800-Flowers.com, Inc., Class A | | * | | | 2,113 | | | | 4,648 | |
Blue Nile, Inc. | | *† | | | 2,444 | | | | 99,911 | |
dELiA*s, Inc. | | * | | | 2,555 | | | | 2,606 | |
Geeknet, Inc. | | * | | | 661 | | | | 11,270 | |
Groupon, Inc., Class A | | *† | | | 5,455 | | | | 112,536 | |
Hollywood Media Corp. | | * | | | 10,671 | | | | 13,552 | |
HSN, Inc. | | | | | 5,319 | | | | 192,867 | |
Liberty Interactive Corp., Series A | | * | | | 77,943 | | | | 1,263,846 | |
Nutrisystem, Inc. | | † | | | 5,029 | | | | 65,025 | |
Overstock.com, Inc. | | * | | | 3,326 | | | | 26,076 | |
Shutterfly, Inc. | | *† | | | 8,472 | | | | 192,823 | |
Valuevision Media, Inc., Class A | | * | | | 6,193 | | | | 11,643 | |
| | | | | | | | | | | | |
| | | | | | | | | 1,996,803 | |
| | | | | | | | | | | | |
| Internet Software & Services—1.4% | |
AOL, Inc. | | * | | | 14,126 | | | | 213,303 | |
Autobytel, Inc. | | * | | | 4,755 | | | | 3,328 | |
comScore, Inc. | | * | | | 2,914 | | | | 61,777 | |
Constant Contact, Inc. | | *† | | | 8,587 | | | | 199,304 | |
Crexendo, Inc. | | † | | | 1,043 | | | | 2,952 | |
DealerTrack Holdings, Inc. | | * | | | 4,113 | | | | 112,120 | |
Digital River, Inc. | | * | | | 5,786 | | | | 86,906 | |
Earthlink, Inc. | | | | | 42,332 | | | | 272,618 | |
Equinix, Inc. | | * | | | 5,548 | | | | 562,567 | |
IAC/InterActiveCorp | | | | | 15,997 | | | | 681,472 | |
InfoSpace, Inc. | | * | | | 11,869 | | | | 130,440 | |
Internap Network Services Corp. | | * | | | 12,216 | | | | 72,563 | |
Ipass, Inc. | | *† | | | 6,163 | | | | 8,567 | |
| | | | | | | | | | | | |
| | | |
| | | | Shares | | | | Value | |
| | | | | | | | | | | | |
j2 Global, Inc. | | † | | | 5,821 | | | $ | 163,803 | |
Keynote Systems, Inc. | | | | | 3,262 | | | | 67,001 | |
Limelight Networks, Inc. | | * | | | 3,711 | | | | 10,985 | |
LinkedIn Corp., Class A | | *† | | | 1,220 | | | | 76,872 | |
LivePerson, Inc. | | * | | | 6,309 | | | | 79,178 | |
LogMeIn, Inc. | | *† | | | 6,170 | | | | 237,853 | |
Looksmart Ltd. | | * | | | 4,010 | | | | 5,173 | |
LoopNet, Inc. | | * | | | 13,367 | | | | 244,349 | |
Marchex, Inc., Class B | | † | | | 2,710 | | | | 16,937 | |
Move, Inc. | | * | | | 14,314 | | | | 90,464 | |
NIC, Inc. | | | | | 10,696 | | | | 142,364 | |
OpenTable, Inc. | | *† | | | 4,703 | | | | 184,028 | |
Openwave Systems, Inc. | | * | | | 21,687 | | | | 34,265 | |
Perficient, Inc. | | * | | | 2,090 | | | | 20,921 | |
Rackspace Hosting, Inc. | | *† | | | 12,978 | | | | 558,184 | |
RealNetworks, Inc. | | † | | | 2,695 | | | | 20,213 | |
RightNow Technologies, Inc. | | * | | | 8,593 | | | | 367,179 | |
Saba Software, Inc. | | *† | | | 3,576 | | | | 28,215 | |
Stamps.com, Inc. | | * | | | 3,772 | | | | 98,562 | |
support.com, Inc. | | * | | | 4,962 | | | | 11,165 | |
United Online, Inc. | | | | | 18,915 | | | | 102,898 | |
ValueClick, Inc. | | * | | | 13,525 | | | | 220,322 | |
Vertro, Inc. | | * | | | 1,316 | | | | 1,355 | |
Vocus, Inc. | | * | | | 2,731 | | | | 60,328 | |
Web.com Group, Inc. | | * | | | 1,785 | | | | 20,438 | |
WebMD Health Corp. | | * | | | 6,687 | | | | 251,097 | |
WebMediaBrands, Inc. | | * | | | 4,020 | | | | 1,829 | |
XO Group, Inc. | | * | | | 3,458 | | | | 28,840 | |
Zix Corp. | | * | | | 18,330 | | | | 51,691 | |
| | | | | | | | | | | | |
| | | | | | | | | 5,604,426 | |
| | | | | | | | | | | | |
| IT Services—2.0% | |
Acxiom Corp. | | * | | | 9,001 | | | | 109,902 | |
Alliance Data Systems Corp. | | * | | | 7,049 | | | | 731,968 | |
Broadridge Financial Solutions, Inc. | | | | | 24,753 | | | | 558,180 | |
CACI International, Inc., Class A | | * | | | 4,046 | | | | 226,252 | |
Cass Information Systems, Inc. | | † | | | 1,334 | | | | 48,541 | |
Ciber, Inc. | | * | | | 14,012 | | | | 54,086 | |
Convergys Corp. | | * | | | 30,359 | | | | 387,684 | |
CoreLogic, Inc. | | * | | | 15,057 | | | | 194,687 | |
CSG Systems International, Inc. | | * | | | 3,644 | | | | 53,603 | |
DST Systems, Inc. | | | | | 9,362 | | | | 426,158 | |
Edgewater Technology, Inc. | | * | | | 2,568 | | | | 7,062 | |
Euronet Worldwide, Inc. | | * | | | 6,728 | | | | 124,333 | |
Forrester Research, Inc. | | * | | | 1,573 | | | | 53,388 | |
Gartner, Inc. | | * | | | 18,144 | | | | 630,867 | |
Genpact Ltd. (Bermuda) | | * | | | 33,812 | | | | 505,489 | |
Global Cash Access Holdings, Inc. | | * | | | 27,153 | | | | 120,831 | |
Global Payments, Inc. | | | | | 12,347 | | | | 585,001 | |
Hackett Group, Inc. (The) | | * | | | 7,902 | | | | 29,554 | |
Heartland Payment Systems, Inc. | | | | | 6,660 | | | | 162,238 | |
Higher One Holdings, Inc. | | *† | | | 896 | | | | 16,522 | |
iGATE Corp. | | * | | | 2,997 | | | | 47,143 | |
Jack Henry & Associates, Inc. | | | | | 12,750 | | | | 428,528 | |
Lender Processing Services, Inc. | | | | | 11,943 | | | | 179,981 | |
Lionbridge Technologies, Inc. | | * | | | 18,369 | | | | 42,065 | |
Management Network Group, Inc. | | * | | | 320 | | | | 486 | |
Mantech International Corp., Class A | | | | | 3,037 | | | | 94,876 | |
See accompanying notes to financial statements.
300
SCHEDULE OF INVESTMENTS—(Continued)
December 31, 2011
| | | | | | | | | | | | |
| Vantagepoint Mid/Small Company Index Fund | | | Shares | | | | Value | |
| | | | | | | | | | | | |
| COMMON STOCKS—(Continued) | |
MAXIMUS, Inc. | | | | | 4,986 | | | $ | 206,171 | |
ModusLink Global Solutions, Inc. | | | | | 3,461 | | | | 18,689 | |
MoneyGram International, Inc. | | * | | | 3,640 | | | | 64,610 | |
NCI, Inc., Class A | | *† | | | 1,956 | | | | 22,787 | |
NeuStar, Inc., Class A | | * | | | 16,328 | | | | 557,928 | |
Online Resources Corp. | | * | | | 2,780 | | | | 6,728 | |
Pfsweb, Inc. | | * | | | 1,209 | | | | 3,978 | |
Sapient Corp. | | | | | 25,306 | | | | 318,856 | |
StarTek, Inc. | | * | | | 1,875 | | | | 3,600 | |
Syntel, Inc. | | | | | 3,095 | | | | 144,753 | |
TeleTech Holdings, Inc. | | * | | | 4,611 | | | | 74,698 | |
TNS, Inc. | | * | | | 6,651 | | | | 117,856 | |
Unisys Corp. | | * | | | 7,450 | | | | 146,840 | |
VeriFone Systems, Inc. | | * | | | 12,855 | | | | 456,610 | |
Wright Express Corp. | | * | | | 4,601 | | | | 249,742 | |
| | | | | | | | | | | | |
| | | | | | | | | 8,213,271 | |
| | | | | | | | | | | | |
| Leisure Equipment & Products—0.3% | |
Arctic Cat, Inc. | | * | | | 1,738 | | | | 39,192 | |
Brunswick Corp. | | | | | 10,281 | | | | 185,675 | |
Callaway Golf Co. | | † | | | 18,335 | | | | 101,393 | |
Eastman Kodak Co. | | *† | | | 13,983 | | | | 9,082 | |
Jakks Pacific, Inc. | | | | | 3,922 | | | | 55,339 | |
Leapfrog Enterprises, Inc. | | * | | | 19,865 | | | | 111,045 | |
Nautilus, Inc. | | * | | | 2,480 | | | | 4,340 | |
Polaris Industries, Inc. | | | | | 7,116 | | | | 398,354 | |
Smith & Wesson Holding Corp. | | * | | | 46,824 | | | | 204,153 | |
Steinway Musical Instruments, Inc. | | * | | | 1,536 | | | | 38,461 | |
Sturm Ruger & Co., Inc. | | | | | 2,146 | | | | 71,805 | |
| | | | | | | | | | | | |
| | | | | | | | | 1,218,839 | |
| | | | | | | | | | | | |
| Life Sciences Tools & Services—0.8% | |
Affymetrix, Inc. | | * | | | 21,563 | | | | 88,193 | |
Albany Molecular Research, Inc. | | * | | | 2,944 | | | | 8,626 | |
Bio-Rad Laboratories, Inc., Class A | | * | | | 2,830 | | | | 271,793 | |
Bruker Corp. | | * | | | 19,689 | | | | 244,537 | |
Cambrex Corp. | | * | | | 2,958 | | | | 21,238 | |
Charles River Laboratories International, Inc. | | * | | | 11,766 | | | | 321,565 | |
Covance, Inc. | | * | | | 7,186 | | | | 328,544 | |
Enzo Biochem, Inc. | | * | | | 6,306 | | | | 14,125 | |
eResearchTechnology, Inc. | | * | | | 6,233 | | | | 29,233 | |
Furiex Pharmaceuticals, Inc. | | * | | | 1,473 | | | | 24,614 | |
Illumina, Inc. | | * | | | 23,166 | | | | 706,100 | |
Luminex Corp. | | * | | | 4,012 | | | | 85,175 | |
Mettler-Toledo International, Inc. | | * | | | 3,252 | | | | 480,353 | |
PAREXEL International Corp. | | * | | | 8,690 | | | | 180,231 | |
Sequenom, Inc. | | *† | | | 27,582 | | | | 122,740 | |
Techne Corp. | | | | | 4,152 | | | | 283,415 | |
| | | | | | | | | | | | |
| | | | | | | | | 3,210,482 | |
| | | | | | | | | | | | |
| Machinery—3.9% | |
Actuant Corp., Class A | | | | | 12,782 | | | | 290,024 | |
AGCO Corp. | | * | | | 12,948 | | | | 556,376 | |
Albany International Corp., Class A | | | | | 5,145 | | | | 118,952 | |
Ampco-Pittsburgh Corp. | | | | | 986 | | | | 19,069 | |
| | | | | | | | | | | | |
| | | |
| | | | Shares | | | | Value | |
| | | | | | | | | | | | |
Astec Industries, Inc. | | * | | | 1,849 | | | $ | 59,556 | |
Barnes Group, Inc. | | | | | 11,835 | | | | 285,342 | |
Blount International, Inc. | | * | | | 10,859 | | | | 157,673 | |
Briggs & Stratton Corp. | | | | | 9,174 | | | | 142,105 | |
Cascade Corp. | | | | | 779 | | | | 36,745 | |
Chart Industries, Inc. | | * | | | 2,690 | | | | 145,448 | |
CIRCOR International, Inc. | | | | | 1,935 | | | | 68,325 | |
CLARCOR, Inc. | | | | | 11,689 | | | | 584,333 | |
Colfax Corp. | | *† | | | 7,548 | | | | 214,967 | |
Columbus McKinnon Corp. | | * | | | 4,765 | | | | 60,468 | |
Commercial Vehicle Group, Inc. | | * | | | 6,660 | | | | 60,206 | |
Crane Co. | | | | | 12,831 | | | | 599,336 | |
Donaldson Co., Inc. | | | | | 13,187 | | | | 897,771 | |
Dynamic Materials Corp. | | † | | | 9,575 | | | | 189,394 | |
EnPro Industries, Inc. | | * | | | 5,844 | | | | 192,735 | |
ESCO Technologies, Inc. | | | | | 2,714 | | | | 78,109 | |
Federal Signal Corp. | | * | | | 19,708 | | | | 81,788 | |
Flow International Corp. | | *† | | | 9,896 | | | | 34,636 | |
FreightCar America, Inc. | | * | | | 2,798 | | | | 58,618 | |
Gardner Denver, Inc. | | | | | 9,936 | | | | 765,668 | |
Gorman-Rupp Co. (The) | | | | | 2,362 | | | | 64,128 | |
Graco, Inc. | | | | | 13,302 | | | | 543,919 | |
Graham Corp. | | | | | 882 | | | | 19,792 | |
Greenbrier Cos., Inc. | | * | | | 1,812 | | | | 43,995 | |
Harsco Corp. | | | | | 14,896 | | | | 306,560 | |
Hurco Cos., Inc. | | * | | | 1,248 | | | | 26,208 | |
IDEX Corp. | | | | | 15,415 | | | | 572,051 | |
ITT Corp. | | | | | 14,806 | | | | 286,200 | |
John Bean Technologies Corp. | | | | | 5,724 | | | | 87,978 | |
Kadant, Inc. | | * | | | 1,553 | | | | 35,113 | |
Kaydon Corp. | | | | | 6,909 | | | | 210,725 | |
Kennametal, Inc. | | | | | 13,046 | | | | 476,440 | |
L.B. Foster Co., Class A | | | | | 951 | | | | 26,904 | |
Lincoln Electric Holdings, Inc. | | | | | 10,014 | | | | 391,748 | |
Lindsay Corp. | | | | | 969 | | | | 53,188 | |
Lydall, Inc. | | * | | | 2,150 | | | | 20,403 | |
Manitowoc Co., Inc. (The) | | | | | 19,361 | | | | 177,928 | |
Meritor, Inc. | | * | | | 20,436 | | | | 108,720 | |
Middleby Corp. | | * | | | 2,361 | | | | 222,028 | |
Mueller Industries, Inc. | | | | | 5,751 | | | | 220,953 | |
Mueller Water Products, Inc., Class A | | † | | | 30,046 | | | | 73,312 | |
NACCO Industries, Inc., Class A | | | | | 310 | | | | 27,658 | |
Navistar International Corp. | | * | | | 7,196 | | | | 272,584 | |
NN, Inc. | | * | | | 6,804 | | | | 40,824 | |
Nordson Corp. | | | | | 7,420 | | | | 305,556 | |
Oshkosh Corp. | | * | | | 13,390 | | | | 286,278 | |
Pentair, Inc. | | | | | 16,606 | | | | 552,814 | |
RBC Bearings, Inc. | | * | | | 6,724 | | | | 280,391 | |
Robbins & Myers, Inc. | | | | | 7,886 | | | | 382,865 | |
Sauer-Danfoss, Inc. | | * | | | 5,746 | | | | 208,063 | |
SPX Corp. | | | | | 5,152 | | | | 310,511 | |
Tecumseh Products Co., Class A | | *† | | | 1,703 | | | | 8,004 | |
Tennant Co. | | † | | | 1,394 | | | | 54,185 | |
Terex Corp. | | * | | | 22,188 | | | | 299,760 | |
Timken Co. | | | | | 14,936 | | | | 578,173 | |
Titan International, Inc. | | | | | 9,793 | | | | 190,572 | |
Toro Co. (The) | | | | | 5,158 | | | | 312,884 | |
Trinity Industries, Inc. | | | | | 7,537 | | | | 226,562 | |
Valmont Industries, Inc. | | | | | 3,340 | | | | 303,239 | |
Wabash National Corp. | | * | | | 10,878 | | | | 85,284 | |
See accompanying notes to financial statements.
301
SCHEDULE OF INVESTMENTS—(Continued)
December 31, 2011
| | | | | | | | | | | | |
| Vantagepoint Mid/Small Company Index Fund | | | Shares | | | | Value | |
| | | | | | | | | | | | |
| COMMON STOCKS—(Continued) | |
WABCO Holdings, Inc. | | * | | | 11,505 | | | $ | 499,317 | |
Wabtec Corp. | | | | | 9,239 | | | | 646,268 | |
Watts Water Technologies, Inc., Class A | | | | | 6,104 | | | | 208,818 | |
Woodward, Inc. | | | | | 6,281 | | | | 257,081 | |
| | | | | | | | | | | | |
| | | | | | | | | 16,003,628 | |
| | | | | | | | | | | | |
| Marine—0.2% | |
Alexander & Baldwin, Inc. | | | | | 4,742 | | | | 193,568 | |
Eagle Bulk Shipping, Inc. | | *† | | | 41,794 | | | | 39,374 | |
Excel Maritime Carriers Ltd. (Greece) | | *† | | | 20,382 | | | | 29,554 | |
Genco Shipping & Trading Ltd. | | *† | | | 24,517 | | | | 165,735 | |
International Shipholding Corp. | | † | | | 724 | | | | 13,532 | |
Kirby Corp. | | * | | | 8,425 | | | | 554,702 | |
| | | | | | | | | | | | |
| | | | | | | | | | | 996,465 | |
| | | | | | | | | | | | |
| Media—2.6% | |
A.H. Belo Corp., Class A | | | | | 3,861 | | | | 18,340 | |
AMC Networks, Inc., Class A | | * | | | 11,748 | | | | 441,490 | |
Arbitron, Inc. | | | | | 3,649 | | | | 125,562 | |
Belo Corp., Class A | | | | | 21,860 | | | | 137,718 | |
Carmike Cinemas, Inc. | | * | | | 6,117 | | | | 42,085 | |
Charter Communications, Inc., Class A | | * | | | 7,269 | | | | 413,897 | |
Cinemark Holdings, Inc. | | | | | 14,316 | | | | 264,703 | |
Clear Channel Outdoor Holdings, Inc., Class A | | * | | | 16,925 | | | | 212,409 | |
Crown Media Holdings, Inc., Class A | | *† | | | 4,399 | | | | 5,323 | |
Cumulus Media, Inc., Class A | | * | | | 13,454 | | | | 44,936 | |
Digital Generation, Inc. | | * | | | 2,455 | | | | 29,264 | |
DISH Network Corp., Class A | | | | | 34,076 | | | | 970,484 | |
DreamWorks Animation SKG, Inc., Class A | | *† | | | 11,561 | | | | 191,855 | |
E.W. Scripps Co., (The), Class A | | * | | | 13,465 | | | | 107,855 | |
Emmis Communications Corp., Class A | | * | | | 4,461 | | | | 2,944 | |
Entercom Communications Corp., Class A | | * | | | 1,873 | | | | 11,519 | |
Entravision Communications Corp., Class A | | | | | 4,930 | | | | 7,691 | |
Gray Television, Inc. | | * | | | 3,878 | | | | 6,282 | |
Harris Interactive, Inc. | | * | | | 6,590 | | | | 3,685 | |
Harte-Hanks, Inc. | | | | | 4,646 | | | | 42,232 | |
John Wiley & Sons, Inc., Class A | | | | | 5,504 | | | | 244,378 | |
Journal Communications, Inc., Class A | | * | | | 3,220 | | | | 14,168 | |
Lamar Advertising Co., Class A | | * | | | 8,776 | | | | 241,340 | |
Liberty Global, Inc., Series A | | * | | | 24,077 | | | | 987,879 | |
Liberty Media Corp.—Liberty Capital, Class A | | * | | | 18,645 | | | | 1,455,242 | |
LIN TV Corp., Class A | | * | | | 2,390 | | | | 10,110 | |
Live Nation Entertainment, Inc. | | * | | | 27,818 | | | | 231,168 | |
Madison Square Garden Co. (The), Class A | | * | | | 14,922 | | | | 427,366 | |
Martha Stewart Living Omnimedia, Class A | | † | | | 20,003 | | | | 88,013 | |
McClatchy Co. (The), Class A | | *† | | | 3,506 | | | | 8,379 | |
Media General, Inc., Class A | | *† | | | 1,595 | | | | 6,492 | |
| | | | | | | | | | | | |
| | | |
| | | | Shares | | | | Value | |
| | | | | | | | | | | | |
Meredith Corp. | | † | | | 8,290 | | | $ | 270,669 | |
Morningstar, Inc. | | | | | 5,535 | | | | 329,056 | |
National CineMedia, Inc. | | | | | 13,811 | | | | 171,256 | |
Navarre Corp. | | * | | | 6,720 | | | | 10,349 | |
New Frontier Media, Inc. | | * | | | 6,104 | | | | 6,348 | |
New York Times Co. (The), Class A | | *† | | | 11,654 | | | | 90,085 | |
Radio Unica Communications Corp. | | *‡d | | | 1,900 | | | | — | |
Regal Entertainment Group, Class A | | † | | | 22,336 | | | | 266,692 | |
Salem Communications Corp., Class A | | * | | | 850 | | | | 2,184 | |
Scholastic Corp. | | † | | | 2,095 | | | | 62,787 | |
Sinclair Broadcast Group, Inc., Class A | | | | | 7,563 | | | | 85,689 | |
Sirius XM Radio, Inc. | | *† | | | 676,489 | | | | 1,231,210 | |
Valassis Communications, Inc. | | * | | | 8,118 | | | | 156,109 | |
Value Line, Inc. | | † | | | 573 | | | | 5,890 | |
Virgin Media, Inc. | | | | | 43,275 | | | | 925,219 | |
World Wrestling Entertainment, Inc., Class A | | † | | | 4,170 | | | | 38,864 | |
| | | | | | | | | | | | |
| | | | | | | | | | | 10,447,216 | |
| | | | | | | | | | | | |
| Metals & Mining—1.7% | |
Allied Nevada Gold Corp. | | * | | | 16,240 | | | | 491,747 | |
AMCOL International Corp. | | | | | 2,631 | | | | 70,642 | |
Carpenter Technology Corp. | | | | | 4,339 | | | | 223,372 | |
Century Aluminum Co. | | * | | | 15,081 | | | | 128,339 | |
Coeur d’Alene Mines Corp. | | * | | | 19,535 | | | | 471,575 | |
Commercial Metals Co. | | | | | 11,670 | | | | 161,396 | |
Compass Minerals International, Inc. | | | | | 3,923 | | | | 270,099 | |
Globe Specialty Metals, Inc. | | | | | 11,348 | | | | 151,950 | |
Haynes International, Inc. | | | | | 1,057 | | | | 57,712 | |
Hecla Mining Co. | | | | | 44,607 | | | | 233,295 | |
Horsehead Holding Corp. | | * | | | 13,896 | | | | 125,203 | |
Kaiser Aluminum Corp. | | | | | 2,084 | | | | 95,614 | |
Materion Corp. | | * | | | 2,925 | | | | 71,019 | |
Molycorp, Inc. | | *† | | | 11,171 | | | | 267,881 | |
Olympic Steel, Inc. | | | | | 3,361 | | | | 78,378 | |
Reliance Steel & Aluminum Co. | | | | | 9,657 | | | | 470,199 | |
Royal Gold, Inc. | | | | | 8,379 | | | | 564,996 | |
RTI International Metals, Inc. | | * | | | 3,141 | | | | 72,903 | |
Schnitzer Steel Industries, Inc., Class A | | | | | 2,485 | | | | 105,066 | |
Southern Copper Corp. | | | | | 34,877 | | | | 1,052,588 | |
Steel Dynamics, Inc. | | | | | 48,394 | | | | 636,381 | |
Stillwater Mining Co. | | * | | | 15,722 | | | | 164,452 | |
Universal Stainless & Alloy Products, Inc. | | * | | | 2,058 | | | | 76,887 | |
Walter Energy, Inc. | | | | | 9,631 | | | | 583,253 | |
Worthington Industries, Inc. | | | | | 8,883 | | | | 145,503 | |
| | | | | | | | | | | | |
| | | | | | | | | | | 6,770,450 | |
| | | | | | | | | | | | |
| Multiline Retail—0.3% | |
99 Cents Only Stores | | * | | | 11,763 | | | | 258,198 | |
Dillard’s, Inc., Class A | | † | | | 6,475 | | | | 290,598 | |
Dollar General Corp. | | * | | | 7,288 | | | | 299,828 | |
Fred’s, Inc., Class A | | † | | | 5,995 | | | | 87,407 | |
Saks, Inc. | | *† | | | 24,378 | | | | 237,686 | |
Tuesday Morning Corp. | | * | | | 1,816 | | | | 6,265 | |
| | | | | | | | | | | | |
| | | | | | | | | | | 1,179,982 | |
| | | | | | | | | | | | |
See accompanying notes to financial statements.
302
SCHEDULE OF INVESTMENTS—(Continued)
December 31, 2011
| | | | | | | | | | | | |
| Vantagepoint Mid/Small Company Index Fund | | | Shares | | | | Value | |
| | | | | | | | | | | | |
| COMMON STOCKS—(Continued) | |
| Multi-Utilities—1.2% | |
Alliant Energy Corp. | | | | | 16,688 | | | $ | 736,108 | |
Avista Corp. | | | | | 12,443 | | | | 320,407 | |
Black Hills Corp. | | | | | 8,743 | | | | 293,590 | |
CH Energy Group, Inc. | | | | | 1,512 | | | | 88,271 | |
MDU Resources Group, Inc. | | | | | 38,677 | | | | 830,008 | |
NorthWestern Corp. | | | | | 9,001 | | | | 322,146 | |
NSTAR | | | | | 18,989 | | | | 891,723 | |
OGE Energy Corp. | | | | | 12,977 | | | | 735,926 | |
Vectren Corp. | | | | | 16,240 | | | | 490,935 | |
| | | | | | | | | | | | |
| | | | | | | | | | | 4,709,114 | |
| | | | | | | | | | | | |
| Office Electronics—0.1% | |
Zebra Technologies Corp., Class A | | * | | | 7,185 | | | | 257,079 | |
| | | | | | | | | | | | |
| Oil, Gas & Consumable Fuels—5.3% | |
Abraxas Petroleum Corp. | | *† | | | 30,906 | | | | 101,990 | |
Adams Resources & Energy, Inc. | | | | | 1,462 | | | | 42,369 | |
Apco Oil and Gas International, Inc. | | | | | 2,488 | | | | 203,319 | |
Approach Resources, Inc. | | * | | | 11,314 | | | | 332,745 | |
Arch Coal, Inc. | | | | | 39,295 | | | | 570,170 | |
ATP Oil & Gas Corp. | | *† | | | 8,607 | | | | 63,348 | |
Berry Petroleum Co., Class A | | | | | 6,599 | | | | 277,290 | |
Bill Barrett Corp. | | * | | | 5,963 | | | | 203,159 | |
Blue Dolphin Energy Co. | | *† | | | 521 | | | | 2,183 | |
BP Prudhoe Bay Royalty Trust | | | | | 2,101 | | | | 239,430 | |
BPZ Resources, Inc. | | *† | | | 15,708 | | | | 44,611 | |
Callon Petroleum Co. | | *† | | | 20,318 | | | | 100,980 | |
Carrizo Oil & Gas, Inc. | | * | | | 8,019 | | | | 211,301 | |
Cheniere Energy, Inc. | | *† | | | 12,363 | | | | 107,434 | |
Cimarex Energy Co. | | | | | 10,870 | | | | 672,853 | |
Clayton Williams Energy, Inc. | | * | | | 1,241 | | | | 94,167 | |
Cloud Peak Energy, Inc. | | * | | | 12,175 | | | | 235,221 | |
Comstock Resources, Inc. | | *† | | | 8,107 | | | | 124,037 | |
Concho Resources, Inc. | | * | | | 14,234 | | | | 1,334,437 | |
Contango Oil & Gas Co. | | * | | | 2,731 | | | | 158,890 | |
Continental Resources, Inc. | | *† | | | 10,476 | | | | 698,854 | |
CREDO Petroleum Corp. | | * | | | 5,377 | | | | 55,383 | |
Cross Timbers Royalty Trust | | | | | 833 | | | | 40,709 | |
Crosstex Energy, Inc. | | | | | 7,011 | | | | 88,619 | |
CVR Energy, Inc. | | * | | | 15,751 | | | | 295,016 | |
DHT Holdings, Inc. (Jersey, Channel Islands) | | | | | 19,677 | | | | 14,561 | |
Energen Corp. | | | | | 12,142 | | | | 607,100 | |
Energy XXI Bermuda Ltd. (Bermuda) | | * | | | 10,852 | | | | 345,962 | |
EXCO Resources, Inc. | | | | | 39,666 | | | | 414,510 | |
Forest Oil Corp. | | * | | | 19,596 | | | | 265,526 | |
FX Energy, Inc. | | * | | | 12,608 | | | | 60,518 | |
GMX Resources, Inc. | | *† | | | 17,772 | | | | 22,215 | |
Goodrich Petroleum Corp. | | *† | | | 9,150 | | | | 125,629 | |
Gulfport Energy Corp. | | * | | | 2,712 | | | | 79,868 | |
Harvest Natural Resources, Inc. | | *† | | | 4,175 | | | | 30,812 | |
HollyFrontier Corp. | | | | | 25,820 | | | | 604,188 | |
Hugoton Royalty Trust | | | | | 8,143 | | | | 153,577 | |
James River Coal Co. | | *† | | | 10,211 | | | | 70,660 | |
Kinder Morgan, Inc. | | † | | | 117,341 | | | | 3,774,860 | |
Kodiak Oil & Gas Corp. | | *† | | | 51,668 | | | | 490,846 | |
Magnum Hunter Resources Corp. | | * | | | 29,727 | | | | 160,229 | |
| | | | | | | | | | | | |
| | | |
| | | | Shares | | | | Value | |
| | | | | | | | | | | | |
McMoRan Exploration Co. | | *† | | | 18,272 | | | $ | 265,858 | |
Northern Oil and Gas, Inc. | | *† | | | 3,099 | | | | 74,314 | |
Oasis Petroleum, Inc. | | *† | | | 6,511 | | | | 189,405 | |
Overseas Shipholding Group, Inc. | | † | | | 3,627 | | | | 39,643 | |
Pacific Ethanol, Inc. | | *† | | | 1,422 | | | | 1,507 | |
Patriot Coal Corp. | | * | | | 28,282 | | | | 239,549 | |
Penn Virginia Corp. | | | | | 4,723 | | | | 24,985 | |
Petroleum Development Corp. | | * | | | 3,828 | | | | 134,401 | |
Petroquest Energy, Inc. | | *† | | | 13,685 | | | | 90,321 | |
Plains Exploration & Production Co. | | * | | | 22,577 | | | | 829,027 | |
PostRock Energy Corp. | | * | | | 295 | | | | 829 | |
Quicksilver Resources, Inc. | | *† | | | 22,131 | | | | 148,499 | |
Rentech, Inc. | | * | | | 80,188 | | | | 105,046 | |
REX American Resources Corp. | | * | | | 1,034 | | | | 22,862 | |
Rosetta Resources, Inc. | | * | | | 8,720 | | | | 379,320 | |
SandRidge Energy, Inc. | | * | | | 63,115 | | | | 515,018 | |
SemGroup Corp., Class A | | * | | | 1,587 | | | | 41,357 | |
Ship Finance International Ltd. (Bermuda) | | † | | | 12,947 | | | | 120,925 | |
SM Energy Co. | | | | | 8,055 | | | | 588,821 | |
Southern Union Co. | | | | | 20,819 | | | | 876,688 | |
Stone Energy Corp. | | * | | | 10,027 | | | | 264,512 | |
Swift Energy Co. | | * | | | 4,183 | | | | 124,319 | |
Syntroleum Corp. | | * | | | 9,066 | | | | 8,703 | |
Teekay Corp. (Canada) | | † | | | 8,465 | | | | 226,269 | |
Tengasco, Inc. | | * | | | 9,394 | | | | 6,629 | |
Toreador Resources Corp. (France) | | * | | | 3,690 | | | | 19,004 | |
Tri-Valley Corp. | | *† | | | 10,477 | | | | 1,490 | |
Ultra Petroleum Corp. | | * | | | 27,652 | | | | 819,329 | |
Uranium Resources, Inc. | | *† | | | 5,500 | | | | 3,993 | |
USEC, Inc. | | *† | | | 30,878 | | | | 35,201 | |
Vaalco Energy, Inc. | | * | | | 28,928 | | | | 174,725 | |
Verenium Corp. | | *† | | | 149 | | | | 325 | |
W&T Offshore, Inc. | | | | | 9,297 | | | | 197,189 | |
Warren Resources, Inc. | | * | | | 8,229 | | | | 26,827 | |
Western Refining, Inc. | | * | | | 19,287 | | | | 256,324 | |
Westmoreland Coal Co. | | * | | | 2,951 | | | | 37,625 | |
Whiting Petroleum Corp. | | * | | | 15,198 | | | | 709,595 | |
World Fuel Services Corp. | | | | | 8,067 | | | | 338,653 | |
| | | | | | | | | | | | |
| | | | | | | | | | | 21,458,663 | |
| | | | | | | | | | | | |
| Paper & Forest Products—0.4% | |
Buckeye Technologies, Inc. | | | | | 10,964 | | | | 366,636 | |
Clearwater Paper Corp. | | * | | | 3,863 | | | | 137,561 | |
Deltic Timber Corp. | | | | | 1,046 | | | | 63,168 | |
Domtar Corp. (Canada) | | | | | 4,889 | | | | 390,924 | |
Louisiana-Pacific Corp. | | * | | | 14,060 | | | | 113,464 | |
Neenah Paper, Inc. | | | | | 2,110 | | | | 47,095 | |
P.H. Glatfelter Co. | | | | | 15,913 | | | | 224,692 | |
Schweitzer-Mauduit International, Inc. | | | | | 1,838 | | | | 122,154 | |
Wausau Paper Corp. | | † | | | 30,223 | | | | 249,642 | |
| | | | | | | | | | | | |
| | | | | | | | | | | 1,715,336 | |
| | | | | | | | | | | | |
| Personal Products—0.5% | |
Elizabeth Arden, Inc. | | * | | | 2,728 | | | | 101,045 | |
Herbalife Ltd. (Cayman Islands) | | | | | 17,345 | | | | 896,216 | |
Mannatech, Inc. | | * | | | 2,631 | | | | 1,079 | |
Medifast, Inc. | | *† | | | 7,859 | | | | 107,826 | |
Nu Skin Enterprises, Inc., Class A | | † | | | 11,061 | | | | 537,233 | |
See accompanying notes to financial statements.
303
SCHEDULE OF INVESTMENTS—(Continued)
December 31, 2011
| | | | | | | | | | | | |
| Vantagepoint Mid/Small Company Index Fund | | | Shares | | | | Value | |
| | | | | | | | | | | | |
| COMMON STOCKS—(Continued) | |
Prestige Brands Holdings, Inc. | | * | | | 21,896 | | | $ | 246,768 | |
Reliv International, Inc. | | | | | 3,018 | | | | 3,923 | |
USANA Health Sciences, Inc. | | *† | | | 2,706 | | | | 82,181 | |
| | | | | | | | | | | | |
| | | | | | | | | | | 1,976,271 | |
| | | | | | | | | | | | |
| Pharmaceuticals—1.0% | |
Alexza Pharmaceuticals, Inc. | | *† | | | 102,706 | | | | 85,246 | |
Auxilium Pharmaceuticals, Inc. | | * | | | 12,905 | | | | 257,197 | |
AVANIR Pharmaceuticals, Inc., Class A | | *† | | | 61,519 | | | | 126,114 | |
Cadence Pharmaceuticals, Inc. | | *† | | | 9,924 | | | | 39,200 | |
Columbia Laboratories, Inc. | | * | | | 5,940 | | | | 14,850 | |
Depomed, Inc. | | * | | | 27,228 | | | | 141,041 | |
Durect Corp. | | * | | | 7,330 | | | | 8,649 | |
Emisphere Technologies, Inc. | | * | | | 3,412 | | | | 733 | |
Endo Pharmaceuticals Holdings, Inc. | | * | | | 20,105 | | | | 694,226 | |
Heska Corp. | | * | | | 446 | | | | 3,256 | |
Hi-Tech Pharmacal Co., Inc. | | * | | | 2,404 | | | | 93,491 | |
Impax Laboratories, Inc. | | *† | | | 8,295 | | | | 167,310 | |
Jazz Pharmaceuticals, Inc. | | * | | | 1,251 | | | | 48,326 | |
KV Pharmaceutical Co., Class A | | *† | | | 32,504 | | | | 45,506 | |
Medicines Co. (The) | | * | | | 9,190 | | | | 171,302 | |
Medicis Pharmaceutical Corp., Class A | | | | | 6,138 | | | | 204,088 | |
Nektar Therapeutics | | *† | | | 9,644 | | | | 53,958 | |
Obagi Medical Products, Inc. | | * | | | 2,119 | | | | 21,529 | |
Optimer Pharmaceuticals, Inc. | | *† | | | 5,641 | | | | 69,046 | |
Pain Therapeutics, Inc. | | * | | | 10,298 | | | | 39,132 | |
Par Pharmaceutical Cos., Inc. | | * | | | 7,244 | | | | 237,096 | |
Pozen, Inc. | | * | | | 1,922 | | | | 7,592 | |
Questcor Pharmaceuticals, Inc. | | * | | | 13,110 | | | | 545,114 | |
Salix Pharmaceuticals Ltd. | | * | | | 7,992 | | | | 382,417 | |
Santarus, Inc. | | * | | | 11,760 | | | | 38,926 | |
Viropharma, Inc. | | * | | | 10,938 | | | | 299,592 | |
Vivus, Inc. | | *† | | | 32,230 | | | | 314,242 | |
XenoPort, Inc. | | * | | | 3,786 | | | | 14,425 | |
| | | | | | | | | | | | |
| | | | | | | | | | | 4,123,604 | |
| | | | | | | | | | | | |
| Professional Services—1.2% | |
Acacia Research—Acacia Technologies | | * | | | 6,992 | | | | 255,278 | |
Advisory Board Co. (The) | | * | | | 1,300 | | | | 96,473 | |
Barrett Business Services, Inc. | | | | | 3,976 | | | | 79,361 | |
CBIZ, Inc. | | *† | | | 32,523 | | | | 198,716 | |
CDI Corp. | | | | | 2,129 | | | | 29,401 | |
Corporate Executive Board Co. (The) | | | | | 6,168 | | | | 235,001 | |
CoStar Group, Inc. | | *† | | | 1,557 | | | | 103,899 | |
CRA International, Inc. | | * | | | 1,427 | | | | 28,312 | |
Exponent, Inc. | | * | | | 1,790 | | | | 82,286 | |
FTI Consulting, Inc. | | *† | | | 9,264 | | | | 392,979 | |
Heidrick & Struggles International, Inc. | | † | | | 2,178 | | | | 46,914 | |
Hudson Highland Group, Inc. | | *† | | | 10,844 | | | | 51,943 | |
Huron Consulting Group, Inc. | | * | | | 2,888 | | | | 111,881 | |
ICF International, Inc. | | * | | | 8,590 | | | | 212,860 | |
IHS, Inc., Class A | | * | | | 6,570 | | | | 566,071 | |
Insperity, Inc. | | † | | | 2,357 | | | | 59,750 | |
Kelly Services, Inc., Class A | | | | | 2,431 | | | | 33,256 | |
Kforce, Inc. | | *† | | | 3,398 | | | | 41,897 | |
Korn/Ferry International | | * | | | 8,421 | | | | 143,662 | |
| | | | | | | | | | | | |
| | | |
| | | | Shares | | | | Value | |
| | | | | | | | | | | | |
Manpower, Inc. | | | | | 8,866 | | | $ | 316,959 | |
Mastech Holdings, Inc. | | * | | | 357 | | | | 1,332 | |
Navigant Consulting, Inc. | | * | | | 11,220 | | | | 128,020 | |
Odyssey Marine Exploration, Inc. | | *† | | | 24,771 | | | | 67,873 | |
On Assignment, Inc. | | * | | | 3,093 | | | | 34,580 | |
RCM Technologies, Inc. | | * | | | 13,065 | | | | 67,677 | |
Resources Connection, Inc. | | | | | 3,825 | | | | 40,507 | |
Towers Watson & Co., Class A | | | | | 12,067 | | | | 723,175 | |
TrueBlue, Inc. | | * | | | 7,619 | | | | 105,752 | |
Verisk Analytics, Inc., Class A | | * | | | 19,772 | | | | 793,450 | |
| | | | | | | | | | | | |
| | | | | | | | | | | 5,049,265 | |
| | | | | | | | | | | | |
| Real Estate Investment Trusts (REITs)—9.2% | |
Acadia Realty Trust REIT | | | | | 16,088 | | | | 324,012 | |
Agree Realty Corp. REIT | | | | | 2,037 | | | | 49,662 | |
Alexander’s, Inc. REIT | | | | | 319 | | | | 118,040 | |
Alexandria Real Estate Equities, Inc. REIT | | | | | 7,841 | | | | 540,794 | |
American Assets Trust, Inc. REIT | | | | | 996 | | | | 20,428 | |
American Campus Communities, Inc. REIT | | | | | 17,073 | | | | 716,383 | |
American Capital Agency Corp. REIT | | | | | 36,448 | | | | 1,023,460 | |
Annaly Capital Management, Inc. REIT | | | | | 180,284 | | | | 2,877,333 | |
Anworth Mortgage Asset Corp. REIT | | | | | 44,342 | | | | 278,468 | |
Apollo Commercial Real Estate Finance, Inc. REIT | | | | | 5,200 | | | | 68,276 | |
Arbor Realty Trust, Inc. REIT | | * | | | 6,648 | | | | 23,401 | |
ARMOUR Residential REIT, Inc. REIT | | | | | 8,789 | | | | 61,962 | |
Ashford Hospitality Trust, Inc. REIT | | | | | 19,635 | | | | 157,080 | |
Associated Estates Realty Corp. REIT | | | | | 18,657 | | | | 297,579 | |
BioMed Realty Trust, Inc. REIT | | | | | 16,790 | | | | 303,563 | |
Brandywine Realty Trust REIT | | | | | 23,412 | | | | 222,414 | |
BRE Properties, Inc. REIT | | | | | 9,388 | | | | 473,906 | |
BRT Realty Trust REIT | | * | | | 9,712 | | | | 61,574 | |
Camden Property Trust REIT | | | | | 9,302 | | | | 578,956 | |
Capital Trust, Inc., Class A REIT | | * | | | 4,198 | | | | 9,445 | |
CapLease, Inc. REIT | | | | | 35,097 | | | | 141,792 | |
Capstead Mortgage Corp. REIT | | | | | 28,246 | | | | 351,380 | |
CBL & Associates Properties, Inc. REIT | | | | | 33,587 | | | | 527,316 | |
Cedar Realty Trust, Inc. REIT | | | | | 4,496 | | | | 19,378 | |
Chimera Investment Corp. REIT | | | | | 109,899 | | | | 275,846 | |
Cogdell Spencer, Inc. REIT | | | | | 46,163 | | | | 196,193 | |
Colonial Properties Trust REIT | | † | | | 17,084 | | | | 356,372 | |
CommonWealth REIT REIT | | | | | 8,590 | | | | 142,938 | |
Corporate Office Properties Trust REIT | | | | | 12,130 | | | | 257,884 | |
Cousins Properties, Inc. REIT | | | | | 43,575 | | | | 279,316 | |
CubeSmart REIT | | | | | 37,992 | | | | 404,235 | |
CYS Investments, Inc. REIT | | † | | | 27,199 | | | | 357,395 | |
DCT Industrial Trust, Inc. REIT | | | | | 18,769 | | | | 96,097 | |
DDR Corp. REIT | | | | | 24,698 | | | | 300,575 | |
See accompanying notes to financial statements.
304
SCHEDULE OF INVESTMENTS—(Continued)
December 31, 2011
| | | | | | | | | | | | |
| Vantagepoint Mid/Small Company Index Fund | | | Shares | | | | Value | |
| | | | | | | | | | | | |
| COMMON STOCKS—(Continued) | |
DiamondRock Hospitality Co. REIT | | | | | 34,477 | | | $ | 332,358 | |
Digital Realty Trust, Inc. REIT | | † | | | 15,523 | | | | 1,034,918 | |
Douglas Emmett, Inc. REIT | | | | | 13,379 | | | | 244,033 | |
Duke Realty Corp. REIT | | | | | 33,895 | | | | 408,435 | |
DuPont Fabros Technology, Inc. REIT | | | | | 12,750 | | | | 308,805 | |
EastGroup Properties, Inc. REIT | | | | | 7,357 | | | | 319,882 | |
Education Realty Trust, Inc. REIT | | | | | 33,387 | | | | 341,549 | |
Entertainment Properties Trust REIT | | | | | 9,895 | | | | 432,510 | |
Equity Lifestyle Properties, Inc. REIT | | | | | 6,813 | | | | 454,359 | |
Equity One, Inc. REIT | | | | | 22,306 | | | | 378,756 | |
Essex Property Trust, Inc. REIT | | | | | 4,738 | | | | 665,736 | |
Extra Space Storage, Inc. REIT | | | | | 24,311 | | | | 589,056 | |
Federal Realty Investment Trust REIT | | | | | 10,111 | | | | 917,573 | |
FelCor Lodging Trust, Inc. REIT | | * | | | 33,618 | | | | 102,535 | |
First Industrial Realty Trust, Inc. REIT | | * | | | 10,948 | | | | 111,998 | |
First Potomac Realty Trust REIT | | | | | 7,225 | | | | 94,286 | |
Franklin Street Properties Corp. REIT | | † | | | 16,006 | | | | 159,260 | |
General Growth Properties, Inc. REIT | | | | | 85,087 | | | | 1,278,007 | |
Getty Realty Corp. REIT | | † | | | 1,935 | | | | 26,993 | |
Glimcher Realty Trust REIT | | | | | 17,380 | | | | 159,896 | |
Government Properties Income Trust REIT | | | | | 14,341 | | | | 323,390 | |
Gramercy Capital Corp. REIT | | * | | | 3,048 | | | | 7,620 | |
Hatteras Financial Corp. REIT | | | | | 12,401 | | | | 327,014 | |
Healthcare Realty Trust, Inc. REIT | | | | | 18,697 | | | | 347,577 | |
Hersha Hospitality Trust REIT | | | | | 37,283 | | | | 181,941 | |
Highwoods Properties, Inc. REIT | | † | | | 11,752 | | | | 348,682 | |
Home Properties, Inc. REIT | | | | | 5,587 | | | | 321,644 | |
Hospitality Properties Trust REIT | | | | | 18,862 | | | | 433,449 | |
Inland Real Estate Corp. REIT | | | | | 22,433 | | | | 170,715 | |
Invesco Mortgage Capital, Inc. REIT | | | | | 10,442 | | | | 146,710 | |
Investors Real Estate Trust REIT | | † | | | 13,985 | | | | 102,021 | |
iStar Financial, Inc. REIT | | *† | | | 17,809 | | | | 94,210 | |
Kilroy Realty Corp. REIT | | | | | 7,577 | | | | 288,456 | |
Kite Realty Group Trust REIT | | | | | 13,680 | | | | 61,697 | |
LaSalle Hotel Properties REIT | | | | | 11,043 | | | | 267,351 | |
Lexington Realty Trust REIT | | † | | | 15,470 | | | | 115,870 | |
Liberty Property Trust REIT | | | | | 14,859 | | | | 458,846 | |
LTC Properties, Inc. REIT | | | | | 6,423 | | | | 198,214 | |
Macerich Co. (The) REIT | | | | | 20,550 | | | | 1,039,830 | |
Mack-Cali Realty Corp. REIT | | | | | 10,597 | | | | 282,834 | |
Medical Properties Trust, Inc. REIT | | | | | 26,987 | | | | 266,362 | |
MFA Financial, Inc. REIT | | | | | 35,167 | | | | 236,322 | |
| | | | | | | | | | | | |
| | | |
| | | | Shares | | | | Value | |
| | | | | | | | | | | | |
Mid-America Apartment Communities, Inc. REIT | | | | | 6,728 | | | $ | 420,836 | |
Mission West Properties, Inc. REIT | | | | | 7,471 | | | | 67,388 | |
Monmouth Real Estate Investment Corp., Class A REIT | | | | | 9,567 | | | | 87,538 | |
MPG Office Trust, Inc. REIT | | *† | | | 10,479 | | | | 20,853 | |
National Health Investors, Inc. REIT | | | | | 2,715 | | | | 119,406 | |
National Retail Properties, Inc. REIT | | | | | 11,298 | | | | 298,041 | |
Newcastle Investment Corp. REIT | | | | | 20,499 | | | | 95,320 | |
NorthStar Realty Finance Corp. REIT | | † | | | 20,272 | | | | 96,697 | |
Omega Healthcare Investors, Inc. REIT | | | | | 19,310 | | | | 373,648 | |
Parkway Properties, Inc. REIT | | † | | | 3,135 | | | | 30,911 | |
Pennsylvania Real Estate Investment Trust REIT | | | | | 5,599 | | | | 58,454 | |
PennyMac Mortgage Investment Trust REIT | | | | | 9,827 | | | | 163,325 | |
Piedmont Office Realty Trust, Inc., Class A REIT | | † | | | 28,141 | | | | 479,523 | |
PMC Commercial Trust REIT | | | | | 2,035 | | | | 14,225 | |
Post Properties, Inc. REIT | | | | | 7,637 | | | | 333,890 | |
Potlatch Corp. REIT | | | | | 9,789 | | | | 304,536 | |
PS Business Parks, Inc. REIT | | | | | 2,662 | | | | 147,555 | |
RAIT Financial Trust REIT | | † | | | 25,884 | | | | 122,949 | |
Ramco-Gershenson Properties Trust REIT | | | | | 14,636 | | | | 143,872 | |
Rayonier, Inc. REIT | | | | | 20,728 | | | | 925,091 | |
Realty Income Corp. REIT | | † | | | 17,777 | | | | 621,484 | |
Redwood Trust, Inc. REIT | | | | | 23,999 | | | | 244,310 | |
Regency Centers Corp. REIT | | | | | 11,350 | | | | 426,987 | |
Resource Capital Corp. REIT | | † | | | 31,183 | | | | 174,937 | |
Sabra Healthcare REIT, Inc. REIT | | | | | 1,477 | | | | 17,857 | |
Saul Centers, Inc. REIT | | | | | 1,310 | | | | 46,400 | |
Senior Housing Properties Trust REIT | | | | | 23,395 | | | | 524,984 | |
SL Green Realty Corp. REIT | | | | | 12,420 | | | | 827,669 | |
Sovran Self Storage, Inc. REIT | | | | | 8,547 | | | | 364,700 | |
Starwood Property Trust, Inc. REIT | | | | | 20,884 | | | | 386,563 | |
Strategic Hotels & Resorts, Inc. REIT | | * | | | 29,212 | | | | 156,868 | |
Sun Communities, Inc. REIT | | † | | | 3,803 | | | | 138,924 | |
Sunstone Hotel Investors, Inc. REIT | | * | | | 15,570 | | | | 126,896 | |
Tanger Factory Outlet Centers, Inc. REIT | | | | | 19,842 | | | | 581,767 | |
Taubman Centers, Inc. REIT | | | | | 8,030 | | | | 498,663 | |
UDR, Inc. REIT | | | | | 30,811 | | | | 773,356 | |
Universal Health Realty Income Trust REIT | | | | | 2,198 | | | | 85,722 | |
Urstadt Biddle Properties, Inc., Class A REIT | | | | | 9,838 | | | | 177,871 | |
Washington Real Estate Investment Trust REIT | | | | | 13,703 | | | | 374,777 | |
Weingarten Realty Investors REIT | | | | | 18,571 | | | | 405,219 | |
Winthrop Realty Trust REIT | | | | | 3,054 | | | | 31,059 | |
| | | | | | | | | | | | |
| | | | | | | | | | | 37,586,224 | |
| | | | | | | | | | | | |
See accompanying notes to financial statements.
305
SCHEDULE OF INVESTMENTS—(Continued)
December 31, 2011
| | | | | | | | | | | | |
| Vantagepoint Mid/Small Company Index Fund | | | Shares | | | | Value | |
| | | | | | | | | | | | |
| COMMON STOCKS—(Continued) | |
| Real Estate Management & Development—0.5% | |
Altisource Portfolio Solutions SA (Luxembourg) | | * | | | 1,020 | | | $ | 51,184 | |
Brookfield Office Properties, Inc. | | | | | 55,336 | | | | 865,455 | |
Consolidated-Tomoka Land Co. | | | | | 530 | | | | 14,347 | |
Forest City Enterprises, Inc., Class A | | * | | | 33,533 | | | | 396,360 | |
Forestar Group, Inc. | | * | | | 8,367 | | | | 126,593 | |
Grubb & Ellis Co. | | * | | | 2,553 | | | | 327 | |
Howard Hughes Corp. (The) | | * | | | 4,367 | | | | 192,890 | |
Jones Lang LaSalle, Inc. | | | | | 4,729 | | | | 289,698 | |
St. Joe Co. (The) | | *† | | | 9,635 | | | | 141,249 | |
Tejon Ranch Co. | | * | | | 2,983 | | | | 73,024 | |
Thomas Properties Group, Inc. | | | | | 2,396 | | | | 7,979 | |
| | | | | | | | | | | | |
| | | | | | | | | | | 2,159,106 | |
| | | | | | | | | | | | |
| Road & Rail—1.3% | |
Amerco, Inc. | | | | | 547 | | | | 48,355 | |
Arkansas Best Corp. | | | | | 2,819 | | | | 54,322 | |
Avis Budget Group, Inc. | | * | | | 13,648 | | | | 146,307 | |
Celadon Group, Inc. | | † | | | 11,882 | | | | 140,326 | |
Con-way, Inc. | | | | | 6,152 | | | | 179,392 | |
Dollar Thrifty Automotive Group, Inc. | | * | | | 5,942 | | | | 417,485 | |
Genesee & Wyoming, Inc., Class A | | * | | | 6,946 | | | | 420,789 | |
Heartland Express, Inc. | | | | | 15,449 | | | | 220,766 | |
Hertz Global Holdings, Inc. | | * | | | 22,711 | | | | 266,173 | |
J.B. Hunt Transport Services, Inc. | | | | | 19,847 | | | | 894,504 | |
Kansas City Southern | | * | | | 16,425 | | | | 1,117,064 | |
Knight Transportation, Inc. | | | | | 11,218 | | | | 175,450 | |
Landstar System, Inc. | | | | | 9,491 | | | | 454,809 | |
Old Dominion Freight Line, Inc. | | * | | | 8,482 | | | | 343,775 | |
PAM Transportation Services, Inc. | | * | | | 1,139 | | | | 10,821 | |
Quality Distribution, Inc. | | * | | | 5,838 | | | | 65,678 | |
Saia, Inc. | | * | | | 1,522 | | | | 18,995 | |
Swift Transportation Co. | | * | | | 21,197 | | | | 174,663 | |
Werner Enterprises, Inc. | | | | | 11,650 | | | | 280,765 | |
YRC Worldwide, Inc. | | * | | | 17 | | | | 169 | |
| | | | | | | | | | | | |
| | | | | | | | | | | 5,430,608 | |
| | | | | | | | | | | | |
| Semiconductors & Semiconductor Equipment—3.2% | |
Advanced Analogic Technologies, Inc. | | * | | | 36,317 | | | | 209,912 | |
Advanced Energy Industries, Inc. | | * | | | 9,964 | | | | 106,914 | |
Aetrium, Inc. | | * | | | 614 | | | | 448 | |
Amkor Technology, Inc. | | *† | | | 26,356 | | | | 114,912 | |
Anadigics, Inc. | | * | | | 15,184 | | | | 33,253 | |
Applied Micro Circuits Corp. | | * | | | 11,626 | | | | 78,127 | |
Atmel Corp. | | * | | | 90,250 | | | | 731,025 | |
ATMI, Inc. | | * | | | 3,386 | | | | 67,822 | |
Axcelis Technologies, Inc. | | * | | | 20,883 | | | | 27,774 | |
AXT, Inc. | | * | | | 5,871 | | | | 24,482 | |
Brooks Automation, Inc. | | | | | 5,831 | | | | 59,884 | |
Cabot Microelectronics Corp. | | * | | | 5,893 | | | | 278,444 | |
Cavium, Inc. | | * | | | 11,274 | | | | 320,520 | |
| | | | | | | | | | | | |
| | | |
| | | | Shares | | | | Value | |
| | | | | | | | | | | | |
Ceva, Inc. | | * | | | 3,801 | | | $ | 115,018 | |
Cirrus Logic, Inc. | | * | | | 16,788 | | | | 266,090 | |
Cohu, Inc. | | | | | 1,889 | | | | 21,440 | |
Cree, Inc. | | *† | | | 14,245 | | | | 313,960 | |
Cymer, Inc. | | * | | | 2,731 | | | | 135,895 | |
Cypress Semiconductor Corp. | | * | | | 21,129 | | | | 356,869 | |
Diodes, Inc. | | * | | | 3,326 | | | | 70,844 | |
DSP Group, Inc. | | * | | | 4,251 | | | | 22,148 | |
Energy Conversion Devices, Inc. | | *† | | | 23,101 | | | | 4,666 | |
Entegris, Inc. | | * | | | 30,372 | | | | 264,996 | |
Exar Corp. | | *† | | | 3,475 | | | | 22,588 | |
Fairchild Semiconductor International, Inc. | | * | | | 10,376 | | | | 124,927 | |
Formfactor, Inc. | | * | | | 11,437 | | | | 57,871 | |
FSI International, Inc. | | * | | | 4,280 | | | | 15,665 | |
GigOptix, Inc. | | * | | | 828 | | | | 1,490 | |
GT Advanced Technologies, Inc. | | *† | | | 28,398 | | | | 205,602 | |
Hittite Microwave Corp. | | * | | | 6,713 | | | | 331,488 | |
Integrated Device Technology, Inc. | | * | | | 48,629 | | | | 265,514 | |
Integrated Silicon Solution, Inc. | | * | | | 2,930 | | | | 26,780 | |
International Rectifier Corp. | | * | | | 7,620 | | | | 147,980 | |
Intersil Corp., Class A | | | | | 27,625 | | | | 288,405 | |
IXYS Corp. | | * | | | 3,270 | | | | 35,414 | |
Kopin Corp. | | *† | | | 5,031 | | | | 19,520 | |
Kulicke & Soffa Industries, Inc. | | * | | | 11,993 | | | | 110,935 | |
Lam Research Corp. | | * | | | 17,348 | | | | 642,223 | |
Lattice Semiconductor Corp. | | * | | | 16,642 | | | | 98,853 | |
LTX-Credence Corp. | | * | | | 8,847 | | | | 47,331 | |
Marvell Technology Group Ltd. (Bermuda) | | * | | | 79,842 | | | | 1,105,812 | |
Mattson Technology, Inc. | | * | | | 4,081 | | | | 5,632 | |
Maxim Integrated Products, Inc. | | | | | 39,272 | | | | 1,022,643 | |
Micrel, Inc. | | | | | 11,121 | | | | 112,433 | |
Microsemi Corp. | | * | | | 13,240 | | | | 221,770 | |
Mindspeed Technologies, Inc. | | *† | | | 9,324 | | | | 42,704 | |
MIPS Technologies, Inc. | | * | | | 15,340 | | | | 68,416 | |
MKS Instruments, Inc. | | | | | 4,420 | | | | 122,964 | |
Monolithic Power Systems, Inc. | | * | | | 2,918 | | | | 43,974 | |
MoSys, Inc. | | *† | | | 3,592 | | | | 15,086 | |
Netlogic Microsystems, Inc. | | * | | | 15,345 | | | | 760,652 | |
NVE Corp. | | * | | | 771 | | | | 42,814 | |
Omnivision Technologies, Inc. | | * | | | 8,046 | | | | 98,443 | |
ON Semiconductor Corp. | | * | | | 62,204 | | | | 480,215 | |
PDF Solutions, Inc. | | *† | | | 9,022 | | | | 62,883 | |
Pericom Semiconductor Corp. | | * | | | 2,254 | | | | 17,153 | |
Photronics, Inc. | | *† | | | 8,274 | | | | 50,306 | |
PLX Technology, Inc. | | * | | | 2,950 | | | | 8,467 | |
PMC—Sierra, Inc. | | * | | | 56,477 | | | | 311,188 | |
Power Integrations, Inc. | | | | | 4,153 | | | | 137,714 | |
QuickLogic Corp. | | *† | | | 14,701 | | | | 38,223 | |
Rambus, Inc. | | *† | | | 13,734 | | | | 103,692 | |
Ramtron International Corp. | | * | | | 1,920 | | | | 3,744 | |
RF Micro Devices, Inc. | | *† | | | 21,336 | | | | 115,214 | |
Rudolph Technologies, Inc. | | * | | | 2,516 | | | | 23,298 | |
Semtech Corp. | | * | | | 9,874 | | | | 245,073 | |
Sigma Designs, Inc. | | * | | | 8,818 | | | | 52,908 | |
Silicon Image, Inc. | | * | | | 8,359 | | | | 39,287 | |
Silicon Laboratories, Inc. | | *† | | | 8,366 | | | | 363,252 | |
Skyworks Solutions, Inc. | | * | | | 30,058 | | | | 487,541 | |
Spire Corp. | | * | | | 1,921 | | | | 1,191 | |
Standard Microsystems Corp. | | * | | | 2,548 | | | | 65,662 | |
SunPower Corp. | | *† | | | 2,843 | | | | 17,712 | |
See accompanying notes to financial statements.
306
SCHEDULE OF INVESTMENTS—(Continued)
December 31, 2011
| | | | | | | | | | | | |
| Vantagepoint Mid/Small Company Index Fund | | | Shares | | | | Value | |
| | | | | | | | | | | | |
| COMMON STOCKS—(Continued) | |
Supertex, Inc. | | * | | | 815 | | | $ | 15,387 | |
Tessera Technologies, Inc. | | * | | | 6,777 | | | | 113,515 | |
Transwitch Corp. | | * | | | 429 | | | | 1,373 | |
Trident Microsystems, Inc. | | * | | | 5,092 | | | | 917 | |
TriQuint Semiconductor, Inc. | | * | | | 34,569 | | | | 168,351 | |
Ultra Clean Holdings, Inc. | | * | | | 6,562 | | | | 40,094 | |
Ultratech, Inc. | | * | | | 2,462 | | | | 60,491 | |
Veeco Instruments, Inc. | | *† | | | 4,306 | | | | 89,565 | |
Volterra Semiconductor Corp. | | * | | | 3,597 | | | | 92,119 | |
| | | | | | | | | | | | |
| | | | | | | | | | | 12,937,907 | |
| | | | | | | | | | | | |
| Software—4.0% | |
Accelrys, Inc. | | * | | | 6,341 | | | | 42,612 | |
ACI Worldwide, Inc. | | * | | | 3,078 | | | | 88,154 | |
Activision Blizzard, Inc. | | | | | 82,863 | | | | 1,020,872 | |
Actuate Corp. | | * | | | 6,674 | | | | 39,110 | |
Advent Software, Inc. | | * | | | 3,638 | | | | 88,622 | |
American Software, Inc., Class A | | | | | 7,072 | | | | 66,830 | |
ANSYS, Inc. | | * | | | 12,310 | | | | 705,117 | |
Ariba, Inc. | | * | | | 13,047 | | | | 366,360 | |
Aspen Technology, Inc. | | * | | | 3,461 | | | | 60,048 | |
Blackbaud, Inc. | | | | | 6,583 | | | | 182,349 | |
Bottomline Technologies, Inc. | | * | | | 7,908 | | | | 183,228 | |
BroadSoft, Inc. | | *† | | | 689 | | | | 20,808 | |
Cadence Design Systems, Inc. | | * | | | 53,095 | | | | 552,188 | |
Callidus Software, Inc. | | * | | | 14,237 | | | | 91,402 | |
CommVault Systems, Inc. | | * | | | 10,616 | | | | 453,516 | |
Compuware Corp. | | * | | | 23,815 | | | | 198,141 | |
Concur Technologies, Inc. | | * | | | 6,460 | | | | 328,103 | |
Datawatch Corp. | | * | | | 3,500 | | | | 19,985 | |
Ebix, Inc. | | † | | | 3,924 | | | | 86,720 | |
EPIQ Systems, Inc. | | † | | | 7,191 | | | | 86,436 | |
Evergreen Energy, Inc. | | *† | | | 373 | | | | 22 | |
Evolving Systems, Inc. | | | | | 1,123 | | | | 8,411 | |
Factset Research Systems, Inc. | | | | | 5,983 | | | | 522,196 | |
Fair Isaac Corp. | | | | | 8,755 | | | | 313,779 | |
FalconStor Software, Inc. | | *† | | | 4,054 | | | | 10,459 | |
Fortinet, Inc. | | * | | | 15,380 | | | | 335,438 | |
Informatica Corp. | | * | | | 14,190 | | | | 524,037 | |
Interactive Intelligence Group, Inc. | | * | | | 1,644 | | | | 37,680 | |
JDA Software Group, Inc. | | * | | | 8,151 | | | | 264,011 | |
Kenexa Corp. | | * | | | 4,449 | | | | 118,788 | |
Magma Design Automation, Inc. | | * | | | 19,146 | | | | 137,468 | |
Manhattan Associates, Inc. | | * | | | 2,125 | | | | 86,020 | |
Mentor Graphics Corp. | | * | | | 32,274 | | | | 437,635 | |
MICROS Systems, Inc. | | * | | | 9,995 | | | | 465,567 | |
MicroStrategy, Inc., Class A | | * | | | 791 | | | | 85,681 | |
Netscout Systems, Inc. | | * | | | 3,784 | | | | 66,598 | |
NetSuite, Inc. | | * | | | 1,387 | | | | 56,243 | |
Nuance Communications, Inc. | | * | | | 45,217 | | | | 1,137,660 | |
Parametric Technology Corp. | | * | | | 25,649 | | | | 468,351 | |
Pegasystems, Inc. | | † | | | 2,142 | | | | 62,975 | |
Progress Software Corp. | | * | | | 6,994 | | | | 135,334 | |
PROS Holdings, Inc. | | *† | | | 1,506 | | | | 22,409 | |
QAD, Inc., Class B | | * | | | 136 | | | | 1,408 | |
QLIK Technologies, Inc. | | * | | | 3,402 | | | | 82,328 | |
Quest Software, Inc. | | * | | | 11,892 | | | | 221,191 | |
Rovi Corp. | | * | | | 17,899 | | | | 439,957 | |
S1 Corp. | | * | | | 7,603 | | | | 72,761 | |
| | | | | | | | | | | | |
| | | |
| | | | Shares | | | | Value | |
| | | | | | | | | | | | |
Scientific Learning Corp. | | * | | | 3,146 | | | $ | 8,022 | |
SeaChange International, Inc. | | * | | | 3,359 | | | | 23,614 | |
Smith Micro Software, Inc. | | * | | | 2,612 | | | | 2,952 | |
SolarWinds, Inc. | | * | | | 12,598 | | | | 352,114 | |
Solera Holdings, Inc. | | | | | 14,309 | | | | 637,323 | |
Sonic Foundry, Inc. | | * | | | 1,155 | | | | 8,743 | |
Sourcefire, Inc. | | * | | | 584 | | | | 18,910 | |
SuccessFactors, Inc. | | * | | | 16,293 | | | | 649,602 | |
Synchronoss Technologies, Inc. | | * | | | 9,776 | | | | 295,333 | |
Synopsys, Inc. | | * | | | 27,041 | | | | 735,515 | |
Take-Two Interactive Software, Inc. | | *† | | | 21,301 | | | | 288,629 | |
Taleo Corp., Class A | | * | | | 9,614 | | | | 371,966 | |
TeleCommunication Systems, Inc., Class A | | * | | | 11,295 | | | | 26,543 | |
THQ, Inc. | | *† | | | 12,835 | | | | 9,755 | |
TIBCO Software, Inc. | | * | | | 28,166 | | | | 673,449 | |
TiVo, Inc. | | * | | | 33,178 | | | | 297,607 | |
Tyler Technologies, Inc. | | * | | | 9,640 | | | | 290,260 | |
Ultimate Software Group, Inc. | | * | | | 1,966 | | | | 128,026 | |
VASCO Data Security International, Inc. | | * | | | 4,225 | | | | 27,547 | |
Versant Corp. | | * | | | 1,264 | | | | 11,705 | |
VirnetX Holding Corp. | | *† | | | 1,128 | | | | 28,166 | |
VMware, Inc., Class A | | * | | | 8,590 | | | | 714,602 | |
Websense, Inc. | | * | | | 4,024 | | | | 75,370 | |
| | | | | | | | | | | | |
| | | | | | | | | | | 16,470,761 | |
| | | | | | | | | | | | |
| Specialty Retail—3.2% | |
Aaron’s, Inc. | | | | | 17,708 | | | | 472,449 | |
Advance Auto Parts, Inc. | | | | | 8,246 | | | | 574,169 | |
Aeropostale, Inc. | | * | | | 8,619 | | | | 131,440 | |
American Eagle Outfitters, Inc. | | | | | 21,971 | | | | 335,937 | |
America’s Car-Mart, Inc. | | * | | | 1,569 | | | | 61,473 | |
ANN, Inc. | | * | | | 10,541 | | | | 261,206 | |
Asbury Automotive Group, Inc. | | * | | | 5,664 | | | | 122,116 | |
Ascena Retail Group, Inc. | | * | | | 9,594 | | | | 285,134 | |
Barnes & Noble, Inc. | | *† | | | 3,301 | | | | 47,798 | |
Bebe Stores, Inc. | | | | | 9,951 | | | | 82,892 | |
Big 5 Sporting Goods Corp. | | | | | 2,416 | | | | 25,223 | |
Brown Shoe Co., Inc. | | | | | 5,385 | | | | 47,926 | |
Buckle, Inc. (The) | | † | | | 3,569 | | | | 145,865 | |
Build-A-Bear Workshop, Inc. | | * | | | 5,570 | | | | 47,122 | |
Cabela’s, Inc. | | * | | | 10,417 | | | | 264,800 | |
Cache, Inc. | | * | | | 2,130 | | | | 13,185 | |
Casual Male Retail Group, Inc. | | * | | | 2,471 | | | | 8,451 | |
Cato Corp. (The), Class A | | | | | 4,713 | | | | 114,055 | |
Charming Shoppes, Inc. | | * | | | 28,295 | | | | 138,646 | |
Chico’s FAS, Inc. | | | | | 19,873 | | | | 221,385 | |
Children’s Place Retail Stores, Inc. (The) | | *† | | | 5,092 | | | | 270,487 | |
Christopher & Banks Corp. | | | | | 9,394 | | | | 21,982 | |
Citi Trends, Inc. | | * | | | 8,340 | | | | 73,225 | |
Coldwater Creek, Inc. | | * | | | 47,132 | | | | 55,616 | |
Collective Brands, Inc. | | * | | | 8,152 | | | | 117,144 | |
Cost Plus, Inc. | | * | | | 2,725 | | | | 26,569 | |
Destination Maternity Corp. | | | | | 1,368 | | | | 22,873 | |
Dick’s Sporting Goods, Inc. | | | | | 10,213 | | | | 376,655 | |
DSW, Inc., Class A | | | | | 5,945 | | | | 262,828 | |
Finish Line, Inc. (The), Class A | | | | | 6,338 | | | | 122,228 | |
Foot Locker, Inc. | | | | | 16,865 | | | | 402,062 | |
Genesco, Inc. | | * | | | 2,452 | | | | 151,386 | |
Group 1 Automotive, Inc. | | | | | 2,367 | | | | 122,611 | |
Guess?, Inc. | | | | | 9,795 | | | | 292,087 | |
See accompanying notes to financial statements.
307
SCHEDULE OF INVESTMENTS—(Continued)
December 31, 2011
| | | | | | | | | | | | |
| Vantagepoint Mid/Small Company Index Fund | | | Shares | | | | Value | |
| | | | | | | | | | | | |
| COMMON STOCKS—(Continued) | |
Haverty Furniture Cos., Inc. | | | | | 2,301 | | | $ | 25,265 | |
Hibbett Sports, Inc. | | * | | | 3,546 | | | | 160,208 | |
Hot Topic, Inc. | | | | | 22,025 | | | | 145,585 | |
JOS A. Bank Clothiers, Inc. | | * | | | 3,491 | | | | 170,221 | |
Kirkland’s, Inc. | | * | | | 2,193 | | | | 29,167 | |
Lithia Motors, Inc., Class A | | | | | 3,558 | | | | 77,778 | |
Lumber Liquidators Holdings, Inc. | | *† | | | 10,206 | | | | 180,238 | |
MarineMax, Inc. | | * | | | 3,026 | | | | 19,730 | |
Men’s Wearhouse, Inc. (The) | | | | | 3,813 | | | | 123,579 | |
Midas, Inc. | | * | | | 5,745 | | | | 49,350 | |
Monro Muffler Brake, Inc. | | † | | | 5,955 | | | | 230,994 | |
Office Depot, Inc. | | * | | | 24,187 | | | | 52,002 | |
OfficeMax, Inc. | | *† | | | 6,942 | | | | 31,517 | |
Pacific Sunwear of California, Inc. | | * | | | 18,790 | | | | 32,131 | |
Penske Automotive Group, Inc. | | | | | 10,147 | | | | 195,330 | |
Pep Boys-Manny, Moe & Jack (The) | | | | | 13,868 | | | | 152,548 | |
PetSmart, Inc. | | | | | 20,170 | | | | 1,034,519 | |
Pier 1 Imports, Inc. | | * | | | 24,617 | | | | 342,915 | |
RadioShack Corp. | | † | | | 19,631 | | | | 190,617 | |
Rent-A-Center, Inc. | | | | | 12,187 | | | | 450,919 | |
Sally Beauty Holdings, Inc. | | * | | | 21,071 | | | | 445,230 | |
Select Comfort Corp. | | * | | | 10,528 | | | | 228,352 | |
Shoe Carnival, Inc. | | * | | | 1,098 | | | | 28,219 | |
Signet Jewelers Ltd. (Bermuda) | | | | | 14,589 | | | | 641,332 | |
Sonic Automotive, Inc., Class A | | † | | | 8,013 | | | | 118,673 | |
Stage Stores, Inc. | | | | | 8,324 | | | | 115,620 | |
Stein Mart, Inc. | | * | | | 3,731 | | | | 25,408 | |
Systemax, Inc. | | * | | | 1,358 | | | | 22,285 | |
Talbots, Inc. | | *† | | | 64,120 | | | | 170,559 | |
Tractor Supply Co. | | | | | 9,450 | | | | 662,918 | |
Trans World Entertainment Corp. | | * | | | 1,932 | | | | 4,869 | |
Ulta Salon Cosmetics & Fragrance, Inc. | | * | | | 10,623 | | | | 689,645 | |
Vitamin Shoppe, Inc. | | * | | | 507 | | | | 20,219 | |
West Marine, Inc. | | * | | | 6,841 | | | | 79,561 | |
Wet Seal, Inc. (The), Class A | | * | | | 48,869 | | | | 159,313 | |
Williams-Sonoma, Inc. | | | | | 8,120 | | | | 312,620 | |
Zale Corp. | | *† | | | 12,363 | | | | 47,103 | |
| | | | | | | | | | | | |
| | | | | | | | | | | 13,185,564 | |
| | | | | | | | | | | | |
| Textiles, Apparel & Luxury Goods—1.2% | |
Carter’s, Inc. | | * | | | 7,568 | | | | 301,282 | |
Charles & Colvard Ltd. | | * | | | 693 | | | | 1,781 | |
Cherokee, Inc. | | † | | | 2,054 | | | | 23,970 | |
Columbia Sportswear Co. | | | | | 1,447 | | | | 67,358 | |
Crocs, Inc. | | * | | | 18,713 | | | | 276,391 | |
Culp, Inc. | | * | | | 888 | | | | 7,566 | |
Deckers Outdoor Corp. | | * | | | 6,528 | | | | 493,321 | |
Forward Industries, Inc. | | *† | | | 3,751 | | | | 6,264 | |
Fossil, Inc. | | * | | | 7,208 | | | | 572,027 | |
Hallwood Group, Inc. (The) | | * | | | 100 | | | | 908 | |
Hanesbrands, Inc. | | * | | | 16,070 | | | | 351,290 | |
Iconix Brand Group, Inc. | | * | | | 10,540 | | | | 171,697 | |
Jones Group, Inc. (The) | | | | | 7,884 | | | | 83,176 | |
Kenneth Cole Productions, Inc., Class A | | * | | | 4,620 | | | | 48,926 | |
K-Swiss, Inc., Class A | | *† | | | 2,909 | | | | 8,494 | |
Liz Claiborne, Inc. | | *† | | | 16,691 | | | | 144,043 | |
| | | | | | | | | | | | |
| | | |
| | | | Shares | | | | Value | |
| | | | | | | | | | | | |
Maidenform Brands, Inc. | | * | | | 2,034 | | | $ | 37,222 | |
Movado Group, Inc. | | | | | 1,527 | | | | 27,746 | |
Oxford Industries, Inc. | | † | | | 3,507 | | | | 158,236 | |
PVH Corp. | | | | | 7,616 | | | | 536,852 | |
Quiksilver, Inc. | | * | | | 7,789 | | | | 28,118 | |
Skechers U.S.A., Inc., Class A | | * | | | 7,438 | | | | 90,149 | |
Steven Madden Ltd. | | * | | | 6,035 | | | | 208,208 | |
True Religion Apparel, Inc. | | * | | | 2,947 | | | | 101,907 | |
Under Armour, Inc., Class A | | * | | | 4,428 | | | | 317,886 | |
Unifi, Inc. | | * | | | 3,223 | | | | 24,495 | |
Warnaco Group, Inc. (The) | | * | | | 5,608 | | | | 280,624 | |
Wolverine World Wide, Inc. | | | | | 11,160 | | | | 397,742 | |
| | | | | | | | | | | | |
| | | | | | | | | 4,767,679 | |
| | | | | | | | | | | | |
| Thrifts & Mortgage Finance—1.0% | |
Apollo Residential Mortgage, Inc. | | | | | 5,328 | | | | 81,305 | |
Astoria Financial Corp. | | | | | 12,205 | | | | 103,620 | |
Bank Mutual Corp. | | | | | 5,557 | | | | 17,671 | |
BankAtlantic Bancorp, Inc., Class A | | * | | | 6,764 | | | | 22,862 | |
BankUnited, Inc. | | | | | 4,652 | | | | 102,297 | |
Beneficial Mutual Bancorp, Inc. | | * | | | 4,733 | | | | 39,568 | |
Brookline Bancorp, Inc. | | | | | 10,999 | | | | 92,832 | |
Capitol Federal Financial, Inc. | | | | | 17,972 | | | | 207,397 | |
CFS Bancorp, Inc. | | | | | 2,085 | | | | 9,028 | |
Dime Community Bancshares, Inc. | | | | | 3,549 | | | | 44,717 | |
Doral Financial Corp. (Puerto Rico) | | * | | | 70,932 | | | | 67,811 | |
ESSA Bancorp, Inc. | | | | | 5,953 | | | | 62,328 | |
Federal Agricultural Mortgage Corp., Class C | | | | | 4,576 | | | | 82,459 | |
Federal Home Loan Mortgage Corp. | | *† | | | 43,895 | | | | 9,306 | |
Federal National Mortgage Association | | * | | | 66,437 | | | | 13,367 | |
First Financial Holdings, Inc. | | | | | 3,864 | | | | 34,505 | |
First Financial Northwest, Inc. | | *† | | | 3,255 | | | | 19,172 | |
Flagstar Bancorp, Inc. | | *† | | | 49,751 | | | | 25,124 | |
Flushing Financial Corp. | | | | | 2,981 | | | | 37,650 | |
Kearny Financial Corp. | | † | | | 3,008 | | | | 28,576 | |
MGIC Investment Corp. | | * | | | 12,237 | | | | 45,644 | |
NASB Financial, Inc. | | * | | | 529 | | | | 5,666 | |
New York Community Bancorp, Inc. | | | | | 58,422 | | | | 722,680 | |
Northfield Bancorp, Inc. | | † | | | 6,837 | | | | 96,812 | |
Northwest Bancshares, Inc. | | | | | 17,417 | | | | 216,667 | |
OceanFirst Financial Corp. | | † | | | 2,108 | | | | 27,552 | |
Ocwen Financial Corp. | | * | | | 23,494 | | | | 340,193 | |
Oritani Financial Corp. | | | | | 20,044 | | | | 255,962 | |
Parkvale Financial Corp. | | | | | 1,077 | | | | 26,473 | |
Provident Financial Services, Inc. | | † | | | 16,334 | | | | 218,712 | |
Provident New York Bancorp | | | | | 5,681 | | | | 37,722 | |
Radian Group, Inc. | | | | | 23,028 | | | | 53,885 | |
Riverview Bancorp, Inc. | | * | | | 2,602 | | | | 6,167 | |
TFS Financial Corp. | | * | | | 13,499 | | | | 120,951 | |
Tree.com, Inc. | | * | | | 5,006 | | | | 27,984 | |
Triad Guaranty, Inc. | | *† | | | 5,663 | | | | 623 | |
Trustco Bank Corp. | | | | | 7,080 | | | | 39,719 | |
United Financial Bancorp, Inc. | | | | | 5,398 | | | | 86,854 | |
ViewPoint Financial Group | | | | | 6,157 | | | | 80,103 | |
Washington Federal, Inc. | | | | | 22,826 | | | | 319,336 | |
See accompanying notes to financial statements.
308
SCHEDULE OF INVESTMENTS—(Continued)
December 31, 2011
| | | | | | | | | | | | |
| Vantagepoint Mid/Small Company Index Fund | | | Shares | | | | Value | |
| | | | | | | | | | | | |
| COMMON STOCKS—(Continued) | |
Westfield Financial, Inc. | | | | | 8,596 | | | $ | 63,267 | |
WSFS Financial Corp. | | | | | 1,929 | | | | 69,367 | |
| | | | | | | | | | | | |
| | | | | | | | | 3,963,934 | |
| | | | | | | | | | | | |
| Tobacco—0.1% | |
Alliance One International, Inc. | | *† | | | 28,423 | | | | 77,311 | |
Universal Corp. | | | | | 3,751 | | | | 172,396 | |
Vector Group Ltd. | | † | | | 19,974 | | | | 354,738 | |
| | | | | | | | | | | | |
| | | | | | | | | 604,445 | |
| | | | | | | | | | | | |
| Trading Companies & Distributors—0.8% | |
Aceto Corp. | | | | | 3,385 | | | | 23,357 | |
Air Lease Corp. | | *† | | | 12,769 | | | | 302,753 | |
Aircastle Ltd. | | | | | 10,414 | | | | 132,466 | |
Applied Industrial Technologies, Inc. | | | | | 8,348 | | | | 293,599 | |
Beacon Roofing Supply, Inc. | | *† | | | 14,827 | | | | 299,950 | |
GATX Corp. | | | | | 9,644 | | | | 421,057 | |
H&E Equipment Services, Inc. | | * | | | 1,490 | | | | 19,996 | |
Houston Wire & Cable Co. | | | | | 6,215 | | | | 85,891 | |
Interline Brands, Inc. | | * | | | 6,176 | | | | 96,160 | |
Kaman Corp. | | | | | 2,736 | | | | 74,748 | |
MSC Industrial Direct Co., Inc., Class A | | | | | 5,515 | | | | 394,598 | |
RSC Holdings, Inc. | | * | | | 8,975 | | | | 166,037 | |
Rush Enterprises, Inc., Class A | | * | | | 3,897 | | | | 81,525 | |
United Rentals, Inc. | | *† | | | 9,145 | | | | 270,235 | |
Watsco, Inc. | | | | | 5,736 | | | | 376,626 | |
WESCO International, Inc. | | * | | | 5,516 | | | | 292,403 | |
Willis Lease Finance Corp. | | * | | | 1,234 | | | | 14,685 | |
| | | | | | | | | | | | |
| | | | | | | | | 3,346,086 | |
| | | | | | | | | | | | |
| Water Utilities—0.5% | |
American States Water Co. | | | | | 3,697 | | | | 129,025 | |
American Water Works Co., Inc. | | | | | 24,820 | | | | 790,765 | |
Aqua America, Inc. | | | | | 28,761 | | | | 634,180 | |
California Water Service Group | | | | | 13,226 | | | | 241,507 | |
Connecticut Water Service, Inc. | | | | | 3,803 | | | | 103,175 | |
Middlesex Water Co. | | | | | 2,861 | | | | 53,386 | |
SJW Corp. | | † | | | 5,096 | | | | 120,470 | |
| | | | | | | | | | | | |
| | | | | | | | | 2,072,508 | |
| | | | | | | | | | | | |
| Wireless Telecommunication Services—1.0% | |
Clearwire Corp., Class A | | *† | | | 23,621 | | | | 45,825 | |
Crown Castle International Corp. | | * | | | 49,830 | | | | 2,232,384 | |
FiberTower Corp. | | *† | | | 657 | | | | 136 | |
Leap Wireless International, Inc. | | *† | | | 16,479 | | | | 153,090 | |
NII Holdings, Inc. | | * | | | 25,758 | | | | 548,646 | |
NTELOS Holdings Corp. | | | | | 1,551 | | | | 31,609 | |
SBA Communications Corp., Class A | | * | | | 21,041 | | | | 903,921 | |
Shenandoah Telecommunications Co. | | † | | | 2,133 | | | | 22,354 | |
Telephone & Data Systems, Inc. | | † | | | 8,952 | | | | 231,767 | |
United States Cellular Corp. | | * | | | 1,375 | | | | 59,991 | |
USA Mobility, Inc. | | | | | 3,582 | | | | 49,682 | |
| | | | | | | | | | | | |
| | | | | | | | | 4,279,405 | |
| | | | | | | | | | | | |
| TOTAL COMMON STOCKS | | | | | |
(Cost $371,308,595) | | | | | | | | | 405,066,552 | |
| | | | | | | | | | | | |
| | | | | | | | | | | | | | |
| | | | | |
Coupon
Rate | |
| Maturity
Date |
| | | | | Face | | | | Value | |
| | | | | | | | | | | | | | |
| U.S. TREASURY OBLIGATIONS—0.1% | |
| U.S. Treasury Bills—0.1% | |
U.S. Treasury Bill | |
0.013% | | | 05/24/2012 | | | ‡‡ | | $ | 110,000 | | | $ | 109,985 | |
0.009% | | | 03/29/2012 | | | ‡‡ | | | 250,000 | | | | 249,989 | |
| | | | | | | | | | | | | | |
| TOTAL U.S. TREASURY OBLIGATIONS | |
(Cost $359,989) | | | | | | | | | | 359,974 | |
| | | | | | | | | | | | | | |
| | | | | | | | | | | | | | | |
| | | | |
| | | | | | | | | | Shares | | | | Value | |
| RIGHTS—0.0% | |
| Biotechnology—0.0% | |
Ligand Pharmaceuticals, Inc., Expires 12/31/2011 | | | *‡d | | | 4,683 | | | | — | |
| | | | | | | | | | | | | | |
| Machinery—0.0% | |
Gerber Scientific, Inc. CVR | | | *‡d | | | 3,478 | | | | — | |
| | | | | | | | | | | | | | |
| Pharmaceuticals—0.0% | |
Forest Laboratories, Inc. | | | *‡d | | | 2,916 | | | | — | |
| | | | | | | | | | | | | | |
| Textiles, Apparel & Luxury Goods—0.0% | |
Mossimo, Inc. | | | *‡d | | | 2,807 | | | | — | |
| | | | | | | | | | | | | | |
| TOTAL RIGHTS | | | | | | | | | | | |
(Cost $—) | | | | | | | | | | — | |
| | | | | | | | | | | | | | |
| | | | | | | | | | | | | | | |
| WARRANTS—0.0% | | | | | | | | | | | |
| Diversified Financial Services—0.0% | |
Pegasus Wireless Corp., Strike $1.00 | | | *‡d | | | 200 | | | | — | |
| | | | | | | | | | | | | | |
| Oil, Gas & Consumable Fuels—0.0% | |
Magnum Hunter Resources Corp., Expires 10/14/2013, Strike $1.00 | | | *†‡d | | | 2,972 | | | | — | |
| | | | | | | | | | | | | | |
| TOTAL WARRANTS | | | | | | | | | | | |
(Cost $—) | | | | | | | | | | — | |
| | | | | | | | | | | | | | |
| | | | | | | | | | | | | | | |
| MONEY MARKET FUNDS—9.0% | |
| Institutional Money Market Funds—9.0% | |
Dreyfus Institutional Cash Advantage Fund, 0.06% | | | ††¥ | | | 5,600,000 | | | | 5,600,000 | |
Fidelity Institutional Money Market: Money Market Portfolio—Institutional Class, 0.23% | | | ¥ | | | 3,202,926 | | | | 3,202,926 | |
Fidelity Institutional Money Market: Money Market Portfolio—Institutional Class, 0.23% | | | ††¥ | | | 5,680,955 | | | | 5,680,955 | |
Fidelity Institutional Money Market: Prime Money Market Portfolio—Institutional Class, 0.17% | | | ††¥ | | | 5,600,000 | | | | 5,600,000 | |
See accompanying notes to financial statements.
309
SCHEDULE OF INVESTMENTS—(Continued)
December 31, 2011
| | | | | | | | | | | | |
| Vantagepoint Mid/Small Company Index Fund | | | Shares | | | | Value | |
| | | | | | | | | | | | |
| MONEY MARKET FUNDS—(Continued) | |
Short-Term Investments Trust Liquid Assets Portfolio, 0.16% | | ††¥ | | | 5,600,000 | | | $ | 5,600,000 | |
Wells Fargo Advantage Cash Investment Money Market Fund—Select Class, 0.11% | | ††¥ | | | 5,600,000 | | | | 5,600,000 | |
Wells Fargo Advantage Heritage Money Market Fund—Select Class, 0.08% | | ††¥ | | | 5,600,000 | | | | 5,600,000 | |
| | | | | | | | | | | | |
| TOTAL MONEY MARKET FUNDS | |
(Cost $36,883,881) | | | | | | | | | 36,883,881 | |
| | | | | | | | | | | | |
| TOTAL INVESTMENTS—108.3% | | | | | |
(Cost $408,552,465) | | | | | | | | | 442,310,407 | |
Other assets less liabilities—(8.3%) | | | | (33,868,981 | ) |
| | | | | | | | | | | | |
| NET ASSETS—100.0% | | | $ | 408,441,426 | |
| | | | | | | | | | | | |
Notes to the Schedule of Investments:
| | |
| CVR | | Contingent Value Rights |
| REIT | | Real Estate Investment Trust |
| * | | Non-income producing. |
| † | | Denotes all or a portion of the security on loan. |
| d | | Security has no market value at December 31, 2011. |
| ‡ | | Security valued at fair value as determined by policies approved by the Board of Directors. |
| ‡‡ | | Security or a portion of the security has been pledged as collateral for futures contracts and/or options contracts. |
| †† | | Represents reinvestment of collateral received in conjunction with securities lending. |
| ¥ | | The rate quoted is the annualized seven-day yield of the fund at period end. |
See accompanying notes to financial statements.
310
SCHEDULE OF INVESTMENTS
December 31, 2011
| | | | | | | | | | | | |
| Vantagepoint Overseas Equity Index Fund | | | | | | | Shares | | | | Value | |
| | | | | | | | | | | | |
| COMMON STOCKS—96.5% | |
| Australia—8.3% | |
AGL Energy Ltd. | | | | | 8,054 | | | $ | 117,845 | |
Alumina Ltd. | | | | | 43,731 | | | | 50,066 | |
Amcor Ltd. | | | | | 22,424 | | | | 165,077 | |
AMP Ltd. | | | | | 51,387 | | | | 213,544 | |
Asciano Ltd. | | | | | 18,139 | | | | 83,355 | |
ASX Ltd. | | | | | 3,174 | | | | 99,075 | |
Australia & New Zealand Banking Group Ltd. | | | | | 47,867 | | | | 1,002,569 | |
Bendigo and Adelaide Bank Ltd. | | | | | 6,445 | | | | 52,750 | |
BHP Billiton Ltd. | | | | | 58,695 | | | | 2,071,854 | |
Boral Ltd. | | | | | 13,708 | | | | 50,335 | |
Brambles Ltd. | | | | | 26,625 | | | | 194,396 | |
Caltex Australia Ltd. | | † | | | 2,904 | | | | 34,870 | |
Campbell Brothers Ltd. | | † | | | 1,108 | | | | 55,483 | |
CFS Retail Property Trust REIT | | † | | | 37,176 | | | | 64,013 | |
Coca-Cola Amatil Ltd. | | | | | 10,055 | | | | 118,141 | |
Cochlear Ltd. | | † | | | 961 | | | | 61,034 | |
Commonwealth Bank of Australia | | † | | | 28,309 | | | | 1,422,001 | |
Computershare Ltd. | | † | | | 7,579 | | | | 61,951 | |
Crown Ltd. | | | | | 8,054 | | | | 66,435 | |
CSL Ltd. | | | | | 9,922 | | | | 323,485 | |
Dexus Property Group REIT | | † | | | 86,134 | | | | 72,995 | |
Echo Entertainment Group Ltd. | | * | | | 13,011 | | | | 47,709 | |
Fairfax Media Ltd. | | † | | | 41,888 | | | | 30,858 | |
Fortescue Metals Group Ltd. | | † | | | 23,363 | | | | 102,202 | |
Goodman Group REIT | | | | | 126,334 | | | | 73,455 | |
GPT Group REIT | | | | | 31,828 | | | | 99,758 | |
Harvey Norman Holdings Ltd. | | | | | 10,998 | | | | 20,531 | |
Iluka Resources Ltd. | | † | | | 7,565 | | | | 119,822 | |
Incitec Pivot Ltd. | | | | | 31,076 | | | | 98,654 | |
Insurance Australia Group Ltd. | | | | | 38,050 | | | | 115,917 | |
Leighton Holdings Ltd. | | | | | 2,521 | | | | 49,007 | |
Lend Lease Group | | | | | 9,706 | | | | 71,077 | |
Lynas Corp. Ltd. | | *† | | | 27,782 | | | | 29,685 | |
Macquarie Group Ltd. | | † | | | 6,443 | | | | 156,456 | |
Metcash Ltd. | | † | | | 14,473 | | | | 59,675 | |
Mirvac Group REIT | | | | | 58,020 | | | | 69,905 | |
National Australia Bank Ltd. | | | | | 40,063 | | | | 954,362 | |
Newcrest Mining Ltd. | | | | | 14,117 | | | | 430,217 | |
OneSteel Ltd. | | | | | 24,172 | | | | 17,283 | |
Orica Ltd. | | | | | 6,618 | | | | 163,756 | |
Origin Energy Ltd. | | | | | 19,451 | | | | 265,246 | |
OZ Minerals Ltd. | | | | | 5,881 | | | | 60,158 | |
Qantas Airways Ltd. | | * | | | 18,484 | | | | 27,513 | |
QBE Insurance Group Ltd. | | † | | | 19,219 | | | | 254,352 | |
QR National Ltd. | | † | | | 30,950 | | | | 108,117 | |
Ramsay Health Care Ltd. | | | | | 2,124 | | | | 41,805 | |
Rio Tinto Ltd. | | † | | | 8,039 | | | | 495,598 | |
Santos Ltd. | | † | | | 17,065 | | | | 213,561 | |
Sonic Healthcare Ltd. | | | | | 7,094 | | | | 81,767 | |
SP AusNet | | | | | 20,280 | | | | 19,461 | |
Stockland REIT | | † | | | 44,711 | | | | 146,062 | |
Suncorp Group Ltd. | | | | | 23,911 | | | | 204,370 | |
Sydney Airport | | | | | 13,260 | | | | 36,042 | |
Tabcorp Holdings Ltd. | | | | | 13,011 | | | | 36,242 | |
Tatts Group Ltd. | | † | | | 25,228 | | | | 62,886 | |
Telstra Corp. Ltd. | | | | | 77,637 | | | | 264,045 | |
| | | | | | | | | | | | |
| | | | | |
| | | | | | | | Shares | | | | Value | |
| | | | | | | | | | | | |
Toll Holdings Ltd. | | | | | 11,926 | | | $ | 51,351 | |
Transurban Group | | | | | 23,600 | | | | 135,546 | |
Wesfarmers Ltd. | | | | | 18,560 | | | | 559,097 | |
Westfield Group REIT | | † | | | 39,727 | | | | 316,957 | |
Westfield Retail Trust REIT | | | | | 51,614 | | | | 131,538 | |
Westpac Banking Corp. | | | | | 55,023 | | | | 1,123,253 | |
Woodside Petroleum Ltd. | | | | | 11,538 | | | | 361,175 | |
Woolworths Ltd. | | | | | 22,447 | | | | 576,178 | |
WorleyParsons Ltd. | | | | | 3,580 | | | | 93,746 | |
| | | | | | | | | | | | |
| | | | | | | | | | | 14,757,669 | |
| | | | | | | | | | | | |
| Austria—0.2% | |
Erste Group Bank AG | | | | | 3,421 | | | | 60,054 | |
IMMOFINANZ AG | | * | | | 17,662 | | | | 52,936 | |
OMV AG | | | | | 2,952 | | | | 89,422 | |
Raiffeisen Bank International AG | | † | | | 930 | | | | 24,073 | |
Telekom Austria AG | | | | | 6,206 | | | | 74,245 | |
Verbund AG | | | | | 1,308 | | | | 35,074 | |
Vienna Insurance Group AG Wiener Versicherung Gruppe | | | | | 618 | | | | 24,409 | |
Voestalpine AG | | | | | 2,136 | | | | 59,846 | |
| | | | | | | | | | | | |
| | | | | | | | | | | 420,059 | |
| | | | | | | | | | | | |
| Belgium—0.9% | |
Ageas | | | | | 40,792 | | | | 63,021 | |
Anheuser-Busch InBev NV | | | | | 14,523 | | | | 886,386 | |
Anheuser-Busch InBev NV STRIP VVPR | | *‡ | | | 4,872 | | | | 6 | |
Belgacom SA | | † | | | 2,808 | | | | 87,861 | |
Colruyt SA | | | | | 1,280 | | | | 48,357 | |
Delhaize Group SA | | | | | 1,850 | | | | 103,698 | |
Groupe Bruxelles Lambert SA | | | | | 1,525 | | | | 101,450 | |
Groupe Bruxelles Lambert SA STRIP VVPR | | *d | | | 127 | | | | — | |
KBC Groep NV | | | | | 2,865 | | | | 35,823 | |
Mobistar SA | | | | | 586 | | | | 30,591 | |
NV Bekaert SA | | † | | | 755 | | | | 24,110 | |
Solvay SA | | | | | 1,122 | | | | 92,111 | |
UCB SA | | | | | 1,717 | | | | 72,034 | |
Umicore SA | | | | | 1,995 | | | | 81,939 | |
| | | | | | | | | | | | |
| | | | | | | | | | | 1,627,387 | |
| | | | | | | | | | | | |
| Bermuda—0.1% | |
Seadrill Ltd. | | | | | 5,956 | | | | 198,627 | |
| | | | | | | | | | | | |
| China—0.0% | |
Foxconn International Holdings Ltd. | | *† | | | 41,000 | | | | 26,366 | |
Yangzijiang Shipbuilding Holdings Ltd. | | | | | 34,000 | | | | 23,796 | |
| | | | | | | | | | | | |
| | | | | | | | | | | 50,162 | |
| | | | | | | | | | | | |
| Denmark—1.0% | |
A.P. Moller—Maersk A/S, Class A | | | | | 10 | | | | 62,113 | |
A.P. Moller—Maersk A/S, Class B | | | | | 24 | | | | 157,864 | |
Carlsberg A/S, Class B | | | | | 1,998 | | | | 140,686 | |
Coloplast A/S, Class B | | | | | 394 | | | | 56,539 | |
Danske Bank A/S | | * | | | 11,830 | | | | 149,484 | |
DSV A/S | | | | | 3,821 | | | | 68,281 | |
Novo Nordisk A/S, Class B | | | | | 7,717 | | | | 886,554 | |
Novozymes A/S, Class B | | | | | 4,195 | | | | 129,240 | |
TDC A/S | | | | | 6,100 | | | | 48,851 | |
See accompanying notes to financial statements.
311
SCHEDULE OF INVESTMENTS—(Continued)
December 31, 2011
| | | | | | | | | | | | |
| Vantagepoint Overseas Equity Index Fund | | | | | | | Shares | | | | Value | |
| | | | | | | | | | | | |
| COMMON STOCKS—(Continued) | |
Tryg A/S | | | | | 491 | | | $ | 27,198 | |
Vestas Wind Systems A/S | | * | | | 3,587 | | | | 38,579 | |
William Demant Holding A/S | | * | | | 358 | | | | 29,693 | |
| | | | | | | | | | | | |
| | | | | | | | | | | 1,795,082 | |
| | | | | | | | | | | | |
| Finland—0.8% | |
Elisa Oyj | | | | | 2,334 | | | | 48,596 | |
Fortum Oyj | | | | | 8,280 | | | | 176,348 | |
Kesko Oyj, Class B | | | | | 1,238 | | | | 41,501 | |
Kone Oyj, Class B | | | | | 2,839 | | | | 146,976 | |
Metso Oyj | | | | | 2,339 | | | | 86,386 | |
Neste Oil Oyj | | | | | 2,068 | | | | 20,799 | |
Nokia Oyj | | | | | 69,083 | | | | 333,037 | |
Nokian Renkaat Oyj | | | | | 1,862 | | | | 59,784 | |
Orion Oyj, Class B | | | | | 1,592 | | | | 30,933 | |
Pohjola Bank plc, Class A | | | | | 2,462 | | | | 23,856 | |
Sampo Oyj, Class A | | | | | 7,657 | | | | 189,404 | |
Sanoma Oyj | | † | | | 1,243 | | | | 14,226 | |
Stora Enso Oyj (Registered), Class R | | | | | 11,073 | | | | 65,950 | |
UPM-Kymmene Oyj | | | | | 9,762 | | | | 106,978 | |
Wartsila Oyj Abp | | | | | 2,858 | | | | 82,204 | |
| | | | | | | | | | | | |
| | | | | | | | | 1,426,978 | |
| | | | | | | | | | | | |
| France—8.3% | |
Accor SA | | | | | 2,627 | | | | 66,204 | |
Aeroports de Paris | | | | | 565 | | | | 38,649 | |
Air Liquide SA | | | | | 5,222 | | | | 644,800 | |
Alcatel-Lucent | | * | | | 41,043 | | | | 63,782 | |
Alstom SA | | | | | 3,861 | | | | 116,640 | |
Arkema SA | | | | | 910 | | | | 63,945 | |
AtoS | | | | | 801 | | | | 34,995 | |
AXA SA | | | | | 31,749 | | | | 410,394 | |
BNP Paribas SA | | | | | 17,525 | | | | 682,413 | |
Bouygues SA | | | | | 3,534 | | | | 111,147 | |
Bureau Veritas SA | | | | | 936 | | | | 67,987 | |
Cap Gemini SA | | | | | 2,683 | | | | 83,415 | |
Carrefour SA | | | | | 10,576 | | | | 240,623 | |
Casino Guichard Perrachon SA | | | | | 967 | | | | 81,315 | |
Christian Dior SA | | | | | 1,015 | | | | 119,808 | |
Cie de Saint-Gobain | | | | | 7,379 | | | | 282,068 | |
Cie Generale de Geophysique-Veritas | | * | | | 2,451 | | | | 56,893 | |
Cie Generale des Etablissements Michelin, Class B | | | | | 3,178 | | | | 187,252 | |
Cie Generale d’Optique Essilor International SA | | | | | 3,730 | | | | 262,934 | |
CNP Assurances | | | | | 2,704 | | | | 33,472 | |
Credit Agricole SA | | | | | 17,899 | | | | 100,284 | |
Danone SA | | | | | 10,760 | | | | 675,216 | |
Dassault Systemes SA | | | | | 1,058 | | | | 84,516 | |
Edenred | | | | | 3,055 | | | | 74,939 | |
EDF SA | | | | | 4,433 | | | | 107,566 | |
Eiffage SA | | | | | 649 | | | | 15,637 | |
Eurazeo | | | | | 610 | | | | 21,623 | |
Eutelsat Communications SA | | | | | 1,875 | | | | 73,033 | |
Fonciere Des Regions REIT | | | | | 530 | | | | 33,908 | |
France Telecom SA | | | | | 34,197 | | | | 535,239 | |
GDF Suez | | | | | 22,805 | | | | 619,683 | |
Gecina SA REIT | | | | | 340 | | | | 28,494 | |
Groupe Eurotunnel SA | | | | | 8,928 | | | | 60,570 | |
ICADE REIT | | | | | 448 | | | | 35,106 | |
Iliad SA | | | | | 312 | | | | 38,402 | |
| | | | | | | | | | | | |
| | | | | |
| | | | | | | | Shares | | | | Value | |
| | | | | | | | | | | | |
Imerys SA | | | | | 725 | | | $ | 33,253 | |
JCDecaux SA | | * | | | 1,204 | | | | 27,644 | |
Klepierre REIT | | | | | 1,610 | | | | 45,745 | |
Lafarge SA | | | | | 3,740 | | | | 130,927 | |
Lagardere SCA | | | | | 2,073 | | | | 54,577 | |
Legrand SA | | | | | 4,026 | | | | 128,955 | |
L’Oreal SA | | | | | 4,431 | | | | 461,488 | |
LVMH Moet Hennessy Louis Vuitton SA | | | | | 4,614 | | | | 649,949 | |
Natixis | | | | | 15,994 | | | | 39,966 | |
Neopost SA | | † | | | 600 | | | | 40,349 | |
Pernod-Ricard SA | | | | | 3,678 | | | | 340,432 | |
Peugeot SA | | | | | 2,753 | | | | 42,887 | |
PPR | | | | | 1,415 | | | | 201,976 | |
Publicis Groupe SA | | | | | 2,581 | | | | 118,453 | |
Renault SA | | | | | 3,588 | | | | 123,906 | |
Safran SA | | | | | 2,985 | | | | 89,270 | |
Sanofi | | | | | 20,838 | | | | 1,523,210 | |
Schneider Electric SA | | | | | 8,968 | | | | 468,859 | |
SCOR SE | | | | | 3,095 | | | | 72,166 | |
Societe BIC SA | | | | | 451 | | | | 39,899 | |
Societe Generale SA | | | | | 11,713 | | | | 258,572 | |
Societe Television Francaise 1 | | | | | 2,108 | | | | 20,505 | |
Sodexo | | | | | 1,672 | | | | 119,668 | |
Suez Environnement Co. | | | | | 4,703 | | | | 54,032 | |
Technip SA | | | | | 1,743 | | | | 163,406 | |
Thales SA | | | | | 1,765 | | | | 55,556 | |
Total SA | | † | | | 38,643 | | | | 1,971,870 | |
Unibail-Rodamco SE (Paris Exchange) REIT | | | | | 1,697 | | | | 303,718 | |
Vallourec SA | | | | | 2,068 | | | | 133,586 | |
Veolia Environnement SA | | | | | 6,165 | | | | 67,546 | |
Vinci SA | | | | | 8,142 | | | | 354,409 | |
Vivendi SA | | | | | 22,828 | | | | 498,324 | |
Wendel SA | | | | | 539 | | | | 35,779 | |
| | | | | | | | | | | | |
| | | | | | | | | | | 14,823,834 | |
| | | | | | | | | | | | |
| Germany—7.1% | |
Adidas AG | | | | | 3,895 | | | | 253,070 | |
Allianz SE (Registered) | | | | | 8,296 | | | | 792,303 | |
Axel Springer AG | | † | | | 720 | | | | 30,897 | |
BASF SE | | | | | 16,787 | | | | 1,168,684 | |
Bayer AG | | | | | 15,114 | | | | 965,232 | |
Bayerische Motoren Werke AG | | | | | 6,016 | | | | 402,158 | |
Beiersdorf AG | | | | | 1,762 | | | | 99,851 | |
Brenntag AG | | | | | 596 | | | | 55,423 | |
Celesio AG | | | | | 1,532 | | | | 24,233 | |
Commerzbank AG | | * | | | 65,572 | | | | 110,364 | |
Continental AG | | * | | | 1,411 | | | | 87,621 | |
Daimler AG (Registered) | | | | | 16,607 | | | | 727,528 | |
Deutsche Bank AG (Registered) | | | | | 17,056 | | | | 646,438 | |
Deutsche Boerse AG | | * | | | 3,551 | | | | 185,852 | |
Deutsche Lufthansa AG (Registered) | | | | | 4,312 | | | | 51,289 | |
Deutsche Post AG (Registered) | | | | | 15,403 | | | | 236,809 | |
Deutsche Telekom AG (Registered) | | | | | 51,397 | | | | 589,569 | |
E.ON AG | | | | | 33,170 | | | | 714,818 | |
Fraport AG Frankfurt Airport Services Worldwide | | | | | 637 | | | | 31,306 | |
Fresenius Medical Care AG & Co. KGaA | | | | | 3,779 | | | | 256,686 | |
Fresenius SE & Co. KGaA | | | | | 1,989 | | | | 183,927 | |
GEA Group AG | | | | | 3,093 | | | | 87,318 | |
See accompanying notes to financial statements.
312
SCHEDULE OF INVESTMENTS—(Continued)
December 31, 2011
| | | | | | | | | | | | |
| Vantagepoint Overseas Equity Index Fund | | | | | | | Shares | | | | Value | |
| | | | | | | | | | | | |
| COMMON STOCKS—(Continued) | |
Hannover Rueckversicherung AG (Registered) | | | | | 1,141 | | | $ | 56,537 | |
HeidelbergCement AG | | | | | 2,572 | | | | 108,936 | |
Henkel AG & Co. KGaA | | | | | 2,276 | | | | 110,115 | |
Hochtief AG | | | | | 816 | | | | 47,116 | |
Infineon Technologies AG | | | | | 19,414 | | | | 145,809 | |
K+S AG | | | | | 3,089 | | | | 139,319 | |
Kabel Deutschland Holding AG | | * | | | 1,605 | | | | 81,366 | |
Lanxess AG | | | | | 1,585 | | | | 81,860 | |
Linde AG | | | | | 3,063 | | | | 455,200 | |
MAN SE | | | | | 1,157 | | | | 102,769 | |
Merck KGaA | | | | | 1,191 | | | | 118,605 | |
Metro AG | | | | | 2,425 | | | | 88,423 | |
Muenchener Rueckversicherungs AG (Registered) | | | | | 3,292 | | | | 403,411 | |
RWE AG | | | | | 8,183 | | | | 287,251 | |
Salzgitter AG | | | | | 718 | | | | 35,812 | |
SAP AG | | | | | 16,706 | | | | 883,608 | |
Siemens AG (Registered) | | | | | 15,036 | | | | 1,438,582 | |
Suedzucker AG | | | | | 1,160 | | | | 36,953 | |
ThyssenKrupp AG | | | | | 6,947 | | | | 159,383 | |
United Internet AG (Registered) | | | | | 2,186 | | | | 38,966 | |
Volkswagen AG | | | | | 542 | | | | 72,560 | |
Wacker Chemie AG | | † | | | 270 | | | | 21,688 | |
| | | | | | | | | | | | |
| | | | | | | | | 12,615,645 | |
| | | | | | | | | | | | |
| Greece—0.1% | |
Coca Cola Hellenic Bottling Co. SA | | * | | | 3,300 | | | | 56,530 | |
Hellenic Telecommunications Organization SA | | | | | 4,058 | | | | 15,074 | |
National Bank of Greece SA | | * | | | 17,188 | | | | 35,531 | |
OPAP SA | | | | | 4,010 | | | | 35,289 | |
| | | | | | | | | | | | |
| | | | | | | | | 142,424 | |
| | | | | | | | | | | | |
| Guernsey, Channel Islands—0.1% | |
Resolution Ltd. | | | | | 25,527 | | | | 99,510 | |
| | | | | | | | | | | | |
| Hong Kong—2.6% | |
AIA Group Ltd. | | | | | 152,800 | | | | 475,654 | |
ASM Pacific Technology Ltd. | | † | | | 3,500 | | | | 39,201 | |
Bank of East Asia Ltd. | | † | | | 27,320 | | | | 103,086 | |
BOC Hong Kong Holdings Ltd. | | | | | 68,000 | | | | 160,456 | |
Cathay Pacific Airways Ltd. | | | | | 23,000 | | | | 39,325 | |
Cheung Kong Holdings Ltd. | | | | | 25,000 | | | | 296,560 | |
Cheung Kong Infrastructure Holdings Ltd. | | | | | 7,000 | | | | 40,928 | |
CLP Holdings Ltd. | | | | | 36,000 | | | | 305,851 | |
First Pacific Co. Ltd. | | | | | 34,000 | | | | 35,278 | |
Galaxy Entertainment Group Ltd. | | *† | | | 20,000 | | | | 36,356 | |
Hang Lung Group Ltd. | | † | | | 16,000 | | | | 87,563 | |
Hang Lung Properties Ltd. | | | | | 46,000 | | | | 130,575 | |
Hang Seng Bank Ltd. | | † | | | 14,300 | | | | 169,389 | |
Henderson Land Development Co. Ltd. | | | | | 17,000 | | | | 84,214 | |
Hong Kong & China Gas Co. Ltd. | | | | | 85,426 | | | | 197,793 | |
| | | | | | | | | | | | |
| | | | | |
| | | | | | | | Shares | | | | Value | |
| | | | | | | | | | | | |
Hong Kong Exchanges and Clearing Ltd. | | † | | | 18,600 | | | $ | 295,963 | |
Hopewell Holdings Ltd. | | | | | 11,000 | | | | 28,098 | |
Hutchison Whampoa Ltd. | | | | | 39,000 | | | | 325,449 | |
Hysan Development Co. Ltd. | | | | | 12,000 | | | | 39,295 | |
Kerry Properties Ltd. | | | | | 12,500 | | | | 41,304 | |
Li & Fung Ltd. | | | | | 103,200 | | | | 190,158 | |
Lifestyle International Holdings Ltd. | | | | | 11,000 | | | | 24,212 | |
Link (The) REIT | | † | | | 42,000 | | | | 154,463 | |
MTR Corp. | | | | | 26,500 | | | | 85,643 | |
New World Development Co. Ltd. | | | | | 72,900 | | | | 58,534 | |
Noble Group Ltd. | | | | | 67,309 | | | | 58,482 | |
NWS Holdings Ltd. | | | | | 26,500 | | | | 38,964 | |
Orient Overseas International Ltd. | | | | | 3,700 | | | | 21,509 | |
PCCW Ltd. | | | | | 84,000 | | | | 28,823 | |
Power Assets Holdings Ltd. | | | | | 25,500 | | | | 188,548 | |
Shangri-La Asia Ltd. | | | | | 24,000 | | | | 41,342 | |
Sino Land Co. Ltd. | | | | | 55,000 | | | | 78,157 | |
SJM Holdings Ltd. | | | | | 25,000 | | | | 40,569 | |
Sun Hung Kai Properties Ltd. | | | | | 26,000 | | | | 324,920 | |
Swire Pacific Ltd., Class A | | | | | 13,500 | | | | 162,655 | |
Wharf Holdings Ltd. | | | | | 27,637 | | | | 124,579 | |
Wheelock & Co. Ltd. | | | | | 17,000 | | | | 42,036 | |
Wing Hang Bank Ltd. | | | | | 3,000 | | | | 24,544 | |
Yue Yuen Industrial Holdings Ltd. | | | | | 14,000 | | | | 44,179 | |
| | | | | | | | | | | | |
| | | | | | | | | | | 4,664,655 | |
| | | | | | | | | | | | |
| Ireland—0.8% | |
CRH plc (Dublin Exchange) | | | | | 13,178 | | | | 260,885 | |
Elan Corp. plc | | * | | | 9,085 | | | | 125,940 | |
Experian plc | | | | | 18,705 | | | | 254,249 | |
Irish Bank Resolution Corp. Ltd. | | *‡d | | | 11,206 | | | | — | |
James Hardie Industries SE CDI | | | | | 7,989 | | | | 55,696 | |
Kerry Group plc, Class A | | | | | 2,615 | | | | 95,727 | |
Shire plc | | | | | 10,469 | | | | 363,841 | |
WPP plc | | | | | 23,355 | | | | 244,930 | |
| | | | | | | | | | | | |
| | | | | | | | | | | 1,401,268 | |
| | | | | | | | | | | | |
| Israel—0.6% | |
Bank Hapoalim BM | | | | | 19,111 | | | | 62,493 | |
Bank Leumi Le-Israel BM | | | | | 21,883 | | | | 62,841 | |
Bezeq Israeli Telecommunication Corp. Ltd. | | | | | 33,542 | | | | 61,550 | |
Cellcom Israel Ltd. | | | | | 826 | | | | 13,857 | |
Delek Group Ltd. | | | | | 66 | | | | 12,452 | |
Elbit Systems Ltd. | | | | | 388 | | | | 15,976 | |
Israel Chemicals Ltd. | | | | | 8,215 | | | | 85,554 | |
Israel Corp. Ltd. (The) | | | | | 39 | | | | 24,425 | |
Israel Discount Bank Ltd., Class A | | * | | | 16,376 | | | | 21,980 | |
Mizrahi Tefahot Bank Ltd. | | | | | 2,045 | | | | 16,239 | |
NICE Systems Ltd. | | * | | | 1,032 | | | | 35,469 | |
Partner Communications Co. Ltd. | | | | | 1,419 | | | | 12,602 | |
Teva Pharmaceutical Industries Ltd. | | | | | 17,247 | | | | 696,211 | |
| | | | | | | | | | | | |
| | | | | | | | | | | 1,121,649 | |
| | | | | | | | | | | | |
See accompanying notes to financial statements.
313
SCHEDULE OF INVESTMENTS—(Continued)
December 31, 2011
| | | | | | | | | | | | |
| Vantagepoint Overseas Equity Index Fund | | | | | | | Shares | | | | Value | |
| | | | | | | | | | | | |
| COMMON STOCKS—(Continued) | |
| Italy—2.1% | |
A2A SpA | | † | | | 17,876 | | | $ | 16,752 | |
Assicurazioni Generali SpA | | | | | 21,168 | | | | 317,760 | |
Atlantia SpA | | | | | 5,652 | | | | 90,214 | |
Autogrill SpA | | | | | 2,307 | | | | 22,426 | |
Banca Carige SpA | | † | | | 12,736 | | | | 24,330 | |
Banca Monte dei Paschi di Siena SpA | | | | | 68,562 | | | | 22,267 | |
Banco Popolare SC | | † | | | 28,197 | | | | 36,377 | |
Enel Green Power SpA | | | | | 31,577 | | | | 65,805 | |
Enel SpA | | | | | 121,525 | | | | 492,995 | |
ENI SpA | | | | | 44,295 | | | | 913,258 | |
Exor SpA | | | | | 1,270 | | | | 25,462 | |
Fiat Industrial SpA | | * | | | 13,899 | | | | 118,411 | |
Fiat SpA | | † | | | 13,899 | | | | 63,436 | |
Finmeccanica SpA | | † | | | 7,024 | | | | 25,863 | |
Intesa Sanpaolo SpA | | | | | 184,364 | | | | 307,061 | |
Intesa Sanpaolo SpA RSP | | | | | 17,138 | | | | 21,258 | |
Luxottica Group SpA | | | | | 1,959 | | | | 54,778 | |
Mediaset SpA | | | | | 13,265 | | | | 36,589 | |
Mediobanca SpA | | | | | 9,302 | | | | 53,391 | |
Pirelli & C. SpA | | | | | 4,877 | | | | 40,883 | |
Prysmian SpA | | | | | 3,602 | | | | 44,505 | |
Saipem SpA | | | | | 4,845 | | | | 204,962 | |
Snam Rete Gas SpA | | | | | 29,013 | | | | 127,789 | |
Telecom Italia SpA | | | | | 174,969 | | | | 187,017 | |
Telecom Italia SpA RSP | | | | | 110,811 | | | | 99,155 | |
Terna Rete Elettrica Nazionale SpA | | | | | 23,458 | | | | 78,945 | |
UniCredit SpA | | | | | 24,600 | | | | 202,904 | |
Unione di Banche Italiane ScpA | | † | | | 14,166 | | | | 57,821 | |
| | | | | | | | | | | | |
| | | | | | | | | 3,752,414 | |
| | | | | | | | | | | | |
| Japan—21.0% | |
ABC-Mart, Inc. | | | | | 600 | | | | 22,793 | |
Advantest Corp. | | | | | 2,800 | | | | 26,591 | |
Aeon Co. Ltd. | | | | | 11,100 | | | | 152,050 | |
Aeon Credit Service Co. Ltd. | | | | | 1,400 | | | | 22,060 | |
Aeon Mall Co. Ltd. | | | | | 1,400 | | | | 29,701 | |
Air Water, Inc. | | | | | 3,000 | | | | 38,076 | |
Aisin Seiki Co. Ltd. | | | | | 3,400 | | | | 96,356 | |
Ajinomoto Co., Inc. | | | | | 12,000 | | | | 144,055 | |
Alfresa Holdings Corp. | | | | | 700 | | | | 29,464 | |
All Nippon Airways Co. Ltd. | | † | | | 15,000 | | | | 41,913 | |
Amada Co. Ltd. | | | | | 7,000 | | | | 44,307 | |
Aozora Bank Ltd. | | | | | 11,000 | | | | 30,266 | |
Asahi Breweries Ltd. | | † | | | 7,100 | | | | 155,752 | |
Asahi Glass Co. Ltd. | | † | | | 18,000 | | | | 150,478 | |
Asahi Kasei Corp. | | | | | 23,000 | | | | 138,610 | |
Asics Corp. | | | | | 3,000 | | | | 33,720 | |
Astellas Pharma, Inc. | | | | | 8,075 | | | | 327,904 | |
Bank of Kyoto Ltd. (The) | | | | | 6,000 | | | | 51,586 | |
Bank of Yokohama Ltd. (The) | | | | | 23,000 | | | | 108,514 | |
Benesse Holdings, Inc. | | | | | 1,300 | | | | 62,844 | |
Bridgestone Corp. | | | | | 11,900 | | | | 269,513 | |
Brother Industries Ltd. | | | | | 4,600 | | | | 56,302 | |
Canon, Inc. | | | | | 20,900 | | | | 919,753 | |
Casio Computer Co. Ltd. | | † | | | 4,500 | | | | 27,230 | |
Central Japan Railway Co. | | | | | 27 | | | | 227,861 | |
Chiba Bank Ltd. (The) | | | | | 14,000 | | | | 90,011 | |
Chiyoda Corp. | | | | | 3,000 | | | | 30,459 | |
Chubu Electric Power Co., Inc. | | | | | 11,900 | | | | 222,684 | |
| | | | | | | | | | | | |
| | | | | |
| | | | | | | | Shares | | | | Value | |
| | | | | | | | | | | | |
Chugai Pharmaceutical Co. Ltd. | | | | | 3,800 | | | $ | 62,637 | |
Chugoku Bank Ltd. (The) | | | | | 3,000 | | | | 41,745 | |
Chugoku Electric Power Co., Inc. (The) | | | | | 5,500 | | | | 96,370 | |
Citizen Holdings Co. Ltd. | | | | | 4,700 | | | | 27,240 | |
Coca-Cola West Holdings Co. Ltd. | | | | | 1,200 | | | | 20,797 | |
Cosmo Oil Co. Ltd. | | | | | 12,000 | | | | 33,496 | |
Credit Saison Co. Ltd. | | | | | 3,100 | | | | 61,910 | |
Dai Nippon Printing Co. Ltd. | | | | | 10,000 | | | | 95,998 | |
Daicel Corp. | | | | | 5,000 | | | | 30,371 | |
Daido Steel Co. Ltd. | | | | | 6,000 | | | | 37,457 | |
Daihatsu Motor Co. Ltd. | | | | | 4,000 | | | | 71,131 | |
Dai-ichi Life Insurance Co. Ltd. (The) | | | | | 162 | | | | 159,035 | |
Daiichi Sankyo Co. Ltd. | | | | | 12,202 | | | | 241,662 | |
Daikin Industries Ltd. | | | | | 4,400 | | | | 120,107 | |
Dainippon Sumitomo Pharma Co. Ltd. | | | | | 3,000 | | | | 34,143 | |
Daito Trust Construction Co. Ltd. | | | | | 1,400 | | | | 119,877 | |
Daiwa House Industry Co. Ltd. | | | | | 9,000 | | | | 107,592 | |
Daiwa Securities Group, Inc. | | | | | 31,000 | | | | 96,390 | |
Dena Co. Ltd. | | | | | 1,800 | | | | 53,922 | |
Denki Kagaku Kogyo K.K. | | | | | 8,000 | | | | 29,480 | |
Denso Corp. | | | | | 9,000 | | | | 247,238 | |
Dentsu, Inc. | | | | | 3,100 | | | | 94,306 | |
East Japan Railway Co. | | | | | 6,200 | | | | 395,178 | |
Eisai Co. Ltd. | | | | | 4,700 | | | | 194,397 | |
Electric Power Development Co. Ltd. | | | | | 2,140 | | | | 56,908 | |
Elpida Memory, Inc. | | *† | | | 3,300 | | | | 15,268 | |
FamilyMart Co. Ltd. | | | | | 1,200 | | | | 48,459 | |
FANUC Corp. | | | | | 3,500 | | | | 533,863 | |
Fast Retailing Co. Ltd. | | | | | 1,000 | | | | 181,905 | |
Fuji Electric Co. Ltd. | | | | | 10,000 | | | | 27,383 | |
Fuji Heavy Industries Ltd. | | | | | 11,000 | | | | 65,976 | |
FUJIFILM Holdings Corp. | | | | | 8,600 | | | | 202,880 | |
Fujitsu Ltd. | | | | | 35,000 | | | | 181,473 | |
Fukuoka Financial Group, Inc. | | | | | 14,000 | | | | 58,658 | |
Furukawa Electric Co. Ltd. | | | | | 12,000 | | | | 27,533 | |
Gree, Inc. | | | | | 1,500 | | | | 51,564 | |
GS Yuasa Corp. | | † | | | 6,000 | | | | 32,137 | |
Gunma Bank Ltd. (The) | | | | | 8,000 | | | | 43,862 | |
Hachijuni Bank Ltd. (The) | | | | | 8,000 | | | | 45,575 | |
Hakuhodo DY Holdings, Inc. | | | | | 480 | | | | 27,520 | |
Hamamatsu Photonics KK | | | | | 1,100 | | | | 38,352 | |
Hino Motors Ltd. | | | | | 5,000 | | | | 30,274 | |
Hirose Electric Co. Ltd. | | | | | 530 | | | | 46,357 | |
Hiroshima Bank Ltd. (The) | | | | | 10,000 | | | | 46,382 | |
Hisamitsu Pharmaceutical Co., Inc. | | | | | 1,200 | | | | 50,863 | |
Hitachi Chemical Co. Ltd. | | | | | 1,700 | | | | 29,758 | |
Hitachi Construction Machinery Co. Ltd. | | † | | | 1,800 | | | | 30,194 | |
Hitachi High-Technologies Corp. | | | | | 1,100 | | | | 23,829 | |
Hitachi Ltd. | | | | | 82,000 | | | | 426,562 | |
Hitachi Metals Ltd. | | | | | 3,000 | | | | 32,556 | |
Hokkaido Electric Power Co., Inc. | | | | | 3,400 | | | | 48,330 | |
Hokuhoku Financial Group, Inc. | | | | | 23,000 | | | | 44,722 | |
Hokuriku Electric Power Co. | | | | | 3,200 | | | | 59,762 | |
See accompanying notes to financial statements.
314
SCHEDULE OF INVESTMENTS—(Continued)
December 31, 2011
| | | | | | | | | | | | |
| Vantagepoint Overseas Equity Index Fund | | | | | | | Shares | | | | Value | |
| | | | | | | | | | | | |
| COMMON STOCKS—(Continued) | |
Honda Motor Co. Ltd. | | | | | 30,000 | | | $ | 913,827 | |
HOYA Corp. | | | | | 7,900 | | | | 169,843 | |
Ibiden Co. Ltd. | | | | | 2,200 | | | | 43,314 | |
Idemitsu Kosan Co. Ltd. | | | | | 400 | | | | 41,223 | |
IHI Corp. | | | | | 26,000 | | | | 63,036 | |
INPEX Corp. | | | | | 40 | | | | 251,849 | |
Isetan Mitsukoshi Holdings Ltd. | | | | | 7,040 | | | | 73,548 | |
Isuzu Motors Ltd. | | | | | 21,000 | | | | 96,674 | |
ITOCHU Corp. | | | | | 27,000 | | | | 273,765 | |
Itochu Techno-Solutions Corp. | | | | | 600 | | | | 26,913 | |
Iyo Bank Ltd. (The) | | | | | 4,000 | | | | 39,416 | |
J. Front Retailing Co. Ltd. | | | | | 8,600 | | | | 41,457 | |
Japan Petroleum Exploration Co. | | | | | 500 | | | | 19,511 | |
Japan Prime Realty Investment Corp. REIT | | | | | 12 | | | | 28,200 | |
Japan Real Estate Investment Corp. REIT | | | | | 9 | | | | 70,071 | |
Japan Retail Fund Investment Corp. REIT | | | | | 31 | | | | 45,857 | |
Japan Steel Works Ltd. (The) | | | | | 6,000 | | | | 41,621 | |
Japan Tobacco, Inc. | | | | | 82 | | | | 385,606 | |
JFE Holdings, Inc. | | | | | 8,600 | | | | 155,488 | |
JGC Corp. | | | | | 4,000 | | | | 96,035 | |
Joyo Bank Ltd. (The) | | | | | 11,000 | | | | 48,544 | |
JS Group Corp. | | | | | 4,500 | | | | 86,247 | |
JSR Corp. | | | | | 3,000 | | | | 55,291 | |
JTEKT Corp. | | | | | 3,700 | | | | 36,161 | |
Jupiter Telecommunications Co. Ltd. | | | | | 33 | | | | 33,403 | |
JX Holdings, Inc. | | | | | 41,810 | | | | 252,306 | |
Kajima Corp. | | | | | 14,000 | | | | 42,966 | |
Kamigumi Co. Ltd. | | | | | 5,000 | | | | 43,157 | |
Kaneka Corp. | | | | | 6,000 | | | | 31,840 | |
Kansai Electric Power Co., Inc. (The) | | | | | 13,900 | | | | 213,520 | |
Kansai Paint Co. Ltd. | | | | | 4,000 | | | | 35,626 | |
Kao Corp. | | | | | 9,600 | | | | 261,946 | |
Kawasaki Heavy Industries Ltd. | | | | | 25,000 | | | | 62,022 | |
Kawasaki Kisen Kaisha Ltd. | | | | | 12,000 | | | | 21,608 | |
KDDI Corp. | | | | | 54 | | | | 346,804 | |
Keikyu Corp. | | | | | 8,000 | | | | 71,847 | |
Keio Corp. | | | | | 11,000 | | | | 77,586 | |
Keisei Electric Railway Co. Ltd. | | | | | 6,000 | | | | 44,114 | |
Keyence Corp. | | | | | 793 | | | | 191,145 | |
Kikkoman Corp. | | | | | 3,000 | | | | 34,411 | |
Kinden Corp. | | | | | 2,000 | | | | 16,860 | |
Kintetsu Corp. | | † | | | 28,000 | | | | 109,366 | |
Kirin Holdings Co. Ltd. | | | | | 15,000 | | | | 182,261 | |
Kobe Steel Ltd. | | | | | 46,000 | | | | 71,094 | |
Koito Manufacturing Co. Ltd. | | | | | 2,000 | | | | 27,955 | |
Komatsu Ltd. | | | | | 17,200 | | | | 401,068 | |
Konami Corp. | | | | | 1,600 | | | | 47,846 | |
Konica Minolta Holdings, Inc. | | | | | 9,000 | | | | 66,922 | |
Kubota Corp. | | | | | 21,000 | | | | 175,739 | |
Kuraray Co. Ltd. | | | | | 6,100 | | | | 86,569 | |
Kurita Water Industries Ltd. | | | | | 2,100 | | | | 54,512 | |
Kyocera Corp. | | | | | 2,800 | | | | 224,542 | |
Kyowa Hakko Kirin Co. Ltd. | | † | | | 5,000 | | | | 61,034 | |
Kyushu Electric Power Co., Inc. | | | | | 6,900 | | | | 98,841 | |
Lawson, Inc. | | | | | 1,100 | | | | 68,536 | |
Mabuchi Motor Co. Ltd. | | | | | 400 | | | | 16,613 | |
Makita Corp. | | | | | 2,100 | | | | 67,749 | |
| | | | | | | | | | | | |
| | | | | |
| | | | | | | | Shares | | | | Value | |
| | | | | | | | | | | | |
Marubeni Corp. | | | | | 31,000 | | | $ | 188,690 | |
Marui Group Co. Ltd. | | | | | 4,000 | | | | 31,095 | |
Maruichi Steel Tube Ltd. | | | | | 1,000 | | | | 22,239 | |
Mazda Motor Corp. | | *† | | | 28,000 | | | | 49,232 | |
McDonald’s Holdings Co. Japan Ltd. | | † | | | 1,000 | | | | 26,927 | |
Medipal Holdings Corp. | | | | | 2,800 | | | | 29,234 | |
MEIJI Holdings Co. Ltd. | | | | | 1,302 | | | | 53,923 | |
Miraca Holdings, Inc. | | | | | 900 | | | | 35,881 | |
Mitsubishi Chemical Holdings Corp. | | | | | 24,000 | | | | 131,530 | |
Mitsubishi Corp. | | | | | 25,600 | | | | 515,962 | |
Mitsubishi Electric Corp. | | | | | 35,000 | | | | 335,434 | |
Mitsubishi Estate Co. Ltd. | | | | | 23,000 | | | | 342,962 | |
Mitsubishi Gas Chemical Co., Inc. | | | | | 7,000 | | | | 38,815 | |
Mitsubishi Heavy Industries Ltd. | | | | | 54,000 | | | | 229,349 | |
Mitsubishi Logistics Corp. | | | | | 2,000 | | | | 22,149 | |
Mitsubishi Materials Corp. | | | | | 21,000 | | | | 56,776 | |
Mitsubishi Motors Corp. | | * | | | 72,000 | | | | 84,840 | |
Mitsubishi Tanabe Pharma Corp. | | | | | 4,000 | | | | 63,192 | |
Mitsubishi UFJ Financial Group, Inc. | | | | | 234,440 | | | | 992,497 | |
Mitsubishi UFJ Lease & Finance Co. Ltd. | | | | | 1,180 | | | | 46,705 | |
Mitsui & Co. Ltd. | | | | | 32,100 | | | | 497,526 | |
Mitsui Chemicals, Inc. | | | | | 15,000 | | | | 45,545 | |
Mitsui Fudosan Co. Ltd. | | | | | 15,000 | | | | 218,726 | |
Mitsui OSK Lines Ltd. | | | | | 21,000 | | | | 80,973 | |
Mizuho Financial Group, Inc. | | | | | 414,780 | | | | 561,657 | |
MS&AD Insurance Group Holdings | | | | | 10,074 | | | | 185,952 | |
Murata Manufacturing Co. Ltd. | | | | | 3,800 | | | | 194,605 | |
Nabtesco Corp. | | | | | 1,500 | | | | 27,286 | |
Namco Bandai Holdings, Inc. | | | | | 3,350 | | | | 47,545 | |
NEC Corp. | | * | | | 47,000 | | | | 95,123 | |
NGK Insulators Ltd. | | | | | 5,000 | | | | 59,198 | |
NGK Spark Plug Co. Ltd. | | | | | 3,000 | | | | 37,077 | |
NHK Spring Co. Ltd. | | | | | 3,000 | | | | 26,515 | |
Nidec Corp. | | | | | 2,000 | | | | 173,652 | |
Nikon Corp. | | | | | 6,200 | | | | 137,395 | |
Nintendo Co. Ltd. | | | | | 1,800 | | | | 247,126 | |
Nippon Building Fund, Inc. REIT | | | | | 10 | | | | 81,839 | |
Nippon Electric Glass Co. Ltd. | | | | | 6,500 | | | | 63,988 | |
Nippon Express Co. Ltd. | | | | | 16,000 | | | | 62,197 | |
Nippon Meat Packers, Inc. | | | | | 3,000 | | | | 37,174 | |
Nippon Paper Group, Inc. | | † | | | 1,900 | | | | 41,487 | |
Nippon Sheet Glass Co. Ltd. | | | | | 16,000 | | | | 29,819 | |
Nippon Steel Corp. | | | | | 93,000 | | | | 231,345 | |
Nippon Telegraph & Telephone Corp. | | | | | 8,800 | | | | 448,007 | |
Nippon Yusen K.K. | | | | | 29,000 | | | | 73,917 | |
Nishi-Nippon City Bank Ltd. (The) | | | | | 11,000 | | | | 31,553 | |
Nissan Motor Co. Ltd. | | | | | 45,100 | | | | 403,875 | |
Nisshin Seifun Group, Inc. | | | | | 3,200 | | | | 38,739 | |
Nisshin Steel Co. Ltd. | | | | | 15,000 | | | | 22,951 | |
Nissin Foods Holdings Co. Ltd. | | | | | 1,100 | | | | 43,128 | |
Nitori Holdings Co. Ltd. | | | | | 700 | | | | 65,637 | |
See accompanying notes to financial statements.
315
SCHEDULE OF INVESTMENTS—(Continued)
December 31, 2011
| | | | | | | | | | | | |
| Vantagepoint Overseas Equity Index Fund | | | | | | | Shares | | | | Value | |
| | | | | | | | | | | | |
| COMMON STOCKS—(Continued) | |
Nitto Denko Corp. | | | | | 3,100 | | | $ | 110,268 | |
NKSJ Holdings, Inc. | | | | | 6,475 | | | | 126,664 | |
NOK Corp. | | | | | 2,000 | | | | 34,118 | |
Nomura Holdings, Inc. | | | | | 64,100 | | | | 192,988 | |
Nomura Real Estate Holdings, Inc. | | | | | 1,700 | | | | 25,225 | |
Nomura Real Estate Office Fund, Inc. REIT | | | | | 5 | | | | 25,660 | |
Nomura Research Institute Ltd. | | | | | 1,650 | | | | 37,224 | |
NSK Ltd. | | | | | 8,000 | | | | 51,674 | |
NTN Corp. | | | | | 9,000 | | | | 36,101 | |
NTT Data Corp. | | | | | 23 | | | | 73,237 | |
NTT DoCoMo, Inc. | | | | | 279 | | | | 512,250 | |
NTT Urban Development Corp. | | | | | 24 | | | | 16,321 | |
Obayashi Corp. | | | | | 11,000 | | | | 48,912 | |
Odakyu Electric Railway Co. Ltd. | | † | | | 11,000 | | | | 106,343 | |
OJI Paper Co. Ltd. | | † | | | 15,000 | | | | 77,012 | |
Olympus Corp. | | | | | 4,000 | | | | 52,580 | |
Omron Corp. | | | | | 3,800 | | | | 76,277 | |
Ono Pharmaceutical Co. Ltd. | | | | | 1,500 | | | | 84,125 | |
Oracle Corp. Japan | | | | | 600 | | | | 19,834 | |
Oriental Land Co. Ltd. | | † | | | 900 | | | | 95,017 | |
ORIX Corp. | | | | | 1,960 | | | | 161,585 | |
Osaka Gas Co. Ltd. | | | | | 35,000 | | | | 138,281 | |
Otsuka Corp. | | | | | 300 | | | | 20,645 | |
Otsuka Holdings Co. Ltd. | | | | | 4,600 | | | | 129,103 | |
Panasonic Corp. | | | | | 40,500 | | | | 341,807 | |
Rakuten, Inc. | | † | | | 133 | | | | 143,088 | |
Resona Holdings, Inc. | | | | | 33,700 | | | | 148,348 | |
Ricoh Co. Ltd. | | | | | 12,000 | | | | 104,380 | |
Rinnai Corp. | | | | | 600 | | | | 42,963 | |
Rohm Co. Ltd. | | | | | 1,800 | | | | 83,702 | |
Sankyo Co. Ltd. | | | | | 900 | | | | 45,502 | |
Sanrio Co. Ltd. | | | | | 700 | | | | 35,904 | |
Santen Pharmaceutical Co. Ltd. | | | | | 1,400 | | | | 57,816 | |
SBI Holdings, Inc. | | | | | 383 | | | | 27,961 | |
Secom Co. Ltd. | | | | | 3,900 | | | | 179,339 | |
Sega Sammy Holdings, Inc. | | | | | 3,548 | | | | 76,649 | |
Seiko Epson Corp. | | | | | 2,400 | | | | 31,722 | |
Sekisui Chemical Co. Ltd. | | | | | 8,000 | | | | 65,901 | |
Sekisui House Ltd. | | | | | 11,000 | | | | 97,750 | |
Seven & I Holdings Co. Ltd. | | | | | 13,940 | | | | 388,504 | |
Seven Bank Ltd. | | | | | 9,000 | | | | 17,612 | |
Sharp Corp. | | | | | 18,000 | | | | 156,907 | |
Shikoku Electric Power Co., Inc. | | | | | 3,200 | | | | 91,801 | |
Shimadzu Corp. | | | | | 4,000 | | | | 33,732 | |
Shimamura Co. Ltd. | | | | | 400 | | | | 40,870 | |
Shimano, Inc. | | † | | | 1,200 | | | | 58,406 | |
Shimizu Corp. | | | | | 10,000 | | | | 42,029 | |
Shin-Etsu Chemical Co. Ltd. | | | | | 7,600 | | | | 373,311 | |
Shinsei Bank Ltd. | | | | | 16,000 | | | | 16,543 | |
Shionogi & Co. Ltd. | | | | | 5,500 | | | | 70,557 | |
Shiseido Co. Ltd. | | | | | 6,400 | | | | 117,522 | |
Shizuoka Bank Ltd. (The) | | † | | | 11,000 | | | | 115,723 | |
Showa Denko K.K. | | † | | | 26,000 | | | | 52,474 | |
Showa Shell Sekiyu K.K. | | | | | 2,900 | | | | 19,499 | |
SMC Corp. | | | | | 1,000 | | | | 160,886 | |
Softbank Corp. | | | | | 16,100 | | | | 472,826 | |
Sojitz Corp. | | † | | | 21,200 | | | | 32,743 | |
Sony Corp. | | | | | 18,500 | | | | 333,573 | |
Sony Financial Holdings, Inc. | | | | | 3,400 | | | | 50,144 | |
Square Enix Holdings Co. Ltd. | | | | | 1,000 | | | | 19,599 | |
Stanley Electric Co. Ltd. | | | | | 2,500 | | | | 36,637 | |
| | | | | | | | | | | | |
| | | | | |
| | | | | | | | Shares | | | | Value | |
| | | | | | | | | | | | |
Sumco Corp. | | * | | | 1,900 | | | $ | 13,986 | |
Sumitomo Chemical Co. Ltd. | | | | | 29,000 | | | | 105,294 | |
Sumitomo Corp. | | | | | 20,900 | | | | 282,508 | |
Sumitomo Electric Industries Ltd. | | | | | 13,400 | | | | 145,078 | |
Sumitomo Heavy Industries Ltd. | | | | | 10,000 | | | | 58,363 | |
Sumitomo Metal Industries Ltd. | | | | | 61,000 | | | | 110,627 | |
Sumitomo Metal Mining Co. Ltd. | | | | | 10,000 | | | | 128,022 | |
Sumitomo Mitsui Financial Group, Inc. | | | | | 24,700 | | | | 685,000 | |
Sumitomo Mitsui Trust Holdings, Inc. | | | | | 57,740 | | | | 169,325 | |
Sumitomo Realty & Development Co. Ltd. | | | | | 6,500 | | | | 113,569 | |
Sumitomo Rubber Industries Ltd. | | | | | 3,000 | | | | 36,025 | |
Suruga Bank Ltd. | | | | | 4,000 | | | | 35,702 | |
Suzuken Co. Ltd. | | | | | 1,260 | | | | 34,890 | |
Suzuki Motor Corp. | | | | | 6,300 | | | | 129,717 | |
Sysmex Corp. | | | | | 1,200 | | | | 39,014 | |
T&D Holdings, Inc. | | | | | 9,700 | | | | 90,316 | |
Taisei Corp. | | | | | 20,000 | | | | 50,697 | |
Taisho Pharmaceutical Holdings Co. Ltd. | | * | | | 690 | | | | 53,249 | |
Taiyo Nippon Sanso Corp. | | | | | 5,000 | | | | 34,771 | |
Takashimaya Co. Ltd. | | | | | 5,000 | | | | 36,014 | |
Takeda Pharmaceutical Co. Ltd. | | | | | 14,320 | | | | 629,013 | |
TDK Corp. | | | | | 2,300 | | | | 101,438 | |
Teijin Ltd. | | | | | 16,000 | | | | 49,088 | |
Terumo Corp. | | | | | 3,000 | | | | 141,029 | |
THK Co. Ltd. | | | | | 2,100 | | | | 41,365 | |
Tobu Railway Co. Ltd. | | | | | 18,000 | | | | 91,844 | |
Toho Co. Ltd. | | | | | 1,800 | | | | 32,054 | |
Toho Gas Co. Ltd. | | | | | 7,000 | | | | 44,572 | |
Tohoku Electric Power Co., Inc. | | | | | 7,600 | | | | 73,017 | |
Tokio Marine Holdings, Inc. | | | | | 13,100 | | | | 290,084 | |
Tokyo Electric Power Co., Inc. (The) | | *† | | | 26,300 | | | | 63,116 | |
Tokyo Electron Ltd. | | | | | 3,200 | | | | 162,136 | |
Tokyo Gas Co. Ltd. | | | | | 47,000 | | | | 216,603 | |
Tokyu Corp. | | | | | 21,000 | | | | 103,416 | |
Tokyu Land Corp. | | | | | 9,000 | | | | 33,963 | |
TonenGeneral Sekiyu K.K. | | † | | | 5,000 | | | | 54,519 | |
Toppan Printing Co. Ltd. | | | | | 10,000 | | | | 73,416 | |
Toray Industries, Inc. | | | | | 26,000 | | | | 186,020 | |
Toshiba Corp. | | | | | 73,000 | | | | 297,916 | |
Tosoh Corp. | | | | | 9,000 | | | | 23,916 | |
TOTO Ltd. | | | | | 5,000 | | | | 38,595 | |
Toyo Seikan Kaisha Ltd. | | | | | 2,500 | | | | 34,023 | |
Toyo Suisan Kaisha Ltd. | | | | | 2,000 | | | | 48,399 | |
Toyoda Gosei Co. Ltd. | | | | | 1,200 | | | | 19,004 | |
Toyota Boshoku Corp. | | | | | 1,400 | | | | 14,574 | |
Toyota Industries Corp. | | | | | 3,300 | | | | 89,284 | |
Toyota Motor Corp. | | | | | 50,400 | | | | 1,666,583 | |
Toyota Tsusho Corp. | | | | | 4,200 | | | | 74,033 | |
Trend Micro, Inc. | | † | | | 1,800 | | | | 53,675 | |
Tsumura & Co. | | | | | 1,000 | | | | 29,480 | |
Ube Industries Ltd. | | | | | 19,000 | | | | 51,933 | |
Unicharm Corp. | | | | | 2,100 | | | | 103,539 | |
Ushio, Inc. | | | | | 1,900 | | | | 27,308 | |
USS Co. Ltd. | | | | | 350 | | | | 31,632 | |
West Japan Railway Co. | | | | | 3,000 | | | | 130,354 | |
Yahoo! Japan Corp. | | | | | 271 | | | | 87,185 | |
See accompanying notes to financial statements.
316
SCHEDULE OF INVESTMENTS—(Continued)
December 31, 2011
| | | | | | | | | | | | |
| Vantagepoint Overseas Equity Index Fund | | | | | Shares | | | | Value | |
| | | | | | | | | | | | |
| COMMON STOCKS—(Continued) | |
Yakult Honsha Co. Ltd. | | | | | 1,900 | | | $ | 59,733 | |
Yamada Denki Co. Ltd. | | | | | 1,510 | | | | 102,860 | |
Yamaguchi Financial Group, Inc. | | | | | 4,000 | | | | 38,115 | |
Yamaha Corp. | | | | | 2,700 | | | | 24,660 | |
Yamaha Motor Co. Ltd. | | † | | | 4,500 | | | | 56,915 | |
Yamato Holdings Co. Ltd. | | | | | 7,000 | | | | 117,815 | |
Yamato Kogyo Co. Ltd. | | | | | 700 | | | | 20,035 | |
Yamazaki Baking Co. Ltd. | | † | | | 2,000 | | | | 26,278 | |
Yaskawa Electric Corp. | | | | | 4,000 | | | | 33,875 | |
Yokogawa Electric Corp. | | * | | | 4,300 | | | | 38,611 | |
| | | | | | | | | | | | |
| | | | | | | | | 37,301,895 | |
| | | | | | | | | | | | |
| Luxembourg—0.4% | |
ArcelorMittal | | | | | 15,855 | | | | 288,093 | |
Millicom International Cellular SA SDR | | † | | | 1,436 | | | | 143,456 | |
SES SA, Class A FDR | | | | | 5,651 | | | | 135,379 | |
Tenaris SA | | | | | 8,640 | | | | 158,900 | |
| | | | | | | | | | | | |
| | | | | | | | | 725,828 | |
| | | | | | | | | | | | |
| Macau—0.1% | |
Sands China Ltd. | | * | | | 42,494 | | | | 119,221 | |
Wynn Macau Ltd. | | | | | 27,256 | | | | 68,041 | |
| | | | | | | | | | | | |
| | | | | | | | | 187,262 | |
| | | | | | | | | | | | |
| Malta—0.0% | |
BGP Holdings plc | | *‡d | | | 142,647 | | | | — | |
| | | | | | | | | | | | |
| Mauritius—0.0% | |
Essar Energy plc | | * | | | 5,270 | | | | 14,038 | |
| | | | | | | | | | | | |
| Mexico—0.1% | |
Fresnillo plc | | | | | 3,383 | | | | 80,159 | |
| | | | | | | | | | | | |
| Netherlands—5.0% | |
Aegon NV | | * | | | 31,176 | | | | 124,601 | |
Akzo Nobel NV | | | | | 4,164 | | | | 200,661 | |
ASML Holding NV | | | | | 7,753 | | | | 323,854 | |
Corio NV REIT | | | | | 1,147 | | | | 49,666 | |
Delta Lloyd NV | | | | | 1,244 | | | | 20,841 | |
European Aeronautic Defence and Space Co. NV | | | | | 7,463 | | | | 232,391 | |
Fugro NV CVA | | | | | 1,311 | | | | 75,888 | |
Heineken Holding NV | | | | | 2,198 | | | | 89,825 | |
Heineken NV | | | | | 4,624 | | | | 213,833 | |
ING Groep NV CVA | | * | | | 70,662 | | | | 505,346 | |
Koninklijke Ahold NV | | | | | 21,671 | | | | 291,271 | |
Koninklijke Boskalis Westminster NV | | | | | 1,198 | | | | 43,879 | |
Koninklijke DSM NV | | | | | 2,899 | | | | 133,996 | |
Koninklijke KPN NV | | | | | 27,055 | | | | 322,960 | |
Koninklijke Philips Electronics NV | | | | | 18,217 | | | | 382,224 | |
Koninklijke Vopak NV | | | | | 1,384 | | | | 72,982 | |
Qiagen NV | | * | | | 4,093 | | | | 56,354 | |
Randstad Holding NV | | | | | 2,045 | | | | 60,159 | |
Reed Elsevier NV | | | | | 12,525 | | | | 145,734 | |
Royal Dutch Shell plc, Class A | | | | | 65,965 | | | | 2,420,209 | |
Royal Dutch Shell plc, Class B | | | | | 49,267 | | | | 1,874,012 | |
SBM Offshore NV | | | | | 3,035 | | | | 62,214 | |
TNT Express NV | | | | | 6,778 | | | | 50,482 | |
| | | | | | | | | | | | |
| | | | | |
| | | | | | | | Shares | | | | Value | |
| | | | | | | | | | | | |
Unilever NV CVA | | | | | 30,014 | | | $ | 1,031,988 | |
Wolters Kluwer NV | | | | | 5,403 | | | | 93,175 | |
| | | | | | | | | | | | |
| | | | | | | | | 8,878,545 | |
| | | | | | | | | | | | |
| New Zealand—0.1% | |
Auckland International Airport Ltd. | | | | | 15,775 | | | | 30,898 | |
Contact Energy Ltd. | | * | | | 5,175 | | | | 21,235 | |
Fletcher Building Ltd. | | | | | 12,180 | | | | 58,162 | |
Sky City Entertainment Group Ltd. | | | | | 12,302 | | | | 32,867 | |
Telecom Corp of New Zealand Ltd. | | | | | 37,806 | | | | 60,575 | |
| | | | | | | | | | | | |
| | | | | | | | | | | 203,737 | |
| | | | | | | | | | | | |
| Norway—0.7% | |
Aker Solutions ASA | | | | | 2,745 | | | | 28,773 | |
DnB ASA | | | | | 17,840 | | | | 173,882 | |
Gjensidige Forsikring ASA | | | | | 3,287 | | | | 38,047 | |
Norsk Hydro ASA | | † | | | 16,520 | | | | 76,259 | |
Orkla ASA | | | | | 14,553 | | | | 108,370 | |
Statoil ASA | | | | | 20,231 | | | | 518,122 | |
Telenor ASA | | | | | 13,756 | | | | 225,100 | |
Yara International ASA | | | | | 3,544 | | | | 141,475 | |
| | | | | | | | | | | | |
| | | | | | | | | | | 1,310,028 | |
| | | | | | | | | | | | |
| Portugal—0.2% | |
Banco Espirito Santo SA (Registered) | | | | | 9,862 | | | | 17,174 | |
Cimpor Cimentos de Portugal SGPS SA | | | | | 4,428 | | | | 30,415 | |
EDP—Energias de Portugal SA | | | | | 36,083 | | | | 111,438 | |
Galp Energia SGPS SA, Class B | | | | | 3,992 | | | | 58,652 | |
Jeronimo Martins SGPS SA | | * | | | 4,265 | | | | 70,447 | |
Portugal Telecom SGPS SA (Registered) | | † | | | 12,095 | | | | 69,660 | |
| | | | | | | | | | | | |
| | | | | | | | | | | 357,786 | |
| | | | | | | | | | | | |
| Singapore—1.6% | |
Ascendas Real Estate Investment Trust REIT | | | | | 28,786 | | | | 40,646 | |
CapitaLand Ltd. | | | | | 46,500 | | | | 79,136 | |
CapitaMall Trust REIT | | | | | 41,000 | | | | 53,681 | |
CapitaMalls Asia Ltd. | | | | | 23,000 | | | | 20,030 | |
City Developments Ltd. | | | | | 10,000 | | | | 68,532 | |
ComfortDelGro Corp. Ltd. | | | | | 37,000 | | | | 40,372 | |
Cosco Corp. Singapore Ltd. | | | | | 18,000 | | | | 12,113 | |
DBS Group Holdings Ltd. | | | | | 31,500 | | | | 279,603 | |
Fraser and Neave Ltd. | | | | | 18,000 | | | | 85,928 | |
Genting Singapore plc | | * | | | 114,000 | | | | 132,650 | |
Global Logistic Properties Ltd. | | * | | | 33,000 | | | | 44,612 | |
Golden Agri-Resources Ltd. | | | | | 119,320 | | | | 65,744 | |
Hutchison Port Holdings Trust | | | | | 96,000 | | | | 59,390 | |
Jardine Cycle & Carriage Ltd. | | | | | 2,000 | | | | 74,207 | |
Keppel Corp. Ltd. | | | | | 26,400 | | | | 188,967 | |
Keppel Land Ltd. | | | | | 12,000 | | | | 20,512 | |
Neptune Orient Lines Ltd. | | | | | 17,000 | | | | 14,701 | |
Olam International Ltd. | | | | | 24,672 | | | | 40,442 | |
Oversea-Chinese Banking Corp. Ltd. | | | | | 45,600 | | | | 275,007 | |
SembCorp Industries Ltd. | | | | | 18,340 | | | | 57,203 | |
SembCorp Marine Ltd. | | | | | 14,000 | | | | 41,144 | |
Singapore Airlines Ltd. | | | | | 9,400 | | | | 73,560 | |
Singapore Exchange Ltd. | | | | | 15,000 | | | | 70,900 | |
See accompanying notes to financial statements.
317
SCHEDULE OF INVESTMENTS—(Continued)
December 31, 2011
| | | | | | | | | | | | |
| Vantagepoint Overseas Equity Index Fund | | | | | Shares | | | | Value | |
| | | | | | | | | | | | |
| COMMON STOCKS—(Continued) | |
Singapore Press Holdings Ltd. | | | | | 27,500 | | | $ | 78,167 | |
Singapore Technologies Engineering Ltd. | | | | | 31,000 | | | | 64,302 | |
Singapore Telecommunications Ltd. | | | | | 144,159 | | | | 343,351 | |
StarHub Ltd. | | | | | 8,730 | | | | 19,587 | |
United Overseas Bank Ltd. | | | | | 23,000 | | | | 270,676 | |
UOL Group Ltd. | | | | | 8,000 | | | | 24,643 | |
Wilmar International Ltd. | | | | | 36,000 | | | | 138,780 | |
| | | | | | | | | | | | |
| | | | | | | | | | | 2,778,586 | |
| | | | | | | | | | | | |
| Spain—3.2% | |
Abertis Infraestructuras SA | | | | | 6,948 | | | | 110,416 | |
Acciona SA | | | | | 445 | | | | 38,245 | |
Acerinox SA | | † | | | 1,819 | | | | 23,251 | |
ACS Actividades de Construccion y Servicios SA | | † | | | 2,634 | | | | 77,771 | |
Amadeus IT Holding SA, Class A | | | | | 5,166 | | | | 83,422 | |
Banco Bilbao Vizcaya Argentaria SA | | | | | 83,195 | | | | 716,658 | |
Banco de Sabadell SA | | † | | | 19,878 | | | | 75,274 | |
Banco Popular Espanol SA | | | | | 16,000 | | | | 72,671 | |
Banco Santander SA | | | | | 153,986 | | | | 1,163,310 | |
Bankia SA | | * | | | 15,810 | | | | 73,420 | |
Bankinter SA | | † | | | 4,095 | | | | 25,057 | |
CaixaBank | | † | | | 14,001 | | | | 68,423 | |
Distribuidora Internacional de Alimentacion SA | | * | | | 10,576 | | | | 47,612 | |
EDP Renovaveis SA | | * | | | 3,747 | | | | 22,882 | |
Enagas SA | | | | | 3,155 | | | | 58,250 | |
Ferrovial SA | | | | | 6,816 | | | | 81,967 | |
Fomento de Construcciones y Contratas SA | | † | | | 1,109 | | | | 28,632 | |
Gas Natural SDG SA | | † | | | 5,822 | | | | 99,782 | |
Grifols SA | | *† | | | 2,792 | | | | 46,782 | |
Iberdrola SA | | | | | 69,993 | | | | 437,207 | |
Inditex SA | | | | | 4,047 | | | | 330,376 | |
Indra Sistemas SA | | † | | | 1,576 | | | | 19,980 | |
Mapfre SA | | | | | 13,416 | | | | 42,435 | |
Red Electrica Corp. SA | | | | | 1,889 | | | | 80,665 | |
Repsol YPF SA | | † | | | 14,401 | | | | 440,603 | |
Telefonica SA | | | | | 75,067 | | | | 1,293,266 | |
Zardoya Otis SA | | † | | | 2,829 | | | | 38,687 | |
| | | | | | | | | | | | |
| | | | | | | | | | | 5,597,044 | |
| | | | | | | | | | | | |
| Sweden—2.9% | |
Alfa Laval AB | | | | | 5,944 | | | | 112,255 | |
Assa Abloy AB, Class B | | | | | 5,854 | | | | 146,383 | |
Atlas Copco AB, Class A | | | | | 12,472 | | | | 267,231 | |
Atlas Copco AB, Class B | | | | | 7,327 | | | | 138,702 | |
Boliden AB | | | | | 5,215 | | | | 75,657 | |
Electrolux AB, Series B | | | | | 4,438 | | | | 70,516 | |
Getinge AB, Class B | | | | | 3,677 | | | | 92,979 | |
Hennes & Mauritz AB, Class B | | | | | 18,866 | | | | 605,220 | |
Hexagon AB, Class B | | | | | 4,884 | | | | 72,707 | |
Holmen AB, Class B | | | | | 1,079 | | | | 30,900 | |
Husqvarna AB, Class B | | | | | 7,817 | | | | 35,890 | |
Industrivarden AB, Class C | | | | | 1,904 | | | | 22,631 | |
Investor AB, Class B | | † | | | 8,353 | | | | 155,355 | |
Kinnevik Investment AB, Class B | | | | | 4,060 | | | | 78,912 | |
| | | | | | | | | | | | |
| | | | | |
| | | | | | | | Shares | | | | Value | |
| | | | | | | | | | | | |
Lundin Petroleum AB | | * | | | 3,653 | | | $ | 89,472 | |
Modern Times Group AB, Class B | | | | | 977 | | | | 46,535 | |
Nordea Bank AB | | | | | 48,123 | | | | 370,915 | |
Ratos AB, Class B | | | | | 3,896 | | | | 45,595 | |
Sandvik AB | | | | | 18,697 | | | | 228,580 | |
Scania AB, Class B | | | | | 5,968 | | | | 88,095 | |
Securitas AB, Class B | | | | | 5,360 | | | | 46,104 | |
Skandinaviska Enskilda Banken AB, Class A | | | | | 25,092 | | | | 145,584 | |
Skanska AB, Class B | | | | | 7,363 | | | | 121,525 | |
SKF AB, Class B | | | | | 7,152 | | | | 150,768 | |
SSAB AB, Class A | | | | | 3,099 | | | | 27,138 | |
Svenska Cellulosa AB, Class B | | | | | 10,399 | | | | 153,512 | |
Svenska Handelsbanken AB, Class A | | | | | 9,095 | | | | 238,340 | |
Swedbank AB, Class A | | | | | 14,641 | | | | 188,936 | |
Swedish Match AB | | | | | 3,922 | | | | 138,931 | |
Tele2 AB, Class B | | | | | 5,766 | | | | 111,743 | |
Telefonaktiebolaget LM Ericsson, Class B | | | | | 55,600 | | | | 563,818 | |
TeliaSonera AB | | | | | 39,665 | | | | 268,769 | |
Volvo AB, Class B | | | | | 25,507 | | | | 277,873 | |
| | | | | | | | | | | | |
| | | | | | | | | | | 5,207,571 | |
| | | | | | | | | | | | |
| Switzerland—8.8% | |
ABB Ltd. (Registered) | | * | | | 40,070 | | | | 752,766 | |
Actelion Ltd. (Registered) | | * | | | 1,903 | | | | 65,096 | |
Adecco SA (Registered) | | * | | | 2,316 | | | | 96,522 | |
Aryzta AG | | | | | 1,539 | | | | 74,246 | |
Baloise Holding AG (Registered) | | | | | 934 | | | | 63,899 | |
Barry Callebaut AG | | * | | | 30 | | | | 29,515 | |
Compagnie Financiere Richemont SA (A Bearer Shares) | | | | | 9,473 | | | | 476,518 | |
Credit Suisse Group AG (Registered) | | * | | | 20,765 | | | | 486,694 | |
GAM Holding AG | | * | | | 3,736 | | | | 40,459 | |
Geberit AG (Registered) | | * | | | 710 | | | | 136,477 | |
Givaudan SA (Registered) | | * | | | 147 | | | | 139,684 | |
Glencore International plc | | | | | 13,654 | | | | 83,370 | |
Holcim Ltd. (Registered) | | * | | | 4,553 | | | | 242,698 | |
Julius Baer Group Ltd. | | * | | | 3,656 | | | | 142,410 | |
Kuehne + Nagel International AG (Registered) | | | | | 1,003 | | | | 112,315 | |
Lindt & Spruengli AG (Participation Certificates) | | | | | 17 | | | | 50,512 | |
Lindt & Spruengli AG (Registered) | | | | | 2 | | | | 66,718 | |
Lonza Group AG (Registered) | | * | | | 854 | | | | 50,320 | |
Nestle SA (Registered) | | | | | 60,490 | | | | 3,473,549 | |
Novartis AG (Registered) | | | | | 42,562 | | | | 2,429,996 | |
Pargesa Holding SA (Bearer) | | | | | 467 | | | | 30,505 | |
Partners Group Holding AG | | | | | 219 | | | | 38,152 | |
Roche Holding AG (Genusschein) | | | | | 12,840 | | | | 2,171,480 | |
Schindler Holding AG (Participation Certificates) | | | | | 842 | | | | 97,874 | |
Schindler Holding AG (Registered) | | | | | 416 | | | | 48,202 | |
SGS SA (Registered) | | | | | 102 | | | | 168,233 | |
Sika AG | | | | | 39 | | | | 73,331 | |
Sonova Holding AG (Registered) | | * | | | 846 | | | | 88,138 | |
STMicroelectronics NV | | | | | 11,906 | | | | 70,482 | |
See accompanying notes to financial statements.
318
SCHEDULE OF INVESTMENTS—(Continued)
December 31, 2011
| | | | | | | | | | | | |
| Vantagepoint Overseas Equity Index Fund | | | | | Shares | | | | Value | |
| | | | | | | | | | | | |
| COMMON STOCKS—(Continued) | |
Straumann Holding AG (Registered) | | | | | 152 | | | $ | 26,179 | |
Sulzer AG (Registered) | | | | | 394 | | | | 41,956 | |
Swatch Group AG (The) (Bearer) | | | | | 565 | | | | 210,303 | |
Swatch Group AG (The) (Registered) | | | | | 843 | | | | 55,903 | |
Swiss Life Holding AG (Registered) | | * | | | 529 | | | | 48,450 | |
Swiss Re AG | | * | | | 6,402 | | | | 325,476 | |
Swisscom AG (Registered) | | | | | 416 | | | | 157,343 | |
Syngenta AG (Registered) | | * | | | 1,715 | | | | 503,954 | |
Transocean Ltd. | | | | | 5,812 | | | | 223,693 | |
UBS AG (Registered) | | * | | | 66,517 | | | | 789,070 | |
Wolseley plc | | | | | 5,343 | | | | 176,721 | |
Xstrata plc | | | | | 37,914 | | | | 577,247 | |
Zurich Financial Services AG (Registered) | | * | | | 2,688 | | | | 605,626 | |
| | | | | | | | | | | | |
| | | | | | | | | | | 15,542,082 | |
| | | | | | | | | | | | |
| United Kingdom—19.3% | |
3i Group plc | | | | | 18,002 | | | | 50,541 | |
Admiral Group plc | | | | | 3,873 | | | | 51,348 | |
Aggreko plc | | | | | 4,645 | | | | 145,346 | |
AMEC plc | | | | | 6,200 | | | | 87,317 | |
Anglo American plc | | | | | 24,285 | | | | 897,092 | |
Antofagasta plc | | | | | 7,392 | | | | 139,802 | |
ARM Holdings plc | | | | | 24,195 | | | | 223,331 | |
Associated British Foods plc | | | | | 6,436 | | | | 110,557 | |
AstraZeneca plc (London Exchange) | | | | | 24,580 | | | | 1,135,400 | |
Aviva plc | | | | | 52,084 | | | | 242,260 | |
Babcock International Group plc | | | | | 6,821 | | | | 77,818 | |
BAE Systems plc | | | | | 62,132 | | | | 274,550 | |
Balfour Beatty plc | | | | | 12,983 | | | | 53,366 | |
Barclays plc | | | | | 210,894 | | | | 577,573 | |
BG Group plc | | | | | 62,246 | | | | 1,329,801 | |
BHP Billiton plc | | | | | 38,582 | | | | 1,127,971 | |
BP plc | | | | | 345,313 | | | | 2,459,764 | |
British American Tobacco plc | | | | | 36,101 | | | | 1,712,645 | |
British Land Co. plc REIT | | | | | 16,013 | | | | 114,931 | |
British Sky Broadcasting Group plc | | | | | 20,764 | | | | 236,238 | |
BT Group plc | | | | | 140,863 | | | | 417,544 | |
Bunzl plc | | | | | 6,330 | | | | 86,857 | |
Burberry Group plc | | | | | 8,125 | | | | 149,400 | |
Cairn Energy plc | | * | | | 25,400 | | | | 104,427 | |
Capita Group plc (The) | | | | | 10,792 | | | | 105,240 | |
Capital Shopping Centres Group plc REIT | | | | | 9,366 | | | | 45,380 | |
Carnival plc | | | | | 3,197 | | | | 105,380 | |
Centrica plc | | | | | 95,276 | | | | 427,932 | |
Cobham plc | | | | | 19,426 | | | | 55,314 | |
Compass Group plc | | | | | 34,973 | | | | 331,851 | |
Diageo plc | | | | | 45,774 | | | | 1,000,166 | |
Eurasian Natural Resources Corp. plc | | | | | 4,297 | | | | 42,379 | |
G4S plc | | | | | 26,041 | | | | 109,921 | |
GKN plc | | | | | 25,510 | | | | 72,441 | |
GlaxoSmithKline plc | | | | | 92,721 | | | | 2,112,734 | |
Hammerson plc REIT | | | | | 13,557 | | | | 75,704 | |
HSBC Holdings plc (London Exchange) | | | | | 325,005 | | | | 2,481,104 | |
| | | | | | | | | | | | |
| | | | | |
| | | | | | | | Shares | | | | Value | |
| | | | | | | | | | | | |
ICAP plc | | | | | 10,418 | | | $ | 56,116 | |
Imperial Tobacco Group plc | | | | | 18,514 | | | | 700,580 | |
Inmarsat plc | | | | | 7,983 | | | | 49,996 | |
Intercontinental Hotels Group plc | | | | | 5,494 | | | | 98,781 | |
International Consolidated Airlines Group SA | | * | | | 16,243 | | | | 36,422 | |
International Power plc | | | | | 28,027 | | | | 146,552 | |
Intertek Group plc | | | | | 3,046 | | | | 96,190 | |
Invensys plc | | | | | 15,349 | | | | 50,195 | |
Investec plc | | | | | 8,651 | | | | 45,527 | |
ITV plc | | | | | 71,294 | | | | 75,318 | |
J. Sainsbury plc | | | | | 21,858 | | | | 102,766 | |
Johnson Matthey plc | | | | | 3,984 | | | | 113,512 | |
Kazakhmys plc | | | | | 3,673 | | | | 53,034 | |
Kingfisher plc | | | | | 43,308 | | | | 168,295 | |
Land Securities Group plc REIT | | | | | 14,369 | | | | 141,721 | |
Legal & General Group plc | | | | | 109,976 | | | | 175,750 | |
Lloyds Banking Group plc | | * | | | 753,005 | | | | 302,467 | |
London Stock Exchange Group plc | | | | | 2,311 | | | | 28,422 | |
Lonmin plc | | | | | 3,101 | | | | 47,248 | |
Man Group plc | | | | | 31,778 | | | | 62,016 | |
Marks & Spencer Group plc | | | | | 28,835 | | | | 139,267 | |
Meggitt plc | | | | | 12,758 | | | | 69,835 | |
National Grid plc | | | | | 64,564 | | | | 624,062 | |
Next plc | | | | | 3,175 | | | | 134,697 | |
Old Mutual plc | | | | | 99,250 | | | | 208,756 | |
Pearson plc | | | | | 15,141 | | | | 284,177 | |
Petrofac Ltd. | | | | | 4,520 | | | | 101,091 | |
Prudential plc | | | | | 46,972 | | | | 464,749 | |
Randgold Resources Ltd. | | | | | 1,649 | | | | 168,592 | |
Reckitt Benckiser Group plc | | | | | 11,380 | | | | 561,262 | |
Reed Elsevier plc | | | | | 22,119 | | | | 178,061 | |
Rexam plc | | | | | 15,419 | | | | 84,385 | |
Rio Tinto plc | | | | | 25,569 | | | | 1,248,958 | |
Rolls-Royce Holdings plc | | * | | | 33,691 | | | | 390,080 | |
Rolls-Royce Holdings plc, Class C | | *‡ | | | 2,324,679 | | | | 3,610 | |
Royal Bank of Scotland Group plc | | * | | | 311,005 | | | | 98,031 | |
RSA Insurance Group plc | | | | | 63,018 | | | | 102,881 | |
SABMiller plc | | | | | 17,546 | | | | 616,857 | |
Sage Group plc (The) | | | | | 23,751 | | | | 108,527 | |
Schroders plc | | | | | 1,968 | | | | 40,125 | |
Segro plc REIT | | | | | 12,863 | | | | 41,650 | |
Serco Group plc | | | | | 9,142 | | | | 67,266 | |
Severn Trent plc | | | | | 4,129 | | | | 95,817 | |
Smith & Nephew plc | | | | | 15,739 | | | | 152,745 | |
Smiths Group plc | | | | | 7,181 | | | | 101,911 | |
SSE plc | | | | | 16,772 | | | | 335,730 | |
Standard Chartered plc (London Exchange) | | | | | 42,931 | | | | 939,009 | |
Standard Life plc | | | | | 40,542 | | | | 129,896 | |
Subsea 7 SA | | * | | | 5,160 | | | | 95,254 | |
Tate & Lyle plc | | | | | 7,672 | | | | 83,874 | |
Tesco plc | | | | | 147,837 | | | | 924,992 | |
TUI Travel plc | | | | | 9,107 | | | | 23,490 | |
Tullow Oil plc | | | | | 16,087 | | | | 349,541 | |
Unilever plc | | | | | 23,676 | | | | 793,953 | |
United Utilities Group plc | | | | | 12,299 | | | | 115,649 | |
Vedanta Resources plc | | | | | 2,170 | | | | 34,237 | |
Vodafone Group plc | | | | | 928,102 | | | | 2,587,648 | |
See accompanying notes to financial statements.
319
SCHEDULE OF INVESTMENTS—(Continued)
December 31, 2011
| | | | | | | | | | | | | | |
| Vantagepoint Overseas Equity Index Fund | | | Shares | | | | Value | |
| | | | | | | | | | | | | | |
| COMMON STOCKS—(Continued) | |
Weir Group plc (The) | | | | | | 4,025 | | | $ | 127,044 | |
Whitbread plc | | | | | | 3,280 | | | | 79,634 | |
Wm Morrison Supermarkets plc | | | | | | 40,967 | | | | 207,211 | |
| | | | | | | | | | | | | | |
| | | | | | | | | | 34,236,887 | |
| | | | | | | | | | | | | | |
| United States—0.1% | |
Sims Metal Management Ltd. | | | | | | 2,945 | | | | 38,145 | |
Synthes, Inc. | | | ^ | | | 1,182 | | | | 197,843 | |
| | | | | | | | | | 235,988 | |
| | | | | | | | | | | | | | |
| TOTAL COMMON STOCKS | |
(Cost $204,978,883) | | | | | | | | | | 171,554,799 | |
| | | | | | | | | | | | | | |
| | | | | | | | | | | | | | | |
| PREFERRED STOCKS—0.4% | |
| Germany—0.4% | |
Bayerische Motoren Werke AG | | | | | | 922 | | | | 43,531 | |
Henkel AG & Co. KGaA | | | | | | 3,261 | | | | 187,991 | |
Porsche Automobil Holding SE | | | | | | 2,900 | | | | 154,816 | |
ProSiebenSat.1 Media AG | | | | | | 1,238 | | | | 22,557 | |
RWE AG | | | | | | 720 | | | | 23,687 | |
Volkswagen AG | | | | | | 2,691 | | | | 402,335 | |
| | | | | | | | | | | | | | |
| TOTAL PREFERRED STOCKS | |
(Cost $761,496) | | | | | | | | | | 834,917 | |
| | | | | | | | | | | | | | |
| | | | | | | | | | | | | | | |
| | | | |
Coupon
Rate | |
| Maturity
Date |
| | | | | Face | | | | Value | |
| | | | | | | | | | | | | | |
| U.S. TREASURY OBLIGATIONS—0.2% | |
| U.S. Treasury Bills—0.2% | |
U.S. Treasury Bill | | | | | | | | | | | |
0.015% | | | 03/22/2012 | | | ‡‡ | | $ | 345,000 | | | | 344,989 | |
0.000% | | | 05/24/2012 | | | ‡‡ | | | 15,000 | | | | 14,998 | |
| | | | | | | | | | | | | | |
| TOTAL U.S. TREASURY OBLIGATIONS | |
(Cost $359,988) | | | | | | | | | | 359,987 | |
| | | | | | | | | | | | | | |
| | | | | | | | | | | | | | | |
| | | | |
| | | | | | | | | | Shares | | | | Value | |
| RIGHTS—0.0% | |
| Spain—0.0% | |
Grifols SA | | | | | | *‡ | | | | | | | | |
(Cost $—) | | | | | | 279 | | | | 3,033 | |
| | | | | | | | | | | | | | |
| | | | | | | | | | | | | | | |
| MONEY MARKET FUNDS—4.7% | |
| Institutional Money Market Funds—4.7% | |
Dreyfus Institutional Cash Advantage Fund, 0.06% | | | ††¥ | | | 1,150,000 | | | | 1,150,000 | |
Fidelity Institutional Money Market: Money Market Portfolio—Institutional Class, 0.23% | | | ¥ | | | 1,699,370 | | | | 1,699,370 | |
Fidelity Institutional Money Market: Money Market Portfolio—Institutional Class, 0.23% | | | ††¥ | | | 852,718 | | | | 852,718 | |
| | | | | | | | | | | | |
| | | | | |
| | | | | | | | Shares | | | | Value | |
| | | | | | | | | | | | |
Fidelity Institutional Money Market: Prime Money Market Portfolio—Institutional Class, 0.17% | | ††¥ | | | 1,150,000 | | | $ | 1,150,000 | |
Short-Term Investments Trust Liquid Assets Portfolio, 0.16% | | ††¥ | | | 1,150,000 | | | | 1,150,000 | |
Wells Fargo Advantage Cash Investment Money Market Fund—Select Class, 0.11% | | ††¥ | | | 1,150,000 | | | | 1,150,000 | |
Wells Fargo Advantage Heritage Money Market Fund—Select Class, 0.08% | | ††¥ | | | 1,150,000 | | | | 1,150,000 | |
| | | | | | | | | | | | |
| TOTAL MONEY MARKET FUNDS | |
(Cost $8,302,088) | | | | | | | | | 8,302,088 | |
| | | | | | | | | | | | |
| TOTAL INVESTMENTS—101.8% | |
(Cost $214,402,455) | | | | | | | | | 181,054,824 | |
Other assets less liabilities—(1.8%) | | | | | | | (3,270,845 | ) |
| | | | | | | | | | | | |
| NET ASSETS—100.0% | | | | | | $ | 177,783,979 | |
| | | | | | | | | | | | |
Notes to the Schedule of Investments:
| | |
| CDI | | Chess Depository Interest |
| CVA | | Dutch Certificate of Shares |
| FDR | | Fiduciary Depository Receipt |
| REIT | | Real Estate Investment Trust |
| RSP | | Risparmio (Italian Savings Shares) |
| SDR | | Swedish Depository Receipt |
| VVPR | | Verlaagde Vooheffing Precompte Reduit (Belgian dividend coupon) |
| † | | Denotes all or a portion of the security on loan. |
| * | | Non-income producing. |
| ‡ | | Security valued at fair value as determined by policies approved by the Board of Directors. |
| d | | Security has no market value at December 31, 2011. |
| ^ | | Securities are not registered under the Securities Act of 1933. These securities may be resold only in transactions exempt from registration, generally to qualified institutional buyers under Securities Act Rule 144A. Such securities are considered illiquid unless deemed liquid by a subadviser under the liquidity procedures adopted by the Board of Directors. The total market value of illiquid 144A securities was $197,843, which represented 0.1% of Net Assets. |
| ‡‡ | | Security or a portion of the security has been pledged as collateral for futures contracts and/or options contracts. |
| †† | | Represents reinvestment of collateral received in conjunction with securities lending. |
| ¥ | | The rate quoted is the annualized seven-day yield of the fund at period end. |
See accompanying notes to financial statements.
320
SCHEDULE OF INVESTMENTS—(Continued)
December 31, 2011
| | | | |
Vantagepoint Overseas
Equity Index Fund | | | | |
| Percentage of Portfolio by Industry (unaudited): | |
| |
| COMMON STOCKS | | | | |
Commercial Banks | | | 10.9% | |
Pharmaceuticals | | | 8.3% | |
Oil, Gas & Consumable Fuels | | | 8.0% | |
Metals & Mining | | | 5.4% | |
Insurance | | | 4.1% | |
Food Products | | | 4.1% | |
Diversified Telecommunication Services | | | 3.6% | |
Chemicals | | | 3.5% | |
Automobiles | | | 2.8% | |
Machinery | | | 2.6% | |
Electric Utilities | | | 2.3% | |
Food & Staples Retailing | | | 2.3% | |
Wireless Telecommunication Services | | | 2.3% | |
Beverages | | | 2.2% | |
Tobacco | | | 1.7% | |
Capital Markets | | | 1.7% | |
Industrial Conglomerates | | | 1.6% | |
Real Estate Management & Development | | | 1.6% | |
Electrical Equipment | | | 1.3% | |
Real Estate Investment Trusts (REITs) | | | 1.3% | |
Trading Companies & Distributors | | | 1.3% | |
Media | | | 1.2% | |
Multi-Utilities | | | 1.2% | |
Textiles, Apparel & Luxury Goods | | | 1.2% | |
Electronic Equipment, Instruments & Components | | | 1.1% | |
Diversified Financial Services | | | 1.1% | |
Road & Rail | | | 1.0% | |
Hotels, Restaurants & Leisure | | | 1.0% | |
Specialty Retail | | | 0.9% | |
Energy Equipment & Services | | | 0.9% | |
Software | | | 0.8% | |
Auto Components | | | 0.8% | |
Aerospace & Defense | | | 0.7% | |
Construction & Engineering | | | 0.7% | |
Office Electronics | | | 0.7% | |
Household Durables | | | 0.7% | |
Health Care Equipment & Supplies | | | 0.7% | |
Semiconductors & Semiconductor Equipment | | | 0.6% | |
Commercial Services & Supplies | | | 0.6% | |
Building Products | | | 0.6% | |
Communications Equipment | | | 0.5% | |
Gas Utilities | | | 0.5% | |
Professional Services | | | 0.5% | |
Construction Materials | | | 0.5% | |
Personal Products | | | 0.5% | |
Multiline Retail | | | 0.4% | |
Transportation Infrastructure | | | 0.4% | |
Household Products | | | 0.4% | |
Health Care Providers & Services | | | 0.4% | |
Computers & Peripherals | | | 0.3% | |
Air Freight & Logistics | | | 0.3% | |
Paper & Forest Products | | | 0.3% | |
Marine | | | 0.3% | |
Biotechnology | | | 0.2% | |
Containers & Packaging | | | 0.2% | |
Independent Power Producers & Energy Traders | | | 0.2% | |
Leisure Equipment & Products | | | 0.2% | |
Distributors | | | 0.2% | |
| | | | |
| | | | | |
IT Services | | | 0.2% | |
Airlines | | | 0.2% | |
Life Sciences Tools & Services | | | 0.1% | |
Internet Software & Services | | | 0.1% | |
Internet & Catalog Retail | | | 0.1% | |
Water Utilities | | | 0.1% | |
Consumer Finance | | | 0.0% | |
Diversified Consumer Services | | | 0.0% | |
| | | | |
| | | 96.5% | |
| | | | |
| PREFERRED STOCKS | | | | |
Automobiles | | | 0.3% | |
Household Products | | | 0.1% | |
Media | | | 0.0% | |
Multi-Utilities | | | 0.0% | |
| | | | |
| | | 0.4% | |
| | | | |
| RIGHTS | | | | |
Biotechnology | | | 0.0% | |
| | | | |
| TOTAL COMMON STOCKS/PREFERRED STOCKS/RIGHTS | | | 96.9% | |
| | | | |
| U.S. TREASURY OBLIGATIONS | | | | |
U.S. Treasury Bills | | | 0.2% | |
| | | | |
| MONEY MARKET FUNDS | | | | |
Institutional Money Market Funds | | | 4.7% | |
| | | | |
| TOTAL INVESTMENTS | | | 101.8% | |
Other assets less liabilities | | | (1.8)% | |
| | | | |
| TOTAL NET ASSETS | | | 100.0% | |
| | | | |
See accompanying notes to financial statements.
321
SCHEDULE OF INVESTMENTS
December 31, 2011
| | | | | | | | |
| Vantagepoint Model Portfolio Savings Oriented Fund | | | Shares | | | | Value | |
| AFFILIATED MUTUAL FUNDS—100.0% | |
Vantagepoint Core Bond Index Fund Class I | | | 2,484,129 | | | $ | 26,008,834 | |
Vantagepoint Diversifying Strategies Fund | | | 5,763,173 | | | | 57,689,365 | |
Vantagepoint Equity Income Fund | | | 3,520,880 | | | | 29,117,677 | |
Vantagepoint Growth & Income Fund | | | 3,063,223 | | | | 29,069,987 | |
Vantagepoint Inflation Protected Securities Fund | | | 3,687,254 | | | | 43,067,122 | |
Vantagepoint International Fund | | | 1,725,302 | | | | 14,354,512 | |
Vantagepoint Low Duration Bond Fund | | | 8,957,906 | | | | 89,220,742 | |
| | | | | | | | |
| | | | | | | 288,528,239 | |
| | | | | | | | |
| TOTAL INVESTMENTS—100.0% | |
(Cost $274,057,453) | | | | | | | 288,528,239 | |
Other assets less liabilities—(0.0%) | | | | (61,232 | ) |
| | | | | | | | |
| NET ASSETS—100.0% | | | | | | $ | 288,467,007 | |
| | | | | | | | |
See accompanying notes to financial statements.
322
SCHEDULE OF INVESTMENTS
December 31, 2011
| | | | | | | | |
| Vantagepoint Model Portfolio Conservative Growth Fund | | | Shares | | | | Value | |
| AFFILIATED MUTUAL FUNDS—100.0% | |
Vantagepoint Aggressive Opportunities Fund | | | 1,821,202 | | | $ | 16,864,334 | |
Vantagepoint Core Bond Index Fund Class I | | | 6,370,782 | | | | 66,702,090 | |
Vantagepoint Diversifying Strategies Fund | | | 10,514,528 | | | | 105,250,423 | |
Vantagepoint Equity Income Fund | | | 7,531,179 | | | | 62,282,851 | |
Vantagepoint Growth & Income Fund | | | 5,328,550 | | | | 50,567,938 | |
Vantagepoint Growth Fund | | | 3,980,553 | | | | 33,277,425 | |
Vantagepoint Inflation Protected Securities Fund | | | 4,737,667 | | | | 55,335,952 | |
Vantagepoint International Fund | | | 5,303,386 | | | | 44,124,172 | |
Vantagepoint Low Duration Bond Fund | | | 10,536,398 | | | | 104,942,525 | |
Vantagepoint Select Value Fund | | | 1,736,868 | | | | 16,899,724 | |
| | | | | | | | |
| | | | | | | 556,247,434 | |
| | | | | | | | |
| TOTAL INVESTMENTS—100.0% | |
(Cost $542,981,265) | | | | | | | 556,247,434 | |
Other assets less liabilities—(0.0%) | | | | (83,491 | ) |
| | | | | | | | |
| NET ASSETS—100.0% | | | | | | $ | 556,163,943 | |
| | | | | | | | |
See accompanying notes to financial statements.
323
SCHEDULE OF INVESTMENTS
December 31, 2011
| | | | | | | | |
| Vantagepoint Model Portfolio Traditional Growth Fund | | | Shares | | | | Value | |
| AFFILIATED MUTUAL FUNDS—100.0% | |
Vantagepoint Aggressive Opportunities Fund | | | 8,108,288 | | | $ | 75,082,748 | |
Vantagepoint Core Bond Index Fund Class I | | | 16,914,639 | | | | 177,096,270 | |
Vantagepoint Discovery Fund | | | 4,791,909 | | | | 41,881,288 | |
Vantagepoint Diversifying Strategies Fund | | | 20,344,181 | | | | 203,645,253 | |
Vantagepoint Equity Income Fund | | | 20,201,435 | | | | 167,065,866 | |
Vantagepoint Growth & Income Fund | | | 17,457,171 | | | | 165,668,550 | |
Vantagepoint Growth Fund | | | 16,265,200 | | | | 135,977,070 | |
Vantagepoint Inflation Protected Securities Fund | | | 4,648,629 | | | | 54,295,988 | |
Vantagepoint International Fund | | | 19,366,837 | | | | 161,132,082 | |
Vantagepoint Low Duration Bond Fund | | | 10,860,289 | | | | 108,168,481 | |
Vantagepoint Select Value Fund | | | 7,837,466 | | | | 76,258,545 | |
| | | | | | | | |
| | | | | | | 1,366,272,141 | |
| | | | | | | | |
| TOTAL INVESTMENTS—100.0% | |
(Cost $1,365,809,437) | | | | 1,366,272,141 | |
Other assets less liabilities—(0.0%) | | | | (164,378 | ) |
| | | | | | | | |
| NET ASSETS—100.0% | | | $ | 1,366,107,763 | |
| | | | | | | | |
See accompanying notes to financial statements.
324
SCHEDULE OF INVESTMENTS
December 31, 2011
| | | | | | | | |
| Vantagepoint Model Portfolio Long-Term Growth Fund | | | Shares | | | | Value | |
| AFFILIATED MUTUAL FUNDS—100.0% | |
Vantagepoint Aggressive Opportunities Fund | | | 15,717,024 | | | $ | 145,539,639 | |
Vantagepoint Core Bond Index Fund Class I | | | 21,160,488 | | | | 221,550,309 | |
Vantagepoint Discovery Fund | | | 8,999,761 | | | | 78,657,912 | |
Vantagepoint Diversifying Strategies Fund | | | 20,348,157 | | | | 203,685,050 | |
Vantagepoint Equity Income Fund | | | 27,395,902 | | | | 226,564,111 | |
Vantagepoint Growth & Income Fund | | | 23,698,063 | | | | 224,894,621 | |
Vantagepoint Growth Fund | | | 23,389,338 | | | | 195,534,864 | |
Vantagepoint International Fund | | | 32,287,323 | | | | 268,630,528 | |
Vantagepoint Select Value Fund | | | 15,145,342 | | | | 147,364,178 | |
| | | | | | | | |
| | | | | | | 1,712,421,212 | |
| | | | | | | | |
| TOTAL INVESTMENTS—100.0% | |
(Cost $1,733,898,725) | | | | | | | 1,712,421,212 | |
Other assets less liabilities—(0.0%) | | | | (193,098 | ) |
| | | | | | | | |
| NET ASSETS—100.0% | | | $ | 1,712,228,114 | |
| | | | | | | | |
See accompanying notes to financial statements.
325
SCHEDULE OF INVESTMENTS
December 31, 2011
| | | | | | | | |
| Vantagepoint Model Portfolio All-Equity Growth Fund | | | Shares | | | | Value | |
| AFFILIATED MUTUAL FUNDS—100.0% | |
Vantagepoint Aggressive Opportunities Fund | | | 6,663,835 | | | $ | 61,707,108 | |
Vantagepoint Discovery Fund | | | 6,779,178 | | | | 59,250,016 | |
Vantagepoint Equity Income Fund | | | 14,301,334 | | | | 118,272,030 | |
Vantagepoint Growth & Income Fund | | | 11,688,376 | | | | 110,922,687 | |
Vantagepoint Growth Fund | | | 13,121,403 | | | | 109,694,932 | |
Vantagepoint International Fund | | | 15,386,079 | | | | 128,012,180 | |
Vantagepoint Select Value Fund | | | 6,377,986 | | | | 62,057,808 | |
| | | | | | | | |
| | | | | | | 649,916,761 | |
| | | | | | | | |
| TOTAL INVESTMENTS—100.0% | | | | | |
(Cost $691,300,112) | | | | | | | 649,916,761 | |
Other assets less liabilities—(0.0%) | | | | (91,252 | ) |
| | | | | | | | |
| NET ASSETS—100.0% | | | $ | 649,825,509 | |
| | | | | | | | |
See accompanying notes to financial statements.
326
SCHEDULE OF INVESTMENTS
December 31, 2011
| | | | | | | | |
| Vantagepoint Milestone Retirement Income Fund | | | Shares | | | | Value | |
| AFFILIATED MUTUAL FUNDS—100.0% | |
Vantagepoint Core Bond Index Fund Class I | | | 1,892,564 | | | $ | 19,815,147 | |
Vantagepoint Diversifying Strategies Fund | | | 4,400,389 | | | | 44,047,897 | |
Vantagepoint Equity Income Fund | | | 2,674,070 | | | | 22,114,561 | |
Vantagepoint Growth & Income Fund | | | 2,326,416 | | | | 22,077,690 | |
Vantagepoint Inflation Protected Securities Fund | | | 2,815,049 | | | | 32,879,772 | |
Vantagepoint International Fund | | | 1,323,538 | | | | 11,011,833 | |
Vantagepoint Low Duration Bond Fund | | | 6,844,333 | | | | 68,169,555 | |
| | | | | | | | |
| | | | | | | 220,116,455 | |
| | | | | | | | |
| TOTAL INVESTMENTS—100.0% | | | | | |
(Cost $219,228,856) | | | | | | | 220,116,455 | |
Other assets less liabilities—(0.0%) | | | | (53,907 | ) |
| | | | | | | | |
| NET ASSETS—100.0% | | | | | | $ | 220,062,548 | |
| | | | | | | | |
See accompanying notes to financial statements.
327
SCHEDULE OF INVESTMENTS
December 31, 2011
| | | | | | | | |
| Vantagepoint Milestone 2010 Fund | | | Shares | | | | Value | |
| AFFILIATED MUTUAL FUNDS—100.0% | |
Vantagepoint Core Bond Index Fund Class I | | | 1,379,141 | | | $ | 14,439,602 | |
Vantagepoint Diversifying Strategies Fund | | | 3,940,226 | | | | 39,441,666 | |
Vantagepoint Equity Income Fund | | | 4,959,529 | | | | 41,015,305 | |
Vantagepoint Growth & Income Fund | | | 2,582,037 | | | | 24,503,536 | |
Vantagepoint Growth Fund | | | 1,883,869 | | | | 15,749,148 | |
Vantagepoint Inflation Protected Securities Fund | | | 2,848,566 | | | | 33,271,253 | |
Vantagepoint International Fund | | | 2,440,283 | | | | 20,303,156 | |
Vantagepoint Low Duration Bond Fund | | | 3,373,663 | | | | 33,601,680 | |
| | | | | | | | |
| | | | | | | 222,325,346 | |
| | | | | | | | |
| TOTAL INVESTMENTS—100.0% | |
(Cost $220,275,449) | | | | | | | 222,325,346 | |
Other assets less liabilities—(0.0%) | | | | (50,685 | ) |
| | | | | | | | |
| NET ASSETS—100.0% | | | $ | 222,274,661 | |
| | | | | | | | |
See accompanying notes to financial statements.
328
SCHEDULE OF INVESTMENTS
December 31, 2011
| | | | | | | | |
| Vantagepoint Milestone 2015 Fund | | | Shares | | | | Value | |
| AFFILIATED MUTUAL FUNDS—100.0% | |
Vantagepoint Core Bond Index Fund Class I | | | 3,631,396 | | | $ | 38,020,714 | |
Vantagepoint Diversifying Strategies Fund | | | 6,275,751 | | | | 62,820,265 | |
Vantagepoint Equity Income Fund | | | 8,906,563 | | | | 73,657,276 | |
Vantagepoint Growth & Income Fund | | | 4,454,139 | | | | 42,269,784 | |
Vantagepoint Growth Fund | | | 3,413,078 | | | | 28,533,331 | |
Vantagepoint Inflation Protected Securities Fund | | | 2,940,335 | | | | 34,343,107 | |
Vantagepoint International Fund | | | 4,887,521 | | | | 40,664,178 | |
Vantagepoint Low Duration Bond Fund | | | 4,105,617 | | | | 40,891,948 | |
Vantagepoint Mid/Small Company Index Fund Class I | | | 1,477,264 | | | | 20,711,236 | |
| | | | | | | | |
| | | | | | | 381,911,839 | |
| | | | | | | | |
| TOTAL INVESTMENTS—100.0% | |
(Cost $375,217,063) | | | | | | | 381,911,839 | |
Other assets less liabilities—(0.0%) | | | | (56,379 | ) |
| | | | | | | | |
| NET ASSETS—100.0% | | | | | | $ | 381,855,460 | |
| | | | | | | | |
See accompanying notes to financial statements.
329
SCHEDULE OF INVESTMENTS
December 31, 2011
| | | | | | | | |
Vantagepoint Milestone
2020 Fund | | | Shares | | | | Value | |
| AFFILIATED MUTUAL FUNDS—100.0% | |
Vantagepoint Core Bond Index Fund Class I | | | 5,224,991 | | | $ | 54,705,655 | |
Vantagepoint Diversifying Strategies Fund | | | 5,867,762 | | | | 58,736,293 | |
Vantagepoint Equity Income Fund | | | 9,964,382 | | | | 82,405,439 | |
Vantagepoint Growth & Income Fund | | | 4,713,621 | | | | 44,732,266 | |
Vantagepoint Growth Fund | | | 3,799,940 | | | | 31,767,501 | |
Vantagepoint Inflation Protected Securities Fund | | | 496,678 | | | | 5,801,205 | |
Vantagepoint International Fund | | | 5,757,998 | | | | 47,906,547 | |
Vantagepoint Low Duration Bond Fund | | | 2,658,092 | | | | 26,474,592 | |
Vantagepoint Mid/Small Company Index Fund Class I | | | 2,414,526 | | | | 33,851,657 | |
| | | | | | | | |
| | | | | | | 386,381,155 | |
| | | | | | | | |
| TOTAL INVESTMENTS—100.0% | | | | | |
(Cost $380,169,540) | | | | | | | 386,381,155 | |
Other assets less liabilities—(0.0%) | | | | (54,168 | ) |
| | | | | | | | |
| NET ASSETS—100.0% | | | | | | $ | 386,326,987 | |
| | | | | | | | |
See accompanying notes to financial statements.
330
SCHEDULE OF INVESTMENTS
December 31, 2011
| | | | | | | | |
Vantagepoint Milestone
2025 Fund | | | Shares | | | | Value | |
| AFFILIATED MUTUAL FUNDS—100.0% | |
Vantagepoint Core Bond Index Fund Class I | | | 3,868,339 | | | $ | 40,501,510 | |
Vantagepoint Diversifying Strategies Fund | | | 3,904,680 | | | | 39,085,846 | |
Vantagepoint Equity Income Fund | | | 8,387,898 | | | | 69,367,916 | |
Vantagepoint Growth & Income Fund | | | 4,100,981 | | | | 38,918,311 | |
Vantagepoint Growth Fund | | | 3,334,013 | | | | 27,872,349 | |
Vantagepoint International Fund | | | 5,146,765 | | | | 42,821,088 | |
Vantagepoint Low Duration Bond Fund | | | 887,626 | | | | 8,840,756 | |
Vantagepoint Mid/Small Company Index Fund Class I | | | 2,419,299 | | | | 33,918,572 | |
| | | | | | | | |
| | | | | | | 301,326,348 | |
| | | | | | | | |
| TOTAL INVESTMENTS—100.0% | | | | | |
(Cost $297,180,209) | | | | | | | 301,326,348 | |
Other assets less liabilities—(0.0%) | | | | (51,719 | ) |
| | | | | | | | |
| NET ASSETS—100.0% | | | | | | $ | 301,274,629 | |
| | | | | | | | |
See accompanying notes to financial statements.
331
SCHEDULE OF INVESTMENTS
December 31, 2011
| | | | | | | | |
| Vantagepoint Milestone 2030 Fund | | | Shares | | | | Value | |
| AFFILIATED MUTUAL FUNDS—100.0% | |
Vantagepoint Core Bond Index Fund Class I | | | 2,070,406 | | | $ | 21,677,154 | |
Vantagepoint Diversifying Strategies Fund | | | 2,476,844 | | | | 24,793,210 | |
Vantagepoint Equity Income Fund | | | 6,980,798 | | | | 57,731,196 | |
Vantagepoint Growth & Income Fund | | | 3,512,647 | | | | 33,335,018 | |
Vantagepoint Growth Fund | | | 2,940,943 | | | | 24,586,286 | |
Vantagepoint International Fund | | | 4,522,463 | | | | 37,626,890 | |
Vantagepoint Low Duration Bond Fund | | | 313,074 | | | | 3,118,218 | |
Vantagepoint Mid/Small Company Index Fund Class I | | | 2,399,010 | | | | 33,634,113 | |
| | | | | | | | |
| | | | | | | 236,502,085 | |
| | | | | | | | |
| TOTAL INVESTMENTS—100.0% | | | | | |
(Cost $231,130,154) | | | | 236,502,085 | |
Other assets less liabilities—(0.0%) | | | | (49,605 | ) |
| | | | | | | | |
| NET ASSETS—100.0% | | | $ | 236,452,480 | |
| | | | | | | | |
See accompanying notes to financial statements.
332
SCHEDULE OF INVESTMENTS
December 31, 2011
| | | | | | | | |
| Vantagepoint Milestone 2035 Fund | | | Shares | | | | Value | |
| AFFILIATED MUTUAL FUNDS—100.0% | |
Vantagepoint Core Bond Index Fund Class I | | | 813,352 | | | $ | 8,515,794 | |
Vantagepoint Diversifying Strategies Fund | | | 902,525 | | | | 9,034,277 | |
Vantagepoint Equity Income Fund | | | 4,690,990 | | | | 38,794,486 | |
Vantagepoint Growth & Income Fund | | | 2,358,033 | | | | 22,377,729 | |
Vantagepoint Growth Fund | | | 2,113,804 | | | | 17,671,405 | |
Vantagepoint International Fund | | | 3,194,539 | | | | 26,578,565 | |
Vantagepoint Low Duration Bond Fund | | | 33,268 | | | | 331,352 | |
Vantagepoint Mid/Small Company Index Fund Class I | | | 1,941,141 | | | | 27,214,803 | |
| | | | | | | | |
| | | | | | | 150,518,411 | |
| | | | | | | | |
| TOTAL INVESTMENTS—100.0% | | | | | |
(Cost $145,937,189) | | | | 150,518,411 | |
Other assets less liabilities—(0.0%) | | | | (46,793 | ) |
| | | | | | | | |
| NET ASSETS—100.0% | | | $ | 150,471,618 | |
| | | | | | | | |
See accompanying notes to financial statements.
333
SCHEDULE OF INVESTMENTS
December 31, 2011
| | | | | | | | |
| Vantagepoint Milestone 2040 Fund | | | Shares | | | | Value | |
| AFFILIATED MUTUAL FUNDS—100.0% | |
Vantagepoint Core Bond Index Fund Class I | | | 698,124 | | | $ | 7,309,356 | |
Vantagepoint Diversifying Strategies Fund | | | 145,686 | | | | 1,458,320 | |
Vantagepoint Equity Income Fund | | | 4,804,231 | | | | 39,730,987 | |
Vantagepoint Growth & Income Fund | | | 2,431,785 | | | | 23,077,644 | |
Vantagepoint Growth Fund | | | 2,176,456 | | | | 18,195,174 | |
Vantagepoint International Fund | | | 3,296,876 | | | | 27,430,006 | |
Vantagepoint Mid/Small Company Index Fund Class I | | | 2,059,906 | | | | 28,879,879 | |
| | | | | | | | |
| | | | | | | 146,081,366 | |
| | | | | | | | |
| TOTAL INVESTMENTS—100.0% | | | | | |
(Cost $134,284,757) | | | | | | | 146,081,366 | |
Other assets less liabilities—(0.0%) | | | | (48,994 | ) |
| | | | | | | | |
| NET ASSETS—100.0% | | | | | | $ | 146,032,372 | |
| | | | | | | | |
See accompanying notes to financial statements.
334
SCHEDULE OF INVESTMENTS
December 31, 2011
| | | | | | | | |
| Vantagepoint Milestone 2045 Fund | | | Shares | | | | Value | |
| AFFILIATED MUTUAL FUNDS—100.1% | |
Vantagepoint Core Bond Index Fund Class I | | | 161,279 | | | $ | 1,688,593 | |
Vantagepoint Equity Income Fund | | | 1,107,479 | | | | 9,158,854 | |
Vantagepoint Growth & Income Fund | | | 563,662 | | | | 5,349,152 | |
Vantagepoint Growth Fund | | | 503,969 | | | | 4,213,181 | |
Vantagepoint International Fund | | | 766,734 | | | | 6,379,230 | |
Vantagepoint Mid/Small Company Index Fund Class I | | | 476,900 | | | | 6,686,132 | |
| | | | | | | | |
| | | | | | | 33,475,142 | |
| | | | | | | | |
| TOTAL INVESTMENTS—100.1% | | | | | |
(Cost $33,383,539) | | | | | | | 33,475,142 | |
Other assets less liabilities—(0.1%) | | | | (41,489 | ) |
| | | | | | | | |
| NET ASSETS—100.0% | | | | | | $ | 33,433,653 | |
| | | | | | | | |
See accompanying notes to financial statements.
335

Item 2 (Code of Ethics):
Sub-item 2a. The board of directors of the registrant has adopted a code of ethics that applies to the registrant’s principal executive officer, principal financial officer, principal accounting officer or controller, and to persons performing similar functions.
Sub-item 2c. Effective March 14, 2011, the registrant adopted an amendment to the code of ethics including a policy addressing the new requirement pursuant to SEC Rule 206(4)-5, “Political Contributions by Certain Investment Advisers.” Other non-material clarifying language was also added to the existing requirements under the code of ethics. The code of ethics along with these amendments applies to the registrant’s principal executive officer, principal financial officer, principal accounting officer or controller, or persons performing similar functions, regardless of whether these individuals are employed by the registrant or a third party.
Sub-item 2d. Not applicable.
Sub-item 2e. Not applicable.
Sub-item 2f. Not applicable.
Item 3 (Audit Committee Financial Expert): Three members of the audit committee of the registrant have been determined by its board of directors to be audit committee financial experts. The audit committee financial experts of the registrant are Arthur Lynch, Anthony Calhoun and Timothy O’Brien, all of whom are independent under the applicable rules.
Item 4 (Principal Accountant Fees and Services):
Sub-item 4a (Audit Fees). The aggregate fees billed for professional services rendered by the registrant’s principal accountant, PricewaterhouseCoopers LLP, for audits of the registrant’s financial statements were $451,067 and $411,225 in 2011 and 2010, respectively.
Sub-item 4b (Audit Related Fees). Not applicable.
Sub-item 4c (Tax Fees). The aggregate fees billed for professional services rendered by PricewaterhouseCoopers LLP for tax compliance, tax advice and tax planning were $169,669 and $233,850 in 2011 and 2010, respectively. These services covered preparation of the registrant’s income tax and excise tax returns, and also included related consulting and tax provision work.
Sub-item 4d (All Other Fees). Not applicable.
Sub-item 4e (1). The registrant’s audit committee pre-approves all audit and non-audit services to be performed by the registrant’s accountant before they are engaged to perform such services.
Sub-item 4e (2). The registrant’s audit committee approved 100% of the services described in Sub-item 4c.
Sub-item 4f. Not applicable.
Sub-item 4g. Not applicable.
Sub-item 4h. Not applicable.
Item 5 (Audit Committee of Listed Registrants): Not applicable to this registrant.
Item 6 (Investments):
Sub-item 6a. Not applicable; included under Item 1 above.
Sub-item 6b. Not applicable; the registrant did not divest itself of securities in accordance with Section 13(c) of the Investment Company Act of 1940.
Item 7 (Disclosure of Proxy Voting Policies & Procedures for Closed-end Management Investment Companies): Not applicable to this registrant.
Item 8 (Portfolio Managers of Closed-End Management Investment Companies): Not applicable to this registrant.
Item 9 (Purchases of Equity Securities by Closed-End Management Investment Company and Affiliated Purchasers): Not applicable to this registrant.
Item 10 (Submission of Matters to a Vote of Security Holders): Not applicable.
Item 11 (Controls and Procedures):
Sub-item 11a. The principal executive and principal financial officers have concluded that the registrant’s disclosure controls and procedures are effective based on their evaluation of the disclosure controls and procedures as of a date within 90 days of the filing of this report.
Sub-item 11b. There was no change in the registrant’s internal control over financial reporting that occurred during the most recent fiscal quarter of the period covered by this report that has materially affected, or is reasonably likely to affect, the registrant’s internal control over financial reporting.
Item 12 (Exhibits):
Sub-item 12a(1). The code of ethics exhibit is attached.
Sub-item 12a(2). The certification exhibits are attached.
Pursuant to the requirements of the Securities Exchange Act of 1934 and the Investment Company Act of 1940, the registrant has duly caused this report to be signed on its behalf by the undersigned, thereunto duly authorized.
| | |
| The Vantagepoint Funds |
| |
| By: | | /s/ Joan McCallen |
| | Joan McCallen, Principal Executive Officer |
| |
| Date: | | March 7, 2012 |
Pursuant to the requirements of the Securities Exchange Act of 1934 and the Investment Company Act of 1940, this report has been signed below by the following persons on behalf of the registrant and in the capacities, and on the dates indicated.
| | |
| By: | | /s/ Joan McCallen |
| | Joan McCallen, Principal Executive Officer |
| |
| Date: | | March 7, 2012 |
| |
| By: | | /s/ Elizabeth Glista |
| | Elizabeth Glista, Principal Financial Officer |
| |
| Date: | | March 7, 2012 |