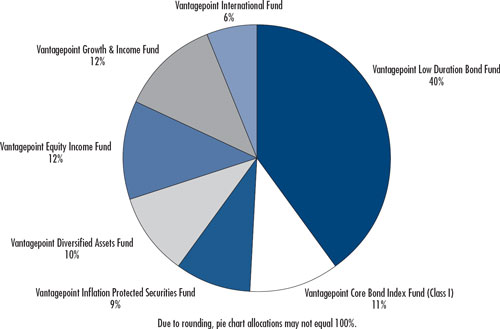
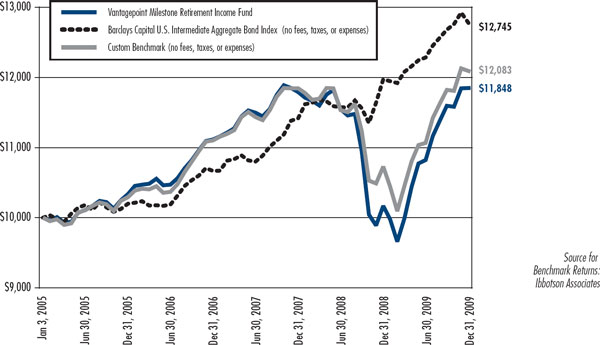
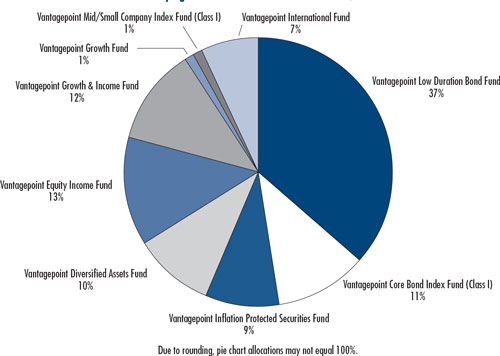
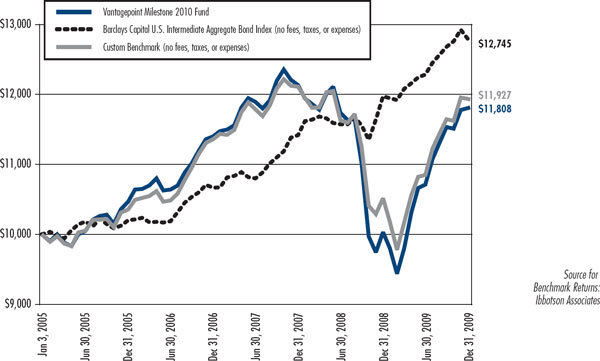
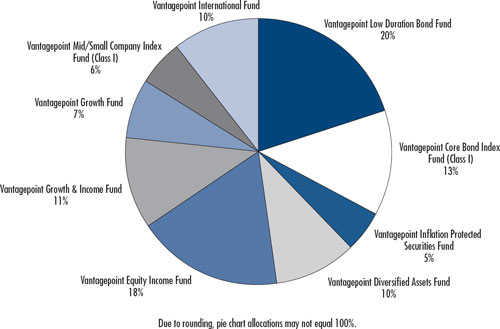
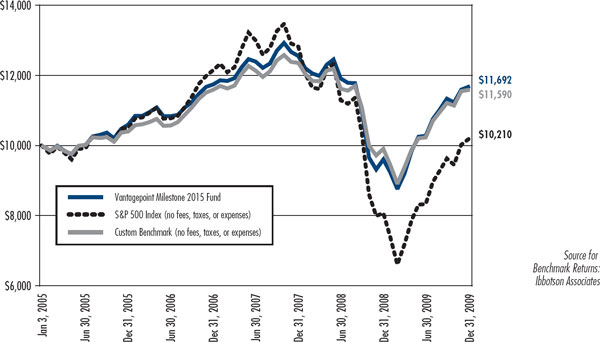
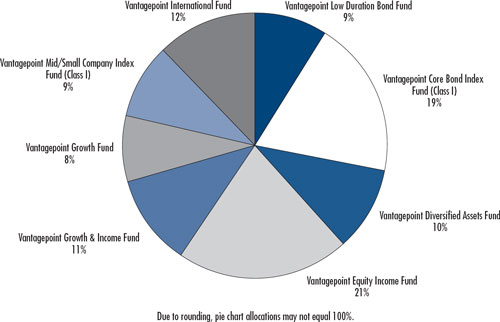
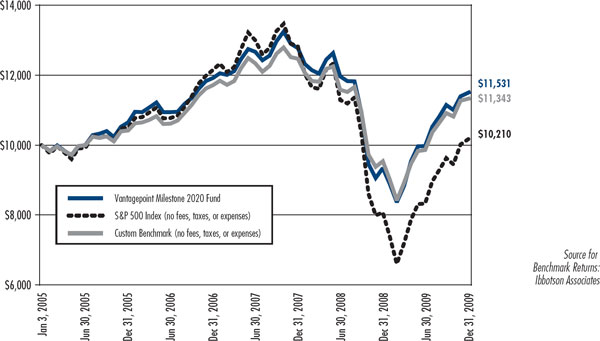
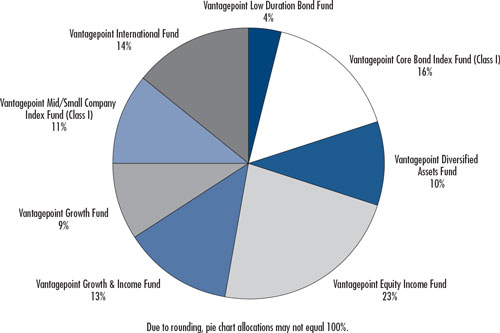
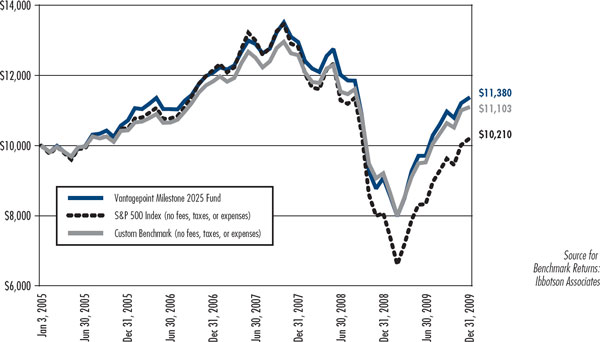
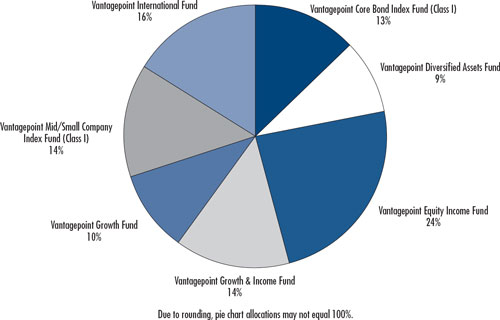
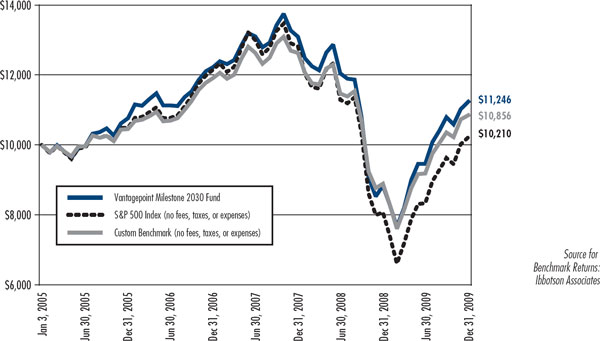
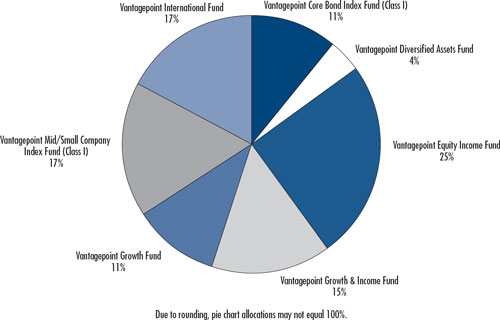
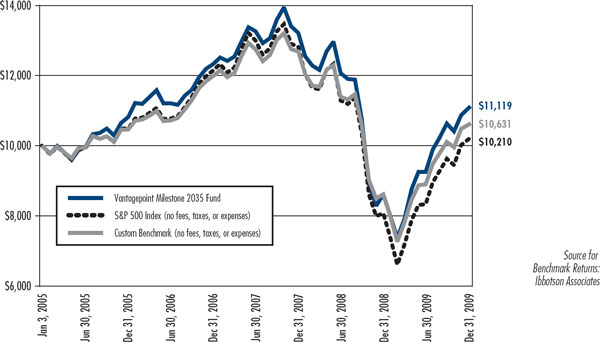
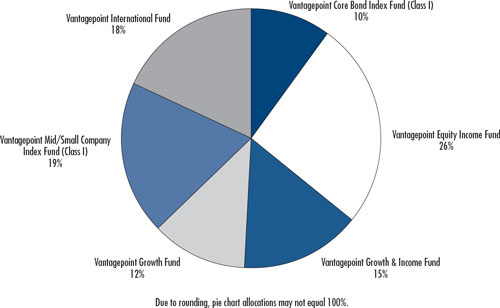
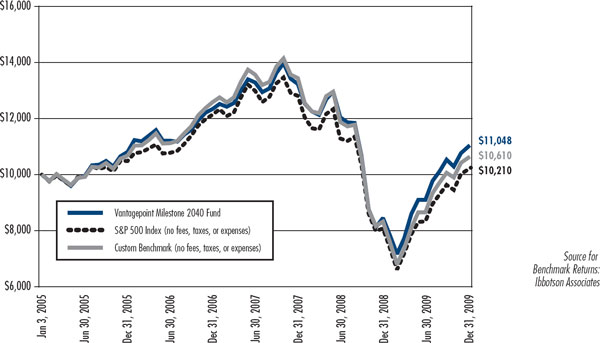
The Milestone Funds invest entirely in underlying funds. Subject to the supervision of the Board, VIA may make allocation changes to the underlying funds based on its periodic analysis to identify the allocation of assets among the different underlying funds that it believes is optimum for each Milestone Fund. Each fund invests in a combination of underlying funds that is believed to be appropriate given the time remaining until a Milestone Fund’s stated retirement date, except for the Milestone Retirement Fund, which is designed for investors who are very close or who at retirement. VIA adjusts the asset allocation of each “dated” Milestone Fund to become more conservative as the designated year approaches*. Each Milestone Fund has a different degree of potential risk and reward and is diversified among various underlying funds in differing allocations. The underlying funds of each Milestone Fund and the investment allocation in each underlying fund as of December 31, 2009, were as follows:
VANTAGEPOINT FUNDS
NOTES TO THE FINANCIAL STATEMENTS—(Continued)
Since the Model Portfolio Funds and Milestone Funds invest entirely in underlying funds, investment earnings are composed of:
| 1. | | ordinary and capital gain dividends from the underlying funds, |
| 2. | | unrealized appreciation/depreciation on investments in the underlying funds, and |
| 3. | | realized gain/loss from sales of the shares of the underlying funds triggered by net outflows associated with normal capital stock activity and rebalancing of the Model Portfolio Funds and Milestone Funds. |
Subadviser Changes from December 31, 2008 to December 31, 2009
At a meeting held on December 12, 2008 (the “December 2008 Meeting”), VIA recommended and the Board approved, the appointment of Fiduciary Management, Inc. (“FMI”) to serve as a subadviser to the Growth & Income Fund, which became effective in January 2009. Also at the December 2008 Meeting, VIA recommended and the Board approved, the termination of Capital Guardian Trust Company (“Capital Guardian”) as subadviser to the Growth & Income Fund, which became effective on January 21, 2009.
Drake Capital Management, LLC (“Drake”) was terminated as a subadviser to the Diversified Assets Fund on April 10, 2009. At a meeting held on March 27, 2009, VIA recommended and the Board, approved an amendment to the existing subadvisory agreement among VIA, the Company and Payden & Rygel providing for Payden & Rygel to receive a fee for managing additional assets of the Diversified Assets Fund, on an interim basis, pursuant to a low duration global fixed income strategy. These assets were previously managed by Drake. The amendment became effective April 3, 2009.
At a meeting on September 25, 2009 (the “September Meeting”), VIA recommended and the Board, approved the termination of Capital Guardian Trust Company (“Capital Guardian”) as a subadviser to the International Fund. Also, at the September Meeting, VIA recommended and the Board, approved the appointment of Mondrian Investment Partners Limited (“Mondrian”) as a subadviser to the International Fund effective October 12, 2009. Also, at the September Meeting, VIA recommended and the Board, approved Payden & Rygel’s appointment to manage the Diversified Assets Fund’s low duration bond strategy on an ongoing basis and approved an amendment to the existing fee schedule with Payden & Rygel (the Board had previously appointed Payden & Rygel to manage this strategy on an interim basis at a meeting on March 27, 2009). Also at the September Meeting, VIA recommended and the Board, approved the appointment of Calamos Advisors, LLC and Shenkman Capital Management, Inc. to manage the convertible securities strategy of the Diversified Assets Fund effective January 4, 2010.
2. | | Significant Accounting Policies |
The Company’s significant accounting policies are consistently applied in the preparation of its financial statements in accordance with accounting principles generally accepted in the United States of America. Management makes estimates and assumptions in the preparation of financial statements that affect the reported amounts of assets and liabilities, including the disclosure of contingent assets and liabilities at the date of the financial statements as well as the revenue and expense amounts during the reporting period. Actual results could differ from those estimates and those differences could be material. Certain prior year amounts have been reclassified to conform to the current year presentation.
FASB Financial Accounting Standards Codification
In June 2009, the Financial Accounting Standards Board (“FASB”) issued FASB ASC 105, The FASB Accounting Standards CodificationTM (“ASC”) and the Hierarchy of Generally Accepted Accounting Principles, (formerly FAS 168). FASB ASC 105 replaces the FAS 162, The Hierarchy of Generally Accepted Accounting Principles, and establishes the FASB Accounting Standards Codification (“Codification”) as the source of authoritative accounting principles recognized by the FASB to be applied by non-governmental entities in the preparation of financial statements in conformity with GAAP. The Codification became the exclusive authoritative reference at September 30, 2009. Updates to the Codification Standards are issued as Accounting Standard Updates (“ASU”s) by the FASB. The adoption of the Codification does not impact the Company’s financial statements except for references made to authoritative accounting literature in the accompanying notes to the financial statements.
Investment Policy and Security Valuation
The equity securities that are traded on a national securities exchange (other than Nasdaq Global/Global Select and Capital Market securities traded primarily on the Nasdaq Stock Market, Inc. exchange (“Nasdaq”)) held by each fund normally will be valued at the last reported sale price on the exchange on which the security is primarily traded. If,
161
VANTAGEPOINT FUNDS
NOTES TO THE FINANCIAL STATEMENTS—(Continued)
on a particular day, an exchange-traded security does not trade on its primary exchange, then the price normally will be the mean between the closing bid and closing offer reported to the primary exchange and made available to quotation vendors or disseminated through an automated quotation system, or obtained by a pricing service from other quotation sources believed to be reliable. Nasdaq Global/Global Select and Capital Market securities traded primarily on Nasdaq will be valued at the Nasdaq Official Closing Price (“NOCP”). If, on any given day, no NOCP is available, the price normally will be the mean between the closing bid and closing offer reported on Nasdaq prior to the calculation of the NAV of a Fund. All equity securities not traded on a national securities exchange (“OTC Equities”) normally are valued at the last reported sale price in the over-the-counter market. If an OTC Equity does not trade in an over-the-counter market on a particular day, then the price normally will be the mean between the closing bid and closing offer obtained from a quotation service or other service believed to be reliable. Short-term debt instruments, such as commercial paper, banker’s acceptances, and U.S. Treasury Bills, with a remaining maturity of less than 60 days are valued at amortized cost. Prices for debt instruments normally will be obtained from a pricing service that may use methodologies designed to identify the market value of debt instruments, which may include reference to actual market transactions, broker-dealer supplied quotations or valuations, matrix pricing, or other valuation techniques. These techniques generally consider such factors as securities’ prices, yields, maturities, call features, ratings and developments relating to specific securities in arriving at valuations. In the event a pricing service is unable to provide a price for a particular security, the security may be priced based on the average of two or more independent broker-dealer quotations. Any security for which market value as described above is not readily available is valued at fair value as determined in good faith in accordance with policies approved by the Board (“Valuation Procedures”). The valuation of certain foreign equity securities is described later in the note.
Shares of the underlying funds in which the Model Portfolio and Milestone Funds invest are valued by using the underlying funds’ current net asset values (“NAVs”) for purchase and/or redemption orders that day.
The Money Market Fund invests substantially all of its assets in the Institutional Class of Short-Term Investments Trust Liquid Assets Portfolio (“Portfolio”) advised by Invesco Aim Advisors, Inc. The Portfolio uses the amortized cost method to value its portfolio securities in accordance with Rule 2a-7 under the 1940 Act. The shares of the Portfolio are valued by the Money Market Fund using the Portfolio’s NAV for purchase or redemption orders placed that day.
On September 10, 2009, in accordance with applicable orders of the United States Bankruptcy Court for the Southern District of New York, the Vantagepoint Diversified Assets Fund filed claims, each in the amount of $54,298, against Lehman Brothers Special Financing Inc. (“LBSF”) and its parent company, Lehman Brothers Holdings, Inc. (“LBHI”). The claims arise out of certain derivatives transactions between the Diversified Assets Fund and LBSF that were guaranteed as to payment by LBHI. The derivatives transactions were terminated upon the bankruptcy filings of LBHI and LBSF and subsequently liquidated, resulting in claims. The timing and amount of distributions payable in connection with the claims (if any) is not presently known.
Valuation of Foreign Equity Securities
For foreign equity securities held by the funds and principally traded in markets outside North and South America, the Board approved the use of a third party fair valuation service. The service uses a multifactor model to calculate a factor that is then applied to adjust the market price for each such security. Additionally, the Board has approved the use of the fair value prices provided by this service on a daily basis without a market trigger or confidence interval filter for all foreign equity securities held by funds that are primarily traded in markets outside North and South America. In the event prices for such foreign securities are not available through the service or another fair value pricing service approved by the Board, the securities may be priced at the average of two or more independent broker-dealer quotations or at the fair value of the security in accordance with the Company’s Valuation Procedures.
ASC 820
The Company adopted Financial Accounting Standards Board’s Accounting Standards CodificationTM (“ASC”), Fair Value Measurements and Disclosures (“ASC 820”), (formerly known as FAS 157), effective January 1, 2008. In accordance with ASC 820, fair value is defined as the price that the fund would receive upon selling an investment in an orderly transaction to an independent buyer in the principal or most advantageous market for the investment. ASC 820 established a three-tier hierarchy, which maximizes the use of observable market data and minimizes the use of unobservable inputs to establish classification of fair value measurements for disclosure purposes. Inputs refer broadly
162
VANTAGEPOINT FUNDS
NOTES TO THE FINANCIAL STATEMENTS—(Continued)
to the assumptions that market participants would use in pricing the asset or liability, including assumptions about risk, for example, the risk inherent in a particular valuation technique used to measure fair value including a pricing model and/or the risk inherent in the inputs to the valuation technique. Inputs may be observable or unobservable.
Observable inputs are inputs that reflect the assumptions market participants would use in pricing the asset or liability developed based on market data obtained from sources independent of the reporting entity. Unobservable inputs are inputs that reflect the reporting entity’s own assumptions about the assumptions market participants would use in pricing the asset or liability based on the best information available in the circumstances. The three-tier hierarchy of inputs is summarized in the three broad levels listed below.
| Level 1— | | quoted prices in active markets for identical investments |
| Level 2— | | other significant observable inputs (including quoted prices for similar investments in active markets, interest rates and yield curves, prepayment speeds, credit risks, etc.) |
| Level 3— | | significant unobservable inputs (including the fund’s own assumptions about the assumptions that market participants would use in determining the fair value of investments) |
The valuation techniques used by the funds to measure fair value during the year ended December 31, 2009, maximized the use of observable inputs and minimized the use of unobservable inputs. The funds utilized fair value techniques such as multi-dimensional relational pricing model and option adjusted spread pricing to estimate prices that would have prevailed in a liquid market given information available at the time of evaluation.
The following is a summary of the inputs used as of December 31, 2009, in valuing each fund’s investment carried at value:
Investment Type | | | �� | Level 1 | | Level 2 | | Level 3 | | Total |
Low Duration Bond Fund | | | | | | | | | | | | | | | | | | |
Investments in Securities: | | | | | | | | | | | | | | | | | | |
| Corporate Obligations | | | | $ | — | | | $ | 222,183,654 | | | $ | — | | | $ | 222,183,654 | |
| U.S. Government Agency Obligations | | | | | — | | | | 29,624,576 | | | | — | | | | 29,624,576 | |
| U.S. Government Agency Mortgage-Backed Securities | | | | | — | | | | 29,548,560 | | | | — | | | | 29,548,560 | |
| U.S. Treasury Obligations | | | | | — | | | | 25,662,021 | | | | — | | | | 25,662,021 | |
| Municipal Obligations | | | | | — | | | | 8,236,626 | | | | — | | | | 8,236,626 | |
| Sovereign Debt Obligations | | | | | — | | | | 5,502,691 | | | | — | | | | 5,502,691 | |
| Asset Backed Securities | | | | | — | | | | 85,762,932 | | | | — | | | | 85,762,932 | |
| Non-Government Mortgage-Backed Securities | | | | | — | | | | 10,453,055 | | | | — | | | | 10,453,055 | |
| Non-U.S. Government Agency Obligations | | | | | — | | | | 7,194,538 | | | | — | | | | 7,194,538 | |
| Cash Equivalents | | | | | 134,520,370 | | | | — | | | | — | | | | 134,520,370 | |
Total Investments in Securities | | | | $ | 134,520,370 | | | $ | 424,168,653 | | | $ | — | | | $ | 558,689,023 | |
Derivative Instruments: | | | | | | | | | | | | | | | | | | |
Assets | | | | | | | | | | | | | | | | | | |
| Futures | | | | | 127,803 | | | | — | | | | — | | | | 127,803 | |
| Forward Currency Contracts | | | | | — | | | | 244,664 | | | | — | | | | 244,664 | |
Total Assets | | | | $ | 127,803 | | | $ | 244,664 | | | $ | — | | | $ | 372,467 | |
Total Derivative Instruments | | | | $ | 127,803 | | | $ | 244,664 | | | $ | — | | | $ | 372,467 | |
163
VANTAGEPOINT FUNDS
NOTES TO THE FINANCIAL STATEMENTS—(Continued)
Investment Type
| | | | Level 1
| | Level 2
| | Level 3
| | Total
|
|---|
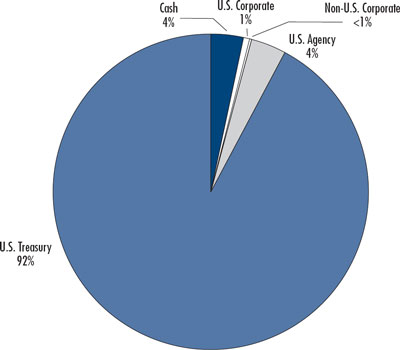
Inflation Protected Securities Fund | | | | | | | | | | | | | | | | | | |
Investments in Securities: | | | | | | | | | | | | | | | | | | |
| Corporate Obligations | | | | $ | — | | | $ | 2,635,694 | | | $ | — | | | $ | 2,635,694 | |
| U.S. Government Agency Obligations | | | | | — | | | | 12,103,531 | | | | — | | | | 12,103,531 | |
| U.S. Treasury Obligations | | | | | — | | | | 307,666,284 | | | | — | | | | 307,666,284 | |
| Sovereign Debt Obligations | | | | | — | | | | 533,871 | | | | — | | | | 533,871 | |
| Cash Equivalents | | | | | 66,519,801 | | | | — | | | | — | | | | 66,519,801 | |
Total Investments in Securities | | | | $ | 66,519,801 | | | $ | 322,939,380 | | | $ | — | | | $ | 389,459,181 | |
Derivative Instruments: | | | | | | | | | | | | | | | | | | |
Assets | | | | | | | | | | | | | | | | | | |
| Futures | | | | | 32,326 | | | | — | | | | — | | | | 32,326 | |
| Forward Currency Contracts | | | | | — | | | | 79,451 | | | | — | | | | 79,451 | |
| Written Options | | | | | — | | | | 91,492 | | | | — | | | | 91,492 | |
| Swap Agreements | | | | | — | | | | 112,296 | | | | — | | | | 112,296 | |
Total Assets | | | | $ | 32,326 | | | $ | 283,239 | | | $ | — | | | $ | 315,565 | |
| |
Liabilities: | | | | | | | | | | | | | | | | | | |
| Futures | | | | | (60,430 | ) | | | — | | | | — | | | | (60,430 | ) |
| Forward Currency Contracts | | | | | — | | | | (16,720 | ) | | | — | | | | (16,720 | ) |
| Written Options | | | | | — | | | | (184,310 | ) | | | — | | | | (184,310 | ) |
Total Liabilities | | | | | (60,430 | ) | | | (201,030 | ) | | | — | | | | (261,460 | ) |
Total Derivative Instruments | | | | $ | (28,104 | ) | | $ | 82,209 | | | $ | — | | | $ | 54,105 | |
| |
Asset Allocation Fund | | | | | | | | | | | | | | | | | | |
Investments in Securities: | | | | | | | | | | | | | | | | | | |
| Common Stocks | | | | $ | 279,116,497 | | | $ | — | | | $ | — | | | $ | 279,116,497 | |
| U.S. Treasury Obligations | | | | | — | | | | 94,717,292 | | | | — | | | | 94,717,292 | |
| Commercial Paper | | | | | — | | | | 49,583,927 | | | | — | | | | 49,583,927 | |
| Cash Equivalents | | | | | 62,594,598 | | | | — | | | | — | | | | 62,594,598 | |
Total Investments in Securities | | | | $ | 341,711,095 | | | $ | 144,301,219 | | | $ | — | | | $ | 486,012,314 | |
Derivative Instruments: | | | | | | | | | | | | | | | | | | |
Assets | | | | | | | | | | | | | | | | | | |
| Futures | | | | | 494,208 | | | | — | | | | — | | | | 494,208 | |
Total Assets | | | | $ | 494,208 | | | $ | — | | | $ | — | | | $ | 494,208 | |
| |
Liabilities: | | | | | | | | | | | | | | | | | | |
| Futures | | | | | (1,787,808 | ) | | | — | | | | — | | | | (1,787,808 | ) |
Total Liabilities | | | | | (1,787,808 | ) | | | — | | | | — | | | | (1,787,808 | ) |
Total Derivative Instruments | | | | $ | (1,293,600 | ) | | $ | — | | | $ | — | | | $ | (1,293,600 | ) |
164
VANTAGEPOINT FUNDS
NOTES TO THE FINANCIAL STATEMENTS—(Continued)
Investment Type
| | | | Level 1
| | Level 2
| | Level 3
| | Total
|
|---|
Equity Income Fund | | | | | | | | | | | | | | | | | | |
Investments in Securities: | | | | | | | | | | | | | | | | | | |
| Common Stocks | | | | $ | 1,383,418,125 | | | $ | 3,354,846 | | | $ | — | | | $ | 1,386,772,971 | |
| Convertible Debt Obligations | | | | | — | | | | 2,676,960 | | | | — | | | | 2,676,960 | |
| Cash Equivalents | | | | | 310,604,691 | | | | — | | | | — | | | | 310,604,691 | |
Total Investments in Securities | | | | $ | 1,694,022,816 | | | $ | 6,031,806 | | | $ | — | | | $ | 1,700,054,622 | |
| |
Growth & Income Fund | | | | | | | | | | | | | | | | | | |
Investments in Securities: | | | | | | | | | | | | | | | | | | |
| Common Stocks | | | | $ | 983,898,255 | | | $ | 5,106,384 | | | $ | — | | | $ | 989,004,639 | |
| Convertible Preferred Stocks | | | | | — | | | | 3,912,024 | | | | — | | | | 3,912,024 | |
| Cash Equivalents | | | | | 111,173,942 | | | | — | | | | — | | | | 111,173,942 | |
Total Investments in Securities | | | | $ | 1,095,072,197 | | | $ | 9,018,408 | | | $ | — | | | $ | 1,104,090,605 | |
Growth Fund | | | | | | | | | | | | | | | | | | |
Investments in Securities: | | | | | | | | | | | | | | | | | | |
| Common Stocks | | | | $ | 1,764,952,445 | | | $ | — | | | $ | — | | | $ | 1,764,952,445 | |
| Cash Equivalents | | | | | 248,117,256 | | | | — | | | | — | | | | 248,117,256 | |
Total Investments in Securities | | | | $ | 2,013,069,701 | | | $ | — | | | $ | — | | | $ | 2,013,069,701 | |
| |
Select Value Fund | | | | | | | | | | | | | | | | | | |
Investments in Securities: | | | | | | | | | | | | | | | | | | |
| Common Stocks | | | | $ | 274,841,972 | | | $ | — | | | $ | — | | | $ | 274,841,972 | |
| Cash Equivalents | | | | | 56,729,100 | | | | — | | | | �� | | | | 56,729,100 | |
Total Investments in Securities | | | | $ | 331,571,072 | | | $ | — | | | $ | — | | | $ | 331,571,072 | |
| |
Aggressive Opportunities Fund | | | | | | | | | | | | | | | | | | |
Investments in Securities: | | | | | | | | | | | | | | | | | | |
| Common Stocks | | | | $ | 937,718,705 | | | $ | 16,521,568 | | | $ | — | | | $ | 954,240,273 | |
| Warrants | | | | | 173,727 | | | | — | | | | — | | | | 173,727 | |
| Cash Equivalents | | | | | 297,399,519 | | | | — | | | | — | | | | 297,399,519 | |
Total Investments in Securities | | | | $ | 1,235,291,951 | | | $ | 16,521,568 | | | $ | — | | | $ | 1,251,813,519 | |
165
VANTAGEPOINT FUNDS
NOTES TO THE FINANCIAL STATEMENTS—(Continued)
Investment Type
| | | | Level 1
| | Level 2
| | Level 3
| | Total
| | | | | | | | | | | | | | | |
|---|
Discovery Fund | | | | | | | | | | | | | | | | | | |
Investments in Securities: | | | | | | | | | | | | | | | | | | |
| Common Stocks | | | | $ | 78,898,665 | | | $ | 601,255 | | | $ | — | | | $ | 79,499,920 | |
| Convertible Preferred Stocks | | | | | — | | | | 1,033,905 | | | | — | | | | 1,033,905 | |
| Warrants | | | | | 69,317 | | | | — | | | | — | | | | 69,317 | |
| Corporate Obligations | | | | | — | | | | 32,590,310 | | | | — | | | | 32,590,310 | |
| U.S. Government Agency Obligations | | | | | — | | | | 21,231,901 | | | | — | | | | 21,231,901 | |
| U.S. Government Agency Mortgage-Backed Securities | | | | | — | | | | 8,702,588 | | | | — | | | | 8,702,588 | |
| U.S. Treasury Obligations | | | | | — | | | | 11,990,199 | | | | — | | | | 11,990,199 | |
| Municipal Obligations | | | | | — | | | | 1,277,231 | | | | — | | | | 1,277,231 | |
| Sovereign Debt Obligations | | | | | — | | | | 411,414 | | | | — | | | | 411,414 | |
| Asset Backed Securities | | | | | — | | | | 5,517,081 | | | | — | | | | 5,517,081 | |
| Non-Government Mortgage-Backed Securities | | | | | — | | | | 2,263,733 | | | | — | | | | 2,263,733 | |
| Non-U.S. Government Agency Obligations | | | | | — | | | | 908,967 | | | | — | | | | 908,967 | |
| Commercial Paper | | | | | — | | | | 799,912 | | | | — | | | | 799,912 | |
| Cash Equivalents | | | | | 38,192,031 | | | | — | | | | — | | | | 38,192,031 | |
Total Investments in Securities | | | | $ | 117,160,013 | | | $ | 87,328,496 | | | $ | — | | | $ | 204,488,509 | |
Derivative Instruments: | | | | | | | | | | | | | | | | | | |
Assets | | | | | | | | | | | | | | | | | | |
| Futures | | | | | 2,934,446 | | | | — | | | | — | | | | 2,934,446 | |
| Forward Currency Contracts | | | | | — | | | | 22,262 | | | | — | | | | 22,262 | |
Total Assets | | | | $ | 2,934,446 | | | $ | 22,262 | | | $ | — | | | $ | 2,956,708 | |
Total Derivative Instruments | | | | $ | 2,934,446 | | | $ | 22,262 | | | $ | — | | | $ | 2,956,708 | |
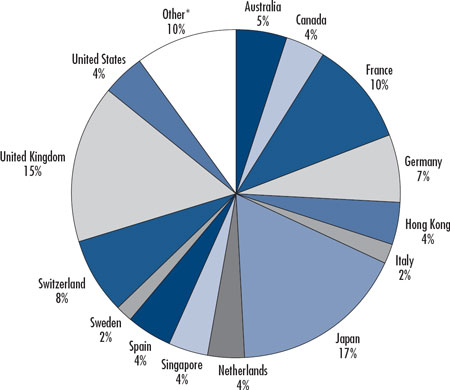
International Fund | | | | | | | | | | | | | | | | | | |
Investments in Securities: | | | | | | | | | | | | | | | | | | |
| Common Stocks | | | | $ | 83,827,150 | | | $ | 897,145,025 | | | $ | — | | | $ | 980,972,175 | |
| Preferred Stocks | | | | | — | | | | 1,280,052 | | | | — | | | | 1,280,052 | |
| Cash Equivalents | | | | | 101,025,566 | | | | — | | | | — | | | | 101,025,566 | |
Total Investments in Securities | | | | $ | 184,852,716 | | | $ | 898,425,077 | | | $ | — | | | $ | 1,083,277,793 | |
166
VANTAGEPOINT FUNDS
NOTES TO THE FINANCIAL STATEMENTS—(Continued)
Investment Type
| | | | Level 1
| | Level 2
| | Level 3
| | Total
|
|---|
Diversified Assets Fund | | | | | | | | | | | | | | | | | | |
Investments in Securities: | | | | | | | | | | | | | | | | | | |
| Corporate Obligations | | | | $ | — | | | $ | 166,097,712 | | | $ | — | | | $ | 166,097,712 | |
| U.S. Government Agency Obligations | | | | | — | | | | 89,411,110 | | | | — | | | | 89,411,110 | |
| U.S. Government Agency Mortgage-Backed Securities | | | | | — | | | | 16,686,230 | | | | — | | | | 16,686,230 | |
| U.S. Treasury Obligations | | | | | — | | | | 62,203,146 | | | | — | | | | 62,203,146 | |
| Municipal Obligations | | | | | — | | | | 9,500,378 | | | | — | | | | 9,500,378 | |
| Sovereign Debt Obligations | | | | | — | | | | 8,559,496 | | | | — | | | | 8,559,496 | |
| Asset Backed Securities | | | | | — | | | | 31,449,515 | | | | — | | | | 31,449,515 | |
| Non-Government Mortgage-Backed Securities | | | | | — | | | | 2,592,344 | | | | — | | | | 2,592,344 | |
| Non-U.S. Government Agency Obligations | | | | | — | | | | 2,454,350 | | | | — | | | | 2,454,350 | |
| Certificates of Deposit | | | | | — | | | | 6,759,143 | | | | — | | | | 6,759,143 | |
| Commercial Paper | | | | | — | | | | 2,199,441 | | | | — | | | | 2,199,441 | |
| Cash Equivalents | | | | | 51,214,149 | | | | — | | | | — | | | | 51,214,149 | |
Total Investments in Securities | | | | $ | 51,214,149 | | | $ | 397,912,865 | | | $ | — | | | $ | 449,127,014 | |
Derivative Instruments: | | | | | | | | | | | | | | | | | | |
Assets | | | | | | | | | | | | | | | | | | |
| Futures | | | | | 1,267,112 | | | | — | | | | — | | | | 1,267,112 | |
| Forward Currency Contracts | | | | | — | | | | 1,064,738 | | | | — | | | | 1,064,738 | |
| Purchased Options | | | | | 2,393,316 | | | | — | | | | — | | | | 2,393,316 | |
Total Assets | | | | $ | 3,660,428 | | | $ | 1,064,738 | | | $ | — | | | $ | 4,725,166 | |
| |
Liabilities: | | | | | | | | | | | | | | | | | | |
| Futures | | | | | (2,017,894 | ) | | | — | | | | — | | | | (2,017,894 | ) |
| Forward Currency Contracts | | | | | — | | | | (2,109,370 | ) | | | — | | | | (2,109,370 | ) |
Total Liabilities | | | | | (2,017,894 | ) | | | (2,109,370 | ) | | | — | | | | (4,127,264 | ) |
Total Derivative Instruments | | | | $ | 1,642,534 | | | $ | (1,044,632 | ) | | $ | — | | | $ | 597,902 | |
167
VANTAGEPOINT FUNDS
NOTES TO THE FINANCIAL STATEMENTS—(Continued)
Investment Type
| | | | Level 1
| | Level 2
| | Level 3
| | Total
|
|---|
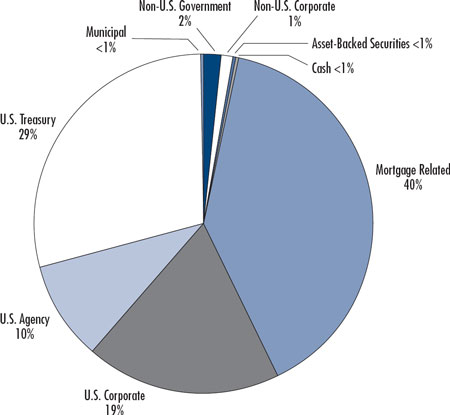
Core Bond Index Fund | | | | | | | | | | | | | | | | | | |
Investments in Securities: | | | | | | | | | | | | | | | | | | |
| Corporate Obligations | | | | $ | — | | | $ | 211,806,196 | | | $ | — | | | $ | 211,806,196 | |
| U.S. Government Agency Obligations | | | | | — | | | | 90,903,478 | | | | — | | | | 90,903,478 | |
| U.S. Government Agency Mortgage-Backed Securities | | | | | — | | | | 401,523,759 | | | | — | | | | 401,523,759 | |
| U.S. Treasury Obligations | | | | | — | | | | 314,181,190 | | | | — | | | | 314,181,190 | |
| Municipal Obligations | | | | | — | | | | 2,553,646 | | | | — | | | | 2,553,646 | |
| Sovereign Debt Obligations | | | | | — | | | | 16,251,582 | | | | — | | | | 16,251,582 | |
| Asset Backed Securities | | | | | — | | | | 3,627,371 | | | | — | | | | 3,627,371 | |
| Non-Government Mortgage-Backed Securities | | | | | — | | | | 29,216,398 | | | | — | | | | 29,216,398 | |
| Non-U.S. Government Agency Obligations | | | | | — | | | | 13,300,591 | | | | — | | | | 13,300,591 | |
| Cash Equivalents | | | | | 279,775,475 | | | | — | | | | — | | | | 279,775,475 | |
Total Investments in Securities | | | | $ | 279,775,475 | | | $ | 1,083,364,211 | | | $ | — | | | $ | 1,363,139,686 | |
| |
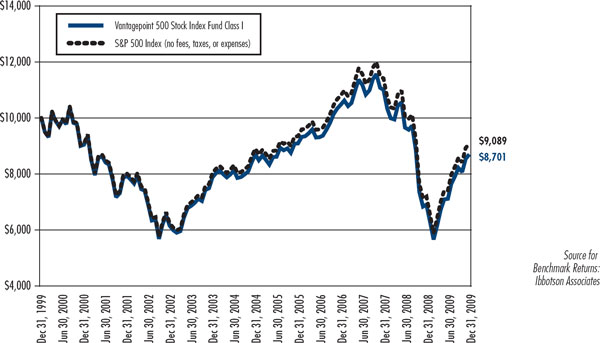
500 Stock Index Fund | | | | | | | | | | | | | | | | | | |
Investments in Securities: | | | | | | | | | | | | | | | | | | |
| Common Stocks | | | | $ | 316,727,745 | | | $ | — | | | $ | — | | | $ | 316,727,745 | |
| U.S. Treasury Obligations | | | | | — | | | | 459,971 | | | | — | | | | 459,971 | |
| Cash Equivalents | | | | | 36,450,753 | | | | — | | | | — | | | | 36,450,753 | |
Total Investments in Securities | | | | $ | 353,178,498 | | | $ | 459,971 | | | $ | — | | | $ | 353,638,469 | |
Derivative Instruments: | | | | | | | | | | | | | | | | | | |
Assets | | | | | | | | | | | | | | | | | | |
| Futures | | | | | 35,558 | | | | — | | | | — | | | | 35,558 | |
Total Assets | | | | $ | 35,558 | | | $ | — | | | $ | — | | | $ | 35,558 | |
Total Derivative Instruments | | | | $ | 35,558 | | | $ | — | | | $ | — | | | $ | 35,558 | |
| |
Broad Market Index Fund | | | | | | | | | | | | | | | | | | |
Investments in Securities: | | | | | | | | | | | | | | | | | | |
| Common Stocks | | | | $ | 472,808,703 | | | $ | 3,169 | | | $ | — | | | $ | 472,811,872 | |
| Rights | | | | | 509 | | | | — | | | | — | | | | 509 | |
| Warrants | | | | | — | | | | — | | | | — | | | | — | |
| U.S. Treasury Obligations | | | | | — | | | | 389,975 | | | | — | | | | 389,975 | |
| Cash Equivalents | | | | | 59,453,972 | | | | — | | | | — | | | | 59,453,972 | |
Total Investments in Securities | | | | $ | 532,263,184 | | | $ | 393,144 | | | $ | — | | | $ | 532,656,328 | |
Derivative Instruments: | | | | | | | | | | | | | | | | | | |
Assets | | | | | | | | | | | | | | | | | | |
| Futures | | | | | 84,442 | | | | — | | | | — | | | | 84,442 | |
Total Assets | | | | $ | 84,442 | | | $ | — | | | $ | — | | | $ | 84,442 | |
Total Derivative Instruments | | | | $ | 84,442 | | | $ | — | | | $ | — | | | $ | 84,442 | |
168
VANTAGEPOINT FUNDS
NOTES TO THE FINANCIAL STATEMENTS—(Continued)
Investment Type
| | | | Level 1
| | Level 2
| | Level 3
| | Total
|
|---|
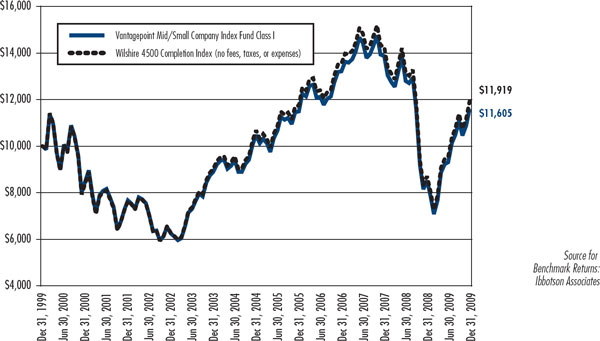
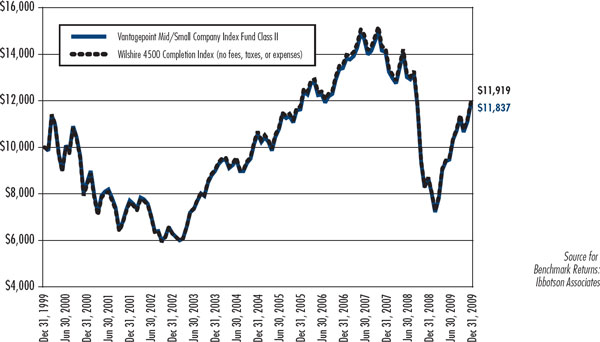
Mid/Small Company Index Fund | | | | | | | | | | | | | | | | | | |
Investments in Securities: | | | | | | | | | | | | | | | | | | |
| Common Stocks | | | | $ | 225,405,017 | | | $ | 7,072 | | | $ | — | | | $ | 225,412,089 | |
| Rights | | | | | 4,301 | | | | 76 | | | | — | | | | 4,377 | |
| Warrants | | | | | — | | | | — | | | | — | | | | — | |
| U.S. Treasury Obligations | | | | | — | | | | 454,971 | | | | — | | | | 454,971 | |
| Cash Equivalents | | | | | 65,146,103 | | | | — | | | | — | | | | 65,146,103 | |
Total Investments in Securities | | | | $ | 290,555,421 | | | $ | 462,119 | | | $ | — | | | $ | 291,017,540 | |
Derivative Instruments: | | | | | | | | | | | | | | | | | | |
Assets | | | | | | | | | | | | | | | | | | |
| Futures | | | | | 143,075 | | | | — | | | | — | | | | 143,075 | |
Total Assets | | | | $ | 143,075 | | | $ | — | | | $ | — | | | $ | 143,075 | |
Total Derivative Instruments | | | | $ | 143,075 | | | $ | — | | | $ | — | | | $ | 143,075 | |
| |
Overseas Equity Index Fund | | | | | | | | | | | | | | | | | | |
Investments in Securities: | | | | | | | | | | | | | | | | | | |
| Common Stocks | | | | $ | — | | | $ | 177,985,986 | | | $ | — | | | $ | 177,985,986 | |
| Preferred Stocks | | | | | — | | | | 630,721 | | | | — | | | | 630,721 | |
| Rights | | | | | — | | | | — | | | | — | | | | — | |
| Warrants | | | | | — | | | | 1,551 | | | | — | | | | 1,551 | |
| U.S. Treasury Obligations | | | | | — | | | | 164,990 | | | | — | | | | 164,990 | |
| Cash Equivalents | | | | | 14,649,806 | | | | — | | | | — | | | | 14,649,806 | |
Total Investments in Securities | | | | $ | 14,649,806 | | | $ | 178,783,248 | | | $ | — | | | $ | 193,433,054 | |
Derivative Instruments: | | | | | | | | | | | | | | | | | | |
Assets | | | | | | | | | | | | | | | | | | |
| Futures | | | | | 34,562 | | | | — | | | | — | | | | 34,562 | |
| Forward Currency Contracts | | | | | — | | | | 139,056 | | | | — | | | | 139,056 | |
Total Assets | | | | $ | 34,562 | | | $ | 139,056 | | | $ | — | | | $ | 173,618 | |
| |
Liabilities: | | | | | | | | | | | | | | | | | | |
| Forward Currency Contracts | | | | | — | | | | (293,395 | ) | | | — | | | | (293,395 | ) |
Total Liabilities | | | | | — | | | | (293,395 | ) | | | — | | | | (293,395 | ) |
Total Derivative Instruments | | | | $ | 34,562 | | | $ | (154,339 | ) | | $ | — | | | $ | (119,777 | ) |
All investments in the Money Market Fund, Model Portfolios, and Milestone Funds are categorized as Level 1.
As of December 31, 2009, the funds did not hold any investment with significant unobservable inputs (Level 3).
When Issued Securities
When issued securities or “To Be Announced” securities are sometimes held by the funds. The funds maintain security positions and cash positions such that sufficient liquid assets will be available to make payments for such securities purchased.
Foreign Currency
The accounting records of the funds are maintained in U.S. dollars. Investment securities and other assets and liabilities denominated in foreign currencies are translated (but not actually converted) into U.S. dollars daily at the closing spot rates supplied by the WM/Reuters Intraday Spot exchange rates provided as of 4:00 pm Eastern Time. Purchases and sales of securities, income receipts and expense payments are translated (but not actually converted) into U.S. dollars
169
VANTAGEPOINT FUNDS
NOTES TO THE FINANCIAL STATEMENTS—(Continued)
at the prevailing exchange rate on the respective dates of such transactions. Unrealized gains and losses, not relating to securities, that result from changes in foreign currency exchange rates, have been included in unrealized appreciation/(depreciation) of securities. Net realized foreign currency gains and losses include foreign currency gains and losses resulting from changes in exchange rates between trade date and settlement date on investment securities transactions, gains and losses on foreign currency transactions, and the difference between the amounts of interest and dividends recorded on the books of the funds and the amounts actually received. The portion of foreign currency gains and losses related to fluctuations in exchange rates between the initial purchase trade date and subsequent sale trade date is included in realized gains/(losses) from security transactions.
Currency symbols utilized throughout the notes to the financial statements are defined as follows:
| AUD— Australian Dollar | | | | JPY— Japanese Yen |
| BRL— Brazilian Real | | | | NOK— Norwegian Krona |
| CAD— Canadian Dollar | | | | NZD— New Zealand Dollar |
| CHF— Swiss Franc | | | | SEK— Swedish Krona |
| EUR— European Monetary Unit | | | | USD— U.S. Dollar |
| GBP— British Pound | | | | | | |
Options (other than Swaptions)
Exchange traded options normally will be priced based on the last reported sale price or official closing price (if available) on the exchange on which the option is primarily traded. Certain markets are not closed at valuation time. In these situations, a pricing service may provide snapshot prices. If no sales are reported on a particular day, a pricing service normally will use the mean between the last bid and asked quotations. Non-exchange traded options normally will be priced using an option valuation model and will be provided by a pricing service.
Futures
Futures contracts normally will be priced at their settlement prices established and reported each day on the exchange on which they are traded, as provided by a pricing service.
Futures exchange abbreviations utilized throughout the notes to the financial statements are defined as follows:
| CBT— Chicago Board of Trade Exchange | | | | MIL— Borsa Italiana Exchange |
| CME— Chicago Mercantile Exchange | | | | MSE— Montreal Exchange |
| EOE— Dutch Options Exchange | | | | NYF— New York Futures Exchange |
| EOP— Euronext Paris Exchange | | | | SFE— Sydney Futures Exchange |
| EUX— Eurex Deutschland Exchange | | | | SGX— Singapore Exchange |
| HKG— Hong Kong Futures Exchange | | | | SSE— Stockholm Stock Exchange |
| LIF— Liffe Exchange | | | | TSE— Tokyo Stock Exchange |
| MFM— Meff Renta Variable Exchange | | | | | | |
Forward Currency Contracts
These contracts normally will be priced using the WM/Reuters Intraday Forwards rates provided as of 4:00 pm Eastern Time.
Interest Rate Swaps and Inflation Swaps
Interest rate and inflation swaps normally will be priced based on the applicable swap valuation model (i.e. interest rate or inflation) which incorporates a snapshot of the relevant swap curve (interest rate curve or inflation rate curve, as applicable). In the event a pricing service is unable to provide a price for a particular swap, the swap will be priced at its fair value in accordance with the Valuation Procedures.
Interest Rate Swaptions
Interest rate swaptions normally will be priced based on a snapshot taken of the relevant swap curve, deriving an implied volatility surface from actual and/or indicative broker-dealer swaption prices, and combining them in a swaption valuation model. In the event a pricing service is unable to provide a price for a particular swaption, the swaption will be priced at its fair value in accordance with the Valuation Procedures.
170
VANTAGEPOINT FUNDS
NOTES TO THE FINANCIAL STATEMENTS—(Continued)
Total Return Swaps
Total return swaps are normally priced based on a valuation model that incorporates cash flow forecasts for the reference asset and a snapshot of the relevant interest rate swap curve. Such prices will be provided by a pricing service. In the event a pricing service is unable to provide a price for a particular total return swap, the total return swap will be priced at its fair value in accordance with the Valuation Procedures.
Security Transactions and Income Recognition
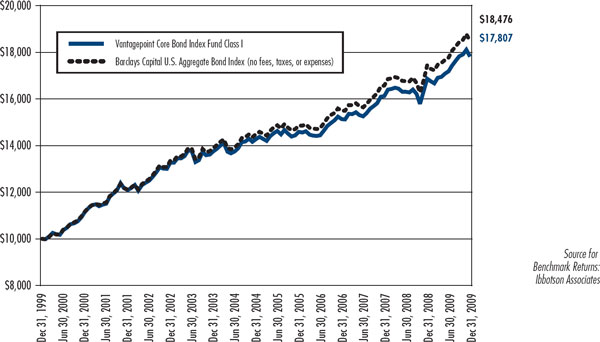
Security transactions are accounted for on the date the securities are purchased or sold (trade date). Dividend income is recognized on the ex-dividend date and interest income is accrued daily. Realized gains or losses are reported on the basis of identified cost of securities delivered. Bond discounts and premiums are amortized for both financial reporting and tax purposes, except for the Core Bond Index Fund, which does not amortize bond premium for tax purposes.
Reclassification of Financial Information—Low Duration Bond Fund
As a result of a revision to the year ended December 31, 2008, amortized premium and discount on debt securities, certain amounts for the fiscal year ended December 31, 2008 have been restated. The impact to net investment income was an increase of $1,609,713 with a corresponding decrease to realized gain and increase to unrealized depreciation of $136,204 and $1,473,509, respectively. The revision has no impact on the net assets and is not material to the financial statements taken as a whole.
Dividends and Distributions to Shareholders
Dividends received from mutual fund investments are reflected as dividend income; capital gain distributions are reflected as realized gain/loss. Dividends from net investment income, if any, are declared and paid monthly to shareholders of the Core Bond Index, Low Duration Bond, and Inflation Protected Securities Funds. Dividends from net investment income, if any, are declared daily and paid monthly to shareholders of the Money Market Fund. For the remaining funds, dividends from net investment income, if any, are declared and paid annually to shareholders. Distributions from any net realized capital gains, if any, are generally declared and paid annually to shareholders. Income and capital gain distributions are determined in accordance with income tax regulations which may differ from accounting principles generally accepted in the United States of America. These differences are primarily due to differing treatments of income and gains on investment securities, and differing characterizations of distributions being made by each fund.
Certain differences are permanent, and result in reclassifications among paid-in capital, net investment income or realized gains. These include net operating losses not utilized during the current year, commission adjustments, pay-down gains and losses, bond premium amortization, foreign currency gains and losses, treasury inflation-protected securities adjustments, taxable over-distributions or returns of capital, and adjustments relating to income received from, or dispositions of, real estate investment trust, passive foreign investment company, publicly traded partnership, and mutual fund company securities. The following reclassifications were made in the financial statements to present the components of fund net assets and distributions on a tax basis for the year ended December 31, 2009. These reclassifications have no effect on net assets or net asset values per share, and they do not affect the net investment income per share calculations presented in the Financial Highlights.
Fund
| | | | Paid-in Capital
Increase/(Decrease)
| | Undistributed Net
Investment Income
Increase/(Decrease)
| | Accumulated Net
Realized Gain/(Loss)
Increase/(Decrease)
|
|---|
| Low Duration Bond | | | | $ | — | | | $ | (899,177 | ) | | $ | 899,177 | |
| Inflation Protected Securities | | | | | — | | | | 489,338 | | | | (489,338 | ) |
| Asset Allocation | | | | | 543 | | | | (357,711 | ) | | | 357,168 | |
| Equity Income | | | | | 1 | | | | (616,666 | ) | | | 616,665 | |
| Growth & Income | | | | | — | | | | (3,904 | ) | | | 3,904 | |
| Growth | | | | | (32,952 | ) | | | 265,327 | | | | (232,375 | ) |
| Select Value | | | | | (110,733 | ) | | | (1,182,281 | ) | | | 1,293,014 | |
| Aggressive Opportunities | | | | | (294,066 | ) | | | (818,495 | ) | | | 1,112,561 | |
171
VANTAGEPOINT FUNDS
NOTES TO THE FINANCIAL STATEMENTS—(Continued)
Fund
| | | | Paid-in Capital
Increase/(Decrease)
| | Undistributed Net
Investment Income
Increase/(Decrease)
| | Accumulated Net
Realized Gain/(Loss)
Increase/(Decrease)
|
|---|
| Discovery | | | | $ | (51,453 | ) | | $ | (321,502 | ) | | $ | 372,955 | |
| International | | | | | (10,637 | ) | | | 2,585,624 | | | | (2,574,987 | ) |
| Diversified Assets | | | | | — | | | | 2,366,462 | | | | (2,366,462 | ) |
| Core Bond Index | | | | | (71,898 | ) | | | 5,900,124 | | | | (5,828,226 | ) |
| 500 Stock Index | | | | | 18,103,366 | | | | (209,510 | ) | | | (17,893,856 | ) |
| Broad Market Index | | | | | 4,086,920 | | | | (610,654 | ) | | | (3,476,266 | ) |
| Mid/Small Company Index | | | | | 1,776,790 | | | | (131,469 | ) | | | (1,645,321 | ) |
| Overseas Equity Index | | | | | 1,112,207 | | | | 431,900 | | | | (1,544,107 | ) |
| Model Portfolio Savings Oriented | | | | | — | | | | (35,330 | ) | | | 35,330 | |
| Model Portfolio Conservative Growth | | | | | — | | | | (80,482 | ) | | | 80,482 | |
| Model Portfolio Traditional Growth | | | | | — | | | | (178,492 | ) | | | 178,492 | |
| Model Portfolio Long-Term Growth | | | | | — | | | | (58,081 | ) | | | 58,081 | |
| Model Portfolio All-Equity Growth | | | | | — | | | | (23,814 | ) | | | 23,814 | |
| Milestone Retirement Income | | | | | — | | | | (14,197 | ) | | | 14,197 | |
| Milestone 2010 | | | | | — | | | | (17,887 | ) | | | 17,887 | |
| Milestone 2015 | | | | | — | | | | (16,440 | ) | | | 16,440 | |
| Milestone 2020 | | | | | — | | | | (3,081 | ) | | | 3,081 | |
| Milestone 2025 | | | | | (1,196 | ) | | | (682 | ) | | | 1,878 | |
| Milestone 2030 | | | | | (736 | ) | | | (969 | ) | | | 1,705 | |
| Milestone 2035 | | | | | (119 | ) | | | (826 | ) | | | 945 | |
| Milestone 2040 | | | | | (829 | ) | | | 36 | | | | 793 | |
Federal Income Taxes
Each fund intends to qualify as a regulated investment company under Subchapter M of the Internal Revenue Code for federal tax purposes. Accordingly, each fund intends to make distributions of substantially all of its net investment company taxable income and any net realized capital gains (after reduction for capital loss carry forwards) sufficient to relieve it from all, or substantially all, federal income and excise taxes. Any taxable income or gains remaining at fiscal year-end are distributed in the following year. Therefore, no provision for federal income or excise taxes was required.
The Financial Accounting Standards Board issued Interpretation ASC 740 (formerly known as “FIN 48”), “Income Taxes,” which establishes guidelines for recognizing, measuring, and disclosing tax return positions in financial statements. Management has evaluated the Company’s tax positions and determined that the application of ASC 740 had no material impact on the Company’s financial statements. Accordingly, no adjustments for unrecognized tax benefits or related interest or penalties were required as of December 31, 2009. If applicable, the Company recognizes interest accrued related to unrecognized tax benefits in interest expense and penalties in “Other Expenses” in the Statement of Operations. The Company is not aware of any tax positions for which it is reasonably possible that the total amounts of unrecognized tax benefits will significantly increase or decrease in the next twelve months. Each of the tax years in the four year period ending December 31, 2009 remains subject to examination by taxing authorities.
At December 31, 2009, the components of distributable earnings on a tax basis were as follows:
Fund
| | | | Undistributed
Ordinary Income
| | Undistributed
Long-Term Gains
| | Total Distributable
Earnings
|
|---|
| Low Duration Bond | | | | $ | 134,813 | | | $ | — | | | $ | 134,813 | |
| Inflation Protected Securities | | | | | 118,975 | | | | — | | | | 118,975 | |
| Asset Allocation | | | | | 1,428,535 | | | | — | | | | 1,428,535 | |
| Equity Income | | | | | 17,872,857 | | | | — | | | | 17,872,857 | |
| Growth & Income | | | | | 3,181,205 | | | | — | | | | 3,181,205 | |
| Growth | | | | | 490,902 | | | | — | | | | 490,902 | |
| International | | | | | 14,111,892 | | | | — | | | | 14,111,892 | |
| Diversified Assets | | | | | 2,823,013 | | | | — | | | | 2,823,013 | |
172
VANTAGEPOINT FUNDS
NOTES TO THE FINANCIAL STATEMENTS—(Continued)
Fund
| | | | Undistributed
Ordinary Income
| | Undistributed
Long-Term Gains
| | Total Distributable
Earnings
|
|---|
| 500 Stock Index | | | | $ | 107,139 | | | $ | — | | | $ | 107,139 | |
| Broad Market Index | | | | | 5,213,300 | | | | — | | | | 5,213,300 | |
| Mid/Small Company Index | | | | | 1,806,344 | | | | — | | | | 1,806,344 | |
| Overseas Equity Index | | | | | 184,429 | | | | — | | | | 184,429 | |
| Model Portfolio Savings Oriented | | | | | 513,500 | | | | — | | | | 513,500 | |
| Model Portfolio Conservative Growth | | | | | 1,229,673 | | | | — | | | | 1,229,673 | |
| Model Portfolio Traditional Growth | | | | | 6,245,449 | | | | — | | | | 6,245,449 | |
| Model Portfolio Long-Term Growth | | | | | 7,275,975 | | | | — | | | | 7,275,975 | |
| Model Portfolio All-Equity Growth | | | | | 1,091,762 | | | | — | | | | 1,091,762 | |
| Milestone Retirement Income | | | | | 177,046 | | | | — | | | | 177,046 | |
| Milestone 2010 | | | | | 398,746 | | | | — | | | | 398,746 | |
| Milestone 2015 | | | | | 1,002,663 | | | | — | | | | 1,002,663 | |
| Milestone 2020 | | | | | 77,861 | | | | — | | | | 77,861 | |
The tax character of distributions paid during 2009 was as follows:
Fund
| | | | Distributions
Paid from
Ordinary
Income
| | Distributions
Paid from
Long-Term
Capital Gains
| | Returns of
Capital
| | Total
Distributions
|
|---|
| Money Market | | | | $ | 749,334 | | | $ | — | | | $ | — | | | $ | 749,334 | |
| Low Duration Bond | | | | | 13,619,201 | | | | — | | | | — | | | | 13,619,201 | |
| Inflation Protected Securities | | | | | 3,796,019 | | | | — | | | | — | | | | 3,796,019 | |
| Asset Allocation | | | | | 6,232,625 | | | | — | | | | — | | | | 6,232,625 | |
| Equity Income | | | | | 25,286,784 | | | | — | | | | — | | | | 25,286,784 | |
| Growth & Income | | | | | 11,876,196 | | | | — | | | | — | | | | 11,876,196 | |
| Growth | | | | | 9,946,245 | | | | — | | | | — | | | | 9,946,245 | |
| Select Value | | | | | 2,291,563 | | | | — | | | | — | | | | 2,291,563 | |
| Aggressive Opportunities | | | | | 2,051,261 | | | | — | | | | — | | | | 2,051,261 | |
| Discovery | | | | | 1,533,607 | | | | — | | | | — | | | | 1,533,607 | |
| International | | | | | 18,665,287 | | | | — | | | | — | | | | 18,665,287 | |
| Diversified Assets | | | | | 2,104,166 | | | | — | | | | — | | | | 2,104,166 | |
| Core Bond Index | | | | | 45,263,235 | | | | — | | | | — | | | | 45,263,235 | |
| 500 Stock Index | | | | | 6,624,175 | | | | — | | | | — | | | | 6,624,175 | |
| Broad Market Index | | | | | 8,412,133 | | | | — | | | | — | | | | 8,412,133 | |
| Mid/Small Company Index | | | | | 2,719,710 | | | | — | | | | — | | | | 2,719,710 | |
| Overseas Equity Index | | | | | 4,518,504 | | | | — | | | | — | | | | 4,518,504 | |
| Model Portfolio Savings Oriented | | | | | 6,178,805 | | | | 89,456 | | | | — | | | | 6,268,261 | |
| Model Portfolio Conservative Growth | | | | | 10,102,929 | | | | — | | | | — | | | | 10,102,929 | |
| Model Portfolio Traditional Growth | | | | | 19,944,289 | | | | 989,933 | | | | — | | | | 20,934,222 | |
| Model Portfolio Long-Term Growth | | | | | 17,548,530 | | | | 7,065,993 | | | | — | | | | 24,614,523 | |
| Model Portfolio All-Equity Growth | | | | | 4,890,721 | | | | 4,261,652 | | | | — | | | | 9,152,373 | |
| Milestone Retirement Income | | | | | 1,194,129 | | | | 68,883 | | | | — | | | | 1,263,012 | |
| Milestone 2010 | | | | | 1,254,740 | | | | 362,908 | | | | — | | | | 1,617,648 | |
| Milestone 2015 | | | | | 2,039,306 | | | | 1,178,592 | | | | — | | | | 3,217,898 | |
| Milestone 2020 | | | | | 3,020,640 | | | | 1,486,573 | | | | — | | | | 4,507,213 | |
| Milestone 2025 | | | | | 2,222,049 | | | | 1,239,920 | | | | — | | | | 3,461,969 | |
| Milestone 2030 | | | | | 1,712,689 | | | | 1,159,773 | | | | — | | | | 2,872,462 | |
| Milestone 2035 | | | | | 1,050,895 | | | | 732,331 | | | | — | | | | 1,783,226 | |
| Milestone 2040 | | | | | 1,260,704 | | | | 792,731 | | | | — | | | | 2,053,435 | |
173
VANTAGEPOINT FUNDS
NOTES TO THE FINANCIAL STATEMENTS—(Continued)
At December 31, 2009, the following funds had net capital loss carryovers:
| | | | Expiring December 31
| |
|---|
Fund
| | | | 2010
| | 2011
| | 2012
| | 2013
|
|---|
| Low Duration Bond | | | | $ | — | | | $ | — | | | $ | — | | | $ | 2,517,298 | |
| Inflation Protected Securities | | | | | — | | | | — | | | | — | | | | — | |
| Asset Allocation | | | | | — | | | | — | | | | — | | | | — | |
| Equity Income | | | | | — | | | | — | | | | — | | | | — | |
| Growth & Income | | | | | — | | | | — | | | | — | | | | — | |
| Growth | | | | | 125,817,886 | | | | 82,974,331 | | | | — | | | | — | |
| Select Value | | | | | — | | | | — | | | | — | | | | — | |
| Aggressive Opportunities | | | | | — | | | | — | | | | — | | | | — | |
| Discovery | | | | | — | | | | — | | | | — | | | | — | |
| International | | | | | — | | | | — | | | | — | | | | — | |
| Diversified Assets | | | | | — | | | | — | | | | — | | | | — | |
| Core Bond Index | | | | | — | | | | — | | | | — | | | | 4,825,601 | |
| 500 Stock Index | | | | | 8,310,436 | | | | 3,056,924 | | | | — | | | | — | |
| Broad Market Index | | | | | 7,397,404 | | | | 7,434,496 | | | | — | | | | — | |
| Overseas Equity Index | | | | | — | | | | — | | | | — | | | | — | |
| Model Portfolio Savings Oriented | | | | | — | | | | — | | | | — | | | | — | |
| Model Portfolio Conservative Growth | | | | | — | | | | — | | | | — | | | | — | |
| Model Portfolio Traditional Growth | | | | | — | | | | — | | | | — | | | | — | |
| Model Portfolio Long-Term Growth | | | | | — | | | | — | | | | — | | | | — | |
| Model Portfolio All-Equity Growth | | | | | — | | | | — | | | | — | | | | — | |
| Milestone Retirement Income | | | | | — | | | | — | | | | — | | | | — | |
| Milestone 2010 | | | | | — | | | | — | | | | — | | | | — | |
| Milestone 2015 | | | | | — | | | | — | | | | — | | | | — | |
| Milestone 2020 | | | | | — | | | | — | | | | — | | | | — | |
| | | | Expiring December 31
| |
|---|
Fund
| | | | 2014
| | 2015
| | 2016
| | 2017
|
|---|
| Low Duration Bond | | | | $ | 3,180,132 | | | $ | 261,945 | | | $ | — | | | $ | 5,317,652 | |
| Inflation Protected Securities | | | | | 422,040 | | | | 48,256 | | | | 1,913,837 | | | | — | |
| Asset Allocation | | | | | — | | | | — | | | | 53,747,955 | | | | 16,049,109 | |
| Equity Income | | | | | — | | | | — | | | | 78,459,730 | | | | 44,412,591 | |
| Growth & Income | | | | | — | | | | — | | | | 75,418,372 | | | | 120,473,836 | |
| Growth | | | | | — | | | | — | | | | 218,570,902 | | | | 314,413,233 | |
| Select Value | | | | | — | | | | — | | | | 35,743,246 | | | | 37,613,177 | |
| Aggressive Opportunities | | | | | — | | | | — | | | | 45,967,040 | | | | 101,968,528 | |
| Discovery | | | | | — | | | | — | | | | 32,801,107 | | | | 16,410,988 | |
| International | | | | | — | | | | — | | | | 36,965,418 | | | | 150,182,044 | |
| Diversified Assets | | | | | — | | | | — | | | | 5,949,499 | | | | — | |
| Core Bond Index | | | | | 8,705,385 | | | | 4,299,528 | | | | 2,798,291 | | | | 4,404,280 | |
| 500 Stock Index | | | | | — | | | | — | | | | 7,028,727 | | | | 1,183,403 | |
| Broad Market Index | | | | | — | | | | — | | | | 265,032 | | | | — | |
| Overseas Equity Index | | | | | — | | | | — | | | | — | | | | 3,000,588 | |
| Model Portfolio Savings Oriented | | | | | — | | | | — | | | | — | | | | 2,061,533 | |
| Model Portfolio Conservative Growth | | | | | — | | | | — | | | | 19,410 | | | | 6,632,356 | |
| Model Portfolio Traditional Growth | | | | | — | | | | — | | | | — | | | | 17,709,713 | |
| Model Portfolio Long-Term Growth | | | | | — | | | | — | | | | — | | | | 7,029,301 | |
| Model Portfolio All-Equity Growth | | | | | — | | | | — | | | | — | | | | 1,085,637 | |
| Milestone Retirement Income | | | | | — | | | | — | | | | — | | | | 224,204 | |
| Milestone 2010 | | | | | — | | | | — | | | | — | | | | 2,710,996 | |
| Milestone 2015 | | | | | — | | | | — | | | | — | | | | 1,002,314 | |
| Milestone 2020 | | | | | — | | | | — | | | | — | | | | 79,247 | |
174
VANTAGEPOINT FUNDS
NOTES TO THE FINANCIAL STATEMENTS—(Continued)
At December 31, 2009, the following funds elected to defer post-October net capital losses and currency losses of:
Fund
| | | | Capital Losses
| | Currency Losses
|
|---|
| Inflation Protected Securities | | | | $ | — | | | $ | 102,877 | |
| Growth & Income | | | | | 3,038,127 | | | | — | |
| Growth | | | | | 6,578,549 | | | | — | |
| Select Value | | | | | 2,161,000 | | | | — | |
| Discovery | | | | | — | | | | 1,788 | |
| International | | | | | 3,094,439 | | | | — | |
| Diversified Assets | | | | | 1,946,551 | | | | 71,859 | |
| 500 Stock Index | | | | | 160,206 | | | | — | |
| Overseas Equity Index | | | | | — | | | | 200,738 | |
| Model Portfolio Savings Oriented | | | | | 78,014 | | | | — | |
| Milestone 2010 | | | | | 231,730 | | | | — | |
| Milestone 2015 | | | | | 4,523 | | | | — | |
| Milestone 2020 | | | | | 3,122 | | | | — | |
| Milestone 2025 | | | | | 11,755 | | | | — | |
| Milestone 2030 | | | | | 165,837 | | | | — | |
| Milestone 2035 | | | | | 4,518 | | | | — | |
| Milestone 2040 | | | | | 25,678 | | | | — | |
3. | | Investments in Derivative Instruments |
Some of the funds use derivative instruments in pursuing their investment objectives. The following discussion provides more detailed information about each type of derivative instrument held by the funds during or as of the end of the reporting period.
Futures Contracts
A futures contract is an agreement between two parties to buy and sell a security, commodity, or index at a set price on a future date.
A fund may enter into futures contracts for purposes of seeking to protect portfolio value against the risk of decline (overall price risk) or seeking to increase portfolio value. Use of derivatives to seek increased portfolio value increases the funds exposure to the risk of loss due to adverse market changes.
Certain funds may enter into futures contracts to seek to manage or “hedge” against certain investment risks to which a fund may be exposed from time to time in pursuing its investment objectives. These risks may include, for example, interest rate risk (which is the risk that interest rates will rise, causing bond prices to fall) or stock market risk (which is the risk that stock prices overall will decline over short or extended periods). Some funds also may use futures contracts to obtain investment exposure to an asset or asset class without purchasing or selling those assets directly.
Funds that may use futures contracts to seek to manage interest rate risk include: the Low Duration Bond Fund, Inflation Protected Securities Fund, Asset Allocation Fund, Discovery Fund, Diversified Assets Fund, and Core Bond Index Fund. Funds that may use futures contracts to seek to manage stock market risks include: Asset Allocation Fund, Equity Income Fund, Growth & Income Fund, Growth Fund, Select Value Fund, Aggressive Opportunities Fund, Discovery Fund, International Fund, Diversified Assets Fund, 500 Stock Index Fund, Broad Market Index Fund, Mid/Small Company Index Fund, and Overseas Equity Index Fund. Funds that may use futures contracts to obtain investment exposure to a certain asset or asset class include: the Asset Allocation Fund, Discovery Fund, Diversified Asset Fund, Low Duration Bond Fund, Inflation Protected Securities Fund, 500 Stock Index Fund, Broad Market Index Fund, Mid/Small Company Index Fund and Overseas Equity Index Fund. Certain funds also may be permitted (but are not required) to use futures contracts for other purposes, as described in the prospectus and statement of additional information, but any such uses generally would not be as common as the uses described above. No fund is required to use futures contracts for any or all of the uses described herein.
A fund may enter into futures contracts based on an equity index in order to increase or to decrease its exposure to changes in equity market conditions, including the risk of market value decreases (equity price risk) or the risk of not participating in equity market increases (risk of missing opportunities for gains).
175
VANTAGEPOINT FUNDS
NOTES TO THE FINANCIAL STATEMENTS—(Continued)
A fund may enter into futures contracts based on a bond index or a specific underlying fixed income security to increase or decrease its exposure to changes in bond market conditions or to changes in the market value of the specific underlying security, including the risk of market value decreases (price risk, interest rate risk, credit risk) or the risk of not participating in market increases (risk of missing opportunities for gains).
Pursuant to the contract, upon entering the contract the fund agrees to deposit an amount equal to a certain percentage of the contract value (initial margin). The fund agrees to subsequently receive from or pay an amount of cash equal to the daily fluctuation in the value of the contract. Such receipts or payments are known as “variation margin” and are recorded by the fund as unrealized gains or losses. When the contract is closed, the fund records a realized gain or loss equal to the difference between the value of the contract at the time it was opened and the value at the time it was closed. Realized gains and losses are a component of net realized gain (loss) on futures contracts in the Statements of Operations.
Risks of entering into futures contracts include the possibility that there may be an illiquid market for the contract and that a change in the value of the contracts may not correlate with the changes in the value of the underlying securities. The amount of risk associated with a futures contract may significantly exceed the amount(s) reflected in the financial statements.
During the year ended December 31, 2009, the following funds purchased or sold futures contracts: Low Duration Bond Fund, Inflation Protected Securities Fund, Asset Allocation Fund, Discovery Fund, Diversified Assets Fund, 500 Stock Index Fund, Broad Market Index Fund, Mid/Small Company Index Fund, and Overseas Equity Index Fund.
As of December 31, 2009, the following funds had open futures contracts outstanding:
Low Duration Bond Fund
Number of
Contracts
| | | | Exchange
| | Contract
| | Expiration Date
| | Contract Value
| | Net
Unrealized
Appreciation
|
|---|
Sold | | | | | | | | | | | | | | | | | | | | |
| 23 | | | | CBT | | U.S. 10 Year Treasury Note | | March 2010 | | $ | 2,655,422 | | | $ | 66,761 | |
| 19 | | | | CBT | | U.S. 2 Year Treasury Note | | March 2010 | | | 4,109,047 | | | | 16,854 | |
| 26 | | | | CBT | | U.S. 5 Year Treasury Note | | March 2010 | | | 2,973,953 | | | | 44,188 | |
| | | | | | | | | | | | | | | $ | 127,803 | |
Inflation Protected Securities Fund
Number of
Contracts
| | | | Exchange
| | Contract
| | Expiration Date
| | Contract Value
| | Net
Unrealized
Appreciation/
(Depreciation)
|
|---|
Purchased | | | | | | | | | | | | | | | | | | | | |
| 8 | | | | CBT | | U.S. 10 Year Treasury Note | | March 2010 | | $ | 923,625 | | | $ | (2,394 | ) |
| 39 | | | | CBT | | U.S. 5 Year Treasury Note | | March 2010 | | | 4,460,930 | | | | (58,036 | ) |
| | | | | | | | | | | | | | | $ | (60,430 | ) |
Sold | | | | | | | | | | | | | | | | | | | | |
| 11 | | | | CBT | | U.S. 30 Year Treasury Bond | | March 2010 | | $ | 1,269,125 | | | $ | 32,326 | |
| | | | | | | | | | | | | | | $ | (28,104 | ) |
176
VANTAGEPOINT FUNDS
NOTES TO THE FINANCIAL STATEMENTS—(Continued)
Asset Allocation Fund
Number of
Contracts
| | | | Exchange
| | Contract
| | Expiration Date
| | Contract Value
| | Net
Unrealized
Appreciation/
(Depreciation)
|
|---|
Purchased | | | | | | | | | | | | | | | | | | | | |
| 128 | | | | CME | | S&P 500 Index | | March 2010 | | $ | 35,542,400 | | | $ | 484,402 | |
| 324 | | | | CBT | | U.S. 30 Year Treasury Bond | | March 2010 | | | 37,381,500 | | | | (1,787,808 | ) |
| | | | | | | | | | | | | | | $ | (1,303,406 | ) |
Sold | | | | | | | | | | | | | | | | | | | | |
| 29 | | | | CME | | E-MINI S&P 500 Index | | March 2010 | | $ | 1,610,515 | | | $ | 9,806 | |
| | | | | | | | | | | | | | | $ | (1,293,600 | ) |
Discovery Fund
Number of
Contracts
| | | | Exchange
| | Contract
| | Expiration Date
| | Contract Value
| | Net
Unrealized
Appreciation
|
|---|
Purchased | | | | | | | | | | | | | | | | | | | | |
| 1,388 | | | | NYF | | E-MINI Russell 2000 Index | | March 2010 | | $ | 86,597,320 | | | $ | 2,927,648 | |
| |
Sold | | | | | | | | | | | | | | | | | | | | |
| 4 | | | | CBT | | U.S. 5 Year Treasury Note | | March 2010 | | $ | 457,531 | | | | 6,798 | |
| | | | | | | | | | | | | | | $ | 2,934,446 | |
Diversified Assets Fund
Number of
Contracts
| | | | Exchange
| | Contract
| | Expiration Date
| | Contract Value
| | Net
Unrealized
Appreciation/
(Depreciation)
|
|---|
Purchased | | | | | | | | | | | | | | | | | | | | |
| 4 | | | | EOE | | Amsterdam Index | | January 2010 | | $ | 384,765 | | | $ | 11,924 | |
| 120 | | | | SFE | | Australian Government
10 Year Bond | | March 2010 | | | 10,973,590 | | | | (148,753 | ) |
| 190 | | | | EOP | | CAC 40 Index | | January 2010 | | | 10,735,641 | | | | 256,875 | |
| 45 | | | | MSE | | Canadian Government
10 Year Bond | | March 2010 | | | 5,070,326 | | | | (78,471 | ) |
| 8 | | | | EUX | | DAX Index | | March 2010 | | | 1,708,648 | | | | 18,693 | |
| 125 | | | | CME | | E-MINI S&P 500 Index | | March 2010 | | | 6,941,875 | | | | (19,562 | ) |
| 180 | | | | LIF | | FTSE 100 Index | | March 2010 | | | 15,587,811 | | | | 292,072 | |
| 6 | | | | MIL | | FTSE/MIB Index | | March 2010 | | | 1,001,320 | | | | 19,713 | |
| 100 | | | | MFM | | IBEX 35 Index | | January 2010 | | | 17,093,650 | | | | 424,985 | |
| 1,026 | | | | SSE | | OMX Stockholm 30 Index | | January 2010 | | | 13,659,159 | | | | (95,334 | ) |
| 4 | | | | MSE | | S&P/TSX 60 Index | | March 2010 | | | 528,412 | | | | 13,458 | |
| 24 | | | | SFE | | SPI 200 Index | | March 2010 | | | 2,629,537 | | | | 141,419 | |
| 1 | | | | CBT | | U.S. 10 Year Treasury Note | | March 2010 | | | 115,453 | | | | (2,148 | ) |
| 72 | | | | LIF | | UK Gilt Long Bond | | March 2010 | | | 13,309,894 | | | | (293,830 | ) |
| | | | | | | | | | | | | | | $ | 541,041 | |
177
VANTAGEPOINT FUNDS
NOTES TO THE FINANCIAL STATEMENTS—(Continued)
Diversified Assets Fund (continued)
Number of
Contracts
| | | | Exchange
| | Contract
| | Expiration Date
| | Contract Value
| | Net
Unrealized
Appreciation/
(Depreciation)
|
|---|
Sold | | | | | | | | | | | | | | | | | | | | |
| 336 | | | | SGX | | 10 Year Mini-JGB | | March 2010 | | $ | 50,409,921 | | | $ | (124,502 | ) |
| 15 | | | | EOE | | Amsterdam Index | | January 2010 | | | 1,442,868 | | | | (52,728 | ) |
| 248 | | | | EOP | | CAC 40 Index | | January 2010 | | | 14,012,836 | | | | (412,495 | ) |
| 23 | | | | EUX | | DAX Index | | March 2010 | | | 4,912,364 | | | | (135,734 | ) |
| 129 | | | | CME | | E-MINI S&P 500 Index | | March 2010 | | | 7,164,015 | | | | (91,478 | ) |
| 35 | | | | MIL | | FTSE/MIB Index | | March 2010 | | | 5,841,035 | | | | (142,730 | ) |
| 20 | | | | HKG | | Hang Seng Index | | January 2010 | | | 2,827,792 | | | | (88,870 | ) |
| 18 | | | | SFE | | SPI 200 Index | | March 2010 | | | 1,972,153 | | | | (90,859 | ) |
| 207 | | | | TSE | | TOPIX Index | | March 2010 | | | 20,103,237 | | | | (240,400 | ) |
| 5 | | | | CBT | | U.S. 10 Year Treasury Note | | March 2010 | | | 577,266 | | | | 14,379 | |
| 44 | | | | CBT | | U.S. 5 Year Treasury Note | | March 2010 | | | 5,032,844 | | | | 73,594 | |
| | | | | | | | | | | | | | | $ | (1,291,823 | ) |
| | | | | | | | | | | | | | | $ | (750,782 | ) |
500 Stock Index Fund | | | | | | | | | | | | | | | | | | | | |
Number of
Contracts
| | | | Exchange
| | Contract
| | Expiration Date
| | Contract Value
| | Net
Unrealized
Appreciation
|
|---|
Purchased | | | | | | | | | | �� | | | | | | | | | | |
| 118 | | | | CME | | E-MINI S&P 500 Index | | March 2010 | | $ | 6,553,130 | | | $ | 35,558 | |
| | | | | | | | | | | | | | | $ | 35,558 | |
Broad Market Index Fund | | | | | | | | | | | | | | | | | | | | |
Number of
Contracts
| | | | Exchange
| | Contract
| | Expiration Date
| | Contract Value
| | Net
Unrealized
Appreciation
|
|---|
Purchased | | | | | | | | | | | | | | | | | | | | |
| 13 | | | | NYF | | E-MINI Russell 2000 Index | | March 2010 | | $ | 811,070 | | | $ | 34,806 | |
| 79 | | | | CME | | E-MINI S&P 500 Index | | March 2010 | | | 4,387,265 | | | | 49,636 | |
| | | | | | | | | | | | | | | $ | 84,442 | |
Mid/Small Company Index Fund | | | | | | | | | | | | | | | | | | | | |
Number of
Contracts
| | | | Exchange
| | Contract
| | Expiration Date
| | Contract Value
| | Net
Unrealized
Appreciation
|
|---|
Purchased | | | | | | | | | | | | | | | | | | | | |
| 48 | | | | NYF | | E-MINI Russell 2000 Index | | March 2010 | | $ | 2,994,720 | | | $ | 81,052 | |
| 41 | | | | CME | | E-MINI S&P MidCap 400 | | March 2010 | | | 2,972,090 | | | | 62,023 | |
| | | | | | | | | | | | | | | $ | 143,075 | |
178
VANTAGEPOINT FUNDS
NOTES TO THE FINANCIAL STATEMENTS—(Continued)
Overseas Equity Index Fund
Number of
Contracts
| | | | Exchange
| | Contract
| | Expiration Date
| | Contract Value
| | Net
Unrealized
Appreciation
|
|---|
Purchased | | | | | | | | | | | | | | | | | | | | |
| 23 | | | | EUX | | DJ Euro STOXX 50 Index | | March 2010 | | $ | 979,917 | | | $ | 14,639 | |
| 6 | | | | LIF | | FTSE 100 Index | | March 2010 | | | 519,594 | | | | 9,274 | |
| 2 | | | | SFE | | SPI 200 Index | | March 2010 | | | 219,128 | | | | 9,836 | |
| 6 | | | | TSE | | TOPIX Index | | March 2010 | | | 582,703 | | | | 813 | |
| | | | | | | | | | | | | | | $ | 34,562 | |
Forward Foreign Currency Exchange Contracts
A forward foreign currency exchange contract is a privately negotiated agreement to pay or receive specific amounts of a currency at a future date in exchange for another currency at an agreed upon exchange rate.
Certain funds may enter into forward foreign currency exchange contracts to seek to manage or “hedge” against the currency risks to which a fund may be exposed from time to time in pursuing its investment objective(s). Generally, currency risk is the risk that foreign currency values will decline relative to the U.S. dollar. This risk may arise in connection with a fund’s investments in securities or other assets that are denominated in foreign currencies, a fund’s direct investment in foreign currency or a fund’s investment in a derivative instrument that provides exposure to a foreign currency. A decline in the value of a foreign currency relative to the U.S. dollar will reduce the value of any securities held by a fund and denominated in that currency. Certain funds may enter into forward foreign currency exchange contracts in order to gain investment exposure to a foreign currency.
The following funds are permitted (but not required) to use forward foreign currency exchange contracts to manage any foreign currency risk to which they may be exposed from time to time: the Low Duration Bond Fund, Inflation Protected Securities Fund, Equity Income Fund, Growth & Income Fund, Growth Fund, Select Value Fund, Aggressive Opportunities Fund, Discovery Fund, International Fund, Diversified Assets Fund, and Overseas Equity Index Fund. Certain funds, such as the Diversified Assets Fund, may enter into forward foreign currency exchange contracts in order to gain investment exposure to a foreign currency. Certain funds may be permitted (but are not required) to enter into forward foreign currency exchange contracts for other purposes, as described in the prospectus and/or statement of additional information, but any such uses generally would not be as common as the primary and secondary uses described above. No fund is required to use forward foreign currency exchange contracts for any or all of the uses described herein.
Risks of entering into forward foreign currency exchange contracts include the possibility that foreign currency values may change unfavorably relative to the U.S. dollar, there may be an illiquid market or a change in the value of the contracts may not correlate with changes in the value of the underlying currency. The amount at risk for such forward foreign currency exchange contracts may exceed the amount reflected in the financial statements. The use of over-the-counter forward foreign currency exchange contracts includes counterparty risk, which is the risk that the other party to a contract may not fulfill its obligations. The risk of loss from non-performance by the counterparty may be reduced by the use of a written agreement with the counterparty that includes certain safeguards regarding the counterparty’s obligations.
The net U.S. dollar value of foreign currency underlying all contractual commitments held by a fund and the resulting unrealized appreciation or depreciation are determined daily using prevailing exchange rates. Realized gain or loss is recorded upon the termination of the contract. Net realized and unrealized gains or losses occurring during the holding period of forward foreign currency exchange contracts are a component of net realized gain (loss) on foreign currency transactions and change in net unrealized appreciation (depreciation) on forward contracts and foreign currency transactions in the Statements of Operations, respectively.
During the year ended December 31, 2009, the following funds purchased or sold forward foreign currency exchange contracts: Low Duration Bond Fund, Inflation Protected Securities Fund, Discovery Fund, Diversified Assets Fund, and Overseas Equity Index Fund.
179
VANTAGEPOINT FUNDS
NOTES TO THE FINANCIAL STATEMENTS—(Continued)
As of December 31, 2009, the following funds had open forward foreign currency exchange contracts outstanding:
Low Duration Bond Fund
Contract Type
| | | | Currency to
Deliver
| | In
Exchange
For
| | Exchange
Date
| | Foreign Currency
Cost/Proceeds
(U.S.$)
| | U.S. Dollar Value at
December 31, 2009
| | Net
Unrealized
Appreciation
|
|---|
| Sale | | | | EUR | | USD | | 01/11/2010 | | $ | 7,475,490 | | | $ | 7,230,826 | | | $ | 244,664 | |
Inflation Protected Securities Fund
Contract Type
| | | | Currency to
Deliver
| | In
Exchange
For
| | Exchange
Date
| | Foreign Currency
Cost/Proceeds
(U.S.$)
| | U.S. Dollar Value at
December 31, 2009
| | Net
Unrealized
Appreciation/
(Depreciation)
|
|---|
| Purchase | | | | EUR | | JPY | | 02/05/2010 | | $ | 1,548,230 | | | $ | 1,531,510 | | | $ | (16,720 | ) |
| Purchase | | | | JPY | | EUR | | 02/05/2010 | | | 1,541,810 | | | | 1,548,230 | | | | 6,420 | |
| | | | | | | | | | | | | | | | | | | $ | (10,300 | ) |
| Sale | | | | EUR | | USD | | 01/20/2010 | | $ | 1,498,697 | | | $ | 1,425,666 | | | $ | 73,031 | |
| | | | | | | | | | | | | | | | | | | $ | 62,731 | |
Discovery Fund
Contract Type
| | | | Currency
to Deliver
| | In
Exchange
For
| | Exchange
Date
| | Foreign Currency
Cost/Proceeds
(U.S.$)
| | U.S. Dollar Value at
December 31, 2009
| | Net
Unrealized
Appreciation
|
|---|
| Sale | | | | EUR | | USD | | 01/11/2010 | | $ | 680,261 | | | $ | 657,999 | | | $ | 22,262 | |
Diversified Assets Fund
Contract Type
| | | | Currency
to Deliver
| | In
Exchange
For
| | Exchange
Date
| | Foreign Currency
Cost/Proceeds
(U.S.$)
| | U.S. Dollar Value at
December 31, 2009
| | Net
Unrealized
Appreciation/
(Depreciation)
|
|---|
| Purchase | | | | USD | | AUD | | 01/07/2010 | | $ | 22,051,368 | | | $ | 21,725,211 | | | $ | (326,157 | ) |
| Purchase | | | | USD | | AUD | | 02/03/2010 | | | 18,447,691 | | | | 18,423,279 | | | | (24,412 | ) |
| Purchase | | | | USD | | CAD | | 01/07/2010 | | | 3,440,348 | | | | 3,456,117 | | | | 15,769 | |
| Purchase | | | | USD | | CHF | | 01/07/2010 | | | 11,604,055 | | | | 11,347,024 | | | | (257,031 | ) |
| Purchase | | | | USD | | CHF | | 02/03/2010 | | | 7,950,131 | | | | 7,944,622 | | | | (5,509 | ) |
| Purchase | | | | USD | | EUR | | 01/07/2010 | | | 10,410,667 | | | | 10,073,556 | | | | (337,111 | ) |
| Purchase | | | | USD | | GBP | | 01/07/2010 | | | 32,666,822 | | | | 32,721,166 | | | | 54,344 | |
| Purchase | | | | USD | | JPY | | 01/07/2010 | | | 14,267,657 | | | | 13,194,526 | | | | (1,073,131 | ) |
| Purchase | | | | USD | | JPY | | 02/03/2010 | | | 10,022,733 | | | | 10,018,374 | | | | (4,359 | ) |
| Purchase | | | | USD | | NOK | | 01/07/2010 | | | 4,736,787 | | | | 4,737,879 | | | | 1,092 | |
| Purchase | | | | USD | | NOK | | 02/03/2010 | | | 4,743,091 | | | | 4,732,215 | | | | (10,876 | ) |
| Purchase | | | | USD | | NZD | | 01/07/2010 | | | 8,788,798 | | | | 8,942,449 | | | | 153,651 | |
| Purchase | | | | USD | | NZD | | 02/03/2010 | | | 6,343,172 | | | | 6,328,091 | | | | (15,081 | ) |
| Purchase | | | | USD | | SEK | | 01/07/2010 | | | 2,547,417 | | | | 2,542,198 | | | | (5,219 | ) |
| | | | | | | | | | | | | | | | | | | $ | (1,834,030 | ) |
180
VANTAGEPOINT FUNDS
NOTES TO THE FINANCIAL STATEMENTS—(Continued)
Contract Type
| | | | Currency
to Deliver
| | In
Exchange
For
| | Exchange
Date
| | Foreign Currency
Cost/Proceeds
(U.S.$)
| | U.S. Dollar Value at
December 31, 2009
| | Net
Unrealized
Appreciation/
(Depreciation)
|
|---|
| Sale | | | | AUD | | USD | | 01/07/2010 | | $ | 21,823,133 | | | $ | 21,725,211 | | | $ | 97,922 | |
| Sale | | | | CAD | | USD | | 01/07/2010 | | | 3,433,120 | | | | 3,456,118 | | | | (22,998 | ) |
| Sale | | | | CAD | | USD | | 02/03/2010 | | | 2,774,436 | | | | 2,781,068 | | | | (6,632 | ) |
| Sale | | | | CHF | | USD | | 01/07/2010 | | | 11,334,737 | | | | 11,347,024 | | | | (12,287 | ) |
| Sale | | | | EUR | | USD | | 01/07/2010 | | | 10,112,175 | | | | 10,073,556 | | | | 38,619 | |
| Sale | | | | EUR | | USD | | 02/03/2010 | | | 3,277,212 | | | | 3,274,654 | | | | 2,558 | |
| Sale | | | | GBP | | USD | | 01/07/2010 | | | 33,219,419 | | | | 32,721,164 | | | | 498,255 | |
| Sale | | | | GBP | | USD | | 02/03/2010 | | | 26,272,997 | | | | 26,280,102 | | | | (7,105 | ) |
| Sale | | | | JPY | | USD | | 01/07/2010 | | | 13,320,773 | | | | 13,194,526 | | | | 126,247 | |
| Sale | | | | NOK | | USD | | 01/07/2010 | | | 4,748,550 | | | | 4,737,878 | | | | 10,672 | |
| Sale | | | | NZD | | USD | | 01/07/2010 | | | 8,940,987 | | | | 8,942,449 | | | | (1,462 | ) |
| Sale | | | | SEK | | USD | | 01/07/2010 | | | 2,602,630 | | | | 2,542,198 | | | | 60,432 | |
| Sale | | | | SEK | | USD | | 02/03/2010 | | | 2,547,727 | | | | 2,542,550 | | | | 5,177 | |
| | | | | | | | | | | | | | | | | | | $ | 789,398 | |
| | | | | | | | | | | | | | | | | | | $ | (1,044,632 | ) |
Overseas Equity Index Fund
Contract Type
| | | | Currency
to Deliver
| | In
Exchange
For
| | Exchange
Date
| | Foreign Currency
Cost/Proceeds
(U.S.$)
| | U.S. Dollar Value at
December 31, 2009
| | Net
Unrealized
Appreciation/
(Depreciation)
|
|---|
| Purchase | | | | USD | | AUD | | 03/17/2010 | | $ | 670,755 | | | $ | 667,154 | | | $ | (3,601 | ) |
| Purchase | | | | USD | | EUR | | 03/17/2010 | | | 4,133,314 | | | | 4,043,512 | | | | (89,802 | ) |
| Purchase | | | | USD | | GBP | | 03/17/2010 | | | 2,466,872 | | | | 2,457,576 | | | | (9,296 | ) |
| Purchase | | | | USD | | JPY | | 03/17/2010 | | | 3,756,200 | | | | 3,565,504 | | | | (190,696 | ) |
| | | | | | | | | | | | | | | | | | | $ | (293,395 | ) |
| Sale | | | | AUD | | USD | | 03/17/2010 | | $ | 597,071 | | | $ | 589,673 | | | $ | 7,398 | |
| Sale | | | | EUR | | USD | | 03/17/2010 | | | 2,817,078 | | | | 2,773,139 | | | | 43,939 | |
| Sale | | | | GBP | | USD | | 03/17/2010 | | | 1,689,970 | | | | 1,681,557 | | | | 8,413 | |
| Sale | | | | JPY | | USD | | 03/17/2010 | | | 1,687,067 | | | | 1,607,761 | | | | 79,306 | |
| | | | | | | | | | | | | | | | | | | $ | 139,056 | |
| | | | | | | | | | | | | | | | | | | $ | (154,339 | ) |
Option Contracts
An option gives the holder the right but not the obligation to enter into a transaction (e.g., the purchase or sale of a security, an index of securities or another instrument, such as a futures contract) with another party at a specified price (called the strike price). The counterparty is obligated to enter into the transaction if the holder elects to exercise the option. A call option gives the holder the right to purchase the underlying security or instrument from the other party; a put option gives the holder the right to sell the underlying security or instrument to the other party. Purchasing a put option contract may protect the purchaser from declines in market value on the underlying index or security. Purchasing a call option contract may enable the purchaser to benefit from price appreciation (if any) in the underlying index or security.
Certain funds may enter into option contracts to seek to manage or “hedge” against one or more of the investment risks to which a fund may be exposed from time to time in pursuing its investment objective(s), including, for example, debt instrument risks (such as interest rate risk, which is the risk that interest rates will rise, causing bond prices to fall, and credit risk, which is the risk that the issuer of a debt instrument will default on its obligation to pay interest and/or principal on the instrument) and stock market risk (which is the risk that stock prices overall will decline over short or extended periods).
181
VANTAGEPOINT FUNDS
NOTES TO THE FINANCIAL STATEMENTS—(Continued)
Funds that may use option contracts to, among other things, seek to manage debt instrument risks include: the Low Duration Bond Fund, Inflation Protected Securities Fund, and the Diversified Assets Fund. Funds that may use option contracts to seek to manage stock market risk include: the Growth Fund, Select Value Fund, Aggressive Opportunities Fund, Discovery Fund, International Fund, and Diversified Assets Fund. In addition, the Diversified Assets Fund and Inflation Protected Securities Fund, may use option contracts to obtain investment exposure to a certain asset or asset class. Certain funds also may be permitted to use option contracts for other purposes, as described in the prospectus and statement of additional information, but any such uses generally would not be as common as the primary and secondary uses described above. No fund is required to use option contracts for any or all of the uses described herein.
Purchases of put and call options are recorded as an investment, the value of which is marked to market at each valuation date. When a purchased option expires, the fund will realize a loss equal to the premium paid. When a fund enters into a closing sale transaction, the fund will realize a gain or loss depending on whether the sales proceeds from the closing sale transaction are greater or less than the cost of the option. When a fund exercises a put option, it will realize a gain or loss from the sale of the underlying security and the proceeds from such sale will be decreased by the premium originally paid. When a fund exercises a call option, the cost of the security which the fund purchases upon exercise will be increased by the premium originally paid. When a fund writes a call or put option, an amount equal to the premium received by the fund is recorded as a liability, the value of each option is marked to market at each valuation date. When a written option expires, the fund realizes a gain equal to the amount of the premium originally received. When a fund enters into a closing purchase transaction, the fund realizes a gain (or loss if the cost of the closing purchase transaction exceeds the premium originally received when the option was sold/written) without regard to any unrealized gain or loss on the underlying security, and the liability related to such option is eliminated. When a written call option is exercised, the fund realizes a gain or loss from the sale of the underlying security and the proceeds from such sale are increased by the amount of the premium originally received. When a written put option is exercised, the amount of the premium originally received will reduce the cost of the security that the fund purchased upon exercise. Options written are reported as a liability in a fund’s Statement of Assets and Liabilities. Gains and losses are reported in a fund’s Statement of Operations. Option contract transactions may incur a commission, in addition to the premium paid or received.
A risk in writing, which is selling, a call option is that the fund gives up the opportunity for profit if the market price of the security increases and the option is exercised. A risk in writing a put option is that the fund may incur a loss if the market price of the security decreases and the option is exercised. A risk in buying an option is that the fund pays a premium whether or not the option is exercised. The use of over-the-counter option contracts may also include counterparty risk, which is the risk that the other party to the contract may not fulfill its obligations. The risk of loss from non-performance by the counterparty may be reduced by the use of a written agreement with the counterparty that includes certain safeguards regarding the counterparty’s obligations.
During the year ended December 31, 2009, the following funds purchased or sold put options and call options: Inflation Protected Securities Fund and Diversified Assets Fund.
Written option activity for the year ended December 31, 2009 was as follows:
| | | | Call Options
| | Put Options
| | Total
| |
|---|
Inflation Protected Securities Fund
| | | | Number of
Contracts
| | Premium
| | Number of
Contracts
| | Premium
| | Number of
Contracts
| | Premium
|
|---|
| Beginning balance as of 01/01/2009 | | | | | — | | | $ | — | | | | — | | | $ | — | | | | — | | | $ | — | |
| Written | | | | | — | | | | — | | | | 28 | | | | 9,547 | | | | 28 | | | | 9,547 | |
| Closed | | | | | — | | | | — | | | | (23 | ) | | | (7,842 | ) | | | (23 | ) | | | (7,842 | ) |
| Expired | | | | | — | | | | — | | | | (5 | ) | | | (1,705 | ) | | | (5 | ) | | | (1,705 | ) |
| Ending balance as of 12/31/2009 | | | | | — | | | $ | — | | | | — | | | $ | — | | | | — | | | $ | — | |
Swap Agreements
Generally, a swap is a privately-negotiated agreement between two parties to exchange the return generated by one instrument for the return generated by another instrument. Interest rate swap agreements involve the exchange between two parties of their respective commitments to pay or receive interest with respect to a notional amount of principal.
182
VANTAGEPOINT FUNDS
NOTES TO THE FINANCIAL STATEMENTS—(Continued)
An inflation swap agreement involves the exchange between two parties of their respective commitments to pay or receive a fixed rate in exchange for the actual rate of change of an inflation index with respect to a notional amount of principal. Total return swap agreements are contracts in which one party agrees to make periodic payments to another party based on the change in market value of the assets underlying the contract, which may include a specified security, basket of securities or securities indices during the specified period, in return for periodic payments based on a fixed or variable interest rate or the total return from other underlying assets. Credit default swaps are contracts whereby one party makes periodic payments to a counterparty in exchange for the right to receive from the counterparty a payment equal to the par (or other agreed-upon) value of a referenced debt obligation in the event of a default by the issuer of the debt obligation.
Certain funds may enter into swap agreements to seek to manage or “hedge” against one or more investment risks to which a fund may be exposed from time to time in pursing its investment objective(s), including, for example, interest rate risk, which is the risk that interest rates will rise, causing bond prices to fall, and credit risk, which is the risk that the issuer of a debt instrument will default on its obligation to pay interest and/or principal on the instrument.
Funds that may use swap agreements to seek to manage interest rate or credit risks include: the Low Duration Bond Fund, Inflation Protected Securities Fund, Discovery Fund, Diversified Assets Fund, and Core Bond Index Fund. In addition, some funds, such as the Diversified Assets Fund and Inflation Protected Securities Fund, may use swap agreements to obtain investment exposure to a certain asset or asset class. Certain funds also may be permitted to use swap agreements for other purposes, as described in the prospectus and statement of additional information, but any such uses generally would not be as common as the uses described above. No fund is required to use swap agreements for any or all of the uses described herein.
The risks of entering into swap agreements include the possible lack of liquidity and unfavorable changes in the underlying investments or instruments. The use of swap agreements may also include counterparty risk, which is the risk that the other party to a swap agreement may not fulfill its obligations. The risk of loss from non-performance by the counterparty may be reduced by the use of a written agreement with the counterparty that includes certain safeguards regarding the counterparty’s obligations.
In certain types of swap transactions, the risk of loss is increased because the fund may be required to make additional or higher payments to the counterparty as a result of market volatility. In addition, swap agreements are not traded on exchanges or other organized markets and thus may be less liquid than other derivative instruments.
The swap listed below is marked to market daily using pricing services or fair values, and the change in value, if any, is recorded as unrealized gain or loss in the Statement of Operations.
Changes in value, including the periodic amounts of interest to be paid or received on swaps, are recorded as unrealized appreciation (depreciation) on swaps. Realized gain or loss is recorded upon receipt or payment of a periodic settlement or termination of swap agreements. Net realized and unrealized gains and losses occurring during the holding period of swap agreements are a component of net realized gain (loss) on swap agreements and change in net unrealized appreciation (depreciation) on swap agreements in the Statements of Operations, respectively.
During the year ended December 31, 2009, the following fund participated in interest rate swap agreements: Inflation Protected Securities Fund.
As of December 31, 2009, the following swap agreement was outstanding:
Inflation Protected Securities Fund
Interest Rate Swaps
|
|
|---|
| | | | Rates Exchanged
| |
|---|
Swap Counterparty
| | | | Payments Made
By The Fund
| | Payments Received
By The Fund
| | Termination
Date
| | Notional
Amount
| | Net Unrealized
Appreciation
|
|---|
| Morgan Stanley Capital Services | | | | Daily Brazil CETIP Interbank Deposit Rate | | | 12.54 | % | | | 01/02/2012 | | | | BRL6,600,000 | | | $ | 112,296 | |
Swap Options (“Swaptions”)
A swaption is a contract that gives a counterparty the right (but not the obligation), in return for the payment of a premium, to enter into a new swap agreement, or shorten, extend, cancel or otherwise modify an existing swap agreement, at some designated future time on specified terms. When a fund purchases a swaption, it risks losing only
183
VANTAGEPOINT FUNDS
NOTES TO THE FINANCIAL STATEMENTS—(Continued)
the amount of the premium it has paid should it decide to let the option expire unexercised. However, when a fund writes a swaption, upon exercise of the option the fund will become obligated according to the terms of the underlying agreement. The use of swaptions includes counterparty risk, which is the risk that the other party to a swaption may not fulfill its obligations. The risk of loss from non-performance by the counterparty may be reduced by the use of a written agreement with the counterparty that includes certain safeguards regarding the counterparty’s obligations.
Certain funds may enter into swap options (or “swaptions”) to seek to manage or “hedge” against one or more investment risks to which a fund may be exposed from time to time in pursuing its investment objective(s), including, for example, interest rate risk, which is the risk that interest rates will rise, causing bond prices to fall, and credit risk, which is the risk that the issuer of a debt instrument will default on its obligation to pay interest and/or principal on the instrument.
Funds that may use swaptions to seek to manage interest rate or credit risks include: the Low Duration Bond Fund, Inflation Protected Securities Fund, Discovery Fund, Diversified Assets Fund, and Core Bond Index Fund. Some funds, such as the Diversified Assets Fund and the Inflation Protected Securities Fund, also may use swaptions to obtain investment exposure to a certain asset or asset class. Certain funds also may be permitted to use swaptions for other purposes, as described in the prospectus and statement of additional information, but any such uses generally would not be as common as the uses described above. No fund is required to use swaptions for any or all of the uses described herein.
Purchases of put and call swaptions are recorded as an investment, the value of which is marked to market at each valuation date. When a purchased swaption expires, the fund will realize a loss equal to the premium paid. When a fund enters into a closing sale transaction, the fund will realize a gain or loss depending on whether the sales proceeds from the closing sale transaction are greater or less than the cost of the swaption. When a fund exercises a put swaption, it will realize a gain or loss from the sale of the underlying security and the proceeds from such sale will be decreased by the premium originally paid. When a fund exercises a call swaption, the cost of the security which the fund purchases upon exercise will be increased by the premium originally paid. When a fund writes a call or put swaption, an amount equal to the premium received by the fund is recorded as a liability, the value of each swaption is marked to market at each valuation date. When a written swaption expires, the fund realizes a gain equal to the amount of the premium originally received. When a fund enters into a closing purchase transaction, the fund realizes a gain (or loss if the cost of the closing purchase transaction exceeds the premium originally received when the swaption was sold/written) without regard to any unrealized gain or loss on the underlying security, and the liability related to such swaption is eliminated. When a written call swaption is exercised, the fund realizes a gain or loss from the sale of the underlying security and the proceeds from such sale are increased by the amount of the premium originally received. When a written put swaption is exercised, the amount of the premium originally received will reduce the cost of the security that the fund purchased upon exercise. Swaptions written are reported as a liability in a fund’s Statement of Assets and Liabilities. Gains and losses are reported in a fund’s Statement of Operations. Swaption contract transactions may incur a commission, in addition to the premium paid or received.
During the year ended December 31, 2009, the following fund participated in interest rate swaption agreements: Inflation Protected Securities Fund.
184
VANTAGEPOINT FUNDS
NOTES TO THE FINANCIAL STATEMENTS—(Continued)
Written swaption activity for the year ended December 31, 2009 was as follows:
| | | | Call Swaptions
| | Put Swaptions
| | Total
| |
|---|
Inflation Protected Securities Fund
| | | | Notional
Amount
| | Premium
| | Notional
Amount
| | Premium
| | Notional
Amount
| | Premium
|
|---|
| Beginning balance as of 01/01/2009 | | | | $ | 4,400,000 | | | $ | 107,490 | | | $ | 1,800,000 | | | $ | 12,343 | | | $ | 6,200,000 | | | $ | 119,833 | |
| Written | | | | | 56,150,000 | | | | 257,830 | | | | 102,150,000 | | | | 730,081 | | | | 158,300,000 | | | | 987,911 | |
| Closed | | | | | (47,150,000 | ) | | | (258,525 | ) | | | (82,950,000 | ) | | | (588,519 | ) | | | (130,100,000 | ) | | | (847,044 | ) |
| Expired | | | | | — | | | | — | | | | — | | | | — | | | | — | | | | — | |
| Ending balance as of 12/31/2009 | | | | $ | 13,400,000 | | | $ | 106,795 | | | $ | 21,000,000 | | | $ | 153,905 | | | $ | 34,400,000 | | | $ | 260,700 | |
Exchange
| | | | Contract
| | Notional
Amount
| | Strike Rate
| | Expiration
Date
| | Net Unrealized
Appreciation/
(Depreciation)
|
|---|
| OTC | | | | Put—Interest Rate Swaption | | $ | 5,300,000 | | | | 3.50 | % | | | 2/17/2010 | | | $ | (53,103 | ) |
| OTC | | | | Call—Interest Rate Swaption | | | 2,900,000 | | | | 3.25 | % | | | 4/19/2010 | | | | 24,037 | |
| OTC | | | | Put—Interest Rate Swaption | | | 2,900,000 | | | | 4.25 | % | | | 4/19/2010 | | | | (25,550 | ) |
| OTC | | | | Call—Interest Rate Swaption | | | 2,200,000 | | | | 2.75 | % | | | 4/19/2010 | | | | 1,805 | |
| OTC | | | | Put—Interest Rate Swaption | | | 2,200,000 | | | | 4.00 | % | | | 4/19/2010 | | | | (7,240 | ) |
| OTC | | | | Call—Interest Rate Swaption | | | 2,000,000 | | | | 3.25 | % | | | 2/17/2010 | | | | 19,649 | |
| OTC | | | | Put—Interest Rate Swaption | | | 1,800,000 | | | | 4.00 | % | | | 4/19/2010 | | | | (12,421 | ) |
| OTC | | | | Call—Interest Rate Swaption | | | 1,800,000 | | | | 3.25 | % | | | 4/19/2010 | | | | 6,850 | |
| OTC | | | | Put—Interest Rate Swaption | | | 1,800,000 | | | | 4.25 | % | | | 4/19/2010 | | | | (14,895 | ) |
| OTC | | | | Call—Interest Rate Swaption | | | 1,800,000 | | | | 2.75 | % | | | 4/19/2010 | | | | 13,177 | |
| OTC | | | | Put—Interest Rate Swaption | | | 1,800,000 | | | | 4.00 | % | | | 2/17/2010 | | | | (13,949 | ) |
| OTC | | | | Call—Interest Rate Swaption | | | 1,700,000 | | | | 3.25 | % | | | 2/17/2010 | | | | 14,768 | |
| OTC | | | | Put—Interest Rate Swaption | | | 1,700,000 | | | | 4.00 | % | | | 2/17/2010 | | | | (19,294 | ) |
| OTC | | | | Put—Interest Rate Swaption | | | 1,500,000 | | | | 4.00 | % | | | 2/17/2010 | | | | (17,983 | ) |
| OTC | | | | Put—Interest Rate Swaption | | | 1,000,000 | | | | 4.25 | % | | | 4/19/2010 | | | | (8,650 | ) |
| OTC | | | | Put—Interest Rate Swaption | | | 1,000,000 | | | | 4.25 | % | | | 4/19/2010 | | | | (11,225 | ) |
| OTC | | | | Call—Interest Rate Swaption | | | 1,000,000 | | | | 3.25 | % | | | 4/19/2010 | | | | 11,206 | |
| | | | | | | | | | | | | | | | | | | $ | (92,818 | ) |
185
VANTAGEPOINT FUNDS
NOTES TO THE FINANCIAL STATEMENTS—(Continued)
In April 2009, the Company adopted FASB ASC 815 “Disclosure about Derivative Instruments and Hedging Activities” (“ASC 815”), which requires enhanced disclosures about the funds’ derivatives and hedging activities. The following tables reflect the value of the funds’ derivative contracts by certain risk exposure types as of December 31, 2009.
| | | | Asset Derivatives
| | Liability Derivatives
| |
|---|
Risk Exposure
| | | | Statement of Assets and
Liabilities Location
| | Value
| | Statement of Assets and
Liabilities Location
| | Value
|
|---|
Low Duration Bond Fund |
| Interest rate | | | | Receivable for variation margin on futures contracts | | $ | 127,803 | * | | Payable for variation margin on futures contracts | | $ | — | |
| Foreign currency | | | | Unrealized appreciation on forward foreign currency exchange contracts | | | 244,664 | | | Unrealized depreciation on forward foreign currency exchange contracts | | | — | |
| Total | | | | | | $ | 372,467 | | | | | $ | — | |
Inflation Protected Securities Fund |
| Interest rate | | | | Receivable for variation margin on futures contracts and unrealized appreciation on swap agreements | | $ | 144,622 | * | | Payable for variation margin on futures contracts and written options at value | | $ | 413,948 | * |
| Foreign currency | | | | Unrealized appreciation on forward foreign currency exchange contracts | | | 79,451 | | | Unrealized depreciation on forward foreign currency exchange contracts | | | 16,720 | |
| Total | | | | | | $ | 224,073 | | | | | $ | 430,668 | |
Asset Allocation Fund |
| Interest rate | | | | Receivable for variation margin on futures contracts | | $ | — | | | Payable for variation margin on futures contracts | | $ | 1,787,808 | * |
| Equity | | | | Receivable for variation margin on futures contracts | | | 494,208 | * | | Payable for variation margin on futures contracts | | | — | |
| Total | | | | | | $ | 494,208 | | | | | $ | 1,787,808 | |
Discovery Fund |
| Interest rate | | | | Receivable for variation margin on futures contracts | | $ | 6,798 | * | | Payable for variation margin on futures contracts | | $ | — | |
| Foreign currency | | | | Unrealized appreciation on forward foreign currency exchange contracts | | | 22,262 | | | Unrealized depreciation on forward foreign currency exchange contracts | | | — | |
| Equity | | | | Receivable for variation margin on futures contracts | | | 2,927,648 | * | | Payable for variation margin on futures contracts | | | — | |
| Total | | | | | | $ | 2,956,708 | | | | | $ | — | |
Diversified Assets Fund |
| Interest rate | | | | Investment in securities, at value — purchased options and receivable for variation margin on futures contracts | | $ | 2,481,289 | ˆ | | Payable for variation margin on futures contracts | | | $647,704 | * |
| Foreign currency | | | | Unrealized appreciation on forward foreign currency exchange contracts | | | 1,064,738 | | | Unrealized depreciation on forward foreign currency exchange contracts | | | 2,109,370 | |
| Equity | | | | Receivable for variation margin on futures contracts | | | 1,179,139 | * | | Payable for variation margin on futures contracts | | | 1,370,190 | * |
| Total | | | | | | $ | 4,725,166 | | | | | $ | 4,127,264 | |
186
VANTAGEPOINT FUNDS
NOTES TO THE FINANCIAL STATEMENTS—(Continued)
| | | | Asset Derivatives
| | Liability Derivatives
| |
|---|
Risk Exposure
| | | | Statement of Assets and
Liabilities Location
| | Value
| | Statement of Assets and
Liabilities Location
| | Value
|
|---|
500 Stock Index Fund |
| Equity | | | | Receivable for variation margin on futures contracts | | $ | 35,558 | * | | Payable for variation margin on futures contracts | | $ | — | |
| Total | | | | | | $ | 35,558 | | | | | $ | — | |
Broad Market Index Fund |
| Equity | | | | Receivable for variation margin on futures contracts | | $ | 84,442 | * | | Payable for variation margin on futures contracts | | $ | — | |
| Total | | | | | | $ | 84,442 | | | | | $ | — | |
Mid/Small Company Index Fund |
| Equity | | | | Receivable for variation margin on futures contracts | | $ | 143,075 | * | | Payable for variation margin on futures contracts | | $ | — | |
| Total | | | | | | $ | 143,075 | | | | | $ | — | |
Overseas Equity Index Fund |
| Foreign currency | | | | Unrealized appreciation on forward foreign currency exchange contracts | | $ | 139,056 | | | Unrealized depreciation on forward foreign currency exchange contracts | | $ | 293,395 | |
| Equity | | | | Receivable for variation margin on futures contracts | | | 34,562 | * | | Payable for variation margin on futures contracts | | | — | |
| Total | | | | | | $ | 173,618 | | | | | $ | 293,395 | |
| | | | | | | | | | | | | | | |
| * | | Includes cumulative appreciation (depreciation) of futures contracts as reported in the Notes to Financial Statements. Only the current day’s variation margin is reported within the asset and liability sections of the Statements of Assets and Liabilities. |
| ˆ | | Includes cumulative appreciation (depreciation) of futures contracts and options on futures at value as reported in the Notes to Financial Statements and Schedule of Investments, respectively. Only the current day’s variation margin is reported within the asset and liability sections of the Statements of Assets and Liabilities. |
187
VANTAGEPOINT FUNDS
NOTES TO THE FINANCIAL STATEMENTS—(Continued)
The following tables reflect the funds’ gains (losses) related to derivative activities by risk exposure types for the year ended December 31, 2009 in accordance with ASC 815. These gains (losses) are included in net realized gain (loss) or net change in unrealized appreciation (depreciation) in the Statements of Operations.
Low Duration Bond Fund
Net Realized Gain (Loss)
|
|
|---|
Risk Exposure
| | | | Option Contracts
| | Futures Contracts
| | Forward Foreign
Currency Contracts
| | Swap Agreements
| | Total
|
|---|
| Interest rate | | | | $ | — | | | $ | (190,784 | ) | | $ | — | | | $ | — | | | $ | (190,784 | ) |
| Foreign currency | | | | | — | | | | — | | | | (2,517,392 | ) | | | — | | | | (2,517,392 | ) |
| Total | | | | $ | — | | | $ | (190,784 | ) | | $ | (2,517,392 | ) | | $ | — | | | $ | (2,708,176 | ) |
| |
Net Change in Unrealized Appreciation (Depreciation)
|
|
|---|
Risk Exposure
| | | | Option Contracts
| | Futures Contracts
| | Forward Foreign
Currency Contracts
| | Swap Agreements
| | Total
|
|---|
| Interest rate | | | | $ | — | | | $ | 12,234 | | | $ | — | | | $ | — | | | $ | 12,234 | |
| Foreign currency | | | | | — | | | | — | | | | 985,933 | | | | — | | | | 985,933 | |
| Total | | | | $ | — | | | $ | 12,234 | | | $ | 985,933 | | | $ | — | | | $ | 998,167 | |
Inflation Protected Securities Fund
Net Realized Gain (Loss)
|
|
|---|
Risk Exposure
| | | | Option Contracts
| | Futures Contracts
| | Forward Foreign
Currency Contracts
| | Swap Agreements
| | Total
|
|---|
| Interest rate | | | | $ | 619,574 | | | $ | 254,841 | | | $ | — | | | $ | 2,081,828 | | | $ | 2,956,243 | |
| Foreign currency | | | | | — | | | | — | | | | 54,020 | | | | — | | | | 54,020 | |
| Total | | | | $ | 619,574 | | | $ | 254,841 | | | $ | 54,020 | | | $ | 2,081,828 | | | $ | 3,010,263 | |
Net Change in Unrealized Appreciation (Depreciation)
|
|
|---|
Risk Exposure
| | | | Option Contracts
| | Futures Contracts
| | Forward Foreign
Currency Contracts
| | Swap Agreements
| | Total
|
|---|
| Interest rate | | | | $ | 51,664 | | | $ | 19,538 | | | $ | — | | | $ | (1,492,715 | ) | | $ | (1,421,513 | ) |
| Foreign currency | | | | | — | | | | — | | | | 62,731 | | | | — | | | | 62,731 | |
| Total | | | | $ | 51,664 | | | $ | 19,538 | | | $ | 62,731 | | | $ | (1,492,715 | ) | | $ | (1,358,782 | ) |
Asset Allocation Fund
Net Realized Gain (Loss)
|
|
|---|
Risk Exposure
| | | | Option Contracts
| | Futures Contracts
| | Forward Foreign
Currency Contracts
| | Swap Agreements
| | Total
|
|---|
| Interest rate | | | | $ | — | | | $ | (1,305,980 | ) | | $ | — | | | $ | — | | | $ | (1,305,980 | ) |
| Equity | | | | | — | | | | (627,971 | ) | | | — | | | | — | | | | (627,971 | ) |
| Total | | | | $ | — | | | $ | (1,933,951 | ) | | $ | — | | | $ | — | | | $ | (1,933,951 | ) |
Net Change in Unrealized Appreciation (Depreciation)
|
|
|---|
Risk Exposure
| | | | Option Contracts
| | Futures Contracts
| | Forward Foreign
Currency Contracts
| | Swap Agreements
| | Total
|
|---|
| Interest rate | | | | $ | — | | | $ | (1,787,808 | ) | | $ | — | | | $ | — | | | $ | (1,787,808 | ) |
| Equity | | | | | — | | | | (187,381 | ) | | | | | | | — | | | | (187,381 | ) |
| Total | | | | $ | — | | | $ | (1,975,189 | ) | | $ | — | | | $ | — | | | $ | (1,975,189 | ) |
188
VANTAGEPOINT FUNDS
NOTES TO THE FINANCIAL STATEMENTS—(Continued)
Discovery Fund
Net Realized Gain (Loss)
|
|
|---|
Risk Exposure
| | | | Option Contracts
| | Futures Contracts
| | Forward Foreign
Currency Contracts
| | Swap Agreements
| | Total
|
|---|
| Interest rate | | | | $ | — | | | $ | (2,684 | ) | | $ | — | | | $ | — | | | $ | (2,684 | ) |
| Foreign currency | | | | | — | | | | — | | | | (319,791 | ) | | | — | | | | (319,791 | ) |
| Equity | | | | | — | | | | 22,000,627 | | | | — | | | | — | | | | 22,000,627 | |
| Total | | | | $ | — | | | $ | 21,997,943 | | | $ | (319,791 | ) | | $ | — | | | $ | 21,678,152 | |
Net Change in Unrealized Appreciation (Depreciation)
|
|
|---|
Risk Exposure
| | | | Option Contracts
| | Futures Contracts
| | Forward Foreign
Currency Contracts
| | Swap Agreements
| | Total
|
|---|
| Interest rate | | | | $ | — | | | $ | 6,798 | | | $ | — | | | $ | — | | | $ | 6,798 | |
| Foreign currency | | | | | — | | | | — | | | | 241,047 | | | | — | | | | 241,047 | |
| Equity | | | | | — | | | | (3,226,601 | ) | | | — | | | | — | | | | (3,226,601 | ) |
| Total | | | | $ | — | | | $ | (3,219,803 | ) | | $ | 241,047 | | | $ | — | | | $ | (2,978,756 | ) |
International Fund
Net Realized Gain (Loss)
|
|
|---|
Risk Exposure
| | | | Option Contracts
| | Futures Contracts
| | Forward Foreign
Currency Contracts
| | Swap Agreements
| | Total
|
|---|
| Foreign currency | | | | $ | — | | | $ | — | | | $ | 182,227 | | | $ | — | | | $ | 182,227 | |
Net Change in Unrealized Appreciation (Depreciation)
|
|
|---|
Risk Exposure
| | | | Option Contracts
| | Futures Contracts
| | Forward Foreign
Currency Contracts
| | Swap Agreements
| | Total
|
|---|
| Foreign currency | | | | $ | — | | | $ | — | | | $ | (127,698 | ) | | $ | — | | | $ | (127,698 | ) |
Diversified Assets Fund
Net Realized Gain (Loss)
|
|
|---|
Risk Exposure
| | | | Option Contracts
| | Futures Contracts
| | Forward Foreign
Currency Contracts
| | Swap Agreements
| | Total
|
|---|
| Interest rate | | | | $ | 1,833,185 | | | $ | 858,072 | | | $ | — | | | $ | — | | | $ | 2,691,257 | |
| Foreign currency | | | | | — | | | | — | | | | 2,083,458 | | | | — | | | | 2,083,458 | |
| Equity | | | | | — | | | | 8,107,111 | | | | — | | | | — | | | | 8,107,111 | |
| Total | | | | $ | 1,833,185 | | | $ | 8,965,183 | | | $ | 2,083,458 | | | $ | — | | | $ | 12,881,826 | |
Net Change in Unrealized Appreciation (Depreciation)
|
|
|---|
Risk Exposure
| | | | Option Contracts
| | Futures Contracts
| | Forward Foreign
Currency Contracts
| | Swap Agreements
| | Total
|
|---|
| Interest rate | | | | $ | (220,241 | ) | | $ | (732,180 | ) | | $ | — | | | $ | (332,335 | ) | | $ | (1,284,756 | ) |
| Foreign currency | | | | | — | | | | — | | | | (982,686 | ) | | | — | | | | (982,686 | ) |
| Equity | | | | | — | | | | (255,482 | ) | | | — | | | | — | | | | (255,482 | ) |
| Total | | | | $ | (220,241 | ) | | $ | (987,662 | ) | | $ | (982,686 | ) | | $ | (332,335 | ) | | $ | (2,522,924 | ) |
189
VANTAGEPOINT FUNDS
NOTES TO THE FINANCIAL STATEMENTS—(Continued)
500 Stock Index Fund
Net Realized Gain (Loss)
|
|
|---|
Risk Exposure
| | | | Option Contracts
| | Futures Contracts
| | Forward Foreign
Currency Contracts
| | Swap Agreements
| | Total
|
|---|
| Equity | | | | $ | — | | | $ | 1,492,920 | | | $ | — | | | $ | — | | | $ | 1,492,920 | |
Net Change in Unrealized Appreciation (Depreciation)
|
|
|---|
Risk Exposure
| | | | Option Contracts
| | Futures Contracts
| | Forward Foreign
Currency Contracts
| | Swap Agreements
| | Total
|
|---|
| Equity | | | | $ | — | | | $ | (48,426 | ) | | $ | — | | | $ | — | | | $ | (48,426 | ) |
Broad Market Index Fund
Net Realized Gain (Loss)
|
|
|---|
Risk Exposure
| | | | Option Contracts
| | Futures Contracts
| | Forward Foreign
Currency Contracts
| | Swap Agreements
| | Total
|
|---|
| Equity | | | | $ | — | | | $ | 1,394,571 | | | $ | — | | | $ | — | | | $ | 1,394,571 | |
Net Change in Unrealized Appreciation (Depreciation)
|
|
|---|
Risk Exposure
| | | | Option Contracts
| | Futures Contracts
| | Forward Foreign
Currency Contracts
| | Swap Agreements
| | Total
|
|---|
| Equity | | | | $ | — | | | $ | (109,929 | ) | | $ | — | | | $ | — | | | $ | (109,929 | ) |
Mid/Small Company Index Fund
Net Realized Gain (Loss)
|
|
|---|
Risk Exposure
| | | | Option Contracts
| | Futures Contracts
| | Forward Foreign
Currency Contracts
| | Swap Agreements
| | Total
|
|---|
| Equity | | | | $ | — | | | $ | 1,625,655 | | | $ | — | | | $ | — | | | $ | 1,625,655 | |
Net Change in Unrealized Appreciation (Depreciation)
|
|
|---|
Risk Exposure
| | | | Option Contracts
| | Futures Contracts
| | Forward Foreign
Currency Contracts
| | Swap Agreements
| | Total
|
|---|
| Equity | | | | $ | — | | | $ | 16,249 | | | $ | — | | | $ | — | | | $ | 16,249 | |
Overseas Equity Index Fund
Net Realized Gain (Loss)
|
|
|---|
Risk Exposure
| | | | Option Contracts
| | Futures Contracts
| | Forward Foreign
Currency Contracts
| | Swap Agreements
| | Total
|
|---|
| Foreign currency | | | | $ | — | | | $ | — | | | $ | 578,244 | | | $ | — | | | $ | 578,244 | |
| Equity | | | | | — | | | | 476,433 | | | | — | | �� | | — | | | | 476,433 | |
| Total | | | | $ | — | | | $ | 476,433 | | | $ | 578,244 | | | $ | — | | | $ | 1,054,677 | |
Net Change in Unrealized Appreciation (Depreciation)
|
|
|---|
Risk Exposure
| | | | Option Contracts
| | Futures Contracts
| | Forward Foreign
Currency Contracts
| | Swap Agreements
| | Total
|
|---|
| Foreign currency | | | | $ | — | | | $ | — | | | $ | (269,480 | ) | | $ | — | | | $ | (269,480 | ) |
| Equity | | | | | — | | | | (30,935 | ) | | | — | | | | — | | | | (30,935 | ) |
| Total | | | | $ | — | | | $ | (30,935 | ) | | $ | (269,480 | ) | | $ | — | | | $ | (300,415 | ) |
The value of derivative instruments at period end and effect of derivatives on the Statements of Operations is indicative of the funds’ typical volume of derivative activity.
190
VANTAGEPOINT FUNDS
NOTES TO THE FINANCIAL STATEMENTS—(Continued)
4. | | Agreements and Other Transactions with Affiliates |
VIA, a wholly owned subsidiary of ICMA-RC, provides investment advisory services to each of the funds. Pursuant to Master Advisory Agreements, VIA is entitled to receive 0.10% of the average daily net assets of each Actively Managed and Milestone Fund and 0.05% of the average daily net assets of the Index Funds. Effective July 1, 2005, VIA is entitled to receive 0.10% on the first $500 million of net assets, 0.09% on the next $500 million of net assets, and 0.08% on net assets over $1 billion for each Model Portfolio Fund. For these services, VIA received $12,570,739 in the aggregate for the year ended December 31, 2009.
VIA and the Company contract with one or more subadvisers (“Subadvisers”) for the day-to-day management of each of the funds other than the Money Market Fund, Model Portfolio Funds and Milestone Funds. Each Subadviser is paid a fee by the funds during the year based on average net assets under management, except that the subadviser fee for Analytic Investors, LLC and Mellon Capital Management Corporation for the Diversified Assets Fund is calculated based on the average net asset value of the fund’s assets allocated and assigned to each of them by VIA. The fee structure for many of the Subadvisers provides for a range of fees so that as average net assets of a fund increase the rate of fee paid decreases. With other Subadvisers, one fee is applicable to all levels of assets under management. Additional information about each Subadviser’s fee is presented in the Company’s prospectus and statement of additional information. Fees paid by each fund to Subadvisers during the year ended December 31, 2009 are presented in the “Additional Information” section of these Notes. The Subadviser’s fees during the year ended December 31, 2009 are shown here as an annual percentage of average net assets under management, except that the subadviser fee for Analytic Investors, LLC and Mellon Capital Management Corporation for the Diversified Assets Fund which is calculated based on the average net asset value of the assets allocated and assigned to each of them by VIA.
Fund
| | | | Subadviser
| | Actual Fee as a Percentage of
Average Daily Net Assets
(net of any subadviser fee waivers)
|
|---|
| Low Duration Bond | | | | Payden & Rygel | | | 0.10% | |
| | | | | STW Fixed Income Management Ltd. | | | 0.20% | |
| |
| Inflation Protected Securities | | | | Pacific Investment Management Company, LLC | | | 0.20% | |
| | | | | BlackRock Financial Management, Inc. | | | 0.11% | |
| |
| Asset Allocation | | | | Mellon Capital Management Corporation | | | 0.29% | |
| |
| Equity Income | | | | Barrow, Hanley, Mewhinney & Strauss, Inc. | | | 0.25% | |
| | | | | T. Rowe Price Associates, Inc. | | | 0.38% | |
| | | | | Southeastern Asset Management, Inc. | | | 0.53% | |
| |
| Growth & Income | | | | Capital Guardian Trust Company (1) | | | 0.24% | |
| | | | | Fiduciary Management, Inc. (2) | | | 0.29% | |
| | | | | T. Rowe Price Associates, Inc. | | | 0.38% | |
| | | | | Wellington Management Company, LLP | | | 0.29% | |
| |
| Growth | | | | Columbus Circle Investors | | | 0.35% | |
| | | | | D.G. Capital Management Trust | | | 0.46% | |
| | | | | Legg Mason Capital Management, Inc. | | | 0.32% | |
| | | | | Tukman Grossman Capital Management, Inc. | | | 0.40% | |
| | | | | Westfield Capital Management Company, L.P. | | | 0.34% | |
| |
| Select Value | | | | Artisan Partners Limited Partnership | | | 0.55% | |
| | | | | Systematic Financial Management L.P. | | | 0.45% | |
| | | | | WEDGE Capital Management L.L.P. | | | 0.56% | |
| |
| Aggressive Opportunities | | | | Legg Mason Capital Management, Inc. | | | 0.32% | |
| | | | | Southeastern Asset Management, Inc. | | | 0.58% | |
| | | | | TimesSquare Capital Management, LLC | | | 0.50% | |
| | | | | T. Rowe Price Associates, Inc. | | | 0.58% | |
191
VANTAGEPOINT FUNDS
NOTES TO THE FINANCIAL STATEMENTS—(Continued)
Fund
| | | | Subadviser
| | Actual Fee as a Percentage of
Average Daily Net Assets
(net of any subadviser fee waivers)
|
|---|
| Discovery | | | | Payden & Rygel | | | 0.15% | |
| | | | | Wellington Management Company, LLP | | | 0.73% | |
| |
| International | | | | Artisan Partners Limited Partnership | | | 0.70% | |
| | | | | Capital Guardian Trust Company (3) | | | 0.47% | |
| | | | | GlobeFlex Capital, LP | | | 0.40% | |
| | | | | Mondrian Investment Partners Limited (4) | | | 0.44% | |
| | | | | Walter Scott & Partners Limited | | | 0.58% | |
| |
| Diversified Assets | | | | Analytic Investors, LLC | | | 0.45% | |
| | | | | Drake Capital Management, LLC (5) | | | 0.23% | |
| | | | | Mellon Capital Management Corporation | | | 0.65% | |
| | | | | Payden & Rygel (short-duration fixed income strategy) | | | 0.08% | |
| | | | | Payden & Rygel (low duration bond strategy) (6) | | | 0.09% | |
| |
| Core Bond Index | | | | Mellon Capital Management Corporation | | | 0.02% | |
| |
| 500 Stock Index | | | | Mellon Capital Management Corporation | | | 0.02% | |
| |
| Broad Market Index | | | | Mellon Capital Management Corporation | | | 0.02% | |
| |
| Mid/Small Company Index | | | | Mellon Capital Management Corporation | | | 0.04% | |
| |
| Overseas Equity Index | | | | Mellon Capital Management Corporation | | | 0.07% | |
| (1) | | Terminated as a subadviser on January 31, 2009. |
| (2) | | Began serving as a subadviser on January 21, 2009. |
| (3) | | Terminated as a subadviser on October 11, 2009. Minimum fee of $337,500 per year. |
| (4) | | Began serving as a subadviser on October 12, 2009. |
| (5) | | Terminated as a subadviser on April 10, 2009. |
| (6) | | Began serving as a subadviser to this portion of the fund on April 3, 2009. |
Expenses
The Model Portfolio Funds and Milestone Funds incur fees and expenses indirectly as shareholders in their respective underlying funds and the Money Market Fund incurs fees and expenses indirectly as a shareholder of the Portfolio. Because the underlying funds have varied expense and fee levels and the Model Portfolio, Milestone and Money Market Funds may own different proportions of such funds at different times, the amount of fees and expenses indirectly incurred by the Model Portfolio, Milestone, and Money Market Funds will vary.
Fee Waivers
VIA will waive its management fee or reimburse expenses to the extent necessary as a result of any increase in subadvisory fees payable by the Growth Fund that would cause the aggregate management and subadvisory fees of the Growth Fund to exceed 0.54% as a result of subadvisory changes. This commitment will continue until such time as shareholders approve an increase in this limit. For the year ended December 31, 2009, no waiver or reimbursement was required.
During the year ended December 31, 2009, VIA waived its fee, on a voluntary basis, for the Money Market Fund. The waived amount during this period was $543,029. Any such waivers were voluntary and there can be no assurance that additional waivers can or will be made in the future.
192
VANTAGEPOINT FUNDS
NOTES TO THE FINANCIAL STATEMENTS—(Continued)
From January 3, 2005 until April 30, 2006, VIA contractually agreed to waive fees and/or reimburse expenses to each of the Milestone Funds limiting the direct operating expenses to no more than 0.05% of the fund’s average daily net assets on an annualized basis. From May 1, 2006 through April 30, 2009, VIA contractually agreed to limit each fund’s total fund operating expenses to the following percentages:
| Milestone Retirement Income | | | | 0.81% |
| Milestone 2010 | | | | 0.88% |
| Milestone 2015 | | | | 0.91% |
| Milestone 2020 | | | | 0.93% |
| Milestone 2025 | | | | 0.95% |
| Milestone 2030 | | | | 0.97% |
| Milestone 2035 | | | | 0.99% |
| Milestone 2040 | | | | 0.99% |
For the year ended December 31, 2009, VIA reimbursed each fund as follows:
| Milestone Retirement Income | | | | $26,965 |
| Milestone 2010 | | | | $17,230 |
| Milestone 2015 | | | | $12,138 |
| Milestone 2020 | | | | $ 8,147 |
| Milestone 2025 | | | | $12,156 |
| Milestone 2030 | | | | $10,676 |
| Milestone 2035 | | | | $12,022 |
| Milestone 2040 | | | | $12,030 |
T. Rowe Price Associates, Inc. (“T. Rowe Price”) voluntarily waives a portion of its aggregate subadvisory fees for the Growth & Income, Equity Income, and Aggressive Opportunities Funds. These voluntary fee waivers were first implemented on May 1, 2003. The fee for each fund managed by T. Rowe Price is voluntarily reduced by the following percentages, which are determined based on the total amount of assets managed by T. Rowe Price for The Vantagepoints Funds: a 2.5% waiver on the first $500 million in total assets and a 5% waiver on total assets above $500 million. For the year ended December 31, 2009, the fee waiver for the Growth & Income Fund totaled $39,906, the fee waiver for the Equity Income Fund totaled $55,105 and the fee waiver for the Aggressive Opportunities Fund totaled $41,998. Payden & Rygel has contractually agreed to waive a portion of its subadvisory fee for assets managed pursuant to its short-duration fixed income strategy until April 30, 2010, for the Diversified Assets Fund so that its fees will not exceed 0.08% of the Diversified Assets Fund’s annual average daily net assets under its management for this strategy. For the year ended December 31, 2009, this waiver totaled $40,059. Payden & Rygel also agreed to voluntarily waive a portion of its subadvisory fee for assets managed pursuant to its low duration bond strategy so that its fee will not exceed 0.08% of the Diversified Assets Fund’s annual average daily net assets under its management for this strategy from April 3, 2009 through September 27, 2009. For the year ended December 31, 2009, this waiver totaled $12,257. Effective October 1, 2008, Tukman Grossman Capital Management, Inc. (“Tukman Grossman”) voluntarily agreed to waive a portion of its subadvisory fee in an amount equal to 0.10% of the average daily market value of the assets of the Growth Fund’s assets under its management. This waiver totaled $298,553 for the year ended December 31, 2009.
5. | | Investment Portfolio Transactions |
Purchases and sales of investments, exclusive of short-term securities, for each fund for the year ended December 31, 2009 were as follows:
| | | | U.S. Government Obligations
| | Other Securities
| |
|---|
Fund
| | | | Purchases at Cost
| | Sales Proceeds
| | Purchases at Cost
| | Sales Proceeds
|
|---|
| Low Duration Bond | | | | $ | — | | | $ | — | | | $ | 252,153,862 | | | $ | 258,276,751 | |
| Inflation Protected Securities | | | | | 227,686,359 | | | | 213,286,129 | | | | 96,766,433 | | | | 104,082,224 | |
| Asset Allocation | | | | | 105,221,974 | | | | 9,834,767 | | | | 14,839,714 | | | | 137,204,239 | |
| Equity Income | | | | | — | | | | — | | | | 257,182,014 | | | | 303,927,037 | |
| Growth & Income | | | | | — | | | | — | | | | 930,987,629 | | | | 900,877,521 | |
193
VANTAGEPOINT FUNDS
NOTES TO THE FINANCIAL STATEMENTS—(Continued)
| | | | U.S. Government Obligations
| | Other Securities
| |
|---|
Fund
| | | | Purchases at Cost
| | Sales Proceeds
| | Purchases at Cost
| | Sales Proceeds
|
|---|
| Growth | | | | $ | — | | | $ | — | | | $ | 1,338,555,531 | | | $ | 1,322,516,571 | |
| Select Value | | | | | — | | | | — | | | | 198,038,064 | | | | 211,711,592 | |
| Aggressive Opportunities | | | | | — | | | | — | | | | 410,083,825 | | | | 426,753,028 | |
| Discovery | | | | | 17,031,073 | | | | 18,991,062 | | | | 108,195,354 | | | | 91,125,642 | |
| International | | | | | — | | | | — | | | | 1,379,410,971 | | | | 1,332,995,654 | |
| Diversified Assets | | | | | — | | | | — | | | | 418,030,172 | | | | 354,980,236 | |
| Core Bond Index | | | | | 361,596,076 | | | | 243,209,832 | | | | 428,774,520 | | | | 337,279,084 | |
| 500 Stock Index | | | | | — | | | | — | | | | 41,796,622 | | | | 46,451,455 | |
| Broad Market Index | | | | | — | | | | — | | | | 26,537,582 | | | | 30,017,512 | |
| Mid/Small Company Index | | | | | — | | | | — | | | | 63,301,257 | | | | 45,855,469 | |
| Overseas Equity Index | | | | | — | | | | — | | | | 26,666,837 | | | | 7,369,298 | |
| Model Portfolio Savings Oriented | | | | | — | | | | — | | | | 39,360,948 | | | | 20,069,830 | |
| Model Portfolio Conservative Growth | | | | | — | | | | — | | | | 70,290,230 | | | | 61,255,951 | |
| Model Portfolio Traditional Growth | | | | | — | | | | — | | | | 138,582,448 | | | | 87,898,511 | |
| Model Portfolio Long-Term Growth | | | | | — | | | | — | | | | 161,034,309 | | | | 64,841,128 | |
| Model Portfolio All-Equity Growth | | | | | — | | | | — | | | | 80,827,050 | | | | 15,571,438 | |
| Milestone Retirement Income | | | | | — | | | | — | | | | 34,123,015 | | | | 7,997,475 | |
| Milestone 2010 | | | | | — | | | | — | | | | 30,167,687 | | | | 15,445,358 | |
| Milestone 2015 | | | | | — | | | | — | | | | 57,050,150 | | | | 18,268,779 | |
| Milestone 2020 | | | | | — | | | | — | | | | 54,319,088 | | | | 9,334,478 | |
| Milestone 2025 | | | | | — | | | | — | | | | 46,047,405 | | | | 5,392,517 | |
| Milestone 2030 | | | | | — | | | | — | | | | 36,348,056 | | | | 3,346,543 | |
| Milestone 2035 | | | | | — | | | | — | | | | 27,252,930 | | | | 2,044,450 | |
| Milestone 2040 | | | | | — | | | | — | | | | 38,441,427 | | | | 2,187,475 | |
6. | | Tax Basis Unrealized Appreciation (Depreciation) |
At December 31, 2009, net unrealized appreciation (depreciation) on investments was as follows:
Fund
| | | | Federal
Income Tax
Cost
| | Gross
Unrealized
Appreciation
| | Gross
Unrealized
Depreciation
| | Tax Basis
Net Unrealized
Appreciation/
(Depreciation)
|
|---|
| Money Market | | | | $ | 452,107,065 | | | $ | — | | | $ | — | | | $ | — | |
| Low Duration Bond | | | | | 549,543,979 | | | | 12,957,342 | | | | 3,812,298 | | | | 9,145,044 | |
| Inflation Protected Securities | | | | | 379,203,800 | | | | 10,452,059 | | | | 196,678 | | | | 10,255,381 | |
| Asset Allocation | | | | | 494,538,822 | | | | 53,821,803 | | | | 62,348,311 | | | | (8,526,508 | ) |
| Equity Income | | | | | 1,655,424,665 | | | | 229,537,653 | | | | 184,907,696 | | | | 44,629,957 | |
| Growth & Income | | | | | 955,497,757 | | | | 166,484,643 | | | | 17,891,795 | | | | 148,592,848 | |
| Growth | | | | | 1,817,115,769 | | | | 245,790,265 | | | | 49,836,333 | | | | 195,953,932 | |
| Select Value | | | | | 300,317,860 | | | | 38,816,486 | | | | 7,563,274 | | | | 31,253,212 | |
| Aggressive Opportunities | | | | | 1,104,720,753 | | | | 197,581,594 | | | | 50,488,828 | | | | 147,092,766 | |
| Discovery | | | | | 190,330,021 | | | | 18,277,588 | | | | 4,119,100 | | | | 14,158,488 | |
| International | | | | | 1,030,812,896 | | | | 81,694,477 | | | | 29,229,580 | | | | 52,464,897 | |
| Diversified Assets | | | | | 449,673,266 | | | | 3,107,705 | | | | 1,260,641 | | | | 1,847,064 | |
| Core Bond Index | | | | | 1,341,215,993 | | | | 34,545,313 | | | | 12,621,620 | | | | 21,923,693 | |
| 500 Stock Index | | | | | 276,876,000 | | | | 130,032,848 | | | | 53,270,379 | | | | 76,762,469 | |
| Broad Market Index | | | | | 443,400,220 | | | | 193,808,406 | | | | 104,552,298 | | | | 89,256,108 | |
| Mid/Small Company Index | | | | | 285,816,384 | | | | 47,244,260 | | | | 42,043,104 | | | | 5,201,156 | |
| Overseas Equity Index | | | | | 207,637,687 | | | | 16,948,721 | | | | 31,153,354 | | | | (14,204,633 | ) |
| Model Portfolio Savings Oriented | | | | | 315,135,293 | | | | 1,899,772 | | | | 9,671,324 | | | | (7,771,552 | ) |
| Model Portfolio Conservative Growth | | | | | 549,521,019 | | | | 1,805,726 | | | | 23,047,066 | | | | (21,241,340 | ) |
194
VANTAGEPOINT FUNDS
NOTES TO THE FINANCIAL STATEMENTS—(Continued)
Fund
| | | | Federal
Income Tax
Cost
| | Gross
Unrealized
Appreciation
| | Gross
Unrealized
Depreciation
| | Tax Basis
Net Unrealized
Appreciation/
(Depreciation)
|
|---|
| Model Portfolio Traditional Growth | | | | $ | 1,445,634,399 | | | $ | 817,226 | | | $ | 93,212,574 | | | $ | (92,395,348 | ) |
| Model Portfolio Long-Term Growth | | | | | 1,738,989,066 | | | | 2,056,302 | | | | 119,735,598 | | | | (117,679,296 | ) |
| Model Portfolio All-Equity Growth | | | | | 686,668,106 | | | | — | | | | 95,050,426 | | | | (95,050,426 | ) |
| Milestone Retirement Income | | | | | 79,386,882 | | | | — | | | | 2,666,822 | | | | (2,666,822 | ) |
| Milestone 2010 | | | | | 94,256,594 | | | | — | | | | 3,427,282 | | | | (3,427,282 | ) |
| Milestone 2015 | | | | | 200,453,683 | | | | 965,309 | | | | 15,382,093 | | | | (14,416,784 | ) |
| Milestone 2020 | | | | | 199,727,000 | | | | 566,169 | | | | 14,098,811 | | | | (13,532,642 | ) |
| Milestone 2025 | | | | | 157,098,088 | | | | 350,101 | | | | 11,009,431 | | | | (10,659,330 | ) |
| Milestone 2030 | | | | | 128,869,945 | | | | 225,023 | | | | 7,836,948 | | | | (7,611,925 | ) |
| Milestone 2035 | | | | | 81,406,002 | | | | 96,504 | | | | 4,592,036 | | | | (4,495,532 | ) |
| Milestone 2040 | | | | | 93,716,681 | | | | 23,053 | | | | 2,356,200 | | | | (2,333,147 | ) |
7. | | Portfolio Securities Loaned |
Certain funds lend securities to approved borrowers to seek to earn additional income. As of December 31, 2009, certain funds had loaned securities, which were collateralized by cash or other forms of collateral as provided for in the Company’s Securities Lending Agency Agreement with JPMorgan Chase Bank, N.A. at least equal to the market value of the securities loaned. The funds receive dividends and interest on the loaned securities and a portion of interest earned on reinvested collateral. All securities loaned are marked to market daily in U.S. dollars and collateral is received and released accordingly on the following day to achieve the required collateralization for the previous day’s market value. A fund retains a portion of the interest received on investment of the cash collateral or receives a fee from the borrower. A fund also continues to receive any distributions paid on the loaned securities. The fund may terminate a loan at any time and generally expects to receive the securities loaned within the normal settlement period for the security involved. As with other extensions of credit, there are risks of delay in recovery or even loss of rights in collateral in the event of default or insolvency of the borrower. The fund may not retain voting rights on securities while they are on loan. Voting rights on the loaned securities may pass to the borrower. The funds, however, are entitled to terminate or recall the loans to vote proxies or otherwise obtain rights to vote or consent with respect to a material event.
The funds will be indemnified by its custodian for securities lending programs conducted through the custodian if, at the time of a default by a borrower, some or all of the loaned securities have not been returned by the borrower. The custodian, as soon as practicable after the time of default, shall deposit in the funds’ accounts securities of the same number, issue, type, class and series of the unreturned loaned securities. If the custodian is unable to purchase replacement securities, it will credit to the funds’ accounts an amount equal to the market value of the unreturned loaned securities.
The market value of the securities on loan and the value of the related collateral as of December 31, 2009, were as follows:
Fund
| | | | Securities on Loan
| | Collateral
| | Collateralization
|
|---|
| Low Duration Bond | | | | $ | 44,250,183 | | | $ | 44,728,953 | | | | 101 | % |
| Inflation Protected Securities | | | | | 53,107,347 | | | | 54,283,620 | | | | 102 | % |
| Asset Allocation | | | | | 48,764,472 | | | | 50,270,860 | | | | 103 | % |
| Equity Income | | | | | 178,527,606 | | | | 184,896,427 | | | | 104 | % |
| Growth & Income | | | | | 79,698,585 | | | | 82,251,772 | | | | 103 | % |
| Growth | | | | | 189,988,524 | | | | 195,541,773 | | | | 103 | % |
| Select Value | | | | | 42,584,724 | | | | 44,370,471 | | | | 104 | % |
| Aggressive Opportunities | | | | | 232,614,390 | | | | 240,717,338 | | | | 103 | % |
| Discovery | | | | | 28,774,455 | | | | 29,670,214 | | | | 103 | % |
| International | | | | | 65,471,243 | | | | 68,440,543 | | | | 105 | % |
| Core Bond Index | | | | | 209,702,889 | | | | 214,395,238 | | | | 102 | % |
| 500 Stock Index | | | | | 29,533,161 | | | | 30,623,579 | | | | 104 | % |
| Broad Market Index | | | | | 53,096,305 | | | | 55,146,175 | | | | 104 | % |
| Mid/Small Company Index | | | | | 57,810,316 | | | | 60,108,194 | | | | 104 | % |
| Overseas Equity Index | | | | | 11,951,816 | | | | 12,542,046 | | | | 105 | % |
195
VANTAGEPOINT FUNDS
NOTES TO THE FINANCIAL STATEMENTS—(Continued)
8. | | Transactions with Affiliated Funds |
At December 31, 2009, the Model Portfolio Funds and Milestone Funds held investments in a number of the underlying funds. The figures presented below represent the percentages of shares outstanding in each of the underlying funds owned by the Model Portfolio and Milestone Funds on that date:
Underlying Fund
| | | | Model
Portfolio
Savings
Oriented
| | Model
Portfolio
Conservative
Growth
| | Model
Portfolio
Traditional
Growth
| | Model
Portfolio
Long-Term
Growth
| | Model
Portfolio
All-Equity
Growth
|
|---|
| Low Duration Bond | | | | | 25.19 | % | | | 23.21 | % | | | 20.17 | % | | | — | | | | — | |
| Inflation Protected Securities | | | | | 8.04 | % | | | 10.00 | % | | | 15.45 | % | | | — | | | | — | |
| Equity Income | | | | | 2.14 | % | | | 3.91 | % | | | 11.03 | % | | | 13.99 | % | | | 7.00 | % |
| Growth & Income | | | | | 3.14 | % | | | 4.74 | % | | | 16.21 | % | | | 20.70 | % | | | 9.77 | % |
| Growth | | | | | — | | | | 1.79 | % | | | 7.59 | % | | | 10.31 | % | | | 5.53 | % |
| Select Value | | | | | — | | | | 5.56 | % | | | 26.25 | % | | | 47.68 | % | | | 19.15 | % |
| Aggressive Opportunities | | | | | — | | | | 1.63 | % | | | 7.76 | % | | | 13.96 | % | | | 5.60 | % |
| Discovery | | | | | — | | | | — | | | | 23.74 | % | | | 42.20 | % | | | 30.46 | % |
| International | | | | | 1.56 | % | | | 4.19 | % | | | 16.08 | % | | | 25.37 | % | | | 11.58 | % |
| Diversified Assets | | | | | 6.67 | % | | | 11.50 | % | | | 28.70 | % | | | 34.96 | % | | | — | |
| Core Bond Index Class I | | | | | 4.57 | % | | | 12.41 | % | | | 27.25 | % | | | 27.62 | % | | | — | |
Underlying Fund
| | | | Milestone
Retirement
Income
| | Milestone
2010
| | Milestone
2015
| | Milestone
2020
| | Milestone
2025
|
|---|
| Low Duration Bond | | | | | 5.93 | % | | | 6.40 | % | | | 7.17 | % | | | 3.22 | % | | | 1.13 | % |
| Inflation Protected Securities | | | | | 2.04 | % | | | 2.28 | % | | | 2.85 | % | | | — | | | | — | |
| Equity Income | | | | | 0.61 | % | | | 0.78 | % | | | 2.19 | % | | | 2.62 | % | | | 2.20 | % |
| Growth & Income | | | | | 0.90 | % | | | 1.05 | % | | | 2.00 | % | | | 2.05 | % | | | 1.83 | % |
| Growth | | | | | — | | | | 0.07 | % | | | 0.74 | % | | | 0.84 | % | | | 0.74 | % |
| International | | | | | 0.45 | % | | | 0.61 | % | | | 1.90 | % | | | 2.27 | % | | | 2.04 | % |
| Diversified Assets | | | | | 1.69 | % | | | 2.00 | % | | | 4.09 | % | | | 4.09 | % | | | 3.21 | % |
| Core Bond Index Class I | | | | | 0.99 | % | | | 1.17 | % | | | 2.78 | % | | | 4.18 | % | | | 2.74 | % |
| Mid/Small Company Index Class I | | | | | — | | | | 0.68 | % | | | 7.89 | % | | | 12.00 | % | | | 12.17 | % |
Underlying Fund
| | | | Milestone
2030
| | Milestone
2035
| | Milestone
2040
| |
|---|
| Equity Income | | | | | 1.93 | % | | | 1.28 | % | | | 1.57 | % | | | | | | | | |
| Growth & Income | | | | | 1.67 | % | | | 1.10 | % | | | 1.34 | % | | | | | | | | |
| Growth | | | | | 0.68 | % | | | 0.47 | % | | | 0.60 | % | | | | | | | | |
| International | | | | | 1.88 | % | | | 1.29 | % | | | 1.62 | % | | | | | | | | |
| Diversified Assets | | | | | 2.40 | % | | | 0.68 | % | | | — | | | | | | | | | |
| Core Bond Index Class I | | | | | 1.86 | % | | | 1.02 | % | | | 1.07 | % | | | | | | | | |
| Mid/Small Company Index Class I | | | | | 12.42 | % | | | 9.56 | % | | | 12.93 | % | | | | | | | | |
9. | | Control Persons and Principal Holders of Securities |
As of December 31, 2009, a majority of the voting shares of all funds, except the Money Market Fund, were held either directly, or indirectly through the Model Portfolio Funds and the Milestone Funds and by VantageTrust, a group trust established and maintained by VantageTrust Company (“Trust Company”). VantageTrust was established for the purpose of holding and investing the assets of public sector retirement and deferred compensation plans. The Trust Company, a New Hampshire non-depository banking corporation, has the power to vote the shares of the funds directly held by VantageTrust and has the power to direct the vote of the shares of the Model Portfolio Funds and the Milestone Funds under the proxy voting policy adopted by VIA, the Company’s adviser. The Trust Company therefore has the power to vote more than 25% of the fund’s voting securities and thus under the 1940 Act is considered a “control” person of the funds. Both the Trust Company and VIA are wholly owned subsidiaries of ICMA-RC. As a control person of
196
VANTAGEPOINT FUNDS
NOTES TO THE FINANCIAL STATEMENTS—(Continued)
all the funds, the Trust Company may possess the ability to control the outcome of matters submitted to the vote of shareholders.
Additionally, at December 31, 2009, the VantageTrust, an affiliated group trust, held directly or indirectly, the outstanding shares of the Company in the percentages shown below:
Fund
| | | | % Owned by
Vantage Trust
|
|---|
| Money Market | | | | | 38.13 | % |
| Low Duration Bond | | | | | 81.12 | % |
| Inflation Protected Securities | | | | | 90.42 | % |
| Asset Allocation | | | | | 97.35 | % |
| Equity Income | | | | | 92.97 | % |
| Growth & Income | | | | | 92.70 | % |
| Growth | | | | | 96.98 | % |
| Select Value | | | | | 95.08 | % |
| Aggressive Opportunities | | | | | 96.46 | % |
| Discovery | | | | | 95.15 | % |
| International | | | | | 93.83 | % |
| Diversified Assets | | | | | 92.29 | % |
| Core Bond Index Class I | | | | | 90.54 | % |
| Core Bond Index Class II | | | | | 93.74 | % |
| 500 Stock Index Class I | | | | | 84.87 | % |
| 500 Stock Index Class II | | | | | 99.95 | % |
| Broad Market Index Class I | | | | | 87.20 | % |
| Broad Market Index Class II | | | | | 90.67 | % |
| Mid/Small Company Index Class I | | | | | 82.49 | % |
| Mid/Small Company Index Class II | | | | | 99.90 | % |
| Overseas Index Class I | | | | | 82.48 | % |
| Overseas Index Class II | | | | | 99.91 | % |
| Model Portfolio Savings Oriented | | | | | 87.13 | % |
| Model Portfolio Conservative Growth | | | | | 89.63 | % |
| Model Portfolio Traditional Growth | | | | | 95.06 | % |
| Model Portfolio Long-Term Growth | | | | | 96.43 | % |
| Model Portfolio All-Equity Growth | | | | | 93.65 | % |
| Milestone Retirement Income | | | | | 71.87 | % |
| Milestone 2010 | | | | | 78.78 | % |
| Milestone 2015 | | | | | 84.58 | % |
| Milestone 2020 | | | | | 86.22 | % |
| Milestone 2025 | | | | | 86.80 | % |
| Milestone 2030 | | | | | 85.23 | % |
| Milestone 2035 | | | | | 82.89 | % |
| Milestone 2040 | | | | | 81.13 | % |
197
VANTAGEPOINT FUNDS
NOTES TO THE FINANCIAL STATEMENTS—(Continued)
Other than VantageTrust below is the name, address, and percentage of ownership the entity owns of record or is known to own beneficially 5% or more of any class of any fund’s outstanding shares as of December 31, 2009:
Money Market Fund
Name
| | | | Address
| Percentage of
Shares Owned
| |
|---|
| Lee County Board of County Commissioners | | | | P.O. Box 398
Fort Meyers, Florida 33902 | 9.44% | |
10. | | Brokerage Commissions |
VIA has entered into agreements with brokers whereby the brokers will rebate a portion of the funds’ brokerage commissions on behalf of certain funds. Such amounts, under such agreements, are included in net realized gain (loss) on the sale of investments presented in the Statements of Operations. For the year ended December 31, 2009, the funds recaptured the following amounts of brokerage commissions:
Fund
| | | | Recaptured Brokerage
Commissions
|
|---|
| Equity Income | | | | $ | 54,089 | |
| Growth & Income | | | | | 82,178 | |
| Growth | | | | | 407,985 | |
| Select Value | | | | | 60,589 | |
| Aggressive Opportunities | | | | | 127,752 | |
| Discovery | | | | | 11,465 | |
| International | | | | | 58,973 | |
11. | | Stock Split in the Low Duration Bond Fund (formerly the Short-Term Bond Fund) |
On October 28, 2005, a “stock split” was processed in the Vantagepoint Low Duration Bond Fund. Specifically, there was a “10 for 1” split meaning that the shares outstanding were increased by a multiple of 10 and the NAV was divided by 10. Therefore, this action had no impact on the aggregate value of the shares outstanding. The record date (shareholders of record on this date were affected) was Thursday, October 27, 2005. The payable date (the date the stock split posted to shareholder accounts) was Friday, October 28, 2005. The ex-date (the date the NAV changed to reflect the split) was Friday, October 28, 2005. Share transactions, shares outstanding, NAVs, and per share ratios for prior years in the Financial Highlights have been restated to reflect historical application of the “10 for 1” split in order to present these items on a comparable basis, as required by generally accepted accounting principles.
Management has evaluated events or transactions that may have occurred since December 31, 2009, that would merit recognition or disclosure in the financial statements. This evaluation was completed through March 1, 2010, the date the financial statements were available to be issued and except as already included below, has determined that no additional items require disclosure.
On January 4, 2010, changes became effective for certain funds as reflected in the Company’s prospectus and statement of additional information dated January 4, 2010. These changes include: (i) changes to the principal investment strategies for the Diversified Assets Fund, including the addition of a convertibles securities strategy and the addition of two new investment subadvisers to manage fund assets in that strategy; (ii) changes to the name of the Diversified Assets Fund, now called the Diversifying Strategies Fund; (iii) changes to the principal investment strategies for each of the Model Portfolio Funds (except the Model Portfolio All-Equity Growth Fund) resulting in an overall reduction in each fund’s then-current fixed income investment allocation, and an increase in the then-current allocation to the multi-strategy fund, with no change to the allocation to equity investments; and (iv) changes to the principal investment strategies for the Milestone Funds involving: extending by 10 years the point in time at which each “dated” Milestone Fund reaches its final constant target allocation; altering the manner in which the dated Milestone Funds’ assets are allocated over time as depicted by their “glide path”; altering the final constant target asset allocation of the dated Milestone Funds; and altering the target asset allocation of the Milestone Retirement Income Fund. Also on January 4, 2010, the Milestone 2045 Fund, a new series of the Company, became effective.
198
VANTAGEPOINT FUNDS
Additional Information (Unaudited)
A. Tax Disclosures
For corporate shareholders, a portion of the ordinary dividends paid during the fund’s year ended December 31, 2009, qualified for the dividends received deduction as follows:
Fund
| | | | |
|---|
| Asset Allocation | | | | | 100.00 | % |
| Equity Income | | | | | 100.00 | % |
| Growth & Income | | | | | 98.22 | % |
| Growth | | | | | 100.00 | % |
| Select Value | | | | | 98.69 | % |
| Aggressive Opportunities | | | | | 51.99 | % |
| International | | | | | 3.51 | % |
| 500 Stock Index | | | | | 100.00 | % |
| Broad Market Index | | | | | 100.00 | % |
| Mid/Small Company Index | | | | | 88.26 | % |
| Model Portfolio Savings Oriented | | | | | 14.88 | % |
| Model Portfolio Conservative Growth | | | | | 18.76 | % |
| Model Portfolio Traditional Growth | | | | | 31.67 | % |
| Model Portfolio Long-Term Growth | | | | | 48.66 | % |
| Model Portfolio All-Equity Growth | | | | | 84.65 | % |
| Milestone Retirement Income | | | | | 21.57 | % |
| Milestone 2010 | | | | | 27.15 | % |
| Milestone 2015 | | | | | 47.70 | % |
| Milestone 2020 | | | | | 38.11 | % |
| Milestone 2025 | | | | | 45.62 | % |
| Milestone 2030 | | | | | 53.60 | % |
| Milestone 2035 | | | | | 59.19 | % |
| Milestone 2040 | | | | | 62.29 | % |
Pursuant to Section 852 of the Internal Revenue Code, the Company designated the following capital gain dividends for the year ended December 31, 2009:
Fund
| | | | Long Term
Capital Gain
Dividend
|
|---|
| Model Portfolio Savings Oriented | | | | $ | 89,456 | |
| Model Portfolio Traditional Growth | | | | | 989,933 | |
| Model Portfolio Long-Term Growth | | | | | 7,065,993 | |
| Model Portfolio All-Equity Growth | | | | | 4,261,652 | |
| Milestone Retirement Income | | | | | 68,883 | |
| Milestone 2010 | | | | | 362,908 | |
| Milestone 2015 | | | | | 1,178,592 | |
| Milestone 2020 | | | | | 1,486,573 | |
| Milestone 2025 | | | | | 1,239,920 | |
| Milestone 2030 | | | | | 1,159,773 | |
| Milestone 2035 | | | | | 732,331 | |
| Milestone 2040 | | | | | 792,731 | |
B. Foreign Taxes Paid
For the year ended December 31, 2009, dividends from foreign countries were $24,261,930 and $4,925,114 for the International and the Overseas Equity Index Funds, respectively. Taxes paid to foreign countries that qualify for the foreign tax credit were $871,899 and $104,647 for the International and the Overseas Equity Index Funds, respectively.
All other funds treat any foreign taxes paid as a reduction of net investment company taxable income by these amounts.
199
VANTAGEPOINT FUNDS
Additional Information (Unaudited)—(Continued)
C. Sources of Income
The following table summarizes the percentage of income received by the Company in 2009 from various obligors:
Fund
| | | | U.S. Treasury
Obligations
| | GNMA
| | FNMA
| | FHL Bank
| | FHLMC
| | Other U.S.
Government
Agencies
| |
|---|
| Low Duration Bond | | | | | 0.39 | % | | | 9.31 | % | | | 1.64 | % | | | 1.34 | % | | | 2.31 | % | | | 0.02 | % | |
| Inflation Protected Securities | | | | | 76.90 | % | | | 0.00 | % | | | 0.08 | % | | | 0.19 | % | | | 0.21 | % | | | 0.21 | % | |
| Asset Allocation | | | | | 14.89 | % | | | 0.00 | % | | | 0.02 | % | | | 0.01 | % | | | 0.01 | % | | | 0.00 | % | |
| Discovery | | | | | 1.50 | % | | | 18.52 | % | | | 5.62 | % | | | 4.47 | % | | | 3.46 | % | | | 0.00 | % | |
| Diversified Assets | | | | | 5.61 | % | | | 0.72 | % | | | 2.43 | % | | | 3.36 | % | | | 3.30 | % | | | 1.41 | % | |
| Core Bond Index | | | | | 20.04 | % | | | 4.82 | % | | | 22.34 | % | | | 1.71 | % | | | 15.36 | % | | | 0.39 | % | |
| 500 Stock Index | | | | | 0.01 | % | | | 0.00 | % | | | 0.00 | % | | | 0.00 | % | | | 0.00 | % | | | 0.00 | % | |
| Broad Market Index | | | | | 0.02 | % | | | 0.00 | % | | | 0.00 | % | | | 0.00 | % | | | 0.00 | % | | | 0.00 | % | |
| Mid/Small Company Index | | | | | 0.02 | % | | | 0.00 | % | | | 0.00 | % | | | 0.00 | % | | | 0.00 | % | | | 0.00 | % | |
| Overseas Equity Index | | | | | 0.01 | % | | | 0.00 | % | | | 0.00 | % | | | 0.00 | % | | | 0.00 | % | | | 0.00 | % | |
D. Qualified Dividend Income
The following are estimates of qualified dividend income received by the Company through December 31, 2009 that qualify for a reduced tax rate pursuant to the Jobs and Growth Tax Relief Reconciliation Act of 2003:
Fund
| | | | Qualified
Dividend
Income
|
|---|
| Asset Allocation | | | | | 100.00 | % |
| Equity Income | | | | | 100.00 | % |
| Growth & Income | | | | | 100.00 | % |
| Growth | | | | | 100.00 | % |
| Select Value | | | | | 100.00 | % |
| Aggressive Opportunities | | | | | 51.99 | % |
| Discovery | | | | | 31.42 | % |
| International | | | | | 90.87 | % |
| 500 Stock Index | | | | | 100.00 | % |
| Broad Market Index | | | | | 100.00 | % |
| Mid/Small Company Index | | | | | 74.80 | % |
| Overseas Equity Index | | | | | 72.25 | % |
| Model Portfolio Savings Oriented | | | | | 19.12 | % |
| Model Portfolio Conservative Growth | | | | | 25.65 | % |
| Model Portfolio Traditional Growth | | | | | 45.22 | % |
| Model Portfolio Long-Term Growth | | | | | 72.80 | % |
| Model Portfolio All-Equity Growth | | | | | 100.00 | % |
| Milestone Retirement Income | | | | | 27.85 | % |
| Milestone 2010 | | | | | 35.14 | % |
| Milestone 2015 | | | | | 62.26 | % |
| Milestone 2020 | | | | | 49.62 | % |
| Milestone 2025 | | | | | 59.60 | % |
| Milestone 2030 | | | | | 70.06 | % |
| Milestone 2035 | | | | | 77.21 | % |
| Milestone 2040 | | | | | 81.17 | % |
200
VANTAGEPOINT FUNDS
Additional Information (Unaudited)—(Continued)
E. Directors Table
Name, Address,*
and Age
|
| Positions
Held with
the Company
|
| Term of Office
and Length of
Time Served
|
| Principal Occupation(s)
During Past Five Years
|
| Other
Directorships
Held By Director
|
|---|
| N. Anthony Calhoun (62) | | Director, Audit Committee Member and Chair, Investment Committee and Nominating Committee Member | | Term expires October 2011
Director since November 1998 | | Executive Deputy State Treasurer—Commonwealth of Pennsylvania (August 2007–March 2009); Secretary to Senate Finance Committee/Minority—State of New York Legislature (January 2007–August 2007); Retired (October 2005–January 2007); and Deputy Chief Financial Officer and Treasurer—District of Columbia (2001–2005) | | N/A |
| Donna K. Gilding (70) | | Director, Investment Committee Member and Chair, and Nominating Committee Member | | Term expires October 2011
Director since November 1998 | | Chief Investment Officer—Lowenhaupt Global Advisors, LLC (Sept. 2006–present); Chief Investment Officer—Lowenhaupt & Chasnoff (2005–Sept. 2006) (wealth management law firm); Chief Investment Officer—Progress Investment Management Company (2000–2005); and Trustee (2007–present) and Chair (2009–present)—The National YMCA Fund, Inc. | | N/A |
| Arthur R. Lynch (55) | | Chair of the Board and Director, Audit Committee Member, Investment Committee Member, and Nominating Committee Member | | Term expires October 2011
Director since November 1998 | | President and Chief Executive Officer—SRJ Government Consultants, LLC (October 2009–present); Deputy City Manager—City of Glendale, Arizona (2005–October 2009); and Chief Financial Officer—City of Glendale, Arizona (1985–2005) | | N/A |
| Timothy M. O���Brien (60) | | Director, Audit Committee Member, Investment Committee Member, and Nominating Committee Member | | Term expires October 2014
Director since September 2005 | | Independent Consultant (pension consulting) (2003–present); and President and Chief Executive Officer—American Humane Association (1999–2003) | | N/A |
| Robert A. Rudell (61) | | Director, Investment Committee Member and Nominating Committee Member | | Term expires October 2014
Director since March 2007 | | Director—Medtox Scientific, Inc. (medical device/clinical lab) (2002–present); Director—Search Institute (non-profit) (2002–present); Trustee—Optimum Fund Trust (registered investment company) (2003–present) Director—Bloodhound Investment Research, Inc. (portfolio construction software) (2003–present); Director/Chairman—Diverse Emerging Music Organization (non-profit) (2004–present); Director/Independent Chair—Heartland Funds (registered investment company (2005–present); and Director—American Investors Bank & Mortgage (bank) (2005–present) | | Director—Medtox Scientific, Inc.; Trustee—Optimum Fund Trust (6 portfolios); Director/Independent Chair—Heartland Funds (3 portfolios) |
| Robin L. Wiessmann (56) | | Director and Investment Committee Member and Nominating Committee Member | | Term expires October 2013
Director since November 1998 | | State Treasurer—Commonwealth of Pennsylvania (April 2007–January 2009); Director—Merrill, Lynch, Pierce, Fenner & Smith Incorporated, (2006–April 2007); and Consultant—Brown Wiessmann Group (financial services consulting) (2002–2006) | | Director—Met-Pro Corporation (December 2009–present) |
201
VANTAGEPOINT FUNDS
Additional Information (Unaudited)—(Continued)
Interested Directors and Officers
Name, Address,*
and Age
|
| Positions
Held with
the Company
|
| Term of Office
and Length of
Time Served
|
| Principal Occupation(s)
During Past Five Years
|
| Other
Directorships
Held By Director
|
|---|
| Robert O’Neill (58)** | | Director | | Term expires October 2010.
Director since June 2008 | | Executive Director-ICMA (2002–present) | | Director—ICMA Retirement Corporation |
| Joan McCallen (57)** | | President and Principal Executive Officer | | Since September 2003 | | Chief Executive Officer—ICMA Retirement Corporation (Aug. 2003–present); President and Manager—Vantagepoint Investment Advisers, LLC; ICMA-RC Services, LLC (broker-dealer); President and Manager—Vantagepoint Transfer Agents, LLC (2003–present); and Director and President, VantageTrust Company (2003–present) | | N/A |
| Bruce James Rohrbacher (57)** | | Vice President and Chief Compliance Officer | | Since September 2004 | | Senior Vice President and Chief Compliance Officer—ICMA Retirement Corporation (2004–present); Chief Compliance Officer— Vantagepoint Investment Advisers, LLC and ICMA-RC Services, LLC (broker-dealer) (2004–present); and Chief Compliance Officer, VantageTrust Company (2004–present) | | N/A |
| Elizabeth Glista (45)** | | Treasurer and Principal Financial Officer | | Since March 2009 | | Senior Vice President and Chief Financial Officer—ICMA Retirement Corporation (April 2009–present); Treasurer—Vantagepoint Investment Advisers, LLC, and Vantagepoint Transfer Agents, LLC (April 2009–present); Treasurer—ICMA-RC Services, LLC (broker-dealer) (April 2009–present); Treasurer—VantageTrust Company (April 2009–present); Managing Vice President, Financial Operations, Analysis & Treasury—ICMA Retirement Corporation (January 2009–April 2009); Vice President Financial Planning & Analysis and Treasury—ICMA-RC (January 2000–September 2007) and (March 2008–January 2009); and Acting Vice President, Internal Audit—ICMA-RC (September 2007–March 2008) | | N/A |
| Angela Montez (42)** | | Secretary | | Since December 2006 | | Managing Vice President, Deputy General Counsel and Assistant Secretary—ICMA Retirement Corporation (2006–present) Corporate Counsel—ICMA Retirement Corporation (2000–2006); Secretary—Vantagepoint Investment Advisers, LLC, Vantagepoint Transfer Agents, LLC and ICMA-RC Services, LLC (broker-dealer) (2006–2007); and Assistant Secretary—VantageTrust Company (February 2008–present) | | N/A |
202
VANTAGEPOINT FUNDS
Additional Information (Unaudited)—(Continued)
Name, Address,*
and Age
|
| Positions
Held with
the Company
|
| Term of Office
and Length of
Time Served
|
| Principal Occupation(s)
During Past Five Years
|
| Other
Directorships
Held By Director
|
|---|
| Kathryn B. McGrath (65)** | | Assistant Secretary | | Since March 2008 | | Senior Vice President and General Counsel—ICMA Retirement Corporation (October 2007–present); Secretary—Vantagepoint Investment Advisers, LLC, Vantagepoint Transfer Agents, LLP and ICMA-RC Services, LLC (broker-dealer) (December 2007–present); Secretary—VantageTrust Company (February 2008–present); Partner—Mayer Brown LLP (law firm) (2005–October 2007); and Partner—Crowell & Moring LLP (law firm) (2002–2005) | | N/A |
| * | | The business address for each Director and Officer is 777 N. Capitol Street N.E., Washington, D.C. 20002. |
| ** | | Mr. O’Neill is considered an Interested Director because he is a director of ICMA Retirement Corporation, the parent corporation of VIA and ICMA-RC Services. Mses. McCallen, Glista, Montez, and McGrath and Mr. Rohrbacher are considered to be “interested persons” of the Company, as that term is defined under the 1940 Act due to their positions as officers of VIA and ICMA-RC Services, the distributor of the Funds, ICMA-RC, the parent company of VIA and ICMA-RC Services, and VantageTrust Company. |
Aggregate compensation that was paid to the directors during the year ended December 31, 2009 totaled $117,158. Executive officers do not receive any compensation from the Company. However, the Company pays a portion of the compensation of the Chief Compliance Officer of the Company and the amount paid by the Company during the year ended December 31, 2009 totaled $247,347.
The statement of additional information includes additional information about the Company’s Board and is available, without charge, upon request, by calling 1-800-669-7400 and on ICMA-RC’s website at www.icmarc.org.
F. Subadviser Fees
Presented below are the fees paid by each fund to Subadvisers during the year ended December 31, 2009. Fees are shown as an annual percentage of average net assets under management except that the subadviser fee for Analytic Investors, LLC and Mellon Capital Management Corporation for the Diversified Assets Fund is calculated based on the average net asset value of the assets allocated and assigned to each of them by VIA. The total dollars below represent amounts paid to Subadvisers for services performed during the period July 1, 2008 through September 30, 2009.
Fund
| | | | Subadviser
| | Actual Fee
as a Percentage of
Average Daily
Net Assets (net of any
subadviser fee waivers)
| | Dollars Paid
|
|---|
| Low Duration Bond | | | | Payden & Rygel | | | 0.10 | % | | $ | 191,489 | |
| | | | | STW Fixed Income Management Ltd. | | | 0.20 | % | | | 427,336 | |
| |
| Inflation Protected Securities | | | | Pacific Investment Management Company, LLC | | | 0.20 | % | | | 297,352 | |
| | | | | BlackRock Financial Management, Inc. | | | 0.11 | % | | | 168,009 | |
| |
| Asset Allocation | | | | Mellon Capital Management Corporation | | | 0.29 | % | | | 1,150,515 | |
| |
| Equity Income | | | | Barrow, Hanley, Mewhinney & Strauss, Inc. | | | 0.25 | % | | | 929,330 | |
| | | | | T. Rowe Price Associates, Inc. | | | 0.38 | % | | | 1,383,900 | |
| | | | | Southeastern Asset Management, Inc. | | | 0.53 | % | | | 2,060,060 | |
| |
| Growth & Income | | | | Capital Guardian Trust Company (1) | | | 0.24 | % | | | 167,365 | |
| | | | | Fiduciary Management, Inc. (2) | | | 0.29 | % | | | 529,385 | |
| | | | | T. Rowe Price Associates, Inc. | | | 0.38 | % | | | 997,563 | |
| | | | | Wellington Management Company, LLP | | | 0.29 | % | | | 746,843 | |
203
VANTAGEPOINT FUNDS
Additional Information (Unaudited)—(Continued)
Fund
| | | | Subadviser
| | Actual Fee
as a Percentage of
Average Daily
Net Assets (net of any
subadviser fee waivers)
| | Dollars Paid
|
|---|
| Growth | | | | Columbus Circle Investors | | | 0.35 | % | | $ | 875,442 | |
| | | | | D.G. Capital Management Trust | | | 0.46 | % | | | 768,958 | |
| | | | | Legg Mason Capital Management, Inc. | | | 0.32 | % | | | 1,195,111 | |
| | | | | Tukman Grossman Capital Management, Inc. | | | 0.40 | % | | | 1,182,382 | |
| | | | | Westfield Capital Management Company, L.P. | | | 0.34 | % | | | 1,264,176 | |
| |
| Select Value | | | | Artisan Partners Limited Partnership | | | 0.55 | % | | | 402,544 | |
| | | | | Systematic Financial Management L.P. | | | 0.45 | % | | | 326,809 | |
| | | | | WEDGE Capital Management L.L.P. | | | 0.56 | % | | | 409,028 | |
| |
| Aggressive Opportunities | | | | Legg Mason Capital Management, Inc. | | | 0.32 | % | | | 607,173 | |
| | | | | Southeastern Asset Management, Inc. | | | 0.58 | % | | | 829,801 | |
| | | | | TimesSquare Capital Management, LLC | | | 0.50 | % | | | 1,068,866 | |
| | | | | T. Rowe Price Associates, Inc. | | | 0.58 | % | | | 1,026,737 | |
| |
| Discovery | | | | Payden & Rygel | | | 0.15 | % | | | 94,177 | |
| | | | | Wellington Management Company, LLP | | | 0.73 | % | | | 458,690 | |
| |
| International | | | | Artisan Partners Limited Partnership | | | 0.70 | % | | | 1,361,142 | |
| | | | | Capital Guardian Trust Company (3) | | | 0.47 | % | | | 1,184,166 | |
| | | | | GlobeFlex Capital, LP | | | 0.40 | % | | | 758,326 | |
| | | | | Mondrian Investment Partners Limited (4) | | | 0.44 | % | | | — | |
| | | | | Walter Scott & Partners Limited | | | 0.58 | % | | | 694,626 | |
| |
| Diversified Assets | | | | Analytic Investors, LLC | | | 0.45 | % | | | 516,333 | |
| | | | | Drake Capital Management, LLC (5) | | | 0.23 | % | | | 66,420 | |
| | | | | Mellon Capital Management Corporation | | | 0.65 | % | | | 745,919 | |
| | | | | Payden & Rygel (short-duration fixed income strategy) | | | 0.08 | % | | | 153,919 | |
| | | | | Payden & Rygel (low duration bond strategy) (6) | | | 0.09 | % | | | 49,027 | |
| |
| Core Bond Index | | | | Mellon Capital Management Corporation | | | 0.02 | % | | | 208,120 | |
| |
| 500 Stock Index | | | | Mellon Capital Management Corporation | | | 0.02 | % | | | 60,762 | |
| |
| Broad Market Index | | | | Mellon Capital Management Corporation | | | 0.02 | % | | | 95,937 | |
| |
| Mid/Small Company Index | | | | Mellon Capital Management Corporation | | | 0.04 | % | | | 78,085 | |
| |
| Overseas Equity Index | | | | Mellon Capital Management Corporation | | | 0.07 | % | | | 99,063 | |
| (1) | | Terminated as a subadviser on January 31, 2009. |
| (2) | | Began serving as a subadviser on January 21, 2009. |
| (3) | | Terminated as a subadviser on October 11, 2009. Minimum fee of $337,500 per year. |
| (4) | | Began serving as a subadviser on October 12, 2009. |
| (5) | | Terminated as a subadviser on April 10, 2009. |
| (6) | | Began serving as a subadviser to this portion of the fund on April 3, 2009. |
G. Directors’ Consideration of Investments Advisory and Subadvisory Agreements
The following relates to the consideration by the Board of Directors of the Company (“Directors” or “Board”), during the period beginning July 1, 2009 through December 31, 2009, of the approval of the Second Master Investment Advisory Agreements between VIA and the Milestone 2045 Fund and certain Investment Subadvisory Agreements for the funds.
204
VANTAGEPOINT FUNDS
Additional Information (Unaudited)—(Continued)
Consideration of the Investment Advisory Agreements and Certain Subadvisory Agreements.
Vantagepoint Milestone 2045 Fund
At a meeting held on September 25, 2009 (“September Meeting”), the Board, including a majority of the Directors who are not “interested persons” as defined in the Investment Company Act of 1940 (“Independent Directors”), initially approved the Second Master Investment Advisory Agreement (“Master Agreement”) between the Company and VIA for the Vantagepoint Milestone 2045 Fund, a new series of the Company (“Milestone 2045 Fund”). Before approving the Master Agreement, the Board considered the recommendations of, and supporting analyses and data presented by, VIA.
With respect to the Board’s initial approval of the Master Agreement between the Company and VIA for the Milestone 2045 Fund, the Directors received written information in advance of the September Meeting, including information regarding: (1) the nature, quality and extent of the services to be provided by VIA; (2) the adequacy of the compliance program that is in place that would relate to the Milestone 2045 Fund; (3) the level of investment advisory fees to be charged by VIA and the fees charged by VIA to each of the other seven series of the Company with a target-date designated in its name (“Dated Milestone Fund Series”); (4) VIA’s experience as investment adviser to the other series of the Company and with respect to the investment strategies to be employed by the Milestone 2045 Fund; (5) the Milestone 2045 Fund’s overall investment advisory fee and expected total expense ratio compared to a group of investment companies categorized by Morningstar, Inc., a provider of independent investment company data (“Morningstar”), as 2041-2045 target-date funds (“Milestone 2045 peer group”); and (6) the expected costs of the services to be provided and net margins (“profit margin”) to be realized by VIA and its affiliates from its relationship with the Milestone 2045 Fund.
In considering the information and materials described above, the Independent Directors received assistance from, and met separately with, their independent legal counsel and were provided with a written description of their statutory responsibilities and the legal standards that are applicable to approvals of advisory agreements.
In determining to approve the Master Agreement with VIA for the Milestone 2045 Fund, the Directors considered the information received in advance of the September Meeting, the presentations made by, and discussions held with, VIA’s personnel and the Company’s Chief Compliance Officer (“CCO”), prior to the September Meeting and at the September Meeting, as applicable, as well as a variety of factors. Although not meant to be all-inclusive, the following discusses some of the factors relevant to the Board’s decision to approve the Master Agreement with VIA relating to the Milestone 2045 Fund.
Nature, Extent and Quality of Services. With respect to the nature, extent and quality of the services expected to be provided by VIA to the Milestone 2045 Fund under the Master Agreement, the Directors considered the specific investment services to be provided, including the development of customized age and time appropriate asset allocations both initially and over time, the monitoring of the underlying funds’ performance and the monitoring of aging (glide) paths and underlying fund allocations, by VIA in managing the assets of the Milestone 2045 Fund. They also considered the experience of VIA’s investment staff with regard to managing the Dated Milestone Fund Series and the adequacy of the compliance program that would relate to the Milestone 2045 Fund. The Directors concluded that the nature, extent and quality of the investment advisory services expected to be provided by VIA were appropriate for the Milestone 2045 Fund in light of its investment objective and strategies and, thus, supported a decision to approve the Master Agreement with VIA relating to the Milestone 2045 Fund.
Investment Performance. At the time of the Board’s consideration of the Master Agreement, the Milestone 2045 Fund had not commenced operations and, therefore, there was no information for the Directors to evaluate regarding the Milestone 2045 Fund’s actual performance.
Advisory Fee, Expense Ratio and Economies of Scale. The Directors considered a comparison of the fee to be charged by VIA to the Milestone 2045 Fund with the fee VIA charges to the other Dated Milestone Fund Series. The Directors considered that the proposed fee for the Milestone 2045 Fund is the same as the fee for the Dated Milestone Fund Series; and the type of services VIA would provide to the Milestone 2045 Fund is comparable to the services currently provided by VIA to the Dated Milestone Fund Series. The Directors also considered comparative data provided by VIA on the advisory fees of the Milestone 2045 peer group. The information provided by VIA showed that the proposed investment advisory fee rate for the Milestone 2045 Fund would be lower than the average and at the median investment
205
VANTAGEPOINT FUNDS
Additional Information (Unaudited)—(Continued)
advisory fee of the Milestone 2045 peer group. The Directors also considered the comparative data provided by VIA with respect to the expected total expense ratio of the Milestone 2045 Fund as compared to the expense ratios of the Milestone 2045 peer group and further noted VIA’s proposed agreement to limit the total operating expenses of the Milestone 2045 Fund until April 30, 2010. The foregoing comparisons assisted the Directors in considering the Master Agreement relating to the Milestone 2045 Fund by providing them with a basis for evaluating the investment advisory fee to be paid to VIA and the Milestone 2045 Fund’s expected total expense ratio on a relative basis. Based on this information, the Directors concluded that the investment advisory fee appeared to be within a reasonable range for the services to be provided.
With respect to the expected costs and profit margins to be realized by VIA (and its affiliates) from its relationship with the Milestone 2045 Fund, the Directors considered the information provided by VIA, which stated that VIA expected to experience similar costs and margins as for the other Dated Milestone Fund Series once the Milestone 2045 Fund achieves a similar asset size. Based on this information, the Directors concluded that VIA may not realize economies of scale with regard to the Milestone 2045 Fund over the short-term and that the proposed fee is appropriate at this time.
Other Considerations. The Directors also considered the potential “fall-out” or ancillary benefits that may accrue to VIA due to its relationship with the Milestone 2045 Fund and that VIA does not expect any direct “fall-out” benefits by virtue of its relationship with the Milestone 2045 Fund. VIA indicated, however, that it may benefit from the enhancement to the set of the Vantagepoint Milestone Funds from a competitive perspective.
Conclusion. After full consideration of the foregoing factors, with no single factor identified as being of paramount importance, the Directors, including a majority of the Independent Directors, concluded that the initial approval of the Master Agreement with VIA relating to the Milestone 2045 Fund was the best interest of the Milestone 2045 Fund and its shareholders, and approved the Master Agreement with, and the fee to be paid to, VIA.
Vantagepoint International Fund
At the September Meeting, the Board, including a majority of the Independent Directors, approved an initial Investment Subadvisory Agreement (“International Subadvisory Agreement”) among the Company, VIA and Mondrian Investment Partners Limited (“Mondrian”), relating to the Vantagepoint International Fund (“International Fund”). Also at the September Meeting, VIA recommended and the Board approved the termination of Capital Guardian Trust Company (“Capital Guardian”) as subadviser to the International Fund. Before approving the appointment of Mondrian as a subadviser to the International Fund, the Board of the Company considered the recommendations of, and supporting analyses and data presented by, VIA.
With respect to the Board’s consideration of the International Subadvisory Agreement with Mondrian, the Directors received written information in advance of the September Meeting from VIA, which included: (1) the process by which VIA selected and recommended for Board approval Mondrian as a subadviser to the International Fund; (2) the nature, extent and quality of the services that Mondrian would provide to the International Fund; (3) Mondrian’s experience, investment management business, personnel and operations; (4) Mondrian’s brokerage and trading policies and practices; (5) the level of the subadvisory fee to be charged to the International Fund by Mondrian and a comparison of that fee to the: (a) fees charged by Mondrian to manage other foreign large cap value accounts; and (b) fees charged by a group of U.S. separate account investment managers utilizing an active international large cap value style; (6) Mondrian’s compliance program; (7) the performance information for Mondrian with respect to a foreign large cap value mandate, and such performance compared to a relevant benchmark and peer group; (8) the International Fund’s expected overall investment advisory fee and projected total expense ratio, taking into account the change in subadvisers, compared to a group of foreign large cap blend funds; and (9) Mondrian’s financial condition.
In considering the information and materials described above, the Independent Directors received assistance from, and met separately with, their independent legal counsel and were provided with a written description of their statutory responsibilities and the legal standards that are applicable to approvals of advisory agreements.
In determining whether to approve the International Subadvisory Agreement, the Directors considered the information received in advance of the September Meeting, the presentations made by, and discussions held with, representatives of Mondrian, VIA’s personnel and the Company’s CCO prior to the September Meeting and at the September Meeting, as applicable, as well as a variety of factors. Although not meant to be all-inclusive, the following discusses some of the factors relevant to the Board’s decision to approve the International Subadvisory Agreement.
206
VANTAGEPOINT FUNDS
Additional Information (Unaudited)—(Continued)
Nature, Extent and Quality of Services. With respect to the nature, extent and quality of the services expected to be provided by Mondrian under the International Subadvisory Agreement, the Directors considered the specific investment process to be employed by Mondrian in managing the assets of the International Fund to be allocated to it; the qualifications of Mondrian’s investment management personnel with regard to implementing a foreign large cap value mandate; the performance information for Mondrian with respect to a foreign large cap value mandate as compared to a relevant benchmark and peer group; Mondrian’s infrastructure and whether it appeared to adequately support a foreign large cap value strategy; and VIA’s review process and favorable assessment as to the nature, quality and extent of the subadvisory services expected to be provided by Mondrian to the International Fund. The Directors acknowledged that Mondrian has experienced portfolio management personnel and appeared to have adequate infrastructure and support staff to seek to achieve favorable results implementing a foreign large cap value mandate for the International Fund. The Directors concluded that the nature, extent and quality of the subadvisory services expected to be provided by Mondrian were appropriate for the International Fund in light of its investment strategy and, thus, supported a decision to approve the International Subadvisory Agreement.
Investment Performance. The Directors evaluated the investment performance information provided by VIA for Mondrian, and considered the performance information versus a relevant benchmark and peer group (based on information provided by an independent third-party source). The Directors concluded that the performance information provided supported approval of the International Subadvisory Agreement with Mondrian.
Subadvisory Fee, Expense Ratio Impact and Economies of Scale. In evaluating the proposed subadvisory fee, the Directors reviewed Mondrian’s subadvisory fee schedule. The Directors considered comparisons of the subadvisory fee to be charged by Mondrian to the International Fund with its fee schedule for managing other accounts with an investment mandate similar to the mandate Mondrian is to employ on behalf of the International Fund. The Directors also considered that, according to the information provided by VIA, the proposed fee schedule for Mondrian reflected the lowest fee rate currently charged by Mondrian to other accounts for which it provides advisory services utilizing a similar mandate, with the exception of a separate account that was the initial client in the strategy. Additionally, the nature of the subadvisory services Mondrian is to provide to the International Fund appeared to be comparable to those Mondrian currently provides to its other subadvisory clients.
The Directors reviewed information provided by VIA (which was based on an independent third-party source) on the fees charged to accounts with assets comparable to the amount of assets to be allocated initially to Mondrian to a group of U.S. separate account investment managers that employ a similar investment style to the investment style Mondrian is to employ for the International Fund. According to the information provided, the effective fee rate to be paid by the International Fund to Mondrian at the proposed initial asset allocation level for Mondrian would be below the median fee charged by such managers.
The Directors also considered information from VIA showing that there would be no increase in the overall contractual subadvisory fees and, therefore, no increase in the total expense ratio of the International Fund as a result of the appointment of Mondrian and the termination of Capital Guardian and given the fee rates of the International Fund’s other three subadvisers and the proposed asset allocation levels. Referring to data provided by VIA and compiled by Morningstar, the Directors also noted that the expected total contractual investment advisory fee for the International Fund, taking into account the proposed subadviser change, was lower than the average and median investment advisory fee of a group of mutual funds in Morningstar’s foreign large cap blend category. The Directors also considered information provided by VIA and compiled by Morningstar on the total expense ratios of a group of mutual funds in Morningstar’s foreign large cap blend category, which showed that, if Mondrian served as a subadviser to the International Fund at the proposed subadvisory fee rate and initial asset allocation level, along with the International Fund’s three other existing subadvisers at their current subadvisory fee rates and based on their proposed asset allocation levels, the International Fund’s expected total expense ratio would be below the average and median expense ratios of such funds.
The foregoing comparisons assisted the Directors in considering the International Subadvisory Agreement by providing them with a basis for evaluating Mondrian’s fee, including in light of the International Fund’s expected overall investment advisory fee and total expense ratio, on a relative basis. Based on this information, the Directors concluded that Mondrian’s subadvisory fee appeared to be within a reasonable range for the services to be provided.
The Directors also reviewed the information provided by Mondrian regarding the estimated profits to be realized from its relationship with the International Fund. In reviewing the extent to which economies of scale may be realized by
207
VANTAGEPOINT FUNDS
Additional Information (Unaudited)—(Continued)
Mondrian as the assets of the International Fund to be managed by it grow, and whether the proposed fee levels reflect these economies, the Directors considered that Mondrian’s proposed fee schedule included breakpoints, which indicates that the proposed subadvisory fee rate is intended to capture certain anticipated economies of scale for the benefit of the International Fund’s shareholders in connection with the services to be provided. The Directors concluded that the proposed fee schedule with respect to Mondrian was appropriate at this time.
Other Considerations. The Directors considered VIA’s judgment that the addition of Mondrian as a subadviser to the International Fund would add value by complementing the investment approach of the International Fund’s current subadvisers, Artisan Partners Limited Partnership, GlobeFlex Capital L.P. and Walter Scott & Partners Limited. In this regard, the Directors considered VIA’s belief that the addition of Mondrian as a subadviser, along with VIA’s recommendation to terminate Capital Guardian and to modify the amount of the International Fund’s assets currently allocated to the existing subadvisers, should serve to enhance the International Fund’s risk/return profile, resulting in higher and more consistent expected returns.
The Directors considered the selection and due diligence process employed by VIA in deciding to recommend Mondrian as a subadviser to the International Fund and also considered VIA’s conclusion that the fee to be paid to Mondrian for its services to the International Fund is reasonable and appropriate in light of the nature and quality of services to be provided by Mondrian and the reasons supporting that conclusion. The Directors also considered information from VIA concerning its strategy to efficiently implement the subadviser transition. The Directors concluded that VIA’s recommendations and conclusions supported approval of the International Subadvisory Agreement.
The Directors also considered the potential “fall-out” or ancillary benefits that may accrue to Mondrian due to its relationship with the International Fund. The Directors considered that Mondrian may direct the International Fund’s brokerage transactions to certain brokers to obtain research and other services. However, the Directors noted that all subadvisers are required to select brokers who meet the International Fund’s requirements for seeking best execution, and that VIA monitors and evaluates the subadvisers’ trade execution with respect to International Fund brokerage transactions on a regular basis and provides reports to the Board in this regard. In addition, Mondrian indicated that it may receive fall-out benefits from its relationship with the International Fund through the possibility of increased business due to the additional exposure Mondrian would receive by serving as subadviser to the International Fund. The Directors concluded that the potential benefits that may accrue to Mondrian by virtue of its relationship with the International Fund appeared to be reasonable.
Conclusion. After full consideration of the foregoing factors, with no single factor identified as being of paramount importance, the Directors, including a majority of the Independent Directors, concluded that the initial approval of the International Subadvisory Agreement was in the best interests of the International Fund and its shareholders, and approved the International Subadvisory Agreement with, and the fee to be paid to, Mondrian.
Vantagepoint Diversified Assets Fund
Approval of Amended Fee Schedule with Payden & Rygel. At the September Meeting, the Board, including a majority of the Independent Directors, approved an amendment, effective September 28, 2009, to the fee schedule (“Amended Fee Schedule”) to the Investment Subadvisory Agreement (“Payden Subadvisory Agreement”) among the Company, VIA and Payden and Rygel (“Payden”), relating to the Vantagepoint Diversified Assets Fund (“Diversified Assets Fund”), in connection with Payden providing investment subadvisory services to the Diversified Assets Fund utilizing its low duration fixed income strategy on an ongoing basis. Payden has served as a subadviser to the Diversified Assets Fund since its inception utilizing a short duration fixed income strategy, and has also served as a subadviser to the Diversified Assets Fund on an interim basis since April 3, 2009, utilizing a low duration fixed income strategy. On March 27, 2009, the Board approved: (i) Payden to manage the assets of the Diversified Assets Fund formerly managed by a different subadviser, Drake Capital Management, LLC (“Drake”), pursuant to a low duration fixed income mandate on an interim basis, while VIA considered Payden, as well as other investment subadvisers, to manage the assets formerly allocated to Drake on an ongoing basis; and (ii) a related amendment to the fee schedule of the Payden Subadvisory Agreement. At the September Meeting, VIA recommended to the Board that Payden continue to manage the portion of the Diversified Assets Fund’s assets allocated to it utilizing its low duration fixed income strategy on an ongoing basis and that the Board approve the Amended Fee Schedule. Before approving the Amended Fee Schedule, the Board of the Company considered the recommendations of, and supporting analyses and data presented by, VIA.
With respect to the Board’s consideration of the Amended Fee Schedule, the Directors received written information in advance of the September Meeting from VIA, which included: (1) VIA’s rationale for recommending to the Board
208
VANTAGEPOINT FUNDS
Additional Information (Unaudited)—(Continued)
that Payden continue to manage the portion of the Diversified Assets Fund’s assets allocated to it pursuant to a low duration fixed income strategy on an ongoing basis; (2) the nature, extent and quality of the services that Payden would provide to the Diversified Assets Fund; (3) Payden’s experience, investment management business, personnel and operations; (4) Payden’s brokerage and trading policies and practices; (5) the level of the subadvisory fee to be charged to the Diversified Assets Fund by Payden for managing Fund assets pursuant to a low duration fixed income strategy and a comparison of that fee to the: (a) fees charged by Payden for managing other comparable accounts; and (b) fees charged by a group of U.S. separate account investment managers utilizing a short duration fixed income mandate (which includes low duration fixed income mandates); (6) Payden’s historical performance returns utilizing a low duration fixed income mandate and such performance compared to a relevant benchmark and peer group; (7) the Diversified Assets Fund’s expected overall investment advisory fee and projected total expense ratio, taking into account the Amended Fee Schedule, compared to a group of long-short funds; and (8) Payden’s financial condition.
In considering the information and materials described above, the Independent Directors received assistance from, and met separately with, their independent legal counsel and were provided with a written description of their statutory responsibilities and the legal standards that are applicable to approvals of advisory agreements.
In determining whether to approve the Amended Fee Schedule, the Directors considered the information received in advance of the September Meeting and discussions held with VIA’s personnel and the Company’s CCO, as well as a variety of factors. Although not meant to be all-inclusive, the following discusses some of the factors relevant to the Board’s decision to approve the Amended Fee Schedule.
Nature, Extent and Quality of Services. With respect to the nature, extent and quality of the services expected to be provided by Payden with respect to its low duration fixed income strategy, the Directors considered the specific investment process to be employed by Payden in managing the Diversified Assets Fund’s assets pursuant to this strategy; the qualifications of Payden’s investment management team with regard to implementing a low duration fixed income mandate; Payden’s overall favorable performance record as compared to a relevant benchmark and peer group; Payden’s infrastructure and whether it appeared to adequately support a low duration fixed income strategy; and VIA’s rationale and favorable assessment as to the nature, quality and extent of the subadvisory services expected to be provided by Payden to the Diversified Assets Fund on an ongoing basis with respect to a low duration fixed income strategy. The Directors acknowledged that Payden has a successful performance record as a low duration fixed income manager; has an experienced portfolio management team; and appears to have adequate infrastructure and support staff to seek to achieve favorable results implementing a low duration fixed income mandate for the Diversified Assets Fund. The Directors concluded that the nature, extent and quality of the subadvisory services expected to be provided by Payden with respect to employing a low duration fixed income strategy on an ongoing basis were appropriate for the Diversified Assets Fund in light of its investment strategy and, thus, supported a decision to approve the Amended Fee Schedule.
Investment Performance. The Directors evaluated Payden’s historical investment performance record in managing its clients’ assets utilizing a low duration fixed income mandate and considered the performance record versus a relevant benchmark and peer group (based on information provided by an independent third-party source). The Directors concluded that the overall historical investment performance record of Payden with respect to employing a low duration fixed income strategy supported approval of the Amended Fee Schedule.
Subadvisory Fee, Expense Ratio Impact and Economies of Scale. In evaluating the proposed subadvisory fee for the low duration fixed income strategy that Payden is to employ for the Diversified Assets Fund on an ongoing basis, the Directors reviewed Payden’s Amended Fee Schedule. The Directors considered comparisons of the subadvisory fee to be charged by Payden to the Diversified Assets Fund for the low duration fixed income mandate under the Amended Fee Schedule with its fee schedule for managing other accounts with an investment mandate similar to the low duration fixed income mandate Payden would continue to employ on behalf of the Diversified Assets Fund. The Directors also considered that, according to the information provided by VIA, the Amended Fee Schedule for Payden reflected the lowest fee rate currently charged by Payden to other accounts similar in size and mandate to the Diversified Assets Fund’s assets allocated to Payden with respect to its low duration fixed income mandate, and, according to the information provided by VIA, is lower than Payden’s standard fee schedule for managing accounts with a similar mandate. Additionally, the nature of the subadvisory services Payden is to provide to the Diversified Assets Fund appeared to be comparable to those Payden currently provides to its other subadvisory relationships.
The Directors reviewed information provided by VIA (which was based on an independent third-party source) on the fees charged to accounts with assets comparable to the amount of assets currently allocated to Payden with respect to
209
VANTAGEPOINT FUNDS
Additional Information (Unaudited)—(Continued)
the low duration fixed income mandate to a group of U.S. separate account investment managers that employ a similar investment style to the investment style Payden is to employ. According to the information provided, the effective fee rate to be paid by the Diversified Assets Fund to Payden for the low duration fixed income mandate at the current asset allocation level would be below the median fee charged by such managers.
The Directors also considered that there would be no increase in the overall contractual subadvisory fees and, therefore, no increase in the total expense ratio of the Diversified Assets Fund due to the Amended Fee Schedule. Referring to data provided by VIA and compiled by Morningstar, the Directors also noted that the expected total investment advisory fee for the Diversified Assets Fund, taking into account the subadvisory fee to be paid to Payden under the Amended Fee Schedule, was lower than the average and median investment advisory fee of a group of mutual funds in Morningstar’s long-short category. The Directors also considered information provided by VIA and compiled by Morningstar on the total expense ratios of a group of mutual funds in Morningstar’s long-short category, which showed that, if Payden continued to manage a low duration fixed income mandate for the Diversified Assets Fund at the current asset allocation level, but under the Amended Fee Schedule, and taking into account the Diversified Assets Fund’s other existing subadvisory arrangements and current subadvisory fee rates, the Diversified Assets Fund’s expected total expense ratio would be below the average and median expense ratios of such funds.
The foregoing comparisons assisted the Directors in considering the Amended Fee Schedule by providing them with a basis for evaluating Payden’s fee for managing the Diversified Assets Fund’s assets pursuant to a low duration fixed income strategy on an ongoing basis, including in light of the Diversified Assets Fund’s expected overall investment advisory fee and total expense ratio, on a relative basis. Based on this information, the Directors concluded that Payden’s subadvisory fee under the Amended Fee Schedule for managing the low duration fixed income mandate for the Diversified Assets Fund appeared to be within a reasonable range for the services to be provided.
The Directors also reviewed the information provided by Payden regarding the estimated profits to be realized from its relationship with the Diversified Assets Fund for managing the assets of the Diversified Assets Fund pursuant to a low duration fixed income mandate under the Amended Fee Schedule. In reviewing the extent to which economies of scale may be realized by the Diversified Assets Fund as the assets of the Diversified Assets Fund to be managed by Payden in the low duration fixed income mandate grow, and whether the proposed fee levels reflect these economies, the Directors considered that Payden’s Amended Fee Schedule for this mandate included breakpoints, which indicates that the proposed subadvisory fee rate is intended to capture certain anticipated economies of scale for the benefit of the Diversified Assets Fund’s shareholders in connection with the services to be provided. The Directors concluded that Payden’s Amended Fee Schedule for managing the assets of the Diversified Assets Fund on an ongoing basis pursuant to a low duration fixed income mandate was appropriate at this time.
Other Considerations. The Directors considered VIA’s judgment that Payden’s experience in managing a low duration fixed income mandate is expected to add value by contributing positively to the Diversified Assets Fund’s performance while controlling risk. The Directors also considered their experience with Payden as a current subadviser to the Diversified Assets Fund and certain other series of the Company, as well as Payden’s familiarity with the Diversified Assets Fund and other series of the Company.
The Directors considered the selection and due diligence process employed by VIA in deciding to recommend that Payden provide ongoing subadvisory services to the Diversified Assets Fund with respect to the low duration fixed income mandate and also considered VIA’s conclusion that the fee to be paid by the Diversified Assets Fund to Payden under the Amended Fee Schedule for managing the Diversified Assets Fund’s assets pursuant to this strategy is reasonable and appropriate in light of the nature and quality of services to be provided by Payden and the reasons supporting that conclusion. The Directors concluded that VIA’s recommendations and conclusions supported approval of the Amended Fee Schedule.
The Directors also considered the potential “fall-out” or ancillary benefits that may accrue to Payden due to its relationship with the Diversified Assets Fund. The Directors considered that Payden does not anticipate any such benefits due to its relationship with the Diversified Assets Fund.
Conclusion. After full consideration of the foregoing factors, with no single factor identified as being of paramount importance, the Directors, including a majority of the Independent Directors, concluded that the approval of the Amended Fee Schedule was in the best interests of the Diversified Assets Fund and its shareholders, and approved the Amended Fee Schedule and the fee to be paid to Payden for managing Diversified Assets Fund assets pursuant to a low duration fixed income strategy on an ongoing basis.
210
VANTAGEPOINT FUNDS
Additional Information (Unaudited)—(Continued)
Vantagepoint Diversified Assets Fund
Approval of New Subadvisory Agreements. Also at the September Meeting, VIA recommended, and the Board approved, the implementation of an additional principal investment strategy for the Diversified Assets Fund, effective January 4, 2010. The additional principal investment strategy provides that the Diversified Assets Fund allocate a portion of its assets to a portfolio of convertible securities of U.S. or foreign companies (which may include those in emerging markets) or replicate exposure to convertible securities by using a combination of either convertible or non-convertible bonds with common stock or equity options (“convertible securities strategy”). In connection with the approval of the convertible securities strategy, the Board, including a majority of the Independent Directors, approved, effective January 4, 2010, two initial Investment Subadvisory Agreements (each a “Diversified Assets Subadvisory Agreement”) among the Company, VIA and each of Calamos Advisors LLC (“Calamos”) and Shenkman Capital Management, Inc. (“Shenkman”), relating to the Diversified Assets Fund. Before approving the appointment of Calamos and Shenkman as subadvisers to the Diversified Assets Fund, the Board of the Company considered the recommendations of, and supporting analyses and data presented by, VIA.
With respect to the Board’s consideration of the respective Diversified Assets Subadvisory Agreements with Calamos and Shenkman, the Directors received written information in advance of the September Meeting from VIA, which included: (1) VIA’s rationale for the convertible securities strategy for the Diversified Assets Fund; (2) the process by which VIA selected and recommended for Board approval Calamos and Shenkman as subadvisers of the Diversified Assets Fund to implement the convertible securities strategy; (3) the nature, extent and quality of the services that Calamos and Shenkman would be expected to provide to the Diversified Assets Fund; (4) each of Calamos’ and Shenkman’s experience, investment management business, personnel and operations; (5) each of Calamos’ and Shenkman’s brokerage and trading policies and practices; (6) the level of the subadvisory fees to be charged to the Diversified Assets Fund by Calamos and Shenkman and a comparison of those fees to the: (a) fees charged by each of Calamos and Shenkman for managing other comparable accounts; and (b) fees charged by a group of U.S. separate account investment managers utilizing an active convertible securities strategy; (7) Calamos’ and Shenkman’s respective compliance programs; (8) Calamos’ and Shenkman’s respective historical performance returns utilizing: (i) a global convertible securities mandate with respect to Calamos; and (ii) a convertible securities bond mandate with respect to Shenkman, and such performance compared to a relevant benchmark and peer group; (9) the Diversified Assets Fund’s expected overall investment advisory fee and projected total expense ratio, taking into account the proposed new subadvisory arrangement, compared to a group of long-short funds; and (10) each of Calamos’ and Shenkman’s financial condition.
In considering the information and materials described above, the Independent Directors received assistance from, and met separately with, their independent legal counsel and were provided with a written description of their statutory responsibilities and the legal standards that are applicable to approvals of advisory agreements.
In determining whether to approve each Diversified Assets Subadvisory Agreement, the Directors considered the information received in advance of the September Meeting, the presentations made by, and discussions held with, representatives of Calamos and Shenkman, VIA’s personnel and the Company’s CCO prior to the September Meeting and at the September Meeting, as applicable, as well as a variety of factors. Although not meant to be all-inclusive, the following discusses some of the factors relevant to the Board’s decision to approve the Diversified Assets Subadvisory Agreements.
Nature, Extent and Quality of Services. With respect to the nature, extent and quality of the services expected to be provided by Calamos and Shenkman under their respective Diversified Assets Subadvisory Agreements, the Directors considered the specific investment process to be employed by each of Calamos and Shenkman in managing the assets of the Diversified Assets Fund to be allocated to them; the qualifications of Calamos’ and Shenkman’s respective investment management personnel with regard to implementing a global convertible securities mandate and convertible securities bond mandate, respectively; each of Calamos’ and Shenkman’s overall favorable performance record as compared to a relevant benchmark and peer group; each of Calamos’ and Shenkman’s infrastructure and whether it appeared to adequately support a global convertible securities strategy and a convertible securities bond strategy, respectively; and VIA’s review process and favorable assessment as to the nature, quality and extent of the subadvisory services expected to be provided by each of Calamos and Shenkman to the Diversified Assets Fund. The Directors acknowledged that Calamos and Shenkman each has a successful performance record as a global convertible securities strategy manager and convertible securities bond strategy manager, respectively; and Calamos and Shenkman each has
211
VANTAGEPOINT FUNDS
Additional Information (Unaudited)—(Continued)
experienced portfolio management personnel and appeared to have adequate infrastructure and support staff to seek to achieve favorable results implementing a global convertible securities strategy and a convertible securities bond strategy, respectively, for the Diversified Assets Fund. The Directors concluded that the nature, extent and quality of the subadvisory services expected to be provided by each of Calamos and Shenkman were appropriate for the Diversified Assets Fund in light of its new convertible securities strategy, effective January 4, 2010, and, thus, supported a decision to approve each Diversified Assets Subadvisory Agreement.
Investment Performance. The Directors evaluated Calamos’ and Shenkman’s historical investment performance record in managing their clients’ assets utilizing a global convertible securities mandate with respect to Calamos and a convertible securities bond mandate with respect to Shenkman and considered each performance record versus a relevant benchmark and peer group (based on information provided by an independent third-party source). The Directors concluded that the historical investment performance record of each of Calamos and Shenkman supported approval of each Diversified Assets Subadvisory Agreement.
Subadvisory Fees, Expense Ratio Impact and Economies of Scale. In evaluating each proposed subadvisory fee, the Directors reviewed Calamos’ and Shenkman’s respective subadvisory fee schedules. The Directors considered comparisons of the subadvisory fee to be charged by each of Calamos and Shenkman to the Diversified Assets Fund with its respective fee schedule for managing other accounts with an investment mandate similar to the mandate the subadviser is to employ on behalf of the Diversified Assets Fund. The Directors also considered that, according to the information provided by VIA, the proposed fee schedule for each of Calamos and Shenkman: (i) reflected the lowest fee rate currently charged by the subadviser to other accounts for which it provides advisory services utilizing a similar mandate; and (ii) is lower than its standard fee schedule for managing accounts with a similar mandate. Additionally, the nature of the subadvisory services each of Calamos and Shenkman is to provide to the Diversified Assets Fund appeared to be comparable to those each subadviser currently provides to its other subadvisory relationships.
The Directors reviewed information provided by VIA (which was based on an independent third-party source) on the fees charged to accounts with assets comparable to the amount of assets to be allocated initially to each of Calamos and Shenkman by a group of U.S. separate account investment managers that employ a similar investment style to the investment style each subadviser is to employ for the Diversified Assets Fund. According to the information provided, the effective fee rate to be paid by the Diversified Assets Fund to each of Calamos and Shenkman at the proposed initial asset allocation levels would be below the median fee charged by such managers.
The Directors also considered that there would be no increase in the overall contractual subadvisory fees to be paid by the Diversified Assets Fund and, therefore, no increase in the total expense ratio of the Diversified Assets Fund as a result of the appointment of each of Calamos and Shenkman. Referring to data provided by VIA and compiled by Morningstar, the Directors also noted that the expected total investment advisory fee for the Diversified Assets Fund, taking into account the proposed subadviser changes, was lower than the average and median investment advisory fee of a group of mutual funds in Morningstar’s long-short category. The Directors also considered information provided by VIA and compiled by Morningstar on the total expense ratios of a group of mutual funds in Morningstar’s long-short category, which showed that, if Calamos and Shenkman each served as a subadviser to the Diversified Assets Fund at the proposed subadvisory fee rate and initial asset allocation level, along with the Diversified Assets Fund’s three other existing subadvisers at their current subadvisory fee rates, the Diversified Assets Fund’s expected total expense ratio would be below the average and median expense ratios of such funds.
The foregoing comparisons assisted the Directors in considering each Diversified Assets Subadvisory Agreement by providing them with a basis for evaluating Calamos’ and Shenkman’s fees, including in light of the Diversified Assets Fund’s expected overall investment advisory fee and total expense ratio, on a relative basis. Based on this information, the Directors concluded that the subadvisory fee of Calamos and Shenkman appeared to be within a reasonable range for the services to be provided.
With respect to the estimated profits to be realized by Calamos and Shenkman from their relationship with the Diversified Assets Fund, and in reviewing the extent to which economies of scale may be realized by Calamos and Shenkman as the assets of the Diversified Assets Fund to be managed by each subadviser grow and whether the proposed fee levels reflect these economies, the Directors considered that each subadviser’s proposed fee schedule included breakpoints, which indicates that each proposed subadvisory fee rate is intended to capture certain anticipated economies of scale for the benefit of the Diversified Assets Fund’s shareholders in connection with the services to be provided. The Directors concluded that each proposed fee schedule with respect to Calamos and Shenkman was appropriate at this time.
212
VANTAGEPOINT FUNDS
Additional Information (Unaudited)—(Continued)
Other Considerations. The Directors considered VIA’s judgment that the addition of the convertible securities strategy to the Diversified Assets Fund, and the addition of Calamos and Shenkman as subadvisers to the Diversified Assets Fund to implement the new convertible securities strategy, would add value by complementing the investment approach of the Diversified Assets Fund’s current investment subadvisers, Analytic Investors, LLC, Mellon Capital Management Corporation and Payden. In this regard, the Directors considered VIA’s belief that the addition of the convertible securities strategy to the Diversified Assets Fund, and the addition of each of Calamos and Shenkman as a subadviser, should serve to better diversify the Diversified Assets Fund with attractive risk/return attributes.
The Directors considered the selection and due diligence process employed by VIA in deciding to recommend Calamos and Shenkman as subadvisers to the Diversified Assets Fund to implement the convertible securities strategy and also considered VIA’s conclusion that the fee to be paid to each of Calamos and Shenkman for their respective services to the Diversified Assets Fund is reasonable and appropriate in light of the nature and quality of services to be provided by each subadviser and the reasons supporting that conclusion. The Directors concluded that VIA’s recommendations and conclusions supported approval of each Diversified Assets Subadvisory Agreement.
The Directors also considered the potential “fall-out” or ancillary benefits that may accrue to Calamos and Shenkman due to each subadviser’s relationship with the Diversified Assets Fund. The Directors considered that Calamos may direct the Diversified Assets Fund’s brokerage transactions to certain brokers to obtain research and other services. However, the Directors noted that all subadvisers are required to select brokers who meet the Diversified Assets Fund’s requirements for seeking best execution, and that VIA monitors and evaluates the subadvisers’ trade execution with respect to Diversified Assets Fund brokerage transactions on a regular basis and provides reports to the Board in this regard. With respect to Shenkman, the Board considered that Shenkman indicated that, by serving as subadviser to the Diversified Assets Fund, it may receive fall-out benefits from its relationship with the Diversified Assets Fund through the potential exposure of the firm and its products. The Directors concluded that the potential benefits that may accrue to Calamos and Shenkman by virtue of their relationships with the Diversified Assets Fund appeared to be reasonable.
Conclusion. After full consideration of the foregoing factors, with no single factor identified as being of paramount importance, the Directors, including a majority of the Independent Directors, concluded that the initial approval of each Diversified Assets Subadvisory Agreement with Calamos and Shenkman was in the best interests of the Diversified Assets Fund and its shareholders, and approved the Diversified Assets Subadvisory Agreement with, and the fee to be paid to, each of Calamos and Shenkman.
H. Householding
Only one copy of this Annual Report may be mailed to households, even if more than one person in a household is a shareholder of record, unless The Vantagepoint Funds have received instructions to the contrary. If you need additional copies of this Annual Report, please contact The Vantagepoint Funds toll free at 800-669-7400 or in writing at 777 North Capitol Street, NE, Suite 600, Washington, D.C. 20002. If you do not want this mailing of this Annual Report to be combined with those for other members of your household, contact The Vantagepoint Funds in writing at 777 North Capitol Street, NE, Suite 600, Washington, D.C. 20002 or toll free at 800-669-7400.
I. Other Available Information
A description of the Company’s proxy voting policies and procedures and the proxy voting record for the 12-month period ended June 30, 2009 are available without charge, upon request by calling 800-669-7400, on the Company’s website at www.icmarc.org, or by accessing the Securities and Exchange Commission’s website at www.sec.gov.
The Company files its complete schedule of portfolio holdings with the SEC for the first and third quarters of each fiscal year on Form N-Q; the Company’s Forms N-Q are available on the SEC’s website at www.sec.gov and may be reviewed and copied at the SEC’s Public Reference Room in Washington, D.C. Information on the operation of the Public Reference Room may be obtained by calling 800-SEC-0330.
213
VANTAGEPOINT FUNDS
Additional Information (Unaudited)—(Continued)
Wilshire®, the Wilshire IndexesSM, Wilshire 5000 Total Market IndexSM, and Wilshire 4500 Completion IndexSM are service marks of Wilshire Associates Incorporated (“Wilshire”) and have been licensed for use by The Vantagepoint Funds, on behalf of the Broad Market Index Fund and the Mid/Small Company Index Fund, respectively. All content of the Wilshire IndexesSM and the aforementioned indexes is ©2009 Wilshire Associates Incorporated, all rights reserved. Wilshire has no relationship with The Vantagepoint Funds, other than the licensing of the aforementioned indexes and its service marks for use in connection with these two Funds. Wilshire does not:
| • | | Sponsor, endorse, sell or promote the Funds. |
| • | | Recommend that any person invest in the Funds or any other securities. |
| • | | Have any responsibility or liability for or make any decisions about the timing, amount or pricing of the Funds. |
| • | | Have any responsibility or liability for the administration, management or marketing of the Funds. |
| • | | Consider the needs of the Funds or their shareholders in determining, composing or calculating the above indexes or have any obligation to do so. |
Wilshire shall have no liability in connection with these Funds. Specifically, Wilshire makes no representation or warranty, express or implied, regarding:
| • | | The results to be obtained by the Funds, their shareholders or any other person in connection with the use of the above indexes and the data included in those indexes; |
| • | | The accuracy or completeness of these indexes and any related data; or |
| • | | The merchantability or the fitness for a particular purpose or use of these indexes and/or its related data. |
Wilshire shall not have any liability for any errors, omissions or interruptions in the above indexes or related data. Under no circumstances will Wilshire be liable for any lost profits or indirect, punitive, special or consequential damages or losses, even if Wilshire knows that they might occur. The licensing agreement between The Vantagepoint Funds, on behalf of the Broad Market Index Fund and the Mid/Small Company Index Fund, and Wilshire is solely for the Funds’ benefit and not for the benefit of Fund shareholders or any other third parties.”
“Standard & Poor’s®”, “S&P®” , “S&P 500®”, “Standard & Poor’s 500®”, and “500” are trademarks of The McGraw-Hill Companies, Inc. and have been licensed for use by the Vantagepoint Funds — 500 Index Fund. The Fund is not sponsored, endorsed, sold or promoted by Standard & Poor’s and Standard & Poor’s makes no representation regarding the advisability of investing in the Fund.
214
SCHEDULE OF INVESTMENTS
December 31, 2009
Vantagepoint
Money Market Fund
|
|
|
| Shares
|
|
|
| Value
|
|---|
| |
MUTUAL FUND—100.0% |
Short-Term Investments Trust Liquid Assets Portfolio
(Cost $452,107,065) | | | | | | | | | 452,107,065 | | | $ | 452,107,065 | |
| |
TOTAL INVESTMENTS—100.0% | | | | | | | |
| (Cost $452,107,065) | | | | | | 452,107,065 | |
| Other assets less liabilities—0.0% | | | | | | 2,167,006 | |
| |
NET ASSETS—100.0% | | | | | | | | | | | | $ | 454,274,071 | |
See accompanying notes to financial statements.
215
SCHEDULE OF INVESTMENTS
December 31, 2009
Vantagepoint Low Duration
Bond Fund
Coupon
Rate
|
|
|
| Maturity
Date
|
|
|
| Face
|
| Value
|
|---|
| |
CORPORATE OBLIGATIONS—42.9% |
| |
Aerospace & Defense—0.6% |
| Boeing Co. (The) | | | |
| 1.875% | | | | 11/20/2012 | | † | | $ | 2,960,000 | | | $ | 2,929,059 | |
| |
Beverages—0.4% |
| Bottling Group LLC | | | |
| 6.950% | | | | 03/15/2014 | | | | | 975,000 | | | | 1,122,878 | |
| Dr. Pepper Snapple Group, Inc. | | | |
| 1.700% | | | | 12/21/2011 | | | | | 1,060,000 | | | | 1,059,445 | |
| | | | | | | | | | | | | | 2,182,323 | |
| |
Capital Markets—1.4% |
| Bank of New York Mellon Corp. (The) | | | |
| 4.300% | | | | 05/15/2014 | | | | | 1,170,000 | | | | 1,232,606 | |
| Goldman Sachs Group, Inc. (The) MTN | | | |
| 6.000% | | | | 05/01/2014 | | | | | 901,000 | | | | 986,428 | |
| 3.625% | | | | 08/01/2012 | | | | | 700,000 | | | | 721,655 | |
| Macquarie Bank Ltd. (Australia) | | | |
| 2.600% | | | | 01/20/2012 | | ˆ | | | 1,230,000 | | | | 1,256,515 | |
| Morgan Stanley | | | |
| 6.000% | | | | 05/13/2014 | | | | | 700,000 | | | | 753,364 | |
| 4.200% | | | | 11/20/2014 | | | | | 720,000 | | | | 721,290 | |
| Morgan Stanley, Series F MTN | | | |
| 2.373% | | | | 05/14/2010 | | # | | | 700,000 | | | | 705,096 | |
| TD Ameritrade Holding Corp. | | | |
| 4.150% | | | | 12/01/2014 | | | | | 1,140,000 | | | | 1,125,191 | |
| | | | | | | | | | | | | | 7,502,145 | |
| |
Chemicals—1.6% |
| Dow Chemical Co. (The) | | | |
| 7.600% | | | | 05/15/2014 | | | | | 4,385,000 | | | | 4,994,349 | |
| 4.850% | | | | 08/15/2012 | | | | | 2,700,000 | | | | 2,839,336 | |
| Praxair, Inc. | | | |
| 1.750% | | | | 11/15/2012 | | | | | 570,000 | | | | 564,882 | |
| | | | | | | | | | | | | | 8,398,567 | |
| |
Commercial Banks—9.2% |
| Barclays Bank plc (United Kingdom) | | | |
| 5.450% | | | | 09/12/2012 | | | | | 4,940,000 | | | | 5,345,648 | |
| 2.700% | | | | 03/05/2012 | | ˆ | | | 1,000,000 | | | | 1,022,286 | |
| BB&T Corp. MTN | | | |
| 3.850% | | | | 07/27/2012 | | | | | 4,818,000 | | | | 4,989,930 | |
| BB&T Corp., Series A MTN | | | |
| 3.375% | | | | 09/25/2013 | | | | | 700,000 | | | | 706,130 | |
| Capital One Financial Corp. | | | |
| 7.375% | | | | 05/23/2014 | | † | | | 4,130,000 | | | | 4,680,550 | |
| Commonwealth Bank of Australia (Australia) | | | |
| 2.400% | | | | 01/12/2012 | | ˆ | | | 1,404,000 | | | | 1,440,246 | |
| ING Bank NV (Netherlands) | | | |
| 2.625% | | | | 02/09/2012 | | ˆ | | | 1,700,000 | | | | 1,738,121 | |
| M&T Bank Corp. | | | |
| 5.375% | | | | 05/24/2012 | | † | | | 5,000,000 | | | | 5,216,535 | |
| National Australia Bank Ltd. (Australia) | | | |
| 2.550% | | | | 01/13/2012 | | ˆ | | | 1,665,000 | | | | 1,690,583 | |
| Regions Financial Corp. | | | |
| 7.750% | | | | 11/10/2014 | | | | | 3,000,000 | | | | 2,961,603 | |
| SunTrust Banks, Inc. | | | |
| 5.250% | | | | 11/05/2012 | | † | | | 4,950,000 | | | | 5,139,283 | |
| Swedbank AB (Sweden) | | | |
| 2.800% | | | | 02/10/2012 | | ˆ | | | 900,000 | | | | 919,866 | |
| Toronto-Dominion Bank (The) MTN (Canada) | | | |
| 1.516% | | | | 09/10/2010 | | # | | | EUR 750,000 | | | | 1,080,493 | |
| US Bancorp | | | |
| 4.200% | | | | 05/15/2014 | | | | $ | 1,300,000 | | | $ | 1,350,795 | |
| US Bancorp MTN | | | |
| 0.678% | | | | 05/06/2010 | | # | | | 1,200,000 | | | | 1,201,958 | |
| Wachovia Bank NA, Bank Note | | | |
| 7.800% | | | | 08/18/2010 | | | | | 1,750,000 | | | | 1,826,356 | |
| Wachovia Corp. | | | |
| 0.406% | | | | 06/01/2010 | | # | | | 3,280,000 | | | | 3,282,755 | |
| Wells Fargo & Co. | | | |
| 5.300% | | | | 08/26/2011 | | | | | 1,240,000 | | | | 1,313,781 | |
| 5.250% | | | | 10/23/2012 | | | | | 1,000,000 | | | | 1,068,271 | |
| Wells Fargo & Co., Series I MTN | | | |
| 3.750% | | | | 10/01/2014 | | | | | 660,000 | | | | 658,764 | |
| | | | | | | | | | | | | | 47,633,954 | |
| |
Communications Equipment—0.2% |
| Cisco Systems, Inc. | | | |
| 5.250% | | | | 02/22/2011 | | | | | 1,250,000 | | | | 1,312,021 | |
| |
Computers & Peripherals—1.0% |
| Hewlett-Packard Co. | | | |
| 4.250% | | | | 02/24/2012 | | | | | 730,000 | | | | 766,115 | |
| 2.250% | | | | 05/27/2011 | | | | | 1,000,000 | | | | 1,014,549 | |
| International Business Machines Corp. | | | |
| 4.950% | | | | 03/22/2011 | | | | | 1,250,000 | | | | 1,305,381 | |
| 2.100% | | | | 05/06/2013 | | | | | 2,170,000 | | | | 2,167,396 | |
| | | | | | | | | | | | | | 5,253,441 | |
| |
Consumer Finance—1.3% |
| American Express Credit Corp. | | | |
| 5.125% | | | | 08/25/2014 | | † | | | 1,000,000 | | | | 1,054,819 | |
| Caterpillar Financial Services Corp. MTN | | | |
| 5.750% | | | | 02/15/2012 | | † | | | 900,000 | | | | 971,941 | |
| HSBC Finance Corp. | | | |
| 6.375% | | | | 10/15/2011 | | | | | 3,150,000 | | | | 3,351,515 | |
| John Deere Capital Corp., Series D MTN | | | |
| 0.984% | | | | 01/18/2011 | | # | | | 1,170,000 | | | | 1,177,486 | |
| | | | | | | | | | | | | | 6,555,761 | |
| |
Containers & Packaging—0.1% |
| Ball Corp. | | | |
| 6.875% | | | | 12/15/2012 | | | | | 455,000 | | | | 462,962 | |
| |
Diversified Consumer Services—0.1% |
| Yale University, Series B MTN | | | |
| 2.900% | | | | 10/15/2014 | | | | | 570,000 | | | | 568,523 | |
| |
Diversified Financial Services—8.4% |
| American Express Travel Related Services Co., Inc. | | | |
| 5.250% | | | | 11/21/2011 | | ˆ† | | | 6,000,000 | | | | 6,294,882 | |
| Bank of America Corp. | | | |
| 6.500% | | | | 08/01/2016 | | | | | 900,000 | | | | 969,087 | |
| 4.875% | | | | 09/15/2012 | | | | | 3,910,000 | | | | 4,099,651 | |
| 4.875% | | | | 01/15/2013 | | † | | | 1,000,000 | | | | 1,040,688 | |
| 4.375% | | | | 12/01/2010 | | | | | 1,240,000 | | | | 1,280,409 | |
| BP Capital Markets plc (United Kingdom) | | | |
| 5.250% | | | | 11/07/2013 | | | | | 800,000 | | | | 872,145 | |
| Citigroup, Inc. | | | |
| 6.375% | | | | 08/12/2014 | | | | | 1,000,000 | | | | 1,047,947 | |
| 1.973% | | | | 05/15/2018 | | # | | | 7,186,000 | | | | 6,687,349 | |
| CME Group, Inc. | | | |
| 5.750% | | | | 02/15/2014 | | | | | 4,850,000 | | | | 5,309,668 | |
| Equifax, Inc. | | | |
| 4.450% | | | | 12/01/2014 | | | | | 240,000 | | | | 241,468 | |
| General Electric Capital Corp. | | | |
| 5.900% | | | | 05/13/2014 | | | | | 680,000 | | | | 735,837 | |
|
See accompanying notes to financial statements.
216
SCHEDULE OF INVESTMENTS—(Continued)
December 31, 2009
Vantagepoint Low Duration
Bond Fund
Coupon
Rate
|
|
|
| Maturity
Date
|
|
|
| Face
|
| Value
|
|---|
| |
CORPORATE OBLIGATIONS—(Continued) |
| General Electric Capital Corp., Series A | | | |
| 3.750% | | | | 11/14/2014 | | | | $ | 6,180,000 | | | $ | 6,176,002 | |
| Hutchison Whampoa International 03/33 Ltd. (Cayman Islands) | | | |
| 5.450% | | | | 11/24/2010 | | ˆ | | | 1,500,000 | | | | 1,545,333 | |
| JPMorgan Chase & Co. | | | |
| 6.750% | | | | 02/01/2011 | | | | | 1,240,000 | | | | 1,308,355 | |
| 4.750% | | | | 05/01/2013 | | † | | | 5,650,000 | | | | 5,968,281 | |
| | | | | | | | | | | | | | 43,577,102 | |
| |
Diversified Telecommunication Services—0.9% |
| AT&T, Inc. | | | |
| 4.850% | | | | 02/15/2014 | | † | | | 600,000 | | | | 638,572 | |
| Cellco Partnership/Verizon Wireless Capital LLC |
| 5.550% | | | | 02/01/2014 | | | | | 400,000 | | | | 434,508 | |
| 3.750% | | | | 05/20/2011 | | | | | 1,000,000 | | | | 1,031,512 | |
| Deutsche Telekom International Finance BV (Netherlands) | | | |
| 5.375% | | | | 03/23/2011 | | | | | 1,250,000 | | | | 1,303,815 | |
| Verizon Global Funding Corp. | | | |
| 7.250% | | | | 12/01/2010 | | | | | 1,250,000 | | | | 1,321,262 | |
| | | | | | | | | | | | | | 4,729,669 | |
| |
Electric Utilities—1.6% |
| Commonwealth Edison Co., Series 105 | | | |
| 5.400% | | | | 12/15/2011 | | | | | 1,400,000 | | | | 1,496,508 | |
| Consumers Energy Co., Series D | | | |
| 5.375% | | | | 04/15/2013 | | | | | 850,000 | | | | 913,363 | |
| Duke Energy Carolinas LLC | | | |
| 6.250% | | | | 01/15/2012 | | | | | 1,165,000 | | | | 1,260,112 | |
| FPL Group Capital, Inc. | | | |
| 5.625% | | | | 09/01/2011 | | | | | 910,000 | | | | 968,377 | |
| Midamerican Energy Holdings Co. | | | |
| 3.150% | | | | 07/15/2012 | | | | | 1,000,000 | | | | 1,019,250 | |
| Pacific Gas & Electric Co. | | | |
| 4.200% | | | | 03/01/2011 | | | | | 1,000,000 | | | | 1,032,219 | |
| 1.206% | | | | 06/10/2010 | | # | | | 1,500,000 | | | | 1,506,195 | |
| | | | | | | | | | | | | | 8,196,024 | |
| |
Electronic Equipment, Instruments & Components—0.1% |
| Thermo Fisher Scientific, Inc. | | | |
| 2.150% | | | | 12/28/2012 | | ˆ | | | 640,000 | | | | 631,616 | |
| |
Food & Staples Retailing—0.2% |
| Safeway, Inc. | | | |
| 5.800% | | | | 08/15/2012 | | | | | 1,000,000 | | | | 1,080,702 | |
| |
Food Products—1.5% |
| Campbell Soup Co. | | | |
| 6.750% | | | | 02/15/2011 | | | | | 800,000 | | | | 851,419 | |
| Kellogg Co. | | | |
| 5.125% | | | | 12/03/2012 | | | | | 1,000,000 | | | | 1,086,001 | |
| Kraft Foods, Inc. | | | |
| 6.750% | | | | 02/19/2014 | | | | | 3,999,000 | | | | 4,426,233 | |
| Unilever Capital Corp. | | | |
| 7.125% | | | | 11/01/2010 | | | | | 1,175,000 | | | | 1,238,807 | |
| | | | | | | | | | | | | | 7,602,460 | |
| |
Health Care Providers & Services—0.9% |
| Express Scripts, Inc. | | | |
| 5.250% | | | | 06/15/2012 | | | | | 1,100,000 | | | | 1,169,532 | �� |
| WellPoint, Inc. | | | |
| 6.800% | | | | 08/01/2012 | | | | $ | 3,290,000 | | | $ | 3,632,084 | |
| | | | | | | | | | | | | | 4,801,616 | |
| |
Household Durables—0.2% |
| Fortune Brands, Inc. | | | |
| 3.000% | | | | 06/01/2012 | | | | | 1,170,000 | | | | 1,160,266 | |
| |
Household Products—0.1% |
| Procter & Gamble Co. (The) | | | |
| 3.500% | | | | 02/15/2015 | | | | | 400,000 | | | | 409,682 | |
| |
Industrial Conglomerates—0.2% |
| 3M Co., Series E MTN | | | |
| 4.500% | | | | 11/01/2011 | | | | | 1,000,000 | | | | 1,059,092 | |
| |
Insurance—2.9% |
| Allstate Corp. (The) | | | |
| 6.200% | | | | 05/16/2014 | | | | | 800,000 | | | | 885,582 | |
| American International Group, Inc. | | | |
| 4.700% | | | | 10/01/2010 | | † | | | 1,000,000 | | | | 999,465 | |
| 4.250% | | | | 05/15/2013 | | | | | 2,800,000 | | | | 2,588,354 | |
| Berkshire Hathaway Finance Corp. | | | |
| 4.000% | | | | 04/15/2012 | | | | | 700,000 | | | | 733,979 | |
| Metropolitan Life Global Funding I | | | |
| 5.125% | | | | 04/10/2013 | | ˆ | | | 4,730,000 | | | | 5,014,680 | |
| 1.001% | | | | 06/25/2010 | | #ˆ | | | 1,100,000 | | | | 1,101,531 | |
| New York Life Global Funding | | | |
| 0.379% | | | | 06/16/2011 | | #ˆ | | | 1,000,000 | | | | 995,047 | |
| Prudential Financial, Inc. | | | |
| 6.200% | | | | 01/15/2015 | | | | | 1,423,000 | | | | 1,532,624 | |
| Prudential Financial, Inc., Series D MTN | | | |
| 3.625% | | | | 09/17/2012 | | † | | | 1,100,000 | | | | 1,116,986 | |
| | | | | | | | | | | | | | 14,968,248 | |
| |
Life Sciences Tools & Services—0.4% |
| Howard Hughes Medical Institute | | | |
| 3.450% | | | | 09/01/2014 | | | | | 1,100,000 | | | | 1,115,809 | |
| Roche Holdings, Inc. | | | |
| 4.500% | | | | 03/01/2012 | | ˆ | | | 853,000 | | | | 896,382 | |
| | | | | | | | | | | | | | 2,012,191 | |
| |
Machinery—0.2% |
| Ingersoll-Rand Global Holding Co. Ltd. (Bermuda) | | | |
| 1.773% | | | | 08/13/2010 | | # | | | 845,000 | | | | 844,311 | |
| |
Media—0.7% |
| Comcast Corp. | | | |
| 5.450% | | | | 11/15/2010 | | | | | 2,250,000 | | | | 2,325,823 | |
| DirecTV Holdings LLC/DirecTV Financing Co., Inc. | | | |
| 4.750% | | | | 10/01/2014 | | ˆ | | | 580,000 | | | | 592,665 | |
| Viacom, Inc. | | | |
| 4.375% | | | | 09/15/2014 | | † | | | 700,000 | | | | 722,645 | |
| | | | | | | | | | | | | | 3,641,133 | |
| |
Metals & Mining—2.8% |
| Alcoa, Inc. | | | |
| 6.000% | | | | 07/15/2013 | | † | | | 5,525,000 | | | | 5,824,831 | |
| Nucor Corp. | | | |
| 5.000% | | | | 06/01/2013 | | | | | 1,328,000 | | | | 1,408,923 | |
| Rio Tinto Finance USA Ltd. (Australia) | | | |
| 5.875% | | | | 07/15/2013 | | | | | 6,974,000 | | | | 7,531,215 | |
| | | | | | | | | | | | | | 14,764,969 | |
|
See accompanying notes to financial statements.
217
SCHEDULE OF INVESTMENTS—(Continued)
December 31, 2009
Vantagepoint Low Duration
Bond Fund
Coupon
Rate
|
|
|
| Maturity
Date
|
|
|
| Face
|
| Value
|
|---|
| |
CORPORATE OBLIGATIONS—(Continued) |
| |
Multi-National—0.7% |
| European Investment Bank MTN (Supranational) | | | |
| 4.750% | | | | 04/15/2011 | | | | | EUR 2,300,000 | | | $ | 3,448,947 | |
| |
Oil, Gas & Consumable Fuels—1.0% |
| Chevron Corp. | | | |
| 3.450% | | | | 03/03/2012 | | | | $ | 1,800,000 | | | | 1,871,748 | |
| ConocoPhillips | | | |
| 4.750% | | | | 02/01/2014 | | | | | 600,000 | | | | 644,813 | |
| 4.600% | | | | 01/15/2015 | | | | | 455,000 | | | | 483,748 | |
| Shell International Finance BV (Netherlands) | | | |
| 5.625% | | | | 06/27/2011 | | | | | 1,860,000 | | | | 1,981,893 | |
| | | | | | | | | | | | | | 4,982,202 | |
| |
Paper & Forest Products—0.1% |
| Weyerhaeuser Co. | | | |
| 6.750% | | | | 03/15/2012 | | | | | 570,000 | | | | 604,208 | |
| |
Pharmaceuticals—1.2% |
| Abbott Laboratories | | | |
| 5.600% | | | | 05/15/2011 | | | | | 1,150,000 | | | | 1,220,132 | |
| Merck & Co., Inc. | | | |
| 1.875% | | | | 06/30/2011 | | | | | 2,100,000 | | | | 2,120,561 | |
| Novartis Capital Corp. | | | |
| 4.125% | | | | 02/10/2014 | | | | | 310,000 | | | | 326,172 | |
| Pfizer, Inc. | | | |
| 4.450% | | | | 03/15/2012 | | | | | 1,000,000 | | | | 1,058,204 | |
| 3.625% | | | | 06/03/2013 | | | | | EUR 200,000 | | | | 295,414 | |
| Wyeth | | | |
| 6.950% | | | | 03/15/2011 | | | | | 1,000,000 | | | | 1,068,572 | |
| | | | | | | | | | | | | | 6,089,055 | |
| |
Road & Rail—0.1% |
| Union Pacific Corp. | | | |
| 6.125% | | | | 01/15/2012 | | | | | 545,000 | | | | 592,737 | |
| |
Software—0.6% |
| Microsoft Corp. | | | |
| 2.950% | | | | 06/01/2014 | | | | | 1,400,000 | | | | 1,416,451 | |
| Oracle Corp. | | | |
| 5.000% | | | | 01/15/2011 | | | | | 1,547,000 | | | | 1,609,137 | |
| | | | | | | | | | | | | | 3,025,588 | |
| |
Specialty Retail—0.1% |
| GameStop Corp./GameStop, Inc. | | | |
| 8.000% | | | | 10/01/2012 | | | | | 325,000 | | | | 338,406 | |
| |
Tobacco—2.1% |
| Altria Group, Inc. | | | |
| 8.500% | | | | 11/10/2013 | | | | | 5,319,000 | | | | 6,151,918 | |
| Philip Morris International, Inc. | | | |
| 6.875% | | | | 03/17/2014 | | | | | 4,120,000 | | | | 4,672,756 | |
| | | | | | | | | | | | | | 10,824,674 | |
| |
TOTAL CORPORATE OBLIGATIONS |
| (Cost $213,343,585) | | | | | | | | 222,183,654 | |
| |
U.S. GOVERNMENT AGENCY OBLIGATIONS—5.7% |
| |
U.S. Government Agency Obligations—4.9% |
| Federal Farm Credit Bank |
| 1.875% | | | | 12/07/2012 | | | | $ | 1,200,000 | | | $ | 1,200,596 | |
| Federal Home Loan Bank |
| 5.375% | | | | 08/19/2011 | | | | | 7,390,000 | | | | 7,891,604 | |
| 1.625% | | | | 01/21/2011 | | | | | 3,100,000 | | | | 3,134,844 | |
| 1.375% | | | | 05/16/2011 | | † | | | 3,000,000 | | | | 3,022,164 | |
| Federal Home Loan Mortgage Corp. |
| 1.750% | | | | 06/15/2012 | | | | | 6,000,000 | | | | 6,030,174 | |
| Federal National Mortgage Association |
| 1.375% | | | | 04/28/2011 | | | | | 4,000,000 | | | | 4,030,728 | |
| | | | | | | | | | | | | | 25,310,110 | |
| |
U.S. Government Backed Corporate Obligations—0.8% |
| General Electric Capital Corp. |
| 1.800% | | | | 03/11/2011 | | † | | | 3,300,000 | | | | 3,338,198 | |
| Western Corporate Federal Credit Union |
| 1.750% | | | | 11/02/2012 | | | | | 980,000 | | | | 976,268 | |
| | | | | | | | | | | | | | 4,314,466 | |
| |
TOTAL U.S. GOVERNMENT AGENCY OBLIGATIONS |
| (Cost $29,431,207) | | | | | | | | 29,624,576 | |
| |
| |
U.S. GOVERNMENT AGENCY MORTGAGE-BACKED SECURITIES—5.7% |
| |
U.S. Government Agency Mortgage-Backed Securities—5.7% |
| Federal Home Loan Mortgage Corp. |
| 6.000% | | | | 11/01/2022 | | | | | 1,160,826 | | | | 1,241,874 | |
| Federal Home Loan Mortgage Corp. REMICS |
| 5.000% | | | | 06/15/2024 | | | | | 393,690 | | | | 396,122 | |
| Federal National Mortgage Association |
| 6.000% | | | | 09/01/2037 | | | | | 2,911,484 | | | | 3,092,997 | |
| 3.191% | | | | 09/01/2034 | | # | | | 285,784 | | | | 290,934 | |
| 3.150% | | | | 09/01/2034 | | # | | | 348,461 | | | | 354,702 | |
| 2.998% | | | | 10/01/2034 | | # | | | 3,026,788 | | | | 3,079,890 | |
| 2.782% | | | | 10/01/2034 | | # | | | 556,671 | | | | 568,095 | |
| Government National Mortgage Association |
| 6.500% | | | | 10/20/2037- 09/20/2038 | | | | | 9,945,218 | | | | 10,609,931 | |
| 6.000% | | | | 07/20/2038 | | | | | 4,333,699 | | | | 4,595,573 | |
| 4.500% | | | | 04/20/2024- 08/20/2035 | | | | | 5,126,533 | | | | 5,318,442 | |
| |
TOTAL U.S. GOVERNMENT AGENCY
MORTGAGE-BACKED SECURITIES |
| (Cost $28,821,794) | | | | | | | | 29,548,560 | |
| |
| |
U.S. TREASURY OBLIGATIONS—4.9% |
| |
U.S. Treasury Bills—4.9% |
| U.S. Treasury Bill |
| 0.394% | | | | 07/29/2010 | | † | | | 8,000,000 | | | | 7,990,160 | |
| 0.386% | | | | 09/23/2010 | | † | | | 10,000,000 | | | | 9,976,570 | |
| 0.316% | | | | 10/21/2010 | | ‡‡ | | | 1,000,000 | | | | 996,939 | |
| 0.163% | | | | 04/29/2010 | | † | | | 6,700,000 | | | | 6,698,352 | |
| |
TOTAL U.S. TREASURY OBLIGATIONS |
| (Cost $25,647,314) | | | | | | | | 25,662,021 | |
See accompanying notes to financial statements.
218
SCHEDULE OF INVESTMENTS—(Continued)
December 31, 2009
Vantagepoint Low Duration
Bond Fund
Coupon
Rate
|
|
|
| Maturity
Date
|
|
|
| Face
|
| Value
|
|---|
| |
MUNICIPAL OBLIGATIONS—1.6% |
| California General Obligation Bonds (California) | | | |
| 5.450% | | | | 04/01/2015 | | | | $ | 3,635,000 | | | $ | 3,660,990 | |
| 5.250% | | | | 04/01/2014 | | | | | 1,200,000 | | | | 1,207,584 | |
| 4.850% | | | | 10/01/2014 | | | | | 1,400,000 | | | | 1,383,592 | |
| Citizens Property Insurance Corp. Revenue Bonds, Series 2007 A (Florida) | | | |
| 5.000% | | | | 03/01/2013 | | | | | 200,000 | | | | 208,266 | |
| Citizens Property Insurance Corp. Revenue Bonds, Series 2009 A-1 (Florida) | | | |
| 5.000% | | | | 06/01/2012 | | | | | 1,700,000 | | | | 1,776,194 | |
| |
TOTAL MUNICIPAL OBLIGATIONS |
| (Cost $8,116,444) | | | | | | | | 8,236,626 | |
| |
| |
SOVEREIGN DEBT OBLIGATIONS—1.1% |
| |
Government Issued—1.1% |
| Caisse d’Amortissement de la Dette Sociale MTN (France) | | | |
| 4.250% | | | | 11/08/2010 | | | | | 1,200,000 | | | | 1,234,242 | |
| Province of Ontario (Canada) | | | |
| 3.125% | | | | 09/08/2010 | | | | | 1,200,000 | | | | 1,222,548 | |
| 2.750% | | | | 02/22/2011 | | † | | | 1,225,000 | | | | 1,248,389 | |
| Province of Quebec, Series PJ (Canada) | | | |
| 6.125% | | | | 01/22/2011 | | † | | | 1,700,000 | | | | 1,797,512 | |
| | | | | | | | | | |
| |
TOTAL SOVEREIGN DEBT OBLIGATIONS |
| (Cost $5,371,051) | | | | | | | | 5,502,691 | |
| |
| |
ASSET BACKED SECURITIES—16.6% |
| |
Automobile—8.4% |
| Ally Auto Receivables Trust |
| Series 2009-A, Class A2 |
| 1.320% | | | | 03/15/2012 | | ˆ | | | 1,180,000 | | | | 1,182,747 | |
| Bank of America Auto Trust |
| Series 2008-1A, Class A4 |
| 5.730% | | | | 01/20/2013 | | ˆ | | | 2,630,000 | | | | 2,762,079 | |
| Bank of America Auto Trust |
| Series 2009-2A, Class A2 |
| 1.160% | | | | 02/15/2012 | | ˆ | | | 1,260,000 | | | | 1,263,268 | |
| Bank of America Auto Trust |
| Series 2009-1A, Class A2 |
| 1.700% | | | | 12/15/2011 | | ˆ | | | 510,000 | | | | 512,681 | |
| BMW Vehicle Lease Trust |
| Series 2009-1, Class A2 |
| 2.040% | | | | 04/15/2011 | | | | | 2,900,000 | | | | 2,915,976 | |
| BMW Vehicle Lease Trust |
| Series 2009-1, Class A1 |
| 0.792% | | | | 06/15/2010 | | | | | 973 | | | | 973 | |
| Capital Auto Receivables Asset Trust |
| Series 2008-1, Class A4B |
| 1.583% | | | | 07/15/2014 | | # | | | 3,000,000 | | | | 3,031,230 | |
| Capital Auto Receivables Asset Trust |
| Series 2007-1, Class A4B |
| 0.273% | | | | 04/16/2012 | | # | | | 1,000,000 | | | | 994,730 | |
| Capital Auto Receivables Asset Trust |
| Series 2008-2, Class A3A |
| 4.680% | | | | 10/15/2012 | | | | | 1,725,000 | | | | 1,782,912 | |
| CarMax Auto Owner Trust |
| Series 2007-1, Class B |
| 5.340% | | | | 10/15/2012 | | | | | 3,000,000 | | | | 3,052,658 | |
| Chase Manhattan Auto Owner Trust |
| Series 2006-B, Class A4 |
| 5.110% | | | | 04/15/2014 | | | | $ | 1,929,673 | | | $ | 1,974,179 | |
| Daimler Chrysler Auto Trust |
| Series 2008-B, Class A4A |
| 5.320% | | | | 11/10/2014 | | | | | 2,000,000 | | | | 2,093,877 | |
| Daimler Chrysler Auto Trust |
| Series 2008-A, Class A3A |
| 3.700% | | | | 06/08/2012 | | | | | 1,295,761 | | | | 1,316,741 | |
| Daimler Chrysler Auto Trust |
| Series 2006-C, Class A4 |
| 4.980% | | | | 11/08/2011 | | | | | 2,679,259 | | | | 2,701,814 | |
| Ford Credit Auto Lease Trust |
| Series 2009-A, Class A2 |
| 2.600% | | | | 05/15/2011 | | ˆ | | | 1,350,000 | | | | 1,359,970 | |
| Ford Credit Auto Lease Trust |
| Series 2009-A, Class A1 |
| 1.237% | | | | 06/15/2010 | | ˆ | | | 295,693 | | | | 295,932 | |
| Ford Credit Auto Owner Trust |
| Series 2007-B, Class A4A |
| 5.240% | | | | 07/15/2012 | | | | | 5,400,000 | | | | 5,668,174 | |
| Ford Credit Auto Owner Trust |
| Series 2009-D, Class A2 |
| 1.210% | | | | 01/15/2012 | | | | | 900,000 | | | | 902,633 | |
| Harley-Davidson Motorcycle Trust |
| Series 2006-3, Class A3 |
| 5.240% | | | | 01/15/2012 | | | | | 14,900 | | | | 14,927 | |
| Harley-Davidson Motorcycle Trust |
| Series 2007-2, Class A4 |
| 5.120% | | | | 08/15/2013 | | | | | 2,725,000 | | | | 2,843,921 | |
| Honda Auto Receivables Owner Trust |
| Series 2009-2, Class A2 |
| 2.220% | | | | 08/15/2011 | | | | | 1,300,000 | | | | 1,308,951 | |
| Nissan Auto Lease Trust |
| Series 2009-A, Class A2 |
| 2.010% | | | | 04/15/2011 | | | | | 1,540,000 | | | | 1,549,438 | |
| Nissan Auto Lease Trust |
| Series 2009-B, Class A2 |
| 1.220% | | | | 09/15/2011 | | | | | 1,130,000 | | | | 1,131,800 | |
| USAA Auto Owner Trust |
| Series 2008-2, Class A3 |
| 4.640% | | | | 10/15/2012 | | | | | 1,007,562 | | | | 1,036,292 | |
| USAA Auto Owner Trust |
| Series 2007-2, Class A3 |
| 4.900% | | | | 02/15/2012 | | | | | 705,085 | | | | 714,181 | |
| Volkswagen Auto Lease Trust |
| Series 2009-A, Class A2 |
| 2.870% | | | | 07/15/2011 | | | | | 977,971 | | | | 986,696 | |
| | | | | | | | | | | | | | 43,398,780 | |
| |
Credit Card—8.2% |
| American Express Credit Account Master Trust |
| Series 2005-4, Class A |
| 0.303% | | | | 01/15/2015 | | # | | | 1,268,000 | | | | 1,252,278 | |
| American Express Credit Account Master Trust |
| Series 2008-5, Class A |
| 1.033% | | | | 03/15/2016 | | # | | | 4,550,000 | | | | 4,560,578 | |
| BA Credit Card Trust |
| Series 2008-A9, Class A9 |
| 4.070% | | | | 07/16/2012 | | | | | 1,650,000 | | | | 1,656,781 | |
| BA Credit Card Trust |
| Series 2006-A15, Class A15 |
| 0.233% | | | | 04/15/2014 | | # | | | 4,200,000 | | | | 4,131,434 | |
| Capital One Multi-Asset Execution Trust |
| Series 2005-A10, Class A |
| 0.313% | | | | 09/15/2015 | | # | | | 1,000,000 | | | | 981,484 | |
See accompanying notes to financial statements.
219
SCHEDULE OF INVESTMENTS—(Continued)
December 31, 2009
Vantagepoint Low Duration
Bond Fund
Coupon
Rate
|
|
|
| Maturity
Date
|
|
|
| Face
|
| Value
|
|---|
| |
ASSET BACKED SECURITIES—(Continued) |
| Capital One Multi-Asset Execution Trust |
| Series 2007-A2, Class A2 |
| 0.313% | | | | 12/16/2019 | | # | | $ | 2,500,000 | | | $ | 2,317,363 | |
| Capital One Multi-Asset Execution Trust |
| Series 2008-A5, Class A5 |
| 4.850% | | | | 02/18/2014 | | | | | 2,550,000 | | | | 2,662,278 | |
| Chase Issuance Trust |
| Series 2007-A9, Class A9 |
| 0.263% | | | | 06/16/2014 | | # | | | 2,250,000 | | | | 2,220,022 | |
| Citibank Credit Card Issuance Trust |
| Series 2009-A5, Class A5 |
| 2.250% | | | | 12/23/2014 | | | | | 4,230,000 | | | | 4,188,044 | |
| Discover Card Master Trust |
| Series 2008-A3, Class A3 |
| 5.100% | | | | 10/15/2013 | | | | | 5,255,000 | | | | 5,500,037 | |
| GE Capital Credit Card Master Note Trust |
| Series 2007-3, Class A2 |
| 5.400% | | | | 06/15/2013 | | | | | 5,915,000 | | | | 6,032,897 | |
| GE Capital Credit Card Master Note Trust |
| Series 2007-4, Class A |
| 0.283% | | | | 06/15/2015 | | # | | | 500,000 | | | | 484,508 | |
| Household Credit Card Master Note Trust I |
| Series 2007-2, Class A |
| 0.783% | | | | 07/15/2013 | | # | | | 6,400,000 | | | | 6,376,448 | |
| | | | | | | | | | | | | | 42,364,152 | |
| |
TOTAL ASSET BACKED SECURITIES |
| (Cost $83,657,838) | | | | | | | | 85,762,932 | |
| |
| |
NON-GOVERNMENT MORTGAGE-BACKED SECURITIES—2.0% |
| |
Mortgage Backed—2.0% |
| Banc of America Mortgage Securities, Inc. |
| Series 2004-L, Class 1A1 |
| 4.874% | | | | 01/25/2035 | | # | | | 892,623 | | | | 792,163 | |
GSR Mortgage Loan Trust
Series 2005-AR6, Class 2A1 |
| 3.336% | | | | 09/25/2035 | | # | | | 3,053,104 | | | | 2,650,888 | |
Harborview Mortgage Loan Trust
Series 2005-14, Class 3A1A |
| 5.315% | | | | 12/19/2035 | | # | | | 3,856,560 | | | | 2,906,543 | |
| MLCC Mortgage Investors, Inc. |
| Series 2004-1, Class 2A2 |
| 2.887% | | | | 12/25/2034 | | # | | | 2,170,689 | | | | 1,958,683 | |
| Provident Funding Mortgage Loan Trust |
| Series 2004-1, Class 1A1 |
| 3.195% | | | | 04/25/2034 | | # | | | 331,969 | | | | 309,338 | |
| Structured Asset Mortgage Investments, Inc. |
| Series 2004-AR5, Class 2A1 |
| 2.164% | | | | 10/19/2034 | | # | | | 749,317 | | | | 540,278 | |
| Thornburg Mortgage Securities Trust |
| Series 2004-1, Class II2A |
| 3.133% | | | | 03/25/2044 | | # | | | 667,833 | | | | 581,431 | |
| Wells Fargo Mortgage Backed Securities Trust |
| Series 2004-S, Class B1 |
| 3.104% | | | | 09/25/2034 | | # | | | 2,001,919 | | | | 713,731 | |
| |
TOTAL NON-GOVERNMENT
MORTGAGE-BACKED SECURITIES |
| (Cost $13,618,707) | | | | | | | | 10,453,055 | |
| |
NON-U.S. GOVERNMENT AGENCY
OBLIGATIONS—1.4% |
| |
Non-U.S. Government Agency Obligations—1.4% |
| Export Development Canada (Canada) | | | |
| 3.750% | | | | 07/15/2011 | | | | $ | 1,365,000 | | | $ | 1,418,030 | |
| Kreditanstalt fuer Wiederaufbau (Germany) | | | |
| 3.750% | | | | 06/27/2011 | | | | | 1,150,000 | | | | 1,194,601 | |
| Nederlandse Waterschapsbank NV MTN (Netherlands) | | | |
| 4.625% | | | | 07/25/2011 | | | | | EUR 1,500,000 | | | | 2,251,455 | |
| Societe Financement de l’Economie Francaise (France) | | | |
| 2.125% | | | | 01/30/2012 | | ˆ | | | 2,300,000 | | | | 2,330,452 | |
| |
TOTAL NON-U.S. GOVERNMENT AGENCY OBLIGATIONS |
| (Cost $7,063,072) | | | | | | | | 7,194,538 | |
| |
| |
| | | | | | | | | | Shares | | | | Value | |
| |
CASH EQUIVALENTS—26.0% |
| |
Institutional Money Market Funds—26.0% |
| Fidelity Institutional Money Market: Money Market Portfolio—Institutional Class | | | | 89,791,417 | | | | 89,791,417 | |
| Fidelity Institutional Money Market: Money Market Portfolio—Institutional Class | †† | | | 8,708,153 | | | | 8,708,153 | |
| Fidelity Institutional Money Market: Prime Money Market Portfolio— Institutional Class | †† | | | 9,000,000 | | | | 9,000,000 | |
| Short-Term Investments Trust Liquid Assets Portfolio | †† | | | 9,000,000 | | | | 9,000,000 | |
| Wells Fargo Advantage Cash Investment Money Market Fund—Select Class | †† | | | 9,020,800 | | | | 9,020,800 | |
| Wells Fargo Advantage Heritage Money Market Fund—Select Class | †† | | | 9,000,000 | | | | 9,000,000 | |
| |
TOTAL CASH EQUIVALENTS |
| (Cost $134,520,370) | | | | | | 134,520,370 | |
| |
TOTAL INVESTMENTS—107.9% | | | |
| (Cost $549,591,382) | | 558,689,023 | |
| Other assets less liabilities—(7.9%) | | (41,030,177 | ) |
| |
NET ASSETS—100.0% | $ | 517,658,846 | |
Notes to the Schedule of Investments:
| |
|---|
| EUR | | | | European Monetary Unit |
| MTN | | | | Medium Term Note |
| REMICS | | | | Real Estate Mortgage Investment Conduits |
| † | | | | Denotes all or a portion of the security on loan. |
| ˆ | | | | Securities are not registered under the Securities Act of 1933. These securities may be resold only in transactions exempt from registration, generally to qualified institutional buyers under Securities Act Rule 144A. 144A securities amounted to $34,846,882, which represents 6.2% of Total Investments. |
| # | | | | Rate is subject to change. Rate shown reflects current rate. |
| ‡‡ | | | | Security or a portion of the security has been pledged as collateral for futures contracts. |
| †† | | | | Represents reinvestment of collateral received in conjunction with securities lending. |
See accompanying notes to financial statements.
220
SCHEDULE OF INVESTMENTS
December 31, 2009
Vantagepoint Inflation Protected
Securities Fund
Coupon
Rate
|
|
|
| Maturity
Date
|
|
|
| Face
|
| Value
|
|---|
| |
CORPORATE OBLIGATIONS—0.8% |
| |
Capital Markets—0.1% |
| Bear Stearns Cos. LLC (The), Series CPI MTN | | | |
| 0.510% | | | | 03/10/2014 | | # | | $ | 380,000 | | | $ | 353,932 | |
| |
Commercial Banks—0.0% |
| Royal Bank of Scotland Group plc, Perpetual Bond (United Kingdom) | | | |
| 7.092% | | | | 09/29/2017 | | # | | | EUR 100,000 | | | | 72,753 | |
| |
Consumer Finance—0.2% |
| SLM Corp. MTN | | | |
| 0.334% | | | | 04/01/2014 | | # | | | 465,000 | | | | 347,443 | |
| SLM Corp., Series B MTN | | | |
| 0.000% | | | | 03/15/2010 | | # | | | 325,000 | | | | 324,864 | |
| | | | | | | | | | | | | | 672,307 | |
| |
Diversified Financial Services—0.2% |
| Citigroup, Inc. | | | |
| 0.361% | | | | 05/18/2011 | | # | | | 700,000 | | | | 688,273 | |
| |
Insurance—0.2% |
| ASIF I, Series E MTN (Cayman Islands) | | | |
| 0.432% | | | | 07/26/2010 | | # | | | 600,000 | | | | 576,495 | |
| |
Multi-National—0.1% |
| International Bank for Reconstruction & Development, Series CPI (Supranational) | | | |
| 0.000% | | | | 12/10/2013 | | # | | | 275,000 | | | | 271,934 | |
| |
TOTAL CORPORATE OBLIGATIONS |
| (Cost $2,690,700) | | | | | | | | 2,635,694 | |
| |
| |
U.S. GOVERNMENT AGENCY OBLIGATIONS—3.6% |
| |
U.S. Government Agency Obligations—2.2% |
| Federal Home Loan Mortgage Corp. Discount Notes |
| 0.121% | | | | 03/02/2010 | | | | | 200,000 | | | | 199,987 | |
| 0.100% | | | | 03/24/2010 | | | | | 900,000 | | | | 899,921 | |
| 0.060% | | | | 02/18/2010 | | | | | 2,000,000 | | | | 1,999,837 | |
| Federal National Mortgage Association Discount Notes |
| 0.648% | | | | 02/17/2010 | | | | | 100,000 | | | | 99,996 | |
| 0.220% | | | | 03/17/2010 | | | | | 800,000 | | | | 799,936 | |
| 0.047% | | | | 02/01/2010 | | | | | 2,400,000 | | | | 2,399,884 | |
| Tennessee Valley Authority |
| 5.250% | | | | 09/15/2039 | | † | | | 900,000 | | | | 895,100 | |
| | | | | | | | | | | | | | 7,294,661 | |
| |
U.S. Government Backed Corporate Obligations—1.4% |
| GMAC, Inc. |
| 0.253% | | | | 12/19/2012 | | # | | | 4,800,000 | | | | 4,808,870 | |
| |
TOTAL U.S. GOVERNMENT
AGENCY OBLIGATIONS |
| (Cost $12,089,060) | | | | | | | | 12,103,531 | |
| |
| |
U.S. TREASURY OBLIGATIONS—90.8% |
| |
U.S. Treasury Inflation Protected Securities Bonds—30.9% |
| U.S. Treasury Bond |
| 3.875% | | | | 04/15/2029 | | † | | | 7,845,000 | | | | 13,307,061 | |
| 3.625% | | | | 04/15/2028 | | | | | 3,540,000 | | | | 5,859,986 | |
| 3.375% | | | | 04/15/2032 | | † | | | 510,000 | | | | 769,812 | |
| 2.500% | | | | 01/15/2029 | | † | | | 9,215,000 | | | | 9,975,003 | |
| 2.375% | | | | 01/15/2025 | | ‡‡ | | $ | 25,725,000 | | | $ | 31,203,725 | |
| 2.375% | | | | 01/15/2027 | | | | | 7,545,000 | | | | 8,531,513 | |
| 2.000% | | | | 01/15/2026 | | † | | | 18,780,000 | | | | 20,593,831 | |
| 1.750% | | | | 01/15/2028 | | | | | 14,513,000 | | | | 14,397,843 | |
| | | | | | | | | | | | | | 104,638,774 | |
| |
U.S. Treasury Inflation Protected Securities Notes—59.9% |
| U.S. Treasury Note |
| 4.250% | | | | 01/15/2010 | | | | | 2,568,660 | | | | 2,573,917 | |
| 3.500% | | | | 01/15/2011 | | | | | 1,610,000 | | | | 2,076,754 | |
| 3.375% | | | | 01/15/2012 | | | | | 2,840,000 | | | | 3,702,318 | |
| 3.000% | | | | 07/15/2012 | | | | | 22,061,000 | | | | 28,551,003 | |
| 2.625% | | | | 07/15/2017 | | | | | 3,925,000 | | | | 4,507,485 | |
| 2.500% | | | | 07/15/2016 | | | | | 3,015,000 | | | | 3,518,596 | |
| 2.375% | | | | 01/15/2017 | | | | | 20,405,000 | | | | 23,652,259 | |
| 2.375% | | | | 04/15/2011 | | † | | | 2,810,000 | | | | 3,154,659 | |
| 2.125% | | | | 01/15/2019 | | † | | | 5,415,000 | | | | 5,790,464 | |
| 2.000% | | | | 04/15/2012 | | † | | | 1,935,000 | | | | 2,156,734 | |
| 2.000% | | | | 01/15/2014-
07/15/2014 | | †‡‡ | | | 37,900,000 | | | | 46,340,404 | |
| 2.000% | | | | 01/15/2016 | | | | | 10,280,000 | | | | 11,837,965 | |
| 1.875% | | | | 07/15/2019 | | † | | | 4,535,000 | | | | 4,772,966 | |
| 1.875% | | | | 07/15/2013-
07/15/2015 | | | | | 23,979,000 | | | | 29,184,385 | |
| 1.625% | | | | 01/15/2015 | | | | | 11,075,000 | | | | 13,055,661 | |
| 1.625% | | | | 01/15/2018 | | † | | | 11,155,000 | | | | 11,801,195 | |
| 1.375% | | | | 07/15/2018 | | † | | | 4,160,000 | | | | 4,185,347 | |
| 1.250% | | | | 04/15/2014 | | † | | | 300,000 | | | | 317,095 | |
| 0.625% | | | | 04/15/2013 | | † | | | 1,775,000 | | | | 1,848,303 | |
| | | | | | | | | | | | | | 203,027,510 | |
| |
TOTAL U.S. TREASURY OBLIGATIONS |
| (Cost $296,605,535) | | | | | | | | 307,666,284 | |
| |
| |
SOVEREIGN DEBT OBLIGATIONS—0.2% |
| |
Government Issued—0.2% |
| Israel Government AID Bond (Israel) | | | |
| 5.500% | | | | 09/18/2023 | | | | | | | | | | |
| (Cost $541,823) | | | | 500,000 | | | | 533,871 | |
| |
| |
| | | | | | | | | | Shares | | | | Value | |
| |
CASH EQUIVALENTS—19.6% |
| |
Institutional Money Market Funds—19.6% |
| Fidelity Institutional Money Market: Money Market Portfolio—Institutional Class | | | | 12,236,181 | | | | 12,236,181 | |
| Fidelity Institutional Money Market: Money Market Portfolio—Institutional Class | †† | | | 10,326,389 | | | | 10,326,389 | |
| Fidelity Institutional Money Market: Prime Money Market Portfolio— Institutional Class | †† | | | 11,000,000 | | | | 11,000,000 | |
| Short-Term Investments Trust Liquid Assets Portfolio | †† | | | 11,000,000 | | | | 11,000,000 | |
| Wells Fargo Advantage Cash Investment Money Market Fund—Select Class | †† | | | 10,957,231 | | | | 10,957,231 | |
| Wells Fargo Advantage Heritage Money Market Fund—Select Class | †† | | | 11,000,000 | | | | 11,000,000 | |
| |
TOTAL CASH EQUIVALENTS |
| (Cost $66,519,801) | | | | | | 66,519,801 | |
See accompanying notes to financial statements.
221
SCHEDULE OF INVESTMENTS
December 31, 2009
Vantagepoint Inflation Protected
Securities Fund
|
|
|
|
|
|
|
| Value
|
|
|---|
| |
TOTAL INVESTMENTS—115.0% | |
| (Cost $378,446,919) | | | | | $ | 389,459,181 | |
| Other assets less liabilities—(15.0%) | | (50,669,574 | ) |
| |
NET ASSETS—100.0% | | | | | $ | 338,789,607 | |
Notes to the Schedule of Investments:
| |
|---|
| EUR | | | | European Monetary Unit |
| MTN | | | | Medium Term Note |
| # | | | | Rate is subject to change. Rate shown reflects current rate. |
| † | | | | Denotes all or a portion of the security on loan. |
| ‡‡ | | | | Security or a portion of the security has been pledged as collateral for futures contracts. |
| †† | | | | Represents reinvestment of collateral received in conjunction with securities lending. |
See accompanying notes to financial statements.
222
SCHEDULE OF INVESTMENTS
December 31, 2009
Vantagepoint
Asset Allocation Fund
| | | | Shares | | Value | |
|---|
| |
COMMON STOCKS—63.9% |
| |
Aerospace & Defense—1.8% |
| Boeing Co. (The) | | | | 20,474 | | | $ | 1,108,258 | |
| General Dynamics Corp. | | | | 10,875 | | | | 741,349 | |
| Goodrich Corp. | | | | 3,370 | | | | 216,523 | |
| Honeywell International, Inc. | | | | 20,985 | | | | 822,612 | |
| ITT Corp. | | | | 5,017 | | | | 249,546 | |
| L-3 Communications Holdings, Inc. | | | | 3,273 | | | | 284,587 | |
| Lockheed Martin Corp. | | | | 9,021 | | | | 679,732 | |
| Northrop Grumman Corp. | | | | 8,853 | | | | 494,440 | |
| Precision Castparts Corp. | | | | 3,999 | | | | 441,290 | |
| Raytheon Co. | | | | 10,824 | | | | 557,652 | |
| Rockwell Collins, Inc. | | | | 4,517 | | | | 250,061 | |
| United Technologies Corp. | | | | 26,422 | | | | 1,833,951 | |
| | | | | | | | | | | | | | 7,680,001 | |
| |
Air Freight & Logistics—0.7% |
| C.H. Robinson Worldwide, Inc. | | | | 4,898 | | | | 287,659 | |
| Expeditors International of Washington, Inc. | † | | | 6,027 | | | | 209,318 | |
| FedEx Corp. | | | | 8,814 | | | | 735,528 | |
| United Parcel Service, Inc., Class B | | | | 28,083 | | | | 1,611,122 | |
| | | | | | | | | | | | | | 2,843,627 | |
| |
Airlines—0.1% |
| Southwest Airlines Co. | | | | 21,045 | | | | 240,544 | |
| |
Auto Components—0.1% |
| Goodyear Tire & Rubber Co. (The) | * | | | 6,976 | | �� | | 98,362 | |
| Johnson Controls, Inc. | | | | 18,558 | | | | 505,520 | |
| | | | | | | | | | | | | | 603,882 | |
| |
Automobiles—0.2% |
| Ford Motor Co. | *† | | | 91,344 | | | | 913,440 | |
| Harley-Davidson, Inc. | † | | | 6,777 | | | | 170,780 | |
| | | | | | | | | | | | | | 1,084,220 | |
| |
Beverages—1.7% |
| Brown-Forman Corp., Class B | | | | 3,112 | | | | 166,710 | |
| Coca-Cola Co. (The) | | | | 65,263 | | | | 3,719,991 | |
| Coca-Cola Enterprises, Inc. | | | | 8,881 | | | | 188,277 | |
| Constellation Brands, Inc., Class A | * | | | 5,953 | | | | 94,831 | |
| Dr. Pepper Snapple Group, Inc. | † | | | 7,149 | | | | 202,317 | |
| Molson Coors Brewing Co., Class B | | | | 4,382 | | | | 197,891 | |
| Pepsi Bottling Group, Inc. | | | | 4,012 | | | | 150,450 | |
| PepsiCo, Inc. | | | | 43,952 | | | | 2,672,282 | |
| | | | | | | | | | | | | | 7,392,749 | |
| |
Biotechnology—1.0% |
| Amgen, Inc. | * | | | 28,516 | | | | 1,613,150 | |
| Biogen Idec, Inc. | * | | | 8,164 | | | | 436,774 | |
| Celgene Corp. | * | | | 12,950 | | | | 721,056 | |
| Cephalon, Inc. | *† | | | 1,903 | | | | 118,766 | |
| Genzyme Corp. | * | | | 7,495 | | | | 367,330 | |
| Gilead Sciences, Inc. | * | | | 25,373 | | | | 1,098,144 | |
| | | | | | | | | | | | | | 4,355,220 | |
| |
Building Products—0.0% |
| Masco Corp. | † | | | 10,095 | | | | 139,412 | |
| |
Capital Markets—1.8% |
| Ameriprise Financial, Inc. | | | | 7,360 | | | $ | 285,715 | |
| Bank of New York Mellon Corp. (The) | | | | 34,098 | | | | 953,721 | |
| Charles Schwab Corp. (The) | | | | 26,851 | | | | 505,336 | |
| E*Trade Financial Corp. | * | | | 39,373 | | | | 68,903 | |
| Federated Investors, Inc., Class B | † | | | 2,858 | | | | 78,595 | |
| Franklin Resources, Inc. | † | | | 4,278 | | | | 450,687 | |
| Goldman Sachs Group, Inc. (The) | | | | 14,442 | | | | 2,438,387 | |
| Invesco Ltd. | | | | 11,785 | | | | 276,830 | |
| Janus Capital Group, Inc. | † | | | 3,725 | | | | 50,101 | |
| Legg Mason, Inc. | † | | | 4,439 | | | | 133,880 | |
| Morgan Stanley | | | | 38,278 | | | | 1,133,029 | |
| Northern Trust Corp. | | | | 6,770 | | | | 354,748 | |
| State Street Corp. | | | | 13,929 | | | | 606,469 | |
| T. Rowe Price Group, Inc. | † | | | 7,271 | | | | 387,181 | |
| | | | | | | | | | | | | | 7,723,582 | |
| |
Chemicals—1.3% |
| Air Products & Chemicals, Inc. | | | | 5,917 | | | | 479,632 | |
| Airgas, Inc. | | | | 2,338 | | | | 111,289 | |
| CF Industries Holdings, Inc. | | | | 1,391 | | | | 126,275 | |
| Dow Chemical Co. (The) | | | | 32,231 | | | | 890,543 | |
| E.I. Du Pont de Nemours & Co. | | | | 25,508 | | | | 858,854 | |
| Eastman Chemical Co. | | | | 2,053 | | | | 123,673 | |
| Ecolab, Inc. | | | | 6,477 | | | | 288,745 | |
| FMC Corp. | † | | | 2,002 | | | | 111,631 | |
| International Flavors & Fragrances, Inc. | | | | 2,025 | | | | 83,308 | |
| Monsanto Co. | | | | 15,356 | | | | 1,255,353 | |
| PPG Industries, Inc. | | | | 4,713 | | | | 275,899 | |
| Praxair, Inc. | | | | 8,649 | | | | 694,601 | |
| Sigma-Aldrich Corp. | | | | 3,603 | | | | 182,060 | |
| | | | | | | | | | | | | | 5,481,863 | |
| |
Commercial Banks—1.7% |
| BB&T Corp. | † | | | 19,480 | | | | 494,208 | |
| Comerica, Inc. | † | | | 3,992 | | | | 118,043 | |
| Fifth Third Bancorp | | | | 19,346 | | | | 188,624 | |
| First Horizon National Corp. | *† | | | 7,199 | | | | 96,469 | |
| Huntington Bancshares, Inc./Ohio | | | | 17,666 | | | | 64,481 | |
| KeyCorp | † | | | 24,239 | | | | 134,526 | |
| M&T Bank Corp. | † | | | 2,048 | | | | 136,991 | |
| Marshall & Ilsley Corp. | † | | | 13,201 | | | | 71,945 | |
| PNC Financial Services Group, Inc. | | | | 13,029 | | | | 687,801 | |
| Regions Financial Corp. | † | | | 30,870 | | | | 163,302 | |
| SunTrust Banks, Inc. | | | | 13,147 | | | | 266,753 | |
| U.S. Bancorp | | | | 53,904 | | | | 1,213,379 | |
| Wells Fargo & Co. | | | | 142,708 | | | | 3,851,689 | |
| Zions Bancorporation | † | | | 3,265 | | | | 41,890 | |
| | | | | | | | | | | | | | 7,530,101 | |
| |
Commercial Services & Supplies—0.3% |
| Avery Dennison Corp. | | | | 2,744 | | | | 100,129 | |
| Cintas Corp. | | | | 3,798 | | | | 98,938 | |
| Iron Mountain, Inc. | * | | | 5,228 | | | | 118,989 | |
| Pitney Bowes, Inc. | | | | 5,882 | | | | 133,874 | |
| R.R. Donnelley & Sons Co. | | | | 5,928 | | | | 132,017 | |
| Republic Services, Inc. | | | | 9,239 | | | | 261,556 | |
| Stericycle, Inc. | *† | | | 2,469 | | | | 136,215 | |
| Waste Management, Inc. | † | | | 13,814 | | | | 467,051 | |
| | | | | | | | | | | | | | 1,448,769 | |
|
See accompanying notes to financial statements.
223
SCHEDULE OF INVESTMENTS—(Continued)
December 31, 2009
Vantagepoint
Asset Allocation Fund
| | | | Shares | | Value | |
|---|
| |
COMMON STOCKS—(Continued) |
| |
Communications Equipment—1.7% |
| Cisco Systems, Inc. | * | | | 161,993 | | | $ | 3,878,113 | |
| Harris Corp. | † | | | 3,788 | | | | 180,120 | |
| JDS Uniphase Corp. | * | | | 6,552 | | | | 54,054 | |
| Juniper Networks, Inc. | * | | | 14,772 | | | | 393,969 | |
| Motorola, Inc. | * | | | 65,186 | | | | 505,843 | |
| QUALCOMM, Inc. | | | | 47,082 | | | | 2,178,013 | |
| Tellabs, Inc. | * | | | 11,354 | | | | 64,491 | |
| | | | | | | | | | | | | | 7,254,603 | |
| |
Computers & Peripherals—3.8% |
| Apple, Inc. | * | | | 25,313 | | | | 5,337,499 | |
| Dell, Inc. | * | | | 49,178 | | | | 706,196 | |
| EMC Corp. | * | | | 57,115 | | | | 997,799 | |
| Hewlett-Packard Co. | | | | 66,751 | | | | 3,438,344 | |
| International Business Machines Corp. | | | | 36,978 | | | | 4,840,420 | |
| Lexmark International, Inc., Class A | *† | | | 1,871 | | | | 48,609 | |
| NetApp, Inc. | * | | | 9,742 | | | | 335,027 | |
| QLogic Corp. | * | | | 3,471 | | | | 65,498 | |
| SanDisk Corp. | *† | | | 6,738 | | | | 195,335 | |
| Sun Microsystems, Inc. | * | | | 20,042 | | | | 187,793 | |
| Teradata Corp. | * | | | 4,699 | | | | 147,690 | |
| Western Digital Corp. | * | | | 6,393 | | | | 282,251 | |
| | | | | | | | | | | | | | 16,582,461 | |
| |
Construction & Engineering—0.1% |
| Fluor Corp. | | | | 5,123 | | | | 230,740 | |
| Jacobs Engineering Group, Inc. | *† | | | 3,776 | | | | 142,015 | |
| Quanta Services, Inc. | *† | | | 5,546 | | | | 115,579 | |
| | | | | | | | | | | | | | 488,334 | |
| |
Construction Materials—0.0% |
| Vulcan Materials Co. | † | | | 3,131 | | | | 164,910 | |
| |
Consumer Finance—0.5% |
| American Express Co. | | | | 33,317 | | | | 1,350,005 | |
| Capital One Financial Corp. | | | | 12,687 | | | | 486,419 | |
| Discover Financial Services | | | | 15,018 | | | | 220,915 | |
| SLM Corp. | * | | | 12,411 | | | | 139,872 | |
| | | | | | | | | | | | | | 2,197,211 | |
| |
Containers & Packaging—0.1% |
| Ball Corp. | † | | | 2,557 | | | | 132,197 | |
| Bemis Co., Inc. | | | | 2,437 | | | | 72,257 | |
| Owens-Illinois, Inc. | * | | | 4,830 | | | | 158,762 | |
| Pactiv Corp. | * | | | 3,433 | | | | 82,873 | |
| Sealed Air Corp. | | | | 4,940 | | | | 107,988 | |
| | | | | | | | | | | | | | 554,077 | |
| |
Distributors—0.0% |
| Genuine Parts Co. | † | | | 4,583 | | | | 173,971 | |
| |
Diversified Consumer Services—0.1% |
| Apollo Group, Inc., Class A | * | | | 3,543 | | | | 214,635 | |
| DeVry, Inc. | † | | | 1,777 | | | | 100,809 | |
| H&R Block, Inc. | † | | | 9,852 | | | | 222,852 | |
| | | | | | | | | | | | | | 538,296 | |
| |
Diversified Financial Services—2.8% |
| Bank of America Corp. | | | | 279,748 | | | | 4,213,005 | |
| Citigroup, Inc. | | | | 540,514 | | | | 1,789,101 | |
| CME Group, Inc. | | | | 1,878 | | | | 630,914 | |
| IntercontinentalExchange, Inc. | * | | | 2,155 | | | | 242,006 | |
| JPMorgan Chase & Co. | | | | 110,961 | | | $ | 4,623,745 | |
| Leucadia National Corp. | *† | | | 5,258 | | | | 125,088 | |
| Moody’s Corp. | † | | | 5,566 | | | | 149,169 | |
| NASDAQ OMX Group, Inc. (The) | *† | | | 3,891 | | | | 77,120 | |
| NYSE Euronext | | | | 7,401 | | | | 187,245 | |
| | | | | | | | | | | | | | 12,037,393 | |
| |
Diversified Telecommunication Services—1.8% |
| AT&T, Inc. | | | | 166,127 | | | | 4,656,540 | |
| CenturyTel, Inc. | † | | | 8,309 | | | | 300,869 | |
| Frontier Communications Corp. | † | | | 8,927 | | | | 69,720 | |
| Qwest Communications International, Inc. | | | | 39,089 | | | | 164,564 | |
| Verizon Communications, Inc. | | | | 79,976 | | | | 2,649,605 | |
| Windstream Corp. | † | | | 12,417 | | | | 136,463 | |
| | | | | | | | | | | | | | 7,977,761 | |
| |
Electric Utilities—1.3% |
| Allegheny Energy, Inc. | | | | 4,715 | | | | 110,708 | |
| American Electric Power Co., Inc. | | | | 13,529 | | | | 470,674 | |
| Duke Energy Corp. | † | | | 36,301 | | | | 624,740 | |
| Edison International | | | | 9,418 | | | | 327,558 | |
| Entergy Corp. | | | | 5,335 | | | | 436,616 | |
| Exelon Corp. | | | | 18,637 | | | | 910,790 | |
| FirstEnergy Corp. | | | | 8,600 | | | | 399,470 | |
| FPL Group, Inc. | | | | 11,802 | | | | 623,382 | |
| Northeast Utilities | † | | | 4,291 | | | | 110,665 | |
| Pepco Holdings, Inc. | † | | | 5,821 | | | | 98,084 | |
| Pinnacle West Capital Corp. | | | | 3,007 | | | | 109,996 | |
| PPL Corp. | | | | 10,810 | | | | 349,271 | |
| Progress Energy, Inc. | | | | 7,998 | | | | 327,998 | |
| Southern Co. | | | | 22,078 | | | | 735,639 | |
| | | | | | | | | | | | | | 5,635,591 | |
| |
Electrical Equipment—0.3% |
| Emerson Electric Co. | | | | 21,218 | | | | 903,887 | |
| First Solar, Inc. | *† | | | 1,379 | | | | 186,716 | |
| Rockwell Automation, Inc. | † | | | 3,995 | | | | 187,685 | |
| Roper Industries, Inc. | | | | 2,559 | | | | 134,015 | |
| | | | | | | | | | | | | | 1,412,303 | |
| |
Electronic Equipment, Instruments & Components—0.4% |
| Agilent Technologies, Inc. | *† | | | 9,886 | | | | 307,158 | |
| Amphenol Corp., Class A | † | | | 5,038 | | | | 232,655 | |
| Corning, Inc. | | | | 43,859 | | | | 846,917 | |
| FLIR Systems, Inc. | *† | | | 3,859 | | | | 126,267 | |
| Jabil Circuit, Inc. | | | | 5,457 | | | | 94,788 | |
| Molex, Inc. | † | | | 3,869 | | | | 83,377 | |
| | | | | | | | | | | | | | 1,691,162 | |
| |
Energy Equipment & Services—1.2% |
| Baker Hughes, Inc. | † | | | 8,894 | | | | 360,029 | |
| BJ Services Co. | | | | 7,632 | | | | 141,955 | |
| Cameron International Corp. | *† | | | 6,115 | | | | 255,607 | |
| Diamond Offshore Drilling, Inc. | † | | | 2,023 | | | | 199,104 | |
| FMC Technologies, Inc. | * | | | 3,459 | | | | 200,069 | |
| Halliburton Co. | | | | 25,481 | | | | 766,723 | |
| Nabors Industries Ltd. (Bermuda) | *† | | | 7,452 | | | | 163,124 | |
| National Oilwell Varco, Inc. | | | | 11,797 | | | | 520,130 | |
| Rowan Cos., Inc. | * | | | 3,284 | | | | 74,350 | |
| Schlumberger Ltd. | | | | 33,816 | | | | 2,201,083 | |
See accompanying notes to financial statements.
224
SCHEDULE OF INVESTMENTS—(Continued)
December 31, 2009
Vantagepoint
Asset Allocation Fund
| | | | Shares | | Value | |
|---|
| |
COMMON STOCKS—(Continued) |
| Smith International, Inc. | | | | 6,155 | | | $ | 167,231 | |
| | | | | | | | | | | | | | 5,049,405 | |
| |
Food & Staples Retailing—1.7% |
| Costco Wholesale Corp. | † | | | 12,283 | | | | 726,785 | |
| CVS Caremark Corp. | | | | 39,831 | | | | 1,282,957 | |
| Kroger Co. (The) | † | | | 18,379 | | | | 377,321 | |
| Safeway, Inc. | | | | 11,484 | | | | 244,494 | |
| SUPERVALU, Inc. | † | | | 5,667 | | | | 72,028 | |
| Sysco Corp. | | | | 16,763 | | | | 468,358 | |
| Walgreen Co. | | | | 27,854 | | | | 1,022,799 | |
| Wal-Mart Stores, Inc. | | | | 60,149 | | | | 3,214,964 | |
| Whole Foods Market, Inc. | *† | | | 4,161 | | | | 114,219 | |
| | | | | | | | | | | | | | 7,523,925 | |
| |
Food Products—1.1% |
| Archer-Daniels-Midland Co. | | | | 18,128 | | | | 567,588 | |
| Campbell Soup Co. | † | | | 5,535 | | | | 187,083 | |
| ConAgra Foods, Inc. | | | | 12,530 | | | | 288,817 | |
| Dean Foods Co. | * | | | 4,133 | | | | 74,559 | |
| General Mills, Inc. | | | | 9,211 | | | | 652,231 | |
| H.J. Heinz Co. | | | | 9,003 | | | | 384,968 | |
| Hershey Co. (The) | † | | | 4,671 | | | | 167,175 | |
| Hormel Foods Corp. | † | | | 2,011 | | | | 77,323 | |
| J.M. Smucker Co. (The) | | | | 3,411 | | | | 210,629 | |
| Kellogg Co. | † | | | 7,184 | | | | 382,189 | |
| Kraft Foods, Inc., Class A | | | | 41,570 | | | | 1,129,873 | |
| McCormick & Co., Inc. | † | | | 3,772 | | | | 136,282 | |
| Sara Lee Corp. | | | | 19,389 | | | | 236,158 | |
| Tyson Foods, Inc., Class A | † | | | 8,698 | | | | 106,724 | |
| | | | | | | | | | | | | | 4,601,599 | |
| |
Gas Utilities—0.1% |
| EQT Corp. | † | | | 3,775 | | | | 165,798 | |
| Nicor, Inc. | † | | | 1,352 | | | | 56,919 | |
| Questar Corp. | | | | 4,635 | | | | 192,677 | |
| | | | | | | | | | | | | | 415,394 | |
| |
Health Care Equipment & Supplies—1.3% |
| Baxter International, Inc. | | | | 17,020 | | | | 998,734 | |
| Becton Dickinson and Co. | † | | | 6,687 | | | | 527,337 | |
| Boston Scientific Corp. | * | | | 43,331 | | | | 389,979 | |
| C.R. Bard, Inc. | | | | 2,732 | | | | 212,823 | |
| CareFusion Corp. | * | | | 5,192 | | | | 129,852 | |
| DENTSPLY International, Inc. | † | | | 4,297 | | | | 151,126 | |
| Hospira, Inc. | * | | | 4,624 | | | | 235,824 | |
| Intuitive Surgical, Inc. | * | | | 1,073 | | | | 325,462 | |
| Medtronic, Inc. | | | | 31,182 | | | | 1,371,384 | |
| St. Jude Medical, Inc. | * | | | 9,444 | | | | 347,350 | |
| Stryker Corp. | † | | | 7,871 | | | | 396,462 | |
| Varian Medical Systems, Inc. | *† | | | 3,496 | | | | 163,788 | |
| Zimmer Holdings, Inc. | * | | | 5,991 | | | | 354,128 | |
| | | | | | | | | | | | | | 5,604,249 | |
| |
Health Care Providers & Services—1.4% |
| Aetna, Inc. | | | | 12,505 | | | | 396,409 | |
| AmerisourceBergen Corp. | | | | 8,204 | | | | 213,878 | |
| Cardinal Health, Inc. | | | | 10,387 | | | | 334,877 | |
| CIGNA Corp. | | | | 7,802 | | | | 275,177 | |
| Coventry Health Care, Inc. | * | | | 3,905 | | | | 94,852 | |
| DaVita, Inc. | * | | | 2,934 | | | | 172,343 | |
| Express Scripts, Inc. | * | | | 7,652 | | | | 661,515 | |
| Humana, Inc. | * | | | 4,596 | | | | 201,718 | |
| Laboratory Corp. of America Holdings | *† | | | 3,007 | | | | 225,044 | |
| McKesson Corp. | | | | 7,628 | | | $ | 476,750 | |
| Medco Health Solutions, Inc. | * | | | 13,520 | | | | 864,063 | |
| Patterson Cos., Inc. | * | | | 2,589 | | | | 72,440 | |
| Quest Diagnostics, Inc. | † | | | 4,391 | | | | 265,129 | |
| Tenet Healthcare Corp. | * | | | 13,376 | | | | 72,097 | |
| UnitedHealth Group, Inc. | | | | 32,746 | | | | 998,098 | |
| WellPoint, Inc. | * | | | 12,964 | | | | 755,672 | |
| | | | | | | | | | | | | | 6,080,062 | |
| |
Health Care Technology—0.0% |
| IMS Health, Inc. | | | | 4,639 | | | | 97,697 | |
| |
Hotels, Restaurants & Leisure—0.9% |
| Carnival Corp. | * | | | 12,327 | | | | 390,643 | |
| Darden Restaurants, Inc. | | | | 3,687 | | | | 129,303 | |
| International Game Technology | | | | 8,520 | | | | 159,920 | |
| Marriott International, Inc., Class A | † | | | 7,360 | | | | 200,560 | |
| McDonald’s Corp. | | | | 30,436 | | | | 1,900,424 | |
| Starbucks Corp. | * | | | 20,952 | | | | 483,153 | |
| Starwood Hotels & Resorts Worldwide, Inc. | † | | | 5,017 | | | | 183,472 | |
| Wyndham Worldwide Corp. | | | | 4,235 | | | | 85,420 | |
| Wynn Resorts Ltd. | | | | 1,499 | | | | 87,287 | |
| Yum! Brands, Inc. | † | | | 13,016 | | | | 455,169 | |
| | | | | | | | | | | | | | 4,075,351 | |
| |
Household Durables—0.2% |
| Black & Decker Corp. | | | | 1,716 | | | | 111,248 | |
| D.R. Horton, Inc. | † | | | 8,237 | | | | 89,536 | |
| Fortune Brands, Inc. | | | | 4,231 | | | | 182,779 | |
| Harman International Industries, Inc. | † | | | 1,969 | | | | 69,466 | |
| Leggett & Platt, Inc. | † | | | 4,219 | | | | 86,068 | |
| Lennar Corp., Class A | | | | 3,951 | | | | 50,454 | |
| Newell Rubbermaid, Inc. | † | | | 8,248 | | | | 123,803 | |
| Pulte Homes, Inc. | *† | | | 9,128 | | | | 91,280 | |
| Whirlpool Corp. | | | | 1,906 | | | | 153,738 | |
| | | | | | | | | | | | | | 958,372 | |
| |
Household Products—1.6% |
| Clorox Co. | | | | 3,812 | | | | 232,532 | |
| Colgate-Palmolive Co. | | | | 14,010 | | | | 1,150,921 | |
| Kimberly-Clark Corp. | | | | 11,709 | | | | 745,980 | |
| Procter & Gamble Co. (The) | | | | 82,258 | | | | 4,987,303 | |
| | | | | | | | | | | | | | 7,116,736 | |
| |
Independent Power Producers & Energy Traders—0.1% |
| AES Corp. (The) | * | | | 18,980 | | | | 252,624 | |
| Constellation Energy Group, Inc. | | | | 5,145 | | | | 180,949 | |
| | | | | | | | | | | | | | 433,573 | |
| |
Industrial Conglomerates—1.4% |
| 3M Co. | | | | 19,709 | | | | 1,629,343 | |
| General Electric Co. | | | | 299,811 | | | | 4,536,141 | |
| Textron, Inc. | † | | | 6,700 | | | | 126,027 | |
| | | | | | | | | | | | | | 6,291,511 | |
| |
Insurance—1.5% |
| Aflac, Inc. | | | | 13,301 | | | | 615,171 | |
| Allstate Corp. (The) | | | | 15,239 | | | | 457,780 | |
| American International Group, Inc. | *† | | | 3,857 | | | | 115,633 | |
| AON Corp. | | | | 7,743 | | | | 296,867 | |
| Assurant, Inc. | | | | 3,199 | | | | 94,306 | |
| Chubb Corp. | | | | 9,661 | | | | 475,128 | |
|
See accompanying notes to financial statements.
225
SCHEDULE OF INVESTMENTS—(Continued)
December 31, 2009
Vantagepoint
Asset Allocation Fund
| | | | Shares | | Value | |
|---|
| |
COMMON STOCKS—(Continued) |
| Cincinnati Financial Corp. | † | | | 4,586 | | | $ | 120,337 | |
| Genworth Financial, Inc., Class A | * | | | 13,245 | | | | 150,331 | |
| Hartford Financial Services Group, Inc. | | | | 10,998 | | | | 255,813 | |
| Lincoln National Corp. | | | | 7,883 | | | | 196,129 | |
| Loews Corp. | | | | 10,182 | | | | 370,116 | |
| Marsh & McLennan Cos., Inc. | | | | 14,744 | | | | 325,547 | |
| MetLife, Inc. | | | | 23,316 | | | | 824,221 | |
| Principal Financial Group, Inc. | † | | | 8,936 | | | | 214,821 | |
| Progressive Corp. (The) | * | | | 19,428 | | | | 349,510 | |
| Prudential Financial, Inc. | | | | 13,130 | | | | 653,349 | |
| Torchmark Corp. | | | | 2,352 | | | | 103,370 | |
| Travelers Cos., Inc. (The) | | | | 15,456 | | | | 770,636 | |
| Unum Group | † | | | 9,393 | | | | 183,351 | |
| XL Capital Ltd., Class A (Bermuda) | | | | 9,375 | | | | 171,844 | |
| | | | | | | | | | | | | | 6,744,260 | |
| |
Internet & Catalog Retail—0.4% |
| Amazon.com, Inc. | * | | | 9,330 | | | | 1,255,072 | |
| Expedia, Inc. | * | | | 5,981 | | | | 153,771 | |
| priceline.com, Inc. | * | | | 1,202 | | | | 262,637 | |
| | | | | | | | | | | | | | 1,671,480 | |
| |
Internet Software & Services—1.3% |
| Akamai Technologies, Inc. | *† | | | 4,824 | | | | 122,192 | |
| eBay, Inc. | * | | | 31,823 | | | | 749,113 | |
| Google, Inc., Class A | * | | | 6,786 | | | | 4,207,184 | |
| VeriSign, Inc. | *† | | | 5,398 | | | | 130,848 | |
| Yahoo! Inc. | * | | | 33,535 | | | | 562,717 | |
| | | | | | | | | | | | | | 5,772,054 | |
| |
IT Services—1.0% |
| Affiliated Computer Services, Inc., Class A | * | | | 2,772 | | | | 165,461 | |
| Automatic Data Processing, Inc. | | | | 14,237 | | | | 609,628 | |
| Cognizant Technology Solutions Corp., Class A | * | | | 8,175 | | | | 370,327 | |
| Computer Sciences Corp. | * | | | 4,226 | | | | 243,122 | |
| Fidelity National Information Services, Inc. | | | | 8,862 | | | | 207,725 | |
| Fiserv, Inc. | * | | | 4,431 | | | | 214,815 | |
| Mastercard, Inc., Class A | † | | | 2,646 | | | | 677,323 | |
| Paychex, Inc. | † | | | 9,264 | | | | 283,849 | |
| SAIC, Inc. | * | | | 7,185 | | | | 136,084 | |
| Total System Services, Inc. | † | | | 5,640 | | | | 97,403 | |
| Visa, Inc., Class A | | | | 12,282 | | | | 1,074,184 | |
| Western Union Co. (The) | | | | 19,545 | | | | 368,423 | |
| | | | | | | | | | | | | | 4,448,344 | |
| |
Leisure Equipment & Products—0.1% |
| Eastman Kodak Co. | *† | | | 8,962 | | | | 37,820 | |
| Hasbro, Inc. | † | | | 3,736 | | | | 119,776 | |
| Mattel, Inc. | | | | 10,137 | | | | 202,537 | |
| | | | | | | | | | | | | | 360,133 | |
| |
Life Sciences Tools & Services—0.3% |
| Life Technologies Corp. | * | | | 5,029 | | | | 262,665 | |
| Millipore Corp. | * | | | 1,552 | | | | 112,287 | |
| PerkinElmer, Inc. | | | | 3,062 | | | | 63,046 | |
| Thermo Fisher Scientific, Inc. | * | | | 11,682 | | | | 557,115 | |
| Waters Corp. | *† | | | 2,808 | | | | 173,984 | |
| | | | | | | | | | | | | | 1,169,097 | |
| |
Machinery—1.1% |
| Caterpillar, Inc. | † | | | 17,625 | | | $ | 1,004,449 | |
| Cummins, Inc. | | | | 5,690 | | | | 260,943 | |
| Danaher Corp. | † | | | 7,355 | | | | 553,096 | |
| Deere & Co. | | | | 12,080 | | | | 653,407 | |
| Dover Corp. | | | | 5,413 | | | | 225,235 | |
| Eaton Corp. | | | | 4,793 | | | | 304,931 | |
| Flowserve Corp. | | | | 1,609 | | | | 152,099 | |
| Illinois Tool Works, Inc. | | | | 10,986 | | | | 527,218 | |
| PACCAR, Inc. | † | | | 10,509 | | | | 381,161 | |
| Pall Corp. | | | | 3,204 | | | | 115,985 | |
| Parker Hannifin Corp. | † | | | 4,604 | | | | 248,063 | |
| Snap-On, Inc. | † | | | 1,761 | | | | 74,420 | |
| Stanley Works (The) | † | | | 2,294 | | | | 118,164 | |
| | | | | | | | | | | | | | 4,619,171 | |
| |
Media—1.9% |
| CBS Corp., Class B | † | | | 19,170 | | | | 269,338 | |
| Comcast Corp., Class A | | | | 80,463 | | | | 1,356,606 | |
| DIRECTV, Class A | *† | | | 26,674 | | | | 889,578 | |
| Gannett Co., Inc. | † | | | 7,351 | | | | 109,162 | |
| Interpublic Group of Cos., Inc. | *† | | | 13,854 | | | | 102,243 | |
| McGraw-Hill Cos., Inc. (The) | † | | | 9,165 | | | | 307,119 | |
| Meredith Corp. | | | | 1,069 | | | | 32,979 | |
| New York Times Co. (The), Class A | * | | | 2,728 | | | | 33,718 | |
| News Corp., Class A | | | | 63,478 | | | | 869,014 | |
| Omnicom Group, Inc. | | | | 8,714 | | | | 341,153 | |
| Scripps Networks Interactive, Inc., Class A | | | | 2,551 | | | | 105,867 | |
| Time Warner Cable, Inc. | † | | | 9,944 | | | | 411,582 | |
| Time Warner, Inc. | † | | | 32,947 | | | | 960,076 | |
| Viacom, Inc., Class B | * | | | 17,338 | | | | 515,459 | |
| Walt Disney Co. (The) | | | | 54,070 | | | | 1,743,757 | |
| Washington Post Co. (The), Class B | | | | 182 | | | | 80,007 | |
| | | | | | | | | | | | | | 8,127,658 | |
| |
Metals & Mining—0.7% |
| AK Steel Holding Corp. | | | | 3,139 | | | | 67,018 | |
| Alcoa, Inc. | † | | | 27,407 | | | | 441,801 | |
| Allegheny Technologies, Inc. | † | | | 2,682 | | | | 120,073 | |
| Cliffs Natural Resources, Inc. | † | | | 3,074 | | | | 141,681 | |
| Freeport-McMoRan Copper & Gold, Inc. | * | | | 12,024 | | | | 965,407 | |
| Newmont Mining Corp. | | | | 13,813 | | | | 653,493 | |
| Nucor Corp. | † | | | 8,888 | | | | 414,625 | |
| Titanium Metals Corp. | *† | | | 2,831 | | | | 35,444 | |
| United States Steel Corp. | † | | | 3,886 | | | | 214,196 | |
| | | | | | | | | | | | | | 3,053,738 | |
| |
Multiline Retail—0.5% |
| Big Lots, Inc. | *† | | | 2,671 | | | | 77,406 | |
| Family Dollar Stores, Inc. | | | | 4,064 | | | | 113,101 | |
| J.C. Penney Co., Inc. | | | | 6,113 | | | | 162,667 | |
| Kohl’s Corp. | * | | | 8,791 | | | | 474,099 | |
| Macy’s, Inc. | † | | | 10,577 | | | | 177,270 | |
| Nordstrom, Inc. | † | | | 4,099 | | | | 154,040 | |
| Sears Holdings Corp. | *† | | | 1,379 | | | | 115,078 | |
| Target Corp. | | | | 21,192 | | | | 1,025,057 | |
| | | | | | | | | | | | | | 2,298,718 | |
| |
Multi-Utilities—0.9% |
| Ameren Corp. | | | | 5,714 | | | | 159,706 | |
| CenterPoint Energy, Inc. | | | | 9,450 | | | | 137,119 | |
| CMS Energy Corp. | † | | | 6,842 | | | | 107,146 | |
| Consolidated Edison, Inc. | | | | 7,879 | | | | 357,943 | |
|
See accompanying notes to financial statements.
226
SCHEDULE OF INVESTMENTS—(Continued)
December 31, 2009
Vantagepoint
Asset Allocation Fund
| | | | Shares | | Value | |
|---|
| |
COMMON STOCKS—(Continued) |
| Dominion Resources, Inc. | | | | 16,660 | | | $ | 648,407 | |
| DTE Energy Co. | † | | | 4,564 | | | | 198,945 | |
| Integrys Energy Group, Inc. | † | | | 2,268 | | | | 95,233 | |
| NiSource, Inc. | † | | | 8,145 | | | | 125,270 | |
| PG&E Corp. | | | | 10,627 | | | | 474,496 | |
| Public Service Enterprise Group, Inc. | | | | 14,137 | | | | 470,055 | |
| SCANA Corp. | | | | 3,151 | | | | 118,730 | |
| Sempra Energy | | | | 6,954 | | | | 389,285 | |
| TECO Energy, Inc. | | | | 6,212 | | | | 100,759 | |
| Wisconsin Energy Corp. | | | | 3,395 | | | | 169,173 | |
| Xcel Energy, Inc. | † | | | 13,310 | | | | 282,438 | |
| | | | | | | | | | | | | | 3,834,705 | |
| |
Office Electronics—0.0% |
| Xerox Corp. | † | | | 25,123 | | | | 212,541 | |
| |
Oil, Gas & Consumable Fuels—6.2% |
| Anadarko Petroleum Corp. | | | | 13,992 | | | | 873,381 | |
| Apache Corp. | | | | 9,481 | | | | 978,155 | |
| Cabot Oil & Gas Corp. | | | | 3,098 | | | | 135,042 | |
| Chesapeake Energy Corp. | | | | 18,009 | | | | 466,073 | |
| Chevron Corp. | | | | 56,501 | | | | 4,350,012 | |
| ConocoPhillips | | | | 41,798 | | | | 2,134,624 | |
| Consol Energy, Inc. | | | | 5,201 | | | | 259,010 | |
| Denbury Resources, Inc. | *† | | | 7,263 | | | | 107,492 | |
| Devon Energy Corp. | | | | 12,523 | | | | 920,440 | |
| El Paso Corp. | | | | 19,049 | | | | 187,252 | |
| EOG Resources, Inc. | | | | 7,173 | | | | 697,933 | |
| Exxon Mobil Corp. | | | | 133,528 | | | | 9,105,274 | |
| Hess Corp. | | | | 8,123 | | | | 491,441 | |
| Marathon Oil Corp. | | | | 19,963 | | | | 623,245 | |
| Massey Energy Co. | † | | | 2,550 | | | | 107,125 | |
| Murphy Oil Corp. | | | | 5,497 | | | | 297,937 | |
| Noble Energy, Inc. | † | | | 4,803 | | | | 342,070 | |
| Occidental Petroleum Corp. | | | | 22,862 | | | | 1,859,824 | |
| Peabody Energy Corp. | | | | 7,570 | | | | 342,240 | |
| Pioneer Natural Resources Co. | | | | 3,240 | | | | 156,071 | |
| Range Resources Corp. | † | | | 4,460 | | | | 222,331 | |
| Southwestern Energy Co. | * | | | 9,850 | | | | 474,770 | |
| Spectra Energy Corp. | | | | 18,246 | | | | 374,225 | |
| Sunoco, Inc. | † | | | 3,360 | | | | 87,696 | |
| Tesoro Corp. | † | | | 4,334 | | | | 58,726 | |
| Valero Energy Corp. | | | | 16,030 | | | | 268,502 | |
| Williams Cos., Inc. (The) | | | | 16,518 | | | | 348,199 | |
| XTO Energy, Inc. | | | | 16,369 | | | | 761,650 | |
| | | | | | | | | | | | | | 27,030,740 | |
| |
Paper & Forest Products—0.2% |
| International Paper Co. | | | | 12,263 | | | | 328,403 | |
| MeadWestvaco Corp. | | | | 4,887 | | | | 139,915 | |
| Weyerhaeuser Co. | | | | 6,106 | | | | 263,413 | |
| | | | | | | | | | | | | | 731,731 | |
| |
Personal Products—0.2% |
| Avon Products, Inc. | | | | 12,305 | | | | 387,608 | |
| Estee Lauder Cos., Inc. (The), Class A | † | | | 3,473 | | | | 167,954 | |
| Mead Johnson Nutrition Co., Class A | † | | | 5,395 | | | | 235,761 | |
| | | | | | | | | | | | | | 791,323 | |
| |
Pharmaceuticals—4.1% |
| Abbott Laboratories | | | | 43,541 | | | | 2,350,779 | |
| Allergan, Inc. | | | | 8,676 | | | | 546,675 | |
| Bristol-Myers Squibb Co. | † | | | 48,072 | | | | 1,213,818 | |
| Eli Lilly & Co. | † | | | 28,497 | | | $ | 1,017,628 | |
| Forest Laboratories, Inc. | *† | | | 8,799 | | | | 282,536 | |
| Johnson & Johnson | | | | 77,668 | | | | 5,002,596 | |
| King Pharmaceuticals, Inc. | *† | | | 6,841 | | | | 83,939 | |
| Merck & Co., Inc. | | | | 85,985 | | | | 3,141,892 | |
| Mylan, Inc. | *† | | | 8,816 | | | | 162,479 | |
| Pfizer, Inc. | | | | 227,164 | | | | 4,132,113 | |
| Watson Pharmaceuticals, Inc. | * | | | 2,837 | | | | 112,373 | |
| | | | | | | | | | | | | | 18,046,828 | |
| |
Professional Services—0.1% |
| Dun & Bradstreet Corp. | | | | 1,570 | | | | 132,461 | |
| Equifax, Inc. | | | | 3,897 | | | | 120,378 | |
| Monster Worldwide, Inc. | *† | | | 3,812 | | | | 66,329 | |
| Robert Half International, Inc. | † | | | 4,132 | | | | 110,448 | |
| | | | | | | | | | | | | | 429,616 | |
| |
Real Estate Investment Trusts (REITs)—0.7% |
| Apartment Investment & Management Co., Class A REIT | † | | | 2,622 | | | | 41,742 | |
| AvalonBay Communities, Inc. REIT | † | | | 2,127 | | | | 174,648 | |
| Boston Properties, Inc. REIT | † | | | 3,919 | | | | 262,847 | |
| Equity Residential REIT | | | | 7,799 | | | | 263,450 | |
| HCP, Inc. REIT | † | | | 8,190 | | | | 250,123 | |
| Health Care REIT, Inc. REIT | | | | 2,833 | | | | 125,558 | |
| Host Hotels & Resorts, Inc. REIT | *† | | | 15,597 | | | | 182,017 | |
| Kimco Realty Corp. REIT | | | | 10,441 | | | | 141,267 | |
| Plum Creek Timber Co., Inc. REIT | † | | | 4,764 | | | | 179,889 | |
| ProLogis REIT | † | | | 12,041 | | | | 164,841 | |
| Public Storage REIT | † | | | 3,529 | | | | 287,437 | |
| Simon Property Group, Inc. REIT | † | | | 8,022 | | | | 640,156 | |
| Ventas, Inc. REIT | | | | 3,992 | | | | 174,610 | |
| Vornado Realty Trust REIT | † | | | 4,405 | | | | 308,086 | |
| | | | | | | | | | | | | | 3,196,671 | |
| |
Real Estate Management & Development—0.0% |
| CB Richard Ellis Group, Inc., Class A | *† | | | 7,019 | | | | 95,248 | |
| |
Road & Rail—0.6% |
| Burlington Northern Santa Fe Corp. | | | | 7,389 | | | | 728,703 | |
| CSX Corp. | | | | 11,081 | | | | 537,318 | |
| Norfolk Southern Corp. | | | | 10,532 | | | | 552,087 | |
| Ryder System, Inc. | | | | 1,466 | | | | 60,355 | |
| Union Pacific Corp. | | | | 14,225 | | | | 908,978 | |
| | | | | | | | | | | | | | 2,787,441 | |
| |
Semiconductors & Semiconductor Equipment—1.7% |
| Advanced Micro Devices, Inc. | *† | | | 15,864 | | | | 153,564 | |
| Altera Corp. | † | | | 8,748 | | | | 197,967 | |
| Analog Devices, Inc. | | | | 8,319 | | | | 262,714 | |
| Applied Materials, Inc. | | | | 37,509 | | | | 522,876 | |
| Broadcom Corp., Class A | * | | | 12,169 | | | | 382,715 | |
| Intel Corp. | | | | 155,758 | | | | 3,177,463 | |
| KLA-Tencor Corp. | | | | 4,693 | | | | 169,699 | |
| Linear Technology Corp. | † | | | 6,231 | | | | 190,295 | |
| LSI Corp. | * | | | 18,627 | | | | 111,948 | |
| MEMC Electronic Materials, Inc. | * | | | 7,043 | | | | 95,926 | |
| Microchip Technology, Inc. | † | | | 5,165 | | | | 150,095 | |
| Micron Technology, Inc. | *† | | | 20,493 | | | | 216,406 | |
| National Semiconductor Corp. | † | | | 6,020 | | | | 92,467 | |
|
See accompanying notes to financial statements.
227
SCHEDULE OF INVESTMENTS—(Continued)
December 31, 2009
Vantagepoint
Asset Allocation Fund
| | | | Shares | | Value | |
|---|
| |
COMMON STOCKS—(Continued) |
| Novellus Systems, Inc. | * | | | 2,716 | | | $ | 63,391 | |
| NVIDIA Corp. | *† | | | 15,444 | | | | 288,494 | |
| Teradyne, Inc. | *† | | | 5,033 | | | | 54,004 | |
| Texas Instruments, Inc. | | | | 35,320 | | | | 920,439 | |
| Xilinx, Inc. | | | | 7,791 | | | | 195,242 | |
| | | | | | | | | | | | | | 7,245,705 | |
| |
Software—2.8% |
| Adobe Systems, Inc. | * | | | 14,814 | | | | 544,859 | |
| Autodesk, Inc. | * | | | 5,953 | | | | 151,266 | |
| BMC Software, Inc. | * | | | 5,402 | | | | 216,620 | |
| CA, Inc. | | | | 11,264 | | | | 252,989 | |
| Citrix Systems, Inc. | *† | | | 5,182 | | | | 215,623 | |
| Compuware Corp. | * | | | 6,686 | | | | 48,340 | |
| Electronic Arts, Inc. | * | | | 9,154 | | | | 162,484 | |
| Intuit, Inc. | *† | | | 9,219 | | | | 283,115 | |
| McAfee, Inc. | * | | | 4,396 | | | | 178,346 | |
| Microsoft Corp. | | | | 217,558 | | | | 6,633,343 | |
| Novell, Inc. | * | | | 12,340 | | | | 51,211 | |
| Oracle Corp. | | | | 110,082 | | | | 2,701,412 | |
| Red Hat, Inc. | * | | | 5,442 | | | | 168,158 | |
| Salesforce.com, Inc. | *† | | | 3,115 | | | | 229,794 | |
| Symantec Corp. | * | | | 22,863 | | | | 409,019 | |
| | | | | | | | | | | | | | 12,246,579 | |
| |
Specialty Retail—1.3% |
| Abercrombie & Fitch Co., Class A | | | | 2,735 | | | | 95,315 | |
| AutoNation, Inc. | *† | | | 2,133 | | | | 40,847 | |
| AutoZone, Inc. | *† | | | 852 | | | | 134,676 | |
| Bed Bath & Beyond, Inc. | * | | | 7,471 | | | | 288,605 | |
| Best Buy Co., Inc. | | | | 9,718 | | | | 383,472 | |
| GameStop Corp., Class A | *† | | | 5,012 | | | | 109,963 | |
| Gap, Inc. (The) | | | | 13,063 | | | | 273,670 | |
| Home Depot, Inc. | | | | 47,886 | | | | 1,385,342 | |
| Limited Brands, Inc. | | | | 7,632 | | | | 146,840 | |
| Lowe’s Cos., Inc. | | | | 41,511 | | | | 970,942 | |
| Office Depot, Inc. | * | | | 7,888 | | | | 50,878 | |
| O’Reilly Automotive, Inc. | *† | | | 3,932 | | | | 149,888 | |
| RadioShack Corp. | | | | 3,692 | | | | 71,994 | |
| Ross Stores, Inc. | † | | | 2,899 | | | | 123,816 | |
| Sherwin-Williams Co. (The) | † | | | 2,807 | | | | 173,052 | |
| Staples, Inc. | | | | 20,460 | | | | 503,111 | |
| Tiffany & Co. | † | | | 3,294 | | | | 141,642 | |
| TJX Cos., Inc. | | | | 11,837 | | | | 432,642 | |
| | | | | | | | | | | | | | 5,476,695 | |
| |
Textiles, Apparel & Luxury Goods—0.3% |
| Coach, Inc. | | | | 9,018 | | | | 329,427 | |
| NIKE, Inc., Class B | | | | 11,054 | | | | 730,338 | |
| Polo Ralph Lauren Corp. | † | | | 1,463 | | | | 118,474 | |
| V.F. Corp. | | | | 2,626 | | | | 192,328 | |
| | | | | | | | | | | | | | 1,370,567 | |
| |
Thrifts & Mortgage Finance—0.1% |
| Hudson City Bancorp, Inc. | | | | 13,622 | | | | 187,030 | |
| People’s United Financial, Inc. | † | | | 10,017 | | | | 167,284 | |
| | | | | | | | | | | | | | 354,314 | |
| |
Tobacco—1.0% |
| Altria Group, Inc. | | | | 58,547 | | | | 1,149,278 | |
| Lorillard, Inc. | | | | 4,550 | | | | 365,046 | |
| Philip Morris International, Inc. | | | | 53,704 | | | $ | 2,587,996 | |
| Reynolds American, Inc. | | | | 4,703 | | | | 249,118 | |
| | | | | | | | | | | | | | 4,351,438 | |
| |
Trading Companies & Distributors—0.1% |
| Fastenal Co. | † | | | 3,595 | | | | 149,696 | |
| W.W. Grainger, Inc. | | | | 1,779 | | | | 172,260 | |
| | | | | | | | | | | | | | 321,956 | |
| |
Wireless Telecommunication Services—0.2% |
| American Tower Corp., Class A | * | | | 11,375 | | | | 491,514 | |
| MetroPCS Communications, Inc. | *† | | | 7,236 | | | | 55,211 | |
| Sprint Nextel Corp. | * | | | 82,269 | | | | 301,104 | |
| | | | | | | | | | | | | | 847,829 | |
| |
TOTAL COMMON STOCKS |
| (Cost $276,382,086) | | | | | | 279,116,497 | |
| |
Coupon
Rate
|
|
|
| Maturity
Date
|
|
|
| Face
|
| Value
|
|---|
| |
U.S. TREASURY OBLIGATIONS—21.7% |
| |
U.S. Treasury Bills—0.9% |
| U.S. Treasury Bill |
| 0.027% | | | | 03/11/2010 | | ‡‡ | | $ | 3,815,000 | | | | 3,814,756 | |
| |
U.S. Treasury Bonds—20.8% |
| U.S. Treasury Bond |
| 8.750% | | | | 08/15/2020 | | | | | 2,466,000 | | | | 3,489,390 | |
| 8.500% | | | | 02/15/2020 | | | | | 871,000 | | | | 1,207,288 | |
| 8.000% | | | | 11/15/2021 | | † | | | 5,151,000 | | | | 7,015,827 | |
| 7.875% | | | | 02/15/2021 | | | | | 1,921,000 | | | | 2,582,544 | |
| 7.625% | | | | 02/15/2025 | | † | | | 4,157,000 | | | | 5,617,799 | |
| 7.250% | | | | 08/15/2022 | | † | | | 2,848,000 | | | | 3,690,387 | |
| 7.125% | | | | 02/15/2023 | | | | | 5,102,000 | | | | 6,544,912 | |
| 6.875% | | | | 08/15/2025 | | | | | 810,000 | | | | 1,028,321 | |
| 6.625% | | | | 02/15/2027 | | | | | 3,063,000 | | | | 3,826,358 | |
| 6.500% | | | | 11/15/2026 | | | | | 758,000 | | | | 934,591 | |
| 6.250% | | | | 05/15/2030 | | † | | | 5,014,000 | | | | 6,126,486 | |
| 6.250% | | | | 08/15/2023 | | | | | 1,534,000 | | | | 1,832,651 | |
| 6.125% | | | | 11/15/2027 | | | | | 1,366,000 | | | | 1,627,675 | |
| 6.125% | | | | 08/15/2029 | | † | | | 617,000 | | | | 740,979 | |
| 6.000% | | | | 02/15/2026 | | | | | 1,021,000 | | | | 1,194,730 | |
| 5.500% | | | | 08/15/2028 | | | | | 772,000 | | | | 860,539 | |
| 5.375% | | | | 02/15/2031 | | † | | | 6,014,000 | | | | 6,647,352 | |
| 5.250% | | | | 11/15/2028 | | † | | | 746,000 | | | | 808,595 | |
| 5.250% | | | | 02/15/2029 | | | | | 760,000 | | | | 823,651 | |
| 5.000% | | | | 05/15/2037 | | | | | 965,000 | | | | 1,025,162 | |
| 4.750% | | | | 02/15/2037 | | | | | 5,961,000 | | | | 6,093,263 | |
| 4.500% | | | | 08/15/2039 | | | | | 10,150,000 | | | | 9,923,219 | |
| 4.500% | | | | 02/15/2036-
05/15/2038 | | † | | | 3,030,000 | | | | 2,977,526 | |
| 4.375% | | | | 11/15/2039 | | | | | 2,230,000 | | | | 2,135,227 | |
| 4.375% | | | | 02/15/2038 | | † | | | 1,033,000 | | | | 992,003 | |
| 4.250% | | | | 05/15/2039 | | | | | 3,450,000 | | | | 3,237,611 | |
| 3.500% | | | | 02/15/2039 | | | | | 9,664,000 | | | | 7,918,450 | |
| | | | | | | | | | | | | | 90,902,536 | |
| |
TOTAL U.S. TREASURY OBLIGATIONS |
| (Cost $98,883,408) | | | | | | | | 94,717,292 | |
See accompanying notes to financial statements.
228
SCHEDULE OF INVESTMENTS—(Continued)
December 31, 2009
Vantagepoint
Asset Allocation Fund
Coupon
Rate
|
|
|
| Maturity
Date
|
|
|
| Face
|
| Value
|
|---|
COMMERCIAL PAPER—11.4%
|
|
|---|
| |
Commercial Banks—6.2% |
| Bank of Nova Scotia (Canada) | | | |
| 0.150% | | | | 02/19/2010 | | | | $ | 9,000,000 | | | $ | 8,997,713 | |
| Lloyds TSB Bank plc (United Kingdom) | | | |
| 0.200% | | | | 03/19/2010 | | | | | 2,000,000 | | | | 1,999,000 | |
| 0.190% | | | | 02/19/2010 | | | | | 16,000,000 | | | | 15,995,778 | |
| | | | | | | | | | | | | | 26,992,491 | |
| |
Diversified Financial Services—5.2% |
| Calyon North America, Inc. | | | |
| 0.205% | | | | 03/24/2010 | | | | | 11,000,000 | | | | 10,994,830 | |
| CBA Delaware Finance, Inc. | | | |
| 0.300% | | | | 03/22/2010 | | | | | 1,600,000 | | | | 1,599,456 | |
| Societe Generale North America, Inc. | | | |
| 0.180% | | | | 02/16/2010 | | | | | 10,000,000 | | | | 9,997,150 | |
| | | | | | | | | | | | | | 22,591,436 | |
| |
TOTAL COMMERCIAL PAPER |
| (Cost $49,584,666) | | | | | | | | 49,583,927 | |
| |
| |
| | | | | | | | | | Shares | | | | Value | |
| |
CASH EQUIVALENTS—14.3% |
| |
Institutional Money Market Funds—14.3% |
| Fidelity Institutional Money Market: Money Market Portfolio—Institutional Class | | | | 12,323,738 | | | | 12,323,738 | |
| Fidelity Institutional Money Market: Money Market Portfolio—Institutional Class | †† | | | 8,628,022 | | | | 8,628,022 | |
| Fidelity Institutional Money Market: Prime Money Market Portfolio— Institutional Class | †† | | | 10,500,000 | | | | 10,500,000 | |
| Short-Term Investments Trust Liquid Assets Portfolio | †† | | | 9,900,000 | | | | 9,900,000 | |
| Wells Fargo Advantage Cash Investment Money Market Fund—Select Class | †† | | | 10,742,838 | | | | 10,742,838 | |
| Wells Fargo Advantage Heritage Money Market Fund—Select Class | †† | | | 10,500,000 | | | | 10,500,000 | |
| |
TOTAL CASH EQUIVALENTS |
| (Cost $62,594,598) | | | | | | 62,594,598 | |
| |
TOTAL INVESTMENTS—111.3% | | | |
| (Cost $487,444,758) | | 486,012,314 | |
| Other assets less liabilities—(11.3%) | | (49,421,949 | ) |
| |
NET ASSETS—100.0% | $ | 436,590,365 | |
| | | | | | | | | | | | | | | | | | | |
Notes to the Schedule of Investments:
| |
|---|
| REIT | | | | Real Estate Investment Trust |
| † | | | | Denotes all or a portion of the security on loan. |
| * | | | | Non-income producing. |
| ‡‡ | | | | Security or a portion of the security has been pledged as collateral for futures contracts. |
| †† | | | | Represents reinvestment of collateral received in conjunction with securities lending. |
See accompanying notes to financial statements.
229
SCHEDULE OF INVESTMENTS
December 31, 2009
Vantagepoint
Equity Income Fund
| | | | Shares | | Value | |
|---|
| |
COMMON STOCKS—91.4% |
| |
Aerospace & Defense—2.5% |
| Boeing Co. (The) | | | | 91,600 | | | $ | 4,958,308 | |
| Honeywell International, Inc. | | | | 387,300 | | | | 15,182,160 | |
| L-3 Communications Holdings, Inc. | | | | 60,200 | | | | 5,234,390 | |
| Lockheed Martin Corp. | | | | 39,000 | | | | 2,938,650 | |
| Raytheon Co. | | | | 187,900 | | | | 9,680,608 | |
| | | | | | | | | | | | | | 37,994,116 | |
| |
Air Freight & Logistics—1.2% |
| FedEx Corp. | | | | 168,600 | | | | 14,069,670 | |
| United Parcel Service, Inc., Class B | | | | 84,800 | | | | 4,864,976 | |
| | | | | | | | | | | | | | 18,934,646 | |
| |
Airlines—0.2% |
| Southwest Airlines Co. | | | | 255,800 | | | | 2,923,794 | |
| |
Automobiles—0.2% |
| Harley-Davidson, Inc. | † | | | 96,000 | | | | 2,419,200 | |
| |
Biotechnology—0.2% |
| Amgen, Inc. | * | | | 51,400 | | | | 2,907,698 | |
| |
Building Products—0.3% |
| Masco Corp. | † | | | 233,500 | | | | 3,224,635 | |
| USG Corp. | *† | | | 77,900 | | | | 1,094,495 | |
| | | | | | | | | | | | | | 4,319,130 | |
| |
Capital Markets—1.5% |
| Bank of New York Mellon Corp. (The) | | | | 663,900 | | | | 18,569,283 | |
| Legg Mason, Inc. | † | | | 122,800 | | | | 3,703,648 | |
| | | | | | | | | | | | | | 22,272,931 | |
| |
Chemicals—1.1% |
| E.I. Du Pont de Nemours & Co. | | | | 391,646 | | | | 13,186,721 | |
| International Flavors & Fragrances, Inc. | | | | 95,500 | | | | 3,928,870 | |
| | | | | | | | | | | | | | 17,115,591 | |
| |
Commercial Banks—3.0% |
| Allied Irish Banks plc ADR (Ireland) | * | | | 124,800 | | | | 438,048 | |
| KeyCorp | † | | | 262,800 | | | | 1,458,540 | |
| Marshall & Ilsley Corp. | | | | 123,500 | | | | 673,075 | |
| PNC Financial Services Group, Inc. | † | | | 150,000 | | | | 7,918,500 | |
| Regions Financial Corp. | | | | 252,500 | | | | 1,335,725 | |
| SunTrust Banks, Inc. | † | | | 510,900 | | | | 10,366,161 | |
| U.S. Bancorp | | | | 313,600 | | | | 7,059,136 | |
| Wells Fargo & Co. | | | | 590,200 | | | | 15,929,498 | |
| | | | | | | | | | | | | | 45,178,683 | |
| |
Commercial Services & Supplies—0.5% |
| Avery Dennison Corp. | | | | 92,300 | | | | 3,368,027 | |
| Pitney Bowes, Inc. | † | | | 202,600 | | | | 4,611,176 | |
| | | | | | | | | | | | | | 7,979,203 | |
| |
Communications Equipment—0.6% |
| Cisco Systems, Inc. | * | | | 84,400 | | | | 2,020,536 | |
| Nokia Oyj ADR (Finland) | † | | | 566,800 | | | | 7,283,380 | |
| | | | | | | | | | | | | | 9,303,916 | |
| |
Computers & Peripherals—4.0% |
| Dell, Inc. | * | | | 2,785,700 | | | $ | 40,002,652 | |
| Hewlett-Packard Co. | | | | 194,600 | | | | 10,023,846 | |
| International Business Machines Corp. | | | | 84,400 | | | | 11,047,960 | |
| | | | | | | | | | | | | | 61,074,458 | |
| |
Construction Materials—1.9% |
| Cemex SAB de CV ADR (Mexico) | * | | | 2,139,922 | | | | 25,293,878 | |
| Vulcan Materials Co. | † | | | 73,100 | | | | 3,850,177 | |
| | | | | | | | | | | | | | 29,144,055 | |
| |
Consumer Finance—3.1% |
| American Express Co. | | | | 605,900 | | | | 24,551,068 | |
| Capital One Financial Corp. | † | | | 296,700 | | | | 11,375,478 | |
| SLM Corp. | * | | | 914,400 | | | | 10,305,288 | |
| | | | | | | | | | | | | | 46,231,834 | |
| |
Distributors—0.1% |
| Genuine Parts Co. | † | | | 53,552 | | | | 2,032,834 | |
| |
Diversified Consumer Services—0.1% |
| H&R Block, Inc. | † | | | 41,700 | | | | 943,254 | |
| |
Diversified Financial Services—3.4% |
| Bank of America Corp. | † | | | 1,084,906 | | | | 16,338,684 | |
| Citigroup, Inc. | | | | 1,299,500 | | | | 4,301,345 | |
| JPMorgan Chase & Co. | | | | 682,700 | | | | 28,448,109 | |
| NYSE Euronext | | | | 96,200 | | | | 2,433,860 | |
| | | | | | | | | | | | | | 51,521,998 | |
| |
Diversified Telecommunication Services—3.4% |
| AT&T, Inc. | | | | 717,942 | | | | 20,123,914 | |
| Level 3 Communications, Inc. | *† | | | 7,327,000 | | | | 11,210,310 | |
| Qwest Communications International, Inc. | | | | 699,300 | | | | 2,944,053 | |
| Verizon Communications, Inc. | | | | 532,441 | | | | 17,639,771 | |
| | | | | | | | | | | | | | 51,918,048 | |
| |
Electric Utilities—1.9% |
| Duke Energy Corp. | | | | 199,400 | | | | 3,431,674 | |
| Entergy Corp. | | | | 158,100 | | | | 12,938,904 | |
| Exelon Corp. | | | | 35,100 | | | | 1,715,337 | |
| FirstEnergy Corp. | | | | 45,000 | | | | 2,090,250 | |
| Pinnacle West Capital Corp. | | | | 72,000 | | | | 2,633,760 | |
| PPL Corp. | | | | 61,800 | | | | 1,996,758 | |
| Progress Energy, Inc. | † | | | 91,000 | | | | 3,731,910 | |
| | | | | | | | | | | | | | 28,538,593 | |
| |
Electrical Equipment—0.8% |
| Cooper Industries plc | | | | 71,400 | | | | 3,044,496 | |
| Emerson Electric Co. | | | | 219,000 | | | | 9,329,400 | |
| | | | | | | | | | | | | | 12,373,896 | |
| |
Energy Equipment & Services—0.5% |
| BJ Services Co. | | | | 75,700 | | | | 1,408,020 | |
| Schlumberger Ltd. | | | | 90,600 | | | | 5,897,154 | |
| | | | | | | | | | | | | | 7,305,174 | |
| |
Food & Staples Retailing—0.1% |
| Wal-Mart Stores, Inc. | | | | 33,700 | | | | 1,801,265 | |
| |
Food Products—0.8% |
| Hershey Co. (The) | † | | | 179,100 | | | | 6,409,989 | |
|
See accompanying notes to financial statements.
230
SCHEDULE OF INVESTMENTS—(Continued)
December 31, 2009
Vantagepoint
Equity Income Fund
| | | | Shares | | Value | |
|---|
| |
COMMON STOCKS—(Continued) |
| Kraft Foods, Inc., Class A | | | | 133,200 | | | $ | 3,620,376 | |
| McCormick & Co., Inc. | † | | | 53,500 | | | | 1,932,955 | |
| | | | | | | | | | | | | | 11,963,320 | |
| |
Health Care Equipment & Supplies—0.5% |
| Baxter International, Inc. | | | | 116,400 | | | | 6,830,352 | |
| |
Health Care Providers & Services—1.5% |
| UnitedHealth Group, Inc. | | | | 312,500 | | | | 9,525,000 | |
| WellPoint, Inc. | * | | | 223,700 | | | | 13,039,473 | |
| | | | | | | | | | | | | | 22,564,473 | |
| |
Hotels, Restaurants & Leisure—4.2% |
| Carnival Corp. | * | | | 291,200 | | | | 9,228,128 | |
| Marriott International, Inc., Class A | † | | | 831,869 | | | | 22,668,430 | |
| MGM MIRAGE | *† | | | 125,500 | | | | 1,144,560 | |
| Yum! Brands, Inc. | | | | 889,000 | | | | 31,088,330 | |
| | | | | | | | | | | | | | 64,129,448 | |
| |
Household Durables—1.0% |
| Black & Decker Corp. | | | | 34,100 | | | | 2,210,703 | |
| D.R. Horton, Inc. | † | | | 80,300 | | | | 872,861 | |
| Fortune Brands, Inc. | | | | 136,300 | | | | 5,888,160 | |
| Harman International Industries, Inc. | † | | | 45,700 | | | | 1,612,296 | |
| Whirlpool Corp. | | | | 62,200 | | | | 5,017,052 | |
| | | | | | | | | | | | | | 15,601,072 | |
| |
Household Products—0.2% |
| Kimberly-Clark Corp. | | | | 57,559 | | | | 3,667,084 | |
| |
Independent Power Producers & Energy Traders—0.2% |
| Constellation Energy Group, Inc. | | | | 69,400 | | | | 2,440,798 | |
| NRG Energy, Inc. | * | | | 49,300 | | | | 1,163,973 | |
| | | | | | | | | | | | | | 3,604,771 | |
| |
Industrial Conglomerates—3.8% |
| 3M Co. | | | | 194,500 | | | | 16,079,315 | |
| General Electric Co. | | | | 1,058,600 | | | | 16,016,618 | |
| Koninklijke Philips Electronics NV NYRS (Netherlands) | † | | | 854,000 | | | | 25,141,760 | |
| | | | | | | | | | | | | | 57,237,693 | |
| |
Insurance—6.6% |
| Allstate Corp. (The) | | | | 236,700 | | | | 7,110,468 | |
| AON Corp. | | | | 297,000 | | | | 11,386,980 | |
| Berkshire Hathaway, Inc., Class A | * | | | 204 | | | | 20,236,800 | |
| Chubb Corp. | | | | 43,600 | | | | 2,144,248 | |
| Fairfax Financial Holdings Ltd. (Canada) | † | | | 93,600 | | | | 36,500,256 | |
| Lincoln National Corp. | | | | 145,590 | | | | 3,622,279 | |
| Marsh & McLennan Cos., Inc. | | | | 223,200 | | | | 4,928,256 | |
| Progressive Corp. (The) | * | | | 110,600 | | | | 1,989,694 | |
| Sun Life Financial, Inc. (Canada) | † | | | 112,300 | | | | 3,225,256 | |
| Travelers Cos., Inc. (The) | | | | 166,006 | | | | 8,277,059 | |
| | | | | | | | | | | | | | 99,421,296 | |
| |
Internet & Catalog Retail—1.3% |
| Liberty Media Corp.— Interactive, Series A | * | | | 1,835,500 | | | | 19,896,820 | |
| |
Internet Software & Services—0.2% |
| eBay, Inc. | * | | | 124,500 | | | $ | 2,930,730 | |
| |
IT Services—0.3% |
| Computer Sciences Corp. | * | | | 84,200 | | | | 4,844,026 | |
| |
Leisure Equipment & Products—0.2% |
| Mattel, Inc. | | | | 173,600 | | | | 3,468,528 | |
| |
Machinery—3.2% |
| Deere & Co. | | | | 94,100 | | | | 5,089,869 | |
| Dover Corp. | † | | | 180,700 | | | | 7,518,927 | |
| Eaton Corp. | | | | 26,800 | | | | 1,705,016 | |
| Illinois Tool Works, Inc. | | | | 396,900 | | | | 19,047,231 | |
| Pall Corp. | | | | 26,000 | | | | 941,200 | |
| Stanley Works (The) | † | | | 278,500 | | | | 14,345,535 | |
| | | | | | | | | | | | | | 48,647,778 | |
| |
Media—7.9% |
| Cablevision Systems Corp., Class A | | | | 137,200 | | | | 3,542,504 | |
| DIRECTV, Class A | *† | | | 1,667,276 | | | | 55,603,655 | |
| McGraw-Hill Cos., Inc. (The) | † | | | 163,800 | | | | 5,488,938 | |
| New York Times Co. (The), Class A | * | | | 208,200 | | | | 2,573,352 | |
| Time Warner, Inc. | † | | | 223,033 | | | | 6,499,182 | |
| Walt Disney Co. (The) | | | | 1,376,200 | | | | 44,382,450 | |
| WPP plc (United Kingdom) | | | | 142,900 | | | | 1,397,605 | |
| | | | | | | | | | | | | | 119,487,686 | |
| |
Metals & Mining—0.5% |
| Alcoa, Inc. | † | | | 133,900 | | | | 2,158,468 | |
| Nucor Corp. | † | | | 112,400 | | | | 5,243,460 | |
| | | | | | | | | | | | | | 7,401,928 | |
| |
Multiline Retail—0.5% |
| J.C. Penney Co., Inc. | † | | | 200,300 | | | | 5,329,983 | |
| Macy’s, Inc. | † | | | 93,700 | | | | 1,570,412 | |
| | | | | | | | | | | | | | 6,900,395 | |
| |
Multi-Utilities—2.0% |
| CenterPoint Energy, Inc. | | | | 66,600 | | | | 966,366 | |
| Dominion Resources, Inc. | | | | 267,000 | | | | 10,391,640 | |
| NiSource, Inc. | † | | | 265,700 | | | | 4,086,466 | |
| PG&E Corp. | | | | 68,700 | | | | 3,067,455 | |
| Sempra Energy | † | | | 133,800 | | | | 7,490,124 | |
| TECO Energy, Inc. | | | | 65,900 | | | | 1,068,898 | |
| Xcel Energy, Inc. | | | | 172,600 | | | | 3,662,572 | |
| | | | | | | | | | | | | | 30,733,521 | |
| |
Oil, Gas & Consumable Fuels—11.8% |
| Anadarko Petroleum Corp. | | | | 55,000 | | | | 3,433,100 | |
| BP plc ADR (United Kingdom) | † | | | 106,298 | | | | 6,162,095 | |
| Cenovus Energy, Inc. (Canada) | | | | 57,100 | | | | 1,438,920 | |
| Chesapeake Energy Corp. | | | | 1,559,000 | | | | 40,346,920 | |
| Chevron Corp. | | | | 167,658 | | | | 12,907,990 | |
| ConocoPhillips | † | | | 314,800 | | | | 16,076,836 | |
| Consol Energy, Inc. | | | | 9,800 | | | | 488,040 | |
| EnCana Corp. (Canada) | | | | 102,300 | | | | 3,313,497 | |
| Exxon Mobil Corp. | | | | 167,560 | | | | 11,425,916 | |
| Marathon Oil Corp. | | | | 364,600 | | | | 11,382,812 | |
| Murphy Oil Corp. | | | | 95,300 | | | | 5,165,260 | |
| Occidental Petroleum Corp. | | | | 244,300 | | | | 19,873,805 | |
| Pioneer Natural Resources Co. | † | | | 527,000 | | | | 25,385,590 | |
|
See accompanying notes to financial statements.
231
SCHEDULE OF INVESTMENTS—(Continued)
December 31, 2009
Vantagepoint
Equity Income Fund
| | | | Shares | | Value | |
|---|
| |
COMMON STOCKS—(Continued) |
| Royal Dutch Shell plc, Class A ADR (Netherlands) | | | | 159,481 | | | $ | 9,586,403 | |
| Spectra Energy Corp. | | | | 454,912 | | | | 9,330,245 | |
| Sunoco, Inc. | † | | | 87,800 | | | | 2,291,580 | |
| Williams Cos., Inc. (The) | | | | 48,800 | | | | 1,028,704 | |
| | | | | | | | | | | | | | 179,637,713 | |
| |
Paper & Forest Products—0.8% |
| International Paper Co. | | | | 250,500 | | | | 6,708,390 | |
| MeadWestvaco Corp. | | | | 115,700 | | | | 3,312,491 | |
| Weyerhaeuser Co. | | | | 42,700 | | | | 1,842,078 | |
| | | | | | | | | | | | | | 11,862,959 | |
| |
Pharmaceuticals—3.8% |
| Bristol-Myers Squibb Co. | † | | | 688,700 | | | | 17,389,675 | |
| Eli Lilly & Co. | | | | 120,600 | | | | 4,306,626 | |
| Johnson & Johnson | | | | 212,800 | | | | 13,706,448 | |
| Merck & Co., Inc. | | | | 157,600 | | | | 5,758,704 | |
| Pfizer, Inc. | | | | 890,087 | | | | 16,190,683 | |
| | | | | | | | | | | | | | 57,352,136 | |
| |
Road & Rail—0.8% |
| Burlington Northern Santa Fe Corp. | | | | 128,400 | | | | 12,662,808 | |
| |
Semiconductors & Semiconductor Equipment—1.9% |
| Analog Devices, Inc. | | | | 148,600 | | | | 4,692,788 | |
| Applied Materials, Inc. | | | | 775,300 | | | | 10,807,682 | |
| Intel Corp. | | | | 637,100 | | | | 12,996,840 | |
| Texas Instruments, Inc. | | | | 25,000 | | | | 651,500 | |
| | | | | | | | | | | | | | 29,148,810 | |
| |
Software—3.2% |
| Electronic Arts, Inc. | * | | | 106,000 | | | | 1,881,500 | |
| Microsoft Corp. | | | | 701,000 | | | | 21,373,490 | |
| Symantec Corp. | * | | | 1,387,000 | | | | 24,813,430 | |
| | | | | | | | | | | | | | 48,068,420 | |
| |
Specialty Retail—1.7% |
| Bed Bath & Beyond, Inc. | *† | | | 138,800 | | | | 5,361,844 | |
| Home Depot, Inc. | | | | 584,600 | | | | 16,912,478 | |
| Tiffany & Co. | | | | 66,500 | | | | 2,859,500 | |
| | | | | | | | | | | | | | 25,133,822 | |
| |
Tobacco—1.7% |
| Altria Group, Inc. | | | | 243,300 | | | | 4,775,979 | |
| Imperial Tobacco Group plc ADR (United Kingdom) | | | | 189,700 | | | | 12,023,186 | |
| Philip Morris International, Inc. | | | | 197,300 | | | | 9,507,887 | |
| | | | | | | | | | | | | | 26,307,052 | |
| |
Wireless Telecommunication Services—0.2% |
| Sprint Nextel Corp. | * | | | 294,200 | | | | 1,076,772 | |
| Vodafone Group plc (United Kingdom) | | | | 845,200 | | | | 1,957,241 | |
| | | | | | | | | | | | | | 3,034,013 | |
| |
TOTAL COMMON STOCKS |
| (Cost $1,321,931,028) | | | | | | 1,386,772,971 | |
|
|
|
|---|
Coupon
Rate
|
|
|
| Maturity
Date
|
|
|
| Face
|
| Value
|
|---|
| |
CONVERTIBLE DEBT OBLIGATIONS—0.2% |
| |
Automobiles—0.2% |
| Ford Motor Co. | | | |
| 4.250% | | | | 12/15/2036 | | | | | | | | | | |
| (Cost $589,141) | | | $ | 2,112,000 | | | $ | 2,676,960 | |
| |
| |
| | | | | | | | | | Shares | | | | Value | |
| |
CASH EQUIVALENTS—20.5% |
| |
Institutional Money Market Funds—20.5% |
| Fidelity Institutional Money Market: Money Market Portfolio—Institutional Class | | | | 125,708,264 | | | | 125,708,264 | |
| Fidelity Institutional Money Market: Money Market Portfolio—Institutional Class | †† | | | 37,118,867 | | | | 37,118,867 | |
| Fidelity Institutional Money Market: Prime Money Market Portfolio— Institutional Class | †† | | | 38,000,000 | | | | 38,000,000 | |
| Short-Term Investments Trust Liquid Assets Portfolio | †† | | | 34,000,000 | | | | 34,000,000 | |
| Wells Fargo Advantage Cash Investment Money Market Fund—Select Class | †† | | | 37,777,560 | | | | 37,777,560 | |
| Wells Fargo Advantage Heritage Money Market Fund—Select Class | †† | | | 38,000,000 | | | | 38,000,000 | |
| | | | | | | | | | |
| |
TOTAL CASH EQUIVALENTS |
| (Cost $310,604,691) | | | | | | 310,604,691 | |
| |
TOTAL INVESTMENTS—112.1% | | | |
| (Cost $1,633,124,860) | | 1,700,054,622 | |
| Other assets less liabilities—(12.1%) | | (183,855,991 | ) |
| |
NET ASSETS—100.0% | $ | 1,516,198,631 | |
Notes to the Schedule of Investments:
| |
|---|
| ADR | | | | American Depositary Receipt |
| NYRS | | | | New York Registry Shares |
| † | | | | Denotes all or a portion of the security on loan. |
| * | | | | Non-income producing. |
| †† | | | | Represents reinvestment of collateral received in conjunction with securities lending. |
See accompanying notes to financial statements.
232
SCHEDULE OF INVESTMENTS
December 31, 2009
Vantagepoint Growth &
Income Fund
| | | | Shares | | Value | |
|---|
| |
COMMON STOCKS—96.6% |
| |
Aerospace & Defense—1.0% |
| Boeing Co. (The) | | | | 80,500 | | | $ | 4,357,465 | |
| Goodrich Corp. | | | | 19,900 | | | | 1,278,575 | |
| Precision Castparts Corp. | | | | 23,800 | | | | 2,626,330 | |
| United Technologies Corp. | | | | 29,400 | | | | 2,040,654 | |
| | | | | | | | | | | | | | 10,303,024 | |
| |
Air Freight & Logistics—1.4% |
| Expeditors International of Washington, Inc. | | | | 24,100 | | | | 836,993 | |
| United Parcel Service, Inc., Class B | | | | 232,000 | | | | 13,309,840 | |
| | | | | | | | | | | | | | 14,146,833 | |
| |
Airlines—0.3% |
| Delta Air Lines, Inc. | *† | | | 235,800 | | | | 2,683,404 | |
| |
Automobiles—0.4% |
| Ford Motor Co. | *† | | | 368,000 | | | | 3,680,000 | |
| |
Beverages—2.5% |
| Coca-Cola Co. (The) | | | | 1,600 | | | | 91,200 | |
| Diageo plc ADR (United Kingdom) | | | | 214,500 | | | | 14,888,445 | |
| Molson Coors Brewing Co., Class B | | | | 78,500 | | | | 3,545,060 | |
| PepsiCo, Inc. | | | | 118,100 | | | | 7,180,480 | |
| | | | | | | | | | | | | | 25,705,185 | |
| |
Biotechnology—1.5% |
| Amgen, Inc. | * | | | 74,800 | | | | 4,231,436 | |
| Celgene Corp. | * | | | 79,700 | | | | 4,437,696 | |
| Gilead Sciences, Inc. | * | | | 120,900 | | | | 5,232,552 | |
| Vertex Pharmaceuticals, Inc. | * | | | 26,800 | | | | 1,148,380 | |
| | | | | | | | | | | | | | 15,050,064 | |
| |
Capital Markets—5.9% |
| Ameriprise Financial, Inc. | | | | 139,400 | | | | 5,411,508 | |
| Bank of New York Mellon Corp. (The) | | | | 723,618 | | | | 20,239,596 | |
| BlackRock, Inc. | † | | | 3,000 | | | | 696,600 | |
| Charles Schwab Corp. (The) | | | | 120,900 | | | | 2,275,338 | |
| Credit Suisse Group AG (Registered) (Switzerland) | | | | 6,325 | | | | 313,349 | |
| Franklin Resources, Inc. | | | | 64,100 | | | | 6,752,935 | |
| Goldman Sachs Group, Inc. (The) | | | | 81,600 | | | | 13,777,344 | |
| Invesco Ltd. | | | | 55,500 | | | | 1,303,695 | |
| Morgan Stanley | | | | 93,700 | | | | 2,773,520 | |
| Northern Trust Corp. | | | | 32,600 | | | | 1,708,240 | |
| State Street Corp. | | | | 36,300 | | | | 1,580,502 | |
| TD Ameritrade Holding Corp. | * | | | 20,900 | | | | 405,042 | |
| UBS AG (Switzerland) | * | | | 200,400 | | | | 3,108,204 | |
| | | | | | | | | | | | | | 60,345,873 | |
| |
Chemicals—1.6% |
| Dow Chemical Co. (The) | | | | 132,900 | | | | 3,672,027 | |
| Ecolab, Inc. | | | | 1,300 | | | | 57,954 | |
| Monsanto Co. | | | | 26,100 | | | | 2,133,675 | |
| Mosaic Co. (The) | | | | 103,300 | | | | 6,170,109 | |
| Praxair, Inc. | | | | 50,100 | | | | 4,023,531 | |
| | | | | | | | | | | | | | 16,057,296 | |
| |
Commercial Banks—2.8% |
| PNC Financial Services Group, Inc. | | | | 154,500 | | | $ | 8,156,055 | |
| U.S. Bancorp | | | | 93,700 | | | | 2,109,187 | |
| Wells Fargo & Co. | | | | 664,100 | | | | 17,924,059 | |
| | | | | | | | | | | | | | 28,189,301 | |
| |
Commercial Services & Supplies—1.6% |
| Cintas Corp. | | | | 474,000 | | | | 12,347,700 | |
| Republic Services, Inc. | | | | 137,900 | | | | 3,903,949 | |
| | | | | | | | | | | | | | 16,251,649 | |
| |
Communications Equipment—2.0% |
| Cisco Systems, Inc. | * | | | 368,600 | | | | 8,824,284 | |
| Juniper Networks, Inc. | *† | | | 183,000 | | | | 4,880,610 | |
| QUALCOMM, Inc. | | | | 145,100 | | | | 6,712,326 | |
| | | | | | | | | | | | | | 20,417,220 | |
| |
Computers & Peripherals—2.9% |
| Apple, Inc. | * | | | 96,800 | | | | 20,411,248 | |
| EMC Corp. | * | | | 45,600 | | | | 796,632 | |
| Hewlett-Packard Co. | | | | 104,500 | | | | 5,382,795 | |
| International Business Machines Corp. | | | | 25,100 | | | | 3,285,590 | |
| | | | | | | | | | | | | | 29,876,265 | |
| |
Consumer Finance—1.3% |
| American Express Co. | | | | 330,700 | | | | 13,399,964 | |
| |
Containers & Packaging—0.4% |
| Rexam plc ADR (United Kingdom) | † | | | 166,700 | | | | 3,965,793 | |
| |
Diversified Consumer Services—0.0% |
| Apollo Group, Inc., Class A | * | | | 8,400 | | | | 508,872 | |
| |
Diversified Financial Services—2.6% |
| Bank of America Corp. | | | | 380,800 | | | | 5,734,848 | |
| CME Group, Inc. | | | | 800 | | | | 268,760 | |
| IntercontinentalExchange, Inc. | * | | | 22,600 | | | | 2,537,980 | |
| JPMorgan Chase & Co. | | | | 436,108 | | | | 18,172,620 | |
| | | | | | | | | | | | | | 26,714,208 | |
| |
Diversified Telecommunication Services—1.1% |
| AT&T, Inc. | | | | 283,206 | | | | 7,938,264 | |
| Verizon Communications, Inc. | | | | 92,100 | | | | 3,051,273 | |
| | | | | | | | | | | | | | 10,989,537 | |
| |
Electric Utilities—1.0% |
| Edison International | | | | 93,700 | | | | 3,258,886 | |
| Entergy Corp. | | | | 49,300 | | | | 4,034,712 | |
| Exelon Corp. | | | | 55,600 | | | | 2,717,172 | |
| | | | | | | | | | | | | | 10,010,770 | |
| |
Electrical Equipment—1.2% |
| First Solar, Inc. | *† | | | 3,300 | | | | 446,820 | |
| Rockwell Automation, Inc. | † | | | 244,800 | | | | 11,500,704 | |
| | | | | | | | | | | | | | 11,947,524 | |
| |
Electronic Equipment, Instruments & Components—1.4% |
| Tyco Electronics Ltd. (Switzerland) | † | | | 568,000 | | | | 13,944,400 | |
See accompanying notes to financial statements.
233
SCHEDULE OF INVESTMENTS—(Continued)
December 31, 2009
Vantagepoint Growth &
Income Fund
| | | | Shares | | Value | |
|---|
| |
COMMON STOCKS—(Continued) |
| |
Energy Equipment & Services—2.5% |
| Baker Hughes, Inc. | † | | | 143,900 | | | $ | 5,825,072 | |
| Cameron International Corp. | * | | | 45,600 | | | | 1,906,080 | |
| FMC Technologies, Inc. | * | | | 34,500 | | | | 1,995,480 | |
| Schlumberger Ltd. | | | | 217,900 | | | | 14,183,111 | |
| Smith International, Inc. | | | | 81,600 | | | | 2,217,072 | |
| | | | | | | | | | | | | | 26,126,815 | |
| |
Food & Staples Retailing—4.0% |
| Costco Wholesale Corp. | | | | 2,200 | | | | 130,174 | |
| CVS Caremark Corp. | | | | 151,786 | | | | 4,889,027 | |
| Sysco Corp. | | | | 629,825 | | | | 17,597,310 | |
| Walgreen Co. | | | | 5,400 | | | | 198,288 | |
| Wal-Mart Stores, Inc. | | | | 344,775 | | | | 18,428,224 | |
| | | | | | | | | | | | | | 41,243,023 | |
| |
Food Products—2.5% |
| Dean Foods Co. | * | | | 209,700 | | | | 3,782,988 | |
| General Mills, Inc. | | | | 67,700 | | | | 4,793,837 | |
| Kellogg Co. | | | | 5,800 | | | | 308,560 | |
| Nestle SA ADR (Switzerland) | † | | | 354,875 | | | | 17,158,206 | |
| | | | | | | | | | | | | | 26,043,591 | |
| |
Health Care Equipment & Supplies—4.3% |
| Alcon, Inc. (Switzerland) | | | | 2,100 | | | | 345,135 | |
| Baxter International, Inc. | | | | 13,100 | | | | 768,708 | |
| CareFusion Corp. | * | | | 247,100 | | | | 6,179,971 | |
| Covidien plc (Ireland) | | | | 332,600 | | | | 15,928,214 | |
| DENTSPLY International, Inc. | | | | 342,975 | | | | 12,062,431 | |
| Intuitive Surgical, Inc. | * | | | 8,100 | | | | 2,456,892 | |
| Medtronic, Inc. | | | | 6,500 | | | | 285,870 | |
| St. Jude Medical, Inc. | * | | | 31,100 | | | | 1,143,858 | |
| Stryker Corp. | | | | 28,000 | | | | 1,410,360 | |
| Zimmer Holdings, Inc. | * | | | 65,300 | | | | 3,859,883 | |
| | | | | | | | | | | | | | 44,441,322 | |
| |
Health Care Providers & Services—3.1% |
| Cardinal Health, Inc. | | | | 270,000 | | | | 8,704,800 | |
| Express Scripts, Inc. | * | | | 71,900 | | | | 6,215,755 | |
| McKesson Corp. | | | | 65,300 | | | | 4,081,250 | |
| Medco Health Solutions, Inc. | * | | | 140,500 | | | | 8,979,355 | |
| UnitedHealth Group, Inc. | | | | 122,400 | | | | 3,730,752 | |
| WellPoint, Inc. | * | | | 800 | | | | 46,632 | |
| | | | | | | | | | | | | | 31,758,544 | |
| |
Health Care Technology—0.1% |
| Cerner Corp. | *† | | | 14,600 | | | | 1,203,624 | |
| |
Hotels, Restaurants & Leisure—1.8% |
| Carnival Corp. | * | | | 49,100 | | | | 1,555,979 | |
| Marriott International, Inc., Class A | † | | | 100,572 | | | | 2,740,587 | |
| McDonald’s Corp. | | | | 128,900 | | | | 8,048,516 | |
| Starbucks Corp. | * | | | 146,100 | | | | 3,369,066 | |
| Wynn Macau Ltd. (Macau) | * | | | 321,600 | | | | 396,120 | |
| Wynn Resorts Ltd. | | | | 8,400 | | | | 489,132 | |
| Yum! Brands, Inc. | | | | 60,200 | | | | 2,105,194 | |
| | | | | | | | | | | | | | 18,704,594 | |
| |
Household Products—1.4% |
| Kimberly-Clark Corp. | | | | 201,000 | | | | 12,805,710 | |
| Procter & Gamble Co. (The) | | | | 28,175 | | | | 1,708,250 | |
| | | | | | | | | | | | | | 14,513,960 | |
| |
Industrial Conglomerates—4.8% |
| 3M Co. | | | | 243,125 | | | $ | 20,099,144 | |
| General Electric Co. | | | | 648,300 | | | | 9,808,779 | |
| McDermott International, Inc. | * | | | 45,700 | | | | 1,097,257 | |
| Textron, Inc. | † | | | 255,200 | | | | 4,800,312 | |
| Tyco International Ltd. (Switzerland) | * | | | 380,000 | | | | 13,558,400 | |
| | | | | | | | | | | | | | 49,363,892 | |
| |
Insurance—2.8% |
| ACE Ltd. (Switzerland) | * | | | 88,800 | | | | 4,475,520 | |
| AON Corp. | | | | 72,800 | | | | 2,791,152 | |
| Berkshire Hathaway, Inc., Class B | *† | | | 4,300 | | | | 14,129,800 | |
| Principal Financial Group, Inc. | † | | | 127,000 | | | | 3,053,080 | |
| Prudential Financial, Inc. | | | | 1,300 | | | | 64,688 | |
| Unum Group | | | | 202,100 | | | | 3,944,992 | |
| | | | | | | | | | | | | | 28,459,232 | |
| |
Internet & Catalog Retail—1.7% |
| Amazon.com, Inc. | * | | | 101,300 | | | | 13,626,876 | |
| Expedia, Inc. | * | | | 76,600 | | | | 1,969,386 | |
| priceline.com, Inc. | * | | | 10,100 | | | | 2,206,850 | |
| | | | | | | | | | | | | | 17,803,112 | |
| |
Internet Software & Services—2.2% |
| eBay, Inc. | * | | | 300 | | | | 7,062 | |
| Google, Inc., Class A | * | | | 28,900 | | | | 17,917,422 | |
| Tencent Holdings Ltd. (China) | † | | | 203,300 | | | | 4,396,915 | |
| VeriSign, Inc. | *† | | | 3,300 | | | | 79,992 | |
| | | | | | | | | | | | | | 22,401,391 | |
| |
IT Services—4.5% |
| Accenture plc, Class A (Ireland) | | | | 416,675 | | | | 17,292,013 | |
| Automatic Data Processing, Inc. | | | | 325,900 | | | | 13,955,038 | |
| Fiserv, Inc. | * | | | 41,300 | | | | 2,002,224 | |
| Mastercard, Inc., Class A | † | | | 20,200 | | | | 5,170,796 | |
| Visa, Inc., Class A | † | | | 60,300 | | | | 5,273,838 | |
| Western Union Co. (The) | | | | 113,700 | | | | 2,143,245 | |
| | | | | | | | | | | | | | 45,837,154 | |
| |
Leisure Equipment & Products—0.4% |
| Mattel, Inc. | | | | 226,000 | | | | 4,515,480 | |
| |
Life Sciences Tools & Services—0.0% |
| Life Technologies Corp. | * | | | 3,300 | | | | 172,359 | |
| |
Machinery—2.7% |
| Cummins, Inc. | | | | 65,100 | | | | 2,985,486 | |
| Danaher Corp. | | | | 130,600 | | | | 9,821,120 | |
| Ingersoll-Rand plc (Ireland) | | | | 182,800 | | | | 6,533,272 | |
| PACCAR, Inc. | † | | | 93,300 | | | | 3,383,991 | |
| Stanley Works (The) | † | | | 95,500 | | | | 4,919,205 | |
| | | | | | | | | | | | | | 27,643,074 | |
| |
Media—4.2% |
| Comcast Corp., Class A | | | | 431,700 | | | | 7,278,462 | |
| Discovery Communications, Inc., Series A | *† | | | 68,650 | | | | 2,105,495 | |
| Discovery Communications, Inc., Series C | * | | | 77,450 | | | | 2,053,974 | |
| McGraw-Hill Cos., Inc. (The) | | | | 402,100 | | | | 13,474,371 | |
| Time Warner, Inc. | | | | 535,483 | | | | 15,603,975 | |
| Walt Disney Co. (The) | | | | 84,000 | | | | 2,709,000 | |
| | | | | | | | | | | | | | 43,225,277 | |
See accompanying notes to financial statements.
234
SCHEDULE OF INVESTMENTS—(Continued)
December 31, 2009
Vantagepoint Growth &
Income Fund
| | | | Shares | | Value | |
|---|
| |
COMMON STOCKS—(Continued) |
| |
Metals & Mining—0.9% |
| Cliffs Natural Resources, Inc. | † | | | 81,400 | | | $ | 3,751,726 | |
| Freeport-McMoRan Copper & Gold, Inc. | * | | | 8,200 | | | | 658,378 | |
| Steel Dynamics, Inc. | | | | 250,800 | | | | 4,444,176 | |
| | | �� | | | | | | | | | | | 8,854,280 | |
| |
Multiline Retail—1.0% |
| Dollar Tree, Inc. | * | | | 9,800 | | | | 473,340 | |
| Kohl’s Corp. | * | | | 79,700 | | | | 4,298,221 | |
| Target Corp. | | | | 105,300 | | | | 5,093,361 | |
| | | | | | | | | | | | | | 9,864,922 | |
| |
Oil, Gas & Consumable Fuels—5.0% |
| BP plc ADR (United Kingdom) | † | | | 284,000 | | | | 16,463,480 | |
| ConocoPhillips | | | | 179,700 | | | | 9,177,279 | |
| EOG Resources, Inc. | | | | 50,200 | | | | 4,884,460 | |
| Exxon Mobil Corp. | | | | 1,600 | | | | 109,104 | |
| Hess Corp. | | | | 72,600 | | | | 4,392,300 | |
| Marathon Oil Corp. | | | | 168,000 | | | | 5,244,960 | |
| Occidental Petroleum Corp. | | | | 65,000 | | | | 5,287,750 | |
| Petroleo Brasileiro SA ADR (Brazil) | | | | 19,900 | | | | 843,561 | |
| Southwestern Energy Co. | * | | | 55,100 | | | | 2,655,820 | |
| Suncor Energy, Inc. (Canada) | | | | 55,400 | | | | 1,956,174 | |
| | | | | | | | | | | | | | 51,014,888 | |
| |
Pharmaceuticals—4.4% |
| Abbott Laboratories | | | | 94,000 | | | | 5,075,060 | |
| Allergan, Inc. | | | | 72,900 | | | | 4,593,429 | |
| Johnson & Johnson | | | | 73,800 | | | | 4,753,458 | |
| Merck & Co., Inc. | | | | 273,040 | | | | 9,976,882 | |
| Pfizer, Inc. | | | | 686,600 | | | | 12,489,254 | |
| Shire plc ADR (Ireland) | † | | | 15,400 | | | | 903,980 | |
| Teva Pharmaceutical Industries Ltd. ADR (Israel) | | | | 122,000 | | | | 6,853,960 | |
| | | | | | | | | | | | | | 44,646,023 | |
| |
Road & Rail—0.1% |
| Union Pacific Corp. | | | | 12,100 | | | | 773,190 | |
| |
Semiconductors & Semiconductor Equipment—3.0% |
| Altera Corp. | † | | | 67,600 | | | | 1,529,788 | |
| Broadcom Corp., Class A | * | | | 89,700 | | | | 2,821,065 | |
| Intel Corp. | | | | 377,300 | | | | 7,696,920 | |
| Marvell Technology Group Ltd. (Bermuda) | * | | | 270,100 | | | | 5,604,575 | |
| Maxim Integrated Products, Inc. | † | | | 110,400 | | | | 2,241,120 | |
| Taiwan Semiconductor Manufacturing Co. Ltd. ADR (Taiwan) | | | | 318,900 | | | | 3,648,216 | |
| Texas Instruments, Inc. | | | | 154,800 | | | | 4,034,088 | |
| Xilinx, Inc. | | | | 143,400 | | | | 3,593,604 | |
| | | | | | | | | | | | | | 31,169,376 | |
| |
Software—2.0% |
| Adobe Systems, Inc. | * | | | 12,200 | | | | 448,716 | |
| Autodesk, Inc. | * | | | 29,100 | | | | 739,431 | |
| Electronic Arts, Inc. | * | | | 15,300 | | | | 271,575 | |
| Intuit, Inc. | *† | | | 12,900 | | | | 396,159 | |
| McAfee, Inc. | * | | | 75,600 | | | $ | 3,067,092 | |
| Microsoft Corp. | | | | 512,000 | | | | 15,610,880 | |
| Salesforce.com, Inc. | *† | | | 3,300 | | | | 243,441 | |
| | | | | | | | | | | | | | 20,777,294 | |
| |
Specialty Retail—1.9% |
| Bed Bath & Beyond, Inc. | * | | | 81,600 | | | | 3,152,208 | |
| CarMax, Inc. | *† | | | 11,100 | | | | 269,175 | |
| Gap, Inc. (The) | | | | 39,200 | | | | 821,240 | |
| Home Depot, Inc. | | | | 121,700 | | | | 3,520,781 | |
| Lowe’s Cos., Inc. | | | | 104,500 | | | | 2,444,255 | |
| O’Reilly Automotive, Inc. | * | | | 35,400 | | | | 1,349,448 | |
| Sherwin-Williams Co. (The) | † | | | 68,900 | | | | 4,247,685 | |
| Staples, Inc. | | | | 147,100 | | | | 3,617,189 | |
| | | | | | | | | | | | | | 19,421,981 | |
| |
Textiles, Apparel & Luxury Goods—0.1% |
| NIKE, Inc., Class B | | | | 17,000 | | | | 1,123,190 | |
| |
Tobacco—0.7% |
| Lorillard, Inc. | | | | 40,200 | | | | 3,225,246 | |
| Philip Morris International, Inc. | | | | 83,800 | | | | 4,038,322 | |
| | | | | | | | | | | | | | 7,263,568 | |
| |
Trading Companies & Distributors—1.0% |
| Fastenal Co. | † | | | 17,700 | | | | 737,028 | |
| W.W. Grainger, Inc. | † | | | 99,600 | | | | 9,644,268 | |
| | | | | | | | | | | | | | 10,381,296 | |
| |
Wireless Telecommunication Services—0.6% |
| American Tower Corp., Class A | * | | | 140,500 | | | | 6,071,005 | |
| |
TOTAL COMMON STOCKS |
| (Cost $825,999,942) | | | | | | 989,004,639 | |
| | | | | | | | |
| |
| |
CONVERTIBLE PREFERRED STOCKS—0.4% |
| |
Diversified Financial Services—0.4% |
| Bank of America Corp., Perpetual 10.000% | # | | | | | | | | |
| (Cost $3,933,000) | | | | 262,200 | | | | 3,912,024 | |
| |
| |
CASH EQUIVALENTS—10.9% |
| |
Institutional Money Market Funds—10.9% |
| Fidelity Institutional Money Market: Money Market Portfolio—Institutional Class | | | | 28,922,170 | | | | 28,922,170 | |
| Fidelity Institutional Money Market: Money Market Portfolio—Institutional Class | †† | | | 11,227,677 | | | | 11,227,677 | |
| Fidelity Institutional Money Market: Prime Money Market Portfolio— Institutional Class | †† | | | 19,000,000 | | | | 19,000,000 | |
| Short-Term Investments Trust Liquid Assets Portfolio | †† | | | 16,000,000 | | | | 16,000,000 | |
| Wells Fargo Advantage Cash Investment Money Market Fund—Select Class | †† | | | 18,024,095 | | | | 18,024,095 | |
See accompanying notes to financial statements.
235
SCHEDULE OF INVESTMENTS—(Continued)
December 31, 2009
Vantagepoint Growth &
Income Fund
| | | | Shares | | Value | |
|---|
| |
CASH EQUIVALENTS—(Continued) |
| Wells Fargo Advantage Heritage Money Market Fund—Select Class | †† | | | 18,000,000 | | | $ | 18,000,000 | |
| |
TOTAL CASH EQUIVALENTS |
| (Cost $111,173,942) | | | | | | 111,173,942 | |
| |
TOTAL INVESTMENTS—107.9% | | | |
| (Cost $941,106,884) | | 1,104,090,605 | |
| Other assets less liabilities—(7.9%) | | (80,455,005 | ) |
| |
NET ASSETS—100.0% | $ | 1,023,635,600 | |
Notes to the Schedule of Investments:
| |
|---|
| ADR | | | | American Depositary Receipt |
| † | | | | Denotes all or a portion of the security on loan. |
| * | | | | Non-income producing. |
| # | | | | Rate is subject to change. Rate shown reflects current rate. |
| †† | | | | Represents reinvestment of collateral received in conjunction with securities lending. |
See accompanying notes to financial statements.
236
SCHEDULE OF INVESTMENTS
December 31, 2009
Vantagepoint
Growth Fund
| | | | Shares | | Value | |
|---|
| |
COMMON STOCKS—97.2% |
| |
Aerospace & Defense—2.4% |
| Goodrich Corp. | | | | 347,968 | | | $ | 22,356,944 | |
| ITT Corp. | | | | 181,500 | | | | 9,027,810 | |
| United Technologies Corp. | | | | 165,000 | | | | 11,452,650 | |
| | | | | | | | | | | | | | 42,837,404 | |
| |
Air Freight & Logistics—1.1% |
| Expeditors International of Washington, Inc. | † | | | 250,500 | | | | 8,699,865 | |
| FedEx Corp. | | | | 35,000 | | | | 2,920,750 | |
| United Parcel Service, Inc., Class B | | | | 151,300 | | | | 8,680,081 | |
| | | | | | | | | | | | | | 20,300,696 | |
| |
Auto Components—0.1% |
| Lear Corp. | * | | | 28,700 | | | | 1,941,268 | |
| |
Automobiles—0.6% |
| Ford Motor Co. | *† | | | 1,050,712 | | | | 10,507,120 | |
| |
Beverages—6.3% |
| Anheuser-Busch InBev NV ADR (Belgium) | *† | | | 65,000 | | | | 3,381,950 | |
| Coca-Cola Co. (The) | | | | 638,500 | | | | 36,394,500 | |
| Diageo plc ADR (United Kingdom) | | | | 91,210 | | | | 6,330,886 | |
| Dr. Pepper Snapple Group, Inc. | | | | 103,000 | | | | 2,914,900 | |
| Hansen Natural Corp. | * | | | 93,953 | | | | 3,607,795 | |
| PepsiCo, Inc. | | | | 1,001,600 | | | | 60,897,280 | |
| | | | | | | | | | | | | | 113,527,311 | |
| |
Biotechnology—2.3% |
| Amgen, Inc. | * | | | 164,400 | | | | 9,300,108 | |
| Celgene Corp. | * | | | 255,350 | | | | 14,217,888 | |
| Genzyme Corp. | * | | | 191,200 | | | | 9,370,712 | |
| Gilead Sciences, Inc. | * | | | 213,850 | | | | 9,255,428 | |
| | | | | | | | | | | | | | 42,144,136 | |
| |
Capital Markets—1.9% |
| Goldman Sachs Group, Inc. (The) | | | | 161,170 | | | | 27,211,943 | |
| Morgan Stanley | | | | 227,500 | | | | 6,734,000 | |
| | | | | | | | | | | | | | 33,945,943 | |
| |
Chemicals—3.5% |
| Dow Chemical Co. (The) | | | | 106,300 | | | | 2,937,069 | |
| Monsanto Co. | | | | 104,400 | | | | 8,534,700 | |
| Mosaic Co. (The) | | | | 230,810 | | | | 13,786,281 | |
| Nalco Holding Co. | | | | 408,518 | | | | 10,421,294 | |
| Potash Corp. of Saskatchewan, Inc. (Canada) | | | | 54,480 | | | | 5,911,080 | |
| Praxair, Inc. | | | | 138,140 | | | | 11,094,024 | |
| Syngenta AG ADR (Switzerland) | | | | 190,900 | | | | 10,741,943 | |
| | | | | | | | | | | | | | 63,426,391 | |
| |
Commercial Banks—2.1% |
| Banco Bradesco SA ADR (Brazil) | † | | | 379,200 | | | | 8,293,104 | |
| SunTrust Banks, Inc. | | | | 94,986 | | | | 1,927,266 | |
| Wells Fargo & Co. | | | | 1,033,100 | | | | 27,883,369 | |
| | | | | | | | | | | | | | 38,103,739 | |
| |
Communications Equipment—4.5% |
| Cisco Systems, Inc. | * | | | 1,602,775 | | | $ | 38,370,434 | |
| Nokia Oyj ADR (Finland) | † | | | 1,068,500 | | | | 13,730,225 | |
| QUALCOMM, Inc. | | | | 634,350 | | | | 29,345,031 | |
| | | | | | | | | | | | | | 81,445,690 | |
| |
Computers & Peripherals—8.0% |
| Apple, Inc. | * | | | 268,210 | | | | 56,554,761 | |
| EMC Corp. | * | | | 1,253,800 | | | | 21,903,886 | |
| Hewlett-Packard Co. | | | | 327,450 | | | | 16,866,949 | |
| International Business Machines Corp. | | | | 381,560 | | | | 49,946,204 | |
| Netezza Corp. | *† | | | 91,700 | | | | 889,490 | |
| | | | | | | | | | | | | | 146,161,290 | |
| |
Construction & Engineering—0.6% |
| Quanta Services, Inc. | *† | | | 514,700 | | | | 10,726,348 | |
| |
Construction Materials—0.2% |
| Martin Marietta Materials, Inc. | † | | | 1,610 | | | | 143,950 | |
| Vulcan Materials Co. | † | | | 55,300 | | | | 2,912,651 | |
| | | | | | | | | | | | | | 3,056,601 | |
| |
Consumer Finance—2.0% |
| American Express Co. | | | | 744,100 | | | | 30,150,932 | |
| Capital One Financial Corp. | | | | 164,857 | | | | 6,320,617 | |
| | | | | | | | | | | | | | 36,471,549 | |
| |
Diversified Consumer Services—0.2% |
| Apollo Group, Inc., Class A | * | | | 49,400 | | | | 2,992,652 | |
| |
Diversified Financial Services—1.1% |
| Bank of America Corp. | | | | 665,522 | | | | 10,022,761 | |
| CME Group, Inc. | | | | 27,780 | | | | 9,332,691 | |
| | | | | | | | | | | | | | 19,355,452 | |
| |
Electrical Equipment—0.8% |
| ABB Ltd. ADR (Switzerland) | * | | | 101,900 | | | | 1,946,290 | |
| Emerson Electric Co. | | | | 280,750 | | | | 11,959,950 | |
| | | | | | | | | | | | | | 13,906,240 | |
| |
Electronic Equipment, Instruments & Components—1.0% |
| Amphenol Corp., Class A | † | | | 135,134 | | | | 6,240,488 | |
| Corning, Inc. | | | | 593,500 | | | | 11,460,485 | |
| | | | | | | | | | | | | | 17,700,973 | |
| |
Energy Equipment & Services—4.2% |
| Baker Hughes, Inc. | | | | 23,800 | | | | 963,424 | |
| Ensco International plc ADR (United Kingdom) | | | | 91,900 | | | | 3,670,486 | |
| Halliburton Co. | | | | 771,450 | | | | 23,212,931 | |
| National Oilwell Varco, Inc. | | | | 289,800 | | | | 12,777,282 | |
| Schlumberger Ltd. | | | | 216,700 | | | | 14,105,003 | |
| Transocean Ltd. (Switzerland) | * | | | 132,900 | | | | 11,004,120 | |
| Weatherford International Ltd. (Switzerland) | * | | | 585,450 | | | | 10,485,409 | |
| | | | | | | | | | | | | | 76,218,655 | |
| |
Food & Staples Retailing—3.4% |
| Costco Wholesale Corp. | † | | | 145,400 | | | | 8,603,318 | |
| CVS Caremark Corp. | | | | 342,450 | | | | 11,030,315 | |
| Kroger Co. (The) | | | | 85,100 | | | | 1,747,103 | |
| Wal-Mart Stores, Inc. | | | | 676,700 | | | | 36,169,615 | |
| Whole Foods Market, Inc. | *† | | | 126,600 | | | | 3,475,170 | |
| | | | | | | | | | | | | | 61,025,521 | |
See accompanying notes to financial statements.
237
SCHEDULE OF INVESTMENTS—(Continued)
December 31, 2009
Vantagepoint
Growth Fund
| | | | Shares | | Value | |
|---|
| |
COMMON STOCKS—(Continued) |
| |
Food Products—0.4% |
| Bunge Ltd. | † | | | 46,860 | | | $ | 2,991,074 | |
| Kraft Foods, Inc., Class A | | | | 184,500 | | | | 5,014,710 | |
| | | | | | | | | | | | | | 8,005,784 | |
| |
Health Care Equipment & Supplies—3.1% |
| Covidien plc (Ireland) | | | | 244,750 | | | | 11,721,078 | |
| Intuitive Surgical, Inc. | * | | | 26,500 | | | | 8,037,980 | |
| Medtronic, Inc. | | | | 452,100 | | | | 19,883,358 | |
| Stryker Corp. | † | | | 334,800 | | | | 16,863,876 | |
| | | | | | | | | | | | | | 56,506,292 | |
| |
Health Care Providers & Services—0.4% |
| McKesson Corp. | | | | 62,200 | | | | 3,887,500 | |
| UnitedHealth Group, Inc. | | | | 90,700 | | | | 2,764,536 | |
| | | | | | | | | | | | | | 6,652,036 | |
| |
Hotels, Restaurants & Leisure—1.4% |
| International Game Technology | † | | | 185,900 | | | | 3,489,343 | |
| Las Vegas Sands Corp. | *† | | | 462,645 | | | | 6,911,916 | |
| Starbucks Corp. | * | | | 203,400 | | | | 4,690,404 | |
| Yum! Brands, Inc. | † | | | 292,300 | | | | 10,221,731 | |
| | | | | | | | | | | | | | 25,313,394 | |
| |
Household Products—2.4% |
| Procter & Gamble Co. (The) | | | | 730,250 | | | | 44,275,058 | |
| |
Industrial Conglomerates—1.3% |
| 3M Co. | | | | 194,400 | | | | 16,071,048 | |
| General Electric Co. | | | | 548,900 | | | | 8,304,857 | |
| | | | | | | | | | | | | | 24,375,905 | |
| |
Insurance—1.9% |
| ACE Ltd. (Switzerland) | * | | | 96,300 | | | | 4,853,520 | |
| Aflac, Inc. | | | | 295,500 | | | | 13,666,875 | |
| Berkshire Hathaway, Inc., Class B | *† | | | 4,515 | | | | 14,836,290 | |
| Marsh & McLennan Cos., Inc. | | | | 66,800 | | | | 1,474,944 | |
| | | | | | | | | | | | | | 34,831,629 | |
| |
Internet & Catalog Retail—2.5% |
| Amazon.com, Inc. | * | | | 288,600 | | | | 38,822,472 | |
| priceline.com, Inc. | * | | | 32,800 | | | | 7,166,800 | |
| | | | | | | | | | | | | | 45,989,272 | |
| |
Internet Software & Services—5.0% |
| eBay, Inc. | * | | | 245,500 | | | | 5,779,070 | |
| Equinix, Inc. | *† | | | 11,944 | | | | 1,267,855 | |
| Google, Inc., Class A | * | | | 88,800 | | | | 55,054,224 | |
| Rackspace Hosting, Inc. | *† | | | 665,354 | | | | 13,872,631 | |
| Yahoo! Inc. | * | | | 894,400 | | | | 15,008,032 | |
| | | | | | | | | | | | | | 90,981,812 | |
| |
IT Services—4.8% |
| Accenture plc, Class A (Ireland) | | | | 240,800 | | | | 9,993,200 | |
| Automatic Data Processing, Inc. | † | | | 604,000 | | | | 25,863,280 | |
| Cognizant Technology Solutions Corp., Class A | * | | | 66,600 | | | | 3,016,980 | |
| Mastercard, Inc., Class A | † | | | 54,350 | | | | 13,912,513 | |
| Paychex, Inc. | † | | | 489,700 | | | | 15,004,408 | |
| Visa, Inc., Class A | † | | | 229,400 | | | | 20,063,324 | |
| | | | | | | | | | | | | | 87,853,705 | |
| |
Life Sciences Tools & Services—1.5% |
| Illumina, Inc. | *† | | | 175,800 | | | $ | 5,388,270 | |
| Life Technologies Corp. | * | | | 61,800 | | | | 3,227,814 | |
| Thermo Fisher Scientific, Inc. | * | | | 398,100 | | | | 18,985,389 | |
| | | | | | | | | | | | | | 27,601,473 | |
| |
Machinery—0.7% |
| Caterpillar, Inc. | | | | 61,800 | | | | 3,521,982 | |
| Danaher Corp. | | | | 129,600 | | | | 9,745,920 | |
| | | | | | | | | | | | | | 13,267,902 | |
| |
Media—2.0% |
| DIRECTV, Class A | *† | | | 58,400 | | | | 1,947,640 | |
| Viacom, Inc., Class B | * | | | 255,750 | | | | 7,603,447 | |
| Walt Disney Co. (The) | † | | | 832,700 | | | | 26,854,575 | |
| | | | | | | | | | | | | | 36,405,662 | |
| |
Metals & Mining—2.1% |
| BHP Billiton Ltd. ADR (Australia) | † | | | 50,520 | | | | 3,868,822 | |
| Cliffs Natural Resources, Inc. | † | | | 88,200 | | | | 4,065,138 | |
| Freeport-McMoRan Copper & Gold, Inc. | * | | | 127,110 | | | | 10,205,662 | |
| Goldcorp, Inc. (Canada) | † | | | 162,050 | | | | 6,375,047 | |
| Newmont Mining Corp. | | | | 179,700 | | | | 8,501,607 | |
| United States Steel Corp. | † | | | 46,500 | | | | 2,563,080 | |
| Xstrata plc ADR (Switzerland) | * | | | 862,100 | | | | 3,146,665 | |
| | | | | | | | | | | | | | 38,726,021 | |
| |
Multiline Retail—1.5% |
| Kohl’s Corp. | * | | | 314,100 | | | | 16,939,413 | |
| Target Corp. | | | | 222,150 | | | | 10,745,396 | |
| | | | | | | | | | | | | | 27,684,809 | |
| |
Oil, Gas & Consumable Fuels—2.7% |
| Anadarko Petroleum Corp. | | | | 43,740 | | | | 2,730,251 | |
| Chesapeake Energy Corp. | | | | 407,400 | | | | 10,543,512 | |
| ConocoPhillips | | | | 103,500 | | | | 5,285,745 | |
| Exxon Mobil Corp. | | | | 70,140 | | | | 4,782,847 | |
| Noble Energy, Inc. | | | | 43,200 | | | | 3,076,704 | |
| Occidental Petroleum Corp. | | | | 111,530 | | | | 9,072,965 | |
| Suncor Energy, Inc. (Canada) | | | | 376,950 | | | | 13,310,104 | |
| | | | | | | | | | | | | | 48,802,128 | |
| |
Personal Products—1.1% |
| Avon Products, Inc. | † | | | 306,600 | | | | 9,657,900 | |
| Estee Lauder Cos., Inc. (The), Class A | | | | 106,003 | | | | 5,126,305 | |
| Mead Johnson Nutrition Co., Class A | † | | | 100,900 | | | | 4,409,330 | |
| | | | | | | | | | | | | | 19,193,535 | |
| |
Pharmaceuticals—5.1% |
| Allergan, Inc. | | | | 281,000 | | | | 17,705,810 | |
| Elan Corp. plc ADR (Ireland) | * | | | 881,900 | | | | 5,749,988 | |
| Johnson & Johnson | | | | 386,300 | | | | 24,881,583 | |
| Merck & Co., Inc. | | | | 155,100 | | | | 5,667,354 | |
| Mylan, Inc. | *† | | | 342,300 | | | | 6,308,589 | |
| Pfizer, Inc. | | | | 320,400 | | | | 5,828,076 | |
| Roche Holding AG ADR (Switzerland) | | | | 94,500 | | | | 3,987,900 | |
| Teva Pharmaceutical Industries Ltd. ADR (Israel) | | | | 236,950 | | | | 13,311,851 | |
| Warner Chilcott plc, Class A (Ireland) | * | | | 316,267 | | | | 9,004,121 | |
| | | | | | | | | | | | | | 92,445,272 | |
|
See accompanying notes to financial statements.
238
SCHEDULE OF INVESTMENTS—(Continued)
December 31, 2009
Vantagepoint
Growth Fund
| | | | Shares | | Value | |
|---|
| |
COMMON STOCKS—(Continued) |
| |
Professional Services—0.1% |
| Verisk Analytics, Inc., Class A | * | | | 64,600 | | | $ | 1,956,088 | |
| |
Semiconductors & Semiconductor Equipment—1.9% |
| Broadcom Corp., Class A | * | | | 303,500 | | | | 9,545,075 | |
| Intel Corp. | | | �� | 482,500 | | | | 9,843,000 | |
| Marvell Technology Group Ltd. (Bermuda) | *† | | | 434,300 | | | | 9,011,725 | |
| NVIDIA Corp. | *† | | | 285,017 | | | | 5,324,118 | |
| | | | | | | | | | | | | | 33,723,918 | |
| |
Software—6.1% |
| Autodesk, Inc. | * | | | 457,600 | | | | 11,627,616 | |
| Check Point Software Technologies (Israel) | *† | | | 230,250 | | | | 7,800,870 | |
| Microsoft Corp. | | | | 2,029,250 | | | | 61,871,833 | |
| Oracle Corp. | | | | 769,400 | | | | 18,881,076 | |
| Red Hat, Inc. | * | | | 364,231 | | | | 11,254,738 | |
| | | | | | | | | | | | | | 111,436,133 | |
| |
Specialty Retail—2.3% |
| Bed Bath & Beyond, Inc. | * | | | 130,900 | | | | 5,056,667 | |
| Best Buy Co., Inc. | | | | 211,800 | | | | 8,357,628 | |
| Gap, Inc. (The) | | | | 157,400 | | | | 3,297,530 | |
| Home Depot, Inc. | | | | 199,000 | | | | 5,757,070 | |
| Lowe’s Cos., Inc. | † | | | 829,800 | | | | 19,409,022 | |
| | | | | | | | | | | | | | 41,877,917 | |
| |
Textiles, Apparel & Luxury Goods—0.6% |
| NIKE, Inc., Class B | | | | 170,300 | | | | 11,251,721 | |
| |
TOTAL COMMON STOCKS |
| (Cost $1,523,458,550) | | | | | | 1,764,952,445 | |
| |
| |
CASH EQUIVALENTS—13.7% |
| |
Institutional Money Market Funds—13.7% |
| Fidelity Institutional Money Market: Money Market Portfolio—Institutional Class | | | | 52,575,483 | | | | 52,575,483 | |
| Fidelity Institutional Money Market: Money Market Portfolio—Institutional Class | †† | | | 35,438,138 | | | | 35,438,138 | |
| Fidelity Institutional Money Market: Prime Money Market Portfolio— Institutional Class | †† | | | 43,000,000 | | | | 43,000,000 | |
| Short-Term Investments Trust Liquid Assets Portfolio | †† | | | 35,000,000 | | | | 35,000,000 | |
| Wells Fargo Advantage Cash Investment Money Market Fund—Select Class | †† | | | 41,703,635 | | | | 41,703,635 | |
| Wells Fargo Advantage Heritage Money Market Fund—Select Class | †† | | | 40,400,000 | | | | 40,400,000 | |
| |
TOTAL CASH EQUIVALENTS |
| (Cost $248,117,256) | | | | | | 248,117,256 | |
| |
TOTAL INVESTMENTS—110.9% | | | |
| (Cost $1,771,575,806) | | 2,013,069,701 | |
| Other assets less liabilities—(10.9%) | | (198,537,201 | ) |
| |
NET ASSETS—100.0% | $ | 1,814,532,500 | |
Notes to the Schedule of Investments:
|
| ADR | | | | American Depositary Receipt |
| † | | | | Denotes all or a portion of the security on loan. |
| * | | | | Non-income producing. |
| †† | | | | Represents reinvestment of collateral received in conjunction with securities lending. |
See accompanying notes to financial statements.
239
SCHEDULE OF INVESTMENTS
December 31, 2009
Vantagepoint
Select Value Fund
| | | | Shares | | Value | |
|---|
| |
COMMON STOCKS—92.9% |
| |
Aerospace & Defense—2.7% |
| Esterline Technologies Corp. | * | | | 8,400 | | | $ | 342,468 | |
| ITT Corp. | | | | 16,775 | | | | 834,389 | |
| L-3 Communications Holdings, Inc. | | | | 24,100 | | | | 2,095,495 | |
| Rockwell Collins, Inc. | | | | 34,700 | | | | 1,920,992 | |
| TransDigm Group, Inc. | † | | | 59,719 | | | | 2,836,055 | |
| | | | | | | | | | | | | | 8,029,399 | |
| |
Auto Components—1.4% |
| Autoliv, Inc. (Sweden) | † | | | 26,950 | | | | 1,168,552 | |
| BorgWarner, Inc. | † | | | 89,100 | | | | 2,959,902 | |
| | | | | | | | | | | | | | 4,128,454 | |
| |
Beverages—0.2% |
| Dr. Pepper Snapple Group, Inc. | | | | 20,700 | | | | 585,810 | |
| |
Building Products—0.2% |
| Owens Corning, Inc. | * | | | 27,100 | | | | 694,844 | |
| |
Capital Markets—1.4% |
| Ameriprise Financial, Inc. | | | | 57,300 | | | | 2,224,386 | |
| Stifel Financial Corp. | *† | | | 32,050 | | | | 1,898,642 | |
| | | | | | | | | | | | | | 4,123,028 | |
| |
Chemicals—1.0% |
| Airgas, Inc. | | | | 28,000 | | | | 1,332,800 | |
| Celanese Corp., Class A | | | | 23,950 | | | | 768,795 | |
| Eastman Chemical Co. | | | | 14,500 | | | | 873,480 | |
| | | | | | | | | | | | | | 2,975,075 | |
| |
Commercial Banks—1.8% |
| Bank of Hawaii Corp. | † | | | 59,800 | | | | 2,814,188 | |
| Fulton Financial Corp. | | | | 135,400 | | | | 1,180,688 | |
| Prosperity Bancshares, Inc. | † | | | 30,000 | | | | 1,214,100 | |
| | | | | | | | | | | | | | 5,208,976 | |
| |
Commercial Services & Supplies—2.7% |
| Cintas Corp. | | | | 66,200 | | | | 1,724,510 | |
| R.R. Donnelley & Sons Co. | | | | 176,113 | | | | 3,922,037 | |
| Steelcase, Inc., Class A | † | | | 309,600 | | | | 1,969,056 | |
| United Stationers, Inc. | *† | | | 8,250 | | | | 469,012 | |
| | | | | | | | | | | | | | 8,084,615 | |
| |
Communications Equipment—1.1% |
| Comtech Telecommunications Corp. | *† | | | 57,100 | | | | 2,001,355 | |
| JDS Uniphase Corp. | * | | | 142,750 | | | | 1,177,687 | |
| | | | | | | | | | | | | | 3,179,042 | |
| |
Computers & Peripherals—0.9% |
| Seagate Technology (Cayman Islands) | | | | 38,700 | | | | 703,953 | |
| Teradata Corp. | * | | | 35,000 | | | | 1,100,050 | |
| Western Digital Corp. | * | | | 16,200 | | | | 715,230 | |
| | | | | | | | | | | | | | 2,519,233 | |
| |
Construction & Engineering—0.3% |
| Fluor Corp. | | | | 22,300 | | | | 1,004,392 | |
| |
Consumer Finance—0.7% |
| Discover Financial Services | | | | 131,150 | | | | 1,929,216 | |
| Student Loan Corp. (The) | † | | | 5,803 | | | | 270,246 | |
| | | | | | | | | | | | | | 2,199,462 | |
| |
Containers & Packaging—2.4% |
| AptarGroup, Inc. | | | | 51,000 | | | $ | 1,822,740 | |
| Sonoco Products Co. | | | | 126,400 | | | | 3,697,200 | |
| Temple-Inland, Inc. | | | | 75,700 | | | | 1,598,027 | |
| | | | | | | | | | | | | | 7,117,967 | |
| |
Diversified Consumer Services—0.6% |
| H&R Block, Inc. | † | | | 80,100 | | | | 1,811,862 | |
| |
Diversified Telecommunication Services—0.5% |
| Qwest Communications International, Inc. | | | | 340,200 | | | | 1,432,242 | |
| |
Electric Utilities—2.3% |
| American Electric Power Co., Inc. | | | | 56,900 | | | | 1,979,551 | |
| NV Energy, Inc. | | | | 43,400 | | | | 537,292 | |
| Pinnacle West Capital Corp. | | | | 76,900 | | | | 2,813,002 | |
| PPL Corp. | | | | 45,600 | | | | 1,473,336 | |
| | | | | | | | | | | | | | 6,803,181 | |
| |
Electrical Equipment—1.8% |
| Acuity Brands, Inc. | † | | | 45,400 | | | | 1,618,056 | |
| Cooper Industries plc | | | | 38,200 | | | | 1,628,848 | |
| Hubbell, Inc., Class B | | | | 42,000 | | | | 1,986,600 | |
| | | | | | | | | | | | | | 5,233,504 | |
| |
Electronic Equipment, Instruments & Components—2.9% |
| Arrow Electronics, Inc. | * | | | 64,000 | | | | 1,895,040 | |
| Avnet, Inc. | * | | | 75,300 | | | | 2,271,048 | |
| Ingram Micro, Inc., Class A | * | | | 127,700 | | | | 2,228,365 | |
| Tyco Electronics Ltd. (Switzerland) | | | | 87,200 | | | | 2,140,760 | |
| | | | | | | | | | | | | | 8,535,213 | |
| |
Energy Equipment & Services—2.8% |
| Nabors Industries Ltd. (Bermuda) | * | | | 111,300 | | | | 2,436,357 | |
| Noble Corp. (Switzerland) | | | | 108,200 | | | | 4,403,740 | |
| Oil States International, Inc. | * | | | 24,775 | | | | 973,410 | |
| Pride International, Inc. | *† | | | 17,700 | | | | 564,807 | |
| | | | | | | | | | | | | | 8,378,314 | |
| |
Food & Staples Retailing—1.8% |
| Kroger Co. (The) | | | | 96,600 | | | | 1,983,198 | |
| Ruddick Corp. | † | | | 70,171 | | | | 1,805,500 | |
| Sysco Corp. | | | | 56,400 | | | | 1,575,816 | |
| | | | | | | | | | | | | | 5,364,514 | |
| |
Food Products—2.6% |
| Campbell Soup Co. | | | | 43,600 | | | | 1,473,680 | |
| H.J. Heinz Co. | | | | 35,500 | | | | 1,517,980 | |
| J.M. Smucker Co. (The) | | | | 29,050 | | | | 1,793,838 | |
| Sara Lee Corp. | | | | 230,800 | | | | 2,811,144 | |
| | | | | | | | | | | | | | 7,596,642 | |
| |
Gas Utilities—1.6% |
| Energen Corp. | | | | 41,100 | | | | 1,923,480 | |
| Questar Corp. | | | | 69,350 | | | | 2,882,879 | |
| | | | | | | | | | | | | | 4,806,359 | |
| |
Health Care Equipment & Supplies—1.6% |
| Beckman Coulter, Inc. | | | | 43,189 | | | | 2,826,288 | |
| Stryker Corp. | | | | 40,400 | | | | 2,034,948 | |
| | | | | | | | | | | | | | 4,861,236 | |
|
See accompanying notes to financial statements.
240
SCHEDULE OF INVESTMENTS—(Continued)
December 31, 2009
Vantagepoint
Select Value Fund
| | | | Shares | | Value | |
|---|
| |
COMMON STOCKS—(Continued) |
| |
Health Care Providers & Services—3.3% |
| Cardinal Health, Inc. | | | | 28,500 | | | $ | 918,840 | |
| CIGNA Corp. | | | | 161,855 | | | | 5,708,626 | |
| Health Management Associates, Inc., Class A | * | | | 269,100 | | | | 1,956,357 | |
| Healthsouth Corp. | *† | | | 68,150 | | | | 1,279,175 | |
| | | | | | | | | | | | | | 9,862,998 | |
| |
Hotels, Restaurants & Leisure—2.1% |
| Burger King Holdings, Inc. | | | | 91,700 | | | | 1,725,794 | |
| Carnival Corp. | * | | | 10,600 | | | | 335,914 | |
| Darden Restaurants, Inc. | | | | 56,100 | | | | 1,967,427 | |
| Wyndham Worldwide Corp. | | | | 109,400 | | | | 2,206,598 | |
| | | | | | | | | | | | | | 6,235,733 | |
| |
Household Durables—1.6% |
| Fortune Brands, Inc. | | | | 26,600 | | | | 1,149,120 | |
| Jarden Corp. | | | | 43,500 | | | | 1,344,585 | |
| Mohawk Industries, Inc. | * | | | 27,100 | | | | 1,289,960 | |
| Newell Rubbermaid, Inc. | † | | | 62,200 | | | | 933,622 | |
| | | | | | | | | | | | | | 4,717,287 | |
| |
Independent Power Producers & Energy Traders—0.6% |
| AES Corp. (The) | * | | | 138,300 | | | | 1,840,773 | |
| |
Industrial Conglomerates—0.8% |
| Carlisle Cos., Inc. | | | | 45,343 | | | | 1,553,451 | |
| Textron, Inc. | † | | | 42,200 | | | | 793,782 | |
| | | | | | | | | | | | | | 2,347,233 | |
| |
Insurance—11.9% |
| Alleghany Corp. | *† | | | 9,396 | | | | 2,593,296 | |
| Allied World Assurance Co. Holdings Ltd. (Bermuda) | | | | 33,500 | | | | 1,543,345 | |
| Allstate Corp. (The) | | | | 192,000 | | | | 5,767,680 | |
| Arch Capital Group Ltd. (Bermuda) | *† | | | 75,550 | | | | 5,405,602 | |
| Brown & Brown, Inc. | † | | | 67,800 | | | | 1,218,366 | |
| Endurance Specialty Holdings Ltd. (Bermuda) | | | | 53,600 | | | | 1,995,528 | |
| Fidelity National Financial, Inc., Class A | | | | 147,500 | | | | 1,985,350 | |
| HCC Insurance Holdings, Inc. | † | | | 101,400 | | | | 2,836,158 | |
| Lincoln National Corp. | | | | 150,560 | | | | 3,745,933 | |
| Loews Corp. | | | | 34,850 | | | | 1,266,798 | |
| Progressive Corp. (The) | * | | | 91,200 | | | | 1,640,688 | |
| Prudential Financial, Inc. | | | | 40,000 | | | | 1,990,400 | |
| Unum Group | | | | 22,950 | | | | 447,984 | |
| W.R. Berkley Corp. | † | | | 54,500 | | | | 1,342,880 | |
| XL Capital Ltd., Class A (Bermuda) | | | | 82,700 | | | | 1,515,891 | |
| | | | | | | | | | | | | | 35,295,899 | |
| |
IT Services—3.4% |
| Amdocs Ltd. (Guernsey, Channel Islands) | * | | | 26,950 | | | | 768,883 | |
| Computer Sciences Corp. | * | | | 68,667 | | | | 3,950,413 | |
| Hewitt Associates, Inc., Class A | * | | | 49,900 | | | | 2,108,774 | |
| SAIC, Inc. | * | | | 87,200 | | | | 1,651,568 | |
| Total System Services, Inc. | † | | | 84,500 | | | | 1,459,315 | |
| | | | | | | | | | | | | | 9,938,953 | |
| |
Leisure Equipment & Products—0.6% |
| Mattel, Inc. | | | | 82,100 | | | | 1,640,358 | |
| |
Life Sciences Tools & Services—0.7% |
| Covance, Inc. | *† | | | 23,100 | | | $ | 1,260,567 | |
| Life Technologies Corp. | * | | | 17,575 | | | | 917,942 | |
| | | | | | | | | | | | | | 2,178,509 | |
| |
Machinery—2.6% |
| Dover Corp. | | | | 110,300 | | | | 4,589,583 | |
| Ingersoll-Rand plc (Ireland) | | | | 53,400 | | | | 1,908,516 | |
| Stanley Works (The) | † | | | 25,250 | | | | 1,300,628 | |
| | | | | | | | | | | | | | 7,798,727 | |
| |
Marine—0.2% |
| Alexander & Baldwin, Inc. | † | | | 20,600 | | | | 705,138 | |
| |
Media—2.0% |
| Gannett Co., Inc. | † | | | 74,650 | | | | 1,108,553 | |
| Marvel Entertainment, Inc. | * | | | 30,600 | | | | 1,654,848 | |
| Omnicom Group, Inc. | | | | 51,700 | | | | 2,024,055 | |
| Viacom, Inc., Class B | * | | | 37,600 | | | | 1,117,848 | |
| | | | | | | | | | | | | | 5,905,304 | |
| |
Metals & Mining—0.6% |
| Cliffs Natural Resources, Inc. | † | | | 25,050 | | | | 1,154,554 | |
| Thompson Creek Metals Co., Inc. (Canada) | *† | | | 58,950 | | | | 690,894 | |
| | | | | | | | | | | | | | 1,845,448 | |
| |
Multiline Retail—0.6% |
| Family Dollar Stores, Inc. | | | | 35,500 | | | | 987,965 | |
| Kohl’s Corp. | * | | | 15,700 | | | | 846,701 | |
| | | | | | | | | | | | | | 1,834,666 | |
| |
Multi-Utilities—3.4% |
| CMS Energy Corp. | † | | | 136,700 | | | | 2,140,722 | |
| DTE Energy Co. | | | | 29,200 | | | | 1,272,828 | |
| NSTAR | | | | 20,250 | | | | 745,200 | |
| OGE Energy Corp. | | | | 39,300 | | | | 1,449,777 | |
| PG&E Corp. | | | | 63,000 | | | | 2,812,950 | |
| SCANA Corp. | | | | 39,800 | | | | 1,499,664 | |
| | | | | | | | | | | | | | 9,921,141 | |
| |
Office Electronics—0.3% |
| Xerox Corp. | | | | 106,600 | | | | 901,836 | |
| |
Oil, Gas & Consumable Fuels—3.6% |
| Alpha Natural Resources, Inc. | * | | | 41,000 | | | | 1,778,580 | |
| Cimarex Energy Co. | † | | | 54,500 | | | | 2,886,865 | |
| El Paso Corp. | | | | 100,650 | | | | 989,389 | |
| EOG Resources, Inc. | | | | 10,700 | | | | 1,041,110 | |
| Newfield Exploration Co. | * | | | 50,050 | | | | 2,413,912 | |
| Whiting Petroleum Corp. | *† | | | 22,900 | | | | 1,636,205 | |
| | | | | | | | | | | | | | 10,746,061 | |
| |
Paper & Forest Products—0.2% |
| Schweitzer-Mauduit International, Inc. | † | | | 9,150 | | | | 643,703 | |
| |
Personal Products—0.6% |
| Bare Escentuals, Inc. | * | | | 66,450 | | | | 812,684 | |
| Nu Skin Enterprises, Inc., Class A | | | | 34,650 | | | | 931,045 | |
| | | | | | | | | | | | | | 1,743,729 | |
| |
Professional Services—2.1% |
| Dun & Bradstreet Corp. | | | | 19,700 | | | | 1,662,089 | |
| Equifax, Inc. | | | | 65,100 | | | | 2,010,939 | |
See accompanying notes to financial statements.
241
SCHEDULE OF INVESTMENTS—(Continued)
December 31, 2009
Vantagepoint
Select Value Fund