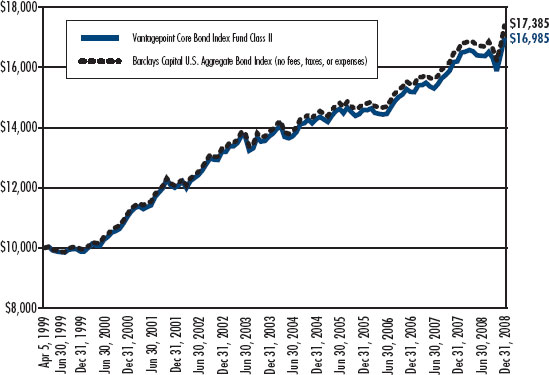
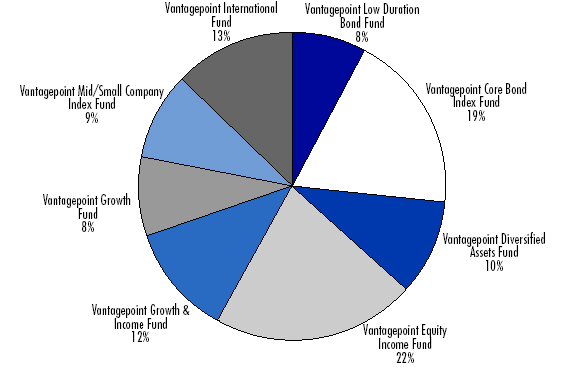
The Directors reviewed information provided by VIA (which was based on an independent third-party source) on the fees charged to accounts with assets comparable to the amount of assets to be allocated initially to each New Subadviser of the applicable Fund by a group of U.S. separate account investment managers that employ a similar investment style to the investment style each New Subadviser is to employ for the applicable Fund. According to the information provided, the effective fee rate to be paid by the applicable Fund to each New Subadviser at the proposed initial asset allocation level for each New Subadviser would be below the median fee charged by such managers.
With respect to the Growth Fund, the Directors then considered that there would be a two basis point increase in overall contractual subadvisory fees and also considered the impact on the total expense ratio of the Growth Fund associated with the appointment of CCI and D.G. Capital, the termination of GSAM and Peregrine and the increase in the amount of the Growth Fund’s assets to be allocated to Westfield. Referring to data provided by VIA and compiled by Morningstar, Inc. (“Morningstar”), a provider of independent investment company data, the Directors also noted that the expected total contractual investment advisory fee for the Growth Fund, taking into account the proposed subadviser changes, was lower than the average and median investment advisory fee of a group of U.S. open-end mutual funds in Morningstar’s large-cap growth category. The Directors also considered information provided by VIA and compiled by Morningstar on the total expense ratios of a group of U.S. open-end mutual funds in Morningstar’s large-cap growth category, which showed that, if CCI and D.G. Capital each served as a subadviser to the Growth Fund at the proposed subadvisory fee rates and initial asset allocation levels, along with the Growth Fund’s three other existing subadvisers at their current contractual subadvisory fee rates, the Growth Fund’s expected total expense ratio would be below the average and median expense ratios of such funds.
With respect to the Select Value Fund, the Directors also considered that there would be an increase in overall subadvisory fees of approximately five basis points, and, therefore, the total expense ratio of the Select Value Fund associated with the appointment of Artisan Partners and the termination of GSAM. The Directors noted that, unlike GSAM’s quantitative approach, Artisan Partners employs an active investment strategy. Referring to data provided by VIA and compiled by Morningstar, the Directors also noted that the expected total investment advisory fee for the Select Value Fund, taking into account the proposed subadviser change, was lower than the average and median investment advisory fee of a group of mutual funds in Morningstar’s mid-cap value category. The Directors also considered information provided by VIA and compiled by Morningstar on the total expense ratios of a group of mutual funds in Morningstar’s mid-cap value category, which showed that, if Artisan Partners served as a subadviser to the Select Value Fund at the proposed subadvisory fee rate and initial asset allocation level, along with the Select Value Fund’s two other existing subadvisers, WEDGE Capital Management, LLP (“WEDGE”) and Systematic Financial Management, L.P. (“Systematic”), at their current subadvisory fee rates, the Select Value Fund’s expected total expense ratio would be below the average and median expense ratios of such funds.
The foregoing comparisons assisted the Directors in considering each Growth Subadvisory Agreement and the Select Value Subadvisory Agreement by providing them with a basis for evaluating each New Subadviser’s fees, including in light of the applicable Fund’s expected overall investment advisory fee and total expense ratio, on a relative basis. Based on this information, the Directors concluded that each New Subadviser’s subadvisory fees each appeared to be within a reasonable range for the services to be provided.
The Directors also reviewed the information provided by each New Subadviser regarding the estimated profits to be realized from each New Subadviser’s relationship with the applicable Fund. In reviewing the extent to which economies of scale may be realized by each New Subadviser as the assets of the applicable Fund to be managed by each New Subadviser grow, and whether the proposed fee levels reflect these economies, the Directors considered that each New Subadviser’s proposed fee schedule included breakpoints, which indicates that each proposed subadvisory fee rate is intended to capture certain anticipated economies of scale for the benefit of the applicable Fund’s shareholders in connection with the services to be provided. The Directors concluded that the proposed fee schedule with respect to each New Subadviser was appropriate at this time.
VANTAGEPOINT FUNDS
Additional Information (Unaudited)—(Continued)
returns. The Directors also considered VIA’s judgment that the addition of Artisan Partners as a subadviser to the Select Value Fund would add value by complementing the investment approach of the Select Value Fund’s current investment subadvisers, WEDGE and Systematic. In this regard, the Directors considered VIA’s belief that the addition of Artisan Partners as a subadviser, along with VIA’s recommendation to terminate GSAM should serve to enhance the Select Value Fund’s risk/return profile while increasing its potential for higher and more consistent expected returns.
The Directors considered the selection and due diligence process employed by VIA in deciding to recommend each New Subadviser as a subadviser to the applicable Fund and also considered VIA’s conclusion that the fees to be paid to each New Subadviser for their respective services to the applicable Fund are reasonable and appropriate in light of the nature and quality of services to be provided by each New Subadviser and the reasons supporting that conclusion. The Directors also considered information from VIA concerning its strategy to efficiently implement the subadviser transitions. The Directors concluded that VIA’s recommendations and conclusions supported approval of each Growth Subadvisory Agreement and the Select Value Subadvisory Agreement.
The Directors also considered the potential “fall-out” or ancillary benefits that may accrue to each New Subadviser due to its relationship with the applicable Fund. The Directors considered that each New Subadviser may direct the applicable Fund’s brokerage transactions to certain brokers to obtain research and other services. However, the Directors noted that all subadvisers are required to select brokers who meet each Fund’s requirements for seeking best execution, and that VIA monitors and evaluates the subadvisers’ trade execution with respect to Fund brokerage transactions on a regular basis and provides reports to the Board in this regard. The Directors concluded that the potential benefits accruing to each New Subadviser by virtue of its relationship with the applicable Fund appeared to be reasonable.
Conclusion. After full consideration of the foregoing factors, with no single factor identified as being of paramount importance, the Directors, including a majority of the Independent Directors, concluded that: (i) the initial approval of each Growth Subadvisory Agreement with CCI and D.G. Capital was in the best interests of the Growth Fund and its shareholders, and approved the Growth Subadvisory Agreements with, and the fee to be paid to, each of CCI and D.G. Capital; and (ii) the initial approval of the Select Value Subadvisory Agreement with Artisan Partners was in the best interests of the Select Value Fund and its shareholders, and approved the Select Value Subadvisory Agreement with, and the fee to be paid to, Artisan Partners.
Vantagepoint Growth & Income Fund
At the December Meeting the Board, including a majority of the Independent Directors, approved an initial Subadvisory Agreement (“G&I Subadvisory Agreement”) among the Company, VIA and FMI, relating to the Growth & Income Fund. Also at the December Meeting, VIA recommended and the Board approved the termination of Capital Guardian as a subadviser to the Growth & Income Fund. Before approving the appointment of FMI as a subadviser to the Growth & Income Fund, the Board of the Company, at the December Meeting, considered the recommendations of, and supporting analyses and data presented by, VIA.
With respect to the Board’s consideration of the G&I Subadvisory Agreement with FMI, the Directors received written information in advance of the December Meeting from VIA, which included: (1) the process by which VIA selected and recommended for Board approval FMI as a subadviser of the Growth & Income Fund; (2) the nature, extent and quality of the services that FMI would provide to the Growth & Income Fund; (3) FMI’s experience, investment management business, personnel and operations; (4) FMI’s brokerage and trading policies and practices; (5) the level of the subadvisory fee to be charged to the Growth & Income Fund by FMI and a comparison of that fee to the: (a) fees charged by FMI to manage other large-cap equity accounts; and (b) fees charged by a group of U.S. separate account investment managers utilizing a large-cap core equity style; (6) FMI’s compliance program; (7) FMI’s historical performance returns utilizing a large-cap equity mandate and such performance compared to a relevant benchmark and peer group; (8) the Growth & Income Fund’s expected overall investment advisory fee and projected total expense ratio, taking into account the change in subadvisers, compared to a group of large-cap equity funds; and (9) FMI’s financial condition.
In considering the information and materials described above, the Independent Directors received assistance from and met separately with their independent legal counsel and were provided with a written description of their statutory responsibilities and the legal standards that are applicable to approvals of advisory agreements.
In determining whether to approve the G&I Subadvisory Agreement, the Directors considered the information received in advance of the December Meeting, the presentations made by, and discussions held with, representatives of FMI,
196
VANTAGEPOINT FUNDS
Additional Information (Unaudited)—(Continued)
VIA’s personnel and the Company’s Chief Compliance Officer at an Investment Committee meeting held prior to the December Meeting and at the December Meeting, as applicable, as well as a variety of factors. Although not meant to be all-inclusive, the following discusses some of the factors relevant to the Board’s decision to approve the G&I Subadvisory Agreement.
Nature, Extent and Quality of Services. With respect to the nature, extent and quality of the services expected to be provided by FMI under the G&I Subadvisory Agreement, the Directors considered the specific investment process to be employed by FMI in managing the assets of the Growth & Income Fund to be allocated to it; the qualifications of FMI’s investment management team with regard to implementing a large-cap equity mandate; FMI’s overall favorable performance record as compared to a relevant benchmark and peer group; FMI’s infrastructure and whether it appeared to adequately support a large-cap equity strategy; and VIA’s review process and favorable assessment as to the nature, quality and extent of the subadvisory services expected to be provided by FMI to the Growth & Income Fund. The Directors acknowledged that FMI has a successful performance record as a large-cap equity manager; has an experienced portfolio management team; and appears to have adequate infrastructure and support staff to seek to achieve favorable results implementing a large-cap equity mandate for the Growth & Income Fund. The Directors concluded that the nature, extent and quality of the subadvisory services expected to be provided by FMI were appropriate for the Growth & Income Fund in light of its investment strategy and, thus, supported a decision to approve the G&I Subadvisory Agreement.
Investment Performance. The Directors evaluated FMI’s historical investment performance record in managing its clients’ assets utilizing a large-cap equity mandate and considered the performance record versus a relevant benchmark and peer group (based on information provided by an independent third-party source). The Directors concluded that the historical investment performance record of FMI supported approval of the G&I Subadvisory Agreement with FMI.
Subadvisory Fee, Expense Ratio Impact and Economies of Scale. In evaluating the proposed subadvisory fee, the Directors reviewed FMI’s subadvisory fee schedule. The Directors considered comparisons of the subadvisory fee to be charged by FMI to the Growth & Income Fund with its fee schedule for managing other accounts with an investment mandate similar to the mandate FMI is to employ on behalf of the Growth & Income Fund. The Directors also considered that, according to the information provided by VIA and statements made by FMI representatives, the proposed fee schedule for FMI reflected the lowest fee rate currently charged by FMI to other accounts for which FMI provides advisory services utilizing a similar mandate, and, according to the information provided by VIA, is lower than its standard fee schedule for managing accounts with a similar mandate. Additionally, the nature of the subadvisory services FMI is to provide to the Growth & Income Fund appeared to be comparable to those FMI currently provides to its other subadvisory clients.
The Directors reviewed information provided by VIA (which was based on an independent third-party source) on the fees charged to accounts with assets comparable to the amount of assets to be allocated initially to FMI to a group of U.S. separate account investment managers that employ a similar investment style to the investment style FMI is to employ for the Growth & Income Fund. According to the information provided, the effective fee rate to be paid by the Growth & Income Fund to FMI at the proposed initial asset allocation level for FMI would be below the median fee charged by such managers.
The Directors also considered that there would be an increase in the overall contractual subadvisory fees of less than one basis point, and, therefore, the total expense ratio of the Growth & Income Fund, due to the appointment of FMI and the termination of Capital Guardian. Referring to data provided by VIA and compiled by Morningstar, the Directors also noted that the expected total contractual investment advisory fee for the Growth & Income Fund, taking into account the proposed subadviser change, was lower than the average and median investment advisory fee of a group of mutual funds in Morningstar’s large-cap blend category. The Directors also considered information provided by VIA and compiled by Morningstar on the total expense ratios of a group of mutual funds in Morningstar’s large-cap blend category, which showed that, if FMI served as a subadviser to the Growth & Income Fund at the proposed subadvisory fee rate and initial asset allocation level, along with the Growth & Income Fund’s two other existing subadvisers, Wellington Management Company, LLP (“Wellington”) and T. Rowe Price at their current subadvisory fee rates, the Growth & Income Fund’s expected total expense ratio would be below the average and median expense ratios of such funds.
The foregoing comparisons assisted the Directors in considering the G&I Subadvisory Agreement by providing them with a basis for evaluating FMI’s fee, including in light of the Growth & Income Fund’s expected overall investment
197
VANTAGEPOINT FUNDS
Additional Information (Unaudited)—(Continued)
advisory fee and total expense ratio, on a relative basis. Based on this information, the Directors concluded that FMI’s subadvisory fee appeared to be within a reasonable range for the services to be provided.
The Directors also reviewed the information provided by FMI regarding the estimated profits to be realized from its relationship with the Growth & Income Fund. In reviewing the extent to which economies of scale may be realized by FMI as the assets of the Growth & Income Fund to be managed by it grow, and whether the proposed fee levels reflect these economies, the Directors considered that FMI’s proposed fee schedule included breakpoints, which indicates that the proposed subadvisory fee rate is intended to capture certain anticipated economies of scale for the benefit of the Growth & Income Fund’s shareholders in connection with the services to be provided. The Directors concluded that the proposed fee schedule with respect to FMI was appropriate at this time.
Other Considerations. The Directors considered VIA’s judgment that the addition of FMI as a subadviser to the Growth & Income Fund would add value by complementing the investment approach of the Growth & Income Fund’s current investment subadvisers, Wellington and T. Rowe. In this regard, the Directors considered VIA’s belief that the addition of FMI as a subadviser, along with VIA’s recommendation to terminate Capital Guardian, should serve to enhance the Growth & Income Fund’s return/risk profile as the styles and underlying characteristics of the subadvisers are complementary, resulting in higher and more consistent expected returns.
The Directors considered the selection and due diligence process employed by VIA in deciding to recommend FMI as a subadviser to the Growth & Income Fund and also considered VIA’s conclusion that the fee to be paid to FMI for its services to the Growth & Income Fund is reasonable and appropriate in light of the nature and quality of services to be provided by FMI and the reasons supporting that conclusion. The Directors also considered information from VIA concerning its strategy to efficiently implement the subadviser transition. The Directors concluded that VIA’s recommendations and conclusions supported approval of the G&I Subadvisory Agreement.
The Directors also considered the potential “fall-out” or ancillary benefits that may accrue to FMI due to its relationship with the Growth & Income Fund. The Directors considered that FMI anticipates it might experience some added visibility in the institutional investment community due to its relationship with the Growth & Income Fund. In addition, the Directors noted that FMI may direct the Growth & Income Fund’s brokerage transactions to certain brokers to obtain research and other services. However, the Directors noted that all subadvisers are required to select brokers who meet the Growth & Income Fund’s requirements for seeking best execution, and that VIA monitors and evaluates the subadvisers’ trade execution with respect to Growth & Income Fund brokerage transactions on a regular basis and provides reports to the Board in this regard. The Directors concluded that the potential benefits accruing to FMI by virtue of its relationship with the Growth & Income Fund appeared to be reasonable.
Conclusion. After full consideration of the foregoing factors, with no single factor identified as being of paramount importance, the Directors, including a majority of the Independent Directors, concluded that the initial approval of the G&I Subadvisory Agreement was in the best interests of the Growth & Income Fund and its shareholders, and approved the G&I Subadvisory Agreement with, and the fee to be paid to, FMI.
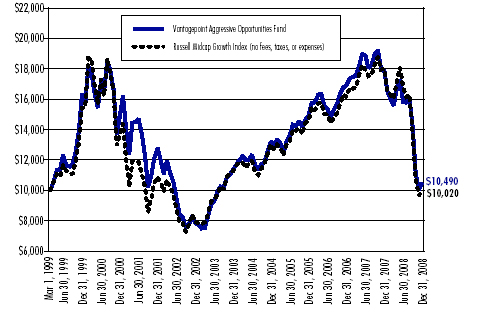
Vantagepoint Aggressive Opportunities Fund
At the December Meeting, the Board, including a majority of the Independent Directors, approved the continuance of the Subadvisory Agreements (“Aggressive Opportunities Subadvisory Agreements”) among VIA, the Company and each of LMCM and TimesSquare Capital Management, LLC with respect to the Vantagepoint Aggressive Opportunities Fund for the period January 25, 2009 through February 28, 2009. The Board approved the short-term continuance of the Aggressive Opportunities Subadvisory Agreements at the December Meeting so that the annual consideration of all applicable Investment Advisory and Subadvisory Agreements of the Company may be considered at the same Board meeting each year in order to make future administration of the Board’s annual consideration of such Agreements more efficient. The Board considered and approved the continuance of these two Aggressive Opportunities Subadvisory Agreements for the one-year period beginning March 1, 2009 through February 28, 2010 at its January 9, 2009 meeting.
Only one copy of this Annual Report may be mailed to households, even if more than one person in a household is a shareholder of record, unless the Company has received instructions to the contrary. If you need additional copies of this Annual Report, please contact The Vantagepoint Funds toll free at 1-800-669-7400 or in writing at 777 North
198
VANTAGEPOINT FUNDS
Additional Information (Unaudited)—(Continued)
Capitol Street, NE, Suite 600, Washington, D.C. 20002. If you do not want this mailing of this Annual Report to be combined with those for other members of your household, contact The Vantagepoint Funds in writing at 777 North Capitol Street, NE, Suite 600, Washington, D.C. 20002 or toll free at 1-800-669-7400.
I. | | Other Available Information |
A description of the Company’s proxy voting policies and procedures and the proxy voting record for the 12-month period ended June 30, 2008 are available on the Company’s website at www.icmarc.org or by accessing the Securities and Exchange Commission’s website at www.sec.gov.
The Company files its complete schedule of portfolio holdings with the U.S. Securities and Exchange Commission (“SEC”) for the first and third quarters of each fiscal year on Form N-Q; the Company’s Forms N-Q are available on the SEC’s website at www.sec.gov and may be reviewed and copied at the SEC’s Public Reference Room in Washington, D.C. Information on the operation of the Public Reference Room may be obtained by calling 1-800-SEC-0330.
199
SCHEDULE OF INVESTMENTS
December 31, 2008
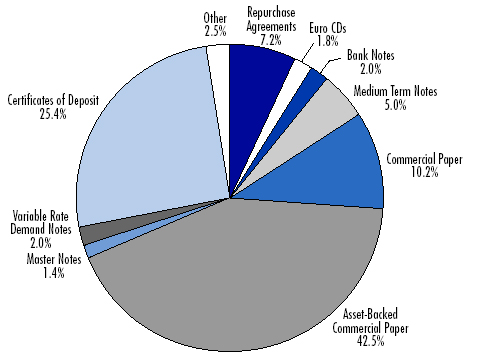
Vantagepoint
Money Market Fund
|
|
|
| Shares
|
|
|
| Value
|
|---|
MUTUAL FUND—100.0% |
AIM Short-Term Investments Trust Liquid Assets Portfolio
(Cost $458,084,379) | | | | | 458,084,379 | | | | | | | $ | 458,084,379 | |
TOTAL INVESTMENTS—100.0% | | | | | | | |
| (Cost $458,084,379) | | | | | | 458,084,379 | |
| Other assets less liabilities—(0.0%) | | | | | | (49,353 | ) |
NET ASSETS—100.0% | | | | | | | | | | | | $ | 458,035,026 | |
See accompanying notes to financial statements.
200
SCHEDULE OF INVESTMENTS
December 31, 2008
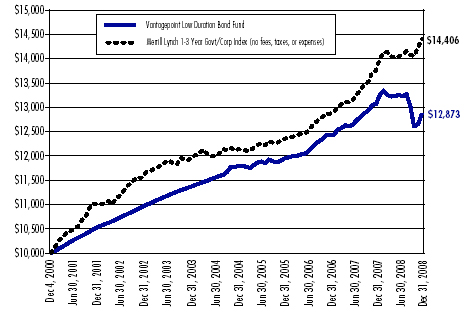
Vantagepoint Low Duration
Bond Fund
Coupon
Rate | | Maturity
Date | | | | Face | | Value | |
|---|
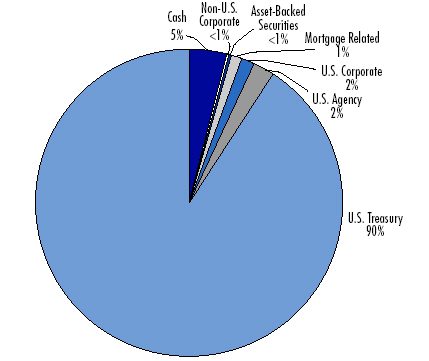
CORPORATE OBLIGATIONS—43.5% |
Banks—5.3% |
| Bank of America Corp. |
| 4.875% | 09/15/2012 | | † | | $ 3,910,000 | | | $ | 3,861,489 | |
| 4.375% | 12/01/2010 | | | | | 1,240,000 | | | | 1,243,138 | |
| Bank of America Corp. MTN |
| 4.900% | 05/01/2013 | | | | | 1,000,000 | | | | 991,456 | |
| Citigroup, Inc. |
| 4.125% | 02/22/2010 | | | | | 1,250,000 | | | | 1,232,116 | |
| 3.849% | 05/15/2018 | | # | | | 7,186,000 | | | | 5,252,736 | |
| JPMorgan Chase & Co. |
| 6.750% | 02/01/2011 | | | | | 1,240,000 | | | | 1,271,825 | |
| 4.750% | 05/01/2013 | | | | | 6,900,000 | | | | 6,815,275 | |
| Nationsbank Corp. |
| 6.600% | 05/15/2010 | | | | | 200,000 | | | | 202,350 | |
| | | | | | | | | | | 20,870,385 | |
Beverages—0.3% |
| Bottling Group LLC |
| 6.950% | 03/15/2014 | | | | | 975,000 | | | | 1,059,817 | |
Biotechnology—0.5% |
| Amgen, Inc. |
| 4.000% | 11/18/2009 | | | | | 1,800,000 | | | | 1,798,895 | |
Capital Markets—1.8% |
| Bank of New York Mellon Corp. (The) |
| 5.125% | 08/27/2013 | | | | | 2,660,000 | | | | 2,720,874 | |
| Northern Trust Corp. |
| 5.500% | 08/15/2013 | | | | | 4,290,000 | | | | 4,409,292 | |
| | | | | | | | | | | 7,130,166 | |
Chemicals—0.1% |
| Nalco Co. |
| 7.750% | 11/15/2011 | | † | | | 545,000 | | | | 525,925 | |
Commercial Banks—8.9% |
| Barclays Bank plc (United Kingdom) |
| 5.450% | 09/12/2012 | | | | | 7,440,000 | | | | 7,540,805 | |
| First Union Corp., Bank Note |
| 7.800% | 08/18/2010 | | | | | 1,750,000 | | | | 1,737,536 | |
| Glitnir Banki HF (Iceland) |
| 6.375% | 09/25/2012 | | | | | 6,270,000 | | | | 329,175 | |
| M&T Bank Corp. |
| 5.375% | 05/24/2012 | | | | | 6,680,000 | | | | 6,143,750 | |
| Marshall & Ilsley Corp. |
| 5.626% | 08/17/2009 | | | | | 6,500,000 | | | | 6,115,889 | |
| SunTrust Banks, Inc. |
| 5.250% | 11/05/2012 | | | | | 6,700,000 | | | | 6,569,551 | |
| Toronto-Dominion Bank MTN (Canada) |
| 4.288% | 09/10/2010 | | # | | | EUR 750,000 | | | | 1,028,462 | |
| US Bancorp MTN |
| 3.106% | 05/06/2010 | | # | | | 1,200,000 | | | | 1,176,586 | |
| Wachovia Corp. |
| 2.353% | 06/01/2010 | | # | | | 3,280,000 | | | | 3,095,608 | |
| Wells Fargo & Co. |
| 5.300% | 08/26/2011 | | † | | | 1,240,000 | | | | 1,258,243 | |
| | | | | | | | | | | 34,995,605 | |
Commercial Services & Supplies—0.1% |
| Allied Waste North America, Inc. |
| 7.875% | 04/15/2013 | | | | | 580,000 | | | | 551,490 | |
Communications Equipment—0.3% |
| Cisco Systems, Inc. |
| 5.250% | 02/22/2011 | | | | $ | 1,250,000 | | | $ | 1,298,317 | |
Computers & Peripherals—0.3% |
| International Business Machines Corp. |
| 4.950% | 03/22/2011 | | | | | 1,250,000 | | | | 1,295,929 | |
Consumer Finance—5.6% |
| American Express Credit Corp., Series C |
| 7.300% | 08/20/2013 | | | | | 2,450,000 | | | | 2,510,238 | |
| CIT Group, Inc. |
| 4.250% | 02/01/2010 | | | | | 275,000 | | | | 252,176 | |
| 3.796% | 07/28/2011 | | # | | | 125,000 | | | | 102,717 | |
| 2.219% | 03/12/2010 | | # | | | 5,780,000 | | | | 5,361,499 | |
| Household Finance Corp. |
| 6.375% | 10/15/2011 | | | | | 3,150,000 | | | | 3,101,068 | |
| 4.750% | 05/15/2009 | | † | | | 4,480,000 | | | | 4,478,723 | |
| International Lease Finance Corp. |
| 6.375% | 03/25/2013 | | | | | 3,200,000 | | | | 2,175,574 | |
| John Deere Capital Corp. MTN |
| 5.203% | 01/18/2011 | | # | | | 1,170,000 | | | | 1,083,997 | |
| SLM Corp., Series A MTN |
| 3.675% | 07/27/2009 | | # | | | 3,160,000 | | | | 2,979,011 | |
| | | | | | | | | | | 22,045,003 | |
Containers & Packaging—0.3% |
| Ball Corp. |
| 6.875% | 12/15/2012 | | † | | | 455,000 | | | | 452,725 | |
| Rock-Tenn Co. |
| 8.200% | 08/15/2011 | | | | | 555,000 | | | | 530,025 | |
| | | | | | | | | | | 982,750 | |
Diversified Financial Services—5.6% |
| Allstate Life Global Funding Trust, Series 2004-1 |
| 4.500% | 05/29/2009 | | | | | 3,750,000 | | | | 3,747,131 | |
| American Express Travel Related Services Co., Inc. |
| 5.250% | 11/21/2011 | | ˆ | | | 6,000,000 | | | | 5,721,150 | |
| BP Capital Markets plc (United Kingdom) |
| 5.250% | 11/07/2013 | | | | | 800,000 | | | | 836,038 | |
| General Electric Capital Corp. MTN |
| 4.875% | 10/21/2010 | | † | | | 4,060,000 | | | | 4,114,270 | |
| General Electric Capital Corp., Series A MTN |
| 4.250% | 09/13/2010 | | | | | 1,500,000 | | | | 1,505,906 | |
| Hutchison Whampoa International 03/33 Ltd. (Cayman Islands) |
| 5.450% | 11/24/2010 | | ˆ | | | 1,500,000 | | | | 1,512,870 | |
| National Rural Utilities Cooperative Finance Corp. |
| 5.750% | 08/28/2009 | | | | | 1,200,000 | | | | 1,207,927 | |
| Private Export Funding Corp., Series I |
| 7.200% | 01/15/2010 | | | | | 1,850,000 | | | | 1,973,495 | |
| Unilever Capital Corp. |
| 7.125% | 11/01/2010 | | | | | 1,175,000 | | | | 1,257,127 | |
| | | | | | | | | | | 21,875,914 | |
Diversified Telecommunication Services—2.3% |
| BellSouth Corp. |
| 4.200% | 09/15/2009 | | | | | 1,762,000 | | | | 1,769,212 | |
| Deutsche Telekom International Finance BV (Netherlands) |
| 5.375% | 03/23/2011 | | | | | 1,250,000 | | | | 1,237,157 | |
| Qwest Capital Funding, Inc. |
| 7.250% | 02/15/2011 | | | | | 265,000 | | | | 223,925 | |
| SBC Communications, Inc. |
| 4.125% | 09/15/2009 | | | | | 2,000,000 | | | | 2,008,534 | |
| Sprint Capital Corp. |
| 8.375% | 03/15/2012 | | | | | 590,000 | | | | 472,308 | |
See accompanying notes to financial statements.
201
SCHEDULE OF INVESTMENTS—(Continued)
December 31, 2008
Vantagepoint Low Duration
Bond Fund
Coupon
Rate | | Maturity
Date | | | | Face | | Value | |
|---|
CORPORATE OBLIGATIONS—(Continued) |
| Verizon Communications, Inc. |
| 4.350% | 02/15/2013 | | | | $ | 2,145,000 | | | $ | 2,076,534 | |
| Verizon Global Funding Corp. | | | |
| 7.250% | 12/01/2010 | | | | | 1,250,000 | | | | 1,311,034 | |
| | | | | | | | | | | 9,098,704 | |
Electric Utilities—0.7% |
| Duke Energy Corp. |
| 6.250% | 01/15/2012 | | | | | 1,165,000 | | | | 1,207,973 | |
| Exelon Corp. |
| 6.750% | 05/01/2011 | | | | | 750,000 | | | | 732,360 | |
| Exelon Generation Co. LLC |
| 6.950% | 06/15/2011 | | | | | 450,000 | | | | 437,055 | |
| Mirant Americas Generation LLC |
| 8.300% | 05/01/2011 | | † | | | 520,000 | | | | 507,000 | |
| | | | | | | | | | | 2,884,388 | |
Food & Staples Retailing—0.5% |
| CVS Caremark Corp. |
| 4.000% | 09/15/2009 | | † | | | 2,000,000 | | | | 1,976,078 | |
Health Care Equipment & Supplies—0.1% |
| Boston Scientific Corp. |
| 6.000% | 06/15/2011 | | | | | 575,000 | | | | 549,125 | |
Health Care Providers & Services—0.5% |
| DaVita, Inc. |
| 6.625% | 03/15/2013 | | | | | 600,000 | | | | 573,000 | |
| UnitedHealth Group, Inc. |
| 2.297% | 03/02/2009 | | # | | | 800,000 | | | | 792,340 | |
| US Oncology, Inc. |
| 9.000% | 08/15/2012 | | | | | 590,000 | | | | 539,850 | |
| | | | | | | | | | | 1,905,190 | |
Insurance—1.5% |
| American International Group, Inc. |
| 4.700% | 10/01/2010 | | † | | | 1,000,000 | | | | 883,830 | |
| Metropolitan Life Global Funding I |
| 5.125% | 04/10/2013 | | ˆ | | | 5,480,000 | | | | 5,110,812 | |
| | | | | | | | | | | 5,994,642 | |
Machinery—0.3% |
| Bombardier, Inc. (Canada) |
| 6.750% | 05/01/2012 | | ˆ | | | 590,000 | | | | 526,575 | |
| Ingersoll-Rand Global Holding Co. Ltd. (Bermuda) |
| 3.675% | 08/13/2010 | | # | | | 845,000 | | | | 782,850 | |
| | | | | | | | | | | 1,309,425 | |
Media—1.0% |
| Comcast Corp. |
| 5.450% | 11/15/2010 | | | | | 2,250,000 | | | | 2,224,908 | |
| CSC Holdings, Inc., Series B |
| 7.625% | 04/01/2011 | | | | | 595,000 | | | | 563,762 | |
| Echostar DBS Corp. |
| 6.375% | 10/01/2011 | | | | | 600,000 | | | | 559,500 | |
| Lamar Media Corp. |
| 7.250% | 01/01/2013 | | † | | | 610,000 | | | | 489,525 | |
| | | | | | | | | | | 3,837,695 | |
Metals & Mining—2.8% |
| Alcoa, Inc. |
| 6.000% | 07/15/2013 | | | | $ | 5,525,000 | | | $ | 5,000,401 | |
| Rio Tinto Finance USA Ltd. (Australia) |
| 5.875% | 07/15/2013 | | | | | 6,974,000 | | | | 5,560,085 | |
| Steel Dynamics, Inc. |
| 7.375% | 11/01/2012 | | | | | 585,000 | | | | 429,975 | |
| | | | | | | | | | | 10,990,461 | |
Multi-National—1.2% |
| European Investment Bank MTN (Supranational) |
| 4.750% | 04/15/2011 | | EUR | | | 2,300,000 | | | | 3,339,988 | |
| International Bank for Reconstruction & Development (Supranational) |
| 3.125% | 11/15/2011 | | | | | 1,200,000 | | | | 1,235,883 | |
| | | | | | | | | | | 4,575,871 | |
Oil, Gas & Consumable Fuels—1.2% |
| Dynegy Holdings, Inc. |
| 6.875% | 04/01/2011 | | | | | 590,000 | | | | 519,200 | |
| Pemex Project Funding Master Trust |
| 7.875% | 02/01/2009 | | | | | 2,350,000 | | | | 2,356,218 | |
| Shell International Finance BV (Netherlands) |
| 5.625% | 06/27/2011 | | | | | 1,860,000 | | | | 1,977,351 | |
| | | | | | | | | | | 4,852,769 | |
Paper & Forest Products—0.1% |
| Georgia-Pacific LLC |
| 8.125% | 05/15/2011 | | † | | | 500,000 | | | | 472,500 | |
Personal Products—0.3% |
| Procter & Gamble Co. MTN |
| 2.366% | 03/09/2010 | | # | | | 1,280,000 | | | | 1,277,393 | |
Pharmaceuticals—0.3% |
| Abbott Laboratories |
| 5.600% | 05/15/2011 | | | | | 1,150,000 | | | | 1,214,898 | |
Software—0.4% |
| Oracle Corp. |
| 5.000% | 01/15/2011 | | | | | 1,547,000 | | | | 1,589,496 | |
Specialty Retail—0.1% |
| GameStop Corp./GameStop, Inc. |
| 8.000% | 10/01/2012 | | | | | 325,000 | | | | 303,875 | |
Tobacco—1.1% |
| Philip Morris International, Inc. |
| 4.875% | 05/16/2013 | | | | | 4,482,000 | | | | 4,499,202 | |
TOTAL CORPORATE OBLIGATIONS |
| (Cost $182,851,484) | | | | | | $ 171,761,908 | |
| |
U.S. GOVERNMENT AGENCY OBLIGATIONS—7.7% |
U.S. Government Agency Obligations—7.7% |
| Federal Home Loan Bank |
| 5.375% | 08/19/2011 | | | | | 8,500,000 | | | | 9,345,946 | |
| Federal Home Loan Mortgage Corp. |
| 4.625% | 10/25/2012 | | † | | | 10,000,000 | | | | 10,825,530 | |
| 2.875% | 06/28/2010 | | | | | 2,970,000 | | | | 3,049,623 | |
| Federal Home Loan Mortgage Corp. MTN |
| 3.000% | 04/01/2011 | | | | | 6,000,000 | | | | 6,030,660 | |
| Federal National Mortgage Association |
| 3.500% | 04/28/2011 | | | | | 1,300,000 | | | | 1,309,262 | |
TOTAL U.S. GOVERNMENT AGENCY OBLIGATIONS |
| (Cost $30,265,146) | | | | | | 30,561,021 | |
|
See accompanying notes to financial statements.
202
SCHEDULE OF INVESTMENTS—(Continued)
December 31, 2008
Vantagepoint Low Duration
Bond Fund
Coupon
Rate | | Maturity
Date | | | | Face | | Value | |
|---|
U.S. GOVERNMENT AGENCY MORTGAGE-BACKED SECURITIES—9.7% |
U.S. Government Agency Mortgage-Backed Securities—9.7% |
| Federal Home Loan Mortgage Corp. |
| 6.000% | 11/01/2022 | | | | $ | 1,659,259 | | | $ | 1,720,948 | |
| Federal Home Loan Mortgage Corp. REMICS |
| 5.000% | 06/15/2024 | | | | | 1,677,506 | | | | 1,692,182 | |
| 4.250% | 06/15/2024 | | | | | 1,106,993 | | | | 1,110,170 | |
| Federal National Mortgage Association |
| 5.090% | 09/01/2034 | | # | | | 421,873 | | | | 425,052 | |
| 5.066% | 10/01/2034 | | # | | | 3,720,067 | | | | 3,724,153 | |
| 4.886% | 09/01/2034 | | # | | | 335,126 | | | | 336,337 | |
| 4.721% | 10/01/2034 | | # | | | 635,409 | | | | 635,592 | |
| Government National Mortgage Association |
| 6.500% | 10/20/2037-
09/20/2038 | | | | | 17,772,703 | | | | 18,490,485 | |
| 6.000% | 07/20/2038 | | | | | 6,874,216 | | | | 7,087,915 | |
| 4.500% | 08/20/2035 | | | | | 3,204,860 | | | | 3,247,817 | |
TOTAL U.S. GOVERNMENT AGENCY
MORTGAGE-BACKED SECURITIES |
| (Cost $38,139,692) | | | | | | 38,470,651 | |
| |
U.S. TREASURY OBLIGATIONS—2.4% |
U.S. Treasury Notes—2.4% |
| U.S. Treasury Note |
| 3.125% | 11/30/2009 | | †‡‡ | | | 500,000 | | | | 512,559 | |
| 1.125% | 12/15/2011 | | | | | 9,000,000 | | | | 9,042,894 | |
TOTAL U.S. TREASURY OBLIGATIONS |
| (Cost $9,555,774) | | | | | | 9,555,453 | |
| |
SOVEREIGN DEBT OBLIGATIONS—2.5% |
Government Issued—2.5% |
| Caisse d’Amortissement de la Dette Sociale MTN (France) |
| 4.250% | 11/08/2010 | | | | | 1,200,000 | | | | 1,253,251 | |
| Export Development Canada (Canada) |
| 3.750% | 07/15/2011 | | | | | 1,365,000 | | | | 1,435,291 | |
| Province of Ontario (Canada) |
| 3.125% | 09/08/2010 | | † | | | 1,200,000 | | | | 1,212,792 | |
| 2.750% | 02/22/2011 | | † | | | 1,225,000 | | | | 1,217,734 | |
| Province of Quebec, Series PJ (Canada) |
| 6.125% | 01/22/2011 | | | | | 1,700,000 | | | | 1,791,093 | |
| Republic of South Africa (South Africa) |
| 9.125% | 05/19/2009 | | † | | | 2,750,000 | | | | 2,783,000 | |
TOTAL SOVEREIGN DEBT OBLIGATIONS |
| (Cost $9,574,084) | | | | | | 9,693,161 | |
| |
ASSET BACKED SECURITIES—25.0% |
Automobile—13.6% |
Bank of America Auto Trust
Series 2008-1A, Class A4 |
| 5.730% | 01/20/2013 | | ˆ | | | 2,630,000 | | | | 2,465,249 | |
Bank of America Auto Trust
Series 2008-1A, Class A3A |
| 4.970% | 09/20/2012 | | ˆ | | | 1,325,000 | | | | 1,270,494 | |
Capital Auto Receivables Asset Trust
Series 2008-1, Class A4B |
| 2.545% | 07/15/2014 | | # | | | 4,000,000 | | | | 3,287,021 | |
Capital Auto Receivables Asset Trust
Series 2008-1, Class A3A |
| 3.860% | 08/15/2012 | | | | $ | 1,000,000 | | | $ | 940,766 | |
Capital Auto Receivables Asset Trust
Series 2008-2, Class A3A |
| 4.680% | 10/15/2012 | | | | | 3,225,000 | | | | 2,998,945 | |
Capital Auto Receivables Asset Trust
Series 2006-SN1A, Class A4A |
| 5.320% | 03/20/2010 | | ˆ | | | 5,751,179 | | | | 5,691,447 | |
Capital Auto Receivables Asset Trust
Series 2007-1, Class A4B |
| 1.235% | 04/16/2012 | | # | | | 1,000,000 | | | | 863,046 | |
Carmax Auto Owner Trust
Series 2007-1, Class B |
| 5.340% | 10/15/2012 | | | | | 3,000,000 | | | | 2,388,554 | |
Chase Manhattan Auto Owner Trust
Series 2006-A, Class A4 |
| 5.360% | 01/15/2013 | | | | | 5,900,000 | | | | 5,779,109 | |
Chase Manhattan Auto Owner Trust
Series 2006-B, Class A4 |
| 5.110% | 04/15/2014 | | | | | 2,400,000 | | | | 2,320,112 | |
Daimler Chrysler Auto Trust
Series 2008-B, Class A4A |
| 5.320% | 11/10/2014 | | | | | 2,000,000 | | | | 1,763,432 | |
Daimler Chrysler Auto Trust
Series 2008-A, Class A3A |
| 3.700% | 06/08/2012 | | | | | 1,600,000 | | | | 1,494,681 | |
Daimler Chrysler Auto Trust
Series 2006-C, Class A4 |
| 4.980% | 11/08/2011 | | | | | 4,500,000 | | | | 4,305,614 | |
Ford Credit Auto Owner Trust
Series 2007-B, Class A4A |
| 5.240% | 07/15/2012 | | | | | 6,400,000 | | | | 5,868,156 | |
Ford Credit Auto Owner Trust
Series 2007-A, Class A4A |
| 5.470% | 06/15/2012 | | | | | 1,825,000 | | | | 1,695,838 | |
Ford Credit Auto Owner Trust
Series 2006-A, Class A3 |
| 5.050% | 03/15/2010 | | | | | 94,149 | | | | 93,966 | |
Ford Credit Auto Owner Trust
Series 2006-B, Class A3 |
| 5.260% | 10/15/2010 | | | | | 1,208,593 | | | | 1,198,654 | |
Harley-Davidson Motorcycle Trust
Series 2007-2, Class A4 |
| 5.120% | 08/15/2013 | | | | | 2,725,000 | | | | 2,620,433 | |
Harley-Davidson Motorcycle Trust
Series 2006-3, Class A3 |
| 5.240% | 01/15/2012 | | | | | 1,421,993 | | | | 1,414,110 | |
USAA Auto Owner Trust
Series 2007-2, Class A3 | | | |
| 4.900% | 02/15/2012 | | | | | 2,000,000 | | | | 1,976,770 | |
USAA Auto Owner Trust
Series 2008-2, Class A3 | | | |
| 4.640% | 10/15/2012 | | | | | 1,100,000 | | | | 1,048,319 | |
USAA Auto Owner Trust
Series 2005-2, Class A4 | | | |
| 4.170% | 02/15/2011 | | | | | 338,007 | | | | 332,340 | |
Wachovia Auto Owner Trust
Series 2005-B, Class A4 | | | |
| 4.840% | 04/20/2011 | | | | | 1,842,075 | | | | 1,826,719 | |
| | | | | | | | | | | 53,643,775 | |
Credit Card—11.4% | | | |
American Express Credit Account Master Trust
Series 2005-4, Class A |
| 1.265% | 01/15/2015 | | # | | | 7,363,000 | | | | 6,039,781 | |
BA Credit Card Trust
Series 2006-A15, Class A15 | | | |
| 1.195% | 04/15/2014 | | # | | | 4,200,000 | | | | 3,556,101 | |
|
See accompanying notes to financial statements.
203
SCHEDULE OF INVESTMENTS—(Continued)
December 31, 2008
Vantagepoint Low Duration
Bond Fund
Coupon
Rate | | Maturity
Date | | | | Face | | Value | |
|---|
ASSET BACKED SECURITIES—(Continued) |
BA Credit Card Trust
Series 2008-A5, Class A5 |
| 2.395% | 12/16/2013 | | # | | $ | 4,173,000 | | | $ | 3,715,126 | |
Bank One Issuance Trust
Series 2004-A6, Class A6 | | | |
| 3.940% | 04/16/2012 | | | | | 1,000,000 | | | | 986,586 | |
Capital One Multi-Asset Execution Trust
Series 2005-A10, Class A |
| 1.275% | 09/15/2015 | | # | | | 1,560,000 | | | | 1,102,892 | |
Capital One Multi-Asset Execution Trust
Series 2008-A5, Class A5 |
| 4.850% | 02/18/2014 | | | | | 2,550,000 | | | | 2,369,814 | |
Chase Issuance Trust
Series 2005-A10, Class A10 |
| 4.650% | 12/17/2012 | | | | | 3,570,000 | | | | 3,415,730 | |
Chase Issuance Trust
Series 2007-A15, Class A |
| 4.960% | 09/17/2012 | | † | | | 1,200,000 | | | | 1,157,311 | |
Citibank Credit Card Issuance Trust
Series 2007-A5, Class A5 |
| 5.500% | 06/22/2012 | | | | | 4,125,000 | | | | 4,050,243 | |
Discover Card Master Trust
Series 2008-A3, Class A3 |
| 5.100% | 10/15/2013 | | | | | 7,755,000 | | | | 7,299,692 | |
GE Capital Credit Card Master Note Trust
Series 2007-3, Class A2 |
| 5.400% | 06/15/2013 | | | | | 5,915,000 | | | | 5,614,123 | |
Household Credit Card Master Note Trust I
Series 2007-2, Class A |
| 1.745% | 07/15/2013 | | # | | | 6,400,000 | | | | 4,709,178 | |
Household Credit Card Master Note Trust I
Series 2007-1, Class A |
| 1.245% | 04/15/2013 | | # | | | 1,500,000 | | | | 945,381 | |
| | | | | | | | | | | 44,961,958 | |
TOTAL ASSET BACKED SECURITIES |
| (Cost $107,699,856) | | | | | | 98,605,733 | |
| |
NON-U.S. GOVERNMENT MORTGAGE-BACKED SECURITIES—3.3% |
Mortgage Backed—3.3% |
Bank of America Mortgage Securities, Inc.
Series 2004-L, Class 1A1 |
| 5.720% | 01/25/2035 | | # | | | 1,118,132 | | | | 895,966 | |
GSR Mortgage Loan Trust
Series 2005-AR6, Class 2A1 |
| 4.540% | 09/25/2035 | | # | | | 3,861,778 | | | | 2,853,424 | |
Harborview Mortgage Loan Trust
Series 2005-14, Class 3A1A |
| 5.303% | 12/19/2035 | | # | | | 5,195,371 | | | | 4,355,192 | |
MLCC Mortgage Investors, Inc.
Series 2004-1, Class 2A2 |
| 4.713% | 12/25/2034 | | # | | | 3,038,060 | | | | 2,280,849 | |
Provident Funding Mortgage Loan Trust
Series 2004-1, Class 1A1 |
| 4.299% | 04/25/2034 | | # | | | 500,185 | | | | 478,699 | |
Structured Asset Mortgage Investments, Inc.
Series 2004-AR5, Class 2A1 |
| 6.162% | 10/19/2034 | | # | | | 751,805 | | | | 392,272 | |
Thornburg Mortgage Securities Trust
Series 2004-1, Class II2A |
| 3.356% | 03/25/2044 | | # | | $ | 762,999 | | | $ | 507,965 | |
Wells Fargo Mortgage Backed Securities Trust
Series 2004-S, Class B1 |
| 3.741% | 09/25/2034 | | # | | | 2,038,055 | | | | 1,165,539 | |
TOTAL NON-U.S. GOVERNMENT MORTGAGE-BACKED SECURITIES |
| (Cost $17,154,075) | | | | | | 12,929,906 | |
| |
NON-U.S. GOVERNMENT AGENCY OBLIGATIONS—0.9% |
Non-U.S. Government Agency Obligations—0.9% |
| Kreditanstalt fuer Wiederaufbau (Germany) |
| 3.750% | 06/27/2011 | | | | | 1,150,000 | | | | 1,197,254 | |
| Nederlandse Waterschapsbank NV MTN (Netherlands) |
| 4.625% | 07/25/2011 | | EUR | | | 1,500,000 | | | | 2,172,362 | |
TOTAL NON-U.S. GOVERNMENT AGENCY OBLIGATIONS |
| (Cost $3,402,007) | | | | | | 3,369,616 | |
| |
|
|
|
| Shares
|
| Value
|
|
|---|
CASH EQUIVALENTS—10.6% |
Institutional Money Market Funds—7.5% |
| AIM Short-Term Investments Trust Prime Assets Portfolio | †† | | | 6,534,334 | | | | 6,534,334 | |
Fidelity Institutional Money
Market: Money Market
Portfolio—Institutional Class | | 22,859,118 | | | | 22,859,118 | |
| | | | | | | | | 29,393,452 | |
| |
Coupon
Rate | | Maturity
Date | | | | Face | | Value | |
|---|
Certificates of Deposit—2.4% |
| Allied Irish Banks plc/New York |
| 1.000% | 01/20/2009 | | †† | | $ | 750,000 | | | | 750,000 | |
| Bayerische Landesbank/New York |
| 2.750% | 01/12/2009 | | †† | | | 1,000,000 | | | | 1,000,000 | |
| Credit Industriel et Commercial |
| 2.240% | 03/17/2009 | | †† | | | 500,000 | | | | 500,000 | |
| HSH Nordbank AG |
| 1.850% | 01/20/2009 | | †† | | | 1,000,044 | | | | 1,000,044 | |
| Landesbank Hessen-Thueringen Girozentrale/New York |
| 3.050% | 01/02/2009 | | †† | | | 750,000 | | | | 750,000 | |
| Natixis/New York |
| 4.133% | 01/02/2009 | | #†† | | | 3,992,787 | | | | 3,992,787 | |
| Norinchukin Bank/New York |
| 1.650% | 01/12/2009 | | †† | | | 900,000 | | | | 900,000 | |
| Westpac Securities NZ Ltd. | | | |
| 2.250% | 03/16/2009 | | †† | | | 745,759 | | | | 745,758 | |
| | | | | | | | | 9,638,589 | |
Medium Term Note—0.2% | | | |
| Royal Bank of Scotland Group plc | | | |
| 3.655% | 01/30/2009 | | †† | | | 754,119 | | | | 754,119 | |
|
See accompanying notes to financial statements.
204
SCHEDULE OF INVESTMENTS—(Continued)
December 31, 2008
Vantagepoint Low Duration
Bond Fund
Coupon
Rate | | Maturity
Date | | | | Face | | Value | |
|---|
CASH EQUIVALENTS—(Continued) |
Time Deposits—0.5% | | | |
| Banco Popular Espanol SA | | | |
| 3.120% | 01/05/2009 | | †† | | $ | 1,000,000 | | | $ | 1,000,000 | |
| Raiffeisen Zentralbank Oesterreich AG | | | |
| 1.750% | 01/20/2009 | | †† | | | 900,000 | | | | 900,000 | |
| | | | | | | 1,900,000 | |
TOTAL CASH EQUIVALENTS | | | |
| (Cost $41,686,160) | | | | | | 41,686,160 | |
TOTAL INVESTMENTS—105.6% |
| (Cost $440,328,278) | | 416,633,609 | |
| Other assets less liabilities—(5.6%) | | (21,929,581 | ) |
NET ASSETS—100.0% | $ | 394,704,028 | |
| Notes to the Schedule of Investments: | |
|---|
| EUR | | | | European Monetary Unit |
| MTN | | | | Medium Term Note |
| REMICS | | | | Real Estate Mortgage Investment Conduits |
| † | | | | Denotes all or a portion of security on loan. |
| # | | | | Rate is subject to change. Rate shown reflects current rate. |
| 5 | | | | Security in default. |
| ˆ | | | | Securities are not registered under the Securities Act of 1933. These securities may be resold in transactions exempt from registration, normally to qualified buyers under Securities Act Rule 144A. 144A securities represent 5.4% of Total Investments. |
| ‡‡ | | | | Security has been pledged as collateral for futures contracts. |
| †† | | | | Represents reinvestment of collateral received in conjunction with securities lending. |
|
See accompanying notes to financial statements.
205
SCHEDULE OF INVESTMENTS
December 31, 2008
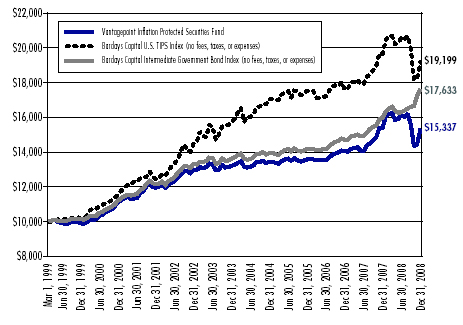
Vantagepoint Inflation Protected
Securities Fund
Coupon
Rate
| | Maturity
Date
| | | | Face | | Value | |
|---|
CORPORATE OBLIGATIONS—1.3% |
Banks—0.3% |
| Goldman Sachs Group, Inc. (The) |
| 6.750% | 10/01/2037 | | | | $ 100,000 | | | $ | 81,412 | |
| JPMorgan Chase & Co., Series C MTN |
| 5.390% | 06/28/2009 | | # | | | 505,000 | | | | 511,696 | |
| Morgan Stanley, Series F MTN |
| 6.625% | 04/01/2018 | | | | | 400,000 | | | | 351,496 | |
| Royal Bank of Scotland Group plc, Perpetual Bond (United Kingdom) |
| 7.092% | 09/29/2017 | | # | | | EUR 100,000 | | | | 63,247 | |
| | | | | | | | | | | 1,007,851 | |
Capital Markets—0.1% |
| Bear Stearns Cos. LLC (The), Series CPI MTN |
| 6.740% | 03/10/2014 | | # | | | 380,000 | | | | 308,609 | |
| Lehman Brothers Holdings, Inc., Series G MTN |
| 6.395% | 06/02/2009 | | 5 | | | 405,000 | | | | 38,475 | |
| | | | | | | | | | | 347,084 | |
Commercial Banks—0.1% |
| American Express Centurion Bank, Bank Note |
| 0.534% | 03/23/2010 | | # | | | 300,000 | | | | 277,357 | |
Consumer Finance—0.1% |
| SLM Corp. MTN |
| 5.280% | 04/01/2014 | | # | | | 465,000 | | | | 218,173 | |
| SLM Corp., Series CPI MTN |
| 5.030% | 06/01/2009 | | # | | | 120,000 | | | | 105,310 | |
| | | | | | | | | | | 323,483 | |
Diversified Financial Services—0.3% |
| General Electric Capital Corp. |
| 5.625% | 05/01/2018 | | | | | 810,000 | | | | 817,340 | |
Insurance—0.2% |
| ASIF II (Cayman Islands) |
| 3.685% | 07/26/2010 | | # | | | 600,000 | | | | 486,750 | |
Multi-National—0.1% |
| International Bank for Reconstruction & Development, Series CPI (Supranational) |
| 6.910% | 12/10/2013 | | # | | | 275,000 | | | | 229,262 | |
Wireless Telecommunication Services—0.1% |
| Verizon Wireless |
| 8.500% | 11/15/2018 | | ˆ | | | 300,000 | | | | 352,111 | |
TOTAL CORPORATE OBLIGATIONS |
| (Cost $4,510,940) | | | | | | 3,841,238 | |
| |
U.S. GOVERNMENT AGENCY OBLIGATIONS—2.3% |
U.S. Government Agency Obligations—2.3% |
| Federal Home Loan Bank |
| 5.375% | 05/18/2016 | | | | | 2,590,000 | | | | 2,966,019 | |
| Federal Home Loan Bank Discount Notes |
| 0.100% | 01/21/2009 | | | | | 2,300,000 | | | | 2,299,866 | |
| 0.080% | 01/22/2009 | | | | | 800,000 | | | | 799,961 | |
| Federal Home Loan Mortgage Corp. |
| 0.122% | 01/26/2009 | | | | $ 100,000 | | | $ | 100,002 | |
| Federal National Mortgage Association |
| 6.077% | 02/17/2009 | | # | | 780,000 | | | | 773,862 | |
TOTAL U.S. GOVERNMENT AGENCY OBLIGATIONS |
| (Cost $6,642,546) | | | | | | 6,939,710 | |
| |
U.S. GOVERNMENT AGENCY MORTGAGE-BACKED SECURITIES—0.9% |
U.S. Government Agency Mortgage-Backed
Securities—0.9% |
| Federal National Mortgage Association TBA |
| 5.500% | 01/25/2038 | | α | | | 2,300,000 | | | | 2,357,859 | |
| 5.000% | 01/25/2038 | | α | | | 500,000 | | | | 510,547 | |
TOTAL U.S. GOVERNMENT AGENCY MORTGAGE-BACKED SECURITIES |
| (Cost $2,831,895) | | | | | | 2,868,406 | |
| |
U.S. TREASURY OBLIGATIONS—89.4% |
U.S. Treasury Bonds—0.4% |
| U.S. Treasury Bond |
| 4.500% | 05/15/2038 | | | | | 850,000 | | | | 1,160,383 | |
| |
U.S. Treasury Inflation Protected Securities Bonds—31.7% |
| U.S. Treasury Bond |
| 3.875% | 04/15/2029 | | † | | | 7,685,000 | | | | 12,507,464 | |
| 3.625% | 04/15/2028 | | ‡‡ | | | 3,540,000 | | | | 5,648,534 | |
| 3.375% | 04/15/2032 | | | | | 510,000 | | | | 767,478 | |
| 2.375% | 01/15/2025-
01/15/2027 | | † | | | 38,230,000 | | | | 42,835,535 | |
| 2.000% | 01/15/2026 | | | | | 17,280,000 | | | | 17,766,819 | |
| 1.750% | 01/15/2028 | | † | | | 16,478,000 | | | | 15,743,726 | |
| | | | | | | | | | | 95,269,556 | |
| |
U.S. Treasury Inflation Protected Securities Notes—57.3% |
| U.S. Treasury Note |
| 4.250% | 01/15/2010 | | | | | 1,855,000 | | | | 2,345,875 | |
| 3.500% | 01/15/2011 | | | | | 2,640,000 | | | | 3,225,286 | |
| 3.375% | 01/15/2012 | | † | | | 4,340,000 | | | | 5,238,043 | |
| 3.000% | 07/15/2012 | | | | | 23,300,000 | | | | 27,514,983 | |
| 2.625% | 07/15/2017 | | | | | 2,055,000 | | | | 2,201,226 | |
| 2.500% | 07/15/2016 | | † | | | 6,230,000 | | | | 6,630,423 | |
| 2.375% | 04/15/2011-
01/15/2017 | | | | | 17,130,000 | | | | 18,258,003 | |
| 2.000% | 04/15/2012-
01/15/2016 | | † | | | 17,890,000 | | | | 18,682,152 | |
| 2.000% | 01/15/2014-
07/15/2014 | | | | | 26,150,000 | | | | 28,603,860 | |
| 1.875% | 07/15/2013-
07/15/2015 | | | | | 17,490,000 | | | | 19,166,920 | |
| 1.625% | 01/15/2015-
01/15/2018 | | | | | 24,930,000 | | | | 24,902,837 | |
| 1.375% | 07/15/2018 | | | | | 7,075,000 | | | | 6,647,655 | |
| 0.875% | 04/15/2010 | | | | | 3,105,000 | | | | 3,337,215 | |
| 0.625% | 04/15/2013 | | † | | | 5,445,000 | | | | 5,335,900 | |
| | | | | | | | | | | | | | | | 172,090,378 | |
TOTAL U.S. TREASURY OBLIGATIONS |
| (Cost $278,902,595) | | | | | | 268,520,317 | |
|
See accompanying notes to financial statements.
206
SCHEDULE OF INVESTMENTS—(Continued)
December 31, 2008
Vantagepoint Inflation Protected
Securities Fund
Coupon
Rate | | Maturity
Date | | | | Face | | Value | |
|---|
SOVEREIGN DEBT OBLIGATIONS—0.0% |
Government Issued—0.0% | | | |
| France Government Bond, Series OATe (France) |
| 3.150% | 07/25/2032 | | | | | | | | | | | | |
| (Cost $74,628) | EUR | 45,660 | | | $ | 73,253 | |
| |
ASSET BACKED SECURITIES—0.4% |
Credit Card—0.3% |
BA Credit Card Trust
Series 2008-A5, Class A5 |
| 2.395% | 12/16/2013 | | # | | $ | 1,000,000 | | | | 890,277 | |
Other—0.1% |
Small Business Administration Participation Certificates
Series 2008-20D, Class 1 |
| 5.370% | 04/01/2028 | | | | | 194,801 | | | | 199,902 | |
TOTAL ASSET BACKED SECURITIES |
| (Cost $1,194,801) | | | | | | 1,090,179 | |
| |
NON-U.S. GOVERNMENT MORTGAGE-BACKED SECURITIES—0.1% |
Mortgage Backed—0.1% |
Countrywide Alternative Loan Trust
Series 2006-OA21, Class A1 |
| 0.698% | 03/20/2047 | | # | | | | | | | | |
| (Cost $495,040) | | 669,336 | | | | 275,268 | |
| |
|
|
|
| Shares
|
| Value
|
|
|---|
PURCHASED OPTIONS—0.1% |
| IRO USD 2 Year Call Swaption, Expires 2/2/2009, Strike 3.50 | | | | | | | |
| (Cost $55,000) | | 5,000,000 | | | | 196,618 | |
| |
CASH EQUIVALENTS—19.2% |
Institutional Money Market Funds—10.4% |
| AIM Short-Term Investments Trust Prime Assets Portfolio | †† | | | | | 14,912,350 | | | | 14,912,350 | |
| Fidelity Institutional Money Market: Money Market Portfolio—Institutional Class | | | | | | | | 16,319,092 | | | | 16,319,092 | |
| |
Coupon
Rate | | Maturity
Date | | | | Face | | Value | |
|---|
Certificates of Deposit—5.6% |
| Allied Irish Banks plc/New York |
| 1.000% | 01/20/2009 | | †† | | $ | 1,000,000 | | | | 1,000,000 | |
| Bayerische Landesbank/New York |
| 2.750% | 01/12/2009 | | †† | | | 2,000,000 | | | | 2,000,000 | |
| Calyon/New York |
| 4.615% | 01/16/2009 | | †† | | | 1,007,254 | | | | 1,007,254 | |
| Credit Industriel et Commercial |
| 2.240% | 03/17/2009 | | †† | | | 1,500,000 | | | | 1,500,000 | |
| HSH Nordbank AG |
| 1.850% | 01/20/2009 | | †† | | | 1,210,896 | | | | 1,210,896 | |
| Landesbank Hessen-Thueringen Girozentrale/New York |
| 3.050% | 01/02/2009 | | †† | | $ | 2,000,000 | | | $ | 2,000,000 | |
| Natixis/New York |
| 4.133% | 01/02/2009 | | #†† | | | 4,990,983 | | | | 4,990,983 | |
| Norinchukin Bank/New York |
| 1.650% | 01/12/2009 | | †† | | | 2,000,000 | | | | 2,000,000 | |
| Westpac Securities NZ Ltd. |
| 2.250% | 03/16/2009 | | †† | | | 994,345 | | | | 994,345 | |
| | | | | | | | | | | 16,703,478 | |
Medium Term Notes—1.5% |
| AT&T, Inc. |
| 4.973% | 04/27/2009 | | †† | | | 1,541,170 | | | | 1,541,170 | |
| BBVA Senior Finance SA |
| 4.620% | 04/17/2009 | | #†† | | | 1,006,866 | | | | 1,006,866 | |
| Royal Bank of Scotland Group plc |
| 3.655% | 01/30/2009 | | †† | | | 2,010,985 | | | | 2,010,985 | |
| | | | | | | | | | | 4,559,021 | |
Time Deposits—1.7% |
| Banco Popular Espanol SA |
| 3.120% | 01/05/2009 | | †† | | | 2,000,000 | | | | 2,000,000 | |
| Danske Bank A/S |
| 2.000% | 02/11/2009 | | †† | | | 1,500,000 | | | | 1,500,000 | |
| Raiffeisen Zentralbank Oesterreich AG |
| 1.750% | 01/20/2009 | | †† | | | 1,500,000 | | | | 1,500,000 | |
| | | | | | | | | | | 5,000,000 | |
TOTAL CASH EQUIVALENTS |
| (Cost $57,493,941) | | | | | | 57,493,941 | |
TOTAL INVESTMENTS—113.7% |
| (Cost $352,201,386) | | | | | | 341,298,930 | |
| Other assets less liabilities—(13.7%) | | (41,151,280 | ) |
NET ASSETS—100.0% | | | | | $ | 300,147,650 | |
| Notes to the Schedule of Investments: | |
|---|
| EUR | | | | European Monetary Unit |
| MTN | | | | Medium Term Note |
| TBA | | | | Security is subject to delayed delivery. |
| # | | | | Rate is subject to change. Rate shown reflects current rate. |
| 5 | | | | Security in default. |
| ˆ | | | | Securities are not registered under the Securities Act of 1933. These securities may be resold in transactions exempt from registration, normally to qualified buyers under Securities Act Rule 144A. 144A securities represent 0.1% of Total Investments. |
| α | | | | Illiquid security. |
| † | | | | Denotes all or a portion of security on loan. |
| ‡‡ | | | | Security has been pledged as collateral for futures contracts. |
| †† | | | | Represents reinvestment of collateral received in conjunction with securities lending. |
|
See accompanying notes to financial statements.
207
SCHEDULE OF INVESTMENTS
December 31, 2008
Vantagepoint
Asset Allocation Fund
| | | | Shares | | Value | |
|---|
COMMON STOCKS—80.1% |
Aerospace & Defense—2.3% |
| Boeing Co. (The) | | | | 31,475 | | | $ | 1,343,038 | |
| General Dynamics Corp. | | | | 16,884 | | | | 972,350 | |
| Goodrich Corp. | | | | 5,043 | | | | 186,692 | |
| Honeywell International, Inc. | | 31,638 | | | | 1,038,676 | |
| L-3 Communications Holdings, Inc. | | | | 5,148 | | | | 379,819 | |
| Lockheed Martin Corp. | † | | | 14,155 | | | | 1,190,152 | |
| Northrop Grumman Corp. | | | | 14,330 | | | | 645,423 | |
| Precision Castparts Corp. | | | | 5,890 | | | | 350,337 | |
| Raytheon Co. | | | | 17,712 | | | | 904,021 | |
| Rockwell Collins, Inc. | † | | | 6,648 | | | | 259,870 | |
| United Technologies Corp. | | | | 41,021 | | | | 2,198,726 | |
| | | | | | | | | | | | | | 9,469,104 | |
Air Freight & Logistics—0.9% |
| C.H. Robinson Worldwide, Inc. | † | | | 7,181 | | | | 395,170 | |
| Expeditors International of Washington, Inc. | † | | | 8,891 | | | | 295,804 | |
| FedEx Corp. | † | | | 13,223 | | | | 848,256 | |
| United Parcel Service, Inc., Class B | | | | 42,889 | | | | 2,365,757 | |
| | | | | | | | | | | | | | 3,904,987 | |
Airlines—0.1% |
| Southwest Airlines Co. | | | | 31,049 | | | | 267,642 | |
Auto Components—0.1% |
| Goodyear Tire & Rubber Co. (The) | * | | | 11,044 | | | | 65,933 | |
| Johnson Controls, Inc. | | | | 25,203 | | | | 457,686 | |
| | | | | | | | | | | | | | 523,619 | |
Automobiles—0.1% |
| Ford Motor Co. | *† | | | 100,868 | | | | 230,988 | |
| General Motors Corp. | † | | | 24,816 | | | | 79,411 | |
| Harley-Davidson, Inc. | † | | | 9,940 | | | | 168,682 | |
| | | | | | | | | | | | | | 479,081 | |
Beverages—2.1% |
| Brown-Forman Corp., Class B | | | | 3,983 | | | | 205,085 | |
| Coca-Cola Co. (The) | | | | 84,809 | | | | 3,839,303 | |
| Coca-Cola Enterprises, Inc. | | | | 14,629 | | | | 175,987 | |
| Constellation Brands, Inc., Class A | * | | | 8,617 | | | | 135,890 | |
| Dr. Pepper Snapple Group, Inc. | * | | | 10,577 | | | | 171,876 | |
| Molson Coors Brewing Co., Class B | | | | 6,466 | | | | 316,317 | |
| Pepsi Bottling Group, Inc. | | | | 5,916 | | | | 133,169 | |
| PepsiCo, Inc. | | | | 66,205 | | | | 3,626,048 | |
| | | | | | | | | | | | | | 8,603,675 | |
Biotechnology—1.7% |
| Amgen, Inc. | * | | | 45,011 | | | | 2,599,385 | |
| Biogen Idec, Inc. | * | | | 12,318 | | | | 586,706 | |
| Celgene Corp. | *† | | | 19,335 | | | | 1,068,839 | |
| Cephalon, Inc. | *† | | | 2,883 | | | | 222,106 | |
| Genzyme Corp. | *† | | | 11,412 | | | | 757,415 | |
| Gilead Sciences, Inc. | * | | | 39,119 | | | | 2,000,546 | |
| | | | | | | | | | | | | | 7,234,997 | |
Building Products—0.0% |
| Masco Corp. | | | | 14,946 | | | | 166,349 | |
Capital Markets—1.9% |
| American Capital Ltd. | † | | | 8,976 | | | $ | 29,082 | |
| Ameriprise Financial, Inc. | | | | 9,714 | | | | 226,919 | |
| Bank of New York Mellon Corp. (The) | | | | 48,730 | | | | 1,380,521 | |
| Charles Schwab Corp. (The) | | | | 39,634 | | | | 640,882 | |
| E*Trade Financial Corp. | *† | | | 18,346 | | | | 21,098 | |
| Federated Investors, Inc., Class B | | | | 4,054 | | | | 68,756 | |
| Franklin Resources, Inc. | | | | 6,457 | | | | 411,827 | |
| Goldman Sachs Group, Inc. (The) | | | | 18,477 | | | | 1,559,274 | |
| Invesco Ltd. | | | | 16,115 | | | | 232,701 | |
| Janus Capital Group, Inc. | † | | | 6,071 | | | | 48,750 | |
| Legg Mason, Inc. | † | | | 6,539 | | | | 143,269 | |
| Merrill Lynch & Co., Inc. | | | | 68,254 | | | | 794,476 | |
| Morgan Stanley | | | | 47,042 | | | | 754,554 | |
| Northern Trust Corp. | | | | 9,381 | | | | 489,125 | |
| State Street Corp. | | | | 18,342 | | | | 721,391 | |
| T. Rowe Price Group, Inc. | † | | | 10,974 | | | | 388,919 | |
| | | | | | | | | | | | | | 7,911,544 | |
Chemicals—1.4% |
| Air Products & Chemicals, Inc. | | 8,989 | | | | 451,877 | |
| CF Industries Holdings, Inc. | | | | 2,592 | | | | 127,423 | |
| Dow Chemical Co. (The) | | | | 39,310 | | | | 593,188 | |
| E.I. Du Pont de Nemours & Co. | | | | 38,359 | | | | 970,483 | |
| Eastman Chemical Co. | † | | | 3,033 | | | | 96,176 | |
| Ecolab, Inc. | † | | | 7,432 | | | | 261,235 | |
| International Flavors & Fragrances, Inc. | | | | 3,091 | | | | 91,865 | |
| Monsanto Co. | | | | 23,395 | | | | 1,645,838 | |
| PPG Industries, Inc. | | | | 6,936 | | | | 294,294 | |
| Praxair, Inc. | | | | 13,383 | | | | 794,415 | |
| Rohm & Haas Co. | | | | 5,246 | | | | 324,150 | |
| Sigma-Aldrich Corp. | † | | | 5,249 | | | | 221,718 | |
| | | | | | | | | | | | | | 5,872,662 | |
Commercial Banks—2.5% |
| BB&T Corp. | † | | | 23,339 | | | | 640,889 | |
| Comerica, Inc. | | | | 6,033 | | | | 119,755 | |
| Fifth Third Bancorp | † | | | 24,105 | | | | 199,107 | |
| First Horizon National Corp. | † | | | 9,479 | | | | 100,193 | |
| Huntington Bancshares, Inc./Ohio | † | | | 15,606 | | | | 119,542 | |
| KeyCorp | | | | 19,727 | | | | 168,074 | |
| M&T Bank Corp. | † | | | 3,140 | | | | 180,267 | |
| Marshall & Ilsley Corp. | † | | | 11,451 | | | | 156,192 | |
| National City Corp. | | | | 84,813 | | | | 153,512 | |
| PNC Financial Services Group, Inc. | † | | | 14,727 | | | | 721,623 | |
| Regions Financial Corp. | | | | 29,323 | | | | 233,411 | |
| SunTrust Banks, Inc. | † | | | 15,012 | | | | 443,455 | |
| U.S. Bancorp | | | | 74,111 | | | | 1,853,516 | |
| Wachovia Corp. | † | | | 91,585 | | | | 507,381 | |
| Wells Fargo & Co. | | | | 161,546 | | | | 4,762,376 | |
| Zions Bancorporation | † | | | 4,920 | | | | 120,589 | |
| | | | | | | | | | | | | | 10,479,882 | |
Commercial Services & Supplies—0.4% |
| Avery Dennison Corp. | † | | | 4,267 | | | | 139,659 | |
| Cintas Corp. | † | | | 6,084 | | | | 141,331 | |
| Pitney Bowes, Inc. | | | | 9,170 | | | | 233,652 | |
| R.R. Donnelley & Sons Co. | | | | 9,448 | | | | 128,304 | |
|
See accompanying notes to financial statements.
208
SCHEDULE OF INVESTMENTS—(Continued)
December 31, 2008
Vantagepoint
Asset Allocation Fund
| | | | Shares | | Value | |
|---|
COMMON STOCKS—(Continued) |
| Republic Services, Inc. | | | | 13,589 | | | $ | 336,871 | |
| Stericycle, Inc. | *† | | | 3,619 | | | | 188,478 | |
| Waste Management, Inc. | † | | | 20,816 | | | | 689,842 | |
| | | | | | | | | | | | | | 1,858,137 | |
Communications Equipment—2.0% |
| Ciena Corp. | *† | | | 3,922 | | | | 26,277 | |
| Cisco Systems, Inc. | * | | | 249,909 | | | | 4,073,517 | |
| Corning, Inc. | | | | 67,043 | | | | 638,920 | |
| Harris Corp. | | | | 5,570 | | | | 211,938 | |
| JDS Uniphase Corp. | *† | | | 9,473 | | | | 34,576 | |
| Juniper Networks, Inc. | * | | | 23,038 | | | | 403,395 | |
| Motorola, Inc. | | | | 96,088 | | | | 425,670 | |
| QUALCOMM, Inc. | | | | 69,819 | | | | 2,501,615 | |
| Tellabs, Inc. | * | | | 12,897 | | | | 53,136 | |
| | | | | | | | | | | | | | 8,369,044 | |
Computers & Peripherals—3.4% |
| Apple, Inc. | * | | | 37,893 | | | | 3,234,168 | |
| Dell, Inc. | * | | | 74,077 | | | | 758,548 | |
| EMC Corp. | * | | | 87,984 | | | | 921,192 | |
| Hewlett-Packard Co. | | | | 104,399 | | | | 3,788,640 | |
| International Business Machines Corp. | | | | 57,371 | | | | 4,828,343 | |
| Lexmark International, Inc., Class A | *† | | | 2,924 | | | | 78,656 | |
| NetApp, Inc. | * | | | 15,873 | | | | 221,746 | |
| QLogic Corp. | *† | | | 6,052 | | | | 81,339 | |
| SanDisk Corp. | *† | | | 9,800 | | | | 94,080 | |
| Sun Microsystems, Inc. | *† | | | 30,172 | | | | 115,257 | |
| Teradata Corp. | * | | | 8,056 | | | | 119,470 | |
| | | | | | | | | | | | | | 14,241,439 | |
Construction & Engineering—0.1% |
| Fluor Corp. | | | | 7,559 | | | | 339,172 | |
| Jacobs Engineering Group, Inc. | * | | | 5,446 | | | | 261,953 | |
| | | | | | | | | | | | | | 601,125 | |
Construction Materials—0.1% |
| Vulcan Materials Co. | † | | | 4,749 | | | | 330,435 | |
Consumer Finance—0.4% |
| American Express Co. | | | | 49,287 | | | | 914,274 | |
| Capital One Financial Corp. | † | | | 15,949 | | | | 508,614 | |
| Discover Financial Services | † | | | 19,882 | | | | 189,475 | |
| SLM Corp. | *† | | | 18,723 | | | | 166,635 | |
| | | | | | | | | | | | | | 1,778,998 | |
Containers & Packaging—0.2% |
| Ball Corp. | | | | 3,826 | | | | 159,123 | |
| Bemis Co., Inc. | | | | 3,857 | | | | 91,334 | |
| Owens-Illinois, Inc. | * | | | 7,098 | | | | 193,988 | |
| Pactiv Corp. | * | | | 5,213 | | | | 129,700 | |
| Sealed Air Corp. | | | | 7,079 | | | | 105,760 | |
| | | | | | | | | | | | | | 679,905 | |
Distributors—0.1% |
| Genuine Parts Co. | | | | 6,736 | | | | 255,025 | |
Diversified Consumer Services—0.2% |
| Apollo Group, Inc., Class A | * | | | 4,364 | | | | 334,370 | |
| H&R Block, Inc. | † | | | 14,400 | | | | 327,168 | |
| | | | | | | | | | | | | | 661,538 | |
Diversified Financial Services—2.7% |
| Bank of America Corp. | | �� | | 212,076 | | | $ | 2,986,030 | |
| CIT Group, Inc. | † | | | 13,165 | | | | 59,769 | |
| Citigroup, Inc. | † | | | 231,713 | | | | 1,554,794 | |
| CME Group, Inc. | | | | 2,853 | | | | 593,738 | |
| IntercontinentalExchange, Inc. | *† | | | 3,141 | | | | 258,944 | |
| JPMorgan Chase & Co. | | | | 159,101 | | | | 5,016,455 | |
| Leucadia National Corp. | *† | | | 7,783 | | | | 154,103 | |
| Moody’s Corp. | † | | | 8,188 | | | | 164,497 | |
| NASDAQ OMX Group, Inc. (The) | *† | | | 5,785 | | | | 142,947 | |
| NYSE Euronext | | | | 10,907 | | | | 298,634 | |
| | | | | | | | | | | | | | 11,229,911 | |
Diversified Telecommunication Services—2.9% |
| AT&T, Inc. | | | | 251,203 | | | | 7,159,286 | |
| CenturyTel, Inc. | | | | 4,058 | | | | 110,905 | |
| Embarq Corp. | | | | 6,854 | | | | 246,470 | |
| Frontier Communications Corp. | † | | | 14,413 | | | | 125,970 | |
| Qwest Communications International, Inc. | † | | | 59,043 | | | | 214,917 | |
| Verizon Communications, Inc. | | 120,435 | | | | 4,082,746 | |
| Windstream Corp. | | | | 19,512 | | | | 179,510 | |
| | | | | | | | | | | | | | 12,119,804 | |
Electric Utilities—2.0% |
| Allegheny Energy, Inc. | † | | | 7,003 | | | | 237,122 | |
| American Electric Power Co., Inc. | | | | 17,066 | | | | 567,956 | |
| Duke Energy Corp. | | | | 53,735 | | | | 806,562 | |
| Edison International | | | | 13,816 | | | | 443,770 | |
| Entergy Corp. | | | | 8,131 | | | | 675,930 | |
| Exelon Corp. | | | | 27,950 | | | | 1,554,300 | |
| FirstEnergy Corp. | | | | 12,941 | | | | 628,674 | |
| FPL Group, Inc. | † | | | 17,346 | | | | 873,024 | |
| Pepco Holdings, Inc. | | | | 8,794 | | | | 156,181 | |
| Pinnacle West Capital Corp. | | | | 4,372 | | | | 140,472 | |
| PPL Corp. | | | | 15,888 | | | | 487,603 | |
| Progress Energy, Inc. | † | | | 11,107 | | | | 442,614 | |
| Southern Co. | † | | | 32,738 | | | | 1,211,306 | |
| | | | | | | | | | | | | | 8,225,514 | |
Electrical Equipment—0.4% |
| Cooper Industries Ltd., Class A | † | | | 7,241 | | | | 211,655 | |
| Emerson Electric Co. | | | | 32,985 | | | | 1,207,581 | |
| Rockwell Automation, Inc. | † | | | 6,426 | | | | 207,174 | |
| | | | | | | | | | | | | | 1,626,410 | |
Electronic Equipment, Instruments & Components—0.3% |
| Agilent Technologies, Inc. | * | | | 15,118 | | | | 236,294 | |
| Amphenol Corp., Class A | | | | 7,351 | | | | 176,277 | |
| Flir Systems, Inc. | * | | | 5,901 | | | | 181,043 | |
| Jabil Circuit, Inc. | | | | 8,930 | | | | 60,278 | |
| Molex, Inc. | † | | | 6,227 | | | | 90,229 | |
| Tyco Electronics Ltd. (Bermuda) | | | | 20,026 | | | | 324,621 | |
| | | | | | | | | | | | | | 1,068,742 | |
Energy Equipment & Services—1.2% |
| Baker Hughes, Inc. | † | | | 13,072 | | | | 419,219 | |
| BJ Services Co. | | | | 11,576 | | | | 135,092 | |
| Cameron International Corp. | *† | | | 9,069 | | | | 185,915 | |
| ENSCO International, Inc. | | | | 5,950 | | | | 168,921 | |
| Halliburton Co. | | | | 37,236 | | | | 676,950 | |
| Nabors Industries Ltd. (Bermuda) | *† | | | 11,281 | | | | 135,034 | |
|
See accompanying notes to financial statements.
209
SCHEDULE OF INVESTMENTS—(Continued)
December 31, 2008
Vantagepoint
Asset Allocation Fund
| | | | Shares | | Value | |
|---|
COMMON STOCKS—(Continued) |
| National Oilwell Varco, Inc. | * | | | 17,697 | | | $ | 432,515 | |
| Noble Corp. | † | | | 11,071 | | | | 244,558 | |
| Rowan Cos., Inc. | | | | 4,817 | | | | 76,590 | |
| Schlumberger Ltd. | | | | 51,043 | | | | 2,160,650 | |
| Smith International, Inc. | | | | 9,127 | | | | 208,917 | |
| Weatherford International Ltd. | * | | | 28,799 | | | | 311,605 | |
| | | | | | | | | | | | | | 5,155,966 | |
Food & Staples Retailing—2.6% |
| Costco Wholesale Corp. | † | | | 18,479 | | | | 970,147 | |
| CVS Caremark Corp. | | | | 61,047 | | | | 1,754,491 | |
| Kroger Co. (The) | | | | 27,812 | | | | 734,515 | |
| Safeway, Inc. | | | | 18,422 | | | | 437,891 | |
| SUPERVALU, Inc. | | | | 8,528 | | | | 124,509 | |
| SYSCO Corp. | | | | 25,561 | | | | 586,369 | |
| Walgreen Co. | | | | 42,071 | | | | 1,037,892 | |
| Wal-Mart Stores, Inc. | | | | 94,971 | | | | 5,324,074 | |
| Whole Foods Market, Inc. | | | | 6,058 | | | | 57,188 | |
| | | | | | | | | | | | | | 11,027,076 | |
Food Products—1.4% |
| Archer-Daniels-Midland Co. | † | | | 27,321 | | | | 787,664 | |
| Campbell Soup Co. | | | | 8,636 | | | | 259,166 | |
| ConAgra Foods, Inc. | | | | 19,154 | | | | 316,041 | |
| Dean Foods Co. | *† | | | 5,435 | | | | 97,667 | |
| General Mills, Inc. | | | | 14,284 | | | | 867,753 | |
| H.J. Heinz Co. | † | | | 13,256 | | | | 498,426 | |
| Hershey Co. (The) | † | | | 6,909 | | | | 240,019 | |
| J.M. Smucker Co. (The) | | | | 5,015 | | | | 217,450 | |
| Kellogg Co. | | | | 10,626 | | | | 465,950 | |
| Kraft Foods, Inc., Class A | † | | | 64,571 | | | | 1,733,731 | |
| McCormick & Co., Inc. | † | | | 4,832 | | | �� | 153,948 | |
| Sara Lee Corp. | | | | 28,781 | | | | 281,766 | |
| Tyson Foods, Inc., Class A | † | | | 13,842 | | | | 121,256 | |
| | | | | | | | | | | | | | 6,040,837 | |
Gas Utilities—0.1% |
| Equitable Resources, Inc. | † | | | 5,542 | | | | 185,934 | |
| Nicor, Inc. | † | | | 1,963 | | | | 68,194 | |
| Questar Corp. | | | | 6,985 | | | | 228,340 | |
| | | | | | | | | | | | | | 482,468 | |
Health Care Equipment & Supplies—1.7% |
| Baxter International, Inc. | | | | 26,692 | | | | 1,430,424 | |
| Becton Dickinson & Co. | | | | 10,345 | | | | 707,495 | |
| Boston Scientific Corp. | * | | | 63,659 | | | | 492,721 | |
| C.R. Bard, Inc. | † | | | 4,200 | | | | 353,892 | |
| Covidien Ltd. | | | | 21,324 | | | | 772,782 | |
| Dentsply International, Inc. | † | | | 6,303 | | | | 177,997 | |
| Hospira, Inc. | * | | | 7,127 | | | | 191,146 | |
| Intuitive Surgical, Inc. | *† | | | 1,707 | | | | 216,772 | |
| Medtronic, Inc. | | | | 47,994 | | | | 1,507,971 | |
| St. Jude Medical, Inc. | * | | | 14,499 | | | | 477,887 | |
| Stryker Corp. | † | | | 10,499 | | | | 419,435 | |
| Varian Medical Systems, Inc. | * | | | 5,186 | | | | 181,717 | |
| Zimmer Holdings, Inc. | * | | | 9,556 | | | | 386,254 | |
| | | | | | | | | | | | | | 7,316,493 | |
Health Care Providers & Services—1.7% |
| Aetna, Inc. | | | | 20,018 | | | | 570,513 | |
| AmerisourceBergen Corp. | | | | 6,575 | | | | 234,464 | |
| Cardinal Health, Inc. | | | | 15,247 | | | | 525,564 | |
| Cigna Corp. | | | | 11,476 | | | | 193,370 | |
| Coventry Health Care, Inc. | * | | | 5,918 | | | | 88,060 | |
| DaVita, Inc. | *† | | | 4,338 | | | | 215,035 | |
| Express Scripts, Inc. | *† | | | 10,469 | | | $ | 575,586 | |
| Humana, Inc. | * | | | 6,882 | | | | 256,561 | |
| Laboratory Corp. of America Holdings | *† | | | 4,642 | | | | 298,991 | |
| McKesson Corp. | | | | 11,704 | | | | 453,296 | |
| Medco Health Solutions, Inc. | * | | | 21,486 | | | | 900,478 | |
| Patterson Cos., Inc. | *† | | | 3,837 | | | | 71,944 | |
| Quest Diagnostics, Inc. | † | | | 6,490 | | | | 336,896 | |
| Tenet Healthcare Corp. | *† | | | 19,138 | | | | 22,009 | |
| UnitedHealth Group, Inc. | | | | 51,743 | | | | 1,376,364 | |
| WellPoint, Inc. | * | | | 21,722 | | | | 915,148 | |
| | | | | | | | | | | | | | 7,034,279 | |
Health Care Technology—0.0% |
| IMS Health, Inc. | | | | 7,098 | | | | 107,606 | |
Hotels, Restaurants & Leisure—1.2% |
| Carnival Corp. | | | | 18,543 | | | | 450,966 | |
| Darden Restaurants, Inc. | | | | 5,557 | | | | 156,596 | |
| International Game Technology | | | | 12,516 | | | | 148,815 | |
| Marriott International, Inc., Class A | † | | | 12,456 | | | | 242,269 | |
| McDonald’s Corp. | | | | 47,851 | | | | 2,975,854 | |
| Starbucks Corp. | * | | | 30,892 | | | | 292,238 | |
| Starwood Hotels & Resorts Worldwide, Inc. | † | | | 7,519 | | | | 134,590 | |
| Wyndham Worldwide Corp. | † | | | 6,641 | | | | 43,499 | |
| Wynn Resorts Ltd. | *† | | | 2,420 | | | | 102,269 | |
| Yum! Brands, Inc. | | | | 19,894 | | | | 626,661 | |
| | | | | | | | | | | | | | 5,173,757 | |
Household Durables—0.3% |
| Black & Decker Corp. | | | | 2,731 | | | | 114,183 | |
| Centex Corp. | | | | 5,370 | | | | 57,137 | |
| D.R. Horton, Inc. | | | | 11,960 | | | | 84,557 | |
| Fortune Brands, Inc. | | | | 6,260 | | | | 258,413 | |
| Harman International Industries, Inc. | | | | 2,854 | | | | 47,748 | |
| KB Home | † | | | 3,394 | | | | 46,226 | |
| Leggett & Platt, Inc. | | | | 6,331 | | | | 96,168 | |
| Lennar Corp., Class A | † | | | 5,972 | | | | 51,777 | |
| Newell Rubbermaid, Inc. | | | | 11,995 | | | | 117,311 | |
| Pulte Homes, Inc. | † | | | 9,419 | | | | 102,950 | |
| Snap-On, Inc. | † | | | 2,539 | | | | 99,986 | |
| Stanley Works (The) | † | | | 3,363 | | | | 114,678 | |
| Whirlpool Corp. | † | | | 2,903 | | | | 120,039 | |
| | | | | | | | | | | | | | 1,311,173 | |
Household Products—2.5% |
| Clorox Co. | | | | 5,692 | | | | 316,247 | |
| Colgate-Palmolive Co. | | | | 21,503 | | | | 1,473,816 | |
| Kimberly-Clark Corp. | | | | 17,647 | | | | 930,703 | |
| Procter & Gamble Co. | | | | 127,048 | | | | 7,854,107 | |
| | | | | | | | | | | | | | 10,574,873 | |
Independent Power Producers & Energy Traders—0.1% |
| AES Corp. (The) | * | | | 27,982 | | | | 230,572 | |
| Constellation Energy Group, Inc. | † | | | 7,847 | | | | 196,881 | |
| Dynegy, Inc., Class A | *† | | | 20,516 | | | | 41,032 | |
| | | | | | | | | | | | | | 468,485 | |
Industrial Conglomerates—2.3% |
| 3M Co. | | | | 29,728 | | | | 1,710,549 | |
| General Electric Co. | | | | 447,698 | | | | 7,252,708 | |
| Textron, Inc. | | | | 10,317 | | | | 143,097 | |
| Tyco International Ltd. (Bermuda) | | | | 20,151 | | | | 435,261 | |
| | | | | | | | | | | | | | 9,541,615 | |
|
See accompanying notes to financial statements.
210
SCHEDULE OF INVESTMENTS—(Continued)
December 31, 2008
Vantagepoint
Asset Allocation Fund
| | | | Shares | | Value | |
|---|
COMMON STOCKS—(Continued) |
Insurance—2.2% |
| Aflac, Inc. | | | | 20,232 | | | $ | 927,435 | |
| Allstate Corp. (The) | | | | 22,992 | | | | 753,218 | |
| American International Group, Inc. | | | | 113,467 | | | | 178,143 | |
| AON Corp. | | | | 11,779 | | | | 538,065 | |
| Assurant, Inc. | | | | 4,791 | | | | 143,730 | |
| Chubb Corp. | | | | 15,309 | | | | 780,759 | |
| Cincinnati Financial Corp. | | | | 7,734 | | | | 224,827 | |
| Genworth Financial, Inc., Class A | | | | 19,514 | | | | 55,225 | |
| Hartford Financial Services Group, Inc. | † | | | 12,566 | | | | 206,334 | |
| Lincoln National Corp. | | | | 10,836 | | | | 204,150 | |
| Loews Corp. | | | | 15,352 | | | | 433,694 | |
| Marsh & McLennan Cos., Inc. | | | | 21,774 | | | | 528,455 | |
| MBIA, Inc. | *† | | | 6,541 | | | | 26,622 | |
| MetLife, Inc. | | | | 33,829 | | | | 1,179,279 | |
| Principal Financial Group, Inc. | † | | | 10,576 | | | | 238,700 | |
| Progressive Corp. (The) | † | | | 28,581 | | | | 423,285 | |
| Prudential Financial, Inc. | | | | 18,133 | | | | 548,704 | |
| Torchmark Corp. | † | | | 3,478 | | | | 155,467 | |
| Travelers Cos., Inc. (The) | | | | 25,098 | | | | 1,134,430 | |
| Unum Group | † | | | 14,404 | | | | 267,914 | |
| XL Capital Ltd., Class A (Bermuda) | | | | 13,995 | | | | 51,781 | |
| | | | | | | | | | | | | | 9,000,217 | |
Internet & Catalog Retail—0.2% |
| Amazon.com, Inc. | *† | | | 13,570 | | | | 695,870 | |
| Expedia, Inc. | * | | | 9,280 | | | | 76,467 | |
| | | | | | | | | | | | | | 772,337 | |
Internet Software & Services—1.1% |
| Akamai Technologies, Inc. | *† | | | 7,142 | | | | 107,773 | |
| eBay, Inc. | *† | | | 46,411 | | | | 647,898 | |
| Google, Inc., Class A | * | | | 10,197 | | | | 3,137,107 | |
| VeriSign, Inc. | *† | | | 7,999 | | | | 152,621 | |
| Yahoo! Inc. | * | | | 58,862 | | | | 718,116 | |
| | | | | | | | | | | | | | 4,763,515 | |
IT Services—0.8% |
| Affiliated Computer Services, Inc., Class A | * | | | 4,312 | | | | 198,136 | |
| Automatic Data Processing, Inc. | | | | 21,614 | | | | 850,295 | |
| Cognizant Technology Solutions Corp., Class A | *† | | | 12,127 | | | | 219,014 | |
| Computer Sciences Corp. | *† | | | 6,273 | | | | 220,433 | |
| Convergys Corp. | * | | | 4,900 | | | | 31,409 | |
| Fidelity National Information Services, Inc. | | | | 7,710 | | | | 125,442 | |
| Fiserv, Inc. | * | | | 6,844 | | | | 248,916 | |
| Mastercard, Inc., Class A | † | | | 3,069 | | | | 438,652 | |
| Paychex, Inc. | † | | | 13,601 | | | | 357,434 | |
| Total System Services, Inc. | | | | 9,144 | | | | 128,016 | |
| Western Union Co. (The) | | | | 30,950 | | | | 443,823 | |
| | | | | | | | | | | | | | 3,261,570 | |
Leisure Equipment & Products—0.1% |
| Eastman Kodak Co. | † | | | 12,583 | | | | 82,796 | |
| Hasbro, Inc. | | | | 5,427 | | | | 158,306 | |
| Mattel, Inc. | † | | | 14,990 | | | | 239,840 | |
| | | | | | | | | | | | | | 480,942 | |
Life Sciences Tools & Services—0.3% |
| Life Technologies Corp. | * | | | 5,957 | | | $ | 138,858 | |
| Millipore Corp. | * | | | 2,546 | | | | 131,170 | |
| PerkinElmer, Inc. | † | | | 4,635 | | | | 64,473 | |
| Thermo Fisher Scientific, Inc. | * | | | 17,798 | | | | 606,378 | |
| Waters Corp. | *† | | | 4,104 | | | | 150,411 | |
| | | | | | | | | | | | | | 1,091,290 | |
Machinery—1.3% |
| Caterpillar, Inc. | | | | 25,876 | | | | 1,155,881 | |
| Cummins, Inc. | | | | 9,100 | | | | 243,243 | |
| Danaher Corp. | | | | 10,833 | | | | 613,256 | |
| Deere & Co. | † | | | 18,135 | | | | 694,933 | |
| Dover Corp. | † | | | 7,926 | | | | 260,924 | |
| Eaton Corp. | | | | 7,027 | | | | 349,312 | |
| Flowserve Corp. | | | | 2,637 | | | | 135,805 | |
| Illinois Tool Works, Inc. | | | | 16,976 | | | | 595,009 | |
| Ingersoll-Rand Co. Ltd., Class A (Bermuda) | † | | | 12,890 | | | | 223,641 | |
| ITT Corp. | | | | 7,477 | | | | 343,867 | |
| Manitowoc Co., Inc. (The) | | | | 5,703 | | | | 49,388 | |
| PACCAR, Inc. | † | | | 15,411 | | | | 440,755 | |
| Pall Corp. | | | | 4,797 | | | | 136,379 | |
| Parker Hannifin Corp. | | | | 7,079 | | | | 301,141 | |
| | | | | | | | | | | | | | 5,543,534 | |
Media—2.1% |
| CBS Corp., Class B | † | | | 28,327 | | | | 231,998 | |
| Comcast Corp., Class A | | | | 124,129 | | | | 2,095,298 | |
| DIRECTV Group, Inc. (The) | *† | | | 22,696 | | | | 519,965 | |
| Gannett Co., Inc. | † | | | 10,491 | | | | 83,928 | |
| Interpublic Group of Cos., Inc. | *† | | | 21,982 | | | | 87,049 | |
| McGraw-Hill Cos., Inc. (The) | | | | 13,413 | | | | 311,047 | |
| Meredith Corp. | | | | 1,895 | | | | 32,442 | |
| New York Times Co. (The), Class A | † | | | 4,293 | | | | 31,468 | |
| News Corp., Class A | | | | 97,547 | | | | 886,702 | |
| Omnicom Group, Inc. | † | | | 13,517 | | | | 363,878 | |
| Scripps Networks Interactive, Inc., Class A | | | | 3,760 | | | | 82,720 | |
| Time Warner, Inc. | | | | 152,352 | | | | 1,532,661 | |
| Viacom, Inc., Class B | * | | | 26,333 | | | | 501,907 | |
| Walt Disney Co. (The) | | | | 79,814 | | | | 1,810,980 | |
| Washington Post Co. (The), Class B | † | | | 265 | | | | 103,416 | |
| | | | | | | | | | | | | | 8,675,459 | |
Metals & Mining—0.6% |
| AK Steel Holding Corp. | | | | 5,177 | | | | 48,250 | |
| Alcoa, Inc. | † | | | 34,480 | | | | 388,245 | |
| Allegheny Technologies, Inc. | † | | | 4,545 | | | | 116,034 | |
| Freeport-McMoRan Copper & Gold, Inc. | † | | | 16,300 | | | | 398,372 | |
| Newmont Mining Corp. | | | | 19,385 | | | | 788,969 | |
| Nucor Corp. | | | | 13,424 | | | | 620,189 | |
| Titanium Metals Corp. | † | | | 3,978 | | | | 35,046 | |
| United States Steel Corp. | | | | 4,889 | | | | 181,871 | |
| | | | | | | | | | | | | | 2,576,976 | |
Multiline Retail—0.6% |
| Big Lots, Inc. | *† | | | 3,784 | | | | 54,830 | |
| Family Dollar Stores, Inc. | | | | 5,300 | | | | 138,171 | |
| J.C. Penney Co., Inc. | † | | | 9,233 | | | | 181,890 | |
| Kohl’s Corp. | *† | | | 12,913 | | | | 467,451 | |
| Macy’s, Inc. | | | | 16,255 | | | | 168,239 | |
|
See accompanying notes to financial statements.
211
SCHEDULE OF INVESTMENTS—(Continued)
December 31, 2008
Vantagepoint
Asset Allocation Fund
| | | | Shares | | Value | |
|---|
COMMON STOCKS—(Continued) |
| Nordstrom, Inc. | † | | | 6,298 | | | $ | 83,826 | |
| Sears Holdings Corp. | *† | | | 2,505 | | | | 97,369 | |
| Target Corp. | | | | 32,084 | | | | 1,107,861 | |
| | | | | | | | | | | | | | 2,299,637 | |
Multi-Utilities—1.2% |
| Ameren Corp. | † | | | 8,767 | | | | 291,590 | |
| Centerpoint Energy, Inc. | | | | 16,679 | | | | 210,489 | |
| CMS Energy Corp. | † | | | 9,922 | | | | 100,312 | |
| Consolidated Edison, Inc. | † | | | 11,586 | | | | 451,043 | |
| Dominion Resources, Inc. | | | | 24,640 | | | | 883,098 | |
| DTE Energy Co. | | | | 6,779 | | | | 241,807 | |
| Integrys Energy Group, Inc. | † | | | 3,300 | | | | 141,834 | |
| NiSource, Inc. | | | | 11,857 | | | | 130,071 | |
| PG&E Corp. | | | | 15,209 | | | | 588,740 | |
| Public Service Enterprise Group, Inc. | | | | 21,581 | | | | 629,518 | |
| SCANA Corp. | | | | 4,994 | | | | 177,786 | |
| Sempra Energy | | | | 10,445 | | | | 445,270 | |
| TECO Energy, Inc. | † | | | 9,094 | | | | 112,311 | |
| Wisconsin Energy Corp. | † | | | 4,973 | | | | 208,767 | |
| Xcel Energy, Inc. | | | | 19,456 | | | | 360,909 | |
| | | | | | | | | | | | | | 4,973,545 | |
Office Electronics—0.1% |
| Xerox Corp. | | | | 36,836 | | | | 293,583 | |
Oil, Gas & Consumable Fuels—9.4% |
| Anadarko Petroleum Corp. | | | | 19,884 | | | | 766,528 | |
| Apache Corp. | | | | 14,214 | | | | 1,059,369 | |
| Cabot Oil & Gas Corp. | † | | | 4,497 | | | | 116,922 | |
| Chesapeake Energy Corp. | † | | | 22,090 | | | | 357,195 | |
| Chevron Corp. | | | | 87,184 | | | | 6,449,000 | |
| ConocoPhillips | | | | 64,148 | | | | 3,322,866 | |
| Consol Energy, Inc. | | | | 7,641 | | | | 218,380 | |
| Devon Energy Corp. | | | | 18,781 | | | | 1,234,100 | |
| El Paso Corp. | † | | | 28,504 | | | | 223,186 | |
| EOG Resources, Inc. | † | | | 10,564 | | | | 703,351 | |
| Exxon Mobil Corp. | | | | 217,409 | | | | 17,355,760 | |
| Hess Corp. | | | | 12,018 | | | | 644,646 | |
| Marathon Oil Corp. | | | | 29,972 | | | | 820,034 | |
| Massey Energy Co. | | | | 3,705 | | | | 51,092 | |
| Murphy Oil Corp. | | | | 8,073 | | | | 358,038 | |
| Noble Energy, Inc. | | | | 7,142 | | | | 351,529 | |
| Occidental Petroleum Corp. | | | | 34,748 | | | | 2,084,533 | |
| Peabody Energy Corp. | | | | 11,496 | | | | 261,534 | |
| Pioneer Natural Resources Co. | | | | 4,795 | | | | 77,583 | |
| Range Resources Corp. | | | | 6,784 | | | | 233,302 | |
| Southwestern Energy Co. | * | | | 14,498 | | | | 420,007 | |
| Spectra Energy Corp. | † | | | 26,075 | | | | 410,421 | |
| Sunoco, Inc. | † | | | 5,593 | | | | 243,072 | |
| Tesoro Corp. | † | | | 6,213 | | | | 81,825 | |
| Valero Energy Corp. | | | | 22,181 | | | | 479,997 | |
| Williams Cos., Inc. | † | | | 24,371 | | | | 352,892 | |
| XTO Energy, Inc. | | | | 24,588 | | | | 867,219 | |
| | | | | | | | | | | | | | 39,544,381 | |
Paper & Forest Products—0.1% |
| International Paper Co. | † | | | 18,082 | | | | 213,367 | |
| MeadWestvaco Corp. | | | | 7,851 | | | | 87,853 | |
| Weyerhaeuser Co. | † | | | 8,959 | | | | 274,235 | |
| | | | | | | | | | | | | | 575,455 | |
Personal Products—0.1% |
| Avon Products, Inc. | | | | 18,066 | | | $ | 434,126 | |
| Estee Lauder Cos., Inc. (The), Class A | † | | | 5,057 | | | | 156,565 | |
| | | | | | | | | | | | | | 590,691 | |
Pharmaceuticals—6.4% |
| Abbott Laboratories | | | | 66,140 | | | | 3,529,892 | |
| Allergan, Inc. | † | | | 13,050 | | | | 526,176 | |
| Bristol-Myers Squibb Co. | | | | 84,185 | | | | 1,957,301 | |
| Eli Lilly & Co. | | | | 42,543 | | | | 1,713,207 | |
| Forest Laboratories, Inc. | * | | | 12,871 | | | | 327,824 | |
| Johnson & Johnson | | | | 118,491 | | | | 7,089,316 | |
| King Pharmaceuticals, Inc. | * | | | 10,183 | | | | 108,143 | |
| Merck & Co., Inc. | | | | 91,149 | | | | 2,770,930 | |
| Mylan, Inc. | *† | | | 14,047 | | | | 138,925 | |
| Pfizer, Inc. | | | | 287,434 | | | | 5,090,456 | |
| Schering-Plough Corp. | | | | 69,083 | | | | 1,176,483 | |
| Watson Pharmaceuticals, Inc. | *† | | | 4,259 | | | | 113,162 | |
| Wyeth | | | | 56,713 | | | | 2,127,305 | |
| | | | | | | | | | | | | | 26,669,120 | |
Professional Services—0.1% |
| Dun & Bradstreet Corp. | | | | 2,285 | | | | 176,402 | |
| Equifax, Inc. | | | | 5,604 | | | | 148,618 | |
| Monster Worldwide, Inc. | *† | | | 5,522 | | | | 66,761 | |
| Robert Half International, Inc. | † | | | 6,180 | | | | 128,668 | |
| | | | | | | | | | | | | | 520,449 | |
Real Estate Investment Trusts (REIT)—0.8% |
| Apartment Investment & Management Co., Class A REIT | † | | | 3,660 | | | | 42,273 | |
| AvalonBay Communities, Inc. REIT | † | | | 3,107 | | | | 188,222 | |
| Boston Properties, Inc. REIT | † | | | 5,079 | | | | 279,345 | |
| Developers Diversified Realty Corp. REIT | † | | | 5,585 | | | | 27,255 | |
| Equity Residential REIT | † | | | 11,493 | | | | 342,721 | |
| HCP, Inc. REIT | † | | | 10,640 | | | | 295,473 | |
| Host Hotels & Resorts, Inc. REIT | † | | | 23,370 | | | | 176,911 | |
| Kimco Realty Corp. REIT | | | | 9,589 | | | | 175,287 | |
| Plum Creek Timber Co., Inc. REIT | † | | | 6,971 | | | | 242,173 | |
| ProLogis REIT | † | | | 11,088 | | | | 154,012 | |
| Public Storage REIT | | | | 5,312 | | | | 422,304 | |
| Simon Property Group, Inc. REIT | † | | | 9,560 | | | | 507,923 | |
| Vornado Realty Trust REIT | † | | | 5,810 | | | | 350,633 | |
| | | | | | | | | | | | | | 3,204,532 | |
Real Estate Management & Development—0.0% |
| CB Richard Ellis Group, Inc., Class A | *† | | | 7,914 | | | | 34,188 | |
Road & Rail—0.8% |
| Burlington Northern Santa Fe Corp. | | | | 12,002 | | | | 908,671 | |
| CSX Corp. | | | | 17,316 | | | | 562,251 | |
| Norfolk Southern Corp. | | | | 15,942 | | | | 750,071 | |
| Ryder System, Inc. | | | | 2,220 | | | | 86,092 | |
| Union Pacific Corp. | | | | 21,648 | | | | 1,034,774 | |
| | | | | | | | | | | | | | 3,341,859 | |
|
See accompanying notes to financial statements.
212
SCHEDULE OF INVESTMENTS—(Continued)
December 31, 2008
Vantagepoint
Asset Allocation Fund
| | | | Shares | | Value | |
|---|
COMMON STOCKS—(Continued) |
Semiconductors & Semiconductor Equipment—1.7% |
| Advanced Micro Devices, Inc. | *† | | | 28,013 | | | $ | 60,508 | |
| Altera Corp. | † | | | 13,510 | | | | 225,752 | |
| Analog Devices, Inc. | | | | 12,255 | | | | 233,090 | |
| Applied Materials, Inc. | | | | 56,988 | | | | 577,288 | |
| Broadcom Corp., Class A | *† | | | 18,632 | | | | 316,185 | |
| Intel Corp. | | | | 237,267 | | | | 3,478,334 | |
| KLA-Tencor Corp. | † | | | 6,993 | | | | 152,378 | |
| Linear Technology Corp. | † | | | 9,230 | | | | 204,168 | |
| LSI Corp. | *† | | | 29,693 | | | | 97,690 | |
| MEMC Electronic Materials, Inc. | *† | | | 10,061 | | | | 143,671 | |
| Microchip Technology, Inc. | † | | | 7,631 | | | | 149,033 | |
| Micron Technology, Inc. | *† | | | 31,818 | | | | 84,000 | |
| National Semiconductor Corp. | † | | | 8,995 | | | | 90,580 | |
| Novellus Systems, Inc. | * | | | 4,032 | | | | 49,755 | |
| Nvidia Corp. | * | | | 24,486 | | | | 197,602 | |
| Teradyne, Inc. | * | | | 8,399 | | | | 35,444 | |
| Texas Instruments, Inc. | | | | 55,722 | | | | 864,805 | |
| Xilinx, Inc. | † | | | 11,509 | | | | 205,090 | |
| | | | | | | | | | | | | | 7,165,373 | |
Software—2.9% |
| Adobe Systems, Inc. | * | | | 22,521 | | | | 479,472 | |
| Autodesk, Inc. | *† | | | 9,038 | | | | 177,597 | |
| BMC Software, Inc. | * | | | 7,890 | | | | 212,320 | |
| CA, Inc. | † | | | 16,621 | | | | 307,987 | |
| Citrix Systems, Inc. | * | | | 7,947 | | | | 187,311 | |
| Compuware Corp. | *† | | | 11,759 | | | | 79,373 | |
| Electronic Arts, Inc. | * | | | 13,513 | | | | 216,748 | |
| Intuit, Inc. | * | | | 13,572 | | | | 322,878 | |
| McAfee, Inc. | *† | | | 6,503 | | | | 224,809 | |
| Microsoft Corp. | | | | 326,481 | | | | 6,346,790 | |
| Novell, Inc. | *† | | | 17,011 | | | | 66,173 | |
| Oracle Corp. | * | | | 166,723 | | | | 2,955,999 | |
| Salesforce.com, Inc. | *† | | | 4,780 | | | | 153,008 | |
| Symantec Corp. | * | | | 35,601 | | | | 481,325 | |
| | | | | | | | | | | | | | 12,211,790 | |
Specialty Retail—1.4% |
| Abercrombie & Fitch Co., Class A | † | | | 3,919 | | | | 90,411 | |
| AutoNation, Inc. | *† | | | 3,471 | | | | 34,293 | |
| AutoZone, Inc. | *† | | | 1,728 | | | | 241,004 | |
| Bed Bath & Beyond, Inc. | *† | | | 10,997 | | | | 279,544 | |
| Best Buy Co., Inc. | † | | | 14,316 | | | | 402,423 | |
| GameStop Corp., Class A | *† | | | 7,231 | | | | 156,623 | |
| Gap, Inc. (The) | | | | 19,492 | | | | 260,998 | |
| Home Depot, Inc. | † | | | 72,225 | | | | 1,662,620 | |
| Limited Brands, Inc. | † | | | 13,166 | | | | 132,187 | |
| Lowe’s Cos., Inc. | | | | 62,306 | | | | 1,340,825 | |
| Office Depot, Inc. | * | | | 13,041 | | | | 38,862 | |
| RadioShack Corp. | | | | 5,381 | | | | 64,249 | |
| Sherwin-Williams Co. (The) | | | | 4,365 | | | | 260,809 | |
| Staples, Inc. | | | | 30,170 | | | | 540,646 | |
| Tiffany & Co. | † | | | 4,965 | | | | 117,323 | |
| TJX Cos, Inc. | † | | | 17,791 | | | | 365,961 | |
| | | | | | | | | | | | | | 5,988,778 | |
Textiles, Apparel & Luxury Goods—0.4% |
| Coach, Inc. | * | | | 14,068 | | | | 292,193 | |
| Jones Apparel Group, Inc. | | | | 3,849 | | | | 22,555 | |
| Nike, Inc., Class B | | | | 16,672 | | | | 850,272 | |
| Polo Ralph Lauren Corp. | † | | | 2,237 | | | $ | 101,582 | |
| V.F. Corp. | † | | | 3,825 | | | | 209,495 | |
| | | | | | | | | | | | | | 1,476,097 | |
Thrifts & Mortgage Finance—0.2% |
| Hudson City Bancorp, Inc. | † | | | 21,971 | | | | 350,657 | |
| People’s United Financial, Inc. | | | | 14,720 | | | | 262,458 | |
| Sovereign Bancorp, Inc. | *† | | | 25,072 | | | | 74,714 | |
| | | | | | | | | | | | | | 687,829 | |
Tobacco—1.5% |
| Altria Group, Inc. | | | | 87,593 | | | | 1,319,151 | |
| Lorillard, Inc. | | | | 7,377 | | | | 415,694 | |
| Philip Morris International, Inc. | | 87,027 | | | | 3,786,545 | |
| Reynolds American, Inc. | † | | | 7,455 | | | | 300,511 | |
| UST, Inc. | | | | 6,243 | | | | 433,139 | |
| | | | | | | | | | | | | | 6,255,040 | |
Trading Companies & Distributors—0.1% |
| Fastenal Co. | † | | | 5,366 | | | | 187,005 | |
| W.W. Grainger, Inc. | † | | | 2,629 | | | | 207,270 | |
| | | | | | | | | | | | | | 394,275 | |
Wireless Telecommunication Services—0.2% |
| American Tower Corp., Class A | *† | | | 16,715 | | | | 490,084 | |
| Sprint Nextel Corp. | * | | | 121,045 | | | | 221,512 | |
| | | | | | | | | | | | | | 711,596 | |
TOTAL COMMON STOCKS |
| (Cost $412,565,575) | | | | | | 335,298,255 | |
| |
Coupon
Rate
|
|
|
| Maturity
Date
|
|
|
| Face
|
| Value
|
|---|
U.S. GOVERNMENT AGENCY OBLIGATIONS—8.4% |
U.S. Government Agency Obligations—8.4% |
| Federal Home Loan Bank Discount Notes |
| 0.070% | | | | 01/07/2009-
01/12/2009 | | | | $ | 9,000,000 | | | | 8,999,839 | |
| 0.050% | | | | 01/12/2009 | | | | | 13,800,000 | | | | 13,799,770 | |
| Federal National Mortgage Association Discount Notes |
| 0.175% | | | | 02/02/2009 | | | | | 3,400,000 | | | | 3,399,454 | |
| 0.170% | | | | 02/03/2009 | | | | | 3,100,000 | | | | 3,099,503 | |
| 0.060% | | | | 01/07/2009 | | | | | 6,000,000 | | | | 5,999,930 | |
TOTAL U.S. GOVERNMENT AGENCY OBLIGATIONS |
| (Cost $35,298,573) | | | | | | 35,298,496 | |
| |
U.S. TREASURY OBLIGATIONS—2.3% |
U.S. Treasury Bills—2.3% |
| U.S. Treasury Bill |
| 0.136% | | | | 06/11/2009 | | ‡‡ | | | | | | | | |
| (Cost $9,514,198) | | 9,520,000 | | | | 9,514,840 | |
| |
COMMERCIAL PAPER—6.0% |
Banks—2.4% |
| Bank of Scotland plc (United Kingdom) |
| 0.744% | | | | 01/07/2009 | | | | | 10,000,000 | | | | 9,998,555 | |
Capital Markets—3.6% |
| Citigroup Funding, Inc. |
| 0.250% | | | | 01/12/2009 | | | | | 15,000,000 | | | | 14,998,710 | |
TOTAL COMMERCIAL PAPER |
| (Cost $24,997,615) | | | | | | 24,997,265 | |
|
See accompanying notes to financial statements.
213
SCHEDULE OF INVESTMENTS—(Continued)
December 31, 2008
Vantagepoint
Asset Allocation Fund
|
|
|
| Shares
|
| Value
|
|
|---|
RIGHTS—0.0% |
Computers & Peripherals—0.0% |
| Seagate Technology (Cayman Islands), Expires TBD | *d | | | | | | | | |
| (Cost $—) | | | | 10,600 | | | $ | — | |
| |
CASH EQUIVALENTS—11.3% |
Institutional Money Market Funds—6.3% |
| AIM Short-Term Investments Trust Prime Assets Portfolio | †† | | | 13,981,167 | | | | 13,981,167 | |
| Fidelity Institutional Money Market: Money Market Portfolio—Institutional Class | | | | 12,559,155 | | | | 12,559,155 | |
| | | | | | | | | 26,540,322 | |
| |
Coupon
Rate
|
|
|
| Maturity
Date
|
|
|
| Face
|
| Value
|
|---|
Certificates of Deposit—3.4% |
| Allied Irish Banks plc/New York |
| 1.000% | | | | 01/20/2009 | | †† | | | $ 2,000,000 | | | | 2,000,000 | |
| Bayerische Landesbank/New York |
| 2.750% | | | | 01/12/2009 | | †† | | | 1,500,000 | | | | 1,500,000 | |
| Credit Industriel et Commercial |
| 2.310% | | | | 03/18/2009 | | †† | | | 1,000,000 | | | | 1,000,000 | |
| 2.240% | | | | 03/17/2009 | | †† | | | 1,000,000 | | | | 1,000,000 | |
| HSH Nordbank AG |
| 1.850% | | | | 01/20/2009 | | †† | | | 1,500,067 | | | | 1,500,066 | |
| Landesbank Hessen-Thueringen Girozentrale/New York |
| 3.050% | | | | 01/02/2009 | | †† | | | 1,500,000 | | | | 1,500,000 | |
| Natixis/New York |
| 4.133% | | | | 01/02/2009 | | #†† | | | 2,495,492 | | | | 2,495,492 | |
| Norinchukin Bank/New York |
| 1.650% | | | | 01/12/2009 | | †† | | | 1,000,000 | | | | 1,000,000 | |
| Ulster Bank Ltd. |
| 1.600% | | | | 02/23/2009 | | †† | | | 498,604 | | | | 498,604 | |
| Westpac Securities NZ Ltd. |
| 2.250% | | | | 03/16/2009 | | †† | | | 1,491,517 | | | | 1,491,517 | |
| | | | | | | | | | | | | | 13,985,679 | |
Medium Term Notes—0.7% |
| BBVA Senior Finance SA |
| 4.620% | | | | 04/17/2009 | | #†† | | | 2,013,731 | | | | 2,013,731 | |
| Royal Bank of Scotland Group plc |
| 3.655% | | | | 01/30/2009 | | †† | | | 1,005,493 | | | | 1,005,493 | |
| | | | | | | | | | | | | | 3,019,224 | |
Time Deposits—0.9% |
| Banco Popular Espanol SA |
| 3.120% | | | | 01/05/2009 | | †† | | | 2,000,000 | | | | 2,000,000 | |
| Raiffeisen Zentralbank Oesterreich AG |
| 1.750% | | | | 01/20/2009 | | †† | | | 1,900,000 | | | | 1,900,000 | |
| | | 3,900,000 | |
TOTAL CASH EQUIVALENTS |
| (Cost $47,445,225) | | | | | | | | 47,445,225 | |
TOTAL INVESTMENTS—108.1% | | | |
| (Cost $529,821,186) | | 452,554,081 | |
| Other assets less liabilities—(8.1%) | | (34,023,689 | ) |
NET ASSETS—100.0% | | | | | $ | 418,530,392 | |
|
|
|---|
Notes to the Schedule of Investments:
| | | | | | | | | | | |
| REIT | | | | Real Estate Investment Trust | | | | | | | | | | | | |
| TBD | | | | To be determined | | | | | | | | | | | | |
| † | | | | Denotes all or a portion of security on loan. | | | | | | | | | | | | |
| * | | | | Non-income producing. | | | | | | | | | | | | |
| ‡‡ | | | | Security has been pledged as collateral for futures contracts. | | | | | | | | | | | | |
| d | | | | Security has no market value at 12/31/2008. | | | | | | | | | | | | |
| †† | | | | Represents reinvestment of collateral received in conjunction with securities lending. | | | | | | | | | | | | |
| # | | | | Rate is subject to change. Rate shown reflects current rate. | | | | | | | | | | | | |
| | | | | | | | | | |
|
See accompanying notes to financial statements.
214
SCHEDULE OF INVESTMENTS
December 31, 2008
Vantagepoint
Equity Income Fund
| | | | Shares | | Value | |
|---|
COMMON STOCKS—96.1% |
Aerospace & Defense—1.8% |
| Boeing Co. (The) | | | | 74,000 | | | $ | 3,157,580 | |
| Honeywell International, Inc. | | 349,600 | | | | 11,477,368 | |
| L-3 Communications Holdings, Inc. | | | | 71,300 | | | | 5,260,514 | |
| | | | | | | | | | | | | | 19,895,462 | |
Air Freight & Logistics—1.3% |
| FedEx Corp. | | | | 168,600 | | | | 10,815,690 | |
| United Parcel Service, Inc., Class B | | | | 61,600 | | | | 3,397,856 | |
| | | | | | | | | | | | | | 14,213,546 | |
Automobiles—0.1% |
| Harley-Davidson, Inc. | | | | 88,500 | | | | 1,501,845 | |
Beverages—0.2% |
| Anheuser-Busch InBev NV (Belgium) | | | | 79,000 | | | | 1,834,636 | |
Biotechnology—0.3% |
| Amgen, Inc. | * | | | 63,500 | | | | 3,667,125 | |
Building Products—0.3% |
| Masco Corp. | † | | | 202,000 | | | | 2,248,260 | |
| USG Corp. | *† | | | 77,900 | | | | 626,316 | |
| | | | | | | | | | | | | | 2,874,576 | |
Capital Markets—1.2% |
| Bank of New York Mellon Corp. (The) | | | | 158,800 | | | | 4,498,804 | |
| Goldman Sachs Group, Inc. (The) | | 35,700 | | | | 3,012,723 | |
| Janus Capital Group, Inc. | † | | | 60,500 | | | | 485,815 | |
| Legg Mason, Inc. | † | | | 25,400 | | | | 556,514 | |
| Merrill Lynch & Co., Inc. | | | | 255,200 | | | | 2,970,528 | |
| UBS AG (Switzerland) | * | | | 131,105 | | | | 1,874,801 | |
| | | | | | | | | | | | | | 13,399,185 | |
Chemicals—1.1% |
| E.I. Du Pont de Nemours & Co. | | 369,746 | | | | 9,354,574 | |
| International Flavors & Fragrances, Inc. | | | | 81,100 | | | | 2,410,292 | |
| | | | | | | | | | | | | | 11,764,866 | |
Commercial Banks—3.2% |
| Allied Irish Banks plc ADR (Ireland) | † | | | 121,100 | | | | 567,959 | |
| Fifth Third Bancorp | | | | 174,600 | | | | 1,442,196 | |
| KeyCorp | | | | 178,600 | | | | 1,521,672 | |
| Marshall & Ilsley Corp. | † | | | 74,800 | | | | 1,020,272 | |
| SunTrust Banks, Inc. | † | | | 383,700 | | | | 11,334,498 | |
| U.S. Bancorp | | | | 209,600 | | | | 5,242,096 | |
| Wells Fargo & Co. | | | | 483,000 | | | | 14,238,840 | |
| | | | | | | | | | | | | | 35,367,533 | |
Commercial Services & Supplies—0.6% |
| Avery Dennison Corp. | | | | 86,100 | | | | 2,818,053 | |
| Pitney Bowes, Inc. | | | | 143,900 | | | | 3,666,572 | |
| | | | | | | | | | | | | | 6,484,625 | |
Communications Equipment—0.6% |
| Alcatel-Lucent ADR (France) | * | | | 159,100 | | | | 342,065 | |
| Cisco Systems, Inc. | * | | | 70,100 | | | | 1,142,630 | |
| Nokia Oyj ADR (Finland) | † | | | 364,500 | | | | 5,686,200 | |
| | | | | | | | | | | | | | 7,170,895 | |
Computers & Peripherals—5.0% |
| Dell, Inc. | * | | | 2,931,500 | | | $ | 30,018,560 | |
| Hewlett-Packard Co. | | | | 161,500 | | | | 5,860,835 | |
| International Business Machines Corp. | | | | 84,400 | | | | 7,103,104 | |
| Sun Microsystems, Inc. | *† | | | 3,239,000 | | | | 12,372,980 | |
| | | | | | | | | | | | | | 55,355,479 | |
Construction Materials—2.1% |
| Cemex SAB de CV ADR (Mexico) | *† | | | 2,057,617 | | | | 18,806,619 | |
| Vulcan Materials Co. | † | | | 55,500 | | | | 3,861,690 | |
| | | | | | | | | | | | | | 22,668,309 | |
Consumer Finance—2.2% |
| American Express Co. | | | | 499,500 | | | | 9,265,725 | |
| Capital One Financial Corp. | † | | | 267,200 | | | | 8,521,008 | |
| SLM Corp. | *† | | | 727,800 | | | | 6,477,420 | |
| | | | | | | | | | | | | | 24,264,153 | |
Distributors—0.2% |
| Genuine Parts Co. | | | | 58,052 | | | | 2,197,849 | |
Diversified Consumer Services—0.2% |
| H&R Block, Inc. | | | | 99,800 | | | | 2,267,456 | |
Diversified Financial Services—2.7% |
| Bank of America Corp. | | | | 564,662 | | | | 7,950,441 | |
| Citigroup, Inc. | | | | 572,669 | | | | 3,842,609 | |
| JPMorgan Chase & Co. | | | | 558,200 | | | | 17,600,046 | |
| | | | | | | | | | | | | | 29,393,096 | |
Diversified Telecommunication Services—4.2% |
| AT&T, Inc. | | | | 666,942 | | | | 19,007,847 | |
| Level 3 Communications, Inc. | *† | | | 7,327,000 | | | | 5,128,900 | |
| Qwest Communications International, Inc. | † | | | 637,600 | | | | 2,320,864 | |
| Verizon Communications, Inc. | | | | 581,641 | | | | 19,717,630 | |
| | | | | | | | | | | | | | 46,175,241 | |
Electric Utilities—2.2% |
| Duke Energy Corp. | | | | 411,824 | | | | 6,181,478 | |
| Entergy Corp. | | | | 140,900 | | | | 11,713,017 | |
| FirstEnergy Corp. | | | | 30,800 | | | | 1,496,264 | |
| Pinnacle West Capital Corp. | | | | 68,000 | | | | 2,184,840 | |
| Progress Energy, Inc. | | | | 74,400 | | | | 2,964,840 | |
| | | | | | | | | | | | | | 24,540,439 | |
Electrical Equipment—0.9% |
| Cooper Industries Ltd., Class A | | | | 58,700 | | | | 1,715,801 | |
| Emerson Electric Co. | | | | 219,000 | | | | 8,017,590 | |
| | | | | | | | | | | | | | 9,733,391 | |
Electronic Equipment, Instruments & Components—0.1% |
| Tyco Electronics Ltd. (Bermuda) | | | | 69,100 | | | | 1,120,111 | |
Energy Equipment & Services—0.2% |
| BJ Services Co. | | | | 63,700 | | | | 743,379 | |
| Schlumberger Ltd. | | | | 46,900 | | | | 1,985,277 | |
| | | | | | | | | | | | | | 2,728,656 | |
|
See accompanying notes to financial statements.
215
SCHEDULE OF INVESTMENTS—(Continued)
December 31, 2008
Vantagepoint
Equity Income Fund
| | | | Shares | | Value | |
|---|
COMMON STOCKS—(Continued) |
Food & Staples Retailing—1.5% |
| Walgreen Co. | | | | 663,000 | | | $ | 16,356,210 | |
| Whole Foods Market, Inc. | † | | | 38,300 | | | | 361,552 | |
| | | | | | | | | | | | | | 16,717,762 | |
Food Products—1.8% |
| H.J. Heinz Co. | † | | | 75,800 | | | | 2,850,080 | |
| Hershey Co. (The) | † | | | 173,300 | | | | 6,020,442 | |
| Kraft Foods, Inc., Class A | | | | 351,224 | | | | 9,430,364 | |
| McCormick & Co., Inc. | † | | | 49,300 | | | | 1,570,698 | |
| | | | | | | | | | | | | | 19,871,584 | |
Health Care Equipment & Supplies—0.8% |
| Baxter International, Inc. | | | | 168,800 | | | | 9,045,992 | |
Health Care Providers & Services—1.8% |
| UnitedHealth Group, Inc. | | | | 344,700 | | | | 9,169,020 | |
| WellPoint, Inc. | * | | | 250,500 | | | | 10,553,565 | |
| | | | | | | | | | | | | | 19,722,585 | |
Hotels, Restaurants & Leisure—5.1% |
| Carnival Corp. | | | | 291,200 | | | | 7,081,984 | |
| Marriott International, Inc., Class A | | | | 1,258,000 | | | | 24,468,100 | |
| MGM MIRAGE | *† | | | 102,000 | | | | 1,403,520 | |
| Yum! Brands, Inc. | | | | 751,000 | | | | 23,656,500 | |
| | | | | | | | | | | | | | 56,610,104 | |
Household Durables—1.9% |
| Black & Decker Corp. | | | | 31,800 | | | | 1,329,558 | |
| D.R. Horton, Inc. | | | | 74,000 | | | | 523,180 | |
| Fortune Brands, Inc. | | | | 115,000 | | | | 4,747,200 | |
| Harman International Industries, Inc. | | | | 45,000 | | | | 752,850 | |
| Newell Rubbermaid, Inc. | | | | 172,600 | | | | 1,688,028 | |
| Stanley Works (The) | † | | | 278,500 | | | | 9,496,850 | |
| Whirlpool Corp. | † | | | 61,700 | | | | 2,551,295 | |
| | | | | | | | | | | | | | 21,088,961 | |
Household Products—0.3% |
| Colgate-Palmolive Co. | | | | 6,200 | | | | 424,948 | |
| Kimberly-Clark Corp. | | | | 49,359 | | | | 2,603,194 | |
| | | | | | | | | | | | | | 3,028,142 | |
Independent Power Producers & Energy Traders—0.1% |
| NRG Energy, Inc. | * | | | 24,700 | | | | 576,251 | |
Industrial Conglomerates—4.0% |
| 3M Co. | | | | 198,500 | | | | 11,421,690 | |
| General Electric Co. | | | | 831,200 | | | | 13,465,440 | |
| Koninklijke Philips Electronics NV (NY Reg Shares) (Netherlands) | | | | 942,000 | | | | 18,717,540 | |
| | | | | | | | | | | | | | 43,604,670 | |
Insurance—4.9% |
| Allstate Corp. (The) | | | | 82,100 | | | | 2,689,596 | |
| Chubb Corp. | | | | 37,000 | | | | 1,887,000 | |
| Fairfax Financial Holdings Ltd. (Canada) | | | | 112,000 | | | | 35,101,920 | |
| Hartford Financial Services Group, Inc. | † | | | 12,400 | | | | 203,608 | |
| Lincoln National Corp. | | | | 112,990 | | �� | | 2,128,732 | |
| Marsh & McLennan Cos., Inc. | | | | 215,600 | | | | 5,232,612 | |
| Progressive Corp. (The) | | | | 112,300 | | | $ | 1,663,163 | |
| Travelers Cos., Inc. (The) | | | | 116,706 | | | | 5,275,111 | |
| | | | | | | | | | | | | | 54,181,742 | |
Internet & Catalog Retail—0.5% |
| Liberty Media Corp.— Interactive, Series A | * | | | 1,835,500 | | | | 5,726,760 | |
Internet Software & Services—2.0% |
| eBay, Inc. | * | | | 1,435,100 | | | | 20,033,996 | |
| Yahoo! Inc. | * | | | 172,200 | | | | 2,100,840 | |
| | | | | | | | | | | | | | 22,134,836 | |
IT Services—0.2% |
| Computer Sciences Corp. | * | | | 70,700 | | | | 2,484,398 | |
Leisure Equipment & Products—0.2% |
| Mattel, Inc. | | | | 154,100 | | | | 2,465,600 | |
Machinery—3.4% |
| Deere & Co. | | | | 74,000 | | | | 2,835,680 | |
| Eaton Corp. | | | | 25,000 | | | | 1,242,750 | |
| Illinois Tool Works, Inc. | | | | 382,700 | | | | 13,413,635 | |
| Ingersoll-Rand Co. Ltd., Class A (Bermuda) | | | | 1,131,000 | | | | 19,622,850 | |
| | | | | | | | | | | | | | 37,114,915 | |
Media—7.9% |
| Cablevision Systems Corp., Class A | | | | 111,100 | | | | 1,870,924 | |
| CBS Corp., Class B | | | | 76,500 | | | | 626,535 | |
| DIRECTV Group, Inc. (The) | *† | | | 480,000 | | | | 10,996,800 | |
| Gannett Co., Inc. | † | | | 49,400 | | | | 395,200 | |
| Liberty Media Corp.— Entertainment, Series A | * | | | 2,282,200 | | | | 39,892,856 | |
| McGraw-Hill Cos., Inc. (The) | | | | 143,600 | | | | 3,330,084 | |
| New York Times Co. (The), Class A | † | | | 175,800 | | | | 1,288,614 | |
| Time Warner, Inc. | | | | 388,000 | | | | 3,903,280 | |
| Walt Disney Co. (The) | | | | 1,058,000 | | | | 24,006,020 | |
| WPP plc (United Kingdom) | | | | 98,700 | | | | 577,131 | |
| | | | | | | | | | | | | | 86,887,444 | |
Metals & Mining—0.5% |
| Alcoa, Inc. | | | | 127,600 | | | | 1,436,776 | |
| Nucor Corp. | | | | 89,300 | | | | 4,125,660 | |
| | | | | | | | | | | | | | 5,562,436 | |
Multiline Retail—0.3% |
| J.C. Penney Co., Inc. | † | | | 135,300 | | | | 2,665,410 | |
| Macy’s, Inc. | | | | 83,000 | | | | 859,050 | |
| | | | | | | | | | | | | | 3,524,460 | |
Multi-Utilities—1.5% |
| Dominion Resources, Inc. | | | | 222,100 | | | | 7,960,064 | |
| NiSource, Inc. | | | | 257,600 | | | | 2,825,872 | |
| PG&E Corp. | | | | 61,600 | | | | 2,384,536 | |
| TECO Energy, Inc. | | | | 56,900 | | | | 702,715 | |
| Xcel Energy, Inc. | | | | 148,000 | | | | 2,745,400 | |
| | | | | | | | | | | | | | 16,618,587 | |
Oil, Gas & Consumable Fuels—11.5% |
| Anadarko Petroleum Corp. | | | | 55,000 | | | | 2,120,250 | |
| BP plc ADR (United Kingdom) | | | | 95,398 | | | | 4,458,903 | |
|
See accompanying notes to financial statements.
216
SCHEDULE OF INVESTMENTS—(Continued)
December 31, 2008
Vantagepoint
Equity Income Fund
| | | | Shares | | Value | |
|---|
COMMON STOCKS—(Continued) |
| Chesapeake Energy Corp. | † | | | 1,770,700 | | | $ | 28,632,219 | |
| Chevron Corp. | | | | 150,758 | | | | 11,151,569 | |
| ConocoPhillips | | | | 214,600 | | | | 11,116,280 | |
| Consol Energy, Inc. | | | | 37,400 | | | | 1,068,892 | |
| Exxon Mobil Corp. | | | | 153,760 | | | | 12,274,661 | |
| Marathon Oil Corp. | | | | 291,400 | | | | 7,972,704 | |
| Murphy Oil Corp. | | | | 91,600 | | | | 4,062,460 | |
| Occidental Petroleum Corp. | | | | 261,400 | | | | 15,681,386 | |
| Pioneer Natural Resources Co. | | | | 527,000 | | | | 8,526,860 | |
| Royal Dutch Shell plc, Class A ADR (Netherlands) | | | | 143,581 | | | | 7,601,178 | |
| Spectra Energy Corp. | † | | | 512,412 | | | | 8,065,365 | |
| Sunoco, Inc. | † | | | 86,800 | | | | 3,772,328 | |
| | | | | | | | | | | | | | 126,505,055 | |
Paper & Forest Products—0.5% |
| International Paper Co. | | | | 239,100 | | | | 2,821,380 | |
| MeadWestvaco Corp. | | | | 111,800 | | | | 1,251,042 | |
| Weyerhaeuser Co. | | | | 30,900 | | | | 945,849 | |
| | | | | | | | | | | | | | 5,018,271 | |
Personal Products—0.0% |
| Estee Lauder Cos., Inc. (The), Class A | | | | 6,200 | | | | 191,952 | |
Pharmaceuticals—6.1% |
| Bristol-Myers Squibb Co. | | | | 667,700 | | | | 15,524,025 | |
| Eli Lilly & Co. | | | | 98,600 | | | | 3,970,622 | |
| Johnson & Johnson | | | | 218,800 | | | | 13,090,804 | |
| Merck & Co., Inc. | | | | 152,000 | | | | 4,620,800 | |
| Pfizer, Inc. | | | | 869,900 | | | | 15,405,929 | |
| Schering-Plough Corp. | | | | 195,500 | | | | 3,329,365 | |
| Wyeth | † | | | 307,200 | | | | 11,523,072 | |
| | | | | | | | | | | | | | 67,464,617 | |
Road & Rail—1.0% |
| Burlington Northern Santa Fe Corp. | | | | 145,000 | | | | 10,977,950 | |
Semiconductors & Semiconductor Equipment—1.6% |
| Analog Devices, Inc. | † | | | 123,300 | | | | 2,345,166 | |
| Applied Materials, Inc. | | | | 716,400 | | | | 7,257,132 | |
| Intel Corp. | | | | 497,200 | | | | 7,288,952 | |
| Texas Instruments, Inc. | | | | 25,000 | | | | 388,000 | |
| | | | | | | | | | | | | | 17,279,250 | |
Software—2.1% |
| Microsoft Corp. | | | | 226,900 | | | | 4,410,936 | |
| Symantec Corp. | * | | | 1,387,000 | | | | 18,752,240 | |
| | | | | | | | | | | | | | 23,163,176 | |
Specialty Retail—1.7% |
| Bed Bath & Beyond, Inc. | *† | | | 147,200 | | | | 3,741,824 | |
| Home Depot, Inc. | † | | | 563,500 | | | | 12,971,770 | |
| Tiffany & Co. | † | | | 66,600 | | | | 1,573,758 | |
| | | | | | | | | | | | | | 18,287,352 | |
Tobacco—2.0% |
| Altria Group, Inc. | | | | 243,300 | | | | 3,664,098 | |
| Imperial Tobacco Group plc ADR (United Kingdom) | | | | 189,700 | | | | 10,262,770 | |
| Philip Morris International, Inc. | | | | 197,300 | | | | 8,584,523 | |
| | | | | | | | | | | | | | 22,511,391 | |
|
Wireless Telecommunication Services—0.2% |
| Sprint Nextel Corp. | * | | | 301,500 | | | $ | 551,745 | |
| Vodafone Group plc (United Kingdom) | | | | 666,300 | | | | 1,364,349 | |
| | | | | | | | | | | | | | 1,916,094 | |
TOTAL COMMON STOCKS |
| (Cost $1,397,800,696) | | | | | | 1,058,900,811 | |
| |
CONVERTIBLE PREFERRED STOCKS—0.2% |
Automobiles—0.2% |
| General Motors Corp., Series B | | | | 690,000 | | | | 2,587,500 | |
Thrifts & Mortgage Finance—0.0% |
| Federal National Mortgage Association, Series 08-1 | | 77,700 | | | | 81,585 | |
TOTAL CONVERTIBLE PREFERRED STOCKS |
| (Cost $11,489,350) | | | | | | 2,669,085 | |
| |
Coupon
Rate | | Maturity
Date | | | | Face | | Value | |
|---|
CONVERTIBLE DEBT OBLIGATIONS—0.0% |
Automobiles—0.0% |
| Ford Motor Co. |
| 4.250% | 12/15/2036 | | | | | | | | | | | | |
| (Cost $436,064) | | | $ | 1,362,000 | | | $ | 357,525 | |
| |
U.S. TREASURY OBLIGATIONS—0.4% |
U.S. Treasury Bills—0.4% | | | |
| U.S. Treasury Bill | | | |
| 1.984% | 01/08/2009 | | | † | | | | | | | | | |
| (Cost $3,998,472) | | | | 4,000,000 | | | | 3,999,835 | |
| |
|
|
|
|
Shares
|
| Value
|
|
|---|
CASH EQUIVALENTS—10.6% |
Institutional Money Market Funds—4.9% |
| AIM Short-Term Investments Trust Prime Assets Portfolio | †† | | | 20,379,744 | | | | 20,379,744 | |
| Fidelity Institutional Money Market: Money Market Portfolio—Institutional Class | | | | 34,199,659 | | | | 34,199,659 | |
| | | | | | | | $ | 54,579,403 | |
| |
Coupon
Rate | | Maturity
Date | | | | Face | | Value | |
|---|
Certificates of Deposit—3.6% |
| Allied Irish Banks plc/New York |
| 1.000% | 01/20/2009 | | †† | | $ | 4,000,000 | | | | 4,000,000 | |
| Bayerische Landesbank/New York | | | |
| 2.750% | 01/12/2009 | | †† | | | 4,000,000 | | | | 4,000,000 | |
| Credit Industriel et Commercial |
| 2.240% | 03/17/2009 | | †† | | | 4,500,000 | | | | 4,500,000 | |
| HSH Nordbank AG |
| 1.850% | 01/20/2009 | | †† | | | 4,000,177 | | | | 4,000,177 | |
| Landesbank Hessen-Thueringen Girozentrale/New York |
| 3.050% | 01/02/2009 | | †† | | | 5,000,000 | | | | 5,000,000 | |
See accompanying notes to financial statements.
217
SCHEDULE OF INVESTMENTS—(Continued)
December 31, 2008
Vantagepoint
Equity Income Fund
|
|
|---|
Coupon
Rate | | Maturity
Date | | | | Face | | Value | |
|---|
CASH EQUIVALENTS—(Continued) |
| Natixis/New York | | | |
| 4.133% | 01/02/2009 | | #†† | | $ | 10,000,000 | | | $ | 10,000,000 | |
| Norinchukin Bank/New York | | | |
| 1.650% | 01/12/2009 | | †† | | | 4,250,000 | | | | 4,250,000 | |
| Ulster Bank Ltd. | | | |
| 1.600% | 02/23/2009 | | †† | | | 498,604 | | | | 498,604 | |
| Westpac Securities NZ Ltd. | | | |
| 2.250% | 03/16/2009 | | †† | | | 2,983,034 | | | | 2,983,034 | |
| | | | | | | | | | | 39,231,815 | |
Medium Term Notes—1.2% | | | |
| AT&T, Inc. | | | |
| 4.973% | 04/27/2009 | | †† | | | 513,723 | | | | 513,723 | |
| BBVA Senior Finance SA | | | |
| 4.620% | 04/17/2009 | | #†† | | | 4,027,463 | | | | 4,027,463 | |
| Royal Bank of Scotland Group plc | | | |
| 3.655% | 01/30/2009 | | †† | | | 4,021,971 | | | | 4,021,970 | |
| Toyota Motor Credit Corp. | | | |
| 0.590% | 08/05/2009 | | #†† | | | 4,906,523 | | | | 4,906,523 | |
| | | | | | | | | | | 13,469,679 | |
Time Deposits—0.9% | | | |
| Banco Popular Espanol SA | | | |
| 3.120% | 01/05/2009 | | †† | | | 5,000,000 | | | | 5,000,000 | |
| Raiffeisen Zentralbank Oesterreich AG | | | |
| 1.750% | 01/20/2009 | | †† | | | 4,500,000 | | | | 4,500,000 | |
| | | | | | | | | | | 9,500,000 | |
TOTAL CASH EQUIVALENTS | | | |
| (Cost $116,780,897) | | | | | | | | 116,780,897 | |
TOTAL INVESTMENTS—107.3% | | | |
| (Cost $1,530,505,479) | | 1,182,708,153 | |
| Other assets less liabilities—(7.3%) | | (80,676,057 | ) |
NET ASSETS—100.0% | | | | | $ | 1,102,032,096 | |
Notes to the Schedule of Investments:
| |
|---|
| ADR | | | | American Depositary Receipt |
| * | | | | Non-income producing. |
| † | | | | Denotes all or a portion of security on loan. |
| †† | | | | Represents reinvestment of collateral received in conjunction with securities lending. |
| # | | | | Rate is subject to change. Rate shown reflects current rate. |
|
See accompanying notes to financial statements.
218
SCHEDULE OF INVESTMENTS
December 31, 2008
Vantagepoint Growth &
Income Fund
|
|
|
| Shares
|
| Value
|
|
|---|
COMMON STOCKS—96.0% |
Aerospace & Defense—1.4% |
| General Dynamics Corp. | | | | 73,500 | | | $ | 4,232,865 | |
| Lockheed Martin Corp. | | | | 12,900 | | | | 1,084,632 | |
| Precision Castparts Corp. | | | | 46,800 | | | | 2,783,664 | |
| Rockwell Collins, Inc. | † | | | 2,100 | | | | 82,089 | |
| United Technologies Corp. | | | | 47,700 | | | | 2,556,720 | |
| | | | | | | | | | | | | | | | | | 10,739,970 | |
Air Freight & Logistics—1.2% | | | | | | | |
| Expeditors International of Washington, Inc. | | | | 23,400 | | | | 778,518 | |
| FedEx Corp. | | | | 14,800 | | | | 949,420 | |
| United Parcel Service, Inc., Class B | | | | 131,400 | | | | 7,248,024 | |
| | | | | | | | | | | | | | | | | | 8,975,962 | |
Airlines—0.1% | | | | | | | |
| Southwest Airlines Co. | | | | 110,200 | | | | 949,924 | |
Auto Components—0.1% | | | | | | | |
| Johnson Controls, Inc. | | | | 30,500 | | | | 553,880 | |
Automobiles—0.2% | | | | | | | |
| Honda Motor Co. Ltd. ADR (Japan) | | | | 53,000 | | | | 1,131,020 | |
Beverages—1.9% | | | | | | | |
| Coca-Cola Co. (The) | | | | 54,000 | | | | 2,444,580 | |
| PepsiCo, Inc. | | | | 210,900 | | | | 11,550,993 | |
| | | | | | | | | | | | | | | | | | 13,995,573 | |
Biotechnology—5.0% | | | | | | | |
| Amgen, Inc. | * | | | 52,100 | | | | 3,008,775 | |
| BioMarin Pharmaceutical, Inc. | * | | | 23,000 | | | | 409,400 | |
| Celgene Corp. | * | | | 193,100 | | | | 10,674,568 | |
| Genentech, Inc. | * | | | 161,100 | | | | 13,356,801 | |
| Genzyme Corp. | *† | | | 6,000 | | | | 398,220 | |
| Gilead Sciences, Inc. | *† | | | 179,600 | | | | 9,184,744 | |
| | | | | | | | | | | | | | | | | | 37,032,508 | |
Capital Markets—4.5% | | | | | | | |
| Ameriprise Financial, Inc. | | | | 3,100 | | | | 72,416 | |
| Bank of New York Mellon Corp. (The) | | | | 194,943 | | | | 5,522,735 | |
| BlackRock, Inc. | † | | | 6,300 | | | | 845,145 | |
| Charles Schwab Corp. (The) | | | | 95,000 | | | | 1,536,150 | |
| Credit Suisse Group AG (Registered) (Switzerland) | | | | 1,525 | | | | 42,738 | |
| Franklin Resources, Inc. | | | | 57,500 | | | | 3,667,350 | |
| Goldman Sachs Group, Inc. (The) | | | | 170,100 | | | | 14,354,739 | |
| Morgan Stanley | | | | 90,500 | | | | 1,451,620 | |
| Northern Trust Corp. | | | | 54,100 | | | | 2,820,774 | |
| State Street Corp. | | | | 81,000 | | | | 3,185,730 | |
| T. Rowe Price Group, Inc. | | | | 11,400 | | | | 404,016 | |
| | | | | | | | | | | | | | | | | | 33,903,413 | |
Chemicals—2.4% | | | | | | | |
| Agrium, Inc. (Canada) | † | | | 85,400 | | | | 2,914,702 | |
| Celanese Corp., Class A | | | | 182,800 | | | | 2,272,204 | |
| E.I. Du Pont de Nemours & Co. | | | | 87,500 | | | | 2,213,750 | |
| Ecolab, Inc. | | | | 11,300 | | | | 397,195 | |
| Monsanto Co. | | | �� | 59,400 | | | | 4,178,790 | |
| Potash Corp. of Saskatchewan (Canada) | | | | 36,400 | | | | 2,665,208 | |
| Praxair, Inc. | | | | 51,900 | | | $ | 3,080,784 | |
| | | | | | | | | | | | | | | | | | 17,722,633 | |
Commercial Banks—2.4% | | | | | | | |
| PNC Financial Services Group, Inc. | † | | | 74,300 | | | | 3,640,700 | |
| SunTrust Banks, Inc. | | | | 4,300 | | | | 127,022 | |
| Wells Fargo & Co. | | | | 477,200 | | | | 14,067,856 | |
| | | | | | | | | | | | | | | | | | 17,835,578 | |
Commercial Services & Supplies—0.4% |
| Iron Mountain, Inc. | * | | | 22,000 | | | | 544,060 | |
| Republic Services, Inc. | | | | 104,700 | | | | 2,595,513 | |
| | | | | | | | | | | | | | | | | | 3,139,573 | |
Communications Equipment—3.6% |
| Brocade Communications Systems, Inc. | * | | | 379,400 | | | | 1,062,320 | |
| Cisco Systems, Inc. | * | | | 636,650 | | | | 10,377,395 | |
| Juniper Networks, Inc. | *† | | | 201,200 | | | | 3,523,012 | |
| Nokia Oyj ADR (Finland) | † | | | 131,700 | | | | 2,054,520 | |
| Polycom, Inc. | * | | | 60,000 | | | | 810,600 | |
| QUALCOMM, Inc. | | | | 216,900 | | | | 7,771,527 | |
| Research In Motion Ltd. (Canada) | * | | | 37,200 | | | | 1,509,576 | |
| | | | | | | | | | | | | | | | | | 27,108,950 | |
Computers & Peripherals—2.9% |
| Apple, Inc. | * | | | 109,500 | | | | 9,345,825 | |
| Dell, Inc. | * | | | 299,300 | | | | 3,064,832 | |
| EMC Corp. | * | | | 69,000 | | | | 722,430 | |
| Hewlett-Packard Co. | | | | 189,000 | | | | 6,858,810 | |
| International Business Machines Corp. | | | | 8,400 | | | | 706,944 | |
| NetApp, Inc. | * | | | 42,500 | | | | 593,725 | |
| | | | | | | | | | | | | | | | | | 21,292,566 | |
Construction & Engineering—0.5% |
| Fluor Corp. | | | | 81,100 | | | | 3,638,957 | |
| Jacobs Engineering Group, Inc. | * | | | 7,800 | | | | 375,180 | |
| | | | | | | | | | | | | | | | | | 4,014,137 | |
Construction Materials—0.2% |
| Vulcan Materials Co. | | | | 18,500 | | | | 1,287,230 | |
Consumer Finance—0.0% | | | | | | | |
| American Express Co. | | | | 16,900 | | | | 313,495 | |
Diversified Consumer Services—0.4% |
| Apollo Group, Inc., Class A | * | | | 40,000 | | | | 3,064,800 | |
Diversified Financial Services—3.5% |
| Bank of America Corp. | | | | 242,600 | | | | 3,415,808 | |
| Citigroup, Inc. | | | | 367,700 | | | | 2,467,267 | |
| CME Group, Inc. | | | | 4,600 | | | | 957,306 | |
| IntercontinentalExchange, Inc. | *† | | | 28,200 | | | | 2,324,808 | |
| JPMorgan Chase & Co. | | | | 547,336 | | | | 17,257,504 | |
| | | | | | | | | | | | | | | | | | 26,422,693 | |
Diversified Telecommunication Services—2.0% |
| AT&T, Inc. | | | | 376,006 | | | | 10,716,171 | |
| Verizon Communications, Inc. | | | | 130,300 | | | | 4,417,170 | |
| | | | | | | | | | | | | | | | | | 15,133,341 | |
Electric Utilities—1.7% | | | | | | | |
| Allegheny Energy, Inc. | | | | 6,800 | | | | 230,248 | |
| Edison International | | | | 15,800 | | | | 507,496 | |
|
See accompanying notes to financial statements.
219
SCHEDULE OF INVESTMENTS—(Continued)
December 31, 2008
Vantagepoint Growth &
Income Fund
|
|
|
| Shares
|
| Value
|
|
|---|
COMMON STOCKS—(Continued) |
| Entergy Corp. | | | | 54,500 | | | $ | 4,530,585 | |
| Exelon Corp. | | | | 33,600 | | | | 1,868,496 | |
| FPL Group, Inc. | | | | 60,600 | | | | 3,049,998 | |
| Southern Co. | | | | 70,000 | | | | 2,590,000 | |
| | | | | | | | | | | | | | | | | | 12,776,823 | |
Electrical Equipment—1.1% | | | | | | | |
| ABB Ltd. ADR (Switzerland) | | | | 317,200 | | | | 4,761,172 | |
| Emerson Electric Co. | | | | 28,000 | | | | 1,025,080 | |
| First Solar, Inc. | * | | | 16,000 | | | | 2,207,360 | |
| Sunpower Corp., Class B | *† | | | 15,900 | | | | 483,996 | |
| | | | | | | | | | | | | | | | | | 8,477,608 | |
ElectronicEquipment,Instruments&Components—0.7% |
| Agilent Technologies, Inc. | * | | | 54,372 | | | | 849,834 | |
| Flextronics International Ltd. (Singapore) | * | | | 136,800 | | | | 350,208 | |
| Ingram Micro, Inc., Class A | * | | | 200,700 | | | | 2,687,373 | |
| Jabil Circuit, Inc. | | | | 165,700 | | | | 1,118,475 | |
| | | | | | | | | | | | | | | | | | 5,005,890 | |
Energy Equipment & Services—1.3% |
| Baker Hughes, Inc. | | | | 17,600 | | | | 564,432 | |
| FMC Technologies, Inc. | *† | | | 7,600 | | | | 181,108 | |
| Schlumberger Ltd. | | | | 142,300 | | | | 6,023,559 | |
| Smith International, Inc. | | | | 124,100 | | | | 2,840,649 | |
| | | | | | | | | | | | | | | | | | 9,609,748 | |
Food & Staples Retailing—3.4% |
| Costco Wholesale Corp. | | | | 38,900 | | | | 2,042,250 | |
| CVS Caremark Corp. | | | | 246,586 | | | | 7,086,882 | |
| Kroger Co. (The) | | | | 108,600 | | | | 2,868,126 | |
| Safeway, Inc. | | | | 104,200 | | | | 2,476,834 | |
| SUPERVALU, Inc. | | | | 127,700 | | | | 1,864,420 | |
| SYSCO Corp. | | | | 108,200 | | | | 2,482,108 | |
| Wal-Mart Stores, Inc. | † | | | 122,800 | | | | 6,884,168 | |
| | | | | | | | | | | | | | | | | | 25,704,788 | |
Food Products—2.4% | | | | | | | |
| Dean Foods Co. | *† | | | 189,400 | | | | 3,403,518 | |
| Kraft Foods, Inc., Class A | | | | 217,882 | | | | 5,850,132 | |
| Nestle SA ADR (Switzerland) | | | | 103,950 | | | | 4,126,815 | |
| Sara Lee Corp. | | | | 370,100 | | | | 3,623,279 | |
| Unilever NV (NY Reg Shares) (Netherlands) | | | | 32,100 | | | | 788,055 | |
| | | | | | | | | | | | | | | | | | 17,791,799 | |
Health Care Equipment & Supplies—3.0% |
| Alcon, Inc. (Switzerland) | | | | 16,600 | | | | 1,480,554 | |
| Baxter International, Inc. | | | | 171,300 | | | | 9,179,967 | |
| Becton Dickinson & Co. | | | | 21,800 | | | | 1,490,902 | |
| Covidien Ltd. | | | | 12,000 | | | | 434,880 | |
| Intuitive Surgical, Inc. | *† | | | 4,400 | | | | 558,756 | |
| Medtronic, Inc. | | | | 141,900 | | | | 4,458,498 | |
| St. Jude Medical, Inc. | * | | | 98,500 | | | | 3,246,560 | |
| Stryker Corp. | † | | | 43,000 | | | | 1,717,850 | |
| | | | | | | | | | | | | | | | | | 22,567,967 | |
Health Care Providers & Services—3.5% |
| Aetna, Inc. | † | | | 109,800 | | | | 3,129,300 | |
| Cardinal Health, Inc. | | | | 64,800 | | | | 2,233,656 | |
| DaVita, Inc. | * | | | 73,600 | | | | 3,648,352 | |
| Express Scripts, Inc. | *† | | | 49,600 | | | | 2,727,008 | |
| Health Net, Inc. | * | | | 9,800 | | | | 106,722 | |
| Humana, Inc. | * | | | 14,600 | | | | 544,288 | |
| McKesson Corp. | | | | 51,800 | | | $ | 2,006,214 | |
| Medco Health Solutions, Inc. | * | | | 108,900 | | | | 4,563,999 | |
| UnitedHealth Group, Inc. | | | | 200,500 | | | | 5,333,300 | |
| WellPoint, Inc. | * | | | 40,100 | | | | 1,689,413 | |
| | | | | | | | | | | | | | | | | | 25,982,252 | |
Health Care Technology—0.2% | | | | | | | |
| Cerner Corp. | * | | | 40,300 | | | | 1,549,535 | |
Hotels, Restaurants & Leisure—1.3% |
| Carnival Corp. | | | | 51,100 | | | | 1,242,752 | |
| International Game Technology | | | | 300 | | | | 3,567 | |
| Las Vegas Sands Corp. | * | | | 92,200 | | | | 546,746 | |
| Marriott International, Inc., Class A | | | | 32,400 | | | | 630,180 | |
| McDonald’s Corp. | | | | 49,100 | | | | 3,053,529 | |
| MGM MIRAGE | *† | | | 26,328 | | | | 362,273 | |
| Wynn Resorts Ltd. | *† | | | 41,200 | | | | 1,741,112 | |
| Yum! Brands, Inc. | | | | 77,400 | | | | 2,438,100 | |
| | | | | | | | | | | | | | | | | | 10,018,259 | |
Household Products—0.5% | | | | | | | |
| Energizer Holdings, Inc. | * | | | 6,200 | | | | 335,668 | |
| Kimberly-Clark Corp. | | | | 51,000 | | | | 2,689,740 | |
| Procter & Gamble Co. | | | | 6,975 | | | | 431,195 | |
| | | | | | | | | | | | | | | | | | 3,456,603 | |
Independent Power Producers & Energy Traders—0.5% |
| NRG Energy, Inc. | * | | | 147,200 | | | | 3,434,176 | |
Industrial Conglomerates—2.2% |
| General Electric Co. | | | | 1,012,300 | | | | 16,399,260 | |
Insurance—2.7% | | | | | | | |
| ACE Ltd. (Switzerland) | | | | 129,000 | | | | 6,826,680 | |
| Aflac, Inc. | | | | 29,700 | | | | 1,361,448 | |
| AON Corp. | | | | 68,800 | | | | 3,142,784 | |
| Berkshire Hathaway, Inc., Class A | * | | | 19 | | | | 1,835,400 | |
| Chubb Corp. | | | | 95,100 | | | | 4,850,100 | |
| Progressive Corp. (The) | | | | 125,100 | | | | 1,852,731 | |
| Prudential Financial, Inc. | | | | 300 | | | | 9,078 | |
| RenaissanceRe Holdings Ltd. (Bermuda) | | | | 8,100 | | | | 417,636 | |
| | | | | | | | | | | | | | | | | | 20,295,857 | |
Internet & Catalog Retail—1.1% |
| Amazon.com, Inc. | *† | | | 144,400 | | | | 7,404,832 | |
| Expedia, Inc. | * | | | 58,200 | | | | 479,568 | |
| priceline.com, Inc. | *† | | | 7,100 | | | | 522,915 | |
| | | | | | | | | | | | | | | | | | 8,407,315 | |
Internet Software & Services—2.5% |
| eBay, Inc. | *† | | | 27,900 | | | | 389,484 | |
| Google, Inc., Class A | * | | | 47,400 | | | | 14,582,610 | |
| Tencent Holdings Ltd. (China) | † | | | 158,400 | | | | 1,029,240 | |
| VeriSign, Inc. | * | | | 81,500 | | | | 1,555,020 | |
| Yahoo! Inc. | * | | | 108,700 | | | | 1,326,140 | |
| | | | | | | | | | | | | | | | | | 18,882,494 | |
IT Services—1.9% | | | | | | | |
| Accenture Ltd., Class A (Bermuda) | | | | 102,700 | | | | 3,367,533 | |
| Automatic Data Processing, Inc. | | | | 41,200 | | | | 1,620,808 | |
| Cognizant Technology Solutions Corp., Class A | * | | | 31,300 | | | | 565,278 | |
| Fiserv, Inc. | * | | | 58,600 | | | | 2,131,282 | |
| Mastercard, Inc., Class A | † | | | 8,900 | | | | 1,272,077 | |
|
See accompanying notes to financial statements.
220
SCHEDULE OF INVESTMENTS—(Continued)
December 31, 2008
Vantagepoint Growth &
Income Fund
|
|
|
| Shares
|
| Value
|
|
|---|
COMMON STOCKS—(Continued) |
| Paychex, Inc. | | | | 86,000 | | | $ | 2,260,080 | |
| Visa, Inc., Class A | | | | 35,800 | | | | 1,877,710 | |
| Western Union Co. (The) | | | | 92,600 | | | | 1,327,884 | |
| | | | | | | | | | | | | | | | | | 14,422,652 | |
Life Sciences Tools & Services—0.0% |
| Thermo Fisher Scientific, Inc. | * | | | 800 | | | | 27,256 | |
Machinery—2.6% | | | | | | | |
| Cummins, Inc. | | | | 112,300 | | | | 3,001,779 | |
| Danaher Corp. | | | | 129,500 | | | | 7,330,995 | |
| Deere & Co. | † | | | 73,400 | | | | 2,812,688 | |
| Illinois Tool Works, Inc. | | | | 65,400 | | | | 2,292,270 | |
| PACCAR, Inc. | † | | | 127,900 | | | | 3,657,940 | |
| | | | | | | | | | | | | | | | | | 19,095,672 | |
Media—3.4% | | | | | | | |
| CBS Corp., Class B | | | | 147,300 | | | | 1,206,387 | |
| Comcast Corp., Class A | | | | 378,850 | | | | 6,394,988 | |
| Discovery Communications, Inc., Class A | * | | | 60,150 | | | | 851,724 | |
| Discovery Communications, Inc., Series C | * | | | 50,750 | | | | 679,542 | |
| Gannett Co., Inc. | | | | 60,600 | | | | 484,800 | |
| McGraw-Hill Cos., Inc. (The) | | | | 123,500 | | | | 2,863,965 | |
| Omnicom Group, Inc. | | | | 105,200 | | | | 2,831,984 | |
| Time Warner Cable, Inc., Class A | * | | | 65,300 | | | | 1,400,685 | |
| Time Warner, Inc. | | | | 104,900 | | | | 1,055,294 | |
| Viacom, Inc., Class B | * | | | 240,600 | | | | 4,585,836 | |
| Walt Disney Co. (The) | | | | 131,600 | | | | 2,986,004 | |
| | | | | | | | | | | | | | | | | | 25,341,209 | |
Metals & Mining—1.5% | | | | | | | |
| Allegheny Technologies, Inc. | | | | 54,466 | | | | 1,390,517 | |
| Barrick Gold Corp. (Canada) | | | | 106,600 | | | | 3,919,682 | |
| BHP Billiton Ltd. (Australia) | | | | 2,900 | | | | 61,608 | |
| Cliffs Natural Resources, Inc. | | | | 120,800 | | | | 3,093,688 | |
| Nucor Corp. | | | | 57,600 | | | | 2,661,120 | |
| | | | | | | | | | | | | | | | | | 11,126,615 | |
Multiline Retail—1.7% | | | | | | | |
| Kohl’s Corp. | *† | | | 169,800 | | | | 6,146,760 | |
| Nordstrom, Inc. | | | | 68,100 | | | | 906,411 | |
| Target Corp. | | | | 168,500 | | | | 5,818,305 | |
| | | | | | | | | | | | | | | | | | 12,871,476 | |
Multi-Utilities—0.5% | | | | | | | |
| SCANA Corp. | † | | | 67,800 | | | | 2,413,680 | |
| TECO Energy, Inc. | | | | 76,700 | | | | 947,245 | |
| | | | | | | | | | | | | | | | | | 3,360,925 | |
Oil, Gas & Consumable Fuels—5.8% |
| Anadarko Petroleum Corp. | | | | 22,200 | | | | 855,810 | |
| Chevron Corp. | | | | 119,872 | | | | 8,866,932 | |
| ConocoPhillips | | | | 29,100 | | | | 1,507,380 | |
| EOG Resources, Inc. | | | | 54,700 | | | | 3,641,926 | |
| Exxon Mobil Corp. | | | | 123,100 | | | | 9,827,073 | |
| Kinder Morgan Management LLC | * | | | 13,586 | | | | 543,168 | |
| Marathon Oil Corp. | | | | 188,800 | | | | 5,165,568 | |
| Occidental Petroleum Corp. | | | | 51,800 | | | | 3,107,482 | |
| Royal Dutch Shell plc, Class A ADR (Netherlands) | | | | 8,300 | | | | 439,402 | |
| Royal Dutch Shell plc, Class B ADR (Netherlands) | | | | 29,856 | | | $ | 1,535,494 | |
| Total SA ADR (France) | | | | 74,300 | | | | 4,108,790 | |
| XTO Energy, Inc. | | | | 102,400 | | | | 3,611,648 | |
| | | | | | | | | | | | | | | | | | 43,210,673 | |
Paper & Forest Products—0.2% |
| International Paper Co. | † | | | 129,700 | | | | 1,530,460 | |
Pharmaceuticals—5.6% | | | | | | | |
| Abbott Laboratories | | | | 139,700 | | | | 7,455,789 | |
| Allergan, Inc. | † | | | 144,900 | | | | 5,842,368 | |
| AstraZeneca plc ADR (United Kingdom) | | | | 35,500 | | | | 1,456,565 | |
| Bristol-Myers Squibb Co. | † | | | 227,200 | | | | 5,282,400 | |
| Forest Laboratories, Inc. | * | | | 42,900 | | | | 1,092,663 | |
| Novartis AG (Registered) (Switzerland) | | | | 12,673 | | | | 634,682 | |
| Pfizer, Inc. | | | | 360,300 | | | | 6,380,913 | |
| Roche Holding AG (Genusschein) (Switzerland) | | | | 12,424 | | | | 1,923,448 | |
| Sanofi-Aventis SA ADR (France) | | | | 23,500 | | | | 755,760 | |
| Schering-Plough Corp. | † | | | 168,500 | | | | 2,869,555 | |
| Teva Pharmaceutical Industries Ltd. ADR (Israel) | † | | | 69,400 | | | | 2,954,358 | |
| Wyeth | † | | | 147,400 | | | | 5,528,974 | |
| | | | | | | | | | | | | | | | | | 42,177,475 | |
Professional Services—0.1% | | | | | | | |
| Monster Worldwide, Inc. | * | | | 57,900 | | | | 700,011 | |
Real Estate Investment Trusts (REIT)—0.6% |
| Host Hotels & Resorts, Inc. REIT | † | | | 261,897 | | | | 1,982,560 | |
| Kimco Realty Corp. REIT | † | | | 123,300 | | | | 2,253,924 | |
| | | | | | | | | | | | | | | | | | 4,236,484 | |
Road & Rail—0.2% | | | | | | | |
| Union Pacific Corp. | | | | 35,900 | | | | 1,716,020 | |
Semiconductors & Semiconductor Equipment—1.8% |
| Altera Corp. | † | | | 50,700 | | | | 847,197 | |
| Broadcom Corp., Class A | *† | | | 56,900 | | | | 965,593 | |
| Intel Corp. | | | | 359,200 | | | | 5,265,872 | |
| KLA-Tencor Corp. | | | | 56,200 | | | | 1,224,598 | |
| Lam Research Corp. | * | | | 13,000 | | | | 276,640 | |
| Marvell Technology Group Ltd. (Bermuda) | * | | | 278,700 | | | | 1,858,929 | |
| Microchip Technology, Inc. | | | | 28,000 | | | | 546,840 | |
| Xilinx, Inc. | † | | | 137,900 | | | | 2,457,378 | |
| | | | | | | | | | | | | | | | | | 13,443,047 | |
Software—3.7% | | | | | | | |
| Adobe Systems, Inc. | * | | | 72,000 | | | | 1,532,880 | |
| Autodesk, Inc. | *† | | | 69,600 | | | | 1,367,640 | |
| Electronic Arts, Inc. | * | | | 83,000 | | | | 1,331,320 | |
| Intuit, Inc. | * | | | 31,600 | | | | 751,764 | |
| McAfee, Inc. | *† | | | 73,700 | | | | 2,547,809 | |
| Microsoft Corp. | | | | 716,200 | | | | 13,922,928 | |
| Nintendo Co. Ltd. ADR (Japan) | | | | 108,200 | | | | 5,166,550 | |
| Oracle Corp. | * | | | 41,200 | | | | 730,476 | |
| | | | | | | | | | | | | | | | | | 27,351,367 | |
Specialty Retail—1.4% | | | | | | | |
| Bed Bath & Beyond, Inc. | *† | | | 60,200 | | | | 1,530,284 | |
| Best Buy Co., Inc. | | | | 29,400 | | | | 826,434 | |
|
See accompanying notes to financial statements.
221
SCHEDULE OF INVESTMENTS—(Continued)
December 31, 2008
Vantagepoint Growth &
Income Fund
|
|
|
| Shares
|
| Value
|
|
|---|
COMMON STOCKS—(Continued) |
| Home Depot, Inc. | | | | 170,700 | | | $ | 3,929,514 | |
| Lowe’s Cos., Inc. | | | | 57,400 | | | | 1,235,248 | |
| Staples, Inc. | | | | 147,100 | | | | 2,636,032 | |
| Urban Outfitters, Inc. | * | | | 37,400 | | | | 560,252 | |
| | | | | | | | | | | | | | | | | | 10,717,764 | |
Textiles, Apparel & Luxury Goods—0.4% |
| Coach, Inc. | * | | | 46,900 | | | | 974,113 | |
| Hanesbrands, Inc. | * | | | 74,137 | | | | 945,247 | |
| Nike, Inc., Class B | | | | 27,500 | | | | 1,402,500 | |
| | | | | | | | | | | | | | | | | | 3,321,860 | |
Thrifts & Mortgage Finance—0.6% |
| Astoria Financial Corp. | | | | 37,000 | | | | 609,760 | |
| Hudson City Bancorp, Inc. | | | | 220,260 | | | | 3,515,350 | |
| | | | | | | | | | | | | | | | | | 4,125,110 | |
Tobacco—1.8% | | | | | | | |
| Altria Group, Inc. | | | | 317,803 | | | | 4,786,113 | |
| Philip Morris International, Inc. | | | | 201,803 | | | | 8,780,449 | |
| | | | | | | | | | | | | | | | | | 13,566,562 | |
Trading Companies & Distributors—0.1% |
| Fastenal Co. | † | | | 17,400 | | | | 606,390 | |
Water Utilities—0.1% | | | | | | | |
| American Water Works Co., Inc. | | | | 44,800 | | | | 935,424 | |
Wireless Telecommunication Services—1.2% |
| America Movil SAB de CV, Series L ADR (Mexico) | † | | | 37,800 | | | | 1,171,422 | |
| American Tower Corp., Class A | *† | | | 227,400 | | | | 6,667,368 | |
| MetroPCS Communications, Inc. | *† | | | 55,000 | | | | 816,750 | |
| | | | | | | | | | | | | | | | | | 8,655,540 | |
TOTAL COMMON STOCKS | | | | | | | |
| (Cost $898,419,770) | | | | | | | | | | 717,517,612 | |
| |
CONVERTIBLE PREFERRED STOCKS—0.1% |
Pharmaceuticals—0.1% |
| Schering-Plough Corp. | | | | | | | | | |
| (Cost $925,000) | | | | 3,700 | | | | 644,956 | |
| |
CASH EQUIVALENTS—10.0% |
Institutional Money Market Funds—5.4% |
| AIM Short-Term Investments Trust Prime Assets Portfolio | †† | | | 13,348,689 | | | | 13,348,689 | |
| Fidelity Institutional Money Market: Money Market Portfolio—Institutional Class | | | | 27,316,029 | | | | 27,316,029 | |
| | | | | | | | | 40,664,718 | |
|
Coupon
Rate
|
| Maturity
Date
|
|
|
| Face
|
| Value
|
|
|---|
Certificates of Deposit—3.6% | | | | | | | |
| Barclays Bank plc/New York | | | | | | | |
| 2.419% | 02/26/2009 | | †† | | $ | 4,010,884 | | | $ | 4,010,884 | |
| Calyon/New York | | | | | | | |
| 4.615% | 01/16/2009 | | †† | | | 1,007,254 | | | | 1,007,254 | |
| Clydesdale Bank plc | | | | | | | |
| 0.900% | 01/20/2009 | | †† | | | 3,000,000 | | | | 3,000,000 | |
| Credit Industriel et Commercial | | | | | | | |
| 2.310% | 03/18/2009 | | †† | | | 4,000,000 | | | | 4,000,000 | |
| DZ Bank AG Deutsche Zentral-Genossenchaftsbank | | | | | | | |
| 1.350% | 01/20/2009 | | †† | | | 3,995,056 | | | | 3,995,056 | |
| HSH Nordbank AG | | | | | | | |
| 1.850% | 01/20/2009 | | †† | | | 2,500,111 | | | | 2,500,111 | |
| Natixis/New York | | | | | | | |
| 4.133% | 01/02/2009 | | #†† | | $ | 5,000,000 | | | | 5,000,000 | |
| Ulster Bank Ltd. | | | | | | | |
| 1.600% | 02/23/2009 | | †† | | | 2,991,623 | | | | 2,991,624 | |
| | | | | | | | | | | | | 26,504,929 | |
Medium Term Note—0.5% | | | | | | | |
| BBVA U.S. Senior SA | | | | | | | |
| 2.109% | 03/12/2009 | | †† | | | 3,502,109 | | | | 3,502,108 | |
Time Deposit—0.5% | | | | | | | |
| Raiffeisen Zentralbank Oesterreich AG |
| 1.750% | 01/20/2009 | | †† | | | 4,000,000 | | | | 4,000,000 | |
TOTAL CASH EQUIVALENTS | | | �� | | | | |
| (Cost $74,671,755) | | | | | | 74,671,755 | |
TOTAL INVESTMENTS—106.1% |
| (Cost $974,016,525) | | 792,834,323 | |
| Other assets less liabilities—(6.1%) | | (45,802,409 | ) |
NET ASSETS—100.0% | $ | 747,031,914 | |
Notes to the Schedule of Investments:
| |
|---|
| ADR | | | | American Depositary Receipt |
| REIT | | | | Real Estate Investment Trust |
| † | | | | Denotes all or a portion of security on loan. |
| * | | | | Non-income producing. |
| †† | | | | Represents reinvestment of collateral received in conjunction with securities lending. |
| # | | | | Rate is subject to change. Rate shown reflects current rate. |
See accompanying notes to financial statements.
222
SCHEDULE OF INVESTMENTS
December 31, 2008
Vantagepoint
Growth Fund
| | | | Shares | | Value | |
|---|
COMMON STOCKS—93.1% |
Aerospace & Defense—1.6% |
| Boeing Co. (The) | | | | 345,900 | | | $ | 14,759,553 | |
| Raytheon Co. | | | | 64,500 | | | | 3,292,080 | |
| United Technologies Corp. | | | | 100,600 | | | | 5,392,160 | |
| | | | | | | | | | | | | | 23,443,793 | |
Air Freight & Logistics—0.9% |
| FedEx Corp. | | | | 34,400 | | | | 2,206,760 | |
| United Parcel Service, Inc., Class B | | | | 185,400 | | | | 10,226,664 | |
| | | | | | | | | | | | | | 12,433,424 | |
Airlines—0.4% |
| Delta Air Lines, Inc. | * | | | 508,687 | | | | 5,829,553 | |
Beverages—4.3% |
| Coca-Cola Co. (The) | | | | 632,900 | | | | 28,651,383 | |
| Diageo plc ADR (United Kingdom) | | | | 31,600 | | | | 1,792,984 | |
| PepsiCo, Inc. | | | | 562,500 | | | | 30,808,125 | |
| | | | | | | | | | | | | | 61,252,492 | |
Biotechnology—4.7% |
| Amgen, Inc. | * | | | 104,300 | | | | 6,023,325 | |
| Biogen Idec, Inc. | * | | | 442,600 | | | | 21,081,038 | |
| Celgene Corp. | * | | | 296,450 | | | | 16,387,756 | |
| Genzyme Corp. | *† | | | 92,100 | | | | 6,112,677 | |
| Gilead Sciences, Inc. | * | | | 337,900 | | | | 17,280,206 | |
| | | | | | | | | | | | | | 66,885,002 | |
Capital Markets—3.0% |
| BlackRock, Inc. | † | | | 37,540 | | | | 5,035,991 | |
| Charles Schwab Corp. (The) | | | | 513,200 | | | | 8,298,444 | |
| Goldman Sachs Group, Inc. (The) | | | | 116,700 | | | | 9,848,313 | |
| Merrill Lynch & Co., Inc. | | | | 198,200 | | | | 2,307,048 | |
| State Street Corp. | | | | 438,800 | | | | 17,258,004 | |
| | | | | | | | | | | | | | 42,747,800 | |
Chemicals—3.3% |
| Air Products & Chemicals, Inc. | | | | 94,650 | | | | 4,758,056 | |
| Monsanto Co. | | | | 198,828 | | | | 13,987,550 | |
| Mosaic Co. (The) | | | | 216,300 | | | | 7,483,980 | |
| Potash Corp. of Saskatchewan (Canada) | | | | 63,860 | | | | 4,675,829 | |
| Praxair, Inc. | | | | 159,000 | | | | 9,438,240 | |
| Syngenta AG ADR (Switzerland) | | | | 190,900 | | | | 7,471,826 | |
| | | | | | | | | | | | | | 47,815,481 | |
Commercial Banks—2.4% |
| Banco Bradesco SA ADR (Brazil) | † | | | 349,300 | | | | 3,447,591 | |
| PNC Financial Services Group, Inc. | | | | 52,100 | | | | 2,552,900 | |
| Wells Fargo & Co. | | | | 956,300 | | | | 28,191,724 | |
| | | | | | | | | | | | | | 34,192,215 | |
Communications Equipment—4.4% |
| Cisco Systems, Inc. | * | | | 1,334,975 | | | | 21,760,093 | |
| Nokia Oyj ADR (Finland) | † | | | 1,115,600 | | | | 17,403,360 | |
| QUALCOMM, Inc. | | | | 677,850 | | | | 24,287,365 | |
| | | | | | | | | | | | | | 63,450,818 | |
Computers & Peripherals—5.6% |
| Apple, Inc. | * | | | 156,740 | | | $ | 13,377,759 | |
| EMC Corp. | * | | | 1,569,700 | | | | 16,434,759 | |
| Hewlett-Packard Co. | | | | 419,150 | | | | 15,210,954 | |
| International Business Machines Corp. | † | | | 312,390 | | | | 26,290,742 | |
| NetApp, Inc. | * | | | 650,800 | | | | 9,091,676 | |
| | | | | | | | | | | | | | 80,405,890 | |
Construction & Engineering—3.0% |
| Foster Wheeler Ltd. | * | | | 605,800 | | | | 14,163,604 | |
| Jacobs Engineering Group, Inc. | * | | | 117,100 | | | | 5,632,510 | |
| Quanta Services, Inc. | *† | | | 658,300 | | | | 13,034,340 | |
| Shaw Group, Inc. (The) | *† | | | 464,700 | | | | 9,512,409 | |
| | | | | | | | | | | | | | 42,342,863 | |
Consumer Finance—1.0% |
| American Express Co. | | | | 580,200 | | | | 10,762,710 | |
| SLM Corp. | * | | | 388,100 | | | | 3,454,090 | |
| | | | | | | | | | | | | | 14,216,800 | |
Diversified Consumer Services—0.6% |
| Apollo Group, Inc., Class A | *† | | | 108,150 | | | | 8,286,453 | |
Diversified Financial Services—2.2% |
| CME Group, Inc. | | | | 13,400 | | | | 2,788,674 | |
| JPMorgan Chase & Co. | † | | | 545,250 | | | | 17,191,733 | |
| NYSE Euronext | † | | | 417,200 | | | | 11,422,936 | |
| | | | | | | | | | | | | | 31,403,343 | |
Electrical Equipment—0.5% |
| Emerson Electric Co. | † | | | 99,800 | | | | 3,653,678 | |
| First Solar, Inc. | * | | | 25,500 | | | | 3,517,980 | |
| | | | | | | | | | | | | | 7,171,658 | |
Energy Equipment & Services—3.2% |
| Halliburton Co. | | | | 971,100 | | | | 17,654,598 | |
| National Oilwell Varco, Inc. | * | | | 253,600 | | | | 6,197,984 | |
| Schlumberger Ltd. | | | | 182,300 | | | | 7,716,759 | |
| Transocean Ltd. | *† | | | 192,300 | | | | 9,086,175 | |
| Weatherford International Ltd. | * | | | 516,800 | | | | 5,591,776 | |
| | | | | | | | | | | | | | 46,247,292 | |
Food & Staples Retailing—5.0% |
| Costco Wholesale Corp. | | | | 47,000 | | | | 2,467,500 | |
| CVS Caremark Corp. | | | | 764,100 | | | | 21,960,234 | |
| Wal-Mart Stores, Inc. | | | | 826,450 | | | | 46,330,787 | |
| | | | | | | | | | | | | | 70,758,521 | |
Food Products—2.3% |
| Archer-Daniels-Midland Co. | † | | | 158,600 | | | | 4,572,438 | |
| Bunge Ltd. | † | | | 154,900 | | | | 8,019,173 | |
| Corn Products International, Inc. | | | | 72,500 | | | | 2,091,625 | |
| General Mills, Inc. | | | | 116,100 | | | | 7,053,075 | |
| J.M. Smucker Co. (The) | | | | 44,000 | | | | 1,907,840 | |
| Nestle SA ADR (Switzerland) | | | | 249,200 | | | | 9,893,240 | |
| | | | | | | | | | | | | | 33,537,391 | |
Health Care Equipment & Supplies—3.2% |
| Alcon, Inc. (Switzerland) | | | | 40,800 | | | | 3,638,952 | |
| Baxter International, Inc. | | | | 261,800 | | | | 14,029,862 | |
|
See accompanying notes to financial statements.
223
SCHEDULE OF INVESTMENTS—(Continued)
December 31, 2008
Vantagepoint
Growth Fund
| | | | Shares | | Value | |
|---|
COMMON STOCKS—(Continued) |
| Covidien Ltd. | | | | 297,600 | | | $ | 10,785,024 | |
| Intuitive Surgical, Inc. | *† | | | 23,200 | | | | 2,946,168 | |
| Medtronic, Inc. | | | | 232,100 | | | | 7,292,582 | |
| Zimmer Holdings, Inc. | * | | | 185,500 | | | | 7,497,910 | |
| | | | | | | | | | | | | | 46,190,498 | |
Health Care Providers & Services—1.2% |
| Aetna, Inc. | | | | 384,500 | | | | 10,958,250 | |
| Express Scripts, Inc. | *† | | | 110,800 | | | | 6,091,784 | |
| | | | | | | | | | | | | | 17,050,034 | |
Hotels, Restaurants & Leisure—1.6% |
| International Game Technology | | | | 697,600 | | | | 8,294,464 | |
| McDonald’s Corp. | | | | 122,600 | | | | 7,624,494 | |
| Yum! Brands, Inc. | | | | 231,700 | | | | 7,298,550 | |
| | | | | | | | | | | | | | 23,217,508 | |
Household Products—2.0% |
| Colgate-Palmolive Co. | | | | 60,100 | | | | 4,119,254 | |
| Procter & Gamble Co. | † | | | 384,900 | | | | 23,794,518 | |
| | | | | | | | | | | | | | 27,913,772 | |
Industrial Conglomerates—2.2% |
| 3M Co. | | | | 194,400 | | | | 11,185,776 | |
| General Electric Co. | | | | 1,250,100 | | | | 20,251,620 | |
| | | | | | | | | | | | | | 31,437,396 | |
Insurance—1.2% |
| Berkshire Hathaway, Inc., Class B | * | | | 3,621 | | | | 11,637,894 | |
| Fidelity National Financial, Inc., Class A | † | | | 116,600 | | | | 2,069,650 | |
| Willis Group Holdings Ltd. (United Kingdom) | | | | 135,500 | | | | 3,371,240 | |
| | | | | | | | | | | | | | 17,078,784 | |
Internet & Catalog Retail—1.1% |
| Amazon.com, Inc. | *† | | | 293,900 | | | | 15,071,192 | |
Internet Software & Services—2.9% |
| eBay, Inc. | * | | | 556,600 | | | | 7,770,136 | |
| Google, Inc., Class A | * | | | 64,300 | | | | 19,781,895 | |
| Yahoo! Inc. | * | | | 1,108,800 | | | | 13,527,360 | |
| | | | | | | | | | | | | | 41,079,391 | |
IT Services—3.3% |
| Automatic Data Processing, Inc. | † | | | 604,000 | | | | 23,761,360 | |
| Cognizant Technology Solutions Corp., Class A | *† | | | 437,200 | | | | 7,895,832 | |
| Mastercard, Inc., Class A | † | | | 39,000 | | | | 5,574,270 | |
| Visa, Inc., Class A | | | | 118,600 | | | | 6,220,570 | |
| Western Union Co. (The) | | | | 241,000 | | | | 3,455,940 | |
| | | | | | | | | | | | | | 46,907,972 | |
Life Sciences Tools & Services—1.5% |
| Illumina, Inc. | *† | | | 175,800 | | | | 4,579,590 | |
| Thermo Fisher Scientific, Inc. | *† | | | 496,900 | | | | 16,929,383 | |
| | | | | | | | | | | | | | 21,508,973 | |
Machinery—2.1% |
| Caterpillar, Inc. | † | | | 327,300 | | | | 14,620,491 | |
| Danaher Corp. | | | | 137,100 | | | | 7,761,231 | |
| ITT Corp. | | | | 163,500 | | | $ | 7,519,365 | |
| | | | | | | | | | | | | | 29,901,087 | |
Media—1.3% |
| DIRECTV Group, Inc. (The) | *† | | | 167,600 | | | | 3,839,716 | |
| Walt Disney Co. (The) | † | | | 663,800 | | | | 15,061,622 | |
| | | | | | | | | | | | | | 18,901,338 | |
Metals & Mining—0.2% |
| Cliffs Natural Resources, Inc. | | | | 96,400 | | | | 2,468,804 | |
Multiline Retail—0.5% |
| Target Corp. | | | | 212,900 | | | | 7,351,437 | |
Oil, Gas & Consumable Fuels—4.7% |
| Anadarko Petroleum Corp. | † | | | 150,000 | | | | 5,782,500 | |
| Canadian Natural Resources Ltd. (Canada) | | | | 59,800 | | | | 2,390,804 | |
| Chesapeake Energy Corp. | † | | | 148,100 | | | | 2,394,777 | |
| Devon Energy Corp. | † | | | 101,900 | | | | 6,695,849 | |
| Exxon Mobil Corp. | | | | 72,300 | | | | 5,771,709 | |
| Hess Corp. | | | | 92,485 | | | | 4,960,895 | |
| Occidental Petroleum Corp. | | | | 183,200 | | | | 10,990,168 | |
| Southwestern Energy Co. | *† | | | 176,400 | | | | 5,110,308 | |
| Total SA ADR (France) | | | | 105,800 | | | | 5,850,740 | |
| XTO Energy, Inc. | † | | | 472,000 | | | | 16,647,440 | |
| | | | | | | | | | | | | | 66,595,190 | |
Paper & Forest Products—0.2% |
| Weyerhaeuser Co. | † | | | 117,330 | | | | 3,591,471 | |
Personal Products—0.5% |
| Avon Products, Inc. | | | | 306,600 | | | | 7,367,598 | |
Pharmaceuticals—6.1% |
| Abbott Laboratories | | | | 238,029 | | | | 12,703,608 | |
| Allergan, Inc. | | | | 208,800 | | | | 8,418,816 | |
| Bristol-Myers Squibb Co. | † | | | 637,200 | | | | 14,814,900 | |
| Elan Corp. plc ADR (Ireland) | *† | | | 910,800 | | | | 5,464,800 | |
| Johnson & Johnson | | | | 386,300 | | | | 23,112,329 | |
| Novartis AG ADR (Switzerland) | | | | 136,100 | | | | 6,772,336 | |
| Roche Holding AG ADR (Switzerland) | | | | 72,700 | | | | 5,565,185 | |
| Wyeth | | | | 276,800 | | | | 10,382,768 | |
| | | | | | | | | | | | | | 87,234,742 | |
Real Estate Investment Trusts (REIT)—0.1% |
| Annaly Capital Management, Inc. REIT | † | | | 105,800 | | | | 1,679,046 | |
Road & Rail—0.2% |
| Union Pacific Corp. | | | | 72,800 | | | | 3,479,840 | |
Semiconductors & Semiconductor Equipment—0.8% |
| Applied Materials, Inc. | | | | 239,700 | | | | 2,428,161 | |
| Intel Corp. | | | | 121,700 | | | | 1,784,122 | |
| Texas Instruments, Inc. | | | | 463,800 | | | | 7,198,176 | |
| | | | | | | | | | | | | | 11,410,459 | |
Software—4.5% |
| Activision Blizzard, Inc. | *† | | | 316,200 | | | | 2,731,968 | |
| Adobe Systems, Inc. | * | | | 77,900 | | | | 1,658,491 | |
| Autodesk, Inc. | * | | | 324,300 | | | | 6,372,495 | |
| Electronic Arts, Inc. | *† | | | 338,200 | | | | 5,424,728 | |
| Microsoft Corp. | | | | 1,767,500 | | | | 34,360,200 | |
|
See accompanying notes to financial statements.
224
SCHEDULE OF INVESTMENTS—(Continued)
December 31, 2008
Vantagepoint
Growth Fund
| | | | Shares | | Value | |
|---|
COMMON STOCKS—(Continued) |
| Oracle Corp. | * | | | 538,700 | | | $ | 9,551,151 | |
| Symantec Corp. | * | | | 258,000 | | | | 3,488,160 | |
| | | | | | | | | | | | | | 63,587,193 | |
Specialty Retail—1.7% |
| Gap, Inc. (The) | | | | 182,100 | | | | 2,438,319 | |
| Home Depot, Inc. | | | | 273,600 | | | | 6,298,272 | |
| Lowe’s Cos., Inc. | | | | 703,000 | | | | 15,128,560 | |
| | | | | | | | | | | | | | 23,865,151 | |
Textiles, Apparel & Luxury Goods—0.9% |
| Nike, Inc., Class B | | | | 238,500 | | | | 12,163,500 | |
Tobacco—0.5% |
| Philip Morris International, Inc. | | | | 160,900 | | | | 7,000,759 | |
Wireless Telecommunication Services—0.2% |
| American Tower Corp., Class A | *† | | | 90,800 | | | | 2,662,256 | |
TOTAL COMMON STOCKS |
| (Cost $1,657,788,449) | | | | | | 1,329,136,180 | |
| |
CASH EQUIVALENTS—22.5% |
Institutional Money Market Funds—7.9% |
| AIM Short-Term Investments Trust Prime Assets Portfolio | †† | | | 6,899,930 | | | | 6,899,930 | |
| Fidelity Institutional Money Market: Money Market Portfolio—Institutional Class | | | | 105,208,383 | | | | 105,208,383 | |
| | | | | | | | | 112,108,313 | |
| |
Coupon
Rate
|
| Maturity
Date
|
|
|
| Face
|
| Value
|
|
|---|
Certificates of Deposit—4.0% | | | | | | | |
| Allied Irish Banks plc/New York | | | | | | | |
| 1.000% | 01/20/2009 | | †† | | $ | 5,500,000 | | | | 5,500,000 | |
| Barclays Bank plc/New York | | | | | | | |
| 2.419% | 02/26/2009 | | †† | | | 7,019,047 | | | | 7,019,046 | |
| Bayerische Landesbank/New York | | | | | | | |
| 2.750% | 01/12/2009 | | †† | | | 4,000,000 | | | | 4,000,000 | |
| Caixa Geral de Depositos SA | | | | | | | |
| 1.300% | 02/23/2009 | | †† | | | 1,496,649 | | | | 1,496,649 | |
| Calyon/New York | | | | | | | |
| 4.615% | 01/16/2009 | | †† | | | 4,029,018 | | | | 4,029,018 | |
| Clydesdale Bank plc | | | | | | | |
| 0.900% | 01/20/2009 | | †† | | | 1,500,000 | | | | 1,500,000 | |
| Credit Industriel et Commercial | | | | | | | |
| 2.310% | 03/18/2009 | | †† | | | 5,000,000 | | | | 5,000,000 | |
| 2.240% | 03/17/2009 | | †† | | | 3,000,000 | | | | 3,000,000 | |
| HSH Nordbank AG | | | | | | | |
| 1.850% | 01/20/2009 | | †† | | | 5,000,222 | | | | 5,000,222 | |
| Landesbank Hessen-Thueringen Girozentrale/New York |
| 3.050% | 01/02/2009 | | †† | | | 5,000,000 | | | | 5,000,000 | |
| Nordeutsche Lendesbank/London | | | | | | | |
| 1.560% | 02/23/2009 | | †† | | | 1,514,584 | | | | 1,514,584 | |
| Norinchukin Bank/New York | | | | | | | |
| 1.650% | 01/12/2009 | | †† | | | 4,500,000 | | | | 4,500,000 | |
| Ulster Bank Ltd. | | | | | | | |
| 1.600% | 02/23/2009 | | †† | | | 1,994,416 | | | | 1,994,416 | |
|
Coupon
Rate
|
| Maturity
Date
|
|
|
| Face
|
| Value
|
|
|---|
| Westpac Securities NZ Ltd. | | | | | | | |
| 2.250% | 03/16/2009 | | †† | | $ | 7,954,757 | | | $ | 7,954,757 | |
| | | | | | | | | | | 57,508,692 | |
Commercial Paper—7.7% | | | | | | | |
| Amsterdam Funding Corp. | | | | | | | |
| 0.050% | 01/02/2009 | | †† | | | 9,999,972 | | | | 9,999,972 | |
| Aspen Funding Corp. | | | | | | | |
| 0.100% | 01/02/2009 | | †† | | | 9,999,944 | | | | 9,999,944 | |
| Atlantic Asset Securitization Corp. | | | | | | | |
| 0.040% | 01/02/2009 | | †† | | | 9,999,978 | | | | 9,999,978 | |
| Edison Asset Securitization LLC | | | | | | | |
| 0.100% | 01/02/2009 | | †† | | | 9,999,944 | | | | 9,999,945 | |
| Gemini Securitization Corp. LLC | | | | | | | |
| 0.070% | 01/02/2009 | | †† | | | 9,999,961 | | | | 9,999,961 | |
| Gotham Funding Corp. | | | | | | | |
| 0.050% | 01/02/2009 | | †† | | | 9,999,972 | | | | 9,999,972 | |
| Newport Funding Corp. | | | | | | | |
| 0.100% | 01/02/2009 | | †† | | | 9,999,944 | | | | 9,999,945 | |
| Rheingold Securitisation Ltd. | | | | | | | |
| 0.150% | 01/02/2009 | | †† | | | 9,999,917 | | | | 9,999,917 | |
| Rhein-Main Securitisation Ltd. | | | | | | | |
| 0.150% | 01/02/2009 | | †† | | | 9,999,917 | | | | 9,999,917 | |
| Three Pillars Funding Corp. | | | | | | | |
| 0.120% | 01/02/2009 | | †† | | | 9,999,933 | | | | 9,999,933 | |
| Windmill Funding Corp. | | | | | | | |
| 0.030% | 01/02/2009 | | †† | | | 9,999,983 | | | | 9,999,983 | |
| | | | | | | | | | | | | 109,999,467 | |
Medium Term Notes—1.3% | | | | | | | |
| AT&T, Inc. | | | | | | | |
| 5.061% | 04/27/2009 | | †† | | | 4,109,786 | | | | 4,109,786 | |
| BBVA Senior Finance SA | | | | | | | |
| 4.620% | 04/17/2009 | | #†† | | | 10,068,657 | | | | 10,068,657 | |
| Royal Bank of Scotland Group plc | | | | | | | |
| 3.655% | 01/30/2009 | | †† | | | 4,021,971 | | | | 4,021,971 | |
| | | | | | | | | | | | | 18,200,414 | |
Time Deposits—1.6% | | | | | | | |
| Banco Popular Espanol SA | | | | | | | |
| 3.120% | 01/05/2009 | | †† | | | 6,500,000 | | | | 6,500,000 | |
| Bank of Nova Scotia (London) | | | | | | | |
| 0.800% | 01/12/2009 | | †† | | | 2,000,000 | | | | 2,000,000 | |
| Danske Bank A/S | | | | | | | |
| 2.000% | 02/11/2009 | | †† | | | 4,000,000 | | | | 4,000,000 | |
| Raiffeisen Zentralbank Oesterreich AG |
| 1.750% | 01/20/2009 | | †† | | | 11,000,000 | | | | 11,000,000 | |
| | | | | | | | | | | | | 23,500,000 | |
TOTAL CASH EQUIVALENTS | | | | | | | |
| (Cost $321,316,886) | | | | | | 321,316,886 | |
TOTAL INVESTMENTS—115.6% |
| (Cost $1,979,105,335) | | 1,650,453,066 | |
| Other assets less liabilities—(15.6%) | | (222,778,480 | ) |
NET ASSETS—100.0% | $ | 1,427,674,586 | |
Notes to the Schedule of Investments:
| |
|---|
| ADR | | | | American Depositary Receipt |
| REIT | | | | Real Estate Investment Trust |
| * | | | | Non-income producing. |
| † | | | | Denotes all or a portion of security on loan. |
| †† | | | | Represents reinvestment of collateral received in conjunction with securities lending. |
| # | | | | Rate is subject to change. Rate shown reflects current rate. |
See accompanying notes to financial statements.
225
SCHEDULE OF INVESTMENTS
December 31, 2008
Vantagepoint
Select Value Fund
| | | | Shares | | Value | |
|---|
COMMON STOCKS—95.9% |
Aerospace & Defense—1.2% |
| Rockwell Collins, Inc. | † | | | 66,400 | | | $ | 2,595,576 | |
Airlines—0.6% |
| Continental Airlines, Inc., Class B | *† | | | 75,200 | | | | 1,358,112 | |
Auto Components—1.1% |
| BorgWarner, Inc. | † | | | 111,900 | | | | 2,436,063 | |
Automobiles—0.5% |
| Thor Industries, Inc. | † | | | 80,200 | | | | 1,057,036 | |
Beverages—0.5% |
| Coca-Cola Enterprises, Inc. | | | | 86,200 | | | | 1,036,986 | |
Capital Markets—1.6% |
| Invesco Ltd. | | | | 126,470 | | | | 1,826,227 | |
| State Street Corp. | | | | 43,200 | | | | 1,699,056 | |
| | | | | | | | | | | | | | 3,525,283 | |
Chemicals—1.4% |
| Celanese Corp., Class A | | | | 46,600 | | | | 579,238 | |
| International Flavors & Fragrances, Inc. | | | | 50,900 | | | | 1,512,748 | |
| Terra Industries, Inc. | | | | 54,100 | | | | 901,847 | |
| | | | | | | | | | | | | | 2,993,833 | |
Commercial Banks—2.0% |
| Bank of Hawaii Corp. | † | | | 28,000 | | | | 1,264,760 | |
| BB&T Corp. | † | | | 9,800 | | | | 269,108 | |
| Comerica, Inc. | † | | | 125,200 | | | | 2,485,220 | |
| Susquehanna Bancshares, Inc. | † | | | 22,400 | | | | 356,384 | |
| | | | | | | | | | | | | | 4,375,472 | |
Commercial Services & Supplies—2.9% |
| Cintas Corp. | | | | 68,300 | | | | 1,586,609 | |
| Covanta Holding Corp. | *† | | | 29,800 | | | | 654,408 | |
| R.R. Donnelley & Sons Co. | | | | 208,100 | | | | 2,825,998 | |
| Steelcase, Inc., Class A | | | | 254,600 | | | | 1,430,852 | |
| | | | | | | | | | | | | | 6,497,867 | |
Communications Equipment—1.1% |
| Comtech Telecommunications Corp. | *† | | | 26,000 | | | | 1,191,320 | |
| Corning, Inc. | | | | 137,400 | | | | 1,309,422 | |
| | | | | | | | | | | | | | 2,500,742 | |
Computers & Peripherals—0.3% |
| Seagate Technology (Cayman Islands) | | | | 168,100 | | | | 744,683 | |
Consumer Finance—0.4% |
| Student Loan Corp. (The) | | | | 21,353 | | | | 875,473 | |
Containers & Packaging—2.6% |
| AptarGroup, Inc. | | | | 43,600 | | | | 1,536,464 | |
| Crown Holdings, Inc. | * | | | 70,800 | | | | 1,359,360 | |
| Sonoco Products Co. | | | | 120,300 | | | | 2,786,148 | |
| | | | | | | | | | | | | | 5,681,972 | |
Diversified Financial Services—0.8% |
| NASDAQ OMX Group, Inc. (The) | *† | | | 71,700 | | | | 1,771,707 | |
Diversified Telecommunication Services—1.4% |
| NTELOS Holdings Corp. | † | | | 123,000 | | | | 3,033,180 | |
Electric Utilities—2.4% |
| American Electric Power Co., Inc. | | | | 26,700 | | | $ | 888,576 | |
| Northeast Utilities | | | | 77,200 | | | | 1,857,432 | |
| NV Energy, Inc. | | | | 128,000 | | | | 1,265,920 | |
| Pinnacle West Capital Corp. | | | | 39,800 | | | | 1,278,774 | |
| | | | | | | | | | | | | | 5,290,702 | |
Electrical Equipment—2.6% |
| Acuity Brands, Inc. | † | | | 65,800 | | | | 2,297,078 | |
| Cooper Industries Ltd., Class A | | | | 25,800 | | | | 754,134 | |
| Hubbell, Inc., Class B | | | | 44,900 | | | | 1,467,332 | |
| Thomas & Betts Corp. | *† | | | 50,400 | | | | 1,210,608 | |
| | | | | | | | | | | | | | 5,729,152 | |
Electronic Equipment, Instruments & Components—3.9% |
| Arrow Electronics, Inc. | * | | | 99,100 | | | | 1,867,044 | |
| Avnet, Inc. | * | | | 114,200 | | | | 2,079,582 | |
| Flextronics International Ltd. (Singapore) | * | | | 829,909 | | | | 2,124,567 | |
| Ingram Micro, Inc., Class A | * | | | 191,300 | | | | 2,561,507 | |
| | | | | | | | | | | | | | 8,632,700 | |
Energy Equipment & Services—2.2% |
| Baker Hughes, Inc. | | | | 35,500 | | | | 1,138,485 | |
| Nabors Industries Ltd. (Bermuda) | * | | | 115,700 | | | | 1,384,929 | |
| Noble Corp. | | | | 102,900 | | | | 2,273,061 | |
| | | | | | | | | | | | | | 4,796,475 | |
Food & Staples Retailing—1.3% |
| Kroger Co. (The) | | | | 49,100 | | | | 1,296,731 | |
| Ruddick Corp. | † | | | 55,271 | | | | 1,528,243 | |
| | | | | | | | | | | | | | 2,824,974 | |
Food Products—2.8% |
| Archer-Daniels-Midland Co. | | | | 34,600 | | | | 997,518 | |
| Dean Foods Co. | * | | | 57,200 | | | | 1,027,884 | |
| Fresh Del Monte Produce, Inc. (Cayman Islands) | * | | | 69,100 | | | | 1,549,222 | |
| J.M. Smucker Co. (The) | | | | 15,700 | | | | 680,752 | |
| Sara Lee Corp. | | | | 204,400 | | | | 2,001,076 | |
| | | | | | | | | | | | | | 6,256,452 | |
Gas Utilities—1.4% |
| Energen Corp. | | | | 20,800 | | | | 610,064 | |
| Questar Corp. | | | | 78,400 | | | | 2,562,896 | |
| | | | | | | | | | | | | | 3,172,960 | |
Health Care Equipment & Supplies—1.0% |
| Beckman Coulter, Inc. | | | | 34,400 | | | | 1,511,536 | |
| Hill-Rom Holdings, Inc. | † | | | 36,300 | | | | 597,498 | |
| | | | | | | | | | | | | | 2,109,034 | |
Health Care Providers & Services—3.3% |
| Cardinal Health, Inc. | | | | 36,600 | | | | 1,261,602 | |
| Cigna Corp. | | | | 216,760 | | | | 3,652,406 | |
| Healthspring, Inc. | * | | | 25,200 | | | | 503,244 | |
| Magellan Health Services, Inc. | * | | | 13,400 | | | | 524,744 | |
| Omnicare, Inc. | † | | | 52,200 | | | | 1,449,072 | |
| | | | | | | | | | | | | | 7,391,068 | |
Health Care Technology—1.0% |
| IMS Health, Inc. | | | | 146,100 | | | | 2,214,876 | |
|
See accompanying notes to financial statements.
226
SCHEDULE OF INVESTMENTS—(Continued)
December 31, 2008
Vantagepoint
Select Value Fund
| | | | Shares | | Value | |
|---|
COMMON STOCKS—(Continued) |
Hotels, Restaurants & Leisure—1.7% |
| Carnival Corp. | | | | 53,900 | | | $ | 1,310,848 | |
| Darden Restaurants, Inc. | | | | 87,644 | | | | 2,469,808 | |
| | | | | | | | | | | | | | 3,780,656 | |
Household Durables—2.7% |
| Leggett & Platt, Inc. | | | | 95,300 | | | | 1,447,607 | |
| Mohawk Industries, Inc. | * | | | 42,800 | | | | 1,839,116 | |
| Snap-On, Inc. | | | | 35,900 | | | | 1,413,742 | |
| Tupperware Brands Corp. | | | | 55,500 | | | | 1,259,850 | |
| | | | | | | | | | | | | | 5,960,315 | |
Independent Power Producers & Energy Traders—0.6% |
| NRG Energy, Inc. | * | | | 54,400 | | | | 1,269,152 | |
Insurance—13.4% |
| Alleghany Corp. | *† | | | 17,700 | | | | 4,991,400 | |
| Allied World Assurance Co. Holdings Ltd. (Bermuda) | | | | 35,900 | | | | 1,457,540 | |
| Allstate Corp. (The) | | | | 69,700 | | | | 2,283,372 | |
| AON Corp. | | | | 29,200 | | | | 1,333,856 | |
| Arch Capital Group Ltd. (Bermuda) | * | | | 44,300 | | | | 3,105,430 | |
| Brown & Brown, Inc. | | | | 79,800 | | | | 1,667,820 | |
| Endurance Specialty Holdings Ltd. (Bermuda) | | | | 53,600 | | | | 1,636,408 | |
| Fidelity National Financial, Inc., Class A | | | | 156,800 | | | | 2,783,200 | |
| HCC Insurance Holdings, Inc. | † | | | 67,900 | | | | 1,816,325 | |
| Lincoln National Corp. | | | | 153,600 | | | | 2,893,824 | |
| Marsh & McLennan Cos., Inc. | | | | 34,700 | | | | 842,169 | |
| Progressive Corp. (The) | | | | 97,700 | | | | 1,446,937 | |
| Unum Group | | | | 104,400 | | | | 1,941,840 | |
| White Mountains Insurance Group Ltd. | | | | 5,100 | | | | 1,362,261 | |
| | | | | | | | | | | | | | 29,562,382 | |
IT Services—3.0% |
| Computer Sciences Corp. | * | | | 86,600 | | | | 3,043,124 | |
| Hewitt Associates, Inc., Class A | * | | | 38,200 | | | | 1,084,116 | |
| Mastercard, Inc., Class A | † | | | 5,950 | | | | 850,434 | |
| SAIC, Inc. | * | | | 83,200 | | | | 1,620,736 | |
| | | | | | | | | | | | | | 6,598,410 | |
Leisure Equipment & Products—0.7% |
| Mattel, Inc. | | | | 100,800 | | | | 1,612,800 | |
Life Sciences Tools & Services—0.4% |
| Life Technologies Corp. | * | | | 37,000 | | | | 862,470 | |
Machinery—2.2% |
| Dover Corp. | | | | 59,700 | | | | 1,965,324 | |
| Eaton Corp. | | | | 42,700 | | | | 2,122,617 | |
| SPX Corp. | | | | 21,500 | | | | 871,825 | |
| | | | | | | | | | | | | | 4,959,766 | |
Marine—0.5% |
| Alexander & Baldwin, Inc. | | | | 39,600 | | | | 992,376 | |
Media—1.5% |
| Marvel Entertainment, Inc. | *† | | | 56,200 | | | | 1,728,150 | |
| Omnicom Group, Inc. | | | | 61,700 | | | | 1,660,964 | |
| | | | | | | | | | | | | | 3,389,114 | |
Metals & Mining—0.2% |
| Reliance Steel & Aluminum Co. | | | | 27,000 | | | $ | 538,380 | |
Multiline Retail—0.9% |
| Family Dollar Stores, Inc. | | | | 18,200 | | | | 474,474 | |
| Kohl’s Corp. | * | | | 40,200 | | | | 1,455,240 | |
| | | | | | | | | | | | | | 1,929,714 | |
Multi-Utilities—3.5% |
| NSTAR | | | | 48,200 | | | | 1,758,818 | |
| PG&E Corp. | | | | 55,000 | | | | 2,129,050 | |
| SCANA Corp. | | | | 56,762 | | | | 2,020,727 | |
| TECO Energy, Inc. | | | | 52,400 | | | | 647,140 | |
| Xcel Energy, Inc. | | | | 58,900 | | | | 1,092,595 | |
| | | | | | | | | | | | | | 7,648,330 | |
Oil, Gas & Consumable Fuels—2.7% |
| Cimarex Energy Co. | | | | 48,800 | | | | 1,306,864 | |
| Noble Energy, Inc. | | | | 23,600 | | | | 1,161,592 | |
| Valero Energy Corp. | | | | 87,000 | | | | 1,882,680 | |
| Walter Industries, Inc. | | | | 37,700 | | | | 660,127 | |
| Whiting Petroleum Corp. | *† | | | 25,950 | | | | 868,287 | |
| | | | | | | | | | | | | | 5,879,550 | |
Paper & Forest Products—0.3% |
| International Paper Co. | | | | 50,300 | | | | 593,540 | |
Professional Services—1.5% |
| Manpower, Inc. | | | | 66,400 | | | | 2,256,936 | |
| Robert Half International, Inc. | † | | | 54,200 | | | | 1,128,444 | |
| | | | | | | | | | | | | | 3,385,380 | |
Real Estate Investment Trusts (REIT)—6.3% |
| Annaly Capital Management, Inc. REIT | | | | 94,000 | | | | 1,491,780 | |
| Apartment Investment & Management Co., Class A REIT | † | | | 53,257 | | | | 615,118 | |
| Digital Realty Trust, Inc. REIT | † | | | 70,100 | | | | 2,302,785 | |
| Duke Realty Corp. REIT | † | | | 271,505 | | | | 2,975,695 | |
| Health Care REIT, Inc. REIT | † | | | 39,500 | | | | 1,666,900 | |
| National Retail Properties, Inc. REIT | † | | | 106,200 | | | | 1,825,578 | |
| Simon Property Group, Inc. REIT | † | | | 58,000 | | | | 3,081,540 | |
| | | | | | | | | | | | | | 13,959,396 | |
Road & Rail—2.2% |
| Con-way, Inc. | † | | | 57,300 | | | | 1,524,180 | |
| Kansas City Southern | * | | | 38,400 | | | | 731,520 | |
| Ryder System, Inc. | | | | 38,000 | | | | 1,473,640 | |
| Werner Enterprises, Inc. | † | | | 69,800 | | | | 1,210,332 | |
| | | | | | | | | | | | | | 4,939,672 | |
Semiconductors & Semiconductor Equipment—3.3% |
| Analog Devices, Inc. | | | | 87,900 | | | | 1,671,858 | |
| Lam Research Corp. | * | | | 70,900 | | | | 1,508,752 | |
| Microchip Technology, Inc. | † | | | 99,600 | | | | 1,945,188 | |
| National Semiconductor Corp. | | | | 106,000 | | | | 1,067,420 | |
| Semtech Corp. | * | | | 88,000 | | | | 991,760 | |
| | | | | | | | | | | | | | 7,184,978 | |
|
See accompanying notes to financial statements.
227
SCHEDULE OF INVESTMENTS—(Continued)
December 31, 2008
Vantagepoint
Select Value Fund
| | | | Shares | | Value | |
|---|
COMMON STOCKS—(Continued) |
Software—1.1% |
| Check Point Software Technologies (Israel) | * | | | 77,200 | | | $ | 1,466,028 | |
| Solera Holdings, Inc. | * | | | 13,700 | | | | 330,170 | |
| Sybase, Inc. | * | | | 26,700 | | | | 661,359 | |
| | | | | | | | | | | | | | 2,457,557 | |
Specialty Retail—3.0% |
| Advance Auto Parts, Inc. | | | | 44,300 | | | | 1,490,695 | |
| AutoZone, Inc. | *† | | | 14,400 | | | | 2,008,368 | |
| Bed Bath & Beyond, Inc. | * | | | 20,600 | | | | 523,652 | |
| Limited Brands, Inc. | † | | | 53,800 | | | | 540,152 | |
| PetSmart, Inc. | | | | 52,500 | | | | 968,625 | |
| Rent-A-Center, Inc. | * | | | 63,300 | | | | 1,117,245 | |
| | | | | | | | | | | | | | 6,648,737 | |
Textiles, Apparel & Luxury Goods—1.5% |
| V.F. Corp. | | | | 45,200 | | | | 2,475,604 | |
| Warnaco Group, Inc. (The) | * | | | 46,800 | | | | 918,684 | |
| | | | | | | | | | | | | | 3,394,288 | |
Thrifts & Mortgage Finance—0.3% |
| New York Community Bancorp, Inc. | | | | 63,100 | | | | 754,676 | |
Tobacco—0.4% |
| Lorillard, Inc. | | | | 16,500 | | | | 929,775 | |
Trading Companies & Distributors—1.7% |
| GATX Corp. | † | | | 46,900 | | | | 1,452,493 | |
| United Rentals, Inc. | *† | | | 258,266 | | | | 2,355,386 | |
| | | | | | | | | | | | | | 3,807,879 | |
TOTAL COMMON STOCKS |
| (Cost $275,760,507) | | | | | | 211,941,671 | |
| |
CASH EQUIVALENTS—18.2% |
Institutional Money Market Funds—9.1% |
| AIM Short-Term Investments Trust Prime Assets Portfolio | †† | | | 13,007,969 | | | | 13,007,969 | |
| Fidelity Institutional Money Market: Money Market Portfolio—Institutional Class | | | | 7,014,260 | | | | 7,014,260 | |
| | | | | | | | | 20,022,229 | |
|
Coupon
Rate
|
| Maturity
Date
|
|
|
| Face
|
| Value
|
|
|---|
Certificates of Deposit—5.9% | | | | | | | |
| Allied Irish Banks plc/New York | | | | | | | |
| 1.000% | 01/20/2009 | | †† | | $ | 1,500,000 | | | $ | 1,500,000 | |
| Bayerische Landesbank/New York | | | | | | | |
| 2.750% | 01/12/2009 | | †† | | | 1,500,000 | | | | 1,500,000 | |
| Calyon/New York | | | | | | | |
| 4.615% | 01/16/2009 | | †† | | | 251,814 | | | | 251,814 | |
| Credit Industriel et Commercial | | | | | | | |
| 2.240% | 03/17/2009 | | †† | | | 1,500,000 | | | | 1,500,000 | |
| HSH Nordbank AG | | | | | | | |
| 1.850% | 01/20/2009 | | †† | | | 1,500,067 | | | | 1,500,066 | |
| Landesbank Hessen-Thueringen Girozentrale/New York |
| 3.050% | 01/02/2009 | | †† | | | 1,000,000 | | | | 1,000,000 | |
| Natixis/New York | | | | | | | |
| 4.133% | 01/02/2009 | | #†† | | | 2,495,492 | | | | 2,495,492 | |
| Norinchukin Bank/New York | | | | | | | |
| 1.650% | 01/12/2009 | | †† | | | 1,500,000 | | | | 1,500,000 | |
| Ulster Bank Ltd. | | | | | | | |
| 1.600% | 02/23/2009 | | †† | | | 249,302 | | | | 249,302 | |
| Westpac Securities NZ Ltd. | | | | | | | |
| 2.250% | 03/16/2009 | | †† | | | 1,491,517 | | | | 1,491,517 | |
| | | | | | | | | | | | | 12,988,191 | |
Medium Term Notes—1.1% | | | | | | | |
| BBVA Senior Finance SA | | | | | | | |
| 4.620% | 04/17/2009 | | #†† | | | 1,006,866 | | | | 1,006,865 | |
| Royal Bank of Scotland Group plc | | | | | | | |
| 3.655% | 01/30/2009 | | †† | | | 1,508,239 | | | | 1,508,239 | |
| | | | | | | | | | | | | 2,515,104 | |
Time Deposits—2.1% | | | | | | | |
| Banco Popular Espanol SA | | | | | | | |
| 3.120% | 01/05/2009 | | †† | | | 1,500,000 | | | | 1,500,000 | |
| Danske Bank A/S | | | | | | | |
| 2.000% | 02/11/2009 | | †† | | | 1,500,000 | | | | 1,500,000 | |
| Raiffeisen Zentralbank Oesterreich AG |
| 1.750% | 01/20/2009 | | †† | | | 1,600,000 | | | | 1,600,000 | |
| | | | | | | | | | | | | 4,600,000 | |
TOTAL CASH EQUIVALENTS | | | | | | | |
| (Cost $40,125,524) | | | | | | 40,125,524 | |
TOTAL INVESTMENTS—114.1% | | | |
| (Cost $315,886,031) | | 252,067,195 | |
| Other assets less liabilities—(14.1%) | | (31,112,092 | ) |
NET ASSETS—100.0% | $ | 220,955,103 | |
Notes to the Schedule of Investments:
| |
|---|
| REIT | | | | Real Estate Investment Trust |
| † | | | | Denotes all or a portion of security on loan. |
| * | | | | Non-income producing. |
| †† | | | | Represents reinvestment of collateral received in conjunction with securities lending. |
| # | | | | Rate is subject to change. Rate shown reflects current rate. |
See accompanying notes to financial statements.
228
SCHEDULE OF INVESTMENTS
December 31, 2008
Vantagepoint Aggressive
Opportunities Fund
| | | | Shares | | Value | |
|---|
COMMON STOCKS—94.9% |
Aerospace & Defense—1.0% |
| L-3 Communications Holdings, Inc. | | | | 47,200 | | | $ | 3,482,416 | |
| Rockwell Collins, Inc. | | | | 74,800 | | | | 2,923,932 | |
| | | | | | | | | | | | | | 6,406,348 | |
Air Freight & Logistics—2.2% |
| C.H. Robinson Worldwide, Inc. | † | | | 52,200 | | | | 2,872,566 | |
| Expeditors International of Washington, Inc. | | | | 94,300 | | | | 3,137,361 | |
| FedEx Corp. | † | | | 58,100 | | | | 3,727,115 | |
| HUB Group, Inc., Class A | *† | | | 87,600 | | | | 2,324,028 | |
| UTi Worldwide, Inc. (Virgin Islands, British) | | | | 176,000 | | | | 2,523,840 | |
| | | | | | | | | | | | | | 14,584,910 | |
Airlines—1.7% |
| Continental Airlines, Inc., Class B | *† | | | 435,100 | | | | 7,857,906 | |
| UAL Corp. | † | | | 295,900 | | | | 3,260,818 | |
| | | | | | | | | | | | | | 11,118,724 | |
Automobiles—0.3% |
| Harley-Davidson, Inc. | | | | 131,400 | | | | 2,229,858 | |
Beverages—0.4% |
| Heckmann Corp. | * | | | 465,900 | | | | 2,632,335 | |
Biotechnology—1.9% |
| Alexion Pharmaceuticals, Inc. | *† | | | 52,300 | | | | 1,892,737 | |
| Alkermes, Inc. | * | | | 311,149 | | | | 3,313,737 | |
| Cephalon, Inc. | *† | | | 32,800 | | | | 2,526,912 | |
| deCODE genetics, Inc. (Iceland) | * | | | 226,900 | | | | 41,976 | |
| Incyte Corp. Ltd. | *† | | | 333,400 | | | | 1,263,586 | |
| Myriad Genetics, Inc. | * | | | 27,300 | | | | 1,808,898 | |
| Regeneron Pharmaceuticals, Inc. | * | | | 62,200 | | | | 1,141,992 | |
| Senomyx, Inc. | *† | | | 178,823 | | | | 498,916 | |
| | | | | | | | | | | | | | 12,488,754 | |
Capital Markets—2.1% |
| Fortress Investment Group LLC, Class A | | | | 304,100 | | | | 304,100 | |
| GHL Acquisition Corp. | * | | | 63,900 | | | | 575,100 | |
| Greenhill & Co., Inc. | † | | | 28,000 | | | | 1,953,560 | |
| Invesco Ltd. | | | | 191,500 | | | | 2,765,260 | |
| Liberty Acquisition Holdings Corp. | * | | | 68,700 | | | | 573,645 | |
| SEI Investments Co. | | | | 304,400 | | | | 4,782,124 | |
| State Street Corp. | | | | 82,100 | | | | 3,228,993 | |
| | | | | | | | | | | | | | 14,182,782 | |
Chemicals—1.5% |
| Ecolab, Inc. | | | | 118,800 | | | | 4,175,820 | |
| Intrepid Potash, Inc. | *† | | | 69,200 | | | | 1,437,284 | |
| Nalco Holding Co. | | | | 258,700 | | | | 2,985,398 | |
| Potash Corp. of Saskatchewan (Canada) | | | | 17,000 | | | | 1,244,740 | |
| | | | | | | | | | | | | | 9,843,242 | |
Commercial Banks—0.2% |
| Signature Bank/New York | * | | | 55,400 | | | | 1,589,426 | |
Commercial Services & Supplies—1.8% |
| Copart, Inc. | * | | | 105,200 | | | $ | 2,860,388 | |
| Iron Mountain, Inc. | *† | | | 100,800 | | | | 2,492,784 | |
| Mobile Mini, Inc. | *† | | | 163,700 | | | | 2,360,554 | |
| Waste Connections, Inc. | * | | | 133,450 | | | | 4,213,016 | |
| | | | | | | | | | | | | | 11,926,742 | |
Communications Equipment—0.9% |
| Blue Coat Systems, Inc. | *† | | | 162,900 | | | | 1,368,360 | |
| Juniper Networks, Inc. | * | | | 254,400 | | | | 4,454,544 | |
| | | | | | | | | | | | | | 5,822,904 | |
Computers & Peripherals—2.8% |
| 3PAR, Inc. | * | | | 99,800 | | | | 761,474 | |
| Dell, Inc. | * | | | 842,000 | | | | 8,622,080 | |
| Lenovo Group Ltd. | | | | 7,401,100 | | | | 2,033,149 | |
| NetApp, Inc. | * | | | 159,700 | | | | 2,231,009 | |
| Palm, Inc. | *† | | | 226,900 | | | | 696,583 | |
| Sun Microsystems, Inc. | *† | | | 1,232,000 | | | | 4,706,240 | |
| | | | | | | | | | | | | | 19,050,535 | |
Construction & Engineering—1.4% |
| Quanta Services, Inc. | * | | | 320,000 | | | | 6,336,000 | |
| URS Corp. | * | | | 69,700 | | | | 2,841,669 | |
| | | | | | | | | | | | | | 9,177,669 | |
Construction Materials—1.3% |
| Cemex SAB de CV ADR (Mexico) | *† | | | 693,520 | | | | 6,338,773 | |
| Martin Marietta Materials, Inc. | † | | | 21,700 | | | | 2,106,636 | |
| | | | | | | | | | | | | | 8,445,409 | |
Consumer Finance—0.5% |
| SLM Corp. | *† | | | 398,100 | | | | 3,543,090 | |
Containers & Packaging—0.3% |
| Pactiv Corp. | * | | | 79,800 | | | | 1,985,424 | |
Distributors—0.3% |
| LKQ Corp. | *† | | | 185,800 | | | | 2,166,428 | |
Diversified Consumer Services—3.6% |
| Apollo Group, Inc., Class A | * | | | 73,000 | | | | 5,593,260 | |
| Capella Education Co. | *† | | | 75,681 | | | | 4,447,016 | |
| Career Education Corp. | * | | | 337,200 | | | | 6,049,368 | |
| K12, Inc. | *† | | | 89,534 | | | | 1,678,762 | |
| Strayer Education, Inc. | † | | | 12,000 | | | | 2,572,920 | |
| Universal Technical Institute, Inc. | *† | | | 233,700 | | | | 4,012,629 | |
| | | | | | | | | | | | | | 24,353,955 | |
Diversified Financial Services—0.2% |
| MSCI, Inc., Class A | * | | | 71,400 | | | | 1,268,064 | |
Electrical Equipment—0.9% |
| Roper Industries, Inc. | | | | 131,800 | | | | 5,721,438 | |
Electronic Equipment, Instruments & Components—0.3% |
| Amphenol Corp., Class A | | | | 73,000 | | | | 1,750,540 | |
Energy Equipment & Services—2.0% |
| Cameron International Corp. | * | | | 120,800 | | | | 2,476,400 | |
| Complete Production Services, Inc. | * | | | 163,800 | | | | 1,334,970 | |
| Exterran Holdings, Inc. | *† | | | 155,900 | | | | 3,320,670 | |
|
See accompanying notes to financial statements.
229
SCHEDULE OF INVESTMENTS—(Continued)
December 31, 2008
Vantagepoint Aggressive
Opportunities Fund
| | | | Shares | | Value | |
|---|
COMMON STOCKS—(Continued) |
| FMC Technologies, Inc. | * | | | 127,400 | | | $ | 3,035,942 | |
| Helix Energy Solutions Group, Inc. | *† | | | 363,000 | | | | 2,628,120 | |
| Smith International, Inc. | | | | 25,556 | | | | 584,977 | |
| Transocean Ltd. | * | | | 1,500 | | | | 70,875 | |
| | | | | | | | | | | | | | 13,451,954 | |
Food & Staples Retailing—1.3% |
| Pantry, Inc. (The) | * | | | 79,200 | | | | 1,698,840 | |
| Walgreen Co. | | | | 278,000 | | | | 6,858,260 | |
| | | | | | | | | | | | | | 8,557,100 | |
Food Products—0.2% |
| Marine Harvest (Norway) | *† | | | 9,840,100 | | | | 1,507,657 | |
Health Care Equipment & Supplies—3.6% |
| Advanced Medical Optics, Inc. | *† | | | 383,300 | | | | 2,533,613 | |
| Arthrocare Corp. | *† | | | 42,400 | | | | 202,248 | |
| Conceptus, Inc. | *† | | | 122,500 | | | | 1,864,450 | |
| Edwards Lifesciences Corp. | * | | | 53,600 | | | | 2,945,320 | |
| Immucor, Inc. | *† | | | 100,287 | | | | 2,665,628 | |
| Mindray Medical International Ltd. ADR (China) | † | | | 87,350 | | | | 1,572,300 | |
| Resmed, Inc. | * | | | 181,700 | | | | 6,810,116 | |
| Stereotaxis, Inc. | *† | | | 90,100 | | | | 396,440 | |
| Varian Medical Systems, Inc. | * | | | 57,000 | | | | 1,997,280 | |
| Zimmer Holdings, Inc. | * | | | 73,800 | | | | 2,982,996 | |
| | | | | | | | | | | | | | 23,970,391 | |
Health Care Providers & Services—5.2% |
| AMERIGROUP Corp. | *† | | | 148,900 | | | | 4,395,528 | |
| Centene Corp. | * | | | 75,200 | | | | 1,482,192 | |
| Coventry Health Care, Inc. | * | | | 157,650 | | | | 2,345,832 | |
| DaVita, Inc. | * | | | 224,000 | | | | 11,103,680 | |
| Express Scripts, Inc. | * | | | 43,700 | | | | 2,402,626 | |
| Healthways, Inc. | *† | | | 66,400 | | | | 762,272 | |
| Henry Schein, Inc. | * | | | 93,000 | | | | 3,412,170 | |
| Humana, Inc. | * | | | 79,500 | | | | 2,963,760 | |
| Laboratory Corp. of America Holdings | *† | | | 32,600 | | | | 2,099,766 | |
| WellPoint, Inc. | * | | | 92,300 | | | | 3,888,599 | |
| | | | | | | | | | | | | | 34,856,425 | |
Hotels, Restaurants & Leisure—3.4% |
| Chipotle Mexican Grill, Inc., Class B | * | | | 24,100 | | | | 1,380,689 | |
| International Game Technology | | | | 377,300 | | | | 4,486,097 | |
| Marriott International, Inc., Class A | † | | | 417,000 | | | | 8,110,650 | |
| P.F. Chang’s China Bistro, Inc. | * | | | 117,000 | | | | 2,449,980 | |
| Panera Bread Co., Class A | *† | | | 65,200 | | | | 3,406,048 | |
| WMS Industries, Inc. | *† | | | 103,200 | | | | 2,776,080 | |
| | | | | | | | | | | | | | 22,609,544 | |
Household Durables—0.9% |
| Lennar Corp., Class A | | | | 697,600 | | | | 6,048,192 | |
Household Products—0.4% |
| Energizer Holdings, Inc. | *† | | | 48,800 | | | | 2,642,032 | |
Independent Power Producers & Energy Traders—0.9% |
| Calpine Corp. | * | | | 376,200 | | | $ | 2,738,736 | |
| Reliant Energy, Inc. | * | | | 624,000 | | | | 3,606,720 | |
| | | | | | | | | | | | | | 6,345,456 | |
Insurance—7.0% |
| AON Corp. | | | | 87,200 | | | | 3,983,296 | |
| Assured Guaranty Ltd. (Bermuda) | † | | | 745,700 | | | | 8,500,980 | |
| eHealth, Inc. | * | | | 41,100 | | | | 545,808 | |
| Fairfax Financial Holdings Ltd. (Canada) | † | | | 47,000 | | | | 14,730,270 | |
| Genworth Financial, Inc., Class A | | | | 346,200 | | | | 979,746 | |
| Markel Corp. | * | | | 5,300 | | | | 1,584,700 | |
| Nipponkoa Insurance Co. Ltd. (Japan) | | | | 1,260,000 | | | | 9,802,554 | |
| Prudential Financial, Inc. | | | | 28,900 | | | | 874,514 | |
| RenaissanceRe Holdings Ltd. (Bermuda) | | | | 92,700 | | | | 4,779,612 | |
| Syncora Holdings Ltd. (Bermuda) | *† | | | 626,661 | | | | 106,532 | |
| XL Capital Ltd., Class A (Bermuda) | | | | 285,900 | | | | 1,057,830 | |
| | | | | | | | | | | | | | 46,945,842 | |
Internet & Catalog Retail—0.7% |
| Expedia, Inc. | * | | | 302,932 | | | | 2,496,160 | |
| Liberty Media Corp.— Interactive, Series A | * | | | 671,275 | | | | 2,094,378 | |
| | | | | | | | | | | | | | 4,590,538 | |
Internet Software & Services—3.2% |
| Ariba, Inc. | *† | | | 58,400 | | | | 421,064 | |
| Digital River, Inc. | *† | | | 46,000 | | | | 1,140,800 | |
| eBay, Inc. | * | | | 704,700 | | | | 9,837,612 | |
| MercadoLibre, Inc. (Argentina) | *† | | | 166,700 | | | | 2,735,547 | |
| Omniture, Inc. | *† | | | 204,700 | | | | 2,178,008 | |
| Rackspace Hosting, Inc. | *† | | | 160,800 | | | | 865,104 | |
| SkillSoft plc ADR | *† | | | 152,800 | | | | 1,090,992 | |
| VeriSign, Inc. | * | | | 154,800 | | | | 2,953,584 | |
| | | | | | | | | | | | | | 21,222,711 | |
IT Services—5.0% |
| Alliance Data Systems Corp. | *† | | | 88,600 | | | | 4,122,558 | |
| DST Systems, Inc. | *† | | | 39,500 | | | | 1,500,210 | |
| Global Payments, Inc. | † | | | 239,500 | | | | 7,853,205 | |
| Heartland Payment Systems, Inc. | † | | | 178,348 | | | | 3,121,090 | |
| NeuStar, Inc., Class A | *† | | | 434,600 | | | | 8,313,898 | |
| Paychex, Inc. | | | | 151,100 | | | | 3,970,908 | |
| RightNow Technologies, Inc. | *† | | | 303,000 | | | | 2,342,190 | |
| SAIC, Inc. | * | | | 49,200 | | | | 958,416 | |
| Total System Services, Inc. | | | | 110,800 | | | | 1,551,200 | |
| | | | | | | | | | | | | | 33,733,675 | |
Leisure Equipment & Products—0.4% |
| Pool Corp. | † | | | 134,400 | | | | 2,415,168 | |
Life Sciences Tools & Services—0.9% |
| Affymetrix, Inc. | *† | | | 569,300 | | | | 1,702,207 | |
| Exelixis, Inc. | *† | | | 276,600 | | | | 1,388,532 | |
| Illumina, Inc. | *† | | | 107,100 | | | | 2,789,955 | |
| | | | | | | | | | | | | | 5,880,694 | |
|
See accompanying notes to financial statements.
230
SCHEDULE OF INVESTMENTS—(Continued)
December 31, 2008
Vantagepoint Aggressive
Opportunities Fund
| | | | Shares | | Value | |
|---|
COMMON STOCKS—(Continued) |
Machinery—3.2% |
| Actuant Corp., Class A | † | | | 273,700 | | | $ | 5,205,774 | |
| Colfax Corp. | *† | | | 78,700 | | | | 817,693 | |
| Harsco Corp. | † | | | 77,100 | | | | 2,134,128 | |
| Ingersoll-Rand Co. Ltd., Class A (Bermuda) | † | | | 379,000 | | | | 6,575,650 | |
| ITT Corp. | | | | 55,400 | | | | 2,547,846 | |
| PACCAR, Inc. | † | | | 90,200 | | | | 2,579,720 | |
| Parker Hannifin Corp. | | | | 43,200 | | | | 1,837,728 | |
| | | | | | | | | | | | | | 21,698,539 | |
Media—6.3% |
| DIRECTV Group, Inc. (The) | *† | | | 285,000 | | | | 6,529,350 | |
| Discovery Communications, Inc., Series C | * | | | 316,200 | | | | 4,233,918 | |
| Liberty Media Corp.— Entertainment, Series A | * | | | 794,820 | | | | 13,893,454 | |
| National CineMedia, Inc. | † | | | 183,100 | | | | 1,856,634 | |
| Virgin Media, Inc. | † | | | 385,400 | | | | 1,923,146 | |
| Walt Disney Co. (The) | | | | 615,000 | | | | 13,954,350 | |
| | | | | | | | | | | | | | 42,390,852 | |
Oil, Gas & Consumable Fuels—3.6% |
| Bill Barrett Corp. | * | | | 52,100 | | | | 1,100,873 | |
| Chesapeake Energy Corp. | † | | | 546,000 | | | | 8,828,820 | |
| Cimarex Energy Co. | | | | 57,300 | | | | 1,534,494 | |
| Denbury Resources, Inc. | * | | | 251,600 | | | | 2,747,472 | |
| Encore Acquisition Co. | * | | | 67,799 | | | | 1,730,230 | |
| Forest Oil Corp. | * | | | 124,400 | | | | 2,051,356 | |
| Range Resources Corp. | | | | 94,600 | | | | 3,253,294 | |
| Ultra Petroleum Corp. | *† | | | 81,400 | | | | 2,809,114 | |
| | | | | | | | | | | | | | 24,055,653 | |
Personal Products—0.4% |
| Herbalife Ltd. (Cayman Islands) | | | | 117,300 | | | | 2,543,064 | |
Pharmaceuticals—1.2% |
| Shire plc ADR (United Kingdom) | † | | | 153,700 | | | | 6,882,686 | |
| XenoPort, Inc. | *† | | | 41,269 | | | | 1,035,027 | |
| | | | | | | | | | | | | | 7,917,713 | |
Professional Services—3.6% |
| Administaff, Inc. | † | | | 107,219 | | | | 2,324,508 | |
| Advisory Board Co. (The) | *† | | | 69,000 | | | | 1,538,700 | |
| Corporate Executive Board Co. (The) | | | | 285,200 | | | | 6,291,512 | |
| Dun & Bradstreet Corp. | | | | 40,500 | | | | 3,126,600 | |
| Huron Consulting Group, Inc. | *† | | | 64,700 | | | | 3,705,369 | |
| Korn/Ferry International | *† | | | 291,200 | | | | 3,325,504 | |
| Resources Connection, Inc. | *† | | | 160,000 | | | | 2,620,800 | |
| School Specialty, Inc. | *† | | | 45,009 | | | | 860,572 | |
| | | | | | | | | | | | | | 23,793,565 | |
Real Estate Investment Trusts (REIT)—1.7% |
| CapitalSource, Inc. REIT | † | | | 254,900 | | | | 1,177,638 | |
| Chimera Investment Corp. REIT | † | | | 365,300 | | | | 1,260,285 | |
| Hatteras Financial Corp. REIT | † | | | 330,775 | | | | 8,798,615 | |
| Thornburg Mortgage, Inc. | * | | | 489,000 | | | | 75,795 | |
| | | | | | | | | | | | | | 11,312,333 | |
Real Estate Management & Development—0.4% |
| Jones Lang LaSalle, Inc. | † | | | 39,700 | | | $ | 1,099,690 | |
| St. Joe Co. (The) | *† | | | 63,400 | | | | 1,541,888 | |
| | | | | | | | | | | | | | 2,641,578 | |
Semiconductors & Semiconductor Equipment—3.9% |
| Analog Devices, Inc. | † | | | 235,600 | | | | 4,481,112 | |
| ASML Holding NV (NY Reg Shares) (Netherlands) | † | | | 105,600 | | | | 1,908,192 | |
| Broadcom Corp., Class A | * | | | 141,400 | | | | 2,399,558 | |
| Cavium Networks, Inc. | * | | | 39,700 | | | | 417,247 | |
| Cymer, Inc. | *† | | | 24,699 | | | | 541,155 | |
| FEI Co. | *† | | | 146,400 | | | | 2,761,104 | |
| Intersil Corp., Class A | | | | 251,900 | | | | 2,314,961 | |
| Marvell Technology Group Ltd. (Bermuda) | * | | | 416,900 | | | | 2,780,723 | |
| National Semiconductor Corp. | | | | 285,500 | | | | 2,874,985 | |
| PMC-Sierra, Inc. | * | | | 363,700 | | | | 1,767,582 | |
| Semtech Corp. | * | | | 147,200 | | | | 1,658,944 | |
| Silicon Laboratories, Inc. | *† | | | 81,000 | | | | 2,007,180 | |
| | | | | | | | | | | | | | 25,912,743 | |
Software—4.9% |
| Amdocs Ltd. (Guernsey, Channel Islands) | * | | | 334,500 | | | | 6,118,005 | |
| Blackboard, Inc. | *† | | | 76,400 | | | | 2,003,972 | |
| Bottomline Technologies, Inc. | *† | | | 78,200 | | | | 555,220 | |
| CA, Inc. | | | | 194,700 | | | | 3,607,791 | |
| Electronic Arts, Inc. | * | | | 158,600 | | | | 2,543,944 | |
| Factset Research Systems, Inc. | † | | | 118,615 | | | | 5,247,528 | |
| Jack Henry & Associates, Inc. | | | | 68,700 | | | | 1,333,467 | |
| Macrovision Solutions Corp. | * | | | 94,400 | | | | 1,194,160 | |
| Red Hat, Inc. | * | | | 405,100 | | | | 5,355,422 | |
| Take-Two Interactive Software, Inc. | * | | | 333,000 | | | | 2,517,480 | |
| Taleo Corp., Class A | * | | | 176,800 | | | | 1,384,344 | |
| Wind River Systems, Inc. | * | | | 117,500 | | | | 1,061,025 | |
| | | | | | | | | | | | | | 32,922,358 | |
Specialty Retail—1.4% |
| A.C. Moore Arts & Crafts, Inc. | * | | | 93,200 | | | | 130,480 | |
| AnnTaylor Stores Corp. | * | | | 191,600 | | | | 1,105,532 | |
| Christopher & Banks Corp. | † | | | 142,600 | | | | 798,560 | |
| O’Reilly Automotive, Inc. | *† | | | 127,900 | | | | 3,931,646 | |
| Tiffany & Co. | † | | | 101,300 | | | | 2,393,719 | |
| Zumiez, Inc. | *† | | | 147,400 | | | | 1,098,130 | |
| | | | | | | | | | | | | | 9,458,067 | |
Textiles, Apparel & Luxury Goods—0.1% |
| Iconix Brand Group, Inc. | *† | | | 74,500 | | | | 728,610 | |
Trading Companies & Distributors—0.7% |
| Fastenal Co. | † | | | 68,100 | | | | 2,373,285 | |
| Interline Brands, Inc. | *† | | | 223,000 | | | | 2,370,490 | |
| | | | | | | | | | | | | | 4,743,775 | |
Wireless Telecommunication Services—2.8% |
| American Tower Corp., Class A | * | | | 284,500 | | | | 8,341,540 | |
| NII Holdings, Inc. | * | | | 275,245 | | | | 5,003,954 | |
See accompanying notes to financial statements.
231
SCHEDULE OF INVESTMENTS—(Continued)
December 31, 2008
Vantagepoint Aggressive
Opportunities Fund
| | | | Shares | | Value | |
|---|
COMMON STOCKS—(Continued) |
| SBA Communications Corp., Class A | *† | | | 331,200 | | | $ | 5,405,184 | |
| | | | | | | | | | | | | | 18,750,678 | |
TOTAL COMMON STOCKS |
| (Cost $866,816,563) | | | | | | 633,935,484 | |
| |
CONVERTIBLE PREFERRED STOCKS—0.3% |
Automobiles—0.3% |
| General Motors Corp., Series B | | | |
| (Cost $6,711,690) | | 547,000 | | | | 2,051,250 | |
| |
Coupon
Rate
|
| Maturity
Date
|
|
|
| Face
|
| Value
|
|
|---|
CORPORATE OBLIGATIONS—0.0% |
Capital Markets—0.0% |
| Downey Financial Corp. | | | |
| 6.500% | 07/01/2014 | | 5 | | | | | | | | |
| (Cost $3,130,390) | | | $ | 4,409,000 | | | | 20,775 | |
| |
|
|
|
|
Shares
|
| Value
|
|
|---|
CASH EQUIVALENTS—26.7% |
Institutional Money Market Funds—9.7% |
| AIM Short-Term Investments Trust Prime Assets Portfolio | †† | | | 33,697,191 | | | | 33,697,191 | |
| Fidelity Institutional Money Market: Money Market Portfolio—Institutional Class | | | | 31,095,414 | | | | 31,095,414 | |
| | | | | | | | | 64,792,605 | |
| |
Coupon
Rate
|
| Maturity
Date
|
|
|
| Face
|
| Value
|
|
|---|
Certificates of Deposit—11.0% |
| Allied Irish Banks plc/New York | | | |
| 1.000% | 01/20/2009 | | †† | | $ | 7,250,000 | | | | 7,250,000 | |
| Barclays Bank plc/New York | | | | | | | |
| 2.419% | 02/26/2009 | | †† | | | 7,019,047 | | | | 7,019,047 | |
| Bayerische Landesbank/New York | | | | | | | |
| 2.750% | 01/12/2009 | | †† | | | 4,750,000 | | | | 4,750,000 | |
| Calyon/New York | | | | | | | |
| 4.615% | 01/16/2009 | | †† | | | 5,036,272 | | | | 5,036,272 | |
| Clydesdale Bank plc | | | | | | | |
| 0.900% | 01/20/2009 | | †† | | | 4,600,000 | | | | 4,600,000 | |
| Credit Industriel et Commercial | | | | | | | |
| 2.310% | 03/18/2009 | | †† | | | 1,000,000 | | | | 1,000,000 | |
| 2.240% | 03/17/2009 | | †† | | | 6,250,000 | | | | 6,250,000 | |
| HSH Nordbank AG | | | | | | | |
| 1.850% | 01/20/2009 | | †† | | | 8,000,355 | | | | 8,000,355 | |
| Landesbank Hessen-Thueringen Girozentrale/New York |
| 3.050% | 01/02/2009 | | †† | | $ | 6,000,000 | | | $ | 6,000,000 | |
| Natixis/New York | | | | | | | |
| 4.133% | 01/02/2009 | | #†† | | | 9,091,971 | | | | 9,091,971 | |
| Norinchukin Bank/New York | | | | | | | |
| 1.650% | 01/12/2009 | | †† | | | 7,500,000 | | | | 7,500,000 | |
| Ulster Bank Ltd. | | | | | | | |
| 1.600% | 02/23/2009 | | †† | | | 997,208 | | | | 997,208 | |
| Westpac Securities NZ Ltd. | | | | | | | |
| 2.250% | 03/16/2009 | | †† | | | 5,966,068 | | | | 5,966,068 | |
| | | | | | | | | | | 73,460,921 | |
Medium Term Notes—2.8% | | | | | | | |
| AT&T, Inc. | | | | | | | |
| 4.973% | 04/27/2009 | | †† | | | 2,054,893 | | | | 2,054,893 | |
| BBVA Senior Finance SA | | | | | | | |
| 4.620% | 04/17/2009 | | #†† | | | 7,048,060 | | | | 7,048,060 | |
| Royal Bank of Scotland Group plc | | | | | | | |
| 3.655% | 01/30/2009 | | †† | | | 7,038,448 | | | | 7,038,448 | |
| Toyota Motor Credit Corp. | | | | | | | |
| 0.590% | 08/05/2009 | | #†† | | | 2,943,914 | | | | 2,943,914 | |
| | | | | | | | | | | 19,085,315 | |
Time Deposits—3.2% | | | | | | | |
| Banco Popular Espanol SA | | | | | | | |
| 3.120% | 01/05/2009 | | †† | | | 6,000,000 | | | | 6,000,000 | |
| Danske Bank A/S | | | | | | | |
| 2.000% | 02/11/2009 | | †† | | | 7,200,000 | | | | 7,200,000 | |
| Raiffeisen Zentralbank Oesterreich AG | | | |
| 1.750% | 01/20/2009 | | †† | | | 8,000,000 | | | | 8,000,000 | |
| | | | | | | | | | | | | 21,200,000 | |
TOTAL CASH EQUIVALENTS |
| (Cost $178,538,841) | | 178,538,841 | |
TOTAL INVESTMENTS—121.9% |
| (Cost $1,055,197,484) | | 814,546,350 | |
| Other assets less liabilities—(21.9%) | | (146,143,595 | ) |
NET ASSETS—100.0% | $ | 668,402,755 | |
| Notes to the Schedule of Investments: | |
|---|
| ADR | | | | American Depositary Receipt |
| REIT | | | | Real Estate Investment Trust |
| † | | | | Denotes all or a portion of security on loan. |
| * | | | | Non-income producing. |
| 5 | | | | Security in default. |
| †† | | | | Represents reinvestment of collateral received in conjunction with securities lending. |
| # | | | | Rate is subject to change. Rate shown reflects current rate. |
|
See accompanying notes to financial statements.
232
SCHEDULE OF INVESTMENTS
December 31, 2008
Vantagepoint
Discovery Fund
|
|
|
| Shares
|
| Value
|
|
|---|
COMMON STOCKS—43.4% |
Aerospace & Defense—0.6% | | | | | | | |
| Allen-Vanguard Corp. (Canada) | * | | | 309,200 | | | $ | 55,102 | |
| Cubic Corp. | † | | | 25,000 | | | | 680,000 | |
| | | | | | | | | | | | | | | | | | 735,102 | |
Biotechnology—2.4% | | | | | | | |
| Arena Pharmaceuticals, Inc. | *† | | | 156,800 | | | | 653,856 | |
| CV Therapeutics, Inc. | *† | | | 72,000 | | | | 663,120 | |
| Human Genome Sciences, Inc. | *† | | | 223,100 | | | | 472,972 | |
| Incyte Corp. Ltd. | *† | | | 177,400 | | | | 672,346 | |
| Rigel Pharmaceuticals, Inc. | *† | | | 77,400 | | | | 619,200 | |
| | | | | | | | | | | | | | | | | | 3,081,494 | |
Building Products—0.4% | | | | | | | |
| Ameron International Corp. | | | | 8,000 | | | | 503,360 | |
Capital Markets—1.3% | | | | | | | |
| Evercore Partners, Inc., Class A | † | | | 30,026 | | | | 375,025 | |
| Gluskin Sheff + Associates, Inc. (Canada) | | | | 34,700 | | | | 206,598 | |
| Highbury Financial, Inc. | * | | | 14,800 | | | | 28,860 | |
| Uranium Participation Corp. (Canada) | * | | | 90,500 | | | | 524,892 | |
| Waddell & Reed Financial, Inc., Class A | | | | 36,000 | | | | 556,560 | |
| | | | | | | | | | | | | | | | | | 1,691,935 | |
Commercial Services & Supplies—0.4% |
| GeoEye, Inc. | *† | | | 25,500 | | | | 490,365 | |
Communications Equipment—2.6% |
| Arris Group, Inc. | *† | | | 86,000 | | | | 683,700 | |
| Harris Stratex Networks, Inc., Class A | * | | | 101,965 | | | | 526,140 | |
| NETGEAR, Inc. | * | | | 40,000 | | | | 456,400 | |
| Parkervision, Inc. | *† | | | 86,713 | | | | 214,181 | |
| SeaChange International, Inc. | * | | | 54,400 | | | | 392,224 | |
| Sierra Wireless, Inc. (Canada) | * | | | 100,500 | | | | 585,915 | |
| Tellabs, Inc. | * | | | 99,500 | | | | 409,940 | |
| | | | | | | | | | | | | | | | | | 3,268,500 | |
Computers & Peripherals—1.1% |
| Imation Corp. | | | | 49,900 | | | | 677,143 | |
| Novatel Wireless, Inc. | * | | | 152,900 | | | | 709,456 | |
| | | | | | | | | | | | | | | | | | 1,386,599 | |
Construction & Engineering—0.9% |
| EMCOR Group, Inc. | * | | | 20,000 | | | | 448,600 | |
| Orion Marine Group, Inc. | *†α | | | 78,500 | | | | 758,310 | |
| | | | | | | | | | | | | | | | | | 1,206,910 | |
Consumer Finance—1.3% | | | | | | | |
| Dollar Financial Corp. | *† | | | 85,200 | | | | 877,560 | |
| World Acceptance Corp. | *† | | | 36,150 | | | | 714,324 | |
| | | | | | | | | | | | | | | | | | 1,591,884 | |
Containers & Packaging—0.4% |
| AptarGroup, Inc. | | | | 13,500 | | | | 475,740 | |
Diversified Consumer Services—0.6% |
| Regis Corp. | | | | 55,900 | | | | 812,227 | |
Diversified Telecommunication Services—0.9% |
| Fairpoint Communications, Inc. | † | | | 213,309 | | | $ | 699,654 | |
| General Communication, Inc., Class A | * | | | 55,000 | | | | 444,950 | |
| | | | | | | | | | | | | | | | | | 1,144,604 | |
Electronic Equipment, Instruments &
Components—2.1% |
| National Instruments Corp. | | | | 19,500 | | | | 475,020 | |
| OSI Systems, Inc. | *† | | | 43,000 | | | | 595,550 | |
| Park Electrochemical Corp. | † | | | 25,600 | | | | 485,376 | |
| Rofin-Sinar Technologies, Inc. | * | | | 7,300 | | | | 150,234 | |
| TTM Technologies, Inc. | * | | | 101,100 | | | | 526,731 | |
| Zygo Corp. | * | | | 58,300 | | | | 402,853 | |
| | | | | | | | | | | | | | | | | | 2,635,764 | |
Energy Equipment & Services—0.8% |
| Atwood Oceanics, Inc. | * | | | 32,000 | | | | 488,960 | |
| Hercules Offshore, Inc. | *† | | | 110,100 | | | | 522,975 | |
| | | | | | | | | | | | | | | | | | 1,011,935 | |
Food Products—2.1% | | | | | | | |
| Asiatic Development BHD (Malaysia) | | | | 548,500 | | | | 563,910 | |
| Cosan SA Industria e Comercio (Brazil) | * | | | 77,300 | | | | 372,578 | |
| Flowers Foods, Inc. | | | | 18,000 | | | | 438,480 | |
| Lance, Inc. | | | | 31,600 | | | | 724,904 | |
| Viterra, Inc. (Canada) | * | | | 75,000 | | | | 577,157 | |
| | | | | | | | | | | | | | | | | | 2,677,029 | |
Health Care Equipment & Supplies—0.4% |
| Quidel Corp. | * | | | 38,000 | | | | 496,660 | |
Health Care Providers & Services—3.5% |
| Amsurg Corp. | * | | | 22,900 | | | | 534,486 | |
| Centene Corp. | * | | | 35,000 | | | | 689,850 | |
| Landauer, Inc. | | | | 8,000 | | | | 586,400 | |
| LHC Group, Inc. | * | | | 14,500 | | | | 522,000 | |
| Mednax, Inc. | * | | | 20,000 | | | | 634,000 | |
| Odyssey HealthCare, Inc. | * | | | 63,200 | | | | 584,600 | |
| Profarma Distribuidora de Produtos Farmaceuticos SA (Brazil) | | | | 56,700 | | | | 128,864 | |
| Res-Care, Inc. | * | | | 47,000 | | | | 705,940 | |
| | | | | | | | | | | | | | | | | | 4,386,140 | |
Hotels, Restaurants & Leisure—0.1% |
| Thunderbird Resorts, Inc. (Panama) | * | | | 71,700 | | | | 107,550 | |
Independent Power Producers & Energy Traders—0.1% |
| Energy Development Corp. (Philippines) | | | | 2,015,000 | | | | 83,991 | |
Industrial Conglomerates—0.4% |
| Carlisle Cos., Inc. | | | | 25,000 | | | | 517,500 | |
Insurance—0.6% | | | | | | | |
| Platinum Underwriters Holdings Ltd. (Bermuda) | | | | 22,500 | | | | 811,800 | |
Internet & Catalog Retail—0.5% |
| Shutterfly, Inc. | * | | | 87,300 | | | | 610,227 | |
See accompanying notes to financial statements.
233
SCHEDULE OF INVESTMENTS—(Continued)
December 31, 2008
Vantagepoint
Discovery Fund
|
|
|
| Shares
|
| Value
|
|
|---|
COMMON STOCKS—(Continued) |
Internet Software & Services—0.9% |
| Akamai Technologies, Inc. | * | | | 30,000 | | | $ | 452,700 | |
| Knot, Inc. (The) | *† | | | 83,600 | | | | 695,552 | |
| | | | | | | | | | | | | | | | | | 1,148,252 | |
IT Services—0.9% | | | | | | | |
| MAXIMUS, Inc. | | | | 16,000 | | | | 561,760 | |
| SRA International, Inc., Class A | * | | | 32,000 | | | | 552,000 | |
| | | | | | | | | | | | | | | | | | 1,113,760 | |
Machinery—1.6% | | | | | | | |
| CIRCOR International, Inc. | | | | 9,043 | | | | 248,682 | |
| Crane Co. | | | | 36,500 | | | | 629,260 | |
| Dynamic Materials Corp. | † | | | 28,000 | | | | 540,680 | |
| Force Protection, Inc. | *† | | | 108,900 | | | | 651,222 | |
| | | | | | | | | | | | | | | | | | 2,069,844 | |
Metals & Mining—1.8% | | | | | | | |
| AMCOL International Corp. | † | | | 19,500 | | | | 408,525 | |
| Carpenter Technology Corp. | | | | 25,900 | | | | 531,986 | |
| Universal Stainless & Alloy Products, Inc. | *† | | | 37,500 | | | | 543,375 | |
| Western Goldfields, Inc. (Canada) | *† | | | 512,700 | | | | 794,685 | |
| | | | | | | | | | | | | | | | | | 2,278,571 | |
Multiline Retail—0.4% | | | | | | | |
| Retail Ventures, Inc. | *† | | | 153,485 | | | | 532,593 | |
Office Electronics—0.4% | | | | | | | |
| Zebra Technologies Corp., Class A | * | | | 24,500 | | | | 496,370 | |
Oil, Gas & Consumable Fuels—2.1% |
| ATP Oil & Gas Corp. | *† | | | 76,000 | | | | 444,600 | |
| BPZ Resources, Inc. | *† | | | 88,800 | | | | 568,320 | |
| Cimarex Energy Co. | | | | 18,000 | | | | 482,040 | |
| Infinity Bio-Energy Ltd. (United Kingdom) | *‡ | | | 146,765 | | | | 19,079 | |
| Nova Biosource Fuels, Inc. | * | | | 401,150 | | | | 40,115 | |
| Oilsands Quest, Inc. (Canada) | *† | | | 160,800 | | | | 117,384 | |
| Swift Energy Co. | *† | | | 26,000 | | | | 437,060 | |
| W&T Offshore, Inc. | | | | 36,000 | | | | 515,520 | |
| | | | | | | | | | | | | | | | | | 2,624,118 | |
Personal Products—0.5% | | | | | | | |
| NBTY, Inc. | * | | | 39,000 | | | | 610,350 | |
Pharmaceuticals—0.5% | | | | | | | |
| Medicines Co. (The) | * | | | 39,800 | | | | 586,254 | |
Professional Services—0.5% | | | | | | | |
| CRA International, Inc. | * | | | 19,900 | | | | 535,907 | |
| Duff & Phelps Corp., Class A | * | | | 7,400 | | | | 141,488 | |
| | | | | | | | | | | | | | | | | | 677,395 | |
Real Estate Investment Trusts (REIT)—3.0% |
| Anworth Mortgage Asset Corp. REIT | | | | 114,200 | | | | 734,306 | |
| Capstead Mortgage Corp. REIT | | | | 74,400 | | | | 801,288 | |
| Dundee Real Estate Investment Trust REIT (Canada) | | | | 7,100 | | | | 72,467 | |
| Hatteras Financial Corp. REIT | | | | 37,000 | | | | 984,200 | |
| Investors Real Estate Trust REIT | † | | | 48,700 | | | $ | 521,577 | |
| MFA Financial, Inc. REIT | | | | 124,200 | | | | 731,538 | |
| | | | | | | | | | | | | | | | | | 3,845,376 | |
Real Estate Management & Development—0.6% |
| Brasil Brokers Participacoes SA (Brazil) | * | | | 171,900 | | | | 121,627 | |
| General Shopping Brasil SA (Brazil) | * | | | 37,500 | | | | 36,503 | |
| Grubb & Ellis Co. | † | | | 486,500 | | | | 603,260 | |
| | | | | | | | | | | | | | | | | | 761,390 | |
Semiconductors & Semiconductor Equipment—0.7% |
| Asyst Technologies, Inc. | * | | | 237,500 | | | | 59,375 | |
| DSP Group, Inc. | * | | | 90,800 | | | | 728,216 | |
| MIPS Technologies, Inc. | * | | | 63,777 | | | | 70,792 | |
| | | | | | | | | | | | | | | | | | 858,383 | |
Software—0.5% | | | | | | | |
| JDA Software Group, Inc. | * | | | 47,300 | | | | 621,049 | |
Specialty Retail—2.9% | | | | | | | |
| Cato Corp. (The), Class A | | | | 46,300 | | | | 699,130 | |
| Dress Barn, Inc. | * | | | 48,500 | | | | 520,890 | |
| DSW, Inc., Class A | *† | | | 46,900 | | | | 584,374 | |
| Dufry South America Ltd. BDR (Bermuda) | | | | 53,600 | | | | 378,786 | |
| Eddie Bauer Holdings, Inc. | * | | | 274,037 | | | | 139,759 | |
| Monro Muffler, Inc. | | | | 18,000 | | | | 459,000 | |
| Office Depot, Inc. | * | | | 58,700 | | | | 174,926 | |
| OfficeMax, Inc. | † | | | 90,010 | | | | 687,676 | |
| | | | | | | | | | | | | | | | | | 3,644,541 | |
Trading Companies & Distributors—2.3% |
Applied Industrial
Technologies, Inc. | | | | 28,500 | | | | 539,220 | |
| H&E Equipment Services, Inc. | *† | | | 78,000 | | | | 601,380 | |
| RSC Holdings, Inc. | *† | | | 64,500 | | | | 549,540 | |
| TAL International Group, Inc. | † | | | 43,453 | | | | 612,687 | |
| Textainer Group Holdings Ltd. (Bermuda) | † | | | 60,300 | | | | 639,180 | |
| | | | | | | | | | | | | | | | | | 2,942,007 | |
Water Utilities—0.3% | | | | | | | |
| Companhia de Saneamento de Minas Gerais-Copasa MG (Brazil) | | | | 41,500 | | | | 334,741 | |
TOTAL COMMON STOCKS | | | | | | | |
| (Cost $77,219,523) | | | | | | | | | | 54,872,310 | |
| |
Coupon
Rate | | Maturity
Date | | | | Face | | Value | |
|---|
CORPORATE OBLIGATIONS—16.6% |
Banks—1.0% | | | |
| Bank of America Corp. |
| 4.375% | 12/01/2010 | | | | $ | 430,000 | | | | 431,088 | |
| Citigroup, Inc. |
| 4.125% | 02/22/2010 | | | | | 430,000 | | | | 423,848 | |
| JPMorgan Chase & Co. |
| 6.750% | 02/01/2011 | | | | | 430,000 | | | | 441,036 | |
| | | | | | | | | | | 1,295,972 | |
See accompanying notes to financial statements.
234
SCHEDULE OF INVESTMENTS—(Continued)
December 31, 2008
Vantagepoint
Discovery Fund
Coupon
Rate | | Maturity
Date | | | | Face | | Value | |
|---|
CORPORATE OBLIGATIONS—(Continued) |
Beverages—0.2% |
| Bottling Group LLC |
| 6.950% | 03/15/2014 | | | | $ | 250,000 | | | $ | 271,748 | |
Biotechnology—0.5% | | | |
| Amgen, Inc. | | | |
| 4.000% | 11/18/2009 | | | | | 690,000 | | | | 689,576 | |
Chemicals—0.1% | | | |
| Nalco Co. | | | |
| 7.750% | 11/15/2011 | | | | | 105,000 | | | | 101,325 | |
Commercial Banks—1.5% | | | |
| Bank of America NA | | | |
| 1.700% | 12/23/2010 | | | | | 600,000 | | | | 602,069 | |
| Toronto-Dominion Bank MTN (Canada) | | | |
| 4.288% | 09/10/2010 | | # | | | EUR 300,000 | | | | 411,385 | |
| US Bancorp MTN | | | |
| 3.106% | 05/06/2010 | | # | | | 400,000 | | | | 392,195 | |
| Wells Fargo & Co. | | | |
| 5.300% | 08/26/2011 | | | | | 430,000 | | | | 436,326 | |
| | | | | | | | | | | | | | | | 1,841,975 | |
Communications Equipment—0.3% | | | |
| Cisco Systems, Inc. | | | |
| 5.250% | 02/22/2011 | | | | | 400,000 | | | | 415,462 | |
Computers & Peripherals—0.3% | | | |
| International Business Machines Corp. | | | |
| 4.950% | 03/22/2011 | | | | | 400,000 | | | | 414,697 | |
Consumer Finance—0.3% | | | |
| John Deere Capital Corp. MTN | | | |
| 5.203% | 01/18/2011 | | # | | | 430,000 | | | | 398,392 | |
Containers & Packaging—0.2% | | | |
| Rock-Tenn Co. | | | |
| 8.200% | 08/15/2011 | | | | | 200,000 | | | | 191,000 | |
Diversified Financial Services—1.5% | | | |
| BP Capital Markets plc (United Kingdom) | | | |
| 5.250% | 11/07/2013 | | | | | 250,000 | | | | 261,262 | |
| General Electric Capital Corp., Series A MTN | | | |
| 4.250% | 09/13/2010 | | | | | 100,000 | | | | 100,393 | |
| National Rural Utilities Cooperative Finance Corp. | | | |
| 5.750% | 08/28/2009 | | | | | 450,000 | | | | 452,973 | |
| Private Export Funding Corp., Series I | | | |
| 7.200% | 01/15/2010 | | | | | 650,000 | | | | 693,390 | |
| Unilever Capital Corp. | | | |
| 7.125% | 11/01/2010 | | | | | 410,000 | | | | 438,657 | |
| | | | | | | | | | | | | | | | 1,946,675 | |
Diversified Telecommunication Services—1.6% |
| BellSouth Corp. | | | |
| 4.200% | 09/15/2009 | | | | | 950,000 | | | | 953,888 | |
| Deutsche Telekom International Finance BV (Netherlands) |
| 5.375% | 03/23/2011 | | | | | 400,000 | | | | 395,890 | |
| Qwest Capital Funding, Inc. | | | |
| 7.250% | 02/15/2011 | | | | | 95,000 | | | | 80,275 | |
| Sprint Capital Corp. | | | |
| 8.375% | 03/15/2012 | | | | | 210,000 | | | | 168,110 | |
| Verizon Global Funding Corp. | | | |
| 7.250% | 12/01/2010 | | | | $ | 400,000 | | | $ | 419,531 | |
| | | | | | | | | | | | | | | | 2,017,694 | |
Electric Utilities—1.1% | | | |
| American Electric Power Co., Inc., Series C | | | |
| 5.375% | 03/15/2010 | | | | | 400,000 | | | | 397,177 | |
| Duke Energy Corp. | | | |
| 6.250% | 01/15/2012 | | | | | 400,000 | | | | 414,755 | |
| Exelon Corp. | | | |
| 6.750% | 05/01/2011 | | | | | 260,000 | | | | 253,885 | |
| Exelon Generation Co. LLC | | | |
| 6.950% | 06/15/2011 | | | | | 155,000 | | | | 150,541 | |
| Mirant Americas Generation LLC | | | |
| 8.300% | 05/01/2011 | | † | | | 205,000 | | | | 199,875 | |
| | | | | | | | | | | | | | | | 1,416,233 | |
Food Products—0.7% | | | |
| Campbell Soup Co. | | | |
| 6.750% | 02/15/2011 | | | | | 485,000 | | | | 512,464 | |
| Kellogg Co., Series B | | | |
| 6.600% | 04/01/2011 | | | | | 400,000 | | | | 418,857 | |
| | | | | | | | | | | | | | | | 931,321 | |
Health Care Equipment & Supplies—0.2% |
| Boston Scientific Corp. | | | |
| 6.000% | 06/15/2011 | | | | | 205,000 | | | | 195,775 | |
Health Care Providers & Services—0.4% | | | |
| UnitedHealth Group, Inc. | | | |
| 5.250% | 03/15/2011 | | | | | 300,000 | | | | 282,221 | |
| US Oncology, Inc. | | | |
| 9.000% | 08/15/2012 | | | | | 210,000 | | | | 192,150 | |
| | | | | | | | | | | | | | | | 474,371 | |
Insurance—0.3% | | | |
| Berkshire Hathaway Finance Corp. | | | |
| 4.200% | 12/15/2010 | | | | | 400,000 | | | | 405,938 | |
Machinery—0.4% | | | |
| Bombardier, Inc. (Canada) | | | |
| 6.750% | 05/01/2012 | | ˆ | | | 210,000 | | | | 187,425 | |
| Ingersoll-Rand Global Holding Co. Ltd. (Bermuda) |
| 3.675% | 08/13/2010 | | # | | | 300,000 | | | | 277,935 | |
| | | | | | | | | | | | | | | | 465,360 | |
Media—0.9% | | | |
| Comcast Corp. | | | |
| 5.450% | 11/15/2010 | | | | | 720,000 | | | | 711,971 | |
| Echostar DBS Corp. | | | |
| 6.375% | 10/01/2011 | | | | | 215,000 | | | | 200,487 | |
| Lamar Media Corp. | | | |
| 7.250% | 01/01/2013 | | † | | | 220,000 | | | | 176,550 | |
| | | | | | | | | | | | | | | | 1,089,008 | |
Metals & Mining—0.1% | | | |
| Steel Dynamics, Inc. | | | |
| 7.375% | 11/01/2012 | | | | | 210,000 | | | | 154,350 | |
Multiline Retail—0.5% | | | |
| Costco Wholesale Corp. | | | |
| 5.300% | 03/15/2012 | | | | | 300,000 | | | | 313,327 | |
| Wal-Mart Stores, Inc. | | | |
| 6.875% | 08/10/2009 | | | | | 250,000 | | | | 257,528 | |
| | | | | | | | | | | | | | | | 570,855 | |
See accompanying notes to financial statements.
235
SCHEDULE OF INVESTMENTS—(Continued)
December 31, 2008
Vantagepoint
Discovery Fund
Coupon
Rate | | Maturity
Date | | | | Face | | Value | |
|---|
CORPORATE OBLIGATIONS—(Continued) |
Multi-National—1.3% | | | |
| European Investment Bank MTN (Supranational) | | | |
| 4.750% | 04/15/2011 | | EUR 830,000 | $ | | 1,205,300 | |
| International Bank for Reconstruction & Development (Supranational) |
| 3.125% | 11/15/2011 | | | | $ | 400,000 | | | | 411,961 | |
| | | | | | | | | | | | | | | | 1,617,261 | |
Oil, Gas & Consumable Fuels—1.0% | | | |
| ConocoPhillips | | | |
| 8.750% | 05/25/2010 | | | | | 400,000 | | | | 421,712 | |
| Dynegy Holdings, Inc. | | | |
| 6.875% | 04/01/2011 | | | | | 210,000 | | | | 184,800 | |
| Shell International Finance BV (Netherlands) | | | |
| 5.625% | 06/27/2011 | | | | | 600,000 | | | | 637,855 | |
| | | | | | | | | | | | | | | | 1,244,367 | |
Paper & Forest Products—0.1% | | | |
| Georgia-Pacific LLC | | | |
| 8.125% | 05/15/2011 | | | | | 175,000 | | | | 165,375 | |
Personal Products—0.4% | | | |
| Procter & Gamble Co. MTN | | | |
| 2.366% | 03/09/2010 | | # | | | 470,000 | | | | 469,043 | |
Pharmaceuticals—0.9% | | | |
| Abbott Laboratories | | | |
| 5.600% | 05/15/2011 | | | | | 400,000 | | | | 422,573 | |
| American Home Products Corp. | | | |
| 6.950% | 03/15/2011 | | | | | 700,000 | | | | 729,339 | |
| | | | | | | | | | | | | | | | 1,151,912 | |
Software—0.4% | | | |
| Oracle Corp. | | | |
| 5.000% | 01/15/2011 | | | | | 510,000 | | | | 524,010 | |
Wireless Telecommunication Services—0.4% |
| Vodafone Group plc (United Kingdom) | | | |
| 7.750% | 02/15/2010 | | | | | 500,000 | | | | 511,143 | |
TOTAL CORPORATE OBLIGATIONS | | | |
| (Cost $21,327,515) | | | | | | | | 20,970,838 | |
| |
U.S. GOVERNMENT AGENCY OBLIGATIONS—11.4% |
U.S. Government Agency Obligations—11.4% |
| Federal Home Loan Bank | | | |
| 5.375% | 08/19/2011 | | | | | 3,000,000 | | | | 3,298,569 | |
| Federal Home Loan Bank Discount Notes | | | |
| 0.350% | 01/14/2009 | | † | | | 2,600,000 | | | | 2,600,021 | |
| Federal Home Loan Mortgage Corp. | | | |
| 5.000% | 07/15/2014 | | † | | | 1,760,000 | | | | 1,985,207 | |
| 4.625% | 10/25/2012 | | † | | | 3,000,000 | | | | 3,247,659 | |
| 4.125% | 09/27/2013 | | | | | 350,000 | | | | 377,542 | |
| 2.875% | 06/28/2010 | | | | | 1,010,000 | | | | 1,037,077 | |
| Federal National Mortgage Association | | | |
| 3.250% | 02/10/2010 | | † | | | 1,490,000 | | | | 1,528,747 | |
| 2.875% | 12/11/2013 | | † | | | 350,000 | | | | 358,908 | |
TOTAL U.S. GOVERNMENT AGENCY OBLIGATIONS |
| (Cost $14,260,116) | | | | | | | | 14,433,730 | |
| |
U.S. GOVERNMENT AGENCY MORTGAGE-BACKED SECURITIES—8.9% |
U.S. Government Agency Mortgage-Backed
Securities—8.9% |
| Federal Home Loan Mortgage Corp. | | | |
| 6.000% | 11/01/2022 | | | | $ | 582,196 | | | $ | 603,841 | |
| Federal Home Loan Mortgage Corp. REMICS | | | |
| 5.000% | 06/15/2024 | | | | | 644,043 | | | | 649,677 | |
| Federal National Mortgage Association REMICS | | | |
| 4.125% | 12/25/2025 | | | | | 1,132,551 | | | | 1,133,288 | |
| Government National Mortgage Association | | | |
| 6.500% | 10/20/2037-
07/20/2038 | | | | | 5,101,320 | | | | 5,306,816 | |
| 6.000% | 07/20/2038 | | | | | 2,320,782 | | | | 2,392,929 | |
| 4.500% | 08/20/2035 | | | | | 1,070,854 | | | | 1,085,208 | |
TOTAL U.S. GOVERNMENT AGENCY MORTGAGE-BACKED SECURITIES | | | |
| (Cost $11,089,210) | | | | | | | | 11,171,759 | |
| |
U.S. TREASURY OBLIGATIONS—3.1% |
U.S. Treasury Notes—3.1% | | | |
| U.S. Treasury Note | | | |
| 1.750% | 11/15/2011 | | † | | | 1,400,000 | | | | 1,432,372 | |
| 1.250% | 11/30/2010 | | † | | | 1,000,000 | | | | 1,011,053 | |
| 0.875% | 12/31/2010 | | | | | 1,500,000 | | | | 1,503,752 | |
| | | | | | | | | | | | | | | | | |
TOTAL U.S. TREASURY OBLIGATIONS | | | |
| (Cost $3,920,435) | | | | | | | | 3,947,177 | |
| |
MUNICIPAL OBLIGATIONS—2.1% |
| City of New York, NY, General Obligation, Series 2000-A (New York) | | | |
| 6.500% | 05/15/2011 | | | | | 1,600,000 | | | | 1,733,504 | |
| State of North Carolina, General Obligation, Series 2004 (North Carolina) | | | |
| 5.000% | 03/01/2010 | | | | | 900,000 | | | | 940,194 | |
TOTAL MUNICIPAL OBLIGATIONS | | | |
| (Cost $2,614,132) | | | | | | | | 2,673,698 | |
| |
SOVEREIGN DEBT OBLIGATIONS—0.7% |
Government Issued—0.7% | | | |
| Caisse d’Amortissement de la Dette Sociale MTN (France) | | | |
| 4.250% | 11/08/2010 | | | | | 400,000 | | | | 417,751 | |
| Export Development Canada (Canada) | | | |
| 3.750% | 07/15/2011 | | † | | | 475,000 | | | | 499,460 | |
TOTAL SOVEREIGN DEBT OBLIGATIONS |
| (Cost $881,813) | | | | | | | | 917,211 | |
| |
NON-U.S. GOVERNMENT MORTGAGE-BACKED SECURITIES—2.1% |
Mortgage Backed—2.1% | | | |
| Harborview Mortgage Loan Trust | | | |
| Series 2005-14, Class 3A1A | | | |
| 5.303% | 12/19/2035 | | # | | | 1,519,114 | | | | 1,273,448 | |
| Thornburg Mortgage Securities Trust | | | |
| Series 2004-1, Class II2A | | | |
| 3.356% | 03/25/2044 | | # | | | 1,473,976 | | | | 981,296 | |
See accompanying notes to financial statements.
236
SCHEDULE OF INVESTMENTS—(Continued)
December 31, 2008
Vantagepoint
Discovery Fund
Coupon
Rate | | Maturity
Date | | | | Face | | Value | |
|---|
NON-U.S. GOVERNMENT MORTGAGE-BACKED SECURITIES—(Continued) |
| WaMu Mortgage Pass Through Certificates | | | |
| Series 2006-AR12, Class 1A1 | | | |
| 6.062% | 10/25/2036 | | # | | $ 487,636 | | $ | 408,498 | |
TOTAL NON-U.S. GOVERNMENT MORTGAGE-BACKED SECURITIES | | | |
| (Cost $3,389,132) | | | | | | | | 2,663,242 | |
| |
NON-U.S. GOVERNMENT AGENCY
OBLIGATIONS—1.0% |
Non-U.S. Government Agency Obligations—1.0% |
| Kreditanstalt fuer Wiederaufbau (Germany) | | | |
| 3.750% | 06/27/2011 | | | | | 400,000 | | | | 416,436 | |
| Nederlandse Waterschapsbank NV MTN (Netherlands) |
| 4.625% | 07/25/2011 | | EUR 550,000 | | | 796,533 | |
TOTAL NON-U.S. GOVERNMENT AGENCY OBLIGATIONS | | | |
| (Cost $1,225,789) | | | | | | | | 1,212,969 | |
| |
|
|
|
|
Shares
|
| Value
|
|
|---|
CASH EQUIVALENTS—22.7% |
Institutional Money Market Funds—14.0% |
| AIM Short-Term Investments Trust Prime Assets Portfolio | †† | | | 7,677,854 | | | | 7,677,854 | |
| Fidelity Institutional Money Market: Money Market Portfolio—Institutional Class | | | | 10,055,906 | | | | 10,055,905 | |
| | | | | | | | | | | | | 17,733,759 | |
| |
Coupon
Rate | | Maturity
Date | | | | Face | | Value | |
|---|
Certificates of Deposit—5.8% | | | |
| Allied Irish Banks plc/New York | | | |
| 1.000% | 01/20/2009 | | †† | | $ | 1,000,000 | | | | 1,000,000 | |
| Bayerische Landesbank/New York | | | |
| 2.750% | 01/12/2009 | | †† | | | 1,000,000 | | | | 1,000,000 | |
| Calyon/New York | | | |
| 4.615% | 01/16/2009 | | †† | | | 151,088 | | | | 151,088 | |
| Credit Industriel et Commercial | | | |
| 2.240% | 03/17/2009 | | †† | | | 850,000 | | | | 850,000 | |
| HSH Nordbank AG | | | |
| 1.850% | 01/20/2009 | | †† | | | 1,000,044 | | | | 1,000,045 | |
| Landesbank Hessen-Thueringen Girozentrale/New York |
| 3.050% | 01/02/2009 | | †† | | | 750,000 | | | | 750,000 | |
| Natixis/New York | | | |
| 4.133% | 01/02/2009 | | #†† | | | 1,497,295 | | | | 1,497,295 | |
| Norinchukin Bank/New York | | | |
| 1.650% | 01/12/2009 | | †† | | | 1,000,000 | | | | 1,000,000 | |
| | | | | | | | | | | 7,248,428 | |
Medium Term Note—0.8% | | | |
| Royal Bank of Scotland Group plc | | | |
| 3.655% | 01/30/2009 | | †† | | | 1,005,493 | | | | 1,005,493 | |
Time Deposits—2.1% | | | |
| Banco Popular Espanol SA | | | |
| 3.120% | 01/05/2009 | | †† | | | 750,000 | | | | 750,000 | |
| Danske Bank A/S | | | |
| 2.000% | 02/11/2009 | | †† | | $ | 1,000,000 | | | $ | 1,000,000 | |
| Raiffeisen Zentralbank Oesterreich AG | | | |
| 1.750% | 01/20/2009 | | †† | | | 900,000 | | | | 900,000 | |
| | | | | | | | | | | 2,650,000 | |
TOTAL CASH EQUIVALENTS | | | |
| (Cost $28,637,680) | | | | | | | | 28,637,680 | |
TOTAL INVESTMENTS—112.0% |
| (Cost $164,565,345) | | | | | | 141,500,614 | |
| Other assets less liabilities—(12.0%) | | (15,118,511 | ) |
NET ASSETS—100.0% | | | | | $ | 126,382,103 | |
| Notes to the Schedule of Investments: | |
|---|
| BDR | | | | Brazilian Depositary Receipt |
| EUR | | | | European Monetary Unit |
| REIT | | | | Real Estate Investment Trust |
| REMICS | | | | Real Estate Mortgage Investment Conduits |
| * | | | | Non-income producing. |
| † | | | | Denotes all or a portion of security on loan. |
| α | | | | Illiquid security. |
| ‡ | | | | Security valued at fair value as determined by policies approved by the board of directors. |
| # | | | | Rate is subject to change. Rate shown reflects current rate. |
| ˆ | | | | Securities are not registered under the Securities Act of 1933. These securities may be resold in transactions exempt from registration, normally to qualified buyers under Securities Act Rule 144A. 144A securities represent 0.1% of Total Investments. |
| †† | | | | Represents reinvestment of collateral received in conjunction with securities lending. |
See accompanying notes to financial statements.
237
SCHEDULE OF INVESTMENTS
December 31, 2008
Vantagepoint
International Fund
|
|
|
| Shares
|
| Value
|
|
|---|
COMMON STOCKS—92.9% |
Australia—2.1% | | | | | | | | | | | |
| Amcor Ltd. | | | | 44,911 | | | $ | 182,510 | |
| Australia & New Zealand Banking Group Ltd. | | | | 46,964 | | | | 507,033 | |
| Brambles Ltd. | | | | 92,122 | | | | 478,624 | |
| Centennial Coal Co. Ltd. | | | | 251,900 | | | | 590,201 | |
| Felix Resources Ltd. | | | | 83,800 | | | | 521,191 | |
| Gloucester Coal Ltd. | | | | 248,300 | | | | 679,835 | |
| Iluka Resources Ltd. | * | | | 1,007,748 | | | | 3,276,706 | |
| JB Hi-Fi Ltd. | | | | 134,400 | | | | 914,494 | |
| Macquarie Group Ltd. | † | | | 11,455 | | | | 232,483 | |
| Newcrest Mining Ltd. | | | | 42,168 | | | | 1,003,720 | |
| QBE Insurance Group Ltd. | † | | | 43,080 | | | | 778,599 | |
| Straits Resources Ltd. | | | | 161,400 | | | | 103,218 | |
| Telstra Corp. Ltd. | | | | 457,423 | | | | 1,224,539 | |
| Wesfarmers Ltd. | † | | | 23,000 | | | | 290,303 | |
| Westpac Banking Corp. | | | | 30,000 | | | | 359,812 | |
| Woodside Petroleum Ltd. | | | | 93,944 | | | | 2,431,020 | |
| Woolworths Ltd. | | | | 67,598 | | | | 1,260,447 | |
| WorleyParsons Ltd. | | | | 134,000 | | | | 1,336,780 | |
| | | | | | | | | | | | | | | | | | 16,171,515 | |
Austria—0.2% | | | | | | | | | | | |
| Telekom Austria AG | | | | 25,500 | | | | 371,029 | |
| Verbund-Oesterreichische Elektrizitaetswirtschafts AG, Class A | † | | | 23,100 | | | | 1,068,091 | |
| | | | | | | | | | | | | | | | | | 1,439,120 | |
Belgium—0.4% | | | | | | | | | | | |
| Anheuser-Busch InBev NV | | | | 96,386 | | | | 2,238,395 | |
| Delhaize Group | | | | 18,323 | | | | 1,132,668 | |
| | | | | | | | | | | | | | | | | | 3,371,063 | |
Bermuda—0.1% | | | | | | | | | | | |
| Seadrill Ltd. | † | | | 112,800 | | | | 919,320 | |
Brazil—0.7% | | | | | | | | | | | |
| Cia Vale do Rio Doce ADR | | | | 40,500 | | | | 431,325 | |
| Petroleo Brasileiro SA, Class A ADR | † | | | 99,593 | | | | 2,032,694 | |
| Redecard SA | | | | 170,489 | | | | 1,878,888 | |
| Vivo Participacoes SA ADR | † | | | 69,986 | | | | 877,624 | |
| | | | | | | | | | | | | | | | | | 5,220,531 | |
Canada—4.9% | | | | | | | | | | | |
| Barrick Gold Corp. | | | | 138,800 | | | | 5,103,677 | |
| BCE, Inc. | | | | 66,300 | | | | 1,349,631 | |
| Cameco Corp. | | | | 57,400 | | | | 978,753 | |
| Canadian Natural Resources Ltd. | | | | 18,500 | | | | 730,559 | |
| Canadian Pacific Railway Ltd. | | | | 116,365 | | | | 3,912,191 | |
| Chemtrade Logistics Income Fund | | | | 65,300 | | | | 459,136 | |
| Dorel Industries, Inc., Class B | | | | 22,200 | | | | 503,524 | |
| Enbridge, Inc. | | | | 14,800 | | | | 474,271 | |
| EnCana Corp. | | | | 15,900 | | | | 733,628 | |
| Fairfax Financial Holdings Ltd. | | | | 11,500 | | | | 3,633,050 | |
| Freehold Royalty Trust | | | | 84,300 | | | | 716,328 | |
| George Weston Ltd. | | | | 47,200 | | | | 2,292,134 | |
| Inmet Mining Corp. | | | | 13,700 | | | | 217,291 | |
| Ivanhoe Mines Ltd. | * | | | 126,800 | | | | 335,874 | |
| Kinross Gold Corp. | | | | 41,800 | | | | 761,847 | |
| Laurentian Bank of Canada | | | | 19,200 | | | | 536,574 | |
| Methanex Corp. | | | | 23,500 | | | | 260,794 | |
| Onex Corp. | | | | 21,800 | | | | 321,217 | |
| Petro-Canada | | | | 13,900 | | | $ | 300,857 | |
| Potash Corp. of Saskatchewan | | | | 32,300 | | | | 2,342,764 | |
| Research In Motion Ltd. | * | | | 91,800 | | | | 3,680,923 | |
| Royal Bank of Canada | | | | 84,300 | | | | 2,465,151 | |
| Shaw Communications, Inc., Class B | | | | 32,800 | | | | 574,166 | |
| Shoppers Drug Mart Corp. | | | | 13,200 | | | | 513,779 | |
| Suncor Energy, Inc. | | | | 197,100 | | | | 3,787,130 | |
| Uni-Select, Inc. | | | | 18,100 | | | | 336,195 | |
| | | | | | | | | | | | | | | | | | 37,321,444 | |
China—1.3% | | | | | | | | | | | |
| China Construction Bank Corp., Class H | † | | | 6,737,372 | | | | 3,748,485 | |
| China Life Insurance Co. Ltd., Class H | † | | | 1,055,700 | | | | 3,243,619 | |
| China Petroleum & Chemical Corp., Class H | | | | 1,834,600 | | | | 1,127,661 | |
| China Shenhua Energy Co. Ltd., Class H | † | | | 186,000 | | | | 398,758 | |
| Shanghai Electric Group Co. Ltd., Class H | *† | | | 3,210,866 | | | | 1,315,434 | |
| Suntech Power Holdings Co. Ltd. ADR | *† | | | 15,000 | | | | 175,500 | |
| | | | | | | | | | | | | | | | | | 10,009,457 | |
Denmark—0.2% | | | | | | | | | | | |
| East Asiatic Co. Ltd. A/S | | | | 11,100 | | | | 377,960 | |
| Novo Nordisk A/S, Class B | | | | 16,000 | | | | 825,343 | |
| Novozymes A/S, Class B | | | | 8,100 | | | | 649,636 | |
| | | | | | | | | | | | | | | | | | 1,852,939 | |
Finland—0.7% | | | | | | | | | | | |
| Fortum Oyj | | | | 245,255 | | | | 5,330,703 | |
| Rautaruukki Oyj | | | | 15,500 | | | | 270,714 | |
| | | | | | | | | | | | | | | | | | 5,601,417 | |
France—10.6% | | | | | | | | | | | |
| Accor SA | | | | 33,900 | | | | 1,669,901 | |
| Air Liquide | | | | 12,924 | | | | 1,183,574 | |
| Alstom SA | | | | 62,732 | | | | 3,738,498 | |
| Altamir Amboise | | | | 261,100 | | | | 926,371 | |
| AXA SA | | | | 87,174 | | | | 1,956,676 | |
| BNP Paribas | | | | 69,589 | | | | 3,003,777 | |
| Bouygues | | | | 210,143 | | | | 8,915,005 | |
| Carrefour SA | | | | 55,564 | | | | 2,147,797 | |
| Cie Generale d’Optique Essilor International SA | | | | 56,000 | | | | 2,630,603 | |
| Compagnie Generale des Etablissements Michelin, Class B | | | | 23,400 | | | | 1,236,310 | |
| EDF | | | | 46,402 | | | | 2,698,828 | |
| Esso SA Francaise | | | | 5,080 | | | | 510,597 | |
| France Telecom SA | | | | 204,547 | | | | 5,701,282 | |
| GDF Suez | | | | 24,801 | | | | 1,231,051 | |
| Gemalto NV | * | | | 19,900 | | | | 500,647 | |
| Groupe Danone | | | | 59,000 | | | | 3,564,774 | |
| Lafarge SA | † | | | 16,500 | | | | 1,009,165 | |
| L’Oreal SA | | | | 81,100 | | | | 7,077,682 | |
| LVMH Moet Hennessy Louis Vuitton SA | † | | | 93,383 | | | | 6,258,401 | |
| Manutan (Societe) | | | | 7,962 | | | | 344,790 | |
| PagesJaunes Groupe | | | | 2,560 | | | | 25,226 | |
| Pernod-Ricard SA | † | | | 38,700 | | | | 2,874,945 | |
| Peugeot SA | | | | 34,000 | | | | 581,287 | |
| Rhodia SA | | | | 19,008 | | | | 120,614 | |
| Sanofi-Aventis SA | | | | 33,100 | | | | 2,117,184 | |
| Schneider Electric SA | | | | 5,358 | | | | 398,924 | |
|
See accompanying notes to financial statements.
238
SCHEDULE OF INVESTMENTS—(Continued)
December 31, 2008
Vantagepoint
International Fund
|
|
|
| Shares
|
| Value
|
|
|---|
COMMON STOCKS—(Continued) |
| Societe Generale | | | | 17,437 | | | $ | 884,631 | |
| Suez Environnement SA | * | | | 6,350 | | | | 107,243 | |
| Technip SA | | | | 13,504 | | | | 414,627 | |
| Total Gabon | | | | 370 | | | | 89,589 | |
| Total SA | | | | 18,940 | | | | 1,041,307 | |
| Vallourec | | | | 25,129 | | | | 2,857,173 | |
| Veolia Environnement | † | | | 93,049 | | | | 2,935,040 | |
| Vinci SA | † | | | 160,596 | | | | 6,777,102 | |
| Vivendi SA | | | | 63,600 | | | | 2,072,983 | |
| Zodiac SA | | | | 44,841 | | | | 1,637,309 | |
| | | | | | | | | | | | | | | | | | 81,240,913 | |
Germany—6.3% | | | | | | | | | | | |
| Adidas AG | | | | 51,500 | | | | 1,963,164 | |
| Allianz SE (Registered) | | | | 54,204 | | | | 5,767,350 | |
| Bayer AG | † | | | 139,448 | | | | 8,125,428 | |
| Bayerische Motoren Werke AG | | | | 21,900 | | | | 672,445 | |
| Commerzbank AG | † | | | 38,481 | | | | 365,613 | |
| Daimler AG (Registered) | † | | | 127,314 | | | | 4,850,905 | |
| Deutsche Bank AG (Registered) | † | | | 11,532 | | | | 456,047 | |
| Deutsche Boerse AG | | | | 8,920 | | | | 645,354 | |
| Deutsche Post AG (Registered) | | | | 29,500 | | | | 498,953 | |
| E.ON AG | | | | 24,450 | | | | 960,084 | |
| Fraport AG Frankfurt Airport Services Worldwide | | | | 53,843 | | | | 2,436,355 | |
| Fresenius Medical Care AG & Co. KGaA | † | | | 16,400 | | | | 753,938 | |
| Hannover Rueckversicherung AG (Registered) | | | | 2,000 | | | | 63,602 | |
| Linde AG | † | | | 59,605 | | | | 5,002,566 | |
| Muenchener Rueckversicherungs AG (Registered) | | | | 29,005 | | | | 4,502,966 | |
| Norddeutsche Affinerie AG | | | | 34,800 | | | | 1,369,994 | |
| SAP AG | | | | 111,500 | | | | 4,046,011 | |
| Siemens AG (Registered) | | | | 7,400 | | | | 557,098 | |
| ThyssenKrupp AG | † | | | 13,900 | | | | 386,950 | |
| Wacker Chemie AG | † | | | 42,612 | | | | 4,563,023 | |
| | | | | | | | | | | | | | | | | | 47,987,846 | |
Greece—0.0% | | | | | | | | | | | |
| Coca Cola Hellenic Bottling Co. SA | | | | 17,400 | | | | 253,008 | |
Hong Kong—4.2% | | | | | | | | | | | |
| Bank of East Asia Ltd. | † | | | 791,100 | | | | 1,668,724 | |
| China Merchants Holdings International Co. Ltd. | † | | | 561,800 | | | | 1,097,158 | |
| China Mobile Ltd. | † | | | 244,000 | | | | 2,475,652 | |
| China Resources Land Ltd. | † | | | 2,142,158 | | | | 2,651,556 | |
| CLP Holdings Ltd. | † | | | 710,000 | | | | 4,827,097 | |
| CNOOC Ltd. | | | | 2,750,000 | | | | 2,615,732 | |
| Dairy Farm International Holdings Ltd. | | | | 410,400 | | | | 1,758,570 | |
| First Pacific Co. | | | | 1,285,000 | | | | 448,620 | |
| Hang Seng Bank Ltd. | | | | 56,000 | | | | 739,346 | |
| Hong Kong & China Gas Co. Ltd. | | | | 1,837,000 | | | | 2,785,749 | |
| Hutchison Whampoa Ltd. | | | | 944,798 | | | | 4,769,545 | |
| Jardine Matheson Holdings Ltd. | | | | 26,400 | | | | 489,523 | |
| Li & Fung Ltd. | † | | | 262,400 | | | | 453,479 | |
| New World Development Ltd. | | | | 524,000 | | | | 536,535 | |
| Noble Group Ltd. | | | | 789,800 | | | | 565,703 | |
| NWS Holdings Ltd. | | | | 844,196 | | | | 1,264,643 | |
| Sun Hung Kai Properties Ltd. | | | | 212,936 | | | | 1,791,759 | |
| Wheelock & Co. Ltd. | | | | 556,000 | | | $ | 1,225,272 | |
| | | | | | | | | | | | | | | | | | 32,164,663 | |
India—0.2% | | | | | | | | | | | |
| ICICI Bank Ltd. ADR | † | | | 85,367 | | | | 1,643,315 | |
Indonesia—0.0% | | | | | | | | | | | |
| Telekomunikasi Indonesia Tbk PT | | | | 96,000 | | | | 61,356 | |
Ireland—0.4% | | | | | | | | | | | |
| CRH plc (Dublin Exchange) | | | | 10,100 | | | | 259,681 | |
| CRH plc (Euro Exchange) | | | | 67,821 | | | | 1,718,494 | |
| Elan Corp. plc ADR | *† | | | 165,369 | | | | 992,214 | |
| | | | | | | | | | | | | | | | | | 2,970,389 | |
Israel—0.1% | | | | | | | | | | | |
| Teva Pharmaceutical Industries Ltd. ADR | | | | 11,500 | | | | 489,555 | |
Italy—1.8% | | | | | | | | | | | |
| Enel SpA | | | | 440,600 | | | | 2,838,170 | |
| ENI SpA | | | | 251,919 | | | | 6,062,099 | |
| Fiat SpA | | | | 169,712 | | | | 1,136,077 | |
| IFIL Investments SpA | † | | | 18,237 | | | | 47,200 | |
| Intesa Sanpaolo SpA | | | | 666,286 | | | | 2,420,412 | |
| Saipem SpA | | | | 55,800 | | | | 951,703 | |
| | | | | | | | | | | | | | | | | | 13,455,661 | |
Japan—23.6% | | | | | | | | | | | |
| Advantest Corp. | † | | | 73,500 | | | | 1,198,125 | |
| Aeon Co. Ltd. | † | | | 139,500 | | | | 1,404,864 | |
| Aeon Mall Co. Ltd. | † | | | 116,500 | | | | 2,252,137 | |
| Ain Pharmaciez, Inc. | | | | 8,300 | | | | 183,435 | |
| Aisin Seiki Co. Ltd. | | | | 140,400 | | | | 2,010,905 | |
| Aloka Co. Ltd. | | | | 71,000 | | | | 635,541 | |
| Aruze Corp. | | | | 16,300 | | | | 164,916 | |
| Astellas Pharma, Inc. | | | | 18,600 | | | | 761,341 | |
| Atrium Co. Ltd. | † | | | 60,000 | | | | 203,411 | |
| Bridgestone Corp. | | | | 50,500 | | | | 757,480 | |
| Canon, Inc. | | | | 137,750 | | | | 4,364,550 | |
| Chiyoda Corp. | † | | | 92,000 | | | | 512,431 | |
| Chugai Pharmaceutical Co. Ltd. | | | | 119,000 | | | | 2,313,215 | |
| Daikin Industries Ltd. | | | | 68,000 | | | | 1,788,299 | |
| Daito Trust Construction Co. Ltd. | | | | 71,000 | | | | 3,727,100 | |
| Denso Corp. | | | | 229,400 | | | | 3,887,038 | |
| East Japan Railway Co. | ‡ | | | 218 | | | | 1,656,944 | |
| Eisai Co. Ltd. | | | | 73,000 | | | | 3,046,260 | |
| Electric Power Development Co. Ltd. | | | | 12,100 | | | | 475,606 | |
| Fanuc Ltd. | | | | 76,400 | | | | 5,475,724 | |
| FCC Co. Ltd. | | | | 145,900 | | | | 1,228,807 | |
| Fuji Machine Manufacturing Co. Ltd. | | | | 50,500 | | | | 433,752 | |
| FUJIFILM Holdings Corp. | | | | 32,100 | | | | 716,604 | |
| Fujitsu Frontech Ltd. | | | | 89,700 | | | | 727,991 | |
| Hankyu Hanshin Holdings, Inc. | † | | | 124,000 | | | | 716,132 | |
| Heiwa Corp. | | | | 72,000 | | | | 722,472 | |
| Hirose Electric Co. Ltd. | † | | | 24,700 | | | | 2,499,173 | |
| Hitachi Capital Corp. | | | | 61,000 | | | | 763,127 | |
| Honda Motor Co. Ltd. | | | | 95,000 | | | | 2,023,375 | |
| HOYA Corp. | | | | 100,000 | | | | 1,746,619 | |
| Imasen Electric Industrial | | | | 66,000 | | | | 378,724 | |
| INPEX Corp. | | | | 65 | | | | 518,184 | |
| ITOCHU Corp. | | | | 780,000 | | | | 3,935,172 | |
See accompanying notes to financial statements.
239
SCHEDULE OF INVESTMENTS—(Continued)
December 31, 2008
Vantagepoint
International Fund