SECURITIES AND EXCHANGE COMMISSION
Washington, D.C. 20549
Form 6-K
REPORT OF FOREIGN PRIVATE ISSUER
PURSUANT TO RULE 13a-16 OR 15d-16 UNDER
THE SECURITIES EXCHANGE ACT OF 1934
For the month of February 2005
DAIMLERCHRYSLER AG
(Translation of registrant’s name into English)
EPPLESTRASSE 225, 70567 STUTTGART, GERMANY
(Address of principal executive office)
[Indicate by check mark whether the registrant files or will file annual reports under cover of Form 20-F or Form 40-F.]
Form 20-F |
| ý |
| Form 40-F |
| o |
[Indicate by check mark whether the registrant by furnishing the information contained in this Form is also thereby furnishing the information to the Commission pursuant to Rule 12g3-2(b) under the Securities Exchange Act of 1934.]
Yes |
| o |
| No |
| ý |
[If “Yes” is marked, indicate below the file number assigned to the registrant in connection with Rule 12g3-2(b): 82- ]
This report on Form 6-K is hereby incorporated by reference in the registration statement on Form F-3 of DaimlerChrysler North America Holding Corporation (Registration Statement No. 333-13160) and the registration statements on Form S-8 (Nos. 333-5074, 333-7082, 333-8998, 333-86934 and 333-86936) of DaimlerChrysler AG
DAIMLERCHRYSLER AG
FORM 6-K: TABLE OF CONTENTS
| ||
2004 Results, Annual Press Conference – Jürgen E. Schrempp, Chairman of the Board of Management |
| |
2004 Results, Annual Press Conference – Bodo Uebber, Chief Financial Officer |
| |
| ||
|
2
CAUTIONARY STATEMENT REGARDING FORWARD-LOOKING STATEMENTS
This document contains forward-looking statements that reflect management’s current views with respect to future events. The words „anticipate,“ „assume,“ „believe,“ „estimate,“ „expect,“ „intend,“ „may,“ „plan,“ „project“ and „should“ and similar expressions identify forward-looking statements. Such statements are subject to risks and uncertainties, including, but not limited to: an economic downturn in Europe or North America; changes in currency exchange rates, interest rates and in raw material prices; introduction of competing products; increased sales incentives; and decline in resale prices of used vehicles. If any of these or other risks and uncertainties occur (some of which are described under the heading “Risk Report” in DaimlerChrysler’s most recent Annual Report and under the heading “Risk Factors” in DaimlerChrysler’s most recent Annual Report on Form 20-F filed with the Securities and Exchange Commission), or if the assumptions underlying any of these statements prove incorrect, then actual results may be materially different from those expressed or implied by such statements. We do not intend or assume any obligation to update any forward-looking statement, which speaks only as of the date on which it is made.
These figures are preliminary and have neither been approved yet by the Supervisory Board nor audited by the external auditor. Publication of Annual Report and Consolidated Financial Statement is scheduled for February 23, 2005. Publication of Form 20-F Report is scheduled for February 28, 2005.
3
DAIMLERCHRYSLER
Contacts |
| Press Information |
Thomas Fröhlich | +49 (0)7 11/17-9 33 11 |
|
Han Tjan | +1 212 909 9063 | Date |
|
| February 10, 2005 |
DaimlerChrysler achieves an operating profit of €5.8 billion
• Net income of €2.5 billion (2003: €0.4 billion)
• Earnings per share of €2.43 (2003: €0.44)
• Revenues up 4% to €142.1 billion
• Operating Profit in 2005 expected to be slightly higher than in 2004
Stuttgart/Auburn Hills. DaimlerChrysler (stock-exchange abbreviation DCX) has today published its preliminary consolidated financial statements and the divisions’ results for the year 2004.
The operating profit with €5.8 billion was, as stated before, considerably higher than €5.1 billion, the operating profit of Full Year 2003 excluding restructuring expenditures at the Chrysler Group and excluding the capital gain realized on the sale of MTU Aero Engines. This increase was primarily due to the improved earnings of the Chrysler Group and in the Commercial Vehicles divisions. The profit contribution from the Services division was at the high level of the prior year, despite the charge from Toll Collect. The contribution to the Group’s operating profit from the Mercedes Car Group decreased sharply, however. The Group's result was negatively impacted by considerable charges from Mitsubishi Fuso Truck and Bus Corporation (MFTBC) and Toll Collect.
The Chairman of the Board of Management of DaimlerChrysler AG, Prof. Jürgen E. Schrempp, stated at the Annual Results Press Conference in Sindelfingen: “One of DaimlerChrysler's key strengths is its ability not only to compensate at the Group level for differing cycles in the divisions and varying regional developments, but also to achieve growth in earnings. The year 2004 shows that our strategy works well – even in such a challenging competitive environment.”
Net income rose from €0.4 billion to €2.5 billion. Earnings per share of €2.43 were also significantly higher than in the prior year.
The Board of Management will propose to the Supervisory Board that an unchanged dividend of €1.50 per share should be distributed (2003: €1.50). This proposal takes account not only of the development of operating profit and cash flow in 2004, but also of expectations for the coming years.
The Group’s workforce will also participate from the positive business developments. DaimlerChrysler’s management and representatives of its employees have together fixed the details of the profit-related bonus for 2004. For some 144,000 employees of DaimlerChrysler AG in Germany, the bonus for 2004 has been set at €1,100. It will be paid out together with wages and salaries in April 2005. Consistent with the collective bargaining agreement, this year’s profit-related bonus for the 68,000 entitled employees of the Chrysler Group in the United States will average $1,500 and will be paid out in March 2005.
The total compensation of the Board of Management decreased by 22.5% from €40.8 million to €31.6 million in 2004. The compensation for the activities of the members of the Supervisory Board of DaimlerChrysler AG amounted to €2.0 million (2003: €2.8 million).
2
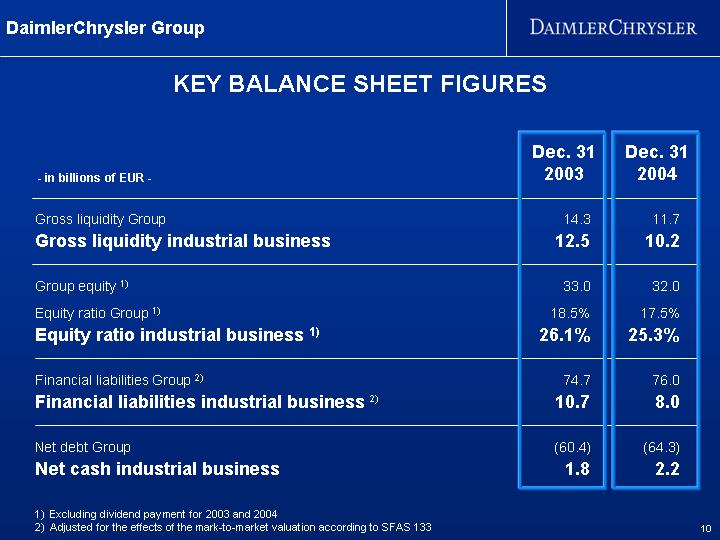
In the industrial business, DaimlerChrysler generated a free cash flow of €1.8 billion. The net liquidity of the industrial business thus continued to improve from €1.8 billion to €2.2 billion – despite an allocation to the pension funds of €1.6 billion and despite the high dividend distribution (€1.5 billion) in 2004.
Growth in unit sales and revenues
DaimlerChrysler sold a total of 4.7 million vehicles in 2004, surpassing the level of the prior year by 8%. The DaimlerChrysler Group’s revenues increased by 4% to €142.1 billion. Adjusted for currency-translation effects and changes in the consolidated Group, revenues were actually 7% higher than in the prior year.
The workforce
As of December 31, 2004, DaimlerChrysler employed 384,723 people worldwide (end of 2003: 362,063). This was an increase of more than 6%. Of this total, 185,154 were employed in Germany (2003: 182,739) and 98,119 in the United States (2003: 102,391). Employment rose sharply in the Commercial Vehicles division in particular, due to new recruitment in Europe and North America and above all the consolidation of Mitsubishi Fuso Truck and Bus Corporation (MFTBC) with 18,281 employees. Adjusted for changes in the consolidated Group, the DaimlerChrysler workforce grew by 2% (+8,413).
Investing to secure the future
Last year, the DaimlerChrysler Group invested a total of €6.4 billion in property, plant and equipment (2003: €6.6 billion). The focus of the investment of €2.3 billion by the Mercedes Car Group was on expanding the plants in Rastatt and Tuscaloosa/USA for the production of the
3
new A-Class and M-Class vehicle families, production preparations for the next S-Class model, and the expansion of production facilities for the new diesel and gasoline engines. The Chrysler Group’s investments of €2.6 billion were primarily applied to prepare for the production of the nine new models launched in 2004, including the very successful Chrysler 300C and the Dodge Magnum, and at least five additional models to come in the year 2005. Important projects in the Commercial Vehicles division, which invested a total of €1.2 billion, included the new Euro-4 truck engines and preparations for the successor to the Sprinter.
Research and development expenditure totaled €5.7 billion in 2004 (2003: €5.6 billion). Of this total, €2.6 billion was accounted for by the Mercedes Car Group. This division’s most important projects were the B-Class and R-Class sports tourers and the successors to the M-Class and S-Class models as well as completely new engine families. Research and development work at the Chrysler Group was influenced by the product offensive; efficiency improvements were achieved once again in terms of the yield on the funds applied. R&D expenditure by the Chrysler Group was at €1.6 billion. €1.2 billion was applied for research and development by Commercial Vehicles (2003: €0.9 billion).
In the planning period of 2005 through 2007, DaimlerChrysler expects to invest a total of €21 billion in property, plant and equipment. DaimlerChrysler plans to invest substantial funds in the context of the Group’s involvement in China. For research and development activities, DaimlerChrysler will spend a total of €17 billion in the period of 2005 through 2007, thus maintaining the high level of recent years.
4
Mercedes Car Group
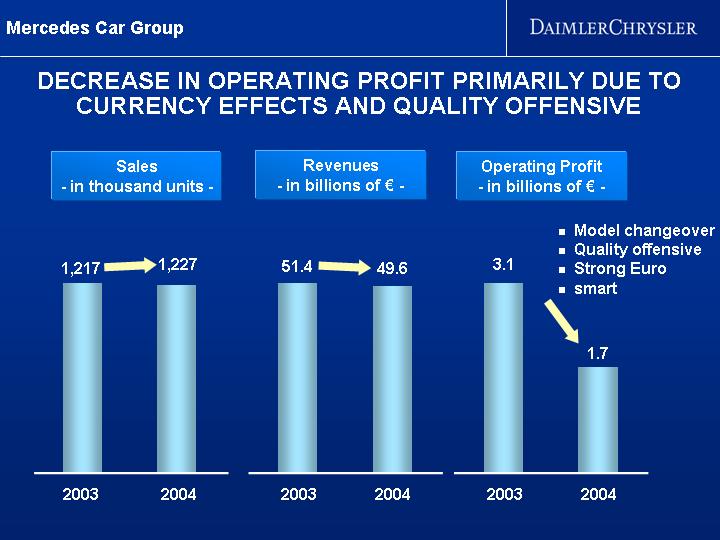
The Mercedes Car Group sold 1,226,800 vehicles in 2004 (2003: 1,216,900). For model life-cycle reasons, unit sales of the Mercedes-Benz brand were 2% lower than in the prior year, however. smart’s unit sales increased by 22% due to the launch of the smart forfour.
The division’s revenues decreased slightly to €49.6 billion (2003: €51.5 billion). This development was due to exchange-rate effects and the changed model mix of Mercedes-Benz passenger cars, which was primarily caused by lifecycle-related factors.
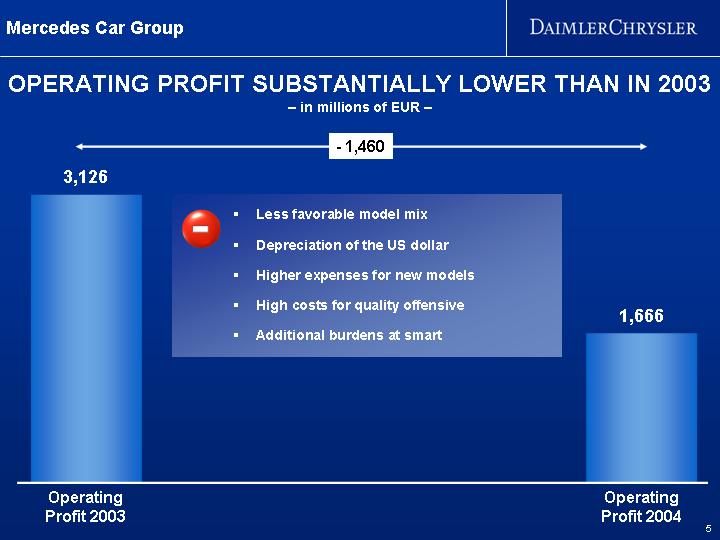
At €1.7 billion, operating profit was significantly lower than the €3.1 billion posted in 2003. This was due partially to the changed model mix and exchange-rate effects, but also due to the high launch costs for new products and the costs of the quality offensive at Mercedes-Benz. In addition, the contribution from the smart brand was significantly negative as a result of higher marketing expenses and launch costs for the smart forfour.
The Mercedes Car Group started a comprehensive program designed to improve efficiency and increase earnings. With the CORE program, the Mercedes Car Group aims to improve its performance by more than €3 billion. As a result, the division should once again achieve a return on sales of 7% in 2007. It also expanded its quality offensive in 2004. For the smart brand, a business model is now being prepared with the goals of increasing unit sales as a result of measures taken in the sales network, improving cost structures and boosting productivity.
With its product and marketing offensive, the Mercedes-Benz brand has succeeded in making its product range even more attractive and significantly younger, and in defending its position as the world’s most
5
successful premium brand, despite intense competition.
The second-generation SLK roadster, which was presented to the public in the spring of 2004, is Number 1 worldwide in its segment. In April 2004, deliveries to customers began of the new super sports car Mercedes-Benz SLR.
In the early summer, Mercedes-Benz launched the new generation of the C-Class. The response to the new C-class has been very positive, with the model becoming the global market leader in its segment shortly after it was launched. In September 2004, the first units of the new CLS-Class were delivered to customers; this is the first four-door coupe in the world to go into series production. Demand is very strong for the new A-Class, deliveries of which also began in September.
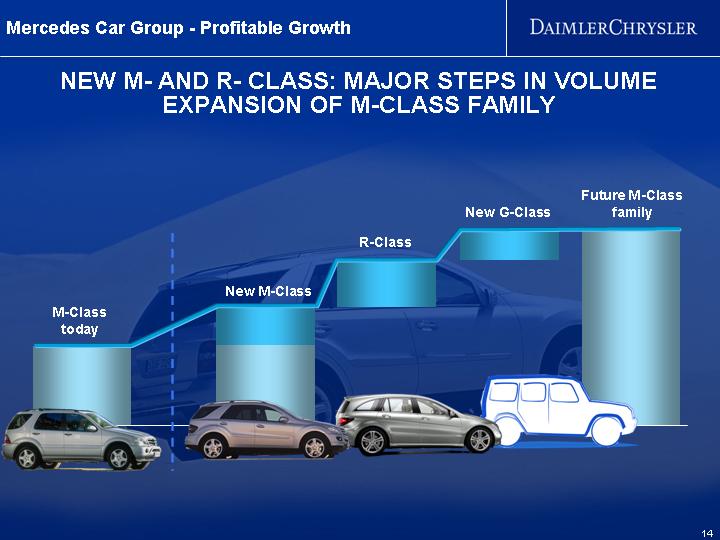
At the 2004 Paris Motor Show, the European version of the “Vision R” grand sports tourer, and for the first time also the new “Vision B” compact sports tourer were presented to the public. The response from both the public and the press was very positive. These two vehicles will be launched in the summer of 2005 as the R-Class and the B-Class. They will extend the M-Class and the A-Class into product families. With these models and the new S-Class to be launched in the fall of 2005, the Mercedes-Benz brand intends to further extend its leading position in the premium segment in the coming years.
More than 500 exclusive Maybach sedans were delivered to customers worldwide in the year 2004.
A sales offensive was started for the smart brand, which has become well established with its unique products in many markets within just a few years. The goal is to utilize the potential of the brand even better than before. At the same time, new markets were gradually added. And
6
with the smart forfour, which was launched in April 2004, smart established itself as a multi-product brand.
Chrysler Group
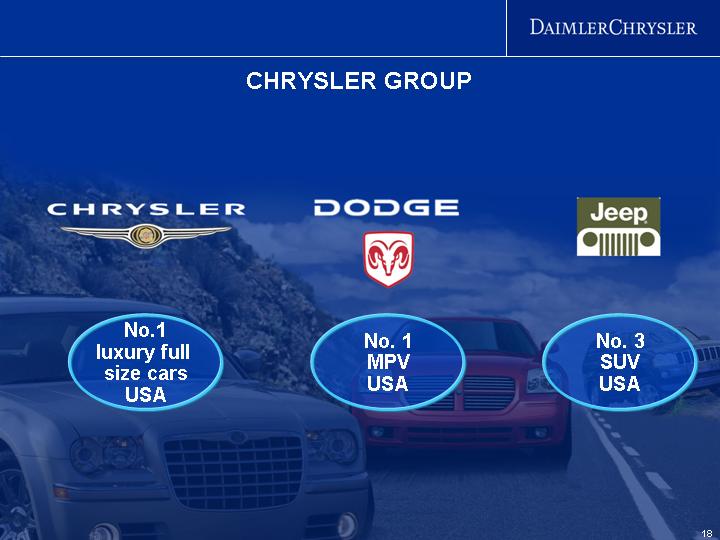
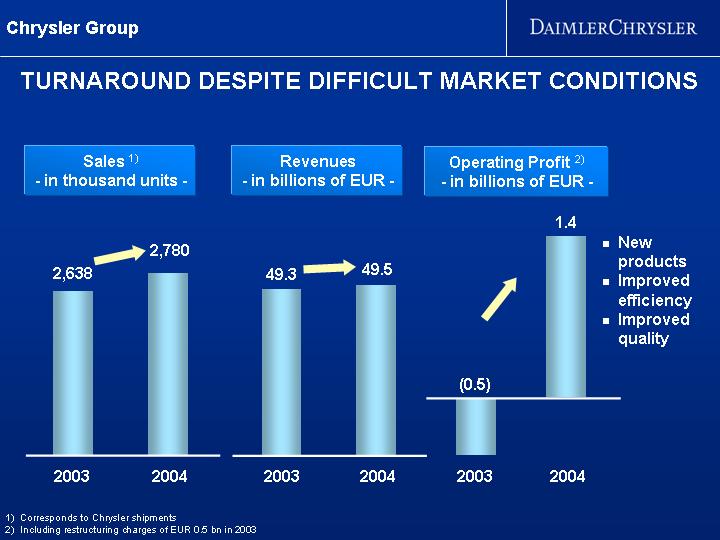
Worldwide, the Chrysler Group posted factory unit sales (shipments) of 2.8 million passenger cars, minivans, sport-utility vehicles and light trucks of the Chrysler, Dodge and Jeep® brands in 2004, a 5% increase over 2003. Worldwide retail sales increased by 4% to 2.7 million vehicles.
The Chrysler Group’s revenues of €49.5 billion were at the same level as in the prior year; calculated in US dollars, the increase was 10%.
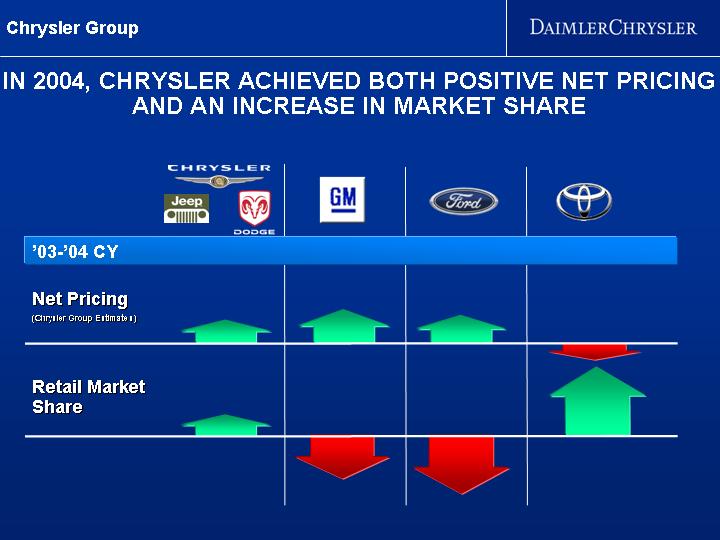
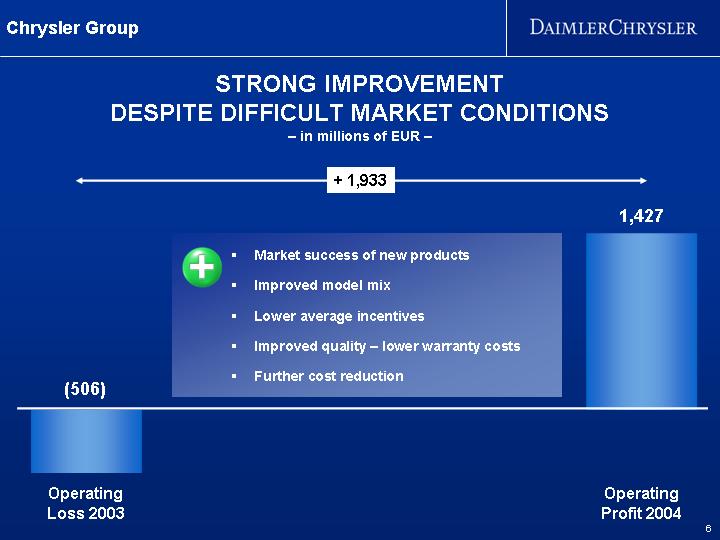
The Chrysler Group’s business development was very positive in 2004, despite the continuation of difficult market conditions in North America: After reporting an operating loss of €506 million in the prior year, in 2004 the Chrysler Group achieved an operating profit of €1.4 billion. Lower average price incentives also contributed to the better result.
In the past four years, the Chrysler Group significantly improved its product quality and raised its manufacturing productivity, resulting in a sustained improvement in its competitive position. According to the “Harbour Report 2004”, the Chrysler Group increased manufacturing productivity by 7.8%. This is the second consecutive year in which the Chrysler Group posted the largest year-over-year improvement among all automotive manufacturers. And according to the “Initial Quality Survey” carried out by J.D. Power, the quality of Chrysler, Jeep® and Dodge vehicles improved by 11% compared with the prior year.
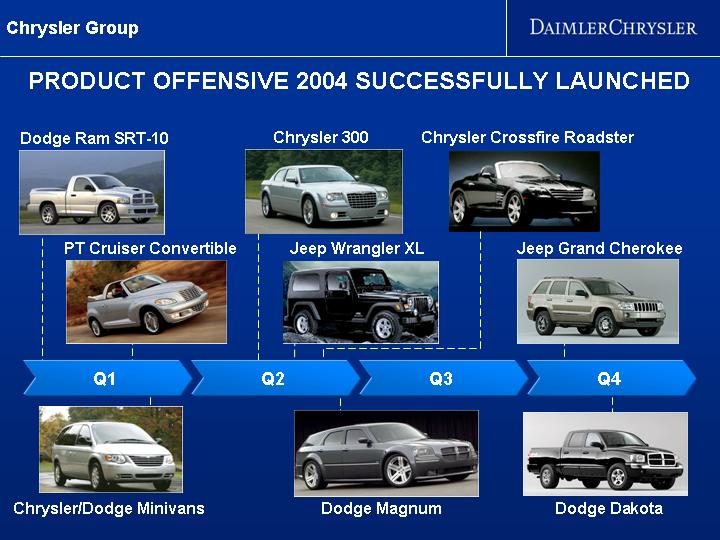
In the year 2004, the Chrysler Group continued its product offensive
7
with nine new products. This represents the greatest number of new models in a single year in the company’s history, and gives it one of the youngest product line-ups in the industry. The model offensive will continue in the years to come. For example, the company will launch several highly anticipated products in 2005, including the Dodge Charger, and the Jeep® Commander, which will be the first Jeep® vehicle ever with three-row seating.
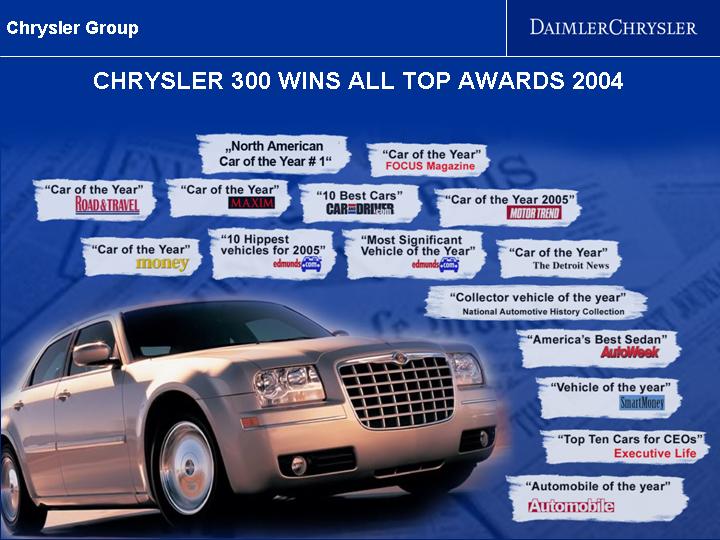
With the 300 and 300C sedans, the Chrysler Group has made an impact on the US market for passenger cars: these models quickly achieved a market share of about 30% in their segment during nine months in the market place. The 300C has also been very well received in Europe. Additional new Chrysler models in the year 2004 were the Chrysler PT Cruiser convertible and the Chrysler Crossfire roadster, which continue the brand’s long and successful tradition of open-air driving. Last year’s new products from the Dodge brand included the Dodge Magnum, the Dodge Dakota and the Dodge Ram SRT-10. Chrysler Group vehicles received more than 70 awards in 2004.
Commercial Vehicles
In a favorable economic environment in 2004, the Commercial Vehicles division boosted its unit sales by 42% to 712,200 trucks, vans and buses. This figure includes 118,100 vehicles of the business unit MFTBC, which was consolidated in April 2004. With the acquisition of a majority stake in MFTBC, DaimlerChrysler has further extended its position as global market leader for commercial vehicles. Even without the consolidation of MFTBC, the number of 594,100 units sold significantly exceeds the previous record set in 1999 (554,000). The increase in unit sales excluding MFTBC amounted to 19% in 2004.
8
Revenues also grew substantially to €34.8 billion (2003: €26.8 billion). Once again, even without MFTBC there would still have been strong growth of 16%.
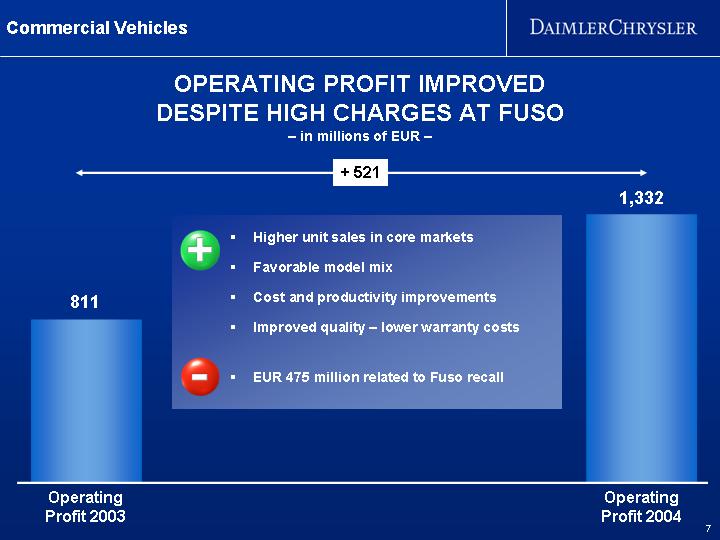
Operating profit of €1.3 billion was far higher than the prior-year earnings of €0.8 billion. This strong result was achieved although the Commercial Vehicles division was burdened by charges of €475 million relating to the expenditure arising at MFTBC for quality measures and recall campaigns. The main reasons for the earnings improvement were the substantially higher unit sales and the successful implementation of efficiency programs.
DaimlerChrysler has meanwhile successfully claimed compensation for the quality problems at MFTBC. At the beginning of this week, the DaimlerChrysler Supervisory Board and the Board of Directors of Mitsubishi Motors Corporation approved a letter of intent regulating compensation for the expenses that DaimlerChrysler has incurred due to those quality problems. An appropriate contract will now be prepared on this basis.
Thanks to the success of the new products and increased demand in the key markets, as well as the full consolidation of MFTBC, sales by Trucks business segment increased by 57% to 403,300 vehicles. With unit sales of 137,400 vehicles, the Trucks Europe/Latin America (Mercedes-Benz) business unit sold 24% more vehicles than in the prior year, thus setting a new record. The Trucks NAFTA business unit (Freightliner, Sterling, Thomas Built Buses) also achieved a strong increase in truck sales of 22% to 152,400 vehicles. MFTBC recorded unit sales of 118,100 trucks and buses. Its decrease in Japan was offset by strong growth in South East Asia, the Middle East and in Europe. The Mercedes-Benz vans business unit posted sales of 260,700 units in 2004 (2003: 230,900). The DaimlerChrysler Buses
9
business unit achieved a new record with sales of 32,800 units (+16%).
The new medium-duty truck Atego 2 and the new Axor 2 were presented in 2004. The two trucks use a large number of shared parts and feature numerous innovations. With the launch of the Atego in Brazil in the summer of 2004, the business unit Trucks Europe/Latin America continued to implement its strategy of selling the European product range in all of the business unit’s key markets and thus achieving economies of scale. This goal is also served in the NAFTA region by assembling axles that share many parts with the axles produced in Europe. The increase in unit sales by the Vans business unit is mainly due to the success of the Sprinter and the Vito and the Viano model series, which were in great demand in all major regions. The new Vito introduced in 2003 was named “Van of the Year 2005”. The positive development of DaimlerChrysler Buses was primarily a result of the continuous further enhancement of the full-line product portfolio and the business unit’s technology leadership.
Services
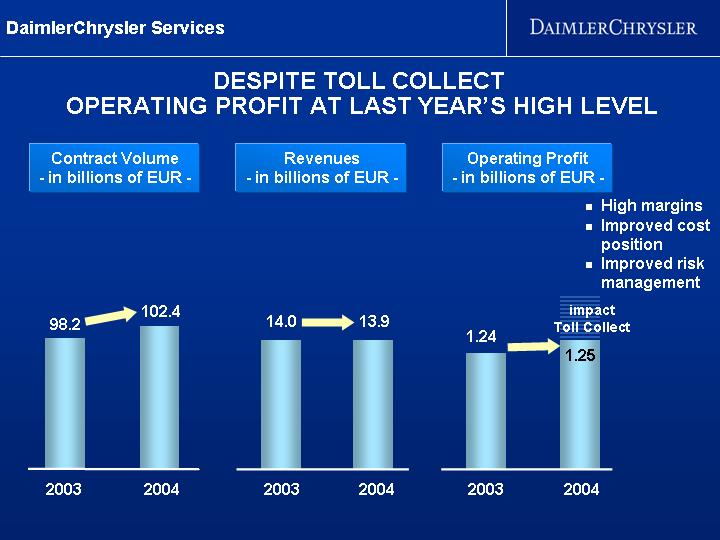
The Services division continued its positive business development in the year 2004. Its operating profit of €1.25 billion was at last year’s high level (2003: €1.24 billion), despite the charges of €472 million from Toll Collect.
New business increased by 7% to €50.9 billion primarily due to the close cooperation with the vehicle divisions. The increase was also assisted by specialized programs, which were given a very positive reception by customers. An additional factor was that DaimlerChrysler Services launched new financial services products in 2004. Contract volume rose to €102.4 billion (2003: €98.2 billion). In total, the portfolio consisted of 6.6 million leased and financed vehicles in 39 countries
10
at the end of 2004.
In order to increase new business and profitability in North America, bonus programs were introduced, and activities designed to enhance customer retention were further expanded. DaimlerChrysler Services Truck Finance introduced a full-service leasing program for the Freightliner brand that allows customers to supplement their financing and leasing contracts with an additional maintenance contract.
DaimlerChrysler Bank continued with the expansion of its core areas of leasing and financing in 2004. New business increased by 9% to €8.2 billion, and contract volume was up 10% to €14.5 billion. DaimlerChrysler Bank also expanded its portfolio in 2004 to include new attractive products such as auto insurance.
In China, preparations continued for the launch of financing activities in that country. In November, DaimlerChrysler Services received a provisional permit to commence business activities, and it plans to support sales of Group vehicle brands in China with its own financing company.
Following the successful execution of important tests of the satellite-based toll-collection system and a full trial confirming the functionality and compatibility of the various system components, Toll Collect was granted a provisional operating permit at the end of 2004. The toll system then started smoothly on January 1, 2005.
Other Activities
The Other Activities segment consists of the Group’s 33% holding in the European Aeronautic Defence and Space Company (EADS) and, since January 1, 2004, the DaimlerChrysler Off-Highway business
11
unit. The prior-year figures have been adjusted for comparability. As DaimlerChrysler did not participate in a capital increase for Mitsubishi Motors Corporation (MMC), the Group’s ownership interest in MMC decreased from 37% to 19.7% at the end of 2004. As a result, since June 30, 2004, the shareholding in Mitsubishi Motors has been included in the consolidated financial statements as a financial investment shown at fair value.
The Other Activities’ operating profit decreased from €1.3 billion to €0.5 billion last year. The reason for the reduction is that the operating profit for the prior year included the profit contribution from MTU Aero Engines, as well as the gain of €1.0 billion realized on the disposal of this unit.
At €1.75 billion, DaimlerChrysler Off-Highway’s revenues in 2004 were about 2% higher than in the prior year. The business unit’s incoming orders totaled €1.84 billion, 7% higher than the figure for 2003.
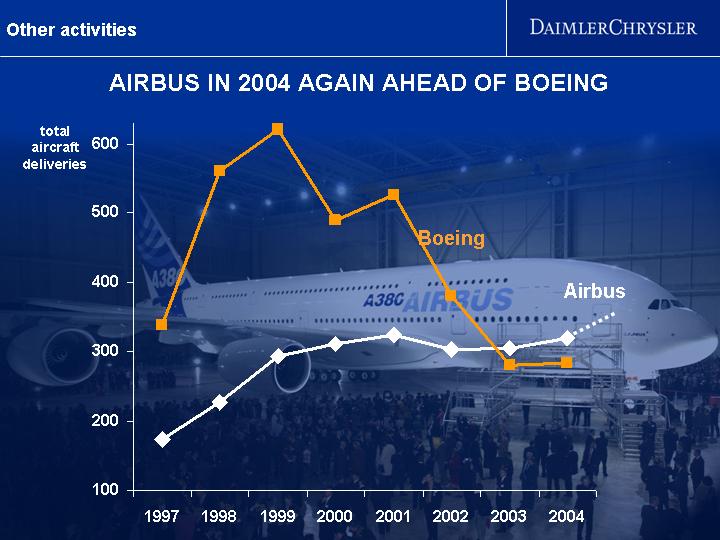
Thanks to increased demand in the civil-aviation sector, EADS performed very well in 2004, and significantly increased its contribution to Group operating profit. The company publishes its figures for the 2004 financial year on March 9, 2005.
Outlook
Assuming a moderate increase in the worldwide demand for automobiles, the DaimlerChrysler Group expects total unit sales to increase in 2005 and the following years. Higher unit sales by all divisions will contribute to this development. Revenues should also continue rising.
After a weaker first and second quarter, for the full-year 2005
12
DaimlerChrysler expects a slightly higher operating profit than in the previous year. Significant earnings improvements are to be expected as of the year 2006, when the Mercedes Car Group’s product offensive takes full effect and additional new models become available from the Chrysler Group. A key contribution to this positive earnings development will also be made by the efficiency-enhancing programs which will be pushed steadily forward in all divisions.
A fundamental condition for the targeted increase in earnings is a generally stable economic and political situation and a further moderate up-turn in worldwide demand for automobiles that is expected for the years of 2005 through 2007. Challenges may arise, however, from a continuation of the weak US dollar and high raw-material prices.
Due to the planned development of unit sales and the expected productivity advances, DaimlerChrysler assumes that employee numbers will remain fairly constant in the years of 2005 through 2007, both for the Group as a whole and in the individual divisions.
Additional charts showing figures for the 2004 financial year can be found on the Internet at: http://www.daimlerchrysler.com/go/press/2005e
These figures are preliminary and have neither been approved yet by the Supervisory Board nor audited by the external auditor. Publication of Annual Report and Consolidated Financial Statement is scheduled for February 23, 2005. Publication of Form 20-F Report is scheduled for February 28, 2005.
This document contains forward-looking statements that reflect management’s current views with respect to future events. The words „anticipate,” „assume,” „believe,” „estimate,” „expect,” „intend,” „may,” „plan,” „project” and „should” and similar expressions identify forward-looking statements. Such statements are subject toc risks and uncertainties, including, but not limited to: an economic downturn in Europe or North America; changes in currency exchange rates, interest rates and in raw material prices; introduction of competing products; increased sales incentives; and decline in resale prices of used vehicles. If any of these or other risks and uncertainties occur (some of which are described under the heading “Risk Report” in DaimlerChrysler’s most recent Annual Report and under the heading “Risk Factors”
13
in DaimlerChrysler’s most recent Annual Report on Form 20-F filed with the Securities and Exchange Commission), or if the assumptions underlying any of these statements prove incorrect, then actual results may be materially different from those expressed or implied by such statements. We do not intend or assume any obligation to update any forward-looking statement, which speaks only as of the date on which it is made.
Further information about DaimlerChrysler is available on the Internet at: www.media.daimlerchrysler.com.
14
DaimlerChrysler – Figures for 2004
|
| 2004 |
| 2003 |
| ||
DaimlerChrysler-Group |
| U.S.-$ |
| € (Euro) |
| € (Euro) |
|
Revenues, in millions |
| 192,319 |
| 142,059 |
| 136,437 |
|
Operating Profit, in millions |
| 7,790 |
| 5,754 |
| 5,686 |
|
Net Income, in millions |
| 3,338 |
| 2,466 |
| 448 |
|
Per Share (EPS) |
| 3.29 |
| 2.43 |
| 0.44 |
|
Dividend proposed |
|
|
| 1.50 |
| 1.50 |
|
Employees (at year-end) |
| 384,723 |
| 362,063 |
| ||
|
|
|
|
|
|
|
|
Operating Profit (Loss) by Segments |
| 2004 |
| 2003 |
| ||
in millions |
| U.S.-$ |
| € (Euro) |
| € (Euro) |
|
Mercedes Car Group |
| 2,255 |
| 1,666 |
| 3,126 |
|
Chrysler Group |
| 1,932 |
| 1,427 |
| (506 | ) |
Commercial Vehicles (1) |
| 1,803 |
| 1,332 |
| 811 |
|
Services |
| 1,692 |
| 1,250 | �� | 1,240 |
|
Other Activities (1) |
| 617 |
| 456 |
| 1,329 |
|
|
|
|
|
|
|
|
|
Revenues by Segments |
| 2004 |
| 2003 |
| ||
in millions |
| U.S.-$ |
| € (Euro) |
| € (Euro) |
|
Mercedes Car Group |
| 67,189 |
| 49,630 |
| 51,446 |
|
Chrysler Group |
| 67,010 |
| 49,498 |
| 49,321 |
|
Commercial Vehicles (1) |
| 47,064 |
| 34,764 |
| 26,806 |
|
Services |
| 18,871 |
| 13,939 |
| 14,037 |
|
Other Activities (1) (2) |
| 2,978 |
| 2,200 |
| 4,084 |
|
|
|
|
|
|
|
|
|
Unit Sales by Segments |
| 2004 |
| 2003 |
|
|
|
Mercedes Car Group |
| 1,226,800 |
| 1,216,900 |
|
|
|
Chrysler Group |
| 2,779,900 |
| 2,637,900 |
|
|
|
Commercial Vehicles |
| 712,200 |
| 501,000 |
|
|
|
Rate of exchange: 1 € = U.S.-$ 1.3538 (based on the noon buying rate on Dec. 31, 2004)
(1) Figures for previous year have been adjusted to reflect the reallocation of the DaimlerChrysler Off-Highway business unit from the Commercial Vehicles Division to the segment Other Activities. Since March 31, 2004 Mitsubishi Fuso Truck and Bus Corporation (MFTBC) is included with a time lag of one month in the Commercial Vehicles Division.
(2) In 2003 figure for discontinued operations (MTU Aero Engines) included.
DaimlerChrysler – Figures for the 4th Quarter 2004
|
| Q4/2004 |
| Q4/2003 |
| ||
DaimlerChrysler-Group |
| U.S.-$ |
| € (Euro) |
| € (Euro) |
|
Revenues, in millions |
| 51,099 |
| 37,745 |
| 35,211 |
|
Operating profit, in millions |
| 1,063 |
| 785 |
| 2,396 |
|
Net income (Loss), in millions |
| 712 |
| 526 |
| 1,404 |
|
Per Share (EPS) |
| 0.70 |
| 0.52 |
| 1.39 |
|
Employees (at year-end) |
| 384,723 |
| 362,063 |
| ||
|
|
|
|
|
|
|
|
Operating Profit (Loss) by Segments |
| Q4/2004 |
| Q4/2003 |
| ||
in millions |
| U.S.-$ |
| € (Euro) |
| € (Euro) |
|
Mercedes Car Group |
| 27 |
| 20 |
| 784 |
|
Chrysler Group |
| 523 |
| 386 |
| 143 |
|
Commercial Vehicles (1) |
| 592 |
| 437 |
| 344 |
|
Services |
| 196 |
| 145 |
| 203 |
|
Other Activities (1) |
| (28 | ) | (21 | ) | 1,144 |
|
|
|
|
|
|
|
|
|
Revenues by Segments |
| Q4/2004 |
| Q4/2003 |
| ||
in millions |
| U.S.-$ |
| € (Euro) |
| € (Euro) |
|
Mercedes Car Group |
| 17,407 |
| 12,858 |
| 13,059 |
|
Chrysler Group |
| 17,210 |
| 12,712 |
| 12,312 |
|
Commercial Vehicles (1) |
| 13,527 |
| 9,992 |
| 7,696 |
|
Services |
| 4,955 |
| 3,660 |
| 3,451 |
|
Other Activities (1) (2) |
| 1,106 |
| 817 |
| 1,274 |
|
|
|
|
|
|
|
|
|
Unit Sales by Segments |
| Q4/2004 |
| Q4/2003 |
|
|
|
Mercedes Car Group |
| 348,300 |
| 302,400 |
|
|
|
Chrysler Group |
| 718,800 |
| 639,600 |
|
|
|
Commercial Vehicles |
| 208,700 |
| 145,000 |
|
|
|
Rate of exchange: 1 € = U.S.-$ 1.3538 (based on the noon buying rate on Dec. 31, 2004)
(1) Figures for previous year have been adjusted to reflect the reallocation of the DaimlerChrysler Off-Highway business unit from the Commercial Vehicles Division to the segment Other Activities. Since March 31, 2004 Mitsubishi Fuso Truck and Bus Corporation (MFTBC) is included with a time lag of one month in the Commercial Vehicles Division.
(2) In 2003 figure for discontinued operations (MTU Aero Engines) included.


Searchable text section of graphics shown above
[GRAPHIC]
DAIMLERCHRYSLER
2004 RESULTS
ANNUAL PRESS CONFERENCE
Jürgen E. Schrempp
Chairman of the Board of Management
Stuttgart
February 10, 2005
DaimlerChrysler Group |
|
|
| [LOGO] |
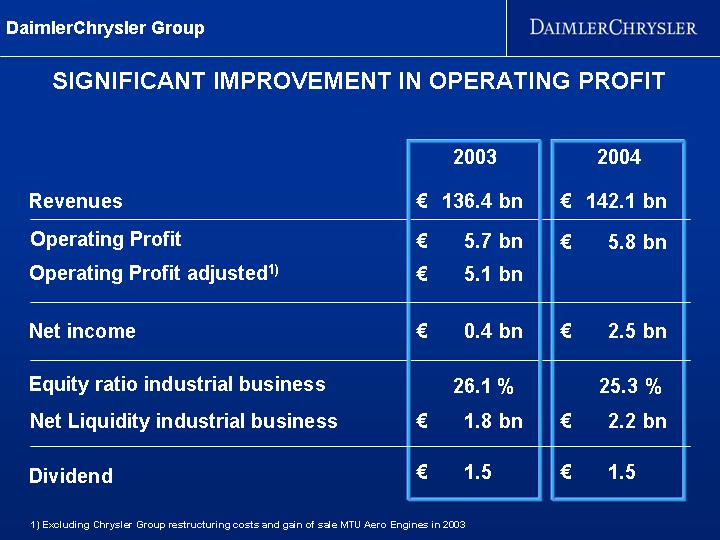
SIGNIFICANT IMPROVEMENT IN OPERATING PROFIT
|
| 2003 |
| 2004 |
| ||
|
|
|
|
|
| ||
Revenues |
| € | 136.4 | bn | € | 142.1 | bn |
|
|
|
|
|
|
|
|
Operating Profit |
| € | 5.7 | bn | € | 5.8 | bn |
Operating Profit adjusted(1) |
| € | 5.1 | bn |
|
| |
|
|
|
|
|
| ||
Net income |
| € | 0.4 | bn | € | 2.5 | bn |
|
|
|
|
|
| ||
Equity ratio industrial business |
| 26.1 | % | 25.3 | % | ||
Net Liquidity industrial business |
| € | 1.8 | bn | € | 2.2 | bn |
|
|
|
|
|
| ||
Dividend |
| € | 1.5 |
| € | 1.5 |
|
(1) Excluding Chrysler Group restructuring costs and gain of sale MTU Aero Engines in 2003
CHRYSLER GROUP AND CVD MORE THAN COMPENSATE
DECLINE AT MERCEDES CAR GROUP
[CHART]
(1) Excluding Chrysler Group restructuring costs and gain of sale MTU Aero Engines in 2003
[GRAPHIC]
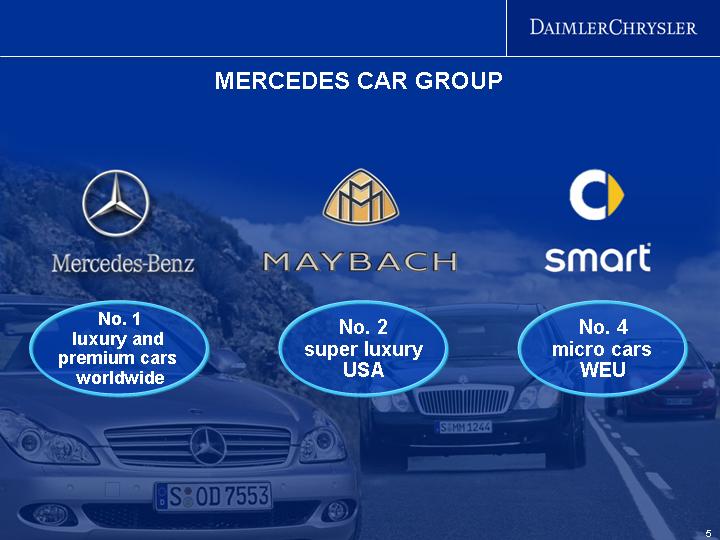
MERCEDES CAR GROUP
[LOGO] |
| [LOGO] |
| [LOGO] |
|
|
|
|
|
|
|
No. 1 |
| No. 2 |
| No. 4 |
|
luxury and |
| super luxury |
| micro cars |
|
premium cars |
| USA |
| WEU |
|
worldwide |
|
|
|
|
|
5
Mercedes Car Group |
|
|
| [LOGO] |
DECREASE IN OPERATING PROFIT PRIMARILY DUE TO
CURRENCY EFFECTS AND QUALITY OFFENSIVE
[CHART]
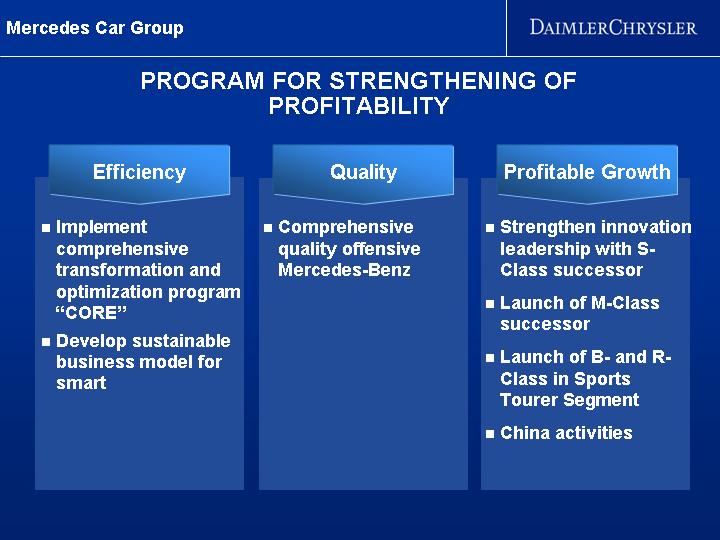
PROGRAM FOR STRENGTHENING OF
PROFITABILITY
Efficiency |
| Quality |
| Profitable Growth |
|
|
|
|
|
• Implement comprehensive transformation and optimization program "CORE"
• Develop sustainable business model for smart |
| • Comprehensive quality offensive Mercedes-Benz |
| • Strengthen innovation leadership with S- Class successor
• Launch of M-Class successor
• Launch of B- and R- Class in Sports Tourer Segment
• China activities |
Mercedes Car Group - Efficiency |
|
|
| [LOGO] |
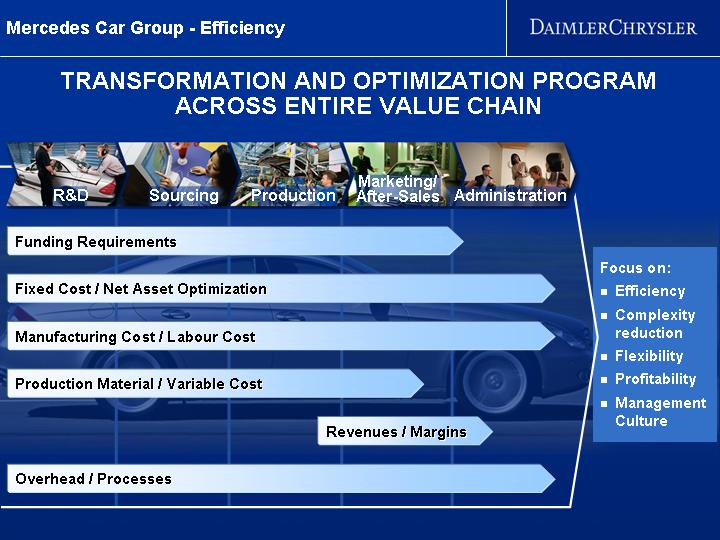
TRANSFORMATION AND OPTIMIZATION PROGRAM
ACROSS ENTIRE VALUE CHAIN
[GRAPHIC]
R&D
Sourcing
Production
Marketing/After-Sales
Administration
Funding Requirements |
|
Fixed Cost / Net Asset Optimization |
|
Manufacturing Cost / Labour Cost |
|
Production Material / Variable Cost |
|
Revenues / Margins |
|
Overhead / Processes |
Focus on:
• Efficiency
• Complexity reduction
• Flexibility
• Profitability
• Management Culture
Mercedes Car Group - Quality |
|
|
| [LOGO] |
[GRAPHIC]
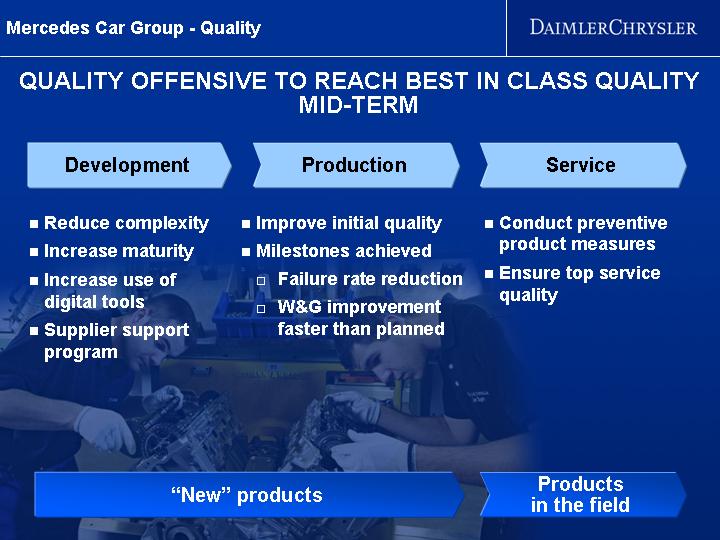
QUALITY OFFENSIVE TO REACH BEST IN CLASS QUALITY
MID-TERM
Development |
| Production |
| Service |
|
|
|
|
|
• Reduce complexity
• Increase maturity
• Increase use of digital tools
• Supplier support program |
| • Improve initial quality
• Milestones achieved
• Failure rate reduction
• W&G improvement faster than planned |
| • Conduct preventive product measures
• Ensure top service quality |
“New” products |
| Products in the field |
Mercedes Car Group - Efficiency |
|
|
| [LOGO] |
[GRAPHIC]
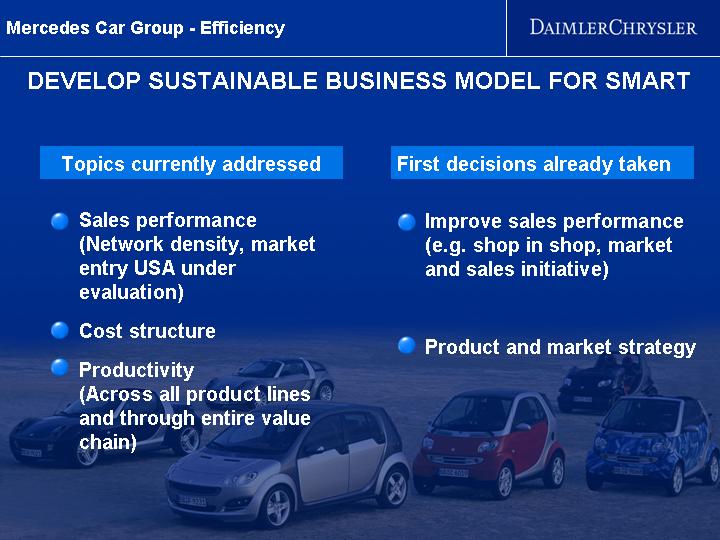
DEVELOP SUSTAINABLE BUSINESS MODEL FOR SMART
Topics currently addressed |
| First decisions already taken |
|
|
|
• Sales performance (Network density, market entry USA under evaluation) |
| • Improve sales performance (e.g. shop in shop, market and sales initiative) |
|
|
|
• Cost structure |
| • Product and market strategy |
|
|
|
• Productivity (Across all product lines and through entire value chain) |
|
|
Mercedes Car Group - Profitable Growth |
|
|
| [LOGO] |
[GRAPHIC]
NEW PRODUCTS IN 2004
• CLS defining new segment of 4-door coupe |
| • SLK wins 32 out of 33 international awards |
|
|
|
• Overwhelming market acceptance |
| • Undisputed market leader in its segment |
Mercedes Car Group - Profitable Growth
[GRAPHIC]
NEW PRODUCTS IN 2004
• A-Class market introduction in September 2004 great success |
| • Over 50,000 units of new A-Class delivered in 2004 |
Mercedes Car Group - Profitable Growth
NEW M- AND R- CLASS: MAJOR STEPS IN VOLUME
EXPANSION OF M-CLASS FAMILY
[CHART]
14
Mercedes Car Group - Profitable Growth
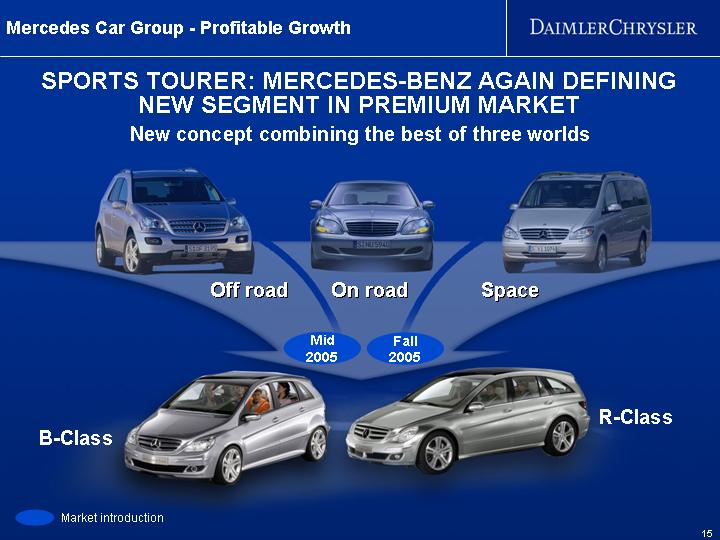
SPORTS TOURER: MERCEDES-BENZ AGAIN DEFINING
NEW SEGMENT IN PREMIUM MARKET
New concept combining the best of three worlds
[GRAPHIC] | |||||||
| |||||||
| Off road | On road | Space | ||||
|
| Mid | Fall |
| |||
|
| 2005 | 2005 |
| |||
| B-Class |
|
| R-Class | |||
Market introduction
15
Mercedes Car Group - Profitable Growth
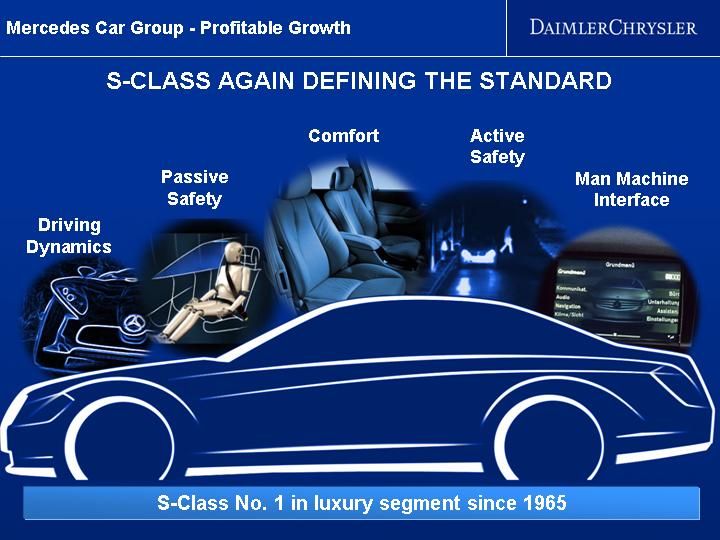
S-CLASS AGAIN DEFINING THE STANDARD
[GRAPHIC]
Driving | Passive | Comfort | Active | Man Machine |
|
|
|
|
|
[GRAPHIC] | [GRAPHIC] | [GRAPHIC] | [GRAPHIC] | [GRAPHIC] |
S-Class No. 1 in luxury segment since 1965
Mercedes Car Group - Profitable Growth
[GRAPHIC]
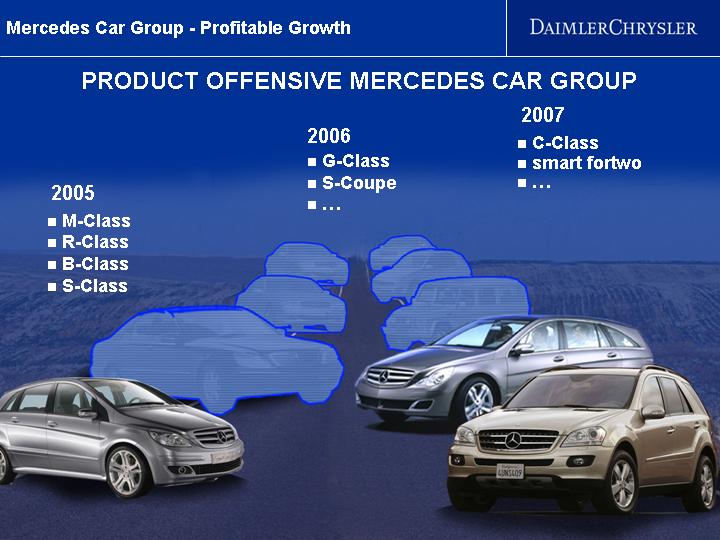
PRODUCT OFFENSIVE MERCEDES CAR GROUP | ||
| ||
| 2007 | |
| 2006 | • C-Class |
| • G-Class | • smart fortwo |
| • S-Coupe | • … |
2005 | • … |
|
• M-Class |
|
|
• R-Class |
|
|
• B-Class |
|
|
• S-Class |
|
|
Chrysler Group
TURNAROUND DESPITE DIFFICULT MARKET CONDITIONS
Sales (1) |
| Revenues |
| Operating Profit (2) |
- in thousand units - |
| - in billions of EUR - |
| - in billions of EUR - |
|
|
|
|
|
[CHART] |
| [CHART] |
| [CHART] |
|
|
|
|
|
• New products |
|
|
|
|
• Improved efficiency |
|
|
|
|
• Improved quality |
|
|
|
|
(1) Corresponds to Chrysler shipments
(2) Including restructuring charges of EUR 0.5 bn in 2003
Chrysler Group
PRODUCT OFFENSIVE 2004 SUCCESSFULLY LAUNCHED | ||||||||
|
|
|
| |||||
Dodge Ram SRT-10 | Chrysler 300 | Chrysler Crossfire Roadster |
| |||||
|
|
|
| |||||
[GRAPHIC] | [GRAPHIC] | [GRAPHIC] |
| |||||
|
|
|
| |||||
| PT Cruiser Convertible | Jeep Wrangler XL | Jeep Grand Cherokee | |||||
|
|
|
| |||||
| [GRAPHIC] | [GRAPHIC] | [GRAPHIC] | |||||
|
|
|
| |||||
Q1 | Q2 | Q3 | Q4 | |||||
|
|
|
| |||||
Chrysler/Dodge Minivans | Dodge Magnum |
| Dodge Dakota | |||||
Chrysler Group
IN 2004, CHRYSLER ACHIEVED BOTH POSITIVE NET PRICING | |||||
AND AN INCREASE IN MARKET SHARE | |||||
| |||||
| [LOGO] |
|
|
|
|
|
|
|
|
| |
|
|
|
|
| |
‘03-’04 CY |
|
|
|
| |
|
|
|
|
| |
Net Pricing |
|
|
|
| |
(Chrysler Group Estimates) | [GRAPHIC] |
|
|
|
|
|
|
|
|
|
|
Retail Market Share | [GRAPHIC] |
|
|
|
|
Chrysler Group
OTHER NEW INTRODUCTIONS ALSO HIGHLY AWARDED
Jeep Grand Cherokee | Minivans with Stow‘N Go |
|
|
[GRAPHIC] | [GRAPHIC] |
|
|
[GRAPHIC] | [GRAPHIC] |
|
|
Dodge Magnum | Dodge Ram SRT-10 & Power Wagon |
Chrysler Group
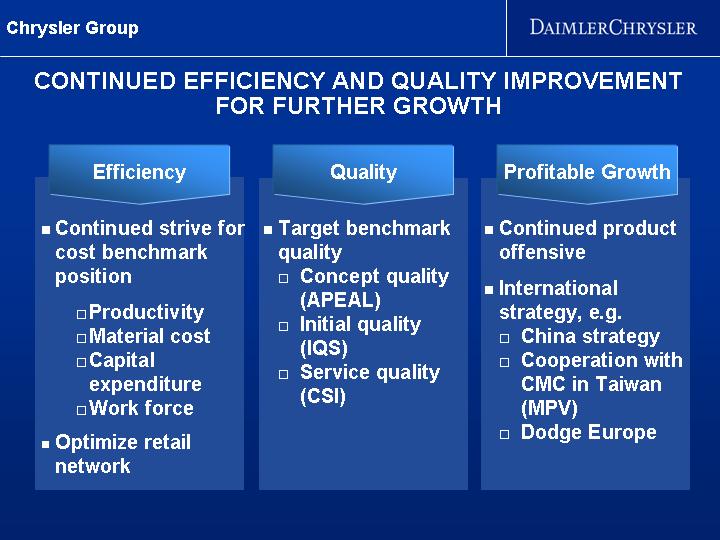
CONTINUED EFFICIENCY AND QUALITY IMPROVEMENT FOR FURTHER GROWTH
Efficiency |
| Quality |
| Profitable Growth | |
|
|
|
|
|
|
• Continued strive for cost benchmark position |
| • Target benchmark quality |
| • Continued product offensive | |
• Productivity • Material cost • Capital expenditure • Work force |
| • Concept quality (APEAL) |
| • International strategy, e.g. | |
| • Initial quality (IQS) |
| • China strategy | ||
| • Service quality (CSI) |
| • Cooperation with CMC in Taiwan (MPV) | ||
|
|
| • Dodge Europe | ||
• Optimize retail network |
|
|
|
| |
Chrysler Group - Profitable Growth
Chrysler Group - Efficiency |
|
|
|
|
|
|
|
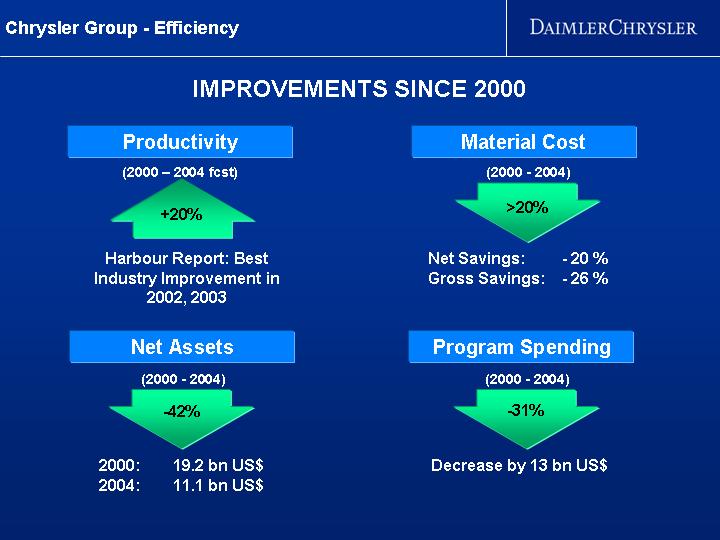
IMPROVEMENTS SINCE 2000 | |||
Productivity | Material Cost | |||||
(2000 – 2004 fcst) | (2000 - 2004) | |||||
|
| |||||
[GRAPHIC] | [GRAPHIC] | |||||
|
| |||||
+20% | >20% | |||||
Harbour Report: Best Industry Improvement in 2002, 2003 |
| Net Savings: | -20% |
| ||
|
| Gross Savings: | -26% |
| ||
|
|
|
|
| ||
Net Assets | Program Spending | |||||
(2000 - 2004) | (2000 - 2004) | |||||
|
| |||||
[GRAPHIC] | [GRAPHIC] | |||||
|
| |||||
-42% | -31% | |||||
| 2000: | 19.2 bn US$ |
| |||
| 2004: | 11.1 bn US$ | Decrease by 13 bn US$ | |||
Chrysler Group - Quality |
|
|
| |
|
|
|
| |
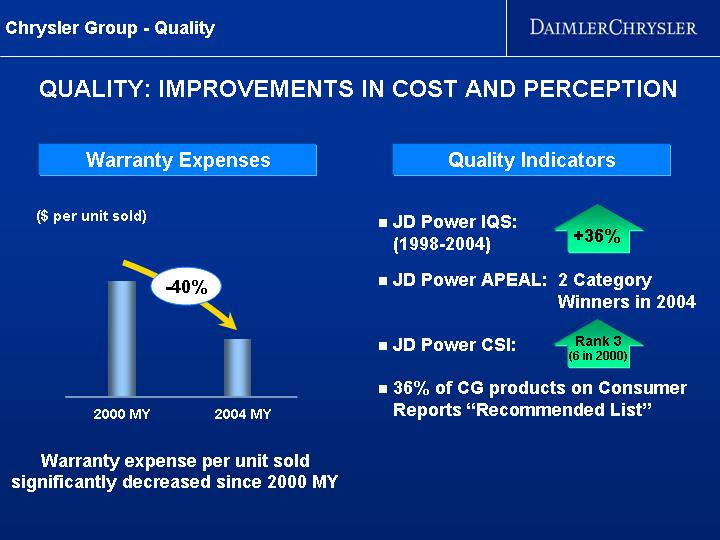
QUALITY: IMPROVEMENTS IN COST AND PERCEPTION | ||||
|
|
|
| |
Warranty Expenses | Quality Indicators | |||
|
| |||
($ per unit sold) |
| • D Power IQS: |
|
|
[CHART] | (1998-2004) | +36% |
| |
|
|
|
| |
Warranty expense per unit sold | • JD Power APEAL: | 2 Category Winners in 2004 | ||
|
| • JD Power CSI: | Rank 3 |
|
|
|
| (6 in 2000) |
|
|
| • 36% of CG products on Consumer Reports “Recommended List” | ||
Chrysler Group - Efficiency |
| |
|
| |
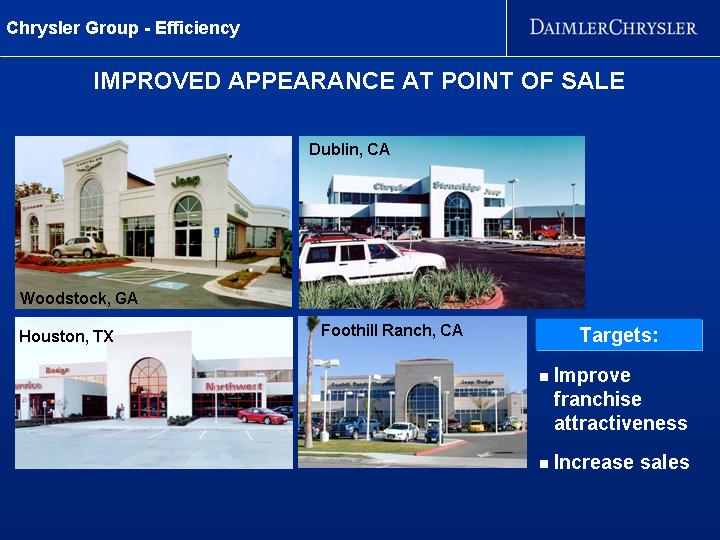
IMPROVED APPEARANCE AT POINT OF SALE | ||
|
| |
[GRAPHIC] | Dublin, CA |
|
|
|
|
Woodstock, GA | [GRAPHIC] |
|
|
|
|
|
|
|
Houston, TX | Foothill Ranch, CA | Targets: |
|
|
|
[GRAPHIC] | [GRAPHIC] |
|
|
| • Improve franchise attractiveness |
|
|
|
|
| • Increase sales |
Chrysler Group - Profitable Growth
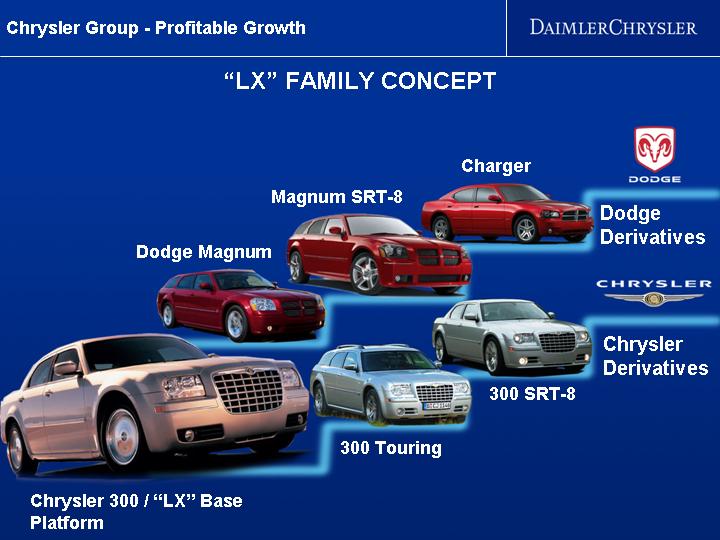
“LX” FAMILY CONCEPT
|
|
| Charger | [LOGO] |
|
| Magnum SRT-8 | [GRAPHIC] | Dodge Derivatives |
| Dodge Magnum | [GRAPHIC] |
|
|
[GRAPHIC] | [GRAPHIC] |
| [GRAPHIC] | [LOGO] |
Chrysler 300 / “LX” Base Platform |
| [GRAPHIC] | 300 SRT-8 | Chrysler Derivatives |
|
| 300 Touring |
|
|
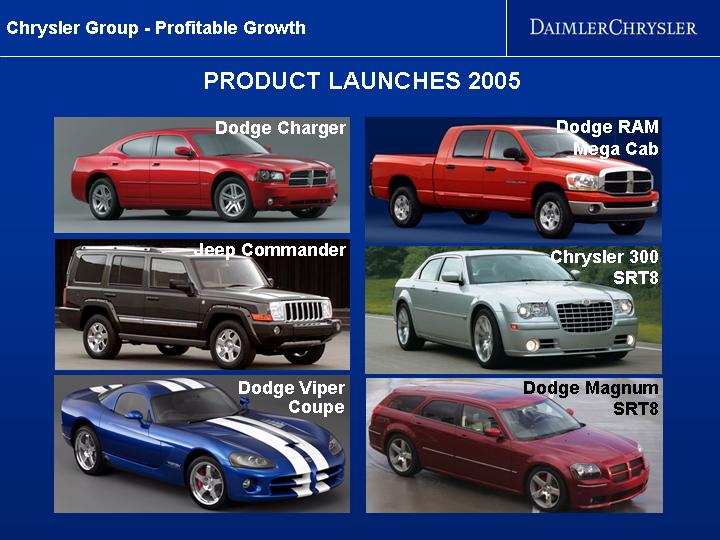
Dodge Charger | Dodge RAM Mega Cab |
|
|
[GRAPHIC] | [GRAPHIC] |
|
|
Jeep Commander | Chrysler 300 SRT8 |
|
|
[GRAPHIC] | [GRAPHIC] |
|
|
Dodge Viper Coupe | Dodge Magnum SRT8 |
|
|
[GRAPHIC] | [GRAPHIC] |
Chrysler Group - Profitable Growth
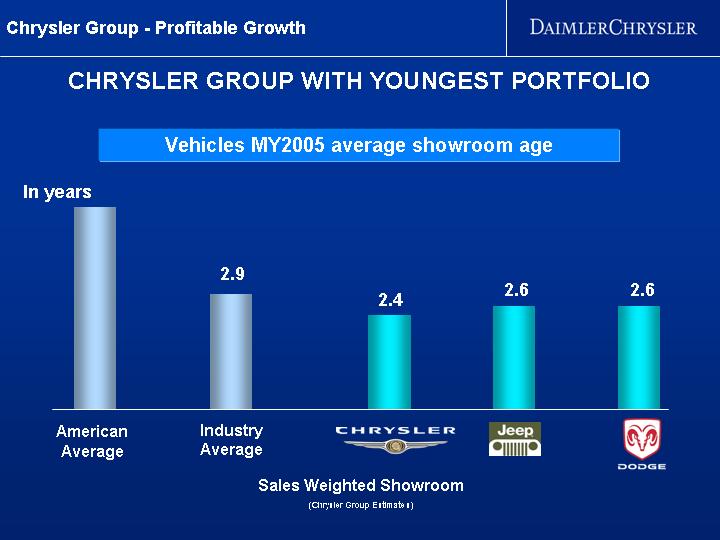
CHRYSLER GROUP WITH YOUNGEST PORTFOLIO
Vehicles MY2005 average showroom age
In years
[CHART]
Sales Weighted Showroom
(Chrysler Group Estimates)
Chrysler Group - Profitable Growth
[GRAPHIC]
PRODUCT OFFENSIVE CHRYSLER GROUP TO BE CONTINUED | ||
|
|
|
|
| 2007 |
| 2006 | • Chrysler models |
2005 | • Chrysler models | • Jeep model |
• Jeep Commander | • Jeep models | • Dodge models |
• Dodge Charger | • Dodge models |
|
• Dodge Viper Coupe |
|
|
• Dodge RAM Mega Cab |
|
|
• SRT8-models |
|
|
[GRAPHIC]
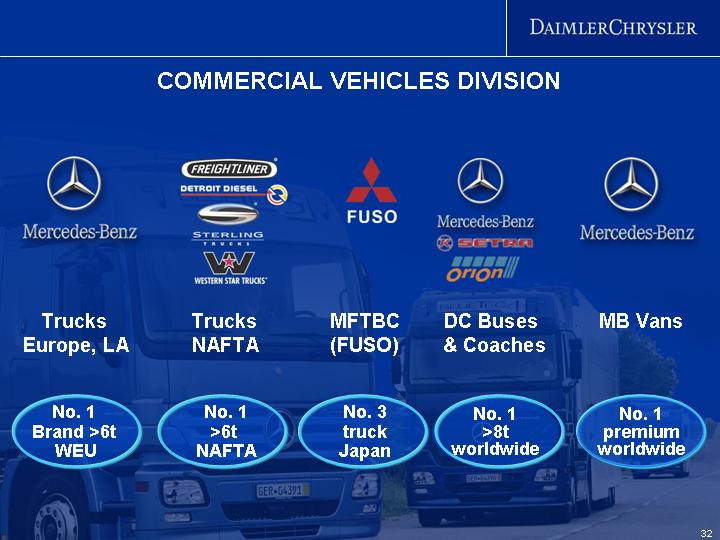
COMMERCIAL VEHICLES DIVISION
[LOGO] | [LOGO] | [LOGO] | [LOGO] | [LOGO] |
|
|
|
|
|
Trucks | Trucks | MFTBC | DC Buses | MB Vans |
Europe, LA | NAFTA | (FUSO) | & Coaches |
|
|
|
|
|
|
No. 1 | No. 1 | No. 3 | No. 1 | No. 1 |
Brand >6t | >6t | truck | >8t | premium |
WEU | NAFTA | Japan | worldwide | worldwide |
32
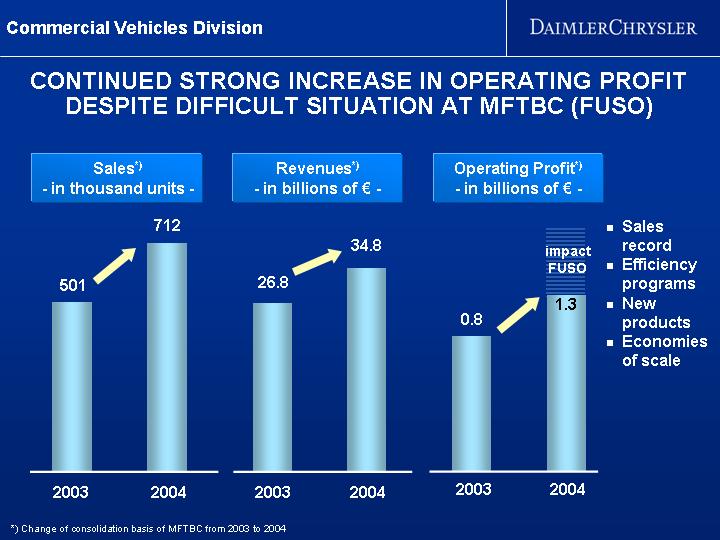
Commercial Vehicles Division
CONTINUED STRONG INCREASE IN OPERATING PROFIT
DESPITE DIFFICULT SITUATION AT MFTBC (FUSO)
Sales*) |
| Revenues*) | Operating Profit*) |
| |||
- in thousand units - |
| - in billions of € - | - in billions of € - |
| |||
|
|
|
|
|
|
| |
[CHART] |
| [CHART] | [CHART] |
| |||
|
|
|
|
|
|
| |
| • Sales record |
|
|
|
| ||
• Efficiency programs |
|
|
|
| |||
• New products |
|
|
|
| |||
| • Economies of scale |
|
|
|
| ||
*) Change of consolidation basis of MFTBC from 2003 to 2004
Commercial Vehicles Division
PRODUCTS HIGHLY AWARDED
[GRAPHIC] | [GRAPHIC] |
|
|
Truck of the Year 2004. | Van of the Year 2005 |
|
|
Der Actros | Der Vito |
Commercial Vehicles Division
NEW PRODUCTS IN 2004
Trucks | Trucks | MFTBC | DC Buses |
Europe, LA | NAFTA | (FUSO) | & Coaches |
|
|
|
|
[GRAPHIC] | [GRAPHIC] | [GRAPHIC] | [GRAPHIC] |
|
|
|
|
Atego new | TBB School | Canter TD | Setra |
| bus C2 | (NAFTA) | Comfort Class |
|
|
|
|
[GRAPHIC] |
|
|
|
|
|
|
|
Axor new |
|
|
|
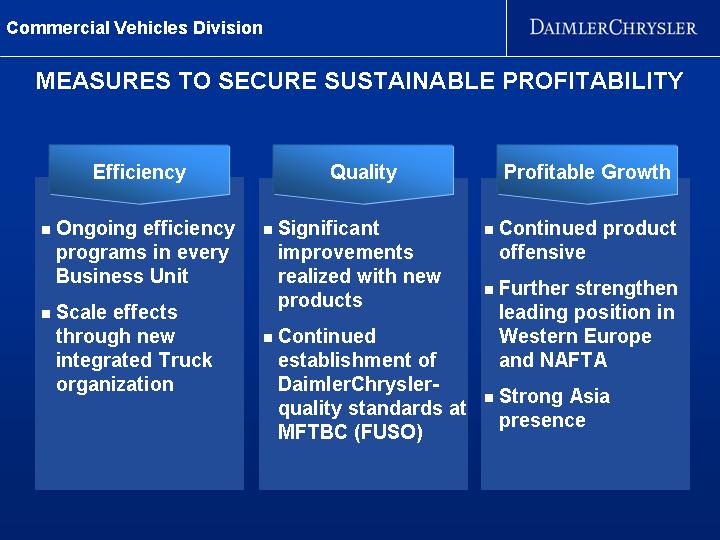
Commercial Vehicles Division
MEASURES TO SECURE SUSTAINABLE PROFITABILITY
Efficiency |
| Quality |
| Profitable Growth |
|
|
|
|
|
|
|
• Ongoing efficiency programs in every Business Unit
• Scale effects through new integrated Truck organization |
| • Significant improvements realized with new products
• Continued establishment of DaimlerChrysler-quality standards at MFTBC (FUSO) |
| • Continued product offensive
• Further strengthen leading position in Western Europe and NAFTA
• Strong Asia presence |
|
Commercial Vehicles Division - Efficiency
TURNING SCALE INTO PROFIT:
LEVERAGE EUROPEAN PRODUCT CONCEPTS
Axor |
| Axor new |
| EUROPE | ||||
|
|
|
|
| ||||
[GRAPHIC] |
| [GRAPHIC] |
|
| ||||
|
| |||||||
Atego |
| Atego new |
|
| ||||
|
|
|
|
| ||||
[GRAPHIC] |
| [GRAPHIC] |
|
| ||||
|
|
| ||||||
HPN |
|
| Axor new | |||||
|
|
|
| |||||
[GRAPHIC] | STOP |
| Regional Adaptations |
| [GRAPHIC] | |||
|
|
|
| |||||
FPN |
|
| Atego new | |||||
|
|
|
|
|
| |||
[GRAPHIC] | LATIN AMERICA |
| [GRAPHIC] | |||||
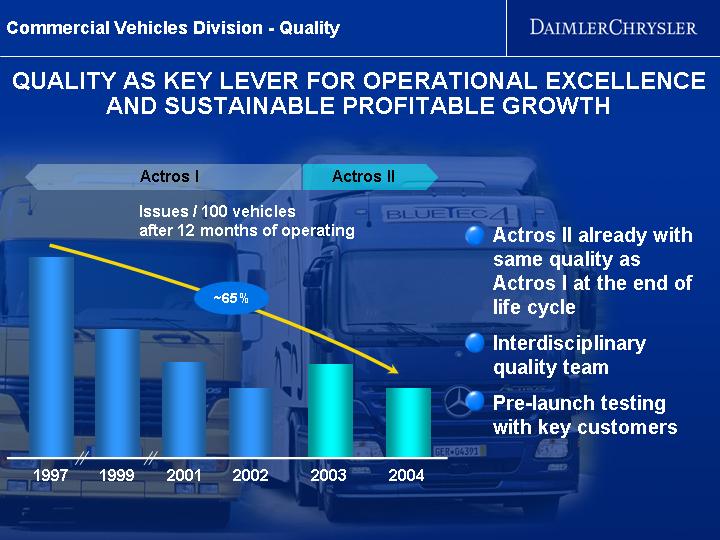
Commercial Vehicles Division - Quality
QUALITY AS KEY LEVER FOR OPERATIONAL EXCELLENCE
AND SUSTAINABLE PROFITABLE GROWTH
[GRAPHIC]
Actros I Actros II
Issues / 100 vehicles after 12 months of operating
[CHART]
• Actros II already with same quality as Actros I at the end of life cycle
• Interdisciplinary quality team
• Pre-launch testing with key customers
Commercial Vehicles Division - Profitable Growth
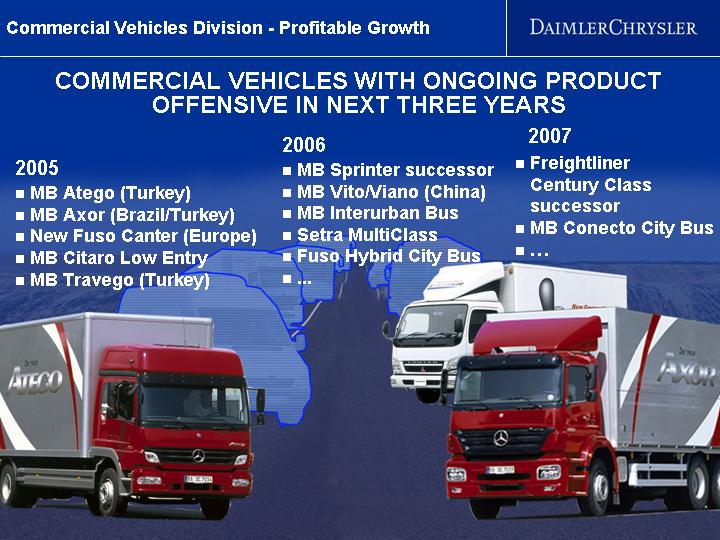
COMMERCIAL VEHICLES WITH ONGOING PRODUCT
OFFENSIVE IN NEXT THREE YEARS
[GRAPHIC]
2005
• MB Atego (Turkey)
• MB Axor (Brazil/Turkey)
• New Fuso Canter (Europe)
• MB Citaro Low Entry
• MB Travego (Turkey)
2006
• MB Sprinter successor
• MB Vito/Viano (China)
• MB Interurban Bus
• Setra MultiClass
• Fuso Hybrid City Bus
• ...
2007
• Freightliner Century Class successor
• MB Conecto City Bus
• …
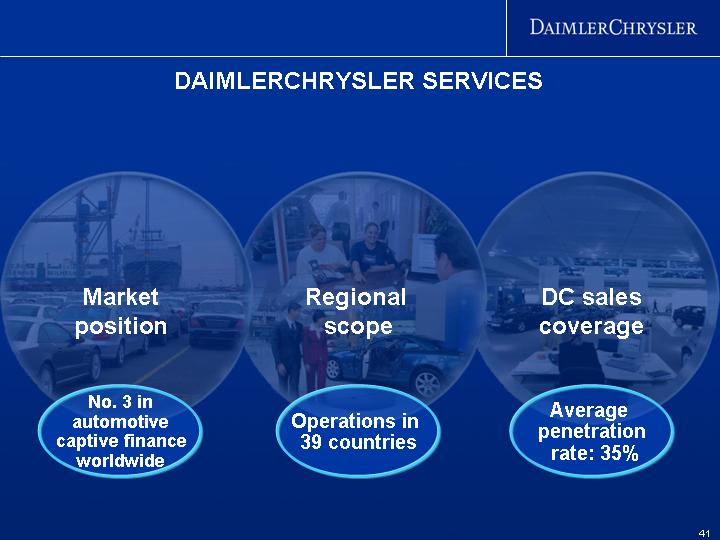
DAIMLERCHRYSLER SERVICES
Market | Regional | DC sales |
|
|
|
[GRAPHIC] | [GRAPHIC] | [GRAPHIC] |
|
|
|
No. 3 in automotive captive finance worldwide | Operations in 39 countries | Average penetration rate: 35% |
DaimlerChrysler Services
DESPITE TOLL COLLECT
OPERATING PROFIT AT LAST YEAR’S HIGH LEVEL
Contract Volume | Revenues | Operating Profit |
- in billions of EUR - | - in billions of EUR - | - in billions of EUR - |
|
|
|
[CHART] | [CHART] | [CHART] |
|
|
|
|
| • High margins • Improved cost position • Improved risk management |
DaimlerChrysler Services
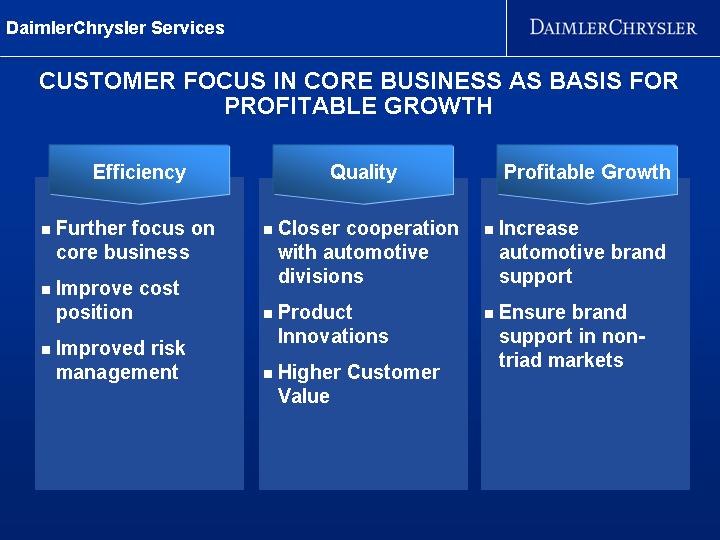
CUSTOMER FOCUS IN CORE BUSINESS AS BASIS FOR
PROFITABLE GROWTH
Efficiency |
| Quality |
| Profitable Growth |
|
|
|
|
|
|
|
• Further focus on core business
• Improve cost position
• Improved risk management |
| • Closer cooperation with automotive divisions
• Product Innovations
• Higher Customer Value |
| • Increase automotive brand support
• Ensure brand support in non-triad markets |
|
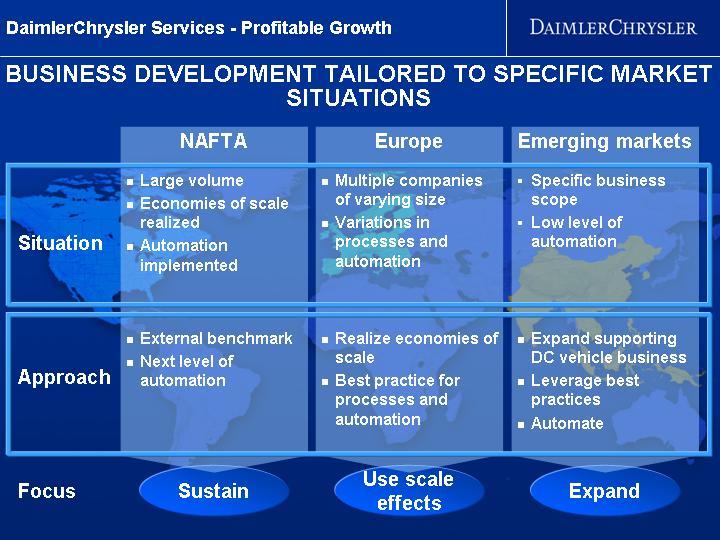
DaimlerChrysler Services - Profitable Growth
[GRAPHIC]
BUSINESS DEVELOPMENT TAILORED TO SPECIFIC MARKET
SITUATIONS
| NAFTA |
| Europe |
| Emerging markets |
|
|
|
|
|
|
|
|
| • Large volume |
| • Multiple companies of varying size |
| • Specific business scope |
|
Situation | • Economies of scale realized • Automation implemented |
| • Variations in processes and automation |
| • Low level of automation |
|
|
|
|
|
|
|
|
Approach | • External benchmark • Next level of automation |
| • Realize economies of scale • Best practice for processes and automation |
| • Expand supporting DC vehicle business • Leverage best practices • Automate |
|
|
|
|
|
|
|
|
Focus | Sustain |
| Use scale effects |
| Expand |
|
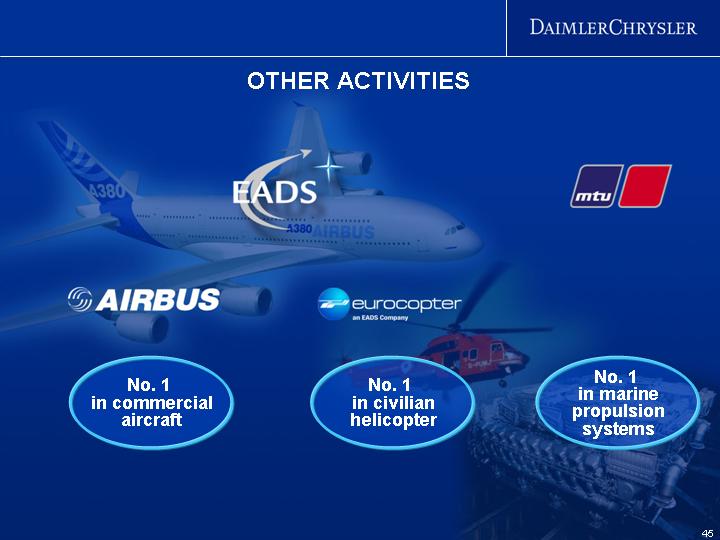
[GRAPHIC]
OTHER ACTIVITIES
[LOGO] | [LOGO] | [LOGO] |
|
|
|
No. 1 | No. 1 | No. 1 |
in commercial aircraft | in civilian helicopter | in marine propulsion systems |
DaimlerChrysler - Corporate Initiatives
[GRAPHIC]
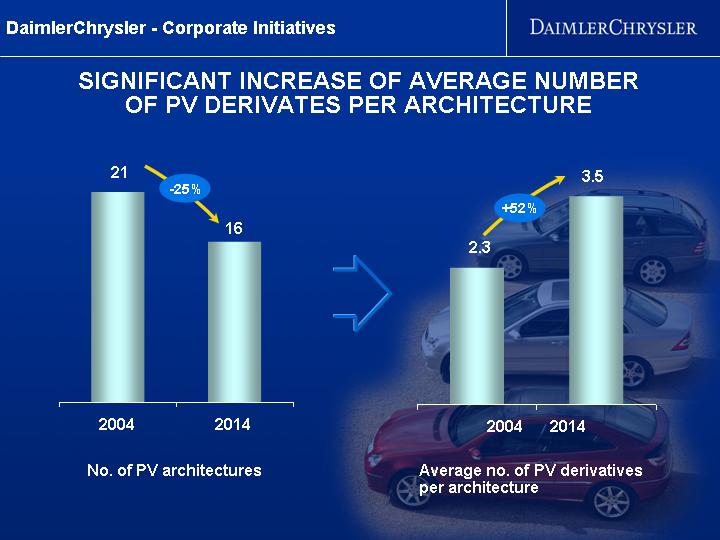
SIGNIFICANT INCREASE OF AVERAGE NUMBER
OF PV DERIVATES PER ARCHITECTURE
[CHART] |
| [CHART] |
|
|
|
No. of PV architectures |
| Average no. of PV derivatives per architecture |
Daimler Chrysler - - Corporate Initiatives
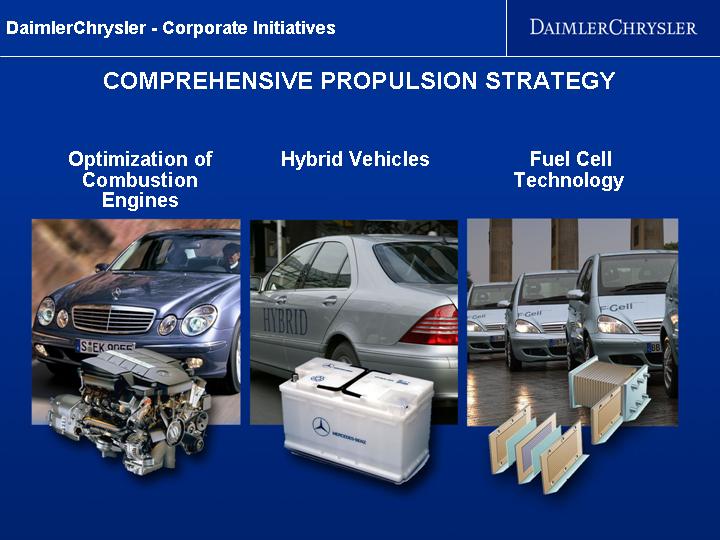
COMPREHENSIVE PROPULSION STRATEGY
Optimization of Combustion Engines |
| Hybrid Vehicles |
| Fuel Cell Technology |
|
|
|
|
|
|
|
[GRAPHIC] |
| [GRAPHIC] |
| [GRAPHIC] |
|
Daimler Chrysler - - Corporate Initiatives
[GRAPHIC]
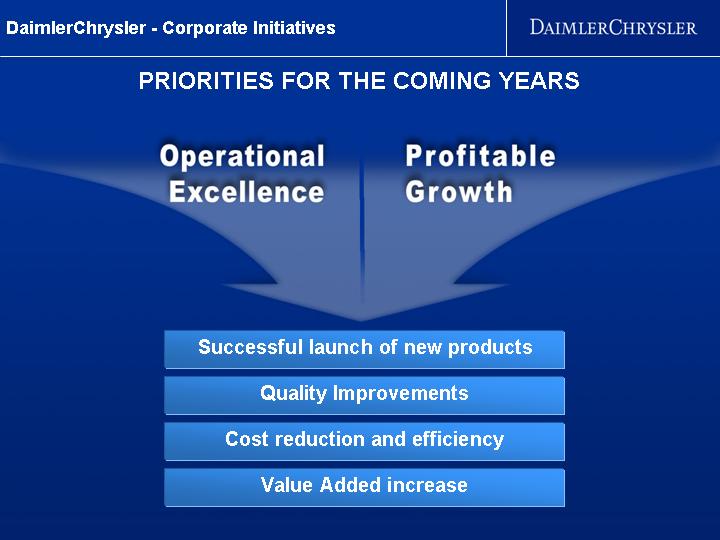
PRIORITIES FOR THE COMING YEARS
Operational Excellence | Profitable Growth |
| |
Successful launch of new products | |
| |
Quality Improvements | |
| |
Cost reduction and efficiency | |
| |
Value Added increase | |
[GRAPHIC]
DAIMLERCHRYSLER
2004 RESULTS
ANNUAL PRESS CONFERENCE
Jürgen E. Schrempp
Chairman of the Board of Management
Stuttgart
February 10, 2005
Link to searchable text of slide shown above
Link to searchable text of slide shown above
Link to searchable text of slide shown above
Link to searchable text of slide shown above
Link to searchable text of slide shown above
Link to searchable text of slide shown above
Link to searchable text of slide shown above

Link to searchable text of slide shown above

Link to searchable text of slide shown above
Link to searchable text of slide shown above
Link to searchable text of slide shown above
Link to searchable text of slide shown above
Link to searchable text of slide shown above
Link to searchable text of slide shown above
Link to searchable text of slide shown above
Link to searchable text of slide shown above

Link to searchable text of slide shown above
Link to searchable text of slide shown above
Searchable text section of graphics shown above
[LOGO]
DAIMLERCHRYSLER
2004 RESULTS
ANNUAL PRESS CONFERENCE
Bodo Uebber
Chief Financial Officer
Stuttgart
February 10, 2005
DaimlerChrysler Group
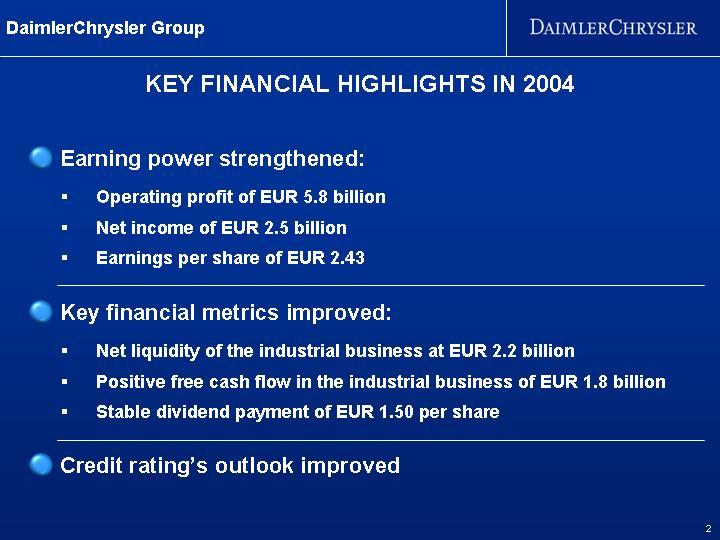
KEY FINANCIAL HIGHLIGHTS IN 2004
• Earning power strengthened:
• Operating profit of EUR 5.8 billion
• Net income of EUR 2.5 billion
• Earnings per share of EUR 2.43
• Key financial metrics improved:
• Net liquidity of the industrial business at EUR 2.2 billion
• Positive free cash flow in the industrial business of EUR 1.8 billion
• Stable dividend payment of EUR 1.50 per share
• Credit rating’s outlook improved
2
REVENUES AND OPERATING PROFIT
– in billions of EUR –
Revenues | Revenues |
|
- reported - | - comparable (1) - | Operating Profit |
|
|
|
[CHART] | [CHART] | [CHART] |
(1) Adjusted for exchange rate effects and changes in the consolidated Group
(2) Excluding the gain on sale of MTU Aero Engines (EUR 1,031 mn) and restructuring charges at Chrysler Group (FY 2003: EUR 469 mn, Q4/2003: EUR 427 mn)
3
OPERATING PERFORMANCE STRENGTHENED
– in billions of EUR –
[CHART]
4
Mercedes Car Group
OPERATING PROFIT SUBSTANTIALLY LOWER THAN IN 2003
– in millions of EUR –
[CHART]
-
• Less favorable model mix
• Depreciation of the US dollar
• Higher expenses for new models
• High costs for quality offensive
• Additional burdens at smart
5
Chrysler Group
STRONG IMPROVEMENT
DESPITE DIFFICULT MARKET CONDITIONS
– in millions of EUR –
[CHART]
+
• Market success of new products
• Improved model mix
• Lower average incentives
• Improved quality – lower warranty costs
• Further cost reduction
6
Commercial Vehicles
OPERATING PROFIT IMPROVED
DESPITE HIGH CHARGES AT FUSO
– in millions of EUR –
[CHART]
+
• Higher unit sales in core markets
• Favorable model mix
• Cost and productivity improvements
• Improved quality – lower warranty costs
-
• EUR 475 million related to Fuso recall
7
Services
OPERATING PROFIT AT PRIOR YEAR’S LEVEL
DESPITE CHARGES FOR TOLL COLLECT
– in millions of EUR –
[CHART]
+
• Continued high margins
• Lower cost of risk
-
• High charges for Toll Collect
• debis AirFinance valuation adjustment
8
DaimlerChrysler Group
NET INCOME AND EARNINGS PER SHARE
Net Income | Earnings per Share |
- in billions of EUR - | - in EUR - |
|
|
[CHART] | [CHART] |
9
KEY BALANCE SHEET FIGURES
- in billions of EUR - |
| Dec. 31 |
| Dec. 31 |
|
|
|
|
|
|
|
Gross liquidity Group |
| 14.3 |
| 11.7 |
|
Gross liquidity industrial business |
| 12.5 |
| 10.2 |
|
|
|
|
|
|
|
Group equity (1) |
| 33.0 |
| 32.0 |
|
Equity ratio Group (1) |
| 18.5 | % | 17.5 | % |
Equity ratio industrial business (1) |
| 26.1 | % | 25.3 | % |
|
|
|
|
|
|
Financial liabilities Group (2) |
| 74.7 |
| 76.0 |
|
Financial liabilities industrial business (2) |
| 10.7 |
| 8.0 |
|
|
|
|
|
|
|
Net debt Group |
| (60.4 | ) | (64.3 | ) |
Net cash industrial business |
| 1.8 |
| 2.2 |
|
(1) Excluding dividend payment for 2003 and 2004
(2) Adjusted for the effects of the mark-to-market valuation according to SFAS 133
10
EUR 12 BILLION EXPENDITURE FOR THE FUTURE
– in billions of EUR –
Capital Expenditure in | Research & Development |
|
|
[CHART] | [CHART] |
11
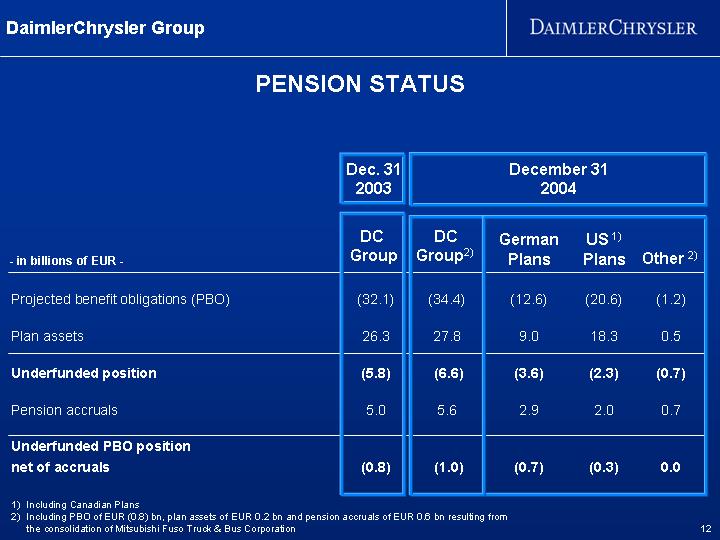
PENSION STATUS
|
| Dec. 31 |
| December 31 |
| ||||||
- in billions of EUR - |
| DC |
| DC |
| German |
| US (1) |
| Other (2) |
|
|
|
|
|
|
|
|
|
|
|
|
|
Projected benefit obligations (PBO) |
| (32.1 | ) | (34.4 | ) | (12.6 | ) | (20.6 | ) | (1.2 | ) |
|
|
|
|
|
|
|
|
|
|
|
|
Plan assets |
| 26.3 |
| 27.8 |
| 9.0 |
| 18.3 |
| 0.5 |
|
|
|
|
|
|
|
|
|
|
|
|
|
Underfunded position |
| (5.8 | ) | (6.6 | ) | (3.6 | ) | (2.3 | ) | (0.7 | ) |
|
|
|
|
|
|
|
|
|
|
|
|
Pension accruals |
| 5.0 |
| 5.6 |
| 2.9 |
| 2.0 |
| 0.7 |
|
|
|
|
|
|
|
|
|
|
|
|
|
Underfunded PBO position net of accruals |
| (0.8 | ) | (1.0 | ) | (0.7 | ) | (0.3 | ) | 0.0 |
|
(1) Including Canadian Plans
(2) Including PBO of EUR (0.8) bn, plan assets of EUR 0.2 bn and pension accruals of EUR 0.6 bn resulting from the consolidation of Mitsubishi Fuso Truck & Bus Corporation
12
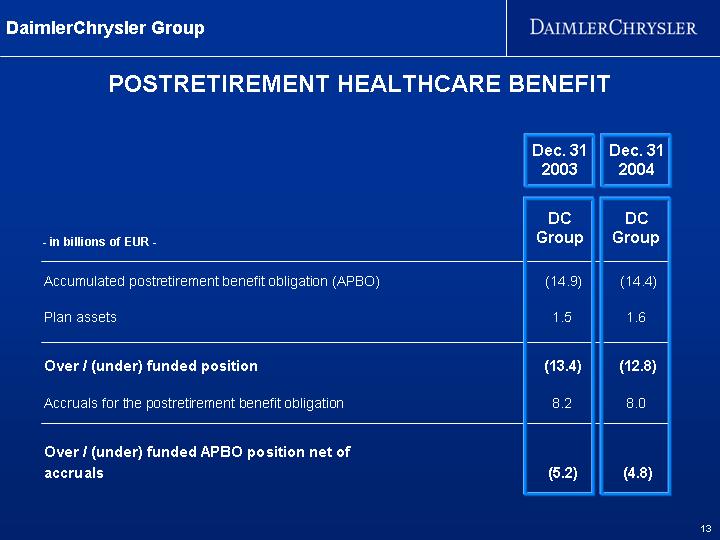
POSTRETIREMENT HEALTHCARE BENEFIT
|
| Dec. 31 |
| Dec. 31 |
|
- in billions of EUR - |
| DC |
| DC |
|
|
|
|
|
|
|
Accumulated postretirement benefit obligation (APBO) |
| (14.9 | ) | (14.4 | ) |
|
|
|
|
|
|
Plan assets |
| 1.5 |
| 1.6 |
|
|
|
|
|
|
|
Over / (under) funded position |
| (13.4 | ) | (12.8 | ) |
|
|
|
|
|
|
Accruals for the postretirement benefit obligation |
| 8.2 |
| 8.0 |
|
|
|
|
|
|
|
Over / (under) funded APBO position net of accruals |
| (5.2 | ) | (4.8 | ) |
13
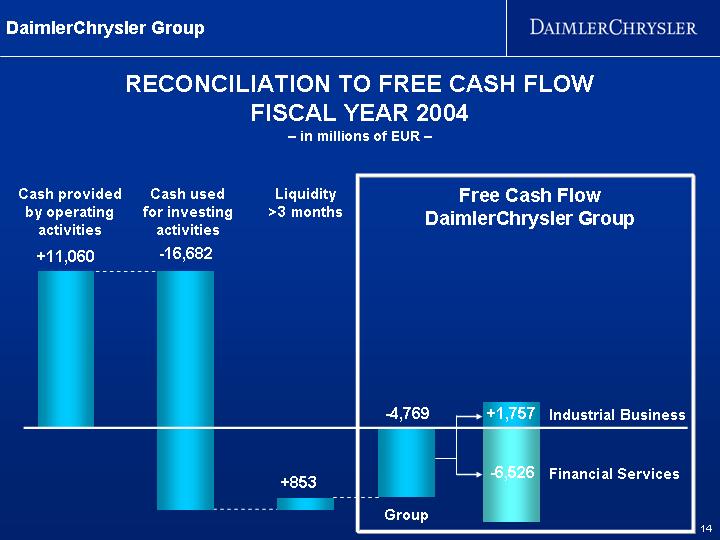
RECONCILIATION TO FREE CASH FLOW
FISCAL YEAR 2004
– in millions of EUR –
[CHART]
14
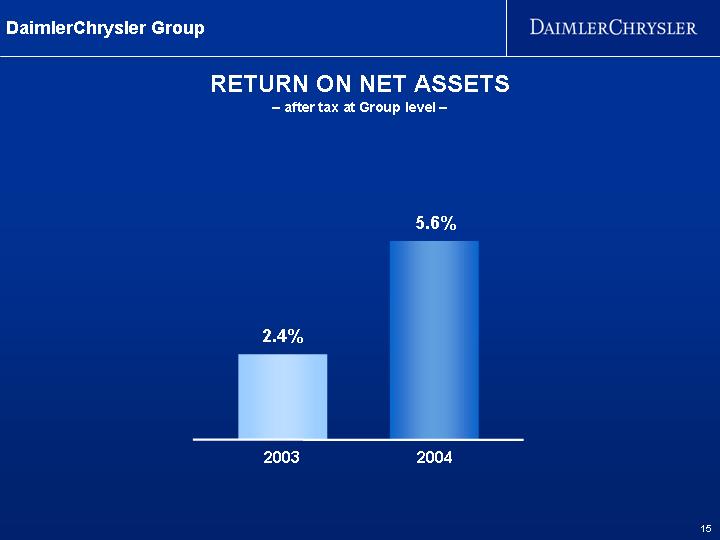
RETURN ON NET ASSETS
– after tax at Group level –
[CHART]
15
RETURN ON NET ASSETS OF THE DIVISIONS
– before taxes –
Mercedes Car | Chrysler Group | Commercial | Financial Services |
|
|
|
|
[CHART] | [CHART] | [CHART] | [CHART] |
16
FINANCIAL OUTLOOK 2005
AND UNDERLYING ASSUMPTIONS
• Assumptions for the automotive markets:
• Stable car markets in Western Europe, NAFTA and Japan
• Stable truck market in Western Europe, further increase in the NAFTA region
• Further growth in emerging markets
• Higher unit sales for all automotive divisions of DaimlerChrysler
• Group operating profit expected to be slightly higher than in 2004
17
DISCLAIMER
These figures are preliminary and have neither been approved yet by the Supervisory Board nor audited by the external auditor. Publication of Annual Report and Consolidated Financial Statement is scheduled for February 23, 2005. Publication of Form 20-F Report is scheduled for February 28, 2005. This presentation contains forward-looking statements that reflect management’s current views with respect to future events. The words „anticipate,“ „assume,“ „believe,“ „estimate,“ „expect,“ „intend,“ „may,“ „plan,“ „project“ and „should“ and similar expressions identify forward-looking statements. Such statements are subject to risks and uncertainties, including, but not limited to: an economic downturn in Europe or North America; changes in currency exchange rates, interest rates and in raw material prices; introduction of competing products; increased sales incentives; and decline in resale prices of used vehicles. If any of these or other risks and uncertainties occur (some of which are described under the heading “Risk Report” in DaimlerChrysler’s most recent Annual Report and under the heading “Risk Factors” in DaimlerChrysler’s most recent Annual Report on Form 20-F filed with the Securities and Exchange Commission), or if the assumptions underlying any of these statements prove incorrect, then actual results may be materially different from those expressed or implied by such statements. We do not intend or assume any obligation to update any forward-looking statement, which speaks only as of the date on which it is made.
18

Fact Sheet Fourth Quarter
& Fiscal Year 2004
- Unaudited Figures -
February 10, 2005
![]()
Contents
DaimlerChrysler Group |
| |
|
|
|
• |
| |
|
|
|
• | Earnings Situation |
|
|
|
|
Sales Information |
| |
|
|
|
• |
| |
|
|
|
• |
| |
|
|
|
• |
| |
These figures are preliminary and have neither been approved yet by the Supervisory Board nor audited by the external auditor. Publication of Annual Report and Consolidated Financial Statement is scheduled for February 23, 2005. Publication of Form 20-F Report is scheduled for February 28, 2005. This presentation contains forward-looking statements that reflect management’s current views with respect to future events. The words „anticipate,“ „assume,“ „believe,“ „estimate,“ „expect,“ „intend,“ „may,“ „plan,“ „project“ and „should“ and similar expressions identify forward-looking statements. Such statements are subject to risks and uncertainties, including, but not limited to: an economic downturn in Europe or North America; changes in currency exchange rates, interest rates and in raw material prices; introduction of competing products; increased sales incentives; and decline in resale prices of used vehicles. If any of these or other risks and uncertainties occur (some of which are described under the heading “Risk Report” in DaimlerChrysler’s most recent Annual Report and under the heading “Risk Factors” in DaimlerChrysler’s most recent Annual Report on Form 20-F filed with the Securities and Exchange Commission), or if the assumptions underlying any of these statements prove incorrect, then actual results may be materially different from those expressed or implied by such statements. We do not intend or assume any obligation to update any forward-looking statement, which speaks only as of the date on which it is made.
2
Earnings per Share (basic):
• 4th Quarter 2004: |
| EUR | 0.52 |
|
• Fiscal Year 2004: |
| EUR | 2.43 |
|
Share Price(1):
• Share Price Frankfurt: |
| EUR | 35.26 |
|
• Share Price New York: |
| US$ | 48.05 |
|
Number of Shares:
• Average Number of Outstanding Shares 2004: |
| 1,012.8 | million |
• Shares Outstanding (December 31, 2004): |
| 1,012.8 | million |
Market Capitalization(1):
• Frankfurt: |
|
| EUR | 35.71 | billion |
• New York: |
|
| US$ | 48.67 | billion |
(1) As of last trading day in FY 2004 (Frankfurt & New York: December 31, 2004).
3
|
| 1st Quarter |
| 2nd Quarter |
| 3rd Quarter |
| 4th Quarter |
| Fiscal Year |
| ||||||||||||||
(in millions of EUR) |
| 2004 |
| 2003 |
| 2004 |
| 2003 |
| 2004 |
| 2003 |
| 2004 |
| 2003 |
| Change |
| 2004 |
| 2003 |
| Change |
|
|
|
|
|
|
|
|
|
|
|
|
|
|
|
|
|
|
|
|
|
|
|
|
|
|
|
Revenues |
| 32,351 |
| 33,252 |
| 37,072 |
| 33,860 |
| 34,891 |
| 34,114 |
| 37,745 |
| 35,211 |
| +7 | % | 142,059 |
| 136,437 |
| +4 | % |
|
|
|
|
|
|
|
|
|
|
|
|
|
|
|
|
|
|
|
|
|
|
|
|
|
|
EBIT (1) (2) |
| 1,314 |
| 1,073 |
| 1,864 |
| 223 |
| 693 |
| 877 |
| 741 |
| 1,215 |
| -39 | % | 4,612 |
| 3,388 |
| +36 | % |
|
|
|
|
|
|
|
|
|
|
|
|
|
|
|
|
|
|
|
|
|
|
|
|
|
|
Depreciation |
| 2,663 |
| 2,837 |
| 2,794 |
| 2,906 |
| 2,815 |
| 2,839 |
| 3,033 |
| 3,138 |
| -3 | % | 11,305 |
| 11,720 |
| -4 | % |
|
|
|
|
|
|
|
|
|
|
|
|
|
|
|
|
|
|
|
|
|
|
|
|
|
|
EBITDA (1) (2) |
| 3,977 |
| 3,910 |
| 4,658 |
| 3,129 |
| 3,508 |
| 3,716 |
| 3,774 |
| 4,353 |
| -13 | % | 15,917 |
| 15,108 |
| +5 | % |
|
|
|
|
|
|
|
|
|
|
|
|
|
|
|
|
|
|
|
|
|
|
|
|
|
|
Operating Profit (Loss) (2) |
| 1,546 |
| 1,403 |
| 2,091 |
| 641 |
| 1,332 |
| 1,246 |
| 785 |
| 2,396 |
| -67 | % | 5,754 |
| 5,686 |
| +1 | % |
|
|
|
|
|
|
|
|
|
|
|
|
|
|
|
|
|
|
|
|
|
|
|
|
|
|
Net Income (Loss) (2) |
| 412 |
| 588 |
| 577 |
| 109 |
| 951 |
| (1,653 | ) | 526 |
| 1,404 |
| -63 | % | 2,466 |
| 448 |
| +450 | % |
|
|
|
|
|
|
|
|
|
|
|
|
|
|
|
|
|
|
|
|
|
|
|
|
|
|
Capital Expenditure |
| 1,368 |
| 1,630 |
| 1,628 |
| 1,484 |
| 1,770 |
| 1,593 |
| 1,620 |
| 1,907 |
| -15 | % | 6,386 |
| 6,614 |
| -3 | % |
|
|
|
|
|
|
|
|
|
|
|
|
|
|
|
|
|
|
|
|
|
|
|
|
|
|
Effective Tax Rate (2) |
|
|
|
|
|
|
|
|
|
|
|
|
|
|
|
|
|
|
| 33.3 | % | 164.3 | % | -0.8 | pts |
(1) EBIT = Income before financial income and income taxes; EBITDA = Income before financial income and income taxes plus depreciation.
(2) Figures for Q1/2004 and Q2/2004 have been adjusted retroactively for effects resulting from the first time application of the Medicare Act in the US.
4
Revenues by Divisions
|
| 1st Quarter |
| 2nd Quarter |
| 3rd Quarter |
| 4th Quarter |
| Fiscal Year |
| ||||||||||||||
(in millions of EUR) |
| 2004 |
| 2003 |
| 2004 |
| 2003 |
| 2004 |
| 2003 |
| 2004 |
| 2003 |
| Change |
| 2004 |
| 2003 |
| Change |
|
|
|
|
|
|
|
|
|
|
|
|
|
|
|
|
|
|
|
|
|
|
|
|
|
|
|
Mercedes Car Group |
| 11,674 |
| 12,424 |
| 12,977 |
| 13,221 |
| 12,121 |
| 12,742 |
| 12,858 |
| 13,059 |
| -2 | % | 49,630 |
| 51,446 |
| -4 | % |
|
|
|
|
|
|
|
|
|
|
|
|
|
|
|
|
|
|
|
|
|
|
|
|
|
|
Chrysler Group |
| 12,060 |
| 12,679 |
| 13,206 |
| 11,834 |
| 11,520 |
| 12,496 |
| 12,712 |
| 12,312 |
| +3 | % | 49,498 |
| 49,321 |
| +0 | % |
- in USD - (1) |
| 15,072 |
| 13,611 |
| 15,908 |
| 13,438 |
| 14,074 |
| 14,055 |
| 16,497 |
| 14,633 |
| +13 | % | 61,551 |
| 55,737 |
| +10 | % |
|
|
|
|
|
|
|
|
|
|
|
|
|
|
|
|
|
|
|
|
|
|
|
|
|
|
Commercial Vehicles (2) |
| 6,612 |
| 5,774 |
| 8,963 |
| 6,580 |
| 9,197 |
| 6,756 |
| 9,992 |
| 7,696 |
| +30 | % | 34,764 |
| 26,806 |
| +30 | % |
|
|
|
|
|
|
|
|
|
|
|
|
|
|
|
|
|
|
|
|
|
|
|
|
|
|
Services |
| 3,372 |
| 3,608 |
| 3,463 |
| 3,508 |
| 3,444 |
| 3,470 |
| 3,660 |
| 3,451 |
| +6 | % | 13,939 |
| 14,037 |
| -1 | % |
|
|
|
|
|
|
|
|
|
|
|
|
|
|
|
|
|
|
|
|
|
|
|
|
|
|
Other Activities (3) |
| 387 |
| 867 |
| 471 |
| 947 |
| 525 |
| 996 |
| 817 |
| 1,274 |
| -36 | % | 2,200 |
| 4,084 |
| -46 | % |
|
|
|
|
|
|
|
|
|
|
|
|
|
|
|
|
|
|
|
|
|
|
|
|
|
|
Eliminations/Discontinued |
|
|
|
|
|
|
|
|
|
|
|
|
|
|
|
|
|
|
|
|
|
|
|
|
|
Operations (3) |
| (1,754 | ) | (2,100 | ) | (2,008 | ) | (2,230 | ) | (1,916 | ) | (2,346 | ) | (2,294 | ) | (2,581 | ) | +11 | % | (7,972 | ) | (9,257 | ) | +14 | % |
|
|
|
|
|
|
|
|
|
|
|
|
|
|
|
|
|
|
|
|
|
|
|
|
|
|
DaimlerChrysler Group (2) |
| 32,351 |
| 33,252 |
| 37,072 |
| 33,860 |
| 34,891 |
| 34,114 |
| 37,745 |
| 35,211 |
| +7 | % | 142,059 |
| 136,437 |
| +4 | % |
(1) Revenues as originally generated by Chrysler Group in US dollars. Figures are therefore not comparable to those shown in the financial statements.
(2) Since April 1, 2004 Mitsubishi Fuso Truck and Bus Corporation (MFTBC) has been included with a time lag of one month.
(3) On December 31, 2003, DaimlerChrysler completed the sale of its 100% ownership interest in MTU Aero Engines GmbH.
5
Operating Profit by Divisions
|
| 1st Quarter |
| 2nd Quarter |
| 3rd Quarter |
| 4th Quarter |
| Fiscal Year |
| ||||||||||||||
(in millions of EUR) |
| 2004 |
| 2003 |
| 2004 |
| 2003 |
| 2004 |
| 2003 |
| 2004 |
| 2003 |
| Change |
| 2004 |
| 2003 |
| Change |
|
|
|
|
|
|
|
|
|
|
|
|
|
|
|
|
|
|
|
|
|
|
|
|
|
|
|
Mercedes Car Group |
| 639 |
| 688 |
| 703 |
| 861 |
| 304 |
| 793 |
| 20 |
| 784 |
| -97 | % | 1,666 |
| 3,126 |
| -47 | % |
|
|
|
|
|
|
|
|
|
|
|
|
|
|
|
|
|
|
|
|
|
|
|
|
|
|
Chrysler Group (1) |
| 303 |
| 152 |
| 521 |
| (948 | ) | 217 |
| 147 |
| 386 |
| 143 |
| +170 | % | 1,427 |
| (506 | ) | — |
|
|
|
|
|
|
|
|
|
|
|
|
|
|
|
|
|
|
|
|
|
|
|
|
|
|
|
Commercial Vehicles (2) |
| 268 |
| 47 |
| 468 |
| 222 |
| 159 |
| 198 |
| 437 |
| 344 |
| +27 | % | 1,332 |
| 811 |
| +64 | % |
|
|
|
|
|
|
|
|
|
|
|
|
|
|
|
|
|
|
|
|
|
|
|
|
|
|
Services |
| 221 |
| 419 |
| 472 |
| 334 |
| 412 |
| 284 |
| 145 |
| 203 |
| -29 | % | 1,250 |
| 1,240 |
| +1 | % |
|
|
|
|
|
|
|
|
|
|
|
|
|
|
|
|
|
|
|
|
|
|
|
|
|
|
Other Activities (3) |
| 134 |
| 72 |
| 85 |
| 217 |
| 258 |
| (104 | ) | (21 | ) | 1,144 |
| — |
| 456 |
| 1,329 |
| -66 | % |
|
|
|
|
|
|
|
|
|
|
|
|
|
|
|
|
|
|
|
|
|
|
|
|
|
|
Eliminations |
| (19 | ) | 25 |
| (158 | ) | (45 | ) | (18 | ) | (72 | ) | (182 | ) | (222 | ) | +18 | % | (377 | ) | (314 | ) | -20 | % |
|
|
|
|
|
|
|
|
|
|
|
|
|
|
|
|
|
|
|
|
|
|
|
|
|
|
DaimlerChrysler Group (1)(2) |
| 1,546 |
| 1,403 |
| 2,091 |
| 641 |
| 1,332 |
| 1,246 |
| 785 |
| 2,396 |
| -67 | % | 5,754 |
| 5,686 |
| +1 | % |
(1) Figures for Q1/2004 and Q2/2004 have been adjusted retroactively for effects resulting from the first time application of the Medicare Act in the US.
(2) Since April 1, 2004 Mitsubishi Fuso Truck and Bus Corporation (MFTBC) has been included with a time lag of one month.
(3) On December 31, 2003, DaimlerChrysler completed the sale of its 100% ownership interest in MTU Aero Engines GmbH. As of June 30, 2004, Mitsubishi Motors Corporation has been included as a financial investment measured at fair value.
6
Earnings per Share
|
| 1st Quarter |
| 2nd Quarter |
| 3rd Quarter |
| 4th Quarter |
| Fiscal Year |
| ||||||||||||||
(in EUR) |
| 2004 |
| 2003 |
| 2004 |
| 2003 |
| 2004 |
| 2003 |
| 2004 |
| 2003 |
| Change |
| 2004 |
| 2003 |
| Change |
|
|
|
|
|
|
|
|
|
|
|
|
|
|
|
|
|
|
|
|
|
|
|
|
|
|
|
EPS (1) |
|
|
|
|
|
|
|
|
|
|
|
|
|
|
|
|
|
|
|
|
|
|
|
|
|
basic |
| 0.41 |
| 0.58 |
| 0.57 |
| 0.11 |
| 0.94 |
| (1.63 | ) | 0.52 |
| 1.39 |
| -63 | % | 2.43 |
| 0.44 |
| +452 | % |
diluted |
| 0.41 |
| 0.58 |
| 0.57 |
| 0.11 |
| 0.94 |
| (1.63 | ) | 0.52 |
| 1.39 |
| -63 | % | 2.43 |
| 0.44 |
| +452 | % |
|
|
|
|
|
|
|
|
|
|
|
|
|
|
|
|
|
|
|
|
|
|
|
|
|
|
Average number of shares outstanding |
|
|
|
|
|
|
|
|
|
|
|
|
|
|
|
|
|
|
|
|
|
|
|
|
|
(in million) |
|
|
|
|
|
|
|
|
|
|
|
|
|
|
|
|
|
|
|
|
|
|
|
|
|
basic number of shares |
| 1,012.7 |
| 1,012.7 |
| 1,012.7 |
| 1,012.6 |
| 1,012.8 |
| 1,012.8 |
| 1,012.8 |
| 1,012.7 |
| +0 | % | 1,012.8 |
| 1,012.7 |
| +0 | % |
diluted number of shares |
| 1,013.8 |
| 1,013.8 |
| 1,015.4 |
| 1,013.6 |
| 1,015.0 |
| 1,012.8 |
| 1,012.8 |
| 1,012.7 |
| +0 | % | 1,014.5 |
| 1,012.7 |
| +0 | % |
(1) Figures for Q1/2004 and Q2/2004 have been adjusted retroactively for effects resulting from the first time application of the Medicare Act in the US.
7
Wholesales
|
| 1st Quarter |
| 2nd Quarter |
| 3rd Quarter |
| 4th Quarter |
| Fiscal Year |
| ||||||||||||||
(in thousand units) |
| 2004 |
| 2003 |
| 2004 |
| 2003 |
| 2004 |
| 2003 |
| 2004 |
| 2003 |
| Change |
| 2004 |
| 2003 |
| Change |
|
|
|
|
|
|
|
|
|
|
|
|
|
|
|
|
|
|
|
|
|
|
|
|
|
|
|
Mercedes Car Group |
| 266 |
| 291 |
| 319 |
| 318 |
| 293 |
| 305 |
| 348 |
| 302 |
| +15 | % | 1,227 |
| 1,217 |
| +1 | % |
|
|
|
|
|
|
|
|
|
|
|
|
|
|
|
|
|
|
|
|
|
|
|
|
|
|
Western Europe |
| 173 |
| 192 |
| 224 |
| 219 |
| 190 |
| 208 |
| 233 |
| 193 |
| +21 | % | 821 |
| 813 |
| +1 | % |
of which Germany |
| 81 |
| 86 |
| 104 |
| 105 |
| 88 |
| 104 |
| 114 |
| 95 |
| +19 | % | 387 |
| 390 |
| -1 | % |
|
|
|
|
|
|
|
|
|
|
|
|
|
|
|
|
|
|
|
|
|
|
|
|
|
|
NAFTA |
| 55 |
| 58 |
| 58 |
| 60 |
| 61 |
| 54 |
| 67 |
| 65 |
| +3 | % | 240 |
| 235 |
| +2 | % |
of which USA |
| 52 |
| 53 |
| 53 |
| 55 |
| 56 |
| 50 |
| 62 |
| 60 |
| +3 | % | 223 |
| 218 |
| +2 | % |
|
|
|
|
|
|
|
|
|
|
|
|
|
|
|
|
|
|
|
|
|
|
|
|
|
|
Japan |
| 11 |
| 11 |
| 8 |
| 10 |
| 10 |
| 11 |
| 12 |
| 13 |
| -12 | % | 41 |
| 46 |
| -10 | % |
|
|
|
|
|
|
|
|
|
|
|
|
|
|
|
|
|
|
|
|
|
|
|
|
|
|
Rest of World |
| 27 |
| 31 |
| 29 |
| 29 |
| 32 |
| 32 |
| 36 |
| 31 |
| +17 | % | 125 |
| 123 |
| +2 | % |
8
Mercedes Car Group
Retail Sales*
|
| 1st Quarter |
| 2nd Quarter |
| 3rd Quarter |
| 4th Quarter |
| Fiscal Year |
| ||||||||||||||
(in thousand units) |
| 2004 |
| 2003 |
| 2004 |
| 2003 |
| 2004 |
| 2003 |
| 2004 |
| 2003 |
| Change |
| 2004 |
| 2003 |
| Change |
|
|
|
|
|
|
|
|
|
|
|
|
|
|
|
|
|
|
|
|
|
|
|
|
|
|
|
Mercedes Car Group |
| 274 |
| 286 |
| 311 |
| 319 |
| 288 |
| 306 |
| 328 |
| 298 |
| +10 | % | 1,200 |
| 1,210 |
| -1 | % |
|
|
|
|
|
|
|
|
|
|
|
|
|
|
|
|
|
|
|
|
|
|
|
|
|
|
Western Europe |
| 180 |
| 188 |
| 214 |
| 219 |
| 189 |
| 207 |
| 216 |
| 194 |
| +11 | % | 799 |
| 808 |
| -1 | % |
of which Germany |
| 81 |
| 86 |
| 104 |
| 105 |
| 88 |
| 104 |
| 114 |
| 95 |
| +19 | % | 387 |
| 390 |
| -1 | % |
|
|
|
|
|
|
|
|
|
|
|
|
|
|
|
|
|
|
|
|
|
|
|
|
|
|
NAFTA |
| 53 |
| 55 |
| 59 |
| 59 |
| 59 |
| 58 |
| 69 |
| 64 |
| +8 | % | 239 |
| 236 |
| +1 | % |
of which USA |
| 49 |
| 52 |
| 54 |
| 54 |
| 54 |
| 54 |
| 64 |
| 59 |
| +8 | % | 222 |
| 219 |
| +1 | % |
|
|
|
|
|
|
|
|
|
|
|
|
|
|
|
|
|
|
|
|
|
|
|
|
|
|
Japan |
| 12 |
| 12 |
| 9 |
| 10 |
| 10 |
| 12 |
| 11 |
| 11 |
| -5 | % | 42 |
| 45 |
| -7 | % |
|
|
|
|
|
|
|
|
|
|
|
|
|
|
|
|
|
|
|
|
|
|
|
|
|
|
Rest of World |
| 29 |
| 31 |
| 29 |
| 31 |
| 30 |
| 30 |
| 32 |
| 30 |
| +9 | % | 120 |
| 121 |
| -1 | % |
* Wholesales for smart in 2003.
9
Mercedes Car Group
Market Shares
|
| 1st Quarter |
| 2nd Quarter |
| 3rd Quarter |
| 4th Quarter |
| Fiscal Year |
| ||||||||||||||
(in %) |
| 2004 |
| 2003 |
| 2004 |
| 2003 |
| 2004 |
| 2003 |
| 2004 |
| 2003 |
| Change |
| 2004 |
| 2003 |
| Change |
|
|
|
|
|
|
|
|
|
|
|
|
|
|
|
|
|
|
|
|
|
|
|
|
|
|
|
Western Europe |
| 4.3 |
| 4.6 |
| 4.5 |
| 5.1 |
| 4.5 |
| 5.1 |
| 5.1 |
| 4.6 |
| 0.5 |
| 4.6 |
| 4.9 |
| -0.3 |
|
of which Germany |
| 10.9 |
| 11.1 |
| 10.6 |
| 11.3 |
| 10.1 |
| 11.8 |
| 10.9 |
| 10.0 |
| 0.9 |
| 10.6 |
| 11.1 |
| -0.5 |
|
|
|
|
|
|
|
|
|
|
|
|
|
|
|
|
|
|
|
|
|
|
|
|
|
|
|
USA |
| 1.6 |
| 1.7 |
| 1.5 |
| 1.5 |
| 1.6 |
| 1.5 |
| 2.0 |
| 1.8 |
| 0.2 |
| 1.7 |
| 1.6 |
| 0.1 |
|
|
|
|
|
|
|
|
|
|
|
|
|
|
|
|
|
|
|
|
|
|
|
|
|
|
|
Japan |
| 0.8 |
| 0.8 |
| 0.8 |
| 0.9 |
| 0.8 |
| 0.9 |
| 0.8 |
| 1.0 |
| -0.2 |
| 0.8 |
| 0.9 |
| -0.1 |
|
10
Shipments
|
| 1st Quarter |
| 2nd Quarter |
| 3rd Quarter |
| 4th Quarter |
| Fiscal Year |
| |||||||||||||||
(in thousand units) |
| 2004 |
| 2003 |
| 2004 |
| 2003 |
| 2004 |
| 2003 |
| 2004 |
| 2003 |
| Change |
| 2004 |
| 2003 |
| Change |
| |
|
|
|
|
|
|
|
|
|
|
|
|
|
|
|
|
|
|
|
|
|
|
|
|
|
| |
Chrysler Group |
| 685 |
| 647 |
| 781 |
| 722 |
| 595 |
| 629 |
| 719 |
| 640 |
| +12 | % | 2,780 |
| 2,638 |
| +5 | % | |
|
|
|
|
|
|
|
|
|
|
|
|
|
|
|
|
|
|
|
|
|
|
|
|
|
| |
of which | Passenger Cars |
| 128 |
| 145 |
| 190 |
| 184 |
| 153 |
| 128 |
| 153 |
| 111 |
| +38 | % | 624 |
| 568 |
| +10 | % |
|
|
|
|
|
|
|
|
|
|
|
|
|
|
|
|
|
|
|
|
|
|
|
|
|
|
|
| Minivans |
| 115 |
| 127 |
| 159 |
| 134 |
| 113 |
| 104 |
| 113 |
| 112 |
| +1 | % | 500 |
| 477 |
| +5 | % |
|
|
|
|
|
|
|
|
|
|
|
|
|
|
|
|
|
|
|
|
|
|
|
|
|
|
|
| Sport Tourers |
| 56 |
| 39 |
| 75 |
| 66 |
| 77 |
| 62 |
| 73 |
| 50 |
| +44 | % | 280 |
| 218 |
| +28 | % |
|
|
|
|
|
|
|
|
|
|
|
|
|
|
|
|
|
|
|
|
|
|
|
|
|
|
|
| SUV’s |
| 214 |
| 174 |
| 175 |
| 174 |
| 121 |
| 165 |
| 198 |
| 197 |
| +1 | % | 708 |
| 710 |
| -0 | % |
|
|
|
|
|
|
|
|
|
|
|
|
|
|
|
|
|
|
|
|
|
|
|
|
|
|
|
| Light Trucks |
| 172 |
| 162 |
| 184 |
| 164 |
| 131 |
| 169 |
| 182 |
| 170 |
| +7 | % | 668 |
| 665 |
| +0 | % |
|
|
|
|
|
|
|
|
|
|
|
|
|
|
|
|
|
|
|
|
|
|
|
|
|
| |
NAFTA |
| 639 |
| 611 |
| 736 |
| 676 |
| 558 |
| 586 |
| 676 |
| 585 |
| +16 | % | 2,610 |
| 2,458 |
| +6 | % | |
of which | USA |
| 583 |
| 531 |
| 638 |
| 582 |
| 484 |
| 517 |
| 582 |
| 498 |
| +17 | % | 2,287 |
| 2,129 |
| +7 | % |
|
|
|
|
|
|
|
|
|
|
|
|
|
|
|
|
|
|
|
|
|
|
|
|
|
| |
Rest of World |
| 45 |
| 36 |
| 46 |
| 46 |
| 37 |
| 43 |
| 42 |
| 55 |
| -23 | % | 170 |
| 180 |
| -6 | % | |
11
Chrysler Group
Retail Sales*
|
| 1st Quarter |
| 2nd Quarter |
| 3rd Quarter |
| 4th Quarter |
| Fiscal Year |
| |||||||||||||||
(in thousand units) |
| 2004 |
| 2003 |
| 2004 |
| 2003 |
| 2004 |
| 2003 |
| 2004 |
| 2003 |
| Change |
| 2004 |
| 2003 |
| Change |
| |
|
|
|
|
|
|
|
|
|
|
|
|
|
|
|
|
|
|
|
|
|
|
|
|
|
| |
Chrysler Group |
| 633 |
| 616 |
| 760 |
| 734 |
| 653 |
| 630 |
| 656 |
| 627 |
| +5 | % | 2,702 |
| 2,607 |
| +4 | % | |
|
|
|
|
|
|
|
|
|
|
|
|
|
|
|
|
|
|
|
|
|
|
|
|
|
| |
of which | Passenger Cars |
| 122 |
| 150 |
| 178 |
| 179 |
| 153 |
| 117 |
| 141 |
| 114 |
| +24 | % | 594 |
| 560 |
| +6 | % |
|
|
|
|
|
|
|
|
|
|
|
|
|
|
|
|
|
|
|
|
|
|
|
|
|
|
|
| Minivans |
| 123 |
| 130 |
| 159 |
| 150 |
| 111 |
| 116 |
| 127 |
| 111 |
| +14 | % | 519 |
| 508 |
| +2 | % |
|
|
|
|
|
|
|
|
|
|
|
|
|
|
|
|
|
|
|
|
|
|
|
|
|
|
|
| Sport Tourers |
| 64 |
| 40 |
| 61 |
| 54 |
| 63 |
| 54 |
| 83 |
| 57 |
| +45 | % | 272 |
| 206 |
| +32 | % |
|
|
|
|
|
|
|
|
|
|
|
|
|
|
|
|
|
|
|
|
|
|
|
|
|
|
|
| SUV’s |
| 175 |
| 147 |
| 189 |
| 171 |
| 164 |
| 177 |
| 166 |
| 185 |
| -10 | % | 694 |
| 679 |
| +2 | % |
|
|
|
|
|
|
|
|
|
|
|
|
|
|
|
|
|
|
|
|
|
|
|
|
|
|
|
| Light Trucks |
| 150 |
| 148 |
| 173 |
| 181 |
| 162 |
| 167 |
| 140 |
| 160 |
| -13 | % | 624 |
| 655 |
| -5 | % |
|
|
|
|
|
|
|
|
|
|
|
|
|
|
|
|
|
|
|
|
|
|
|
|
|
|
|
NAFTA |
| 593 |
| 577 |
| 715 |
| 694 |
| 613 |
| 589 |
| 617 |
| 581 |
| +6 | % | 2,538 |
| 2,440 |
| +4 | % | |
of which | USA |
| 519 |
| 502 |
| 620 |
| 603 |
| 538 |
| 516 |
| 535 |
| 506 |
| +6 | % | 2,211 |
| 2,127 |
| +4 | % |
|
|
|
|
|
|
|
|
|
|
|
|
|
|
|
|
|
|
|
|
|
|
|
|
|
| |
Rest of World |
| 40 |
| 39 |
| 44 |
| 41 |
| 40 |
| 41 |
| 39 |
| 46 |
| -14 | % | 165 |
| 167 |
| -1 | % | |
* Includes Sprinter vans sold under the Freightliner brand.
12
Chrysler Group
Market Shares
|
| 1st Quarter |
| 2nd Quarter |
| 3rd Quarter |
| 4th Quarter |
| Fiscal Year |
| ||||||||||||||
(in %) |
| 2004 |
| 2003 |
| 2004 |
| 2003 |
| 2004 |
| 2003 |
| 2004 |
| 2003 |
| Change |
| 2004 |
| 2003 |
| Change |
|
|
|
|
|
|
|
|
|
|
|
|
|
|
|
|
|
|
|
|
|
|
|
|
|
|
|
Chrysler Group USA & Canada |
| 13.0 |
| 13.2 |
| 13.5 |
| 13.3 |
| 11.9 |
| 11.4 |
| 12.8 |
| 12.5 |
| 0.3 |
| 12.8 |
| 12.6 |
| 0.2 |
|
|
|
|
|
|
|
|
|
|
|
|
|
|
|
|
|
|
|
|
|
|
|
|
|
|
|
Passenger Cars USA |
| 6.0 |
| 6.9 |
| 7.4 |
| 7.3 |
| 6.0 |
| 4.8 |
| 6.4 |
| 5.3 |
| 1.1 |
| 6.5 |
| 6.1 |
| 0.4 |
|
|
|
|
|
|
|
|
|
|
|
|
|
|
|
|
|
|
|
|
|
|
|
|
|
|
|
Trucks USA |
| 18.3 |
| 18.6 |
| 18.1 |
| 18.2 |
| 16.0 |
| 16.5 |
| 17.1 |
| 17.4 |
| -0.3 |
| 17.3 |
| 17.6 |
| -0.3 |
|
13
Chrysler Group
Division specific data
|
| 1st Quarter |
| 2nd Quarter |
| 3rd Quarter |
| 4th Quarter |
| Fiscal Year |
| ||||||||||||||
|
| 2004 |
| 2003 |
| 2004 |
| 2003 |
| 2004 |
| 2003 |
| 2004 |
| 2003 |
| Change |
| 2004 |
| 2003 |
| Change |
|
|
|
|
|
|
|
|
|
|
|
|
|
|
|
|
|
|
|
|
|
|
|
|
|
|
|
Fleet % of Total USA |
| 27.2 | % | 27.4 | % | 27.5 | % | 29.8 | % | 15.4 | % | 16.2 | % | 25.1 | % | 20.5 | % | 4.6 |
| 23.9 | % | 23.7 | % | 0.2 |
|
|
|
|
|
|
|
|
|
|
|
|
|
|
|
|
|
|
|
|
|
|
|
|
|
|
|
U.S. Lease % of Total Retail |
| 14.5 | % | 15.6 | % | 15.5 | % | 10.7 | % | 16.2 | % | 11.7 | % | 18.7 | % | 15.9 | % | 2.8 |
| 16.2 | % | 13.4 | % | 2.8 |
|
|
|
|
|
|
|
|
|
|
|
|
|
|
|
|
|
|
|
|
|
|
|
|
|
|
|
U.S. Field Stock |
| 585 |
| 536 |
| 606 |
| 519 |
| 563 |
| 528 |
| 601 |
| 521 |
| 80 |
|
|
|
|
|
|
|
|
|
|
|
|
|
|
|
|
|
|
|
|
|
|
|
|
|
|
|
|
|
|
|
|
|
U.S. Days Supply |
| 77 |
| 69 |
| 72 |
| 63 |
| 83 |
| 86 |
| 81 |
| 74 |
| 7 |
|
|
|
|
|
|
|
|
|
|
|
|
|
|
|
|
|
|
|
|
|
|
|
|
|
|
|
|
|
|
|
|
|
U.S. Marketing Cost |
| 20.4 | % | 20.0 | % | 20.4 | % | 28.7 | % | 16.6 | % | 20.3 | % | 20.7 | % | 19.1 | % | 1.6 | pts. | 19.7 | % | 22.2 | % | -2.5 | pts |
14
Wholesales*
|
| 1st Quarter |
| 2nd Quarter |
| 3rd Quarter |
| 4th Quarter |
| Fiscal Year |
| ||||||||||||||
(in thousand units) |
| 2004 |
| 2003 |
| 2004 |
| 2003 |
| 2004 |
| 2003 |
| 2004 |
| 2003 |
| Change |
| 2004 |
| 2003 |
| Change |
|
|
|
|
|
|
|
|
|
|
|
|
|
|
|
|
|
|
|
|
|
|
|
|
|
|
|
Commercial Vehicles |
| 126 |
| 107 |
| 185 |
| 126 |
| 193 |
| 123 |
| 209 |
| 145 |
| +44 | % | 712 |
| 501 |
| +42 | % |
|
|
|
|
|
|
|
|
|
|
|
|
|
|
|
|
|
|
|
|
|
|
|
|
|
|
Western Europe |
| 56 |
| 53 |
| 75 |
| 64 |
| 63 |
| 59 |
| 80 |
| 74 |
| +8 | % | 274 |
| 250 |
| +10 | % |
of which Germany |
| 20 |
| 18 |
| 29 |
| 26 |
| 26 |
| 26 |
| 36 |
| 31 |
| +15 | % | 111 |
| 102 |
| +9 | % |
|
|
|
|
|
|
|
|
|
|
|
|
|
|
|
|
|
|
|
|
|
|
|
|
|
|
NAFTA |
| 39 |
| 29 |
| 44 |
| 34 |
| 45 |
| 34 |
| 49 |
| 37 |
| +31 | % | 177 |
| 134 |
| +32 | % |
of which USA |
| 34 |
| 24 |
| 38 |
| 29 |
| 38 |
| 29 |
| 41 |
| 32 |
| +28 | % | 151 |
| 115 |
| +32 | % |
|
|
|
|
|
|
|
|
|
|
|
|
|
|
|
|
|
|
|
|
|
|
|
|
|
|
Latin America |
| 12 |
| 9 |
| 14 |
| 9 |
| 17 |
| 11 |
| 15 |
| 11 |
| +28 | % | 58 |
| 40 |
| +43 | % |
|
|
|
|
|
|
|
|
|
|
|
|
|
|
|
|
|
|
|
|
|
|
|
|
|
|
Asia/Australia |
| 6 |
| 6 |
| 31 |
| 7 |
| 47 |
| 8 |
| 45 |
| 9 |
| — |
| 130 |
| 29 |
| — |
|
of which Japan |
| 1 |
| 0 |
| 10 |
| 0 |
| 17 |
| 0 |
| 15 |
| 1 |
| — |
| 43 |
| 1 |
| — |
|
|
|
|
|
|
|
|
|
|
|
|
|
|
|
|
|
|
|
|
|
|
|
|
|
|
|
Rest of World |
| 13 |
| 10 |
| 20 |
| 12 |
| 20 |
| 12 |
| 20 |
| 14 |
| +49 | % | 73 |
| 48 |
| +53 | % |
* Since April 1, 2004 Mitsubishi Fuso Truck and Bus Corporation (MFTBC) included with a time lag of one month, therefore the 2nd quarter 2004 only includes two months.
15
Commercial Vehicles
Retail Sales*
|
| 1st Quarter |
| 2nd Quarter |
| 3rd Quarter |
| 4th Quarter |
| Fiscal Year |
| ||||||||||||||
(in thousand units) |
| 2004 |
| 2003 |
| 2004 |
| 2003 |
| 2004 |
| 2003 |
| 2004 |
| 2003 |
| Change |
| 2004 |
| 2003 |
| Change |
|
|
|
|
|
|
|
|
|
|
|
|
|
|
|
|
|
|
|
|
|
|
|
|
|
|
|
Commercial Vehicles |
| 124 |
| 103 |
| 183 |
| 125 |
| 192 |
| 125 |
| 213 |
| 140 |
| +52 | % | 711 |
| 493 |
| +44 | % |
|
|
|
|
|
|
|
|
|
|
|
|
|
|
|
|
|
|
|
|
|
|
|
|
|
|
Western Europe |
| 56 |
| 52 |
| 75 |
| 65 |
| 64 |
| 62 |
| 85 |
| 70 |
| +21 | % | 280 |
| 250 |
| +12 | % |
of which Germany |
| 20 |
| 18 |
| 29 |
| 26 |
| 26 |
| 26 |
| 36 |
| 31 |
| +15 | % | 111 |
| 102 |
| +9 | % |
|
|
|
|
|
|
|
|
|
|
|
|
|
|
|
|
|
|
|
|
|
|
|
|
|
|
NAFTA |
| 37 |
| 25 |
| 43 |
| 32 |
| 43 |
| 34 |
| 48 |
| 36 |
| +33 | % | 172 |
| 127 |
| +35 | % |
of which USA |
| 32 |
| 21 |
| 37 |
| 28 |
| 37 |
| 29 |
| 41 |
| 31 |
| +31 | % | 146 |
| 108 |
| +35 | % |
|
|
|
|
|
|
|
|
|
|
|
|
|
|
|
|
|
|
|
|
|
|
|
|
|
|
Latin America |
| 12 |
| 9 |
| 14 |
| 9 |
| 17 |
| 11 |
| 15 |
| 11 |
| +28 | % | 58 |
| 40 |
| +43 | % |
|
|
|
|
|
|
|
|
|
|
|
|
|
|
|
|
|
|
|
|
|
|
|
|
|
|
Asia/Australia |
| 6 |
| 6 |
| 31 |
| 7 |
| 48 |
| 7 |
| 45 |
| 9 |
| — |
| 130 |
| 29 |
| — |
|
of which Japan |
| 1 |
| 0 |
| 10 |
| 0 |
| 17 |
| 0 |
| 15 |
| 0 |
| — |
| 42 |
| 1 |
| — |
|
|
|
|
|
|
|
|
|
|
|
|
|
|
|
|
|
|
|
|
|
|
|
|
|
|
|
Rest of World |
| 13 |
| 10 |
| 20 |
| 12 |
| 19 |
| 12 |
| 20 |
| 13 |
| +51 | % | 71 |
| 47 |
| +52 | % |
* Since April 1, 2004 Mitsubishi Fuso Truck and Bus Corporation (MFTBC) included with a time lag of one month, therefore the 2nd quarter 2004 only includes two months.
16
Commercial Vehicles
Market Shares
|
| 1st Quarter |
| 2nd Quarter |
| 3rd Quarter |
| 4th Quarter |
| Fiscal Year |
| ||||||||||||||
(in %) |
| 2004 |
| 2003 |
| 2004 |
| 2003 |
| 2004 |
| 2003 |
| 2004 |
| 2003 |
| Change |
| 2004 |
| 2003 |
| Change |
|
|
|
|
|
|
|
|
|
|
|
|
|
|
|
|
|
|
|
|
|
|
|
|
|
|
|
Trucks |
|
|
|
|
|
|
|
|
|
|
|
|
|
|
|
|
|
|
|
|
|
|
|
|
|
|
|
|
|
|
|
|
|
|
|
|
|
|
|
|
|
|
|
|
|
|
|
|
|
|
|
Trucks Europe / Latin America (Mercedes-Benz) |
|
|
|
|
|
|
|
|
|
|
|
|
|
|
|
|
|
|
|
|
|
|
|
|
|
Western Europe |
| 19.7 |
| 19.0 |
| 22.1 |
| 19.7 |
| 23.0 |
| 21.7 |
| 21.4 |
| 22.2 |
| -0.8 |
| 21.7 |
| 20.9 |
| 0.8 |
|
Germany |
| 37.8 |
| 39.4 |
| 42.7 |
| 38.6 |
| 43.4 |
| 44.3 |
| 41.4 |
| 43.4 |
| -2.0 |
| 41.7 |
| 41.7 |
| 0.0 |
|
Brazil |
| 31.4 |
| 35.2 |
| 30.6 |
| 32.1 |
| 30.7 |
| 33.9 |
| 30.5 |
| 33.6 |
| -3.1 |
| 30.7 |
| 33.6 |
| -2.9 |
|
|
|
|
|
|
|
|
|
|
|
|
|
|
|
|
|
|
|
|
|
|
|
|
|
|
|
Trucks NAFTA (Freightliner/ Sterling/Western Star) |
|
|
|
|
|
|
|
|
|
|
|
|
|
|
|
|
|
|
|
|
|
|
|
|
|
USA Class 8 |
| 40.5 |
| 41.7 |
| 36.7 |
| 41.5 |
| 33.7 |
| 40.1 |
| 36.5 |
| 39.3 |
| -2.8 |
| 36.3 |
| 40.3 |
| -4.0 |
|
USA Class 5-7 |
| 25.6 |
| 28.1 |
| 27.3 |
| 25.5 |
| 26.4 |
| 28.2 |
| 25.1 |
| 25.9 |
| -0.8 |
| 26.1 |
| 26.7 |
| -0.6 |
|
|
|
|
|
|
|
|
|
|
|
|
|
|
|
|
|
|
|
|
|
|
|
|
|
|
|
Vans (Mercedes-Benz) |
|
|
|
|
|
|
|
|
|
|
|
|
|
|
|
|
|
|
|
|
|
|
|
|
|
Western Europe |
| 17.3 |
| 17.9 |
| 17.1 |
| 16.8 |
| 18.0 |
| 17.5 |
| 17.5 |
| 16.7 |
| 0.8 |
| 17.5 |
| 17.1 |
| 0.4 |
|
Germany |
| 27.3 |
| 29.6 |
| 27.0 |
| 26.9 |
| 29.3 |
| 27.5 |
| 30.6 |
| 27.7 |
| 2.9 |
| 28.8 |
| 27.7 |
| 1.1 |
|
|
|
|
|
|
|
|
|
|
|
|
|
|
|
|
|
|
|
|
|
|
|
|
|
|
|
Buses & Coaches |
|
|
|
|
|
|
|
|
|
|
|
|
|
|
|
|
|
|
|
|
|
|
|
|
|
Western Europe |
| 27.1 |
| 25.3 |
| 26.7 |
| 26.2 |
| 25.9 |
| 29.4 |
| 31.7 |
| 31.1 |
| 0.6 |
| 28.2 |
| 28.4 |
| -0.2 |
|
Germany |
| 57.8 |
| 56.6 |
| 48.9 |
| 55.4 |
| 66.6 |
| 58.2 |
| 60.1 |
| 63.6 |
| -3.5 |
| 58.0 |
| 59.6 |
| -1.6 |
|
|
|
|
|
|
|
|
|
|
|
|
|
|
|
|
|
|
|
|
|
|
|
|
|
|
|
Mitsubishi Fuso Truck & Bus |
|
|
|
|
|
|
|
|
|
|
|
|
|
|
|
|
|
|
|
|
|
|
|
|
|
Trucks & Buses Japan |
| 30.4 |
| 30.1 |
| 31.4 |
| 29.8 |
| 25.9 |
| 28.8 |
| 21.7 |
| 28.2 |
| -6.5 |
| 26.9 |
| 28.9 |
| -2.0 |
|
17
Key Figures |
| DAIMLERCHRYSLER |
- unaudited -
DaimlerChrysler Group
(amounts in millions) |
| 2004 |
| 2004 |
| 2003 |
| 2002 |
| 04/03 |
|
Revenues |
| 192,319 |
| 142,059 |
| 136,437 |
| 147,368 |
| +4 | (2) |
European Union |
| 64,162 |
| 47,394 |
| 48,496 |
| 46,546 |
| -2 |
|
of which: Germany |
| 30,210 |
| 22,315 |
| 24,182 |
| 23,121 |
| -8 |
|
North America |
| 99,188 |
| 73,266 |
| 73,477 |
| 87,831 |
| -0 |
|
of which: USA |
| 86,957 |
| 64,232 |
| 64,757 |
| 77,686 |
| -1 |
|
Other markets |
| 28,970 |
| 21,399 |
| 16,397 |
| 15,206 |
| +31 |
|
Discontinued operations |
| — |
| — |
| (1,933 | ) | (2,215 | ) | — |
|
Employees (at year-end) |
|
|
| 384,723 |
| 362,063 |
| 365,571 |
| +6 |
|
Investments in property, plant and equipment |
| 8,645 |
| 6,386 |
| 6,614 |
| 7,145 |
| -3 |
|
Research and development expenditure |
| 7,660 |
| 5,658 |
| 5,571 |
| 5,942 |
| +2 |
|
Cash provided by operating activities |
| 14,973 |
| 11,060 |
| 13,826 |
| 15,909 |
| -20 |
|
Operating profit (loss) |
| 7,790 |
| 5,754 |
| 5,686 |
| 6,854 |
| +1 |
|
Net income (loss) |
| 3,338 |
| 2,466 |
| 448 |
| 4,718 |
| +450 |
|
per share (in US $/€) |
| 3.29 |
| 2.43 |
| 0.44 |
| 4.68 |
| +452 |
|
Total dividend |
| 2,057 |
| 1,519 |
| 1,519 |
| 1,519 |
| ±0 |
|
Dividend per share (in €) |
|
|
| 1.50 |
| 1.50 |
| 1.50 |
| ±0 |
|
(1) Rate of exchange: € 1 = US $ 1.3538 (based on the noon buying rate on Dec. 31, 2004).
(2) A 7% increase after adjusting for the effects of currency translation and changes in the consolidated Group.
Divisions |
|
|
- unaudited -
Mercedes Car Group
(amounts in millions) |
| 2004 |
| 2004 |
| 2003 |
| 04/03 |
|
Operating profit |
| 2,255 |
| 1,666 |
| 3,126 |
| -47 |
|
Revenues |
| 67,189 |
| 49,630 |
| 51,446 |
| -4 |
|
Investments in property, plant and equipment |
| 3,172 |
| 2,343 |
| 2,939 |
| -20 |
|
Research and development expenditure |
| 3,566 |
| 2,634 |
| 2,687 |
| -2 |
|
Unit sales |
|
|
| 1,226,773 |
| 1,216,938 |
| +1 |
|
Employees (Dec. 31) |
|
|
| 105,857 |
| 104,151 |
| +2 |
|
|
|
|
|
|
|
|
|
|
|
Chrysler Group
(amounts in millions) |
| 2004 |
| 2004 |
| 2003 |
| 04/03 |
|
Operating profit (loss) |
| 1,932 |
| 1,427 |
| (506 | ) | — |
|
Revenues |
| 67,010 |
| 49,498 |
| 49,321 |
| +0 |
|
Investments in property, plant and equipment |
| 3,584 |
| 2,647 |
| 2,487 |
| +6 |
|
Research and development expenditure |
| 2,125 |
| 1,570 |
| 1,689 |
| -7 |
|
Unit sales |
|
|
| 2,779,895 |
| 2,637,867 |
| +5 |
|
Employees (Dec. 31) |
|
|
| 84,375 |
| 93,062 |
| -9 |
|
Commercial Vehicles
(amounts in millions) |
| 2004 |
| 2004 |
| 2003 |
| 04/03 |
|
Operating profit |
| 1,803 |
| 1,332 |
| 811 |
| +64 |
|
Revenues |
| 47,064 |
| 34,764 |
| 26,806 |
| +30 |
|
Investments in property, plant and equipment |
| 1,603 |
| 1,184 |
| 958 |
| +24 |
|
Research and development expenditure |
| 1,660 |
| 1,226 |
| 946 |
| +30 |
|
Unit sales |
|
|
| 712,166 |
| 500,981 |
| +42 |
|
Employees (Dec. 31) |
|
|
| 114,602 |
| 88,014 |
| +30 |
|
Services
(amounts in millions) |
| 2004 |
| 2004 |
| 2003 |
| 04/03 |
|
Operating profit |
| 1,692 |
| 1,250 |
| 1,240 |
| +1 |
|
Revenues |
| 18,871 |
| 13,939 |
| 14,037 |
| -1 |
|
Contract volume |
| 138,628 |
| 102,399 |
| 98,199 |
| +4 |
|
Investment in property, plant and equipment |
| 123 |
| 91 |
| 76 |
| +20 |
|
Employees (Dec. 31) |
|
|
| 11,224 |
| 11,035 |
| +2 |
|
Other Activities
(amounts in millions) |
| 2004 |
| 2004 |
| 2003 |
| 04/03 |
|
Operating profit(2) |
| 617 |
| 456 |
| 1,329 |
| -66 |
|
Revenues(2) |
| 2,978 |
| 2,200 |
| 4,084 |
| -46 |
|
Investment in property, plant and equipment(2) |
| 181 |
| 134 |
| 169 |
| -21 |
|
Research and development expenditure(2) |
| 309 |
| 228 |
| 420 |
| -46 |
|
Employees (Dec. 31) |
|
|
| 20,636 |
| 20,192 |
| +2 |
|
(1) Rate of exchange: € 1 = US $1.3538 (based on the noon buying rate on Dec. 31, 2004).
(2) In 2003 figures of discontinued operations (MTU Aero Engines) are included.
4th Quarter Key Figures |
|
- unaudited -
DaimlerChrysler Group
(amounts in millions) |
| Q IV/2004 |
| Q IV/2004 |
| Q IV/2003 |
| 04/03 |
|
Revenues |
| 51,099 |
| 37,745 |
| 35,211 |
| +7 |
|
Operating profit |
| 1,063 |
| 785 |
| 2,396 |
| -67 |
|
Net income |
| 712 |
| 526 |
| 1,404 |
| -63 |
|
per share (in US $/€) |
| 0.70 |
| 0.52 |
| 1.39 |
| -63 |
|
Mercedes Car Group
(amounts in millions) |
| Q IV/2004 |
| Q IV/2004 |
| Q IV/2003 |
| 04/03 |
|
Unit sales |
|
|
| 348,260 |
| 302,365 |
| +15 |
|
Revenues |
| 17,407 |
| 12,858 |
| 13,059 |
| -2 |
|
Operating profit |
| 27 |
| 20 |
| 784 |
| -97 |
|
Chrysler Group
(amounts in millions) |
| Q IV/2004 |
| Q IV/2004 |
| Q IV/2003 |
| 04/03 |
|
Unit sales |
|
|
| 718,772 |
| 639,621 |
| +12 |
|
Revenues |
| 17,210 |
| 12,712 |
| 12,312 |
| +3 |
|
Operating profit |
| 523 |
| 386 |
| 143 |
| +170 |
|
Commercial Vehicles
(amounts in millions) |
| Q IV/2004 |
| Q IV/2004 |
| Q IV/2003 |
| 04/03 |
|
Unit sales |
|
|
| 208,672 |
| 145,007 |
| +44 |
|
Revenues |
| 13,527 |
| 9,992 |
| 7,696 |
| +30 |
|
Operating profit |
| 592 |
| 437 |
| 344 |
| +27 |
|
Services
(amounts in millions) |
| Q IV/2004 |
| Q IV/2004 |
| Q IV/2003 |
| 04/03 |
|
Revenues |
| 4,955 |
| 3,660 |
| 3,451 |
| +6 |
|
Operating profit |
| 196 |
| 145 |
| 203 |
| -29 |
|
Other Activities
(amounts in millions) |
| Q IV/2004 |
| Q IV/2004 |
| Q IV/2003 |
| 04/03 |
|
Revenues(2) |
| 1,106 |
| 817 |
| 1,274 |
| -36 |
|
Operating profit (loss)(2) |
| (28 | ) | (21 | ) | 1,144 |
| — |
|
(1) Rate of exchange: € 1 = US $1.3538 (based on the noon buying rate on Dec. 31, 2004).
(2) In 2003 figures of discontinued operations (MTU Aero Engines) are included.
Consolidated Statement of Income (Loss) - Group |
|
- unaudited -
|
| year ended December 31, |
| ||||||
(in millions, except EPS) |
| 2004 |
| 2004 |
| 2003 |
| 2002 |
|
|
| US $(1) |
| € |
| € |
| € |
|
Revenues |
| 192,319 |
| 142,059 |
| 136,437 |
| 147,368 |
|
Cost of sales |
| (155,100 | ) | (114,567 | ) | (109,926 | ) | (119,624 | ) |
Gross profit |
| 37,219 |
| 27,492 |
| 26,511 |
| 27,744 |
|
Selling, administrative and other expenses |
| (24,330 | ) | (17,972 | ) | (17,772 | ) | (18,166 | ) |
Research and development |
| (7,660 | ) | (5,658 | ) | (5,571 | ) | (5,942 | ) |
Other income |
| 1,211 |
| 895 |
| 689 |
| 777 |
|
Turnaround plan expenses - Chrysler Group |
| (196 | ) | (145 | ) | (469 | ) | (694 | ) |
Income (expense) before financial income |
| 6,244 |
| 4,612 |
| 3,388 |
| 3,719 |
|
Impairment of investment in EADS |
| — |
| — |
| (1,960 | ) | — |
|
Other financial income (expense, net) |
| (1,458 | ) | (1,077 | ) | (832 | ) | 2,206 |
|
Financial income (expense), net |
| (1,458 | ) | (1,077 | ) | (2,792 | ) | 2,206 |
|
Income (loss) before income taxes |
| 4,786 |
| 3,535 |
| 596 |
| 5,925 |
|
Income tax benefit (expense) |
| (1,594 | ) | (1,177 | ) | (979 | ) | (1,115 | ) |
Minority interests |
| 146 |
| 108 |
| (35 | ) | (15 | ) |
Income (loss) from continuing operations |
| 3,338 |
| 2,466 |
| (418 | ) | 4,795 |
|
Income from discontinued operations, net of taxes |
| — |
| — |
| 14 |
| 82 |
|
Income on disposal of discontinued operations, net of taxes |
| — |
| — |
| 882 |
| — |
|
Cumulative effect of changes in accounting principles |
| — |
| — |
| (30 | ) | (159 | ) |
Net income (loss) |
| 3,338 |
| 2,466 |
| 448 |
| 4,718 |
|
|
|
|
|
|
|
|
|
|
|
Earnings (loss) per share |
|
|
|
|
|
|
|
|
|
Basic earnings per share |
| 3.29 |
| 2.43 |
| 0.44 |
| 4.68 |
|
Diluted earnings per share |
| 3.29 |
| 2.43 |
| 0.44 |
| 4.67 |
|
(1) Rate of exchange: € 1 = US $ 1.3538 (based on the noon buying rate on Dec. 31, 2004).
Consolidated Statements of Income (Loss) - Industrial Business and Financial Services |
|
- unaudited -
|
| Industrial Business |
| Financial Services |
| ||||||||
|
| year ended December 31, |
| year ended December 31, |
| ||||||||
(in millions) |
| 2004 |
| 2003 |
| 2002 |
| 2004 |
| 2003 |
| 2002 |
|
|
| € |
| € |
| € |
| € |
| € |
| € |
|
Revenues |
| 128,133 |
| 122,397 |
| 131,668 |
| 13,926 |
| 14,040 |
| 15,700 |
|
Cost of sales |
| (103,771 | ) | (98,937 | ) | (106,443 | ) | (10,796 | ) | (10,989 | ) | (13,181 | ) |
Gross profit |
| 24,362 |
| 23,460 |
| 25,225 |
| 3,130 |
| 3,051 |
| 2,519 |
|
Selling, administrative and other expenses |
| (16,741 | ) | (16,374 | ) | (16,451 | ) | (1,231 | ) | (1,398 | ) | (1,715 | ) |
Research and development |
| (5,658 | ) | (5,571 | ) | (5,942 | ) | — |
| — |
| — |
|
Other income |
| 833 |
| 637 |
| 709 |
| 62 |
| 52 |
| 68 |
|
Turnaround plan expenses - Chrysler Group |
| (145 | ) | (469 | ) | (694 | ) | — |
| — |
| — |
|
Income (expense) before financial income |
| 2,651 |
| 1,683 |
| 2,847 |
| 1,961 |
| 1,705 |
| 872 |
|
Impairment of investment in EADS |
| — |
| (1,960 | ) | — |
| — |
| — |
| — |
|
Other financial income (expense), net |
| (1,043 | ) | (775 | ) | 2,325 |
| (34 | ) | (57 | ) | (119 | ) |
Financial income (expense), net |
| (1,043 | ) | (2,735 | ) | 2,325 |
| (34 | ) | (57 | ) | (119 | ) |
Income (loss) before income taxes |
| 1,608 |
| (1,052 | ) | 5,172 |
| 1,927 |
| 1,648 |
| 753 |
|
Income tax benefit (expense) |
| (442 | ) | (352 | ) | (738 | ) | (735 | ) | (627 | ) | (377 | ) |
Minority interests |
| 113 |
| (30 | ) | (12 | ) | (5 | ) | (5 | ) | (3 | ) |
Income (loss) from continuing operations |
| 1,279 |
| (1,434 | ) | 4,422 |
| 1,187 |
| 1,016 |
| 373 |
|
Income from discontinued operations, net of taxes |
| — |
| 14 |
| 82 |
| — |
| — |
| — |
|
Income on disposal of discontinued operations, net of taxes |
| — |
| 882 |
| — |
| — |
| — |
| — |
|
Cumulative effect of changes in accounting principles |
| — |
| (30 | ) | (124 | ) | — |
| — |
| (35 | ) |
Net income (loss) |
| 1,279 |
| (568 | ) | 4,380 |
| 1,187 |
| 1,016 |
| 338 |
|
Reconciliation to Income before Financial Income and Financial Income, net |
|
- unaudited -
Reconciliation of operating profit to income (loss)
before financial income
(in millions) |
| 2004 |
| 2004 |
| 2003 |
|
|
| US $(1) |
| € |
| € |
|
Operating profit |
| 7,790 |
| 5,754 |
| 5,686 |
|
Pension and postretirement benefit (expenses) income, other than current and prior service costs and settlement/curtailment losses |
| (1,144 | ) | (845 | ) | (870 | ) |
Operating (profit) loss from affiliated and associated companies and financial (income) loss from related operating companies |
| 118 |
| 87 |
| (5 | ) |
Operating profit from discontinued operations |
| — |
| — |
| (84 | ) |
Pre-tax gains from the sale of operating businesses and discontinued operations |
| — |
| — |
| (1,031 | ) |
Miscellaneous items |
| (520 | ) | (384 | ) | (308 | ) |
Income (loss) before financial income |
| 6,244 |
| 4,612 |
| 3,388 |
|
(1) Rate of exchange: € 1 = US $ 1.3538 (based on the noon buying rate on Dec. 31, 2004).
- unaudited -
Financial income (expense), net
|
| year ended December 31, |
| ||||
(in millions) |
| 2004 |
| 2003 |
| 2002 |
|
|
| € |
| € |
| € |
|
Impairment of investment in EADS |
| — |
| (1,960 | ) | — |
|
Other income from investments |
| (606 | ) | (477 | ) | 2,638 |
|
Income (loss) from investments, net |
| (606 | ) | (2,437 | ) | 2,638 |
|
Interest expense, net |
| (300 | ) | (390 | ) | (320 | ) |
Other financial income (loss), net |
| (171 | ) | 35 |
| (112 | ) |
Financial income (expense), net |
| (1,077 | ) | (2,792 | ) | 2,206 |
|
Consolidated Balance Sheet - Group |
|
- unaudited -
|
| at December 31, |
| ||||
(in millions) |
| 2004 |
| 2004 |
| 2003 |
|
|
| US $(1) |
| € |
| € |
|
Assets |
|
|
|
|
|
|
|
Goodwill |
| 2,712 |
| 2,003 |
| 1,816 |
|
Other intangible assets |
| 3,616 |
| 2,671 |
| 2,819 |
|
Property, plant and equipment, net |
| 46,031 |
| 34,001 |
| 32,917 |
|
Investments and long-term financial assets |
| 9,535 |
| 7,043 |
| 8,748 |
|
Equipment on operating leases, net |
| 36,160 |
| 26,711 |
| 24,385 |
|
Fixed Assets |
| 98,054 |
| 72,429 |
| 70,685 |
|
Inventories |
| 22,733 |
| 16,792 |
| 14,948 |
|
Trade receivables |
| 9,410 |
| 6,951 |
| 6,081 |
|
Receivables from financial services |
| 76,876 |
| 56,785 |
| 52,638 |
|
Other receivables |
| 17,497 |
| 12,924 |
| 15,848 |
|
Securities |
| 5,258 |
| 3,884 |
| 3,268 |
|
Cash and cash equivalents |
| 10,520 |
| 7,771 |
| 11,017 |
|
Non-fixed assets |
| 142,294 |
| 105,107 |
| 103,800 |
|
Deferred taxes |
| 5,591 |
| 4,130 |
| 2,688 |
|
Prepaid expenses |
| 1,395 |
| 1,030 |
| 1,095 |
|
Total assets |
| 247,334 |
| 182,696 |
| 178,268 |
|
|
|
|
|
|
|
|
|
Liabilities and stockholders’ equity |
|
|
|
|
|
|
|
Stockholder’s equity |
| 45,408 |
| 33,541 |
| 34,481 |
|
Minority interests |
| 1,231 |
| 909 |
| 470 |
|
Accrued liabilities |
| 56,272 |
| 41,566 |
| 39,172 |
|
Financial liabilities |
| 103,728 |
| 76,620 |
| 75,690 |
|
Trade liabilities |
| 17,483 |
| 12,914 |
| 11,583 |
|
Other liabilities |
| 11,788 |
| 8,707 |
| 8,805 |
|
Liabilities |
| 132,999 |
| 98,241 |
| 96,078 |
|
Deferred taxes |
| 2,963 |
| 2,189 |
| 2,736 |
|
Deferred income |
| 8,461 |
| 6,250 |
| 5,331 |
|
Total liabilities and stockholders’ equity |
| 247,334 |
| 182,696 |
| 178,268 |
|
|
|
|
|
|
|
|
|
Equity ratio [%](2) |
| 17.5 |
| 17.5 |
| 18.5 |
|
(1) Rate of exchange: € 1 = US $ 1.3538 (based on the noon buying rate on Dec. 31, 2004).
(2) Based on equity excluding proposed dividend.
Consolidated Balance Sheets - Industrial Business and Financial Services |
|
|
- unaudited -
|
| Industrial Business |
| Financial Services |
| ||||
|
| at December 31, |
| at December 31, |
| ||||
(in millions) |
| 2004 |
| 2003 |
| 2004 |
| 2003 |
|
|
| € |
| € |
| € |
| € |
|
Assets |
|
|
|
|
|
|
|
|
|
Goodwill |
| 1,945 |
| 1,757 |
| 58 |
| 59 |
|
Other intangible assets |
| 2,602 |
| 2,731 |
| 69 |
| 88 |
|
Property, plant and equipment, net |
| 33,835 |
| 32,761 |
| 166 |
| 156 |
|
Investments and long-term financial assets |
| 6,767 |
| 8,416 |
| 276 |
| 332 |
|
Equipment on operating leases, net |
| 3,099 |
| 2,890 |
| 23,612 |
| 21,495 |
|
Fixed Assets |
| 48,248 |
| 48,555 |
| 24,181 |
| 22,130 |
|
Inventories |
| 15,317 |
| 13,560 |
| 1,475 |
| 1,388 |
|
Trade receivables |
| 6,755 |
| 5,851 |
| 196 |
| 230 |
|
Receivables from financial services |
| — |
| — |
| 56,785 |
| 52,638 |
|
Other receivables |
| 9,209 |
| 11,129 |
| 3,715 |
| 4,719 |
|
Securities |
| 3,474 |
| 2,801 |
| 410 |
| 467 |
|
Cash and cash equivalents |
| 6,771 |
| 9,719 |
| 1,000 |
| 1,298 |
|
Non-fixed assets |
| 41,526 |
| 43,060 |
| 63,581 |
| 60,740 |
|
Deferred taxes |
| 3,988 |
| 2,527 |
| 142 |
| 161 |
|
Prepaid expenses |
| 953 |
| 1,002 |
| 77 |
| 93 |
|
Total assets |
| 94,715 |
| 95,144 |
| 87,981 |
| 83,124 |
|
|
|
|
|
|
|
|
|
|
|
Liabilities and stockholders’ equity |
|
|
|
|
|
|
|
|
|
Stockholder’s equity |
| 25,439 |
| 26,361 |
| 8,102 |
| 8,120 |
|
Minority interests |
| 885 |
| 454 |
| 24 |
| 16 |
|
Accrued liabilities |
| 40,506 |
| 38,439 |
| 1,060 |
| 733 |
|
Financial liabilities |
| 8,680 |
| 11,779 |
| 67,940 |
| 63,911 |
|
Trade liabilities |
| 12,704 |
| 11,359 |
| 210 |
| 224 |
|
Other liabilities |
| 6,095 |
| 6,030 |
| 2,612 |
| 2,775 |
|
Liabilities |
| 27,479 |
| 29,168 |
| 70,762 |
| 66,910 |
|
Deferred taxes |
| (3,989 | ) | (3,377 | ) | 6,178 |
| 6,113 |
|
Deferred income |
| 4,395 |
| 4,099 |
| 1,855 |
| 1,232 |
|
Total liabilities and stockholders’ equity |
| 94,715 |
| 95,144 |
| 87,981 |
| 83,124 |
|
|
|
|
|
|
|
|
|
|
|
Equity ratio [%](1) |
| 25.3 |
| 26.1 |
|
|
|
|
|
(1) Based on equity excluding proposed dividend.
Cash Flow and Net Liquidity |
|
|
- unaudited -
Cash flow information
|
|
|
|
|
| Industrial Business |
| Financial Services |
| ||||
|
| at December 31, |
| at December 31, |
| at December 31, |
| ||||||
(in millions) |
| 2004 |
| 2003 |
| 2004 |
| 2003 |
| 2004 |
| 2003 |
|
|
| € |
| € |
| € |
| € |
| € |
| € |
|
Cash provided by operating activities(1) |
| 11,060 |
| 13,826 |
| 3,753 |
| 6,785 |
| 7,307 |
| 7,041 |
|
Cash used for investing activities(1) |
| (16,682 | ) | (13,608 | ) | (2,869 | ) | (3,180 | ) | (13,813 | ) | (10,428 | ) |
Cash provided by (used for) financing activities |
| 2,549 |
| 2,518 |
| (3,681 | ) | (1,316 | ) | 6,230 |
| 3,834 |
|
(1) Amounts reported in previous years have been reclassified to conform with current year presentation.
Reconciliation to free cash flow
|
|
|
|
|
| Industrial Business |
| Financial Services |
| ||||
|
| at December 31, |
| at December 31, |
| at December 31, |
| ||||||
(in millions) |
| 2004 |
| 2003 |
| 2004 |
| 2003 |
| 2004 |
| 2003 |
|
|
| € |
| € |
| € |
| € |
| € |
| € |
|
Cash provided by operating activities |
| 11,060 |
| 13,826 |
| 3,753 |
| 6,785 |
| 7,307 |
| 7,041 |
|
Cash used for investing activities |
| (16,682 | ) | (13,608 | ) | (2,869 | ) | (3,180 | ) | (13,813 | ) | (10,428 | ) |
Change in liquidity (> 3 months) |
| 853 |
| 396 |
| 873 |
| 272 |
| (20 | ) | 124 |
|
Free Cash Flow |
| (4,769 | ) | 614 |
| 1,757 |
| 3,877 |
| (6,526 | ) | (3,263 | ) |
Net liquidity
|
|
|
|
|
| Industrial Business |
| Financial Services |
| ||||
|
| at December 31, |
| at December 31, |
| at December 31, |
| ||||||
(in millions) |
| 2004 |
| 2003 |
| 2004 |
| 2003 |
| 2004 |
| 2003 |
|
|
| € |
| € |
| € |
| € |
| € |
| € |
|
Cash & cash equivalents |
|
|
|
|
|
|
|
|
|
|
|
|
|
originally maturing within 3 months |
| 7,381 |
| 10,767 |
| 6,381 |
| 9,469 |
| 1,000 |
| 1,298 |
|
originally maturing after 3 months |
| 390 |
| 250 |
| 390 |
| 250 |
| — |
| — |
|
Total cash and cash equivalents |
| 7,771 |
| 11,017 |
| 6,771 |
| 9,719 |
| 1,000 |
| 1,298 |
|
Securities |
| 3,884 |
| 3,268 |
| 3,474 |
| 2,801 |
| 410 |
| 467 |
|
Other |
| — |
| — |
| — |
| — |
| — |
| — |
|
Liquidity |
| 11,655 |
| 14,285 |
| 10,245 |
| 12,520 |
| 1,410 |
| 1,765 |
|
Financial liabilities(1) |
| (75,990 | ) | (74,652 | ) | (8,051 | ) | (10,745 | ) | (67,939 | ) | (63,907 | ) |
Net liquidity |
| (64,335 | ) | (60,367 | ) | 2,194 |
| 1,775 |
| (66,529 | ) | (62,142 | ) |
(1) Adjusted for market valuation.
Performance Measures |
|
|
- unaudited -
Net Assets and Return on Net Assets
|
| 2004 |
| 2003 |
| 2004 |
| 2003 |
|
|
| (annual average, in billions of €) |
| % |
| % |
| ||
|
| Net Assets |
| Return on Net Assets |
| ||||
DaimlerChrysler Group (after taxes) |
| 56.3 |
| 60.0 |
| 5.6 |
| 2.4 |
|
|
|
|
|
|
|
|
|
|
|
Industrial divisions (before interest and taxes) |
|
|
|
|
|
|
|
|
|
Mercedes Car Group |
| 13.5 |
| 12.8 |
| 12.3 |
| 24.3 |
|
Chysler Group |
| 8.7 |
| 11.6 |
| 16.4 |
| (4.4 | ) |
Commercial Vehicles |
| 9.7 |
| 7.0 |
| 13.8 |
| 11.5 |
|
Other industrial activities (1) |
| 4.7 |
| 6.4 |
| 13.4 |
| 22.4 |
|
|
| Stockholder’s Equity |
| Return on Equity |
| ||||
|
|
|
|
|
|
|
|
|
|
Financial Services (before taxes) |
| 8.1 |
| 8.4 |
| 22.0 |
| 17.7 |
|
(1) Includes the Business Unit Off-Highway and the investment in EADS; 2003 also including MTU Aero Engines and the investment in MMC.
Net Assets (year-end) of the DaimlerChrysler Group
(in millions) |
| 2004 |
| 2003 |
|
|
| € |
| € |
|
Stockholder’s equity |
| 31,479 |
| 31,913 |
|
Minority interests |
| 909 |
| 470 |
|
Financial liabilities of the industrial segment |
| 8,680 |
| 11,779 |
|
Pension provisions of the industrial segment |
| 13,867 |
| 13,416 |
|
Net assets |
| 54,935 |
| 57,578 |
|
Reconciliation to Net Operating Income
(in millions) |
| 2004 |
| 2003 |
|
|
| € |
| € |
|
Net income (loss) |
| 2,466 |
| 448 |
|
Minority interests |
| (108 | ) | 35 |
|
Interest expense related to industrial activities, after taxes |
| 295 |
| 377 |
|
Interest cost of pensions related to industrial activities, after taxes |
| 512 |
| 607 |
|
Net operating income |
| 3,165 |
| 1,467 |
|
Assumptions for the valuation of pension obligations and return on plan assets
|
| 2004 |
| 2003 |
| ||||
(in%) |
| German |
| US |
| German |
| US |
|
Discount rate for the valuation of the projected benefit obligations at year-end |
| 4.75 |
| 5.75 |
| 5.25 |
| 6.25 |
|
Expected return on plan assets |
| 7.50 |
| 8.50 |
| 7.50 |
| 8.50 |
|
Actual return on plan assets |
| 8.20 |
| 13.70 |
| 14.60 |
| 23.00 |
|
Compensation of the Board of Management |
|
- unaudited -
Compensation of the Board of Management
|
| 2004 |
| 2003 |
| 04/03 |
|
Total remuneration (in millions of €) |
| 31.6 |
| 40.8 |
| -22.5 | % |
Number of performance-based awards |
| 395,000 |
| 503,000 |
| -21.5 | % |
Number of stock options |
| 1,265,000 |
| 3,140,000 |
| -59.7 | % |
SIGNATURES
Pursuant to the requirements of the Securities Exchange Act of 1934, the registrant has duly caused this report to be signed on its behalf by the undersigned, thereunto duly authorized.
| DaimlerChrysler AG | |||
|
|
| ||
|
|
| ||
| By: | /s/ ppa. | Robert Köthner |
|
|
| Name: | Robert Köthner | |
|
| Title: | Vice President | |
|
|
| Chief Accounting Officer | |
|
|
|
| |
|
|
|
| |
| By: | /s/ i.V. | Silvia Nierbauer |
|
|
| Name: | Silvia Nierbauer | |
|
| Title: | Director | |
|
|
| ||
|
|
| ||
Date: February 10, 2005 |
|
| ||