UNITED STATES
SECURITIES AND EXCHANGE COMMISSION
Washington, D.C. 20549
FORM N-CSR
CERTIFIED SHAREHOLDER REPORT OF REGISTERED MANAGEMENT
INVESTMENT COMPANIES
| | |
| Investment Company Act file number: | | 811-08915 |
| |
| Exact name of registrant as specified in charter: | | Strategic Partners Asset Allocation Funds |
| |
| Address of principal executive offices: | | Gateway Center 3, 100 Mulberry Street, Newark, New Jersey 07102 |
| |
| Name and address of agent for service: | | Deborah A. Docs Gateway Center 3, 100 Mulberry Street, Newark, New Jersey 07102 |
| |
| Registrant’s telephone number, including area code: | | 973-367-7521 |
| |
| Date of fiscal year end: | | 7/31/2005 |
| |
| Date of reporting period: | | 1/31/2005 |
Item 1 – Reports to Stockholders – [ INSERT REPORT ]
SEMIANNUAL REPORT
JANUARY 31, 2005

STRATEGIC PARTNERS
ASSET ALLOCATION FUNDS

STRATEGIC PARTNERS
Conservative Growth Fund
OBJECTIVE
Seeks current income and a reasonable level of capital appreciation
This report is not authorized for distribution to prospective investors unless preceded or accompanied by a current prospectus.
The views expressed in this report and information about the Fund’s portfolio holdings are for the period covered by this report and are subject to change thereafter.
Dear Shareholder,
March 15, 2005
We hope that you find the semiannual report for the Strategic Partners Conservative Growth Fund informative and useful. As a Strategic Partners Mutual Fund shareholder, you may be thinking where you can find additional growth opportunities. You could invest in last year’s top-performing asset class and hope that history repeats itself or you could stay in cash while waiting for the “right moment” to invest.
We believe it is wise to take advantage of developing domestic and global investment opportunities through a diversified portfolio of stock and bond mutual funds. A diversified asset allocation offers two advantages. It helps you manage downside risk by not being overly exposed to any particular asset class, plus it gives you a better opportunity to have at least some of your assets in the right place at the right time. Your financial professional can help you create a diversified investment plan that may include mutual funds that cover all the basic asset classes and reflects your personal investment profile and tolerance for risk.
Strategic Partners Mutual Funds gives you a wide range of choices that can help you make progress toward your financial goals. Our funds feature leading asset managers not just from a single company but from the entire investment industry.
Thank you for choosing Strategic Partners Mutual Funds.
Sincerely,

Judy A. Rice, President
Strategic Partners Conservative Growth Fund
| | |
| Strategic Partners Asset Allocation Funds/Strategic Partners Conservative Growth Fund | | 1 |
Your Fund’s Performance
Performance data quoted represent past performance. Past performance does not guarantee future results. The investment return and principal value of an investment will fluctuate so that an investor’s shares, when redeemed, may be worth more or less than their original cost. Current performance may be lower or higher than the past performance data quoted. An investor may obtain performance data current to the most recent month-end by visiting our website at www.strategicpartners.com or by calling (800) 225-1852. The maximum initial sales charge is 5.50% (Class A Shares).
| | | | | | | | |
| Cumulative Total Returns1 as of 1/31/05 | | | | | | | | |
| | | Six Months | | One Year | | Five Years | | Since Inception2 |
Class A | | 6.87% | | 5.87% | | 29.50% | | 43.88% |
Class B | | 6.48 | | 5.10 | | 24.91 | | 37.51 |
Class C | | 6.48 | | 5.10 | | 24.91 | | 37.51 |
Class M | | N/A | | N/A | | N/A | | 3.20 |
Class R | | N/A | | N/A | | N/A | | 3.29 |
Class X | | N/A | | N/A | | N/A | | 3.11 |
Class Z | | 7.00 | | 6.13 | | 31.03 | | 46.12 |
S&P 500 Index3 | | 8.15 | | 6.22 | | –8.55 | | *** |
Customized Blend4 | | 6.99 | | 6.30 | | 28.18 | | **** |
Lipper Balanced Funds Avg.5 | | 6.88 | | 5.12 | | 13.39 | | ***** |
| | | | | | | | | |
| Average Annual Total Returns1 as of 12/31/04 | | | | |
| | | | | One Year | | Five Years | | Since Inception2 |
Class A | | | | 2.77% | | 3.90% | | 5.35% |
Class B | | | | 2.86 | | 4.14 | | 5.54 |
Class C | | | | 6.86 | | 4.31 | | 5.54 |
Class M | | | | N/A | | N/A | | N/A |
Class R | | | | N/A | | N/A | | N/A |
Class X | | | | N/A | | N/A | | N/A |
Class Z | | | | 9.02 | | 5.33 | | 6.60 |
S&P 500 Index3 | | | | 10.87 | | –2.30 | | 2.17 |
Customized Blend4 | | | | 9.10 | | 4.89 | | 5.75 |
Lipper Balanced Funds Avg.5 | | | | 7.93 | | 2.01 | | 3.82 |
The cumulative total returns do not reflect the deduction of applicable sales charges. If reflected, the applicable sales charges would reduce the cumulative total returns performance quoted. Class A shares are subject to a maximum front-end sales charge of 5.50%. Under certain circumstances, Class A shares may be subject to a contingent deferred sales charge (CDSC) of 1%. Class B and Class C shares are subject to a maximum CDSC of 5% and 1% respectively. Class M and Class X shares are subject to a maximum CDSC of 6%. Class R and Class Z shares are not subject to a sales charge.
| | |
| 2 | | Visit our website at www.strategicpartners.com |
1Source: Prudential Investments LLC and Lipper Inc. The average annual total returns take into account applicable sales charges. During certain periods shown, fee waivers and/or expense reimbursements were in effect. Without such fee waivers and expense reimbursements, the returns for the classes would have been lower. Class A, Class B, Class C, Class M, Class R, and Class X shares are subject to an annual distribution and service (12b-1) fee of up to 0.30%, 1.00%, 1.00%, 1.00%, 0.75%, and 1.00% respectively. Approximately seven years after purchase, Class B shares will automatically convert to Class A shares on a quarterly basis. Approximately eight years after purchase, Class M shares will automatically convert to Class A shares on a quarterly basis. Approximately ten years after purchase (eight years in the case of shares purchased prior to August 19, 1998), Class X shares will automatically convert to Class A shares on a quarterly basis. Class Z shares are not subject to a 12b-1 fee. The returns in the tables do not reflect the deduction of taxes that a shareholder would pay on Fund distributions or following the redemption of Fund shares.
2Inception dates: Class A, Class B, Class C, and Class Z, 11/18/98; Class M, Class R, and Class X, 10/04/04.
3The Standard & Poor’s 500 Composite Stock Price Index (S&P 500 Index) is an unmanaged index of 500 stocks of large U.S. public companies. It gives a broad look at how U.S. stock prices have performed.
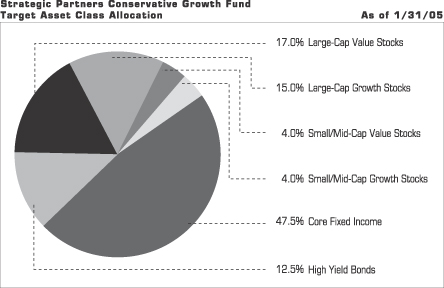
4The Customized Benchmark for Strategic Partners Conservative Growth Fund (Customized Blend) is a model portfolio consisting of the S&P Barra Value Index (15%), the S&P Barra Growth Index (15%), the Russell 2000 Value Index (5%), the Russell 2000 Growth Index (5%), the Lehman Brothers U.S. Aggregate Bond Index (40%), and the Lehman Brothers U.S. Corporate High Yield Index (20%). Each component of the Customized Blend is an unmanaged index generally considered as representing the performance of its asset class. The Customized Blend is intended to provide a theoretical comparison to the Fund’s performance, based on the amounts allocated to each asset class. The Customized Blend does not reflect deductions for any sales charges or operating expenses of a mutual fund.
5The Lipper Balanced Funds Average (Lipper Average) represents returns based on the average return of all funds in the Lipper Balanced Funds category for the periods noted. Funds in the Lipper Average have a primary investment objective of conserving principal by maintaining at all times a balanced portfolio of both stocks and bonds. Typically, the stock:bond ratio ranges around 60%:40%.
Investors cannot invest directly in an index. The returns for the S&P 500 Index and the Customized Blend would be lower if they included the effects of sales charges, operating expenses of a mutual fund, or taxes. Returns for the Lipper Average reflect the deduction of operating expenses, but not sales charges or taxes. The Since Inception returns for the S&P 500 Index, Customized Blend, and the Lipper Average are measured from the closest month-end to inception date, and not from the Fund’s actual inception date.
***S&P 500 Index Closest Month-End to inception cumulative total returns as of 1/31/05 are 11.18% for Classes A, B, C, and Z. S&P 500 Index Closest Month-End to inception cumulative total returns as of 1/31/05 are 6.57% for Classes M, R, and X.
****Customized Blend Closest Month-End to inception cumulative total returns as of 1/31/05 are 39.22% for Classes A, B, C, and Z. Customized Blend Closest Month-End to inception cumulative total returns as of 1/31/05 are 4.46% for Classes M, R, and X.
*****Lipper Average Closest Month-End to inception cumulative total returns as of 1/31/05 are 25.31% for Classes A, B, C, and Z. Lipper Average Closest Month-End to inception cumulative total returns as of 1/31/05 are 5.02% for Classes M, R, and X.
| | |
| Strategic Partners Asset Allocation Funds/Strategic Partners Conservative Growth Fund | | 3 |
Your Fund’s Performance
Fund objective
The investment objective of the Strategic Partners Conservative Growth Fund (the Fund) is current income and a reasonable level of capital appreciation. There can be no assurance that the Fund will achieve its investment objective.
Please note that on or about March 31, 2005, the Fund intends to change its name to Strategic Partners Conservative Allocation Fund and to change certain subadvisers for certain portions of the Fund’s portfolio.
Asset classes are classifications of investments
Stocks are shares of ownership in a firm. Owners share in the profits after debts are paid and in the firm’s appreciation in value. Generally, the prices of stocks vary with investors’ estimates of a firm’s earnings prospects, including the impact of broader economic conditions.
Bonds are loans to a company, government, or government agency. They carry a fixed interest rate or one that varies according to the terms specified in the bond. They have a maturity date at which they must be repaid. Generally, bond prices fluctuate with current interest rates and with events that affect the debtor’s prospects of repaying the loan. High yield bonds are also known as “junk” bonds. They are subject to greater risk of loss of principal and interest, including default risk, than higher-rated bonds.
| | |
| 4 | | Visit our website at www.strategicpartners.com |
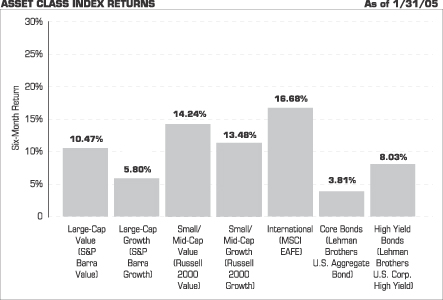
Source: Lipper Inc.
The chart above shows the total returns for six months ended January 31, 2005, of various securities indexes that are generally considered representative of broad market sectors and does not reflect a mutual fund’s expenses. The performance cited does not represent the performance of the Strategic Partners Conservative Growth Fund. Past performance is not indicative of future results. Investors cannot invest directly in an index.
The S&P Barra Value Index contains those securities in the S&P 500 Index with higher book-to-price ratios.
The S&P Barra Growth Index contains those securities in the S&P 500 Index with lower book-to-price ratios.
The Russell 2000 Value Index contains those securities in the Russell 2000 Index with a below-average growth orientation. Companies in this index generally have low price-to-book and price-to-earnings ratios, higher dividend yields, and lower forecasted growth values.
The Russell 2000 Growth Index contains those securities in the Russell 2000 Index with an above-average growth orientation. Companies in this index tend to exhibit higher price-to-book and price-to-earnings ratios, lower dividend yields, and higher forecasted growth values.
The Morgan Stanley Capital International Europe, Australasia, and Far East Index (MSCI EAFE Index) is an unmanaged, weighted index that reflects stock price movements in Europe, Australasia, and the Far East. It gives a broad look at how foreign stock prices have performed.
The Lehman Brothers U.S. Aggregate Bond Index is an unmanaged index of investment-grade securities issued by the U.S. government and its agencies, and by corporations with between 1 and 10 years remaining to maturity. It gives a broad look at how short- and intermediate-term bonds have performed.
The Lehman Brothers U.S. Corporate High Yield Index is an unmanaged index of fixed-rate, noninvestment-grade debt securities with at least one year remaining to maturity. The Lehman Brothers U.S. Corporate High Yield Index gives a broad look at how high yield (junk) bonds have performed.
| | |
| Strategic Partners Asset Allocation Funds/Strategic Partners Conservative Growth Fund | | 5 |
Fees and Expenses (Unaudited)
As a shareholder of the Fund, you incur two types of costs: (1) transaction costs, including sales charges (loads) on purchase payments and redemptions, as applicable, and (2) ongoing costs, including management fees, distribution and/or service (12b-1) fees, and other Fund expenses, as applicable. This example is intended to help you understand your ongoing costs (in dollars) of investing in the Fund and to compare these costs with the ongoing costs of investing in other mutual funds.
The example is based on an investment of $1,000 invested on August 1, 2004, at the beginning of the period, and held through the six-month period ended January 31, 2005.
The Fund may charge additional fees to holders of certain accounts that are not included in the expenses shown in the table. These fees apply to Individual Retirement Accounts (IRAs), Section 403(b) accounts, and Section 529 plan accounts. As of the close of the six months covered by the table, IRA fees included a setup fee of $5, a maintenance fee of up to $36 annually ($18 for the six-month period), and a termination fee of $10. Section 403(b) accounts and Section 529 plan accounts are each charged an annual $25 fiduciary maintenance fee ($12.50 for the six-month period). Some of the fees vary in amount, or are waived, based on your total account balance or the number of JennisonDryden or Strategic Partners funds, including the Fund, that you own. You should consider the additional fees that were charged to your Fund account over the six-month period when you estimate the total ongoing expenses paid over the period and the impact of these fees on your ending account value, as these additional expenses are not reflected in the information provided in the expense table. Additional fees have the effect of reducing investment returns.
Actual Expenses
The first line for each share class in the following table provides information about actual account values and actual expenses. You may use the information on this line, together with the amount you invested, to estimate the expenses that you paid over the period. Simply divide your account value by $1,000 (for example, an $8,600 account value ÷ $1,000 = 8.6), then multiply the result by the number in the first line under the heading “Expenses Paid During the Six-Month Period” to estimate the expenses you paid on your account during this period.
Hypothetical Example for Comparison Purposes
The second line for each share class in the following table provides information about hypothetical account values and hypothetical expenses based on the Fund’s actual expense ratio and an assumed rate of return of 5% per year before expenses, which is not the Fund’s actual return. The hypothetical account values and expenses may not
| | |
| 6 | | Visit our website at www.strategicpartners.com |
be used to estimate the actual ending account balance or expenses you paid for the period. You may use this information to compare the ongoing costs of investing in the Fund and other funds. To do so, compare this 5% hypothetical example with the 5% hypothetical examples that appear in the shareholder reports of the other funds.
Please note that the expenses shown in the table are meant to highlight your ongoing costs only, and do not reflect any transactional costs such as sales charges (loads). Therefore the second line for each share class in the table is useful in comparing ongoing costs only, and will not help you determine the relative total costs of owning different funds. In addition, if these transactional costs were included, your costs would have been higher.
Classes M, R and X have been in existence for less than six months, therefore no expenses are presented for these classes. Classes M, R and X commenced October 4, 2004.
| | | | | | | | | | | | | | |
Strategic Partners
Conservative Growth
Fund | | Beginning Account
Value
August 1, 2004 | | Ending Account
Value January 31, 2005 | | Annualized
Expense Ratio
Based on the
Six-Month Period | | | Expenses Paid
During the Six-
Month Period* |
| | | | | | | | | | | | | | | |
| Class A | | Actual | | $ | 1,000 | | $ | 1,069 | | 1.37 | % | | $ | 7.14 |
| | | Hypothetical | | $ | 1,000 | | $ | 1,018 | | 1.37 | % | | $ | 6.97 |
| | | | | | | | | | | | | | | |
| Class B | | Actual | | $ | 1,000 | | $ | 1,065 | | 2.12 | % | | $ | 11.03 |
| | | Hypothetical | | $ | 1,000 | | $ | 1,015 | | 2.12 | % | | $ | 10.77 |
| | | | | | | | | | | | | | | |
| Class C | | Actual | | $ | 1,000 | | $ | 1,065 | | 2.12 | % | | $ | 11.03 |
| | | Hypothetical | | $ | 1,000 | | $ | 1,015 | | 2.12 | % | | $ | 10.77 |
| | | | | | | | | | | | | | | |
| Class Z | | Actual | | $ | 1,000 | | $ | 1,070 | | 1.12 | % | | $ | 5.84 |
| | | Hypothetical | | $ | 1,000 | | $ | 1,020 | | 1.12 | % | | $ | 5.70 |
| | | | | | | | | | | | | | | |
* Fund expenses for each share class are equal to the annualized expense ratio for each share class (provided in the table), multiplied by the average account value over the period, multiplied by the 184 days in the six-month period ended January 31, 2005, and divided by the 365 days in the Fund’s fiscal year ending July 31, 2005 (to reflect the six-month period).
| | |
| Strategic Partners Asset Allocation Funds/Strategic Partners Conservative Growth Fund | | 7 |
This Page Intentionally Left Blank
Portfolio of Investments
as of January 31, 2005 (Unaudited)
| | | | | |
| Shares | | Description | | Value (Note1) |
| | | | | | |
LONG-TERM INVESTMENTS 79.6% | | | |
COMMON STOCK 38.5% | | | |
| |
Aerospace & Defense 0.6% | | | |
| 2,240 | | Applied Signal Technology, Inc. | | $ | 66,013 |
| 2,580 | | DRS Technologies, Inc.(a) | | | 104,748 |
| 200 | | Empresa Brasileira de Aeronautica SA | | | 6,370 |
| 1,500 | | Engineered Support Systems, Inc. | | | 87,015 |
| 6,400 | | Lockheed Martin Corp. | | | 369,984 |
| 2,990 | | Mercury Computer Systems, Inc.(a) | | | 92,600 |
| 2,750 | | Moog, Inc. (Class A shares)(a) | | | 119,598 |
| 6,500 | | Northrop Grumman Corp. | | | 337,220 |
| | | | |
|
|
| | | | | | 1,183,548 |
| |
Air Freight & Logistics 0.2% | | | |
| 6,900 | | United Parcel Service, Inc., (Class B shares) | | | 515,292 |
| |
Apparel 0.2% | | | |
| 9,160 | | Ashworth, Inc.(a) | | | 103,233 |
| 2,580 | | Oxford Industries, Inc. | | | 95,925 |
| 5,400 | | Phillips-Van Heusen Corp. | | | 146,934 |
| | | | |
|
|
| | | | | | 346,092 |
| |
Auto Components | | | |
| 5,420 | | IMPCO Technologies, Inc.(a) | | | 31,599 |
| | |
Automobiles | | | | | |
| 2,200 | | Winnebago Industries, Inc. | | | 75,878 |
| |
Banks 0.1% | | | |
| 3,300 | | BankUnited Financial Corp. (Class A shares)(a) | | | 96,294 |
| 1,100 | | Hibernia Corp. (Class A shares) | | | 28,952 |
| 2,700 | | PrivateBancorp, Inc. | | | 88,290 |
| | | | |
|
|
| | | | | | 213,536 |
| |
Biotechnology 0.9% | | | |
| 10,400 | | Amgen, Inc.(a) | | | 647,296 |
| 14,900 | | Genentech, Inc.(a) | | | 710,879 |
| 10,500 | | Gilead Sciences, Inc.(a) | | | 347,550 |
| 10,300 | | Medimmune, Inc.(a) | | | 243,647 |
| | | | |
|
|
| | | | | | 1,949,372 |
See Notes to Financial Statements.
| | |
| Strategic Partners Asset Allocation Funds/Strategic Partners Conservative Growth Fund | | 9 |
Portfolio of Investments
as of January 31, 2005 (Unaudited) Cont’d.
| | | | | |
| Shares | | Description | | Value (Note1) |
| | | | | | |
Building Products 0.1% | | | |
| 3,400 | | Watsco, Inc. | | $ | 117,674 |
| |
Capital Markets 1.6% | | | |
| 4,800 | | Goldman Sachs Group, Inc. | | | 517,680 |
| 7,800 | | Lehman Brothers Holdings, Inc. | | | 711,282 |
| 9,500 | | Mellon Financial Corp. | | | 278,825 |
| 19,400 | | Merrill Lynch & Co., Inc. | | | 1,165,358 |
| 16,000 | | The Bank of New York Co., Inc. | | | 475,360 |
| 25,100 | | The Charles Schwab Corp. | | | 282,124 |
| | | | |
|
|
| | | | | | 3,430,629 |
| |
Chemicals 0.5% | | | |
| 8,600 | | E. I. Du Pont de Nemours & Co. | | | 409,016 |
| 27,100 | | Mosaic Company(a) | | | 447,150 |
| 1,600 | | Scotts Co. (Class A shares)(a) | | | 108,736 |
| 1,500 | | Valspar Corp. | | | 73,500 |
| | | | |
|
|
| | | | | | 1,038,402 |
| |
Commercial Banks 0.5% | | | |
| 15,706 | | Bank of America Corp. | | | 728,287 |
| 4,330 | | Nara Bancorp, Inc. | | | 86,384 |
| 2,900 | | Oriental Financial Group | | | 81,780 |
| 1,780 | | Signature Bank(a) | | | 54,165 |
| 2,950 | | Southwest Bancorp of Texas, Inc. | | | 58,322 |
| | | | |
|
|
| | | | | | 1,008,938 |
| |
Commercial Services & Supplies 1.1% | | | |
| 5,300 | | Administaff, Inc.(a) | | | 77,327 |
| 8,100 | | Allied Waste Industries, Inc.(a) | | | 67,311 |
| 20,100 | | Cendant Corp. | | | 473,356 |
| 1,750 | | Chemed Corp. | | | 125,335 |
| 2,300 | | Kelly Services, Inc. (Class A shares) | | | 66,930 |
| 9,660 | | Kforce, Inc.(a) | | | 106,936 |
| 2,090 | | Laureate Education, Inc.(a) | | | 92,712 |
| 1,590 | | Mcgrath Rentcorp | | | 68,306 |
| 3,220 | | Navigant Consulting, Inc.(a) | | | 77,055 |
| 18,900 | | PHH Corp.(a) | | | 415,800 |
| 3,890 | | Providence Service, Corp.(a) | | | 78,967 |
| 3,200 | | Republic Services, Inc. | | | 105,504 |
| 2,500 | | School Specialty, Inc.(a) | | | 97,225 |
| 15,700 | | Waste Management, Inc. | | | 455,300 |
| | | | |
|
|
| | | | | | 2,308,064 |
See Notes to Financial Statements.
| | |
| 10 | | Visit our website at www.strategicpartners.com |
| | | | | |
| Shares | | Description | | Value (Note1) |
| | | | | | |
Communication Equipment 1.1% | | | |
| 19,400 | | Avaya, Inc.(a) | | $ | 278,390 |
| 34,400 | | Cisco Systems, Inc.(a) | | | 620,576 |
| 6,700 | | Harmonic, Inc.(a) | | | 76,380 |
| 97,200 | | Nortel Networks Corp. (Canada)(a) | | | 315,900 |
| 18,500 | | Qualcomm, Inc. | | | 688,940 |
| 3,700 | | Research In Motion Ltd.(a) | | | 263,773 |
| 6,960 | | Symmetricom, Inc.(a) | | | 67,721 |
| | | | |
|
|
| | | | | | 2,311,680 |
| |
Computers & Peripherals 1.2% | | | |
| 11,600 | | Apple Computer, Inc.(a) | | | 892,040 |
| 17,300 | | Dell, Inc.(a) | | | 722,448 |
| 4,000 | | IBM Corp. | | | 373,680 |
| 1,900 | | Lexmark International, Inc.(a) | | | 158,365 |
| 3,100 | | M-Systems Flash Disk Pioneers (Israel)(a) | | | 62,341 |
| 3,880 | | Optimal Group, Inc.(a) | | | 51,876 |
| 15,900 | | Seagate Technology (Cayman Islands)(a) | | | 269,028 |
| | | | |
|
|
| | | | | | 2,529,778 |
| |
Consumer Finance 0.6% | | | |
| 17,900 | | American Express Co. | | | 954,965 |
| 12,500 | | MBNA Corp. | | | 332,250 |
| | | | |
|
|
| | | | | | 1,287,215 |
| | |
Distributors | | | | | |
| 4,030 | | Beacon Roofing Supply, Inc.(a) | | | 80,600 |
| |
Diversified Financial Services 1.9% | | | |
| 2,900 | | Accredited Home Lenders Holding Co.(a) | | | 140,882 |
| 7,900 | | AmeriCredit Corp.(a) | | | 193,945 |
| 2,300 | | Astoria Financial Corp. | | | 86,572 |
| 22,500 | | Citigroup, Inc. | | | 1,103,625 |
| 6,600 | | Eaton Vance Corp. | | | 165,198 |
| 33,100 | | J.P. Morgan Chase & Co. | | | 1,235,622 |
| 4,500 | | Jefferies Group, Inc. | | | 175,500 |
| 13,700 | | Principal Financial Group | | | 555,946 |
| 4,750 | | Raymond James Financial, Inc. | | | 148,058 |
| 500 | | Student Loan Corp. | | | 90,330 |
| | | | |
|
|
| | | | | | 3,895,678 |
| |
Diversified Manufacturing | | | |
| 142 | | GenTek, Inc.(a) | | | 6,355 |
See Notes to Financial Statements.
| | |
| Strategic Partners Asset Allocation Funds/Strategic Partners Conservative Growth Fund | | 11 |
Portfolio of Investments
as of January 31, 2005 (Unaudited) Cont’d.
| | | | | |
| Shares | | Description | | Value (Note1) |
| | | | | | |
Diversified Telecommunication Services 0.6% | | | |
| 6,400 | | Alltel Corp. | | $ | 352,256 |
| 3,340 | | SafeNet, Inc.(a) | | | 113,360 |
| 22,300 | | SBC Communications, Inc. | | | 529,848 |
| 8,200 | | Verizon Communications, Inc. | | | 291,838 |
| | | | |
|
|
| | | | | | 1,287,302 |
| |
Electric Utilities 0.8% | | | |
| 3,000 | | E.ON AG ADR (Germany) | | | 268,170 |
| 9,400 | | Exelon Corp. | | | 415,950 |
| 4,200 | | PNM Resources, Inc. | | | 105,966 |
| 12,600 | | TXU Corp. | | | 871,920 |
| | | | |
|
|
| | | | | | 1,662,006 |
| |
Electrical Equipment | | | |
| 8,050 | | Artesyn Technologies, Inc.(a) | | | 81,949 |
| |
Electronic Equipment & Instruments 0.7% | | | |
| 31,200 | | Agilent Technologies, Inc.(a) | | | 689,832 |
| 3,190 | | BEI Technologies, Inc. | | | 89,926 |
| 1,200 | | Ceradyne, Inc.(a) | | | 40,476 |
| 7,400 | | Checkpoint Systems, Inc.(a) | | | 115,144 |
| 2,360 | | Faro Technologies, Inc.(a) | �� | | 68,062 |
| 3,600 | | FLIR Systems, Inc.(a) | | | 219,420 |
| 3,260 | | Radisys Corp.(a) | | | 56,887 |
| 10,100 | | Sanmina-SCI Corp.(a) | | | 62,418 |
| 12,850 | | SRS Labs., Inc.(a) | | | 66,692 |
| | | | |
|
|
| | | | | | 1,408,857 |
| |
Energy Equipment & Services 1.4% | | | |
| 1,730 | | Cal Dive International, Inc.(a) | | | 75,601 |
| 5,000 | | ENSCO International, Inc. | | | 171,150 |
| 18,100 | | GlobalSantaFe Corp. | | | 640,016 |
| 11,100 | | Halliburton Co. | | | 456,543 |
| 2,160 | | Maverick Tube Corp.(a) | | | 73,570 |
| 5,500 | | Patterson-UTI Energy, Inc. | | | 106,975 |
| 17,300 | | Schlumberger Ltd. (Netherlands) | | | 1,177,092 |
| 5,620 | | Superior Energy Services, Inc.(a) | | | 89,470 |
| 1,900 | | Unit Corp.(a) | | | 69,426 |
| | | | |
|
|
| | | | | | 2,859,843 |
See Notes to Financial Statements.
| | |
| 12 | | Visit our website at www.strategicpartners.com |
| | | | | |
| Shares | | Description | | Value (Note1) |
| | | | | | |
Food & Staples Retailing 0.9% | | | |
| 6,400 | | Costco Wholesale Corp. | | $ | 302,528 |
| 52,900 | | Kroger Co.(a) | | | 904,590 |
| 7,600 | | Whole Foods Market, Inc. | | | 679,592 |
| | | | |
|
|
| | | | | | 1,886,710 |
| |
Food Products 0.3% | | | |
| 19,700 | | Cadbury Schweppes PLC, ADR | | | 715,110 |
| |
Health Care Equipment & Supplies 0.6% | | | |
| 5,200 | | Abaxis, Inc.(a) | | | 70,512 |
| 1,490 | | Advanced Neuromodulation Systems, Inc.(a) | | | 58,870 |
| 4,200 | | Alcon, Inc. (Switzerland) | | | 332,639 |
| 3,700 | | Closure Medical Corp.(a) | | | 73,408 |
| 3,700 | | Cooper Companies, Inc. | | | 283,789 |
| 12,650 | | Encore Medical Corp.(a) | | | 71,346 |
| 900 | | Intuitive Surgical, Inc.(a) | | | 35,910 |
| 1,630 | | Laserscope(a) | | | 48,167 |
| 3,650 | | Lifeline Systems, Inc.(a) | | | 99,609 |
| 15,950 | | Orthovita, Inc.(a) | | | 61,089 |
| 2,590 | | PolyMedica Corp. | | | 96,944 |
| 15,450 | | Spectranetics Corp.(a) | | | 95,790 |
| 900 | | St. Jude Medical, Inc. | | | 35,352 |
| | | | |
|
|
| | | | | | 1,363,425 |
| |
Health Care Providers & Services 1.9% | | | |
| 4,200 | | Accredo Health, Inc.(a) | | | 125,076 |
| 3,690 | | America Service Group, Inc.(a) | | | 101,217 |
| 5,000 | | American Healthways, Inc.(a) | | | 155,900 |
| 2,100 | | Amerigroup Corp.(a) | | | 86,331 |
| 9,400 | | Caremark Rx, Inc.(a) | | | 367,540 |
| 6,300 | | Cigna Corp. | | | 505,575 |
| 3,700 | | Covance, Inc.(a) | | | 157,250 |
| 8,600 | | Express Scripts, Inc. (Class A shares)(a) | | | 638,033 |
| 2,640 | | Kindred Healthcare, Inc.(a) | | | 72,310 |
| 3,570 | | LabOne, Inc.(a) | | | 119,774 |
| 6,804 | | Medco Health Solutions, Inc.(a) | | | 289,646 |
| 4,800 | | Pharmaceutical Product Development, Inc.(a) | | | 198,960 |
| 5,100 | | Serologicals Corp. International(a) | | | 120,564 |
| 6,400 | | UnitedHealth Group, Inc. | | | 568,959 |
| 4,400 | | WellPoint, Inc.(a) | | | 534,600 |
| | | | |
|
|
| | | | | | 4,041,735 |
See Notes to Financial Statements.
| | |
| Strategic Partners Asset Allocation Funds/Strategic Partners Conservative Growth Fund | | 13 |
Portfolio of Investments
as of January 31, 2005 (Unaudited) Cont’d.
| | | | | |
| Shares | | Description | | Value (Note1) |
| | | | | | |
Homebuilding 0.2% | | | |
| 6,200 | | Hovnanian Enterprises, Inc. (Class A shares)(a) | | $ | 323,888 |
| |
Hotels, Restaurants & Leisure 0.8% | | | |
| 3,200 | | Brinker International, Inc.(a) | | | 120,352 |
| 2,200 | | CEC Entertainment, Inc.(a) | | | 86,108 |
| 10,020 | | Cosi, Inc.(a) | | | 60,120 |
| 11,000 | | McDonald’s Corp. | | | 356,290 |
| 2,300 | | Mikohn Gaming Corp.(a) | | | 23,000 |
| 3,025 | | Rare Hospitality International, Inc.(a) | | | 95,288 |
| 6,950 | | Scientific Games Corp. (Class A shares)(a) | | | 178,754 |
| 3,300 | | Sonic Corp.(a) | | | 105,072 |
| 10,600 | | Starbucks Corp.(a) | | | 572,400 |
| | | | |
|
|
| | | | | | 1,597,384 |
| |
Household Durables 0.6% | | | |
| 6,200 | | Harman International Industries, Inc. | | | 754,230 |
| 3,200 | | Meritage Corp.(a) | | | 206,880 |
| 4,200 | | Snap-On, Inc. | | | 139,062 |
| 2,800 | | Standard-Pacific Corp. | | | 186,284 |
| | | | |
|
|
| | | | | | 1,286,456 |
| |
Household Products 0.5% | | | |
| 2,270 | | Cost Plus, Inc.(a) | | | 59,542 |
| 6,900 | | Kimberly-Clark Corp. | | | 452,019 |
| 8,300 | | Procter & Gamble Co. | | | 441,809 |
| | | | |
|
|
| | | | | | 953,370 |
| |
Industrial Conglomerates 1.5% | | | |
| 53,300 | | General Electric Co. | | | 1,925,729 |
| 4,800 | | Phelps Dodge Corp. | | | 462,240 |
| 18,800 | | Tyco International Ltd. (Bermuda) | | | 679,432 |
| | | | |
|
|
| | | | | | 3,067,401 |
| |
Insurance 1.8% | | | |
| 4,800 | | Affirmative Insurance Holdings, Inc.(a) | | | 77,184 |
| 7,062 | | American International Group, Inc. | | | 468,140 |
| 2,500 | | Commerce Group, Inc. | | | 163,275 |
| 2,650 | | Delphi Financial Group (Class A shares) | | | 119,091 |
| 13,400 | | Genworth Financial, Inc. | | | 355,502 |
| 3,110 | | Infinity Property & Casualty Corp. | | | 101,853 |
| 8,200 | | Loews Corp. | | | 557,600 |
| 5,600 | | MBIA, Inc. | | | 334,544 |
See Notes to Financial Statements.
| | |
| 14 | | Visit our website at www.strategicpartners.com |
| | | | | |
| Shares | | Description | | Value (Note1) |
| | | | | | |
| 3,100 | | Philadelphia Consolidated Holding Corp.(a) | | $ | 207,917 |
| 1,500 | | Protective Life Corp. | | | 61,740 |
| 14,341 | | St. Paul Travelers Cos., Inc. (The) | | | 538,361 |
| 9,050 | | Tower Group, Inc. | | | 106,247 |
| 9,100 | | XL Capital, Ltd. (Cayman Islands) (Class A shares) | | | 680,498 |
| | | | |
|
|
| | | | | | 3,771,952 |
| |
Internet & Catalog Retail 0.5% | | | |
| 12,500 | | eBay, Inc.(a) | | | 1,018,750 |
| |
Internet Software & Services 1.3% | | | |
| 3,590 | | Ask Jeeves, Inc.(a) | | | 101,812 |
| 12,010 | | Digitas, Inc.(a) | | | 125,384 |
| 1,700 | | Equinix, Inc.(a) | | | 71,298 |
| 5,000 | | Google, Inc. (Class A shares)(a) | | | 978,150 |
| 2,020 | | InfoSpace, Inc.(a) | | | 95,364 |
| 3,710 | | j2 Global Communications, Inc.(a) | | | 120,501 |
| 8,650 | | Keynote Systems, Inc.(a) | | | 107,866 |
| 4,890 | | RADVision Ltd. (Israel)(a) | | | 71,883 |
| 2,370 | | RADWARE Ltd. (Israel)(a) | | | 57,804 |
| 28,800 | | Yahoo!, Inc.(a) | | | 1,014,049 |
| | | | |
|
|
| | | | | | 2,744,111 |
| |
IT Services 0.2% | | | |
| 15,900 | | Accenture Ltd.(a) | | | 414,195 |
| |
Leisure Equipment & Products | | | |
| 6,770 | | K2, Inc.(a) | | | 95,186 |
| |
Machinery 0.2% | | | |
| 5,100 | | Deere & Co. | | | 354,093 |
| |
Media 0.8% | | | |
| 5,900 | | CNET Networks, Inc.(a) | | | 64,900 |
| 2,900 | | DirectTV Group, Inc.(a) | | | 43,645 |
| 5,840 | | Image Entertainment, Inc.(a) | | | 33,288 |
| 20,182 | | News Corp. Inc. (Class A shares) | | | 343,094 |
| 2,600 | | Scholastic Corp.(a) | | | 89,050 |
| 6,800 | | Sinclair Broadcast Group, Inc. (Class A shares) | | | 55,964 |
| 24,000 | | Sirius Satellite Radio, Inc.(a) | | | 158,880 |
| 8,000 | | Univision Communications, Inc. (Class A shares)(a) | | | 218,480 |
| 5,810 | | Valueclick, Inc.(a) | | | 76,866 |
See Notes to Financial Statements.
| | |
| Strategic Partners Asset Allocation Funds/Strategic Partners Conservative Growth Fund | | 15 |
Portfolio of Investments
as of January 31, 2005 (Unaudited) Cont’d.
| | | | | |
| Shares | | Description | | Value (Note1) |
| | | | | | |
| 10,214 | | Viacom, Inc. (Class B shares) | | $ | 381,391 |
| 5,600 | | XM Satellite Radio Holdings, Inc. (Class A shares)(a) | | | 178,696 |
| | | | |
|
|
| | | | | | 1,644,254 |
| |
Metals & Mining 0.2% | | | |
| 12,100 | | Inco Ltd. (Canada)(a) | | | 398,211 |
| |
Multi-Utilities & Unregulated Power 0.6% | | | |
| 6,800 | | Dominion Resources, Inc. | | | 471,784 |
| 3,900 | | Oneok, Inc. | | | 108,030 |
| 15,300 | | Sempra Energy | | | 569,466 |
| | | | |
|
|
| | | | | | 1,149,280 |
| |
Multiline Retail 0.4% | | | |
| 15,400 | | Target Corp. | | | 781,858 |
| |
Office Electronics 0.4% | | | |
| 2,800 | | Marlin Business Services, Inc.(a) | | | 50,960 |
| 43,400 | | Xerox Corp.(a) | | | 689,192 |
| | | | |
|
|
| | | | | | 740,152 |
| |
Oil & Gas 2.5% | | | |
| 6,100 | | Cabot Oil and Gas Corp. | | | 287,188 |
| 8,800 | | Chesapeake Energy Corp. | | | 154,616 |
| 4,900 | | Eni SpA—ADR (Italy) | | | 598,780 |
| 5,400 | | Exxon Mobil Corp. | | | 278,640 |
| 15,540 | | Grey Wolf, Inc.(a) | | | 82,362 |
| 6,600 | | Kerr-McGee Corp. | | | 407,550 |
| 13,200 | | Nexen, Inc. (Canada) | | | 548,328 |
| 11,300 | | Occidental Petroleum Corp. | | | 659,693 |
| 3,930 | | Oil States International, Inc.(a) | | | 74,867 |
| 28,300 | | Suncor Energy, Inc. (Canada) | | | 905,599 |
| 6,400 | | Swift Energy Co.(a) | | | 193,728 |
| 2,080 | | Total SA, (France) (Class B Shares) | | | 446,023 |
| 5,044 | | Total SA, ADR (France) | | | 542,482 |
| | | | |
|
|
| | | | | | 5,179,856 |
| |
Paper & Forest Products 0.3% | | | |
| 12,000 | | Georgia-Pacific Corp. | | | 385,200 |
| 8,200 | | International Paper Co. | | | 321,030 |
| | | | |
|
|
| | | | | | 706,230 |
See Notes to Financial Statements.
| | |
| 16 | | Visit our website at www.strategicpartners.com |
| | | | | |
| Shares | | Description | | Value (Note1) |
| | | | | | |
Personal Products 0.3% | | | |
| 8,400 | | Estee Lauder Cos., Inc. (The) | | $ | 379,176 |
| 6,000 | | Gillette Co. | | | 304,320 |
| | | | |
|
|
| | | | | | 683,496 |
| |
Pharmaceuticals 2.1% | | | |
| 3,390 | | Alexion Pharmaceuticals, Inc.(a) | | | 83,869 |
| 5,300 | | Allergan, Inc. | | | 402,535 |
| 3,460 | | Atherogenics, Inc.(a) | | | 64,183 |
| 1,975 | | Barr Pharmaceuticals, Inc.(a) | | | 93,911 |
| 3,500 | | Chattem, Inc.(a) | | | 126,245 |
| 3,420 | | Connetics Corp.(a) | | | 83,516 |
| 4,900 | | Cypress Bioscience, Inc.(a) | | | 66,910 |
| 17,600 | | Eli Lilly & Co. | | | 954,623 |
| 6,750 | | KV Pharmaceutical Co. (Class A Shares)(a) | | | 138,713 |
| 9,202 | | Nabi Biopharmaceuticals(a) | | | 118,798 |
| 24,700 | | Novartis AG ADR (Switzerland) | | | 1,182,635 |
| 5,680 | | QLT, Inc. (Canada)(a) | | | 91,846 |
| 2,720 | | Rigel Pharmaceuticals, Inc.(a) | | | 52,197 |
| 10,500 | | Roche Holding AG ADR (Switzerland) | | | 559,233 |
| 4,890 | | Salix Pharmaceuticals Ltd.(a) | | | 73,595 |
| 2,500 | | Vaxgen, Inc.(a) | | | 37,200 |
| 6,500 | | Wyeth | | | 257,595 |
| | | | |
|
|
| | | | | | 4,387,604 |
| |
Real Estate Investment Trust 0.1% | | | |
| 2,500 | | Entertainment Properties Trust | | | 105,275 |
| 3,230 | | Saxon Capital, Inc. | | | 69,930 |
| 1,800 | | SL Green Realty Corp. | | | 95,814 |
| | | | |
|
|
| | | | | | 271,019 |
| |
Retail 0.2% | | | |
| 2,400 | | Aaron Rents, Inc. (Class B shares) | | | 50,976 |
| 5,300 | | CSK Auto Corp.(a) | | | 83,581 |
| 3,390 | | Ezcorp, Inc.(a) | | | 64,681 |
| 2,100 | | Guitar Center, Inc.(a) | | | 120,225 |
| 3,890 | | Jos. A. Bank Clothiers, Inc.(a) | | | 111,643 |
| | | | |
|
|
| | | | | | 431,106 |
| |
Semiconductors & Semiconductor Equipment 0.6% | | | |
| 16,200 | | Marvell Technology Group Ltd. (Bermuda)(a) | | | 541,890 |
| 9,600 | | Maxim Integrated Products | | | 374,496 |
See Notes to Financial Statements.
| | |
| Strategic Partners Asset Allocation Funds/Strategic Partners Conservative Growth Fund | | 17 |
Portfolio of Investments
as of January 31, 2005 (Unaudited) Cont’d.
| | | | | |
| Shares | | Description | | Value (Note1) |
| | | | | | |
| 4,080 | | Microsemi Corporation(a) | | $ | 62,954 |
| 9,380 | | O2Micro International Ltd.(a) | | | 83,201 |
| 6,080 | | Sirf Technology Holdings, Inc.(a) | | | 64,144 |
| 3,810 | | Ultratech Stepper, Inc.(a) | | | 56,426 |
| | | | |
|
|
| | | | | | 1,183,111 |
| |
Software 2.0% | | | |
| 5,500 | | Adobe Systems, Inc. | | | 312,950 |
| 13,500 | | Electronic Arts, Inc.(a) | | | 868,590 |
| 7,950 | | Embarcadero Technologies, Inc.(a) | | | 62,328 |
| 6,120 | | Epicor Software Corp.(a) | | | 82,559 |
| 2,700 | | Global Payments, Inc. | | | 154,683 |
| 5,500 | | Infocrossing, Inc.(a) | | | 98,945 |
| 8,200 | | Mercury Interactive Corp.(a) | | | 358,914 |
| 4,670 | | Merge Technologies, Inc.(a) | | | 86,629 |
| 41,300 | | Microsoft Corp. | | | 1,085,363 |
| 4,700 | | Navteq Corp.(a) | | | 179,963 |
| 4,560 | | Smith Micro Software, Inc.(a) | | | 34,063 |
| 3,900 | | Sonic Solutions(a) | | | 69,459 |
| 12,070 | | Synplicity, Inc.(a) | | | 82,076 |
| 13,900 | | Systeme, Anwedungen, Produkte AG, ADR (Germany) | | | 538,208 |
| 3,280 | | THQ, Inc.(a) | | | 72,980 |
| | | | |
|
|
| | | | | | 4,087,710 |
| |
Specialty Retail 1.2% | | | |
| 14,200 | | Bed Bath & Beyond, Inc.(a) | | | 572,118 |
| 7,230 | | Charlotte Russe Holdings, Inc.(a) | | | 77,506 |
| 12,600 | | Chico’s FAS, Inc.(a) | | | 663,768 |
| 6,900 | | Lowe’s Cos., Inc. | | | 393,231 |
| 2,400 | | Stein Mart, Inc.(a) | | | 47,352 |
| 24,800 | | Toys R’ Us, Inc.(a) | | | 531,960 |
| 6,600 | | Williams-Sonoma, Inc.(a) | | | 228,360 |
| | | | |
|
|
| | | | | | 2,514,295 |
| |
Telecommunications | | | |
| 19,021 | | Netia SA (Poland)(a) | | | 26,275 |
| 226 | | NTL, Inc.(a) | | | 15,375 |
| | | | |
|
|
| | | | | | 41,650 |
| |
Textiles, Apparel & Luxury Goods 0.2% | | | |
| 5,900 | | Coach, Inc.(a) | | | 330,990 |
See Notes to Financial Statements.
| | |
| 18 | | Visit our website at www.strategicpartners.com |
| | | | | |
| Shares | | Description | | Value (Note1) |
| | | | | | |
Thrifts & Mortgage Finance 0.2% | | | |
| 6,400 | | Freddie Mac | | $ | 417,856 |
| |
Tobacco 0.4% | | | |
| 13,900 | | Altria Group, Inc. | | | 887,237 |
| |
Transportation 0.1% | | | |
| 1,520 | | Forward Air Corp.(a) | | | 64,775 |
| 1,965 | | Old Dominion Freight Line, Inc.(a) | | | 69,463 |
| 6,030 | | Vitran Corp., Inc. (Canada) (Class A shares)(a) | | | 89,605 |
| | | | |
|
|
| | | | | | 223,843 |
| |
Wireless Telecommunication Services 0.6% | | | |
| 17,500 | | American Tower Corp. (Class A shares)(a) | | | 317,100 |
| 35,200 | | Nextel Communications, Inc.(a) | | | 1,009,888 |
| | | | |
|
|
| | | | | | 1,326,988 |
| | | | |
|
|
| | | Total common stocks | | | 80,650,799 |
| | | | |
|
|
PREFERRED STOCK | | | |
| |
Telecommunications | | | |
| 350 | | McLeodUSA, Inc., 2.50% | | | 945 |
| | | | |
|
|
See Notes to Financial Statements.
| | |
| Strategic Partners Asset Allocation Funds/Strategic Partners Conservative Growth Fund | | 19 |
Portfolio of Investments
as of January 31, 2005 (Unaudited) Cont’d.
| | | | | | | | |
Moody’s
Rating | | Principal
Amount (000) | | Description | | Value (Note 1) |
| | | | | | | | | |
| CORPORATE BONDS 15.4% |
|
| Aerospace/Defense 0.3% |
| B2 | | $ | 75 | | Alliant Techsystems, Inc., Sr. Sub. Notes,
8.50%, 5/15/11 | | $ | 80,813 |
| Caa3 | | | 105 | | BE Aerospace, Inc., Sr. Sub. Notes,
8.875%, 5/1/11 | | | 107,100 |
| B1 | | | 125 | | Esterline Technologies, Sr. Sub. Notes,
7.75%, 6/15/13 | | | 135,000 |
| Caa1 | | | 50 | | K & F Acquisition Inc., Sr. Sub. Notes,
7.75%, 11/15/14 | | | 49,750 |
| Ba3 | | | 100 | | L-3 Communications Corp., Sr. Sub. Notes,
7.625%, 6/15/12 | | | 109,000 |
| B1 | | | 100 | | Sequa Corp., Sr. Notes,
8.875%, 4/1/08 | | | 107,500 |
| Caa1 | | | 25 | | Standard Aero, Inc. Sr. Sub. Notes,
8.25%, 9/1/14 | | | 26,875 |
| B3 | | | 50 | | TD Funding Corp., Gtd. Notes,
8.375%, 7/15/11 | | | 53,000 |
| | | | | | | |
|
|
| | | | | | | | | 669,038 |
|
| Airlines 0.1% |
| Caa2 | | | 150 | | AMR Corp., Notes, MTN
10.55%, 3/12/21 | | | 88,500 |
| Ba2 | | | 45 | | Continental Airlines, Inc., Notes,
7.57%, 3/15/20 | | | 36,209 |
| Ba2 | | | 39 | | Continental Airlines, Inc., Ser. 981B,
6.75%, 3/15/17 | | | 31,147 |
| Ba2 | | | 70 | | Continental Airlines, Inc., Ser. 991B,
6.80%, 8/2/18 | | | 57,429 |
| | | | | | Delta Air Lines, Inc., Notes, | | | |
| Caa2 | | | 40 | | 10.00%, 8/15/08 | | | 23,000 |
| Ca | | | 50 | | 8.30%, 12/15/29 | | | 19,750 |
| | | | | | | |
|
|
| | | | | | | | | 256,035 |
|
| Automobiles 0.1% |
| A3 | | | 200 | | DaimlerChrysler NA Holding Corp., Notes, FRN, MTN
2.96%, 5/24/06(e) | | | 200,861 |
See Notes to Financial Statements.
| | |
| 20 | | Visit our website at www.strategicpartners.com |
| | | | | | | | |
Moody’s
Rating | | Principal
Amount (000) | | Description | | Value (Note 1) |
| | | | | | | | | |
| Automotive 0.2% |
| Baa3 | | $ | 125 | | ArvinMeritor, Inc., Notes,
8.75%, 3/1/12 | | $ | 139,844 |
| B3 | | | 10 | | Collins & Aikman Products Co.,
Sr. Sub. Notes,
12.875%, 8/15/12 | | | 8,275 |
| B3 | | | 10 | | Cooper-Standard Automotive, Inc., Notes,
8.375%, 12/15/14 | | | 9,500 |
| B3 | | | 50 | | Tenneco Automotive, Inc., Sr. Sub Notes,
8.625%, 11/15/14 | | | 52,000 |
| B1 | | | 59 | | TRW Automotive, Inc., Sr. Notes,
9.375%, 2/15/13 | | | 66,375 |
| | | | | | Visteon Corp., Notes, | | | |
| Ba1 | | | 20 | | 8.25%, 8/1/10 | | | 20,100 |
| Ba1 | | | 50 | | 7.00%, 3/10/14 | | | 45,750 |
| | | | | | | |
|
|
| | | | | | | | | 341,844 |
|
| Banking 0.2% |
| AA2 | | | 400 | | HSBC Bank, Sr. Notes, FRN
2.59%, 9/21/07(e) | | | 400,138 |
| Baa2 | | | 110 | | Kazkommerts International BV (Netherlands), Gtd. Notes,
7.875%, 4/7/14 | | | 109,175 |
| | | | | | | |
|
|
| | | | | | | | | 509,313 |
|
| Building Materials & Construction 0.2% |
| Ba2 | | | 100 | | American Standard, Inc., Gtd. Notes,
7.375%, 4/15/05 | | | 100,857 |
| Ba1 | | | 100 | | D.R. Horton, Inc., Sr. Notes,
7.875%, 8/15/11 | | | 114,929 |
| B3 | | | 25 | | Goodman Global Holding Co., Inc.
Sr. Notes, FRN
5.76%, 6/15/12(e) | | | 25,625 |
| Ba2 | | | 25 | | K Hovnanian Enterprises, Inc., Gtd. Notes,
6.25%, 1/15/15 | | | 25,344 |
| Ba2 | | | 65 | | KB Home, Sr. Sub. Notes,
8.625%, 12/15/08 | | | 73,409 |
| B3 | | | 50 | | THL Buildco, Inc., Sr. Sub Notes,
8.50%, 9/1/14 | | | 51,375 |
| | | | | | | |
|
|
| | | | | | | | | 391,539 |
See Notes to Financial Statements.
| | |
| Strategic Partners Asset Allocation Funds/Strategic Partners Conservative Growth Fund | | 21 |
Portfolio of Investments
as of January 31, 2005 (Unaudited) Cont’d.
| | | | | | | | |
Moody's
Rating | | Principal
Amount (000) | | Description | | Value (Note 1) |
| | | | | | | | | |
| Cable 0.4% |
| Ca | | $ | 50 | | Callahan Nordrhein Westfalen (Germany), Sr. Disc. Notes, Zero Coupon (until 7/15/05),
16.00%, 7/15/10(b)(f) | | $ | 2,000 |
| B2 | | | 175 | | Charter Communications Holdings LLC,
Sr. Notes,
10.25%, 1/15/10 - 9/15/10 | | | 166,625 |
| Ca | | | 420 | | Charter Communications Holdings,
Sr. Disc. Notes,
Zero Coupon (until 5/15/06),
11.75%, 5/15/11(f) | | | 291,900 |
| Ca | | | 100 | | Charter Communications Holdings,
Sr. Notes,
10.00%, 5/15/11 | | | 79,750 |
| B1 | | | 25 | | CSC Holdings, Inc., Sr. Notes, Series B,
7.625%, 4/1/11 | | | 27,250 |
| | | | | | Sr. Notes, | | | |
| B1 | | | 50 | | 6.75%, 4/15/12 | | | 52,500 |
| B1 | | | 50 | | 7.25%, 7/15/08 | | | 52,875 |
| B1 | | | 50 | | 7.875%, 12/15/07 | | | 53,875 |
| B2 | | | 60 | | Kabel Deutschland GmbH, (Germany),
Sr. Notes,
10.625%, 7/1/14 | | | 67,800 |
| Ba3 | | | 145 | | Rogers Cablesystems Ltd. (Canada),
Sr. Notes,
10.00%, 3/15/05 | | | 146,022 |
| | | | | | | |
|
|
| | | | | | | | | 940,597 |
|
| Capital Goods 0.8% |
| B3 | | | 75 | | ALH Finance LLC, Sr. Sub. Notes,
8.50%, 1/15/13 | | | 76,500 |
| | | | | | Allied Waste of North America, Inc.,
Sr. Notes, | | | |
| B2 | | | 220 | | 8.50%, 12/1/08 | | | 229,349 |
| B2 | | | 25 | | 7.875%, 4/15/13 | | | 24,813 |
| B3 | | | 75 | | Amsted Industries, Inc., Sr. Notes,
10.25%, 10/15/11 | | | 84,375 |
| Caa1 | | | 75 | | Blount, Inc., Sr. Sub. Notes,
8.875%, 8/1/12 | | | 81,563 |
| Ba3 | | | 95 | | Case New Holland, Inc., Sr. Notes,
9.25%, 8/1/11 | | | 103,788 |
See Notes to Financial Statements.
| | |
| 22 | | Visit our website at www.strategicpartners.com |
| | | | | | | | |
Moody’s
Rating | | Principal
Amount (000) | | Description | | Value (Note 1) |
| | | | | | | | | |
| Caa2 | | $ | 35 | | Great Lakes Dredge & Dock Corp.,
Sr. Sub. Notes,
7.75%, 12/15/13 | | $ | 30,450 |
| B3 | | | 60 | | Invensys PLC (United Kingdom), Sr. Notes,
9.875%, 3/15/11 | | | 64,350 |
| B3 | | | 75 | | Johnson Diversified Holdings, Inc.,
Zero Coupon (until 5/15/07),
10.67%, 5/15/13(f) | | | 65,063 |
| B2 | | | 75 | | Johnson Diversified, Inc., Gtd. Notes,
9.625%, 5/15/12 | | | 83,625 |
| B1 | | | 125 | | Joy Global, Inc., Sr. Sub. Notes,
8.75%, 3/15/12 | | | 139,999 |
| B3 | | | 100 | | Rexnord Corp., Gtd. Notes,
10.125%, 12/15/12 | | | 112,000 |
| Caa1 | | | 75 | | Sensus Metering Systems, Inc.,
Sr. Sub. Notes,
8.625%, 12/15/13 | | | 77,250 |
| Ba3 | | | 20 | | SPX Corp., Sr. Notes,
7.50%, 1/1/13 | | | 21,950 |
| Ba3 | | | 75 | | Stena AB, (Sweeden),
7.50%, 11/1/13 | | | 76,313 |
| B3 | | | 90 | | Terex Corp.,
Gtd. Notes,
10.375%, 4/1/11 | | | 99,900 |
| B3 | | | 20 | | Sr. Sub. Notes,
9.25%, 7/15/11 | | | 22,150 |
| B2 | | | 100 | | The Manitowoc Co., Inc., Sr. Sub. Notes,
10.50%, 8/1/12 | | | 114,999 |
| Caa1 | | | 75 | | Thermadyne Holdings Corp., Gtd. Notes,
9.25%, 2/1/14 | | | 72,750 |
| B1 | | | 25 | | United Rentals of North America, Inc.,
Gtd. Notes,
6.50%, 2/15/12 | | | 24,563 |
| B2 | | | 50 | | Sr. Sub. Notes,
7.75%, 11/15/13 | | | 48,625 |
| | | | | | | |
|
|
| | | | | | | | | 1,654,375 |
|
| Chemicals 0.6% |
| B3 | | | 50 | | Borden US Finance Corp./Nova Scotia Finance, Sec’d Notes,
9.00%, 7/15/14 | | | 55,000 |
See Notes to Financial Statements.
| | |
| Strategic Partners Asset Allocation Funds/Strategic Partners Conservative Growth Fund | | 23 |
Portfolio of Investments
as of January 31, 2005 (Unaudited) Cont’d.
| | | | | | | | |
Moody’s
Rating | | Principal
Amount (000) | | Description | | Value (Note 1) |
| | | | | | | | | |
| B2 | | $ | 80 | | Equistar Chemicals L.P., Gtd. Notes,
10.125%, 9/1/08 | | $ | 91,200 |
| | | | | | Huntsman International LLC, Gtd. Notes, | | | |
| Baa3 | | | 150 | | Hercules, Inc., Debs. Notes,
6.60%, 8/1/27 | | | 152,999 |
| B2 | | | 10 | | Huntsman Advanced Materials,
Sec’d. Notes,
11.00%, 7/15/10 | | | 11,750 |
| | | | | | Huntsman International LLC, Gtd. Notes, | | | |
| B3 | | | 75 | | 9.875%, 3/1/09 | | | 81,750 |
| Caa1 | | | 14 | | 10.125%, 7/1/09 | | | 14,700 |
| B2 | | | 125 | | IMC Global, Inc.,
Debs.,
6.875%, 7/15/07 | | | 127,500 |
| B1 | | | 90 | | Gtd. Notes,
11.25%, 6/1/11 | | | 101,700 |
| B2 | | | 75 | | ISP Chemco, Inc., Gtd. Notes,
10.25%, 7/1/11 | | | 83,625 |
| B2 | | | 50 | | Koppers, Inc., Gtd Notes,
9.875%, 10/15/13 | | | 56,750 |
| B1 | | | 25 | | Lyondell Chemical Co., Sec’d Notes,
11.125%, 7/15/12 | | | 29,375 |
| B2 | | | 125 | | Nalco Co., Sr. Notes,
7.75%, 11/15/11 | | | 134,063 |
| Caa1 | | | 45 | | OM Group, Inc., Gtd. Notes,
9.25%, 12/15/11 | | | 47,925 |
| B3 | | | 75 | | Rhodia SA, (France)
Sr. Notes,
10.25%, 6/1/10 | | | 85,313 |
| Caa1 | | | 75 | | Sr. Sub. Notes,
8.875%, 6/1/11 | | | 76,875 |
| B3 | | | 50 | | Rockwood Specialties Corp.,
Sr. Sub. Notes,
10.625%, 5/15/11 | | | 57,000 |
| | | | | | | |
|
|
| | | | | | | | | 1,207,525 |
|
| Consumer 0.4% |
| B2 | | | 50 | | Alderwoods Group, Inc., Sr. Notes,
7.75%, 9/15/12 | | | 53,625 |
| A3 | | | 500 | | Clorox Co., Notes, FRN
2.54%, 12/14/07(e) | | | 499,809 |
See Notes to Financial Statements.
| | |
| 24 | | Visit our website at www.strategicpartners.com |
| | | | | | | | |
Moody’s
Rating | | Principal
Amount (000) | | Description | | Value (Note 1) |
| | | | | | | | | |
| NR | | $ | 50 | | K2, Inc., Sr. Notes,
7.375%, 7/1/14 | | $ | 53,688 |
| B3 | | | 59 | | KinderCare Learning Centers, Inc.,
Sr. Sub. Notes,
9.50%, 2/15/09 | | | 59,148 |
| B3 | | | 50 | | Knowledge Learning Corp Inc.,
Sr. Sub Notes,
7.75%, 2/1/15 | | | 50,250 |
| Ca | | | 80 | | Levi Strauss & Co., Sr. Notes,
12.25%, 12/15/12 | | | 86,400 |
| Caa1 | | | 75 | | Propex Fabrics, Inc., Sr. Notes,
10.00%, 12/1/12 | | | 75,938 |
| | | | | | | |
|
|
| | | | | | | | | 878,858 |
|
| Electric 1.8% |
| B1 | | | 40 | | AES Corp.,
Sec’d. Notes,
8.75%, 5/15/13 | | | 44,800 |
| B2 | | | 195 | | Sr. Notes,
9.375%, 9/15/10 | | | 220,593 |
| Ba1 | | | 132 | | AES Eastern Energy LP,
9.00%, 1/2/17 | | | 150,827 |
| B3 | | | 30 | | Allegheny Energy Supply, Notes,
8.25%, 4/15/12 | | | 33,375 |
| B2 | | | 130 | | Aquila, Inc., Sr. Notes,
9.95%, 2/1/11 | | | 146,413 |
| B | | | 205 | | Calpine Corp., Sec’d. Notes,
8.75%, 7/15/13 | | | 155,800 |
| | | | | | CMS Energy Corp., Sr. Notes, | | | |
| B3 | | | 115 | | 7.50%, 1/15/09 | | | 121,756 |
| B3 | | | 50 | | 8.50%, 4/15/11 | | | 55,813 |
| | | | | | Dynegy Holdings, Inc., Sec’d. Notes, | | | |
| B3 | | | 60 | | 9.875%, 7/15/10 | | | 65,700 |
| B3 | | | 145 | | 10.125%, 7/15/13 | | | 160,950 |
| B1 | | | 75 | | Edison Mission Energy, Sr. Notes,
7.73%, 6/15/09 | | | 79,500 |
| | | | | | Endesa (Chile), Ser. W.I., | | | |
| Ba2 | | | 75 | | 8.35%, 8/1/13 | | | 87,938 |
| Ba2 | | | 150 | | 8.625%, 8/1/15 | | | 180,414 |
| Ba2 | | | 74 | | Homer City Funding LLC, Gtd. Notes,
8.14%, 10/1/19 | | | 83,055 |
See Notes to Financial Statements.
| | |
| Strategic Partners Asset Allocation Funds/Strategic Partners Conservative Growth Fund | | 25 |
Portfolio of Investments
as of January 31, 2005 (Unaudited) Cont’d.
| | | | | | | |
Moody’s
Rating | | Principal
Amount (000) | | Description | | Value (Note 1) |
| | | | | | | | |
| Ba3 | | $ 4 | | Midland Funding Corp,
Sr. Sec’d. Notes, Ser. A,
11.75%, 7/23/05 | | $ | 4,619 |
| | | | | Midwest Generation LLC, | | | |
| B1 | | 30 | | 8.30%, 7/2/09 | | | 32,400 |
| B1 | | 60 | | 8.56%, 1/2/16 | | | 67,200 |
| B1 | | 50 | | 8.75%, 5/1/34 | | | 55,875 |
| B3 | | 35 | | Mission Energy Holdings, Sec’d. Notes,
13.50%, 7/15/08 | | | 43,663 |
| Ba2 | | 60 | | Nevada Power Co.,
6.50%, 4/15/12 | | | 63,150 |
| Ba2 | | 5 | | Notes,
10.875%, 10/15/09 | | | 5,731 |
| NR | | GBP 7 | | NoteCo Ltd., (United Kingdom), FRN,
6.92%, 6/30/25(e) | | | 13,995 |
| B2 | | $170 | | NRG Energy, Inc., Sec’d. Notes
8.00%, 12/15/13 | | | 183,175 |
| B2 | | 50 | | Orion Power Holdings, Inc., Sr. Notes,
12.00%, 5/1/10 | | | 62,500 |
| Baa2 | | 150 | | Pacific Gas & Electric Co.,
1st Mortgage, FRN
3.26%, 4/3/06(e) | | | 150,148 |
| Baa3 | | 200 | | PP&L Capital Funding, Inc., Sr. Notes,
7.75%, 4/15/05 | | | 201,692 |
| Ba1 | | 300 | | PPL Capital Funding Trust, Gtd. Notes,
7.29%, 5/18/06 | | | 312,356 |
| B1 | | 66 | | Reliant Energy-Mid Atlantic, Ser. B,
9.24%, 7/2/17 | | | 75,564 |
| B1 | | 125 | | Reliant Resources, Inc., Sec’d. Notes,
9.50%, 7/15/13 | | | 140,000 |
| B2 | | 40 | | Sierra Pacific Resources, Sr. Notes,
8.625%, 3/15/14 | | | 44,450 |
| Ba2 | | 175 | | TECO Energy, Inc., Sr. Notes,
7.50%, 6/15/10 | | | 192,500 |
| B1 | | 150 | | Texas Genco LLC, Sr. Notes,
6.875%, 12/15/14 | | | 155,250 |
| B2 | | 75 | | TNP Enterprises, Inc., Sr. Sub. Notes,
10.25%, 4/1/10 | | | 79,125 |
| Baa2 | | 95 | | TXU Energy Co. LLC, Notes, FRN
3.42%, 1/17/06(e) | | | 95,248 |
See Notes to Financial Statements.
| | |
| 26 | | Visit our website at www.strategicpartners.com |
| | | | | | | | |
Moody’s
Rating | | Principal
Amount (000) | | Description | | Value (Note 1) |
| | | | | | | | | |
| B2 | | $ | 15 | | Utilicorp Canada Finance Corp.,
Gtd. Notes,
7.75%, 6/15/11 | | $ | 15,525 |
| | | | | | | |
|
|
| | | | | | | | | 3,581,100 |
|
| Energy-Other 0.6% |
| BA2 | | | 150 | | Chesapeake Energy Corp., Sr. Notes,
6.375%, 6/15/15 | | | 152,999 |
| B2 | | | 25 | | Encore Acquisition Co., Sr. Sub. Notes,
6.25%, 4/15/14 | | | 24,938 |
| Ba3 | | | 30 | | Forest Oil Corp., Sr. Notes
8.00%, 12/15/11 | | | 34,013 |
| B3 | | | 75 | | Hanover Compressor Co., Sr. Notes,
8.625%, 12/15/10 | | | 81,000 |
| B2 | | | 50 | | Hanover Equipment Trust, Sec’d Notes,
8.75%, 9/1/11 | | | 54,000 |
| B2 | | | 25 | | Houston Exploration Co., Sr. Sub. Notes,
7.00%, 6/15/13 | | | 26,250 |
| B2 | | | 8 | | Magnum Hunter Resources, Inc.,
Gtd. Notes,
9.60%, 3/15/12 | | | 9,140 |
| Ba3 | | | 50 | | Newfield Exploration Co., Sr. Sub. Notes,
8.375%, 8/15/12 | | | 55,500 |
| B2 | | | 100 | | Parker Drilling Co., Sr. Notes,
9.625%, 10/1/13 | | | 111,125 |
| NR | | | 250 | | Pemex Project Funding Master Trust,
9.25%, 3/30/18 | | | 312,499 |
| Ba3 | | | 75 | | Premcor Refining Group,
Gtd. Notes,
6.75%, 5/1/14 | | | 78,563 |
| Ba3 | | | 25 | | Sr. Notes,
6.75%, 2/1/11 | | | 26,688 |
| B2 | | | 50 | | Sr. Sub. Notes,
7.75%, 2/1/12 | | | 54,375 |
| | | | | | Pride International Inc., Sr. Notes, | | | |
| NR | | | 25 | | 7.375%, 7/15/14 | | | 27,500 |
| B2 | | | 105 | | Stone Energy Corp., Sr. Sub. Notes,
8.25%, 12/15/11 | | | 112,875 |
| Ba3 | | | 50 | | Vintage Petrolium, Inc.,
Sr. Notes,
8.25%, 5/1/12 | | | 55,000 |
See Notes to Financial Statements.
| | |
| Strategic Partners Asset Allocation Funds/Strategic Partners Conservative Growth Fund | | 27 |
Portfolio of Investments
as of January 31, 2005 (Unaudited) Cont’d.
| | | | | | | | |
Moody’s
Rating | | Principal
Amount (000) | | Description | | Value (Note 1) |
| | | | | | | | | |
| B1 | | $ | 25 | | Sr. Sub. Notes,
7.875%, 5/15/11 | | $ | 26,688 |
| | | | | | | |
|
|
| | | | | | | | | 1,243,153 |
|
| Food 0.3% |
| B3 | | | 8 | | Agrilink Foods, Inc., Sr. Sub. Notes,
11.875%, 11/1/08 | | | 8,320 |
| Ba3 | | | 25 | | Ahold Finance USA, Inc., Notes,
8.25%, 7/15/10 | | | 28,250 |
| B3 | | | 50 | | Carrols Corp., Sr. Sub. Notes,
9.00%, 1/15/13 | | | 52,125 |
| | | | | | Del Monte Corp., Sr. Sub. Notes, | | | |
| B2 | | | 125 | | 8.625%, 12/15/12 | | | 138,906 |
| B2 | | | 125 | | 6.75%, 2/15/15 | | | 126,250 |
| Ba1 | | | 140 | | Delhaize America, Inc., Gtd. Notes,
8.125%, 4/15/11 | | | 162,753 |
| | | | | | Dole Foods Co., Sr. Notes, | | | |
| B2 | | | 50 | | 8.625%, 5/1/09 | | | 54,813 |
| B2 | | | 50 | | 8.875%, 3/15/11 | | | 53,688 |
| B3 | | | 40 | | Pathmark Stores, Inc., Gtd. Notes,
8.75%, 2/1/12 | | | 38,250 |
| Ba2 | | | 80 | | Smithfield Foods, Inc., Sr. Notes,
8.00%, 10/15/09 | | | 88,300 |
| | | | | | | |
|
|
| | | | | | | | | 751,655 |
|
| Gaming 0.7% |
| B1 | | | 75 | | Argosy Gaming Co., Sr. Sub. Notes,
7.00%, 1/15/14 | | | 82,500 |
| Ba3 | | | 100 | | Aztar Corp., Sr. Sub. Notes,
9.00%, 8/15/11 | | | 109,750 |
| Ba3 | | | 15 | | 7.875%, 6/15/14 | | | 16,500 |
| B1 | | | 50 | | Boyd Gaming Corp., Sr. Sub. Notes,
8.75%, 4/15/12 | | | 55,125 |
| B2 | | | 50 | | Isle of Capri Casinos, Inc., Sr. Sub. Notes,
7.00%, 3/1/14 | | | 50,625 |
| B2 | | | 55 | | Kerzner International Ltd., Gtd. Notes,
8.875%, 8/15/11 | | | 59,950 |
| Ba1 | | | 250 | | MGM Mirage, Inc.,
Notes,
6.00%, 10/1/09 | | | 255,000 |
| Ba2 | | | 130 | | Gtd. Notes,
9.75%, 6/1/07 | | | 144,300 |
See Notes to Financial Statements.
| | |
| 28 | | Visit our website at www.strategicpartners.com |
| | | | | | | | |
Moody’s
Rating | | Principal
Amount (000) | | Description | | Value (Note 1) |
| | | | | | | | | |
| Ba3 | | $ | 100 | | Mohegan Tribal Gaming Authority,
Sr. Sub. Notes,
8.00%, 4/1/12 | | $ | 107,625 |
| | | | | | Park Place Entertainment Corp., Sr. Notes, | | | |
| Ba2 | | | 20 | | 9.375%, 2/15/07 | | | 21,875 |
| Ba2 | | | 20 | | 8.875%, 9/15/08 | | | 22,525 |
| Ba1 | | | 130 | | 7.50%, 9/1/09 | | | 144,300 |
| Ba2 | | | 35 | | 8.125%, 5/15/11 | | | 40,075 |
| Ba3 | | | 90 | | Station Casinos, Inc., Sr. Notes,
6.00%, 4/1/12 | | | 92,250 |
| B2 | | | 105 | | Venetian Casino Resort LLC, Gtd. Notes,
11.00%, 6/15/10 | | | 118,650 |
| NR | | | 75 | | Wynn Las Vegas LLC,
6.625%, 12/1/14 | | | 73,688 |
| | | | | | | |
|
|
| | | | | | | | | 1,394,738 |
|
| Health Care & Pharmaceuticals 1.0% |
| B3 | | | 25 | | Alliance Imaging, Inc., Sr. Sub. Notes,
7.25%, 12/15/12 | | | 25,250 |
| B3 | | | 75 | | Concentra Operating Corp.,
9.50%, 8/15/10 | | | 83,250 |
| B3 | | | 125 | | 9.125%, 6/1/12 | | | 138,750 |
| Ba1 | | | 25 | | Coventry Health Care, Inc., Sr. Notes,
5.875%, 1/15/12 | | | 25,375 |
| Ba1 | | | 45 | | Sr. Notes,
8.125%, 2/15/12 | | | 49,163 |
| B3 | | | 75 | | Elan Finance PLC, Sr. Notes,
7.75%, 11/15/11 | | | 78,375 |
| Ba2 | | | 180 | | HCA, Inc., Debs.,
7.50%, 12/15/23 | | | 185,520 |
| Ba2 | | | 60 | | Notes, MTN
9.00%, 12/15/14 | | | 71,159 |
| Caa2 | | | 75 | | Healthsouth Corp., Notes,
7.625%, 6/1/12 | | | 75,188 |
| Caa2 | | | 150 | | Sr. Notes,
8.50%, 2/1/08 | | | 155,062 |
| B3 | | | 40 | | IASIS Healthcare LLC, Sr. Sub. Notes,
8.75%, 6/15/14 | | | 43,100 |
| Caa1 | | | 45 | | Inverness Medical Innovations, Inc., Sr. Sub Notes,
8.75%, 2/15/12 | | | 46,125 |
See Notes to Financial Statements.
| | |
| Strategic Partners Asset Allocation Funds/Strategic Partners Conservative Growth Fund | | 29 |
Portfolio of Investments
as of January 31, 2005 (Unaudited) Cont’d.
| | | | | | | | |
Moody’s
Rating | | Principal
Amount (000) | | Description | | Value (Note 1) |
| | | | | | | | | |
| B3 | | $ | 131 | | Magellan Health Services, Inc., Sr, Notes,
9.375%, 11/15/08 | | $ | 141,579 |
| Ba1 | | | 50 | | Medco Health Solutions, Inc., Sr. Notes,
7.25%, 8/15/13 | | | 56,512 |
| Caa1 | | | 65 | | Medical Device Manufacturing, Gtd. Notes,
10.00%, 7/15/12 | | | 70,200 |
| B3 | | | 100 | | Medquest, Inc., Sr. Sub. Notes,
11.875%, 8/15/12 | | | 117,000 |
| Ba3 | | | 40 | | NeighborCare, Inc., Sr. Sub. Notes,
6.875%, 11/15/13 | | | 42,150 |
| B1 | | | 50 | | Omega Healthcare Investors, Inc., Notes,
6.95%, 8/1/07 | | | 51,875 |
| B1 | | | 25 | | 7.00%, 4/1/14 | | | 25,250 |
| B2 | | | 100 | | Resources-Care, Inc., Sr. Notes,
10.625%, 11/15/08 | | | 109,250 |
| B2 | | | 55 | | Select Medical Corp., Sr. Sub. Notes,
9.50%, 6/15/09 | | | 58,644 |
| Ba2 | | | 60 | | Senior Housing Properties Trust, Sr. Notes,
8.625%, 1/15/12 | | | 68,250 |
| B3 | | | 50 | | Tenet Healthcare Corp., Sr. Notes,
6.375%, 12/1/11 | | | 44,875 |
| B3 | | | 35 | | 6.50%, 6/1/12 | | | 31,150 |
| B3 | | | 50 | | 9.25%, 2/1/15 | | | 50,000 |
| NR | | | 75 | | Vanguard Health Holding Co.,
Sr. Sub. Notes,
9.00%, 10/1/14 | | | 80,250 |
| Ba3 | | | 40 | | Ventas Realty LP, Gtd. Notes,
8.75%, 5/1/09 | | | 44,250 |
| Ba3 | | | 110 | | Sr. Notes,
9.00%, 5/1/12 | | | 127,600 |
| Caa1 | | | 100 | | Warner Chilcott Corp., Sr. Sub. Notes,
8.75%, 2/1/15 | | | 102,750 |
| | | | | | | |
|
|
| | | | | | | | | 2,197,902 |
| | |
| Lodging 0.5% | | | | | |
| B1 | | | 75 | | FelCor Lodging LP, Gtd. Notes,
9.00%, 6/1/11 | | | 84,375 |
| B1 | | | 50 | | FelCor Suites LP, Gtd. Notes,
7.625%, 10/1/07 | | | 52,375 |
| Ba3 | | | 40 | | HMH Properties, Inc., Sr. Notes, Ser. B,
7.875%, 8/1/08 | | | 41,050 |
See Notes to Financial Statements.
| | |
| 30 | | Visit our website at www.strategicpartners.com |
| | | | | | | | |
Moody’s
Rating | | Principal
Amount (000) | | Description | | Value (Note 1) |
| | | | | | | | | |
| Ba3 | | $ | 125 | | Host Marriott LP, Sr. Notes,
9.50%, 1/15/07 | | $ | 135,313 |
| Ba3 | | | 75 | | 7.00%, 8/15/12 | | | 78,375 |
| Ba3 | | | 40 | | 7.125%, 11/1/13 | | | 42,100 |
| B2 | | | 25 | | John Q Hammons Hotels LP,
8.875%, 5/15/12 | | | 28,125 |
| Ba3 | | | 100 | | La Quinta Properties, Inc., Sr. Notes,
8.875%, 3/15/11 | | | 110,375 |
| Ba2 | | | 125 | | Royal Caribbean Cruises Ltd. (Liberia), Sr. Notes,
8.00%, 5/15/10 | | | 141,250 |
| | | | | | Starwood Hotels & Resorts Worldwide, Inc., Notes, | | | |
| Ba1 | | | 125 | | 7.875%, 5/1/12 | | | 142,500 |
| Ba1 | | | 175 | | 7.375%, 11/15/15 | | | 196,000 |
| | | | | | | |
|
|
| | | | | | | | | 1,051,838 |
| |
| Media & Entertainment 1.1% | | | |
| Caa1 | | | 75 | | Advertising Direct Solutions, Sr. Notes,
9.25%, 11/15/12 | | | 79,125 |
| B3 | | | 40 | | AMC Entertainment, Inc., Sr. Sub. Notes,
8.00%, 3/1/14 | | | 39,650 |
| Caa1 | | | 65 | | American Color Graphics, Notes,
10.00%, 6/15/10 | | | 55,413 |
| B2 | | | 5 | | American Media Operation, Inc.,
Gtd. Notes, Ser. B,
10.25%, 5/1/09 | | | 5,231 |
| B2 | | | 100 | | Canwest Media, Inc. (Canada),
Sr. Sub. Notes,
10.625%, 5/15/11 | | | 111,375 |
| B2 | | | 82 | | Dex Media East LLC, Gtd. Notes,
12.125%, 11/15/12 | | | 98,195 |
| B2 | | | 167 | | Dex Media West LLC, Sr. Sub. Notes,
9.875%, 8/15/13 | | | 189,335 |
| B1 | | | 80 | | DirecTV Holdings LLC, Sr. Notes,
8.375%, 3/15/13 | | | 90,100 |
| Ba3 | | | 80 | | Echostar DBS Corp., Gtd. Notes,
6.625%, 10/1/14 | | | 80,800 |
| Ba2 | | | 30 | | Entercom Radio LLC, Gtd. Notes,
7.625%, 3/1/14 | | | 32,250 |
See Notes to Financial Statements.
| | |
| Strategic Partners Asset Allocation Funds/Strategic Partners ConservativeGrowth Fund | | 31 |
Portfolio of Investments
as of January 31, 2005 (Unaudited) Cont’d.
| | | | | | | | |
Moody’s
Rating | | Principal
Amount (000) | | Description | | Value (Note 1) |
| | | | | | | | | |
| B2 | | $ | 150 | | Gray Communications Systems, Inc.,
Sr. Sub Notes,
9.25%, 12/15/11 | | $ | 166,875 |
| B1 | | | 125 | | Intelsat Bermuda, Sr. Notes,
8.25%, 1/15/13 | | | 129,375 |
| B1 | | | 75 | | Intrawest Corp., Sr. Notes,
7.50%, 10/15/13 | | | 78,750 |
| | | | | | Leslies Poolmart, Sr. Notes, | | | |
| B2 | | | 100 | | 7.75%, 2/1/13 | | | 101,750 |
| B3 | | | 35 | | Lowes Cineplex Entertainment Corp., Sr. Sub. Notes,
9.00%, 8/1/14 | | | 36,663 |
| B2 | | | 100 | | Marquee, Inc., Sr. Notes,
8.625%, 8/15/12 | | | 108,500 |
| B2 | | | 75 | | Medianews Group, Inc., Sr. Sub. Notes,
6.875%, 10/1/13 | | | 74,625 |
| Ba3 | | | 30 | | Morris Publishing, Sr. Sub. Notes,
7.00%, 8/1/13 | | | 30,525 |
| B3 | | | 25 | | New Skies Satellites NV (Netherlands)
Sr. Notes, FRN
7.44%, 11/1/11(e) | | | 26,063 |
| Caa1 | | | 25 | | Sr. Sub. Notes,
9.125%, 11/1/12 | | | 25,750 |
| B3 | | | 25 | | Primedia, Inc.,
Sr. Notes, FRN
7.67%, 5/15/10(e) | | | 26,375 |
| B3 | | | 50 | | Gtd. Notes,
8.875%, 5/15/11 | | | 52,750 |
| B2 | | | 50 | | Quebecor Media, Inc. (Canada), Sr. Notes,
11.125%, 7/15/11 | | | 56,250 |
| B2 | | | 175 | | R.R. Donnelley Financial Corp.,
Sr. Sub. Notes,
10.875%, 12/15/12 | | | 204,749 |
| Caa1 | | | 45 | | Six Flags, Inc., Sr. Notes,
9.625%, 6/1/14 | | | 42,413 |
| Ba3 | | | 150 | | Sun Media Corp. (Canada), Gtd. Notes,
7.625%, 2/15/13 | | | 159,750 |
| B3 | | | 50 | | Universal City Florida Holding Co.,
Sr. Notes,
8.375%, 5/1/10 | | | 52,000 |
| B2 | | | 45 | | Vail Resorts, Inc., Sr. Sub. Notes.,
6.75%, 2/15/14 | | | 45,394 |
See Notes to Financial Statements.
| | |
| 32 | | Visit our website at www.strategicpartners.com |
| | | | | | | | |
Moody’s
Rating | | Principal
Amount (000) | | Description | | Value (Note 1) |
| | | | | | | | | |
| | | | | | Vertis, Inc., Sec’d. Notes, | | | |
| B2 | | $ | 66 | | 9.75%, 4/1/09 | | $ | 71,775 |
| B3 | | | 55 | | 10.875%, 6/15/09 | | | 59,263 |
| Caa1 | | | 10 | | WDAC Subsidiary Corp.,
8.375%, 12/1/14 | | | 9,750 |
| | | | | | | |
|
|
| | | | | | | | | 2,340,819 |
|
| Metals 0.5% |
| B3 | | | 125 | | AK Steel Corp., Gtd.,
7.875%, 2/15/09 | | | 128,125 |
| B3 | | | 50 | | Sr. Notes,
7.75%, 6/15/12 | | | 51,375 |
| Ba3 | | | 50 | | Arch Western Finance LLC, Sr. Notes,
6.75%, 7/1/13 | | | 51,000 |
| B1 | | | 75 | | Century Aluminum Co., Gtd. Notes,
7.50%, 8/15/14 | | | 80,063 |
| B1 | | | 80 | | CSN Islands VII Corp. (Cayman Islands), Gtd. Notes,
10.75%, 9/12/08 | | | 90,700 |
| B1 | | | 50 | | Foundation PA Coal Co. Notes,
7.25%, 8/1/14 | | | 52,375 |
| B3 | | | 118 | | Ispat Inland ULC, Sec’d. Notes,
9.75%, 4/1/14 | | | 145,434 |
| B1 | | | 75 | | Novelis, Inc., (Canada) Sr. Notes,
7.25%, 2/15/15 | | | 76,875 |
| B1 | | | 25 | | Oregon Steel Mills, Inc., Gtd. Notes,
10.00%, 7/15/09 | | | 27,750 |
| Ba3 | | | 100 | | Russel Metals, Inc., (Canada), Sr. Notes,
6.375%, 3/1/14 | | | 100,000 |
| B2 | | | 50 | | Ryerson Tull, Inc., Sr. Notes,
8.25%, 12/15/11 | | | 49,000 |
| Ba2 | | | 89 | | United States Steel LLC, Sr. Notes,
10.75%, 8/1/08 | | | 105,243 |
| | | | | | | |
|
|
| | | | | | | | | 957,940 |
|
| Non Captive Finance 1.5% |
| A3 | | | 400 | | Ford Motor Credit Co., Notes,
7.50%, 3/15/05 | | | 401,899 |
| A3 | | | 600 | | Ford Motor Credit Co., Notes, FRN, MTN
3.10%, 7/18/05 | | | 598,686 |
| Aaa | | JPY | 67,000 | | General Electric Capital Corp., (Japan)
Sr. Notes,
1.40%, 11/2/06 | | | 661,102 |
See Notes to Financial Statements.
| | |
| Strategic Partners Asset Allocation Funds/Strategic Partners Conservative Growth Fund | | 33 |
Portfolio of Investments
as of January 31, 2005 (Unaudited) Cont’d.
| | | | | | | |
Moody’s
Rating | | Principal
Amount (000) | | Description | | Value (Note 1) |
| | | | | | | | |
| Aaa | | JPY 8,000 | | General Electric Capital Corp., (Japan) Sr. Unsub. Notes,
0.10%, 12/20/05 | | $ | 77,315 |
| Baa1 | | $ 100 | | General Motors Acceptance Corp. MTN, FRN,
4.23%, 5/19/05 | | | 100,420 |
| Baa1 | | 300 | | General Motors Acceptance Corp.,
7.50%, 7/15/05 | | | 304,988 |
| Baa1 | | 1,000 | | General Motors Acceptance Corp., Notes,
6.875%, 9/15/11 | | | 1,004,167 |
| | | | | | |
|
|
| | | | | | | | 3,148,577 |
|
| Packaging 0.4% |
| B2 | | 75 | | Anchor Glass Container Corp., Sec’d. Notes,
11.00%, 2/15/13 | | | 80,625 |
| B3 | | 100 | | Berry Plastics, Sr. Sub. Notes,
10.75%, 7/15/12 | | | 114,000 |
| B1 | | 100 | | Crown Euro Holdings SA (France),
Sec’d. Notes,
9.50%, 3/1/11 | | | 111,500 |
| Caa1 | | 25 | | Graham Packaging Co., Inc., Sr. Notes,
8.50%, 10/15/12 | | | 25,938 |
| Caa2 | | 75 | | 9.875%, 10/15/14 | | | 78,563 |
| B2 | | 175 | | Greif Brothers Corp., Sr. Sub. Notes,
8.875%, 8/1/12 | | | 193,375 |
| B1 | | 180 | | Owens-Brockway Glass Containers,
Sec’d. Notes,
8.75%, 11/15/12 | | | 200,249 |
| | | | | | |
|
|
| | | | | | | | 804,250 |
| |
| Paper 0.4% | | | |
| Ba3 | | 125 | | Abitibi-Consolidated Co. CDA,
5.25%, 6/20/08 | | | 121,874 |
| B2 | | 85 | | Ainsworth Lumber Co. Ltd.,
Sr. Notes, (Canada)
6.75%, 3/15/14 | | | 82,344 |
| Ba3 | | 75 | | Bowater Canada Finance, Gtd. Notes,
7.95%, 11/15/11 | | | 80,352 |
| Caa1 | | 25 | | Caraustar Industries, Inc., Gtd. Notes,
9.875%, 4/1/11 | | | 27,438 |
| Ba3 | | 60 | | Cascades, Inc. (Canada),
7.25%, 2/15/13 | | | 62,700 |
See Notes to Financial Statements.
| | |
| 34 | | Visit our website at www.strategicpartners.com |
| | | | | | | | |
Moody’s
Rating | | Principal
Amount (000) | | Description | | Value (Note 1) |
| | | | | | | | | |
| B2 | | $ | 100 | | Cellu Tissue Holdings, Inc., Sec’d. Notes,
9.75%, 3/15/10 | | $ | 105,250 |
| Ba3 | | | 75 | | Georgia-Pacific Corp., Notes,
7.50%, 5/15/06 | | | 78,094 |
| Ba3 | | | 20 | | 8.125%, 5/15/11 | | | 23,000 |
| Ba3 | | | 75 | | 8.875%, 5/15/31 | �� | | 95,625 |
| B2 | | | 75 | | Millar Western Forest Products Ltd. (Canada),
7.75%, 11/15/13 | | | 78,375 |
| Ba3 | | | 25 | | Tembec Industries, Inc. (Canada), Gtd. Notes,
8.625%, 6/30/09 | | | 24,844 |
| Ba3 | | | 55 | | 7.75%, 3/15/12 | | | 52,250 |
| | | | | | | |
|
|
| | | | | | | | | 832,146 |
| |
| Pipelines & Other 0.6% | | | |
| B2 | | | 75 | | AmeriGas Partners, LP, Sr. Notes,
8.875%, 5/20/11 | | | 81,000 |
| B3 | | | 210 | | EL Paso Corp.,
Gtd. Notes,
7.75%, 6/1/13
| | | 218,400 |
| Caa1 | | | 25 | | Sr. Notes,
7.00%, 5/15/11 | | | 25,125 |
| Caa1 | | | 150 | | 7.75%, 1/15/32 | | | 145,875 |
| Baa3 | | | 50 | | Enterprise Products Operation LP, Sr. Notes,
5.60%, 10/15/14 | | | 51,235 |
| B2 | | | 40 | | Ferrellgas Partners LP, Notes,
8.75%, 6/15/12 | | | 42,800 |
| B1 | | | 50 | | Inergy LP, Sr. Notes,
6.875%, 12/15/14 | | | 49,750 |
| B1 | | | 25 | | MarkWest Energy Partners LP, Sr. Notes,
6.875%, 11/1/14 | | | 25,125 |
| Ba2 | | | 50 | | Pacific Energy Partners LP, Sr. Notes,
7.125%, 6/15/14 | | | 52,750 |
| B1 | | | 50 | | Southern Natural Gas, Notes,
8.875%, 3/15/10 | | | 55,625 |
| | | | | | Tennessee Gas Pipeline, Debs., | | | |
| B1 | | | 160 | | 7.00%, 3/15/27 - 10/15/28 | | | 165,353 |
| B1 | | | 125 | | 7.625%, 4/1/37 | | | 132,500 |
See Notes to Financial Statements.
| | |
| Strategic Partners Asset Allocation Funds/Strategic Partners Conservative Growth Fund | | 35 |
Portfolio of Investments
as of January 31, 2005 (Unaudited) Cont’d.
| | | | | | | | |
Moody’s
Rating | | Principal
Amount (000) | | Description | | Value (Note 1) |
| | | | | | | | | |
| B3 | | $ | 40 | | TranMontaigne, Inc., Sr. Sub. Notes,
9.125%, 6/1/10 | | $ | 43,000 |
| | | | | | Williams Companies., Inc., Notes, | | | |
| B1 | | | 150 | | 7.125%, 9/1/11 | | | 163,125 |
| B1 | | | 45 | | 8.125%, 3/15/12 | | | 51,750 |
| | | | | | | |
|
|
| | | | | | | | | 1,303,413 |
|
| Retailers 0.4% |
| B3 | | | 25 | | Asbury Automotive Group, Inc.,
Sr. Sub. Notes,
8.00%, 3/15/14 | | | 25,063 |
| Ba2 | | | 15 | | AutoNation, Inc., Sr. Notes,
9.00%, 8/1/08 | | | 16,875 |
| B1 | | | 75 | | Group 1 Automotive, Inc., Sr. Sub. Notes,
8.25%, 8/15/13 | | | 78,750 |
| Ba2 | | | 225 | | JC Penney Co., Inc., Debs.,
7.40%, 4/1/37 | | | 246,374 |
| | | | | | Jean Coutu Group, Inc., (Canada),
Sr. Notes, | | | |
| B2 | | | 25 | | 7.625%, 8/1/12 | | | 26,000 |
| | | | | | Sr. Sub. Notes, | | | |
| B3 | | | 50 | | 8.50%, 8/1/14 | | | 49,875 |
| NR | | | 120 | | Lazy Days RV Center, Inc., Sr. Notes,
11.75%, 5/15/12 | | | 132,600 |
| B3 | | | 50 | | Pantry, Inc., Sr. Sub. Notes,
7.75%, 2/15/14 | | | 52,500 |
| Ba3 | | | 90 | | Saks, Inc., Notes,
7.375%, 2/15/19 | | | 89,775 |
| Ba2 | | | 25 | | Toys R’ Us, Inc., Notes,
7.875%, 4/15/13 | | | 25,688 |
| | | | | | | |
|
|
| | | | | | | | | 743,500 |
|
| Technology 0.4% |
| | | | | | Fairchild Semiconductor International, Inc., Sr. Sub. Notes, | | | |
| B2 | | | 100 | | 10.50%, 2/1/09 | | | 105,250 |
| Ba2 | | | 50 | | Flextronics International Ltd,
Sr. Sub. Notes,
6.25%, 11/15/14 | | | 49,000 |
| Ba2 | | | 25 | | Freescale Semiconductor, Inc., Sr. Notes,
6.875%, 7/15/11 | | | 26,563 |
See Notes to Financial Statements.
| | |
| 36 | | Visit our website at www.strategicpartners.com |
| | | | | | | | |
Moody’s
Rating | | Principal
Amount (000) | | Description | | Value (Note 1) |
| | | | | | | | | |
| Caa1 | | $ | 75 | | Iron Mountain, Inc., Gtd. Notes,
8.625%, 4/1/13 | | $ | 79,313 |
| B3 | | | 25 | | Nortel Networks Ltd. (Canada) Notes,
6.125%, 2/15/06 | | | 25,344 |
| Ba2 | | | 95 | | Sanmina-SCI Corp., Sec’d. Notes,
10.375%, 1/15/10 | | | 107,824 |
| Ba2 | | | 125 | | Seagate Technology Holdings, Notes,
8.00%, 5/15/09 | | | 134,374 |
| Ba2 | | | 75 | | STATS ChiPAC Ltd., Sr. Notes,
6.75%, 11/15/11 | | | 73,125 |
| B3 | | | 75 | | UGS Corp., Sr. Sub. Notes,
10.00%, 6/1/12 | | | 83,625 |
| Ba1 | | | 75 | | Unisys Corp., Sr. Notes,
8.125%, 6/1/06 | | | 78,375 |
| Ba2 | | | 75 | | Xerox Corp., Sr. Notes,
7.625%, 6/15/13 | | | 80,813 |
| | | | | | | |
|
|
| | | | | | | | | 843,606 |
|
| Telecommunications 1.8% |
| Caa1 | | | 75 | | Alamosa Delaware, Inc.,
Sr. Notes,
8.50%, 1/31/12 | | | 79,875 |
| Caa1 | | | 50 | | Gtd. Notes,
11.00%, 7/31/10 | | | 58,250 |
| Ba1 | | | 153 | | AT&T Corp., Sr. Notes,
9.05%, 11/15/11 | | | 177,480 |
| AA3 | | | 400 | | BellSouth Corp., Notes,
4.12%, 4/26/21 | | | 401,095 |
| Caa1 | | | 100 | | Centennial Commumications, Notes,
8.125%, 2/1/14 | | | 105,750 |
| B3 | | | 50 | | Cincinnati Bell, Inc., Sr. Sub. Notes,
8.375%, 1/15/14 | | | 50,750 |
| Ba3 | | | 30 | | Citizens Communications Co., Notes,
9.25%, 5/15/11 | | | 35,025 |
| Ba3 | | | 100 | | 6.25%, 1/15/13 | | | 99,750 |
| B3 | | | 50 | | Crown Castle International Corp., Sr. Notes,
9.375%, 8/1/11 | | | 55,500 |
| B3 | | | 125 | | 7.50%, 12/1/13 | | | 132,656 |
| B2 | | | 25 | | Dobson Cellular Systems,
Sec’d Notes, FRN
7.49%, 11/1/11(e) | | | 26,313 |
| B1 | | | 50 | | Eircom Funding (Ireland),
8.25%, 8/15/13 | | | 54,625 |
| B2 | | | 65 | | MCI, Inc., Sr. Notes,
6.91%, 5/1/07 | | | 66,463 |
| | |
| Strategic Partners Asset Allocation Funds/Strategic Partners Conservative Growth Fund | | 37 |
Portfolio of Investments
as of January 31, 2005 (Unaudited) Cont’d.
| | | | | | | | |
Moody’s
Rating | | Principal
Amount (000) | | Description | | Value (Note 1) |
| | | | | | | | | |
| B2 | | $ | 59 | | 7.69%, 5/1/09 | | $ | 61,581 |
| B2 | | | 60 | | 8.74%, 5/1/14 | | | 65,625 |
| Ba3 | | | 50 | | Nextel Communications, Inc., Sr. Notes,
5.95%, 3/15/14 | | | 51,875 |
| Ba3 | | | 235 | | 7.375%, 8/1/15 | | | 259,088 |
| Caa2 | | | 100 | | Qwest Corp.,
Gtd. Notes,
7.25%, 2/15/11 | | | 96,000 |
| Ba3 | | | 100 | | Sr. Notes,
7.875%, 9/1/11 | | | 107,000 |
| | | | | | Qwest Services Corp., Notes, | | | |
| Caa1 | | | 287 | | 14.00%, 12/15/10 | | | 340,812 |
| BB(d) | | | 75 | | Rogers Wireless Communications, Inc.,
Sec’s Notes, (Canada)
7.50%, 3/15/15 | | | 80,438 |
| B+(d) | | | 75 | | Rogers Wireless, Inc.,
Sr. Sub Notes, (Canada)
8.00%, 12/15/12 | | | 80,250 |
| A2 | | | 700 | | SBC Communications, Inc., Notes,
4.21%, 6/5/21 | | | 702,974 |
| Caa1 | | | 75 | | UbiquiTel Operating Co., Sr. Notes,
9.875%, 3/1/11 | | | 82,688 |
| B2 | | | 25 | | US Unwired, Inc., Ser. B, Sec’d Notes, FRN
6.74%, 6/15/10(e) | | | 25,813 |
| A3 | | | 300 | | Verizon Wireless Capital, FRN
2.42%, 5/23/05(e) | | | 299,943 |
| | | | | | | |
|
|
| | | | | | | | | 3,597,619 |
|
| Tobacco 0.1% |
| B1 | | | 75 | | DIMON, Inc., Sr. Notes,
9.625%, 10/15/11 | | | 84,000 |
| B2 | | | 10 | | North Atlantic Trading Co., Sr. Notes,
9.25%, 3/1/12 | | | 7,850 |
| Ba3 | | | 75 | | Standard Commercial Corp., Sr. Notes,
8.00%, 4/15/12 | | | 77,062 |
| | | | | | | |
|
|
| | | | | | | | | 168,912 |
| | | | | | | |
|
|
| | | | | | Total corporate bonds | | | 32,011,153 |
| | | | | | | |
|
|
|
| CONVERTIBLE BONDS |
|
| Capital Goods |
| Baa3 | | | 25 | | Tyco International Group SA, Gtd. Notes,
3.125%, 1/15/23 | | | 42,281 |
See Notes to Financial Statements.
| | |
| 38 | | Visit our website at www.strategicpartners.com |
| | | | | | | | |
Moody’s
Rating | | Principal
Amount (000) | | Description | | Value (Note 1) |
| | | | | | | | | |
|
| Technology |
| B3 | | $ | 20 | | Nortel Networks Corp., Gtd. Notes,
4.25%, 9/1/08 | | $ | 19,275 |
| | | | | | | |
|
|
| | | | | | Total convertible bonds | | | 61,556 |
| | | | | | | |
|
|
|
| MORTGAGE RELATED SECURITIES 2.9% |
| AAA(d) | | | 470 | | ACE Securities Corp.,
Ser. 2004, Class 2A, FRN,
2.53%, 4/25/34(e) | | | 470,024 |
| Aaa | | | 900 | | American Express Credit Account Master Trust, Ser. 2000-5, FRN,
2.62%, 4/15/08(e) | | | 900,745 |
| AAA(d) | | | 252 | | Ameriquest Mortgage Securities,
Ser. 2004, Class R2 A, FRN,
2.62%, 4/25/34(e) | | | 251,537 |
| Aaa | | | 693 | | Argent Securites, Inc., FRN,
2.64%, 5/25/34(e) | | | 693,266 |
| Aaa | | | 900 | | Capital Auto Receivable Asset Trust,
2.64%, 3/17/08 | | | 895,376 |
| | | | | | Home Equity Mortgage Trust, Ser. 2004-4, Class A2 , FRN, | | | |
| Aaa | | | 267 | | 2.68%, 12/25/34(e) | | | 266,719 |
| | | | | | Honda Auto Receivables Owners Trust,
Ser. 2004-3, Class A1, | | | |
| A-1+(d) | | | 308 | | 2.09%, 11/18/05 | | | 307,931 |
| Aaa | | | 83 | | Mellon Residential Funding Corp.,
FRN, Ser. 1999, Class A-3,
2.85%, 7/25/29(e) | | | 83,653 |
| Caa2 | | | 264 | | Quest Capital Funding, Inc.,
FRN, Gtd. Notes,
3.09%, 6/25/34(e) | | | 264,627 |
| NR | | | 362 | | Vendee Mortgage Trust,
FRN, Ser. 2000-1, Class 1A,
6.81%, 1/15/30(e) | | | 374,725 |
| Aaa | | | 34 | | Washington Mutual, Ser. 2002-S2,
Class 3A-1,
6.00%, 3/25/17 | | | 33,709 |
| Aaa | | | 1,628 | | Washington Mutual, Ser. 2003-R1,
Class A1, FRN,
2.80%, 12/25/27(e) | | | 1,626,550 |
| | | | | | | |
|
|
| | | | | | Total mortgage related securities | | | 6,168,862 |
| | | | | | | |
|
|
See Notes to Financial Statements.
| | |
| Strategic Partners Asset Allocation Funds/Strategic Partners Conservative Growth Fund | | 39 |
Portfolio of Investments
as of January 31, 2005 (Unaudited) Cont’d.
| | | | | | | | |
Moody’s
Rating | | Principal
Amount (000) | | Description | | Value (Note 1) |
| | | | | | | | | |
| |
| MUNICIPAL BONDS 2.0% | | | |
| Aaa | | $ | 400 | | Chicago Illinois, Project & Refunding,
Ser. A,
5.00%, 1/1/41 | | $ | 410,316 |
| Aa2 | | | 400 | | Florida St. Board of Ed.,
5.00%, 6/1/32 | | | 417,408 |
| Aaa | | | 200 | | Georgia State Road & Tollway Auth. Rev.,
5.00%, 3/1/21 | | | 214,254 |
| Baa2 | | | 250 | | Golden State Tobacco Settlement Rev.,
6.25%, 6/1/33 | | | 251,270 |
| Baa2 | | | 100 | | 6.75%, 6/1/39 | | | 102,095 |
| Aaa | | | 250 | | Massachusetts St. Water Res. Auth., Ser. J,
5.00%, 8/1/32 | | | 260,135 |
| | | | | | New Jersey, Tobacco Settlement Financing Corp., | | | |
| Baa3 | | | 250 | | 6.375%, 6/1/32 | | | 249,498 |
| Baa3 | | | 300 | | 6.00%, 6/1/37 | | | 285,249 |
| Aa2 | | | 500 | | New York St. Dormitory Authority Revs.,
6.65%, 8/15/30 | | | 592,585 |
| Aaa | | | 400 | | San Antonio Water Rev.,
5.00%, 5/15/25 | | | 419,876 |
| Aaa | | | 200 | | South Carolina St. Hwy., Ser. B,
5.00%, 4/1/17 | | | 217,060 |
| Aaa | | | 600 | | South Central Connecticut Regional Water Auth., Ser. B-1,
5.00%, 8/1/26 | | | 639,198 |
| | | | | | | |
|
|
| | | | | | Total municipal bonds | | | 4,058,944 |
| | | | | | | |
|
|
| |
| U.S. GOVERNMENT AND AGENCY SECURITIES 16.7% | | | |
| | | | | | Federal Home Loan Mortgage Corp., | | | |
| | | | 29 | | 3.62%, 8/1/23(c)(e), | | | 30,237 |
| | | | 373 | | 6.00%, 9/1/22(c) | | | 387,308 |
| | | | 276 | | 10.00%, 5/15/20(c) | | | 275,798 |
| | | | | | Federal National Mortgage Association, | | | |
| | | | 149 | | 4.16%, 5/1/36(c)(e) | | | 152,132 |
| | | | 81 | | 4.50%, 8/1/33(c) | | | 79,474 |
| | | | 99 | | 5.00%, 1/1/19(c) | | | 100,375 |
| | | | 4,486 | | 5.00%, 10/1/34 - 1/1/35(c) | | | 4,478,563 |
| | | | 287 | | 6.00%, 5/1/16 - 12/1/17(c) | | | 301,162 |
| | | | 84 | | 6.50%, 9/1/05 - 1/1/16(c) | | | 88,439 |
| | | | 174 | | 7.50%, 1/1/32(c) | | | 186,125 |
| | | | 53 | | 8.00%, 8/25/22(c) | | | 57,524 |
See Notes to Financial Statements.
| | |
| 40 | | Visit our website at www.strategicpartners.com |
| | | | | | | |
Moody’s
Rating | | Principal
Amount (000) | | Description | | Value (Note 1) |
| | | | | | | | |
| | | | | Government National Mortgage Association, | | | |
| | | $ 16 | | 3.75%, 9/20/22(c)(e), | | $ | 15,918 |
| | | 80 | | 4.50%, 8/15/33 - 9/15/33(c) | | | 79,322 |
| | | 162 | | 8.50%, 2/20/30 - 6/15/30(c) | | | 177,521 |
| | | | | United States Inflation Index Bonds, | | | |
| | | 1,411 | | 0.875%, 4/15/10(c) | | | 1,391,176 |
| | | 1,551 | | 2.00%, 1/15/14(c) | | | 1,604,121 |
| | | 2,170 | | 3.375%, 1/15/07(c) | | | 2,275,720 |
| | | 1,773 | | 3.625%, 1/15/08(c) | | | 1,910,934 |
| | | 221 | | 3.875%, 4/15/29(c) | | | 303,666 |
| | | | | United States Treasury Bonds, | | | |
| | | 600 | | 8.875%, 8/15/17(c) | | | 859,500 |
| | | 400 | | 12.00%, 8/15/13(c) | | | 511,312 |
| | | 3,100 | | United States Treasury Notes,
2.50%, 9/30/06(c) | | | 3,065,004 |
| | | 700 | | 3.375%, 10/15/09(c) | | | 690,813 |
| | | 300 | | 3.875%, 5/15/09(c) | | | 303,234 |
| | | 1,000 | | 4.00%, 6/15/09(c) | | | 1,014,883 |
| | | 4,400 | | 4.875%, 2/15/12(c) | | | 4,653,172 |
| | | 2,500 | | 5.00%, 8/15/11(c) | | | 2,659,668 |
| | | 6,000 | | 6.00%, 2/15/26(c) | | | 7,068,750 |
| | | 600 | | United States Treasury Strip,
Zero Coupon,
11/15/16 - 2/15/22(c) | | | 280,761 |
| | | | | | |
|
|
| | | | | Total U.S. government and agency securities | | | 35,002,612 |
| | | | | | |
|
|
|
| FOREIGN GOVERNMENT SECURITIES 4.1% |
| Aaa | | EUR 600 | | Deutsche Bundesrepublik (Germany),
6.50%, 7/4/27 | | | 1,071,450 |
| NR | | EUR1,000 | | France Government Bond,
5.00%, 4/25/12 | | | 1,445,014 |
| Ba1 | | $ 300 | | Government of Panama,
9.63%, 2/8/11 | | | 352,500 |
| Aa2 | | JPY3,000 | | Italy Government International Bond,
3.80%, 3/27/08 | | | 32,208 |
| | | | | | | | |
| B1 | | $ 55 | | Republic of Brazil,
10.00%, 8/7/11 | | | 62,700 |
| B1 | | 45 | | 8.25%, 1/20/34 | | | 42,188 |
| B1 | | 860 | | 11.00%, 8/17/40 | | | 995,450 |
See Notes to Financial Statements.
| | |
| Strategic Partners Asset Allocation Funds/Strategic Partners Conservative Growth Fund | | 41 |
Portfolio of Investments
as of January 31, 2005 (Unaudited) Cont’d.
| | | | | | | |
Moody’s
Rating | | Principal
Amount (000) | | Description | | Value (Note 1) |
| | | | | | | | |
| B1 | | $ 48 | | Republic of Brazil, FRN
3.06%, 4/15/06(e) | | $ | 48,178 |
| Ba2 | | 75 | | Republic of Columbia,
10.00%, 1/23/12 | | | 84,450 |
| Baa3 | | 1,550 | | Russian Government Bonds,
(Step Coupon)
5.00%, 3/31/30 | | | 1,627,189 |
| Aaa | | GBP 500 | | United Kingdom Treasury Bond,
5.75%, 12/7/09 | | | 991,711 |
| Aaa | | GBP 800 | | 5.00%, 9/7/14 | | | 1,554,749 |
| Baa2 | | $ 325 | | United Mexican States,
5.875%, 1/15/14 | | | 336,375 |
| | | | | | |
|
|
| | | | | Total foreign government securities | | | 8,644,162 |
| | | | | | |
|
|
| | | |
| | | Units
| | | | |
|
| WARRANTS |
| | | 166 | | Gentek, Inc. Warrant B, expiring 10/31/08, | | | 398 |
| | | 81 | | Gentek, Inc. Warrant C, expiring 10/31/10, | | | 143 |
| | | 776 | | McLeodUSA, Inc. expiring 4/16/07, | | | 109 |
| | | 300,000 | | United Mexican States,
Ser. C, expiring 6/30/05, | | | 4,050 |
| | | 300,000 | | United Mexican States,
Ser. D, expiring 6/30/06, | | | 7,650 |
| | | 300,000 | | United Mexican States,
Ser. E, expiring 6/30/07, | | | 6,750 |
| | | | | | |
|
|
| | | | | Total warrants | | | 19,100 |
| | | | | | |
|
|
| | | | | Total long-term investments
(cost $148,879,908) | | | 166,618,133 |
| | | | | | |
|
|
|
| SHORT-TERM INVESTMENTS 18.9% |
|
| COMMERCIAL PAPER 15.2% |
| | | |
| | | Principal
Amount (000)
| | | | |
| P-1 | | $1,400 | | ANZ Delaware, Disc. Note,
2.38%, 2/22/05 | | $ | 1,398,127 |
| | | | | ASB Bank Ltd., Disc. Note, | | | |
| P-1 | | 500 | | 2.04%, 2/14/05 | | | 499,554 |
| P-1 | | 1,800 | | 2.42%, 4/7/05 | | | 1,791,674 |
See Notes to Financial Statements.
| | |
| 42 | | Visit our website at www.strategicpartners.com |
| | | | | | | | |
Moody’s
Rating | | Principal
Amount (000) | | Description | | Value (Note 1) |
| | | | | | | | | |
| P-1 | | $ | 2,200 | | Bank of Ireland, Disc. Note,
2.53%, 4/11/05 | | $ | 2,189,022 |
| P-1 | | | 2,500 | | Barclays U.S. Funding, Disc. Note,
2.52%, 4/5/05 | | | 2,488,800 |
| P-1 | | | 500 | | CBA (Delaware) Finance, Disc. Note,
2.53%, 4/11/05 | | | 497,535 |
| P-1 | | | 1,500 | | CDC Corp., Disc. Note,
2.04%, 2/22/05 | | | 1,497,993 |
| | | | | | Danske Corp., Disc. Note, | | | |
| P-1 | | | 1,400 | | 2.04%, 2/14/05 | | | 1,398,750 |
| P-1 | | | 700 | | 2.37%, 3/14/05 - 4/1/05 | | | 697,613 |
| P-1 | | | 700 | | 2.50%, 4/7/05 | | | 696,759 |
| P-1 | | | 1,300 | | Dexia Delaware LLC., Disc. Note,
2.36%, 3/3/05 | | | 1,297,443 |
| P-1 | | | 2,500 | | DNB Bank, Disc. Note,
2.41%, 2/23/05 | | | 2,496,325 |
| P-1 | | | 500 | | European Investment Bank, Disc. Note,
2.27%, 2/1/05 | | | 500,000 |
| P-1 | | | 400 | | Ford Motor Credit Co., Disc. Note,
2.52%, 4/7/05 | | | 397,924 |
| | | | | | General Electric Capital Corp., Disc. Note, | | | |
| P-1 | | | 300 | | 2.28%, 2/23/05 | | | 299,574 |
| P-1 | | | 1,200 | | 2.32%, 2/24/05 | | | 1,198,187 |
| P-1 | | | 100 | | 2.49%, 4/5/05 | | | 99,563 |
| | | | | | ING US Funding LLC, Disc. Note, | | | |
| P-1 | | | 1,100 | | 2.45%, 3/21/05 | | | 1,096,351 |
| P-1 | | | 1,600 | | 2.40%, 4/5/05 | | | 1,592,832 |
| P-1 | | | 2,400 | | Nestle Capital Corp., Disc Note,
2.22%, 2/15/05 | | | 2,397,693 |
| P-1 | | | 2,000 | | Nordea North America, Inc. Disc., Note,
2.60%, 4/25/05 | | | 1,987,840 |
| P-1 | | | 500 | | Rabobank USA, Disc. Note,
2.64%, 5/20/05 | | | 496,005 |
| P-1 | | | 1,400 | | Skandi Bank, Disc. Note,
2.12%, 2/4/05 | | | 1,399,649 |
| | | | | | UBS Finance (Delaware) LLC, Disc. Note, | | | |
| P-1 | | | 100 | | 2.03%, 2/22/05 | | | 99,866 |
| P-1 | | | 2,500 | | 2.51%, 4/27/05 | | | 2,484,575 |
| P-1 | | | 200 | | 2.57%, 5/6/05 | | | 198,626 |
| P-1 | | | 700 | | Westpac Capital, Disc. Note,
2.40%, 3/10/05 | | | 698,334 |
| | | | | | | |
|
|
| | | | | | Total commercial paper | | | 31,896,614 |
| | | | | | | |
|
|
See Notes to Financial Statements.
| | |
| Strategic Partners Asset Allocation Funds/Strategic Partners Conservative Growth Fund | | 43 |
Portfolio of Investments
as of January 31, 2005 (Unaudited) Cont’d.
| | | | | | | | |
Moody’s
Rating | | Principal
Amount (000) | | Description | | Value (Note 1) |
| | | | | | | | | |
|
| U.S. GOVERNMENT AND AGENCY SECURITIES 0.5% |
| | | | | | United States Treasury Bill, | | | |
| | | $ | 255 | | 2.18%, 3/3/05(c) | | $ | 254,560 |
| | | | 855 | | 2.20%, 3/17/05(c) | | | 852,782 |
| | | | | | | |
|
|
| | | | | | Total U.S. government and agency securities | | | 1,107,342 |
| | | | | | | |
|
|
| | | |
| | | Shares
| | | | |
|
| MUTUAL FUND 3.2% |
| | | | 6,735 | | Dryden Core Investment Fund - Taxable Money Market Series | | | 6,735,130 |
| | | | | | | |
|
|
| | | | | | Total short-term investments
(cost $39,742,633) | | | 39,739,086 |
| | | | | | | |
|
|
| | | |
| | | Contracts
| | | | |
|
| OUTSTANDING OPTIONS PURCHASED |
|
| Put Options |
| | | | 25 | | Euro Futures, expiring
3/14/05 @ 93.25 | | | 313 |
| | | | 48 | | Euro Futures, expiring
9/19/05 @ 94.75 | | | 300 |
| | | | | | | |
|
|
| | | | | | | | | 613 |
| | | | | | | |
|
|
| | | |
| | | Notional
Amount (000)
| | | | |
|
| SWAP OPTIONS |
|
| Call Options |
| | | $ | 500 | | Swap Option 3 month LIBOR, expiring
4/27/09 @ 5.75% | | | 57,689 |
See Notes to Financial Statements.
| | |
| 44 | | Visit our website at www.strategicpartners.com |
| | | | | | | | | | |
Moody’s
Rating | | Notional
Amount (000) | | | | | Value (Note 1) | |
|
| Put Options | |
| | | $ | 500 | | | Swap Option 3 month LIBOR, expiring
4/27/09 @ 6.25% 4/27/09 | | $ | 18,164 | |
| | | | | | | | |
|
|
|
| | | | | | | | | | 75,853 | |
| | | | | | | | |
|
|
|
| | | | | | | Total outstanding options purchased
(cost $62,330) | | | 76,466 | |
| | | | | | | | |
|
|
|
| | | | | | | Total Investments, Before Outstanding Options Written and Securities Sold Short 98.6%
(cost $188,684,871) | | | 206,433,685 | |
| | | | | | | | |
|
|
|
| | | | | | | | | | | |
| | | |
| | | Contracts
| | | | | | |
|
| OUTSTANDING OPTIONS WRITTEN (0.1)% | |
|
| Call Options (0.1)% | |
| | | | (15 | ) | | United States Treasury Notes, expiring
2/18/05 @ 113 | | | (3,516 | ) |
| | | | (31 | ) | | United States Treasury Notes, expiring
2/18/05 @ 114 | | | (1,453 | ) |
| | | | (4 | ) | | United States Treasury Notes, expiring
5/20/05 @ 114 | | | (1,312 | ) |
| | | | | | | | |
|
|
|
| | | | | | | | | | (6,281 | ) |
|
| Put Options | |
| | | | (5 | ) | | 90 Day GBP LIBOR, expiring
12/21/05 @ 94.25 | | | (295 | ) |
| | | | (54 | ) | | United States Treasury Notes, expiring
2/18/05 @ 108 | | | (844 | ) |
| | | | (129 | ) | | United States Treasury Notes, expiring
5/20/05 @ 108 | | | (52,406 | ) |
| | | | | | | | |
|
|
|
| | | | | | | | | | (53,545 | ) |
| | | |
| | | Notional
Amount (000)
| | | | | | |
|
| SWAP OPTIONS | |
|
| Call Options | |
| | | $ | (1,300 | ) | | Swap Option 3 month LIBOR, expiring
10/31/05 @ 4.00% | | | (9,089 | ) |
| | |
| Strategic Partners Asset Allocation Funds/Strategic Partners Conservative Growth Fund | | 45 |
Portfolio of Investments
as of January 31, 2005 (Unaudited) Cont’d.
| | | | | | | | | | |
Moody’s
Rating | | Notional
Amount (000) | | | | | Value (Note 1) | |
| | | $ | (2,900 | ) | | Swap Option 3 month LIBOR, expiring
7/07/06 @ 4.00% | | $ | (29,296 | ) |
| | | | (3,000 | ) | | Swap Option 3 month LIBOR, expiring
9/23/05 @ 4.00% | | | (18,906 | ) |
| | | | | | | | |
|
|
|
| | | | | | | | | | (57,291 | ) |
| | | | | | | | |
|
|
|
| | |
| Put Options | | | | | | | |
| | | | (1,300 | ) | | Swap Option 3 month LIBOR, expiring
10/31/05 @ 7.00% | | | (185 | ) |
| | | | (2,900 | ) | | Swap Option 3 month LIBOR, expiring
7/03/06 @ 6.00% | | | (15,933 | ) |
| | | | (3,000 | ) | | Swap Option 3 month LIBOR, expiring
9/23/05 @ 7.00% | | | (201 | ) |
| | | | | | | | |
|
|
|
| | | | | | | | | | (16,319 | ) |
| | | | | | | | |
|
|
|
| | | | | | | Total outstanding options written
(premiums received $392,959) | | | (133,436 | ) |
| | | | | | | | |
|
|
|
| | | |
| | | Principal
Amount (000)
| | | | | | |
| |
| INVESTMENTS SOLD SHORT (2.1)% | | | | |
| | | | (4,500 | ) | | Federal National Mortgage Association,
5.00%, 2/1/34
(proceeds $4,452,891) | | | (4,488,750 | ) |
| | | | | | | | |
|
|
|
| | | | | | | Total Investments, Net of Outstanding Option Written and Securities Sold Short 96.4%
(cost $183,839,021; Note 5) | | | 201,811,499 | |
| | | | | | | Other assets in excess of liabilities(g) 3.6% | | | 7,613,860 | |
| | | | | | | | |
|
|
|
| | | | | | | Net Assets 100% | | $ | 209,425,359 | |
| | | | | | | | |
|
|
|
ADR—American Depository Receipt.
EUR—Euro Dollar.
FRN—Floating Rate Note.
GBP—Great British Pounds.
JPY—Japanese Yen.
MTN—Medium Term Note.
| (a) | Non-income producing security. |
| (b) | Represents issuer in default on interest payments, non-income producing security. |
| (c) | Securities with an aggregate market value of $36,109,954 have been segregated with the custodian to cover margin requirements for futures contracts, forwards, swaps, short sells and written options open at January 31, 2005. |
| (e) | Floating rate note. The coupon is indexed to a floating interest rate, the rate shown is the rate at January 31, 2005. |
| (f) | The rate shown reflects the coupon after the stop date. |
| (g) | Other assets in excess of liabilities includes net unrealized appreciation (depreciation) on futures contracts, foreign currency exchange contracts and swaps. |
See Notes to Financial Statements.
| | |
| 46 | | Visit our website at www.strategicpartners.com |
| | Open future contracts outstanding at January 31, 2005: |
| | | | | | | | | | | | | | |
Number of
Contracts
| | Type
| | Expiration
Date
| | Value at
January 31, 2005
| | Value at Trade Date
| | Unrealized
Appreciation
(Depreciation)
| |
| | | Long Positions: | | | | | | | | | | | | |
| 131 | | 5 Yr. US T-Note | | Mar. 2005 | | $ | 14,311,750 | | $ | 14,290,000 | | $ | 21,750 | |
| 129 | | 90 Day Euro | | Dec. 2005 | | | 31,058,362 | | | 31,038,325 | | | 20,037 | |
| 50 | | 90 Day Euro | | Mar. 2006 | | | 12,021,250 | | | 12,016,875 | | | 4,375 | |
| 45 | | Euro-BOBL | | Mar. 2005 | | | 6,657,294 | | | 6,636,197 | | | 21,097 | |
| 20 | | US T-Bond | | Mar. 2005 | | | 2,296,875 | | | 2,252,500 | | | 44,375 | |
| 17 | | 90 Day Euro | | Dec. 2006 | | | 4,076,600 | | | 4,081,487 | | | (4,887 | ) |
| 15 | | 90 Day GBP LIBOR | | Dec. 2005 | | | 3,364,917 | | | 3,368,458 | | | (3,541 | ) |
| 10 | | 2 Yr. US T-Note | | Apr. 2005 | | | 2,090,625 | | | 2,098,125 | | | (7,500 | ) |
| 3 | | 90 Day GBP LIBOR | | Mar. 2005 | | | 672,842 | | | 680,020 | | | (7,178 | ) |
| | | | | | | | | | | | |
|
|
|
| | | | | | | | | | | | | $ | 88,528 | |
| | | | | | | | | | | | |
|
|
|
| | | Short Positions: | | | | | | | | | | | | |
| 33 | | US T-Bond | | Mar. 2005 | | $ | 3,704,766 | | $ | 3,689,937 | | $ | (14,829 | ) |
| | | | | | | | | | | | |
|
|
|
| | Foreign currency exchange contracts outstanding at January 31, 2005: |
| | | | | | | | | | |
Purchase Contracts
| | Value at Settlement
Date Payable
| | Current
Value
| | Unrealized
Depreciation
| |
Japanese Yen | | | | | | | | | | |
58,958,000 Expiring 3/10/05 | | $ | 574,474 | | $ | 569,890 | | $ | (4,584 | ) |
| | | | | | | | |
|
|
|
| | | |
Sale Contracts
| | Value at Settlement
Date Receivable
| | Current
Value
| | Unrealized
Appreciation
(Depreciation)
| |
Euros, | | | | | | | | | | |
1,045,000 Expiring 2/10/05 | | $ | 1,383,377 | | $ | 1,362,209 | | $ | 21,168 | |
Pound Sterling, | | | | | | | | | | |
842,000 Expiring 2/17/05 | | | 1,578,254 | | | 1,588,095 | | | (9,841 | ) |
| | | | | | | | |
|
|
|
| | | | | | | | | $ | 11,327 | |
| | | | | | | | |
|
|
|
| | |
| Strategic Partners Asset Allocation Funds/Strategic Partners Conservative Growth Fund | | 47 |
Portfolio of Investments
as of January 31, 2005 (Unaudited) Cont’d.
| | Interest rate swap agreements outstanding at January 31, 2005: |
| | | | | | | | | | | | | | |
Counterparty
| | Termination
Date
| | Notional
Amount
(000)
| | Fixed
Rate
| | | Floating Rate
| | Unrealized
Appreciation
(Depreciation)
| |
| Lehman Brothers, Inc. (1) | | 6/15/2005 | | USD | 4,800 | | 5.00 | % | | 3 month LIBOR | | $ | (38,557 | ) |
| Goldman Sachs (2) | | 12/15/2007 | | USD | 1,500 | | 4.00 | % | | 3 month LIBOR | | | (1,266 | ) |
| Merrill Lynch & Co. (2) | | 6/15/2008 | | GBP | 100 | | 5.00 | % | | 6 month LIBOR | | | 1,544 | |
| Goldman Sachs (2) | | 6/15/2010 | | USD | 3,100 | | 4.00 | % | | 3 month LIBOR | | | 1,539 | |
| Merrill Lynch & Co. (2) | | 6/15/2010 | | USD | 1,100 | | 4.00 | % | | 3 month LIBOR | | | 645 | |
| UBS Warburg LLC (2) | | 6/17/2010 | | EUR | 400 | | 4.00 | % | | 6 month LIBOR | | | 16,381 | |
| JP Morgan (2) | | 6/17/2010 | | EUR | 400 | | 4.00 | % | | 6 month LIBOR | | | 16,381 | |
| UBS Warburg LLC (1) | | 12/15/2014 | | EUR | 3,700 | | 5.00 | % | | 6 month LIBOR | | | (463,289 | ) |
| Lehman Brothers, Inc. (1) | | 6/15/2025 | | USD | 1,500 | | 6.00 | % | | 3 month LIBOR | | | (44,507 | ) |
| Barclay’s Capital (1) | | 3/15/2032 | | GBP | 900 | | 5.00 | % | | 6 month LIBOR | | | (16,395 | ) |
| JP Morgan (2) | | 3/15/2032 | | EUR | 1,100 | | 6.00 | % | | 6 month EBOR | | | 88,828 | |
| Barclay's Capital (1) | | 6/18/2034 | | GBP | 400 | | 5.00 | % | | 6 month LIBOR | | | (14,181 | ) |
| JP Morgan (2) | | 6/18/2034 | | EUR | 600 | | 6.00 | % | | 6 month LIBOR | | | 76,006 | |
| | | | | | | | | | | | |
|
|
|
| | | | | | | | | | | | | $ | (376,871 | ) |
| | | | | | | | | | | | |
|
|
|
| (1) | Fund pays the fixed rate and receives the floating rate. |
| (2) | Fund pays the floating rate and receives the fixed rate. |
| Credit | default swap agreements outstanding at January 31, 2005: |
| | | | | | | | | | | | |
Counterparty
| | Termination Date
| | Notional
Amount
(000)
| | Fixed
Rate
| | Underlying Bond
| | Unrealized
Appreciation
(Depreciation)
| |
| | | | | | | | | Allstate Insurance | | | | |
Morgan Stanley & Co., Inc. (1) | | 12/20/2008 | | 200 | | 0.26% | | 6.125%, 2/15/12 | | $ | (808 | ) |
| | | | | | | | | Ingersoll Rand | | | | |
Merrill Lynch & Co. (1) | | 12/20/2008 | | 100 | | 0.32% | | 6.48%, 6/1/25 | | | (529 | ) |
| | | | | | | | | Emerson | | | | |
Morgan Stanley & Co., Inc. (1) | | 12/20/2008 | | 100 | | 0.21% | | 4.625%, 10/15/12 | | | (219 | ) |
| | | | | | | | | Eli Lilly | | | | |
Barclay’s Bank PLC (1) | | 12/20/2008 | | 200 | | 0.16% | | 6.00%, 3/15/12 | | | (274 | ) |
| | | | | | | | | E.I. Dupont | | | | |
Bank of America Securities LLC (1) | | 12/20/2008 | | 100 | | 0.13% | | 6.875%, 10/15/09 | | | (94 | ) |
| | | | | | | | | Hewlett Packard | | | | |
Bear Stearns & Co. (1) | | 12/20/2008 | | 200 | | 0.32% | | 6.50%, 7/12/12 | | | (899 | ) |
| | | | | | | | | Johnson & Johnson | | | | |
Lehman Brothers, Inc. (1) | | 12/20/2008 | | 200 | | 0.11% | | 3.80%, 5/15/13 | | | (190 | ) |
| | | | | | | | | Home Depot | | | | |
Lehman Brothers, Inc. (1) | | 12/20/2008 | | 200 | | 0.12% | | 5.375%, 4/01/06 | | | (473 | ) |
See Notes to Financial Statements.
| | |
| 48 | | Visit our website at www.strategicpartners.com |
| | | | | | | | | | | | |
Counterparty
| | Termination Date
| | Notional
Amount
(000)
| | Fixed
Rate
| | Underlying Bond
| | Unrealized
Appreciation
(Depreciation)
| |
| | | | | | | | | Federal Express | | | | |
Citigroup Global Partners, Inc. (1) | | 12/20/2008 | | 100 | | 0.29% | | 7.25%, 2/15/11 | | $ | (444 | ) |
| | | | | | | | | Whirlpool | | | | |
Lehman Brothers, Inc. (1) | | 12/20/2008 | | 100 | | 0.29% | | 8.60%, 5/1/10 | | | (54 | ) |
| | | | | | | | | Eaton Vance | | | | |
Citigroup Global Partners, Inc. (1) | | 12/20/2008 | | 200 | | 0.28% | | 5.75%, 7/15/12 | | | (1,111 | ) |
| | | | | | | | | Wal-Mart | | | | |
Citigroup Global Partners, Inc. (1) | | 12/20/2008 | | 300 | | 0.14% | | 6.875%, 8/10/09 | | | (386 | ) |
| | | | | | | | | AutoZone | | | | |
UBS Warburg LLC (1) | | 12/20/2008 | | 300 | | 0.35% | | 5.875%, 10/15/12 | | | 2,870 | |
| | | | | | | | | Costco | | | | |
Lehman Brothers, Inc. (1) | | 12/20/2008 | | 100 | | 0.24% | | 5.50%, 3/15/07 | | | (438 | ) |
| | | | | | | | | Masco | | | | |
Lehman Brothers, Inc. (1) | | 12/20/2008 | | 100 | | 0.35% | | 5.875%, 7/15/12 | | | (277 | ) |
| | | | | | | | | RadioShack | | | | |
Lehman Brothers, Inc. (1) | | 12/20/2008 | | 100 | | 0.35% | | 7.375%, 5/15/11 | | | (456 | ) |
| | | | | | | | | Walt Disney | | | | |
Barclay’s Bank PLC (1) | | 12/20/2008 | | 100 | | 0.67% | | 6.375%, 3/1/12 | | | (1,662 | ) |
| | | | | | | | | Northrop Grumman | | | | |
Lehman Brothers, Inc. (1) | | 12/20/2008 | | 100 | | 0.48% | | 7.1425%, 2/15/11 | | | (844 | ) |
| | | | | | | | | Lockheed Martin | | | | |
Lehman Brothers, Inc. (1) | | 12/20/2008 | | 100 | | 0.53% | | 8.20%, 12/1/09 | | | (964 | ) |
| | | | | | | | | Goodrich | | | | |
UBS Warburg LLC (1) | | 12/20/2008 | | 100 | | 0.97% | | 7.625%, 12/15/12 | | | (2,338 | ) |
| | | | | | | | | Peoples Republic of China | | | | |
Lehman Brothers, Inc. (1) | | 6/20/2009 | | 500 | | 0.40% | | 6.80%, 05/23/11 | | | (3,453 | ) |
| | | | | | | | | General Motors | | | | |
Bear Stearns & Co. (2) | | 6/20/2005 | | 2,000 | | 0.69% | | 7.125%, 07/15/13 | | | 3,090 | |
| | | | | | | | | General Motors Accept. Corp. | | | | |
Bear Stearns & Co. (1) | | 6/20/2005 | | 2,000 | | 0.55% | | 6.875%, 08/28/12 | | | (1,433 | ) |
| | | | | | | | | | |
|
|
|
| | | | | | | | | | | $ | (11,386 | ) |
| | | | | | | | | | |
|
|
|
| (1) | Fund pays the fixed rate and receives from the counterparty payment in the event that the underlying bond defaults. |
| (2) | Fund pays the counterparty payment in the event that the underlying bond defaults and receives the fixed rate. |
See Notes to Financial Statements.
| | |
| Strategic Partners Asset Allocation Funds/Strategic Partners Conservative Growth Fund | | 49 |
Portfolio of Investments
as of January 31, 2005 (Unaudited) Cont’d.
The industry classification of portfolio holdings and other assets in excess of liabilities shown as a percentage of net assets as of January 31, 2005 were as follows:
| | | |
US Government and Agency Securities | | 17.2 | % |
Commercial Paper | | 15.2 | |
Foreign Government Securities | | 4.1 | |
Mutual Fund | | 3.2 | |
Mortgage Related Securities | | 2.9 | |
Oil & Gas | | 2.5 | |
Pharmaceuticals | | 2.1 | |
Diversified Financial Services | | 2.0 | |
Municipal Bonds | | 2.0 | |
Software | | 2.0 | |
Health Care Providers & Services | | 1.9 | |
Insurance | | 1.8 | |
Telecommunications | | 1.8 | |
Electric | | 1.8 | |
Capital Markets | | 1.5 | |
Industrial Conglomerates | | 1.5 | |
Non Captive Finance | | 1.5 | |
Energy Equipment & Services | | 1.4 | |
Internet Software & Services | | 1.3 | |
Computers & Peripherals | | 1.2 | |
Food & Staples Retailing | | 1.2 | |
Specialty Retail | | 1.2 | |
Commercial Services & Supplies | | 1.1 | |
Communication Equipment | | 1.1 | |
Chemicals | | 1.1 | |
Media & Entertainment | | 1.1 | |
Health Care & Pharmaceuticals | | 1.0 | |
Biotechnology | | 0.9 | |
Aerospace & Defense | | 0.9 | |
Electric Utilities | | 0.8 | |
Hotels, Restaurants & Leisure | | 0.8 | |
Media | | 0.8 | |
Capital Goods | | 0.8 | |
Electronic Equipment & Instruments | | 0.7 | |
Gaming | | 0.7 | |
Consumer Finance | | 0.6 | |
Diversified Telecommunication Services | | 0.6 | |
Health Care Equipment & Supplies | | 0.6 | |
Household Durables | | 0.6 | |
Semiconductors & Semiconductor Equipment | | 0.6 | |
Wireless Communication | | 0.6 | |
Multi-Utilities & Unregulated Power | | 0.6 | |
Energy — Other | | 0.6 | |
Pipelines & Other | | 0.6 | |
Commercial Banks | | 0.5 | |
Household Products | | 0.5 | |
See Notes to Financial Statements.
| | |
| 50 | | Visit our website at www.strategicpartners.com |
| | | |
Internet & Catalog Retail | | 0.5 | % |
Tobacco | | 0.5 | |
Lodging | | 0.5 | |
Metals | | 0.5 | |
Multiline Retail | | 0.4 | |
Office Electronics | | 0.4 | |
Transportation | | 0.4 | |
Cable | | 0.4 | |
Consumer | | 0.4 | |
Packaging | | 0.4 | |
Paper | | 0.4 | |
Retailers | | 0.4 | |
Technology | | 0.4 | |
Apparel | | 0.3 | |
Paper & Forest Products | | 0.3 | |
Personal Products | | 0.3 | |
Food | | 0.3 | |
Homebuilding | | 0.2 | |
IT Services | | 0.2 | |
Machinery | | 0.2 | |
Metals & Mining | | 0.2 | |
Retail | | 0.2 | |
Thrifts & Mortgage Finance | | 0.2 | |
Automotive | | 0.2 | |
Banking | | 0.2 | |
Building Materials & Construction | | 0.2 | |
Banks | | 0.1 | |
Building Products | | 0.1 | |
Real Estate Investment Trust | | 0.1 | |
Airlines | | 0.1 | |
Automobiles | | 0.1 | |
Auto Components | | 0.0 | * |
Distributors | | 0.0 | * |
Diversified Manufacturing | | 0.0 | * |
Electrical Equipment | | 0.0 | * |
Leisure Equipment & Products | | 0.0 | * |
Warrants | | 0.0 | * |
Options Purchased | | 0.0 | * |
Outstanding Options Written | | (0.1 | ) |
Investments Sold Short | | (2.1 | ) |
| | |
|
|
| | | 96.4 | |
Other assets in excess of liabilities | | 3.6 | |
| | |
|
|
| | | 100.0 | % |
| | |
|
|
| * | Amount represents less than 0.1% of net assets. |
See Notes to Financial Statements.
| | |
| Strategic Partners Asset Allocation Funds/Strategic Partners Conservative Growth Fund | | 51 |
Statement of Assets and Liabilities
January 31, 2005 (Unaudited)
| | | | |
ASSETS | | | | |
Investments, at value (cost $188,684,871) | | $ | 206,433,685 | |
Cash | | | 6,481,849 | |
Foreign currency, at value (cost $359,514) | | | 361,136 | |
Receivable for investments sold | | | 7,943,787 | |
Interest and dividends receivable | | | 1,376,853 | |
Receivable for Fund shares sold | | | 475,864 | |
Unrealized appreciation on swap agreements | | | 207,284 | |
Premium paid for interest rate swap | | | 76,535 | |
Unrealized appreciation on forward foreign currency contracts | | | 21,168 | |
Prepaid expenses and other assets | | | 6,793 | |
| | |
|
|
|
Total assets | | | 223,384,954 | |
| | |
|
|
|
| |
LIABILITIES | | | | |
Payable for investments purchased | | | 6,966,631 | |
Securities sold short, at value (proceeds $4,452,891) | | | 4,488,750 | |
Payable for Fund shares reacquired | | | 897,990 | |
Unrealized depreciation on swap agreements | | | 595,541 | |
Premium received for interest rate swap | | | 454,049 | |
Distribution fee payable | | | 144,206 | |
Accrued expenses and other liabilities | | | 134,496 | |
Outstanding options written (premium received $392,959) | | | 133,436 | |
Management fee payable | | | 113,448 | |
Unrealized depreciation on forward foreign currency contracts | | | 14,425 | |
Due to broker—variation margin | | | 9,110 | |
Deferred trustee’s fees | | | 7,513 | |
| | |
|
|
|
Total liabilities | | | 13,959,595 | |
| | |
|
|
|
| |
NET ASSETS | | $ | 209,425,359 | |
| | |
|
|
|
| | | | | |
Net assets were comprised of: | | | | |
Shares of beneficial interest, at par | | $ | 19,174 | |
Paid-in capital, in excess of par | | | 188,782,263 | |
| | |
|
|
|
| | | | 188,801,437 | |
Accumulated net investment loss | | | (463,955 | ) |
Accumulated net realized gain on investments and foreign currency transactions | | | 3,387,149 | |
Net unrealized appreciation on investments and foreign currency transactions | | | 17,700,728 | |
| | |
|
|
|
Net assets, January 31, 2005 | | $ | 209,425,359 | |
| | |
|
|
|
See Notes to Financial Statements.
| | |
| 52 | | Visit our website at www.strategicpartners.com |
| | | |
Class A: | | | |
Net asset value and redemption price per share
($43,220,312 ÷ 3,950,857 shares of beneficial interest issued and outstanding) | | $ | 10.94 |
Maximum sales charge (5.5% of offering price) | | | 0.64 |
| | |
|
|
Maximum offering price to public | | $ | 11.58 |
| | |
|
|
| |
Class B: | | | |
Net asset value, offering price and redemption price per share
($114,976,418 ÷ 10,531,945 shares of beneficial interest issued and outstanding) | | $ | 10.92 |
| | |
|
|
| |
Class C: | | | |
Net asset value, offering price and redemption price per share
($43,783,367 ÷ 4,010,927 shares of beneficial interest issued and outstanding) | | $ | 10.92 |
| | |
|
|
| |
Class M: | | | |
Net asset value, offering price and redemption price per share
($992,330 ÷ 90,901 shares of beneficial interest issued and outstanding) | | $ | 10.92 |
| | |
|
|
| |
Class R: | | | |
Net asset value, offering price and redemption price per share
($2,526 ÷ 231 shares of beneficial interest issued and outstanding) | | $ | 10.94 |
| | |
|
|
| |
Class X: | | | |
Net asset value, offering price and redemption price per share
($1,264,305 ÷ 115,873 shares of beneficial interest issued and outstanding) | | $ | 10.91 |
| | |
|
|
| |
Class Z: | | | |
Net asset value, offering price and redemption price per share
($5,186,101 ÷ 473,686 shares of beneficial interest issued and outstanding) | | $ | 10.95 |
| | |
|
|
See Notes to Financial Statements.
| | |
| Strategic Partners Asset Allocation Funds/Strategic Partners Conservative Growth Fund | | 53 |
Statement of Operations
Six Months Ended January 31, 2005 (Unaudited)
| | | | |
NET INVESTMENT INCOME | | | | |
Income | | | | |
Interest (net of foreign withholding taxes of $2,966) | | $ | 2,192,387 | |
Dividends (net of foreign withholding taxes of $3,560) | | | 650,215 | |
| | |
|
|
|
Total income | | | 2,842,602 | |
| | |
|
|
|
| |
Expenses | | | | |
Management fee | | | 767,751 | |
Distribution fee—Class A | | | 50,317 | |
Distribution fee—Class B | | | 570,486 | |
Distribution fee—Class C | | | 223,305 | |
Distribution fee—Class M | | | 1,928 | |
Distribution fee—Class R | | | 4 | |
Distribution fee—Class X | | | 141 | |
Custodian’s fees and expenses | | | 192,000 | |
Transfer agent’s fees and expenses | | | 96,000 | |
Reports to shareholders | | | 30,000 | |
Registration fees | | | 25,000 | |
Legal fees | | | 15,000 | |
Audit fee | | | 9,000 | |
Trustees’ fees | | | 7,000 | |
Miscellaneous | | | 6,164 | |
| | |
|
|
|
Total expenses | | | 1,994,096 | |
| | |
|
|
|
Net investment income | | | 848,506 | |
| | |
|
|
|
| |
NET REALIZED AND UNREALIZED GAIN (LOSS) ON INVESTMENTS AND FOREIGN CURRENCY TRANSACTIONS | | | | |
Net realized gain (loss) on: | | | | |
Investment transactions | | | 4,120,901 | |
Options written | | | 126,968 | |
Short sales | | | (24,873 | ) |
Foreign currency transactions | | | (88,134 | ) |
Futures | | | 991,096 | |
Swaps | | | 617,589 | |
| | |
|
|
|
| | | | 5,743,547 | |
| | |
|
|
|
Net change in unrealized appreciation (depreciation) on: | | | | |
Investments | | | 6,790,618 | |
Foreign currencies | | | (30,058 | ) |
Financial futures contracts | | | (126,997 | ) |
Short sales | | | (23,836 | ) |
Options written | | | 55,589 | |
Swaps | | | (496,979 | ) |
| | |
|
|
|
| | | | 6,168,337 | |
| | |
|
|
|
Net gain on investments | | | 11,911,884 | |
| | |
|
|
|
NET INCREASE IN NET ASSETS RESULTING FROM OPERATIONS | | $ | 12,760,390 | |
| | |
|
|
|
See Notes to Financial Statements.
| | |
| 54 | | Visit our website at www.strategicpartners.com |
Statement of Changes in Net Assets
(Unaudited)
| | | | | | | | |
| | | Six Months
Ended
January 31, 2005 | | | Year
Ended
July 31, 2004 | |
INCREASE IN NET ASSETS | | | | | | | | |
Operations | | | | | | | | |
Net investment income | | $ | 848,506 | | | $ | 1,959,777 | |
Net realized gain (loss) on investments and foreign currency transactions | | | 5,743,547 | | | | 11,124,858 | |
Net change in unrealized appreciation (depreciation) of investments and foreign currencies | | | 6,168,337 | | | | 2,240,113 | |
| | |
|
|
| |
|
|
|
Net increase in net assets resulting from operations | | | 12,760,390 | | | | 15,324,748 | |
| | |
|
|
| |
|
|
|
Dividends and distributions (Note 1) | | | | | | | | |
Dividends from net investment income | | | | | | | | |
Class A | | | (446,777 | ) | | | (576,932 | ) |
Class B | | | (843,420 | ) | | | (1,080,185 | ) |
Class C | | | (331,607 | ) | | | (438,054 | ) |
Class M | | | (3,154 | ) | | | — | |
Class R | | | (25 | ) | | | — | |
Class X | | | (44 | ) | | | — | |
Class Z | | | (66,714 | ) | | | (95,908 | ) |
| | |
|
|
| |
|
|
|
Total dividends from net investment income | | | (1,691,741 | ) | | | (2,191,079 | ) |
| | |
|
|
| |
|
|
|
Distributions from net realized gain | | | | | | | | |
Class A | | | (615,026 | ) | | | — | |
Class B | | | (1,740,925 | ) | | | — | |
Class C | | | (684,630 | ) | | | — | |
Class M | | | (10,101 | ) | | | — | |
Class R | | | (39 | ) | | | — | |
Class X | | | (114 | ) | | | — | |
Class Z | | | (82,388 | ) | | | — | |
| | |
|
|
| |
|
|
|
| | | | (3,133,223 | ) | | | — | |
| | |
|
|
| |
|
|
|
Fund share transactions (net of share conversions) (Note 6) | | | | | | | | |
Net proceeds from shares sold | | | 24,620,181 | | | | 68,272,778 | |
Net asset value of shares issued in reinvestment of dividends and distributions | | | 4,414,518 | | | | 1,996,741 | |
Cost of shares reacquired | | | (22,634,503 | ) | | | (46,848,589 | ) |
| | |
|
|
| |
|
|
|
Net increase in net assets from Fund share transactions | | | 6,400,196 | | | | 23,420,930 | |
| | |
|
|
| |
|
|
|
Total increase | | | 14,335,622 | | | | 36,554,599 | |
| | |
NET ASSETS | | | | | | | | |
Beginning of period | | | 195,089,737 | | | | 158,535,138 | |
| | |
|
|
| |
|
|
|
End of period | | $ | 209,425,359 | | | $ | 195,089,737 | |
| | |
|
|
| |
|
|
|
(a) Includes undistributed net investment income of: | | $ | — | | | $ | 379,280 | |
| | |
|
|
| |
|
|
|
See Notes to Financial Statements.
| | |
| Strategic Partners Asset Allocation Funds/Strategic Partners Conservative Growth Fund | | 55 |
Notes to Financial Statements
(Unaudited)
Strategic Partners Asset Allocation Funds (the “Trust”), is registered under the Investment Company Act of 1940 as an open-end, diversified management investment company presently consisting of three portfolios: Strategic Partners Conservative Growth Fund (the “Fund”), Strategic Partners Moderate Growth Fund and Strategic Partners High Growth Fund. These financial statements relate only to Strategic Partners Conservative Growth Fund. The financial statements of the other portfolios are not presented herein. The Trust was organized as a business trust in Delaware on July 29, 1998.
Jennison Associates LLC (“Jennison”), Prudential Investment Management, Inc. (“PIM”), Pacific Investment Management Company LLC, RS Investment Management, L.P. and EARNEST Partners, LLC are the Fund’s “Advisers”.
The investment objective of the Fund is to provide current income and a reasonable level of capital appreciation. The Fund seeks to achieve its investment objective by investing in a diversified portfolio of debt obligations and equity securities. The ability of the issuers of the debt securities held by the Fund to meet their obligations may be affected by economic developments in a specific industry or country.
Note 1. Accounting Policies
The following is a summary of significant accounting policies followed by the Trust in the preparation of its financial statements.
Securities Valuation: Securities listed on a securities exchange (other than options on securities and indices) are valued at the last sale price on such exchange on the day of valuation or, if there was no sale on such day, at the mean between the last reported bid and asked prices, or at the last bid price on such day in the absence of an asked price. Securities traded via Nasdaq are valued at the official closing price provided by Nasdaq. Securities that are actively traded in the over-the-counter market, including listed securities for which the primary market is believed by Prudential Investments LLC (“PI” or “Manager”), in consultation with the Advisers, to be over-the-counter, are valued at market value using prices provided by a independent pricing agent or principal market maker. Futures contracts and options thereon traded on a commodities exchange or board of trade are valued at the last sale price at the close of trading on such exchange or board of trade or, if there was no sale on the applicable commodities exchange or board of trade on such day, at the mean between the most recently quoted prices on such exchange or board of trade or
| | |
| 56 | | Visit our website at www.strategicpartners.com |
at the last bid price in the absence of an asked price. Certain fixed income securities for which daily market quotations are not readily available may be valued with reference to fixed income securities whose prices are more readily available, pursuant to guidelines established by the Board of Trustees. Prices may be obtained from independent pricing services which use information provided by market makers or estimates of market values obtained from yield data relating to investments or securities with similar characteristics. Securities for which reliable market quotations are not readily available, or whose values have been affected by events occurring after the close of the security’s foreign market and before the Fund’s normal pricing time, are valued at fair value in accordance with Board of Trustees’ approved fair valuation procedures. Using fair value to price securities may result in a value that is different from a security’s most recent closing price and from the price used by other mutual funds to calculate their net asset values.
Investments in mutual funds are valued at their net asset value as of the close of the New York Stock Exchange on the date of valuation.
Short-term securities, which mature in sixty days or less, are valued at amortized cost, which approximates market value. The amortized cost method involves valuing a security at its cost on the date of purchase and thereafter assuming a constant amortization to maturity of the difference between the principal amount due at maturity and cost. Short-term securities, which mature in more than sixty days are valued at current market quotations.
Foreign Currency Translation: The books and records of the Fund are maintained in U.S. dollars. Foreign currency amounts are translated into U.S. Dollars on the following basis:
(i) market value of investment securities, other assets and liabilities—at the current daily rates of exchange.
(ii) purchases and sales of investment securities, income and expenses—at the rate of exchange prevailing on the respective dates of such transactions.
Although the net assets of the Fund are presented at the foreign exchange rates and market values at the close of the period, the Fund does not isolate that portion of the results of operations arising as a result of changes in the foreign exchange rates from the fluctuations arising from changes in the market prices of securities held at the end of the period. Similarly, the Fund does not isolate the effect of changes in foreign exchange rates from the fluctuations arising from changes in the market prices of portfolio securities sold during the period. Accordingly, realized foreign currency gains or losses are included in the reported net realized gains or losses on investment transactions.
| | |
| Strategic Partners Asset Allocation Funds/Strategic Partners Conservative Growth Fund | | 57 |
Notes to Financial Statements
Cont’d
Net realized gains or losses on foreign currency transactions represent net foreign exchange gains or losses from the holding of foreign currencies, currency gains or losses realized between the trade and settlement dates on security transactions, and the difference between the amounts of dividends, interest and foreign withholding taxes recorded on the Fund’s books and the U.S. dollar equivalent amounts actually received or paid. Net unrealized currency gains or losses from valuing foreign currency denominated assets and liabilities (other than investments) at period end exchange rates are reflected as a component of net unrealized appreciation (depreciation) on investments and foreign currencies. Foreign security and currency transactions may involve certain considerations and risks not typically associated with those of domestic origin as a result of, among other factors, the possibility of political and economic instability and the level of governmental supervision and regulation of foreign securities markets.
Repurchase Agreements: In connection with transactions in repurchase agreements with United States financial institutions, it is the Fund’s policy that its custodian or designated subcustodians under triparty repurchase agreements, as the case may be, take possession of the underlying collateral securities, the value of which exceeds the principal amount of the repurchase transaction, including accrued interest. To the extent that any repurchase transaction exceeds one business day, the value of the collateral is marked-to-market on a daily basis to ensure the adequacy on the collateral. If the seller defaults and the value of the collateral declines or if bankruptcy proceedings are commenced with respect to the seller of the security, realization of the collateral by the Fund may be delayed or limited.
Financial Futures Contracts: A financial futures contract is an agreement to purchase (long) or sell (short) an agreed amount of securities at a set price for delivery on a future date. Upon entering into a financial futures contract, the Fund is required to pledge to the broker an amount of cash and/or other assets equal to a certain percentage of the contract amount. This amount is known as the “initial margin.” Subsequent payments known as “variation margin,” are made or received by the Fund each day, depending on the daily fluctuations in the value of the underlying security. Such variation margin is recorded for financial statement purposes on a daily basis as unrealized gain or loss. When the contract expires or is closed, the gain or loss is realized and is presented in the Statement of Operations as net realized gain or loss on financial futures contracts.
| | |
| 58 | | Visit our website at www.strategicpartners.com |
The Fund invests in financial futures contracts in order to hedge its existing portfolio securities, or securities the Fund intends to purchase, against fluctuations in value caused by changes in prevailing interest rates or market conditions. Should interest rates move unexpectedly, the Fund may not achieve the anticipated benefits of the financial futures contracts and may realize a loss. The use of futures transactions involves the risk of imperfect correlation in movements in the price of futures contracts, interest rates and the underlying hedged assets.
Forward Currency Contracts: A forward currency contract is a commitment to purchase or sell a foreign currency at a future date at a negotiated forward rate. The Fund may enter into forward currency contracts in order to hedge its exposure to changes in foreign currency exchange rates on its foreign portfolio holdings or on specific receivables and payables denominated in a foreign currency. The contracts are valued daily at current exchange rates and any unrealized gain or loss is included in the Statement of Assets and Liabilities as in unrealized appreciation and/or depreciation on forward foreign currency contracts. Gain or loss is realized on the settlement date of the contract equal to the difference between the settlement value of the original and renegotiated forward contracts. This gain or loss, if any, is included in net realized gain or loss on foreign currency transactions. Risks may arise upon entering into these contracts from the potential inability of the counterparties to meet the terms of their contracts.
Securities Transactions and Net Investment Income: Securities transactions are recorded on the trade date. Realized gains or losses on sales of securities are calculated on the identified cost basis. Dividend income is recorded on the ex-dividend date and interest income, including amortization of premium and accretion of discount on debt securities as required, is recorded on the accrual basis. Expenses are recorded on the accrual basis. Net investment income or loss (other than distribution fees, which are charged directly to respective class) and unrealized and realized gains or losses, are allocated daily to each class of shares based upon the relative proportion of net assets of each class at the beginning of the day.
Dividends and Distributions: The Fund expects to pay dividends of net investment income quarterly, and distributions of net realized capital and currency gains, if any, annually. Dividends and distributions to shareholders, which are determined in accordance with federal income tax regulations and which may differ from generally accepted accounting principles, are recorded on the ex-dividend date. Permanent book/tax differences relating to income and gains are reclassified amongst undistributed net investment income, accumulated net realized gain or loss and paid in capital in excess of par as appropriate.
| | |
| Strategic Partners Asset Allocation Funds/Strategic Partners Conservative Growth Fund | | 59 |
Notes to Financial Statements
Cont’d
Options: The Fund may either purchase or write options in order to hedge against adverse market movements or fluctuations in value caused by changes in prevailing interest rates or foreign currency exchange rates with respect to securities or currencies which the Fund currently owns or intends to purchase. The Fund’s principal reason for writing options is to realize, through receipt of premiums, a greater current return than would be realized on the underlying security alone. When the Fund writes an option, it receives a premium and an amount equal to that premium is recorded as a liability. When the Fund purchases an option, it pays a premium and an amount equal to that premium is recorded as an asset. The asset or liability is adjusted daily to reflect the current market value of the option.
If an option expires unexercised, the Fund realizes a gain or loss to the extent of the premium received or paid. If an option is exercised, the premium received or paid is recorded as an adjustment to the proceeds from the sale or the cost basis of the purchase in determining whether the Fund has realized a gain or loss. The difference between the premium and the amount received or paid on effecting a closing purchase or sale transaction is also treated as a realized gain or loss. Gain or loss on purchased options is included in net realized gain or loss on investment transactions. Gain or loss on written options is presented separately as net realized gain or loss on options written.
The Fund, as writer of an option, has no control over whether the underlying securities or currencies may be sold (called) or purchased (put). As a result, the Fund bears the market risk of an unfavorable change in the price of the security or currency underlying the written option. The Fund, as purchaser of an option, bears the risk of the potential inability of the counterparties to meet the terms of their contracts.
Short Sales: The Fund may make short sales of securities as a method of hedging potential price declines in similar securities owned. The Fund may sell a security it does not own in anticipation of a decline in the market value of that security (short sale). When the Fund makes a short sale, it will borrow the security sold short and deliver it to the broker-dealer through which it made the short sale as collateral for its obligation to deliver the security upon conclusion of the sale. The Fund may have to pay a fee to borrow the particular securities and may be obligated to return any interest or dividends received on such borrowed securities.
A gain, limited to the price at which the Fund sold the security short, or a loss, unlimited as to dollar amount, will be recognized upon the termination of a short sale
| | |
| 60 | | Visit our website at www.strategicpartners.com |
if the market price is less or greater than the proceeds originally received, respectively, and is presented in the Statement of Operations as net realized gain or loss on short sales.
Swaps: The Fund may enter into swap agreements. A swap is an agreement to exchange the return generated by one instrument for the return generated by another instrument. The Fund enters into interest rate, forward swap spread lock and credit default swap agreements to manage its exposure to interest rates and credit risk.
Interest rate swap agreements involve the exchange by the Fund with another party of their respective commitments to pay or receive interest and may involve payment/receipt of a premium at the time of initiation of the swap agreement. Forward spread lock swap agreements involve commitments to pay or receive a settlement amount calculated as the difference between the swap spread and a fixed spread, multiplied by the notional amount times the duration of the swap. The swap spread is the difference between the benchmark swap rate (market rate) and the specific Treasury rate. In a credit default swap, one party makes a stream of payments to another party in exchange for the right to receive a specified return in the event of a default by a third party, typically corporate issues or sovereign issues of an emerging country, on its obligation. Dividends and interest on the securities in the swap are included in the value of the exchange. The swaps are valued daily at current market value and any unrealized gain or loss is included in the net unrealized appreciation or depreciation on investments. Gain or loss is realized on the termination date of the swap and is equal to the difference between the Fund’s basis in the swap and the proceeds of the closing transaction, including fees. During the period that the swap agreement is open, the Fund may be subject to risk from the potential inability of the counterparty to meet the terms of the agreement.
Written options, future contracts, forward foreign currency exchange contracts and swaps involve elements of both market and credit risk in excess of the amounts reflected on the Statement of Assets and Liabilities.
Taxes: It is the Fund’s policy to continue to meet the requirements of the Internal Revenue Code applicable to regulated investment companies and to distribute all of its taxable net investment income and capital gains, if any, to its shareholders. Therefore, no federal income tax provision is required.
Withholding taxes on foreign dividends are recorded net of reclaimable amounts, at the time the related income is earned.
| | |
| Strategic Partners Asset Allocation Funds/Strategic Partners Conservative Growth Fund | | 61 |
Notes to Financial Statements
Cont’d
Estimates: The preparation of the financial statements requires management to make estimates and assumptions that affect the reported amounts and disclosures in the financial statements. Actual results could differ from those estimates.
Note 2. Agreements
The Trust has a management agreement with PI. Pursuant to this agreement, PI manages the investment operations of the Fund, administers the Fund’s affairs and supervises the Advisers’ performance of all investment advisory services. Pursuant to the advisory agreement, PI pays the cost of compensation of officers of the Fund, occupancy and certain clerical and accounting costs of the Fund. The Fund bears all other costs and expenses. The management fee paid to PI is computed daily and payable monthly at an annual rate of 0.75 of 1% of average daily net assets up to $500 million, 0.70 of 1% of average daily net assets for the next $500 million and 0.65 of 1% of average daily net assets in excess of $1 billion. The effective management fee rate was .75 of 1% for the six months ended January 31, 2005.
The Fund has a distribution agreement with Prudential Investment Management Services LLC (“PIMS”) which acts as the distributor of the Class A, Class B, Class C, Class M, Class R, Class X and Class Z shares of the Fund. The Fund compensates PIMS for distributing and servicing the Fund’s Class A, Class B, Class C, Class M, Class R and Class X shares, pursuant to plans of distribution (the “Distribution Plans”), regardless of expenses actually incurred by PIMS. The distribution fees are accrued daily and payable monthly. No distribution or service fees are paid to PIMS as distributor for Class Z shares of the Fund.
Pursuant to the Distribution Plans, the Fund compensates PIMS for distribution related activities at an annual rate of up to .30 of 1%, 1%, 1%, 1%, .75 of 1% and 1% of the average daily net assets of the Class A, B, C, M, R and X shares, respectively. Such expenses under the plans were .25 of 1%, 1%, 1%, 1%, .50 of 1% and 1% of the average daily net assets of the Class A, B, C, M, R and X shares, respectively, for the six months ended January 31, 2005.
PIMS has advised the Fund that it has received approximately $175,000 in front-end sales charges resulting from sales of Class A shares during the six months ended January 31, 2005. From these fees, PIMS paid such sales charges to broker-dealers, which in turn paid commissions to sales persons and incurred other distribution costs.
| | |
| 62 | | Visit our website at www.strategicpartners.com |
PIMS has advised the Fund that for the six months ended January 31, 2005, it has received approximately $106,100, $9,700, $3,000, $0 and $0 in contingent deferred sales charges imposed upon certain redemptions by Class B, Class C, Class M, Class R and Class X shareholders, respectively.
Jennison, PIMS, PIM and PI are indirect, wholly owned subsidiaries of Prudential Financial, Inc. (“Prudential”).
The Fund, along with other affiliated registered investment companies (the “Funds”), is a party to a syndicated credit agreement (“SCA”) with a group of banks. The SCA provided for a commitment of $500 million. Interest on any borrowings under the SCA would be incurred at market rates. The Funds paid a commitment fee of .08 of 1% of the unused portion of the SCA. The commitment fee is accrued daily and paid quarterly and is allocated to the Funds pro rata, based on net assets. The purpose of the SCA is to serve as an alternative source of funding for capital share redemptions. The expiration date of the SCA was October 29, 2004. Effective October 29, 2004, the Funds entered into a revised credit agreement with two banks. The commitment under the revised credit agreement continues to be $500 million. The Funds pay a commitment fee of .075 of 1% of the unused portion of the revised credit agreement. The expiration date of the revised credit agreement is October 28, 2005. The Fund did not borrow any amounts pursuant to the SCA during the period ended January 31, 2005.
Note 3. Other Transactions with Affiliates
Prudential Mutual Fund Services LLC (“PMFS”), an affiliate of PI and an indirect, wholly owned subsidiary of Prudential, serves as the Fund’s transfer agent. During the six months ended January 31, 2005, the Fund incurred fees of approximately $72,100 for the services of PMFS. As of January 31, 2005, approximately $12,300 of such fees were due to PMFS. Transfer agent fees and expenses in the Statement of Operations include certain out–of-pocket expenses paid to non-affiliates, where applicable.
The Fund pays networking fees to affiliated and unaffiliated broker/dealers. These networking fees are payments made to broker/dealers that clear mutual fund transactions through a national mutual fund clearing system. The Fund incurred approximately $22,800 in total networking fees, of which the amount relating to the services of Wachovia Securities, LLC (“Wachovia”) and First Clearing Corporation (“First Clearing”), affiliates of PI, were approximately $2,400 and $17,700, respectively for the six months ended January 31, 2005. As of January 31, 2005, approximately $3,065 of such fees were due to First Clearing. These amounts are included in transfer agent’s fees and expenses in the Statement of Operations.
| | |
| Strategic Partners Asset Allocation Funds/Strategic Partners Conservative Growth Fund | | 63 |
Notes to Financial Statements
Cont’d
For the six months ended January 31, 2005, Wachovia earned $1,060 and Prudential Equity Group, a wholly owned subsidiary of Prudential, earned $1,848 in brokerage commissions from portfolio transactions executed on behalf of the Fund.
The Fund invests in the Taxable Money Market Series (the “Series”), a portfolio of Dryden Core Investment Fund, formally known as Prudential Core Investment Fund, pursuant to an exemptive order received from the Securities and Exchange Commission. The Series is a money market mutual fund registered under the Investment Company Act of 1940, as amended, and managed by PI. For the six months ended January 31, 2005, the Fund earned income of approximately $62,535 from the Series by investing its excess cash.
Note 4. Portfolio Securities
Purchases and sales of portfolio securities, excluding short-term investments, for the six months ended January 31, 2005, aggregated $155,646,288 and $150,326,799 respectively.
Transactions in options written during the six months ended January 31, 2005, were as follows:
| | | | | | | |
| | | Number of
Contracts/
Notional
Amount
| | | Premiums
Received
| |
Options outstanding at July 31, 2004 | | 16,600,021 | | | $ | 314,079 | |
Options written | | 447 | | | | 206,128 | |
Options closed | | (8 | ) | | | (1,845 | ) |
Options expired | | (2,200,222 | ) | | | (125,403 | ) |
| | |
|
| |
|
|
|
Options outstanding at January 31, 2005 | | 14,400,238 | | | $ | 392,959 | |
| | |
|
| |
|
|
|
| | |
| 64 | | Visit our website at www.strategicpartners.com |
Note 5. Tax Information
The United States federal income tax basis of the Fund’s investments and the net unrealized appreciation (depreciation) as of January 31, 2005 were follows:
| | | | | | | | |
Tax Basis
| | Appreciation
| | Depreciation
| | Other Cost Basis
Adjustments
| | Total Net
Unrealized
Appreciation
|
| $189,146,811 | | $18,936,799 | | $1,649,925 | | $(48,086) | | $17,238,788 |
The difference between book basis and tax basis were primarily attributable to deferred losses on wash sales. The other cost basis adjustments are primarily attributable to appreciation (depreciation) of foreign currency and mark to market of receivables, payables and swaps.
Note 6. Capital
The Fund offers Class A, Class B, Class C, Class M, Class R, Class X and Class Z shares. Class A shares are subject to a maximum front-end sales charge of 5.50%. Investors who purchase $1 million or more of Class A shares and sell these shares within 12 months of purchase are not subject to an initial sales charge but are subject to a contingent deferred sales charge (CDSC) of 1%, including investors who purchase their shares through broker-dealers affiliated with Prudential. Class B shares are subject to a CDSC of 5%, which decreases by 1% annually to 1% in the fifth and sixth years and 0% in the seventh year. Class B shares automatically convert to Class A shares on a quarterly basis approximately seven years after purchase. The CDSC for Class C shares is 1% for shares redeemed within 12 months of purchase. Class M shares are generally closed to new purchases. Class M shares are subject to a CDSC of 6%, which decreases by 1% annually to 2% in the fifth and sixth years and 1% in the seventh year. Class M shares automatically convert to Class A shares approximately eight years after purchase. Class X shares are generally closed to new purchases. Class X shares are subject to a CDSC of 6%, which decreases by 1% annually to 4% in the third and fourth years, by 1% annually to 2% in the sixth and seventh years, and 1% in the eighth year. Class X shares automatically convert to Class A shares on a quarterly basis approximately ten years (eight years in the case of shares purchased prior to August 19, 1998) after purchase. An exchange privilege is also available for shareholders who qualify to purchase Class A shares at net asset value. Class R and Class Z shares are not subject to any sales or redemption charge and are offered exclusively for sale to a limited group of investors.
The Fund has authorized an unlimited number of shares of beneficial interest at $.001 par value per share. As of January 31, 2005, Prudential owned 231 shares each of Class M, Class R and Class X shares.
| | |
| Strategic Partners Asset Allocation Funds/Strategic Partners Conservative Growth Fund | | 65 |
Notes to Financial Statements
Cont’d
Transactions in shares of beneficial interest were as follows:
| | | | | | | |
Class A
| | Shares
| | | Amount
| |
Six months ended January 31, 2005: | | | | | | | |
Shares sold | | 725,796 | | | $ | 7,848,841 | |
Shares issued in reinvestment of dividends and distributions | | 89,575 | | | | 974,390 | |
Shares reacquired | | (378,408 | ) | | | (4,104,323 | ) |
| | |
|
| |
|
|
|
Net increase (decrease) in shares outstanding before conversion | | 436,963 | | | | 4,718,908 | |
Shares issued upon conversion from class B | | 60,495 | | | | 656,046 | |
| | |
|
| |
|
|
|
Net increase (decrease) in shares outstanding | | 497,458 | | | $ | 5,374,954 | |
| | |
|
| |
|
|
|
Year ended July 31, 2004: | | | | | | | |
Shares sold | | 1,599,242 | | | $ | 16,662,932 | |
Shares issued in reinvestment of dividends and distributions | | 50,872 | | | | 530,296 | |
Shares reacquired | | (1,111,788 | ) | | | (11,545,933 | ) |
| | |
|
| |
|
|
|
Net increase (decrease) in shares outstanding before conversion | | 538,326 | | | | 5,647,295 | |
Shares issued upon conversion from class B | | 97,569 | | | | 1,018,465 | |
| | |
|
| |
|
|
|
Net increase (decrease) in shares outstanding | | 635,895 | | | $ | 6,665,760 | |
| | |
|
| |
|
|
|
Class B
| | | | | | |
Six months ended January 31, 2005: | | | | | | | |
Shares sold | | 876,178 | | | $ | 9,475,555 | |
Shares issued in reinvestment of dividends and distributions | | 223,575 | | | | 2,427,921 | |
Shares reacquired | | (1,004,185 | ) | | | (10,852,009 | ) |
| | |
|
| |
|
|
|
Net increase (decrease) in shares outstanding before conversion | | 95,568 | | | | 1,051,467 | |
Shares reacquired upon conversion from class A | | (60,603 | ) | | | (656,046 | ) |
| | |
|
| |
|
|
|
Net increase (decrease) in shares outstanding | | 34,965 | | | $ | 395,421 | |
| | |
|
| |
|
|
|
Year ended July 31, 2004: | | | | | | | |
Shares sold | | 2,995,449 | | | $ | 31,176,646 | |
Shares issued in reinvestment of dividends and distributions | | 97,295 | | | | 1,013,655 | |
Shares reacquired | | (1,785,062 | ) | | | (18,629,690 | ) |
| | |
|
| |
|
|
|
Net increase (decrease) in shares outstanding before conversion | | 1,307,682 | | | | 13,560,611 | |
Shares reacquired upon conversion from class A | | (97,799 | ) | | | (1,018,465 | ) |
| | |
|
| |
|
|
|
Net increase (decrease) in shares outstanding | | 1,209,883 | | | $ | 12,542,146 | |
| | |
|
| |
|
|
|
Class C
| | | | | | |
Six months ended January 31, 2005: | | | | | | | |
Shares sold | | 391,804 | | | $ | 4,201,683 | |
Shares issued in reinvestment of dividends and distributions | | 79,118 | | | | 858,663 | |
Shares reacquired | | (594,130 | ) | | | (6,404,926 | ) |
| | |
|
| |
|
|
|
Net increase (decrease) in shares outstanding | | (123,208 | ) | | $ | (1,344,580 | ) |
| | |
|
| |
|
|
|
| | |
| 66 | | Visit our website at www.strategicpartners.com |
| | | | | | | |
Class C
| | Shares
| | | Amount
| |
Year ended July 31, 2004: | | | | | | | |
Shares sold | | 1,466,771 | | | $ | 15,247,425 | |
Shares issued in reinvestment of dividends and distributions | | 35,157 | | | | 364,536 | |
Shares reacquired | | (1,228,827 | ) | | | (12,719,029 | ) |
| | |
|
| |
|
|
|
Net increase (decrease) in shares outstanding | | 273,101 | | | $ | 2,892,932 | |
| | |
|
| |
|
|
|
Class M
| | | | | | |
October 4, 2004 to January 31, 2005: | | | | | | | |
Shares sold | | 105,550 | | | $ | 1,159,833 | |
Shares issued in reinvestment of dividends and distributions | | 1,212 | | | | 13,196 | |
Shares reacquired | | (15,861 | ) | | | (174,756 | ) |
| | |
|
| |
|
|
|
Net increase (decrease) in shares outstanding | | 90,901 | | | $ | 998,273 | |
| | |
|
| |
|
|
|
Class R
| | | | | | |
October 4, 2004 to January 31, 2005: | | | | | | | |
Shares sold | | 231 | | | $ | 2,500 | |
Shares issued in reinvestment of dividends and distributions | | — | | | | — | |
Shares reacquired | | — | | | | — | |
| | |
|
| |
|
|
|
Net increase (decrease) in shares outstanding | | 231 | | | $ | 2,500 | |
| | |
|
| |
|
|
|
Class X
| | | | | | |
October 4, 2004 to January 31, 2005: | | | | | | | |
Shares sold | | 115,866 | | | $ | 1,259,477 | |
Shares issued in reinvestment of dividends and distributions | | 9 | | | | 99 | |
Shares reacquired | | (2 | ) | | | (25 | ) |
| | |
|
| |
|
|
|
Net increase (decrease) in shares outstanding | | 115,873 | | | $ | 1,259,551 | |
| | |
|
| |
|
|
|
Class Z
| | | | | | |
Six months ended January 31, 2005: | | | | | | | |
Shares sold | | 61,903 | | | $ | 672,292 | |
Shares issued in reinvestment of dividends and distributions | | 12,904 | | | | 140,249 | |
Shares reacquired | | (101,703 | ) | | | (1,098,464 | ) |
| | |
|
| |
|
|
|
Net increase (decrease) in shares outstanding | | (26,896 | ) | | $ | (285,923 | ) |
| | |
|
| |
|
|
|
Year ended July 31, 2004: | | | | | | | |
Shares sold | | 487,029 | | | $ | 5,185,775 | |
Shares issued in reinvestment of dividends and distributions | | 8,402 | | | | 88,254 | |
Shares reacquired | | (376,938 | ) | | | (3,953,937 | ) |
| | |
|
| |
|
|
|
Net increase (decrease) in shares outstanding | | 118,493 | | | $ | 1,320,092 | |
| | |
|
| |
|
|
|
| | |
| Strategic Partners Asset Allocation Funds/Strategic Partners Conservative Growth Fund | | 67 |
Financial Highlights
(Unaudited)
| | | | |
| | | Class A
| |
| | | Six Months Ended
01/31/2005(b) | |
Per Share Operating Performance: | | | | |
Net Asset Value, Beginning Of Period | | $ | 10.51 | |
| | |
|
|
|
Income (loss) from investment operations | | | | |
Net investment income | | | .08 | |
Net realized and unrealized gain (loss) on investment transactions | | | .64 | |
| | |
|
|
|
Total from investment operations | | | .72 | |
| | |
|
|
|
Less Distributions | | | | |
Dividends from net investment income | | | (.12 | ) |
Distributions from net realized gains on investments | | | (.17 | ) |
| | |
|
|
|
Total dividends and distributions | | | (.29 | ) |
| | |
|
|
|
Net asset value, end of period | | $ | 10.94 | |
| | |
|
|
|
Total Return(a) | | | 6.87 | % |
Ratios/Supplemental Data: | | | | |
Net assets, end of period (000) | | $ | 43,220 | |
Average net assets (000) | | $ | 39,925 | |
Ratio to average net assets : | | | | |
Expenses, including distribution and service (12b-1) fees(e) | | | 1.37 | %(c) |
Expenses, excluding distribution and service (12b-1) fees | | | 1.12 | %(c) |
Net investment income (loss) | | | 1.41 | %(c) |
For Class A, B, C, M, R, X and Z shares: | | | | |
Portfolio turnover rate | | | 114 | %(d) |
| (a) | Total return does not consider the effect of sales loads. Total return is calculated assuming a purchase of shares on the first day and a sale on the last day of each period reported and includes reinvestment of dividends and distributions. Total returns for periods less than one full year are not annualized. |
| (b) | Calculated based upon weighted average shares outstanding during the period. |
| (e) | The distributor of the fund has contractually agreed to limit its distribution and service (12b-1) fees to .25 of 1% on the average daily net assets of the Class A shares. |
| * | Effective August 1, 2001, the Fund has adopted the provisions of the AICPA Audit and Accounting Guide for Investment Companies and began amortizing premium and accreting market discount on debt securities. The effect of this change for the year ended July 31,2002 was to decrease net investment income and increase net realized and unrealized gain (loss) per share by less than $.005 and decrease the ratio of net investment income from 2.72% to 2.71%. Per share amounts and ratios for the years ended prior to July 31, 2002 have not been restated to reflect this change in presentation. |
See Notes to Financial Statements.
| | |
| 68 | | Visit our website at www.strategicpartners.com |
| | | | | | | | | | | | | | | | | | |
| Class A | |
| Year Ended July 31, | |
| 2004 | | | 2003 | | | 2002* | | | 2001 | | | 2000 | |
| | | | | | | | | | | | | | | | | | | |
| $ | 9.71 | | | $ | 8.81 | | | $ | 9.95 | | | $ | 11.06 | | | $ | 10.36 | |
|
|
| |
|
|
| |
|
|
| |
|
|
| |
|
|
|
| | | | | | | | | | | | | | | | | | | |
| | .17 | | | | .24 | | | | .26 | | | | .37 | | | | .37 | |
| | .82 | | | | .89 | | | | (1.15 | ) | | | (.30 | ) | | | .82 | |
|
|
| |
|
|
| |
|
|
| |
|
|
| |
|
|
|
| | .99 | | | | 1.13 | | | | (.89 | ) | | | .07 | | | | 1.19 | |
|
|
| |
|
|
| |
|
|
| |
|
|
| |
|
|
|
| | | | | | | | | | | | | | | | | | | |
| | (.19 | ) | | | (.23 | ) | | | (.25 | ) | | | (.36 | ) | | | (.37 | ) |
| | — | | | | — | | | | — | | | | (.82 | ) | | | (.12 | ) |
|
|
| |
|
|
| |
|
|
| |
|
|
| |
|
|
|
| | (.19 | ) | | | (.23 | ) | | | (.25 | ) | | | (1.18 | ) | | | (.49 | ) |
|
|
| |
|
|
| |
|
|
| |
|
|
| |
|
|
|
| $ | 10.51 | | | $ | 9.71 | | | $ | 8.81 | | | $ | 9.95 | | | $ | 11.06 | |
|
|
| |
|
|
| |
|
|
| |
|
|
| |
|
|
|
| | 10.18 | % | | | 13.08 | % | | | (9.10 | )% | | | 1.00 | % | | | 11.73 | % |
| | | | | | | | | | | | | | | | | | | |
| $ | 36,307 | | | $ | 27,364 | | | $ | 20,234 | | | $ | 16,760 | | | $ | 14,514 | |
| $ | 32,710 | | | $ | 22,847 | | | $ | 18,414 | | | $ | 15,985 | | | $ | 12,535 | |
| | | | | | | | | | | | | | | | | | | |
| | 1.42 | % | | | 1.51 | % | | | 1.62 | % | | | 1.72 | % | | | 1.73 | % |
| | 1.17 | % | | | 1.26 | % | | | 1.37 | % | | | 1.47 | % | | | 1.48 | % |
| | 1.67 | % | | | 2.66 | % | | | 2.71 | % | | | 3.61 | % | | | 3.46 | % |
| | | | | | | | | | | | | | | | | | | |
| | 160 | % | | | 269 | % | | | 338 | % | | | 334 | % | | | 244 | % |
See Notes to Financial Statements.
| | |
| Strategic Partners Asset Allocation Funds/Strategic Partners Conservative Growth Fund | | 69 |
Financial Highlights
(unaudited) Cont’d
| | | | |
| | | Class B
| |
| | | Six Months Ended
01/31/2005(b) | |
Per Share Operating Performance: | | | | |
Net asset value, beginning of period | | $ | 10.49 | |
| | |
|
|
|
Income (loss) from investment operations | | | | |
Net investment income | | | .03 | |
Net realized and unrealized gain (loss) on investment transactions | | | .65 | |
| | |
|
|
|
Total from investment operations | | | .68 | |
| | |
|
|
|
Less distributions | | | | |
Dividends from net investment income | | | (.08 | ) |
Distributions from net realized gains on investments | | | (.17 | ) |
| | |
|
|
|
Total dividends and distributions | | | (.25 | ) |
| | |
|
|
|
Net asset value, end of period | | $ | 10.92 | |
| | |
|
|
|
Total Return(a) | | | 6.48 | % |
Ratios/Supplemental Data: | | | | |
Net assets, end of period (000) | | $ | 114,976 | |
Average net assets (000) | | $ | 113,167 | |
Ratio to average net assets : | | | | |
Expenses, including distribution and service (12b-1) fees | | | 2.12 | %(c) |
Expenses, excluding distribution and service (12b-1) fees | | | 1.12 | %(c) |
Net investment income (loss) | | | .65 | %(c) |
| (a) | Total return does not consider the effect of sales loads. Total return is calculated assuming a purchase of shares on the first day and a sale on the last day of each period reported and includes reinvestment of dividends and distributions. Total returns for periods less than one full year are not annualized. |
| (b) | Calculated based upon weighted average shares outstanding during the period. |
| * | Effective August 1, 2001, the Fund has adopted the provisions of the AICPA Audit and Accounting Guide for Investment Companies and began amortizing premium and accreting market discount on debt securities. The effect of this change for the year ended July 31,2002 was to decrease net investment income and increase net realized and unrealized gain (loss) per share by less than $.005 and decrease the ratio of net investment income from 2.72% to 2.71%. Per share amounts and ratios for the years ended prior to July 31, 2002 have not been restated to reflect this change in presentation. |
See Notes to Financial Statements.
| | |
| 70 | | Visit our website at www.strategicpartners.com |
| | | | | | | | | | | | | | | | | | |
|
| Year Ended July 31, | |
| 2004 | | | 2003 | | | 2002* | | | 2001 | | | 2000 | |
| | | | | | | | | | | | | | | | | | | |
| $ | 9.69 | | | $ | 8.79 | | | $ | 9.93 | | | $ | 11.05 | | | $ | 10.35 | |
|
|
| |
|
|
| |
|
|
| |
|
|
| |
|
|
|
| | | | | | | | | | | | | | | | | | | |
| | .10 | | | | .18 | | | | .19 | | | | .29 | | | | .29 | |
| | .81 | | | | .88 | | | | (1.15 | ) | | | (.29 | ) | | | .82 | |
|
|
| |
|
|
| |
|
|
| |
|
|
| |
|
|
|
| | .91 | | | | 1.06 | | | | (.96 | ) | | | — | | | | 1.11 | |
|
|
| |
|
|
| |
|
|
| |
|
|
| |
|
|
|
| | | | | | | | | | | | | | | | | | | |
| | (.11 | ) | | | (.16 | ) | | | (.18 | ) | | | (.30 | ) | | | (.29 | ) |
| | — | | | | — | | | | — | | | | (.82 | ) | | | (.12 | ) |
|
|
| |
|
|
| |
|
|
| |
|
|
| |
|
|
|
| | (.11 | ) | | | (.16 | ) | | | (.18 | ) | | | (1.12 | ) | | | (.41 | ) |
|
|
| |
|
|
| |
|
|
| |
|
|
| |
|
|
|
| $ | 10.49 | | | $ | 9.69 | | | $ | 8.79 | | | $ | 9.93 | | | $ | 11.05 | |
|
|
| |
|
|
| |
|
|
| |
|
|
| |
|
|
|
| | 9.40 | % | | | 12.27 | % | | | (9.81 | )% | | | .34 | % | | | 10.89 | % |
| | | | | | | | | | | | | | | | | | | |
| $ | 110,140 | | | $ | 90,029 | | | $ | 68,841 | | | $ | 62,177 | | | $ | 43,838 | |
| $ | 104,309 | | | $ | 78,562 | | | $ | 67,736 | | | $ | 52,433 | | | $ | 36,574 | |
| | | | | | | | | | | | | | | | | | | |
| | 2.17 | % | | | 2.26 | % | | | 2.37 | % | | | 2.47 | % | | | 2.48 | % |
| | 1.17 | % | | | 1.26 | % | | | 1.37 | % | | | 1.47 | % | | | 1.48 | % |
| | .93 | % | | | 1.93 | % | | | 1.97 | % | | | 2.84 | % | | | 2.70 | % |
See Notes to Financial Statements.
| | |
| Strategic Partners Asset Allocation Funds/Strategic Partners Conservative Growth Fund | | 71 |
Financial Highlights
(Unaudited) Cont’d
| | | | |
| | | Class C
| |
| | | Six Months Ended
01/31/2005(b) | |
Per Share Operating Performance: | | | | |
Net Asset Value, Beginning Of Period | | $ | 10.49 | |
| | |
|
|
|
Income (loss) from investment operations | | | | |
Net investment income | | | .03 | |
Net realized and unrealized gain (loss) on investment transactions | | | .65 | |
| | |
|
|
|
Total from investment operations | | | .68 | |
| | |
|
|
|
Less distributions | | | | |
Dividends from net investment income | | | (.08 | ) |
Distributions from net realized gains on investments | | | (.17 | ) |
| | |
|
|
|
Total dividends and distributions | | | (.25 | ) |
| | |
|
|
|
Net asset value, end of period | | $ | 10.92 | |
| | |
|
|
|
Total Return(a) | | | 6.48 | % |
Ratios/Supplemental Data: | | | | |
Net assets, end of period (000) | | $ | 43,783 | |
Average net assets (000) | | $ | 44,297 | |
Ratio to average net assets : | | | | |
Expenses, including distribution and service (12b-1) fees | | | 2.12 | %(c) |
Expenses, excluding distribution and service (12b-1) fees | | | 1.12 | %(c) |
Net investment income (loss) | | | .65 | %(c) |
| (a) | Total return does not consider the effect of sales loads. Total return is calculated assuming a purchase of shares on the first day and a sale on the last day of each period reported and includes reinvestment of dividends and distributions. Total returns for periods less than one full year are not annualized. |
| (b) | Calculated based upon weighted average shares outstanding during the period. |
| * | Effective August 1, 2001, the Fund has adopted the provisions of the AICPA Audit and Accounting Guide for Investment Companies and began amortizing premium and accreting market discount on debt securities. The effect of this change for the year ended July 31,2002 was to decrease net investment income and increase net realized and unrealized gain (loss) per share by less than $.005 and decrease the ratio of net investment income from 2.72% to 2.71%. Per share amounts and ratios for the years ended prior to July 31, 2002 have not been restated to reflect this change in presentation. |
See Notes to Financial Statements.
| | |
| 72 | | Visit our website at www.strategicpartners.com |
| | | | | | | | | | | | | | | | | | |
| Class C | |
| Year Ended July 31, | |
| 2004 | | | 2003 | | | 2002* | | | 2001 | | | 2000 | |
| | | | | | | | | | | | | | | | | | | |
| $ | 9.69 | | | $ | 8.79 | | | $ | 9.93 | | | $ | 11.05 | | | $ | 10.35 | |
|
|
| |
|
|
| |
|
|
| |
|
|
| |
|
|
|
| | | | | | | | | | | | | | | | | | | |
| | .10 | | | | .17 | | | | .19 | | | | .29 | | | | .28 | |
| | .81 | | | | .89 | | | | (1.15 | ) | | | (.29 | ) | | | .83 | |
|
|
| �� |
|
|
| |
|
|
| |
|
|
| |
|
|
|
| | .91 | | | | 1.06 | | | | (.96 | ) | | | — | | | | 1.11 | |
|
|
| |
|
|
| |
|
|
| |
|
|
| |
|
|
|
| | | | | | | | | | | | | | | | | | | |
| | (.11 | ) | | | (.16 | ) | | | (.18 | ) | | | (.30 | ) | | | (.29 | ) |
| | — | | | | — | | | | — | | | | (.82 | ) | | | (.12 | ) |
|
|
| |
|
|
| |
|
|
| |
|
|
| |
|
|
|
| | (.11 | ) | | | (.16 | ) | | | (.18 | ) | | | (1.12 | ) | | | (.41 | ) |
|
|
| |
|
|
| |
|
|
| |
|
|
| |
|
|
|
| $ | 10.49 | | | $ | 9.69 | | | $ | 8.79 | | | $ | 9.93 | | | $ | 11.05 | |
|
|
| |
|
|
| |
|
|
| |
|
|
| |
|
|
|
| | 9.40 | % | | | 12.27 | % | | | (9.81 | )% | | | .34 | % | | | 10.89 | % |
| | | | | | | | | | | | | | | | | | | |
| $ | 43,375 | | | $ | 37,429 | | | $ | 25,419 | | | $ | 14,626 | | | $ | 11,301 | |
| $ | 41,938 | | | $ | 31,449 | | | $ | 18,350 | | | $ | 12,763 | | | $ | 12,954 | |
| | | | | | | | | | | | | | | | | | | |
| | 2.17 | % | | | 2.26 | % | | | 2.37 | % | | | 2.47 | % | | | 2.48 | % |
| | 1.17 | % | | | 1.26 | % | | | 1.37 | % | | | 1.47 | % | | | 1.48 | % |
| | .94 | % | | | 1.91 | % | | | 1.97 | % | | | 2.84 | % | | | 2.63 | % |
| | |
| Strategic Partners Asset Allocation Funds/Strategic Partners Conservative Growth Fund | | 73 |
Financial Highlights
Unaudited Cont’d
| | | | |
| | | Class M
| |
| | | October 4, 2004
through January 31, 2005(a)(d) | |
Per Share Operating Performance: | | | | |
Net Asset Value, Beginning Of Period | | $ | 10.81 | |
| | |
|
|
|
Income (loss) from investment operations | | | | |
Net investment income | | | .03 | |
Net realized and unrealized gain (loss) on investment transactions | | | .34 | |
| | |
|
|
|
Total from investment operations | | | .37 | |
| | |
|
|
|
Less Distributions | | | | |
Dividends from net investment income | | | (.09 | ) |
Distributions from net realized gains on investments | | | (.17 | ) |
| | |
|
|
|
Total dividends and distributions | | | (.26 | ) |
| | |
|
|
|
Net asset value, end of period | | $ | 10.92 | |
| | |
|
|
|
Total Return(b) | | | 3.20 | % |
Ratios/Supplemental Data: | | | | |
Net assets, end of period (000) | | $ | 992 | |
Average net assets (000) | | $ | 591 | |
Ratio to average net assets : | | | | |
Expenses, including distribution and service (12b-1) fees(e) | | | 2.12 | %(c) |
Expenses, excluding distribution and service (12b-1) fees | | | 1.12 | %(c) |
Net investment income (loss) | | | .89 | %(c) |
| (a) | Commencement of offering of new share class. |
| (b) | Total return does not consider the effect of sales loads. Total return is calculated assuming a purchase of shares on the first day and a sale on the last day of each period reported and includes reinvestment of dividends and distributions. Total returns for periods less than one full year are not annualized. |
| (d) | Calculated based upon weighted average shares outstanding during the period. |
| (e) | The distributor of the fund has contractually agreed to limit its distribution and service (12b-1) fees to .50 of 1% on the average daily net assets of the Class R shares. |
See Notes to Financial Statements.
| | |
| 74 | | Visit our website at www.strategicpartners.com |
| | | | | | |
| Class R | | | Class X | |
October 4, 2004
through January 31, 2005(a)(d) | | | October 4, 2004
through January 31, 2005(a)(d) | |
| | | | | | | |
| $ | 10.84 | | | $ | 10.81 | |
|
|
| |
|
|
|
| | | | | | | |
| | .05 | | | | .01 | |
| | .33 | | | | .35 | |
|
|
| |
|
|
|
| | .38 | | | | .36 | |
|
|
| |
|
|
|
| | | | | | | |
| | (.11 | ) | | | (.09 | ) |
| | (.17 | ) | | | (.17 | ) |
|
|
| |
|
|
|
| | (.28 | ) | | | (.26 | ) |
|
|
| |
|
|
|
| $ | 10.94 | | | $ | 10.91 | |
|
|
| |
|
|
|
| | 3.29 | % | | | 3.11 | % |
| | | | | | | |
| $ | 3 | | | $ | 1,264 | |
| $ | 3 | | | $ | 43 | |
| | | | | | | |
| | 1.62 | %(c) | | | 2.12 | %(c) |
| | 1.12 | %(c) | | | 1.12 | %(c) |
| | 1.46 | %(c) | | | 1.11 | %(c) |
| | |
| Strategic Partners Asset Allocation Funds/Strategic Partners Conservative Growth Fund | | 75 |
Financial Highlights
(Unaudited) Cont’d
| | | | |
| | | Class Z
| |
| | | Six Months Ended
01/31/2005(b) | |
Per Share Operating Performance:(d) | | | | |
Net asset value, beginning of period | | $ | 10.52 | |
| | |
|
|
|
Income (loss) from investment operations | | | | |
Net investment income | | | .09 | |
Net realized and unrealized gain (loss) on investment transactions | | | .65 | |
| | |
|
|
|
Total from investment operations | | | 0.74 | |
| | |
|
|
|
Less distributions | | | | |
Dividends from net investment income | | | (.14 | ) |
Distributions from net realized gains on investments | | | (.17 | ) |
| | |
|
|
|
Total dividends and distributions | | | (.31 | ) |
| | |
|
|
|
Net asset value, end of period | | $ | 10.95 | |
| | |
|
|
|
Total Return(a) | | | 7.00 | % |
Ratios/Supplemental Data: | | | | |
Net assets, end of period (000) | | $ | 5,186 | |
Average net assets (000) | | $ | 5,263 | |
Ratio to average net assets : | | | | |
Expenses, including distribution and service (12b-1) fees | | | 1.12 | %(c) |
Expenses, excluding distribution and service (12b-1) fees | | | 1.12 | %(c) |
Net investment income (loss) | | | 1.66 | %(c) |
| (a) | Total return does not consider the effect of sales loads. Total return is calculated assuming a purchase of shares on the first day and a sale on the last day of each period reported and includes reinvestment of dividends and distributions. Total returns for periods less than one full year are not annualized. |
| (b) | Calculated based upon weighted average shares outstanding during the period. |
| * | Effective August 1, 2001, the Fund has adopted the provisions of the AICPA Audit and Accounting Guide for Investment Companies and began amortizing premium and accreting market discount on debt securities. The effect of this change for the year ended July 31,2002 was to decrease net investment income and increase net realized and unrealized gain (loss) per share by less than $.005 and decrease the ratio of net investment income from 2.72% to 2.71%. Per share amounts and ratios for the years ended prior to July 31, 2002 have not been restated to reflect this change in presentation. |
See Notes to Financial Statements.
| | |
| 76 | | Visit our website at www.strategicpartners.com |
| | | | | | | | | | | | | | | | | | |
| Class Z | |
| Year Ended July 31, | |
| 2004 | | | 2003 | | | 2002* | | | 2001 | | | 2000 | |
| | | | | | | | | | | | | | | | | | | |
| $ | 9.72 | | | $ | 8.81 | | | $ | 9.95 | | | $ | 11.05 | | | $ | 10.37 | |
|
|
| |
|
|
| |
|
|
| |
|
|
| |
|
|
|
| | | | | | | | | | | | | | | | | | | |
| | .20 | | | | .26 | | | | .28 | | | | .38 | | | | .35 | |
| | .81 | | | | .90 | | | | (1.14 | ) | | | (.28 | ) | | | .85 | |
|
|
| |
|
|
| |
|
|
| |
|
|
| |
|
|
|
| | 1.01 | | | | 1.16 | | | | (.86 | ) | | | .10 | | | | 1.20 | |
|
|
| |
|
|
| |
|
|
| |
|
|
| |
|
|
|
| | | | | | | | | | | | | | | | | | | |
| | (.21 | ) | | | (.25 | ) | | | (.28 | ) | | | (.38 | ) | | | (.40 | ) |
| | — | | | | — | | | | — | | | | (.82 | ) | | | (.12 | ) |
|
|
| |
|
|
| |
|
|
| |
|
|
| |
|
|
|
| | (.21 | ) | | | (.25 | ) | | | (.28 | ) | | | (1.20 | ) | | | (.52 | ) |
|
|
| |
|
|
| |
|
|
| |
|
|
| |
|
|
|
| $ | 10.52 | | | $ | 9.72 | | | $ | 8.81 | | | $ | 9.95 | | | $ | 11.05 | |
|
|
| |
|
|
| |
|
|
| |
|
|
| |
|
|
|
| | 10.44 | % | | | 13.45 | % | | | (8.87 | )% | | | 1.30 | % | | | 11.84 | % |
| | | | | | | | | | | | | | | | | | | |
| $ | 5,267 | | | $ | 3,714 | | | $ | 2,250 | | | $ | 1,432 | | | $ | 471 | |
| $ | 4,712 | | | $ | 3,139 | | | $ | 1,773 | | | $ | 949 | | | $ | 12,354 | |
| | | | | | | | | | | | | | | | | | | |
| | 1.17 | % | | | 1.26 | % | | | 1.37 | % | | | 1.47 | % | | | 1.48 | % |
| | 1.17 | % | | | 1.26 | % | | | 1.37 | % | | | 1.47 | % | | | 1.48 | % |
| | 1.93 | % | | | 2.90 | % | | | 2.96 | % | | | 3.78 | % | | | 3.30 | % |
See Notes to Financial Statements.
| | |
| Strategic Partners Asset Allocation Funds/Strategic Partners Conservative Growth Fund | | 77 |
| | | | |
| n MAIL | | n TELEPHONE | | n WEBSITE |
Gateway Center Three 100 Mulberry Street Newark, NJ 07102 | | (800) 225-1852 | | www.strategicpartners.com |
|
| PROXY VOTING |
| The Board of Trustees of the Fund has delegated to the Fund’s investment advisers the responsibility for voting any proxies and maintaining proxy recordkeeping with respect to the Fund. A description of these proxy voting policies and procedures is available without charge, upon request, by calling (800) 225-1852 or by visiting the Securities and Exchange Commission’s (the Commission) website at http://www.sec.gov. Information regarding how the Fund voted proxies relating to portfolio securities during the most recent 12-month period ended June 30, 2004, is available on the Fund’s website at http://www.prudential.com and on the Commission’s website at http:/www.sec.gov. |
|
| TRUSTEES |
David E.A. Carson • Robert F. Gunia • Robert E. La Blanc • Douglas H. McCorkindale •
Richard A. Redeker • Judy A. Rice • Robin B. Smith • Stephen G. Stoneburn • Clay T. Whitehead |
|
| OFFICERS |
| Judy A. Rice, President • Robert F. Gunia, Vice President • Grace C. Torres, Treasurer and Principal Financial and Accounting Officer • William V. Healey, Chief Legal Officer • Deborah A. Docs, Secretary • Maryanne Ryan, Anti-Money Laundering Officer • Helene Gurian, Acting Anti-Money Laundering Compliance Officer • Lee D. Augsburger, Chief Compliance Officer |
| | | | |
| MANAGER | | Prudential Investments LLC | | Gateway Center Three
100 Mulberry Street
Newark, NJ 07102 |
|
INVESTMENT ADVISERS* (as of January 31, 2005) | | EARNEST Partners, LLC | | 75 14th Street, Suite 2300
Atlanta, GA 30309 |
|
| | | Jennison Associates LLC | | 466 Lexington Avenue
New York, NY 10017 |
|
| | | Pacific Investment
Management Company LLC | | 840 Newport Center Drive
Newport Beach, CA 92660 |
|
| | | Prudential Investment
Management, Inc. | | Gateway Center Two
100 Mulberry Street
Newark, NJ 07102 |
|
| | | RS Investment
Management, L.P. | | 388 Market Street
Suite 1700
San Francisco, CA 94111 |
|
| DISTRIBUTOR | | Prudential Investment
Management Services LLC | | Gateway Center Three
100 Mulberry Street
Newark, NJ 07102 |
|
| CUSTODIAN | | The Bank of New York | | One Wall Street
New York, NY 10286 |
|
| TRANSFER AGENT | | Prudential Mutual Fund
Services LLC | | PO Box 8098
Philadelphia, PA 19176 |
*Investment Advisers are subject to change by the Manager.
| | | | |
| INDEPENDENT REGISTERED PUBLIC ACCOUNTING FIRM | | KPMG LLP | | 757 Third Avenue
New York, NY 10017 |
|
| FUND COUNSEL | | Shearman & Sterling LLP | | 599 Lexington Avenue
New York, NY 10022 |
| | | | | | | | | | | | | | | | | | |
| Strategic Partners Conservative Growth Fund | | | | | | | | |
| Share Class | | | | A | | B | | C | | M | | R | | X | | Z | | |
NASDAQ | | | | PCGAX | | PBCFX | | PCCFX | | CNGWM | | CNGWR | | CNGWX | | PDCZX | | |
CUSIP | | | | 86276X103 | | 86276X202 | | 86276X301 | | 86276X848 | | 86276X822 | | 86276X830 | | 86276X400 | | |
| | | | | | | | | | | | | | | | | | | |
|
| An investor should consider the investment objectives, risks, and charges and expenses of the Fund carefully before investing. The prospectus for the Fund contains this and other information about the Fund. An investor may obtain a prospectus by visiting our website at www.strategicpartners.com or by calling (800) 225-1852. The prospectus should be read carefully before investing. |
|
| |
| E-DELIVERY |
| To receive your mutual fund documents on-line, go to www.icsdelivery.com/prudential/funds and enroll. Instead of receiving printed documents by mail, you will receive notification via e-mail when new materials are available. You can cancel your enrollment or change your e-mail address at any time by clicking on the change/cancel enrollment option at the icsdelivery website address. |
|
| |
| SHAREHOLDER COMMUNICATIONS WITH TRUSTEES |
| Shareholders of the Fund can communicate directly with the Board of Trustees by writing to the Chair of the Board, Strategic Partners Conservative Growth Fund, P.O. Box 13964, Philadelphia, PA 19176. Shareholders can communicate directly with an individual Trustee by writing to that Trustee at Strategic Partners Conservative Growth Fund P.O. Box 13964, Philadelphia, PA 19176. Such communications to the Board or individual Trustees are not screened before being delivered to the addressee. |
|
| AVAILABILITY OF QUARTERLY PORTFOLIO SCHEDULE |
| The Fund files its complete schedule of portfolio holdings with the Securities and Exchange Commission (the Commission) for the first and third quarters of each fiscal year on Form N-Q. The Fund’s Forms N-Q are available on the Commission’s website at http://www.sec.gov. The Fund’s Forms N-Q may also be reviewed and copied at the Commission’s Public Reference Room in Washington, D.C. Information on the operation of the Public Reference Room may be obtained by calling (800) SEC-0330 (732-0330). The Fund will provide a full list of its portfolio holdings as of the end of each fiscal quarter on its website at www.strategicpartners.com within 60 days after the end of the fiscal quarter. |
Mutual Funds:
| | | | |
| ARE NOT INSURED BY THE FDIC OR ANY FEDERAL GOVERNMENT AGENCY | | MAY LOSE VALUE | | ARE NOT A DEPOSIT OF OR GUARANTEED BY ANY BANK OR ANY BANK AFFILIATE |

| | | | | | | | | | | | | | | | | | |
| Strategic Partners Conservative Growth Fund | | | | | | | | | | |
| | | Share Class | | A | | B | | C | | M | | R | | X | | Z | | |
| | | NASDAQ | | PCGAX | | PBCFX | | PCCFX | | CNGWM | | CNGWR | | CNGWX | | PDCZX | | |
| | | CUSIP | | 86276X103 | | 86276X202 | | 86276X301 | | 86276X848 | | 86276X822 | | 86276X830 | | 86276X400 | | |
| | | | | | | | | | | | | | | | | | | |
MFSP504E2 IFS-A102102 Ed. 03/2005
SEMIANNUAL REPORT
JANUARY 31, 2005

STRATEGIC PARTNERS
ASSET ALLOCATION FUNDS
STRATEGIC PARTNERS
Moderate Growth Fund
OBJECTIVE
Seeks capital appreciation and a reasonable level of current income

This report is not authorized for distribution to prospective investors unless preceded or accompanied by a current prospectus.
The views expressed in this report and information about the Fund’s portfolio holdings are for the period covered by this report and are subject to change thereafter.
Dear Shareholder,
March 15, 2005
We hope that you find the semiannual report for the Strategic Partners Moderate Growth Fund informative and useful. As a Strategic Partners Mutual Fund shareholder, you may be thinking where you can find additional growth opportunities. You could invest in last year’s top-performing asset class and hope that history repeats itself or you could stay in cash while waiting for the “right moment” to invest.
We believe it is wise to take advantage of developing domestic and global investment opportunities through a diversified portfolio of stock and bond mutual funds. A diversified asset allocation offers two advantages. It helps you manage downside risk by not being overly exposed to any particular asset class, plus it gives you a better opportunity to have at least some of your assets in the right place at the right time. Your financial professional can help you create a diversified investment plan that may include mutual funds that cover all the basic asset classes and reflects your personal investment profile and tolerance for risk.
Strategic Partners Mutual Funds gives you a wide range of choices that can help you make progress toward your financial goals. Our funds feature leading asset managers not just from a single company but from the entire investment industry.
Thank you for choosing Strategic Partners Mutual Funds.
Sincerely,

Judy A. Rice, President
Strategic Partners Moderate Growth Fund
| | |
| Strategic Partners Asset Allocation Funds/Strategic Partners Moderate Growth Fund | | 1 |
Your Fund’s Performance
Performance data quoted represent past performance. Past performance does not guarantee future results. The investment return and principal value of an investment will fluctuate so that an investor’s shares, when redeemed, may be worth more or less than their original cost. Current performance may be lower or higher than the past performance data quoted. An investor may obtain performance data current to the most recent month-end by visiting our website at www.strategicpartners.com or by calling (800) 225-1852. The maximum initial sales charge is 5.50% (Class A Shares).
| | | | | | | | | | | | |
| Cumulative Total Returns1 as of 1/31/05 | | | | | | | | | | | | |
| | | Six Months | | | One Year | | | Five Years | | | Since Inception2 | |
Class A | | 9.27 | % | | 7.24 | % | | 19.37 | % | | 40.28 | % |
Class B | | 8.92 | | | 6.49 | | | 15.00 | | | 33.74 | |
Class C | | 8.92 | | | 6.49 | | | 15.00 | | | 33.74 | |
Class M | | N/A | | | N/A | | | N/A | | | 4.67 | |
Class R | | N/A | | | N/A | | | N/A | | | 4.87 | |
Class X | | N/A | | | N/A | | | N/A | | | 4.67 | |
Class Z | | 9.48 | | | 7.58 | | | 20.85 | | | 42.45 | |
S&P 500 Index3 | | 8.15 | | | 6.22 | | | –8.55 | | | *** | |
Customized Blend4 | | 9.00 | | | 7.74 | | | 17.35 | | | **** | |
Lipper Multi-Cap Core Funds Avg.5 | | 9.43 | | | 6.08 | | | 6.54 | | | ***** | |
| | | | | | | | |
| Average Annual Total Returns1 as of 12/31/04 | | | | | | | | |
| | | One Year | | Five Years | | | Since Inception2 | |
Class A | | 5.09% | | 2.08 | % | | 5.03 | % |
Class B | | 5.34 | | 2.29 | | | 5.18 | |
Class C | | 9.34 | | 2.47 | | | 5.18 | |
Class M | | N/A | | N/A | | | N/A | |
Class R | | N/A | | N/A | | | N/A | |
Class X | | N/A | | N/A | | | N/A | |
Class Z | | 11.46 | | 3.51 | | | 6.25 | |
S&P 500 Index3 | | 10.87 | | –2.30 | | | 2.17 | |
Customized Blend4 | | 11.72 | | 2.97 | | | 5.26 | |
Lipper Multi-Cap Core Funds Avg.5 | | 11.05 | | 0.38 | | | 4.77 | |
The cumulative total returns do not reflect the deduction of applicable sales charges. If reflected, the applicable sales charges would reduce the cumulative total returns performance quoted. Class A shares are subject to a maximum front-end sales charge of 5.50%. Under certain circumstances, Class A shares may be subject to a contingent deferred sales charge (CDSC) of 1%. Class B and Class C shares are subject to a maximum CDSC of 5% and 1% respectively. Class M and Class X shares are subject to a maximum CDSC of 6%. Class R and Class Z shares are not subject to a sales charge.
| | |
| 2 | | Visit our website at www.strategicpartners.com |
1Source: Prudential Investments LLC and Lipper Inc. The average annual total returns take into account applicable sales charges. During certain periods shown, fee waivers and/or expense reimbursements were in effect. Without such fee waivers and expense reimbursements, the returns for the classes would have been lower. Class A, Class B, Class C, Class M, Class R, and Class X shares are subject to an annual distribution and service (12b-1) fee of up to 0.30%, 1.00%, 1.00%, 1.00%, 0.75%, and 1.00% respectively. Approximately seven years after purchase, Class B shares will automatically convert to Class A shares on a quarterly basis. Approximately eight years after purchase, Class M shares will automatically convert to Class A shares on a quarterly basis. Approximately ten years after purchase (eight years in the case of shares purchased prior to August 19, 1998), Class X shares will automatically convert to Class A shares on a quarterly basis. Class Z shares are not subject to a 12b-1 fee. The returns in the tables do not reflect the deduction of taxes that a shareholder would pay on Fund distributions or following the redemption of Fund shares.
2Inception dates: Class A, Class B, Class C, and Class Z, 11/18/98; Class M, Class R, and Class X, 10/04/04.
3The Standard & Poor’s 500 Composite Stock Price Index (S&P 500 Index) is an unmanaged index of 500 stocks of large U.S. public companies. It gives a broad look at how U.S. stock prices have performed.
4The Customized Benchmark for Strategic Partners Moderate Growth Fund (Customized Blend) is a model portfolio consisting of the S&P Barra Value Index (20%), the S&P Barra Growth Index (20%), the Russell 2000 Value Index (7.5%), the Russell 2000 Growth Index (7.5%), the Morgan Stanley Capital International Europe, Australasia, and Far East (MSCI EAFE) Index (10%), the Lehman Brothers U.S. Aggregate Bond Index (20%), and the Lehman Brothers U.S. Corporate High Yield Index (15%). Each component of the Customized Blend is an unmanaged index generally considered as representing the performance of its asset class. The Customized Blend is intended to provide a theoretical comparison to the Fund’s performance, based on the amounts allocated to each asset class. The Customized Blend does not reflect deductions for any sales charges or operating expenses of a mutual fund.
5The Lipper Multi-Cap Core Funds Average (Lipper Average) represents returns based on the average return of all funds in the Lipper Multi-Cap Core Funds category for the periods noted. Funds in the Lipper Average invest in a variety of market capitalization ranges without concentrating 75% of their equity assets in any one market capitalization range over an extended period of time. Multi-cap funds typically have between 25% and 75% of their assets invested in companies with market capitalizations (on a three-year weighted basis) above 300% of the dollar-weighted median market capitalization of the 1,000 securities of the S&P SuperComposite 1500 Index. Multi-cap funds typically have an average price-to-earnings ratio, price-to-book ratio, and three-year sales-per-share growth value compared with the S&P SuperComposite 1500 Index.
Investors cannot invest directly in an index. The returns for the S&P 500 Index and the Customized Blend would be lower if they included the effects of sales charges, operating expenses of a mutual fund, or taxes. Returns for the Lipper Average reflect the deduction of operating expenses, but not sales charges or taxes. The Since Inception returns for the S&P 500 Index, the Customized Blend, and the Lipper Average are measured from the closest month-end to inception date, and not from the Fund’s actual inception date.
***S&P 500 Index Closest Month-End to inception cumulative total returns as of 1/31/05 are 11.18% for Classes A, B, C, and Z. S&P 500 Index Closest Month-End to inception cumulative total returns as of 1/31/05 are 6.57% for Classes M, R, and X.
****Customized Blend Closest Month-End to inception cumulative total returns as of 1/31/05 are 34.28% for Classes A, B, C, and Z. Customized Blend Closest Month-End to inception cumulative total returns as of 1/31/05 are 6.35% for Classes M, R, and X.
*****Lipper Average Closest Month-End to inception cumulative total returns as of 1/31/05 are 34.87% for Classes A, B, C, and Z. Lipper Average Closest Month-End to inception cumulative total returns as of 1/31/05 are 7.37% for Classes M, R, and X.
| | |
| Strategic Partners Asset Allocation Funds/Strategic Partners Moderate Growth Fund | | 3 |
Your Fund’s Performance
Fund objective
The investment objective of the Strategic Partners Moderate Growth Fund (the Fund) is capital appreciation and a reasonable level of current income. There can be no assurance that the Fund will achieve its investment objective.
Please note that on or about March 31, 2005, the Fund intends to change its name to Strategic Partners Moderate Allocation Fund and to change subadvisers for certain portions of the Fund’s portfolio.
Asset classes are classifications of investments
Stocks are shares of ownership in a firm. Owners share in the profits after debts are paid and in the firm’s appreciation in value. Generally, the prices of stocks vary with investors’ estimates of a firm’s earnings prospects, including the impact of broader economic conditions.
Bonds are loans to a company, government, or government agency. They carry a fixed interest rate or one that varies according to the terms specified in the bond. They have a maturity date at which they must be repaid. Generally, bond prices fluctuate with current interest rates and with events that affect the debtor’s prospects of repaying the loan. High yield bonds are also known as “junk” bonds. They are subject to greater risk of loss of principal and interest, including default risk, than higher-rated bonds.
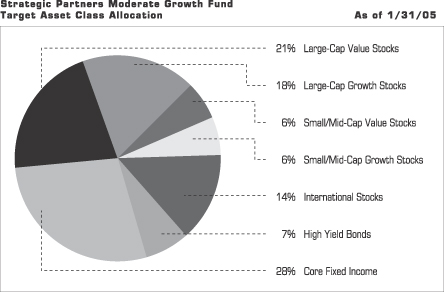
| | |
| 4 | | Visit our website at www.strategicpartners.com |
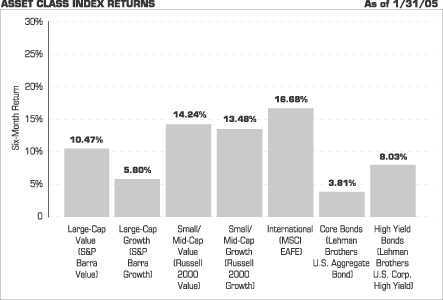
Source: Lipper Inc.
The chart above shows the total returns for six months ended January 31, 2005, of various securities indexes that are generally considered representative of broad market sectors and does not reflect a mutual fund’s expenses. The performance cited does not represent the performance of the Strategic Partners Moderate Growth Fund. Past performance is not indicative of future results. Investors cannot invest directly in an index.
The S&P Barra Value Index contains those securities in the S&P 500 Index with lower book-to-price ratios.
The S&P Barra Growth Index contains those securities in the S&P 500 Index with higher book-to- price ratios.
The Russell 2000 Value Index contains those securities in the Russell 2000 Index with a below-average growth orientation. Companies in this index generally have low price-to-book and price-to-earnings ratios, higher dividend yields, and lower forecasted growth values.
The Russell 2000 Growth Index contains those securities in the Russell 2000 Index with an above-average growth orientation. Companies in this index tend to exhibit higher price-to-book and price-to-earnings ratios, lower dividend yields, and higher forecasted growth values.
The Morgan Stanley Capital International Europe, Australasia, and Far East Index (MSCI EAFE Index) is an unmanaged, weighted index that reflects stock price movements in Europe, Australasia, and the Far East. It gives a broad look at how foreign stock prices have performed.
The Lehman Brothers U.S. Aggregate Bond Index is an unmanaged index of investment-grade securities issued by the U.S. government and its agencies, and by corporations with between 1 and 10 years remaining to maturity. It gives a broad look at how short- and intermediate-term bonds have performed.
The Lehman Brothers U.S. Corporate High Yield Index is an unmanaged index of fixed-rate, noninvestment-grade debt securities with at least one year remaining to maturity. The Lehman Brothers U.S. Corporate High Yield Index gives a broad look at how high yield (junk) bonds have performed.
| | |
| Strategic Partners Asset Allocation Funds/Strategic Partners Moderate Growth Fund | | 5 |
Fees and Expenses (Unaudited)
As a shareholder of the Fund, you incur two types of costs: (1) transaction costs, including sales charges (loads) on purchase payments and redemptions, as applicable, and (2) ongoing costs, including management fees, distribution and/or service (12b-1) fees, and other Fund expenses, as applicable. This example is intended to help you understand your ongoing costs (in dollars) of investing in the Fund and to compare these costs with the ongoing costs of investing in other mutual funds.
The example is based on an investment of $1,000 invested on August 1, 2004, at the beginning of the period, and held through the six-month period ended January 31, 2005.
The Fund may charge additional fees to holders of certain accounts that are not included in the expenses shown in the table. These fees apply to Individual Retirement Accounts (IRAs), Section 403(b) accounts, and Section 529 plan accounts. As of the close of the six months covered by the table, IRA fees included a setup fee of $5, a maintenance fee of up to $36 annually ($18 for the six-month period), and a termination fee of $10. Section 403(b) accounts and Section 529 plan accounts are each charged an annual $25 fiduciary maintenance fee ($12.50 for the six-month period). Some of the fees vary in amount, or are waived, based on your total account balance or the number of JennisonDryden or Strategic Partners funds, including the Fund, that you own. You should consider the additional fees that were charged to your Fund account over the six-month period when you estimate the total ongoing expenses paid over the period and the impact of these fees on your ending account value, as these additional expenses are not reflected in the information provided in the expense table. Additional fees have the effect of reducing investment returns.
Actual Expenses
The first line for each share class in the following table provides information about actual account values and actual expenses. You may use the information on this line, together with the amount you invested, to estimate the expenses that you paid over the period. Simply divide your account value by $1,000 (for example, an $8,600 account value ÷ $1,000 = 8.6), then multiply the result by the number in the first line under the heading “Expenses Paid During the Six-Month Period” to estimate the expenses you paid on your account during this period.
Hypothetical Example for Comparison Purposes
The second line for each share class in the following table provides information about hypothetical account values and hypothetical expenses based on the Fund’s actual expense ratio and an assumed rate of return of 5% per year before expenses, which is not the Fund’s actual return. The hypothetical account values and expenses may not
| | |
| 6 | | Visit our website at www.strategicpartners.com |
be used to estimate the actual ending account balance or expenses you paid for the period. You may use this information to compare the ongoing costs of investing in the Fund and other funds. To do so, compare this 5% hypothetical example with the 5% hypothetical examples that appear in the shareholder reports of the other funds.
Please note that the expenses shown in the table are meant to highlight your ongoing costs only, and do not reflect any transactional costs such as sales charges (loads). Therefore the second line for each share class in the table is useful in comparing ongoing costs only, and will not help you determine the relative total costs of owning different funds. In addition, if these transactional costs were included, your costs would have been higher.
Classes M, R and X have been in existence for less than six months, therefore no expenses are presented for these classes. Classes M, R and X commenced October 4, 2004.
| | | | | | | | | | | | | | |
Strategic Partners
Moderate Growth Fund | | Beginning Account
Value
August 1, 2004 | | Ending Account
Value January 31, 2005 | | Annualized
Expense Ratio
Based on the
Six-Month Period | | | Expenses Paid
During the Six-
Month Period* |
| | | | | | | | | | | | | | | |
| Class A | | Actual | | $ | 1,000 | | $ | 1,093 | | 1.30 | % | | $ | 6.86 |
| | | Hypothetical | | $ | 1,000 | | $ | 1,019 | | 1.30 | % | | $ | 6.62 |
| | | | | | | | | | | | | | | |
| Class B | | Actual | | $ | 1,000 | | $ | 1,089 | | 2.05 | % | | $ | 10.79 |
| | | Hypothetical | | $ | 1,000 | | $ | 1,015 | | 2.05 | % | | $ | 10.41 |
| | | | | | | | | | | | | | | |
| Class C | | Actual | | $ | 1,000 | | $ | 1,089 | | 2.05 | % | | $ | 10.79 |
| | | Hypothetical | | $ | 1,000 | | $ | 1,015 | | 2.05 | % | | $ | 10.41 |
| | | | | | | | | | | | | | | |
| Class Z | | Actual | | $ | 1,000 | | $ | 1,095 | | 1.05 | % | | $ | 5.54 |
| | | Hypothetical | | $ | 1,000 | | $ | 1,020 | | 1.05 | % | | $ | 5.35 |
| | | | | | | | | | | | | | | |
* Fund expenses for each share class are equal to the annualized expense ratio for each share class (provided in the table), multiplied by the average account value over the period, multiplied by the 184 days in the six-month period ended January 31, 2005, and divided by the 365 days in the Fund’s fiscal year ending July 31, 2005 (to reflect the six-month period).
| | |
| Strategic Partners Asset Allocation Funds/Strategic Partners Moderate Growth Fund | | 7 |
This Page Intentionally Left Blank
Portfolio of Investments
as of January 31, 2005 (Unaudited)
| | | | | |
| Shares | | Description | | Value (Note 1) |
| | | | | | |
LONG-TERM INVESTMENTS 84.9% | | | |
COMMON STOCKS 62.6% | | | |
| |
Aerospace/Defense 0.7% | | | |
| 6,350 | | Applied Signal Technology, Inc. | | $ | 187,135 |
| 6,740 | | Cobham PLC | | | 169,836 |
| 7,320 | | DRS Technologies, Inc.(a) | | | 297,192 |
| 600 | | Empresa Brasileira de Aeronautica, SA | | | 19,110 |
| 4,270 | | Engineered Support Systems, Inc. | | | 247,703 |
| 15,000 | | Lockheed Martin Corp. | | | 867,149 |
| 7,850 | | Moog, Inc. (Class A shares)(a) | | | 341,397 |
| 15,300 | | Northrop Grumman Corp. | | | 793,764 |
| | | | |
|
|
| | | | | | 2,923,286 |
| |
Air Freight & Logistics 0.3% | | | |
| 15,300 | | United Parcel Service, Inc. (Class B Shares) | | | 1,142,604 |
| |
Automobiles 0.6% | | | |
| 98,100 | | Nissan Motor Co., Ltd. (Japan) | | | 1,038,321 |
| 24,000 | | Volkswagen AG (Germany) | | | 1,152,859 |
| 6,100 | | Winnebago Industries, Inc. | | | 210,389 |
| | | | |
|
|
| | | | | | 2,401,569 |
| |
Automobiles & Parts | | | |
| 15,190 | | IMPCO Technologies, Inc.(a) | | | 88,558 |
| |
Beverages 0.6% | | | |
| 61,600 | | Cadbury Schweppes PLC (United Kingdom) | | | 552,454 |
| 88,500 | | Diageo PLC (United Kingdom) | | | 1,207,664 |
| 15,238 | | Heineken NV (Netherlands) | | | 521,615 |
| | | | |
|
|
| | | | | | 2,281,733 |
| |
Biotechnology 1.1% | | | |
| 23,200 | | Amgen, Inc.(a) | | | 1,443,968 |
| 33,200 | | Genentech, Inc.(a) | | | 1,583,972 |
| 23,600 | | Gilead Sciences, Inc.(a) | | | 781,160 |
| 23,400 | | Medimmune, Inc.(a) | | | 553,527 |
| | | | |
|
|
| | | | | | 4,362,627 |
| |
Building & Construction 0.4% | | | |
| 3,500 | | CRH PLC, ADR (Ireland) (London Exchange) | | | 92,435 |
| 20,129 | | CRH PLC, ADR (Ireland) (Dublin Exchange) | | | 533,442 |
| 18,600 | | Hovnanian Enterprises, Inc. (Class A shares)(a) | | | 971,664 |
| | | | |
|
|
| | | | | | 1,597,541 |
See Notes to Financial Statements.
| | |
| Strategic Partners Asset Allocation Funds/Strategic Partners Moderate Growth Fund | | 9 |
Portfolio of Investments
as of January 31, 2005 (Unaudited) Cont’d.
| | | | | |
| Shares | | Description | | Value (Note 1) |
| | | | | | |
| |
Building Products 0.1% | | | |
| 9,500 | | Watsco, Inc. | | $ | 328,795 |
| |
Cable | | | |
| 401 | | NTL, Inc.(a) | | | 27,280 |
| 6,138 | | UnitedGlobalCom, Inc.(a) | | | 59,968 |
| | | | |
|
|
| | | | | | 87,248 |
| |
Capital Goods | | | |
| 285 | | GenTek, Inc.(a) | | | 12,754 |
| |
Capital Markets 2.2% | | | |
| 37,700 | | Bank of New York Co., Inc. (The) | | | 1,120,067 |
| 55,700 | | Charles Schwab Corp. (The) | | | 626,068 |
| 10,800 | | Goldman Sachs Group, Inc. (The) | | | 1,164,780 |
| 18,500 | | Lehman Brothers Holdings, Inc. | | | 1,687,015 |
| 22,500 | | Mellon Financial Corp. | | | 660,375 |
| 43,000 | | Merrill Lynch & Co., Inc. | | | 2,583,010 |
| 77,000 | | Nomura Holdings, Inc. (Japan) | | | 1,012,972 |
| | | | |
|
|
| | | | | | 8,854,287 |
| |
Chemicals 1.0% | | | |
| 19,700 | | E.I. Du Pont de Nemours & Co. | | | 936,932 |
| 64,900 | | Mosaic Co. (The)(a) | | | 1,070,850 |
| 4,000 | | Scotts Co. (Class A shares)(a) | | | 271,840 |
| 21,000 | | Shin-Etsu Chemical Co., Ltd. (Japan) | | | 832,246 |
| 11,000 | | Takeda Chemical Industries Ltd. (Japan) | | | 523,126 |
| 3,300 | | Valspar Corp. | | | 161,700 |
| | | | |
|
|
| | | | | | 3,796,694 |
| |
Commercial Banks 3.2% | | | |
| 37,102 | | Bank of America Corp. | | | 1,720,420 |
| 23,500 | | Bank of Ireland (Ireland) (Dublin Exchange) | | | 370,664 |
| 21,300 | | Bank of Ireland (Ireland) (London Exchange) | | | 338,740 |
| 9,500 | | Bank United Financial Corp. (Class A shares)(a) | | | 277,210 |
| 119,100 | | Barclays PLC (United Kingdom) | | | 1,307,372 |
| 13,000 | | Comerzbank AG (Germany) | | | 276,222 |
| 36,009 | | Credit Agricole SA (France) | | | 1,072,568 |
| 33,930 | | Credit Suisse Group, Inc. (Switzerland)(a) | | | 1,366,050 |
| 36,000 | | DNB NOR ASA (Norway) | | | 330,067 |
| 3,400 | | Hibernia Corp. (Class A shares) | | | 89,488 |
| 102,510 | | HSBC Holdings PLC (United Kingdom) | | | 1,698,527 |
See Notes to Financial Statements.
| | |
| 10 | | Visit our website at www.strategicpartners.com |
| | | | | |
| Shares | | Description | | Value (Note 1) |
| | | | | | |
| 12,290 | | Nara Bancorp, Inc. | | $ | 245,186 |
| 8,300 | | Oriental Financial Group | | | 234,060 |
| 84,400 | | Overseas-Chinese Banking Corp., Ltd. (Singapore) | | | 706,514 |
| 7,660 | | PrivateBanCorp., Inc. | | | 250,482 |
| 48,700 | | Royal Bank of Scotland PLC (The) (United Kingdom) | | | 1,617,531 |
| 5,080 | | Signature Bank(a) | | | 154,584 |
| 8,390 | | Southwest Bancorporation of Texas, Inc. | | | 165,870 |
| 81,000 | | Sumitomo Trust & Banking Co. Ltd. (The) (Japan) | | | 550,413 |
| | | | |
|
|
| | | | | | 12,771,968 |
| |
Commercial Services & Supplies 1.6% | | | |
| 14,900 | | Administaff, Inc.(a) | | | 217,391 |
| 21,800 | | Allied Waste Industries, Inc.(a) | | | 181,158 |
| 47,400 | | Cendant Corp. | | | 1,116,271 |
| 6,900 | | Global Payments, Inc. | | | 395,301 |
| 6,400 | | Kelly Services, Inc. (Class A shares) | | | 186,240 |
| 5,940 | | Laureate Education, Inc.(a) | | | 263,498 |
| 4,500 | | Mcgrath Rentcorp. | | | 193,320 |
| 9,300 | | Navigant Consulting, Inc.(a) | | | 222,549 |
| 44,400 | | PHH Corp.(a) | | | 976,800 |
| 198,900 | | Rentokil Initial PLC (United Kingdom) | | | 570,220 |
| 9,100 | | Republic Services, Inc. | | | 300,027 |
| 7,000 | | School Specialty, Inc.(a) | | | 272,230 |
| 19,670 | | Scientific Games Corp. (Class A shares)(a) | | | 505,912 |
| 37,700 | | Waste Management, Inc. | | | 1,093,300 |
| | | | |
|
|
| | | | | | 6,494,217 |
| |
Communication Equipment 1.3% | | | |
| 45,600 | | Avaya, Inc.(a) | | | 654,360 |
| 77,300 | | Cisco Systems, Inc.(a) | | | 1,394,492 |
| 219,900 | | Nortel Networks Corp. (Canada)(a) | | | 714,675 |
| 41,500 | | Qualcomm, Inc. | | | 1,545,460 |
| 8,300 | | Research In Motion Ltd.(a) | | | 591,707 |
| | | | |
|
|
| | | | | | 4,900,694 |
| |
Computer & Peripherals 1.9% | | | |
| 26,000 | | Apple Computer, Inc.(a) | | | 1,999,400 |
| 38,700 | | Dell, Inc.(a) | | | 1,616,112 |
| 113,000 | | Fujitsu Ltd. | | | 657,542 |
| 8,900 | | IBM Corp. | | | 831,438 |
| 4,400 | | Lexmark International, Inc. (Class A Shares)(a) | | | 366,740 |
| 8,800 | | M-Systems Flash Disk Pioneers, Ltd. (Israel)(a) | | | 176,968 |
| 8,500 | | Mercury Computer Systems, Inc.(a) | | | 263,245 |
See Notes to Financial Statements.
| | |
| Strategic Partners Asset Allocation Funds/Strategic Partners Moderate Growth Fund | | 11 |
Portfolio of Investments
as of January 31, 2005 (Unaudited) Cont’d.
| | | | | |
| Shares | | Description | | Value (Note 1) |
| | | | | | |
| 13,280 | | Merge Technologies, Inc.(a) | | $ | 246,344 |
| 10,980 | | Optimal Group, Inc.(a) | | | 146,803 |
| 9,260 | | Radisys Corp.(a) | | | 161,587 |
| 37,400 | | Seagate Technology | | | 632,808 |
| 34,160 | | Synplicity, Inc.(a) | | | 232,288 |
| | | | |
|
|
| | | | | | 7,331,275 |
| |
Consumer Finance 0.7% | | | |
| 40,000 | | American Express Co. | | | 2,134,000 |
| 29,400 | | MBNA Corp. | | | 781,452 |
| | | | |
|
|
| | | | | | 2,915,452 |
| |
Distributors 0.1% | | | |
| 11,390 | | Beacon Roofing Supply, Inc.(a) | | | 227,800 |
| |
Diversified Financial Services 2.7% | | | |
| 8,500 | | Accredited Home Lenders Holding Co.(a) | | | 412,930 |
| 7,260 | | Acom Co. Ltd. (Japan) | | | 510,877 |
| 4,650 | | Aiful Corp. (Japan) | | | 528,578 |
| 22,900 | | AmeriCredit Corp.(a) | | | 562,195 |
| 6,500 | | Astoria Financial Corp. | | | 244,660 |
| 53,000 | | Citigroup, Inc. | | | 2,599,650 |
| 18,600 | | Eaton Vance Corp. | | | 465,558 |
| 76,100 | | J.P. Morgan Chase & Co. | | | 2,840,813 |
| 13,400 | | Jefferies Group, Inc. | | | 522,600 |
| 33,400 | | Principal Financial Group, Inc. | | | 1,355,372 |
| 12,600 | | Raymond James Financial, Inc. | | | 392,742 |
| 1,600 | | Student Loan Corp. (The) | | | 289,056 |
| | | | |
|
|
| | | | | | 10,725,031 |
| |
Diversified Telecommunication Services 0.8% | | | |
| 14,800 | | Alltel Corp. | | | 814,592 |
| 9,460 | | SafeNet, Inc.(a) | | | 321,072 |
| 52,500 | | SBC Communications, Inc. | | | 1,247,400 |
| 19,800 | | Verizon Communications, Inc. | | | 704,682 |
| | | | |
|
|
| | | | | | 3,087,746 |
| |
Electric Utilities 1.6% | | | |
| 14,800 | | E.ON AG (Germany) | | | 1,325,783 |
| 7,200 | | E.ON AG Sponsored ADR (Germany) | | | 643,608 |
| 62,600 | | Enel SpA (Italy) | | | 588,352 |
| 22,400 | | Exelon Corp. | | | 991,200 |
| 11,750 | | PNM Resources, Inc. | | | 296,453 |
See Notes to Financial Statements.
| | |
| 12 | | Visit our website at www.strategicpartners.com |
| | | | | |
| Shares | | Description | | Value (Note 1) |
| | | | | | |
| 118,200 | | Terna SpA (Italy)(a) | | $ | 326,264 |
| 30,700 | | TXU Corp. | | | 2,124,439 |
| | | | |
|
|
| | | | | | 6,296,099 |
| |
Electrical Equipment 0.1% | | | |
| 47,520 | | Kesa Electricals PLC (United Kingdom) | | | 286,360 |
| 36,270 | | SRS Labs, Inc.(a) | | | 188,241 |
| | | | |
|
|
| | | | | | 474,601 |
| |
Electronic Equipment & Instruments 1.7% | | | |
| 72,200 | | Agilent Technologies, Inc.(a) | | | 1,596,342 |
| 23,000 | | Artesyn Technologies, Inc.(a) | | | 234,140 |
| 9,080 | | BEI Technologies, Inc. | | | 255,965 |
| 3,405 | | Ceradyne, Inc.(a) | | | 114,851 |
| 22,000 | | CheckPoint Systems, Inc.(a) | | | 342,320 |
| 13,700 | | FANUC Ltd. (Japan) | | | 925,649 |
| 6,700 | | Faro Technologies, Inc.(a) | | | 193,228 |
| 13,900 | | FLIR Systems, Inc.(a) | | | 847,205 |
| 7,970 | | Marlin Business Services, Inc.(a) | | | 145,054 |
| 16,700 | | Murata Manufacturing Co. Ltd. (Japan) | | | 873,298 |
| 7,700 | | NEC Electronics Corp. (Japan) | | | 390,005 |
| 26,560 | | O2Micro International, Ltd. (Cayman Islands) | | | 235,587 |
| 28,400 | | Sanmina-SCI Corp.(a) | | | 175,512 |
| 7,400 | | Schneider Electric SA (France) | | | 565,271 |
| | | | |
|
|
| | | | | | 6,894,427 |
| |
Energy Equipment & Services 1.7% | | | |
| 4,940 | | Cal Dive International, Inc.(a) | | | 215,878 |
| 11,800 | | ENSCO International, Inc. | | | 403,914 |
| 43,000 | | GlobalSantaFe Corp. | | | 1,520,480 |
| 26,900 | | Halliburton Co. | | | 1,106,397 |
| 6,110 | | Maverick Tube Corp.(a) | | | 208,107 |
| 15,570 | | Patterson-UTI Energy, Inc. | | | 302,837 |
| 39,200 | | Schlumberger, Ltd. | | | 2,667,167 |
| 15,960 | | Superior Energy Services, Inc.(a) | | | 254,083 |
| | | | |
|
|
| | | | | | 6,678,863 |
| |
Food & Drug Retailing 0.1% | | | |
| 11,300 | | Carrefour SA (France) | | | 582,576 |
See Notes to Financial Statements.
| | |
| Strategic Partners Asset Allocation Funds/Strategic Partners Moderate Growth Fund | | 13 |
Portfolio of Investments
as of January 31, 2005 (Unaudited) Cont’d.
| | | | | |
| Shares | | Description | | Value (Note 1) |
| | | | | | |
| |
Food & Staples Retailing 1.1% | | | |
| 14,200 | | Costco Wholesale Corp. | | $ | 671,234 |
| 124,800 | | Kroger Co. (The)(a) | | | 2,134,080 |
| 17,000 | | Whole Foods Market, Inc. | | | 1,520,140 |
| | | | |
|
|
| | | | | | 4,325,454 |
| |
Food Products 0.9% | | | |
| 45,300 | | Cadbury Schweppes PLC, ADR | | | 1,644,391 |
| 3,100 | | Nestle SA | | | 813,799 |
| 121,600 | | Unilever PLC (United Kingdom) | | | 1,155,922 |
| | | | |
|
|
| | | | | | 3,614,112 |
| |
Gas Utilities 0.1% | | | |
| 11,000 | | Oneok, Inc. | | | 304,700 |
| |
Health Care Equipment & Supplies 0.7% | | | |
| 9,400 | | Alcon, Inc. | | | 744,480 |
| 10,510 | | Closure Medical Corp.(a) | | | 208,518 |
| 10,300 | | Cooper Companies, Inc. (The) | | | 790,010 |
| 2,570 | | Intuitive Surgical, Inc.(a) | | | 102,543 |
| 27,450 | | Kforce, Inc.(a) | | | 303,872 |
| 44,850 | | Orthovita, Inc.(a) | | | 171,776 |
| 7,370 | | PolyMedica Corp. | | | 275,859 |
| 42,000 | | Spectranetics Corp.(a) | | | 260,400 |
| 1,900 | | St. Jude Medical, Inc.(a) | | | 74,632 |
| | | | |
|
|
| | | | | | 2,932,090 |
| |
Health Care Providers & Services 3.0% | | | |
| 14,700 | | Abaxis, Inc.(a) | | | 199,332 |
| 12,300 | | Accredo Health, Inc.(a) | | | 366,294 |
| 4,230 | | Advanced Neuromodulation Systems, Inc.(a) | | | 167,127 |
| 10,605 | | America Service Group, Inc.(a) | | | 290,895 |
| 14,600 | | American Healthways, Inc.(a) | | | 455,228 |
| 5,900 | | Amerigroup Corp.(a) | | | 242,549 |
| 21,300 | | Caremark RX, Inc.(a) | | | 832,830 |
| 5,000 | | Chemed Corp. | | | 358,100 |
| 16,200 | | CIGNA Corp. | | | 1,300,050 |
| 12,600 | | Covance, Inc.(a) | | | 535,500 |
| 35,850 | | Encore Medical Corp.(a) | | | 202,194 |
| 20,100 | | Express Scripts, Inc.(a) | | | 1,491,219 |
| 7,500 | | Kindred Healthcare, Inc.(a) | | | 205,425 |
| 10,160 | | LabOne, Inc.(a) | | | 340,868 |
See Notes to Financial Statements.
| | |
| 14 | | Visit our website at www.strategicpartners.com |
| | | | | |
| Shares | | Description | | Value (Note 1) |
| | | | | | |
| 4,650 | | Laserscope, Inc.(a) | | $ | 137,407 |
| 10,300 | | Lifeline Systems, Inc.(a) | | | 281,087 |
| 16,474 | | Medco Health Solutions, Inc.(a) | | | 701,298 |
| 14,300 | | Pharmaceutical Product Development, Inc.(a) | | | 592,735 |
| 11,200 | | Providence Service Corp.(a) | | | 227,360 |
| 15,200 | | Serologicals Corp.(a) | | | 359,328 |
| 14,200 | | UnitedHealth Group, Inc. | | | 1,262,380 |
| 9,900 | | WellPoint Health Networks, Inc.(a) | | | 1,202,850 |
| | | | |
|
|
| | | | | | 11,752,056 |
| |
Hotels, Restaurants & Leisure 0.9% | | | |
| 9,100 | | Brinker International, Inc.(a) | | | 342,251 |
| 7,400 | | CEC Entertainment, Inc.(a) | | | 289,636 |
| 19,230 | | K2, Inc.(a) | | | 270,374 |
| 26,000 | | McDonald’s Corp. | | | 842,140 |
| 6,500 | | Mikohn Gaming Corp(a) | | | 65,000 |
| 8,600 | | RARE Hospitality International, Inc.(a) | | | 270,900 |
| 9,450 | | Sonic Corp.(a) | | | 300,888 |
| 23,800 | | Starbucks Corp.(a) | | | 1,285,200 |
| | | | |
|
|
| | | | | | 3,666,389 |
| |
Household Durables 1.0% | | | |
| 15,700 | | Harman International Industries, Inc. | | | 1,909,905 |
| 36,956 | | Koninklijke Philips Electronics N.V.(Denmark) | | | 966,370 |
| 9,400 | | Meritage Corp.(a) | | | 607,710 |
| 8,100 | | Standard-Pacific Corp. | | | 538,893 |
| | | | |
|
|
| | | | | | 4,022,878 |
| |
Household Products 0.5% | | | |
| 15,900 | | Kimberly-Clark Corp. | | | 1,041,609 |
| 18,600 | | Procter & Gamble Co. (The) | | | 990,078 |
| | | | |
|
|
| | | | | | 2,031,687 |
| |
Industrial Conglomerates 2.1% | | | |
| 121,800 | | General Electric Co. | | | 4,400,634 |
| 10,900 | | Phelps Dodge Corp. | | | 1,049,670 |
| 15,100 | | Siemens AG (Germany) | | | 1,200,700 |
| 44,900 | | Tyco International, Ltd. (Bermuda) | | | 1,622,686 |
| | | | |
|
|
| | | | | | 8,273,690 |
See Notes to Financial Statements.
| | |
| Strategic Partners Asset Allocation Funds/Strategic Partners Moderate Growth Fund | | 15 |
Portfolio of Investments
as of January 31, 2005 (Unaudited) Cont’d.
| | | | | |
| Shares | | Description | | Value (Note 1) |
| | | | | | |
| |
Insurance 2.8% | | | |
| 13,650 | | Affirmative Insurance Holdings, Inc. | | $ | 219,492 |
| 15,512 | | American International Group, Inc. | | | 1,028,290 |
| 7,100 | | Commerce Group, Inc. | | | 463,701 |
| 8,100 | | Delphi Financial Group (Class A shares) | | | 364,014 |
| 31,500 | | Genworth Financial, Inc. (Class A Shares) | | | 835,695 |
| 8,850 | | Infinity Property & Casualty Corp. | | | 289,838 |
| 18,600 | | Loews Corp. | | | 1,264,800 |
| 13,300 | | MBIA, Inc. | | | 794,542 |
| 8,800 | | Philadelphia Consolidated Holding Corp.(a) | | | 590,216 |
| 3,800 | | Protective Life Corp. | | | 156,408 |
| 103,716 | | Prudential PLC (United Kingdom) | | | 899,846 |
| 32,993 | | St. Paul Travelers Companies, Inc. (The) | | | 1,238,557 |
| 14,200 | | Swiss Reinsurance Co. (Switzerland) | | | 971,359 |
| 25,650 | | Tower Group, Inc. | | | 301,131 |
| 21,800 | | XL Capital, Ltd. (Cayman Islands) (Class A Shares) | | | 1,630,204 |
| | | | |
|
|
| | | | | | 11,048,093 |
| |
Internet 0.2% | | | |
| 10,210 | | Ask Jeeves, Inc.(a) | | | 289,556 |
| 13,830 | | RADVision Ltd.(a) | | | 203,301 |
| 16,430 | | ValueClick, Inc.(a) | | | 217,369 |
| | | | |
|
|
| | | | | | 710,226 |
| |
Internet & Catalog Retail 0.6% | | | |
| 28,100 | | eBay, Inc.(a) | | | 2,290,150 |
| |
Internet Software & Services 1.6% | | | |
| 34,170 | | Digitas, Inc.(a) | | | 356,735 |
| 4,850 | | Equinix, Inc.(a) | | | 203,409 |
| 11,300 | | Google, Inc (Class A Shares)(a) | | | 2,210,619 |
| 5,740 | | InfoSpace, Inc.(a) | | | 270,985 |
| 10,540 | | j2 Global Communications, Inc.(a) | | | 342,339 |
| 25,150 | | Keynote Systems, Inc.(a) | | | 313,621 |
| 6,820 | | RADWARE Ltd. (Israel)(a) | | | 166,340 |
| 64,800 | | Yahoo!, Inc.(a) | | | 2,281,608 |
| | | | |
|
|
| | | | | | 6,145,656 |
| |
IT Services 0.3% | | | |
| 38,300 | | Accenture Ltd.(a) | | | 997,715 |
See Notes to Financial Statements.
| | |
| 16 | | Visit our website at www.strategicpartners.com |
| | | | | |
| Shares | | Description | | Value (Note 1) |
| | | | | | |
| |
Machinery 0.3% | | | |
| 12,100 | | Deere & Co. | | $ | 840,103 |
| 11,700 | | Snap-On, Inc. | | | 387,387 |
| | | | |
|
|
| | | | | | 1,227,490 |
| |
Media 1.3% | | | |
| 16,760 | | CNET Networks, Inc.(a) | | | 184,360 |
| 6,800 | | DIRECTV Group, Inc. (The)(a) | | | 102,340 |
| 16,540 | | Image Entertainment, Inc.(a) | | | 94,278 |
| 8,300 | | Lagardere SA (France) | | | 626,447 |
| 48,728 | | News Corp. | | | 828,376 |
| 7,800 | | Scholastic Corp.(a) | | | 267,150 |
| 19,900 | | Sinclair Broadcast Group, Inc. (Class A shares) | | | 163,777 |
| 53,900 | | Sirius Satellite Radio, Inc.(a) | | | 356,818 |
| 18,000 | | Univision Communications, Inc. (Class A shares)(a) | | | 491,580 |
| 24,192 | | Viacom, Inc. (Class B shares) | | | 903,329 |
| 28,700 | | Vivendi Universal SA | | | 907,987 |
| 12,700 | | XM Satellite Radio Holdings, Inc. (Class A Shares)(a) | | | 405,257 |
| | | | |
|
|
| | | | | | 5,331,699 |
| |
Metals & Mining 0.3% | | | |
| 28,600 | | Inco Ltd.(a) | | | 941,226 |
| 2,400 | | Rio Tinto PLC (United Kingdom) | | | 74,690 |
| | | | |
|
|
| | | | | | 1,015,916 |
| |
Multi-Utilities & Unregulated Power 0.6% | | | |
| 15,800 | | Dominion Resources, Inc. | | | 1,096,204 |
| 36,800 | | Sempra Energy | | | 1,369,696 |
| | | | |
|
|
| | | | | | 2,465,900 |
| |
Multiline Retail 0.7% | | | |
| 9,640 | | EZCORP, Inc. (Class A shares)(a) | | | 183,931 |
| 132,000 | | Marks & Spencer Group PLC (United Kingdom) | | | 898,764 |
| 34,700 | | Target Corp. | | | 1,761,719 |
| | | | |
|
|
| | | | | | 2,844,414 |
| |
Office Electronics 0.4% | | | |
| 102,300 | | Xerox Corp.(a) | | | 1,624,524 |
| |
Oil & Gas 5.2% | | | |
| 80,900 | | BP PLC (United Kingdom) | | | 798,021 |
| 17,700 | | Cabot Oil & Gas Corp. | | | 833,316 |
See Notes to Financial Statements.
| | |
| Strategic Partners Asset Allocation Funds/Strategic Partners Moderate Growth Fund | | 17 |
Portfolio of Investments
as of January 31, 2005 (Unaudited) Cont’d.
| | | | | |
| Shares | | Description | | Value (Note 1) |
| | | | | | |
| 23,000 | | Chesapeake Energy Corp. | | $ | 404,110 |
| 57,900 | | Eni SpA (Italy) | | | 1,406,864 |
| 11,600 | | Eni SpA, ADR (Italy) | | | 1,417,520 |
| 12,700 | | ExxonMobil Corp. | | | 655,320 |
| 44,150 | | Grey Wolf, Inc.(a) | | | 233,995 |
| 15,300 | | Kerr-McGee Corp. | | | 944,775 |
| 30,700 | | Nexen, Inc. (Canada) | | | 1,275,278 |
| 27,300 | | Occidental Petroleum Corp. | | | 1,593,774 |
| 11,290 | | Oil States International, Inc.(a) | | | 215,075 |
| 37,800 | | Royal Dutch Petroleum Co. (Netherlands) | | | 2,195,164 |
| 41,400 | | Statoil ASA (Norway) | | | 628,828 |
| 65,100 | | Suncor Energy, Inc. (Canada) | | | 2,083,200 |
| 17,600 | | Swift Energy Co.(a) | | | 532,752 |
| 225,000 | | Tokyo Gas Co. Ltd. (Japan) | | | 930,840 |
| 12,103 | | Total SA (France) (Class B shares) | | | 2,595,293 |
| 11,885 | | Total SA, ADR (France) | | | 1,278,232 |
| 5,400 | | Unit Corp.(a) | | | 197,316 |
| | | | |
|
|
| | | | | | 20,219,673 |
| |
Paper & Forest Products 0.6% | | | |
| 27,500 | | Georgia-Pacific Corp. | | | 882,750 |
| 19,100 | | International Paper Co. | | | 747,765 |
| 47,100 | | Stora Enso Oyj (Class R shares) (Finland) | | | 678,439 |
| | | | |
|
|
| | | | | | 2,308,954 |
| |
Personal Products 0.5% | | | |
| 9,700 | | Chattem, Inc.(a) | | | 349,879 |
| 18,900 | | Estee Lauder Companies, Inc. (The) (Class A shares) | | | 853,146 |
| 13,500 | | Gillette Co. (The) | | | 684,720 |
| | | | |
|
|
| | | | | | 1,887,745 |
| |
Pharmaceuticals 3.5% | | | |
| 9,640 | | Alexion Pharmaceuticals, Inc.(a) | | | 238,494 |
| 11,700 | | Allergan, Inc. | | | 888,615 |
| 9,820 | | AtheroGenics, Inc. (Israel)(a) | | | 182,161 |
| 5,750 | | Barr Pharmaceuticals, Inc.(a) | | | 273,413 |
| 9,720 | | Connetics Corp.(a) | | | 237,362 |
| 13,850 | | Cypress Bioscience, Inc.(a) | | | 189,122 |
| 40,200 | | Eli Lilly & Co. | | | 2,180,447 |
| 75,800 | | GlaxoSmithKline PLC (United Kingdom) | | | 1,679,854 |
| 11,150 | | KV Pharmaceutical Co. (Class A Shares)(a) | | | 229,133 |
| 26,912 | | Nabi Biopharmaceuticals(a) | | | 347,434 |
| 56,200 | | Novartis AG ADR (Switzerland) | | | 2,690,855 |
See Notes to Financial Statements.
| | |
| 18 | | Visit our website at www.strategicpartners.com |
| | | | | |
| Shares | | Description | | Value (Note 1) |
| | | | | | |
| 100 | | Priority Healthcare Corp.(a) | | $ | 2,306 |
| 16,060 | | QLT, Inc. (Canada)(a) | | | 259,690 |
| 7,720 | | Rigel Pharmaceuticals, Inc.(a) | | | 148,147 |
| 23,100 | | Roche Holding AG, ADR (Switzerland) | | | 1,230,315 |
| 13,900 | | Salix Pharmaceuticals Ltd.(a) | | | 209,195 |
| 15,191 | | Sanofi-Synthelabo SA (France) | | | 1,133,677 |
| 16,800 | | Schering AG (Germany) | | | 1,134,620 |
| 7,050 | | Vaxgen, Inc.(a) | | | 104,904 |
| 15,000 | | Wyeth | | | 594,450 |
| | | | |
|
|
| | | | | | 13,954,194 |
| |
Real Estate Investment Trust 0.4% | | | |
| 7,200 | | Entertainment Properties Trust | | | 303,192 |
| 71,000 | | Mitsubishi Estate Co. Ltd. (Japan) | | | 898,352 |
| 9,180 | | Saxon Capital, Inc. | | | 198,747 |
| 5,200 | | SL Green Realty Corp. | | | 276,796 |
| | | | |
|
|
| | | | | | 1,677,087 |
| |
Retail 0.3% | | | |
| 20,550 | | Charlotte Russe Holdings, Inc.(a) | | | 220,296 |
| 28,470 | | Cosi, Inc.(a) | | | 170,820 |
| 7,330 | | Oxford Industries, Inc. | | | 272,529 |
| 16,800 | | Phillips-Van Heusen Corp. | | | 457,128 |
| 4,800 | | Stein Mart, Inc.(a) | | | 94,704 |
| | | | |
|
|
| | | | | | 1,215,477 |
| |
Semiconductor & Semiconductor Equipment 0.7% | | | |
| 36,400 | | Marvell Technology Group Ltd.(a) | | | 1,217,580 |
| 21,600 | | Maxim Integrated Products, Inc. | | | 842,616 |
| 11,580 | | Microsemi Corp.(a) | | | 178,679 |
| 17,280 | | Sirf Technology Holdings Inc.(a) | | | 182,304 |
| 10,970 | | Ultratech, Inc.(a) | | | 162,466 |
| | | | |
|
|
| | | | | | 2,583,645 |
| |
Software 2.2% | | | |
| 12,400 | | Adobe Systems, Inc. | | | 705,560 |
| 30,200 | | Electronic Arts, Inc.(a) | | | 1,943,068 |
| 22,620 | | Embarcadero Technologies, Inc.(a) | | | 177,341 |
| 17,400 | | Epicor Software Corp.(a) | | | 234,726 |
| 15,630 | | Infocrossing, Inc.(a) | | | 281,184 |
| 18,600 | | Mercury Interactive Corp.(a) | | | 814,122 |
| 94,600 | | Microsoft Corp. | | | 2,486,087 |
| 10,500 | | NAVTEQ Corp.(a) | | | 402,045 |
See Notes to Financial Statements.
| | |
| Strategic Partners Asset Allocation Funds/Strategic Partners Moderate Growth Fund | | 19 |
Portfolio of Investments
as of January 31, 2005 (Unaudited) Cont’d.
| | | | | |
| Shares | | Description | | Value (Note 1) |
| | | | | | |
| 31,300 | | SAP AG, ADR (Germany) | | $ | 1,211,936 |
| 13,130 | | Smith Micro Software Inc.(a) | | | 98,081 |
| 11,450 | | Sonic Solutions, Inc.(a) | | | 203,925 |
| 9,310 | | THQ, Inc.(a) | | | 207,148 |
| | | | |
|
|
| | | | | | 8,765,223 |
| |
Speciality Retail 1.9% | | | |
| 6,835 | | Aaron Rents, Inc., (Class B shares) | | | 145,175 |
| 26,180 | | Ashworth, Inc.(a) | | | 295,049 |
| 31,800 | | Bed, Bath & Beyond, Inc.(a) | | | 1,281,222 |
| 28,100 | | Chico’s FAS, Inc.(a) | | | 1,480,308 |
| 18,500 | | Compagnie Financiere Richemont AG (Switzerland) | | | 579,049 |
| 6,560 | | Cost Plus, Inc.(a) | | | 172,069 |
| 15,600 | | CSK Auto Corp.(a) | | | 246,012 |
| 5,880 | | Guitar Center, Inc.(a) | | | 336,630 |
| 11,177 | | Jos. A. Bank Clothiers, Inc.(a) | | | 320,780 |
| 15,600 | | Lowe’s Companies, Inc. | | | 889,044 |
| 58,600 | | Toys “R” Us, Inc.(a) | | | 1,256,970 |
| 14,600 | | Williams-Sonoma, Inc. (The)(a) | | | 505,160 |
| | | | |
|
|
| | | | | | 7,507,468 |
| |
Telecommunications | | | |
| 47,555 | | Netia SA (Poland)(a) | | | 65,691 |
| |
Textiles, Apparel and Luxury Goods 0.2% | | | |
| 13,300 | | Coach, Inc.(a) | | | 746,130 |
| |
Thrifts & Mortgage Finance 0.2% | | | |
| 15,100 | | Freddie Mac | | | 985,879 |
| |
Tobacco 0.7% | | | |
| 31,500 | | Altria Group, Inc. | | | 2,010,645 |
| 29,180 | | Imperial Tobacco Group PLC (United Kingdom) | | | 766,106 |
| | | | |
|
|
| | | | | | 2,776,751 |
| |
Transportation 0.3% | | | |
| 93 | | East Japan Railway Co. (Japan) | | | 502,508 |
| 4,110 | | Forward Air Corp.(a) | | | 175,148 |
| 5,600 | | Old Dominion Freight Line, Inc.(a) | | | 197,960 |
| 17,160 | | Vitran Corporation, Inc. (Class A shares) (Canada)(a) | | | 254,998 |
| | | | |
|
|
| | | | | | 1,130,614 |
See Notes to Financial Statements.
| | |
| 20 | | Visit our website at www.strategicpartners.com |
| | | | | | | | |
| Shares | | | | Description | | Value (Note 1) |
| | | | | | | | | |
|
| Wireless Telecommunication Services 2.0% |
| 56,100 | | | | | American Tower Corp., (Class A shares)(a) | | $ | 1,016,532 |
| 71,500 | | | | | Deutsche Telekom AG (Germany) | | | 1,546,251 |
| 19,040 | | | | | Harmonic Inc.(a) | | | 217,056 |
| 81,100 | | | | | Nextel Communications, Inc. (Class A Shares)(a) | | | 2,326,759 |
| 118,500 | | | | | Nokia Oyj (Finland) | | | 1,815,031 |
| 370 | | | | | NTT DoCoMo, Inc. (Japan) | | | 643,758 |
| 19,680 | | | | | Symmetricom Inc.(a) | | | 191,486 |
| 29,200 | | | | | Vodafone Group PLC (United Kingdom) | | | 75,452 |
| | | | | | | |
|
|
| | | | | | | | | 7,832,325 |
| | | | | | | |
|
|
| | | | | | Total common stocks
(cost $201,452,025) | | | 247,540,140 |
| | | | | | | |
|
|
| Preferred Stock 0.2% |
|
| Automobiles 0.2% |
| 830 | | | | | Porsche AG (Germany) | | | 540,973 |
|
| Media & Entertainment |
| 6 | | | | | Paxson Communications Corp.,(a) | | | 47,194 |
| 500 | | | | | Primedia, Inc. | | | 50,000 |
| | | | | | | |
|
|
| | | | | | | | | 97,194 |
|
| Telecommunications |
| 687 | | | | | McLeodUSA, Inc., Ser. A,(a) | | | 1,855 |
| | | | | | | |
|
|
| | | | | | Total preferred stocks
(cost $712,805) | | | 640,022 |
| | | | | | | |
|
|
| | | |
Moody’s
Rating
| | Principal
Amount (000)#
| | | | |
| ASSET-BACKED SECURITIES 0.6% |
| Aaa | | $ | 470 | | ACE Securities Corp.,
Ser. 2004, Class 2A,
2.53%, 4/25/34(f), F.R.N. | | | 470,024 |
| Aaa | | | 900 | | American Express Credit Account Master Trust, Ser. 2005-5,
2.62%, 4/15/08(f), F.R.N. | | | 900,745 |
| Aaa | | | 252 | | Ameriquest Mortgage Securities, Inc.,
2.62%, 4/25/34(f), F.R.N. | | | 251,537 |
See Notes to Financial Statements.
| | |
| Strategic Partners Asset Allocation Funds/Strategic Partners Moderate Growth Fund | | 21 |
Portfolio of Investments
as of January 31, 2005 (Unaudited) Cont’d.
| | | | | | | | |
Moody’s
Rating | | Principal
Amount (000)# | | Description | | Value (Note 1) |
| | | | | | | | | |
| Aaa | | $ | 271 | | Brazos Student Finance Corp., Student Loan Assoc., Notes,
2.80%, 6/1/23(f), F.R.N. | | $ | 274,083 |
| NR | | | 308 | | Honda Auto Receivables Owners Trust,
Ser. 2004-3, Class A1,
2.09%, 11/18/05(f) F.R.N. | | | 307,931 |
| | | | | | | |
|
|
| | | | | | Total asset-backed securities
(cost 2,200,743) | | | 2,204,320 |
| | | | | | | |
|
|
|
| COLLATERALIZED MORTGAGE SECURITIES 0.5% |
| NR | | | 330 | | BankTrust Mortgage Trust,
Ser. 1, Class G,
5.70%, 12/1/23 | | | 272,134 |
| Aaa | | | 1,693 | | Washington Mutual,
Ser. 2003-R1, Class A1,
2.80%, 12/25/27(f), F.R.N. | | | 1,691,613 |
| | | | | | | |
|
|
| | | | | | Total collateralized securities
(cost $2,018,606) | | | 1,963,747 |
| | | | | | | |
|
|
|
| CORPORATE BONDS 8.6% |
|
| Aerospace/Defense 0.1% |
| B2 | | | 85 | | Alliant Techsystems, Inc.,
Sr. Sub. Notes,
8.50%, 5/15/11 | | | 91,588 |
| Caa3 | | | 100 | | BE Aerospace, Inc., Sr. Sub. Notes,
8.875%, 5/1/11 | | | 102,000 |
| Caa1 | | | 50 | | K & F Acquisition, Inc., Sr. Sub Notes,
7.75%, 11/15/14 | | | 49,750 |
| Ba3 | | | 125 | | L-3 Communications Corp.,
7.63%, 6/15/12 | | | 136,250 |
| B1 | | | 125 | | Sequa Corp., Sr. Notes,
8.875%, 4/1/08 | | | 134,375 |
| Caa1 | | | 40 | | Standard Aero Holdings, Inc.,
Sr. Sub. Notes,
8.25%, 9/1/14 | | | 43,000 |
| | | | | | | |
|
|
| | | | | | | | | 556,963 |
See Notes to Financial Statements.
| | |
| 22 | | Visit our website at www.strategicpartners.com |
| | | | | | | | |
Moody’s
Rating | | Principal
Amount (000)# | | Description | | Value (Note 1) |
| | | | | | | | | |
|
| Airlines 0.1% |
| Caa2 | | $ | 50 | | AMR Corp., Debs.,
10.00%, 4/15/21 | | $ | 31,250 |
| Caa2 | | | 100 | | AMR Corp., M.T.N., Ser. B,
10.55%, 3/12/21 | | | 59,000 |
| Ba1 | | | 77 | | Continental Airlines, Inc.,
Pass Through Certificates,
Ser. 01-1,
7.373%, 12/15/15 | | | 61,397 |
| B3 | | | 22 | | Ser. 1996-C,
9.50%, 10/15/13 | | | 16,344 |
| Ba2 | | | 39 | | Ser. 981B,
6.748%, 3/15/17 | | | 31,147 |
| Ba2 | | | 93 | | Ser. 991B,
6.795%, 8/2/18 | | | 76,571 |
| Ca | | | 110 | | Delta Air Lines, Inc., Notes,
8.30%, 12/15/29 | | | 43,450 |
| | | | | | | |
|
|
| | | | | | | | | 319,159 |
|
| Automotive 0.2% |
| Baa3 | | | 125 | | ArvinMeritor, Inc., Notes,
8.75%, 3/1/12 | | | 139,844 |
| B3 | | | 10 | | Collins & Aikman Products Co.,
Sr, Sub. Notes,
12.875%, 8/15/12 | | | 8,275 |
| B3 | | | 10 | | Cooper-Standard Automotive, Inc., Notes,
8.375%, 12/15/14 | | | 9,500 |
| A3 | | | 600 | | DaimlerChrysler, Series, M.T.N.,
2.96%, 5/24/06(f), F.R.N. | | | 602,584 |
| B3 | | | 50 | | Tenneco Automotive, Inc.,
Sr. Sub Notes, Series 144A
8.625%, 11/15/14 | | | 52,000 |
| B1 | | | 59 | | TRW Automotive, Inc., Sr. Notes,
9.375%, 2/15/13 | | | 66,375 |
| | | | | | Visteon Corp., Notes, | | | |
| Ba1 | | | 20 | | 8.25%, 8/1/10 | | | 20,100 |
| Ba1 | | | 60 | | 7.00%, 3/10/14 | | | 54,900 |
| | | | | | | |
|
|
| | | | | | | | | 953,578 |
See Notes to Financial Statements.
| | |
| Strategic Partners Asset Allocation Funds/Strategic Partners Moderate Growth Fund | | 23 |
Portfolio of Investments
as of January 31, 2005 (Unaudited) Cont’d.
| | | | | | | | |
Moody’s
Rating | | Principal
Amount (000)# | | Description | | Value (Note 1) |
| | | | | | | | | |
|
| Banking 0.1% |
| Aa2 | | $ | 400 | | HSBC Bank USA, Sr. Notes
2.59%, 9/21/07(f), F.R.N. | | $ | 400,138 |
| Baa2 | | | 150 | | Kazkommerts International BV, (Netherlands), Gtd. Notes,
7.875%, 4/7/14 | | | 148,875 |
| | | | | | | |
|
|
| | | | | | | | | 549,013 |
|
| Building Materials & Construction 0.1% |
| Ba1 | | | 115 | | D.R. Horton, Inc., Sr. Notes,
7.875%, 8/15/11 | | | 132,169 |
| Ba1 | | | 25 | | K. Hovnanian Enterprises, Inc.
6.25%, 1/15/15 | | | 25,344 |
| Ba2 | | | 95 | | KB Home, Sr. Sub. Notes,
8.625%, 12/15/08 | | | 107,290 |
| B3 | | | 75 | | THL Buildco, Inc., Sr. Sub Notes,
8.50%, 9/1/14 | | | 77,062 |
| | | | | | | |
|
|
| | | | | | | | | 341,865 |
|
| Cable 0.2% |
| Ca | | | 50 | | Callahan Nordrhein Westfalen GmbH (Germany), Sr. Notes
7/15/10(b) | | | 2,000 |
| Ca | | | 445 | | Charter Communications Holdings, Inc., Sr. Disc. Notes,
Zero Coupon, (until 5/15/06), 5/15/11 | | | 309,275 |
| | | | | | Sr. Notes | | | |
| Ca | | | 100 | | 8.625%, 4/1/09 | | | 80,000 |
| Caa1 | | | 125 | | 10.25%, 9/15/10 | | | 130,000 |
| Ca | | | 100 | | 10.00%, 5/15/11 | | | 79,750 |
| B1 | | | 75 | | CSC Holdings, Inc.
6.75%, 4/15/12 | | | 78,750 |
| | | | | | Sr. Notes, | | | |
| B1 | | | 50 | | 7.875%, 12/15/07 | | | 53,875 |
| B1 | | | 75 | | 7.25%, 7/15/08 | | | 79,312 |
See Notes to Financial Statements.
| | |
| 24 | | Visit our website at www.strategicpartners.com |
| | | | | | | | |
Moody’s
Rating | | Principal
Amount (000)# | | Description | | Value (Note 1) |
| | | | | | | | | |
| B2 | | $ | 65 | | Kabel Deutschland, (Germany)
Sr. Notes,
10.625%, 7/1/14 | | $ | 73,450 |
| Ba2 | | | 100 | | Rogers Cablesystems Ltd., (Canada) Sr. Notes,
10.00%, 3/15/05 | | | 100,705 |
| | | | | | | |
|
|
| | | | | | | | | 987,117 |
|
| Capital Goods 0.5% |
| B3 | | | 100 | | ALH Finance, LLC, Sr. Sub Notes,
8.50%, 1/15/13 | | | 102,000 |
| | | | | | Allied Waste North America, Inc.,
Sr. Notes, | | | |
| B2 | | | 165 | | 8.50%, 12/1/08 | | | 172,013 |
| B2 | | | 50 | | 7.875%, 4/15/13 | | | 49,625 |
| B2 | | | 55 | | Sr. Sec’d. Notes,
6.50%, 11/15/10 | | | 52,250 |
| B3 | | | 75 | | Amsted Industry, Inc., Sr. Notes,
10.25%, 10/15/11 | | | 84,375 |
| Caa1 | | | 100 | | Blount, Inc., Sr. Sub. Notes,
8.875%, 8/1/12 | | | 108,750 |
| Ba3 | | | 100 | | Case New Holland, Inc., Sr. Notes,
9.25%, 8/1/11 | | | 109,250 |
| Caa2 | | | 40 | | Great Lakes Dredge & Dock Corp.,
7.75%, 12/15/13 | | | 34,800 |
| B3 | | | 70 | | Invensys PLC, Sr. Notes,
9.875%, 3/15/11 | | | 75,075 |
| B3 | | | 100 | | Johnson Diversified Holdings, Inc.,
Sr. Disc. Notes,
Zero Coupon, (until 5/15/07)
10.67% 5/15/13 | | | 86,750 |
| B2 | | | 55 | | Gtd., Notes,
9.625%, 5/15/12 | | | 61,325 |
| Ba2 | | | 100 | | Joy Global, Inc., Gtd. Notes,
8.75%, 3/15/12 | | | 112,000 |
| B2 | | | 127 | | Manitowoc Co., Inc., Sr. Sub. Notes,
10.50%, 8/1/12 | | | 146,050 |
| B3 | | | 125 | | Rexnord Corp., Sr. Sub. Notes,
10.125%, 12/15/12 | | | 140,000 |
| Caa1 | | | 85 | | Sensus Metering Systems, Inc.,
Sr. Sub. Notes,
8.625%, 12/15/13 | | | 87,550 |
See Notes to Financial Statements.
| | |
| Strategic Partners Asset Allocation Funds/Strategic Partners Moderate Growth Fund | | 25 |
Portfolio of Investments
as of January 31, 2005 (Unaudited) Cont’d.
| | | | | | | | |
Moody’s
Rating | | Principal
Amount (000)# | | Description | | Value (Note 1) |
| | | | | | | | | |
| Ba3 | | $ | 20 | | SPX Corp., Sr. Notes,
7.50%, 1/1/13 | | $ | 21,950 |
| Ba3 | | | 75 | | Stena AB (Sweden), Sr. Notes,
7.50%, 11/1/13 | | | 76,313 |
| B3 | | | 170 | | Terex Corp., Gtd. Notes,
10.375%, 4/1/11 | | | 188,699 |
| Caa1 | | | 100 | | Thermadyne Holdings Corp., Gtd. Notes,
9.25%, 2/1/14 | | | 97,000 |
| B1 | | | 25 | | United Rentals North America, Inc., Gtd. Notes,
6.50%, 2/15/12
| | | 24,563 |
| B2 | | | 50 | | Sr. Sub. Notes,
7.75%, 11/15/13 | | | 48,625 |
| | | | | | | |
|
|
| | | | | | | | | 1,878,963 |
|
| Chemicals 0.4% |
| B3 | | | 75 | | Borden U.S. Finance Corp./Nova Scotia Finance ULC,
9.00%, 7/15/14 | | | 82,500 |
| B2 | | | 75 | | Equistar Chemicals LP, Gtd., Notes,
10.125%, 9/1/08 | | | 85,500 |
| Ba1 | | | 200 | | Hercules, Inc., Debs.,
6.60%, 8/1/27 | | | 204,000 |
| B2 | | | 10 | | Huntsman Advanced Materials,
Sr. Sec’d. Notes,
11.00%, 7/15/10 | | | 11,750 |
| B3 | | | 75 | | Huntsman International, LLC,
Sr. Sec’d Notes,
9.875%, 3/1/09 | | | 81,750 |
| Caa1 | | | 15 | | 10.125%, 7/1/09 | | | 15,750 |
| B1 | | | 225 | | IMC Global, Inc., Sr. Sec’d Notes,
10.875%, 6/1/08 - 8/1/13 | | | 271,437 |
| B1 | | | 50 | | 11.25%, 6/1/11 | | | 56,500 |
| B2 | | | 100 | | ISP Chemco, Inc., Sr. Sub. Notes, Ser. B,
10.25%, 7/1/11 | | | 111,500 |
| B2 | | | 50 | | Koppers, Inc., Gtd. Notes,
9.875%, 10/15/13 | | | 56,750 |
| B2 | | | 175 | | Nalco Co., Sr. Notes,
7.75%, 11/15/11 | | | 187,688 |
| Caa1 | | | 54 | | OM Group, Inc., Gtd. Notes,
9.25%, 12/15/11 | | | 57,510 |
See Notes to Financial Statements.
| | |
| 26 | | Visit our website at www.strategicpartners.com |
| | | | | | | | |
Moody’s
Rating | | Principal
Amount (000)# | | Description | | Value (Note 1) |
| | | | | | | | | |
| B3 | | $ | 75 | | Rhodia SA,
Sr. Notes,
10.25%, 6/1/10 | | $ | 85,313 |
| Caa1 | | | 95 | | Sr. Sub. Notes,
8.875%, 6/1/11 | | | 97,375 |
| B3 | | | 100 | | Rockwood Specialties Corp.,
Sr. Sub. Notes,
10.625%, 5/15/11 | | | 114,000 |
| | | | | | | |
|
|
| | | | | | | | | 1,519,323 |
|
| Consumer 0.1% |
| B2 | | | 50 | | Alderwoods Group, Inc., Sr. Notes,
7.75%, 9/15/12 | | | 53,625 |
| NR | | | 75 | | K2 Corp., Sr. Notes,
7.375%, 7/1/14 | | | 80,531 |
| B3 | | | 120 | | KinderCare Learning Center, Inc.,
Sr. Sub. Notes,
9.50%, 2/15/09 | | | 120,300 |
| B3 | | | 50 | | Knowledge Learning Corp., Sr. Sub Notes,
7.75%, 2/1/15 | | | 50,250 |
| Ca | | | 90 | | Levi Strauss & Co., Sr. Notes,
12.25%, 12/15/12 | | | 97,200 |
| Caa1 | | | 75 | | Propex Fabrics, Inc., Sr. Notes,
10.00%, 12/1/12 | | | 75,938 |
| | | | | | | |
|
|
| | | | | | | | | 477,844 |
|
| Electric 0.9% |
| B2 | | | 175 | | AES Corp., Sr. Notes,
9.375%, 9/15/10 | | | 197,968 |
| Ba1 | | | 165 | | AES Eastern Energy,
Pass-Thru Certificates., Class A-1,
9.00%, 1/2/17 | | | 188,532 |
| B3 | | | 30 | | Allegheny Energy Supply, Bonds,
8.25%, 4/15/12 | | | 33,375 |
| B2 | | | 90 | | Aquila, Inc., Sr. Notes,
9.95%, 2/1/11 | | | 101,362 |
| B2 | | | 25 | | 7.75%, 6/15/11 | | | 25,875 |
| B(e) | | | 245 | | Calpine Corp., Sr. Notes,
8.75%, 7/15/13 | | | 186,200 |
| B1 | | | 140 | | CMS Energy Corp., Sr. Notes,
7.50%, 1/15/09 | | | 148,225 |
| B1 | | | 60 | | 8.50%, 4/15/11 | | | 66,975 |
See Notes to Financial Statements.
| | |
| Strategic Partners Asset Allocation Funds/Strategic Partners Moderate Growth Fund | | 27 |
Portfolio of Investments
as of January 31, 2005 (Unaudited) Cont’d.
| | | | | | | | |
Moody’s
Rating | | Principal
Amount (000)# | | Description | | Value (Note 1) |
| | | | | | | | | |
| B3 | | $ | 10 | | Dynegy Holdings, Inc., Sec’d. Notes,
9.875%, 7/15/10 | | $ | 10,950 |
| B3 | | | 130 | | 10.125%, 7/15/13 | | | 144,300 |
| B1 | | | 130 | | Edison Mission Energy, Sr. Notes,
7.73%, 6/15/09 | | | 137,800 |
| Ba2 | | | 150 | | Empresa Nacional de Electricdad SA (Chile), Sr. Notes,
8.35%, 8/1/13 | | | 175,876 |
| Ba2 | | | 49 | | Homer City Funding LLC, Gtd. Notes,
8.137%, 10/1/19 | | | 55,370 |
| B1 | | | 30 | | Midwest Generation LLC, Notes,
Pass Through Certificates,
Series A,
8.30%, 7/2/09 | | | 32,400 |
| B1 | | | 15 | | Pass Through Certificates,
Series B,
8.56%, 1/2/16 | | | 16,800 |
| B1 | | | 75 | | Sec’d. Notes,
8.75%, 5/1/34 | | | 83,813 |
| B3 | | | 30 | | Mission Energy Holdings Co.,
Sr. Sec’d. Notes,
13.50%, 7/15/08 | | | 37,425 |
| Ba2 | | | 10 | | Nevada Power Co., Notes,
10.875%, 10/15/09 | | | 11,463 |
| Ba2 | | | 80 | | Nevada Power, Ref. Mtge. Bonds,
6.50%, 4/15/12 | | | 84,200 |
| NR | | | GBP 11 | | NoteCo Ltd., Notes,
6.92%, 6/30/25(f) F.R.N. | | | 21,992 |
| B2 | | | 137 | | NRG Energy, Inc., Sr. Sec’d. Notes,
8.00%, 12/15/13 | | | 147,618 |
| B2 | | | 115 | | Orion Power Holdings, Inc., Sr. Notes,
12.00%, 5/1/10 | | | 143,750 |
| Baa2 | | | 55 | | Pacific Gas & Electric Co.,
First Mortgage Bonds,
3.26%, 4/3/06(f), F.R.N. | | | 55,054 |
| Baa3 | | | 200 | | PP&L Capital Funding, Inc.,
Sr. Notes, M.T.N.,
7.75%, 4/15/05 | | | 201,693 |
| Ba1 | | | 300 | | PPL Capital Funding Trust I, Gtd. Notes,
7.29%, 5/18/06 | | | 312,357 |
| B1 | | | 135 | | Reliant Resources, Inc., Sr. Sec’d. Notes,
9.50%, 7/15/13 | | | 151,200 |
See Notes to Financial Statements.
| | |
| 28 | | Visit our website at www.strategicpartners.com |
| | | | | | | | |
Moody’s
Rating | | Principal
Amount (000)# | | Description | | Value (Note 1) |
| | | | | | | | | |
| B2 | | $ | 60 | | Sierra Pacific Resources, Sr. Notes,
8.625%, 3/15/14 | | $ | 66,675 |
| Ba2 | | | 100 | | TECO Energy, Inc., Sr. Notes,
7.50%, 6/15/10 | | | 110,000 |
| B1 | | | 175 | | Texas Genco LLC, Sr. Notes,
6.875%, 12/15/14 | | | 181,125 |
| B2 | | | 40 | | TNP Enterprises, Inc., Sr. Sub. Notes,
10.25%, 4/1/10 | | | 42,200 |
| Baa2 | | | 99 | | TXU Energy Co., LLC,
3.42%, 1/17/06(f), F.R.N. | | | 99,258 |
| | | | | | | |
|
|
| | | | | | | | | 3,271,831 |
|
| Energy – Other 0.3% |
| Ba2 | | | 175 | | Chesapeake Energy Corp., Sr. Notes,
6.375%, 6/15/15 | | | 178,500 |
| B2 | | | 50 | | Encore Acquisition,
6.25%, 4/15/14 | | | 49,875 |
| Ba3 | | | 40 | | Forest Oil Corp., Sr. Notes,
8.00%, 12/15/11 | | | 45,350 |
| B3 | | | 75 | | Hanover Compress Co., Sr. Notes
8.625%, 12/15/10 | | | 81,000 |
| B2 | | | 50 | | Hanover Equipment Trust,
Sr. Sec’d. Notes, Ser. B,
8.75%, 9/1/11 | | | 54,000 |
| B2 | | | 50 | | Houston Exploration Co., Sr. Sub. Notes,
7.00%, 6/15/13 | | | 52,500 |
| B2 | | | 7 | | Magnum Hunter Resources Inc.,
Gtd. Notes,
9.60%, 3/15/12 | | | 7,998 |
| Ba3 | | | 50 | | Newfield Exploration, Inc., Sr. Sub. Notes,
8.375%, 8/15/12 | | | 55,500 |
| B2 | | | 73 | | Parker Drilling Co., Sr. Notes,
10.125%, 11/15/09 | | | 76,760 |
| Baa1 | | | 250 | | Pemex Project Funding Master Trust
9.25%, 3/30/18 | | | 312,499 |
| Ba3 | | | 110 | | Premcor Refining Group, Inc.,
Gtd. Notes,
6.75%, 5/1/14 | | | 115,225 |
| B2 | | | 50 | | Sr. Notes,
7.75%, 2/1/12 | | | 54,375 |
| Ba3 | | | 25 | | 7.50%, 6/15/15 | | | 26,875 |
See Notes to Financial Statements.
| | |
| Strategic Partners Asset Allocation Funds/Strategic Partners Moderate Growth Fund | | 29 |
Portfolio of Investments
as of January 31, 2005 (Unaudited) Cont’d.
| | | | | | | | |
Moody’s
Rating | | Principal
Amount (000)# | | Description | | Value (Note 1) |
| | | | | | | | | |
| Ba2 | | $ | 25 | | Pride International, Inc. Sr. Notes,
7.375%, 7/15/14 | | $ | 27,500 |
| B2 | | | 145 | | Stone Energy Corp., Sr. Sub. Notes,
8.25%, 12/15/11 | | | 155,875 |
| Ba3 | | | 75 | | Vintage Petrolium, Inc., Sr. Notes,
8.25%, 5/1/12 | | | 82,500 |
| | | | | | | |
|
|
| | | | | | | | | 1,376,332 |
|
| Financial Services 0.8% |
| A3 | | | 500 | | Ford Motor Credit Co., Notes,
7.50%, 3/15/05 | | | 502,373 |
| A3 | | | 700 | | Ford Motor Credit, M.T.N,
3.10%, 7/18/05(f), F.R.N. | | | 698,466 |
| Aaa | | | JPY 36,000 | | General Electric Capital Corp.
1.40%, 11/2/06 | | | 355,219 |
| Baa1 | | | 100 | | General Motors Acceptance Corp.,
Notes, M.T.N.
5.25%, 5/16/05 | | | 100,672 |
| Baa1 | | | 200 | | 4.23%, 5/19/05(f) F.R.N. | | | 200,840 |
| Baa1 | | | 350 | | 7.50%, 7/15/05 | | | 355,820 |
| Baa1 | | | 400 | | 3.92%, 10/20/05(f) F.R.N. | | | 401,767 |
| Baa1 | | | 500 | | 6.875%, 9/15/11 | | | 502,084 |
| | | | | | | |
|
|
| | | | | | | | | 3,117,241 |
|
| Foods 0.2% |
| B3 | | | 17 | | Agrilink Foods, Inc., Sr. Sub. Notes,
11.875%, 11/1/08 | | | 17,680 |
| Ba3 | | | 25 | | Ahold Finance USA, Inc., Sr. Notes,
8.25%, 7/15/10 | | | 28,250 |
| B3 | | | 50 | | Carrols Corp., Sr. Sub Notes,
9.00%, 1/15/13 | | | 52,125 |
| B2 | | | 175 | | Del Monte Corp., Sr. Sub Notes,
8.625%, 12/15/12 | | | 194,469 |
| B2 | | | 100 | | 6.75%, 2/15/15 | | | 101,000 |
| Ba1 | | | 95 | | Delhaize America Inc., Gtd. Notes,
8.125%, 4/15/11 | | | 110,440 |
| B2 | | | 50 | | Dole Foods Co., Sr. Notes,
8.625%, 5/1/09 | | | 54,813 |
| B2 | | | 155 | | 8.875%, 3/15/11 | | | 166,431 |
See Notes to Financial Statements.
| | |
| 30 | | Visit our website at www.strategicpartners.com |
| | | | | | | | |
Moody’s
Rating | | Principal
Amount (000)# | | Description | | Value (Note 1) |
| | | | | | | | | |
| B3 | | $ | 45 | | Pathmark Stores, Gtd. Notes,
8.75%, 2/1/12 | | $ | 43,031 |
| Ba2 | | | 100 | | Smithfield Foods, Inc., Sr. Notes,
8.00%, 10/15/09 | | | 110,375 |
| | | | | | | |
|
|
| | | | | | | | | 878,614 |
|
| Gaming 0.4% |
| B1 | | | 100 | | Argosy Gaming,
7.00%, 1/15/14 | | | 110,000 |
| Ba3 | | | 150 | | Aztar Corp, Sr. Sub. Notes,
9.00%, 8/15/11 | | | 164,625 |
| Ba3 | | | 20 | | 7.875%, 6/15/14 | | | 22,000 |
| B1 | | | 80 | | Boyd Gaming Corp., Sr. Sub. Notes,
8.75%, 4/15/12 | | | 88,200 |
| B2 | | | 75 | | Isle of Capri Casinos, Inc.,
Sr. Sub. Notes,
7.00%, 3/1/14 | | | 75,938 |
| B2 | | | 55 | | Kerzner International Ltd.
8.875%, 8/15/11 | | | 59,950 |
| Ba1 | | | 290 | | MGM Mirage, Inc.
6.00%, 10/1/09 | | | 295,799 |
| Ba2 | | | 145 | | Gtd. Notes,
9.75%, 6/1/07 | | | 160,950 |
| Ba3 | | | 110 | | Mohegan Tribal Gaming Authority,
Sr. Notes,
8.00%, 4/1/12 | | | 118,388 |
| Ba2 | | | 30 | | Park Place Entertainment Corp.,
Sr. Notes,
9.375%, 2/15/07 | | | 32,813 |
| Ba2 | | | 125 | | 7.875%, 3/15/10 | | | 139,375 |
| Ba2 | | | 60 | | 8.125%, 5/15/11 | | | 68,700 |
| B2 | | | 110 | | Venetian Casino Resort LLC,
Second Mortgage., Bonds.,
11.00%, 6/15/10 | | | 124,300 |
| NR | | | 90 | | Wynn Las Vegas, LLC,
6.625%, 12/1/14 | | | 88,425 |
| | | | | | | |
|
|
| | | | | | | | | 1,549,463 |
|
| Health Care & Pharmaceutical 0.6% |
| B3 | | | 25 | | Alliance Imaging, Sr. Sub Notes,
7.25%, 12/15/12 | | | 25,250 |
See Notes to Financial Statements.
| | |
| Strategic Partners Asset Allocation Funds/Strategic Partners Moderate Growth Fund | | 31 |
Portfolio of Investments
as of January 31, 2005 (Unaudited) Cont’d.
| | | | | | | | |
Moody’s
Rating | | Principal
Amount (000)# | | Description | | Value (Note 1) |
| | | | | | | | | |
| Ba3 | | $ | 100 | | Bio-Rad Laboratories, Inc., Sr. Sub Notes,
6.125%, 12/15/14 | | $ | 101,375 |
| B3 | | | 100 | | Concentra Operating Corp., Gtd. Notes,
9.125%, 6/1/12 | | | 111,000 |
| Ba1 | | | 25 | | Coventry Health Care, Inc., Sr. Notes,
5.875%, 1/15/12 | | | 25,375 |
| Ba1 | | | 50 | | 8.125%, 2/15/12 | | | 54,625 |
| Ba2 | | | 50 | | HCA Inc., Notes,
5.50%, 12/1/09 | | | 49,795 |
| Ba1 | | | 50 | | HCA, Inc.,
8.36%, 4/15/24 | | | 54,930 |
| Ba1 | | | 75 | | 7.50%, 11/15/95 | | | 72,393 |
| Ba1 | | | 50 | | HCA, Inc., Debs,
7.50%, 12/15/23 | | | 51,534 |
| Ba1 | | | 55 | | HCA, Inc., Notes, M.T.N.,
9.00%, 12/15/14 | | | 65,229 |
| Caa2 | | | 100 | | HealthSouth Corp,
Notes,
7.625%, 6/1/12 | | | 100,250 |
| Caa2 | | | 50 | | Sr. Notes,
6.875%, 6/15/05 | | | 50,250 |
| Caa2 | | | 100 | | 8.50%, 2/1/08 | | | 103,375 |
| B3 | | | 70 | | IASIS Healthcare LLC, Sr. Sub Notes,
8.75%, 6/15/14 | | | 75,425 |
| Caa1 | | | 55 | | Inverness Medical Innovations, Inc.,
Sr. Sub. Notes,
8.75%, 2/15/12 | | | 56,375 |
| B3 | | | 178 | | Magellan Health Services, Sr. Notes,
9.375%, 11/15/08 | | | 191,493 |
| Ba1 | | | 50 | | MedcoHealth Solutions, Sr. Notes,
7.25%, 8/15/13 | | | 56,512 |
| Caa1 | | | 75 | | Medical Device Manufacturing,
Gtd. Notes,
10.00%, 7/15/12 | | | 81,000 |
| B3 | | | 100 | | MedQuest, Inc., Sr. Sub. Notes,
11.875%, 8/15/12 | | | 117,000 |
| Ba3 | | | 50 | | NeighborCare, Inc., Sr. Sub. Notes,
6.875%, 11/15/13 | | | 52,688 |
| B1 | | | 25 | | Omega Healthcare, Investors, Inc.,
Sr. Notes,
7.00%, 4/1/14 | | | 25,250 |
See Notes to Financial Statements.
| | |
| 32 | | Visit our website at www.strategicpartners.com |
| | | | | | | | |
Moody’s
Rating | | Principal
Amount (000)# | | Description | | Value (Note 1) |
| | | | | | | | | |
| B2 | | $ | 110 | | Res-Care, Inc., Sr. Notes,
10.625%, 11/15/08 | | $ | 120,175 |
| B2 | | | 75 | | Select Medical Corp., Sr. Sub. Notes,
9.50%, 6/15/09 | | | 79,969 |
| Ba2 | | | 80 | | Senior Housing Properties Trust,
Sr. Notes,
8.625%, 1/15/12 | | | 91,000 |
| B3 | | | 65 | | Tenet Healthcare Corp., Sr. Notes,
6.375%, 12/1/11 | | | 58,338 |
| B3 | | | 40 | | 6.50%, 6/1/12 | | | 35,600 |
| B3 | | | 25 | | 9.25%, 2/1/15 | | | 25,000 |
| NR | | | 75 | | Vanguard Health Holdings Co. II LLC.,
Sr. Sub. Notes
9.00%, 10/1/14 | | | 80,250 |
| Ba3 | | | 121 | | Ventas Realty L.P., Gtd. Notes,
8.75%, 5/1/09 | | | 133,855 |
| Ba3 | | | 120 | | 9.00%, 5/1/12 | | | 139,199 |
| Caa1 | | | 125 | | Warner Chilcott Corp., Sr. Sub. Notes,
8.75%, 2/1/15 | | | 128,438 |
| | | | | | | |
|
|
| | | | | | | | | 2,412,948 |
|
| Household Products 0.1% |
| A3 | | | 500 | | Clorox Co., Notes,
2.54%, 12/14/07(f), F.R.N. | | | 499,810 |
|
| Lodging 0.3% |
| B1 | | | 75 | | FelCor Suites LP, Gtd. Notes,
7.625%, 10/1/07 | | | 78,563 |
| Ba3 | | | 30 | | HMH Properties, Inc., Gtd. Notes, Ser. B,
7.875%, 8/1/08 | | | 30,788 |
| Ba3 | | | 50 | | Host Marriott L.P.,
Gtd. Notes,
9.25%, 10/1/07 | | | 55,250 |
| Ba3 | | | 185 | | Sr. Notes,
9.50%, 1/15/07 | | | 200,262 |
| Ba3 | | | 75 | | 7.00%, 8/15/12 | | | 78,375 |
| Ba3 | | | 45 | | 7.125%, 11/1/13 | | | 47,363 |
| B2 | | | 25 | | John Q. Hammons Hotels LP,
8.875%, 5/15/12 | | | 28,125 |
| Ba3 | | | 125 | | La Quinta Properties, Inc., Sr. Notes,
8.875%, 3/15/11 | | | 137,969 |
See Notes to Financial Statements.
| | |
| Strategic Partners Asset Allocation Funds/Strategic Partners Moderate Growth Fund | | 33 |
Portfolio of Investments
as of January 31, 2005 (Unaudited) Cont’d.
| | | | | | | | |
Moody’s
Rating | | Principal
Amount (000)# | | Description | | Value (Note 1) |
| | | | | | | | | |
| Ba2 | | $ | 125 | | Royal Caribbean Cruises, Ltd.,
Sr. Notes,
8.00%, 5/15/10 | | $ | 141,249 |
| Ba2 | | | 25 | | Debs,
7.50%, 10/15/27 | | | 27,563 |
| Ba1 | | | 70 | | Starwood Hotels & Resorts Worldwide, Inc., Notes,
7.875%, 5/1/12 | | | 79,800 |
| Ba1 | | | 200 | | 7.375%, 11/15/15 | | | 223,999 |
| | | | | | | |
|
|
| | | | | | | | | 1,129,306 |
|
| Media & Entertainment 0.6% |
| Caa1 | | | 75 | | Advertising Directory Solutions, Sr. Notes,
9.25%, 11/15/12 | | | 79,125 |
| B3 | | | 50 | | AMC Entertainment, Inc., Sr. Sub Notes,
8.00%, 3/1/14 | | | 49,563 |
| Caa1 | | | 70 | | American Color Graphics, Inc., Sr. Notes,
10.00%, 6/15/10 | | | 59,675 |
| B2 | | | 5 | | American Media Operation, Inc.,
Sr. Notes,
10.25%, 5/1/09 | | | 5,231 |
| B2 | | | 75 | | CanWest Media, Inc. (Canada),
Sr. Sub. Notes,
10.625%, 5/15/11 | | | 83,531 |
| B2 | | | 134 | | Dex Media East LLC, Sr. Sub. Notes,
12.125%, 11/15/12 | | | 160,464 |
| B2 | | | 147 | | Dex Media West LLC., Sr. Sub. Notes,
9.875%, 8/15/13 | | | 166,660 |
| B1 | | | 110 | | DirecTV Holdings LLC., Sr. Notes,
8.375%, 3/15/13 | | | 123,888 |
| Ba3 | | | 20 | | Echostar DBS Corp., Gtd. Notes,
6.625%, 10/1/14 | | | 20,200 |
| Ba3 | | | 40 | | Entercom Radio LLC, Gtd. Notes,
7.625%, 3/1/14 | | | 43,000 |
| B2 | | | 100 | | Gray Television, Inc., Gtd. Notes,
9.25%, 12/15/11 | | | 111,250 |
| B1 | | | 150 | | Intelsat Bermuda Ltd., Sr. Notes,
8.25%, 1/15/13 | | | 155,250 |
| B1 | | | 75 | | Intrawest Corp., Sr. Notes,
7.50%, 10/15/13 | | | 78,750 |
| B3 | | | 50 | | LCE Acquisition Corp., Sr. Sub. Notes,
9.00%, 8/1/14 | | | 52,375 |
See Notes to Financial Statements.
| | |
| 34 | | Visit our website at www.strategicpartners.com |
| | | | | | | | |
Moody’s
Rating | | Principal
Amount (000)# | | Description | | Value (Note 1) |
| | | | | | | | | |
| B2 | | $ | 125 | | Leslie’s Poolmart, Inc., Sr. Notes,
7.75%, 2/1/13 | | $ | 127,188 |
| B2 | | | 75 | | Marquee, Inc. Sr. Notes,
8.625%, 8/15/12 | | | 81,375 |
| B2 | | | 100 | | Medianews Group, Inc., Sr. Sub. Notes,
6.875%, 10/1/13 | | | 99,500 |
| Ba3 | | | 40 | | Morris Publishing Group LLC., Gtd. Notes,
7.00%, 8/1/13 | | | 40,700 |
| B3 | | | 25 | | New Skies Satellites NV, (Netherlands)
Sr. Notes,
7.44%, 11/1/11(f), F.R.N., | | | 26,063 |
| Caa1 | | | 25 | | Sr. Sub. Notes,
9.125%, 11/1/12 | | | 25,750 |
| B2 | | | 150 | | Quebecor Media, Inc. (Canada),
Sr. Notes,
11.125%, 7/15/11 | | | 168,749 |
| B2 | | | 100 | | R.R. Donnelley Financial Corp.,
Sr. Sub. Notes,
10.875%, 12/15/12 | | | 117,000 |
| B3 | | | 25 | | Six Flags, Inc., Sr. Notes,
9.625%, 6/1/14 | | | 23,563 |
| B3 | | | 75 | | Universal City Florida Holdings Co.,
Sr. Notes,
8.375%, 5/1/10 | | | 78,000 |
| B2 | | | 70 | | Vail Resorts, Inc., Sr. Sub. Notes,
6.75%, 2/15/14 | | | 70,613 |
| B3 | | | 135 | | Vertis, Inc., Gtd. Notes,
10.875%, 6/15/09 | | | 145,463 |
| Caa1 | | | 10 | | WDAC Subsidiary Corp., Sr. Notes,
8.375%, 12/1/14 | | | 9,750 |
| | | | | | | |
|
|
| | | | | | | | | 2,202,676 |
|
| Metals 0.2% |
| B3 | | | 125 | | AK Steel Corp., Sr. Notes,
7.875%, 2/15/09 | | | 128,125 |
| B3 | | | 60 | | 7.75%, 6/15/12 | | | 61,650 |
| Ba3 | | | 50 | | Arch Western Finance LLC, Sr. Notes,
6.75%, 7/1/13 | | | 51,000 |
| B1 | | | 75 | | Century Aluminum Co., Gtd. Notes,
7.50%, 8/15/14 | | | 80,063 |
See Notes to Financial Statements.
| | |
| Strategic Partners Asset Allocation Funds/Strategic Partners Moderate Growth Fund | | 35 |
Portfolio of Investments
as of January 31, 2005 (Unaudited) Cont’d.
| | | | | | | | |
Moody’s
Rating | | Principal
Amount (000)# | | Description | | Value (Note 1) |
| | | | | | | | | |
| BB-(e) | | $ | 105 | | CSN Islands VII Corp., (Cayman Islands), Gtd. Notes,
10.75%, 9/12/08 | | $ | 119,044 |
| B3 | | | 76 | | Ispat Inland Ulc., Series WI, Sec’d Notes,
9.75%, 4/1/14 | | | 93,670 |
| B1 | | | 50 | | Novelis, Inc., Sr. Notes,
7.25%, 2/15/15 | | | 51,250 |
| B2 | | | 25 | | Oregon Steel Mills, Inc.
10.00%, 7/15/09 | | | 27,750 |
| Ba3 | | | 75 | | Russel Metals, Inc. (Canada), Sr. Notes,
6.375%, 3/1/14 | | | 75,000 |
| B2 | | | 50 | | Ryerson Tull, Inc., Sr. Notes,
8.25%, 12/15/11 | | | 49,000 |
| B1 | | | 125 | | United States Steel LLC, Sr. Notes,
10.75%, 8/1/08 | | | 147,812 |
| | | | | | | |
|
|
| | | | | | | | | 884,364 |
|
| Packaging 0.2% |
| B2 | | | 85 | | Anchor Glass Container Corp.,
Sr. Sec’d Notes,
11.00%, 2/15/13 | | | 91,375 |
| B3 | | | 125 | | Berry Plastics, Sr. Sub. Notes,
10.75%, 7/15/12 | | | 142,500 |
| B1 | | | 100 | | Crown Euro Holdings SA (France),
Sr. Sec’d. Notes,
9.50%, 3/1/11 | | | 111,500 |
| Caa1 | | | 50 | | Graham Packaging Co., Inc., Sr. Notes,
8.50%, 10/15/12 | | | 51,875 |
| Caa2 | | | 50 | | 9.875%, 10/15/14 | | | 52,375 |
| B2 | | | 175 | | Greif Brothers Corp., Gtd., Sr. Sub. Notes,
8.875%, 8/1/12 | | | 193,375 |
| B2 | | | 140 | | Owens-Brockway Glass Containers,
Sr. Sec’d. Notes,
8.75%, 11/15/12 | | | 155,750 |
| | | | | | | |
|
|
| | | | | | | | | 798,750 |
|
| Paper 0.3% |
| Ba3 | | | 150 | | Abitibi-Consolidated Co., (Canada) Notes,
5.25%, 6/20/08 | | | 146,250 |
See Notes to Financial Statements.
| | |
| 36 | | Visit our website at www.strategicpartners.com |
| | | | | | | | |
Moody’s
Rating | | Principal
Amount (000)# | | Description | | Value (Note 1) |
| | | | | | | | | |
| | | | | | Ainsworth Lumber Co. Ltd.,
Sr. Notes, (Canada) | | | |
| B2 | | $ | 25 | | 7.25%, 10/1/12 | | $ | 25,000 |
| B2 | | | 25 | | 6.75%, 3/15/14 | | | 24,219 |
| Ba3 | | | 75 | | Bowater Canada Finance, Gtd. Notes,
7.95%, 11/15/11 | | | 80,352 |
| Caa1 | | | 50 | | Caraustar Industries, Inc., Gtd. Notes,
9.875%, 4/1/11 | | | 54,875 |
| Ba1 | | | 70 | | Cascades, Inc., Sr. Notes,
7.25%, 2/15/13 | | | 73,150 |
| B2 | | | 100 | | Cellu Tissue Holdings, Inc., Sec’d. Notes,
9.75%, 3/15/10 | | | 105,250 |
| | | | | | Georgia-Pacific Corp., Sr. Notes, | | | |
| Ba3 | | | 100 | | 7.50%, 5/15/06 | | | 104,125 |
| Ba3 | | | 45 | | 8.125%, 5/15/11 | | | 51,750 |
| Ba3 | | | 80 | | 8.875%, 5/15/31 | | | 102,000 |
| B2 | | | 100 | | Millar Western Forest, Inc., Sr. Notes,
7.75%, 11/15/13 | | | 104,500 |
| B2 | | | 25 | | Smurfit-Stone Container, Sr. Notes
8.375%, 7/1/12 | | | 26,500 |
| | | | | | Tembec Industries, Inc., Gtd. Notes, | | | |
| Ba3 | | | 25 | | 8.625%, 6/30/09 | | | 24,844 |
| Ba3 | | | 90 | | 7.75%, 3/15/12 | | | 85,500 |
| | | | | | | |
|
|
| | | | | | | | | 1,008,315 |
|
| Pipelines & Other 0.4% |
| B2 | | | 75 | | AmeriGas Partners, L.P., Sr. Notes,
8.875%, 5/20/11 | | | 81,000 |
| | | | | | El Paso Corp., Sr. Notes, | | | |
| Caa1 | | | 55 | | 7.00%, 5/15/11 | | | 55,275 |
| Caa1 | | | 250 | | 7.80%, 8/1/31 M.T.N. | | | 242,500 |
| B3 | | | 275 | | EL Paso Production Holding Co.,
Gtd. Notes,
7.75%, 6/1/13 | | | 286,000 |
| Baa3 | | | 50 | | Enterprise Products Operating LP,
Sr. Notes,
5.60%, 10/15/14 | | | 51,235 |
| B2 | | | 50 | | Ferrellgas Partners L.P., Sr. Notes,
8.75%, 6/15/12 | | | 53,500 |
| B1 | | | 50 | | Inergy LP, Sr. Notes,
6.875%, 12/15/14 | | | 49,750 |
See Notes to Financial Statements.
| | |
| Strategic Partners Asset Allocation Funds/Strategic Partners Moderate Growth Fund | | 37 |
Portfolio of Investments
as of January 31, 2005 (Unaudited) Cont’d.
| | | | | | | | |
Moody’s
Rating | | Principal
Amount (000)# | | Description | | Value (Note 1) |
| | | | | | | | | |
| B1 | | $ | 25 | | MarkWest Energy Partners L.P., Sr. Notes,
6.875%, 11/1/14 | | $ | 25,125 |
| Ba2 | | | 75 | | Pacific Energy Partners L.P., Sr. Notes,
7.125%, 6/15/14 | | | 79,125 |
| B1 | | | 50 | | Southern Natural Gas Inc., Notes,
8.875%, 3/15/10 | | | 55,625 |
| | | | | | Tennessee Gas Pipeline Co., Debs., | | | |
| B1 | | | 105 | | 7.00%, 3/15/27 | | | 109,632 |
| B1 | | | 55 | | 7.00%, 10/15/28 | | | 50,500 |
| B1 | | | 155 | | 7.625%, 4/1/37 | | | 164,300 |
| B3 | | | 55 | | TransMontaigne, Inc., Sr. Sub. Notes,
9.125%, 6/1/10 | | | 59,125 |
| | | | | | Williams Companies., Inc., Sr. Notes, | | | |
| B3 | | | 175 | | 7.125%, 9/1/11 | | | 190,313 |
| B3 | | | 95 | | 8.13%, 3/15/12 | | | 109,250 |
| | | | | | | |
|
|
| | | | | | | | | 1,662,255 |
|
| Retailers 0.3% |
| B3 | | | 50 | | Asbury Automotive Group, Inc.,
Sr. Sub. Notes,
8.00%, 3/15/14 | | | 50,125 |
| Ba2 | | | 25 | | AutoNation, Inc., Sr. Notes,
9.00%, 8/1/08 | | | 28,125 |
| B1 | | | 100 | | Group 1 Automotive, Inc., Sr. Sub. Notes,
8.25%, 8/15/13 | | | 105,000 |
| Ba2 | | | 25 | | J.C. Penney Co., Inc.,
Debs.,
7.65%, 8/15/16 | | | 28,563 |
| Ba2 | | | 260 | | 7.40%, 4/1/37 | | | 284,699 |
| Ba2 | | | 25 | | Notes,
6.875%, 10/15/15 | | | 27,125 |
| B3 | | | 90 | | Jean Coutu Group, Inc., Sr. Sub. Notes,
8.50%, 8/1/14 | | | 89,775 |
| B3 | | | 170 | | Lazydays RV Center, Inc., Sr. Notes,
11.75%, 5/15/12 | | | 187,850 |
| B3 | | | 50 | | Pantry, Inc., (Canada) Sr. Sub. Notes,
7.75%, 2/15/14 | | | 52,500 |
| Ba3 | | | 125 | | Saks, Inc., Notes,
7.375%, 2/15/19 | | | 124,688 |
| Ba2 | | | 50 | | Toys R US, Inc.,
7.875%, 4/15/13 | | | 51,375 |
| | | | | | | |
|
|
| | | | | | | | | 1,029,825 |
See Notes to Financial Statements.
| | |
| 38 | | Visit our website at www.strategicpartners.com |
| | | | | | | | |
Moody’s
Rating | | Principal
Amount (000)# | | Description | | Value (Note 1) |
| | | | | | | | | |
|
| Technology 0.3% |
| B2 | | $ | 140 | | Fairchild Semiconductor International, Inc., Gtd. Notes,
10.50%, 2/1/09 | | $ | 147,349 |
| Ba2 | | | 50 | | Flextronics Internationall, Ltd.,
Sr. Sub Notes,
6.25%, 11/15/14 | | | 49,000 |
| Ba2 | | | 50 | | Freescale Semiconductor, Inc. Sr. Notes,
6.875%, 7/15/11 | | | 53,125 |
| B3 | | | 75 | | Iron Mountain, Inc., Sr. Sub. Notes,
8.625%, 4/1/13 | | | 79,313 |
| B3 | | | 25 | | Nortel Networks, Corp., Notes,
6.125%, 2/15/06 | | | 25,344 |
| Ba2 | | | 115 | | Sanmina-SCI Corp., Sr. Sec’d Notes,
10.375%, 1/15/10 | | | 130,525 |
| Ba2 | | | 125 | | Seagate Technology HDD Holdings,
Gtd. Notes,
8.00%, 5/15/09 | | | 134,375 |
| Ba2 | | | 100 | | Stats Chippac, Ltd., Sr. Notes,
6.75%, 11/15/11 | | | 97,500 |
| B3 | | | 100 | | UGS Corp., Sr. Sub. Notes,
10.00%, 6/1/12 | | | 111,500 |
| Ba1 | | | 100 | | Unisys Corp., Sr. Notes,
8.125%, 6/1/06 | | | 104,500 |
| Ba2 | | | 125 | | Xerox Corp., Sr. Notes,
7.625%, 6/15/13 | | | 134,688 |
| | | | | | | |
|
|
| | | | | | | | | 1,067,219 |
|
| Telecommunications 0.9% |
| Caa1 | | | 100 | | Alamosa Delaware, Inc.,
Gtd. Notes,
11.00%, 7/31/10 | | | 116,500 |
| Caa1 | | | 125 | | Sr. Notes,
8.50%, 1/31/12 | | | 133,125 |
| Ba1 | | | 181 | | AT&T Corp., Sr. Notes,
9.05%, 11/15/11 | | | 209,959 |
| Caa1 | | | 125 | | Centennial Communications Corp.,
Sr. Notes,
8.125%, 2/1/14 | | | 132,188 |
| B3 | | | 50 | | Cinncinati Bell, Inc., Sr. Notes,
8.375%, 1/15/14 | | | 50,750 |
See Notes to Financial Statements.
| | |
| Strategic Partners Asset Allocation Funds/Strategic Partners Moderate Growth Fund | | 39 |
Portfolio of Investments
as of January 31, 2005 (Unaudited) Cont’d.
| | | | | | | | |
Moody’s
Rating | | Principal
Amount (000)# | | Description | | Value (Note 1) |
| | | | | | | | | |
| Ba3 | | $ | 55 | | Citizens Communications Co.,
Notes,
9.25%, 5/15/11 | | $ | 64,213 |
| Ba3 | | | 85 | | Sr. Notes,
6.25%, 1/15/13 | | | 84,788 |
| B3 | | | 100 | | Crown Castle International Corp.,
Sr. Notes,
9.375%, 8/1/11 | | | 111,000 |
| B3 | | | 50 | | 7.50%, 12/1/13 | | | 53,063 |
| | | | | | Series B | | | |
| B3 | | | 25 | | 7.50%, 12/1/13 | | | 26,531 |
| B2 | | | 25 | | Dobson Cellular Systems,
7.50%, 11/1/11(f), F.R.N. | | | 26,313 |
| B1 | | | 55 | | Eircom Funding (Ireland), Sr. Notes,
8.25%, 8/15/13 | | | 60,088 |
| | | | | | MCI, Inc., Sr. Notes, | | | |
| B2 | | | 70 | | 6.91%, 5/1/07 | | | 71,575 |
| B2 | | | 101 | | 7.69%, 5/1/09 | | | 105,419 |
| B2 | | | 42 | | 8.74%, 5/1/14 | | | 45,938 |
| Ba3 | | | 250 | | Nextel Communications Inc., Sr. Notes,
7.375%, 8/1/15 | | | 275,624 |
| Caa2 | | | 100 | | Qwest Capital Funding, Inc., Gtd. Notes,
7.25%, 2/15/11 | | | 96,000 |
| Ba3 | | | 225 | | Qwest Corp., Sr. Notes,
7.875%, 9/1/11 | | | 240,749 |
| Caa1 | | | 236 | | Qwest Services Corp., Notes,
14.00%, 12/15/10 | | | 280,249 |
| Ba3 | | | 65 | | Rogers Wireless Communications, Inc. (Canada), Sec’d. Notes,
9.625%, 5/1/11 | | | 76,700 |
| Ba3 | | | 25 | | 8.00%, 12/15/12 | | | 26,750 |
| Ba3 | | | 25 | | 7.50%, 3/15/15 | | | 26,813 |
| A2 | | | 600 | | SBC Communications, Inc., Notes,
4.21%, 6/5/21 | | | 602,549 |
| B2 | | | 25 | | U.S. Unwired, Inc., Series B, Sec’d. Notes,
6.74%, 6/15/10(f), F.R.N. | | | 25,813 |
| Caa1 | | | 75 | | UbiquiTel Operating Co., Sr. Notes,
9.875%, 3/1/11 | | | 82,688 |
| A3 | | | 200 | | Verizon Wireless Capital LLC, Notes,
2.41%, 5/23/05(f), F.R.N. | | | 199,962 |
| | | | | | | |
|
|
| | | | | | | | | 3,225,347 |
See Notes to Financial Statements.
| | |
| 40 | | Visit our website at www.strategicpartners.com |
| | | | | | | | |
Moody’s
Rating | | Principal
Amount (000)# | | Description | | Value (Note 1) |
| | | | | | | | | |
|
| Tobacco |
| B1 | | $ | 50 | | DIMON, Inc., Sr. Notes,
9.625%, 10/15/11 | | $ | 56,000 |
| B2 | | | 10 | | North Atlantic Trading Co., Sr. Notes,
9.25%, 3/1/12 | | | 7,850 |
| Ba3 | | | 125 | | Standard Commercial Corp., Sr. Notes,
8.00%, 4/15/12 | | | 128,438 |
| | | | | | | |
|
|
| | | | | | | | | 192,288 |
| | | | | | | |
|
|
| | | | | | Total corporate bonds
(cost $32,381,855) | | | 33,890,409 |
| | | | | | | |
|
|
|
| CONVERTIBLE BONDS |
|
| Capital Goods |
| Baa3 | | | 50 | | Tyco International Group SA (Luxembourg), Gtd. Notes,
3.125%, 1/15/23 | | | 84,563 |
|
| Technology |
| B3 | | | 40 | | Nortel Networks Corp. (Canada),
Sr. Notes,
4.25%, 9/1/08 | | | 38,550 |
| | | | | | | |
|
|
| | | | | | Total convertible bonds
(cost $82,329) | | | 123,113 |
| | | | | | | |
|
|
|
| FOREIGN GOVERNMENT SECURITIES 2.2% |
| B2 | | | 70 | | Brazilian Government Bonds,
10.00%, 8/7/11(d) | | | 79,800 |
| B2 | | | 350 | | 11.00%, 1/11/12(d) | | | 418,251 |
| B2 | | | 60 | | 8.25%, 1/20/34 | | | 56,250 |
| B2 | | | 450 | | 11.00%, 8/17/40(d) | | | 520,875 |
| Ba2 | | | 75 | | Colombia Government Bonds,
10.00%, 1/23/12 | | | 84,450 |
| Aaa | | | EUR100 | | German Government Bonds,
3.75%, 1/4/09(d) | | | 134,901 |
| Aaa | | | 500 | | 4.00%, 7/4/09(d) | | | 681,493 |
| Aaa | | | 250 | | 4.50%, 1/4/13(d) | | | 351,750 |
| Aaa | | | 600 | | 6.50%, 7/4/27(d) | | | 1,071,450 |
| Aa2 | | | JPY54,000 | | Italy Government Bonds,
3.80%, 3/27/08(d) | | | 579,743 |
See Notes to Financial Statements.
| | |
| Strategic Partners Asset Allocation Funds/Strategic Partners Moderate Growth Fund | | 41 |
Portfolio of Investments
as of January 31, 2005 (Unaudited) Cont’d.
| | | | | | | | |
Moody’s
Rating | | Principal
Amount (000)# | | Description | | Value (Note 1) |
| | | | | | | | | |
| Baa2 | | $ | 275 | | Mexico Government Bonds, M.T.N.,
5.875%, 1/15/14(d) | | $ | 284,625 |
| Ba1 | | | 200 | | Panamanian Government Bonds,
9.625%, 2/8/11(d) | | | 235,000 |
| Baa3 | | | 1,550 | | Russian Government Bonds,
5.00%, 3/31/30(d) | | | 1,627,190 |
| Aaa | | | GBP 500 | | United Kingdom Treasury Bonds,
5.75%, 12/7/09(d) | | | 991,711 |
| Aaa | | | GBP 900 | | 5.00%, 9/7/14(d) | | | 1,749,092 |
| | | | | | | |
|
|
| | | | | | Total foreign government securities
(cost $8,378,021) | | | 8,866,581 |
| | | | | | | |
|
|
|
| MUNICIPAL BONDS 0.9% |
| Aa2 | | | 400 | | Florida State Board of Education,
5.00%, 6/1/32(d) | | | 417,408 |
| Aaa | | | 200 | | Georgia State Thruway Authority Rev.,
5.00%, 3/1/21(d) | | | 214,254 |
| Baa2 | | | 250 | | Golden State Tobacco Settlement Rev.,
Ser. 2003-A-1,
6.25%, 6/1/33(d) | | | 251,270 |
| Aaa | | | 250 | | Massachusetts St Wtr. Res. Auth., Ser. J,
5.00%, 8/1/32(d) | | | 260,135 |
| Aa2 | | | 500 | | Salt River Project, Ser. B,
4.75%, 1/1/32(d) | | | 508,565 |
| Aaa | | | 400 | | San Antonio Texas Water Rev.,
5.00%, 5/15/25(d) | | | 419,876 |
| Aaa | | | 200 | | South Carolina St. Hwy, Ser. B,
5.00%, 4/1/17(d) | | | 217,060 |
| Aaa | | | 600 | | South Central Connecticut Regional Water Authority,
5.00%, 8/1/26(d) | | | 639,198 |
| Baa3 | | | 250 | | Tobacco Settlement Financing Corp., New Jersey,
6.375%, 6/1/32 | | | 249,498 |
| Baa3 | | | 300 | | 6.00%, 6/1/37 | | | 285,249 |
| | | | | | | |
|
|
| | | | | | Total municipal bonds
(cost $3,274,866) | | | 3,462,513 |
| | | | | | | |
|
|
See Notes to Financial Statements.
| | |
| 42 | | Visit our website at www.strategicpartners.com |
| | | | | | | | |
Moody’s
Rating | | Principal
Amount (000)# | | Description | | Value (Note 1) |
| | | | | | | | | |
| U.S. GOVERNMENT AND AGENCY SECURITIES 9.3% |
| | | $ | 94 | | Federal Home Loan Mortgage Corp.,
Ser. 119, Class H,
7.50%, 1/15/21(d) | | $ | 93,986 |
| | | | 17 | | Ser. 2266, Class F,
2.93%, 11/15/30, F.R.N. (d)(f), | | | 16,778 |
| | | | 821 | | Ser. 2535, Class DT,
6.00%, 8/1/06 - 9/1/22(d) | | | 856,943 |
| | | | | | Federal National Mortgage Association, | | | |
| | | | 386 | | 5.936%, 11/1/11(d) | | | 416,503 |
| | | | 507 | | 5.50%, 7/1/14(d) | | | 524,378 |
| | | | 85 | | 6.00%, 3/1/17(d) | | | 88,904 |
| | | | 163 | | 5.00%, 2/1/19TBA | | | 166,089 |
| | | | 28 | | 2.93%, 10/18/30, F.R.N. (d)(f) | | | 28,041 |
| | | | 485 | | 6.50%, 3/1/33(d) | | | 507,102 |
| | | | 811 | | 4.50%, 8/1/33(d) | | | 792,961 |
| | | | 241 | | 5.06%, 9/1/34, F.R.N. (d)(f) | | | 242,276 |
| | | | 149 | | 4.16%, 5/1/36, F.R.N. (d)(f) | | | 152,132 |
| | | | 718 | | 6.30%, 10/17/38(d) | | | 757,209 |
| | | | | | Government National Mortgage Association, | | | |
| | | | 14 | | 3.75%, 9/20/22 F.R.N. (d)( f) | | | 14,461 |
| | | | 25 | | 4.63%, 10/20/27 F.R.N. (d)( f) | | | 25,541 |
| | | | 42 | | 4.00%, 11/20/29 F.R.N. (d)(f) | | | 42,594 |
| | | | 69 | | 2.98%, 2/16/30 F.R.N. (d)(f) | | | 69,721 |
| | | | 25 | | 8.50%, 5/20/30 - 4/20/31(d) | | | 27,028 |
| | | | 196 | | 5.50%, 1/15/32(d) | | | 201,215 |
| | | | 77 | | 4.50%, 8/15/33(d) | | | 76,286 |
| | | | | | United States Inflation Index Bonds, | | | |
| | | | 2,411 | | 3.375%, 1/15/07(d) | | | 2,528,578 |
| | | | 1,064 | | 3.625%, 1/15/08(d) | | | 1,146,560 |
| | | | 3,187 | | 3.00%, 7/15/12(d) | | | 3,541,840 |
| | | | 1,344 | | 2.00%, 1/15/14(d) | | | 1,390,239 |
| | | | | | United States Treasury Notes, | | | |
| | | | 5,800 | | 5.00%, 2/15/11 - 8/15/11(d) | | | 6,169,698 |
| | | | 9,400 | | 4.88%, 2/15/12(d) | | | 9,940,867 |
| | | | 1,300 | | 4.00%, 2/15/14(d) | | | 1,289,538 |
| | | | 1,100 | | 8.875%, 8/15/17(d) | | | 1,575,750 |
| | | | 4,100 | | 6.00%, 2/15/26(d) | | | 4,830,313 |
| | | | 1,550 | | United States Treasury Strips, P/O,
11/15/16 - 2/15/22 | | | 731,423 |
| | | | | | | |
|
|
| | | | | | Total U.S. government and agency securities
(cost $38,024,613) | | | 38,244,954 |
| | | | | | | |
|
|
See Notes to Financial Statements.
| | |
| Strategic Partners Asset Allocation Funds/Strategic Partners Moderate Growth Fund | | 43 |
Portfolio of Investments
as of January 31, 2005 (Unaudited) Cont’d.
| | | | | | | |
Moody’s
Rating | | Units | | Description | | Value (Note 1) |
| | | | | | | | |
|
| WARRANTS(a) |
| | | | | GenTek, Inc. | | | |
| | | 333 | | Class B, expires 10/31/08 | | $ | 799 |
| | | 162 | | Class C, expires 10/31/10 | | | 285 |
| | | 1,525 | | McLeod USA, Inc., expires 4/16/07 | | | 214 |
| | | | | | |
|
|
| | | | | Total warrants
(cost $0) | | | 1,298 |
| | | | | | |
|
|
| | | | | Total long-term investments
(cost $288,525,863) | | | 336,937,097 |
| | | | | | |
|
|
| | | |
| | | Principal
Amount (000)#
| | | | |
| |
| SHORT-TERM INVESTMENT 14.3% | | | |
| |
| Commercial Paper 10.4% | | | |
| | | | | Anz (Delaware), Inc., | | | |
| P-1 | | 1,400 | | 2.38%, 2/22/05(d) | | | 1,398,127 |
| P-1 | | 1,500 | | 2.42%, 3/16/05(d) | | | 1,495,802 |
| | | | | ASB Bank Ltd., | | | |
| P-1 | | 600 | | 2.04%, 2/14/05(c)(d) | | | 599,464 |
| P-1 | | 2,100 | | 2.42%, 4/7/05(d) | | | 2,090,286 |
| | | | | Bank of Ireland, | | | |
| | | 2,700 | | 2.53%, 4/11/05(d) | | | 2,686,526 |
| | | | | Barclays US Funding Corp., | | | |
| P-1 | | 300 | | 2.52%, 4/5/05(d) | | | 298,656 |
| P-1 | | 2,700 | | 2.53%, 5/3/05(d) | | | 2,682,733 |
| | | | | CBA Finance, Inc., | | | |
| P-1 | | 300 | | 2.53%, 4/11/05(d) | | | 298,521 |
| | | | | CDC Corp., | | | |
| P-1 | | 1,600 | | 2.10%, 2/23/05(c)(d) | | | 1,597,726 |
| | | | | Danske Corp., | | | |
| P-1 | | 1,000 | | 2.04%, 2/14/05(c)(d) | | | 999,107 |
| P-1 | | 1,100 | | 2.44%, 3/23/05(d) | | | 1,096,294 |
| P-1 | | 800 | | 2.375%, 4/1/05(d) | | | 796,632 |
| P-1 | | 100 | | 2.50%, 4/7/05(d) | | | 99,537 |
| | | | | DBN Bank ASA, | | | |
| P-1 | | 2,700 | | 2.41%, 2/23/05(d) | | | 2,696,031 |
| P-1 | | 300 | | 2.66%, 4/25/05(d) | | | 298,177 |
| | | | | Dexia Delaware, LLC, | | | |
| P-1 | | 800 | | 2.36%, 3/3/05(d) | | | 798,427 |
| | | | | European Investment Bank, | | | |
| P-1 | | 800 | | 2.27%, 2/1/05(d) | | | 800,000 |
See Notes to Financial Statements.
| | |
| 44 | | Visit our website at www.strategicpartners.com |
| | | | | | | |
Moody’s
Rating | | Principal
Amount (000)# | | Description | | Value (Note 1) |
| | | | | Ford Motor Credit Co., | | | |
| P-1 | | 300 | | 2.52%, 4/7/05(c)(d) | | $ | 298,443 |
| | | | | General Electric Capital Corp., | | | |
| P-1 | | 500 | | 2.04%, 2/4/05(c)(d) | | | 499,876 |
| P-1 | | 700 | | 2.28%, 2/23/05(d) | | | 699,005 |
| P-1 | | 300 | | 2.32%, 2/24/05(d) | | | 299,547 |
| P-1 | | 600 | | 2.54%, 4/12/05(d) | | | 596,994 |
| | | | | General Motors Acceptance Corp., | | | |
| P-1 | | 100 | | 2.36%, 3/21/05(c)(d) | | | 99,685 |
| P-1 | | 550 | | 2.50%, 4/5/05(c)(d) | | | 547,624 |
| | | | | ING US Funding LLC, | | | |
| P-1 | | 1,000 | | 2.45%, 3/21/05(d) | | | 996,682 |
| P-1 | | 2,000 | | 2.40%, 4/5/05(d) | | | 1,991,040 |
| | | | | IXIS, | | | |
| P-1 | | 1,400 | | 2.56%, 4/22/05(d) | | | 1,391,908 |
| | | | | Nestle Capital Co., | | | |
| P-1 | | 2,500 | | 2.22%, 2/15/05(d) | | | 2,497,596 |
| | | | | Noreda North America Inc., | | | |
| P-1 | | 500 | | 1.97%, 2/1/05(c)(d) | | | 499,969 |
| | | | | Skandi Ensk, | | | |
| P-1 | | 2,500 | | 2.12%, 2/4/05(d) | | | 2,499,374 |
| | | | | Swedbank, (Switzerland), | | | |
| P-1 | | 1,600 | | 2.44%, 3/10/05(d) | | | 1,595,988 |
| P-1 | | 1,400 | | 2.45%, 3/28/05(d) | | | 1,394,551 |
| | | | | UBS Finance (Delaware) LLC, | | | |
| P-1 | | 100 | | 2.03%, 2/22/05(c)(d) | | | 99,866 |
| P-1 | | 1,000 | | 2.37%, 3/10/05(d) | | | 997,620 |
| | | 1,900 | | 2.51%, 4/27/05(d) | | | 1,888,277 |
| | | | | Westpac Capital Corp., | | | |
| P-1 | | 1,600 | | 2.40%, 3/10/05(d) | | | 1,596,193 |
| | | | | | |
|
|
| | | | | Total commercial paper
(cost $41,225,765) | | | 41,222,284 |
| | | | | | |
|
|
| |
| U.S. Government And Agency Securities 0.6% | | | |
| | | | | United States Treasury Bill, | | | |
| | | 400 | | 2.145%, 3/17/05(d) | | | 398,964 |
| | | 600 | | 2.13%, 5/5/05(d) | | | 596,189 |
| | | | | | |
|
|
| | | | | Total U.S. government and agency securities
(cost $995,626) | | | 995,153 |
| | | | | | |
|
|
See Notes to Financial Statements.
| | |
| Strategic Partners Asset Allocation Funds/Strategic Partners Moderate Growth Fund | | 45 |
Portfolio of Investments
as of January 31, 2005 (Unaudited) Cont’d.
| | | | | | | | |
Moody’s
Rating | | Shares | | Description | | Value (Note 1) | |
| |
| Mutual Fund 3.3% | | | | |
| | | 13,180,716 | | Dryden Core Investment Fund — Taxable Money Market Series (cost $13,180,716; Note 3) | | $ | 13,180,716 | |
| | | | | | |
|
|
|
| | | | | Total short-term investment
(cost $55,402,107) | | | 55,398,153 | |
| | | | | | |
|
|
|
| | | |
| | | Contracts/
Notional
Amount (000)#
| | | | | |
| OUTSTANDING OPTIONS PURCHASED | |
|
| Call Options | |
| | | 38 | | United States Treasury Notes, expiring 2/18/05 @ 115 | | | 30,875 | |
| | | | | | |
|
|
|
|
| Put Options | |
| | | 20 | | Euro Futures, expiring 9/19/05 @ 93.75 | | | 125 | |
| | | | | | |
|
|
|
| SWAP OPTIONS | |
|
| Call Options | |
| | | 600 | | Swap Option 3 Month LIBOR, expiring 4/27/09 @ 5.75% | | | 69,227 | |
| | | | | | |
|
|
|
|
| Put Options | |
| | | 600 | | Swap Option 3 Month LIBOR, expiring 4/27/09 @ 6.25% | | | 21,797 | |
| | | | | | |
|
|
|
| | | | | | | | 91,024 | |
| | | | | | |
|
|
|
| | | | | Total outstanding options purchased (cost $101,509) | | | 122,024 | |
| | | | | | |
|
|
|
| | | | | Total Investments, Before Outstanding Options Written and Securities Sold Short — 99.2% (cost $344,029,479) | | | 392,457,274 | |
| | | | | | |
|
|
|
| OUTSTANDING OPTIONS WRITTEN | |
|
| Call Options | |
| | | 18 | | United States Treasury Notes, expiring 2/18/05 @ 113 | | | (4,219 | ) |
| | | 85 | | United States Treasury Notes, expiring 2/18/05 @ 114 | | | (3,984 | ) |
| | | 11 | | United States Treasury Notes, expiring 5/20/05 @ 114 | | | (3,610 | ) |
| | | | | | |
|
|
|
| | | | | | | | (11,813 | ) |
| | | | | | |
|
|
|
See Notes to Financial Statements.
| | |
| 46 | | Visit our website at www.strategicpartners.com |
| | | | | | | | |
| | | Contracts/
Notional
Amount (000)# | | Description | | Value (Note 1) | |
|
| Put Options | |
| | | 5 | | 90-day GBP, Expiring 12/21/05 @ 94.25 | | $ | (295 | ) |
| | | 20 | | United States Treasury Notes,
expiring 5/20/05 @ 108 | | | (8,125 | ) |
| | | 60 | | United States Treasury Notes,
expiring 2/18/05 @ 108 | | | (937 | ) |
| | | | | | |
|
|
|
| | | | | | | | (9,357 | ) |
| | | | | | |
|
|
|
| SWAP OPTIONS | |
|
| Call Options | |
| | | 1,700 | | Swap Option 3 Month LIBOR,
expiring 7/03/06 @ 4.0% | | | (17,173 | ) |
| | | 5,900 | | Swap Option 3 Month LIBOR,
expiring, 9/23/05 @ 4.0% | | | (37,182 | ) |
| | | | | | |
|
|
|
| | | | | | | | (54,355 | ) |
| | | | | | |
|
|
|
|
| Put Options | |
| | | 1,700 | | Swap Option 3 Month LIBOR,
expiring 7/03/06 @ 6.0% | | | (9,340 | ) |
| | | 3,300 | | Swap Option 3 Month LIBOR,
expiring, 9/23/05 @ 7.0% | | | (221 | ) |
| | | | | | |
|
|
|
| | | | | | | | (9,561 | ) |
| | | | | | |
|
|
|
| | | | | Total outstanding options written | | | | |
| | | | | (premiums received $307,069) | | | (85,086 | ) |
| | | | | | |
|
|
|
| | | |
| | | Principal
Amount (000)#
| | | | | |
| SECURITIES SOLD SHORT (0.9)% | | | | |
| | | | | Federal National Mortgage Association, | | | | |
| | | 500 | | 6.50%, 2/25/35 | | | (523,125 | ) |
| | | | | | |
|
|
|
| | | | | United States Treasury Notes, | | | | |
| | | 3,000 | | 4.875%, 2/15/12 | | | (3,172,617 | ) |
| | | | | | |
|
|
|
| | | | | Total securities sold short (proceeds $3,745,504) | | | (3,695,742 | ) |
| | | | | | |
|
|
|
| | | | | Total Investments, net of outstanding options written and securities sold short 98.3% (cost $339,976,906;
Note 5) | | | 388,676,446 | |
| | | | | Other assets in excess of other liabilities(g) 1.7% | | | 6,863,932 | |
| | | | | | |
|
|
|
| | | | | Net Assets 100% | | $ | 395,540,378 | |
| | | | | | |
|
|
|
See Notes to Financial Statements.
| | |
| Strategic Partners Asset Allocation Funds/Strategic Partners Moderate Growth Fund | | 47 |
Portfolio of Investments
as of January 31, 2005 (Unaudited) Cont’d.
ADR- American Depository Receipt.
BRB- Brady Bond.
EUR- Euro Dollar
F.R.N.- Floating Rate Note
GBP- Great British Pounds.
JPY- Japanese Yen
M.T.N—Medium Term Note
NR—Not Rated by Moody’s or Standard & Poor’s
P/O—Principal Only Securities
TBA—To Be Announced Securities. Such securities are purchased on a forward commitment basis.
# Principal Amount is in U.S. Dollars unless otherwise indicated.
The Fund’s current Prospectus contains a description of Moody’s and Standard & Poor’s ratings.
| (a) | Non-income producing security. |
| (b) | Represents issuer in default on interest payments, non-income producing security. |
| (c) | Percentage quoted represents yield-to-maturity as of purchase date. |
| (d) | Securities with an aggregate market value of $91,218,526 have been segregated with the custodian to cover margin requirements for open futures contracts. |
| (f) | Rate shown reflects current rate on variable rate instrument. |
| (g) | Includes net unrealized depreciation on futures, foreign currency contracts and swaps of $411,478. |
Open futures contracts outstanding at January 31, 2005:
| | | | | | | | | | | | | | |
Number of
Contracts
| | Type
| | Expiration
Date
| | Value at
January 31,
2005
| | Value at
Trade Date
| | Unrealized
Appreciation
(Depreciation)
| |
| Long Positions | | | | | | | | | | | | | | |
| 128 | | 10yr US T-Note | | Mar. 2005 | | $ | 14,370,000 | | $ | 14,136,000 | | $ | 234,000 | |
| 118 | | 90 Day Euro | | Dec. 2005 | | | 28,409,975 | | | 28,382,425 | | | 27,550 | |
| 68 | | 90 Day Euro | | Sept. 2005 | | | 16,403,300 | | | 16,439,300 | | | (36,000 | ) |
| 42 | | Euro-BOBL | | Mar. 2005 | | | 6,213,474 | | | 6,193,784 | | | 19,690 | |
| 22 | | 90 Day Euro | | Mar. 2006 | | | 5,289,350 | | | 5,287,425 | | | 1,925 | |
| 21 | | US T-Long Bond | | Mar. 2005 | | | 2,411,719 | | | 2,365,125 | | | 46,594 | |
| 15 | | 90 Day GBP LIBOR | | Dec. 2005 | | | 3,364,918 | | | 3,362,847 | | | 2,071 | |
| 3 | | 90 Day GBP LIBOR | | Mar. 2005 | | | 672,842 | | | 680,020 | | | (7,178 | ) |
| | | | | | | | | | | | |
|
|
|
| | | | | | | | | | | | | $ | 288,652 | |
| | | | | | | | | | | | |
|
|
|
| Short Positions | | | | | | | | | | | | | | |
| 73 | | 5yr US T-Note | | Mar. 2005 | | | 7,975,250 | | | 8,005,570 | | $ | (30,320 | ) |
| | | | | | | | | | | | |
|
|
|
See Notes to Financial Statements.
| | |
| 48 | | Visit our website at www.strategicpartners.com |
Foreign currency exchange contracts outstanding at January 31, 2005:
| | | | | | | | | | | | |
Purchase Contracts
| | Notional
Amount
| | Value at Settlement
Date Payable
| | Current
Value
| | Unrealized
Appreciation
(Depreciation)
| |
Euros,
Expiring 2/10/05 | | 47,000 | | $ | 60,969 | | $ | 61,267 | | $ | 298 | |
Japanese Yen
Expiring 3/10/05 | | 51,063,000 | | | 497,104 | | | 493,577 | | | (3,527 | ) |
Pound Sterling,
Expiring 2/01/05 | | 15,559 | | | 29,254 | | | 29,346 | | | 92 | |
| | | | |
|
| |
|
| |
|
|
|
| | | | | $ | 587,327 | | $ | 584,190 | | $ | (3,137 | ) |
| | | | |
|
| |
|
| |
|
|
|
| | | | |
Sale Contracts
| | Notional
Amount
| | Value at Settlement
Date Receivable
| | Current
Value
| | Unrealized
Appreciation
(Depreciation)
| |
Euros,
Expiring 2/10/05 | | 892,000 | | $ | 1,180,835 | | $ | 1,162,767 | | $ | 18,068 | |
Pound Sterling,
Expiring 2/01/05 | | 137,910 | | | 258,872 | | | 260,113 | | | (1,241 | ) |
| | | | |
|
| |
|
| |
|
|
|
| | | | | $ | 1,439,707 | | $ | 1,422,880 | | $ | 16,827 | |
| | | | |
|
| |
|
| |
|
|
|
See Notes to Financial Statements.
| | |
| Strategic Partners Asset Allocation Funds/Strategic Partners Moderate Growth Fund | | 49 |
Portfolio of Investments
as of January 31, 2005 (Unaudited) Cont’d.
Interest swap agreements outstanding at January 31, 2005:
The Fund entered into interest rate swap agreements during the six months ended January 31, 2005. Details of the swap agreements outstanding as of January 31, 2005 were as follows:
| | | | | | | | | | | | | |
Counterparty
| | Termination
Date
| | Notional
Amount (000)
| | Fixed
Rate
| | | Floating Rate
| | Unrealized
Appreciation
(Depreciation)
| |
| Lehman Brothers Inc.(a) | | 6/15/2005 | | USD 5,000 | | 5.00 | % | | 3 month LIBOR | | $ | (40,163 | ) |
| Goldman Sachs(a) | | 6/15/2015 | | USD 4,400 | | 5.00 | % | | 3 month LIBOR | | | (82,441 | ) |
| Greenwich Capital(b) | | 6/15/2010 | | USD 1,200 | | 4.00 | % | | 3 Month LIBOR | | | 6,716 | |
| Merrill Lynch & Co.(b) | | 6/15/2010 | | USD 400 | | 4.00 | % | | 3 month LIBOR | | | 235 | |
| UBS Warburg LLC(a) | | 6/18/2034 | | GBP 300 | | 5.00 | % | | 6 month LIBOR | | | (9,414 | ) |
| UBS Warburg LLC(b) | | 6/17/2010 | | EUR 600 | | 4.00 | % | | 6 month LIBOR | | | 24,571 | |
| JP Morgan(b) | | 6/17/2010 | | EUR 400 | | 4.00 | % | | 6 month LIBOR | | | 12,285 | |
| UBS Warburg LLC(a) | | 12/15/2014 | | EUR 3,100 | | 5.00 | % | | 6 month LIBOR | | | (388,161 | ) |
| Lehman Brothers Inc.(a) | | 6/15/2025 | | USD 2,400 | | 6.00 | % | | 3 month LIBOR | | | (71,211 | ) |
| Barclay's Capital(a) | | 3/15/2032 | | GBP 900 | | 5.00 | % | | 6 month LIBOR | | | (16,395 | ) |
| JP Morgan(b) | | 3/15/2032 | | EUR 1,100 | | 6.00 | % | | 6 month EBOR | | | 88,828 | |
| Barclay's Capital(a) | | 6/18/2034 | | GBP 200 | | 5.00 | % | | 6 month LIBOR | | | (6,475 | ) |
| JP Morgan(b) | | 6/18/2034 | | EUR 700 | | 6.00 | % | | 6 month LIBOR | | | 85,293 | |
| Bank of America Securities LLC(b) | | 6/15/2010 | | USD 1,700 | | 4.00 | % | | 3 Month LIBOR | | | 844 | |
| Bank of America Securities LLC(b) | | 6/15/2007 | | USD 7,400 | | 4.00 | % | | 3 Month LIBOR | | | (4,049 | ) |
| Goldman Sachs(b) | | 6/15/2010 | | USD 2,700 | | 4.00 | % | | 3 Month LIBOR | | | 1,340 | |
| | | | | | | | | | | |
|
|
|
| | | | | | | | | | | | $ | (398,197 | ) |
| | | | | | | | | | | |
|
|
|
| (a) | Fund pays the fixed rate and receives the floating rate. |
| (b) | Fund pays the floating rate and receives the fixed rate. |
The Fund entered into credit default swap agreements during the six months ended January 31, 2005. Details of the swap agreements outstanding as of January 31, 2005 were as follows:
| | | | | | | | | | | | |
Counterparty
| | Termination
Date
| | Notional
Amount (000)
| | Fixed
Rate
| | Underlying Bond
| | Unrealized
Appreciation
(Depreciation)
| |
| Morgan Stanley & Co. Inc.(a) | | 12/20/2008 | | 200 | | 0.26% | | Allstate
6.125%, 2/15/12 | | $ | (808 | ) |
| Merrill Lynch & Co.(a) | | 12/20/2008 | | 100 | | 0.32% | | Ingersoll
6.48%, 6/1/25 | | | (529 | ) |
| Morgan Stanley & Co. Inc.(a) | | 12/20/2008 | | 100 | | 0.21% | | Emerson
4.625%, 10/15/12 | | | (219 | ) |
| Barclay's Bank PLC(a) | | 12/20/2008 | | 200 | | 0.16% | | Eli Lilly
6.00%, 3/15/12 | | | (274 | ) |
See Notes to Financial Statements.
| | |
| 50 | | Visit our website at www.strategicpartners.com |
| | | | | | | | | | | | |
Counterparty
| | Termination
Date
| | Notional
Amount (000)
| | Fixed
Rate
| | Underlying Bond
| | Unrealized
Appreciation
(Depreciation)
| |
| Bank of America Securities LLC(a) | | 12/20/2008 | | 100 | | 0.13% | | E.I. Dupont
6.875%, 10/15/09 | | $ | (94 | ) |
| Bear Stearns & Co.(a) | | 12/20/2008 | | 100 | | 0.32% | | Hewlett Packard
6.50%, 7/12/12 | | | (450 | ) |
| Lehman Brothers Inc.(a) | | 12/20/2008 | | 100 | | 0.11% | | Johnson
3.80%, 5/15/13 | | | (95 | ) |
| Lehman Brothers Inc.(a) | | 12/20/2008 | | 100 | | 0.12% | | Home Depot 5.375%, 4/01/06 | | | (236 | ) |
| Citigroup Global Partners Inc.(a) | | 12/20/2008 | | 100 | | 0.29% | | Fedex
7.25%, 2/15/11 | | | (444 | ) |
| Lehman Brothers Inc.(a) | | 12/20/2008 | | 100 | | 0.29% | | Whirlpool
8.60%, 5/1/10 | | | (54 | ) |
| Citigroup Global Partners, Inc.(a) | | 12/20/2008 | | 100 | | 0.28% | | Eaton
5.75%, 7/15/12 | | | (556 | ) |
| Citigroup Global Partners Inc.(a) | | 12/20/2008 | | 300 | | 0.14% | | Wal-Mart
6.875%, 8/10/09 | | | (386 | ) |
| UBS Warburg LLC(a) | | 12/20/2008 | | 200 | | 0.35% | | AutoZone
5.875%, 10/15/12 | | | 1,913 | |
| Lehman Brothers Inc.(a) | | 12/20/2008 | | 100 | | 0.30% | | Masco
5.875%, 7/15/12 | | | (277 | ) |
| Lehman Brothers Inc.(a) | | 12/20/2008 | | 100 | | 0.35% | | RadioShack
7.375%, 5/15/11 | | | (456 | ) |
| Barclay's Bank PLC(a) | | 12/20/2008 | | 100 | | 0.67% | | Walt Disney
6.375%, 3/1/12 | | | (1,662 | ) |
| Lehman Brothers Inc.(a) | | 12/20/2008 | | 100 | | 0.48% | | Northrop
7.1425%, 2/15/11 | | | (844 | ) |
| Lehman Brothers Inc.(a) | | 12/20/2008 | | 100 | | 0.53% | | Lockheed
8.20%, 12/1/09 | | | (964 | ) |
| Lehman Brothers, Inc.(a) | | 12/20/2008 | | 100 | | 0.97% | | Goodrich
7.625%, 12/15/12 | | | (2,338 | ) |
| Lehman Brothers Inc.(a) | | 06/20/2009 | | 500 | | 0.40% | | Peoples Republic
of China
6.80% 5/23/11 | | | (3,453 | ) |
| Bear Stearns & Co.(b) | | 06/20/2005 | | 1,700 | | 0.69% | | General Motors
7.125% 7/15/13 | | | 2,627 | |
| Bear Stearns & Co.(a) | | 06/20/2005 | | 1,700 | | 0.55% | | General Motors
Accept. Corp.
6.875% 8/28/12 | | | (1,218 | ) |
| | | | | | | | | | |
|
|
|
| | | | | | | | | | | $ | (10,817 | ) |
| | | | | | | | | | |
|
|
|
| (1) | Fund pays the fixed rate and receives from the counterparty payment in the event that the underlying bond defaults. |
| (2) | Fund pays the counterparty payment in the event that the underlying bond defaults and receives the fixed rate. |
See Notes to Financial Statements.
| | |
| Strategic Partners Asset Allocation Funds/Strategic Partners Moderate Growth Fund | | 51 |
Portfolio of Investments
as of January 31, 2005 (Unaudited)
The industry classification of portfolio holdings and other assets in excess of liabilities shown as a percentage of net assets as of January 31, 2005 were as follows:
| | | |
Commercial Paper | | 10.4 | % |
US Government and Agency Securities | | 9.9 | |
Oil & Gas | | 5.2 | |
Pharmaceuticals | | 3.5 | |
Mutual Fund | | 3.3 | |
Commercial Banks | | 3.2 | |
Health Care Providers & Services | | 3.0 | |
Insurance | | 2.8 | |
Diversified Financial Services | | 2.7 | |
Capital Markets | | 2.2 | |
Foreign Government Securities | | 2.2 | |
Software | | 2.2 | |
Industrial Conglomerates | | 2.1 | |
Wireless Telecommunication Services | | 2.0 | |
Computers & Peripherals | | 1.9 | |
Specialty Retail | | 1.9 | |
Electronic Equipment & Instruments | | 1.7 | |
Energy Equipment & Services | | 1.7 | |
Commercial Services & Supplies | | 1.6 | |
Electric Utilities | | 1.6 | |
Internet Software & Services | | 1.6 | |
Chemicals | | 1.4 | |
Communication Equipment | | 1.3 | |
Media | | 1.3 | |
Biotechnology | | 1.1 | |
Food & Staples Retailing | | 1.1 | |
Food Products | | 1.1 | |
Household Durables | | 1.0 | |
Electric | | 0.9 | |
Hotels, Restaurants & Leisure | | 0.9 | |
Municipal Bonds | | 0.9 | |
Telecommunications | | 0.9 | |
Aerospace & Defense | | 0.8 | |
Automobiles | | 0.8 | |
Diversified Telecommunication Services | | 0.8 | |
Financial Services | | 0.8 | |
Consumer Finance | | 0.7 | |
Health Care Equipment & Supplies | | 0.7 | |
Multiline Retails | | 0.7 | |
Semiconductor & Semiconductor Equipment | | 0.7 | |
Tobacco | | 0.7 | |
Asset Backed Securities | | 0.6 | |
Health Care & Pharmaceutical | | 0.6 | |
Household Products | | 0.6 | |
Internet & Catalog Retail | | 0.6 | |
Media & Entertainment | | 0.6 | |
See Notes to Financial Statements.
| | |
| 52 | | Visit our website at www.strategicpartners.com |
| | | |
Multi-Utilities | | 0.6 | % |
Paper & Forest Products | | 0.6 | |
Capital Goods | | 0.5 | |
Collateralized Mortgage Securities | | 0.5 | |
Personal Products | | 0.5 | |
Beverages | | 0.4 | |
Building Construction | | 0.4 | |
Gaming | | 0.4 | |
Office Electronics | | 0.4 | |
Pipelines & Other | | 0.4 | |
Real Estate Investment Trust | | 0.4 | |
Air Freight & Logistics | | 0.3 | |
Energy-Other | | 0.3 | |
IT Services | | 0.3 | |
Lodging | | 0.3 | |
Machinery | | 0.3 | |
Metals & Mining | | 0.3 | |
Paper | | 0.3 | |
Retail | | 0.3 | |
Retailers | | 0.3 | |
Technology | | 0.3 | |
Transportation | | 0.3 | |
Automotive | | 0.2 | |
Cable | | 0.2 | |
Foods | | 0.2 | |
Internet | | 0.2 | |
Metals | | 0.2 | |
Packaging | | 0.2 | |
Textiles, Apparel & Luxury Goods | | 0.2 | |
Thrifts & Mortgage Finance | | 0.2 | |
Airlines | | 0.1 | |
Banking | | 0.1 | |
Building Materials & Construction | | 0.1 | |
Building Products | | 0.1 | |
Consumer | | 0.1 | |
Distributors | | 0.1 | |
Electrical Equipment | | 0.1 | |
Food & Drug Retailing | | 0.1 | |
Gas Utilities | | 0.1 | |
Automobiles & Parts | | 0.0 | * |
Outstanding Options Purchased | | 0.0 | * |
Outstanding Options Written | | 0.0 | * |
Securities Sold Short | | (0.9 | ) |
| | |
|
|
| | | 98.3 | |
Other assets in excess of liabilities | | 1.7 | |
| | |
|
|
| | | 100.0 | % |
| | |
|
|
| * | Amount represents less than 0.1% of net assets. |
See Notes to Financial Statements.
| | |
| Strategic Partners Asset Allocation Funds/Strategic Partners Moderate Growth Fund | | 53 |
Statement of Assets and Liabilities
as of January 31, 2005 (Unaudited)
| | | | |
Assets | | | | |
Investments, at value (cost $344,029,479) | | $ | 392,457,274 | |
Cash | | | 11,442,790 | |
Foreign currency at value (cost $330,670) | | | 332,017 | |
Receivable for investments sold | | | 9,153,541 | |
Interest and dividends receivable | | | 1,450,069 | |
Receivable for Fund shares sold | | | 1,042,902 | |
Unrealized appreciation on swap agreements | | | 224,652 | |
Premium for interest rate swaps purchased | | | 103,375 | |
Tax Reclaim Receivable | | | 45,850 | |
Unrealized appreciation on forward foreign contracts | | | 18,458 | |
Prepaid expenses | | | 10,409 | |
| | |
|
|
|
Total assets | | | 416,281,337 | |
| | |
|
|
|
| |
Liabilities | | | | |
Payable for investments purchased | | | 14,240,216 | |
Securities sold short, at fair value (proceeds $3,745,504) | | | 3,695,742 | |
Payable for Fund shares reacquired | | | 670,138 | |
Unrealized depreciation on swap agreements | | | 633,666 | |
Premium received for interest rate swaps | | | 611,932 | |
Distribution fee payable | | | 271,316 | |
Management fee payable | | | 251,730 | |
Accrued expenses and other liabilities | | | 250,128 | |
Outstanding options written (premiums received $307,069) | | | 85,086 | |
Due to broker—variation margin | | | 16,154 | |
Deferred trustees fees | | | 10,083 | |
Unrealized depreciation on forward foreign contracts | | | 4,768 | |
| | |
|
|
|
Total liabilities | | | 20,740,959 | |
| | |
|
|
|
| |
Net Assets | | $ | 395,540,378 | |
| | |
|
|
|
| | | | | |
Net assets were comprised of: | | | | |
Shares of beneficial interest, at par | | $ | 33,328 | |
Paid-in capital, in excess of par | | | 352,914,159 | |
| | |
|
|
|
| | | | 352,947,487 | |
Undistributed net investment income | | | (576,172 | ) |
Accumulated net realized loss on investments and foreign currency transactions | | | (5,464,760 | ) |
Net unrealized appreciation on investments and foreign currencies | | | 48,633,823 | |
| | |
|
|
|
Net assets, January 31, 2005 | | $ | 395,540,378 | |
| | |
|
|
|
See Notes to Financial Statements.
| | |
| 54 | | Visit our website at www.strategicpartners.com |
| | | |
Class A | | | |
Net asset value and redemption price per share | | | |
($89,845,918 ÷ 7,550,216 shares of beneficial interest issued and outstanding) | | $ | 11.90 |
Maximum sales charge (5.50% of offering price) | | | 0.69 |
| | |
|
|
Maximum offering price to public | | $ | 12.59 |
| | |
|
|
| |
Class B | | | |
Net asset value, offering price and redemption price per share | | | |
($185,575,780 ÷ 15,651,064 shares of beneficial interest issued and outstanding) | | $ | 11.86 |
| | |
|
|
| |
Class C | | | |
Net asset value, offering price and redemption price per share | | | |
($108,968,381 ÷ 9,189,976 shares of beneficial interest issued and outstanding) | | $ | 11.86 |
| | |
|
|
| |
Class M | | | |
Net asset value, offering price and redemption price per share | | | |
($1,665,372 ÷ 140,730 shares of beneficial interest issued and outstanding) | | $ | 11.83 |
| | |
|
|
| |
Class R | | | |
Net asset value, offering price and redemption price per share | | | |
($2,607 ÷ 219 shares of beneficial interest issued and outstanding) | | $ | 11.90 |
| | |
|
|
| |
Class X | | | |
Net asset value, offering price and redemption price per share | | | |
($1,208,615 ÷ 101,950 shares of beneficial interest issued and outstanding) | | $ | 11.85 |
| | |
|
|
| |
Class Z | | | |
Net asset value, offering price and redemption price per share | | | |
($8,273,705 ÷ 694,338 shares of beneficial interest issued and outstanding) | | $ | 11.92 |
| | |
|
|
See Notes to Financial Statements.
| | |
| Strategic Partners Asset Allocation Funds/Strategic Partners Moderate Growth Fund | | 55 |
Statement of Operations
Six Months Ended January 31, 2005 (Unaudited)
| | | | |
Net Investment Income | | | | |
Income | | | | |
Dividends (Net of foreign withholding taxes of $54,701) | | $ | 1,797,098 | |
Interest (Net of foreign withholding taxes of $3,314) | | | 2,458,352 | |
| | |
|
|
|
Total income | | | 4,255,450 | |
| | |
|
|
|
| |
Expenses | | | | |
Management fee | | | 1,434,602 | |
Distribution fee—Class A | | | 107,210 | |
Distribution fee—Class B | | | 906,491 | |
Distribution fee—Class C | | | 531,049 | |
Distribution fee—Class M | | | 2,431 | |
Distribution fee—Class R | | | 6 | |
Distribution fee—Class X | | | 785 | |
Transfer agent's fees and expenses | | | 242,000 | |
Custodian's fees and expenses | | | 199,000 | |
Reports to shareholders | | | 55,000 | |
Registration fees | | | 41,000 | |
Legal fees | | | 14,000 | |
Audit fee | | | 8,000 | |
Trustees’ fees | | | 6,000 | |
Miscellaneous | | | 19,251 | |
| | |
|
|
|
Total expenses | | | 3,566,825 | |
| | |
|
|
|
Net investment income | | | 688,625 | |
| | |
|
|
|
| |
Net Realized And Unrealized Gain (Loss) On Investments And Foreign Currency Transactions | | | | |
Net realized gain (loss) on: | | | | |
Investment transactions | | | 9,549,234 | |
Financial futures transactions | | | 1,081,330 | |
Swaps | | | 506,934 | |
Options written | | | 227,408 | |
Short Sales | | | (19,431 | ) |
Foreign currency transactions | | | (33,640 | ) |
| | |
|
|
|
| | | | 11,311,835 | |
| | |
|
|
|
Net change in unrealized appreciation (depreciation) on: | | | | |
Investments | | | 20,660,103 | |
Short Sales | | | 47,236 | |
Financial futures contracts | | | 29,068 | |
Options written | | | 3,596 | |
Foreign currencies | | | (8,071 | ) |
Swaps | | | (488,657 | ) |
| | |
|
|
|
| | | | 20,243,275 | |
| | |
|
|
|
Net gain on investments | | | 31,555,110 | |
| | |
|
|
|
Net Increase In Net Assets Resulting From Operations | | $ | 32,243,735 | |
| | |
|
|
|
See Notes to Financial Statements.
| | |
| 56 | | Visit our website at www.strategicpartners.com |
Statement of Changes in Net Assets
(Unaudited)
| | | | | | | | |
| | | Six Months
Ended
January 31, 2005 | | | Year
Ended
July 31, 2004 | |
Increase (Decrease) In Net Assets | | | | | | | | |
Operations | | | | | | | | |
Net investment income | | $ | 688,625 | | | $ | 1,984,672 | |
Net realized gain (loss) on investments and foreign currency transactions | | | 11,311,835 | | | | 24,356,612 | |
Net change in unrealized appreciation (depreciation) of investments and foreign currencies | | | 20,243,275 | | | | 6,702,805 | |
| | |
|
|
| |
|
|
|
Net increase in net assets resulting from operations | | | 32,243,735 | | | | 33,044,089 | |
| | |
|
|
| |
|
|
|
Dividends and distributions (Note 1) | | | | | | | | |
Dividends from net investment income | | | | | | | | |
Class A | | | (550,746 | ) | | | (955,286 | ) |
Class B | | | (525,205 | ) | | | (879,791 | ) |
Class C | | | (306,479 | ) | | | (525,020 | ) |
Class M | | | (1,356 | ) | | | — | |
Class R | | | (16 | ) | | | — | |
Class X | | | (281 | ) | | | — | |
Class Z | | | (63,469 | ) | | | (139,371 | ) |
| | |
|
|
| |
|
|
|
Total dividends from net investment income | | | (1,447,552 | ) | | | (2,499,468 | ) |
| | |
|
|
| |
|
|
|
| | |
Fund share transactions (net of share conversions) (Note 6) | | | | | | | | |
Net proceeds from shares sold | | | 39,967,332 | | | | 113,695,226 | |
Net asset value of shares issued in reinvestment of dividends and distributions | | | 1,331,485 | | | | 2,301,177 | |
Cost of shares reacquired | | | (34,979,742 | ) | | | (62,423,425 | ) |
| | |
|
|
| |
|
|
|
Net increase in net assets from Fund share transactions | | | 6,319,075 | | | | 53,572,978 | |
| | |
|
|
| |
|
|
|
Total increase | | | 37,115,258 | | | | 84,117,599 | |
| | |
Net Assets | | | | | | | | |
Beginning of period(a) | | | 358,425,120 | | | | 274,307,521 | |
| | |
|
|
| |
|
|
|
End of period | | $ | 395,540,378 | | | $ | 358,425,120 | |
| | |
|
|
| |
|
|
|
(a) Includes undistributed net investment income of: | | $ | — | | | $ | 182,755 | |
| | |
|
|
| |
|
|
|
See Notes to Financial Statements.
| | |
| Strategic Partners Asset Allocation Funds/Strategic Partners Moderate Growth Fund | | 57 |
Notes to Financial Statements
(Unaudited)
Strategic Partners Asset Allocation Funds (the “Trust”), is registered under the Investment Company Act of 1940 as an open-end, diversified management investment company presently consisting of three portfolios: Strategic Partners Moderate Growth Fund (the “Fund”), Strategic Partners Conservative Growth Fund and Strategic Partners High Growth Fund. These financial statements relate only to Strategic Partners Moderate Growth Fund. The financial statements of the other portfolios are not presented herein. The Trust was organized as a business trust in Delaware on July 29, 1998.
Jennison Associates LLC (“Jennison”), Prudential Investment Management, Inc. (“PIM”), Lazard Asset Management LLC, Pacific Investment Management Company LLC, RS Investment Management, L.P. and EARNEST Partners, LLC are the “Advisers”.
The investment objective of the Fund is to provide capital appreciation and a reasonable level of current income. The Fund seeks to achieve its investment objective by investing in a diversified portfolio of equity and fixed income securities. The ability of the issuers of the debt securities held by the Fund to meet their obligations may be affected by economic developments in a specific industry or country.
Note 1. Accounting Policies
The following is a summary of significant accounting policies followed by the Trust in the preparation of its financial statements.
Securities Valuation: Securities listed on a securities exchange (other than options on securities and indices) are valued at the last sale price on such exchange on the day of valuation or, if there was no sale on such day, at the mean between the last reported bid and ask prices, or at the last bid price on such day in the absence of an asked price. Securities traded via Nasdaq are valued at the NASDAQ official closing price (NOCP) on the day of valuation, or if there was no NOCP, at the last sale prize. Securities that are actively traded in the over-the-counter market, including listed securities for which the primary market is believed by Prudential Investments LLC (“PI” or “Manager”), in consultation with the subadviser(s); to be over-the-counter, are valued at market value using prices provided by an independent pricing agent or principal market maker. Options on securities and indices traded on an exchange are valued at the last sale price as of the close of trading on the applicable exchange or, if
| | |
| 58 | | Visit our website at www.strategicpartners.com |
there was no sale, at the mean between the most recently quoted bid and asked prices on such exchange or at the last bid price in the absence of an asked price. Futures contracts and options thereon traded on a commodities exchange or board of trade are valued at the last sale price at the close of trading on such exchange or board of trade or, if there was no sale on the applicable commodities exchange or board of trade on such day, at the mean between the most recently quoted prices on such exchange or board of trade or at the last bid price in the absence of an asked price. Certain fixed income securities for which daily market quotations are not readily available may be valued with reference to fixed income securities whose prices are more readily available, pursuant to guidelines established by the Board of Trustees. Prices may be obtained from independent pricing services which use information provided by market makers or estimates of market values obtained from yield data relating to investments or securities with similar characteristics. Securities for which reliable market quotations are not readily available, or whose values have been affected by events occurring after the close of the security’s foreign market and before the Fund’s normal pricing time, are valued at fair value in accordance with Board of Trustees’ approved fair valuation procedures. Using fair value to price securities may result in a value that is different from a security’s most recent closing price and from the price used by other mutual funds to calculate their net asset value.
Investments in mutual funds are valued at their net asset value as of the close of the New York Stock Exchange on the date of valuation.
Short-term securities, which mature in sixty days or less, are valued at amortized cost, which approximates market value. The amortized cost method involves valuing a security at its cost on the date of purchase and thereafter assuming a constant amortization to maturity of the difference between the principal amount due at maturity and cost. Short-term securities, which mature in more than sixty days are valued at current market quotation.
Foreign Currency Translation: The books and records of the Fund are maintained in U.S. dollars. Foreign currency amounts are translated into U.S. dollars on the following basis:
(i) market value of investment securities, other assets and liabilities-at the current daily rates of exchange;
(ii) purchases and sales of investment securities, income and expenses-at the rates of exchange prevailing on the respective dates of such transactions.
Although the net assets of the Fund are presented at the foreign exchange rates and market values at the close of the period, the Fund does not isolate that portion of the
| | |
| Strategic Partners Asset Allocation Funds/Strategic Partners Moderate Growth Fund | | 59 |
Notes to Financial Statements
(Unaudited) Cont’d
results of operations arising as a result of changes in the foreign exchange rates from the fluctuations arising from changes in the market prices of securities held at the end of the period. Similarly, the Fund does not isolate the effect of changes in foreign exchange rates from the fluctuations arising from changes in the market prices of portfolio securities sold during the period. Accordingly, realized foreign currency gains or losses are included in the reported net realized gains or losses on investment transactions.
Net realized gains or losses on foreign currency transactions represent net foreign exchange gains or losses from the holdings of foreign currencies, currency gains or losses realized between the trade and settlement dates on security transactions, and the difference between the amounts of dividends, interest and foreign withholding taxes recorded on the Fund’s books and the U.S. dollar equivalent amounts actually received or paid. Net unrealized currency gains or losses from valuing foreign currency denominated assets and liabilities (other than investments) at period end exchange rates are reflected as a component of net unrealized appreciation (depreciation) on foreign currencies. Foreign security and currency transactions may involve certain considerations and risks not typically associated with those of domestic origin as a result of, among other factors, the possibility of political and economic instability and the level of governmental supervision and regulation of foreign securities markets.
Financial Futures Contracts: A financial futures contract is an agreement to purchase (long) or sell (short) an agreed amount of securities at a set price for delivery on a future date. Upon entering into a financial futures contract, the Fund is required to pledge to the broker an amount of cash and/or other assets equal to a certain percentage of the contract amount. This amount is known as the “initial margin.” Subsequent payments known as “variation margin,” are made or received by the Fund each day, depending on the daily fluctuations in the value of the underlying security. Such variation margin is recorded for financial statement purposes on a daily basis as unrealized gain or loss. When the contract expires or is closed, the gain or loss is realized and is presented in the Statement of Operations as net realized gain or loss on financial futures contracts.
The Fund invests in financial futures contracts in order to hedge its existing portfolio securities, or securities the Fund intends to purchase, against fluctuations in value caused by changes in prevailing interest rates or market conditions. Should interest rates move unexpectedly, the Fund may not achieve the anticipated benefits of the
| | |
| 60 | | Visit our website at www.strategicpartners.com |
financial futures contracts and may realize a loss. The use of futures transactions involves the risk of imperfect correlation in movements in the price of futures contracts, interest rates and the underlying hedged assets.
Forward Currency Contracts: A forward currency contract is a commitment to purchase or sell a foreign currency at a future date at a negotiated forward rate. The Fund may enter into forward currency contracts in order to hedge its exposure to changes in foreign currency exchange rates on its foreign portfolio holdings or on specific receivables and payables denominated in a foreign currency. The contracts are valued daily at current exchange rates and any unrealized gain or loss is included in the Statement of Assets and Liabilities as unrealized appreciation and/or depreciation on forward foreign currency contracts. Gain or loss is realized on the settlement date of the contract equal to the difference between the settlement value of the original and renegotiated forward contracts. This gain or loss, if any, is included in net realized gain or loss on foreign currency transactions. Risks may arise upon entering into these contracts from the potential inability of the counterparties to meet the terms of their contracts.
Options: The Fund may either purchase or write options in order to hedge against adverse market movements or fluctuations in value caused by changes in prevailing interest rates or foreign currency exchange rates with respect to securities or currencies, which the Fund currently owns or intends to purchase. The Fund’s principal reason for writing options is to realize, through receipt of premiums, a greater current return than would be realized on the underlying security alone. When the Fund purchases an option, it pays a premium and an amount equal to that premium is recorded as an asset. When the Fund writes an option, it receives a premium and an amount equal to that premium is recorded as a liability. The asset or liability is adjusted daily to reflect the current market value of the option.
If an option expires unexercised, the Fund realizes a gain or loss to the extent of the premium received or paid. If an option is exercised, the premium received or paid is recorded as an adjustment to the proceeds from the sale or the cost basis of the purchase in determining whether the Fund has realized a gain or loss. The difference between the premium and the amount received or paid on effecting a closing purchase or sale transaction is also treated as a realized gain or loss. Gain or loss on purchased options is included in net realized gain or loss on investment transactions. Gain or loss on written options is presented separately as net realized gain or loss on options written.
The Fund, as writer of an option, has no control over whether the underlying securities may be sold (called) or purchased (put). As a result, the Fund bears the
| | |
| Strategic Partners Asset Allocation Funds/Strategic Partners Moderate Growth Fund | | 61 |
Notes to Financial Statements
(Unaudited) Cont’d
market risk of an unfavorable change in the price of the security or currency underlying the written option. The Fund, as purchaser of an option, bears the risk of the potential inability of the counterparties to meet the terms of their contracts.
Short Sales: The Fund may make short sales of securities as a method of hedging potential price declines in similar securities owned. The Fund may sell a security it does not own in anticipation of a decline in the market value of that security (short sale). When the Fund makes a short sale, it will borrow the security sold short and deliver it to the broker-dealer through which it made the short sale as collateral for its obligation to deliver the security upon conclusion of the sale. The Fund may have to pay a fee to borrow the particular securities and may be obligated to return any interest or dividends received on such borrowed securities. A gain, limited to the price at which the Fund sold the security short, or a loss, unlimited as to dollar amount, will be recognized upon the termination of a short sale if the market price is less or greater than the proceeds originally received, respectively, and is presented in the Statement of Operations as net realized gain or loss on short sales.
Swaps: The Fund may enter into swap agreements. A swap is an agreement to exchange the return generated by one instrument for the return generated by another instrument. The Fund enters into interest rate, forward swap spread lock and credit default swap agreements to manage its exposure to interest rates and credit risk. Interest rate swap agreements involve the exchange by the Fund with another party of their respective commitments to pay or receive interest and may involve payment/receipt of a premium at the time of initiation of the swap agreement. Forward spread lock swap agreements involve commitments to pay or receive a settlement amount calculated as the difference between the swap spread and a fixed spread, multiplied by the notional amount times the duration of the swap. The swap spread is the difference between the benchmark swap rate (market rate) and the specific Treasury rate. In a credit default swap, one party makes a stream of payments to another party in exchange for the right to receive a specified return in the event of a default by a third party, typically corporate issues or sovereign issues of an emerging country, on its obligation. Dividends and interest on the securities in the swap are included in the value of the exchange. The swaps are valued daily at current market value and any unrealized gain or loss is included in the net unrealized appreciation or depreciation on investments. Gain or loss is realized on the termination date of the swap and is equal to the difference between the Fund’s basis in the swap and the proceeds of the closing transaction, including fees. During the period that the swap agreement is
| | |
| 62 | | Visit our website at www.strategicpartners.com |
open, the Fund may be subject to risk from the potential inability of the counterparty to meet the terms of the agreement.
Written options, futures contracts, forward foreign currency exchange contracts and swaps involve elements of both market and credit risk in excess of the amounts reflected on the Statement of Assets and Liabilities.
Repurchase Agreements: In connection with transactions in repurchase agreements with United States financial institutions, it is the Fund’s policy that its custodian or designated subcustodians under triparty repurchase agreements, as the case may be, take possession of the underlying collateral securities, the value of which exceeds the principal amount of the repurchase transaction, including accrued interest. To the extent that any repurchase transaction exceeds one business day, the value of the collateral is marked to market on a daily basis to ensure the adequacy of the collateral. If the seller defaults and the value of the collateral declines or if bankruptcy proceedings are commenced with respect to the seller of the security, realization of the collateral by the Fund may be delayed or limited.
When-Issued/Delayed Delivery Securities: Securities purchased or sold on a when issued or delayed-delivery basis may be settled a month or more after trade date; interest income is not accrued until settlement date. At the time a fund enters into such transactions, it instructs the custodian to segregate assets with a current value at least equal to the amount of its when-issued or delayed-delivery purchase commitments.
Securities Transactions and Net Investment Income: Securities transactions are recorded on the trade date. Realized gains or losses on sales of securities are calculated on the identified cost basis. Dividend income is recorded on the ex-dividend date and interest income, including amortization of premium and accretion of discount, on debt securities as required, is recorded on the accrual basis. Expenses are recorded on accrual basis.
Net investment income or loss (other than distribution fees, which are charged directly to respective class), unrealized and realized gains or losses, are allocated daily to each class of shares based upon the relative proportion of net assets of each class at the beginning of the day.
Dividends and Distributions: Dividends from net investment income are declared and paid semi-annually. Distributions of net realized capital and currency gains, if any, annually.
Dividends and distributions to shareholders which are determined in accordance with federal income tax regulations and which may differ from generally accepted
| | |
| Strategic Partners Asset Allocation Funds/Strategic Partners Moderate Growth Fund | | 63 |
Notes to Financial Statements
(Unaudited) Cont’d
accounting principles, are recorded on the ex-dividend date. Permanent book/tax differences relating to income and gains are reclassified amongst undistributed net investment income, accumulated net realized gain or loss and paid-in capital in excess of par, as appropriate.
Taxes: It is the Fund’s intention to continue to meet the requirements of the Internal Revenue Code applicable to regulated investment companies and to distribute all of its taxable net investment income and capital gains, if any, to its shareholders. Therefore, no federal income tax provision is required.
Withholding taxes on foreign dividends are recorded net of reclaimable amounts, at the time the related income is earned.
Estimates: The preparation of the financial statements requires management to make estimates and assumptions that affect the reported amounts and disclosures in the financial statements. Actual results could differ from those estimates.
Note 2. Agreements
The Trust has a management agreement with PI. Pursuant to this agreement, PI manages the investment operations of the Fund, administers the Fund’s affairs and supervises the Advisers’ performance of all investment advisory services. Pursuant to the advisory agreements, PI pays the cost of compensation of officers of the Fund, occupancy and certain clerical and accounting costs of the Fund. The Fund bears all other costs and expenses.
The management fee paid to PI is computed daily and payable monthly at an annual rate of 0.75 of 1% of the daily net assets up to $500 million, 0.70 of 1% of average daily net assets for the next $500 million and 0.65 of 1% of average daily net assets in excess of $1 billion. The effective management fee rate was .75% of 1% for the six months ended January 31, 2005.
The Fund has a distribution agreement with Prudential Investment Management Services LLC (“PIMS”), which acts as the distributor of the Class A, B, C, M, R, X and Z shares of the Fund. The Fund compensates PIMS for distributing and servicing the Fund’s Class A, B, C, M, R and X shares, pursuant to plans of distribution (the “Distribution Plans”), regardless of expenses actually incurred by PIMS. The distribution fees are accrued daily and payable monthly. No distribution or service fees are paid to PIMS as distributor for Class Z shares of the Fund.
| | |
| 64 | | Visit our website at www.strategicpartners.com |
Pursuant to the Distribution Plans, the Fund compensates PIMS for distribution related activities at an annual rate of up to .30 of 1%, 1%, 1%, 1%, .75% of 1% and 1% of the average daily net assets of the Class A, B, C, M, R and X shares, respectively. Such expenses under the Plans were .25 of 1%, 1%, 1%, 1%, .50% of 1% and 1% of the average daily net assets of the Class A, B, C, M, R and X shares, respectively, for the six months ended January 31, 2005.
PIMS has advised the Fund that it has received approximately $248,400 in front-end sales charges resulting from sales of Class A shares during the six months ended January 31, 2005. From these fees, PIMS paid such sales charges to broker-dealers, which in turn paid commissions to salespersons and incurred other distribution costs.
PIMS has advised the Fund that for the six months ended January 31, 2005, it has received approximately $151,600 and $16,500 in contingent deferred sales charges imposed upon certain redemptions by Class B and Class C shareholders, respectively.
There was no contingent deferred Sales Charges received on Class M and Class X shares.
Jennison, PIMS, PIM and PI are indirect, wholly-owned subsidiaries of Prudential Financial, Inc. (“Prudential”).
The Fund, along with other affiliated registered investment companies (the “Funds”), is a party to a syndicated credit agreement (“SCA”) with a group of banks. The purpose of the SCA is to serve as an alternative source of funding for capital share redemptions. The SCA provided for a commitment of $500 million. Interest on any borrowings under the SCA would be incurred at market rates. The Funds paid a commitment fee of .08 of 1% of the unused portion of the SCA. The expiration date of the SCA was October 29, 2004. Effective October 29, 2004, the Funds entered into a revised credit agreement with two banks. The commitment under the revised credit agreement continues to be $500 million. The Funds pay a commitment fee of .075 of 1% of the unused portion of the revised credit agreement. The commitment fee is accrued daily and paid quarterly and is allocated to the Funds pro rata, based on nest assets. The expiration date of the revised credit agreement is October 28, 2005. The Fund did not borrow any amounts pursuant to the SCA during the six months ended January 31, 2005.
Note 3. Other Transactions with Affiliates
Prudential Mutual Fund Services LLC (“PMFS”), an affiliate of PI and an indirect, wholly owned subsidiary of Prudential, serves as the Fund’s transfer agent. During the six months ended January 31, 2005, the Fund incurred fees of approximately $171,200 for the services of PMFS. As of January 31, 2005, approximately $29,000 of such fees were due to PMFS. Transfer agent fees and expenses in the Statement of Operations include certain out-of-pocket expenses paid to non-affiliates, where applicable.
| | |
| Strategic Partners Asset Allocation Funds/Strategic Partners Moderate Growth Fund | | 65 |
Notes to Financial Statements
(Unaudited) Cont’d
The Fund pays networking fees to affiliated and unaffiliated broker/dealers. These networking fees are payments made to broker/dealers that clear mutual fund transactions through a national mutual fund clearing system. The Fund incurred approximately $61,700 in total networking fees, of which the amount relating to the services of Wachovia Securities, LLC (“Wachovia”) and First Clearing Corporation (“First Clearing”), affiliates of PI, was approximately $5,600 and $42,100, respectively, for the six months ended January 31, 2005. As of January 31, 2005, approximately $8,400 of such fees were due to First Clearing. These amounts are included in transfer agent’s fees and expenses in the Statement of Operations.
For the six months ended January 31, 2005, Wachovia earned $2,441 and Prudential Equity Group, a wholly owned subsidiary of Prudential, earned $4,172 in brokerage commissions from portfolio transactions executed on behalf of the Fund.
The Fund invests in the Taxable Money Market Series (the “Series”), a portfolio of Dryden Core Investment Fund, pursuant to an exemptive order received from the Securities and Exchange Commission. The Series is a money market mutual fund registered under the Investment Company Act of 1940, as amended, and managed by PI. For the six months ended January 31, 2005, the Fund earned income of approximately $122,666 from the Series by investing its excess cash.
Note 4. Portfolio Securities
Purchases and sales of portfolio securities, excluding short-term investments and U.S. government securities, for the six months ended January 31, 2005, aggregated $235,763,980 and $239,948,016, respectively.
Transactions in call options written during the six months ended January 31, 2005 were as follows:
| | | | | | | |
Moderate Growth
| | Number of
Contracts/
Notional
Amount (000)
| | | Premiums
Received
| |
Options outstanding at July 31, 2004 | | 21,421 | | | $ | 301,079 | |
Options written | | 521 | | | | 234,168 | |
Options closed | | (22 | ) | | | (5,168 | ) |
Options expired | | (9,121 | ) | | | (223,010 | ) |
| | |
|
| |
|
|
|
Options outstanding at January 31, 2005 | | 12,799 | | | $ | 307,069 | |
| | |
|
| |
|
|
|
| | |
| 66 | | Visit our website at www.strategicpartners.com |
Note 5. Tax Information
The United States federal income tax basis of the Fund’s investments and the net unrealized appreciation (depreciation) as of January 31, 2005 were follows:
| | | | | | | | |
Tax Basis
| | Appreciation
| | Depreciation
| | Other
Cost Basis
Adjustments
| | Total Net
Unrealized
Appreciation
|
| $345,261,120 | | $51,084,272 | | $3,888,118 | | $1,437,669 | | $47,196,154 |
The difference between book basis and tax basis were primarily attributable to deferred losses on wash sales. The other cost basis adjustments are primarily attributable to appreciation (depreciation) of foreign currency and mark to market of receivables, payables and swaps.
For federal income tax purposes, the Fund had capital loss carryforward as of July 31, 2004 of approximately $14,541,000, which expires in 2011. Approximately $17,394,000 of its capital loss carryforward was used to offset net taxable gains realized in the fiscal year ended July 31, 2004. Accordingly, no capital gains distribution is expected to be paid to shareholders until net gains have been realized in excess of the capital loss carryforward.
Note 6. Capital
The Fund offers Class A, Class B, Class C, Class M, Class R, Class X and Class Z shares. Class A shares are subject to a maximum front-end sales charge of 5.50%. Investors who purchase $1 million or more of Class A shares and sell these shares within 12 months of purchase are not subject to an initial sales charge but are subject to a contingent deferred sales charge (CDSC) of 1%, including investors who purchase their shares through broker-dealers affiliated with Prudential. Class B shares are subject to a CDSC of 5%, which decreases by 1% annually to 1% in the fifth and sixth years and 0% in the seventh year. Class B shares automatically convert to Class A shares on a quarterly basis approximately seven years after purchase. The CDSC for Class C shares is 1% for shares redeemed within 12 months of purchase. Class M shares are generally closed to new purchases. Class M shares are subject to a CDSC of 6%, which decreases by 1% annually to 2% in the fifth and sixth years and 1% in the seventh year. Class M shares automatically convert to Class A shares approximately eight years after purchase. Class X shares are generally closed to new purchases. Class X shares are subject to a CDSC of 6%, which decreases by 1% annually to 4% in the third and fourth years, by 1% annually to 2% in the sixth and seventh years, and 1% in the eighth year. Class X shares automatically convert to Class A shares on a quarterly basis approximately ten years (eight years in the case of shares purchased prior to August 19, 1998) after purchase. An
| | |
| Strategic Partners Asset Allocation Funds/Strategic Partners Moderate Growth Fund | | 67 |
Notes to Financial Statements
(Unaudited) Cont’d
exchange privilege is also available for shareholders who qualify to purchase Class A shares at net asset value. Class R and Class Z shares are not subject to any sales or redemption charge and are offered exclusively for sale to a limited group of investors. As of January 31, 2005, Prudential owns 220 shares, 219 shares and 220 shares of Class M, Class R and Class X shares, respectively.
The Fund has authorized an unlimited number of shares of beneficial interest at $.001 par value per share.
Transactions in shares of beneficial interest were as follows:
| | | | | | | |
Class A
| | Shares
| | | Amount
| |
Six months ended January 31, 2005: | | | | | | | |
Shares sold | | 972,678 | | | $ | 11,207,171 | |
Shares issued in reinvestment of dividends and distributions | | 44,362 | | | | 524,993 | |
Shares reacquired | | (764,924 | ) | | | (8,816,245 | ) |
| | |
|
| |
|
|
|
Net increase (decrease) in shares outstanding before conversion | | 252,116 | | | | 2,915,919 | |
Shares issued upon conversion from class B | | 74,524 | | | | 866,618 | |
| | |
|
| |
|
|
|
Net increase (decrease) in shares outstanding | | 326,640 | | | $ | 3,782,537 | |
| | |
|
| |
|
|
|
Year ended July 31, 2004: | | | | | | | |
Shares sold | | 2,493,627 | | | $ | 27,179,168 | |
Shares issued in reinvestment of dividends and distributions | | 83,298 | | | | 907,145 | |
Shares reacquired | | (1,433,352 | ) | | | (15,669,901 | ) |
| | |
|
| |
|
|
|
Net increase (decrease) in shares outstanding before conversion | | 1,143,573 | | | | 12,416,412 | |
Shares issued upon conversion from class B | | 127,315 | | | | 1,391,954 | |
| | |
|
| |
|
|
|
Net increase (decrease) in shares outstanding | | 1,270,888 | | | $ | 13,808,366 | |
| | |
|
| |
|
|
|
Class B
| | | | | | |
Six months ended January 31, 2005: | | | | | | | |
Shares sold | | 1,179,505 | | | $ | 13,560,714 | |
Shares issued in reinvestment of dividends and distributions | | 41,929 | | | | 494,477 | |
Shares reacquired | | (1,137,137 | ) | | | (13,087,794 | ) |
| | |
|
| |
|
|
|
Net increase (decrease) in shares outstanding before conversion | | 84,297 | | | | 967,397 | |
Shares reacquired upon conversion into class A | | (74,768 | ) | | | (866,618 | ) |
| | |
|
| |
|
|
|
Net increase (decrease) in shares outstanding | | 9,529 | | | $ | 100,779 | |
| | |
|
| |
|
|
|
Year ended July 31, 2004: | | | | | | | |
Shares sold | | 4,430,282 | | | $ | 48,146,465 | |
Shares issued in reinvestment of dividends and distributions | | 77,042 | | | | 835,048 | |
Shares reacquired | | (1,903,819 | ) | | | (20,799,776 | ) |
| | |
|
| |
|
|
|
Net increase (decrease) in shares outstanding before conversion | | 2,603,505 | | | | 28,181,737 | |
Shares reacquired upon conversion into class A | | (127,876 | ) | | | (1,391,954 | ) |
| | |
|
| |
|
|
|
Net increase (decrease) in shares outstanding | | 2,475,629 | | | $ | 26,789,783 | |
| | |
|
| |
|
|
|
| | |
| 68 | | Visit our website at www.strategicpartners.com |
| | | | | | | |
Class C
| | Shares
| | | Amount
| |
Six months ended January 31, 2005: | | | | | | | |
Shares sold | | 974,601 | | | $ | 11,171,584 | |
Shares issued in reinvestment of dividends and distributions | | 22,187 | | | | 260,492 | |
Shares reacquired | | (1,026,237 | ) | | | (11,796,888 | ) |
| | |
|
| |
|
|
|
Net increase (decrease) in shares outstanding | | (29,449 | ) | | $ | (364,812 | ) |
| | |
|
| |
|
|
|
Year ended July 31, 2004: | | | | | | | |
Shares sold | | 3,174,344 | | | $ | 34,329,067 | |
Shares issued in reinvestment of dividends and distributions | | 41,328 | | | | 447,399 | |
Shares reacquired | | (1,809,659 | ) | | | (19,750,825 | ) |
| | |
|
| |
|
|
|
Net increase (decrease) in shares outstanding | | 1,406,013 | | | $ | 15,025,641 | |
| | |
|
| |
|
|
|
Class M
| | | | | | |
October 4, 2004 to January 31, 2005: | | | | | | | |
Shares sold | | 140,631 | | | $ | 1,659,359 | |
Shares issued in reinvestment of dividends and distributions | | 114 | | | | 1,343 | |
Shares reacquired | | (15 | ) | | | (173 | ) |
| | |
|
| |
|
|
|
Net increase in shares outstanding | | 140,730 | | | $ | 1,660,529 | |
| | |
|
| |
|
|
|
Class R
| | | | | | |
October 4, 2004 to January 31, 2005: | | | | | | | |
Shares sold | | 219 | | | $ | 2,500 | |
Shares issued in reinvestment of dividends and distributions | | — | | | | — | |
Shares reacquired | | — | | | | — | |
| | |
|
| |
|
|
|
Net increase in shares outstanding | | 219 | | | $ | 2,500 | |
| | |
|
| |
|
|
|
Class X
| | | | | | |
October 4, 2004 to January 31, 2005: | | | | | | | |
Shares sold | | 101,927 | | | $ | 1,204,363 | |
Shares issued in reinvestment of dividends and distributions | | 23 | | | | 267 | |
Shares reacquired | | — | | | | — | |
| | |
|
| |
|
|
|
Net increase in shares outstanding | | 101,950 | | | $ | 1,204,630 | |
| | |
|
| |
|
|
|
Class Z
| | | | | | |
Six months ended January 31, 2005: | | | | | | | |
Shares sold | | 100,295 | | | $ | 1,161,641 | |
Shares issued in reinvestment of dividends and distributions | | 4,216 | | | | 49,913 | |
Shares reacquired | | (109,858 | ) | | | (1,278,642 | ) |
| | |
|
| |
|
|
|
Net increase (decrease) in shares outstanding | | (5,347 | ) | | $ | (67,088 | ) |
| | |
|
| |
|
|
|
Year ended July 31, 2004: | | | | | | | |
Shares sold | | 375,867 | | | $ | 4,040,526 | |
Shares issued in reinvestment of dividends and distributions | | 10,261 | | | | 111,585 | |
Shares reacquired | | (563,049 | ) | | | (6,202,923 | ) |
| | |
|
| |
|
|
|
Net increase (decrease) in shares outstanding | | (176,921 | ) | | $ | (2,050,812 | ) |
| | |
|
| |
|
|
|
| | |
| Strategic Partners Asset Allocation Funds/Strategic Partners Moderate Growth Fund | | 69 |
Financial Highlights
| | | | |
| | | Class A
| |
| | | Six Months Ended
January 31, 2005(b) | |
Per Share Operating Performance: | | | | |
Net asset value, beginning of period | | $ | 10.96 | |
| | |
|
|
|
Income (loss) from investment operations | | | | |
Net investment income | | | .05 | |
Net realized and unrealized gain (loss) on investment transactions | | | .97 | |
| | |
|
|
|
Total from investment operations | | | 1.02 | |
| | |
|
|
|
Less distributions | | | | |
Dividends from net investment income | | | (.08 | ) |
Distributions from net realized gains on investments | | | — | |
| | |
|
|
|
| | | | (.08 | ) |
| | |
|
|
|
Net asset value, end of period | | $ | 11.90 | |
| | |
|
|
|
Total Return(a) | | | 9.27 | % |
Ratios/Supplemental Data: | | | | |
Net assets, end of period (000) | | $ | 89,846 | |
Average net assets (000) | | $ | 85,069 | |
Ratio to average net assets: | | | | |
Expenses, including distribution and service (12b-1) fees(d) | | | 1.30 | %(c) |
Expenses, excluding distribution and service (12b-1) fees | | | 1.05 | %(c) |
Net investment income | | | .92 | %(c) |
For Class A, B, C, M, R, X and Z shares: | | | | |
Portfolio turnover rate | | | 85 | %(e) |
| (a) | Total return does not consider the effect of sales loads. Total return is calculated assuming a purchase of shares on the first day and a sale on the last day of each period reported and includes reinvestment of dividends and distributions. Total returns for periods less than one full year are not annualized. |
| (b) | Calculated based upon weighted average shares outstanding during the period. |
| (d) | The Distributor has contractually agreed to reduce its distribution and service (12b-1) fees for Class A shares to .25 of 1% of the average daily net assets of Class A shares. |
See Notes to Financial Statements.
| | |
| 70 | | Visit our website at www.strategicpartners.com |
| | | | | | | | | | | | | | | | | | |
| Class A | |
| Year Ended July 31, | |
| 2004 | | | 2003(b) | | | 2002(b) | | | 2001(b) | | | 2000(b) | |
| | | | | | | | | | | | | | | | | | | |
| $ | 9.89 | | | $ | 8.86 | | | $ | 10.70 | | | $ | 12.03 | | | $ | 10.86 | |
|
|
| |
|
|
| |
|
|
| |
|
|
| |
|
|
|
| | | | | | | | | | | | | | | | | | | |
| | .12 | | | | .15 | | | | .19 | | | | .24 | | | | .26 | |
| | 1.09 | | | | 1.02 | | | | (1.76 | ) | | | (.83 | ) | | | 1.25 | |
|
|
| |
|
|
| |
|
|
| |
|
|
| |
|
|
|
| | 1.21 | | | | 1.17 | | | | (1.57 | ) | | | (.59 | ) | | | 1.51 | |
|
|
| |
|
|
| |
|
|
| |
|
|
| |
|
|
|
| | | | | | | | | | | | | | | | | | | |
| | (.14 | ) | | | (.14 | ) | | | (.27 | ) | | | (.14 | ) | | | (.26 | ) |
| | — | | | | — | | | | — | | | | (.60 | ) | | | (.08 | ) |
|
|
| |
|
|
| |
|
|
| |
|
|
| |
|
|
|
| | (.14 | ) | | | (.14 | ) | | | (.27 | ) | | | (.74 | ) | | | (.34 | ) |
|
|
| |
|
|
| |
|
|
| |
|
|
| |
|
|
|
| $ | 10.96 | | | $ | 9.89 | | | $ | 8.86 | | | $ | 10.70 | | | $ | 12.03 | |
|
|
| |
|
|
| |
|
|
| |
|
|
| |
|
|
|
| | 12.27 | % | | | 13.29 | % | | | (14.92 | )% | | | (4.89 | )% | | | 13.96 | % |
| | | | | | | | | | | | | | | | | | | |
| $ | 79,172 | | | $ | 58,862 | | | $ | 50,559 | | | $ | 58,517 | | | $ | 48,786 | |
| $ | 72,043 | | | $ | 51,006 | | | $ | 57,234 | | | $ | 56,627 | | | $ | 34,809 | |
| | | | | | | | | | | | | | | | | | | |
| | 1.35 | % | | | 1.49 | % | | | 1.48 | % | | | 1.54 | % | | | 1.49 | % |
| | 1.10 | % | | | 1.24 | % | | | 1.23 | % | | | 1.29 | % | | | 1.24 | % |
| | 1.15 | % | | | 1.66 | % | | | 1.68 | % | | | 2.18 | % | | | 2.27 | % |
| | | | | | | | | | | | | | | | | | | |
| | 100 | % | | | 158 | % | | | 217 | % | | | 246 | % | | | 155 | % |
See Notes to Financial Statements.
| | |
| Strategic Partners Asset Allocation Funds/Strategic Partners Moderate Growth Fund | | 71 |
Financial Highlights
Cont’d
| | | | |
| | | Class B
| |
| | | Six Months Ended
January 31, 2005(b) | |
Per Share Operating Performance: | | | | |
Net asset value, beginning of period | | $ | 10.92 | |
| | |
|
|
|
Income (loss) from investment operations | | | | |
Net investment income | | | .01 | |
Net realized and unrealized gain (loss) on investment transactions | | | 0.96 | |
| | |
|
|
|
Total from investment operations | | | 0.97 | |
| | |
|
|
|
Less distributions | | | | |
Dividends from net investment income | | | (.03 | ) |
Distributions from net realized gains on investments | | | — | |
| | |
|
|
|
Total dividends and distributions | | | (.03 | ) |
| | |
|
|
|
Net asset value, end of period | | $ | 11.86 | |
| | |
|
|
|
Total Return(a) | | | 8.92 | % |
Ratios/Supplemental Data: | | | | |
Net assets, end of period (000) | | $ | 185,576 | |
Average net assets (000) | | $ | 179,820 | |
Ratio to average net assets: | | | | |
Expenses, including distribution and service (12b-1) fees | | | 2.05 | %(c) |
Expenses, excluding distribution and service (12b-1) fees | | | 1.05 | %(c) |
Net investment income | | | .17 | %(c) |
| (a) | Total return does not consider the effect of sales loads. Total return is calculated assuming a purchase of shares on the first day and a sale on the last day of each period reported and includes reinvestment of dividends and distributions. Total returns for periods less than one full year are not annualized. |
| (b) | Calculated based upon weighted average shares outstanding during the period. |
See Notes to Financial Statements.
| | |
| 72 | | Visit our website at www.strategicpartners.com |
| | | | | | | | | | | | | | | | | | |
| Class B | |
| Year Ended July 31, | |
| 2004 | | | 2003(b) | | | 2002(b) | | | 2001(b) | | | 2000(b) | |
| | | | | | | | | | | | | | | | | | | |
| $ | 9.86 | | | $ | 8.83 | | | $ | 10.63 | | | $ | 12.01 | | | $ | 10.85 | |
|
|
| |
|
|
| |
|
|
| |
|
|
| |
|
|
|
| | | | | | | | | | | | | | | | | | | |
| | .04 | | | | .08 | | | | .11 | | | | .16 | | | | .17 | |
| | 1.08 | | | | 1.03 | | | | (1.75 | ) | | | (.84 | ) | | | 1.23 | |
|
|
| |
|
|
| |
|
|
| |
|
|
| |
|
|
|
| | 1.12 | | | | 1.11 | | | | (1.64 | ) | | | (.68 | ) | | | 1.40 | |
|
|
| |
|
|
| |
|
|
| |
|
|
| |
|
|
|
| | | | | | | | | | | | | | | | | | | |
| | (.06 | ) | | | (.08 | ) | | | (.16 | ) | | | (.10 | ) | | | (.16 | ) |
| | — | | | | — | | | | — | | | | (.60 | ) | | | (.08 | ) |
|
|
| |
|
|
| |
|
|
| |
|
|
| |
|
|
|
| | (.06 | ) | | | (.08 | ) | | | (.16 | ) | | | (.70 | ) | | | (.24 | ) |
|
|
| |
|
|
| |
|
|
| |
|
|
| |
|
|
|
| $ | 10.92 | | | $ | 9.86 | | | $ | 8.83 | | | $ | 10.63 | | | $ | 12.01 | |
|
|
| |
|
|
| |
|
|
| |
|
|
| |
|
|
|
| | 11.37 | % | | | 12.58 | % | | | (15.56 | )% | | | (5.72 | )% | | | 12.88 | % |
| | | | | | | | | | | | | | | | | | | |
| $ | 170,863 | | | $ | 129,759 | | | $ | 107,775 | | | $ | 117,664 | | | $ | 99,950 | |
| $ | 157,550 | | | $ | 113,902 | | | $ | 116,960 | | | $ | 109,534 | | | $ | 79,855 | |
| | | | | | | | | | | | | | | | | | | |
| | 2.10 | % | | | 2.24 | % | | | 2.23 | % | | | 2.29 | % | | | 2.24 | % |
| | 1.10 | % | | | 1.24 | % | | | 1.23 | % | | | 1.29 | % | | | 1.24 | % |
| | .41 | % | | | .91 | % | | | .93 | % | | | 1.43 | % | | | 1.48 | % |
See Notes to Financial Statements.
| | |
| Strategic Partners Asset Allocation Funds/Strategic Partners Moderate Growth Fund | | 73 |
Financial Highlights
Cont’d
| | | | |
| | | Class C
| |
| | | Six Months Ended
January 31, 2005(b) | |
Per Share Operating Performance: | | | | |
Net asset value, beginning of period | | $ | 10.92 | |
| | |
|
|
|
Income (loss) from investment operations | | | | |
Net investment income | | | .01 | |
Net realized and unrealized gain (loss) on investment transactions | | | .96 | |
| | |
|
|
|
Total from investment operations | | | 0.97 | |
| | |
|
|
|
Less distributions | | | | |
Dividends from net investment income | | | (.03 | ) |
Distributions from net realized gains on investments | | | — | |
| | |
|
|
|
Total dividends and distributions | | | (.03 | ) |
| | |
|
|
|
Net asset value, end of period | | $ | 11.86 | |
| | |
|
|
|
Total Return(a) | | | 8.92 | % |
Ratios/Supplemental Data: | | | | |
Net assets, end of period (000) | | $ | 108,968 | |
Average net assets (000) | | $ | 105,742 | |
Ratio to average net assets: | | | | |
Expenses, including distribution and service (12b-1) fees | | | 2.05 | %(c) |
Expenses, excluding distribution and service (12b-1) fees | | | 1.05 | %(c) |
Net investment income | | | .17 | %(c) |
| (a) | Total return does not consider the effect of sales loads. Total return is calculated assuming a purchase of shares on the first day and a sale on the last day of each period reported and includes reinvestment of dividends and distributions. Total returns for periods less than one full year are not annualized. |
| (b) | Calculated based upon weighted average shares outstanding during the period. |
See Notes to Financial Statements.
| | |
| 74 | | Visit our website at www.strategicpartners.com |
| | | | | | | | | | | | | | | | | | |
| Class C | |
| Year Ended July 31, | |
| 2004 | | | 2003(b) | | | 2002(b) | | | 2001(b) | | | 2000(b) | |
| | | | | | | | | | | | | | | | | | | |
| $ | 9.86 | | | $ | 8.83 | | | $ | 10.63 | | | $ | 12.01 | | | $ | 10.85 | |
|
|
| |
|
|
| |
|
|
| |
|
|
| |
|
|
|
| | | | | | | | | | | | | | | | | | | |
| | .04 | | | | .08 | | | | .11 | | | | .16 | | | | .17 | |
| | 1.08 | | | | 1.03 | | | | (1.75 | ) | | | (.84 | ) | | | 1.23 | |
|
|
| |
|
|
| |
|
|
| |
|
|
| |
|
|
|
| | 1.12 | | | | 1.11 | | | | (1.64 | ) | | | (.68 | ) | | | 1.40 | |
|
|
| |
|
|
| |
|
|
| |
|
|
| |
|
|
|
| | | | | | | | | | | | | | | | | | | |
| | (.06 | ) | | | (.08 | ) | | | (.16 | ) | | | (.10 | ) | | | (.16 | ) |
| | — | | | | — | | | | — | | | | (.60 | ) | | | (.08 | ) |
|
|
| |
|
|
| |
|
|
| |
|
|
| |
|
|
|
| | (.06 | ) | | | (.08 | ) | | | (.16 | ) | | | (.70 | ) | | | (.24 | ) |
|
|
| |
|
|
| |
|
|
| |
|
|
| |
|
|
|
| $ | 10.92 | | | $ | 9.86 | | | $ | 8.83 | | | $ | 10.63 | | | $ | 12.01 | |
|
|
| |
|
|
| |
|
|
| |
|
|
| |
|
|
|
| | 11.37 | % | | | 12.58 | % | | | (15.56 | )% | | | (5.72 | )% | | | 12.88 | % |
| | | | | | | | | | | | | | | | | | | |
| $ | 100,712 | | | $ | 77,008 | | | $ | 47,165 | | | $ | 34,021 | | | $ | 28,040 | |
| $ | 94,252 | | | $ | 59,626 | | | $ | 40,465 | | | $ | 30,623 | | | $ | 25,835 | |
| | | | | | | | | | | | | | | | | | | |
| | 2.10 | % | | | 2.24 | % | | | 2.23 | % | | | 2.29 | % | | | 2.24 | % |
| | 1.10 | % | | | 1.24 | % | | | 1.23 | % | | | 1.29 | % | | | 1.24 | % |
| | .41 | % | | | .89 | % | | | .95 | % | | | 1.43 | % | | | 1.44 | % |
See Notes to Financial Statements.
| | |
| Strategic Partners Asset Allocation Funds/Strategic Partners Moderate Growth Fund | | 75 |
Financial Highlights
Cont’d
| | | | |
| | | Class M
| |
| | | October 4, 2004(a)(e)
Through
January 31, 2005 | |
Per Share Operating Performance: | | | | |
Net asset value, beginning of period | | $ | 11.34 | |
| | |
|
|
|
Income (loss) from investment operations | | | | |
Net investment income | | | — | (f) |
Net realized and unrealized gain (loss) on investment transactions | | | .55 | |
| | |
|
|
|
Total from investment operations | | | .55 | |
| | |
|
|
|
Less distributions | | | | |
Dividends from net investment income | | | (.06 | ) |
Distributions from net realized gains on investments | | | — | |
| | |
|
|
|
Total dividends and distributions | | | (.06 | ) |
| | |
|
|
|
Net asset value, end of period | | $ | 11.83 | |
| | |
|
|
|
Total Return(b) | | | 4.67 | % |
Ratios/Supplemental Data: | | | | |
Net assets, end of period (000) | | $ | 1,665 | |
Average net assets (000) | | $ | 746 | |
Ratio to average net assets: | | | | |
Expenses, including distribution and service (12b-1) fees | | | 2.05 | %(c) |
Expenses, excluding distribution and service (12b-1) fees | | | 1.05 | %(c) |
Net investment income (loss) | | | (.07 | )%(c) |
| (a) | Commencement of offering of new share class. |
| (b) | Total return does not consider the effect of sales loads. Total return is calculated assuming a purchase of shares on the first day and a sale on the last day of each period reported and includes reinvestment of dividends and distributions. Total returns for periods less than one full year are not annualized. |
| (d) | The Distributor has contractually agreed to reduce its distribution and service (12b-1) fees for Class R shares to .50% of 1% of the average daily net assets of Class R shares. |
| (e) | Calculated based upon weighted average shares outstanding during the period. |
| (f) | Less than $0.005 per share. |
See Notes to Financial Statements.
| | |
| 76 | | Visit our website at www.strategicpartners.com |
| | | | | | |
Class R
| | | Class X
| |
October 4, 2004(a)(e)
Through
January 31, 2005 | | | October 4, 2004(a)(e)
Through
January 31, 2005 | |
| | | | | | | |
| $ | 11.40 | | | $ | 11.34 | |
|
|
| |
|
|
|
| | | | | | | |
| | .03 | | | | — | (f) |
| | .55 | | | | .57 | |
|
|
| |
|
|
|
| | .58 | | | | .57 | |
|
|
| |
|
|
|
| | | | | | | |
| | (.08 | ) | | | (.06 | ) |
| | — | | | | — | |
|
|
| |
|
|
|
| | (.08 | ) | | | (.06 | ) |
|
|
| |
|
|
|
| $ | 11.90 | | | $ | 11.85 | |
|
|
| |
|
|
|
| | 4.87 | % | | | 4.67 | % |
| | | | | | | |
| $ | 3 | | | $ | 1,209 | |
| $ | 3 | | | $ | 241 | |
| | | | | | | |
| | 1.55 | %(c)(d) | | | 2.05 | %(c) |
| | 1.05 | %(c) | | | 1.05 | %(c) |
| | .82 | %(c) | | | (.09 | )%(c) |
See Notes to Financial Statements.
| | |
| Strategic Partners Asset Allocation Funds/Strategic Partners Moderate Growth Fund | | 77 |
Financial Highlights
Cont’d.
| | | | |
| | | Class Z
| |
| | | Six Months Ended
January 31, 2005(b) | |
Per Share Operating Performance: | | | | |
Net asset value, beginning of period | | $ | 10.97 | |
| | |
|
|
|
Income (loss) from investment operations | | | | |
Net investment income | | | .07 | |
Net realized and unrealized gain (loss) on investment transactions | | | .97 | |
| | |
|
|
|
Total from investment operations | | | 1.04 | |
| | |
|
|
|
Less distributions | | | | |
Dividends from net investment income | | | (.09 | ) |
Distributions from net realized gains on investments | | | — | |
| | |
|
|
|
Total dividends and distributions | | | (.09 | ) |
| | |
|
|
|
Net asset value, end of period | | $ | 11.92 | |
| | |
|
|
|
Total Return(a) | | | 7.58 | % |
Ratios/Supplemental Data: | | | | |
Net assets, end of period (000) | | $ | 8,274 | |
Average net assets (000) | | $ | 8,171 | |
Ratio to average net assets: | | | | |
Expenses, including distribution and service (12b-1) fees | | | 1.05 | %(c) |
Expenses, excluding distribution and service (12b-1) fees | | | 1.05 | %(c) |
Net investment income | | | 1.17 | %(c) |
| (a) | Total return does not consider the effect of sales loads. Total return is calculated assuming a purchase of shares on the first day and a sale on the last day of each period reported and includes reinvestment of dividends and distributions. Total returns for periods less than one full year are not annualized. |
| (b) | Calculated based upon weighted average shares outstanding during the period. |
See Notes to Financial Statements.
| | |
| 78 | | Visit our website at www.strategicpartners.com |
| | | | | | | | | | | | | | | | | | |
| Class Z | |
| Year Ended July 31, | |
| 2004 | | | 2003(b) | | | 2002(b) | | | 2001(b) | | | 2000(b) | |
| | | | | | | | | | | | | | | | | | | |
| $ | 9.90 | | | $ | 8.87 | | | $ | 10.72 | | | $ | 12.05 | | | $ | 10.87 | |
|
|
| |
|
|
| |
|
|
| |
|
|
| |
|
|
|
| | | | | | | | | | | | | | | | | | | |
| | .15 | | | | .16 | | | | .22 | | | | .25 | | | | .27 | |
| | 1.09 | | | | 1.03 | | | | (1.77 | ) | | | (.82 | ) | | | 1.27 | |
|
|
| |
|
|
| |
|
|
| |
|
|
| |
|
|
|
| | 1.24 | | | | 1.19 | | | | (1.55 | ) | | | (.57 | ) | | | 1.54 | |
|
|
| |
|
|
| |
|
|
| |
|
|
| |
|
|
|
| | | | | | | | | | | | | | | | | | | |
| | (.17 | ) | | | (.16 | ) | | | (.30 | ) | | | (.16 | ) | | | (.28 | ) |
| | — | | | | — | | | | — | | | | (.60 | ) | | | (.08 | ) |
|
|
| |
|
|
| |
|
|
| |
|
|
| |
|
|
|
| | (.17 | ) | | | (.16 | ) | | | (.30 | ) | | | (.76 | ) | | | (.36 | ) |
|
|
| |
|
|
| |
|
|
| |
|
|
| |
|
|
|
| $ | 10.97 | | | $ | 9.90 | | | $ | 8.87 | | | $ | 10.72 | | | $ | 12.05 | |
|
|
| |
|
|
| |
|
|
| |
|
|
| |
|
|
|
| | 12.53 | % | | | 13.54 | % | | | (14.70 | )% | | | (4.75 | )% | | | 14.18 | % |
| | | | | | | | | | | | | | | | | | | |
| $ | 7,678 | | | $ | 8,679 | | | $ | 2,749 | | | $ | 4,272 | | | $ | 1,348 | |
| $ | 9,098 | | | $ | 4,090 | | | $ | 4,262 | | | $ | 2,685 | | | $ | 4,102 | |
| | | | | | | | | | | | | | | | | | | |
| | 1.10 | % | | | 1.24 | % | | | 1.23 | % | | | 1.29 | % | | | 1.24 | % |
| | 1.10 | % | | | 1.24 | % | | | 1.23 | % | | | 1.29 | % | | | 1.24 | % |
| | 1.41 | % | | | 1.86 | % | | | 1.93 | % | | | 2.39 | % | | | 2.11 | % |
See Notes to Financial Statements.
| | |
| Strategic Partners Asset Allocation Funds/Strategic Partners Moderate Growth Fund | | 79 |
| | | | |
| n MAIL | | n TELEPHONE | | n WEBSITE |
Gateway Center Three 100 Mulberry Street Newark, NJ 07102 | | (800) 225-1852 | | www.strategicpartners.com |
|
| PROXY VOTING |
| The Board of Trustees of the Fund has delegated to the Fund’s investment advisers the responsibility for voting any proxies and maintaining proxy recordkeeping with respect to the Fund. A description of these proxy voting policies and procedures is available without charge, upon request, by calling (800) 225-1852 or by visiting the Securities and Exchange Commission’s (the Commission) website at http://www.sec.gov. Information regarding how the Fund voted proxies relating to portfolio securities during the most recent 12-month period ended June 30, 2004, is available on the Fund’s website at http://www.prudential.com and on the Commission’s website at http:/www.sec.gov. |
|
| TRUSTEES |
David E.A. Carson • Robert F. Gunia • Robert E. La Blanc • Douglas H. McCorkindale •
Richard A. Redeker • Judy A. Rice • Robin B. Smith • Stephen G. Stoneburn •
Clay T. Whitehead |
|
| OFFICERS |
Judy A. Rice, President • Robert F. Gunia, Vice President • Grace C. Torres, Treasurer and Principal Financial and Accounting Officer • William V. Healey, Chief Legal Officer •
Deborah A. Docs, Secretary • Maryanne Ryan, Anti-Money Laundering Officer • Helene Gurian, Acting Anti-Money Laundering Compliance Officer • Lee D. Augsburger, Chief Compliance Officer |
| | | | |
| MANAGER | | Prudential Investments LLC | | Gateway Center Three
100 Mulberry Street
Newark, NJ 07102 |
|
INVESTMENT ADVISERS* (as of January 31, 2005) | | EARNEST Partners, LLC | | 75 14th Street, Suite 2300
Atlanta, GA 30309 |
|
| | | Jennison Associates LLC | | 466 Lexington Avenue
New York, NY 10017 |
|
| | | Pacific Investment
Management Company LLC | | 840 Newport Center Drive
Newport Beach, CA 92660 |
|
| | | Prudential Investment
Management, Inc. | | Gateway Center Two
100 Mulberry Street
Newark, NJ 07102 |
|
| | | Lazard Asset
Management LLC | | 30 Rockefeller Plaza
New York, NY 10112 |
|
| | | RS Investment
Management, L.P. | | 388 Market Street
Suite 1700
San Francisco, CA 94111 |
|
| DISTRIBUTOR | | Prudential Investment
Management Services LLC | | Gateway Center Three
100 Mulberry Street
Newark, NJ 07102 |
| |
* Investment Advisers are subject to change by the Manager.
| | | | |
| CUSTODIAN | | The Bank of New York | | One Wall Street
New York, NY 10286 |
|
| TRANSFER AGENT | | Prudential Mutual Fund
Services LLC | | PO Box 8098
Philadelphia, PA 19176 |
|
| INDEPENDENT REGISTERED PUBLIC ACCOUNTING FIRM | | KPMG LLP | | 757 Third Avenue
New York, NY 10017 |
|
| FUND COUNSEL | | Shearman & Sterling LLP | | 599 Lexington Avenue
New York, NY 10022 |
| | | | | | | | | | | | | | | | | | |
| Strategic Partners Moderate Growth Fund | | | | |
| Share Class | | | | A | | B | | C | | M | | R | | X | | Z | | |
NASDAQ | | | | PAMGX | | DMGBX | | PIMGX | | MDGWM | | MDGWR | | MDGWX | | PDMZX | | |
CUSIP | | | | 86276X889 | | 86276X871 | | 86276X863 | | 86276X814 | | 86276X780 | | 86276X798 | | 86276X855 | | |
| | | | | | | | | | | | | | | | | | | |
|
| An investor should consider the investment objectives, risks, and charges and expenses of the Fund carefully before investing. The prospectus for the Fund contains this and other information about the Fund. An investor may obtain a prospectus by visiting our website at www.strategicpartners.com or by calling (800) 225-1852. The prospectus should be read carefully before investing. |
|
| |
| E-DELIVERY |
| To receive your mutual fund documents on-line, go to www.icsdelivery.com/prudential/funds and enroll. Instead of receiving printed documents by mail, you will receive notification via e-mail when new materials are available. You can cancel your enrollment or change your e-mail address at any time by clicking on the change/cancel enrollment option at the icsdelivery website address. |
|
| SHAREHOLDER COMMUNICATIONS WITH TRUSTEES |
| Shareholders of the Fund can communicate directly with the Board of Trustees by writing to the Chair of the Board, Strategic Partners Moderate Growth Fund, Inc., P.O. Box 13964, Philadelphia, PA 19176. Shareholders can communicate directly with an individual Trustee by writing to that Trustee at Strategic Partners Moderate Growth Fund, Inc., P.O. Box 13964, Philadelphia, PA 19176. Such communications to the Board or individual Trustees are not screened before being delivered to the addressee. |
|
| AVAILABILITY OF QUARTERLY PORTFOLIO SCHEDULE |
| The Fund files its complete schedule of portfolio holdings with the Securities and Exchange Commission (the Commission) for the first and third quarters of each fiscal year on Form N-Q. The Fund’s Forms N-Q are available on the Commission’s website at http://www.sec.gov. The Fund’s Forms N-Q may also be reviewed and copied at the Commission’s Public Reference Room in Washington, D.C. Information on the operation of the Public Reference Room may be obtained by calling (800) SEC-0330 (732-0330). The Fund will provide a full list of its portfolio holdings as of the end of each fiscal quarter on its website at www.strategicpartners.com within 60 days after the end of the fiscal quarter. |
Mutual Funds:
| | | | |
| ARE NOT INSURED BY THE FDIC OR ANY FEDERAL GOVERNMENT AGENCY | | MAY LOSE VALUE | | ARE NOT A DEPOSIT OF OR GUARANTEED BY ANY BANK OR ANY BANK AFFILIATE |

| | | | | | | | | | | | | | | | | | |
| Strategic Partners Moderate Growth Fund | | | | | | | | | | |
| | | Share Class | | A | | B | | C | | M | | R | | X | | Z | | |
| | | NASDAQ | | PAMGX | | DMGBX | | PIMGX | | MDGWM | | MDGWR | | MDGWX | | PDMZX | | |
| | | CUSIP | | 86276X889 | | 86276X871 | | 86276X863 | | 86276X814 | | 86276X780 | | 86276X798 | | 86276X855 | | |
| | | | | | | | | | | | | | | | | | | |
MFSP504E4 IFS-A102104 Ed. 03/2005
SEMIANNUAL REPORT
JANUARY 31, 2005

STRATEGIC PARTNERS
ASSET ALLOCATION FUNDS
STRATEGIC PARTNERS
High Growth Fund
OBJECTIVE
Seeks long-term capital appreciation

This report is not authorized for distribution to prospective investors unless preceded or accompanied by a current prospectus.
The views expressed in this report and information about the Fund’s portfolio holdings are for the period covered by this report and are subject to change thereafter.
Dear Shareholder,
March 15, 2005
We hope that you find the semiannual report for the Strategic Partners High Growth Fund informative and useful. As a Strategic Partners Mutual Fund shareholder, you may be thinking where you can find additional growth opportunities. You could invest in last year’s top-performing asset class and hope that history repeats itself or you could stay in cash while waiting for the “right moment” to invest.
We believe it is wise to take advantage of developing domestic and global investment opportunities through a diversified portfolio of stock and bond mutual funds. A diversified asset allocation offers two advantages. It helps you manage downside risk by not being overly exposed to any particular asset class, plus it gives you a better opportunity to have at least some of your assets in the right place at the right time. Your financial professional can help you create a diversified investment plan that may include mutual funds that cover all the basic asset classes and reflects your personal investment profile and tolerance for risk.
Strategic Partners Mutual Funds gives you a wide range of choices that can help you make progress toward your financial goals. Our funds feature leading asset managers not just from a single company but from the entire investment industry.
Thank you for choosing Strategic Partners Mutual Funds.
Sincerely,

Judy A. Rice, President
Strategic Partners High Growth Fund
| | |
| Strategic Partners Asset Allocation Funds/Strategic Partners High Growth Fund | | 1 |
Your Fund’s Performance
Performance data quoted represent past performance. Past performance does not guarantee future results. The investment return and principal value of an investment will fluctuate so that an investor’s shares, when redeemed, may be worth more or less than their original cost. Current performance may be lower or higher than the past performance data quoted. An investor may obtain performance data current to the most recent month-end by visiting our website at www.strategicpartners.com or by calling (800) 225-1852. The maximum initial sales charge is 5.50% (Class A Shares).
| | | | | | | | | | | | |
| Cumulative Total Returns1 as of 1/31/05 | | | | | | | | | | | | |
| | | Six Months | | | One Year | | | Five Years | | | Since Inception2 | |
Class A | | 12.14 | % | | 8.38 | % | | 9.89 | % | | 42.02 | % |
Class B | | 11.65 | | | 7.47 | | | 5.85 | | | 35.61 | |
Class C | | 11.65 | | | 7.47 | | | 5.85 | | | 35.61 | |
Class M | | N/A | | | N/A | | | N/A | | | 6.22 | |
Class R | | N/A | | | N/A | | | N/A | | | 6.41 | |
Class X | | N/A | | | N/A | | | N/A | | | 6.31 | |
Class Z | | 12.24 | | | 8.62 | | | 11.37 | | | 44.40 | |
S&P 500 Index3 | | 8.15 | | | 6.22 | | | –8.55 | | | *** | |
Customized Blend4 | | 11.55 | | | 8.98 | | | 6.15 | | | **** | |
Lipper Multi-Cap Core Funds Average5 | | 9.43 | | | 6.08 | | | 6.54 | | | ***** | |
| | | | | | | | | | | | | |
| Average Annual Total Returns1 as of 12/31/04 | | | | | | | | | | |
| | | | | | One Year | | | Five Years | | | Since Inception2 | |
Class A | | | | | 7.71 | % | | 0.32 | % | | 5.41 | % |
Class B | | | | | 8.05 | | | 0.53 | | | 5.59 | |
Class C | | | | | 12.14 | | | 0.73 | | | 5.61 | |
Class M | | | | | N/A | | | N/A | | | N/A | |
Class R | | | | | N/A | | | N/A | | | N/A | |
Class X | | | | | N/A | | | N/A | | | N/A | |
Class Z | | | | | 14.25 | | | 1.75 | | | 6.68 | |
S&P 500 Index3 | | | | | 10.87 | | | –2.30 | | | 2.17 | |
Customized Blend4 | | | | | 14.98 | | | 0.91 | | | 4.95 | |
Lipper Multi-Cap Core Funds Average5 | | | | | 11.05 | | | 0.38 | | | 4.77 | |
The cumulative total returns do not reflect the deduction of applicable sales charges. If reflected, the applicable sales charges would reduce the cumulative total returns performance quoted. Class A shares are subject to a maximum front-end sales charge of 5.50%. Under certain circumstances, Class A shares may be subject to a contingent deferred sales charge (CDSC) of 1%. Class B and Class C shares are subject to a maximum CDSC of 5% and 1% respectively. Class M and Class X shares are subject to a maximum CDSC of 6%. Class R and Class Z shares are not subject to a sales charge.
| | |
| 2 | | Visit our website at www.strategicpartners.com |
1Source: Prudential Investments LLC and Lipper Inc. The average annual total returns take into account applicable sales charges. During certain periods shown, fee waivers and/or expense reimbursements were in effect. Without such fee waivers and expense reimbursements, the returns for the classes would have been lower. Class A, Class B, Class C, Class M, Class R, and Class X shares are subject to an annual distribution and service (12b-1) fee of up to 0.30%, 1.00%, 1.00%, 1.00%, 0.75%, and 1.00% respectively. Approximately seven years after purchase, Class B shares will automatically convert to Class A shares on a quarterly basis. Approximately eight years after purchase, Class M shares will automatically convert to Class A shares on a quarterly basis. Approximately ten years after purchase (eight years in the case of shares purchased prior to August 19, 1998), Class X shares will automatically convert to Class A shares on a quarterly basis. Class Z shares are not subject to a 12b-1 fee. The returns in the tables do not reflect the deduction of taxes that a shareholder would pay on Fund distributions or following the redemption of Fund shares.
2Inception dates: Class A, Class B, Class C, and Class Z, 11/18/98; Class M, Class R, and Class X, 10/04/04.
3The Standard & Poor’s 500 Composite Stock Price Index (S&P 500 Index) is an unmanaged index of 500 stocks of large U.S. public companies. It gives a broad look at how U.S. stock prices have performed.
4The Customized Benchmark for Strategic Partners High Growth Fund (Customized Blend) is a model portfolio consisting of the S&P Barra Value Index (25%), the S&P Barra Growth Index (25%), the Russell 2000 Value Index (15%), the Russell 2000 Growth Index (15%), and the Morgan Stanley Capital International Europe, Australasia, and Far East (MSCI EAFE) Index (20%). Each component of the Customized Blend is an unmanaged index generally considered as representing the performance of its asset class. The Customized Blend is intended to provide a theoretical comparison to the Fund’s performance, based on the amounts allocated to each asset class. The Customized Blend does not reflect deductions for any sales charges or operating expenses of a mutual fund.
5The Lipper Multi-Cap Core Funds Average (Lipper Average) represents returns based on the average return of all funds in the Lipper Multi-Cap Core Funds category for the periods noted. Funds in the Lipper Average invest in a variety of market capitalization ranges without concentrating 75% of their equity assets in any one market capitalization range over an extended period of time. Multi-cap funds typically have between 25% and 75% of their assets invested in companies with market capitalizations (on a three-year weighted basis) above 300% of the dollar-weighted median market capitalization of the 1,000 securities of the S&P SuperComposite 1500 Index. Multi-cap funds typically have an average price-to-earnings ratio, price-to-book ratio, and three-year sales-per-share growth value compared with the S&P SuperComposite 1500 Index.
Investors cannot invest directly in an index. The returns for the S&P 500 Index and the Customized Blend would be lower if they included the effects of sales charges, operating expenses of a mutual fund, or taxes. Returns for the Lipper Average reflect the deduction of operating expenses, but not sales charges or taxes. The Since Inception returns for the S&P 500 Index, the Customized Blend, and the Lipper Average are measured from the closest month-end to inception date, and not from the Fund’s actual inception date.
***S&P 500 Index Closest Month-End to inception cumulative total returns as of 1/31/05 are 11.18% for Classes A, B, C, and Z. S&P 500 Index Closest Month-End to inception cumulative total returns as of 1/31/05 are 6.57% for Classes M, R, and X.
****Customized Blend Closest Month-End to inception cumulative total returns as of 1/31/05 are 30.33% for Classes A, B, C, and Z. Customized Blend Closest Month-End to inception cumulative total returns as of 1/31/05 are 8.73% for Classes M, R, and X.
*****Lipper Average Closest Month-End to inception cumulative total returns as of 1/31/05 are 34.87% for Classes A, B, C, and Z. Lipper Average Closest Month-End to inception cumulative total returns as of 1/31/05 are 7.37% for Classes M, R, and X.
| | |
| Strategic Partners Asset Allocation Funds/Strategic Partners High Growth Fund | | 3 |
Your Fund’s Performance
Fund objective
The investment objective of the Strategic Partners High Growth Fund (the Fund) is long-term capital appreciation. There can be no assurance that the Fund will achieve its investment objective.
Please note that on or about March 31, 2005, the Fund intends to change its name to Strategic Partners Growth Allocation Fund and to change certain subadvisers for certain portions of the Fund’s portfolio.
Asset classes are classifications of investments
Stocks are shares of ownership in a firm. Owners share in the profits after debts are paid and in the firm’s appreciation in value. Generally, the prices of stocks vary with investors’ estimates of a firm’s earnings prospects, including the impact of broader economic conditions.
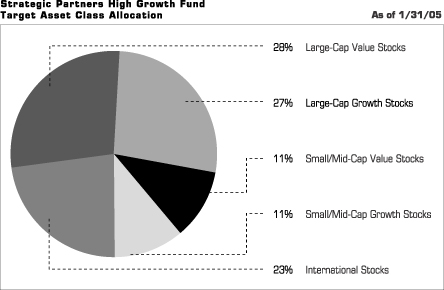
| | |
| 4 | | Visit our website at www.strategicpartners.com |
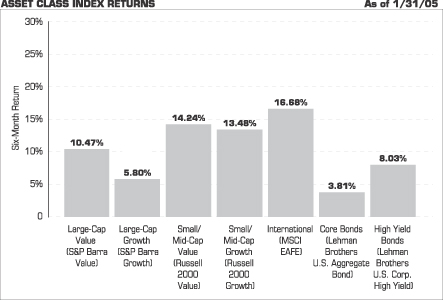
Source: Lipper Inc.
The chart above shows the total returns for six months ended January 31, 2005, of various securities indexes that are generally considered representative of broad market sectors and does not reflect a mutual fund’s expenses. The performance cited does not represent the performance of the Strategic Partners High Growth Fund. Past performance is not indicative of future results. Investors cannot invest directly in an index.
The S&P Barra Value Index contains those securities in the S&P 500 Index with higher book-to- price ratios.
The S&P Barra Growth Index contains those securities in the S&P 500 Index with lower book-to- price ratios.
The Russell 2000 Value Index contains those securities in the Russell 2000 Index with a below-average growth orientation. Companies in this index generally have low price-to-book and price-to-earnings ratios, higher dividend yields, and lower forecasted growth values.
The Russell 2000 Growth Index contains those securities in the Russell 2000 Index with an above-average growth orientation. Companies in this index tend to exhibit higher price-to-book and price-to-earnings ratios, lower dividend yields, and higher forecasted growth values.
The Morgan Stanley Capital International Europe, Australasia, and Far East Index (MSCI EAFE Index) is an unmanaged, weighted index that reflects stock price movements in Europe, Australasia, and the Far East. It gives a broad look at how foreign stock prices have performed.
The Lehman Brothers U.S. Aggregate Bond Index is an unmanaged index of investment-grade securities issued by the U.S. government and its agencies, and by corporations with between 1 and 10 years remaining to maturity. It gives a broad look at how short- and intermediate-term bonds have performed.
The Lehman Brothers U.S. Corporate High Yield Index is an unmanaged index of fixed-rate, noninvestment-grade debt securities with at least one year remaining to maturity. The Lehman Brothers U.S. Corporate High Yield Index gives a broad look at how high yield (“junk”) bonds have performed.
| | |
| Strategic Partners Asset Allocation Funds/Strategic Partners High Growth Fund | | 5 |
Fees and Expenses (Unaudited)
As a shareholder of the Fund, you incur two types of costs: (1) transaction costs, including sales charges (loads) on purchase payments and redemptions, as applicable, and (2) ongoing costs, including management fees, distribution and/or service (12b-1) fees, and other Fund expenses, as applicable. This example is intended to help you understand your ongoing costs (in dollars) of investing in the Fund and to compare these costs with the ongoing costs of investing in other mutual funds.
The example is based on an investment of $1,000 invested on August 1, 2004, at the beginning of the period, and held through the six-month period ended January 31, 2005.
The Fund may charge additional fees to holders of certain accounts that are not included in the expenses shown in the table. These fees apply to Individual Retirement Accounts (IRAs), Section 403(b) accounts, and Section 529 plan accounts. As of the close of the six months covered by the table, IRA fees included a setup fee of $5, a maintenance fee of up to $36 annually ($18 for the six-month period), and a termination fee of $10. Section 403(b) accounts and Section 529 plan accounts are each charged an annual $25 fiduciary maintenance fee ($12.50 for the six-month period). Some of the fees vary in amount, or are waived, based on your total account balance or the number of JennisonDryden or Strategic Partners funds, including the Fund, that you own. You should consider the additional fees that were charged to your Fund account over the six-month period when you estimate the total ongoing expenses paid over the period and the impact of these fees on your ending account value, as these additional expenses are not reflected in the information provided in the expense table. Additional fees have the effect of reducing investment returns.
Actual Expenses
The first line for each share class in the following table provides information about actual account values and actual expenses. You may use the information on this line, together with the amount you invested, to estimate the expenses that you paid over the period. Simply divide your account value by $1,000 (for example, an $8,600 account value ÷ $1,000 = 8.6), then multiply the result by the number in the first line under the heading “Expenses Paid During the Six-Month Period” to estimate the expenses you paid on your account during this period.
Hypothetical Example for Comparison Purposes
The second line for each share class in the following table provides information about hypothetical account values and hypothetical expenses based on the Fund’s actual expense ratio and an assumed rate of return of 5% per year before expenses, which is not the Fund’s actual return. The hypothetical account values and expenses may not
| | |
| 6 | | Visit our website at www.strategicpartners.com |
be used to estimate the actual ending account balance or expenses you paid for the period. You may use this information to compare the ongoing costs of investing in the Fund and other funds. To do so, compare this 5% hypothetical example with the 5% hypothetical examples that appear in the shareholder reports of the other funds.
Please note that the expenses shown in the table are meant to highlight your ongoing costs only, and do not reflect any transactional costs such as sales charges (loads). Therefore the second line for each share class in the table is useful in comparing ongoing costs only, and will not help you determine the relative total costs of owning different funds. In addition, if these transactional costs were included, your costs would have been higher.
Classes M, R, and X have been in existence for less than six months, therefore no expenses are presented for these classes. Classes M, R, and X commenced October 4, 2004.
| | | | | | | | | | | | | | |
Strategic Partners
High Growth Fund | | Beginning Account
Value
August 1, 2004 | | Ending Account
Value January 31, 2005 | | Annualized
Expense Ratio
Based on the
Six-Month Period | | | Expenses Paid
During the Six-
Month Period* |
| | | | | | | | | | | | | | | |
| Class A | | Actual | | $ | 1,000 | | $ | 1,121 | | 1.38 | % | | $ | 7.38 |
| | | Hypothetical | | $ | 1,000 | | $ | 1,018 | | 1.38 | % | | $ | 7.02 |
| | | | | | | | | | | | | | | |
| Class B | | Actual | | $ | 1,000 | | $ | 1,116 | | 2.13 | % | | $ | 11.36 |
| | | Hypothetical | | $ | 1,000 | | $ | 1,014 | | 2.13 | % | | $ | 10.81 |
| | | | | | | | | | | | | | | |
| Class C | | Actual | | $ | 1,000 | | $ | 1,116 | | 2.13 | % | | $ | 11.36 |
| | | Hypothetical | | $ | 1,000 | | $ | 1,014 | | 2.13 | % | | $ | 10.81 |
| | | | | | | | | | | | | | | |
| Class Z | | Actual | | $ | 1,000 | | $ | 1,122 | | 1.13 | % | | $ | 6.04 |
| | | Hypothetical | | $ | 1,000 | | $ | 1,020 | | 1.13 | % | | $ | 5.75 |
| | | | | | | | | | | | | | | |
* Fund expenses for each share class are equal to the annualized expense ratio for each share class (provided in the table), multiplied by the average account value over the period, multiplied by the 184 days in the six-month period ended January 31, 2005, and divided by the 365 days in the Fund’s fiscal year ending July 31, 2005 (to reflect the six-month period).
| | |
| Strategic Partners Asset Allocation Funds/Strategic Partners High Growth Fund | | 7 |
This Page Intentionally Left Blank
Portfolio of Investments
as of January 31, 2005 (Unaudited)
| | | | | |
| Shares | | Description | | Value (Note 1) |
| | | | | | |
LONG-TERM INVESTMENTS 94.3% | | | |
COMMON STOCKS 94.1% | | | |
| |
Aerospace & Defense 1.1% | | | |
| 6,430 | | Cobham PLC (United Kingdom) | | $ | 162,025 |
| 7,700 | | DRS Technologies, Inc.(a) | | | 312,620 |
| 400 | | Empresa Brasileira de Aeronautica SA ADR (Brazil) | | | 12,740 |
| 4,490 | | Engineered Support Systems, Inc. | | | 260,465 |
| 11,500 | | Lockheed Martin Corp. | | | 664,814 |
| 8,950 | | Mercury Computer Systems, Inc.(a) | | | 277,182 |
| 8,350 | | Moog, Inc. (Class A shares)(a) | | | 363,142 |
| 11,500 | | Northrop Grumman Corp. | | | 596,620 |
| | | | |
|
|
| | | | | | 2,649,608 |
| |
Air Freight & Logistics 0.4% | | | |
| 13,000 | | United Parcel Service, Inc. (Class B Shares) | | | 970,840 |
| |
Auto Components | | | |
| 15,580 | | IMPCO Technologies, Inc.(a) | | | 90,831 |
| |
Automobiles 1.0% | | | |
| 93,600 | | Nissan Motor Co., Ltd. (Japan) | | | 990,692 |
| 22,800 | | Volkswagen AG (Germany) | | | 1,095,216 |
| 6,400 | | Winnebago Industries, Inc. | | | 220,736 |
| | | | |
|
|
| | | | | | 2,306,644 |
| |
Beverages 0.7% | | | |
| 84,800 | | Diageo PLC (United Kingdom) | | | 1,157,174 |
| 14,912 | | Heineken NV (Netherlands) | | | 510,456 |
| | | | |
|
|
| | | | | | 1,667,630 |
| |
Biotechnology 1.7% | | | |
| 19,600 | | Amgen, Inc.(a) | | | 1,219,904 |
| 28,100 | | Genentech, Inc.(a) | | | 1,340,651 |
| 20,400 | | Gilead Sciences, Inc.(a) | | | 675,240 |
| 18,100 | | Medimmune, Inc.(a) | | | 428,156 |
| 16,100 | | Serologicals Corp.(a) | | | 380,604 |
| | | | |
|
|
| | | | | | 4,044,555 |
| |
Building Products 0.4% | | | |
| 22,577 | | CRH PLC (Ireland) | | | 598,317 |
| 100 | | CRH PLC (United Kingdom) | | | 2,641 |
| 9,800 | | Watsco, Inc. | | | 339,178 |
| | | | |
|
|
| | | | | | 940,136 |
See Notes to Financial Statements.
| | |
| Strategic Partners Asset Allocation Funds/Strategic Partners High Growth Fund | | 9 |
Portfolio of Investments
as of January 31, 2005 (Unaudited) Cont’d.
| | | | | |
| Shares | | Description | | Value (Note 1) |
| | | | | | |
| |
Capital Markets 3.1% | | | |
| 28,800 | | Bank of New York Co., Inc. (The) | | $ | 855,648 |
| 47,600 | | Charles Schwab Corp. (The) | | | 535,024 |
| 9,300 | | Goldman Sachs Group, Inc. | | | 1,003,005 |
| 14,100 | | Lehman Brothers Holdings, Inc. | | | 1,285,779 |
| 17,600 | | Mellon Financial Corp. | | | 516,560 |
| 35,200 | | Merrill Lynch & Co., Inc. | | | 2,114,464 |
| 66,000 | | Nomura Holdings, Inc. (Japan) | | | 868,262 |
| | | | |
|
|
| | | | | | 7,178,742 |
| |
Chemicals 1.4% | | | |
| 14,900 | | E.I. Du Pont de Nemours & Co. | | | 708,644 |
| 50,600 | | Mosaic Co. (The)(a) | | | 834,901 |
| 4,400 | | Scotts Co. (The) (Class A shares)(a) | | | 299,024 |
| 20,000 | | Shin-Etsu Chemical Co. Ltd. (Japan) | | | 792,615 |
| 8,900 | | Takeda Chemical Industries Ltd. (Japan) | | | 423,256 |
| 4,300 | | Valspar Corp. | | | 210,700 |
| | | | |
|
|
| | | | | | 3,269,140 |
| |
Commercial Banks 4.7% | | | |
| 6,900 | | Astoria Financial Corp. | | | 259,716 |
| 28,438 | | Bank of America Corp. | | | 1,318,670 |
| 26,900 | | Bank of Ireland (Ireland) | | | 424,292 |
| 15,800 | | Bank of Ireland (United Kingdom) | | | 251,272 |
| 10,200 | | BankUnited Financial Corp. (Class A shares)(a) | | | 297,636 |
| 113,400 | | Barclays PLC (United Kingdom) | | | 1,244,802 |
| 12,400 | | Comerzbank AG (Germany) | | | 263,473 |
| 34,290 | | Credit Agricole SA (France) | | | 1,021,366 |
| 34,600 | | Den Norske Bank (Norway) | | | 317,231 |
| 3,900 | | Hibernia Corp. (Class A shares) | | | 102,648 |
| 97,584 | | HSBC Holdings PLC (United Kingdom) | | | 1,616,907 |
| 12,930 | | Nara Bancorp, Inc. | | | 257,954 |
| 8,800 | | Oriental Financial Group (Puerto Rico) | | | 248,160 |
| 80,250 | | Overseas-Chinese Banking Corp., Ltd. (Singapore) | | | 671,774 |
| 8,060 | | PrivateBancorp., Inc. | | | 263,562 |
| 46,200 | | Royal Bank of Scotland Group PLC (United Kingdom) | | | 1,534,496 |
| 8,660 | | Southwest Bancorp of Texas, Inc. | | | 171,208 |
| 77,000 | | Sumitomo Trust & Banking Co., Ltd. (The) (Japan) | | | 523,232 |
| | | | |
|
|
| | | | | | 10,788,399 |
See Notes to Financial Statements.
| | |
| 10 | | Visit our website at www.strategicpartners.com |
| | | | | |
| Shares | | Description | | Value (Note 1) |
| | | | | | |
| |
Commercial Services & Supplies 2.8% | | | |
| 15,200 | | Administaff, Inc.(a) | | $ | 221,768 |
| 23,600 | | Allied Waste Industries, Inc.(a) | | | 196,116 |
| 36,300 | | Cendant Corp. | | | 854,865 |
| 7,200 | | Global Payments, Inc. | | | 412,488 |
| 6,400 | | Kelly Services, Inc. (Class A shares) | | | 186,240 |
| 28,890 | | Kforce, Inc.(a) | | | 319,812 |
| 6,250 | | Laureate Education, Inc.(a) | | | 277,250 |
| 4,740 | | McGrath RentCorp | | | 203,630 |
| 9,350 | | Navigant Consulting, Inc.(a) | | | 223,746 |
| 34,000 | | PHH Corp.(a) | | | 748,000 |
| 11,520 | | Providence Service Corp. (The)(a) | | | 233,856 |
| 191,100 | | Rentokil Initial PLC (United Kingdom) | | | 547,859 |
| 9,900 | | Republic Services, Inc. | | | 326,403 |
| 7,900 | | School Specialty, Inc.(a) | | | 307,231 |
| 20,010 | | Scientific Games Corp.(a) | | | 514,657 |
| 29,000 | | Waste Management, Inc. | | | 841,000 |
| | | | |
|
|
| | | | | | 6,414,921 |
| |
Communication Equipment 2.7% | | | |
| 34,900 | | Avaya, Inc.(a) | | | 500,815 |
| 66,300 | | Cisco Systems, Inc.(a) | | | 1,196,052 |
| 20,040 | | Harmonic, Inc.(a) | | | 228,456 |
| 112,700 | | Nokia Oyj (Finland) | | | 1,726,194 |
| 173,900 | | Nortel Networks Corp. (Canada)(a) | | | 565,175 |
| 35,000 | | Qualcomm, Inc. | | | 1,303,400 |
| 7,000 | | Research In Motion Ltd.(a) | | | 499,030 |
| 20,080 | | Symmetricom, Inc.(a) | | | 195,378 |
| | | | |
|
|
| | | | | | 6,214,500 |
| |
Computer & Peripherals 2.5% | | | |
| 22,500 | | Apple Computer, Inc.(a) | | | 1,730,249 |
| 32,700 | | Dell, Inc.(a) | | | 1,365,552 |
| 107,000 | | Fujitsu Ltd. (Japan) | | | 622,628 |
| 7,900 | | International Business Machines Corp. | | | 738,018 |
| 3,800 | | Lexmark International, Inc. (Class A Shares)(a) | | | 316,730 |
| 9,260 | | M-Systems Flash Disk Pioneers Ltd.(a) | | | 186,219 |
| 13,970 | | Merge Technologies, Inc.(a) | | | 259,144 |
| 11,510 | | Optimal Robotics Group Corp. (Canada)(a) | | | 153,889 |
| 28,600 | | Seagate Technology (Cayman Islands) | | | 483,912 |
| | | | |
|
|
| | | | | | 5,856,341 |
See Notes to Financial Statements.
| | |
| Strategic Partners Asset Allocation Funds/Strategic Partners High Growth Fund | | 11 |
Portfolio of Investments
as of January 31, 2005 (Unaudited) Cont’d.
| | | | | |
| Shares | | Description | | Value (Note 1) |
| | | | | | |
| |
Consumer Finance 1.0% | | | |
| 34,300 | | American Express Co. | | $ | 1,829,905 |
| 22,500 | | MBNA Corp. | | | 598,050 |
| | | | |
|
|
| | | | | | 2,427,955 |
| |
Distributors 0.1% | | | |
| 11,930 | | Beacon Roofing Supply, Inc.(a) | | | 238,600 |
| |
Diversified Financial Services 4.7% | | | |
| 9,200 | | Accredited Home Lenders Holding Co.(a) | | | 446,936 |
| 7,100 | | Acom Co., Ltd. (Japan) | | | 499,618 |
| 4,500 | | Aiful Corp. | | | 511,527 |
| 24,600 | | AmeriCredit Corp.(a) | | | 603,930 |
| 40,400 | | Citigroup, Inc. | | | 1,981,620 |
| 33,120 | | Credit Suisse Group (Switzerland) | | | 1,333,439 |
| 19,200 | | Eaton Vance Corp. | | | 480,576 |
| 62,600 | | J.P. Morgan Chase & Co. | | | 2,336,857 |
| 13,500 | | Jefferies Group, Inc. | | | 526,500 |
| 8,380 | | Marlin Business Services, Inc.(a) | | | 152,516 |
| 25,200 | | Principal Financial Group | | | 1,022,616 |
| 13,300 | | Raymond James Financial, Inc. | | | 414,561 |
| 9,650 | | Saxon Capital, Inc. | | | 208,923 |
| 5,340 | | Signature Bank(a) | | | 162,496 |
| 1,500 | | Student Loan Corp. | | | 270,990 |
| | | | |
|
|
| | | | | | 10,953,105 |
| |
Diversified Telecommunication Services 1.8% | | | |
| 11,700 | | Alltel Corp. | | | 643,968 |
| 6,680 | | Applied Signal Technology, Inc. | | | 196,860 |
| 68,100 | | Deutsche Telekom AG (Germany) | | | 1,472,723 |
| 9,650 | | Safenet, Inc.(a) | | | 327,521 |
| 40,100 | | SBC Communications, Inc. | | | 952,776 |
| 14,800 | | Verizon Communications, Inc. | | | 526,732 |
| | | | |
|
|
| | | | | | 4,120,580 |
| |
Electric Utilities 2.3% | | | |
| 14,200 | | E.ON AG (Germany) | | | 1,272,035 |
| 5,400 | | E.ON AG Sponsored ADR | | | 482,706 |
| 59,500 | | Enel SpA | | | 559,216 |
| 17,500 | | Exelon Corp. | | | 774,375 |
| 12,550 | | PNM Resources, Inc. | | | 316,637 |
| 121,000 | | Terna SpA (Italy) | | | 333,992 |
See Notes to Financial Statements.
| | |
| 12 | | Visit our website at www.strategicpartners.com |
| | | | | |
| Shares | | Description | | Value (Note 1) |
| | | | | | |
| 23,400 | | TXU Corp. | | $ | 1,619,280 |
| | | | |
|
|
| | | | | | 5,358,241 |
| |
Electrical Equipment 0.8% | | | |
| 47,000 | | Kesa Electricals PLC (United Kingdom) | | | 283,226 |
| 35,147 | | Koninklijke (Royal) Philips Electronics NV ADR (Netherlands) | | | 919,066 |
| 7,000 | | Schneider Electric SA (France) | | | 534,716 |
| | | | |
|
|
| | | | | | 1,737,008 |
| |
Electronic Equipment & Instruments 2.6% | | | |
| 59,700 | | Agilent Technologies, Inc.(a) | | | 1,319,967 |
| 23,650 | | Artesyn Technologies, Inc.(a) | | | 240,757 |
| 9,240 | | BEI Technologies, Inc. | | | 260,476 |
| 3,480 | | Ceradyne, Inc.(a) | | | 117,380 |
| 23,500 | | Checkpoint Systems, Inc.(a) | | | 365,660 |
| 13,100 | | Fanuc Ltd. (Japan) | | | 885,109 |
| 7,050 | | Faro Technologies, Inc.(a) | | | 203,322 |
| 14,500 | | FLIR Systems, Inc.(a) | | | 883,775 |
| 15,900 | | Murata Manufacturing Co. Ltd. (Japan) | | | 831,463 |
| 7,400 | | NEC Electronics Corp. (Japan) | | | 374,810 |
| 9,750 | | Radisys Corp.(a) | | | 170,138 |
| 29,400 | | Sanmina-SCI Corp.(a) | | | 181,692 |
| 37,880 | | SRS Labs, Inc.(a) | | | 196,597 |
| | | | |
|
|
| | | | | | 6,031,146 |
| |
Energy Equipment & Services 2.3% | | | |
| 5,150 | | Cal Dive International, Inc.(a) | | | 225,055 |
| 8,900 | | ENSCO International, Inc. | | | 304,647 |
| 33,600 | | GlobalSantaFe Corp. | | | 1,188,096 |
| 20,300 | | Halliburton Co. | | | 834,939 |
| 32,800 | | Schlumberger, Ltd. | | | 2,231,712 |
| 16,800 | | Superior Energy Services, Inc.(a) | | | 267,456 |
| 5,600 | | Unit Corp.(a) | | | 204,624 |
| | | | |
|
|
| | | | | | 5,256,529 |
| |
Food & Staples Retailing 1.8% | | | |
| 10,800 | | Carrefour SA (France) | | | 556,798 |
| 29,960 | | Cosi, Inc.(a) | | | 179,760 |
| 12,100 | | Costco Wholesale Corp. | | | 571,967 |
| 95,500 | | Kroger Co. (The)(a) | | | 1,633,050 |
| 14,300 | | Whole Foods Market, Inc. | | | 1,278,706 |
| | | | |
|
|
| | | | | | 4,220,281 |
See Notes to Financial Statements.
| | |
| Strategic Partners Asset Allocation Funds/Strategic Partners High Growth Fund | | 13 |
Portfolio of Investments
as of January 31, 2005 (Unaudited) Cont’d.
| | | | | |
| Shares | | Description | | Value (Note 1) |
| | | | | | |
| |
Food Products 1.6% | | | |
| 36,200 | | Cadbury Schweppes PLC, ADR (United Kingdom) | | $ | 1,314,060 |
| 61,100 | | Cadbury Schweppes PLC, ADR (United Kingdom) | | | 547,969 |
| 2,900 | | Nestle SA | | | 761,296 |
| 115,700 | | Unilever PLC (United Kingdom) | | | 1,099,837 |
| | | | |
|
|
| | | | | | 3,723,162 |
| |
Gas Utilities 0.1% | | | |
| 11,400 | | Oneok, Inc. | | | 315,780 |
| |
Health Care Equipment & Supplies 1.7% | | | |
| 14,950 | | Abaxis, Inc.(a) | | | 202,722 |
| 4,450 | | Advanced Neuromodulation Systems, Inc.(a) | | | 175,820 |
| 8,200 | | Alcon, Inc. (Switzerland) | | | 649,440 |
| 10,300 | | Chattem, Inc.(a) | | | 371,521 |
| 11,060 | | Closure Medical Corp.(a) | | | 219,430 |
| 10,900 | | Cooper Cos., Inc. | | | 836,029 |
| 37,200 | | Encore Medical Corp.(a) | | | 209,808 |
| 2,700 | | Intuitive Surgical, Inc.(a) | | | 107,730 |
| 4,880 | | Laserscope(a) | | | 144,204 |
| 10,200 | | Lifeline Systems, Inc.(a) | | | 278,358 |
| 45,450 | | Orthovita, Inc.(a) | | | 174,074 |
| 7,750 | | PolyMedica Corp. | | | 290,083 |
| 43,050 | | Spectranetics Corp.(a) | | | 266,910 |
| 1,700 | | St. Jude Medical, Inc.(a) | | | 66,776 |
| | | | |
|
|
| | | | | | 3,992,905 |
| |
Health Care Providers & Services 3.9% | | | |
| 13,300 | | Accredo Health, Inc.(a) | | | 396,074 |
| 11,100 | | America Service Group, Inc.(a) | | | 304,473 |
| 18,200 | | American Healthways, Inc.(a) | | | 567,476 |
| 6,400 | | AMERIGROUP Corp.(a) | | | 263,104 |
| 18,000 | | Caremark Rx, Inc.(a) | | | 703,800 |
| 5,200 | | Chemed Corp. | | | 372,424 |
| 11,700 | | Cigna Corp. | | | 938,925 |
| 13,300 | | Covance, Inc.(a) | | | 565,250 |
| 15,400 | | Express Scripts, Inc.(a) | | | 1,142,526 |
| 7,750 | | Kindred Healthcare, Inc.(a) | | | 212,273 |
| 10,460 | | LabOne, Inc.(a) | | | 350,933 |
| 11,695 | | Medco Health Solutions, Inc.(a) | | | 497,856 |
| 15,100 | | Pharmaceutical Product Development, Inc.(a) | | | 625,895 |
| 100 | | Priority Healthcare Corp. (Class B shares)(a) | | | 2,306 |
See Notes to Financial Statements.
| | |
| 14 | | Visit our website at www.strategicpartners.com |
| | | | | |
| Shares | | Description | | Value (Note 1) |
| | | | | | |
| 12,000 | | UnitedHealth Group, Inc. | | $ | 1,066,800 |
| 8,300 | | WellPoint, Inc.(a) | | | 1,008,450 |
| | | | |
|
|
| | | | | | 9,018,565 |
| |
Hotels, Restaurants & Leisure 1.3% | | | |
| 9,400 | | Brinker International, Inc.(a) | | | 353,534 |
| 7,800 | | CEC Entertainment, Inc.(a) | | | 305,292 |
| 20,300 | | McDonald’s Corp. | | | 657,517 |
| 9,050 | | RARE Hospitality International, Inc.(a) | | | 285,075 |
| 10,000 | | Sonic Corp.(a) | | | 318,400 |
| 20,400 | | Starbucks Corp.(a) | | | 1,101,600 |
| | | | |
|
|
| | | | | | 3,021,418 |
| |
Household Durables 1.9% | | | |
| 15,100 | | Harman International Industries, Inc. | | | 1,836,915 |
| 19,800 | | Hovnanian Enterprises, Inc. (Class A shares)(a) | | | 1,034,352 |
| 9,200 | | Meritage Corp.(a) | | | 594,780 |
| 13,800 | | Snap-On, Inc. | | | 456,918 |
| 8,300 | | Standard Pacific Corp. | | | 552,199 |
| | | | |
|
|
| | | | | | 4,475,164 |
| |
Household Products 0.7% | | | |
| 12,600 | | Kimberly-Clark Corp. | | | 825,426 |
| 15,800 | | Procter & Gamble Co. | | | 841,034 |
| | | | |
|
|
| | | | | | 1,666,460 |
| |
Industrial Conglomerates 2.9% | | | |
| 99,400 | | General Electric Co. | | | 3,591,322 |
| 8,300 | | Phelps Dodge Corp. | | | 799,290 |
| 14,400 | | Siemens AG (Germany) | | | 1,145,038 |
| 34,600 | | Tyco International Ltd. (Bermuda) | | | 1,250,444 |
| | | | |
|
|
| | | | | | 6,786,094 |
| |
Insurance 4.1% | | | |
| 13,950 | | Affirmative Insurance Holdings, Inc. | | | 224,316 |
| 13,350 | | American International Group, Inc. | | | 884,972 |
| 7,100 | | Commerce Group, Inc. | | | 463,701 |
| 5,450 | | Delphi Financial Group (Class A shares) | | | 244,923 |
| 24,100 | | Genworth Financial, Inc. | | | 639,373 |
| 9,310 | | Infinity Property & Casualty Corp. | | | 304,903 |
| 14,700 | | Loews Corp. | | | 999,600 |
| 10,100 | | MBIA, Inc. | | | 603,374 |
See Notes to Financial Statements.
| | |
| Strategic Partners Asset Allocation Funds/Strategic Partners High Growth Fund | | 15 |
Portfolio of Investments
as of January 31, 2005 (Unaudited) Cont’d.
| | | | | |
| Shares | | Description | | Value (Note 1) |
| | | | | | |
| 9,300 | | Philadelphia Consolidated Holding Corp.(a) | | $ | 623,751 |
| 5,100 | | Protective Life Corp. | | | 209,916 |
| 100,800 | | Prudential Corp. PLC (United Kingdom) | | | 874,546 |
| 13,500 | | Swiss Reinsurance Co. (Switzerland) | | | 923,475 |
| 25,942 | | The St. Paul Travelers Cos., Inc. | | | 973,863 |
| 25,950 | | Tower Group, Inc. | | | 304,653 |
| 16,500 | | XL Capital, Ltd. (Class A shares) (Cayman Islands) | | | 1,233,869 |
| | | | |
|
|
| | | | | | 9,509,235 |
| |
Internet & Catalog Retail 0.8% | | | |
| 23,800 | | eBay, Inc.(a) | | | 1,939,700 |
| |
Internet Software & Services 2.7% | | | |
| 10,550 | | Ask Jeeves, Inc.(a) | | | 299,198 |
| 35,900 | | Digitas, Inc.(a) | | | 374,796 |
| 5,340 | | Equinix, Inc.(a) | | | 223,960 |
| 9,600 | | Google Inc (Class A shares)(a) | | | 1,878,048 |
| 6,040 | | InfoSpace, Inc.(a) | | | 285,148 |
| 11,090 | | j2 Global Communications, Inc.(a) | | | 360,203 |
| 25,210 | | Keynote Systems, Inc.(a) | | | 314,369 |
| 14,110 | | RADVision Ltd. (Israel)(a) | | | 207,417 |
| 7,050 | | RADWARE Ltd. (Israel)(a) | | | 171,950 |
| 17,080 | | Valueclick, Inc.(a) | | | 225,968 |
| 54,900 | | Yahoo!, Inc.(a) | | | 1,933,029 |
| | | | |
|
|
| | | | | | 6,274,086 |
| |
IT Services 0.3% | | | |
| 28,900 | | Accenture Ltd. (Bermuda)(a) | | | 752,845 |
| |
Leisure Equipment & Products 0.2% | | | |
| 20,230 | | K2, Inc.(a) | | | 284,434 |
| 6,900 | | Mikohn Gaming Corp.(a) | | | 69,000 |
| | | | |
|
|
| | | | | | 353,434 |
| |
Machinery 0.3% | | | |
| 9,100 | | Deere & Co. | | | 631,813 |
| |
Media 2.0% | | | |
| 17,640 | | CNET Networks, Inc.(a) | | | 194,040 |
| 5,300 | | DIRECTV Group, Inc. (The)(a) | | | 79,765 |
| 17,170 | | Image Entertainment, Inc.(a) | | | 97,869 |
| 7,850 | | Lagardere SA (France) | | | 592,483 |
| 37,078 | | News Corp., Inc. (Class A shares) | | | 630,326 |
See Notes to Financial Statements.
| | |
| 16 | | Visit our website at www.strategicpartners.com |
| | | | | |
| Shares | | Description | | Value (Note 1) |
| | | | | | |
| 8,000 | | Scholastic Corp.(a) | | $ | 274,000 |
| 21,100 | | Sinclair Broadcast Group, Inc. (Class A shares) | | | 173,653 |
| 45,500 | | Sirius Satellite Radio, Inc.(a) | | | 301,210 |
| 15,300 | | Univision Communications, Inc. (Class A shares)(a) | | | 417,843 |
| 18,454 | | Viacom, Inc. (Class B shares) | | | 689,072 |
| 27,300 | | Vivendi Universal SA (France)(a) | | | 863,695 |
| 10,700 | | XM Satellite Radio Holdings, Inc. (Class A Shares)(a) | | | 341,437 |
| | | | |
|
|
| | | | | | 4,655,393 |
| |
Metals & Mining 0.3% | | | |
| 21,900 | | Inco Ltd. (Canada)(a) | | | 720,729 |
| 2,300 | | Rio Tinto PLC (United Kingdom) | | | 71,577 |
| | | | |
|
|
| | | | | | 792,306 |
| |
Multi-Utilities & Unregulated Power 0.8% | | | |
| 12,400 | | Dominion Resources, Inc. | | | 860,312 |
| 27,800 | | Sempra Energy | | | 1,034,716 |
| | | | |
|
|
| | | | | | 1,895,028 |
| |
Multiline Retail 1.0% | | | |
| 125,600 | | Marks & Spencer Group PLC (United Kingdom) | | | 855,187 |
| 29,300 | | Target Corp. | | | 1,487,561 |
| | | | |
|
|
| | | | | | 2,342,748 |
| |
Office Electronics 0.5% | | | |
| 78,200 | | Xerox Corp.(a) | | | 1,241,816 |
| |
Oil & Gas 8.0% | | | |
| 78,717 | | BP PLC (United Kingdom) | | | 776,488 |
| 21,700 | | Cabot Oil & Gas Corp. | | | 1,021,636 |
| 33,000 | | Chesapeake Energy Corp. | | | 579,810 |
| 55,000 | | ENI S.p.A (Italy) | | | 1,336,399 |
| 9,100 | | ENI S.p.A ADR (Italy) | | | 1,112,020 |
| 9,600 | | ExxonMobil Corp. | | | 495,360 |
| 46,460 | | Grey Wolf, Inc.(a) | | | 246,238 |
| 12,000 | | Kerr-McGee Corp. | | | 741,000 |
| 6,340 | | Maverick Tube Corp.(a) | | | 215,940 |
| 24,200 | | Nexen, Inc. (Canada) | | | 1,005,268 |
| 21,200 | | Occidental Petroleum Corp. | | | 1,237,656 |
| 11,620 | | Oil States International, Inc.(a) | | | 221,361 |
| 15,890 | | Patterson-UTI Energy, Inc. | | | 309,061 |
| 36,000 | | Royal Dutch Petroleum Co. (Netherlands) | | | 2,090,634 |
| 41,100 | | Statoil ASA (Norway) | | | 624,271 |
See Notes to Financial Statements.
| | |
| Strategic Partners Asset Allocation Funds/Strategic Partners High Growth Fund | | 17 |
Portfolio of Investments
as of January 31, 2005 (Unaudited) Cont’d.
| | | | | |
| Shares | | Description | | Value (Note 1) |
| | | | | | |
| 52,300 | | Suncor Energy, Inc. (Canada) | | $ | 1,673,600 |
| 21,500 | | Swift Energy Co.(a) | | | 650,805 |
| 215,000 | | Tokyo Gas Co. Ltd. (Japan) | | | 889,469 |
| 7,110 | | Total SA (Class B shares) (France) | | | 1,524,625 |
| 17,333 | | Total SA ADR (France) | | | 1,864,164 |
| | | | |
|
|
| | | | | | 18,615,805 |
| |
Paper & Forest Products 0.8% | | | |
| 21,300 | | Georgia-Pacific Corp. | | | 683,730 |
| 14,500 | | International Paper Co. | | | 567,675 |
| 44,500 | | Stora Enso Oyj (Class R shares) (Finland) | | | 640,988 |
| | | | |
|
|
| | | | | | 1,892,393 |
| |
Personal Products 0.6% | | | |
| 16,000 | | Estee Lauder Cos., Inc. (Class A shares) | | | 722,240 |
| 11,600 | | Gillette Co. (The) | | | 588,352 |
| | | | |
|
|
| | | | | | 1,310,592 |
| |
Pharmaceuticals 5.5% | | | |
| 9,930 | | Alexion Pharmaceuticals, Inc.(a) | | | 245,668 |
| 10,200 | | Allergan, Inc. | | | 774,690 |
| 10,330 | | Atherogenics, Inc.(a) | | | 191,622 |
| 6,075 | | Barr Pharmaceuticals, Inc.(a) | | | 288,866 |
| 10,230 | | Connetics Corp.(a) | | | 249,817 |
| 14,690 | | Cypress Bioscience, Inc.(a) | | | 200,592 |
| 32,300 | | Eli Lilly & Co. | | | 1,751,951 |
| 72,100 | | GlaxoSmithKline PLC (United Kingdom) | | | 1,597,856 |
| 17,200 | | K-V Pharmaceutical Co. (Class A shares)(a) | | | 353,460 |
| 28,388 | | Nabi Biopharmaceuticals(a) | | | 366,489 |
| 45,700 | | Novartis AG ADR (Switzerland) | | | 2,188,115 |
| 16,690 | | QLT, Inc. (Canada)(a) | | | 269,877 |
| 8,120 | | Rigel Pharmaceuticals, Inc.(a) | | | 155,823 |
| 19,800 | | Roche Holding AG ADR (Switzerland) | | | 1,054,556 |
| 14,630 | | Salix Pharmaceuticals Ltd.(a) | | | 220,182 |
| 15,679 | | Sanofi-Synthelabo SA (France) | | | 1,170,096 |
| 16,000 | | Schering AG (Germany) | | | 1,080,591 |
| 7,300 | | Vaxgen, Inc.(a) | | | 108,624 |
| 11,600 | | Wyeth | | | 459,708 |
| | | | |
|
|
| | | | | | 12,728,583 |
| |
Real Estate 0.4% | | | |
| 67,000 | | Mitsubishi Estate Co. Ltd. (Japan) | | | 847,741 |
See Notes to Financial Statements.
| | |
| 18 | | Visit our website at www.strategicpartners.com |
| | | | | |
| Shares | | Description | | Value (Note 1) |
| | | | | | |
| |
Real Estate Investment Trust 0.3% | | | |
| 7,600 | | Entertainment Properties Trust | | $ | 320,036 |
| 5,600 | | SL Green Realty Corp. | | | 298,088 |
| | | | |
|
|
| | | | | | 618,124 |
| |
Road & Rail 0.2% | | | |
| 91 | | East Japan Railway Co. (Japan) | | | 491,702 |
| |
Semiconductors & Semiconductor Equipment 1.1% | | | |
| 30,900 | | Marvell Technology Group Ltd. (Bermuda)(a) | | | 1,033,604 |
| 18,400 | | Maxim Integrated Products, Inc. | | | 717,784 |
| 12,190 | | Microsemi Corp.(a) | | | 188,092 |
| 27,500 | | O2 Micro International Ltd. (Cayman Islands)(a) | | | 243,925 |
| 18,190 | | Sirf Technology Holdings, Inc.(a) | | | 191,905 |
| 11,290 | | Ultratech, Inc.(a) | | | 167,205 |
| | | | |
|
|
| | | | | | 2,542,515 |
| |
Software 3.4% | | | |
| 10,400 | | Adobe Systems, Inc. | | | 591,760 |
| 25,900 | | Electronic Arts, Inc.(a) | | | 1,666,406 |
| 23,780 | | Embarcadero Technologies, Inc.(a) | | | 186,435 |
| 18,310 | | Epicor Software Corp.(a) | | | 247,002 |
| 16,440 | | Infocrossing, Inc.(a) | | | 295,756 |
| 15,900 | | Mercury Interactive Corp.(a) | | | 695,943 |
| 78,000 | | Microsoft Corp. | | | 2,049,839 |
| 9,100 | | NAVTEQ Corp.(a) | | | 348,439 |
| 26,600 | | SAP AG-Sponsored ADR (Germany) | | | 1,029,952 |
| 13,810 | | Smith Micro Software, Inc.(a) | | | 103,161 |
| 11,500 | | Sonic Solutions(a) | | | 204,815 |
| 34,850 | | Synplicity, Inc.(a) | | | 236,980 |
| 9,800 | | THQ Inc.(a) | | | 218,050 |
| | | | |
|
|
| | | | | | 7,874,538 |
| |
Specialty Retail 3.5% | | | |
| 7,075 | | Aaron Rents, Inc. (Class B shares) (Isreal) | | | 150,273 |
| 27,670 | | Ashworth, Inc.(a) | | | 311,841 |
| 27,200 | | Bed Bath & Beyond, Inc.(a) | | | 1,095,888 |
| 21,630 | | Charlotte Russe Holding, Inc.(a) | | | 231,874 |
| 24,100 | | Chico’s FAS, Inc.(a) | | | 1,269,587 |
| 18,300 | | Compagnie Financiere Richemont AG (Class A shares)(Switzerland) | | | 572,789 |
| 6,790 | | Cost Plus, Inc.(a) | | | 178,102 |
| 16,500 | | CSK Auto Corp.(a) | | | 260,205 |
See Notes to Financial Statements.
| | |
| Strategic Partners Asset Allocation Funds/Strategic Partners High Growth Fund | | 19 |
Portfolio of Investments
as of January 31, 2005 (Unaudited) Cont’d.
| | | | | |
| Shares | | Description | | Value (Note 1) |
| | | | | | |
| 10,140 | | Ezcorp, Inc.(a) | | $ | 193,471 |
| 5,970 | | Guitar Center, Inc.(a) | | | 341,783 |
| 29,120 | | Imperial Tobacco Group PLC (United Kingdom) | | | 764,531 |
| 13,200 | | Lowe’s Cos, Inc. | | | 752,268 |
| 17,800 | | Phillips-Van Heusen Corp. | | | 484,338 |
| 4,800 | | Stein Mart, Inc.(a) | | | 94,704 |
| 45,500 | | Toys ‘R’ Us, Inc.(a) | | | 975,975 |
| 12,400 | | Williams-Sonoma, Inc.(a) | | | 429,040 |
| | | | |
|
|
| | | | | | 8,106,669 |
| |
Textiles, Apparel & Luxury Goods 0.5% | | | |
| 11,300 | | Coach, Inc.(a) | | | 633,930 |
| 11,510 | | Jos. A. Bank Clothiers, Inc.(a) | | | 330,337 |
| 7,580 | | Oxford Industries, Inc. | | | 281,824 |
| | | | |
|
|
| | | | | | 1,246,091 |
| |
Thrifts & Mortgage Finance 0.3% | | | |
| 11,500 | | Freddie Mac | | | 750,835 |
| |
Tobacco 0.7% | | | |
| 24,700 | | Altria Group, Inc. | | | 1,576,601 |
| |
Transportation 0.3% | | | |
| 4,170 | | Forward Air Corp.(a) | | | 177,705 |
| 5,890 | | Old Dominion Freight Line, Inc.(a) | | | 208,212 |
| 18,040 | | Vitran Corp., Inc. (Class A shares) (Canada)(a) | | | 268,073 |
| | | | |
|
|
| | | | | | 653,990 |
| |
Wireless Telecommunication Services 1.5% | | | |
| 52,400 | | American Tower Corp. (Class A shares)(a) | | | 949,488 |
| 65,000 | | Nextel Communications, Inc. (Class A Shares)(a) | | | 1,864,850 |
| 383 | | NTT DoCoMo, Inc. (Japan) | | | 666,377 |
| 27,800 | | Vodafone Group PLC (United Kingdom) | | | 71,834 |
| | | | |
|
|
| | | | | | 3,552,549 |
| | | | |
|
|
| | | Total common stocks
(cost $178,299,010) | | | 218,932,412 |
| | | | |
|
|
PREFERRED STOCK 0.2% | | | |
| |
Automobiles | | | |
| 760 | | Porsche AG Pfd. (Germany) | | | 495,349 |
| | | | |
|
|
| | | Total preferred stocks
(cost $430,426) | | | |
| | | Total long-term investments
(cost $178,729,436) | | | 219,427,761 |
| | | | |
|
|
See Notes to Financial Statements.
| | |
| 20 | | Visit our website at www.strategicpartners.com |
| | | | | |
| Shares | | Description | | Value (Note 1) |
| | | | | | |
SHORT-TERM INVESTMENTS 4.2% | | | |
| |
Mutual Fund | | | |
| 9,715,324 | | Dryden Core Investment Fund - Taxable Money Market Series
(cost $9,715,324; Note 3) | | $ | 9,715,324 |
| | | | |
|
|
| | | Total Investments 98.5%
(cost $188,444,760; Note 5) | | | 229,143,085 |
| | | Other assets in excess of liabilities 1.5% | | | 3,591,305 |
| | | | |
|
|
| | | Net Assets 100% | | $ | 232,734,390 |
| | | | |
|
|
| (a) | Non-income producing security. |
ADR—American Depository Receipt.
See Notes to Financial Statements.
| | |
| Strategic Partners Asset Allocation Funds/Strategic Partners High Growth Fund | | 21 |
The industry classification of portfolio holdings and other assets in excess of liabilities shown as a percentage of net assets as of January 31, 2005 were as follows:
| | | |
Oil & Gas | | 8.0 | % |
Pharmaceuticals | | 5.5 | |
Diversified Financial Services | | 4.7 | |
Commercial Banks | | 4.7 | |
Mutual Fund | | 4.2 | |
Insurance | | 4.1 | |
Health Care Providers & Services | | 3.9 | |
Specialty Retail | | 3.5 | |
Software | | 3.4 | |
Capital Markets | | 3.1 | |
Industrial Conglomerates | | 2.9 | |
Commercial Services & Supplies | | 2.8 | |
Communication Equipment | | 2.7 | |
Internet Software & Services | | 2.7 | |
Electronic Equipment & Instruments | | 2.6 | |
Computer & Peripherals | | 2.5 | |
Electric Utilities | | 2.3 | |
Energy Equipment & Services | | 2.3 | |
Media | | 2.0 | |
Household Durables | | 1.9 | |
Diversified Telecommunication Services | | 1.8 | |
Food & Staples Retailing | | 1.8 | |
Biotechnology | | 1.7 | |
Health Care Equipment & Supplies | | 1.7 | |
Food Products | | 1.6 | |
Wireless Telecommunication Services | | 1.5 | |
Chemicals | | 1.4 | |
Hotels, Restaurants & Leisure | | 1.3 | |
Automobiles | | 1.2 | |
Aerospace/Defense | | 1.1 | |
Semiconductors & Semiconductor Equipment | | 1.1 | |
Consumer Finance | | 1.0 | |
Multiline Retail | | 1.0 | |
Internet & Catalog Retail | | 0.8 | |
Multi-Utilities & Unregulated Power | | 0.8 | |
Paper & Forest Products | | 0.8 | |
Electrical Equipment | | 0.8 | |
Beverages | | 0.7 | |
Household Products | | 0.7 | |
Tobacco | | 0.7 | |
Personal Products | | 0.6 | |
Office Electronics | | 0.5 | |
Textiles, Apparel & Luxury Goods | | 0.5 | |
Air Freight & Logistics | | 0.4 | |
Building Products | | 0.4 | |
Real Estate | | 0.4 | |
See Notes to Financial Statements.
| | |
| 22 | | Visit our website at www.strategicpartners.com |
| | | |
IT Services | | 0.3 | % |
Machinery | | 0.3 | |
Metals & Mining | | 0.3 | |
Real Estate Investment Trust | | 0.3 | |
Thrifts & Mortgage Finance | | 0.3 | |
Transportation | | 0.3 | |
Leisure Equipment & Products | | 0.2 | |
Road & Rail | | 0.2 | |
Distributors | | 0.1 | |
Gas Utilities | | 0.1 | |
| | |
|
|
| | | 98.5 | |
Other assets in excess of liabilities | | 1.5 | |
| | |
|
|
| | | 100.0 | % |
| | |
|
|
See Notes to Financial Statements.
| | |
| Strategic Partners Asset Allocation Funds/Strategic Partners High Growth Fund | | 23 |
Statement of Assets and Liabilities
as of January 31, 2005 (Unaudited)
| | | | |
ASSETS | | | | |
Investments, at value (cost $188,444,760) | | $ | 229,143,085 | |
Cash | | | 3,866,131 | |
Foreign currency, at value (cost $15,469) | | | 15,469 | |
Receivable for investments sold | | | 2,072,018 | |
Receivable for Fund shares sold | | | 811,009 | |
Dividends and interest receivable | | | 208,393 | |
Prepaid expenses | | | 7,466 | |
| | |
|
|
|
Total assets | | | 236,123,571 | |
| | |
|
|
|
| |
LIABILITIES | | | | |
Payable for investments purchased | | | 2,346,196 | |
Payable for Fund shares reacquired | | | 572,548 | |
Distribution fee payable | | | 159,278 | |
Accrued expenses | | | 154,066 | |
Management fee payable | | | 147,981 | |
Deferred Trustee’s fees | | | 9,112 | |
| | |
|
|
|
Total liabilities | | | 3,389,181 | |
| | |
|
|
|
| |
Net Assets | | $ | 232,734,390 | |
| | |
|
|
|
| | | | | |
Net assets were comprised of: | | | | |
Shares of beneficial interest, at par | | $ | 19,530 | |
Paid-in capital, in excess of par | | | 205,180,503 | |
| | |
|
|
|
| | | | 205,200,033 | |
Accumulated net investment loss | | | (905,259 | ) |
Accumulated net realized loss on investments and foreign currency transactions | | | (12,270,246 | ) |
Net unrealized appreciation on investments and foreign currencies | | | 40,709,862 | |
| | |
|
|
|
Net Assets, January 31, 2005 | | $ | 232,734,390 | |
| | |
|
|
|
See Notes to Financial Statements.
| | |
| 24 | | Visit our website at www.strategicpartners.com |
| | | |
| |
Class A: | | | |
Net asset value and redemption price per share
($52,153,927 ÷ 4,243,644 shares of beneficial interest issued and outstanding) | | $ | 12.29 |
Maximum sales charge (5.5% of offering price) | | | 0.72 |
| | |
|
|
Maximum offering price to public | | $ | 13.01 |
| | |
|
|
| |
Class B: | | | |
Net asset value, offering price and redemption price per share ($104,158,758 ÷ 8,832,260 shares of beneficial interest issued and outstanding) | | $ | 11.79 |
| | |
|
|
| |
Class C: | | | |
Net asset value, offering price and redemption price per share ($69,176,558 ÷ 5,865,445 shares of beneficial interest issued and outstanding) | | $ | 11.79 |
| | |
|
|
| |
Class M: | | | |
Net asset value, offering price and redemption price per share ($1,096,057 ÷ 92,960 shares of beneficial interest issued and outstanding) | | $ | 11.79 |
| | |
|
|
| |
Class R: | | | |
Net asset value, offering price and redemption price per share
($2,665 ÷ 217 shares of beneficial interest issued and outstanding) | | $ | 12.28 |
| | |
|
|
| |
Class X: | | | |
Net asset value, offering price and redemption price per share
($645,254 ÷ 54,647 shares of beneficial interest issued and outstanding) | | $ | 11.81 |
| | |
|
|
| |
Class Z: | | | |
Net asset value, offering price and redemption price per share ($5,501,171 ÷ 440,925 shares of beneficial interest issued and outstanding) | | $ | 12.48 |
| | |
|
|
See Notes to Financial Statements.
| | |
| Strategic Partners Asset Allocation Funds/Strategic Partners High Growth Fund | | 25 |
Statement of Operations
Six Months Ended January 31, 2005 (Unaudited)
| | | | |
Net Investment Loss | | | | |
Income | | | | |
Dividends (net of foreign withholding taxes of $49,611) | | $ | 1,590,990 | |
Interest | | | 7,358 | |
| | |
|
|
|
Total income | | | 1,598,348 | |
| | |
|
|
|
| |
Expenses | | | | |
Management fee | | | 833,548 | |
Distribution fee—Class A | | | 62,075 | |
Distribution fee—Class B | | | 503,475 | |
Distribution fee—Class C | | | 330,524 | |
Distribution fee—Class M | | | 1,502 | |
Distribution fee—Class R | | | 6 | |
Distribution fee—Class X | | | 674 | |
Transfer agent’s fees and expenses | | | 199,000 | |
Custodian’s fees and expenses | | | 121,000 | |
Reports to shareholders | | | 29,000 | |
Registration fees | | | 26,000 | |
Legal fees | | | 15,000 | |
Audit fee | | | 10,000 | |
Trustees’ fees | | | 5,000 | |
Miscellaneous | | | 17,263 | |
| | |
|
|
|
Total expenses | | | 2,154,067 | |
| | |
|
|
|
Net investment loss | | | (555,719 | ) |
| | |
|
|
|
|
Net Realized And Unrealized Gain (Loss) On Investments And Foreign Currency Transactions | |
Net realized gain (loss) on: | | | | |
Investment transactions | | | 6,918,859 | |
Foreign currency transactions | | | (83,232 | ) |
| | |
|
|
|
| | | | 6,835,627 | |
| | |
|
|
|
Net change in unrealized appreciation (depreciation) on: | | | | |
Investments | | | 18,050,282 | |
Foreign currencies | | | 18,577 | |
| | |
|
|
|
| | | | 18,068,859 | |
| | |
|
|
|
Net gain on investments and foreign currencies | | | 24,904,486 | |
| | |
|
|
|
Net Increase In Net Assets Resulting From Operations | | $ | 24,348,767 | |
| | |
|
|
|
See Notes to Financial Statements.
| | |
| 26 | | Visit our website at www.strategicpartners.com |
Statement of Changes in Net Assets
(Unaudited)
| | | | | | | | |
| | | Six Months
Ended
January 31, 2005 | | | Year
Ended
July 31, 2004 | |
Increase (Decrease) in Net Assets | | | | | | | | |
Operations | | | | | | | | |
Net investment loss | | $ | (555,719 | ) | | $ | (1,597,410 | ) |
Net realized gain on investments and foreign currency transactions | | | 6,835,627 | | | | 20,541,271 | |
Net change in unrealized appreciation on investments and foreign currencies | | | 18,068,859 | | | | 4,547,256 | |
| | |
|
|
| |
|
|
|
Net increase in net assets resulting from operations | | | 24,348,767 | | | | 23,491,117 | |
| | |
|
|
| |
|
|
|
| | |
Fund share transactions (Net of share conversions) (Note 6) | | | | | | | | |
Net proceeds from shares sold | | | 21,248,823 | | | | 58,052,831 | |
Cost of shares reacquired | | | (19,454,338 | ) | | | (37,484,393 | ) |
| | |
|
|
| |
|
|
|
Net increase in net assets from Fund share transactions | | | 1,794,485 | | | | 20,568,438 | |
| | |
|
|
| |
|
|
|
Total increase | | | 26,143,252 | | | | 44,059,555 | |
| | |
Net Assets | | | | | | | | |
Beginning of period | | | 206,591,138 | | | | 162,531,583 | |
| | |
|
|
| |
|
|
|
End of period | | $ | 232,734,390 | | | $ | 206,591,138 | |
| | |
|
|
| |
|
|
|
See Notes to Financial Statements.
| | |
| Strategic Partners Asset Allocation Funds/Strategic Partners High Growth Fund | | 27 |
Notes to Financial Statements
Strategic Partners Asset Allocation Funds (the “Trust”), is registered under the Investment Company Act of 1940 as an open-end, diversified management investment company presently consisting of three portfolios: Strategic Partners High Growth Fund (the “Fund”), Strategic Partners Conservative Growth Fund and Strategic Partners Moderate Growth Fund. These financial statements relate only to Strategic Partners High Growth Fund. The financial statements of the other portfolios are not presented herein. The Trust was organized as a business trust in Delaware on July 29, 1998.
Jennison Associates LLC (“Jennison”), Prudential Investment Management, Inc. (“PIM”), Lazard Asset Management LLC, RS Investment Management, L.P. and EARNEST Partners, LLC are the Fund’s “Advisers”.
The investment objective of the Fund is to provide long-term capital appreciation. The Fund seeks to achieve its investment objective by investing in a diversified portfolio of equity securities issued by U.S. and foreign companies. Under normal circumstances, substantially all of the Fund’s assets will be invested in equity securities, including common stock, securities convertible into common stock and preferred stock.
Note 1. Accounting Policies
The following is a summary of significant accounting policies followed by the Trust in the preparation of its financial statements.
Securities Valuation: Securities listed on a securities exchange (other than options on securities and indices) are valued at the last sale price on such exchange on the day of valuation or, if there was no sale on such day, at the mean between the last reported bid and asked prices, or at the last bid price on such day in the absence of an asked price. Securities traded via Nasdaq are valued at the official closing price provided by Nasdaq. Securities that are actively traded in the over-the-counter market, including listed securities for which the primary market is believed by Prudential Investments LLC (“PI” or “Manager”) in consultation with the subadvisor, to be over-the-counter, are valued at market value using prices provided by an independent pricing agent or principal market maker. Futures contracts and options thereon traded on a commodities exchange or board of trade are valued at the last sale price at the close of trading on such exchange or board of trade or, if there was no sale on the applicable commodities exchange or board of trade on such day, at the mean between the most recently quoted prices on such exchange or board of trade or at the last bid price in the absence of an asked price. Prices may be obtained from
| | |
| 28 | | Visit our website at www.strategicpartners.com |
independent pricing services which use information provided by market makers or estimates of market values obtained from yield data relating to investments or securities with similar characteristics. Securities for which reliable market quotations are not readily available, or whose values have been affected by events occurring after the close of the security’s foreign market and before the Fund’s normal pricing time, are valued at fair value in accordance with the Board of Trustees’ approved fair valuation procedures. Using fair value to price securities may result in a value that is different from a security’s most recent closing price and from the price used by other mutual funds to calculate their net asset value.
Investments in mutual funds are valued at their net asset value as of the close of the New York Stock Exchange on the date of valuation.
Short-term securities which mature in 60 days or less are valued at amortized cost, which approximates market value. The amortized cost method involves valuing a security at its cost on the date of purchase and thereafter assuming a constant amortization to maturity of the difference between the principal amount due at maturity and cost. Short-term securities which mature in more than 60 days are valued at current market quotations.
Foreign Currency Translation: The books and records of the Fund are maintained in U.S. dollars. Foreign currency amounts are translated into U.S. dollars on the following basis:
(i) market value of investment securities, other assets and liabilities-at the current daily rates of exchange.
(ii) purchases and sales of investment securities, income and expenses-at the rates of exchange prevailing on the respective dates of such transactions.
Although the net assets of the Fund are presented at the foreign exchange rates and market values at the close of the fiscal year, the Fund does not isolate that portion of the results of operations arising as a result of changes in the foreign exchange rates from the fluctuations arising from changes in the market prices of securities held at the end of the period. Similarly, the Fund does not isolate the effect of changes in foreign exchange rates from the fluctuations arising from changes in the market prices of portfolio securities sold during the period. Accordingly, realized foreign currency gains or losses are included in the reported net realized gains or losses on investment transactions.
Net realized gains or losses on foreign currency transactions represent net foreign exchange gains or losses from the holdings of foreign currencies, currency gains or
| | |
| Strategic Partners Asset Allocation Funds/Strategic Partners High Growth Fund | | 29 |
Notes to Financial Statements
Cont’d
losses realized between the trade date and settlement date on securities transactions, and the difference between the amounts of dividends, interest and foreign withholding taxes recorded on the Fund’s books and the U.S. dollar equivalent amounts actually received or paid. Net unrealized currency gains or losses from valuing foreign currency denominated assets and liabilities (other than investments) at year-end exchange rates are reflected as a component of net unrealized appreciation (depreciation) on investments and foreign currencies.
Foreign security and currency transactions may involve certain considerations and risks not typically associated with those of domestic origin as a result of, among other factors, the possibility of political and economic instability and the level of governmental supervision and regulation of foreign securities markets.
Securities Transactions and Net Investment Income: Securities transactions are recorded on the trade date. Realized gains or losses on sales of securities are calculated on the identified cost basis. Dividend income is recorded on the ex-dividend date and interest income, including amortization of premium and accretion of discount on debt securities as required, is recorded on the accrual basis. Expenses are recorded on the accrual basis.
Net investment income or loss (other than distribution fees, which are charged directly to respective class) and unrealized and realized gains or losses are allocated daily to each class of shares based upon the relative proportion of net assets of each class at the beginning of the day.
Dividends and Distributions: The Fund expects to pay dividends of net investment income and distributions of net realized capital and currency gains, if any, annually.
Dividends and distributions to shareholders, which are determined in accordance with federal income tax regulations and which may differ from generally accepted accounting principles, are recorded on the ex-dividend date. Permanent book/tax differences relating to income and gains are reclassified amongst undistributed net investment income, accumulated net realized gain or loss and paid-in capital in excess of par as appropriate.
Taxes: It is the Fund’s policy to continue to meet the requirements of the Internal Revenue Code applicable to regulated investment companies and to distribute all of
| | |
| 30 | | Visit our website at www.strategicpartners.com |
its taxable net investment income and capital gains, if any, to its shareholders. Therefore, no federal income tax provision is required.
Withholding taxes on foreign dividends are recorded net of reclaimable amounts, at the time the related income is earned.
Estimates: The preparation of the financial statements requires management to make estimates and assumptions that affect the reported amounts and disclosures in the financial statements. Actual results could differ from those estimates.
Note 2. Agreements
The Trust has a management agreement with PI. Pursuant to this agreement, PI manages the investment operations of the Fund, administers the Fund’s affairs and supervises the Advisers’ performance of all investment advisory services. Pursuant to the advisory agreement, PI pays the cost of compensation of officers of the Fund, occupancy and certain clerical and accounting costs of the Fund. The Fund bears all other costs and expenses.
The management fee paid to PI is computed daily and payable monthly at an annual rate of 0.75 of 1% of average daily net assets up to $500 million, 0.70 of 1% of average daily net assets for the next $500 million and 0.65 of 1% of average daily net assets in excess of $1 billion. The effective management fee rate was .75 of 1% for the six months ended January 31, 2005.
The Fund has a distribution agreement with Prudential Investment Management Services LLC (“PIMS”) which acts as the distributor of the Class A, B, C, M, R, X and Z shares of the Fund. The Fund compensates PIMS for distributing and servicing the Fund’s Class A, B, C, M, R and X shares, pursuant to plans of distribution (the “Distribution Plans”) regardless of expenses actually incurred by PIMS. The distribution fees are accrued daily and payable monthly. No distribution or service fees are paid to PIMS as distributor for Class Z shares of the Fund.
Pursuant to the Distribution Plans, the Fund compensates PIMS for distribution related activities at an annual rate of up to .30 of 1%, 1%, 1%, 1%, .75% of 1% and 1% of the average daily net assets of the Class A, B, C, M, R and X shares, respectively. Such expenses under the Plans were .25 of 1%, 1%, 1%, 1%, .50% of 1% and 1% of the average daily net assets of the Class A, B, C, M, R and X shares, respectively, for the six months ended January 31, 2005.
| | |
| Strategic Partners Asset Allocation Funds/Strategic Partners High Growth Fund | | 31 |
Notes to Financial Statements
Cont’d
PIMS has advised the Fund that it has received approximately $112,100 in front-end sales charges resulting from sales of Class A during the six months ended January 31, 2005. From these fees, PIMS paid such sales charges to broker-dealers which in turn paid commissions to salespersons and incurred other distribution costs.
PIMS has advised the Fund that for the six months ended January 31, 2005, it has received approximately $83,600 and $9,300 in contingent deferred sales charges imposed upon certain redemptions by Class B and Class C shareholders, respectively. There were no contingent deferred sales charges imposed upon certain redemptions by Class M, Class R and Class X, respectively.
Jennison, PIMS, PIM and PI are indirect, wholly-owned subsidiaries of Prudential Financial, Inc. (“Prudential”).
The Fund, along with other affiliated investment companies (the “Funds”), is a party to a syndicated credit agreement (“SCA”) with a group of banks. The purpose of the SCA is to serve as an alternative source of funding for capital share redemptions. The SCA provided for a commitment of $500 million. Interest on any borrowings under the SCA would be incurred at market rates. The Funds paid a commitment fee of .08 of 1% of the unused portion of the SCA. The expiration date of the SCA was October 29, 2004. Effective October 29, 2004, the Funds entered into a revised credit agreement with two banks. The commitment under the revised credit agreement continues to be $500 million. The Funds pay a commitment fee of 0.75 of 1% of the unused portion of the revised credit agreement. The commitment fee is accrued daily and paid quarterly and is allocated to the Funds pro rata, based on nest assets. The expiration date of the revised credit agreement is October 28, 2005.
Note 3. Other Transactions with Affiliates
Prudential Mutual Fund Services LLC (“PMFS”), an affiliate of PI and an indirect, wholly-owned subsidiary of Prudential, serves as the Fund’s transfer agent. During the six months January 31, 2005, the Fund incurred fees of approximately $144,800 for the services of PMFS. As of January 31, 2005, approximately $24,500 of such fees were due to PMFS. Transfer agent fees and expenses in the Statement of Operations include certain out-of-pocket expenses paid to non-affiliates, where applicable.
The Fund pays networking fees to affiliated and unaffiliated broker/dealers. These networking fees are payments made to broker/dealers that clear mutual fund transactions through a national clearing system. The Fund incurred approximately
| | |
| 32 | | Visit our website at www.strategicpartners.com |
$48,900 in total networking fees, of which the amounts relating to the services of Wachovia Securities, LLC (“Wachovia”) and First Clearing Corporation (“First Clearing”), affiliates of PI, were approximately $4,900 and $45,300, respectively, for the six months ended January 31, 2005. As of January 31, 2005 $7,400 of such fees were due to First Clearing. These amounts are included in transfer agent’s fees and expenses in the Statement of Operations.
For the six months ended January 31, 2005, Wachovia earned $1,987 and Prudential Equity Group, LLC, a wholly owned subsidiary of Prudential, earned $3,181, in brokerage commissions from portfolio transactions executed on behalf of the Fund.
The Fund invests in the Taxable Money Market Series (the “Series”), a portfolio of Dryden Core Investment Fund, formerly known as Prudential Core Investment Fund, pursuant to an exemptive order received from the Securities and Exchange Commission. The Series is a money market mutual fund registered under the Investment Company Act of 1940, as amended, and managed by PI. For the six months ended January 31, 2005, the Fund earned income of approximately $75,524 from the Series by investing its excess cash.
Note 4. Portfolio Securities
Purchases and sales of portfolio securities, excluding short-term investments, for the six months ended January 31, 2005, aggregated $63,811,891 and $64,322,926, respectively.
Note 5. Tax Information
The United States federal income tax basis of the Fund’s investments and the net unrealized appreciation (depreciation) as of January 31, 2005 were as follows:
| | | | | | | | | | |
Tax Basis
| | Appreciation
| | Depreciation
| | Net Unrealized
Appreciation of
Investments
| | Other
Cost Basis
Adjustments
| | Total Net
Unrealized
Appreciation
(Depreciation)
|
| $189,515,512 | | $42,387,701 | | $2,760,128 | | $39,627,573 | | $11,538 | | $39,639,111 |
The difference between book basis and tax basis were primarily attributable to deferred losses on wash sales. The other cost basis adjustments are primarily attributable to appreciation (depreciation) of foreign currency and mark to market of receivables and payables.
As of July 31,2004, the Fund had a capital loss carryforward for tax purposes of approximately $17,389,000 which expires in 2011. Approximately $12,530,000 of its
| | |
| Strategic Partners Asset Allocation Funds/Strategic Partners High Growth Fund | | 33 |
Notes to Financial Statements
Cont’d
capital loss carryforward was used to offset net taxable gains realized in the fiscal year July 31, 2004. Accordingly, no capital gains distribution is expected to be paid to shareholders until net gains have been realized in excess of such amounts. The Fund elected to treat Post-October currency losses of $160,413 incurred during the nine month period ended July 31, 2004 as incurred during fiscal year ending July 31, 2005.
Note 6. Capital
The Fund offers Class A, Class B, Class C, Class M, Class R, Class X and Class Z shares. Class A shares are subject to a maximum front-end sales charge of 5.50%. Investors who purchase $1 million or more of Class A shares and sell these shares within 12 months of purchase are not subject to an initial sales charge but are subject to a contingent deferred sales charge (CDSC) of 1%, including investors who purchase their shares through broker-dealers affiliated with Prudential. Class B shares are subject to a CDSC of 5%, which decreases by 1% annually to 1% in the fifth and sixth years and 0% in the seventh year. Class B shares automatically convert to Class A shares on a quarterly basis approximately seven years after purchase. The CDSC for Class C shares is 1% for shares redeemed within 12 months of purchase. Class M shares are subject to a CDSC of 6%, which decreases by 1% annually to 2% in the fifth and sixth years and 1% in the seventh year. Class M shares are generally closed to new purchases. Class M shares automatically convert to Class A shares approximately eight years after purchase. Class X shares are generally closed to new purchases. Class X shares are subject to a CDSC of 6%, which decreases by 1% annually to 4% in the third and fourth years, by 1% annually to 2% in the sixth and seventh years, and 1% in the eighth year. Class X shares automatically convert to Class A shares on a quarterly basis approximately ten years (eight years in the case of shares purchased prior to August 19, 1998) after purchase. An exchange privilege is also available for shareholders who qualify to purchase Class A shares at net asset value. Class R and Class Z shares are not subject to any sales or redemption charge and are offered exclusively for sale to a limited group of investors.
The Fund has authorized an unlimited number of shares of beneficial interest at $.001 par value per share. As of January 31, 2005 Prudential owned 226 Class M shares, 217 Class R shares and 226 Class X shares of the Fund.
| | |
| 34 | | Visit our website at www.strategicpartners.com |
Transactions in shares of beneficial interest were as follows:
| | | | | | | |
Class A
| | Shares
| | | Amount
| |
Six months ended January 31, 2005: | | | | | | | |
Shares sold | | 476,079 | | | $ | 5,612,177 | |
Shares reacquired | | (465,076 | ) | | | (5,501,306 | ) |
| | |
|
| |
|
|
|
Net increase (decrease) in shares outstanding before conversion | | 11,003 | | | | 110,871 | |
Shares issued upon conversion from class B | | 70,754 | | | | 841,606 | |
| | |
|
| |
|
|
|
Net increase (decrease) shares outstanding | | 81,757 | | | $ | 952,477 | |
| | |
|
| |
|
|
|
Year ended July 31, 2004: | | | | | | | |
Shares sold | | 1,353,050 | | | $ | 14,741,225 | |
Shares reacquired | | (1,047,282 | ) | | | (11,562,070 | ) |
| | |
|
| |
|
|
|
Net increase (decrease) in shares outstanding before conversion | | 305,768 | | | | 3,179,155 | |
Shares issued upon conversion from class B | | 89,435 | | | | 986,017 | |
| | |
|
| |
|
|
|
Net increase (decrease) shares outstanding | | 395,203 | | | $ | 4,165,172 | |
| | |
|
| |
|
|
|
Class B
| | | | | | |
Six months ended January 31, 2005: | | | | | | | |
Shares sold | | 580,660 | | | $ | 6,524,549 | |
Shares reacquired | | (583,503 | ) | | | (6,588,770 | ) |
| | |
|
| |
|
|
|
Net increase (decrease) in shares outstanding before conversion | | (2,843 | ) | | | (64,221 | ) |
Shares reacquired upon conversion into class A | | (73,611 | ) | | | (841,606 | ) |
| | |
|
| |
|
|
|
Net increase (decrease) shares outstanding | | (76,454 | ) | | $ | (905,827 | ) |
| | |
|
| |
|
|
|
Year ended July 31, 2004: | | | | | | | |
Shares sold | | 1,799,671 | | | $ | 19,067,894 | |
Shares reacquired | | (1,062,013 | ) | | | (11,231,265 | ) |
| | |
|
| |
|
|
|
Net increase (decrease) in shares outstanding before conversion | | 737,658 | | | | 7,836,629 | |
Shares reacquired upon conversion into class A | | (92,583 | ) | | | (986,017 | ) |
| | |
|
| |
|
|
|
Net increase (decrease) shares outstanding | | 645,075 | | | $ | 6,850,612 | |
| | |
|
| |
|
|
|
Class C
| | | | | | |
Six months ended January 31, 2005: | | | | | | | |
Shares sold | | 587,145 | | | $ | 6,682,898 | |
Shares reacquired | | (555,708 | ) | | | (6,267,995 | ) |
| | |
|
| |
|
|
|
Net increase (decrease) shares outstanding | | 31,437 | | | $ | 414,903 | |
| | |
|
| |
|
|
|
Year ended July 31, 2004: | | | | | | | |
Shares sold | | 1,916,438 | | | $ | 20,221,584 | |
Shares reacquired | | (1,230,102 | ) | | | (12,991,880 | ) |
| | |
|
| |
|
|
|
Net increase (decrease) shares outstanding | | 686,336 | | | $ | 7,229,704 | |
| | |
|
| |
|
|
|
| | |
| Strategic Partners Asset Allocation Funds/Strategic Partners High Growth Fund | | 35 |
Financial Highlights
(Unaudited) Cont’d
| | | | | | | |
Class M
| | Shares
| | | Amount
| |
October 4, 2004 to January 31, 2005: | | | | | | | |
Shares sold | | 97,420 | | | $ | 1,144,941 | |
Shares reacquired | | (4,460 | ) | | | (52,543 | ) |
| | |
|
| |
|
|
|
Net increase (decrease) shares outstanding | | 92,960 | | | $ | 1,092,398 | |
| | |
|
| |
|
|
|
Class R
| | | | | | |
October 4, 2004 to January 31, 2005: | | | | | | | |
Shares sold | | 217 | | | $ | 2,500 | |
Shares reacquired | | — | | | | — | |
| | |
|
| |
|
|
|
Net increase (decrease) shares outstanding | | 217 | | | $ | 2,500 | |
| | |
|
| |
|
|
|
Class X
| | | | | | |
October 4, 2004 to January 31, 2005: | | | | | | | |
Shares sold | | 55,818 | | | $ | 655,573 | |
Shares reacquired | | (1,171 | ) | | | (13,616 | ) |
| | |
|
| |
|
|
|
Net increase (decrease) shares outstanding | | 54,647 | | | $ | 641,957 | |
| | |
|
| |
|
|
|
Class Z
| | | | | | |
Six months ended January 31, 2005: | | | | | | | |
Shares sold | | 52,157 | | | $ | 626,185 | |
Shares reacquired | | (87,890 | ) | | | (1,030,108 | ) |
| | |
|
| |
|
|
|
Net increase (decrease) shares outstanding | | (35,733 | ) | | $ | (403,923 | ) |
| | |
|
| |
|
|
|
Year ended July 31, 2004: | | | | | | | |
Shares sold | | 364,721 | | | $ | 4,022,128 | |
Shares reacquired | | (156,673 | ) | | | (1,699,178 | ) |
| | |
|
| |
|
|
|
Net increase (decrease) shares outstanding | | 208,048 | | | $ | 2,322,950 | |
| | |
|
| |
|
|
|
See Notes to Financial Statements.
| | |
| 36 | | Visit our website at www.strategicpartners.com |
SEMI-ANNUAL REPORT
JANUARY 31, 2005
STRATEGIC PARTNERS
HIGH GROWTH FUND
FINANCIAL HIGHLIGHTS
Financial Highlights
(Unaudited)
| | | | |
| | | Class A
| |
| | | Six Months Ended
January 31, 2005(b) | |
Per Share Operating Performance: | | | | |
Net Asset Value, Beginning Of Period | | $ | 10.96 | |
| | |
|
|
|
Income (loss) from investment operations | | | | |
Net investment income (loss) | | | — | (f) |
Net realized and unrealized gain (loss) on investment transactions | | | 1.33 | |
| | |
|
|
|
Total from investment operations | | | 1.33 | |
| | |
|
|
|
Less Distributions | | | | |
Distributions in excess of net investment income | | | — | |
Distributions from net realized gains | | | — | |
| | |
|
|
|
Total dividends and distributions | | | — | |
| | |
|
|
|
Net asset value, end of period | | $ | 12.29 | |
| | |
|
|
|
Total Return(a) | | | 12.14 | % |
Ratios/Supplemental Data: | | | | |
Net assets, end of period (000) | | $ | 52,154 | |
Average net assets (000) | | $ | 49,255 | |
Ratio to average net assets: | | | | |
Expenses, including distribution and service (12b-1) fees(e) | | | 1.38 | %(c) |
Expenses, excluding distribution and service (12b-1) fees | | | 1.13 | %(c) |
Net investment income (loss) | | | .06 | %(c) |
Net Assets | | | | |
Portfolio turnover rate | | | 31 | %(d) |
| (a) | Total return does not consider the effect of sales loads. Total return is calculated assuming a purchase of shares on the first day and a sale on the last day of each period reported and includes reinvestment of dividends and distributions. Total returns for periods less than one full year are not annualized. |
| (b) | Calculations are based on average shares outstanding during the period. |
| (e) | The distributor of the fund contractually agreed to limit its distribution and services (12b-1) fees to .25 of 1% of the average net assets of the class A shares. |
| (f) | Less than $.005 per share. |
See Notes to Financial Statements.
| | |
| 38 | | Visit our website at www.strategicpartners.com |
| | | | | | | | | | | | | | | | | | |
| Class A | |
| Year Ended July 31, | |
| 2004(b) | | | 2003(b) | | | 2002 | | | 2001(b) | | | 2000(b) | |
| | | | | | | | | | | | | | | | | | | |
| $ | 9.53 | | | $ | 8.38 | | | $ | 10.70 | | | $ | 12.95 | | | $ | 11.52 | |
|
|
| |
|
|
| |
|
|
| |
|
|
| |
|
|
|
| | | | | | | | | | | | | | | | | | | |
| | (.03 | ) | | | (.03 | ) | | | (.03 | ) | | | — | (f) | | | — | (f) |
| | 1.46 | | | | 1.18 | | | | (2.27 | ) | | | (1.27 | ) | | | 2.14 | |
|
|
| |
|
|
| |
|
|
| |
|
|
| |
|
|
|
| | 1.43 | | | | 1.15 | | | | (2.30 | ) | | | (1.27 | ) | | | 2.14 | |
|
|
| |
|
|
| |
|
|
| |
|
|
| |
|
|
|
| | | | | | | | | | | | | | | | | | | |
| | — | | | | — | | | | — | | | | — | | | | (.43 | ) |
| | — | | | | — | | | | (.02 | ) | | | (.98 | ) | | | (.28 | ) |
|
|
| |
|
|
| |
|
|
| |
|
|
| |
|
|
|
| | — | | | | — | | | | (.02 | ) | | | (.98 | ) | | | (.71 | ) |
|
|
| |
|
|
| |
|
|
| |
|
|
| |
|
|
|
| $ | 10.96 | | | $ | 9.53 | | | $ | 8.38 | | | $ | 10.70 | | | $ | 12.95 | |
|
|
| |
|
|
| |
|
|
| |
|
|
| |
|
|
|
| | 15.01 | % | | | 13.72 | % | | | (21.49 | )% | | | (10.09 | )% | | | 18.99 | % |
| | | | | | | | | | | | | | | | | | | |
| $ | 45,622 | | | $ | 35,897 | | | $ | 30,337 | | | $ | 39,528 | | | $ | 35,678 | |
| $ | 43,525 | | | $ | 31,290 | | | $ | 36,514 | | | $ | 39,128 | | | $ | 27,528 | |
| | | | | | | | | | | | | | | | | | | |
| | 1.43 | % | | | 1.71 | % | | | 1.57 | % | | | 1.64 | % | | | 1.54 | % |
| | 1.18 | % | | | 1.46 | % | | | 1.32 | % | | | 1.39 | % | | | 1.29 | % |
| | (.25 | )% | | | (.31 | )% | | | (.35 | )% | | | .02 | % | | | .01 | % |
| | | | | | | | | | | | | | | | | | | |
| | 79 | % | | | 89 | % | | | 98 | % | | | 83 | % | | | 67 | % |
See Notes to Financial Statements.
| | |
| Strategic Partners Asset Allocation Funds/Strategic Partners High Growth Fund | | 39 |
Financial Highlights
(Unaudited) Cont’d
| | | | |
| | | Class B
| |
| | | Six Months Ended
January 31, 2005(b) | |
Per Share Operating Performance: | | | | |
Net Asset Value, Beginning Of Period | | $ | 10.56 | |
| | |
|
|
|
Income (loss) from investment operations | | | | |
Net investment income (loss) | | | (.04 | ) |
Net realized and unrealized gain (loss) on investment transactions | | | 1.27 | |
| | |
|
|
|
Total from investment operations | | | 1.23 | |
| | |
|
|
|
Less Distributions | | | | |
Distributions in excess of net investment income | | | — | |
Distributions from net realized gains | | | — | |
| | |
|
|
|
Total dividends and distributions | | | — | |
| | |
|
|
|
Net asset value, end of period | | $ | 11.79 | |
| | |
|
|
|
Total Return(a) | | | 11.65 | % |
Ratios/Supplemental Data: | | | | |
Net assets, end of period (000) | | $ | 104,159 | |
Average net assets (000) | | $ | 99,874 | |
Ratio to average net assets: | | | | |
Expenses, including distribution and service (12b-1) fees | | | 2.13 | %(c) |
Expenses, excluding distribution and service (12b-1) fees | | | 1.13 | %(c) |
Net investment income (loss) | | | (.69 | )%(c) |
| (a) | Total return does not consider the effect of sales loads. Total return is calculated assuming a purchase of shares on the first day and a sale on the last day of each period reported and includes reinvestment of dividends and distributions. Total returns for periods less than one full year are not annualized. |
| (b) | Calculations are based on average shares outstanding during the period. |
See Notes to Financial Statements.
| | |
| 40 | | Visit our website at www.strategicpartners.com |
| | | | | | | | | | | | | | | | | | |
| Class B | |
| Year Ended July 31, | |
| 2004(b) | | | 2003(b) | | | 2002 | | | 2001(b) | | | 2000(b) | |
| | | | | | | | | | | | | | | | | | | |
| $ | 9.25 | | | $ | 8.20 | | | $ | 10.55 | | | $ | 12.86 | | | $ | 11.47 | |
|
|
| |
|
|
| |
|
|
| |
|
|
| |
|
|
|
| | | | | | | | | | | | | | | | | | | |
| | (.11 | ) | | | (.09 | ) | | | (.11 | ) | | | (.08 | ) | | | (.09 | ) |
| | 1.42 | | | | 1.14 | | | | (2.22 | ) | | | (1.25 | ) | | | 2.12 | |
|
|
| |
|
|
| |
|
|
| |
|
|
| |
|
|
|
| | 1.31 | | | | 1.05 | | | | (2.33 | ) | | | (1.33 | ) | | | 2.03 | |
|
|
| |
|
|
| |
|
|
| |
|
|
| |
|
|
|
| | | | | | | | | | | | | | | | | | | |
| | — | | | | — | | | | — | | | | — | | | | (.36 | ) |
| | — | | | | — | | | | (.02 | ) | | | (.98 | ) | | | (.28 | ) |
|
|
| |
|
|
| |
|
|
| |
|
|
| |
|
|
|
| | — | | | | — | | | | (.02 | ) | | | (.98 | ) | | | (.64 | ) |
|
|
| |
|
|
| |
|
|
| |
|
|
| |
|
|
|
| $ | 10.56 | | | $ | 9.25 | | | $ | 8.20 | | | $ | 10.55 | | | $ | 12.86 | |
|
|
| |
|
|
| |
|
|
| |
|
|
| |
|
|
|
| | 14.16 | % | | | 12.80 | % | | | (22.08 | )% | | | (10.66 | )% | | | 18.13 | % |
| | | | | | | | | | | | | | | | | | | |
| $ | 94,066 | | | $ | 76,430 | | | $ | 70,043 | | | $ | 86,941 | | | $ | 79,793 | |
| $ | 90,535 | | | $ | 67,723 | | | $ | 82,953 | | | $ | 84,949 | | | $ | 60,994 | |
| | | | | | | | | | | | | | | | | | | |
| | 2.18 | % | | | 2.46 | % | | | 2.32 | % | | | 2.39 | % | | | 2.29 | % |
| | 1.18 | % | | | 1.46 | % | | | 1.32 | % | | | 1.39 | % | | | 1.29 | % |
| | (1.00 | )% | | | (1.07 | )% | | | (1.09 | )% | | | (.72 | )% | | | (.71 | )% |
See Notes to Financial Statements.
| | |
| Strategic Partners Asset Allocation Funds/Strategic Partners High Growth Fund | | 41 |
Financial Highlights
(Unaudited) Cont’d
| | | | |
| | | Class C
| |
| | | Six Months Ended
January 31, 2005(b) | |
Per Share Operating Performance: | | | | |
Net Asset Value, Beginning Of Period | | $ | 10.56 | |
| | |
|
|
|
Income (loss) from investment operations | | | | |
Net investment income (loss) | | | (.04 | ) |
Net realized and unrealized gain (loss) on investment transactions | | | 1.27 | |
| | |
|
|
|
Total from investment operations | | | 1.23 | |
| | |
|
|
|
Less Distributions | | | | |
Distributions in excess of net investment income | | | — | |
Distributions from net realized gains | | | — | |
| | |
|
|
|
Total dividends and distributions | | | — | |
| | |
|
|
|
Net asset value, end of period | | $ | 11.79 | |
| | |
|
|
|
Total Return(a) | | | 11.65 | % |
Ratios/Supplemental Data: | | | | |
Net assets, end of period (000) | | $ | 69,176 | |
Average net assets (000) | | $ | 65,566 | |
Ratio to average net assets: | | | | |
Expenses, including distribution and service (12b-1) fees | | | 2.13 | %(c) |
Expenses, excluding distribution and service (12b-1) fees | | | 1.13 | %(c) |
Net investment income (loss) | | | (.69 | )%(c) |
| (a) | Total return does not consider the effect of sales loads. Total return is calculated assuming a purchase of shares on the first day and a sale on the last day of each period reported and includes reinvestment of dividends and distributions. Total returns for periods less than one full year are not annualized. |
| (b) | Calculations are based on average shares outstanding during the period. |
See Notes to Financial Statements.
| | |
| 42 | | Visit our website at www.strategicpartners.com |
| | | | | | | | | | | | | | | | | | |
| Class C | |
| Year Ended July 31, | |
| 2004(b) | | | 2003(b) | | | 2002 | | | 2001(b) | | | 2000(b) | |
| | | | | | | | | | | | | | | | | | | |
| $ | 9.25 | | | $ | 8.20 | | | $ | 10.55 | | | $ | 12.86 | | | $ | 11.47 | |
|
|
| |
|
|
| |
|
|
| |
|
|
| |
|
|
|
| | | | | | | | | | | | | | | | | | | |
| | (.11 | ) | | | (.09 | ) | | | (.09 | ) | | | (.08 | ) | | | (.09 | ) |
| | 1.42 | | | | 1.14 | | | | (2.24 | ) | | | (1.25 | ) | | | 2.12 | |
|
|
| |
|
|
| |
|
|
| |
|
|
| |
|
|
|
| | 1.31 | | | | 1.05 | | | | (2.33 | ) | | | (1.33 | ) | | | 2.03 | |
|
|
| |
|
|
| |
|
|
| |
|
|
| |
|
|
|
| | | | | | | | | | | | | | | | | | | |
| | — | | | | — | | | | — | | | | — | | | | (.36 | ) |
| | — | | | | — | | | | (.02 | ) | | | (.98 | ) | | | (.28 | ) |
|
|
| |
|
|
| |
|
|
| |
|
|
| |
|
|
|
| | — | | | | — | | | | (.02 | ) | | | (.98 | ) | | | (.64 | ) |
|
|
| |
|
|
| |
|
|
| |
|
|
| |
|
|
|
| $ | 10.56 | | | $ | 9.25 | | | $ | 8.20 | | | $ | 10.55 | | | $ | 12.86 | |
|
|
| |
|
|
| |
|
|
| |
|
|
| |
|
|
|
| | 15.01 | % | | | 12.80 | % | | | (22.08 | )% | | | (10.66 | )% | | | 18.13 | % |
| | | | | | | | | | | | | | | | | | | |
| $ | 61,606 | | | $ | 47,616 | | | $ | 37,468 | | | $ | 36,507 | | | $ | 31,636 | |
| $ | 58,465 | | | $ | 39,926 | | | $ | 38,874 | | | $ | 35,387 | | | $ | 26,413 | |
| | | | | | | | | | | | | | | | | | | |
| | 2.18 | % | | | 2.46 | % | | | 2.32 | % | | | 2.39 | % | | | 2.29 | % |
| | 1.18 | % | | | 1.46 | % | | | 1.32 | % | | | 1.39 | % | | | 1.29 | % |
| | (1.00 | )% | | | (1.06 | )% | | | (1.09 | )% | | | (.73 | )% | | | (.73 | )% |
See Notes to Financial Statements.
| | |
| Strategic Partners Asset Allocation Funds/Strategic Partners High Growth Fund | | 43 |
Financial Highlights
(Unaudited) Cont’d
| | | | |
| | | Class M
| |
| | | October 4, 2004(a)
Through
January 31, 2005(d) | |
Per Share Operating Performance: | | | | |
Net Asset Value, Beginning Of Period | | $ | 11.07 | |
| | |
|
|
|
Income (loss) from investment operations | | | | |
Net investment income | | | (.03 | ) |
Net realized and unrealized gain (loss) on investment transactions | | | .75 | |
| | |
|
|
|
Total from investment operations | | | .72 | |
| | |
|
|
|
Less Distributions | | | | |
Distributions in excess of net investment income | | | — | |
Distributions from net realized gains on investments | | | — | |
| | |
|
|
|
Total dividends and distributions | | | — | |
| | |
|
|
|
Net asset value, end of period | | $ | 11.79 | |
| | |
|
|
|
Total Return(b) | | | 6.22 | % |
Ratios/Supplemental Data: | | | | |
Net assets, end of period (000) | | $ | 1,096 | |
Average net assets (000) | | $ | 461 | |
Ratio to average net assets: | | | | |
Expenses, including distribution and service (12b-1) fees(e) | | | 2.13 | %(c) |
Expenses, excluding distribution and service (12b-1) fees | | | 1.13 | %(c) |
Net investment income (loss) | | | (1.04 | )%(c) |
| (a) | Commencement of offering of new share class. |
| (b) | Total return does not consider the effect of sales loads. Total return is calculated assuming a purchase of shares on the first day and a sale on the last day of each period reported and includes reinvestment of dividends and distributions. Total returns for periods less than one full year are not annualized. |
| (d) | Calculations are based on average shares outstanding during the period. |
| (e) | The distributor of the fund contractually agreed to limit its distribution and services (12b-1) fees to .50 of 1% of the average net assets of the Class R shares. |
See Notes to Financial Statements.
| | |
| 44 | | Visit our website at www.strategicpartners.com |
| | | | | | |
Class R
| | | Class X
| |
October 4, 2004(a)
Through
January 31, 2005(d) | | | October 4, 2004(a)
Through
January 31, 2005(d) | |
| | | | | | | |
| $ | 11.51 | | | $ | 11.07 | |
|
|
| |
|
|
|
| | | | | | | |
| | (.01 | ) | | | (.03 | ) |
| | .78 | | | | .77 | |
|
|
| |
|
|
|
| | .77 | | | | .74 | |
|
|
| |
|
|
|
| | | | | | | |
| | — | | | | — | |
| | — | | | | — | |
|
|
| |
|
|
|
| | — | | | | — | |
|
|
| |
|
|
|
| $ | 12.28 | | | $ | 11.81 | |
|
|
| |
|
|
|
| | 6.41 | % | | | 6.31 | % |
| | | | | | | |
| $ | 3 | | | $ | 645 | |
| $ | 3 | | | $ | 207 | |
| | | | | | | |
| | 1.63 | %(c) | | | 2.13 | %(c) |
| | 1.13 | %(c) | | | 1.13 | %(c) |
| | (.12 | )%(c) | | | (1.02 | )%(c) |
See Notes to Financial Statements.
| | |
| Strategic Partners Asset Allocation Funds/Strategic Partners High Growth Fund | | 45 |
Financial Highlights
(Unaudited) Cont’d
| | | | |
| | | Class Z
| |
| | | Six Months Ended
January 31, 2005(b) | |
Per Share Operating Performance: | | | | |
Net Asset Value, Beginning Of Period | | $ | 11.11 | |
| | |
|
|
|
Income (loss) from investment operations | | | | |
Net investment income (loss) | | | .02 | |
Net realized and unrealized gain (loss) on investment transactions | | | 1.35 | |
| | |
|
|
|
Total from investment operations | | | 1.37 | |
| | |
|
|
|
Less Distributions | | | | |
Distributions in excess of net investment income | | | — | |
Distributions from net realized gains | | | — | |
| | |
|
|
|
Total dividends and distributions | | | — | |
| | |
|
|
|
Net asset value, end of period | | $ | 12.48 | |
| | |
|
|
|
Total Return(a) | | | 12.24 | % |
Ratios/Supplemental Data: | | | | |
Net assets, end of period (000) | | $ | 5,501 | |
Average net assets (000) | | $ | 5,101 | |
Ratio to average net assets: | | | | |
Expenses, including distribution and service (12b-1) fees | | | 1.13 | %(c) |
Expenses, excluding distribution and service (12b-1) fees | | | 1.13 | %(c) |
Net investment income (loss) | | | .31 | %(c) |
| (a) | Total return does not consider the effect of sales loads. Total return is calculated assuming a purchase of shares on the first day and a sale on the last day of each period reported and includes reinvestment of dividends and distributions. Total returns for periods less than one full year are not annualized. |
| (b) | Calculations are based on average shares outstanding during the period. |
| (d) | Less than $.005 per share. |
See Notes to Financial Statements.
| | |
| 46 | | Visit our website at www.strategicpartners.com |
| | | | | | | | | | | | | | | | | | |
| Class Z | |
| Year Ended July 31, | |
| 2004(b) | | | 2003(b) | | | 2002 | | | 2001(b) | | | 2000(b) | |
| | | | | | | | | | | | | | | | | | | |
| $ | 9.64 | | | $ | 8.45 | | | $ | 10.77 | | | $ | 12.98 | | | $ | 11.56 | |
|
|
| |
|
|
| |
|
|
| |
|
|
| |
|
|
|
| | | | | | | | | | | | | | | | | | | |
| | — | (d) | | | — | (d) | | | (.01 | ) | | | .03 | | | | .02 | |
| | 1.47 | | | | 1.19 | | | | (2.29 | ) | | | (1.26 | ) | | | 2.14 | |
|
|
| |
|
|
| |
|
|
| |
|
|
| |
|
|
|
| | 1.47 | | | | 1.19 | | | | (2.30 | ) | | | (1.23 | ) | | | 2.16 | |
|
|
| |
|
|
| |
|
|
| |
|
|
| |
|
|
|
| | | | | | | | | | | | | | | | | | | |
| | — | | | | — | | | | — | | | | — | | | | (.46 | ) |
| | — | | | | — | | | | (.02 | ) | | | (.98 | ) | | | (.28 | ) |
|
|
| |
|
|
| |
|
|
| |
|
|
| |
|
|
|
| | — | | | | — | | | | (.02 | ) | | | (.98 | ) | | | (.74 | ) |
|
|
| |
|
|
| |
|
|
| |
|
|
| |
|
|
|
| $ | 11.11 | | | $ | 9.64 | | | $ | 8.45 | | | $ | 10.77 | | | $ | 12.98 | |
|
|
| |
|
|
| |
|
|
| |
|
|
| |
|
|
|
| | 15.25 | % | | | 14.08 | % | | | (21.35 | )% | | | (9.74 | )% | | | 19.23 | % |
| | | | | | | | | | | | | | | | | | | |
| $ | 5,297 | | | $ | 2,589 | | | $ | 1,897 | | | $ | 3,413 | | | $ | 1,318 | |
| $ | 3,837 | | | $ | 2,767 | | | $ | 2,778 | | | $ | 2,270 | | | $ | 25,793 | |
| | | | | | | | | | | | | | | | | | | |
| | 1.18 | % | | | 1.46 | % | | | 1.32 | % | | | 1.39 | % | | | 1.29 | % |
| | 1.18 | % | | | 1.46 | % | | | 1.32 | % | | | 1.39 | % | | | 1.29 | % |
| | — | %(e) | | | (.02 | )% | | | (.10 | )% | | | .23 | % | | | .12 | % |
See Notes to Financial Statements.
| | |
| Strategic Partners Asset Allocation Funds/Strategic Partners High Growth Fund | | 47 |
| | | | |
| n MAIL | | n TELEPHONE | | n WEBSITE |
Gateway Center Three 100 Mulberry Street Newark, NJ 07102 | | (800) 225-1852 | | www.strategicpartners.com |
|
| PROXY VOTING |
| The Board of Trustees of the Fund has delegated to the Fund’s investment advisers the responsibility for voting any proxies and maintaining proxy recordkeeping with respect to the Fund. A description of these proxy voting policies and procedures is available without charge, upon request, by calling (800) 225-1852 or by visiting the Securities and Exchange Commission’s (the Commission) website at http://www.sec.gov. Information regarding how the Fund voted proxies relating to portfolio securities during the most recent 12-month period ended June 30, 2004, is available on the Fund’s website at http://www.prudential.com and on the Commission’s website at http:/www.sec.gov. |
|
| TRUSTEES |
David E.A. Carson • Robert F. Gunia • Robert E. La Blanc • Douglas H. McCorkindale •
Richard A. Redeker • Judy A. Rice • Robin B. Smith • Stephen G. Stoneburn •
Clay T. Whitehead |
|
| OFFICERS |
Judy A. Rice, President • Robert F. Gunia, Vice President • Grace C. Torres, Treasurer and Principal Financial and Accounting Officer • William V. Healey, Chief Legal Officer •
Deborah A. Docs, Secretary • Maryanne Ryan, Anti-Money Laundering Officer • Helene Gurian, Acting Anti-Money Laundering Compliance Officer • Lee D. Augsburger, Chief Compliance Officer |
| | | | |
| MANAGER | | Prudential Investments LLC | | Gateway Center Three
100 Mulberry Street
Newark, NJ 07102 |
|
INVESTMENT ADVISERS* (as of January 31, 2005) | | EARNEST Partners, LLC | | 75 14th Street, Suite 2300
Atlanta, GA 30309 |
|
| | | Jennison Associates LLC | | 466 Lexington Avenue
New York, NY 10017 |
|
| | | Lazard Asset
Management LLC | | 30 Rockefeller Plaza
New York, NY 10112 |
|
| | | RS Investment
Management, L.P. | | 388 Market Street
Suite 1700
San Francisco, CA 94111 |
|
| DISTRIBUTOR | | Prudential Investment
Management Services LLC | | Gateway Center Three
100 Mulberry Street
Newark, NJ 07102 |
|
| CUSTODIAN | | The Bank of New York | | One Wall Street
New York, NY 10286 |
|
| TRANSFER AGENT | | Prudential Mutual Fund
Services LLC | | PO Box 8098
Philadelphia, PA 19176 |
* Investment Advisers are subject to change by the Manager.
| | | | |
| INDEPENDENT REGISTERED PUBLIC ACCOUNTING FIRM | | KPMG LLP | | 757 Third Avenue
New York, NY 10017 |
|
| FUND COUNSEL | | Shearman & Sterling LLP | | 599 Lexington Avenue
New York, NY 10022 |
| | | | | | | | | | | | | | | | | | |
| Strategic Partners High Growth Fund | | | | | | | | | | |
| | | Share Class | | A | | B | | C | | M | | R | | X | | Z | | |
| | | NASDAQ | | PHGAX | | PIHGX | | PHGCX | | HIGWM | | HIGWR | | HIGWX | | PDHZX | | |
| | | CUSIP | | 86276X509 | | 86276X608 | | 86276X707 | | 86276X772 | | 86276X756 | | 86276X764 | | 86276X806 | | |
| | | | | | | | | | | | | | | | | | | |
|
| An investor should consider the investment objectives, risks, and charges and expenses of the Fund carefully before investing. The prospectus for the Fund contains this and other information about the Fund. An investor may obtain a prospectus by visiting our website at www.strategicpartners.com or by calling (800) 225-1852. The prospectus should be read carefully before investing. |
|
| E-DELIVERY |
| To receive your mutual fund documents on-line, go to www.icsdelivery.com/prudential/funds and enroll. Instead of receiving printed documents by mail, you will receive notification via e-mail when new materials are available. You can cancel your enrollment or change your e-mail address at any time by clicking on the change/cancel enrollment option at the icsdelivery website address. |
|
| SHAREHOLDER COMMUNICATIONS WITH TRUSTEES |
| Shareholders of the Fund can communicate directly with the Board of Trustees by writing to the Chair of the Board, Strategic Partners High Growth Fund, PO Box 13964, Philadelphia, PA 19176. Shareholders can communicate directly with an individual Trustee by writing to that Trustee at Strategic Partners High Growth Fund, PO Box 13964, Philadelphia, PA 19176. Such communications to the Board or individual Trustees are not screened before being delivered to the addressee. |
|
| AVAILABILITY OF QUARTERLY PORTFOLIO SCHEDULE |
| The Fund files its complete schedule of portfolio holdings with the Securities and Exchange Commission (the Commission) for the first and third quarters of each fiscal year on Form N-Q. The Fund’s Forms N-Q are available on the Commission’s website at http://www.sec.gov. The Fund’s Forms N-Q may also be reviewed and copied at the Commission’s Public Reference Room in Washington, D.C. Information on the operation of the Public Reference Room may be obtained by calling (800) SEC-0330 (732-0330). The Fund will provide a full list of its portfolio holdings as of the end of each fiscal quarter on its website at www.strategicpartners.com within 60 days after the end of the fiscal quarter. |
Mutual Funds:
| | | | |
| ARE NOT INSURED BY THE FDIC OR ANY FEDERAL GOVERNMENT AGENCY | | MAY LOSE VALUE | | ARE NOT A DEPOSIT OF OR GUARANTEED BY ANY BANK OR ANY BANK AFFILIATE |

| | | | | | | | | | | | | | | | | | |
| Strategic Partners High Growth Fund | | | | | | | | | | | | |
| | | Share Class | | A | | B | | C | | M | | R | | X | | Z | | |
| | | NASDAQ | | PHGAX | | PIHGX | | PHGCX | | HIGWM | | HIGWR | | HIGWX | | PDHZX | | |
| | | CUSIP | | 86276X509 | | 86276X608 | | 86276X707 | | 86276X772 | | 86276X756 | | 86276X764 | | 86276X806 | | |
| | | | | | | | | | | | | | | | | | | |
MFSP504E6 IFS-A102101 Ed. 03/2005
Item 2 – Code of Ethics – Not required as this is not an annual filing.
Item 3 – Audit Committee Financial Expert – Not applicable with semi-annual filing.
Item 4 – Principal Accountant Fees and Services – Not applicable with semi-annual filing.
Item 5 – Audit Committee of Listed Registrants – Not applicable.
Item 6 – Schedule of Investments – The schedule is included as part of the report to shareholders filed under Item 1 of this Form.
Item 7 – Disclosure of Proxy Voting Policies and Procedures for Closed-End Management Investment Companies – Not applicable.
Item 8 – Portfolio Managers of Closed-End Management Investment Companies – Not applicable.
Item 9 – Purchases of Equity Securities by Closed-End Management Investment Company and Affiliated Purchasers – Not applicable.
Item 10 – Submission of Matters to a Vote of Security Holders – Not applicable.
Item 11 – Controls and Procedures
| | (a) | It is the conclusion of the registrant’s principal executive officer and principal financial officer that the effectiveness of the registrant’s current disclosure controls and procedures (such disclosure controls and procedures having been evaluated within 90 days of the date of this filing) provide reasonable assurance that the information required to be disclosed by the registrant has been recorded, processed, summarized and reported within the time period specified in the Commission’s rules and forms and that the information required to be disclosed by the registrant has been accumulated and communicated to the registrant’s principal executive officer and principal financial officer in order to allow timely decisions regarding required disclosure. |
| | (b) | There have been no significant changes in the registrant’s internal controls or in other factors that could significantly affect these controls subsequent to the date of their evaluation, including any corrective actions with regard to significant deficiencies and material weaknesses. |
Item 12 – Exhibits
| | (a) | Code of Ethics – Not applicable with semi-annual filing. |
| | (b) | Certifications pursuant to Section 302 and 906 of the Sarbanes-Oxley Act – Attached hereto |
SIGNATURES
Pursuant to the requirements of the Securities Exchange Act of 1934 and the Investment Company Act of 1940, the registrant has duly caused this report to be signed on its behalf by the undersigned, thereunto duly authorized.
| | |
| (Registrant) | | Strategic Partners Asset Allocation Funds |
| | |
| |
| By (Signature and Title)* | | /s/ DEBORAH A. DOCS |
| | | Deborah A. Docs |
| | | Secretary |
Pursuant to the requirements of the Securities Exchange Act of 1934 and the Investment Company Act of 1940, this report has been signed below by the following persons on behalf of the registrant and in the capacities and on the dates indicated.
| | |
| |
| By (Signature and Title)* | | /s/ JUDY A. RICE |
| | | Judy A. Rice |
| | | President and Principal Executive Officer |
| | |
| |
| By (Signature and Title)* | | /s/ GRACE C. TORRES |
| | | Grace C. Torres |
| | | Treasurer and Principal Financial Officer |
| * | Print the name and title of each signing officer under his or her signature. |