UNITED STATES
SECURITIES AND EXCHANGE COMMISSION
Washington, D.C. 20549
FORM N-CSR
CERTIFIED SHAREHOLDER REPORT OF REGISTERED MANAGEMENT
INVESTMENT COMPANIES
| | |
| Investment Company Act file number: | | 811-08915 |
| |
| Exact name of registrant as specified in charter: | | Target Asset Allocation Funds |
| |
| Address of principal executive offices: | | Gateway Center 3, 100 Mulberry Street, Newark, New Jersey 07102 |
| |
| Name and address of agent for service: | | Deborah A. Docs Gateway Center 3, 100 Mulberry Street, Newark, New Jersey 07102 |
| |
| Registrant’s telephone number, including area code: | | 800-225-1852 |
| |
| Date of fiscal year end: | | 7/31/2008 |
| |
| Date of reporting period: | | 1/31/2008 |
Item 1 – Reports to Stockholders

| | |
| JANUARY 31, 2008 | | SEMIANNUAL REPORT |
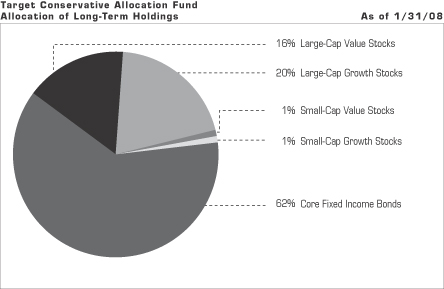
Target Conservative Allocation Fund
OBJECTIVE
Seeks current income and a reasonable level of capital appreciation
This report is not authorized for distribution to prospective investors unless preceded or accompanied by a current prospectus.
The views expressed in this report and information about the Fund’s portfolio holdings are for the period covered by this report and are subject to change thereafter.
The accompanying financial statements as of January 31, 2008, were not audited and, accordingly, no auditor’s opinion is expressed on them.
Target Funds, Prudential, Prudential Financial and the Rock Prudential logo are registered service marks of The Prudential Insurance Company of America, Newark, NJ, and its affiliates.

March 14, 2008
Dear Shareholder:
On the following pages, you’ll find your semiannual report for the Target Conservative Allocation Fund.
Target Asset Allocation Funds are managed by institutional-quality asset managers selected, matched, and monitored by a research team from Prudential Investments LLC. Portions of the Funds’ assets are assigned to carefully chosen asset managers, with the allocations actively managed on the basis of our projections for the financial markets and the managers’ individual strengths.
We believe our Target Conservative Allocation Fund will help you to achieve broad, actively managed diversification at a targeted risk/return balance with a single investment purchase. We appreciate your continued confidence in us.
Sincerely,

Judy A. Rice, President
Target Asset Allocation Funds
| | |
| Target Asset Allocation Funds/Target Conservative Allocation Fund | | 1 |
Your Fund’s Performance
Performance data quoted represent past performance. Past performance does not guarantee future results. The investment return and principal value of an investment will fluctuate, so that an investor’s shares, when redeemed, may be worth more or less than their original cost. Current performance may be lower or higher than the past performance data quoted. An investor may obtain performance data as of the most recent month-end by visiting our website at www.prudential.com or by calling (800) 225-1852. The maximum initial sales charge is 5.50% (Class A shares). Gross operating expenses: Class A, 1.50%; Class B, 2.20%; Class C, 2.20%; Class M, 2.20%; Class R, 1.95%; Class X, 2.20%; Class Z, 1.20%. Net operating expenses apply to: Class A, 1.45%; Class B, 2.20%; Class C, 2.20%; Class M, 2.20%; Class R, 1.70%; Class X, 2.20%; Class Z, 1.20%, after contractual reduction through 11/30/2008.
| | | | | | | | | | | | |
| Cumulative Total Returns as of 1/31/08 | | | | | | | | | | |
| | | Six Months | | | One Year | | | Five Years | | | Since Inception1 | |
Class A | | 4.07 | % | | 5.32 | % | | 55.05 | % | | 72.85 | % |
Class B | | 3.70 | | | 4.54 | | | 49.44 | | | 61.50 | |
Class C | | 3.70 | | | 4.54 | | | 49.44 | | | 61.50 | |
Class M | | 3.70 | | | 4.54 | | | N/A | | | 21.44 | |
Class R | | 3.94 | | | 4.95 | | | N/A | | | 23.46 | |
Class X | | 3.80 | | | 4.54 | | | N/A | | | 21.45 | |
Class Z | | 4.20 | | | 5.58 | | | 57.07 | | | 76.84 | |
Customized Blend2 | | 2.26 | | | 4.11 | | | 47.21 | | | ** | |
S&P 500 Index3 | | –4.32 | | | –2.31 | | | 76.44 | | | *** | |
Lipper Mixed-Asset Target Allocation Conservative Funds Avg.4 | | 1.19 | | | 2.44 | | | 36.64 | | | **** | |
| | | | | | | | | | | | |
| Average Annual Total Returns5 as of 12/31/07 | | | | | | | | | | |
| | | | | | One Year | | | Five Years | | | Since Inception1 | |
Class A | | | | | 1.05 | % | | 8.10 | % | | 5.62 | % |
Class B | | | | | 1.05 | | | 8.36 | | | 5.48 | |
Class C | | | | | 5.04 | | | 8.51 | | | 5.48 | |
Class M | | | | | 0.05 | | | N/A | | | 5.64 | |
Class R | | | | | 6.55 | | | N/A | | | 6.97 | |
Class X | | | | | 0.14 | | | N/A | | | 5.37 | |
Class Z | | | | | 7.09 | | | 9.60 | | | 6.53 | |
Customized Blend2 | | | | | 6.38 | | | 8.15 | | | ** | |
S&P 500 Index3 | | | | | 5.49 | | | 12.82 | | | *** | |
Lipper Mixed-Asset Target Allocation Conservative Funds Avg.4 | | | | | 4.49 | | | 6.66 | | | **** | |
The cumulative total returns do not reflect the deduction of applicable sales charges. If reflected, the applicable sales charges would reduce the cumulative total returns
| | |
| 2 | | Visit our website at www.prudential.com |
performance quoted. Class A shares are subject to a maximum front-end sales charge of 5.50%. Under certain circumstances, Class A shares may be subject to a contingent deferred sales charge (CDSC) of 1%. Class B and Class C shares are subject to a maximum CDSC of 5% and 1%, respectively. Class M and Class X shares are subject to a maximum CDSC of 6%. Class R and Class Z shares are not subject to a sales charge.
Source: Prudential Investments LLC and Lipper Inc. Performance figures may reflect fee waivers and/or expense reimbursements. In the absence of such fee waivers and/or expense reimbursements, total returns would be lower.
1Inception dates: Class A, B, C, and Z, 11/18/98; Class M, R, and X, 10/04/04.
2The Customized Benchmark for Target Conservative Allocation Fund (Customized Blend) is a model portfolio consisting of the Russell 3000 Index (40%) and the Lehman Brothers U.S. Aggregate Bond Index (60%). The Customized Blend is an unmanaged index generally considered as representing the performance of the Fund’s asset classes. The Customized Blend is intended to provide a theoretical comparison of the Fund’s performance, based on the amounts allocated to each asset class rather than on amounts allocated to various Fund segments. The Customized Blend does not reflect deductions for any sales charges or operating expenses of a mutual fund.
3The Standard & Poor’s 500 Composite Stock Price Index (S&P 500 Index) is an unmanaged index of 500 stocks of large U.S. public companies. It gives an indication of how U.S. stock prices have performed.
4The Lipper Mix-Asset Target Allocation Conservative Funds Average (Lipper Average) represents returns based on the average return of all funds in the Lipper Mixed-Equity Funds category for the periods noted. Funds in the Lipper Average have a primary investment objective of conserving principal by maintaining at all times a balanced portfolio of both stocks and bonds. Mixed-Asset Funds are funds that, by portfolio practice, maintain a mix of between 20% and 40% equity securities, with the remainder invested in bonds, cash, and cash equivalents.
5The average annual total returns take into account applicable sales charges. Class A, Class B, Class C, Class M, Class R, and Class X shares are subject to an annual distribution and service (12b-1) fee of up to 0.30%, 1.00%, 1.00%, 1.00%, 0.75%, and 1.00%, respectively. Approximately seven years after purchase, Class B shares will automatically convert to Class A shares on a quarterly basis. Approximately eight years after purchase, Class M shares will automatically convert to Class A shares on a quarterly basis. Approximately 10 years after purchase, Class X shares will automatically convert to Class A shares on a quarterly basis. Class Z shares are not subject to a 12b-1 fee. The returns in the tables do not reflect the deduction of taxes that a shareholder would pay on Fund distributions or following the redemption of Fund shares.
**Customized Blend Closest Month-End to Inception cumulative total returns as of 1/31/08 are 63.22% for Classes A, B, C, and Z; and 24.11% for Classes M, R, and X. Customized Blend Closest Month-End to Inception average annual total returns as of 12/31/07 are 5.71% for Classes A, B, C, and Z; and 7.34% for Classes M, R, and X.
***S&P 500 Index Closest Month-End to Inception cumulative total returns as of 1/31/08 are 37.26% for Classes A, B, C, and Z; and 31.56% for Classes M, R, and X. S&P 500 Index Closest Month-End to Inception average annual total returns as of 12/31/07 are 4.26% for Classes A, B, C, and Z; and 10.90% for Classes M, R, and X.
****Lipper Average Closest Month-End to Inception cumulative total returns as of 1/31/08 are 55.09% for Classes A, B, C, and Z; and 18.17% for Classes M, R, and X. Lipper Average Closest Month-End to Inception average annual total returns as of 12/31/07 are 5.04% for Classes A, B, C, and Z; and 5.69% for Classes M, R, and X.
Investors cannot invest directly in an index. The returns for the S&P 500 Index and the Customized Blend would be lower if they included the effects of sales charges, operating expenses of a mutual fund, or taxes. Returns for the Lipper Average reflect the deduction of operating expenses, but not sales charges or taxes. The Since Inception returns for the S&P 500 Index, the Customized Blend, and the Lipper Average are measured from the closest month-end to inception date, and not from the Fund’s actual inception date.
| | |
| Target Asset Allocation Funds/Target Conservative Allocation Fund | | 3 |
Your Fund’s Performance (continued)
Fund objective
The investment objective of the Target Conservative Allocation Fund is current income and a reasonable level of capital appreciation. There can be no assurance that the Fund will achieve its investment objective.
| | |
| 4 | | Visit our website at www.prudential.com |
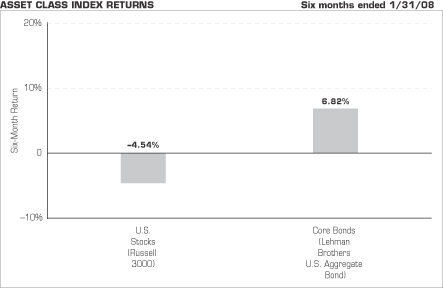
Source: Lipper Inc.
The chart above shows the total returns for six months ended January 31, 2008, of various securities indexes that are generally considered representative of broad market sectors. It does not reflect a mutual fund’s expenses. The performance cited does not represent the performance of the Target Conservative Allocation Fund. Past performance is not indicative of future results. Investors cannot invest directly in an index.
The Russell 3000 Index measures the performance of the 3,000 largest U.S. companies based on total market capitalization, which represents approximately 98% of the investable U.S. equity market.
The Lehman Brothers U.S. Aggregate Bond Index is an unmanaged index of investment-grade securities issued by the U.S. government and its agencies, and by corporations with between one and 10 years remaining to maturity. It gives a broad look at how short- and intermediate-term bonds have performed.
| | |
| Target Asset Allocation Funds/Target Conservative Allocation Fund | | 5 |
Fees and Expenses (Unaudited)
As a shareholder of the Fund, you incur two types of costs: (1) transaction costs, including sales charges (loads) on purchase payments and redemptions, as applicable, and (2) ongoing costs, including management fees, distribution and/or service (12b-1) fees, and other Fund expenses, as applicable. This example is intended to help you understand your ongoing costs (in dollars) of investing in the Fund and to compare these costs with the ongoing costs of investing in other mutual funds.
The example is based on an investment of $1,000 invested on August 1, 2007, at the beginning of the period, and held through the six-month period ended January 31, 2008. The example is for illustrative purposes only; you should consult the Prospectus for information on initial and subsequent minimum investment requirements.
The Fund’s transfer agent may charge additional fees to holders of certain accounts that are not included in the expenses shown in the table on the following page. These fees apply to individual retirement accounts (IRAs) and Section 403(b) accounts. As of the close of the six-month period covered by the table, IRA fees included an annual maintenance fee of $15 per account (subject to a maximum annual maintenance fee of $25 for all accounts held by the same shareholder). Section 403(b) accounts are charged an annual $25 fiduciary maintenance fee. Some of the fees may vary in amount, or may be waived, based on your total account balance or the number of JennisonDryden Funds, including the Target Asset Allocation Funds, that you own. You should consider the additional fees that were charged to your Fund account over the six-month period when you estimate the total ongoing expenses paid over the period and the impact of these fees on your ending account value, as these additional expenses are not reflected in the information provided in the expense table. Additional fees have the effect of reducing investment returns.
Actual Expenses
The first line for each share class in the table on the following page provides information about actual account values and actual expenses. You may use the information on this line, together with the amount you invested, to estimate the expenses that you paid over the period. Simply divide your account value by $1,000 (for example, an $8,600 account value ÷ $1,000 = 8.6), then multiply the result by the number on the first line under the heading “Expenses Paid During the Six-Month Period” to estimate the expenses you paid on your account during this period.
Hypothetical Example for Comparison Purposes
The second line for each share class in the table on the following page provides information about hypothetical account values and hypothetical expenses based on the Fund’s actual expense ratio and an assumed rate of return of 5% per year before
| | |
| 6 | | Visit our website at www.prudential.com |
expenses, which is not the Fund’s actual return. The hypothetical account values and expenses may not be used to estimate the actual ending account balance or expenses you paid for the period. You may use this information to compare the ongoing costs of investing in the Fund and other funds. To do so, compare this 5% hypothetical example with the 5% hypothetical examples that appear in the shareholder reports of the other funds.
Please note that the expenses shown in the table are meant to highlight your ongoing costs only, and do not reflect any transactional costs such as sales charges (loads). Therefore the second line for each share class in the table is useful in comparing ongoing costs only, and will not help you determine the relative total costs of owning different funds. In addition, if these transactional costs were included, your costs would have been higher.
| | | | | | | | | | | | | | |
Target
Conservative
Allocation Fund | | Beginning Account
Value
August 1, 2007 | | Ending Account
Value January 31, 2008 | | Annualized
Expense Ratio
Based on the
Six-Month Period | | | Expenses Paid
During the Six-
Month Period* |
| | | | | | | | | | | | | | |
| Class A | | Actual | | $ | 1,000.00 | | $ | 1,040.70 | | 1.45 | % | | $ | 7.44 |
| | | Hypothetical | | $ | 1,000.00 | | $ | 1,017.85 | | 1.45 | % | | $ | 7.35 |
| | | | | | | | | | | | | | |
| Class B | | Actual | | $ | 1,000.00 | | $ | 1,037.00 | | 2.20 | % | | $ | 11.26 |
| | | Hypothetical | | $ | 1,000.00 | | $ | 1,014.08 | | 2.20 | % | | $ | 11.14 |
| | | | | | | | | | | | | | |
| Class C | | Actual | | $ | 1,000.00 | | $ | 1,037.00 | | 2.20 | % | | $ | 11.26 |
| | | Hypothetical | | $ | 1,000.00 | | $ | 1,014.08 | | 2.20 | % | | $ | 11.14 |
| | | | | | | | | | | | | | |
| Class M | | Actual | | $ | 1,000.00 | | $ | 1,037.00 | | 2.20 | % | | $ | 11.26 |
| | | Hypothetical | | $ | 1,000.00 | | $ | 1,014.08 | | 2.20 | % | | $ | 11.14 |
| | | | | | | | | | | | | | |
| Class R | | Actual | | $ | 1,000.00 | | $ | 1,039.40 | | 1.70 | % | | $ | 8.71 |
| | | Hypothetical | | $ | 1,000.00 | | $ | 1,016.59 | | 1.70 | % | | $ | 8.62 |
| | | | | | | | | | | | | | |
| Class X | | Actual | | $ | 1,000.00 | | $ | 1,038.00 | | 2.20 | % | | $ | 11.27 |
| | | Hypothetical | | $ | 1,000.00 | | $ | 1,014.08 | | 2.20 | % | | $ | 11.14 |
| | | | | | | | | | | | | | |
| Class Z | | Actual | | $ | 1,000.00 | | $ | 1,042.00 | | 1.20 | % | | $ | 6.16 |
| | | Hypothetical | | $ | 1,000.00 | | $ | 1,019.10 | | 1.20 | % | | $ | 6.09 |
* Fund expenses (net of fee waivers or subsidies, if any) for each share class are equal to the annualized expense ratio for each share class (provided in the table), multiplied by the average account value over the period, multiplied by the 184 days in the six-month period ended January 31, 2008, and divided by the 366 days in the Fund’s fiscal year ending July 31, 2008 (to reflect the six-month period). Expenses presented in the table include the expenses of any underlying portfolios in which the Fund may invest.
| | |
| Target Asset Allocation Funds/Target Conservative Allocation Fund | | 7 |
Portfolio of Investments
as of January 31, 2008 (Unaudited)
| | | | | |
| Shares | | Description | | Value (Note 1) |
| | | | | |
LONG-TERM INVESTMENTS 102.9% | | | |
COMMON STOCKS 39.8% | | | |
| |
Aerospace 0.7% | | | |
| 1,070 | | Aerovironment, Inc.(a) | | $ | 24,621 |
| 315 | | Alliant Techsystems, Inc.(a) | | | 33,343 |
| 630 | | BE Aerospace, Inc.(a) | | | 24,324 |
| 1,750 | | Boeing Co. (The) | | | 145,565 |
| 420 | | DRS Technologies, Inc. | | | 22,541 |
| 7,137 | | Lockheed Martin Corp. | | | 770,225 |
| 1,075 | | Moog, Inc. (Class A Stock)(a) | | | 49,493 |
| 1,520 | | Orbital Sciences Corp.(a) | | | 35,416 |
| 2,000 | | United Technologies Corp. | | | 146,820 |
| | | | | |
| | | | | 1,252,348 |
| |
Aerospace & Defense 0.9% | | | |
| 700 | | AAR Corp.(a) | | | 20,622 |
| 7,281 | | General Dynamics Corp. | | | 614,953 |
| 200 | | Goodrich Corp. | | | 12,510 |
| 1,000 | | HEICO Corp. | | | 44,510 |
| 4,600 | | Honeywell International, Inc. | | | 271,722 |
| 7,750 | | Northrop Grumman Corp. | | | 615,040 |
| 100 | | Teledyne Technologies, Inc.(a) | | | 5,163 |
| | | | | |
| | | | | 1,584,520 |
| |
Air Freight & Couriers 0.1% | | | |
| 1,100 | | FedEx Corp. | | | 102,828 |
| |
Airlines | | | |
| 2,200 | | Southwest Airlines Co. | | | 25,806 |
| |
Auto Components 0.1% | | | |
| 6,750 | | Johnson Controls, Inc. | | | 238,747 |
| |
Auto Parts & Related 0.1% | | | |
| 5,900 | | AutoNation, Inc.(a) | | | 96,052 |
| |
Automobile Manufacturers | | | |
| 4,000 | | Ford Motor Co.(a) | | | 26,560 |
| 200 | | Winnebago Industries, Inc. | | | 4,212 |
| | | | | |
| | | | | 30,772 |
See Notes to Financial Statements.
| | |
| Target Asset Allocation Funds/Target Conservative Allocation Fund | | 9 |
Portfolio of Investments
as of January 31, 2008 (Unaudited) continued
| | | | | |
| Shares | | Description | | Value (Note 1) |
| | | | | |
COMMON STOCKS (Continued) | | | |
| |
Automobiles | | | |
| 3,000 | | General Motors Corp. | | $ | 84,930 |
| |
Automotive Parts 0.1% | | | |
| 250 | | Advance Auto Parts, Inc. | | | 8,920 |
| 1,630 | | Amerigon, Inc.(a) | | | 27,906 |
| 1,950 | | Paccar, Inc. | | | 91,494 |
| | | | | |
| | | | | 128,320 |
| |
Beverages 0.5% | | | |
| 2,400 | | Anheuser-Busch Cos., Inc. | | | 111,648 |
| 10,579 | | Coca-Cola Co. (The) | | | 625,959 |
| 2,400 | | Coca-Cola Enterprises, Inc. | | | 55,368 |
| 400 | | Molson Coors Brewing Co. (Class B Stock) | | | 17,868 |
| 2,600 | | PepsiCo, Inc. | | | 177,294 |
| | | | | |
| | | | | 988,137 |
| |
Biotechnology 0.6% | | | |
| 5,300 | | Amgen, Inc.(a) | | | 246,927 |
| 9,044 | | Genentech, Inc.(a) | | | 634,798 |
| 890 | | Genomic Health, Inc.(a) | | | 18,681 |
| 500 | | LifeCell Corp.(a) | | | 19,755 |
| 7,900 | | Millennium Pharmaceuticals, Inc.(a) | | | 119,843 |
| | | | | |
| | | | | 1,040,004 |
| |
Building Products 0.1% | | | |
| 785 | | Lennox International, Inc. | | | 29,171 |
| 3,600 | | Masco Corp. | | | 82,548 |
| | | | | |
| | | | | 111,719 |
| |
Business Services 0.1% | | | |
| 200 | | Administaff, Inc. | | | 6,002 |
| 2,300 | | Manpower, Inc. | | | 129,398 |
| | | | | |
| | | | | 135,400 |
| |
Capital Markets 0.1% | | | |
| 675 | | KBW, Inc.(a) | | | 20,054 |
| 2,297 | | Raymond James Financial, Inc. | | | 64,523 |
| 675 | | Waddell & Reed Financial, Inc. (Class A Stock) | | | 22,396 |
| | | | | |
| | | | | 106,973 |
See Notes to Financial Statements.
| | |
| 10 | | Visit our website at www.prudential.com |
| | | | | |
| Shares | | Description | | Value (Note 1) |
| | | | | |
COMMON STOCKS (Continued) | | | |
| |
Chemicals 1.1% | | | |
| 2,561 | | Air Products & Chemicals, Inc. | | $ | 230,541 |
| 575 | | Airgas, Inc. | | | 26,686 |
| 1,700 | | Celanese Corp. (Class A Stock) | | | 63,206 |
| 12,200 | | Dow Chemical Co. (The) | | | 471,652 |
| 450 | | DuPont (E.I.) de Nemours & Co. | | | 20,331 |
| 3,500 | | Eastman Chemical Co. | | | 231,245 |
| 325 | | FMC Corp. | | | 17,277 |
| 400 | | Lubrizol Corp. (The) | | | 21,044 |
| 200 | | Mosaic Co. (The)(a) | | | 18,202 |
| 2,500 | | PPG Industries, Inc. | | | 165,225 |
| 4,718 | | Praxair, Inc. | | | 381,733 |
| 3,050 | | Rohm & Haas Co. | | | 162,718 |
| 1,050 | | Scotts Miracle-Gro Co. (The) (Class A Stock) | | | 40,992 |
| 900 | | Terra Industries, Inc.(a) | | | 40,563 |
| 1,425 | | Valspar Corp. | | | 28,543 |
| 620 | | Zoltek Cos., Inc.(a) | | | 22,630 |
| | | | | |
| | | | | 1,942,588 |
| |
Clothing & Apparel 0.2% | | | |
| 2,720 | | FGX International Holdings Ltd. (Virgin Islands)(a) | | | 27,472 |
| 5,900 | | Gap, Inc. (The) | | | 112,808 |
| 1,480 | | Iconix Brand Group, Inc.(a) | | | 30,769 |
| 950 | | NIKE, Inc. (Class B Stock) | | | 58,672 |
| 1,050 | | Phillips-Van Heusen Corp. | | | 44,247 |
| 300 | | VF Corp. | | | 23,211 |
| | | | | |
| | | | | 297,179 |
| |
Commercial Banks 0.5% | | | |
| 25 | | City National Corp. | | | 1,422 |
| 1,800 | | Colonial BancGroup, Inc. (The) | | | 28,260 |
| 2,750 | | Comerica, Inc. | | | 119,955 |
| 550 | | Cullen/Frost Bankers, Inc. | | | 29,942 |
| 5,100 | | Huntington Bancshares, Inc. | | | 68,595 |
| 1,900 | | National City Corp. | | | 33,801 |
| 800 | | Provident Bankshares Corp. | | | 16,584 |
| 500 | | Sterling Financial Corp. | | | 8,895 |
| 575 | | United Bankshares, Inc. | | | 18,492 |
| 15,600 | | Wachovia Corp. | | | 607,308 |
| | | | | |
| | | | | 933,254 |
See Notes to Financial Statements.
| | |
| Target Asset Allocation Funds/Target Conservative Allocation Fund | | 11 |
Portfolio of Investments
as of January 31, 2008 (Unaudited) continued
| | | | | |
| Shares | | Description | | Value (Note 1) |
| | | | | |
COMMON STOCKS (Continued) | | | |
| |
Commercial Services 0.6% | | | |
| 5,700 | | Accenture Ltd. (Class A Stock) (Bermuda) | | $ | 197,334 |
| 3,500 | | Apollo Group, Inc. (Class A Stock)(a) | | | 279,090 |
| 2,791 | | Cardtronics, Inc.(a) | | | 21,853 |
| 560 | | FirstService Corp. (Canada)(a) | | | 12,628 |
| 1,038 | | Healthcare Services Group, Inc. | | | 25,170 |
| 1,225 | | Healthspring, Inc.(a) | | | 25,345 |
| 630 | | HMS Holdings Corp.(a) | | | 19,908 |
| 800 | | HNI Corp. | | | 26,928 |
| 1,500 | | ITT Educational Services, Inc.(a) | | | 137,025 |
| 600 | | McKesson Corp. | | | 37,674 |
| 1,500 | | Moody’s Corp. | | | 52,485 |
| 400 | | Paychex, Inc. | | | 13,088 |
| 800 | | Pharmaceutical Product Development, Inc. | | | 34,688 |
| 2,040 | | Rollins, Inc. | | | 36,292 |
| 940 | | Team, Inc.(a) | | | 28,247 |
| 3,000 | | Waste Management, Inc. | | | 97,320 |
| 525 | | Watson Wyatt Worldwide, Inc. (Class A Stock) | | | 25,804 |
| 700 | | Weight Watchers International, Inc. | | | 29,820 |
| | | | | |
| | | | | 1,100,699 |
| |
Communication Equipment 0.1% | | | |
| 9,200 | | Alcatel-Lucent (France) | | | 58,236 |
| 1,300 | | Arris Group, Inc.(a) | | | 11,427 |
| 525 | | CommScope, Inc.(a) | | | 23,284 |
| | | | | |
| | | | | 92,947 |
| |
Computer Hardware 0.8% | | | |
| 150 | | Affiliated Computer Services, Inc. (Class A Stock)(a) | | | 7,312 |
| 6,480 | | Apple, Inc.(a) | | | 877,133 |
| 100 | | Computer Sciences Corp.(a) | | | 4,232 |
| 5,700 | | Dell, Inc.(a) | | | 114,228 |
| 9,900 | | EMC Corp.(a) | | | 157,113 |
| 1,450 | | International Business Machines Corp. | | | 155,643 |
| 1,780 | | Magma Design Automation, Inc.(a) | | | 20,292 |
| 300 | | Oracle Corp.(a) | | | 6,165 |
| 5,200 | | Synopsys, Inc.(a) | | | 114,504 |
| | | | | |
| | | | | 1,456,622 |
| |
Computer Networking | | | |
| 610 | | Atheros Communications, Inc.(a) | | | 16,659 |
See Notes to Financial Statements.
| | |
| 12 | | Visit our website at www.prudential.com |
| | | | | |
| Shares | | Description | | Value (Note 1) |
| | | | | |
COMMON STOCKS (Continued) | | | |
| |
Computer Services & Software 0.1% | | | |
| 1,290 | | Advent Software, Inc.(a) | | $ | 58,256 |
| 600 | | Autodesk, Inc.(a) | | | 24,690 |
| 370 | | Concur Technologies, Inc.(a) | | | 12,972 |
| 200 | | Diebold, Inc. | | | 5,176 |
| 1,610 | | Innerworkings, Inc.(a) | | | 22,298 |
| 265 | | Micros Systems, Inc.(a) | | | 16,319 |
| 1,940 | | Nuance Communications, Inc.(a) | | | 30,827 |
| 350 | | SanDisk Corp.(a) | | | 8,908 |
| 550 | | Sun Microsystems, Inc.(a) | | | 9,625 |
| | | | | |
| | | | | 189,071 |
| |
Computers & Peripherals | | | |
| 800 | | Lexmark International, Inc. (Class A Stock)(a) | | | 28,968 |
| |
Construction 0.1% | | | |
| 900 | | Granite Construction, Inc. | | | 34,263 |
| 200 | | Herman Miller, Inc. | | | 6,356 |
| 600 | | Hovnanian Enterprises, Inc. (Class A Stock)(a) | | | 5,934 |
| 900 | | KBR, Inc.(a) | | | 28,431 |
| 300 | | Meritage Homes Corp.(a) | | | 4,815 |
| 2,625 | | Toll Brothers, Inc.(a) | | | 61,110 |
| | | | | |
| | | | | 140,909 |
| |
Consumer Finance | | | |
| 370 | | Cash America International, Inc. | | | 12,029 |
| 1,775 | | First Cash Financial Services, Inc.(a) | | | 17,768 |
| 740 | | McGrath RentCorp | | | 17,234 |
| | | | | |
| | | | | 47,031 |
| |
Consumer Products & Services 0.7% | | | |
| 13,000 | | Altria Group, Inc. | | | 985,660 |
| 1,000 | | American Greetings Corp. (Class A Stock) | | | 20,520 |
| 400 | | Avon Products, Inc. | | | 14,008 |
| 1,370 | | Bare Escentuals, Inc.(a) | | | 32,661 |
| 3,850 | | Procter & Gamble Co. | | | 253,907 |
| 300 | | Snap-On, Inc. | | | 14,736 |
| | | | | |
| | | | | 1,321,492 |
| |
Containers & Packaging | | | |
| 450 | | Silgan Holdings, Inc. | | | 21,312 |
See Notes to Financial Statements.
| | |
| Target Asset Allocation Funds/Target Conservative Allocation Fund | | 13 |
Portfolio of Investments
as of January 31, 2008 (Unaudited) continued
| | | | | |
| Shares | | Description | | Value (Note 1) |
| | | | | |
COMMON STOCKS (Continued) | | | |
| |
Distribution/Wholesale | | | |
| 450 | | Owens & Minor, Inc. | | $ | 18,594 |
| 550 | | WESCO International, Inc.(a) | | | 23,232 |
| | | | | |
| | | | | 41,826 |
| |
Distributors | | | |
| 200 | | W.W. Grainger, Inc. | | | 15,914 |
| |
Diversified 0.1% | | | |
| 6,300 | | Ingersoll-Rand Co. Ltd. (Class A Stock) (Bermuda) | | | 248,976 |
| |
Diversified Financial Services 0.4% | | | |
| 100 | | GFI Group, Inc.(a) | | | 8,821 |
| 1,500 | | Janus Capital Group, Inc. | | | 40,515 |
| 13,417 | | JPMorgan Chase & Co. | | | 637,978 |
| 1,482 | | KKR Financial Holdings LLC | | | 24,068 |
| | | | | |
| | | | | 711,382 |
| |
Diversified Manufacturing Operations 0.3% | | | |
| 13,664 | | Hewlett-Packard Co. | | | 597,800 |
| |
Education | | | |
| 543 | | American Public Education, Inc.(a) | | | 21,399 |
| 720 | | DeVry, Inc. | | | 39,737 |
| | | | | |
| | | | | 61,136 |
| |
Electric Utilities 0.3% | | | |
| 500 | | Entergy Corp. | | | 54,090 |
| 2,000 | | Exelon Corp. | | | 152,380 |
| 1,900 | | FirstEnergy Corp. | | | 135,318 |
| 2,400 | | FPL Group, Inc. | | | 154,752 |
| 4,100 | | Sierra Pacific Resources | | | 61,377 |
| | | | | |
| | | | | 557,917 |
| |
Electrical Equipment 0.1% | | | |
| 425 | | General Cable Corp.(a) | | | 24,654 |
| 575 | | Regal-Beloit Corp. | | | 21,804 |
| 1,300 | | Thomas & Betts Corp.(a) | | | 58,825 |
| | | | | |
| | | | | 105,283 |
| |
Electronic Components 0.6% | | | |
| 1,800 | | Agilent Technologies, Inc.(a) | | | 61,038 |
| 600 | | Checkpoint Systems, Inc.(a) | | | 14,256 |
See Notes to Financial Statements.
| | |
| 14 | | Visit our website at www.prudential.com |
| | | | | |
| Shares | | Description | | Value (Note 1) |
| | | | | |
COMMON STOCKS (Continued) | | | |
| |
Electronic Components (continued) | | | |
| 300 | | Emerson Electric Co. | | $ | 15,252 |
| 2,100 | | Energizer Holdings, Inc.(a) | | | 196,602 |
| 1,400 | | FLIR Systems, Inc.(a) | | | 42,392 |
| 1,000 | | Garmin Ltd. | | | 72,150 |
| 200 | | Hubbell, Inc. (Class B Stock) | | | 9,536 |
| 300 | | Itron, Inc.(a) | | | 24,720 |
| 200 | | PerkinElmer, Inc. | | | 4,978 |
| 175 | | Rofin-Sinar Technologies, Inc.(a) | | | 7,439 |
| 13,475 | | Tyco Electronics Ltd. (Bermuda) | | | 455,590 |
| 2,700 | | Waters Corp.(a) | | | 155,115 |
| | | | | |
| | | | | 1,059,068 |
| |
Electronic Equipment & Instruments 0.2% | | | |
| 3,500 | | Avnet, Inc.(a) | | | 124,635 |
| 1,400 | | Diamond Offshore Drilling, Inc. | | | 158,102 |
| | | | | |
| | | | | 282,737 |
| |
Energy - Alternate Sources | | | |
| 100 | | First Solar, Inc.(a) | | | 18,177 |
| |
Energy Equipment | | | |
| 1,280 | | Oil States International, Inc.(a) | | | 44,877 |
| |
Energy Equipment & Services 0.3% | | | |
| 400 | | Cameron International Corp.(a) | | | 16,104 |
| 575 | | Complete Production Services, Inc.(a) | | | 9,143 |
| 730 | | Dril-Quip, Inc.(a) | | | 35,434 |
| 11,500 | | Halliburton Co. | | | 381,455 |
| 2,500 | | National-Oilwell Varco, Inc.(a) | | | 150,575 |
| 1,355 | | Superior Energy Services, Inc.(a) | | | 54,322 |
| | | | | |
| | | | | 647,033 |
| |
Engineering/Construction 0.1% | | | |
| 100 | | Fluor Corp. | | | 12,167 |
| 800 | | Foster Wheeler Ltd.(a) | | | 54,776 |
| 925 | | URS Corp.(a) | | | 40,607 |
| | | | | |
| | | | | 107,550 |
| |
Entertainment & Leisure 0.4% | | | |
| 1,440 | | Allegiant Travel Co.(a) | | | 45,043 |
| 1,600 | | Harley-Davidson, Inc. | | | 64,928 |
| 5,483 | | Las Vegas Sands, Inc.(a) | | | 480,695 |
See Notes to Financial Statements.
| | |
| Target Asset Allocation Funds/Target Conservative Allocation Fund | | 15 |
Portfolio of Investments
as of January 31, 2008 (Unaudited) continued
| | | | | |
| Shares | | Description | | Value (Note 1) |
| | | | | |
COMMON STOCKS (Continued) | | | |
| |
Entertainment & Leisure (continued) | | | |
| 630 | | Life Time Fitness, Inc.(a) | | $ | 27,934 |
| 950 | | Royal Caribbean Cruises Ltd. | | | 38,266 |
| 1,570 | | Scientific Games Corp. (Class A Stock)(a) | | | 37,366 |
| | | | | |
| | | | | 694,232 |
| |
Environmental Services | | | |
| 1,300 | | Allied Waste Industries, Inc.(a) | | | 12,805 |
| 2,890 | | Darling International, Inc.(a) | | | 33,524 |
| 655 | | Waste Connections, Inc.(a) | | | 19,100 |
| | | | | |
| | | | | 65,429 |
| |
Exchange Traded Funds | | | |
| 500 | | iShares Nasdaq Biotechnology Index Fund | | | 38,975 |
| 10 | | iShares Russell 1000 Value Index Fund | | | 769 |
| 650 | | iShares Russell 2000 Value Index Fund | | | 44,018 |
| | | | | |
| | | | | 83,762 |
| |
Farming & Agriculture 0.6% | | | |
| 9,121 | | Monsanto Co. | | | 1,025,565 |
| |
Financial - Bank & Trust 1.5% | | | |
| 750 | | Astoria Financial Corp. | | | 20,385 |
| 27,249 | | Bank of America Corp. | | | 1,207,614 |
| 1,850 | | Bank of New York Mellon Corp. (The) | | | 86,265 |
| 1,600 | | BB&T Corp. | | | 58,048 |
| 500 | | Pacific Capital Bancorp | | | 10,750 |
| 700 | | Prosperity Bancshares, Inc. | | | 20,125 |
| 10,275 | | Regions Financial Corp. | | | 259,341 |
| 300 | | Sovereign Bancorp, Inc. | | | 3,741 |
| 700 | | State Street Corp. | | | 57,484 |
| 1,325 | | SunTrust Banks, Inc. | | | 91,359 |
| 2,650 | | TCF Financial Corp. | | | 56,313 |
| 5,725 | | U.S. Bancorp | | | 194,364 |
| 21,218 | | Wells Fargo & Co. | | | 721,624 |
| 600 | | Whitney Holding Corp. | | | 16,104 |
| 750 | | Zions Bancorp | | | 41,055 |
| | | | | |
| | | | | 2,844,572 |
| |
Financial - Brokerage | | | |
| 3,725 | | TD Ameritrade Holding Corp.(a) | | | 69,881 |
See Notes to Financial Statements.
| | |
| 16 | | Visit our website at www.prudential.com |
| | | | | |
| Shares | | Description | | Value (Note 1) |
| | | | | |
COMMON STOCKS (Continued) | | | |
| |
Financial Services 2.0% | | | |
| 575 | | Affiliated Managers Group, Inc.(a) | | $ | 56,528 |
| 2,150 | | AMBAC Financial Group, Inc. | | | 25,198 |
| 1,560 | | Ameriprise Financial, Inc. | | | 86,284 |
| 300 | | Bear Stearns Cos., Inc. (The) | | | 27,090 |
| 246 | | Calamos Asset Management, Inc. (Class A Stock) | | | 5,368 |
| 2,850 | | Capital One Financial Corp. | | | 156,209 |
| 2,850 | | CIT Group, Inc. | | | 79,686 |
| 18,025 | | Citigroup, Inc. | | | 508,665 |
| 100 | | CME Group, Inc. | | | 61,890 |
| 1,800 | | Eaton Vance Corp. | | | 67,086 |
| 1,100 | | Federated Investors, Inc. (Class B Stock) | | | 46,827 |
| 4,646 | | Goldman Sachs Group, Inc. (The) | | | 932,777 |
| 819,000 | | Industrial And Commercial Bank of China (Class H Stock) (China) | | | 493,020 |
| 590 | | Investment Technology Group, Inc.(a) | | | 27,712 |
| 800 | | Jefferies Group, Inc. | | | 16,176 |
| 8,863 | | Lehman Brothers Holdings, Inc. | | | 568,739 |
| 1,350 | | Merrill Lynch & Co., Inc. | | | 76,140 |
| 6,150 | | Morgan Stanley | | | 303,994 |
| 100 | | Student Loan Corp. (The) | | | 11,842 |
| 2,840 | | TheStreet.com, Inc. | | | 31,524 |
| 1,790 | | ValueClick, Inc.(a) | | | 39,076 |
| 2,900 | | Western Union Co. (The) | | | 64,960 |
| | | | | |
| | | | | 3,686,791 |
| |
Food Products 0.2% | | | |
| 5,000 | | Archer-Daniels-Midland Co. | | | 220,250 |
| 2,050 | | General Mills, Inc. | | | 111,950 |
| | | | | |
| | | | | 332,200 |
| |
Foods 0.3% | | | |
| 200 | | Campbell Soup Co. | | | 6,322 |
| 600 | | Corn Products International, Inc. | | | 20,280 |
| 100 | | Kellogg Co. | | | 4,790 |
| 6,800 | | Kraft Foods, Inc. (Class A Stock) | | | 198,968 |
| 6,900 | | Kroger Co. (The) | | | 175,605 |
| 575 | | Ralcorp Holdings, Inc.(a) | | | 31,286 |
| 850 | | SYSCO Corp. | | | 24,692 |
| 5,700 | | Tyson Foods, Inc. (Class A Stock) | | | 81,225 |
| | | | | |
| | | | | 543,168 |
| |
Gas Utilities | | | |
| 800 | | Atmos Energy Corp. | | | 22,976 |
See Notes to Financial Statements.
| | |
| Target Asset Allocation Funds/Target Conservative Allocation Fund | | 17 |
Portfolio of Investments
as of January 31, 2008 (Unaudited) continued
| | | | | |
| Shares | | Description | | Value (Note 1) |
| | | | | |
COMMON STOCKS (Continued) | | | |
| |
Healthcare Equipment & Supplies 0.2% | | | |
| 3,925 | | Covidien Ltd. | | $ | 175,173 |
| 1,900 | | Kinetic Concepts, Inc.(a) | | | 94,582 |
| 875 | | Medical Action Industries, Inc.(a) | | | 14,630 |
| 500 | | Somanetics Corp.(a) | | | 13,400 |
| | | | | |
| | | | | 297,785 |
| |
Healthcare Providers & Services 0.2% | | | |
| 7,950 | | CIGNA Corp. | | | 390,822 |
| 450 | | Inventiv Health, Inc.(a) | | | 14,800 |
| 1,050 | | LHC Group, Inc.(a) | | | 24,213 |
| | | | | |
| | | | | 429,835 |
| |
Healthcare Services 0.9% | | | |
| 225 | | Aetna, Inc. | | | 11,984 |
| 860 | | Amedisys, Inc.(a) | | | 36,662 |
| 500 | | AMERIGROUP Corp.(a) | | | 18,760 |
| 3,500 | | Biogen Idec, Inc.(a) | | | 213,325 |
| 300 | | Covance, Inc.(a) | | | 24,948 |
| 1,230 | | Healthways, Inc.(a) | | | 69,249 |
| 1,800 | | Humana, Inc.(a) | | | 144,540 |
| 200 | | Intuitive Surgical, Inc.(a) | | | 50,800 |
| 693 | | IPC The Hospitalist Co., Inc.(a) | | | 14,567 |
| 1,075 | | Pediatrix Medical Group, Inc.(a) | | | 73,197 |
| 1,220 | | Psychiatric Solutions, Inc.(a) | | | 36,807 |
| 3,140 | | Radnet, Inc.(a) | | | 28,291 |
| 700 | | Sunrise Senior Living, Inc.(a) | | | 20,097 |
| 17,393 | | UnitedHealth Group, Inc. | | | 884,260 |
| 1,150 | | WellPoint, Inc.(a) | | | 89,930 |
| | | | | |
| | | | | 1,717,417 |
| |
Hotels & Motels 0.5% | | | |
| 5,733 | | MGM Mirage(a) | | | 419,770 |
| 1,225 | | Starwood Hotels & Resorts Worldwide, Inc. | | | 55,431 |
| 4,635 | | Wynn Resorts Ltd. | | | 532,933 |
| | | | | |
| | | | | 1,008,134 |
| |
Hotels & Restaurants | | | |
| 1,475 | | AFC Enterprises, Inc.(a) | | | 13,673 |
| 2,475 | | Triarc Cos., Inc. (Class B Stock) | | | 23,018 |
| | | | | |
| | | | | 36,691 |
See Notes to Financial Statements.
| | |
| 18 | | Visit our website at www.prudential.com |
| | | | | |
| Shares | | Description | | Value (Note 1) |
| | | | | |
COMMON STOCKS (Continued) | | | |
| |
Hotels, Restaurants & Leisure 0.8% | | | |
| 6,100 | | Carnival Corp. | | $ | 271,389 |
| 200 | | Chipotle Mexican Grill, Inc. (Class A Stock)(a) | | | 24,348 |
| 980 | | Home Inns & Hotels Management, Inc., ADR (China)(a) | | | 27,430 |
| 20,664 | | McDonald’s Corp. | | | 1,106,557 |
| 1,700 | | Wyndham Worldwide Corp. | | | 40,052 |
| | | | | |
| | | | | 1,469,776 |
| |
Household Durables 0.2% | | | |
| 300 | | Black & Decker Corp. | | | 21,762 |
| 3,600 | | Centex Corp. | | | 100,008 |
| 1,300 | | Fortune Brands, Inc. | | | 90,896 |
| 3,400 | | Lennar Corp. (Class A Stock) | | | 70,040 |
| 800 | | Lennar Corp. (Class B Stock) | | | 15,376 |
| 1,150 | | Tempur-Pedic International, Inc. | | | 22,793 |
| | | | | |
| | | | | 320,875 |
| |
Household Products 0.1% | | | |
| 3,000 | | Kimberly-Clark Corp. | | | 196,950 |
| |
Independent Power Producers & Energy Traders 0.1% | | | |
| 1,900 | | NRG Energy, Inc.(a) | | | 73,321 |
| 8,925 | | Reliant Energy, Inc.(a) | | | 189,835 |
| | | | | |
| | | | | 263,156 |
| |
Industrial Conglomerates 0.7% | | | |
| 4,675 | | 3M Co. | | | 372,364 |
| 19,250 | | General Electric Co. | | | 681,642 |
| 350 | | Teleflex, Inc. | | | 20,692 |
| 5,875 | | Tyco International Ltd. (Bermuda) | | | 231,240 |
| | | | | |
| | | | | 1,305,938 |
| |
Insurance 1.7% | | | |
| 550 | | AFLAC, Inc. | | | 33,732 |
| 9,400 | | Allstate Corp. (The) | | | 463,138 |
| 2,300 | | American International Group, Inc. | | | 126,868 |
| 3,740 | | Amtrust Financial Services, Inc. | | | 58,718 |
| 750 | | Assurant, Inc. | | | 48,668 |
| 2,000 | | Axis Capital Holdings Ltd. | | | 80,080 |
| 1,050 | | Chubb Corp. | | | 54,380 |
| 425 | | Delphi Financial Group, Inc. (Class A Stock) | | | 13,337 |
| 640 | | eHealth, Inc.(a) | | | 16,762 |
| 800 | | Endurance Specialty Holdings Ltd. (Bermuda) | | | 32,416 |
See Notes to Financial Statements.
| | |
| Target Asset Allocation Funds/Target Conservative Allocation Fund | | 19 |
Portfolio of Investments
as of January 31, 2008 (Unaudited) continued
| | | | | |
| Shares | | Description | | Value (Note 1) |
| | | | | |
COMMON STOCKS (Continued) | | | |
| |
Insurance (continued) | | | |
| 10,725 | | Genworth Financial, Inc. (Class A Stock) | | $ | 261,046 |
| 1,800 | | Hanover Insurance Group, Inc. (The) | | | 81,990 |
| 1,400 | | Hartford Financial Services Group, Inc. | | | 113,078 |
| 1,462 | | HCC Insurance Holdings, Inc. | | | 40,731 |
| 655 | | Hilb Rogal & Hobbs Co. | | | 23,698 |
| 1,000 | | IPC Holdings Ltd. (Bermuda) | | | 25,730 |
| 1,175 | | Lincoln National Corp. | | | 63,873 |
| 2,650 | | MBIA, Inc. | | | 41,075 |
| 9,750 | | MetLife, Inc. | | | 574,957 |
| 600 | | Philadelphia Consolidated Holding Corp.(a) | | | 21,480 |
| 1,150 | | Protective Life Corp. | | | 45,701 |
| 1,100 | | Prudential Financial, Inc. | | | 92,807 |
| 1,350 | | RenaissanceRe Holdings Ltd. (Bermuda) | | | 76,936 |
| 500 | | State Auto Financial Corp. | | | 13,965 |
| 7,600 | | Travelers Cos., Inc. (The) | | | 365,560 |
| 1,140 | | United Fire & Casualty Co. | | | 38,053 |
| 7,850 | | Unum Group | | | 177,567 |
| 350 | | W.R. Berkley Corp. | | | 10,591 |
| 2,200 | | XL Capital Ltd. (Class A Stock) (Cayman Islands) | | | 99,000 |
| | | | | |
| | | | | 3,095,937 |
| |
Internet Services 1.0% | | | |
| 1,110 | | Aladdin Knowledge Systems Ltd. (Israel)(a) | | | 23,432 |
| 2,900 | | Amazon.com, Inc.(a) | | | 225,330 |
| 2,420 | | CyberSource Corp.(a) | | | 40,535 |
| 1,140 | | Digital River, Inc.(a) | | | 42,750 |
| 4,350 | | eBay, Inc.(a) | | | 116,972 |
| 370 | | Equinix, Inc.(a) | | | 27,946 |
| 4,400 | | Expedia, Inc.(a) | | | 101,288 |
| 1,198 | | Google, Inc. (Class A Stock)(a) | | | 676,031 |
| 3,877 | | Internet Brands, Inc. (Class A Stock)(a) | | | 29,930 |
| 2,500 | | j2 Global Communications, Inc.(a) | | | 54,775 |
| 6,410 | | NaviSite, Inc.(a) | | | 28,845 |
| 2,380 | | NIC, Inc. | | | 17,017 |
| 1,270 | | NutriSystem, Inc.(a) | | | 36,347 |
| 990 | | Shutterly, Inc.(a) | | | 19,256 |
| 13,700 | | Symantec Corp.(a) | | | 245,641 |
| 2,270 | | Trizetto Group, Inc.(a) | | | 44,310 |
| 800 | | VeriSign, Inc.(a) | | | 27,136 |
| 475 | | Yahoo!, Inc.(a) | | | 9,111 |
| | | | | |
| | | | | 1,766,652 |
See Notes to Financial Statements.
| | |
| 20 | | Visit our website at www.prudential.com |
| | | | | |
| Shares | | Description | | Value (Note 1) |
| | | | | |
COMMON STOCKS (Continued) | | | |
| |
IT Services 0.2% | | | |
| 14,700 | | Electronic Data Systems Corp. | | $ | 295,470 |
| |
Leisure Equipment | | | |
| 750 | | Brunswick Corp. | | | 14,243 |
| |
Machinery 0.5% | | | |
| 625 | | Actuant Corp. (Class A Stock) | | | 17,081 |
| 3,700 | | AGCO Corp.(a) | | | 222,814 |
| 4,500 | | Caterpillar, Inc. | | | 320,130 |
| 1,000 | | Crane Co. | | | 40,870 |
| 1,455 | | Deere & Co. | | | 127,691 |
| 2,000 | | Dover Corp. | | | 80,720 |
| 500 | | Lincoln Electric Holdings, Inc. | | | 30,825 |
| 400 | | Nordson Corp. | | | 19,952 |
| 1,300 | | SPX Corp. | | | 130,780 |
| | | | | |
| | | | | 990,863 |
| |
Machinery & Equipment | | | |
| 1,250 | | Rockwell Automation, Inc. | | | 71,275 |
| |
Manufacturing 0.1% | | | |
| 550 | | Danaher Corp. | | | 40,947 |
| 750 | | Eaton Corp. | | | 62,070 |
| 500 | | Harsco Corp. | | | 28,460 |
| 1,100 | | Hexcel Corp.(a) | | | 24,013 |
| | | | | |
| | | | | 155,490 |
| |
Media 0.9% | | | |
| 18,850 | | CBS Corp. (Class B Stock) | | | 474,831 |
| 2,140 | | DG FastChannel, Inc.(a) | | | 45,304 |
| 5,786 | | DIRECTV Group, Inc. (The)(a) | | | 130,648 |
| 500 | | Dish Network Corp. (Class A Stock)(a) | | | 14,120 |
| 7,500 | | Idearc, Inc. | | | 121,950 |
| 7,100 | | News Corp. (Class A Stock) | | | 134,190 |
| 17,450 | | Time Warner, Inc. | | | 274,663 |
| 13,250 | | Walt Disney Co. (The) | | | 396,573 |
| | | | | |
| | | | | 1,592,279 |
| |
Medical Supplies & Equipment 0.5% | | | |
| 950 | | Boston Scientific Corp.(a) | | | 11,523 |
| 350 | | C.R. Bard, Inc. | | | 33,799 |
| 200 | | Edwards Lifesciences Corp.(a) | | | 9,254 |
See Notes to Financial Statements.
| | |
| Target Asset Allocation Funds/Target Conservative Allocation Fund | | 21 |
Portfolio of Investments
as of January 31, 2008 (Unaudited) continued
| | | | | |
| Shares | | Description | | Value (Note 1) |
| | | | | |
COMMON STOCKS (Continued) | | | |
| |
Medical Supplies & Equipment (continued) | | | |
| 520 | | Immucor, Inc.(a) | | $ | 14,997 |
| 600 | | Invitrogen Corp.(a) | | | 51,402 |
| 6,250 | | Johnson & Johnson | | | 395,375 |
| 1,000 | | Medtronic, Inc. | | | 46,570 |
| 2,290 | | Micrus Endovascular Corp.(a) | | | 43,991 |
| 410 | | Myriad Genetics, Inc.(a) | | | 17,634 |
| 4,560 | | NovaMed, Inc.(a) | | | 18,012 |
| 980 | | NuVasive, Inc.(a) | | | 38,622 |
| 300 | | Sepracor, Inc.(a) | | | 8,472 |
| 3,460 | | Spectranetics Corp. (The)(a) | | | 43,181 |
| 2,600 | | St. Jude Medical, Inc.(a) | | | 105,326 |
| 770 | | Wright Medical Group, Inc.(a) | | | 21,021 |
| 600 | | Zoll Medical Corp.(a) | | | 15,996 |
| | | | | |
| | | | | 875,175 |
| |
Metals & Mining 1.0% | | | |
| 7,000 | | Alcoa, Inc. | | | 231,700 |
| 770 | | Bucyrus International, Inc. (Class A Stock) | | | 71,387 |
| 150 | | Century Aluminum Co.(a) | | | 7,798 |
| 175 | | Cleveland-Cliffs, Inc. | | | 17,822 |
| 520 | | Dynamic Materials Corp. | | | 27,862 |
| 3,400 | | Freeport-McMoRan Copper & Gold, Inc. (Class B Stock) | | | 302,702 |
| 550 | | Joy Global, Inc. | | | 34,677 |
| 910 | | Ladish Co., Inc.(a) | | | 32,296 |
| 100 | | Newmont Mining Corp. | | | 5,434 |
| 1,900 | | Nucor Corp. | | | 109,820 |
| 1,000 | | Southern Copper Corp. | | | 93,840 |
| 600 | | Timken Co. | | | 18,138 |
| 5,567 | | Transocean, Inc.(a) | | | 682,514 |
| 1,200 | | United States Steel Corp. | | | 122,532 |
| | | | | |
| | | | | 1,758,522 |
| |
Multi-Line Retail | | | |
| 1,400 | | J.C. Penney Co., Inc. | | | 66,374 |
| 50 | | Macy’s, Inc. | | | 1,382 |
| | | | | |
| | | | | 67,756 |
| |
Multi-Utilities | | | |
| 1,200 | | Vectren Corp. | | | 32,940 |
| |
Multimedia | | | |
| 1,200 | | Viacom, Inc. (Class B Stock)(a) | | | 46,512 |
See Notes to Financial Statements.
| | |
| 22 | | Visit our website at www.prudential.com |
| | | | | |
| Shares | | Description | | Value (Note 1) |
| | | | | |
COMMON STOCKS (Continued) | | | |
| |
Office Equipment 0.1% | | | |
| 300 | | School Specialty, Inc.(a) | | $ | 9,738 |
| 12,200 | | Xerox Corp. | | | 187,880 |
| | | | | |
| | | | | 197,618 |
| |
Oil & Gas Exploration/Production | | | |
| 270 | | Core Laboratories NV (Netherlands)(a) | | | 30,429 |
| |
Oil, Gas & Consumable Fuels 3.5% | | | |
| 3,300 | | Anadarko Petroleum Corp. | | | 193,347 |
| 3,650 | | Apache Corp. | | | 348,356 |
| 1,280 | | Arena Resources, Inc.(a) | | | 45,530 |
| 800 | | Ashland, Inc. | | | 36,424 |
| 1,100 | | Cabot Oil & Gas Corp. | | | 42,559 |
| 3,500 | | Chevron Corp. | | | 295,750 |
| 1,175 | | Concho Resources, Inc.(a) | | | 23,852 |
| 9,250 | | ConocoPhillips | | | 742,960 |
| 1,025 | | Continental Resources, Inc.(a) | | | 25,533 |
| 2,550 | | Devon Energy Corp. | | | 216,699 |
| 800 | | Dresser-Rand Group, Inc.(a) | | | 25,360 |
| 15,200 | | Exxon Mobil Corp. | | | 1,313,280 |
| 7,700 | | Global Industry Ltd.(a) | | | 135,982 |
| 1,275 | | Gulfport Energy Corp.(a) | | | 19,316 |
| 2,360 | | Hess Corp. | | | 214,359 |
| 8,375 | | Marathon Oil Corp. | | | 392,369 |
| 900 | | Nabors Industries Ltd. (Bermuda)(a) | | | 24,498 |
| 3,150 | | Occidental Petroleum Corp. | | | 213,790 |
| 400 | | ONEOK, Inc. | | | 18,800 |
| 3,850 | | Patterson-UTI Energy, Inc. | | | 75,383 |
| 1,000 | | Petrohawk Energy Corp.(a) | | | 15,750 |
| 5,699 | | Petroleo Brasileiro SA, ADR (Brazil) | | | 633,387 |
| 1,550 | | Petroquest Energy, Inc.(a) | | | 20,026 |
| 500 | | Pioneer Natural Resources Co. | | | 20,950 |
| 2,100 | | Royal Dutch Shell PLC (Class B Stock), ADR (United Kingdom) | | | 145,215 |
| 7,495 | | Schlumberger Ltd. (Netherlands) | | | 565,573 |
| 500 | | St. Mary Land & Exploration Co. | | | 17,615 |
| 1,750 | | Sunoco, Inc. | | | 108,850 |
| 400 | | Swift Energy Co.(a) | | | 17,260 |
| 5,200 | | Valero Energy Corp. | | | 307,788 |
| 400 | | W&T Offshore, Inc. | | | 11,316 |
| 2,500 | | XTO Energy, Inc. | | | 129,850 |
| | | | | |
| | | | | 6,397,727 |
See Notes to Financial Statements.
| | |
| Target Asset Allocation Funds/Target Conservative Allocation Fund | | 23 |
Portfolio of Investments
as of January 31, 2008 (Unaudited) continued
| | | | | |
| Shares | | Description | | Value (Note 1) |
| | | | | |
COMMON STOCKS (Continued) | | | |
| |
Paper & Forest Products 0.1% | | | |
| 7,850 | | Domtar Corp.(a) | | $ | 63,350 |
| 3,300 | | International Paper Co. | | | 106,425 |
| 200 | | Owens Illinois, Inc.(a) | | | 10,080 |
| 200 | | Weyerhaeuser Co. | | | 13,544 |
| | | | | |
| | | | | 193,399 |
| |
Pharmaceuticals 2.2% | | | |
| 2,850 | | Abbott Laboratories | | | 160,455 |
| 6,297 | | Amylin Pharmaceuticals, Inc.(a) | | | 186,706 |
| 2,200 | | AstraZeneca PLC, ADR (United Kingdom) | | | 92,070 |
| 200 | | Barr Pharmaceuticals, Inc.(a) | | | 10,438 |
| 1,900 | | Bristol-Meyers Squibb Co. | | | 44,061 |
| 450 | | Celgene Corp.(a) | | | 25,249 |
| 7,400 | | Eli Lilly & Co. | | | 381,248 |
| 3,000 | | Express Scripts, Inc.(a) | | | 202,470 |
| 5,900 | | Gilead Sciences, Inc.(a) | | | 269,571 |
| 2,300 | | K-V Pharmaceutical Co. (Class A Stock)(a) | | | 59,754 |
| 6,720 | | LeMaitre Vascular, Inc.(a) | | | 36,960 |
| 6,200 | | Medco Health Solutions, Inc.(a) | | | 310,496 |
| 22,838 | | Merck & Co., Inc. | | | 1,056,943 |
| 39,125 | | Pfizer, Inc. | | | 915,134 |
| 8,000 | | Schering-Plough Corp. | | | 156,560 |
| 1,890 | | Sciele Pharma, Inc.(a) | | | 45,209 |
| 700 | | Watson Pharmaceuticals, Inc.(a) | | | 18,277 |
| 4,600 | | Wyeth | | | 183,080 |
| | | | | |
| | | | | 4,154,681 |
| |
Real Estate 0.1% | | | |
| 1,600 | | Jones Lang LaSalle, Inc. | | | 124,480 |
| |
Real Estate Investment Trusts 0.6% | | | |
| 200 | | Alexandria Real Estate Equities, Inc. | | | 19,646 |
| 700 | | AMB Property Corp. | | | 35,420 |
| 1,500 | | Apartment Investment & Management Co. (Class A Stock) | | | 59,460 |
| 750 | | Chimera Investment Corp. | | | 14,363 |
| 2,200 | | Douglas Emmett, Inc. | | | 50,270 |
| 2,050 | | Duke Realty Corp. | | | 48,462 |
| 2,350 | | Hospitality Properties Trust | | | 79,782 |
| 2,000 | | Host Hotels & Resorts, Inc. | | | 33,480 |
| 450 | | Liberty Property Trust | | | 14,450 |
| 300 | | Macerich Co. (The) | | | 20,511 |
| 8,050 | | ProLogis | | | 477,767 |
See Notes to Financial Statements.
| | |
| 24 | | Visit our website at www.prudential.com |
| | | | | |
| Shares | | Description | | Value (Note 1) |
| | | | | |
COMMON STOCKS (Continued) | | | |
| |
Real Estate Investment Trusts (continued) | | | |
| 650 | | Public Storage, Inc. | | $ | 50,862 |
| 200 | | Regency Centers Corp. | | | 12,286 |
| 1,100 | | Simon Property Group, Inc. | | | 96,063 |
| 200 | | SL Green Realty Corp. | | | 18,562 |
| 350 | | UDR, Inc. | | | 7,991 |
| 900 | | Ventas, Inc. | | | 39,780 |
| | | | | |
| | | | | 1,079,155 |
| |
Retail | | | |
| 1,250 | | Family Dollar Stores, Inc. | | | 26,288 |
| |
Retail & Merchandising 1.2% | | | |
| 200 | | Abercrombie & Fitch Co. (Class A Stock) | | | 15,938 |
| 2,700 | | Best Buy Co., Inc. | | | 131,787 |
| 1,600 | | BJ’s Wholesale Club, Inc.(a) | | | 51,904 |
| 500 | | Brinker International, Inc. | | | 9,305 |
| 9,998 | | CVS Corp. | | | 390,622 |
| 1,900 | | GameStop Corp. (Class A Stock)(a) | | | 98,287 |
| 1,222 | | Jos. A. Bank Clothiers, Inc.(a) | | | 33,287 |
| 350 | | Kohl’s Corp.(a) | | | 15,974 |
| 13,865 | | Lowe’s Cos., Inc. | | | 366,591 |
| 500 | | Lululemon Athletica, Inc. (Canada)(a) | | | 16,945 |
| 550 | | Ross Stores, Inc. | | | 16,033 |
| 2,925 | | Safeway, Inc. | | | 90,646 |
| 600 | | Sonic Corp.(a) | | | 13,308 |
| 1,025 | | Staples, Inc. | | | 24,538 |
| 20,556 | | Tesco PLC (United Kingdom) | | | 171,839 |
| 6,900 | | Wal-Mart Stores, Inc. | | | 351,072 |
| 13,834 | | Yum! Brands, Inc. | | | 472,569 |
| | | | | |
| | | | | 2,270,645 |
| |
Semiconductors 0.7% | | | |
| 800 | | Analog Devices, Inc. | | | 22,688 |
| 600 | | ATMI, Inc.(a) | | | 15,780 |
| 800 | | Broadcom Corp. (Class A Stock)(a) | | | 17,664 |
| 1,600 | | Brooks Automation, Inc.(a) | | | 19,664 |
| 32,451 | | Intel Corp. | | | 687,961 |
| 900 | | MEMC Electronic Materials, Inc.(a) | | | 64,314 |
| 1,125 | | Microsemi Corp.(a) | | | 25,560 |
| 900 | | National Semiconductor Corp. | | | 16,587 |
| 2,100 | | O2Micro International Ltd., ADR (Cayman Islands)(a) | | | 16,737 |
| 10,500 | | Texas Instruments, Inc. | | | 324,765 |
See Notes to Financial Statements.
| | |
| Target Asset Allocation Funds/Target Conservative Allocation Fund | | 25 |
Portfolio of Investments
as of January 31, 2008 (Unaudited) continued
| | | | | |
| Shares | | Description | | Value (Note 1) |
| | | | | |
COMMON STOCKS (Continued) | | | |
| |
Semiconductors (continued) | | | |
| 1,250 | | Ultra Clean Holdings, Inc.(a) | | $ | 12,238 |
| 1,700 | | Xilinx, Inc. | | | 37,179 |
| | | | | |
| | | | | 1,261,137 |
| |
Semiconductors & Semiconductor Equipment 0.1% | | | |
| 5,850 | | NVIDIA Corp.(a) | | | 143,851 |
| 550 | | Varian Semiconductor Equipment Associates, Inc.(a) | | | 17,716 |
| | | | | |
| | | | | 161,567 |
| |
Software 2.0% | | | |
| 3,000 | | Adobe Systems, Inc.(a) | | | 104,790 |
| 4,100 | | BMC Software, Inc.(a) | | | 131,364 |
| 16,364 | | CA, Inc. | | | 360,499 |
| 3,100 | | Fair Isaac Corp. | | | 79,050 |
| 500 | | Global Payments, Inc. | | | 18,700 |
| 4,836 | | Mastercard, Inc. (Class A Stock) | | | 1,001,052 |
| 57,339 | | Microsoft Corp. | | | 1,869,251 |
| 600 | | MoneyGram International, Inc. | | | 3,204 |
| 1,070 | | Phase Forward, Inc.(a) | | | 18,458 |
| 1,800 | | PROS Holdings, Inc.(a) | | | 27,630 |
| 1,375 | | Sybase, Inc.(a) | | | 38,802 |
| 1,400 | | Tyler Technologies, Inc.(a) | | | 18,732 |
| | | | | |
| | | | | 3,671,532 |
| |
Specialty Retail 0.3% | | | |
| 1,765 | | Aaron Rents, Inc. | | | 33,747 |
| 200 | | AutoZone, Inc.(a) | | | 24,176 |
| 10,952 | | Home Depot, Inc. (The) | | | 335,898 |
| 3,500 | | Limited Brands, Inc. | | | 66,815 |
| 510 | | Monro Muffler Brake, Inc. | | | 9,435 |
| 6,600 | | RadioShack Corp. | | | 114,510 |
| | | | | |
| | | | | 584,581 |
| |
Telecommunication 2.5% | | | |
| 9,169 | | America Movil SAB de CV (Class L Stock), ADR (Mexico) | | | 549,315 |
| 4,200 | | AmerisourceBergen Corp. | | | 195,930 |
| 35,626 | | AT&T, Inc. | | | 1,371,245 |
| 820 | | Cbeyond, Inc.(a) | | | 27,667 |
| 1,700 | | CenturyTel, Inc. | | | 62,747 |
| 39,000 | | China Mobile Ltd. (Hong Kong) | | | 574,985 |
| 18,851 | | Cisco Systems, Inc.(a) | | | 461,849 |
| 2,300 | | Corning, Inc. | | | 55,361 |
See Notes to Financial Statements.
| | |
| 26 | | Visit our website at www.prudential.com |
| | | | | |
| Shares | | Description | | Value (Note 1) |
| | | | | |
COMMON STOCKS (Continued) | | | |
| |
Telecommunication (continued) | | | |
| 125 | | Crown Castle International Corp.(a) | | $ | 4,524 |
| 930 | | GeoEye, Inc.(a) | | | 32,513 |
| 9,150 | | Juniper Networks, Inc.(a) | | | 248,422 |
| 125 | | Motorola, Inc. | | | 1,441 |
| 3,733 | | QUALCOMM, Inc. | | | 158,354 |
| 24,017 | | Sprint Nextel Corp. | | | 252,899 |
| 400 | | Telephone & Data Systems, Inc. | | | 21,096 |
| 14,900 | | Verizon Communications, Inc. | | | 578,716 |
| | | | | |
| | | | | 4,597,064 |
| |
Textiles, Apparel & Luxury Goods 0.1% | | | |
| 5,700 | | Jones Apparel Group, Inc. | | | 95,760 |
| |
Thrifts & Mortgage Finance 0.4% | | | |
| 2,325 | | Countrywide Financial Corp. | | | 16,182 |
| 7,900 | | Federal Home Loan Mortgage Corp. | | | 240,081 |
| 3,700 | | Federal National Mortgage Assoc. | | | 125,282 |
| 20,100 | | Washington Mutual, Inc. | | | 400,392 |
| | | | | |
| | | | | 781,937 |
| |
Tobacco Products 0.1% | | | |
| 300 | | Universal Corp. | | | 14,943 |
| 4,500 | | UST, Inc. | | | 233,820 |
| | | | | |
| | | | | 248,763 |
| |
Trading Companies & Distributors | | | |
| 200 | | Watsco, Inc. | | | 7,376 |
| |
Transportation 0.6% | | | |
| 1,200 | | Burlington Northern Santa Fe Corp. | | | 103,824 |
| 675 | | Forward Air Corp. | | | 20,925 |
| 4,600 | | J.B. Hunt Transport Services, Inc. | | | 143,060 |
| 4,923 | | Norfolk Southern Corp. | | | 267,762 |
| 300 | | Overseas Shipholding Group, Inc. | | | 19,566 |
| 800 | | Ryder System, Inc. | | | 41,648 |
| 4,330 | | Union Pacific Corp. | | | 541,380 |
| 900 | | United Parcel Service, Inc. (Class B Stock) | | | 65,844 |
| | | | | |
| | | | | 1,204,009 |
| |
Utilities 0.6% | | | |
| 4,150 | | American Electric Power Co., Inc. | | | 177,744 |
| 5,900 | | CMS Energy Corp. | | | 92,453 |
| 2,000 | | Dominion Resources, Inc. | | | 86,000 |
See Notes to Financial Statements.
| | |
| Target Asset Allocation Funds/Target Conservative Allocation Fund | | 27 |
Portfolio of Investments
as of January 31, 2008 (Unaudited) continued
| | | | | | | | |
| Shares | | | | Description | | Value (Note 1) |
| | | | | | | | |
| COMMON STOCKS (Continued) | | | |
| |
| Utilities (continued) | | | |
| 1,300 | | | | | DTE Energy Co. | | $ | 55,445 |
| 800 | | | | | Duke Energy Corp. | | | 14,928 |
| 7,050 | | | | | Edison International | | | 367,728 |
| 601 | | | | | Headwaters, Inc.(a) | | | 6,773 |
| 750 | | | | | Illinois Tool Works, Inc. | | | 37,800 |
| 2,250 | | | | | Northeast Utilities | | | 62,370 |
| 125 | | | | | PG&E Corp. | | | 5,130 |
| 50 | | | | | Pinnacle West Capital Corp. | | | 1,921 |
| 500 | | | | | PNM Resources, Inc. | | | 9,660 |
| 950 | | | | | SCANA Corp. | | | 35,426 |
| 1,075 | | | | | Westar Energy, Inc. | | | 26,187 |
| 675 | | | | | Wisconsin Energy Corp. | | | 30,733 |
| 4,650 | | | | | Xcel Energy, Inc. | | | 96,674 |
| | | | | | | | |
| | | | | | | | 1,106,972 |
| | | | | | | | |
| | | | | TOTAL COMMON STOCKS
(cost $67,248,290) | | | 73,388,330 |
| | | | | | | | |
| | | |
Moody’s(†)
Ratings | | Principal
Amount (000)# | | | | |
| |
| ASSET-BACKED SECURITIES 1.7% | | | |
| Aaa | | $ | 7 | | Aames Mortgage Investment Trust, Series 2006-1, Class A1
3.436%(b), 04/25/36 | | | 6,868 |
| AAA(c) | | | 305 | | Asset Backed Funding Certificates, Series 2004-OPT5, Class A1
3.726%(b), 06/25/34 | | | 270,907 |
| Aaa | | | 500 | | Bank One Issuance Trust,
Series 2003-A3, Class A3
4.346%(b), 12/15/10 | | | 499,844 |
| Aaa | | | 147 | | Countrywide Asset-Backed Certificates,
Series 2006-11, Class 3AV1
3.436%(b), 06/29/36 | | | 145,429 |
| Aaa | | | 344 | | First Franklin Mortgage Loan Asset-Backed Certificates,
Series 2006-FF15, Class A3 3.426%(b), 11/25/36 | | | 333,665 |
| Aaa | | | 116 | | Fremont Home Loan Trust,
Series 2005-E, Class 2A2 3.546%(b), 01/25/36 | | | 115,565 |
| Aaa | | | 100 | | JPMorgan Mortgage Acquisition Corp., Series 2006-WMC1, Class A2
3.446%(b), 03/25/36 | | | 99,917 |
See Notes to Financial Statements.
| | |
| 28 | | Visit our website at www.prudential.com |
| | | | | | | | |
Moody’s(†)
Ratings | | Principal
Amount (000)# | | Description | | Value (Note 1) |
| | | | | | | | |
| ASSET-BACKED SECURITIES (continued) | | | |
| Aaa | | $ | 500 | | MBNA Master Credit Card Trust,
Series 1998-E, Class A
4.403%(b), 09/15/10 | | $ | 501,280 |
| Aaa | | | 324 | | Merrill Lynch Mortgage Investors, Inc.,
Series 2006-RM5, Class A2A 3.436%(b), 10/25/37 | | | 303,038 |
| Aaa | | | 265 | | Morgan Stanley ABS Capital I,
Series 2006-HE7, Class A2A
3.426%(b), 09/25/36 | | | 260,397 |
| Aaa | | | 296 | | Soundview Home Equity Loan Trust,
(original cost $295,651; purchased 10/13/06) Series 2006-NLC1,
Class A1, 144A(j)(k)
3.436%(b), 11/25/36 | | | 291,124 |
| Aaa | | | 292 | | Structured Asset Securities Corp.,
Series 2006-BC3, Class A2 3.426%(b), 10/25/36 | | | 287,142 |
| | | | | | | | |
| | | | | TOTAL ASSET-BACKED SECURITIES
(cost $3,202,851) | | | 3,115,176 |
| | | | | | | | |
| COLLATERALIZED MORTGAGE OBLIGATIONS 2.7% |
| Aaa | | | 219 | | American Home Mortgage Investment Trust, Series 2005-2, Class 5A2
3.526%(b), 09/25/35 | | | 219,054 |
| Aaa | | | 242 | | Bear Stearns Adjustable Rate Mortgage Trust, Series 2005-4, Class 23A2
5.368%(b), 05/25/35 | | | 238,781 |
| Aaa | | | 105 | | Federal Home Loan Mortgage Corp., Series 41, Class F
10.00%, 05/15/20 | | | 111,383 |
| Aaa | | | 108 | | Series 1565, Class G
6.00%, 08/15/08 | | | 108,148 |
| Aaa | | | 615 | | Series 2801, Class EH
4.50%, 11/15/16 | | | 620,054 |
| Aaa | | | 511 | | Series 2962, Class YC
4.50%, 09/15/14 | | | 514,242 |
| Aaa | | | 443 | | Series 3117, Class PN
5.00%, 11/15/21 | | | 446,737 |
| Aaa | | | 25 | | Federal National Mortgage Assoc., Series 1992-146, Class PZ
8.00%, 08/25/22 | | | 27,545 |
See Notes to Financial Statements.
| | |
| Target Asset Allocation Funds/Target Conservative Allocation Fund | | 29 |
Portfolio of Investments
as of January 31, 2008 (Unaudited) continued
| | | | | | | | |
Moody’s(†)
Ratings | | Principal
Amount (000)# | | Description | | Value (Note 1) |
| | | | | | | | |
| COLLATERALIZED MORTGAGE OBLIGATIONS (continued) | | | |
| Aaa | | $ | 730 | | FHLMC Structured Pass-Through Securities, Series T-61, Class 1A1
6.188%(b), 07/25/44 | | $ | 736,170 |
| AAA(c) | | | 360 | | GSR Mortgage Loan Trust,
Series 2005-AR6, Class 2A1
4.539%(b), 09/25/35 | | | 352,425 |
| Aaa | | | 243 | | Harborview Mortgage Loan Trust,
Series 2006-12, Class 2A11
4.024%(b), 01/19/38 | | | 237,840 |
| NR | | | 153 | | Vendee Mortgage Trust,
Series 2001-1, Class 1A
6.814%(b), 01/15/30 | | | 159,540 |
| Aaa | | | 849 | | Washington Mutual, Inc.,
Series 2003-R1, Class A1
3.916%(b), 12/25/27 | | | 810,926 |
| Aaa | | | 407 | | Series 2006-AR15, Class 2A
6.162%(b), 11/25/46 | | | 386,913 |
| | | | | | | | |
| | | | | TOTAL COLLATERALIZED MORTGAGE OBLIGATIONS
(cost $4,992,055) | | | 4,969,758 |
| | | | | | | | |
| CORPORATE BONDS 11.8% |
|
| Advertising 0.2% |
| Baa1 | | | 300 | | Omnicom Group, Inc., Gtd. Notes
5.90%, 04/15/16 | | | 312,014 |
|
| Automobile Manufacturers 0.1% |
| A3 | | | 200 | | DaimlerChrysler NA Holding Corp., Gtd. Notes, MTN
5.75%, 09/08/11 | | | 208,007 |
|
| Commercial Services 0.3% |
| B1 | | | 500 | | Service Corp. International,
Sr. Unsec’d. Notes
6.50%, 03/15/08 | | | 501,110 |
|
| Diversified Financial Services 1.6% |
| B1 | | | 500 | | Ford Motor Credit Co., Notes
7.00%, 10/01/13 | | | 419,160 |
| Aaa | | | 800 | | General Electric Capital Corp.,
Sr. Unsec’d. Notes, MTN
5.031%(b), 03/16/09 | | | 800,956 |
See Notes to Financial Statements.
| | |
| 30 | | Visit our website at www.prudential.com |
| | | | | | | | |
Moody’s(†)
Ratings | | Principal
Amount (000)# | | Description | | Value (Note 1) |
| | | | | | | | |
| CORPORATE BONDS (continued) | | | |
|
| Diversified Financial Services (cont’d.) |
| Aaa | | $ | 1,000 | | General Electric Capital Corp.,
Sr. Unsec’d. Notes
5.875%, 01/14/38 | | $ | 977,236 |
| A1 | | | 700 | | Goldman Sachs Group, Inc. (The),
Sub. Notes
6.75%, 10/01/37 | | | 686,735 |
| | | | | | | | |
| | | | | | | | 2,884,087 |
|
| Entertainment & Leisure 0.3% |
| NR | | | 500 | | Harrah’s Operating Co., Inc.,
(original cost $501,250; purchased 11/18/05) Notes, 144A(j)(k) 5.498%(b), 02/08/08 | | | 500,085 |
|
| Financial-Bank & Trust 3.2% |
| Aa3 | | | 2,100 | | Bank of America Corp., Notes
8.00%(b), 12/29/49 | | | 2,181,375 |
| Aa2 | | | 2,600 | | Barclays Bank PLC,
(original cost $2,582,502; purchased 12/07/07) Sub. Notes, 144A (United Kingdom)(j)(k)
6.05%, 12/04/17 | | | 2,678,941 |
| Aa2 | | | 1,000 | | Unicredito Luxembourg Finance SA,
(original cost $1,000,000; purchased 10/17/06) Gtd. Notes, 144A (Luxembourg)(j)(k)
3.768%(b), 10/24/08 | | | 998,297 |
| | | | | | | | |
| | | | | | | | 5,858,613 |
|
| Financial Services 2.6% |
| A2 | | | 1,000 | | Bear Stearns Cos., Inc. (The),
Sr. Unsec’d. Notes
7.25%, 02/01/18 | | | 999,963 |
| A1 | | | 1,000 | | Citigroup Capital XXI, Gtd. Notes
8.30%(b), 12/21/57 | | | 1,078,045 |
| Aaa | | | 900 | | General Electric Capital Corp.,
Sr. Unsec’d. Notes, MTN
3.244%(b), 10/24/08 | | | 898,612 |
| Aa1 | | | 500 | | General Electric Capital Corp.,
(original cost $999,960; purchased 08/30/07), Sub. Notes, 144A(j)(k) 6.50%(b), 09/15/47 | | | 976,903 |
See Notes to Financial Statements.
| | |
| Target Asset Allocation Funds/Target Conservative Allocation Fund | | 31 |
Portfolio of Investments
as of January 31, 2008 (Unaudited) continued
| | | | | | | | |
Moody’s(†)
Ratings | | Principal
Amount (000)# | | Description | | Value (Note 1) |
| CORPORATE BONDS (continued) | | | | | |
| | | | | | | | |
| |
| Financial Services (cont’d.) | | | |
| B1 | | $ | 500 | | General Motors Acceptance Corp.,
Sr. Unsec’d. Notes
8.00%, 11/01/31 | | $ | 414,380 |
| A1 | | | 500 | | Lehman Brothers Holdings, Inc.,
Sr. Unsec’d. Notes, MTN
5.625%, 01/24/13 | | | 506,459 |
| | | | | | | | |
| | | | | | | | 4,874,362 |
|
| Insurance 0.3% |
| Aa2 | | | 600 | | American International Group, Inc.,
Sr. Unsec’d. Notes, MTN
5.85%, 01/16/18 | | | 601,558 |
|
| Medical Supplies & Equipment 0.3% |
| B2 | | | 500 | | HCA, Inc., Sr. Sec’d. Notes
9.25%, 11/15/16 | | | 524,375 |
|
| Oil, Gas & Consumable Fuels 0.4% |
| Baa1 | | | 377 | | Petroleum Export Ltd.,
(original cost $377,418; purchased 07/14/05), Sr. Notes, 144A (Cayman Islands)(j)(k)
5.265%, 06/15/11 | | | 375,455 |
| Baa2 | | | 400 | | Transocean, Inc., Sr. Unsec’d. Notes 5.341%(b), 09/05/08 | | | 398,656 |
| | | | | | | | |
| | | | | | | | 774,111 |
|
| Pharmaceuticals 0.2% |
| Baa2 | | | 400 | | Cardinal Health, Inc.,
(original cost $400,000; purchased 09/28/06), Sr. Unsec’d. Notes, 144A(j)(k)
5.499%(b), 10/02/09 | | | 401,618 |
|
| Telecommunications 1.2% |
| A2 | | | 400 | | BellSouth Corp., Sr. Unsec’d. Notes 4.969%(b), 08/15/08 | | | 399,589 |
| Baa3 | | | 900 | | Embarq Corp., Sr. Unsec’d. Notes 6.738%, 06/01/13 | | | 923,322 |
| Ba1 | | | 1,000 | | Qwest Corp., Sr. Notes
7.625%, 06/15/15 | | | 1,007,500 |
| | | | | | | | |
| | | | | | | | 2,330,411 |
See Notes to Financial Statements.
| | |
| 32 | | Visit our website at www.prudential.com |
| | | | | | | | |
Moody’s(†)
Ratings | | Principal
Amount (000)# | | Description | | Value (Note 1) |
| | | | | | | | |
| CORPORATE BONDS (continued) | | | | | |
| Transportation 1.1% |
| Baa3 | | $ | 2,000 | | Con-Way, Inc., Sr. Unsec’d. Notes 7.25%, 01/15/18 | | $ | 2,043,668 |
| | | | | | | | |
| | | | | TOTAL CORPORATE BONDS
(cost $21,679,974) | | | 21,814,019 |
| | | | | | | | |
| FOREIGN GOVERNMENT BONDS 2.7% |
| Aaa | | EUR | 800 | | Deutsche Bundesrepublik (Germany) 6.25%, 01/04/30 | | | 1,484,085 |
| Aa2 | | JPY | 3,000 | | Federal Republic of Italy (Italy)
3.80%, 03/27/08 | | | 28,322 |
| Aaa | | EUR | 800 | | France Government Bond (France) 5.75%, 10/25/32 | | | 1,403,458 |
| Ba1 | | BRL | 1,300 | | Republic of Brazil (Brazil)
12.50%, 01/05/22 | | | 811,114 |
| Ba1 | | | 180 | | Republic of Panama (Panama)
9.625%, 02/08/11 | | | 204,750 |
| Aaa | | GBP | 300 | | United Kingdom Gilt (United Kingdom) 4.25%, 03/07/11 | | | 595,639 |
| Aaa | | GBP | 200 | | United Kingdom Gilt (United Kingdom) 5.75%, 12/07/09 | | | 407,891 |
| | | | | | | | |
| | | | | TOTAL FOREIGN GOVERNMENT BOND
(cost $4,718,555) | | | 4,935,259 |
| | | | | | | | |
| MUNICIPAL BOND 0.1% |
| Aaa | | | 200 | | Georgia State Road & Tollway Authority, Revenue Bonds
5.00%, 03/01/21
(cost $196,792) | | | 210,306 |
| | | | | | | | |
| U.S. GOVERNMENT MORTGAGE-BACKED OBLIGATIONS 39.5% |
| | | 868 | | Federal Home Loan Mortgage Corp.
5.00 %, 11/01/35 - 01/01/36 | | | 865,204 |
| | | 443 | | 5.031%(b), 03/01/36 | | | 449,755 |
| | | 1,000 | | 5.50%, TBA | | | 1,012,188 |
| | | 194 | | 6.00%, 09/01/22 | | | 200,317 |
| | | 13 | | 7.179%(b), 08/01/23 | | | 12,824 |
| | | 810 | | Federal National Mortgage Assoc.
4.00 %, 08/01/18 - 06/01/19 | | | 799,652 |
| | | 1,884 | | 4.50 %, 09/01/35 - 11/01/35 | | | 1,830,646 |
| | | 5,276 | | 5.00 %, 01/01/19 - 11/01/33 | | | 5,264,286 |
| | | 821 | | 5.089%(b), 06/01/35 | | | 837,098 |
| | | 20,747 | | 5.50 %, 09/01/33 - 12/01/37 | | | 21,030,180 |
| | | 15,000 | | 5.50%, TBA | | | 15,196,875 |
See Notes to Financial Statements.
| | |
| Target Asset Allocation Funds/Target Conservative Allocation Fund | | 33 |
Portfolio of Investments
as of January 31, 2008 (Unaudited) continued
| | | | | |
Principal
Amount (000)# | | Description | | Value (Note 1) |
| | | | | |
U.S. GOVERNMENT MORTGAGE-BACKED OBLIGATIONS (continued) | | | |
| | Federal National Mortgage Assoc. (continued) | | | |
| $ 81 | | 5.622%(b), 05/01/36 | | $ | 81,144 |
| 1,365 | | 6.00 %, 05/01/16 - 10/01/36 | | | 1,402,103 |
| 3,000 | | 6.00%, TBA | | | 3,077,814 |
| 1,425 | | 6.50 %, 01/01/16 - 10/01/37 | | | 1,479,488 |
| 167 | | 7.50%, 01/01/32 | | | 180,999 |
| 53 | | Government National Mortgage Assoc.
4.50 %, 08/15/33 - 09/15/33 | | | 51,702 |
| 6,861 | | 5.00 %, 06/15/33 - 07/15/37 | | | 6,880,305 |
| 4,937 | | 5.50 %, 07/15/37 - 09/15/37 | | | 5,035,305 |
| 8 | | 5.625%(b), 09/20/22 | | | 8,314 |
| 1,777 | | 6.00 %, 12/15/36 - 09/15/37 | | | 1,835,429 |
| 5,000 | | 6.00%, TBA | | | 5,162,500 |
| 64 | | 8.50 %, 02/20/30 - 06/15/30 | | | 70,962 |
| | | | | |
| | TOTAL U.S. GOVERNMENT MORTGAGE-BACKED OBLIGATIONS
(cost $71,169,236) | | | 72,765,090 |
| | | | | |
|
U.S. Treasury Obligations 3.5% |
| 100 | | U.S. Treasury Bonds
4.75%, 02/15/37 | | | 106,531 |
| 400 | | 12.00%, 08/15/13 | | | 420,188 |
| 900 | | U.S. Treasury Inflation Index Bonds, TIPS
1.75%, 01/15/28 | | | 910,363 |
| 900 | | 2.00%, 01/15/14 - 01/15/16 | | | 1,031,962 |
| 1,400 | | 2.375%, 04/15/11 - 01/15/25 | | | 1,688,835 |
| 190 | | 3.875%, 04/15/29 | | | 337,399 |
| 100 | | U.S. Treasury Notes
4.25%, 11/15/17 | | | 105,016 |
| 1,300 | | 4.625%, 07/31/12 | | | 1,402,476 |
| 200 | | 5.125%, 06/30/11 | | | 217,531 |
| 500 | | U.S. Treasury Strip Coupon, IO
7.25%, 02/15/22 | | | 268,066 |
| | | | | |
| | TOTAL U.S. TREASURY OBLIGATIONS
(cost $6,124,464) | | | 6,488,367 |
| | | | | |
|
Bank Notes 1.1% |
| | Chrysler Finco Term (original cost $1,895,250, purchased 11/28/07)(j)(k) | | | |
| 1,995 | | 8.99%, 08/03/12 | | | 1,785,026 |
| 300 | | TXU (Tceh) Term B3 (original cost $291,000, purchased 01/16/08)(j)(k)
8.40%, 10/10/14 | | | 276,443 |
| | | | | |
| | TOTAL BANK NOTES
(cost $2,188,673) | | | 2,061,469 |
| | | | | |
| | TOTAL LONG-TERM INVESTMENTS
(cost $181,520,890) | | | 189,747,774 |
| | | | | |
See Notes to Financial Statements.
| | |
| 34 | | Visit our website at www.prudential.com |
| | | | | |
Principal
Amount (000)# | | Description | | Value (Note 1) |
| | | | | |
SHORT-TERM INVESTMENTS 14.1% |
|
U.S. Treasury Obligations(d)(e) 0.3% |
| | U.S. Treasury Bills | | | |
| $ 30 | | 2.91%, 03/13/08 | | $ | 29,896 |
| 40 | | 2.933%, 02/28/08 | | | 39,913 |
| 540 | | 2.955%, 03/13/08 | | | 538,131 |
| 10 | | 3.04%, 03/13/08 | | | 9,965 |
| | | | | |
| | TOTAL U.S. TREASURY OBLIGATIONS
(cost $617,961) | | | 617,905 |
| | | | | |
| | |
Contracts/
Notional
Amount (000)# | | | | |
Outstanding Options Purchased(a) 1.4% | | | |
| |
Call Options 1.3% | | | |
| | 5 Year U.S. Treasury Note Futures, | | | |
| 21,000 | | expiring 02/22/2008, Strike Price $122.00 | | | 3,281 |
| | 20 Year U.S. Treasury Bond Futures, | | | |
| 12,100 | | expiring 02/22/2008, Strike Price $137.00 | | | 1,891 |
| | Currency Option USD vs. JPY, | | | |
| 4,500 | | expiring 09/16/2008 @ FX Rate 118.00 | | | 4,991 |
| 1,700 | | expiring 03/31/2010 @ FX Rate 104.65 | | | 66,055 |
| | Eurodollar Futures, | | | |
| 116,000 | | expiring 03/17/2008, Strike Price $95.00 | | | 607,550 |
| | Swap on 3 Month LIBOR, | | | |
| 6,500 | | expiring 09/19/2008 @ 4.55% | | | 189,886 |
| 16,100 | | expiring 09/26/2008 @ 4.75% | | | 525,221 |
| 16,000 | | expiring 12/19/2008 @ 4.50% | | | 419,126 |
| 9,600 | | expiring 12/31/2008 @ 3.75% | | | 144,193 |
| EUR 42,400 | | expiring 04/20/2009 @ 4.18% | | | 561,020 |
| | | | | |
| | | | | 2,523,214 |
|
Put Options 0.1% |
| | 10 Year U.S. Treasury Note Futures, | | | |
| 15,100 | | expiring 02/22/2008, Strike Price $109.50 | | | 2,359 |
| | Currency Option USD vs. JPY, | | | |
| 1,700 | | expiring 03/31/2010 @ FX Rate 104.65 | | | 110,837 |
| | Eurodollar Futures, | | | |
| 200,000 | | expiring 03/17/2008, Strike Price $91.75 | | | 1,250 |
| 149,000 | | expiring 03/17/2008, Strike Price $92.50 | | | 931 |
See Notes to Financial Statements.
| | |
| Target Asset Allocation Funds/Target Conservative Allocation Fund | | 35 |
Portfolio of Investments
as of January 31, 2008 (Unaudited) continued
| | | | | | | | |
| | | Contracts/
Notional
Amount (000)# | | Description | | Value (Note 1) |
| | | | | | | | |
| Put Options (continued) | | | |
| | | | | FNMA, | | | |
| | $ | 4,000 | | expiring 04/07/2008, Strike Price $86.00 | | $ | 44 |
| | | | | Swap on 3 Month LIBOR, | | | |
| | GBP | 39,500 | | expiring 03/19/2008, Strike Price $93.00 | | | — |
| | GBP | 17,500 | | expiring 03/19/2008, Strike Price $93.13 | | | — |
| | GBP | 44,500 | | expiring 06/18/2008, Strike Price $92.50 | | | — |
| | GBP | 43,500 | | expiring 12/17/2008, Strike Price $92.00 | | | — |
| | | | | | | | |
| | | | | | | | 115,421 |
| | | | | | | | |
| | | | | TOTAL OUTSTANDING OPTIONS PURCHASED
(cost $998,384) | | | 2,638,635 |
| | | | | | | | |
| | | |
| | | Shares | | | | |
|
| Affiliated Money Market Mutual Fund 5.7% |
| | | 10,420,283 | | Dryden Core Investment Fund - Taxable Money Market Series(f)
(cost $10,420,283) | | | 10,420,283 |
| | | | | | | | |
| | | |
Moody’s(†)
Ratings | | Principal
Amount (000)# | | | | |
|
| Commercial Paper(e) 6.7% |
| A1+ | | $ | 2,800 | | Danske Corp.
(cost $2,792,010; purchased 01/29/08)(h)
3.21%, 03/04/08 | | | 2,792,010 |
| A1 | | | 2,700 | | Den Norske Bank
(cost $2,673,438; purchased 01/02/08)(h)
4.66%, 04/17/08 | | | 2,682,213 |
| A1+ | | | 2,000 | | Rabobank USA
3.01%, 02/01/08 | | | 2,000,000 |
| A1+ | | | 2,800 | | UBS Finance
3.02%, 02/01/08 | | | 2,800,000 |
| A1 | | | 2,000 | | Unicred Bank
(cost $1,983,673; purchased 01/02/08)(h)
4.665%, 04/04/08 | | | 1,989,048 |
| | | | | | | | |
| | | | | TOTAL COMMERCIAL PAPER
(cost $12,249,122) | | | 12,263,271 |
| | | | | | | | |
| | | | | TOTAL SHORT-TERM INVESTMENTS
(cost $24,285,750) | | | 25,940,094 |
| | | | | | | | |
| | | | | TOTAL INVESTMENTS, BEFORE OUTSTANDING OPTIONS WRITTEN AND SECURITIES SOLD SHORT(i) 117.0%
(cost $205,806,640; Note 5) | | | 215,687,868 |
| | | | | | | | |
See Notes to Financial Statements.
| | |
| 36 | | Visit our website at www.prudential.com |
| | | | | | |
Principal
Amount (000)# | | Description | | Value (Note 1) | |
| | | | | | |
Securities Sold Short (7.2)% | | | | |
| | Federal National Mortgage Assoc. | | | | |
| $ 2,000 | | 5.00%, TBA | | $ | (1,991,250 | ) |
| | Government National Mortgage Assoc. | | | | |
| 1,500 | | 5.00%, TBA | | | (1,503,282 | ) |
| 7,500 | | U.S. Treasury Bonds
5.00%, 05/15/37 | | | (8,306,835 | ) |
| 600 | | 5.375%, 02/15/31 | | | (687,610 | ) |
| 700 | | U.S. Treasury Notes
4.25%, 11/15/17 | | | (735,109 | ) |
| | | | | | |
| | TOTAL SECURITIES SOLD SHORT
(proceeds received $13,147,411) | | | (13,224,086 | ) |
| | | | | | |
| | |
Contracts/
Notional
Amount (000)# | | | | | |
OUTSTANDING OPTIONS WRITTEN(a) (0.8)% | | | | |
| |
Call Options (0.8)% | | | | |
| | Swap on 3 Month LIBOR, | | | | |
| 2,100 | | expiring 09/19/2008 @ 5.05% | | | (131,267 | ) |
| 7,000 | | expiring 09/26/2008 @ 4.95% | | | (391,328 | ) |
| 5,400 | | expiring 12/19/2008 @ 5.00% | | | (307,330 | ) |
| 3,200 | | expiring 12/31/2008 @ 5.22% | | | (213,205 | ) |
| EUR 13,700 | | expiring 04/20/2009 @ 4.44% | | | (425,960 | ) |
| | | | | | |
| | | | | (1,469,090 | ) |
| | | | | | |
| | |
Put Option | | | | | | |
| | Currency Option USD vs. JPY, | | | | |
| 2,200 | | expiring 09/16/2008, @ FX Rate 100.00 | | | (39,349 | ) |
| | | | | | |
| | TOTAL OUTSTANDING OPTIONS WRITTEN
(premium received $542,034) | | | (1,508,439 | ) |
| | | | | | |
| | TOTAL INVESTMENTS, NET OF OUTSTANDING OPTIONS WRITTEN AND SECURITIES SOLD SHORT 109.0%
(cost $192,117,195; Note 5) | | | 200,955,343 | |
| | Other liabilities in excess of other assets(l) (9.0)% | | | (16,641,157 | ) |
| | | | | | |
| | NET ASSETS 100% | | $ | 184,314,186 | |
| | | | | | |
See Notes to Financial Statements.
| | |
| Target Asset Allocation Funds/Target Conservative Allocation Fund | | 37 |
Portfolio of Investments
as of January 31, 2008 (Unaudited) continued
| The | following abbreviations are used in portfolio descriptions: |
144A—Security was purchased pursuant to Rule 144A under the securities Act of 1933 and may not be resold subject to that rule except to qualified institutional buyers. Unless otherwise noted, 144A securities are deemed to be liquid.
ADR—American Depositary Receipt
IO—Interest Only
MTN—Medium Term Note
NR—Not Rated by Moody’s or Standard & Poor’s
TBA—To Be Announced
TIPS—Treasury Inflation Protected Securities
#—Principal amount is shown in U.S. dollars unless otherwise stated.
AUD—Australian Dollar
BRL—Brazilian Real
CNY—Chinese Yuan
EUR—Euro
GBP—British Pound
INR—Indian Rupee
JPY—Japanese Yen
KRW—Korean Won
MXN—Mexican Peso
RUB—Russian Ruble
| (a) | Non-income producing security. |
| (b) | Indicates a variable rate security. |
| (c) | Standard & Poor’s rating. |
| (d) | Securities segregated as collateral for futures contracts. |
| (e) | Rates shown are the effective yields at purchase date. |
| (f) | Prudential Investments LLC, the manager of the Portfolio, also serves as manager of the underlying portfolios in which the Portfolio invests. |
| (h) | Security is restricted as to resale and generally is sold only to institutional investors who agree that they are purchasing the paper for investment and not with a view to public distribution (does not include 144A securities—see footnote above). At the end of the current reporting period, the aggregate cost of such securities was $7,449,121. The aggregate market value of $7,463,271 is approximately 4.0% of net assets. These securities have been deemed to be liquid under procedures established by the Board of Trustees. |
| (i) | As of January 31, 2008, 3 securities representing $1,239,843 and 0.7% of the total market value were fair valued in accordance with the policies adopted by the Board of Trustees. |
| (j) | Indicates a security that has been deemed illiquid. |
| (k) | Private Placement restricted as to resale and does not have a readily available market. The aggregate original cost of such securities is $8,343,031. The aggregate value of $8,283,892 is approximately 4.5% of net assets. |
| † | The ratings reflected are as of January 31, 2008. Ratings of certain bonds may have changed subsequent to that date. |
See Notes to Financial Statements.
| | |
| 38 | | Visit our website at www.prudential.com |
| (l) | Other liabilities in excess of other assets includes unrealized appreciation (depreciation) on futures contracts, forward exchange currency contracts, interest rate and credit default swaps as follows: |
Future contracts open at January 31, 2008:
| | | | | | | | | | | | | | |
Number of
Contracts | | Type | | Expiration
Date | | Value at
Trade
Date | | Value at
January 31,
2008 | | Unrealized
Appreciation
(Depreciation) | |
| | Long Positions: | | | | | | | | | | | | |
| 392 | | 10 Year U.S. Treasury Notes | | Mar 08 | | $ | 45,086,031 | | $ | 45,753,750 | | $ | 667,719 | |
| 30 | | 10 Year U.S. Treasury Notes | | Jun 08 | | | 3,480,469 | | | 3,472,031 | | | (8,438 | ) |
| 16 | | 90 Day Euro | | Jun 08 | | | 3,849,000 | | | 3,900,400 | | | 51,400 | |
| 29 | | 90 Day Euro | | Sept 08 | | | 6,952,375 | | | 7,072,738 | | | 120,363 | |
| 20 | | 90 Day Euro | | Jun 09 | | | 4,773,500 | | | 4,853,250 | | | 79,750 | |
| 31 | | 90 Day Euro | | Sep 09 | | | 7,399,313 | | | 7,509,363 | | | 110,050 | |
| 31 | | 90 Day Euro | | Dec 09 | | | 7,391,175 | | | 7,496,963 | | | 105,788 | |
| 22 | | 90 Day Euro EURIBOR | | Jun 08 | | | 7,815,881 | | | 7,855,099 | | | 39,218 | |
| 54 | | 90 Day Euro EURIBOR | | Sep 08 | | | 19,177,052 | | | 19,329,869 | | | 152,817 | |
| 25 | | 90 Day Sterling | | Mar 08 | | | 5,859,764 | | | 5,877,396 | | | 17,632 | |
| 62 | | 90 Day Sterling | | Sept 08 | | | 14,588,719 | | | 14,671,492 | | | 82,773 | |
| 77 | | 90 Day Sterling | | Dec 08 | | | 18,110,235 | | | 18,247,842 | | | 137,607 | |
| 13 | | 90 Day Sterling | | Jun 09 | | | 3,033,950 | | | 3,083,067 | | | 49,117 | |
| 7 | | S&P 500 Mini | | Mar 08 | | | 468,125 | | | 482,860 | | | 14,735 | |
| | | | | | | | | | | | | | |
| | | | | | | | | | | | $ | 1,620,531 | |
| | | | | | | | | | | | | | |
| | Short Positions: | | | | | | | | | | | | |
| 58 | | 2 Year U.S. Treasury Notes | | Mar 08 | | $ | 12,160,063 | | $ | 12,366,688 | | $ | (206,625 | ) |
| 230 | | 5 Year U.S. Treasury Notes | | Mar 08 | | | 25,617,141 | | | 25,990,000 | | | (372,859 | ) |
| 10 | | 30 Year U.S. Treasury Bonds | | Mar 08 | | | 1,161,125 | | | 1,193,125 | | | (32,000 | ) |
| 81 | | 90 Day Sterling | | Jun 08 | | | 19,018,603 | | | 19,115,246 | | | (96,643 | ) |
| 7 | | Euro-Bund | | Mar 08 | | | 1,205,848 | | | 1,214,382 | | | (8,534 | ) |
| | | | | | | | | | | | | | |
| | | | | | | | | | | | $ | (716,661 | ) |
| | | | | | | | | | | | | | |
See Notes to Financial Statements.
| | |
| Target Asset Allocation Funds/Target Conservative Allocation Fund | | 39 |
Portfolio of Investments
as of January 31, 2008 (Unaudited) continued
Forward foreign currency exchange contracts outstanding at January 31, 2008:
| | | | | | | | | | | | | | |
Purchase
Contracts | | | | Notional
Amount
(000) | | Value at Settlement
Date Payable | | Current
Value | | Unrealized
Appreciation
(Depreciation) | |
Austrailian Dollar,
Expiring 02/28/08 | | AUD | | 37 | | $ | 32,775 | | $ | 33,160 | | $ | 385 | |
Brazilian Real,
Expiring 07/02/08 | | BRL | | 3,205 | | | 1,623,629 | | | 1,771,520 | | | 147,891 | |
Chinese Yuan,
Expiring 03/05/08
Expiring 10/10/08 | | CNY
CNY | | 9,340
12,912 | |
| 1,272,000
1,880,809 | |
| 1,311,379
1,908,598 | |
| 39,379
27,789 |
|
Indian Rupee,
Expiring 05/12/08 | | INR | | 102,948 | | | 2,494,069 | | | 2,596,908 | | | 102,839 | |
Japanese Yen,
Expiring 02/07/08 | | JPY | | 300,618 | | | 2,708,295 | | | 2,828,189 | | | 119,894 | |
Mexican Peso,
Expiring 03/13/08 | | MXN | | 4,457 | | | 391,000 | | | 409,856 | | | 18,856 | |
South Korean Won,
Expiring 08/04/08 | | KRW | | 863,395 | | | 934,114 | | | 912,082 | | | (22,032 | ) |
Russian Ruble,
Expiring 07/10/08
Expiring 11/19/08 | | RUB
RUB | | 25,354
34,657 | |
| 1,000,000
1,397,740 | |
| 1,028,844
1,391,813 | | | 28,844 (5,927 | ) |
| | | | | | | | | | | | | | |
| | | | | | $ | 13,734,431 | | $ | 14,192,349 | | $ | 457,918 | |
| | | | | | | | | | | | | | |
| | | | | | | | | | | | | | |
| Sale Contracts | | | | Notional
Amount
(000) | | Value at Settlement
Date Receivable | | Current
Value | | Unrealized
Appreciation
(Depreciation) | |
Brazilian Real,
Expiring 07/02/08 | | BRL | | 2,444 | | $ | 1,347,000 | | $ | 1,350,517 | | $ | (3,517 | ) |
British Pound,
Expiring 03/06/08 | | GBP | | 1,452 | | | 2,874,017 | | | 2,881,444 | | | (7,427 | ) |
Euros,
Expiring 02/26/08 | | EUR | | 1,004 | | | 1,482,502 | | | 1,491,668 | | | (9,166 | ) |
Indian Rupee,
Expiring 05/12/08 | | INR | | 60,936 | | | 1,538,000 | | | 1,537,124 | | | 876 | |
Japanese Yen,
Expiring 02/07/08 | | JPY | | 122,332 | | | 1,141,000 | | | 1,150,327 | | | (9,327 | ) |
Mexican Peso,
Expiring 03/13/08 | | MXN | | 4,457 | | | 403,711 | | | 409,855 | | | (6,144 | ) |
Russian Ruble,
Expiring 07/10/08 | | RUB | | 12,664 | | | 515,000 | | | 513,893 | | | 1,107 | |
| | | | | | | | | | | | | | |
| | | | | | $ | 9,301,230 | | $ | 9,334,828 | | $ | (33,598 | ) |
| | | | | | | | | | | | | | |
See Notes to Financial Statements.
| | |
| 40 | | Visit our website at www.prudential.com |
The Fund entered into interest rate swap agreements during the six months ended January 31, 2008. Details of the interest rate swap agreements outstanding as of January 31, 2008 were as follows:
| | | | | | | | | | | | | |
Counterparty | | Termination
Date | | Notional
Amount# | | Fixed
Rate | | Floating Rate | | Unrealized
Appreciation
(Depreciation) | |
Bank of America
Securities LLC(1) | | 06/18/23 | | $ | 2,000,000 | | 5.00% | | 3 Month LIBOR | | $ | 65,630 | |
Bank of America
Securities LLC(1) | | 06/18/10 | | | 54,200,000 | | 4.00% | | 3 Month LIBOR | | | (97,636 | ) |
Barclays Capital(2) | | 06/18/13 | | | 9,800,000 | | 4.00% | | 3 Month LIBOR | | | 298,348 | |
Barclays Capital(2) | | 06/18/38 | | | 400,000 | | 5.00% | | 3 Month LIBOR | | | 12,772 | |
Citibank(1) | | 06/20/17 | | | 2,800,000 | | 5.00% | | 3 Month LIBOR | | | (133,828 | ) |
Citibank(1) | | 06/18/23 | | | 1,900,000 | | 5.00% | | 3 Month LIBOR | | | 58,287 | |
Deutsche Bank(2) | | 06/18/13 | | | 2,500,000 | | 4.00% | | 3 Month LIBOR | | | 22,343 | |
Deutsche Bank(2) | | 06/18/15 | | | 2,300,000 | | 5.00% | | 3 Month LIBOR | | | 62,799 | |
Lehman Brothers(1) | | 06/18/23 | | | 1,200,000 | | 5.00% | | 3 Month LIBOR | | | (14,181 | ) |
Merrill Lynch & Co.(1) | | 06/18/18 | | | 2,800,000 | | 5.00% | | 3 Month LIBOR | | | (72,378 | ) |
Merrill Lynch & Co.(2) | | 12/17/10 | | | 3,000,000 | | 4.00% | | 3 Month LIBOR | | | 39,168 | |
Morgan Stanley & Co.(1) | | 06/18/18 | | | 7,200,000 | | 5.00% | | 3 Month LIBOR | | | (68,963 | ) |
Morgan Stanley & Co.(1) | | 06/18/10 | | | 10,400,000 | | 4.00% | | 3 Month LIBOR | | | (17,042 | ) |
Morgan Stanley & Co.(2) | | 06/20/37 | | | 800,000 | | 5.00% | | 3 Month LIBOR | | | 39,795 | |
Morgan Stanley & Co.(2) | | 06/18/13 | | | 28,200,000 | | 4.00% | | 3 Month LIBOR | | | 886,120 | |
UBS AG(2) | | 06/20/37 | | | 1,900,000 | | 5.00% | | 3 Month LIBOR | | | 105,124 | |
Citigroup(2) | | 04/15/09 | | AUD | 5,000,000 | | 7.00% | | 3 Month Australian
Bank Bill rate | | | (5,102 | ) |
Citigroup(2) | | 09/15/09 | | AUD | 15,000,000 | | 7.00% | | 3 Month Australian
Bank Bill rate | | | (43,740 | ) |
Deutsche Bank(2) | | 06/15/09 | | AUD | 8,000,000 | | 7.00% | | 3 Month Australian
Bank Bill rate | | | 7,597 | |
UBS AG(2) | | 09/15/09 | | AUD | 9,700,000 | | 7.00% | | 3 Month Australian
Bank Bill rate | | | (29,060 | ) |
Morgan Stanley & Co.(2) | | 12/15/09 | | AUD | 2,700,000 | | 7.00% | | 6 Month Australian
Bank Bill rate | | | (10,427 | ) |
Goldman Sachs & Co.(2) | | 01/02/12 | | BRL | 4,400,000 | | 10.15% | | Brazilian interbank
lending rate | | | (180,014 | ) |
Morgan Stanley & Co.(2) | | 01/02/12 | | BRL | 9,800,000 | | 10.12% | | Brazilian interbank
lending rate | | | (304,516 | ) |
UBS AG(2) | | 01/02/12 | | BRL | 5,600,000 | | 10.58% | | Brazilian interbank
lending rate | | | (141,602 | ) |
Barclays Capital(2) | | 06/15/10 | | EUR | 4,400,000 | | 4.50% | | 6 Month EURIBOR | | | 51,435 | |
Deutsche Bank(2) | | 06/18/34 | | EUR | 600,000 | | 5.00% | | 6 Month EURIBOR | | | 1,693 | |
See Notes to Financial Statements.
| | |
| Target Asset Allocation Funds/Target Conservative Allocation Fund | | 41 |
Portfolio of Investments
as of January 31, 2008 (Unaudited) continued
| | | | | | | | | | | | | |
Counterparty | | Termination
Date | | Notional
Amount# | | Fixed
Rate | | Floating Rate | | Unrealized
Appreciation
(Depreciation) | |
Deutsche Bank(2) | | 06/15/13 | | EUR | 100,000 | | 4.00% | | 6 Month EURIBOR | | $ | 1,540 | |
UBS AG(2) | | 10/15/10 | | EUR | 100,000 | | 2.15% | | FRC - Excluding
Tobacco - Non-
Revised
Consumer
Price Index | | | 1,299 | |
Barclays Capital(1) | | 09/15/10 | | GBP | 2,500,000 | | 5.00% | | 6 Month LIBOR | | | 21,981 | |
Barclays Capital(1) | | 06/20/17 | | JPY | 20,000,000 | | 2.00% | | 6 Month LIBOR | | | (2,271 | ) |
UBS AG(1) | | 06/20/17 | | JPY | 50,000,000 | | 2.00% | | 6 Month LIBOR | | | (7,808 | ) |
| | | | | | | | | | | | | |
| | | | | | | | | | | $ | 547,363 | |
| | | | | | | | | | | | | |
| (1) | Fund pays the fixed rate and receives the floating rate. |
| (2) | Fund pays the floating rate and receives the fixed rate. |
| # | Notional Amount is shown in U.S. dollars unless otherwise stated. |
The Fund entered into credit default swap agreements during the six months ended January 31, 2008. Details of the credit default swap agreements outstanding as of January 31, 2008 were as follows:
| | | | | | | | | | | | | |
Counterparty | | Termination
Date | | Notional
Amount# | | Fixed
Rate | | Reference Entity/
Obligation | | Unrealized
Appreciation
(Depreciation) | |
Goldman Sachs(2) | | 03/20/08 | | $ | 700,000 | | 0.05% | | AIG, 5.60%, due 10/18/16 | | $ | (998 | ) |
Morgan Stanley & Co.(1) | | 12/20/08 | | | 200,000 | | 0.26% | | Allstate Corp., 6.125%, due 02/15/12 | | | 145 | |
UBS AG(1) | | 12/20/08 | | | 300,000 | | 0.35% | | AutoZone, Inc., 5.875%, due 10/15/12 | | | 103 | |
Lehman Brothers(1) | | 03/20/18 | | | 1,000,000 | | 2.20% | | Bear Stearns Co. Inc., 7.25%, due 02/01/18 | | | — | |
Bank of America Securities LLC(1) | | 03/20/18 | | | 2,000,000 | | 1.83% | | Con-way Inc. 7.25%, due 01/15/18 | | | (9,301 | ) |
Lehman Brothers(1) | | 12/20/08 | | | 100,000 | | 0.24% | | Costco Wholesale Corp., 5.50%, due 03/15/07 | | | 5 | |
Barclays Bank PLC(1) | | 09/20/11 | | | 200,000 | | 0.58% | | DaimlerChrysler, 5.75%, due 09/08/11 | | | 163 | |
Barclays Bank PLC(1) | | 12/20/11 | | | 600,000 | | 0.75% | | Dow Jones CDX HVOL7 Index | | | 37,071 | |
Lehman Brothers(1) | | 12/20/11 | | | 100,000 | | 0.00% | | Dow Jones CDX HY7 Index | | | 17,307 | |
Citigroup(2) | | 06/20/12 | | | 4,000,000 | | 2.11% | | Dow Jones CDX HY7 Index | | | (264,705 | ) |
See Notes to Financial Statements.
| | |
| 42 | | Visit our website at www.prudential.com |
| | | | | | | | | | | | | |
Counterparty | | Termination
Date | | Notional
Amount# | | Fixed
Rate | | Reference Entity/
Obligation | | Unrealized
Appreciation
(Depreciation) | |
Merrill Lynch & Co.(1) | | 12/20/11 | | $ | 300,000 | | 0.00% | | Dow Jones CDX HY7 Index | | $ | 52,949 | |
Merrill Lynch & Co.(1) | | 06/20/12 | | | 300,000 | | 2.75% | | Dow Jones CDX HY8 Index | | | 18,876 | |
Deutsche Bank(2) | | 12/20/12 | | | 100,000 | | 3.75% | | Dow Jones CDX HY9 Index | | | (3,687 | ) |
Morgan Stanley & Co.(2) | | 12/20/15 | | | 470,000 | | 0.46% | | Dow Jones CDX IG5 Index | | | (44,264 | ) |
Morgan Stanley & Co.(1) | | 12/20/12 | | | 700,000 | | 0.14% | | Dow Jones CDX IG5 Index | | | 47,747 | |
Morgan Stanley & Co.(2) | | 12/20/15 | | | 1,500,000 | | 0.46% | | Dow Jones CDX IG5 Index | | | (140,769 | ) |
Morgan Stanley & Co.(1) | | 12/20/12 | | | 2,100,000 | | 0.14% | | Dow Jones CDX IG5 Index | | | 143,242 | |
Goldman Sachs(1) | | 12/20/16 | | | 100,000 | | 0.65% | | Dow Jones CDX IG7 Index | | | 4,758 | |
Morgan Stanley & Co.(1) | | 12/20/16 | | | 1,000,000 | | 0.65% | | Dow Jones CDX IG7 Index | | | 47,922 | |
Lehman Brothers(1) | | 06/20/12 | | | 1,000,000 | | 0.35% | | Dow Jones CDX IG8 Index | | | 22,492 | |
Goldman Sachs(2) | | 12/20/12 | | | 1,000,000 | | 0.60% | | Dow Jones CDX IG9 5Y Index | | | 5,220 | |
JPMorgan Chase Bank(1) | | 12/20/11 | | | 1,000,000 | | 1.65% | | Dow Jones CDX XO7 Index | | | 55,635 | |
Bank of America Securities LLC(1) | | 12/20/08 | | | 100,000 | | 0.13% | | E.I. DuPont, 6.875%, due 10/15/09 | | | 3 | |
Citigroup(1) | | 12/20/08 | | | 200,000 | | 0.28% | | Eaton Corp.,
5.75%, due 07/15/12 | | | (5 | ) |
Barclays Bank PLC(1) | | 12/20/08 | | | 200,000 | | 0.16% | | Eli Lilly & Co., 6.00%, due 03/15/12 | | | (225 | ) |
Morgan Stanley & Co.(1) | | 12/20/08 | | | 100,000 | | 0.21% | | Emerson Electric Co., 6.48%, due 10/15/12 | | | (56 | ) |
Citigroup(1) | | 12/20/08 | | | 100,000 | | 0.29% | | FedEx Corp.,
7.25%, due 02/15/11 | | | (99 | ) |
Lehman Brothers(1) | | 12/20/08 | | | 100,000 | | 0.97% | | Goodrich Corp.,
7.625%, due 12/15/12 | | | (845 | ) |
Bear Stearns International Ltd.(1) | | 12/20/08 | | | 200,000 | | 0.32% | | Hewlett Packard Co., 6.50% due 07/01/12 | | | (309 | ) |
Lehman Brothers(1) | | 12/20/08 | | | 200,000 | | 0.12% | | Home Depot, Inc., 5.375%, due 04/01/06 | | | 808 | |
Merrill Lynch & Co.(1) | | 12/20/08 | | | 100,000 | | 0.32% | | Ingersoll-Rand Co., 6.48%, due 06/01/25 | | | (76 | ) |
Barclays Bank PLC(1) | | 12/20/12 | | | 2,000,000 | | 0.47% | | International Paper Co., 5.85%, due 10/30/18 | | | 37,086 | |
Lehman Brothers(1) | | 12/20/08 | | | 200,000 | | 0.11% | | Johnson & Johnson, 3.80%, due 05/15/13 | | | (145 | ) |
Lehman Brothers(1) | | 12/20/08 | | | 100,000 | | 0.53% | | Lockheed Martin Corp., 8.20%, due 12/01/09 | | | (442 | ) |
See Notes to Financial Statements.
| | |
| Target Asset Allocation Funds/Target Conservative Allocation Fund | | 43 |
Portfolio of Investments
as of January 31, 2008 (Unaudited) continued
| | | | | | | | | | | | | |
Counterparty | | Termination
Date | | Notional
Amount# | | Fixed
Rate | | Reference Entity/
Obligation | | Unrealized
Appreciation
(Depreciation) | |
Lehman Brothers(1) | | 12/20/08 | | $ | 100,000 | | 0.30% | | Masco Corp., 5.875%, due 07/15/12 | | $ | 1,708 | |
Bear Stearns International Ltd.(1) | | 12/20/12 | | | 500,000 | | 0.29% | | Nordstrom, Inc., 6.95%, due 03/15/28 | | | 14,008 | |
Lehman Brothers(1) | | 12/20/08 | | | 100,000 | | 0.48% | | Northrop & Grumman Corp.,
7.125%, due 02/15/11 | | | (427 | ) |
Morgan Stanley & Co.(1) | | 06/20/16 | | | 300,000 | | 0.39% | | Omnicom
5.90%, due 04/15/16 | | | 10,075 | |
Lehman Brothers(1) | | 06/20/09 | | | 500,000 | | 0.40% | | People’s Republic of China,
6.80%, due 05/23/11 | | | (710 | ) |
Lehman Brothers(1) | | 12/20/08 | | | 100,000 | | 0.35% | | RadioShack Corp., 7.375%, due 05/15/11 | | | 827 | |
Morgan Stanley & Co.(1) | | 05/20/16 | | | 1,000,000 | | 0.54% | | Republic of Hungary, 4.75%, due 02/03/15 | | | 21,646 | |
JPMorgan Chase Bank(1) | | 05/20/16 | | | 300,000 | | 0.54% | | Republic of Hungary, 4.75%, due 02/03/15 | | | 6,387 | |
Citigroup(1) | | 02/09/46 | | | 600,000 | | 2.20% | | Vertical CDO, Ltd., 7.01%, due 02/09/46 | | | 531,887 | |
Lehman Brothers(1) | | 09/20/12 | | | 200,000 | | 0.60% | | Viacom, Inc., 4.625%, due 05/15/18 | | | 3,267 | |
Goldman Sachs(1) | | 12/20/12 | | | 500,000 | | 0.24% | | Wal-Mart Stores, Inc., 5.75%, due 12/19/30 | | | 2,155 | |
Citigroup(1) | | 12/20/08 | | | 300,000 | | 0.14% | | Wal-Mart Stores, Inc., 6.875%, due 08/10/09 | | | 60 | |
Barclays Bank PLC(1) | | 12/20/08 | | | 100,000 | | 0.67% | | Walt Disney Co. (The), 6.375%, due 03/12/12 | | | (402 | ) |
Lehman Brothers(1) | | 12/20/08 | | | 100,000 | | 0.29% | | Whirlpool Corp., 8.60%, due 05/01/10 | | | 167 | |
Barclays Bank PLC(1) | | 03/20/12 | | | 100,000 | | 0.21% | | XL Capital, Ltd., 6.50%, due 01/15/12 | | | 8,670 | |
| | | | | | | | | | | | | |
| | | | | | | | | | | $ | 624,924 | |
| | | | | | | | | | | | | |
| (1) | Fund pays the fixed rate and receives from the counterparty par in the event that the underlying bond defaults. |
| (2) | Fund receives the fixed rate and pays the counterparty par in the event that the underlying bond defaults. |
See Notes to Financial Statements.
| | |
| 44 | | Visit our website at www.prudential.com |
The industry classification of investments and other liabilities in excess of other assets shown as a percentage of net assets as January 31, 2008 were as follows:
| | | |
U.S. Government Mortgage-Backed Obligations | | 39.5 | % |
Commercial Paper | | 6.7 | |
Affiliated Money Market Mutual Fund | | 5.7 | |
Financial—Bank & Trust | | 4.7 | |
Financial Services | | 4.6 | |
Oil, Gas & Consumable Fuels | | 3.9 | |
U.S. Treasury Obligations | | 3.8 | |
Telecommunications | | 3.7 | |
Collateralized Mortgage Obligations | | 2.7 | |
Foreign Government Bonds | | 2.7 | |
Pharmaceuticals | | 2.4 | |
Insurance | | 2.0 | |
Software | | 2.0 | |
Diversified Financial Services | | 2.0 | |
Transportation | | 1.7 | |
Asset-Backed Securities | | 1.7 | |
Outstanding Options Purchased | | 1.4 | |
Retail & Merchandising | | 1.2 | |
Bank Notes | | 1.1 | |
Chemicals | | 1.1 | |
Internet Services | | 1.0 | |
Metals & Mining | | 1.0 | |
Healthcare Services | | 0.9 | |
Commercial Services | | 0.9 | |
Media | | 0.9 | |
Aerospace & Defense | | 0.9 | |
Hotels, Restaurants & Leisure | | 0.8 | |
Computer Hardware | | 0.8 | |
Medical Supplies & Equipment | | 0.8 | |
Consumer Products & Services | | 0.7 | |
Industrial Conglomerates | | 0.7 | |
Semiconductors | | 0.7 | |
Aerospace | | 0.7 | |
Entertainment & Leisure | | 0.7 | |
Utilities | | 0.6 | |
Real Estate Investment Trusts | | 0.6 | |
Electronic Components | | 0.6 | |
Biotechnology | | 0.6 | |
Farming & Agriculture | | 0.6 | |
Hotels & Motels | | 0.5 | |
Machinery | | 0.5 | |
Beverages | | 0.5 | |
Commercial Banks | | 0.5 | |
Thrifts & Mortgage Finance | | 0.4 | |
Energy Equipment & Services | | 0.3 | |
See Notes to Financial Statements.
| | |
| Target Asset Allocation Funds/Target Conservative Allocation Fund | | 45 |
Portfolio of Investments
as of January 31, 2008 (Unaudited) continued
| | | |
Diversified Manufacturing Operations | | 0.3 | % |
Specialty Retail | | 0.3 | |
Electric Utilities | | 0.3 | |
Foods | | 0.3 | |
Healthcare Providers & Services | | 0.2 | |
Food Products | | 0.2 | |
Household Durables | | 0.2 | |
Advertising | | 0.2 | |
Healthcare Equipment & Supplies | | 0.2 | |
Clothing & Apparel | | 0.2 | |
IT Services | | 0.2 | |
Electronic Equipment & Instruments | | 0.2 | |
Independent Power Producers & Energy Traders | | 0.1 | |
Diversified | | 0.1 | |
Tobacco Products | | 0.1 | |
Automobile Manufacturers | | 0.1 | |
Auto Components | | 0.1 | |
Municipal Bonds | | 0.1 | |
Office Equipment | | 0.1 | |
Household Products | | 0.1 | |
Paper & Forest Products | | 0.1 | |
Computer Services & Software | | 0.1 | |
Semiconductors & Semiconductor Equipment | | 0.1 | |
Manufacturing | | 0.1 | |
Construction | | 0.1 | |
Business Services | | 0.1 | |
Automotive Parts | | 0.1 | |
Real Estate | | 0.1 | |
Building Products | | 0.1 | |
Engineering/Construction | | 0.1 | |
Capital Markets | | 0.1 | |
Electrical Equipment | | 0.1 | |
Air Freight & Couriers | | 0.1 | |
Auto Parts & Related | | 0.1 | |
Textiles, Apparel & Luxury Goods | | 0.1 | |
Communication Equipment | | 0.1 | |
| | | |
| | 117.0 | |
Written options and securities sold short | | (8.0 | ) |
Other liabilities in excess of other assets | | (9.0 | ) |
| | | |
| | 100.0 | % |
| | | |
See Notes to Financial Statements.
| | |
| 46 | | Visit our website at www.prudential.com |
Financial Statements
(Unaudited)
| | |
| JANUARY 31, 2008 | | SEMIANNUAL REPORT |
Target Asset Allocation Funds/Target Conservative Allocation Fund
Statement of Assets and Liabilities
January 31, 2008 (Unaudited)
| | | | |
Assets | | | | |
Investments at value: | | | | |
Unaffiliated investments (cost $195,386,357) | | $ | 205,267,585 | |
Affiliated investments (cost $10,420,283) | | | 10,420,283 | |
Foreign currency, at value (cost $2,450,031) | | | 2,442,360 | |
Receivable for investments sold | | | 91,583,179 | |
Unrealized appreciation on swap agreements | | | 2,768,320 | |
Dividends and interest receivable | | | 688,216 | |
Unrealized appreciation on foreign currency exchange contracts | | | 487,860 | |
Receivable for Fund shares sold | | | 223,297 | |
Prepaid expenses | | | 3,980 | |
| | | | |
Total assets | | | 313,885,080 | |
| | | | |
| |
Liabilities | | | | |
Payable for investments purchased | | | 109,387,020 | |
Securities sold short, at value (proceeds $13,147,411) | | | 13,224,086 | |
Payments received for swaps agreements | | | 2,590,277 | |
Unrealized depreciation on swap agreements | | | 1,596,033 | |
Outstanding options written (premiums received $542,034) | | | 1,508,439 | |
Payable for Fund shares reacquired | | | 328,301 | |
Accrued expenses and other liabilities | | | 259,657 | |
Payable to custodian | | | 202,714 | |
Management fee payable | | | 116,770 | |
Distribution fee payable | | | 107,472 | |
Interest payable on investments sold short | | | 87,264 | |
Unrealized depreciation on foreign currency exchange contracts | | | 63,540 | |
Transfer agent fee payable | | | 61,689 | |
Payable to broker-variation margin | | | 29,457 | |
Deferred trustees’ fees | | | 8,175 | |
| | | | |
Total liabilities | | | 129,570,894 | |
| | | | |
| |
Net Assets | | $ | 184,314,186 | |
| | | | |
| | | | | |
Net assets were comprised of: | | | | |
Shares of beneficial interest, at par | | $ | 21,552 | |
Paid-in capital, in excess of par | | | 171,524,883 | |
| | | | |
| | | 171,546,435 | |
Distributions in excess of net investment income | | | (749,573 | ) |
Accumulated net realized gain on investments | | | 2,330,290 | |
Net unrealized appreciation on investments and foreign currencies | | | 11,187,034 | |
| | | | |
Net assets, January 31, 2008 | | $ | 184,314,186 | |
| | | | |
See Notes to Financial Statements.
| | |
| 48 | | Visit our website at www.prudential.com |
| | | |
Class A: | | | |
Net asset value and redemption price per share
($66,245,574 ÷ 6,330,629 shares of beneficial interest issued and outstanding) | | $ | 10.46 |
Maximum sales charge (5.5% of offering price) | | | .61 |
| | | |
Maximum offering price to public | | $ | 11.07 |
| | | |
| |
Class B: | | | |
Net asset value, offering price and redemption price per share
($70,567,990 ÷ 6,758,895 shares of beneficial interest issued and outstanding) | | $ | 10.44 |
| | | |
| |
Class C: | | | |
Net asset value, offering price and redemption price per share
($32,290,411 ÷ 3,092,949 shares of beneficial interest issued and outstanding) | | $ | 10.44 |
| | | |
| |
Class M: | | | |
Net asset value, offering price and redemption price per share
($2,659,510 ÷ 254,739 shares of beneficial interest issued and outstanding) | | $ | 10.44 |
| | | |
| |
Class R: | | | |
Net asset value, offering price and redemption price per share
($5,152,287 ÷ 491,890 shares of beneficial interest issued and outstanding) | | $ | 10.47 |
| | | |
| |
Class X: | | | |
Net asset value, offering price and redemption price per share
($2,568,749 ÷ 246,106 shares of beneficial interest issued and outstanding) | | $ | 10.44 |
| | | |
| |
Class Z: | | | |
Net asset value, offering price and redemption price per share
($4,829,665 ÷ 461,082 shares of beneficial interest issued and outstanding) | | $ | 10.47 |
| | | |
See Notes to Financial Statements.
| | |
| Target Asset Allocation Funds/Target Conservative Allocation Fund | | 49 |
Statement of Operations
Six Months Ended January 31, 2008 (Unaudited)
| | | | |
Net Investment Income | | | | |
Income | | | | |
Unaffiliated interest | | $ | 2,639,990 | |
Unaffiliated dividends (net of foreign withholding taxes $2,109) | | | 746,180 | |
Affiliated dividends | | | 264,553 | |
| | | | |
| | | 3,650,723 | |
| | | | |
| |
Expenses | | | | |
Management fee | | | 708,727 | |
Distribution fee—Class A | | | 80,500 | |
Distribution fee—Class B | | | 382,321 | |
Distribution fee—Class C | | | 164,781 | |
Distribution fee—Class M | | | 14,038 | |
Distribution fee—Class R | | | 10,881 | |
Distribution fee—Class X | | | 12,860 | |
Custodian’s fees and expenses | | | 150,000 | |
Transfer agent’s fees and expenses (including affiliated expense of $66,600) | | | 137,000 | |
Registration fees | | | 49,000 | |
Reports to shareholders | | | 34,000 | |
Audit fee | | | 25,000 | |
Legal fee | | | 12,000 | |
Trustees’ fees | | | 7,000 | |
Insurance expense | | | 2,000 | |
Miscellaneous | | | 10,385 | |
| | | | |
Total expenses | | | 1,800,493 | |
| | | | |
Net investment income | | | 1,850,230 | |
| | | | |
| |
Net Realized And Unrealized Gain (Loss) On Investments And Foreign Currency | | | | |
Net realized gain (loss) on: | | | | |
Investment transactions | | | 2,224,871 | |
Options written | | | 329,763 | |
Foreign currency transactions | | | 789,251 | |
Futures | | | (400,458 | ) |
Swaps | | | 2,967,602 | |
Short sale transactions | | | (154,038 | ) |
| | | | |
| | | 5,756,991 | |
| | | | |
Net change in unrealized appreciation (depreciation) on: | | | | |
Investments | | | (1,465,769 | ) |
Short sales | | | (92,676 | ) |
Foreign currencies | | | (54,291 | ) |
Futures | | | 1,773,485 | |
Swaps | | | 502,569 | |
Options written | | | (986,739 | ) |
| | | | |
| | | (323,421 | ) |
| | | | |
Net gain on investments | | | 5,433,570 | |
| | | | |
Net Increase In Net Assets Resulting From Operations | | $ | 7,283,800 | |
| | | | |
See Notes to Financial Statements.
| | |
| 50 | | Visit our website at www.prudential.com |
Statement of Changes in Net Assets
(Unaudited)
| | | | | | | | |
| | | Six Months
Ended
January 31, 2008 | | | Year
Ended
July 31, 2007 | |
Increase (Decrease) In Net Assets | | | | | | | | |
Operations | | | | | | | | |
Net investment income | | $ | 1,850,230 | | | $ | 3,767,379 | |
Net realized gain on investments and foreign currency transactions | | | 5,756,991 | | | | 6,438,690 | |
Net change in unrealized appreciation (depreciation) on investments and foreign currencies | | | (323,421 | ) | | | 4,486,748 | |
| | | | | | | | |
Net increase in net assets resulting from operations | | | 7,283,800 | | | | 14,692,817 | |
| | | | | | | | |
Dividends and distributions (Note 1) | | | | | | | | |
Dividends from net investment income: | | | | | | | | |
Class A | | | (790,616 | ) | | | (1,528,934 | ) |
Class B | | | (638,179 | ) | | | (1,540,436 | ) |
Class C | | | (278,688 | ) | | | (611,152 | ) |
Class M | | | (23,171 | ) | | | (57,363 | ) |
Class R | | | (40,867 | ) | | | (185,681 | ) |
Class X | | | (21,455 | ) | | | (42,951 | ) |
Class Z | | | (73,499 | ) | | | (124,828 | ) |
| | | | | | | | |
| | | (1,866,475 | ) | | | (4,091,345 | ) |
| | | | | | | | |
Distributions from net realized gains: | | | | | | | | |
Class A | | | (3,033,792 | ) | | | (1,207,325 | ) |
Class B | | | (3,278,171 | ) | | | (1,817,015 | ) |
Class C | | | (1,469,678 | ) | | | (700,590 | ) |
Class M | | | (127,929 | ) | | | (67,656 | ) |
Class R | | | (237,051 | ) | | | (162,551 | ) |
Class X | | | (111,378 | ) | | | (46,264 | ) |
Class Z | | | (249,783 | ) | | | (91,039 | ) |
| | | | | | | | |
| | | (8,507,782 | ) | | | (4,092,440 | ) |
| | | | | | | | |
| | |
Fund share transactions (Net of share conversions) (Note 6) | | | | | | | | |
Net proceeds from shares sold | | | 13,636,591 | | | | 20,503,014 | |
Net asset value of shares issued in reinvestment of distributions | | | 9,672,964 | | | | 7,491,465 | |
Cost of shares reacquired | | | (27,352,574 | ) | | | (48,723,968 | ) |
| | | | | | | | |
Net decrease in net assets resulting from Fund share transactions | | | (4,043,019 | ) | | | (20,729,489 | ) |
| | | | | | | | |
Total decrease | | | (7,133,476 | ) | | | (14,220,457 | ) |
| | |
Net Assets | | | | | | | | |
Beginning of period | | | 191,447,662 | | | | 205,668,119 | |
| | | | | | | | |
End of period | | $ | 184,314,186 | | | $ | 191,447,662 | |
| | | | | | | | |
See Notes to Financial Statements.
| | |
| Target Asset Allocation Funds/Target Conservative Allocation Fund | | 51 |
Notes to Financial Statements
(Unaudited)
Target Asset Allocation Funds (the “Trust”) is registered under the Investment Company Act of 1940 as an open-end, diversified management investment company presently consisting of three portfolios: Target Moderate Allocation Fund, Target Conservative Allocation Fund (the “Fund”) and Target Growth Allocation Fund. These financial statements relate only to Target Conservative Allocation Fund. The financial statements of the other portfolios are not presented herein. The Trust was organized as a business trust in Delaware on July 29, 1998.
The Fund uses investment managers (“Subadvisers”), each managing a portion of the Fund’s assets. The following lists the Subadvisers and their respective segment during the six months ended January 31, 2008.
| | |
Fund Segment | | Subadvisors |
Large-cap value stocks | | Hotchkis & Wiley Capital Management LLC
J.P. Morgan Asset Management
NFJ Investment Group L.P. |
Large-cap growth stocks | | Marsico Capital Management, LLC
Goldman Sachs Asset Management L.P. |
Core fixed income bonds | | Pacific Investment Management Company LLC |
Small-cap value stocks | | EARNEST Partners, LLC
Vaughan Nelson Investment Management, L.P. |
Small-cap growth stocks | | RS Investment Management Co. LLC |
The investment objective of the Fund is to provide current income and a reasonable level of capital appreciation. The Fund seeks to achieve its investment objective by investing in a diversified portfolio of debt obligations and equity securities. The ability of the issuers of the debt securities held by the Fund to meet their obligations may be affected by economic developments in a specific industry or country.
Note 1. Accounting Policies
The following is a summary of significant accounting policies followed by the Trust in the preparation of its financial statements.
Securities Valuation: Securities listed on a securities exchange (other than options on securities and indices) are valued at the last sale price on such exchange on the day of valuation or, if there was no sale on such day, at the mean between the last reported bid and asked prices, or at the last bid price on such day in the absence of an asked price. Securities traded via Nasdaq are valued at the official closing price provided by Nasdaq. Securities that are actively traded in the over-the-counter
| | |
| 52 | | Visit our website at www.prudential.com |
market, including listed securities for which the primary market is believed by Prudential Investments LLC (“PI” or “Manager”), in consultation with the Subadvisers, to be over- the-counter, are valued at market value using prices provided by an independent pricing agent or principal market maker. Futures contracts and options thereon traded on a commodities exchange or board of trade are valued at the last sale price at the close of trading on such exchange or board of trade or, if there was no sale on the applicable commodities exchange or board of trade on such day, at the mean between the most recently quoted prices on such exchange or board of trade or at the last bid price in the absence of an asked price. Certain fixed income securities for which daily market quotations are not readily available may be valued with reference to fixed income securities whose prices are more readily available, pursuant to guidelines established by the Board of Trustees. Prices may be obtained from independent pricing services which use information provided by market makers or estimates of market values obtained from yield data relating to investments or securities with similar characteristics. Securities for which reliable market quotations are not readily available, or whose values have been affected by events occurring after the close of the security’s foreign market and before the Fund’s normal pricing time, are valued at fair value in accordance with Board of Trustees’ approved fair valuation procedures. When determining the fair valuation of securities some of the factors influencing the valuation include the nature of any restrictions on disposition of the securities; assessment of the general liquidity of the securities; the issuer’s financial condition and the markets in which it does business; the cost of the investment; the size of the holding and the capitalization of issuer; the prices of any recent transactions or bids/offers for such securities or any comparable securities; any available analyst media or other reports or information deemed reliable by the investment advisor regarding the issuer or the markets or industry in which it operates. Using fair value to price securities may result in a value that is different from a security’s most recent closing price and from the price used by other mutual funds to calculate their net asset values. As of January 31, 2008, there were 3 securities representing $1,239,843 whose values were adjusted in accordance with procedures approved by the Board of Trustees.
Investments in mutual funds are valued at their net asset value as of the close of the New York Stock Exchange on the date of valuation.
Short-term securities, which mature in sixty days or less, are valued at amortized cost, which approximates market value. The amortized cost method involves valuing a security at its cost on the date of purchase and thereafter assuming a constant amortization to maturity of the difference between the principal amount due at maturity and cost. Short-term securities, which mature in more than sixty days are valued at current market quotations.
| | |
| Target Asset Allocation Funds/Target Conservative Allocation Fund | | 53 |
Notes to Financial Statements
(Unaudited) continued
Foreign Currency Translation: The books and records of the Fund are maintained in U.S. dollars. Foreign currency amounts are translated into U.S. Dollars on the following basis:
(i) market value of investment securities, other assets and liabilities-at the current daily rates of exchange.
(ii) purchases and sales of investment securities, income and expenses-at the rate of exchange prevailing on the respective dates of such transactions.
Although the net assets of the Fund are presented at the foreign exchange rates and market values at the close of the period, the Fund does not isolate that portion of the results of operations arising as a result of changes in the foreign exchange rates from the fluctuations arising from changes in the market prices of securities held at the end of the period. Similarly, the Fund does not isolate the effect of changes in foreign exchange rates from the fluctuations arising from changes in the market prices of portfolio securities sold during the period. Accordingly, realized foreign currency gains or losses are included in the reported net realized gains or losses on investment transactions.
Net realized gains or losses on foreign currency transactions represent net foreign exchange gains or losses from the holding of foreign currencies, currency gains or losses realized between the trade and settlement dates on security transactions, and the difference between the amounts of dividends, interest and foreign withholding taxes recorded on the Fund’s books and the U.S. dollar equivalent amounts actually received or paid. Net unrealized currency gains or losses from valuing foreign currency denominated assets and liabilities (other than investments) at period end exchange rates are reflected as a component of net unrealized appreciation (depreciation) on investments and foreign currencies. Foreign security and currency transactions may involve certain considerations and risks not typically associated with those of domestic origin as a result of, among other factors, the possibility of political and economic instability and the level of governmental supervision and regulation of foreign securities markets.
Forward Currency Contracts: A forward currency contract is a commitment to purchase or sell a foreign currency at a future date at a negotiated forward rate. The Fund may enter into forward currency contracts in order to hedge its exposure to changes in foreign currency exchange rates on its foreign portfolio holdings or on specific receivables and payables denominated in a foreign currency. The contracts
| | |
| 54 | | Visit our website at www.prudential.com |
are valued daily at current exchange rates and any unrealized gain or loss is included in the Statement of Assets and Liabilities as in unrealized appreciation and/or depreciation on forward foreign currency contracts. Gain or loss is realized on the settlement date of the contract equal to the difference between the settlement value of the original and renegotiated forward contracts. This gain or loss, if any, is included in net realized gain or loss on foreign currency transactions. Risks may arise upon entering into these contracts from the potential inability of the counterparties to meet the terms of their contracts.
Options: The Fund may either purchase or write options in order to hedge against adverse market movements or fluctuations in value caused by changes in prevailing interest rates or foreign currency exchange rates with respect to securities or currencies which the Fund currently owns or intends to purchase. The Fund’s principal reason for writing options is to realize, through receipt of premiums, a greater current return than would be realized on the underlying security alone. When the Fund writes an option, it receives a premium and an amount equal to that premium is recorded as a liability. When the Fund purchases an option, it pays a premium and an amount equal to that premium is recorded as an asset. The asset or liability is adjusted daily to reflect the current market value of the option.
If an option expires unexercised, the Fund realizes a gain or loss to the extent of the premium received or paid. If an option is exercised, the premium received or paid is recorded as an adjustment to the proceeds from the sale or the cost basis of the purchase in determining whether the Fund has realized a gain or loss. The difference between the premium and the amount received or paid on effecting a closing purchase or sale transaction is also treated as a realized gain or loss. Gain or loss on purchased options is included in net realized gain or loss on investment transactions. Gain or loss on written options is presented separately as net realized gain or loss on options written.
The Fund, as writer of an option, has no control over whether the underlying securities or currencies may be sold (called) or purchased (put). As a result, the Fund bears the market risk of an unfavorable change in the price of the security or currency underlying the written option. The Fund, as purchaser of an option, bears the risk of the potential inability of the counterparties to meet the terms of their contracts.
When a Fund writes an option on a swap contract, an amount equal to any premium received by the Fund is recorded as a liability and is subsequently adjusted to the current market value of the written option on the swap. If a call option on a swap is exercised, the Fund becomes obligated to pay a fixed interest rate (noted as the strike price) and receive a variable interest rate on a notional amount. If a put option on a
| | |
| Target Asset Allocation Funds/Target Conservative Allocation Fund | | 55 |
Notes to Financial Statements
(Unaudited) continued
swap is exercised, the Fund becomes obligated to pay a variable interest rate and receive a fixed interest rate (noted as the strike price) on a notional amount. Premiums received from writing options on swaps that expire or are exercised are treated as realized gains upon the expiration or exercise of such options on swaps. The risk associated with writing put and call options on swaps, is that the Portfolio will be obligated to be party to a swap agreement if an option on a swap is exercised.
Short Sales: The Fund may make short sales of securities as a method of hedging potential price declines in similar securities owned. The Fund may sell a security it does not own in anticipation of a decline in the market value of that security (short sale). When the Fund makes a short sale, it will borrow the security sold short and deliver it to the broker-dealer through which it made the short sale as collateral for its obligation to deliver the security upon conclusion of the sale. The Fund may have to pay a fee to borrow the particular securities and may be obligated to return any interest or dividends received on such borrowed securities.
A gain, limited to the price at which the Fund sold the security short, or a loss, unlimited as to dollar amount, will be recognized upon the termination of a short sale if the market price is less or greater than the proceeds originally received, respectively, and is presented in the Statement of Operations as net realized gain or loss on short sales.
Swaps: The Fund may enter into swap agreements. A swap is an agreement to exchange the return generated by one instrument for the return generated by another instrument. The Fund enters into interest rate, forward swap spread lock and credit default swap agreements to manage its exposure to interest rates and credit risk.
Interest rate swap agreements involve the exchange by the Fund with another party of their respective commitments to pay or receive interest and may involve payment/ receipt of a premium at the time of initiation of the swap agreement. Forward spread lock swap agreements involve commitments to pay or receive a settlement amount calculated as the difference between the swap spread and a fixed spread, multiplied by the notional amount times the duration of the swap. The swap spread is the difference between the benchmark swap rate (market rate) and the specific Treasury rate. In a credit default swap, one party makes a stream of payments to another party in exchange for the right to receive a specified return in the event of a default by a third party, typically corporate issues or sovereign issues of an emerging country, on its obligation. Dividends and interest on the securities in the swap are included in the
| | |
| 56 | | Visit our website at www.prudential.com |
value of the exchange. The swaps are valued daily at current market value and any unrealized gain or loss is included in the net unrealized appreciation or depreciation on investments. Gain or loss is realized on the termination date of the swap and is equal to the difference between the Fund’s basis in the swap and the proceeds of the closing transaction, including fees. During the period that the swap agreement is open, the Fund may be subject to risk from the potential inability of the counterparty to meet the terms of the agreement.
Written options, future contracts, forward foreign currency exchange contracts and swaps involve elements of both market and credit risk in excess of the amounts reflected on the Statement of Assets and Liabilities.
Repurchase Agreements: In connection with transactions in repurchase agreements with United States financial institutions, it is the Fund’s policy that its custodian or designated subcustodians under triparty repurchase agreements, as the case may be, take possession of the underlying collateral securities, the value of which exceeds the principal amount of the repurchase transaction, including accrued interest. To the extent that any repurchase transaction exceeds one business day, the value of the collateral is marked-to-market on a daily basis to ensure the adequacy on the collateral. If the seller defaults and the value of the collateral declines or if bankruptcy proceedings are commenced with respect to the seller of the security, realization of the collateral by the Fund may be delayed or limited.
Financial Futures Contracts: A financial futures contract is an agreement to purchase (long) or sell (short) an agreed amount of securities at a set price for delivery on a future date. Upon entering into a financial futures contract, the Fund is required to pledge to the broker an amount of cash and/or other assets equal to a certain percentage of the contract amount. This amount is known as the “initial margin.” Subsequent payments known as “variation margin,” are made or received by the Fund each day, depending on the daily fluctuations in the value of the underlying security. Such variation margin is recorded for financial statement purposes on a daily basis as unrealized gain or loss. When the contract expires or is closed, the gain or loss is realized and is presented in the Statement of Operations as net realized gain or loss on financial futures contracts.
The Fund invests in financial futures contracts in order to hedge its existing portfolio securities, or securities the Fund intends to purchase, against fluctuations in value caused by changes in prevailing interest rates or market conditions. Should interest rates move unexpectedly, the Fund may not achieve the anticipated benefits of the financial futures contracts and may realize a loss. The use of futures transactions involves the risk of imperfect correlation in movements in the price of futures contracts, interest rates and the underlying hedged assets.
| | |
| Target Asset Allocation Funds/Target Conservative Allocation Fund | | 57 |
Notes to Financial Statements
(Unaudited) continued
Securities Transactions and Net Investment Income: Securities transactions are recorded on the trade date. Realized gains or losses on sales of securities are calculated on the identified cost basis. Dividend income is recorded on the ex-dividend date and interest income, including amortization of premium and accretion of discount on debt securities as required, is recorded on the accrual basis. Expenses are recorded on the accrual basis. Net investment income or loss (other than distribution fees, which are charged directly to respective class) and unrealized and realized gains or losses, are allocated daily to each class of shares based upon the relative proportion of net assets of each class at the beginning of the day.
Dividends and Distributions: The Fund expects to pay dividends of net investment income quarterly, and distributions of net realized capital and currency gains, if any, annually. Dividends and distributions to shareholders, which are determined in accordance with federal income tax regulations and which may differ from generally accepted accounting principles, are recorded on the ex-dividend date. Permanent book/tax differences relating to income and gains are reclassified amongst undistributed net investment income, accumulated net realized gain or loss and paid in capital in excess of par as appropriate.
Taxes: It is the Fund’s policy to continue to meet the requirements of the Internal Revenue Code applicable to regulated investment companies and to distribute all of its taxable net investment income and capital gains, if any, to its shareholders. Therefore, no federal income tax provision is required.
Withholding taxes on foreign dividends are recorded net of reclaimable amounts, at the time the related income is earned.
Estimates: The preparation of the financial statements requires management to make estimates and assumptions that affect the reported amounts and disclosures in the financial statements. Actual results could differ from those estimates.
Note 2. Agreements
The Trust has a management agreement with PI. Pursuant to this agreement, PI manages the investment operations of the Fund, administers the Fund’s affairs and supervises the Subadvisers’ performance of all investment advisory services. Pursuant to the advisory agreement, PI pays the cost of compensation of officers of the Fund, occupancy and certain clerical and accounting costs of the Fund. The Fund bears all
| | |
| 58 | | Visit our website at www.prudential.com |
other costs and expenses. The management fee paid to PI is computed daily and payable monthly at an annual rate of .75 of 1% of average daily net assets up to $500 million, .70 of 1% of average daily net assets for the next $500 million and .65 of 1% of average daily net assets in excess of $1 billion. The effective management fee rate was .75 of 1% for the six months ended January 31, 2008.
The Fund has a distribution agreement with Prudential Investment Management Services LLC (“PIMS”) which acts as the distributor of the Class A, Class B, Class C, Class M, Class R, Class X and Class Z shares of the Fund. The Fund compensates PIMS for distributing and servicing the Fund’s Class A, Class B, Class C, Class M, Class R and Class X shares, pursuant to plans of distribution (the Distribution Plans”), regardless of expenses actually incurred by PIMS. The distribution fees are accrued daily and payable monthly. No distribution or service fees are paid to PIMS as distributor for Class Z shares of the Fund.
Pursuant to the Distribution Plans, the Fund compensates PIMS for distribution related activities at an annual rate of up to .30 of 1%, 1%, 1%, 1%, .75 of 1% and 1% of the average daily net assets of the Class A, B, C, M, R and X shares, respectively. Such expenses under the plans were .25 of 1%, 1%, 1%, 1%, .50 of 1% and 1% of the average daily net assets of the Class A, B, C, M, R and X shares, respectively, for the six months ended January 31, 2008.
PIMS has advised the Fund that it has received approximately $81,400 in front-end sales charges resulting from sales of Class A shares during the six months ended January 31, 2008. From these fees, PIMS paid such sales charges to broker-dealers, which in turn paid commissions to sales persons and incurred other distribution costs. PIMS has advised the Fund that for the six months ended January 31, 2008, it has received approximately $48,000, $2,300, $3,100 and 600 in contingent deferred sales charges imposed upon certain redemptions by Class B, Class C, Class M and Class X shareholders, respectively.
PIMS and PI are indirect, wholly-owned subsidiaries of Prudential Financial, Inc. (“Prudential”).
Note 3. Other Transactions with Affiliates
Prudential Mutual Fund Services LLC (“PMFS”), an affiliate of PI, and an indirect, wholly-owned subsidiary of Prudential, serves as the Fund’s transfer agent. Transfer agent fees and expenses in the Statement of Operations include certain out–of-pocket expenses paid to non-affiliates, where applicable.
| | |
| Target Asset Allocation Funds/Target Conservative Allocation Fund | | 59 |
Notes to Financial Statements
(Unaudited) continued
The Fund pays networking fees to affiliated and unaffiliated broker/dealers. These networking fees are payments made to broker/dealers that clear mutual fund transactions through a national mutual fund clearing system. First Clearing Corporation, an affiliate of PI, served as a broker/dealer. The Fund incurred approximately $25,000 in total networking fees. These amounts are included in transfer agent’s fees and expenses in the Statement of Operations.
The Fund invests in the Taxable Money Market Series (the “Series”), a portfolio of Dryden Core Investment Fund, formally known as Prudential Core Investment Fund, pursuant to an exemptive order received from the Securities and Exchange Commission. The Series is a money market mutual fund registered under the Investment Company Act of 1940, as amended, and managed by PI. Earnings from the Series are disclosed on the Statement of Operations as affiliated dividends.
Note 4. Portfolio Securities
Purchases and sales of portfolio securities, excluding short-term investments and U.S. Government investments, for the six months ended January 31, 2008, aggregated $58,778,424 and $43,014,041, respectively.
Transactions in options/swap options written during the six months ended January 31, 2008, were as follows:
| | | | | | | |
| | | Number of
Contracts/
Notional
Amount | | | Premium | |
Options outstanding at July 31, 2007 | | 9,100,000 | | | $ | 98,509 | |
Written options | | 30,170,000 | | | | 692,581 | |
Expired options | | (450,000 | ) | | | (36,604 | ) |
Closed options | | (5,220,000 | ) | | | (212,452 | ) |
| | | | | | | |
| Options outstanding at January 31, 2008 | | 33,600,000 | | | $ | 542,034 | |
| | | | | | | |
Note 5. Distributions and Tax Information
The United States federal income tax basis of the Fund’s investments and the net unrealized appreciation (depreciation) as of January 31, 2008 were as follows:
| | | | | | |
Tax Basis | | Appreciation | | (Depreciation) | | Total
Net Unrealized
Appreciation |
| $207,215,246 | | $13,264,004 | | $(4,791,382) | | $8,472,622 |
| | |
| 60 | | Visit our website at www.prudential.com |
The difference between book basis and tax basis were primarily attributable to deferred losses on wash sales, passive foreign investment companies, are real estate investment trusts.
Management has analyzed the Funds’ tax positions taken on federal income tax returns for all open tax years and has concluded that as of January 31, 2008, no provision for income tax would be required in the Funds’ financial statements. The Fund’s federal and state income and federal excise tax returns for tax years for which the applicable statutes of limitations have not expired are subject to examination by the Internal Revenue Service and state departments of revenue.
Note 6. Capital
The Fund offers Class A, Class B, Class C, Class M, Class R, Class X and Class Z shares. Class A shares are subject to a maximum front-end sales charge of 5.50%. Investors who purchase $1 million or more of Class A shares and sell these shares within 12 months of purchase are not subject to an initial sales charge but are subject to a contingent deferred sales charge (CDSC) of 1%, including investors who purchase their shares through broker-dealers affiliated with Prudential. Class B shares are subject to a CDSC of 5%, which decreases by 1% annually to 1% in the fifth and sixth years and 0% in the seventh year. Class B shares automatically convert to Class A shares on a quarterly basis approximately seven years after purchase. The CDSC for Class C shares is 1% for shares redeemed within 12 months of purchase. Class M shares are generally closed to new purchases. Class M shares are subject to a CDSC of 6%, which decreases by 1% annually to 2% in the fifth and sixth years and 1% in the seventh year. Class M shares automatically convert to Class A shares approximately eight years after purchase. Class X shares are generally closed to new purchases. Class X shares are subject to a CDSC of 6%, which decreases by 1% annually to 4% in the third and fourth years, by 1% annually to 2% in the sixth and seventh years, and 1% in the eighth year. Class X shares automatically convert to Class A shares on a quarterly basis approximately ten years (eight years in the case of shares purchased prior to August 19, 1998) after purchase. An exchange privilege is also available for shareholders who qualify to purchase Class A shares at net asset value. Class R and Class Z shares are not subject to any sales or redemption charge and are offered exclusively for sale to a limited group of investors.
The Fund has authorized an unlimited number of shares of beneficial interest at $.001 par value per share. As of January 31, 2008, Prudential owned 231 shares of Class R shares.
| | |
| Target Asset Allocation Funds/Target Conservative Allocation Fund | | 61 |
Notes to Financial Statements
(Unaudited) continued
Transactions in shares of beneficial interest were as follows:
| | | | | | | |
Class A | | Shares | | | Amount | |
Six Months ended January 31, 2008: | | | | | | | |
Shares sold | | 378,060 | | | $ | 4,071,185 | |
Shares issued in reinvestment of dividends and distributions | | 343,206 | | | | 3,617,059 | |
Shares reacquired | | (572,075 | ) | | | (6,201,923 | ) |
| | | | | | | |
Net increase (decrease) in shares outstanding before conversion | | 149,191 | | | | 1,486,321 | |
Shares issued, upon conversion from Class B , Class M, and Class X | | 489,321 | | | | 5,372,891 | |
| | | | | | | |
Net increase (decrease) in shares outstanding | | 638,512 | | | $ | 6,859,212 | |
| | | | | | | |
Year ended July 31, 2007: | | | | | | | |
Shares sold | | 708,999 | | | $ | 7,558,267 | |
Shares issued in reinvestment of dividends and distributions | | 234,424 | | | | 2,495,939 | |
Shares reacquired | | (1,672,038 | ) | | | (17,823,019 | ) |
| | | | | | | |
Net increase (decrease) in shares outstanding before conversion | | (728,615 | ) | | | (7,768,813 | ) |
Shares issued, upon conversion from Class B , Class M, and Class X | | 793,444 | | | | 8,402,196 | |
| | | | | | | |
Net increase (decrease) in shares outstanding | | 64,829 | | | $ | 633,383 | |
| | | | | | | |
Class B | | | | | | |
Six Months ended January 31, 2008: | | | | | | | |
Shares sold | | 163,064 | | | $ | 1,747,662 | |
Shares issued in reinvestment of dividends and distributions | | 350,194 | | | | 3,679,813 | |
Shares reacquired | | (655,198 | ) | | | (7,093,638 | ) |
| | | | | | | |
Net increase (decrease) in shares outstanding before conversion | | (141,940 | ) | | | (1,666,163 | ) |
Shares reacquired upon conversion into Class A | | (460,752 | ) | | | (5,047,681 | ) |
| | | | | | | |
Net increase (decrease) in shares outstanding | | (602,692 | ) | | $ | (6,713,844 | ) |
| | | | | | | |
Year ended July 31, 2007: | | | | | | | |
Shares sold | | 360,646 | | | $ | 3,829,609 | |
Shares issued in reinvestment of dividends and distributions | | 297,375 | | | | 3,158,718 | |
Shares reacquired | | (1,650,176 | ) | | | (17,542,206 | ) |
| | | | | | | |
Net increase (decrease) in shares outstanding before conversion | | (992,155 | ) | | | (10,553,879 | ) |
Shares reacquired upon conversion into Class A | | (763,338 | ) | | | (8,065,713 | ) |
| | | | | | | |
Net increase (decrease) in shares outstanding | | (1,755,493 | ) | | $ | (18,619,592 | ) |
| | | | | | | |
| | |
| 62 | | Visit our website at www.prudential.com |
| | | | | | | |
Class C | | Shares | | | Amount | |
Six Months ended January 31, 2008: | | | | | | | |
Shares sold | | 289,919 | | | $ | 3,082,062 | |
Shares issued in reinvestment of dividends and distributions | | 145,474 | | | | 1,527,997 | |
Shares reacquired | | (426,385 | ) | | | (4,605,281 | ) |
| | | | | | | |
Net increase (decrease) in shares outstanding | | 9,008 | | | $ | 4,778 | |
| | | | | | | |
Year ended July 31, 2007: | | | | | | | |
Shares sold | | 429,500 | | | $ | 4,541,607 | |
Shares issued in reinvestment of dividends and distributions | | 103,500 | | | | 1,099,586 | |
Shares reacquired | | (901,063 | ) | | | (9,586,340 | ) |
| | | | | | | |
Net increase (decrease) in shares outstanding | | (368,063 | ) | | $ | (3,945,147 | ) |
| | | | | | | |
Class M | | | | | | |
Six Months ended January 31, 2008: | | | | | | | |
Shares sold | | 57,521 | | | $ | 633,562 | |
Shares issued in reinvestment of dividends and distributions | | 11,782 | | | | 123,702 | |
Shares reacquired | | (60,580 | ) | | | (659,294 | ) |
| | | | | | | |
Net increase (decrease) in shares outstanding before conversion | | 8,723 | | | | 97,970 | |
Shares reacquired upon conversion into Class A | | (30,023 | ) | | | (324,849 | ) |
| | | | | | | |
Net increase (decrease) in shares outstanding | | (21,300 | ) | | $ | (226,879 | ) |
| | | | | | | |
Year ended July 31, 2007: | | | | | | | |
Shares sold | | 113,195 | | | $ | 1,197,385 | |
Shares issued in reinvestment of dividends and distributions | | 9,071 | | | | 96,359 | |
Shares reacquired | | (148,497 | ) | | | (1,568,630 | ) |
| | | | | | | |
Net increase (decrease) in shares outstanding before conversion | | (26,231 | ) | | | (274,886 | ) |
Shares reacquired upon conversion into Class A | | (31,304 | ) | | | (334,305 | ) |
| | | | | | | |
Net increase (decrease) in shares outstanding | | (57,535 | ) | | $ | (609,191 | ) |
| | | | | | | |
Class R | | | | | | |
Six Months ended January 31, 2008: | | | | | | | |
Shares sold | | 290,069 | | | $ | 3,181,082 | |
Shares issued in reinvestment of dividends and distributions | | 26,421 | | | | 277,753 | |
Shares reacquired | | (644,762 | ) | | | (6,956,201 | ) |
| | | | | | | |
Net increase (decrease) in shares outstanding | | (328,272 | ) | | $ | (3,497,366 | ) |
| | | | | | | |
Year ended July 31, 2007: | | | | | | | |
Shares sold | | 102,568 | | | $ | 1,091,897 | |
Shares issued in reinvestment of dividends and distributions | | 32,644 | | | | 348,127 | |
Shares reacquired | | (32,387 | ) | | | (345,325 | ) |
| | | | | | | |
Net increase (decrease) in shares outstanding | | 102,825 | | | $ | 1,094,699 | |
| | | | | | | |
| | |
| Target Asset Allocation Funds/Target Conservative Allocation Fund | | 63 |
Notes to Financial Statements
(Unaudited) continued
| | | | | | | |
Class X | | Shares | | | Amount | |
Six Months ended January 31, 2008: | | | | | | | |
Shares sold | | 21,226 | | | $ | 223,658 | |
Shares issued in reinvestment of dividends and distributions | | 12,574 | | | | 132,129 | |
Shares reacquired | | (32,330 | ) | | | (352,656 | ) |
| | | | | | | |
Net increase (decrease) in shares outstanding before conversion | | 1,470 | | | | 3,131 | |
Shares reacquired upon conversion into Class A | | (32 | ) | | | (361 | ) |
| | | | | | | |
Net increase (decrease) in shares outstanding | | 1,438 | | | $ | 2,770 | |
| | | | | | | |
Year ended July 31, 2007: | | | | | | | |
Shares sold | | 66,376 | | | $ | 711,109 | |
Shares issued in reinvestment of dividends and distributions | | 8,204 | | | | 87,135 | |
Shares reacquired | | (82,695 | ) | | | (876,344 | ) |
| | | | | | | |
Net increase (decrease) in shares outstanding before conversion | | (8,115 | ) | | | (78,100 | ) |
Shares reacquired upon conversion into Class A | | (202 | ) | | | (2,178 | ) |
| | | | | | | |
Net increase (decrease) in shares outstanding | | (8,317 | ) | | $ | (80,278 | ) |
| | | | | | | |
Class Z | | | | | | |
Six Months ended January 31, 2008: | | | | | | | |
Shares sold | | 64,295 | | | $ | 697,380 | |
Shares issued in reinvestment of dividends and distributions | | 29,813 | | | | 314,511 | |
Shares reacquired | | (138,999 | ) | | | (1,483,581 | ) |
| | | | | | | |
Net increase (decrease) in shares outstanding | | (44,891 | ) | | $ | (471,690 | ) |
| | | | | | | |
Year ended July 31, 2007: | | | | | | | |
Shares sold | | 146,494 | | | $ | 1,573,140 | |
Shares issued in reinvestment of dividends and distributions | | 19,291 | | | | 205,601 | |
Shares reacquired | | (92,195 | ) | | | (982,104 | ) |
| | | | | | | |
Net increase (decrease) in shares outstanding | | 73,590 | | | $ | 796,637 | |
| | | | | | | |
Note 7. Borrowings
The Trust, along with other affiliated registered investment companies (the “Companies”), is a party to a syndicated credit agreement (“SCA”) with two banks. The SCA provides for a commitment of $500 million. Interest on any borrowings under the SCA is incurred at market rates and a commitment fee for the unused amount is accrued daily and paid quarterly. Effective October 26, 2007, the Companies renewed the SCA with the two banks. The Companies pays a commitment fee of .06 of 1% of the unused portion of the SCA. The expiration date of the SCA will be October 24, 2008. The purpose of the SCA is to serve as an alternative source of funding for capital share redemptions.
| | |
| 64 | | Visit our website at www.prudential.com |
The Trust did not utilize the line of credit during the six months ended January 31, 2008.
Note 8. New Accounting Pronouncements
On September 20, 2006, the FASB released Statement of Financial Accounting Standards No. 157 “Fair Value Measurements” (FAS 157). FAS 157 establishes an authoritative definition of fair value, sets out a framework for measuring fair value, and requires additional disclosures about fair-value measurements. The application of FAS 157 is required for fiscal years beginning after November 15, 2007 and interim periods within those fiscal years. At this time, management is evaluating the implications of FAS 157 and its impact, if any, in the financial statements has not yet been determined.
| | |
| Target Asset Allocation Funds/Target Conservative Allocation Fund | | 65 |
Financial Highlights
(Unaudited)
| | | | |
| | | Class A | |
| | | Six Months Ended
January 31, 2008(c) | |
Per Share Operating Performance: | | | | |
Net Asset Value, Beginning Of Period | | $ | 10.66 | |
| | | | |
Income (loss) from investment operations: | | | | |
Net investment income | | | .13 | |
Net realized and unrealized gains (loss) on investments transactions | | | .30 | |
| | | | |
Total from investment operations | | | .43 | |
| | | | |
Less Dividends and Distributions: | | | | |
Dividends from net investment income | | | (.13 | ) |
Distributions from net realized gains on investments | | | (.50 | ) |
| | | | |
Total dividends and distributions | | | (.63 | ) |
| | | | |
Net asset value, end of period | | $ | 10.46 | |
| | | | |
Total Return(a) | | | 4.07 | % |
Ratios/Supplemental Data: | | | | |
Net assets, end of period (000) | | $ | 66,246 | |
Average net assets (000) | | $ | 64,050 | |
Ratios to average net assets(f): | | | | |
Expenses, including distribution and service (12b-1) fees(b) | | | 1.45 | %(d) |
Expenses, excluding distribution and service (12b-1) fees | | | 1.20 | %(d) |
Net investment income | | | 2.42 | %(d) |
For Class A, B, C, M, R, X and Z shares: | | | | |
Portfolio turnover rate | | | 156 | %(e) |
| (a) | Total return does not consider the effects of sales loads. Total return is calculated assuming a purchase of a share on the first day and a sale on the last day of each period reported and includes reinvestment of dividends and distributions. Total returns may reflect adjustments to conform to generally accepted accounting principles. Total returns for periods less than one full year are not annualized. |
| (b) | The distributor of the Fund contractually agreed to limit its distribution and service (12b-1) fees to .25 of 1% of the average daily assets of the Class A shares. |
| (c) | Calculated based upon the average shares outstanding during the period. |
| (f) | Does not include expenses of the underlying portfolios in which the Fund invests. |
See Notes to Financial Statements.
| | |
| 66 | | Visit our website at www.prudential.com |
| | | | | | | | | | | | | | | | | | |
Class A | |
| Year Ended July 31, | |
| 2007 | | | 2006(c) | | | 2005 | | | 2004 | | | 2003 | |
| | | | | | | | | | | | | | | | | | |
| $ | 10.33 | | | $ | 11.36 | | | $ | 10.51 | | | $ | 9.71 | | | $ | 8.81 | |
| | | | | | | | | | | | | | | | | | | |
| | | | | | | | | | | | | | | | | | |
| | .25 | | | | .28 | | | | .18 | | | | .17 | | | | .24 | |
| | .56 | | | | (.05 | ) | | | 1.05 | | | | .82 | | | | .89 | |
| | | | | | | | | | | | | | | | | | | |
| | .81 | | | | .23 | | | | 1.23 | | | | .99 | | | | 1.13 | |
| | | | | | | | | | | | | | | | | | | |
| | | | | | | | | | | | | | | | | | |
| | (.27 | ) | | | (.30 | ) | | | (.21 | ) | | | (.19 | ) | | | (.23 | ) |
| | (.21 | ) | | | (.96 | ) | | | (.17 | ) | | | — | | | | — | |
| | | | | | | | | | | | | | | | | | | |
| | (.48 | ) | | | (1.26 | ) | | | (.38 | ) | | | (.19 | ) | | | (.23 | ) |
| | | | | | | | | | | | | | | | | | | |
| $ | 10.66 | | | $ | 10.33 | | | $ | 11.36 | | | $ | 10.51 | | | $ | 9.71 | |
| | | | | | | | | | | | | | | | | | | |
| | 7.93 | % | | | 2.20 | % | | | 11.85 | % | | | 10.18 | % | | | 13.08 | % |
| | | | | | | | | | | | | | | | | | |
| $ | 60,657 | | | $ | 58,130 | | | $ | 46,743 | | | $ | 36,307 | | | $ | 27,364 | |
| $ | 61,106 | | | $ | 51,963 | | | $ | 42,639 | | | $ | 32,710 | | | $ | 22,847 | |
| | | | | | | | | | | | | | | | | | |
| | 1.35 | % | | | 1.41 | % | | | 1.44 | % | | | 1.42 | % | | | 1.51 | % |
| | 1.10 | % | | | 1.16 | % | | | 1.19 | % | | | 1.17 | % | | | 1.26 | % |
| | 2.34 | % | | | 2.57 | % | | | 1.65 | % | | | 1.67 | % | | | 2.66 | % |
| | | | | | | | | | | | | | | | | | |
| | 395 | % | | | 481 | % | | | 379 | % | | | 160 | % | | | 269 | % |
See Notes to Financial Statements.
| | |
| Target Asset Allocation Funds/Target Conservative Allocation Fund | | 67 |
Financial Highlights
(Unaudited) continued
| | | | |
| | | Class B | |
| | | Six Months Ended
January 31, 2008(b) | |
Per Share Operating Performance: | | | | |
Net Asset Value, Beginning Of Period | | $ | 10.64 | |
| | | | |
Income (loss) from investment operations: | | | | |
Net investment income | | | .09 | |
Net realized and unrealized gains (loss) on investments transactions | | | .30 | |
| | | | |
Total from investment operations | | | .39 | |
| | | | |
Less Dividends and Distributions: | | | | |
Dividends from net investment income | | | (.09 | ) |
Distributions from net realized gains on investments | | | (.50 | ) |
| | | | |
Total dividends and distributions | | | (.59 | ) |
| | | | |
Net asset value, end of period | | $ | 10.44 | |
| | | | |
Total Return(a) | | | 3.70 | % |
Ratios/Supplemental Data: | | | | |
Net assets, end of period (000) | | $ | 70,568 | |
Average net assets (000) | | $ | 76,049 | |
Ratios to average net assets(d): | | | | |
Expenses, including distribution and service (12b-1) fees | | | 2.20 | %(c) |
Expenses, excluding distribution and service (12b-1) fees | | | 1.20 | %(c) |
Net investment income | | | 1.66 | %(c) |
| (a) | Total return does not consider the effects of sales loads. Total return is calculated assuming a purchase of a share on the first day and a sale on the last day of each period reported and includes reinvestment of dividends and distributions. Total returns may reflect adjustments to conform to generally accepted accounting principles. Total returns for periods less than one full year are not annualized. |
| (b) | Calculated based upon the average shares outstanding during the period. |
| (d) | Does not include expenses of the underlying portfolios in which the Fund invests. |
See Notes to Financial Statements.
| | |
| 68 | | Visit our website at www.prudential.com |
| | | | | | | | | | | | | | | | | | |
| Class B | |
| Year Ended July 31, | |
| 2007 | | | 2006(b) | | | 2005 | | | 2004 | | | 2003 | |
| | | | | | | | | | | | | | | | | | |
| $ | 10.31 | | | $ | 11.34 | | | $ | 10.49 | | | $ | 9.69 | | | $ | 8.79 | |
| | | | | | | | | | | | | | | | | | | |
| | | | | | | | | | | | | | | | | | |
| | .17 | | | | .18 | | | | .10 | | | | .10 | | | | .18 | |
| | .56 | | | | (.03 | ) | | | 1.05 | | | | .81 | | | | .88 | |
| | | | | | | | | | | | | | | | | | | |
| | .73 | | | | .15 | | | | 1.15 | | | | .91 | | | | 1.06 | |
| | | | | | | | | | | | | | | | | | | |
| | | | | | | | | | | | | | | | | | |
| | (.19 | ) | | | (.22 | ) | | | (.13 | ) | | | (.11 | ) | | | (.16 | ) |
| | (.21 | ) | | | (.96 | ) | | | (.17 | ) | | | — | | | | — | |
| | | | | | | | | | | | | | | | | | | |
| | (.40 | ) | | | (1.18 | ) | | | (.30 | ) | | | (.11 | ) | | | (.16 | ) |
| | | | | | | | | | | | | | | | | | | |
| $ | 10.64 | | | $ | 10.31 | | | $ | 11.34 | | | $ | 10.49 | | | $ | 9.69 | |
| | | | | | | | | | | | | | | | | | | |
| | 7.12 | % | | | 1.40 | % | | | 11.02 | % | | | 9.40 | % | | | 12.27 | % |
| | | | | | | | | | | | | | | | | | |
| $ | 78,305 | | | $ | 94,011 | | | $ | 116,378 | | | $ | 110,140 | | | $ | 90,029 | |
| $ | 87,224 | | | $ | 106,189 | | | $ | 114,342 | | | $ | 104,309 | | | $ | 78,562 | |
| | | | | | | | | | | | | | | | | | |
| | 2.10 | % | | | 2.16 | % | | | 2.19 | % | | | 2.17 | % | | | 2.26 | % |
| | 1.10 | % | | | 1.16 | % | | | 1.19 | % | | | 1.17 | % | | | 1.26 | % |
| | 1.60 | % | | | 1.68 | % | | | .89 | % | | | .93 | % | | | 1.93 | % |
See Notes to Financial Statements.
| | |
| Target Asset Allocation Funds/Target Conservative Allocation Fund | | 69 |
Financial Highlights
(Unaudited) continued
| | | | |
| | | Class C | |
| | | Six Months Ended
January 31, 2008(b) | |
Per Share Operating Performance: | | | | |
Net Asset Value, Beginning Of Period | | $ | 10.64 | |
| | | | |
Income (loss) from investment operations: | | | | |
Net investment income | | | .09 | |
Net realized and unrealized gains (loss) on investments transactions | | | .30 | |
| | | | |
Total from investment operations | | | .39 | |
| | | | |
Less Dividends and Distributions: | | | | |
Dividends from net investment income | | | (.09 | ) |
Distributions from net realized gains on investments | | | (.50 | ) |
| | | | |
Total dividends and distributions | | | (.59 | ) |
| | | | |
Net asset value, end of period | | $ | 10.44 | |
| | | | |
Total Return(a) | | | 3.70 | % |
Ratios/Supplemental Data: | | | | |
Net assets, end of period (000) | | $ | 32,290 | |
Average net assets (000) | | $ | 32,777 | |
Ratios to average net assets(d): | | | | |
Expenses, including distribution and service (12b-1) fees | | | 2.20 | %(c) |
Expenses, excluding distribution and service (12b-1) fees | | | 1.20 | %(c) |
Net investment income | | | 1.66 | %(c) |
| (a) | Total return does not consider the effects of sales loads. Total return is calculated assuming a purchase of a share on the first day and a sale on the last day of each period reported and includes reinvestment of dividends and distributions. Total returns may reflect adjustments to conform to generally accepted accounting principles. Total returns for periods less than one full year are not annualized. |
| (b) | Calculated based upon the average shares outstanding during the period. |
| (d) | Does not include expenses of the underlying portfolios in which the Fund invests. |
See Notes to Financial Statements.
| | |
| 70 | | Visit our website at www.prudential.com |
| | | | | | | | | | | | | | | | | | |
| | | | Class C | |
| | | | Year Ended July 31, | |
| 2007 | | | 2006(b) | | | 2005 | | | 2004 | | | 2003 | |
| | | | | | | | | | | | | | | | | | |
| $ | 10.31 | | | $ | 11.34 | | | $ | 10.49 | | | $ | 9.69 | | | $ | 8.79 | |
| | | | | | | | | | | | | | | | | | | |
| | | | | | | | | | | | | | | | | | |
| | .17 | | | | .20 | | | | .10 | | | | .10 | | | | .17 | |
| | .56 | | | | (.05 | ) | | | 1.05 | | | | .81 | | | | .89 | |
| | | | | | | | | | | | | | | | | | | |
| | .73 | | | | .15 | | | | 1.15 | | | | .91 | | | | 1.06 | |
| | | | | | | | | | | | | | | | | | | |
| | | | | | | | | | | | | | | | | | |
| | (.19 | ) | | | (.22 | ) | | | (.13 | ) | | | (.11 | ) | | | (.16 | ) |
| | (.21 | ) | | | (.96 | ) | | | (.17 | ) | | | — | | | | — | |
| | | | | | | | | | | | | | | | | | | |
| | (.40 | ) | | | (1.18 | ) | | | (.30 | ) | | | (.11 | ) | | | (.16 | ) |
| | | | | | | | | | | | | | | | | | | |
| $ | 10.64 | | | $ | 10.31 | | | $ | 11.34 | | | $ | 10.49 | | | $ | 9.69 | |
| | | | | | | | | | | | | | | | | | | |
| | 7.12 | % | | | 1.40 | % | | | 11.02 | % | | | 9.40 | % | | | 12.27 | % |
| | | | | | | | | | | | | | | | | | |
| $ | 32,800 | | | $ | 35,591 | | | $ | 43,787 | | | $ | 43,375 | | | $ | 37,429 | |
| $ | 34,907 | | | $ | 39,175 | | | $ | 43,819 | | | $ | 41,938 | | | $ | 31,449 | |
| | | | | | | | | | | | | | | | | | |
| | 2.10 | % | | | 2.16 | % | | | 2.19 | % | | | 2.17 | % | | | 2.26 | % |
| | 1.10 | % | | | 1.16 | % | | | 1.19 | % | | | 1.17 | % | | | 1.26 | % |
| | 1.60 | % | | | 1.83 | % | | | .89 | % | | | .94 | % | | | 1.91 | % |
See Notes to Financial Statements.
| | |
| Target Asset Allocation Funds/Target Conservative Allocation Fund | | 71 |
Financial Highlights
(Unaudited) continued
| | | | |
| | | Class M | |
| |
| | | Six Months Ended
January 31, 2008(d) | |
Per Share Operating Performance: | | | | |
Net Asset Value, Beginning Of Period | | $ | 10.64 | |
| | | | |
Income (loss) from investment operations: | | | | |
Net investment income | | | .09 | |
Net realized and unrealized gains (loss) on investments transactions | | | .30 | |
| | | | |
Total from investment operations | | | .39 | |
| | | | |
Less Dividends and Distributions: | | | | |
Dividends from net investment income | | | (.09 | ) |
Distributions from net realized gains on investments | | | (.50 | ) |
| | | | |
Total dividends and distributions | | | (.59 | ) |
| | | | |
Net asset value, end of period | | $ | 10.44 | |
| | | | |
Total Return(b) | | | 3.70 | % |
Ratios/Supplemental Data: | | | | |
Net assets, end of period (000) | | $ | 2,660 | |
Average net assets (000) | | $ | 2,792 | |
Ratios to average net assets(e): | | | | |
Expenses, including distribution and service (12b-1) fees | | | 2.20 | %(c) |
Expenses, excluding distribution and service (12b-1) fees | | | 1.20 | %(c) |
Net investment income | | | 1.67 | %(c) |
| (a) | Commencement of offering new share class. |
| (b) | Total return does not consider the effects of sales loads. Total return is calculated assuming a purchase of a share on the first day and a sale on the last day of each period reported and includes reinvestment of dividends and distributions. Total returns may reflect adjustments to conform to generally accepted accounting principles. Total returns for periods less than one full year are not annualized. |
| (d) | Calculated based upon the average shares outstanding during the period. |
| (e) | Does not include expenses of the underlying portfolios in which the Fund invests. |
See Notes to Financial Statements.
| | |
| 72 | | Visit our website at www.prudential.com |
| | | | | | | | | | |
| Class M | |
| Year Ended July 31, | | | October 4, 2004(a)
Through
July 31, 2005 | |
| 2007 | | | 2006(d) | | |
| | | | | | | | | | |
| $ | 10.31 | | | $ | 11.34 | | | $ | 10.81 | |
| | | | | | | | | | | |
| | | | | | | | | | |
| | .17 | | | | .19 | | | | .14 | |
| | .56 | | | | (.04 | ) | | | .69 | |
| | | | | | | | | | | |
| | .73 | | | | .15 | | | | .83 | |
| | | | | | | | | | | |
| | | | | | | | | | |
| | (.19 | ) | | | (.22 | ) | | | (.13 | ) |
| | (.21 | ) | | | (.96 | ) | | | (.17 | ) |
| | | | | | | | | | | |
| | (.40 | ) | | | (1.18 | ) | | | (.30 | ) |
| | | | | | | | | | | |
| $ | 10.64 | | | $ | 10.31 | | | $ | 11.34 | |
| | | | | | | | | | | |
| | 7.12 | % | | | 1.41 | % | | | 7.80 | % |
| | | | | | | | | | |
| $ | 2,936 | | | $ | 3,439 | | | $ | 1,900 | |
| $ | 3,219 | | | $ | 2,579 | | | $ | 1,115 | |
| | | | | | | | | | |
| | 2.10 | % | | | 2.16 | % | | | 2.19 | %(c) |
| | 1.10 | % | | | 1.16 | % | | | 1.19 | %(c) |
| | 1.60 | % | | | 1.84 | % | | | 1.25 | %(c) |
See Notes to Financial Statements.
| | |
| Target Asset Allocation Funds/Target Conservative Allocation Fund | | 73 |
Financial Highlights
(Unaudited) continued
| | | | |
| | | Class R | |
| |
| | | Six Months Ended
January 31, 2008(e) | |
Per Share Operating Performance: | | | | |
Net Asset Value, Beginning Of Period | | $ | 10.67 | |
| | | | |
Income (loss) from investment operations: | | | | |
Net investment income | | | .12 | |
Net realized and unrealized gains (loss) on investments transactions | | | .30 | |
| | | | |
Total from investment operations | | | .42 | |
| | | | |
Less Dividends and Distributions: | | | | |
Dividends from net investment income | | | (.12 | ) |
Distributions from net realized gains on investments | | | (.50 | ) |
| | | | |
Total dividends and distributions | | | (.62 | ) |
| | | | |
Net asset value, end of period | | $ | 10.47 | |
| | | | |
Total Return(b) | | | 3.94 | % |
Ratios/Supplemental Data: | | | | |
Net assets, end of period (000) | | $ | 5,152 | |
Average net assets (000) | | $ | 4,329 | |
Ratios to average net assets(f): | | | | |
Expenses, including distribution and service (12b-1) fees(d) | | | 1.70 | %(c) |
Expenses, excluding distribution and service (12b-1) fees | | | 1.20 | %(c) |
Net investment income | | | 2.13 | %(c) |
| (a) | Commencement of offering new share class. |
| (b) | Total return does not consider the effects of sales loads. Total return is calculated assuming a purchase of a share on the first day and a sale on the last day of each period reported and includes reinvestment of dividends and distributions. Total returns may reflect adjustments to conform to generally accepted accounting principles. Total returns for periods less than one full year are not annualized. |
| (d) | The distributor of the Fund contractually agreed to limit its distribution and service (12b-1) fees to .50 of 1% of the average daily assets of the Class R shares. |
| (e) | Calculated based upon the average shares outstanding during the period. |
| (f) | Does not include expenses of the underlying portfolios in which the Fund invests. |
See Notes to Financial Statements.
| | |
| 74 | | Visit our website at www.prudential.com |
| | | | | | | | | | |
| Class R | |
| Year Ended July 31, | | | October 4, 2004(a)
Through
July 31, 2005 | |
| 2007 | | | 2006(e) | | |
| | | | | | | | | | |
| $ | 10.34 | | | $ | 11.37 | | | $ | 10.84 | |
| | | | | | | | | | | |
| | | | | | | | | | |
| | .23 | | | | .25 | | | | .16 | |
| | .55 | | | | (.05 | ) | | | .72 | |
| | | | | | | | | | | |
| | .78 | | | | .20 | | | | .88 | |
| | | | | | | | | | | |
| | | | | | | | | | |
| | (.24 | ) | | | (.27 | ) | | | (.18 | ) |
| | (.21 | ) | | | (.96 | ) | | | (.17 | ) |
| | | | | | | | | | | |
| | (.45 | ) | | | (1.23 | ) | | | (.35 | ) |
| | | | | | | | | | | |
| $ | 10.67 | | | $ | 10.34 | | | $ | 11.37 | |
| | | | | | | | | | | |
| | 7.64 | % | | | 1.93 | % | | | 8.25 | % |
| | | | | | | | | | |
| $ | 8,751 | | | $ | 7,419 | | | $ | 3 | |
| $ | 8,273 | | | $ | 4,498 | | | $ | 3 | |
| | | | | | | | | | |
| | 1.60 | % | | | 1.66 | % | | | 1.69 | %(c) |
| | 1.10 | % | | | 1.16 | % | | | 1.19 | %(c) |
| | 2.09 | % | | | 2.31 | % | | | 1.77 | %(c) |
See Notes to Financial Statements.
| | |
| Target Asset Allocation Funds/Target Conservative Allocation Fund | | 75 |
Financial Highlights
(Unaudited) continued
| | | | |
| | | Class X | |
| |
| | | Six Months Ended
January 31, 2008(d) | |
Per Share Operating Performance: | | | | |
Net Asset Value, Beginning Of Period | | $ | 10.63 | |
| | | | |
Income (loss) from investment operations: | | | | |
Net investment income | | | .09 | |
Net realized and unrealized gains (loss) on investments transactions | | | .31 | |
| | | | |
Total from investment operations | | | .40 | |
| | | | |
Less Dividends and Distributions: | | | | |
Dividends from net investment income | | | (.09 | ) |
Distributions from net realized gains on investments | | | (.50 | ) |
| | | | |
Total dividends and distributions | | | (.59 | ) |
| | | | |
Net asset value, end of period | | $ | 10.44 | |
| | | | |
Total Return(b) | | | 3.80 | % |
Ratios/Supplemental Data: | | | | |
Net assets, end of period (000) | | $ | 2,569 | |
Average net assets (000) | | $ | 2,558 | |
Ratios to average net assets(e): | | | | |
Expenses, including distribution and service (12b-1) fees | | | 2.20 | %(c) |
Expenses, excluding distribution and service (12b-1) fees | | | 1.20 | %(c) |
Net investment income | | | 1.66 | %(c) |
| (a) | Commencement of offering new share class. |
| (b) | Total return does not consider the effects of sales loads. Total return is calculated assuming a purchase of a share on the first day and a sale on the last day of each period reported and includes reinvestment of dividends and distributions. Total returns may reflect adjustments to conform to generally accepted accounting principles. Total returns for periods less than one full year are not annualized. |
| (d) | Calculated based upon the average shares outstanding during the period. |
| (e) | Does not include expenses of the underlying portfolios in which the Fund invests. |
See Notes to Financial Statements.
| | |
| 76 | | Visit our website at www.prudential.com |
| | | | | | | | | | |
| Class X | |
| Year Ended July 31, | | | October 4, 2004(a)
Through
July 31, 2005 | |
| 2007 | | | 2006(d) | | |
| | | | | | | | | | |
| $ | 10.31 | | | $ | 11.33 | | | $ | 10.81 | |
| | | | | | | | | | | |
| | | | | | | | | | |
| | .17 | | | | .19 | | | | .15 | |
| | .55 | | | | (.03 | ) | | | .67 | |
| | | | | | | | | | | |
| | .72 | | | | .16 | | | | .82 | |
| | | | | | | | | | | |
| | | | | | | | | | |
| | (.19 | ) | | | (.22 | ) | | | (.13 | ) |
| | (.21 | ) | | | (.96 | ) | | | (.17 | ) |
| | | | | | | | | | | |
| | (.40 | ) | | | (1.18 | ) | | | (.30 | ) |
| | | | | | | | | | | |
| $ | 10.63 | | | $ | 10.31 | | | $ | 11.33 | |
| | | | | | | | | | | |
| | 7.13 | % | | | 1.41 | % | | | 7.71 | % |
| | | | | | | | | | |
| $ | 2,601 | | | $ | 2,607 | | | $ | 1,688 | |
| $ | 2,463 | | | $ | 1,892 | | | $ | 853 | |
| | | | | | | | | | |
| | 2.10 | % | | | 2.16 | % | | | 2.19 | %(c) |
| | 1.10 | % | | | 1.16 | % | | | 1.19 | %(c) |
| | 1.60 | % | | | 1.86 | % | | | 1.31 | %(c) |
See Notes to Financial Statements.
| | |
| Target Asset Allocation Funds/Target Conservative Allocation Fund | | 77 |
Financial Highlights
(Unaudited) continued
| | | | |
| | | Class Z | |
| | | Six Months Ended
January 31, 2008(b) | |
Per Share Operating Performance: | | | | |
Net Asset Value, Beginning Of Period | | $ | 10.67 | |
| | | | |
Income (loss) from investment operations: | | | | |
Net investment income | | | .15 | |
Net realized and unrealized gains (loss) on investments transactions | | | .30 | |
| | | | |
Total from investment operations | | | .45 | |
| | | | |
Less Dividends and Distributions: | | | | |
Dividends from net investment income | | | (.15 | ) |
Distributions from net realized gains on investments | | | (.50 | ) |
| | | | |
Total dividends and distributions | | | (.65 | ) |
| | | | |
Net asset value, end of period | | $ | 10.47 | |
| | | | |
Total Return(a) | | | 4.20 | % |
Ratios/Supplemental Data: | | | | |
Net assets, end of period (000) | | $ | 4,830 | |
Average net assets (000) | | $ | 5,412 | |
Ratios to average net assets(d): | | | | |
Expenses, including distribution and service (12b-1) fees | | | 1.20 | %(c) |
Expenses, excluding distribution and service (12b-1) fees | | | 1.20 | %(c) |
Net investment income | | | 2.66 | %(c) |
| (a) | Total return does not consider the effects of sales loads. Total return is calculated assuming a purchase of a share on the first day and a sale on the last day of each period reported and includes reinvestment of dividends and distributions. Total returns may reflect adjustments to conform to generally accepted accounting principles. Total returns for periods less than one full year are not annualized. |
| (b) | Calculated based upon the average shares outstanding during the period. |
| (d) | Does not include expenses of the underlying portfolios in which the Fund invests. |
See Notes to Financial Statements.
| | |
| 78 | | Visit our website at www.prudential.com |
| | | | | | | | | | | | | | | | | | |
| Class Z | |
| Year Ended July 31, | |
| 2007 | | | 2006(b) | | | 2005 | | | 2004 | | | 2003 | |
| | | | | | | | | | | | | | | | | | |
| $ | 10.34 | | | $ | 11.37 | | | $ | 10.52 | | | $ | 9.72 | | | $ | 8.81 | |
| | | | | | | | | | | | | | | | | | | |
| | | | | | | | | | | | | | | | | | |
| | .28 | | | | .30 | | | | .21 | | | | .20 | | | | .26 | |
| | .56 | | | | (.04 | ) | | | 1.05 | | | | .81 | | | | .90 | |
| | | | | | | | | | | | | | | | | | | |
| | .84 | | | | .26 | | | | 1.26 | | | | 1.01 | | | | 1.16 | |
| | | | | | | | | | | | | | | | | | | |
| | | | | | | | | | | | | | | | | | |
| | (.30 | ) | | | (.33 | ) | | | (.24 | ) | | | (.21 | ) | | | (.25 | ) |
| | (.21 | ) | | | (.96 | ) | | | (.17 | ) | | | — | | | | — | |
| | | | | | | | | | | | | | | | | | | |
| | (.51 | ) | | | (1.29 | ) | | | (.41 | ) | | | (.21 | ) | | | (.25 | ) |
| | | | | | | | | | | | | | | | | | | |
| $ | 10.67 | | | $ | 10.34 | | | $ | 11.37 | | | $ | 10.52 | | | $ | 9.72 | |
| | | | | | | | | | | | | | | | | | | |
| | 8.20 | % | | | 2.47 | % | | | 12.10 | % | | | 10.44 | % | | | 13.45 | % |
| | | | | | | | | | | | | | | | | | |
| $ | 5,397 | | | $ | 4,471 | | | $ | 4,611 | | | $ | 5,267 | | | $ | 3,714 | |
| $ | 4,521 | | | $ | 4,587 | | | $ | 4,731 | | | $ | 4,712 | | | $ | 3,139 | |
| | | | | | | | | | | | | | | | | | |
| | 1.10 | % | | | 1.16 | % | | | 1.19 | % | | | 1.17 | % | | | 1.26 | % |
| | 1.10 | % | | | 1.16 | % | | | 1.19 | % | | | 1.17 | % | | | 1.26 | % |
| | 2.59 | % | | | 2.83 | % | | | 2.02 | % | | | 1.93 | % | | | 2.90 | % |
See Notes to Financial Statements.
| | |
| Target Asset Allocation Funds/Target Conservative Allocation Fund | | 79 |
| | | | |
| n MAIL | | n TELEPHONE | | n WEBSITE |
Gateway Center Three 100 Mulberry Street Newark, NJ 07102 | | (800) 225-1852 | | www.prudential.com |
|
| PROXY VOTING |
| The Board of Trustees of the Fund has delegated to the Fund’s investment subadvisers the responsibility for voting any proxies and maintaining proxy recordkeeping with respect to the Fund. A description of these proxy voting policies and procedures is available without charge, upon request, by calling (800) 225-1852 or by visiting the Securities and Exchange Commission’s website at www.sec.gov. Information regarding how the Fund voted proxies relating to portfolio securities during the most recent 12-month period ended June 30 is available on the Fund’s website and on the Commission’s website. |
|
| TRUSTEES |
| Linda W. Bynoe • David E.A. Carson • Robert F. Gunia • Robert E. La Blanc • Douglas H. McCorkindale • Richard A. Redeker • Judy A. Rice • Robin B. Smith • Stephen G. Stoneburn • Clay T. Whitehead |
|
| OFFICERS |
| Judy A. Rice, President • Robert F. Gunia, Vice President • Grace C. Torres, Treasurer and Principal Financial and Accounting Officer • Kathryn L. Quirk, Chief Legal Officer • Deborah A. Docs, Secretary • Timothy J. Knierim, Chief Compliance Officer • Valerie M. Simpson, Deputy Chief Compliance Officer • Noreen M. Fierro, Acting Anti-Money Laundering Compliance Officer • Jonathan D. Shain, Assistant Secretary • Claudia DiGiacomo, Assistant Secretary • John P. Schwartz, Assistant Secretary • Andrew R. French, Assistant Secretary • M. Sadiq Peshimam, Assistant Treasurer • Peter Parrella, Assistant Treasurer |
| | | | |
| MANAGER | | Prudential Investments LLC | | Gateway Center Three 100 Mulberry Street Newark, NJ 07102 |
|
| INVESTMENT SUBADVISERS | | EARNEST Partners, LLC | | 75 14th Street, Suite 2300 Atlanta, GA 30309 |
|
| | Goldman Sachs Asset
Management | | 32 Old Slip 23rd Floor New York, NY 10005 |
|
| | Hotchkis and Wiley Capital
Management LLC | | 725 South Figueroa Street Suite 3900 Los Angeles, CA 90017 |
|
| | J.P. Morgan Asset
Management | | 522 Fifth Avenue New York, NY 10036 |
|
| | Marsico Capital
Management, LLC | | 1200 17th Street Suite 1600 Denver, CO 80202 |
|
| | NFJ Investment Group L.P. | | 2100 Ross Avenue Suite 1840 Dallas, TX 75201 |
|
| | Pacific Investment Management Company LLC | | 840 Newport Center Drive Newport Beach, CA 92660 |
|
| | RS Investment
Management Co. LLC | | 388 Market Street Suite 1700 San Francisco, CA 94111 |
|
| | Vaughan Nelson Investment
Management, L.P. | | 600 Travis Street Suite 6300 Houston, TX 77002 |
|
| | | | |
| DISTRIBUTOR | | Prudential Investment
Management Services LLC | | Gateway Center Three 100 Mulberry Street Newark, NJ 07102 |
|
| CUSTODIAN | | PFPC Trust Company | | 400 Bellevue Parkway Wilmington, DE 19809 |
|
| TRANSFER AGENT | | Prudential Mutual Fund
Services LLC | | PO Box 9658 Providence, RI 02940 |
|
INDEPENDENT REGISTERED
PUBLIC ACCOUNTING FIRM | | KPMG LLP | | 345 Park Avenue New York, NY 10154 |
|
| FUND COUNSEL | | Willkie Farr & Gallagher LLP | | 787 Seventh Avenue New York, NY 10019 |
|
| An investor should consider the investment objectives, risks, charges, and expenses of the Fund carefully before investing. The prospectus for the Fund contains this and other information about the Fund. An investor may obtain a prospectus by visiting our website at www.prudential.com or by calling (800) 225-1852. The prospectus should be read carefully before investing. |
|
| E-DELIVERY |
| To receive your mutual fund documents on-line, go to www.icsdelivery.com/prudential/funds and enroll. Instead of receiving printed documents by mail, you will receive notification via e-mail when new materials are available. You can cancel your enrollment or change your e-mail address at any time by clicking on the change/cancel enrollment option at the icsdelivery website address. |
|
| SHAREHOLDER COMMUNICATIONS WITH TRUSTEES |
| Shareholders can communicate directly with the Board of Trustees by writing to the Chair of the Board, Target Asset Allocation Funds, Prudential Investments, Attn: Board of Trustees, 100 Mulberry Street, Gateway Center Three, Newark, NJ 07102. Shareholders can communicate directly with an individual Trustee by writing to the same address. Communications are not screened before being delivered to the addressee. |
|
| AVAILABILITY OF PORTFOLIO SCHEDULE |
| The Fund files its complete schedule of portfolio holdings with the Securities and Exchange Commission for the first and third quarters of each fiscal year on Form N-Q. The Fund’s Forms N-Q are available on the Commission’s website at www.sec.gov. The Fund’s Forms N-Q may also be reviewed and copied at the Commission’s Public Reference Room in Washington, D.C. Information on the operation and location of the Public Reference Room may be obtained by calling (800) SEC-0330 (732-0330). The Fund’s schedule of portfolio holdings is also available on the Fund’s website as of the end of each fiscal quarter. |
Mutual Funds:
| | | | |
ARE NOT INSURED BY THE FDIC OR ANY
FEDERAL GOVERNMENT AGENCY | | MAY LOSE VALUE | | ARE NOT A DEPOSIT OF OR GUARANTEED
BY ANY BANK OR ANY BANK AFFILIATE |

| | | | | | | | | | | | | | | | | | |
| Target Conservative Allocation Fund | | | | | | | | | | |
| | | Share Class | | A | | B | | C | | M | | R | | X | | Z | | |
| | NASDAQ | | PCGAX | | PBCFX | | PCCFX | | N/A | | PCLRX | | N/A | | PDCZX | | |
| | CUSIP | | 87612A104 | | 87612A203 | | 87612A302 | | 87612A609 | | 87612A401 | | 87612A708 | | 87612A500 | | |
| | | | | | | | | | | | | | | | | | |
MFSP504E2 IFS-A145516 Ed. 03/2008

| | |
| JANUARY 31, 2008 | | SEMIANNUAL REPORT |
Target
Moderate Allocation Fund
OBJECTIVE
Seeks capital appreciation and a reasonable level of current income
This report is not authorized for distribution to prospective investors unless preceded or accompanied by a current prospectus.
The views expressed in this report and information about the Fund’s portfolio holdings are for the period covered by this report and are subject to change thereafter.
The accompanying financial statements as of January 31, 2008, were not audited and, accordingly, no auditor’s opinion is expressed on them.
Target Funds, Prudential, Prudential Financial and the Rock Prudential logo are registered service marks of The Prudential Insurance Company of America, Newark, NJ, and its affiliates.

March 14, 2008
Dear Shareholder:
On the following pages, you’ll find your semiannual report for the Target Moderate Allocation Fund.
Target Asset Allocation Funds are managed by institutional-quality asset managers selected, matched, and monitored by a research team from Prudential Investments LLC. Portions of the Funds’ assets are assigned to carefully chosen asset managers, with the allocations actively managed on the basis of our projections for the financial markets and the managers’ individual strengths.
We believe our Target Moderate Allocation Fund will help you to achieve broad, actively managed diversification at a targeted risk/return balance with a single investment purchase. We appreciate your continued confidence in us.
Sincerely,

Judy A. Rice, President
Target Asset Allocation Funds
| | |
| Target Asset Allocation Funds/Target Moderate Allocation Fund | | 1 |
Your Fund’s Performance
Performance data quoted represent past performance. Past performance does not guarantee future results. The investment return and principal value of an investment will fluctuate, so that an investor’s shares, when redeemed, may be worth more or less than their original cost. Current performance may be lower or higher than the past performance data quoted. An investor may obtain performance data as of the most recent month-end by visiting our website at www.prudential.com or by calling (800) 225-1852. The maximum initial sales charge is 5.50% (Class A shares). Gross operating expenses: Class A, 1.32%; Class B, 2.02%; Class C, 2.02%; Class M, 2.02%; Class R, 1.77%; Class X, 2.02%; Class Z, 1.02%. Net operating expenses apply to: Class A, 1.27%; Class B, 2.02%; Class C, 2.02%; Class M, 2.02%; Class R, 1.52%; Class X, 2.02%; Class Z, 1.02%, after contractual reduction through 11/30/2008.
| | | | | | | | | | | | |
| Cumulative Total Returns as of 1/31/08 | | | | | | | | | | |
| | | Six Months | | | One Year | | | Five Years | | | Since Inception1 | |
Class A | | –0.70 | % | | 1.88 | % | | 75.56 | % | | 76.41 | % |
Class B | | –1.11 | | | 1.08 | | | 69.04 | | | 64.42 | |
Class C | | –1.11 | | | 1.08 | | | 69.04 | | | 64.42 | |
Class M | | –1.11 | | | 1.08 | | | N/A | | | 28.97 | |
Class R | | –0.82 | | | 1.62 | | | N/A | | | 31.23 | |
Class X | | –1.11 | | | 1.08 | | | N/A | | | 29.14 | |
Class Z | | –0.57 | | | 2.13 | | | 77.73 | | | 80.41 | |
Customized Blend2 | | –0.96 | | | 1.60 | | | 68.48 | | | ** | |
S&P 500 Index3 | | –4.32 | | | –2.31 | | | 76.44 | | | *** | |
Lipper Mixed-Asset Target Allocation Growth Funds Avg.4 | | –1.97 | | | 0.52 | | | 62.54 | | | **** | |
| | | | | | | | | | | | |
| Average Annual Total Returns5 as of 12/31/07 | | | | | | | | | | |
| | | | | | One Year | | | Five Years | | | Since Inception1 | |
Class A | | | | | 1.22 | % | | 11.25 | % | | 6.21% | |
Class B | | | | | 1.53 | | | 11.56 | | | 6.06 | |
Class C | | | | | 5.42 | | | 11.69 | | | 6.06 | |
Class M | | | | | 0.57 | | | N/A | | | 8.72 | |
Class R | | | | | 6.84 | | | N/A | | | 10.03 | |
Class X | | | | | 0.56 | | | N/A | | | 8.51 | |
Class Z | | | | | 7.37 | | | 12.79 | | | 7.13 | |
Customized Blend2 | | | | | 6.70 | | | 11.45 | | | ** | |
S&P 500 Index3 | | | | | 5.49 | | | 12.82 | | | *** | |
Lipper Mixed-Asset Target Allocation Growth Funds Avg.4 | | | | | 6.41 | | | 10.71 | | | **** | |
The cumulative total returns do not reflect the deduction of applicable sales charges. If reflected, the applicable sales charges would reduce the cumulative total returns
| | |
| 2 | | Visit our website at www.prudential.com |
performance quoted. Class A shares are subject to a maximum front-end sales charge of 5.50%. Under certain circumstances, Class A shares may be subject to a contingent deferred sales charge (CDSC) of 1%. Class B and Class C shares are subject to a maximum CDSC of 5% and 1%, respectively. Class M and Class X shares are subject to a maximum CDSC of 6%. Class R and Class Z shares are not subject to a sales charge.
Source: Prudential Investments LLC and Lipper Inc. Performance figures may reflect fee waivers and/or expense reimbursements. In the absence of such fee waivers and/or expense reimbursements, total returns would be lower.
1Inception dates: Class A, B, C, and Z, 11/18/98; Class M, R, and X, 10/04/04.
2The Customized Benchmark for Target Moderate Allocation Fund (Customized Blend) is a model portfolio consisting of the Russell 3000® Index (52%), MSCI EAFE (13%), and the Lehman Brothers U.S. Aggregate Bond Index (35%). Each component of the Customized Blend is an unmanaged index generally considered as representing the performance of the Fund’s asset classes. The Customized Blend is intended to provide a theoretical comparison of the Fund’s performance, based on the amounts allocated to each asset class rather than based on amounts allocated to various Fund segments. The Customized Blend does not reflect deductions for any sales charges or operating expenses of a mutual fund.
3The Standard & Poor’s 500 Composite Stock Price Index (S&P 500 Index) is an unmanaged index of 500 stocks of large U.S. public companies. It gives an indication of how U.S. stock prices have performed.
4The Lipper Mixed-Asset Target Allocation Growth Funds Average (Lipper Average) represents returns based on the average return of all funds in the Lipper Mixed-Equity Funds category for the periods noted. Funds in the Lipper Average invest in a variety of market capitalization ranges without concentrating 75% of their equity assets in any one market capitalization range over an extended period of time. Mixed-Asset Funds are funds that, by portfolio practice, maintain a mix of between 60% and 80% equity securities, with the remainder invested in bonds, cash, and cash equivalents.
5The average annual total returns take into account applicable sales charges. Class A, Class B, Class C, Class M, Class R, and Class X shares are subject to an annual distribution and service (12b-1) fee of up to 0.30%, 1.00%, 1.00%, 1.00%, 0.75%, and 1.00%, respectively. Approximately seven years after purchase, Class B shares will automatically convert to Class A shares on a quarterly basis. Approximately eight years after purchase, Class M shares will automatically convert to Class A shares on a quarterly basis. Approximately 10 years after purchase, Class X shares will automatically convert to Class A shares on a quarterly basis. Class Z shares are not subject to a 12b-1 fee. The returns in the tables do not reflect the deduction of taxes that a shareholder would pay on Fund distributions or following the redemption of Fund shares.
**Customized Blend Closest Month-End to Inception cumulative total returns as of 1/31/08 are 62.35% for Classes A, B, C, and Z; and 32.07% for Classes M, R, and X. Customized Blend Closest Month-End to Inception average annual total returns as of 12/31/07 are 5.93% for Classes A, B, C, and Z; and 10.23% for Classes M, R, and X.
***S&P 500 Index Closest Month-End to Inception cumulative total returns as of 1/31/08 are 37.26% for Classes A, B, C, and Z; and 31.56% for Classes M, R, and X. S&P 500 Index Closest Month-End to Inception average annual total returns as of 12/31/07 are 4.26% for Classes A, B, C, and Z; and 10.90% for Classes M, R, and X.
****Lipper Average Closest Month-End to Inception cumulative total returns as of 1/31/08 are 54.41% for Classes A, B, C, and Z; and 29.29% for Classes M, R, and X. Lipper Average Closest Month-End to Inception average annual total returns as of 12/31/07 are 5.27% for Classes A, B, C, and Z; and 9.65% for Classes M, R, and X.
Investors cannot invest directly in an index. The returns for the S&P 500 Index and the Customized Blend would be lower if they included the effects of sales charges, operating expenses of a mutual fund, or taxes. Returns for the Lipper Average reflect the deduction of operating expenses, but not sales charges or taxes. The Since Inception returns for the S&P 500 Index, the Customized Blend, and the Lipper Average are measured from the closest month-end to inception date, and not from the Fund’s actual inception date.
| | |
| Target Asset Allocation Funds/Target Moderate Allocation Fund | | 3 |
Your Fund’s Performance (continued)
Fund objective
The investment objective of the Target Moderate Allocation Fund is capital appreciation and a reasonable level of current income. There can be no assurance that the Fund will achieve its investment objective.
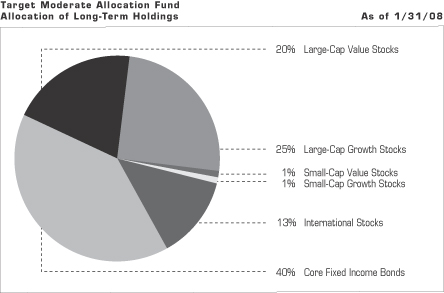
| | |
| 4 | | Visit our website at www.prudential.com |
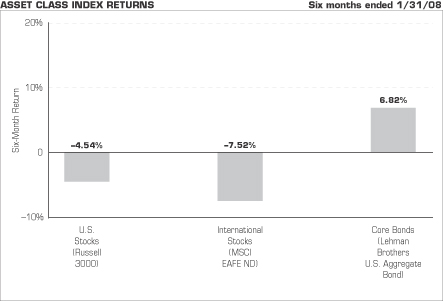
Source: Lipper Inc.
The chart above shows the total returns for six months ended January 31, 2008, of various securities indexes that are generally considered representative of broad market sectors. It does not reflect a mutual fund’s expenses. The performance cited does not represent the performance of the Target Moderate Allocation Fund. Past performance is not indicative of future results. Investors cannot invest directly in an index.
The Russell 3000 Index measures the performance of the 3,000 largest U.S. companies based on total market capitalization, which represents approximately 98% of the investable U.S. equity market.
The Morgan Stanley Capital International Europe, Australasia, and Far East Index (MSCI EAFE ND Index) is an unmanaged, weighted index that reflects stock price movements in Europe, Australasia, and the Far East. It gives a broad look at how foreign stock prices have performed. The Fund utilizes the net dividends (ND) version of the MSCI EAFE Index. The net dividends and gross dividends versions of the MSCI EAFE Index differ in that net dividends returns reflect the impact of the maximum withholding taxes on reinvested dividends, while the gross dividends version does not reflect the impact of withholding taxes on reinvested dividends. These returns do not include the effect of any investment management expenses. These returns would have been lower if they included the effect of these expenses.
The Lehman Brothers U.S. Aggregate Bond Index is an unmanaged index of investment-grade securities issued by the U.S. government and its agencies, and by corporations with between one and 10 years remaining to maturity. It gives a broad look at how short- and intermediate-term bonds have performed.
| | |
| Target Asset Allocation Funds/Target Moderate Allocation Fund | | 5 |
Fees and Expenses (Unaudited)
As a shareholder of the Fund, you incur two types of costs: (1) transaction costs, including sales charges (loads) on purchase payments and redemptions, as applicable, and (2) ongoing costs, including management fees, distribution and/or service (12b-1) fees, and other Fund expenses, as applicable. This example is intended to help you understand your ongoing costs (in dollars) of investing in the Fund and to compare these costs with the ongoing costs of investing in other mutual funds.
The example is based on an investment of $1,000 invested on August 1, 2007, at the beginning of the period, and held through the six-month period ended January 31, 2008. The example is for illustrative purposes only; you should consult the Prospectus for information on initial and subsequent minimum investment requirements.
The Fund’s transfer agent may charge additional fees to holders of certain accounts that are not included in the expenses shown in the table on the following page. These fees apply to individual retirement accounts (IRAs) and Section 403(b) accounts. As of the close of the six-month period covered by the table, IRA fees included an annual maintenance fee of $15 per account (subject to a maximum annual maintenance fee of $25 for all accounts held by the same shareholder). Section 403(b) accounts are charged an annual $25 fiduciary maintenance fee. Some of the fees may vary in amount, or may be waived, based on your total account balance or the number of JennisonDryden Funds, including the Target Asset Allocation Funds, that you own. You should consider the additional fees that were charged to your Fund account over the six-month period when you estimate the total ongoing expenses paid over the period and the impact of these fees on your ending account value, as these additional expenses are not reflected in the information provided in the expense table. Additional fees have the effect of reducing investment returns.
Actual Expenses
The first line for each share class in the table on the following page provides information about actual account values and actual expenses. You may use the information on this line, together with the amount you invested, to estimate the expenses that you paid over the period. Simply divide your account value by $1,000 (for example, an $8,600 account value ÷ $1,000 = 8.6), then multiply the result by the number on the first line under the heading “Expenses Paid During the Six-Month Period” to estimate the expenses you paid on your account during this period.
Hypothetical Example for Comparison Purposes
The second line for each share class in the table on the following page provides information about hypothetical account values and hypothetical expenses based on the Fund’s actual expense ratio and an assumed rate of return of 5% per year before
| | |
| 6 | | Visit our website at www.prudential.com |
expenses, which is not the Fund’s actual return. The hypothetical account values and expenses may not be used to estimate the actual ending account balance or expenses you paid for the period. You may use this information to compare the ongoing costs of investing in the Fund and other funds. To do so, compare this 5% hypothetical example with the 5% hypothetical examples that appear in the shareholder reports of the other funds.
Please note that the expenses shown in the table are meant to highlight your ongoing costs only, and do not reflect any transactional costs such as sales charges (loads). Therefore the second line for each share class in the table is useful in comparing ongoing costs only, and will not help you determine the relative total costs of owning different funds. In addition, if these transactional costs were included, your costs would have been higher.
| | | | | | | | | | | | | | |
Target Moderate Allocation Fund | | Beginning Account
Value
August 1, 2007 | | Ending Account
Value January 31, 2008 | | Annualized
Expense Ratio
Based on the
Six-Month Period | | | Expenses Paid
During the Six-
Month Period* |
| | | | | | | | | | | | | | |
| Class A | | Actual | | $ | 1,000.00 | | $ | 993.00 | | 1.27 | % | | $ | 6.36 |
| | | Hypothetical | | $ | 1,000.00 | | $ | 1,018.75 | | 1.27 | % | | $ | 6.44 |
| | | | | | | | | | | | | | |
| Class B | | Actual | | $ | 1,000.00 | | $ | 988.90 | | 2.02 | % | | $ | 10.10 |
| | | Hypothetical | | $ | 1,000.00 | | $ | 1,014.98 | | 2.02 | % | | $ | 10.23 |
| | | | | | | | | | | | | | |
| Class C | | Actual | | $ | 1,000.00 | | $ | 988.90 | | 2.02 | % | | $ | 10.10 |
| | | Hypothetical | | $ | 1,000.00 | | $ | 1,014.98 | | 2.02 | % | | $ | 10.23 |
| | | | | | | | | | | | | | |
| Class M | | Actual | | $ | 1,000.00 | | $ | 988.90 | | 2.02 | % | | $ | 10.10 |
| | | Hypothetical | | $ | 1,000.00 | | $ | 1,014.98 | | 2.02 | % | | $ | 10.23 |
| | | | | | | | | | | | | | |
| Class R | | Actual | | $ | 1,000.00 | | $ | 991.80 | | 1.52 | % | | $ | 7.61 |
| | | Hypothetical | | $ | 1,000.00 | | $ | 1,017.50 | | 1.52 | % | | $ | 7.71 |
| | | | | | | | | | | | | | |
| Class X | | Actual | | $ | 1,000.00 | | $ | 988.90 | | 2.02 | % | | $ | 10.10 |
| | | Hypothetical | | $ | 1,000.00 | | $ | 1,014.98 | | 2.02 | % | | $ | 10.23 |
| | | | | | | | | | | | | | |
| Class Z | | Actual | | $ | 1,000.00 | | $ | 994.30 | | 1.02 | % | | $ | 5.11 |
| | | Hypothetical | | $ | 1,000.00 | | $ | 1,020.01 | | 1.02 | % | | $ | 5.18 |
* Fund expenses (net of fee waivers or subsidies, if any) for each share class are equal to the annualized expense ratio for each share class (provided in the table), multiplied by the average account value over the period, multiplied by the 184 days in the six-month period ended January 31, 2008, and divided by the 366 days in the Fund’s fiscal year ending July 31, 2008 (to reflect the six-month period). Expenses presented in the table include the expenses of any underlying portfolios in which the Fund may invest.
| | |
| Target Asset Allocation Funds/Target Moderate Allocation Fund | | 7 |
Portfolio of Investments
as of January 31, 2008 (Unaudited)
| | | | | |
| Shares | | Description | | Value (Note 1) |
| | | | | |
LONG-TERM INVESTMENTS 108.0% | | | |
COMMON STOCKS 65.3% | | | |
| |
Aerospace 0.9% | | | |
| 350 | | Alliant Techsystems, Inc.* | | $ | 37,048 |
| 1,500 | | BE Aerospace, Inc.* | | | 57,915 |
| 5,100 | | Boeing Co. (The) | | | 424,218 |
| 455 | | DRS Technologies, Inc. | | | 24,420 |
| 11,100 | | Empresa Brasileira de Aeronautica SA, ADR (Brazil) | | | 481,740 |
| 22,395 | | Lockheed Martin Corp. | | | 2,416,868 |
| 1,700 | | Moog, Inc. (Class A Stock)* | | | 78,268 |
| 4,400 | | Raytheon Co. | | | 286,616 |
| 6,600 | | United Technologies Corp. | | | 484,506 |
| | | | | |
| | | | | 4,291,599 |
| |
Aerospace & Defense 1.2% | | | |
| 1,500 | | AAR Corp.* | | | 44,190 |
| 2,580 | | Aerovironment, Inc.* | | | 59,366 |
| 5,100 | | Finmeccanica SpA (Italy) | | | 152,436 |
| 23,148 | | General Dynamics Corp. | | | 1,955,080 |
| 1,000 | | Goodrich Corp. | | | 62,550 |
| 2,390 | | HEICO Corp. | | | 106,379 |
| 11,000 | | Honeywell International, Inc. | | | 649,770 |
| 27,600 | | Northrop Grumman Corp. | | | 2,190,336 |
| 3,640 | | Orbital Sciences Corp.* | | | 84,812 |
| 600 | | Teledyne Technologies, Inc.* | | | 30,978 |
| 2,300 | | Thales SA (France) | | | 133,294 |
| 1,570 | | Zoltek Cos., Inc.* | | | 57,305 |
| | | | | |
| | | | | 5,526,496 |
| |
Air Freight & Couriers 0.1% | | | |
| 3,600 | | FedEx Corp. | | | 336,528 |
| 1,900 | | United Parcel Service, Inc. (Class B Stock) | | | 139,004 |
| | | | | |
| | | | | 475,532 |
| |
Air Freight & Logistics | | | |
| 700 | | Forward Air Corp. | | | 21,700 |
| |
Airlines 0.2% | | | |
| 75,500 | | Air New Zealand Ltd. (New Zealand) | | | 108,720 |
| 3,450 | | Allegiant Travel Co.* | | | 107,916 |
| 5,200 | | Deutsche Lufthansa AG (Germany) | | | 124,669 |
| 61,500 | | Qantas Airways Ltd. (Australia) | | | 261,037 |
See Notes to Financial Statements.
| | |
| Target Asset Allocation Funds/Target Moderate Allocation Fund | | 9 |
Portfolio of Investments
as of January 31, 2008 (Unaudited) continued
| | | | | |
| Shares | | Description | | Value (Note 1) |
| | | | | |
COMMON STOCKS (Continued) | | | |
| |
Airlines (cont’d.) | | | |
| 17,434 | | Singapore Airlines Ltd. (Singapore) | | $ | 192,030 |
| 4,600 | | Southwest Airlines Co. | | | 53,958 |
| | | | | |
| | | | | 848,330 |
| |
Auto Parts & Related | | | |
| 1,800 | | Compagnie Generale des Establissements Michelin (Class B Stock) (France) | | | 173,714 |
| |
Auto/Trucks Parts & Equipment | | | |
| 6,700 | | Nifco, Inc. (Japan) | | | 150,041 |
| |
Automobiles 0.8% | | | |
| 3,300 | | DaimlerChrysler AG (Germany) | | | 258,058 |
| 12,400 | | Ford Motor Co.* | | | 82,336 |
| 53,000 | | Fuji Heavy Industries Ltd. (Japan) | | | 212,764 |
| 10,000 | | General Motors Corp. | | | 283,100 |
| 4,900 | | Harley-Davidson, Inc. | | | 198,842 |
| 12,100 | | Honda Motor Co. Ltd. (Japan) | | | 374,177 |
| 39,000 | | Nissan Motor Co. Ltd. (Japan) | | | 364,258 |
| 3,400 | | Peugeot SA (France) | | | 251,691 |
| 1,500 | | Renault SA (France) | | | 171,205 |
| 19,300 | | Toyota Motor Corp. (Japan) | | | 1,044,923 |
| 3,000 | | Valeo SA (France) | | | 110,855 |
| 7,700 | | Volvo AB (Class B Stock) (Sweden) | | | 104,227 |
| 400 | | Winnebago Industries, Inc. | | | 8,424 |
| | | | | |
| | | | | 3,464,860 |
| |
Automotive Components 0.3% | | | |
| 22,800 | | Johnson Controls, Inc. | | | 806,436 |
| 7,200 | | Paccar, Inc. | | | 337,824 |
| | | | | |
| | | | | 1,144,260 |
| |
Automotive Parts 0.1% | | | |
| 700 | | Advance Auto Parts, Inc. | | | 24,976 |
| 3,900 | | Amerigon, Inc.* | | | 66,768 |
| 200 | | Georg Fischer AG (Switzerland)* | | | 87,608 |
| 37,300 | | GKN PLC (United Kingdom) | | | 197,594 |
| | | | | |
| | | | | 376,946 |
See Notes to Financial Statements.
| | |
| 10 | | Visit our website at www.prudential.com |
| | | | | |
| Shares | | Description | | Value (Note 1) |
| | | | | |
COMMON STOCKS (Continued) | | | |
| |
Beverages 1.2% | | | |
| 9,000 | | Anheuser-Busch Cos., Inc. | | $ | 418,680 |
| 4,000 | | Carlsberg A/S (Class B Stock) (Denmark) | | | 421,932 |
| 35,852 | | Coca-Cola Co. (The) | | | 2,121,363 |
| 9,300 | | Coca-Cola Enterprises, Inc. | | | 214,551 |
| 33,931 | | Heinekin NV, ADR (Netherlands) | | | 944,483 |
| 1,000 | | Pepsi Bottling Group, Inc. | | | 34,850 |
| 2,800 | | PepsiAmericas, Inc. | | | 68,992 |
| 9,500 | | PepsiCo, Inc. | | | 647,805 |
| 28,128 | | SABMiller PLC (United Kingdom) | | | 608,565 |
| | | | | |
| | | | | 5,481,221 |
| |
Biotechnology 1.0% | | | |
| 20,700 | | Amgen, Inc.* | | | 964,413 |
| 10,200 | | Biogen Idec, Inc.* | | | 621,690 |
| 1,900 | | Celgene Corp.* | | | 106,609 |
| 36,043 | | Genentech, Inc.* | | | 2,529,858 |
| 2,140 | | Genomic Health, Inc.* | | | 44,919 |
| 1,700 | | Invitrogen Corp.* | | | 145,639 |
| 2,700 | | Millennium Pharmaceuticals, Inc.* | | | 40,959 |
| | | | | |
| | | | | 4,454,087 |
| |
Broadcasting | | | |
| 1,900 | | Liberty Media Corp. - Capital (Class A Stock)* | | | 204,478 |
| |
Building Materials 0.1% | | | |
| 500 | | Ciments Francais SA (France) | | | 75,894 |
| 61,000 | | Kurabo Industries Ltd. (Japan) | | | 138,245 |
| 40,000 | | Sanwa Holdings Corp. (Japan) | | | 192,845 |
| | | | | |
| | | | | 406,984 |
| |
Building Products 0.1% | | | |
| 860 | | Lennox International, Inc. | | | 31,958 |
| 11,000 | | Masco Corp. | | | 252,230 |
| | | | | |
| | | | | 284,188 |
| |
Business Services 0.1% | | | |
| 500 | | Administaff, Inc. | | | 15,005 |
| 7,500 | | Manpower, Inc. | | | 421,950 |
| | | | | |
| | | | | 436,955 |
See Notes to Financial Statements.
| | |
| Target Asset Allocation Funds/Target Moderate Allocation Fund | | 11 |
Portfolio of Investments
as of January 31, 2008 (Unaudited) continued
| | | | | |
| Shares | | Description | | Value (Note 1) |
| | | | | |
COMMON STOCKS (Continued) | | | |
| |
Cable Television | | | |
| 700 | | Dish Network Corp. (Class A Stock)* | | $ | 19,768 |
| |
Capital Goods | | | |
| 1,200 | | Harsco Corp. | | | 68,304 |
| |
Capital Markets 0.3% | | | |
| 20,800 | | Morgan Stanley | | | 1,028,144 |
| 3,622 | | Raymond James Financial, Inc. | | | 101,742 |
| 725 | | Waddell & Reed Financial, Inc. (Class A Stock) | | | 24,055 |
| | | | | |
| | | | | 1,153,941 |
| |
Chemicals 1.9% | | | |
| 7,910 | | Air Products & Chemicals, Inc. | | | 712,058 |
| 625 | | Airgas, Inc. | | | 29,006 |
| 80 | | Arkema (France)* | | | 4,537 |
| 28,000 | | Asahi Kasei Corp. (Japan) | | | 171,819 |
| 9,249 | | BASF AG (Germany) | | | 1,204,600 |
| 3,200 | | Celanese Corp. (Class A Stock) | | | 118,976 |
| 300 | | CF Industries Holdings, Inc. | | | 32,079 |
| 2,300 | | Ciba Specialty Chemicals AG (Switzerland) | | | 93,525 |
| 21,300 | | Denki Kagaku Kogyo Kabushiki Kiasha (Japan) | | | 86,888 |
| 40,200 | | Dow Chemical Co. | | | 1,554,132 |
| 3,100 | | DuPont (E.I.) de Nemours & Co. | | | 140,058 |
| 11,800 | | Eastman Chemical Co. | | | 779,626 |
| 350 | | FMC Corp. | | | 18,606 |
| 425 | | Givaudan SA (Switzerland) | | | 419,099 |
| 1,100 | | Lubrizol Corp. (The) | | | 57,871 |
| 25,100 | | Mitsubishi Chemical Holdings Corp. (Japan) | | | 182,724 |
| 1,600 | | Mosaic Co. (The)* | | | 145,616 |
| 23,000 | | Nippon Shokubai Co. Ltd. (Japan) | | | 204,801 |
| 7,150 | | PPG Industries, Inc. | | | 472,543 |
| 15,394 | | Praxair, Inc. | | | 1,245,529 |
| 10,100 | | Rohm & Haas Co. | | | 538,835 |
| 3,100 | | Terra Industries, Inc.* | | | 139,717 |
| 2,200 | | Valspar Corp. (The) | | | 44,066 |
| | | | | |
| | | | | 8,396,711 |
| |
Clothing & Apparel 0.1% | | | |
| 3,560 | | Iconix Brand Group, Inc.* | | | 74,012 |
| 3,250 | | NIKE, Inc. (Class B Stock) | | | 200,720 |
| 1,775 | | Phillips-Van Heusen Corp. | | | 74,799 |
| 1,100 | | VF Corp. | | | 85,107 |
| | | | | |
| | | | | 434,638 |
See Notes to Financial Statements.
| | |
| 12 | | Visit our website at www.prudential.com |
| | | | | |
| Shares | | Description | | Value (Note 1) |
| | | | | |
COMMON STOCKS (Continued) | | | |
| |
Commercial Banks 1.2% | | | |
| 11,900 | | Alliance & Leicester PLC (United Kingdom) | | $ | 156,354 |
| 5,900 | | Allied Irish Banks PLC (Ireland) | | | 131,419 |
| 4,600 | | Bank of New York Mellon Corp. (The) | | | 214,498 |
| 29,000 | | Barclays PLC (United Kingdom) | | | 273,750 |
| 25 | | City National Corp. | | | 1,422 |
| 6,100 | | Colonial BancGroup, Inc. (The) | | | 95,770 |
| 9,400 | | Comerica, Inc. | | | 410,028 |
| 600 | | Cullen/Frost Bankers, Inc. | | | 32,664 |
| 3,100 | | Deutsche Bank AG (Germany) | | | 348,926 |
| 16,700 | | Huntington Bancshares, Inc. | | | 224,615 |
| 25,100 | | Lloyds TSB Group PLC (United Kingdom) | | | 219,207 |
| 6,500 | | National City Corp. | | | 115,635 |
| 750 | | Prosperity Bancshares, Inc. | | | 21,562 |
| 850 | | Provident Bankshares Corp. | | | 17,620 |
| 34,000 | | Regions Financial Corp. | | | 858,160 |
| 625 | | United Bankshares, Inc. | | | 20,100 |
| 57,300 | | Wachovia Corp. | | | 2,230,689 |
| 650 | | Whitney Holding Corp. | | | 17,446 |
| | | | | |
| | | | | 5,389,865 |
| |
Commercial Services 0.8% | | | |
| 22,800 | | Accenture Ltd. (Class A Stock) (Bermuda) | | | 789,336 |
| 1,666 | | American Public Education, Inc.* | | | 65,657 |
| 11,000 | | Apollo Group, Inc. (Class A Stock)* | | | 877,140 |
| 6,696 | | Cardtronics, Inc.* | | | 52,430 |
| 12,900 | | Davis Service Group PLC (United Kingdom) | | | 130,676 |
| 1,000 | | Deluxe Corp. | | | 24,320 |
| 1,340 | | FirstService Corp. (Canada)* | | | 30,217 |
| 1,100 | | Healthcare Services Group, Inc. | | | 26,686 |
| 1,520 | | HMS Holdings Corp.* | | | 48,032 |
| 4,000 | | HNI Corp. | | | 134,640 |
| 7,100 | | ITT Educational Services, Inc.* | | | 648,585 |
| 1,800 | | McKesson Corp. | | | 113,022 |
| 3,100 | | Moody’s Corp. | | | 108,469 |
| 1,400 | | Paychex, Inc. | | | 45,808 |
| 4,900 | | Rollins, Inc. | | | 87,171 |
| 2,105 | | Team, Inc.* | | | 63,255 |
| 15,000 | | Toppan Printing Co. Ltd. (Japan) | | | 150,416 |
| 697 | | Waste Connections, Inc.* | | | 20,325 |
| 9,700 | | Waste Management, Inc. | | | 314,668 |
See Notes to Financial Statements.
| | |
| Target Asset Allocation Funds/Target Moderate Allocation Fund | | 13 |
Portfolio of Investments
as of January 31, 2008 (Unaudited) continued
| | | | | |
| Shares | | Description | | Value (Note 1) |
| | | | | |
COMMON STOCKS (Continued) | | | |
| |
Commercial Services (cont’d.) | | | |
| 550 | | Watson Wyatt Worldwide, Inc. (Class A Stock) | | $ | 27,032 |
| 100 | | Weight Watchers International, Inc. | | | 4,260 |
| | | | | |
| | | | | 3,762,145 |
| |
Communication Equipment 0.1% | | | |
| 30,800 | | Alcatel-Lucent, ADR (France) | | | 194,964 |
| 3,400 | | Arris Group, Inc.* | | | 29,886 |
| 575 | | CommScope, Inc.* | | | 25,501 |
| 4,650 | | Nuance Communications, Inc.* | | | 73,889 |
| | | | | |
| | | | | 324,240 |
| |
Computer Hardware 1.0% | | | |
| 20,372 | | Apple, Inc.* | | | 2,757,554 |
| 300 | | Cadence Design Systems, Inc.* | | | 3,045 |
| 500 | | Computer Sciences Corp.* | | | 21,160 |
| 21,500 | | Dell, Inc.* | | | 430,860 |
| 31,800 | | EMC Corp.* | | | 504,666 |
| 4,750 | | International Business Machines Corp. | | | 509,865 |
| 4,206 | | Logitech International SA (Switzerland)* | | | 127,733 |
| 4,280 | | Magma Design Automation, Inc.* | | | 48,792 |
| 12,500 | | Synopsys, Inc.* | | | 275,250 |
| | | | | |
| | | | | 4,678,925 |
| |
Computer Networking | | | |
| 2,750 | | Aladdin Knowledge Systems Ltd. (Israel)* | | | 58,052 |
| 1,470 | | Atheros Communications, Inc.* | | | 40,146 |
| | | | | |
| | | | | 98,198 |
| |
Computer Services & Software 0.1% | | | |
| 3,550 | | Advent Software, Inc.* | | | 160,318 |
| 200 | | Affiliated Computer Services, Inc. (Class A Stock)* | | | 9,750 |
| 1,500 | | Autodesk, Inc.* | | | 61,725 |
| 890 | | Concur Technologies, Inc.* | | | 31,203 |
| 1,400 | | Global Payments, Inc. | | | 52,360 |
| 3,860 | | Innerworkings, Inc.* | | | 53,461 |
| 265 | | Micros Systems, Inc.* | | | 16,319 |
| 1,400 | | NCR Corp.* | | | 30,072 |
| 6,700 | | TietoEnator Oyj (Finland) | | | 124,900 |
| | | | | |
| | | | | 540,108 |
See Notes to Financial Statements.
| | |
| 14 | | Visit our website at www.prudential.com |
| | | | | |
| Shares | | Description | | Value (Note 1) |
| | | | | |
COMMON STOCKS (Continued) | | | |
| |
Computers 0.5% | | | |
| 45,188 | | Hewlett-Packard Co. | | $ | 1,976,975 |
| 3,200 | | Lexmark International, Inc. (Class A Stock)* | | | 115,872 |
| 1,200 | | SanDisk Corp.* | | | 30,540 |
| 1,700 | | Sun Microsystems, Inc.* | | | 29,750 |
| | | | | |
| | | | | 2,153,137 |
| |
Conglomerates 0.1% | | | |
| 38,300 | | Marubeni Corp. (Japan) | | | 267,145 |
| |
Construction 0.2% | | | |
| 59,700 | | CSR Ltd. (Australia) | | | 169,041 |
| 800 | | Fluor Corp. | | | 97,336 |
| 1,600 | | Foster Wheeler Ltd.* | | | 109,552 |
| 1,425 | | Granite Construction, Inc. | | | 54,250 |
| 1,000 | | Herman Miller, Inc. | | | 31,780 |
| 3,300 | | KBR, Inc.* | | | 104,247 |
| 20,800 | | Taylor Woodrow PLC (United Kingdom) | | | 75,207 |
| 9,100 | | Toll Brothers, Inc.* | | | 211,848 |
| 1,650 | | URS Corp.* | | | 72,435 |
| | | | | |
| | | | | 925,696 |
| |
Consumer Finance | | | |
| 868 | | Cash America International, Inc. | | | 28,219 |
| 1,900 | | First Cash Financial Services, Inc.* | | | 19,019 |
| 785 | | McGrath RentCorp | | | 18,282 |
| | | | | |
| | | | | 65,520 |
| |
Consumer Products & Services 0.4% | | | |
| 3,300 | | Bare Escentuals, Inc.* | | | 78,672 |
| 9,500 | | Electrolux AB (Class B Stock) (Sweden) | | | 149,431 |
| 55,000 | | Pacific Brands Ltd. (Australia) | | | 141,449 |
| 12,850 | | Procter & Gamble Co. | | | 847,457 |
| 11,900 | | Reckitt Benckiser PLC (United Kingdom) | | | 623,321 |
| | | | | |
| | | | | 1,840,330 |
| |
Containers & Packaging | | | |
| 475 | | Silgan Holdings, Inc. | | | 22,496 |
| |
Distribution/Wholesale 0.1% | | | |
| 16,500 | | Sumitomo Corp. (Japan) | | | 230,575 |
| 3,700 | | W.W. Grainger, Inc. | | | 294,409 |
| | | | | |
| | | | | 524,984 |
See Notes to Financial Statements.
| | |
| Target Asset Allocation Funds/Target Moderate Allocation Fund | | 15 |
Portfolio of Investments
as of January 31, 2008 (Unaudited) continued
| | | | | |
| Shares | | Description | | Value (Note 1) |
| | | | | |
COMMON STOCKS (Continued) | | | |
| |
Distributors | | | |
| 570 | | WESCO International, Inc.* | | $ | 24,077 |
| |
Diversified Financial Services 2.3% | | | |
| 960 | | Affiliated Managers Group, Inc.* | | | 94,377 |
| 90,509 | | Bank of America Corp. | | | 4,011,264 |
| 61,900 | | Citigroup, Inc. | | | 1,746,818 |
| 5,100 | | Janus Capital Group, Inc. | | | 137,751 |
| 48,037 | | JPMorgan Chase & Co. | | | 2,284,159 |
| 725 | | KBW, Inc.* | | | 21,540 |
| 3,558 | | KKR Financial Holdings LLC | | | 57,782 |
| 28,023 | | Lehman Brothers Holdings, Inc. | | | 1,798,236 |
| 7,700 | | Nomura Holdings, Inc. (Japan) | | | 112,540 |
| | | | | |
| | | | | 10,264,467 |
| |
Diversified Manufacturing | | | |
| 9,300 | | AGFA-Gevaert NV (Belgium) | | | 103,598 |
| 2,800 | | Crane Co. | | | 114,436 |
| | | | | |
| | | | | 218,034 |
| |
Diversified Manufacturing Operations 0.2% | | | |
| 2,100 | | Eaton Corp. | | | 173,796 |
| 14,400 | | Ingersoll-Rand Co. Ltd. (Class A Stock) (Bermuda) | | | 569,088 |
| | | | | |
| | | | | 742,884 |
| |
Diversified Operations 0.2% | | | |
| 50,148 | | Citic Pacific Ltd. (Hong Kong) | | | 248,774 |
| 6,657 | | LVMH Moet Hennessy Louis Vuitton SA (France) | | | 683,628 |
| | | | | |
| | | | | 932,402 |
| |
Diversified Telecommunication Services 1.6% | | | |
| 119,892 | | AT&T, Inc. | | | 4,614,643 |
| 9,600 | | Royal KPN NV (Netherlands) | | | 174,232 |
| 59,750 | | Verizon Communications, Inc. | | | 2,320,690 |
| | | | | |
| | | | | 7,109,565 |
| |
Education | | | |
| 1,720 | | DeVry, Inc. | | | 94,927 |
| |
Electric 0.2% | | | |
| 4,200 | | NRG Energy, Inc.* | | | 162,078 |
| 28,459 | | Reliant Energy, Inc.* | | | 605,323 |
| | | | | |
| | | | | 767,401 |
See Notes to Financial Statements.
| | |
| 16 | | Visit our website at www.prudential.com |
| | | | | |
| Shares | | Description | | Value (Note 1) |
| | | | | |
COMMON STOCKS (Continued) | | | |
| |
Electric Utilities 0.6% | | | |
| 1,600 | | Entergy Corp. | | $ | 173,088 |
| 6,200 | | Exelon Corp. | | | 472,378 |
| 6,350 | | FirstEnergy Corp. | | | 452,247 |
| 26,179 | | Fortum Oyj (Finland) | | | 1,061,293 |
| 8,100 | | FPL Group, Inc. | | | 522,288 |
| 14,700 | | Sierra Pacific Resources | | | 220,059 |
| 1,145 | | Westar Energy, Inc. | | | 27,892 |
| | | | | |
| | | | | 2,929,245 |
| |
Electrical Equipment | | | |
| 500 | | First Solar, Inc.* | | | 90,885 |
| 625 | | Regal-Beloit Corp. | | | 23,700 |
| | | | | |
| | | | | 114,585 |
| |
Electronic Components 0.7% | | | |
| 5,800 | | Agilent Technologies, Inc.* | | | 196,678 |
| 11,400 | | Alpine Electronics, Inc. (Japan) | | | 168,911 |
| 12,100 | | Alps Electric Co. Ltd. (Japan) | | | 139,099 |
| 8,200 | | Avnet, Inc.* | | | 292,002 |
| 6,800 | | Energizer Holdings, Inc.* | | | 636,616 |
| 7,600 | | Fanuc Ltd. (Japan) | | | 674,515 |
| 3,800 | | FLIR Systems, Inc.* | | | 115,064 |
| 2,000 | | Hokkaido Electric Power Co., Inc. (Japan) | | | 43,870 |
| 30,000 | | HongKong Electric Holdings (Hong Kong) | | | 171,191 |
| 400 | | Hubbell, Inc. (Class B Stock) | | | 19,072 |
| 763 | | Itron, Inc.* | | | 62,871 |
| 500 | | Kyushu Electric Power Co., Inc. (Japan) | | | 12,646 |
| 1,000 | | L-3 Communications Holdings, Inc. | | | 110,830 |
| 4,800 | | PerkinElmer, Inc. | | | 119,472 |
| 150 | | Pinnacle West Capital Corp. | | | 5,763 |
| 1,250 | | PNM Resources, Inc. | | | 24,150 |
| 14,100 | | TT Electronics PLC (United Kingdom) | | | 25,430 |
| 100 | | Varian, Inc.* | | | 5,425 |
| 7,700 | | Waters Corp.* | | | 442,365 |
| | | | | |
| | | | | 3,265,970 |
| |
Electronic Components & Equipment | | | |
| 17,000 | | SMK Corp. (Japan) | | | 105,935 |
See Notes to Financial Statements.
| | |
| Target Asset Allocation Funds/Target Moderate Allocation Fund | | 17 |
Portfolio of Investments
as of January 31, 2008 (Unaudited) continued
| | | | | |
| Shares | | Description | | Value (Note 1) |
| | | | | |
COMMON STOCKS (Continued) | | | |
| |
Electronic Equipment & Instruments 0.3% | | | |
| 2,000 | | Tech Data Corp.* | | $ | 68,760 |
| 40,150 | | Tyco Electronics Ltd. | | | 1,357,471 |
| | | | | |
| | | | | 1,426,231 |
| |
Electronics 0.1% | | | |
| 3,200 | | Garmin Ltd. (Cayman Islands) | | | 230,880 |
| 2,500 | | Thomas & Betts Corp.* | | | 113,125 |
| | | | | |
| | | | | 344,005 |
| |
Energy Equipment & Services 0.6% | | | |
| 100 | | BJ Services Co. | | | 2,175 |
| 800 | | Cameron International Corp.* | | | 32,208 |
| 557,341 | | China Petroleum & Chemical Corp. (Class H Stock) (China) | | | 584,974 |
| 600 | | Complete Production Services, Inc.* | | | 9,540 |
| 4,600 | | Diamond Offshore Drilling, Inc. | | | 519,478 |
| 1,750 | | Dril-Quip, Inc.* | | | 84,945 |
| 39,700 | | Halliburton Co. | | | 1,316,849 |
| 2,395 | | Oil States International, Inc.* | | | 83,969 |
| 2,610 | | Superior Energy Services, Inc.* | | | 104,635 |
| | | | | |
| | | | | 2,738,773 |
| |
Entertainment & Leisure 0.8% | | | |
| 800 | | Brunswick Corp. | | | 15,192 |
| 14,900 | | Carnival PLC (United Kingdom) | | | 648,579 |
| 17,470 | | Las Vegas Sands Corp.* | | | 1,531,595 |
| 1,370 | | Life Time Fitness, Inc.* | | | 60,746 |
| 1,839 | | Nintendo Co. Ltd. (Japan) | | | 929,951 |
| 3,100 | | Royal Caribbean Cruises Ltd. | | | 124,868 |
| 3,820 | | Scientific Games Corp. (Class A Stock)* | | | 90,916 |
| | | | | |
| | | | | 3,401,847 |
| |
Environmental Control | | | |
| 6,930 | | Darling International, Inc.* | | | 80,388 |
| |
Environmental Services | | | |
| 3,400 | | Allied Waste Industries, Inc.* | | | 33,490 |
| |
Exchange Traded Funds | | | |
| 1,200 | | iShares Nasdaq Biotechnology Index Fund | | | 93,540 |
| 10 | | iShares Russell 1000 Value Index Fund | | | 769 |
| 700 | | iShares Russell 2000 Value Index Fund | | | 47,404 |
| | | | | |
| | | | | 141,713 |
See Notes to Financial Statements.
| | |
| 18 | | Visit our website at www.prudential.com |
| | | | | |
| Shares | | Description | | Value (Note 1) |
| | | | | |
COMMON STOCKS (Continued) | | | |
| |
Farming & Agriculture 1.3% | | | |
| 39,000 | | Altria Group, Inc. | | $ | 2,956,980 |
| 38,400 | | AWB Ltd. (Australia) | | | 75,551 |
| 246,139 | | Chaoda Modern Agriculture Holdings Ltd. (Cayman Islands) | | | 250,466 |
| 23,308 | | Monsanto Co. | | | 2,620,752 |
| | | | | |
| | | | | 5,903,749 |
| |
Finance - Consumer Loans | | | |
| 900 | | Promise Co. Ltd. (Japan) | | | 29,531 |
| |
Financial - Bank & Trust 2.3% | | | |
| 1,850 | | Astoria Financial Corp. | | | 50,283 |
| 13,900 | | Banco Bilbao Vizcaya Argentaria SA (Spain) | | | 292,397 |
| 28,400 | | Banco Santander Central Hispano SA (Spain) | | | 499,490 |
| 5,700 | | BB&T Corp. | | | 206,796 |
| 3,900 | | BNP Paribas SA (France) | | | 386,858 |
| 23,900 | | Bradford & Bingley PLC (United Kingdom) | | | 119,553 |
| 99,217 | | China Merchants Bank Co. Ltd. (Class H Stock) (China) | | | 349,802 |
| 4,400 | | Commonwealth Bank of Australia (Australia) | | | 198,144 |
| 5,300 | | Credit Agricole SA (France) | | | 163,099 |
| 7,000 | | Credit Suisse Group (Switzerland) | | | 398,562 |
| 4,100 | | Danske Bank A/S (Denmark) | | | 147,328 |
| 5,300 | | Dexia (Belgium) | | | 128,679 |
| 5,000 | | Fortis (Belgium) | | | 111,835 |
| 25,900 | | HBOS PLC (United Kingdom) | | | 360,892 |
| 26,789 | | Intesa Sanpaolo SpA (Italy) | | | 190,652 |
| 7,100 | | National Bank of Greece SA (Greece) | | | 433,952 |
| 6,000 | | Natixis (France) | | | 101,908 |
| 14,700 | | Nordea Bank AB (Sweden) | | | 200,657 |
| 1,400 | | Pacific Capital Bancorp | | | 30,100 |
| 33,300 | | Royal Bank of Scotland Group PLC (United Kingdom) | | | 256,726 |
| 110,000 | | Sberbank (Class S Stock) (Russia) | | | 396,000 |
| 900 | | Societe Generale (France) | | | 113,051 |
| 100 | | Sovereign Bancorp, Inc. | | | 1,247 |
| 2,400 | | State Street Corp. | | | 197,088 |
| 1,200 | | Sterling Financial Corp. | | | 21,348 |
| 200 | | Student Loan Corp. (The) | | | 23,684 |
| 32,000 | | Sumitomo Trust & Banking Co. Ltd. (The) (Japan) | | | 206,012 |
| 4,300 | | SunTrust Banks, Inc. | | | 296,485 |
| 3,700 | | Takefuji Corp. (Japan) | | | 106,328 |
| 9,000 | | TCF Financial Corp. | | | 191,250 |
| 17,500 | | U.S. Bancorp | | | 594,125 |
See Notes to Financial Statements.
| | |
| Target Asset Allocation Funds/Target Moderate Allocation Fund | | 19 |
Portfolio of Investments
as of January 31, 2008 (Unaudited) continued
| | | | | |
| Shares | | Description | | Value (Note 1) |
| | | | | |
COMMON STOCKS (Continued) | | | |
| |
Financial - Bank & Trust (cont’d.) | | | |
| 24,102 | | UBS AG (Switzerland) | | $ | 1,001,290 |
| 6,000 | | Unione di Banche Italiane ScpA (Italy) | | | 150,032 |
| 600 | | Verwaltungs und Privat Bank AG (Switzerland) | | | 140,225 |
| 69,344 | | Wells Fargo & Co. | | | 2,358,389 |
| 2,800 | | Zions Bancorp | | | 153,272 |
| | | | | |
| | | | | 10,577,539 |
| |
Financial Services 2.2% | | | |
| 6,900 | | AMBAC Financial Group, Inc. | | | 80,868 |
| 7,440 | | Ameriprise Financial, Inc. | | | 411,506 |
| 22,000 | | AXA SA (France) | | | 755,643 |
| 900 | | Bear Stearns Cos., Inc. (The) | | | 81,270 |
| 590 | | Calamos Asset Management, Inc. (Class A Stock) | | | 12,874 |
| 9,700 | | Capital One Financial Corp. | | | 531,657 |
| 9,050 | | CIT Group, Inc. | | | 253,038 |
| 500 | | CME Group, Inc. | | | 309,450 |
| 3,600 | | Eaton Vance Corp. | | | 134,172 |
| 1,900 | | Federated Investors, Inc. | | | 80,883 |
| 200 | | GFI Group, Inc.* | | | 17,642 |
| 14,885 | | Goldman Sachs Group, Inc. (The) | | | 2,988,461 |
| 24,600 | | Hong Kong Exchanges and Clearing Ltd. (Hong Kong) | | | 512,976 |
| 2,421,000 | | Industrial and Commercial Bank of China (Class H Stock) (China) | | | 1,457,388 |
| 1,540 | | Investment Technology Group, Inc.* | | | 72,334 |
| 7,400 | | Irish Life & Permanent PLC (Ireland) | | | 118,599 |
| 2,000 | | Jefferies Group, Inc. | | | 40,440 |
| 47,400 | | Marks & Spencer Group PLC (United Kingdom) | | | 423,848 |
| 300 | | Marshall & Ilsley Corp. | | | 8,370 |
| 3,950 | | Merrill Lynch & Co., Inc. | | | 222,780 |
| 11,400 | | Okasan Holdings, Inc. (Japan) | | | 65,552 |
| 10,900 | | Santos Ltd. (Australia) | | | 119,567 |
| 6,100 | | Shinhan Financial Group Co. Ltd., ADR (South Korea)* | | | 660,264 |
| 12,500 | | TD Ameritrade Holding Corp.* | | | 234,500 |
| 6,820 | | TheStreet.com, Inc. | | | 75,702 |
| 4,300 | | ValueClick, Inc.* | | | 93,869 |
| 7,300 | | Western Union Co. (The) | | | 163,520 |
| | | | | |
| | | | | 9,927,173 |
| |
Food 1.2% | | | |
| 14,000 | | Archer-Daniels-Midland Co. | | | 616,700 |
| 500 | | Campbell Soup Co. | | | 15,805 |
See Notes to Financial Statements.
| | |
| 20 | | Visit our website at www.prudential.com |
| | | | | |
| Shares | | Description | | Value (Note 1) |
| | | | | |
COMMON STOCKS (Continued) | | | |
| |
Food (cont’d.) | | | |
| 625 | | Corn Products International, Inc. | | $ | 21,125 |
| 6,200 | | General Mills, Inc. | | | 338,582 |
| 10,200 | | Groupe Danone (France) | | | 824,394 |
| 100 | | Kellogg Co. | | | 4,790 |
| 23,700 | | Kraft Foods, Inc. (Class A Stock) | | | 693,462 |
| 20,100 | | Kroger Co. (The) | | | 511,545 |
| 2,144 | | Nestle SA (Switzerland) | | | 959,858 |
| 600 | | Ralcorp Holdings, Inc.* | | | 32,646 |
| 10,600 | | Safeway, Inc. | | | 328,494 |
| 3,100 | | Sysco Corp. | | | 90,055 |
| 64,684 | | Tesco PLC (United Kingdom) | | | 540,729 |
| 31,600 | | Tyson Foods, Inc. (Class A Stock) | | | 450,300 |
| | | | | |
| | | | | 5,428,485 |
| |
Food & Beverage 0.1% | | | |
| 12,400 | | Dairy Crest Group PLC (United Kingdom) | | | 133,302 |
| 48,600 | | Northern Foods PLC (United Kingdom) | | | 95,694 |
| 10,500 | | Tate & Lyle PLC (United Kingdom) | | | 102,612 |
| | | | | |
| | | | | 331,608 |
| |
Gaming 0.1% | | | |
| 15,640 | | OPAP SA (Greece) | | | 546,399 |
| |
Gas Utilities | | | |
| 850 | | Atmos Energy Corp. | | | 24,412 |
| |
Healthcare Equipment & Supplies 0.1% | | | |
| 9,750 | | Covidien Ltd. (Bermuda) | | | 435,143 |
| 3,600 | | Kinetic Concepts, Inc.* | | | 179,208 |
| 1,000 | | Somanetics Corp.* | | | 26,800 |
| | | | | |
| | | | | 641,151 |
| |
Healthcare Providers & Services 0.3% | | | |
| 26,300 | | CIGNA Corp. | | | 1,292,908 |
| 475 | | inVentiv Health, Inc.* | | | 15,623 |
| 1,400 | | Kindred Healthcare, Inc.* | | | 38,556 |
| 1,125 | | LHC Group, Inc.* | | | 25,942 |
| 500 | | Owens & Minor, Inc. | | | 20,660 |
| | | | | |
| | | | | 1,393,689 |
See Notes to Financial Statements.
| | |
| Target Asset Allocation Funds/Target Moderate Allocation Fund | | 21 |
Portfolio of Investments
as of January 31, 2008 (Unaudited) continued
| | | | | |
| Shares | | Description | | Value (Note 1) |
| | | | | |
COMMON STOCKS (Continued) | | | |
| |
Healthcare Services 0.9% | | | |
| 1,300 | | Aetna, Inc. | | $ | 69,238 |
| 2,030 | | Amedisys, Inc.* | | | 86,539 |
| 1,400 | | Amerigroup Corp.* | | | 52,528 |
| 2,900 | | Apria Healthcare Group, Inc.* | | | 61,538 |
| 800 | | Covance, Inc.* | | | 66,528 |
| 1,325 | | Healthspring, Inc.* | | | 27,414 |
| 2,990 | | Healthways, Inc.* | | | 168,337 |
| 3,300 | | Humana, Inc.* | | | 264,990 |
| 1,643 | | IPC The Hospitalist Co., Inc.* | | | 34,536 |
| 1,955 | | Pediatrix Medical Group, Inc.* | | | 133,116 |
| 2,930 | | Psychiatric Solutions, Inc.* | | | 88,398 |
| 7,540 | | RadNet, Inc.* | | | 67,936 |
| 1,600 | | Sunrise Senior Living, Inc.* | | | 45,936 |
| 5,590 | | TriZetto Group, Inc. (The)* | | | 109,117 |
| 55,593 | | UnitedHealth Group, Inc. | | | 2,826,348 |
| 3,200 | | WellPoint, Inc.* | | | 250,240 |
| | | | | |
| | | | | 4,352,739 |
| |
Healthcare-Products | | | |
| 500 | | Intuitive Surgical, Inc.* | | | 127,000 |
| |
Home Furnishings 0.1% | | | |
| 9,000 | | Matsushita Electric Industrial Co. Ltd. (Japan) | | | 191,927 |
| 9,200 | | Thomson (France) | | | 112,480 |
| | | | | |
| | | | | 304,407 |
| |
Hotels & Motels 0.7% | | | |
| 19,525 | | MGM Mirage* | | | 1,429,620 |
| 3,200 | | Starwood Hotels & Resorts Worldwide, Inc. | | | 144,800 |
| 14,824 | | Wynn Resorts Ltd. | | | 1,704,464 |
| | | | | |
| | | | | 3,278,884 |
| |
Hotels, Restaurants & Leisure 1.1% | | | |
| 19,300 | | Carnival Corp. | | | 858,657 |
| 1,600 | | Chipotle Mexican Grill, Inc. (Class A Stock)* | | | 194,784 |
| 2,570 | | Home Inns & Hotels Management, Inc., ADR (China)* | | | 71,934 |
| 69,945 | | McDonald’s Corp. | | | 3,745,555 |
| 2,650 | | Triarc Cos., Inc. (Class B Stock) | | | 24,645 |
| 6,700 | | Wyndham Worldwide Corp. | | | 157,852 |
| | | | | |
| | | | | 5,053,427 |
See Notes to Financial Statements.
| | |
| 22 | | Visit our website at www.prudential.com |
| | | | | |
| Shares | | Description | | Value (Note 1) |
| | | | | |
COMMON STOCKS (Continued) | | | |
| |
Household Durables 0.2% | | | |
| 500 | | Black & Decker Corp. | | $ | 36,270 |
| 13,200 | | Centex Corp. | | | 366,696 |
| 3,400 | | Fortune Brands, Inc. | | | 237,728 |
| 11,500 | | Lennar Corp. (Class A Stock) | | | 236,900 |
| 2,900 | | Lennar Corp. (Class B Stock) | | | 55,738 |
| 1,225 | | Tempur-Pedic International, Inc. | | | 24,280 |
| | | | | |
| | | | | 957,612 |
| |
Household Products 0.1% | | | |
| 8,900 | | Kimberly-Clark Corp. | | | 584,285 |
| 1,800 | | Scotts Miracle-Gro Co. (The) (Class B Stock) | | | 70,272 |
| | | | | |
| | | | | 654,557 |
Independent Power Producers & Energy Traders | | | |
| 12,783 | | Drax Group PLC (United Kingdom) | | | 128,889 |
| |
Industrial Conglomerates 1.0% | �� | | |
| 16,850 | | 3M Co. | | | 1,342,102 |
| 64,600 | | General Electric Co. | | | 2,287,486 |
| 100 | | McDermott International, Inc.* | | | 4,718 |
| 375 | | Teleflex, Inc. | | | 22,170 |
| 19,400 | | Tyco International Ltd. | | | 763,584 |
| | | | | |
| | | | | 4,420,060 |
| |
Insurance 2.7% | | | |
| 7,600 | | Aegon NV (Netherlands) | | | 113,541 |
| 2,200 | | Aflac, Inc. | | | 134,926 |
| 29,150 | | Allstate Corp. (The) | | | 1,436,220 |
| 8,100 | | American International Group, Inc. | | | 446,796 |
| 9,000 | | AmTrust Financial Services, Inc. | | | 141,300 |
| 2,300 | | Assurant, Inc. | | | 149,247 |
| 9,500 | | Aviva PLC (United Kingdom) | | | 119,182 |
| 6,200 | | Axis Capital Holdings Ltd. (Bermuda) | | | 248,248 |
| 1,600 | | Baloise Holding AG (Switzerland) | | | 142,215 |
| 38,100 | | Beazley Group PLC (United Kingdom) | | | 128,623 |
| 3,200 | | Chubb Corp. | | | 165,728 |
| 1,000 | | Delphi Financial Group, Inc. (Class A Stock) | | | 31,380 |
| 1,530 | | eHealth, Inc.* | | | 40,071 |
| 35,050 | | Genworth Financial, Inc. (Class A Stock) | | | 853,117 |
| 5,900 | | Hanover Insurance Group, Inc. (The) | | | 268,745 |
| 4,200 | | Hartford Financial Services Group, Inc. | | | 339,234 |
See Notes to Financial Statements.
| | |
| Target Asset Allocation Funds/Target Moderate Allocation Fund | | 23 |
Portfolio of Investments
as of January 31, 2008 (Unaudited) continued
| | | | | |
| Shares | | Description | | Value (Note 1) |
| | | | | |
COMMON STOCKS (Continued) | | | |
| |
Insurance (cont’d.) | | | |
| 1,562 | | HCC Insurance Holdings, Inc. | | $ | 43,517 |
| 700 | | Hilb Rogal & Hobbs Co. | | | 25,326 |
| 10,900 | | ING Groep NV, ADR (Netherlands) | | | 355,143 |
| 1,100 | | IPC Holdings Ltd. (Bermuda) | | | 28,303 |
| 50,500 | | Legal & General PLC (United Kingdom) | | | 133,692 |
| 3,900 | | Lincoln National Corp. | | | 212,004 |
| 8,800 | | MBIA, Inc. | | | 136,400 |
| 34,900 | | MetLife, Inc. | | | 2,058,053 |
| 2,100 | | Muenchener Rueckversicherungs AG (Germany) | | | 377,296 |
| 50,900 | | Old Mutual PLC (United Kingdom) | | | 126,984 |
| 1,500 | | Philadelphia Consolidated Holding Corp.* | | | 53,700 |
| 4,500 | | Protective Life Corp. | | | 178,830 |
| 3,400 | | Prudential Financial, Inc.(i) | | | 286,858 |
| 4,600 | | RenaissanceRe Holdings Ltd. (Bermuda) | | | 262,154 |
| 1,200 | | State Auto Financial Corp. | | | 33,516 |
| 4,500 | | Swiss Reinsurance Co. (Switzerland) | | | 338,109 |
| 25,000 | | Travelers Cos., Inc. (The) | | | 1,202,500 |
| 1,600 | | United Fire & Casualty Co. | | | 53,408 |
| 24,600 | | Unum Group | | | 556,452 |
| 2,800 | | W.R. Berkely Corp. | | | 84,728 |
| 7,200 | | XL Capital Ltd. (Class A Stock) (Bermuda) | | | 324,000 |
| 1,300 | | Zurich Financial Services AG (Switzerland) | | | 372,231 |
| | | | | |
| | | | | 12,001,777 |
| |
Internet 0.2% | | | |
| 9,800 | | Amazon.com, Inc.* | | | 761,460 |
| 2,740 | | Digital River, Inc.* | | | 102,750 |
| | | | | |
| | | | | 864,210 |
| |
Internet Services 1.0% | | | |
| 5,910 | | CyberSource Corp.* | | | 98,992 |
| 13,300 | | eBay, Inc.* | | | 357,637 |
| 880 | | Equinix, Inc.* | | | 66,466 |
| 11,900 | | Expedia, Inc.* | | | 273,938 |
| 3,722 | | Google, Inc. (Class A Stock)* | | | 2,100,325 |
| 9,373 | | Internet Brands, Inc. (Class A Stock)* | | | 72,360 |
| 6,190 | | j2 Global Communications, Inc.* | | | 135,623 |
| 15,370 | | NaviSite, Inc.* | | | 69,165 |
| 5,670 | | NIC, Inc. | | | 40,541 |
| 3,160 | | NutriSystem, Inc.* | | | 90,439 |
See Notes to Financial Statements.
| | |
| 24 | | Visit our website at www.prudential.com |
| | | | | |
| Shares | | Description | | Value (Note 1) |
| | | | | |
COMMON STOCKS (Continued) | | | |
| |
Internet Services (cont’d.) | | | |
| 2,390 | | Shutterfly, Inc.* | | $ | 46,485 |
| 48,800 | | Symantec Corp.* | | | 874,984 |
| 1,400 | | VeriSign, Inc.* | | | 47,488 |
| 2,250 | | Yahoo! Inc.* | | | 43,155 |
| | | | | |
| | | | | 4,317,598 |
| |
Iron/Steel | | | |
| 400 | | AK Steel Holding Corp.* | | | 19,112 |
| |
IT Services 0.2% | | | |
| 50,100 | | Electronic Data Systems Corp. | | | 1,007,010 |
| |
Machinery 0.8% | | | |
| 675 | | Actuant Corp. (Class A Stock) | | | 18,448 |
| 11,500 | | AGCO Corp.* | | | 692,530 |
| 25,800 | | Bluescope Steel Ltd. (Australia) | | | 239,142 |
| 1,890 | | Bucyrus International, Inc. (Class A Stock) | | | 175,222 |
| 16,600 | | Caterpillar, Inc. | | | 1,180,924 |
| 4,648 | | Deere & Co. | | | 407,909 |
| 6,600 | | Dover Corp. | | | 266,376 |
| 450 | | General Cable Corp.* | | | 26,105 |
| 6,600 | | Heidelberger Druckmaschinen AG (Germany) | | | 179,060 |
| 525 | | Lincoln Electric Holdings, Inc. | | | 32,366 |
| 300 | | Rieter Holdings AG (Switzerland) | | | 108,716 |
| 175 | | Rofin Sinar Technologies, Inc.* | | | 7,439 |
| 900 | | Snap-on, Inc. | | | 44,208 |
| 1,300 | | SPX Corp. | | | 130,780 |
| | | | | |
| | | | | 3,509,225 |
| |
Machinery & Equipment 0.1% | | | |
| 425 | | Nordson Corp. | | | 21,199 |
| 5,800 | | Rockwell Automation, Inc. | | | 330,716 |
| | | | | |
| | | | | 351,915 |
| |
Machinery - Construction & Mining 0.1% | | | |
| 11,500 | | Komatsu Ltd. (Japan) | | | 280,361 |
| |
Manufacturing | | | |
| 1,800 | | Danaher Corp. | | | 134,010 |
| 2,900 | | Hexcel Corp.* | | | 63,307 |
| | | | | |
| | | | | 197,317 |
See Notes to Financial Statements.
| | |
| Target Asset Allocation Funds/Target Moderate Allocation Fund | | 25 |
Portfolio of Investments
as of January 31, 2008 (Unaudited) continued
| | | | | |
| Shares | | Description | | Value (Note 1) |
| | | | | |
COMMON STOCKS (Continued) | | | |
| |
Media 1.4% | | | |
| 57,750 | | CBS Corp. (Class B Stock) | | $ | 1,454,723 |
| 5,130 | | DG FastChannel, Inc.* | | | 108,602 |
| 15,868 | | DIRECTV Group, Inc. (The)* | | | 358,299 |
| 23,000 | | Idearc, Inc. | | | 373,980 |
| 23,900 | | News Corp. (Class A Stock) | | | 451,710 |
| 22,200 | | Rogers Communications, Inc. (Class B Stock) (Canada) | | | 848,820 |
| 57,700 | | Time Warner, Inc. | | | 908,198 |
| 1,500 | | Viacom, Inc. (Class B Stock)* | | | 58,140 |
| 5,000 | | Vivendi (France) | | | 201,478 |
| 45,900 | | Walt Disney Co. (The) | | | 1,373,787 |
| | | | | |
| | | | | 6,137,737 |
| |
Medical Supplies & Equipment 0.4% | | | |
| 1,300 | | Bard (C.R.), Inc. | | | 125,541 |
| 500 | | Baxter International, Inc. | | | 30,370 |
| 400 | | Beckman Coulter, Inc. | | | 26,600 |
| 2,900 | | Boston Scientific Corp.* | | | 35,177 |
| 1,350 | | Immucor, Inc.* | | | 38,934 |
| 950 | | Medical Action Industries, Inc.* | | | 15,884 |
| 6,000 | | Medtronic, Inc. | | | 279,420 |
| 5,770 | | Micrus Endovascular Corp.* | | | 110,842 |
| 980 | | Myriad Genetics, Inc.* | | | 42,150 |
| 6,600 | | Nipro Corp. (Japan) | | | 132,436 |
| 11,100 | | NovaMed, Inc.* | | | 43,845 |
| 2,340 | | NuVasive, Inc.* | | | 92,220 |
| 600 | | Sepracor, Inc.* | | | 16,944 |
| 8,500 | | Spectranetics Corp. (The)* | | | 106,080 |
| 10,400 | | St. Jude Medical, Inc.* | | | 421,304 |
| 200 | | Stryker Corp. | | | 13,394 |
| 1,850 | | Wright Medical Group, Inc.* | | | 50,505 |
| 1,440 | | Zoll Medical Corp.* | | | 38,390 |
| | | | | |
| | | | | 1,620,036 |
| |
Metals & Mining 1.4% | | | |
| 21,000 | | Alcoa, Inc. | | | 695,100 |
| 150 | | Century Aluminum Co.* | | | 7,799 |
| 175 | | Cleveland-Cliffs, Inc. | | | 17,822 |
| 9,300 | | Crane Group Ltd. (Australia) | | | 123,672 |
| 1,240 | | Dynamic Materials Corp. | | | 66,439 |
| 13,600 | | Freeport-McMoRan Copper & Gold, Inc. | | | 1,210,808 |
See Notes to Financial Statements.
| | |
| 26 | | Visit our website at www.prudential.com |
| | | | | |
| Shares | | Description | | Value (Note 1) |
| | | | | |
COMMON STOCKS (Continued) | | | |
| |
Metals & Mining (cont’d.) | | | |
| 1,300 | | Joy Global, Inc. | | $ | 81,965 |
| 2,260 | | Ladish Co., Inc.* | | | 80,207 |
| 400 | | Newmont Mining Corp. | | | 21,736 |
| 6,500 | | Nucor Corp. | | | 375,700 |
| 900 | | Precision Castparts Corp. | | | 102,420 |
| 3,000 | | Rautaruukki Oyj (Finland) | | | 124,249 |
| 1,200 | | Southern Copper Corp. | | | 112,608 |
| 7,500 | | ThyssenKrupp AG (Germany) | | | 366,676 |
| 1,600 | | Timken Co. | | | 48,368 |
| 18,416 | | Transocean, Inc.* | | | 2,257,802 |
| 4,000 | | United States Steel Corp. | | | 408,440 |
| 7,500 | | Zinifex Ltd. (Australia) | | | 71,001 |
| | | | | |
| | | | | 6,172,812 |
| |
Multi-Line Retail 0.1% | | | |
| 4,900 | | J.C. Penney Co., Inc. | | | 232,309 |
| 200 | | Macy’s, Inc. | | | 5,528 |
| | | | | |
| | | | | 237,837 |
| |
Multi-Utilities 0.1% | | | |
| 7,800 | | Dominion Resources, Inc. | | | 335,400 |
| 1,300 | | Vectren Corp. | | | 35,685 |
| | | | | |
| | | | | 371,085 |
| |
Office Equipment 0.2% | | | |
| 8,800 | | OCE NV (Netherlands) | | | 176,971 |
| 9,000 | | Ricoh Co. Ltd. (Japan) | | | 141,700 |
| 300 | | Seiko Epson Corp. (Japan) | | | 7,336 |
| 40,400 | | Xerox Corp. | | | 622,160 |
| | | | | |
| | | | | 948,167 |
| |
Oil & Gas | | | |
| 6,553 | | StatoilHydro ASA (Norway) | | | 172,541 |
| |
Oil & Gas Exploration/Production 0.2% | | | |
| 650 | | Core Laboratories NV (Netherlands)* | | | 73,255 |
| 15,100 | | OAO Gazprom, ADR (Russia) | | | 726,310 |
| 400 | | St. Mary Land & Exploration Co. | | | 14,092 |
| | | | | |
| | | | | 813,657 |
See Notes to Financial Statements.
| | |
| Target Asset Allocation Funds/Target Moderate Allocation Fund | | 27 |
Portfolio of Investments
as of January 31, 2008 (Unaudited) continued
| | | | | |
| Shares | | Description | | Value (Note 1) |
| | | | | |
COMMON STOCKS (Continued) | | | |
| |
Oil, Gas & Consumable Fuels 5.9% | | | |
| 7,510 | | Air Liquide (France) | | $ | 1,047,171 |
| 3,100 | | Anadarko Petroleum Corp. | | | 181,629 |
| 12,000 | | Apache Corp. | | | 1,145,280 |
| 2,405 | | Arena Resources, Inc.* | | | 85,546 |
| 200 | | Ashland, Inc. | | | 9,106 |
| 57,600 | | BP PLC (United Kingdom) | | | 613,900 |
| 2,800 | | Cabot Oil & Gas Corp. | | | 108,332 |
| 9,600 | | Canadian Natural Resources Ltd. (Canada) | | | 613,930 |
| 12,000 | | ChevronTexaco Corp. | | | 1,014,000 |
| 1,250 | | Concho Resources, Inc.* | | | 25,375 |
| 29,500 | | ConocoPhillips | | | 2,369,440 |
| 1,075 | | Continental Resources, Inc.* | | | 26,778 |
| 46,800 | | Cosmo Oil Co. Ltd. (Japan) | | | 159,672 |
| 8,100 | | Devon Energy Corp. | | | 688,338 |
| 1,800 | | Dresser-Rand Group, Inc.* | | | 57,060 |
| 15,100 | | Eni SpA (Italy) | | | 488,221 |
| 50,500 | | Exxon Mobil Corp. | | | 4,363,200 |
| 19,400 | | Global Industry Ltd.* | | | 342,604 |
| 1,375 | | Gulfport Energy Corp.* | | | 20,831 |
| 20,509 | | Hess Corp. | | | 1,862,833 |
| 26,350 | | Marathon Oil Corp. | | | 1,234,498 |
| 2,900 | | Nabors Industries Ltd. (Bermuda)* | | | 78,938 |
| 6,600 | | National Oilwell Varco, Inc.* | | | 397,518 |
| 27,700 | | Nippon Oil Corp. (Japan) | | | 187,907 |
| 2,100 | | Noble Energy, Inc. | | | 152,418 |
| 7,600 | | Norsk Hydro ASA (Norway) | | | 91,063 |
| 9,600 | | Occidental Petroleum Corp. | | | 651,552 |
| 1,000 | | ONEOK, Inc. | | | 47,000 |
| 13,600 | | Patterson-UTI Energy, Inc. | | | 266,288 |
| 1,075 | | PetroHawk Energy Corp.* | | | 16,931 |
| 18,315 | | Petroleo Brasileiro SA, ADR (Brazil) | | | 2,035,529 |
| 1,650 | | Petroquest Energy, Inc.* | | | 21,318 |
| 1,400 | | Pioneer Natural Resources Co. | | | 58,660 |
| 9,700 | | Repsol YPF SA (Spain) | | | 310,226 |
| 3,300 | | Royal Dutch Shell PLC (Class A Stock) (Netherlands) | | | 118,029 |
| 19,600 | | Royal Dutch Shell PLC (Class B Stock) (United Kingdom) | | | 681,118 |
| 6,900 | | Royal Dutch Shell PLC (Class B Stock), ADR (United Kingdom) | | | 477,135 |
| 32,116 | | Schlumberger Ltd. | | | 2,423,473 |
| 100 | | SEACOR Holdings, Inc.* | | | 8,820 |
| 5,700 | | Sunoco, Inc. | | | 354,540 |
| 900 | | Swift Energy Co.* | | | 38,835 |
See Notes to Financial Statements.
| | |
| 28 | | Visit our website at www.prudential.com |
| | | | | |
| Shares | | Description | | Value (Note 1) |
| | | | | |
COMMON STOCKS (Continued) | | | |
| |
Oil, Gas & Consumable Fuels (cont’d.) | | | |
| 3,200 | | Total SA (France) | | $ | 232,891 |
| 18,200 | | Valero Energy Corp. | | | 1,077,258 |
| 900 | | W&T Offshore, Inc. | | | 25,461 |
| 8,500 | | XTO Energy, Inc. | | | 441,490 |
| | | | | |
| | | | | 26,652,142 |
| |
Paper & Forest Products 0.2% | | | |
| 27,500 | | Domtar Corp. (Canada)* | | | 221,925 |
| 10,300 | | International Paper Co. | | | 332,175 |
| 70 | | Nippon Paper Group, Inc. (Japan) | | | 165,385 |
| 3,000 | | Oji Paper Co. Ltd. (Japan) | | | 12,842 |
| 800 | | Owens-Illinois, Inc.* | | | 40,320 |
| 700 | | Weyerhaeuser Co. | | | 47,404 |
| | | | | |
| | | | | 820,051 |
| |
Pharmaceuticals 4.7% | | | |
| 3,900 | | Abbott Laboratories | | | 219,570 |
| 16,000 | | AmerisourceBergen Corp. | | | 746,400 |
| 17,953 | | Amylin Pharmaceuticals, Inc.* | | | 532,306 |
| 11,000 | | AstraZeneca PLC (United Kingdom) | | | 461,964 |
| 7,200 | | AstraZeneca PLC, ADR (United Kingdom) | | | 301,320 |
| 550 | | Barr Pharmaceuticals, Inc.* | | | 28,705 |
| 6,600 | | Bristol-Myers Squibb Co. | | | 153,054 |
| 20,900 | | Eli Lilly & Co. | | | 1,076,768 |
| 8,500 | | Express Scripts, Inc.* | | | 573,665 |
| 22,700 | | Gilead Sciences, Inc.* | | | 1,037,163 |
| 10,100 | | GlaxoSmithKline PLC (United Kingdom) | | | 239,374 |
| 8,700 | | H. Lundbeck A/S (Denmark) | | | 211,775 |
| 18,800 | | Johnson & Johnson | | | 1,189,288 |
| 5,710 | | K-V Pharmaceutical Co. (Class A Stock)* | | | 148,346 |
| 17,180 | | LeMaitre Vascular, Inc* | | | 94,490 |
| 1,190 | | LifeCell Corp.* | | | 47,017 |
| 19,600 | | Medco Health Solutions, Inc.* | | | 981,568 |
| 79,539 | | Merck & Co., Inc. | | | 3,681,065 |
| 13,700 | | Novartis AG (Switzerland) | | | 694,088 |
| 17,500 | | Novo Nordisk AS (Class B Stock) (Denmark) | | | 1,104,083 |
| 131,000 | | Pfizer, Inc. | | | 3,064,090 |
| 2,000 | | Pharmaceutical Product Development, Inc. | | | 86,720 |
| 6,229 | | Roche Holding AG (Switzerland) | | | 1,131,007 |
| 7,200 | | Sanofi-Aventis (France) | | | 587,146 |
See Notes to Financial Statements.
| | |
| Target Asset Allocation Funds/Target Moderate Allocation Fund | | 29 |
Portfolio of Investments
as of January 31, 2008 (Unaudited) continued
| | | | | |
| Shares | | Description | | Value (Note 1) |
| | | | | |
COMMON STOCKS (Continued) | | | |
| |
Pharmaceuticals (cont’d.) | | | |
| 26,200 | | Schering-Plough Corp. | | $ | 512,734 |
| 4,530 | | Sciele Pharma, Inc.* | | | 108,358 |
| 25,557 | | Teva Pharmaceutical Industries Ltd., ADR (Israel) | | | 1,176,644 |
| 5,100 | | Watson Pharmaceuticals, Inc.* | | | 133,161 |
| 21,900 | | Wyeth | | | 871,620 |
| | | | | |
| | | | | 21,193,489 |
| |
Real Estate 0.4% | | | |
| 800 | | Chimera Investment Corp. | | | 15,320 |
| 356,300 | | Country Garden Holdings Co. Ltd. (China)* | | | 270,107 |
| 1,500 | | Hovnanian Enterprises, Inc. (Class A Stock)* | | | 14,835 |
| 2,500 | | Jones Lang LaSalle, Inc. | | | 194,500 |
| 900 | | Meritage Homes Corp.* | | | 14,445 |
| 7,425 | | Potash Corp. of Saskatchewan, Inc. (Canada) | | | 1,046,034 |
| 327,500 | | Soho China Ltd. (China)* | | | 279,306 |
| | | | | |
| | | | | 1,834,547 |
| |
Real Estate Investment Trusts 0.8% | | | |
| 600 | | Alexandria Real Estate Equities, Inc. | | | 58,938 |
| 3,600 | | AMB Property Corp. | | | 182,160 |
| 5,200 | | Apartment Investment & Management Co. (Class A Stock) | | | 206,128 |
| 1,800 | | AvalonBay Communities, Inc. | | | 169,110 |
| 6,500 | | Duke Realty Corp. | | | 153,660 |
| 8,000 | | Hospitality Properties Trust | | | 271,600 |
| 6,100 | | Host Hotels & Resorts, Inc. | | | 102,114 |
| 1,600 | | Liberty Property Trust | | | 51,376 |
| 2,700 | | Macerich Co. (The) | | | 184,599 |
| 26,900 | | ProLogis | | | 1,596,515 |
| 2,100 | | Public Storage, Inc. | | | 164,325 |
| 3,400 | | Simon Property Group, Inc. | | | 296,922 |
| 400 | | SL Green Realty Corp. | | | 37,124 |
| 2,000 | | UDR, Inc. | | | 45,660 |
| 4,300 | | Ventas, Inc. | | | 190,060 |
| | | | | |
| | | | | 3,710,291 |
| |
Retail 0.5% | | | |
| 1,575 | | AFC Enterprises, Inc.* | | | 14,600 |
| 57,700 | | DSG International PLC (United Kingdom) | | | 87,786 |
| 4,000 | | Family Dollar Stores, Inc. | | | 84,120 |
| 7,330 | | FGX International Holdings Ltd. (British Virgin Islands)* | | | 74,033 |
See Notes to Financial Statements.
| | |
| 30 | | Visit our website at www.prudential.com |
| | | | | |
| Shares | | Description | | Value (Note 1) |
| | | | | |
COMMON STOCKS (Continued) | | | |
| |
Retail (cont’d.) | | | |
| 13,939 | | NEXT PLC (United Kingdom) | | $ | 393,418 |
| 1,900 | | Rallye SA (France) | | | 106,341 |
| 149,700 | | Wal-Mart de Mexico SA de CV (Mexico) | | | 536,810 |
| 17,900 | | Wal-Mart Stores, Inc. | | | 910,752 |
| | | | | |
| | | | | 2,207,860 |
| |
Retail & Merchandising 1.1% | | | |
| 600 | | Abercrombie & Fitch Co. (Class A Stock) | | | 47,814 |
| 100 | | Best Buy Co., Inc. | | | 4,881 |
| 800 | | BJ’s Wholesale Club, Inc.* | | | 25,952 |
| 1,300 | | Brinker International, Inc. | | | 24,193 |
| 32,788 | | CVS Caremark Corp. | | | 1,281,027 |
| 5,300 | | GameStop Corp. (Class A Stock)* | | | 274,169 |
| 2,946 | | Jos. A. Bank Clothiers, Inc.* | | | 80,249 |
| 900 | | Kohl’s Corp.* | | | 41,076 |
| 40,475 | | Lowe’s Cos., Inc. | | | 1,070,159 |
| 1,190 | | Lululemon Athletica, Inc. (Canada)* | | | 40,329 |
| 1,600 | | Ross Stores, Inc. | | | 46,640 |
| 1,400 | | Ruddick Corp. | | | 47,712 |
| 800 | | School Specialty, Inc.* | | | 25,968 |
| 1,625 | | Sonic Corp.* | | | 36,043 |
| 3,400 | | Staples, Inc. | | | 81,396 |
| 4,772 | | Yamada Denki Co. Ltd. (Japan) | | | 511,123 |
| 42,346 | | Yum! Brands, Inc. | | | 1,446,539 |
| | | | | |
| | | | | 5,085,270 |
| |
Road & Rail 0.1% | | | |
| 3,900 | | Burlington Northern Santa Fe Corp. | | | 337,428 |
| |
Semiconductor Components 0.1% | | | |
| 123,400 | | ARM Holdings PLC (United Kingdom) | | | 288,785 |
| |
Semiconductors 1.0% | | | |
| 2,100 | | Analog Devices, Inc. | | | 59,556 |
| 645 | | ATMI, Inc.* | | | 16,964 |
| 2,000 | | Broadcom Corp. (Class A Stock)* | | | 44,160 |
| 1,725 | | Brooks Automation, Inc.* | | | 21,200 |
| 1,600 | | Checkpoint Systems, Inc.* | | | 38,016 |
| 93,452 | | Intel Corp. | | | 1,981,182 |
| 2,700 | | LSI Logic Corp.* | | | 14,094 |
| 2,500 | | MEMC Electronic Materials, Inc.* | | | 178,650 |
See Notes to Financial Statements.
| | |
| Target Asset Allocation Funds/Target Moderate Allocation Fund | | 31 |
Portfolio of Investments
as of January 31, 2008 (Unaudited) continued
| | | | | |
| Shares | | Description | | Value (Note 1) |
| | | | | |
COMMON STOCKS (Continued) | | | |
| |
Semiconductors (cont’d.) | | | |
| 1,200 | | Microsemi Corp.* | | $ | 27,264 |
| 9,600 | | National Semiconductor Corp. | | | 176,928 |
| 14,800 | | Novellus Systems, Inc.* | | | 351,648 |
| 18,650 | | NVIDIA Corp.* | | | 458,603 |
| 5,280 | | O2Micro International Ltd., ADR (Cayman Islands)* | | | 42,082 |
| 29,200 | | Texas Instruments, Inc. | | | 903,156 |
| 1,325 | | Ultra Clean Holdings, Inc.* | | | 12,972 |
| 5,800 | | Xilinx, Inc. | | | 126,846 |
| | | | | |
| | | | | 4,453,321 |
| |
Semiconductors & Semiconductor Equipment | | | |
| 600 | | Varian Semiconductor Equipment Associates, Inc.* | | | 19,326 |
| |
Software 2.6% | | | |
| 10,000 | | Adobe Systems, Inc.* | | | 349,300 |
| 4,500 | | BEA Systems, Inc.* | | | 84,105 |
| 14,000 | | BMC Software, Inc.* | | | 448,560 |
| 49,605 | | CA, Inc. | | | 1,092,798 |
| 13,300 | | Fair Isaac Corp. | | | 339,150 |
| 14,882 | | MasterCard, Inc. (Class A Stock) | | | 3,080,574 |
| 184,441 | | Microsoft Corp. | | | 6,012,777 |
| 1,500 | | MoneyGram International, Inc. | | | 8,010 |
| 2,560 | | Phase Forward, Inc.* | | | 44,160 |
| 4,790 | | PROS Holdings, Inc.* | | | 73,526 |
| 1,475 | | Sybase, Inc.* | | | 41,625 |
| 1,500 | | Tyler Technologies, Inc.* | | | 20,070 |
| | | | | |
| | | | | 11,594,655 |
| |
Specialty Retail 0.6% | | | |
| 2,555 | | Aaron Rents, Inc. | | | 48,852 |
| 38,200 | | AutoNation, Inc.* | | | 621,896 |
| 700 | | AutoZone, Inc.* | | | 84,616 |
| 19,700 | | Gap, Inc. (The) | | | 376,664 |
| 35,894 | | Home Depot, Inc. | | | 1,100,869 |
| 11,800 | | Limited Brands, Inc. | | | 225,262 |
| 537 | | Monro Muffler Brake, Inc. | | | 9,934 |
| 20,600 | | RadioShack Corp. | | | 357,410 |
| | | | | |
| | | | | 2,825,503 |
| |
Steel Producers/Products | | | |
| 2,900 | | Voestalpine AG (Austria) | | | 178,830 |
See Notes to Financial Statements.
| | |
| 32 | | Visit our website at www.prudential.com |
| | | | | |
| Shares | | Description | | Value (Note 1) |
| | | | | |
COMMON STOCKS (Continued) | | | |
| |
Telecommunication Services | | | |
| 300 | | Crown Castle International Corp.* | | $ | 10,857 |
| |
Telecommunications 3.4% | | | |
| 17,700 | | Amdocs Ltd. (Guernsey)* | | | 585,693 |
| 41,786 | | America Movil SAB de CV (Class L Stock), ADR (Mexico) | | | 2,503,399 |
| 73,300 | | BT Group PLC (United Kingdom) | | | 380,859 |
| 1,960 | | Cbeyond, Inc.* | | | 66,130 |
| 3,300 | | CenturyTel, Inc. | | | 121,803 |
| 159,413 | | China Mobile Ltd. (China) | | | 2,350,258 |
| 66,802 | | Cisco Systems, Inc.* | | | 1,636,649 |
| 7,500 | | Corning, Inc. | | | 180,525 |
| 400 | | Embarq Corp. | | | 18,120 |
| 24,551 | | France Telecom SA (France) | | | 865,862 |
| 2,230 | | GeoEye, Inc.* | | | 77,961 |
| 28,200 | | Juniper Networks, Inc.* | | | 765,630 |
| 100,170 | | MobileOne Ltd. (Singapore) | | | 134,019 |
| 500 | | Motorola, Inc. | | | 5,765 |
| 70 | | Nippon Telegraph and Telephone Corp. (Japan) | | | 333,138 |
| 26,100 | | Nokia Oyj (Finland) | | | 961,065 |
| 200 | | NTT DoCoMo, Inc. (Japan) | | | 316,190 |
| 11,757 | | QUALCOMM, Inc. | | | 498,732 |
| 78,915 | | Sprint Nextel Corp. | | | 830,975 |
| 800 | | Swisscom AG (Switzerland) | | | 319,355 |
| 34,000 | | Telefonica SA (Spain) | | | 993,943 |
| 45,700 | | Telestra Corp. Ltd. (Australia) | | | 179,793 |
| 122,200 | | Vodafone Group PLC (United Kingdom) | | | 427,487 |
| 24,958 | | Vodafone Group PLC, ADR (United Kingdom) | | | 868,539 |
| | | | | |
| | | | | 15,421,890 |
| |
Textiles, Apparel & Luxury Goods 0.1% | | | |
| 17,900 | | Jones Apparel Group, Inc. | | | 300,720 |
| |
Thrifts & Mortgage Finance 0.6% | | | |
| 7,000 | | Countrywide Financial Corp. | | | 48,720 |
| 11,900 | | Fannie Mae | | | 402,934 |
| 26,500 | | Freddie Mac | | | 805,335 |
| 66,800 | | Washington Mutual, Inc. | | | 1,330,656 |
| | | | | |
| | | | | 2,587,645 |
See Notes to Financial Statements.
| | |
| Target Asset Allocation Funds/Target Moderate Allocation Fund | | 33 |
Portfolio of Investments
as of January 31, 2008 (Unaudited) continued
| | | | | |
| Shares | | Description | | Value (Note 1) |
| | | | | |
COMMON STOCKS (Continued) | | | |
| |
Tobacco Products 0.2% | | | |
| 3,000 | | Universal Corp. | | $ | 149,430 |
| 13,790 | | UST, Inc. | | | 716,528 |
| | | | | |
| | | | | 865,958 |
| |
Trading Companies & Distributors | | | |
| 600 | | Watsco, Inc. | | | 22,128 |
| |
Transportation 0.9% | | | |
| 14,200 | | Canadian National Railway Co. (Canada) | | | 718,592 |
| 10,800 | | J.B. Hunt Transport Services, Inc. | | | 335,880 |
| 47,000 | | Neptune Orient Lines Ltd. (Singapore) | | | 109,099 |
| 16,506 | | Norfolk Southern Corp. | | | 897,761 |
| 17,690 | | Orient Overseas International Ltd. (Bermuda) | | | 107,795 |
| 800 | | Overseas Shipholding Group, Inc. | | | 52,176 |
| 900 | | Ryder System, Inc. | | | 46,854 |
| 13,838 | | Union Pacific Corp. | | | 1,730,165 |
| | | | | |
| | | | | 3,998,322 |
| |
Utilities 1.0% | | | |
| 13,800 | | American Electric Power Co., Inc. | | | 591,054 |
| 20,000 | | CMS Energy Corp. | | | 313,400 |
| 4,000 | | DTE Energy Co. | | | 170,600 |
| 7,200 | | Duke Energy Corp. | | | 134,352 |
| 3,700 | | Dynegy, Inc. (Class A Stock)* | | | 25,974 |
| 5,637 | | E.ON AG (Germany) | | | 1,038,093 |
| 24,200 | | Edison International | | | 1,262,272 |
| 1,472 | | Headwaters, Inc.* | | | 16,589 |
| 1,900 | | Illinois Tool Works, Inc. | | | 95,760 |
| 7,500 | | Northeast Utilities | | | 207,900 |
| 3,300 | | SCANA Corp. | | | 123,057 |
| 2,350 | | Wisconsin Energy Corp. | | | 106,996 |
| 14,000 | | Xcel Energy, Inc. | | | 291,060 |
| | | | | |
| | | | | 4,377,107 |
| | | | | |
| | TOTAL COMMON STOCKS
(cost $270,206,220) | | | 295,033,314 |
| | | | | |
See Notes to Financial Statements.
| | |
| 34 | | Visit our website at www.prudential.com |
| | | | | | | | |
Moody’s
Ratings† | | Principal
Amount (000)# | | Description | | Value (Note 1) |
| | | | | | | | |
| ASSET-BACKED SECURITIES 0.1% | | | |
| | | | | Bear Stearns Commercial Mortgage Securities,
Series 2006-BBA7, Class A1, 144A
(original cost $381,679; purchased 06/05/06)(b)(d) |
| Aaa | | $ | 382 | | 4.346%(a), 03/15/19 | | $ | 371,253 |
| | | | | Brazos Student Finance Corp.,
Series 1998-A, Class A2 |
| Aaa | | | 54 | | 4.21%(a), 06/01/23 | | | 53,751 |
| | | | | Nelnet Student Loan Trust,
Series 2005-1, Class A2 |
| Aaa | | | 54 | | 3.341%(a), 01/26/15 | | | 53,690 |
| | | | | | | | |
| | | | | TOTAL ASSET-BACKED SECURITIES
(cost $486,781) | | | 478,694 |
| | | | | | | | |
| |
| COLLATERALIZED MORTGAGE OBLIGATIONS 1.4% | | | |
| | | | | Bank Trust Mortgage Trust,
Series 1, Class G |
| AAA(h) | | | 104 | | 5.70%, 12/01/23 | | | 102,167 |
| | | | | Bear Stearns Adjustable Rate Mortgage Trust,
Series 2005-4, Class 23A2 |
| Aaa | | | 242 | | 5.373%(a), 05/25/35 | | | 238,781 |
| | | | | Federal Home Loan Mortgage Corp.,
Series 119, Class H |
| Aaa | | | 38 | | 7.50%, 01/15/21 | | | 37,851 |
| | | | | Series 2266, Class F | | | |
| Aaa | | | 6 | | 4.686%(a), 11/15/30 | | | 5,745 |
| | | | | Series 3346, Class FA | | | |
| Aaa | | | 2,567 | | 4.466%(a), 02/15/19 | | | 2,549,231 |
| | | | | Federal National Mortgage Assoc.,
Series 1998-73, Class MZ |
| Aaa | | | 589 | | 6.30%, 10/17/38 | | | 593,223 |
| | | | | Series 2000-32, Class FM | | | |
| Aaa | | | 12 | | 4.439%(a), 10/18/30 | | | 11,994 |
| | | | | Series 2006-5, Class 3A2 | | | |
| Aaa | | | 1,200 | | 4.671%, 05/25/35 | | | 1,221,790 |
| | | | | Government National Mortgage Assoc.,
Series 2000-9, Class FH |
| Aaa | | | 33 | | 4.581%(a), 02/16/30 | | | 33,360 |
| | | | | GSR Mortgage Loan Trust,
Series 2005-AR6, Class 2A1 |
| Aaa | | | 432 | | 4.54%, 12/25/35 | | | 422,911 |
See Notes to Financial Statements.
| | |
| Target Asset Allocation Funds/Target Moderate Allocation Fund | | 35 |
Portfolio of Investments
as of January 31, 2008 (Unaudited) continued
| | | | | | | | |
Moody’s
Ratings† | | Principal
Amount (000)# | | Description | | Value (Note 1) |
| | | | | | | | |
| COLLATERALIZED MORTGAGE OBLIGATIONS (Continued) | | | |
| | | | | Structured Asset Mortgage Investments, Inc.,
Series 2005-AR7, Class A8 |
| Aaa | | $ | 161 | | 3.45%(a), 08/25/36 | | $ | 159,421 |
| | | | | Washington Mutual Mortgage Pass-Through
Certificates, Series 2003-R1, Class A1 |
| Aaa | | | 883 | | 3.916%(a), 12/25/27 | | | 843,363 |
| | | | | | | | |
| | | | | TOTAL COLLATERALIZED MORTGAGE OBLIGATIONS
(cost $6,279,594) | | | 6,219,837 |
| | | | | | | | |
| |
| CORPORATE BONDS 5.1% | | | |
| |
| Advertising 0.1% | | | |
| | | | | Omnicom Group, Inc., Gtd. Notes | | | |
| Baa1 | | | 300 | | 5.90%, 04/15/16 | | | 312,014 |
| |
| Automobile Manufacturers | | | |
| | | | | DaimlerChrysler NA Holding Corp., Gtd. Notes, MTN |
| A3 | | | 100 | | 5.75%, 09/08/11 | | | 104,003 |
| |
| Diversified Manufacturing 0.2% | | | |
| | | | | Siemens Financieringsmat NV, Gtd.
Notes, 144A (Netherlands)
(original cost $1,000,000; purchased 08/09/06)(b)(d) |
| A1 | | | 1,000 | | 4.92%(a), 08/14/09 | | | 1,000,597 |
| |
| Financial Services 3.4% | | | |
| | | | | Bank of America Corp., Notes | | | |
| Aa3 | | | 1,500 | | 8.00%(a), 12/29/49 | | | 1,558,125 |
| | | | | Bank of America Corp., Sr. Unsec’d. Notes |
| Aa1 | | | 2,800 | | 5.75%, 12/01/17 | | | 2,880,864 |
| | | | | Citigroup Capital XXI, Gtd. Notes |
| A1 | | | 1,400 | | 8.30%(a), 12/21/57 | | | 1,509,263 |
| | | | | General Electric Capital Corp., Sr. Unsec’d. Notes, MTN |
| Aaa | | | 2,200 | | 5.625%, 09/15/17 | | | 2,270,756 |
| | | | | General Electric Capital Corp., Sub. Notes, 144A
(original cost $1,399,944; purchased 08/30/07)(b)(d) |
| Aa1 | | GBP | 700 | | 6.50%(a), 09/15/47 | | | 1,367,664 |
| | | | | GMAC LLC, Sr. Unsec’d. Notes | | | |
| B1 | | | 700 | | 8.00%, 11/01/31 | | | 580,131 |
| | | | | Goldman Sachs Group, Inc. (The), Sub. Notes |
| A1 | | | 900 | | 6.75%, 10/01/37 | | | 882,945 |
See Notes to Financial Statements.
| | |
| 36 | | Visit our website at www.prudential.com |
| | | | | | | | |
Moody’s
Ratings† | | Principal
Amount (000)# | | Description | | Value (Note 1) |
| | | | | | | | |
| CORPORATE BONDS (Continued) | | | |
| |
| Financial Services (cont’d.) | | | |
| | | | | JPMorgan Chase Bank NA, Sub. Notes | | | |
| Aa1 | | $ | 1,400 | | 6.00%, 10/01/17 | | $ | 1,459,576 |
| | | | | Morgan Stanley, Sr. Unsec`d. Notes, MTN |
| Aa3 | | | 1,300 | | 5.75%, 10/18/16 | | | 1,299,241 |
| | | | | SLM Corp., Sr. Notes, MTN, 144A
(original cost $1,493,955; purchased 06/08/07)(b)(d) |
| Baa1 | | | 1,500 | | 3.944%(a), 04/18/08 | | | 1,489,233 |
| | | | | SLM Corp., Unsec’d. Notes | | | |
| Baa1 | | | 200 | | 4.246%(a), 04/14/08 | | | 198,637 |
| | | | | | | | |
| | | | | | | | 15,496,435 |
| |
| Food 0.3% | | | |
| | | | | Kraft Foods, Inc., Sr. Unsec’d. Notes | | | |
| Baa2 | | | 400 | | 6.125%, 02/01/18 | | | 406,020 |
| | | | | Kraft Foods, Inc., Sr. Unsec’d. Notes | | | |
| Baa2 | | | 900 | | 6.875%, 02/01/38 | | | 914,110 |
| | | | | | | | |
| | | | | | | | 1,320,130 |
| |
| Healthcare & Pharmaceuticals 0.2% | | | |
| | | | | HCA, Inc., Gtd. Notes, 144A | | | |
| B2 | | | 600 | | 9.25%, 11/15/16 | | | 631,500 |
| | | | | Merck & Co., Inc., Sr. Unsec’d. Notes | | | |
| Aa3 | | | 100 | | 4.75%, 03/01/15 | | | 101,997 |
| | | | | | | | |
| | | | | | | | 733,497 |
| |
| Paper & Forest Products 0.1% | | | |
| | | | | Georgia-Pacific Corp., Gtd. Notes, 144A
(original cost $300,000; purchased 12/13/06)(b)(d) |
| Ba3 | | | 300 | | 7.00%, 01/15/15 | | | 288,000 |
| | | | | Georgia-Pacific Corp., Gtd. Notes, 144A
(original cost $400,000; purchased 12/13/06)(b)(d) |
| Ba3 | | | 400 | | 7.125%, 01/15/17 | | | 381,000 |
| | | | | | | | |
| | | | | | | | 669,000 |
| |
| Real Estate Investment Trusts 0.1% | | | |
| | | | | Nationwide Health Properties, Inc., Unsec’d. Notes |
| Baa3 | | | 200 | | 6.50%, 07/15/11 | | | 212,226 |
| |
| Telecommunications 0.3% | | | |
| A2 | | | 400 | | BellSouth Corp., Sr. Unsec’d. Notes
4.969%(a), 08/15/08 | | | 399,590 |
See Notes to Financial Statements.
| | |
| Target Asset Allocation Funds/Target Moderate Allocation Fund | | 37 |
Portfolio of Investments
as of January 31, 2008 (Unaudited) continued
| | | | | | | | |
Moody’s
Ratings† | | Principal
Amount (000)# | | Description | | Value (Note 1) |
| | | | | | | | |
| CORPORATE BONDS (Continued) | | | |
| |
| Telecommunications (cont’d.) | | | |
| Baa3 | | $ | 1,000 | | Embarq Corp., Sr. Unsec’d. Notes
7.082%, 06/01/16 | | $ | 1,012,123 |
| | | | | | | | |
| | | | | | | | 1,411,713 |
| |
| Utilities - Electric 0.4% | | | |
| Aaa | | | 1,500 | | General Electric Capital Corp.,
Sr. Unsec’d. Notes
5.875%, 01/14/38 | | | 1,465,854 |
| Baa3 | | | 368 | | Midwest Generation LLC, Pass-Through Certificates, Series A
8.30%, 07/02/09 | | | 372,864 |
| | | | | | | | |
| | | | | | | | 1,838,718 |
| | | | | | | | |
| | | | | TOTAL CORPORATE BONDS
(cost $22,769,666) | | | 23,098,333 |
| | | | | | | | |
|
| FOREIGN GOVERNMENT BONDS 1.1% |
| Aaa | | EUR | 800 | | Deutsche Bundesrepublik
6.25%, 01/04/30 | | | 1,484,085 |
| Aaa | | EUR | 800 | | French Government Bond
5.75%, 10/25/32 | | | 1,403,458 |
| Ba1 | | BRL | 1,800 | | Republic of Brazil
12.50%, 01/05/22 | | | 1,123,081 |
| Aa2 | | JPY | 54,000 | | Republic of Italy
3.80%, 03/27/08 | | | 509,794 |
| Ba1 | | | 120 | | Republic of Panama
9.625%, 02/08/11 | | | 136,500 |
| Aaa | | GBP | 200 | | United Kingdom Gilt
5.75%, 12/07/09 | | | 407,891 |
| | | | | | | | |
| | | | | TOTAL FOREIGN GOVERNMENT BONDS
(cost $4,898,091) | | | 5,064,809 |
| | | | | | | | |
|
| MUNICIPAL BONDS 0.2% |
| Aa1 | | | 500 | | Arizona Agricultural Improvement & Power District, Salt River Project, Revenue Bonds
4.75%, 01/01/32 | | | 505,440 |
| Aaa | | | 200 | | Georgia State Road & Tollway Authority, Revenue Bonds
5.00%, 03/01/21 | | | 210,306 |
| | | | | | | | |
| | | | | TOTAL MUNICIPAL BONDS
(cost $695,376) | | | 715,746 |
| | | | | | | | |
See Notes to Financial Statements.
| | |
| 38 | | Visit our website at www.prudential.com |
| | | | | | |
Principal
Amount (000)# | | Description | | Value (Note 1) |
| | | | | | |
| | U.S. GOVERNMENT MORTGAGE-BACKED OBLIGATIONS 27.4% | | | |
| $ | 327 | | Federal Home Loan Mortgage Corp.
4.365%(a), 09/01/35 | | $ | 325,861 |
| | 1,989 | | 5.50%, 09/01/37 | | | 2,014,498 |
| | 405 | | 6.00%, 04/01/16 - 09/01/22 | | | 419,179 |
| | 8,009 | | Federal National Mortgage Assoc.
4.00%, 08/01/18 - 01/01/20 | | | 7,897,460 |
| | 2,354 | | 4.50%, 01/01/22 - 09/01/35 | | | 2,317,375 |
| | 257 | | 4.533%(a), 12/01/34 | | | 261,002 |
| | 10,931 | | 5.00%, 02/01/19 - 11/01/33 | | | 10,906,530 |
| | 81 | | 5.496%(a), 05/01/36 | | | 81,144 |
| | 35,883 | | 5.50%, 07/01/14 - 12/01/37 | | | 36,380,964 |
| | 5,000 | | 5.50%, TBA | | | 5,065,625 |
| | 291 | | 5.862%(a), 06/01/43 | | | 291,601 |
| | 12,501 | | 6.00%, 03/01/17 - 07/01/37 | | | 12,830,699 |
| | 117 | | 6.114%(a), 09/01/34 | | | 119,349 |
| | 3,000 | | 6.50%, TBA | | | 3,113,436 |
| | 50 | | Government National Mortgage Assoc.
4.50%, 08/15/33 | | | 49,248 |
| | 12,353 | | 5.00%, 11/15/36 - 06/15/37 | | | 12,388,026 |
| | 21 | | 5.125%, 10/20/27 - 11/20/29 | | | 21,797 |
| | 12,902 | | 5.50%, 01/15/32 - 12/15/37 | | | 13,159,001 |
| | 2,000 | | 5.50%, TBA | | | 2,038,750 |
| | 7 | | 5.625%(a), 09/20/22 | | | 7,431 |
| | 9,000 | | 6.00%, TBA | | | 9,292,500 |
| | 5,000 | | 6.50%, TBA | | | 5,204,690 |
| | 11 | | 8.50%, 05/20/30 - 04/20/31 | | | 11,331 |
| | | | | | |
| | | TOTAL U.S. GOVERNMENT MORTGAGE-BACKED OBLIGATIONS
(cost $121,857,598) | | | 124,197,497 |
| | | | | | |
|
| | U.S. TREASURY OBLIGATIONS 7.1% |
| | 1,500 | | U.S. Treasury Bonds
5.00%, 05/15/37 | | | 1,661,367 |
| | 1,100 | | U.S. Treasury Inflation Index Bonds, TIPS
1.75%, 01/15/28 | | | 1,112,665 |
| | 100 | | 2.00%, 01/15/16 | | | 112,772 |
| | 3,300 | | 2.00%, 07/15/14 | | | 3,922,563 |
| | 200 | | 2.375%, 01/15/27 | | | 231,945 |
| | 700 | | 2.375%, 01/15/25 | | | 860,408 |
| | 800 | | 2.50%, 07/15/16 | | | 921,195 |
| | 5,000 | | U.S. Treasury Notes
4.25%, 11/15/17 | | | 5,250,780 |
See Notes to Financial Statements.
| | |
| Target Asset Allocation Funds/Target Moderate Allocation Fund | | 39 |
Portfolio of Investments
as of January 31, 2008 (Unaudited) continued
| | | | | | | | |
Moody’s
Ratings† | | Principal
Amount (000)# | | Description | | Value (Note 1) |
| | | | | | | | |
| U.S. TREASURY OBLIGATIONS (Continued) | | | |
| | | | | U.S. Treasury Notes (cont’d.) | | | |
| | $ | 2,400 | | 4.625%(a), 02/15/17 | | $ | 2,587,126 |
| | | 1,500 | | 5.125%, 06/30/11-05/15/16 | | | 1,653,046 |
| | | 12,300 | | 5.13%, 11/15/14 | | | 13,069,709 |
| | | 1,250 | | U.S. Treasury Strip, PO
7.25%, 02/15/22 | | | 670,165 |
| | | | | | | | |
| | | | | TOTAL U.S. TREASURY OBLIGATIONS
(cost $32,009,190) | | | 32,053,741 |
| | | | | | | | |
|
| BANK LOANS 0.3% |
| Ba- | | | 1,097 | | Chrysler Finco Term, 144A
(original cost $1,045,000; purchased 07/31/07)(b)(d)
8.99%, 08/03/12 | | | 981,764 |
| | | | | Ford Motor Co. Term B, 144A
(original cost $495,000; purchased 12/12/06)(b)(d) | | | |
| Ba- | | | 495 | | 8.00%, 12/15/13 | | | 432,000 |
| | | | | | | | |
| | | | | TOTAL BANK LOANS
(cost $1,540,954) | | | 1,413,764 |
| | | | | | | | |
| | | | | TOTAL LONG-TERM INVESTMENTS
(cost $460,743,470) | | | 488,275,735 |
| | | | | | | | |
|
| SHORT-TERM INVESTMENTS 5.4% |
|
| U.S. TREASURY OBLIGATIONS 0.4% |
| | | | | U.S. Treasury Bills(c)(f) | | | |
| | | 500 | | 2.06%, 03/13/08 | | | 498,827 |
| | | 560 | | 2.91%, 03/13/08 | | | 558,061 |
| | | 435 | | 2.955%, 03/13/08 | | | 433,494 |
| | | 150 | | 2.971%, 02/28/08 | | | 149,674 |
| | | 70 | | 3.058%, 02/28/08 | | | 69,848 |
| | | | | | | | |
| | | | | TOTAL U.S. TREASURY OBLIGATIONS
(cost $1,710,012) | | | 1,709,904 |
| | | | | | | | |
| | | |
| | | Shares | | | | |
|
| AFFILIATED MONEY MARKET MUTUAL FUND 4.2% |
| | | 18,889,822 | | Dryden Core Investment Fund—Taxable Money Market Series
(cost $18,889,822)(e) | | | 18,889,822 |
| | | | | | | | |
See Notes to Financial Statements.
| | |
| 40 | | Visit our website at www.prudential.com |
| | | | | | |
Contracts/
Notional Amount (000)# | | Description | | Value (Note 1) |
| | | | | | |
| | OUTSTANDING OPTIONS PURCHASED* 0.8% |
|
| | Call Options 0.8% |
| $ | 16,000 | | 2 Year U.S. Treasury Note Futures,
expiring 02/22/2008, Strike Price $112.00 | | $ | 1,250 |
| | 16,100 | | 5 Year U.S. Treasury Note Futures,
expiring 02/22/2008, Strike Price $134.00 | | | 2,516 |
| | 2,400 | | 20 Year U.S. Treasury Bond Futures,
expiring 02/22/2008, Strike Price $139.00 | | | 375 |
| | 1,700 | | Currency Option on USD vs JPY,
expiring 09/16/2008 @ FX Rate 118.00 | | | 1,885 |
| | 156,000 | | Eurodollar Futures,
expiring 03/17/2008, Strike Price $95.00 | | | 817,050 |
| | 26,600 | | Interest Rate Swap Option,
expiring 12/19/2008 @ 4.50% | | | 696,796 |
| | EUR 62,500 | | expiring 04/20/2009 @ 4.18% | | | 826,976 |
| | | Swap on 3 Month LIBOR, | | | |
| | 10,600 | | expiring 09/19/2008 @ 4.55% | | | 309,660 |
| | 20,400 | | expiring 09/26/2008 @ 4.75% | | | 665,469 |
| | 13,600 | | expiring 12/31/2008 @ 4.72% | | | 401,199 |
| | | | | | |
| | | | | | 3,723,176 |
| | | | | | |
|
| | Put Options |
| | | 90 Day Sterling Futures, | | | |
| | GBP 22,000 | | expiring 03/19/2008, Strike Price $92.75 | | | — |
| | GBP 35,000 | | expiring 03/19/2008, Strike Price $93.00 | | | — |
| | GBP 38,500 | | expiring 06/18/2008, Strike Price $92.50 | | | — |
| | | EURIBOR Futures, | | | |
| | EUR 10,000 | | expiring 03/17/2008, Strike Price $95.12 | | | — |
| | | Eurodollar Futures, | | | |
| | 255,000 | | expiring 03/17/2008, Strike Price $91.75 | | | 1,594 |
| | 68,000 | | expiring 03/17/2008, Strike Price $92.25 | | | 425 |
| | 104,000 | | expiring 03/17/2008, Strike Price $92.50 | | | 650 |
| | | Federal National Mortgage Assoc., | | | |
| | 2,000 | | expiring 02/05/2008, Strike Price $87.00 | | | — |
| | 4,000 | | expiring 04/07/2008, Strike Price $86.00 | | | 88 |
| | | Swap on 3 Month LIBOR, | | | |
| | 10,000 | | expiring 04/07/2008, Strike Price $91.00 | | | 240 |
| | | | | | |
| | | | | | 2,997 |
| | | | | | |
| | | TOTAL OUTSTANDING OPTIONS PURCHASED
(cost $1,199,124) | | | 3,726,173 |
| | | | | | |
| | | TOTAL SHORT-TERM INVESTMENTS
(cost $21,798,958) | | | 24,325,899 |
| | | | | | |
| | | TOTAL INVESTMENTS, BEFORE SECURITIES SOLD SHORT AND OUTSTANDING OPTIONS WRITTEN 113.4%
(cost $482,542,428; Note 5)(g) | | | 512,601,634 |
| | | | | | |
See Notes to Financial Statements.
| | |
| Target Asset Allocation Funds/Target Moderate Allocation Fund | | 41 |
Portfolio of Investments
as of January 31, 2008 (Unaudited) continued
| | | | | | | |
Principal
Amount (000)# | | Description | | Value (Note 1) | |
| | | | | | | |
| | SECURITIES SOLD SHORT (8.7)% | | | | |
| | | Government National Mortgage Assoc. | | | | |
| $ | 12,000 | | 5.00%, TBA | | $ | (12,026,256 | ) |
| | | U.S. Treasury Bonds | | | | |
| | 300 | | 4.75%, 02/15/37 | | | (319,594 | ) |
| | 900 | | 5.375%, 02/15/31 | | | (1,031,415 | ) |
| | | U.S. Treasury Notes | | | | |
| | 12,300 | | 4.25%, 11/15/14 | | | (13,069,709 | ) |
| | 1,400 | | 4.25%, 11/15/17 | | | (1,470,218 | ) |
| | 10,600 | | 4.625%, 02/15/17 | | | (11,426,471 | ) |
| | | | | | | |
| | | TOTAL SECURITIES SOLD SHORT
(proceeds received $38,053,225) | | | (39,343,663 | ) |
| | | | | | | |
Contracts/
Notional
Amount (000)# | | | | | |
| |
| | OUTSTANDING OPTIONS WRITTEN* (0.5)% | | | | |
| |
| | Call Options (0.5)% | | | | |
| | | Swap on 3 Month LIBOR, | | | | |
| | 3,500 | | expiring 09/19/2008 @ 5.05% | | | (218,779 | ) |
| | 8,900 | | expiring 09/26/2008 @ 4.95% | | | (497,518 | ) |
| | 8,800 | | expiring 12/19/2008 @ 5.00% | | | (500,833 | ) |
| | 4,500 | | expiring 12/31/2008 @ 5.22% | | | (299,820 | ) |
| | EUR 20,200 | | expiring 04/20/2009 @ 4.44% | | | (628,058 | ) |
| | | | | | | |
| | | | | | (2,145,008 | ) |
| | | | | | | |
| |
| | Put Option | | | | |
| | | Currency Option on USD vs JPY, | | | | |
| | 800 | | expiring 09/16/2008 @ FX Rate 100.00 | | | (14,309) | |
| | | | | | | |
| | | TOTAL OUTSTANDING OPTIONS WRITTEN
(premiums received $950,881) | | | (2,159,317 | ) |
| | | | | | | |
| | | TOTAL INVESTMENTS, NET OF SECURITIES SOLD SHORT AND OUTSTANDING OPTIONS WRITTEN 104.2%
(cost $443,538,322; Note 5) | | | 471,098,654 | |
| | | Other liabilities in excess of other assets(j) (4.2)% | | | (19,039,076 | ) |
| | | | | | | |
| | | NET ASSETS 100% | | $ | 452,059,578 | |
| | | | | | | |
The following abbreviations are used in portfolio descriptions:
144A—Security was purchased pursuant to Rule 144A under the securities Act of 1933 and may not be resold subject to that rule except to qualified institutional buyers. Unless otherwise noted, 144A securities are deemed to be liquid.
ADR—American Depositary Receipt
See Notes to Financial Statements.
| | |
| 42 | | Visit our website at www.prudential.com |
MTN—Medium Term Note
PO—Principal Only Securities
TBA—To Be Announced
TIPS—Treasury Inflation Protected Securities
AUD—Australian Dollar
BRL—Brazilian Real
CHF—Swiss Franc
CNY—Chinese Yuan
EUR—Euro
GBP—British Pound
INR—Indian Rupee
JPY—Japanese Yen
KRW—South Korean Won
MXN—Mexico Peso
RUB—Russian Ruble
| † | The ratings reflected are as of January 31, 2008. Ratings of certain bonds may have changed subsequent to that date. |
| # | Principal and notional amount is shown in U.S. dollars unless otherwise stated. |
| * | Non-income producing security. |
| (a) | Indicates a variable rate security. |
| (b) | Private Placement restricted as to resale and does not have a readily available market. The aggregate original cost of such securities is $6,515,578. The aggregate value of $6,311,511 is approximately 1.4% of net assets. |
| (c) | Securities segregated as collateral for futures contracts. |
| (d) | Indicates a security that has been deemed illiquid. |
| (e) | Prudential Investments LLC, the manager of the Fund, also serves as manager of the Dryden Core Investment Fund—Taxable Money Market Series. |
| (f) | Rates shown are the effective yields at purchase date. |
| (g) | As of January 31, 2008, 171 securities representing $53,790,223 and 11.9% of net assets were fair valued in accordance with policies adopted by the Board of Trustees. |
| (h) | Standard & Poor’s rating. |
See Notes to Financial Statements.
| | |
| Target Asset Allocation Funds/Target Moderate Allocation Fund | | 43 |
Portfolio of Investments
as of January 31, 2008 (Unaudited) continued
| (j) | Other liabilities in excess of other assets includes net unrealized appreciation (depreciation) on futures contracts, forward foreign currency exchange contracts and swap agreements as follows: |
Futures contracts open at January 31, 2008:
| | | | | | | | | | | | | | |
Number of
Contracts | | Type | | Expiration
Date | | Value at
Trade
Date | | Value at
January 31,
2008 | | Unrealized
Appreciation
(Depreciation) | |
| | Long Positions: | | | | | | | | | | | | |
| 89 | | 90 Day Euro | | Jun 08 | | $ | 21,410,063 | | $ | 21,695,975 | | $ | 285,912 | |
| 141 | | 90 Day Euro | | Dec 08 | | | 33,756,226 | | | 34,345,839 | | | 589,613 | |
| 23 | | 90 Day Euro | | Jun 09 | | | 5,489,525 | | | 5,581,238 | | | 91,713 | |
| 19 | | 90 Day Euro | | Sep 09 | | | 4,535,063 | | | 4,602,513 | | | 67,450 | |
| 18 | | 90 Day Euro | | Dec 09 | | | 4,291,650 | | | 4,353,075 | | | 61,425 | |
| 96 | | 90 Day Euro EURIBOR | | Jun 08 | | | 34,112,066 | | | 34,276,794 | | | 164,728 | |
| 20 | | 90 Day Sterling | | Mar 08 | | | 4,687,972 | | | 4,701,917 | | | 13,945 | |
| 77 | | 90 Day Sterling | | Sep 08 | | | 18,114,660 | | | 18,221,047 | | | 106,387 | |
| 90 | | 90 Day Sterling | | Dec 08 | | | 21,163,250 | | | 21,328,647 | | | 165,397 | |
| 17 | | 90 Day Sterling | | Jun 09 | | | 3,967,472 | | | 4,031,702 | | | 64,230 | |
| 5 | | 10 Year EURO-BUND | | Mar 08 | | | 863,476 | | | 867,416 | | | 3,940 | |
| 65 | | 10 Year U.S. Treasury Notes | | Mar 08 | | | 7,566,047 | | | 7,586,719 | | | 20,672 | |
| 19 | | S&P 500 Mini | | Mar 08 | | | 1,270,625 | | | 1,310,620 | | | 39,995 | |
| | | | | | | | | | | | | | |
| | | | | | | | | | | | $ | 1,675,407 | |
| | | | | | | | | | | | | | |
| | Short Positions: | | | | | | | | | | | | |
| 11 | | 90 Day Euro | | Mar 08 | | $ | 2,654,163 | | $ | 2,670,113 | | $ | (15,950 | ) |
| 12 | | 90 Day Euro EURIBOR | | Sep 08 | | | 4,272,334 | | | 4,295,527 | | | (23,193 | ) |
| 75 | | 90 Day Sterling | | Jun 08 | | | 17,609,817 | | | 17,699,302 | | | (89,485 | ) |
| 80 | | 2 Year U.S. Treasury Notes | | Mar 08 | | | 16,852,500 | | | 17,057,500 | | | (205,000 | ) |
| 195 | | 5 Year U.S. Treasury Notes | | Mar 08 | | | 21,388,047 | | | 22,035,000 | | | (646,953 | ) |
| 79 | | 30 Year U.S. Treasury Bonds | | Mar 08 | | | 9,067,219 | | | 9,425,688 | | | (358,469 | ) |
| | | | | | | | | | | | | | |
| | | | | | | | | | | | | (1,339,050 | ) |
| | | | | | | | | | | | | | |
| | | | | | | | | | | | $ | 336,357 | |
| | | | | | | | | | | | | | |
See Notes to Financial Statements.
| | |
| 44 | | Visit our website at www.prudential.com |
Forward foreign currency exchange contracts outstanding at January 31, 2008:
| | | | | | | | | | | | | |
| Purchase Contracts | | Notional
Amount
(000) | | Value at Settlement
Date Payable | | Current
Value | | Unrealized
Appreciation
(Depreciation) | |
| Brazilian Real, | | | | | | | | | | | | | |
| Expiring 07/02/08 | | BRL | 4,418 | | $ | 2,241,574 | | $ | 2,441,778 | | $ | 200,204 | |
| Chinese Yuan, | | | | | | | | | | | | | |
| Expiring 02/27/08 | | CNY | 723 | | | 100,000 | | | 101,255 | | | 1,255 | |
| Expiring 03/05/08 | | CNY | 12,490 | | | 1,701,000 | | | 1,753,660 | | | 52,660 | |
| Expiring 10/10/08 | | CNY | 14,015 | | | 2,041,571 | | | 2,071,735 | | | 30,164 | |
| Indian Rupee, | | | | | | | | | | | | | |
| Expiring 05/12/08 | | INR | 140,357 | | | 3,415,069 | | | 3,540,565 | | | 125,496 | |
| Japanese Yen, | | | | | | | | | | | | | |
| Expiring 02/07/08 | | JPY | 170,969 | | | 1,540,275 | | | 1,608,462 | | | 68,187 | |
| Mexican Peso, | | | | | | | | | | | | | |
| Expiring 03/13/08 | | MXN | 5,950 | | | 522,000 | | | 547,172 | | | 25,172 | |
| Expiring 06/06/08 | | MXN | 2,000 | | | 181,570 | | | 182,025 | | | 455 | |
| Russian Ruble, | | | | | | | | | | | | | |
| Expiring 07/10/08 | | RUB | 53,243 | | | 2,100,000 | | | 2,160,572 | | | 60,572 | |
| Expiring 11/19/08 | | RUB | 42,243 | | | 1,703,703 | | | 1,696,479 | | | (7,224 | ) |
| South Korean Won, | | | | | | | | | | | | | |
| Expiring 08/04/08 | | KRW | 1,167,795 | | | 1,263,446 | | | 1,233,647 | | | (29,799 | ) |
| | | | | | | | | | | | | |
| | | | | $ | 16,810,208 | | $ | 17,337,350 | | $ | 527,142 | |
| | | | | | | | | | | | | |
| | | | |
| Sale Contracts | | Notional
Amount
(000) | | Value at Settlement
Date Receivable | | Current
Value | | Unrealized
Appreciation
(Depreciation) | |
| Brazilian Real, | | | | | | | | | | | | | |
| Expiring 07/02/08 | | BRL | 3,898 | | $ | 2,149,000 | | $ | 2,154,266 | | $ | (5,266 | ) |
| British Pound, | | | | | | | | | | | | | |
| Expiring 03/06/08 | | GBP | 1,521 | | | 3,010,591 | | | 3,018,372 | | | (7,781 | ) |
| Euros, | | | | | | | | | | | | | |
| Expiring 02/26/08 | | EUR | 2,375 | | | 3,502,671 | | | 3,528,597 | | | (25,926 | ) |
| Expiring 06/24/08 | | EUR | 1,450 | | | 2,080,460 | | | 2,144,809 | | | (64,349 | ) |
| Indian Rupee, | | | | | | | | | | | | | |
| Expiring 05/12/08 | | INR | 80,468 | | | 2,031,000 | | | 2,029,843 | | | 1,157 | |
| Japanese Yen, | | | | | | | | | | | | | |
| Expiring 02/07/08 | | JPY | 34,416 | | | 321,000 | | | 323,622 | | | (2,622 | ) |
| Mexican Peso, | | | | | | | | | | | | | |
| Expiring 03/13/08 | | MXN | 5,950 | | | 538,970 | | | 547,173 | | | (8,203 | ) |
| Expiring 06/06/08 | | MXN | 14,100 | | | 1,272,333 | | | 1,283,279 | | | (10,946 | ) |
| Russian Ruble, | | | | | | | | | | | | | |
| Expiring 07/10/08 | | RUB | 22,942 | | | 933,000 | | | 930,995 | | | 2,005 | |
| Swiss Franc, | | | | | | | | | | | | | |
| Expiring 06/24/08 | | CHF | 732 | | | 638,743 | | | 678,561 | | | (39,818 | ) |
| | | | | | | | | | | | | |
| | | | | $ | 16,477,768 | | $ | 16,639,517 | | $ | (161,749 | ) |
| | | | | | | | | | | | | |
See Notes to Financial Statements.
| | |
| Target Asset Allocation Funds/Target Moderate Allocation Fund | | 45 |
Portfolio of Investments
as of January 31, 2008 (Unaudited) continued
The Fund entered into interest rate swap agreements during the six months ended January 31, 2008. Details of the interest rate swap agreements outstanding as of January 31, 2008 were as follows:
| | | | | | | | | | | | | |
Counterparty | | Termination
Date | | Notional
Amount# | | Fixed
Rate | | Floating Rate | | Unrealized
Appreciation
(Depreciation) | |
Bank of America Securities LLC(1) | | 06/18/23 | | $ | 3,400,000 | | 5.00% | | 3 Month LIBOR | | $ | 111,571 | |
Bank of America Securities LLC(1) | | 06/18/10 | | | 25,000,000 | | 4.00% | | 3 Month LIBOR | | | (40,330 | ) |
Bank of America Securities LLC(2) | | 06/15/35 | | | 700,000 | | 6.00% | | 3 Month LIBOR | | | 128,208 | |
Bank of America Securities LLC(2) | | 06/18/08 | | | 2,900,000 | | 5.00% | | 3 Month LIBOR | | | 2,459 | |
Barclays Capital, Inc.(2) | | 06/18/13 | | | 15,200,000 | | 4.00% | | 3 Month LIBOR | | | 462,744 | |
Citigroup, Inc.(1) | | 06/20/17 | | | 4,300,000 | | 5.00% | | 3 Month LIBOR | | | (206,119 | ) |
Citigroup, Inc.(1) | | 06/18/23 | | | 3,400,000 | | 5.00% | | 3 Month LIBOR | | | 104,304 | |
Deutsche Bank(1) | | 06/18/38 | | | 3,200,000 | | 5.00% | | 3 Month LIBOR | | | (180,446 | ) |
Deutsche Bank(2) | | 06/18/15 | | | 3,100,000 | | 5.00% | | 3 Month LIBOR | | | 84,642 | |
Lehman Brothers, Inc.(1) | | 06/18/23 | | | 1,500,000 | | 5.00% | | 3 Month LIBOR | | | (17,727 | ) |
Morgan Stanley & Co.(1) | | 06/18/10 | | | 14,400,000 | | 4.00% | | 3 Month LIBOR | | | (26,012 | ) |
Morgan Stanley & Co.(2) | | 06/18/13 | | | 31,800,000 | | 4.00% | | 3 Month LIBOR | | | 990,872 | |
Citigroup, Inc.(2) | | 04/15/09 | | AUD | 7,000,000 | | 7.00% | | 3 month Australian
Bank Bill rate | | | (50,526 | ) |
Citigroup, Inc.(2) | | 09/15/09 | | AUD | 18,900,000 | | 7.00% | | 3 month Australian
Bank Bill rate | | | (55,112 | ) |
UBS AG(2) | | 09/15/09 | | AUD | 13,800,000 | | 7.00% | | 3 month Australian
Bank Bill rate | | | (41,343 | ) |
Morgan Stanley & Co.(2) | | 12/15/09 | | AUD | 3,000,000 | | 7.00% | | 6 month Australian
Bank Bill rate | | | (36,353 | ) |
Goldman Sachs & Co.(2) | | 01/02/12 | | BRL | 5,900,000 | | 10.15% | | Brazilian interbank
lending rate | | | (241,349 | ) |
Morgan Stanley & Co.(2) | | 01/02/12 | | BRL | 7,800,000 | | 10.12% | | Brazilian interbank
lending rate | | | (279,697 | ) |
UBS AG(2) | | 01/02/12 | | BRL | 6,000,000 | | 10.58% | | Brazilian interbank
lending rate | | | (151,716 | ) |
Barclays Capital, Inc.(2) | | 06/15/10 | | EUR | 6,900,000 | | 4.50% | | 6 Month EURIBOR | | | 80,659 | |
Deutsche Bank(2) | | 06/18/34 | | EUR | 900,000 | | 5.00% | | 6 Month EURIBOR | | | 2,538 | |
Deutsche Bank(2) | | 06/15/13 | | EUR | 2,100,000 | | 4.00% | | 6 Month EURIBOR | | | 32,332 | |
UBS AG(2) | | 10/15/10 | | EUR | 100,000 | | 2.15% | | FRC—Excluding
Tobacco—Non-
Revised Consumer
Price Index | | | 1,332 | |
See Notes to Financial Statements.
| | |
| 46 | | Visit our website at www.prudential.com |
| | | | | | | | | | | | | |
Counterparty | | Termination
Date | | Notional
Amount# | | Fixed
Rate | | Floating Rate | | Unrealized
Appreciation
(Depreciation) | |
Barclays Capital, Inc.(2) | | 09/15/10 | | GBP | 3,500,000 | | 5.00% | | 6 Month LIBOR | | $ | 60,435 | |
Barclays Capital, Inc.(1) | | 06/20/17 | | JPY | 30,000,000 | | 2.00% | | 6 Month LIBOR | | | (3,407 | ) |
UBS AG(1) | | 06/20/17 | | JPY | 60,000,000 | | 2.00% | | 6 Month LIBOR | | | (9,369 | ) |
Merrill Lynch & Co., Inc.(2) | | 11/04/16 | | MXN | 31,000,000 | | 8.17% | | 28 day Mexican
interbank rate | | | (127,686 | ) |
| | | | | | | | | | | | | |
| | | | | | | | | | | $ | 594,904 | |
| | | | | | | | | | | | | |
| (1) | Fund pays the fixed rate and receives the floating rate. |
| (2) | Fund pays the floating rate and receives the fixed rate. |
| # | Notional Amount is shown in U.S. dollars unless otherwise stated. |
The Fund entered into credit default swap agreements during the six months ended January 31, 2008. Details of the dredit default swap agreements outstanding as of January 31, 2008 were as follows:
| | | | | | | | | | | | | |
Counterparty | | Termination
Date | | Notional
Amount# | | Fixed
Rate | | Reference Entity/
Obligation | | Unrealized
Appreciation
(Depreciation) | |
Credit Suisse International(2) | | 08/25/37 | | $ | 800,000 | | 0.09% | | ABX HE AAA 07-1 | | $ | 12,928 | |
Morgan Stanley & Co.(1) | | 12/20/08 | | | 200,000 | | 0.26% | | Allstate Corp.,
6.125%, due 02/15/12 | | | 146 | |
UBS AG(1) | | 12/20/08 | | | 200,000 | | 0.35% | | AutoZone, Inc.,
5.875%, due 10/15/12 | | | 69 | |
Barclays Capital, Inc.(1) | | 09/20/11 | | | 100,000 | | 0.54% | | DaimlerChrysler N.A.,
5.75%, due 09/08/11 | | | 241 | |
Lehman Brothers, Inc.(1) | | 12/20/11 | | | 700,000 | | 0.00% | | Dow Jones CDX HY7 Index | | | 17,307 | |
Merrill Lynch & Co.(1) | | 12/20/11 | | | 300,000 | | 0.00% | | Dow Jones CDX HY7 Index | | | 52,949 | |
Morgan Stanley & Co.(2) | | 06/20/12 | | | 1,600,000 | | 2.08% | | Dow Jones CDX HY8 Index | | | (107,242 | ) |
Citigroup, Inc.(1) | | 06/20/12 | | | 6,700,000 | | 0.47% | | Dow Jones CDX HY8 Index | | | (144,446 | ) |
Merrill Lynch & Co.(1) | | 06/20/12 | | | 2,500,000 | | 2.75% | | Dow Jones CDX HY8 Index | | | 157,506 | |
Citigroup, Inc.(1) | | 06/20/12 | | | 300,000 | | 2.14% | | Dow Jones CDX HY8 Index | | | (19,379 | ) |
Deutsche Bank(2) | | 12/20/12 | | | 1,800,000 | | 3.75% | | Dow Jones CDX HY9 Index | | | (66,372 | ) |
Morgan Stanley & Co.(2) | | 12/20/15 | | | 530,000 | | 0.46% | | Dow Jones CDX IG5 Index | | | (49,919 | ) |
Morgan Stanley & Co.(1) | | 12/20/12 | | | 700,000 | | 0.14% | | Dow Jones CDX IG5 Index | | | 47,747 | |
Morgan Stanley & Co.(2) | | 12/20/15 | | | 1,900,000 | | 0.46% | | Dow Jones CDX IG5 Index | | | (178,308 | ) |
Morgan Stanley & Co.(1) | | 12/20/12 | | | 2,700,000 | | 0.14% | | Dow Jones CDX IG5 Index | | | 184,168 | |
Goldman Sachs & Co.(1) | | 12/20/16 | | | 100,000 | | 0.65% | | Dow Jones CDX IG7 Index | | | 4,751 | |
Barclays Capital, Inc.(1) | | 12/20/11 | | | 1,300,000 | | 0.75% | | Dow Jones CDX IG7 Index | | | 80,322 | |
Morgan Stanley & Co.(1) | | 12/20/16 | | | 1,200,000 | | 0.65% | | Dow Jones CDX IG7 Index | | | 57,505 | |
See Notes to Financial Statements.
| | |
| Target Asset Allocation Funds/Target Moderate Allocation Fund | | 47 |
Portfolio of Investments
as of January 31, 2008 (Unaudited) continued
| | | | | | | | | | | | | |
Counterparty | | Termination
Date | | Notional
Amount# | | Fixed
Rate | | Reference Entity/
Obligation | | Unrealized
Appreciation
(Depreciation) | |
Goldman Sachs & Co.(1) | | 12/20/17 | | $ | 1,300,000 | | 0.80% | | Dow Jones CDX IG9
Index | | $ | 36,495 | |
JPMorgan Chase Bank(1) | | 12/20/11 | | | 1,000,000 | | 1.65% | | Dow Jones CDX XO7
Index | | | 55,635 | |
Bank of America Securities LLC(1) | | 12/20/08 | | | 100,000 | | 0.13% | | E.I. DuPont,
6.875%, due 10/15/09 | | | 4 | |
Citigroup, Inc.(1) | | 12/20/08 | | | 100,000 | | 0.28% | | Eaton Corp.,
5.75%, due 07/15/12 | | | (2 | ) |
Barclays Capital, Inc.(1) | | 12/20/08 | | | 200,000 | | 0.16% | | Eli Lilly & Co.,
6.00%, due 03/15/12 | | | (225 | ) |
Morgan Stanley & Co.(1) | | 12/20/08 | | | 100,000 | | 0.21% | | Emerson Electric Co.,
6.48%, due 10/15/12 | | | (56 | ) |
Lehman Brothers, Inc.(2) | | 02/20/12 | | | 350,000 | | 0.93% | | Federal Republic of
Brazil,
12.25%, due 03/06/30 | | | (2,045 | ) |
Citigroup, Inc.(1) | | 12/20/08 | | | 100,000 | | 0.29% | | FedEx Corp.,
7.25%, due 02/15/11 | | | (98 | ) |
Lehman Brothers, Inc.(1) | | 12/20/08 | | | 100,000 | | 0.97% | | Goodrich Corp.,
7.625%, due 12/15/12 | | | (844 | ) |
Bear Stearns International Ltd.(1) | | 12/20/08 | | | 100,000 | | 0.32% | | Hewlett Packard Co.,
6.50%, due 07/01/12 | | | (154 | ) |
Lehman Brothers, Inc.(1) | | 12/20/08 | | | 100,000 | | 0.12% | | Home Depot, Inc.,
3.75%, due 09/15/09 | | | 404 | |
Merrill Lynch & Co.(1) | | 12/20/08 | | | 100,000 | | 0.32% | | Ingersoll-Rand Co.,
6.48%, due 06/01/25 | | | (76 | ) |
Lehman Brothers, Inc.(1) | | 12/20/08 | | | 100,000 | | 0.11% | | Johnson & Johnson,
3.80%, due 05/15/13 | | | (72 | ) |
Lehman Brothers, Inc.(1) | | 12/20/08 | | | 100,000 | | 0.53% | | Lockheed Martin Corp.,
8.20%, due 12/01/09 | | | (442 | ) |
Lehman Brothers, Inc.(1) | | 12/20/08 | | | 100,000 | | 0.30% | | Masco Corp.,
5.875%, due 07/15/12 | | | 1,709 | |
Lehman Brothers, Inc.(1) | | 09/20/17 | | | 700,000 | | 1.02% | | Masco Corp.,
5.875%, due 07/15/12 | | | 33,693 | |
Lehman Brothers, Inc.(1) | | 03/20/15 | | | 100,000 | | 0.14% | | Merck & Co.,
4.75%, due 03/01/15 | | | 1,024 | |
Deutsche Bank(1) | | 09/20/11 | | | 200,000 | | 0.62% | | Nationwide Health,
6.50%, due 07/15/11 | | | 9,441 | |
Bear Stearns International Ltd.(1) | | 12/20/12 | | | 600,000 | | 0.29% | | Nordstrom, Inc.,
6.95%, due 03/15/28 | | | 16,809 | |
Lehman Brothers, Inc.(1) | | 12/20/08 | | | 100,000 | | 0.48% | | Northrop & Grumman
Corp.,
7.125%, due 02/15/11 | | | (427 | ) |
See Notes to Financial Statements.
| | |
| 48 | | Visit our website at www.prudential.com |
| | | | | | | | | | | | | |
Counterparty | | Termination
Date | | Notional
Amount# | | Fixed
Rate | | Reference Entity/
Obligation | | Unrealized
Appreciation
(Depreciation) | |
Morgan Stanley & Co.(1) | | 06/20/16 | | $ | 300,000 | | 0.39% | | Omnicom Group, Inc.,
5.90%, due 04/15/16 | | $ | 10,075 | |
Lehman Brothers, Inc.(1) | | 06/20/09 | | | 500,000 | | 0.40% | | People’s Republic of
China,
6.80%, due 05/23/11 | | | (710 | ) |
Lehman Brothers, Inc.(1) | | 12/20/08 | | | 100,000 | | 0.35% | | RadioShack Corp.,
7.375%, due 05/15/11 | | | 828 | |
Morgan Stanley & Co.(1) | | 05/20/16 | | | 1,200,000 | | 0.54% | | Republic of Hungary,
4.75%, due 02/03/15 | | | 25,975 | |
JPMorgan Chase Bank(1) | | 05/20/16 | | | 300,000 | | 0.54% | | Republic of Hungary,
4.75%, due 02/03/15 | | | 6,387 | |
Morgan Stanley & Co.(1) | | 12/20/12 | | | 600,000 | | 0.33% | | TJX Cos., Inc.,
7.45%, due 12/15/09 | | | 9,259 | |
Lehman Brothers, Inc.(1) | | 09/20/12 | | | 500,000 | | 0.60% | | Viacom, Inc.,
4.625%, due 05/15/18 | | | 8,167 | |
Goldman Sachs & Co.(1) | | 12/20/12 | | | 600,000 | | 0.24% | | Wal-Mart Stores, Inc.,
5.75%, due 12/19/30 | | | 2,585 | |
Citigroup, Inc.(1) | | 12/20/08 | | | 300,000 | | 0.14% | | Wal-Mart Stores, Inc.,
6.875%, due 08/10/09 | | | 60 | |
Barclays Capital, Inc.(1) | | 12/20/08 | | | 100,000 | | 0.67% | | Walt Disney Co. (The),
6.375%, due 03/12/12 | | | (401 | ) |
Bear Stearns International Ltd.(1) | | 06/20/16 | | | 200,000 | | 0.63% | | Whirlpool Corp.,
6.50%, due 06/15/16 | | | 6,626 | |
Lehman Brothers, Inc.(1) | | 12/20/08 | | | 100,000 | | 0.29% | | Whirlpool Corp.,
8.60%, due 05/01/10 | | | 168 | |
Barclays Capital, Inc.(1) | | 03/20/12 | | | 100,000 | | 0.21% | | XL Capital Ltd.,
6.50%, due 01/15/12 | | | 8,670 | |
| | | | | | | | | | | | | |
| | | | | | | | | | | $ | 278,435 | |
| | | | | | | | | | | | | |
| (1) | Fund pays the fixed rate and receives from the counterparty par in the event that the underlying bond defaults. |
| (2) | Fund receives the fixed rate and pays the counterparty par in the event that the underlying bond defaults. |
| # | Notional Amount is shown in U.S. dollars unless otherwise stated. |
The industry classification of investments and other liabilities in excess of other assets shown as a percentage of net assets as January 31, 2008 were as follows:
| | | |
U.S. Government Mortgage-Backed Obligations | | 27.4 | % |
U.S. Treasury Obligations | | 7.5 | |
Oil, Gas & Consumable Fuels | | 5.9 | |
Financial Services | | 5.6 | |
Pharmaceuticals | | 4.7 | |
See Notes to Financial Statements.
| | |
| Target Asset Allocation Funds/Target Moderate Allocation Fund | | 49 |
Portfolio of Investments
as of January 31, 2008 (Unaudited) continued
| | | |
Industry (cont’d.) | | | |
Affiliated Money Market Mutual Fund | | 4.2 | % |
Telecommunications | | 3.7 | |
Insurance | | 2.7 | |
Software | | 2.6 | |
Financial—Bank & Trust | | 2.3 | |
Diversified Financial Services | | 2.3 | |
Chemicals | | 1.9 | |
Diversified Telecommunication Services | | 1.6 | |
Food | | 1.5 | |
Collateralized Mortgage Obligations | | 1.4 | |
Metals & Mining | | 1.4 | |
Media | | 1.4 | |
Farming & Agriculture | | 1.3 | |
Aerospace & Defense | | 1.2 | |
Beverages | | 1.2 | |
Commercial Banks | | 1.2 | |
Retail & Merchandising | | 1.1 | |
Foreign Government Bonds | | 1.1 | |
Hotels, Restaurants & Leisure | | 1.1 | |
Computer Hardware | | 1.0 | |
Biotechnology | | 1.0 | |
Semiconductors | | 1.0 | |
Industrial Conglomerates | | 1.0 | |
Utilities | | 1.0 | |
Internet Services | | 1.0 | |
Aerospace | | 0.9 | |
Healthcare Services | | 0.9 | |
Transportation | | 0.9 | |
Real Estate Investment Trusts | | 0.9 | |
Commercial Services | | 0.8 | |
Outstanding Options Purchased | | 0.8 | |
Machinery | | 0.8 | |
Automobiles | | 0.8 | |
Entertainment & Leisure | | 0.8 | |
Hotels & Motels | | 0.7 | |
Electronic Components | | 0.7 | |
Electric Utilities | | 0.6 | |
Specialty Retail | | 0.6 | |
Thrifts & Mortgage Finance | | 0.6 | |
Energy Equipment & Services | | 0.6 | |
Retail | | 0.5 | |
Computers | | 0.5 | |
Consumer Products & Services | | 0.4 | |
Utilities—Electric | | 0.4 | |
Real Estate | | 0.4 | |
Medical Supplies & Equipment | | 0.4 | |
Paper & Forest Products | | 0.3 | |
Electronic Equipment & Instruments | | 0.3 | |
See Notes to Financial Statements.
| | |
| 50 | | Visit our website at www.prudential.com |
| | | |
Industry (cont’d.) | | | |
Bank Loans | | 0.3 | % |
Healthcare Providers & Services | | 0.3 | |
Capital Markets | | 0.3 | |
Automotive Components | | 0.3 | |
Diversified Manufacturing | | 0.2 | |
IT Services | | 0.2 | |
Internet | | 0.2 | |
Household Durables | | 0.2 | |
Office Equipment | | 0.2 | |
Diversified Operations | | 0.2 | |
Construction | | 0.2 | |
Tobacco Products | | 0.2 | |
Airlines | | 0.2 | |
Oil & Gas Exploration/Production | | 0.2 | |
Electric | | 0.2 | |
Diversified Manufacturing Operations | | 0.2 | |
Healthcare & Pharmaceuticals | | 0.2 | |
Municipal Bonds | | 0.2 | |
Household Products | | 0.1 | |
Healthcare Equipment & Supplies | | 0.1 | |
Gaming | | 0.1 | |
Computer Services & Software | | 0.1 | |
Distribution/Wholesale | | 0.1 | |
Asset-Backed Securities | | 0.1 | |
Air Freight & Couriers | | 0.1 | |
Business Services | | 0.1 | |
Clothing & Apparel | | 0.1 | |
Building Materials | | 0.1 | |
Automotive Parts | | 0.1 | |
Multi-Utilities | | 0.1 | |
Machinery & Equipment | | 0.1 | |
Electronics | | 0.1 | |
Road & Rail | | 0.1 | |
Food & Beverage | | 0.1 | |
Communication Equipment | | 0.1 | |
Advertising | | 0.1 | |
Home Furnishings | | 0.1 | |
Textiles, Apparel & Luxury Goods | | 0.1 | |
Semiconductor Components | | 0.1 | |
Building Products | | 0.1 | |
Machinery—Construction & Mining | | 0.1 | |
Conglomerates | | 0.1 | |
Multi-Line Retail | | 0.1 | |
| | | |
| | 113.4 | |
Securities Sold Short and Outstanding Options Written | | (9.2 | ) |
Other liabilities in excess of other assets | | (4.2 | ) |
| | | |
| | 100.0 | % |
| | | |
See Notes to Financial Statements.
| | |
| Target Asset Allocation Funds/Target Moderate Allocation Fund | | 51 |
Statement of Assets and Liabilities
January 31, 2008 (Unaudited)
| | | | |
Assets | | | | |
Investments at value: | | | | |
Unaffiliated investments (cost $463,652,606) | | $ | 493,711,812 | |
Affiliated investments (cost $18,889,822) | | | 18,889,822 | |
Cash | | | 272,775 | |
Foreign currency, at value (cost $599,610) | | | 612,578 | |
Receivable for investments sold | | | 115,032,825 | |
Unrealized appreciation on swap agreements | | | 2,911,749 | |
Dividends and interest receivable | | | 1,788,527 | |
Receivable for Fund shares sold | | | 718,138 | |
Unrealized appreciation on foreign currency exchange contracts | | | 567,327 | |
Tax reclaim receivable | | | 214,863 | |
Receivable from broker-variation margin | | | 18,956 | |
Prepaid expenses | | | 9,197 | |
| | | | |
Total assets | | | 634,748,569 | |
| | | | |
| |
Liabilities | | | | |
Payable for investments purchased | | | 134,264,850 | |
Securities sold short, at value (proceeds $38,053,225) | | | 39,343,663 | |
Outstanding options written (premiums received $950,881) | | | 2,159,317 | |
Payments received for swaps agreements | | | 2,121,839 | |
Unrealized depreciation on swap agreements | | | 2,038,410 | |
Payable for Fund shares reacquired | | | 1,321,120 | |
Interest payable on investments sold short | | | 453,171 | |
Management fee payable | | | 290,699 | |
Distribution fee payable | | | 268,023 | |
Unrealized depreciation on foreign currency exchange contracts | | | 201,934 | |
Accrued expenses and other liabilities | | | 181,480 | |
Transfer agent fee payable | | | 37,780 | |
Deferred trustees’ fees | | | 6,705 | |
| | | | |
Total liabilities | | | 182,688,991 | |
| | | | |
| |
Net Assets | | $ | 452,059,578 | |
| | | | |
| | | | | |
Net assets were comprised of: | | | | |
Shares of beneficial interest, at par | | $ | 39,105 | |
Paid-in capital, in excess of par | | | 419,548,173 | |
| | | | |
| | | 419,587,278 | |
Distributions in excess of net investment income | | | (344,124 | ) |
Accumulated net realized gain on investments | | | 3,452,708 | |
Net unrealized appreciation on investments and foreign currencies | | | 29,363,716 | |
| | | | |
Net assets, January 31, 2008 | | $ | 452,059,578 | |
| | | | |
See Notes to Financial Statements.
| | |
| 52 | | Visit our website at www.prudential.com |
| | | |
Class A: | | | |
Net asset value and redemption price per share | | | |
($165,903,981 ÷ 14,297,906 shares of beneficial interest issued and outstanding) | | $ | 11.60 |
Maximum sales charge (5.50% of offering price) | | | .68 |
| | | |
Maximum offering price to public | | $ | 12.28 |
| | | |
| |
Class B: | | | |
Net asset value, offering price and redemption price per share | | | |
($138,659,087 ÷ 12,025,413 shares of beneficial interest issued and outstanding) | | $ | 11.53 |
| | | |
| |
Class C: | | | |
Net asset value, offering price and redemption price per share | | | |
($118,497,613 ÷ 10,276,740 shares of beneficial interest issued and outstanding) | | $ | 11.53 |
| | | |
| |
Class M: | | | |
Net asset value, offering price and redemption price per share | | | |
($6,822,657 ÷ 593,183 shares of beneficial interest issued and outstanding) | | $ | 11.50 |
| | | |
| |
Class R: | | | |
Net asset value, offering price and redemption price per share | | | |
($3,502,677 ÷ 301,660 shares of beneficial interest issued and outstanding) | | $ | 11.61 |
| | | |
| |
Class X: | | | |
Net asset value, offering price and redemption price per share | | | |
($5,128,364 ÷ 445,063 shares of beneficial interest issued and outstanding) | | $ | 11.52 |
| | | |
| |
Class Z: | | | |
Net asset value, offering price and redemption price per share | | | |
($13,545,199 ÷ 1,165,117 shares of beneficial interest issued and outstanding) | | $ | 11.63 |
| | | |
See Notes to Financial Statements.
| | |
| Target Asset Allocation Funds/Target Moderate Allocation Fund | | 53 |
Statement of Operations
Six Months Ended January 31, 2008 (Unaudited)
| | | | |
Net Investment Income | | | | |
Income | | | | |
Unaffiliated interest | | $ | 3,959,633 | |
Unaffiliated dividends (net of foreign withholding taxes $8,393) | | | 3,291,462 | |
Affiliated dividends | | | 442,619 | |
| | | | |
| | | 7,693,714 | |
| | | | |
| |
Expenses | | | | |
Management fee | | | 1,820,928 | |
Distribution fee—Class A | | | 215,230 | |
Distribution fee—Class B | | | 765,828 | |
Distribution fee—Class C | | | 639,134 | |
Distribution fee—Class M | | | 39,050 | |
Distribution fee—Class R | | | 9,856 | |
Distribution fee—Class X | | | 28,223 | |
Transfer agent’s fees and expenses (including affiliated expense of $107,000) | | | 338,000 | |
Custodian’s fees and expenses | | | 181,000 | |
Registration fees | | | 46,000 | |
Reports to shareholders | | | 31,000 | |
Audit fee | | | 26,000 | |
Legal fee | | | 11,000 | |
Trustees’ fees | | | 10,000 | |
Insurance expense | | | 4,000 | |
Miscellaneous | | | 10,384 | |
| | | | |
Total expenses | | | 4,175,633 | |
| | | | |
Net investment income | | | 3,518,081 | |
| | | | |
| |
Net Realized And Unrealized Gain (Loss) On Investments And Foreign Currency | | | | |
Net realized gain (loss) on: | | | | |
Investment transactions | | | 9,669,623 | |
Options written | | | 491,475 | |
Foreign currency transactions | | | 1,033,947 | |
Futures | | | (1,074,600 | ) |
Swaps | | | 5,338,448 | |
Short sale transactions | | | (1,686,048 | ) |
| | | | |
| | | 13,772,845 | |
| | | | |
Net change in unrealized appreciation (depreciation) on: | | | | |
Investments | | | (20,425,291 | ) |
Short sales | | | (671,922 | ) |
Foreign currencies | | | (8,570 | ) |
Futures | | | 1,165,006 | |
Swaps | | | 106,941 | |
Options written | | | (1,230,659 | ) |
| | | | |
| | | (21,064,495 | ) |
| | | | |
Net loss on investments | | | (7,291,650 | ) |
| | | | |
Net Decrease In Net Assets Resulting From Operations | | $ | (3,773,569 | ) |
| | | | |
See Notes to Financial Statements.
| | |
| 54 | | Visit our website at www.prudential.com |
Statement of Changes in Net Assets
(Unaudited)
| | | | | | | | |
| | | Six Months
Ended
January 31, 2008 | | | Year
Ended
July 31, 2007 | |
Increase (Decrease) In Net Assets | | | | | | | | |
Operations | | | | | | | | |
Net investment income | | $ | 3,518,081 | | | $ | 6,010,659 | |
Net realized gain on investment and foreign currency transactions | | | 13,772,845 | | | | 30,939,205 | |
Net change in unrealized appreciation (deprecation) on investments and foreign currencies | | | (21,064,495 | ) | | | 19,566,878 | |
| | | | | | | | |
Net increase (decrease) in net assets resulting from operations | | | (3,773,569 | ) | | | 56,516,742 | |
| | | | | | | | |
Dividends and distributions (Note 1) | | | | | | | | |
Dividends from net investment income: | | | | | | | | |
Class A | | | (1,359,816 | ) | | | (2,678,977 | ) |
Class B | | | (776,790 | ) | | | (1,635,647 | ) |
Class C | | | (667,903 | ) | | | (1,272,432 | ) |
Class M | | | (38,235 | ) | | | (87,858 | ) |
Class R | | | (25,015 | ) | | | (56,724 | ) |
Class X | | | (29,534 | ) | | | (56,621 | ) |
Class Z | | | (134,530 | ) | | | (286,174 | ) |
| | | | | | | | |
| | | (3,031,823 | ) | | | (6,074,433 | ) |
| | | | | | | | |
Distributions from net realized gains: | | | | | | | | |
Class A | | | (13,380,539 | ) | | | (5,577,407 | ) |
Class B | | | (11,111,908 | ) | | | (6,601,806 | ) |
Class C | | | (9,554,299 | ) | | | (4,920,293 | ) |
Class M | | | (546,953 | ) | | | (358,046 | ) |
Class R | | | (291,666 | ) | | | (138,633 | ) |
Class X | | | (422,473 | ) | | | (223,136 | ) |
Class Z | | | (1,144,078 | ) | | | (530,902 | ) |
| | | | | | | | |
| | | (36,451,916 | ) | | | (18,350,223 | ) |
| | | | | | | | |
| | |
Fund share transactions (Net of share conversions)
(Note 6) | | | | | | | | |
Net proceeds from shares sold | | | 21,618,168 | | | | 64,086,705 | |
Net asset value of shares issued in reinvestment of distributions | | | 36,842,139 | | | | 22,612,482 | |
Cost of shares reacquired | | | (45,927,089 | ) | | | (93,926,981 | ) |
| | | | | | | | |
Net increase (decrease) in net assets resulting from Fund share transactions | | | 12,533,218 | | | | (7,227,794 | ) |
| | | | | | | | |
Total increase (decrease) | | | (30,724,090 | ) | | | 24,864,292 | |
| | |
Net Assets | | | | | | | | |
Beginning of period | | | 482,783,668 | | | | 457,919,376 | |
| | | | | | | | |
End of period | | $ | 452,059,578 | | | $ | 482,783,668 | |
| | | | | | | | |
See Notes to Financial Statements.
| | |
| Target Asset Allocation Funds/Target Moderate Allocation Fund | | 55 |
Notes to Financial Statements
(Unaudited)
Target Asset Allocation Funds (the “Trust”) is registered under the Investment Company Act of 1940 as an open-end, diversified management investment company presently consisting of three portfolios: Target Moderate Allocation Fund (the “Fund”), Target Conservative Allocation Fund and Target Growth Allocation Fund. These financial statements relate only to Target Moderate Allocation Fund. The financial statements of the other portfolios are not presented herein. The Trust was organized as a business trust in Delaware on July 29, 1998.
The Fund uses investment managers (“Subadvisors”), each managing a portion of the Fund’s assets. The following lists the Subadvisors and their respective segment during the six months ended January 31, 2008.
| | |
| | | Fund Segment |
Hotchkis & Wiley Capital Management LLC
JP Morgan Investment Management, Inc.
NFJ Investment Group L.P. | | Large-cap value stocks |
| |
LSV Asset Management
Thornburg Investment Management, Inc. | | International stocks |
| |
Marsico Capital Management, LLC
Goldman Sachs Asset Management LP | | Large-cap growth stocks |
| |
EARNEST Partners, LLC
Vaughan Nelson Investment Management, LP | | Small-cap value stocks |
| |
Pacific Investment Management Company LLC | | Core fixed income bonds |
| |
RS Investment Management, L.P. | | Small-cap growth stocks |
The investment objective of the Fund is to provide capital appreciation and a reasonable level of current income. The Fund seeks to achieve its investment objective by investing in a diversified portfolio of equity and fixed income securities. The ability of the issuers of the debt securities held by the Fund to meet their obligations may be affected by economic developments in a specific industry or country.
Note 1. Accounting Policies
The following is a summary of significant accounting policies followed by the Trust in the preparation of its financial statements.
Securities Valuation: Securities listed on a securities exchange (other than options on securities and indices) are valued at the last sale price on such exchange on the day of valuation or, if there was no sale on such day, at the mean between the last
| | |
| 56 | | Visit our website at www.prudential.com |
reported bid and ask prices, or at the last bid price on such day in the absence of an asked price. Securities traded via Nasdaq are valued at the NASDAQ official closing price (NOCP) on the day of valuation, or if there was no NOCP, at the last sale price. Securities that are actively traded in the over-the-counter market, including listed securities for which the primary market is believed by Prudential Investments LLC (“PI” or “Manager”), in consultation with the Subadvisor(s); to be over-the-counter, are valued at market value using prices provided by an independent pricing agent or principal market maker. Options on securities and indices traded on an exchange are valued at the last sale price as of the close of trading on the applicable exchange or, if there was no sale, at the mean between the most recently quoted bid and asked prices on such exchange or at the last bid price in the absence of an asked price. Futures contracts and options thereon traded on a commodities exchange or board of trade are valued at the last sale price at the close of trading on such exchange or board of trade or, if there was no sale on the applicable commodities exchange or board of trade on such day, at the mean between the most recently quoted prices on such exchange or board of trade or at the last bid price in the absence of an asked price. Certain fixed income securities for which daily market quotations are not readily available may be valued with reference to fixed income securities whose prices are more readily available, pursuant to guidelines established by the Board of Trustees. Prices may be obtained from independent pricing services which use information provided by market makers or estimates of market values obtained from yield data relating to investments or securities with similar characteristics. Securities for which reliable market quotations are not readily available, or whose values have been affected by events occurring after the close of the security’s foreign market and before the Fund’s normal pricing time, are valued at fair value in accordance with Board of Trustees’ approved fair valuation procedures. When determining the fair valuation of securities, some of the factors influencing the valuation include the nature of any restrictions on disposition of the securities; assessment of the general liquidity of the securities; the issuer’s financial condition and the markets in which it does business; the cost of the investment; the size of the holding and the capitalization of issuer; the prices of any recent transactions or bids/offers for such securities or any comparable securities; any available analyst media or other reports or information deemed reliable by the investment adviser regarding the issuer or the markets or industry in which it operates. Using fair value to price securities may result in a value that is different from a security’s most recent closing price and from the price used by other mutual funds to calculate their net asset value. As of January 31, 2008, there were 171 securities representing $53,790,223 whose values were adjusted in accordance with procedures approved by the Board of Trustees.
Investments in mutual funds are valued at their net asset value as of the close of the New York Stock Exchange on the date of valuation.
| | |
| Target Asset Allocation Funds/Target Moderate Allocation Fund | | 57 |
Notes to Financial Statements
(Unaudited) continued
Short-term debt securities, which mature in sixty days or less, are valued at amortized cost, which approximates market value. The amortized cost method involves valuing a security at its cost on the date of purchase and thereafter assuming a constant amortization to maturity of the difference between the principal amount due at maturity and cost. Short-term debt securities, which mature in more than sixty days are valued at current market quotation.
Foreign Currency Translation: The books and records of the Fund are maintained in U.S. dollars. Foreign currency amounts are translated into U.S. dollars on the following basis:
(i) market value of investment securities, other assets and liabilities-at the current daily rates of exchange;
(ii) purchases and sales of investment securities, income and expenses-at the rates of exchange prevailing on the respective dates of such transactions.
Although the net assets of the Fund are presented at the foreign exchange rates and market values at the close of the period, the Fund does not isolate that portion of the results of operations arising as a result of changes in the foreign exchange rates from the fluctuations arising from changes in the market prices of securities held at the end of the period. Similarly, the Fund does not isolate the effect of changes in foreign exchange rates from the fluctuations arising from changes in the market prices of portfolio securities sold during the period. Accordingly, realized foreign currency gains or losses are included in the reported net realized gains or losses on investment transactions.
Net realized gains or losses on foreign currency transactions represent net foreign exchange gains or losses from the holdings of foreign currencies, currency gains or losses realized between the trade and settlement dates on security transactions, and the difference between the amounts of dividends, interest and foreign withholding taxes recorded on the Fund’s books and the U.S. dollar equivalent amounts actually received or paid. Net unrealized currency gains or losses from valuing foreign currency denominated assets and liabilities (other than investments) at period end exchange rates are reflected as a component of net unrealized appreciation (depreciation) on foreign currencies. Foreign security and currency transactions may involve certain considerations and risks not typically associated with those of domestic origin as a result of, among other factors, the possibility of political and economic instability and the level of governmental supervision and regulation of foreign securities markets.
| | |
| 58 | | Visit our website at www.prudential.com |
Financial Futures Contracts: A financial futures contract is an agreement to purchase (long) or sell (short) an agreed amount of securities at a set price for delivery on a future date. Upon entering into a financial futures contract, the Fund is required to pledge to the broker an amount of cash and/or other assets equal to a certain percentage of the contract amount. This amount is known as the “initial margin.” Subsequent payments known as “variation margin,” are made or received by the Fund each day, depending on the daily fluctuations in the value of the underlying security. Such variation margin is recorded for financial statement purposes on a daily basis as unrealized gain or loss. When the contract expires or is closed, the gain or loss is realized and is presented in the Statement of Operations as net realized gain or loss on financial futures contracts.
The Fund invests in financial futures contracts in order to hedge its existing portfolio securities, or securities the Fund intends to purchase, against fluctuations in value caused by changes in prevailing interest rates or market conditions. Should interest rates move unexpectedly, the Fund may not achieve the anticipated benefits of the financial futures contracts and may realize a loss. The use of futures transactions involves the risk of imperfect correlation in movements in the price of futures contracts, interest rates and the underlying hedged assets.
Forward Currency Contracts: A forward currency contract is a commitment to purchase or sell a foreign currency at a future date at a negotiated forward rate. The Fund may enter into forward currency contracts in order to hedge its exposure to changes in foreign currency exchange rates on its foreign portfolio holdings or on specific receivables and payables denominated in a foreign currency. The contracts are valued daily at current exchange rates and any unrealized gain or loss is included in the Statement of Assets and Liabilities as unrealized appreciation and/or depreciation on forward foreign currency contracts. Gain or loss is realized on the settlement date of the contract equal to the difference between the settlement value of the original and renegotiated forward contracts. This gain or loss, if any, is included in net realized gain or loss on foreign currency transactions. Risks may arise upon entering into these contracts from the potential inability of the counterparties to meet the terms of their contracts.
Options: The Fund may either purchase or write options in order to hedge against adverse market movements or fluctuations in value caused by changes in prevailing interest rates or foreign currency exchange rates with respect to securities or currencies, which the Fund currently owns or intends to purchase. The Fund’s principal reason for writing options is to realize, through receipt of premiums, a greater current return than would be realized on the underlying security alone. When the Fund purchases an option, it pays a premium and an amount equal to that
| | |
| Target Asset Allocation Funds/Target Moderate Allocation Fund | | 59 |
Notes to Financial Statements
(Unaudited) continued
premium is recorded as an asset. When the Fund writes an option, it receives a premium and an amount equal to that premium is recorded as a liability. The asset or liability is adjusted daily to reflect the current market value of the option.
If an option expires unexercised, the Fund realizes a gain or loss to the extent of the premium received or paid. If an option is exercised, the premium received or paid is recorded as an adjustment to the proceeds from the sale or the cost basis of the purchase in determining whether the Fund has realized a gain or loss. The difference between the premium and the amount received or paid on effecting a closing purchase or sale transaction is also treated as a realized gain or loss. Gain or loss on purchased options is included in net realized gain or loss on investment transactions. Gain or loss on written options is presented separately as net realized gain or loss on options written.
The Fund, as writer of an option, has no control over whether the underlying securities may be sold (called) or purchased (put). As a result, the Fund bears the market risk of an unfavorable change in the price of the security or currency underlying the written option. The Fund, as purchaser of an OTC option, bears the risk of the potential inability of the counterparties to meet the terms of their contracts.
When the Fund writes an option on a swap contract, an amount equal to any premium received by the Fund is recorded as a liability and is subsequently adjusted to the current market value of the written option on the swap. If a call option on a swap is exercised, the Fund becomes obligated to pay a fixed interest rate (noted as the strike price) and receive a variable interest rate on a notional amount. If a put option on a swap is exercised, the Fund becomes obligated to pay a variable interest rate and receive a fixed interest rate (noted as the strike price) on a notional amount. Premiums received from writing options on swaps that expire or are exercised are treated as realized gains upon the expiration or exercise of such options on swaps. The risk associated with writing put and call options on swaps is that the Fund will be obligated to be party to a swap agreement if an option on a swap is exercised.
Short Sales: The Fund may make short sales of securities as a method of hedging potential price declines in similar securities owned. The Fund may sell a security it does not own in anticipation of a decline in the market value of that security (short sale). When the Fund makes a short sale, it will borrow the security sold short and deliver it to the broker-dealer through which it made the short sale as collateral for its
| | |
| 60 | | Visit our website at www.prudential.com |
obligation to deliver the security upon conclusion of the sale. The Fund may have to pay a fee to borrow the particular securities and may be obligated to return any interest or dividends received on such borrowed securities. A gain, limited to the price at which the Fund sold the security short, or a loss, unlimited as to dollar amount, will be recognized upon the termination of a short sale if the market price is less or greater than the proceeds originally received, respectively, and is presented in the Statement of Operations as net realized gain or loss on short sales.
Swaps: The Fund may enter into swap agreements. A swap is an agreement to exchange the return generated by one instrument for the return generated by another instrument. The Fund enters into interest rate, forward swap spread lock and credit default swap agreements to manage its exposure to interest rates and credit risk. Interest rate swap agreements involve the exchange by the Fund with another party of their respective commitments to pay or receive interest and may involve payment/receipt of a premium at the time of initiation of the swap agreement. Forward spread lock swap agreements involve commitments to pay or receive a settlement amount calculated as the difference between the swap spread and a fixed spread, multiplied by the notional amount times the duration of the swap. The swap spread is the difference between the benchmark swap rate (market rate) and the specific Treasury rate. In a credit default swap, one party makes a stream of payments to another party in exchange for the right to receive a specified return in the event of a default by a third party, typically corporate issues or sovereign issues of an emerging country, on its obligation. Dividends and interest on the securities in the swap are included in the value of the exchange. The swaps are valued daily at current market value and any unrealized gain or loss is included in the net unrealized appreciation or depreciation on investments. Gain or loss is realized on the termination date of the swap and is equal to the difference between the Fund’s basis in the swap and the proceeds of the closing transaction, including fees. During the period that the swap agreement is open, the Fund may be subject to risk from the potential inability of the counterparty to meet the terms of the agreement.
Written options, futures contracts, forward foreign currency exchange contracts and swaps involve elements of both market and credit risk in excess of the amounts reflected on the Statement of Assets and Liabilities.
When-Issued/Delayed Delivery Securities: Securities purchased or sold on a when issued or delayed-delivery basis may be settled a month or more after trade date; interest income is not accrued until settlement date. At the time a fund enters into such transactions, it instructs the custodian to segregate assets with a current value at least equal to the amount of its when-issued or delayed-delivery purchase commitments.
| | |
| Target Asset Allocation Funds/Target Moderate Allocation Fund | | 61 |
Notes to Financial Statements
(Unaudited) continued
Securities Transactions and Net Investment Income: Securities transactions are recorded on the trade date. Realized gains or losses on sales of securities are calculated on the identified cost basis. Dividend income is recorded on the ex-dividend date and interest income, including amortization of premium and accretion of discount, on debt securities as required, is recorded on the accrual basis. Expenses are recorded on accrual basis.
Net investment income or loss (other than distribution fees, which are charged directly to respective class), unrealized and realized gains or losses, are allocated daily to each class of shares based upon the relative proportion of net assets of each class at the beginning of the day.
Dividends and Distributions: Dividends from net investment income are declared and paid semi-annually. Distributions of net realized capital and currency gains, if any, annually.
Dividends and distributions to shareholders which are determined in accordance with federal income tax regulations and which may differ from generally accepted accounting principles, are recorded on the ex-dividend date. Permanent book/tax differences relating to income and gains are reclassified amongst undistributed net investment income, accumulated net realized gain or loss and paid-in capital in excess of par, as appropriate.
Taxes: It is the Fund’s intention to continue to meet the requirements of the Internal Revenue Code applicable to regulated investment companies and to distribute all of its taxable net investment income and capital gains, if any, to its shareholders. Therefore, no federal income tax provision is required.
Withholding taxes on foreign dividends are recorded net of reclaimable amounts, at the time the related income is earned.
Estimates: The preparation of the financial statements requires management to make estimates and assumptions that affect the reported amounts and disclosures in the financial statements. Actual results could differ from those estimates.
Note 2. Agreements
The Trust has a management agreement with PI. Pursuant to this agreement, PI manages the investment operations of the Fund, administers the Fund’s affairs and
| | |
| 62 | | Visit our website at www.prudential.com |
supervises the Subadvisors’ performance of all investment advisory services. Pursuant to the advisory agreements, PI pays the cost of compensation of officers of the Fund, occupancy and certain clerical and accounting costs of the Fund. The Fund bears all other costs and expenses.
The management fee paid to PI is computed daily and payable monthly at an annual rate of .75 of 1% of the average daily net assets up to $500 million, .70 of 1% of average daily net assets for the next $500 million and .65 of 1% of average daily net assets in excess of $1 billion. The effective management fee rate was .75 of 1% for the six months ended January 31, 2008.
The Fund has a distribution agreement with Prudential Investment Management Services LLC (“PIMS”), which acts as the distributor of the Class A, B, C, M, R, X and Z shares of the Fund. The Fund compensates PIMS for distributing and servicing the Fund’s Class A, B, C, M, R and X shares, pursuant to plans of distribution (the “Distribution Plans”), regardless of expenses actually incurred by PIMS. The distribution fees are accrued daily and payable monthly. No distribution or service fees are paid to PIMS as distributor for Class Z shares of the Fund.
Pursuant to the Distribution Plans, the Fund compensates PIMS for distribution related activities at an annual rate of up to .30 of 1%, 1%, 1%, 1%, .75% of 1% and 1% of the average daily net assets of the Class A, B, C, M, R and X shares, respectively. Such expenses under the Plans were .25 of 1%, 1%, 1%, 1%, .50 of 1% and 1% of the average daily net assets of the Class A, B, C, M, R and X shares, respectively, for the six months ended January 31, 2008.
PIMS has advised the Fund that it has received approximately $149,600 in front-end sales charges resulting from sales of Class A shares during the six months ended January 31, 2008. From these fees, PIMS paid such sales charges to broker-dealers, which in turn paid commissions to salespersons and incurred other distribution costs. PIMS has advised the Fund that for the six months ended January 31, 2008, it has received approximately $92,800, $4,700, $10,100 and $1,200 in contingent deferred sales charges imposed upon certain redemptions by Class B, Class C, Class M and Class X shareholders, respectively.
PIMS and PI are indirect, wholly-owned subsidiaries of Prudential Financial, Inc. (“Prudential”).
Note 3. Other Transactions with Affiliates
Prudential Mutual Fund Services LLC (“PMFS”), an affiliate of PI, and an indirect, wholly-owned subsidiary of Prudential, serves as the Fund’s transfer agent. Transfer
| | |
| Target Asset Allocation Funds/Target Moderate Allocation Fund | | 63 |
Notes to Financial Statements
(Unaudited) continued
agent fees and expenses in the Statement of Operations include certain out-of-pocket expenses paid to non-affiliates, where applicable.
The Fund pays networking fees to affiliated and unaffiliated broker/dealers, including fees related to the services of First Clearing, LLC (“First Clearing”), an affiliate of PI. These networking fees are payments made to broker/dealers that clear mutual fund transactions through a national clearing system. For the six months ended January 31, 2008, the Fund incurred approximately $77,500 in total networking fees, of which $48,900 was paid to First Clearing. These amounts are included in transfer agent’s fees and expenses in the Statement of Operations.
The Fund invests in the Taxable Money Market Series (the “Series”), a portfolio of Dryden Core Investment Fund, pursuant to an exemptive order received from the Securities and Exchange Commission. The Series is a money market mutual fund registered under the Investment Company Act of 1940, as amended, and managed by PI. Earnings from the Series are disclosed on the Statement of Operations as affiliated dividends.
Note 4. Portfolio Securities
Purchases and sales of portfolio securities, excluding short-term investments and U.S. government securities, for the six months ended January 31, 2008, aggregated $145,606,763 and $137,531,756, respectively.
Transactions in options written during the six months ended January 31, 2008 were as follows:
| | | | | | | |
| | | Number of
Contracts/
Swap Notional
Amount | | | Premium | |
Options outstanding at July 31, 2007 | | 11,200,000 | | | $ | 119,060 | |
Written swap options | | 39,900,000 | | | | 901,730 | |
Expired swap options | | (2,100,000 | ) | | | (36,680 | ) |
Closed swap options | | (2,300,000 | ) | | | (33,229 | ) |
| | | | | | | |
Options outstanding at January 31, 2008 | | 46,700,000 | | | $ | 950,881 | |
| | | | | | | |
| | |
| 64 | | Visit our website at www.prudential.com |
Note 5. Tax Information
The United States federal income tax basis of the Fund’s investments and the net unrealized appreciation as of January 31, 2008 were as follows:
| | | | | | |
Tax Basis | | Appreciation | | Depreciation | | Net Unrealized
Appreciation |
| $486,269,476 | | $45,288,112 | | $(18,955,954) | | $26,332,158 |
The difference between book basis and tax basis were primarily attributable to deferred losses on wash sales, investments in real estate investment trusts and other differences between financial reporting and tax accounting. The other cost basis adjustments are primarily attributable to appreciation (depreciation) of foreign currency, mark-to-market of receivables and payable and swaps.
Management has analyzed the Funds’ tax positions taken on federal income tax returns for all open tax years and has concluded that as of January 31, 2008, no provision for income tax would be required in the Funds’ financial statements. The Fund’s federal and state income and federal excise tax returns for tax years for which the applicable statutes of limitations have not expired are subject to examination by the Internal Revenue Service and state departments of revenue.
Note 6. Capital
The Fund offers Class A, Class B, Class C, Class M, Class R, Class X and Class Z shares. Class A shares are subject to a maximum front-end sales charge of 5.50%. Investors who purchase $1 million or more of Class A shares and sell these shares within 12 months of purchase are not subject to an initial sales charge but are subject to a contingent deferred sales charge (CDSC) of 1%, including investors who purchase their shares through broker-dealers affiliated with Prudential. Class B shares are subject to a CDSC of 5%, which decreases by 1% annually to 1% in the fifth and sixth years and 0% in the seventh year. Class B shares automatically convert to Class A shares on a quarterly basis approximately seven years after purchase. The CDSC for Class C shares is 1% for shares redeemed within 12 months of purchase. Class M shares are generally closed to new purchases. Class M shares are subject to a CDSC of 6%, which decreases by 1% annually to 2% in the fifth and sixth years and 1% in the seventh year. Class M shares automatically convert to Class A shares approximately eight years after purchase. Class X shares are generally closed to new purchases. Class X shares are subject to a CDSC of 6%, which decreases by 1% annually to 4% in the third and fourth years, by 1% annually to 2% in the sixth and seventh years, and 1% in the eighth year. Class X shares automatically convert to Class A shares on a quarterly basis approximately ten years after purchase. An exchange privilege is also available for shareholders who qualify to purchase Class A
| | |
| Target Asset Allocation Funds/Target Moderate Allocation Fund | | 65 |
Notes to Financial Statements
(Unaudited) continued
shares at net asset value. Class R and Class Z shares are not subject to any sales or redemption charge and are offered exclusively for sale to a limited group of investors. As of January 31, 2008, Prudential owns 219 shares of Class R.
The Fund has authorized an unlimited number of shares of beneficial interest at $.001 par value per share.
Transactions in shares of beneficial interest were as follows:
| | | | | | | |
Class A | | Shares | | | Amount | |
Six months ended January 31, 2008: | | | | | | | |
Shares sold | | 781,193 | | | $ | 9,951,037 | |
Shares issued in reinvestment of dividends and distributions | | 1,189,626 | | | | 14,180,193 | |
Shares reacquired | | (1,467,789 | ) | | | (18,414,843 | ) |
| | | | | | | |
Net increase (decrease) in shares outstanding before conversion | | 503,030 | | | | 5,716,387 | |
Shares issued upon conversion from Class B and Class M | | 851,231 | | | | 11,093,588 | |
| | | | | | | |
Net increase (decrease) in shares outstanding | | 1,354,261 | | | $ | 16,809,975 | |
| | | | | | | |
Year ended July 31, 2007: | | | | | | | |
Shares sold | | 1,722,340 | | | $ | 21,673,917 | |
Shares issued in reinvestment of dividends and distributions | | 626,078 | | | | 7,832,814 | |
Shares reacquired | | (2,569,276 | ) | | | (32,392,119 | ) |
| | | | | | | |
Net increase (decrease) in shares outstanding before conversion | | (220,858 | ) | | | (2,885,388 | ) |
Shares issued upon conversion from Class B, Class M, and Class X | | 1,805,802 | | | | 22,444,000 | |
| | | | | | | |
Net increase (decrease) in shares outstanding | | 1,584,944 | | | $ | 19,558,612 | |
| | | | | | | |
Class B | | | | | | |
Six months ended January 31, 2008: | | | | | | | |
Shares sold | | 316,811 | | | $ | 3,994,596 | |
Shares issued in reinvestment of dividends and distributions | | 955,707 | | | | 11,334,701 | |
Shares reacquired | | (795,804 | ) | | | (10,001,401 | ) |
| | | | | | | |
Net increase (decrease) in shares outstanding before conversion | | 476,714 | | | | 5,327,896 | |
Shares reaquired upon conversion into Class A | | (791,706 | ) | | | (10,272,710 | ) |
| | | | | | | |
Net increase (decrease) in shares outstanding | | (314,992 | ) | | $ | (4,944,814 | ) |
| | | | | | | |
Year ended July 31, 2007: | | | | | | | |
Shares sold | | 1,048,193 | | | $ | 13,100,465 | |
Shares issued in reinvestment of dividends and distributions | | 633,789 | | | | 7,858,701 | |
Shares reacquired | | (2,006,715 | ) | | | (25,094,086 | ) |
| | | | | | | |
Net increase (decrease) in shares outstanding before conversion | | (324,733 | ) | | | (4,134,920 | ) |
Shares reaquired upon conversion into Class A | | (1,762,481 | ) | | | (21,769,606 | ) |
| | | | | | | |
Net increase (decrease) in shares outstanding | | (2,087,214 | ) | | $ | (25,904,526 | ) |
| | | | | | | |
| | |
| 66 | | Visit our website at www.prudential.com |
| | | | | | | |
Class C | | Shares | | | Amount | |
Six months ended January 31, 2008: | | | | | | | |
Shares sold | | 418,379 | | | $ | 5,197,612 | |
Shares issued in reinvestment of dividends and distributions | | 747,139 | | | | 8,861,178 | |
Shares reacquired | | (989,327 | ) | | | (12,403,394 | ) |
| | | | | | | |
Net increase (decrease) in shares outstanding | | 176,191 | | | $ | 1,655,396 | |
| | | | | | | |
Year ended July 31, 2007: | | | | | | | |
Shares sold | | 1,500,167 | | | $ | 18,642,374 | |
Shares issued in reinvestment of dividends and distributions | | 432,560 | | | | 5,366,142 | |
Shares reacquired | | (2,223,906 | ) | | | (27,822,107 | ) |
| | | | | | | |
Net increase (decrease) in shares outstanding | | (291,179 | ) | | $ | (3,813,591 | ) |
| | | | | | | |
Class M | | | | | | |
Six months ended January 31, 2008: | | | | | | | |
Shares sold | | 53,724 | | | $ | 663,086 | |
Shares issued in reinvestment of dividends and distributions | | 47,700 | | | | 564,291 | |
Shares reacquired | | (96,869 | ) | | | (1,222,183 | ) |
| | | | | | | |
Net increase (decrease) in shares outstanding before conversion | | 4,555 | | | | 5,194 | |
Shares reaquired upon conversion into Class A | | (64,925 | ) | | | (820,878 | ) |
| | | | | | | |
Net increase (decrease) in shares outstanding | | (60,370 | ) | | $ | (815,684 | ) |
| | | | | | | |
Year ended July 31, 2007: | | | | | | | |
Shares sold | | 414,317 | | | $ | 5,145,890 | |
Shares issued in reinvestment of dividends and distributions | | 33,470 | | | | 414,011 | |
Shares reacquired | | (271,560 | ) | | | (3,409,806 | ) |
| | | | | | | |
Net increase (decrease) in shares outstanding before conversion | | 176,227 | | | | 2,150,095 | |
Shares reaquired upon conversion into Class A | | (52,144 | ) | | | (662,084 | ) |
| | | | | | | |
Net increase (decrease) in shares outstanding | | 124,083 | | | $ | 1,488,011 | |
| | | | | | | |
Class R | | | | | | |
Six months ended January 31, 2008: | | | | | | | |
Shares sold | | 6,829 | | | $ | 86,144 | |
Shares issued in reinvestment of dividends and distributions | | 26,525 | | | | 316,445 | |
Shares reacquired | | (44,724 | ) | | | (558,543 | ) |
| | | | | | | |
Net increase (decrease) in shares outstanding | | (11,370 | ) | | $ | (155,954 | ) |
| | | | | | | |
Year ended July 31, 2007: | | | | | | | |
Shares sold | | 66,409 | | | $ | 855,613 | |
Shares issued in reinvestment of dividends and distributions | | 15,613 | | | | 195,210 | |
Shares reacquired | | (57,198 | ) | | | (724,439 | ) |
| | | | | | | |
Net increase (decrease) in shares outstanding | | 24,824 | | | $ | 326,384 | |
| | | | | | | |
| | |
| Target Asset Allocation Funds/Target Moderate Allocation Fund | | 67 |
Notes to Financial Statements
(Unaudited) continued
| | | | | | | |
Class X | | Shares | | | Amount | |
Six months ended January 31, 2008: | | | | | | | |
Shares sold | | 4,539 | | | $ | 58,873 | |
Shares issued in reinvestment of dividends and distributions | | 38,144 | | | | 452,007 | |
Shares reacquired | | (40,339 | ) | | | (501,616 | ) |
| | | | | | | |
Net increase (decrease) in shares outstanding | | 2,344 | | | $ | 9,264 | |
| | | | | | | |
Year ended July 31, 2007: | | | | | | | |
Shares sold | | 122,185 | | | $ | 1,514,502 | |
Shares issued in reinvestment of dividends and distributions | | 22,064 | | | | 273,486 | |
Shares reacquired | | (102,704 | ) | | | (1,292,654 | ) |
| | | | | | | |
Net increase (decrease) in shares outstanding before conversion | | 41,545 | | | | 495,334 | |
Shares reaquired upon conversion into Class A | | (949 | ) | | | (12,310 | ) |
| | | | | | | |
Net increase (decrease) in shares outstanding | | 40,596 | | | $ | 483,024 | |
| | | | | | | |
Class Z | | | | | | |
Six months ended January 31, 2008: | | | | | | | |
Shares sold | | 132,922 | | | $ | 1,666,820 | |
Shares issued in reinvestment of dividends and distributions | | 94,918 | | | | 1,133,324 | |
Shares reacquired | | (229,413 | ) | | | (2,825,109 | ) |
| | | | | | | |
Net increase (decrease) in shares outstanding | | (1,573 | ) | | $ | (24,965 | ) |
| | | | | | | |
Year ended July 31, 2007: | | | | | | | |
Shares sold | | 247,064 | | | $ | 3,153,944 | |
Shares issued in reinvestment of dividends and distributions | | 53,637 | | | | 672,118 | |
Shares reacquired | | (255,541 | ) | | | (3,191,770 | ) |
| | | | | | | |
Net increase (decrease) in shares outstanding | | 45,160 | | | $ | 634,292 | |
| | | | | | | |
Note 7. Borrowings
The Trust, along with other affiliated registered investment companies (the “Companies”), is a party to a syndicated credit agreement (“SCA”) with two banks. The SCA provides for a commitment of $500 million. Interest on any borrowings under the SCA is incurred at market rates and a commitment fee for the unused amount is accrued daily and paid quarterly. Effective October 26, 2007, the Companies renewed the SCA with the two banks. The Companies pays a commitment fee of .06 of 1% of the unused portion of the SCA. The expiration date of the SCA will be October 24, 2008. For the period October 27, 2006 through October 26, 2007, the Companies paid a commitment fee of .07 of 1% of the unused portion of the agreement. The purpose of the SCA is to serve as an alternative source of funding for capital share redemptions.
| | |
| 68 | | Visit our website at www.prudential.com |
The Fund did not borrow any amounts pursuant to the SCA during the six months ended January 31, 2008.
Note 8. New Accounting Pronouncements
On September 20, 2006, the Financial Accounting Standards Board (“FASB”) released Statement of Financial Accounting Standards No. 157 “Fair Value Measurements” (FAS 157). FAS 157 establishes an authoritative definition of fair value, sets out a framework for measuring fair value, and requires additional disclosures about fair-value measurements. The application of FAS 157 is required for fiscal years beginning after November 15, 2007 and interim periods within those fiscal years. At this time, management is evaluating the implications of FAS 157 and its impact, if any, in the financial statements has not yet been determined.
| | |
| Target Asset Allocation Funds/Target Moderate Allocation Fund | | 69 |
Financial Highlights
(Unaudited)
| | | | |
| | | Class A | |
| | | Six Months Ended January 31, 2008(b) | |
Per Share Operating Performance: | | | | |
Net Asset Value, Beginning Of Period | | $ | 12.75 | |
| | | | |
Income (loss) from investment operations: | | | | |
Net investment income | | | .12 | |
Net realized and unrealized gain (loss) on investment transactions | | | (.18 | ) |
| | | | |
Total from investment operations | | | (.06 | ) |
| | | | |
Less Dividends and Distributions: | | | | |
Dividends from net investment income | | | (.10 | ) |
Distributions from net realized gains | | | (.99 | ) |
| | | | |
Total dividends and distributions | | | (1.09 | ) |
| | | | |
Net asset value, end of period | | $ | 11.60 | |
| | | | |
Total Return(a) | | | (0.70 | )% |
Ratios/Supplemental Data: | | | | |
Net assets, end of period (000) | | $ | 165,904 | |
Average net assets (000) | | $ | 171,248 | |
Ratios to average net assets(d): | | | | |
Expenses, including distribution and service (12b-1) fees(c) | | | 1.27 | %(e) |
Expenses, excluding distribution and service (12b-1) fees | | | 1.02 | %(e) |
Net investment income | | | 1.89 | %(e) |
Portfolio turnover rate | | | 106 | %(f) |
| (a) | Total return does not consider the effects of sales loads. Total return is calculated assuming a purchase of a share on the first day and a sale on the last day of each period reported and includes reinvestment of dividends and distributions. Total returns may reflect adjustments to conform to generally accepted accounting principles. Total returns for periods less than one full year are not annualized. |
| (b) | Calculated based upon average shares outstanding during the period. |
| (c) | The distributor of the Fund has contractually agreed to limit its distribution and service (12b-1) fees to .25 of 1% of the average daily net assets of the Class A shares. |
| (d) | Does not include expenses of the underlying portfolios in which the Fund invests. |
See Notes to Financial Statements.
| | |
| 70 | | Visit our website at www.prudential.com |
| | | | | | | | | | | | | | | | | | |
| Class A | |
| Year Ended July 31, | |
| 2007(b) | | | 2006(b) | | | 2005(b) | | | 2004 | | | 2003(b) | |
| | | | | | | | | | | | | | | | | | |
| $ | 11.92 | | | $ | 12.56 | | | $ | 10.96 | | | $ | 9.89 | | | $ | 8.86 | |
| | | | | | | | | | | | | | | | | | | |
| | | | | | | | | | | | | | | | | | |
| | .22 | | | | .20 | | | | .14 | | | | .12 | | | | .15 | |
| | 1.31 | | | | .45 | | | | 1.61 | | | | 1.09 | | | | 1.02 | |
| | | | | | | | | | | | | | | | | | | |
| | 1.53 | | | | .65 | | | | 1.75 | | | | 1.21 | | | | 1.17 | |
| | | | | | | | | | | | | | | | | | | |
| | | | | | | | | | | | | | | | | | |
| | (.22 | ) | | | (.22 | ) | | | (.15 | ) | | | (.14 | ) | | | (.14 | ) |
| | (.48 | ) | | | (1.07 | ) | | | — | | | | — | | | | — | |
| | | | | | | | | | | | | | | | | | | |
| | (.70 | ) | | | (1.29 | ) | | | (.15 | ) | | | (.14 | ) | | | (.14 | ) |
| | | | | | | | | | | | | | | | | | | |
| $ | 12.75 | | | $ | 11.92 | | | $ | 12.56 | | | $ | 10.96 | | | $ | 9.89 | |
| | | | | | | | | | | | | | | | | | | |
| | 13.03 | % | | | 5.53 | % | | | 16.01 | % | | | 12.27 | % | | | 13.29 | % |
| | | | | | | | | | | | | | | | | | |
| $ | 165,073 | | | $ | 135,384 | | | $ | 103,989 | | | $ | 79,172 | | | $ | 58,862 | |
| $ | 154,791 | | | $ | 118,651 | | | $ | 91,030 | | | $ | 72,043 | | | $ | 51,006 | |
| | | | | | | | | | | | | | | | | | |
| | 1.18 | % | | | 1.33 | % | | | 1.32 | % | | | 1.35 | % | | | 1.49 | % |
| | .93 | % | | | 1.08 | % | | | 1.07 | % | | | 1.10 | % | | | 1.24 | % |
| | 1.72 | % | | | 1.67 | % | | | 1.17 | % | | | 1.15 | % | | | 1.66 | % |
| | | | | | | | | | | | | | | | | | |
| | 195 | % | | | 324 | % | | | 285 | % | | | 100 | % | | | 158 | % |
See Notes to Financial Statements.
| | |
| Target Asset Allocation Funds/Target Moderate Allocation Fund | | 71 |
Financial Highlights
(Unaudited) continued
| | | | |
| | | Class B | |
| | | Six Months Ended
January 31, 2008(b) | |
Per Share Operating Performance: | | | | |
Net Asset Value, Beginning Of Period | | $ | 12.70 | |
| | | | |
Income (loss) from investment operations: | | | | |
Net investment income | | | .07 | |
Net realized and unrealized gain (loss) on investment transactions | | | (.18 | ) |
| | | | |
Total from investment operations | | | (.11 | ) |
| | | | |
Less Dividends and Distributions: | | | | |
Dividends from net investment income | | | (.07 | ) |
Distributions from net realized gains | | | (.99 | ) |
| | | | |
Total dividends and distributions | | | (1.06 | ) |
| | | | |
Net asset value, end of period | | $ | 11.53 | |
| | | | |
Total Return(a) | | | (1.11 | )% |
Ratios/Supplemental Data: | | | | |
Net assets, end of period (000) | | $ | 138,659 | |
Average net assets (000) | | $ | 152,333 | |
Ratios to average net assets(c): | | | | |
Expenses, including distribution and service (12b-1) fees | | | 2.02 | %(d) |
Expenses, excluding distribution and service (12b-1) fees | | | 1.02 | %(d) |
Net investment income | | | 1.15 | %(d) |
| (a) | Total return does not consider the effects of sales loads. Total return is calculated assuming a purchase of a share on the first day and a sale on the last day of each period reported and includes reinvestment of dividends and distributions. Total returns may reflect adjustments to conform to generally accepted accounting principles. Total returns for periods less than one full year are not annualized. |
| (b) | Calculated based upon average shares outstanding during the period. |
| (c) | Does not include expenses of the underlying portfolios in which the Fund invests. |
See Notes to Financial Statements.
| | |
| 72 | | Visit our website at www.prudential.com |
| | | | | | | | | | | | | | | | | | |
| Class B | |
| Year Ended July 31, | |
| 2007(b) | | | 2006(b) | | | 2005(b) | | | 2004 | | | 2003(b) | |
| | | | | | | | | | | | | | | | | | |
| $ | 11.87 | | | $ | 12.52 | | | $ | 10.92 | | | $ | 9.86 | | | $ | 8.83 | |
| | | | | | | | | | | | | | | | | | | |
| | | | | | | | | | | | | | | | | | |
| | .12 | | | | .11 | | | | .05 | | | | .04 | | | | .08 | |
| | 1.32 | | | | .44 | | | | 1.61 | | | | 1.08 | | | | 1.03 | |
| | | | | | | | | | | | | | | | | | | |
| | 1.44 | | | | .55 | | | | 1.66 | | | | 1.12 | | | | 1.11 | |
| | | | | | | | | | | | | | | | | | | |
| | | | | | | | | | | | | | | | | | |
| | (.13 | ) | | | (.13 | ) | | | (.06 | ) | | | (.06 | ) | | | (.08 | ) |
| | (.48 | ) | | | (1.07 | ) | | | — | | | | — | | | | — | |
| | | | | | | | | | | | | | | | | | | |
| | (.61 | ) | | | (1.20 | ) | | | (.06 | ) | | | (.06 | ) | | | (.08 | ) |
| | | | | | | | | | | | | | | | | | | |
| $ | 12.70 | | | $ | 11.87 | | | $ | 12.52 | | | $ | 10.92 | | | $ | 9.86 | |
| | | | | | | | | | | | | | | | | | | |
| | 12.27 | % | | | 4.65 | % | | | 15.24 | % | | | 11.37 | % | | | 12.58 | % |
| | | | | | | | | | | | | | | | | | |
| $ | 156,676 | | | $ | 171,286 | | | $ | 193,795 | | | $ | 170,863 | | | $ | 129,759 | |
| $ | 167,764 | | | $ | 187,321 | | | $ | 184,197 | | | $ | 157,550 | | | $ | 113,902 | |
| | | | | | | | | | | | | | | | | | |
| | 1.93 | % | | | 2.08 | % | | | 2.07 | % | | | 2.10 | % | | | 2.24 | % |
| | .93 | % | | | 1.08 | % | | | 1.07 | % | | | 1.10 | % | | | 1.24 | % |
| | .97 | % | | | .92 | % | | | .41 | % | | | .41 | % | | | .91 | % |
See Notes to Financial Statements.
| | |
| Target Asset Allocation Funds/Target Moderate Allocation Fund | | 73 |
Financial Highlights
(Unaudited) continued
| | | | |
| | | Class C | |
| | | Six Months Ended January 31, 2008(b) | |
Per Share Operating Performance: | | | | |
Net Asset Value, Beginning Of Period | | $ | 12.70 | |
| | | | |
Income (loss) from investment operations: | | | | |
Net investment income | | | .07 | |
Net realized and unrealized gain (loss) on investment transactions | | | (.18 | ) |
| | | | |
Total from investment operations | | | (.11 | ) |
| | | | |
Less Dividends and Distributions: | | | | |
Dividends from net investment income | | | (.07 | ) |
Distributions from net realized gains | | | (.99 | ) |
| | | | |
Total dividends and distributions | | | (1.06 | ) |
| | | | |
Net asset value, end of period | | $ | 11.53 | |
| | | | |
Total Return(a) | | | (1.11 | )% |
Ratios/Supplemental Data: | | | | |
Net assets, end of period (000) | | $ | 118,498 | |
Average net assets (000) | | $ | 127,132 | |
Ratios to average net assets(c): | | | | |
Expenses, including distribution and service (12b-1) fees | | | 2.02 | %(d) |
Expenses, excluding distribution and service (12b-1) fees | | | 1.02 | %(d) |
Net investment income | | | 1.15 | %(d) |
| (a) | Total return does not consider the effects of sales loads. Total return is calculated assuming a purchase of a share on the first day and a sale on the last day of each period reported and includes reinvestment of dividends and distributions. Total returns may reflect adjustments to conform to generally accepted accounting principles. Total returns for periods less than one full year are not annualized. |
| (b) | Calculated based upon average shares outstanding during the period. |
| (c) | Does not include expenses of the underlying portfolios in which the Fund invests. |
See Notes to Financial Statements.
| | |
| 74 | | Visit our website at www.prudential.com |
| | | | | | | | | | | | | | | | | | |
Class C | |
Year Ended July 31, | |
| 2007(b) | | | 2006(b) | | | 2005(b) | | | 2004 | | | 2003(b) | |
| | | | | | | | | | | | | | | | | | |
| $ | 11.87 | | | $ | 12.52 | | | $ | 10.92 | | | $ | 9.86 | | | $ | 8.83 | |
| | | | | | | | | | | | | | | | | | | |
| | | | | | | | | | | | | | | | | | |
| | .12 | | | | .11 | | | | .05 | | | | .04 | | | | .08 | |
| | 1.32 | | | | .44 | | | | 1.61 | | | | 1.08 | | | | 1.03 | |
| | | | | | | | | | | | | | | | | | | |
| | 1.44 | | | | .55 | | | | 1.66 | | | | 1.12 | | | | 1.11 | |
| | | | | | | | | | | | | | | | | | | |
| | | | | | | | | | | | | | | | | | |
| | (.13 | ) | | | (.13 | ) | | | (.06 | ) | | | (.06 | ) | | | (.08 | ) |
| | (.48 | ) | | | (1.07 | ) | | | — | | | | — | | | | — | |
| | | | | | | | | | | | | | | | | | | |
| | (.61 | ) | | | (1.20 | ) | | | (.06 | ) | | | (.06 | ) | | | (.08 | ) |
| | | | | | | | | | | | | | | | | | | |
| $ | 12.70 | | | $ | 11.87 | | | $ | 12.52 | | | $ | 10.92 | | | $ | 9.86 | |
| | | | | | | | | | | | | | | | | | | |
| | 12.27 | % | | | 4.65 | % | | | 15.24 | % | | | 11.37 | % | | | 12.58 | % |
| | | | | | | | | | | | | | | | | | |
| $ | 128,243 | | | $ | 123,378 | | | $ | 116,893 | | | $ | 100,712 | | | $ | 77,008 | |
| $ | 129,699 | | | $ | 121,100 | | | $ | 108,434 | | | $ | 94,252 | | | $ | 59,626 | |
| | | | | | | | | | | | | | | | | | |
| | 1.93 | % | | | 2.08 | % | | | 2.07 | % | | | 2.10 | % | | | 2.24 | % |
| | .93 | % | | | 1.08 | % | | | 1.07 | % | | | 1.10 | % | | | 1.24 | % |
| | .97 | % | | | .92 | % | | | .41 | % | | | .41 | % | | | .89 | % |
See Notes to Financial Statements.
| | |
| Target Asset Allocation Funds/Target Moderate Allocation Fund | | 75 |
Financial Highlights
(Unaudited) continued
| | | | |
| | |
Class M | |
| | | Six Months Ended
January 31, 2008(c) | |
Per Share Operating Performance: | | | | |
Net Asset Value, Beginning Of Period | | $ | 12.66 | |
| | | | |
Income (loss) from investment operations: | | | | |
Net investment income | | | .07 | |
Net realized and unrealized gain (loss) on investment transactions | | | (.17 | ) |
| | | | |
Total from investment operations | | | (.10 | ) |
| | | | |
Less Dividends and Distributions: | | | | |
Dividends from net investment income | | | (.07 | ) |
Distributions from net realized gains | | | (.99 | ) |
| | | | |
Total dividends and distributions | | | (1.06 | ) |
| | | | |
Net asset value, end of period | | $ | 11.50 | |
| | | | |
Total Return(b) | | | (1.11 | )% |
Ratios/Supplemental Data: | | | | |
Net assets, end of period (000) | | $ | 6,823 | |
Average net assets (000) | | $ | 7,768 | |
Ratios to average net assets(d): | | | | |
Expenses, including distribution and service (12b-1) fees | | | 2.02 | %(e) |
Expenses, excluding distribution and service (12b-1) fees | | | 1.02 | %(e) |
Net investment income | | | 1.16 | %(e) |
| (a) | Commencement of offering new share class. |
| (b) | Total return does not consider the effects of sales loads. Total return is calculated assuming a purchase of a share on the first day and a sale on the last day of each period reported and includes reinvestment of dividends and distributions. Total returns may reflect adjustments to conform to generally accepted accounting principles. Total returns for periods less than one full year are not annualized. |
| (c) | Calculated based upon average shares outstanding during the period. |
| (d) | Does not include expenses of the underlying portfolios in which the Fund invests. |
See Notes to Financial Statements.
| | |
| 76 | | Visit our website at www.prudential.com |
| | | | | | | | | | |
| Class M | |
| Year Ended July 31, | | | October 4, 2004(a)
Through
July 31, 2005 | |
| 2007(c) | | | 2006(c) | | |
| | | | | | | | | | |
| $ | 11.85 | | | $ | 12.49 | | | $ | 11.34 | |
| | | | | | | | | | | |
| | | | | | | | | | |
| | .12 | | | | .11 | | | | .09 | |
| | 1.30 | | | | .45 | | | | 1.15 | |
| | | | | | | | | | | |
| | 1.42 | | | | .56 | | | | 1.24 | |
| | | | | | | | | | | |
| | | | | | | | | | |
| | (.13 | ) | | | (.13 | ) | | | (.09 | ) |
| | (.48 | ) | | | (1.07 | ) | | | — | |
| | | | | | | | | | | |
| | (.61 | ) | | | (1.20 | ) | | | (.09 | ) |
| | | | | | | | | | | |
| $ | 12.66 | | | $ | 11.85 | | | $ | 12.49 | |
| | | | | | | | | | | |
| | 12.21 | % | | | 4.74 | % | | | 10.96 | % |
| | | | | | | | | | |
| $ | 8,277 | | | $ | 6,272 | | | $ | 4,233 | |
| $ | 8,529 | | | $ | 5,622 | | | $ | 2,203 | |
| | | | | | | | | | |
| | 1.93 | % | | | 2.08 | % | | | 2.07 | %(e) |
| | .93 | % | | | 1.08 | % | | | 1.07 | %(e) |
| | .96 | % | | | .93 | % | | | .54 | %(e) |
See Notes to Financial Statements.
| | |
| Target Asset Allocation Funds/Target Moderate Allocation Fund | | 77 |
Financial Highlights
(Unaudited) continued
| | | | |
| | |
Class R | |
| | | Six Months Ended
January 31, 2008(c) | |
Per Share Operating Performance: | | | | |
Net Asset Value, Beginning Of Period | | $ | 12.76 | |
| | | | |
Income (loss) from investment operations: | | | | |
Net investment income | | | .11 | |
Net realized and unrealized gain (loss) on investment transactions | | | (.19 | ) |
| | | | |
Total from investment operations | | | (.08 | ) |
| | | | |
Less Dividends and Distributions: | | | | |
Dividends from net investment income | | | (.08 | ) |
Distributions from net realized gains | | | (.99 | ) |
| | | | |
Total dividends and distributions | | | (1.07 | ) |
| | | | |
Net asset value, end of period | | $ | 11.61 | |
| | | | |
Total Return(b) | | | (0.82 | )% |
Ratios/Supplemental Data: | | | | |
Net assets, end of period (000) | | $ | 3,503 | |
Average net assets (000) | | $ | 3,921 | |
Ratios to average net assets(e): | | | | |
Expenses, including distribution and service (12b-1) fees(d) | | | 1.52 | %(f) |
Expenses, excluding distribution and service (12b-1) fees | | | 1.02 | %(f) |
Net investment income | | | 1.65 | %(f) |
| (a) | Commencement of offering new share class. |
| (b) | Total return is calculated assuming a purchase of a share on the first day and a sale on the last day of each period reported and includes reinvestment of dividends and distributions. Total returns may reflect adjustments to conform to generally accepted accounting principles. Total returns for periods less than one full year are not annualized. |
| (c) | Calculated based upon average shares outstanding during the period. |
| (d) | The distributor of the Fund has contractually agreed to limit its distribution and service (12b-1) fees to .50 of 1% of the average daily net assets of the Class R shares. |
| (e) | Does not include expenses of the underlying portfolios in which the Fund invests. |
See Notes to Financial Statements.
| | |
| 78 | | Visit our website at www.prudential.com |
| | | | | | | | | | |
| Class R | |
| Year Ended July 31, | | | October 4, 2004(a)
Through
July 31, 2005 | |
| 2007(c) | | | 2006(c) | | |
| | | | | | | | | | |
| $ | 11.93 | | | $ | 12.56 | | | $ | 11.40 | |
| | | | | | | | | | | |
| | | | | | | | | | |
| | .18 | | | | .18 | | | | .10 | |
| | 1.32 | | | | .46 | | | | 1.19 | |
| | | | | | | | | | | |
| | 1.50 | | | | .64 | | | | 1.29 | |
| | | | | | | | | | | |
| | | | | | | | | | |
| | (.19 | ) | | | (.20 | ) | | | (.13 | ) |
| | (.48 | ) | | | (1.07 | ) | | | — | |
| | | | | | | | | | | |
| | (.67 | ) | | | (1.27 | ) | | | (.13 | ) |
| | | | | | | | | | | |
| $ | 12.76 | | | $ | 11.93 | | | $ | 12.56 | |
| | | | | | | | | | | |
| | 12.75 | % | | | 5.35 | % | | | 11.39 | % |
| | | | | | | | | | |
| $ | 3,995 | | | $ | 3,438 | | | $ | 3 | |
| $ | 3,679 | | | $ | 2,872 | | | $ | 3 | |
| | | | | | | | | | |
| | 1.43 | % | | | 1.58 | % | | | 1.57 | %(f) |
| | .93 | % | | | 1.08 | % | | | 1.07 | %(f) |
| | 1.46 | % | | | 1.42 | % | | | 1.02 | %(f) |
See Notes to Financial Statements.
| | |
| Target Asset Allocation Funds/Target Moderate Allocation Fund | | 79 |
Financial Highlights
(Unaudited) continued
| | | | |
| | |
Class X | |
| | | Six Months Ended
January 31, 2008(c) | |
Per Share Operating Performance: | | | | |
Net Asset Value, Beginning Of Period | | $ | 12.69 | |
| | | | |
Income (loss) from investment operations: | | | | |
Net investment income | | | .07 | |
Net realized and unrealized gain (loss) on investment transactions | | | (.18 | ) |
| | | | |
Total from investment operations | | | (.11 | ) |
| | | | |
Less Dividends and Distributions: | | | | |
Dividends from net investment income | | | (.07 | ) |
Distributions from net realized gains | | | (.99 | ) |
| | | | |
Total dividends and distributions | | | (1.06 | ) |
| | | | |
Net asset value, end of period | | $ | 11.52 | |
| | | | |
Total Return(b) | | | (1.11 | )% |
Ratios/Supplemental Data: | | | | |
Net assets, end of period (000) | | $ | 5,128 | |
Average net assets (000) | | $ | 5,614 | |
Ratios to average net assets(d): | | | | |
Expenses, including distribution and service (12b-1) fees | | | 2.02 | %(e) |
Expenses, excluding distribution and service (12b-1) fees | | | 1.02 | %(e) |
Net investment income | | | 1.15 | %(e) |
| (a) | Commencement of offering new share class. |
| (b) | Total return does not consider the effects of sales loads. Total return is calculated assuming a purchase of a share on the first day and a sale on the last day of each period reported and includes reinvestment of dividends and distributions. Total returns may reflect adjustments to conform to generally accepted accounting principles. Total returns for periods less than one full year are not annualized. |
| (c) | Calculated based upon average shares outstanding during the period. |
| (d) | Does not include expenses of the underlying portfolios in which the Fund invests. |
See Notes to Financial Statements.
| | |
| 80 | | Visit our website at www.prudential.com |
| | | | | | | | | | |
| Class X | |
| Year Ended July 31, | | | October 4, 2004(a)
Through
July 31, 2005 | |
| 2007(c) | | | 2006(c) | | |
| | | | | | | | | | |
| $ | 11.87 | | | $ | 12.52 | | | $ | 11.34 | |
| | | | | | | | | | | |
| | | | | | | | | | |
| | .12 | | | | .12 | | | | .09 | |
| | 1.31 | | | | .43 | | | | 1.18 | |
| | | | | | | | | | | |
| | 1.43 | | | | .55 | | | | 1.27 | |
| | | | | | | | | | | |
| | | | | | | | | | |
| | (.13 | ) | | | (.13 | ) | | | (.09 | ) |
| | (.48 | ) | | | (1.07 | ) | | | — | |
| | | | | | | | | | | |
| | (.61 | ) | | | (1.20 | ) | | | (.09 | ) |
| | | | | | | | | | | |
| $ | 12.69 | | | $ | 11.87 | | | $ | 12.52 | |
| | | | | | | | | | | |
| | 12.19 | % | | | 4.65 | % | | | 11.23 | % |
| | | | | | | | | | |
| $ | 5,617 | | | $ | 4,773 | | | $ | 2,284 | |
| $ | 5,644 | | | $ | 3,571 | | | $ | 1,105 | |
| | | | | | | | | | |
| | 1.93 | % | | | 2.08 | % | | | 2.07 | %(e) |
| | .93 | % | | | 1.08 | % | | | 1.07 | %(e) |
| | .96 | % | | | .96 | % | | | .59 | %(e) |
See Notes to Financial Statements.
| | |
| Target Asset Allocation Funds/Target Moderate Allocation Fund | | 81 |
Financial Highlights
(Unaudited) continued
| | | | |
| | | Class Z | |
| | | Six Months Ended
January 31, 2008(b) | |
Per Share Operating Performance: | | | | |
Net Asset Value, Beginning Of Period | | $ | 12.77 | |
| | | | |
Income (loss) from investment operations: | | | | |
Net investment income | | | .14 | |
Net realized and unrealized gain (loss) on investment transactions | | | (.17 | ) |
| | | | |
Total from investment operations | | | (.03 | ) |
| | | | |
Less Dividends and Distributions: | | | | |
Dividends from net investment income | | | (.12 | ) |
Distributions from net realized gains | | | (.99 | ) |
| | | | |
Total dividends and distributions | | | (1.11 | ) |
| | | | |
Net asset value, end of period | | $ | 11.63 | |
| | | | |
Total Return(a) | | | (0.57 | )% |
Ratios/Supplemental Data: | | | | |
Net assets, end of period (000) | | $ | 13,545 | |
Average net assets (000) | | $ | 14,926 | |
Ratios to average net assets(c): | | | | |
Expenses, including distribution and service (12b-1) fees | | | 1.02 | %(d) |
Expenses, excluding distribution and service (12b-1) fees | | | 1.02 | %(d) |
Net investment income | | | 2.15 | %(d) |
| (a) | Total return is calculated assuming a purchase of a share on the first day and a sale on the last day of each period reported and includes reinvestment of dividends and distributions. Total returns may reflect adjustments to conform to generally accepted accounting principles. Total returns for periods less than one full year are not annualized. |
| (b) | Calculated based upon average shares outstanding during the period. |
| (c) | Does not include expenses of the underlying portfolios in which the Fund invests. |
See Notes to Financial Statements.
| | |
| 82 | | Visit our website at www.prudential.com |
| | | | | | | | | | | | | | | | | | |
| Class Z | |
| Year Ended July 31, | |
| 2007(b) | | | 2006(b) | | | 2005(b) | | | 2004 | | | 2003(b) | |
| | | | | | | | | | | | | | | | | | |
| $ | 11.94 | | | $ | 12.58 | | | $ | 10.97 | | | $ | 9.90 | | | $ | 8.87 | |
| | | | | | | | | | | | | | | | | | | |
| | | | | | | | | | | | | | | | | | |
| | .25 | | | | .24 | | | | .17 | | | | .15 | | | | .16 | |
| | 1.31 | | | | .44 | | | | 1.62 | | | | 1.09 | | | | 1.03 | |
| | | | | | | | | | | | | | | | | | | |
| | 1.56 | | | | .68 | | | | 1.79 | | | | 1.24 | | | | 1.19 | |
| | | | | | | | | | | | | | | | | | | |
| | | | | | | | | | | | | | | | | | |
| | (.25 | ) | | | (.25 | ) | | | (.18 | ) | | | (.17 | ) | | | (.16 | ) |
| | (.48 | ) | | | (1.07 | ) | | | — | | | | — | | | | — | |
| | | | | | | | | | | | | | | | | | | |
| | (.73 | ) | | | (1.32 | ) | | | (.18 | ) | | | (.17 | ) | | | (.16 | ) |
| | | | | | | | | | | | | | | | | | | |
| $ | 12.77 | | | $ | 11.94 | | | $ | 12.58 | | | $ | 10.97 | | | $ | 9.90 | |
| | | | | | | | | | | | | | | | | | | |
| | 13.30 | % | | | 5.78 | % | | | 16.36 | % | | | 12.53 | % | | | 13.54 | % |
| | | | | | | | | | | | | | | | | | |
| $ | 14,902 | | | $ | 13,388 | | | $ | 9,329 | | | $ | 7,678 | | | $ | 8,679 | |
| $ | 14,168 | | | $ | 12,022 | | | $ | 8,425 | | | $ | 9,098 | | | $ | 4,090 | |
| | | | | | | | | | | | | | | | | | |
| | .93 | % | | | 1.08 | % | | | 1.07 | % | | | 1.10 | % | | | 1.24 | % |
| | .93 | % | | | 1.08 | % | | | 1.07 | % | | | 1.10 | % | | | 1.24 | % |
| | 1.97 | % | | | 1.93 | % | | | 1.41 | % | | | 1.41 | % | | | 1.86 | % |
See Notes to Financial Statements.
| | |
| Target Asset Allocation Funds/Target Moderate Allocation Fund | | 83 |
| | | | |
| n MAIL | | n TELEPHONE | | n WEBSITE |
Gateway Center Three 100 Mulberry Street Newark, NJ 07102 | | (800) 225-1852 | | www.prudential.com |
|
| PROXY VOTING |
| The Board of Trustees of the Fund has delegated to the Fund’s investment subadvisers the responsibility for voting any proxies and maintaining proxy recordkeeping with respect to the Fund. A description of these proxy voting policies and procedures is available without charge, upon request, by calling (800) 225-1852 or by visiting the Securities and Exchange Commission’s website at www.sec.gov. Information regarding how the Fund voted proxies relating to portfolio securities during the most recent 12-month period ended June 30 is available on the Fund’s website and on the Commission’s website. |
|
| TRUSTEES |
| Linda W. Bynoe • David E.A. Carson • Robert F. Gunia • Robert E. La Blanc • Douglas H. McCorkindale • Richard A. Redeker • Judy A. Rice • Robin B. Smith • Stephen G. Stoneburn • Clay T. Whitehead |
|
| OFFICERS |
| Judy A. Rice, President • Robert F. Gunia, Vice President • Grace C. Torres, Treasurer and Principal Financial and Accounting Officer • Kathryn L. Quirk, Chief Legal Officer • Deborah A. Docs, Secretary • Timothy J. Knierim, Chief Compliance Officer • Valerie M. Simpson, Deputy Chief Compliance Officer • Noreen M. Fierro, Anti-Money Laundering Compliance Officer • Jonathan D. Shain, Assistant Secretary • Claudia DiGiacomo, Assistant Secretary • John P. Schwartz, Assistant Secretary • Andrew R. French, Assistant Secretary • M. Sadiq Peshimam, Assistant Treasurer • Peter Parrella, Assistant Treasurer |
| | | | |
| MANAGER | | Prudential Investments LLC | | Gateway Center Three 100 Mulberry Street Newark, NJ 07102 |
|
| INVESTMENT SUBADVISERS | | EARNEST Partners, LLC | | 75 14th Street, Suite 2300 Atlanta, GA 30309 |
|
| | Goldman Sachs Asset Management LP | | 32 Old Slip 23rd Floor New York, NY 10005 |
|
| | Hotchkis and Wiley Capital Management LLC | | 725 South Figueroa Street Suite 3900 Los Angeles, CA 90017 |
|
| | JP Morgan Investment Management, Inc. | | 522 Fifth Avenue New York, NY 10036 |
|
| | LSV Asset Management | | One North Wacker Drive Suite 4000 Chicago, IL 60606 |
|
| | Marsico Capital Management, LLC | | 1200 17th Street Suite 1600 Denver, CO 80202 |
|
| | NFJ Investment Group L.P. | | 2100 Ross Avenue Suite 1840 Dallas, TX 75201 |
|
| | Pacific Investment Management Company LLC | | 840 Newport Center Drive Newport Beach, CA 92660 |
| | | | |
| | RS Investment Management Co. LLC | | 388 Market Street Suite 1700 San Francisco, CA 94111 |
|
| | Thornburg Investment Management, Inc. | | 119 East Marcy Street Santa Fe, NM 87501 |
|
| | Vaughan Nelson Investment Management, LP | | 600 Travis Street Suite 6300 Houston, TX 77002 |
|
| DISTRIBUTOR | | Prudential Investment
Management Services LLC | | Gateway Center Three
100 Mulberry Street
Newark, NJ 07102 |
|
| CUSTODIAN | | PFPC Trust Company | | 400 Bellevue Parkway
Wilmington, DE 19809 |
|
| TRANSFER AGENT | | Prudential Mutual Fund
Services LLC | | PO Box 9658
Providence, RI 02940 |
|
| INDEPENDENT REGISTERED PUBLIC ACCOUNTING FIRM | | KPMG LLP | | 345 Park Avenue
New York, NY 10154 |
|
| FUND COUNSEL | | Willkie Farr & Gallagher LLP | | 787 Seventh Avenue New York, NY 10019 |
|
| An investor should consider the investment objectives, risks, charges, and expenses of the Fund carefully before investing. The prospectus for the Fund contains this and other information about the Fund. An investor may obtain a prospectus by visiting our website at www.prudential.com or by calling (800) 225-1852. The prospectus should be read carefully before investing. |
|
| |
| E-DELIVERY |
| To receive your mutual fund documents on-line, go to www.icsdelivery.com/prudential/funds and enroll. Instead of receiving printed documents by mail, you will receive notification via e-mail when new materials are available. You can cancel your enrollment or change your e-mail address at any time by clicking on the change/cancel enrollment option at the icsdelivery website address. |
|
| SHAREHOLDER COMMUNICATIONS WITH TRUSTEES |
| Shareholders can communicate directly with the Board of Trustees by writing to the Chair of the Board, Target Asset Allocation Funds, Prudential Investments, Attn: Board of Trustees, 100 Mulberry Street, Gateway Center Three, Newark, NJ 07102. Shareholders can communicate directly with an individual Trustee by writing to the same address. Communications are not screened before being delivered to the addressee. |
|
| AVAILABILITY OF PORTFOLIO SCHEDULE |
| The Fund files its complete schedule of portfolio holdings with the Securities and Exchange Commission for the first and third quarters of each fiscal year on Form N-Q. The Fund’s Forms N-Q are available on the Commission’s website at www.sec.gov. The Fund’s Forms N-Q may also be reviewed and copied at the Commission’s Public Reference Room in Washington, D.C. Information on the operation and location of the Public Reference Room may be obtained by calling (800) SEC-0330 (732-0330). The Fund’s schedule of portfolio holdings is also available on the Fund’s website as of the end of each fiscal quarter. |
Mutual Funds:
| | | | |
ARE NOT INSURED BY THE FDIC OR ANY FEDERAL GOVERNMENT AGENCY | | MAY LOSE VALUE | | ARE NOT A DEPOSIT OF OR GUARANTEED BY ANY BANK OR ANY BANK AFFILIATE |

| | | | | | | | | | | | | | | | | | |
| Target Moderate Allocation Fund | | | | | | | | | | |
| | | Share Class | | A | | B | | C | | M | | R | | X | | Z | | |
| | NASDAQ | | PAMGX | | DMGBX | | PIMGX | | N/A | | SPMRX | | N/A | | PDMZX | | |
| | CUSIP | | 87612A807 | | 87612A880 | | 87612A872 | | 87612A849 | | 87612A864 | | 87612A831 | | 87612A856 | | |
| | | | | | | | | | | | | | | | | | |
MFSP504E4 IFS-A145509 Ed. 03/2008

| | |
| JANUARY 31, 2008 | | SEMIANNUAL REPORT |
Target Growth Allocation Fund
OBJECTIVE
Seeks long-term capital appreciation
This report is not authorized for distribution to prospective investors unless preceded or accompanied by a current prospectus.
The views expressed in this report and information about the Fund’s portfolio holdings are for the period covered by this report and are subject to change thereafter.
The accompanying financial statements as of January 31, 2008, were not audited and, accordingly, no auditor’s opinion is expressed on them.
Target Funds, Prudential, Prudential Financial and the Rock Prudential logo are registered service marks of The Prudential Insurance Company of America, Newark, NJ, and its affiliates.

March 14, 2008
Dear Shareholder:
On the following pages, you’ll find your semiannual report for the Target Growth Allocation Fund.
Target Asset Allocation Funds are managed by institutional-quality asset managers selected, matched, and monitored by a research team from Prudential Investments LLC. Portions of the Funds’ assets are assigned to carefully chosen asset managers, with the allocations actively managed on the basis of our projections for the financial markets and the managers’ individual strengths.
We believe our Target Growth Allocation Fund will help you to achieve broad, actively managed diversification at a targeted risk/return balance with a single investment purchase. We appreciate your continued confidence in us.
Sincerely,

Judy A. Rice, President
Target Asset Allocation Funds
| | |
| Target Asset Allocation Funds/Target Growth Allocation Fund | | 1 |
Your Fund’s Performance
Performance data quoted represent past performance. Past performance does not guarantee future results. The investment return and principal value of an investment will fluctuate, so that an investor’s shares, when redeemed, may be worth more or less than their original cost. Current performance may be lower or higher than the past performance data quoted. An investor may obtain performance data as of the most recent month-end by visiting our website at www.prudential.com or by calling (800) 225-1852. The maximum initial sales charge is 5.50% (Class A shares). Gross operating expenses: Class A, 1.37%; Class B, 2.07%; Class C, 2.07%; Class M, 2.07%; Class R, 1.82%; Class X, 2.07%; Class Z, 1.07%. Net operating expenses apply to: Class A, 1.32%; Class B, 2.07%; Class C, 2.07%; Class M, 2.07%; Class R, 1.57%; Class X, 2.07%; Class Z, 1.07%, after contractual reduction through 11/30/2008.
| | | | | | | | | | | |
| Cumulative Total Returns as of 1/31/08 | | | | | | | | | |
| | | Six Months | | One Year | | | Five Years | | | Since Inception1 | |
Class A | | –5.80% | | –3.21 | % | | 98.43 | % | | 83.67 | % |
Class B | | –6.12 | | –3.94 | | | 91.26 | | | 71.59 | |
Class C | | –6.12 | | –3.94 | | | 91.26 | | | 71.59 | |
Class M | | –6.10 | | –3.93 | | | N/A | | | 35.05 | |
Class R | | –6.00 | | –3.47 | | | N/A | | | 37.00 | |
Class X | | –6.11 | | –3.93 | | | N/A | | | 34.84 | |
Class Z | | –5.70 | | –2.98 | | | 101.02 | | | 88.31 | |
Customized Blend2 | | –5.12 | | –2.39 | | | 94.86 | | | ** | |
S&P 500 Index3 | | –4.32 | | –2.31 | | | 76.44 | | | *** | |
Lipper Multi-Cap Core Funds Average4 | | –5.02 | | –2.41 | | | 79.82 | | | **** | |
| | | | | | | | |
| Average Annual Total Returns5 as of 12/31/07 | | | | | | |
| | | One Year | | Five Years | | | Since Inception1 | |
Class A | | 0.38% | | 14.38 | % | | 7.08 | % |
Class B | | 0.67 | | 14.71 | | | 6.95 | |
Class C | | 4.50 | | 14.82 | | | 6.95 | |
Class M | | –0.30 | | N/A | | | 11.48 | |
Class R | | 5.92 | | N/A | | | 12.70 | |
Class X | | –0.29 | | N/A | | | 11.19 | |
Class Z | | 6.49 | | 15.98 | | | 8.04 | |
Customized Blend2 | | 6.36 | | 15.21 | | | ** | |
S&P 500 Index3 | | 5.49 | | 12.82 | | | *** | |
Lipper Multi-Cap Core Funds Average4 | | 6.42 | | 13.32 | | | **** | |
The cumulative total returns do not reflect the deduction of applicable sales charges. If reflected, the applicable sales charges would reduce the cumulative total returns performance quoted. Class A shares are subject to a maximum front-end sales charge of 5.50%. Under certain circumstances, Class A shares may be subject to a contingent
| | |
| 2 | | Visit our website at www.prudential.com |
deferred sales charge (CDSC) of 1%. Class B and Class C shares are subject to a maximum CDSC of 5% and 1%, respectively. Class M and Class X shares are subject to a maximum CDSC of 6%. Class R and Class Z shares are not subject to a sales charge.
Source: Prudential Investments LLC and Lipper Inc. Performance figures may reflect fee waivers and/or expense reimbursements. In the absence of such fee waivers and/or expense reimbursements, total returns would be lower.
1Inception dates: Class A, B, C, and Z, 11/18/98; Class M, R, and X, 10/04/04.
2The Customized Benchmark for Target Growth Allocation Fund (Customized Blend) is a model portfolio consisting of the Russell 3000® Index (80%) and the MSCI EAFE (20%). Each component of the Customized Blend is an unmanaged index generally considered as representing the performance of the Fund’s asset classes. The Customized Blend is intended to provide a theoretical comparison of the Fund’s performance, based on the amounts allocated to each asset class rather than on amounts allocated to various Fund segments. The Customized Blend does not reflect deductions for any sales charges or operating expenses of a mutual fund.
3The Standard & Poor’s 500 Composite Stock Price Index (S&P 500 Index) is an unmanaged index of 500 stocks of large U.S. public companies. It gives an indication of how U.S. stock prices have performed.
4The Lipper Multi-Cap Core Funds Average (Lipper Average) represents funds that, by portfolio practice, invest in a variety of market capitalization ranges without concentrating 75% of their equity assets in any one market capitalization range over an extended period of time. Multi-cap funds typically have between 25% and 75% of their assets invested in companies with market capitalizations (on a three year weighted basis) above 300% of the dollar-weighted median market capitalization of the middle 1,000 securities of the S&P SuperComposite 1500 Index. Multi-cap core funds have more latitude in the companies in which they invest. These funds typically have an average price-to-earnings ratio, price-to-book ratio, and three-year sales-per-share growth value, compared to the S&P SuperComposite 1500 Index.
5The average annual total returns take into account applicable sales charges. Class A, Class B, Class C, Class M, Class R, and Class X shares are subject to an annual distribution and service (12b-1) fee of up to 0.30%, 1.00%, 1.00%, 1.00%, 0.75%, and 1.00%, respectively. Approximately seven years after purchase, Class B shares will automatically convert to Class A shares on a quarterly basis. Approximately eight years after purchase, Class M shares will automatically convert to Class A shares on a quarterly basis. Approximately 10 years after purchase, Class X shares will automatically convert to Class A shares on a quarterly basis. Class Z shares are not subject to a 12b-1 fee. The returns in the tables do not reflect the deduction of taxes that a shareholder would pay on Fund distributions or following the redemption of Fund shares.
**Customized Blend Closest Month-End to Inception cumulative total returns as of 1/31/08 are 53.95% for Classes A, B, C, and Z; and 39.87% for Classes M, R, and X. Customized Blend Closest Month-End to Inception average annual total returns as of 12/31/07 are 5.67% for Classes A, B, C, and Z; and 13.27% for Classes M, R, and X.
***S&P 500 Index Closest Month-End to Inception cumulative total returns as of 1/31/08 are 37.26% for Classes A, B, C, and Z; and 31.56% for Classes M, R, and X. S&P 500 Index Closest Month-End to Inception average annual total returns as of 12/31/07 are 4.26% for Classes A, B, C, and Z; and 10.90% for Classes M, R, and X.
****Lipper Average Closest Month-End to Inception cumulative total returns as of 1/31/08 are 73.47% for Classes A, B, C, and Z; and 32.86% for Classes M, R, and X. Lipper Average Closest Month-End to Inception average annual total returns as of 12/31/07 are 6.62% for Classes A, B, C, and Z; and 11.32% for Classes M, R, and X.
Investors cannot invest directly in an index. The returns for the S&P 500 Index and the Customized Blend would be lower if they included the effects of sales charges, operating expenses of a mutual fund, or taxes. Returns for the Lipper Average reflect the deduction of operating expenses, but not sales charges or taxes. The Since Inception returns for the S&P 500 Index, Customized Blend, and the Lipper Average are measured from the closest month-end to inception date, and not from the Fund’s actual inception date.
| | |
| Target Asset Allocation Funds/Target Growth Allocation Fund | | 3 |
Your Fund’s Performance (continued)
Fund objective
The investment objective of the Target Growth Allocation Fund is long-term capital appreciation. There can be no assurance that the Fund will achieve its investment objective.
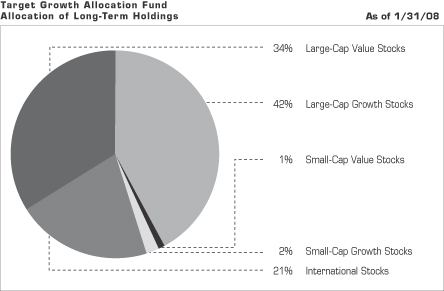
| | |
| 4 | | Visit our website at www.prudential.com |
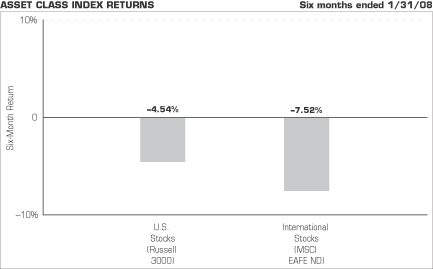
Source: Lipper Inc.
The chart above shows the total returns for six months ended January 31, 2008, of various securities indexes that are generally considered representative of broad market sectors. It does not reflect a mutual fund’s expenses. The performance cited does not represent the performance of the Target Growth Allocation Fund. Past performance is not indicative of future results. Investors cannot invest directly in an index.
The Russell 3000 Index measures the performance of the 3,000 largest U.S. companies based on total market capitalization, which represents approximately 98% of the investable U.S. equity market.
The Morgan Stanley Capital International Europe, Australasia, and Far East Index (MSCI EAFE ND Index) is an unmanaged, weighted index that reflects stock price movements in Europe, Australasia, and the Far East. It gives a broad look at how foreign stock prices have performed. The Fund utilizes the net dividends (ND) version of the MSCI EAFE Index. The net dividends and gross dividends versions of the MSCI EAFE Index differ in that net dividends returns reflect the impact of the maximum withholding taxes on reinvested dividends, while the gross dividends version does not reflect the impact of withholding taxes on reinvested dividends. These returns do not include the effect of any investment management expenses. These returns would have been lower if they included the effect of these expenses.
| | |
| Target Asset Allocation Funds/Target Growth Allocation Fund | | 5 |
Fees and Expenses (Unaudited)
As a shareholder of the Fund, you incur two types of costs: (1) transaction costs, including sales charges (loads) on purchase payments and redemptions, as applicable, and (2) ongoing costs, including management fees, distribution and/or service (12b-1) fees, and other Fund expenses, as applicable. This example is intended to help you understand your ongoing costs (in dollars) of investing in the Fund and to compare these costs with the ongoing costs of investing in other mutual funds.
The example is based on an investment of $1,000 invested on August 1, 2007, at the beginning of the period, and held through the six-month period ended January 31, 2008. The example is for illustrative purposes only; you should consult the Prospectus for information on initial and subsequent minimum investment requirements.
The Fund’s transfer agent may charge additional fees to holders of certain accounts that are not included in the expenses shown in the table on the following page. These fees apply to individual retirement accounts (IRAs) and Section 403(b) accounts. As of the close of the six-month period covered by the table, IRA fees included an annual maintenance fee of $15 per account (subject to a maximum annual maintenance fee of $25 for all accounts held by the same shareholder). Section 403(b) accounts are charged an annual $25 fiduciary maintenance fee. Some of the fees may vary in amount, or may be waived, based on your total account balance or the number of JennisonDryden Funds, including the Target Asset Allocation Funds, that you own. You should consider the additional fees that were charged to your Fund account over the six-month period when you estimate the total ongoing expenses paid over the period and the impact of these fees on your ending account value, as these additional expenses are not reflected in the information provided in the expense table. Additional fees have the effect of reducing investment returns.
Actual Expenses
The first line for each share class in the table on the following page provides information about actual account values and actual expenses. You may use the information on this line, together with the amount you invested, to estimate the expenses that you paid over the period. Simply divide your account value by $1,000 (for example, an $8,600 account value ÷ $1,000 = 8.6), then multiply the result by the number on the first line under the heading “Expenses Paid During the Six-Month Period” to estimate the expenses you paid on your account during this period.
Hypothetical Example for Comparison Purposes
The second line for each share class in the table on the following page provides information about hypothetical account values and hypothetical expenses based on the Fund’s actual expense ratio and an assumed rate of return of 5% per year before
| | |
| 6 | | Visit our website at www.prudential.com |
expenses, which is not the Fund’s actual return. The hypothetical account values and expenses may not be used to estimate the actual ending account balance or expenses you paid for the period. You may use this information to compare the ongoing costs of investing in the Fund and other funds. To do so, compare this 5% hypothetical example with the 5% hypothetical examples that appear in the shareholder reports of the other funds.
Please note that the expenses shown in the table are meant to highlight your ongoing costs only, and do not reflect any transactional costs such as sales charges (loads). Therefore the second line for each share class in the table is useful in comparing ongoing costs only, and will not help you determine the relative total costs of owning different funds. In addition, if these transactional costs were included, your costs would have been higher.
| | | | | | | | | | | | | | |
Target
Growth
Allocation Fund | | Beginning Account
Value
August 1, 2007 | | Ending Account
Value January 31, 2008 | | Annualized
Expense Ratio
Based on the
Six-Month
Period | | | Expenses Paid
During the
Six-Month
Period* |
| | | | | | | | | | | | | | |
| Class A | | Actual | | $ | 1,000.00 | | $ | 942.00 | | 1.32 | % | | $ | 6.44 |
| | | Hypothetical | | $ | 1,000.00 | | $ | 1,018.50 | | 1.32 | % | | $ | 6.70 |
| | | | | | | | | | | | | | |
| Class B | | Actual | | $ | 1,000.00 | | $ | 938.80 | | 2.07 | % | | $ | 10.09 |
| | | Hypothetical | | $ | 1,000.00 | | $ | 1,014.73 | | 2.07 | % | | $ | 10.48 |
| | | | | | | | | | | | | | |
| Class C | | Actual | | $ | 1,000.00 | | $ | 938.80 | | 2.07 | % | | $ | 10.09 |
| | | Hypothetical | | $ | 1,000.00 | | $ | 1,014.73 | | 2.07 | % | | $ | 10.48 |
| | | | | | | | | | | | | | |
| Class M | | Actual | | $ | 1,000.00 | | $ | 939.00 | | 2.07 | % | | $ | 10.09 |
| | | Hypothetical | | $ | 1,000.00 | | $ | 1,014.73 | | 2.07 | % | | $ | 10.48 |
| | | | | | | | | | | | | | |
| Class R | | Actual | | $ | 1,000.00 | | $ | 940.00 | | 1.57 | % | | $ | 7.66 |
| | | Hypothetical | | $ | 1,000.00 | | $ | 1,017.24 | | 1.57 | % | | $ | 7.96 |
| | | | | | | | | | | | | | |
| Class X | | Actual | | $ | 1,000.00 | | $ | 938.90 | | 2.07 | % | | $ | 10.09 |
| | | Hypothetical | | $ | 1,000.00 | | $ | 1,014.73 | | 2.07 | % | | $ | 10.48 |
| | | | | | | | | | | | | | |
| Class Z | | Actual | | $ | 1,000.00 | | $ | 943.00 | | 1.07 | % | | $ | 5.23 |
| | | Hypothetical | | $ | 1,000.00 | | $ | 1,019.76 | | 1.07 | % | | $ | 5.43 |
* Fund expenses (net of fee waivers or subsidies, if any) for each share class are equal to the annualized expense ratio for each share class (provided in the table), multiplied by the average account value over the period, multiplied by the 184 days in the six-month period ended January 31, 2008, and divided by the 366 days in the Fund’s fiscal year ending July 31, 2008 (to reflect the six-month period). Expenses presented in the table include the expenses of any underlying portfolios in which the Fund may invest.
| | |
| Target Asset Allocation Funds/Target Growth Allocation Fund | | 7 |
Portfolio of Investments
as of January 31, 2008 (Unaudited)
| | | | | |
| Shares | | Description | | Value (Note 1) |
| | | | | |
LONG-TERM INVESTMENTS 96.8% | | | |
COMMON STOCKS | | | |
| |
Aerospace & Defense 3.1% | | | |
| 1,500 | | AAR Corp.* | | $ | 44,190 |
| 2,670 | | Aerovironment, Inc.* | | | 61,437 |
| 350 | | Alliant Techsystems, Inc.* | | | 37,048 |
| 1,550 | | BE Aerospace, Inc.* | | | 59,845 |
| 8,000 | | Boeing Co. (The) | | | 665,440 |
| 455 | | DRS Technologies, Inc. | | | 24,420 |
| 10,800 | | Empresa Brasileira de Aeronautica SA, ADR (Brazil) | | | 468,720 |
| 7,100 | | Finmeccanica SpA (Italy) | | | 212,215 |
| 24,088 | | General Dynamics Corp. | | | 2,034,472 |
| 1,100 | | Goodrich Corp. | | | 68,805 |
| 2,470 | | HEICO Corp. | | | 109,940 |
| 24,669 | | Lockheed Martin Corp. | | | 2,662,278 |
| 1,750 | | Moog, Inc. (Class A Stock)* | | | 80,570 |
| 28,600 | | Northrop Grumman Corp. | | | 2,269,696 |
| 3,770 | | Orbital Sciences Corp.* | | | 87,841 |
| 6,100 | | Raytheon Co. | | | 397,354 |
| 600 | | Teledyne Technologies, Inc.* | | | 30,978 |
| 2,200 | | Thales SA (France) | | | 127,499 |
| 6,450 | | United Technologies Corp. | | | 473,494 |
| | | | | |
| | | | | 9,916,242 |
|
Agricultural Chemicals 0.3% |
| 7,600 | | Potash Corp. of Saskatchewan, Inc. (Canada) | | | 1,070,688 |
|
Agriculture/Heavy Equipment |
| 1,500 | | Universal Corp. | | | 74,715 |
|
Air Freight & Couriers 0.1% |
| 3,900 | | FedEx Corp. | | | 364,572 |
|
Air Freight & Logistics |
| 700 | | Forward Air Corp. | | | 21,700 |
|
Airlines 0.2% |
| 82,000 | | Air New Zealand Ltd. (New Zealand) | | | 118,080 |
| 68,800 | | Qantas Airways Ltd. (Australia) | | | 292,021 |
| 19,513 | | Singapore Airlines Ltd. (Singapore) | | | 214,934 |
| 4,400 | | Southwest Airlines Co. | | | 51,612 |
| | | | | |
| | | | | 676,647 |
See Notes to Financial Statements.
| | |
| Target Asset Allocation Funds/Target Growth Allocation Fund | | 9 |
Portfolio of Investments
as of January 31, 2008 (Unaudited) continued
| | | | | |
| Shares | | Description | | Value (Note 1) |
| | | | | |
COMMON STOCKS (continued) | | | |
|
Auto Components 0.1% |
| 7,425 | | Paccar, Inc. | | $ | 348,381 |
|
Auto/Trucks Parts & Equipment 0.1% |
| 7,300 | | Nifco, Inc. (Japan) | | | 163,478 |
|
Automobile Manufacturers 1.7% |
| 3,800 | | Daimler AG (Germany) | | | 297,158 |
| 16,800 | | Ford Motor Co.* | | | 111,552 |
| 47,000 | | Fuji Heavy Industries Ltd. (Japan) | | | 188,678 |
| 27,000 | | General Motors Corp. | | | 764,370 |
| 15,200 | | Honda Motor Co. Ltd. (Japan) | | | 470,041 |
| 43,600 | | Nissan Motor Co. Ltd. (Japan) | | | 407,221 |
| 4,000 | | PSA Peugeot Citroen SA (France) | | | 296,107 |
| 2,100 | | Renault SA (France) | | | 239,687 |
| 19,400 | | Toyota Motor Corp. (Japan) | | | 1,050,337 |
| 13,412 | | Toyota Motor Corp., ADR (Japan) | | | 1,455,872 |
| 700 | | Volkswagen AG (Germany) | | | 158,542 |
| | | | | |
| | | | | 5,439,565 |
|
Automotive Parts 0.5% |
| 4,040 | | Amerigon, Inc.* | | | 69,165 |
| 2,000 | | Compagnie Generale des Establissements Michelin (Class B Stock) (France) | | | 193,015 |
| 200 | | Georg Fischer AG (Switzerland)* | | | 87,608 |
| 41,200 | | GKN PLC (United Kingdom) | | | 218,254 |
| 24,800 | | Johnson Controls, Inc. | | | 877,176 |
| 3,300 | | Valeo SA (France) | | | 121,940 |
| 30,000 | | Yokohama Rubber Co. Ltd. (Japan) | | | 169,491 |
| | | | | |
| | | | | 1,736,649 |
|
Banks |
| 6,400 | | Colonial BancGroup, Inc. (The) | | | 100,480 |
| 850 | | Provident Bankshares Corp. | | | 17,620 |
| 775 | | United Bankshares, Inc. | | | 24,924 |
| | | | | |
| | | | | 143,024 |
|
Beverages 1.4% |
| 9,000 | | Anheuser-Busch Cos., Inc. | | | 418,680 |
| 4,300 | | Carlsberg AS (Denmark) | | | 453,576 |
| 30,213 | | Coca-Cola Co. (The) | | | 1,787,703 |
See Notes to Financial Statements.
| | |
| 10 | | Visit our website at www.prudential.com |
| | | | | |
| Shares | | Description | | Value (Note 1) |
| | | | | |
COMMON STOCKS (continued) | | | |
|
Beverages (cont’d.) |
| 1,400 | | Hansen Natural Corp.* | | $ | 53,984 |
| 2,000 | | Molson Coors Brewing Co. (Class B Stock) | | | 89,340 |
| 2,400 | | PepsiAmericas, Inc. | | | 59,136 |
| 16,000 | | PepsiCo, Inc. | | | 1,091,040 |
| 29,028 | | SABMiller PLC (United Kingdom) | | | 628,038 |
| | | | | |
| | | | | 4,581,497 |
|
Biotechnology 1.1% |
| 4,000 | | Applera Corp. - Applied Biosystems Group | | | 126,120 |
| 1,900 | | Celgene Corp.* | | | 106,609 |
| 36,150 | | Genentech, Inc.* | | | 2,537,368 |
| 2,220 | | Genomic Health, Inc.* | | | 46,598 |
| 16,300 | | Gilead Sciences, Inc.* | | | 744,747 |
| | | | | |
| | | | | 3,561,442 |
|
Building Materials 0.1% |
| 5,075 | | Rollins, Inc. | | | 90,284 |
| 35,000 | | Sanwa Holdings Corp. (Japan) | | | 168,739 |
| | | | | |
| | | | | 259,023 |
|
Building Products 0.1% |
| 935 | | Lennox International, Inc. | | | 34,745 |
| 11,400 | | Masco Corp. | | | 261,402 |
| | | | | |
| | | | | 296,147 |
| |
Business Services 1.1% | | | |
| 500 | | Administaff, Inc. | | | 15,005 |
| 3,300 | | Fair Isaac Corp. | | | 84,150 |
| 7,100 | | Manpower, Inc. | | | 399,446 |
| 15,077 | | MasterCard, Inc. (Class A Stock) | | | 3,120,939 |
| | | | | |
| | | | | 3,619,540 |
| |
Cable Television 0.4% | | | |
| 16,700 | | DIRECTV Group, Inc. (The)* | | | 377,086 |
| 22,800 | | Rogers Communications, Inc. (Class B Stock) (Canada) | | | 871,761 |
| | | | | |
| | | | | 1,248,847 |
| |
Capital Markets 0.4% | | | |
| 725 | | KBW, Inc.* | | | 21,540 |
| 21,900 | | Morgan Stanley | | | 1,082,517 |
See Notes to Financial Statements.
| | |
| Target Asset Allocation Funds/Target Growth Allocation Fund | | 11 |
Portfolio of Investments
as of January 31, 2008 (Unaudited) continued
| | | | | |
| Shares | | Description | | Value (Note 1) |
| | | | | |
COMMON STOCKS (continued) | | | |
| |
Capital Markets (cont’d.) | | | |
| 3,672 | | Raymond James Financial, Inc. | | $ | 103,146 |
| | | | | |
| | | | | 1,207,203 |
| |
Chemicals 4.0% | | | |
| 8,277 | | Air Products & Chemicals, Inc. | | | 745,096 |
| 625 | | Airgas, Inc. | | | 29,006 |
| 120 | | Arkema (France)* | | | 6,813 |
| 26,000 | | Asahi Kasei Corp. (Japan) | | | 159,547 |
| 9,700 | | BASF AG (Germany) | | | 1,263,338 |
| 2,300 | | Celanese Corp. | | | 85,514 |
| 4,100 | | CF Industries Holdings, Inc. | | | 438,413 |
| 2,500 | | Ciba Specialty Chemicals AG (Switzerland) | | | 101,657 |
| 35,700 | | Denki Kagaku Kogyo Kabushiki Kiasha (Japan) | | | 145,629 |
| 45,800 | | Dow Chemical Co. | | | 1,770,628 |
| 2,400 | | DuPont (E.I.) de Nemours & Co. | | | 108,432 |
| 12,500 | | Eastman Chemical Co. | | | 825,875 |
| 350 | | FMC Corp. | | | 18,606 |
| 500 | | Givaudan SA (Switzerland) | | | 493,058 |
| 900 | | Lubrizol Corp. (The) | | | 47,349 |
| 1,060 | | Minerals Technologies, Inc. | | | 57,664 |
| 26,600 | | Mitsubishi Chemical Holdings Corp. (Japan) | | | 193,643 |
| 29,470 | | Monsanto Co. | | | 3,313,607 |
| 1,100 | | Mosaic Co. (The)* | | | 100,111 |
| 22,000 | | Nippon Shokubai Co. Ltd. (Japan) | | | 195,897 |
| 7,000 | | PPG Industries, Inc. | | | 462,630 |
| 16,710 | | Praxair, Inc. | | | 1,352,006 |
| 10,300 | | Rohm & Haas Co. | | | 549,505 |
| 1,800 | | Scotts Miracle-Gro Co. (The) | | | 70,272 |
| 5,100 | | Terra Industries, Inc.* | | | 229,857 |
| 2,300 | | Valspar Corp. (The) | | | 46,069 |
| | | | | |
| | | | | 12,810,222 |
| |
Clothing & Apparel 0.3% | | | |
| 8,010 | | FGX International Holdings Ltd.* | | | 80,901 |
| 21,000 | | Gap, Inc. (The) | | | 401,520 |
| 3,690 | | Iconix Brand Group, Inc.* | | | 76,715 |
| 3,250 | | NIKE, Inc. (Class B Stock) | | | 200,720 |
| 1,775 | | Phillips-Van Heusen Corp. | | | 74,799 |
| 1,200 | | VF Corp. | | | 92,844 |
| | | | | |
| | | | | 927,499 |
See Notes to Financial Statements.
| | |
| 12 | | Visit our website at www.prudential.com |
| | | | | |
| Shares | | Description | | Value (Note 1) |
| | | | | |
COMMON STOCKS (continued) | | | |
| |
Commercial Banks 1.9% | | | |
| 10,400 | | Alliance & Leicester PLC (United Kingdom) | | $ | 136,645 |
| 6,600 | | Allied Irish Banks PLC (Ireland) | | | 147,011 |
| 94,825 | | Bank of America Corp. | | | 4,202,505 |
| 12,950 | | Bank of New York Mellon Corp. (The) | | | 603,859 |
| 25 | | City National Corp. | | | 1,422 |
| 3,900 | | Commonwealth Bank of Australia (Australia) | | | 175,628 |
| 600 | | Cullen Frost Bankers, Inc. | | | 32,664 |
| 17,800 | | Huntington Bancshares, Inc. | | | 239,410 |
| 53,700 | | Royal Bank of Scotland Group PLC (United Kingdom) | | | 413,999 |
| 1,100 | | Societe Generale (France) | | | 138,174 |
| 600 | | Verwaltungs und Privat Bank AG (Liechtenstein) | | | 140,225 |
| | | | | |
| | | | | 6,231,542 |
| |
Commercial Services 0.7% | | | |
| 14,100 | | Accenture Ltd. (Class A Stock) (Bermuda) | | | 488,142 |
| 1,819 | | American Public Education, Inc.* | | | 71,687 |
| 6,932 | | Cardtronics, Inc.* | | | 54,278 |
| 28,700 | | Domtar Corp. (Canada)* | | | 231,609 |
| 1,380 | | FirstService Corp. (Canada)* | | | 31,119 |
| 1,113 | | Healthcare Services Group, Inc. | | | 26,989 |
| 1,325 | | Healthspring, Inc.* | | | 27,414 |
| 1,570 | | HMS Holdings Corp.* | | | 49,612 |
| 4,200 | | HNI Corp. | | | 141,372 |
| 6,900 | | ITT Educational Services, Inc.* | | | 630,315 |
| 2,700 | | McKesson Corp. | | | 169,533 |
| 1,100 | | Paychex, Inc. | | | 35,992 |
| 2,165 | | Team, Inc.* | | | 65,058 |
| 685 | | Waste Connections, Inc.* | | | 19,975 |
| 10,500 | | Waste Management, Inc. | | | 340,620 |
| | | | | |
| | | | | 2,383,715 |
| |
Commercial Services & Supplies | | | |
| 550 | | Watson Wyatt Worldwide, Inc. | | | 27,033 |
| |
Communications Equipment 0.1% | | | |
| 32,800 | | Alcatel-Lucent, ADR (France) | | | 207,624 |
| 3,500 | | Arris Group, Inc.* | | | 30,765 |
| 575 | | CommScope, Inc.* | | | 25,501 |
| 4,810 | | Nuance Communications, Inc.* | | | 76,431 |
| | | | | |
| | | | | 340,321 |
See Notes to Financial Statements.
| | |
| Target Asset Allocation Funds/Target Growth Allocation Fund | | 13 |
Portfolio of Investments
as of January 31, 2008 (Unaudited) continued
| | | | | |
| Shares | | Description | | Value (Note 1) |
| | | | | |
COMMON STOCKS (continued) | | | |
| |
Computer Hardware 2.3% | | | |
| 21,685 | | Apple, Inc.* | | $ | 2,935,281 |
| 1,200 | | Computer Sciences Corp.* | | | 50,784 |
| 34,400 | | Dell, Inc.* | | | 689,376 |
| 45,500 | | EMC Corp.* | | | 722,085 |
| 39,836 | | Hewlett-Packard Co. | | | 1,742,825 |
| 6,900 | | International Business Machines Corp. | | | 740,646 |
| 4,306 | | Logitech International Sa (Switzerland)* | | | 130,770 |
| 4,430 | | Magma Design Automation, Inc.* | | | 50,502 |
| 22,000 | | Synopsys, Inc.* | | | 484,440 |
| | | | | |
| | | | | 7,546,709 |
| |
Computer Networking | | | |
| 2,810 | | Aladdin Knowledge Systems Ltd. (Israel)* | | | 59,319 |
| 1,530 | | Atheros Communications* | | | 41,784 |
| | | | | |
| | | | | 101,103 |
| |
Computer Services & Software 0.2% | | | |
| 2,310 | | Advent Software, Inc.* | | | 104,320 |
| 1,000 | | Autodesk, Inc.* | | | 41,150 |
| 800 | | Cadence Design System, Inc.* | | | 8,120 |
| 920 | | Concur Technologies, Inc.* | | | 32,255 |
| 1,400 | | Global Payments, Inc. | | | 52,360 |
| 3,990 | | Innerworkings, Inc.* | | | 55,261 |
| 265 | | Micros Systems, Inc.* | | | 16,319 |
| 8,900 | | TietoEnator Oyj (Finland) | | | 165,912 |
| | | | | |
| | | | | 475,697 |
| |
Computer Software 2.0% | | | |
| 196,514 | | Microsoft Corp. | | | 6,406,356 |
| |
Computers 0.4% | | | |
| 54,900 | | Electronic Data Systems Corp. | | | 1,103,490 |
| 950 | | SanDisk Corp.* | | | 24,177 |
| | | | | |
| | | | | 1,127,667 |
| |
Computers & Peripherals | | | |
| 2,600 | | Lexmark International, Inc. (Class A Stock)* | | | 94,146 |
| 1,700 | | Sun Microsystems, Inc.* | | | 29,750 |
| | | | | |
| | | | | 123,896 |
See Notes to Financial Statements.
| | |
| 14 | | Visit our website at www.prudential.com |
| | | | | |
| Shares | | Description | | Value (Note 1) |
| | | | | |
COMMON STOCKS (continued) | | | |
| |
Construction 0.2% | | | |
| 700 | | Ciments Francais SA (France) | | $ | 106,251 |
| 1,425 | | Granite Construction, Inc. | | | 54,250 |
| 1,600 | | Hovnanian Enterprises, Inc. (Class A Stock)* | | | 15,824 |
| 2,600 | | KBR, Inc.* | | | 82,134 |
| 900 | | Meritage Homes Corp.* | | | 14,445 |
| 31,500 | | Taylor Wimpey PLC (United Kingdom) | | | 113,895 |
| 10,500 | | Toll Brothers, Inc.* | | | 244,440 |
| | | | | |
| | | | | 631,239 |
| |
Construction Materials | | | |
| 44,900 | | CSR Ltd. (Australia) | | | 127,135 |
| 600 | | Herman Miller, Inc. | | | 19,068 |
| | | | | |
| | | | | 146,203 |
| |
Consumer Finance 0.2% | | | |
| 10,600 | | Capital One Financial Corp. | | | 580,986 |
| 859 | | Cash America International, Inc. | | | 27,926 |
| 1,900 | | First Cash Financial Services, Inc.* | | | 19,019 |
| | | | | |
| | | | | 627,931 |
| |
Consumer Products | | | |
| 9,300 | | Electrolux AB (Class B Stock) (Sweden) | | | 146,285 |
| |
Consumer Products & Services 0.7% | | | |
| 5,100 | | American Greetings Corp. (Class A Stock) | | | 104,652 |
| 3,410 | | Bare Escentuals, Inc.* | | | 81,294 |
| 3,230 | | NutriSystem, Inc.* | | | 92,442 |
| 59,700 | | Pacific Brands Ltd. (Australia) | | | 153,537 |
| 13,400 | | Procter & Gamble Co. | | | 883,730 |
| 13,800 | | Reckitt Benckiser Group PLC (United Kingdom) | | | 722,843 |
| 900 | | Snap-on, Inc. | | | 44,208 |
| | | | | |
| | | | | 2,082,706 |
| |
Consumer Services 0.3% | | | |
| 12,000 | | Apollo Group, Inc. (Class A Stock)* | | | 956,880 |
| 785 | | McGrath RentCorp | | | 18,283 |
| | | | | |
| | | | | 975,163 |
| |
Containers & Packaging | | | |
| 475 | | Silgan Holdings, Inc. | | | 22,496 |
See Notes to Financial Statements.
| | |
| Target Asset Allocation Funds/Target Growth Allocation Fund | | 15 |
Portfolio of Investments
as of January 31, 2008 (Unaudited) continued
| | | | | |
| Shares | | Description | | Value (Note 1) |
| | | | | |
COMMON STOCKS (continued) | | | |
| |
Distribution/Wholesale 0.2% | | | |
| 26,800 | | Marubeni Corp. (Japan) | | $ | 186,932 |
| 500 | | Owens & Minor, Inc. | | | 20,660 |
| 18,100 | | Sumitomo Corp. (Japan) | | | 252,933 |
| 500 | | W.W. Grainger, Inc. | | | 39,785 |
| | | | | |
| | | | | 500,310 |
| |
Distributors | | | |
| 570 | | WESCO International, Inc.* | | | 24,077 |
| |
Diversified Financial Services 0.9% | | | |
| 20 | | Ameriprise Financial, Inc. | | | 1,106 |
| 46,627 | | JPMorgan Chase & Co. | | | 2,217,114 |
| 3,691 | | KKR Financial Holdings LLC | | | 59,942 |
| 10,616 | | Shinhan Financial Group Co. Ltd. (South Korea)* | | | 568,273 |
| | | | | |
| | | | | 2,846,435 |
| |
Diversified Operations 0.5% | | | |
| 22,900 | | Ingersoll-Rand Co. Ltd. (Class A Stock) (Bermuda) | | | 905,008 |
| 6,801 | | LVMH Moet Hennessy Louis Vuitton (France) | | | 698,417 |
| | | | | |
| | | | | 1,603,425 |
| |
Diversified Telecommunication Services 0.1% | | | |
| 9,800 | | Koninklijke (Royal) KPN NV (Netherlands) | | | 177,861 |
| 47,700 | | Telestra Corp. Ltd. (Australia) | | | 187,662 |
| | | | | |
| | | | | 365,523 |
| |
Education | | | |
| 1,790 | | DeVry, Inc. | | | 98,790 |
| |
Electric Utilities 1.0% | | | |
| 1,700 | | Entergy Corp. | | | 183,906 |
| 6,700 | | Exelon Corp. | | | 510,473 |
| 6,700 | | FirstEnergy Corp. | | | 477,174 |
| 28,800 | | Fortum Oyj (Finland) | | | 1,167,548 |
| 8,500 | | FPL Group, Inc. | | | 548,080 |
| 16,000 | | Sierra Pacific Resources | | | 239,520 |
| 1,145 | | Westar Energy, Inc. | | | 27,892 |
| | | | | |
| | | | | 3,154,593 |
See Notes to Financial Statements.
| | |
| 16 | | Visit our website at www.prudential.com |
| | | | | |
| Shares | | Description | | Value (Note 1) |
| | | | | |
COMMON STOCKS (continued) | | | |
| |
Electronic Components 0.9% | | | |
| 2,900 | | Broadcom Corp. (Class A Shares)* | | $ | 64,032 |
| 1,500 | | Checkpoint Systems, Inc.* | | | 35,640 |
| 800 | | Emerson Electric Co. | | | 40,672 |
| 6,400 | | Energizer Holdings, Inc.* | | | 599,168 |
| 7,700 | | Fanuc Ltd. (Japan) | | | 683,390 |
| 3,900 | | FLIR Systems, Inc.* | | | 118,092 |
| 2,800 | | Garmin Ltd. | | | 202,020 |
| 450 | | General Cable Corp.* | | | 26,105 |
| 32,000 | | HongKong Electric Holdings Ltd. (Hong Kong) | | | 182,604 |
| 760 | | Itron, Inc.* | | | 62,624 |
| 12,000 | | Matsushita Electric Industrial Co. Ltd. (Japan) | | | 255,902 |
| 4,500 | | PerkinElmer, Inc. | | | 112,005 |
| 12,900 | | Sanmina-SCI Corp.* | | | 20,253 |
| 2,700 | | Thomas & Betts Corp.* | | | 122,175 |
| 13,475 | | TT electronics PLC (United Kingdom) | | | 24,302 |
| 4,800 | | Waters Corp.* | | | 275,760 |
| | | | | |
| | | | | 2,824,744 |
| |
Electronic Equipment & Instruments 0.9% | | | |
| 12,100 | | Alps Electric Co. Ltd. (Japan) | | | 139,099 |
| 5,000 | | Tech Data Corp.* | | | 171,900 |
| 49,075 | | Tyco Electronics Ltd. (Bermuda) | | | 1,659,226 |
| 20,475 | | Tyco International Ltd. (Bermuda) | | | 805,896 |
| | | | | |
| | | | | 2,776,121 |
| |
Energy - Alternate Sources | | | |
| 500 | | First Solar, Inc.* | | | 90,885 |
| |
Energy Equipment & Services 0.8% | | | |
| 1,000 | | Cameron International Corp.* | | | 40,260 |
| 600 | | Complete Production Services, Inc.* | | | 9,540 |
| 4,900 | | Diamond Offshore Drilling, Inc. | | | 553,357 |
| 1,810 | | Dril-Quip, Inc.* | | | 87,858 |
| 41,800 | | Halliburton Co. | | | 1,386,506 |
| 7,100 | | National-Oilwell Varco, Inc.* | | | 427,633 |
| 2,455 | | Oil States International, Inc.* | | | 86,072 |
| 2,690 | | Superior Energy Services, Inc.* | | | 107,842 |
| | | | | |
| | | | | 2,699,068 |
See Notes to Financial Statements.
| | |
| Target Asset Allocation Funds/Target Growth Allocation Fund | | 17 |
Portfolio of Investments
as of January 31, 2008 (Unaudited) continued
| | | | | |
| Shares | | Description | | Value (Note 1) |
| | | | | |
COMMON STOCKS (continued) | | | |
| |
Engineering/Construction 0.1% | | | |
| 200 | | Fluor Corp. | | $ | 24,334 |
| 4,000 | | Foster Wheeler Ltd.* | | | 273,880 |
| 1,650 | | URS Corp.* | | | 72,435 |
| | | | | |
| | | | | 370,649 |
| |
Entertainment & Leisure 1.4% | | | |
| 3,570 | | Allegiant Travel Co.* | | | 111,670 |
| 15,400 | | Carnival PLC (United Kingdom) | | | 670,344 |
| 5,100 | | Harley-Davidson, Inc. | | | 206,958 |
| 19,048 | | Las Vegas Sands Corp.* | | | 1,669,938 |
| 1,410 | | Life Time Fitness, Inc.* | | | 62,519 |
| 15,834 | | OPAP SA (Greece) | | | 553,177 |
| 1,896 | | Nintendo Co. Ltd. (Japan) | | | 958,775 |
| 3,500 | | Royal Caribbean Cruises Ltd. | | | 140,980 |
| 3,910 | | Scientific Games Corp. (Class A Stock)* | | | 93,058 |
| | | | | |
| | | | | 4,467,419 |
| |
Environmental Control | | | |
| 7,170 | | Darling International, Inc.* | | | 83,172 |
| |
Environmental Services | | | |
| 3,500 | | Allied Waste Industries, Inc.* | | | 34,475 |
| |
Equipment & Services | | | |
| 1,100 | | Schneider Electric SA (France) | | | 127,240 |
| |
Exchange Traded Funds 0.1% | | | |
| 1,300 | | iShares Nasdaq Biotechnology Index Fund | | | 101,335 |
| 10 | | iShares Russell 1000 Value Index Fund | | | 769 |
| 700 | | iShares Russell 2000 Value Index Fund | | | 47,404 |
| | | | | |
| | | | | 149,508 |
| |
Farming & Agriculture 0.1% | | | |
| 25,100 | | AWB Ltd. (Australia) | | | 49,384 |
| 209,891 | | Chaoda Modern Agriculture Holdings Ltd. (Hong Kong) | | | 213,581 |
| | | | | |
| | | | | 262,965 |
| |
Financial - Bank & Trust 4.6% | | | |
| 1,850 | | Astoria Financial Corp. | | | 50,283 |
| 3,100 | | Banche Popolari Unite ScpA (Italy) | | | 77,516 |
| 14,900 | | Banco Bilbao Vizcaya Argentaria SA (Spain) | | | 313,433 |
See Notes to Financial Statements.
| | |
| 18 | | Visit our website at www.prudential.com |
| | | | | |
| Shares | | Description | | Value (Note 1) |
| | | | | |
COMMON STOCKS (continued) | | | |
| |
Financial - Bank & Trust (cont’d.) | | | |
| 34,200 | | Banco Santander Central Hispano SA (Spain) | | $ | 601,499 |
| 32,400 | | Barclays PLC (United Kingdom) | | | 305,844 |
| 5,650 | | BB&T Corp. | | | 204,982 |
| 4,200 | | BNP Paribas (France) | | | 416,616 |
| 23,500 | | Bradford & Bingley PLC (United Kingdom) | | | 117,552 |
| 67,106 | | China Merchants Bank Co. Ltd. (China) | | | 236,591 |
| 10,400 | | Comerica, Inc. | | | 453,648 |
| 5,800 | | Credit Agricole SA (France) | | | 178,485 |
| 7,700 | | Credit Suisse Group (Switzerland) | | | 438,418 |
| 4,600 | | Danske Bank A/S (Denmark) | | | 165,294 |
| 4,000 | | Deutsche Bank AG (Germany) | | | 450,228 |
| 3,400 | | Dexia NV/SA (Belgium) | | | 82,548 |
| 5,600 | | Fortis NV/SA (Belgium) | | | 125,255 |
| 29,400 | | HBOS PLC (United Kingdom) | | | 409,661 |
| 33,700 | | Intesa Sanpaolo SpA (Italy) | | | 239,837 |
| 15,500 | | Lloyds TSB Group PLC (United Kingdom) | | | 135,367 |
| 5,000 | | Natexis Banques Populaire (France) | | | 84,923 |
| 7,200 | | National Bank of Greece SA (Greece) | | | 440,064 |
| 7,000 | | National City Corp. | | | 124,530 |
| 9,000 | | Nomura Holdings, Inc. (Japan) | | | 131,540 |
| 15,800 | | Nordea Bank AB (Sweden) | | | 215,673 |
| 1,400 | | Pacific Capital Bancorp | | | 30,100 |
| 750 | | Prosperity Bancshares, Inc. | | | 21,563 |
| 35,900 | | Regions Financial Corp. | | | 906,116 |
| 115,000 | | Sberbank (Russia) | | | 414,000 |
| 100 | | Standard & Poor’s Depositary Receipts | | | 13,710 |
| 2,600 | | State Street Corp. | | | 213,512 |
| 1,200 | | Sterling Financial Corp. (WA) | | | 21,348 |
| 25,000 | | Sumitomo Trust & Banking Co. Ltd. (The) (Japan) | | | 160,946 |
| 4,550 | | SunTrust Banks, Inc. | | | 313,723 |
| 12,000 | | TCF Financial Corp. | | | 255,000 |
| 19,100 | | U.S. Bancorp | | | 648,445 |
| 25,300 | | UBS AG (Switzerland) | | | 1,051,060 |
| 60,800 | | Wachovia Corp. | | | 2,366,944 |
| 72,648 | | Wells Fargo & Co. | | | 2,470,758 |
| 650 | | Whitney Holding Corp. | | | 17,446 |
| 1,100 | | Zions Bancorp | | | 60,214 |
| | | | | |
| | | | | 14,964,672 |
See Notes to Financial Statements.
| | |
| Target Asset Allocation Funds/Target Growth Allocation Fund | | 19 |
Portfolio of Investments
as of January 31, 2008 (Unaudited) continued
| | | | | |
| Shares | | Description | | Value (Note 1) |
| | | | | |
COMMON STOCKS (continued) | | | |
| |
Financial Services 3.8% | | | |
| 980 | | Affiliated Managers Group, Inc.* | | $ | 96,344 |
| 7,200 | | AMBAC Financial Group, Inc. | | | 84,384 |
| 1,000 | | Bear Stearns Cos., Inc. | | | 90,300 |
| 573 | | Calamos Asset Management, Inc. | | | 12,503 |
| 9,450 | | CIT Group, Inc. | | | 264,222 |
| 65,900 | | Citigroup, Inc. | | | 1,859,698 |
| 800 | | CME Group, Inc. | | | 495,120 |
| 6,000 | | Eaton Vance Corp. | | | 223,620 |
| 1,200 | | Federated Investors, Inc. (Class B Stock) | | | 51,084 |
| 200 | | GFI Group, Inc.* | | | 17,642 |
| 15,709 | | Goldman Sachs Group, Inc. | | | 3,153,896 |
| 25,400 | | Hong Kong Exchanges and Clearing Ltd. (Hong Kong) | | | 529,659 |
| 2,920,000 | | Industrial & Commercial Bank of China (China) | | | 1,757,774 |
| 1,600 | | Investment Technology Group, Inc.* | | | 75,152 |
| 18,200 | | Irish Life & Permanent PLC (Ireland) | | | 291,690 |
| 2,100 | | Jefferies Group, Inc. | | | 42,462 |
| 29,563 | | Lehman Brothers Holdings, Inc. | | | 1,897,058 |
| 700 | | Marshall & Ilsley Corp. | | | 19,530 |
| 4,200 | | Merrill Lynch & Co., Inc. | | | 236,880 |
| 1,600 | | MoneyGram International, Inc. | | | 8,544 |
| 2,100 | | Muenchener Rueckversicherungs AG (Germany) | | | 377,296 |
| 200 | | Student Loan Corp. (The) | | | 23,684 |
| 4,000 | | Takefuji Corp. (Japan) | | | 114,949 |
| 13,700 | | TD Ameritrade Holding Corp.* | | | 257,012 |
| 7,060 | | TheStreet.com, Inc. | | | 78,366 |
| 100 | | Tri-Continental Corp. | | | 1,947 |
| 725 | | Waddell & Reed Financial, Inc. (Class A Stock) | | | 24,055 |
| 11,300 | | Western Union Co. | | | 253,120 |
| | | | | |
| | | | | 12,337,991 |
| |
Food Products 0.3% | | | |
| 9,900 | | Groupe Danone (France) | | | 800,147 |
| |
Foods 1.2% | | | |
| 15,000 | | Archer-Daniels-Midland Co. | | | 660,750 |
| 700 | | Campbell Soup Co. | | | 22,127 |
| 625 | | Corn Products International, Inc. | | | 21,125 |
| 11,800 | | Dairy Crest Group PLC (United Kingdom) | | | 126,852 |
| 6,900 | | General Mills, Inc. | | | 376,809 |
| 200 | | Kellogg Co. | | | 9,580 |
| 23,800 | | Kraft Foods, Inc. (Class A Stock) | | | 696,388 |
See Notes to Financial Statements.
| | |
| 20 | | Visit our website at www.prudential.com |
| | | | | |
| Shares | | Description | | Value (Note 1) |
| | | | | |
COMMON STOCKS (continued) | | | |
| |
Foods (cont’d.) | | | |
| 2,250 | | Nestle SA (Switzerland) | | $ | 1,007,314 |
| 46,600 | | Northern Foods PLC (United Kingdom) | | | 91,757 |
| 625 | | Ralcorp Holdings, Inc.* | | | 34,006 |
| 3,200 | | SYSCO Corp. | | | 92,960 |
| 10,300 | | Tate & Lyle PLC (United Kingdom) | | | 100,657 |
| 35,700 | | Tyson Foods, Inc. (Class A Stock) | | | 508,725 |
| | | | | |
| | | | | 3,749,050 |
| |
Gas Utilities | | | |
| 850 | | Atmos Energy Corp. | | | 24,412 |
| |
Healthcare - Services 0.1% | | | |
| 1,676 | | IPC The Hospitalist Co., Inc.* | | | 35,229 |
| 7,810 | | Radnet, Inc.* | | | 70,368 |
| 4,690 | | Sciele Pharma, Inc.* | | | 112,185 |
| | | | | |
| | | | | 217,782 |
| |
Healthcare Equipment & Supplies 0.3% | | | |
| 11,375 | | Covidien Ltd. (Bermuda) | | | 507,666 |
| 1,700 | | Edwards Lifesciences Corp.* | | | 78,659 |
| 6,800 | | Kinetic Concepts, Inc.* | | | 338,504 |
| 937 | | Medical Action Industries, Inc.* | | | 15,667 |
| 1,100 | | Somanetics Corp.* | | | 29,480 |
| | | | | |
| | | | | 969,976 |
| |
Healthcare Products & Services | | | |
| 475 | | Inventiv Health, Inc.* | | | 15,623 |
| 1,125 | | LHC Group, Inc.* | | | 25,942 |
| | | | | |
| | | | | 41,565 |
| |
Healthcare Providers & Services 2.0% | | | |
| 1,500 | | Aetna, Inc. | | | 79,890 |
| 2,080 | | Amedisys, Inc.* | | | 88,670 |
| 1,500 | | AMERIGROUP Corp.* | | | 56,280 |
| 10,000 | | Biogen Idec, Inc.* | | | 609,500 |
| 21,600 | | CIGNA Corp. | | | 1,061,856 |
| 800 | | Covance, Inc.* | | | 66,528 |
| 11,400 | | Express Scripts, Inc.* | | | 769,386 |
| 1,000 | | Health Net, Inc.* | | | 46,490 |
| 3,070 | | Healthways, Inc.* | | | 172,841 |
See Notes to Financial Statements.
| | |
| Target Asset Allocation Funds/Target Growth Allocation Fund | | 21 |
Portfolio of Investments
as of January 31, 2008 (Unaudited) continued
| | | | | |
| Shares | | Description | | Value (Note 1) |
| | | | | |
COMMON STOCKS (continued) | | | |
| |
Healthcare Providers & Services (cont’d.) | | | |
| 800 | | Humana, Inc.* | | $ | 64,240 |
| 2,005 | | Pediatrix Medical Group, Inc.* | | | 136,520 |
| 3,040 | | Psychiatric Solutions, Inc.* | | | 91,717 |
| 1,600 | | Sunrise Senior Living, Inc.* | | | 45,936 |
| 5,730 | | TriZetto Group, Inc. (The)* | | | 111,850 |
| 59,027 | | UnitedHealth Group, Inc. | | | 3,000,933 |
| | | | | |
| | | | | 6,402,637 |
| |
Healthcare - Products 0.1% | | | |
| 700 | | Intuitive Surgical, Inc.* | | | 177,800 |
| |
Hotels & Motels 1.1% | | | |
| 20,628 | | MGM Mirage* | | | 1,510,382 |
| 1,900 | | Starwood Hotels & Resorts Worldwide, Inc. | | | 85,975 |
| 16,121 | | Wynn Resorts Ltd. | | | 1,853,593 |
| | | | | |
| | | | | 3,449,950 |
| |
Hotels, Restaurants & Leisure 2.1% | | | |
| 20,500 | | Carnival Corp. | | | 912,045 |
| 2,610 | | Home Inns & Hotels Management, Inc. ADR (China)* | | | 73,054 |
| 75,555 | | McDonald’s Corp. | | | 4,045,970 |
| 5,200 | | Wyndham Worldwide Corp. | | | 122,512 |
| 42,434 | | Yum! Brands, Inc. | | | 1,449,546 |
| | | | | |
| | | | | 6,603,127 |
| |
Household Durables 0.4% | | | |
| 7,400 | | Alpine Electronics, Inc. (Japan) | | | 109,644 |
| 300 | | Black & Decker Corp. | | | 21,762 |
| 15,900 | | Centex Corp. | | | 441,702 |
| 4,500 | | Fortune Brands, Inc. | | | 314,640 |
| 12,200 | | Lennar Corp. (Class A Stock) | | | 251,320 |
| 2,200 | | Lennar Corp. (Class B Stock) | | | 42,284 |
| 1,225 | | Tempur-Pedic International, Inc. | | | 24,280 |
| | | | | |
| | | | | 1,205,632 |
| |
Household Products 0.2% | | | |
| 10,000 | | Kimberly-Clark Corp. | | | 656,500 |
| |
Independent Power Producers & Energy Traders | | | |
| 2,500 | | NRG Energy, Inc.* | | | 96,475 |
See Notes to Financial Statements.
| | |
| 22 | | Visit our website at www.prudential.com |
| | | | | |
| Shares | | Description | | Value (Note 1) |
| | | | | |
COMMON STOCKS (continued) | | | |
| |
Industrial Conglomerates 0.4% | | | |
| 12,650 | | 3M Co. | | $ | 1,007,573 |
| 63,852 | | Citic Pacific Ltd. (Hong Kong) | | | 316,756 |
| 375 | | Teleflex, Inc. | | | 22,170 |
| | | | | |
| | | | | 1,346,499 |
| |
Industrial Products 0.3% | | | |
| 1,300 | | Harsco Corp. | | | 73,996 |
| 49,200 | | Kurabo Industries Ltd. (Japan) | | | 111,503 |
| 1,600 | | Precision Castparts Corp. | | | 182,080 |
| 30,477 | | Reliant Energy, Inc.* | | | 648,246 |
| | | | | |
| | | | | 1,015,825 |
| |
Industrials - Defense/Aerospace | | | |
| 1,630 | | Zoltek Cos., Inc.* | | | 59,495 |
| |
Insurance 4.0% | | | |
| 11,800 | | Aegon NV (Netherlands) | | | 176,287 |
| 2,550 | | AFLAC, Inc. | | | 156,392 |
| 30,550 | | Allstate Corp. (The) | | | 1,505,198 |
| 8,100 | | American International Group, Inc. | | | 446,796 |
| 9,310 | | AmTrust Financial Services, Inc. | | | 146,167 |
| 2,800 | | Assurant, Inc. | | | 181,692 |
| 10,500 | | Aviva PLC (United Kingdom) | | | 131,727 |
| 22,900 | | AXA SA (France) | | | 786,556 |
| 6,700 | | AXIS Capital Holdings Ltd. (Bermuda) | | | 268,268 |
| 1,700 | | Baloise Holding (Switzerland) | | | 151,104 |
| 3,700 | | Chubb Corp. | | | 191,623 |
| 975 | | Delphi Financial Group, Inc. (Class A Stock) | | | 30,596 |
| 1,590 | | eHealth, Inc.* | | | 41,642 |
| 36,850 | | Genworth Financial, Inc. (Class A Stock) | | | 896,929 |
| 6,400 | | Hanover Insurance Group, Inc. (The) | | | 291,520 |
| 4,400 | | Hartford Financial Services Group, Inc. | | | 355,388 |
| 1,562 | | HCC Insurance Holdings, Inc. | | | 43,517 |
| 700 | | Hilb Rogal & Hobbs Co. | | | 25,326 |
| 13,700 | | ING Groep NV, ADR (Netherlands) | | | 446,373 |
| 1,075 | | IPC Holdings Ltd. (Bermuda) | | | 27,660 |
| 56,600 | | Legal & General PLC (United Kingdom) | | | 149,841 |
| 4,600 | | Lincoln National Corp. | | | 250,056 |
| 9,500 | | MBIA, Inc. | | | 147,250 |
| 32,700 | | MetLife, Inc. | | | 1,928,319 |
| 49,800 | | Old Mutual PLC (United Kingdom) | | | 124,240 |
See Notes to Financial Statements.
| | |
| Target Asset Allocation Funds/Target Growth Allocation Fund | | 23 |
Portfolio of Investments
as of January 31, 2008 (Unaudited) continued
| | | | | |
| Shares | | Description | | Value (Note 1) |
| | | | | |
COMMON STOCKS (continued) | | | |
| |
Insurance (cont’d.) | | | |
| 1,500 | | Philadelphia Consolidated Holding Corp.* | | $ | 53,700 |
| 3,600 | | Protective Life Corp. | | | 143,064 |
| 3,700 | | Prudential Financial, Inc.(c) | | | 312,169 |
| 5,100 | | RenaissanceRe Holdings Ltd. (Bermuda) | | | 290,649 |
| 1,200 | | State Auto Financial Corp. | | | 33,516 |
| 4,600 | | Swiss Re (Switzerland) | | | 345,622 |
| 28,200 | | Travelers Cos., Inc. (The) | | | 1,356,420 |
| 1,600 | | United Fire & Casualty Co. | | | 53,408 |
| 24,800 | | UnumProvident Corp. | | | 560,976 |
| 3,000 | | W.R. Berkely Corp. | | | 90,780 |
| 7,500 | | XL Capital Ltd. (Class A Stock) (Bermuda) | | | 337,500 |
| 1,000 | | Zurich Financial Services AG (Switzerland) | | | 286,331 |
| | | | | |
| | | | | 12,764,602 |
|
Internet Services 2.3% |
| 11,400 | | Amazon.com, Inc.* | | | 885,780 |
| 6,120 | | CyberSource Corp.* | | | 102,510 |
| 2,450 | | Digital River, Inc.* | | | 91,875 |
| 16,800 | | eBay, Inc.* | | | 451,752 |
| 910 | | Equinix, Inc.* | | | 68,732 |
| 11,300 | | Expedia, Inc.* | | | 260,126 |
| 3,974 | | Google, Inc. (Class A Stock)* | | | 2,242,528 |
| 97,575 | | Intel Corp. | | | 2,068,590 |
| 6,320 | | j2 Global Communications, Inc.* | | | 138,471 |
| 15,910 | | NaviSite, Inc.* | | | 71,595 |
| 5,860 | | NIC, Inc. | | | 41,899 |
| 2,470 | | Shutterfly, Inc.* | | | 48,042 |
| 46,200 | | Symantec Corp.* | | | 828,366 |
| 4,450 | | ValueClick, Inc.* | | | 97,144 |
| 1,450 | | Yahoo!, Inc.* | | | 27,811 |
| | | | | |
| | | | | 7,425,221 |
|
Internet Software & Services 0.1% |
| 9,997 | | Internet Brands, Inc. (Class A Stock)* | | | 77,177 |
| 6,000 | | VeriSign, Inc.* | | | 203,520 |
| | | | | |
| | | | | 280,697 |
|
Investment Management |
| 5,100 | | Janus Capital Group, Inc. | | | 137,751 |
See Notes to Financial Statements.
| | |
| 24 | | Visit our website at www.prudential.com |
| | | | | |
| Shares | | Description | | Value (Note 1) |
| | | | | |
COMMON STOCKS (continued) | | | |
|
Leisure Equipment |
| 800 | | Brunswick Corp. | | $ | 15,192 |
|
Machinery 0.2% |
| 675 | | Actuant Corp. (Class A Stock) | | | 18,448 |
| 2,900 | | Crane Co. | | | 118,523 |
| 6,800 | | Dover Corp. | | | 274,448 |
| 7,100 | | Heidelberger Druckmaschinen AG (Germany) | | | 192,626 |
| 525 | | Lincoln Electric Holdings, Inc. | | | 32,366 |
| 175 | | Rofin-Sinar Technologies, Inc.* | | | 7,439 |
| | | | | |
| | | | | 643,850 |
|
Machinery & Equipment 1.1% |
| 12,600 | | AGCO Corp.* | | | 758,772 |
| 2,030 | | Bucyrus International, Inc. (Class A Stock) | | | 188,201 |
| 16,300 | | Caterpillar, Inc. | | | 1,159,582 |
| 4,925 | | Deere & Co. | | | 432,218 |
| 1,300 | | Joy Global, Inc. | | | 81,965 |
| 425 | | Nordson Corp. | | | 21,199 |
| 625 | | Regal-Beloit Corp. | | | 23,700 |
| 300 | | Rieter Holdings AG (Switzerland) | | | 108,717 |
| 5,600 | | Rockwell Automation, Inc. | | | 319,312 |
| 2,200 | | SPX Corp. | | | 221,320 |
| 8,600 | | Volvo AB (Class B Stock) (Sweden) | | | 116,410 |
| | | | | |
| | | | | 3,431,396 |
|
Machinery - Construction & Mining 0.1% |
| 11,700 | | Komatsu Ltd. (Japan) | | | 285,237 |
|
Manufacturing 0.9% |
| 1,850 | | Danaher Corp. | | | 137,732 |
| 2,000 | | Eaton Corp. | | | 165,520 |
| 71,500 | | General Electric Co. | | | 2,531,815 |
| 3,000 | | Hexcel Corp.* | | | 65,490 |
| | | | | |
| | | | | 2,900,557 |
|
Media 1.2% |
| 64,100 | | CBS Corp. (Class B Stock) | | | 1,614,679 |
| 5,310 | | DG FastChannel, Inc.* | | | 112,413 |
| 18,900 | | Idearc, Inc. | | | 307,314 |
| 24,900 | | News Corp. (Class A Stock) | | | 470,610 |
| 42,450 | | Walt Disney Co. (The) | | | 1,270,528 |
| | | | | |
| | | | | 3,775,544 |
See Notes to Financial Statements.
| | |
| Target Asset Allocation Funds/Target Growth Allocation Fund | | 25 |
Portfolio of Investments
as of January 31, 2008 (Unaudited) continued
| | | | | |
| Shares | | Description | | Value (Note 1) |
| | | | | |
COMMON STOCKS (continued) | | | |
|
Medical Supplies & Equipment 1.5% |
| 1,400 | | Bard (C.R.), Inc. | | $ | 135,198 |
| 2,750 | | Boston Scientific Corp.* | | | 33,358 |
| 25,400 | | Eli Lilly & Co. | | | 1,308,608 |
| 1,470 | | Immucor, Inc.* | | | 42,395 |
| 3,000 | | Invitrogen Corp.* | | | 257,010 |
| 20,300 | | Johnson & Johnson | | | 1,284,178 |
| 18,500 | | Medtronic, Inc. | | | 861,545 |
| 5,900 | | Micrus Endovascular Corp.* | | | 113,339 |
| 1,020 | | Myriad Genetics, Inc.* | | | 43,870 |
| 51 | | Nipro Corp. (Japan) | | | 1,023 |
| 11,620 | | NovaMed, Inc.* | | | 45,899 |
| 2,430 | | NuVasive, Inc.* | | | 95,766 |
| 1,600 | | Sepracor, Inc.* | | | 45,184 |
| 8,680 | | Spectranetics Corp. (The)* | | | 108,327 |
| 800 | | Stryker Corp. | | | 53,576 |
| 3,400 | | WellPoint, Inc.* | | | 265,880 |
| 1,910 | | Wright Medical Group, Inc.* | | | 52,143 |
| 1,490 | | Zoll Medical Corp.* | | | 39,723 |
| | | | | |
| | | | | 4,787,022 |
| |
Metals & Mining 2.1% | | | |
| 21,000 | | Alcoa, Inc. | | | 695,100 |
| 37,100 | | BlueScope Steel Ltd. (Australia) | | | 343,882 |
| 150 | | Century Aluminum Co.* | | | 7,798 |
| 175 | | Cleveland-Cliffs, Inc. | | | 17,822 |
| 10,400 | | Crane Group Ltd. (Australia) | | | 138,300 |
| 1,280 | | Dynamic Materials Corp. | | | 68,582 |
| 15,300 | | Freeport-McMoRan Copper & Gold, Inc. (Class B Stock) | | | 1,362,159 |
| 2,300 | | Ladish Co., Inc.* | | | 81,627 |
| 400 | | Newmont Mining Corp. | | | 21,736 |
| 6,900 | | Nucor Corp. | | | 398,820 |
| 5,500 | | Rautaruukki Oyj (Finland) | | | 227,790 |
| 1,000 | | Southern Copper Corp. | | | 93,840 |
| 8,400 | | ThyssenKrup AG (Germany) | | | 410,677 |
| 1,700 | | Timken Co. | | | 51,391 |
| 18,931 | | Transocean, Inc.* | | | 2,320,941 |
| 4,200 | | United States Steel Corp. | | | 428,862 |
| 11,900 | | Zinifex Ltd. (Australia) | | | 112,655 |
| | | | | |
| | | | | 6,781,982 |
See Notes to Financial Statements.
| | |
| 26 | | Visit our website at www.prudential.com |
| | | | | |
| Shares | | Description | | Value (Note 1) |
| | | | | |
COMMON STOCKS (continued) | | | |
| |
Miscellaneous Manufacturing 0.3% | | | |
| 9,900 | | AGFA-Gevaert NV (Belgium) | | $ | 110,282 |
| 13,500 | | Honeywell International, Inc. | | | 797,445 |
| | | | | |
| | | | | 907,727 |
| |
Multi-Line Retail 0.2% | | | |
| 5,100 | | J.C. Penney Co., Inc. | | | 241,791 |
| 600 | | Macy’s, Inc. | | | 16,584 |
| 14,253 | | NEXT PLC (United Kingdom) | | | 402,280 |
| | | | | |
| | | | | 660,655 |
| |
Multi-Utilities 0.5% | | | |
| 8,400 | | Dominion Resources, Inc. | | | 361,200 |
| 26,000 | | Edison International | | | 1,356,160 |
| 1,300 | | Vectren Corp. | | | 35,685 |
| | | | | |
| | | | | 1,753,045 |
| |
Multimedia 0.4% | | | |
| 60,100 | | Time Warner, Inc. | | | 945,974 |
| 7,400 | | Viacom, Inc. (Class B Stock)* | | | 286,824 |
| 5,000 | | Vivendi (France) | | | 201,478 |
| | | | | |
| | | | | 1,434,276 |
| |
Office Electronics 0.2% | | | |
| 43,200 | | Xerox Corp. | | | 665,280 |
| |
Office Equipment 0.1% | | | |
| 8,600 | | OCE NV (Netherlands) | | | 172,949 |
| 15,700 | | Ricoh Co. Ltd. (Japan) | | | 247,188 |
| | | | | |
| | | | | 420,137 |
| |
Oil & Gas Exploration/Production 0.3% | | | |
| 17,100 | | OAO Gazprom, ADR (Russia) | | | 822,510 |
| |
Oil, Gas & Consumable Fuels 8.5% | | | |
| 6,670 | | Air Liquide (France) | | | 930,044 |
| 9,500 | | Anadarko Petroleum Corp. | | | 556,605 |
| 11,800 | | Apache Corp. | | | 1,126,192 |
| 2,490 | | Arena Resources, Inc.* | | | 88,569 |
| 600 | | Ashland, Inc. | | | 27,318 |
| 64,100 | | BP PLC (United Kingdom) | | | 683,177 |
| 2,900 | | Cabot Oil & Gas Corp. | | | 112,201 |
See Notes to Financial Statements.
| | |
| Target Asset Allocation Funds/Target Growth Allocation Fund | | 27 |
Portfolio of Investments
as of January 31, 2008 (Unaudited) continued
| | | | | |
| Shares | | Description | | Value (Note 1) |
| | | | | |
COMMON STOCKS (continued) | | | |
| |
Oil, Gas & Consumable Fuels (cont’d.) | | | |
| 8,700 | | Canadian Natural Resources Ltd. (Canada) | | $ | 556,374 |
| 12,700 | | ChevronTexaco Corp. | | | 1,073,150 |
| 576,821 | | China Petroleum & Chemical Corp. (China) | | | 605,421 |
| 1,600 | | Cimarex Energy Co. | | | 65,296 |
| 1,250 | | Concho Resources, Inc.* | | | 25,375 |
| 30,800 | | ConocoPhillips | | | 2,473,856 |
| 1,075 | | Continental Resources, Inc.* | | | 26,778 |
| 670 | | Core Laboratories N.V. (Netherlands)* | | | 75,509 |
| 45,200 | | Cosmo Oil Co. Ltd. (Japan) | | | 154,214 |
| 8,100 | | Devon Energy Corp. | | | 688,338 |
| 8,100 | | Dresser-Rand Group, Inc.* | | | 256,770 |
| 15,800 | | Eni SpA (Italy) | | | 510,854 |
| 53,100 | | Exxon Mobil Corp. | | | 4,587,840 |
| 400 | | FMC Technologies, Inc.* | | | 19,264 |
| 25,100 | | Global Industry Ltd.* | | | 443,266 |
| 1,375 | | Gulfport Energy Corp.* | | | 20,831 |
| 1,459 | | Headwaters, Inc.* | | | 16,443 |
| 7,858 | | Hess Corp. | | | 713,742 |
| 26,900 | | Marathon Oil Corp. | | | 1,260,265 |
| 3,300 | | Nabors Industries Ltd. (Bermuda)* | | | 89,826 |
| 29,500 | | Nippon Oil Corp. (Japan) | | | 200,118 |
| 100 | | Noble Energy, Inc. | | | 7,258 |
| 10,000 | | Norsk Hydro ASA (Norway) | | | 119,820 |
| 9,450 | | Occidental Petroleum Corp. | | | 641,372 |
| 1,000 | | ONEOK, Inc. | | | 47,000 |
| 7,300 | | Patterson-UTI Energy, Inc. | | | 142,934 |
| 1,075 | | Petrohawk Energy Corp.* | | | 16,931 |
| 19,585 | | Petroleo Brasileiro SA, ADR (Brazil) | | | 2,176,677 |
| 1,675 | | Petroquest Energy, Inc.* | | | 21,641 |
| 1,300 | | Pioneer Natural Resources Co. | | | 54,470 |
| 10,800 | | Repsol YPF SA (Spain) | | | 345,406 |
| 7,400 | | Royal Dutch Shell PLC (Class A Stock) (Netherlands) | | | 264,670 |
| 18,200 | | Royal Dutch Shell PLC (Class B Stock) (United Kingdom) | | | 632,466 |
| 7,300 | | Royal Dutch Shell PLC (Class B Stock), ADR (United Kingdom) | | | 504,795 |
| 14,000 | | Santos Ltd. (Australia) | | | 153,572 |
| 34,164 | | Schlumberger Ltd. (Netherlands) | | | 2,578,015 |
| 100 | | SEACOR Holdings, Inc.* | | | 8,820 |
| 900 | | St. Mary Land & Exploration Co. | | | 31,707 |
| 6,200 | | StatoilHydro ASA (Norway) | | | 163,253 |
| 6,300 | | Sunoco, Inc. | | | 391,860 |
| 900 | | Swift Energy Co.* | | | 38,835 |
| 4,200 | | Total SA (France) | | | 305,670 |
| 17,400 | | Valero Energy Corp. | | | 1,029,906 |
See Notes to Financial Statements.
| | |
| 28 | | Visit our website at www.prudential.com |
| | | | | |
| Shares | | Description | | Value (Note 1) |
| | | | | |
COMMON STOCKS (continued) | | | |
| |
Oil, Gas & Consumable Fuels (cont’d.) | | | |
| 1,000 | | W&T Offshore, Inc. | | $ | 28,290 |
| 8,900 | | XTO Energy, Inc. | | | 462,266 |
| | | | | |
| | | | | 27,555,270 |
|
Paper & Forest Products 0.2% |
| 42,200 | | DS Smith PLC (United Kingdom) | | | 133,216 |
| 5,400 | | International Paper Co. | | | 174,150 |
| 20 | | Nippon Unipac Group, Inc. (Japan) | | | 47,253 |
| 5,000 | | Oji Paper Co. Ltd. (Japan) | | | 21,402 |
| 1,100 | | Owens Illinois, Inc.* | | | 55,440 |
| 800 | | Weyerhaeuser Co. | | | 54,176 |
| | | | | |
| | | | | 485,637 |
|
Pharmaceuticals 5.9% |
| 4,250 | | Abbott Laboratories | | | 239,275 |
| 18,000 | | AmerisourceBergen Corp. | | | 839,700 |
| 24,400 | | Amgen, Inc.* | | | 1,136,796 |
| 17,371 | | Amylin Pharmaceuticals, Inc.* | | | 515,050 |
| 7,700 | | AstraZeneca PLC (United Kingdom) (UN) | | | 322,245 |
| 12,400 | | AstraZeneca PLC (United Kingdom) (LN) | | | 520,760 |
| 575 | | Barr Pharmaceuticals, Inc.* | | | 30,009 |
| 6,800 | | Bristol-Meyers Squibb Co. | | | 157,692 |
| 10,200 | | GlaxoSmithKline PLC (United Kingdom) | | | 241,745 |
| 9,700 | | H. Lundbeck A/S (Denmark) | | | 236,117 |
| 5,830 | | K-V Pharmaceutical Co. (Class A Stock)* | | | 151,463 |
| 19,950 | | LeMaitre Vascular, Inc.* | | | 109,725 |
| 1,230 | | LifeCell Corp.* | | | 48,597 |
| 21,400 | | Medco Health Solutions, Inc.* | | | 1,071,712 |
| 83,659 | | Merck & Co., Inc. | | | 3,871,739 |
| 1,600 | | Millennium Pharmaceuticals, Inc.* | | | 24,272 |
| 14,000 | | Novartis AG (Switzerland) | | | 709,287 |
| 18,300 | | Novo Nordisk SA (Class B Stock) (Denmark) | | | 1,154,555 |
| 141,300 | | Pfizer, Inc. | | | 3,305,007 |
| 2,100 | | Pharmaceutical Product Development, Inc. | | | 91,056 |
| 6,473 | | Roche Holding AG (Switzerland) | | | 1,175,311 |
| 7,100 | | Sanofi-Aventis SA (France) | | | 578,991 |
| 23,000 | | Schering-Plough Corp. | | | 450,110 |
| 26,806 | | Teva Pharmaceutical Industries Ltd., ADR (Israel) | | | 1,234,148 |
| 9,500 | | Watson Pharmaceuticals, Inc.* | | | 248,045 |
| 16,600 | | Wyeth | | | 660,680 |
| | | | | |
| | | | | 19,124,087 |
See Notes to Financial Statements.
| | |
| Target Asset Allocation Funds/Target Growth Allocation Fund | | 29 |
Portfolio of Investments
as of January 31, 2008 (Unaudited) continued
| | | | | |
| Shares | | Description | | Value (Note 1) |
| | | | | |
COMMON STOCKS (continued) | | | |
|
Real Estate 0.2% |
| 53,600 | | Beazley Group PLC (United Kingdom) | | $ | 180,950 |
| 373,400 | | Country Garden Holdings Co. Ltd. (China)* | | | 283,070 |
| 332,200 | | Soho China Ltd. (China)* | | | 283,314 |
| | | | | |
| | | | | 747,334 |
|
Real Estate Investment Trusts 1.3% |
| 600 | | Alexandria Real Estate Equities, Inc. | | | 58,938 |
| 2,650 | | AMB Property Corp. | | | 134,090 |
| 5,855 | | Apartment Investment & Management Co. (Class A Stock) | | | 232,092 |
| 1,200 | | AvalonBay Communities, Inc. | | | 112,740 |
| 6,300 | | Duke Realty Corp. | | | 148,932 |
| 800 | | General Growth Properties, Inc. | | | 29,216 |
| 8,450 | | Hospitality Properties Trust | | | 286,877 |
| 6,800 | | Host Hotels & Resorts, Inc. | | | 113,832 |
| 4,000 | | Jones Lang LaSalle, Inc. | | | 311,200 |
| 1,800 | | Liberty Property Trust | | | 57,798 |
| 3,100 | | Macerich Co. (The) | | | 211,947 |
| 27,900 | | ProLogis | | | 1,655,865 |
| 2,350 | | Public Storage, Inc. | | | 183,888 |
| 1,000 | | Regency Centers Corp. | | | 61,430 |
| 3,800 | | Simon Property Group, Inc. | | | 331,854 |
| 500 | | SL Green Realty Corp. | | | 46,405 |
| 1,200 | | UDR, Inc. | | | 27,396 |
| 2,700 | | Ventas, Inc. | | | 119,340 |
| | | | | |
| | | | | 4,123,840 |
|
Recreational Vehicles |
| 400 | | Winnebago Industries, Inc. | | | 8,424 |
|
Restaurants 0.1% |
| 1,900 | | AFC Enterprises, Inc.* | | | 17,613 |
| 1,350 | | Brinker International, Inc. | | | 25,123 |
| 600 | | Chipotle Mexican Grill, Inc.* | | | 73,044 |
| 1,700 | | Sonic Corp.* | | | 37,706 |
| 2,650 | | Triarc Cos., Inc. (Class B Stock) | | | 24,645 |
| | | | | |
| | | | | 178,131 |
|
Retail & Merchandising 2.2% |
| 700 | | Abercrombie & Fitch Co. (Class A Stock) | | | 55,783 |
| 35,800 | | AutoNation, Inc.* | | | 582,824 |
| 1,100 | | Barnes & Noble, Inc. | | | 37,345 |
| 4,200 | | BJ’s Wholesale Club, Inc.* | | | 136,248 |
See Notes to Financial Statements.
| | |
| 30 | | Visit our website at www.prudential.com |
| | | | | |
| Shares | | Description | | Value (Note 1) |
| | | | | |
COMMON STOCKS (continued) | | | |
|
Retail & Merchandising (cont’d.) |
| 34,305 | | CVS Caremark Corp. | | $ | 1,340,296 |
| 91,700 | | DSG International PLC (United Kingdom) | | | 139,514 |
| 4,200 | | Family Dollar Stores, Inc. | | | 88,326 |
| 10,000 | | GameStop Corp. (Class A Stock)* | | | 517,300 |
| 3,050 | | Jos. A. Bank Clothiers, Inc.* | | | 83,082 |
| 1,000 | | Kohl’s Corp.* | | | 45,640 |
| 45,270 | | Lowe’s Cos., Inc. | | | 1,196,939 |
| 1,230 | | Lululemon Athletica, Inc. (Canada)* | | | 41,685 |
| 2,700 | | Rallye SA (France) | | | 151,116 |
| 800 | | School Specialty, Inc.* | | | 25,968 |
| 3,800 | | Staples, Inc. | | | 90,972 |
| 144,300 | | Wal-Mart de Mexico SA de CV (Mexico) | | | 517,446 |
| 27,200 | | Wal-Mart Stores, Inc. | | | 1,383,936 |
| 4,553 | | Yamada Denki Co. Ltd. (Japan) | | | 487,666 |
| | | | | |
| | | | | 6,922,086 |
| |
Retailers 0.1% | | | |
| 48,900 | | Marks & Spencer Group PLC (United Kingdom) | | | 437,261 |
| |
Retailers - Food & Drug 0.3% | | | |
| 9,400 | | Kroger Co. (The) | | | 239,230 |
| 9,050 | | Safeway, Inc. | | | 280,460 |
| 55,057 | | Tesco PLC (United Kingdom) | | | 460,251 |
| | | | | |
| | | | | 979,941 |
| |
Semiconductor Components 0.1% | | | |
| 125,900 | | ARM Holdings PLC (United Kingdom) | | | 294,636 |
| |
Semiconductors 0.7% | | | |
| 6,100 | | Agilent Technologies, Inc.* | | | 206,851 |
| 645 | | ATMI, Inc.* | | | 16,963 |
| 11,000 | | Avnet, Inc.* | | | 391,710 |
| 1,725 | | Brooks Automation, Inc.* | | | 21,200 |
| 3,900 | | MEMC Electronic Materials, Inc.* | | | 278,694 |
| 1,200 | | Microsemi Corp.* | | | 27,264 |
| 1,500 | | Novellus Systems, Inc.* | | | 35,640 |
| 17,500 | | NVIDIA Corp.* | | | 430,325 |
| 5,380 | | O2Micro International Ltd., ADR (Cayman Islands)* | | | 42,879 |
| 23,000 | | Texas Instruments, Inc. | | | 711,390 |
| 1,325 | | Ultra Clean Holdings, Inc.* | | | 12,972 |
| 600 | | Varian Semiconductor Equipment Associates, Inc.* | | | 19,326 |
| 5,900 | | Xilinx, Inc. | | | 129,033 |
| | | | | |
| | | | | 2,324,247 |
See Notes to Financial Statements.
| | |
| Target Asset Allocation Funds/Target Growth Allocation Fund | | 31 |
Portfolio of Investments
as of January 31, 2008 (Unaudited) continued
| | | | | |
| Shares | | Description | | Value (Note 1) |
| | | | | |
COMMON STOCKS (continued) | | | |
| |
Semiconductors & Semiconductor Equipment 0.2% | | | |
| 19,800 | | Analog Devices, Inc. | | $ | 561,528 |
| 6,400 | | National Semiconductor Corp. | | | 117,952 |
| | | | | |
| | | | | 679,480 |
| |
Software 0.8% | | | |
| 10,300 | | Adobe Systems, Inc.* | | | 359,779 |
| 1,100 | | Automatic Data Processing, Inc. | | | 44,627 |
| 15,200 | | BMC Software, Inc.* | | | 487,008 |
| 66,805 | | CA, Inc. | | | 1,471,714 |
| 2,650 | | Phase Forward, Inc.* | | | 45,712 |
| 4,900 | | PROS Holdings, Inc.* | | | 75,215 |
| 1,475 | | Sybase, Inc.* | | | 41,625 |
| 1,500 | | Tyler Technologies, Inc.* | | | 20,070 |
| | | | | |
| | | | | 2,545,750 |
| |
Software/Services | | | |
| 6,700 | | Novell, Inc.* | | | 42,612 |
| |
Specialty Finance | | | |
| 800 | | Chimera Investment Corp. | | | 15,320 |
| |
Specialty Retail 0.6% | | | |
| 2,655 | | Aaron Rents, Inc. | | | 50,764 |
| 800 | | Advance Auto Parts, Inc. | | | 28,544 |
| 700 | | AutoZone, Inc.* | | | 84,616 |
| 1,100 | | Best Buy Co., Inc. | | | 53,691 |
| 38,030 | | Home Depot, Inc. (The) | | | 1,166,380 |
| 12,400 | | Limited Brands, Inc. | | | 236,716 |
| 550 | | Monro Muffler Brake, Inc. | | | 10,175 |
| 21,300 | | RadioShack Corp. | | | 369,555 |
| 1,500 | | Ross Stores, Inc. | | | 43,725 |
| | | | | |
| | | | | 2,044,166 |
| |
Steel Producers/Products 0.1% | | | |
| 2,400 | | Voestalpine AG (Austria) | | | 147,997 |
| |
Telecommunications 6.8% | | | |
| 18,200 | | Amdocs Ltd. (Guernsey)* | | | 602,238 |
| 44,800 | | America Movil SAB de CV (Class L Stock), ADR (Mexico) | | | 2,683,968 |
| 128,417 | | AT&T, Inc. | | | 4,942,770 |
| 89,300 | | BT Group PLC (United Kingdom) | | | 463,993 |
| 2,030 | | Cbeyond, Inc.* | | | 68,492 |
See Notes to Financial Statements.
| | |
| 32 | | Visit our website at www.prudential.com |
| | | | | |
| Shares | | Description | | Value (Note 1) |
| | | | | |
COMMON STOCKS (continued) | | | |
| |
Telecommunications (cont’d.) | | | |
| 191,212 | | China Mobile Ltd. (China) | | $ | 2,819,077 |
| 65,602 | | Cisco Systems, Inc.* | | | 1,607,249 |
| 7,500 | | Corning, Inc. | | | 180,525 |
| 900 | | Embarq Corp. | | | 40,770 |
| 24,400 | | France Telecom SA (France) | | | 860,537 |
| 2,310 | | GeoEye, Inc.* | | | 80,758 |
| 30,100 | | Juniper Networks, Inc.* | | | 817,215 |
| 95,490 | | MobileOne Ltd. (Singapore) | | | 127,758 |
| 300 | | Motorola, Inc. | | | 3,459 |
| 80 | | Nippon Telegraph and Telephone Corp. (Japan) | | | 380,729 |
| 26,963 | | Nokia Oyj (Finland) | | | 992,843 |
| 200 | | NTT Docomo, Inc. (Japan) | | | 316,190 |
| 9,564 | | QUALCOMM, Inc. | | | 405,705 |
| 81,961 | | Sprint Nextel Corp. | | | 863,049 |
| 900 | | Swisscom AG (Switzerland) | | | 359,274 |
| 37,200 | | Telefonica SA (Spain) | | | 1,087,490 |
| 100 | | Telephone & Data Systems, Inc. | | | 5,274 |
| 1,000 | | Telephone & Data Systems, Inc. (Special Shares) | | | 48,400 |
| 58,150 | | Verizon Communications, Inc. | | | 2,258,546 |
| | | | | |
| | | | | 22,016,309 |
| |
Telecommunications - Cellular 0.4% | | | |
| 128,800 | | Vodafone Group PLC (United Kingdom) | | | 450,576 |
| 25,690 | | Vodafone Group PLC, ADR (United Kingdom) | | | 894,012 |
| | | | | |
| | | | | 1,344,588 |
| |
Textiles, Apparel & Luxury Goods 0.1% | | | |
| 22,000 | | Jones Apparel Group, Inc. | | | 369,600 |
| |
Thrifts & Mortgage Finance 0.9% | | | |
| 9,700 | | Countrywide Financial Corp. | | | 67,512 |
| 12,700 | | Fannie Mae | | | 430,022 |
| 28,200 | | Federal Home Loan Mortgage Corp. | | | 856,998 |
| 71,200 | | Washington Mutual, Inc. | | | 1,418,304 |
| | | | | |
| | | | | 2,772,836 |
| |
Tobacco 1.2% | | | |
| 41,600 | | Altria Group, Inc. | | | 3,154,112 |
| 14,200 | | UST, Inc. | | | 737,832 |
| | | | | |
| | | | | 3,891,944 |
See Notes to Financial Statements.
| | |
| Target Asset Allocation Funds/Target Growth Allocation Fund | | 33 |
Portfolio of Investments
as of January 31, 2008 (Unaudited) continued
| | | | | | |
| Shares | | Description | | Value (Note 1) | |
| | | | | | |
COMMON STOCKS (continued) | | | | |
| |
Trading Companies & Distributors | | | | |
| 600 | | Watsco, Inc. | | $ | 22,128 | |
| |
Transportation 1.6% | | | | |
| 5,500 | | Burlington Northern Santa Fe Corp. | | | 475,860 | |
| 11,900 | | Canadian National Railway Co. (Canada) | | | 602,200 | |
| 15,700 | | J.B. Hunt Transport Services, Inc. | | | 488,270 | |
| 72,900 | | Neptune Orient Lines Ltd. (Singapore) | | | 169,220 | |
| 17,446 | | Norfolk Southern Corp. | | | 948,888 | |
| 19,908 | | Orient Overseas International Ltd. (Hong Kong) | | | 121,310 | |
| 3,200 | | Overseas Shipholding Group, Inc. | | | 208,704 | |
| 2,500 | | Ryder System, Inc. | | | 130,150 | |
| 14,692 | | Union Pacific Corp. | | | 1,836,941 | |
| 2,500 | | United Parcel Service, Inc. (Class B Stock) | | | 182,900 | |
| | | | | | |
| | | | | 5,164,443 | |
Utilities 1.1% | | | | |
| 14,300 | | American Electric Power Co., Inc. | | | 612,469 | |
| 20,200 | | CMS Energy Corp. | | | 316,534 | |
| 5,100 | | DTE Energy Co. | | | 217,515 | |
| 6,900 | | Duke Energy Corp. | | | 128,754 | |
| 4,300 | | Dynegy, Inc.* | | | 30,186 | |
| 5,953 | | E.ON AG (Germany) | | | 1,096,287 | |
| 2,500 | | Hokkaido Electric Power Co., Inc. (Japan) | | | 54,838 | |
| 2,500 | | Illinois Tool Works, Inc. | | | 126,000 | |
| 500 | | Kyushu Electric Power Co., Inc. (Japan) | | | 12,646 | |
| 7,700 | | Northeast Utilities | | | 213,444 | |
| 1,350 | | PNM Resources, Inc. | | | 26,082 | |
| 3,300 | | SCANA Corp. | | | 123,057 | |
| 2,100 | | Wisconsin Energy Corp. | | | 95,613 | |
| 15,400 | | Xcel Energy, Inc. | | | 320,166 | |
| | | | | | |
| | | | | 3,373,591 | |
| | | | | | |
| | TOTAL LONG-TERM INVESTMENTS
(cost $287,334,875) | | | 311,966,416 | |
| | | | | | |
SHORT-TERM INVESTMENT 3.6% | | | | |
| |
AFFILIATED MONEY MARKET MUTUAL FUND | | | | |
| | Dryden Core Investment Fund - Taxable Money Market Series | | | | |
| 11,577,947 | | (cost $11,577,947) (Note 3)(a) | | | 11,577,947 | |
| | | | | | |
| | TOTAL INVESTMENTS(b) 100.4%
(cost $298,912,822; Note 5) | | | 323,544,363 | |
| | Liabilities in excess of other assets(d) (0.4%) | | | (1,154,991 | ) |
| | | | | | |
| | NET ASSETS 100% | | $ | 322,389,372 | |
| | | | | | |
See Notes to Financial Statements.
| | |
| 34 | | Visit our website at www.prudential.com |
The following abbreviations are used in portfolio descriptions:
ADR—American Depository Receipt
EUR—Euro
CHF—Swiss Franc
MXN—Mexican Peso
| * | Non-income producing security. |
| (a) | Prudential Investments LLC, the manager of the fund also serves as manager of the Dryden Core Investment Fund - Taxable Money Market Series. |
| (b) | As of January 31, 2008, 168 securities representing $57,594,923 and 17.9% of the total net assets were fair valued in accordance with the policies adopted by the Board of Trustees. |
| (d) | Liabilities in excess of other assets include net unrealized appreciation (depreciation) on futures contracts and forward foreign currency contracts of: |
Futures contracts open at January 31, 2008:
| | | | | | | | | | | | | | |
Number of
Contracts | | Type | | Expiration
Date | | Value at
Trade
Date | | Value at
January 31,
2008 | | Unrealized
Depreciation | |
| | Long Positions | | | | | | | | | | | | |
| 3 | | S&P 500 E-Mini | | Mar. 08 | | $ | 219,375 | | $ | 206,940 | | $ | (12,435 | ) |
| | | | | | | | | | | | | | |
Forward foreign currency contracts outstanding at January 31, 2008:
| | | | | | | | | | | | | |
Purchase Contracts | | Notional
Amount
(000) | | Value at Settlement
Date Payable | | Current
Value | | Unrealized
Appreciation | |
Mexican Peso,
Expiring 06/06/08 | | | MXN 3,700 | | | $335,337 | | | $336,747 | | | $1,410 | |
| | | | | | | | | | | | | |
| | | | |
Sale Contracts | | Notional
Amount
(000) | | Value at Settlement
Date Receivable | | Current
Value | | Unrealized
Depreciation | |
Euro,
Expiring 06/24/08 | | EUR | 1,622 | | $ | 2,327,245 | | $ | 2,399,227 | | $ | (71,982 | ) |
Mexican Peso,
Expiring 06/06/08 | | MXN | 15,000 | | | 1,353,546 | | | 1,365,190 | | | (11,644 | ) |
Swiss Franc,
Expiring 06/24/08 | | CHF | 792 | | | 691,099 | | | 734,181 | | | (43,082 | ) |
| | | | | | | | | | | | | |
| | | | | $ | 4,371,890 | | $ | 4,498,598 | | $ | (126,708 | ) |
| | | | | | | | | | | | | |
See Notes to Financial Statements.
| | |
| Target Asset Allocation Funds/Target Growth Allocation Fund | | 35 |
Portfolio of Investments
as of January 31, 2008 (Unaudited) continued
The industry classification of investments and liabilities in excess of other assets shown as a percentage of net assets as January 31, 2008 were as follows:
| | | |
Oil, Gas & Consumable Fuels | | 8.5 | % |
Telecommunications | | 6.8 | |
Pharmaceuticals | | 5.9 | |
Financial - Bank & Trust | | 4.6 | |
Chemicals | | 4.0 | |
Insurance | | 4.0 | |
Financial Services | | 3.8 | |
Affiliated Money Market Mutual Fund | | 3.6 | |
Aerospace & Defense | | 3.1 | |
Computer Hardware | | 2.3 | |
Internet Services | | 2.3 | |
Retail & Merchandising | | 2.2 | |
Metals & Mining | | 2.1 | |
Hotels, Restaurants & Leisure | | 2.1 | |
Computer Software | | 2.0 | |
Healthcare Providers & Services | | 2.0 | |
Commercial Banks | | 1.9 | |
Automobile Manufacturers | | 1.7 | |
Transportation | | 1.6 | |
Medical Supplies & Equipment | | 1.5 | |
Beverages | | 1.4 | |
Entertainment & Leisure | | 1.4 | |
Real Estate Investment Trusts | | 1.3 | |
Tobacco | | 1.2 | |
Media | | 1.2 | |
Foods | | 1.2 | |
Business Services | | 1.1 | |
Biotechnology | | 1.1 | |
Hotels & Motels | | 1.1 | |
Machinery & Equipment | | 1.1 | |
Utilities | | 1.1 | |
Electric Utilities | | 1.0 | |
Manufacturing | | 0.9 | |
Diversified Financial Services | | 0.9 | |
Electronic Components | | 0.9 | |
Electronic Equipment & Instruments | | 0.9 | |
Thrifts & Mortgage Finance | | 0.9 | |
Energy Equipment & Services | | 0.8 | |
Software | | 0.8 | |
Commercial Services | | 0.7 | |
Semiconductors | | 0.7 | |
Consumer Products & Services | | 0.7 | |
Specialty Retail | | 0.6 | |
Multi-utilities | | 0.5 | |
Automotive Parts | | 0.5 | |
Diversified Operations | | 0.5 | |
Multimedia | | 0.4 | |
Industrial Conglomerates | | 0.4 | |
See Notes to Financial Statements.
| | |
| 36 | | Visit our website at www.prudential.com |
| | | |
Industry (cont’d.) | | | |
Telecommunications - Cellular | | 0.4 | % |
Cable Television | | 0.4 | |
Capital Markets | | 0.4 | |
Household Durables | | 0.4 | |
Computers | | 0.4 | |
Agricultural Chemicals | | 0.3 | |
Industrial Products | | 0.3 | |
Retailers - Food & Drug | | 0.3 | |
Consumer Services | | 0.3 | |
Healthcare Equipment & Supplies | | 0.3 | |
Clothing & Apparel | | 0.3 | |
Miscellaneous Manufacturing | | 0.3 | |
Oil & Gas Exploration/Production | | 0.3 | |
Food Products | | 0.3 | |
Real Estate | | 0.2 | |
Semiconductors & Semiconductor Equipment | | 0.2 | |
Airlines | | 0.2 | |
Office Electronics | | 0.2 | |
Multi-line Retail | | 0.2 | |
Household Products | | 0.2 | |
Machinery | | 0.2 | |
Construction | | 0.2 | |
Consumer Finance | | 0.2 | |
Distribution/Wholesale | | 0.2 | |
Paper & Forest Products | | 0.2 | |
Computer Services & Software | | 0.2 | |
Retailers | | 0.1 | |
Office Equipment | | 0.1 | |
Engineering/Construction | | 0.1 | |
Textiles, Apparel & Luxury Goods | | 0.1 | |
Diversified Telecommunication Services | | 0.1 | |
Air Freight & Couriers | | 0.1 | |
Auto Components | | 0.1 | |
Communications Equipment | | 0.1 | |
Building Products | | 0.1 | |
Semiconductor Components | | 0.1 | |
Machinery - Construction & Mining | | 0.1 | |
Internet Software & Services | | 0.1 | |
Farming & Agriculture | | 0.1 | |
Building Materials | | 0.1 | |
Healthcare - Services | | 0.1 | |
Restaurants | | 0.1 | |
Healthcare - Products | | 0.1 | |
Auto/Trucks Parts & Equipment | | 0.1 | |
Exchange Traded Funds | | 0.1 | |
Steel Producers/Products | | 0.1 | |
| | | |
| | 100.4 | |
Liabilities in excess of other assets | | (0.4 | ) |
| | | |
| | 100.0 | % |
| | | |
See Notes to Financial Statements.
| | |
| Target Asset Allocation Funds/Target Growth Allocation Fund | | 37 |
Statement of Assets and Liabilities
January 31, 2008 (Unaudited)
| | | | |
Assets | |
Investments at value: | | | | |
Unaffiliated investments (cost $287,334,875) | | $ | 311,966,416 | |
Affiliated investments (cost $11,577,947) | | | 11,577,947 | |
Cash | | | 62,000 | |
Foreign currency, at value (cost $504,472) | | | 508,362 | |
Receivable for investments sold | | | 2,219,751 | |
Dividends and interest receivable | | | 478,168 | |
Tax reclaim receivable | | | 248,461 | |
Receivable for Fund shares sold | | | 189,294 | |
Prepaid expenses | | | 5,587 | |
Receivable from broker—variation margin | | | 4,350 | |
Unrealized appreciation on foreign currency exchange contracts | | | 1,410 | |
| | | | |
Total assets | | | 327,261,746 | |
| | | | |
| |
Liabilities | | | | |
Payable for investments purchased | | | 3,088,156 | |
Payable for Fund shares reacquired | | | 928,693 | |
Management fee payable | | | 209,689 | |
Distribution fee payable | | | 187,836 | |
Payable to custodian | | | 157,640 | |
Unrealized depreciation on foreign currency exchange contracts | | | 126,708 | |
Accrued expenses and other liabilities | | | 99,227 | |
Transfer agent fee payable | | | 67,423 | |
Deferred trustees’ fees | | | 7,002 | |
| | | | |
Total liabilities | | | 4,872,374 | |
| | | | |
| |
Net Assets | | $ | 322,389,372 | |
| | | | |
| | | | | |
Net assets were comprised of: | | | | |
Shares of beneficial interest, at par | | $ | 26,853 | |
Paid-in capital, in excess of par | | | 299,512,204 | |
| | | | |
| | | 299,539,057 | |
Distributions in excess of net investment income | | | (127,802 | ) |
Accumulated net realized loss on investments and foreign currency transactions | | | (1,561,211 | ) |
Net unrealized appreciation on investments and foreign currencies | | | 24,539,328 | |
| | | | |
Net assets, January 31, 2008 | | $ | 322,389,372 | |
| | | | |
See Notes to Financial Statements.
| | |
| 38 | | Visit our website at www.prudential.com |
| | | |
Class A: | | | |
Net asset value and redemption price per share,
($132,499,742 / 10,590,899 shares of common stock issued and outstanding) | | $ | 12.51 |
Maximum sales charge (5.5% of offering price) | | | 0.73 |
| | | |
Maximum offering price to public | | $ | 13.24 |
| | | |
| |
Class B: | | | |
Net asset value, offering price and redemption price per share,
($76,764,958 / 6,596,617 shares of common stock issued and outstanding) | | $ | 11.64 |
| | | |
| |
Class C: | | | |
Net asset value, offering price and redemption price per share,
($93,877,570 / 8,067,948 shares of common stock issued and outstanding) | | $ | 11.64 |
| | | |
| |
Class M: | | | |
Net asset value, offering price and redemption price per share,
($7,821,934 / 670,340 shares of common stock issued and outstanding) | | $ | 11.67 |
| | | |
| |
Class R: | | | |
Net asset value, offering price and redemption price per share,
($326,159 / 26,228 shares of common stock issued and outstanding) | | $ | 12.44 |
| | | |
| |
Class X: | | | |
Net asset value, offering price and redemption price per share,
($4,395,732 / 377,410 shares of common stock issued and outstanding) | | $ | 11.65 |
| | | |
| |
Class Z: | | | |
Net asset value, offering price and redemption price per share,
($6,703,277 / 523,407 shares of common stock issued and outstanding) | | $ | 12.81 |
| | | |
See Notes to Financial Statements.
| | |
| Target Asset Allocation Funds/Target Growth Allocation Fund | | 39 |
Statement of Operations
Six Months Ended January 31, 2008 (Unaudited)
| | | | |
Net Investment Income | | | | |
Income | | | | |
Unaffiliated dividends (net of foreign withholding taxes $18,504) | | $ | 3,637,285 | |
Affiliated dividends | | | 247,959 | |
Unaffiliated interest | | | 8,262 | |
| | | | |
| | | 3,893,506 | |
| | | | |
| |
Expenses | | | | |
Management fee | | | 1,362,509 | |
Distribution fee—Class A | | | 177,323 | |
Distribution fee—Class B | | | 444,471 | |
Distribution fee—Class C | | | 541,857 | |
Distribution fee—Class M | | | 49,391 | |
Distribution fee—Class R | | | 856 | |
Distribution fee—Class X | | | 23,846 | |
Transfer agent’s fees and expenses (including affiliated expense of $197,000) | | | 308,000 | |
Custodian’s fees and expenses | | | 124,000 | |
Registration fees | | | 45,000 | |
Reports to shareholders | | | 38,000 | |
Audit fee | | | 21,000 | |
Legal fee | | | 18,000 | |
Trustees’ fees | | | 8,000 | |
Insurance expense | | | 3,000 | |
Loan interest expense (Note 2) | | | 2,165 | |
Miscellaneous | | | 14,601 | |
| | | | |
Total expenses | | | 3,182,019 | |
| | | | |
Net Investment Income | | | 711,487 | |
| | | | |
| |
Net Realized And Unrealized Gain (loss) On Investments And Foreign Currency | | | | |
Net realized gain (loss) on: | | | | |
Investment transactions | | | 5,687,005 | |
Foreign currency transactions | | | 39,780 | |
Futures | | | (10,434 | ) |
| | | | |
| | | 5,716,351 | |
| | | | |
Net change in unrealized appreciation (depreciation) on: | | | | |
Investments | | | (27,130,318 | ) |
Foreign currencies | | | (122,369 | ) |
Futures | | | (12,435 | ) |
| | | | |
| | | (27,265,122 | ) |
| | | | |
Net loss on investments | | | (21,548,771 | ) |
| | | | |
Net Decrease In Net Assets Resulting From Operations | | $ | (20,837,284 | ) |
| | | | |
See Notes to Financial Statements.
| | |
| 40 | | Visit our website at www.prudential.com |
Statement of Changes in Net Assets
(Unaudited)
| | | | | | | | |
| | | Six Months
Ended
January 31, 2008 | | | Year
Ended
July 31, 2007 | |
Increase (Decrease) In Net Assets | | | | | | | | |
Operations | | | | | | | | |
Net investment income | | $ | 711,487 | | | $ | 691,837 | |
Net realized gain on investments and foreign currency transactions | | | 5,716,351 | | | | 28,307,092 | |
Net change in unrealized appreciation/depreciation on investments and foreign currencies | | | (27,265,122 | ) | | | 23,124,443 | |
| | | | | | | | |
Net increase (decrease) in net assets resulting from operations | | | (20,837,284 | ) | | | 52,123,372 | |
| | | | | | | | |
Dividends and distributions (Note 1) | | | | | | | | |
Dividends from net investment income: | | | | | | | | |
Class A | | | (700,945 | ) | | | (80,517 | ) |
Class R | | | (841 | ) | | | (165 | ) |
Class Z | | | (64,600 | ) | | | (19,271 | ) |
| | | | | | | | |
| | | (766,386 | ) | | | (99,953 | ) |
| | | | | | | | |
Distributions from net realized gains: | | | | | | | | |
Class A | | | (12,326,416 | ) | | | (6,758,577 | ) |
Class B | | | (7,641,952 | ) | | | (6,359,352 | ) |
Class C | | | (9,720,578 | ) | | | (6,372,627 | ) |
Class M | | | (820,147 | ) | | | (731,583 | ) |
Class R | | | (29,312 | ) | | | (16,842 | ) |
Class X | | | (456,100 | ) | | | (291,807 | ) |
Class Z | | | (759,788 | ) | | | (475,776 | ) |
| | | | | | | | |
| | | (31,754,293 | ) | | | (21,006,564 | ) |
| | | | | | | | |
| | |
Fund share transactions (Net of share conversions) (Note 6) | | | | | | | | |
Net proceeds from shares sold | | | 18,262,781 | | | | 70,164,507 | |
Net asset value of shares issued in reinvestment of dividends and distributions | | | 30,556,566 | | | | 19,534,860 | |
Cost of shares reacquired | | | (39,346,004 | ) | | | (64,222,987 | ) |
| | | | | | | | |
Net increase in net assets resulting from Fund share transactions | | | 9,473,343 | | | | 25,476,380 | |
| | | | | | | | |
Total increase (decrease) | | | (43,884,620 | ) | | | 56,493,235 | |
| | |
Net Assets | | | | | | | | |
Beginning of period | | | 366,273,992 | | | | 309,780,757 | |
| | | | | | | | |
End of period | | $ | 322,389,372 | | | $ | 366,273,992 | |
| | | | | | | | |
See Notes to Financial Statements.
| | |
| Target Asset Allocation Funds/Target Growth Allocation Fund | | 41 |
Notes to Financial Statements
(Unaudited) continued
Target Asset Allocation Funds (the “Trust”) is registered under the Investment Company Act of 1940 as an open-end, diversified management investment company presently consisting of three portfolios: Target Moderate Allocation Fund, Target Conservative Allocation Fund and Target Growth Allocation Fund. These financial statements relate only to Target Growth Allocation Fund (the “Fund”). The financial statements of the other portfolios are not presented herein. The Trust was organized as a business trust in Delaware on July 29, 1998.
The Fund uses investment managers (“Subadvisers”), each managing a portion of the Fund’s assets. The following lists the Subadvisers and their respective segment during the six months ended January 31, 2008.
| | |
Fund Segment | | Subadviser |
Large-cap growth stocks | | Marsico Capital Management, LLC
Goldman Sachs Asset Management L.P. |
Large-cap value stocks | | Hotchkis and Wiley Capital Management LLC
J.P. Morgan Investment Management Inc.
NFJ Investment Group L.P. |
International stocks | | LSV Asset Management
Thornburg Investment Management, Inc. |
Small/Mid-cap growth stocks | | RS Investment Management, L.P. |
Small/Mid-cap value stocks | | EARNEST Partners, LLC
Vaughan Nelson Investment Management, L.P. |
The investment objective of the Fund is to provide long-term capital appreciation. The Fund seeks to achieve its investment objective by investing in a diversified portfolio of equity securities issued by U.S. and foreign companies. Under normal circumstances substantially all of the Fund’s assets will be invested in equity securities, including common stock, securities convertible into common stock and preferred stock.
Note 1. Accounting Policies
The following is a summary of significant accounting policies followed by the Trust in the preparation of its financial statements.
Securities Valuation: Securities listed on a securities exchange (other than options on securities and indices) are valued at the last sale price on such exchange on the day of valuation or, if there was no sale on such day, at the mean between the last reported bid and asked prices, or at the last bid price on such day in the absence of an asked price. Securities traded via Nasdaq are valued at the official closing price provided by Nasdaq. Securities that are actively traded in the over-the-counter
| | |
| 42 | | Visit our website at www.prudential.com |
market, including listed securities for which the primary market is believed by Prudential Investments LLC (“PI” or “Manager”) in consultation with the subadviser, to be over-the-counter, are valued at market value using prices provided by an independent pricing agent or principal market maker. Futures contracts and options thereon traded on a commodities exchange or board of trade are valued at the last sale price at the close of trading on such exchange or board of trade or, if there was no sale on the applicable commodities exchange or board of trade on such day, at the mean between the most recently quoted prices on such exchange or board of trade or at the last bid price in the absence of an asked price. Prices may be obtained from independent pricing services which use information provided by market makers or estimates of market values obtained from yield data relating to investments or securities with similar characteristics. Securities for which reliable market quotations are not readily available, or whose values have been affected by events occurring after the close of the security’s foreign market and before the Fund’s normal pricing time, are valued at fair value in accordance with the Board of Trustees’ approved fair valuation procedures. When determining the fair valuation of securities, some of the factors influencing the valuation include the nature of any restrictions on disposition of the securities; assesment of the general liquidity of the securities; the issuer’s financial condition and the markets in which it does business; the cost of the investments; the size of the holding and the capitalization of issuer; the prices of any recent transactions or bids offers for such securities or any comparable securities; any available analyst media or other reports or information deemed reliable by the investment adviser regarding the issuer or the markets or industry in which it operates. Using fair value to price securities may result in a value that is different from a security’s most recent closing price and from the price used by other mutual funds to calculate their net asset value. As of January 31, 2008, there were 168 securities representing $57,594,923 whose values were adjusted in accordance with procedures approved by the Board of Trustees.
Investments in mutual funds are valued at their net asset value as of the close of the New York Stock Exchange on the date of valuation.
Short-term securities which mature in 60 days or less are valued at amortized cost, which approximates market value. The amortized cost method involves valuing a security at its cost on the date of purchase and thereafter assuming a constant amortization to maturity of the difference between the principal amount due at maturity and cost. Short-term securities which mature in more than 60 days are valued at current market quotations.
| | |
| Target Asset Allocation Funds/Target Growth Allocation Fund | | 43 |
Notes to Financial Statements
(Unaudited) continued
Foreign Currency Translation: The books and records of the Fund are maintained in U.S. dollars. Foreign currency amounts are translated into U.S. dollars on the following basis:
(i) market value of investment securities, other assets and liabilities-at the current daily rates of exchange.
(ii) purchases and sales of investment securities, income and expenses-at the rates of exchange prevailing on the respective dates of such transactions.
Although the net assets of the Fund are presented at the foreign exchange rates and market values at the close of the fiscal period, the Fund does not isolate that portion of the results of operations arising as a result of changes in the foreign exchange rates from the fluctuations arising from changes in the market prices of securities held at the end of the period. Similarly, the Fund does not isolate the effect of changes in foreign exchange rates from the fluctuations arising from changes in the market prices of portfolio securities sold during the period. Accordingly, realized foreign currency gains or losses are included in the reported net realized gains or losses on investment transactions.
Net realized gains or losses on foreign currency transactions represent net foreign exchange gains or losses from the holdings of foreign currencies, currency gains or losses realized between the trade date and settlement date on securities transactions, and the difference between the amounts of dividends, interest and foreign withholding taxes recorded on the Fund’s books and the U.S. dollar equivalent amounts actually received or paid. Net unrealized currency gains or losses from valuing foreign currency denominated assets and liabilities (other than investments) at year-end exchange rates are reflected as a component of net unrealized appreciation (depreciation) on investments and foreign currencies.
Foreign security and currency transactions may involve certain considerations and risks not typically associated with those of domestic origin as a result of, among other factors, the possibility of political and economic instability and the level of governmental supervision and regulation of foreign securities markets.
Forward Currency Contracts: A forward currency contract is a commitment to purchase or sell a foreign currency at a future date at a negotiated forward rate. The Fund may enter into forward currency contracts in order to hedge its exposure to changes in foreign currency exchange rates on its foreign portfolio holdings or on
| | |
| 44 | | Visit our website at www.prudential.com |
specific receivables and payables denominated in a foreign currency. The contracts are valued daily at current exchange rates and any unrealized gain or loss is included in the Statement of Assets and Liabilities as unrealized appreciation and/or depreciation on forward foreign currency contracts. Gain or loss is realized on the settlement date of the contract equal to the difference between the settlement value of the original and renegotiated forward contracts. This gain or loss, if any, is included in net realized gain or loss on foreign currency transactions. Risks may arise upon entering into these contracts from the potential inability of the counterparties to meet the terms of their contracts.
Financial Futures Contracts: A financial futures contract is an agreement to purchase (long) or sell (short) an agreed amount of securities at a set price for delivery on a future date. Upon entering into a financial futures contract, the Fund is required to pledge to the broker an amount of cash and/or other assets equal to a certain percentage of the contract amount. This amount is known as the “initial margin.” Subsequent payments known as “variation margin,” are made or received by the Fund each day, depending on the daily fluctuations in the value of the underlying security. Such variation margin is recorded for financial statement purposes on a daily basis as unrealized gain or loss. When the contract expires or is closed, the gain or loss is realized and is presented in the Statement of Operations as net realized gain or loss on financial futures contracts.
The Fund invests in financial futures contracts in order to hedge its existing portfolio securities, or securities the Fund intends to purchase, against fluctuations in value caused by changes in prevailing interest rates or market conditions. Should interest rates move unexpectedly, the Fund may not achieve the anticipated benefits of the financial futures contracts and may realize a loss. The use of futures transactions involves the risk of imperfect correlation in movements in the price of futures contracts, interest rates and the underlying hedged assets.
Securities Transactions and Net Investment Income: Securities transactions are recorded on the trade date. Realized gains or losses on sales of securities are calculated on the identified cost basis. Dividend income is recorded on the ex-dividend date and interest income, including amortization of premium and accretion of discount on debt securities as required, is recorded on the accrual basis. Expenses are recorded on the accrual basis. Net investment income or loss (other than distribution fees, which are charged directly to respective class) and unrealized and realized gains or losses are allocated daily to each class of shares based upon the relative proportion of net assets of each class at the beginning of the day.
Dividends and Distributions: The Fund expects to pay dividends of net investment income and distributions of net realized capital and currency gains, if any, annually.
| | |
| Target Asset Allocation Funds/Target Growth Allocation Fund | | 45 |
Notes to Financial Statements
(Unaudited) continued
Dividends and distributions to shareholders, which are determined in accordance with federal income tax regulations and which may differ from generally accepted accounting principles, are recorded on the ex-dividend date. Permanent book/tax differences relating to income and gains are reclassified amongst undistributed net investment income, accumulated net realized gain or loss and paid-in capital in excess of par as appropriate.
Taxes: It is the Fund’s policy to continue to meet the requirements of the Internal Revenue Code applicable to regulated investment companies and to distribute all of its taxable net investment income and capital gains, if any, to its shareholders. Therefore, no federal income tax provision is required.
Withholding taxes on foreign dividends are recorded net of reclaimable amounts, at the time the related income is earned.
Estimates: The preparation of the financial statements requires management to make estimates and assumptions that affect the reported amounts and disclosures in the financial statements. Actual results could differ from those estimates.
Note 2. Agreements
The Trust has a management agreement with PI. Pursuant to this agreement, PI manages the investment operations of the Fund, administers the Fund’s affairs and supervises the Subadvisers’ performance of all investment advisory services. Pursuant to the advisory agreement, PI pays the cost of compensation of officers of the Fund, occupancy and certain clerical and accounting costs of the Fund. The Fund bears all other costs and expenses.
The management fee paid to PI is computed daily and payable monthly at an annual rate of 0.75 of 1% of average daily net assets up to $500 million, 0.70 of 1% of average daily net assets for the next $500 million and 0.65 of 1% of average daily net assets in excess of $1 billion. The effective management fee rate was .75 of 1% for the six months ended January 31, 2008.
The Fund has a distribution agreement with Prudential Investment Management Services LLC (“PIMS”) which acts as the distributor of the Class A, B, C, M, R, X and Z shares of the Fund. The Fund compensates PIMS for distributing and servicing the Fund’s Class A, B, C, M, R and X shares, pursuant to plans of distribution (the
| | |
| 46 | | Visit our website at www.prudential.com |
“Distribution Plans”) regardless of expenses actually incurred by PIMS. The distribution fees are accrued daily and payable monthly. No distribution or service fees are paid to PIMS as distributor for Class Z shares of the Fund.
Pursuant to the Distribution Plans, the Fund compensates PIMS for distribution related activities at an annual rate of up to .30 of 1%, 1%, 1%, 1%, .75% of 1% and 1% of the average daily net assets of the Class A, B, C, M, R and X shares, respectively. Such expenses under the Plans were .25 of 1%, 1%, 1%, 1%, .50% of 1% and 1% of the average daily net assets of the Class A, B, C, M, R and X shares, respectively, for the six months ended January 31, 2008.
PIMS has advised the Fund that it has received approximately $138,100 in front-end sales charges resulting from sales of Class A during the six months ended January 31, 2008. From these fees, PIMS paid such sales charges to broker-dealers which in turn paid commissions to salespersons and incurred other distribution costs.
PIMS has advised the Fund that for the six months ended January 31, 2008, it has received approximately $59,100, $9,100, $8,700 and $500 in contingent deferred sales charges imposed upon certain redemptions by Class B, Class C, Class M and Class X shareholders, respectively.
PIMS and PI are indirect, wholly-owned subsidiaries of Prudential Financial, Inc. (“Prudential”).
The Fund, along with other affiliated registered investment companies (the “Funds”), is a party to a Syndicated Credit Agreement (“SCA”) with two banks. The SCA provides for a commitment of $500 million. Interest on any borrowings under the SCA is incurred at contracted market rates and a commitment fee for the unused amount is accrued daily and paid quarterly. Effective October 26, 2007, the Funds renewed the SCA with the banks. The Funds pay a commitment fee of .06 of 1% of the unused portion of the renewed SCA. The expiration date of the renewed SCA will be October 24, 2008. For the period from October 27, 2006 through October 26, 2007, the Funds paid a commitment fee of .07 of 1% of the unused portion of the agreement. The purpose of the SCA is to provide an alternative source of temporary funding for capital share redemptions.
The Fund utilized the line of credit during the six months ended January 31, 2008. The average daily balance for the 24 days the Fund had an outstanding balance was approximately $720,000 at a weighted average interest rate of approximately 4.51%.
| | |
| Target Asset Allocation Funds/Target Growth Allocation Fund | | 47 |
Notes to Financial Statements
(Unaudited) continued
Note 3. Other Transactions with Affiliates
Prudential Mutual Fund Services LLC (“PMFS”), an affiliate of PI and an indirect, wholly-owned subsidiary of Prudential, serves as the Fund’s transfer agent. Transfer agent fees and expenses in the Statement of Operations include certain out-of-pocket expenses paid to non-affiliates, where applicable.
The Fund pays networking fees to affiliated and unaffiliated broker/dealers, including fees related to the services of First Clearing, LLC (“First Clearing”), an affiliate of PI. These networking fees are payments made to broker/dealers that clear mutual fund transactions through a national clearing system. For the six months ended January 31, 2008, the Fund incurred approximately $102,000 in total networking fees, of which $47,300 was paid to First Clearing. These amounts are included in transfer agent’s fees and expenses in the Statement of Operations.
The Fund invests in the Taxable Money Market Series (the “Series”), a portfolio of Dryden Core Investment Fund, pursuant to an exemptive order received from the Securities and Exchange Commission. The Series is a money market mutual fund registered under the Investment Company Act of 1940, as amended, and managed by PI.
Note 4. Portfolio Securities
Purchases and sales of portfolio securities, excluding short-term investments, for the six months ended January 31, 2008, aggregated $143,224,298 and $166,786,982, respectively.
Note 5. Tax Information
The United States federal income tax basis of the Fund’s investments and the net unrealized appreciation as of January 31, 2008 were as follows:
| | | | | | |
Tax Basis | | Appreciation | | Depreciation | | Net Unrealized
Appreciation |
| $302,576,811 | | $40,546,182 | | $(19,578,630) | | $20,967,552 |
The difference between book basis and tax basis were primarily attributable to deferred losses on wash sales and investments in real estate investment trusts.
| | |
| 48 | | Visit our website at www.prudential.com |
Management has analyzed the Fund’s tax positions taken on federal income tax returns for all open tax years and has concluded that as of January 31, 2008, no provision for income tax would be required in the Fund’s financial statements. The Fund’s federal and state income and federal excise tax returns for tax years for which the applicable statutes of limitations have not expired are subject to examination by the Internal Revenue Service and state departments of revenue.
Note 6. Capital
The Fund offers Class A, Class B, Class C, Class M, Class R, Class X and Class Z shares. Class A shares are subject to a maximum front-end sales charge of 5.50%. Investors who purchase $1 million or more of Class A shares and sell these shares within 12 months of purchase are not subject to an initial sales charge but are subject to a contingent deferred sales charge (CDSC) of 1%, including investors who purchase their shares through broker-dealers affiliated with Prudential. Class B shares are subject to a CDSC of 5%, which decreases by 1% annually to 1% in the fifth and sixth years and 0% in the seventh year. Class B shares automatically convert to Class A shares on a quarterly basis approximately seven years after purchase. The CDSC for Class C shares is 1% for shares redeemed within 12 months of purchase. Class M shares are subject to a CDSC of 6%, which decreases by 1% annually to 2% in the fifth and sixth years and 1% in the seventh year. Class M shares are generally closed to new purchases. Class M shares automatically convert to Class A shares approximately eight years after purchase. Class X shares are generally closed to new purchases. Class X shares are subject to a CDSC of 6%, which decreases by 1% annually to 4% in the third and fourth years, by 1% annually to 2% in the sixth and seventh years, and 1% in the eighth year. Class X shares automatically convert to Class A shares on a quarterly basis approximately ten years (eight years in the case of shares purchased prior to August 19, 1998) after purchase. An exchange privilege is also available for shareholders who qualify to purchase Class A shares at net asset value. Class R and Class Z shares are not subject to any sales or redemption charge and are offered exclusively for sale to a limited group of investors.
The Fund has authorized an unlimited number of shares of beneficial interest at $.001 par value per share. As of January 31, 2008 Prudential owned 217 Class R shares of the Fund.
| | |
| Target Asset Allocation Funds/Target Growth Allocation Fund | | 49 |
Notes to Financial Statements
(Unaudited) continued
| | | | | | | |
Class A | | Shares | | | Amount | |
Six Months ended January 31, 2008: | | | | | | | |
Shares sold | | 476,678 | | | $ | 6,782,402 | |
Shares issued in reinvestment of dividends and distributions | | 953,846 | | | | 12,590,769 | |
Shares reacquired | | (949,200 | ) | | | (13,496,230 | ) |
| | | | | | | |
Net increase (decrease) in shares outstanding before conversion | | 481,324 | | | | 5,876,941 | |
Shares issued upon conversion from Class B, Class M, and Class X | | 631,643 | | | | 9,326,231 | |
| | | | | | | |
Net increase (decrease) in shares outstanding | | 1,112,967 | | | $ | 15,203,172 | |
| | | | | | | |
Year ended July 31, 2007: | | | | | | | |
Shares sold | | 1,458,380 | | | $ | 20,695,160 | |
Shares issued in reinvestment of dividends and distributions | | 461,229 | | | | 6,383,410 | |
Shares reacquired | | (1,418,010 | ) | | | (20,293,986 | ) |
| | | | | | | |
Net increase (decrease) in shares outstanding before conversion | | 501,599 | | | | 6,784,584 | |
Shares issued upon conversion from Class B, Class M, and Class X | | 1,440,694 | | | | 20,263,501 | |
| | | | | | | |
Net increase (decrease) in shares outstanding | | 1,942,293 | | | $ | 27,048,085 | |
| | | | | | | |
Class B | | | | | | |
Six Months ended January 31, 2008: | | | | | | | |
Shares sold | | 229,775 | | | $ | 3,073,902 | |
Shares issued in reinvestment of dividends and distributions | | 591,345 | | | | 7,267,618 | |
Shares reacquired | | (437,699 | ) | | | (5,820,247 | ) |
| | | | | | | |
Net increase (decrease) in shares outstanding before conversion | | 383,421 | | | | 4,521,273 | ) |
Shares reacquired upon conversion into Class A | | (590,664 | ) | | | (8,166,024 | ) |
| | | | | | | |
Net increase (decrease) in shares outstanding | | (207,243 | ) | | $ | (3,644,751 | ) |
| | | | | | | |
Year ended July 31, 2007: | | | | | | | |
Shares sold | | 793,001 | | | $ | 10,600,170 | |
Shares issued in reinvestment of dividends and distributions | | 469,590 | | | | 6,109,371 | |
Shares reacquired | | (993,677 | ) | | | (13,339,889 | ) |
| | | | | | | |
Net increase (decrease) in shares outstanding before conversion | | 268,914 | | | | 3,369,652 | |
Shares reacquired upon conversion into Class A | | (1,437,730 | ) | | | (18,962,629 | ) |
| | | | | | | |
Net increase (decrease) in shares outstanding | | (1,168,816 | ) | | $ | (15,592,977 | ) |
| | | | | | | |
Class C | | | | | | |
Six Months ended January 31, 2008: | | | | | | | |
Shares sold | | 468,936 | | | $ | 6,232,504 | |
Shares issued in reinvestment of dividends and distributions | | 707,551 | | | | 8,695,678 | |
Shares reacquired | | (1,148,262 | ) | | | (14,905,838 | ) |
| | | | | | | |
Net increase (decrease) in shares outstanding | | 28,225 | | | $ | 22,344 | |
| | | | | | | |
Year ended July 31, 2007: | | | | | | | |
Shares sold | | 2,064,408 | | | $ | 27,648,478 | |
Shares issued in reinvestment of dividends and distributions | | 434,693 | | | | 5,655,361 | |
Shares reacquired | | (1,647,041 | ) | | | (22,156,258 | ) |
| | | | | | | |
Net increase (decrease) in shares outstanding | | 852,060 | | | $ | 11,147,581 | |
| | | | | | | |
| | |
| 50 | | Visit our website at www.prudential.com |
| | | | | | | |
Class M | | Shares | | | Amount | |
Six Months ended January 31, 2008: | | | | | | | |
Shares sold | | 33,852 | | | $ | 461,661 | |
Shares issued in reinvestment of dividends and distributions | | 64,944 | | | | 800,109 | |
Shares reacquired | | (136,887 | ) | | | (1,826,066 | ) |
| | | | | | | |
Net increase (decrease) in shares outstanding before conversion | | (38,091 | ) | | | (564,296 | ) |
Shares reacquired upon conversion into Class A | | (83,449 | ) | | | (1,126,841 | ) |
| | | | | | | |
Net increase (decrease) in shares outstanding | | (121,540 | ) | | $ | (1,691,137 | ) |
| | | | | | | |
Year ended July 31, 2007: | | | | | | | |
Shares sold | | 490,869 | | | $ | 6,568,876 | |
Shares issued in reinvestment of dividends and distributions | | 51,728 | | | | 674,530 | |
Shares reacquired | | (294,502 | ) | | | (3,962,467 | ) |
| | | | | | | |
Net increase (decrease) in shares outstanding before conversion | | 248,095 | | | | 3,280,939 | |
Shares reacquired upon conversion into Class A | | (95,632 | ) | | | (1,292,647 | ) |
| | | | | | | |
Net increase (decrease) in shares outstanding | | 152,463 | | | $ | 1,988,292 | |
| | | | | | | �� |
Class R | | | | | | |
Six Months ended January 31, 2008: | | | | | | | |
Shares sold | | 2,372 | | | $ | 33,562 | |
Shares issued in reinvestment of dividends and distributions | | 2,277 | | | | 29,872 | |
Shares reacquired | | (1,334 | ) | | | (19,501 | ) |
| | | | | | | |
Net increase (decrease) in shares outstanding | | 3,315 | | | $ | 43,933 | |
| | | | | | | |
Year ended July 31, 2007: | | | | | | | |
Shares sold | | 14,326 | | | $ | 204,165 | |
Shares issued in reinvestment of dividends and distributions | | 1,222 | | | | 16,823 | |
Shares reacquired | | (7,387 | ) | | | (104,342 | ) |
| | | | | | | |
Net increase (decrease) in shares outstanding | | 8,161 | | | $ | 116,646 | |
| | | | | | | |
Class X | | | | | | |
Six Months ended January 31, 2008: | | | | | | | |
Shares sold | | 55,199 | | | $ | 768,219 | |
Shares issued in reinvestment of dividends and distributions | | 37,025 | | | | 455,407 | |
Shares reacquired | | (49,587 | ) | | | (652,699 | ) |
| | | | | | | |
Net increase (decrease) in shares outstanding before conversion | | 42,637 | | | | 570,927 | |
Shares reacquired upon conversion into Class A | | (2,409 | ) | | | (33,366 | ) |
| | | | | | | |
Net increase (decrease) in shares outstanding | | 40,228 | | | $ | 537,561 | |
| | | | | | | |
Year ended July 31, 2007: | | | | | | | |
Shares sold | | 159,233 | | | $ | 2,128,949 | |
Shares issued in reinvestment of dividends and distributions | | 21,717 | | | | 282,753 | |
Shares reacquired | | (138,157 | ) | | | (1,867,921 | ) |
| | | | | | | |
Net increase (decrease) in shares outstanding before conversion | | 42,793 | | | | 543,781 | |
Shares reacquired upon conversion into Class A | | (591 | ) | | | (8,225 | ) |
| | | | | | | |
Net increase (decrease) in shares outstanding | | 42,202 | | | $ | 535,556 | |
| | | | | | | |
| | |
| Target Asset Allocation Funds/Target Growth Allocation Fund | | 51 |
Notes to Financial Statements
(Unaudited) continued
| | | | | | | |
Class Z | | Shares | | | Amount | |
Six Months ended January 31, 2008: | | | | | | | |
Shares sold | | 60,322 | | | $ | 910,531 | |
Shares issued in reinvestment of dividends and distributions | | 53,080 | | | | 717,113 | |
Shares reacquired | | (189,520 | ) | | | (2,625,423 | ) |
| | | | | | | |
Net increase (decrease) in shares outstanding | | (76,118 | ) | | $ | (997,779 | ) |
| | | | | | | |
Year ended July 31, 2007: | | | | | | | |
Shares sold | | 160,507 | | | $ | 2,318,709 | |
Shares issued in reinvestment of dividends and distributions | | 29,201 | | | | 412,612 | |
Shares reacquired | | (172,552 | ) | | | (2,498,124 | ) |
| | | | | | | |
Net increase (decrease) in shares outstanding | | 17,156 | | | $ | 233,197 | |
| | | | | | | |
Note 7. New Accounting Pronouncements
On September 20, 2006, the FASB released Statement of Financial Accounting Standards No. 157 “Fair Value Measurements” (FAS 157). FAS 157 establishes an authoritative definition of fair value, sets out a framework for measuring fair value, and requires additional disclosures about fair-value measurements. The application of FAS 157 is required for fiscal years beginning after November 15, 2007 and interim periods within those fiscal years. At this time, management is evaluating the implications of FAS 157 and its impact, if any, in the financial statements has not yet been determined.
| | |
| 52 | | Visit our website at www.prudential.com |
Financial Highlights
(Unaudited)
| | |
| JANUARY 31, 2008 | | SEMIANNUAL REPORT |
Target Growth Allocation Fund
Financial Highlights
(Unaudited)
| | | | |
| | | Class A | |
| | | Six Months Ended
January 31, 2008(b) | |
Per Share Operating Performance: | | | | |
Net Asset Value, Beginning Of Period | | $ | 14.62 | |
| | | | |
Income from investment operations: | | | | |
Net investment income (loss) | | | .06 | |
Net realized and unrealized gains (loss) on investments transactions | | | (.84 | ) |
| | | | |
Total from investment operations | | | (.78 | ) |
| | | | |
Less Dividends and Distributions: | | | | |
Dividends from net investment income | | | (.07 | ) |
Distributions from net realized gains on investments | | | (1.26 | ) |
| | | | |
Total dividends and distributions | | | (1.33 | ) |
| | | | |
Net asset value, end of period | | $ | 12.51 | |
| | | | |
Total Return(a) | | | (5.80 | )% |
Ratios/Supplemental Data: | | | | |
Net assets, end of period (000) | | $ | 132,500 | |
Average net assets (000) | | $ | 141,087 | |
Ratios to average net assets(f): | | | | |
Expenses, including distribution and service (12b-1) fees(c) | | | 1.32 | %(d) |
Expenses, excluding distribution and service (12b-1) fees | | | 1.07 | %(d) |
Net investment income (loss) | | | .81 | %(d) |
For Class A, B, C, M, R, X and Z shares: | | | | |
Portfolio turnover rate | | | 41 | %(e) |
| (a) | Total return does not consider the effects of sales loads. Total return is calculated assuming a purchase of a share on the first day and a sale on the last day of each period reported and includes reinvestment of dividends and distributions. Total returns may reflect adjustments to conform to generally accepted accounting principles. Total returns for periods less than one full year are not annualized. |
| (b) | Calculations are based on average shares outstanding during the period. |
| (c) | The distributor of the Fund contractually agreed to limit its distribution and service (12b-1) fees to .25 of 1% of the average daily assets of the Class A shares. |
| (f) | Does not include expenses of the underlying portfolios in which the Fund invests. |
See Notes to Financial Statements.
| | |
| 54 | | Visit our website at www.prudential.com |
| | | | | | | | | | | | | | | | | | |
| Class A | |
| Year Ended July 31, | |
| 2007(b) | | | 2006(b) | | | 2005(b) | | | 2004(b) | | | 2003(b) | |
| | | | | | | | | | | | | | | | | | |
| $ | 13.26 | | | $ | 13.36 | | | $ | 10.96 | | | $ | 9.53 | | | $ | 8.38 | |
| | | | | | | | | | | | | | | | | | | |
| | | | | | | | | | | | | | | | | | |
| | .09 | | | | .08 | | | | .02 | | | | (.03 | ) | | | (.03 | ) |
| | 2.12 | | | | .93 | | | | 2.38 | | | | 1.46 | | | | 1.18 | |
| | | | | | | | | | | | | | | | | | | |
| | 2.21 | | | | 1.01 | | | | 2.40 | | | | 1.43 | | | | 1.15 | |
| | | | | | | | | | | | | | | | | | | |
| | | | | | | | | | | | | | | | | | |
| | (.01 | ) | | | — | | | | — | | | | — | | | | — | |
| | (.84 | ) | | | (1.11 | ) | | | — | | | | — | | | | — | |
| | | | | | | | | | | | | | | | | | | |
| | (.85 | ) | | | (1.11 | ) | | | — | | | | — | | | | — | |
| | | | | | | | | | | | | | | | | | | |
| $ | 14.62 | | | $ | 13.26 | | | $ | 13.36 | | | $ | 10.96 | | | $ | 9.53 | |
| | | | | | | | | | | | | | | | | | | |
| | 16.93 | % | | | 8.00 | % | | | 21.90 | % | | | 15.01 | % | | | 13.72 | % |
| | | | | | | | | | | | | | | | | | |
| $ | 138,579 | | | $ | 99,960 | | | $ | 62,948 | | | $ | 45,622 | | | $ | 35,897 | |
| $ | 124,296 | | | $ | 78,993 | | | $ | 52,589 | | | $ | 43,525 | | | $ | 31,290 | |
| | | | | | | | | | | | | | | | | | |
| | 1.35 | % | | | 1.38 | % | | | 1.38 | % | | | 1.43 | % | | | 1.71 | % |
| | 1.10 | % | | | 1.13 | % | | | 1.13 | % | | | 1.18 | % | | | 1.46 | % |
| | .65 | % | | | .57 | % | | | .20 | % | | | (.25 | )% | | | (.31 | )% |
| | | | | | | | | | | | | | | | | | |
| | 71 | % | | | 85 | % | | | 200 | % | | | 79 | % | | | 89 | % |
See Notes to Financial Statements.
| | |
| Target Asset Allocation Funds/Target Growth Allocation Fund | | 55 |
Financial Highlights
(Unaudited) continued
| | | | |
| | | Class B | |
| | | Six Months Ended
January 31, 2008(b) | |
Per Share Operating Performance: | | | | |
Net Asset Value, Beginning Of Period | | $ | 13.67 | |
| | | | |
Income from investment operations: | | | | |
Net investment income (loss) | | | .01 | |
Net realized and unrealized gains (loss) on investments transactions | | | (.78 | ) |
| | | | |
Total from investment operations | | | (.77 | ) |
| | | | |
Less Dividends and Distributions: | | | | |
Dividends from net investment income from investments | | | — | |
Distributions from net realized gains from investments | | | (1.26 | ) |
| | | | |
Total distributions | | | (1.26 | ) |
| | | | |
Net asset value, end of period | | $ | 11.64 | |
| | | | |
Total Return(a) | | | (6.12 | )% |
Ratios/Supplemental Data: | | | | |
Net assets, end of period (000) | | $ | 76,765 | |
Average net assets (000) | | $ | 88,411 | |
Ratios to average net assets(d): | | | | |
Expenses, including distribution and service (12b-1) fees | | | 2.07 | %(c) |
Expenses, excluding distribution and service (12b-1) fees | | | 1.07 | %(c) |
Net investment income (loss) | | | .08 | %(c) |
| (a) | Total return does not consider the effects of sales loads. Total return is calculated assuming a purchase of a share on the first day and a sale on the last day of each period reported and includes reinvestment of dividends and distributions. Total returns may reflect adjustments to conform to generally accepted accounting principles. Total returns for periods less than one full year are not annualized. |
| (b) | Calculations are based on average shares outstanding during the period. |
| (d) | Does not include expenses of the underlying portfolios in which the Fund invests. |
See Notes to Financial Statements.
| | |
| 56 | | Visit our website at www.prudential.com |
| | | | | | | | | | | | | | | | | | |
| Class B | |
| Year Ended July 31, | |
| 2007(b) | | | 2006(b) | | | 2005(b) | | | 2004(b) | | | 2003(b) | |
| | | | | | | | | | | | | | | | | | |
| $ | 12.53 | | | $ | 12.78 | | | $ | 10.56 | | | $ | 9.25 | | | $ | 8.20 | |
| | | | | | | | | | | | | | | | | | | |
| | | | | | | | | | | | | | | | | | |
| | (.01 | ) | | | (.03 | ) | | | (.06 | ) | | | (.11 | ) | | | (.09 | ) |
| | 1.99 | | | | .89 | | | | 2.28 | | | | 1.42 | | | | 1.14 | |
| | | | | | | | | | | | | | | | | | | |
| | 1.98 | | | | .86 | | | | 2.22 | | | | 1.31 | | | | 1.05 | |
| | | | | | | | | | | | | | | | | | | |
| | | | | | | | | | | | | | | | | | |
| | — | | | | — | | | | — | | | | — | | | | — | |
| | (.84 | ) | | | (1.11 | ) | | | — | | | | — | | | | — | |
| | | | | | | | | | | | | | | | | | | |
| | (.84 | ) | | | (1.11 | ) | | | — | | | | — | | | | — | |
| | | | | | | | | | | | | | | | | | | |
| $ | 13.67 | | | $ | 12.53 | | | $ | 12.78 | | | $ | 10.56 | | | $ | 9.25 | |
| | | | | | | | | | | | | | | | | | | |
| | 16.14 | % | | | 7.06 | % | | | 21.02 | % | | | 14.16 | % | | | 12.80 | % |
| | | | | | | | | | | | | | | | | | |
| $ | 93,021 | | | $ | 99,928 | | | $ | 112,312 | | | $ | 94,066 | | | $ | 76,430 | |
| $ | 100,142 | | | $ | 109,700 | | | $ | 103,140 | | | $ | 90,535 | | | $ | 67,723 | |
| | | | | | | | | | | | | | | | | | |
| | 2.10 | % | | | 2.13 | % | | | 2.13 | % | | | 2.18 | % | | | 2.46 | % |
| | 1.10 | % | | | 1.13 | % | | | 1.13 | % | | | 1.18 | % | | | 1.46 | % |
| | (.08 | )% | | | (.20 | )% | | | (.55 | )% | | | (1.00 | )% | | | (1.07 | )% |
See Notes to Financial Statements.
| | |
| Target Asset Allocation Funds/Target Growth Allocation Fund | | 57 |
Financial Highlights
(Unaudited) continued
| | | | |
| | | Class C | |
| | | Six Months Ended
January 31, 2008(b) | |
Per Share Operating Performance: | | | | |
Net Asset Value, Beginning Of Period | | $ | 13.67 | |
| | | | |
Income from investment operations: | | | | |
Net investment income (loss) | | | .01 | |
Net realized and unrealized gains (loss) on investments transactions | | | (.78 | ) |
| | | | |
Total from investment operations | | | (.77 | ) |
| | | | |
Less Dividends and Distributions: | | | | |
Dividends from net investment income from investments | | | — | |
Distributions from net realized gains from investments | | | (1.26 | ) |
| | | | |
Total distributions | | | (1.26 | ) |
| | | | |
Net asset value, end of period | | $ | 11.64 | |
| | | | |
Total Return(a) | | | (6.12 | )% |
Ratios/Supplemental Data: | | | | |
Net assets, end of period (000) | | $ | 93,878 | |
Average net assets (000) | | $ | 107,782 | |
Ratios to average net assets(d): | | | | |
Expenses, including distribution and service (12b-1) fees | | | 2.07 | %(c) |
Expenses, excluding distribution and service (12b-1) fees | | | 1.07 | %(c) |
Net investment income (loss) | | | .08 | %(c) |
| (a) | Total return does not consider the effects of sales loads. Total return is calculated assuming a purchase of a share on the first day and a sale on the last day of each period reported and includes reinvestment of dividends and distributions. Total returns may reflect adjustments to conform to generally accepted accounting principles. Total returns for periods less than one full year are not annualized. |
| (b) | Calculations are based on average shares outstanding during the period. |
| (d) | Does not include expenses of the underlying portfolios in which the Fund invests. |
See Notes to Financial Statements.
| | |
| 58 | | Visit our website at www.prudential.com |
| | | | | | | | | | | | | | | | | | |
| Class C | |
| Year Ended July 31, | |
| 2007(b) | | | 2006(b) | | | 2005(b) | | | 2004(b) | | | 2003(b) | |
| | | | | | | | | | | | | | | | | | |
| $ | 12.53 | | | $ | 12.78 | | | $ | 10.56 | | | $ | 9.25 | | | $ | 8.20 | |
| | | | | | | | | | | | | | | | | | | |
| | | | | | | | | | | | | | | | | | |
| | (.01 | ) | | | (.02 | ) | | | (.06 | ) | | | (.11 | ) | | | (.09 | ) |
| | 1.99 | | | | .88 | | | | 2.28 | | | | 1.42 | | | | 1.14 | |
| | | | | | | | | | | | | | | | | | | |
| | 1.98 | | | | .86 | | | | 2.22 | | | | 1.31 | | | | 1.05 | |
| | | | | | | | | | | | | | | | | | | |
| | | | | | | | | | | | | | | | | | |
| | — | | | | — | | | | — | | | | — | | | | — | |
| | (.84 | ) | | | (1.11 | ) | | | — | | | | — | | | | — | |
| | | | | | | | | | | | | | | | | | | |
| | (.84 | ) | | | (1.11 | ) | | | — | | | | — | | | | — | |
| | | | | | | | | | | | | | | | | | | |
| $ | 13.67 | | | $ | 12.53 | | | $ | 12.78 | | | $ | 10.56 | | | $ | 9.25 | |
| | | | | | | | | | | | | | | | | | | |
| | 16.14 | % | | | 7.06 | % | | | 21.02 | % | | | 14.16 | % | | | 12.80 | % |
| | | | | | | | | | | | | | | | | | |
| $ | 109,912 | | | $ | 90,092 | | | $ | 76,811 | | | $ | 61,606 | | | $ | 47,616 | |
| $ | 105,155 | | | $ | 83,200 | | | $ | 68,555 | | | $ | 58,465 | | | $ | 39,926 | |
| | | | | | | | | | | | | | | | | | |
| | 2.10 | % | | | 2.13 | % | | | 2.13 | % | | | 2.18 | % | | | 2.46 | % |
| | 1.10 | % | | | 1.13 | % | | | 1.13 | % | | | 1.18 | % | | | 1.46 | % |
| | (.09 | )% | | | (.19 | )% | | | (.55 | )% | | | (1.00 | )% | | | (1.06 | )% |
See Notes to Financial Statements.
| | |
| Target Asset Allocation Funds/Target Growth Allocation Fund | | 59 |
Financial Highlights
(Unaudited) continued
| | | | |
| | | Class M | |
| |
| | | Six Months Ended
January 31, 2008(d) | |
Per Share Operating Performance: | | | | |
Net Asset Value, Beginning Of Period | | $ | 13.70 | |
| | | | |
Income from investment operations: | | | | |
Net investment income (loss) | | | .01 | |
Net realized and unrealized gains (loss) on investments transactions | | | (.78 | ) |
| | | | |
Total from investment operations | | | (.77 | ) |
| | | | |
Less Dividends and Distributions: | | | | |
Dividends from net investment income from investments | | | — | |
Distributions from net realized gains from investments | | | (1.26 | ) |
| | | | |
Total distributions | | | (1.26 | ) |
| | | | |
Net asset value, end of period | | $ | 11.67 | |
| | | | |
Total Return(b) | | | (6.10 | )% |
Ratios/Supplemental Data: | | | | |
Net assets, end of period (000) | | $ | 7,822 | |
Average net assets (000) | | $ | 9,824 | |
Ratios to average net assets(e): | | | | |
Expenses, including distribution and service (12b-1) fees | | | 2.07 | %(c) |
Expenses, excluding distribution and service (12b-1) fees | | | 1.07 | %(c) |
Net investment income (loss) | | | .10 | %(c) |
| (a) | Commencement of offering new share class. |
| (b) | Total return does not consider the effects of sales loads. Total return is calculated assuming a purchase of a share on the first day and a sale on the last day of each period reported and includes reinvestment of dividends and distributions. Total returns may reflect adjustments to conform to generally accepted accounting principles. Total returns for periods less than one full year are not annualized. |
| (d) | Calculations are based on average shares outstanding during the period. |
| (e) | Does not include expenses of the underlying portfolios in which the Fund invests. |
See Notes to Financial Statements.
| | |
| 60 | | Visit our website at www.prudential.com |
| | | | | | | | | | |
| Class M | |
| Year Ended July 31, | | | October 4, 2004(a)
Through
July 31, 2005(d) | |
| 2007(d) | | | 2006(d) | | |
| | | | | | | | | | |
| $ | 12.54 | | | $ | 12.78 | | | $ | 11.07 | |
| | | | | | | | | | | |
| | | | | | | | | | |
| | (.01 | ) | | | (.02 | ) | | | (.05 | ) |
| | 2.01 | | | | .89 | | | | 1.76 | |
| | | | | | | | | | | |
| | 2.00 | | | | .87 | | | | 1.71 | |
| | | | | | | | | | | |
| | | | | | | | | | |
| | — | | | | — | | | | — | |
| | (.84 | ) | | | (1.11 | ) | | | — | |
| | | | | | | | | | | |
| | (.84 | ) | | | (1.11 | ) | | | — | |
| | | | | | | | | | | |
| $ | 13.70 | | | $ | 12.54 | | | $ | 12.78 | |
| | | | | | | | | | | |
| | 16.28 | % | | | 7.14 | % | | | 15.45 | % |
| | | | | | | | | | |
| $ | 10,851 | | | $ | 8,019 | | | $ | 2,990 | |
| $ | 10,882 | | | $ | 5,619 | | | $ | 1,542 | |
| | | | | | | | | | |
| | 2.10 | % | | | 2.13 | % | | | 2.13 | %(c) |
| | 1.10 | % | | | 1.13 | % | | | 1.13 | %(c) |
| | (.10 | )% | | | (.13 | )% | | | (.51 | )%(c) |
See Notes to Financial Statements.
| | |
| Target Asset Allocation Funds/Target Growth Allocation Fund | | 61 |
Financial Highlights
(Unaudited) continued
| | | | |
| | | Class R | |
| |
| | | Six Months Ended
January 31, 2008(d) | |
Per Share Operating Performance: | | | | |
Net Asset Value, Beginning Of Period | | $ | 14.52 | |
| | | | |
Income from investment operations: | | | | |
Net investment income (loss) | | | .04 | |
Net realized and unrealized gains (loss) on investments transactions | | | (.82 | ) |
| | | | |
Total from investment operations | | | (.78 | ) |
| | | | |
Less Dividends and Distributions: | | | | |
Dividends from net investment income from investments | | | (.04 | ) |
Distributions from net realized gains from investments | | | (1.26 | ) |
| | | | |
Total distributions | | | (1.30 | ) |
| | | | |
Net asset value, end of period | | $ | 12.44 | |
| | | | |
Total Return(b) | | | (6.00 | )% |
Ratios/Supplemental Data: | | | | |
Net assets, end of period (000) | | $ | 326 | |
Average net assets (000) | | $ | 341 | |
Ratios to average net assets(h): | | | | |
Expenses, including distribution and service (12b-1) fees(f) | | | 1.57 | %(c) |
Expenses, excluding distribution and service (12b-1) fees | | | 1.07 | %(c) |
Net investment income (loss) | | | .56 | %(c) |
| (a) | Commencement of offering new share class. |
| (b) | Total return does not consider the effects of sales loads. Total return is calculated assuming a purchase of a share on the first day and a sale on the last day of each period reported and includes reinvestment of dividends and distributions. Total returns may reflect adjustments to conform to generally accepted accounting principles. Total returns for periods less than one full year are not annualized. |
| (d) | Calculations are based on average shares outstanding during the period. |
| (e) | Less than $.005 per share. |
| (f) | The distributor of the Fund contractually agreed to limit its distribution and service (12b-1) fees to .50 of 1% of the average daily assets of the Class R shares. |
| (h) | Does not include expenses of the underlying portfolios in which the Fund invests. |
See Notes to Financial Statements.
| | |
| 62 | | Visit our website at www.prudential.com |
| | | | | | | | | | |
| Class R | |
| Year Ended July 31, | | | October 4, 2004(a)
Through
July 31, 2005(d) | |
| 2007(d) | | | 2006(d) | | |
| | | | | | | | | | |
| $ | 13.21 | | | $ | 13.34 | | | $ | 11.51 | |
| | | | | | | | | | | |
| | | | | | | | | | |
| | .05 | | | | .07 | | | | — | (e) |
| | 2.11 | | | | .91 | | | | 1.83 | |
| | | | | | | | | | | |
| | 2.16 | | | | .98 | | | | 1.83 | |
| | | | | | | | | | | |
| | | | | | | | | | |
| | (.01 | ) | | | — | | | | — | |
| | (.84 | ) | | | (1.11 | ) | | | — | |
| | | | | | | | | | | |
| | (.85 | ) | | | (1.11 | ) | | | — | |
| | | | | | | | | | | |
| $ | 14.52 | | | $ | 13.21 | | | $ | 13.34 | |
| | | | | | | | | | | |
| | 16.76 | % | | | 7.69 | % | | | 15.90 | % |
| | | | | | | | | | |
| $ | 333 | | | $ | 195 | | | $ | 3 | |
| $ | 284 | | | $ | 89 | | | $ | 3 | |
| | | | | | | | | | |
| | 1.60 | % | | | 1.63 | % | | | 1.63 | %(c) |
| | 1.10 | % | | | 1.13 | % | | | 1.13 | %(c) |
| | .36 | % | | | .51 | % | | | — | %(c)(g) |
See Notes to Financial Statements.
| | |
| Target Asset Allocation Funds/Target Growth Allocation Fund | | 63 |
Financial Highlights
(Unaudited) continued
| | | | |
| | | Class X | |
| |
| | | Six Months Ended
January 31, 2008(d) | |
Per Share Operating Performance: | | | | |
Net Asset Value, Beginning Of Period | | $ | 13.68 | |
| | | | |
Income from investment operations: | | | | |
Net investment income (loss) | | | — | (e) |
Net realized and unrealized gains (loss) on investments transactions | | | (.77 | ) |
| | | | |
Total from investment operations | | | (.77 | ) |
| | | | |
Less Dividends and Distributions: | | | | |
Dividends from net investment income from investments | | | — | |
Distributions from net realized gains from investments | | | (1.26 | ) |
| | | | |
Total distributions | | | (1.26 | ) |
| | | | |
Net asset value, end of period | | $ | 11.65 | |
| | | | |
Total Return(b) | | | (6.11 | )% |
Ratios/Supplemental Data: | | | | |
Net assets, end of period (000) | | $ | 4,396 | |
Average net assets (000) | | $ | 4,743 | |
Ratios to average net assets(f): | | | | |
Expenses, including distribution and service (12b-1) fees | | | 2.07 | %(c) |
Expenses, excluding distribution and service (12b-1) fees | | | 1.07 | %(c) |
Net investment income (loss) | | | .06 | %(c) |
| (a) | Commencement of offering new share class. |
| (b) | Total return does not consider the effects of sales loads. Total return is calculated assuming a purchase of a share on the first day and a sale on the last day of each period reported and includes reinvestment of dividends and distributions. Total returns may reflect adjustments to conform to generally accepted accounting principles. Total returns for periods less than one full year are not annualized. |
| (d) | Calculations are based on average shares outstanding during the period. |
| (e) | Less than $.005 per share. |
| (f) | Does not include expenses of the underlying portfolios in which the Fund invests. |
See Notes to Financial Statements.
| | |
| 64 | | Visit our website at www.prudential.com |
| | | | | | | | | | |
| Class X | |
| Year Ended July 31, | | | October 4, 2004(a)
Through
July 31, 2005(d) | |
| 2007(d) | | | 2006(d) | | |
| | | | | | | | | | |
| $ | 12.55 | | | $ | 12.79 | | | $ | 11.07 | |
| | | | | | | | | | | |
| | | | | | | | | | |
| | (.01 | ) | | | (.01 | ) | | | (.05 | ) |
| | 1.98 | | | | .88 | | | | 1.77 | |
| | | | | | | | | | | |
| | 1.97 | | | | .87 | | | | 1.72 | |
| | | | | | | | | | | |
| | | | | | | | | | |
| | — | | | | — | | | | — | |
| | (.84 | ) | | | (1.11 | ) | | | — | |
| | | | | | | | | | | |
| | (.84 | ) | | | (1.11 | ) | | | — | |
| | | | | | | | | | | |
| $ | 13.68 | | | $ | 12.55 | | | $ | 12.79 | |
| | | | | | | | | | | |
| | 16.03 | % | | | 7.13 | % | | | 15.54 | % |
| | | | | | | | | | |
| $ | 4,613 | | | $ | 3,703 | | | $ | 1,158 | |
| $ | 4,643 | | | $ | 2,043 | | | $ | 608 | |
| | | | | | | | | | |
| | 2.10 | % | | | 2.13 | % | | | 2.13 | %(c) |
| | 1.10 | % | | | 1.13 | % | | | 1.13 | %(c) |
| | (.09 | )% | | | (.09 | )% | | | (.52 | )%(c) |
See Notes to Financial Statements.
| | |
| Target Asset Allocation Funds/Target Growth Allocation Fund | | 65 |
Financial Highlights
(Unaudited) continued
| | | | |
| | | Class Z | |
| | | Six Months Ended
January 31, 2008(b) | |
Per Share Operating Performance: | | | | |
Net Asset Value, Beginning Of Period | | $ | 14.95 | |
| | | | |
Income from investment operations: | | | | |
Net investment income (loss) | | | .08 | |
Net realized and unrealized gains (loss) on investments transactions | | | (.85 | ) |
| | | | |
Total from investment operations | | | (.77 | ) |
| | | | |
Less Dividends and Distributions: | | | | |
Distributions from net investment income from investments | | | (.11 | ) |
Distributions from net realized gains from investments | | | (1.26 | ) |
| | | | |
Total distributions | | | (1.37 | ) |
| | | | |
Net asset value, end of period | | $ | 12.81 | |
| | | | |
Total Return(a) | | | (5.70 | )% |
Ratios/Supplemental Data: | | | | |
Net assets, end of period (000) | | $ | 6,703 | |
Average net assets (000) | | $ | 8,841 | |
Ratios to average net assets(f): | | | | |
Expenses, including distribution and service (12b-1) fees | | | 1.07 | %(e) |
Expenses, excluding distribution and service (12b-1) fees | | | 1.07 | %(e) |
Net investment income (loss) | | | 1.10 | %(e) |
| (a) | Total return does not consider the effects of sales loads. Total return is calculated assuming a purchase of a share on the first day and a sale on the last day of each period reported and includes reinvestment of dividends and distributions. Total returns may reflect adjustments to conform to generally accepted accounting principles. Total returns for periods less than one full year are not annualized. |
| (b) | Calculations are based on average shares outstanding during the period. |
| (c) | Less than $.005 per share. |
| (f) | Does not include expenses of the underlying portfolios in which the Fund invests. |
See Notes to Financial Statements.
| | |
| 66 | | Visit our website at www.prudential.com |
| | | | | | | | | | | | | | | | | | |
| Class Z | |
| Year Ended July 31, | |
| 2007(b) | | | 2006(b) | | | 2005(b) | | | 2004(b) | | | 2003(b) | |
| | | | | | | | | | | | | | | | | | |
| $ | 13.54 | | | $ | 13.58 | | | $ | 11.11 | | | $ | 9.64 | | | $ | 8.45 | |
| | | | | | | | | | | | | | | | | | | |
| | | | | | | | | | | | | | | | | | |
| | .13 | | | | .11 | | | | .05 | | | | — | (c) | | | — | (c) |
| | 2.15 | | | | .96 | | | | 2.42 | | | | 1.47 | | | | 1.19 | |
| | | | | | | | | | | | | | | | | | | |
| | 2.28 | | | | 1.07 | | | | 2.47 | | | | 1.47 | | | | 1.19 | |
| | | | | | | | | | | | | | | | | | | |
| | | | | | | | | | | | | | | | | | |
| | (.03 | ) | | | — | | | | — | | | | — | | | | — | |
| | (.84 | ) | | | (1.11 | ) | | | — | | | | — | | | | — | |
| | | | | | | | | | | | | | | | | | | |
| | (.87 | ) | | | (1.11 | ) | | | — | | | | — | | | | — | |
| | | | | | | | | | | | | | | | | | | |
| $ | 14.95 | | | $ | 13.54 | | | $ | 13.58 | | | $ | 11.11 | | | $ | 9.64 | |
| | | | | | | | | | | | | | | | | | | |
| | 17.32 | % | | | 8.25 | % | | | 22.23 | % | | | 15.25 | % | | | 14.08 | % |
| | | | | | | | | | | | | | | | | | |
| $ | 8,965 | | | $ | 7,884 | | | $ | 7,179 | | | $ | 5,297 | | | $ | 2,589 | |
| $ | 8,670 | | | $ | 6,977 | | | $ | 5,709 | | | $ | 3,837 | | | $ | 2,767 | |
| | | | | | | | | | | | | | | | | | |
| | 1.10 | % | | | 1.13 | % | | | 1.13 | % | | | 1.18 | % | | | 1.46 | % |
| | 1.10 | % | | | 1.13 | % | | | 1.13 | % | | | 1.18 | % | | | 1.46 | % |
| | .91 | % | | | .86 | % | | | .45 | % | | | — | %(d) | | | (.02 | )% |
See Notes to Financial Statements.
| | |
| Target Asset Allocation Funds/Target Growth Allocation Fund | | 67 |
| | | | |
| n MAIL | | n TELEPHONE | | n WEBSITE |
Gateway Center Three 100 Mulberry Street Newark, NJ 07102 | | (800) 225-1852 | | www.prudential.com |
|
| PROXY VOTING |
| The Board of Trustees of the Fund has delegated to the Fund’s investment subadvisers the responsibility for voting any proxies and maintaining proxy recordkeeping with respect to the Fund. A description of these proxy voting policies and procedures is available without charge, upon request, by calling (800) 225-1852 or by visiting the Securities and Exchange Commission’s website at www.sec.gov. Information regarding how the Fund voted proxies relating to portfolio securities during the most recent 12-month period ended June 30 is available on the Fund’s website and on the Commission’s website. |
|
| TRUSTEES |
| Linda W. Bynoe • David E.A. Carson • Robert F. Gunia • Robert E. La Blanc • Douglas H. McCorkindale • Richard A. Redeker • Judy A. Rice • Robin B. Smith • Stephen G. Stoneburn • Clay T. Whitehead |
|
| OFFICERS |
| Judy A. Rice, President • Robert F. Gunia, Vice President • Grace C. Torres, Treasurer and Principal Financial and Accounting Officer • Kathryn L. Quirk, Chief Legal Officer • Deborah A. Docs, Secretary • Timothy J. Knierim, Chief Compliance Officer • Valerie M. Simpson, Deputy Chief Compliance Officer • Noreen M. Fierro, Anti-Money Laundering Compliance Officer • Jonathan D. Shain, Assistant Secretary • Claudia DiGiacomo, Assistant Secretary • John P. Schwartz, Assistant Secretary • Andrew R. French, Assistant Secretary • M. Sadiq Peshimam, Assistant Treasurer • Peter Parrella, Assistant Treasurer |
| | | | |
| MANAGER | | Prudential Investments LLC | | Gateway Center Three 100 Mulberry Street Newark, NJ 07102 |
|
| INVESTMENT SUBADVISERS | | EARNEST Partners, LLC | | 75 14th Street, Suite 2300 Atlanta, GA 30309 |
|
| | Goldman Sachs Asset
Management L.P. | | 32 Old Slip, 23rd Floor New York, NY 10005 |
|
| | Hotchkis and Wiley Capital
Management LLC | | 725 South Figueroa Street Suite 3900 Los Angeles, CA 90017 |
|
| | J.P. Morgan Investment
Management, Inc. | | 522 Fifth Avenue 13th Floor New York, NY 10036 |
|
| | LSV Asset Management | | One North Wacker Drive Suite 4000 Chicago, IL 60606 |
|
| | Marsico Capital
Management, LLC | | 1200 17th Street Suite 1600 Denver, CO 80202 |
|
| | NFJ Investment Group L.P. | | 2100 Ross Avenue Suite 1840 Dallas, TX 75201 |
|
| | RS Investment
Management Co. LLC | | 388 Market Street Suite 1700 San Francisco, CA 94111 |
|
| | Thornburg Investment
Management, Inc. | | 119 East Marcy Street Santa Fe, NM 87501 |
|
| | Vaughan Nelson Investment
Management, L.P. | | 600 Travis Street Suite 6300 Houston, TX 77002 |
| | | | |
| DISTRIBUTOR | | Prudential Investment
Management Services LLC | | Gateway Center Three 100 Mulberry Street Newark, NJ 07102 |
|
| CUSTODIAN | | PFPC Trust Company | | 400 Bellevue Parkway Wilmington, DE 19809 |
|
| TRANSFER AGENT | | Prudential Mutual Fund
Services LLC | | PO Box 9658 Providence, RI 02940 |
|
| INDEPENDENT REGISTERED PUBLIC ACCOUNTING FIRM | | KPMG LLP | | 345 Park Avenue New York, NY 10154 |
|
| FUND COUNSEL | | Willkie Farr & Gallagher LLP | | 787 Seventh Avenue New York, NY 10019 |
|
| An investor should consider the investment objectives, risks, charges, and expenses of the Fund carefully before investing. The prospectus for the Fund contains this and other information about the Fund. An investor may obtain a prospectus by visiting our website at www.prudential.com or by calling (800) 225-1852. The prospectus should be read carefully before investing. |
|
| E-DELIVERY |
| To receive your mutual fund documents on-line, go to www.icsdelivery.com/prudential/funds and enroll. Instead of receiving printed documents by mail, you will receive notification via e-mail when new materials are available. You can cancel your enrollment or change your e-mail address at any time by clicking on the change/cancel enrollment option at the icsdelivery website address. |
|
| SHAREHOLDER COMMUNICATIONS WITH TRUSTEES |
| Shareholders can communicate directly with the Board of Trustees by writing to the Chair of the Board, Target Asset Allocation Funds, Prudential Investments, Attn: Board of Trustees, 100 Mulberry Street, Gateway Center Three, Newark, NJ 07102. Shareholders can communicate directly with an individual Trustee by writing to the same address. Communications are not screened before being delivered to the addressee. |
|
| AVAILABILITY OF PORTFOLIO SCHEDULE |
| The Fund files its complete schedule of portfolio holdings with the Securities and Exchange Commission for the first and third quarters of each fiscal year on Form N-Q. The Fund’s Forms N-Q are available on the Commission’s website at www.sec.gov. The Fund’s Forms N-Q may also be reviewed and copied at the Commission’s Public Reference Room in Washington, D.C. Information on the operation and location of the Public Reference Room may be obtained by calling (800) SEC-0330 (732-0330). The Fund’s schedule of portfolio holdings is also available on the Fund’s website as of the end of each fiscal quarter. |
Mutual Funds:
| | | | |
| ARE NOT INSURED BY THE FDIC OR ANY FEDERAL GOVERNMENT AGENCY | | MAY LOSE VALUE | | ARE NOT A DEPOSIT OF OR GUARANTEED BY ANY BANK OR ANY BANK AFFILIATE |

| | | | | | | | | | | | | | | | | | |
| Target Growth Allocation Fund | | | | | | | | | | |
| | | Share Class | | A | | B | | C | | M | | R | | X | | Z | | |
| | NASDAQ | | PHGAX | | PIHGX | | PHGCX | | N/A | | PGARX | | N/A | | PDHZX | | |
| | CUSIP | | 87612A823 | | 87612A815 | | 87612A799 | | 87612A765 | | 87612A781 | | 87612A757 | | 87612A773 | | |
| | | | | | | | | | | | | | | | | | |
MFSP504E6 IFS-A145511 Ed. 03/2008
Item 2 – Code of Ethics – Not required, as this is not an annual filing.
Item 3 – Audit Committee Financial Expert – Not required, as this is not an annual filing.
Item 4 – Principal Accountant Fees and Services – Not required, as this is not an annual filing.
Item 5 – Audit Committee of Listed Registrants – Not applicable.
Item 6 – Schedule of Investments – The schedule is included as part of the report to shareholders filed under Item 1 of this Form.
Item 7 – Disclosure of Proxy Voting Policies and Procedures for Closed-End Management Investment Companies – Not applicable.
Item 8 – Portfolio Managers of Closed-End Management Investment Companies – Not applicable.
Item 9 – Purchases of Equity Securities by Closed-End Management Investment Company and Affiliated Purchasers – Not applicable.
Item 10 – Submission of Matters to a Vote of Security Holders – Not applicable.
Item 11 – Controls and Procedures
| | (a) | It is the conclusion of the registrant’s principal executive officer and principal financial officer that the effectiveness of the registrant’s current disclosure controls and procedures (such disclosure controls and procedures having been evaluated within 90 days of the date of this filing) provide reasonable assurance that the information required to be disclosed by the registrant has been recorded, processed, summarized and reported within the time period specified in the Commission’s rules and forms and that the information required to be disclosed by the registrant has been accumulated and communicated to the registrant’s principal executive officer and principal financial officer in order to allow timely decisions regarding required disclosure. |
| | (b) | There has been no significant change in the registrant’s internal control over financial reporting that occurred during the registrant’s most recent fiscal quarter of the period covered by this report that has materially affected, or is likely to materially affect, the registrant’s internal control over financial reporting. |
Item 12 – Exhibits
| | | | | | | | |
| | (a) | | | | (1) | | Code of Ethics – Not required, as this is not an annual filing. |
| | | | |
| | | | | | (2) | | Certifications pursuant to Section 302 of the Sarbanes-Oxley Act – Attached hereto as Exhibit EX-99.CERT. |
| | | | |
| | | | | | (3) | | Any written solicitation to purchase securities under Rule 23c-1. – Not applicable. |
| | (b) | Certifications pursuant to Section 906 of the Sarbanes-Oxley Act – Attached hereto as Exhibit EX-99.906CERT. |
SIGNATURES
Pursuant to the requirements of the Securities Exchange Act of 1934 and the Investment Company Act of 1940, the registrant has duly caused this report to be signed on its behalf by the undersigned, thereunto duly authorized.
| | | | | | |
| (Registrant) Target Asset Allocation Funds | | |
| | | |
By (Signature and Title)* | | /s/ Deborah A. Docs | | | | |
| | Deborah A. Docs | | | | |
| | Secretary | | | | |
| |
Date March 25, 2008 | | |
Pursuant to the requirements of the Securities Exchange Act of 1934 and the Investment Company Act of 1940, this report has been signed below by the following persons on behalf of the registrant and in the capacities and on the dates indicated.
| | | | | | |
By (Signature and Title)* | | /s/ Judy A. Rice | | | | |
| | Judy A. Rice | | | | |
| | President and Principal Executive Officer | | |
| | |
| Date March 25, 2008 | | | | |
| | | |
By (Signature and Title)* | | /s/ Grace C. Torres | | | | |
| | Grace C. Torres | | | | |
| | Treasurer and Principal Financial Officer | | |
| |
| Date March 25, 2008 | | |
* | Print the name and title of each signing officer under his or her signature. |