UNITED STATES
SECURITIES AND EXCHANGE COMMISSION
Washington, D.C. 20549
FORM N-CSR
CERTIFIED SHAREHOLDER REPORT OF REGISTERED MANAGEMENT
INVESTMENT COMPANIES
| | |
Investment Company Act file number: | | 811-08915 |
Target Asset Allocation Funds
|
| Exact name of registrant as specified in charter: |
|
Gateway Center 3, 100 Mulberry Street, Newark, New Jersey 07102 |
| Address of principal executive offices: |
Deborah A. Docs
Gateway Center 3,
100 Mulberry Street,
Newark, New Jersey 07102
|
| Name and address of agent for service: |
Registrant’s telephone number, including area code: 800-225-1852
Date of fiscal year end: 7/31/2009
Date of reporting period: 1/31/2009
Item 1 – Reports to Stockholders

| | |
| JANUARY 31, 2009 | | SEMIANNUAL REPORT |
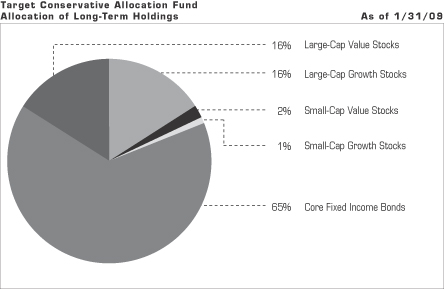
Target Conservative Allocation Fund
OBJECTIVE
Seeks current income and a reasonable level of capital appreciation
This report is not authorized for distribution to prospective investors unless preceded or accompanied by a current prospectus.
The views expressed in this report and information about the Fund’s portfolio holdings are for the period covered by this report and are subject to change thereafter.
The accompanying financial statements as of January 31, 2009, were not audited and, accordingly, no auditor’s opinion is expressed on them.
Target Funds, Prudential, Prudential Financial and the Rock Prudential logo are registered service marks of The Prudential Insurance Company of America, Newark, NJ, and its affiliates.

March 16, 2009
Dear Shareholder:
On the following pages, you’ll find your semiannual report for the Target Conservative Allocation Fund.
Target Asset Allocation Funds are managed by institutional-quality asset managers selected, matched, and monitored by a research team from Prudential Investments LLC. Portions of the Funds’ assets are assigned to carefully chosen asset managers, with the allocations actively managed on the basis of our projections for the financial markets and the managers’ individual strengths.
We believe our Target Conservative Allocation Fund will help you to achieve broad, actively managed diversification at a targeted risk/return balance with a single investment purchase. We appreciate your continued confidence in us. Keep in mind that diversification and asset allocation do not assure a profit or protect against a loss in a declining market.
Sincerely,

Judy A. Rice, President
Target Asset Allocation Funds
| | |
| Target Asset Allocation Funds/Target Conservative Allocation Fund | | 1 |
Your Fund’s Performance
Performance data quoted represent past performance. Past performance does not guarantee future results. The investment return and principal value of an investment will fluctuate, so that an investor’s shares, when redeemed, may be worth more or less than their original cost. Current performance may be lower or higher than the past performance data quoted. An investor may obtain performance data as of the most recent month-end by visiting our website at www.prudential.com or by calling (800) 225-1852. The maximum initial sales charge is 5.50% (Class A shares). Gross operating expenses: Class A, 1.57%; Class B, 2.27%; Class C, 2.27%; Class M, 2.27%; Class R, 2.02%; Class X, 2.27%; Class Z, 1.27%. Net operating expenses apply to: Class A, 1.52%; Class B, 2.27%; Class C, 2.27%; Class M, 2.27%; Class R, 1.77%; Class X, 2.24%; Class Z, 1.27%, after contractual reduction through 11/30/2009 for Class A and Class R shares.
| | | | | | | | | | | | | | |
| Cumulative Total Returns as of 1/31/09 | | | | | | |
| | | Six Months | | | One Year | | | Five Years | | | Ten Years | | | Since Inception1 |
Class A | | –17.07 | % | | –20.91 | % | | 0.59 | % | | 29.79 | % | | — |
Class B | | –17.42 | | | –21.55 | | | –3.17 | | | 20.38 | | | — |
Class C | | –17.41 | | | –21.55 | | | –3.17 | | | 20.38 | | | — |
Class M | | –17.42 | | | –21.56 | | | N/A | | | N/A | | | –4.74% (10/04/04) |
Class R | | –17.16 | | | –21.10 | | | N/A | | | N/A | | | –2.59 (10/04/04) |
Class X | | –17.42 | | | –21.41 | | | N/A | | | N/A | | | –4.55 (10/04/04) |
Class Z | | –16.96 | | | –20.70 | | | 1.86 | | | 32.99 | | | — |
Customized Blend2 | | –13.59 | | | –15.92 | | | 5.78 | | | 31.26 | | | ** |
S&P 500 Index3 | | –33.96 | | | –38.63 | | | –19.52 | | | –23.54 | | | *** |
Lipper Mixed-Asset Target Allocation Conservative Funds Avg.4 | | –15.65 | | | –18.02 | | | –0.12 | | | 21.39 | | | **** |
| | | | | | | | | | | | | | |
| Average Annual Total Returns5 as of 12/31/08 | | | | | | |
| | | | | | One Year | | | Five Years | | | Ten Years | | | Since Inception1 |
Class A | | | | | –22.77 | % | | 0.10 | % | | 2.68 | % | | — |
Class B | | | | | –22.54 | | | 0.33 | | | 2.51 | | | — |
Class C | | | | | –19.56 | | | 0.48 | | | 2.51 | | | — |
Class M | | | | | –23.28 | | | N/A | | | N/A | | | –0.50% (10/04/04) |
Class R | | | | | –18.36 | | | N/A | | | N/A | | | 0.37 (10/04/04) |
Class X | | | | | –23.13 | | | N/A | | | N/A | | | –0.63 (10/04/04) |
Class Z | | | | | –17.98 | | | 1.49 | | | 3.53 | | | — |
Customized Blend2 | | | | | –13.76 | | | 2.20 | | | 3.35 | | | ** |
S&P 500 Index3 | | | | | –36.99 | | | –2.19 | | | –1.38 | | | *** |
Lipper Mixed-Asset Target Allocation Conservative Funds Avg.4 | | | | | –17.21 | | | 0.55 | | | 2.17 | | | **** |
The cumulative total returns do not reflect the deduction of applicable sales charges. If reflected, the applicable sales charges would reduce the cumulative total returns
| | |
| 2 | | Visit our website at www.prudential.com |
performance quoted. Class A shares are subject to a maximum front-end sales charge of 5.50%. Under certain circumstances, Class A shares may be subject to a contingent deferred sales charge (CDSC) of 1%. Class B and Class C shares are subject to a maximum CDSC of 5% and 1%, respectively. Class M and Class X shares are subject to a maximum CDSC of 6%. Class R and Class Z shares are not subject to a sales charge.
Source: Prudential Investments LLC and Lipper Inc. Performance figures may reflect fee waivers and/or expense reimbursements. In the absence of such fee waivers and/or expense reimbursements, total returns would be lower.
1Inception date returns are provided for any share class with less than 10 calendar years of returns.
2The Customized Benchmark for Target Conservative Allocation Fund (Customized Blend) is a model portfolio consisting of the Russell 3000 Index (40%) and the Barclays Capital U.S. Aggregate Bond Index (60%). The Customized Blend is an unmanaged index generally considered as representing the performance of the Fund’s asset classes. The Customized Blend is intended to provide a theoretical comparison of the Fund’s performance, based on the amounts allocated to each asset class rather than on amounts allocated to various Fund segments. The Customized Blend does not reflect deductions for any sales charges or operating expenses of a mutual fund.
3The Standard & Poor’s 500 Composite Stock Price Index (S&P 500 Index) is an unmanaged index of 500 stocks of large U.S. public companies. It gives an indication of how U.S. stock prices have performed.
4The Lipper Mixed-Asset Target Allocation Conservative Funds Average (Lipper Average) represents returns based on the average return of all funds in the Lipper Mixed-Equity Funds category for the periods noted. Funds in the Lipper Average have a primary investment objective of conserving principal by maintaining at all times a balanced portfolio of both stocks and bonds. Mixed-Asset Funds are funds that, by portfolio practice, maintain a mix of between 20% and 40% equity securities, with the remainder invested in bonds, cash, and cash equivalents.
5The average annual total returns take into account applicable sales charges. Class A, Class B, Class C, Class M, Class R, and Class X shares are subject to an annual distribution and service (12b-1) fee of up to 0.30%, 1.00%, 1.00%, 1.00%, 0.75%, and 1.00%, respectively. Approximately seven years after purchase, Class B shares will automatically convert to Class A shares on a quarterly basis. Approximately eight years after purchase, Class M shares will automatically convert to Class A shares on a quarterly basis. Approximately 10 years after purchase, Class X shares will automatically convert to Class A shares on a quarterly basis. Class Z shares are not subject to a 12b-1 fee. The returns in the tables do not reflect the deduction of taxes that a shareholder would pay on Fund distributions or following the redemption of Fund shares.
**Customized Blend Closest Month-End to Inception cumulative total return as of 1/31/09 is 4.35% for Classes M, R, and X. Customized Blend Closest Month-End to Inception average annual total return as of 12/31/08 is 1.95% for Classes M, R, and X.
***S&P 500 Index Closest Month-End to Inception cumulative total return as of 1/31/09 is –19.26% for Classes M, R, and X. S&P 500 Index Closest Month-End to Inception average annual total return as of 12/31/08 is –2.92% for Classes M, R, and X.
****Lipper Average Closest Month-End to Inception cumulative total return as of 1/31/09 is –0.96% for Classes M, R, and X. Lipper Average Closest Month-End to Inception average annual total return as of 12/31/08 is 0.20% for Classes M, R, and X.
Investors cannot invest directly in an index. The returns for the S&P 500 Index and the Customized Blend would be lower if they included the effects of sales charges, operating expenses of a mutual fund, or taxes. Returns for the Lipper Average reflect the deduction of operating expenses, but not sales charges or taxes. The Since Inception returns for the S&P 500 Index, the Customized Blend, and the Lipper Average are measured from the closest month-end to inception date, and not from the Fund’s actual inception date.
| | |
| Target Asset Allocation Funds/Target Conservative Allocation Fund | | 3 |
Your Fund’s Performance (continued)
Fund objective
The investment objective of the Target Conservative Allocation Fund is current income and a reasonable level of capital appreciation. There can be no assurance that the Fund will achieve its investment objective.
| | |
| 4 | | Visit our website at www.prudential.com |
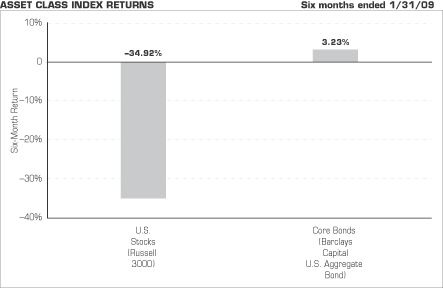
Source: Lipper Inc.
The chart above shows the total returns for six months ended January 31, 2009, of various securities indexes that are generally considered representative of broad market sectors. It does not reflect a mutual fund’s expenses. The performance cited does not represent the performance of the Target Conservative Allocation Fund. Past performance is not indicative of future results. Investors cannot invest directly in an index.
The Russell 3000 Index measures the performance of the 3,000 largest U.S. companies based on total market capitalization, which represents approximately 98% of the investable U.S. equity market.
The Barclays Capital U.S. Aggregate Bond Index is an unmanaged index of investment-grade securities issued by the U.S. government and its agencies, and by corporations with between one and 10 years remaining to maturity. It gives a broad look at how short- and intermediate-term bonds have performed.
| | |
| Target Asset Allocation Funds/Target Conservative Allocation Fund | | 5 |
Fees and Expenses (Unaudited)
As a shareholder of the Fund, you incur two types of costs: (1) transaction costs, including sales charges (loads) on purchase payments and redemptions, as applicable, and (2) ongoing costs, including management fees, distribution and/or service (12b-1) fees, and other Fund expenses, as applicable. This example is intended to help you understand your ongoing costs (in dollars) of investing in the Fund and to compare these costs with the ongoing costs of investing in other mutual funds.
The example is based on an investment of $1,000 invested on August 1, 2008, at the beginning of the period, and held through the six-month period ended January 31, 2009. The example is for illustrative purposes only; you should consult the Prospectus for information on initial and subsequent minimum investment requirements.
The Fund’s transfer agent may charge additional fees to holders of certain accounts that are not included in the expenses shown in the table on the following page. These fees apply to individual retirement accounts (IRAs) and Section 403(b) accounts. As of the close of the six-month period covered by the table, IRA fees included an annual maintenance fee of $15 per account (subject to a maximum annual maintenance fee of $25 for all accounts held by the same shareholder). Section 403(b) accounts are charged an annual $25 fiduciary maintenance fee. Some of the fees may vary in amount, or may be waived, based on your total account balance or the number of JennisonDryden Funds, including the Target Asset Allocation Funds, that you own. You should consider the additional fees that were charged to your Fund account over the six-month period when you estimate the total ongoing expenses paid over the period and the impact of these fees on your ending account value, as these additional expenses are not reflected in the information provided in the expense table. Additional fees have the effect of reducing investment returns.
Actual Expenses
The first line for each share class in the table on the following page provides information about actual account values and actual expenses. You may use the information on this line, together with the amount you invested, to estimate the expenses that you paid over the period. Simply divide your account value by $1,000 (for example, an $8,600 account value ÷ $1,000 = 8.6), then multiply the result by the number on the first line under the heading “Expenses Paid During the Six-Month Period” to estimate the expenses you paid on your account during this period.
Hypothetical Example for Comparison Purposes
The second line for each share class in the table on the following page provides information about hypothetical account values and hypothetical expenses based on the Fund’s actual expense ratio and an assumed rate of return of 5% per year before expenses, which is not the Fund’s actual return. The hypothetical account values and
| | |
| 6 | | Visit our website at www.prudential.com |
expenses may not be used to estimate the actual ending account balance or expenses you paid for the period. You may use this information to compare the ongoing costs of investing in the Fund and other funds. To do so, compare this 5% hypothetical example with the 5% hypothetical examples that appear in the shareholder reports of the other funds.
Please note that the expenses shown in the table are meant to highlight your ongoing costs only and do not reflect any transactional costs such as sales charges (loads). Therefore, the second line for each share class in the table is useful in comparing ongoing costs only and will not help you determine the relative total costs of owning different funds. In addition, if these transactional costs were included, your costs would have been higher.
| | | | | | | | | | | | | | |
Target
Conservative
Allocation Fund | | Beginning Account
Value
August 1, 2008 | | Ending Account
Value January 31, 2009 | | Annualized
Expense Ratio
Based on the
Six-Month Period | | | Expenses Paid
During the
Six-Month Period* |
| | | | | | | | | | | | | | |
| Class A | | Actual | | $ | 1,000.00 | | $ | 829.30 | | 1.52 | % | | $ | 7.01 |
| | | Hypothetical | | $ | 1,000.00 | | $ | 1,017.54 | | 1.52 | % | | $ | 7.73 |
| | | | | | | | | | | | | | |
| Class B | | Actual | | $ | 1,000.00 | | $ | 825.80 | | 2.27 | % | | $ | 10.45 |
| | | Hypothetical | | $ | 1,000.00 | | $ | 1,013.76 | | 2.27 | % | | $ | 11.52 |
| | | | | | | | | | | | | | |
| Class C | | Actual | | $ | 1,000.00 | | $ | 825.90 | | 2.27 | % | | $ | 10.45 |
| | | Hypothetical | | $ | 1,000.00 | | $ | 1,013.76 | | 2.27 | % | | $ | 11.52 |
| | | | | | | | | | | | | | |
| Class M | | Actual | | $ | 1,000.00 | | $ | 825.80 | | 2.27 | % | | $ | 10.45 |
| | | Hypothetical | | $ | 1,000.00 | | $ | 1,013.76 | | 2.27 | % | | $ | 11.52 |
| | | | | | | | | | | | | | |
| Class R | | Actual | | $ | 1,000.00 | | $ | 828.40 | | 1.77 | % | | $ | 8.16 |
| | | Hypothetical | | $ | 1,000.00 | | $ | 1,016.28 | | 1.77 | % | | $ | 9.00 |
| | | | | | | | | | | | | | |
| Class X | | Actual | | $ | 1,000.00 | | $ | 825.80 | | 2.24 | % | | $ | 10.31 |
| | | Hypothetical | | $ | 1,000.00 | | $ | 1,013.91 | | 2.24 | % | | $ | 11.37 |
| | | | | | | | | | | | | | |
| Class Z | | Actual | | $ | 1,000.00 | | $ | 830.40 | | 1.27 | % | | $ | 5.86 |
| | | Hypothetical | | $ | 1,000.00 | | $ | 1,018.80 | | 1.27 | % | | $ | 6.46 |
* Fund expenses (net of fee waivers or subsidies, if any) for each share class are equal to the annualized expense ratio for each share class (provided in the table), multiplied by the average account value over the period, multiplied by the 184 days in the six-month period ended January 31, 2009, and divided by the 365 days in the Fund’s fiscal year ending July 31, 2009 (to reflect the six-month period). Expenses presented in the table include the expenses of any underlying portfolios in which the Fund may invest.
| | |
| Target Asset Allocation Funds/Target Conservative Allocation Fund | | 7 |
Portfolio of Investments
as of January 31, 2009 (Unaudited)
| | | | | |
| Shares | | Description | | Value (Note 1) |
| | | | | |
LONG-TERM INVESTMENTS 108.9% | | | |
COMMON STOCKS 38.0% | | | |
| |
Aerospace 0.9% | | | |
| 340 | | Alliant Techsystems, Inc.(a) | | $ | 27,475 |
| 10,367 | | Lockheed Martin Corp. | | | 850,509 |
| 375 | | Moog, Inc. (Class A Stock)(a) | | | 11,235 |
| 4,000 | | United Technologies Corp. | | | 191,960 |
| | | | | |
| | | | | 1,081,179 |
| |
Aerospace & Defense 0.9% | | | |
| 500 | | AAR Corp.(a) | | | 9,070 |
| 3,100 | | Embraer-Empresa Brasileira de Aeronautica SA, ADR (Brazil) | | | 46,717 |
| 8,432 | | General Dynamics Corp. | | | 478,348 |
| 8,100 | | Northrop Grumman Corp. | | | 389,772 |
| 1,481 | | Raytheon Co. | | | 74,968 |
| 300 | | Teledyne Technologies, Inc.(a) | | | 8,361 |
| | | | | |
| | | | | 1,007,236 |
| |
Air Freight & Couriers 0.1% | | | |
| 1,600 | | FedEx Corp. | | | 81,504 |
| |
Air Freight & Logistics | | | |
| 850 | | Forward Air Corp. | | | 17,221 |
| |
Airlines | | | |
| 2,980 | | UAL Corp.(a) | | | 28,131 |
| |
Auto Components 0.1% | | | |
| 4,300 | | Johnson Controls, Inc. | | | 53,793 |
| |
Automotive Parts 0.1% | | | |
| 1,050 | | O’Reilly Automotive, Inc.(a) | | | 30,523 |
| 3,500 | | PACCAR, Inc. | | | 92,365 |
| | | | | |
| | | | | 122,888 |
| |
Beverages 0.2% | | | |
| 1,900 | | Coca-Cola Co. (The) | | | 81,168 |
| 1,180 | | Molson Coors Brewing Co. (Class B Stock) | | | 47,519 |
| 2,040 | | PepsiCo, Inc. | | | 102,469 |
| | | | | |
| | | | | 231,156 |
See Notes to Financial Statements.
| | |
| Target Asset Allocation Funds/Target Conservative Allocation Fund | | 9 |
Portfolio of Investments
as of January 31, 2009 (Unaudited) continued
| | | | | |
| Shares | | Description | | Value (Note 1) |
| | | | | |
COMMON STOCKS (Continued) | | | |
| |
Biotechnology 1.1% | | | |
| 3,400 | | Amgen, Inc.(a) | | $ | 186,490 |
| 9,416 | | Genentech, Inc.(a) | | | 764,956 |
| 5,174 | | Genzyme Corp.(a) | | | 356,592 |
| | | | | |
| | | | | 1,308,038 |
| |
Building Products | | | |
| 545 | | Texas Industries, Inc. | | | 12,377 |
| |
Business Services 0.1% | | | |
| 950 | | FTI Consulting, Inc.(a) | | | 38,960 |
| 1,960 | | ICON PLC, ADR (Ireland)(a) | | | 39,396 |
| | | | | |
| | | | | 78,356 |
| |
Capital Markets | | | |
| 1,272 | | Raymond James Financial, Inc. | | | 23,545 |
| 2,075 | | Waddell & Reed Financial, Inc. (Class A Stock) | | | 29,299 |
| | | | | |
| | | | | 52,844 |
| |
Chemicals 0.9% | | | |
| 3,432 | | Air Products & Chemicals, Inc. | | | 172,630 |
| 775 | | Airgas, Inc. | | | 27,365 |
| 9,700 | | Dow Chemical Co. (The) | | | 112,423 |
| 2,300 | | Eastman Chemical Co. | | | 59,685 |
| 1,330 | | Ecolab, Inc. | | | 45,167 |
| 6,115 | | Huntsman Corp. | | | 16,266 |
| 1,305 | | Intrepid Potash, Inc.(a) | | | 26,596 |
| 500 | | Linde AG (Germany) | | | 33,450 |
| 1,750 | | Macrovision Solutions Corp.(a) | | | 22,942 |
| 2,300 | | PPG Industries, Inc. | | | 86,434 |
| 6,713 | | Praxair, Inc. | | | 417,951 |
| 655 | | Quaker Chemical Corp. | | | 7,474 |
| 1,200 | | Scotts Miracle-Gro Co. (The) (Class A Stock) | | | 38,664 |
| 1,185 | | Terra Industries, Inc. | | | 24,269 |
| 400 | | Valspar Corp. (The) | | | 6,940 |
| | | | | |
| | | | | 1,098,256 |
| |
Clothing & Apparel 0.4% | | | |
| 3,700 | | Gap, Inc. (The) | | | 41,736 |
| 9,704 | | NIKE, Inc. (Class B Stock) | | | 439,106 |
| 1,875 | | Phillips-Van Heusen Corp. | | | 35,662 |
| | | | | |
| | | | | 516,504 |
See Notes to Financial Statements.
| | |
| 10 | | Visit our website at www.prudential.com |
| | | | | |
| Shares | | Description | | Value (Note 1) |
| | | | | |
COMMON STOCKS (Continued) | | | |
| |
Commercial Banks 0.4% | | | |
| 2,500 | | Comerica, Inc. | | $ | 41,650 |
| 700 | | Cullen/Frost Bankers, Inc. | | | 30,639 |
| 7,000 | | KeyCorp | | | 50,960 |
| 3,137 | | Northern Trust Corp. | | | 180,440 |
| 5,100 | | PNC Financial Services Group, Inc. | | | 165,852 |
| 400 | | Sterling Financial Corp. | | | 740 |
| 900 | | SunTrust Banks, Inc. | | | 11,034 |
| 500 | | Trustmark Corp. | | | 10,150 |
| 1,250 | | United Bankshares, Inc. | | | 26,238 |
| | | | | |
| | | | | 517,703 |
| |
Commercial Services 0.5% | | | |
| 3,030 | | Accenture Ltd. (Class A Stock) (Bermuda) | | | 95,627 |
| 600 | | Apollo Group, Inc. (Class A Stock)(a) | | | 48,876 |
| 1,700 | | Corrections Corp. of America(a) | | | 23,426 |
| 1,830 | | GEO Group, Inc. (The)(a) | | | 27,084 |
| 1,088 | | Healthcare Services Group, Inc. | | | 16,661 |
| 1,575 | | Healthspring, Inc.(a) | | | 27,436 |
| 700 | | Moody’s Corp. | | | 14,994 |
| 700 | | Pharmaceutical Product Development, Inc. | | | 16,723 |
| 9,400 | | Waste Management, Inc. | | | 293,186 |
| | | | | |
| | | | | 564,013 |
| |
Commercial Services & Supplies | | | |
| 375 | | Hillenbrand, Inc. | | | 6,934 |
| 1,365 | | Monster Worldwide, Inc.(a) | | | 12,571 |
| | | | | |
| | | | | 19,505 |
| |
Communication Equipment 0.1% | | | |
| 41,900 | | Alcatel-Lucent, ADR (France)(a) | | | 82,543 |
| 1,400 | | Arris Group, Inc.(a) | | | 9,968 |
| 1,025 | | Nice Systems Ltd., ADR (Israel)(a) | | | 19,670 |
| | | | | |
| | | | | 112,181 |
| |
Computer Hardware 0.8% | | | |
| 7,025 | | Apple, Inc.(a)(f) | | | 633,163 |
| 6,660 | | EMC Corp.(a) | | | 73,527 |
| 13,635 | | Oracle Corp.(a) | | | 229,477 |
| | | | | |
| | | | | 936,167 |
See Notes to Financial Statements.
| | |
| Target Asset Allocation Funds/Target Conservative Allocation Fund | | 11 |
Portfolio of Investments
as of January 31, 2009 (Unaudited) continued
| | | | | |
| Shares | | Description | | Value (Note 1) |
| | | | | |
COMMON STOCKS (Continued) | | | |
| |
Computer Services & Software 0.1% | | | |
| 3,350 | | Compellent Technologies, Inc.(a) | | $ | 40,535 |
| 725 | | Hansen Medical, Inc.(a) | | | 3,277 |
| 805 | | MICROS Systems, Inc.(a) | | | 11,592 |
| 2,820 | | Netezza Corp.(a) | | | 17,117 |
| 5,350 | | Nuance Communications, Inc.(a) | | | 52,751 |
| 2,575 | | SRA International, Inc. (Class A Stock)(a) | | | 42,050 |
| | | | | |
| | | | | 167,322 |
| |
Computers & Peripherals 0.6% | | | |
| 1,020 | | Cognizant Technology Solutions Corp. (Class A Stock)(a) | | | 19,105 |
| 7,253 | | International Business Machines Corp. | | | 664,737 |
| 3,990 | | NetApp, Inc.(a) | | | 59,172 |
| | | | | |
| | | | | 743,014 |
| |
Construction | | | |
| 300 | | Granite Construction, Inc. | | | 10,566 |
| 500 | | Hovnanian Enterprises, Inc. (Class A Stock)(a) | | | 845 |
| 300 | | Meritage Homes Corp.(a) | | | 3,306 |
| | | | | |
| | | | | 14,717 |
| |
Consumer Finance | | | |
| 1,725 | | First Cash Financial Services, Inc.(a) | | | 29,015 |
|
Consumer Products & Services 0.3% |
| 1,760 | | Alberto-Culver Co. | | | 43,050 |
| 15,900 | | Altria Group, Inc. | | | 262,986 |
| 1,400 | | Avon Products, Inc. | | | 28,630 |
| 300 | | Snap-on, Inc. | | | 9,054 |
| 400 | | Toro Co. (The) | | | 11,844 |
| | | | | |
| | | | | 355,564 |
|
Containers & Packaging 0.1% |
| 1,325 | | Owens-Illinois, Inc.(a) | | | 25,175 |
| 1,650 | | Pactiv Corp.(a) | | | 35,673 |
| 850 | | Silgan Holdings, Inc. | | | 38,964 |
| | | | | |
| | | | | 99,812 |
|
Distribution/Wholesale |
| 270 | | MWI Veterinary Supply, Inc.(a) | | | 5,651 |
See Notes to Financial Statements.
| | |
| 12 | | Visit our website at www.prudential.com |
| | | | | |
| Shares | | Description | | Value (Note 1) |
| | | | | |
COMMON STOCKS (Continued) | | | |
| |
Diversified Financial Services 0.6% | | | |
| 4,310 | | Charles Schwab Corp. (The) | | $ | 58,573 |
| 1,010 | | Franklin Resources, Inc. | | | 48,904 |
| 22,975 | | JPMorgan Chase & Co. | | | 586,092 |
| | | | | |
| | | | | 693,569 |
| |
Diversified Manufacturing Operations 0.4% | | | |
| 15,100 | | Hewlett-Packard Co. | | | 524,725 |
| |
Education 0.1% | | | |
| 495 | | American Public Education, Inc.(a) | | | 19,384 |
| 780 | | DeVry, Inc. | | | 41,793 |
| 490 | | New Oriental Education & Technology Group, Inc., ADR (China)(a) | | | 24,833 |
| | | | | |
| | | | | 86,010 |
| |
Electric Utilities 0.7% | | | |
| 1,800 | | Allegheny Energy, Inc. | | | 59,832 |
| 600 | | Entergy Corp. | | | 45,816 |
| 3,100 | | Exelon Corp. | | | 168,082 |
| 3,894 | | FirstEnergy Corp. | | | 194,661 |
| 2,700 | | FPL Group, Inc. | | | 139,185 |
| 6,200 | | Public Service Enterprise Group, Inc. | | | 195,734 |
| | | | | |
| | | | | 803,310 |
| |
Electrical Equipment | | | |
| 525 | | Smith (A.O.) Corp. | | | 14,427 |
| 465 | | Sunpower Corp. (Class A Stock)(a) | | | 15,605 |
| | | | | |
| | | | | 30,032 |
| |
Electronic Components 0.2% | | | |
| 425 | | Belden CDT, Inc. | | | 5,550 |
| 500 | | Checkpoint Systems, Inc.(a) | | | 4,475 |
| 480 | | Dolby Laboratories, Inc. (Class A Stock)(a) | | | 12,269 |
| 1,500 | | Emerson Electric Co. | | | 49,050 |
| 900 | | FLIR Systems, Inc.(a) | | | 22,473 |
| 300 | | Itron, Inc.(a) | | | 19,590 |
| 2,600 | | Sanmina-SCI Corp.(a) | | | 858 |
| 7,975 | | Tyco Electronics Ltd. (Bermuda) | | | 112,926 |
| 2,075 | | Universal Electronics, Inc.(a) | | | 23,406 |
| | | | | |
| | | | | 250,597 |
See Notes to Financial Statements.
| | |
| Target Asset Allocation Funds/Target Conservative Allocation Fund | | 13 |
Portfolio of Investments
as of January 31, 2009 (Unaudited) continued
| | | | | |
| Shares | | Description | | Value (Note 1) |
| | | | | |
COMMON STOCKS (Continued) | | | |
| |
Electronics | | | |
| 1,495 | | Coherent, Inc.(a) | | $ | 27,045 |
| |
Energy Equipment | | | |
| 425 | | Oil States International, Inc.(a) | | | 7,782 |
| |
Energy Equipment & Services 0.4% | | | |
| 3,405 | | Diamond Offshore Drilling, Inc. | | | 213,698 |
| 12,000 | | Halliburton Co. | | | 207,000 |
| | | | | |
| | | | | 420,698 |
| |
Engineering/Construction 0.1% | | | |
| 5,499 | | ABB Ltd., ADR (Switzerland) | | | 71,762 |
| 375 | | Foster Wheeler Ltd.(a) | | | 7,489 |
| 1,025 | | URS Corp.(a) | | | 34,901 |
| | | | | |
| | | | | 114,152 |
| |
Entertainment & Leisure 0.4% | | | |
| 1,895 | | Bally Technologies, Inc.(a) | | | 38,260 |
| 2,130 | | DreamWorks Animation SKG, Inc. (Class A Stock)(a) | | | 46,754 |
| 4,500 | | Harley-Davidson, Inc. | | | 54,810 |
| 1,720 | | Hasbro, Inc. | | | 41,504 |
| 3,760 | | International Game Technology | | | 39,856 |
| 34,571 | | Las Vegas Sands Corp.(a) | | | 178,041 |
| 500 | | Life Time Fitness, Inc.(a) | | | 7,405 |
| 2,830 | | Lions Gate Entertainment Corp. (Canada)(a) | | | 15,876 |
| 100 | | Nintendo Co. Ltd. (Japan) | | | 31,001 |
| 1,165 | | WMS Industries, Inc.(a) | | | 25,886 |
| | | | | |
| | | | | 479,393 |
| |
Environmental Services 0.1% | | | |
| 3,120 | | Republic Services, Inc. | | | 80,683 |
| 2,620 | | Waste Connections, Inc.(a) | | | 76,033 |
| | | | | |
| | | | | 156,716 |
| |
Farming & Agriculture 0.6% | | | |
| 9,155 | | Monsanto Co. | | | 696,329 |
| |
Financial - Bank & Trust 1.0% | | | |
| 650 | | Astoria Financial Corp. | | | 5,902 |
| 19,953 | | Bank of America Corp. | | | 131,291 |
See Notes to Financial Statements.
| | |
| 14 | | Visit our website at www.prudential.com |
| | | | | |
| Shares | | Description | | Value (Note 1) |
| | | | | |
COMMON STOCKS (Continued) | | | |
| |
Financial - Bank & Trust (cont’d.) | | | |
| 2,540 | | Bank of New York Mellon Corp. (The) | | $ | 65,380 |
| 14,900 | | Citigroup, Inc. | | | 52,895 |
| 50 | | Danvers Bancorp, Inc. | | | 629 |
| 600 | | East West Bancorp, Inc. | | | 5,694 |
| 500 | | Pacific Capital Bancorp | | | 5,305 |
| 1,275 | | Prosperity Bancshares, Inc. | | | 34,489 |
| 2,420 | | State Street Corp. | | | 56,313 |
| 14,332 | | U.S. Bancorp | | | 212,687 |
| 34,097 | | Wells Fargo & Co. | | | 644,433 |
| | | | | |
| | | | | 1,215,018 |
| |
Financial - Brokerage 0.5% | | | |
| 10,869 | | Visa, Inc. (Class A Stock) | | | 536,385 |
| |
Financial Services 0.7% | | | |
| 600 | | Eaton Vance Corp. | | | 11,484 |
| 1,400 | | First Commonwealth Financial Corp. | | | 13,426 |
| 4,465 | | Goldman Sachs Group, Inc. (The) | | | 360,460 |
| 649,000 | | Industrial & Commercial Bank of China Ltd. (Class H Stock) (China) | | | 274,394 |
| 725 | | Investment Technology Group, Inc.(a) | | | 15,718 |
| 700 | | Jefferies Group, Inc. | | | 8,078 |
| 505 | | Lender Processing Services, Inc. | | | 13,090 |
| 900 | | Morgan Stanley | | | 18,207 |
| 150 | | Student Loan Corp. (The) | | | 7,041 |
| 3,990 | | Western Union Co. (The) | | | 54,503 |
| | | | | |
| | | | | 776,401 |
| |
Food & Drug Retailers 0.2% | | | |
| 13,500 | | Safeway, Inc. | | | 289,305 |
| |
Foods 0.5% | | | |
| 1,401 | | Groupe Danone (France) | | | 72,202 |
| 525 | | JM Smucker Co. (The) | | | 23,704 |
| 700 | | Kellogg Co. | | | 30,583 |
| 850 | | Kraft Foods, Inc. (Class A Stock) | | | 23,842 |
| 8,660 | | Kroger Co. (The) | | | 194,850 |
| 7,574 | | Nestle SA (Switzerland) | | | 262,370 |
| 375 | | Ralcorp Holdings, Inc.(a) | | | 22,207 |
| 450 | | TreeHouse Foods, Inc.(a) | | | 11,876 |
| | | | | |
| | | | | 641,634 |
See Notes to Financial Statements.
| | |
| Target Asset Allocation Funds/Target Conservative Allocation Fund | | 15 |
Portfolio of Investments
as of January 31, 2009 (Unaudited) continued
| | | | | |
| Shares | | Description | | Value (Note 1) |
| | | | | |
COMMON STOCKS (Continued) | | | |
| |
Gaming | | | |
| 4,395 | | Shuffle Master, Inc.(a) | | $ | 14,899 |
| |
Gas Utilities | | | |
| 500 | | Atmos Energy Corp. | | | 12,275 |
| |
Healthcare Equipment & Supplies 0.4% | | | |
| 770 | | Alcon, Inc. (Switzerland) | | | 65,943 |
| 2,308 | | Covidien Ltd. (Bermuda) | | | 88,489 |
| 2,105 | | Cutera, Inc.(a) | | | 14,124 |
| 6,010 | | Medtronic, Inc. | | | 201,275 |
| 2,170 | | Thoratec Corp.(a) | | | 62,865 |
| | | | | |
| | | | | 432,696 |
| |
Healthcare Providers & Services 0.1% | | | |
| 1,175 | | inVentiv Health, Inc.(a) | | | 11,210 |
| 700 | | LHC Group, Inc.(a) | | | 18,627 |
| 965 | | Lincare Holdings, Inc.(a) | | | 23,208 |
| 250 | | Owens & Minor, Inc. | | | 9,943 |
| 1,550 | | Patterson Cos., Inc.(a) | | | 28,504 |
| 325 | | Teleflex, Inc. | | | 17,283 |
| | | | | |
| | | | | 108,775 |
| |
Healthcare Services 0.4% | | | |
| 3,900 | | Aetna, Inc. | | | 120,900 |
| 630 | | Amedisys, Inc.(a) | | | 25,975 |
| 500 | | AMERIGROUP Corp.(a) | | | 13,985 |
| 575 | | AmSurg Corp.(a) | | | 11,264 |
| 1,390 | | Biogen Idec, Inc.(a) | | | 67,623 |
| 1,905 | | Centene Corp.(a) | | | 33,776 |
| 300 | | Covance, Inc.(a) | | | 11,580 |
| 600 | | Healthways, Inc.(a) | | | 8,292 |
| 1,325 | | MEDNAX, Inc.(a) | | | 44,480 |
| 3,015 | | UnitedHealth Group, Inc. | | | 85,415 |
| | | | | |
| | | | | 423,290 |
| |
Healthcare Techology | | | |
| 4,090 | | Eclipsys Corp.(a) | | | 35,828 |
See Notes to Financial Statements.
| | |
| 16 | | Visit our website at www.prudential.com |
| | | | | |
| Shares | | Description | | Value (Note 1) |
| | | | | |
COMMON STOCKS (Continued) | | | |
| |
Hotels, Restaurants & Leisure 1.1% | | | |
| 1,880 | | BJ’s Restaurants, Inc.(a) | | $ | 20,868 |
| 20,600 | | McDonald’s Corp. | | | 1,195,212 |
| 1,351 | | Wendy’s/Arby’s Group, Inc. (Class A Stock) | | | 6,809 |
| 4,596 | | Wynn Resorts Ltd.(a) | | | 138,248 |
| | | | | |
| | | | | 1,361,137 |
| |
Household Durables 0.1% | | | |
| 2,000 | | Fortune Brands, Inc. | | | 64,000 |
| |
Household Products 0.3% | | | |
| 7,900 | | Kimberly-Clark Corp. | | | 406,613 |
| |
Household/Personal Care 0.1% | | | |
| 2,000 | | Colgate-Palmolive Co. | | | 130,080 |
| |
Industrial Conglomerates 0.4% | | | |
| 4,100 | | 3M Co. | | | 220,539 |
| 4,500 | | General Electric Co. | | | 54,585 |
| 6,775 | | Tyco International Ltd. (Bermuda) | | | 142,410 |
| | | | | |
| | | | | 417,534 |
| |
Insurance 1.3% | | | |
| 3,162 | | ACE Ltd. (Switzerland) | | | 138,053 |
| 10,100 | | Allstate Corp. (The) | | | 218,867 |
| 775 | | Aspen Insurance Holdings Ltd. (Bermuda) | | | 17,128 |
| 3,800 | | Chubb Corp. | | | 161,804 |
| 425 | | Delphi Financial Group, Inc. (Class A Stock) | | | 6,447 |
| 950 | | Gallagher, (Arthur J.) & Co. | | | 22,391 |
| 7,100 | | Genworth Financial, Inc. (Class A Stock) | | | 16,472 |
| 1,000 | | Hanover Insurance Group, Inc. (The) | | | 40,420 |
| 1,512 | | HCC Insurance Holdings, Inc. | | | 35,396 |
| 850 | | IPC Holdings Ltd. (Bermuda) | | | 21,811 |
| 14,064 | | MetLife, Inc. | | | 404,059 |
| 300 | | Protective Life Corp. | | | 2,484 |
| 400 | | State Auto Financial Corp. | | | 8,840 |
| 10,200 | | Travelers Cos., Inc. (The) | | | 394,128 |
| 635 | | United Fire & Casualty Co. | | | 12,732 |
| 2,800 | | Unum Group | | | 39,648 |
| 8,100 | | XL Capital Ltd. (Class A Stock) (Cayman Islands) | | | 23,490 |
| | | | | |
| | | | | 1,564,170 |
See Notes to Financial Statements.
| | |
| Target Asset Allocation Funds/Target Conservative Allocation Fund | | 17 |
Portfolio of Investments
as of January 31, 2009 (Unaudited) continued
| | | | | |
| Shares | | Description | | Value (Note 1) |
| | | | | |
COMMON STOCKS (Continued) | | | |
| |
Internet Services 0.8% | | | |
| 400 | | Amazon.com, Inc.(a) | | $ | 23,528 |
| 300 | | Digital River, Inc.(a) | | | 7,431 |
| 1,590 | | Google, Inc. (Class A Stock)(a) | | | 538,263 |
| 1,625 | | Internet Capital Group, Inc.(a) | | | 7,004 |
| 3,980 | | McAfee, Inc.(a) | | | 121,350 |
| 410 | | NetFlix, Inc.(a) | | | 14,817 |
| 6,735 | | TIBCO Software, Inc.(a) | | | 36,032 |
| 8,610 | | VeriSign, Inc.(a) | | | 166,259 |
| 1,600 | | Yahoo!, Inc.(a) | | | 18,768 |
| | | | | |
| | | | | 933,452 |
| |
Internet Software & Services 0.1% | | | |
| 5,200 | | eBay, Inc.(a) | | | 62,504 |
| |
IT Services | | | |
| 650 | | CACI International, Inc. (Class A Stock)(a) | | | 29,348 |
| |
Life Science Tools & Services 0.1% | | | |
| 4,340 | | Thermo Fisher Scientific, Inc.(a) | | | 155,936 |
| |
Machinery 0.4% | | | |
| 675 | | Actuant Corp. (Class A Stock) | | | 11,124 |
| 7,400 | | Caterpillar, Inc. | | | 228,290 |
| 1,000 | | Cummins, Inc. | | | 23,980 |
| 2,865 | | Deere & Co. | | | 99,530 |
| 800 | | General Cable Corp.(a) | | | 13,168 |
| 475 | | Kaydon Corp. | | | 12,920 |
| 450 | | Lincoln Electric Holdings, Inc. | | | 18,526 |
| 225 | | Lindsay Corp. | | | 5,850 |
| 175 | | Nordson Corp. | | | 5,287 |
| 375 | | Rofin-Sinar Technologies, Inc.(a) | | | 6,334 |
| 900 | | Roper Industries, Inc. | | | 37,026 |
| | | | | |
| | | | | 462,035 |
| |
Manufacturing 0.2% | | | |
| 4,340 | | Danaher Corp. | | | 242,736 |
| 400 | | Harsco Corp. | | | 9,488 |
| 1,000 | | Hexcel Corp.(a) | | | 8,290 |
| | | | | |
| | | | | 260,514 |
See Notes to Financial Statements.
| | |
| 18 | | Visit our website at www.prudential.com |
| | | | | |
| Shares | | Description | | Value (Note 1) |
| | | | | |
COMMON STOCKS (Continued) | | | |
| |
Media 0.6% | | | |
| 12,000 | | CBS Corp. (Class B Stock) | | $ | 68,640 |
| 12,100 | | Comcast Corp. (Class A Stock) | | | 177,265 |
| 3,590 | | Entravision Communications Corp. (Class A Stock)(a) | | | 3,016 |
| 17,700 | | Time Warner, Inc. | | | 165,141 |
| 5,476 | | Vivendi (France) | | | 141,701 |
| 6,619 | | Walt Disney Co. (The) | | | 136,881 |
| 1,145 | | Wiley, (John) & Sons, Inc. (Class A Stock) | | | 40,567 |
| | | | | |
| | | | | 733,211 |
| |
Medical Supplies & Equipment 1.0% | | | |
| 1,845 | | Advanced Energy Industries, Inc.(a) | | | 16,568 |
| 4,350 | | Baxter International, Inc. | | | 255,128 |
| 610 | | Becton, Dickinson and Co. | | | 44,329 |
| 7,326 | | Boston Scientific Corp.(a) | | | 64,982 |
| 10,510 | | Johnson & Johnson | | | 606,322 |
| 290 | | Myriad Genetics, Inc.(a) | | | 21,625 |
| 1,085 | | Quality Systems, Inc. | | | 40,449 |
| 1,360 | | ResMed, Inc.(a) | | | 54,264 |
| 2,990 | | St. Jude Medical, Inc.(a) | | | 108,746 |
| 1,330 | | Stryker Corp. | | | 56,179 |
| 200 | | SurModics, Inc.(a) | | | 3,966 |
| 890 | | Vital Images, Inc.(a) | | | 10,066 |
| | | | | |
| | | | | 1,282,624 |
| |
Metals & Mining 0.5% | | | |
| 12,000 | | Alcoa, Inc. | | | 93,480 |
| 895 | | Alpha Natural Resources, Inc.(a) | | | 14,606 |
| 1,623 | | BHP Billiton Ltd., ADR (Australia) | | | 60,927 |
| 1,470 | | BHP Billiton PLC (United Kingdom) | | | 25,159 |
| 1,050 | | Bucyrus International, Inc. (Class A Stock) | | | 16,275 |
| 1,435 | | Cliffs Natural Resources, Inc. | | | 33,249 |
| 795 | | Northwest Pipe Co.(a) | | | 28,032 |
| 4,561 | | Nucor Corp. | | | 186,043 |
| 2,100 | | Peabody Energy Corp. | | | 52,500 |
| 830 | | Precision Castparts Corp. | | | 53,909 |
| 975 | | Steel Dynamics, Inc. | | | 10,355 |
| 600 | | Timken Co. | | | 8,934 |
| | | | | |
| | | | | 583,469 |
See Notes to Financial Statements.
| | |
| Target Asset Allocation Funds/Target Conservative Allocation Fund | | 19 |
Portfolio of Investments
as of January 31, 2009 (Unaudited) continued
| | | | | |
| Shares | | Description | | Value (Note 1) |
| | | | | |
COMMON STOCKS (Continued) | | | |
| |
Multi-Line Retail 0.1% | | | |
| 4,100 | | JC Penney Co., Inc. | | $ | 68,675 |
| |
Multi-Utilities 0.1% | | | |
| 450 | | Vectren Corp. | | | 11,605 |
| 1,700 | | Wisconsin Energy Corp. | | | 75,786 |
| | | | | |
| | | | | 87,391 |
| |
Office Equipment 0.2% | | | |
| 1,215 | | School Specialty, Inc.(a) | | | 20,047 |
| 25,600 | | Xerox Corp. | | | 169,984 |
| | | | | |
| | | | | 190,031 |
| |
Oil & Gas Exploration/Production | | | |
| 295 | | Core Laboratories NV (Netherlands) | | | 19,821 |
| 400 | | St. Mary Land & Exploration Co. | | | 7,740 |
| | | | | |
| | | | | 27,561 |
| |
Oil, Gas & Consumable Fuels 3.6% | | | |
| 3,185 | | Anadarko Petroleum Corp. | | | 117,017 |
| 4,945 | | Apache Corp. | | | 370,875 |
| 600 | | Arena Resources, Inc.(a) | | | 14,616 |
| 420 | | Atwood Oceanics, Inc.(a) | | | 6,993 |
| 700 | | Cabot Oil & Gas Corp. | | | 19,243 |
| 8,382 | | Chevron Corp. | | | 591,099 |
| 625 | | Concho Resources, Inc.(a) | | | 15,763 |
| 11,600 | | ConocoPhillips | | | 551,348 |
| 1,155 | | Denbury Resources, Inc.(a) | | | 14,137 |
| 2,143 | | Devon Energy Corp. | | | 132,009 |
| 975 | | Equitable Resources, Inc. | | | 33,374 |
| 3,450 | | Exxon Mobil Corp. | | | 263,856 |
| 3,320 | | Hess Corp. | | | 184,625 |
| 1,040 | | Lufkin Industries, Inc. | | | 36,348 |
| 11,000 | | Marathon Oil Corp. | | | 299,530 |
| 3,394 | | Occidental Petroleum Corp. | | | 185,143 |
| 300 | | ONEOK, Inc. | | | 8,766 |
| 8,009 | | Petroleo Brasileiro SA, ADR (Brazil) | | | 209,836 |
| 900 | | Plains Exploration & Production Co.(a) | | | 19,008 |
| 4,500 | | Royal Dutch Shell PLC (Class B Stock), ADR (United Kingdom) | | | 215,235 |
| 3,477 | | Schlumberger Ltd. (Netherlands) | | | 141,896 |
| 1,510 | | Southwestern Energy Co.(a) | | | 47,791 |
| 500 | | Swift Energy Co.(a) | | | 7,660 |
See Notes to Financial Statements.
| | |
| 20 | | Visit our website at www.prudential.com |
| | | | | |
| Shares | | Description | | Value (Note 1) |
| | | | | |
COMMON STOCKS (Continued) | | | |
| |
Oil, Gas & Consumable Fuels (cont’d.) | | | |
| 8,820 | | Transocean Ltd. (Switzerland)(a) | | $ | 481,748 |
| 1,300 | | Weatherford International Ltd.(a) | | | 14,339 |
| 400 | | WGL Holdings, Inc. | | | 12,840 |
| 7,531 | | XTO Energy, Inc. | | | 279,325 |
| | | | | |
| | | | | 4,274,420 |
| |
Paper & Forest Products | | | |
| 4,500 | | International Paper Co. | | | 41,040 |
| |
Pharmaceuticals 3.1% | | | |
| 7,357 | | Abbott Laboratories | | | 407,872 |
| 2,770 | | Allergan, Inc. | | | 105,592 |
| 3,665 | | American Medical Systems Holdings, Inc.(a) | | | 39,216 |
| 960 | | BioMarin Pharmaceutical, Inc.(a) | | | 18,490 |
| 4,900 | | Bristol-Myers Squibb Co. | | | 104,909 |
| 5,300 | | Cardinal Health, Inc. | | | 199,545 |
| 2,480 | | Celgene Corp.(a) | | | 131,316 |
| 570 | | Cephalon, Inc.(a) | | | 43,993 |
| 1,060 | | Cubist Pharmaceuticals, Inc.(a) | | | 22,695 |
| 11,100 | | Eli Lilly & Co. | | | 408,702 |
| 11,720 | | Gilead Sciences, Inc.(a) | | | 595,024 |
| 785 | | Herbalife Ltd. (Cayman Islands) | | | 16,100 |
| 2,350 | | Medco Health Solutions, Inc.(a) | | | 105,585 |
| 10,800 | | Merck & Co., Inc. | | | 308,340 |
| 235 | | Onyx Pharmaceuticals, Inc.(a) | | | 7,151 |
| 32,000 | | Pfizer, Inc. | | | 466,560 |
| 18,160 | | Schering-Plough Corp. | | | 318,890 |
| 2,030 | | Teva Pharmaceutical Industries Ltd., ADR (Israel) | | | 84,143 |
| 6,670 | | Wyeth | | | 286,610 |
| | | | | |
| | | | | 3,670,733 |
| |
Professional Services | | | |
| 800 | | Watson Wyatt Worldwide, Inc. (Class A Stock) | | | 37,200 |
| |
Real Estate Investment Trusts 0.2% | | | |
| 1,605 | | AvalonBay Communities, Inc. | | | 83,143 |
| 4,300 | | MFA Mortgage Investments, Inc. | | | 24,639 |
| 3,300 | | Simon Property Group, Inc. | | | 141,834 |
| | | | | |
| | | | | 249,616 |
| |
Retail & Merchandising 2.7% | | | |
| 510 | | Abercrombie & Fitch Co. (Class A Stock) | | | 9,104 |
| 4,720 | | Best Buy Co., Inc. | | | 132,254 |
See Notes to Financial Statements.
| | |
| Target Asset Allocation Funds/Target Conservative Allocation Fund | | 21 |
Portfolio of Investments
as of January 31, 2009 (Unaudited) continued
| | | | | |
| Shares | | Description | | Value (Note 1) |
| | | | | |
COMMON STOCKS (Continued) | | | |
| |
Retail & Merchandising (cont’d.) | | | |
| 400 | | Brinker International, Inc. | | $ | 4,388 |
| 1,870 | | Cash America International, Inc. | | | 34,184 |
| 5,398 | | Costco Wholesale Corp. | | | 243,072 |
| 29,684 | | CVS Caremark Corp. | | | 797,906 |
| 930 | | GameStop Corp. (Class A Stock)(a) | | | 23,045 |
| 2,450 | | Genesco, Inc.(a) | | | 37,730 |
| 1,530 | | Kohl’s Corp.(a) | | | 56,166 |
| 22,200 | | Lowe’s Cos., Inc. | | | 405,594 |
| 2,000 | | Sonic Corp.(a) | | | 19,480 |
| 11,450 | | Staples, Inc. | | | 182,513 |
| 7,298 | | Target Corp. | | | 227,698 |
| 2,785 | | TJX Cos., Inc. | | | 54,085 |
| 9,411 | | Wal-Mart Stores, Inc. | | | 443,446 |
| 4,390 | | Walgreen Co. | | | 120,330 |
| 13,834 | | Yum! Brands, Inc. | | | 395,929 |
| | | | | |
| | | | | 3,186,924 |
| |
Road & Rail | | | |
| 250 | | Landstar System, Inc. | | | 8,968 |
| |
Semiconductors 0.3% | | | |
| 1,400 | | Broadcom Corp. (Class A Stock)(a) | | | 22,190 |
| 400 | | Hittite Microwave Corp.(a) | | | 10,248 |
| 5,760 | | Intel Corp. | | | 74,304 |
| 2,140 | | Linear Technology Corp. | | | 50,119 |
| 6,310 | | Marvell Technology Group Ltd. (Bermuda)(a) | | | 46,000 |
| 1,975 | | Microsemi Corp.(a) | | | 16,590 |
| 1,115 | | OYO Geospace Corp.(a) | | | 16,669 |
| 3,800 | | Texas Instruments, Inc. | | | 56,810 |
| 2,120 | | Varian Semiconductor Equipment Associates, Inc.(a) | | | 40,365 |
| | | | | |
| | | | | 333,295 |
| |
Software 1.5% | | | |
| 925 | | ANSYS, Inc.(a) | | | 22,996 |
| 4,300 | | BMC Software, Inc.(a) | | | 108,919 |
| 13,264 | | CA, Inc. | | | 238,619 |
| 1,100 | | Citrix Systems, Inc.(a) | | | 23,144 |
| 2,330 | | Electronic Arts, Inc.(a) | | | 35,975 |
| 1,160 | | FactSet Research Systems, Inc. | | | 46,168 |
| 500 | | Global Payments, Inc. | | | 17,355 |
See Notes to Financial Statements.
| | |
| 22 | | Visit our website at www.prudential.com |
| | | | | |
| Shares | | Description | | Value (Note 1) |
| | | | | |
COMMON STOCKS (Continued) | | | |
| |
Software (cont’d.) | | | |
| 4,148 | | MasterCard, Inc. (Class A Stock) | | $ | 563,215 |
| 28,856 | | Microsoft Corp. | | | 493,438 |
| 2,070 | | Research In Motion Ltd. (Canada)(a) | | | 114,678 |
| 1,450 | | Sybase, Inc.(a) | | | 39,599 |
| 1,625 | | Tyler Technologies, Inc.(a) | | | 20,459 |
| | | | | |
| | | | | 1,724,565 |
| |
Specialty Retail 0.3% | | | |
| 1,015 | | Aaron Rents, Inc. | | | 22,188 |
| 2,500 | | AutoNation, Inc.(a) | | | 23,200 |
| 1,300 | | CarMax, Inc.(a) | | | 10,751 |
| 12,852 | | Home Depot, Inc. (The) | | | 276,703 |
| 2,800 | | Limited Brands, Inc. | | | 22,176 |
| | | | | |
| | | | | 355,018 |
| |
Telecommunications 1.7% | | | |
| 1,010 | | America Movil SAB de CV (Class L Stock), ADR (Mexico) | | | 28,795 |
| 22,700 | | AT&T, Inc. | | | 558,874 |
| 14,180 | | Cisco Systems, Inc.(a) | | | 212,275 |
| 2,440 | | EMS Technologies, Inc.(a) | | | 58,560 |
| 530 | | Juniper Networks, Inc.(a) | | | 7,505 |
| 2,650 | | MetroPCS Communications, Inc.(a) | | | 36,013 |
| 14,358 | | QUALCOMM, Inc. | | | 496,069 |
| 2,000 | | Syniverse Holdings, Inc.(a) | | | 27,120 |
| 18,500 | | Verizon Communications, Inc. | | | 552,595 |
| | | | | |
| | | | | 1,977,806 |
| |
Textiles, Apparel & Luxury Goods | | | |
| 1,750 | | Hanesbrands, Inc.(a) | | | 15,733 |
| 5,000 | | Jones Apparel Group, Inc. | | | 17,300 |
| | | | | |
| | | | | 33,033 |
| |
Thrifts & Mortgage Finance | | | |
| 17,300 | | Washington Mutual, Inc. | | | — |
| |
Tobacco Products 0.5% | | | |
| 1,800 | | Lorillard, Inc. | | | 107,028 |
| 14,180 | | Philip Morris International, Inc. | | | 526,787 |
| | | | | |
| | | | | 633,815 |
See Notes to Financial Statements.
| | |
| Target Asset Allocation Funds/Target Conservative Allocation Fund | | 23 |
Portfolio of Investments
as of January 31, 2009 (Unaudited) continued
| | | | | | | | |
| Shares | | | | Description | | Value (Note 1) |
| | | | | | | | |
| COMMON STOCKS (Continued) | | | |
| |
| Trading Companies & Distributors | | | |
| 200 | | | | | Watsco, Inc. | | $ | 6,610 |
| |
| Transportation 1.0% | | | |
| 3,500 | | | | | Burlington Northern Santa Fe Corp. | | | 231,875 |
| 2,170 | | | | | J.B. Hunt Transport Services, Inc. | | | 48,326 |
| 6,137 | | | | | Norfolk Southern Corp. | | | 235,415 |
| 14,143 | | | | | Union Pacific Corp. | | | 619,322 |
| | | | | | | | |
| | | | | | | | 1,134,938 |
| |
| Utilities 0.6% | | | |
| 3,300 | | | | | Dominion Resources, Inc. | | | 116,094 |
| 14,198 | | | | | Edison International | | | 462,429 |
| 501 | | | | | Headwaters, Inc.(a) | | | 2,269 |
| 2,106 | | | | | PG&E Corp. | | | 81,439 |
| 575 | | | | | Westar Energy, Inc. | | | 11,546 |
| | | | | | | | |
| | | | | | | | 673,777 |
| | | | | | | | |
| | | | | TOTAL COMMON STOCKS
(cost $53,694,173) | | | 45,193,054 |
| | | | | | | | |
| PREFERRED STOCK | | | |
| |
| Financial-Bank & Trust | | | |
| 2,625 | | | | | Wells Fargo & Co. Series J, 8.00%, CVT
(cost $50,451) | | | 47,775 |
| | | | | | | | |
| | | |
Moody’s
Ratings† | | Principal
Amount (000)# | | | | |
| ASSET-BACKED SECURITIES 2.1% | | | |
| AAA(e) | | $ | 305 | | Asset Backed Funding Certificates,
Series 2004-OPT5, Class A1
0.739%(d), 06/25/34 | | | 149,456 |
| Aaa | | | 13 | | Countrywide Asset-Backed Certificates,
Series 2006-11, Class 3AV1
0.449%(d), 09/25/46 | | | 13,015 |
| Aaa | | | 499 | | Ford Credit Auto Owner Trust,
Series 2008-C, Class A2B
1.233%(d), 01/15/11 | | | 481,896 |
| B3 | | | 123 | | Merrill Lynch Mortgage Investors, Inc.,
Series 2006-RM5, Class A2A
0.449%(d), 10/25/37 | | | 84,004 |
See Notes to Financial Statements.
| | |
| 24 | | Visit our website at www.prudential.com |
| | | | | | | | |
Moody’s
Ratings† | | Principal
Amount (000)# | | Description | | Value (Note 1) |
| | | | | | | | |
| ASSET-BACKED SECURITIES (Continued) | | | |
| Aaa | | $ | 98 | | Morgan Stanley ABS Capital I,
Series 2006-HE7, Class A2A
0.439%(d), 09/25/36 | | $ | 84,771 |
| Aaa | | | 1,496 | | SLM Student Loan Trust,
Series 2008-9, Class A
2.659%(d), 04/25/23 | | | 1,436,970 |
| Aaa | | | 149 | | Soundview Home Equity Loan Trust,
Series 2006-NLC1, Class A1, 144A
(original cost $149,415; purchased 10/13/06)(c)(i)
0.449%(d), 11/25/36 | | | 121,988 |
| Aaa | | | 144 | | Structured Asset Securities Corp.,
Series 2006-BC3, Class A2
0.439%(d), 10/25/36 | | | 133,992 |
| | | | | | | | |
| | | | | TOTAL ASSET-BACKED SECURITIES
(cost $2,822,045) | | | 2,506,092 |
| | | | | | | | |
| |
| COLLATERALIZED MORTGAGE OBLIGATIONS 3.7% | | | |
| Aaa | | | 392 | | American Home Mortgage Assets,
Series 2006-1, Class 2A1
0.579%(d), 05/25/46 | | | 155,171 |
| Aaa | | | 208 | | Bear Stearns Adjustable Rate Mortgage Trust,
Series 2005-4, Class 23A2
5.366%(d), 05/25/35 | | | 150,559 |
| AAA(e) | | | 196 | | Series 2007-3, Class 1A1
5.473%(d), 05/25/47 | | | 119,435 |
| Aaa | | | 390 | | Countrywide Alternative Loan Trust,
Series 2006-OA9, Class 2A1A
0.569%(d), 07/20/46 | | | 160,772 |
| Aaa | | | 21 | | Fannie Mae,
Series 1992-146, Class PZ
8.00%, 08/25/22 | | | 22,797 |
| Aaa | | | 605 | | FHLMC Structured Pass-Through Securities,
Series T-61, Class 1A1
3.655%(d), 07/25/44 | | | 537,476 |
| Aaa | | | 91 | | Freddie Mac,
Series 41, Class F
10.00%, 05/15/20 | | | 96,580 |
| Aaa | | | 391 | | Series 2801, Class EH
4.50%, 11/15/16 | | | 395,754 |
| Aaa | | | 240 | | Series 2962, Class YC
4.50%, 09/15/14 | | | 242,068 |
See Notes to Financial Statements.
| | |
| Target Asset Allocation Funds/Target Conservative Allocation Fund | | 25 |
Portfolio of Investments
as of January 31, 2009 (Unaudited) continued
| | | | | | | | |
Moody’s
Ratings† | | Principal
Amount (000)# | | Description | | Value (Note 1) |
| | | | | | | | |
| COLLATERALIZED MORTGAGE OBLIGATIONS (Continued) | | | |
| Aaa | | $ | 176 | | Series 3117, Class PN
5.00%, 11/15/21 | | $ | 176,584 |
| AAA(e) | | | 318 | | GSR Mortgage Loan Trust,
Series 2005-AR6, Class 2A1
4.541%(d), 09/25/35 | | | 261,633 |
| Aaa | | | 780 | | Series 2006-OA1, Class 2A2
0.649%(d), 08/25/46 | | | 214,369 |
| Aaa | | | 151 | | Harborview Mortgage Loan Trust,
Series 2006-12, Class 2A11
0.449%(d), 01/19/38 | | | 136,425 |
| Ba1 | | | 859 | | Homebanc Mortgage Trust,
Series 2006-1, Class 4A1
5.791%(d), 04/25/37 | | | 614,443 |
| NR | | | 136 | | Vendee Mortgage Trust,
Series 2000-1, Class 1A
6.81%(d), 01/15/30 | | | 141,588 |
| Aaa | | | 716 | | WaMu Mortgage Pass-Through Certificates,
Series 2003-R1, Class A1
0.929%(d), 12/25/27 | | | 593,141 |
| Aaa | | | 387 | | Series 2006-AR15, Class 2A
3.553%(d), 11/25/46 | | | 255,665 |
| Aaa | | | 386 | | Series 2007-OA2, Class 1A
2.753%(d), 03/25/47 | | | 133,516 |
| | | | | | | | |
| | | | | TOTAL COLLATERALIZED MORTGAGE OBLIGATIONS
(cost $5,409,657) | | | 4,407,976 |
| | | | | | | | |
| |
| CORPORATE BONDS 27.8% | | | |
| |
| Advertising 0.2% | | | |
| Baa1 | | | 300 | | Omnicom Group, Inc.,
Gtd. Notes
5.90%, 04/15/16 | | | 252,138 |
| | | | | | | | |
| |
| Automobile Manufacturers 0.2% | | | |
| A3 | | | 200 | | DaimlerChrysler NA Holding Corp.,
Gtd. Notes, MTN
5.75%, 09/08/11 | | | 190,038 |
| | | | | | | | |
| |
| Automotive - OEM 0.2% | | | |
| C | | | 500 | | General Motors Acceptance Corp. LLC,
Sr. Unsec’d. Notes
6.75%, 12/01/14 | | | 287,272 |
| | | | | | | | |
See Notes to Financial Statements.
| | |
| 26 | | Visit our website at www.prudential.com |
| | | | | | | | |
Moody’s
Ratings† | | Principal
Amount (000)# | | Description | | Value (Note 1) |
| | | | | | | | |
| CORPORATE BONDS (Continued) | | | |
| |
| Commercial Banks 0.8% | | | |
| Aa2 | | $ | 1,000 | | ANZ National International Ltd.,
Bank Gtd. Notes, 144A (New Zealand)
(original cost $999,060; purchased 07/09/08)(c)(i)
6.20%, 07/19/13 | | $ | 969,325 |
| | | | | | | | |
| |
| Diversified Financial Services 0.7% | | | |
| Caa1 | | | 500 | | Ford Motor Credit Co. LLC,
Sr. Unsec’d. Notes
7.00%, 10/01/13 | | | 311,273 |
| Aaa | | | 200 | | General Electric Capital Corp.,
Sr. Unsec’d. Notes, MTN
5.875%, 01/14/38 | | | 159,060 |
| Aa1 | | GBP | 500 | | General Electric Capital Corp.,
Sub. Notes, 144A
(original cost $999,960; purchased 08/30/07)(c)(i)
6.50%(d), 09/15/67 | | | 419,780 |
| | | | | | | | |
| | | | | | | | 890,113 |
| | | | | | | | |
| |
| Financial - Bank & Trust 11.7% | | | |
| A1 | | | 3,000 | | American Express Bank FSB,
Sr. Unsec’d. Notes
5.50%, 04/16/13 | | | 2,869,632 |
| A1 | | | 300 | | Bank of America Corp.,
Sr. Unsec’d. Notes
5.65%, 05/01/18 | | | 271,701 |
| Baa1 | | | 2,100 | | Jr. Sub. Notes
8.00%(d), 12/29/49 | | | 1,112,265 |
| Baa1 | | | 1,500 | | Jr. Sub. Notes
8.125%(d), 12/29/49 | | | 778,335 |
| A1 | | | 2,600 | | Barclays Bank PLC,
Sr. Sub. Notes, 144A (United Kingdom)
(original cost $2,582,502; purchased 12/07/07)(c)(i)
6.05%, 12/04/17 | | | 2,222,137 |
| A1 | | | 1,000 | | Sub. Notes, 144A (United Kingdom)
(original cost $1,000,000; purchased 04/18/08)(c)(i)
7.70%(d), 04/29/49 | | | 543,480 |
| Baa3 | | | 1,300 | | Citigroup, Inc.,
Jr. Sub. Notes
8.40%(d), 04/29/49 | | | 474,799 |
| A2 | | | 1,500 | | Sr. Unsec’d. Notes
5.50%, 04/11/13 | | | 1,372,161 |
| A2 | | | 2,000 | | Unsec’d. Notes
6.125%, 05/15/18 | | | 1,814,638 |
| Aa1 | | | 2,000 | | Deutsche Bank AG,
Sr. Unsec’d. Notes (Germany)
4.875%, 05/20/13 | | | 1,955,128 |
See Notes to Financial Statements.
| | |
| Target Asset Allocation Funds/Target Conservative Allocation Fund | | 27 |
Portfolio of Investments
as of January 31, 2009 (Unaudited) continued
| | | | | | | | |
Moody’s
Ratings† | | Principal
Amount (000)# | | Description | | Value (Note 1) |
| | | | | | | | |
| CORPORATE BONDS (Continued) | | | |
| |
| Financial - Bank & Trust (cont’d.) | | | |
| Aa1 | | $ | 500 | | National Australia Bank Ltd.,
Bonds, 144A (Australia)
(original cost $500,000; purchased 02/01/08)(c)(i)
2.838%(d), 02/08/10 | | $ | 500,034 |
| | | | | | | | |
| | | | | | | | 13,914,310 |
| | | | | | | | |
| Financial Services 5.3% | | | |
| A2 | | | 400 | | American Express Co.,
Sr. Unsec’d. Notes
7.00%, 03/19/18 | | | 397,622 |
| Aa3 | | | 1,000 | | Bear Stearns Cos. LLC (The),
Sr. Unsec’d. Notes
7.25%, 02/01/18 | | | 1,064,451 |
| A3 | | | 1,000 | | Citigroup Capital XXI,
Gtd. Notes
8.30%(d), 12/21/57 | | | 518,530 |
| Aa1 | | | 1,500 | | Credit Suisse / New York NY,
Sr. Unsec’d. Notes, MTN (Switzerland)
5.00%, 05/15/13 | | | 1,453,044 |
| A2 | | | 700 | | Goldman Sachs Group, Inc. (The),
Sub. Notes
6.75%, 10/01/37 | | | 532,100 |
| NR | | | 500 | | Lehman Brothers Holdings, Inc.,
Sr. Unsec’d. Notes, MTN(k)
5.625%, 01/24/13 | | | 70,000 |
| NR | | | 400 | | 6.875%, 05/02/18 | | | 56,000 |
| A1 | | | 1,000 | | Merrill Lynch & Co., Inc.,
Notes, MTN
6.875%, 04/25/18 | | | 962,716 |
| A2 | | | 1,400 | | Morgan Stanley,
Sr. Unsec’d. Notes, MTN
6.00%, 04/28/15 | | | 1,268,792 |
| | | | | | | | |
| | | | | | | | 6,323,255 |
| | | | | | | | |
| Hotels & Motels 0.7% | | | |
| Baa2 | | | 1,000 | | Marriott International, Inc.,
Sr. Unsec’d. Notes
6.375%, 06/15/17 | | | 830,348 |
| | | | | | | | |
| |
| Insurance 0.9% | | | |
| A3 | | | 600 | | American International Group, Inc.,
Sr. Unsec’d. Notes, MTN
5.85%, 01/16/18 | | | 427,636 |
| A3 | | | 800 | | Sr. Unsec’d. Notes, 144A
(original cost $800,000; purchased 08/13/08)(c)(i)
8.25%, 08/15/18 | | | 655,460 |
| | | | | | | | |
| | | | | | | | 1,083,096 |
| | | | | | | | |
See Notes to Financial Statements.
| | |
| 28 | | Visit our website at www.prudential.com |
| | | | | | | | |
Moody’s
Ratings† | | Principal
Amount (000)# | | Description | | Value (Note 1) |
| | | | | | | | |
| CORPORATE BONDS (Continued) | | | |
| |
| IT Services 0.4% | | | |
| A2 | | $ | 500 | | Electronic Data Systems Corp.,
Sr. Unsec’d. Notes
6.00%, 08/01/13 | | $ | 531,027 |
| | | | | | | | |
| |
| Medical Supplies & Equipment 0.4% | | | |
| B2 | | | 500 | | HCA, Inc.,
Sr. Sec’d. Notes
9.25%, 11/15/16 | | | 477,500 |
| | | | | | | | |
| |
| Metals & Mining 0.8% | | | |
| Baa1 | | | 1,000 | | Spectra Energy Capital LLC,
Gtd. Notes
6.20%, 04/15/18 | | | 893,660 |
| | | | | | | | |
| |
| Oil, Gas & Consumable Fuels 0.9% | | | |
| Baa1 | | | 1,000 | | Nabors Industries, Inc.,
Gtd. Notes
6.15%, 02/15/18 | | | 808,190 |
| Baa1 | | | 302 | | Petroleum Export Ltd.,
Sr. Sec’d. Notes, 144A (Cayman Islands)
(original cost $302,300; purchased 07/14/05)(c)(i)
5.265%, 06/15/11 | | | 254,303 |
| | | | | | | | |
| | | | | | | | 1,062,493 |
| | | | | | | | |
| |
| Pharmaceuticals 0.7% | | | |
| Baa2 | | | 400 | | Cardinal Health, Inc.,
Sr. Unsec’d. Notes
1.705%(d), 10/02/09 | | | 390,530 |
| Baa2 | | | 500 | | 6.00%, 06/15/17 | | | 449,944 |
| | | | | | | | |
| | | | | | | | 840,474 |
| | | | | | | | |
| |
| Telecommunications 1.5% | | | |
| Baa3 | | | 900 | | Embarq Corp.,
Sr. Unsec’d. Notes
6.738%, 06/01/13 | | | 855,000 |
| Ba1 | | | 1,000 | | Qwest Corp.,
Sr. Unsec’d. Notes
7.625%, 06/15/15 | | | 905,000 |
| | | | | | | | |
| | | | | | | | 1,760,000 |
| | | | | | | | |
| |
| Transportation 1.2% | | | |
| Baa3 | | | 2,000 | | Con-Way, Inc.,
Sr. Unsec’d. Notes
7.25%, 01/15/18 | | | 1,461,750 |
| | | | | | | | |
See Notes to Financial Statements.
| | |
| Target Asset Allocation Funds/Target Conservative Allocation Fund | | 29 |
Portfolio of Investments
as of January 31, 2009 (Unaudited) continued
| | | | | | | | |
Moody’s
Ratings† | | Principal
Amount (000)# | | Description | | Value (Note 1) |
| | | | | | | | |
| CORPORATE BONDS (Continued) | | | |
| |
| Utilities 1.2% | | | |
| Baa2 | | $ | 500 | | American Electric Power Co., Inc.,
Sr. Unsec’d. Notes
5.25%, 06/01/15 | | $ | 458,379 |
| Baa3 | | | 1,000 | | Illinois Power Co.,
Sr. Sec’d. Notes
6.25%, 04/01/18 | | | 912,320 |
| | | | | | | | |
| | | | | | | | 1,370,699 |
| | | | | | | | |
| | | | | TOTAL CORPORATE BONDS
(cost $41,258,317) | | | 33,137,498 |
| | | | | | | | |
| |
| FOREIGN GOVERNMENT BONDS 2.8% | | | |
| Aaa | | EUR | 500 | | Bundesrepublik Deutschland, Bonds (Germany)
4.25%, 07/04/39 | | | 679,831 |
| Aaa | | EUR | 800 | | 6.25%, 01/04/30 | | | 1,313,950 |
| Ba1 | | BRL | 1,300 | | Republic of Brazil,
Sr. Unsec’d. Notes (Brazil)
12.50%, 01/05/22 | | | 588,362 |
| Aaa | | GBP | 300 | | United Kingdom Gilt, Bonds (United Kingdom)
4.25%, 03/07/11 | | | 459,434 |
| Aaa | | GBP | 200 | | 5.75%, 12/07/09 | | | 301,577 |
| | | | | | | | |
| | | | | TOTAL FOREIGN GOVERNMENT BONDS
(cost $3,861,487) | | | 3,343,154 |
| | | | | | | | |
| | |
| MUNICIPAL BONDS 1.1% | | | | | |
| | |
| California 0.5% | | | | | |
| Aa3 | | | 700 | | Los Angeles Unified School District,
General Obligation
4.50%, 07/01/25 | | | 635,250 |
| | | | | | | | |
| | |
| Georgia 0.2% | | | | | |
| Aaa | | | 200 | | Georgia State Road & Tollway Authority,
Revenue Bonds
5.00%, 03/01/21 | | | 207,098 |
| | | | | | | | |
| | |
| Illinois 0.4% | | | | | |
| Aa3 | | | 500 | | Chicago Illinois Transit Authority,
Revenue Bonds
6.899%, 12/01/40 | | | 515,570 |
| | | | | | | | |
| | | | | TOTAL MUNICIPAL BONDS
(cost $1,311,592) | | | 1,357,918 |
| | | | | | | | |
| |
| U.S. GOVERNMENT MORTGAGE-BACKED OBLIGATIONS 27.1% | | | |
| | | 351 | | Federal Home Loan Mortgage Corp.
4.999%(d), 03/01/36 | | | 355,750 |
| | | 806 | | 5.00%, 11/01/36 | | | 819,592 |
See Notes to Financial Statements.
| | |
| 30 | | Visit our website at www.prudential.com |
| | | | | | | | |
Moody’s
Ratings† | | Principal
Amount (000)# | | Description | | Value (Note 1) |
| | | | | | | | |
| U.S. GOVERNMENT MORTGAGE-BACKED OBLIGATIONS (Continued) | | | |
| | $ | 11 | | 5.209%(d), 08/01/23 | | $ | 11,207 |
| | | 1,000 | | 5.50%, TBA | | | 1,020,312 |
| | | 163 | | 6.00%, 09/01/22 | | | 169,380 |
| | | 706 | | Federal National Mortgage Assoc.
4.00 %, 08/01/18 - 06/01/19 | | | 714,441 |
| | | 68 | | 4.488%(d), 05/01/36 | | | 67,537 |
| | | 1,766 | | 4.50 %, 09/01/35 - 11/01/35 | | | 1,779,598 |
| | | 1,882 | | 5.00 %, 06/01/23 - 11/01/33 | | | 1,921,813 |
| | | 4,000 | | 5.00%, TBA | | | 4,055,000 |
| | | 1,000 | | 5.00%, TBA | | | 1,016,562 |
| | | 815 | | 5.089%(d), 06/01/35 | | | 834,521 |
| | | 3,769 | | 5.50 %, 09/01/33 - 08/01/37 | | | 3,868,860 |
| | | 3,900 | | 5.50%, TBA | | | 3,991,408 |
| | | 131 | | 6.00 %, 05/01/16 - 12/01/17 | | | 137,033 |
| | | 378 | | 6.50 %, 01/01/16 - 09/01/36 | | | 394,696 |
| | | 165 | | 7.50%, 01/01/32 | | | 175,540 |
| | | 49 | | Government National Mortgage Assoc.
4.50 %, 08/15/33 - 09/15/33 | | | 49,101 |
| | | 7 | | 4.625%(d), 09/20/22 | | | 6,736 |
| | | 5,000 | | 5.00%, TBA | | | 5,095,310 |
| | | 5,500 | | 6.00%, TBA | | | 5,658,125 |
| | | 61 | | 8.50 %, 02/20/30 - 06/15/30 | | | 65,360 |
| | | | | | | | |
| | | | | TOTAL U.S. GOVERNMENT MORTGAGE-BACKED OBLIGATIONS
(cost $31,904,782) | | | 32,207,882 |
| | | | | | | | |
| |
| U.S. TREASURY OBLIGATIONS 4.5% | | | |
| | | 500 | | U.S. Treasury Bonds
7.125%, 02/15/23 | | | 675,469 |
| | | 500 | | 7.25%, 08/15/22 | | | 679,219 |
| | | 1,000 | | 8.875%, 08/15/17 | | | 1,418,125 |
| | | 200 | | U.S. Treasury Inflation Index Bonds, TIPS
2.00%, 01/15/26 | | | 198,201 |
| | | 1,100 | | 2.125%, 01/15/19 | | | 1,128,484 |
| | | 700 | | 2.50%, 01/15/29 | | | 697,348 |
| | | 190 | | 3.875%, 04/15/29 | | | 293,159 |
| | | 500 | | U.S. Treasury Strip Coupon, IO
7.25%, 02/15/22 | | | 292,550 |
| | | | | | | | |
| | | | | TOTAL U.S. TREASURY OBLIGATIONS
(cost $5,335,298) | | | 5,382,555 |
| | | | | | | | |
See Notes to Financial Statements.
| | |
| Target Asset Allocation Funds/Target Conservative Allocation Fund | | 31 |
Portfolio of Investments
as of January 31, 2009 (Unaudited) continued
| | | | | | | | | | |
Moody’s
Ratings† | | | Principal
Amount (000)# | | Description | | Value (Note 1) |
| | | | | | | | | | |
| | BANK LOANS(d) 1.8% | | | |
| | CAA | (e) | | $ | 1,975 | | Chrysler Financial, Term, 144A
(original cost $1,876,250;
purchased 11/28/07)(c)(i)
6.00%, 08/03/12 | | $ | 1,183,590 |
| | BA- | (e) | | | 1,287 | | TXU Corp., Term B3
(original cost $1,195,522;
purchased 09/11/08)(c)(i)
3.91%, 10/10/14 | | | 894,121 |
| | | | | | | | | | |
| | | | | | | TOTAL BANK LOANS
(cost $3,107,850) | | | 2,077,711 |
| | | | | | | | | | |
| | | | | | | TOTAL LONG-TERM INVESTMENTS
(cost $148,755,652) | | | 129,661,615 |
| | | | | | | | | | |
| |
| | SHORT-TERM INVESTMENTS 10.7% | | | |
| | | |
Contracts/
Notional
Amount (000)# | | | | | | | |
| | OPTIONS PURCHASED(a) 1.2% | | | |
| |
| | Call Options 1.0% | | | |
| EUR | 4,800 | | | | | | 2 Year Euro-Schatz,
expiring 02/20/2009, Strike Price $120.00 | | | 307 |
| | 1,700 | | | | | | Currency Option USD vs. JPY,
expiring 03/31/2010 @ FX Rate 104.65 | | | 13,469 |
| | 21,000 | | | | | | Interest Rate Swap Options,
expiring 08/03/2009 @ 3.45% | | | 610,900 |
| | 2,200 | | | | | | expiring 08/03/2009 @ 3.45% | | | 63,999 |
| | 1,600 | | | | | | expiring 08/03/2009 @ 3.45% | | | 46,545 |
| | 12,300 | | | | | | expiring 08/03/2009 @ 3.85% | | | 450,032 |
| | | | | | | | | | |
| | | | | | | | | | 1,185,252 |
| | | | | | | | | | |
| |
| | Put Options 0.2% | | | |
| | 1,700 | | | | | | Currency Option USD vs. JPY,
expiring 03/31/2010 @ FX Rate 104.65 | | | 271,210 |
| | 4,000 | | | | | | GNMA,
expiring 02/12/2009, Strike Price $51.00 | | | — |
| | | | | | | | | | |
| | | | | | | | | | 271,210 |
| | | | | | | | | | |
| | | | | | | TOTAL OPTIONS PURCHASED
(cost $567,666) | | | 1,456,462 |
| | | | | | | | | | |
See Notes to Financial Statements.
| | |
| 32 | | Visit our website at www.prudential.com |
| | | | | | | |
Principal
Amount (000)# | | Description | | Value (Note 1) | |
| | | | | | | |
| | REPURCHASE AGREEMENT 1.3% | | | | |
| $ | 1,500 | | Credit Suisse Securities LLC, 0.26%, dated 01/30/09,
due 02/02/09 due in the amount of $1,500,033
(cost $1,500,000; the value of collateral plus accrued interest was $1,539,532)(b) | | $ | 1,500,000 | |
| | | | | | | |
| |
| | U.S. TREASURY OBLIGATIONS(g) 1.8% | | | | |
| | 500 | | U.S. Treasury Bills
0.04%, 03/26/09 | | | 499,941 | |
| | 1,230 | | 0.119%, 04/09/09 | | | 1,229,513 | |
| | 400 | | 0.80%, 06/04/09 | | | 399,641 | |
| | | | | | | |
| | | TOTAL U.S. TREASURY OBLIGATIONS
(cost $2,129,249) | | | 2,129,095 | |
| | | | | | | |
| | |
Shares | | | | | |
| | AFFILIATED MONEY MARKET MUTUAL FUND 6.4% | | | | |
| | 7,626,623 | | Dryden Core Investment Fund—Taxable Money Market Series (cost $7,626,623)(h) | | | 7,626,623 | |
| | | | | | | |
| | | TOTAL SHORT-TERM INVESTMENTS
(cost $11,823,538) | | | 12,712,180 | |
| | | | | | | |
| | | TOTAL INVESTMENTS, BEFORE OPTIONS WRITTEN AND SECURITY SOLD SHORT(j) 119.6%
(cost $160,579,190; Note 5) | | | 142,373,795 | |
| | | | | | | |
| | |
Contracts/
Notional
Amount (000)# | | | | | |
| | OPTIONS WRITTEN (0.8)% | | | | |
| |
| | Call Options (0.8)% | | | | |
| | | Interest Rate Swap Options, | | | | |
| $ | 700 | | expiring 08/03/2009 @ 4.15% | | | (48,514 | ) |
| | 3,800 | | expiring 08/03/2009 @ 4.40% | | | (357,508 | ) |
| | 700 | | expiring 08/03/2009 @ 4.40% | | | (65,857 | ) |
| | 4,100 | | expiring 08/03/2009 @ 4.55% | | | (421,975 | ) |
| | | | | | | |
| | | | | | (893,854 | ) |
| | | | | | | |
| |
| | Put Option | | | | |
| | 36,000 | | 90 Euro Dollar Futures,
expiring 03/16/2009, Strike Price $98.88 | | | (22,050 | ) |
| | | | | | | |
| | | TOTAL OPTIONS WRITTEN
(premium received $313,439) | | | (915,904 | ) |
| | | | | | | |
See Notes to Financial Statements.
| | |
| Target Asset Allocation Funds/Target Conservative Allocation Fund | | 33 |
Portfolio of Investments
as of January 31, 2009 (Unaudited) continued
| | | | | | | |
Principal
Amount (000)# | | Description | | Value (Note 1) | |
| | SECURITY SOLD SHORT (0.8)% | | | | |
| $ | 1,000 | | Federal National Mortgage Assoc.
4.50%, TBA
(proceeds received $1,007,812) | | $ | (1,003,125 | ) |
| | | | | | | |
| | | TOTAL INVESTMENTS, NET OF OPTIONS WRITTEN AND SECURITY SOLD SHORT 118.0%
(cost $159,257,939; Note 5) | | | 140,454,766 | |
| | | Other liabilities in excess of other assets(l) (18.0)% | | | (21,406,262 | ) |
| | | | | | | |
| | | NET ASSETS 100% | | $ | 119,048,504 | |
| | | | | | | |
The following abbreviations are used in Portfolio descriptions:
144A—Security was purchased pursuant to Rule 144A under the Securities Act of 1933 and may not be resold subject to that rule except to qualified institutional buyers. Unless otherwise noted, 144A securities are deemed to be liquid.
ADR—American Depositary Receipt
CVT—Convertible Security
FHLMC—Federal Home Loan Mortgage Corp.
FSB—Federal Savings Bank
GNMA—Government National Mortgage Assoc.
IO—Interest Only
MTN—Medium Term Note
NR—Not Rated by Moody’s or Standard & Poor’s
TBA—To Be Announced
TIPS—Treasury Inflation Protected Securities
BRL—Brazilian Real
CNY—Chinese Yuan
EUR—Euro
GBP—British Pound
INR—Indian Rupee
JPY—Japanese Yen
RUB—Russian Ruble
USD—United States Dollar
| † | The rating reflected is as of January 31, 2009. Rating of certain bonds may have changed subsequent to that date. |
| # | Principal amount is shown in U.S. dollars unless otherwise stated. |
| (a) | Non-income producing security. |
| (b) | Repurchase agreement is collateralized by United States Treasuries or federal agency obligations. |
| (c) | Private Placement restricted as to resale and does not have a readily available market. The aggregate original cost of such securities is $10,405,009. The aggregate value of $7,764,218 is approximately 6.5% of net assets. |
| (d) | Indicates a variable rate security. |
| (e) | Standard & Poor’s rating. |
| (f) | Securities segregated as collateral for futures contracts. |
| (g) | Rates shown are the effective yields at purchase date. |
See Notes to Financial Statements.
| | |
| 34 | | Visit our website at www.prudential.com |
| (h) | Prudential Investments LLC, the manager of the Portfolio, also serves as manager of the underlying portfolios in which the Portfolio invests. |
| (i) | Indicates a security that has been deemed illiquid. |
| (j) | As of January 31, 2009, 3 securities representing $305,396 and 0.3% of the total market value were fair valued in accordance with the policies adopted by the Board of Directors. |
| (k) | Represents issuer in default on interest payments. Non-income producing security. |
| (l) | Other liabilities in excess of other assets includes net unrealized appreciation (depreciation) on futures contracts, forward foreign currency exchange contracts, interest rate swaps and credit default swaps as follows: |
Futures contracts open at January 31, 2009:
| | | | | | | | | | | | | | |
Number of
Contracts | | Type | | Expiration
Date | | Value at
Trade
Date | | Value at
January 31,
2009 | | Unrealized
Appreciation | |
| | Long Positions: | | | | | | | | | | | | |
| 40 | | 90 Day Euro | | Mar 09 | | $ | 9,796,975 | | $ | 9,875,500 | | $ | 78,525 | |
| 13 | | 90 Day Euro | | Jun 09 | | | 3,179,313 | | | 3,208,888 | | | 29,575 | |
| 5 | | 90 Day Euro | | Sep 09 | | | 1,208,938 | | | 1,232,938 | | | 24,000 | |
| 56 | | 90 Day Euro | | Mar 10 | | | 13,469,950 | | | 13,759,900 | | | 289,950 | |
| 51 | | 90 Day Euro EURIBOR | | Mar 09 | | | 15,517,357 | | | 16,023,002 | | | 505,645 | |
| 38 | | 90 Day Sterling | | Mar 09 | | | 6,697,293 | | | 6,772,488 | | | 75,195 | |
| 13 | | 90 Day Sterling | | Jun 09 | | | 2,211,050 | | | 2,320,201 | | | 109,151 | |
| 22 | | 90 Day Sterling | | Mar 10 | | | 3,780,327 | | | 3,913,741 | | | 133,414 | |
| 9 | | 90 Day Sterling | | Sept 10 | | | 1,591,539 | | | 1,593,495 | | | 1,956 | |
| 11 | | 90 Day Sterling | | Dec 10 | | | 1,938,438 | | | 1,941,527 | | | 3,089 | |
| 4 | | 5 Year Euro-Bobl | | Mar 09 | | | 590,363 | | | 592,028 | | | 1,665 | |
| 1 | | 10 Year U.K. Gilt | | Mar 09 | | | 168,831 | | | 170,164 | | | 1,333 | |
| | | | | | | | | | | | | | |
| | | | | | | | | | | | $ | 1,253,498 | (1) |
| | | | | | | | | | | | | | |
(1) | Cash of $388,600 has been segregated with the broker to cover requirements for open futures contracts as of January 31, 2009. |
See Notes to Financial Statements.
| | |
| Target Asset Allocation Funds/Target Conservative Allocation Fund | | 35 |
Portfolio of Investments
as of January 31, 2009 (Unaudited) continued
Forward foreign currency exchange contracts outstanding at January 31, 2009:
| | | | | | | | | | | | | |
Purchase Contracts | | Notional
Amount
(000) | | Value at
Settlement Date
Payable | | Current
Value | | Unrealized
Appreciation
(Depreciation) | |
Brazilian Real, | | | | | | | | | | | | | |
Expiring 02/03/09 | | BRL | 1,016 | | $ | 448,019 | | $ | 437,330 | | $ | (10,689 | ) |
Expiring 06/02/09 | | BRL | 508 | | | 215,330 | | | 211,608 | | | (3,722 | ) |
Chinese Yuan, | | | | | | | | | | | | | |
Expiring 05/06/09 | | CNY | 6,687 | | | 966,063 | | | 965,831 | | | (232 | ) |
Expiring 07/15/09 | | CNY | 8,550 | | | 1,254,868 | | | 1,227,312 | | | (27,556 | ) |
Expiring 09/08/09 | | CNY | 3,240 | | | 470,000 | | | 463,214 | | | (6,786 | ) |
Euro, | | | | | | | | | | | | | |
Expiring 02/12/09 | | EUR | 99 | | | 129,201 | | | 126,736 | | | (2,465 | ) |
Indian Rupee, | | | | | | | | | | | | | |
Expiring 04/09/09 | | INR | 42,729 | | | 851,241 | | | 868,443 | | | 17,202 | |
Russian Ruble, | | | | | | | | | | | | | |
Expiring 05/06/09 | | RUB | 24,221 | | | 809,088 | | | 621,045 | | | (188,043 | ) |
| | | | | | | | | | | | | |
| | | | | $ | 5,143,810 | | $ | 4,921,519 | | $ | (222,291 | ) |
| | | | | | | | | | | | | |
| | | | | | | | | | | | | |
Sale Contracts | | Notional
Amount
(000) | | Value at
Settlement Date
Receivable | | Current
Value | | Unrealized
Appreciation
(Depreciation) | |
Brazilian Real, | | | | | | | | | | | | | |
Expiring 02/03/09 | | BRL | 1,016 | | $ | 441,128 | | $ | 437,594 | | $ | 3,534 | |
Expiring 06/02/09 | | BRL | 1,399 | | | 620,276 | | | 582,719 | | | 37,557 | |
British Pound, | | | | | | | | | | | | | |
Expiring 02/26/09 | | GBP | 1,965 | | | 2,932,989 | | | 2,846,528 | | | 86,461 | |
Chinese Yuan, | | | | | | | | | | | | | |
Expiring 07/15/09 | | CNY | 15,780 | | | 2,268,000 | | | 2,265,172 | | | 2,828 | |
Euro, | | | | | | | | | | | | | |
Expiring 02/12/09 | | EUR | 2,034 | | | 2,724,401 | | | 2,603,843 | | | 120,558 | |
Indian Rupee, | | | | | | | | | | | | | |
Expiring 04/09/09 | | INR | 43,171 | | | 861,000 | | | 877,419 | | | (16,419 | ) |
Japanese Yen, | | | | | | | | | | | | | |
Expiring 03/05/09 | | JPY | 165,430 | | | 1,782,501 | | | 1,842,576 | | | (60,075 | ) |
Russian Ruble, | | | | | | | | | | | | | |
Expiring 05/06/09 | | RUB | 24,221 | | | 750,726 | | | 621,045 | | | 129,681 | |
| | | | | | | | | | | | | |
| | | | | $ | 12,381,021 | | $ | 12,076,896 | | $ | 304,125 | |
| | | | | | | | | | | | | |
See Notes to Financial Statements.
| | |
| 36 | | Visit our website at www.prudential.com |
Interest rate swap agreements outstanding at January 31, 2009:
| | | | | | | | | | | | | | |
Counterparty | | Termination
Date | | Notional
Amount#
(000) | | Fixed
Rate | | | Floating
Rate | | Unrealized
Appreciation
(Depreciation) | |
Bank of America Securities LLC(2) | | 12/17/13 | | $ | 5,100 | | 4.00 | % | | 3 Month LIBOR | | $ | 410,709 | |
Barclays Capital(1) | | 12/17/28 | | | 400 | | 5.00 | | | 3 Month LIBOR | | | (96,032 | ) |
Citigroup, Inc.(1) | | 06/17/19 | | | 2,200 | | 4.00 | | | 3 Month LIBOR | | | (69,694 | ) |
Citigroup, Inc.(2) | | 06/17/14 | | | 5,000 | | 4.00 | | | 3 Month LIBOR | | | 666 | |
Credit Suisse International(1) | | 06/17/19 | | | 900 | | 4.00 | | | 3 Month LIBOR | | | (59,669 | ) |
Credit Suisse International(1) | | 06/17/24 | | | 4,300 | | 4.00 | | | 3 Month LIBOR | | | 215,069 | |
Merrill Lynch & Co.(1) | | 12/17/18 | | | 4,000 | | 5.00 | | | 3 Month LIBOR | | | (623,684 | ) |
Merrill Lynch & Co.(1) | | 12/17/28 | | | 1,500 | | 5.00 | | | 3 Month LIBOR | | | (338,150 | ) |
Merrill Lynch & Co.(2) | | 12/17/13 | | | 100 | | 4.00 | | | 3 Month LIBOR | | | 7,934 | |
Morgan Stanley & Co.(1) | | 12/17/18 | | | 4,700 | | 5.00 | | | 3 Month LIBOR | | | (654,885 | ) |
Morgan Stanley & Co.(1) | | 06/17/19 | | | 200 | | 4.00 | | | 3 Month LIBOR | | | 10,314 | |
Morgan Stanley & Co.(1) | | 06/17/14 | | | 11,500 | | 4.00 | | | 3 Month LIBOR | | | (22,029 | ) |
Morgan Stanley & Co.(2) | | 12/17/38 | | | 600 | | 5.00 | | | 3 Month LIBOR | | | 206,360 | |
Goldman Sachs & Co.(2) | | 01/02/12 | | BRL | 4,400 | | 10.15 | | | Brazilian interbank lending rate | | | (120,893 | ) |
Merrill Lynch & Co.(2) | | 01/02/12 | | BRL | 200 | | 14.77 | | | Brazilian interbank lending rate | | | 4,410 | |
Morgan Stanley & Co.(2) | | 01/02/12 | | BRL | 4,200 | | 10.12 | | | Brazilian interbank lending rate | | | 47,021 | |
UBS AG(2) | | 01/02/12 | | BRL | 5,200 | | 10.58 | | | Brazilian interbank lending rate | | | (77,944 | ) |
Barclays Capital(1) | | 09/17/18 | | EUR | 600 | | 5.00 | | | 6 Month EURIBOR | | | (82,747 | ) |
Barclays Capital(1) | | 09/17/38 | | EUR | 500 | | 5.00 | | | 6 Month EURIBOR | | | (126,482 | ) |
Barclays Capital(2) | | 03/18/10 | | EUR | 600 | | 5.00 | | | 6 Month EURIBOR | | | 24,542 | |
Deutsche Bank(1) | | 09/17/18 | | EUR | 800 | | 5.00 | | | 6 Month EURIBOR | | | (98,955 | ) |
Deutsche Bank(2) | | 06/15/13 | | EUR | 100 | | 4.00 | | | 6 Month EURIBOR | | | 2,447 | |
Goldman Sachs & Co.(1) | | 09/17/18 | | EUR | 100 | | 5.00 | | | 6 Month EURIBOR | | | (12,512 | ) |
Goldman Sachs & Co.(1) | | 03/18/39 | | EUR | 600 | | 5.00 | | | 6 Month EURIBOR | | | (141,633 | ) |
Goldman Sachs & Co.(2) | | 03/18/10 | | EUR | 1,400 | | 5.00 | | | 6 Month EURIBOR | | | 57,310 | |
UBS AG(2) | | 10/15/10 | | EUR | 100 | | 2.15 | | | FRC - Excluding Tobacco - Non-Revised Consumer Price Index | | | 4,543 | |
Barclays Capital(1) | | 06/15/37 | | GBP | 300 | | 4.00 | | | 6 Month LIBOR | | | (19,756 | ) |
Barclays Capital(2) | | 09/15/10 | | GBP | 2,500 | | 5.00 | | | 6 Month LIBOR | | | 182,563 | |
Barclays Capital(2) | | 03/17/12 | | GBP | 2,000 | | 3.00 | | | 6 Month LIBOR | | | 15,634 | |
Deutsche Bank(1) | | 06/15/37 | | GBP | 1,100 | | 4.25 | | | 6 Month LIBOR | | | (75,965 | ) |
See Notes to Financial Statements.
| | |
| Target Asset Allocation Funds/Target Conservative Allocation Fund | | 37 |
Portfolio of Investments
as of January 31, 2009 (Unaudited) continued
Interest rate swap agreements outstanding at January 31, 2009 (cont’d.):
| | | | | | | | | | | | | | |
Counterparty | | Termination
Date | | Notional
Amount#
(000) | | Fixed
Rate | | | Floating
Rate | | Unrealized
Appreciation
(Depreciation) | |
Goldman Sachs & Co.(1) | | 06/15/37 | | GBP | 300 | | 4.00 | % | | 6 Month LIBOR | | $ | (19,213 | ) |
Goldman Sachs & Co.(2) | | 09/17/11 | | GBP | 1,000 | | 4.50 | | | 6 Month LIBOR | | | 95,181 | |
Morgan Stanley & Co.(1) | | 06/15/37 | | GBP | 400 | | 4.25 | | | 6 Month LIBOR | | | (27,072 | ) |
UBS AG(1) | | 06/17/18 | | JPY | 70,000 | | 1.50 | | | 6 Month LIBOR | | | (9,457 | ) |
| | | | | | | | | | | | | | |
| | | | | | | | | | | | $ | (1,392,069 | ) |
| | | | | | | | | | | | | | |
| (1) | Fund pays the fixed rate and receives the floating rate. |
| (2) | Fund pays the floating rate and receives the fixed rate. |
| # | Notional Amount is shown in U.S. dollars unless otherwise stated. |
Credit default swap agreements outstanding at January 31, 2009:
| | | | | | | | | | | | | | | | | | | | | |
Counterparty | | Termination
Date | | Notional
Amount#
(000)(4) | | Fixed
Rate | | | Reference
Entity/
Obligation | | Fair
Value(3) | | | Upfront
Premiums
Paid
(Received) | | Unrealized
Appreciation
(Depreciation) | |
| Credit default swaps on credit indices—Sell Protection(1): | | | | | | |
Citigroup, Inc. | | 06/20/12 | | $ | 4,000 | | 2.11 | % | | Dow Jones CDX
HY8 5Y Index | | $ | (1,089,455 | ) | | $ | — | | $ | (1,089,455 | ) |
Morgan Stanley & Co. | | 12/20/15 | | | 470 | | 0.46 | | | Dow Jones CDX
IG5 10Y Index | | | (120,430 | ) | | | — | | | (120,430 | ) |
Morgan Stanley & Co. | | 12/20/15 | | | 1,500 | | 0.46 | | | Dow Jones CDX
IG5 10Y Index | | | (383,909 | ) | | | — | | | (383,909 | ) |
Goldman Sachs | | 12/20/12 | | | 2,139 | | 0.70 | | | Dow Jones CDX
IG9 5Y Index | | | 20,179 | | | | — | | | 20,179 | |
| | | | | | | | | | | | | | | | | | | | | |
| | | | | | | | | | | | $ | (1,573,615 | ) | | $ | — | | $ | (1,573,615 | ) |
| | | | | | | | | | | | | | | | | | | | | |
| | | | | | | | | | | | | | | | | | | | | | | | |
| | | | | | | | |
Counterparty | | Termination
Date | | Notional
Amount#
(000)(4) | | Fixed
Rate | | | Reference
Entity/
Obligation | | Implied
Credit
Spread at
January 31,
2009(5) | | | Fair
Value | | | Upfront
Premiums
Paid
(Received) | | Unrealized
(Depreciation) | |
| Credit default swaps on corporate and/or sovereign issues—Sell Protection(1): | | | |
Barclays Bank PLC(2) | | 03/20/09 | | $ | 800 | | 1.10 | % | | General Electric
Capital Corp.,
6.00%, due
06/15/12 | | 4.924 | % | | $ | (3,085 | ) | | $ | — | | $ | (3,085 | ) |
| | | | | | | | | | | | | | | | | | | | | | | | |
See Notes to Financial Statements.
| | |
| 38 | | Visit our website at www.prudential.com |
Credit default swap agreements outstanding at January 31, 2009 (cont’d.):
Credit default swaps—Buy Protection(2):
| | | | | | | | | | | | | | |
Counterparty | | Termination
Date | | Notional
Amount#
(000)(4) | | Fixed
Rate | | | Reference Entity/
Obligation | | Unrealized
Appreciation
(Depreciation) | |
Citigroup, Inc. | | 06/20/15 | | $ | 500 | | 0.62 | % | | American Electric Power, 5.25%, due 06/01/15 | | $ | (1,536 | ) |
UBS AG | | 06/20/17 | | | 500 | | 0.56 | | | Cardinal Health Inc.,
6.00%, due 06/15/17 | | | 9,756 | |
Deutsche Bank | | 06/20/18 | | | 2,000 | | 0.86 | | | Citigroup, Inc., due 6.125%, due 05/15/18 | | | 251,638 | |
Bank of America Securities LLC | | 03/20/18 | | | 2,000 | | 1.83 | | | Con-way, Inc., 7.25%, due 01/15/18 | | | 233,508 | |
Barclays Bank PLC | | 09/20/11 | | | 200 | | 0.58 | | | DaimlerChrysler, 5.75%, due 09/08/11 | | | 15,263 | |
Barclays Bank PLC | | 12/20/11 | | | 600 | | 0.75 | | | Dow Jones CDX HVOL7 Index | | | 67,526 | |
Barclays Bank PLC | | 06/20/13 | | | 495 | | 5.00 | | | Dow Jones CDX HY10 Index | | | 102,054 | |
UBS AG | | 06/20/13 | | | 396 | | 5.00 | | | Dow Jones CDX HY10 Index | | | 81,857 | |
Merrill Lynch & Co. | | 12/20/11 | | | 300 | | 0.00 | | | Dow Jones CDX HY7 Index | | | 164,146 | |
Merrill Lynch & Co. | | 06/20/12 | | | 294 | | 2.75 | | | Dow Jones CDX HY8 Index | | | 60,767 | |
Deutsche Bank | | 06/20/18 | | | 1,659 | | 1.50 | | | Dow Jones CDX IG10 10Y Index | | | 34,763 | |
Goldman Sachs & Co. | | 06/20/18 | | | 4,490 | | 1.50 | | | Dow Jones CDX IG10 10Y Index | | | 167,816 | |
Morgan Stanley & Co. | | 06/20/18 | | | 4,392 | | 1.50 | | | Dow Jones CDX IG10 10Y Index | | | 135,197 | |
Deutsche Bank | | 06/20/13 | | | 1,269 | | 1.55 | | | Dow Jones CDX IG10 5Y Index | | | 32,332 | |
Goldman Sachs | | 06/20/13 | | | 4,978 | | 1.55 | | | Dow Jones CDX IG10 5Y Index | | | 46,469 | |
Morgan Stanley & Co. | | 12/20/12 | | | 700 | | 0.14 | | | Dow Jones CDX IG5 Index | | | 123,482 | |
Morgan Stanley & Co. | | 12/20/12 | | | 2,100 | | 0.14 | | | Dow Jones CDX IG5 Index | | | 370,438 | |
Barclays Bank PLC | | 12/20/17 | | | 1,074 | | 0.80 | | | Dow Jones CDX IG9 10Y Index | | | 47,408 | |
Goldman Sachs | | 12/20/17 | | | 1,659 | | 0.80 | | | Dow Jones CDX IG9 10Y Index | | | 64,735 | |
Merrill Lynch & Co. | | 12/20/17 | | | 195 | | 0.80 | | | Dow Jones CDX IG9 10Y Index | | | 7,237 | |
Morgan Stanley & Co. | | 12/20/17 | | | 1,562 | | 0.80 | | | Dow Jones CDX IG9 10Y Index | | | 50,663 | |
Goldman Sachs | | 12/20/12 | | | 488 | | 0.60 | | | Dow Jones CDX IG9 5Y Index | | | 18,165 | |
JPMorgan Chase Bank | | 12/20/11 | | | 943 | | 1.65 | | | Dow Jones CDX XO7 Index | | | 142,302 | |
Morgan Stanley & Co. | | 09/20/13 | | | 500 | | 1.22 | | | Electronic Data Systems,
6.00%, due 08/01/13 | | | (17,760 | ) |
Bank of America Securities LLC | | 06/20/17 | | | 1,000 | | 1.73 | | | Marriott International,
6.375%, due 06/15/17 | | | 173,442 | |
Goldman Sachs | | 03/20/18 | | | 1,000 | | 1.02 | | | Nabors Industries, Inc., 6.15%, due 02/15/18 | | | 174,599 | |
Morgan Stanley & Co. | | 06/20/16 | | | 300 | | 0.39 | | | Omnicom
5.90%, due 04/15/16 | | | 42,851 | |
See Notes to Financial Statements.
| | |
| Target Asset Allocation Funds/Target Conservative Allocation Fund | | 39 |
Portfolio of Investments
as of January 31, 2009 (Unaudited) continued
Credit default swap agreements outstanding at January 31, 2009 (cont’d.):
| | | | | | | | | | | | | |
Counterparty | | Termination
Date | | Notional
Amount#
(000)(4) | | Fixed
Rate | | | Reference Entity/
Obligation | | Unrealized
Appreciation
(Depreciation) |
Deutsche Bank | | 06/20/18 | | $ | 1,000 | | 0.84 | % | | Spectra Energy Capital,
6.20%, due 04/15/18 | | $ | 48,272 |
Citigroup, Inc. | | 02/09/46 | | | 600 | | 2.20 | | | Vertical CDO, Ltd.,
7.01%, due 02/09/46 | | | 590,487 |
Goldman Sachs | | 12/20/12 | | | 500 | | 0.24 | | | Wal-Mart Stores, Inc.,
5.75%, due 12/19/30 | | | 13,332 |
Barclays Bank PLC | | 03/20/12 | | | 100 | | 0.21 | | | XL Capital, Ltd.,
6.50%, due 01/15/12 | | | 21,358 |
| | | | | | | | | | | | | |
| | | | | | | | | | | | $ | 3,272,567 |
| | | | | | | | | | | | | |
The Fund entered into credit default swap agreements on corporate issues, sovereign issues, asset-backed securities and credit indices as the protection seller to provide a measure of protection against the current portfolio of investments’ exposure to market conditions, or to take an active position with respect to the likelihood of a particular issuer’s default or the referenced entity’s credit soundness.
| (1) | If the Fund is a seller of protection, it receives the fixed rate. When a credit event occurs, as defined under the terms of that particular swap agreement, the Fund will either (i) pay to the buyer of protection an amount equal to the notional amount of the swap and take delivery of the referenced obligation or underlying securities comprising the referenced index or (ii) pay a net settlement amount in the form of cash or securities equal to the notional amount of the swap less the recovery value of the referenced obligation or underlying securities comprising the referenced index. |
| (2) | If the Fund is a buyer of protection, it pays the fixed rate. When a credit event occurs, as defined under the terms of that particular swap agreement, the Fund will either (i) receive from the seller of protection an amount up to the notional amount of the swap and make delivery of the referenced obligation or underlying securities comprising the referenced index or (ii) receive a net settlement amount in the form of cash or securities up to the notional amount of the swap less the recovery value of the referenced obligation or underlying securities comprising the referenced index. |
| (3) | The fair value of credit default swap agreements on asset-backed securities and credit indices serves as an indicator of the current status of the payment/performance risk and represents the likelihood of an expected liability (or profit) for the credit derivative should the notional amount of the swap agreement be closed/sold as of the reporting date. Increasing fair value in absolute terms, represent a deterioration of the referenced entity’s credit soundness and a greater likelihood of risk of default or other credit event occurring as defined under the terms of the agreement. |
| (4) | Notional amount represents the maximum potential amount the Fund could be required to pay as a seller of credit protection or receive as a buyer of credit protection if a credit event occurs as defined under the terms of that particular swap agreement. |
See Notes to Financial Statements.
| | |
| 40 | | Visit our website at www.prudential.com |
Credit default swap agreements outstanding at January 31, 2009 (cont’d.):
| (5) | Implied credit spreads, represented in absolute terms, utilized in determining the fair value of credit default swap agreements on corporate issues or sovereign issues of an emerging country as of reporting date serve as an indicator of the current status of the payment/performance risk and represent the likelihood of risk of default for the credit derivative. The implied credit spread of a particular referenced entity reflects the cost of buying/selling protection and may include up-front payments required to be made to enter into the agreement. Wider credit spreads represent a deterioration of the referenced entity’s credit soundness and a greater likelihood of risk of default or other credit event occurring as defined under the terms of the agreement. |
| # | Notional Amount is shown in U.S. dollars unless otherwise stated. |
Various inputs are used in determining the value of the Fund's investments. These inputs are summarized in the three broad levels listed below.
Level 1—quoted prices in active markets for identical securities
Level 2—other significant observable inputs (including quoted prices for similar securities, interest rates, prepayment speeds, credit risk, etc.)
Level 3—significant unobservable inputs (including the Fund's own assumptions in determining the fair value of investments)
The following is a summary of the inputs used as of January 31, 2009 in valuing the Fund's assets carried at fair value:
| | | | | | | | |
Valuation inputs | | Investments
in Securities | | | Other Financial
Instruments* | |
Level 1—Quoted Prices | | $ | 52,562,056 | | | $ | 1,253,498 | |
Level 2—Other Significant Observable Inputs—Long | | | 88,895,835 | | | | (209,398 | ) |
Level 2—Other Significant Observable Inputs—Short | | | (1,003,125 | ) | | | — | |
Level 3—Significant Unobservable Inputs | | | — | | | | 595,030 | |
| | | | | | | | |
Total | | $ | 140,454,766 | | | $ | 1,639,130 | |
| | | | | | | | |
| * | Other financial instruments are derivative instruments not reflected in the Portfolio of Investments, such as futures, forwards and swap contracts, which are valued at the unrealized appreciation/depreciation on the instrument. |
The following is a reconciliation of assets in which significant unobservable inputs (Level 3) were used in determining fair value:
| | | | | | | |
| | | Investments
in Securities | | Other Financial
Instruments* | |
Balance as of 7/31/08 | | $ | — | | $ | 590,925 | |
Accrued discounts/premiums | | | — | | | (6 | ) |
Realized gain (loss) | | | — | | | — | |
Change in unrealized appreciation (depreciation) | | | — | | | (147,264 | ) |
Net purchases (sales) | | | — | | | 151,375 | |
Transfers in and/or out of Level 3 | | | — | | | — | |
| | | | | | | |
Balance as of 1/31/09 | | $ | — | | $ | 595,030 | |
| | | | | | | |
See Notes to Financial Statements.
| | |
| Target Asset Allocation Funds/Target Conservative Allocation Fund | | 41 |
Portfolio of Investments
as of January 31, 2009 (Unaudited) continued
The industry classification of investments and other liabilities in excess of other assets shown as a percentage of net assets as January 31, 2009 were as follows:
| | | |
U.S. Government Mortgage-Backed Obligations | | 27.1 | % |
Financial—Bank & Trust | | 12.6 | |
Affiliated Money Market Mutual Fund | | 6.4 | |
U.S. Treasury Obligations | | 6.3 | |
Financial Services | | 6.0 | |
Oil, Gas & Consumable Fuels | | 4.5 | |
Pharmaceuticals | | 3.8 | |
Collateralized Mortgage Obligations | | 3.7 | |
Telecommunications | | 3.2 | |
Foreign Government Bonds | | 2.8 | |
Retail & Merchandising | | 2.7 | |
Insurance | | 2.2 | |
Transportation | | 2.2 | |
Asset-Backed Securities | | 2.1 | |
Bank Loans | | 1.8 | |
Utilities | | 1.8 | |
Software | | 1.5 | |
Medical Supplies & Equipment | | 1.4 | |
Diversified Financial Services | | 1.3 | |
Repurchase Agreements | | 1.3 | |
Metals & Mining | | 1.3 | |
Commercial Banks | | 1.2 | |
Options Purchased | | 1.2 | |
Municipal Bonds | | 1.1 | |
Biotechnology | | 1.1 | |
Hotels, Restaurants & Leisure | | 1.1 | |
Chemicals | | 0.9 | |
Aerospace | | 0.9 | |
Aerospace & Defense | | 0.9 | |
Hotels & Motels | | 0.8 | |
Computer Hardware | | 0.8 | |
Internet Services | | 0.8 | |
Electric Utilities | | 0.7 | |
Computers & Peripherals | | 0.6 | |
Media | | 0.6 | |
Farming & Agriculture | | 0.6 | |
Foods | | 0.5 | |
Tobacco Products | | 0.5 | |
Commercial Services | | 0.5 | |
Financial—Brokerage | | 0.5 | |
IT Services | | 0.4 | |
Diversified Manufacturing Operations | | 0.4 | |
Clothing & Apparel | | 0.4 | |
Entertainment & Leisure | | 0.4 | |
Machinery | | 0.4 | |
Healthcare Equipment & Supplies | | 0.4 | |
See Notes to Financial Statements.
| | |
| 42 | | Visit our website at www.prudential.com |
Industry (cont’d.)
| | | |
Healthcare Services | | 0.4 | % |
Energy Equipment & Services | | 0.4 | |
Industrial Conglomerates | | 0.4 | |
Household Products | | 0.3 | |
Consumer Products & Services | | 0.3 | |
Specialty Retail | | 0.3 | |
Semiconductors | | 0.3 | |
Food & Drug Retailers | | 0.2 | |
Automotive—OEM | | 0.2 | |
Manufacturing | | 0.2 | |
Advertising | | 0.2 | |
Electronic Components | | 0.2 | |
Real Estate Investment Trusts | | 0.2 | |
Beverages | | 0.2 | |
Automobile Manufacturers | | 0.2 | |
Office Equipment | | 0.2 | |
Computer Services & Software | | 0.1 | |
Environmental Services | | 0.1 | |
Life Science Tools & Services | | 0.1 | |
Household/Personal Care | | 0.1 | |
Automotive Parts | | 0.1 | |
Engineering/Construction | | 0.1 | |
Healthcare Providers & Services | | 0.1 | |
Containers & Packaging | | 0.1 | |
Communication Equipment | | 0.1 | |
Multi-Utilities | | 0.1 | |
Education | | 0.1 | |
Air Freight & Couriers | | 0.1 | |
Business Services | | 0.1 | |
Multi-Line Retail | | 0.1 | |
Household Durables | | 0.1 | |
Internet Software & Services | | 0.1 | |
Auto Components | | 0.1 | |
| | | |
| | 119.6 | |
Options Written and Security Sold Short | | (1.6 | ) |
Other liabilities in excess of other assets | | (18.0 | ) |
| | | |
| | 100.0 | % |
| | | |
See Notes to Financial Statements.
| | |
| Target Asset Allocation Funds/Target Conservative Allocation Fund | | 43 |
Statement of Assets and Liabilities
January 31, 2009 (Unaudited)
| | | | |
Assets | | | | |
Investments at value: | | | | |
Unaffiliated investments (cost $152,952,567) | | $ | 134,747,172 | |
Affiliated investments (cost $7,626,623) | | | 7,626,623 | |
Cash | | | 388,600 | |
Receivable for investments sold | | | 25,126,235 | |
Foreign currency, at value (cost $2,323,149) | | | 2,309,959 | |
Dividends and interest receivable | | | 1,068,763 | |
Unrealized appreciation on foreign currency exchange contracts | | | 397,821 | |
Unrealized appreciation on swap agreements | | | 4,596,745 | |
Receivable for Fund shares sold | | | 62,381 | |
Prepaid expenses | | | 1,816 | |
| | | | |
Total assets | | | 176,326,115 | |
| | | | |
| |
Liabilities | | | | |
Payable for investments purchased | | | 48,881,229 | |
Unrealized depreciation on swap agreements | | | 4,292,947 | |
Securities sold short, at value (proceeds $1,007,812) | | | 1,003,125 | |
Options written (premiums received $313,439) | | | 915,904 | |
Due to broker | | | 580,000 | |
Unrealized depreciation on foreign currency exchange contracts | | | 315,987 | |
Payable for Fund shares reacquired | | | 328,975 | |
Premium received for swap agreements | | | 288,920 | |
Payable to custodian | | | 260,417 | |
Accrued expenses and other liabilities | | | 152,773 | |
Management fee payable | | | 79,308 | |
Transfer agent fee payable | | | 67,682 | |
Distribution fee payable | | | 64,620 | |
Payable to broker-variation margin | | | 37,738 | |
Deferred trustees’ fees | | | 7,986 | |
| | | | |
Total liabilities | | | 57,277,611 | |
| | | | |
| |
Net Assets | | $ | 119,048,504 | |
| | | | |
| | | | | |
Net assets were comprised of: | | | | |
Shares of beneficial interest, at par | | $ | 15,864 | |
Paid-in capital, in excess of par | | | 154,831,203 | |
| | | | |
| | | 154,847,067 | |
Distributions in excess of net investment income | | | (3,235,351 | ) |
Accumulated net realized loss on investment and foreign currency transactions | | | (15,545,154 | ) |
Net unrealized depreciation on investments and foreign currencies | | | (17,018,058 | ) |
| | | | |
Net assets, January 31, 2009 | | $ | 119,048,504 | |
| | | | |
See Notes to Financial Statements.
| | |
| 44 | | Visit our website at www.prudential.com |
| | | |
Class A: | | | |
Net asset value and redemption price per share
($55,911,876 ÷ 7,442,265 shares of beneficial interest issued and outstanding) | | $ | 7.51 |
Maximum sales charge (5.50% of offering price) | | | .44 |
| | | |
Maximum offering price to public | | $ | 7.95 |
| | | |
| |
Class B: | | | |
Net asset value, offering price and redemption price per share
($35,723,593 ÷ 4,766,210 shares of beneficial interest issued and outstanding) | | $ | 7.50 |
| | | |
| |
Class C: | | | |
Net asset value, offering price and redemption price per share
($21,643,278 ÷ 2,888,040 shares of beneficial interest issued and outstanding) | | $ | 7.49 |
| | | |
| |
Class M: | | | |
Net asset value, offering price and redemption price per share
($552,422 ÷ 73,686 shares of beneficial interest issued and outstanding) | | $ | 7.50 |
| | | |
| |
Class R: | | | |
Net asset value, offering price and redemption price per share
($667,871 ÷ 88,736 shares of beneficial interest issued and outstanding) | | $ | 7.53 |
| | | |
| |
Class X: | | | |
Net asset value, offering price and redemption price per share
($1,065,162 ÷ 142,099 shares of beneficial interest issued and outstanding) | | $ | 7.50 |
| | | |
| |
Class Z: | | | |
Net asset value, offering price and redemption price per share
($3,484,302 ÷ 463,229 shares of beneficial interest issued and outstanding) | | $ | 7.52 |
| | | |
See Notes to Financial Statements.
| | |
| Target Asset Allocation Funds/Target Conservative Allocation Fund | | 45 |
Statement of Operations
Six Months Ended January 31, 2009 (Unaudited)
| | | | |
Net Investment Income | | | | |
Income | | | | |
Unaffiliated interest income | | $ | 2,466,177 | |
Unaffiliated dividend income (net of foreign withholding taxes $113) | | | 703,582 | |
Affiliated dividend income | | | 99,253 | |
| | | | |
| | | 3,269,012 | |
| | | | |
| |
Expenses | | | | |
Management fee | | | 529,057 | |
Distribution fee—Class A | | | 77,104 | |
Distribution fee—Class B | | | 226,350 | |
Distribution fee—Class C | | | 125,958 | |
Distribution fee—Class M | | | 3,939 | |
Distribution fee—Class R | | | 4,606 | |
Distribution fee—Class X | | | 7,827 | |
Custodian’s fees and expenses | | | 145,000 | |
Transfer agent’s fees and expenses (including affiliated expense of $38,000) | | | 115,000 | |
Registration fees | | | 33,000 | |
Reports to shareholders | | | 29,000 | |
Audit fee | | | 25,000 | |
Legal fee | | | 9,000 | |
Trustees’ fees | | | 7,000 | |
Insurance expense | | | 1,000 | |
Miscellaneous | | | 6,185 | |
| | | | |
Total expenses | | | 1,345,026 | |
| | | | |
Net investment income | | | 1,923,986 | |
| | | | |
| |
Net Realized And Unrealized Gain (Loss) On Investments And Foreign Currencies | | | | |
Net realized gain (loss) on: | | | | |
Investment transactions | | | (11,272,461 | ) |
Options written transactions | | | 89,472 | |
Foreign currency transactions | | | 606,348 | |
Futures transactions | | | (3,306,574 | ) |
Swap agreement transactions | | | 2,919,226 | |
Short sale transactions | | | (1,347,020 | ) |
| | | | |
| | | (12,311,009 | ) |
| | | | |
Net change in unrealized appreciation (depreciation) on: | | | | |
Investments | | | (17,388,835 | ) |
Foreign currencies | | | 285,441 | |
Futures | | | 1,219,179 | |
Swap agreements | | | 77,948 | |
Short Sales | | | (146,467 | ) |
Options written | | | (1,034,726 | ) |
| | | | |
| | | (16,987,460 | ) |
| | | | |
Net loss on investments and foreign currencies | | | (29,298,469 | ) |
| | | | |
Net Decrease In Net Assets Resulting From Operations | | $ | (27,374,483 | ) |
| | | | |
See Notes to Financial Statements.
| | |
| 46 | | Visit our website at www.prudential.com |
Statement of Changes in Net Assets
(Unaudited)
| | | | | | | | |
| | | Six Months
Ended January 31, 2009 | | | Year
Ended July 31, 2008 | |
Increase (Decrease) In Net Assets | | | | | | | | |
Operations | | | | | | | | |
Net investment income | | $ | 1,923,986 | | | $ | 3,939,778 | |
Net realized gain (loss) on investment and foreign currency transactions | | | (12,311,009 | ) | | | 5,950,182 | |
Net change in unrealized appreciation (depreciation) on investments and foreign currencies | | | (16,987,460 | ) | | | (11,541,053 | ) |
| | | | | | | | |
Net decrease in net assets resulting from operations | | | (27,374,483 | ) | | | (1,651,093 | ) |
| | | | | | | | |
| | |
Dividends and Distributions (Note 1) | | | | | | | | |
Dividends from net investment income: | | | | | | | | |
Class A | | | (2,936,462 | ) | | | (1,725,649 | ) |
Class B | | | (1,874,569 | ) | | | (1,251,835 | ) |
Class C | | | (1,089,705 | ) | | | (582,587 | ) |
Class M | | | (33,447 | ) | | | (40,141 | ) |
Class R | | | (48,509 | ) | | | (106,615 | ) |
Class X | | | (65,178 | ) | | | (48,312 | ) |
Class Z | | | (234,198 | ) | | | (166,060 | ) |
| | | | | | | | |
| | | (6,282,068 | ) | | | (3,921,199 | ) |
| | | | | | | | |
Distributions from net realized gains: | | | | | | | | |
Class A | | | (1,826,262 | ) | | | (3,033,792 | ) |
Class B | | | (1,168,700 | ) | | | (3,278,171 | ) |
Class C | | | (701,143 | ) | | | (1,469,678 | ) |
Class M | | | (20,383 | ) | | | (127,929 | ) |
Class R | | | (27,725 | ) | | | (237,051 | ) |
Class X | | | (36,500 | ) | | | (111,378 | ) |
Class Z | | | (139,433 | ) | | | (249,783 | ) |
| | | | | | | | |
| | | (3,920,146 | ) | | | (8,507,782 | ) |
| | | | | | | | |
| | |
Fund share transactions (Net of share conversions) (Note 6) | | | | | | | | |
Net proceeds from shares sold | | | 9,387,448 | | | | 27,307,677 | |
Net asset value of shares issued in reinvestment of dividends and distributions | | | 9,495,838 | | | | 11,557,664 | |
Cost of shares reacquired | | | (29,727,884 | ) | | | (48,763,130 | ) |
| | | | | | | | |
Net decrease in net assets resulting from Fund share transactions | | | (10,844,598 | ) | | | (9,897,789 | ) |
| | | | | | | | |
Total decrease | | | (48,421,295 | ) | | | (23,977,863 | ) |
| | |
Net Assets | | | | | | | | |
Beginning of period | | | 167,469,799 | | | | 191,447,662 | |
| | | | | | | | |
End of period(a) | | $ | 119,048,504 | | | $ | 167,469,799 | |
| | | | | | | | |
(a) Includes undistributed net income of: | | $ | — | | | $ | 1,122,731 | |
| | | | | | | | |
See Notes to Financial Statements.
| | |
| Target Asset Allocation Funds/Target Conservative Allocation Fund | | 47 |
Notes to Financial Statements
(Unaudited)
Target Asset Allocation Funds (the “Trust”) is registered under the Investment Company Act of 1940 as an open-end, diversified management investment company presently consisting of three portfolios: Target Moderate Allocation Fund, Target Conservative Allocation Fund (the “Fund”) and Target Growth Allocation Fund. These financial statements relate only to Target Conservative Allocation Fund. The financial statements of the other portfolios are not presented herein. The Trust was organized as a business trust in Delaware on July 29, 1998.
The Fund uses investment managers (“Subadvisors”), each managing a portion of the Fund’s assets. The following lists the Subadvisors and their respective segment during the six months ended January 31, 2009.
| | |
Fund Segment | | Subadvisors |
| Large-Cap value stocks | | Hotchkis & Wiley Capital Management Eaton Vance Management* NFJ Investment Group L.P. |
| |
| Large-Cap growth stocks | | Marsico Capital Management, LLC Massachusetts Financial Services Company** |
| |
| Core Fixed income bonds | | Pacific Investment Management Company LLC |
| |
| Small-Cap value stocks | | EARNEST Partners, LLC Vaughan Nelson Investment Management, L.P. |
| |
| Small-Cap growth stocks | | Eagle Asset Management, Inc. |
| * | Effective December 13, 2008 Eaton Vance Management replaced J.P. Morgan Investment Management Inc. |
| ** | Effective December 13, 2008, Massachusetts Financial Services Company replaced Goldman Sachs Asset Management L.P. |
The investment objective of the Fund is to provide current income and a reasonable level of capital appreciation. The Fund seeks to achieve its investment objective by investing in a diversified portfolio of debt obligations and equity securities. The ability of the issuers of the debt securities held by the Fund to meet their obligations may be affected by economic developments in a specific industry or country.
Note 1. Accounting Policies
The following is a summary of significant accounting policies followed by the Trust in the preparation of its financial statements.
| | |
| 48 | | Visit our website at www.prudential.com |
Securities Valuation: Securities listed on a securities exchange (other than options on securities and indices) are valued at the last sale price on such exchange on the day of valuation or, if there was no sale on such day, at the mean between the last reported bid and asked prices, or at the last bid price on such day in the absence of an asked price. Securities traded via Nasdaq are valued at the official closing price provided by Nasdaq. Securities that are actively traded in the over-the-counter market, including listed securities for which the primary market is believed by Prudential Investments LLC (“PI” or “Manager”), in consultation with the Subadvisers, to be over- the-counter, are valued at market value using prices provided by an independent pricing agent or principal market maker. Futures contracts and options thereon traded on a commodities exchange or board of trade are valued at the last sale price at the close of trading on such exchange or board of trade or, if there was no sale on the applicable commodities exchange or board of trade on such day, at the mean between the most recently quoted prices on such exchange or board of trade or at the last bid price in the absence of an asked price. Certain fixed income securities for which daily market quotations are not readily available may be valued with reference to fixed income securities whose prices are more readily available, pursuant to guidelines established by the Board of Trustees. Prices may be obtained from independent pricing services which use information provided by market makers or estimates of market values obtained from yield data relating to investments or securities with similar characteristics. Securities for which reliable market quotations are not readily available, or whose values have been affected by events occurring after the close of the security’s foreign market and before the Fund’s normal pricing time, are valued at fair value in accordance with Board of Trustees’ approved fair valuation procedures. When determining the fair valuation of securities some of the factors influencing the valuation include the nature of any restrictions on disposition of the securities; assessment of the general liquidity of the securities; the issuer’s financial condition and the markets in which it does business; the cost of the investment; the size of the holding and the capitalization of issuer; the prices of any recent transactions or bids/offers for such securities or any comparable securities; any available analyst media or other reports or information deemed reliable by the investment advisor regarding the issuer or the markets or industry in which it operates. Using fair value to price securities may result in a value that is different from a security’s most recent closing price and from the price used by other mutual funds to calculate their net asset values.
Investments in mutual funds are valued at their net asset value as of the close of the New York Stock Exchange on the date of valuation.
Short-term debt securities, which mature in sixty days or less, are valued at amortized cost, which approximates market value. The amortized cost method involves valuing a security at its cost on the date of purchase and thereafter assuming a constant
| | |
| Target Asset Allocation Funds/Target Conservative Allocation Fund | | 49 |
Notes to Financial Statements
(Unaudited) continued
amortization to maturity of the difference between the principal amount due at maturity and cost. Short-term debt securities, which mature in more than sixty days are valued at current market quotations.
Foreign Currency Translation: The books and records of the Fund are maintained in U.S. dollars. Foreign currency amounts are translated into U.S. Dollars on the following basis:
(i) market value of investment securities, other assets and liabilities-at the current daily rates of exchange.
(ii) purchases and sales of investment securities, income and expenses-at the rate of exchange prevailing on the respective dates of such transactions.
Although the net assets of the Fund are presented at the foreign exchange rates and market values at the close of the period, the Fund does not isolate that portion of the results of operations arising as a result of changes in the foreign exchange rates from the fluctuations arising from changes in the market prices of securities held at the end of the period. Similarly, the Fund does not isolate the effect of changes in foreign exchange rates from the fluctuations arising from changes in the market prices of portfolio securities sold during the period. Accordingly, realized foreign currency gains or losses are included in the reported net realized gains or losses on investment transactions.
Net realized gains or losses on foreign currency transactions represent net foreign exchange gains or losses from the holding of foreign currencies, currency gains or losses realized between the trade and settlement dates on security transactions, and the difference between the amounts of dividends, interest and foreign withholding taxes recorded on the Fund’s books and the U.S. dollar equivalent amounts actually received or paid. Net unrealized currency gains or losses from valuing foreign currency denominated assets and liabilities (other than investments) at period end exchange rates are reflected as a component of net unrealized appreciation (depreciation) on investments and foreign currencies. Foreign security and currency transactions may involve certain considerations and risks not typically associated with those of domestic origin as a result of, among other factors, the possibility of political and economic instability and the level of governmental supervision and regulation of foreign securities markets.
Forward Currency Contracts: A forward currency contract is a commitment to purchase or sell a foreign currency at a future date at a negotiated forward rate. The
| | |
| 50 | | Visit our website at www.prudential.com |
Fund may enter into forward currency contracts in order to hedge its exposure to changes in foreign currency exchange rates on its foreign portfolio holdings or on specific receivables and payables denominated in a foreign currency. The contracts are valued daily at current exchange rates and any unrealized gain or loss is included in the Statement of Assets and Liabilities as in unrealized appreciation and/or depreciation on forward foreign currency contracts. Gain or loss is realized on the settlement date of the contract equal to the difference between the settlement value of the original and renegotiated forward contracts. This gain or loss, if any, is included in net realized gain or loss on foreign currency transactions. Risks may arise upon entering into these contracts from the potential inability of the counterparties to meet the terms of their contracts.
Options: The Fund may either purchase or write options in order to hedge against adverse market movements or fluctuations in value caused by changes in prevailing interest rates or foreign currency exchange rates with respect to securities or currencies which the Fund currently owns or intends to purchase. The Fund’s principal reason for writing options is to realize, through receipt of premiums, a greater current return than would be realized on the underlying security alone. When the Fund writes an option, it receives a premium and an amount equal to that premium is recorded as a liability. When the Fund purchases an option, it pays a premium and an amount equal to that premium is recorded as an asset. The asset or liability is adjusted daily to reflect the current market value of the option.
If an option expires unexercised, the Fund realizes a gain or loss to the extent of the premium received or paid. If an option is exercised, the premium received or paid is recorded as an adjustment to the proceeds from the sale or the cost basis of the purchase in determining whether the Fund has realized a gain or loss. The difference between the premium and the amount received or paid on effecting a closing purchase or sale transaction is also treated as a realized gain or loss. Gain or loss on purchased options is included in net realized gain or loss on investment transactions. Gain or loss on written options is presented separately as net realized gain or loss on options written.
The Fund, as writer of an option, has no control over whether the underlying securities or currencies may be sold (called) or purchased (put). As a result, the Fund bears the market risk of an unfavorable change in the price of the security or currency underlying the written option. The Fund, as purchaser of an option, bears the risk of the potential inability of the counterparties to meet the terms of their contracts.
When a Fund writes an option on a swap contract, an amount equal to any premium received by the Fund is recorded as a liability and is subsequently adjusted to the
| | |
| Target Asset Allocation Funds/Target Conservative Allocation Fund | | 51 |
Notes to Financial Statements
(Unaudited) continued
current market value of the written option on the swap. If a call option on a swap is exercised, the Fund becomes obligated to pay a fixed interest rate (noted as the strike price) and receive a variable interest rate on a notional amount. If a put option on a swap is exercised, the Fund becomes obligated to pay a variable interest rate and receive a fixed interest rate (noted as the strike price) on a notional amount. Premiums received from writing options on swaps that expire or are exercised are treated as realized gains upon the expiration or exercise of such options on swaps. The risk associated with writing put and call options on swaps, is that the Portfolio will be obligated to be party to a swap agreement if an option on a swap is exercised.
Short Sales: The Fund may make short sales of securities as a method of hedging potential price declines in similar securities owned. The Fund may sell a security it does not own in anticipation of a decline in the market value of that security (short sale). When the Fund makes a short sale, it will borrow the security sold short and deliver it to the broker-dealer through which it made the short sale as collateral for its obligation to deliver the security upon conclusion of the sale. The Fund may have to pay a fee to borrow the particular securities and may be obligated to return any interest or dividends received on such borrowed securities.
A gain, limited to the price at which the Fund sold the security short, or a loss, unlimited as to dollar amount, will be recognized upon the termination of a short sale if the market price is less or greater than the proceeds originally received, respectively, and is presented in the Statement of Operations as net realized gain or loss on short sales.
Swap Agreements: The Fund may enter into credit default, interest rate, total return and other forms of swap agreements. A swap agreement is an agreement to exchange the return generated by one instrument for the return generated by another instrument. In connection with these agreements, securities may be identified as collateral or received as collateral from the counterparty in accordance with the terms of the respective swap agreements to provide or receive assets of value and serve as recourse in the event of default or bankruptcy/insolvency of either party.
Interest rate swaps represent an agreement between counterparties to exchange cash flows based on the difference between two interest rates, applied to a notional principal amount for a specified period.
| | |
| 52 | | Visit our website at www.prudential.com |
Credit default swaps involve one party (the protection buyer) making a stream of payments to another party (the protection seller) in exchange for the right to receive a specified payment in the event of a default or as a result of a default (“credit event”) for the referenced party, typically corporate issues or sovereign issues of an emerging country, on its obligation; or in the event of a write-down, principal shortfall, interest shortfall or default of all or part of the referenced entities comprising a credit index.
The Fund may use credit default swaps to provide a measure of protection against defaults of the issuers or to take an active long or short position with respect to the likelihood of a particular issuer’s default. The Fund may use credit default swaps on credit indices to hedge a portfolio of credit default swaps or bonds, which is less expensive than it would be to buy many credit default swaps to achieve a similar effect.
As a seller of protection on credit default swap agreements, the Fund will generally receive from the buyer of protection an agreed upon payment throughout the term of the swap provided that there is no credit event. As the seller, the Fund would effectively increase investment risk to its portfolio because, in addition to its total net assets, the Fund may be subject to investment exposure on the notional amount of the swap.
The maximum amount of the payments that the Fund as a seller of protection could be required to pay under a credit default swap agreement would be equal the notional amount of the underlying security or index contract as a result of a credit event. These potential amounts will be partially offset by any recovery values of the respective referenced obligations, or net amounts received from the settlement of buy protection credit default swap agreements entered into by the Fund for the same referenced entity or index. As a buyer of protection, the Fund generally receives an amount up to the notional value of the swap if a credit event occurs.
Implied credit spreads, represented in absolute terms, utilized in determining the fair value of credit default swap agreements on corporate issues or sovereign issues of an emerging country as of reporting date are disclosed in the footnotes to the Schedules of Investments and serve as an indicator of the current status of the payment/performance risk and represent the likelihood of risk of default for the credit derivative. The implied credit spread of a particular referenced entity reflects the cost of buying/selling protection and may include upfront payments required to enter into the agreement. For credit default swap agreements on asset-backed securities and credit indices, the fair values serve as the indicator of the current status of the payment/performance risk. Wider credits spreads and increasing fair value in absolute terms, when compared to the notional amount of the swap, represent a deterioration of the referenced entity’s credit soundness and a greater likelihood of risk of default or other credit event occurring as defined under the terms of the agreement.
| | |
| Target Asset Allocation Funds/Target Conservative Allocation Fund | | 53 |
Notes to Financial Statements
(Unaudited) continued
Some Funds may enter into total return swaps to manage their exposure to a security, commodity or an index. In a total return swap, one party would receive payments based on the market value of the security or the commodity involved, or total return of a specific referenced asset, such as an equity, index or bond, and in return pay a fixed amount.
These swap agreements involve, to varying degrees, elements of credit, market risk and documentation risk. Such risks involve the possibility that there will be no liquid market for these agreements, that the counterparty to the agreement may default on its obligation to perform or disagree as to the meaning of the contractual terms in the agreement, and that there will be unfavorable changes in net interest rates. The swaps are valued daily at current fair value and any change in value is included in the net unrealized appreciation or depreciation on investments. Payments received or paid by the Fund are recorded as realized gains or losses upon termination or maturity of the swap. Risk of loss may exceed amounts recognized on the statements of assets and liabilities. Swap agreements outstanding at reporting date, if any, are listed on the Schedule of Investments.
Certain Funds have entered into over-the-counter derivative agreements. Such agreements include conditions which when materialized, give the counterparty the right to cause an early termination of the transactions under those agreements. Any election by the counterparty for early termination the contract(s) may impact the amounts reported on financial statements. As of January 31, 2009 , Target Conservative Allocation Fund has not met conditions under such agreements, which give the counterparty the right to call for an early termination.
Repurchase Agreements: In connection with transactions in repurchase agreements with United States financial institutions, it is the Fund’s policy that its custodian or designated subcustodians under triparty repurchase agreements, as the case may be, take possession of the underlying collateral securities, the value of which exceeds the principal amount of the repurchase transaction, including accrued interest. To the extent that any repurchase transaction exceeds one business day, the value of the collateral is marked-to-market on a daily basis to ensure the adequacy on the collateral. If the seller defaults and the value of the collateral declines or if bankruptcy proceedings are commenced with respect to the seller of the security, realization of the collateral by the Fund may be delayed or limited.
| | |
| 54 | | Visit our website at www.prudential.com |
Financial Futures Contracts: A financial futures contract is an agreement to purchase (long) or sell (short) an agreed amount of securities at a set price for delivery on a future date. Upon entering into a financial futures contract, the Fund is required to pledge to the broker an amount of cash and/or other assets equal to a certain percentage of the contract amount. This amount is known as the “initial margin.” Subsequent payments known as “variation margin,” are made or received by the Fund each day, depending on the daily fluctuations in the value of the underlying security. Such variation margin is recorded for financial statement purposes on a daily basis as unrealized gain or loss. When the contract expires or is closed, the gain or loss is realized and is presented in the Statement of Operations as net realized gain or loss on financial futures contracts.
The Fund invests in financial futures contracts in order to hedge its existing portfolio securities, or securities the Fund intends to purchase, against fluctuations in value caused by changes in prevailing interest rates or market conditions. Should interest rates move unexpectedly, the Fund may not achieve the anticipated benefits of the financial futures contracts and may realize a loss. The use of futures transactions involves the risk of imperfect correlation in movements in the price of futures contracts, interest rates and the underlying hedged assets.
When-Issued/Delayed Delivery Securities: Securities purchased or sold on a when issued or delayed-delivery basis may be settled a month or more after trade date; interest income is not accrued until settlement date. At the time a fund enters into such transactions, it instructs the custodian to segregate assets with a current value at least equal to the amount of its when-issued or delayed-delivery purchase commitments.
Securities Transactions and Net Investment Income: Securities transactions are recorded on the trade date. Realized gains or losses on sales of securities are calculated on the identified cost basis. Dividend income is recorded on the ex-dividend date and interest income, including amortization of premium and accretion of discount on debt securities as required, is recorded on the accrual basis. Expenses are recorded on the accrual basis. Net investment income or loss (other than distribution fees, which are charged directly to respective class) and unrealized and realized gains or losses, are allocated daily to each class of shares based upon the relative proportion of net assets of each class at the beginning of the day.
Dividends and Distributions: The Fund expects to pay dividends of net investment income quarterly, and distributions of net realized capital and currency gains, if any, annually. Dividends and distributions to shareholders, which are determined in accordance with federal income tax regulations and which may differ from generally accepted accounting principles, are recorded on the ex-dividend date. Permanent book/tax differences relating to income and gains are reclassified amongst
| | |
| Target Asset Allocation Funds/Target Conservative Allocation Fund | | 55 |
Notes to Financial Statements
(Unaudited) continued
undistributed net investment income, accumulated net realized gain or loss and paid in capital in excess of par as appropriate.
Taxes: It is the Fund’s policy to continue to meet the requirements of the Internal Revenue Code applicable to regulated investment companies and to distribute all of its taxable net investment income and capital gains, if any, to its shareholders. Therefore, no federal income tax provision is required.
Withholding taxes on foreign dividends are recorded net of reclaimable amounts, at the time the related income is earned.
Estimates: The preparation of the financial statements requires management to make estimates and assumptions that affect the reported amounts and disclosures in the financial statements. Actual results could differ from those estimates.
Note 2. Agreements
The Trust has a management agreement with PI. Pursuant to this agreement, PI manages the investment operations of the Fund, administers the Fund’s affairs and supervises the Subadvisers’ performance of all investment advisory services. Pursuant to the advisory agreement, PI pays the cost of compensation of officers of the Fund, occupancy and certain clerical and accounting costs of the Fund. The Fund bears all other costs and expenses. The management fee paid to PI is computed daily and payable monthly at an annual rate of .75 of 1% of average daily net assets up to $500 million, .70 of 1% of average daily net assets for the next $500 million and .65 of 1% of average daily net assets in excess of $1 billion. The effective management fee rate was .75 of 1% for the six months ended January 31, 2009.
The Fund has a distribution agreement with Prudential Investment Management Services LLC (“PIMS”) which acts as the distributor of the Class A, Class B, Class C, Class M, Class R, Class X and Class Z shares of the Fund. The Fund compensates PIMS for distributing and servicing the Fund’s Class A, Class B, Class C, Class M, Class R and Class X shares, pursuant to plans of distribution (the Distribution Plans”), regardless of expenses actually incurred by PIMS. The distribution fees are accrued daily and payable monthly. No distribution or service fees are paid to PIMS as distributor for Class Z shares of the Fund.
Pursuant to the Distribution Plans, the Fund compensates PIMS for distribution related activities at an annual rate of up to .30 of 1%, 1%, 1%, 1%, .75 of 1% and 1% of the
| | |
| 56 | | Visit our website at www.prudential.com |
average daily net assets of the Class A, B, C, M, R and X shares, respectively. Such expenses under the plans were .25 of 1%, 1%, 1%, 1%, .50 of 1% and 1% of the average daily net assets of the Class A, B, C, M, R and X shares, respectively, for the six months ended January 31, 2009.
PIMS has advised the Fund that it has received approximately $23,600 in front-end sales charges resulting from sales of Class A shares during the six months ended January 31, 2009. From these fees, PIMS paid such sales charges to broker-dealers, which in turn paid commissions to sales persons and incurred other distribution costs. PIMS has advised the Fund that for the six months ended January 31, 2009, it has received approximately $58,200, $1,200, $1,700 and $150 in contingent deferred sales charges imposed upon certain redemptions by Class B, Class C, Class M and Class X shareholders, respectively.
PIMS and PI are indirect, wholly-owned subsidiaries of Prudential Financial, Inc. (“Prudential”).
Note 3. Other Transactions with Affiliates
Prudential Mutual Fund Services LLC (“PMFS”), an affiliate of PI, and an indirect, wholly-owned subsidiary of Prudential, serves as the Fund’s transfer agent. Transfer agent fees and expenses in the Statement of Operations include certain out-of-pocket expenses paid to non-affiliates, where applicable.
The Fund pays networking fees to affiliated and unaffiliated broker/dealers, including fees related to the services of First Clearing, LLC (“First Clearing”), an affiliate of PI. These networking fees are payments made to broker/dealers that clear mutual fund transactions through a national clearing system. For the six months ended January 31, 2009, the Fund incurred approximately $14,900 in total networking fees, of which $6,800 was paid to First Clearing. These amounts are included in transfer agent’s fees and expenses in the Statement of Operations.
The Fund invests in the Taxable Money Market Series (the “Series”), a portfolio of Dryden Core Investment Fund, formally known as Prudential Core Investment Fund. The Series is a money market mutual fund registered under the Investment Company Act of 1940, as amended, and managed by PI. Earnings from the Series are disclosed on the Statement of Operations as affiliated dividends.
Note 4. Portfolio Securities
Purchases and sales of portfolio securities, excluding short-term investments and U.S. Government investments, for the six months ended January 31, 2009, aggregated $246,782,148 and $263,702,679, respectively.
| | |
| Target Asset Allocation Funds/Target Conservative Allocation Fund | | 57 |
Notes to Financial Statements
(Unaudited) continued
Transactions in options/swap options written during the six months ended January 31, 2009, were as follows:
| | | | | | | |
| | | Number of
Contracts/
Notional Amount | | | Premiums
Received | |
Options outstanding at July 31, 2008 | | 38,500,000 | | | $ | 957,144 | |
Written options | | 39,800,000 | | | | 8,460 | |
Expired options | | (7,000,000 | ) | | | (44,325 | ) |
Closed options | | (26,000,000 | ) | | | (607,840 | ) |
| | | | | | | |
Options outstanding at January 31, 2009 | | 45,300,000 | | | $ | 313,439 | |
| | | | | | | |
Note 5. Distributions and Tax Information
The United States federal income tax basis of the Fund’s investments and the net unrealized depreciation as of January 31, 2009 were as follows:
| | | | | | |
Tax Basis | | Appreciation | | Depreciation | | Net
Unrealized Depreciation
on Investments |
$165,341,419 | | $3,607,862 | | $(26,575,486) | | $(22,967,624) |
The difference between book basis and tax basis was primarily attributable to deferred losses on wash sales and investments in real estate investment trusts.
Management has analyzed the Fund’s tax positions taken on federal income tax returns for all open tax years and has concluded that as of January 31, 2009, no provision for income tax would be required in the Fund’s financial statements. The Fund’s federal and state income and federal excise tax returns for tax years for which the applicable statutes of limitations have not expired are subject to examination by the Internal Revenue Service and state departments of revenue.
Note 6. Capital
The Fund offers Class A, Class B, Class C, Class M, Class R, Class X and Class Z shares. Class A shares are subject to a maximum front-end sales charge of 5.50%. Investors who purchase $1 million or more of Class A shares and sell these shares
| | |
| 58 | | Visit our website at www.prudential.com |
within 12 months of purchase are not subject to an initial sales charge but are subject to a contingent deferred sales charge (CDSC) of 1%, including investors who purchase their shares through broker-dealers affiliated with Prudential. Class B shares are subject to a CDSC of 5%, which decreases by 1% annually to 1% in the fifth and sixth years and 0% in the seventh year. Class B shares automatically convert to Class A shares on a quarterly basis approximately seven years after purchase. The CDSC for Class C shares is 1% for shares redeemed within 12 months of purchase. Class M shares are generally closed to new purchases. Class M shares are subject to a CDSC of 6%, which decreases by 1% annually to 2% in the fifth and sixth years and 1% in the seventh year. Class M shares automatically convert to Class A shares approximately eight years after purchase. Class X shares are generally closed to new purchases. Class X shares are subject to a CDSC of 6%, which decreases by 1% annually to 4% in the third and fourth years, by 1% annually to 2% in the sixth and seventh years, and 1% in the eighth year. Class X shares automatically convert to Class A shares on a quarterly basis approximately ten years after purchase. An exchange privilege is also available for shareholders who qualify to purchase Class A shares at net asset value. Class R and Class Z shares are not subject to any sales or redemption charge and are offered exclusively for sale to a limited group of investors.
The Fund has authorized an unlimited number of shares of beneficial interest at $.001 par value per share. As of January 31, 2009, Prudential owned 245 shares of Class R shares.
Transactions in shares of beneficial interest were as follows:
| | | | | | | |
Class A | | Shares | | | Amount | |
Six months ended January 31, 2009: | | | | | | | |
Shares sold | | 582,724 | | | $ | 5,041,505 | |
Shares issued in reinvestment of dividends and distributions | | 571,932 | | | | 4,492,654 | |
Shares reacquired | | (1,146,643 | ) | | | (9,822,648 | ) |
| | | | | | | |
Net increase (decrease) in shares outstanding before conversion | | 8,013 | | | | (288,489 | ) |
Shares issued, upon conversion from Class B , Class M, and Class X | | 480,897 | | | | 4,299,762 | |
| | | | | | | |
Net increase (decrease) in shares outstanding | | 488,910 | | | $ | 4,011,273 | |
| | | | | | | |
Year ended July 31, 2008: | | | | | | | |
Shares sold | | 708,999 | | | $ | 7,558,267 | |
Shares issued in reinvestment of dividends and distributions | | 234,424 | | | | 2,495,939 | |
Shares reacquired | | (1,672,038 | ) | | | (17,823,019 | ) |
| | | | | | | |
Net increase (decrease) in shares outstanding before conversion | | (728,615 | ) | | | (7,768,813 | ) |
Shares issued, upon conversion from Class B , Class M, and Class X | | 793,444 | | | | 8,402,196 | |
| | | | | | | |
Net increase (decrease) in shares outstanding | | 64,829 | | | $ | 633,383 | |
| | | | | | | |
| | |
| Target Asset Allocation Funds/Target Conservative Allocation Fund | | 59 |
Notes to Financial Statements
(Unaudited) continued
| | | | | | | |
Class B | | Shares | | | Amount | |
Six months ended January 31, 2009: | | | | | | | |
Shares sold | | 123,200 | | | $ | 1,076,981 | |
Shares issued in reinvestment of dividends and distributions | | 365,773 | | | | 2,873,275 | |
Shares reacquired | | (1,053,786 | ) | | | (8,997,667 | ) |
| | | | | | | |
Net increase (decrease) in shares outstanding before conversion | | (564,813 | ) | | | (5,047,411 | ) |
Shares reacquired upon conversion into Class A | | (460,038 | ) | | | (4,102,770 | ) |
| | | | | | | |
Net increase (decrease) in shares outstanding | | (1,024,851 | ) | | $ | (9,150,181 | ) |
| | | | | | | |
Year ended July 31, 2008: | | | | | | | |
Shares sold | | 360,646 | | | $ | 3,829,609 | |
Shares issued in reinvestment of dividends and distributions | | 297,375 | | | | 3,158,718 | |
Shares reacquired | | (1,650,176 | ) | | | (17,542,206 | ) |
| | | | | | | |
Net increase (decrease) in shares outstanding before conversion | | (992,155 | ) | | | (10,553,879 | ) |
Shares reacquired upon conversion into Class A | | (763,338 | ) | | | (8,065,713 | ) |
| | | | | | | |
Net increase (decrease) in shares outstanding | | (1,755,493 | ) | | $ | (18,619,592 | ) |
| | | | | | | |
Class C | | | | | | |
Six months ended January 31, 2009: | | | | | | | |
Shares sold | | 174,116 | | | $ | 1,508,852 | |
Shares issued in reinvestment of dividends and distributions | | 200,023 | | | | 1,569,339 | |
Shares reacquired | | (482,966 | ) | | | (4,087,207 | ) |
| | | | | | | |
Net increase (decrease) in shares outstanding | | (108,827 | ) | | $ | (1,009,016 | ) |
| | | | | | | |
Year ended July 31, 2008: | | | | | | | |
Shares sold | | 429,500 | | | $ | 4,541,607 | |
Shares issued in reinvestment of dividends and distributions | | 103,500 | | | | 1,099,586 | |
Shares reacquired | | (901,063 | ) | | | (9,586,340 | ) |
| | | | | | | |
Net increase (decrease) in shares outstanding | | (368,063 | ) | | $ | (3,945,147 | ) |
| | | | | | | |
Class M | | | | | | |
Six months ended January 31, 2009: | | | | | | | |
Shares sold | | 13,716 | | | $ | 122,554 | |
Shares issued in reinvestment of dividends and distributions | | 6,589 | | | | 51,861 | |
Shares reacquired | | (43,616 | ) | | | (366,882 | ) |
| | | | | | | |
Net increase (decrease) in shares outstanding before conversion | | (23,311 | ) | | | (192,467 | ) |
Shares reacquired upon conversion into Class A | | (9,605 | ) | | | (84,415 | ) |
| | | | | | | |
Net increase (decrease) in shares outstanding | | (32,916 | ) | | $ | (276,882 | ) |
| | | | | | | |
| | |
| 60 | | Visit our website at www.prudential.com |
| | | | | | | |
Class M | | Shares | | | Amount | |
Year ended July 31, 2008: | | | | | | | |
Shares sold | | 113,195 | | | $ | 1,197,385 | |
Shares issued in reinvestment of dividends and distributions | | 9,071 | | | | 96,359 | |
Shares reacquired | | (148,497 | ) | | | (1,568,630 | ) |
| | | | | | | |
Net increase (decrease) in shares outstanding before conversion | | (26,231 | ) | | | (274,886 | ) |
Shares reacquired upon conversion into Class A | | (31,304 | ) | | | (334,305 | ) |
| | | | | | | |
Net increase (decrease) in shares outstanding | | (57,535 | ) | | $ | (609,191 | ) |
| | | | | | | |
Class R | | | | | | |
Six months ended January 31, 2009: | | | | | | | |
Shares sold | | 20,982 | | | $ | 176,860 | |
Shares issued in reinvestment of dividends and distributions | | 9,651 | | | | 76,191 | |
Shares reacquired | | (349,519 | ) | | | (3,187,563 | ) |
| | | | | | | |
Net increase (decrease) in shares outstanding | | (318,886 | ) | | $ | (2,934,512 | ) |
| | | | | | | |
Year ended July 31, 2008: | | | | | | | |
Shares sold | | 102,568 | | | $ | 1,091,897 | |
Shares issued in reinvestment of dividends and distributions | | 32,644 | | | | 348,127 | |
Shares reacquired | | (32,387 | ) | | | (345,325 | ) |
| | | | | | | |
Net increase (decrease) in shares outstanding | | 102,825 | | | $ | 1,094,699 | |
| | | | | | | |
Class X | | | | | | |
Six months ended January 31, 2009: | | | | | | | |
Shares sold | | 6,576 | | | $ | 55,295 | |
Shares issued in reinvestment of dividends and distributions | | 12,792 | | | | 100,793 | |
Shares reacquired | | (80,347 | ) | | | (643,917 | ) |
| | | | | | | |
Net increase (decrease) in shares outstanding before conversion | | (60,979 | ) | | | (487,829 | ) |
Shares reacquired upon conversion into Class A | | (12,864 | ) | | | (112,577 | ) |
| | | | | | | |
Net increase (decrease) in shares outstanding | | (73,843 | ) | | $ | (600,406 | ) |
| | | | | | | |
Year ended July 31, 2008: | | | | | | | |
Shares sold | | 66,376 | | | $ | 711,109 | |
Shares issued in reinvestment of dividends and distributions | | 8,204 | | | | 87,135 | |
Shares reacquired | | (82,695 | ) | | | (876,344 | ) |
| | | | | | | |
Net increase (decrease) in shares outstanding before conversion | | (8,115 | ) | | | (78,100 | ) |
Shares reacquired upon conversion into Class A | | (202 | ) | | | (2,178 | ) |
| | | | | | | |
Net increase (decrease) in shares outstanding | | (8,317 | ) | | $ | (80,278 | ) |
| | | | | | | |
Class Z | | | | | | |
Six months ended January 31, 2009: | | | | | | | |
Shares sold | | 158,037 | | | $ | 1,405,401 | |
Shares issued in reinvestment of dividends and distributions | | 42,146 | | | | 331,725 | |
Shares reacquired | | (306,695 | ) | | | (2,622,000 | ) |
| | | | | | | |
Net increase (decrease) in shares outstanding | | (106,512 | ) | | $ | (884,874 | ) |
| | | | | | | |
| | |
| Target Asset Allocation Funds/Target Conservative Allocation Fund | | 61 |
Notes to Financial Statements
(Unaudited) continued
| | | | | | | |
Class Z | | Shares | | | Amount | |
Year ended July 31, 2008: | | | | | | | |
Shares sold | | 146,494 | | | $ | 1,573,140 | |
Shares issued in reinvestment of dividends and distributions | | 19,291 | | | | 205,601 | |
Shares reacquired | | (92,195 | ) | | | (982,104 | ) |
| | | | | | | |
Net increase (decrease) in shares outstanding | | 73,590 | | | $ | 796,637 | |
| | | | | | | |
Note 7. Borrowings
The Trust, along with other affiliated registered investment companies (the “Companies”), are a party to a Syndicated Credit Agreement (“SCA”) with two banks. The SCA provides for a commitment of $500 million. Interest on any borrowings under the SCA would be incurred at market rates and a commitment fee for the unused amount is accrued daily and paid quarterly. Effective October 24, 2008, the Companies renewed the SCA with the banks. The commitment under the renewed SCA continues to be $500 million. The Companies pay a commitment fee of .13 of 1% of the unused portion of the renewed SCA. The expiration date of the renewed SCA will be October 23, 2009. For the period from October 26, 2007 through October 23, 2008, the Companies paid a commitment fee of .06 of 1% of the unused portion of the agreement. The purpose of the SCA is to provide an alternative source of temporary funding for capital share redemptions.
The Trust did not utilize the line of credit during the year ended January 31, 2009.
Note 8. New Accounting Pronouncements
In March 2008, Financial Accounting Standards Board (“FASB”) released “Statement of Financial Accounting Standards No. 161, Disclosures about Derivative Instruments and Hedging Activities” (“FAS 161”). FAS 161 requires qualitative disclosures about objectives and strategies for using derivatives, quantitative disclosures about fair value amounts of and gains and losses on derivative instruments, and disclosures about credit-risk-related contingent features in derivative agreements. The application of FAS 161 is required for any reporting period beginning after November 15, 2008. At this time, management is evaluating the implications of FAS 161 and its impact on the financial statements has not yet been determined.
| | |
| 62 | | Visit our website at www.prudential.com |
Financial Highlights
(Unaudited)
| | |
| JANUARY 31, 2009 | | SEMIANNUAL REPORT |
Target Asset Allocation Funds/
Target Conservative Allocation Fund
Financial Highlights
(Unaudited)
| | | | |
| | | Class A | |
| | | Six Months Ended
January 31, 2009(c) | |
Per Share Operating Performance: | | | | |
Net Asset Value, Beginning Of Period | | $ | 9.84 | |
| | | | |
Income (loss) from investment operations: | | | | |
Net investment income | | | .13 | |
Net realized and unrealized gain (loss) on investments | | | (1.79 | ) |
| | | | |
Total from investment operations | | | (1.66 | ) |
| | | | |
Less Dividends and Distributions: | | | | |
Dividends from net investment income | | | (.42 | ) |
Distributions from net realized gains on investments | | | (.25 | ) |
| | | | |
Total dividends and distributions | | | (.67 | ) |
| | | | |
Net asset value, end of period | | $ | 7.51 | |
| | | | |
Total Return(a) | | | (17.07 | )% |
Ratios/Supplemental Data: | | | | |
Net assets, end of period (000) | | $ | 55,912 | |
Average net assets (000) | | $ | 61,180 | |
Ratios to average net assets(d): | | | | |
Expenses, including distribution and service (12b-1) fees(b) | | | 1.52 | %(e) |
Expenses, excluding distribution and service (12b-1) fees | | | 1.27 | %(e) |
Net investment income | | | 3.10 | %(e) |
For Class A, B, C, M, R, X and Z shares | | | | |
Portfolio turnover rate | | | 198 | %(f) |
| (a) | Total return does not consider the effects of sales loads. Total return is calculated assuming a purchase of a share on the first day and a sale on the last day of each period reported and includes reinvestment of dividends and distributions. Total returns may reflect adjustments to conform to generally accepted accounting principles. Total returns for periods less than one full year are not annualized. |
| (b) | The distributor of the Fund contractually agreed to limit its distribution and service (12b-1) fees to .25 of 1% of the average daily assets of the Class A shares. |
| (c) | Calculated based upon the average shares outstanding during the period. |
| (d) | Does not include expenses of the underlying portfolios in which the Fund invests. |
See Notes to Financial Statements.
| | |
| 64 | | Visit our website at www.prudential.com |
| | | | | | | | | | | | | | | | | | |
| Class A | |
| Year Ended July 31, | |
| 2008(c) | | | 2007 | | | 2006(c) | | | 2005 | | | 2004 | |
| | | | | | | | | | | | | | | | | | |
| $ | 10.66 | | | $ | 10.33 | | | $ | 11.36 | | | $ | 10.51 | | | $ | 9.71 | |
| | | | | | | | | | | | | | | | | | | |
| | | | | | | | | | | | | | | | | | |
| | .27 | | | | .25 | | | | .28 | | | | .18 | | | | .17 | |
| | (.32 | ) | | | .56 | | | | (.05 | ) | | | 1.05 | | | | .82 | |
| | | | | | | | | | | | | | | | | | | |
| | (.05 | ) | | | .81 | | | | .23 | | | | 1.23 | | | | .99 | |
| | | | | | | | | | | | | | | | | | | |
| | | | | | | | | | | | | | | | | | |
| | (.27 | ) | | | (.27 | ) | | | (.30 | ) | | | (.21 | ) | | | (.19 | ) |
| | (.50 | ) | | | (.21 | ) | | | (.96 | ) | | | (.17 | ) | | | — | |
| | | | | | | | | | | | | | | | | | | |
| | (.77 | ) | | | (.48 | ) | | | (1.26 | ) | | | (.38 | ) | | | (.19 | ) |
| | | | | | | | | | | | | | | | | | | |
| $ | 9.84 | | | $ | 10.66 | | | $ | 10.33 | | | $ | 11.36 | | | $ | 10.51 | |
| | | | | | | | | | | | | | | | | | | |
| | (0.75 | )% | | | 7.93 | % | | | 2.20 | % | | | 11.85 | % | | | 10.18 | % |
| | | | | | | | | | | | | | | | | | |
| $ | 68,408 | | | $ | 60,657 | | | $ | 58,130 | | | $ | 46,743 | | | $ | 36,307 | |
| $ | 65,817 | | | $ | 61,106 | | | $ | 51,963 | | | $ | 42,639 | | | $ | 32,710 | |
| | | | | | | | | | | | | | | | | | |
| | 1.43 | % | | | 1.35 | % | | | 1.41 | % | | | 1.44 | % | | | 1.42 | % |
| | 1.18 | % | | | 1.10 | % | | | 1.16 | % | | | 1.19 | % | | | 1.17 | % |
| | 2.59 | % | | | 2.34 | % | | | 2.57 | % | | | 1.65 | % | | | 1.67 | % |
| | | | | | | | | | | | | | | | | | |
| | 353 | % | | | 395 | % | | | 481 | % | | | 379 | % | | | 160 | % |
See Notes to Financial Statements.
| | |
| Target Asset Allocation Funds/Target Conservative Allocation Fund | | 65 |
Financial Highlights
(Unaudited) continued
| | | | |
| | | Class B | |
| | | Six Months Ended
January 31, 2009(b) | |
Per Share Operating Performance: | | | | |
Net Asset Value, Beginning Of Period | | $ | 9.82 | |
| | | | |
Income (loss) from investment operations: | | | | |
Net investment income | | | .10 | |
Net realized and unrealized gain (loss) on investments | | | (1.78 | ) |
| | | | |
Total from investment operations | | | (1.68 | ) |
| | | | |
Less Dividends and Distributions: | | | | |
Dividends from net investment income | | | (.39 | ) |
Distributions from net realized gains on investments | | | (.25 | ) |
| | | | |
Total dividends and distributions | | | (.64 | ) |
| | | | |
Net asset value, end of period | | $ | 7.50 | |
| | | | |
Total Return(a) | | | (17.42 | )% |
Ratios/Supplemental Data: | | | | |
Net assets, end of period (000) | | $ | 35,724 | |
Average net assets (000) | | $ | 44,901 | |
Ratios to average net assets(c): | | | | |
Expenses, including distribution and service (12b-1) fees | | | 2.27 | %(d) |
Expenses, excluding distribution and service (12b-1) fees | | | 1.27 | %(d) |
Net investment income | | | 2.37 | %(d) |
| (a) | Total return does not consider the effects of sales loads. Total return is calculated assuming a purchase of a share on the first day and a sale on the last day of each period reported and includes reinvestment of dividends and distributions. Total returns may reflect adjustments to conform to generally accepted accounting principles. Total returns for periods less than one full year are not annualized. |
| (b) | Calculated based upon the average shares outstanding during the period. |
| (c) | Does not include expenses of the underlying portfolios in which the Fund invests. |
See Notes to Financial Statements.
| | |
| 66 | | Visit our website at www.prudential.com |
| | | | | | | | | | | | | | | | | | |
| Class B | |
| Year Ended July 31, | |
| 2008(b) | | | 2007 | | | 2006(b) | | | 2005 | | | 2004 | |
| | | | | | | | | | | | | | | | | | |
| $ | 10.64 | | | $ | 10.31 | | | $ | 11.34 | | | $ | 10.49 | | | $ | 9.69 | |
| | | | | | | | | | | | | | | | | | | |
| | | | | | | | | | | | | | | | | | |
| | .19 | | | | .17 | | | | .18 | | | | .10 | | | | .10 | |
| | (.32 | ) | | | .56 | | | | (.03 | ) | | | 1.05 | | | | .81 | |
| | | | | | | | | | | | | | | | | | | |
| | (.13 | ) | | | .73 | | | | .15 | | | | 1.15 | | | | .91 | |
| | | | | | | | | | | | | | | | | | | |
| | | | | | | | | | | | | | | | | | |
| | (.19 | ) | | | (.19 | ) | | | (.22 | ) | | | (.13 | ) | | | (.11 | ) |
| | (.50 | ) | | | (.21 | ) | | | (.96 | ) | | | (.17 | ) | | | — | |
| | | | | | | | | | | | | | | | | | | |
| | (.69 | ) | | | (.40 | ) | | | (1.18 | ) | | | (.30 | ) | | | (.11 | ) |
| | | | | | | | | | | | | | | | | | | |
| $ | 9.82 | | | $ | 10.64 | | | $ | 10.31 | | | $ | 11.34 | | | $ | 10.49 | |
| | | | | | | | | | | | | | | | | | | |
| | (1.49 | )% | | | 7.12 | % | | | 1.40 | % | | | 11.02 | % | | | 9.40 | % |
| | | | | | | | | | | | | | | | | | |
| $ | 56,853 | | | $ | 78,305 | | | $ | 94,011 | | | $ | 116,378 | | | $ | 110,140 | |
| $ | 70,345 | | | $ | 87,224 | | | $ | 106,189 | | | $ | 114,342 | | | $ | 104,309 | |
| | | | | | | | | | | | | | | | | | |
| | 2.18 | % | | | 2.10 | % | | | 2.16 | % | | | 2.19 | % | | | 2.17 | % |
| | 1.18 | % | | | 1.10 | % | | | 1.16 | % | | | 1.19 | % | | | 1.17 | % |
| | 1.82 | % | | | 1.60 | % | | | 1.68 | % | | | .89 | % | | | .93 | % |
See Notes to Financial Statements.
| | |
| Target Asset Allocation Funds/Target Conservative Allocation Fund | | 67 |
Financial Highlights
(Unaudited) continued
| | | | |
| | | Class C | |
| | | Six Months Ended
January 31, 2009(b) | |
Per Share Operating Performance: | | | | |
Net Asset Value, Beginning Of Period | | $ | 9.82 | |
| | | | |
Income (loss) from investment operations: | | | | |
Net investment income | | | .10 | |
Net realized and unrealized gain (loss) on investments | | | (1.79 | ) |
| | | | |
Total from investment operations | | | (1.69 | ) |
| | | | |
Less Dividends and Distributions: | | | | |
Dividends from net investment income | | | (.39 | ) |
Distributions from net realized gains on investments | | | (.25 | ) |
| | | | |
Total dividends and distributions | | | (.64 | ) |
| | | | |
Net asset value, end of period | | $ | 7.49 | |
| | | | |
Total Return(a) | | | (17.41 | )% |
Ratios/Supplemental Data: | | | | |
Net assets, end of period (000) | | $ | 21,643 | |
Average net assets (000) | | $ | 24,986 | |
Ratios to average net assets(c): | | | | |
Expenses, including distribution and service (12b-1) fees | | | 2.27 | %(d) |
Expenses, excluding distribution and service (12b-1) fees | | | 1.27 | %(d) |
Net investment income | | | 2.36 | %(d) |
| (a) | Total return does not consider the effects of sales loads. Total return is calculated assuming a purchase of a share on the first day and a sale on the last day of each period reported and includes reinvestment of dividends and distributions. Total returns may reflect adjustments to conform to generally accepted accounting principles. Total returns for periods less than one full year are not annualized. |
| (b) | Calculated based upon the average shares outstanding during the period. |
| (c) | Does not include expenses of the underlying portfolios in which the Fund invests. |
See Notes to Financial Statements.
| | |
| 68 | | Visit our website at www.prudential.com |
| | | | | | | | | | | | | | | | | | |
| Class C | |
| Year Ended July 31, | |
| 2008(b) | | | 2007 | | | 2006(b) | | | 2005 | | | 2004 | |
| | | | | | | | | | | | | | | | | | |
| $ | 10.64 | | | $ | 10.31 | | | $ | 11.34 | | | $ | 10.49 | | | $ | 9.69 | |
| | | | | | | | | | | | | | | | | | | |
| | | | | | | | | | | | | | | | | | |
| | .19 | | | | .17 | | | | .20 | | | | .10 | | | | .10 | |
| | (.32 | ) | | | .56 | | | | (.05 | ) | | | 1.05 | | | | .81 | |
| | | | | | | | | | | | | | | | | | | |
| | (.13 | ) | | | .73 | | | | .15 | | | | 1.15 | | | | .91 | |
| | | | | | | | | | | | | | | | | | | |
| | | | | | | | | | | | | | | | | | |
| | (.19 | ) | | | (.19 | ) | | | (.22 | ) | | | (.13 | ) | | | (.11 | ) |
| | (.50 | ) | | | (.21 | ) | | | (.96 | ) | | | (.17 | ) | | | — | |
| | | | | | | | | | | | | | | | | | | |
| | (.69 | ) | | | (.40 | ) | | | (1.18 | ) | | | (.30 | ) | | | (.11 | ) |
| | | | | | | | | | | | | | | | | | | |
| $ | 9.82 | | | $ | 10.64 | | | $ | 10.31 | | | $ | 11.34 | | | $ | 10.49 | |
| | | | | | | | | | | | | | | | | | | |
| | (1.49 | )% | | | 7.12 | % | | | 1.40 | % | | | 11.02 | % | | | 9.40 | % |
| | | | | | | | | | | | | | | | | | |
| $ | 29,417 | | | $ | 32,800 | | | $ | 35,591 | | | $ | 43,787 | | | $ | 43,375 | |
| $ | 32,068 | | | $ | 34,907 | | | $ | 39,175 | | | $ | 43,819 | | | $ | 41,938 | |
| | | | | | | | | | | | | | | | | | |
| | 2.18 | % | | | 2.10 | % | | | 2.16 | % | | | 2.19 | % | | | 2.17 | % |
| | 1.18 | % | | | 1.10 | % | | | 1.16 | % | | | 1.19 | % | | | 1.17 | % |
| | 1.83 | % | | | 1.60 | % | | | 1.83 | % | | | .89 | % | | | .94 | % |
See Notes to Financial Statements.
| | |
| Target Asset Allocation Funds/Target Conservative Allocation Fund | | 69 |
Financial Highlights
(Unaudited) continued
| | | | |
| |
| | | Class M | |
| | | Six Months Ended
January 31, 2009(d) | |
Per Share Operating Performance: | | | | |
Net Asset Value, Beginning Of Period | | $ | 9.82 | |
| | | | |
Income (loss) from investment operations: | | | | |
Net investment income | | | .10 | |
Net realized and unrealized gain (loss) on investments | | | (1.78 | ) |
| | | | |
Total from investment operations | | | (1.68 | ) |
| | | | |
Less Dividends and Distributions: | | | | |
Dividends from net investment income | | | (.39 | ) |
Distributions from net realized gains on investments | | | (.25 | ) |
| | | | |
Total dividends and distributions | | | (.64 | ) |
| | | | |
Net asset value, end of period | | $ | 7.50 | |
| | | | |
Total Return(b) | | | (17.42 | )% |
Ratios/Supplemental Data: | | | | |
Net assets, end of period (000) | | $ | 552 | |
Average net assets (000) | | $ | 781 | |
Ratios to average net assets(e): | | | | |
Expenses, including distribution and service (12b-1) fees | | | 2.27 | %(c) |
Expenses, excluding distribution and service (12b-1) fees | | | 1.27 | %(c) |
Net investment income | | | 2.38 | %(c) |
| (a) | Commencement of offering new share class. |
| (b) | Total return does not consider the effects of sales loads. Total return is calculated assuming a purchase of a share on the first day and a sale on the last day of each period reported and includes reinvestment of dividends and distributions. Total returns may reflect adjustments to conform to generally accepted accounting principles. Total returns for periods less than one full year are not annualized. |
| (d) | Calculated based upon the average shares outstanding during the period. |
| (e) | Does not include expenses of the underlying portfolios in which the Fund invests. |
See Notes to Financial Statements.
| | |
| 70 | | Visit our website at www.prudential.com |
| | | | | | | | | | | | | | |
| Class M | |
| Year Ended July 31, | | | October 4, 2004(a)
through
July 31, 2005 | |
| 2008(d) | | | 2007 | | | 2006(d) | | |
| | | | | | | | | | | | | | |
| $ | 10.64 | | | $ | 10.31 | | | $ | 11.34 | | | $ | 10.81 | |
| | | | | | | | | | | | | | | |
| | | | | | | | | | | | | | |
| | .19 | | | | .17 | | | | .19 | | | | .14 | |
| | (.32 | ) | | | .56 | | | | (.04 | ) | | | .69 | |
| | | | | | | | | | | | | | | |
| | (.13 | ) | | | .73 | | | | .15 | | | | .83 | |
| | | | | | | | | | | | | | | |
| | | | | | | | | | | | | | |
| | (.19 | ) | | | (.19 | ) | | | (.22 | ) | | | (.13 | ) |
| | (.50 | ) | | | (.21 | ) | | | (.96 | ) | | | (.17 | ) |
| | | | | | | | | | | | | | | |
| | (.69 | ) | | | (.40 | ) | | | (1.18 | ) | | | (.30 | ) |
| | | | | | | | | | | | | | | |
| $ | 9.82 | | | $ | 10.64 | | | $ | 10.31 | | | $ | 11.34 | |
| | | | | | | | | | | | | | | |
| | (1.49 | )% | | | 7.12 | % | | | 1.41 | % | | | 7.80 | % |
| | | | | | | | | | | | | | |
| $ | 1,047 | | | $ | 2,936 | | | $ | 3,439 | | | $ | 1,900 | |
| $ | 2,357 | | | $ | 3,219 | | | $ | 2,579 | | | $ | 1,115 | |
| | | | | | | | | | | | | | |
| | 2.18 | % | | | 2.10 | % | | | 2.16 | % | | | 2.19 | %(c) |
| | 1.18 | % | | | 1.10 | % | | | 1.16 | % | | | 1.19 | %(c) |
| | 1.81 | % | | | 1.60 | % | | | 1.84 | % | | | 1.25 | %(c) |
See Notes to Financial Statements.
| | |
| Target Asset Allocation Funds/Target Conservative Allocation Fund | | 71 |
Financial Highlights
(Unaudited) continued
| | | | |
| |
| | | Class R | |
| | | Six Months Ended January 31, 2009(e) | |
Per Share Operating Performance: | | | | |
Net Asset Value, Beginning Of Period | | $ | 9.85 | |
| | | | |
Income (loss) from investment operations: | | | | |
Net investment income | | | .13 | |
Net realized and unrealized gain (loss) on investments | | | (1.79 | ) |
| | | | |
Total from investment operations | | | (1.66 | ) |
| | | | |
Less Dividends and Distributions: | | | | |
Dividends from net investment income | | | (.41 | ) |
Distributions from net realized gains on investments | | | (.25 | ) |
| | | | |
Total dividends and distributions | | | (.66 | ) |
| | | | |
Net asset value, end of period | | $ | 7.53 | |
| | | | |
Total Return(b) | | | (17.16 | )% |
Ratios/Supplemental Data: | | | | |
Net assets, end of period (000) | | $ | 668 | |
Average net assets (000) | | $ | 1,831 | |
Ratios to average net assets(f): | | | | |
Expenses, including distribution and service (12b-1) fees(d) | | | 1.77 | %(c) |
Expenses, excluding distribution and service (12b-1) fees | | | 1.27 | %(c) |
Net investment income | | | 2.90 | %(c) |
| (a) | Commencement of offering new share class. |
| (b) | Total return does not consider the effects of sales loads. Total return is calculated assuming a purchase of a share on the first day and a sale on the last day of each period reported and includes reinvestment of dividends and distributions. Total returns may reflect adjustments to conform to generally accepted accounting principles. Total returns for periods less than one full year are not annualized. |
| (d) | The distributor of the Fund contractually agreed to limit its distribution and service (12b-1) fees to .50 of 1% of the average daily assets of the Class R shares. |
| (e) | Calculated based upon the average shares outstanding during the period. |
| (f) | Does not include expenses of the underlying portfolios in which the Fund invests. |
See Notes to Financial Statements.
| | |
| 72 | | Visit our website at www.prudential.com |
| | | | | | | | | | | | | | |
| Class R | |
| Year Ended July 31, | | | October 4, 2004(a)
through
July 31, 2005 | |
| 2008(e) | | | 2007 | | | 2006(e) | | |
| | | | | | | | | | | | | | |
| $ | 10.67 | | | $ | 10.34 | | | $ | 11.37 | | | $ | 10.84 | |
| | | | | | | | | | | | | | | |
| | | | | | | | | | | | | | |
| | .24 | | | | .23 | | | | .25 | | | | .16 | |
| | (.31 | ) | | | .55 | | | | (.05 | ) | | | .72 | |
| | | | | | | | | | | | | | | |
| | (.07 | ) | | | .78 | | | | .20 | | | | .88 | |
| | | | | | | | | | | | | | | |
| | | | | | | | | | | | | | |
| | (.25 | ) | | | (.24 | ) | | | (.27 | ) | | | (.18 | ) |
| | (.50 | ) | | | (.21 | ) | | | (.96 | ) | | | (.17 | ) |
| | | | | | | | | | | | | | | |
| | (.75 | ) | | | (.45 | ) | | | (1.23 | ) | | | (.35 | ) |
| | | | | | | | | | | | | | | |
| $ | 9.85 | | | $ | 10.67 | | | $ | 10.34 | | | $ | 11.37 | |
| | | | | | | | | | | | | | | |
| | (0.99 | )% | | | 7.64 | % | | | 1.93 | % | | | 8.25 | % |
| | | | | | | | | | | | | | |
| $ | 4,015 | | | $ | 8,751 | | | $ | 7,419 | | | $ | 3 | |
| $ | 4,787 | | | $ | 8,273 | | | $ | 4,498 | | | $ | 3 | |
| | | | | | | | | | | | | | |
| | 1.68 | % | | | 1.60 | % | | | 1.66 | % | | | 1.69 | %(c) |
| | 1.18 | % | | | 1.10 | % | | | 1.16 | % | | | 1.19 | %(c) |
| | 2.33 | % | | | 2.09 | % | | | 2.31 | % | | | 1.77 | %(c) |
See Notes to Financial Statements.
| | |
| Target Asset Allocation Funds/Target Conservative Allocation Fund | | 73 |
Financial Highlights
(Unaudited) continued
| | | | |
| |
| | | Class X | |
| | | Six Months Ended
January 31, 2009(b) | |
Per Share Operating Performance: | | | | |
Net Asset Value, Beginning Of Period | | $ | 9.82 | |
| | | | |
Income (loss) from investment operations: | | | | |
Net investment income | | | .11 | |
Net realized and unrealized gain (loss) on investments | | | (1.79 | ) |
| | | | |
Total from investment operations | | | (1.68 | ) |
| | | | |
Less Dividends and Distributions: | | | | |
Dividends from net investment income | | | (.39 | ) |
Distributions from net realized gains on investments | | | (.25 | ) |
| | | | |
Total dividends and distributions | | | (.64 | ) |
| | | | |
Net asset value, end of period | | $ | 7.50 | |
| | | | |
Total Return(b) | | | (17.42 | )% |
Ratios/Supplemental Data: | | | | |
Net assets, end of period (000) | | $ | 1,065 | |
Average net assets (000) | | $ | 1,604 | |
Ratios to average net assets(e): | | | | |
Expenses, including distribution and service (12b-1) fees | | | 2.24 | %(c) |
Expenses, excluding distribution and service (12b-1) fees | | | 1.27 | %(c) |
Net investment income | | | 2.43 | %(c) |
| (a) | Commencement of offering new share class. |
| (b) | Total return does not consider the effects of sales loads. Total return is calculated assuming a purchase of a share on the first day and a sale on the last day of each period reported and includes reinvestment of dividends and distributions. Total returns may reflect adjustments to conform to generally accepted accounting principles. Total returns for periods less than one full year are not annualized. |
| (d) | Calculated based upon the average shares outstanding during the period. |
| (e) | Does not include expenses of the underlying portfolios in which the Fund invests. |
See Notes to Financial Statements.
| | |
| 74 | | Visit our website at www.prudential.com |
| | | | | | | | | | | | | | |
| Class X | |
| Year Ended July 31, | | | October 4, 2004(a)
through
July 31, 2005 | |
| 2008(d) | | | 2007 | | | 2006(d) | | |
| | | | | | | | | | | | | | |
| $ | 10.63 | | | $ | 10.31 | | | $ | 11.33 | | | $ | 10.81 | |
| | | | | | | | | | | | | | | |
| | | | | | | | | | | | | | |
| | .21 | | | | .17 | | | | .19 | | | | .15 | |
| | (.31 | ) | | | .55 | | | | (.03 | ) | | | .67 | |
| | | | | | | | | | | | | | | |
| | (.10 | ) | | | .72 | | | | .16 | | | | .82 | |
| | | | | | | | | | | | | | | |
| | | | | | | | | | | | | | |
| | (.21 | ) | | | (.19 | ) | | | (.22 | ) | | | (.13 | ) |
| | (.50 | ) | | | (.21 | ) | | | (.96 | ) | | | (.17 | ) |
| | | | | | | | | | | | | | | |
| | (.71 | ) | | | (.40 | ) | | | (1.18 | ) | | | (.30 | ) |
| | | | | | | | | | | | | | | |
| $ | 9.82 | | | $ | 10.63 | | | $ | 10.31 | | | $ | 11.33 | |
| | | | | | | | | | | | | | | |
| | (1.22 | )% | | | 7.13 | % | | | 1.41 | % | | | 7.71 | % |
| | | | | | | | | | | | | | |
| $ | 2,120 | | | $ | 2,601 | | | $ | 2,607 | | | $ | 1,688 | |
| $ | 2,441 | | | $ | 2,463 | | | $ | 1,892 | | | $ | 853 | |
| | | | | | | | | | | | | | |
| | 1.99 | % | | | 2.10 | % | | | 2.16 | % | | | 2.19 | %(c) |
| | 1.18 | % | | | 1.10 | % | | | 1.16 | % | | | 1.19 | %(c) |
| | 2.02 | % | | | 1.60 | % | | | 1.86 | % | | | 1.31 | %(c) |
See Notes to Financial Statements.
| | |
| Target Asset Allocation Funds/Target Conservative Allocation Fund | | 75 |
Financial Highlights
(Unaudited) continued
| | | | |
| | | Class Z | |
| | | Six Months Ended
January 31, 2009(b) | |
Per Share Operating Performance: | | | | |
Net Asset Value, Beginning Of Period | | $ | 9.85 | |
| | | | |
Income (loss) from investment operations: | | | | |
Net investment income | | | .15 | |
Net realized and unrealized gain (loss) on investments | | | (1.80 | ) |
| | | | |
Total from investment operations | | | (1.65 | ) |
| | | | |
Less Dividends and Distributions: | | | | |
Dividends from net investment income | | | (.43 | ) |
Distributions from net realized gains on investments | | | (.25 | ) |
| | | | |
Total dividends and distributions | | | (.68 | ) |
| | | | |
Net asset value, end of period | | $ | 7.52 | |
| | | | |
Total Return(a) | | | (16.96 | )% |
Ratios/Supplemental Data: | | | | |
Net assets, end of period (000) | | $ | 3,484 | |
Average net assets (000) | | $ | 4,648 | |
Ratios to average net assets(c): | | | | |
Expenses, including distribution and service (12b-1) fees | | | 1.27 | %(d) |
Expenses, excluding distribution and service (12b-1) fees | | | 1.27 | %(d) |
Net investment income | | | 3.36 | %(d) |
| (a) | Total return is calculated assuming a purchase of a share on the first day and a sale on the last day of each period reported and includes reinvestment of dividends and distributions. Total returns may reflect adjustments to conform to generally accepted accounting principles. Total returns for periods less than one full year are not annualized. |
| (b) | Calculated based upon the average shares outstanding during the period. |
| (c) | Does not include expenses of the underlying portfolios in which the Fund invests. |
See Notes to Financial Statements.
| | |
| 76 | | Visit our website at www.prudential.com |
| | | | | | | | | | | | | | | | | | |
| Class Z | |
| Year Ended July 31, | |
| 2008(b) | | | 2007 | | | 2006(b) | | | 2005 | | | 2004 | |
| | | | | | | | | | | | | | | | | | |
| $ | 10.67 | | | $ | 10.34 | | | $ | 11.37 | | | $ | 10.52 | | | $ | 9.72 | |
| | | | | | | | | | | | | | | | | | | |
| | | | | | | | | | | | | | | | | | |
| | .30 | | | | .28 | | | | .30 | | | | .21 | | | | .20 | |
| | (.32 | ) | | | .56 | | | | (.04 | ) | | | 1.05 | | | | .81 | |
| | | | | | | | | | | | | | | | | | | |
| | (.02 | ) | | | .84 | | | | .26 | | | | 1.26 | | | | 1.01 | |
| | | | | | | | | | | | | | | | | | | |
| | | | | | | | | | | | | | | | | | |
| | (.30 | ) | | | (.30 | ) | | | (.33 | ) | | | (.24 | ) | | | (.21 | ) |
| | (.50 | ) | | | (.21 | ) | | | (.96 | ) | | | (.17 | ) | | | — | |
| | | | | | | | | | | | | | | | | | | |
| | (.80 | ) | | | (.51 | ) | | | (1.29 | ) | | | (.41 | ) | | | (.21 | ) |
| | | | | | | | | | | | | | | | | | | |
| $ | 9.85 | | | $ | 10.67 | | | $ | 10.34 | | | $ | 11.37 | | | $ | 10.52 | |
| | | | | | | | | | | | | | | | | | | |
| | (0.50 | )% | | | 8.20 | % | | | 2.47 | % | | | 12.10 | % | | | 10.44 | % |
| | | | | | | | | | | | | | | | | | |
| $ | 5,610 | | | $ | 5,397 | | | $ | 4,471 | | | $ | 4,611 | | | $ | 5,267 | |
| $ | 5,771 | | | $ | 4,521 | | | $ | 4,587 | | | $ | 4,731 | | | $ | 4,712 | |
| | | | | | | | | | | | | | | | | | |
| | 1.18 | % | | | 1.10 | % | | | 1.16 | % | | | 1.19 | % | | | 1.17 | % |
| | 1.18 | % | | | 1.10 | % | | | 1.16 | % | | | 1.19 | % | | | 1.17 | % |
| | 2.85 | % | | | 2.59 | % | | | 2.83 | % | | | 2.02 | % | | | 1.93 | % |
See Notes to Financial Statements.
| | |
| Target Asset Allocation Funds/Target Conservative Allocation Fund | | 77 |
| | | | |
| n MAIL | | n TELEPHONE | | n WEBSITE |
Gateway Center Three 100 Mulberry Street Newark, NJ 07102 | | (800) 225-1852
| | www.prudential.com |
|
| PROXY VOTING |
| The Board of Trustees of the Fund has delegated to the Fund’s investment subadvisers the responsibility for voting any proxies and maintaining proxy recordkeeping with respect to the Fund. A description of these proxy voting policies and procedures is available without charge, upon request, by calling (800) 225-1852 or by visiting the Securities and Exchange Commission’s website at www.sec.gov. Information regarding how the Fund voted proxies relating to portfolio securities during the most recent 12-month period ended June 30 is available on the Fund’s website and on the Commission’s website. |
|
| TRUSTEES |
| Kevin J. Bannon • Linda W. Bynoe • David E.A. Carson • Robert F. Gunia • Michael S. Hyland • Robert E. La Blanc • Douglas H. McCorkindale • Stephen P. Munn • Richard A. Redeker • Judy A. Rice • Robin B. Smith • Stephen G. Stoneburn |
|
| OFFICERS |
| Judy A. Rice, President • Robert F. Gunia, Vice President • Grace C. Torres, Treasurer and Principal Financial and Accounting Officer • Kathryn L. Quirk, Chief Legal Officer • Deborah A. Docs, Secretary • Timothy J. Knierim, Chief Compliance Officer • Valerie M. Simpson, Deputy Chief Compliance Officer • Theresa C. Thompson, Deputy Chief Compliance Officer • Noreen M. Fierro, Anti-Money Laundering Compliance Officer • Jonathan D. Shain, Assistant Secretary • Claudia DiGiacomo, Assistant Secretary • John P. Schwartz, Assistant Secretary • Andrew R. French, Assistant Secretary • M. Sadiq Peshimam, Assistant Treasurer • Peter Parrella, Assistant Treasurer |
| | | | |
| MANAGER | | Prudential Investments LLC | | Gateway Center Three
100 Mulberry Street Newark, NJ 07102 |
|
| INVESTMENT SUBADVISERS | | Eagle Asset Management, Inc. | | 880 Carillon Parkway
St. Petersburg, Fl 33716 |
|
| | EARNEST Partners, LLC | | 1180 Peachtree Street
Suite 2300 Atlanta, GA 30309 |
|
| | Eaton Vance Management | | Two International Place
Boston, MA 02110 |
|
| | Hotchkis and Wiley Capital
Management | | 725 South Figueroa Street
Suite 3900 Los Angeles, CA 90017 |
|
| | Marsico Capital
Management, LLC | | 1200 17th Street
Suite 1600 Denver, CO 80202 |
|
| | Massachusetts Financial
Services Company | | 500 Boylston Street
Boston, MA 02116 |
|
| | NFJ Investment Group L.P.
| | 2100 Ross Avenue
Suite 1840 Dallas, TX 75201 |
|
| | Pacific Investment
Management Company LLC | | 840 Newport Center Drive
Newport Beach, CA 92660 |
|
| | Vaughan Nelson Investment
Management, L.P. | | 600 Travis Street
Suite 6300 Houston, TX 77002 |
|
| | | | |
| DISTRIBUTOR | | Prudential Investment
Management Services LLC | | Gateway Center Three
100 Mulberry Street Newark, NJ 07102 |
|
| CUSTODIAN | | PFPC Trust Company | | 400 Bellevue Parkway
Wilmington, DE 19809 |
|
| TRANSFER AGENT | | Prudential Mutual Fund
Services LLC | | PO Box 9658
Providence, RI 02940 |
|
INDEPENDENT REGISTERED
PUBLIC ACCOUNTING FIRM | | KPMG LLP | | 345 Park Avenue
New York, NY 10154 |
|
| FUND COUNSEL | | Willkie Farr & Gallagher LLP | | 787 Seventh Avenue
New York, NY 10019 |
|
| An investor should consider the investment objectives, risks, charges, and expenses of the Fund carefully before investing. The prospectus for the Fund contains this and other information about the Fund. An investor may obtain a prospectus by visiting our website at www.prudential.com or by calling (800) 225-1852. The prospectus should be read carefully before investing. |
|
| E-DELIVERY |
| To receive your mutual fund documents on-line, go to www.prudential.com/myaccess and enroll. Instead of receiving printed documents by mail, you will receive notification via e-mail when new materials are available. You can cancel your enrollment or change your e-mail address at any time by clicking on the view/change option at the website address above. |
|
| SHAREHOLDER COMMUNICATIONS WITH TRUSTEES |
| Shareholders can communicate directly with the Board of Trustees by writing to the Chair of the Board, Target Asset Allocation Funds, Prudential Investments, Attn: Board of Trustees, 100 Mulberry Street, Gateway Center Three, Newark, NJ 07102. Shareholders can communicate directly with an individual Trustee by writing to the same address. Communications are not screened before being delivered to the addressee. |
|
| AVAILABILITY OF PORTFOLIO SCHEDULE |
| The Fund files its complete schedule of portfolio holdings with the Securities and Exchange Commission for the first and third quarters of each fiscal year on Form N-Q. The Fund’s Forms N-Q are available on the Commission’s website at www.sec.gov. The Fund’s Forms N-Q may also be reviewed and copied at the Commission’s Public Reference Room in Washington, D.C. Information on the operation and location of the Public Reference Room may be obtained by calling (202) 551-8090. The Fund’s schedule of portfolio holdings is also available on the Fund’s website as of the end of each fiscal quarter. |
Mutual Funds:
| | | | |
ARE NOT INSURED BY THE FDIC OR ANY
FEDERAL GOVERNMENT AGENCY | | MAY LOSE VALUE | | ARE NOT A DEPOSIT OF OR GUARANTEED
BY ANY BANK OR ANY BANK AFFILIATE |

| | | | | | | | | | | | | | | | | | |
| Target Conservative Allocation Fund | | | | | | | | | | |
| | | Share Class | | A | | B | | C | | M | | R | | X | | Z | | |
| | NASDAQ | | PCGAX | | PBCFX | | PCCFX | | N/A | | PCLRX | | N/A | | PDCZX | | |
| | CUSIP | | 87612A104 | | 87612A203 | | 87612A302 | | 87612A609 | | 87612A401 | | 87612A708 | | 87612A500 | | |
| | | | | | | | | | | | | | | | | | |
MFSP504E2 IFS-A162944 Ed. 03/2009

| | |
| JANUARY 31, 2009 | | SEMIANNUAL REPORT |
Target
Moderate Allocation Fund
OBJECTIVE
Seeks capital appreciation and a reasonable level of current income
This report is not authorized for distribution to prospective investors unless preceded or accompanied by a current prospectus.
The views expressed in this report and information about the Fund’s portfolio holdings are for the period covered by this report and are subject to change thereafter.
The accompanying financial statements as of January 31, 2009, were not audited and, accordingly, no auditor’s opinion is expressed on them.
Target Funds, Prudential, Prudential Financial and the Rock Prudential logo are registered service marks of The Prudential Insurance Company of America, Newark, NJ, and its affiliates.

March 16, 2009
Dear Shareholder:
On the following pages, you’ll find your semiannual report for the Target Moderate Allocation Fund.
Target Asset Allocation Funds are managed by institutional-quality asset managers selected, matched, and monitored by a research team from Prudential Investments LLC. Portions of the Funds’ assets are assigned to carefully chosen asset managers, with the allocations actively managed on the basis of our projections for the financial markets and the managers’ individual strengths.
We believe our Target Moderate Allocation Fund will help you to achieve broad, actively managed diversification at a targeted risk/return balance with a single investment purchase. We appreciate your continued confidence in us. Keep in mind that diversification and asset allocation do not assure a profit or protect against a loss in a declining market.
Sincerely,

Judy A. Rice, President
Target Asset Allocation Funds
| | |
| Target Asset Allocation Funds/Target Moderate Allocation Fund | | 1 |
Your Fund’s Performance
Performance data quoted represent past performance. Past performance does not guarantee future results. The investment return and principal value of an investment will fluctuate, so that an investor’s shares, when redeemed, may be worth more or less than their original cost. Current performance may be lower or higher than the past performance data quoted. An investor may obtain performance data as of the most recent month-end by visiting our website at www.prudential.com or by calling (800) 225-1852. The maximum initial sales charge is 5.50% (Class A shares). Gross operating expenses: Class A, 1.48%; Class B, 2.18%; Class C, 2.18%; Class M, 2.18%; Class R, 1.93%; Class X, 2.18%; Class Z, 1.18%. Net operating expenses apply to: Class A, 1.43%; Class B, 2.18%; Class C, 2.18%; Class M, 2.18%; Class R, 1.68%; Class X, 2.18%; Class Z, 1.18%, after contractual reduction through 11/30/2009 for Class A and Class R shares.
| | | | | | | | | | | | | | |
| Cumulative Total Returns as of 1/31/09 | | | | | | | | | |
| | | Six Months | | | One Year | | | Five Years | | | Ten Years | | | Since Inception1 |
Class A | | –25.56 | % | | –30.24 | % | | –5.92 | % | | 15.05 | % | | — |
Class B | | –25.83 | | | –30.79 | | | –9.39 | | | 6.56 | | | — |
Class C | | –25.83 | | | –30.79 | | | –9.39 | | | 6.56 | | | — |
Class M | | –25.79 | | | –30.70 | | | N/A | | | N/A | | | –10.62% (10-04-04) |
Class R | | –25.59 | | | –30.42 | | | N/A | | | N/A | | | –8.69 (10-04-04) |
Class X | | –25.83 | | | –30.73 | | | N/A | | | N/A | | | –10.55 (10-04-04) |
Class Z | | –25.43 | | | –30.02 | | | –4.66 | | | 17.98 | | | — |
Customized Blend2 | | –23.88 | | | –26.87 | | | –2.40 | | | 12.03 | | | ** |
S&P 500 Index3 | | –33.96 | | | –38.63 | | | –19.52 | | | –23.54 | | | *** |
Lipper Mixed-Asset Target Allocation Growth Funds Avg.4 | | –26.76 | | | –30.36 | | | –9.07 | | | 3.15 | | | **** |
| | | | | | | | | | | | | | |
| Average Annual Total Returns5 as of 12/31/08 | | | | | | | | | |
| | | | | | One Year | | | Five Years | | | Ten Years | | | Since Inception1 |
Class A | | | | | –32.45 | % | | –0.74 | % | | 1.70 | % | | — |
Class B | | | | | –32.51 | | | –0.51 | | | 1.50 | | | — |
Class C | | | | | –29.76 | | | –0.35 | | | 1.50 | | | — |
Class M | | | | | –33.19 | | | N/A | | | N/A | | | –1.52% (10-04-04) |
Class R | | | | | –28.70 | | | N/A | | | N/A | | | –0.67 (10-04-04) |
Class X | | | | | –33.15 | | | N/A | | | N/A | | | –1.66 (10-04-04) |
Class Z | | | | | –28.30 | | | 0.65 | | | 2.54 | | | — |
Customized Blend2 | | | | | –25.17 | | | 1.05 | | | 1.96 | | | ** |
S&P 500 Index3 | | | | | –36.99 | | | –2.19 | | | –1.38 | | | *** |
Lipper Mixed-Asset Target
Allocation Growth Funds Avg.4 | | | | | –29.85 | | | –0.71 | | | 0.79 | | | **** |
| | |
| 2 | | Visit our website at www.prudential.com |
The cumulative total returns do not reflect the deduction of applicable sales charges. If reflected, the applicable sales charges would reduce the cumulative total returns performance quoted. Class A shares are subject to a maximum front-end sales charge of 5.50%. Under certain circumstances, Class A shares may be subject to a contingent deferred sales charge (CDSC) of 1%. Class B and Class C shares are subject to a maximum CDSC of 5% and 1%, respectively. Class M and Class X shares are subject to a maximum CDSC of 6%. Class R and Class Z shares are not subject to a sales charge.
Source: Prudential Investments LLC and Lipper Inc. Performance figures may reflect fee waivers and/or expense reimbursements. In the absence of such fee waivers and/or expense reimbursements, total returns would be lower.
1Inception date returns are provided for any share class with less than 10 calendar years of returns.
2The Customized Benchmark for Target Moderate Allocation Fund (Customized Blend) is a model portfolio consisting of the Russell 3000® Index (52%), MSCI EAFE (13%), and the Barclays Capital U.S. Aggregate Bond Index (35%). Each component of the Customized Blend is an unmanaged index generally considered as representing the performance of the Fund’s asset classes. The Customized Blend is intended to provide a theoretical comparison of the Fund’s performance, based on the amounts allocated to each asset class rather than based on amounts allocated to various Fund segments. The Customized Blend does not reflect deductions for any sales charges or operating expenses of a mutual fund.
3The Standard & Poor’s 500 Composite Stock Price Index (S&P 500 Index) is an unmanaged index of 500 stocks of large U.S. public companies. It gives an indication of how U.S. stock prices have performed.
4The Lipper Mixed-Asset Target Allocation Growth Funds Average (Lipper Average) represents returns based on the average return of all funds in the Lipper Mixed-Equity Funds category for the periods noted. Funds in the Lipper Average invest in a variety of market capitalization ranges without concentrating 75% of their equity assets in any one market capitalization range over an extended period of time. Mixed-Asset Funds are funds that, by portfolio practice, maintain a mix of between 60% and 80% equity securities, with the remainder invested in bonds, cash, and cash equivalents.
5The average annual total returns take into account applicable sales charges. Class A, Class B, Class C, Class M, Class R, and Class X shares are subject to an annual distribution and service (12b-1) fee of up to 0.30%, 1.00%, 1.00%, 1.00%, 0.75%, and 1.00%, respectively. Approximately seven years after purchase, Class B shares will automatically convert to Class A shares on a quarterly basis. Approximately eight years after purchase, Class M shares will automatically convert to Class A shares on a quarterly basis. Approximately 10 years after purchase, Class X shares will automatically convert to Class A shares on a quarterly basis. Class Z shares are not subject to a 12b-1 fee. The returns in the tables do not reflect the deduction of taxes that a shareholder would pay on Fund distributions or following the redemption of Fund shares.
**Customized Blend Closest Month-End to Inception cumulative total returns as of 1/31/09 is –3.41% for Classes M, R, and X. Customized Blend Closest Month-End to Inception average annual total returns as of 12/31/08 is 0.63% for Classes M, R, and X.
***S&P 500 Index Closest Month-End to Inception cumulative total returns as of 1/31/09 is –19.26% for Classes M, R, and X. S&P 500 Index Closest Month-End to Inception average annual total returns as of 12/31/08 is –2.92% for Classes M, R, and X.
****Lipper Average Closest Month-End to Inception cumulative total returns as of 1/31/09 is –9.62% for Classes M, R, and X. Lipper Average Closest Month-End to Inception average annual total returns as of 12/31/08 is –1.26% for Classes M, R, and X.
| | |
| Target Asset Allocation Funds/Target Moderate Allocation Fund | | 3 |
Your Fund’s Performance (continued)
Investors cannot invest directly in an index. The returns for the S&P 500 Index and the Customized Blend would be lower if they included the effects of sales charges, operating expenses of a mutual fund, or taxes. Returns for the Lipper Average reflect the deduction of operating expenses, but not sales charges or taxes. The Since Inception returns for the S&P 500 Index, the Customized Blend, and the Lipper Average are measured from the closest month-end to inception date, and not from the Fund’s actual inception date.
Fund objective
The investment objective of the Target Moderate Allocation Fund is capital appreciation and a reasonable level of current income. There can be no assurance that the Fund will achieve its investment objective.
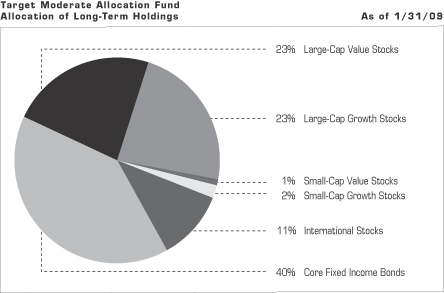
| | |
| 4 | | Visit our website at www.prudential.com |
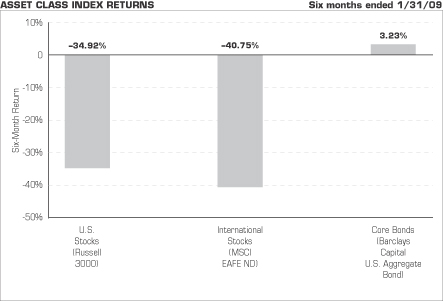
Source: Lipper Inc.
The chart above shows the total returns for six months ended January 31, 2009, of various securities indexes that are generally considered representative of broad market sectors. It does not reflect a mutual fund’s expenses. The performance cited does not represent the performance of the Target Moderate Allocation Fund. Past performance is not indicative of future results. Investors cannot invest directly in an index.
The Russell 3000 Index measures the performance of the 3,000 largest U.S. companies based on total market capitalization, which represents approximately 98% of the investable U.S. equity market.
The Morgan Stanley Capital International Europe, Australasia, and Far East Index (MSCI EAFE ND Index) is an unmanaged, weighted index that reflects stock price movements in Europe, Australasia, and the Far East. It gives a broad look at how foreign stock prices have performed. The Fund utilizes the net dividends (ND) version of the MSCI EAFE Index. The net dividends and gross dividends versions of the MSCI EAFE Index differ in that net dividends returns reflect the impact of the maximum withholding taxes on reinvested dividends, while the gross dividends version does not reflect the impact of withholding taxes on reinvested dividends. These returns do not include the effect of any investment management expenses. These returns would have been lower if they included the effect of these expenses.
The Barclays Capital U.S. Aggregate Bond Index is an unmanaged index of investment-grade securities issued by the U.S. government and its agencies, and by corporations with between one and 10 years remaining to maturity. It gives a broad look at how short- and intermediate-term bonds have performed.
| | |
| Target Asset Allocation Funds/Target Moderate Allocation Fund | | 5 |
Fees and Expenses (Unaudited)
As a shareholder of the Fund, you incur two types of costs: (1) transaction costs, including sales charges (loads) on purchase payments and redemptions, as applicable, and (2) ongoing costs, including management fees, distribution and/or service (12b-1) fees, and other Fund expenses, as applicable. This example is intended to help you understand your ongoing costs (in dollars) of investing in the Fund and to compare these costs with the ongoing costs of investing in other mutual funds.
The example is based on an investment of $1,000 invested on August 1, 2008, at the beginning of the period, and held through the six-month period ended January 31, 2009. The example is for illustrative purposes only; you should consult the Prospectus for information on initial and subsequent minimum investment requirements.
The Fund’s transfer agent may charge additional fees to holders of certain accounts that are not included in the expenses shown in the table on the following page. These fees apply to individual retirement accounts (IRAs) and Section 403(b) accounts. As of the close of the six-month period covered by the table, IRA fees included an annual maintenance fee of $15 per account (subject to a maximum annual maintenance fee of $25 for all accounts held by the same shareholder). Section 403(b) accounts are charged an annual $25 fiduciary maintenance fee. Some of the fees may vary in amount, or may be waived, based on your total account balance or the number of JennisonDryden Funds, including the Target Asset Allocation Funds, that you own. You should consider the additional fees that were charged to your Fund account over the six-month period when you estimate the total ongoing expenses paid over the period and the impact of these fees on your ending account value, as these additional expenses are not reflected in the information provided in the expense table. Additional fees have the effect of reducing investment returns.
Actual Expenses
The first line for each share class in the table on the following page provides information about actual account values and actual expenses. You may use the information on this line, together with the amount you invested, to estimate the expenses that you paid over the period. Simply divide your account value by $1,000 (for example, an $8,600 account value ÷ $1,000 = 8.6), then multiply the result by the number on the first line under the heading “Expenses Paid During the Six-Month Period” to estimate the expenses you paid on your account during this period.
Hypothetical Example for Comparison Purposes
The second line for each share class in the table on the following page provides information about hypothetical account values and hypothetical expenses based on the Fund’s actual expense ratio and an assumed rate of return of 5% per year before expenses, which is not the Fund’s actual return. The hypothetical account values and
| | |
| 6 | | Visit our website at www.prudential.com |
expenses may not be used to estimate the actual ending account balance or expenses you paid for the period. You may use this information to compare the ongoing costs of investing in the Fund and other funds. To do so, compare this 5% hypothetical example with the 5% hypothetical examples that appear in the shareholder reports of the other funds.
Please note that the expenses shown in the table are meant to highlight your ongoing costs only and do not reflect any transactional costs such as sales charges (loads). Therefore, the second line for each share class in the table is useful in comparing ongoing costs only and will not help you determine the relative total costs of owning different funds. In addition, if these transactional costs were included, your costs would have been higher.
| | | | | | | | | | | | | | |
Target Moderate Allocation Fund | | Beginning Account
Value
August 1, 2008 | | Ending Account
Value January 31, 2009 | | Annualized
Expense Ratio
Based on the
Six-Month Period | | | Expenses Paid
During the
Six-Month Period* |
| | | | | | | | | | | | | | |
| Class A | | Actual | | $ | 1,000.00 | | $ | 744.40 | | 1.43 | % | | $ | 6.29 |
| | | Hypothetical | | $ | 1,000.00 | | $ | 1,018.00 | | 1.43 | % | | $ | 7.27 |
| | | | | | | | | | | | | | |
| Class B | | Actual | | $ | 1,000.00 | | $ | 741.70 | | 2.18 | % | | $ | 9.57 |
| | | Hypothetical | | $ | 1,000.00 | | $ | 1,014.22 | | 2.18 | % | | $ | 11.07 |
| | | | | | | | | | | | | | |
| Class C | | Actual | | $ | 1,000.00 | | $ | 741.70 | | 2.18 | % | | $ | 9.57 |
| | | Hypothetical | | $ | 1,000.00 | | $ | 1,014.22 | | 2.18 | % | | $ | 11.07 |
| | | | | | | | | | | | | | |
| Class M | | Actual | | $ | 1,000.00 | | $ | 742.10 | | 2.18 | % | | $ | 9.57 |
| | | Hypothetical | | $ | 1,000.00 | | $ | 1,014.22 | | 2.18 | % | | $ | 11.07 |
| | | | | | | | | | | | | | |
| Class R | | Actual | | $ | 1,000.00 | | $ | 744.10 | | 1.68 | % | | $ | 7.39 |
| | | Hypothetical | | $ | 1,000.00 | | $ | 1,016.74 | | 1.68 | % | | $ | 8.54 |
| | | | | | | | | | | | | | |
| Class X | | Actual | | $ | 1,000.00 | | $ | 741.70 | | 2.15 | % | | $ | 9.44 |
| | | Hypothetical | | $ | 1,000.00 | | $ | 1,014.37 | | 2.15 | % | | $ | 10.92 |
| | | | | | | | | | | | | | |
| Class Z | | Actual | | $ | 1,000.00 | | $ | 745.70 | | 1.18 | % | | $ | 5.19 |
| | | Hypothetical | | $ | 1,000.00 | | $ | 1,019.26 | | 1.18 | % | | $ | 6.01 |
* Fund expenses (net of fee waivers or subsidies, if any) for each share class are equal to the annualized expense ratio for each share class (provided in the table), multiplied by the average account value over the period, multiplied by the 184 days in the six-month period ended January 31, 2009, and divided by the 365 days in the Fund’s fiscal year ending July 31, 2009 (to reflect the six-month period). Expenses presented in the table include the expenses of any underlying portfolios in which the Fund may invest.
| | |
| Target Asset Allocation Funds/Target Moderate Allocation Fund | | 7 |
Portfolio of Investments
as of January 31, 2009 (Unaudited)
| | | | | |
| Shares | | Description | | Value (Note 1) |
| | | | | |
LONG-TERM INVESTMENTS 103.2% | | | |
COMMON STOCKS 61.6% | | | |
| |
Aerospace 1.5% | | | |
| 475 | | Alliant Techsystems, Inc.* | | $ | 38,385 |
| 19,900 | | Embraer-Empresa Brasileira de Aeronautica SA, ADR (Brazil) | | | 299,893 |
| 32,195 | | Lockheed Martin Corp. | | | 2,641,278 |
| 1,075 | | Moog, Inc. (Class A Stock)* | | | 32,207 |
| 3,900 | | MTU Aero Engines Holding AG (Germany) | | | 109,358 |
| 4,414 | | Raytheon Co. | | | 223,437 |
| 9,800 | | Safran SA (France) | | | 122,843 |
| 11,900 | | United Technologies Corp. | | | 571,081 |
| | | | | |
| | | | | 4,038,482 |
| |
Aerospace & Defense 1.1% | | | |
| 1,500 | | AAR Corp.* | | | 27,210 |
| 26,875 | | General Dynamics Corp. | | | 1,524,619 |
| 24,600 | | Northrop Grumman Corp. | | | 1,183,752 |
| 800 | | Teledyne Technologies, Inc.* | | | 22,296 |
| 2,300 | | Thales SA (France) | | | 102,350 |
| | | | | |
| | | | | 2,860,227 |
| |
Air Freight & Couriers 0.1% | | | |
| 3,500 | | FedEx Corp. | | | 178,290 |
| |
Air Freight & Logistics | | | |
| 1,225 | | Forward Air Corp. | | | 24,818 |
| |
Airlines 0.2% | | | |
| 75,500 | | Air New Zealand Ltd. (New Zealand) | | | 34,242 |
| 10,000 | | Deutsche Lufthansa AG (Germany) | | | 121,637 |
| 61,500 | | Qantas Airways Ltd. (Australia) | | | 94,199 |
| 15,183 | | Singapore Airlines Ltd. (Singapore) | | | 110,963 |
| 8,520 | | UAL Corp.* | | | 80,429 |
| | | | | |
| | | | | 441,470 |
| |
Auto Parts & Related | | | |
| 1,500 | | Compagnie Generale des Establissements Michelin (Class B Stock) (France) | | | 59,001 |
| |
Auto/Trucks Parts & Equipment 0.1% | | | |
| 9,500 | | Keihin Corp. (Japan) | | | 80,154 |
| 6,700 | | Nifco, Inc. (Japan) | | | 59,748 |
| | | | | |
| | | | | 139,902 |
See Notes to Financial Statements.
| | |
| Target Asset Allocation Funds/Target Moderate Allocation Fund | | 9 |
Portfolio of Investments
as of January 31, 2009 (Unaudited) continued
| | | | | |
| Shares | | Description | | Value (Note 1) |
| | | | | |
COMMON STOCKS (Continued) | | | |
| |
Automobiles 0.4% | | | |
| 1,500 | | DaimlerChrysler AG (Germany) | | $ | 42,253 |
| 24,000 | | Fuji Heavy Industries Ltd. (Japan) | | | 69,167 |
| 15,000 | | Harley-Davidson, Inc. | | | 182,700 |
| 11,600 | | Honda Motor Co. Ltd. (Japan) | | | 266,590 |
| 33,300 | | Nissan Motor Co. Ltd. (Japan) | | | 100,319 |
| 6,000 | | Nissan Shatai Co. Ltd. (Japan) | | | 38,085 |
| 1,000 | | Renault SA (France) | | | 19,411 |
| 16,000 | | Toyota Motor Corp. (Japan) | | | 514,691 |
| 2,100 | | Valeo SA (France) | | | 23,500 |
| 7,700 | | Volvo AB (Class B Stock) (Sweden) | | | 30,926 |
| | | | | |
| | | | | 1,287,642 |
| |
Automotive Components 0.1% | | | |
| 13,900 | | Johnson Controls, Inc. | | | 173,889 |
| |
Automotive Parts 0.1% | | | |
| 400 | | Georg Fischer AG (Switzerland)* | | | 66,109 |
| 39,500 | | GKN PLC (United Kingdom) | | | 48,227 |
| 3,050 | | O’Reilly Automotive, Inc.* | | | 88,664 |
| 17,500 | | Sumitomo Electric Industries Ltd. (Japan) | | | 131,725 |
| | | | | |
| | | | | 334,725 |
| |
Banking 0.2% | | | |
| 32,178 | | Standard Chartered PLC (United Kingdom) | | | 408,497 |
| |
Banks | | | |
| 29,600 | | Mizuho Financial Group, Inc. (Japan) | | | 73,268 |
| |
Beverages 0.3% | | | |
| 5,320 | | Coca-Cola Co. (The) | | | 227,271 |
| 3,270 | | Molson Coors Brewing Co. (Class B Stock) | | | 131,683 |
| 5,970 | | PepsiCo, Inc. | | | 299,873 |
| 13,828 | | SABMiller PLC (United Kingdom) | | | 226,846 |
| | | | | |
| | | | | 885,673 |
| |
Biotechnology 1.7% | | | |
| 9,603 | | Amgen, Inc.* | | | 526,725 |
| 3,550 | | BioMarin Pharmaceutical, Inc.* | | | 68,373 |
| 6,900 | | Celgene Corp.* | | | 365,355 |
| 3,925 | | Cubist Pharmaceuticals, Inc.* | | | 84,034 |
See Notes to Financial Statements.
| | |
| 10 | | Visit our website at www.prudential.com |
| | | | | |
| Shares | | Description | | Value (Note 1) |
| | | | | |
COMMON STOCKS (Continued) | | | |
| |
Biotechnology (cont’d.) | | | |
| 29,300 | | Genentech, Inc.* | | $ | 2,380,332 |
| 14,822 | | Genzyme Corp.* | | | 1,021,532 |
| 1,080 | | Myriad Genetics, Inc.* | | | 80,536 |
| | | | | |
| | | | | 4,526,887 |
| |
Broadcasting | | | |
| 9,525 | | British Sky Broadcasting Group PLC (United Kingdom) | | | 68,604 |
| |
Building Materials 0.1% | | | |
| 19,000 | | Asahi Glass Co. Ltd. (Japan) | | | 99,225 |
| 500 | | Ciments Francais SA (France) | | | 38,399 |
| 21,000 | | Kurabo Industries Ltd. (Japan) | | | 33,184 |
| 32,000 | | Sanwa Holdings Corp. (Japan) | | | 109,385 |
| | | | | |
| | | | | 280,193 |
| |
Business Services 0.1% | | | |
| 3,520 | | FTI Consulting, Inc.* | | | 144,355 |
| |
Capital Goods | | | |
| 1,200 | | Harsco Corp. | | | 28,464 |
| |
Capital Markets 0.1% | | | |
| 12,260 | | Charles Schwab Corp. (The) | | | 166,613 |
| 2,690 | | Investment Technology Group, Inc.* | | | 58,319 |
| 2,600 | | Morgan Stanley | | | 52,598 |
| 2,897 | | Raymond James Financial, Inc. | | | 53,624 |
| 2,975 | | Waddell & Reed Financial, Inc. (Class A Stock) | | | 42,007 |
| | | | | |
| | | | | 373,161 |
| |
Chemicals 1.6% | | | |
| 10,544 | | Air Products & Chemicals, Inc. | | | 530,363 |
| 1,125 | | Airgas, Inc. | | | 39,724 |
| 80 | | Arkema (France) | | | 1,133 |
| 44,000 | | Asahi Kasei Corp. (Japan) | | | 179,993 |
| 6,700 | | BASF SE (Germany) | | | 194,907 |
| 2,300 | | Ciba Holding AG (Switzerland) | | | 97,124 |
| 14,800 | | Clariant AG (Switzerland)* | | | 73,751 |
| 21,300 | | Denki Kagaku Kogyo Kabushiki Kaisha (Japan) | | | 44,411 |
| 31,500 | | Dow Chemical Co. (The) | | | 365,085 |
| 7,000 | | Eastman Chemical Co. | | | 181,650 |
See Notes to Financial Statements.
| | |
| Target Asset Allocation Funds/Target Moderate Allocation Fund | | 11 |
Portfolio of Investments
as of January 31, 2009 (Unaudited) continued
| | | | | |
| Shares | | Description | | Value (Note 1) |
| | | | | |
COMMON STOCKS (Continued) | | | |
| |
Chemicals (cont’d.) | | | |
| 3,900 | | Ecolab, Inc. | | $ | 132,444 |
| 364 | | Givaudan SA (Switzerland) | | | 247,133 |
| 22,555 | | Huntsman Corp. | | | 59,996 |
| 4,820 | | Intrepid Potash, Inc.* | | | 98,232 |
| 4,400 | | Koninklijke DSM NV (Netherlands) | | | 105,914 |
| 1,400 | | Linde AG (Germany) | | | 93,661 |
| 19,000 | | Nippon Shokubai Co. Ltd. (Japan) | | | 126,444 |
| 7,200 | | PPG Industries, Inc. | | | 270,576 |
| 21,174 | | Praxair, Inc. | | | 1,318,293 |
| 2,415 | | Quaker Chemical Corp. | | | 27,555 |
| 3,900 | | Terra Industries, Inc. | | | 79,872 |
| 1,100 | | Valspar Corp. (The) | | | 19,085 |
| | | | | |
| | | | | 4,287,346 |
| |
Clothing & Apparel 0.5% | | | |
| 28,054 | | NIKE, Inc. (Class B Stock) | | | 1,269,444 |
| 10,000 | | Onward Holdings Co. Ltd. (Japan) | | | 67,845 |
| 3,300 | | Phillips-Van Heusen Corp. | | | 62,766 |
| | | | | |
| | | | | 1,400,055 |
| |
Commercial Banks 0.5% | | | |
| 4,500 | | Allied Irish Banks PLC (Ireland) | | | 7,030 |
| 9,300 | | Banco Espirito Santo SA (Portugal) | | | 61,920 |
| 15,000 | | Bank of Ireland (Ireland) | | | 12,484 |
| 7,180 | | Bank of New York Mellon Corp. (The) | | | 184,813 |
| 18,300 | | Barclays PLC (United Kingdom) | | | 28,138 |
| 7,100 | | Comerica, Inc. | | | 118,286 |
| 975 | | Cullen/Frost Bankers, Inc. | | | 42,676 |
| 5,170 | | First Commonwealth Financial Corp. | | | 49,580 |
| 21,100 | | KeyCorp | | | 153,608 |
| 41,179 | | Lloyds TSB Group PLC (United Kingdom) | | | 54,127 |
| 9,085 | | Northern Trust Corp. | | | 522,569 |
| 1,825 | | Prosperity Bancshares, Inc. | | | 49,366 |
| 1,500 | | Trustmark Corp. | | | 30,450 |
| 2,375 | | United Bankshares, Inc. | | | 49,851 |
| | | | | |
| | | | | 1,364,898 |
| |
Commercial Services & Supplies 1.3% | | | |
| 8,550 | | Accenture Ltd. (Class A Stock) (Bermuda) | | | 269,838 |
| 2,600 | | Adecco SA (Switzerland) | | | 87,556 |
See Notes to Financial Statements.
| | |
| 12 | | Visit our website at www.prudential.com |
| | | | | |
| Shares | | Description | | Value (Note 1) |
| | | | | |
COMMON STOCKS (Continued) | | | |
| |
Commercial Services & Supplies (cont’d.) | | | |
| 1,640 | | Apollo Group, Inc. (Class A Stock)* | | $ | 133,594 |
| 6,290 | | Corrections Corp. of America* | | | 86,676 |
| 5,300 | | Davis Service Group PLC (United Kingdom) | | | 19,029 |
| 6,760 | | GEO Group, Inc. (The)* | | | 100,048 |
| 1,550 | | Healthcare Services Group, Inc. | | | 23,746 |
| 1,900 | | Moody’s Corp. | | | 40,698 |
| 31,396 | | Visa, Inc. (Class A Stock) | | | 1,549,393 |
| 7,072 | | Waste Connections, Inc.* | | | 205,229 |
| 29,500 | | Waste Management, Inc. | | | 920,105 |
| | | | | |
| | | | | 3,435,912 |
| |
Communication Equipment 0.2% | | | |
| 128,700 | | Alcatel-Lucent, ADR (France)* | | | 253,539 |
| 4,000 | | Arris Group, Inc.* | | | 28,480 |
| 9,035 | | EMS Technologies, Inc.* | | | 216,840 |
| 1,500 | | Nice Systems Ltd., ADR (Israel)* | | | 28,785 |
| 15,290 | | Nuance Communications, Inc.* | | | 150,759 |
| | | | | |
| | | | | 678,403 |
| |
Computer Hardware 0.8% | | | |
| 21,310 | | Apple, Inc.* | | | 1,920,670 |
| 18,790 | | EMC Corp.* | | | 207,442 |
| 14,548 | | Logitech International SA (Switzerland)* | | | 141,353 |
| | | | | |
| | | | | 2,269,465 |
| |
Computer Services & Software 0.5% | | | |
| 6,520 | | Electronic Arts, Inc.* | | | 100,669 |
| 1,400 | | Global Payments, Inc. | | | 48,594 |
| 1,155 | | MICROS Systems, Inc.* | | | 16,632 |
| 39,782 | | Oracle Corp.* | | | 669,531 |
| 11,706 | | SAP AG (Germany) | | | 417,424 |
| 6,700 | | TietoEnator Oyj (Finland) | | | 76,092 |
| | | | | |
| | | | | 1,328,942 |
| |
Computers 0.6% | | | |
| 46,360 | | Hewlett-Packard Co. | | | 1,611,010 |
| |
Computers & Peripherals 0.9% | | | |
| 2,850 | | Cognizant Technology Solutions Corp. (Class A Stock)* | | | 53,381 |
| 12,380 | | Compellent Technologies, Inc.* | | | 149,798 |
See Notes to Financial Statements.
| | |
| Target Asset Allocation Funds/Target Moderate Allocation Fund | | 13 |
Portfolio of Investments
as of January 31, 2009 (Unaudited) continued
| | | | | |
| Shares | | Description | | Value (Note 1) |
| | | | | |
COMMON STOCKS (Continued) | | | |
| |
Computers & Peripherals (cont’d.) | | | |
| 21,237 | | International Business Machines Corp. | | $ | 1,946,371 |
| 11,400 | | NetApp, Inc.* | | | 169,062 |
| 10,435 | | Netezza Corp.* | | | 63,340 |
| | | | | |
| | | | | 2,381,952 |
| |
Conglomerates 0.1% | | | |
| 30,300 | | Marubeni Corp. (Japan) | | | 107,837 |
| 7,400 | | Mitsubishi Corp. (Japan) | | | 97,785 |
| | | | | |
| | | | | 205,622 |
| |
Construction 0.1% | | | |
| 525 | | Foster Wheeler Ltd.* | | | 10,484 |
| 800 | | Granite Construction, Inc. | | | 28,176 |
| 2,005 | | Texas Industries, Inc. | | | 45,534 |
| 2,000 | | URS Corp.* | | | 68,100 |
| | | | | |
| | | | | 152,294 |
| |
Construction & Engineering | | | |
| 3,370 | | Northwest Pipe Co.* | | | 118,826 |
| |
Consumer Finance 0.1% | | | |
| 6,593 | | Cash America International, Inc. | | | 120,520 |
| 2,475 | | First Cash Financial Services, Inc.* | | | 41,630 |
| | | | | |
| | | | | 162,150 |
| |
Consumer Products & Services 0.4% | | | |
| 5,010 | | Alberto-Culver Co. | | | 122,545 |
| 3,840 | | Avon Products, Inc. | | | 78,528 |
| 5,540 | | Colgate-Palmolive Co. | | | 360,322 |
| 11,600 | | Electrolux AB (Class B Stock) (Sweden) | | | 83,890 |
| 55,000 | | Pacific Brands Ltd. (Australia) | | | 14,586 |
| 12,948 | | Reckitt Benckiser Group PLC (United Kingdom) | | | 501,940 |
| 1,000 | | Toro Co. (The) | | | 29,610 |
| | | | | |
| | | | | 1,191,421 |
| |
Containers & Packaging 0.1% | | | |
| 16,500 | | Amcor Ltd. (Australia) | | | 55,853 |
| 1,900 | | Owens-Illinois, Inc.* | | | 36,100 |
| 2,350 | | Pactiv Corp.* | | | 50,807 |
| 1,225 | | Silgan Holdings, Inc. | | | 56,154 |
| | | | | |
| | | | | 198,914 |
See Notes to Financial Statements.
| | |
| 14 | | Visit our website at www.prudential.com |
| | | | | |
| Shares | | Description | | Value (Note 1) |
| | | | | |
COMMON STOCKS (Continued) | | | |
| |
Distribution/Wholesale 0.1% | | | |
| 16,500 | | Sumitomo Corp. (Japan) | | $ | 149,316 |
| |
Diversified 0.1% | | | |
| 4,835 | | BHP Billiton Ltd., ADR (Australia) | | | 181,506 |
| |
Diversified Consumer Services | | | |
| 1,520 | | American Public Education, Inc.* | | | 59,523 |
| 500 | | Hillenbrand, Inc. | | | 9,245 |
| | | | | |
| | | | | 68,768 |
| |
Diversified Financial Services 1.5% | | | |
| 47,400 | | Citigroup, Inc. | | | 168,270 |
| 70,210 | | JPMorgan Chase & Co. | | | 1,791,057 |
| 14,100 | | Redecard SA (Brazil) | | | 159,537 |
| 104,209 | | Wells Fargo & Co. | | | 1,969,550 |
| | | | | |
| | | | | 4,088,414 |
| |
Diversified Manufacturing 0.1% | | | |
| 9,300 | | AGFA-Gevaert NV (Belgium)* | | | 32,746 |
| 25,600 | | IMI PLC (United Kingdom) | | | 99,704 |
| 53,100 | | Tomkins PLC (United Kingdom) | | | 90,611 |
| | | | | |
| | | | | 223,061 |
| |
Diversified Operations 0.2% | | | |
| 25,648 | | CITIC Pacific Ltd. (Hong Kong) | | | 30,151 |
| 6,657 | | LVMH Moet Hennessy Louis Vuitton SA (France) | | | 364,852 |
| 10,000 | | Mitsui & Co. Ltd. (Japan) | | | 104,353 |
| | | | | |
| | | | | 499,356 |
| |
Diversified Telecommunication Services 1.3% | | | |
| 68,000 | | AT&T, Inc. | | | 1,674,160 |
| 57,200 | | Verizon Communications, Inc. | | | 1,708,564 |
| | | | | |
| | | | | 3,382,724 |
| |
Education 0.1% | | | |
| 2,020 | | DeVry, Inc. | | | 108,231 |
| 940 | | K12, Inc.* | | | 15,012 |
| 1,370 | | New Oriental Education & Technology Group, Inc., ADR (China)* | | | 69,432 |
| | | | | |
| | | | | 192,675 |
See Notes to Financial Statements.
| | |
| Target Asset Allocation Funds/Target Moderate Allocation Fund | | 15 |
Portfolio of Investments
as of January 31, 2009 (Unaudited) continued
| | | | | |
| Shares | | Description | | Value (Note 1) |
| | | | | |
COMMON STOCKS (Continued) | | | |
| |
Electric 0.1% | | | |
| 5,030 | | Allegheny Energy, Inc. | | $ | 167,197 |
| 600 | | Integrys Energy Group, Inc. | | | 25,050 |
| | | | | |
| | | | | 192,247 |
| |
Electric Utilities 0.6% | | | |
| 10,200 | | Enel SpA (Italy) | | | 57,399 |
| 1,900 | | Entergy Corp. | | | 145,084 |
| 9,400 | | Exelon Corp. | | | 509,668 |
| 11,607 | | FirstEnergy Corp. | | | 580,234 |
| 7,600 | | FPL Group, Inc. | | | 391,780 |
| 820 | | Westar Energy, Inc. | | | 16,465 |
| | | | | |
| | | | | 1,700,630 |
| |
Electrical Equipment | | | |
| 750 | | Smith (A.O.) Corp. | | | 20,610 |
| 1,720 | | SunPower Corp. (Class A Stock) | | | 57,723 |
| | | | | |
| | | | | 78,333 |
| |
Electronic Components 0.3% | | | |
| 11,400 | | Alpine Electronics, Inc. (Japan) | | | 80,516 |
| 12,100 | | Alps Electric Co. Ltd. (Japan) | | | 50,799 |
| 4,400 | | Emerson Electric Co. | | | 143,880 |
| 5,400 | | Fanuc Ltd. (Japan) | | | 320,021 |
| 2,100 | | FLIR Systems, Inc.* | | | 52,437 |
| 763 | | Itron, Inc.* | | | 49,824 |
| 7,700 | | Sanmina-SCI Corp.* | | | 2,541 |
| 14,100 | | TT Electronics PLC (United Kingdom) | | | 6,130 |
| | | | | |
| | | | | 706,148 |
| |
Electronic Components & Equipment 0.1% | | | |
| 7,500 | | Koninklijke Philips Electronics NV (Netherlands) | | | 136,362 |
| 6,400 | | Omron Corp. (Japan) | | | 76,223 |
| | | | | |
| | | | | 212,585 |
| |
Electronic Equipment & Instruments 0.4% | | | |
| 5,520 | | Coherent, Inc.* | | | 99,857 |
| 1,780 | | Dolby Laboratories, Inc. (Class A Stock)* | | | 45,497 |
| 28,250 | | Tyco Electronics Ltd. (Bermuda) | | | 400,020 |
| 19,850 | | Tyco International Ltd. (Bermuda) | | | 417,247 |
| | | | | |
| | | | | 962,621 |
See Notes to Financial Statements.
| | |
| 16 | | Visit our website at www.prudential.com |
| | | | | |
| Shares | | Description | | Value (Note 1) |
| | | | | |
COMMON STOCKS (Continued) | | | |
| |
Electronics | | | |
| 625 | | Belden CDT, Inc. | | $ | 8,163 |
| |
Energy Equipment & Services 0.7% | | | |
| 1,090 | | Core Laboratories NV (Netherlands) | | | 73,237 |
| 10,397 | | Diamond Offshore Drilling, Inc. | | | 652,516 |
| 36,600 | | Halliburton Co. | | | 631,350 |
| 3,840 | | Lufkin Industries, Inc. | | | 134,208 |
| 625 | | Oil States International, Inc.* | | | 11,444 |
| 4,115 | | OYO Geospace Corp.* | | | 61,519 |
| 4,595 | | Vestas Wind Systems A/S (Denmark)* | | | 224,545 |
| | | | | |
| | | | | 1,788,819 |
| |
Engineering/Construction 0.1% | | | |
| 15,989 | | ABB Ltd., ADR (Switzerland) | | | 208,656 |
| |
Entertainment & Leisure 0.8% | | | |
| 17,348 | | Carnival PLC (United Kingdom) | | | 319,034 |
| 6,120 | | DreamWorks Animation SKG, Inc. (Class A Stock)* | | | 134,334 |
| 13,702 | | Hennes & Mauritz AB (Class B Stock) (Sweden) | | | 530,670 |
| 10,730 | | International Game Technology | | | 113,738 |
| 107,715 | | Las Vegas Sands Corp.* | | | 554,732 |
| 1,400 | | Life Time Fitness, Inc.* | | | 20,734 |
| 1,539 | | Nintendo Co. Ltd. (Japan) | | | 477,113 |
| 16,200 | | Tabcorp Holdings Ltd. (Australia) | | | 66,929 |
| | | | | |
| | | | | 2,217,284 |
| |
Environmental Services 0.1% | | | |
| 8,380 | | Republic Services, Inc. | | | 216,707 |
| |
Equipment Services 0.1% | | | |
| 40,000 | | Downer EDI Ltd. (Australia) | | | 88,937 |
| 6,900 | | Kyoei Steel Ltd (Japan) | | | 115,890 |
| | | | | |
| | | | | 204,827 |
| |
Farming & Agriculture 1.1% | | | |
| 51,000 | | Altria Group, Inc. | | | 843,540 |
| 38,400 | | AWB Ltd. (Australia) | | | 53,124 |
| 141,384 | | Chaoda Modern Agriculture Holdings Ltd. (Cayman Islands) | | | 89,275 |
| 27,159 | | Monsanto Co. | | | 2,065,713 |
| | | | | |
| | | | | 3,051,652 |
See Notes to Financial Statements.
| | |
| Target Asset Allocation Funds/Target Moderate Allocation Fund | | 17 |
Portfolio of Investments
as of January 31, 2009 (Unaudited) continued
| | | | | |
| Shares | | Description | | Value (Note 1) |
| | | | | |
COMMON STOCKS (Continued) | | | |
| |
Financial - Bank & Trust 1.5% | | | |
| 1,850 | | Astoria Financial Corp. | | $ | 16,798 |
| 12,200 | | Banco Bilbao Vizcaya Argentaria SA (Spain) | | | 114,501 |
| 38,500 | | Banco Santander SA (Spain)(CHIX) | | | 311,545 |
| 3,967 | | Banco Santander SA (Spain)(XLON) | | | 31,760 |
| 61,359 | | Bank of America Corp. | | | 403,742 |
| 10,532 | | BNP Paribas (France) | | | 404,688 |
| 23,900 | | Bradford & Bingley PLC (United Kingdom)* | | | — |
| 146,332 | | China Merchants Bank Co. Ltd. (Class H Stock) (China) | | | 236,298 |
| 5,300 | | Credit Agricole SA (France) | | | 64,739 |
| 6,600 | | Credit Saison Co. Ltd. (Japan) | | | 64,743 |
| 5,100 | | Credit Suisse Group AG (Switzerland) | | | 131,204 |
| 3,100 | | Danske Bank A/S (Denmark) | | | 31,416 |
| 75 | | Danvers Bancorp, Inc. | | | 944 |
| 3,100 | | Deutsche Bank AG (Germany) | | | 82,163 |
| 5,300 | | Dexia NV/SA (Belgium)* | | | 16,660 |
| 1,900 | | East West Bancorp, Inc. | | | 18,031 |
| 26,789 | | Intesa Sanpaolo SpA (Italy)* | | | 84,808 |
| 11,100 | | National Australia Bank Ltd. (Australia) | | | 130,917 |
| 14,356 | | National Bank of Greece SA (Greece) | | | 242,266 |
| 6,000 | | Natixis SA (France) | | | 9,411 |
| 5,700 | | Nordea Bank AB (Sweden) | | | 30,252 |
| 1,400 | | Pacific Capital Bancorp | | | 14,854 |
| 15,400 | | PNC Financial Services Group, Inc. | | | 500,808 |
| 34,133 | | Royal Bank of Scotland Group PLC (United Kingdom) | | | 10,882 |
| 6,960 | | State Street Corp. | | | 161,959 |
| 1,200 | | Sterling Financial Corp. | | | 2,220 |
| 400 | | Student Loan Corp. (The) | | | 18,776 |
| 17,000 | | Sumitomo Trust & Banking Co. Ltd. (The) (Japan) | | | 83,359 |
| 2,800 | | SunTrust Banks, Inc. | | | 34,328 |
| 9,700 | | Takefuji Corp. (Japan) | | | 68,501 |
| 42,933 | | U.S. Bancorp | | | 637,126 |
| 6,000 | | Unione di Banche Italiane ScpA (Italy) | | | 74,903 |
| 400 | | Verwaltungs und Privat Bank AG (Switzerland) | | | 40,279 |
| | | | | |
| | | | | 4,074,881 |
| |
Financial Services 1.1% | | | |
| 7,600 | | Alpha Bank A.E. (Greece) | | | 64,030 |
| 33,200 | | DnB NOR ASA (Norway) | | | 113,137 |
| 1,700 | | Eaton Vance Corp. | | | 32,538 |
| 3,399 | | Franklin Resources, Inc. | | | 164,580 |
See Notes to Financial Statements.
| | |
| 18 | | Visit our website at www.prudential.com |
| | | | | |
| Shares | | Description | | Value (Note 1) |
| | | | | |
COMMON STOCKS (Continued) | | | |
| |
Financial Services (cont’d.) | | | |
| 13,367 | | Goldman Sachs Group, Inc. (The) | | $ | 1,079,118 |
| 27,909 | | Hong Kong Exchanges and Clearing Ltd. (Hong Kong) | | | 239,716 |
| 1,940,000 | | Industrial & Commercial Bank of China Ltd. (Class H Stock) (China) | | | 820,223 |
| 7,400 | | Irish Life & Permanent PLC (Ireland) | | | 15,634 |
| 2,000 | | Jefferies Group, Inc. | | | 23,080 |
| 6,179 | | Julius Baer Holding AG (Switzerland) | | | 184,214 |
| 1,855 | | Lender Processing Services, Inc. | | | 48,082 |
| 3,300 | | Macquarie Group Ltd. (Australia) | | | 52,758 |
| 37,000 | | Noble Group Ltd. (Hong Kong) | | | 24,926 |
| 11,320 | | Western Union Co. (The) | | | 154,631 |
| | | | | |
| | | | | 3,016,667 |
| |
Food 1.1% | | | |
| 5,900 | | CSM NV (Netherlands) | | | 75,392 |
| 86,200 | | Goodman Fielder Ltd. (Australia) | | | 82,984 |
| 11,377 | | Groupe Danone (France) | | | 586,323 |
| 750 | | JM Smucker Co. (The) | | | 33,863 |
| 1,900 | | Kellogg Co. | | | 83,011 |
| 2,340 | | Kraft Foods, Inc. (Class A Stock) | | | 65,637 |
| 23,700 | | Kroger Co. (The) | | | 533,250 |
| 39,926 | | Nestle SA (Switzerland) | | | 1,383,073 |
| 550 | | Ralcorp Holdings, Inc.* | | | 32,571 |
| 3,000 | | Suedzucker AG (Germany) | | | 47,515 |
| 650 | | TreeHouse Foods, Inc.* | | | 17,154 |
| | | | | |
| | | | | 2,940,773 |
| |
Food & Beverage | | | |
| 12,400 | | Dairy Crest Group PLC (United Kingdom) | | | 35,940 |
| 48,600 | | Northern Foods PLC (United Kingdom) | | | 37,680 |
| 10,500 | | Tate & Lyle PLC (United Kingdom) | | | 50,595 |
| | | | | |
| | | | | 124,215 |
| |
Food & Drug Retailers 0.3% | | | |
| 42,700 | | Safeway, Inc. | | | 915,061 |
| |
Gaming | | | |
| 4,486 | | OPAP SA (Greece) | | | 130,960 |
| |
Gas Distribution | | | |
| 31,900 | | Centrica PLC (United Kingdom) | | | 119,271 |
See Notes to Financial Statements.
| | |
| Target Asset Allocation Funds/Target Moderate Allocation Fund | | 19 |
Portfolio of Investments
as of January 31, 2009 (Unaudited) continued
| | | | | |
| Shares | | Description | | Value (Note 1) |
| | | | | |
COMMON STOCKS (Continued) | | | |
| |
Gas Utilities | | | |
| 700 | | Atmos Energy Corp. | | $ | 17,185 |
| |
Healthcare Equipment & Supplies 0.4% | | | |
| 2,090 | | Alcon, Inc. (Switzerland) | | | 178,988 |
| 13,555 | | American Medical Systems Holdings, Inc.* | | | 145,038 |
| 6,878 | | Covidien Ltd. (Bermuda) | | | 263,703 |
| 7,790 | | Cutera, Inc.* | | | 52,271 |
| 2,675 | | Hansen Medical, Inc.* | | | 12,091 |
| 3,925 | | Resmed, Inc.* | | | 156,607 |
| 735 | | SurModics, Inc.* | | | 14,575 |
| 450 | | Teleflex, Inc. | | | 23,931 |
| 8,005 | | Thoratec Corp.* | | | 231,905 |
| | | | | |
| | | | | 1,079,109 |
| |
Healthcare Products & Services 0.1% | | | |
| 4,418 | | Biogen Idec, Inc.* | | | 214,935 |
| 2,225 | | Patterson Cos., Inc.* | | | 40,918 |
| | | | | |
| | | | | 255,853 |
| |
Healthcare Providers & Services 0.1% | | | |
| 2,295 | | Amedisys, Inc.* | | | 94,623 |
| 7,030 | | Centene Corp.* | | | 124,642 |
| 1,675 | | inventive Health, Inc.* | | | 15,979 |
| 1,000 | | LHC Group, Inc.* | | | 26,610 |
| 2,960 | | Lincare Holdings, Inc.* | | | 71,188 |
| 1,000 | | MWI Veterinary Supply, Inc.* | | | 20,930 |
| 350 | | Owens & Minor, Inc. | | | 13,920 |
| | | | | |
| | | | | 367,892 |
| |
Healthcare Services 0.3% | | | |
| 11,700 | | Aetna, Inc. | | | 362,700 |
| 1,400 | | AMERIGROUP Corp.* | | | 39,158 |
| 825 | | AmSurg Corp.* | | | 16,162 |
| 800 | | Covance, Inc.* | | | 30,880 |
| 2,275 | | HealthSpring, Inc.* | | | 39,631 |
| 1,700 | | Healthways, Inc.* | | | 23,494 |
| 2,355 | | MEDNAX, Inc.* | | | 79,057 |
| 8,873 | | UnitedHealth Group, Inc. | | | 251,372 |
| | | | | |
| | | | | 842,454 |
See Notes to Financial Statements.
| | |
| 20 | | Visit our website at www.prudential.com |
| | | | | |
| Shares | | Description | | Value (Note 1) |
| | | | | |
COMMON STOCKS (Continued) | | | |
| |
Healthcare Technology 0.1% | | | |
| 16,155 | | Eclipsys Corp.* | | $ | 141,518 |
| 3,290 | | Vital Images, Inc.* | | | 37,210 |
| | | | | |
| | | | | 178,728 |
| |
Home Furnishings 0.1% | | | |
| 11,000 | | Panasonic Corp. (Japan) | | | 133,459 |
| 9,200 | | THOMSON (France)* | | | 13,205 |
| | | | | |
| | | | | 146,664 |
| |
Hotels, Restaurants & Leisure 1.7% | | | |
| 7,010 | | Bally Technologies, Inc.* | | | 141,532 |
| 6,960 | | BJ’s Restaurants, Inc.* | | | 77,256 |
| 63,606 | | McDonald’s Corp. | | | 3,690,420 |
| 16,260 | | Shuffle Master, Inc.* | | | 55,121 |
| 3,625 | | Sonic Corp.* | | | 35,308 |
| 1,969 | | Wendy’s/Arby’s Group, Inc. (Class A Stock) | | | 9,924 |
| 4,310 | | WMS Industries, Inc.* | | | 95,768 |
| 14,699 | | Wynn Resorts Ltd.* | | | 442,146 |
| | | | | |
| | | | | 4,547,475 |
| |
Household Durables 0.1% | | | |
| 8,000 | | Fortune Brands, Inc. | | | 256,000 |
| 8,375 | | Universal Electronics, Inc.* | | | 94,470 |
| | | | | |
| | | | | 350,470 |
| |
Household Products 0.5% | | | |
| 22,200 | | Kimberly-Clark Corp. | | | 1,142,634 |
| 2,225 | | Scotts Miracle-Gro Co. (The) (Class A Stock) | | | 71,689 |
| | | | | |
| | | | | 1,214,323 |
| |
Independent Power Producers & Energy Traders | | | |
| 12,783 | | Drax Group PLC (United Kingdom) | | | 103,092 |
| |
Industrial Conglomerates 0.3% | | | |
| 10,500 | | 3M Co. | | | 564,795 |
| 13,500 | | General Electric Co. | | | 163,755 |
| | | | | |
| | | | | 728,550 |
See Notes to Financial Statements.
| | |
| Target Asset Allocation Funds/Target Moderate Allocation Fund | | 21 |
Portfolio of Investments
as of January 31, 2009 (Unaudited) continued
| | | | | |
| Shares | | Description | | Value (Note 1) |
| | | | | |
COMMON STOCKS (Continued) | | | |
| |
Insurance 2.5% | | | |
| 9,426 | | ACE Ltd. (Switzerland) | | $ | 411,539 |
| 7,600 | | Aegon NV (Netherlands) | | | 40,286 |
| 32,500 | | Allstate Corp. (The) | | | 704,275 |
| 1,125 | | Aspen Insurance Holdings Ltd. (Bermuda) | | | 24,863 |
| 29,500 | | Aviva PLC (United Kingdom) | | | 133,384 |
| 21,800 | | AXA SA (France) | | | 340,952 |
| 1,600 | | Baloise Holding AG (Switzerland) | | | 99,664 |
| 38,100 | | Beazley Group PLC (United Kingdom) | | | 70,674 |
| 25,700 | | Brit Insurance Holdings PLC (United Kingdom) | | | 75,513 |
| 163,200 | | China Life Insurance Co. Ltd. (Class H Stock) (China) | | | 429,538 |
| 11,300 | | Chubb Corp. | | | 481,154 |
| 1,400 | | Delphi Financial Group, Inc. (Class A Stock) | | | 21,238 |
| 1,375 | | Gallagher, (Arthur J.) & Co. | | | 32,409 |
| 20,000 | | Genworth Financial, Inc. (Class A Stock) | | | 46,400 |
| 3,200 | | Hanover Insurance Group, Inc. (The) | | | 129,344 |
| 2,162 | | HCC Insurance Holdings, Inc. | | | 50,612 |
| 10,200 | | ING Groep NV, ADR (Netherlands) | | | 83,349 |
| 1,225 | | IPC Holdings Ltd. (Bermuda) | | | 31,433 |
| 121,100 | | Legal & General Group PLC (United Kingdom) | | | 108,106 |
| 44,048 | | MetLife, Inc. | | | 1,265,499 |
| 1,800 | | Muenchener Rueckversicherungs AG (Germany) | | | 238,998 |
| 50,900 | | Old Mutual PLC (United Kingdom) | | | 38,652 |
| 900 | | Protective Life Corp. | | | 7,452 |
| 1,200 | | State Auto Financial Corp. | | | 26,520 |
| 10,773 | | Swiss Re (Switzerland) | | | 287,367 |
| 31,300 | | Travelers Cos., Inc. (The) | | | 1,209,432 |
| 1,300 | | United Fire & Casualty Co. | | | 26,065 |
| 10,000 | | Unum Group | | | 141,600 |
| 26,000 | | XL Capital Ltd. (Class A Stock) (Bermuda) | | | 75,400 |
| 1,100 | | Zurich Financial Services AG (Switzerland) | | | 199,155 |
| | | | | |
| | | | | 6,830,873 |
| |
Internet Services 0.9% | | | |
| 1,100 | | Amazon.com, Inc.* | | | 64,702 |
| 1,000 | | Digital River, Inc.* | | | 24,770 |
| 4,647 | | Google, Inc. (Class A Stock)* | | | 1,573,149 |
| 1,520 | | NetFlix, Inc.* | | | 54,933 |
| 4,525 | | SRA International, Inc. (Class A Stock)* | | | 73,893 |
| 24,570 | | VeriSign, Inc.* | | | 474,447 |
| 4,600 | | Yahoo!, Inc.* | | | 53,958 |
| | | | | |
| | | | | 2,319,852 |
See Notes to Financial Statements.
| | |
| 22 | | Visit our website at www.prudential.com |
| | | | | |
| Shares | | Description | | Value (Note 1) |
| | | | | |
COMMON STOCKS (Continued) | | | |
| |
Internet Software & Services 0.1% | | | |
| 1,300 | | Baidu.com, Inc., ADR (China)* | | $ | 165,308 |
| 17,000 | | eBay, Inc.* | | | 204,340 |
| 3,425 | | Internet Capital Group, Inc.* | | | 14,762 |
| | | | | |
| | | | | 384,410 |
|
Iron/Steel |
| 28,000 | | Nisshin Steel Co. Ltd. (Japan) | | | 46,780 |
|
IT Services |
| 925 | | CACI International, Inc. (Class A Stock)* | | | 41,764 |
| 93,800 | | Logica PLC (United Kingdom) | | | 89,376 |
| | | | | |
| | | | | 131,140 |
|
Leisure Equipment & Products |
| 5,020 | | Hasbro, Inc. | | | 121,133 |
|
Life Science Tools & Services 0.2% |
| 7,035 | | ICON PLC, ADR* | | | 141,403 |
| 12,430 | | Thermo Fisher Scientific, Inc.* | | | 446,610 |
| | | | | |
| | | | | 588,013 |
|
Machinery 0.7% |
| 975 | | Actuant Corp. (Class A Stock) | | | 16,068 |
| 28,000 | | BlueScope Steel Ltd. (Australia) | | | 61,547 |
| 2,350 | | Bucyrus International, Inc. (Class A Stock) | | | 36,425 |
| 23,300 | | Caterpillar, Inc. | | | 718,805 |
| 5,400 | | Cummins, Inc. | | | 129,492 |
| 8,496 | | Deere & Co. | | | 295,151 |
| 1,125 | | General Cable Corp.* | | | 18,518 |
| 3,400 | | Heidelberger Druckmaschinen AG (Germany) | | | 13,278 |
| 675 | | Kaydon Corp. | | | 18,360 |
| 650 | | Lincoln Electric Holdings, Inc. | | | 26,761 |
| 10,800 | | PACCAR, Inc. | | | 285,012 |
| 300 | | Rieter Holding AG (Switzerland) | | | 33,856 |
| 525 | | Rofin-Sinar Technologies, Inc.* | | | 8,867 |
| 2,580 | | Roper Industries, Inc. | | | 106,141 |
| 900 | | Snap-on, Inc. | | | 27,162 |
| | | | | |
| | | | | 1,795,443 |
See Notes to Financial Statements.
| | |
| Target Asset Allocation Funds/Target Moderate Allocation Fund | | 23 |
Portfolio of Investments
as of January 31, 2009 (Unaudited) continued
| | | | | |
| Shares | | Description | | Value (Note 1) |
| | | | | |
COMMON STOCKS (Continued) | | | |
|
Machinery & Equipment |
| 325 | | Lindsay Corp. | | $ | 8,450 |
| 275 | | Nordson Corp. | | | 8,308 |
| | | | | |
| | | | | 16,758 |
|
Machinery - Construction & Mining 0.1% |
| 15,394 | | Komatsu Ltd. (Japan) | | | 158,923 |
|
Manufacturing 0.3% |
| 12,300 | | Danaher Corp. | | | 687,939 |
| 3,000 | | Hexcel Corp.* | | | 24,870 |
| | | | | |
| | | | | 712,809 |
|
Materials 0.1% |
| 2,425 | | Potash Corp. of Saskatchewan, Inc. (Canada) | | | 181,535 |
|
Media 1.1% |
| 40,000 | | CBS Corp. (Class B Stock) | | | 228,800 |
| 36,000 | | Comcast Corp. (Class A Stock) | | | 527,400 |
| 7,590 | | Entravision Communications Corp. (Class A Stock)* | | | 6,375 |
| 2,200 | | Lagardere SCA (France) | | | 84,111 |
| 10,470 | | Lions Gate Entertainment Corp. (Canada)* | | | 58,737 |
| 16,600 | | Rogers Communications, Inc. (Class B Stock) (Canada) | | | 468,117 |
| 53,900 | | Time Warner, Inc. | | | 502,887 |
| 21,323 | | Vivendi (France) | | | 551,770 |
| 19,584 | | Walt Disney Co. (The) | | | 404,997 |
| 3,365 | | Wiley, (John) & Sons, Inc. (Class A Stock) | | | 119,222 |
| | | | | |
| | | | | 2,952,416 |
|
Medical Supplies & Equipment 1.0% |
| 12,350 | | Baxter International, Inc. | | | 724,327 |
| 1,640 | | Becton, Dickinson and Co. | | | 119,179 |
| 25,607 | | Boston Scientific Corp.* | | | 227,134 |
| 2,900 | | Fresenius Medical Care AG & Co. KGaA (Germany) | | | 129,997 |
| 17,980 | | Medtronic, Inc. | | | 602,150 |
| 53,300 | | Smith & Nephew PLC (United Kingdom) | | | 385,051 |
| 8,600 | | St. Jude Medical, Inc.* | | | 312,782 |
| 3,800 | | Stryker Corp. | | | 160,512 |
| | | | | |
| | | | | 2,661,132 |
See Notes to Financial Statements.
| | |
| 24 | | Visit our website at www.prudential.com |
| | | | | |
| Shares | | Description | | Value (Note 1) |
| | | | | |
COMMON STOCKS (Continued) | | | |
|
Metals & Mining 0.6% |
| 38,400 | | Alcoa, Inc. | | $ | 299,136 |
| 3,295 | | Alpha Natural Resources, Inc.* | | | 53,774 |
| 4,275 | | Cliffs Natural Resources, Inc. | | | 99,052 |
| 39,000 | | Mincor Resources NL (Australia) | | | 15,250 |
| 46,000 | | Mitsui Mining & Smelting Co. Ltd. (Japan) | | | 82,680 |
| 87,000 | | Nippon Light Metal Co. Ltd. (Japan) | | | 70,454 |
| 11,152 | | Nucor Corp. | | | 454,890 |
| 23,948 | | OZ Minerals Ltd. (Australia) | | | 8,369 |
| 6,200 | | Peabody Energy Corp. | | | 155,000 |
| 2,300 | | Precision Castparts Corp. | | | 149,385 |
| 3,000 | | Rautaruukki Oyj (Finland) | | | 47,823 |
| 1,400 | | Steel Dynamics, Inc. | | | 14,868 |
| 9,500 | | ThyssenKrupp AG (Germany) | | | 193,890 |
| 1,600 | | Timken Co. | | | 23,824 |
| | | | | |
| | | | | 1,668,395 |
|
Mining |
| 4,073 | | BHP Billiton PLC (United Kingdom) | | | 69,709 |
|
Multi-Line Retail 0.1% |
| 16,600 | | JC Penney Co., Inc. | | | 278,050 |
|
Multi-Utilities 0.4% |
| 10,000 | | Dominion Resources, Inc. | | | 351,800 |
| 18,600 | | Public Service Enterprise Group, Inc. | | | 587,202 |
| 650 | | Vectren Corp. | | | 16,763 |
| 4,500 | | Wisconsin Energy Corp. | | | 200,610 |
| | | | | |
| | | | | 1,156,375 |
|
Office Equipment 0.3% |
| 8,800 | | Oce NV (Netherlands)* | | | 22,760 |
| 13,000 | | Ricoh Co. Ltd. (Japan) | | | 158,648 |
| 80,500 | | Xerox Corp. | | | 534,520 |
| | | | | |
| | | | | 715,928 |
|
Oil & Gas Exploration/Production |
| 6,600 | | Gazprom OAO, ADR (Russia) | | | 85,602 |
| 1,400 | | St. Mary Land & Exploration Co. | | | 27,090 |
| | | | | |
| | | | | 112,692 |
See Notes to Financial Statements.
| | |
| Target Asset Allocation Funds/Target Moderate Allocation Fund | | 25 |
Portfolio of Investments
as of January 31, 2009 (Unaudited) continued
| | | | | |
| Shares | | Description | | Value (Note 1) |
| | | | | |
COMMON STOCKS (Continued) | | | |
|
Oil, Gas & Consumable Fuels 5.7% |
| 2,202 | | Air Liquide (France) | | $ | 160,806 |
| 9,219 | | Anadarko Petroleum Corp. | | | 338,706 |
| 13,829 | | Apache Corp. | | | 1,037,175 |
| 850 | | Arena Resources, Inc.* | | | 20,706 |
| 1,550 | | Atwood Oceanics, Inc.* | | | 25,808 |
| 63,000 | | BP PLC (United Kingdom) | | | 451,474 |
| 1,900 | | Cabot Oil & Gas Corp. | | | 52,231 |
| 5,700 | | Canadian Natural Resources Ltd. (Canada) | | | 204,015 |
| 3,700 | | Canadian Oil Sands Trust (Canada) | | | 56,424 |
| 23,341 | | Chevron Corp. | | | 1,646,007 |
| 900 | | Concho Resources, Inc.* | | | 22,698 |
| 34,900 | | ConocoPhillips | | | 1,658,797 |
| 15,800 | | Cosmo Oil Co. Ltd. (Japan) | | | 42,026 |
| 4,260 | | Denbury Resources, Inc.* | | | 52,142 |
| 6,469 | | Devon Energy Corp. | | | 398,490 |
| 10,200 | | ENI SpA (Italy) | | | 217,319 |
| 1,400 | | Equitable Resources, Inc. | | | 47,922 |
| 10,160 | | Exxon Mobil Corp. | | | 777,037 |
| 23,249 | | Hess Corp. | | | 1,292,877 |
| 30,000 | | Marathon Oil Corp. | | | 816,900 |
| 27,700 | | Nippon Oil Corp. (Japan) | | | 120,365 |
| 7,600 | | Norsk Hydro ASA (Norway) | | | 27,216 |
| 10,114 | | Occidental Petroleum Corp. | | | 551,719 |
| 1,000 | | ONEOK, Inc. | | | 29,220 |
| 23,842 | | Petroleo Brasileiro SA, ADR (Brazil) | | | 624,660 |
| 2,600 | | Plains Exploration & Production Co.* | | | 54,912 |
| 11,200 | | Repsol YPF SA (Spain) | | | 201,339 |
| 20,400 | | Royal Dutch Shell PLC (Class B Stock) (United Kingdom) | | | 490,163 |
| 14,200 | | Royal Dutch Shell PLC (Class B Stock), ADR (United Kingdom) | | | 679,186 |
| 14,701 | | Schlumberger Ltd. (Netherlands) | | | 599,948 |
| 4,340 | | Southwestern Energy Co.* | | | 137,361 |
| 3,901 | | StatoilHydro ASA (Norway) | | | 67,421 |
| 1,400 | | Swift Energy Co.* | | | 21,448 |
| 3,200 | | Total SA (France) | | | 160,510 |
| 26,037 | | Transocean Ltd.* | | | 1,422,141 |
| 3,600 | | Weatherford International Ltd.* | | | 39,708 |
| 1,100 | | WGL Holdings, Inc. | | | 35,310 |
| 22,372 | | XTO Energy, Inc. | | | 829,777 |
| | | | | |
| | | | | 15,411,964 |
See Notes to Financial Statements.
| | |
| 26 | | Visit our website at www.prudential.com |
| | | | | |
| Shares | | Description | | Value (Note 1) |
| | | | | |
COMMON STOCKS (Continued) | | | |
|
Paper & Forest Products 0.1% |
| 15,500 | | International Paper Co. | | $ | 141,360 |
|
Pharmaceuticals 5.8% |
| 21,426 | | Abbott Laboratories | | | 1,187,858 |
| 7,920 | | Allergan, Inc. | | | 301,910 |
| 4,400 | | Astellas Pharma, Inc. (Japan) | | | 166,594 |
| 9,000 | | AstraZeneca PLC (United Kingdom) | | | 348,371 |
| 13,900 | | Bristol-Myers Squibb Co. | | | 297,599 |
| 16,400 | | Cardinal Health, Inc. | | | 617,460 |
| 1,630 | | Cephalon, Inc.* | | | 125,803 |
| 3,800 | | Daiichi Sankyo Co. Ltd. (Japan) | | | 85,325 |
| 33,200 | | Eli Lilly & Co. | | | 1,222,424 |
| 35,977 | | Gilead Sciences, Inc.* | | | 1,826,552 |
| 8,300 | | GlaxoSmithKline PLC (United Kingdom) | | | 146,685 |
| 6,600 | | H. Lundbeck A/S (Denmark) | | | 138,305 |
| 2,905 | | Herbalife Ltd. (Cayman Islands) | | | 59,582 |
| 29,502 | | Johnson & Johnson | | | 1,701,970 |
| 6,670 | | Medco Health Solutions, Inc.* | | | 299,683 |
| 31,500 | | Merck & Co., Inc. | | | 899,325 |
| 8,709 | | Novartis AG (Switzerland) | | | 361,004 |
| 14,300 | | Novo Nordisk A/S (Class B Stock) (Denmark) | | | 767,576 |
| 865 | | Onyx Pharmaceuticals, Inc.* | | | 26,322 |
| 97,700 | | Pfizer, Inc. | | | 1,424,466 |
| 2,000 | | Pharmaceutical Product Development, Inc. | | | 47,780 |
| 4,429 | | Roche Holding AG (Switzerland) | | | 623,932 |
| 5,800 | | Sanofi-Aventis SA (France) | | | 327,388 |
| 54,026 | | Schering-Plough Corp. | | | 948,697 |
| 1,700 | | Takeda Pharmaceutical Co. Ltd. (Japan) | | | 79,659 |
| 23,287 | | Teva Pharmaceutical Industries Ltd., ADR (Israel) | | | 965,246 |
| 16,910 | | Wyeth | | | 726,623 |
| | | | | |
| | | | | 15,724,139 |
|
Professional Services 0.1% |
| 5,035 | | Monster Worldwide, Inc.* | | | 46,372 |
| 4,180 | | School Specialty, Inc.* | | | 68,970 |
| 1,125 | | Watson Wyatt Worldwide, Inc. (Class A Stock) | | | 52,313 |
| | | | | |
| | | | | 167,655 |
See Notes to Financial Statements.
| | |
| Target Asset Allocation Funds/Target Moderate Allocation Fund | | 27 |
Portfolio of Investments
as of January 31, 2009 (Unaudited) continued
| | | | | |
| Shares | | Description | | Value (Note 1) |
| | | | | |
COMMON STOCKS (Continued) | | | |
|
Real Estate |
| 1,600 | | Hovnanian Enterprises, Inc. (Class A Stock)* | | $ | 2,704 |
| 900 | | Meritage Homes Corp.* | | | 9,918 |
| | | | | |
| | | | | 12,622 |
|
Real Estate Investment Trusts 0.3% |
| 4,779 | | AvalonBay Communities, Inc. | | | 247,608 |
| 6,200 | | MFA Mortgage Investments, Inc. | | | 35,526 |
| 10,200 | | Simon Property Group, Inc. | | | 438,396 |
| | | | | |
| | | | | 721,530 |
|
Retail 0.6% |
| 57,700 | | DSG International PLC (United Kingdom) | | | 18,396 |
| 1,900 | | Rallye SA (France) | | | 38,048 |
| 6,000 | | UNY Co. Ltd. (Japan) | | | 49,872 |
| 128,100 | | Wal-Mart de Mexico SAB de CV (Class V Stock) (Mexico) | | | 267,393 |
| 27,622 | | Wal-Mart Stores, Inc. | | | 1,301,549 |
| | | | | |
| | | | | 1,675,258 |
|
Retail & Merchandising 2.9% |
| 1,470 | | Abercrombie & Fitch Co. (Class A Stock) | | | 26,239 |
| 13,680 | | Best Buy Co., Inc. | | | 383,314 |
| 1,300 | | Brinker International, Inc. | | | 14,261 |
| 17,126 | | Costco Wholesale Corp. | | | 771,184 |
| 89,340 | | CVS Caremark Corp. | | | 2,401,459 |
| 2,640 | | GameStop Corp. (Class A Stock)* | | | 65,419 |
| 4,420 | | Kohl’s Corp.* | | | 162,258 |
| 69,026 | | Lowe’s Cos., Inc. | | | 1,261,105 |
| 33,320 | | Staples, Inc. | | | 531,121 |
| 20,944 | | Target Corp. | | | 653,453 |
| 8,299 | | TJX Cos., Inc. | | | 161,167 |
| 12,490 | | Walgreen Co. | | | 342,351 |
| 36,646 | | Yum! Brands, Inc. | | | 1,048,808 |
| | | | | |
| | | | | 7,822,139 |
|
Road & Rail 0.3% |
| 10,000 | | Burlington Northern Santa Fe Corp. | | | 662,500 |
| 350 | | Landstar System, Inc. | | | 12,554 |
| | | | | |
| | | | | 675,054 |
See Notes to Financial Statements.
| | |
| 28 | | Visit our website at www.prudential.com |
| | | | | |
| Shares | | Description | | Value (Note 1) |
| | | | | |
COMMON STOCKS (Continued) | | | |
|
Semiconductor Components 0.1% |
| 131,000 | | ARM Holdings PLC (United Kingdom) | | $ | 174,182 |
|
Semiconductors 0.2% |
| 4,030 | | Broadcom Corp. (Class A Stock)* | | | 63,876 |
| 1,600 | | Checkpoint Systems, Inc.* | | | 14,320 |
| 16,330 | | Intel Corp. | | | 210,657 |
| 6,160 | | Linear Technology Corp. | | | 144,267 |
| 2,850 | | Microsemi Corp.* | | | 23,940 |
| 12,100 | | Texas Instruments, Inc. | | | 180,895 |
| | | | | |
| | | | | 637,955 |
|
Semiconductors & Semiconductor Equipment 0.1% |
| 6,825 | | Advanced Energy Industries, Inc.* | | | 61,288 |
| 990 | | Hittite Microwave Corp.* | | | 25,364 |
| 18,000 | | Marvell Technology Group Ltd.* | | | 131,220 |
| 5,720 | | Varian Semiconductor Equipment Associates, Inc.* | | | 108,909 |
| | | | | |
| | | | | 326,781 |
|
Software 2.1% |
| 3,545 | | ANSYS, Inc.* | | | 88,129 |
| 11,700 | | BMC Software, Inc.* | | | 296,361 |
| 41,205 | | CA, Inc. | | | 741,278 |
| 3,200 | | Citrix Systems, Inc. | | | 67,328 |
| 2,905 | | FactSet Research Systems, Inc. | | | 115,619 |
| 6,465 | | Macrovision Solutions Corp.* | | | 84,756 |
| 12,401 | | MasterCard, Inc. (Class A Stock) | | | 1,683,808 |
| 11,330 | | McAfee, Inc.* | | | 345,451 |
| 90,730 | | Microsoft Corp. | | | 1,551,483 |
| 4,005 | | Quality Systems, Inc. | | | 149,306 |
| 5,930 | | Research In Motion Ltd. (Canada)* | | | 328,522 |
| 2,075 | | Sybase, Inc.* | | | 56,668 |
| 24,905 | | TIBCO Software, Inc.* | | | 133,242 |
| 2,325 | | Tyler Technologies, Inc.* | | | 29,272 |
| | | | | |
| | | | | 5,671,223 |
|
Specialty Retail 0.5% |
| 2,080 | | Aaron Rents, Inc. | | | 45,469 |
| 7,800 | | AutoNation, Inc.* | | | 72,384 |
| 3,700 | | CarMax, Inc.* | | | 30,599 |
| 16,700 | | Gap, Inc. (The) | | | 188,376 |
See Notes to Financial Statements.
| | |
| Target Asset Allocation Funds/Target Moderate Allocation Fund | | 29 |
Portfolio of Investments
as of January 31, 2009 (Unaudited) continued
| | | | | |
| Shares | | Description | | Value (Note 1) |
| | | | | |
COMMON STOCKS (Continued) | | | |
|
Specialty Retail (cont’d.) |
| 9,060 | | Genesco, Inc.* | | $ | 139,524 |
| 40,394 | | Home Depot, Inc. (The) | | | 869,683 |
| 8,300 | | Limited Brands, Inc. | | | 65,736 |
| | | | | |
| | | | | 1,411,771 |
|
Steel Producers/Products |
| 2,900 | | Voestalpine AG (Austria) | | | 56,514 |
|
Telecommunications 2.2% |
| 12,400 | | Amdocs Ltd. (Guernsey)* | | | 209,808 |
| 11,720 | | America Movil SAB de CV (Class L Stock), ADR (Mexico) | | | 334,137 |
| 91,700 | | BT Group PLC (United Kingdom) | | | 139,402 |
| 37,513 | | China Mobile Ltd. (China) | | | 337,684 |
| 40,800 | | Cisco Systems, Inc.* | | | 610,776 |
| 18,029 | | France Telecom SA (France) | | | 405,359 |
| 1,530 | | Juniper Networks, Inc.* | | | 21,665 |
| 7,670 | | MetroPCS Communications, Inc.* | | | 104,235 |
| 79,170 | | MobileOne Ltd. (Singapore) | | | 84,657 |
| 5,000 | | Nippon Telegraph & Telephone Corp. (Japan) | | | 242,160 |
| 30,500 | | Nokia Oyj (Finland) | | | 374,509 |
| 80 | | NTT DoCoMo, Inc. (Japan) | | | 139,365 |
| 15,200 | | Portugal Telecom SGPS SA (Portugal) | | | 122,610 |
| 41,551 | | QUALCOMM, Inc. | | | 1,435,587 |
| 1,800 | | SBA Communications Corp. (Class A Stock)* | | | 35,820 |
| 600 | | Swisscom AG (Switzerland) | | | 189,197 |
| 2,875 | | Syniverse Holdings, Inc.* | | | 38,985 |
| 127,800 | | Telecom Italia SpA (Italy) | | | 157,662 |
| 27,100 | | Telefonica SA (Spain) | | | 483,352 |
| 63,200 | | Vodafone Group PLC (United Kingdom) | | | 118,791 |
| 21,358 | | Vodafone Group PLC, ADR (United Kingdom) | | | 397,045 |
| 13,000 | | WPP Group PLC (United Kingdom) | | | 73,568 |
| | | | | |
| | | | | 6,056,374 |
|
Textiles, Apparel & Luxury Goods |
| 2,525 | | Hanesbrands, Inc.* | | | 22,700 |
| 15,600 | | Jones Apparel Group, Inc. | | | 53,976 |
| | | | | |
| | | | | 76,676 |
See Notes to Financial Statements.
| | |
| 30 | | Visit our website at www.prudential.com |
| | | | | |
| Shares | | Description | | Value (Note 1) |
| | | | | |
COMMON STOCKS (Continued) | | | |
|
Thrifts & Mortgage Finance |
| 57,000 | | Washington Mutual, Inc. | | $ | — |
|
Tobacco Products 0.8% |
| 6,255 | | British American Tobacco PLC (United Kingdom) | | | 172,229 |
| 5,600 | | Lorillard, Inc. | | | 332,976 |
| 41,510 | | Philip Morris International, Inc. | | | 1,542,097 |
| | | | | |
| | | | | 2,047,302 |
|
Trading Companies & Distributors |
| 600 | | Watsco, Inc. | | | 19,830 |
|
Transportation 1.2% |
| 10,300 | | Canadian National Railway Co. (Canada) | | | 360,931 |
| 5,500 | | Go-Ahead Group PLC (United Kingdom) | | | 78,390 |
| 6,220 | | J.B. Hunt Transport Services, Inc. | | | 138,519 |
| 47,000 | | Neptune Orient Lines Ltd. (Singapore) | | | 34,270 |
| 19,353 | | Norfolk Southern Corp. | | | 742,381 |
| 17,690 | | Orient Overseas International Ltd. (Bermuda) | | | 41,649 |
| 43,349 | | Union Pacific Corp. | | | 1,898,253 |
| | | | | |
| | | | | 3,294,393 |
|
Utilities 0.9% |
| 14,619 | | E.ON AG (Germany) | | | 472,444 |
| 42,188 | | Edison International | | | 1,374,063 |
| 10,162 | | Fortum Oyj (Finland) | | | 198,814 |
| 1,472 | | Headwaters, Inc.* | | | 6,668 |
| 6,975 | | PG&E Corp. | | | 269,723 |
| | | | | |
| | | | | 2,321,712 |
| | | | | |
| | TOTAL COMMON STOCKS
(cost $208,482,170) | | | 165,951,673 |
| | | | | |
PREFERRED STOCK 0.1% |
|
Financial - Bank & Trust |
| 7,650 | | Wells Fargo & Co., Series 3, 8.00%, CVT
(cost $147,038) | | | 139,230 |
| | | | | |
See Notes to Financial Statements.
| | |
| Target Asset Allocation Funds/Target Moderate Allocation Fund | | 31 |
Portfolio of Investments
as of January 31, 2009 (Unaudited) continued
| | | | | | | | |
Moody’s
Ratings† | | Principal
Amount (000)# | | Description | | Value (Note 1) |
| | | | | | | | |
| ASSET-BACKED SECURITIES 0.8% | | | |
| Aaa | | $ | 366 | | Bear Stearns Commercial Mortgage Securities,
Series 2006-BBA7, Class A1, 144A
(original cost $365,829; purchased 06/05/06)(c)(e)
0.571%(a), 03/15/19 | | $ | 311,238 |
| Aaa | | | 26 | | Brazos Student Finance Corp., Series 1998-A, Class A2
2.78%(a), 06/01/23 | | | 25,331 |
| Aaa | | | 547 | | Indymac Index Mortgage Loan Trust,
Series 2007-FLX2, Class A2
0.579%(a), 04/25/37 | | | 83,878 |
| Aaa | | | 1,994 | | SLM Student Loan Trust,
Series 2008-9, Class A
2.659%(a), 04/25/23 | | | 1,915,960 |
| | | | | | | | |
| | | | | TOTAL ASSET-BACKED SECURITIES
(cost $2,706,551) | | | 2,336,407 |
| | | | | | | | |
| |
| COLLATERALIZED MORTGAGE OBLIGATIONS 2.7% | | | |
| Aaa | | | 70 | | Bank Trust Mortgage Trust, Series 1, Class G
5.70%, 12/01/23 | | | 60,632 |
| Aa3 | | | 208 | | Bear Stearns Adjustable Rate Mortgage Trust,
Series 2005-4, Class 23A2
5.366%(a), 05/25/35 | | | 150,560 |
| AAA(d) | | | 584 | | Countrywide Alternative Loan Trust,
Series 2006-HY13, Class 4A1
5.894%, 02/25/37 | | | 299,462 |
| Aaa | | | 579 | | Series 2006-OA11, Class A1B
0.579%(a), 09/25/46 | | | 229,119 |
| Aaa | | | 30 | | Federal Home Loan Mortgage Corp.,
Series 119, Class H
7.50%, 01/15/21 | | | 30,411 |
| Aaa | | | 5 | | Series 2266, Class F
0.905%(a), 11/15/30 | | | 5,192 |
| Aaa | | | 2,117 | | Series 3346, Class FA
0.685%(a), 02/15/19 | | | 2,070,811 |
| Aaa | | | 314 | | Federal National Mortgage Assoc.,
Series 1998-73, Class MZ
6.30%, 10/17/38 | | | 313,914 |
| Aaa | | | 10 | | Series 2000-32, Class FM
0.911%(a), 10/18/30 | | | 10,262 |
| Aaa | | | 1,008 | | Series 2006-5, Class 3A2
4.668%(a), 05/25/35 | | | 1,017,484 |
See Notes to Financial Statements.
| | |
| 32 | | Visit our website at www.prudential.com |
| | | | | | | | |
Moody’s
Ratings† | | Principal
Amount (000)# | | Description | | Value (Note 1) |
| | | | | | | | |
| COLLATERALIZED MORTGAGE OBLIGATIONS (Continued) | | | |
| Aaa | | $ | 130 | | FHLMC Structured Pass-Through Securities,
Series T-61, Class 1A1
3.655%(a), 07/25/44 | | $ | 115,173 |
| Aaa | | | 29 | | Government National Mortgage Assoc.,
Series 2000-9, Class FH
0.955%(a), 02/16/30 | | | 28,500 |
| AAA(d) | | | 382 | | GSR Mortgage Loan Trust,
Series 2005-AR6, Class 2A1
4.541%(a), 09/25/35 | | | 313,960 |
| AAA(d) | | | 781 | | Series 2005-AR7, Class 4A1
5.346%(a), 11/25/35 | | | 512,509 |
| Aaa | | | 589 | | Harborview Mortgage Loan Trust,
Series 2006-5, Class 2A1A
0.646%(a), 07/19/46 | | | 240,640 |
| Aaa | | | 520 | | Series 2006-12, Class 2A2B
0.716%(a), 01/19/38 | | | 111,245 |
| Aaa | | | 101 | | Structured Asset Mortgage Investments, Inc.,
Series 2006-AR7, Class A8
0.459%(a), 08/25/36 | | | 95,101 |
| Aaa | | | 745 | | Washington Mutual Mortgage Pass-Through Certificates,
Series 2003-R1, Class A1
0.929%(a), 12/25/27 | | | 616,867 |
| BB(d) | | | 593 | | Series 2007-HY1, Class 2A3
5.859%, 02/25/37 | | | 430,270 |
| AAA(d) | | | 589 | | Series 2007-HY2, Class 1A1
5.601%, 12/25/36 | | | 324,257 |
| Aaa | | | 589 | | Series 2007-OA3, Class 2A1A
2.813%, 04/25/47 | | | 264,137 |
| | | | | | | | |
| | | | | TOTAL COLLATERALIZED MORTGAGE OBLIGATIONS
(cost $8,505,211) | | | 7,240,506 |
| | | | | | | | |
| |
| CORPORATE BONDS 9.5% | | | |
| |
| Advertising 0.1% | | | |
| Baa1 | | | 300 | | Omnicom Group, Inc., Gtd. Notes
5.90%, 04/15/16 | | | 252,138 |
| | | | | | | | |
| |
| Automobile Manufacturers | | | |
| A3 | | | 100 | | DaimlerChrysler NA Holding Corp., Gtd. Notes, MTN
5.75%, 09/08/11 | | | 95,019 |
| | | | | | | | |
See Notes to Financial Statements.
| | |
| Target Asset Allocation Funds/Target Moderate Allocation Fund | | 33 |
Portfolio of Investments
as of January 31, 2009 (Unaudited) continued
| | | | | | | | |
Moody’s
Ratings† | | Principal
Amount (000)# | | Description | | Value (Note 1) |
| | | | | | | | |
| CORPORATE BONDS (Continued) | | | |
| |
| Capital Markets 0.7% | | | |
| A2 | | $ | 1,300 | | Morgan Stanley, Sr. Unsec’d. Notes, MTN
5.75%, 10/18/16 | | $ | 1,123,351 |
| A2 | | | 700 | | 6.00%, 04/28/15 | | | 634,396 |
| | | | | | | | |
| | | | | | | | 1,757,747 |
| | | | | | | | |
| |
| Commercial Banks 0.3% | | | |
| A1 | | | 1,400 | | Barclays Bank PLC, Sub. Notes (United Kingdom), 144A
(original cost $1,400,000; purchased 04/18/08)(c)(e)
7.70%(a), 04/29/49 | | | 760,872 |
| | | | | | | | |
| |
| Diversified Financial Services 2.4% | | | |
| A2 | | | 600 | | American Express Co., Sr. Unsec’d. Notes
7.00%, 03/19/18 | | | 596,434 |
| A3 | | | 1,400 | | Citigroup Capital XXI, Gtd. Notes
8.30%(a), 12/21/57 | | | 725,942 |
| Baa3 | | | 1,700 | | Citigroup, Inc.,
Jr. Sub. Notes
8.40%, 04/29/49 | | | 620,891 |
| A2 | | | 2,100 | | Sr. Unsec’d. Notes
5.50%, 04/11/13 | | | 1,921,025 |
| Aa2 | | | 2,700 | | JPMorgan Chase Bank NA, Sub. Notes
6.00%, 10/01/17 | | | 2,630,524 |
| | | | | | | | |
| | | | | | | | 6,494,816 |
| | | | | | | | |
| |
| Diversified Manufacturing 0.4% | | | |
| A1 | | | 1,000 | | Siemens Financieringsmaatschappij NV, Gtd. Notes (Netherlands), 144A (original cost $1,000,000; purchased 08/09/06)(c)(e)
1.288%(a), 08/14/09 | | | 1,000,424 |
| | | | | | | | |
| |
| Electronic Components 0.5% | | | |
| Aa3 | | | 900 | | Electricite de France,
Notes (France), 144A(c)(e)
6.50%, 01/26/19 (original cost $897,192;
purchased 01/21/09) | | | 933,812 |
| Aa3 | | | 300 | | 6.95%, 01/26/39 (original cost $295,653;
purchased 01/21/09) | | | 309,318 |
| | | | | | | | |
| | | | | | | | 1,243,130 |
| | | | | | | | |
See Notes to Financial Statements.
| | |
| 34 | | Visit our website at www.prudential.com |
| | | | | | | | |
Moody’s
Ratings† | | Principal
Amount (000)# | | Description | | Value (Note 1) |
| | | | | | | | |
| CORPORATE BONDS (Continued) | | | |
| |
| Financial - Bank & Trust 1.0% | | | |
| A1 | | $ | 400 | | American Express Bank FSB, Sr. Unsec’d. Notes
5.50%, 04/16/13 | | $ | 382,618 |
| Baa1 | | | 1,500 | | Bank of America Corp.,
Jr. Sub. Notes
8.00%(a), 12/29/49 | | | 794,475 |
| Baa1 | | | 900 | | 8.125%(a), 12/29/49 | | | 467,001 |
| | | | | Sr. Unsec’d. Notes | | | |
| A1 | | | 300 | | 5.65%, 05/01/18 | | | 271,702 |
| | | | | National Australia Bank Ltd., Bonds (Australia), 144A (original cost $700,000; purchased 02/01/08)(c)(e) | | | |
| Aa1 | | | 700 | | 1.691%(a), 02/08/10 | | | 700,047 |
| | | | | | | | |
| | | | | | | | 2,615,843 |
| | | | | | | | |
| |
| Financial Services 1.4% | | | |
| | | | | General Motors Acceptance Corp. LLC, | | | |
| | | | | Sr. Unsec’d. Notes | | | |
| C | | | 600 | | 6.75%, 12/01/14 | | | 344,726 |
| C | | | 100 | | 8.00%, 11/01/31 | | | 51,370 |
| A2 | | | 900 | | Goldman Sachs Group, Inc. (The), Sub. Notes
6.75%, 10/01/37 | | | 684,128 |
| NR | | | 500 | | Lehman Brothers Holdings, Inc.,
Sr. Unsec’d. Notes, MTN(g)
6.875%, 05/02/18 | | | 70,000 |
| A1 | | | 2,800 | | Merrill Lynch & Co., Inc., Notes, MTN
6.875%, 04/25/18 | | | 2,695,605 |
| | | | | | | | |
| | | | | | | | 3,845,829 |
| | | | | | | | |
| |
| Food 0.3% | | | |
| Baa2 | | | 900 | | Kraft Foods, Inc., Sr. Unsec’d. Notes
6.875%, 02/01/38 | | | 899,429 |
| | | | | | | | |
| |
| Industrial Conglomerates 1.1% | | | |
| Aaa | | | 2,200 | | General Electric Capital Corp.,
Sr. Unsec’d. Notes, MTN
5.625%, 09/15/17 | | | 2,025,815 |
| Aaa | | | 400 | | 5.875%, 01/14/38 | | | 318,119 |
| Aa1 | | GBP | 700 | | Sub. Notes, 144A(c)(e)
6.50%(a), 09/15/67 (original cost $1,399,944; purchased 08/30/07) | | | 587,692 |
| | | | | | | | |
| | | | | | | | 2,931,626 |
| | | | | | | | |
See Notes to Financial Statements.
| | |
| Target Asset Allocation Funds/Target Moderate Allocation Fund | | 35 |
Portfolio of Investments
as of January 31, 2009 (Unaudited) continued
| | | | | | | | |
Moody’s
Ratings† | | Principal
Amount (000)# | | Description | | Value (Note 1) |
| | | | | | | | |
| CORPORATE BONDS (Continued) | | | |
| |
| Insurance 0.3% | | | |
| A3 | | | $ 1,100 | | American International Group, Inc., Sr. Unsec’d. Notes (original cost $1,100,000; purchased
08/13/08), 144A(c)(e)
8.25%, 08/15/18 | | $ | 901,258 |
| | | | | | | | |
| |
| Medical Supplies & Equipment 0.2% | | | |
| B2 | | | 600 | | HCA, Inc., Sr. Sec’d. Notes
9.25%, 11/15/16 | | | 573,000 |
| | | | | | | | |
| |
| Paper & Forest Products 0.2% | | | |
| Ba3 | | | 300 | | Georgia-Pacific LLC,
Gtd. Notes(c)(e)
7.00%, 01/15/15 (original cost $300,000;
purchased 12/13/06) | | | 276,000 |
| Ba3 | | | 400 | | 7.125%, 01/15/17 (original cost $400,000;
purchased 12/13/06) | | | 365,000 |
| | | | | | | | |
| | | | | | | | 641,000 |
| | | | | | | | |
| |
| Real Estate Investment Trust 0.1% | | | |
| Baa3 | | | 200 | | Nationwide Health Properties, Inc., Sr. Unsec’d. Notes
6.50%, 07/15/11 | | | 180,563 |
| | | | | | | | |
| |
| Telecommunications 0.5% | | | |
| Baa3 | | | 1,000 | | Embarq Corp., Sr. Unsec’d. Notes
7.082%, 06/01/16 | | | 890,000 |
| Baa3 | | | 700 | | Motorola, Inc., Sr. Unsec’d. Notes
6.00%, 11/15/17 | | | 428,942 |
| | | | | | | | |
| | | | | | | | 1,318,942 |
| | | | | | | | |
| |
| Utilities - Electric | | | |
| Baa3 | | | 128 | | Midwest Generation LLC, Pass-Thru. Certificates
8.30%, 07/02/09 | | | 127,772 |
| | | | | | | | |
| | | | | TOTAL CORPORATE BONDS
(cost $32,299,062) | | | 25,639,408 |
| | | | | | | | |
| |
| FOREIGN GOVERNMENT BONDS 1.4% | | | |
| Aaa | | EUR | 1,000 | | Bundesrepublik Deutschland Bonds (Germany)
4.25%, 07/04/39 | | | 1,359,662 |
| Aaa | | EUR | 800 | | 6.25%, 01/04/30 | | | 1,313,950 |
See Notes to Financial Statements.
| | |
| 36 | | Visit our website at www.prudential.com |
| | | | | | | | |
Moody’s
Ratings† | | Principal
Amount (000)# | | Description | | Value (Note 1) |
| | | | | | | | |
| FOREIGN GOVERNMENT BONDS (Continued) | | | |
| Ba1 | | BRL | 1,800 | | Republic of Brazil Sr. Unsec’d. Notes (Brazil)
12.50%, 01/05/22 | | $ | 814,655 |
| Aaa | | GBP | 200 | | United Kingdom Gilt Bonds (United Kingdom)
5.75%, 12/07/09 | | | 301,577 |
| | | | | | | | |
| | | | | TOTAL FOREIGN GOVERNMENT BONDS
(cost $4,248,824) | | | 3,789,844 |
| | | | | | | | |
| |
| MUNICIPAL BONDS 1.8% | | | |
| |
| Arizona 0.2% | | | |
| Aa1 | | $ | 500 | | Salt River Project Agricultural Improvement & Power District, Revenue Bonds
4.75%, 01/01/32 | | | 478,440 |
| | | | | | | | |
| |
| California 0.7% | | | |
| A1 | | | 700 | | State of California, General Obligation Unlimited
5.00%, 06/01/37 | | | 629,657 |
| A1 | | | 1,100 | | 5.00%, 11/01/37 | | | 988,801 |
| A1 | | | 300 | | 5.00%, 12/01/37 | | | 266,196 |
| | | | | | | | |
| | | | | | | | 1,884,654 |
| | | | | | | | |
| |
| Georgia 0.1% | | | |
| Aaa | | | 200 | | Georgia State Road & Tollway Authority, Revenue Bonds
5.00%, 03/01/21 | | | 207,098 |
| | | | | | | | |
| |
| Illinois 0.8% | | | |
| Aa3 | | | 2,200 | | Chicago Illinois Transit Authority, Revenue Bonds
6.899%, 12/01/40 | | | 2,268,508 |
| | | | | | | | |
| | | | | TOTAL MUNICIPAL BONDS
(cost $4,992,513) | | | 4,838,700 |
| | | | | | | | |
| |
| U.S. GOVERNMENT MORTGAGE-BACKED OBLIGATIONS 19.9% | | | |
| | | 194 | | Federal Home Loan Mortgage Corp.
5.333%(a), 09/01/35 | | | 198,792 |
| | | 2,000 | | 5.50%, 12/01/36 - 08/19/38 | | | 2,048,109 |
| | | 321 | | 6.00%, 04/01/16 - 09/01/22 | | | 334,957 |
| | | 223 | | Federal National Mortgage Assoc.
3.253%(a), 06/01/43 | | | 220,949 |
| | | 2,045 | | 4.00%, 08/01/18 - 01/01/20 | | | 2,064,930 |
| | | 2,072 | | 4.50%, 01/01/22 - 09/01/35 | | | 2,093,466 |
See Notes to Financial Statements.
| | |
| Target Asset Allocation Funds/Target Moderate Allocation Fund | | 37 |
Portfolio of Investments
as of January 31, 2009 (Unaudited) continued
| | | | | | | | |
Moody’s
Ratings† | | Principal
Amount (000)# | | Description | | Value (Note 1) |
| | | | | | | | |
| U.S. GOVERNMENT MORTGAGE-BACKED OBLIGATIONS (Continued) | | | |
| | $ | 5,000 | | 4.50%, TBA | | $ | 5,068,750 |
| | | 222 | | 4.572%(a), 12/01/34 | | | 224,174 |
| | | 68 | | 4.584%(a), 05/01/36 | | | 67,537 |
| | | 8,025 | | 5.00%, 02/01/19 - 11/01/33 | | | 8,191,574 |
| | | 4,000 | | 5.00%, TBA | | | 4,066,248 |
| | | 5,500 | | 5.00%, TBA | | | 5,575,625 |
| | | 99 | | 5.472%(a), 09/01/34 | | | 98,585 |
| | | 11,880 | | 5.50%, 07/01/14 - 09/01/38 | | | 12,174,283 |
| | | 4,000 | | 5.50%, TBA | | | 4,093,752 |
| | | 4,453 | | 6.00%, 03/01/17 - 07/01/37 | | | 4,594,860 |
| | | 1,000 | | 6.50%, TBA | | | 1,041,562 |
| | | 10 | | Government National Mortgage Assoc.
4.125%(a), 11/20/29 | | | 9,775 |
| | | 46 | | 4.50%, 08/15/33 | | | 46,905 |
| | | 6 | | 4.625%(a), 09/20/22 | | | 6,120 |
| | | 1,300 | | 5.00%, TBA | | | 1,319,906 |
| | | 9 | | 5.125%, 10/20/27(a) | | | 8,654 |
| | | 10 | | 8.50%, 05/20/30 - 04/20/31 | | | 10,255 |
| | | | | | | | |
| | | | | TOTAL U.S. GOVERNMENT MORTGAGE-BACKED OBLIGATIONS
(cost $52,742,132) | | | 53,559,768 |
| | | | | | | | |
| |
| U.S. TREASURY OBLIGATIONS 4.9% | | | |
| | | 1,100 | | U.S. Treasury Bonds
7.125%, 02/15/23 | | | 1,486,032 |
| | | 1,100 | | 7.25%, 08/15/22 | | | 1,494,282 |
| | | 2,100 | | 8.875%, 08/15/17 | | | 2,978,062 |
| | | 1,400 | | U.S. Treasury Inflationary Indexed Bonds, TIPS
2.125%, 01/15/19 | | | 1,436,252 |
| | | 1,200 | | 2.375%, 01/15/17 - 01/15/25 | | | 1,307,993 |
| | | 800 | | 2.50%, 01/15/29 | | | 796,970 |
| | | 1,250 | | U.S. Treasury Strip, IO
7.25%, 02/15/22 | | | 731,375 |
| | | 300 | | 8.00%, 11/15/21 | | | 177,388 |
| | | 1,500 | | U.S. Treasury Strip, PO
8.00%, 11/15/21 | | | 888,718 |
| | | 3,300 | | 8.125%, 05/15/21 - 08/15/21 | | | 1,997,835 |
| | | | | | | | |
| | | | | TOTAL U.S. TREASURY OBLIGATIONS
(cost $12,952,467) | | | 13,294,907 |
| | | | | | | | |
See Notes to Financial Statements.
| | |
| 38 | | Visit our website at www.prudential.com |
| | | | | | | | |
Moody’s
Ratings† | | Principal
Amount (000)# | | Description | | Value (Note 1) |
| | | | | | | | |
| BANK LOANS(a) 0.5% | | | |
| Caa | | $ | 1,084 | | Chrysler Financial, Term
(original cost $1,029,325; purchased 07/31/07)(c)(e)
6.00%, 08/03/12 | | $ | 649,326 |
| B | | | 490 | | Ford Motor Co., Term B
(original cost $490,000; purchased 12/12/06)(c)(e)
5.00%, 12/16/13 | | | 175,992 |
| Ba- | | | 689 | | TXU Corp., Term B3(c)(e)
3.91%, 10/10/14
(original cost $637,814; purchased 02/01/08 - 11/06/08) | | | 479,012 |
| Ba- | | | 4 | | 3.91%, 10/10/14 (original cost $3,509; purchased 09/11/08) | | | 2,438 |
| | | | | | | | |
| | | | | TOTAL BANK LOANS
(cost $2,178,997) | | | 1,306,768 |
| | | | | | | | |
| | | |
| | | Units | | | | |
| RIGHTS* | | | | | | | | |
| | |
| Financial Services | | | | | |
| | | 5,000 | | Fortis, expiring on 03/09/09 (Belgium)
(cost $0)* | | | — |
| | | | | | | | |
| | | | | TOTAL LONG-TERM INVESTMENTS
(cost $329,254,965) | | | 278,097,211 |
| | | | | | | | |
| | | |
| | | Principal
Amount (000)# | | | | |
| SHORT-TERM INVESTMENTS 8.6% | | | |
| |
| U.S. TREASURY OBLIGATIONS 1.6% | | | |
| | | 590 | | U.S. Treasury Bills(h)
0.02%, 02/26/09 | | | 589,984 |
| | | 500 | | 0.04%, 03/26/09 | | | 499,941 |
| | | 2,860 | | 0.119%, 04/09/09 | | | 2,858,867 |
| | | 330 | | 0.80%, 06/04/09 | | | 329,704 |
| | | | | | | | |
| | | | | TOTAL U.S. TREASURY OBLIGATIONS
(cost $4,278,735) | | | 4,278,496 |
| | | | | | | | |
| |
| REPURCHASE AGREEMENT 1.2% | | | |
| | | 3,200 | | Credit Suisse Securities LLC, 0.26%, dated 01/30/09, due 02/02/09 due in the amount of $3,200,069
(cost $3,200,000; the value of collateral plus accrued interest was $3,278,427)(i) | | | 3,200,000 |
| | | | | | | | |
See Notes to Financial Statements.
| | |
| Target Asset Allocation Funds/Target Moderate Allocation Fund | | 39 |
Portfolio of Investments
as of January 31, 2009 (Unaudited) continued
| | | | | | | |
Contracts/
Notional
Amount (000)# | | Description | | Value (Note 1) | |
| | | | | | | |
| | OPTIONS PURCHASED* 0.2% | | | | |
| |
| | Call Options | | | | |
| | 1,800 | | Interest Rate Swap Options,
expiring 08/03/2009 @ 3.45% | | $ | 52,363 | |
| | 2,800 | | expiring 08/03/2009 @ 3.45% | | | 81,453 | |
| | 15,800 | | expiring 08/03/2009 @ 3.85% | | | 578,091 | |
| | | | | | | |
| | | TOTAL OPTIONS PURCHASED
(cost $218,065) | | | 711,907 | |
| | | | | | | |
| | |
Shares | | | | | |
| | AFFILIATED MONEY MARKET MUTUAL FUND 5.6% | |
| | 15,052,669 | | Dryden Core Investment Fund—Taxable Money Market Series (cost $15,052,669)(b) | | | 15,052,669 | |
| | | | | | | |
| | | TOTAL SHORT-TERM INVESTMENTS
(cost $22,749,469) | | | 23,243,072 | |
| | | | | | | |
| | | TOTAL INVESTMENTS, BEFORE OPTIONS WRITTEN AND SECURITIES SOLD SHORT(f) 111.8%
(cost $352,004,434; Note 5) | | | 301,340,283 | |
| | | | | | | |
| | |
Contracts/
Notional
Amount (000)# | | | | | |
| | OPTIONS WRITTEN (0.2)% | |
| |
| | Call Options | | | | |
| | 800 | | Interest Rate Swap Options,
expiring 08/03/2009 @ 4.15% | | | (55,444 | ) |
| | 5,300 | | expiring 08/03/2009 @ 4.55% | | | (545,481 | ) |
| | | | | | | |
| | | TOTAL OPTIONS WRITTEN
(premiums received $182,355) | | | (600,925 | ) |
| | | | | | | |
| | |
Principal
Amount (000)# | | | | | |
| | SECURITIES SOLD SHORT (0.4)% | |
| $ | 1,000 | | Federal National Mortgage Assoc.
4.50%, TBA | | | (1,003,125 | ) |
| | 100 | | Government National Mortgage Assoc.
5.50%, TBA | | | (102,437 | ) |
| | | | | | | |
| | | TOTAL SECURITIES SOLD SHORT
(proceeds received $1,111,234) | | | (1,105,562 | ) |
| | | | | | | |
See Notes to Financial Statements.
| | |
| 40 | | Visit our website at www.prudential.com |
| | | | | | |
| | | Description | | Value (Note 1) | |
| | TOTAL INVESTMENTS, NET OF OPTIONS WRITTEN AND SECURITIES SOLD SHORT 111.2%
(cost $350,710,845) | | $ | 299,633,796 | |
| | Other liabilities in excess of other assets(j) (11.2)% | | | (30,215,163 | ) |
| | | | | | |
| | NET ASSETS 100% | | $ | 269,418,633 | |
| | | | | | |
The following abbreviations are used in portfolio descriptions:
144A—Security was purchased pursuant to Rule 144A under the Securities Act of 1933 and may not be resold subject to that rule except to qualified institutional buyers. Unless otherwise noted, 144A securities are deemed to be liquid.
ADR—American Depositary Receipt
CHIX—European Equity Exchange
CVT—Convertible Security
FSB—Federal Savings Bank
IO—Interest Only
MTN—Medium Term Note
NR—Not Rated by Moody’s or Standard & Poor’s
PO—Principal Only Securities
TBA—To Be Announced
TIPS—Treasury Inflation Protected Securities
XLON—London Stock Exchange
BRL—Brazilian Real
CNY—Chinese Yuan
EUR—Euro
GBP—British Pound
INR—Indian Rupee
JPY—Japanese Yen
MXN—Mexican Peso
MYR—Malaysian Ringgit
RUB—Russian Ruble
| # | Principal and notional amount is shown in U.S. dollars unless otherwise stated. |
| * | Non-income producing security. |
| † | The rating reflected is as of January 31, 2009. Rating of certain bonds may have changed subsequent to that date. |
| (a) | Indicates a variable rate security. |
| (b) | Prudential Investments LLC, the manager of the Fund, also serves as manager of the Dryden Core Investment Fund—Taxable Money Market Series. |
| (c) | Private Placement restricted as to resale and does not have a readily available market. The aggregate original cost of such securities is $10,019,266. The aggregate value of $7,452,429 is approximately 2.8% of net assets. |
| (d) | Standard & Poor’s rating. |
| (e) | Indicates a security that has been deemed illiquid. |
| (f) | As of January 31, 2009, 72 securities representing $8,703,561 and 3.2% of net assets were fair valued in accordance with the policies adopted by the Board of Trustees. |
| (g) | Represents issuer in default on interest payments. Non-income producing security. |
| (h) | Rates shown are the effective yields at purchase date. |
| (i) | Repurchase agreement is collateralized by United States Treasuries or federal agency obligations. |
See Notes to Financial Statements.
| | |
| Target Asset Allocation Funds/Target Moderate Allocation Fund | | 41 |
Portfolio of Investments
as of January 31, 2009 (Unaudited) continued
| (j) | Other liabilities in excess of other assets includes unrealized appreciation (depreciation) on futures contracts, forward foreign currency exchange contracts, interest rate and credit default swaps as follows: |
Futures contracts open at January 31, 2009:
| | | | | | | | | | | | | | |
Number of
Contracts | | Type | | Expiration
Date | | Value at
Trade
Date | | Value at
January 31,
2009 | | Unrealized
Appreciation
(Depreciation) | |
| | Long Positions: | | | | | | | | | | | | |
| 80 | | 90 Day Euro | | Jun 09 | | $ | 19,302,425 | | $ | 19,747,000 | | $ | 444,575 | |
| 59 | | 90 Day Euro | | Sep 09 | | | 14,225,438 | | | 14,548,663 | | | 323,225 | |
| 104 | | 90 Day Euro | | Mar 10 | | | 25,071,338 | | | 25,554,100 | | | 482,762 | |
| 55 | | 90 Day Sterling | | Mar 09 | | | 9,693,478 | | | 9,802,285 | | | 108,807 | |
| 17 | | 90 Day Sterling | | Jun 09 | | | 2,891,373 | | | 3,034,109 | | | 142,736 | |
| 87 | | 90 Day Sterling | | Sep 09 | | | 14,943,444 | | | 15,525,133 | | | 581,689 | |
| 66 | | 90 Day Sterling | | Sep 10 | | | 11,672,282 | | | 11,685,627 | | | 13,345 | |
| 92 | | 90 Day Sterling | | Dec 09 | | | 15,805,231 | | | 16,389,883 | | | 584,652 | |
| 69 | | 90 Day Sterling | | Dec 10 | | | 12,161,546 | | | 12,178,669 | | | 17,123 | |
| 8 | | 2 Year Euro-Schatz | | Mar 09 | | | 1,105,696 | | | 1,104,211 | | | (1,485 | ) |
| 2 | | 10 Year U.K. Gilt | | Mar 09 | | | 337,662 | | | 340,328 | | | 2,666 | |
| | | | | | | | | | | | | | |
| | | | | | | | | | | | | 2,700,095 | |
| | | | | | | | | | | | | | |
| | Short Position: | | | | | | | | | | | | |
| 44 | | 5 Year Euro-Bobl | | Mar 09 | | | 6,497,100 | | | 6,512,311 | | | (15,211 | ) |
| | | | | | | | | | | | | | |
| | | | | | | | | | | | $ | 2,684,884 | (1) |
| | | | | | | | | | | | | | |
(1) | Cash of $782,000 has been segregated with the broker to cover requirements for open futures contracts as of January 31, 2009. |
Forward foreign currency exchange contracts outstanding at January 31, 2009:
| | | | | | | | | | | | | |
Purchase Contracts | | Notional
Amount
(000) | | Value at
Settlement
Date Payable | | Current Value | | Unrealized
Appreciation
(Depreciation) | |
Brazilian Real, | | | | | | | | | | | | | |
Expiring 02/03/09 | | BRL | 1,520 | | $ | 670,097 | | $ | 654,110 | | $ | (15,987 | ) |
Expiring 06/02/09 | | BRL | 760 | | | 322,067 | | | 316,500 | | | (5,567 | ) |
British Pound, | | | | | | | | | | | | | |
Expiring 02/03/09 | | GBP | 1 | | | 789 | | | 800 | | | 11 | |
Expiring 02/26/09 | | GBP | 140 | | | 203,279 | | | 202,806 | | | (473 | ) |
Chinese Yuan, | | | | | | | | | | | | | |
Expiring 05/06/09 | | CNY | 9,132 | | | 1,319,309 | | | 1,318,991 | | | (318 | ) |
Expiring 07/15/09 | | CNY | 10,470 | | | 1,536,662 | | | 1,502,919 | | | (33,743 | ) |
Expiring 09/08/09 | | CNY | 4,481 | | | 650,000 | | | 640,615 | | | (9,385 | ) |
See Notes to Financial Statements.
| | |
| 42 | | Visit our website at www.prudential.com |
Forward foreign currency exchange contracts outstanding at January 31, 2009 (cont’d):
| | | | | | | | | | | | | |
Purchase Contracts | | Notional
Amount
(000) | | Value at
Settlement
Date Payable | | Current Value | | Unrealized
Appreciation
(Depreciation) | |
Euro, | | | | | | | | | | | | | |
Expiring 02/12/09 | | EUR | 615 | | $ | 804,982 | | $ | 787,298 | | $ | (17,684 | ) |
Expiring 06/16/09 | | EUR | 626 | | | 856,431 | | | 800,656 | | | (55,775 | ) |
Indian Rupee, | | | | | | | | | | | | | |
Expiring 04/09/09 | | INR | 60,919 | | | 1,213,809 | | | 1,238,144 | | | 24,335 | |
Malaysian Ringgit, | | | | | | | | | | | | | |
Expiring 02/12/09 | | MYR | 826 | | | 233,848 | | | 228,770 | | | (5,078 | ) |
Expiring 04/14/09 | | MYR | 670 | | | 190,000 | | | 185,342 | | | (4,658 | ) |
Expiring 08/12/09 | | MYR | 830 | | | 234,007 | | | 230,050 | | | (3,957 | ) |
Mexican Peso, | | | | | | | | | | | | | |
Expiring 05/19/09 | | MXN | 44 | | | 4,068 | | | 3,029 | | | (1,039 | ) |
Russian Ruble, | | | | | | | | | | | | | |
Expiring 05/06/09 | | RUB | 33,713 | | | 1,193,018 | | | 864,426 | | | (328,592 | ) |
| | | | | | | | | | | | | |
| | | | | $ | 9,432,366 | | $ | 8,974,456 | | $ | (457,910 | ) |
| | | | | | | | | | | | | |
| | | | | | | | | | | | | |
Sale Contracts | | Notional
Amount
(000) | | Value at
Settlement
Date Receivable | | Current Value | | Unrealized
Appreciation
(Depreciation) | |
Brazilian Real, | | | | | | | | | | | | | |
Expiring 02/03/09 | | BRL | 1,520 | | $ | 659,790 | | $ | 654,504 | | $ | 5,286 | |
Expiring 06/02/09 | | BRL | 2,144 | | | 989,429 | | | 893,166 | | | 96,263 | |
British Pound, | | | | | | | | | | | | | |
Expiring 02/26/09 | | GBP | 1,498 | | | 2,196,779 | | | 2,170,025 | | | 26,754 | |
Expiring 06/19/09 | | GBP | 239 | | | 366,279 | | | 346,169 | | | 20,110 | |
Chinese Yuan, | | | | | | | | | | | | | |
Expiring 07/15/09 | | CNY | 21,071 | | | 3,028,000 | | | 3,024,586 | | | 3,414 | |
Euro, | | | | | | | | | | | | | |
Expiring 02/12/09 | | EUR | 2,713 | | | 3,658,565 | | | 3,473,071 | | | 185,494 | |
Expiring 06/08/09 | | EUR | 1,117 | | | 1,488,818 | | | 1,428,653 | | | 60,165 | |
Indian Rupee, | | | | | | | | | | | | | |
Expiring 04/09/09 | | INR | 61,522 | | | 1,227,000 | | | 1,250,398 | | | (23,398 | ) |
Malaysian Ringgit, | | | | | | | | | | | | | |
Expiring 02/12/09 | | MYR | 826 | | | 234,166 | | | 228,770 | | | 5,396 | |
Mexican Peso, | | | | | | | | | | | | | |
Expiring 05/29/09 | | MXN | 7,070 | | | 496,750 | | | 481,151 | | | 15,599 | |
Russian Ruble, | | | | | | | | | | | | | |
Expiring 05/06/09 | | RUB | 33,713 | | | 1,044,640 | | | 864,426 | | | 180,214 | |
| | | | | | | | | | | | | |
| | | | | $ | 15,390,216 | | $ | 14,814,919 | | $ | 575,297 | |
| | | | | | | | | | | | | |
See Notes to Financial Statements.
| | |
| Target Asset Allocation Funds/Target Moderate Allocation Fund | | 43 |
Portfolio of Investments
as of January 31, 2009 (Unaudited) continued
Interest rate swap agreements outstanding at January 31, 2009:
| | | | | | | | | | | | | | |
Counterparty | | Termination
Date | | Notional
Amount#
(000) | | Fixed
Rate | | | Floating
Rate | | Unrealized
Appreciation
(Depreciation) | |
Bank of America Securities LLC(2) | | 06/15/35 | | $ | 700 | | 6.00 | % | | 3 Month LIBOR | | $ | 324,984 | |
Merrill Lynch & Co., Inc.(1) | | 06/17/19 | | | 1,100 | | 4.00 | | | 3 Month LIBOR | | | 14,734 | |
Merrill Lynch & Co., Inc.(1) | | 12/17/23 | | | 10,300 | | 5.00 | | | 3 Month LIBOR | | | (2,058,553 | ) |
Merrill Lynch & Co., Inc.(1) | | 12/17/28 | | | 1,000 | | 5.00 | | | 3 Month LIBOR | | | (225,434 | ) |
Morgan Stanley & Co.(1) | | 06/17/19 | | | 2,000 | | 4.00 | | | 3 Month LIBOR | | | 103,139 | |
Morgan Stanley & Co.(1) | | 12/17/23 | | | 8,900 | | 5.00 | | | 3 Month LIBOR | | | (1,892,090 | ) |
Morgan Stanley & Co.(2) | | 12/17/13 | | | 27,900 | | 4.00 | | | 3 Month LIBOR | | | 2,252,759 | |
Goldman Sachs & Co.(2) | | 01/02/12 | | BRL | 5,900 | | 10.15 | | | Brazilian interbank
lending rate | | | (162,080 | ) |
Merrill Lynch & Co., Inc.(2) | | 01/02/12 | | BRL | 600 | | 14.77 | | | Brazilian interbank
lending rate | | | 12,823 | |
Morgan Stanley & Co.(2) | | 01/02/12 | | BRL | 5,000 | | 10.12 | | | Brazilian interbank
lending rate | | | (82,068 | ) |
UBS AG(2) | | 01/02/12 | | BRL | 5,100 | | 10.58 | | | Brazilian interbank
lending rate | | | (76,444 | ) |
Barclays Capital, Inc.(1) | | 09/17/18 | | EUR | 100 | | 5.00 | | | 6 Month EURIBOR | | | (10,439 | ) |
Barclays Capital, Inc.(1) | | 09/17/38 | | EUR | 1,000 | | 5.00 | | | 6 Month EURIBOR | | | (251,855 | ) |
Barclays Capital, Inc.(2) | | 03/18/10 | | EUR | 700 | | 5.00 | | | 6 Month EURIBOR | | | 28,633 | |
Deutsche Bank(1) | | 09/17/18 | | EUR | 500 | | 5.00 | | | 6 Month EURIBOR | | | (61,293 | ) |
Deutsche Bank(2) | | 06/15/13 | | EUR | 2,100 | | 4.00 | | | 6 Month EURIBOR | | | 43,220 | |
Goldman Sachs & Co.(1) | | 03/18/39 | | EUR | 600 | | 5.00 | | | 6 Month EURIBOR | | | (141,633 | ) |
UBS AG(2) | | 10/15/10 | | EUR | 100 | | 2.15 | | | FRC - Excluding
Tobacco - Non-Revised
Consumer Price Index | | | 4,563 | |
Barclays Capital, Inc.(1) | | 06/15/37 | | GBP | 800 | | 4.00 | | | 6 Month LIBOR | | | (52,685 | ) |
Deutsche Bank(1) | | 06/15/37 | | GBP | 700 | | 4.25 | | | 6 Month LIBOR | | | (48,341 | ) |
Goldman Sachs & Co.(1) | | 06/15/37 | | GBP | 800 | | 4.00 | | | 6 Month LIBOR | | | (51,235 | ) |
Goldman Sachs & Co.(2) | | 09/17/11 | | GBP | 600 | | 4.50 | | | 6 Month LIBOR | | | 52,048 | |
Morgan Stanley & Co.(1) | | 06/15/37 | | GBP | 300 | | 4.25 | | | 6 Month LIBOR | | | (20,304 | ) |
Morgan Stanley & Co.(1) | | 06/15/37 | | GBP | 300 | | 4.00 | | | 6 Month LIBOR | | | (19,355 | ) |
UBS AG(1) | | 06/17/18 | | JPY | 90,000 | | 1.50 | | | 6 Month LIBOR | | | (12,159 | ) |
Merrill Lynch & Co., Inc.(2) | | 11/04/16 | | MXN | 31,000 | | 8.17 | | | 28 day Mexican
interbank rate | | | 9,574 | |
| | | | | | | | | | | | | | |
| | | | | | | | | | | | $ | (2,319,491 | ) |
| | | | | | | | | | | | | | |
| (1) | Fund pays the fixed rate and receives the floating rate. |
| (2) | Fund pays the floating rate and receives the fixed rate. |
| # | Notional Amount is shown in U.S. dollars unless otherwise stated. |
See Notes to Financial Statements.
| | |
| 44 | | Visit our website at www.prudential.com |
Credit default swap agreements outstanding at January 31, 2009:
| | | | | | | | | | | | | | | | | | | | | | |
Counterparty | | Termination
Date | | Notional
Amount#
(000)(4) | | Fixed
Rate | | | Reference
Entity/
Obligation | | Fair
Value(3) | | | Upfront
Premiums
Paid
(Received) | | | Unrealized
(Depreciation) | |
| Credit default swaps on credit indices—Sell Protection(1): | |
Credit Suisse International | | 05/25/46 | | $ | 4,400 | | 0.11 | % | | ABX HE AAA 06-2 | | $ | (2,364,903 | ) | | $ | (928,402 | ) | | $ | (1,436,501 | ) |
Credit Suisse International | | 08/25/37 | | | 800 | | 0.09 | % | | ABX HE AAA 07-1 | | | (522,306 | ) | | | (212,326 | ) | | | (309,980 | ) |
Citigroup, Inc. | | 06/20/12 | | | 6,572 | | 0.47 | % | | Dow Jones CDX
HY8 5Y Index | | | (539,501 | ) | | | — | | | | (539,501 | ) |
Citigroup, Inc. | | 06/20/12 | | | 300 | | 2.14 | % | | Dow Jones CDX
HY8 5Y Index | | | (81,364 | ) | | | — | | | | (81,364 | ) |
Merrill Lynch & Co. | | 06/20/12 | | | 1,600 | | 2.08 | % | | Dow Jones CDX
HY8 5Y Index | | | (436,774 | ) | | | — | | | | (436,774 | ) |
Morgan Stanley & Co. | | 12/20/15 | | | 530 | | 0.46 | % | | Dow Jones CDX
IG5 10Y Index | | | (135,797 | ) | | | — | | | | (135,797 | ) |
Morgan Stanley & Co. | | 12/20/15 | | | 1,900 | | 0.46 | % | | Dow Jones CDX
IG5 10Y Index | | | (486,298 | ) | | | — | | | | (486,298 | ) |
| | | | | | | | | | | | | | | | | | | | | | |
| | | | | | | | | | | | $ | (4,566,943 | ) | | $ | (1,140,728 | ) | | $ | (3,426,215 | ) |
| | | | | | | | | | | | | | | | | | | | | | |
The Fund entered into credit default swap agreements on corporate issues, sovereign issues, asset-backed securities and credit indices as the protection seller to provide a measure of protection against the current portfolio of investments’ exposure to market conditions, or to take an active position with respect to the likelihood of a particular issuer’s default or the referenced entity’s credit soundness.
Credit default swaps—Buy Protection(2):
| | | | | | | | | | | | | |
Counterparty | | Termination
Date | | Notional
Amount#
(000)(4) | | Fixed
Rate | | | Reference Entity/
Obligation | | Unrealized
Appreciation |
Barclays Capital, Inc. | | 09/20/11 | | $ | 100 | | 0.54 | % | | DaimlerChrysler N.A.,
5.75%, due 09/08/11 | | $ | 7,747 |
Barclays Capital, Inc. | | 06/20/13 | | | 693 | | 5.00 | | | Dow Jones CDX HY10
Index | | | 142,876 |
See Notes to Financial Statements.
| | |
| Target Asset Allocation Funds/Target Moderate Allocation Fund | | 45 |
Portfolio of Investments
as of January 31, 2009 (Unaudited) continued
Credit default swap agreements outstanding at January 31, 2009 (cont’d):
| | | | | | | | | | | | | |
Counterparty | | Termination
Date | | Notional
Amount#
(000)(4) | | Fixed
Rate | | | Reference Entity/
Obligation | | Unrealized
Appreciation |
UBS AG | | 06/20/13 | | $ | 693 | | 5.00 | % | | Dow Jones CDX HY10
Index | | $ | 143,251 |
Merrill Lynch & Co. | | 12/20/11 | | | 300 | | 0.00 | | | Dow Jones CDX HY7
Index | | | 164,146 |
Merrill Lynch & Co. | | 06/20/12 | | | 2,450 | | 2.75 | | | Dow Jones CDX HY8
Index | | | 506,552 |
Deutsche Bank | | 06/20/18 | | | 1,854 | | 1.50 | | | Dow Jones CDX IG10
10Y Index | | | 38,853 |
Goldman Sachs & Co. | | 06/20/18 | | | 2,245 | | 1.50 | | | Dow Jones CDX IG10
10Y Index | | | 88,521 |
Morgan Stanley & Co. | | 06/20/18 | | | 5,270 | | 1.50 | | | Dow Jones CDX IG10
10Y Index | | | 172,902 |
Deutsche Bank | | 06/20/13 | | | 2,245 | | 1.55 | | | Dow Jones CDX IG10
5Y Index | | | 57,234 |
Morgan Stanley & Co. | | 12/20/12 | | | 700 | | 0.14 | | | Dow Jones CDX IG5
Index | | | 123,479 |
Morgan Stanley & Co. | | 12/20/12 | | | 2,700 | | 0.14 | | | Dow Jones CDX IG5
Index | | | 476,277 |
Barclays Capital, Inc. | | 12/20/11 | | | 1,300 | | 0.75 | | | Dow Jones CDX IG7
Index | | | 146,335 |
Barclays Capital, Inc. | | 12/20/17 | | | 976 | | 0.80 | | | Dow Jones CDX IG9
10Y Index | | | 41,470 |
Goldman Sachs & Co. | | 12/20/17 | | | 3,904 | | 0.80 | | | Dow Jones CDX IG9
10Y Index | | | 182,208 |
Merrill Lynch & Co. | | 12/20/17 | | | 1,952 | | 0.80 | | | Dow Jones CDX IG9
10Y Index | | | 69,472 |
Morgan Stanley & Co. | | 12/20/17 | | | 4,099 | | 0.80 | | | Dow Jones CDX IG9
10Y Index | | | 131,009 |
Goldman Sachs & Co. | | 12/20/12 | | | 488 | | 0.60 | | | Dow Jones CDX IG9
5Y Index | | | 18,165 |
JPMorgan Chase Bank | | 12/20/11 | | | 943 | | 1.65 | | | Dow Jones CDX XO7
Index | | | 142,302 |
Deutsche Bank | | 09/20/11 | | | 200 | | 0.62 | | | Nationwide Health,
6.50%, due 07/15/11 | | | 26,159 |
Morgan Stanley & Co. | | 06/20/16 | | | 300 | | 0.39 | | | Omnicom Group, Inc.,
5.90%, due 04/15/16 | | | 42,851 |
Morgan Stanley & Co. | | 12/20/12 | | | 600 | | 0.33 | | | TJX Cos., Inc.,
7.45%, due 12/15/09 | | | 19,713 |
Goldman Sachs & Co. | | 12/20/12 | | | 600 | | 0.24 | | | Wal-Mart Stores, Inc.,
5.75%, due 12/19/30 | | | 15,998 |
See Notes to Financial Statements.
| | |
| 46 | | Visit our website at www.prudential.com |
Credit default swap agreements outstanding at January 31, 2009 (cont’d):
| | | | | | | | | | | | | |
Counterparty | | Termination
Date | | Notional
Amount#
(000)(4) | | Fixed
Rate | | | Reference Entity/
Obligation | | Unrealized
Appreciation |
Bear Stearns International Ltd. | | 06/20/16 | | $ | 200 | | 0.63 | % | | Whirlpool Corp.,
6.50%, due 06/15/16 | | $ | 33,566 |
Barclays Capital, Inc. | | 03/20/12 | | | 100 | | 0.21 | | | XL Capital Ltd.,
6.50%, due 01/15/12 | | | 21,358 |
| | | | | | | | | | | | | |
| | | | | | | | | | | | $ | 2,812,444 |
| | | | | | | | | | | | | |
| (1) | If the Fund is a seller of protection, it receives the fixed rate. When a credit event occurs, as defined under the terms of that particular swap agreement, the Fund will either (i) pay to the buyer of protection an amount equal to the notional amount of the swap and take delivery of the referenced obligation or underlying securities comprising the referenced index or (ii) pay a net settlement amount in the form of cash or securities equal to the notional amount of the swap less the recovery value of the referenced obligation or underlying securities comprising the referenced index. |
| (2) | If the Fund is a buyer of protection, it pays the fixed rate. When a credit event occurs, as defined under the terms of that particular swap agreement, the Fund will either (i) receive from the seller of protection an amount up to the notional amount of the swap and make delivery of the referenced obligation or underlying securities comprising the referenced index or (ii) receive a net settlement amount in the form of cash or securities up to the notional amount of the swap less the recovery value of the referenced obligation or underlying securities comprising the referenced index. |
| (3) | The fair value of credit default swap agreements on asset-backed securities and credit indices serves as an indicator of the current status of the payment/performance risk and represents the likelihood of an expected liability (or profit) for the credit derivative should the notional amount of the swap agreement be closed/sold as of the reporting date. Increasing fair value in absolute terms, represent a deterioration of the referenced entity’s credit soundness and a greater likelihood of risk of default or other credit event occurring as defined under the terms of the agreement. |
| (4) | Notional amount represents the maximum potential amount the Fund could be required to pay as a seller of credit protection or receive as a buyer of credit protection if a credit event occurs as defined under the terms of that particular swap agreement. |
| # | Notional Amount is shown in U.S. dollars unless otherwise stated. |
Various inputs are used in determining the value of the Fund’s investments. These inputs are summarized in the three broad levels listed below.
Level 1—quoted prices in active markets for identical securities
Level 2—other significant observable inputs (including quoted prices for similar securities, interest rates, prepayment speeds, credit risk, etc.)
Level 3—significant unobservable inputs (including the Fund’s own assumptions in determining the fair value of investments)
See Notes to Financial Statements.
| | |
| Target Asset Allocation Funds/Target Moderate Allocation Fund | | 47 |
Portfolio of Investments
as of January 31, 2009 (Unaudited) continued
The following is a summary of the inputs used as of January 31, 2009 in valuing the Fund’s assets carried at fair value:
| | | | | | | | |
Valuation inputs | | Investments
in Securities | | | Other Financial
Instruments* | |
Level 1—Quoted Prices | | $ | 172,537,527 | | | $ | 2,684,884 | |
Level 2—Other Significant Observable Inputs—Long | | | 128,733,755 | | | | (2,820,438 | ) |
Level 2—Other Significant Observable Inputs—Short | | | (1,706,487 | ) | | | — | |
Level 3—Significant Unobservable Inputs | | | 69,001 | | | | 4,563 | |
| | | | | | | | |
Total | | $ | 299,633,796 | | | $ | (130,991 | ) |
| | | | | | | | |
| * | Other financial instruments are derivative instruments not reflected in the Portfolio of Investments, such as futures, forwards and swap contracts, which are valued at the unrealized appreciation/depreciation on the instrument. |
The following is a reconciliation of assets in which significant unobservable inputs (Level 3) were used in determining fair value:
| | | | | | | | |
| | | Investments
in Securities | | | Other Financial
Instruments* | |
Balance as of 7/31/08 | | $ | 75,730 | | | $ | (561 | ) |
Accrued discounts/premiums | | | 3 | | | | — | |
Realized gain (loss) | | | (538,591 | ) | | | — | |
Change in unrealized appreciation (depreciation) | | | 46,155 | | | | 5,124 | |
Net purchases (sales) | | | (221,517 | ) | | | — | |
Transfers in and/or out of Level 3 | | | 707,221 | | | | — | |
| | | | | | | | |
Balance as of 1/31/09 | | $ | 69,001 | | | $ | 4,563 | |
| | | | | | | | |
The industry classification of investments and other liabilities in excess of other assets shown as a percentage of net assets as January 31, 2009 were as follows:
| | | |
U.S. Government Mortgage-Backed Obligations | | 19.9 | % |
U.S. Treasury Obligations | | 6.5 | |
Pharmaceuticals | | 5.8 | |
Oil, Gas & Consumable Fuels | | 5.7 | |
Affiliated Money Market Mutual Fund | | 5.6 | |
Diversified Financial Services | | 3.9 | |
Retail & Merchandising | | 2.9 | |
Insurance | | 2.8 | |
Telecommunications | | 2.7 | |
Collateralized Mortgage Obligations | | 2.7 | |
Financial—Bank & Trust | | 2.6 | |
See Notes to Financial Statements.
| | |
| 48 | | Visit our website at www.prudential.com |
| | | |
| |
| Industry (cont’d) | | | |
Financial Services | | 2.5 | % |
Software | | 2.1 | |
Municipal Bonds | | 1.8 | |
Hotels, Restaurants & Leisure | | 1.7 | |
Biotechnology | | 1.7 | |
Chemicals | | 1.6 | |
Aerospace | | 1.5 | |
Food | | 1.4 | |
Foreign Government Bonds | | 1.4 | |
Industrial Conglomerates | | 1.4 | |
Commercial Services & Supplies | | 1.3 | |
Diversified Telecommunication Services | | 1.3 | |
Transportation | | 1.2 | |
Medical Supplies & Equipment | | 1.2 | |
Repurchase Agreement | | 1.2 | |
Farming & Agriculture | | 1.1 | |
Media | | 1.1 | |
Aerospace & Defense | | 1.1 | |
Computers & Peripherals | | 0.9 | |
Utilities | | 0.9 | |
Internet Services | | 0.9 | |
Asset-Backed Securities | | 0.8 | |
Computer Hardware | | 0.8 | |
Entertainment��& Leisure | | 0.8 | |
Capital Markets | | 0.8 | |
Commercial Banks | | 0.8 | |
Tobacco Products | | 0.8 | |
Electronic Components | | 0.8 | |
Machinery | | 0.7 | |
Energy Equipment & Services | | 0.7 | |
Electric Utilities | | 0.6 | |
Retail | | 0.6 | |
Metals & Mining | | 0.6 | |
Computers | | 0.6 | |
Specialty Retail | | 0.5 | |
Clothing & Apparel | | 0.5 | |
Computer Services & Software | | 0.5 | |
Bank Loans | | 0.5 | |
Diversified Manufacturing | | 0.5 | |
Household Products | | 0.5 | |
Automobiles | | 0.4 | |
Consumer Products & Services | | 0.4 | |
Multi-utilities | | 0.4 | |
Healthcare Equipment & Supplies | | 0.4 | |
Electronic Equipment & Instruments | | 0.4 | |
Real Estate Investment Trusts | | 0.4 | |
Food & Drug Retailers | | 0.3 | |
Beverages | | 0.3 | |
See Notes to Financial Statements.
| | |
| Target Asset Allocation Funds/Target Moderate Allocation Fund | | 49 |
Portfolio of Investments
as of January 31, 2009 (Unaudited) continued
| | | |
| |
| Industry (cont’d) | | | |
Healthcare Services | | 0.3 | % |
Paper & Forest Products | | 0.3 | |
Office Equipment | | 0.3 | |
Manufacturing | | 0.3 | |
Road & Rail | | 0.3 | |
Options Purchased | | 0.2 | |
Communication Equipment | | 0.2 | |
Semiconductors | | 0.2 | |
Life Science Tools & Services | | 0.2 | |
Diversified Operations | | 0.2 | |
Airlines | | 0.2 | |
Banking | | 0.2 | |
Internet Software & Services | | 0.1 | |
Healthcare Providers & Services | | 0.1 | |
Household Durables | | 0.1 | |
Automotive Parts | | 0.1 | |
Semiconductors & Semiconductor Equipment | | 0.1 | |
Building Materials | | 0.1 | |
Multi-Line Retail | | 0.1 | |
Healthcare Products & Services | | 0.1 | |
Advertising | | 0.1 | |
Environmental Services | | 0.1 | |
Electronic Components & Equipment | | 0.1 | |
Engineering/Construction | | 0.1 | |
Conglomerates | | 0.1 | |
Equipment Services | | 0.1 | |
Containers & Packaging | | 0.1 | |
Education | | 0.1 | |
Electric | | 0.1 | |
Materials | | 0.1 | |
Diversified | | 0.1 | |
Healthcare Technology | | 0.1 | |
Air Freight & Couriers | | 0.1 | |
Semiconductor Components | | 0.1 | |
Automotive Components | | 0.1 | |
Professional Services | | 0.1 | |
Consumer Finance | | 0.1 | |
Machinery—Construction & Mining | | 0.1 | |
Construction | | 0.1 | |
Distribution/Wholesale | | 0.1 | |
Home Furnishings | | 0.1 | |
Business Services | | 0.1 | |
Auto/Trucks Parts & Equipment | | 0.1 | |
| | | |
| | 111.8 | |
Options Written and Securities Sold Short | | (0.6 | ) |
Other liabilities in excess of other assets | | (11.2 | ) |
| | | |
| | 100.0 | % |
| | | |
See Notes to Financial Statements.
| | |
| 50 | | Visit our website at www.prudential.com |
Financial Statements
(Unaudited)
| | |
| JANUARY 31, 2009 | | SEMIANNUAL REPORT |
Target Asset Allocation Funds/
Target Moderate Allocation Fund
Statement of Assets and Liabilities
January 31, 2009 (Unaudited)
| | | | |
Assets | | | | |
Investments at value: | | | | |
Unaffiliated investments (cost $336,951,765) | | $ | 286,287,614 | |
Affiliated investments (cost $15,052,669) | | | 15,052,669 | |
Deposit with broker | | | 782,000 | |
Foreign currency, at value (cost $1,788,583) | | | 1,759,541 | |
Receivable for investments sold | | | 33,226,336 | |
Unrealized appreciation on swap agreements | | | 5,658,921 | |
Dividends and interest receivable | | | 1,250,443 | |
Unrealized appreciation on foreign currency exchange contracts | | | 623,041 | |
Receivable for Fund shares sold | | | 283,547 | |
Tax reclaim receivable | | | 228,854 | |
Prepaid expenses | | | 4,297 | |
| | | | |
Total assets | | | 345,157,263 | |
| | | | |
| |
Liabilities | | | | |
Payable for investments purchased | | | 60,568,856 | |
Unrealized depreciation on swap agreements | | | 8,592,183 | |
Payments received for swap agreements | | | 1,857,339 | |
Payable to custodian | | | 1,254,942 | |
Securities sold short, at value (proceeds $1,111,234) | | | 1,105,562 | |
Outstanding options written (premiums received $182,355) | | | 600,925 | |
Unrealized depreciation on foreign currency exchange contracts | | | 505,654 | |
Payable for Fund shares reacquired | | | 446,871 | |
Accrued expenses and other liabilities | | | 311,397 | |
Management fee payable | | | 179,847 | |
Distribution fee payable | | | 152,548 | |
Payable to broker-variation margin | | | 87,185 | |
Affiliated transfer agent fee payable | | | 66,712 | |
Deferred trustees’ fees | | | 8,609 | |
| | | | |
Total liabilities | | | 75,738,630 | |
| | | | |
| |
Net Assets | | $ | 269,418,633 | |
| | | | |
| | | | | |
Net assets were comprised of: | | | | |
Shares of beneficial interest, at par | | $ | 34,719 | |
Paid-in capital, in excess of par | | | 375,571,454 | |
| | | | |
| | | 375,606,173 | |
Undistributed net investment income | | | 1,069,106 | |
Accumulated net realized loss on investment and foreign currency transactions | | | (56,118,004 | ) |
Net unrealized depreciation on investments and foreign currencies | | | (51,138,642 | ) |
| | | | |
Net assets, January 31, 2009 | | $ | 269,418,633 | |
| | | | |
See Notes to Financial Statements.
| | |
| 52 | | Visit our website at www.prudential.com |
| | | |
Class A: | | | |
Net asset value and redemption price per share
($119,861,823 ÷ 15,438,677 shares of beneficial interest issued and outstanding) | | $ | 7.76 |
Maximum sales charge (5.50% of offering price) | | | .45 |
| | | |
Maximum offering price to public | | $ | 8.21 |
| | | |
| |
Class B: | | | |
Net asset value, offering price and redemption price per share
($69,317,782 ÷ 8,935,774 shares of beneficial interest issued and outstanding) | | $ | 7.76 |
| | | |
| |
Class C: | | | |
Net asset value, offering price and redemption price per share
($66,365,746 ÷ 8,557,294 shares of beneficial interest issued and outstanding) | | $ | 7.76 |
| | | |
| |
Class M: | | | |
Net asset value, offering price and redemption price per share
($2,416,462 ÷ 312,174 shares of beneficial interest issued and outstanding) | | $ | 7.74 |
| | | |
| |
Class R: | | | |
Net asset value, offering price and redemption price per share
($722,040 ÷ 92,957 shares of beneficial interest issued and outstanding) | | $ | 7.77 |
| | | |
| |
Class X: | | | |
Net asset value, offering price and redemption price per share
($2,602,318 ÷ 335,533 shares of beneficial interest issued and outstanding) | | $ | 7.76 |
| | | |
| |
Class Z: | | | |
Net asset value, offering price and redemption price per share
($8,132,462 ÷ 1,046,437 shares of beneficial interest issued and outstanding) | | $ | 7.77 |
| | | |
See Notes to Financial Statements.
| | |
| Target Asset Allocation Funds/Target Moderate Allocation Fund | | 53 |
Statement of Operations
Six Months Ended January 31, 2009 (Unaudited)
| | | | |
Net Investment Income | | | | |
Income | | | | |
Unaffiliated interest | | $ | 3,234,095 | |
Unaffiliated dividends (net of foreign withholding taxes $31,769) | | | 2,548,175 | |
Affiliated dividend income | | | 190,375 | |
| | | | |
| | | 5,972,645 | |
| | | | |
| |
Expenses | | | | |
Management fee | | | 1,221,569 | |
Distribution fee—Class A | | | 172,074 | |
Distribution fee—Class B | | | 438,298 | |
Distribution fee—Class C | | | 408,480 | |
Distribution fee—Class M | | | 17,231 | |
Distribution fee—Class R | | | 3,463 | |
Distribution fee—Class X | | | 16,974 | |
Transfer agent’s fees and expenses (including affiliated expense of $123,000) | | | 313,000 | |
Custodian’s fees and expenses | | | 221,000 | |
Registration fees | | | 51,000 | |
Reports to shareholders | | | 40,000 | |
Audit fee | | | 28,000 | |
Trustees’ fees | | | 12,000 | |
Legal fee | | | 10,000 | |
Insurance expense | | | 2,000 | |
Miscellaneous | | | 21,274 | |
| | | | |
Total expenses | | | 2,976,363 | |
| | | | |
Net investment income | | | 2,996,282 | |
| | | | |
| |
Net Realized And Unrealized Gain (Loss) On Investments And Foreign Currency | | | | |
Net realized gain (loss) on: | | | | |
Investment transactions | | | (45,130,482 | ) |
Options written transactions | | | 432,412 | |
Foreign currency transactions | | | 1,246,998 | |
Future transactions | | | (4,206,310 | ) |
Swap agreement transactions | | | 1,852,659 | |
Short sale transactions | | | (1,497,907 | ) |
| | | | |
| | | (47,302,630 | ) |
| | | | |
Net change in unrealized appreciation (depreciation) on: | | | | |
Investments | | | (55,509,965 | ) |
Options written | | | (832,858 | ) |
Foreign currencies | | | 190,590 | |
Futures | | | 3,065,056 | |
Swap agreements | | | (1,119,096 | ) |
Short sales | | | 65,357 | |
| | | | |
| | | (54,140,916 | ) |
| | | | |
Net loss on investments and foreign currencies | | | (101,443,546 | ) |
| | | | |
Net Decrease In Net Assets Resulting From Operations | | $ | (98,447,264 | ) |
| | | | |
See Notes to Financial Statements.
| | |
| 54 | | Visit our website at www.prudential.com |
Statement of Changes in Net Assets
(Unaudited)
| | | | | | | | |
| | | Six Months
Ended
January 31, 2009 | | | Year
Ended
July 31, 2008 | |
Increase (Decrease) In Net Assets | | | | | | | | |
Operations | | | | | | | | |
Net investment income | | $ | 2,996,282 | | | $ | 7,380,419 | |
Net realized gain (loss) on investment and foreign
currency transactions | | | (47,302,630 | ) | | | 7,420,272 | |
Net change in unrealized appreciation (depreciation) on investments and foreign currencies | | | (54,140,916 | ) | | | (47,425,937 | ) |
| | | | | | | | |
Net decrease in net assets resulting from operations | | | (98,447,264 | ) | | | (32,625,246 | ) |
| | | | | | | | |
| | |
Dividends and distributions (Note 1) | | | | | | | | |
Dividends from net investment income: | | | | | | | | |
Class A | | | (2,124,545 | ) | | | (3,483,116 | ) |
Class B | | | (583,125 | ) | | | (1,808,665 | ) |
Class C | | | (565,943 | ) | | | (1,612,152 | ) |
Class M | | | (21,997 | ) | | | (83,226 | ) |
Class R | | | (18,024 | ) | | | (51,794 | ) |
Class X | | | (24,259 | ) | | | (69,914 | ) |
Class Z | | | (167,486 | ) | | | (326,369 | ) |
| | | | | | | | |
| | | (3,505,379 | ) | | | (7,435,236 | ) |
| | | | | | | | |
Distributions from net realized gains: | | | | | | | | |
Class A | | | (1,512,131 | ) | | | (13,380,539 | ) |
Class B | | | (888,910 | ) | | | (11,111,908 | ) |
Class C | | | (862,718 | ) | | | (9,554,299 | ) |
Class M | | | (33,532 | ) | | | (546,953 | ) |
Class R | | | (13,156 | ) | | | (291,666 | ) |
Class X | | | (36,981 | ) | | | (422,473 | ) |
Class Z | | | (104,679 | ) | | | (1,144,078 | ) |
| | | | | | | | |
| | | (3,452,107 | ) | | | (36,451,916 | ) |
| | | | | | | | |
Fund share transactions (Net of share conversions) (Note 6) | | | | | | | | |
Net proceeds from shares sold | | | 15,362,575 | | | | 45,261,636 | |
Net asset value of shares issued in reinvestment
of dividends and distributions | | | 6,573,205 | | | | 40,963,421 | |
Cost of shares reacquired | | | (45,421,475 | ) | | | (94,187,249 | ) |
| | | | | | | | |
Net decrease in net assets resulting from Fund
share transactions | | | (23,485,695 | ) | | | (7,962,192 | ) |
| | | | | | | | |
Total increase (decrease) | | | (128,890,445 | ) | | | (84,474,590 | ) |
| | |
Net Assets | | | | | | | | |
Beginning of period | | | 398,309,078 | | | | 482,783,668 | |
| | | | | | | | |
End of period(a) | | $ | 269,418,633 | | | $ | 398,309,078 | |
| | | | | | | | |
(a) Includes undistributed net investment income of: | | $ | 1,069,106 | | | $ | 1,578,203 | |
| | | | | | | | |
See Notes to Financial Statements.
| | |
| Target Asset Allocation Funds/Target Moderate Allocation Fund | | 55 |
Notes to Financial Statements
(Unaudited)
Target Asset Allocation Funds (the “Trust”) is registered under the Investment Company Act of 1940 as an open-end, diversified management investment company presently consisting of three portfolios: Target Moderate Allocation Fund (the “Fund”), Target Conservative Allocation Fund and Target Growth Allocation Fund. These financial statements relate only to Target Moderate Allocation Fund. The financial statements of the other portfolios are not presented herein. The Trust was organized as a business trust in Delaware on July 29, 1998.
The Fund uses investment managers (“Subadvisors”), each managing a portion of the Fund’s assets. The following lists the Subadvisors and their respective segment during the six months ended January 31, 2009.
| | |
| | | Fund Segment |
Hotchkis & Wiley Capital Management LLC Eaton Vance Management* NFJ Investment Group L.P. | | Large-cap value stocks |
| |
LSV Asset Management Thornburg Investment Management, Inc. | | International stocks |
| |
Marsico Capital Management, LLC Massachusetts Financial Services Company** | | Large-cap growth stocks |
| |
EARNEST Partners, LLC Vaughan Nelson Investment Management, LP | | Small-cap value stocks |
| |
| Pacific Investment Management Company LLC | | Core fixed income bonds |
| |
| RS Investment Management, L.P. | | Small-cap growth stocks |
| * | Effective December 13, 2008, Eaton Vance Management replaced J.P. Morgan Investment Management Inc. |
| ** | Effective December 13, 2008, Massachusetts Financial Services Company replaced Goldman Sachs Asset Management L.P |
The investment objective of the Fund is to provide capital appreciation and a reasonable level of current income. The Fund seeks to achieve its investment objective by investing in a diversified portfolio of equity and fixed income securities. The ability of the issuers of the debt securities held by the Fund to meet their obligations may be affected by economic developments in a specific industry or country.
Note 1. Accounting Policies
The following is a summary of significant accounting policies followed by the Trust in the preparation of its financial statements.
Securities Valuation: Securities listed on a securities exchange (other than options on securities and indices) are valued at the last sale price on such exchange on the day
| | |
| 56 | | Visit our website at www.prudential.com |
of valuation or, if there was no sale on such day, at the mean between the last reported bid and ask prices, or at the last bid price on such day in the absence of an asked price. Securities traded via Nasdaq are valued at the NASDAQ official closing price (NOCP) on the day of valuation, or if there was no NOCP, at the last sale price. Securities that are actively traded in the over-the-counter market, including listed securities for which the primary market is believed by Prudential Investments LLC (“PI” or “Manager”), in consultation with the Subadvisor(s); to be over-the-counter, are valued at market value using prices provided by an independent pricing agent or principal market maker. Options on securities and indices traded on an exchange are valued at the last sale price as of the close of trading on the applicable exchange or, if there was no sale, at the mean between the most recently quoted bid and asked prices on such exchange or at the last bid price in the absence of an asked price. Futures contracts and options thereon traded on a commodities exchange or board of trade are valued at the last sale price at the close of trading on such exchange or board of trade or, if there was no sale on the applicable commodities exchange or board of trade on such day, at the mean between the most recently quoted prices on such exchange or board of trade or at the last bid price in the absence of an asked price. Certain fixed income securities for which daily market quotations are not readily available may be valued with reference to fixed income securities whose prices are more readily available, pursuant to guidelines established by the Board of Trustees. Prices may be obtained from independent pricing services which use information provided by market makers or estimates of market values obtained from yield data relating to investments or securities with similar characteristics. Securities for which reliable market quotations are not readily available, or whose values have been affected by events occurring after the close of the security’s foreign market and before the Fund’s normal pricing time, are valued at fair value in accordance with Board of Trustees’ approved fair valuation procedures. When determining the fair valuation of securities, some of the factors influencing the valuation include the nature of any restrictions on disposition of the securities; assessment of the general liquidity of the securities; the issuer’s financial condition and the markets in which it does business; the cost of the investment; the size of the holding and the capitalization of issuer; the prices of any recent transactions or bids/offers for such securities or any comparable securities; any available analyst media or other reports or information deemed reliable by the investment adviser regarding the issuer or the markets or industry in which it operates. Using fair value to price securities may result in a value that is different from a security’s most recent closing price and from the price used by other mutual funds to calculate their net asset value.
Investments in mutual funds are valued at their net asset value as of the close of the New York Stock Exchange on the date of valuation.
| | |
| Target Asset Allocation Funds/Target Moderate Allocation Fund | | 57 |
Notes to Financial Statements
(Unaudited) continued
Short-term debt securities, which mature in sixty days or less, are valued at amortized cost, which approximates market value. The amortized cost method involves valuing a security at its cost on the date of purchase and thereafter assuming a constant amortization to maturity of the difference between the principal amount due at maturity and cost. Short-term debt securities, which mature in more than sixty days are valued at current market quotation.
Foreign Currency Translation: The books and records of the Fund are maintained in U.S. dollars. Foreign currency amounts are translated into U.S. dollars on the following basis:
(i) market value of investment securities, other assets and liabilities-at the current daily rates of exchange;
(ii) purchases and sales of investment securities, income and expenses-at the rates of exchange prevailing on the respective dates of such transactions.
Although the net assets of the Fund are presented at the foreign exchange rates and market values at the close of the period, the Fund does not isolate that portion of the results of operations arising as a result of changes in the foreign exchange rates from the fluctuations arising from changes in the market prices of securities held at the end of the period. Similarly, the Fund does not isolate the effect of changes in foreign exchange rates from the fluctuations arising from changes in the market prices of portfolio securities sold during the period. Accordingly, realized foreign currency gains or losses are included in the reported net realized gains or losses on investment transactions.
Net realized gains or losses on foreign currency transactions represent net foreign exchange gains or losses from the holdings of foreign currencies, currency gains or losses realized between the trade and settlement dates on security transactions, and the difference between the amounts of dividends, interest and foreign withholding taxes recorded on the Fund’s books and the U.S. dollar equivalent amounts actually received or paid. Net unrealized currency gains or losses from valuing foreign currency denominated assets and liabilities (other than investments) at period end exchange rates are reflected as a component of net unrealized appreciation (depreciation) on foreign currencies. Foreign security and currency transactions may involve certain considerations and risks not typically associated with those of domestic origin as a result of, among other factors, the possibility of political and economic instability and the level of governmental supervision and regulation of foreign securities markets.
| | |
| 58 | | Visit our website at www.prudential.com |
Financial Futures Contracts: A financial futures contract is an agreement to purchase (long) or sell (short) an agreed amount of securities at a set price for delivery on a future date. Upon entering into a financial futures contract, the Fund is required to pledge to the broker an amount of cash and/or other assets equal to a certain percentage of the contract amount. This amount is known as the “initial margin.” Subsequent payments known as “variation margin,” are made or received by the Fund each day, depending on the daily fluctuations in the value of the underlying security. Such variation margin is recorded for financial statement purposes on a daily basis as unrealized gain or loss. When the contract expires or is closed, the gain or loss is realized and is presented in the Statement of Operations as net realized gain or loss on financial futures contracts.
The Fund invests in financial futures contracts in order to hedge its existing portfolio securities, or securities the Fund intends to purchase, against fluctuations in value caused by changes in prevailing interest rates or market conditions. Should interest rates move unexpectedly, the Fund may not achieve the anticipated benefits of the financial futures contracts and may realize a loss. The use of futures transactions involves the risk of imperfect correlation in movements in the price of futures contracts, interest rates and the underlying hedged assets.
Forward Currency Contracts: A forward currency contract is a commitment to purchase or sell a foreign currency at a future date at a negotiated forward rate. The Fund may enter into forward currency contracts in order to hedge its exposure to changes in foreign currency exchange rates on its foreign portfolio holdings or on specific receivables and payables denominated in a foreign currency. The contracts are valued daily at current exchange rates and any unrealized gain or loss is included in the Statement of Assets and Liabilities as unrealized appreciation and/or depreciation on forward foreign currency contracts. Gain or loss is realized on the settlement date of the contract equal to the difference between the settlement value of the original and renegotiated forward contracts. This gain or loss, if any, is included in net realized gain or loss on foreign currency transactions. Risks may arise upon entering into these contracts from the potential inability of the counterparties to meet the terms of their contracts.
Options: The Fund may either purchase or write options in order to hedge against adverse market movements or fluctuations in value caused by changes in prevailing interest rates or foreign currency exchange rates with respect to securities or currencies, which the Fund currently owns or intends to purchase. The Fund’s principal reason for writing options is to realize, through receipt of premiums, a greater current return than would be realized on the underlying security alone. When the Fund purchases an option, it pays a premium and an amount equal to that
| | |
| Target Asset Allocation Funds/Target Moderate Allocation Fund | | 59 |
Notes to Financial Statements
(Unaudited) continued
premium is recorded as an asset. When the Fund writes an option, it receives a premium and an amount equal to that premium is recorded as a liability. The asset or liability is adjusted daily to reflect the current market value of the option.
If an option expires unexercised, the Fund realizes a gain or loss to the extent of the premium received or paid. If an option is exercised, the premium received or paid is recorded as an adjustment to the proceeds from the sale or the cost basis of the purchase in determining whether the Fund has realized a gain or loss. The difference between the premium and the amount received or paid on effecting a closing purchase or sale transaction is also treated as a realized gain or loss. Gain or loss on purchased options is included in net realized gain or loss on investment transactions. Gain or loss on written options is presented separately as net realized gain or loss on options written.
The Fund, as writer of an option, has no control over whether the underlying securities may be sold (called) or purchased (put). As a result, the Fund bears the market risk of an unfavorable change in the price of the security or currency underlying the written option. The Fund, as purchaser of an OTC option, bears the risk of the potential inability of the counterparties to meet the terms of their contracts.
When a Fund writes an option on a swap contract, an amount equal to any premium received by the Fund is recorded as a liability and is subsequently adjusted to the current market value of the written option on the swap. If a call option on a swap is exercised, the Fund becomes obligated to pay a fixed interest rate (noted as the strike price) and receive a variable interest rate on a notional amount. If a put option on a swap is exercised, the Fund becomes obligated to pay a variable interest rate and receive a fixed interest rate (noted as the strike price) on a notional amount. Premiums received from writing options on swaps that expire or are exercised are treated as realized gains upon the expiration or exercise of such options on swaps. The risk associated with writing put and call options on swaps is that the Fund will be obligated to be party to a swap agreement if an option on a swap is exercised.
Short Sales: The Fund may make short sales of securities as a method of hedging potential price declines in similar securities owned. The Fund may sell a security it does not own in anticipation of a decline in the market value of that security (short sale). When the Fund makes a short sale, it will borrow the security sold short and deliver it to the broker-dealer through which it made the short sale as collateral for its
| | |
| 60 | | Visit our website at www.prudential.com |
obligation to deliver the security upon conclusion of the sale. The Fund may have to pay a fee to borrow the particular securities and may be obligated to return any interest or dividends received on such borrowed securities. A gain, limited to the price at which the Fund sold the security short, or a loss, unlimited as to dollar amount, will be recognized upon the termination of a short sale if the market price is less or greater than the proceeds originally received, respectively, and is presented in the Statement of Operations as net realized gain or loss on short sales.
Swap Agreements: The Fund may enter into credit default, interest rate, total return and other forms of swap agreements. A swap agreement is an agreement to exchange the return generated by one instrument for the return generated by another instrument. In connection with these agreements, securities may be identified as collateral or received as collateral from the counterparty in accordance with the terms of the respective swap agreements to provide or receive assets of value and serve as recourse in the event of default or bankruptcy/insolvency of either party.
Interest rate swaps represent an agreement between counterparties to exchange cash flows based on the difference between two interest rates, applied to a notional principal amount for a specified period.
Credit default swaps involve one party (the protection buyer) making a stream of payments to another party (the protection seller) in exchange for the right to receive a specified payment in the event of a default or as a result of a default (“credit event”) for the referenced party, typically corporate issues or sovereign issues of an emerging country, on its obligation; or in the event of a write-down, principal shortfall, interest shortfall or default of all or part of the referenced entities comprising a credit index.
The Fund may use credit default swaps to provide a measure of protection against defaults of the issuers or to take an active long or short position with respect to the likelihood of a particular issuer’s default. The Fund may use credit default swaps on credit indices to hedge a portfolio of credit default swaps or bonds, which is less expensive than it would be to buy many credit default swaps to achieve a similar effect.
As a seller of protection on credit default swap agreements, the Fund will generally receive from the buyer of protection an agreed upon payment throughout the term of the swap provided that there is no credit event. As the seller, the Fund would effectively increase investment risk to its portfolio because, in addition to its total net assets, the Fund may be subject to investment exposure on the notional amount of the swap.
The maximum amount of the payments that the Fund as a seller of protection could be required to pay under a credit default swap agreement would be equal the notional amount of the underlying security or index contract as a result of a credit
| | |
| Target Asset Allocation Funds/Target Moderate Allocation Fund | | 61 |
Notes to Financial Statements
(Unaudited) continued
event. These potential amounts will be partially offset by any recovery values of the respective referenced obligations, or net amounts received from the settlement of buy protection credit default swap agreements entered into by the Fund for the same referenced entity or index. As a buyer of protection, the Fund generally receives an amount up to the notional value of the swap if a credit event occurs.
Implied credit spreads, represented in absolute terms, utilized in determining the fair value of credit default swap agreements on corporate issues or sovereign issues of an emerging country as of reporting date are disclosed in the footnotes to the Portfolio of Investments and serve as an indicator of the current status of the payment/performance risk and represent the likelihood of risk of default for the credit derivative. The implied credit spread of a particular referenced entity reflects the cost of buying/selling protection and may include upfront payments required to enter into the agreement. For credit default swap agreements on asset-backed securities and credit indices, the fair values serve as the indicator of the current status of the payment/performance risk. Wider credits spreads and increasing fair value in absolute terms, when compared to the notional amount of the swap, represent a deterioration of the referenced entity’s credit soundness and a greater likelihood of risk of default or other credit event occurring as defined under the terms of the agreement.
The Fund may enter into total return swaps to manage their exposure to a security, commodity or an index. In a total return swap, one party would receive payments based on the market value of the security or the commodity involved, or total return of a specific referenced asset, such as an equity, index or bond, and in return pay a fixed amount.
These swap agreements involve, to varying degrees, elements of credit, market risk and documentation risk. Such risks involve the possibility that there will be no liquid market for these agreements, that the counterparty to the agreement may default on its obligation to perform or disagree as to the meaning of the contractual terms in the agreement, and that there will be unfavorable changes in net interest rates. The swaps are valued daily at current fair value and any change in value is included in the net unrealized appreciation or depreciation on investments. Payments received or paid by the Fund are recorded as realized gains or losses upon termination or maturity of the swap. Risk of loss may exceed amounts recognized on the statement of assets and liabilities. Swap agreements outstanding at reporting date, if any, are listed on the Portfolio of Investments.
| | |
| 62 | | Visit our website at www.prudential.com |
The Fund has entered into over-the-counter derivative agreements. Such agreements include conditions which when materialized, give the counterparty the right to cause an early termination of the transactions under those agreements. Any election by the counterparty for early termination the contract(s) may impact the amounts reported on financial statements. As of January 31, 2009 , the Fund has not met conditions under such agreements, which give the counterparty the right to call for an early termination.
When-Issued/Delayed Delivery Securities: Securities purchased or sold on a when issued or delayed-delivery basis may be settled a month or more after trade date; interest income is not accrued until settlement date. At the time a fund enters into such transactions, it instructs the custodian to segregate assets with a current value at least equal to the amount of its when-issued or delayed-delivery purchase commitments.
Securities Transactions and Net Investment Income: Securities transactions are recorded on the trade date. Realized gains or losses on sales of securities are calculated on the identified cost basis. Dividend income is recorded on the ex-dividend date and interest income, including amortization of premium and accretion of discount, on debt securities as required, is recorded on the accrual basis. Expenses are recorded on accrual basis.
Net investment income or loss (other than distribution fees, which are charged directly to respective class), unrealized and realized gains or losses, are allocated daily to each class of shares based upon the relative proportion of net assets of each class at the beginning of the day.
Dividends and Distributions: Dividends from net investment income are declared and paid semi-annually. Distributions of net realized capital and currency gains, if any, annually.
Dividends and distributions to shareholders which are determined in accordance with federal income tax regulations and which may differ from generally accepted accounting principles, are recorded on the ex-dividend date. Permanent book/tax differences relating to income and gains are reclassified amongst undistributed net investment income, accumulated net realized gain or loss and paid-in capital in excess of par, as appropriate.
Taxes: It is the Fund’s intention to continue to meet the requirements of the Internal Revenue Code applicable to regulated investment companies and to distribute all of its taxable net investment income and capital gains, if any, to its shareholders. Therefore, no federal income tax provision is required.
| | |
| Target Asset Allocation Funds/Target Moderate Allocation Fund | | 63 |
Notes to Financial Statements
(Unaudited) continued
Withholding taxes on foreign dividends are recorded net of reclaimable amounts, at the time the related income is earned.
Estimates: The preparation of the financial statements requires management to make estimates and assumptions that affect the reported amounts and disclosures in the financial statements. Actual results could differ from those estimates.
Note 2. Agreements
The Trust has a management agreement with PI. Pursuant to this agreement, PI manages the investment operations of the Fund, administers the Fund’s affairs and supervises the Subadvisors’ performance of all investment advisory services. Pursuant to the advisory agreements, PI pays the cost of compensation of officers of the Fund, occupancy and certain clerical and accounting costs of the Fund. The Fund bears all other costs and expenses.
The management fee paid to PI is computed daily and payable monthly at an annual rate of .75 of 1% of the average daily net assets up to $500 million, .70 of 1% of average daily net assets for the next $500 million and .65 of 1% of average daily net assets in excess of $1 billion. The effective management fee rate was .75 of 1% for the six months ended January 31, 2009.
The Fund has a distribution agreement with Prudential Investment Management Services LLC (“PIMS”), which acts as the distributor of the Class A, B, C, M, R, X and Z shares of the Fund. The Fund compensates PIMS for distributing and servicing the Fund’s Class A, B, C, M, R and X shares, pursuant to plans of distribution (the “Distribution Plans”), regardless of expenses actually incurred by PIMS. The distribution fees are accrued daily and payable monthly. No distribution or service fees are paid to PIMS as distributor for Class Z shares of the Fund.
Pursuant to the Distribution Plans, the Fund compensates PIMS for distribution related activities at an annual rate of up to .30 of 1%, 1%, 1%, 1%, .75% of 1% and 1% of the average daily net assets of the Class A, B, C, M, R and X shares, respectively. Such expenses under the Plans were .25 of 1%, 1%, 1%, 1%, .50 of 1% and 1% of the average daily net assets of the Class A, B, C, M, R and X shares, respectively, for the six months ended January 31, 2009.
PIMS has advised the Fund that it has received approximately $67,700 in front-end sales charges resulting from sales of Class A shares during the six months ended
| | |
| 64 | | Visit our website at www.prudential.com |
January 31, 2009. From these fees, PIMS paid such sales charges to broker-dealers, which in turn paid commissions to salespersons and incurred other distribution costs. PIMS has advised the Fund that for the six months ended January 31, 2009, it has received approximately, $72,600, $2,800, $1,600 and $900 in contingent deferred sales charges imposed upon certain redemptions by Class B, Class C, Class M and Class X shareholders, respectively.
PIMS and PI are indirect, wholly-owned subsidiaries of Prudential Financial, Inc. (“Prudential”).
Note 3. Other Transactions with Affiliates
Prudential Mutual Fund Services LLC (“PMFS”), an affiliate of PI, and an indirect, wholly-owned subsidiary of Prudential, serves as the Fund’s transfer agent. Transfer agent fees and expenses in the Statement of Operations include certain out-of-pocket expenses paid to non-affiliates, where applicable.
The Fund pays networking fees to affiliated and unaffiliated broker/dealers, including fees related to the services of First Clearing, LLC (“First Clearing”) and Wachovia Securities, LLC (“Wachovia”), affiliates of PI. These networking fees are payments made to broker/dealers that clear mutual fund transactions through a national clearing system. For the six months ended January 31, 2009, the Fund incurred approximately $63,900 in total networking fees, of which $42,600 and $300 was paid to First Clearing and Wachovia, respectively. These amounts are included in transfer agent’s fees and expenses in the Statement of Operations.
The Fund invests in the Taxable Money Market Series (the “Series”), a portfolio of Dryden Core Investment Fund. The Series is a money market mutual fund registered under the Investment Company Act of 1940, as amended, and managed by PI. Earnings from the Series are disclosed on the Statement of Operations as affiliated dividends.
Note 4. Portfolio Securities
Purchases and sales of portfolio securities, excluding short-term investments and U.S. government securities, for the six months ended January 31, 2009, aggregated $435,113,130 and $472,830,453, respectively.
| | |
| Target Asset Allocation Funds/Target Moderate Allocation Fund | | 65 |
Notes to Financial Statements
(Unaudited) continued
Transactions in options written during the six months ended January 31, 2009 were as follows:
| | | | | | | |
| | | Number of
Contracts/
Swap Notional
Amount | | | Premiums
Received | |
Options outstanding at July 31, 2008 | | 43,700,000 | | | $ | 1,012,350 | |
Expired swap options | | (4,200,000 | ) | | | (16,820 | ) |
Closed swap options | | (33,400,000 | ) | | | (813,175 | ) |
| | | | | | | |
Options outstanding at January 31, 2009 | | 6,100,000 | | | $ | 182,355 | |
| | | | | | | |
Note 5. Tax Information
The United States federal income tax basis of the Fund’s investments and the net unrealized depreciation as of January 31, 2009 were as follows:
| | | | | | |
| Tax Basis | | Appreciation | | Depreciation | | Net
Unrealized
Depreciation |
| $366,157,202 | | $8,922,330 | | $(73,739,249) | | $(64,816,919) |
The difference between book basis and tax basis was primarily attributable to deferred losses on wash sales.
Management has analyzed the Fund’s tax positions taken on federal income tax returns for all open tax years and has concluded that as of January 31, 2009, no provisions for income tax would be required in the Fund’s financial statements. The Fund’s federal and state income and federal excise tax returns for tax years for which the applicable statuses of limitations have not expired are subject to examination by the Internal Revenue Service and state departments of revenue.
Note 6. Capital
The Fund offers Class A, Class B, Class C, Class M, Class R, Class X and Class Z shares. Class A shares are subject to a maximum front-end sales charge of 5.50%. Investors who purchase $1 million or more of Class A shares and sell these shares within 12 months of purchase are not subject to an initial sales charge but are subject
| | |
| 66 | | Visit our website at www.prudential.com |
to a contingent deferred sales charge (CDSC) of 1%, including investors who purchase their shares through broker-dealers affiliated with Prudential. Class B shares are subject to a CDSC of 5%, which decreases by 1% annually to 1% in the fifth and sixth years and 0% in the seventh year. Class B shares automatically convert to Class A shares on a quarterly basis approximately seven years after purchase. The CDSC for Class C shares is 1% for shares redeemed within 12 months of purchase. Class M shares are generally closed to new purchases. Class M shares are subject to a CDSC of 6%, which decreases by 1% annually to 2% in the fifth and sixth years and 1% in the seventh year. Class M shares automatically convert to Class A shares approximately eight years after purchase. Class X shares are generally closed to new purchases. Class X shares are subject to a CDSC of 6%, which decreases by 1% annually to 4% in the third and fourth years, by 1% annually to 2% in the sixth and seventh years, and 1% in the eighth year. Class X shares automatically convert to Class A shares on a quarterly basis approximately ten years after purchase. An exchange privilege is also available for shareholders who qualify to purchase Class A shares at net asset value. Class R and Class Z shares are not subject to any sales or redemption charge and are offered exclusively for sale to a limited group of investors. As of January 31, 2009, Prudential owns 226 shares of Class R.
The Fund has authorized an unlimited number of shares of beneficial interest at $.001 par value per share.
Transactions in shares of beneficial interest were as follows:
| | | | | | | |
Class A | | Shares | | | Amount | |
Six months ended January 31, 2009: | | | | | | | |
Shares sold | | 1,132,149 | | | $ | 10,150,454 | |
Shares issued in reinvestment of dividends and distributions | | 427,654 | | | | 3,511,041 | |
Shares reacquired | | (2,008,972 | ) | | | (18,216,329 | ) |
| | | | | | | |
Net increase (decrease) in shares outstanding before conversion | | (449,169 | ) | | | (4,554,834 | ) |
Shares issued upon conversion from Class B, Class M, and Class X | | 761,421 | | | | 6,986,928 | |
| | | | | | | |
Net increase (decrease) in shares outstanding | | 312,252 | | | $ | 2,432,094 | |
| | | | | | | |
Year ended July 31, 2008: | | | | | | | |
Shares sold | | 1,984,280 | | | $ | 23,562,433 | |
Shares issued in reinvestment of dividends and distributions | | 1,379,683 | | | | 16,213,155 | |
Shares reacquired | | (3,140,460 | ) | | | (37,265,309 | ) |
| | | | | | | |
Net increase (decrease) in shares outstanding before conversion | | 223,503 | | | | 2,510,279 | |
Shares issued upon conversion from Class B and Class M | | 1,959,277 | | | | 23,531,858 | |
| | | | | | | |
Net increase (decrease) in shares outstanding | | 2,182,780 | | | $ | 26,042,137 | |
| | | | | | | |
| | |
| Target Asset Allocation Funds/Target Moderate Allocation Fund | | 67 |
Notes to Financial Statements
(Unaudited) continued
| | | | | | | |
Class B | | Shares | | | Amount | |
Six months ended January 31, 2009: | | | | | | | |
Shares sold | | 201,184 | | | $ | 1,791,913 | |
Shares issued in reinvestment of dividends and distributions | | 170,926 | | | | 1,403,305 | |
Shares reacquired | | (1,143,708 | ) | | | (10,201,199 | ) |
| | | | | | | |
Net increase (decrease) in shares outstanding before conversion | | (771,598 | ) | | | (7,005,981 | ) |
Shares reaquired upon conversion into class A | | (687,159 | ) | | | (6,294,763 | ) |
| | | | | | | |
Net increase (decrease) in shares outstanding | | (1,458,757 | ) | | $ | (13,300,744 | ) |
| | | | | | | |
Year ended July 31, 2008: | | | | | | | |
Shares sold | | 612,982 | | | $ | 7,337,016 | |
Shares issued in reinvestment of dividends and distributions | | 1,047,838 | | | | 12,313,985 | |
Shares reacquired | | (1,825,950 | ) | | | (21,508,559 | ) |
| | | | | | | |
Net increase (decrease) in shares outstanding before conversion | | (165,130 | ) | | | (1,857,558 | ) |
Shares reaquired upon conversion into Class A | | (1,780,744 | ) | | | (21,270,836 | ) |
| | | | | | | |
Net increase (decrease) in shares outstanding | | (1,945,874 | ) | | $ | (23,128,394 | ) |
| | | | | | | |
Class C | | | | | | |
Six months ended January 31, 2009: | | | | | | | |
Shares sold | | 269,282 | | | $ | 2,385,027 | |
Shares issued in reinvestment of dividends and distributions | | 153,692 | | | | 1,261,813 | |
Shares reacquired | | (1,322,689 | ) | | | (11,768,928 | ) |
| | | | | | | |
Net increase (decrease) in shares outstanding | | (899,715 | ) | | $ | (8,122,088 | ) |
| | | | | | | |
Year ended July 31, 2008: | | | | | | | |
Shares sold | | 805,916 | | | $ | 9,589,938 | |
Shares issued in reinvestment of dividends and distributions | | 824,222 | | | | 9,680,568 | |
Shares reacquired | | (2,273,678 | ) | | | (26,767,725 | ) |
| | | | | | | |
Net increase (decrease) in shares outstanding | | (643,540 | ) | | $ | (7,497,219 | ) |
| | | | | | | |
Class M | | | | | | |
Six months ended January 31, 2009: | | | | | | | |
Shares sold | | 8,239 | | | $ | 69,805 | |
Shares issued in reinvestment of dividends and distributions | | 6,736 | | | | 55,234 | |
Shares reacquired | | (85,040 | ) | | | (785,431 | ) |
| | | | | | | |
Net increase (decrease) in shares outstanding before conversion | | (70,065 | ) | | | (660,392 | ) |
Shares reaquired upon conversion into Class A | | (60,484 | ) | | | (505,727 | ) |
| | | | | | | |
Net increase (decrease) in shares outstanding | | (130,549 | ) | | $ | (1,166,119 | ) |
| | | | | | | |
Year ended July 31, 2008: | | | | | | | |
Shares sold | | 90,317 | | | $ | 1,085,792 | |
Shares issued in reinvestment of dividends and distributions | | 51,885 | | | | 608,691 | |
Shares reacquired | | (159,851 | ) | | | (1,929,212 | ) |
| | | | | | | |
Net increase (decrease) in shares outstanding before conversion | | (17,649 | ) | | | (234,729 | ) |
Shares reaquired upon conversion into Class A | | (193,181 | ) | | | (2,261,022 | ) |
| | | | | | | |
Net increase (decrease) in shares outstanding | | (210,830 | ) | | $ | (2,495,751 | ) |
| | | | | | | |
| | |
| 68 | | Visit our website at www.prudential.com |
| | | | | | | |
Class R | | Shares | | | Amount | |
Six months ended January 31, 2009: | | | | | | | |
Shares sold | | 16,044 | | | $ | 150,186 | |
Shares issued in reinvestment of dividends and distributions | | 3,798 | | | | 31,180 | |
Shares reacquired | | (108,560 | ) | | | (949,452 | ) |
| | | | | | | |
Net increase (decrease) in shares outstanding | | (88,718 | ) | | $ | (768,086 | ) |
| | | | | | | |
Year ended July 31, 2008: | | | | | | | |
Shares sold | | 33,467 | | | $ | 385,045 | |
Shares issued in reinvestment of dividends and distributions | | 29,025 | | | | 343,197 | |
Shares reacquired | | (193,847 | ) | | | (2,232,564 | ) |
| | | | | | | |
Net increase (decrease) in shares outstanding | | (131,355 | ) | | $ | (1,504,322 | ) |
| | | | | | | |
Class X | | | | | | |
Six months ended January 31, 2009: | | | | | | | |
Shares sold | | 4,123 | | | $ | 34,846 | |
Shares issued in reinvestment of dividends and distributions | | 7,459 | | | | 61,240 | |
Shares reacquired | | (59,754 | ) | | | (483,114 | ) |
| | | | | | | |
Net increase (decrease) in shares outstanding | | (48,172 | ) | | | (387,028 | ) |
Shares reaquired upon conversion into Class A | | (19,699 | ) | | | (186,438 | ) |
| | | | | | | |
Net increase (decrease) in shares outstanding | | (67,871 | ) | | $ | (573,466 | ) |
| | | | | | | |
Year ended July 31, 2008: | | | | | | | |
Shares sold | | 9,412 | | | $ | 115,480 | |
Shares issued in reinvestment of dividends and distributions | | 41,915 | | | | 492,089 | |
Shares reacquired | | (90,642 | ) | | | (1,061,716 | ) |
| | | | | | | |
Net increase (decrease) in shares outstanding before conversion | | (39,315 | ) | | $ | (454,147 | ) |
| | | | | | | |
Class Z | | | | | | |
Six months ended January 31, 2009: | | | | | | | |
Shares sold | | 84,199 | | | $ | 780,344 | |
Shares issued in reinvestment of dividends and distributions | | 30,339 | | | | 249,392 | |
Shares reacquired | | (330,237 | ) | | | (3,017,022 | ) |
| | | | | | | |
Net increase (decrease) in shares outstanding | | (215,699 | ) | | $ | (1,987,286 | ) |
| | | | | | | |
Year ended July 31, 2008: | | | | | | | |
Shares sold | | 266,010 | | | $ | 3,185,932 | |
Shares issued in reinvestment of dividends and distributions | | 111,577 | | | | 1,311,736 | |
Shares reacquired | | (282,141 | ) | | | (3,422,164 | ) |
| | | | | | | |
Net increase (decrease) in shares outstanding | | 95,446 | | | $ | 1,075,504 | |
| | | | | | | |
Note 7. Borrowings
The Trust, along with other affiliated registered investment companies (the “Companies”), are a party to a Syndicated Credit Agreement (“SCA”) with two banks. The SCA provides for a commitment of $500 million. Interest on any borrowings
| | |
| Target Asset Allocation Funds/Target Moderate Allocation Fund | | 69 |
Notes to Financial Statements
(Unaudited) continued
under the SCA would be incurred at market rates and a commitment fee for the unused amount is accrued daily and paid quarterly. Effective October 24, 2008, the Companies renewed the SCA with the banks. The commitment under the renewed SCA continues to be $500 million. The Companies pay a commitment fee of .13 of 1% of the unused portion of the renewed SCA. The expiration date of the renewed SCA will be October 23, 2009. For the period from October 26, 2007 through October 23, 2008, the Companies paid a commitment fee of .06 of 1% of the unused portion of the agreement. The purpose of the SCA is to provide an alternative source of temporary funding for capital share redemptions.
The Fund did not borrow any amounts pursuant to the SCA during the six months ended January 31, 2009.
Note 8. New Accounting Pronouncements
In March 2008, Financial Accounting Standards Board (“FASB”) released “Statement of Financial Accounting Standards No. 161, Disclosures about Derivative Instruments and Hedging Activities” (“FAS 161”). FAS 161 requires qualitative disclosures about objectives and strategies for using derivatives, quantitative disclosures about fair value amounts of and gains and losses on derivative instruments, and disclosures about credit-risk-related contingent features in derivative agreements. The application of FAS 161 is required for any reporting period beginning after November 15, 2008. At this time, management is evaluating the implications of FAS 161 and its impact on the financial statements has not yet been determined.
| | |
| 70 | | Visit our website at www.prudential.com |
Financial Highlights
(Unaudited)
| | |
| JANUARY 31, 2009 | | SEMIANNUAL REPORT |
Target Asset Allocation Funds/
Target Moderate Allocation Fund
Financial Highlights
(Unaudited)
| | | | |
| | | Class A | |
| | | Six Months Ended
January 31, 2009(b) | |
Per Share Operating Performance: | | | | |
Net Asset Value, Beginning Of Period | | $ | 10.72 | |
| | | | |
Income (loss) from investment operations: | | | | |
Net investment income | | | .10 | |
Net realized and unrealized gain (loss) on investments | | | (2.82 | ) |
| | | | |
Total from investment operations | | | (2.72 | ) |
| | | | |
Less Dividends and Distributions: | | | | |
Dividends from net investment income | | | (.14 | ) |
Distributions from net realized gains | | | (.10 | ) |
| | | | |
Total dividends and distributions | | | (.24 | ) |
| | | | |
Net asset value, end of period | | $ | 7.76 | |
| | | | |
Total Return(a) | | | (25.49 | )% |
Ratios/Supplemental Data: | | | | |
Net assets, end of period (000) | | $ | 119,862 | |
Average net assets (000) | | $ | 136,537 | |
Ratios to average net assets(d): | | | | |
Expenses, including distribution and service (12b-1) fees(c) | | | 1.43 | %(e) |
Expenses, excluding distribution and service (12b-1) fees | | | 1.18 | %(e) |
Net investment income | | | 2.12 | %(e) |
Portfolio turnover rate | | | 140 | %(f) |
| (a) | Total return does not consider the effects of sales loads. Total return is calculated assuming a purchase of a share on the first day and a sale on the last day of each period reported, and includes reinvestment of dividends and distributions. Total returns may reflect adjustments to conform to generally accepted accounting principles. Total returns for periods less than one full year are not annualized. |
| (b) | Calculated based upon average shares outstanding during the period. |
| (c) | The distributor of the Fund has contractually agreed to limit its distribution and service (12b-1) fees to .25 of 1% of the average daily net assets of the Class A shares. |
| (d) | Does not include expenses of the underlying portfolios in which the Fund invests. |
See Notes to Financial Statements.
| | |
| 72 | | Visit our website at www.prudential.com |
| | | | | | | | | | | | | | | | | | |
| Class A | |
| Year Ended July 31, | |
| 2008(b) | | | 2007(b) | | | 2006(b) | | | 2005(b) | | | 2004 | |
| | | | | | | | | | | | | | | | | | |
| $ | 12.75 | | | $ | 11.92 | | | $ | 12.56 | | | $ | 10.96 | | | $ | 9.89 | |
| | | | | | | | | | | | | | | | | | | |
| | | | | | | | | | | | | | | | | | |
| | .25 | | | | .22 | | | | .20 | | | | .14 | | | | .12 | |
| | (1.05 | ) | | | 1.31 | | | | .45 | | | | 1.61 | | | | 1.09 | |
| | | | | | | | | | | | | | | | | | | |
| | (.80 | ) | | | 1.53 | | | | .65 | | | | 1.75 | | | | 1.21 | |
| | | | | | | | | | | | | | | | | | | |
| | | | | | | | | | | | | | | | | | |
| | (.24 | ) | | | (.22 | ) | | | (.22 | ) | | | (.15 | ) | | | (.14 | ) |
| | (.99 | ) | | | (.48 | ) | | | (1.07 | ) | | | — | | | | — | |
| | | | | | | | | | | | | | | | | | | |
| | (1.23 | ) | | | (.70 | ) | | | (1.29 | ) | | | (.15 | ) | | | (.14 | ) |
| | | | | | | | | | | | | | | | | | | |
| $ | 10.72 | | | $ | 12.75 | | | $ | 11.92 | | | $ | 12.56 | | | $ | 10.96 | |
| | | | | | | | | | | | | | | | | | | |
| | (7.02 | )% | | | 13.03 | % | | | 5.53 | % | | | 16.01 | % | | | 12.27 | % |
| | | | | | | | | | | | | | | | | | |
| $ | 162,212 | | | $ | 165,073 | | | $ | 135,384 | | | $ | 103,989 | | | $ | 79,172 | |
| $ | 169,156 | | | $ | 154,791 | | | $ | 118,651 | | | $ | 91,030 | | | $ | 72,043 | |
| | | | | | | | | | | | | | | | | | |
| | 1.39 | % | | | 1.18 | % | | | 1.33 | % | | | 1.32 | % | | | 1.35 | % |
| | 1.14 | % | | | .93 | % | | | 1.08 | % | | | 1.07 | % | | | 1.10 | % |
| | 2.05 | % | | | 1.72 | % | | | 1.67 | % | | | 1.17 | % | | | 1.15 | % |
| | 213 | % | | | 195 | % | | | 324 | % | | | 285 | % | | | 100 | % |
See Notes to Financial Statements.
| | |
| Target Asset Allocation Funds/Target Moderate Allocation Fund | | 73 |
Financial Highlights
(Unaudited) continued
| | | | |
| | | Class B | |
| | | Six Months Ended
January 31, 2009(b) | |
Per Share Operating Performance: | | | | |
Net Asset Value, Beginning Of Period | | $ | 10.66 | |
| | | | |
Income (loss) from investment operations: | | | | |
Net investment income | | | .06 | |
Net realized and unrealized gain (loss) on investments | | | (2.79 | ) |
| | | | |
Total from investment operations | | | (2.73 | ) |
| | | | |
Less Dividends and Distributions: | | | | |
Dividends from net investment income | | | (.07 | ) |
Distributions from net realized gains | | | (.10 | ) |
| | | | |
Total dividends and distributions | | | (.17 | ) |
| | | | |
Net asset value, end of period | | $ | 7.76 | |
| | | | |
Total Return(a) | | | (25.74 | )% |
Ratios/Supplemental Data: | | | | |
Net assets, end of period (000) | | $ | 69,318 | |
Average net assets (000) | | $ | 86,945 | |
Ratios to average net assets(c): | | | | |
Expenses, including distribution and service (12b-1) fees | | | 2.18 | %(d) |
Expenses, excluding distribution and service (12b-1) fees | | | 1.18 | %(d) |
Net investment income | | | 1.36 | %(d) |
| (a) | Total return does not consider the effects of sales loads. Total return is calculated assuming a purchase of a share on the first day and a sale on the last day of each period reported, and includes reinvestment of dividends and distributions. Total returns may reflect adjustments to conform to generally accepted accounting principles. Total returns for periods less than one full year are not annualized. |
| (b) | Calculated based upon average shares outstanding during the period. |
| (c) | Does not include expenses of the underlying portfolios in which the Fund invests. |
See Notes to Financial Statements.
| | |
| 74 | | Visit our website at www.prudential.com |
| | | | | | | | | | | | | | | | | | |
| Class B | |
| Year Ended July 31, | |
| 2008(b) | | | 2007(b) | | | 2006(b) | | | 2005(b) | | | 2004 | |
| | | | | | | | | | | | | | | | | | |
| $ | 12.70 | | | $ | 11.87 | | | $ | 12.52 | | | $ | 10.92 | | | $ | 9.86 | |
| | | | | | | | | | | | | | | | | | | |
| | | | | | | | | | | | | | | | | | |
| | .16 | | | | .12 | | | | .11 | | | | .05 | | | | .04 | |
| | (1.04 | ) | | | 1.32 | | | | .44 | | | | 1.61 | | | | 1.08 | |
| | | | | | | | | | | | | | | | | | | |
| | (.88 | ) | | | 1.44 | | | | .55 | | | | 1.66 | | | | 1.12 | |
| | | | | | | | | | | | | | | | | | | |
| | | | | | | | | | | | | | | | | | |
| | (.17 | ) | | | (.13 | ) | | | (.13 | ) | | | (.06 | ) | | | (.06 | ) |
| | (.99 | ) | | | (.48 | ) | | | (1.07 | ) | | | — | | | | — | |
| | | | | | | | | | | | | | | | | | | |
| | (1.16 | ) | | | (.61 | ) | | | (1.20 | ) | | | (.06 | ) | | | (.06 | ) |
| | | | | | | | | | | | | | | | | | | |
| $ | 10.66 | | | $ | 12.70 | | | $ | 11.87 | | | $ | 12.52 | | | $ | 10.92 | |
| | | | | | | | | | | | | | | | | | | |
| | (7.72 | )% | | | 12.27 | % | | | 4.65 | % | | | 15.24 | % | | | 11.37 | % |
| | | | | | | | | | | | | | | | | | |
| $ | 110,784 | | | $ | 156,676 | | | $ | 171,286 | | | $ | 193,795 | | | $ | 170,863 | |
| $ | 139,512 | | | $ | 167,764 | | | $ | 187,321 | | | $ | 184,197 | | | $ | 157,550 | |
| | | | | | | | | | | | | | | | | | |
| | 2.14 | % | | | 1.93 | % | | | 2.08 | % | | | 2.07 | % | | | 2.10 | % |
| | 1.14 | % | | | .93 | % | | | 1.08 | % | | | 1.07 | % | | | 1.10 | % |
| | 1.30 | % | | | .97 | % | | | .92 | % | | | .41 | % | | | .41 | % |
See Notes to Financial Statements.
| | |
| Target Asset Allocation Funds/Target Moderate Allocation Fund | | 75 |
Financial Highlights
(Unaudited) continued
| | | | |
| | | Class C | |
| | | Six Months Ended
January 31, 2009(b) | |
Per Share Operating Performance: | | | | |
Net Asset Value, Beginning Of Period | | $ | 10.66 | |
| | | | |
Income (loss) from investment operations: | | | | |
Net investment income | | | .06 | |
Net realized and unrealized gain (loss) on investments | | | (2.79 | ) |
| | | | |
Total from investment operations | | | (2.73 | ) |
| | | | |
Less Dividends and Distributions: | | | | |
Dividends from net investment income | | | (.07 | ) |
Distributions from net realized gains | | | (.10 | ) |
| | | | |
Total dividends and distributions | | | (.17 | ) |
| | | | |
Net asset value, end of period | | $ | 7.76 | |
| | | | |
Total Return(a) | | | (25.74 | )% |
Ratios/Supplemental Data: | | | | |
Net assets, end of period (000) | | $ | 66,366 | |
Average net assets (000) | | $ | 81,030 | |
Ratios to average net assets(c): | | | | |
Expenses, including distribution and service (12b-1) fees | | | 2.18 | %(d) |
Expenses, excluding distribution and service (12b-1) fees | | | 1.18 | %(d) |
Net investment income | | | 1.36 | %(d) |
| (a) | Total return does not consider the effects of sales loads. Total return is calculated assuming a purchase of a share on the first day and a sale on the last day of each period reported, and includes reinvestment of dividends and distributions. Total returns may reflect adjustments to conform to generally accepted accounting principles. Total returns for periods less than one full year are not annualized. |
| (b) | Calculated based upon average shares outstanding during the period. |
| (c) | Does not include expenses of the underlying portfolios in which the Fund invests. |
See Notes to Financial Statements.
| | |
| 76 | | Visit our website at www.prudential.com |
| | | | | | | | | | | | | | | | | | |
| Class C | |
| Year Ended July 31, | |
| 2008(b) | | | 2007(b) | | | 2006(b) | | | 2005(b) | | | 2004 | |
| | | | | | | | | | | | | | | | | | |
| $ | 12.70 | | | $ | 11.87 | | | $ | 12.52 | | | $ | 10.92 | | | $ | 9.86 | |
| | | | | | | | | | | | | | | | | | | |
| | | | | | | | | | | | | | | | | | |
| | .16 | | | | .12 | | | | .11 | | | | .05 | | | | .04 | |
| | (1.04 | ) | | | 1.32 | | | | .44 | | | | 1.61 | | | | 1.08 | |
| | | | | | | | | | | | | | | | | | | |
| | (.88 | ) | | | 1.44 | | | | .55 | | | | 1.66 | | | | 1.12 | |
| | | | | | | | | | | | | | | | | | | |
| | | | | | | | | | | | | | | | | | |
| | (.17 | ) | | | (.13 | ) | | | (.13 | ) | | | (.06 | ) | | | (.06 | ) |
| | (.99 | ) | | | (.48 | ) | | | (1.07 | ) | | | — | | | | — | |
| | | | | | | | | | | | | | | | | | | |
| | (1.16 | ) | | | (.61 | ) | | | (1.20 | ) | | | (.06 | ) | | | (.06 | ) |
| | | | | | | | | | | | | | | | | | | |
| $ | 10.66 | | | $ | 12.70 | | | $ | 11.87 | | | $ | 12.52 | | | $ | 10.92 | |
| | | | | | | | | | | | | | | | | | | |
| | (7.72 | )% | | | 12.27 | % | | | 4.65 | % | | | 15.24 | % | | | 11.37 | % |
| | | | | | | | | | | | | | | | | | |
| $ | 100,797 | | | $ | 128,243 | | | $ | 123,378 | | | $ | 116,893 | | | $ | 100,712 | |
| $ | 119,437 | | | $ | 129,699 | | | $ | 121,100 | | | $ | 108,434 | | | $ | 94,252 | |
| | | | | | | | | | | | | | | | | | |
| | 2.14 | % | | | 1.93 | % | | | 2.08 | % | | | 2.07 | % | | | 2.10 | % |
| | 1.14 | % | | | .93 | % | | | 1.08 | % | | | 1.07 | % | | | 1.10 | % |
| | 1.30 | % | | | .97 | % | | | .92 | % | | | .41 | % | | | .41 | % |
See Notes to Financial Statements.
| | |
| Target Asset Allocation Funds/Target Moderate Allocation Fund | | 77 |
Financial Highlights
(Unaudited) continued
| | | | |
| |
| | | Class M | |
| | | Six Months Ended
January 31, 2009(c) | |
Per Share Operating Performance: | | | | |
Net Asset Value, Beginning Of Period | | $ | 10.64 | |
| | | | |
Income (loss) from investment operations: | | | | |
Net investment income | | | .06 | |
Net realized and unrealized gain (loss) on investments | | | (2.79 | ) |
| | | | |
Total from investment operations | | | (2.73 | ) |
| | | | |
Less Dividends and Distributions: | | | | |
Dividends from net investment income | | | (.07 | ) |
Distributions from net realized gains | | | (.10 | ) |
| | | | |
Total dividends and distributions | | | (.17 | ) |
| | | | |
Net asset value, end of period | | $ | 7.74 | |
| | | | |
Total Return(b) | | | (25.79 | )% |
Ratios/Supplemental Data: | | | | |
Net assets, end of period (000) | | $ | 2,416 | |
Average net assets (000) | | $ | 3,418 | |
Ratios to average net assets(d): | | | | |
Expenses, including distribution and service (12b-1) fees | | | 2.18 | %(e) |
Expenses, excluding distribution and service (12b-1) fees | | | 1.18 | %(e) |
Net investment income | | | 1.36 | %(e) |
| (a) | Commencement of offering new share class. |
| (b) | Total return does not consider the effects of sales loads. Total return is calculated assuming a purchase of a share on the first day and a sale on the last day of each period reported, and includes reinvestment of dividends and distributions. Total returns may reflect adjustments to conform to generally accepted accounting principles. Total returns for periods less than one full year are not annualized. |
| (c) | Calculated based upon average shares outstanding during the period. |
| (d) | Does not include expenses of the underlying portfolios in which the Fund invests. |
See Notes to Financial Statements.
| | |
| 78 | | Visit our website at www.prudential.com |
| | | | | | | | | | | | | | |
| Class M | |
| Year Ended July 31, | | | October 4, 2004(a) through July 31, 2005 | |
| 2008(c) | | | 2007(c) | | | 2006(c) | | |
| | | | | | | | | | | | | | |
| $ | 12.66 | | | $ | 11.85 | | | $ | 12.49 | | | $ | 11.34 | |
| | | | | | | | | | | | | | | |
| | | | | | | | | | | | | | |
| | .16 | | | | .12 | | | | .11 | | | | .09 | |
| | (1.02 | ) | | | 1.30 | | | | .45 | | | | 1.15 | |
| | | | | | | | | | | | | | | |
| | (.86 | ) | | | 1.42 | | | | .56 | | | | 1.24 | |
| | | | | | | | | | | | | | | |
| | | | | | | | | | | | | | |
| | (.17 | ) | | | (.13 | ) | | | (.13 | ) | | | (.09 | ) |
| | (.99 | ) | | | (.48 | ) | | | (1.07 | ) | | | — | |
| | | | | | | | | | | | | | | |
| | (1.16 | ) | | | (.61 | ) | | | (1.20 | ) | | | (.09 | ) |
| | | | | | | | | | | | | | | |
| $ | 10.64 | | | $ | 12.66 | | | $ | 11.85 | | | $ | 12.49 | |
| | | | | | | | | | | | | | | |
| | (7.58 | )% | | | 12.21 | % | | | 4.74 | % | | | 10.96 | % |
| | | | | | | | | | | | | | |
| $ | 4,709 | | | $ | 8,277 | | | $ | 6,272 | | | $ | 4,233 | |
| $ | 6,746 | | | $ | 8,529 | | | $ | 5,622 | | | $ | 2,203 | |
| | | | | | | | | | | | | | |
| | 2.14 | % | | | 1.93 | % | | | 2.08 | % | | | 2.07 | %(e) |
| | 1.14 | % | | | .93 | % | | | 1.08 | % | | | 1.07 | %(e) |
| | 1.29 | % | | | .96 | % | | | .93 | % | | | .54 | %(e) |
See Notes to Financial Statements.
| | |
| Target Asset Allocation Funds/Target Moderate Allocation Fund | | 79 |
Financial Highlights
(Unaudited) continued
| | | | |
| |
| | | Class R | |
| | | Six Months Ended
January 31, 2009(c) | |
Per Share Operating Performance: | | | | |
Net Asset Value, Beginning Of Period | | $ | 10.73 | |
| | | | |
Income (loss) from investment operations: | | | | |
Net investment income | | | .09 | |
Net realized and unrealized gain (loss) on investments | | | (2.81 | ) |
| | | | |
Total from investment operations | | | (2.72 | ) |
| | | | |
Less Dividends and Distributions: | | | | |
Dividends from net investment income | | | (.14 | ) |
Distributions from net realized gains | | | (.10 | ) |
| | | | |
Total dividends and distributions | | | (.24 | ) |
| | | | |
Net asset value, end of period | | $ | 7.77 | |
| | | | |
Total Return(b) | | | (25.50 | )% |
Ratios/Supplemental Data: | | | | |
Net assets, end of period (000) | | $ | 722 | |
Average net assets (000) | | $ | 1,374 | |
Ratios to average net assets(e): | | | | |
Expenses, including distribution and service (12b-1) fees(d) | | | 1.68 | %(f) |
Expenses, excluding distribution and service (12b-1) fees | | | 1.18 | %(f) |
Net investment income | | | 1.86 | %(f) |
| (a) | Commencement of offering new share class. |
| (b) | Total return is calculated assuming a purchase of a share on the first day and a sale on the last day of each period reported, and includes reinvestment of dividends and distributions. Total returns may reflect adjustments to conform to generally accepted accounting principles. Total returns for periods less than one full year are not annualized. |
| (c) | Calculated based upon average shares outstanding during the period. |
| (d) | The distributor of the Fund has contractually agreed to limit its distribution and service (12b-1) fees to .50 of 1% of the average daily net assets of the Class R shares. |
| (e) | Does not include expenses of the underlying portfolios in which the Fund invests. |
See Notes to Financial Statements.
| | |
| 80 | | Visit our website at www.prudential.com |
| | | | | | | | | | | | | | |
| Class R | |
| Year Ended July 31, | | | October 4, 2004(a) through July 31, 2005 | |
| 2008(c) | | | 2007(c) | | | 2006(c) | | |
| | | | | | | | | | | | | | |
| $ | 12.76 | | | $ | 11.93 | | | $ | 12.56 | | | $ | 11.40 | |
| | | | | | | | | | | | | | | |
| | | | | | | | | | | | | | |
| | .22 | | | | .18 | | | | .18 | | | | .10 | |
| | (1.05 | ) | | | 1.32 | | | | .46 | | | | 1.19 | |
| | | | | | | | | | | | | | | |
| | (.83 | ) | | | 1.50 | | | | .64 | | | | 1.29 | |
| | | | | | | | | | | | | | | |
| | | | | | | | | | | | | | |
| | (.21 | ) | | | (.19 | ) | | | (.20 | ) | | | (.13 | ) |
| | (.99 | ) | | | (.48 | ) | | | (1.07 | ) | | | — | |
| | | | | | | | | | | | | | | |
| | (1.20 | ) | | | (.67 | ) | | | (1.27 | ) | | | (.13 | ) |
| | | | | | | | | | | | | | | |
| $ | 10.73 | | | $ | 12.76 | | | $ | 11.93 | | | $ | 12.56 | |
| | | | | | | | | | | | | | | |
| | (7.25 | )% | | | 12.75 | % | | | 5.35 | % | | | 11.39 | % |
| | | | | | | | | | | | | | |
| $ | 1,950 | | | $ | 3,995 | | | $ | 3,438 | | | $ | 3 | |
| $ | 3,358 | | | $ | 3,679 | | | $ | 2,872 | | | $ | 3 | |
| | | | | | | | | | | | | | |
| | 1.64 | % | | | 1.43 | % | | | 1.58 | % | | | 1.57 | %(f) |
| | 1.14 | % | | | .93 | % | | | 1.08 | % | | | 1.07 | %(f) |
| | 1.78 | % | | | 1.46 | % | | | 1.42 | % | | | 1.02 | %(f) |
See Notes to Financial Statements.
| | |
| Target Asset Allocation Funds/Target Moderate Allocation Fund | | 81 |
Financial Highlights
(Unaudited) continued
| | | | |
| |
| | | Class X | |
| | | Six Months Ended
January 31, 2009(c) | |
Per Share Operating Performance: | | | | |
Net Asset Value, Beginning Of Period | | $ | 10.66 | |
| | | | |
Income (loss) from investment operations: | | | | |
Net investment income | | | .06 | |
Net realized and unrealized gain (loss) on investments | | | (2.79 | ) |
| | | | |
Total from investment operations | | | (2.73 | ) |
| | | | |
Less Dividends and Distributions: | | | | |
Dividends from net investment income | | | (.07 | ) |
Distributions from net realized gains | | | (.10 | ) |
| | | | |
Total dividends and distributions | | | (.17 | ) |
| | | | |
Net asset value, end of period | | $ | 7.76 | |
| | | | |
Total Return(b) | | | (25.74 | )% |
Ratios/Supplemental Data: | | | | |
Net assets, end of period (000) | | $ | 2,602 | |
Average net assets (000) | | $ | 3,472 | |
Ratios to average net assets(d): | | | | |
Expenses, including distribution and service (12b-1) fees | | | 2.15 | %(e) |
Expenses, excluding distribution and service (12b-1) fees | | | 1.18 | %(e) |
Net investment income | | | 1.40 | %(e) |
| (a) | Commencement of offering new share class. |
| (b) | Total return does not consider the effects of sales loads. Total return is calculated assuming a purchase of a share on the first day and a sale on the last day of each period reported, and includes reinvestment of dividends and distributions. Total returns may reflect adjustments to conform to generally accepted accounting principles. Total returns for periods less than one full year are not annualized. |
| (c) | Calculated based upon average shares outstanding during the period. |
| (d) | Does not include expenses of the underlying portfolios in which the Fund invests. |
See Notes to Financial Statements.
| | |
| 82 | | Visit our website at www.prudential.com |
| | | | | | | | | | | | | | |
| Class X | |
| Year Ended July 31, | | | October 4, 2004(a) through July 31, 2005 | |
| 2008(c) | | | 2007(c) | | | 2006(c) | | |
| | | | | | | | | | | | | | |
| $ | 12.69 | | | $ | 11.87 | | | $ | 12.52 | | | $ | 11.34 | |
| | | | | | | | | | | | | | | |
| | | | | | | | | | | | | | |
| | .16 | | | | .12 | | | | .12 | | | | .09 | |
| | (1.03 | ) | | | 1.31 | | | | .43 | | | | 1.18 | |
| | | | | | | | | | | | | | | |
| | (.87 | ) | | | 1.43 | | | | .55 | | | | 1.27 | |
| | | | | | | | | | | | | | | |
| | | | | | | | | | | | | | |
| | (.17 | ) | | | (.13 | ) | | | (.13 | ) | | | (.09 | ) |
| | (.99 | ) | | | (.48 | ) | | | (1.07 | ) | | | — | |
| | | | | | | | | | | | | | | |
| | (1.16 | ) | | | (.61 | ) | | | (1.20 | ) | | | (.09 | ) |
| | | | | | | | | | | | | | | |
| $ | 10.66 | | | $ | 12.69 | | | $ | 11.87 | | | $ | 12.52 | |
| | | | | | | | | | | | | | | |
| | (7.64 | )% | | | 12.19 | % | | | 4.65 | % | | | 11.23 | % |
| | | | | | | | | | | | | | |
| $ | 4,299 | | | $ | 5,617 | | | $ | 4,773 | | | $ | 2,284 | |
| $ | 5,199 | | | $ | 5,644 | | | $ | 3,571 | | | $ | 1,105 | |
| | | | | | | | | | | | | | |
| | 2.08 | % | | | 1.93 | % | | | 2.08 | % | | | 2.07 | %(e) |
| | 1.14 | % | | | .93 | % | | | 1.08 | % | | | 1.07 | %(e) |
| | 1.35 | % | | | .96 | % | | | .96 | % | | | .59 | %(e) |
See Notes to Financial Statements.
| | |
| Target Asset Allocation Funds/Target Moderate Allocation Fund | | 83 |
Financial Highlights
(Unaudited) continued
| | | | |
| | | Class Z | |
| | | Six Months Ended
January 31, 2009(b) | |
Per Share Operating Performance: | | | | |
Net Asset Value, Beginning Of Period | | $ | 10.74 | |
| | | | |
Income (loss) from investment operations: | | | | |
Net investment income | | | .11 | |
Net realized and unrealized gain (loss) on investments | | | (2.82 | ) |
| | | | |
Total from investment operations | | | (2.71 | ) |
| | | | |
Less Dividends and Distributions: | | | | |
Dividends from net investment income | | | (.16 | ) |
Distributions from net realized gains | | | (.10 | ) |
| | | | |
Total dividends and distributions | | | (.26 | ) |
| | | | |
Net asset value, end of period | | $ | 7.77 | |
| | | | |
Total Return(a) | | | (25.37 | )% |
Ratios/Supplemental Data: | | | | |
Net assets, end of period (000) | | $ | 8,132 | |
Average net assets (000) | | $ | 10,319 | |
Ratios to average net assets(c): | | | | |
Expenses, including distribution and service (12b-1) fees | | | 1.18 | %(d) |
Expenses, excluding distribution and service (12b-1) fees | | | 1.18 | %(d) |
Net investment income | | | 2.36 | %(d) |
| (a) | Total return is calculated assuming a purchase of a share on the first day and a sale on the last day of each period reported, and includes reinvestment of dividends and distributions. Total returns may reflect adjustments to conform to generally accepted accounting principles. Total returns for periods less than one full year are not annualized. |
| (b) | Calculated based upon average shares outstanding during the period. |
| (c) | Does not include expenses of the underlying portfolios in which the Fund invests. |
See Notes to Financial Statements.
| | |
| 84 | | Visit our website at www.prudential.com |
| | | | | | | | | | | | | | | | | | |
| Class Z | |
| Year Ended July 31, | |
| 2008(b) | | | 2007(b) | | | 2006(b) | | | 2005(b) | | | 2004 | |
| | | | | | | | | | | | | | | | | | |
| $ | 12.77 | | | $ | 11.94 | | | $ | 12.58 | | | $ | 10.97 | | | $ | 9.90 | |
| | | | | | | | | | | | | | | | | | | |
| | | | | | | | | | | | | | | | | | |
| | .28 | | | | .25 | | | | .24 | | | | .17 | | | | .15 | |
| | (1.05 | ) | | | 1.31 | | | | .44 | | | | 1.62 | | | | 1.09 | |
| | | | | | | | | | | | | | | | | | | |
| | (.77 | ) | | | 1.56 | | | | .68 | | | | 1.79 | | | | 1.24 | |
| | | | | | | | | | | | | | | | | | | |
| | | | | | | | | | | | | | | | | | |
| | (.27 | ) | | | (.25 | ) | | | (.25 | ) | | | (.18 | ) | | | (.17 | ) |
| | (.99 | ) | | | (.48 | ) | | | (1.07 | ) | | | — | | | | — | |
| | | | | | | | | | | | | | | | | | | |
| | (1.26 | ) | | | (.73 | ) | | | (1.32 | ) | | | (.18 | ) | | | (.17 | ) |
| | | | | | | | | | | | | | | | | | | |
| $ | 10.74 | | | $ | 12.77 | | | $ | 11.94 | | | $ | 12.58 | | | $ | 10.97 | |
| | | | | | | | | | | | | | | | | | | |
| | (6.78 | )% | | | 13.30 | % | | | 5.78 | % | | | 16.36 | % | | | 12.53 | % |
| | | | | | | | | | | | | | | | | | |
| $ | 13,558 | | | $ | 14,902 | | | $ | 13,388 | | | $ | 9,329 | | | $ | 7,678 | |
| $ | 14,407 | | | $ | 14,168 | | | $ | 12,022 | | | $ | 8,425 | | | $ | 9,098 | |
| | | | | | | | | | | | | | | | | | |
| | 1.14 | % | | | .93 | % | | | 1.08 | % | | | 1.07 | % | | | 1.10 | % |
| | 1.14 | % | | | .93 | % | | | 1.08 | % | | | 1.07 | % | | | 1.10 | % |
| | 2.30 | % | | | 1.97 | % | | | 1.93 | % | | | 1.41 | % | | | 1.41 | % |
See Notes to Financial Statements.
| | |
| Target Asset Allocation Funds/Target Moderate Allocation Fund | | 85 |
| | | | |
| n MAIL | | n TELEPHONE | | n WEBSITE |
Gateway Center Three 100 Mulberry Street Newark, NJ 07102 | | (800) 225-1852 | | www.prudential.com |
|
| PROXY VOTING |
| The Board of Trustees of the Fund has delegated to the Fund’s investment subadvisers the responsibility for voting any proxies and maintaining proxy recordkeeping with respect to the Fund. A description of these proxy voting policies and procedures is available without charge, upon request, by calling (800) 225-1852 or by visiting the Securities and Exchange Commission’s website at www.sec.gov. Information regarding how the Fund voted proxies relating to portfolio securities during the most recent 12-month period ended June 30 is available on the Fund’s website and on the Commission’s website. |
|
| TRUSTEES |
| Kevin J. Bannon • Linda W. Bynoe • David E.A. Carson • Robert F. Gunia • Michael S. Hyland • Robert E. La Blanc • Douglas H. McCorkindale • Stephen P. Munn • Richard A. Redeker • Judy A. Rice • Robin B. Smith • Stephen G. Stoneburn |
|
| OFFICERS |
| Judy A. Rice, President • Robert F. Gunia, Vice President • Grace C. Torres, Treasurer and Principal Financial and Accounting Officer • Kathryn L. Quirk, Chief Legal Officer • Deborah A. Docs, Secretary • Timothy J. Knierim, Chief Compliance Officer • Valerie M. Simpson, Deputy Chief Compliance Officer • Theresa C. Thompson, Deputy Chief Compliance Officer • Noreen M. Fierro, Anti-Money Laundering Compliance Officer • Jonathan D. Shain, Assistant Secretary • Claudia DiGiacomo, Assistant Secretary • John P. Schwartz, Assistant Secretary • Andrew R. French, Assistant Secretary • M. Sadiq Peshimam, Assistant Treasurer • Peter Parrella, Assistant Treasurer |
| | | | |
| MANAGER | | Prudential Investments LLC | | Gateway Center Three 100 Mulberry Street Newark, NJ 07102 |
|
| INVESTMENT SUBADVISERS | | Eagle Asset Management, Inc. | | 880 Carillon Parkway St. Petersburg, FL 33716 |
|
| | EARNEST Partners, LLC | | 1180 Peachtree Street Suite 2300 Atlanta, GA 30309 |
|
| | Eaton Vance Management | | Two International Place Boston, MA 02110 |
|
| | Hotchkis and Wiley Capital Management | | 725 South Figueroa Street Suite 3900 Los Angeles, CA 90017 |
|
| | LSV Asset Management | | One North Wacker Drive Suite 4000 Chicago, IL 60606 |
|
| | Marsico Capital Management, LLC | | 1200 17th Street Suite 1600 Denver, CO 80202 |
| | | | |
| | Massachusetts Financial
Services Company | | 500 Boylston Street
Boston, MA 02116 |
|
| | NFJ Investment Group L.P. | | 2100 Ross Avenue
Suite 1840 Dallas, TX 75201 |
|
| | Pacific Investment
Management Company LLC | | 840 Newport Center Drive
Newport Beach, CA 92660 |
|
| | Thornburg Investment
Management, Inc. | | 119 East Marcy Street
Santa Fe, NM 87501 |
|
| | Vaughan Nelson
Investment Management, L.P. | | 600 Travis Street
Suite 6300 Houston, TX 77002 |
|
| DISTRIBUTOR | | Prudential Investment
Management Services LLC | | Gateway Center Three
100 Mulberry Street
Newark, NJ 07102 |
|
| CUSTODIAN | | PFPC Trust Company | | 400 Bellevue Parkway
Wilmington, DE 19809 |
|
| TRANSFER AGENT | | Prudential Mutual Fund
Services LLC | | PO Box 9658
Providence, RI 02940 |
|
| INDEPENDENT REGISTERED PUBLIC ACCOUNTING FIRM | | KPMG LLP | | 345 Park Avenue
New York, NY 10154 |
|
| FUND COUNSEL | | Willkie Farr & Gallagher LLP | | 787 Seventh Avenue
New York, NY 10019 |
|
| An investor should consider the investment objectives, risks, charges, and expenses of the Fund carefully before investing. The prospectus for the Fund contains this and other information about the Fund. An investor may obtain a prospectus by visiting our website at www.prudential.com or by calling (800) 225-1852. The prospectus should be read carefully before investing. |
|
| |
| E-DELIVERY |
| To receive your mutual fund documents on-line, go to www.prudential.com/myaccess and enroll. Instead of receiving printed documents by mail, you will receive notification via e-mail when new materials are available. You can cancel your enrollment or change your e-mail address at any time by clicking on the view/change option at the website address above. |
|
| SHAREHOLDER COMMUNICATIONS WITH TRUSTEES |
| Shareholders can communicate directly with the Board of Trustees by writing to the Chair of the Board, Target Asset Allocation Funds, Prudential Investments, Attn: Board of Trustees, 100 Mulberry Street, Gateway Center Three, Newark, NJ 07102. Shareholders can communicate directly with an individual Trustee by writing to the same address. Communications are not screened before being delivered to the addressee. |
|
| AVAILABILITY OF PORTFOLIO SCHEDULE |
| The Fund files its complete schedule of portfolio holdings with the Securities and Exchange Commission for the first and third quarters of each fiscal year on Form N-Q. The Fund’s Forms N-Q are available on the Commission’s website at www.sec.gov. The Fund’s Forms N-Q may also be reviewed and copied at the Commission’s Public Reference Room in Washington, D.C. Information on the operation and location of the Public Reference Room may be obtained by calling (202) 551-8090. The Fund’s schedule of portfolio holdings is also available on the Fund’s website as of the end of each fiscal quarter. |
Mutual Funds:
| | | | |
ARE NOT INSURED BY THE FDIC OR ANY FEDERAL GOVERNMENT AGENCY | | MAY LOSE VALUE | | ARE NOT A DEPOSIT OF OR GUARANTEED BY ANY BANK OR ANY BANK AFFILIATE |

| | | | | | | | | | | | | | | | | | |
| Target Moderate Allocation Fund | | | | | | | | | | |
| | | Share Class | | A | | B | | C | | M | | R | | X | | Z | | |
| | NASDAQ | | PAMGX | | DMGBX | | PIMGX | | N/A | | SPMRX | | N/A | | PDMZX | | |
| | CUSIP | | 87612A807 | | 87612A880 | | 87612A872 | | 87612A849 | | 87612A864 | | 87612A831 | | 87612A856 | | |
| | | | | | | | | | | | | | | | | | |
MFSP504E4 IFS-A162966 Ed. 03/2009

| | |
| JANUARY 31, 2009 | | SEMIANNUAL REPORT |
Target Growth Allocation Fund
OBJECTIVE
Seeks long-term capital appreciation
This report is not authorized for distribution to prospective investors unless preceded or accompanied by a current prospectus.
The views expressed in this report and information about the Fund’s portfolio holdings are for the period covered by this report and are subject to change thereafter.
The accompanying financial statements as of January 31, 2009, were not audited and, accordingly, no auditor’s opinion is expressed on them.
Target Funds, Prudential, Prudential Financial and the Rock Prudential logo are registered service marks of The Prudential Insurance Company of America, Newark, NJ, and its affiliates.

March 16, 2009
Dear Shareholder:
On the following pages, you’ll find your semiannual report for the Target Growth Allocation Fund.
Target Asset Allocation Funds are managed by institutional-quality asset managers selected, matched, and monitored by a research team from Prudential Investments LLC. Portions of the Funds’ assets are assigned to carefully chosen asset managers, with the allocations actively managed on the basis of our projections for the financial markets and the managers’ individual strengths.
We believe our Target Growth Allocation Fund will help you to achieve broad, actively managed diversification at a targeted risk/return balance with a single investment purchase. We appreciate your continued confidence in us. Keep in mind that diversification and asset allocation do not assure a profit or protect against a loss in a declining market.
Sincerely,

Judy A. Rice, President
Target Asset Allocation Funds
| | |
| Target Asset Allocation Funds/Target Growth Allocation Fund | | 1 |
Your Fund’s Performance
Performance data quoted represent past performance. Past performance does not guarantee future results. The investment return and principal value of an investment will fluctuate, so that an investor’s shares, when redeemed, may be worth more or less than their original cost. Current performance may be lower or higher than the past performance data quoted. An investor may obtain performance data as of the most recent month-end by visiting our website at www.prudential.com or by calling (800) 225-1852. The maximum initial sales charge is 5.50% (Class A shares). Gross operating expenses: Class A, 1.60%; Class B, 2.30%; Class C, 2.30%; Class M, 2.30%; Class R, 2.05%; Class X, 2.30%; Class Z, 1.30%. Net operating expenses apply to: Class A, 1.55%; Class B, 2.30%; Class C, 2.30%; Class M, 2.30%; Class R, 1.80%; Class X, 2.30%; Class Z, 1.30%, after contractual reduction through 11/30/2009 for Class A and Class R shares.
| | | | | | | | | | | | | | |
| Cumulative Total Returns as of 1/31/09 | | | | | | | | | | | | |
| | | Six Months | | | One Year | | | Five Years | | | Ten Years | | | Since Inception1 |
Class A | | –36.46 | % | | –41.48 | % | | –17.98 | % | | –1.67 | % | | — |
Class B | | –36.78 | | | –41.99 | | | –21.12 | | | –8.77 | | | — |
Class C | | –36.69 | | | –41.91 | | | –21.00 | | | –8.63 | | | — |
Class M | | –36.71 | | | –41.97 | | | N/A | | | N/A | | | –21.63% (10/04/04) |
Class R | | –36.53 | | | –41.59 | | | N/A | | | N/A | | | –19.97 (10/04/04) |
Class X | | –36.69 | | | –41.96 | | | N/A | | | N/A | | | –21.73 (10/04/04) |
Class Z | | –36.41 | | | –41.38 | | | –16.95 | | | 0.91 | | | — |
Customized Blend2 | | –36.08 | | | –39.81 | | | –15.65 | | | –14.75 | | | ** |
S&P 500 Index3 | | –33.96 | | | –38.63 | | | –19.52 | | | –23.54 | | | *** |
Lipper Multi-Cap Core Funds Average4 | | –35.28 | | | –39.09 | | | –19.97 | | | 1.25 | | | **** |
|
| Average Annual Total Returns5 as of 12/31/08 | | | | | | | | | |
| | | | | | One Year | | | Five Years | | | Ten Years | | | Since Inception1 |
Class A | | | | | –43.50 | % | | –2.73 | % | | 0.45 | % | | — |
Class B | | | | | –43.62 | | | –2.52 | | | 0.28 | | | — |
Class C | | | | | –41.19 | | | –2.34 | | | 0.29 | | | — |
Class M | | | | | –44.19 | | | N/A | | | N/A | | | –3.80% (10/04/04) |
Class R | | | | | –40.32 | | | N/A | | | N/A | | | –2.98 (10/04/04) |
Class X | | | | | –44.18 | | | N/A | | | N/A | | | –4.00 (10/04/04) |
Class Z | | | | | –40.07 | | | –1.38 | | | 1.29 | | | — |
Customized Blend2 | | | | | –38.50 | | | –1.19 | | | –0.42 | | | ** |
S&P 500 Index3 | | | | | –36.99 | | | –2.19 | | | –1.38 | | | *** |
Lipper Multi-Cap Core Funds Average4 | | | | | –38.79 | | | –2.61 | | | 0.82 | | | **** |
| | |
| 2 | | Visit our website at www.prudential.com |
The cumulative total returns do not reflect the deduction of applicable sales charges. If reflected, the applicable sales charges would reduce the cumulative total returns performance quoted. Class A shares are subject to a maximum front-end sales charge of 5.50%. Under certain circumstances, Class A shares may be subject to a contingent deferred sales charge (CDSC) of 1%. Class B and Class C shares are subject to a maximum CDSC of 5% and 1%, respectively. Class M and Class X shares are subject to a maximum CDSC of 6%. Class R and Class Z shares are not subject to a sales charge.
Source: Prudential Investments LLC and Lipper Inc. Performance figures may reflect fee waivers and/or expense reimbursements. In the absence of such fee waivers and/or expense reimbursements, total returns would be lower.
1Inception returns are provided for any share class with less than 10 calendar years of returns.
2The Customized Benchmark for Target Growth Allocation Fund (Customized Blend) is a model portfolio consisting of the Russell 3000® Index (80%) and the MSCI EAFE (20%). Each component of the Customized Blend is an unmanaged index generally considered as representing the performance of the Fund’s asset classes. The Customized Blend is intended to provide a theoretical comparison of the Fund’s performance, based on the amounts allocated to each asset class rather than on amounts allocated to various Fund segments. The Customized Blend does not reflect deductions for any sales charges or operating expenses of a mutual fund.
3The Standard & Poor’s 500 Composite Stock Price Index (S&P 500 Index) is an unmanaged index of 500 stocks of large U.S. public companies. It gives an indication of how U.S. stock prices have performed.
4The Lipper Multi-Cap Core Funds Average (Lipper Average) represents funds that, by portfolio practice, invest in a variety of market capitalization ranges without concentrating 75% of their equity assets in any one market capitalization range over an extended period of time. Multi-cap funds typically have between 25% and 75% of their assets invested in companies with market capitalizations (on a three year weighted basis) above 300% of the dollar-weighted median market capitalization of the middle 1,000 securities of the S&P SuperComposite 1500 Index. Multi-cap core funds have more latitude in the companies in which they invest. These funds typically have an average price-to-earnings ratio, price-to-book ratio, and three-year sales-per-share growth value, compared to the S&P SuperComposite 1500 Index.
5The average annual total returns take into account applicable sales charges. Class A, Class B, Class C, Class M, Class R, and Class X shares are subject to an annual distribution and service (12b-1) fee of up to 0.30%, 1.00%, 1.00%, 1.00%, 0.75%, and 1.00%, respectively. Approximately seven years after purchase, Class B shares will automatically convert to Class A shares on a quarterly basis. Approximately eight years after purchase, Class M shares will automatically convert to Class A shares on a quarterly basis. Approximately 10 years after purchase, Class X shares will automatically convert to Class A shares on a quarterly basis. Class Z shares are not subject to a 12b-1 fee. The returns in the tables do not reflect the deduction of taxes that a shareholder would pay on Fund distributions or following the redemption of Fund shares.
**Customized Blend Closest Month-End to Inception cumulative total return as of 1/31/09 is –15.81% for Classes M, R, and X. Customized Blend Closest Month-End to Inception average annual total return as of 12/31/08 is –1.90% for Classes M, R, and X.
***S&P 500 Index Closest Month-End to Inception cumulative total return as of 1/31/09 is –19.26% for Classes M, R, and X. S&P 500 Index Closest Month-End to Inception average annual total return as of 12/31/08 is –2.92% for Classes M, R, and X.
****Lipper Average Closest Month-End to Inception cumulative total return as of 1/31/09 is –19.14% for Classes M, R, and X. Lipper Average Closest Month-End to Inception average annual total return as of 12/31/08 is –3.29% for Classes M, R, and X.
| | |
| Target Asset Allocation Funds/Target Growth Allocation Fund | | 3 |
Your Fund’s Performance (continued)
Investors cannot invest directly in an index. The returns for the S&P 500 Index and the Customized Blend would be lower if they included the effects of sales charges, operating expenses of a mutual fund, or taxes. Returns for the Lipper Average reflect the deduction of operating expenses, but not sales charges or taxes. The Since Inception returns for the S&P 500 Index, Customized Blend, and the Lipper Average are measured from the closest month-end to inception date, and not from the Fund’s actual inception date.
Fund objective
The investment objective of the Target Growth Allocation Fund is long-term capital appreciation. There can be no assurance that the Fund will achieve its investment objective.
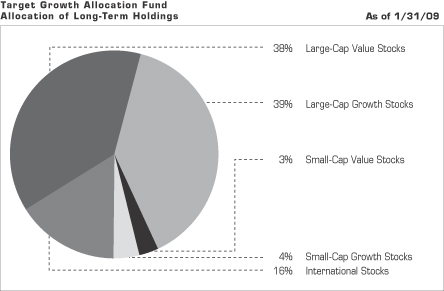
| | |
| 4 | | Visit our website at www.prudential.com |
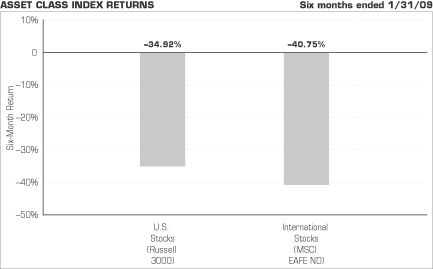
Source: Lipper Inc.
The chart above shows the total returns for six months ended January 31, 2009, of various securities indexes that are generally considered representative of broad market sectors. It does not reflect a mutual fund’s expenses. The performance cited does not represent the performance of the Target Growth Allocation Fund. Past performance is not indicative of future results. Investors cannot invest directly in an index.
The Russell 3000 Index measures the performance of the 3,000 largest U.S. companies based on total market capitalization, which represents approximately 98% of the investable U.S. equity market.
The Morgan Stanley Capital International Europe, Australasia, and Far East Index (MSCI EAFE ND Index) is an unmanaged, weighted index that reflects stock price movements in Europe, Australasia, and the Far East. It gives a broad look at how foreign stock prices have performed. The Fund utilizes the net dividends (ND) version of the MSCI EAFE Index. The net dividends and gross dividends versions of the MSCI EAFE Index differ in that net dividends returns reflect the impact of the maximum withholding taxes on reinvested dividends, while the gross dividends version does not reflect the impact of withholding taxes on reinvested dividends. These returns do not include the effect of any investment management expenses. These returns would have been lower if they included the effect of these expenses.
| | |
| Target Asset Allocation Funds/Target Growth Allocation Fund | | 5 |
Fees and Expenses (Unaudited)
As a shareholder of the Fund, you incur two types of costs: (1) transaction costs, including sales charges (loads) on purchase payments and redemptions, as applicable, and (2) ongoing costs, including management fees, distribution and/or service (12b-1) fees, and other Fund expenses, as applicable. This example is intended to help you understand your ongoing costs (in dollars) of investing in the Fund and to compare these costs with the ongoing costs of investing in other mutual funds.
The example is based on an investment of $1,000 invested on August 1, 2008, at the beginning of the period, and held through the six-month period ended January 31, 2009. The example is for illustrative purposes only; you should consult the Prospectus for information on initial and subsequent minimum investment requirements.
The Fund’s transfer agent may charge additional fees to holders of certain accounts that are not included in the expenses shown in the table on the following page. These fees apply to individual retirement accounts (IRAs) and Section 403(b) accounts. As of the close of the six-month period covered by the table, IRA fees included an annual maintenance fee of $15 per account (subject to a maximum annual maintenance fee of $25 for all accounts held by the same shareholder). Section 403(b) accounts are charged an annual $25 fiduciary maintenance fee. Some of the fees may vary in amount, or may be waived, based on your total account balance or the number of JennisonDryden Funds, including the Target Asset Allocation Funds, that you own. You should consider the additional fees that were charged to your Fund account over the six-month period when you estimate the total ongoing expenses paid over the period and the impact of these fees on your ending account value, as these additional expenses are not reflected in the information provided in the expense table. Additional fees have the effect of reducing investment returns.
Actual Expenses
The first line for each share class in the table on the following page provides information about actual account values and actual expenses. You may use the information on this line, together with the amount you invested, to estimate the expenses that you paid over the period. Simply divide your account value by $1,000 (for example, an $8,600 account value ÷ $1,000 = 8.6), then multiply the result by the number on the first line under the heading “Expenses Paid During the Six-Month Period” to estimate the expenses you paid on your account during this period.
Hypothetical Example for Comparison Purposes
The second line for each share class in the table on the following page provides information about hypothetical account values and hypothetical expenses based on the Fund’s actual expense ratio and an assumed rate of return of 5% per year before
| | |
| 6 | | Visit our website at www.prudential.com |
expenses, which is not the Fund’s actual return. The hypothetical account values and expenses may not be used to estimate the actual ending account balance or expenses you paid for the period. You may use this information to compare the ongoing costs of investing in the Fund and other funds. To do so, compare this 5% hypothetical example with the 5% hypothetical examples that appear in the shareholder reports of the other funds.
Please note that the expenses shown in the table are meant to highlight your ongoing costs only, and do not reflect any transactional costs such as sales charges (loads). Therefore the second line for each share class in the table is useful in comparing ongoing costs only, and will not help you determine the relative total costs of owning different funds. In addition, if these transactional costs were included, your costs would have been higher.
| | | | | | | | | | | | | | |
Target Growth
Allocation Fund | | Beginning Account
Value
August 1, 2008 | | Ending Account
Value January 31, 2009 | | Annualized
Expense Ratio
Based on the
Six-Month Period | | | Expenses Paid
During the
Six-Month Period* |
| | | | | | | | | | | | | | |
| Class A | | Actual | | $ | 1,000.00 | | $ | 635.40 | | 1.55 | % | | $ | 6.39 |
| | | Hypothetical | | $ | 1,000.00 | | $ | 1,017.39 | | 1.55 | % | | $ | 7.88 |
| | | | | | | | | | | | | | |
| Class B | | Actual | | $ | 1,000.00 | | $ | 632.20 | | 2.30 | % | | $ | 9.46 |
| | | Hypothetical | | $ | 1,000.00 | | $ | 1,013.61 | | 2.30 | % | | $ | 11.67 |
| | | | | | | | | | | | | | |
| Class C | | Actual | | $ | 1,000.00 | | $ | 633.10 | | 2.30 | % | | $ | 9.47 |
| | | Hypothetical | | $ | 1,000.00 | | $ | 1,013.61 | | 2.30 | % | | $ | 11.67 |
| | | | | | | | | | | | | | |
| Class M | | Actual | | $ | 1,000.00 | | $ | 632.90 | | 2.30 | % | | $ | 9.47 |
| | | Hypothetical | | $ | 1,000.00 | | $ | 1,013.61 | | 2.30 | % | | $ | 11.67 |
| | | | | | | | | | | | | | |
| Class R | | Actual | | $ | 1,000.00 | | $ | 634.70 | | 1.80 | % | | $ | 7.42 |
| | | Hypothetical | | $ | 1,000.00 | | $ | 1,016.13 | | 1.80 | % | | $ | 9.15 |
| | | | | | | | | | | | | | |
| Class X | | Actual | | $ | 1,000.00 | | $ | 633.10 | | 2.30 | % | | $ | 9.47 |
| | | Hypothetical | | $ | 1,000.00 | | $ | 1,013.61 | | 2.30 | % | | $ | 11.67 |
| | | | | | | | | | | | | | |
| Class Z | | Actual | | $ | 1,000.00 | | $ | 635.90 | | 1.30 | % | | $ | 5.36 |
| | | Hypothetical | | $ | 1,000.00 | | $ | 1,018.65 | | 1.30 | % | | $ | 6.61 |
* Fund expenses (net of fee waivers or subsidies, if any) for each share class are equal to the annualized expense ratio for each share class (provided in the table), multiplied by the average account value over the period, multiplied by the 184 days in the six-month period ended January 31, 2009, and divided by the 365 days in the Fund’s fiscal year ending July 31, 2009 (to reflect the six-month period). Expenses presented in the table include the expenses of any underlying portfolios in which the Fund may invest.
| | |
| Target Asset Allocation Funds/Target Growth Allocation Fund | | 7 |
Portfolio of Investments
as of January 31, 2009 (Unaudited)
| | | | | |
| Shares | | Description | | Value (Note 1) |
| | | | | |
LONG-TERM INVESTMENTS 94.7% | | | |
COMMON STOCKS 94.6% | | | |
| |
Aerospace & Defense 4.2% | | | |
| 2,300 | | AAR Corp.* | | $ | 41,722 |
| 600 | | Alliant Techsystems, Inc.* | | | 48,486 |
| 14,900 | | Embraer-Empresa Brasileira de Aeronautica SA, ADR (Brazil) | | | 224,543 |
| 27,541 | | General Dynamics Corp. | | | 1,562,401 |
| 33,529 | | Lockheed Martin Corp. | | | 2,750,719 |
| 1,725 | | Moog, Inc. (Class A Stock)* | | | 51,681 |
| 2,600 | | MTU Aero Engines Holding AG (Germany) | | | 72,906 |
| 23,700 | | Northrop Grumman Corp. | | | 1,140,444 |
| 4,090 | | Raytheon Co. | | | 207,036 |
| 1,200 | | Teledyne Technologies, Inc.* | | | 33,444 |
| 1,800 | | Thales SA (France) | | | 80,100 |
| 11,000 | | United Technologies Corp. | | | 527,890 |
| | | | | |
| | | | | 6,741,372 |
| |
Air Freight & Couriers 0.1% | | | |
| 3,600 | | FedEx Corp. | | | 183,384 |
| |
Air Freight & Logistics | | | �� |
| 1,575 | | Forward Air Corp. | | | 31,910 |
| |
Airlines 0.2% | | | |
| 119,300 | | Air New Zealand Ltd. (New Zealand) | | | 54,106 |
| 58,300 | | Qantas Airways Ltd. (Australia) | | | 89,297 |
| 14,767 | | Singapore Airlines Ltd. (Singapore) | | | 107,923 |
| 7,990 | | UAL Corp.* | | | 75,426 |
| | | | | |
| | | | | 326,752 |
| |
Auto Components 0.1% | | | |
| 14,300 | | Johnson Controls, Inc. | | | 178,893 |
| |
Auto/Trucks Parts & Equipment 0.1% | | | |
| 10,300 | | JTEKT Corp. (Japan) | | | 63,661 |
| 8,600 | | Keihin Corp. (Japan) | | | 72,560 |
| 7,300 | | Nifco, Inc. (Japan) | | | 65,099 |
| | | | | |
| | | | | 201,320 |
| |
Automobile Manufacturers 0.6% | | | |
| 2,800 | | Daimler AG (Germany) | | | 78,872 |
| 19,000 | | Fuji Heavy Industries Ltd. (Japan) | | | 54,757 |
| 12,000 | | Honda Motor Co. Ltd. (Japan) | | | 275,783 |
See Notes to Financial Statements.
| | |
| Target Asset Allocation Funds/Target Growth Allocation Fund | | 9 |
Portfolio of Investments
as of January 31, 2009 (Unaudited) continued
| | | | | |
| Shares | | Description | | Value (Note 1) |
| | | | | |
COMMON STOCKS (Continued) | | | |
| |
Automobile Manufacturers (cont’d.) | | | |
| 34,500 | | Nissan Motor Co. Ltd. (Japan) | | $ | 103,934 |
| 1,500 | | PSA Peugeot Citroen SA (France) | | | 25,553 |
| 1,000 | | Renault SA (France) | | | 19,411 |
| 12,500 | | Toyota Motor Corp. (Japan) | | | 402,102 |
| | | | | |
| | | | | 960,412 |
| |
Automobiles 0.1% | | | |
| 16,000 | | Harley-Davidson, Inc. | | | 194,880 |
| |
Automotive Parts 0.2% | | | |
| 1,200 | | Compagnie Generale des Establissements Michelin
(Class B Stock) (France) | | | 47,200 |
| 200 | | Georg Fischer AG (Switzerland)* | | | 33,055 |
| 26,000 | | GKN PLC (United Kingdom) | | | 31,744 |
| 2,800 | | O’Reilly Automotive, Inc.* | | | 81,396 |
| 8,800 | | Sumitomo Electric Industries Ltd. (Japan) | | | 66,239 |
| 2,500 | | Valeo SA (France) | | | 27,977 |
| 25,500 | | Yokohama Rubber Co. Ltd. (The) (Japan) | | | 89,588 |
| | | | | |
| | | | | 377,199 |
| |
Banks 0.7% | | | |
| 19,200 | | Mizuho Financial Group, Inc. (Japan) | | | 47,525 |
| 10,200 | | National Australia Bank Ltd. (Australia) | | | 120,302 |
| 8,478 | | Northern Trust Corp. | | | 487,655 |
| 24,641 | | Standard Chartered PLC (United Kingdom) | | | 312,815 |
| 3,350 | | United Bankshares, Inc. | | | 70,316 |
| | | | | |
| | | | | 1,038,613 |
| |
Beverages 0.5% | | | |
| 5,000 | | Coca-Cola Co. (The) | | | 213,600 |
| 700 | | Foster’s Group Ltd. (Australia) | | | 2,407 |
| 3,010 | | Molson Coors Brewing Co. (Class B Stock) | | | 121,213 |
| 5,610 | | PepsiCo, Inc. | | | 281,790 |
| 11,028 | | SABMiller PLC (United Kingdom) | | | 180,913 |
| | | | | |
| | | | | 799,923 |
| |
Biotechnology 3.5% | | | |
| 6,470 | | Celgene Corp.* | | | 342,587 |
| 29,968 | | Genentech, Inc.* | | | 2,434,600 |
| 13,884 | | Genzyme Corp.* | | | 956,885 |
See Notes to Financial Statements.
| | |
| 10 | | Visit our website at www.prudential.com |
| | | | | |
| Shares | | Description | | Value (Note 1) |
| | | | | |
COMMON STOCKS (Continued) | | | |
| |
Biotechnology (cont’d.) | | | |
| 36,276 | | Gilead Sciences, Inc.* | | $ | 1,841,733 |
| | | | | |
| | | | | 5,575,805 |
| |
Building Materials 0.1% | | | |
| 35,000 | | Sanwa Holdings Corp. (Japan) | | | 119,640 |
| |
Building Products | | | |
| 1,705 | | Texas Industries, Inc. | | | 38,721 |
| |
Business Services 1.2% | | | |
| 3,355 | | FTI Consulting, Inc.* | | | 137,589 |
| 6,045 | | ICON PLC, ADR (Ireland)* | | | 121,504 |
| 11,121 | | MasterCard, Inc. (Class A Stock) | | | 1,510,009 |
| 2,850 | | URS Corp.* | | | 97,043 |
| | | | | |
| | | | | 1,866,145 |
| |
Cable Television 0.2% | | | |
| 12,800 | | Rogers Communications, Inc. (Class B Stock) (Canada) | | | 360,957 |
| |
Capital Markets 0.1% | | | |
| 2,400 | | Morgan Stanley | | | 48,552 |
| 3,800 | | Waddell & Reed Financial, Inc. (Class A Stock) | | | 53,656 |
| | | | | |
| | | | | 102,208 |
| |
Chemicals 2.5% | | | |
| 10,650 | | Air Products & Chemicals, Inc. | | | 535,695 |
| 1,425 | | Airgas, Inc. | | | 50,317 |
| 120 | | Arkema (France) | | | 1,701 |
| 26,000 | | Asahi Kasei Corp. (Japan) | | | 106,359 |
| 5,600 | | BASF SE (Germany) | | | 162,907 |
| 2,500 | | Ciba Holding AG (Switzerland) | | | 105,569 |
| 10,600 | | Clariant AG (Switzerland)* | | | 52,822 |
| 35,700 | | Denki Kagaku Kogyo Kabushiki Kaisha (Japan) | | | 74,435 |
| 29,000 | | Dow Chemical Co. (The) | | | 336,110 |
| 6,300 | | Eastman Chemical Co. | | | 163,485 |
| 3,590 | | Ecolab, Inc. | | | 121,916 |
| 240 | | Givaudan SA (Switzerland) | | | 162,945 |
| 20,700 | | Huntsman Corp. | | | 55,062 |
| 3,600 | | Koninklijke DSM NV (Netherlands) | | | 86,657 |
| 1,300 | | Linde AG (Germany) | | | 86,971 |
| 7,165 | | Macrovision Solutions Corp.* | | | 93,933 |
See Notes to Financial Statements.
| | |
| Target Asset Allocation Funds/Target Growth Allocation Fund | | 11 |
Portfolio of Investments
as of January 31, 2009 (Unaudited) continued
| | | | | |
| Shares | | Description | | Value (Note 1) |
| | | | | |
COMMON STOCKS (Continued) | | | |
| |
Chemicals (cont’d.) | | | |
| 16,000 | | Nippon Shokubai Co. Ltd. (Japan) | | $ | 106,480 |
| 4,900 | | PPG Industries, Inc. | | | 184,142 |
| 21,980 | | Praxair, Inc. | | | 1,368,475 |
| 1,965 | | Quaker Chemical Corp. | | | 22,421 |
| 3,175 | | Scotts Miracle-Gro Co. (The) (Class A Stock) | | | 102,298 |
| 3,795 | | Terra Industries, Inc. | | | 77,722 |
| 1,800 | | Valspar Corp. (The) | | | 31,230 |
| | | | | |
| | | | | 4,089,652 |
| |
Clothing & Apparel 0.8% | | | |
| 26,122 | | NIKE, Inc. (Class B Stock) | | | 1,182,020 |
| 4,600 | | Phillips-Van Heusen Corp. | | | 87,492 |
| | | | | |
| | | | | 1,269,512 |
| |
Commercial Banks 0.7% | | | |
| 6,600 | | Allied Irish Banks PLC (Ireland) | | | 10,310 |
| 14,600 | | Bank of Ireland (Ireland) | | | 12,151 |
| 6,780 | | Bank of New York Mellon Corp. (The) | | | 174,517 |
| 1,250 | | Cullen/Frost Bankers, Inc. | | | 54,712 |
| 33,700 | | Intesa Sanpaolo SpA (Italy) | | | 106,687 |
| 18,900 | | KeyCorp | | | 137,592 |
| 13,900 | | PNC Financial Services Group, Inc. | | | 452,028 |
| 2,350 | | Prosperity Bancshares, Inc. | | | 63,567 |
| 34,748 | | Royal Bank of Scotland Group PLC (United Kingdom) | | | 11,078 |
| 1,100 | | Societe Generale (France) | | | 46,408 |
| 2,299 | | Trustmark Corp. | | | 46,670 |
| 500 | | Verwaltungs und Privat Bank AG (Liechtenstein) | | | 50,349 |
| | | | | |
| | | | | 1,166,069 |
|
Commercial Services 0.5% |
| 8,070 | | Accenture Ltd. (Class A Stock) (Bermuda) | | | 254,689 |
| 1,485 | | American Public Education, Inc.* | | | 58,153 |
| 5,745 | | Corrections Corp. of America* | | | 79,166 |
| 6,235 | | GEO Group, Inc. (The)* | | | 92,278 |
| 1,988 | | Healthcare Services Group, Inc. | | | 30,449 |
| 1,700 | | Moody’s Corp. | | | 36,414 |
| 6,960 | | Waste Connections, Inc.* | | | 201,979 |
| | | | | |
| | | | | 753,128 |
|
Commercial Services & Supplies 0.6% |
| 4,620 | | Monster Worldwide, Inc.* | | | 42,550 |
See Notes to Financial Statements.
| | |
| 12 | | Visit our website at www.prudential.com |
| | | | | |
| Shares | | Description | | Value (Note 1) |
| | | | | |
COMMON STOCKS (Continued) | | | |
|
Commercial Services & Supplies (cont’d.) |
| 29,500 | | Waste Management, Inc. | | $ | 920,105 |
| | | | | |
| | | | | 962,655 |
|
Communication Equipment |
| 1,925 | | Nice Systems Ltd., ADR (Israel)* | | | 36,941 |
|
Communications Equipment 0.1% |
| 116,100 | | Alcatel-Lucent, ADR (France)* | | | 228,717 |
|
Computer Hardware 3.3% |
| 20,795 | | Apple, Inc.* | | | 1,874,253 |
| 42,000 | | Hewlett-Packard Co. | | | 1,459,500 |
| 20,051 | | International Business Machines Corp. | | | 1,837,674 |
| 10,071 | | Logitech International SA (Switzerland)* | | | 97,854 |
| | | | | |
| | | | | 5,269,281 |
|
Computer Services & Software 1.6% |
| 11,765 | | Compellent Technologies, Inc.* | | | 142,356 |
| 17,660 | | EMC Corp.* | | | 194,966 |
| 2,990 | | Factset Research Systems, Inc. | | | 119,002 |
| 2,200 | | Global Payments, Inc. | | | 76,362 |
| 2,175 | | Hansen Medical, Inc.* | | | 9,831 |
| 1,480 | | MICROS Systems, Inc.* | | | 21,312 |
| 83,186 | | Microsoft Corp. | | | 1,422,481 |
| 9,385 | | Netezza Corp.* | | | 56,967 |
| 11,471 | | SAP AG (Germany) | | | 409,044 |
| 4,400 | | TietoEnator Oyj (Finland) | | | 49,971 |
| | | | | |
| | | | | 2,502,292 |
|
Computers 0.1% |
| 10,670 | | NetApp, Inc.* | | | 158,236 |
|
Computers & Peripherals |
| 2,640 | | Cognizant Technology Solutions Corp. (Class A Stock)* | | | 49,447 |
|
Construction 0.1% |
| 700 | | Ciments Francais SA (France) | | | 53,759 |
| 1,200 | | Granite Construction, Inc. | | | 42,264 |
| 2,400 | | Hovnanian Enterprises, Inc. (Class A Stock)* | | | 4,056 |
| 1,300 | | Meritage Homes Corp.* | | | 14,326 |
| | | | | |
| | | | | 114,405 |
See Notes to Financial Statements.
| | |
| Target Asset Allocation Funds/Target Growth Allocation Fund | | 13 |
Portfolio of Investments
as of January 31, 2009 (Unaudited) continued
| | | | | |
| Shares | | Description | | Value (Note 1) |
| | | | | |
COMMON STOCKS (Continued) | | | |
|
Construction Materials |
| 32,200 | | CSR Ltd. (Australia) | | $ | 28,503 |
|
Consumer Finance |
| 3,175 | | First Cash Financial Services, Inc.* | | | 53,404 |
|
Consumer Products & Services 0.6% |
| 1,520 | | Apollo Group, Inc. (Class A Stock)* | | | 123,819 |
| 3,620 | | Avon Products, Inc. | | | 74,029 |
| 5,210 | | Colgate-Palmolive Co. | | | 338,859 |
| 59,700 | | Pacific Brands Ltd. (Australia) | | | 15,833 |
| 9,912 | | Reckitt Benckiser Group PLC (United Kingdom) | | | 384,247 |
| 1,400 | | Snap-on, Inc. | | | 42,252 |
| 1,600 | | Toro Co. (The) | | | 47,376 |
| | | | | |
| | | | | 1,026,415 |
|
Containers & Packaging 0.1% |
| 450 | | Owens & Minor, Inc. | | | 17,897 |
| 3,025 | | Pactiv Corp.* | | | 65,400 |
| 1,600 | | Silgan Holdings, Inc. | | | 73,344 |
| | | | | |
| | | | | 156,641 |
|
Cosmetics & Toiletries 0.1% |
| 4,680 | | Alberto-Culver Co. | | | 114,473 |
|
Distribution/Wholesale 0.2% |
| 26,800 | | Marubeni Corp. (Japan) | | | 95,381 |
| 810 | | MWI Veterinary Supply, Inc.* | | | 16,954 |
| 11,000 | | Sumitomo Corp. (Japan) | | | 99,544 |
| 1,000 | | Watsco, Inc. | | | 33,050 |
| | | | | |
| | | | | 244,929 |
|
Diversified Consumer Services |
| 650 | | Hillenbrand, Inc. | | | 12,019 |
|
Diversified Financial Services 1.3% |
| 52,707 | | Bank of America Corp. | | | 346,812 |
| 11,550 | | Charles Schwab Corp. (The) | | | 156,964 |
| 60,010 | | JPMorgan Chase & Co. | | | 1,530,855 |
| 9,200 | | Redecard SA (Brazil) | | | 104,095 |
| | | | | |
| | | | | 2,138,726 |
See Notes to Financial Statements.
| | |
| 14 | | Visit our website at www.prudential.com |
| | | | | |
| Shares | | Description | | Value (Note 1) |
| | | | | |
COMMON STOCKS (Continued) | | | |
|
Diversified Manufacturing 0.1% |
| 19,800 | | IMI PLC (United Kingdom) | | $ | 77,115 |
| 41,000 | | Tomkins PLC (United Kingdom) | | | 69,963 |
| | | | | |
| | | | | 147,078 |
|
Diversified Operations 0.2% |
| 4,801 | | LVMH Moet Hennessy Louis Vuitton SA (France) | | | 263,130 |
| 5,000 | | Mitsui & Co. Ltd. (Japan) | | | 52,176 |
| | | | | |
| | | | | 315,306 |
|
Diversified Telecommunication Services 0.9% |
| 49,600 | | Verizon Communications, Inc. | | | 1,481,552 |
|
Education 0.1% |
| 1,820 | | DeVry, Inc. | | | 97,515 |
| 1,360 | | New Oriental Education & Technology Group, Inc., ADR (China)* | | | 68,925 |
| | | | | |
| | | | | 166,440 |
|
Electric Utilities 1.7% |
| 4,660 | | Allegheny Energy, Inc. | | | 154,898 |
| 40,187 | | Edison International | | | 1,308,891 |
| 11,800 | | Enel SpA (Italy) | | | 66,402 |
| 1,500 | | Entergy Corp. | | | 114,540 |
| 8,400 | | Exelon Corp. | | | 455,448 |
| 7,722 | | Fortum Oyj (Finland) | | | 151,076 |
| 6,900 | | FPL Group, Inc. | | | 355,695 |
| 1,000 | | Integrys Energy Group, Inc. | | | 41,750 |
| 1,045 | | Westar Energy, Inc. | | | 20,984 |
| | | | | |
| | | | | 2,669,684 |
|
Electrical Equipment |
| 975 | | Smith (A.O.) Corp. | | | 26,793 |
|
Electronic Components 0.5% |
| 2,500 | | Checkpoint Systems, Inc.* | | | 22,375 |
| 1,890 | | Dolby Laboratories, Inc. (Class A Stock)* | | | 48,308 |
| 4,000 | | Emerson Electric Co. | | | 130,800 |
| 2,200 | | FLIR Systems, Inc.* | | | 54,934 |
| 12,000 | | Panasonic Corp. (Japan) | | | 145,592 |
| 11,500 | | Sanmina-SCI Corp.* | | | 3,795 |
| 1,580 | | SunPower Corp. (Class A Stock)* | | | 53,025 |
| 13,475 | | TT Electronics PLC (United Kingdom) | | | 5,858 |
See Notes to Financial Statements.
| | |
| Target Asset Allocation Funds/Target Growth Allocation Fund | | 15 |
Portfolio of Investments
as of January 31, 2009 (Unaudited) continued
| | | | | |
| Shares | | Description | | Value (Note 1) |
| | | | | |
COMMON STOCKS (Continued) | | | |
|
Electronic Components (cont’d.) |
| 7,770 | | Universal Electronics, Inc.* | | $ | 87,646 |
| 4,787 | | Vestas Wind Systems A/S (Denmark)* | | | 233,927 |
| | | | | |
| | | | | 786,260 |
|
Electronic Components & Equipment 0.3% |
| 800 | | Belden CDT, Inc. | | | 10,448 |
| 5,370 | | Coherent, Inc.* | | | 97,143 |
| 4,100 | | Fanuc Ltd. (Japan) | | | 242,979 |
| 4,200 | | Koninklijke Philips Electronics NV (Netherlands) | | | 76,363 |
| 3,350 | | OYO Geospace Corp.* | | | 50,082 |
| | | | | |
| | | | | 477,015 |
|
Electronic Equipment & Instruments 0.3% |
| 12,100 | | Alps Electric Co. Ltd. (Japan) | | | 50,799 |
| 1,160 | | Itron, Inc.* | | | 75,748 |
| 25,175 | | Tyco Electronics Ltd. (Bermuda) | | | 356,478 |
| | | | | |
| | | | | 483,025 |
|
Energy Equipment & Services 0.7% |
| 9,022 | | Diamond Offshore Drilling, Inc. | | | 566,221 |
| 35,200 | | Halliburton Co. | | | 607,200 |
| | | | | |
| | | | | 1,173,421 |
|
Engineering/Construction 0.2% |
| 14,890 | | ABB Ltd., ADR (Switzerland) | | | 194,314 |
| 23,400 | | Downer EDI Ltd. (Australia) | | | 52,028 |
| 675 | | Foster Wheeler Ltd.* | | | 13,480 |
| | | | | |
| | | | | 259,822 |
|
Entertainment & Leisure 1.2% |
| 6,485 | | Bally Technologies, Inc.* | | | 130,932 |
| 12,015 | | Carnival PLC (United Kingdom) | | | 220,959 |
| 5,710 | | DreamWorks Animation SKG, Inc. (Class A Stock)* | | | 125,334 |
| 4,690 | | Hasbro, Inc. | | | 113,170 |
| 96,138 | | Las Vegas Sands Corp.* | | | 495,111 |
| 2,200 | | Life Time Fitness, Inc.* | | | 32,582 |
| 10,210 | | Lions Gate Entertainment Corp. (Canada)* | | | 57,278 |
| 1,395 | | NetFlix, Inc.* | | | 50,415 |
| 1,196 | | Nintendo Co. Ltd. (Japan) | | | 370,778 |
| 4,500 | | OPAP SA (Greece) | | | 131,368 |
See Notes to Financial Statements.
| | |
| 16 | | Visit our website at www.prudential.com |
| | | | | |
| Shares | | Description | | Value (Note 1) |
| | | | | |
COMMON STOCKS (Continued) | | | |
|
Entertainment & Leisure (cont’d.) |
| 14,675 | | Shuffle Master, Inc.* | | $ | 49,748 |
| 9,600 | | Tabcorp Holdings Ltd. (Australia) | | | 39,662 |
| 3,580 | | WMS Industries, Inc.* | | | 79,548 |
| | | | | |
| | | | | 1,896,885 |
|
Environmental Services 0.2% |
| 27,000 | | Centennial Coal Co. Ltd. (Australia) | | | 47,131 |
| 8,025 | | Republic Services, Inc. | | | 207,526 |
| | | | | |
| | | | | 254,657 |
|
Farming & Agriculture 1.3% |
| 25,100 | | AWB Ltd. (Australia) | | | 34,724 |
| 116,367 | | Chaoda Modern Agriculture Holdings Ltd. (Hong Kong) | | | 73,478 |
| 4,475 | | Intrepid Potash, Inc.* | | | 91,201 |
| 25,167 | | Monsanto Co. | | | 1,914,202 |
| | | | | |
| | | | | 2,113,605 |
|
Financial - Bank & Trust 3.5% |
| 2,850 | | Astoria Financial Corp. | | | 25,878 |
| 3,100 | | Banche Popolari Unite ScpA (Italy) | | | 38,700 |
| 13,200 | | Banco Bilbao Vizcaya Argentaria SA (Spain) | | | 123,886 |
| 23,300 | | Banco Santander SA (NYSE) (Spain) | | | 188,546 |
| 3,467 | | Banco Santander SA (XLON) (Spain) | | | 27,757 |
| 27,600 | | Barclays PLC (United Kingdom) | | | 42,437 |
| 8,800 | | BNP Paribas (France) | | | 338,136 |
| 23,500 | | Bradford & Bingley PLC (United Kingdom)* | | | — |
| 124,803 | | China Merchants Bank Co. Ltd. (Class H Stock) (China) | | | 201,533 |
| 6,700 | | Comerica, Inc. | | | 111,622 |
| 5,800 | | Credit Agricole SA (France) | | | 70,847 |
| 6,900 | | Credit Suisse Group AG (Switzerland) | | | 177,512 |
| 3,200 | | Danske Bank A/S (Denmark) | | | 32,429 |
| 100 | | Danvers Bancorp, Inc. | | | 1,259 |
| 3,200 | | Deutsche Bank AG (Germany) | | | 84,813 |
| 3,400 | | Dexia NV/SA (Belgium) | | | 10,687 |
| 2,900 | | East West Bancorp, Inc. | | | 27,521 |
| 12,339 | | Goldman Sachs Group, Inc. (The) | | | 996,127 |
| 4,941 | | Julius Baer Holding AG (Switzerland) | | | 147,306 |
| 33,752 | | Lloyds TSB Group PLC (United Kingdom) | | | 44,365 |
| 10,168 | | National Bank of Greece SA (Greece) | | | 171,591 |
| 5,000 | | Natixis SA (France) | | | 7,842 |
See Notes to Financial Statements.
| | |
| Target Asset Allocation Funds/Target Growth Allocation Fund | | 17 |
Portfolio of Investments
as of January 31, 2009 (Unaudited) continued
| | | | | |
| Shares | | Description | | Value (Note 1) |
| | | | | |
COMMON STOCKS (Continued) | | | |
|
Financial - Bank & Trust (cont’d.) |
| 5,900 | | Nordea Bank AB (Sweden) | | $ | 31,313 |
| 2,200 | | Pacific Capital Bancorp | | | 23,342 |
| 6,610 | | State Street Corp. | | | 153,815 |
| 1,800 | | Sterling Financial Corp. | | | 3,330 |
| 13,000 | | Sumitomo Trust & Banking Co. Ltd. (The) (Japan) | | | 63,745 |
| 2,500 | | SunTrust Banks, Inc. | | | 30,650 |
| 39,502 | | U.S. Bancorp | | | 586,210 |
| 96,410 | | Wells Fargo & Co. | | | 1,822,149 |
| | | | | |
| | | | | 5,585,348 |
|
Financial Services 2.2% |
| 42,200 | | Citigroup, Inc. | | | 149,810 |
| 13,100 | | DnB NOR ASA (Norway) | | | 44,641 |
| 2,700 | | Eaton Vance Corp. | | | 51,678 |
| 4,880 | | First Commonwealth Financial Corp. | | | 46,799 |
| 3,149 | | Franklin Resources, Inc. | | | 152,474 |
| 22,310 | | Hong Kong Exchanges and Clearing Ltd. (Hong Kong) | | | 191,625 |
| 1,790,000 | | Industrial & Commercial Bank of China Ltd. (Class H Stock) (China) | | | 756,804 |
| 2,570 | | Investment Technology Group, Inc.* | | | 55,718 |
| 10,900 | | Irish Life & Permanent PLC (Ireland) | | | 23,028 |
| 3,200 | | Jefferies Group, Inc. | | | 36,928 |
| 1,705 | | Lender Processing Services, Inc. | | | 44,194 |
| 1,800 | | Muenchener Rueckversicherungs AG (Germany) | | | 238,998 |
| 25,000 | | Noble Group Ltd. (Hong Kong) | | | 16,842 |
| 4,247 | | Raymond James Financial, Inc. | | | 78,612 |
| 700 | | Student Loan Corp. (The) | | | 32,858 |
| 29,225 | | Visa, Inc. (Class A Stock) | | | 1,442,254 |
| 10,610 | | Western Union Co. (The) | | | 144,933 |
| | | | | |
| | | | | 3,508,196 |
|
Food 1.3% |
| 11,800 | | Dairy Crest Group PLC (United Kingdom) | | | 34,201 |
| 9,929 | | Groupe Danone (France) | | | 511,699 |
| 950 | | JM Smucker Co. (The) | | | 42,893 |
| 1,700 | | Kellogg Co. | | | 74,273 |
| 2,210 | | Kraft Foods, Inc. (Class A Stock) | | | 61,990 |
| 33,982 | | Nestle SA (Switzerland) | | | 1,177,168 |
| 46,600 | | Northern Foods PLC (United Kingdom) | | | 36,130 |
| 700 | | Ralcorp Holdings, Inc.* | | | 41,454 |
| 2,300 | | Suedzucker AG (Germany) | | | 36,428 |
See Notes to Financial Statements.
| | |
| 18 | | Visit our website at www.prudential.com |
| | | | | |
| Shares | | Description | | Value (Note 1) |
| | | | | |
COMMON STOCKS (Continued) | | | |
|
Food (cont’d.) |
| 17,300 | | Tate & Lyle PLC (United Kingdom) | | $ | 83,361 |
| 825 | | TreeHouse Foods, Inc.* | | | 21,772 |
| | | | | |
| | | | | 2,121,369 |
|
Food & Drug Retailers 1.4% |
| 85,359 | | CVS Caremark Corp. | | | 2,294,450 |
|
Food & Staples Retailing 0.5% |
| 40,200 | | Safeway, Inc. | | | 861,486 |
|
Furniture |
| 9,300 | | Electrolux AB (Class B Stock) (Sweden) | | | 67,256 |
|
Gas Utilities |
| 900 | | Atmos Energy Corp. | | | 22,095 |
|
Healthcare Equipment & Supplies 1.0% |
| 1,980 | | Alcon, Inc. (Switzerland) | | | 169,567 |
| 11,570 | | Baxter International, Inc. | | | 678,580 |
| 6,980 | | Cutera, Inc.* | | | 46,836 |
| 16,750 | | Medtronic, Inc. | | | 560,958 |
| 7,345 | | Thoratec Corp.* | | | 212,785 |
| | | | | |
| | | | | 1,668,726 |
|
Healthcare Providers & Services 0.6% |
| 2,560 | | Amedisys, Inc.* | | | 105,549 |
| 15,300 | | Cardinal Health, Inc. | | | 576,045 |
| 2,150 | | inVentiv Health, Inc.* | | | 20,511 |
| 1,300 | | LHC Group, Inc.* | | | 34,593 |
| 2,755 | | Lincare Holdings, Inc.* | | | 66,258 |
| 8,238 | | UnitedHealth Group, Inc. | | | 233,382 |
| | | | | |
| | | | | 1,036,338 |
|
Healthcare Services 0.8% |
| 10,900 | | Aetna, Inc. | | | 337,900 |
| 2,200 | | AMERIGROUP Corp.* | | | 61,534 |
| 1,075 | | AmSurg Corp.* | | | 21,059 |
| 2,900 | | Astellas Pharma, Inc. (Japan) | | | 109,801 |
| 4,094 | | Biogen Idec, Inc.* | | | 199,173 |
| 6,465 | | Centene Corp.* | | | 114,624 |
| 1,300 | | Covance, Inc.* | | | 50,180 |
| 2,200 | | Fresenius Medical Care AG & Co. KGaA (Germany) | | | 98,618 |
See Notes to Financial Statements.
| | |
| Target Asset Allocation Funds/Target Growth Allocation Fund | | 19 |
Portfolio of Investments
as of January 31, 2009 (Unaudited) continued
| | | | | |
| Shares | | Description | | Value (Note 1) |
| | | | | |
COMMON STOCKS (Continued) | | | |
|
Healthcare Services (cont’d.) |
| 2,925 | | Healthspring, Inc.* | | $ | 50,954 |
| 2,600 | | Healthways, Inc.* | | | 35,932 |
| 3,280 | | Mednax, Inc.* | | | 110,110 |
| 2,875 | | Patterson Cos., Inc.* | | | 52,871 |
| | | | | |
| | | | | 1,242,756 |
|
Hotels, Restaurants & Leisure 3.3% |
| 10,060 | | International Game Technology | | | 106,636 |
| 63,536 | | McDonald’s Corp. | | | 3,686,359 |
| 15,985 | | Wynn Resorts Ltd.* | | | 480,829 |
| 38,734 | | Yum! Brands, Inc. | | | 1,108,567 |
| | | | | |
| | | | | 5,382,391 |
|
Household Durables 0.2% |
| 7,400 | | Alpine Electronics, Inc. (Japan) | | | 52,265 |
| 6,000 | | Fortune Brands, Inc. | | | 192,000 |
| | | | | |
| | | | | 244,265 |
|
Household Products 0.6% |
| 18,000 | | Kimberly-Clark Corp. | | | 926,460 |
|
Industrial Conglomerates 0.6% |
| 10,300 | | 3M Co. | | | 554,037 |
| 25,352 | | CITIC Pacific Ltd. (Hong Kong) | | | 29,803 |
| 575 | | Teleflex, Inc. | | | 30,579 |
| 17,675 | | Tyco International Ltd. (Bermuda) | | | 371,528 |
| | | | | |
| | | | | 985,947 |
|
Industrial Products 0.2% |
| 1,900 | | Harsco Corp. | | | 45,068 |
| 28,200 | | Kurabo Industries Ltd. (Japan) | | | 44,562 |
| 2,200 | | Precision Castparts Corp. | | | 142,890 |
| 2,460 | | Roper Industries, Inc. | | | 101,204 |
| | | | | |
| | | | | 333,724 |
|
Insurance 3.7% |
| 8,735 | | ACE Ltd. (Switzerland) | | | 381,370 |
| 11,800 | | Aegon NV (Netherlands) | | | 62,550 |
| 32,400 | | Allstate Corp. (The) | | | 702,108 |
| 1,450 | | Aspen Insurance Holdings Ltd. (Bermuda) | | | 32,045 |
| 10,500 | | Aviva PLC (United Kingdom) | | | 47,475 |
See Notes to Financial Statements.
| | |
| 20 | | Visit our website at www.prudential.com |
| | | | | |
| Shares | | Description | | Value (Note 1) |
| | | | | |
COMMON STOCKS (Continued) | | | |
|
Insurance (cont’d.) |
| 15,500 | | AXA SA (France) | | $ | 242,420 |
| 1,700 | | Baloise Holding AG (Switzerland) | | | 105,893 |
| 133,200 | | China Life Insurance Co. Ltd. (Class H Stock) (China) | | | 350,579 |
| 10,400 | | Chubb Corp. | | | 442,832 |
| 2,175 | | Delphi Financial Group, Inc. (Class A Stock) | | | 32,995 |
| 1,775 | | Gallagher, (Arthur J.) & Co. | | | 41,837 |
| 17,900 | | Genworth Financial, Inc. (Class A Stock) | | | 41,528 |
| 2,900 | | Hanover Insurance Group, Inc. (The) | | | 117,218 |
| 2,787 | | HCC Insurance Holdings, Inc. | | | 65,244 |
| 10,500 | | ING Groep NV, ADR (Netherlands) | | | 85,800 |
| 1,575 | | IPC Holdings Ltd. (Bermuda) | | | 40,414 |
| 56,600 | | Legal & General Group PLC (United Kingdom) | | | 50,527 |
| 42,621 | | MetLife, Inc. | | | 1,224,501 |
| 49,800 | | Old Mutual PLC (United Kingdom) | | | 37,817 |
| 1,400 | | Protective Life Corp. | | | 11,592 |
| 1,800 | | State Auto Financial Corp. | | | 39,780 |
| 9,393 | | Swiss Reinsurance (Switzerland) | | | 250,556 |
| 27,300 | | Travelers Cos., Inc. (The) | | | 1,054,872 |
| 1,875 | | United Fire & Casualty Co. | | | 37,594 |
| 8,600 | | Unum Group | | | 121,776 |
| 24,200 | | XL Capital Ltd. (Class A Stock) (Bermuda) | | | 70,180 |
| 1,000 | | Zurich Financial Services AG (Switzerland) | | | 181,050 |
| | | | | |
| | | | | 5,872,553 |
|
Internet Services 1.2% |
| 1,500 | | Digital River, Inc.* | | | 37,155 |
| 4,316 | | Google, Inc. (Class A Stock)* | | | 1,461,096 |
| 15,230 | | Intel Corp. | | | 196,467 |
| 4,885 | | Internet Capital Group, Inc.* | | | 21,054 |
| 24,080 | | TIBCO Software, Inc.* | | | 128,828 |
| | | | | |
| | | | | 1,844,600 |
|
Internet Software & Services 0.9% |
| 1,000 | | Amazon.com, Inc.* | | | 58,820 |
| 1,000 | | Baidu, Inc., ADR (China)* | | | 127,160 |
| 15,200 | | eBay, Inc.* | | | 182,704 |
| 37,483 | | Oracle Corp.* | | | 630,839 |
| 23,000 | | VeriSign, Inc.* | | | 444,130 |
| 4,300 | | Yahoo!, Inc.* | | | 50,439 |
| | | | | |
| | | | | 1,494,092 |
See Notes to Financial Statements.
| | |
| Target Asset Allocation Funds/Target Growth Allocation Fund | | 21 |
Portfolio of Investments
as of January 31, 2009 (Unaudited) continued
| | | | | |
| Shares | | Description | | Value (Note 1) |
| | | | | |
COMMON STOCKS (Continued) | | | |
|
IT Services 0.1% |
| 1,200 | | CACI International, Inc. (Class A Stock)* | | $ | 54,180 |
| 66,400 | | Logica PLC (United Kingdom) | | | 63,269 |
| 6,225 | | SRA International, Inc. (Class A Stock)* | | | 101,654 |
| | | | | |
| | | | | 219,103 |
|
Life Science Tools & Services 0.3% |
| 11,630 | | Thermo Fisher Scientific, Inc.* | | | 417,866 |
|
Machinery 0.8% |
| 1,250 | | Actuant Corp. (Class A Stock) | | | 20,600 |
| 3,550 | | Bucyrus International, Inc. | | | 55,025 |
| 22,300 | | Caterpillar, Inc. | | | 687,955 |
| 4,800 | | Cummins, Inc. | | | 115,104 |
| 1,450 | | General Cable Corp.* | | | 23,867 |
| 3,500 | | Heidelberger Druckmaschinen AG (Germany) | | | 13,668 |
| 850 | | Kaydon Corp. | | | 23,120 |
| 825 | | Lincoln Electric Holdings, Inc. | | | 33,965 |
| 9,300 | | PACCAR, Inc. | | | 245,427 |
| 300 | | Rieter Holding AG (Switzerland) | | | 33,857 |
| 675 | | Rofin-Sinar Technologies, Inc.* | | | 11,401 |
| | | | | |
| | | | | 1,263,989 |
|
Machinery & Equipment 0.2% |
| 7,866 | | Deere & Co. | | | 273,265 |
| 425 | | Lindsay Corp. | | | 11,050 |
| 350 | | Nordson Corp. | | | 10,573 |
| 8,600 | | Volvo AB (Class B Stock) (Sweden) | | | 34,541 |
| | | | | |
| | | | | 329,429 |
|
Machinery - Construction & Mining 0.1% |
| 12,049 | | Komatsu Ltd. (Japan) | | | 124,390 |
|
Manufacturing 0.5% |
| 11,530 | | Danaher Corp. | | | 644,873 |
| 16,000 | | General Electric Co. | | | 194,080 |
| 4,600 | | Hexcel Corp.* | | | 38,134 |
| | | | | |
| | | | | 877,087 |
|
Materials 0.1% |
| 1,600 | | Potash Corp. of Saskatchewan, Inc. (Canada) | | | 119,776 |
See Notes to Financial Statements.
| | |
| 22 | | Visit our website at www.prudential.com |
| | | | | |
| Shares | | Description | | Value (Note 1) |
| | | | | |
COMMON STOCKS (Continued) | | | |
|
Media 1.1% |
| 7,344 | | British Sky Broadcasting Group PLC (United Kingdom) | | $ | 52,895 |
| 40,000 | | CBS Corp. (Class B Stock) | | | 228,800 |
| 33,400 | | Comcast Corp. (Class A Stock) | | | 489,310 |
| 10,795 | | Entravision Communications Corp. (Class A Stock)* | | | 9,068 |
| 50,100 | | Time Warner, Inc. | | | 467,433 |
| 18,141 | | Walt Disney Co. (The) | | | 375,156 |
| 3,330 | | Wiley, (John) & Sons, Inc. (Class A Stock) | | | 117,982 |
| | | | | |
| | | | | 1,740,644 |
|
Medical Supplies & Equipment 1.1% |
| 1,530 | | Becton, Dickinson and Co. | | | 111,185 |
| 23,731 | | Boston Scientific Corp.* | | | 210,494 |
| 6,373 | | Covidien Ltd. | | | 244,341 |
| 875 | | Myriad Genetics, Inc.* | | | 65,249 |
| 3,675 | | Quality Systems, Inc. | | | 137,004 |
| 3,695 | | ResMed, Inc.* | | | 147,431 |
| 43,700 | | Smith & Nephew PLC (United Kingdom) | | | 315,698 |
| 8,050 | | St. Jude Medical, Inc.* | | | 292,779 |
| 3,500 | | Stryker Corp. | | | 147,840 |
| 610 | | SurModics, Inc.* | | | 12,096 |
| 2,675 | | Vital Images, Inc.* | | | 30,254 |
| | | | | |
| | | | | 1,714,371 |
|
Metals & Mining 1.1% |
| 35,800 | | Alcoa, Inc. | | | 278,882 |
| 3,020 | | Alpha Natural Resources, Inc.* | | | 49,286 |
| 4,608 | | BHP Billiton Ltd., ADR (Australia) | | | 172,984 |
| 3,737 | | BHP Billiton PLC (United Kingdom) | | | 63,959 |
| 23,600 | | BlueScope Steel Ltd. (Australia) | | | 51,875 |
| 4,150 | | Cliffs Natural Resources, Inc. | | | 96,156 |
| 6,800 | | Kyoei Steel Ltd. (Japan) | | | 114,210 |
| 3,215 | | Northwest Pipe Co.* | | | 113,361 |
| 11,210 | | Nucor Corp. | | | 457,256 |
| 37,998 | | OZ Minerals Ltd. (Australia) | | | 13,279 |
| 5,700 | | Peabody Energy Corp. | | | 142,500 |
| 3,300 | | Rautaruukki Oyj (Finland) | | | 52,605 |
| 1,800 | | Steel Dynamics, Inc. | | | 19,116 |
| 4,500 | | ThyssenKrupp AG (Germany) | | | 91,843 |
| 2,600 | | Timken Co. | | | 38,714 |
| | | | | |
| | | | | 1,756,026 |
See Notes to Financial Statements.
| | |
| Target Asset Allocation Funds/Target Growth Allocation Fund | | 23 |
Portfolio of Investments
as of January 31, 2009 (Unaudited) continued
| | | | | |
| Shares | | Description | | Value (Note 1) |
| | | | | |
COMMON STOCKS (Continued) | | | |
|
Miscellaneous Manufacturing |
| 9,900 | | AGFA-Gevaert NV (Belgium)* | | $ | 34,859 |
|
Multi-Line Retail 0.2% |
| 14,700 | | JC Penney Co., Inc. | | | 246,225 |
|
Multi-Utilities 0.7% |
| 11,000 | | Dominion Resources, Inc. | | | 386,980 |
| 17,200 | | Public Service Enterprise Group, Inc. | | | 543,004 |
| 850 | | Vectren Corp. | | | 21,921 |
| 4,000 | | Wisconsin Energy Corp. | | | 178,320 |
| | | | | |
| | | | | 1,130,225 |
|
Multimedia 0.3% |
| 20,127 | | Vivendi (France) | | | 520,821 |
|
Office Electronics 0.3% |
| 77,900 | | Xerox Corp. | | | 517,256 |
|
Office Equipment 0.1% |
| 8,600 | | Oce NV (Netherlands) | | | 22,243 |
| 15,700 | | Ricoh Co. Ltd. (Japan) | | | 191,598 |
| | | | | |
| | | | | 213,841 |
|
Oil & Gas 0.5% |
| 21,300 | | Centrica PLC (United Kingdom) | | | 79,639 |
| 10,268 | | Hess Corp. | | | 571,004 |
| 800 | | Oil States International, Inc.* | | | 14,648 |
| 5,300 | | StatoilHydro ASA (Norway) | | | 91,606 |
| | | | | |
| | | | | 756,897 |
|
Oil & Gas Exploration/Production |
| 5,300 | | Gazprom OAO, ADR (Russia) | | | 68,741 |
|
Oil, Gas & Consumable Fuels 8.3% |
| 1,408 | | Air Liquide (France) | | | 102,822 |
| 8,603 | | Anadarko Petroleum Corp. | | | 316,074 |
| 13,536 | | Apache Corp. | | | 1,015,200 |
| 1,100 | | Arena Resources, Inc.* | | | 26,796 |
| 1,425 | | Atwood Oceanics, Inc.* | | | 23,726 |
| 55,200 | | BP PLC (United Kingdom) | | | 395,577 |
| 3,100 | | Cabot Oil & Gas Corp. | | | 85,219 |
| 4,400 | | Canadian Natural Resources Ltd. (Canada) | | | 157,485 |
See Notes to Financial Statements.
| | |
| 24 | | Visit our website at www.prudential.com |
| | | | | |
| Shares | | Description | | Value (Note 1) |
| | | | | |
COMMON STOCKS (Continued) | | | |
|
Oil, Gas & Consumable Fuels (cont’d.) |
| 3,800 | | Canadian Oil Sands Trust (Canada) | | $ | 57,949 |
| 22,393 | | Chevron Corp. | | | 1,579,154 |
| 1,150 | | Concho Resources, Inc.* | | | 29,003 |
| 32,600 | | ConocoPhillips | | | 1,549,478 |
| 885 | | Core Laboratories NV (Netherlands) | | | 59,463 |
| 200 | | Cosmo Oil Co. Ltd. (Japan) | | | 532 |
| 3,910 | | Denbury Resources, Inc.* | | | 47,858 |
| 6,035 | | Devon Energy Corp. | | | 371,756 |
| 11,500 | | ENI SpA (Italy) | | | 245,016 |
| 1,800 | | Equitable Resources, Inc. | | | 61,614 |
| 9,460 | | Exxon Mobil Corp. | | | 723,501 |
| 2,259 | | Headwaters, Inc.* | | | 10,233 |
| 3,470 | | Lufkin Industries, Inc. | | | 121,277 |
| 30,000 | | Marathon Oil Corp. | | | 816,900 |
| 29,500 | | Nippon Oil Corp. (Japan) | | | 128,187 |
| 10,000 | | Norsk Hydro ASA (Norway) | | | 35,810 |
| 9,605 | | Occidental Petroleum Corp. | | | 523,953 |
| 1,500 | | ONEOK, Inc. | | | 43,830 |
| 21,978 | | Petroleo Brasileiro SA, ADR (Brazil) | | | 575,824 |
| 2,500 | | Plains Exploration & Production Co.* | | | 52,800 |
| 6,500 | | Repsol YPF SA (Spain) | | | 116,849 |
| 18,000 | | Royal Dutch Shell PLC (Class B Stock) (Netherlands) | | | 432,497 |
| 12,700 | | Royal Dutch Shell PLC, ADR (Netherlands) | | | 607,441 |
| 12,486 | | Schlumberger Ltd. (Netherlands) | | | 509,554 |
| 4,140 | | Southwestern Energy Co.* | | | 131,031 |
| 2,200 | | St. Mary Land & Exploration Co. | | | 42,570 |
| 2,300 | | Swift Energy Co.* | | | 35,236 |
| 2,000 | | Total SA (France) | | | 100,319 |
| 23,684 | | Transocean Ltd. (Switzerland)* | | | 1,293,620 |
| 3,400 | | Weatherford International Ltd.* | | | 37,502 |
| 1,700 | | WGL Holdings, Inc. | | | 54,570 |
| 20,692 | | XTO Energy, Inc. | | | 767,466 |
| | | | | |
| | | | | 13,285,692 |
|
Paper & Forest Products 0.1% |
| 42,200 | | DS Smith PLC (United Kingdom) | | | 49,536 |
| 15,000 | | International Paper Co. | | | 136,800 |
| 2,450 | | Owens-Illinois, Inc.* | | | 46,550 |
| | | | | |
| | | | | 232,886 |
See Notes to Financial Statements.
| | |
| Target Asset Allocation Funds/Target Growth Allocation Fund | | 25 |
Portfolio of Investments
as of January 31, 2009 (Unaudited) continued
| | | | | |
| Shares | | Description | | Value (Note 1) |
| | | | | |
COMMON STOCKS (Continued) | | | |
|
Pharmaceuticals 8.0% |
| 19,810 | | Abbott Laboratories | | $ | 1,098,267 |
| 7,410 | | Allergan, Inc. | | | 282,469 |
| 12,710 | | American Medical Systems Holdings, Inc.* | | | 135,997 |
| 8,898 | | Amgen, Inc.* | | | 488,055 |
| 8,100 | | AstraZeneca PLC (United Kingdom) | | | 313,534 |
| 3,305 | | BioMarin Pharmaceutical, Inc.* | | | 63,654 |
| 12,400 | | Bristol-Myers Squibb Co. | | | 265,484 |
| 1,520 | | Cephalon, Inc.* | | | 117,314 |
| 3,925 | | Cubist Pharmaceuticals, Inc.* | | | 84,034 |
| 2,700 | | Daiichi Sankyo Co. Ltd. (Japan) | | | 60,625 |
| 30,800 | | Eli Lilly & Co. | | | 1,134,056 |
| 10,200 | | GlaxoSmithKline PLC (United Kingdom) | | | 180,264 |
| 6,800 | | H. Lundbeck A/S (Denmark) | | | 142,497 |
| 2,665 | | Herbalife Ltd. | | | 54,659 |
| 28,458 | | Johnson & Johnson | | | 1,641,742 |
| 6,330 | | Medco Health Solutions, Inc.* | | | 284,407 |
| 28,700 | | Merck & Co., Inc. | | | 819,385 |
| 6,467 | | Novartis AG (Switzerland) | | | 268,069 |
| 10,900 | | Novo Nordisk A/S (Class B Stock) (Denmark) | | | 585,075 |
| 795 | | Onyx Pharmaceuticals, Inc.* | | | 24,192 |
| 91,600 | | Pfizer, Inc. | | | 1,335,528 |
| 2,700 | | Pharmaceutical Product Development, Inc. | | | 64,503 |
| 3,273 | | Roche Holding AG (Switzerland) | | | 461,081 |
| 5,600 | | Sanofi-Aventis SA (France) | | | 316,098 |
| 49,965 | | Schering-Plough Corp. | | | 877,386 |
| 1,300 | | Takeda Pharmaceutical Co. Ltd. (Japan) | | | 60,916 |
| 18,976 | | Teva Pharmaceutical Industries Ltd., ADR (Israel) | | | 786,555 |
| 21,790 | | Wyeth | | | 936,316 |
| | | | | |
| | | | | 12,882,162 |
|
Professional Services |
| 1,450 | | Watson Wyatt Worldwide, Inc. (Class A Stock) | | | 67,425 |
|
Real Estate |
| 36,100 | | Beazley Group PLC (United Kingdom) | | | 66,964 |
|
Real Estate Investment Trusts 0.4% |
| 4,426 | | AvalonBay Communities, Inc. | | | 229,294 |
| 7,950 | | MFA Mortgage Investments, Inc. | | | 45,554 |
| 6,700 | | Simon Property Group, Inc. | | | 287,966 |
| | | | | |
| | | | | 562,814 |
See Notes to Financial Statements.
| | |
| 26 | | Visit our website at www.prudential.com |
| | | | | |
| Shares | | Description | | Value (Note 1) |
| | | | | |
COMMON STOCKS (Continued) | | | |
| |
Restaurants 0.1% | | | |
| 6,340 | | BJ’s Restaurants, Inc.* | | $ | 70,374 |
| 2,050 | | Brinker International, Inc. | | | 22,488 |
| 2,471 | | Wendy’s/Arby’s Group, Inc. (Class A Stock) | | | 12,454 |
| | | | | |
| | | | | 105,316 |
| |
Retail & Merchandising 3.8% | | | |
| 1,350 | | Abercrombie & Fitch Co. (Class A Stock) | | | 24,098 |
| 6,639 | | Cash America International, Inc. | | | 121,361 |
| 17,440 | | Costco Wholesale Corp. | | | 785,323 |
| 69,600 | | DSG International PLC (United Kingdom) | | | 22,190 |
| 2,480 | | GameStop Corp. (Class A Stock)* | | | 61,454 |
| 8,555 | | Genesco, Inc.* | | | 131,747 |
| 9,628 | | Hennes & Mauritz AB (Class B Stock) (Sweden) | | | 372,886 |
| 4,100 | | Kohl’s Corp.* | | | 150,511 |
| 69,102 | | Lowe’s Cos., Inc. | | | 1,262,494 |
| 2,700 | | Rallye SA (France) | | | 54,068 |
| 3,950 | | School Specialty, Inc.* | | | 65,175 |
| 5,175 | | Sonic Corp.* | | | 50,404 |
| 31,040 | | Staples, Inc. | | | 494,778 |
| 19,460 | | Target Corp. | | | 607,152 |
| 7,690 | | TJX Cos., Inc. | | | 149,340 |
| 3,000 | | UNY Co. Ltd. (Japan) | | | 24,936 |
| 122,900 | | Wal-Mart de Mexico SAB de CV (Class V Stock) (Mexico) | | | 256,539 |
| 25,597 | | Wal-Mart Stores, Inc. | | | 1,206,131 |
| 11,720 | | Walgreen Co. | | | 321,245 |
| | | | | |
| | | | | 6,161,832 |
| |
Retailers - Food & Drug 0.3% | | | |
| 23,921 | | Kroger Co. (The) | | | 538,222 |
| |
Road & Rail 0.4% | | | |
| 9,700 | | Burlington Northern Santa Fe Corp. | | | 642,625 |
| 450 | | Landstar System, Inc. | | | 16,141 |
| | | | | |
| | | | | 658,766 |
| |
Semiconductor Components 0.1% | | | |
| 92,100 | | ARM Holdings PLC (United Kingdom) | | | 122,459 |
| |
Semiconductors 0.3% | | | |
| 16,880 | | Marvell Technology Group Ltd. (Bermuda)* | | | 123,055 |
| 3,650 | | Microsemi Corp.* | | | 30,660 |
| 10,800 | | Texas Instruments, Inc. | | | 161,460 |
See Notes to Financial Statements.
| | |
| Target Asset Allocation Funds/Target Growth Allocation Fund | | 27 |
Portfolio of Investments
as of January 31, 2009 (Unaudited) continued
| | | | | |
| Shares | | Description | | Value (Note 1) |
| | | | | |
COMMON STOCKS (Continued) | | | |
| |
Semiconductors (cont’d.) | | | |
| 5,740 | | Varian Semiconductor Equipment Associates, Inc.* | | $ | 109,290 |
| | | | | |
| | | | | 424,465 |
| |
Semiconductors & Semiconductor Equipment 0.2% | | | |
| 5,795 | | Advanced Energy Industries, Inc.* | | | 52,039 |
| 3,700 | | Broadcom Corp. (Class A Stock)* | | | 58,645 |
| 880 | | Hittite Microwave Corp.* | | | 22,546 |
| 5,840 | | Linear Technology Corp. | | | 136,773 |
| | | | | |
| | | | | 270,003 |
| |
Software 1.4% | | | |
| 3,100 | | ANSYS, Inc.* | | | 77,066 |
| 11,100 | | BMC Software, Inc.* | | | 281,163 |
| 36,805 | | CA, Inc. | | | 662,122 |
| 3,000 | | Citrix Systems, Inc. | | | 63,120 |
| 14,390 | | Eclipsys Corp.* | | | 126,056 |
| 6,070 | | Electronic Arts, Inc.* | | | 93,721 |
| 10,630 | | McAfee, Inc.* | | | 324,109 |
| 14,310 | | Nuance Communications, Inc.* | | | 141,097 |
| 5,580 | | Research In Motion Ltd.* (Canada) | | | 309,132 |
| 2,675 | | Sybase, Inc.* | | | 73,054 |
| 3,000 | | Tyler Technologies, Inc.* | | | 37,770 |
| | | | | |
| | | | | 2,188,410 |
| |
Specialty Retail 1.0% | | | |
| 3,030 | | Aaron Rents, Inc. | | | 66,236 |
| 7,000 | | AutoNation, Inc.* | | | 64,960 |
| 12,670 | | Best Buy Co., Inc. | | | 355,013 |
| 5,800 | | CarMax, Inc.* | | | 47,966 |
| 14,900 | | Gap, Inc. (The) | | | 168,072 |
| 38,630 | | Home Depot, Inc. (The) | | | 831,704 |
| 7,100 | | Limited Brands, Inc. | | | 56,232 |
| | | | | |
| | | | | 1,590,183 |
| |
Steel Producers/Products | | | |
| 2,400 | | Voestalpine AG (Austria) | | | 46,770 |
| |
Telecommunication Services | | | |
| 3,700 | | Syniverse Holdings, Inc.* | | | 50,172 |
| |
Telecommunications 4.2% | | | |
| 9,200 | | Amdocs Ltd.* (Guernsey) | | | 155,664 |
See Notes to Financial Statements.
| | |
| 28 | | Visit our website at www.prudential.com |
| | | | | |
| Shares | | Description | | Value (Note 1) |
| | | | | |
COMMON STOCKS (Continued) | | | |
| |
Telecommunications (cont’d.) | | | |
| 9,100 | | America Movil SAB de CV, ADR (Class L Stock) (Mexico) | | $ | 259,441 |
| 6,000 | | Arris Group, Inc.* | | | 42,720 |
| 57,100 | | AT&T, Inc. | | | 1,405,802 |
| 88,200 | | BT Group PLC (United Kingdom) | | | 134,082 |
| 32,512 | | China Mobile Ltd. (Hong Kong) | | | 292,666 |
| 38,140 | | Cisco Systems, Inc.* | | | 570,956 |
| 8,345 | | EMS Technologies, Inc.* | | | 200,280 |
| 18,469 | | France Telecom SA (France) | | | 415,252 |
| 1,460 | | Juniper Networks, Inc.* | | | 20,674 |
| 7,150 | | MetroPCS Communications, Inc.* | | | 97,168 |
| 95,490 | | MobileOne Ltd. (Singapore) | | | 102,108 |
| 4,000 | | Nippon Telegraph & Telephone Corp. (Japan) | | | 193,728 |
| 22,663 | | Nokia Oyj (Finland) | | | 278,278 |
| 70 | | NTT DoCoMo, Inc. (Japan) | | | 121,944 |
| 10,300 | | Portugal Telecom SGPS SA (Portugal)* | | | 83,085 |
| 38,628 | | QUALCOMM, Inc. | | | 1,334,597 |
| 2,700 | | SBA Communications Corp. (Class A Stock)* | | | 53,730 |
| 700 | | Swisscom AG (Switzerland) | | | 220,730 |
| 60,000 | | Telecom Italia SpA (Italy) | | | 74,019 |
| 20,700 | | Telefonica SA (Spain) | | | 369,203 |
| 13,800 | | Vodafone Group PLC (United Kingdom) | | | 25,938 |
| 17,790 | | Vodafone Group PLC, ADR (United Kingdom) | | | 330,716 |
| | | | | |
| | | | | 6,782,781 |
| |
Textiles, Apparel & Luxury Goods 0.1% | | | |
| 3,225 | | Hanesbrands, Inc.* | | | 28,993 |
| 14,100 | | Jones Apparel Group, Inc. | | | 48,786 |
| | | | | |
| | | | | 77,779 |
| |
Thrifts & Mortgage Finance | | | |
| 58,000 | | Washington Mutual, Inc. | | | — |
| |
Tobacco 1.6% | | | |
| 46,400 | | Altria Group, Inc. | | | 767,456 |
| 4,871 | | British American Tobacco PLC (United Kingdom) | | | 134,121 |
| 5,000 | | Lorillard, Inc. | | | 297,300 |
| 38,900 | | Philip Morris International, Inc. | | | 1,445,135 |
| | | | | |
| | | | | 2,644,012 |
| |
Transportation 1.9% | | | |
| 7,200 | | Canadian National Railway Co. (Canada) | | | 252,301 |
See Notes to Financial Statements.
| | |
| Target Asset Allocation Funds/Target Growth Allocation Fund | | 29 |
Portfolio of Investments
as of January 31, 2009 (Unaudited) continued
| | | | | | |
| Shares | | Description | | Value (Note 1) | |
| | | | | | |
COMMON STOCKS (Continued) | | | | |
| |
Transportation (cont’d.) | | | | |
| 5,780 | | J.B. Hunt Transport Services, Inc. | | $ | 128,721 | |
| 51,900 | | Neptune Orient Lines Ltd. (Singapore) | | | 37,843 | |
| 19,190 | | Norfolk Southern Corp. | | | 736,128 | |
| 19,908 | | Orient Overseas International Ltd. (Hong Kong) | | | 46,871 | |
| 41,932 | | Union Pacific Corp. | | | 1,836,202 | |
| | | | | | |
| | | | | 3,038,066 | |
| |
Utilities 0.7% | | | | |
| 10,967 | | E.ON AG (Germany) | | | 354,422 | |
| 10,757 | | FirstEnergy Corp. | | | 537,742 | |
| 6,464 | | PG&E Corp. | | | 249,963 | |
| | | | | | |
| | | | | 1,142,127 | |
| | | | | | |
| | TOTAL COMMON STOCKS
(cost $191,834,287) | | | 152,208,026 | |
| | | | | | |
PREFERRED STOCK 0.1% | | | | |
| |
Financial - Bank & Trust 0.1% | | | | |
| 7,125 | | Wells Fargo & Co. Series J, 8.00%, CVT
(cost $136,952) | | | 129,675 | |
RIGHTS* | | | | | | |
| |
Financial Services | | | | |
| 5,600 | | Fortis, expiring 03/09/09 (Belgium)
(cost $0) | | | — | |
| | | | | | |
| | TOTAL LONG-TERM INVESTMENTS
(cost $191,971,239) | | | 152,337,701 | |
| | | | | | |
SHORT-TERM INVESTMENT 5.6% | | | | |
| |
Affiliated Money Market Mutual Fund | | | | |
| 9,003,352 | | Dryden Core Investment Fund-Taxable Money Market Series
(cost $9,003,352)(a) | | | 9,003,352 | |
| | | | | | |
| | TOTAL INVESTMENTS(b) 100.3%
(cost $200,974,591; Note 5) | | | 161,341,053 | |
| | Liabilities in excess of other assets(c) (0.3%) | | | (448,741 | ) |
| | | | | | |
| | NET ASSETS 100% | | $ | 160,892,312 | |
| | | | | | |
The following abbreviations are used in Portfolio descriptions:
ADR—American Depositary Receipt
See Notes to Financial Statements.
| | |
| 30 | | Visit our website at www.prudential.com |
CVT—Convertible Security
NYSE—New York Stock Exchange
XLON—London Stock Exchange
AUD—Australian Dollar
EUR—Euro
GBP—British Pound
MXN—Mexico Peso
| * | Non-income producing security. |
| (a) | Prudential Investments LLC, the manager of the fund also serves as manager of the Dryden Core Investment Fund—Taxable Money Market Series. |
| (b) | As of January 31, 2009, 61 securities representing $6,754,072 and 4.2% of net assets were fair valued in accordance with the policies adopted by the Board of Trustees. |
| (c) | Liabilities in excess of other assets include net unrealized appreciation (depreciation) on foreign currency exchange contracts of: |
Forward foreign currency exchange contracts outstanding at January 31, 2009:
| | | | | | | | | | | | | |
Purchase Contracts | | Notional
Amount
(000) | | Value at
Settlement Date
Payable | | Current
Value | | Unrealized
Appreciation
(Depreciation) | |
British Pound,
Expiring 02/03/09 | | GBP | 2 | | $ | 2,765 | | $ | 2,798 | | $ | 33 | |
Euro,
Expiring 06/16/09 | | EUR | 741 | | | 1,013,762 | | | 947,741 | | | (66,021 | ) |
Mexican Peso,
Expiring 05/29/09 | | MXN | 1,220 | | | 85,470 | | | 83,027 | | | (2,443 | ) |
| | | | | | | | | | | | | |
| | | | | $ | 1,101,997 | | $ | 1,033,566 | | $ | (68,431 | ) |
| | | | | | | | | | | | | |
| | | | | | | | | | | | |
Sale Contracts | | Notional
Amount
(000) | | Value at
Settlement Date
Receivable | | Current
Value | | Unrealized
Appreciation |
Australia Dollar,
Expiring 02/03/09 | | AUD | 4 | | $ | 2,765 | | $ | 2,688 | | $ | 77 |
British Pound,
Expiring 06/19/09 | | GBP | 185 | | | 283,522 | | | 267,955 | | | 15,567 |
Euro,
Expiring 06/16/09 | | EUR | 1,139 | | | 1,518,141 | | | 1,456,785 | | | 61,356 |
Mexican Peso,
Expiring 05/29/09 | | MXN | 7,300 | | | 512,910 | | | 496,804 | | | 16,106 |
| | | | | | | | | | | | |
| | | | | $ | 2,317,338 | | $ | 2,224,232 | | $ | 93,106 |
| | | | | | | | | | | | |
See Notes to Financial Statements.
| | |
| Target Asset Allocation Funds/Target Growth Allocation Fund | | 31 |
Portfolio of Investments
as of January 31, 2009 (Unaudited) continued
Various inputs are used in determining the value of the Fund's investments. These inputs are summarized in the three broad levels listed below.
Level 1—quoted prices in active markets for identical securities
Level 2—other significant observable inputs (including quoted prices for similar securities, interest rates, prepayment speeds, credit risk, etc.)
Level 3—significant unobservable inputs (including the Fund's own assumptions in determining the fair value of investments)
The following is a summary of the inputs used as of January 31, 2009 in valuing the Fund's assets carried at fair value:
| | | | | | |
Valuation inputs | | Investments
in Securities | | Other Financial
Instruments* |
Level 1—Quoted Prices | | $ | 154,586,981 | | | — |
Level 2—Other Significant Observable Inputs | | | 6,740,793 | | $ | 24,675 |
Level 3—Significant Unobservable Inputs | | | 13,279 | | | — |
| | | | | | |
Total | | $ | 161,341,053 | | $ | 24,675 |
| | | | | | |
| * | Other financial instruments are derivative instruments not reflected in the Portfolio of Investments, such as futures, forwards and swap contracts, which are valued at the unrealized appreciation/depreciation on the instrument. |
The following is a reconciliation of assets in which significant unobservable inputs (Level 3) were used in determining fair value:
| | | | |
| | | Investments
in Securities | |
Balance as of 7/31/08 | | | — | |
Accrued discounts/premiums | | | — | |
Realized gain (loss) | | $ | (424,225 | ) |
Change in unrealized appreciation (depreciation) | | | (82,325 | ) |
Net purchases (sales) | | | (141,921 | ) |
Transfers in and/or out of Level 3 | | | 661,750 | |
| | | | |
Balance as of 1/31/09 | | $ | 13,279 | |
| | | | |
See Notes to Financial Statements.
| | |
| 32 | | Visit our website at www.prudential.com |
The industry classification of investments and liabilities in excess of other assets shown as a percentage of net assets as January 31, 2009 were as follows:
| | | |
Oil, Gas & Consumable Fuels | | 8.3 | % |
Pharmaceuticals | | 8.0 | |
Affiliated Money Market Mutual Fund | | 5.6 | |
Telecommunications | | 4.2 | |
Aerospace & Defense | | 4.2 | |
Retail & Merchandising | | 3.8 | |
Insurance | | 3.7 | |
Financial—Bank & Trust | | 3.6 | |
Biotechnology | | 3.5 | |
Hotels, Restaurants & Leisure | | 3.3 | |
Computer Hardware | | 3.3 | |
Chemicals | | 2.5 | |
Financial Services | | 2.2 | |
Transportation | | 1.9 | |
Electric Utilities | | 1.7 | |
Tobacco | | 1.6 | |
Computer Services & Software | | 1.6 | |
Food & Drug Retailers | | 1.4 | |
Software | | 1.4 | |
Diversified Financial Services | | 1.3 | |
Food | | 1.3 | |
Farming & Agriculture | | 1.3 | |
Entertainment & Leisure | | 1.2 | |
Business Services | | 1.2 | |
Internet Services | | 1.2 | |
Metals & Mining | | 1.1 | |
Media | | 1.1 | |
Medical Supplies & Equipment | | 1.1 | |
Healthcare Equipment & Supplies | | 1.0 | |
Specialty Retail | | 1.0 | |
Internet Software & Services | | 0.9 | |
Diversified Telecommunication Services | | 0.9 | |
Clothing & Apparel | | 0.8 | |
Machinery | | 0.8 | |
Healthcare Services | | 0.8 | |
Energy Equipment & Services | | 0.7 | |
Commercial Banks | | 0.7 | |
Utilities | | 0.7 | |
Multi-Utilities | | 0.7 | |
Banks | | 0.7 | |
Healthcare Providers & Services | | 0.6 | |
Consumer Products & Services | | 0.6 | |
Industrial Conglomerates | | 0.6 | |
Commercial Services & Supplies | | 0.6 | |
Automobile Manufacturers | | 0.6 | |
Household Products | | 0.6 | |
See Notes to Financial Statements.
| | |
| Target Asset Allocation Funds/Target Growth Allocation Fund | | 33 |
Portfolio of Investments
as of January 31, 2009 (Unaudited) continued
| | | |
Industry (cont’d.) | | | |
Manufacturing | | 0.5 | % |
Food & Staples Retailing | | 0.5 | |
Beverages | | 0.5 | |
Electronic Components | | 0.5 | |
Oil & Gas | | 0.5 | |
Commercial Services | | 0.5 | |
Road & Rail | | 0.4 | |
Real Estate Investment Trusts | | 0.4 | |
Retailers—Food & Drug | | 0.3 | |
Multimedia | | 0.3 | |
Office Electronics | | 0.3 | |
Electronic Equipment & Instruments | | 0.3 | |
Electronic Components & Equipment | | 0.3 | |
Semiconductors | | 0.3 | |
Life Science Tools & Services | | 0.3 | |
Automotive Parts | | 0.2 | |
Cable Television | | 0.2 | |
Industrial Products | | 0.2 | |
Machinery & Equipment | | 0.2 | |
Airlines | | 0.2 | |
Diversified Operations | | 0.2 | |
Semiconductors & Semiconductor Equipment | | 0.2 | |
Engineering/Construction | | 0.2 | |
Environmental Services | | 0.2 | |
Multi-Line Retail | | 0.2 | |
Distribution/Wholesale | | 0.2 | |
Household Durables | | 0.2 | |
Paper & Forest Products | | 0.1 | |
Communications Equipment | | 0.1 | |
IT Services | | 0.1 | |
Office Equipment | | 0.1 | |
Auto/Trucks Parts & Equipment | | 0.1 | |
Automobiles | | 0.1 | |
Air Freight & Couriers | | 0.1 | |
Auto Components | | 0.1 | |
Education | | 0.1 | |
Computers | | 0.1 | |
Containers & Packaging | | 0.1 | |
Diversified Manufacturing | | 0.1 | |
Machinery—Construction & Mining | | 0.1 | |
Semiconductor Components | | 0.1 | |
Materials | | 0.1 | |
Building Materials | | 0.1 | |
Cosmetics & Toiletries | | 0.1 | |
Construction | | 0.1 | |
Restaurants | | 0.1 | |
Capital Markets | | 0.1 | |
Textiles, Apparel & Luxury Goods | | 0.1 | |
| | | |
| | 100.3 | |
Liabilities in excess of other assets | | (0.3 | ) |
| | | |
| | 100.0 | % |
| | | |
See Notes to Financial Statements.
| | |
| 34 | | Visit our website at www.prudential.com |
Financial Statements
(Unaudited)
| | |
| JANUARY 31, 2009 | | SEMIANNUAL REPORT |
Target Asset Allocation Funds/
Target Growth Allocation Fund
Statement of Assets and Liabilities
January 31, 2009 (Unaudited)
| | | | |
Assets | | | | |
Investments at value: | | | | |
Unaffiliated Investments (cost $191,971,239) | | $ | 152,337,701 | |
Affiliated Investments (cost $9,003,352) | | | 9,003,352 | |
Foreign currency, at value (cost $36,104) | | | 34,741 | |
Cash | | | 543,102 | |
Receivable for investments sold | | | 2,888,399 | |
Tax reclaim receivable | | | 256,059 | |
Dividends and interest receivable | | | 194,877 | |
Unrealized appreciation on foreign currency exchange contracts | | | 93,139 | |
Prepaid expenses | | | 2,951 | |
| | | | |
Total assets | | | 165,354,321 | |
| | | | |
| |
Liabilities | | | | |
Payable for investments purchased | | | 3,666,174 | |
Accrued expenses and other liabilities | | | 234,992 | |
Payable for Fund shares reacquired | | | 216,374 | |
Management fee payable | | | 108,820 | |
Distribution fee payable | | | 90,273 | |
Affiliated transfer agent fee payable | | | 68,919 | |
Unrealized depreciation on foreign currency exchange contracts | | | 68,464 | |
Deferred trustees’ fees | | | 7,993 | |
| | | | |
Total liabilities | | | 4,462,009 | |
| | | | |
| |
Net Assets | | $ | 160,892,312 | |
| | | | |
| | | | | |
Net assets were comprised of: | | | | |
Shares of beneficial interest, at par | | $ | 23,147 | |
Paid-in capital, in excess of par | | | 261,748,552 | |
| | | | |
| | | 261,771,699 | |
Accumulated net investment loss | | | (495,214 | ) |
Accumulated net realized loss on investment and foreign currency transactions | | | (60,773,331 | ) |
Net unrealized depreciation on investments and foreign currencies | | | (39,610,842 | ) |
| | | | |
Net assets, January 31, 2009 | | $ | 160,892,312 | |
| | | | |
See Notes to Financial Statements.
| | |
| 36 | | Visit our website at www.prudential.com |
| | | |
Class A: | | | |
Net asset value and redemption price per share,
($77,383,073 ÷ 10,732,017 shares of common stock issued and outstanding) | | $ | 7.21 |
Maximum sales charge (5.5% of offering price) | | | 0.42 |
| | | |
Maximum offering price to public | | $ | 7.63 |
| | | |
| |
Class B: | | | |
Net asset value, offering price and redemption price per share,
($31,795,736 ÷ 4,742,815 shares of common stock issued and outstanding) | | $ | 6.70 |
| | | |
| |
Class C: | | | |
Net asset value, offering price and redemption price per share,
($44,749,016 ÷ 6,671,063 shares of common stock issued and outstanding) | | $ | 6.71 |
| | | |
| |
Class M: | | | |
Net asset value, offering price and redemption price per share,
($2,398,643 ÷ 356,833 shares of common stock issued and outstanding) | | $ | 6.72 |
| | | |
| |
Class R: | | | |
Net asset value, offering price and redemption price per share,
($163,343 ÷ 22,785 shares of common stock issued and outstanding) | | $ | 7.17 |
| | | |
| |
Class X: | | | |
Net asset value, offering price and redemption price per share,
($1,879,609 ÷ 280,091 shares of common stock issued and outstanding) | | $ | 6.71 |
| | | |
| |
Class Z: | | | |
Net asset value, offering price and redemption price per share,
($2,522,892 ÷ 341,718 shares of common stock issued and outstanding) | | $ | 7.38 |
| | | |
See Notes to Financial Statements.
| | |
| Target Asset Allocation Funds/Target Growth Allocation Fund | | 37 |
Statement of Operations
Six Months Ended January 31, 2009 (Unaudited)
| | | | |
Net Investment Income | | | | |
Income | | | | |
Unaffiliated dividend income (net of foreign withholding taxes $28,070) | | $ | 2,497,141 | |
Affiliated dividend income | | | 141,728 | |
Unaffiliated interest income | | | 1,435 | |
| | | | |
| | | 2,640,304 | |
| | | | |
| |
Expenses | | | | |
Management fee | | | 782,605 | |
Distribution fee—Class A | | | 121,291 | |
Distribution fee—Class B | | | 216,627 | |
Distribution fee—Class C | | | 290,731 | |
Distribution fee—Class M | | | 16,859 | |
Distribution fee—Class R | | | 581 | |
Distribution fee—Class X | | | 13,225 | |
Transfer agent’s fees and expenses (including affiliated expense of $145,500) | | | 282,000 | |
Custodian’s fees and expenses | | | 149,000 | |
Registration fees | | | 47,000 | |
Reports to shareholders | | | 41,000 | |
Audit fee | | | 21,000 | |
Legal fee | | | 10,000 | |
Trustees’ fees | | | 9,000 | |
Insurance expense | | | 2,000 | |
Miscellaneous | | | 15,903 | |
| | | | |
Total expenses | | | 2,018,822 | |
| | | | |
Net investment income | | | 621,482 | |
| | | | |
| |
Net Realized And Unrealized Gain (Loss) On Investments And Foreign Currency | | | | |
Net realized gain (loss) on: | | | | |
Investment transactions | | | (49,384,771 | ) |
Foreign currency transactions | | | 545,911 | |
Futures transactions | | | (58,463 | ) |
| | | | |
| | | (48,897,323 | ) |
| | | | |
Net change in unrealized appreciation (depreciation) on: | | | | |
Investments | | | (48,572,466 | ) |
Foreign currencies | | | 14,413 | |
Futures | | | 13,928 | |
| | | | |
| | | (48,544,125 | ) |
| | | | |
Net loss on investments | | | (97,441,448 | ) |
| | | | |
Net Decrease In Net Assets Resulting From Operations | | $ | (96,819,966 | ) |
| | | | |
See Notes to Financial Statements.
| | |
| 38 | | Visit our website at www.prudential.com |
Statement of Changes in Net Assets
(Unaudited)
| | | | | | | | |
| | | Six Months
Ended
January 31, 2009 | | | Year
Ended
July 31, 2008 | |
Increase (Decrease) In Net Assets | | | | | | | | |
Operations | | | | | | | | |
Net investment income | | $ | 621,482 | | | $ | 1,944,661 | |
Net realized gain (loss) on investments and foreign currency transactions | | | (48,897,323 | ) | | | (4,867,283 | ) |
Net change in unrealized appreciation (depreciation) on investments and foreign currencies | | | (48,544,125 | ) | | | (42,871,167 | ) |
| | | | | | | | |
Net decrease in net assets resulting from operations | | | (96,819,966 | ) | | | (45,793,789 | ) |
| | | | | | | | |
| | |
Dividends and Distributions (Note 1) | | | | | | | | |
Dividends from net investment income: | | | | | | | | |
Class A | | | (1,210,107 | ) | | | (700,945 | ) |
Class B | | | (247,862 | ) | | | — | |
Class C | | | (350,085 | ) | | | — | |
Class M | | | (19,222 | ) | | | — | |
Class R | | | (2,216 | ) | | | (841 | ) |
Class X | | | (15,162 | ) | | | — | |
Class Z | | | (53,192 | ) | | | (64,600 | ) |
| | | | | | | | |
| | | (1,897,846 | ) | | | (766,386 | ) |
| | | | | | | | |
Distributions from net realized gains: | | | | | | | | |
Class A | | | (25,481 | ) | | | (12,326,417 | ) |
Class B | | | (11,326 | ) | | | (7,641,952 | ) |
Class C | | | (15,999 | ) | | | (9,720,578 | ) |
Class M | | | (879 | ) | | | (820,147 | ) |
Class R | | | (57 | ) | | | (29,312 | ) |
Class X | | | (693 | ) | | | (456,100 | ) |
Class Z | | | (949 | ) | | | (759,788 | ) |
| | | | | | | | |
| | | (55,384 | ) | | | (31,754,294 | ) |
| | | | | | | | |
| | |
Fund share transactions (Net of share conversions) (Note 6) | | | | | | | | |
Net proceeds from shares sold | | | 10,276,180 | | | | 33,777,034 | |
Net asset value of shares issued in reinvestment of dividends and distributions | | | 1,858,212 | | | | 30,556,140 | |
Cost of shares reacquired | | | (26,555,353 | ) | | | (78,206,228 | ) |
| | | | | | | | |
Net decrease in net assets resulting from Fund share transactions | | | (14,420,961 | ) | | | (13,873,054 | ) |
| | | | | | | | |
Total decrease | | | (113,194,157 | ) | | | (92,187,523 | ) |
| | |
Net Assets | | | | | | | | |
Beginning of period | | | 274,086,469 | | | | 366,273,992 | |
| | | | | | | | |
End of period(a) | | $ | 160,892,312 | | | $ | 274,086,469 | |
| | | | | | | | |
(a) Includes undistributed net income of: | | $ | — | | | $ | 781,150 | |
| | | | | | | | |
See Notes to Financial Statements.
| | |
| Target Asset Allocation Funds/Target Growth Allocation Fund | | 39 |
Notes to Financial Statements
(Unaudited)
Target Asset Allocation Funds (the “Trust”) is registered under the Investment Company Act of 1940 as an open-end, diversified management investment company presently consisting of three portfolios: Target Moderate Allocation Fund, Target Conservative Allocation Fund and Target Growth Allocation Fund (the “Fund”). These financial statements relate only to Target Growth Allocation Fund. The financial statements of the other portfolios are not presented herein. The Trust was organized as a business trust in Delaware on July 29, 1998.
The Fund uses investment managers (“Subadvisers”), each managing a portion of the Fund’s assets. The following lists the Subadvisers and their respective segment during the six months ended January 31, 2009.
| | |
Fund Segment | | Subadviser |
| Large-cap growth stocks | | Marsico Capital Management, LLC Massachusetts Financial Services Company* |
| |
| Large-cap value stocks | | Eaton Vance Management** Hotchkis and Wiley Capital Management LLC NFJ Investment Group L.P. |
| |
| International stocks | | LSV Asset Management Thornburg Investment Management, Inc. |
| |
| Small/Mid-cap growth stocks | | Eagle Asset Management, Inc. |
| |
| Small/Mid-cap value stocks | | EARNEST Partners, LLC
Vaughan Nelson Investment Management, L.P. |
| * | Effective December 13, 2008, Massachusetts Financial Services Company replaced Goldman Sachs Asset Management L.P. |
| ** | Effective December 13, 2008 Eaton Vance Management replaced J.P. Morgan Investment Management Inc. |
The investment objective of the Fund is to provide long-term capital appreciation. The Fund seeks to achieve its investment objective by investing in a diversified portfolio of equity securities issued by U.S. and foreign companies. Under normal circumstances substantially all of the Fund’s assets will be invested in equity securities, including common stock, securities convertible into common stock and preferred stock.
Note 1. Accounting Policies
The following is a summary of significant accounting policies followed by the Trust in the preparation of its financial statements.
Securities Valuation: Securities listed on a securities exchange (other than options on securities and indices) are valued at the last sale price on such exchange on the day
| | |
| 40 | | Visit our website at www.prudential.com |
of valuation or, if there was no sale on such day, at the mean between the last reported bid and asked prices, or at the last bid price on such day in the absence of an asked price. Securities traded via Nasdaq are valued at the official closing price provided by Nasdaq. Securities that are actively traded in the over-the-counter market, including listed securities for which the primary market is believed by Prudential Investments LLC (“PI” or “Manager”) in consultation with the subadviser, to be over-the-counter, are valued at market value using prices provided by an independent pricing agent or principal market maker. Futures contracts and options thereon traded on a commodities exchange or board of trade are valued at the last sale price at the close of trading on such exchange or board of trade or, if there was no sale on the applicable commodities exchange or board of trade on such day, at the mean between the most recently quoted prices on such exchange or board of trade or at the last bid price in the absence of an asked price. Prices may be obtained from independent pricing services which use information provided by market makers or estimates of market values obtained from yield data relating to investments or securities with similar characteristics. Securities for which reliable market quotations are not readily available, or whose values have been affected by events occurring after the close of the security’s foreign market and before the Fund’s normal pricing time, are valued at fair value in accordance with the Board of Trustees’ approved fair valuation procedures. When determining the fair valuation of securities, some of the factors influencing the valuation include the nature of any restrictions on disposition of the securities; assessment of the general liquidity of the securities; the issuer’s financial condition and the markets in which it does business; the cost of the investments; the size of the holding and the capitalization of issuer; the prices of any recent transactions or bids offers for such securities or any comparable securities; any available analyst media or other reports or information deemed reliable by the investment adviser regarding the issuer or the markets or industry in which it operates. Using fair value to price securities may result in a value that is different from a security’s most recent closing price and from the price used by other mutual funds to calculate their net asset value.
Investments in mutual funds are valued at their net asset value as of the close of the New York Stock Exchange on the date of valuation.
Short-term securities which mature in 60 days or less are valued at amortized cost, which approximates market value. The amortized cost method involves valuing a security at its cost on the date of purchase and thereafter assuming a constant amortization to maturity of the difference between the principal amount due at maturity and cost. Short-term securities which mature in more than 60 days are valued at current market quotations.
| | |
| Target Asset Allocation Funds/Target Growth Allocation Fund | | 41 |
Notes to Financial Statements
(Unaudited) continued
Foreign Currency Translation: The books and records of the Fund are maintained in U.S. dollars. Foreign currency amounts are translated into U.S. dollars on the following basis:
(i) market value of investment securities, other assets and liabilities-at the current daily rates of exchange.
(ii) purchases and sales of investment securities, income and expenses-at the rates of exchange prevailing on the respective dates of such transactions.
Although the net assets of the Fund are presented at the foreign exchange rates and market values at the close of the fiscal period, the Fund does not isolate that portion of the results of operations arising as a result of changes in the foreign exchange rates from the fluctuations arising from changes in the market prices of securities held at the end of the period. Similarly, the Fund does not isolate the effect of changes in foreign exchange rates from the fluctuations arising from changes in the market prices of portfolio securities sold during the period. Accordingly, realized foreign currency gains or losses are included in the reported net realized gains or losses on investment transactions.
Net realized gains or losses on foreign currency transactions represent net foreign exchange gains or losses from the holdings of foreign currencies, currency gains or losses realized between the trade date and settlement date on securities transactions, and the difference between the amounts of dividends, interest and foreign withholding taxes recorded on the Fund’s books and the U.S. dollar equivalent amounts actually received or paid. Net unrealized currency gains or losses from valuing foreign currency denominated assets and liabilities (other than investments) at year-end exchange rates are reflected as a component of net unrealized appreciation (depreciation) on investments and foreign currencies.
Foreign security and currency transactions may involve certain considerations and risks not typically associated with those of domestic origin as a result of, among other factors, the possibility of political and economic instability and the level of governmental supervision and regulation of foreign securities markets.
Forward Currency Contracts: A forward currency contract is a commitment to purchase or sell a foreign currency at a future date at a negotiated forward rate. The Fund may enter into forward currency contracts in order to hedge its exposure to changes in foreign currency exchange rates on its foreign portfolio holdings or on
| | |
| 42 | | Visit our website at www.prudential.com |
specific receivables and payables denominated in a foreign currency. The contracts are valued daily at current exchange rates and any unrealized gain or loss is included in the Statement of Assets and Liabilities as unrealized appreciation and/or depreciation on forward foreign currency contracts. Gain or loss is realized on the settlement date of the contract equal to the difference between the settlement value of the original and renegotiated forward contracts. This gain or loss, if any, is included in net realized gain or loss on foreign currency transactions. Risks may arise upon entering into these contracts from the potential inability of the counterparties to meet the terms of their contracts.
Financial Futures Contracts: A financial futures contract is an agreement to purchase (long) or sell (short) an agreed amount of securities at a set price for delivery on a future date. Upon entering into a financial futures contract, the Fund is required to pledge to the broker an amount of cash and/or other assets equal to a certain percentage of the contract amount. This amount is known as the “initial margin.” Subsequent payments known as “variation margin,” are made or received by the Fund each day, depending on the daily fluctuations in the value of the underlying security. Such variation margin is recorded for financial statement purposes on a daily basis as unrealized gain or loss. When the contract expires or is closed, the gain or loss is realized and is presented in the Statement of Operations as net realized gain or loss on financial futures contracts.
The Fund invests in financial futures contracts in order to hedge its existing portfolio securities, or securities the Fund intends to purchase, against fluctuations in value caused by changes in prevailing interest rates or market conditions. Should interest rates move unexpectedly, the Fund may not achieve the anticipated benefits of the financial futures contracts and may realize a loss. The use of futures transactions involves the risk of imperfect correlation in movements in the price of futures contracts, interest rates and the underlying hedged assets.
Securities Transactions and Net Investment Income: Securities transactions are recorded on the trade date. Realized gains or losses on sales of securities are calculated on the identified cost basis. Dividend income is recorded on the ex-dividend date and interest income, including amortization of premium and accretion of discount on debt securities as required, is recorded on the accrual basis. Expenses are recorded on the accrual basis. Net investment income or loss (other than distribution fees, which are charged directly to respective class) and unrealized and realized gains or losses are allocated daily to each class of shares based upon the relative proportion of net assets of each class at the beginning of the day.
| | |
| Target Asset Allocation Funds/Target Growth Allocation Fund | | 43 |
Notes to Financial Statements
(Unaudited) continued
Dividends and Distributions: The Fund expects to pay dividends of net investment income and distributions of net realized capital and currency gains, if any, annually.
Dividends and distributions to shareholders, which are determined in accordance with federal income tax regulations and which may differ from generally accepted accounting principles, are recorded on the ex-dividend date. Permanent book/tax differences relating to income and gains are reclassified amongst undistributed net investment income, accumulated net realized gain or loss and paid-in capital in excess of par as appropriate.
Taxes: It is the Fund’s policy to continue to meet the requirements of the Internal Revenue Code applicable to regulated investment companies and to distribute all of its taxable net investment income and capital gains, if any, to its shareholders. Therefore, no federal income tax provision is required.
Withholding taxes on foreign dividends are recorded net of reclaimable amounts, at the time the related income is earned.
Estimates: The preparation of the financial statements requires management to make estimates and assumptions that affect the reported amounts and disclosures in the financial statements. Actual results could differ from those estimates.
Note 2. Agreements
The Trust has a management agreement with PI. Pursuant to this agreement, PI manages the investment operations of the Fund, administers the Fund’s affairs and supervises the Subadvisers’ performance of all investment advisory services. Pursuant to the advisory agreement, PI pays the cost of compensation of officers of the Fund, occupancy and certain clerical and accounting costs of the Fund. The Fund bears all other costs and expenses. The management fee paid to PI is computed daily and payable monthly at an annual rate of .75 of 1% of average daily net assets up to $500 million, .70 of 1% of average daily net assets for the next $500 million and .65 of 1% of average daily net assets in excess of $1 billion. The effective management fee rate was .75 of 1% for the six months ended January 31, 2009.
The Fund has a distribution agreement with Prudential Investment Management Services LLC (“PIMS”) which acts as the distributor of the Class A, B, C, M, R, X and Z
| | |
| 44 | | Visit our website at www.prudential.com |
shares of the Fund. The Fund compensates PIMS for distributing and servicing the Fund’s Class A, B, C, M, R and X shares, pursuant to plans of distribution (the “Distribution Plans”) regardless of expenses actually incurred by PIMS. The distribution fees are accrued daily and payable monthly. No distribution or service fees are paid to PIMS as distributor for Class Z shares of the Fund.
Pursuant to the Distribution Plans, the Fund compensates PIMS for distribution related activities at an annual rate of up to .30 of 1%, 1%, 1%, 1%, .75% of 1% and 1% of the average daily net assets of the Class A, B, C, M, R and X shares, respectively. Such expenses under the Plans were .25 of 1%, 1%, 1%, 1%, .50% of 1% and 1% of the average daily net assets of the Class A, B, C, M, R and X shares, respectively, for the six months ended January 31, 2009.
PIMS has advised the Fund that it has received approximately $64,200 in front-end sales charges resulting from sales of Class A during the six months ended January 31, 2009. From these fees, PIMS paid such sales charges to broker-dealers which in turn paid commissions to salespersons and incurred other distribution costs.
PIMS has advised the Fund that for the six months ended January 31, 2009, it has received approximately $45,100, $3,800, $3,200 and $600 in contingent deferred sales charges imposed upon certain redemptions by Class B, Class C, Class M and Class X shareholders, respectively.
PIMS and PI are indirect, wholly-owned subsidiaries of Prudential Financial, Inc. (“Prudential”).
The Trust, along with other affiliated registered investment companies (the “Companies”), are a party to a Syndicated Credit Agreement (“SCA”) with two banks. The SCA provides for a commitment of $500 million. Interest on any borrowings under the SCA would be incurred at market rates and a commitment fee for the unused amount is accrued daily and paid quarterly. Effective October 24, 2008, the Companies renewed the SCA with the banks. The commitment under the renewed SCA continues to be $500 million. The Companies pay a commitment fee of .13 of 1% of the unused portion of the renewed SCA. The expiration date of the renewed SCA will be October 23, 2009. For the period from October 26, 2007 through October 23, 2008, the Companies paid a commitment fee of .06 of 1% of the unused portion of the agreement. The purpose of the SCA is to provide an alternative source of temporary funding for capital share redemptions.
During the six months ended January 31, 2009, the Fund did not utilize the line of credit.
| | |
| Target Asset Allocation Funds/Target Growth Allocation Fund | | 45 |
Notes to Financial Statements
(Unaudited) continued
Note 3. Other Transactions with Affiliates
Prudential Mutual Fund Services LLC (“PMFS”), an affiliate of PI and an indirect, wholly-owned subsidiary of Prudential, serves as the Fund’s transfer agent. Transfer agent fees and expenses in the Statement of Operations include certain out-of-pocket expenses paid to non-affiliates, where applicable.
The Fund pays networking fees to affiliated and unaffiliated broker/dealers, including fees related to the services of First Clearing, LLC (“First Clearing”), an affiliate of PI. These networking fees are payments made to broker/dealers that clear mutual fund transactions through a national clearing system. For the six months ended January 31, 2009, the Fund incurred approximately $57,400 in total networking fees, of which $41,100 was paid to First Clearing. These amounts are included in transfer agent’s fees and expenses in the Statement of Operations.
The Fund invests in the Taxable Money Market Series (the “Series”), a portfolio of Dryden Core Investment Fund. The Series is a money market mutual fund registered under the Investment Company Act of 1940, as amended, and managed by PI.
Note 4. Portfolio Securities
Purchases and sales of portfolio securities, excluding short-term investments, for the six months ended January 31, 2009, aggregated $128,660,428 and $136,400,649, respectively.
Note 5. Tax Information
The United States federal income tax basis of the Fund’s investments and the net unrealized depreciation as of January 31, 2009 were as follows:
| | | | | | |
Tax Basis | | Appreciation | | Depreciation | | Net Unrealized
Depreciation on
Investments |
| $216,130,595 | | $6,215,235 | | $(61,004,777) | | $(54,789,542) |
| | |
| 46 | | Visit our website at www.prudential.com |
The difference between book basis and tax basis was primarily attributable to deferred losses on wash sales.
Management has analyzed the Fund’s tax positions taken on federal income tax returns for all open tax years and has concluded that as of July 31, 2008, no provisions for income tax would be required in the Fund’s financial statements. The Fund’s federal and state income and federal excise tax returns for tax years for which the applicable statuses of limitations have not expired are subject to examination by the Internal Revenue Service and state departments of revenue.
Note 6. Capital
The Fund offers Class A, Class B, Class C, Class M, Class R, Class X and Class Z shares. Class A shares are subject to a maximum front-end sales charge of 5.50%. Investors who purchase $1 million or more of Class A shares and sell these shares within 12 months of purchase are not subject to an initial sales charge but are subject to a contingent deferred sales charge (CDSC) of 1%, including investors who purchase their shares through broker-dealers affiliated with Prudential. Class B shares are subject to a CDSC of 5%, which decreases by 1% annually to 1% in the fifth and sixth years and 0% in the seventh year. Class B shares automatically convert to Class A shares on a quarterly basis approximately seven years after purchase. The CDSC for Class C shares is 1% for shares redeemed within 12 months of purchase. Class M shares are subject to a CDSC of 6%, which decreases by 1% annually to 2% in the fifth and sixth years and 1% in the seventh year. Class M shares are generally closed to new purchases. Class M shares automatically convert to Class A shares approximately eight years after purchase. Class X shares are generally closed to new purchases. Class X shares are subject to a CDSC of 6%, which decreases by 1% annually to 4% in the third and fourth years, by 1% annually to 2% in the sixth and seventh years, and 1% in the eighth year. Class X shares automatically convert to Class A shares on a quarterly basis approximately ten years after purchase. An exchange privilege is also available for shareholders who qualify to purchase Class A shares at net asset value. Class R and Class Z shares are not subject to any sales or redemption charge and are offered exclusively for sale to a limited group of investors.
The Fund has authorized an unlimited number of shares of beneficial interest at $.001 par value per share. As of January 31, 2009 Prudential owned 217 Class R shares of the Fund.
| | |
| Target Asset Allocation Funds/Target Growth Allocation Fund | | 47 |
Notes to Financial Statements
(Unaudited) continued
| | | | | | | |
Class A | | Shares | | | Amount | |
Six months ended January 31, 2009: | | | | | | | |
Shares sold | | 577,741 | | | $ | 5,065,627 | |
Shares issued in reinvestment of dividends and distributions | | 157,950 | | | | 1,197,260 | |
Shares reacquired | | (1,315,328 | ) | | | (11,987,666 | ) |
| | | | | | | |
Net increase (decrease) in shares outstanding before conversion | | (579,637 | ) | | | (5,724,779 | ) |
Shares issued upon conversion from Class B, Class M, and Class X | | 497,576 | | | | 4,599,760 | |
| | | | | | | |
Net increase (decrease) in shares outstanding | | (82,061 | ) | | $ | (1,125,019 | ) |
| | | | | | | |
Year ended July 31, 2008: | | | | | | | |
Shares sold | | 1,105,992 | | | $ | 14,489,729 | |
Shares issued in reinvestment of dividends and distributions | | 953,821 | | | | 12,590,443 | |
Shares reacquired | | (2,181,622 | ) | | | (28,410,675 | ) |
| | | | | | | |
Net increase (decrease) in shares outstanding before conversion | | (121,809 | ) | | | (1,330,503 | ) |
Shares issued upon conversion from Class B, Class M, and Class X | | 1,457,955 | | | | 19,252,304 | |
| | | | | | | |
Net increase (decrease) in shares outstanding | | 1,336,146 | | | $ | 17,921,801 | |
| | | | | | | |
Class B | | | | | | |
Six months ended January 31, 2009: | | | | | | | |
Shares sold | | 203,382 | | | $ | 1,640,204 | |
Shares issued in reinvestment of dividends and distributions | | 34,821 | | | | 245,836 | |
Shares reacquired | | (510,738 | ) | | | (4,310,131 | ) |
| | | | | | | |
Net increase (decrease) in shares outstanding before conversion | | (272,535 | ) | | | (2,424,091 | ) |
Shares reacquired upon conversion into Class A | | (489,033 | ) | | | (4,181,908 | ) |
| | | | | | | |
Net increase (decrease) in shares outstanding | | (761,568 | ) | | $ | (6,605,999 | ) |
| | | | | | | |
Year ended July 31, 2008: | | | | | | | |
Shares sold | | 467,814 | | | $ | 5,767,594 | |
Shares issued in reinvestment of dividends and distributions | | 591,337 | | | | 7,267,519 | |
Shares reacquired | | (1,003,869 | ) | | | (12,198,850 | ) |
| | | | | | | |
Net increase (decrease) in shares outstanding before conversion | | 55,282 | | | | 836,263 | |
Shares reacquired upon conversion into Class A | | (1,354,759 | ) | | | (16,669,325 | ) |
| | | | | | | |
Net increase (decrease) in shares outstanding | | (1,299,477 | ) | | $ | (15,833,062 | ) |
| | | | | | | |
Class C | | | | | | |
Six months ended January 31, 2009: | | | | | | | |
Shares sold | | 342,485 | | | $ | 2,792,117 | |
Shares issued in reinvestment of dividends and distributions | | 46,891 | | | | 331,053 | |
Shares reacquired | | (903,938 | ) | | | (7,650,679 | ) |
| | | | | | | |
Net increase (decrease) in shares outstanding | | (514,562 | ) | | $ | (4,527,509 | ) |
| | | | | | | |
| | |
| 48 | | Visit our website at www.prudential.com |
| | | | | | | |
Class C | | Shares | | | Amount | |
Year ended July 31, 2008: | | | | | | | |
Shares sold | | 789,792 | | | $ | 9,878,220 | |
Shares issued in reinvestment of dividends and distributions | | 707,551 | | | | 8,695,678 | |
Shares reacquired | | (2,351,441 | ) | | | (28,475,126 | ) |
| | | | | | | |
Net increase (decrease) in shares outstanding | | (854,098 | ) | | $ | (9,901,228 | ) |
| | | | | | | |
Class M | | | | | | |
Six months ended January 31, 2009: | | | | | | | |
Shares sold | | 5,441 | | | $ | 43,927 | |
Shares issued in reinvestment of dividends and distributions | | 2,809 | | | | 19,885 | |
Shares reacquired | | (61,764 | ) | | | (536,265 | ) |
| | | | | | | |
Net increase (decrease) in shares outstanding before conversion | | (53,514 | ) | | | (472,453 | ) |
Shares reacquired upon conversion into Class A | | (30,022 | ) | | | (236,963 | ) |
| | | | | | | |
Net increase (decrease) in shares outstanding | | (83,536 | ) | | $ | (709,416 | ) |
| | | | | | | |
Year ended July 31, 2008: | | | | | | | |
Shares sold | | 56,883 | | | $ | 714,473 | |
Shares issued in reinvestment of dividends and distributions | | 64,944 | | | | 800,109 | |
Shares reacquired | | (264,274 | ) | | | (3,285,302 | ) |
| | | | | | | |
Net increase (decrease) in shares outstanding before conversion | | (142,447 | ) | | | (1,770,720 | ) |
Shares reacquired upon conversion into Class A | | (209,064 | ) | | | (2,549,474 | ) |
| | | | | | | |
Net increase (decrease) in shares outstanding | | (351,511 | ) | | $ | (4,320,194 | ) |
| | | | | | | |
Class R | | | | | | |
Six months ended January 31, 2009: | | | | | | | |
Shares sold | | 3,788 | | | $ | 33,228 | |
Shares issued in reinvestment of dividends and distributions | | 301 | | | | 2,272 | |
Shares reacquired | | (9,588 | ) | | | (89,097 | ) |
| | | | | | | |
Net increase (decrease) in shares outstanding | | (5,499 | ) | | $ | (53,597 | ) |
| | | | | | | |
Year ended July 31, 2008: | | | | | | | |
Shares sold | | 8,629 | | | $ | 108,044 | |
Shares issued in reinvestment of dividends and distributions | | 2,277 | | | | 29,872 | |
Shares reacquired | | (5,535 | ) | | | (72,823 | ) |
| | | | | | | |
Net increase (decrease) in shares outstanding | | 5,371 | | | $ | 65,093 | |
| | | | | | | |
Class X | | | | | | |
Six months ended January 31, 2009: | | | | | | | |
Shares sold | | 48,722 | | | $ | 433,180 | |
Shares issued in reinvestment of dividends and distributions | | 2,240 | | | | 15,838 | |
Shares reacquired | | (104,174 | ) | | | (872,606 | ) |
| | | | | | | |
Net increase (decrease) in shares outstanding before conversion | | (53,212 | ) | | | (423,588 | ) |
Shares reacquired upon conversion into Class A | | (18,832 | ) | | | (180,889 | ) |
| | | | | | | |
Net increase (decrease) in shares outstanding | | (72,044 | ) | | $ | (604,477 | ) |
| | | | | | | |
| | |
| Target Asset Allocation Funds/Target Growth Allocation Fund | | 49 |
Notes to Financial Statements
(Unaudited) continued
| | | | | | | |
Class X | | Shares | | | Amount | |
Year ended July 31, 2008: | | | | | | | |
Shares sold | | 114,969 | | | $ | 1,438,388 | |
Shares issued in reinvestment of dividends and distributions | | 37,025 | | | | 455,406 | |
Shares reacquired | | (134,619 | ) | | | (1,625,903 | ) |
| | | | | | | |
Net increase (decrease) in shares outstanding before conversion | | 17,375 | | | | 267,891 | |
Shares reacquired upon conversion into Class A | | (2,422 | ) | | | (33,505 | ) |
| | | | | | | |
Net increase (decrease) in shares outstanding | | 14,953 | | | $ | 234,386 | |
| | | | | | | |
Class Z | | | | | | |
Six months ended January 31, 2009: | | | | | | | |
Shares sold | | 27,168 | | | $ | 267,897 | |
Shares issued in reinvestment of dividends and distributions | | 5,937 | | | | 46,068 | |
Shares reacquired | | (134,601 | ) | | | (1,108,909 | ) |
| | | | | | | |
Net increase (decrease) in shares outstanding | | (101,496 | ) | | $ | (794,944 | ) |
| | | | | | | |
Year ended July 31, 2008: | | | | | | | |
Shares sold | | 97,926 | | | $ | 1,380,586 | |
Shares issued in reinvestment of dividends and distributions | | 53,080 | | | | 717,113 | |
Shares reacquired | | (307,317 | ) | | | (4,137,549 | ) |
| | | | | | | |
Net increase (decrease) in shares outstanding | | (156,311 | ) | | $ | (2,039,850 | ) |
| | | | | | | |
Note 7. New Accounting Pronouncements
In March 2008, Financial Accounting Standards Board (“FASB”) released “Statement of Financial Accounting Standards No. 161, Disclosures about Derivative Instruments and Hedging Activities” (“FAS 161”). FAS 161 requires qualitative disclosures about objectives and strategies for using derivatives, quantitative disclosures about fair value amounts of and gains and losses on derivative instruments, and disclosures about credit-risk-related contingent features in derivative agreements. The application of FAS 161 is required for any reporting period beginning after November 15, 2008. At this time, management is evaluating the implications of FAS 161 and its impact on the financial statements has not yet been determined.
| | |
| 50 | | Visit our website at www.prudential.com |
Financial Highlights
(Unaudited)
| | |
| JANUARY 31, 2009 | | SEMIANNUAL REPORT |
Target Asset Allocation Funds/
Target Growth Allocation Fund
Financial Highlights
(Unaudited)
| | | | |
| | | Class A | |
| | | Six Months Ended
January 31, 2009(b) | |
Per Share Operating Performance: | | | | |
Net Asset Value, Beginning Of Period | | $ | 11.52 | |
| | | | |
Income (loss) from investment operations: | | | | |
Net investment income (loss) | | | .04 | |
Net realized and unrealized gain (loss) on investments | | | (4.24 | ) |
| | | | |
Total from investment operations | | | (4.20 | ) |
| | | | |
Less Dividends and Distributions: | | | | |
Dividends from net investment income | | | (.11 | ) |
Distributions from net realized gains | | | — | (g) |
| | | | |
Total dividends and distributions | | | (.11 | ) |
| | | | |
Net asset value, end of period | | $ | 7.21 | |
| | | | |
Total Return(a) | | | (36.46 | )% |
Ratios/Supplemental Data: | | | | |
Net assets, end of period (000) | | $ | 77,383 | |
Average net assets (000) | | $ | 96,242 | |
Ratios to average net assets(f): | | | | |
Expenses, including distribution and service (12b-1) fees(c) | | | 1.55 | %(d) |
Expenses, excluding distribution and service (12b-1) fees | | | 1.30 | %(d) |
Net investment income (loss) | | | .96 | %(d) |
For Class A, B, C, M, R, X and Z shares: | | | | |
Portfolio turnover rate | | | 64 | %(e) |
| (a) | Total return does not consider the effects of sales loads. Total return is calculated assuming a purchase of a share on the first day and a sale on the last day of each period reported and includes reinvestment of dividends and distributions. Total returns may reflect adjustments to conform to generally accepted accounting principles. Total returns for periods less than one full year are not annualized. |
| (b) | Calculations are based on average shares outstanding during the period. |
| (c) | The distributor of the Fund contractually agreed to limit its distribution and service (12b-1) fees to .25 of 1% of the average daily assets of the Class A shares. |
| (f) | Does not include expenses of the underlying portfolios in which the Fund invests. |
| (g) | Less than $.005 per share. |
See Notes to Financial Statements.
| | |
| 52 | | Visit our website at www.prudential.com |
| | | | | | | | | | | | | | | | | | |
| Class A | |
| Year Ended July 31, | |
| 2008(b) | | | 2007(b) | | | 2006(b) | | | 2005(b) | | | 2004(b) | |
| | | | | | | | | | | | | | | | | | |
| $ | 14.62 | | | $ | 13.26 | | | $ | 13.36 | | | $ | 10.96 | | | $ | 9.53 | |
| | | | | | | | | | | | | | | | | | | |
| | | | | | | | | | | | | | | | | | |
| | .13 | | | | .09 | | | | .08 | | | | .02 | | | | (.03 | ) |
| | (1.90 | ) | | | 2.12 | | | | .93 | | | | 2.38 | | | | 1.46 | |
| | | | | | | | | | | | | | | | | | | |
| | (1.77 | ) | | | 2.21 | | | | 1.01 | | | | 2.40 | | | | 1.43 | |
| | | | | | | | | | | | | | | | | | | |
| | | | | | | | | | | | | | | | | | |
| | (.07 | ) | | | (.01 | ) | | | — | | | | — | | | | — | |
| | (1.26 | ) | | | (.84 | ) | | | (1.11 | ) | | | — | | | | — | |
| | | | | | | | | | | | | | | | | | | |
| | (1.33 | ) | | | (.85 | ) | | | (1.11 | ) | | | — | | | | — | |
| | | | | | | | | | | | | | | | | | | |
| $ | 11.52 | | | $ | 14.62 | | | $ | 13.26 | | | $ | 13.36 | | | $ | 10.96 | |
| | | | | | | | | | | | | | | | | | | |
| | (13.25 | )% | | | 16.93 | % | | | 8.00 | % | | | 21.90 | % | | | 15.01 | % |
| | | | | | | | | | | | | | | | | | |
| $ | 124,579 | | | $ | 138,579 | | | $ | 99,960 | | | $ | 62,948 | | | $ | 45,622 | |
| $ | 135,539 | | | $ | 124,296 | | | $ | 78,993 | | | $ | 52,589 | | | $ | 43,525 | |
| | | | | | | | | | | | | | | | | | |
| | 1.36 | % | | | 1.35 | % | | | 1.38 | % | | | 1.38 | % | | | 1.43 | % |
| | 1.11 | % | | | 1.10 | % | | | 1.13 | % | | | 1.13 | % | | | 1.18 | % |
| | 1.01 | % | | | .65 | % | | | .57 | % | | | .20 | % | | | (.25 | )% |
| | | | | | | | | | | | | | | | | | |
| | 83 | % | | | 71 | % | | | 85 | % | | | 200 | % | | | 79 | % |
See Notes to Financial Statements.
| | |
| Target Asset Allocation Funds/Target Growth Allocation Fund | | 53 |
Financial Highlights
(Unaudited) continued
| | | | |
| | | Class B | |
| | | Six Months Ended
January 31, 2009(b) | |
Per Share Operating Performance: | | | | |
Net Asset Value, Beginning Of Period | | $ | 10.68 | |
| | | | |
Income (loss) from investment operations: | | | | |
Net investment income (loss) | | | .01 | |
Net realized and unrealized gain (loss) on investments | | | (3.94 | ) |
| | | | |
Total from investment operations | | | (3.93 | ) |
| | | | |
Less Dividends and Distributions: | | | | |
Dividends from net investment income | | | (.05 | ) |
Distributions from net realized gains | | | — | (e) |
| | | | |
Total dividends and distributions | | | (.05 | ) |
| | | | |
Net asset value, end of period | | $ | 6.70 | |
| | | | |
Total Return(a) | | | (36.78 | )% |
Ratios/Supplemental Data: | | | | |
Net assets, end of period (000) | | $ | 31,796 | |
Average net assets (000) | | $ | 42,972 | |
Ratios to average net assets(d): | | | | |
Expenses, including distribution and service (12b-1) fees | | | 2.30 | %(c) |
Expenses, excluding distribution and service (12b-1) fees | | | 1.30 | %(c) |
Net investment income (loss) | | | .25 | %(c) |
| (a) | Total return does not consider the effects of sales loads. Total return is calculated assuming a purchase of a share on the first day and a sale on the last day of each period reported and includes reinvestment of dividends and distributions. Total returns may reflect adjustments to conform to generally accepted accounting principles. Total returns for periods less than one full year are not annualized. |
| (b) | Calculations are based on average shares outstanding during the period. |
| (d) | Does not include expenses of the underlying portfolios in which the Fund invests. |
| (e) | Less than $.005 per share. |
See Notes to Financial Statements.
| | |
| 54 | | Visit our website at www.prudential.com |
| | | | | | | | | | | | | | | | | | |
| Class B | |
| Year Ended July 31, | |
| 2008(b) | | | 2007(b) | | | 2006(b) | | | 2005(b) | | | 2004(b) | |
| | | | | | | | | | | | | | | | | | |
| $ | 13.67 | | | $ | 12.53 | | | $ | 12.78 | | | $ | 10.56 | | | $ | 9.25 | |
| | | | | | | | | | | | | | | | | | | |
| | | | | | | | | | | | | | | | | | |
| | .03 | | | | (.01 | ) | | | (.03 | ) | | | (.06 | ) | | | (.11 | ) |
| | (1.76 | ) | | | 1.99 | | | | .89 | | | | 2.28 | | | | 1.42 | |
| | | | | | | | | | | | | | | | | | | |
| | (1.73 | ) | | | 1.98 | | | | .86 | | | | 2.22 | | | | 1.31 | |
| | | | | | | | | | | | | | | | | | | |
| | | | | | | | | | | | | | | | | | |
| | — | | | | — | | | | — | | | | — | | | | — | |
| | (1.26 | ) | | | (.84 | ) | | | (1.11 | ) | | | — | | | | — | |
| | | | | | | | | | | | | | | | | | | |
| | (1.26 | ) | | | (.84 | ) | | | (1.11 | ) | | | — | | | | — | |
| | | | | | | | | | | | | | | | | | | |
| $ | 10.68 | | | $ | 13.67 | | | $ | 12.53 | | | $ | 12.78 | | | $ | 10.56 | |
| | | | | | | | | | | | | | | | | | | |
| | (13.86 | )% | | | 16.14 | % | | | 7.06 | % | | | 21.02 | % | | | 14.16 | % |
| | | | | | | | | | | | | | | | | | |
| $ | 58,763 | | | $ | 93,021 | | | $ | 99,928 | | | $ | 112,312 | | | $ | 94,066 | |
| $ | 78,596 | | | $ | 100,142 | | | $ | 109,700 | | | $ | 103,140 | | | $ | 90,535 | |
| | | | | | | | | | | | | | | | | | |
| | 2.11 | % | | | 2.10 | % | | | 2.13 | % | | | 2.13 | % | | | 2.18 | % |
| | 1.11 | % | | | 1.10 | % | | | 1.13 | % | | | 1.13 | % | | | 1.18 | % |
| | .26 | % | | | (.08 | )% | | | (.20 | )% | | | (.55 | )% | | | (1.00 | )% |
See Notes to Financial Statements.
| | |
| Target Asset Allocation Funds/Target Growth Allocation Fund | | 55 |
Financial Highlights
(Unaudited) continued
| | | | |
| | | Class C | |
| | | Six Months Ended
January 31, 2009(b) | |
Per Share Operating Performance: | | | | |
Net Asset Value, Beginning Of Period | | $ | 10.68 | |
| | | | |
Income (loss) from investment operations: | | | | |
Net investment income (loss) | | | .01 | |
Net realized and unrealized gain (loss) on investments | | | (3.93 | ) |
| | | | |
Total from investment operations | | | (3.92 | ) |
| | | | |
Less Dividends and Distributions: | | | | |
Dividends from net investment income | | | (.05 | ) |
Distributions from net realized gains | | | — | (e) |
| | | | |
Total dividends and distributions | | | (.05 | ) |
| | | | |
Net asset value, end of period | | $ | 6.71 | |
| | | | |
Total Return(a) | | | (36.69 | )% |
Ratios/Supplemental Data: | | | | |
Net assets, end of period (000) | | $ | 44,749 | |
Average net assets (000) | | $ | 57,672 | |
Ratios to average net assets(d): | | | | |
Expenses, including distribution and service (12b-1) fees | | | 2.30 | %(c) |
Expenses, excluding distribution and service (12b-1) fees | | | 1.30 | %(c) |
Net investment income (loss) | | | .23 | %(c) |
| (a) | Total return does not consider the effects of sales loads. Total return is calculated assuming a purchase of a share on the first day and a sale on the last day of each period reported and includes reinvestment of dividends and distributions. Total returns may reflect adjustments to conform to generally accepted accounting principles. Total returns for periods less than one full year are not annualized. |
| (b) | Calculations are based on average shares outstanding during the period. |
| (d) | Does not include expenses of the underlying portfolios in which the Fund invests. |
| (e) | Less than $.005 per share. |
See Notes to Financial Statements.
| | |
| 56 | | Visit our website at www.prudential.com |
| | | | | | | | | | | | | | | | | | |
| Class C | |
| Year Ended July 31, | |
| 2008(b) | | | 2007(b) | | | 2006(b) | | | 2005(b) | | | 2004(b) | |
| | | | | | | | | | | | | | | | | | |
| $ | 13.67 | | | $ | 12.53 | | | $ | 12.78 | | | $ | 10.56 | | | $ | 9.25 | |
| | | | | | | | | | | | | | | | | | | |
| | | | | | | | | | | | | | | | | | |
| | .03 | | | | (.01 | ) | | | (.02 | ) | | | (.06 | ) | | | (.11 | ) |
| | (1.76 | ) | | | 1.99 | | | | .88 | | | | 2.28 | | | | 1.42 | |
| | | | | | | | | | | | | | | | | | | |
| | (1.73 | ) | | | 1.98 | | | | .86 | | | | 2.22 | | | | 1.31 | |
| | | | | | | | | | | | | | | | | | | |
| | | | | | | | | | | | | | | | | | |
| | — | | | | — | | | | — | | | | — | | | | — | |
| | (1.26 | ) | | | (.84 | ) | | | (1.11 | ) | | | — | | | | — | |
| | | | | | | | | | | | | | | | | | | |
| | (1.26 | ) | | | (.84 | ) | | | (1.11 | ) | | | — | | | | — | |
| | | | | | | | | | | | | | | | | | | |
| $ | 10.68 | | | $ | 13.67 | | | $ | 12.53 | | | $ | 12.78 | | | $ | 10.56 | |
| | | | | | | | | | | | | | | | | | | |
| | (13.86 | )% | | | 16.14 | % | | | 7.06 | % | | | 21.02 | % | | | 14.16 | % |
| | | | | | | | | | | | | | | | | | |
| $ | 76,714 | | | $ | 109,912 | | | $ | 90,092 | | | $ | 76,811 | | | $ | 61,606 | |
| $ | 96,952 | | | $ | 105,155 | | | $ | 83,200 | | | $ | 68,555 | | | $ | 58,465 | |
| | | | | | | | | | | | | | | | | | |
| | 2.11 | % | | | 2.10 | % | | | 2.13 | % | | | 2.13 | % | | | 2.18 | % |
| | 1.11 | % | | | 1.10 | % | | | 1.13 | % | | | 1.13 | % | | | 1.18 | % |
| | .26 | % | | | (.09 | )% | | | (.19 | )% | | | (.55 | )% | | | (1.00 | )% |
See Notes to Financial Statements.
| | |
| Target Asset Allocation Funds/Target Growth Allocation Fund | | 57 |
Financial Highlights
(Unaudited) continued
| | | | |
| |
| | | Class M | |
| | | Six Months Ended
January 31, 2009(d) | |
Per Share Operating Performance: | | | | |
Net Asset Value, Beginning Of Period | | $ | 10.70 | |
| | | | |
Income (loss) from investment operations: | | | | |
Net investment income (loss) | | | .01 | |
Net realized and unrealized gain (loss) on investments | | | (3.94 | ) |
| | | | |
Total from investment operations | | | (3.93 | ) |
| | | | |
Less Dividends and Distributions: | | | | |
Dividends from net investment income | | | (.05 | ) |
Distributions from net realized gains | | | — | (f) |
| | | | |
Total dividends and distributions | | | (.05 | ) |
| | | | |
Net asset value, end of period | | $ | 6.72 | |
| | | | |
Total Return(b) | | | (36.71 | )% |
Ratios/Supplemental Data: | | | | |
Net assets, end of period (000) | | $ | 2,399 | |
Average net assets (000) | | $ | 3,344 | |
Ratios to average net assets(e): | | | | |
Expenses, including distribution and service (12b-1) fees | | | 2.30 | %(c) |
Expenses, excluding distribution and service (12b-1) fees | | | 1.30 | %(c) |
Net investment income (loss) | | | .27 | %(c) |
| (a) | Commencement of offering new share class. |
| (b) | Total return does not consider the effects of sales loads. Total return is calculated assuming a purchase of a share on the first day and a sale on the last day of each period reported and includes reinvestment of dividends and distributions. Total returns may reflect adjustments to conform to generally accepted accounting principles. Total returns for periods less than one full year are not annualized. |
| (d) | Calculations are based on average shares outstanding during the period. |
| (e) | Does not include expenses of the underlying portfolios in which the Fund invests. |
| (f) | Less than $.005 per share. |
See Notes to Financial Statements.
| | |
| 58 | | Visit our website at www.prudential.com |
| | | | | | | | | | | | | | |
| Class M | |
| Year Ended July 31, | | | October 4, 2004(a)
through
July 31, 2005(d) | |
| 2008(d) | | | 2007(d) | | | 2006(d) | | |
| | | | | | | | | | | | | | |
| $ | 13.70 | | | $ | 12.54 | | | $ | 12.78 | | | $ | 11.07 | |
| | | | | | | | | | | | | | | |
| | | | | | | | | | | | | | |
| | .03 | | | | (.01 | ) | | | (.02 | ) | | | (.05 | ) |
| | (1.77 | ) | | | 2.01 | | | | .89 | | | | 1.76 | |
| | | | | | | | | | | | | | | |
| | (1.74 | ) | | | 2.00 | | | | .87 | | | | 1.71 | |
| | | | | | | | | | | | | | | |
| | | | | | | | | | | | | | |
| | — | | | | — | | | | — | | | | — | |
| | (1.26 | ) | | | (.84 | ) | | | (1.11 | ) | | | — | |
| | | | | | | | | | | | | | | |
| | (1.26 | ) | | | (.84 | ) | | | (1.11 | ) | | | — | |
| | | | | | | | | | | | | | | |
| $ | 10.70 | | | $ | 13.70 | | | $ | 12.54 | | | $ | 12.78 | |
| | | | | | | | | | | | | | | |
| | (13.91 | )% | | | 16.28 | % | | | 7.14 | % | | | 15.45 | % |
| | | | | | | | | | | | | | |
| $ | 4,712 | | | $ | 10,851 | | | $ | 8,019 | | | $ | 2,990 | |
| $ | 8,028 | | | $ | 10,882 | | | $ | 5,619 | | | $ | 1,542 | |
| | | | | | | | | | | | | | |
| | 2.11 | % | | | 2.10 | % | | | 2.13 | % | | | 2.13 | %(c) |
| | 1.11 | % | | | 1.10 | % | | | 1.13 | % | | | 1.13 | %(c) |
| | .25 | % | | | (.10 | )% | | | (.13 | )% | | | (.51 | )%(c) |
See Notes to Financial Statements.
| | |
| Target Asset Allocation Funds/Target Growth Allocation Fund | | 59 |
Financial Highlights
(Unaudited) continued
| | | | |
| |
| | | Class R | |
| | | Six Months Ended
January 31, 2009(d) | |
Per Share Operating Performance: | | | | |
Net Asset Value, Beginning Of Period | | $ | 11.44 | |
| | | | |
Income (loss) from investment operations: | | | | |
Net investment income | | | .04 | |
Net realized and unrealized gain (loss) on investments | | | (4.22 | ) |
| | | | |
Total from investment operations | | | (4.18 | ) |
| | | | |
Less Dividends and Distributions: | | | | |
Dividends from net investment income | | | (.09 | ) |
Distributions from net realized gains | | | — | (e) |
| | | | |
Total dividends and distributions | | | (.09 | ) |
| | | | |
Net asset value, end of period | | $ | 7.17 | |
| | | | |
Total Return(b) | | | (36.53 | )% |
Ratios/Supplemental Data: | | | | |
Net assets, end of period (000) | | $ | 163 | |
Average net assets (000) | | $ | 231 | |
Ratios to average net assets (h): | | | | |
Expenses, including distribution and service (12b-1) fees(f) | | | 1.80 | %(c) |
Expenses, excluding distribution and service (12b-1) fees | | | 1.30 | %(c) |
Net investment income | | | .79 | %(c) |
| (a) | Commencement of offering new share class. |
| (b) | Total return is calculated assuming a purchase of a share on the first day and a sale on the last day of each period reported and includes reinvestment of dividends and distributions. Total returns may reflect adjustments to conform to generally accepted accounting principles. Total returns for periods less than one full year are not annualized. |
| (d) | Calculations are based on average shares outstanding during the period. |
| (e) | Less than $.005 per share. |
| (f) | The distributor of the Fund contractually agreed to limit its distribution and service (12b-1) fees to .50 of 1% of the average daily assets of the Class R shares. |
| (h) | Does not include expenses of the underlying portfolios in which the Fund invests. |
See Notes to Financial Statements.
| | |
| 60 | | Visit our website at www.prudential.com |
| | | | | | | | | | | | | | |
| Class R | |
| Year Ended July 31, | | | October 4, 2004(a)
through
July 31, 2005(d) | |
| 2008(d) | | | 2007(d) | | | 2006(d) | | |
| | | | | | | | | | | | | | |
| $ | 14.52 | | | $ | 13.21 | | | $ | 13.34 | | | $ | 11.51 | |
| | | | | | | | | | | | | | | |
| | | | | | | | | | | | | | |
| | .10 | | | | .05 | | | | .07 | | | | — | (e) |
| | (1.88 | ) | | | 2.11 | | | | .91 | | | | 1.83 | |
| | | | | | | | | | | | | | | |
| | (1.78 | ) | | | 2.16 | | | | .98 | | | | 1.83 | |
| | | | | | | | | | | | | | | |
| | | | | | | | | | | | | | |
| | (.04 | ) | | | (.01 | ) | | | — | | | | — | |
| | (1.26 | ) | | | (.84 | ) | | | (1.11 | ) | | | — | |
| | | | | | | | | | | | | | | |
| | (1.30 | ) | | | (.85 | ) | | | (1.11 | ) | | | — | |
| | | | | | | | | | | | | | | |
| $ | 11.44 | | | $ | 14.52 | | | $ | 13.21 | | | $ | 13.34 | |
| | | | | | | | | | | | | | | |
| | (13.42 | )% | | | 16.76 | % | | | 7.69 | % | | | 15.90 | % |
| | | | | | | | | | | | | | |
| $ | 323 | | | $ | 333 | | | $ | 195 | | | $ | 3 | |
| $ | 339 | | | $ | 284 | | | $ | 89 | | | $ | 3 | |
| | | | | | | | | | | | | | |
| | 1.61 | % | | | 1.60 | % | | | 1.63 | % | | | 1.63 | %(c) |
| | 1.11 | % | | | 1.10 | % | | | 1.13 | % | | | 1.13 | %(c) |
| | .77 | % | | | .36 | % | | | .51 | % | | | — | %(c)(g) |
See Notes to Financial Statements.
| | |
| Target Asset Allocation Funds/Target Growth Allocation Fund | | 61 |
Financial Highlights
(Unaudited) continued
| | | | |
| |
| | | Class X | |
| | | Six Months Ended
January 31, 2009(d) | |
Per Share Operating Performance: | | | | |
Net Asset Value, Beginning Of Period | | $ | 10.68 | |
| | | | |
Income (loss) from investment operations: | | | | |
Net investment income (loss) | | | .01 | |
Net realized and unrealized gain (loss) on investments | | | (3.93 | ) |
| | | | |
Total from investment operations | | | (3.92 | ) |
| | | | |
Less Dividends and Distributions: | | | | |
Dividends from net investment income | | | (.05 | ) |
Distributions from net realized gains | | | — | (f) |
| | | | |
Total dividends and distributions | | | (.05 | ) |
| | | | |
Net asset value, end of period | | $ | 6.71 | |
| | | | |
Total Return(b) | | | (36.69 | )% |
Ratios/Supplemental Data: | | | | |
Net assets, end of period (000) | | $ | 1,880 | |
Average net assets (000) | | $ | 2,623 | |
Ratios to average net assets(e): | | | | |
Expenses, including distribution and service (12b-1) fees | | | 2.30 | %(c) |
Expenses, excluding distribution and service (12b-1) fees | | | 1.30 | %(c) |
Net investment income (loss) | | | .28 | %(c) |
| (a) | Commencement of offering new share class. |
| (b) | Total return does not consider the effects of sales loads. Total return is calculated assuming a purchase of a share on the first day and a sale on the last day of each period reported and includes reinvestment of dividends and distributions. Total returns may reflect adjustments to conform to generally accepted accounting principles. Total returns for periods less than one full year are not annualized. |
| (d) | Calculations are based on average shares outstanding during the period. |
| (e) | Does not include expenses of the underlying portfolios in which the Fund invests. |
| (f) | Less than $.005 per share. |
See Notes to Financial Statements.
| | |
| 62 | | Visit our website at www.prudential.com |
| | | | | | | | | | | | | | |
| Class X | |
| Year Ended July 31, | | | October 4, 2004(a)
through
July 31, 2005(d) | |
| 2008(d) | | | 2007(d) | | | 2006(d) | | |
| | | | | | | | | | | | | | |
| $ | 13.68 | | | $ | 12.55 | | | $ | 12.79 | | | $ | 11.07 | |
| | | | | | | | | | | | | | | |
| | | | | | | | | | | | | | |
| | .03 | | | | (.01 | ) | | | (.01 | ) | | | (.05 | ) |
| | (1.77 | ) | | | 1.98 | | | | .88 | | | | 1.77 | |
| | | | | | | | | | | | | | | |
| | (1.74 | ) | | | 1.97 | | | | .87 | | | | 1.72 | |
| | | | | | | | | | | | | | | |
| | | | | | | | | | | | | | |
| | — | | | | — | | | | — | | | | — | |
| | (1.26 | ) | | | (.84 | ) | | | (1.11 | ) | | | — | |
| | | | | | | | | | | | | | | |
| | (1.26 | ) | | | (.84 | ) | | | (1.11 | ) | | | — | |
| | | | | | | | | | | | | | | |
| $ | 10.68 | | | $ | 13.68 | | | $ | 12.55 | | | $ | 12.79 | |
| | | | | | | | | | | | | | | |
| | (13.93 | )% | | | 16.03 | % | | | 7.13 | % | | | 15.54 | % |
| | | | | | | | | | | | | | |
| $ | 3,759 | | | $ | 4,613 | | | $ | 3,703 | | | $ | 1,158 | |
| $ | 4,440 | | | $ | 4,643 | | | $ | 2,043 | | | $ | 608 | |
| | | | | | | | | | | | | | |
| | 2.11 | % | | | 2.10 | % | | | 2.13 | % | | | 2.13 | %(c) |
| | 1.11 | % | | | 1.10 | % | | | 1.13 | % | | | 1.13 | %(c) |
| | .26 | % | | | (.09 | )% | | | (.09 | )% | | | (.52 | )%(c) |
See Notes to Financial Statements.
| | |
| Target Asset Allocation Funds/Target Growth Allocation Fund | | 63 |
Financial Highlights
(Unaudited) continued
| | | | |
| | | Class Z | |
| | | Six Months Ended
January 31, 2009(b) | |
Per Share Operating Performance: | | | | |
Net Asset Value, Beginning Of Period | | $ | 11.81 | |
| | | | |
Income (loss) from investment operations: | | | | |
Net investment income (loss) | | | .06 | |
Net realized and unrealized gain (loss) on investments | | | (4.36 | ) |
| | | | |
Total from investment operations | | | (4.30 | ) |
| | | | |
Less Dividends and Distributions: | | | | |
Dividends from net investment income | | | (.13 | ) |
Distributions from net realized gains | | | — | (c) |
| | | | |
Total dividends and distributions | | | (.13 | ) |
| | | | |
Net asset value, end of period | | $ | 7.38 | |
| | | | |
Total Return(a) | | | (36.41 | )% |
Ratios/Supplemental Data: | | | | |
Net assets, end of period (000) | | $ | 2,523 | |
Average net assets (000) | | $ | 3,909 | |
Ratios to average net assets(f): | | | | |
Expenses, including distribution and service (12b-1) fees | | | 1.30 | %(e) |
Expenses, excluding distribution and service (12b-1) fees | | | 1.30 | %(e) |
Net investment income (loss) | | | 1.28 | %(e) |
| (a) | Total return does not consider the effects of sales loads. Total return is calculated assuming a purchase of a share on the first day and a sale on the last day of each period reported and includes reinvestment of dividends and distributions. Total returns may reflect adjustments to conform to generally accepted accounting principles. Total returns for periods less than one full year are not annualized. |
| (b) | Calculations are based on average shares outstanding during the period. |
| (c) | Less than $.005 per share. |
| (f) | Does not include expenses of the underlying portfolios in which the Fund invests. |
See Notes to Financial Statements.
| | |
| 64 | | Visit our website at www.prudential.com |
| | | | | | | | | | | | | | | | | | |
| Class Z | |
| Year Ended July 31, | |
| 2008(b) | | | 2007(b) | | | 2006(b) | | | 2005(b) | | | 2004(b) | |
| | | | | | | | | | | | | | | | | | |
| $ | 14.95 | | | $ | 13.54 | | | $ | 13.58 | | | $ | 11.11 | | | $ | 9.64 | |
| | | | | | | | | | | | | | | | | | | |
| | | | | | | | | | | | | | | | | | |
| | .17 | | | | .13 | | | | .11 | | | | .05 | | | | — | (c) |
| | (1.94 | ) | | | 2.15 | | | | .96 | | | | 2.42 | | | | 1.47 | |
| | | | | | | | | | | | | | | | | | | |
| | (1.77 | ) | | | 2.28 | | | | 1.07 | | | | 2.47 | | | | 1.47 | |
| | | | | | | | | | | | | | | | | | | |
| | | | | | | | | | | | | | | | | | |
| | (.11 | ) | | | (.03 | ) | | | — | | | | — | | | | — | |
| | (1.26 | ) | | | (.84 | ) | | | (1.11 | ) | | | — | | | | — | |
| | | | | | | | | | | | | | | | | | | |
| | (1.37 | ) | | | (.87 | ) | | | (1.11 | ) | | | — | | | | — | |
| | | | | | | | | | | | | | | | | | | |
| $ | 11.81 | | | $ | 14.95 | | | $ | 13.54 | | | $ | 13.58 | | | $ | 11.11 | |
| | | | | | | | | | | | | | | | | | | |
| | (13.00 | )% | | | 17.32 | % | | | 8.25 | % | | | 22.23 | % | | | 15.25 | % |
| | | | | | | | | | | | | | | | | | |
| $ | 5,234 | | | $ | 8,965 | | | $ | 7,884 | | | $ | 7,179 | | | $ | 5,297 | |
| $ | 7,414 | | | $ | 8,670 | | | $ | 6,977 | | | $ | 5,709 | | | $ | 3,837 | |
| | | | | | | | | | | | | | | | | | |
| | 1.11 | % | | | 1.10 | % | | | 1.13 | % | | | 1.13 | % | | | 1.18 | % |
| | 1.11 | % | | | 1.10 | % | | | 1.13 | % | | | 1.13 | % | | | 1.18 | % |
| | 1.25 | % | | | .91 | % | | | .86 | % | | | .45 | % | | | — | %(d) |
See Notes to Financial Statements.
| | |
| Target Asset Allocation Funds/Target Growth Allocation Fund | | 65 |
| | | | |
| n MAIL | | n TELEPHONE | | n WEBSITE |
Gateway Center Three 100 Mulberry Street Newark, NJ 07102 | | (800) 225-1852 | | www.prudential.com |
|
| PROXY VOTING |
| The Board of Trustees of the Fund has delegated to the Fund’s investment subadvisers the responsibility for voting any proxies and maintaining proxy recordkeeping with respect to the Fund. A description of these proxy voting policies and procedures is available without charge, upon request, by calling (800) 225-1852 or by visiting the Securities and Exchange Commission’s website at www.sec.gov. Information regarding how the Fund voted proxies relating to portfolio securities during the most recent 12-month period ended June 30 is available on the Fund’s website and on the Commission’s website. |
|
| TRUSTEES |
| Kevin J. Bannon • Linda W. Bynoe • David E.A. Carson • Robert F. Gunia • Michael S. Hyland • Robert E. La Blanc • Douglas H. McCorkindale • Stephen P. Munn • Richard A. Redeker • Judy A. Rice • Robin B. Smith • Stephen G. Stoneburn |
|
| OFFICERS |
| Judy A. Rice, President • Robert F. Gunia, Vice President • Grace C. Torres, Treasurer and Principal Financial and Accounting Officer • Kathryn L. Quirk, Chief Legal Officer • Deborah A. Docs, Secretary • Timothy J. Knierim, Chief Compliance Officer • Valerie M. Simpson, Deputy Chief Compliance Officer • Theresa C. Thompson, Deputy Chief Compliance Officer • Noreen M. Fierro, Anti-Money Laundering Compliance Officer • Jonathan D. Shain, Assistant Secretary • Claudia DiGiacomo, Assistant Secretary • John P. Schwartz, Assistant Secretary • Andrew R. French, Assistant Secretary • M. Sadiq Peshimam, Assistant Treasurer • Peter Parrella, Assistant Treasurer |
| | | | |
| MANAGER | | Prudential Investments LLC | | Gateway Center Three
100 Mulberry Street Newark, NJ 07102 |
|
| INVESTMENT SUBADVISERS | | Eagle Asset Management, Inc. | | 880 Carillon Parkway
St. Petersburg, FL 33716 |
|
| | EARNEST Partners, LLC | | 1180 Peachtree Street
Suite 2300Atlanta, GA 30309 |
|
| | Eaton Vance Management | | Two International Place
Boston, MA 02110 |
|
| | Hotchkis and Wiley Capital
Management | | 725 South Figueroa Street
Suite 3900 Los Angeles, CA 90017 |
|
| | LSV Asset Management | | One North Wacker Drive
Suite 4000 Chicago, IL 60606 |
|
| | Marsico Capital
Management, LLC | | 1200 17th Street
Suite 1600 Denver, CO 80202 |
| | | | |
| | Massachusetts Financial
Services Company | | 500 Boylston Street
Boston, MA 02116 |
|
| | NFJ Investment Group L.P. | | 2100 Ross Avenue
Suite 1840 Dallas, TX 75201 |
|
| | Thornburg Investment
Management, Inc. | | 119 East Marcy Street
Santa Fe, NM 87501 |
|
| | Vaughan Nelson Investment
Management, L.P. | | 600 Travis Street
Suite 6300 Houston, TX 77002 |
|
| DISTRIBUTOR | | Prudential Investment
Management Services LLC | | Gateway Center Three
100 Mulberry Street Newark, NJ 07102 |
|
| CUSTODIAN | | PFPC Trust Company | | 400 Bellevue Parkway
Wilmington, DE 19809 |
|
| TRANSFER AGENT | | Prudential Mutual Fund
Services LLC | | PO Box 9658
Providence, RI 02940 |
|
| INDEPENDENT REGISTERED PUBLIC ACCOUNTING FIRM | | KPMG LLP | | 345 Park Avenue
New York, NY 10154 |
|
| FUND COUNSEL | | Willkie Farr & Gallagher LLP | | 787 Seventh Avenue
New York, NY 10019 |
|
| An investor should consider the investment objectives, risks, charges, and expenses of the Fund carefully before investing. The prospectus for the Fund contains this and other information about the Fund. An investor may obtain a prospectus by visiting our website at www.prudential.com or by calling (800) 225-1852. The prospectus should be read carefully before investing. |
|
| E-DELIVERY |
| To receive your mutual fund documents on-line, go to www.prudential.com/myaccess and enroll. Instead of receiving printed documents by mail, you will receive notification via e-mail when new materials are available. You can cancel your enrollment or change your e-mail address at any time by clicking on the view/change option at the website address above. |
|
| SHAREHOLDER COMMUNICATIONS WITH TRUSTEES |
| Shareholders can communicate directly with the Board of Trustees by writing to the Chair of the Board, Target Asset Allocation Funds, Prudential Investments, Attn: Board of Trustees, 100 Mulberry Street, Gateway Center Three, Newark, NJ 07102. Shareholders can communicate directly with an individual Trustee by writing to the same address. Communications are not screened before being delivered to the addressee. |
|
| AVAILABILITY OF PORTFOLIO SCHEDULE |
| The Fund files its complete schedule of portfolio holdings with the Securities and Exchange Commission for the first and third quarters of each fiscal year on Form N-Q. The Fund’s Forms N-Q are available on the Commission’s website at www.sec.gov. The Fund’s Forms N-Q may also be reviewed and copied at the Commission’s Public Reference Room in Washington, D.C. Information on the operation and location of the Public Reference Room may be obtained by calling (202) 551-8090. The Fund’s schedule of portfolio holdings is also available on the Fund’s website as of the end of each fiscal quarter. |
Mutual Funds:
| | | | |
| ARE NOT INSURED BY THE FDIC OR ANY FEDERAL GOVERNMENT AGENCY | | MAY LOSE VALUE | | ARE NOT A DEPOSIT OF OR GUARANTEED BY ANY BANK OR ANY BANK AFFILIATE |

| | | | | | | | | | | | | | | | | | |
| Target Growth Allocation Fund | | | | | | | | | | |
| | | Share Class | | A | | B | | C | | M | | R | | X | | Z | | |
| | NASDAQ | | PHGAX | | PIHGX | | PHGCX | | N/A | | PGARX | | N/A | | PDHZX | | |
| | CUSIP | | 87612A823 | | 87612A815 | | 87612A799 | | 87612A765 | | 87612A781 | | 87612A757 | | 87612A773 | | |
| | | | | | | | | | | | | | | | | | |
MFSP504E6 IFS-A162963 Ed. 03/2009
Item 2 – Code of Ethics – Not required, as this is not an annual filing.
Item 3 – Audit Committee Financial Expert – Not required, as this is not an annual filing.
Item 4 – Principal Accountant Fees and Services – Not required, as this is not an annual filing.
Item 5 – Audit Committee of Listed Registrants – Not applicable.
Item 6 – Schedule of Investments – The schedule is included as part of the report to shareholders filed under Item 1 of this Form.
Item 7 – Disclosure of Proxy Voting Policies and Procedures for Closed-End Management Investment Companies – Not applicable.
Item 8 – Portfolio Managers of Closed-End Management Investment Companies – Not applicable.
Item 9 – Purchases of Equity Securities by Closed-End Management Investment Company and Affiliated Purchasers – Not applicable.
Item 10 – Submission of Matters to a Vote of Security Holders – Not applicable.
Item 11 – Controls and Procedures
| | (a) | It is the conclusion of the registrant’s principal executive officer and principal financial officer that the effectiveness of the registrant’s current disclosure controls and procedures (such disclosure controls and procedures having been evaluated within 90 days of the date of this filing) provide reasonable assurance that the information required to be disclosed by the registrant has been recorded, processed, summarized and reported within the time period specified in the Commission’s rules and forms and that the information required to be disclosed by the registrant has been accumulated and communicated to the registrant’s principal executive officer and principal financial officer in order to allow timely decisions regarding required disclosure. |
| | (b) | There has been no significant change in the registrant’s internal control over financial reporting that occurred during the registrant’s most recent fiscal quarter of the period covered by this report that has materially affected, or is likely to materially affect, the registrant’s internal control over financial reporting. |
Item 12 – Exhibits
| | |
| (a) | | (1) Code of Ethics – Not required, as this is not an annual filing. |
| |
| | (2) Certifications pursuant to Section 302 of the Sarbanes-Oxley Act – Attached hereto as Exhibit EX-99.CERT. |
| |
| | (3) Any written solicitation to purchase securities under Rule 23c-1. – Not applicable. |
| |
| (b) | | Certifications pursuant to Section 906 of the Sarbanes-Oxley Act – Attached hereto as Exhibit EX-99.906CERT. |
SIGNATURES
Pursuant to the requirements of the Securities Exchange Act of 1934 and the Investment Company Act of 1940, the registrant has duly caused this report to be signed on its behalf by the undersigned, thereunto duly authorized.
| | |
| (Registrant) | | Target Asset Allocation Funds |
| |
| By (Signature and Title)* | | /s/ Deborah A. Docs |
| | Deborah A. Docs |
| | Secretary |
| |
| Date | | March 31, 2009 |
Pursuant to the requirements of the Securities Exchange Act of 1934 and the Investment Company Act of 1940, this report has been signed below by the following persons on behalf of the registrant and in the capacities and on the dates indicated.
| | |
| By (Signature and Title)* | | /s/ Judy A. Rice |
| | Judy A. Rice |
| | President and Principal Executive Officer |
| |
| Date | | March 31, 2009 |
| |
| By (Signature and Title)* | | /s/ Grace C. Torres |
| | Grace C. Torres |
| | Treasurer and Principal Financial Officer |
| |
| Date | | March 31, 2009 |
* | Print the name and title of each signing officer under his or her signature. |