UNITED STATES
SECURITIES AND EXCHANGE COMMISSION
Washington, D.C. 20549
FORM N-CSR
CERTIFIED SHAREHOLDER REPORT OF REGISTERED
MANAGEMENT INVESTMENT COMPANIES
| | |
| |
| Investment Company Act file number: | | 811-08915 |
| |
| Exact name of registrant as specified in charter: | | Target Asset Allocation Funds |
| |
| Address of principal executive offices: | | Gateway Center 3, |
| | 100 Mulberry Street, |
| | Newark, New Jersey 07102 |
| |
| Name and address of agent for service: | | Deborah A. Docs |
| | Gateway Center 3, |
| | 100 Mulberry Street, |
| | Newark, New Jersey 07102 |
| |
| Registrant’s telephone number, including area code: | | 800-225-1852 |
| |
| Date of fiscal year end: | | 7/31/2012 |
| |
| Date of reporting period: | | 1/31/2012 |
Item 1 – Reports to Stockholders

PRUDENTIAL INVESTMENTS»MUTUAL FUNDS
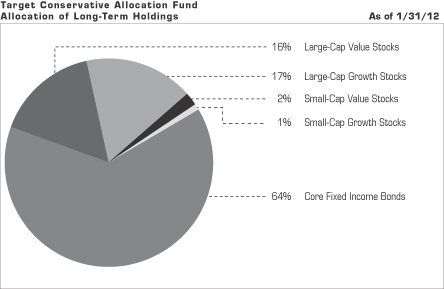
TARGET CONSERVATIVE ALLOCATION FUND
SEMIANNUAL REPORT · JANUARY 31, 2012
Objective
Seeks current income and a reasonable level of capital appreciation
This report is not authorized for distribution to prospective investors unless preceded or accompanied by a current prospectus.
The views expressed in this report and information about the Fund’s portfolio holdings are for the period covered by this report and are subject to change thereafter.
The accompanying financial statements as of January 31, 2012, were not audited and, accordingly, no auditor’s opinion is expressed on them.
Target Funds, Prudential Investments, Prudential, the Prudential logo, and the Rock symbol are service marks of Prudential Financial, Inc. and its related entities, registered in many jurisdictions worldwide.

March 15, 2012
Dear Shareholder:
After an extraordinary career at Prudential, Judy Rice retired at the end of 2011 as President of Prudential Investments and President and Trustee of the Target Conservative Allocation Fund (the Fund). While she will remain as Chairman of Prudential Investments until the end of 2012, I was named to succeed her as President of Prudential Investments and as President and Trustee of the Fund effective January 1, 2012. I previously served as Executive Vice President of Retail Mutual Fund Distribution for Prudential Investments for the past six years.
Since this is my first letter to shareholders, I would like to recognize Judy for her significant contributions and her unflagging commitment to helping investors like you meet the challenges of a rapidly changing investment environment. My goal is to build on Judy’s accomplishments, with a particular focus on delivering the solutions you need to address your financial goals.
On the following pages, you’ll find your semiannual report for the Fund. Target Asset Allocation Funds are managed by institutional-quality asset managers selected, matched, and monitored by a research team from Prudential Investments. We believe the Fund will help you to achieve broad diversification at a targeted risk/return balance with a single investment purchase. We appreciate your continued confidence in us. Keep in mind that diversification and asset allocation do not assure a profit or protect against a loss in a declining market.
Sincerely,

Stuart S. Parker, President
Target Asset Allocation Funds
| | | | |
| Target Asset Allocation Funds/Target Conservative Allocation Fund | | | 1 | |
Your Fund’s Performance (Unaudited)
Performance data quoted represent past performance. Past performance does not guarantee future results. The investment return and principal value of an investment will fluctuate, so that an investor’s shares, when redeemed, may be worth more or less than their original cost. Current performance may be lower or higher than the past performance data quoted. An investor may obtain performance data as of the most recent month-end by visiting our website at www.prudentialfunds.com or by calling (800) 225-1852. The maximum initial sales charge is 5.50% (Class A shares). Gross operating expenses: Class A, 1.62%; Class B, 2.32%; Class C, 2.32%; Class M, 2.32%; Class R, 2.07%; Class X, 2.32%; Class Z, 1.32%. Net operating expenses: Class A, 1.57%; Class B, 2.32%; Class C, 2.32%; Class M, 2.32%; Class R, 1.82%; Class X, 2.32%; Class Z, 1.32%, after contractual reduction through 11/30/2012 for Class A and Class R shares.
| | | | | | | | | | | | | | | | | | |
Cumulative Total Returns (Without Sales Charges) as of 1/31/12 |
| | | Six Months | | | One Year | | | Five Years | | | Ten Years | | | Since Inception |
Class A | | | 1.48 | % | | | 4.11 | % | | | 18.27 | % | | | 63.36 | % | | — |
Class B | | | 1.07 | | | | 3.31 | | | | 13.92 | | | | 51.60 | | | — |
Class C | | | 0.98 | | | | 3.21 | | | | 13.81 | | | | 51.45 | | | — |
Class M | | | 0.98 | | | | 3.21 | | | | 13.80 | | | | N/A | | | 32.20% (10/4/04) |
Class R | | | 1.34 | | | | 3.87 | | | | 16.76 | | | | N/A | | | 37.35 (10/4/04) |
Class X | | | 0.98 | | | | 3.21 | | | | 14.02 | | | | N/A | | | 32.46 (10/4/04) |
Class Z | | | 1.52 | | | | 4.34 | | | | 19.74 | | | | 67.53 | | | — |
Customized Blend | | | 3.73 | | | | 7.11 | | | | 25.85 | | | | 70.88 | | | — |
S&P 500 Index | | | 2.70 | | | | 4.19 | | | | 1.65 | | | | 41.36 | | | — |
Lipper Mixed-Asset Target Allocation Conservative Funds Avg. | | | 0.99 | | | | 3.99 | | | | 18.30 | | | | 55.35 | | | — |
| | |
| 2 | | Visit our website at www.prudentialfunds.com |
| | | | | | | | | | | | | | | | |
Average Annual Total Returns (With Sales Charges) as of 12/31/11 |
| | | | | One Year | | | Five Years | | | Ten Years | | | Since Inception |
Class A | | | | | –3.82 | % | | | 1.78 | % | | | 3.96 | % | | — |
Class B | | | | | –3.92 | | | | 1.99 | | | | 3.78 | | | — |
Class C | | | | | –0.02 | | | | 2.14 | | | | 3.77 | | | — |
Class M | | | | | –5.02 | | | | 1.79 | | | | N/A | | | 3.50% (10/4/04) |
Class R | | | | | 1.54 | | | | 2.67 | | | | N/A | | | 4.04 (10/4/04) |
Class X | | | | | –4.92 | | | | 1.70 | | | | N/A | | | 3.44 (10/4/04) |
Class Z | | | | | 2.01 | | | | 3.19 | | | | 4.83 | | | — |
Customized Blend | | | | | 5.43 | | | | 4.33 | | | | 5.24 | | | — |
S&P 500 Index | | | | | 2.09 | | | | –0.25 | | | | 2.92 | | | — |
Lipper Mixed-Asset Target Allocation Conservative Funds Avg. | | | | | 2.06 | | | | 2.88 | | | | 4.05 | | | — |
Source: Prudential Investments LLC and Lipper Inc. Performance figures may reflect fee waivers and/or expense reimbursements. In the absence of such fee waivers and/or expense reimbursements, total returns would be lower.
Inception returns are provided for any share class with less than 10 calendar years of returns.
The average annual total returns take into account applicable sales charges. Class A shares are subject to a maximum front-end sales charge of 5.50%, and a 12b-1 fee of up to 0.30% annually. All investors who purchase Class A shares in an amount of $1 million or more and sell these shares within 12 months of purchase are subject to a contingent deferred sales charge (CDSC) of 1%. The Class A CDSC is waived for purchases by certain retirement and/or benefit plans. Under certain circumstances, an exchange may be made from specified share classes of the Fund to one or more other share classes of the Fund. Class B shares are subject to a declining CDSC of 5%, 4%, 3%, 2%, 1%, and 1%, respectively, for the first six years after purchase and a 12b-1 fee of 1% annually. Approximately seven years after purchase, Class B shares will automatically convert to Class A shares on a quarterly basis. Class C shares are not subject to a front-end sales charge, but charge a CDSC of 1% for Class C shares sold within 12 months from the date of purchase, and an annual 12b-1 fee of 1%. Class M shares are closed to new purchases. Class M shares are subject to a CDSC of 6%, which decreases by 1% annually to 2% in the fifth and sixth years and 1% in the seventh year, and a 12b-1 fee of 1% annually. Class M shares automatically convert to Class A shares on a monthly basis approximately eight years after purchase. Class X shares are generally closed to new purchases. Class X shares are subject to a declining CDSC of 6%, 5%, 4%, 4%, 3%, 2%, 2%, and 1%, respectively, for the first eight years after purchase and a 12b-1 fee of 1% annually. Class X shares automatically convert to Class A shares on a monthly basis approximately 10 years after purchase. Class R and Z shares are not subject to a sales charge. Class R shares are subject to a 12b-1 fee of up to 0.75% annually. Class Z shares are not subject to a 12b-1 fee. The returns in the tables do not reflect the deduction of taxes that a shareholder would pay on Fund distributions or following the redemption of Fund shares. The returns in the tables reflect the share class expense structure in effect at the close of the fiscal period.
| | | | |
| Target Asset Allocation Funds/Target Conservative Allocation Fund | | | 3 | |
Your Fund’s Performance (continued)
Benchmark Definitions
Customized Blend
The Customized Benchmark for the Target Conservative Allocation Fund (Customized Blend) is a model portfolio consisting of the Russell 3000 Index (40%) and the Barclays Capital U.S. Aggregate Bond Index (60%). The Customized Blend is an unmanaged index generally considered as representing the performance of the Fund’s asset classes. The Customized Blend is intended to provide a theoretical comparison to the Fund’s performance, based on the amounts allocated to each asset class rather than on amounts allocated to various Fund segments. The Customized Blend does not reflect deductions for any sales charges or operating expenses of a mutual fund. The Russell 3000 Index is an unmanaged index which measures the performance of the 3,000 largest U.S. companies based on total market capitalization, which represents approximately 98% of the investable U.S. equity market. The Barclays Capital U.S. Aggregate Bond Index is an unmanaged index of investment-grade securities issued by the U.S. government and its agencies and by corporations with between one and 10 years remaining to maturity. It gives a broad look at how short- and intermediate-term bonds have performed. Customized Blend Closest Month-End to Inception cumulative total return as of 1/31/12 is 50.03% for Class M, Class R, and Class X. Customized Blend Closest Month-End to Inception average annual total return as of 12/31/11 is 5.39% for Class M, Class R, and Class X.
S&P 500 Index
The Standard & Poor’s 500 Composite Stock Price Index (S&P 500 Index) is an unmanaged index of 500 stocks of large U.S. public companies. It gives an indication of how U.S. stock prices have performed. S&P 500 Index Closest Month-End to Inception cumulative total return as of 1/31/12 is 36.90% for Class M, Class R, and Class X. S&P 500 Index Closest Month-End to Inception average annual total return as of 12/31/11 is 3.80% for Class M, Class R, and Class X.
Lipper Mixed-Asset Target Allocation Conservative Funds Average
The Lipper Mixed-Asset Target Allocation Conservative Funds Average (Lipper Average) represents returns based on the average return of all funds in the Lipper Mixed-Asset Target Allocation Conservative Funds category for the periods noted. Funds in the Lipper Average have a primary investment objective of conserving principal by maintaining at all times a balanced portfolio of both stocks and bonds. Mixed-Asset Funds are funds that, by portfolio practice, maintain a mix of between 20% and 40% equity securities, with the remainder invested in bonds, cash, and cash equivalents. Lipper Average Closest Month-End to Inception cumulative total return as of 1/31/12 is 38.13% for Class M, Class R, and Class X. Lipper Average Closest Month-End to Inception average annual total return as of 12/31/11 is 4.13% for Class M, Class R, and Class X.
Investors cannot invest directly in an index or average. The returns for the Indexes would be lower if they included the effects of sales charges, operating expenses of a mutual fund, or taxes. Returns for the Lipper Average reflect the deduction of operating expenses, but not sales charges or taxes. The Since Inception returns for the Indexes are measured from the closest month-end to inception date, and not from the Fund’s actual inception date.
| | |
| 4 | | Visit our website at www.prudentialfunds.com |
| | | | |
| Target Asset Allocation Funds/Target Conservative Allocation Fund | | | 5 | |
Your Fund’s Performance (continued)
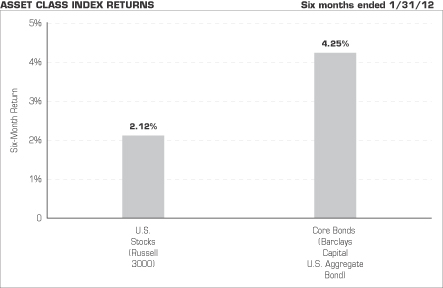
Source: Lipper Inc.
The chart above shows the total returns for six months ended January 31, 2012, of various securities indexes that are generally considered representative of broad market sectors. It does not reflect a mutual fund’s expenses. The performance cited does not represent the performance of the Target Conservative Allocation Fund. Past performance is not indicative of future results. Investors cannot invest directly in an index or average.
The Russell 3000 Index is an unmanaged index which measures the performance of the 3,000 largest U.S. companies based on total market capitalization, which represents approximately 98% of the investable U.S. equity market.
The Barclays Capital U.S. Aggregate Bond Index is an unmanaged index of investment-grade securities issued by the U.S. government and its agencies and by corporations with between one and 10 years remaining to maturity. It gives a broad look at how short- and intermediate-term bonds have performed.
| | |
| 6 | | Visit our website at www.prudentialfunds.com |
Fees and Expenses (Unaudited)
As a shareholder of the Fund, you incur two types of costs: (1) transaction costs, including sales charges (loads) on purchase payments and redemptions, as applicable, and (2) ongoing costs, including management fees, distribution and/or service (12b-1) fees, and other Fund expenses, as applicable. This example is intended to help you understand your ongoing costs (in dollars) of investing in the Fund and to compare these costs with the ongoing costs of investing in other mutual funds.
The example is based on an investment of $1,000 invested on August 1, 2011, at the beginning of the period, and held through the six-month period ended January 31, 2012. The example is for illustrative purposes only; you should consult the Prospectus for information on initial and subsequent minimum investment requirements.
The Fund’s transfer agent may charge additional fees to holders of certain accounts that are not included in the expenses shown in the table on the following page. These fees apply to individual retirement accounts (IRAs) and Section 403(b) accounts. As of the close of the six-month period covered by the table, IRA fees included an annual maintenance fee of $15 per account (subject to a maximum annual maintenance fee of $25 for all accounts held by the same shareholder). Section 403(b) accounts are charged an annual $25 fiduciary maintenance fee. Some of the fees may vary in amount, or may be waived, based on your total account balance or the number of Prudential Investments Funds, including the Target Asset Allocation Funds, that you own. You should consider the additional fees that were charged to your Fund account over the six-month period when you estimate the total ongoing expenses paid over the period and the impact of these fees on your ending account value, as these additional expenses are not reflected in the information provided in the expense table. Additional fees have the effect of reducing investment returns.
Actual Expenses
The first line for each share class in the table on the following page provides information about actual account values and actual expenses. You may use the information on this line, together with the amount you invested, to estimate the expenses that you paid over the period. Simply divide your account value by $1,000 (for example, an $8,600 account value ÷ $1,000 = 8.6), then multiply the result by the number on the first line under the heading “Expenses Paid During the Six-Month Period” to estimate the expenses you paid on your account during this period.
Hypothetical Example for Comparison Purposes
The second line for each share class in the table on the following page provides information about hypothetical account values and hypothetical expenses based on the Fund’s actual expense ratio and an assumed rate of return of 5% per year before expenses, which is not the Fund’s actual return. The hypothetical account values and
| | | | |
| Target Asset Allocation Funds/Target Conservative Allocation Fund | | | 7 | |
Fees and Expenses (continued)
expenses may not be used to estimate the actual ending account balance or expenses you paid for the period. You may use this information to compare the ongoing costs of investing in the Fund and other funds. To do so, compare this 5% hypothetical example with the 5% hypothetical examples that appear in the shareholder reports of the other funds.
Please note that the expenses shown in the table are meant to highlight your ongoing costs only and do not reflect any transactional costs such as sales charges (loads). Therefore, the second line for each share class in the table is useful in comparing ongoing costs only and will not help you determine the relative total costs of owning different funds. In addition, if these transactional costs were included, your costs would have been higher.
| | | | | | | | | | | | | | | | | | |
Target
Conservative
Allocation Fund | | Beginning Account
Value
August 1, 2011 | | | Ending Account
Value January 31, 2012 | | | Annualized Expense Ratio Based on the Six-Month Period | | | Expenses Paid During the Six-Month Period* | |
| | | | | | | | | | | | | | | | | | |
| Class A | | Actual | | $ | 1,000.00 | | | $ | 1,014.80 | | | | 1.57 | % | | $ | 7.95 | |
| | | Hypothetical | | $ | 1,000.00 | | | $ | 1,017.24 | | | | 1.57 | % | | $ | 7.96 | |
| | | | | | | | | | | | | | | | | | |
| Class B | | Actual | | $ | 1,000.00 | | | $ | 1,010.70 | | | | 2.32 | % | | $ | 11.73 | |
| | | Hypothetical | | $ | 1,000.00 | | | $ | 1,013.47 | | | | 2.32 | % | | $ | 11.74 | |
| | | | | | | | | | | | | | | | | | |
| Class C | | Actual | | $ | 1,000.00 | | | $ | 1,009.80 | | | | 2.32 | % | | $ | 11.72 | |
| | | Hypothetical | | $ | 1,000.00 | | | $ | 1,013.47 | | | | 2.32 | % | | $ | 11.74 | |
| | | | | | | | | | | | | | | | | | |
| Class M | | Actual | | $ | 1,000.00 | | | $ | 1,009.80 | | | | 2.32 | % | | $ | 11.72 | |
| | | Hypothetical | | $ | 1,000.00 | | | $ | 1,013.47 | | | | 2.32 | % | | $ | 11.74 | |
| | | | | | | | | | | | | | | | | | |
| Class R | | Actual | | $ | 1,000.00 | | | $ | 1,013.40 | | | | 1.82 | % | | $ | 9.21 | |
| | | Hypothetical | | $ | 1,000.00 | | | $ | 1,015.99 | | | | 1.82 | % | | $ | 9.22 | |
| | | | | | | | | | | | | | | | | | |
| Class X | | Actual | | $ | 1,000.00 | | | $ | 1,009.80 | | | | 2.32 | % | | $ | 11.72 | |
| | | Hypothetical | | $ | 1,000.00 | | | $ | 1,013.47 | | | | 2.32 | % | | $ | 11.74 | |
| | | | | | | | | | | | | | | | | | |
| Class Z | | Actual | | $ | 1,000.00 | | | $ | 1,015.20 | | | | 1.32 | % | | $ | 6.69 | |
| | | Hypothetical | | $ | 1,000.00 | | | $ | 1,018.50 | | | | 1.32 | % | | $ | 6.70 | |
* Fund expenses (net of fee waivers or subsidies, if any) for each share class are equal to the annualized expense ratio for each share class (provided in the table), multiplied by the average account value over the period, multiplied by the 184 days in the six-month period ended January 31, 2012, and divided by the 366 days in the Fund’s fiscal year ending July 31, 2012 (to reflect the six-month period). Expenses presented in the table include the expenses of any underlying portfolios in which the Fund may invest.
| | |
| 8 | | Visit our website at www.prudentialfunds.com |
Portfolio of Investments
as of January 31, 2012 (Unaudited)
| | | | | | |
| Shares | | Description | | Value (Note 1) | |
| | | | | | |
LONG-TERM INVESTMENTS 110.0% | |
COMMON STOCKS 39.0% | |
|
Aerospace & Defense 0.7% | |
| 252 | | AAR Corp. | | $ | 5,340 | |
| 1,456 | | Boeing Co. (The) | | | 108,006 | |
| 1,100 | | Embraer SA, ADR (Brazil) | | | 30,162 | |
| 700 | | General Dynamics Corp. | | | 48,412 | |
| 981 | | Hexcel Corp.(a) | | | 24,594 | |
| 2,490 | | Lockheed Martin Corp. | | | 204,977 | |
| 189 | | Moog, Inc. (Class A Stock)(a) | | | 8,055 | |
| 4,400 | | Northrop Grumman Corp. | | | 255,420 | |
| 134 | | Teledyne Technologies, Inc.(a) | | | 7,606 | |
| 431 | | Triumph Group, Inc. | | | 26,967 | |
| 2,126 | | United Technologies Corp. | | | 166,572 | |
| | | | | | |
| | | | | 886,111 | |
|
Air Freight & Logistics 0.1% | |
| 486 | | Atlas Air Worldwide Holdings, Inc.(a) | | | 23,151 | |
| 700 | | FedEx Corp. | | | 64,043 | |
| | | | | | |
| | | | | 87,194 | |
|
Airlines | |
| 2,356 | | JetBlue Airways Corp.(a) | | | 13,971 | |
|
Auto Components 0.3% | |
| 7,116 | | Johnson Controls, Inc. | | | 226,075 | |
| 2,500 | | Magna International, Inc. (Canada) | | | 103,350 | |
| | | | | | |
| | | | | 329,425 | |
|
Auto Parts & Equipment | |
| 932 | | Meritor, Inc.(a) | | | 5,853 | |
| 266 | | WABCO Holdings, Inc.(a) | | | 13,792 | |
| | | | | | |
| | | | | 19,645 | |
|
Automobile Manufacturers | |
| 1,331 | | Ford Motor Co. | | | 16,531 | |
|
Automobiles | |
| 600 | | Harley-Davidson, Inc. | | | 26,514 | |
|
Beverages 0.2% | |
| 690 | | Coca-Cola Enterprises, Inc. | | | 18,485 | |
See Notes to Financial Statements.
| | | | |
| Target Asset Allocation Funds/Target Conservative Allocation Fund | | | 9 | |
Portfolio of Investments
as of January 31, 2012 (Unaudited) continued
| | | | | | |
| Shares | | Description | | Value (Note 1) | |
| | | | | | |
COMMON STOCKS (Continued) | |
|
Beverages (cont’d.) | |
| 5,236 | | Diageo PLC (United Kingdom) | | $ | 115,677 | |
| 441 | | Green Mountain Coffee Roasters, Inc.(a) | | | 23,523 | |
| 1,500 | | Molson Coors Brewing Co. (Class B Stock) | | | 64,335 | |
| 1,082 | | PepsiCo, Inc. | | | 71,055 | |
| | | | | | |
| | | | | 293,075 | |
|
Biotechnology 0.8% | |
| 1,370 | | Alexion Pharmaceuticals, Inc.(a) | | | 105,161 | |
| 2,462 | | Amgen, Inc. | | | 167,196 | |
| 3,569 | | Biogen Idec, Inc.(a) | | | 420,857 | |
| 1,794 | | Celgene Corp.(a) | | | 130,424 | |
| 1,620 | | Gilead Sciences, Inc.(a) | | | 79,121 | |
| 329 | | Seattle Genetics, Inc.(a) | | | 6,228 | |
| 294 | | United Therapeutics Corp.(a) | | | 14,459 | |
| | | | | | |
| | | | | 923,446 | |
|
Building Products 0.1% | |
| 725 | | A.O. Smith Corp. | | | 30,798 | |
| 425 | | Lennox International, Inc. | | | 15,385 | |
| 1,390 | | Owens Corning(a) | | | 46,913 | |
| | | | | | |
| | | | | 93,096 | |
|
Business Services 0.1% | |
| 336 | | ICON PLC, ADR (Ireland)(a) | | | 6,555 | |
| 368 | | MasterCard, Inc. (Class A Stock) | | | 130,850 | |
| | | | | | |
| | | | | 137,405 | |
|
Capital Markets 0.2% | |
| 1,448 | | Goldman Sachs Group, Inc. (The) | | | 161,409 | |
| 950 | | LPL Investment Holdings, Inc.(a) | | | 31,207 | |
| 2,581 | | State Street Corp. | | | 101,124 | |
| | | | | | |
| | | | | 293,740 | |
|
Chemicals 1.0% | |
| 551 | | Air Products & Chemicals, Inc. | | | 48,505 | |
| 870 | | Airgas, Inc. | | | 68,669 | |
| 810 | | Celanese Corp. (Class A Stock) | | | 39,455 | |
| 300 | | CF Industries Holdings, Inc. | | | 53,214 | |
| 5,431 | | Dow Chemical Co. (The) | | | 181,993 | |
| 1,229 | | Huntsman Corp. | | | 15,645 | |
See Notes to Financial Statements.
| | |
| 10 | | Visit our website at www.prudentialfunds.com |
| | | | | | |
| Shares | | Description | | Value (Note 1) | |
| | | | | | |
COMMON STOCKS (Continued) | |
|
Chemicals (cont’d.) | |
| 301 | | Intrepid Potash, Inc.(a) | | $ | 7,191 | |
| 525 | | Kraton Performance Polymers, Inc.(a) | | | 14,931 | |
| 475 | | Olin Corp. | | | 10,545 | |
| 1,372 | | PPG Industries, Inc. | | | 122,904 | |
| 4,864 | | Praxair, Inc. | | | 516,557 | |
| 468 | | Quaker Chemical Corp. | | | 20,732 | |
| 1,008 | | Scotts Miracle-Gro Co. (The) (Class A Stock) | | | 47,739 | |
| 600 | | Sensient Technologies Corp. | | | 23,772 | |
| 225 | | TPC Group, Inc.(a) | | | 7,391 | |
| 85 | | Valspar Corp. (The) | | | 3,675 | |
| | | | | | |
| | | | | 1,182,918 | |
|
Commercial Banks 1.4% | |
| 2,225 | | Associated Banc-Corp. | | | 27,723 | |
| 475 | | Bank of Hawaii Corp. | | | 21,717 | |
| 7,960 | | Fifth Third Bancorp | | | 103,560 | |
| 2,080 | | FirstMerit Corp. | | | 32,635 | |
| 6,656 | | PNC Financial Services Group, Inc. | | | 392,172 | |
| 675 | | Prosperity Bancshares, Inc. | | | 28,019 | |
| 8,700 | | Regions Financial Corp. | | | 45,414 | |
| 408 | | Trustmark Corp. | | | 9,617 | |
| 154 | | UMB Financial Corp. | | | 5,941 | |
| 232 | | United Bankshares, Inc. | | | 6,475 | |
| 250 | | Webster Financial Corp. | | | 5,300 | |
| 34,462 | | Wells Fargo & Co. | | | 1,006,635 | |
| | | | | | |
| | | | | 1,685,208 | |
|
Commercial Services 0.7% | |
| 383 | | Acacia Research - Acacia Technologies(a) | | | 15,764 | |
| 375 | | Consolidated Graphics, Inc.(a) | | | 19,046 | |
| 1,650 | | Corrections Corp. of America(a) | | | 38,824 | |
| 990 | | FleetCor Technologies, Inc.(a) | | | 33,650 | |
| 851 | | GEO Group, Inc. (The)(a) | | | 14,961 | |
| 1,925 | | KAR Auction Services, Inc.(a) | | | 28,375 | |
| 700 | | McGrath RentCorp | | | 22,288 | |
| 451 | | PAREXEL International Corp.(a) | | | 10,869 | |
| 358 | | Sotheby’s | | | 12,004 | |
| 2,230 | | Verisk Analytics, Inc. (Class A Stock)(a) | | | 89,356 | |
| 5,531 | | Visa, Inc. (Class A Stock) | | | 556,640 | |
See Notes to Financial Statements.
| | | | |
| Target Asset Allocation Funds/Target Conservative Allocation Fund | | | 11 | |
Portfolio of Investments
as of January 31, 2012 (Unaudited) continued
| | | | | | |
| Shares | | Description | | Value (Note 1) | |
| | | | | | |
COMMON STOCKS (Continued) | |
|
Commercial Services (cont’d.) | |
| 602 | | Waste Connections, Inc. | | $ | 19,451 | |
| | | | | | |
| | | | | 861,228 | |
|
Communications Equipment | |
| 600 | | ADTRAN, Inc. | | | 20,778 | |
| 1,325 | | Calix, Inc.(a) | | | 10,030 | |
| 500 | | Cisco Systems, Inc. | | | 9,815 | |
| | | | | | |
| | | | | 40,623 | |
|
Computer Hardware 1.3% | |
| 3,482 | | Apple, Inc.(a) | | | 1,589,463 | |
|
Computer Services & Software 1.2% | |
| 279 | | 3D Systems Corp.(a) | | | 5,334 | |
| 5,797 | | Accenture PLC (Class A Stock) (Ireland) | | | 332,400 | |
| 632 | | Allscripts Healthcare Solutions, Inc.(a) | | | 12,084 | |
| 2,310 | | Autodesk, Inc.(a) | | | 83,160 | |
| 8,160 | | EMC Corp.(a) | | | 210,202 | |
| 759 | | Fortinet, Inc.(a) | | | 17,313 | |
| 74 | �� | Global Payments, Inc. | | | 3,701 | |
| 1,202 | | Google, Inc. (Class A Stock)(a) | | | 697,292 | |
| 280 | | Informatica Corp.(a) | | | 11,844 | |
| 100 | | Manhattan Associates, Inc.(a) | | | 4,389 | |
| 670 | | MSCI, Inc. (Class A Stock)(a) | | | 21,829 | |
| 339 | | Riverbed Technology, Inc.(a) | | | 8,116 | |
| 89 | | salesforce.com, Inc.(a) | | | 10,395 | |
| 850 | | Super Micro Computer, Inc.(a) | | | 14,348 | |
| 700 | | VeriFone Systems, Inc.(a) | | | 29,890 | |
| | | | | | |
| | | | | 1,462,297 | |
|
Computers & Peripherals 0.4% | |
| 2,057 | | Cognizant Technology Solutions Corp. (Class A Stock)(a) | | | 147,590 | |
| 10,468 | | Hewlett-Packard Co. | | | 292,894 | |
| 1,700 | | QLogic Corp.(a) | | | 29,444 | |
| | | | | | |
| | | | | 469,928 | |
|
Construction | |
| 226 | | Meritage Homes Corp.(a) | | | 5,469 | |
| 650 | | MYR Group, Inc.(a) | | | 12,987 | |
| 205 | | Texas Industries, Inc. | | | 6,408 | |
See Notes to Financial Statements.
| | |
| 12 | | Visit our website at www.prudentialfunds.com |
| | | | | | |
| Shares | | Description | | Value (Note 1) | |
| | | | | | |
COMMON STOCKS (Continued) | |
|
Construction (cont’d.) | |
| 191 | | URS Corp.(a) | | $ | 7,860 | |
| | | | | | |
| | | | | 32,724 | |
|
Construction Materials | |
| 525 | | Eagle Materials, Inc. | | | 15,440 | |
|
Consumer Finance 0.1% | |
| 2,000 | | Capital One Financial Corp. | | | 91,500 | |
| 575 | | First Cash Financial Services, Inc.(a) | | | 23,144 | |
| | | | | | |
| | | | | 114,644 | |
|
Consumer Products & Services 0.2% | |
| 3,158 | | Estee Lauder Cos., Inc. (The) (Class A Stock) | | | 182,943 | |
| 195 | | Snap-on, Inc. | | | 11,019 | |
| 598 | | Vitamin Shoppe, Inc.(a) | | | 25,559 | |
| | | | | | |
| | | | | 219,521 | |
|
Containers & Packaging 0.1% | |
| 650 | | Packaging Corp. of America | | | 18,291 | |
| 1,200 | | Silgan Holdings, Inc. | | | 49,872 | |
| | | | | | |
| | | | | 68,163 | |
|
Cosmetics/Personal Care | |
| 260 | | Colgate-Palmolive Co. | | | 23,587 | |
|
Distribution/Wholesale 0.1% | |
| 48,000 | | Li & Fung Ltd. (Bermuda) | | | 104,971 | |
| 700 | | LKQ Corp.(a) | | | 22,820 | |
| | | | | | |
| | | | | 127,791 | |
|
Diversified Consumer Services 0.1% | |
| 4,700 | | H&R Block, Inc. | | | 76,892 | |
|
Diversified Financial Services 1.2% | |
| 640 | | Affiliated Managers Group, Inc.(a) | | | 64,326 | |
| 3,622 | | American Express Co. | | | 181,607 | |
| 984 | | Ameriprise Financial, Inc. | | | 52,693 | |
| 15,153 | | Bank of America Corp. | | | 108,041 | |
| 498 | | BlackRock, Inc. | | | 90,636 | |
| 7,934 | | Citigroup, Inc. | | | 243,733 | |
See Notes to Financial Statements.
| | | | |
| Target Asset Allocation Funds/Target Conservative Allocation Fund | | | 13 | |
Portfolio of Investments
as of January 31, 2012 (Unaudited) continued
| | | | | | |
| Shares | | Description | | Value (Note 1) | |
| | | | | | |
COMMON STOCKS (Continued) | |
|
Diversified Financial Services (cont’d.) | |
| 19,422 | | JPMorgan Chase & Co. | | $ | 724,441 | |
| | | | | | |
| | | | | 1,465,477 | |
|
Diversified Operations | |
| 249 | | LVMH Moet Hennessy Louis Vuitton SA (France) | | | 40,257 | |
|
Diversified Telecommunication Services 0.3% | |
| 12,649 | | AT&T, Inc. | | | 372,007 | |
|
Electric Utilities 0.7% | |
| 6,443 | | American Electric Power Co., Inc. | | | 254,885 | |
| 5,000 | | Edison International | | | 205,200 | |
| 275 | | El Paso Electric Co. | | | 9,570 | |
| 4,200 | | Exelon Corp. | | | 167,076 | |
| 150 | | Great Plains Energy, Inc. | | | 3,093 | |
| 5,988 | | PPL Corp. | | | 166,407 | |
| | | | | | |
| | | | | 806,231 | |
|
Electronic Components 0.1% | |
| 510 | | Checkpoint Systems, Inc.(a) | | | 5,365 | |
| 378 | | Coherent, Inc.(a) | | | 21,123 | |
| 517 | | DTS, Inc.(a) | | | 14,647 | |
| 142 | | FLIR Systems, Inc. | | | 3,657 | |
| 814 | | GrafTech International Ltd.(a) | | | 13,366 | |
| 239 | | Universal Display Corp.(a) | | | 10,064 | |
| 1,267 | | Universal Electronics, Inc.(a) | | | 23,439 | |
| | | | | | |
| | | | | 91,661 | |
|
Electronic Equipment & Instruments 0.1% | |
| 5,700 | | Corning, Inc. | | | 73,359 | |
| 341 | | EnerSys(a) | | | 9,882 | |
| 216 | | Itron, Inc.(a) | | | 8,379 | |
| 375 | | ScanSource, Inc.(a) | | | 14,089 | |
| 1,575 | | TE Connectivity Ltd. (Switzerland) | | | 53,707 | |
| | | | | | |
| | | | | 159,416 | |
|
Energy Equipment & Services 0.9% | |
| 2,470 | | Cameron International Corp.(a) | | | 131,404 | |
| 1,000 | | Diamond Offshore Drilling, Inc. | | | 62,300 | |
| 2,690 | | Ensco PLC, ADR (United Kingdom) | | | 141,602 | |
See Notes to Financial Statements.
| | |
| 14 | | Visit our website at www.prudentialfunds.com |
| | | | | | |
| Shares | | Description | | Value (Note 1) | |
| | | | | | |
COMMON STOCKS (Continued) | |
|
Energy Equipment & Services (cont’d.) | |
| 10,717 | | Halliburton Co. | | $ | 394,171 | |
| 4,177 | | National Oilwell Varco, Inc. | | | 309,014 | |
| 500 | | Oil States International, Inc.(a) | | | 39,845 | |
| 550 | | Unit Corp.(a) | | | 24,888 | |
| | | | | | |
| | | | | 1,103,224 | |
|
Engineering/Construction 0.1% | |
| 920 | | Fluor Corp. | | | 51,741 | |
| 1,250 | | MasTec, Inc.(a) | | | 20,362 | |
| | | | | | |
| | | | | 72,103 | |
|
Entertainment & Leisure 0.1% | |
| 470 | | Bally Technologies, Inc.(a) | | | 19,843 | |
| 246 | | Life Time Fitness, Inc.(a) | | | 12,089 | |
| 736 | | Pinnacle Entertainment, Inc.(a) | | | 7,139 | |
| 1,150 | | Royal Caribbean Cruises Ltd. (Liberia) | | | 31,257 | |
| 2,457 | | Shuffle Master, Inc.(a) | | | 31,450 | |
| | | | | | |
| | | | | 101,778 | |
|
Environmental Control | |
| 520 | | Stericycle, Inc.(a) | | | 43,690 | |
|
Farming & Agriculture 0.4% | |
| 6,302 | | Monsanto Co. | | | 517,079 | |
|
Financial—Bank & Trust 0.1% | |
| 523 | | Astoria Financial Corp. | | | 4,357 | |
| 8,267 | | KeyCorp | | | 64,234 | |
| | | | | | |
| | | | | 68,591 | |
|
Financial Services 0.4% | |
| 290 | | Eaton Vance Corp. | | | 7,450 | |
| 349 | | Jefferies Group, Inc. | | | 5,308 | |
| 113 | | Raymond James Financial, Inc. | | | 3,955 | |
| 15,267 | | U.S. Bancorp | | | 430,835 | |
| | | | | | |
| | | | | 447,548 | |
|
Food & Staples Retailing 0.6% | |
| 9,469 | | CVS Caremark Corp. | | | 395,331 | |
| 2,300 | | Kroger Co. (The) | | | 54,648 | |
See Notes to Financial Statements.
| | | | |
| Target Asset Allocation Funds/Target Conservative Allocation Fund | | | 15 | |
Portfolio of Investments
as of January 31, 2012 (Unaudited) continued
| | | | | | |
| Shares | | Description | | Value (Note 1) | |
| | | | | | |
COMMON STOCKS (Continued) | |
|
Food & Staples Retailing (cont’d.) | |
| 4,600 | | Safeway, Inc. | | $ | 101,108 | |
| 2,091 | | Wal-Mart Stores, Inc. | | | 128,304 | |
| | | | | | |
| | | | | 679,391 | |
|
Food Products 0.3% | |
| 4,300 | | ConAgra Foods, Inc. | | | 114,681 | |
| 5,024 | | Kraft Foods, Inc. (Class A Stock) | | | 192,419 | |
| | | | | | |
| | | | | 307,100 | |
|
Foods 0.2% | |
| 1,185 | | Danone (France) | | | 73,138 | |
| 340 | | Fresh Market, Inc. (The)(a) | | | 14,640 | |
| 990 | | General Mills, Inc. | | | 39,432 | |
| 1,224 | | Nestle SA (Switzerland) | | | 70,142 | |
| 2,913 | | Unilever NV (Netherlands) | | | 97,149 | |
| | | | | | |
| | | | | 294,501 | |
|
Gas Utilities | |
| 875 | | Atmos Energy Corp. | | | 28,359 | |
| 219 | | South Jersey Industries, Inc. | | | 12,018 | |
| | | | | | |
| | | | | 40,377 | |
|
Hand/Machine Tools 0.1% | |
| 166 | | Franklin Electric Co., Inc. | | | 8,310 | |
| 1,070 | | Stanley Black & Decker, Inc. | | | 75,093 | |
| | | | | | |
| | | | | 83,403 | |
|
Healthcare Equipment & Supplies 0.2% | |
| 156 | | Cantel Medical Corp. | | | 4,925 | |
| 157 | | MEDNAX, Inc.(a) | | | 11,182 | |
| 2,100 | | Medtronic, Inc. | | | 80,997 | |
| 580 | | Sirona Dental Systems, Inc.(a) | | | 28,043 | |
| 650 | | Teleflex, Inc. | | | 39,773 | |
| 399 | | Thoratec Corp.(a) | | | 11,731 | |
| 600 | | Zimmer Holdings, Inc.(a) | | | 36,450 | |
| | | | | | |
| | | | | 213,101 | |
|
Healthcare Products 0.3% | |
| 1,039 | | Arthrocare Corp.(a) | | | 32,115 | |
See Notes to Financial Statements.
| | |
| 16 | | Visit our website at www.prudentialfunds.com |
| | | | | | |
| Shares | | Description | | Value (Note 1) | |
| | | | | | |
COMMON STOCKS (Continued) | |
|
Healthcare Products (cont’d.) | |
| 978 | | Bruker Corp.(a) | | $ | 13,887 | |
| 411 | | Cepheid, Inc.(a) | | | 18,109 | |
| 398 | | Cooper Cos., Inc. (The) | | | 28,712 | |
| 4,012 | | Covidien PLC (Ireland) | | | 206,618 | |
| 310 | | IDEXX Laboratories, Inc.(a) | | | 26,223 | |
| 575 | | West Pharmaceutical Services, Inc. | | | 23,276 | |
| | | | | | |
| | | | | 348,940 | |
|
Healthcare Providers & Services 0.2% | |
| 553 | | Centene Corp.(a) | | | 24,995 | |
| 2,900 | | CIGNA Corp. | | | 130,007 | |
| 600 | | LifePoint Hospitals, Inc.(a) | | | 24,114 | |
| 375 | | Owens & Minor, Inc. | | | 11,404 | |
| | | | | | |
| | | | | 190,520 | |
|
Healthcare Services 0.3% | |
| 235 | | Air Methods Corp.(a) | | | 19,810 | |
| 259 | | Amedisys, Inc.(a) | | | 2,720 | |
| 448 | | AMERIGROUP Corp.(a) | | | 30,468 | |
| 142 | | Covance, Inc.(a) | | | 6,221 | |
| 287 | | Healthways, Inc.(a) | | | 2,170 | |
| 650 | | Humana, Inc. | | | 57,863 | |
| 4,724 | | UnitedHealth Group, Inc. | | | 244,656 | |
| | | | | | |
| | | | | 363,908 | |
|
Hotels & Motels 0.3% | |
| 3,407 | | Wynn Resorts Ltd. | | | 392,589 | |
|
Hotels, Restaurants & Leisure 0.6% | |
| 370 | | BJ’s Restaurants, Inc.(a) | | | 18,511 | |
| 2,377 | | Carnival Corp. (Panama) | | | 71,785 | |
| 475 | | Choice Hotels International, Inc. | | | 17,261 | |
| 1,760 | | Las Vegas Sands Corp.(a) | | | 86,434 | |
| 4,772 | | McDonald’s Corp. | | | 472,667 | |
| 943 | | Orient-Express Hotels Ltd. (Class A Stock) (Bermuda)(a) | | | 7,978 | |
| | | | | | |
| | | | | 674,636 | |
|
Household Products 0.1% | |
| 78 | | Helen of Troy Ltd. (Bermuda)(a) | | | 2,509 | |
| 1,500 | | Kimberly-Clark Corp. | | | 107,340 | |
See Notes to Financial Statements.
| | | | |
| Target Asset Allocation Funds/Target Conservative Allocation Fund | | | 17 | |
Portfolio of Investments
as of January 31, 2012 (Unaudited) continued
| | | | | | |
| Shares | | Description | | Value (Note 1) | |
| | | | | | |
COMMON STOCKS (Continued) | |
|
Household Products (cont’d.) | |
| 375 | | WD-40 Co. | | $ | 16,403 | |
| | | | | | |
| | | | | 126,252 | |
|
Industrial Conglomerates 0.4% | |
| 23,284 | | General Electric Co. | | | 435,644 | |
|
Insurance 1.2% | |
| 1,535 | | ACE Ltd. (Switzerland) | | | 106,836 | |
| 11,500 | | Allstate Corp. (The) | | | 331,775 | |
| 725 | | American Equity Investment Life Holding Co. | | | 8,359 | |
| 2,250 | | Aon Corp. | | | 108,967 | |
| 2,900 | | CNO Financial Group, Inc.(a) | | | 19,488 | |
| 89 | | Delphi Financial Group, Inc. (Class A Stock) | | | 3,961 | |
| 1,487 | | HCC Insurance Holdings, Inc. | | | 41,279 | |
| 100 | | Loews Corp. | | | 3,731 | |
| 10,061 | | MetLife, Inc. | | | 355,455 | |
| 367 | | Protective Life Corp. | | | 9,179 | |
| 61 | | Reinsurance Group of America, Inc. | | | 3,324 | |
| 201 | | State Auto Financial Corp. | | | 2,517 | |
| 1,300 | | Tower Group, Inc. | | | 28,067 | |
| 3,042 | | Travelers Cos., Inc. (The) | | | 177,349 | |
| 187 | | United Fire & Casualty Co. | | | 3,671 | |
| 3,400 | | Unum Group | | | 77,622 | |
| 509 | | Validus Holdings Ltd. (Bermuda) | | | 16,324 | |
| 8,824 | | XL Group PLC (Ireland) | | | 178,862 | |
| | | | | | |
| | | | | 1,476,766 | |
|
Internet & Catalog Retail 0.5% | |
| 303 | | Amazon.com, Inc.(a) | | | 58,915 | |
| 908 | | priceline.com, Inc.(a) | | | 480,768 | |
| | | | | | |
| | | | | 539,683 | |
|
Internet Services 0.2% | |
| 242 | | Digital River, Inc.(a) | | | 3,875 | |
| 710 | | F5 Networks, Inc.(a) | | | 85,015 | |
| 956 | | Monster Worldwide, Inc.(a) | | | 6,883 | |
| 1,499 | | Sapient Corp. | | | 19,337 | |
| 632 | | TIBCO Software, Inc.(a) | | | 16,476 | |
| 3,412 | | Youku.com, Inc., ADR (Cayman Islands)(a) | | | 72,983 | |
| | | | | | |
| | | | | 204,569 | |
See Notes to Financial Statements.
| | |
| 18 | | Visit our website at www.prudentialfunds.com |
| | | | | | |
| Shares | | Description | | Value (Note 1) | |
| | | | | | |
COMMON STOCKS (Continued) | |
|
Internet Software & Services 0.7% | |
| 3,400 | | Baidu, Inc., ADR (Cayman Islands)(a) | | $ | 433,568 | |
| 14,185 | | Oracle Corp. | | | 400,017 | |
| 890 | | VeriSign, Inc. | | | 32,983 | |
| | | | | | |
| | | | | 866,568 | |
|
Investment Companies 0.1% | |
| 203,000 | | Hutchison Port Holdings Trust (Singapore) | | | 152,250 | |
| 698 | | KKR Financial Holdings LLC | | | 6,177 | |
| | | | | | |
| | | | | 158,427 | |
|
IT Services 0.3% | |
| 1,275 | | Broadridge Financial Solutions, Inc. | | | 30,562 | |
| 350 | | CACI International, Inc. (Class A Stock)(a) | | | 20,542 | |
| 1,384 | | International Business Machines Corp. | | | 266,558 | |
| | | | | | |
| | | | | 317,662 | |
|
Leisure Equipment & Products 0.1% | |
| 2,000 | | Mattel, Inc. | | | 62,000 | |
|
Life Sciences Tools & Services 0.2% | |
| 4,161 | | Thermo Fisher Scientific, Inc.(a) | | | 220,117 | |
|
Machinery 0.7% | |
| 1,450 | | Actuant Corp. (Class A Stock) | | | 36,757 | |
| 2,759 | | Cummins, Inc. | | | 286,936 | |
| 787 | | Deere & Co. | | | 67,800 | |
| 2,800 | | PACCAR, Inc. | | | 123,760 | |
| 700 | | Parker Hannifin Corp. | | | 56,476 | |
| 210 | | Regal-Beloit Corp. | | | 11,922 | |
| 1,894 | | Rockwell Automation, Inc. | | | 147,486 | |
| 333 | | Terex Corp.(a) | | | 6,593 | |
| 243 | | Twin Disc, Inc. | | | 7,516 | |
| 350 | | Valmont Industries, Inc. | | | 36,719 | |
| | | | | | |
| | | | | 781,965 | |
|
Manufacturing 0.6% | |
| 115 | | Colfax Corp.(a) | | | 3,491 | |
| 8,478 | | Danaher Corp. | | | 445,180 | |
| 2,784 | | Eaton Corp. | | | 136,500 | |
| 253 | | Harsco Corp. | | | 5,624 | |
See Notes to Financial Statements.
| | | | |
| Target Asset Allocation Funds/Target Conservative Allocation Fund | | | 19 | |
Portfolio of Investments
as of January 31, 2012 (Unaudited) continued
| | | | | | |
| Shares | | Description | | Value (Note 1) | |
| | | | | | |
COMMON STOCKS (Continued) | |
|
Manufacturing (cont’d.) | |
| 2,530 | | Honeywell International, Inc. | | $ | 146,841 | |
| | | | | | |
| | | | | 737,636 | |
|
Media 1.5% | |
| 18,792 | | British Sky Broadcasting Group PLC (United Kingdom) | | | 204,325 | |
| 2,200 | | CBS Corp. (Class B Stock) | | | 62,656 | |
| 3,385 | | Comcast Corp. (Class A Stock) | | | 90,007 | |
| 9,716 | | Comcast Corp. (Special Class A Stock) | | | 247,661 | |
| 1,340 | | Discovery Communications, Inc. (Class A Stock)(a) | | | 57,459 | |
| 1,000 | | Interpublic Group of Cos., Inc. (The) | | | 10,330 | |
| 4,570 | | News Corp. (Class A Stock) | | | 86,053 | |
| 16,504 | | Time Warner, Inc. | | | 611,638 | |
| 3,400 | | Viacom, Inc. (Class B Stock) | | | 159,936 | |
| 4,330 | | Walt Disney Co. (The) | | | 168,437 | |
| 675 | | Wiley, (John) & Sons, Inc. (Class A Stock) | | | 30,639 | |
| | | | | | |
| | | | | 1,729,141 | |
|
Medical Supplies & Equipment | |
| 561 | | Quality Systems, Inc. | | | 22,754 | |
|
Metals & Mining 0.8% | |
| 324 | | AMCOL International Corp. | | | 9,254 | |
| 1,446 | | BHP Billiton Ltd., ADR (Australia) | | | 114,870 | |
| 275 | | Cloud Peak Energy, Inc.(a) | | | 5,211 | |
| 5,850 | | Freeport-McMoRan Copper & Gold, Inc. | | | 270,329 | |
| 840 | | Joy Global, Inc. | | | 76,180 | |
| 672 | | Northwest Pipe Co.(a) | | | 15,328 | |
| 2,600 | | Precision Castparts Corp. | | | 425,568 | |
| 754 | | RTI International Metals, Inc.(a) | | | 18,978 | |
| 86 | | Timken Co. | | | 4,199 | |
| 939 | | Titanium Metals Corp. | | | 14,442 | |
| | | | | | |
| | | | | 954,359 | |
|
Miscellaneous Manufacturers | |
| 1,062 | | Polypore International, Inc.(a) | | | 40,441 | |
|
Multi-Line Retail 0.2% | |
| 2,300 | | JC Penney Co., Inc. | | | 95,565 | |
| 2,129 | | Kohl’s Corp. | | | 97,913 | |
| | | | | | |
| | | | | 193,478 | |
See Notes to Financial Statements.
| | |
| 20 | | Visit our website at www.prudentialfunds.com |
| | | | | | |
| Shares | | Description | | Value (Note 1) | |
| | | | | | |
COMMON STOCKS (Continued) | |
|
Multi-Utilities 0.4% | |
| 1,100 | | Dominion Resources, Inc. | | $ | 55,044 | |
| 275 | | NorthWestern Corp. | | | 9,663 | |
| 7,861 | | Public Service Enterprise Group, Inc. | | | 238,503 | |
| 2,283 | | Sempra Energy | | | 129,903 | |
| | | | | | |
| | | | | 433,113 | |
|
Office Electronics 0.1% | |
| 15,100 | | Xerox Corp. | | | 117,025 | |
|
Oil, Gas & Consumable Fuels 3.2% | |
| 2,574 | | Anadarko Petroleum Corp. | | | 207,773 | |
| 1,837 | | Apache Corp. | | | 181,643 | |
| 1,338 | | Baker Hughes, Inc. | | | 65,736 | |
| 1,380 | | Cabot Oil & Gas Corp. | | | 44,022 | |
| 4,700 | | Chesapeake Energy Corp. | | | 99,311 | |
| 4,062 | | Chevron Corp. | | | 418,711 | |
| 6,618 | | ConocoPhillips | | | 451,414 | |
| 802 | | Continental Resources, Inc.(a) | | | 64,705 | |
| 45 | | Core Laboratories NV (Netherlands) | | | 4,780 | |
| 1,230 | | Dresser-Rand Group, Inc.(a) | | | 63,013 | |
| 101 | | Dril-Quip, Inc.(a) | | | 6,663 | |
| 840 | | EQT Corp. | | | 42,437 | |
| 2,441 | | Exxon Mobil Corp. | | | 204,409 | |
| 750 | | FMC Technologies, Inc.(a) | | | 38,332 | |
| 288 | | Gulfport Energy Corp.(a) | | | 9,467 | |
| 1,268 | | Hess Corp. | | | 71,388 | |
| 818 | | Lufkin Industries, Inc. | | | 61,530 | |
| 3,800 | | Marathon Oil Corp. | | | 119,282 | |
| 1,230 | | Noble Energy, Inc. | | | 123,824 | |
| 1,689 | | Oasis Petroleum, Inc.(a) | | | 56,987 | |
| 7,178 | | Occidental Petroleum Corp. | | | 716,149 | |
| 750 | | Oceaneering International, Inc. | | | 36,443 | |
| 51 | | ONEOK, Inc. | | | 4,241 | |
| 3,118 | | Peabody Energy Corp. | | | 106,293 | |
| 410 | | Pioneer Natural Resources Co. | | | 40,713 | |
| 2,600 | | Royal Dutch Shell PLC (Class B Stock), ADR (United Kingdom) | | | 190,684 | |
| 605 | | Schlumberger Ltd. (Netherlands) | | | 45,478 | |
| 490 | | SM Energy Co. | | | 35,564 | |
| 248 | | Swift Energy Co.(a) | | | 8,221 | |
| 3,500 | | Total SA, ADR (France) | | | 185,395 | |
See Notes to Financial Statements.
| | | | |
| Target Asset Allocation Funds/Target Conservative Allocation Fund | | | 21 | |
Portfolio of Investments
as of January 31, 2012 (Unaudited) continued
| | | | | | |
| Shares | | Description | | Value (Note 1) | |
| | | | | | |
COMMON STOCKS (Continued) | |
|
Oil, Gas & Consumable Fuels (cont’d.) | |
| 2,300 | | Valero Energy Corp. | | $ | 55,177 | |
| 244 | | WGL Holdings, Inc. | | | 10,407 | |
| | | | | | |
| | | | | 3,770,192 | |
|
Paper & Forest Products 0.1% | |
| 2,400 | | International Paper Co. | | | 74,736 | |
|
Pharmaceuticals 2.5% | |
| 3,700 | | Abbott Laboratories | | | 200,355 | |
| 3,522 | | Allergan, Inc. | | | 309,619 | |
| 940 | | AmerisourceBergen Corp. | | | 36,632 | |
| 307 | | BioMarin Pharmaceutical, Inc.(a) | | | 10,951 | |
| 6,293 | | Bristol-Myers Squibb Co. | | | 202,886 | |
| 323 | | Catalyst Health Solutions, Inc.(a) | | | 17,688 | |
| 4,900 | | Eli Lilly & Co. | | | 194,726 | |
| 122 | | Herbalife Ltd. (Cayman Islands) | | | 7,061 | |
| 7,833 | | Johnson & Johnson | | | 516,273 | |
| 6,215 | | Mead Johnson Nutrition Co. | | | 460,469 | |
| 8,776 | | Merck & Co., Inc. | | | 335,770 | |
| 1,100 | | Novartis AG, ADR (Switzerland) | | | 59,796 | |
| 245 | | Onyx Pharmaceuticals, Inc.(a) | | | 10,030 | |
| 24,603 | | Pfizer, Inc. | | | 526,504 | |
| 420 | | Salix Pharmaceuticals Ltd.(a) | | | 20,244 | |
| 1,700 | | Sanofi, ADR (France) | | | 63,121 | |
| 930 | | Teva Pharmaceutical Industries Ltd., ADR (Israel) | | | 41,971 | |
| 292 | | Theravance, Inc.(a) | | | 5,180 | |
| | | | | | |
| | | | | 3,019,276 | |
|
Professional Services 0.1% | |
| 956 | | Duff & Phelps Corp. (Class A Stock) | | | 14,655 | |
| 1,000 | | Manpower, Inc. | | | 40,110 | |
| 675 | | Towers Watson & Co. (Class A Stock) | | | 40,365 | |
| | | | | | |
| | | | | 95,130 | |
|
Real Estate | |
| 370 | | Jones Lang LaSalle, Inc. | | | 29,141 | |
|
Real Estate Investment Trusts 0.7% | |
| 3,623 | | American Tower Corp. | | | 230,097 | |
| 7,400 | | Annaly Capital Management, Inc. | | | 124,616 | |
See Notes to Financial Statements.
| | |
| 22 | | Visit our website at www.prudentialfunds.com |
| | | | | | |
| Shares | | Description | | Value (Note 1) | |
| | | | | | |
COMMON STOCKS (Continued) | |
|
Real Estate Investment Trusts (cont’d.) | |
| 925 | | AvalonBay Communities, Inc. | | $ | 125,809 | |
| 1,161 | | Boston Properties, Inc. | | | 120,802 | |
| 423 | | First Potomac Realty Trust | | | 6,294 | |
| 725 | | Government Properties Income Trust | | | 17,473 | |
| 950 | | Highwoods Properties, Inc. | | | 31,435 | |
| 450 | | LaSalle Hotel Properties | | | 12,173 | |
| 3,406 | | Medical Properties Trust, Inc. | | | 36,512 | |
| 699 | | Redwood Trust, Inc. | | | 8,213 | |
| 872 | | Simon Property Group, Inc. | | | 118,470 | |
| | | | | | |
| | | | | 831,894 | |
|
Retail & Merchandising 2.9% | |
| 169 | | AutoZone, Inc.(a) | | | 58,792 | |
| 600 | | Big Lots, Inc.(a) | | | 23,694 | |
| 706 | | Cash America International, Inc. | | | 30,965 | |
| 524 | | Chico’s FAS, Inc. | | | 5,995 | |
| 52,864 | | Cie Financiere Richemont SA, ADR (Switzerland) | | | 299,210 | |
| 900 | | Costco Wholesale Corp. | | | 74,043 | |
| 1,560 | | Dollar General Corp.(a) | | | 66,472 | |
| 823 | | Dollar Tree, Inc.(a) | | | 69,799 | |
| 243 | | EZCORP, Inc. (Class A Stock)(a) | | | 6,517 | |
| 677 | | Genesco, Inc.(a) | | | 41,344 | |
| 737 | | GNC Holdings, Inc. (Class A Stock)(a) | | | 20,275 | |
| 981 | | Lululemon Athletica, Inc.(a) | | | 61,930 | |
| 1,574 | | Macy’s, Inc. | | | 53,028 | |
| 2,554 | | O’Reilly Automotive, Inc.(a) | | | 208,177 | |
| 1,125 | | Penske Automotive Group, Inc. | | | 25,177 | |
| 1,240 | | PetSmart, Inc. | | | 65,993 | |
| 2,560 | | Ross Stores, Inc. | | | 130,099 | |
| 12,483 | | Starbucks Corp. | | | 598,310 | |
| 3,743 | | Target Corp. | | | 190,182 | |
| 720 | | Tiffany & Co. | | | 45,936 | |
| 12,054 | | TJX Cos., Inc. (The) | | | 821,360 | |
| 550 | | Tractor Supply Co. | | | 44,423 | |
| 1,860 | | Urban Outfitters, Inc.(a) | | | 49,290 | |
| 6,981 | | Yum! Brands, Inc. | | | 442,107 | |
| | | | | | |
| | | | | 3,433,118 | |
|
Road & Rail | |
| 326 | | Landstar System, Inc. | | | 16,675 | |
See Notes to Financial Statements.
| | | | |
| Target Asset Allocation Funds/Target Conservative Allocation Fund | | | 23 | |
Portfolio of Investments
as of January 31, 2012 (Unaudited) continued
| | | | | | |
| Shares | | Description | | Value (Note 1) | |
| | | | | | |
COMMON STOCKS (Continued) | |
|
Road & Rail (cont’d.) | |
| 775 | | Werner Enterprises, Inc. | | $ | 20,251 | |
| | | | | | |
| | | | | 36,926 | |
|
Semiconductors 0.3% | |
| 1,230 | | Altera Corp. | | | 48,942 | |
| 863 | | ASML Holding NV (Netherlands) | | | 37,100 | |
| 2,223 | | Broadcom Corp. (Class A Stock)(a) | | | 76,338 | |
| 161 | | Cabot Microelectronics Corp.(a) | | | 8,118 | |
| 282 | | Cavium, Inc.(a) | | | 9,063 | |
| 450 | | Cymer, Inc.(a) | | | 22,405 | |
| 875 | | Fairchild Semiconductor International, Inc.(a) | | | 12,233 | |
| 1,500 | | Microsemi Corp.(a) | | | 29,670 | |
| 404 | | OYO Geospace Corp.(a) | | | 35,556 | |
| 4,250 | | RF Micro Devices, Inc.(a) | | | 21,207 | |
| 300 | | Silicon Laboratories, Inc.(a) | | | 13,152 | |
| 1,971 | | Teradyne, Inc.(a) | | | 32,226 | |
| | | | | | |
| | | | | 346,010 | |
|
Semiconductors & Semiconductor Equipment 0.2% | |
| 6,900 | | Intel Corp. | | | 182,298 | |
| 779 | | Veeco Instruments, Inc.(a) | | | 19,015 | |
| | | | | | |
| | | | | 201,313 | |
|
Shipbuilding | |
| 250 | | Huntington Ingalls Industries, Inc.(a) | | | 9,420 | |
|
Software 1.1% | |
| 292 | | ANSYS, Inc.(a) | | | 17,663 | |
| 6,064 | | CA, Inc. | | | 156,330 | |
| 680 | | Cerner Corp.(a) | | | 41,405 | |
| 4,433 | | Check Point Software Technologies Ltd. (Israel)(a) | | | 249,534 | |
| 270 | | Citrix Systems, Inc.(a) | | | 17,607 | |
| 2,122 | | Compuware Corp.(a) | | | 16,636 | |
| 753 | | MedAssets, Inc.(a) | | | 7,952 | |
| 247 | | Medidata Solutions, Inc.(a) | | | 5,162 | |
| 18,098 | | Microsoft Corp. | | | 534,434 | |
| 1,160 | | Nuance Communications, Inc.(a) | | | 33,083 | |
| 186 | | OPNET Technologies, Inc. | | | 6,594 | |
| 468 | | Progress Software Corp.(a) | | | 10,918 | |
| 627 | | QLIK Technologies, Inc.(a) | | | 17,681 | |
See Notes to Financial Statements.
| | |
| 24 | | Visit our website at www.prudentialfunds.com |
| | | | | | |
| Shares | | Description | | Value (Note 1) | |
| | | | | | |
COMMON STOCKS (Continued) | |
|
Software (cont’d.) | |
| 2,250 | | Red Hat, Inc.(a) | | $ | 104,333 | |
| 775 | | Verint Systems, Inc.(a) | | | 21,940 | |
| 200 | | VMware, Inc. (Class A Stock)(a) | | | 18,254 | |
| | | | | | |
| | | | | 1,259,526 | |
|
Specialty Retail 0.4% | |
| 1,513 | | Aaron’s, Inc. | | | 40,261 | |
| 425 | | DSW, Inc. (Class A Stock) | | | 21,237 | |
| 326 | | Francesca’s Holdings Corp.(a) | | | 7,228 | |
| 7,200 | | Gap, Inc. (The) | | | 136,656 | |
| 125 | | Group 1 Automotive, Inc. | | | 6,668 | |
| 6,134 | | Home Depot, Inc. (The) | | | 272,288 | |
| 349 | | Sally Beauty Holdings, Inc.(a) | | | 7,196 | |
| | | | | | |
| | | | | 491,534 | |
|
Telecommunications 0.5% | |
| 216 | | Acme Packet, Inc.(a) | | | 6,314 | |
| 846 | | Arris Group, Inc.(a) | | | 9,881 | |
| 2,283 | | CenturyLink, Inc. | | | 84,539 | |
| 294 | | EZchip Semiconductor Ltd. (Israel)(a) | | | 9,608 | |
| 186 | | IPG Photonics Corp.(a) | | | 9,819 | |
| 456 | | NICE Systems Ltd., ADR (Israel)(a) | | | 16,398 | |
| 8,618 | | QUALCOMM, Inc. | | | 506,911 | |
| 57 | | SBA Communications Corp. (Class A Stock)(a) | | | 2,606 | |
| | | | | | |
| | | | | 646,076 | |
|
Textiles, Apparel & Luxury Goods 0.8% | |
| 3,503 | | Coach, Inc. | | | 245,385 | |
| 701 | | Deckers Outdoor Corp.(a) | | | 56,676 | |
| 4,937 | | NIKE, Inc. (Class B Stock) | | | 513,399 | |
| 337 | | PVH Corp. | | | 26,013 | |
| 371 | | Steven Madden Ltd.(a) | | | 15,263 | |
| 338 | | VF Corp. | | | 44,443 | |
| 600 | | Wolverine World Wide, Inc. | | | 23,454 | |
| | | | | | |
| | | | | 924,633 | |
|
Thrifts & Mortgage Finance 0.1% | |
| 2,600 | | Capitol Federal Financial, Inc. | | | 30,030 | |
| 1,750 | | Washington Federal, Inc. | | | 27,580 | |
| | | | | | |
| | | | | 57,610 | |
See Notes to Financial Statements.
| | | | |
| Target Asset Allocation Funds/Target Conservative Allocation Fund | | | 25 | |
Portfolio of Investments
as of January 31, 2012 (Unaudited) continued
| | | | | | |
| Shares | | Description | | Value (Note 1) | |
| | | | | | |
COMMON STOCKS (Continued) | |
|
Tobacco 0.2% | |
| 2,400 | | Altria Group, Inc. | | $ | 68,160 | |
| 2,730 | | Philip Morris International, Inc. | | | 204,122 | |
| | | | | | |
| | | | | 272,282 | |
|
Trading Companies & Distributors 0.1% | |
| 450 | | United Rentals, Inc.(a) | | | 17,208 | |
| 700 | | WESCO International, Inc.(a) | | | 44,016 | |
| | | | | | |
| | | | | 61,224 | |
|
Transportation 0.8% | |
| 216 | | Bristow Group, Inc. | | | 10,597 | |
| 1,715 | | Expeditors International of Washington, Inc. | | | 76,575 | |
| 1,510 | | Kansas City Southern(a) | | | 103,646 | |
| 6,202 | | Union Pacific Corp. | | | 708,951 | |
| | | | | | |
| | | | | 899,769 | |
|
Utilities 0.1% | |
| 2,519 | | PG&E Corp. | | | 102,423 | |
|
Wireless Telecommunication Services 0.2% | |
| 10,233 | | Vodafone Group PLC, ADR (United Kingdom) | | | 277,212 | |
| | | | | | |
| | TOTAL COMMON STOCKS
(cost $36,341,655) | | | 46,225,153 | |
| | | | | | |
EXCHANGE TRADED FUND 0.1% | |
| 1,325 | | iShares Russell 2000 Value Index Fund
(cost $86,037) | | | 92,816 | |
| | | | | | |
PREFERRED STOCK 0.1% | |
|
Commercial Banks | |
| 2,650 | | Wells Fargo & Co., Series J, 8.00%
(cost $50,782) | | | 77,327 | |
| | | | | | |
UNAFFILIATED MUTUAL FUND | |
| 3,100 | | Ares Capital Corp.
(cost $41,771) | | | 49,135 | |
| | | | | | |
See Notes to Financial Statements.
| | |
| 26 | | Visit our website at www.prudentialfunds.com |
| | | | | | | | | | |
Moody’s
Ratings† | | Principal
Amount (000)# | | | Description | | Value (Note 1) | |
| | | | | | | | | | |
ASSET-BACKED SECURITIES 2.2% | |
| Aaa | | $ | 281 | | | Asset Backed Funding Certificates,
Series 2004-OPT5, Class A1
0.626%(b), 06/25/34 | | $ | 199,847 | |
| NR | | EUR | 224 | | | Magnolia Funding Ltd.,
Series 2010-1A, Class A1 (United Kingdom)
3.00%, 04/20/17 | | | 291,758 | |
| C | | | 89 | | | Merrill Lynch Mortgage Investors, Inc.,
Series 2006-RM5, Class A2A
0.336%(b), 10/25/37 | | | 20,762 | |
| AAA(c) | | | 281 | | | Plymouth Rock CLO Ltd.,
Series 2010-1A, Class A, 144A
1.998%(b), 02/16/19 | | | 279,379 | |
| Aaa | | | 1,105 | | | SLM Student Loan Trust,
Series 2008-9, Class A
2.06%(b), 04/25/23 | | | 1,127,526 | |
| Caa3 | | | 56 | | | Soundview Home Equity Loan Trust,
Series 2006-NLC1, Class A1, 144A
0.336%(b), 11/25/36 | | | 16,172 | |
| Aaa | | | 700 | | | Venture CDO Ltd.,
Series 2007-8A, Class A2A, 144A
0.781%(b), 07/22/21 | | | 653,171 | |
| | | | | | | | | | |
| | | | | | TOTAL ASSET-BACKED SECURITIES
(cost $2,765,203) | | | 2,588,615 | |
| | | | | | | | | | |
|
CORPORATE BONDS 24.0% | |
| |
Airlines 0.3% | | | | |
| Ba2 | | | 300 | | | Continental Airlines, Inc.,
Sr. Sec’d. Notes, 144A
6.75%, 09/15/15 | | | 300,000 | |
| |
Automobile Manufacturers 1.3% | | | | |
| A2 | | | 800 | | | BMW US Capital LLC,
Gtd. Notes, MTN
1.013%(b), 12/21/12 | | | 799,880 | |
| A3 | | | 700 | | | Daimler Finance North America LLC,
Gtd. Notes, 144A
1.184%(b), 03/28/14 | | | 687,387 | |
| | | | | | | | | | |
| | | | | | | | | 1,487,267 | |
See Notes to Financial Statements.
| | | | |
| Target Asset Allocation Funds/Target Conservative Allocation Fund | | | 27 | |
Portfolio of Investments
as of January 31, 2012 (Unaudited) continued
| | | | | | | | | | |
Moody’s
Ratings† | | Principal
Amount (000)# | | | Description | | Value (Note 1) | |
| | | | | | | | | | |
CORPORATE BONDS (Continued) | |
|
Building & Construction 0.5% | |
| Ba3 | | $ | 600 | | | Urbi Desarrollos Urbanos SAB de CV,
Gtd. Notes, 144A (Mexico)
9.50%, 01/21/20 | | $ | 609,720 | |
|
Capital Markets 1.8% | |
| A1 | | AUD | 1,500 | | | Goldman Sachs Group, Inc. (The),
Sr. Unsec’d. Notes
4.98%(b), 04/12/16 | | | 1,429,818 | |
| A2 | | | 700 | | | Morgan Stanley,
Sr. Unsec’d. Notes
1.533%(b), 04/29/13 | | | 682,560 | |
| | | | | | | | | | |
| | | | | | | | | 2,112,378 | |
|
Diversified Financial Services 3.3% | |
| Baa1 | | | 200 | | | AK Transneft OJSC Via TransCapitalInvest Ltd.,
Gtd. Notes (Ireland)
8.70%, 08/07/18 | | | 243,000 | |
| A3 | | | 1,500 | | | Citigroup, Inc.,
Sr. Unsec’d. Notes
5.50%, 04/11/13 | | | 1,556,673 | |
| Ba1 | | | 200 | | | Ford Motor Credit Co. LLC,
Sr. Unsec’d. Notes
5.625%, 09/15/15 | | | 212,638 | |
| Ba1 | | | 500 | | | 7.00%, 10/01/13 | | | 534,966 | |
| Aa3 | | GBP | 100 | | | General Electric Capital Corp.,
Sub. Notes, 144A
6.50%(b), 09/15/67 | | | 144,973 | |
| Ba3 | | | 700 | | | International Lease Finance Corp.,
Sr. Sec’d. Notes, 144A
7.125%, 09/01/18 | | | 766,500 | |
| Aa3 | | | 500 | | | JPMorgan Chase & Co.,
Sr. Unsec’d. Notes
4.25%, 10/15/20 | | | 508,936 | |
| | | | | | | | | | |
| | | | | | | | | 3,967,686 | |
|
Electric Utilities 0.6% | |
| Baa1 | | | 600 | | | Ameren Illinois Co.,
Sr. Sec’d. Notes
6.25%, 04/01/18 | | | 705,957 | |
See Notes to Financial Statements.
| | |
| 28 | | Visit our website at www.prudentialfunds.com |
| | | | | | | | | | |
Moody’s
Ratings† | | Principal
Amount (000)# | | | Description | | Value (Note 1) | |
| | | | | | | | | | |
CORPORATE BONDS (Continued) | |
|
Financial—Bank & Trust 3.7% | |
| Aa3 | | $ | 100 | | | Abbey National Treasury Services PLC,
Bank Gtd. Notes, 144A (United Kingdom)
3.875%, 11/10/14 | | $ | 97,990 | |
| BBB(c) | | | 600 | | | Banco Santander Brazil SA,
Sr. Unsec’d. Notes, 144A (Brazil)
2.659%(b), 03/18/14 | | | 572,725 | |
| Baa1 | | | 800 | | | Barclays Bank PLC,
Sub. Notes, 144A (United Kingdom)
6.05%, 12/04/17 | | | 806,521 | |
| Aaa | | | 100 | | | ING Bank NV, Gov’t. Liquid
Gtd. Notes, 144A (Netherlands)
3.90%, 03/19/14 | | | 105,334 | |
| A1 | | | 700 | | | Lloyds TSB Bank PLC, (United Kingdom)
Bank Gtd. Notes, 144A, MTN
4.375%, 01/12/15 | | | 706,273 | |
| Ba1 | | | 800 | | | Jr. Sub. Notes, 144A
12.00%(b), 12/29/49 | | | 735,960 | |
| Aa2 | | | 700 | | | Nordea Bank AB,
Sr. Unsec’d. Notes, 144A (Sweden)
4.875%, 01/14/21 | | | 734,709 | |
| A2 | | | 600 | | | Royal Bank of Scotland PLC, (The),
Bank Gtd. Notes (United Kingdom)
4.375%, 03/16/16 | | | 607,966 | |
| | | | | | | | | | |
| | | | | | | | | 4,367,478 | |
|
Financial Services 2.4% | |
| B1 | | | 800 | | | Ally Financial, Inc.,
Gtd. Notes
8.00%, 03/15/20 | | | 880,000 | |
| NR | | | 500 | | | Lehman Brothers Holdings, Inc.,(d)
Sr. Unsec’d. Notes, MTN
5.625%, 01/24/13 | | | 136,250 | |
| NR | | | 400 | | | 6.875%, 05/02/18 | | | 110,000 | |
| Baa1 | | | 100 | | | Merrill Lynch & Co., Inc.,
Sr. Unsec’d. Notes, MTN
5.571%, 10/04/12 | | | 101,624 | |
| Baa1 | | | 500 | | | 6.875%, 04/25/18 | | | 539,579 | |
See Notes to Financial Statements.
| | | | |
| Target Asset Allocation Funds/Target Conservative Allocation Fund | | | 29 | |
Portfolio of Investments
as of January 31, 2012 (Unaudited) continued
| | | | | | | | | | |
Moody’s
Ratings�� | | Principal
Amount (000)# | | | Description | | Value (Note 1) | |
| | | | | | | | | | |
CORPORATE BONDS (Continued) | |
|
Financial Services (cont’d.) | |
| Baa2 | | $ | 600 | | | TNK-BP Finance SA,
Gtd. Notes (Luxembourg)
6.625%, 03/20/17 | | $ | 635,250 | |
| Aa3 | | | 400 | | | UBS AG, Notes (Switzerland)
4.875%, 08/04/20 | | | 416,120 | |
| | | | | | | | | | |
| | | | | | | | | 2,818,823 | |
|
Food Products 0.6% | |
| Baa1 | | | 700 | | | WM Wrigley Jr. Co.,
Sec’d. Notes, 144A
2.45%, 06/28/12 | | | 704,848 | |
|
Healthcare Providers & Services 0.5% | |
| Baa3 | | | 500 | | | Cardinal Health, Inc.,
Sr. Unsec’d. Notes
6.00%, 06/15/17 | | | 578,897 | |
|
Insurance 1.0% | |
| Baa1 | | | 500 | | | American International Group, Inc.,
Sr. Unsec’d. Notes
8.25%, 08/15/18 | | | 575,752 | |
| Baa1 | | | 600 | | | Sr. Unsec’d. Notes, MTN
5.85%, 01/16/18 | | | 625,617 | |
| | | | | | | | | | |
| | | | | | | | | 1,201,369 | |
|
IT Services 0.4% | |
| A2 | | | 500 | | | Electronic Data Systems LLC,
Sr. Unsec’d. Notes
6.00%, 08/01/13 | | | 533,366 | |
|
Metals & Mining 1.5% | |
| Ba1 | | | 600 | | | CSN Resources SA,
Gtd. Notes, 144A (Luxembourg)
6.50%, 07/21/20 | | | 634,800 | |
| Baa2 | | | 1,000 | | | Spectra Energy Capital LLC,
Gtd. Notes
6.20%, 04/15/18 | | | 1,160,673 | |
| | | | | | | | | | |
| | | | | | | | | 1,795,473 | |
See Notes to Financial Statements.
| | |
| 30 | | Visit our website at www.prudentialfunds.com |
| | | | | | | | | | |
Moody’s
Ratings† | | Principal
Amount (000)# | | | Description | | Value (Note 1) | |
| | | | | | | | | | |
CORPORATE BONDS (Continued) | |
|
Oil, Gas & Consumable Fuels 1.9% | |
| A2 | | $ | 400 | | | BP Capital Markets PLC,
Gtd. Notes (United Kingdom)
3.125%, 10/01/15 | | $ | 424,124 | |
| A2 | | | 300 | | | 4.50%, 10/01/20 | | | 335,935 | |
| Baa1 | | | 700 | | | Gazprom Via Gaz Capital SA,
Sr. Unsec’d. Notes (Luxembourg)
9.25%, 04/23/19 | | | 859,600 | |
| Baa1 | | | 500 | | | Pride International, Inc.,
Gtd. Notes
7.875%, 08/15/40 | | | 679,964 | |
| | | | | | | | | | |
| | | | | | | | | 2,299,623 | |
|
Pharmaceuticals 0.3% | |
| B1 | | | 300 | | | Valeant Pharmaceuticals International,
Gtd. Notes, 144A
6.75%, 08/15/21 | | | 301,500 | |
|
Telecommunications 1.2% | |
| Baa3 | | | 300 | | | Embarq Corp.,
Sr. Unsec’d. Notes
6.738%, 06/01/13 | | | 313,198 | |
| Baa3 | | | 1,000 | | | Qwest Corp.,
Sr. Unsec’d. Notes
7.625%, 06/15/15 | | | 1,138,466 | |
| | | | | | | | | | |
| | | | | | | | | 1,451,664 | |
|
Tobacco 0.8% | |
| Baa1 | | | 700 | | | Altria Group, Inc.,
Gtd. Notes
9.70%, 11/10/18 | | | 964,039 | |
|
Transportation 1.9% | |
| Baa3 | | | 2,000 | | | Con-Way, Inc.,
Sr. Unsec’d. Notes
7.25%, 01/15/18 | | | 2,277,430 | |
| | | | | | | | | | |
| | | | | | TOTAL CORPORATE BONDS
(cost $27,489,077) | | | 28,477,518 | |
| | | | | | | | | | |
See Notes to Financial Statements.
| | | | |
| Target Asset Allocation Funds/Target Conservative Allocation Fund | | | 31 | |
Portfolio of Investments
as of January 31, 2012 (Unaudited) continued
| | | | | | | | | | |
Moody’s
Ratings† | | Principal
Amount (000)# | | | Description | | Value (Note 1) | |
| | | | | | | | | | |
FOREIGN GOVERNMENT BONDS 4.0% | |
| Aaa | | AUD | 900 | | | Australia Government,
Sr. Unsec’d. Notes (Australia)
5.25%, 03/15/19 | | $ | 1,057,178 | |
| Aaa | | AUD | 1,100 | | | 5.50%, 01/21/18 | | | 1,295,527 | |
| Aaa | | AUD | 400 | | | 6.00%, 02/15/17 | | | 477,186 | |
| Aaa | | CAD | 300 | | | Canadian Government, Bonds (Canada)
3.25%, 06/01/21 | | | 333,510 | |
| Aaa | | $ | 700 | | | Kommunalbanken A/S,
Sr. Unsec’d. Notes, 144A (Norway)
2.375%, 01/19/16 | | | 725,340 | |
| Baa3 | | BRL | 1,300 | | | Republic of Brazil,
Sr. Unsec’d. Notes (Brazil)
12.50%, 01/05/22 | | | 926,339 | |
| | | | | | | | | | |
| | | | | | TOTAL FOREIGN GOVERNMENT BONDS
(cost $4,361,788) | | | 4,815,080 | |
| | | | | | | | | | |
|
MUNICIPAL BONDS 2.7% | |
| | |
California 1.0% | | | | | | | |
| Aa3 | | | 400 | | | California State Public Works Board Lease,
Revenue Bonds
7.804%, 03/01/35 | | | 462,020 | |
| Aa2 | | | 700 | | | Los Angeles Unified School District,
Series A-1, General Obligation Unlimited
4.50%, 07/01/25 | | | 771,260 | |
| | | | | | | | | | |
| | | | | | | | | 1,233,280 | |
|
Illinois 1.4% | |
| Aa3 | | | 200 | | | Chicago Transit Authority,
Series A, Revenue Bonds
6.899%, 12/01/40 | | | 246,368 | |
| Aa3 | | | 300 | | | Chicago Transit Authority,
Series B, Revenue Bonds
6.899%, 12/01/40 | | | 369,552 | |
| A2 | | | 1,000 | | | State of Illinois, General Obligation Unlimited
4.071%, 01/01/14 | | | 1,036,440 | |
| | | | | | | | | | |
| | | | | | | | | 1,652,360 | |
See Notes to Financial Statements.
| | |
| 32 | | Visit our website at www.prudentialfunds.com |
| | | | | | | | | | |
Moody’s
Ratings† | | Principal
Amount (000)# | | | Description | | Value (Note 1) | |
| | | | | | | | | | |
MUNICIPAL BONDS (Continued) | |
|
Texas 0.3% | |
| AAA(c) | | $ | 300 | | | Dallas County Hospital District,
Series B, General Obligation Limited
6.171%, 08/15/34 | | $ | 340,236 | |
| | | | | | | | | | |
| | | | | | TOTAL MUNICIPAL BONDS
(cost $2,852,613) | | | 3,225,876 | |
| | | | | | | | | | |
|
RESIDENTIAL MORTGAGE-BACKED SECURITIES 2.6% | |
| Ca | | | 281 | | | American Home Mortgage Assets,
Series 2006-1, Class 2A1
0.466%(b), 05/25/46 | | | 134,980 | |
| CCC(c) | | | 139 | | | Bear Stearns Adjustable Rate Mortgage Trust,
Series 2007-3, Class 1A1
5.059%(b), 05/25/47 | | | 87,685 | |
| Caa1 | | | 153 | | | Bear Stearns ALT-A Trust,
Series 2005-4, Class 23A2
2.605%(b), 05/25/35 | | | 122,051 | |
| Ca | | | 316 | | | Countrywide Alternative Loan Trust,
Series 2006-OA9, Class 2A1A
0.491%(b), 07/20/46 | | | 116,935 | |
| Aaa | | | 14 | | | Fannie Mae,
Series 1992-146, Class PZ
8.00%, 08/25/22 | | | 15,299 | |
| Aaa | | | 419 | | | FHLMC Structured Pass-Through Securities,
Series T-61, Class 1A1
1.608%(b), 07/25/44 | | | 430,534 | |
| Aaa | | | 46 | | | Freddie Mac,
Series 41, Class F
10.00%, 05/15/20 | | | 49,684 | |
| Aaa | | | 184 | | | GSR Mortgage Loan Trust,
Series 2005-AR6, Class 2A1
2.658%(b), 09/25/35 | | | 158,733 | |
| C | | | 780 | | | Series 2006-OA1, Class 2A2
0.536%(b), 08/25/46 | | | 140,062 | |
| Caa1 | | | 579 | | | Homebanc Mortgage Trust,
Series 2006-1, Class 4A1
5.662%(b), 04/25/37 | | | 472,747 | |
| Aaa | | | 200 | | | Permanent Master Issuer PLC, (United Kingdom)
Series 2011-1A, Class 1A1, 144A
1.967%(b), 07/15/42 | | | 199,227 | |
See Notes to Financial Statements.
| | | | |
| Target Asset Allocation Funds/Target Conservative Allocation Fund | | | 33 | |
Portfolio of Investments
as of January 31, 2012 (Unaudited) continued
| | | | | | | | | | |
Moody’s
Ratings† | | Principal
Amount (000)# | | | Description | | Value (Note 1) | |
| | | | | | | | | | |
RESIDENTIAL MORTGAGE-BACKED SECURITIES (Continued) | |
| Aaa | | EUR | 500 | | | Series 2011-1A, Class 1A3, 144A
2.531%(b), 07/15/42 | | $ | 651,985 | |
| NR | | $ | 102 | | | Vendee Mortgage Trust,
Series 2000-1, Class 1A
6.809%(b), 01/15/30 | | | 123,035 | |
| Caa1 | | | 286 | | | Washington Mutual Mortgage Pass-Through Certificates,
Series 2006-AR15, Class 2A
1.708%(b), 11/25/46 | | | 198,179 | |
| Caa3 | | | 290 | | | Series 2007-OA2, Class 1A
0.897%(b), 03/25/47 | | | 160,883 | |
| | | | | | | | | | |
| | | | | | TOTAL RESIDENTIAL MORTGAGE-BACKED SECURITIES
(cost $3,732,638) | | | 3,062,019 | |
| | | | | | | | | | |
|
U.S. GOVERNMENT MORTGAGE-BACKED OBLIGATIONS 24.5% | |
| | | 7 | | | Federal Home Loan Mortgage Corp.
2.488%(b), 08/01/23 | | | 7,016 | |
| | | 235 | | | 2.496%(b), 03/01/36 | | | 247,976 | |
| | | 105 | | | 5.50%, 01/01/38 | | | 114,268 | |
| | | 331 | | | Federal National Mortgage Assoc.
2.26%(b), 06/01/35 | | | 348,898 | |
| | | 9,212 | | | 3.50%, 08/01/40 - 11/01/41 | | | 9,582,151 | |
| | | 2,000 | | | 3.50%, TBA | | | 2,077,812 | |
| | | 6,000 | | | 3.50%, TBA | | | 6,313,125 | |
| | | 39 | | | 3.978%(b), 05/01/36 | | | 41,806 | |
| | | 5,841 | | | 4.00%, 05/01/24 - 08/01/41 | | | 6,185,625 | |
| | | 1,000 | | | 4.00%, TBA | | | 1,059,844 | |
| | | 1,499 | | | 4.50%, 03/01/24 - 01/01/26 | | | 1,609,275 | |
| | | 1,000 | | | 4.50%, TBA | | | 1,069,062 | |
| | | 30 | | | 5.00%, 06/01/23 | | | 32,369 | |
| | | 193 | | | 5.50%, 12/01/36 | | | 209,611 | |
| | | 36 | | | 7.50%, 01/01/32 | | | 37,350 | |
| | | 4 | | | Government National Mortgage Assoc.
1.625%(b), 09/20/22 | | | 4,587 | |
| | | 29 | | | 4.50%, 08/15/33 - 09/15/33 | | | 32,526 | |
| | | 37 | | | 8.50%, 02/20/30 - 06/15/30 | | | 44,144 | |
| | | | | | | | | | |
| | | | | | TOTAL U.S. GOVERNMENT MORTGAGE-BACKED OBLIGATIONS
(cost $28,275,630) | | | 29,017,445 | |
| | | | | | | | | | |
See Notes to Financial Statements.
| | |
| 34 | | Visit our website at www.prudentialfunds.com |
| | | | | | | | | | |
Moody’s
Ratings† | | Principal
Amount (000)# | | | Description | | Value (Note 1) | |
| | | | | | | | | | |
U.S. TREASURY OBLIGATIONS 10.8% | |
| | $ | 2,900 | | | U.S. Treasury Bonds
2.00%, 11/15/21 | | $ | 2,950,750 | |
| | | 2,100 | | | 2.125%, 08/15/21 | | | 2,167,759 | |
| | | 1,200 | | | 3.125%, 11/15/41 | | | 1,243,874 | |
| | | 1,900 | | | 3.75%, 08/15/41 | | | 2,214,984 | |
| | | 200 | | | 4.375%, 02/15/38 - 11/15/39 | | | 257,656 | |
| | | 100 | | | 7.50%, 11/15/24 | | | 160,156 | |
| | | 36 | | | 8.125%, 05/15/21 | | | 56,278 | |
| | | 200 | | | U.S. Treasury Inflationary Indexed Bonds, TIPS
2.125%, 02/15/41 | | | 289,747 | |
| | | 300 | | | 2.50%, 01/15/29 | | | 433,750 | |
| | | 700 | | | U.S. Treasury Notes
2.125%, 12/31/15 | | | 745,282 | |
| | | 100 | | | 2.375%, 05/31/18 | | | 108,000 | |
| | | 1,338 | | | 2.625%, 08/15/20 - 11/15/20 | | | 1,451,383 | |
| | | 600 | | | 3.375%, 11/15/19 | | | 688,500 | |
| | | | | | | | | | |
| | | | | | TOTAL U.S. TREASURY OBLIGATIONS
(cost $12,418,617) | | | 12,768,119 | |
| | | | | | | | | | |
| | | | | | TOTAL LONG-TERM INVESTMENTS
(cost $118,415,811) | | | 130,399,103 | |
| | | | | | | | | | |
|
SHORT-TERM INVESTMENTS 4.1% | |
|
U.S. TREASURY OBLIGATIONS(g) 0.4% | |
| | | 506 | | | U.S. Treasury Bills
0.035%, 03/29/12(e) | | | 505,962 | |
| | | 27 | | | 0.143%, 05/03/12 | | | 26,996 | |
| | | | | | | | | | |
| | | | | | TOTAL U.S. TREASURY OBLIGATIONS
(cost $532,968) | | | 532,958 | |
| | | | | | | | | | |
| | | |
| | | Shares | | | | | | |
AFFILIATED MONEY MARKET MUTUAL FUND 3.7% | |
| | | 4,369,591 | | | Prudential Investment Portfolios 2 - Prudential Core Taxable Money Market Fund
(cost $4,369,591)(f) | | | 4,369,591 | |
| | | | | | | | | | |
| | | | | | TOTAL SHORT-TERM INVESTMENTS
(cost $4,902,559) | | | 4,902,549 | |
| | | | | | | | | | |
| | | | | | TOTAL INVESTMENTS, BEFORE OPTIONS WRITTEN AND SECURITY SOLD SHORT 114.1%
(cost $123,318,370; Note 5) | | | 135,301,652 | |
| | | | | | | | | | |
See Notes to Financial Statements.
| | | | |
| Target Asset Allocation Funds/Target Conservative Allocation Fund | | | 35 | |
Portfolio of Investments
as of January 31, 2012 (Unaudited) continued
| | | | | | | | | | |
Notional
Amount (000)# | | | Description | | Counterparty | | Value (Note 1) | |
| | | | | | | | | | |
| OPTIONS WRITTEN(a) | | | | |
| | |
| Put Options | | | | | | |
| $ | 1,200 | | | Interest Rate Swap Options, Received a fixed rate of 10.00% and pay a floating rate based on 3-month LIBOR, expiring 07/10/12 | | Morgan Stanley | | $ | — | |
| | 200 | | | Received a fixed rate of 2.25% and pay a floating rate based on 3-month LIBOR, expiring 09/24/12 | | Citigroup Global Markets | | | (22 | ) |
| | | | | | | | | | |
| | | | TOTAL OPTIONS WRITTEN
(premiums received $8,765) | | | | | (22 | ) |
| | | | | | | | | | |
| | | |
Principal
Amount (000)# | | | | | | | | |
| SECURITY SOLD SHORT (3.6)% | |
|
| U.S. GOVERNMENT MORTGAGE-BACKED OBLIGATION | |
| | 4,000 | | | Federal National Mortgage Assoc.
(proceeds received ($4,191,719)
4.00%, TBA | | | (4,228,125 | ) |
| | | | | | | | | | |
| | | | TOTAL INVESTMENTS, AFTER OPTIONS WRITTEN AND SECURITY SOLD SHORT 110.5%
(cost $119,117,886; Note 5) | | | 131,073,505 | |
| | | | Liabilities in excess of other assets(h) (10.5)% | | | (12,494,808 | ) |
| | | | | | | | | | |
| | | | NET ASSETS 100% | | $ | 118,578,697 | |
| | | | | | | | | | |
The following abbreviations are used in the Portfolio descriptions:
144A—Security was purchased pursuant to Rule 144A under the Securities Act of 1933 and may not be resold subject to that rule except to qualified institutional buyers. Unless otherwise noted, 144A securities are deemed to be liquid.
ADR—American Depositary Receipt
CDO—Collaterlized Debt Obligation
CDX—Credit Derivative Index
CLO—Collateralized Loan Obligations
FHLMC—Federal Home Loan Mortgage Corporation
LIBOR—London Interbank Offered Rate
MSCI—Morgan Stanley Capital International
MTN—Medium Term Note
NR—Not Rated by Moody’s or Standard & Poor’s
SLM—Student Loan Mortgage
See Notes to Financial Statements.
| | |
| 36 | | Visit our website at www.prudentialfunds.com |
TBA—To Be Announced
TIPS—Treasury Inflation Protected Securities
AUD—Australian Dollar
BRL—Brazilian Real
CAD—Canadian Dollar
CNY—Chinese Yuan
EUR—Euro
GBP—British Pound
INR—Indian Rupee
JPY—Japanese Yen
KRW—South Korean Won
MXN—Mexican Peso
NOK—Norwegian Krone
SGD—Singapore Dollar
TWD—New Taiwanese Dollar
| † | The ratings reflected are as of January 31, 2012. Ratings of certain bonds may have changed subsequent to that date. |
| # | Principal and notional amount is shown in U.S. dollars unless otherwise stated. |
| (a) | Non-income producing security. |
| (b) | Variable rate instrument. The interest rate shown reflects the rate in effect at January 31, 2012. |
| (c) | Standard & Poor’s rating. |
| (d) | Represents issuer in default on interest payments. Non-income producing security. |
| (e) | Represents security, or a portion thereof, segregated as collateral for futures contracts. |
| (f) | Prudential Investments LLC, the manager of the Fund, also serves as manager of the Prudential Investment Portfolios 2 - Prudential Core Taxable Money Market Fund. |
| (g) | Rates shown are the effective yields at purchase date. |
| (h) | Includes net unrealized appreciation (depreciation) on the following derivative contracts held at reporting period end: |
Futures contracts open at January 31, 2012:
| | | | | | | | | | | | | | | | | | | | |
Number of
Contracts | | | Type | | Expiration
Date | | | Value at
Trade
Date | | | Value at
January 31,
2012 | | | Unrealized
Appreciation
(Depreciation) | |
| | | | Long Positions: | |
| | 28 | | | 90 Day Euro Dollar | | | Mar. 2014 | | | $ | 6,924,750 | | | $ | 6,954,150 | | | $ | 29,400 | |
| | 7 | | | 90 Day Euro Dollar | | | Jun. 2014 | | | | 1,727,425 | | | | 1,736,962 | | | | 9,537 | |
| | | | | | | | | | | | | | | | | | | | |
| | | | | | | | | | | | | | | | | | | 38,937 | |
| | | | | | | | | | | | | | | | | | | | |
| | | | Short Positions: | |
| | 29 | | | 5 Year U.S. Treasury Notes | | | Mar. 2012 | | | | 3,558,454 | | | | 3,597,360 | | | | (38,906 | ) |
| | 12 | | | 10 Year U.S. Treasury Notes | | | Mar. 2012 | | | | 1,561,406 | | | | 1,587,000 | | | | (25,594 | ) |
| | | | | | | | | | | | | | | | | | | | |
| | | | | | | | | | | | | | | | | | | (64,500 | ) |
| | | | | | | | | | | | | | | | | | | | |
| | | | | | | | | | | | | | | | | | $ | (25,563 | ) |
| | | | | | | | | | | | | | | | | | | | |
See Notes to Financial Statements.
| | | | |
| Target Asset Allocation Funds/Target Conservative Allocation Fund | | | 37 | |
Portfolio of Investments
as of January 31, 2012 (Unaudited) continued
Forward foreign currency exchange contracts outstanding at January 31, 2012:
| | | | | | | | | | | | | | | | | | |
Purchase Contracts | | Counterparty | | Notional
Amount
(000) | | | Value at
Settlement
Date
Payable | | | Current
Value | | | Unrealized
Appreciation
(Depreciation) | |
Australian Dollar, | | | | | | | | | | | | | | | | | | |
Expiring 02/02/12 | | Citigroup Global Markets | | AUD | 776 | | | $ | 789,891 | | | $ | 823,661 | | | $ | 33,770 | |
Expiring 02/02/12 | | Deutsche Bank | | AUD | 51 | | | | 53,023 | | | | 54,132 | | | | 1,109 | |
Canadian Dollar, | | | | | | | | | | | | | | | | | | |
Expiring 02/09/12 | | Royal Bank of Scotland | | CAD | 326 | | | | 326,490 | | | | 325,170 | | | | (1,320 | ) |
Chinese Yuan, | | | | | | | | | | | | | | | | | | |
Expiring 02/13/12 | �� | Barclays Capital Group | | CNY | 2,524 | | | | 392,329 | | | | 399,996 | | | | 7,667 | |
Expiring 02/13/12 | | Barclays Capital Group | | CNY | 701 | | | | 108,709 | | | | 111,092 | | | | 2,383 | |
Expiring 02/13/12 | | Citigroup Global Markets | | CNY | 2,072 | | | | 322,420 | | | | 328,363 | | | | 5,943 | |
Expiring 02/13/12 | | Citigroup Global Markets | | CNY | 1,458 | | | | 226,525 | | | | 231,114 | | | | 4,589 | |
Expiring 02/13/12 | | Citigroup Global Markets | | CNY | 668 | | | | 103,591 | | | | 105,845 | | | | 2,254 | |
Expiring 02/13/12 | | Deutsche Bank | | CNY | 664 | | | | 103,102 | | | | 105,280 | | | | 2,178 | |
Expiring 02/13/12 | | Deutsche Bank | | CNY | 639 | | | | 99,178 | | | | 101,281 | | | | 2,103 | |
Expiring 02/13/12 | | JPMorgan Chase | | CNY | 854 | | | | 134,000 | | | | 135,313 | | | | 1,313 | |
Expiring 02/13/12 | | JPMorgan Chase | | CNY | 848 | | | | 133,000 | | | | 134,335 | | | | 1,335 | |
Expiring 02/13/12 | | JPMorgan Chase | | CNY | 847 | | | | 133,000 | | | | 134,313 | | | | 1,313 | |
Expiring 02/13/12 | | JPMorgan Chase | | CNY | 810 | | | | 126,000 | | | | 128,422 | | | | 2,422 | |
Expiring 02/13/12 | | JPMorgan Chase | | CNY | 676 | | | | 104,910 | | | | 107,135 | | | | 2,225 | |
Expiring 02/13/12 | | UBS Securities | | CNY | 534 | | | | 82,867 | | | | 84,572 | | | | 1,705 | |
Expiring 06/01/12 | | BNP Paribas | | CNY | 383 | | | | 60,269 | | | | 60,710 | | | | 441 | |
Expiring 06/01/12 | | Citigroup Global Markets | | CNY | 497 | | | | 78,016 | | | | 78,704 | | | | 688 | |
Expiring 02/01/13 | | Barclays Capital Group | | CNY | 13,295 | | | | 2,108,628 | | | | 2,108,219 | | | | (409 | ) |
Expiring 02/01/13 | | Deutsche Bank | | CNY | 291 | | | | 46,248 | | | | 46,151 | | | | (97 | ) |
Expiring 02/01/13 | | Deutsche Bank | | CNY | 27 | | | | 4,186 | | | | 4,206 | | | | 20 | |
Expiring 02/01/13 | | Goldman Sachs & Co. | | CNY | 797 | | | | 127,000 | | | | 126,331 | | | | (669 | ) |
Expiring 02/01/13 | | JPMorgan Chase | | CNY | 718 | | | | 114,373 | | | | 113,879 | | | | (494 | ) |
Expiring 08/05/13 | | Deutsche Bank | | CNY | 743 | | | | 118,601 | | | | 117,698 | | | | (903 | ) |
See Notes to Financial Statements.
| | |
| 38 | | Visit our website at www.prudentialfunds.com |
| | | | | | | | | | | | | | | | | | |
Purchase Contracts | | Counterparty | | Notional
Amount
(000) | | | Value at
Settlement
Date
Payable | | | Current
Value | | | Unrealized
Appreciation
(Depreciation) | |
Euro, | | | | | | | | | | | | | | | | | | |
Expiring 04/16/12 | | Citigroup Global Markets | | EUR | 33 | | | $ | 43,335 | | | $ | 43,177 | | | $ | (158 | ) |
Indian Rupee, | | | | | | | | | | | | | | | | | | |
Expiring 07/12/12 | | JPMorgan Chase | | INR | 26,241 | | | | 564,571 | | | | 513,494 | | | | (51,077 | ) |
Mexican Peso, | | | | | | | | | | | | | | | | | | |
Expiring 03/15/12 | | Barclays Capital Group | | MXN | 57 | | | | 4,047 | | | | 4,320 | | | | 273 | |
Expiring 03/15/12 | | Hong Kong & Shanghai Bank | | MXN | 8,284 | | | | 610,643 | | | | 633,239 | | | | 22,596 | |
New Taiwanese Dollar, | | | | | | | | | | | | | | | | | | |
Expiring 04/09/12 | | Barclays Capital Group | | TWD | 13,711 | | | | 453,837 | | | | 463,970 | | | | 10,133 | |
Norwegian Krone, | | | | | | | | | | | | | | | | | | |
Expiring 02/16/12 | | Credit Suisse First Boston Corp. | | NOK | 635 | | | | 105,503 | | | | 108,166 | | | | 2,663 | |
Expiring 02/16/12 | | Goldman Sachs & Co. | | NOK | 634 | | | | 105,196 | | | | 107,996 | | | | 2,800 | |
Expiring 02/16/12 | | UBS Securities | | NOK | 635 | | | | 105,459 | | | | 108,166 | | | | 2,707 | |
Singapore Dollar, | | | | | | | | | | | | | | | | | | |
Expiring 02/10/12 | | JPMorgan Chase | | SGD | 1 | | | | 626 | | | | 648 | | | | 22 | |
Expiring 05/15/12 | | UBS Securities | | SGD | 1 | | | | 644 | | | | 649 | | | | 5 | |
South Korean Won, | | | | | | | | | | | | | | | | | | |
Expiring 02/27/12 | | Citigroup Global Markets | | KRW | 790,783 | | | | 706,529 | | | | 702,459 | | | | (4,070 | ) |
| | | | | | | | | | | | | | | | | | |
| | | | | | | | $ | 8,596,746 | | | $ | 8,652,206 | | | $ | 55,460 | |
| | | | | | | | | | | | | | | | | | |
| | | | | | | | | | | | | | | | | | |
Sale Contracts | | Counterparty | | Notional
Amount
(000) | | | Value at
Settlement
Date
Receivable | | | Current
Value | | | Unrealized
Appreciation
(Depreciation) | |
Australian Dollar, | | | | | | | | | | | | | | | | | | |
Expiring 02/02/12 | | Westpac Banking Corp. | | AUD | 5,899 | | | $ | 5,806,977 | | | $ | 6,261,314 | | | $ | (454,337 | ) |
Expiring 03/15/12 | | Hong Kong & Shanghai Bank | | AUD | 5,072 | | | | 5,370,741 | | | | 5,362,154 | | | | 8,587 | |
See Notes to Financial Statements.
| | | | |
| Target Asset Allocation Funds/Target Conservative Allocation Fund | | | 39 | |
Portfolio of Investments
as of January 31, 2012 (Unaudited) continued
| | | | | | | | | | | | | | | | | | |
Sale Contracts | | Counterparty | | Notional
Amount
(000) | | | Value at
Settlement
Date
Receivable | | | Current
Value | | | Unrealized
Appreciation
(Depreciation) | |
Brazilian Real, | | | | | | | | | | | | | | | | | | |
Expiring 03/02/12 | | UBS Securities | | BRL | 2,025 | | | $ | 1,117,652 | | | $ | 1,149,904 | | | $ | (32,252 | ) |
British Pound, | | | | | | | | | | | | | | | | | | |
Expiring 03/12/12 | | JPMorgan Chase | | GBP | 514 | | | | 806,119 | | | | 809,697 | | | | (3,578 | ) |
Canadian Dollar, | | | | | | | | | | | | | | | | | | |
Expiring 02/09/12 | | Deutsche Bank | | CAD | 326 | | | | 319,316 | | | | 325,057 | | | | (5,741 | ) |
Expiring 03/22/12 | | Royal Bank of Scotland | | CAD | 326 | | | | 326,170 | | | | 324,904 | | | | 1,266 | |
Chinese Yuan, | | | | | | | | | | | | | | | | | | |
Expiring 02/13/12 | | Barclays Capital Group | | CNY | 13,295 | | | | 2,106,289 | | | | 2,107,060 | �� | | | (771 | ) |
Euro, | | | | | | | | | | | | | | | | | | |
Expiring 04/16/12 | | Barclays Capital Group | | EUR | 312 | | | | 399,937 | | | | 408,215 | | | | (8,278 | ) |
Expiring 04/16/12 | | Citigroup Global Markets | | EUR | 230 | | | | 294,322 | | | | 300,928 | | | | (6,606 | ) |
Expiring 04/16/12 | | Deutsche Bank | | EUR | 735 | | | | 943,042 | | | | 961,661 | | | | (18,619 | ) |
Expiring 04/16/12 | | UBS Securities | | EUR | 320 | | | | 406,904 | | | | 418,682 | | | | (11,778 | ) |
Expiring 04/16/12 | | UBS Securities | | EUR | 244 | | | | 311,322 | | | | 319,245 | | | | (7,923 | ) |
Japanese Yen, | | | | | | | | | | | | | | | | | | |
Expiring 02/14/12 | | Deutsche Bank | | JPY | 20,372 | | | | 265,721 | | | | 267,318 | | | | (1,597 | ) |
Singapore Dollar, | | | | | | | | | | | | | | | | | | |
Expiring 02/10/12 | | UBS Securities | | SGD | 1 | | | | 644 | | | | 648 | | | | (4 | ) |
South Korean Won, | | | | | | | | | | | | | | | | | | |
Expiring 02/27/12 | | Citigroup Global Markets | | KRW | 172,635 | | | | 150,000 | | | | 153,353 | | | | (3,353 | ) |
Expiring 02/27/12 | | Goldman Sachs & Co. | | KRW | 223,779 | | | | 194,000 | | | | 198,785 | | | | (4,785 | ) |
Expiring 02/27/12 | | UBS Securities | | KRW | 200,048 | | | | 174,000 | | | | 177,704 | | | | (3,704 | ) |
Expiring 02/27/12 | | UBS Securities | | KRW | 159,794 | | | | 139,000 | | | | 141,947 | | | | (2,947 | ) |
Expiring 02/27/12 | | UBS Securities | | KRW | 40,240 | | | | 35,000 | | | | 35,745 | | | | (745 | ) |
| | | | | | | | | | | | | | | | | | |
| | | | | | | | $ | 19,167,156 | | | $ | 19,724,321 | | | $ | (557,165 | ) |
| | | | | | | | | | | | | | | | | | |
See Notes to Financial Statements.
| | |
| 40 | | Visit our website at www.prudentialfunds.com |
Interest rate swap agreements outstanding at January 31, 2012:
| | | | | | | | | | | | | | | | | | | | | | | | | | |
Notional
Amount
(000)# | | | Termination
Date | | | Fixed
Rate | | | Floating
Rate | | Fair
Value | | | Upfront
Premiums
Paid
(Received) | | | Unrealized
Appreciation
(Depreciation) | | | Counterparty |
| Over-the-counter swap agreements: |
| $ | 1,200 | | | | 11/16/16 | | | | 1.750% | | | 3 month LIBOR(2) | | $ | (52,743 | ) | | $ | — | | | $ | (52,743 | ) | | Credit Suisse International |
| AUD | 400 | | | | 12/15/17 | | | | 5.500% | | | 6 month Australian Bank Bill rate(1) | | | 27,390 | | | | (1,615 | ) | | | 29,005 | | | Barclays Bank PLC |
| AUD | 200 | | | | 12/15/17 | | | | 5.500% | | | 6 month Australian Bank Bill rate(1) | | | 13,694 | | | | (723 | ) | | | 14,417 | | | Deutsche Bank |
| BRL | 500 | | | | 01/02/14 | | | | 10.580% | | | Brazilian overnight interbank lending rate(1) | | | 2,413 | | | | 1,742 | | | | 671 | | | Morgan Stanley & Co. |
| BRL | 1,900 | | | | 01/02/14 | | | | 10.580% | | | Brazilian overnight interbank lending rate(1) | | | 7,132 | | | | 5,116 | | | | 2,016 | | | UBS AG |
| BRL | 4,400 | | | | 01/02/14 | | | | 11.960% | | | Brazilian overnight interbank lending rate(1) | | | 111,303 | | | | (3,132 | ) | | | 114,435 | | | Goldman Sachs & Co. |
| BRL | 2,900 | | | | 01/02/14 | | | | 11.860% | | | Brazilian overnight interbank lending rate(1) | | | 57,604 | | | | 2,580 | | | | 55,024 | | | Bank of America Securities LLC |
| BRL | 2,100 | | | | 01/02/14 | | | | 11.990% | | | Brazilian overnight interbank lending rate(1) | | | 53,980 | | | | 340 | | | | 53,640 | | | Barclays Bank PLC |
| EUR | 1,200 | | | | 03/21/17 | | | | 2.000% | | | 6 month Euribor(1) | | | 34,560 | | | | (7,531 | ) | | | 42,091 | | | Barclays Bank PLC |
| MXN | 8,400 | | | | 03/05/13 | | | | 6.500% | | | 28 day Mexican interbank rate(1) | | | 10,719 | | | | (187 | ) | | | 10,906 | | | Morgan Stanley & Co. |
| MXN | 7,300 | | | | 06/02/21 | | | | 7.500% | | | 28 day Mexican interbank rate(1) | | | 54,946 | | | | 23,390 | | | | 31,556 | | | UBS AG |
See Notes to Financial Statements.
| | | | |
| Target Asset Allocation Funds/Target Conservative Allocation Fund | | | 41 | |
Portfolio of Investments
as of January 31, 2012 (Unaudited) continued
| | | | | | | | | | | | | | | | | | | | | | | | | | |
Notional
Amount
(000)# | | | Termination
Date | | | Fixed
Rate | | | Floating
Rate | | Fair
Value | | | Upfront
Premiums
Paid
(Received) | | | Unrealized
Appreciation
(Depreciation) | | | Counterparty |
| Exchange-traded swap agreements: |
| $ | 2,300 | | | | 10/13/16 | | | | 1.800% | | | 3 month LIBOR(1) | | $ | (104,200 | ) | | $ | (44,292 | ) | | $ | (59,908 | ) | | — |
| EUR | 1,200 | | | | 03/21/17 | | | | 2.000% | | | 6 month Euribor(1) | | | 31,833 | | | | 7,203 | | | | 24,630 | | | — |
| | | | | | | | | | | | | | | | | | | | | | | | | | |
| | | | | | | | | | | | | | $ | 248,631 | | | $ | (17,109 | ) | | | $265,740 | | | |
| | | | | | | | | | | | | | | | | | | | | | | | | | |
| (1) | Fund pays the floating rate and receives the fixed rate. |
| (2) | Fund pays the fixed rate and receives the floating rate. |
| # | Notional amount is shown in U.S. dollars unless otherwise stated. |
Credit default swap agreements outstanding at January 31, 2012:
| | | | | | | | | | | | | | | | | | | | | | | | | | |
Reference
Entity/
Obligation | | Termination
Date | | | Fixed
Rate | | | Notional
Amount
(000)(4)# | | | Fair
Value(3) | | | Upfront
Premiums
Paid
(Received) | | | Unrealized
Depreciation | | | Counterparty |
Over-the-counter credit default swaps on credit indices—Sell Protection(1): |
Dow Jones CDX IG5 10Y Index | | | 12/20/15 | | | | 0.460% | | | $ | 1,500 | | | $ | (145,027 | ) | | $ | — | | | $ | (145,027 | ) | | Morgan Stanley & Co. |
Dow Jones CDX IG5 10Y Index | | | 12/20/15 | | | | 0.460% | | | | 470 | | | | (45,533 | ) | | | — | | | | (45,533 | ) | | Morgan Stanley & Co. |
| | | | | | | | | | | | | | | | | | | | | | | | | | |
| | | | | | | | | | | | | | $ | (190,560 | ) | | $ | — | | | $ | (190,560 | ) | | |
| | | | | | | | | | | | | | | | | | | | | | | | | | |
The Fund entered into credit default swap agreements on credit indices as the protection seller to provide a measure of protection against the current portfolio of investments’ exposure to market conditions, or to take an active position with respect to the likelihood of a particular issuer’s default or the referenced entity’s credit soundness.
| | | | | | | | | | | | | | | | | | | | | | | | | | |
Reference
Entity/
Obligation | | Termination
Date | | | Fixed
Rate | | | Notional
Amount
(000)(4)# | | | Fair
Value | | | Upfront
Premiums
Paid
(Received) | | | Unrealized
Appreciation
(Depreciation) | | | Counterparty |
Over-the-counter credit default swaps—Buy Protection(2): |
Cardinal Health Inc., | | | 06/20/17 | | | | 0.560% | | | $ | 500 | | | $ | (5,181 | ) | | $ | — | | | $ | (5,181 | ) | | UBS AG |
Con-way, Inc., | | | 03/20/18 | | | | 1.830% | | | | 2,000 | | | | 68,625 | | | | — | | | | 68,625 | | | Bank of America Securities LLC |
Dow Jones CDX HY15 5Y Index | | | 12/20/15 | | | | 5.000% | | | | 784 | | | | (5,035 | ) | | | (22,083 | ) | | | 17,048 | | | Citigroup, Inc. |
See Notes to Financial Statements.
| | |
| 42 | | Visit our website at www.prudentialfunds.com |
| | | | | | | | | | | | | | | | | | | | | | | | | | |
Reference
Entity/
Obligation | | Termination
Date | | | Fixed
Rate | | | Notional
Amount
(000)(4)# | | | Fair
Value | | | Upfront
Premiums
Paid
(Received) | | | Unrealized
Appreciation
(Depreciation) | | | Counterparty |
Over-the-counter credit default swaps—Buy Protection(2) (cont’d.): |
Dow Jones CDX IG5 Index | | | 12/20/12 | | | | 0.140% | | | $ | 2,100 | | | $ | 1,203 | | | $ | — | | | $ | 1,203 | | | Morgan Stanley & Co. |
Dow Jones CDX IG5 Index | | | 12/20/12 | | | | 0.140% | | | | 700 | | | | 401 | | | | — | | | | 401 | | | Morgan Stanley & Co. |
Embarq Corp. | | | 06/20/13 | | | | 1.000% | | | | 200 | | | | (524 | ) | | | (1,332 | ) | | | 808 | | | Barclays Bank PLC |
Embarq Corp. | | | 03/20/14 | | | | 1.250% | | | | 400 | | | | (1,472 | ) | | | — | | | | (1,472 | ) | | Deutsche Bank |
Embarq Corp. | | | 03/20/14 | | | | 1.270% | | | | 200 | | | | (826 | ) | | | — | | | | (826 | ) | | Deutsche Bank |
Embarq Corp. | | | 03/20/14 | | | | 1.430% | | | | 100 | | | | (758 | ) | | | — | | | | (758 | ) | | Deutsche Bank |
Spectra Energy Capital | | | 06/20/18 | | | | 0.840% | | | | 1,000 | | | | 31,830 | | | | — | | | | 31,830 | | | Deutsche Bank |
Vertical CDO, Ltd. | | | 02/09/46 | | | | 2.200% | | | | 600 | | | | 552,221 | | | | — | | | | 552,221 | | | Citigroup, Inc. |
|
Exchange-traded credit default swaps—Buy Protection(2): |
Dow Jones CDX IG09 10Y Index | | | 12/20/17 | | | | 0.800% | | | | 4,453 | | | | 96,361 | | | | 198,344 | | | | (101,983 | ) | | — |
Dow Jones CDX IG10 10Y Index | | | 06/20/18 | | | | 1.500% | | | | 10,454 | | | | (183,957 | ) | | | 94,242 | | | | (278,199 | ) | | — |
Dow Jones CDX IG10 5Y Index | | | 06/20/13 | | | | 1.550% | | | | 6,195 | | | | (65,138 | ) | | | (28,645 | ) | | | (36,493 | ) | | — |
Dow Jones CDX IG14 5Y Index | | | 06/20/15 | | | | 1.000% | | | | 2,100 | | | | (19,498 | ) | | | 9,434 | | | | (28,932 | ) | | — |
| | | | | | | | | | | | | | �� | | | | | | | | | | | | |
| | | | | | | | | | | | | | $ | 468,252 | | | $ | 249,960 | | | $ | 218,292 | | | |
| | | | | | | | | | | | | | | | | | | | | | | | | | |
| (1) | If the Fund is a seller of protection, it receives the fixed rate. When a credit event occurs, as defined under the terms of that particular swap agreement, the Fund will either (i) pay to the buyer of protection an amount equal to the notional amount of the swap and take delivery of the referenced obligation or underlying securities comprising the referenced index or (ii) pay a net settlement amount in the form of cash or securities equal to the notional amount of the swap less the recovery value of the referenced obligation of underlying securities comprising the referenced index. |
| (2) | If the Fund is a buyer of protection, it pays the fixed rate. When a credit event occurs, as defined under the terms of that particular swap agreement, the Fund will either (i) receive from the seller of protection an amount equal to the notional amount of the swap and make delivery of the referenced obligation or underlying securities comprising the referenced index or (ii) receive a net settlement amount in the form of cash or securities equal to the notional amount of the swap less the recovery value of the referenced obligation of underlying securities comprising the referenced index. |
| (3) | The fair value of credit default swap agreements on asset-backed securities and credit indices serves as an indicator of the current status of the payment/performance risk and represents the likelihood of an expected liability (or profit) for the credit derivative should the notional amount of the swap agreement be closed/sold as of |
See Notes to Financial Statements.
| | | | |
| Target Asset Allocation Funds/Target Conservative Allocation Fund | | | 43 | |
Portfolio of Investments
as of January 31, 2012 (Unaudited) continued
| | the reporting date. Increasing fair value in absolute terms, represents a determination of the referenced entity’s credit soundness and a greater likelihood of risk of default or other credit event occurring as defined under the terms of the agreement. |
| (4) | Notional amount represents the maximum potential amount the Fund could be required to pay as a seller of credit protection or receive as a buyer of credit protection if a credit event occurs as defined under the terms of that particular swap agreement. |
| # | Notional amount is shown in U.S. dollars unless otherwise stated. |
Reverse Repurchase Agreement outstanding at January 31, 2012:
| | | | | | | | | | | | | | | | | | | | |
Broker | | Interest
Rate | | | Trade
Date | | | Value at
January 31,
2012 | | | Maturity
Date | | | Cost | |
Deutsche Bank | | | 0.15 | % | | | 1/19/2012 | | | $ | 307,875 | | | | 2/22/2012 | | | $ | 307,875 | |
| | | | | | | | | | | | | | | | | | | | |
Various inputs are used in determining the value of the Portfolio’s investments. These inputs are summarized in the three broad levels listed below.
Level 1—quoted prices generally for securities actively traded on a regulated securities exchange and for open-end mutual funds which trade at daily net asset value.
Level 2—other significant observable inputs (including, but not limited to, quoted prices for similar securities, interest rates, prepayment speeds, foreign currency exchange rates, and amortized cost) generally for debt securities, swaps, forward foreign currency contracts and for foreign stocks priced using vendor modeling tools.
Level 3—significant unobservable inputs for securities valued in accordance with Board approved fair valuation procedures.
The following is a summary of the inputs used as of January 31, 2012 in valuing such portfolio securities:
| | | | | | | | | | | | |
| | | Level 1 | | | Level 2 | | | Level 3 | |
Investments in Securities | | | | | | | | | | | | |
Common Stocks | | $ | 46,225,153 | | | $ | — | | | $ | — | |
Exchange Traded Fund | | | 92,816 | | | | — | | | | — | |
Preferred Stock | | | 77,327 | | | | — | | | | — | |
Unaffiliated Mutual Fund | | | 49,135 | | | | — | | | | — | |
Asset-Backed Securities | | | — | | | | 2,296,857 | | | | 291,758 | |
See Notes to Financial Statements.
| | |
| 44 | | Visit our website at www.prudentialfunds.com |
| | | | | | | | | | | | |
| | | Level 1 | | | Level 2 | | | Level 3 | |
Investments in Securities (continued) | | | | | | | | | | | | |
Corporate Bonds | | $ | — | | | $ | 28,477,518 | | | $ | — | |
Foreign Government Bonds | | | — | | | | 4,815,080 | | | | — | |
Municipal Bonds | | | — | | | | 3,225,876 | | | | — | |
Residential Mortgage-Backed Securities | | | — | | | | 3,062,019 | | | | — | |
U.S. Government Mortgage-Backed Obligations | | | — | | | | 29,017,445 | | | | — | |
U.S. Treasury Obligations | | | — | | | | 13,301,077 | | | | — | |
Affiliated Money Market Mutual Fund | | | 4,369,591 | | | | — | | | | — | |
Options Written | | | — | | | | (22 | ) | | | — | |
Security Sold Short—U.S. Government Mortgage-Backed Obligation | | | — | | | | (4,228,125 | ) | | | — | |
Reverse Repurchase Agreement | | | — | | | | (307,875 | ) | | | — | |
Other Financial Instruments* | | | | | | | | | | | | |
Futures | | | (25,563 | ) | | | — | | | | — | |
Forward foreign currency exchange contracts | | | — | | | | (501,705 | ) | | | — | |
Interest rate swap agreements | | | (35,278 | ) | | | 301,018 | | | | — | |
Credit default swap agreements | | | (445,607 | ) | | | (78,882 | ) | | | 552,221 | |
| | | | | | | | | | | | |
Total | | $ | 50,307,574 | | | $ | 79,380,281 | | | $ | 843,979 | |
| | | | | | | | | | | | |
| * | Other financial instruments are derivative instruments not reflected in the Portfolio of Investments, such as futures, forwards and swap contracts, which are recorded at the unrealized appreciation/depreciation on the instrument. |
The investment allocation of Portfolio holdings and liabilities in excess of other assets shown as a percentage of net assets as of January 31, 2012 were as follows:
| | | | |
U.S. Government Mortgage-Backed Obligations | | | 24.5 | % |
U.S. Treasury Obligations | | | 11.2 | |
Oil, Gas & Consumable Fuels | | | 5.1 | |
Diversified Financial Services | | | 4.5 | |
Foreign Government Bonds | | | 4.0 | |
Financial—Bank & Trust | | | 3.8 | |
Affiliated Money Market Mutual Fund | | | 3.7 | |
Retail & Merchandising | | | 2.9 | |
Pharmaceuticals | | | 2.8 | |
Financial Services | | | 2.8 | |
Municipal Bonds | | | 2.7 | |
Transportation | | | 2.7 | |
Residential Mortgage-Backed Securities | | | 2.6 | |
Metals & Mining | | | 2.3 | |
Insurance | | | 2.2 | |
Asset-Backed Securities | | | 2.2 | |
Capital Markets | | | 2.0 | |
Telecommunications | | | 1.7 | |
Commercial Banks | | | 1.5 | % |
Media | | | 1.5 | |
Computer Hardware | | | 1.3 | |
Electric Utilities | | | 1.3 | |
Automobile Manufacturers | | | 1.3 | |
Computer Services & Software | | | 1.2 | |
Software | | | 1.1 | |
Tobacco | | | 1.0 | |
Chemicals | | | 1.0 | |
Energy Equipment & Services | | | 0.9 | |
Food Products | | | 0.9 | |
Textiles, Apparel & Luxury Goods | | | 0.8 | |
Biotechnology | | | 0.8 | |
Aerospace & Defense | | | 0.7 | |
Internet Software & Services | | | 0.7 | |
Commercial Services | | | 0.7 | |
IT Services | | | 0.7 | |
Real Estate Investment Trusts | | | 0.7 | |
Machinery | | | 0.7 | |
See Notes to Financial Statements.
| | | | |
| Target Asset Allocation Funds/Target Conservative Allocation Fund | | | 45 | |
Portfolio of Investments
as of January 31, 2012 (Unaudited) continued
| | | | |
Industry (cont’d.) | | | |
Healthcare Providers & Services | | | 0.7 | % |
Manufacturing | | | 0.6 | |
Food & Staples Retailing | | | 0.6 | |
Hotels, Restaurants & Leisure | | | 0.6 | |
Building & Construction | | | 0.5 | |
Internet & Catalog Retail | | | 0.5 | |
Farming & Agriculture | | | 0.4 | |
Specialty Retail | | | 0.4 | |
Computers & Peripherals | | | 0.4 | |
Industrial Conglomerates | | | 0.4 | |
Multi-Utilities | | | 0.4 | |
Hotels & Motels | | | 0.3 | |
Diversified Telecommunication Services | | | 0.3 | |
Healthcare Services | | | 0.3 | |
Healthcare Products | | | 0.3 | |
Semiconductors | | | 0.3 | |
Auto Components | | | 0.3 | |
Airlines | | | 0.3 | |
Foods | | | 0.2 | |
Beverages | | | 0.2 | |
Wireless Telecommunication Services | | | 0.2 | |
Life Sciences Tools & Services | | | 0.2 | |
Consumer Products & Services | | | 0.2 | |
Healthcare Equipment & Supplies | | | 0.2 | |
Internet Services | | | 0.2 | |
Semiconductors & Semiconductor Equipment | | | 0.2 | |
Multi-Line Retail | | | 0.2 | |
Electronic Equipment & Instruments | | | 0.1 | % |
Investment Companies | | | 0.1 | |
Business Services | | | 0.1 | |
Distribution/Wholesale | | | 0.1 | |
Household Products | | | 0.1 | |
Office Electronics | | | 0.1 | |
Consumer Finance | | | 0.1 | |
Utilities | | | 0.1 | |
Entertainment & Leisure | | | 0.1 | |
Professional Services | | | 0.1 | |
Building Products | | | 0.1 | |
Exchange Traded Fund | | | 0.1 | |
Electronic Components | | | 0.1 | |
Air Freight & Logistics | | | 0.1 | |
Hand/Machine Tools | | | 0.1 | |
Diversified Consumer Services | | | 0.1 | |
Paper & Forest Products | | | 0.1 | |
Engineering/Construction | | | 0.1 | |
Containers & Packaging | | | 0.1 | |
Leisure Equipment & Products | | | 0.1 | |
Trading Companies & Distributors | | | 0.1 | |
Thrifts & Mortgage Finance | | | 0.1 | |
| | | | |
| | | 114.1 | |
Options Written and Security Sold Short | | | (3.6 | ) |
Liabilities in excess of other assets | | | (10.5 | ) |
| | | | |
| | | 100.0 | % |
| | | | |
See Notes to Financial Statements.
| | |
| 46 | | Visit our website at www.prudentialfunds.com |
The Fund invested in derivative instruments during the reporting period. The primary types of risk associated with these derivative instruments are credit risk, foreign exchange risk and interest rate risk. The effect of such derivative instruments on the Fund’s financial position and financial performance as reflected in the Statement of Assets and Liabilities and Statement of Operations is presented in the summary below.
Fair values of derivative instruments as of January 31, 2012 as presented in the Statement of Assets and Liabilities:
| | | | | | | | | | | | |
Derivatives not accounted
for as hedging instruments,
carried at fair value | | Asset Derivatives | | | Liability Derivatives | |
| | Balance
Sheet Location | | Fair
Value | | | Balance
Sheet Location | | Fair
Value | |
| Interest rate contracts | | Receivable from broker—
variation margin | | $ | 39,937 | * | | Receivable from broker—
variation margin | | $ | 64,500 | |
| Interest rate contracts | | Premiums paid for swap agreements | | | 40,371 | | | Premiums received for swap agreements | | | 57,480 | |
| Interest rate contracts | | Unrealized appreciation on swap agreements | | | 378,391 | | | Unrealized depreciation on swap agreements | | | 112,651 | |
| Interest rate contracts | | — | | | | | | Outstanding options written, at value | | | 22 | |
| Foreign exchange contracts | | Unrealized appreciation on foreign currency exchange contracts | | | 124,510 | | | Unrealized depreciation on foreign currency exchange contracts | | | 626,215 | |
| Credit contracts | | Unrealized appreciation on swap agreements | | | 672,136 | | | Unrealized depreciation on swap agreements | | | 644,404 | |
| Credit contracts | | Premiums paid for swap agreements | | | 302,020 | | | Premiums received for swap agreements | | | 52,060 | |
| | | | | | | | | | | | |
Total | | | | $ | 1,557,365 | | | | | $ | 1,557,332 | |
| | | | | | | | | | | | |
| * | Includes cumulative appreciation/depreciation on futures contracts as reported in the Portfolio of Investments. Only unsettled variation margin receivable (payable) is reported within the Statement of Assets and Liabilities. |
See Notes to Financial Statements.
| | | | |
| Target Asset Allocation Funds/Target Conservative Allocation Fund | | | 47 | |
Portfolio of Investments
as of January 31, 2012 (Unaudited) continued
The effects of derivative instruments on the Statement of Operations for the six months ended January 31, 2012 are as follows:
| | | | | | | | | | | | | | | | | | | | |
Amount of Realized Gain or (Loss) on Derivatives Recognized in Income | |
Derivatives not accounted for as hedging
instruments, carried at fair value | | Futures | | | Written
Options | | | Swaps | | | Forward
Currency
Contracts | | | Total | |
Interest rate contracts | | $ | 158,590 | | | $ | 37,130 | | | $ | 48,445 | | | $ | — | | | $ | 244,165 | |
Foreign exchange contracts | | | — | | | | — | | | | — | | | | 423,339 | | | | 423,339 | |
Credit contracts | | | — | | | | 4,830 | | | | 301,263 | | | | — | | | | 306,093 | |
| | | | | | | | | | | | | | | | | | | | |
Total | | $ | 158,590 | | | $ | 41,960 | | | $ | 349,708 | | | $ | 423,339 | | | $ | 973,597 | |
| | | | | | | | | | | | | | | | | | | | |
| | | | | | | | | | | | | | | | | | | | |
Change in Unrealized Appreciation or (Depreciation) on Derivatives Recognized in Income | |
Derivatives not accounted for as hedging
instruments, carried at fair value | | Futures | | | Written
Options | | | Swaps | | | Forward
Currency
Contracts | | | Total | |
Interest rate contracts | | $ | (148,939 | ) | | $ | (864 | ) | | $ | 369,075 | | | $ | — | | | $ | 219,272 | |
Foreign exchange contracts | | | — | | | | — | | | | — | | | | (360,369 | ) | | | (360,369 | ) |
Credit contracts | | | — | | | | (3,281 | ) | | | (454,629 | ) | | | — | | | | (457,910 | ) |
| | | | | | | | | | | | | | | | | | | | |
Total | | $ | (148,939 | ) | | $ | (4,145 | ) | | $ | (85,554 | ) | | $ | (360,369 | ) | | $ | (599,007 | ) |
| | | | | | | | | | | | | | | | | | | | |
For the six months ended January 31, 2012, the Fund’s average volume of derivative activities are as follows:
| | | | | | | | | | | | | | | | | | | | | | | | | | | | | | |
Written
Options(1) | | | Futures
Contracts—
Long
Positions(2) | | | Futures
Contracts—
Short
Positions(2) | | | Forward
Foreign
Currency
Exchange
Purchase
Contracts(3) | | | Forward
Foreign
Currency
Exchange
Sale
Contracts(4) | | | Interest
Rate Swap
Agreements(5) | | | Credit
Default Swap
Agreements—
Buy
Protection(5) | | | Credit
Default Swap
Agreements—
Sell
Protection(5) | |
| $ | 50,069 | | | $ | 27,587,470 | | | $ | 5,301,115 | | | $ | 9,403,210 | | | $ | 15,867,369 | | | $ | 13,628,436 | | | $ | 31,978,717 | | | $ | 3,303,333 | |
| (3) | Value at Settlement Date Payable. |
| (4) | Value at Settlement Date Receivable. |
See Notes to Financial Statements.
| | |
| 48 | | Visit our website at www.prudentialfunds.com |
Financial Statements
(Unaudited)
| | |
| JANUARY 31, 2012 | | SEMIANNUAL REPORT |
Target Asset Allocation Funds/Target Conservative Allocation Fund
Statement of Assets and Liabilities
as of January 31, 2012 (Unaudited)
| | | | |
Assets | | | | |
Investments at value: | | | | |
Unaffiliated investments (cost $118,948,779) | | $ | 130,932,061 | |
Affiliated investments (cost $4,369,591) | | | 4,369,591 | |
Foreign currency, at value (cost $69,564) | | | 71,056 | |
Deposit with broker | | | 143,000 | |
Receivable for investments sold | | | 5,645,868 | |
Unrealized appreciation on swap agreements | | | 1,050,527 | |
Dividends and interest receivable | | | 643,582 | |
Receivable for Fund shares sold | | | 395,905 | |
Premiums paid for swap agreements | | | 342,391 | |
Receivable from broker-variation margin | | | 210,677 | |
Unrealized appreciation on foreign currency exchange contracts | | | 124,510 | |
Tax reclaim receivable | | | 1,445 | |
Prepaid expenses | | | 1,359 | |
| | | | |
Total assets | | | 143,931,972 | |
| | | | |
| |
Liabilities | | | | |
Payable for investments purchased | | | 17,799,019 | |
Securities sold short, at value (proceeds $4,191,719) | | | 4,228,125 | |
Payable to broker | | | 870,000 | |
Unrealized depreciation on swap agreements | | | 757,055 | |
Unrealized depreciation on foreign currency exchange contracts | | | 626,215 | |
Reverse repurchase agreement | | | 307,875 | |
Payable to custodian | | | 285,769 | |
Accrued expenses and other liabilities | | | 184,668 | |
Premiums received for swap agreements | | | 109,540 | |
Management fee payable | | | 74,296 | |
Payable for Fund shares reacquired | | | 51,618 | |
Distribution fee payable | | | 42,087 | |
Affiliated transfer agent fee payable | | | 12,927 | |
Deferred trustees’ fees | | | 4,059 | |
Outstanding options written (premiums received $8,765) | | | 22 | |
| | | | |
Total liabilities | | | 25,353,275 | |
| | | | |
| |
Net Assets | | $ | 118,578,697 | |
| | | | |
| | | | | |
Net assets were comprised of: | | | | |
Shares of beneficial interest, at par | | $ | 11,578 | |
Paid-in capital, in excess of par | | | 115,708,945 | |
| | | | |
| | | 115,720,523 | |
Accumulated net investment loss | | | (215,686 | ) |
Accumulated net realized loss on investment and foreign currency transactions | | | (8,662,047 | ) |
Net unrealized appreciation on investments and foreign currencies | | | 11,735,907 | |
| | | | |
Net assets, January 31, 2012 | | $ | 118,578,697 | |
| | | | |
See Notes to Financial Statements.
| | |
| 50 | | Visit our website at www.prudentialfunds.com |
| | | | |
Class A: | | | | |
Net asset value and redemption price per share,
($84,794,907 ÷ 8,258,594 shares of common stock issued and outstanding) | | $ | 10.27 | |
Maximum sales charge (5.5% of offering price) | | | .60 | |
| | | | |
Maximum offering price to public | | $ | 10.87 | |
| | | | |
| |
Class B: | | | | |
Net asset value, offering price and redemption price per share,
($11,159,718 ÷ 1,098,734 shares of common stock issued and outstanding) | | $ | 10.16 | |
| | | | |
| |
Class C: | | | | |
Net asset value, offering price and redemption price per share,
($17,748,938 ÷ 1,747,850 shares of common stock issued and outstanding) | | $ | 10.15 | |
| | | | |
| |
Class M: | | | | |
Net asset value, offering price and redemption price per share,
($9,924 ÷ 977.3 shares of common stock issued and outstanding) | | $ | 10.15 | |
| | | | |
| |
Class R: | | | | |
Net asset value, offering price and redemption price per share,
($214,866 ÷ 20,949 shares of common stock issued and outstanding) | | $ | 10.26 | |
| | | | |
| |
Class X: | | | | |
Net asset value, offering price and redemption price per share,
($105,992 ÷ 10,436 shares of common stock issued and outstanding) | | $ | 10.16 | |
| | | | |
| |
Class Z: | | | | |
Net asset value, offering price and redemption price per share,
($4,544,352 ÷ 440,675 shares of common stock issued and outstanding) | | $ | 10.31 | |
| | | | |
See Notes to Financial Statements.
| | | | |
| Target Asset Allocation Funds/Target Conservative Allocation Fund | | | 51 | |
Statement of Operations
Six Months Ended January 31, 2012 (Unaudited)
| | | | |
Net Investment Income | | | | |
Income | | | | |
Unaffiliated interest income | | $ | 1,498,817 | |
Unaffiliated dividend income (net of foreign withholding taxes $2,887) | | | 439,843 | |
Affiliated dividend income | | | 19,374 | |
| | | | |
| | | 1,958,034 | |
| | | | |
| |
Expenses | | | | |
Management fee | | | 442,409 | |
Distribution fee—Class A | | | 103,878 | |
Distribution fee—Class B | | | 61,283 | |
Distribution fee—Class C | | | 89,125 | |
Distribution fee—Class M | | | 144 | |
Distribution fee—Class R | | | 537 | |
Distribution fee—Class X | | | 584 | |
Custodian’s fees and expenses | | | 120,000 | |
Transfer agent’s fees and expenses (including affiliated expense of $36,000) (Note 3) | | | 86,000 | |
Registration fees | | | 43,000 | |
Audit fee | | | 34,000 | |
Reports to shareholders | | | 25,000 | |
Legal fee | | | 11,000 | |
Trustees’ fees | | | 6,000 | |
Insurance expense | | | 1,000 | |
Miscellaneous | | | 8,922 | |
| | | | |
Total expenses | | | 1,032,882 | |
| | | | |
Net investment income | | | 925,152 | |
| | | | |
| |
Net Realized And Unrealized Gain (loss) On Investments And Foreign Currencies | | | | |
Net realized gain (loss) on: | | | | |
Investment transactions | | | 980,099 | |
Options written transactions | | | 41,960 | |
Foreign currency transactions | | | 750,567 | |
Futures transactions | | | 158,590 | |
Swap agreement transactions | | | 349,708 | |
Short sale transactions | | | (24,766 | ) |
| | | | |
| | | 2,256,158 | |
| | | | |
Net change in unrealized appreciation (depreciation) on: | | | | |
Investments | | | (1,266,960 | ) |
Options written | | | (4,145 | ) |
Foreign currencies | | | (338,007 | ) |
Futures | | | (148,939 | ) |
Swaps | | | (85,554 | ) |
Short Sales | | | (36,406 | ) |
| | | | |
| | | (1,880,011 | ) |
| | | | |
Net gain on investments | | | 376,147 | |
| | | | |
Net Increase In Net Assets Resulting From Operations | | $ | 1,301,299 | |
| | | | |
See Notes to Financial Statements.
| | |
| 52 | | Visit our website at www.prudentialfunds.com |
Statement of Changes in Net Assets
(Unaudited)
| | | | | | | | |
| | | Six Months
Ended
January 31, 2012 | | | Year
Ended
July 31, 2011 | |
Increase (Decrease) In Net Assets | | | | | | | | |
Operations | | | | | | | | |
Net investment income | | $ | 925,152 | | | $ | 1,726,785 | |
Net realized gain on investment and foreign currency transactions | | | 2,256,158 | | | | 5,787,128 | |
Net change in unrealized appreciation (depreciation) on investments and foreign currencies | | | (1,880,011 | ) | | | 4,416,591 | |
| | | | | | | | |
Net increase in net assets resulting from operations | | | 1,301,299 | | | | 11,930,504 | |
| | | | | | | | |
| | |
Dividends and Distributions (Note 1) | | | | | | | | |
Dividends from net investment income: | | | | | | | | |
Class A | | | (1,357,601 | ) | | | (1,475,714 | ) |
Class B | | | (103,939 | ) | | | (236,821 | ) |
Class C | | | (165,496 | ) | | | (245,325 | ) |
Class M | | | (182 | ) | | | (1,302 | ) |
Class R | | | (2,943 | ) | | | (12,420 | ) |
Class X | | | (1,007 | ) | | | (5,173 | ) |
Class Z | | | (93,184 | ) | | | (67,702 | ) |
| | | | | | | | |
| | | (1,724,352 | ) | | | (2,044,457 | ) |
| | | | | | | | |
| | |
Fund share transactions (Net of share conversions) (Note 6) | | | | | | | | |
Net proceeds from shares sold | | | 5,588,383 | | | | 16,425,355 | |
Net asset value of shares issued in reinvestment of dividends and distributions | | | 1,655,543 | | | | 1,985,733 | |
Cost of shares reacquired | | | (12,442,298 | ) | | | (27,536,944 | ) |
| | | | | | | | |
Net decrease in net assets resulting from Fund share transactions | | | (5,198,372 | ) | | | (9,125,856 | ) |
| | | | | | | | |
Total increase (decrease) | | | (5,621,425 | ) | | | 760,191 | |
| | |
Net Assets | | | | | | | | |
Beginning of period | | | 124,200,122 | | | | 123,439,931 | |
| | | | | | | | |
End of period(a) | | $ | 118,578,697 | | | $ | 124,200,122 | |
| | | | | | | | |
(a) Includes undistributed net income of: | | $ | — | | | $ | 583,514 | |
| | | | | | | | |
See Notes to Financial Statements.
| | | | |
| Target Asset Allocation Funds/Target Conservative Allocation Fund | | | 53 | |
Notes to Financial Statements
(Unaudited)
Target Asset Allocation Funds (the “Trust”) is registered under the Investment Company Act of 1940, as amended, (“1940 Act”) as an open-end, diversified management investment company presently consisting of three portfolios: Target Moderate Allocation Fund, Target Conservative Allocation Fund (the “Fund”) and Target Growth Allocation Fund. These financial statements relate only to Target Conservative Allocation Fund. The financial statements of the other portfolios are not presented herein. The Trust was organized as a business trust in Delaware on July 29, 1998.
The Fund uses investment managers (“Subadvisors”), each managing a portion of the Fund’s assets. The following lists the Subadvisors and their respective segment during the six months ended January 31, 2012.
| | |
Fund Segment | | Subadvisors |
| Large-cap value stocks | | Hotchkis and Wiley Capital Management
Eaton Vance Management
NFJ Investment Group LLC |
| |
| Large-cap growth stocks | | Marsico Capital Management, LLC
Massachusetts Financial Services Company |
| |
| Core fixed income bonds | | Pacific Investment Management Company LLC |
| |
| Small-cap value stocks | | EARNEST Partners, LLC
Vaughan Nelson Investment Management, L.P. |
| |
| Small-cap growth stocks | | Eagle Asset Management, Inc. |
The investment objective of the Fund is to seek to provide current income and a reasonable level of capital appreciation.
Note 1. Accounting Policies
The following is a summary of significant accounting policies followed by the Trust in the preparation of its financial statements.
Securities Valuation: Securities listed on a securities exchange (other than options on securities and indices) are valued at the last sale price on such exchange on the day of valuation or, if there was no sale on such day, at the mean between the last reported bid and asked prices, or at the last bid price on such day in the absence of an asked price. Securities traded via NASDAQ are valued at the NASDAQ official
| | |
| 54 | | Visit our website at www.prudentialfunds.com |
closing price (“NOCP”) on the day of valuation, or if there was no NOCP, at the last sale price. Securities that are actively traded in the over-the-counter market, including listed securities for which the primary market is believed by Prudential Investments LLC (“PI” or “Manager”), in consultation with the Subadvisers, to be over-the-counter, are valued at market value using prices provided by an independent pricing agent or principal market maker. Options on securities and indices traded on an exchange are valued at the last sale price as of the close of trading on the applicable exchange or, if there was no sale, at the mean between the most recently quoted bid and asked prices on such exchange or at the last bid price in the absence of an asked price. Futures contracts and options thereon traded on a commodities exchange or board of trade are valued at the last sale price at the close of trading on such exchange or board of trade or, if there was no sale on the applicable commodities exchange or board of trade on such day, at the mean between the most recently quoted bid and asked prices on such exchange or board of trade or at the last bid price in the absence of an asked price. Certain fixed income securities for which daily market quotations are not readily available may be valued with reference to fixed income securities whose prices are more readily available, pursuant to guidelines established by the Board of Trustees. Prices may be obtained from independent pricing services which use information provided by market makers or estimates of market values obtained from yield data relating to investments or securities with similar characteristics. Securities for which reliable market quotations are not readily available, or whose values have been affected by events occurring after the close of the security’s foreign market and before the Fund’s normal pricing time, are valued at fair value in accordance with the Board of Trustees’ approved fair valuation procedures. When determining the fair valuation of securities some of the factors influencing the valuation include the nature of any restrictions on disposition of the securities; assessment of the general liquidity of the securities; the issuer’s financial condition and the markets in which it does business; the cost of the investment; the size of the holding and the capitalization of issuer; the prices of any recent transactions or bids/offers for such securities or any comparable securities; any available analyst media or other reports or information deemed reliable by the investment advisor regarding the issuer or the markets or industry in which it operates. Using fair value to price securities may result in a value that is different from a security’s most recent closing price and from the price used by other mutual funds to calculate their net asset values.
Investments in open-end, non-exchange-traded mutual funds are valued at their net asset value as of the close of the New York Stock Exchange on the date of valuation.
Short-term debt securities of sufficient credit quality, which mature in sixty days or less, are valued at amortized cost, which approximates fair value. The amortized cost
| | | | |
| Target Asset Allocation Funds/Target Conservative Allocation Fund | | | 55 | |
Notes to Financial Statements
(Unaudited) continued
method involves valuing a security at its cost on the date of purchase and thereafter assuming a constant amortization to maturity of the difference between the principal amount due at maturity and cost. Short-term debt securities which mature in more than sixty days are valued at fair value.
Foreign Currency Translation: The books and records of the Fund are maintained in U.S. dollars. Foreign currency amounts are translated into U.S. Dollars on the following basis:
(i) market value of investment securities, other assets and liabilities-at the current daily rates of exchange.
(ii) purchases and sales of investment securities, income and expenses-at the rate of exchange prevailing on the respective dates of such transactions.
Although the net assets of the Fund are presented at the foreign exchange rates and market values at the close of the period, the Fund does not isolate that portion of the results of operations arising as a result of changes in the foreign exchange rates from the fluctuations arising from changes in the market prices of securities held at the end of the period. Similarly, the Fund does not isolate the effect of changes in foreign exchange rates from the fluctuations arising from changes in the market prices of portfolio securities sold during the period. Accordingly, realized foreign currency gains or losses are included in the reported net realized gains or losses on investment transactions.
Net realized gains or losses on foreign currency transactions represent net foreign exchange gains or losses from the holding of foreign currencies, currency gains or losses realized between the trade and settlement dates on security transactions, and the difference between the amounts of dividends, interest and foreign withholding taxes recorded on the Fund’s books and the U.S. dollar equivalent amounts actually received or paid. Net unrealized currency gains or losses from valuing foreign currency denominated assets and liabilities (other than investments) at period end exchange rates are reflected as a component of net unrealized appreciation (depreciation) on investments and foreign currencies. Foreign security and currency transactions may involve certain considerations and risks not typically associated with those of domestic origin as a result of, among other factors, the possibility of political and economic instability and the level of governmental supervision and regulation of foreign securities markets.
| | |
| 56 | | Visit our website at www.prudentialfunds.com |
Forward Currency Contracts: A forward currency contract is a commitment to purchase or sell a foreign currency at a future date at a negotiated forward rate. The Fund entered into forward currency contracts in order to hedge its exposure to changes in foreign currency exchange rates on its foreign portfolio holdings or on specific receivables and payables denominated in a foreign currency. The contracts are valued daily at current exchange rates and any unrealized gain or loss is included in unrealized appreciation or depreciation on forward foreign currency contracts. Gain or loss is realized on the settlement date of the contract equal to the difference between the settlement value of the original and renegotiated forward contracts. This gain or loss, if any, is included in net realized gain or loss on foreign currency transactions. Risks may arise upon entering into these contracts from the potential inability of the counterparties to meet the terms of their contracts. Forward currency contracts involve risks from currency exchange rate and credit risk in excess of the amounts reflected on the Statement of Assets and Liabilities. The Fund’s maximum risk of loss from counterparty credit risk is the net value of the cash flows to be received from the counterparty at the end of the contract’s life. This risk may be mitigated by having a master netting arrangement between the Fund and the counterparty which may permit the Fund to offset amounts payable by the Fund to the same counterparty against amounts to be received; and by the receipt of collateral from the counterparty by the Fund to cover the Fund’s exposure to the counterparty. However, there is no assurance that such mitigating factors are easily enforceable.
Short Sales: The Fund may sell a security it does not own in anticipation of a decline in the market value of that security (short sale). When the Fund makes a short sale, it will borrow the security sold short and deliver it to the broker-dealer through which it made the short sale as collateral for its obligation to deliver the security upon conclusion of the sale. The Fund may have to pay a fee to borrow the particular securities and may be obligated to return any interest or dividends received on such borrowed securities. Dividends declared on short positions open are recorded on the ex-date and interest payable is accrued daily on fixed income securities sold short, both of which are recorded as an expense.
A gain, limited to the price at which the Fund sold the security short, or a loss, unlimited in magnitude, will be recognized upon the termination of a short sale if the market price at termination is less than or greater than, respectively the proceeds originally received.
Options: The Fund purchased and wrote options in order to hedge against adverse market movements or fluctuations in value caused by changes in prevailing interest rates, value of equities or foreign currency exchange rates, with respect to securities or currencies which the Fund currently owns or intends to purchase. The Fund’s
| | | | |
| Target Asset Allocation Funds/Target Conservative Allocation Fund | | | 57 | |
Notes to Financial Statements
(Unaudited) continued
principal reason for writing options is to realize, through receipt of premiums, a greater current return than would be realized on the underlying security alone. When the Fund writes an option, it receives a premium and an amount equal to that premium is recorded as a liability. When the Fund purchases an option, it pays a premium and an amount equal to that premium is recorded as an asset. The asset or liability is adjusted daily to reflect the current market value of the option.
If an option expires unexercised, the Fund realizes a gain or loss to the extent of the premium received or paid. If an option is exercised, the premium received or paid is recorded as an adjustment to the proceeds from the sale or the cost basis of the purchase in determining whether the Fund has realized a gain or loss. The difference between the premium and the amount received or paid on affecting a closing purchase or sale transaction is also treated as a realized gain or loss. Gain or loss on purchased options is included in net realized gain or loss on investment transactions. Gain or loss on written options is presented separately as net realized gain or loss on options written transactions.
The Fund, as writer of an option, has no control over whether the underlying securities or currencies may be sold (called) or purchased (put). As a result, the Fund bears the market risk of an unfavorable change in the price of the security or currency underlying the written option. Over-the-counter options involve the risk of the potential inability of the counterparties to meet the terms of their contracts.
When a Fund writes an option on a swap contract, an amount equal to any premium received by the Fund is recorded as a liability and is subsequently adjusted to the current market value of the written option on the swap. If a call option on a swap is exercised, the Fund becomes obligated to pay a fixed interest rate (noted as the strike price) and receive a variable interest rate on a notional amount. If a put option on a swap is exercised, the Fund becomes obligated to pay a variable interest rate and receive a fixed interest rate (noted as the strike price) on a notional amount. Premiums received from writing options on swaps that expire or are exercised are treated as realized gains upon the expiration or exercise of such options on swaps. The risk associated with writing put and call options on swaps, is that the Fund will be obligated to be party to a swap agreement if an option on a swap is exercised.
Financial Futures Contracts: A financial futures contract is an agreement to purchase (long) or sell (short) an agreed amount of securities at a set price for delivery on a future date. Upon entering into a financial futures contract, the Fund is required to
| | |
| 58 | | Visit our website at www.prudentialfunds.com |
pledge to the broker an amount of cash and/or other assets equal to a certain percentage of the contract amount. This amount is known as the “initial margin.” Subsequent payments known as “variation margin,” are made or received by the Fund each day, depending on the daily fluctuations in the value of the underlying security. Such variation margin is recorded for financial statement purposes on a daily basis as unrealized gain or loss. When the contract expires or is closed, the gain or loss is realized and is presented in the Statement of Operations as net realized gain or loss on financial futures contracts.
The Fund invests in financial futures contracts in order to hedge its existing portfolio securities, or securities the Fund intends to purchase, against fluctuations in value caused by changes in prevailing interest rates or market conditions. Should interest rates move unexpectedly, the Fund may not achieve the anticipated benefits of the financial futures contracts and may realize a loss. The use of futures transactions involves the risk of imperfect correlation in movements in the price of futures contracts, interest rates and the underlying hedged assets.
With exchange-traded futures and option contracts, there is minimal counterparty credit risk to the Fund since the exchanges’ clearinghouse acts as counterparty to all exchange traded futures and options and guarantees the futures and options against default.
Swap Agreements: The Fund entered into credit default and interest rate swap agreements. A swap agreement is an agreement to exchange the return generated by one instrument for the return generated by another instrument. Swap agreements are negotiated in the over-the-counter market and may be executed either directly with counterparty (“OTC Traded”) or through a central clearing facility, such as a registered commodities exchange (“Exchange Traded”). Swap agreements are valued daily at current market value and any change in value is included in the net unrealized appreciation or depreciation on investments. Upon entering into an exchange traded swap, the Fund pledges with the clearing broker an initial margin and thereafter, pays or receives an amount, known as “variation margin”, based on daily changes in valuation of swap contract. Payments received or paid by the Fund are recorded as realized gains or losses upon termination or maturity of the swap. Risk of loss may exceed amounts recognized on the statements of assets and liabilities. Swap agreements outstanding at reporting date, if any, are listed on the Schedule of Investments.
Interest Rate Swaps: Interest rate swaps represent an agreement between counterparties to exchange cash flows based on the difference between two interest rates, applied to a notional principal amount for a specified period. The Fund is
| | | | |
| Target Asset Allocation Funds/Target Conservative Allocation Fund | | | 59 | |
Notes to Financial Statements
(Unaudited) continued
subject to interest rate risk exposure in the normal course of pursuing its investment objectives. The Fund used interest rate swaps to either maintain its ability to generate steady cash flow by receiving a stream of fixed rate payments and to increase exposure to prevailing market rates by receiving floating rate payments using interest rate swap contracts. The Fund’s maximum risk of loss from counterparty credit risk is the discounted net value of the cash flows to be received from the counterparty over the contract’s remaining life. This risk may be mitigated by having a master netting arrangement between the Fund and the counterparty which may permit the Fund to offset amounts payable by the Fund to the same counterparty against amounts to be received; and by the receipt of collateral from the counterparty by the Portfolio to cover the Fund’s exposure to the counterparty. However, there is no assurance that such mitigating factors are easily enforceable.
Credit Default Swaps: Credit default swaps involve one party (the protection buyer) making a stream of payments to another party (the protection seller) in exchange for the right to receive a specified payment in the event of a default or as a result of a default (“credit event”) for the referenced party, typically corporate issues or sovereign issues of an emerging country, on its obligation; or in the event of a write-down, principal shortfall, interest shortfall or default of all or part of the referenced entities comprising a credit index.
The Fund is subject to credit risk in the normal course of pursuing its investment objectives. The Fund purchased credit default swaps to provide a measure of protection against defaults of the issuers. The Fund used credit default swaps on credit indices to hedge a portfolio of credit default swaps or bonds, which is less expensive than it would be to buy many credit default swaps to achieve a similar effect. The Fund’s maximum risk of loss from counterparty credit risk for purchased credit default swaps is the notional value of a credit default swap agreement. This risk may be mitigated by having a master netting arrangement between the Fund and the counterparty which may permit the Fund to offset amounts payable by the Fund to the same counterparty against amounts to be received; and by the receipt of collateral from the counterparty by the Fund to cover the Fund’s exposure to the counterparty. However, there is no assurance that such mitigating factors are easily enforceable.
As a seller of protection on credit default swap agreements, a Fund will generally receive from the buyer of protection an agreed upon payment throughout the term of the swap provided that there is no credit event. As the seller, the Fund would
| | |
| 60 | | Visit our website at www.prudentialfunds.com |
effectively increase investment risk to its portfolio because, in addition to its total net assets, the Fund may be subject to investment exposure on the notional amount of the swap.
The maximum amount of the payment that the Fund as a seller of protection could be required to make under a credit default swap agreement would be equal to the notional amount of the underlying security or index contract as a result of a credit event. These potential amounts will be partially offset by any recovery values of the respective referenced obligations, or net amounts received from the settlement of buy protection credit default swap agreements entered into by the Fund for the same referenced entity or index. As a buyer of protection, the Fund generally receives an amount up to the notional value of the swap if a credit event occurs.
Implied credit spreads, represented in absolute terms, utilized in determining the market value of credit default swap agreements on corporate issues or sovereign issues of an emerging country as of the reporting date are disclosed in the footnotes to the Schedules of Investments and serve as an indicator of the current status of the payment/performance risk and represent the likelihood of risk of default for the credit derivative. The implied credit spread of a particular referenced entity reflects the cost of buying/selling protection and may include upfront payments required to enter into the agreement. For credit default swap agreements on asset-backed securities and credit indices, the quoted market prices and resulting values serve as the indicator of the current status of the payment and/or performance risk. Wider credit spreads and increasing market value in absolute terms, when compared to the notional amount of the swap, represent a deterioration of the referenced entity’s credit soundness and a greater likelihood of risk of default or other credit event occurring as defined under the terms of the agreement.
In addition to each instrument’s primary underlying risk exposure (e.g. interest rate, credit, equity or foreign exchange, etc.), swap agreements involve, to varying degrees, elements of credit, market and documentation risk. Such risks involve the possibility that there will be no liquid market for these agreements, that the counterparty to the agreement may default on its obligation to perform or disagree as to the meaning of the contractual terms in the agreement, and that there will be unfavorable changes in net interest rates. In connection with these agreements, securities in the portfolio may be identified as collateral or received as collateral from the counterparty in accordance with the terms of the respective swap agreements to provide or receive assets of value and serve as recourse in the event of default or bankruptcy/insolvency of either party. Such over-the-counter derivative agreements include conditions which when materialized, give the counterparty the right to cause an early termination of the transactions under those agreements. Any election by the counterparty for early termination of the contract(s) may impact the amounts reported on financial statements.
| | | | |
| Target Asset Allocation Funds/Target Conservative Allocation Fund | | | 61 | |
Notes to Financial Statements
(Unaudited) continued
As of January 31, 2012, the Fund has not met conditions under such agreements, which give the counterparty the right to call for an early termination.
Forward currency contracts, written options, short sales, swaps and financial futures contracts involve elements of both market and credit risk in excess of the amounts reflected on the Statement of Assets and Liabilities.
Repurchase Agreements: In connection with transactions in repurchase agreements with United States financial institutions, it is the Fund’s policy that its custodian or designated subcustodians under triparty repurchase agreements, as the case may be, take possession of the underlying collateral securities, the value of which exceeds the principal amount of the repurchase transaction, including accrued interest. To the extent that any repurchase transaction exceeds one business day, the value of the collateral is marked-to-market on a daily basis to ensure the adequacy on the collateral. If the seller defaults and the value of the collateral declines or if bankruptcy proceedings are commenced with respect to the seller of the security, realization of the collateral by the Fund may be delayed or limited.
Reverse Repurchase Agreements: The Fund enters into reverse repurchase agreements with qualified, third party broker-dealers as determined by and under the direction of the Trust’s Board of Trustees. Interest on the value of reverse repurchase agreements entered into and outstanding is based upon competitive market rates at the time of execution of the agreement. At the time the Fund enters into a reverse repurchase agreement, it establishes and maintains a segregated account with the lender containing liquid investment grade securities having a value not less than the repurchase price, including accrued interest, of the reverse repurchase agreement.
Securities Transactions and Net Investment Income: Securities transactions are recorded on the trade date. Realized gains or losses on sales of securities are calculated on the identified cost basis. Dividend income is recorded on the ex-dividend date and interest income, including amortization of premium and accretion of discount on debt securities as required, is recorded on the accrual basis. Expenses are recorded on the accrual basis. Net investment income or loss (other than distribution fees, which are charged directly to respective class) and unrealized and realized gains or losses, are allocated daily to each class of shares based upon the relative proportion of net assets of each class at the beginning of the day.
| | |
| 62 | | Visit our website at www.prudentialfunds.com |
Dividends and Distributions: The Fund expects to pay dividends of net investment income and distributions of net realized capital and currency gains, if any, annually. Dividends and distributions to shareholders, which are determined in accordance with federal income tax regulations and which may differ from generally accepted accounting principles, are recorded on the ex-dividend date. Permanent book/tax differences relating to income and gains are reclassified amongst undistributed net investment income, accumulated net realized gain or loss and paid in capital in excess of par as appropriate.
Taxes: It is the Fund’s policy to continue to meet the requirements of the Internal Revenue Code applicable to regulated investment companies and to distribute all of its taxable net investment income and capital gains, if any, to its shareholders. Therefore, no federal income tax provision is required.
Withholding taxes on foreign dividends are recorded net of reclaimable amounts, at the time the related income is earned.
Estimates: The preparation of the financial statements requires management to make estimates and assumptions that affect the reported amounts and disclosures in the financial statements. Actual results could differ from those estimates.
Note 2. Agreements
The Trust has a management agreement with PI. Pursuant to this agreement, PI manages the investment operations of the Fund, administers the Fund’s affairs and supervises the Subadvisers’ performance of all investment advisory services. Pursuant to the advisory agreement, PI pays the cost of compensation of officers of the Fund, occupancy and certain clerical and accounting costs of the Fund. The Fund bears all other costs and expenses. The management fee paid to PI is computed daily and payable monthly at an annual rate of 0.75% of average daily net assets up to $500 million, 0.70% of average daily net assets for the next $500 million and 0.65% of average daily net assets in excess of $1 billion. The effective management fee rate was 0.75% for the six months ended January 31, 2012.
The Fund has a distribution agreement with Prudential Investment Management Services LLC (“PIMS”), which acts as the distributor of the Class A, Class B, Class C, Class R and Class Z shares of the Fund. In addition, the Fund has a distribution agreement with Prudential Annuities Distributors, Inc. (“PAD”), which, together with PIMS, serves as co-distributor of the Class M and Class X shares of the Fund. The Fund compensates PIMS and PAD, as applicable, for distributing and servicing the Fund’s Class A, Class B, Class C, Class M, Class R and Class X shares, pursuant to plans of distribution (the “Class A, B, C, M, R and X Plans”), regardless of expenses actually
| | | | |
| Target Asset Allocation Funds/Target Conservative Allocation Fund | | | 63 | |
Notes to Financial Statements
(Unaudited) continued
incurred by PIMS or PAD. The distribution fees are accrued daily and payable monthly. No distribution or service fees are paid to PIMS as distributor of the Class Z shares of the Fund.
Pursuant to the Class A, B, C, M, R and X Plans, the Fund compensates PIMS and PAD, as applicable, for distribution related activities at an annual rate of up to 0.30%, 1%, 1%, 1%, 0.75% and 1% of the average daily net assets of the Class A, B, C, M, R and X shares, respectively. PIMS has contractually agreed through November 30, 2012 to limit such expenses to 0.25% and 0.50% of the average daily net assets of the Class A and Class R shares, respectively.
PIMS has advised the Fund that it has received $15,404 in front-end sales charges resulting from sales of Class A shares during the six months ended January 31, 2012. From these fees, PIMS paid such sales charges to broker-dealers, which in turn paid commissions to sales persons and incurred other distribution costs. PIMS has advised the Fund that for the six months ended January 31, 2012, it has received $6,246 and $679 in contingent deferred sales charges imposed upon certain redemptions by Class B and Class C, respectively.
PIMS and PI are indirect, wholly-owned subsidiaries of Prudential Financial, Inc. (“Prudential”).
Note 3. Other Transactions with Affiliates
Prudential Mutual Fund Services LLC (“PMFS”), an affiliate of PI, and an indirect, wholly-owned subsidiary of Prudential, serves as the Fund’s transfer agent. Transfer agent fees and expenses in the Statement of Operations include certain out-of-pocket expenses paid to non-affiliates, where applicable.
The Fund invests in the Prudential Taxable Core Money Market Fund (the “Core Fund”), a portfolio of Prudential Investment Portfolios 2, registered under the 1940 Act, and managed by PI. Earnings from the Core Fund are disclosed on the Statement of Operations as affiliated dividend income.
Note 4. Portfolio Securities
Purchases and sales of portfolio securities, excluding short-term investments and U.S. Government investments, for the six months ended January 31, 2012, aggregated $105,606,276 and $112,297,609, respectively.
| | |
| 64 | | Visit our website at www.prudentialfunds.com |
Transactions in options written during the six months ended January 31, 2012, were as follows:
| | | | | | | | |
| | | Notional
Amount | | | Premiums
Received | |
Options outstanding at July 31, 2011 | | | 28,700,000 | | | $ | 86,344 | |
Written options | | | — | | | | — | |
Expired options | | | (8,370,000 | ) | | | (43,053 | ) |
Closed options | | | (18,930,000 | ) | | | (34,526 | ) |
| | | | | | | | |
Options outstanding at January 31, 2012 | | | 1,400,000 | | | $ | 8,765 | |
| | | | | | | | |
Note 5. Distributions and Tax Information
The United States federal income tax basis of the Fund’s investments and the net unrealized appreciation as of January 31, 2012 were as follows:
| | | | | | |
Tax Basis | | Appreciation | | Depreciation | | Net
Unrealized
Appreciation |
| $126,460,161 | | $11,244,942 | | $(2,403,451) | | $8,841,491 |
The difference between book basis and tax basis was primarily attributable to deferred losses on wash sales and straddles as of the most recent fiscal year end.
For federal income tax purposes, the Fund had a capital loss carryforward as of July 31, 2011 of approximately $8,236,000 which expires in 2018. The Fund utilized approximately $5,973,000 of its capital loss carryforward to offset net taxable gains realized in the year ended July 31, 2011. Accordingly, no capital gains distributions are expected to be paid to shareholders until net gains have been realized in excess of such carryforward. Under the recently enacted Regulated Investment Company Modernization Act of 2010 (“the Act”), the Fund is permitted to carryforward capital losses incurred in taxable years beginning after December 22, 2010 (“post-enactment losses”) for an unlimited period. However, any post-enactment losses are required to be utilized before the utilization of losses incurred prior to the effective date of the Act. As a result of this ordering rule, capital loss carryforwards related to the taxable years beginning prior to the effective date of the Act may have an increased likelihood to expire unused. Additionally, post-enactment capital losses that are carried forward will retain their character as either short-term or long-term capital losses rather than being considered all short-term as under previous law.
In addition, the Fund has elected to treat net foreign currency losses of approximately $259,000, incurred between November 1, 2010 and July 31, 2011 as being incurred during the year ending July 31, 2012.
| | | | |
| Target Asset Allocation Funds/Target Conservative Allocation Fund | | | 65 | |
Notes to Financial Statements
(Unaudited) continued
Management has analyzed the Fund’s tax positions taken on federal income tax returns for all open tax years and has concluded that no provision for income tax would be required in the Fund’s financial statements for the current reporting period. The Fund’s federal and state income and federal excise tax returns for tax years for which the applicable statutes of limitations have not expired are subject to examination by the Internal Revenue Service and state departments of revenue.
Note 6. Capital
The Fund offers Class A, Class B, Class C, Class M, Class R, Class X and Class Z shares. Class A shares are subject to a maximum front-end sales charge of 5.50%.
Investors who purchase $1 million or more of Class A shares and sell these shares within 12 months of purchase are not subject to an initial sales charge but are subject to a contingent deferred sales charge (CDSC) of 1%. The Class A CDSC is waived for purchases by certain retirement or benefit plans. Class B shares are subject to a CDSC of 5%, which decreases by 1% annually to 1% in the fifth and sixth years and 0% in the seventh year. Class B shares automatically convert to Class A shares on a quarterly basis approximately seven years after purchase. The CDSC for Class C shares is 1% for shares redeemed within 12 months of purchase. Class M shares are generally closed to new purchases. Class M shares are subject to a CDSC of 6%, which decreases by 1% annually to 2% in the fifth and sixth years and 1% in the seventh year. Class M shares automatically convert to Class A shares approximately eight years after purchase. Class X shares are generally closed to new purchases. Class X shares are subject to a CDSC of 6%, which decreases by 1% annually to 4% in the third and fourth years, by 1% annually to 2% in the sixth and seventh years, and 1% in the eighth year. Class X shares automatically convert to Class A shares on a monthly basis approximately ten years after purchase. An exchange privilege is also available for shareholders who qualify to purchase Class A shares at net asset value. Class R and Class Z shares are not subject to any sales or redemption charge and are offered exclusively for sale to a limited group of investors.
The Fund has authorized an unlimited number of shares of beneficial interest at $.001 par value per share. As of January 31, 2012, Prudential owned 250 shares of Class R shares.
| | |
| 66 | | Visit our website at www.prudentialfunds.com |
Transactions in shares of beneficial interest were as follows:
| | | | | | | | |
Class A | | Shares | | | Amount | |
Six Months ended January 31, 2012: | | | | | | | | |
Shares sold | | | 300,511 | | | $ | 3,014,509 | |
Shares issued in reinvestment of dividends and distributions | | | 134,861 | | | | 1,324,336 | |
Shares reacquired | | | (840,115 | ) | | | (8,380,931 | ) |
| | | | | | | | |
Net increase (decrease) in shares outstanding before conversion | | | (404,743 | ) | | | (4,042,086 | ) |
Shares issued upon conversion from Class B, Class M, and Class X | | | 240,391 | | | | 2,405,726 | |
| | | | | | | | |
Net increase (decrease) in shares outstanding | | | (164,352 | ) | | $ | (1,636,360 | ) |
| | | | | | | | |
Year ended July 31, 2011: | | | | | | | | |
Shares sold | | | 1,236,113 | | | $ | 12,355,878 | |
Shares issued in reinvestment of dividends and distributions | | | 146,654 | | | | 1,440,143 | |
Shares reacquired | | | (1,774,883 | ) | | | (17,850,211 | ) |
| | | | | | | | |
Net increase (decrease) in shares outstanding before conversion | | | (392,116 | ) | | | (4,054,190 | ) |
Shares issued upon conversion from Class B, Class M, and Class X | | | 918,469 | | | | 9,177,661 | |
| | | | | | | | |
Net increase (decrease) in shares outstanding | | | 526,353 | | | $ | 5,123,471 | |
| | | | | | | | |
Class B | | | | | | |
Six Months ended January 31, 2012: | | | | | | | | |
Shares sold | | | 35,033 | | | $ | 344,396 | |
Shares issued in reinvestment of dividends and distributions | | | 10,392 | | | | 101,111 | |
Shares reacquired | | | (86,347 | ) | | | (851,523 | ) |
| | | | | | | | |
Net increase (decrease) in shares outstanding before conversion | | | (40,922 | ) | | | (406,016 | ) |
Shares reacquired upon conversion into Class A | | | (238,489 | ) | | | (2,349,387 | ) |
| | | | | | | | |
Net increase (decrease) in shares outstanding | | | (279,411 | ) | | $ | (2,755,403 | ) |
| | | | | | | | |
Year ended July 31, 2011: | | | | | | | | |
Shares sold | | | 113,360 | | | $ | 1,125,382 | |
Shares issued in reinvestment of dividends and distributions | | | 23,533 | | | | 228,979 | |
Shares reacquired | | | (378,904 | ) | | | (3,749,663 | ) |
| | | | | | | | |
Net increase (decrease) in shares outstanding before conversion | | | (242,011 | ) | | | (2,395,302 | ) |
Shares reacquired upon conversion into Class A | | | (846,320 | ) | | | (8,353,080 | ) |
| | | | | | | | |
Net increase (decrease) in shares outstanding | | | (1,088,331 | ) | | $ | (10,748,382 | ) |
| | | | | | | | |
Class C | | | | | | |
Six Months ended January 31, 2012: | | | | | | | | |
Shares sold | | | 66,938 | | | $ | 662,046 | |
Shares issued in reinvestment of dividends and distributions | | | 16,158 | | | | 157,216 | |
Shares reacquired | | | (219,602 | ) | | | (2,161,941 | ) |
| | | | | | | | |
Net increase (decrease) in shares outstanding | | | (136,506 | ) | | $ | (1,342,679 | ) |
| | | | | | | | |
Year ended July 31, 2011: | | | | | | | | |
Shares sold | | | 127,848 | | | $ | 1,261,855 | |
Shares issued in reinvestment of dividends and distributions | | | 23,842 | | | | 231,983 | |
Shares reacquired | | | (445,836 | ) | | | (4,425,705 | ) |
| | | | | | | | |
Net increase (decrease) in shares outstanding | | | (294,146 | ) | | $ | (2,931,867 | ) |
| | | | | | | | |
| | | | |
| Target Asset Allocation Funds/Target Conservative Allocation Fund | | | 67 | |
Notes to Financial Statements
(Unaudited) continued
| | | | | | | | |
Class M | | Shares | | | Amount | |
Six Months ended January 31, 2012: | | | | | | | | |
Shares sold | | | — | | | $ | — | |
Shares issued in reinvestment of dividends and distributions | | | 19 | | | | 182 | |
Shares reacquired | | | (749 | ) | | | (7,320 | ) |
| | | | | | | | |
Net increase (decrease) in shares outstanding before conversion | | | (730 | ) | | | (7,138 | ) |
Shares reacquired upon conversion into Class A | | | (3,179 | ) | | | (31,516 | ) |
| | | | | | | | |
Net increase (decrease) in shares outstanding | | | (3,909 | ) | | $ | (38,654 | ) |
| | | | | | | | |
Year ended July 31, 2011: | | | | | | | | |
Shares sold | | | 1,156 | | | $ | 11,297 | |
Shares issued in reinvestment of dividends and distributions | | | 134 | | | | 1,302 | |
Shares reacquired | | | (1,844 | ) | | | (17,937 | ) |
| | | | | | | | |
Net increase (decrease) in shares outstanding before conversion | | | (554 | ) | | | (5,338 | ) |
Shares reacquired upon conversion into Class A | | | (12,448 | ) | | | (121,609 | ) |
| | | | | | | | |
Net increase (decrease) in shares outstanding | | | (13,002 | ) | | $ | (126,947 | ) |
| | | | | | | | |
Class R | | | | | | |
Six Months ended January 31, 2012: | | | | | | | | |
Shares sold | | | 641 | | | $ | 6,404 | |
Shares issued in reinvestment of dividends and distributions | | | 300 | | | | 2,943 | |
Shares reacquired | | | (2,609 | ) | | | (25,543 | ) |
| | | | | | | | |
Net increase (decrease) in shares outstanding | | | (1,668 | ) | | $ | (16,196 | ) |
| | | | | | | | |
Year ended July 31, 2011: | | | | | | | | |
Shares sold | | | 20,749 | | | $ | 203,885 | |
Shares issued in reinvestment of dividends and distributions | | | 1,265 | | | | 12,420 | |
Shares reacquired | | | (71,666 | ) | | | (741,615 | ) |
| | | | | | | | |
Net increase (decrease) in shares outstanding | | | (49,652 | ) | | $ | (525,310 | ) |
| | | | | | | | |
| | |
| 68 | | Visit our website at www.prudentialfunds.com |
| | | | | | | | |
Class X | | Shares | | | Amount | |
Six Months ended January 31, 2012: | | | | | | | | |
Shares sold | | | 3,223 | | | $ | 31,683 | |
Shares issued in reinvestment of dividends and distributions | | | 103 | | | | 1,007 | |
Shares reacquired | | | (2,484 | ) | | | (23,725 | ) |
| | | | | | | | |
Net increase (decrease) in shares outstanding before conversion | | | 842 | | | | 8,965 | |
Shares reacquired upon conversion into Class A | | | (2,522 | ) | | | (24,823 | ) |
| | | | | | | | |
Net increase (decrease) in shares outstanding | | | (1,680 | ) | | $ | (15,858 | ) |
| | | | | | | | |
Year ended July 31, 2011: | | | | | | | | |
Shares sold | | | 16,286 | | | $ | 158,552 | |
Shares issued in reinvestment of dividends and distributions | | | 532 | | | | 5,173 | |
Shares reacquired | | | (15,021 | ) | | | (146,500 | ) |
| | | | | | | | |
Net increase (decrease) in shares outstanding before conversion | | | 1,797 | | | | 17,225 | |
Shares reacquired upon conversion into Class A | | | (71,382 | ) | | | (702,972 | ) |
| | | | | | | | |
Net increase (decrease) in shares outstanding | | | (69,585 | ) | | $ | (685,747 | ) |
| | | | | | | | |
Class Z | | | | | | |
Six Months ended January 31, 2012: | | | | | | | | |
Shares sold | | | 153,962 | | | $ | 1,529,345 | |
Shares issued in reinvestment of dividends and distributions | | | 6,973 | | | | 68,748 | |
Shares reacquired | | | (98,938 | ) | | | (991,315 | ) |
| | | | | | | | |
Net increase (decrease) in shares outstanding | | | 61,997 | | | $ | 606,778 | |
| | | | | | | | |
Year ended July 31, 2011: | | | | | | | | |
Shares sold | | | 131,164 | | | $ | 1,308,506 | |
Shares issued in reinvestment of dividends and distributions | | | 6,667 | | | | 65,733 | |
Shares reacquired | | | (59,727 | ) | | | (605,313 | ) |
| | | | | | | | |
Net increase (decrease) in shares outstanding | | | 78,104 | | | $ | 768,926 | |
| | | | | | | | |
Note 7. Borrowings
The Trust, along with other affiliated registered investment companies (the “Funds”), is a party to a Syndicated Credit Agreement (“SCA”) with a group of banks. The purpose of the SCA is to provide an alternative source of temporary funding for capital share redemptions. The SCA provides for a commitment of $900 million for the period December 16, 2011 through December 14, 2012. The Funds pay an annualized commitment fee of 0.08% of the unused portion of the SCA. Prior to December 16, 2011, the Funds had another Syndicated Credit Agreement with a $750 million commitment with an annualized commitment fee of 0.10% of the unused portion. Interest on any borrowings under these SCAs is paid at contracted market rates. The commitment fee for the unused amount is accrued daily and paid quarterly.
The Fund did not utilize the SCA during the six months ended January 31, 2012.
| | | | |
| Target Asset Allocation Funds/Target Conservative Allocation Fund | | | 69 | |
Notes to Financial Statements
(Unaudited) continued
The average daily balance of reverse repurchase agreements outstanding during the six months ended January 31, 2012 was $307,875 at a weighted average interest rate of approximately 0.15%. The average daily balance is based on the number of days the Fund had an outstanding balance. The maximum amount of total reverse repurchase agreements outstanding at any month-end during the period was $307,875 as of January 31, 2012 which was 0.3% of total assets.
Note 8. New Accounting Pronouncement
In April 2011, the Financial Accounting Standards Board (“FASB”) issued Accounting Standards Update (“ASU”) No. 2011-03 “Reconsideration of Effective Control for Repurchase Agreements.” The objective of ASU 2011-03 is to improve the accounting for repurchase agreements and other agreements that both entitle and obligate a transferor to repurchase or redeem financial assets before their maturity. Under previous guidance, whether or not to account for a transaction as a sale was based on, in part, if the entity maintained effective control over the transferred financial assets. ASU 2011-03 removes the transferor’s ability criterion from the effective control assessment. This guidance is effective prospectively for interim and annual reporting periods beginning on or after December 15, 2011. At this time, management is evaluating the implications of ASU No. 2011-03 and its impact on the financial statements has not been determined.
In May 2011, the FASB issued ASU No. 2011-04 “Amendments to Achieve Common Fair Value Measurement and Disclosure Requirements in U.S. GAAP and IFRSs.” ASU 2011-04 includes common requirements for measurement of and disclosure about fair value between U.S. GAAP and IFRS. ASU 2011-04 will require reporting entities to disclose quantitative information about the unobservable inputs used in the fair value measurements categorized within Level 3 of the fair value hierarchy. In addition, ASU 2011-04 will require reporting entities to make disclosures about amounts and reasons for all transfers in and out of Level 1 and Level 2 fair value measurements. The new and revised disclosures are effective for interim and annual reporting periods beginning after December 15, 2011. At this time, management is evaluating the implications of ASU No. 2011-04 and its impact on the financial statements has not been determined.
| | |
| 70 | | Visit our website at www.prudentialfunds.com |
Financial Highlights
(Unaudited)
| | | | | | | | | | | | | | | | | | | | | | | | | | |
| Class A Shares | |
| | | Six Months
Ended
January 31, | | | | | Year Ended July 31, | |
| | | 2012(c) | | | | | 2011(c) | | | 2010(c) | | | 2009(c) | | | 2008(c) | | | 2007 | |
| Per Share Operating Performance: | | | | | | | | | | | | | | | | | | | | | | | | | | |
| Net Asset Value, Beginning Of Period | | | $10.30 | | | | | | $9.53 | | | | $8.48 | | | | $9.84 | | | | $10.66 | | | | $10.33 | |
| Income (loss) from investment operations: | | | | | | | | | | | | | | | | | | | | | | | | | | |
| Net investment income | | | .09 | | | | | | .16 | | | | .18 | | | | .23 | | | | .27 | | | | .25 | |
| Net realized and unrealized gain (loss) on investments | | | .04 | | | | | | .79 | | | | .90 | | | | (.92 | ) | | | (.32 | ) | | | .56 | |
| Total from investment operations | | | .13 | | | | | | .95 | | | | 1.08 | | | | (.69 | ) | | | (.05 | ) | | | .81 | |
| Less Dividends and Distributions: | | | | | | | | | | | | | | | | | | | | | | | | | | |
| Dividends from net investment income | | | (.16 | ) | | | | | (.18 | ) | | | (.03 | ) | | | (.37 | ) | | | (.27 | ) | | | (.27 | ) |
| Tax return of capital | | | - | | | | | | - | | | | - | | | | (.05 | ) | | | - | | | | - | |
| Distributions from net realized gains on investments | | | - | | | | | | - | | | | - | | | | (.25 | ) | | | (.50 | ) | | | (.21 | ) |
| Total dividends and distributions | | | (.16 | ) | | | | | (.18 | ) | | | (.03 | ) | | | (.67 | ) | | | (.77 | ) | | | (.48 | ) |
| Net asset value, end of period | | | $10.27 | | | | | | $10.30 | | | | $9.53 | | | | $8.48 | | | | $9.84 | | | | $10.66 | |
| Total Return(a) | | | 1.38% | | | | | | 10.04% | | | | 12.72% | | | | (6.36)% | | | | (.75)% | | | | 7.93% | |
| |
| Ratios/Supplemental Data: | | | | | | | | | | | | | |
| Net assets, end of period (000) | | | $84,795 | | | | | | $86,746 | | | | $75,228 | | | | $63,491 | | | | $68,408 | | | | $60,657 | |
| Average net assets (000) | | | $82,651 | | | | | | $83,395 | | | | $70,865 | | | | $59,479 | | | | $65,817 | | | | $61,106 | |
| Ratios to average net assets(d): | | | | | | | | | | | | | | | | | | | | | | | | | | |
| Expenses, including distribution and service (12b-1) fees(b) | | | 1.57% | (f) | | | | | 1.52% | | | | 1.52% | | | | 1.64% | (e) | | | 1.43% | | | | 1.35% | |
| Expenses, excluding distribution and service (12b-1) fees | | | 1.32% | (f) | | | | | 1.27% | | | | 1.27% | | | | 1.39% | (e) | | | 1.18% | | | | 1.10% | |
| Net investment income | | | 1.75% | (f) | | | | | 1.59% | | | | 2.00% | | | | 2.76% | | | | 2.59% | | | | 2.34% | |
| For Class A, B, C, M, R, X and Z shares: | | | | | | | | | | | | | | | | | | | | | | | | | | |
| Portfolio turnover rate | | | 122% | (g) | | | | | 188% | | | | 200% | | | | 356% | | | | 353% | | | | 395% | |
(a) Total return does not consider the effects of sales loads. Total return is calculated assuming a purchase of a share on the first day and a sale on the last day of each period reported and includes reinvestment of dividends and distributions. Total returns may reflect adjustments to conform to generally accepted accounting principles. Total returns for periods less than one full year are not annualized.
(b) The distributor of the Fund has contractually agreed to limit its distribution and service (12b-1) fees to .25% of the average daily assets of the Class A shares.
(c) Calculated based upon the average shares outstanding during the period.
(d) Does not include expenses of the underlying portfolios in which the Fund invests.
(e) Includes interest expense of .06%.
(f) Annualized.
(g) Not annualized.
See Notes to Financial Statements.
| | | | |
| Target Asset Allocation Funds/Target Conservative Allocation Fund | | | 71 | |
Financial Highlights
(Unaudited) continued
| | | | | | | | | | | | | | | | | | | | | | | | | | |
| Class B Shares | |
| | | Six Months
Ended
January 31, | | | | | Year Ended July 31, | |
| | | 2012(b) | | | | | 2011(b) | | | 2010(b) | | | 2009(b) | | | 2008(b) | | | 2007 | |
| Per Share Operating Performance: | | | | | | | | | | | | | | | | | | | | | | | | | | |
| Net Asset Value, Beginning Of Period | | | $10.15 | | | | | | $9.41 | | | | $8.43 | | | | $9.82 | | | | $10.64 | | | | $10.31 | |
| Income (loss) from investment operations: | | | | | | | | | | | | | | | | | | | | | | | | | | |
| Net investment income | | | .05 | | | | | | .08 | | | | .11 | | | | .17 | | | | .19 | | | | .17 | |
| Net realized and unrealized gain (loss) on investments | | | .05 | | | | | | .78 | | | | .89 | | | | (.92 | ) | | | (.32 | ) | | | .56 | |
| Total from investment operations | | | .10 | | | | | | .86 | | | | 1.00 | | | | (.75 | ) | | | (.13 | ) | | | .73 | |
| Less Dividends and Distributions: | | | | | | | | | | | | | | | | | | | | | | | | | | |
| Dividends from net investment income | | | (.09 | ) | | | | | (.12 | ) | | | (.02 | ) | | | (.34 | ) | | | (.19 | ) | | | (.19 | ) |
| Tax return of capital | | | - | | | | | | - | | | | - | | | | (.05 | ) | | | - | | | | - | |
| Distributions from net realized gains on investments | | | - | | | | | | - | | | | - | | | | (.25 | ) | | | (.50 | ) | | | (.21 | ) |
| Total dividends and distributions | | | (.09 | ) | | | | | (.12 | ) | | | (.02 | ) | | | (.64 | ) | | | (.69 | ) | | | (.40 | ) |
| Net asset value, end of period | | | $10.16 | | | | | | $10.15 | | | | $9.41 | | | | $8.43 | | | | $9.82 | | | | $10.64 | |
| Total Return(a) | | | 1.07% | | | | | | 9.20% | | | | 11.82% | | | | (7.05)% | | | | (1.49)% | | | | 7.12% | |
| |
| Ratios/Supplemental Data: | |
| Net assets, end of period (000) | | | $11,160 | | | | | | $13,995 | | | | $23,212 | | | | $32,609 | | | | $56,853 | | | | $78,305 | |
| Average net assets (000) | | | $12,190 | | | | | | $18,900 | | | | $28,746 | | | | $39,077 | | | | $70,345 | | | | $87,224 | |
| Ratios to average net assets(c): | | | | | | | | | | | | | | | | | | | | | | | | | | |
| Expenses, including distribution and service (12b-1) fees | | | 2.32% | (e) | | | | | 2.27% | | | | 2.27% | | | | 2.39% | (d) | | | 2.18% | | | | 2.10% | |
| Expenses, excluding distribution and service (12b-1) fees | | | 1.32% | (e) | | | | | 1.27% | | | | 1.27% | | | | 1.39% | (d) | | | 1.18% | | | | 1.10% | |
| Net investment income | | | 1.01% | (e) | | | | | .82% | | | | 1.26% | | | | 2.08% | | | | 1.82% | | | | 1.60% | |
(a) Total return does not consider the effects of sales loads. Total return is calculated assuming a purchase of a share on the first day and a sale on the last day of each period reported and includes reinvestment of dividends and distributions. Total returns may reflect adjustments to conform to generally accepted accounting principles. Total returns for periods less than one full year are not annualized.
(b) Calculated based upon the average shares outstanding during the period.
(c) Does not include expenses of the underlying portfolios in which the Fund invests.
(d) Includes interest expense of .06%.
(e) Annualized.
See Notes to Financial Statements.
| | |
| 72 | | Visit our website at www.prudentialfunds.com |
| | | | | | | | | | | | | | | | | | | | | | | | | | |
| Class C Shares | |
| | | Six Months
Ended
January 31, | | | | | Year Ended July 31, | |
| | | 2012(b) | | | | | 2011(b) | | | 2010(b) | | | 2009(b) | | | 2008(b) | | | 2007 | |
| Per Share Operating Performance: | | | | | | | | | | | | | | | | | | | | | | | | | | |
| Net Asset Value, Beginning Of Period | | | $10.15 | | | | | | $9.41 | | | | $8.43 | | | | $9.82 | | | | $10.64 | | | | $10.31 | |
| Income (loss) from investment operations: | | | | | | | | | | | | | | | | | | | | | | | | | | |
| Net investment income | | | .05 | | | | | | .08 | | | | .11 | | | | .17 | | | | .19 | | | | .17 | |
| Net realized and unrealized gain (loss) on investments | | | .04 | | | | | | .78 | | | | .89 | | | | (.92 | ) | | | (.32 | ) | | | .56 | |
| Total from investment operations | | | .09 | | | | | | .86 | | | | 1.00 | | | | (.75 | ) | | | (.13 | ) | | | .73 | |
| Less Dividends and Distributions: | | | | | | | | | | | | | | | | | | | | | | | | | | |
| Dividends from net investment income | | | (.09 | ) | | | | | (.12 | ) | | | (.02 | ) | | | (.34 | ) | | | (.19 | ) | | | (.19 | ) |
| Tax return of capital | | | - | | | | | | - | | | | - | | | | (.05 | ) | | | - | | | | - | |
| Distributions from net realized gains on investments | | | - | | | | | | - | | | | - | | | | (.25 | ) | | | (.50 | ) | | | (.21 | ) |
| Total dividends and distributions | | | (.09 | ) | | | | | (.12 | ) | | | (.02 | ) | | | (.64 | ) | | | (.69 | ) | | | (.40 | ) |
| Net asset value, end of period | | | $10.15 | | | | | | $10.15 | | | | $9.41 | | | | $8.43 | | | | $9.82 | | | | $10.64 | |
| Total Return(a) | | | .98% | | | | | | 9.20% | | | | 11.82% | | | | (7.05)% | | | | (1.49)% | | | | 7.12% | |
| |
| Ratios/Supplemental Data: | |
| Net assets, end of period (000) | | | $17,749 | | | | | | $19,133 | | | | $20,499 | | | | $21,777 | | | | $29,417 | | | | $32,800 | |
| Average net assets (000) | | | $17,728 | | | | | | $20,208 | | | | $21,746 | | | | $23,090 | | | | $32,068 | | | | $34,907 | |
| Ratios to average net assets(c): | | | | | | | | | | | | | | | | | | | | | | | | | | |
| Expenses, including distribution and service (12b-1) fees | | | 2.32% | (e) | | | | | 2.27% | | | | 2.27% | | | | 2.39% | (d) | | | 2.18% | | | | 2.10% | |
| Expenses, excluding distribution and service (12b-1) fees | | | 1.32% | (e) | | | | | 1.27% | | | | 1.27% | | | | 1.39% | (d) | | | 1.18% | | | | 1.10% | |
| Net investment income | | | 1.00% | (e) | | | | | .83% | | | | 1.26% | | | | 2.04% | | | | 1.83% | | | | 1.60% | |
(a) Total return does not consider the effects of sales loads. Total return is calculated assuming a purchase of a share on the first day and a sale on the last day of each period reported and includes reinvestment of dividends and distributions. Total returns may reflect adjustments to conform to generally accepted accounting principles. Total returns for periods less than one full year are not annualized.
(b) Calculated based upon the average shares outstanding during the period.
(c) Does not include expenses of the underlying portfolios in which the Fund invests.
(d) Includes interest expense of .06%.
(e) Annualized.
See Notes to Financial Statements.
| | | | |
| Target Asset Allocation Funds/Target Conservative Allocation Fund | | | 73 | |
Financial Highlights
(Unaudited) continued
| | | | | | | | | | | | | | | | | | | | | | | | | | |
| Class M Shares | |
| | | Six Months
Ended
January 31, | | | | | Year Ended July 31, | |
| | | 2012(b) | | | | | 2011(b) | | | 2010(b) | | | 2009(b) | | | 2008(b) | | | 2007 | |
| Per Share Operating Performance: | | | | | | | | | | | | | | | | | | | | | | | | | | |
| Net Asset Value, Beginning Of Period | | | $10.15 | | | | | | $9.41 | | | | $8.43 | | | | $9.82 | | | | $10.64 | | | | $10.31 | |
| Income (loss) from investment operations: | | | | | | | | | | | | | | | | | | | | | | | | | | |
| Net investment income | | | .05 | | | | | | .08 | | | | .12 | | | | .17 | | | | .19 | | | | .17 | |
| Net realized and unrealized gain (loss) on investments | | | .04 | | | | | | .78 | | | | .88 | | | | (.92 | ) | | | (.32 | ) | | | .56 | |
| Total from investment operations | | | .09 | | | | | | .86 | | | | 1.00 | | | | (.75 | ) | | | (.13 | ) | | | .73 | |
| Less Dividends and Distributions: | | | | | | | | | | | | | | | | | | | | | | | | | | |
| Dividends from net investment income | | | (.09 | ) | | | | | (.12 | ) | | | (.02 | ) | | | (.34 | ) | | | (.19 | ) | | | (.19 | ) |
| Tax return of capital | | | - | | | | | | - | | | | - | | | | (.05 | ) | | | - | | | | - | |
| Distributions from net realized gains on investments | | | - | | | | | | - | | | | - | | | | (.25 | ) | | | (.50 | ) | | | (.21 | ) |
| Total dividends and distributions | | | (.09 | ) | | | | | (.12 | ) | | | (.02 | ) | | | (.64 | ) | | | (.69 | ) | | | (.40 | ) |
| Net asset value, end of period | | | $10.15 | | | | | | $10.15 | | | | $9.41 | | | | $8.43 | | | | $9.82 | | | | $10.64 | |
| Total Return(a) | | | .98% | | | | | | 9.20% | | | | 11.82% | | | | (7.06)% | | | | (1.49)% | | | | 7.12% | |
| |
| Ratios/Supplemental Data: | | | | | | | | | | | | | | | | | | | | |
| Net assets, end of period (000) | | | $10 | | | | | | $50 | | | | $168 | | | | $479 | | | | $1,047 | | | | $2,936 | |
| Average net assets (000) | | | $29 | | | | | | $94 | | | | $339 | | | | $654 | | | | $2,357 | | | | $3,219 | |
| Ratios to average net assets(c): | | | | | | | | | | | | | | | | | | | | | | | | | | |
| Expenses, including distribution and service (12b-1) fees | | | 2.32% | (e) | | | | | 2.27% | | | | 2.27% | | | | 2.39% | (d) | | | 2.18% | | | | 2.10% | |
| Expenses, excluding distribution and service (12b-1) fees | | | 1.32% | (e) | | | | | 1.27% | | | | 1.27% | | | | 1.39% | (d) | | | 1.18% | | | | 1.10% | |
| Net investment income | | | 1.07% | (e) | | | | | .80% | | | | 1.28% | | | | 2.09% | | | | 1.81% | | | | 1.60% | |
(a) Total return does not consider the effects of sales loads. Total return is calculated assuming a purchase of a share on the first day and a sale on the last day of each period reported and includes reinvestment of dividends and distributions. Total returns may reflect adjustments to conform to generally accepted accounting principles. Total returns for periods less than one full year are not annualized.
(b) Calculated based upon the average shares outstanding during the period.
(c) Does not include expenses of the underlying portfolios in which the Fund invests.
(d) Includes interest expense of .06%.
(e) Annualized.
See Notes to Financial Statements.
| | |
| 74 | | Visit our website at www.prudentialfunds.com |
| | | | | | | | | | | | | | | | | | | | | | | | | | |
| Class R Shares | |
| | | Six Months
Ended
January 31, | | | | | Year Ended July 31, | |
| | | 2012(c) | | | | | 2011(c) | | | 2010(c) | | | 2009(c) | | | 2008(c) | | | 2007 | |
| Per Share Operating Performance: | | | | | | | | | | | | | | | | | | | | | | | | | | |
| Net Asset Value, Beginning Of Period | | | $10.28 | | | | | | $9.51 | | | | $8.48 | | | | $9.85 | | | | $10.67 | | | | $10.34 | |
| Income (loss) from investment operations: | | | | | | | | | | | | | | | | | | | | | | | | | | |
| Net investment income | | | .08 | | | | | | .13 | | | | .16 | | | | .24 | | | | .24 | | | | .23 | |
| Net realized and unrealized gain (loss) on investments | | | .04 | | | | | | .80 | | | | .89 | | | | (.95 | ) | | | (.31 | ) | | | .55 | |
| Total from investment operations | | | .12 | | | | | | .93 | | | | 1.05 | | | | (.71 | ) | | | (.07 | ) | | | .78 | |
| Less Dividends and Distributions: | | | | | | | | | | | | | | | | | | | | | | | | | | |
| Dividends from net investment income | | | (.14 | ) | | | | | (.16 | ) | | | (.02 | ) | | | (.36 | ) | | | (.25 | ) | | | (.24 | ) |
| Tax return of capital | | | - | | | | | | - | | | | - | | | | (.05 | ) | | | - | | | | - | |
| Distributions from net realized gains on investments | | | - | | | | | | - | | | | - | | | | (.25 | ) | | | (.50 | ) | | | (.21 | ) |
| Total dividends and distributions | | | (.14 | ) | | | | | (.16 | ) | | | (.02 | ) | | | (.66 | ) | | | (.75 | ) | | | (.45 | ) |
| Net asset value, end of period | | | $10.26 | | | | | | $10.28 | | | | $9.51 | | | | $8.48 | | | | $9.85 | | | | $10.67 | |
| Total Return(a) | | | 1.24% | | | | | | 9.84% | | | | 12.44% | | | | (6.59)% | | | | (.99)% | | | | 7.64% | |
| |
| Ratios/Supplemental Data: | |
| Net assets, end of period (000) | | | $215 | | | | | | $232 | | | | $687 | | | | $721 | | | | $4,015 | | | | $8,751 | |
| Average net assets (000) | | | $214 | | | | | | $669 | | | | $686 | | | | $1,255 | | | | $4,787 | | | | $8,273 | |
| Ratios to average net assets(d): | | | | | | | | | | | | | | | | | | | | | | | | | | |
| Expenses, including distribution and service (12b-1) fees(b) | | | 1.82% | (f) | | | | | 1.77% | | | | 1.77% | | | | 1.89% | (e) | | | 1.68% | | | | 1.60% | |
| Expenses, excluding distribution and service (12b-1) fees | | | 1.32% | (f) | | | | | 1.27% | | | | 1.27% | | | | 1.39% | (e) | | | 1.18% | | | | 1.10% | |
| Net investment income | | | 1.50% | (f) | | | | | 1.29% | | | | 1.76% | | | | 2.70% | | | | 2.33% | | | | 2.09% | |
(a) Total return is calculated assuming a purchase of a share on the first day and a sale on the last day of each period reported and includes reinvestment of dividends and distributions. Total returns may reflect adjustments to conform to generally accepted accounting principles. Total returns for periods less than one full year are not annualized.
(b) The distributor of the Fund has contractually agreed to limit its distribution and service (12b-1) fees to .50% of the average daily assets of the Class R shares.
(c) Calculated based upon the average shares outstanding during the period.
(d) Does not include expenses of the underlying portfolios in which the Fund invests.
(e) Includes interest expense of .06%.
(f) Annualized.
See Notes to Financial Statements.
| | | | |
| Target Asset Allocation Funds/Target Conservative Allocation Fund | | | 75 | |
Financial Highlights
(Unaudited) continued
| | | | | | | | | | | | | | | | | | | | | | | | | | |
Class X Shares | |
| | | Six Months
Ended
January 31, | | | | | Year Ended July 31, | |
| | | 2012(b) | | | | 2011(b) | | | 2010(b) | | | 2009(b) | | | 2008(b) | | | 2007 | |
| Per Share Operating Performance: | | | | | | | | | | | | | | | | | | | | | | | | | | |
| Net Asset Value, Beginning Of Period | | | $10.16 | | | | | | $9.41 | | | | $8.43 | | | | $9.82 | | | | $10.63 | | | | $10.31 | |
| Income (loss) from investment operations: | | | | | | | | | | | | | | | | | | | | | | | | | | |
| Net investment income | | | .05 | | | | | | .08 | | | | .12 | | | | .18 | | | | .21 | | | | .17 | |
| Net realized and unrealized gain (loss) on investments | | | .04 | | | | | | .79 | | | | .88 | | | | (.93 | ) | | | (.31 | ) | | | .55 | |
| Total from investment operations | | | .09 | | | | | | .87 | | | | 1.00 | | | | (.75 | ) | | | (.10 | ) | | | .72 | |
| Less Dividends and Distributions: | | | | | | | | | | | | | | | | | | | | | | | | | | |
| Dividends from net investment income | | | (.09 | ) | | | | | (.12 | ) | | | (.02 | ) | | | (.34 | ) | | | (.21 | ) | | | (.19 | ) |
| Tax return of capital | | | - | | | | | | - | | | | - | | | | (.05 | ) | | | - | | | | - | |
| Distributions from net realized gains on investments | | | - | | | | | | - | | | | - | | | | (.25 | ) | | | (.50 | ) | | | (.21 | ) |
| Total dividends and distributions | | | (.09 | ) | | | | | (.12 | ) | | | (.02 | ) | | | (.64 | ) | | | (.71 | ) | | | (.40 | ) |
| Net asset value, end of period | | | $10.16 | | | | | | $10.16 | | | | $9.41 | | | | $8.43 | | | | $9.82 | | | | $10.63 | |
| Total Return(a) | | | .98% | | | | | | 9.31% | | | | 11.82% | | | | (7.05)% | | | | (1.22)% | | | | 7.13% | |
| |
| Ratios/Supplemental Data: | |
| Net assets, end of period (000) | | | $106 | | | | | | $123 | | | | $769 | | | | $977 | | | | $2,120 | | | | $2,601 | |
| Average net assets (000) | | | $116 | | | | | | $391 | | | | $863 | | | | $1,342 | | | | $2,441 | | | | $2,463 | |
| Ratios to average net assets(c): | | | | | | | | | | | | | | | | | | | | | | | | | | |
| Expenses, including distribution and service (12b-1) fees | | | 2.32% | (e) | | | | | 2.27% | | | | 2.27% | | | | 2.37% | (d) | | | 1.99% | | | | 2.10% | |
| Expenses, excluding distribution and service (12b-1) fees | | | 1.32% | (e) | | | | | 1.27% | | | | 1.27% | | | | 1.39% | (d) | | | 1.18% | | | | 1.10% | |
| Net investment income | | | .99% | (e) | | | | | .78% | | | | 1.26% | | | | 2.13% | | | | 2.02% | | | | 1.60% | |
(a) Total return does not consider the effects of sales loads. Total return is calculated assuming a purchase of a share on the first day and a sale on the last day of each period reported and includes reinvestment of dividends and distributions. Total returns may reflect adjustments to conform to generally accepted accounting principles. Total returns for periods less than one full year are not annualized.
(b) Calculated based upon the average shares outstanding during the period.
(c) Does not include expenses of the underlying portfolios in which the Fund invests.
(d) Includes interest expense of .06%.
(e) Annualized.
See Notes to Financial Statements.
| | |
| 76 | | Visit our website at www.prudentialfunds.com |
| | | | | | | | | | | | | | | | | | | | | | | | | | |
| Class Z Shares | |
| | | Six Months
Ended
January 31, | | | | | Year Ended July 31, | |
| | | 2012(b) | | | | 2011(b) | | | 2010(b) | | | 2009(b) | | | 2008(b) | | | 2007 | |
| Per Share Operating Performance: | | | | | | | | | | | | | | | | | | | | | | | | | | |
| Net Asset Value, Beginning Of Period | | | $10.35 | | | | | | $9.57 | | | | $8.50 | | | | $9.85 | | | | $10.67 | | | | $10.34 | |
| Income (loss) from investment operations: | | | | | | | | | | | | | | | | | | | | | | | | | | |
| Net investment income | | | .10 | | | | | | .19 | | | | .21 | | | | .26 | | | | .30 | | | | .28 | |
| Net realized and unrealized gain (loss) on investments | | | .05 | | | | | | .79 | | | | .89 | | | | (.93 | ) | | | (.32 | ) | | | .56 | |
| Total from investment operations | | | .15 | | | | | | .98 | | | | 1.10 | | | | (.67 | ) | | | (.02 | ) | | | .84 | |
| Less Dividends and Distributions: | | | | | | | | | | | | | | | | | | | | | | | | | | |
| Dividends from net investment income | | | (.19 | ) | | | | | (.20 | ) | | | (.03 | ) | | | (.38 | ) | | | (.30 | ) | | | (.30 | ) |
| Tax return of capital | | | - | | | | | | - | | | | - | | | | (.05 | ) | | | - | | | | - | |
| Distributions from net realized gains on investments | | | - | | | | | | - | | | | - | | | | (.25 | ) | | | (.50 | ) | | | (.21 | ) |
| Total dividends and distributions | | | (.19 | ) | | | | | (.20 | ) | | | (.03 | ) | | | (.68 | ) | | | (.80 | ) | | | (.51 | ) |
| Net asset value, end of period | | | $10.31 | | | | | | $10.35 | | | | $9.57 | | | | $8.50 | | | | $9.85 | | | | $10.67 | |
| Total Return(a) | | | 1.52% | | | | | | 10.31% | | | | 12.97% | | | | (6.14)% | | | | (.50)% | | | | 8.20% | |
| |
| Ratios/Supplemental Data: | |
| Net assets, end of period (000) | | | $4,544 | | | | | | $3,921 | | | | $2,877 | | | | $3,156 | | | | $5,610 | | | | $5,397 | |
| Average net assets (000) | | | $4,407 | | | | | | $3,567 | | | | $3,031 | | | | $3,809 | | | | $5,771 | | | | $4,521 | |
| Ratios to average net assets(c): | | | | | | | | | | | | | | | | | | | | | | | | | | |
| Expenses, including distribution and service (12b-1) fees | | | 1.32% | (e) | | | | | 1.27% | | | | 1.27% | | | | 1.39% | (d) | | | 1.18% | | | | 1.10% | |
| Expenses, excluding distribution and service (12b-1) fees | | | 1.32% | (e) | | | | | 1.27% | | | | 1.27% | | | | 1.39% | (d) | | | 1.18% | | | | 1.10% | |
| Net investment income | | | 2.00% | (e) | | | | | 1.84% | | | | 2.26% | | | | 3.10% | | | | 2.85% | | | | 2.59% | |
(a) Total return is calculated assuming a purchase of a share on the first day and a sale on the last day of each period reported and includes reinvestment of dividends and distributions. Total returns may reflect adjustments to conform to generally accepted accounting principles. Total returns for periods less than one full year are not annualized.
(b) Calculated based upon the average shares outstanding during the period.
(c) Does not include expenses of the underlying portfolios in which the Fund invests.
(d) Includes interest expense of .06%.
(e) Annualized.
See Notes to Financial Statements.
| | | | |
| Target Asset Allocation Funds/Target Conservative Allocation Fund | | | 77 | |
| | | | |
| n MAIL | | n TELEPHONE | | n WEBSITE |
Gateway Center Three 100 Mulberry Street Newark, NJ 07102 | | (800) 225-1852
| | www.prudentialfunds.com |
|
| PROXY VOTING |
| The Board of Trustees of the Fund has delegated to the Fund’s investment subadvisers the responsibility for voting any proxies and maintaining proxy recordkeeping with respect to the Fund. A description of these proxy voting policies and procedures is available without charge, upon request, by calling (800) 225-1852. Information regarding how the Fund voted proxies relating to portfolio securities during the most recent 12-month period ended June 30 is available on the Fund’s website and on the website of the Securities and Exchange Commission at www.sec.gov. |
|
| TRUSTEES |
| Kevin J. Bannon • Scott E. Benjamin • Linda W. Bynoe • Michael S. Hyland • Douglas H. McCorkindale • Stephen P. Munn • Stuart S. Parker • Richard A. Redeker • Robin B. Smith • Stephen G. Stoneburn |
|
| OFFICERS |
| Stuart S. Parker, President • Judy A. Rice, Vice President • Scott E. Benjamin, Vice President • Grace C. Torres, Treasurer and Principal Financial and Accounting Officer • Kathryn L. Quirk, Chief Legal Officer • Deborah A. Docs, Secretary • Timothy J. Knierim, Chief Compliance Officer • Valerie M. Simpson, Deputy Chief Compliance Officer • Theresa C. Thompson, Deputy Chief Compliance Officer • Richard W. Kinville, Anti-Money Laundering Compliance Officer • Jonathan D. Shain, Assistant Secretary • Claudia DiGiacomo, Assistant Secretary • John P. Schwartz, Assistant Secretary • Andrew R. French, Assistant Secretary • M. Sadiq Peshimam, Assistant Treasurer • Peter Parrella, Assistant Treasurer |
| | | | |
| MANAGER | | Prudential Investments LLC | | Gateway Center Three
100 Mulberry Street Newark, NJ 07102 |
|
| INVESTMENT SUBADVISERS | | Eagle Asset Management, Inc. | | 880 Carillon Parkway
St. Petersburg, FL 33716 |
|
| | EARNEST Partners, LLC | | 1180 Peachtree Street
Suite 2300 Atlanta, GA 30309 |
|
| | Eaton Vance Management | | Two International Place
Boston, MA 02110 |
|
| | Hotchkis and Wiley Capital
Management | | 725 South Figueroa Street
39th Floor Los Angeles, CA 90017 |
|
| | Marsico Capital
Management, LLC | | 1200 17th Street
Suite 1600 Denver, CO 80202 |
|
| | Massachusetts Financial
Services Company | | 500 Boylston Street
Boston, MA 02116 |
|
| | | | |
| | NFJ Investment Group L.P.
| | 2100 Ross Avenue
Dallas, TX 75201 |
|
| | Pacific Investment
Management Company LLC | | 840 Newport Center Drive
Newport Beach, CA 92660 |
|
| | Vaughan Nelson Investment
Management, L.P. | | 600 Travis Street
Suite 6300 Houston, TX 77002 |
|
| DISTRIBUTOR | | Prudential Investment
Management Services LLC | | Gateway Center Three
100 Mulberry Street Newark, NJ 07102 |
|
| CUSTODIAN | | The Bank of New York Mellon | | One Wall Street
New York, NY 10286 |
|
| TRANSFER AGENT | | Prudential Mutual Fund
Services LLC | | PO Box 9658
Providence, RI 02940 |
|
INDEPENDENT REGISTERED
PUBLIC ACCOUNTING FIRM | | KPMG LLP | | 345 Park Avenue
New York, NY 10154 |
|
| FUND COUNSEL | | Willkie Farr & Gallagher LLP | | 787 Seventh Avenue
New York, NY 10019 |
|
|
An investor should consider the investment objectives, risks, charges, and expenses of the Fund carefully before investing. The prospectus and summary prospectus contain this and other information about the Fund. An investor may obtain a prospectus and summary prospectus by visiting our website at www.prudentialfunds.com or by calling (800) 225-1852. The prospectus and summary prospectus should be read carefully before investing. |
|
| E-DELIVERY |
| To receive your mutual fund documents online, go to www.prudentialfunds.com/edelivery and enroll. Instead of receiving printed documents by mail, you will receive notification via email when new materials are available. You can cancel your enrollment or change your email address at any time by visiting the website address above. |
|
| SHAREHOLDER COMMUNICATIONS WITH TRUSTEES |
| Shareholders can communicate directly with the Board of Trustees by writing to the Chair of the Board, Target Asset Allocation Funds, Prudential Investments, Attn: Board of Trustees, 100 Mulberry Street, Gateway Center Three, Newark, NJ 07102. Shareholders can communicate directly with an individual Trustee by writing to the same address. Communications are not screened before being delivered to the addressee. |
|
AVAILABILITY OF PORTFOLIO SCHEDULE |
The Fund files its complete schedule of portfolio holdings with the Securities and Exchange Commission for the first and third quarters of each fiscal year on Form N-Q. The Fund’s Forms N-Q are available on the Commission’s website at www.sec.gov. The Fund’s Forms N-Q may also be reviewed and copied at the Commission’s Public Reference Room in Washington, D.C. Information on the operation and location of the Public Reference Room may be obtained by calling (202) 551-8090. The Fund’s schedule of portfolio holdings as of the end of each calendar month is also available on the Fund’s website no sooner than approximately three business days prior to the end of the following month. |
Mutual Funds:
| | | | |
ARE NOT INSURED BY THE FDIC OR ANY
FEDERAL GOVERNMENT AGENCY | | MAY LOSE VALUE | | ARE NOT A DEPOSIT OF OR GUARANTEED
BY ANY BANK OR ANY BANK AFFILIATE |

TARGET CONSERVATIVE ALLOCATION FUND
| | | | | | | | | | | | | | |
| SHARE CLASS | | A | | B | | C | | M | | R | | X | | Z |
| NASDAQ | | PCGAX | | PBCFX | | PCCFX | | N/A | | PCLRX | | N/A | | PDCZX |
| CUSIP | | 87612A104 | | 87612A203 | | 87612A302 | | 87612A609 | | 87612A401 | | 87612A708 | | 87612A500 |
MFSP504E2 0220859-00001-00

PRUDENTIAL INVESTMENTS»MUTUAL FUNDS
TARGET MODERATE ALLOCATION FUND
SEMIANNUAL REPORT · JANUARY 31, 2012
Objective
Seeks capital appreciation and a reasonable level of current income
This report is not authorized for distribution to prospective investors unless preceded or accompanied by a current prospectus.
The views expressed in this report and information about the Fund’s portfolio holdings are for the period covered by this report and are subject to change thereafter.
The accompanying financial statements as of January 31, 2012, were not audited and, accordingly, no auditor’s opinion is expressed on them.
Target Funds, Prudential Investments, Prudential, the Prudential logo, and the Rock symbol are service marks of Prudential Financial, Inc. and its related entities, registered in many jurisdictions worldwide.

March 15, 2012
Dear Shareholder:
After an extraordinary career at Prudential, Judy Rice retired at the end of 2011 as President of Prudential Investments and President and Trustee of the Target Moderate Allocation Fund (the Fund). While she will remain as Chairman of Prudential Investments until the end of 2012, I was named to succeed her as President of Prudential Investments and as President and Trustee of the Fund effective January 1, 2012. I previously served as Executive Vice President of Retail Mutual Fund Distribution for Prudential Investments for the past six years.
Since this is my first letter to shareholders, I would like to recognize Judy for her significant contributions and her unflagging commitment to helping investors like you meet the challenges of a rapidly changing investment environment. My goal is to build on Judy’s accomplishments, with a particular focus on delivering the solutions you need to address your financial goals.
On the following pages, you’ll find your semiannual report for the Fund. Target Asset Allocation Funds are managed by institutional-quality asset managers selected, matched, and monitored by a research team from Prudential Investments. We believe the Fund will help you to achieve broad diversification at a targeted risk/return balance with a single investment purchase. We appreciate your continued confidence in us. Keep in mind that diversification and asset allocation do not assure a profit or protect against a loss in a declining market.
Sincerely,

Stuart S. Parker, President
Target Asset Allocation Funds
| | | | |
| Target Asset Allocation Funds/Target Moderate Allocation Fund | | | 1 | |
Your Fund’s Performance (Unaudited)
Performance data quoted represent past performance. Past performance does not guarantee future results. The investment return and principal value of an investment will fluctuate, so that an investor’s shares, when redeemed, may be worth more or less than their original cost. Current performance may be lower or higher than the past performance data quoted. An investor may obtain performance data as of the most recent month-end by visiting our website at www.prudentialfunds.com or by calling (800) 225-1852. The maximum initial sales charge is 5.50% (Class A shares). Gross operating expenses: Class A, 1.48%; Class B, 2.18%; Class C, 2.18%; Class M, 2.18%; Class R, 1.93%; Class X, 2.18%; Class Z, 1.18%. Net operating expenses: Class A, 1.43%; Class B, 2.18%; Class C, 2.18%; Class M, 2.18%; Class R, 1.68%; Class X, 1.43%; Class Z, 1.18%, after contractual reduction through 11/30/2012 for Class A and Class R shares.
| | | | | | | | | | | | | | | | | | |
Cumulative Total Returns (Without Sales Charges) as of 1/31/12 |
| | | Six Months | | | One Year | | | Five Years | | | Ten Years | | | Since Inception |
Class A | | | –0.77 | % | | | 1.42 | % | | | 4.64 | % | | | 56.80 | % | | — |
Class B | | | –1.10 | | | | 0.63 | | | | 0.75 | | | | 45.54 | | | — |
Class C | | | –1.10 | | | | 0.63 | | | | 0.75 | | | | 45.54 | | | — |
Class M | | | –1.19 | | | | 0.63 | | | | 0.74 | | | | N/A | | | 28.54% (10/4/04) |
Class R | | | –0.85 | | | | 1.15 | | | | 3.33 | | | | N/A | | | 33.43 (10/4/04) |
Class X | | | –0.77 | | | | 1.42 | | | | 2.43 | | | | N/A | | | 30.87 (10/4/04) |
Class Z | | | –0.60 | | | | 1.68 | | | | 5.96 | | | | 60.63 | | | — |
Customized Blend | | | 1.47 | | | | 4.04 | | | | 13.73 | | | | 68.09 | | | — |
S&P 500 Index | | | 2.70 | | | | 4.19 | | | | 1.65 | | | | 41.36 | | | — |
Lipper Mixed-Asset Target Allocation Growth Funds Avg. | | | –0.55 | | | | 1.23 | | | | 6.50 | | | | 53.90 | | | — |
| | | | | | | | | | | | | | | | | | |
Average Annual Total Returns (With Sales Charges) as of 12/31/11 |
| | | | | | One Year | | | Five Years | | | Ten Years | | | Since Inception |
Class A | | | | | | | –6.55 | % | | | –0.73 | % | | | 3.46 | % | | — |
Class B | | | | | | | –6.86 | | | | –0.53 | | | | 3.27 | | | — |
Class C | | | | | | | –2.86 | | | | –0.36 | | | | 3.27 | | | — |
Class M | | | | | | | –7.76 | | | | –0.69 | | | | N/A | | | 3.01% (10/4/04) |
Class R | | | | | | | –1.37 | | | | 0.15 | | | | N/A | | | 3.53 (10/4/04) |
Class X | | | | | | | –6.99 | | | | –0.54 | | | | N/A | | | 3.15 (10/4/04) |
Class Z | | | | | | | –0.95 | | | | 0.64 | | | | 4.29 | | | — |
Customized Blend | | | | | | | 1.89 | | | | 2.09 | | | | 4.84 | | | — |
S&P 500 Index | | | | | | | 2.09 | | | | –0.25 | | | | 2.92 | | | — |
Lipper Mixed-Asset Target Allocation Growth Funds Avg. | | | | | | | –1.30 | | | | 0.63 | | | | 3.80 | | | — |
| | |
| 2 | | Visit our website at www.prudentialfunds.com |
Source: Prudential Investments LLC and Lipper Inc. Performance figures may reflect fee waivers and/or expense reimbursements. In the absence of such fee waivers and/or expense reimbursements, total returns would be lower.
Inception returns are provided for any share class with less than 10 calendar years of returns.
The average annual total returns take into account applicable sales charges. Class A shares are subject to a maximum front-end sales charge of 5.50%, and a 12b-1 fee of up to 0.30% annually. All investors who purchase Class A shares in an amount of $1 million or more and sell these shares within 12 months of purchase are subject to a contingent deferred sales charge (CDSC) of 1%. The Class A CDSC is waived for purchases by certain retirement and/or benefit plans. Under certain circumstances an exchange may be made from specified share classes of the Fund to one or more other share classes of the Fund. Class B shares are subject to a declining CDSC of 5%, 4%, 3%, 2%, 1%, and 1%, respectively, for the first six years after purchase and a 12b-1 fee of 1% annually. Approximately seven years after purchase, Class B shares will automatically convert to Class A shares on a quarterly basis. Class C shares are not subject to a front-end sales charge, but charge a CDSC of 1% for Class C shares sold within 12 months from the date of purchase, and an annual 12b-1 fee of 1%. Class M shares are closed to new purchases. Class M shares are subject to a CDSC of 6%, which decreases by 1% annually to 2% in the fifth and sixth years and to 1% in the seventh year, and a 12b-1 fee of 1% annually. Class M shares automatically convert to Class A shares on a monthly basis approximately eight years after purchase. Class X shares are closed to new purchases. Class X shares are subject to a declining CDSC of 6%, 5%, 4%, 4%, 3%, 2%, 2%, and 1%, respectively, for the first eight years after purchase and a 12b-1 fee of 1% annually. Class X shares automatically convert to Class A shares on a monthly basis approximately 10 years after purchase. Class R and Z shares are not subject to a sales charge. Class R shares are subject to a 12b-1 fee of up to 0.75% annually. Class Z shares are not subject to a 12b-1 fee. The returns in the tables reflect the share class expense structure in effect at the close of the fiscal period. The returns in the tables do not reflect the deduction of taxes that a shareholder would pay on Fund distributions or following the redemption of Fund shares.
Benchmark Definitions
Customized Blend
The Customized Benchmark for the Target Moderate Allocation Fund (Customized Blend) is a model portfolio consisting of the Russell 3000® Index (52%), Morgan Stanley Capital International Europe, Australasia, and Far East Index (MSCI EAFE ND Index) (13%), and the Barclays Capital U.S. Aggregate Bond Index (35%). Each component of the Customized Blend is an unmanaged index generally considered as representing the performance of the Fund’s asset classes. The Customized Blend is intended to provide a theoretical comparison to the Fund’s performance, based on the amounts allocated to each asset class rather than on amounts allocated to various Fund segments. The Customized Blend does not reflect deductions for any sales charges or operating expenses of a mutual fund. The Russell 3000 Index is an unmanaged index which measures the performance of the 3,000 largest U.S. companies based on total market capitalization, which represents approximately 98% of the investable U.S. equity market. The MSCI EAFE ND Index is an unmanaged weighted index that reflects stock price movements in Europe, Australasia, and the Far East. It gives a broad look at how foreign stock prices have performed. The Fund utilizes the net dividends (ND) version of the MSCI EAFE Index. The net dividends and gross dividends versions of the MSCI EAFE Index differ in that the net dividends returns reflect the impact of the maximum withholding taxes on reinvested dividends, while the gross dividends version does not reflect the impact of the maximum withholding taxes on reinvested dividends. These returns do not include the effect of any investment management expenses. These returns would have been lower if they included the effect of these expenses. The Barclays Capital U.S.
| | | | |
| Target Asset Allocation Funds/Target Moderate Allocation Fund | | | 3 | |
Your Fund’s Performance (continued)
Aggregate Bond Index is an unmanaged index of investment-grade securities issued by the U.S. government and its agencies and by corporations with between one and 10 years remaining to maturity. It gives a broad look at how short- and intermediate-term bonds have performed. Customized Blend Closest Month-End to Inception cumulative total return as of 1/31/12 is 47.83% for Class M, Class R, and Class X. Customized Blend Closest Month-End to Inception average annual total return as of 12/31/11 is 5.02% for Class M, Class R, and Class X.
S&P 500 Index
The Standard & Poor’s 500 Composite Stock Price Index (S&P 500 Index) is an unmanaged index of 500 stocks of large U.S. public companies. It gives an indication of how U.S. stock prices have performed. S&P 500 Index Closest Month-End to Inception cumulative total return as of 1/31/12 is 36.90% for Class M, Class R, and Class X. S&P 500 Index Closest Month-End to Inception average annual total return as of 12/31/11 is 3.80% for Class M, Class R, and Class X.
Lipper Mixed-Asset Target Allocation Growth Funds Average
The Lipper Mixed-Asset Target Allocation Growth Funds Average (Lipper Average) represents returns based on the average return of all funds in the Lipper Mixed-Asset Target Allocation Growth Funds category for the periods noted. Funds in the Lipper Average invest in a variety of market capitalization ranges without concentrating 75% of their equity assets in any one market capitalization range over an extended period of time. Mixed-Asset Funds are funds that, by portfolio practice, maintain a mix of between 60% and 80% equity securities, with the remainder invested in bonds, cash, and cash equivalents. Lipper Average Closest Month-End to Inception cumulative total return as of 1/31/12 is 38.52% for Class M, Class R, and Class X. Lipper Average Closest Month-End to Inception average annual total return as of 12/31/11 is 4.00% for Class M, Class R, and Class X.
Investors cannot invest directly in an index or average. The returns for the Indexes would be lower if they included the effects of sales charges, operating expenses of a mutual fund, or taxes. Returns for the Lipper Average reflect the deduction of operating expenses, but not sales charges or taxes. The Since Inception returns for the Indexes are measured from the closest month-end to inception date, and not from the Fund’s actual inception date.
| | |
| 4 | | Visit our website at www.prudentialfunds.com |
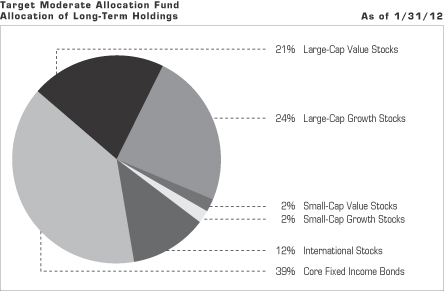
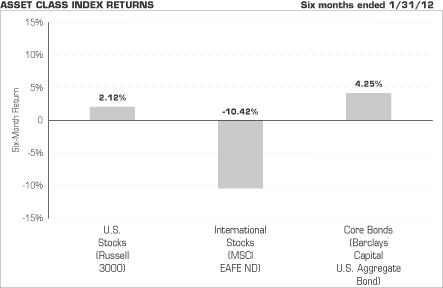
Source: Lipper Inc.
The chart above shows the total returns for six months ended January 31, 2012, of various securities indexes that are generally considered representative of broad market sectors. It does not reflect a mutual fund’s expenses.
| | | | |
| Target Asset Allocation Funds/Target Moderate Allocation Fund | | | 5 | |
Your Fund’s Performance (continued)
The performance cited does not represent the performance of the Target Moderate Allocation Fund. Past performance is not indicative of future results. Investors cannot invest directly in an index or average.
The Russell 3000 Index is an unmanaged index which measures the performance of the 3,000 largest U.S. companies based on total market capitalization, which represents approximately 98% of the investable U.S. equity market.
The Morgan Stanley Capital International Europe, Australasia, and Far East Index (MSCI EAFE ND Index) is an unmanaged weighted index that reflects stock price movements in Europe, Australasia, and the Far East. It gives a broad look at how foreign stock prices have performed. The Fund utilizes the net dividends (ND) version of the MSCI EAFE Index. The net dividends and gross dividends versions of the MSCI EAFE Index differ in that the net dividends returns reflect the impact of the maximum withholding taxes on reinvested dividends, while the gross dividends version does not reflect the impact of withholding taxes on reinvested dividends. These returns do not include the effect of any investment management expenses. These returns would have been lower if they included the effect of these expenses.
The Barclays Capital U.S. Aggregate Bond Index is an unmanaged index of investment-grade securities issued by the U.S. government and its agencies and by corporations with between one and 10 years remaining to maturity. It gives a broad look at how short- and intermediate-term bonds have performed.
| | |
| 6 | | Visit our website at www.prudentialfunds.com |
Fees and Expenses (Unaudited)
As a shareholder of the Fund, you incur two types of costs: (1) transaction costs, including sales charges (loads) on purchase payments and redemptions, as applicable, and (2) ongoing costs, including management fees, distribution and/or service (12b-1) fees, and other Fund expenses, as applicable. This example is intended to help you understand your ongoing costs (in dollars) of investing in the Fund and to compare these costs with the ongoing costs of investing in other mutual funds.
The example is based on an investment of $1,000 invested on August 1, 2011, at the beginning of the period, and held through the six-month period ended January 31, 2012. The example is for illustrative purposes only; you should consult the Prospectus for information on initial and subsequent minimum investment requirements.
The Fund’s transfer agent may charge additional fees to holders of certain accounts that are not included in the expenses shown in the table on the following page. These fees apply to individual retirement accounts (IRAs) and Section 403(b) accounts. As of the close of the six-month period covered by the table, IRA fees included an annual maintenance fee of $15 per account (subject to a maximum annual maintenance fee of $25 for all accounts held by the same shareholder). Section 403(b) accounts are charged an annual $25 fiduciary maintenance fee. Some of the fees may vary in amount, or may be waived, based on your total account balance or the number of Prudential Investments Funds, including the Target Asset Allocation Funds, that you own. You should consider the additional fees that were charged to your Fund account over the six-month period when you estimate the total ongoing expenses paid over the period and the impact of these fees on your ending account value, as these additional expenses are not reflected in the information provided in the expense table. Additional fees have the effect of reducing investment returns.
Actual Expenses
The first line for each share class in the table on the following page provides information about actual account values and actual expenses. You may use the information on this line, together with the amount you invested, to estimate the expenses that you paid over the period. Simply divide your account value by $1,000 (for example, an $8,600 account value ÷ $1,000 = 8.6), then multiply the result by the number on the first line under the heading “Expenses Paid During the Six-Month Period” to estimate the expenses you paid on your account during this period.
Hypothetical Example for Comparison Purposes
The second line for each share class in the table on the following page provides information about hypothetical account values and hypothetical expenses based on the Fund’s actual expense ratio and an assumed rate of return of 5% per year before expenses, which is not the Fund’s actual return. The hypothetical account values and
| | | | |
| Target Asset Allocation Funds/Target Moderate Allocation Fund | | | 7 | |
Fees and Expenses (continued)
expenses may not be used to estimate the actual ending account balance or expenses you paid for the period. You may use this information to compare the ongoing costs of investing in the Fund and other funds. To do so, compare this 5% hypothetical example with the 5% hypothetical examples that appear in the shareholder reports of the other funds.
Please note that the expenses shown in the table are meant to highlight your ongoing costs only and do not reflect any transactional costs such as sales charges (loads). Therefore, the second line for each share class in the table is useful in comparing ongoing costs only and will not help you determine the relative total costs of owning different funds. In addition, if these transactional costs were included, your costs would have been higher.
| | | | | | | | | | | | | | | | | | |
Target Moderate Allocation Fund | | Beginning Account
Value
August 1, 2011 | | | Ending Account
Value
January 31, 2012 | | | Annualized
Expense Ratio
Based on the
Six-Month Period | | | Expenses Paid
During the
Six-Month Period* | |
| | | | | | | | | | | | | | | | | | |
| Class A | | Actual | | $ | 1,000.00 | | | $ | 992.30 | | | | 1.43 | % | | $ | 7.16 | |
| | | Hypothetical | | $ | 1,000.00 | | | $ | 1,017.95 | | | | 1.43 | % | | $ | 7.25 | |
| | | | | | | | | | | | | | | | | | |
| Class B | | Actual | | $ | 1,000.00 | | | $ | 989.00 | | | | 2.18 | % | | $ | 10.90 | |
| | | Hypothetical | | $ | 1,000.00 | | | $ | 1,014.18 | | | | 2.18 | % | | $ | 11.04 | |
| | | | | | | | | | | | | | | | | | |
| Class C | | Actual | | $ | 1,000.00 | | | $ | 989.00 | | | | 2.18 | % | | $ | 10.90 | |
| | | Hypothetical | | $ | 1,000.00 | | | $ | 1,014.18 | | | | 2.18 | % | | $ | 11.04 | |
| | | | | | | | | | | | | | | | | | |
| Class M | | Actual | | $ | 1,000.00 | | | $ | 988.10 | | | | 2.18 | % | | $ | 10.89 | |
| | | Hypothetical | | $ | 1,000.00 | | | $ | 1,014.18 | | | | 2.18 | % | | $ | 11.04 | |
| | | | | | | | | | | | | | | | | | |
| Class R | | Actual | | $ | 1,000.00 | | | $ | 991.50 | | | | 1.68 | % | | $ | 8.41 | |
| | | Hypothetical | | $ | 1,000.00 | | | $ | 1,016.69 | | | | 1.68 | % | | $ | 8.52 | |
| | | | | | | | | | | | | | | | | | |
| Class X | | Actual | | $ | 1,000.00 | | | $ | 992.30 | | | | 1.43 | % | | $ | 7.16 | |
| | | Hypothetical | | $ | 1,000.00 | | | $ | 1,017.95 | | | | 1.43 | % | | $ | 7.25 | |
| | | | | | | | | | | | | | | | | | |
| Class Z | | Actual | | $ | 1,000.00 | | | $ | 994.00 | | | | 1.18 | % | | $ | 5.91 | |
| | | Hypothetical | | $ | 1,000.00 | | | $ | 1,019.20 | | | | 1.18 | % | | $ | 5.99 | |
* Fund expenses (net of fee waivers or subsidies, if any) for each share class are equal to the annualized expense ratio for each share class (provided in the table), multiplied by the average account value over the period, multiplied by the 184 days in the six-month period ended January 31, 2012, and divided by the 366 days in the Fund’s fiscal year ending July 31, 2012 (to reflect the six-month period). Expenses presented in the table include the expenses of any underlying portfolios in which the Fund may invest.
| | |
| 8 | | Visit our website at www.prudentialfunds.com |
Portfolio of Investments
as of January 31, 2012 (Unaudited)
| | | | | | |
| Shares | | Description | | Value (Note 1) | |
| | | | | | |
LONG-TERM INVESTMENTS 103.8% | | | | |
COMMON STOCKS 63.3% | | | | |
|
Advertising 0.1% | |
| 4,350 | | Publicis Groupe SA (France) | | $ | 218,837 | |
|
Aerospace & Defense 1.4% | |
| 1,400 | | AAR Corp. | | | 29,666 | |
| 43,500 | | BAE Systems PLC (United Kingdom) | | | 210,988 | |
| 4,482 | | Boeing Co. (The) | | | 332,475 | |
| 1,900 | | Elbit Systems Ltd. (Israel) | | | 79,214 | |
| 8,800 | | Embraer SA, ADR (Brazil) | | | 241,296 | |
| 5,400 | | Finmeccanica SpA (Italy) | | | 24,298 | |
| 2,195 | | General Dynamics Corp. | | | 151,806 | |
| 4,538 | | Hexcel Corp.* | | | 113,768 | |
| 7,820 | | Honeywell International, Inc. | | | 453,873 | |
| 750 | | Huntington Ingalls Industries, Inc.* | | | 28,260 | |
| 7,617 | | Lockheed Martin Corp. | | | 627,031 | |
| 975 | | Moog, Inc. (Class A Stock)* | | | 41,555 | |
| 13,600 | | Northrop Grumman Corp. | | | 789,480 | |
| 14,890 | | Rolls-Royce Holdings PLC (United Kingdom)* | | | 172,575 | |
| 700 | | Teledyne Technologies, Inc.* | | | 39,732 | |
| 1,903 | | Triumph Group, Inc. | | | 119,071 | |
| 6,541 | | United Technologies Corp. | | | 512,487 | |
| | | | | | |
| | | | | 3,967,575 | |
|
Air Freight & Logistics 0.1% | |
| 1,565 | | Atlas Air Worldwide Holdings, Inc.* | | | 74,549 | |
| 2,000 | | FedEx Corp. | | | 182,980 | |
| | | | | | |
| | | | | 257,529 | |
|
Airlines 0.1% | |
| 75,500 | | Air New Zealand Ltd. (New Zealand) | | | 56,726 | |
| 54,000 | | Cathay Pacific Airways Ltd. (Hong Kong) | | | 106,951 | |
| 10,501 | | JetBlue Airways Corp.* | | | 62,271 | |
| | | | | | |
| | | | | 225,948 | |
|
Apparel & Textile 0.2% | |
| 5,131 | | Adidas AG (Germany) | | | 369,673 | |
| 2,662 | | Deckers Outdoor Corp.* | | | 215,223 | |
| 875 | | Wolverine World Wide, Inc. | | | 34,204 | |
| | | | | | |
| | | | | 619,100 | |
See Notes to Financial Statements.
| | | | |
| Target Asset Allocation Funds/Target Moderate Allocation Fund | | | 9 | |
Portfolio of Investments
as of January 31, 2012 (Unaudited) continued
| | | | | | |
| Shares | | Description | | Value (Note 1) | |
| | | | | | |
COMMON STOCKS (Continued) | | | | |
|
Auto Components 0.4% | |
| 21,792 | | Johnson Controls, Inc. | | $ | 692,332 | |
| 7,700 | | Magna International, Inc. (Canada) | | | 318,318 | |
| | | | | | |
| | | | | 1,010,650 | |
|
Auto Parts & Equipment 0.1% | |
| 6,200 | | Keihin Corp. (Japan) | | | 114,125 | |
| 5,113 | | Meritor, Inc.* | | | 32,109 | |
| 1,129 | | WABCO Holdings, Inc.* | | | 58,539 | |
| | | | | | |
| | | | | 204,773 | |
| |
Automobile Manufacturers 0.4% | | | | |
| 2,000 | | Daimler AG (Germany) | | | 110,517 | |
| 4,095 | | Ford Motor Co. | | | 50,860 | |
| 1,206 | | Hyundai Motor Co. (South Korea) | | | 237,260 | |
| 10,000 | | Nissan Shatai Co. Ltd. (Japan) | | | 103,910 | |
| 8,153 | | Toyota Motor Corp. (Japan) | | | 300,576 | |
| 1,500 | | Volkswagen AG (Germany) | | | 242,315 | |
| | | | | | |
| | | | | 1,045,438 | |
| |
Automobiles 0.1% | | | | |
| 2,000 | | Harley-Davidson, Inc. | | | 88,380 | |
| 1,700 | | Renault SA (France) | | | 72,414 | |
| 3,100 | | Valeo SA (France) | | | 145,511 | |
| | | | | | |
| | | | | 306,305 | |
| |
Automotive Parts | | | | |
| 300 | | Georg Fischer AG (Switzerland)* | | | 125,883 | |
| |
Banks 0.4% | | | | |
| 7,600 | | Banco Espanol de Credito SA (Spain) | | | 38,770 | |
| 22,900 | | Bank Hapoalim BM (Israel) | | | 79,868 | |
| 14,800 | | Bendigo and Adelaide Bank Ltd. (Australia) | | | 130,256 | |
| 23,000 | | Fukuoka Financial Group, Inc. (Japan) | | | 98,071 | |
| 4,141 | | Julius Baer Group Ltd. (Switzerland)* | | | 168,249 | |
| 105,900 | | Mizuho Financial Group, Inc. (Japan) | | | 159,781 | |
| 28,000 | | Nishi-Nippon City Bank Ltd. (The) (Japan) | | | 81,921 | |
| 25,900 | | Sapporo Hokuyo Holdings, Inc. (Japan) | | | 93,107 | |
| 15,667 | | Standard Chartered PLC (United Kingdom) | | | 378,714 | |
| | | | | | |
| | | | | 1,228,737 | |
See Notes to Financial Statements.
| | |
| 10 | | Visit our website at www.prudentialfunds.com |
| | | | | | |
| Shares | | Description | | Value (Note 1) | |
| | | | | | |
COMMON STOCKS (Continued) | | | | |
| |
Beverages 0.4% | | | | |
| 2,110 | | Coca-Cola Enterprises, Inc. | | $ | 56,527 | |
| 15,961 | | Diageo PLC (United Kingdom) | | | 352,621 | |
| 1,347 | | Green Mountain Coffee Roasters, Inc.* | | | 71,849 | |
| 4,200 | | Molson Coors Brewing Co. (Class B Stock) | | | 180,138 | |
| 3,281 | | PepsiCo, Inc. | | | 215,463 | |
| 5,826 | | SABMiller PLC (United Kingdom) | | | 221,069 | |
| | | | | | |
| | | | | 1,097,667 | |
| |
Biotechnology 0.9% | | | | |
| 4,210 | | Alexion Pharmaceuticals, Inc.* | | | 323,159 | |
| 11,040 | | Biogen Idec, Inc.* | | | 1,301,837 | |
| 906 | | BioMarin Pharmaceutical, Inc.* | | | 32,317 | |
| 5,464 | | Celgene Corp.* | | | 397,233 | |
| 4,960 | | Gilead Sciences, Inc.* | | | 242,246 | |
| 1,402 | | Seattle Genetics, Inc.* | | | 26,540 | |
| 1,255 | | United Therapeutics Corp.* | | | 61,721 | |
| | | | | | |
| | | | | 2,385,053 | |
|
Building Materials 0.2% | |
| 500 | | Ciments Francais SA (France) | | | 36,880 | |
| 800 | | Eagle Materials, Inc. | | | 23,528 | |
| 65,513 | | Kingfisher PLC (United Kingdom) | | | 263,972 | |
| 4,300 | | Owens Corning* | | | 145,125 | |
| | | | | | |
| | | | | 469,505 | |
|
Building Products | |
| 1,075 | | A.O. Smith Corp. | | | 45,666 | |
| 625 | | Lennox International, Inc. | | | 22,625 | |
| | | | | | |
| | | | | 68,291 | |
|
Capital Goods | |
| 1,400 | | Harsco Corp. | | | 31,122 | |
|
Capital Markets 0.3% | |
| 4,201 | | Goldman Sachs Group, Inc. (The) | | | 468,285 | |
| 1,375 | | LPL Investment Holdings, Inc.* | | | 45,169 | |
| 1,600 | | Raymond James Financial, Inc. | | | 56,000 | |
| 8,022 | | State Street Corp. | | | 314,302 | |
| | | | | | |
| | | | | 883,756 | |
See Notes to Financial Statements.
| | | | |
| Target Asset Allocation Funds/Target Moderate Allocation Fund | | | 11 | |
Portfolio of Investments
as of January 31, 2012 (Unaudited) continued
| | | | | | |
| Shares | | Description | | Value (Note 1) | |
| | | | | | |
COMMON STOCKS (Continued) | | | | |
|
Chemicals 2.3% | |
| 1,696 | | Air Products & Chemicals, Inc. | | $ | 149,299 | |
| 2,730 | | Airgas, Inc. | | | 215,479 | |
| 2,600 | | BASF SE (Germany) | | | 199,906 | |
| 2,200 | | Bayer AG (Germany) | | | 154,072 | |
| 2,500 | | Celanese Corp. (Class A Stock) | | | 121,775 | |
| 1,000 | | CF Industries Holdings, Inc. | | | 177,380 | |
| 5,100 | | Clariant AG (Switzerland)* | | | 61,942 | |
| 16,662 | | Dow Chemical Co. (The) | | | 558,344 | |
| 5,243 | | Huntsman Corp. | | | 66,743 | |
| 1,422 | | Intrepid Potash, Inc.* | | | 33,972 | |
| 3,200 | | Koninklijke DSM NV (Netherlands) | | | 164,186 | |
| 775 | | Kraton Performance Polymers, Inc.* | | | 22,041 | |
| 20,868 | | Monsanto Co. | | | 1,712,219 | |
| 8,000 | | Nippon Shokubai Co. Ltd. (Japan) | | | 90,160 | |
| 700 | | Olin Corp. | | | 15,540 | |
| 5,435 | | Potash Corp. of Saskatchewan, Inc. (Canada) | | | 254,032 | |
| 4,477 | | PPG Industries, Inc. | | | 401,050 | |
| 14,306 | | Praxair, Inc. | | | 1,519,297 | |
| 1,585 | | Quaker Chemical Corp. | | | 70,215 | |
| 2,200 | | Scotts Miracle-Gro Co. (The) (Class A Stock) | | | 104,192 | |
| 875 | | Sensient Technologies Corp. | | | 34,667 | |
| 26,000 | | Toagosei Co. Ltd. (Japan) | | | 108,817 | |
| 350 | | TPC Group, Inc.* | | | 11,498 | |
| 1,200 | | Valspar Corp. (The) | | | 51,888 | |
| | | | | | |
| | | | | 6,298,714 | |
| |
Clothing & Apparel 0.9% | | | | |
| 11,009 | | Coach, Inc. | | | 771,180 | |
| 15,200 | | NIKE, Inc. (Class B Stock) | | | 1,580,648 | |
| 1,747 | | Steven Madden Ltd.* | | | 71,872 | |
| 1,052 | | VF Corp. | | | 138,327 | |
| | | | | | |
| | | | | 2,562,027 | |
| |
Commercial Banks 2.2% | | | | |
| 4,500 | | Allied Irish Banks PLC (Ireland)* | | | 453 | |
| 4,800 | | Alpha Bank A.E. (Greece)* | | | 9,543 | |
| 3,275 | | Associated Banc-Corp. | | | 40,806 | |
| 8,300 | | Banco Espirito Santo SA (Portugal) | | | 13,712 | |
| 18,500 | | Banco Santander SA (Spain) | | | 143,983 | |
| 700 | | Bank of Hawaii Corp. | | | 32,004 | |
See Notes to Financial Statements.
| | |
| 12 | | Visit our website at www.prudentialfunds.com |
| | | | | | |
| Shares | | Description | | Value (Note 1) | |
| | | | | | |
COMMON STOCKS (Continued) | | | | |
| |
Commercial Banks (cont’d.) | | | | |
| 15,000 | | Bank of Ireland (Ireland)* | | $ | 2,237 | |
| 32,300 | | Barclays PLC (United Kingdom) | | | 108,184 | |
| 5,000 | | Chiba Bank Ltd. (The) (Japan) | | | 30,963 | |
| 25,070 | | Fifth Third Bancorp | | | 326,161 | |
| 3,036 | | FirstMerit Corp. | | | 47,635 | |
| 27,148 | | KeyCorp | | | 210,940 | |
| 21,579 | | PNC Financial Services Group, Inc. | | | 1,271,435 | |
| 975 | | Prosperity Bancshares, Inc. | | | 40,472 | |
| 25,700 | | Regions Financial Corp. | | | 134,154 | |
| 7,700 | | Sumitomo Mitsui Financial Group, Inc. (Japan) | | | 244,982 | |
| 13,410 | | Sumitomo Mitsui Trust Holdings, Inc. (Japan) | | | 41,873 | |
| 2,200 | | Trustmark Corp. | | | 51,854 | |
| 39,100 | | Turkiye Garanti Bankasi A/S (Turkey) | | | 141,274 | |
| 947 | | UMB Financial Corp. | | | 36,535 | |
| 1,200 | | United Bankshares, Inc. | | | 33,492 | |
| 550 | | Webster Financial Corp. | | | 11,660 | |
| 104,542 | | Wells Fargo & Co. | | | 3,053,672 | |
| | | | | | |
| | | | | 6,028,024 | |
| |
Commercial Services 0.1% | | | | |
| 1,664 | | Acacia Research - Acacia Technologies* | | | 68,490 | |
| 2,825 | | KAR Auction Services, Inc.* | | | 41,640 | |
| 4,700 | | Nichii Gakkan Co. (Japan) | | | 56,731 | |
| 2,026 | | PAREXEL International Corp.* | | | 48,827 | |
| | | | | | |
| | | | | 215,688 | |
| |
Commercial Services & Supplies 1.0% | | | | |
| 550 | | Consolidated Graphics, Inc.* | | | 27,935 | |
| 2,425 | | Corrections Corp. of America* | | | 57,060 | |
| 3,030 | | FleetCor Technologies, Inc.* | | | 102,990 | |
| 3,749 | | GEO Group, Inc. (The)* | | | 65,907 | |
| 1,132 | | MasterCard, Inc. (Class A Stock) | | | 402,505 | |
| 1,000 | | McGrath RentCorp | | | 31,840 | |
| 1,503 | | Sotheby’s | | | 50,396 | |
| 6,770 | | Verisk Analytics, Inc. (Class A Stock)* | | | 271,274 | |
| 17,038 | | Visa, Inc. (Class A Stock) | | | 1,714,704 | |
| 2,536 | | Waste Connections, Inc. | | | 81,938 | |
| | | | | | |
| | | | | 2,806,549 | |
See Notes to Financial Statements.
| | | | |
| Target Asset Allocation Funds/Target Moderate Allocation Fund | | | 13 | |
Portfolio of Investments
as of January 31, 2012 (Unaudited) continued
| | | | | | |
| Shares | | Description | | Value (Note 1) | |
| | | | | | |
COMMON STOCKS (Continued) | | | | |
| |
Communications Equipment | | | | |
| 4,700 | | Arris Group, Inc.* | | $ | 54,896 | |
| 1,950 | | Calix, Inc.* | | | 14,761 | |
| 1,300 | | Cisco Systems, Inc. | | | 25,519 | |
| | | | | | |
| | | | | 95,176 | |
| |
Computer Hardware 1.8% | | | | |
| 10,683 | | Apple, Inc.* | | | 4,876,576 | |
| |
Computer Services & Software 1.2% | | | | |
| 1,482 | | 3D Systems Corp.* | | | 28,336 | |
| 17,733 | | Accenture PLC (Class A Stock) (Ireland) | | | 1,016,810 | |
| 2,802 | | Allscripts Healthcare Solutions, Inc.* | | | 53,574 | |
| 7,120 | | Autodesk, Inc.* | | | 256,320 | |
| 25,140 | | EMC Corp.* | | | 647,606 | |
| 3,906 | | Fortinet, Inc.* | | | 89,096 | |
| 1,000 | | Global Payments, Inc. | | | 50,020 | |
| 1,319 | | Informatica Corp.* | | | 55,794 | |
| 1,500 | | Itochu Techno-Solutions Corp. (Japan) | | | 69,372 | |
| 16,192 | | Micro Focus International PLC (United Kingdom) | | | 107,853 | |
| 2,020 | | MSCI, Inc. (Class A Stock)* | | | 65,812 | |
| 3,560 | | Nuance Communications, Inc.* | | | 101,531 | |
| 828 | | Opnet Technologies, Inc. | | | 29,353 | |
| 2,716 | | QLIK Technologies, Inc.* | | | 76,591 | |
| 1,111 | | Riverbed Technology, Inc.* | | | 26,597 | |
| 261 | | salesforce.com, Inc.* | | | 30,485 | |
| 7,068 | | SAP AG (Germany) | | | 427,038 | |
| 1,225 | | Super Micro Computer, Inc.* | | | 20,678 | |
| 6,700 | | Tieto Oyj (Finland) | | | 101,135 | |
| 2,150 | | VeriFone Systems, Inc.* | | | 91,805 | |
| 610 | | VMware, Inc. (Class A Stock)* | | | 55,675 | |
| | | | | | |
| | | | | 3,401,481 | |
| |
Computers & Peripherals 0.5% | | | | |
| 6,320 | | Cognizant Technology Solutions Corp. (Class A Stock)* | | | 453,460 | |
| 32,356 | | Hewlett-Packard Co. | | | 905,321 | |
| 2,500 | | QLogic Corp.* | | | 43,300 | |
| | | | | | |
| | | | | 1,402,081 | |
|
Construction & Engineering 0.2% | |
| 8,800 | | COMSYS Holdings Corp. (Japan) | | | 98,483 | |
See Notes to Financial Statements.
| | |
| 14 | | Visit our website at www.prudentialfunds.com |
| | | | | | |
| Shares | | Description | | Value (Note 1) | |
| | | | | | |
COMMON STOCKS (Continued) | | | | |
|
Construction & Engineering (cont’d.) | |
| 2,800 | | Fluor Corp. | | $ | 157,472 | |
| 9,800 | | Kyowa Exeo Corp. (Japan) | | | 98,232 | |
| 1,850 | | MasTec, Inc.* | | | 30,137 | |
| 950 | | MYR Group, Inc.* | | | 18,981 | |
| 4,300 | | NCC AB (Class B Stock) (Sweden) | | | 88,876 | |
| 1,914 | | Northwest Pipe Co.* | | | 43,658 | |
| 728 | | Texas Industries, Inc. | | | 22,757 | |
| 1,000 | | URS Corp.* | | | 41,150 | |
| | | | | | |
| | | | | 599,746 | |
|
Consumer Finance 0.4% | |
| 10,959 | | American Express Co. | | | 549,485 | |
| 6,200 | | Capital One Financial Corp. | | | 283,650 | |
| 3,628 | | Cash America International, Inc. | | | 159,124 | |
| 825 | | First Cash Financial Services, Inc.* | | | 33,206 | |
| | | | | | |
| | | | | 1,025,465 | |
|
Consumer Products & Services 0.4% | |
| 780 | | Colgate-Palmolive Co. | | | 70,761 | |
| 9,662 | | Estee Lauder Cos., Inc. (The) (Class A Stock) | | | 559,720 | |
| 155,400 | | Pacific Brands Ltd. (Australia) | | | 102,288 | |
| 7,097 | | Reckitt Benckiser Group PLC (United Kingdom) | | | 377,552 | |
| 2,778 | | Vitamin Shoppe, Inc.* | | | 118,732 | |
| | | | | | |
| | | | | 1,229,053 | |
|
Containers & Packaging 0.1% | |
| 950 | | Packaging Corp. of America | | | 26,733 | |
| 20,400 | | Rexam PLC (United Kingdom) | | | 120,227 | |
| 1,775 | | Silgan Holdings, Inc. | | | 73,769 | |
| | | | | | |
| | | | | 220,729 | |
|
Cosmetics & Toiletries 0.1% | |
| 8,800 | | Natura Cosmeticos SA (Brazil) | | | 188,471 | |
|
Distribution/Wholesale 0.3% | |
| 160,000 | | Li & Fung Ltd. (Bermuda) | | | 349,903 | |
| 2,170 | | LKQ Corp.* | | | 70,742 | |
| 6,100 | | Mitsui & Co. Ltd. (Japan) | | | 103,561 | |
| 18,000 | | Sumitomo Corp. (Japan) | | | 258,593 | |
See Notes to Financial Statements.
| | | | |
| Target Asset Allocation Funds/Target Moderate Allocation Fund | | | 15 | |
Portfolio of Investments
as of January 31, 2012 (Unaudited) continued
| | | | | | |
| Shares | | Description | | Value (Note 1) | |
| | | | | | |
COMMON STOCKS (Continued) | | | | |
|
Distribution/Wholesale (cont’d.) | |
| 6,200 | | Toyota Tsusho Corp. (Japan) | | $ | 117,541 | |
| | | | | | |
| | | | | 900,340 | |
|
Diversified Consumer Services 0.1% | |
| 14,400 | | H&R Block, Inc. | | | 235,584 | |
|
Diversified Financial Services 1.3% | |
| 48,359 | | Bank of America Corp. | | | 344,799 | |
| 20,150 | | BM&FBOVESPA SA (Brazil) | | | 126,745 | |
| 22,900 | | Challenger Ltd. (Australia) | | | 107,458 | |
| 24,544 | | Citigroup, Inc. | | | 753,992 | |
| 3,200 | | Fuyo General Lease Co. Ltd. (Japan) | | | 117,302 | |
| 59,429 | | JPMorgan Chase & Co. | | | 2,216,702 | |
| 11,400 | | Tullett Prebon PLC (United Kingdom) | | | 53,497 | |
| | | | | | |
| | | | | 3,720,495 | |
| |
Diversified Manufacturing Operations 0.2% | | | | |
| 15,800 | | Cookson Group PLC (United Kingdom) | | | 143,659 | |
| 3,000 | | Siemens AG (Germany) | | | 283,087 | |
| | | | | | |
| | | | | 426,746 | |
| |
Diversified Operations 0.2% | | | | |
| 3,266 | | LVMH Moet Hennessy Louis Vuitton SA (France) | | | 528,028 | |
| |
Diversified Telecommunication Services 0.5% | | | | |
| 38,975 | | AT&T, Inc. | | | 1,146,255 | |
| 9,800 | | Koninklijke KPN NV (Netherlands) | | | 107,422 | |
| | | | | | |
| | | | | 1,253,677 | |
| |
Electric Utilities 0.9% | | | | |
| 19,901 | | American Electric Power Co., Inc. | | | 787,284 | |
| 15,300 | | Edison International | | | 627,912 | |
| 300 | | El Paso Electric Co. | | | 10,440 | |
| 44,200 | | Enel SpA (Italy) | | | 180,731 | |
| 13,000 | | Exelon Corp. | | | 517,140 | |
| 175 | | Great Plains Energy, Inc. | | | 3,609 | |
| 18,408 | | PPL Corp. | | | 511,558 | |
| | | | | | |
| | | | | 2,638,674 | |
| |
Electrical Equipment | | | | |
| 3,456 | | GrafTech International Ltd.* | | | 56,747 | |
See Notes to Financial Statements.
| | |
| 16 | | Visit our website at www.prudentialfunds.com |
| | | | | | |
| Shares | | Description | | Value (Note 1) | |
| | | | | | |
COMMON STOCKS (Continued) | | | | |
| |
Electronic Components 0.2% | | | | |
| 2,228 | | DTS, Inc.* | | $ | 63,119 | |
| 1,176 | | Fanuc Corp. (Japan) | | | 197,646 | |
| 2,000 | | FLIR Systems, Inc. | | | 51,500 | |
| 1,163 | | Itron, Inc.* | | | 45,113 | |
| 10,000 | | Nippon Electric Glass Co. Ltd. (Japan) | | | 87,116 | |
| | | | | | |
| | | | | 444,494 | |
| |
Electronic Equipment & Instruments 0.2% | | | | |
| 1,657 | | Coherent, Inc.* | | | 92,593 | |
| 17,400 | | Corning, Inc. | | | 223,938 | |
| 1,800 | | EnerSys* | | | 52,164 | |
| 28,000 | | Kingboard Chemical Holdings Ltd. (Cayman Islands) | | | 96,579 | |
| 575 | | ScanSource, Inc.* | | | 21,603 | |
| 4,750 | | TE Connectivity Ltd. (Switzerland) | | | 161,975 | |
| 941 | | Universal Display Corp.* | | | 39,625 | |
| | | | | | |
| | | | | 688,477 | |
| |
Energy Equipment & Services 1.0% | | | | |
| 7,630 | | Cameron International Corp.* | | | 405,916 | |
| 600 | | Core Laboratories NV (Netherlands) | | | 63,738 | |
| 3,000 | | Diamond Offshore Drilling, Inc. | | | 186,900 | |
| 435 | | Dril-Quip, Inc.* | | | 28,697 | |
| 8,330 | | Ensco PLC, ADR (United Kingdom) | | | 438,491 | |
| 32,778 | | Halliburton Co. | | | 1,205,575 | |
| 3,635 | | Lufkin Industries, Inc. | | | 273,425 | |
| 750 | | Oil States International, Inc.* | | | 59,768 | |
| 948 | | OYO Geospace Corp.* | | | 83,433 | |
| 800 | | Unit Corp.* | | | 36,200 | |
| | | | | | |
| | | | | 2,782,143 | |
| |
Entertainment & Leisure 0.4% | | | | |
| 7,324 | | Carnival Corp. (Panama) | | | 221,185 | |
| 7,366 | | Carnival PLC (United Kingdom) | | | 219,378 | |
| 10,104 | | Hennes & Mauritz AB (Class B Stock) (Sweden) | | | 330,785 | |
| 1,300 | | Life Time Fitness, Inc.* | | | 63,882 | |
| 4,060 | | Pinnacle Entertainment, Inc.* | | | 39,382 | |
| 3,540 | | Royal Caribbean Cruises Ltd. (Liberia) | | | 96,217 | |
| 1,300 | | Sankyo Co. Ltd. (Japan) | | | 63,533 | |
| 36,200 | | Thomas Cook Group PLC (United Kingdom) | | | 7,701 | |
| | | | | | |
| | | | | 1,042,063 | |
See Notes to Financial Statements.
| | | | |
| Target Asset Allocation Funds/Target Moderate Allocation Fund | | | 17 | |
Portfolio of Investments
as of January 31, 2012 (Unaudited) continued
| | | | | | |
| Shares | | Description | | Value (Note 1) | |
| | | | | | |
COMMON STOCKS (Continued) | | | | |
| |
Environmental Control | | | | |
| 1,600 | | Stericycle, Inc.* | | $ | 134,432 | |
| |
Equipment Services | | | | |
| 19,200 | | Downer EDI Ltd. (Australia)* | | | 73,585 | |
| |
Farming & Agriculture | | | | |
| 58,000 | | Chaoda Modern Agriculture Holdings Ltd. (Cayman Islands) | | | 75 | |
| |
Financial—Bank & Trust 0.8% | | | | |
| 2,850 | | Astoria Financial Corp. | | | 23,741 | |
| 10,000 | | Banco Bilbao Vizcaya Argentaria SA (Spain) | | | 87,299 | |
| 15,800 | | Bank of Queensland Ltd. (Australia) | | | 127,147 | |
| 3,200 | | BNP Paribas (France) | | | 135,493 | |
| 94,862 | | China Merchants Bank Co. Ltd. (Class H Stock) (China) | | | 209,410 | |
| 11,400 | | Credit Agricole SA (France) | | | 70,249 | |
| 15,800 | | Credit Suisse Group AG (Switzerland)* | | | 409,890 | |
| 3,100 | | Danske Bank A/S (Denmark)* | | | 45,273 | |
| 3,100 | | Deutsche Bank AG (Germany) | | | 131,319 | |
| 5,860 | | Dexia SA (Belgium)* | | | 2,568 | |
| 7,700 | | DnB NOR ASA (Norway) | | | 81,239 | |
| 56,700 | | Mitsubishi UFJ Financial Group, Inc. (Japan) | | | 259,621 | |
| 10,500 | | National Australia Bank Ltd. (Australia) | | | 265,864 | |
| 1,675 | | Societe Generale (France) | | | 44,619 | |
| 2,900 | | Svenska Handelsbanken AB (Class A Stock) (Sweden) | | | 86,968 | |
| 6,200 | | UBS AG (Switzerland)* | | | 84,395 | |
| 400 | | Verwaltungs-und Privat-Bank AG (Liechtenstein) | | | 36,480 | |
| | | | | | |
| | | | | 2,101,575 | |
| |
Financial Services 0.9% | | | | |
| 1,960 | | Affiliated Managers Group, Inc.* | | | 197,000 | |
| 3,028 | | Ameriprise Financial, Inc. | | | 162,149 | |
| 1,534 | | BlackRock, Inc. | | | 279,188 | |
| 1,600 | | Eaton Vance Corp. | | | 41,104 | |
| 16,795 | | Hong Kong Exchanges and Clearing Ltd. (Hong Kong) | | | 291,492 | |
| 265,984 | | Industrial & Commercial Bank of China Ltd. (Class H Stock) (China) | | | 186,233 | |
| 7,400 | | Irish Life & Permanent Group Holdings PLC (Ireland)* | | | 310 | |
| 1,900 | | Jefferies Group, Inc. | | | 28,899 | |
| 46,761 | | U.S. Bancorp | | | 1,319,595 | |
| | | | | | |
| | | | | 2,505,970 | |
See Notes to Financial Statements.
| | |
| 18 | | Visit our website at www.prudentialfunds.com |
| | | | | | |
| Shares | | Description | | Value (Note 1) | |
| | | | | | |
COMMON STOCKS (Continued) | | | | |
| |
Food & Beverage | | | | |
| 12,400 | | Dairy Crest Group PLC (United Kingdom) | | $ | 61,257 | |
| |
Food & Staples Retailing 0.8% | | | | |
| 28,345 | | CVS Caremark Corp. | | | 1,183,404 | |
| 8,400 | | Kroger Co. (The) | | | 199,584 | |
| 12,900 | | Safeway, Inc. | | | 283,542 | |
| 87,500 | | Wal-Mart de Mexico SAB de CV (Class V Stock) (Mexico) | | | 270,205 | |
| 6,315 | | Wal-Mart Stores, Inc. | | | 387,488 | |
| | | | | | |
| | | | | 2,324,223 | |
| |
Food Products 0.3% | | | | |
| 12,100 | | ConAgra Foods, Inc. | | | 322,707 | |
| 14,809 | | Kraft Foods, Inc. (Class A Stock) | | | 567,185 | |
| | | | | | |
| | | | | 889,892 | |
| |
Foods 0.9% | | | | |
| 3,611 | | Danone (France) | | | 222,871 | |
| 2,600 | | Delhaize Group (Belgium) | | | 141,597 | |
| 1,689 | | Fresh Market, Inc. (The)* | | | 72,728 | |
| 3,030 | | General Mills, Inc. | | | 120,685 | |
| 142,658 | | Goodman Fielder Ltd. (Australia) | | | 79,513 | |
| 41,400 | | J. Sainsbury PLC (United Kingdom) | | | 188,146 | |
| 16,000 | | Koninklijke Ahold NV (Netherlands) | | | 212,008 | |
| 23,700 | | Metcash Ltd. (Australia) | | | 101,651 | |
| 2,900 | | Metro AG (Germany) | | | 111,562 | |
| 10,183 | | Nestle SA (Switzerland) | | | 583,545 | |
| 57,014 | | Tesco PLC (United Kingdom) | | | 287,137 | |
| 8,963 | | Unilever NV (Netherlands) | | | 298,916 | |
| 42,100 | | WM Morrison Supermarkets PLC (United Kingdom) | | | 189,735 | |
| | | | | | |
| | | | | 2,610,094 | |
| |
Hand/Machine Tools 0.1% | | | | |
| 3,280 | | Stanley Black & Decker, Inc. | | | 230,190 | |
| |
Healthcare Equipment & Supplies 0.5% | | | | |
| 17,445 | | Covidien PLC (Ireland) | | | 898,417 | |
| 4,400 | | Medtronic, Inc. | | | 169,708 | |
| 2,140 | | Sirona Dental Systems, Inc.* | | | 103,469 | |
| 950 | | Teleflex, Inc. | | | 58,131 | |
| 1,759 | | Thoratec Corp.* | | | 51,715 | |
See Notes to Financial Statements.
| | | | |
| Target Asset Allocation Funds/Target Moderate Allocation Fund | | | 19 | |
Portfolio of Investments
as of January 31, 2012 (Unaudited) continued
| | | | | | |
| Shares | | Description | | Value (Note 1) | |
| | | | | | |
COMMON STOCKS (Continued) | | | | |
| |
Healthcare Equipment & Supplies (cont’d.) | | | | |
| 850 | | West Pharmaceutical Services, Inc. | | $ | 34,408 | |
| 1,800 | | Zimmer Holdings, Inc.* | | | 109,350 | |
| | | | | | |
| | | | | 1,425,198 | |
| |
Healthcare Products 0.1% | | | | |
| 2,641 | | Arthrocare Corp.* | | | 81,633 | |
| 4,193 | | Bruker Corp.* | | | 59,541 | |
| 800 | | Cantel Medical Corp. | | | 25,256 | |
| 1,738 | | Cepheid, Inc.* | | | 76,576 | |
| 950 | | IDEXX Laboratories, Inc.* | | | 80,361 | |
| | | | | | |
| | | | | 323,367 | |
| |
Healthcare Providers & Services 0.5% | | | | |
| 1,400 | | Amedisys, Inc.* | | | 14,700 | |
| 2,285 | | Centene Corp.* | | | 103,282 | |
| 8,500 | | CIGNA Corp. | | | 381,055 | |
| 575 | | Owens & Minor, Inc. | | | 17,486 | |
| 14,535 | | UnitedHealth Group, Inc. | | | 752,767 | |
| | | | | | |
| | | | | 1,269,290 | |
| |
Healthcare Services 0.2% | | | | |
| 685 | | Air Methods Corp.* | | | 57,746 | |
| 2,197 | | AMERIGROUP Corp.* | | | 149,418 | |
| 800 | | Covance, Inc.* | | | 35,048 | |
| 1,500 | | Healthways, Inc.* | | | 11,340 | |
| 1,999 | | Humana, Inc. | | | 177,951 | |
| 875 | | LifePoint Hospitals, Inc.* | | | 35,166 | |
| 800 | | MEDNAX, Inc.* | | | 56,976 | |
| | | | | | |
| | | | | 523,645 | |
| |
Healthcare Technology | | | | |
| 9,300 | | AGFA-Gevaert NV (Belgium)* | | | 16,787 | |
| |
Holding Companies - Diversified 0.1% | | | | |
| 161,000 | | First Pacific Co. Ltd. (Bermuda) | | | 183,934 | |
|
Home Furnishings | |
| 6,300 | | Electrolux AB (Class B Stock) (Sweden) | | | 115,396 | |
See Notes to Financial Statements.
| | |
| 20 | | Visit our website at www.prudentialfunds.com |
| | | | | | |
| Shares | | Description | | Value (Note 1) | |
| | | | | | |
COMMON STOCKS (Continued) | | | | |
|
Hotels, Restaurants & Leisure 1.2% | |
| 2,100 | | Bally Technologies, Inc.* | | $ | 88,662 | |
| 1,834 | | BJ’s Restaurants, Inc.* | | | 91,755 | |
| 700 | | Choice Hotels International, Inc. | | | 25,438 | |
| 5,410 | | Las Vegas Sands Corp.* | | | 265,685 | |
| 14,416 | | McDonald’s Corp. | | | 1,427,905 | |
| 4,814 | | Orient-Express Hotels Ltd. (Class A Stock) (Bermuda)* | | | 40,726 | |
| 10,127 | | Shuffle Master, Inc.* | | | 129,626 | |
| 10,422 | | Wynn Resorts Ltd. | | | 1,200,927 | |
| | | | | | |
| | | | | 3,270,724 | |
|
Household Durables 0.1% | |
| 5,800 | | Alpine Electronics, Inc. (Japan) | | | 73,052 | |
| 1,100 | | Helen of Troy Ltd. (Bermuda)* | | | 35,387 | |
| 2,966 | | Universal Electronics, Inc.* | | | 54,871 | |
| | | | | | |
| | | | | 163,310 | |
|
Household Products 0.1% | |
| 5,100 | | Kimberly-Clark Corp. | | | 364,956 | |
| 550 | | WD-40 Co. | | | 24,057 | |
| | | | | | |
| | | | | 389,013 | |
|
Independent Power Producers & Energy Traders | |
| 8,700 | | Drax Group PLC (United Kingdom) | | | 72,866 | |
|
Industrial Conglomerates 0.5% | |
| 68,081 | | General Electric Co. | | | 1,273,795 | |
|
Insurance 2.5% | |
| 4,724 | | ACE Ltd. (Switzerland) | | | 328,790 | |
| 7,600 | | Aegon NV (Netherlands)* | | | 36,832 | |
| 3,950 | | Allianz SE (Germany) | | | 434,319 | |
| 32,900 | | Allstate Corp. (The) | | | 949,165 | |
| 1,200 | | American Equity Investment Life Holding Co. | | | 13,836 | |
| 6,935 | | Aon Corp. | | | 335,862 | |
| 21,100 | | Aviva PLC (United Kingdom) | | | 116,173 | |
| 4,600 | | AXA SA (France) | | | 69,827 | |
| 1,900 | | Baloise Holding AG (Switzerland) | | | 145,725 | |
| 37,900 | | Beazley PLC (United Kingdom) | | | 83,731 | |
| 46,000 | | China Life Insurance Co. Ltd. (Class H Stock) (China) | | | 135,533 | |
| 4,275 | | CNO Financial Group, Inc.* | | | 28,728 | |
See Notes to Financial Statements.
| | | | |
| Target Asset Allocation Funds/Target Moderate Allocation Fund | | | 21 | |
Portfolio of Investments
as of January 31, 2012 (Unaudited) continued
| | | | | | |
| Shares | | Description | | Value (Note 1) | |
| | | | | | |
COMMON STOCKS (Continued) | | | | |
|
Insurance (cont’d.) | |
| 112 | | Dai-ichi Life Insurance Co. Ltd. (The) (Japan) | | $ | 117,554 | |
| 1,200 | | Delphi Financial Group, Inc. (Class A Stock) | | | 53,412 | |
| 2,162 | | HCC Insurance Holdings, Inc. | | | 60,017 | |
| 23,800 | | ING Groep NV, CVA (Netherlands)* | | | 216,613 | |
| 61,400 | | Legal & General Group PLC (United Kingdom) | | | 111,654 | |
| 200 | | Loews Corp. | | | 7,462 | |
| 31,839 | | MetLife, Inc. | | | 1,124,872 | |
| 1,200 | | Muenchener Rueckversicherungs AG (Germany) | | | 156,338 | |
| 50,900 | | Old Mutual PLC (United Kingdom) | | | 117,104 | |
| 2,000 | | Protective Life Corp. | | | 50,020 | |
| 900 | | Reinsurance Group of America, Inc. | | | 49,041 | |
| 3,300 | | SCOR SE (France) | | | 83,029 | |
| 1,100 | | State Auto Financial Corp. | | | 13,772 | |
| 900 | | Swiss Life Holding AG (Switzerland)* | | | 89,364 | |
| 3,200 | | Swiss Re Ltd. (Switzerland)* | | | 173,575 | |
| 1,900 | | Tower Group, Inc. | | | 41,021 | |
| 10,513 | | Travelers Cos., Inc. (The) | | | 612,908 | |
| 1,000 | | United Fire & Casualty Co. | | | 19,630 | |
| 10,400 | | Unum Group | | | 237,432 | |
| 2,153 | | Validus Holdings Ltd. (Bermuda) | | | 69,047 | |
| 26,928 | | XL Group PLC (Ireland) | | | 545,831 | |
| 800 | | Zurich Financial Services AG (Switzerland)* | | | 192,070 | |
| | | | | | |
| | | | | 6,820,287 | |
|
Internet 0.3% | |
| 2,210 | | F5 Networks, Inc.* | | | 264,625 | |
| 6,862 | | Sapient Corp. | | | 88,520 | |
| 7,306 | | Tencent Holdings Ltd. (Cayman Islands) | | | 178,710 | |
| 3,800 | | Yandex NV (Class A Stock) (Netherlands)* | | | 77,406 | |
| 10,437 | | Youku.com, Inc., ADR (Cayman Islands)* | | | 223,247 | |
| | | | | | |
| | | | | 832,508 | |
|
Internet Services 1.4% | |
| 951 | | Amazon.com, Inc.* | | | 184,913 | |
| 1,300 | | Digital River, Inc.* | | | 20,813 | |
| 3,673 | | Google, Inc. (Class A Stock)* | | | 2,130,744 | |
| 2,815 | | priceline.com, Inc.* | | | 1,490,486 | |
| | | | | | |
| | | | | 3,826,956 | |
See Notes to Financial Statements.
| | |
| 22 | | Visit our website at www.prudentialfunds.com |
| | | | | | |
| Shares | | Description | | Value (Note 1) | |
| | | | | | |
COMMON STOCKS (Continued) | | | | |
|
Internet Software & Services 1.0% | |
| 10,508 | | Baidu, Inc., ADR (Cayman Islands)* | | $ | 1,339,980 | |
| 43,725 | | Oracle Corp. | | | 1,233,045 | |
| 2,740 | | VeriSign, Inc. | | | 101,545 | |
| | | | | | |
| | | | | 2,674,570 | |
|
Investment Companies 0.2% | |
| 645,000 | | Hutchison Port Holdings Trust (Singapore) | | | 483,750 | |
| 3,538 | | KKR Financial Holdings LLC | | | 31,311 | |
| | | | | | |
| | | | | 515,061 | |
|
IT Services 0.3% | |
| 500 | | CACI International, Inc. (Class A Stock)* | | | 29,345 | |
| 4,122 | | International Business Machines Corp. | | | 793,897 | |
| 51,000 | | Logica PLC (United Kingdom) | | | 60,917 | |
| | | | | | |
| | | | | 884,159 | |
|
Leisure Equipment & Products 0.1% | |
| 6,100 | | Mattel, Inc. | | | 189,100 | |
|
Life Sciences Tools & Services 0.3% | |
| 1,657 | | ICON PLC, ADR (Ireland)* | | | 32,328 | |
| 12,834 | | Thermo Fisher Scientific, Inc.* | | | 678,919 | |
| | | | | | |
| | | | | 711,247 | |
|
Machinery 1.1% | |
| 2,075 | | Actuant Corp. (Class A Stock) | | | 52,601 | |
| 28,000 | | BlueScope Steel Ltd. (Australia) | | | 12,039 | |
| 9,339 | | Cummins, Inc. | | | 971,256 | |
| 2,422 | | Deere & Co. | | | 208,655 | |
| 1,000 | | Franklin Electric Co., Inc. | | | 50,060 | |
| 13,663 | | Komatsu Ltd. (Japan) | | | 385,224 | |
| 44,000 | | Mitsui Engineering & Shipbuilding Co. Ltd. (Japan) | | | 77,355 | |
| 9,300 | | PACCAR, Inc. | | | 411,060 | |
| 2,700 | | Parker Hannifin Corp. | | | 217,836 | |
| 950 | | Regal-Beloit Corp. | | | 53,932 | |
| 1,800 | | Rheinmetall AG (Germany) | | | 96,522 | |
| 5,754 | | Rockwell Automation, Inc. | | | 448,064 | |
| 1,000 | | Snap-on, Inc. | | | 56,510 | |
| 1,410 | | Terex Corp.* | | | 27,918 | |
| 979 | | Twin Disc, Inc. | | | 30,280 | |
See Notes to Financial Statements.
| | | | |
| Target Asset Allocation Funds/Target Moderate Allocation Fund | | | 23 | |
Portfolio of Investments
as of January 31, 2012 (Unaudited) continued
| | | | | | |
| Shares | | Description | | Value (Note 1) | |
| | | | | | |
COMMON STOCKS (Continued) | | | | |
|
Machinery (cont’d.) | |
| 550 | | Valmont Industries, Inc. | | $ | 57,701 | |
| | | | | | |
| | | | | 3,157,013 | |
|
Manufacturing 0.7% | |
| 492 | | Colfax Corp.* | | | 14,937 | |
| 26,150 | | Danaher Corp. | | | 1,373,137 | |
| 8,569 | | Eaton Corp. | | | 420,138 | |
| 3,650 | | Polypore International, Inc.* | | | 138,992 | |
| | | | | | |
| | | | | 1,947,204 | |
|
Media 2.1% | |
| 57,498 | | British Sky Broadcasting Group PLC (United Kingdom) | | | 625,175 | |
| 8,100 | | CBS Corp. (Class B Stock) | | | 230,688 | |
| 10,416 | | Comcast Corp. (Class A Stock) | | | 276,961 | |
| 29,917 | | Comcast Corp. (Special Class A Stock) | | | 762,584 | |
| 4,100 | | Discovery Communications, Inc. (Class A Stock)* | | | 175,808 | |
| 2,900 | | Interpublic Group of Cos., Inc. (The) | | | 29,957 | |
| 14,050 | | News Corp. (Class A Stock) | | | 264,562 | |
| 9,896 | | Pearson PLC (United Kingdom) | | | 182,919 | |
| 51,435 | | Time Warner, Inc. | | | 1,906,181 | |
| 10,480 | | Viacom, Inc. (Class B Stock) | | | 492,979 | |
| 11,500 | | Vivendi (France) | | | 240,680 | |
| 13,323 | | Walt Disney Co. (The) | | | 518,265 | |
| 975 | | Wiley, (John) & Sons, Inc. (Class A Stock) | | | 44,255 | |
| | | | | | |
| | | | | 5,751,014 | |
|
Medical Supplies & Equipment 0.2% | |
| 1,462 | | Cooper Cos., Inc. (The) | | | 105,469 | |
| 4,690 | | Fresenius Medical Care AG & Co. KGaA (Germany) | | | 334,649 | |
| | | | | | |
| | | | | 440,118 | |
|
Metals & Mining 1.5% | |
| 1,700 | | AMCOL International Corp. | | | 48,552 | |
| 5,742 | | BHP Billiton Ltd. (Australia) | | | 228,478 | |
| 4,724 | | BHP Billiton Ltd., ADR (Australia) | | | 375,275 | |
| 13,400 | | Boliden AB (Sweden) | | | 229,095 | |
| 1,420 | | Cloud Peak Energy, Inc.* | | | 26,909 | |
| 17,982 | | Freeport-McMoRan Copper & Gold, Inc. | | | 830,948 | |
| 2,580 | | Joy Global, Inc. | | | 233,980 | |
| 33,800 | | Mincor Resources NL (Australia) | | | 26,733 | |
See Notes to Financial Statements.
| | |
| 24 | | Visit our website at www.prudentialfunds.com |
| | | | | | |
| Shares | | Description | | Value (Note 1) | |
| | | | | | |
COMMON STOCKS (Continued) | | | | |
|
Metals & Mining (cont’d.) | |
| 88,700 | | OneSteel Ltd. (Australia) | | $ | 69,685 | |
| 8,591 | | Precision Castparts Corp. | | | 1,406,175 | |
| 3,500 | | Rio Tinto Ltd. (Australia) | | | 256,983 | |
| 3,343 | | RTI International Metals, Inc.* | | | 84,143 | |
| 4,200 | | ThyssenKrupp AG (Germany) | | | 119,050 | |
| 1,200 | | Timken Co. | | | 58,596 | |
| 4,336 | | Titanium Metals Corp. | | | 66,688 | |
| 1,640 | | Vallourec SA (France) | | | 110,756 | |
| | | | | | |
| | | | | 4,172,046 | |
|
Multi-Line Retail 0.4% | |
| 2,517 | | Dollar Tree, Inc.* | | | 213,467 | |
| 7,000 | | J.C. Penney Co., Inc. | | | 290,850 | |
| 7,265 | | Kohl’s Corp. | | | 334,117 | |
| 4,845 | | Macy’s, Inc. | | | 163,228 | |
| | | | | | |
| | | | | 1,001,662 | |
|
Multi-Utilities 0.4% | |
| 3,400 | | Dominion Resources, Inc. | | | 170,136 | |
| 375 | | NorthWestern Corp. | | | 13,177 | |
| 24,064 | | Public Service Enterprise Group, Inc. | | | 730,102 | |
| 3,000 | | RWE AG (Germany) | | | 114,742 | |
| | | | | | |
| | | | | 1,028,157 | |
|
Office Electronics 0.2% | |
| 5,091 | | Canon, Inc. (Japan) | | | 219,751 | |
| 48,000 | | Xerox Corp. | | | 372,000 | |
| | | | | | |
| | | | | 591,751 | |
|
Oil, Gas & Consumable Fuels 6.0% | |
| 2,359 | | Air Liquide SA (France) | | | 296,904 | |
| 8,148 | | Anadarko Petroleum Corp. | | | 657,707 | |
| 4,579 | | Apache Corp. | | | 452,772 | |
| 1,275 | | Atmos Energy Corp. | | | 41,323 | |
| 4,118 | | Baker Hughes, Inc. | | | 202,317 | |
| 15,853 | | BG Group PLC (United Kingdom) | | | 355,981 | |
| 49,400 | | BP PLC (United Kingdom) | | | 366,530 | |
| 4,280 | | Cabot Oil & Gas Corp. | | | 136,532 | |
| 6,160 | | Canadian Natural Resources Ltd. (Canada) | | | 244,016 | |
| 4,838 | | Cenovus Energy, Inc. (Canada) | | | 176,546 | |
See Notes to Financial Statements.
| | | | |
| Target Asset Allocation Funds/Target Moderate Allocation Fund | | | 25 | |
Portfolio of Investments
as of January 31, 2012 (Unaudited) continued
| | | | | | |
| Shares | | Description | | Value (Note 1) | |
| �� | | | | | |
COMMON STOCKS (Continued) | | | | |
|
Oil, Gas & Consumable Fuels (cont’d.) | |
| 13,200 | | Chesapeake Energy Corp. | | $ | 278,916 | |
| 12,167 | | Chevron Corp. | | | 1,254,174 | |
| 153,054 | | CNOOC Ltd. (Hong Kong) | | | 314,582 | |
| 20,071 | | ConocoPhillips | | | 1,369,043 | |
| 2,436 | | Continental Resources, Inc.* | | | 196,536 | |
| 3,770 | | Dresser-Rand Group, Inc.* | | | 193,137 | |
| 10,700 | | ENI SpA (Italy) | | | 236,534 | |
| 2,600 | | EQT Corp. | | | 131,352 | |
| 7,510 | | Exxon Mobil Corp. | | | 628,887 | |
| 2,310 | | FMC Technologies, Inc.* | | | 118,064 | |
| 1,297 | | Gulfport Energy Corp.* | | | 42,632 | |
| 4,058 | | Hess Corp. | | | 228,465 | |
| 12,980 | | JX Holdings, Inc. (Japan) | | | 78,336 | |
| 14,000 | | Marathon Oil Corp. | | | 439,460 | |
| 12,862 | | National Oilwell Varco, Inc. | | | 951,531 | |
| 3,770 | | Noble Energy, Inc. | | | 379,526 | |
| 4,747 | | Oasis Petroleum, Inc.* | | | 160,164 | |
| 22,038 | | Occidental Petroleum Corp. | | | 2,198,731 | |
| 2,340 | | Oceaneering International, Inc. | | | 113,701 | |
| 4,300 | | OMV AG (Austria) | | | 140,980 | |
| 700 | | ONEOK, Inc. | | | 58,212 | |
| 8,318 | | Peabody Energy Corp. | | | 283,561 | |
| 1,260 | | Pioneer Natural Resources Co. | | | 125,118 | |
| 7,500 | | Repsol YPF SA (Spain) | | | 206,017 | |
| 18,500 | | Royal Dutch Shell PLC (Class B Stock) (United Kingdom) | | | 672,979 | |
| 8,000 | | Royal Dutch Shell PLC (Class B Stock), ADR (United Kingdom) | | | 586,720 | |
| 6,222 | | Schlumberger Ltd. (Netherlands) | | | 467,708 | |
| 7,025 | | Sempra Energy | | | 399,723 | |
| 1,520 | | SM Energy Co. | | | 110,322 | |
| 1,025 | | South Jersey Industries, Inc. | | | 56,252 | |
| 5,400 | | Statoil ASA (Norway) | | | 135,391 | |
| 1,300 | | Swift Energy Co.* | | | 43,095 | |
| 6,000 | | Total SA (France) | | | 317,109 | |
| 10,700 | | Total SA, ADR (France) | | | 566,779 | |
| 8,600 | | Valero Energy Corp. | | | 206,314 | |
| 1,300 | | WGL Holdings, Inc. | | | 55,445 | |
| | | | | | |
| | | | | 16,676,124 | |
|
Paper & Forest Products 0.1% | |
| 7,500 | | International Paper Co. | | | 233,550 | |
See Notes to Financial Statements.
| | |
| 26 | | Visit our website at www.prudentialfunds.com |
| | | | | | |
| Shares | | Description | | Value (Note 1) | |
| | | | | | |
COMMON STOCKS (Continued) | | | | |
|
Paper & Forest Products (cont’d.) | |
| 11,800 | | Mondi PLC (United Kingdom) | | $ | 93,902 | |
| | | | | | |
| | | | | 327,452 | |
|
Pharmaceuticals 4.6% | |
| 11,230 | | Abbott Laboratories | | | 608,104 | |
| 10,794 | | Allergan, Inc. | | | 948,901 | |
| 2,870 | | AmerisourceBergen Corp. | | | 111,844 | |
| 7,767 | | Amgen, Inc. | | | 527,457 | |
| 7,200 | | AstraZeneca PLC (United Kingdom) | | | 346,555 | |
| 19,249 | | Bristol-Myers Squibb Co. | | | 620,588 | |
| 1,321 | | Catalyst Health Solutions, Inc.* | | | 72,338 | |
| 14,200 | | Eli Lilly & Co. | | | 564,308 | |
| 7,400 | | GlaxoSmithKline PLC (United Kingdom) | | | 164,418 | |
| 6,600 | | H. Lundbeck A/S (Denmark) | | | 130,064 | |
| 410 | | Herbalife Ltd. (Cayman Islands) | | | 23,731 | |
| 23,918 | | Johnson & Johnson | | | 1,576,435 | |
| 4,000 | | Kyorin Holdings, Inc. (Japan) | | | 69,536 | |
| 19,145 | | Mead Johnson Nutrition Co. | | | 1,418,453 | |
| 27,533 | | Merck & Co., Inc. | | | 1,053,413 | |
| 1,100 | | Merck KGaA (Germany) | | | 114,763 | |
| 8,449 | | Novartis AG (Switzerland) | | | 457,100 | |
| 3,300 | | Novartis AG, ADR (Switzerland) | | | 179,388 | |
| 3,452 | | Novo Nordisk A/S (Class B Stock) (Denmark) | | | 408,165 | |
| 1,051 | | Onyx Pharmaceuticals, Inc.* | | | 43,028 | |
| 75,515 | | Pfizer, Inc. | | | 1,616,021 | |
| 1,400 | | Roche Holding AG (Switzerland) | | | 236,958 | |
| 2,060 | | Salix Pharmaceuticals Ltd.* | | | 99,292 | |
| 5,400 | | Sanofi (France) | | | 398,872 | |
| 5,400 | | Sanofi, ADR (France) | | | 200,502 | |
| 51,899 | | Sinopharm Group Co. Ltd. (Class H Stock) (China) | | | 123,000 | |
| 400 | | Teva Pharmaceutical Industries Ltd. (Israel) | | | 18,024 | |
| 10,633 | | Teva Pharmaceutical Industries Ltd., ADR (Israel) | | | 479,867 | |
| 1,245 | | Theravance, Inc.* | | | 22,086 | |
| | | | | | |
| | | | | 12,633,211 | |
|
Professional Services 0.1% | |
| 2,602 | | Duff & Phelps Corp. (Class A Stock) | | | 39,889 | |
| 3,000 | | Manpower, Inc. | | | 120,330 | |
| 4,672 | | Monster Worldwide, Inc.* | | | 33,638 | |
See Notes to Financial Statements.
| | | | |
| Target Asset Allocation Funds/Target Moderate Allocation Fund | | | 27 | |
Portfolio of Investments
as of January 31, 2012 (Unaudited) continued
| | | | | | |
| Shares | | Description | | Value (Note 1) | |
| | | | | | |
COMMON STOCKS (Continued) | | | | |
|
Professional Services (cont’d.) | |
| 950 | | Towers Watson & Co. (Class A Stock) | | $ | 56,810 | |
| | | | | | |
| | | | | 250,667 | |
|
Real Estate | |
| 1,200 | | Meritage Homes Corp.* | | | 29,040 | |
|
Real Estate Investment Trusts 0.9% | |
| 11,179 | | American Tower Corp. | | | 709,978 | |
| 29,500 | | Annaly Capital Management, Inc. | | | 496,780 | |
| 2,846 | | AvalonBay Communities, Inc. | | | 387,084 | |
| 3,573 | | Boston Properties, Inc. | | | 371,771 | |
| 2,300 | | First Potomac Realty Trust | | | 34,224 | |
| 1,050 | | Government Properties Income Trust | | | 25,305 | |
| 1,400 | | Highwoods Properties, Inc. | | | 46,326 | |
| 675 | | LaSalle Hotel Properties | | | 18,259 | |
| 8,050 | | Medical Properties Trust, Inc. | | | 86,296 | |
| 3,595 | | Redwood Trust, Inc. | | | 42,241 | |
| 2,664 | | Simon Property Group, Inc. | | | 361,931 | |
| | | | | | |
| | | | | 2,580,195 | |
|
Real Estate Management & Development | |
| 1,180 | | Jones Lang LaSalle, Inc. | | | 92,937 | |
|
Retail 0.1% | |
| 35,200 | | Home Retail Group PLC (United Kingdom) | | | 59,573 | |
| 2,200 | | Next PLC (United Kingdom) | | | 90,794 | |
| 1,400 | | Rallye SA (France) | | | 45,287 | |
| 4,600 | | Shimachu Co. Ltd. (Japan) | | | 109,417 | |
| | | | | | |
| | | | | 305,071 | |
|
Retail & Merchandising 3.5% | |
| 6,100 | | Aoyama Trading Co. Ltd. (Japan) | | | 109,723 | |
| 875 | | Big Lots, Inc.* | | | 34,554 | |
| 2,626 | | Chico’s FAS, Inc. | | | 30,041 | |
| 162,188 | | Cie Financiere Richemont SA, ADR (Switzerland) | | | 917,984 | |
| 5,300 | | Circle K Sunkus Co. Ltd. (Japan) | | | 91,300 | |
| 2,790 | | Costco Wholesale Corp. | | | 229,533 | |
| 4,740 | | Dollar General Corp.* | | | 201,971 | |
| 811 | | Ezcorp, Inc. (Class A Stock)* | | | 21,751 | |
| 1,381 | | Francesca’s Holdings Corp.* | | | 30,617 | |
See Notes to Financial Statements.
| | |
| 28 | | Visit our website at www.prudentialfunds.com |
| | | | | | |
| Shares | | Description | | Value (Note 1) | |
| | | | | | |
COMMON STOCKS (Continued) | | | | |
|
Retail & Merchandising (cont’d.) | |
| 3,119 | | GNC Holdings, Inc. (Class A Stock)* | | $ | 85,804 | |
| 2,200 | | K’s Holdings Corp. (Japan) | | | 76,922 | |
| 1,816 | | Lululemon Athletica, Inc.* | | | 114,644 | |
| 33,200 | | Marks & Spencer Group PLC (United Kingdom) | | | 170,970 | |
| 4,500 | | Matsumotokiyoshi Holdings Co. Ltd. (Japan) | | | 92,220 | |
| 5,406 | | O’Reilly Automotive, Inc.* | | | 440,643 | |
| 7,931 | | Ross Stores, Inc. | | | 403,053 | |
| 1,199 | | Sally Beauty Holdings, Inc.* | | | 24,723 | |
| 38,433 | | Starbucks Corp. | | | 1,842,094 | |
| 350 | | Swatch Group AG (The) (Switzerland) | | | 147,453 | |
| 11,405 | | Target Corp. | | | 579,488 | |
| 2,220 | | Tiffany & Co. | | | 141,636 | |
| 37,097 | | TJX Cos., Inc. (The) | | | 2,527,790 | |
| 20,060 | | Yum! Brands, Inc. | | | 1,270,400 | |
| | | | | | |
| | | | | 9,585,314 | |
|
Road & Rail | |
| 1,150 | | Landstar System, Inc. | | | 58,823 | |
| 1,125 | | Werner Enterprises, Inc. | | | 29,396 | |
| | | | | | |
| | | | | 88,219 | |
|
Savings & Loan | |
| 3,800 | | Capitol Federal Financial, Inc. | | | 43,890 | |
|
Semiconductors 0.3% | |
| 3,800 | | Altera Corp. | | | 151,202 | |
| 17,348 | | ARM Holdings PLC (United Kingdom) | | | 166,619 | |
| 2,620 | | ASML Holding NV (Netherlands) | | | 112,634 | |
| 6,850 | | Broadcom Corp. (Class A Stock)* | | | 235,229 | |
| 900 | | Cabot Microelectronics Corp. | | | 45,378 | |
| 1,295 | | Cavium, Inc.* | | | 41,621 | |
| 2,700 | | Checkpoint Systems, Inc.* | | | 28,404 | |
| 2,200 | | Microsemi Corp.* | | | 43,516 | |
| 6,441 | | Teradyne, Inc.* | | | 105,310 | |
| | | | | | |
| | | | | 929,913 | |
|
Semiconductors & Semiconductor Equipment 0.3% | |
| 1,470 | | Cymer, Inc.* | | | 73,191 | |
| 1,275 | | Fairchild Semiconductor International, Inc.* | | | 17,825 | |
| 21,300 | | Intel Corp. | | | 562,746 | |
See Notes to Financial Statements.
| | | | |
| Target Asset Allocation Funds/Target Moderate Allocation Fund | | | 29 | |
Portfolio of Investments
as of January 31, 2012 (Unaudited) continued
| | | | | | |
| Shares | | Description | | Value (Note 1) | |
| | | | | | |
COMMON STOCKS (Continued) | | | | |
|
Semiconductors & Semiconductor Equipment (cont��d.) | |
| 6,250 | | RF Micro Devices, Inc.* | | $ | 31,188 | |
| 450 | | Silicon Laboratories, Inc.* | | | 19,728 | |
| 2,152 | | Veeco Instruments, Inc.* | | | 52,530 | |
| | | | | | |
| | | | | 757,208 | |
|
Software 1.5% | |
| 1,315 | | ANSYS, Inc.* | | | 79,544 | |
| 1,850 | | Broadridge Financial Solutions, Inc. | | | 44,345 | |
| 18,505 | | CA, Inc. | | | 477,059 | |
| 2,070 | | Cerner Corp.* | | | 126,042 | |
| 16,980 | | Check Point Software Technologies Ltd. (Israel)* | | | 955,804 | |
| 820 | | Citrix Systems, Inc.* | | | 53,472 | |
| 8,456 | | Compuware Corp.* | | | 66,295 | |
| 200 | | Manhattan Associates, Inc.* | | | 8,778 | |
| 3,230 | | MedAssets, Inc.* | | | 34,109 | |
| 1,324 | | Medidata Solutions, Inc.* | | | 27,672 | |
| 54,980 | | Microsoft Corp. | | | 1,623,559 | |
| 2,243 | | Progress Software Corp.* | | | 52,329 | |
| 2,294 | | Quality Systems, Inc. | | | 93,045 | |
| 6,920 | | Red Hat, Inc.* | | | 320,880 | |
| 2,465 | | TIBCO Software, Inc.* | | | 64,263 | |
| 1,150 | | Verint Systems, Inc.* | | | 32,557 | |
| | | | | | |
| | | | | 4,059,753 | |
|
Specialty Retail 0.8% | |
| 3,695 | | Aaron’s, Inc. | | | 98,324 | |
| 515 | | AutoZone, Inc.* | | | 179,158 | |
| 650 | | DSW, Inc. (Class A Stock) | | | 32,481 | |
| 22,200 | | Gap, Inc. (The) | | | 421,356 | |
| 3,623 | | Genesco, Inc.* | | | 221,257 | |
| 200 | | Group 1 Automotive, Inc. | | | 10,668 | |
| 18,896 | | Home Depot, Inc. (The) | | | 838,793 | |
| 1,675 | | Penske Automotive Group, Inc. | | | 37,486 | |
| 3,810 | | PetSmart, Inc. | | | 202,768 | |
| 1,700 | | Tractor Supply Co. | | | 137,309 | |
| 5,740 | | Urban Outfitters, Inc.* | | | 152,110 | |
| | | | | | |
| | | | | 2,331,710 | |
|
Steel Producers/Products | |
| 3,200 | | Voestalpine AG (Austria) | | | 104,916 | |
See Notes to Financial Statements.
| | |
| 30 | | Visit our website at www.prudentialfunds.com |
| | | | | | |
| Shares | | Description | | Value (Note 1) | |
| | | | | | |
COMMON STOCKS (Continued) | | | | |
|
Telecommunications 1.5% | |
| 917 | | Acme Packet, Inc.* | | $ | 26,804 | |
| 875 | | ADTRAN, Inc. | | | 30,301 | |
| 89,700 | | BT Group PLC (United Kingdom) | | | 287,645 | |
| 70,600 | | Cable & Wireless Communications PLC (United Kingdom) | | | 47,727 | |
| 7,025 | | CenturyLink, Inc. | | | 260,136 | |
| 1,237 | | EZchip Semiconductor Ltd. (Israel)* | | | 40,425 | |
| 4,500 | | France Telecom SA (France) | | | 67,485 | |
| 3,379 | | HTC Corp. (Taiwan) | | | 55,446 | |
| 828 | | IPG Photonics Corp.* | | | 43,710 | |
| 67 | | KDDI Corp. (Japan) | | | 424,574 | |
| 2,257 | | NICE Systems Ltd., ADR (Israel)* | | | 81,162 | |
| 5,000 | | Nippon Telegraph & Telephone Corp. (Japan) | | | 249,934 | |
| 10,600 | | Nokia Oyj (Finland) | | | 52,938 | |
| 100 | | NTT DoCoMo, Inc. (Japan) | | | 177,644 | |
| 26,418 | | QUALCOMM, Inc. | | | 1,553,907 | |
| 800 | | SBA Communications Corp. (Class A Stock)* | | | 36,576 | |
| 100,000 | | Telecom Italia SpA (Italy) | | | 101,700 | |
| 4,200 | | Telefonica SA (Spain) | | | 73,232 | |
| 33,300 | | Telstra Corp. Ltd. (Australia) | | | 117,725 | |
| 150,530 | | Vodafone Group PLC (United Kingdom) | | | 405,145 | |
| | | | | | |
| | | | | 4,134,216 | |
|
Textiles, Apparel & Luxury Goods 0.1% | |
| 11,000 | | Kurabo Industries Ltd. (Japan) | | | 22,225 | |
| 1,300 | | PVH Corp. | | | 100,347 | |
| 41,000 | | Yue Yuen Industrial Holdings Ltd. (Bermuda) | | | 125,559 | |
| | | | | | |
| | | | | 248,131 | |
|
Thrifts & Mortgage Finance | |
| 2,550 | | Washington Federal, Inc. | | | 40,188 | |
|
Tobacco 0.4% | |
| 6,000 | | Altria Group, Inc. | | | 170,400 | |
| 8,308 | | British American Tobacco PLC (United Kingdom) | | | 381,885 | |
| 8,548 | | Philip Morris International, Inc. | | | 639,134 | |
| | | | | | |
| | | | | 1,191,419 | |
|
Trading Companies & Distributors 0.1% | |
| 30,000 | | Marubeni Corp. (Japan) | | | 207,032 | |
| 675 | | United Rentals, Inc.* | | | 25,812 | |
See Notes to Financial Statements.
| | | | |
| Target Asset Allocation Funds/Target Moderate Allocation Fund | | | 31 | |
Portfolio of Investments
as of January 31, 2012 (Unaudited) continued
| | | | | | |
| Shares | | Description | | Value (Note 1) | |
| | | | | | |
COMMON STOCKS (Continued) | | | | |
|
Trading Companies & Distributors (cont’d.) | |
| 1,025 | | WESCO International, Inc.* | | $ | 64,452 | |
| | | | | | |
| | | | | 297,296 | |
|
Transportation 1.2% | |
| 1,200 | | Bristow Group, Inc. | | | 58,872 | |
| 3,670 | | Canadian National Railway Co. (Canada) | | | 276,815 | |
| 5,275 | | Expeditors International of Washington, Inc. | | | 235,529 | |
| 3,600 | | Go-Ahead Group PLC (United Kingdom) | | | 71,989 | |
| 4,610 | | Kansas City Southern* | | | 316,430 | |
| 74 | | Orient Overseas International Ltd. (Bermuda) | | | 387 | |
| 18,000 | | Sankyu, Inc. (Japan) | | | 69,194 | |
| 19,040 | | Union Pacific Corp. | | | 2,176,462 | |
| | | | | | |
| | | | | 3,205,678 | |
|
Utilities 0.1% | |
| 3,400 | | E.ON AG (Germany) | | | 72,692 | |
| 7,736 | | PG&E Corp. | | | 314,546 | |
| | | | | | |
| | | | | 387,238 | |
|
Wireless Telecommunication Services 0.3% | |
| 31,418 | | Vodafone Group PLC, ADR (United Kingdom) | | | 851,114 | |
| | | | | | |
| | TOTAL COMMON STOCKS
(cost $144,530,963) | | | 175,465,788 | |
| | | | | | |
EXCHANGE TRADED FUND | |
| 1,950 | | iShares Russell 2000 Value Index Fund
(cost $128,821) | | | 136,598 | |
| | | | | | |
PREFERRED STOCKS 0.2% | |
|
Automobile Manufacturers 0.1% | |
| 1,729 | | Volkswagen AG, 1.81% (Germany) | | | 306,109 | |
|
Commercial Banks 0.1% | |
| 7,950 | | Wells Fargo & Co., Series J, 8.00%, CVT | | | 231,981 | |
| | | | | | |
| | TOTAL PREFERRED STOCKS
(cost $301,844) | | | 538,090 | |
| | | | | | |
UNAFFILIATED MUTUAL FUND | |
| 4,575 | | Ares Capital Corp.
(cost $62,485) | | | 72,514 | |
| | | | | | |
See Notes to Financial Statements.
| | |
| 32 | | Visit our website at www.prudentialfunds.com |
| | | | | | | | | | |
Moody’s
Ratings† | | Principal
Amount (000)# | | | Description | | Value (Note 1) | |
| | | | | | | | | | |
ASSET-BACKED SECURITIES 2.6% | | | | |
| Aaa | | EUR | 1,937 | | | Avoca CLO I BV,
Series III-X, Class A (Ireland)
1.974%(a), 09/15/21 | | $ | 2,382,072 | |
| Aaa | | GBP | 600 | | | Chester Asset Receivables Dealings,
Series 2004-1, Class A (United Kingdom)
1.198%(a), 04/15/16 | | | 921,112 | |
| NR | | EUR | 313 | | | Magnolia Funding Ltd.,
Series 2010-1A, Class A1, 144A (United Kingdom)
3.00%, 04/20/17 | | | 408,462 | |
| Aaa | | $ | 600 | | | Penarth Master Issuer PLC,
Series 2011-1A, Class A1, 144A (United Kingdom)
0.932%(a), 05/18/15 | | | 601,369 | |
| AAA(b) | | | 422 | | | Plymouth Rock CLO Ltd., Inc.,
Series 2010-1A, Class A, 144A
1.961%(a), 02/16/19 | | | 419,068 | |
| Aaa | | | 1,473 | | | SLM Student Loan Trust,
Series 2008-9, Class A
2.06%(a), 04/25/23 | | | 1,503,368 | |
| Aaa | | | 1,000 | | | Venture CDO Ltd.,
Series 2007-8A, Class A2A, 144A
0.781%(a), 07/22/21 | | | 933,101 | |
| | | | | | | | | | |
| | | | | | TOTAL ASSET-BACKED SECURITIES
(cost $7,451,685) | | | 7,168,552 | |
| | | | | | | | | | |
| |
COMMERCIAL MORTGAGE-BACKED SECURITY 0.1% | | | | |
| Aaa | | | 132 | | | Federal National Mortgage Assoc.,
Series 1998-73, Class MZ
(cost $130,806)
6.30%, 10/17/38 | | | 152,388 | |
| | | | | | | | | | |
| |
CORPORATE BONDS 10.2% | | | | |
| |
Automobile Manufacturers 0.7% | | | | |
| A2 | | | 1,000 | | | BMW US Capital LLC,
Gtd. Notes, MTN
1.013%(a), 12/21/12 | | | 999,850 | |
| A3 | | | 900 | | | Daimler Finance North America LLC,
Gtd. Notes, 144A
1.184%(a), 03/28/14 | | | 883,783 | |
| | | | | | | | | | |
| | | | | | | | | 1,883,633 | |
See Notes to Financial Statements.
| | | | |
| Target Asset Allocation Funds/Target Moderate Allocation Fund | | | 33 | |
Portfolio of Investments
as of January 31, 2012 (Unaudited) continued
| | | | | | | | | | |
Moody’s
Ratings† | | Principal
Amount (000)# | | | Description | | Value (Note 1) | |
| | | | | | | | | | |
CORPORATE BONDS (Continued) | | | | |
| |
Commercial Banks 2.4% | | | | |
| A1 | | $ | 400 | | | Abbey National Treasury Services PLC,
Bank Gtd. Notes (United Kingdom)
2.137%(a), 04/25/14 | | $ | 379,322 | |
| B1 | | | 100 | | | Ally Financial, Inc.,
Sr. Unsec’d. Notes
8.00%, 11/01/31 | | | 103,727 | |
| Baa1 | | | 400 | | | Banco Santander Brazil SA,
Sr. Unsec’d. Notes, 144A (Brazil)
2.659%(a), 03/18/14 | | | 381,817 | |
| Baa1 | | | 1,120 | | | Barclays Bank PLC,
Sub. Notes, 144A (United Kingdom)
10.179%, 06/12/21 | | | 1,284,617 | |
| | | | | | Cooperatieve Centrale Raiffeisen-Boerenleenbank BA,
Gtd. Notes (Netherlands) | | | | |
| Aaa | | | 1,000 | | | 4.50%, 01/11/21 | | | 1,079,837 | |
| A1 | | | 600 | | | Lloyds TSB Bank PLC, (United Kingdom)
Bank Gtd. Notes, 144A, MTN
4.375%, 01/12/15 | | | 605,377 | |
| BB+(b) | | | 1,000 | | | Jr. Sub. Notes, 144A
12.00%(a), 12/29/49 | | | 919,950 | |
| A2 | | | 700 | | | Morgan Stanley,
Sr. Unsec’d. Notes
1.533%(a), 04/29/13 | | | 682,559 | |
| A2 | | | 1,000 | | | Royal Bank of Scotland PLC (The),
Bank Gtd. Notes (United Kingdom)
4.375%, 03/16/16 | | | 1,013,277 | |
| A2 | | | 100 | | | 4.875%, 03/16/15 | | | 101,226 | |
| | | | | | | | | | |
| | | | | | | | | 6,551,709 | |
| |
Consumer Finance 0.3% | | | | |
| A3 | | | 600 | | | American Express Co.,
Sr. Unsec’d. Notes
7.00%, 03/19/18 | | | 736,757 | |
| |
Diversified Financial Services 2.7% | | | | |
| Baa1 | | | 1,000 | | | Bank of America Corp.,
Sr. Unsec’d. Notes
6.00%, 09/01/17 | | | 1,047,562 | |
See Notes to Financial Statements.
| | |
| 34 | | Visit our website at www.prudentialfunds.com |
| | | | | | | | | | |
Moody’s
Ratings† | | Principal
Amount (000)# | | | Description | | Value (Note 1) | |
| | | | | | | | | | |
CORPORATE BONDS (Continued) | | | | |
| |
Diversified Financial Services (cont’d.) | | | | |
| Aa3 | | $ | 900 | | | Bear Stearns Cos. LLC (The),
Sr. Unsec’d. Notes
6.40%, 10/02/17 | | $ | 1,022,548 | |
| Aaa | | | 1,000 | | | Credit Agricole Home Loan SFH,
Covered Bonds, 144A (France)
1.311%(a), 07/21/14 | | | 953,217 | |
| Ba1 | | | 500 | | | Ford Motor Credit Co. LLC,
Sr. Unsec’d. Notes
5.625%, 09/15/15 | | | 531,595 | |
| Ba1 | | | 100 | | | 7.50%, 08/01/12 | | | 102,759 | |
| Baa2 | | | 600 | | | FUEL Trust, Sec’d. Notes, 144A
3.984%, 12/15/22 | | | 610,994 | |
| Aa3 | | GBP | 100 | | | General Electric Capital Corp.,
Sub. Notes, 144A
6.50%(a), 09/15/67 | | | 144,973 | |
| Ba3 | | | 500 | | | International Lease Finance Corp.,
Sr. Sec’d. Notes, 144A
7.125%, 09/01/18 | | | 547,500 | |
| Aa3 | | | 700 | | | JPMorgan Chase & Co.,
Sr. Unsec’d. Notes
4.25%, 10/15/20 | | | 712,510 | |
| Aa2 | | | 700 | | | JPMorgan Chase Bank NA,
Sub. Notes
6.00%, 10/01/17 | | | 777,324 | |
| NR | | | 500 | | | Lehman Brothers Holdings, Inc.,
Sr. Unsec’d. Notes, MTN(c)
6.875%, 05/02/18 | | | 137,500 | |
| Baa1 | | | 900 | | | Merrill Lynch & Co., Inc.,
Sr. Unsec’d. Notes, MTN
5.571%, 10/04/12 | | | 914,617 | |
| Baa1 | | | 100 | | | 6.875%, 04/25/18 | | | 107,916 | |
| | | | | | | | | | |
| | | | | | | | | 7,611,015 | |
| |
Financial—Bank & Trust 0.2% | | | | |
| Aa3 | | | 500 | | | UBS AG, Notes (Switzerland)
4.875%, 08/04/20 | | | 520,150 | |
See Notes to Financial Statements.
| | | | |
| Target Asset Allocation Funds/Target Moderate Allocation Fund | | | 35 | |
Portfolio of Investments
as of January 31, 2012 (Unaudited) continued
| | | | | | | | | | |
Moody’s
Ratings† | | Principal
Amount (000)# | | | Description | | Value (Note 1) | |
| | | | | | | | | | |
CORPORATE BONDS (Continued) | | | | |
| |
Food Products 0.3% | | | | |
| Baa1 | | $ | 900 | | | WM Wrigley Jr. Co.,
Sec’d. Notes, 144A
2.45%, 06/28/12 | | $ | 906,233 | |
| |
Insurance 0.7% | | | | |
| Baa1 | | | 1,600 | | | American International Group, Inc.,
Sr. Unsec’d. Notes
8.25%, 08/15/18 | | | 1,842,407 | |
| |
Metals & Mining 0.3% | | | | |
| Baa1 | | | 900 | | | Barrick North America Finance LLC,
Gtd. Notes, 144A
4.40%, 05/30/21 | | | 990,716 | |
| |
Oil, Gas & Consumable Fuels 0.9% | | | | |
| A2 | | | 400 | | | BP Capital Markets PLC,
Gtd. Notes (United Kingdom)
4.50%, 10/01/20 | | | 447,913 | |
| Baa1 | | | 800 | | | Gazprom OAO Via Gaz Capital SA,
Sr. Unsec’d. Notes (Luxembourg)
9.25%, 04/23/19 | | | 982,400 | |
| Baa2 | | | 1,000 | | | TNK-BP Finance SA,
Gtd. Notes (Luxembourg)
7.50%, 03/13/13 | | | 1,051,250 | |
| | | | | | | | | | |
| | | | | | | | | 2,481,563 | |
| |
Paper & Forest Products 0.2% | | | | |
| Baa3 | | | 500 | | | Georgia-Pacific LLC,
Gtd. Notes, 144A
5.40%, 11/01/20 | | | 565,213 | |
| |
Pharmaceuticals 0.1% | | | | |
| B1 | | | 400 | | | Valeant Pharmaceuticals International,
Gtd. Notes, 144A
6.75%, 08/15/21 | | | 402,000 | |
| |
Real Estate Investment Trusts 0.4% | | | | |
| Baa3 | | | 1,000 | | | Goodman Funding Pty Ltd.,
Gtd. Notes, 144A (Australia)
6.375%, 11/12/20 | | | 1,049,230 | |
See Notes to Financial Statements.
| | |
| 36 | | Visit our website at www.prudentialfunds.com |
| | | | | | | | | | |
Moody’s
Ratings† | | Principal
Amount (000)# | | | Description | | Value (Note 1) | |
| | | | | | | | | | |
CORPORATE BONDS (Continued) | | | | |
| |
Telecommunications 0.4% | | | | |
| Baa3 | | $ | 1,000 | | | Embarq Corp.,
Sr. Unsec’d. Notes
7.082%, 06/01/16 | | $ | 1,116,616 | |
| |
Tobacco 0.4% | | | | |
| Baa1 | | | 800 | | | Altria Group, Inc.,
Gtd. Notes
9.25%, 08/06/19 | | | 1,089,131 | |
| |
Utilities 0.2% | | | | |
| A1 | | | 500 | | | Korea Electric Power Corp.,
Sr. Unsec’d. Notes, 144A (South Korea)
3.00%, 10/05/15 | | | 501,054 | |
| | | | | | | | | | |
| | | | | | TOTAL CORPORATE BONDS
(cost $27,646,769) | | | 28,247,427 | |
| | | | | | | | | | |
| |
FOREIGN GOVERNMENT BONDS 2.1% | | | | |
| Aaa | | AUD | 1,300 | | | Australia Government,
Sr. Unsec’d. Notes (Australia)
5.25%, 03/15/19 | | | 1,527,034 | |
| Aaa | | AU | D1,400 | | | 5.50%, 01/21/18 | | | 1,648,853 | |
| Aaa | | AUD | 600 | | | 6.00%, 02/15/17 | | | 715,779 | |
| Aaa | | CAD | 200 | | | Canadian Government, Bonds (Canada)
1.50%, 03/01/12 | | | 199,565 | |
| Aaa | | CAD | 400 | | | 3.25%, 06/01/21 | | | 444,679 | |
| Baa3 | | BRL | 1,800 | | | Republic of Brazil, Sr. Unsec’d. Notes (Brazil)
12.50%, 01/05/22 | | | 1,282,624 | |
| | | | | | | | | | |
| | | | | | TOTAL FOREIGN GOVERNMENT BONDS
(cost $5,245,487) | | | 5,818,534 | |
| | | | | | | | | | |
|
MUNICIPAL BONDS 2.1% | |
|
California 0.7% | |
| Aa3 | | | 500 | | | California State Public Works Board Lease Revenue, Revenue Bonds
7.804%, 03/01/35 | | | 577,525 | |
| A1 | | | 400 | | | State of California, General Obligation Unlimited
5.00%, 06/01/37 | | | 420,588 | |
| A1 | | | 800 | | | 5.00%, 11/01/37 | | | 844,048 | |
| A1 | | | 200 | | | 5.00%, 12/01/37 | | | 211,156 | |
| | | | | | | | | | |
| | | | | | | | | 2,053,317 | |
See Notes to Financial Statements.
| | | | |
| Target Asset Allocation Funds/Target Moderate Allocation Fund | | | 37 | |
Portfolio of Investments
as of January 31, 2012 (Unaudited) continued
| | | | | | | | | | |
Moody’s
Ratings† | | Principal
Amount (000)# | | | Description | | Value (Note 1) | |
| | | | | | | | | | |
MUNICIPAL BONDS (Continued) | |
|
Illinois 1.4% | |
| Aa3 | | $ | 1,100 | | | Chicago Transit Authority,
Series A, Revenue Bonds
6.899%, 12/01/40 | | $ | 1,355,024 | |
| Aa3 | | | 800 | | | Chicago Transit Authority,
Series B, Revenue Bonds
6.899%, 12/01/40 | | | 985,472 | |
| A1 | | | 1,400 | | | State of Illinois, General
Obligation Unlimited
4.071%, 01/01/14 | | | 1,451,016 | |
| | | | | | | | | | |
| | | | | | | | | 3,791,512 | |
| | | | | | | | | | |
| | | | | | TOTAL MUNICIPAL BONDS
(cost $5,236,716) | | | 5,844,829 | |
| | | | | | | | | | |
|
RESIDENTIAL MORTGAGE-BACKED SECURITIES 1.4% | |
| CCC(b) | | | 33 | | | BankTrust Mortgage Trust,
Series 1, Class G
5.70%, 12/01/23 | | | 31,148 | |
| Caa1 | | | 153 | | | Bear Stearns Adjustable Rate Mortgage Trust,
Series 2005-4, Class 23A2
2.605%(a), 05/25/35 | | | 122,051 | |
| CCC(b) | | | 410 | | | Countrywide Alternative Loan Trust,
Series 2006-HY13, Class 4A1
3.137%(a), 02/25/37 | | | 244,997 | |
| Ca | | | 434 | | | Series 2006-OA11, Class A1B
0.466%(a), 09/25/46 | | | 222,403 | |
| Aaa | | | 18 | | | Federal Home Loan Mortgage Corp.,
Series 119, Class H
7.50%, 01/15/21 | | | 20,459 | |
| Aaa | | | 3 | | | Series 2266, Class F
0.74%(a), 11/15/30 | | | 3,095 | |
| Aaa | | | 6 | | | Federal National Mortgage Assoc.,
Series 2000-32, Class FM
0.735%(a), 10/18/30 | | | 6,020 | |
| Aaa | | | 435 | | | Series 2006-5, Class 3A2
2.39%(a), 05/25/35 | | | 455,271 | |
| Aaa | | | 90 | | | FHLMC Structured Pass-Through Securities,
Series T-61, Class 1A1
1.608%(a), 07/25/44 | | | 92,257 | |
See Notes to Financial Statements.
| | |
| 38 | | Visit our website at www.prudentialfunds.com |
| | | | | | | | | | |
Moody’s
Ratings† | | Principal
Amount (000)# | | | Description | | Value (Note 1) | |
| | | | | | | | | | |
RESIDENTIAL MORTGAGE-BACKED SECURITIES (Continued) | |
| Aaa | | $ | 17 | | | Government National Mortgage Assoc.,
Series 2000-9, Class FH
0.79%(a), 02/16/30 | | $ | 17,280 | |
| Aaa | | GBP | 464 | | | Granite Mortgages PLC,
Series 2004-3, Class 3A2 (United Kingdom)
1.45%(a), 09/20/44 | | | 711,923 | |
| AAA(b) | | | 221 | | | GSR Mortgage Loan Trust,
Series 2005-AR6, Class 2A1
2.658%(a), 09/25/35 | | | 190,480 | |
| CC(b) | | | 472 | | | Series 2005-AR7, Class 4A1
5.231%(a), 11/25/35 | | | 357,876 | |
| Caa3 | | | 490 | | | Harborview Mortgage Loan Trust,
Series 2006-5, Class 2A1A
0.461%(a), 07/19/46 | | | 262,545 | |
| C | | | 384 | | | Series 2006-12, Class 2A2B
0.531%(a), 01/19/38 | | | 120,682 | |
| C | | | 412 | | | Indymac Index Mortgage Loan Trust,
Series 2007-FLX2, Class A2
0.466%(a), 04/25/37 | | | 76,979 | |
| CCC(b) | | | 388 | | | Washington Mutual Mortgage Pass-Through Certificates,
Series 2007-HY1, Class 2A3
5.409%(a), 02/25/37 | | | 268,413 | |
| CCC(b) | | | 431 | | | Series 2007-HY2, Class 1A1
2.545%(a), 12/25/36 | | | 271,381 | |
| CCC(b) | | | 445 | | | Series 2007-OA3, Class 2A1A
0.957%(a), 04/25/47 | | | 276,046 | |
| | | | | | | | | | |
| | | | | | TOTAL RESIDENTIAL MORTGAGE-BACKED SECURITIES
(cost $4,448,387) | | | 3,751,306 | |
| | | | | | | | | | |
| |
U.S. GOVERNMENT MORTGAGE-BACKED OBLIGATIONS 15.0% | | | | |
| | | 87 | | | Federal Home Loan Mortgage Corp.
2.521%(a), 09/01/35 | | | 92,646 | |
| | | 3,000 | | | 4.00%, TBA | | | 3,155,156 | |
| | | 56 | | | 5.50%, 12/01/36 | | | 61,294 | |
| | | 76 | | | 6.00%, 04/01/16 - 07/01/17 | | | 81,095 | |
| | | 136 | | | Federal National Mortgage Assoc.
1.408%(a), 06/01/43 | | | 136,369 | |
| | | 91 | | | 2.272%(a), 12/01/34 | | | 95,226 | |
| | | 6,835 | | | 3.50%, 10/01/40 - 11/01/41 | | | 7,109,713 | |
| | | 6,000 | | | 3.50%, TBA | | | 6,313,125 | |
| | | 1,000 | | | 3.50%, TBA | | | 1,050,313 | |
See Notes to Financial Statements.
| | | | |
| Target Asset Allocation Funds/Target Moderate Allocation Fund | | | 39 | |
Portfolio of Investments
as of January 31, 2012 (Unaudited) continued
| | | | | | | | | | |
Moody’s
Ratings† | | Principal
Amount (000)# | | | Description | | Value (Note 1) | |
| | | | | | | | | | |
U.S. GOVERNMENT MORTGAGE-BACKED OBLIGATIONS (Continued) | | | | |
| | $ | 2,000 | | | 3.50%, TBA | | $ | 2,077,812 | |
| | | 39 | | | 3.978%(a), 05/01/36 | | | 41,806 | |
| | | 16,142 | | | 4.00%, 03/01/24 - 08/01/41 | | | 17,100,649 | |
| | | 2,030 | | | 4.50%, 07/01/20 - 03/01/41 | | | 2,176,564 | |
| | | 52 | | | 4.677%(a), 09/01/34 | | | 55,847 | |
| | | 500 | | | 5.00%, TBA | | | 539,922 | |
| | | 312 | | | 5.50%, 06/01/36 | | | 339,551 | |
| | | 1,031 | | | 6.00%, 09/01/37 | | | 1,133,830 | |
| | | 4 | | | Government National Mortgage Assoc.
1.625%(a), 09/20/22 | | | 4,167 | |
| | | 12 | | | 2.125%, 10/20/27 - 11/20/29 | | | 12,636 | |
| | | 27 | | | 4.50%, 08/15/33 | | | 29,630 | |
| | | 5 | | | 8.50%, 05/20/30 - 04/20/31 | | | 5,536 | |
| | | | | | | | | | |
| | | | | | TOTAL U.S. GOVERNMENT MORTGAGE-BACKED OBLIGATIONS
(cost $40,573,365) | | | 41,612,887 | |
| | | | | | | | | | |
| |
U.S. TREASURY OBLIGATIONS 6.8% | | | | |
| | | 2,100 | | | U.S. Treasury Bonds
3.75%, 08/15/41 | | | 2,448,140 | |
| | | 400 | | | 4.375%, 05/15/41 | | | 516,938 | |
| | | 100 | | | 7.50%, 11/15/24 | | | 160,156 | |
| | | 1,700 | | | U.S. Treasury Inflationary Indexed Bonds, TIPS
1.125%, 01/15/21(d) | | | 2,010,618 | |
| | | 600 | | | 2.125%, 02/15/40 - 02/15/41 | | | 870,219 | |
| | | 300 | | | U.S. Treasury Notes
1.50%, 06/30/16 | | | 311,977 | |
| | | 4,300 | | | 2.00%, 11/15/21 | | | 4,375,250 | |
| | | 4,400 | | | 2.125%, 12/31/15 - 08/15/21 | | | 4,571,150 | |
| | | 500 | | | 2.25%, 07/31/18 | | | 535,664 | |
| | | 400 | | | 2.625%, 11/15/20 | | | 433,875 | |
| | | 2,400 | | | 3.125%, 11/15/41 | | | 2,487,749 | |
| | | | | | | | | | |
| | | | | | TOTAL U.S. TREASURY OBLIGATIONS
(cost $17,884,452) | | | 18,721,736 | |
| | | | | | | | | | |
| | | | | | TOTAL LONG-TERM INVESTMENTS
(cost $253,641,780) | | | 287,530,649 | |
| | | | | | | | | | |
See Notes to Financial Statements.
| | |
| 40 | | Visit our website at www.prudentialfunds.com |
| | | | | | | | | | | | |
| | | Principal
Amount (000)# | | | Description | | | | Value (Note 1) | |
| | | | | | | | | | | | |
SHORT-TERM INVESTMENTS 4.6% | | | | | | |
| | |
U.S. TREASURY OBLIGATION(g) 0.1% | | | | | | |
| | $ | 259 | | | U.S. Treasury Bills(e)
(cost $258,986)
0.035%, 03/29/12 | | $ | 258,980 | |
| | | | | | | | | | | | |
| | |
REPURCHASE AGREEMENT(f) | | | | | | |
| | | 100 | | | Credit Suisse Securities (USA) LLC,
0.20%, dated 01/31/12,
due 02/01/12 in the amount of $100,001
(cost $100,000) | | | 100,000 | |
| | | | | | | | | | | | |
| | | | |
| | | Shares | | | | | | | | |
AFFILIATED MONEY MARKET MUTUAL FUND 4.5% | | | | | | |
| | | 12,347,481 | | | Prudential Investment Portfolios 2 - Prudential Core Taxable Money Market Fund
(cost $12,347,481)(h) | | | 12,347,481 | |
| | | | | | | | | | | | |
| | | | | | TOTAL SHORT-TERM INVESTMENTS
(cost $12,706,467) | | | 12,706,461 | |
| | | | | | | | | | | | |
| | | | | | TOTAL INVESTMENTS, BEFORE OPTIONS WRITTIEN AND SECURITIES SOLD SHORT 108.4%
(cost $266,348,247; Note 5) | | | 300,237,110 | |
| | | | | | | | | | | | |
| | | | |
| | | Notional
Amount (000)# | | | | | Counterparty | | | |
OPTIONS WRITTEN* | | | | | | |
| | | |
Put Options | | | | | | | | | |
| | $ | 1,600 | | | Interest Rate Swap Options,
Receive a fixed rate of 10.00% and pay a floating rate based on 3-month LIBOR, expiring 07/10/12 | | Morgan Stanley | | | — | |
| | | 300 | | | Receive a fixed rate of 2.25% and pay a floating rate based on 3-month LIBOR, expiring 09/24/12 | | Citigroup Global Markets | | | (33 | ) |
| | | | | | | | | | | | |
| | | | | | TOTAL OPTIONS WRITTEN
(premiums received $11,914) | | | | | (33 | ) |
| | | | | | | | | | | | |
See Notes to Financial Statements.
| | | | |
| Target Asset Allocation Funds/Target Moderate Allocation Fund | | | 41 | |
Portfolio of Investments
as of January 31, 2012 (Unaudited) continued
| | | | | | | | |
Principal
Amount (000)# | | | Description | | Value (Note 1) | |
| SECURITIES SOLD SHORT (3.0)% | | | | |
| |
| U.S. GOVERNMENT MORTGAGE-BACKED OBLIGATIONS (2.7)% | | | | |
| $ | 6,000 | | | Federal National Mortgage Assoc.
4.00%, TBA | | $ | (6,342,187 | ) |
| | 1,000 | | | 6.00%, TBA | | | (1,097,071 | ) |
| | | | | | | | |
| | | | TOTAL U.S. GOVERNMENT MORTGAGE-BACKED OBLIGATIONS
(proceeds received $7,383,750) | | | (7,439,258 | ) |
| | | | | | | | |
| |
| U.S. TREASURY OBLIGATION (0.3)% | | | | |
| | 700 | | | U.S. Treasury Notes
(proceeds received $710,533)
2.125%, 08/15/21 | | | (722,586 | ) |
| | | | | | | | |
| | | | TOTAL SECURITIES SOLD SHORT
(proceeds received $8,094,283) | | | (8,161,844 | ) |
| | | | | | | | |
| | | | TOTAL INVESTMENTS, NET OF OPTIONS WRITTEN AND SECURITIES SOLD SHORT 105.4%
(cost $258,242,050; Note 5) | | | 292,075,233 | |
| | | | Liabilities in excess of other assets(i) (5.4)% | | | (14,918,780 | ) |
| | | | | | | | |
| | | | NET ASSETS 100% | | $ | 277,156,453 | |
| | | | | | | | |
The following abbreviations are used in the Portfolio descriptions:
144A—Security was purchased pursuant to Rule 144A under the Securities Act of 1933 and may not be resold subject to that rule except to qualified institutional buyers. Unless otherwise noted, 144A securities are deemed to be liquid.
ADR—American Depositary Receipt
CDO—Collaterlized Debt Obligation
CLO—Collateralized Loan Obligations
CVA—Certificate Van Aandelen (Bearer)
CVT—Convertible Security
FHLMC—Federal Home Loan Mortgage Corporation
LIBOR—London Interbank Offered Rate
NR—Not Rated by Moody’s or Standard & Poor’s
MTN—Medium Term Note
SLM—Student Loan Mortgage
TBA—To Be Announced
TIPS—Treasury Inflation Protected Securities
AUD—Australian Dollar
BRL—Brazilian Real
CAD—Canadian Dollar
CNY—Chinese Yuan
See Notes to Financial Statements.
| | |
| 42 | | Visit our website at www.prudentialfunds.com |
EUR—Euro
GBP—British Pound
INR—Indian Rupee
JPY—Japanese Yen
KRW—South Korean Won
MXN—Mexican Peso
MYR—Malaysian Ringgit
NOK—Norwegian Krone
SGD—Singapore Dollar
TWD—New Taiwanese Dollar
| # | Principal or notional amount is shown in U.S. dollars unless otherwise stated. |
| * | Non-income producing security. |
| † | The ratings reflected are as of January 31, 2012. Ratings of certain bonds may have changed subsequent to that date. |
| (a) | Variable rate instrument. The interest rate shown reflects the rate in effect at January 31, 2012. |
| (b) | Standard & Poor’s rating. |
| (c) | Represents issuer in default on interest payments. Non-income producing security. |
| (d) | Represents security, or a portion thereof, segregated as collateral for futures contracts. |
| (e) | Represents security, or a portion thereof, segregated as collateral for swap agreements. |
| (f) | Repurchase agreement is collateralized by U.S. Treasury Notes, (coupon rate 1.50%, maturity date 12/31/13), with the aggregate value, including accrued interest of $102,585. |
| (g) | Rates shown are the effective yields at purchase date. |
| (h) | Prudential Investments LLC, the manager of the Fund, also serves as manager of the Prudential Investment Portfolios 2 - Prudential Core Taxable Money Market Fund. |
| (i) | Includes net unrealized appreciation (depreciation) on the following derivative contracts held at reporting period end: |
Futures contracts open at January 31, 2012:
| | | | | | | | | | | | | | | | | | | | |
Number of
Contracts | | | Type | | Expiration
Date | | | Value at
Trade
Date | | | Value at
January 31,
2012 | | | Unrealized
Appreciation
(Depreciation) | |
| | | | Long Positions: | | | | | | | | | | | | | | | | |
| | 70 | | | 90 Day Euro Dollar | | | Mar. 2014 | | | $ | 17,023,513 | | | $ | 17,385,375 | | | $ | 361,862 | |
| | 3 | | | 90 Day Euro Dollar | | | Jun. 2014 | | | | 740,326 | | | | 744,413 | | | | 4,087 | |
| | 20 | | | 10 Year U.S. Treasury Notes | | | Mar. 2012 | | | | 2,597,812 | | | | 2,645,000 | | | | 47,188 | |
| | | | | | | | | | | | | | | | | | | | |
| | | | | | | | | | | | | | | | | | | 413,137 | |
| | | | | | | | | | | | | | | | | | | | |
| | | | Short Positions: | | | | | | | | | | | | | | | | |
| | 14 | | | 5 Year U.S. Treasury Notes | | | Mar. 2012 | | | | 1,717,297 | | | | 1,736,656 | | | | (19,359 | ) |
| | | | | | | | | | | | | | | | | | | | |
| | | | | | | | | | | | | | | | | | $ | 393,778 | |
| | | | | | | | | | | | | | | | | | | | |
See Notes to Financial Statements.
| | | | |
| Target Asset Allocation Funds/Target Moderate Allocation Fund | | | 43 | |
Portfolio of Investments
as of January 31, 2012 (Unaudited) continued
Forward foreign currency exchange contracts outstanding at January 31, 2012:
| | | | | | | | | | | | | | | | | | |
Purchase Contracts | | Counterparty | | Notional
Amount
(000) | | | Value at
Settlement
Date
Payable | | | Current
Value | | | Unrealized
Appreciation
(Depreciation) | |
British Pound, | | | | | | | | | | | | | | | | | | |
Expiring 02/02/12 | | Barclays Capital Group | | GBP | 1,049 | | | $ | 1,644,832 | | | $ | 1,652,985 | | | $ | 8,153 | |
Expiring 02/02/12 | | Citigroup Global Markets | | GBP | 248 | | | | 385,764 | | | | 390,791 | | | | 5,027 | |
Expiring 02/02/12 | | Morgan Stanley | | GBP | 926 | | | | 1,442,129 | | | | 1,459,165 | | | | 17,036 | |
Expiring 02/02/12 | | Morgan Stanley | | GBP | 52 | | | | 80,439 | | | | 81,940 | | | | 1,501 | |
Canadian Dollar, | | | | | | | | | | | | | | | | | | |
Expiring 02/09/12 | | Royal Bank of Canada | | CAD | 638 | | | | 638,959 | | | | 636,155 | | | | (2,804 | ) |
Chinese Yuan, | | | | | | | | | | | | | | | | | | |
Expiring 02/13/12 | | Barclays Capital Group | | CNY | 3,295 | | | | 512,131 | | | | 522,139 | | | | 10,008 | |
Expiring 02/13/12 | | Barclays Capital Group | | CNY | 895 | | | | 138,833 | | | | 141,876 | | | | 3,043 | |
Expiring 02/13/12 | | Citigroup Global Markets | | CNY | 2,705 | | | | 420,875 | | | | 428,633 | | | | 7,758 | |
Expiring 02/13/12 | | Citigroup Global Markets | | CNY | 1,904 | | | | 295,697 | | | | 301,687 | | | | 5,990 | |
Expiring 02/13/12 | | Citigroup Global Markets | | CNY | 853 | | | | 132,296 | | | | 135,175 | | | | 2,879 | |
Expiring 02/13/12 | | Deutsche Bank | | CNY | 848 | | | | 131,673 | | | | 134,455 | | | | 2,782 | |
Expiring 02/13/12 | | Deutsche Bank | | CNY | 816 | | | | 126,632 | | | | 129,317 | | | | 2,685 | |
Expiring 02/13/12 | | Deutsche Bank | | CNY | 347 | | | | 53,506 | | | | 55,052 | | | | 1,546 | |
Expiring 02/13/12 | | Hong Kong & Shanghai Bank | | CNY | 638 | | | | 100,000 | | | | 101,114 | | | | 1,114 | |
Expiring 02/13/12 | | JPMorgan Chase | | CNY | 1,064 | | | | 167,000 | | | | 168,676 | | | | 1,676 | |
Expiring 02/13/12 | | JPMorgan Chase | | CNY | 1,064 | | | | 167,000 | | | | 168,649 | | | | 1,649 | |
Expiring 02/13/12 | | JPMorgan Chase | | CNY | 1,058 | | | | 166,000 | | | | 167,626 | | | | 1,626 | |
Expiring 02/13/12 | | JPMorgan Chase | | CNY | 1,035 | | | | 161,000 | | | | 164,095 | | | | 3,095 | |
Expiring 02/13/12 | | JPMorgan Chase | | CNY | 863 | | | | 133,950 | | | | 136,791 | | | | 2,841 | |
Expiring 02/13/12 | | UBS Securities | | CNY | 681 | | | | 105,806 | | | | 107,982 | | | | 2,176 | |
Expiring 06/01/12 | | BNP Paribas | | CNY | 441 | | | | 69,309 | | | | 69,816 | | | | 507 | |
Expiring 06/01/12 | | Citigroup Global Markets | | CNY | 689 | | | | 108,182 | | | | 109,136 | | | | 954 | |
Expiring 08/05/13 | | UBS Securities | | CNY | 1,035 | | | | 163,861 | | | | 163,936 | | | | 75 | |
Expiring 02/01/13 | | Barclays Capital Group | | CNY | 18,066 | | | | 2,865,398 | | | | 2,864,843 | | | | (555 | ) |
Expiring 02/01/13 | | Deutsche Bank | | CNY | 456 | | | | 72,526 | | | | 72,374 | | | | (152 | ) |
Expiring 02/01/13 | | Deutsche Bank | | CN | Y40 | | | | 6,279 | | | | 6,310 | | | | 31 | |
Expiring 02/01/13 | | Goldman Sachs & Co. | | CNY | 1,060 | | | | 169,000 | | | | 168,110 | | | | (890 | ) |
Expiring 02/01/13 | | JPMorgan Chase | | CNY | 1,064 | | | | 169,441 | | | | 168,710 | | | | (731 | ) |
Indian Rupee, | | | | | | | | | | | | | | | | | | |
Expiring 07/12/12 | | JPMorgan Chase | | INR | 35,632 | | | | 766,611 | | | | 697,256 | | | | (69,355 | ) |
Malaysian Ringgit, | | | | | | | | | | | | | | | | | | |
Expiring 04/23/12 | | JPMorgan Chase | | MYR | 9 | | | | 2,966 | | | | 2,942 | | | | (24 | ) |
See Notes to Financial Statements.
| | |
| 44 | | Visit our website at www.prudentialfunds.com |
| | | | | | | | | | | | | | | | | | |
Purchase Contracts | | Counterparty | | Notional
Amount
(000) | | | Value at
Settlement
Date
Payable | | | Current
Value | | | Unrealized
Appreciation
(Depreciation) | |
Mexican Peso, | | | | | | | | | | | | | | | | | | |
Expiring 03/15/12 | | Barclays Capital Group | | MXN | 72 | | | $ | 5,133 | | | $ | 5,480 | | | $ | 347 | |
Expiring 03/15/12 | | Hong Kong & Shanghai Bank | | MXN | 11,520 | | | | 849,168 | | | | 880,590 | | | | 31,422 | |
New Taiwanese Dollar, | | | | | | | | | | | | | | | | | | |
Expiring 04/09/12 | | Barclays Capital Group | | TWD | 21,560 | | | | 713,658 | | | | 729,592 | | | | 15,934 | |
Norwegian Krone, | | | | | | | | | | | | | | | | | | |
Expiring 02/16/12 | | Credit Suisse First Boston Corp. | | NOK | 841 | | | | 139,729 | | | | 143,256 | | | | 3,527 | |
Expiring 02/16/12 | | Goldman Sachs & Co. | | NOK | 842 | | | | 139,709 | | | | 143,427 | | | | 3,718 | |
Expiring 02/16/12 | | UBS Securities | | NOK | 841 | | | | 139,671 | | | | 143,256 | | | | 3,585 | |
Singapore Dollar, | | | | | | | | | | | | | | | | | | |
Expiring 02/10/12 | | JPMorgan Chase | | SGD | 1 | | | | 1,091 | | | | 1,130 | | | | 39 | |
Expiring 05/15/12 | | UBS Securities | | SGD | 1 | | | | 1,123 | | | | 1,131 | | | | 8 | |
South Korean Won, | | | | | | | | | | | | | | | | | | |
Expiring 02/27/12 | | Citigroup Global Markets | | KRW | 1,087,387 | | | | 971,532 | | | | 965,935 | | | | (5,597 | ) |
| | | | | | | | | | | | | | | | | | |
| | | | | | | | $ | 14,358,909 | | | $ | 14,421,533 | | | $ | 62,624 | |
| | | | | | | | | | | | | | | | | | |
| | | | | | | | | | | | | | | | | | |
Sale Contracts | | Counterparty | | Notional
Amount
(000) | | | Value at
Settlement
Date
Receivable | | | Current
Value | | | Unrealized
Appreciation
(Depreciation) | |
Australian Dollar, | | | | | | | | | | | | | | | | | | |
Expiring 02/23/12 | | Goldman Sachs & Co. | | AUD | 5,225 | | | $ | 5,134,216 | | | $ | 5,533,300 | | | $ | (399,084 | ) |
Brazilian Real, | | | | | | | | | | | | | | | | | | |
Expiring 03/02/12 | | UBS Securities | | BRL | 2,789 | | | | 1,539,246 | | | | 1,583,664 | | | | (44,418 | ) |
British Pound, | | | | | | | | | | | | | | | | | | |
Expiring 02/02/12 | | Royal Bank of Canada | | GBP | 2,275 | | | | 3,561,751 | | | | 3,584,881 | | | | (23,130 | ) |
Expiring 03/02/12 | | Barclays Capital Group | | GBP | 1,049 | | | | 1,644,438 | | | | 1,652,618 | | | | (8,180 | ) |
Expiring 03/02/12 | | Citigroup Global Markets | | GBP | 248 | | | | 385,673 | | | | 390,705 | | | | (5,032 | ) |
Expiring 03/02/12 | | Morgan Stanley | | GBP | 926 | | | | 1,441,782 | | | | 1,458,841 | | | | (17,059 | ) |
Canadian Dollar, | | | | | | | | | | | | | | | | | | |
Expiring 02/09/12 | | Deutsche Bank | | CAD | 638 | | | | 624,921 | | | | 636,155 | | | | (11,234 | ) |
Expiring 03/22/12 | | Royal Bank of Canada | | CAD | 638 | | | | 638,332 | | | | 635,541 | | | | 2,791 | |
Chinese Yuan, | | | | | | | | | | | | | | | | | | |
Expiring 02/13/12 | | Barclays Capital Group | | CNY | 18,066 | | | | 2,862,220 | | | | 2,863,267 | | | | (1,047 | ) |
See Notes to Financial Statements.
| | | | |
| Target Asset Allocation Funds/Target Moderate Allocation Fund | | | 45 | |
Portfolio of Investments
as of January 31, 2012 (Unaudited) continued
| | | | | | | | | | | | | | | | | | |
Sale Contracts | | Counterparty | | Notional
Amount
(000) | | | Value at
Settlement
Date
Receivable | | | Current
Value | | | Unrealized
Appreciation
(Depreciation) | |
Euro, | | | | | | | | | | | | | | | | | | |
Expiring 02/23/12 | | Bank of New York Mellon | | EUR | 219 | | | $ | 282,336 | | | $ | 286,146 | | | $ | (3,810 | ) |
Expiring 04/16/12 | | Barclays Capital Group | | EUR | 620 | | | | 794,747 | | | | 811,197 | | | | (16,450 | ) |
Expiring 04/16/12 | | Citigroup Global Markets | | EUR | 458 | | | | 586,084 | | | | 599,239 | | | | (13,155 | ) |
Expiring 04/16/12 | | Deutsche Bank | | EUR | 1,464 | | | | 1,878,385 | | | | 1,915,471 | | | | (37,086 | ) |
Expiring 04/16/12 | | UBS Securities | | EUR | 636 | | | | 808,722 | | | | 832,131 | | | | (23,409 | ) |
Expiring 04/16/12 | | UBS Securities | | EUR | 485 | | | | 618,817 | | | | 634,565 | | | | (15,748 | ) |
Expiring 05/09/12 | | Bank of New York Mellon | | EUR | 610 | | | | 836,963 | | | | 797,695 | | | | 39,268 | |
Japanese Yen, | | | | | | | | | | | | | | | | | | |
Expiring 02/14/12 | | Deutsche Bank | | JPY | 27,361 | | | | 356,881 | | | | 359,026 | | | | (2,145 | ) |
Singapore Dollar, | | | | | | | | | | | | | | | | | | |
Expiring 02/10/12 | | UBS Securities | | SGD | 1 | | | | 1,123 | | | | 1,130 | | | | (7 | ) |
South Korean Won, | | | | | | | | | | | | | | | | | | |
Expiring 02/27/12 | | Citigroup Global Markets | | KRW | 238,236 | | | | 207,000 | | | | 211,627 | | | | (4,627 | ) |
Expiring 02/27/12 | | Goldman Sachs & Co. | | KRW | 309,138 | | | | 268,000 | | | | 274,610 | | | | (6,610 | ) |
Expiring 02/27/12 | | UBS Securities | | KRW | 275,928 | | | | 240,000 | | | | 245,109 | | | | (5,109 | ) |
Expiring 02/27/12 | | UBS Securities | | KRW | 219,574 | | | | 191,000 | | | | 195,049 | | | | (4,049 | ) |
Expiring 02/27/12 | | UBS Securities | | KRW | 55,186 | | | | 48,000 | | | | 49,022 | | | | (1,022 | ) |
| | | | | | | | | | | | | | | | | | |
| | | | | | | | $ | 24,950,637 | | | $ | 25,550,989 | | | $ | (600,352 | ) |
| | | | | | | | | | | | | | | | | | |
Interest rate swap agreements outstanding at January 31, 2012:
| | | | | | | | | | | | | | | | | | | | | | | | | | |
Notional
Amount (000)# | | | Termination
Date | | | Fixed
Rate | | | Floating
Rate | | Fair
Value | | | Upfront
Premiums
Paid
(Received) | | | Unrealized
Appreciation
(Depreciation) | | | Counterparty |
| Over-the-counter swap agreements: | | | | | | | | | | | | | | |
| AUD | 500 | | | | 12/15/17 | | | | 5.500% | | | 6 month Australian Bank Bill rate(1) | | $ | 34,246 | | | $ | (2,015 | ) | | $ | 36,261 | | | Barclays Bank PLC |
| AUD | 300 | | | | 12/15/17 | | | | 5.500% | | | 6 month Australian Bank Bill rate(1) | | | 20,548 | | | | (1,081 | ) | | | 21,629 | | | Deutsche Bank |
| BRL | 5,900 | | | | 01/02/14 | | | | 11.960% | | | Brazilian overnight interbank lending rate(1) | | | 149,248 | | | | (4,396 | ) | | | 153,644 | | | Goldman Sachs & Co. |
| BRL | 4,000 | | | | 01/02/14 | | | | 11.860% | | | Brazilian overnight interbank lending rate(1) | | | 79,454 | | | | 3,513 | | | | 75,941 | | | Bank of America Securities LLC |
| BRL | 2,800 | | | | 01/02/14 | | | | 11.990% | | | Brazilian overnight interbank lending rate(1) | | | 71,972 | | | | 448 | | | | 71,524 | | | Barclays Bank PLC |
| EUR | 1,600 | | | | 03/21/17 | | | | 2.000% | | | 6 month Euribor(1) | | | 46,081 | | | | (10,041 | ) | | | 56,122 | | | Barclays Bank PLC |
See Notes to Financial Statements.
| | |
| 46 | | Visit our website at www.prudentialfunds.com |
| | | | | | | | | | | | | | | | | | | | | | | | | | |
Notional
Amount (000)# | | | Termination
Date | | | Fixed
Rate | | | Floating
Rate | | Fair
Value | | | Upfront
Premiums
Paid
(Received) | | | Unrealized
Appreciation
(Depreciation) | | | Counterparty |
| Over-the-counter swap agreements (cont’d.): | | | | | | | | | | | | | | |
| MXN | 10,800 | | | | 03/05/13 | | | | 6.500% | | | 28 day Mexican interbank rate(1) | | $ | 13,783 | | | $ | (239 | ) | | $ | 14,022 | | | Morgan Stanley & Co. |
| MXN | 10,000 | | | | 06/02/21 | | | | 7.500% | | | 28 day Mexican interbank rate(1) | | | 75,269 | | | | 31,920 | | | | 43,349 | | | UBS AG |
| | | | |
| Exchange-traded swap agreements: | | | | | | | | | | | | | | |
| $ | 4,300 | | | | 12/21/16 | | | | 1.500% | | | 3 month LIBOR(1) | | | (115,552 | ) | | | (5,031 | ) | | | (110,521 | ) | | — |
| | 2,400 | | | | 12/21/21 | | | | 3.250% | | | 3 month LIBOR(1) | | | (311,463 | ) | | | (191,644 | ) | | | (119,819 | ) | | — |
| | 1,500 | | | | 10/13/16 | | | | 1.800% | | | 3 month LIBOR(1) | | | (67,958 | ) | | | (28,886 | ) | | | (39,072 | ) | | — |
| EUR | 1,600 | | | | 03/21/17 | | | | 2.000% | | | 6 month Euribor(1) | | | 42,444 | | | | 9,604 | | | | 32,840 | | | — |
| | | | | | | | | | | | | | | | | | | | | | | | | | |
| | | | | | | | | | | | | | $ | 38,072 | | | $ | (197,848 | ) | | $ | 235,920 | | | |
| | | | | | | | | | | | | | | | | | | | | | | | | | |
| (1) | Fund pays the floating rate and receives the fixed rate. |
| # | Notional Amount is shown in U.S. dollars unless otherwise stated. |
Credit default swap agreements outstanding at January 31, 2012:
| | | | | | | | | | | | | | | | | | | | | | | | | | |
Reference
Entity/
Obligation | | Termination
Date | | | Fixed
Rate | | | Notional
Amount
(000)(4)# | | | Fair
Value(3) | | | Upfront
Premiums
Paid
(Received) | | | Unrealized
Depreciation | | | Counterparty |
Over-the-counter credit default swaps on credit indices—Sell Protection(1): | | | |
Dow Jones CDX IG5 10Y Index | | | 12/20/15 | | | | 0.460% | | | $ | 1,900 | | | $ | (183,702 | ) | | $ | — | | | $ | (183,702 | ) | | Morgan Stanley & Co. |
Dow Jones CDX IG5 10Y Index | | | 12/20/15 | | | | 0.460% | | | | 530 | | | | (51,350 | ) | | | — | | | | (51,350 | ) | | Morgan Stanley & Co. |
| | | | | | | | | | | | | | | | | | | | | | | | | | |
| | | | | | | | | | | | | | $ | (235,052 | ) | | $ | — | | | $ | (235,052 | ) | | |
| | | | | | | | | | | | | | | | | | | | | | | | | | |
The Fund entered into credit default swap agreements on credit indices as the protection seller to provide a measure of protection against the current portfolio of investments’ exposure to market conditions, or to take an active position with respect to the likelihood of a particular issuer’s default or the referenced entity’s credit soundness.
| | | | | | | | | | | | | | | | | | | | | | | | | | |
Reference
Entity/
Obligation | | Termination
Date | | | Fixed
Rate | | | Notional
Amount
(000)(4)# | | | Fair
Value | | | Upfront
Premiums
Paid
(Received) | | | Unrealized
Appreciation
(Depreciation) | | | Counterparty |
Over-the-counter credit default swaps—Buy Protection(2): | | | | | | | |
Dow Jones CDX IG5 Index | | | 12/20/12 | | | | 0.140% | | | $ | 2,700 | | | $ | 1,546 | | | $ | — | | | $ | 1,546 | | | Morgan Stanley & Co. |
See Notes to Financial Statements.
| | | | |
| Target Asset Allocation Funds/Target Moderate Allocation Fund | | | 47 | |
Portfolio of Investments
as of January 31, 2012 (Unaudited) continued
| | | | | | | | | | | | | | | | | | | | | | | | | | |
Reference
Entity/
Obligation | | Termination
Date | | | Fixed
Rate | | | Notional
Amount
(000)(4)# | | | Fair
Value | | | Upfront
Premiums
Paid
(Received) | | | Unrealized
Appreciation
(Depreciation) | | | Counterparty |
Over-the-counter credit default swaps—Buy Protection(2) (cont’d.): | | | | | | | |
Dow Jones CDX IG5 Index | | | 12/20/12 | | | | 0.140% | | | $ | 700 | | | $ | 401 | | | $ | — | | | $ | 401 | | | Morgan Stanley & Co. |
Embarq Corp. | | | 03/20/14 | | | | 1.250% | | | | 300 | | | | (1,104 | ) | | | — | | | | (1,104 | ) | | Deutsche Bank |
Embarq Corp. | | | 03/20/14 | | | | 1.270% | | | | 200 | | | | (825 | ) | | | — | | | | (825 | ) | | Deutsche Bank |
Embarq Corp. | | | 03/20/14 | | | | 1.430% | | | | 200 | | | | (1,517 | ) | | | 13 | | | | (1,530 | ) | | Deutsche Bank |
Embarq Corp. | | | 03/20/14 | | | | 1.300% | | | | 100 | | | | (479 | ) | | | 6 | | | | (485 | ) | | Morgan Stanley & Co. |
| | |
Exchange-traded credit default swaps—Buy Protection(2): | | | | | | | |
Dow Jones CDX IG09 10Y Index | | | 12/20/17 | | | | 0.800% | | | | 10,842 | | | | 234,619 | | | | 482,925 | | | | (248,306 | ) | | — |
Dow Jones CDX IG10 10Y Index | | | 06/20/18 | | | | 1.500% | | | | 9,293 | | | | (163,518 | ) | | | 83,770 | | | | (247,288 | ) | | — |
Dow Jones CDX IG10 5Y Index | | | 06/20/13 | | | | 1.550% | | | | 2,226 | | | | (23,409 | ) | | | (6,426 | ) | | | (16,983 | ) | | — |
Dow Jones CDX IG14 5Y Index | | | 06/20/15 | | | | 5.000% | | | | 294 | | | | (4,237 | ) | | | 4,410 | | | | (8,647 | ) | | — |
Dow Jones CDX IG14 5Y Index | | | 06/20/15 | | | | 1.000% | | | | 4,000 | | | | (37,140 | ) | | | 17,920 | | | | (55,060 | ) | | — |
| | | | | | | | | | | | | | | | | | | | | | | | | | |
| | | | | | | | | | | | | | $ | 4,337 | | | $ | 582,618 | | | $ | (578,281 | ) | | |
| | | | | | | | | | | | | | | | | | | | | | | | | | |
| (1) | If the Fund is a seller of protection, it receives the fixed rate. When a credit event occurs, as defined under the terms of that particular swap agreement, the Fund will either (i) pay to the buyer of protection an amount equal to the notional amount of the swap and take delivery of the referenced obligation or underlying securities comprising the referenced Index or (ii) pay a net settlement amount in the form of cash or securities equal to the notional amount of the swap less the recovery value of the referenced obligation or underlying securities comprising the referenced index. |
| (2) | If the Fund is a buyer of protection, it pays the fixed rate. When a credit event occurs, as defined under the terms of that particular swap agreement, the Fund will either (i) receive from the seller of protection an amount equal to the notional amount of the swap and take delivery of the referenced obligation or underlying securities comprising the referenced Index or (ii) receive a net settlement amount in the form of cash or securities equal to the notional amount of the swap less the recovery value of the referenced obligation or underlying securities comprising the referenced index. |
| (3) | The fair value of credit default swap agreements on asset-backed securities and credit indices serves as an indicator of the current status of the payment/performance risk and represents the likelihood of an expected liability (or profit) for the credit derivative should the notional amount of the swap agreement be closed/sold as of the reporting date. Increasing fair value in absolute terms, represents a deterioration of the referenced entity’s credit soundness and a greater likelihood of risk of default or other credit event occurring as defined under the terms of the agreement. |
| (4) | Notional amount represents the maximum potential amount the Fund could be required to pay as a seller of credit protection or receive as a buyer of credit protection if a credit event occurs as defined under the terms of that particular swap agreement. |
| # | Notional Amount is shown in U.S. dollars unless otherwise stated. |
See Notes to Financial Statements.
| | |
| 48 | | Visit our website at www.prudentialfunds.com |
Reverse Repurchase Agreements outstanding at January 31, 2012:
| | | | | | | | | | | | | | | | | | | | |
Broker | | Interest
Rate | | | Trade
Date | | | Value at
January 31,
2012 | | | Maturity
Date | | | Cost | |
| Citigroup Global Markets | | | 2.00 | % | | | 1/23/2012 | | | $ | 2,796,500 | | | | 2/14/2012 | | | $ | 2,796,500 | |
| | | | | | | | | | | | | | | | | | | | |
Various inputs are used in determining the value of the Portfolio’s investments. These inputs are summarized in the three broad levels listed below.
Level 1—quoted prices generally for securities actively traded on a regulated securities exchange and for open-end mutual funds which trade at daily net asset value.
Level 2—other significant observable inputs (including, but not limited to, quoted prices for similar securities, interest rates, prepayment speeds, foreign currency exchange rates, and amortized cost) generally for debt securities, swaps, forward foreign currency contracts and for foreign stocks priced using vendor modeling tools.
Level 3—significant unobservable inputs for securities valued in accordance with Board approved fair valuation procedures.
The following is a summary of the inputs used as of January 31, 2012 in valuing such portfolio securities:
| | | | | | | | | | | | |
| | | Level 1 | | | Level 2 | | | Level 3 | |
Investments in Securities | | | | | | | | | | | | |
Common Stocks | | $ | 175,465,713 | | | $ | — | | | $ | 75 | |
Exchange Traded Fund | | | 136,598 | | | | — | | | | — | |
Preferred Stocks | | | 538,090 | | | | — | | | | — | |
Unaffiliated Mutual Fund | | | 72,514 | | | | — | | | | — | |
Asset-Backed Securities | | | — | | | | 6,760,090 | | | | 408,462 | |
Commerical Mortgage-Backed Security | | | — | | | | 152,388 | | | | — | |
Corporate Bonds | | | — | | | | 28,247,427 | | | | — | |
Foreign Government Bonds | | | — | | | | 5,818,534 | | | | — | |
Municipal Bonds | | | — | | | | 5,844,829 | | | | — | |
Residential Mortgage-Backed Securities | | | — | | | | 3,720,158 | | | | 31,148 | |
U.S. Government Mortgage-Backed Obligations | | | — | | | | 41,612,887 | | | | — | |
U.S. Treasury Obligations | | | — | | | | 18,980,716 | | | | — | |
Repurchase Agreement | | | — | | | | 100,000 | | | | — | |
See Notes to Financial Statements.
| | | | |
| Target Asset Allocation Funds/Target Moderate Allocation Fund | | | 49 | |
Portfolio of Investments
as of January 31, 2012 (Unaudited) continued
| | | | | | | | | | | | |
| | | Level 1 | | | Level 2 | | | Level 3 | |
Investments in Securities (continued) | | | | | | | | | | | | |
Options Written | | $ | — | | | $ | (33 | ) | | $ | — | |
Affiliated Money Market Mutual Fund | | | 12,347,481 | | | | — | | | | — | |
Securities Sold Short—U.S. Government Mortgage-Backed Obligations | | | — | | | | (7,439,258 | ) | | | — | |
Security Sold Short—U.S. Treasury Obligation | | | — | | | | (722,586 | ) | | | — | |
Reverse Repurchase Agreement | | | — | | | | (2,796,500 | ) | | | — | |
Other Financial Instruments* | | | | | | | | | | | | |
Futures | | | 393,778 | | | | — | | | | — | |
Forward foreign currency exchange contracts | | | — | | | | (537,728 | ) | | | — | |
Interest rate swap agreements | | | (236,572 | ) | | | 472,492 | | | | — | |
Credit default swap agreements | | | (576,284 | ) | | | (237,049 | ) | | | — | |
| | | | | | | | | | | | |
Total | | $ | 188,141,318 | | | $ | 99,976,367 | | | $ | 439,685 | |
| | | | | | | | | | | | |
| * | Other financial instruments are derivative instruments not reflected in the Schedule of Investments, such as futures, forwards and swap contracts, which are recorded at the unrealized appreciation/depreciation on the instrument. |
The investment allocation of Portfolio holdings and liabilities in excess of other assets shown as a percentage of net assets as of January 31, 2012 were as follows:
| | | | |
U.S. Government Mortgage-Backed Obligations | | | 15.0 | % |
Oil, Gas & Consumable Fuels | | | 6.9 | |
U.S. Treasury Obligations | | | 6.9 | |
Pharmaceuticals | | | 4.7 | |
Commercial Banks | | | 4.7 | |
Affiliated Money Market Mutual Fund | | | 4.5 | |
Diversified Financial Services | | | 4.0 | |
Retail & Merchandising | | | 3.5 | |
Insurance | | | 3.2 | |
Asset-Backed Securities | | | 2.6 | |
Chemicals | | | 2.3 | |
Municipal Bonds | | | 2.1 | |
Foreign Government Bonds | | | 2.1 | |
Media | | | 2.1 | |
Telecommunications | | | 1.9 | |
Metals & Mining | | | 1.8 | |
Computer Hardware | | | 1.8 | |
Software | | | 1.5 | |
Aerospace & Defense | | | 1.4 | |
Internet Services | | | 1.4 | |
Residential Mortgage-Backed Securities | | | 1.4 | |
Real Estate Investment Trusts | | | 1.3 | |
Computer Services & Software | | | 1.2 | |
Hotels, Restaurants & Leisure | | | 1.2 | |
Automobile Manufacturers | | | 1.2 | |
Transportation | | | 1.2 | % |
Machinery | | | 1.1 | |
Commercial Services & Supplies | | | 1.0 | |
Energy Equipment & Services | | | 1.0 | |
Internet Software & Services | | | 1.0 | |
Financial—Bank & Trust | | | 1.0 | |
Electric Utilities | | | 0.9 | |
Foods | | | 0.9 | |
Clothing & Apparel | | | 0.9 | |
Financial Services | | | 0.9 | |
Biotechnology | | | 0.9 | |
Specialty Retail | | | 0.8 | |
Food & Staples Retailing | | | 0.8 | |
Tobacco | | | 0.8 | |
Manufacturing | | | 0.7 | |
Consumer Finance | | | 0.7 | |
Food Products | | | 0.6 | |
Healthcare Equipment & Supplies | | | 0.5 | |
Computers & Peripherals | | | 0.5 | |
Industrial Conglomerates | | | 0.5 | |
Healthcare Providers & Services | | | 0.5 | |
Diversified Telecommunication Services | | | 0.5 | |
Consumer Products & Services | | | 0.4 | |
Banks | | | 0.4 | |
Beverages | | | 0.4 | |
Entertainment & Leisure | | | 0.4 | |
See Notes to Financial Statements.
| | |
| 50 | | Visit our website at www.prudentialfunds.com |
| | | | |
Industry (cont’d.) | | | |
Multi-Utilities | | | 0.4 | % |
Auto Components | | | 0.4 | |
Multi-Line Retail | | | 0.4 | |
Semiconductors | | | 0.3 | |
Distribution/Wholesale | | | 0.3 | |
Paper & Forest Products | | | 0.3 | |
Utilities | | | 0.3 | |
IT Services | | | 0.3 | |
Capital Markets | | | 0.3 | |
Wireless Telecommunication Services | | | 0.3 | |
Internet | | | 0.3 | |
Semiconductors & Semiconductor Equipment | | | 0.3 | |
Life Sciences Tools & Services | | | 0.3 | |
Electronic Equipment & Instruments | | | 0.2 | |
Apparel & Textile | | | 0.2 | |
Construction & Engineering | | | 0.2 | |
Office Electronics | | | 0.2 | |
Diversified Operations | | | 0.2 | |
Healthcare Services | | | 0.2 | |
Investment Companies | | | 0.2 | |
Building Materials | | | 0.2 | |
Electronic Components | | | 0.2 | |
Medical Supplies & Equipment | | | 0.2 | |
Diversified Manufacturing Operations | | | 0.2 | |
Household Products | | | 0.1 | % |
Healthcare Products | | | 0.1 | |
Automobiles | | | 0.1 | |
Retail | | | 0.1 | |
Trading Companies & Distributors | | | 0.1 | |
Air Freight & Logistics | | | 0.1 | |
Professional Services | | | 0.1 | |
Textiles, Apparel & Luxury Goods | | | 0.1 | |
Diversified Consumer Services | | | 0.1 | |
Hand/Machine Tools | | | 0.1 | |
Airlines | | | 0.1 | |
Containers & Packaging | | | 0.1 | |
Advertising | | | 0.1 | |
Commercial Services | | | 0.1 | |
Auto Parts & Equipment | | | 0.1 | |
Leisure Equipment & Products | | | 0.1 | |
Cosmetics & Toiletries | | | 0.1 | |
Holding Companies—Diversified | | | 0.1 | |
Household Durables | | | 0.1 | |
Commercial Mortgage-Backed Securities | | | 0.1 | |
| | | | |
| | | 108.4 | |
Options Written and Securities Sold Short | | | (3.0 | ) |
Liabilities in excess of other assets | | | (5.4 | ) |
| | | | |
| | | 100.0 | % |
| | | | |
The Fund invested in various derivative instruments during the reporting period. The primary types of risk associated with these derivative instruments are credit risk, foreign exchange risk and interest rate risk. The effect of such derivative instruments on the Fund’s financial position and financial performance as reflected in the Statement of Assets and Liabilities and Statement of Operations is presented in the summary below.
Fair values of derivative instruments as of January 31, 2012 as presented in the Statement of Assets and Liabilities:
| | | | | | | | | | | | |
Derivatives not accounted
for as hedging instruments,
carried at fair value | | Asset Derivatives | | | Liability Derivatives | |
| | Balance
Sheet Location | | Fair
Value | | | Balance
Sheet Location | | Fair
Value | |
| Interest rate contracts | | Receivable from broker—variation margin | | $ | 413,137 | * | | Receivable from broker—variation margin | | $ | 19,359 | * |
| Interest rate contracts | | — | | | — | | | Outstanding options written, at value | | | 33 | |
See Notes to Financial Statements.
| | | | |
| Target Asset Allocation Funds/Target Moderate Allocation Fund | | | 51 | |
Portfolio of Investments
as of January 31, 2012 (Unaudited) continued
| | | | | | | | | | | | |
Derivatives not accounted
for as hedging instruments,
carried at fair value | | Asset Derivatives | | | Liability Derivatives | |
| | Balance
Sheet Location | | Fair
Value | | | Balance
Sheet Location | | Fair
Value | |
| Interest rate contracts | | Premiums paid for swap agreements | | $ | 45,485 | | | Premiums received for swap agreements | | $ | 243,333 | |
| Interest rate contracts | | Unrealized appreciation on swap agreements | | | 505,332 | | | Unrealized depreciation on swap agreements | | | 269,412 | |
| Foreign exchange contracts | | Unrealized appreciation on foreign currency exchange contracts | | | 184,791 | | | Unrealized depreciation on foreign currency exchange contracts | | | 722,519 | |
| Credit contracts | | Unrealized appreciation on swap agreements | | | 1,947 | | | Unrealized depreciation on swap agreements | | | 815,280 | |
| Credit contracts | | Premiums paid for swap agreements | | | 589,044 | | | Premiums received for swap agreements | | | 6,426 | |
| | | | | | | | | | | | |
Total | | | | $ | 1,739,736 | | | | | $ | 2,076,362 | |
| | | | | | | | | | | | |
| * | Includes cumulative appreciation/depreciation on futures contracts as reported in the Schedule of Investments. Only unsettled variation margin receivable (payable) is reported within the Statement of Assets and Liabilities. |
The effects of derivative instruments on the Statement of Operations for the six months ended January 31, 2012 are as follows:
| | | | | | | | | | | | | | | | | | | | |
Amount of Realized Gain or (Loss) on Derivatives Recognized in Income | |
Derivatives not accounted for as hedging
instruments, carried at fair value | | Futures | | | Written
Options | | | Swaps | | | Forward
Currency
Contracts | | | Total | |
Interest rate contracts | | $ | 868,937 | | | $ | 78,521 | | | $ | (189,935 | ) | | $ | — | | | $ | 757,523 | |
Foreign exchange contracts | | | — | | | | — | | | | — | | | | 680,214 | | | | 680,214 | |
Credit contracts | | | — | | | | 6,409 | | | | 570,791 | | | | — | | | | 577,200 | |
| | | | | | | | | | | | | | | | | | | | |
Total | | $ | 868,937 | | | $ | 84,930 | | | $ | 380,856 | | | $ | 680,214 | | | $ | 2,014,937 | |
| | | | | | | | | | | | | | | | | | | | |
|
Change in Unrealized Appreciation or (Depreciation) on Derivatives Recognized in Income | |
Derivatives not accounted for as hedging
instruments, carried at fair value | | Futures | | | Written
Options | | | Swaps | | | Forward
Currency
Contracts | | | Total | |
Interest rate contracts | | $ | (295,008 | ) | | $ | (1,053 | ) | | $ | 406,455 | | | $ | — | | | $ | 110,394 | |
Foreign exchange contracts | | | — | | | | — | | | | — | | | | (352,020 | ) | | | (352,020 | ) |
Credit contracts | | | — | | | | (4,340 | ) | | | (838,209 | ) | | | — | | | | (842,549 | ) |
| | | | | | | | | | | | | | | | | | | | |
Total | | $ | (295,008 | ) | | $ | (5,393 | ) | | $ | (431,754 | ) | | $ | (352,020 | ) | | $ | (1,084,175 | ) |
| | | | | | | | | | | | | | | | | | | | |
See Notes to Financial Statements.
| | |
| 52 | | Visit our website at www.prudentialfunds.com |
For the six months ended January 31, 2012, the Fund’s average volume of derivative activities are as follows:
| | | | | | | | | | | | | | | | | | | | | | | | | | | | | | |
Written
Options(1) | | | Futures
Contracts—
Long
Positions(2) | | | Futures
Contracts—
Short
Positions(2) | | | Forward
Foreign
Currency
Exchange
Purchase
Contracts(3) | | | Forward
Foreign
Currency
Exchange
Sale
Contracts(4) | | | Interest
Rate
Swap
Agreements(5) | | | Credit Default
Swap
Agreements—
Buy
Protection(5) | | | Credit
Default
Swap
Agreements—
Sell
Protection(5) | |
| $ | 84,458 | | | $ | 47,397,050 | | | $ | 2,797,995 | | | $ | 14,355,850 | | | $ | 22,995,175 | | | $ | 20,717,791 | | | $ | 31,107,117 | | | $ | 3,130,000 | |
| (3) | Value at Settlement Date Payable. |
| (4) | Value at Settlement Date Receivable. |
See Notes to Financial Statements.
| | | | |
| Target Asset Allocation Funds/Target Moderate Allocation Fund | | | 53 | |
Statement of Assets and Liabilities
as of January 31, 2012 (Unaudited)
| | | | |
Assets | | | | |
Investments at value: | | | | |
Unaffiliated Investments (cost $254,000,766) | | $ | 287,889,629 | |
Affiliated Investments (cost $12,347,481) | | | 12,347,481 | |
Cash | | | 14,216 | |
Foreign currency, at value (cost $431,127) | | | 429,848 | |
Deposit with broker | | | 332,000 | |
Receivable for investments sold | | | 15,552,684 | |
Dividends and interest receivable | | | 939,858 | |
Premiums paid for swap agreements | | | 634,529 | |
Unrealized appreciation on swap agreements | | | 507,279 | |
Receivable from broker-variation margin | | | 395,100 | |
Unrealized appreciation on foreign currency exchange contracts | | | 184,791 | |
Tax reclaim receivable | | | 68,707 | |
Receivable for Fund shares sold | | | 60,811 | |
Prepaid expenses | | | 3,282 | |
| | | | |
Total assets | | | 319,360,215 | |
| | | | |
| |
Liabilities | | | | |
Payable for investments purchased | | | 27,937,211 | |
Securities sold short, at value (proceeds $8,094,283) | | | 8,161,844 | |
Reverse repurchase agreement | | | 2,796,500 | |
Unrealized depreciation on swap agreements | | | 1,084,692 | |
Unrealized depreciation on foreign currency exchange contracts | | | 722,519 | |
Payable for Fund shares reacquired | | | 678,574 | |
Premiums received for swap agreements | | | 249,759 | |
Accrued expenses and other liabilities | | | 239,307 | |
Management fee payable | | | 174,694 | |
Distribution fee payable | | | 110,460 | |
Affiliated transfer agent fee payable | | | 37,171 | |
Interest payable on investments sold short | | | 6,939 | |
Deferred trustees’ fees | | | 4,059 | |
Outstanding options written (premiums received $11,914) | | | 33 | |
| | | | |
Total liabilities | | | 42,203,762 | |
| | | | |
| |
Net Assets | | $ | 277,156,453 | |
| | | | |
| | | | | |
Net assets were comprised of: | | | | |
Shares of beneficial interest, at par | | $ | 25,391 | |
Paid-in capital, in excess of par | | | 286,176,820 | |
| | | | |
| | | 286,202,211 | |
Undistributed net investment income | | | 894,779 | |
Accumulated net realized loss on investment and foreign currency transactions | | | (43,049,826 | ) |
Net unrealized appreciation on investments and foreign currencies | | | 33,109,289 | |
| | | | |
Net assets, January 31, 2012 | | $ | 277,156,453 | |
| | | | |
See Notes to Financial Statements.
| | |
| 54 | | Visit our website at www.prudentialfunds.com |
| | | | |
Class A: | | | | |
Net asset value and redemption price per share,
($189,188,432 ÷ 17,327,106 shares of common stock issued and outstanding) | | $ | 10.92 | |
Maximum sales charge (5.5% of offering price) | | | .64 | |
| | | | |
Maximum offering price to public | | $ | 11.56 | |
| | | | |
| |
Class B: | | | | |
Net asset value, offering price and redemption price per share,
($30,602,022 ÷ 2,804,938 shares of common stock issued and outstanding) | | $ | 10.91 | |
| | | | |
| |
Class C: | | | | |
Net asset value, offering price and redemption price per share,
($53,410,751 ÷ 4,896,657 shares of common stock issued and outstanding) | | $ | 10.91 | |
| | | | |
| |
Class M: | | | | |
Net asset value, offering price and redemption price per share,
($55,126 ÷ 5,065 shares of common stock issued and outstanding) | | $ | 10.88 | |
| | | | |
| |
Class R: | | | | |
Net asset value, offering price and redemption price per share,
($299,233 ÷ 27,405 shares of common stock issued and outstanding) | | $ | 10.92 | |
| | | | |
| |
Class X: | | | | |
Net asset value, offering price and redemption price per share,
($414,048 ÷ 37,908 shares of common stock issued and outstanding) | | $ | 10.92 | |
| | | | |
| |
Class Z: | | | | |
Net asset value, offering price and redemption price per share,
($3,186,841 ÷ 291,662 shares of common stock issued and outstanding) | | $ | 10.93 | |
| | | | |
See Notes to Financial Statements.
| | | | |
| Target Asset Allocation Funds/Target Moderate Allocation Fund | | | 55 | |
Statement of Operations
Six Months Ended January 31, 2012 (Unaudited)
| | | | |
Net Investment Income | | | | |
Income | | | | |
Unaffiliated interest income | | $ | 1,758,311 | |
Unaffiliated dividend income (net of foreign withholding taxes $72,727) | | | 1,694,253 | |
Affiliated dividend income | | | 26,633 | |
| | | | |
| | | 3,479,197 | |
| | | | |
| |
Expenses | | | | |
Management fee | | | 1,030,431 | |
Distribution fee—Class A | | | 231,165 | |
Distribution fee—Class B | | | 161,107 | |
Distribution fee—Class C | | | 267,068 | |
Distribution fee—Class M | | | 662 | |
Distribution fee—Class R | | | 765 | |
Distribution fee—Class X | | | 771 | |
Transfer agent’s fees and expenses (including affiliated expense of $100,000) | | | 227,000 | |
Custodian’s fees and expenses | | | 193,000 | |
Registration fees | | | 53,000 | |
Audit fee | | | 37,000 | |
Reports to shareholders | | | 30,000 | |
Legal fee | | | 12,000 | |
Trustees’ fees | | | 10,000 | |
Interest expense | | | 4,493 | |
Insurance expense | | | 3,000 | |
Miscellaneous | | | 21,051 | |
| | | | |
Total expenses | | | 2,282,513 | |
| | | | |
Net investment income | | | 1,196,684 | |
| | | | |
| |
Net Realized And Unrealized Gain (Loss) On Investments And Foreign Currencies | | | | |
Net realized gain (loss) on: | | | | |
Investment transactions | | | 626,356 | |
Options written transactions | | | 84,930 | |
Foreign currency transactions | | | 1,095,033 | |
Futures transactions | | | 868,937 | |
Swap agreement transactions | | | 380,856 | |
Short sale transactions | | | (69,792 | ) |
| | | | |
| | | 2,986,320 | |
| | | | |
Net change in unrealized appreciation (depreciation) on: | | | | |
Investments | | | (6,282,509 | ) |
Options written | | | (5,393 | ) |
Foreign currencies | | | (374,953 | ) |
Futures | | | (295,008 | ) |
Swaps | | | (431,754 | ) |
Short sales | | | (67,444 | ) |
| | | | |
| | | (7,457,061 | ) |
| | | | |
Net loss on investments | | | (4,470,741 | ) |
| | | | |
Net Decrease In Net Assets Resulting From Operations | | $ | (3,274,057 | ) |
| | | | |
See Notes to Financial Statements.
| | |
| 56 | | Visit our website at www.prudentialfunds.com |
Statement of Changes in Net Assets
(Unaudited)
| | | | | | | | |
| | | Six Months
Ended
January 31, 2012 | | | Year
Ended July 31, 2011 | |
Increase (Decrease) In Net Assets | | | | | | | | |
Operations | | | | | | | | |
Net investment income | | $ | 1,196,684 | | | $ | 2,697,404 | |
Net realized gain on investment and foreign currency transactions | | | 2,986,320 | | | | 19,713,869 | |
Net change in unrealized appreciation (depreciation) on investments and foreign currencies | | | (7,457,061 | ) | | | 14,582,018 | |
| | | | | | | | |
Net increase (decrease) in net assets resulting from operations | | | (3,274,057 | ) | | | 36,993,291 | |
| | | | | | | | |
| | |
Dividends and Distributions (Note 1) | | | | | | | | |
Dividends from net investment income: | | | | | | | | |
Class A | | | (1,884,201 | ) | | | (1,566,050 | ) |
Class B | | | (76,350 | ) | | | (72,164 | ) |
Class C | | | (134,475 | ) | | | (97,074 | ) |
Class M | | | (177 | ) | | | (1,307 | ) |
Class R | | | (2,203 | ) | | | (3,071 | ) |
Class X | | | (5,882 | ) | | | (10,214 | ) |
Class Z | | | (38,968 | ) | | | (42,371 | ) |
| | | | | | | | |
| | | (2,142,256 | ) | | | (1,792,251 | ) |
| | | | | | | | |
| | |
Capital Contributions (Note 2) | | | | | | | | |
Class X | | | 205 | | | | 106 | |
| | | | | | | | |
| | |
Fund share transactions (Net of share conversions) (Note 6) | | | | | | | | |
Net proceeds from shares sold | | | 8,953,579 | | | | 35,562,345 | |
Net asset value of shares issued in reinvestment of dividends and distributions | | | 2,087,642 | | | | 1,746,778 | |
Cost of shares reacquired | | | (26,122,422 | ) | | | (62,541,358 | ) |
| | | | | | | | |
Net decrease in net assets resulting from Fund share transactions | | | (15,081,201 | ) | | | (25,232,235 | ) |
| | | | | | | | |
Total increase (decrease) | | | (20,497,309 | ) | | | 9,968,911 | |
| | |
Net Assets | | | | | | | | |
Beginning of period | | | 297,653,762 | | | | 287,684,851 | |
| | | | | | | | |
End of period (a) | | $ | 277,156,453 | | | $ | 297,653,762 | |
| | | | | | | | |
(a) Includes undistributed net income of: | | $ | 894,779 | | | $ | 1,840,351 | |
| | | | | | | | |
See Notes to Financial Statements.
| | | | |
| Target Asset Allocation Funds/Target Moderate Allocation Fund | | | 57 | |
Notes to Financial Statements
(Unaudited)
Target Asset Allocation Funds (the “Trust”) is registered under the Investment Company Act of 1940, as amended, (“1940 Act”) as an open-end, diversified management investment company presently consisting of three portfolios: Target Moderate Allocation Fund (the “Fund”), Target Conservative Allocation Fund and Target Growth Allocation Fund. These financial statements relate only to Target Moderate Allocation Fund. The financial statements of the other portfolios are not presented herein. The Trust was organized as a business trust in Delaware on July 29, 1998.
The Fund uses investment managers (“Subadvisors”), each managing a portion of the Fund’s assets. The following lists the Subadvisors and their respective segment during the six months ended January 31, 2012.
| | |
Fund Segment | | |
| Large-cap value stocks | | Eaton Vance Management
Hotchkis and Wiley Capital Management LLC
NFJ Investment Group LLC |
| |
| International stocks | | LSV Asset Management
Thornburg Investment Management, Inc. |
| |
| Large-cap growth stocks | | Marsico Capital Management, LLC
Massachusetts Financial Services Company |
| |
| Small-cap value stocks | | EARNEST Partners, LLC Vaughan Nelson Investment Management, LP |
| |
| Core fixed income bonds | | Pacific Investment Management Company LLC |
| |
| Small-cap growth stocks | | Eagle Asset Management |
The investment objective of the Fund is to provide capital appreciation and a reasonable level of current income.
Note 1. Accounting Policies
The following is a summary of significant accounting policies followed by the Trust in the preparation of its financial statements.
Securities Valuation: Securities listed on a securities exchange (other than options on securities and indices) are valued at the last sale price on such exchange on the day of valuation or, if there was no sale on such day, at the mean between the last
| | |
| 58 | | Visit our website at www.prudentialfunds.com |
reported bid and ask prices, or at the last bid price on such day in the absence of an asked price. Securities traded via NASDAQ are valued at the NASDAQ official closing price (NOCP) on the day of valuation, or if there was no NOCP, at the last sale price. Securities that are actively traded in the over-the-counter market, including listed securities for which the primary market is believed by Prudential Investments LLC (“PI” or “Manager”), in consultation with the Subadvisor(s); to be over-the-counter, are valued at market value using prices provided by an independent pricing agent or principal market maker. Options on securities and indices traded on an exchange are valued at the last sale price as of the close of trading on the applicable exchange or, if there was no sale, at the mean between the most recently quoted bid and asked prices on such exchange or at the last bid price in the absence of an asked price. Futures contracts and options thereon traded on a commodities exchange or board of trade are valued at the last sale price at the close of trading on such exchange or board of trade or, if there was no sale on the applicable commodities exchange or board of trade on such day, at the mean between the most recently quoted bid and asked prices on such exchange or board of trade or at the last bid price in the absence of an asked price. Certain fixed income securities for which daily market quotations are not readily available may be valued with reference to fixed income securities whose prices are more readily available, pursuant to guidelines established by the Board of Trustees. Prices may be obtained from independent pricing services which use information provided by market makers or estimates of market values obtained from yield data relating to investments or securities with similar characteristics. Securities for which reliable market quotations are not readily available, or whose values have been affected by events occurring after the close of the security’s foreign market and before the Fund’s normal pricing time, are valued at fair value in accordance with the Board of Trustees’ approved fair valuation procedures. When determining the fair valuation of securities, some of the factors influencing the valuation include the nature of any restrictions on disposition of the securities; assessment of the general liquidity of the securities; the issuer’s financial condition and the markets in which it does business; the cost of the investment; the size of the holding and the capitalization of issuer; the prices of any recent transactions or bids/offers for such securities or any comparable securities; any available analyst media or other reports or information deemed reliable by the investment adviser regarding the issuer or the markets or industry in which it operates. Using fair value to price securities may result in a value that is different from a security’s most recent closing price and from the price used by other mutual funds to calculate their net asset value.
Investments in open end, non exchange traded mutual funds are valued at their net asset value as of the close of the New York Stock Exchange on the date of valuation.
| | | | |
| Target Asset Allocation Funds/Target Moderate Allocation Fund | | | 59 | |
Notes to Financial Statements
(Unaudited) continued
Short-term debt securities of sufficient credit quality, which mature in sixty days or less, are valued at amortized cost, which approximates fair value. The amortized cost method involves valuing a security at its cost on the date of purchase and thereafter assuming a constant amortization to maturity of the difference between the principal amount due at maturity and cost. Short-term debt securities which mature in more than sixty days are valued at fair value.
Foreign Currency Translation: The books and records of the Fund are maintained in U.S. dollars. Foreign currency amounts are translated into U.S. dollars on the following basis:
(i) market value of investment securities, other assets and liabilities-at the current daily rates of exchange;
(ii) purchases and sales of investment securities, income and expenses-at the rates of exchange prevailing on the respective dates of such transactions.
Although the net assets of the Fund are presented at the foreign exchange rates and market values at the close of the period, the Fund does not isolate that portion of the results of operations arising as a result of changes in the foreign exchange rates from the fluctuations arising from changes in the market prices of securities held at the end of the period. Similarly, the Fund does not isolate the effect of changes in foreign exchange rates from the fluctuations arising from changes in the market prices of portfolio securities sold during the period. Accordingly, realized foreign currency gains or losses are included in the reported net realized gains or losses on investment transactions.
Net realized gains or losses on foreign currency transactions represent net foreign exchange gains or losses from the holdings of foreign currencies, currency gains or losses realized between the trade and settlement dates on security transactions, and the difference between the amounts of dividends, interest and foreign withholding taxes recorded on the Fund’s books and the U.S. dollar equivalent amounts actually received or paid. Net unrealized currency gains or losses from valuing foreign currency denominated assets and liabilities (other than investments) at period end exchange rates are reflected as a component of net unrealized appreciation (depreciation) on foreign currencies. Foreign security and currency transactions may involve certain considerations and risks not typically associated with those of domestic origin as a result of, among other factors, the possibility of political and
| | |
| 60 | | Visit our website at www.prudentialfunds.com |
economic instability and the level of governmental supervision and regulation of foreign securities markets.
Repurchase Agreements: In connection with transactions in repurchase agreements with United States financial institutions, it is the Fund’s policy that its custodian or designated subcustodians, as the case may be, under triparty repurchase agreements, take possession of the underlying collateral securities, the value of which exceeds the principal amount of the repurchase transaction, including accrued interest. To the extent that any repurchase transaction exceeds one business day, the value of the collateral is marked to market on a daily basis to ensure the adequacy of the collateral. If the seller defaults or the value of the collateral declines, or if bankruptcy proceedings are commenced with respect to the seller of the security, realization of the collateral by the Fund may by delayed or limited.
Reverse Repurchase Agreements: The Fund enters into reverse repurchase agreements with qualified, third party broker-dealers as determined by and under the direction of the Trust’s Board of Trustees. Interest on the value of reverse repurchase agreements entered into and outstanding is based upon competitive market rates at the time of execution of the agreement. At the time the Fund enters into a reverse repurchase agreement, it establishes and maintains a segregated account with the lender containing liquid investment grade securities having a value not less than the repurchase price, including accrued interest, of the reverse repurchase agreement.
Forward Currency Contracts: A forward currency contract is a commitment to purchase or sell a foreign currency at a future date at a negotiated forward rate between two parties. The Fund entered into forward currency contracts in order to hedge its exposure to changes in foreign currency exchange rates on its foreign portfolio holdings or on specific receivables and payables denominated in a foreign currency and to gain exposure to certain currencies. The contracts are valued daily at current exchange rates and any unrealized gain or loss is included in the Statement of Assets and Liabilities as unrealized appreciation and depreciation on foreign currencies. Gain or loss is realized on the settlement date of the contract equal to the difference between the settlement value of the original and renegotiated forward contracts. This gain or loss, if any, is included in net realized gain (loss) on foreign currency transactions. Forward currency contracts involve risks from currency exchange rate and credit risk in excess of the amounts reflected on the Statement of Assets and Liabilities. Risks may also arise upon entering into these contracts from the potential inability of the counterparties to meet the terms of their contracts. The Fund’s maximum risk of loss from counterparty credit risk is the net value of the cash flows to be received from the counterparty at the end of the contract’s life. A master netting agreement exists between the Fund and the counterparty which permits the
| | | | |
| Target Asset Allocation Funds/Target Moderate Allocation Fund | | | 61 | |
Notes to Financial Statements
(Unaudited) continued
Fund to offset amounts payable by the Fund to the same counterparty against amounts to be received; and by the receipt of collateral from the counterparty by the Fund to cover the Fund’s exposure to the counterparty. However, there is no assurance that such mitigating factors are easily enforceable.
Short Sales: The Fund may sell a security it does not own in anticipation of a decline in the market value of that security (short sale). When the Fund makes a short sale, it will borrow the security sold short and deliver it to the broker-dealer through which it made the short sale as collateral for its obligation to deliver the security upon conclusion of the sale. The Fund may have to pay a fee to borrow the particular securities and may be obligated to return any interest or dividends received on such borrowed securities. A gain, limited to the price at which the Fund sold the security short, or a loss, unlimited in magnitude, will be recognized upon the termination of a short sale if the market price at termination is less than or greater than respectively the proceeds originally received.
Options: The Fund purchased and wrote options in order to hedge against adverse market movements or fluctuations in value caused by changes in prevailing interest rates or foreign currency exchange rates with respect to securities or financial instruments which the Fund currently owns or intends to purchase. The Fund also purchased options to gain exposure to certain securities and foreign currencies. The Fund’s principal reason for writing options is to realize, through receipt of premiums, a greater current return than would be realized on the underlying security alone. When the Fund purchases an option, it pays a premium and an amount equal to that premium is recorded as an asset. When the Fund writes an option, it receives a premium and an amount equal to that premium is recorded as a liability. The asset or liability is adjusted daily to reflect the current market value of the option.
If an option expires unexercised, the Fund realizes a gain or loss to the extent of the premium received or paid. If an option is exercised, the premium received or paid is recorded as an adjustment to the proceeds from the sale or the cost basis of the purchase in determining whether the Fund has realized a gain or loss. The difference between the premium and the amount received or paid on affecting a closing purchase or sale transaction is also treated as a realized gain or loss. Gain or loss on purchased options is included in net realized gain or loss on investment transactions. Gain or loss on written options is presented separately as net realized gain or loss on options written.
| | |
| 62 | | Visit our website at www.prudentialfunds.com |
The Fund, as writer of an option, has no control over whether the underlying securities may be sold (called) or purchased (put). As a result, the Fund bears the market risk of an unfavorable change in the price of the security or currency underlying the written option. Over-the-counter options involve the risk of the potential inability of the counterparties to meet the terms of their contracts.
When a Fund writes an option on a swap contract, an amount equal to any premium received by the Fund is recorded as a liability and is subsequently adjusted to the current market value of the written option on the swap. If a call option on a swap is exercised, the Fund becomes obligated to pay a fixed interest rate (noted as the strike price) and receive a variable interest rate on a notional amount. If a put option on a swap is exercised, the Fund becomes obligated to pay a variable interest rate and receive a fixed interest rate (noted as the strike price) on a notional amount. Premiums received from writing options on swaps that expire or are exercised are treated as realized gains upon the expiration or exercise of such options on swaps. The risk associated with writing put and call options on swaps is that the Fund will be obligated to be party to a swap agreement if an option on a swap is exercised.
Financial Futures Contracts: A financial futures contract is an agreement to purchase (long) or sell (short) an agreed amount of securities at a set price for delivery on a future date. Upon entering into a financial futures contract, the Fund is required to pledge to the broker an amount of cash and/or other assets equal to a certain percentage of the contract amount. This amount is known as the “initial margin.” Subsequent payments known as “variation margin,” are made or received by the Fund each day, depending on the daily fluctuations in the value of the underlying security. Such variation margin is recorded for financial statement purposes on a daily basis as unrealized gain or loss. When the contract expires or is closed, the gain or loss is realized and is presented in the Statement of Operations as net realized gain or loss on financial futures contracts.
The Fund invested in financial futures contracts in order to hedge its existing portfolio securities, or securities the Fund intends to purchase, against fluctuations in value caused by changes in prevailing interest rates, and to manage yield curve and duration. The Fund may not achieve the anticipated benefits of the financial futures contracts and may realize a loss. The use of futures transactions involves the risk of imperfect correlation in movements in the price of futures contracts, interest rates and the underlying hedged assets. Financial futures contracts involve elements of risk in excess of the amounts reflected on the Statement of Assets and Liabilities.
With exchange-traded futures and options contracts, there is minimal counterparty credit risk to the Fund since the exchanges’ clearinghouse acts as counterparty to all
| | | | |
| Target Asset Allocation Funds/Target Moderate Allocation Fund | | | 63 | |
Notes to Financial Statements
(Unaudited) continued
exchange traded futures and options, and guarantees the futures and options contracts against default.
Swap Agreements: The Fund entered into credit default and interest rate swap agreements. A swap agreement is an agreement to exchange the return generated by one instrument for the return generated by another instrument. Swap agreements are negotiated in the over-the-counter market and may be executed either directly with counterparty (“OTC Traded”) or through a central clearing facility, such as a registered commodities exchange (“Exchange Traded”). Swap agreements are valued daily at current market value and any change in value is included in the net unrealized appreciation or depreciation on investments. Upon entering into an exchange traded swap, the Fund pledges with the clearing broker an initial margin and thereafter, pays or receives an amount, known as “variation margin”, based on daily changes in valuation of swap contract. Payments received or paid by the Fund are recorded as realized gains or losses upon termination or maturity of the swap. Risk of loss may exceed amounts recognized on the statements of assets and liabilities. Swap agreements outstanding at reporting date, if any, are listed on the Schedule of Investments.
Interest Rate Swaps: Interest rate swaps represent agreements between counterparties to exchange cash flows based on the difference between two interest rates, applied to a notional principal amount for a specified period. The Fund is subject to interest rate risk exposure in the normal course of pursuing its investment objectives. The Fund used interest rate swaps to generate steady cash flow by receiving a stream of fixed rate payments and to increase exposure to prevailing market rates by receiving floating rate payments. The Fund’s maximum risk of loss from counterparty credit risk is the discounted net value of the cash flows to be received from the counterparty over the contract’s remaining life. A master netting agreement exists between the Fund and the counterparty which permits the Fund to offset amounts payable by the Fund to the same counterparty against amounts to be received; and by the receipt of collateral from the counterparty by the Fund to cover the Fund’s exposure to the counterparty. However, there is no assurance that such mitigating factors are easily enforceable.
Credit Default Swaps: Credit default swaps involve one party (the protection buyer) making a stream of payments to another party (the protection seller) in exchange for the right to receive a specified payment in the event of a default or as a result of a
| | |
| 64 | | Visit our website at www.prudentialfunds.com |
default (“credit event”) for the referenced party, typically corporate issues or sovereign issues of an emerging country, on its obligation; or in the event of a write-down, principal shortfall, interest shortfall or default of all or part of the referenced entities comprising a credit index.
The Fund is subject to credit risk in the normal course of pursuing its investment objectives. The Fund purchased credit default swaps to provide a measure of protection against defaults of the issuers. The Fund used credit default swaps on credit indices to hedge a portfolio of credit default swaps or bonds, which is less expensive than it would be to buy many credit default swaps to achieve a similar effect. The Fund took an active short position with respect to the likelihood of a particular issue’s default by selling credit default swaps. The Fund’s maximum risk of loss from counterparty credit risk for purchased credit default swaps is the notional value of a credit default swap agreement. A master netting agreement exists between the Fund and the counterparty which permits the Fund to offset amounts payable by the Fund to the same counterparty against amounts to be received; and by the receipt of collateral from the counterparty by the Fund to cover the Fund’s exposure to the counterparty. However, there is no assurance that such mitigating factors are easily enforceable.
As a seller of protection on credit default swap agreements, a Fund will generally receive from the buyer of protection an agreed upon payment throughout the term of the swap provided that there is no credit event. As the seller, the Fund would effectively increase investment risk to its portfolio because, in addition to its total net assets, the Fund may be subject to investment exposure on the notional amount of the swap.
The maximum amount of the payment that the Fund as a seller of protection could be required to make under a credit default swap agreement would be equal to the notional amount of the underlying security or index contract as a result of a credit event. These potential amounts will be partially offset by any recovery values of the respective referenced obligations, or net amounts received from the settlement of buy protection credit default swap agreements entered into by the Fund for the same referenced entity or index. As a buyer of protection, the Fund generally receives an amount up to the notional value of the swap if a credit event occurs.
Implied credit spreads, represented in absolute terms, utilized in determining the market value of credit default swap agreements on corporate issues or sovereign issues of an emerging country as of the reporting date are disclosed in the footnotes to the Portfolio of Investments and serve as an indicator of the current status of the payment/performance risk and represent the likelihood of risk of default for the credit
| | | | |
| Target Asset Allocation Funds/Target Moderate Allocation Fund | | | 65 | |
Notes to Financial Statements
(Unaudited) continued
derivative. The implied credit spread of a particular referenced entity reflects the cost of buying/selling protection and may include upfront payments required to enter into the agreement. For credit default swap agreements on asset-backed securities and credit indices, the quoted market prices and resulting values serve as the indicator of the current status of the payment and/or performance risk. Wider credit spreads and increasing market value in absolute terms, when compared to the notional amount of the swap, represent a deterioration of the referenced entity’s credit soundness and a greater likelihood of risk of default or other credit event occurring as defined under the terms of the agreement. In addition to each instrument’s primary underlying risk exposure (e.g. interest rate, credit, equity or foreign exchange, etc.), swap agreements involve, to varying degrees, elements of credit, market and documentation risk. Such risks involve the possibility that there will be no liquid market for these agreements, that the counterparty to the agreement may default on its obligation to perform or disagree as to the meaning of the contractual terms in the agreement, and that there will be unfavorable changes in net interest rates. In connection with these agreements, securities in the portfolio may be identified as collateral or received as collateral from the counterparty in accordance with the terms of the respective swap agreements to provide or receive assets of value and serve as recourse in the event of default or bankruptcy/insolvency of either party. Such over-the-counter derivative agreements include conditions which when materialized, give the counterparty the right to cause an early termination of the transactions under those agreements. Any election by the counterparty for early termination of the contract(s) may impact the amounts reported on financial statements.
As of January 31, 2012, the Fund has not met conditions under such agreements, which give the counterparty the right to call for an early termination.
Forward currency contracts, written options, short sales, swaps and financial futures contracts involve elements of both market and credit risk in excess of the amounts reflected on the Statement of Assets and Liabilities.
When-Issued/Delayed Delivery Securities: Securities purchased or sold on a when issued or delayed-delivery basis may be settled a month or more after trade date; interest income is not accrued until settlement date. At the time a fund enters into such transactions, it instructs the custodian to segregate assets with a current value at least equal to the amount of its when-issued or delayed-delivery purchase commitments.
| | |
| 66 | | Visit our website at www.prudentialfunds.com |
Securities Transactions and Net Investment Income: Securities transactions are recorded on the trade date. Realized gains or losses on sales of securities are calculated on the identified cost basis. Dividend income is recorded on the ex-dividend date and interest income, including amortization of premium and accretion of discount, on debt securities as required, is recorded on the accrual basis. Expenses are recorded on the accrual basis.
Net investment income or loss (other than distribution fees, which are charged directly to its respective class), unrealized and realized gains or losses, are allocated daily to each class of shares based upon the relative proportion of net assets of each class at the beginning of the day.
Dividends and Distributions: Dividends from net investment income are declared and paid annually. Distributions of net realized capital and currency gains, if any, are declared and paid annually.
Dividends and distributions to shareholders which are determined in accordance with federal income tax regulations and which may differ from generally accepted accounting principles are recorded on the ex-dividend date. Permanent book/tax differences relating to income and gains are reclassified amongst undistributed net investment income, accumulated net realized gain or loss and paid-in capital in excess of par, as appropriate.
Taxes: It is the Fund’s intention to continue to meet the requirements of the Internal Revenue Code applicable to regulated investment companies and to distribute all of its taxable net investment income and capital gains, if any, to its shareholders. Therefore, no federal income tax provision is required.
Withholding taxes on foreign dividends are recorded net of reclaimable amounts, at the time the related income is earned.
Estimates: The preparation of the financial statements requires management to make estimates and assumptions that affect the reported amounts and disclosures in the financial statements. Actual results could differ from those estimates.
Note 2. Agreements
The Trust has a management agreement with PI. Pursuant to this agreement, PI manages the investment operations of the Fund, administers the Fund’s affairs and supervises the Subadvisors’ performance of all investment advisory services. Pursuant
| | | | |
| Target Asset Allocation Funds/Target Moderate Allocation Fund | | | 67 | |
Notes to Financial Statements
(Unaudited) continued
to the advisory agreements, PI pays the cost of compensation of officers of the Fund, occupancy and certain clerical and accounting costs of the Fund. The Fund bears all other costs and expenses.
The management fee paid to PI is computed daily and payable monthly at an annual rate of 0.75% of the average daily net assets up to $500 million, 0.70% of average daily net assets for the next $500 million and 0.65% of average daily net assets in excess of $1 billion. The effective management fee rate was 0.75% for the six months ended January 31, 2012.
The Fund has a distribution agreement with Prudential Investment Management Services LLC (“PIMS”), which acts as the distributor of the Class A, Class B, Class C, Class R and Class Z shares of the Fund. In addition, the Fund has a distribution agreement with Prudential Annuities Distributors, Inc. (“PAD”), which, together with PIMS, serves as co-distributor of the Class M and Class X shares of the Fund. The Fund compensates PIMS and PAD, as applicable, for distributing and servicing the Fund’s Class A, Class B, Class C, Class M, Class R and Class X shares, pursuant to plans of distribution (the “Class A, B, C, M, R and X Plans”), regardless of expenses actually incurred by PIMS or PAD. The distribution fees are accrued daily and payable monthly. No distribution or service fees are paid to PIMS as distributor of the Class Z shares of the Fund.
Pursuant to the Class A, B, C, M, R and X Plans, the Fund compensates PIMS and PAD, as applicable, for distribution related activities at an annual rate of up to 0.30%,1%, 1%, 1%, 0.75% and 1% of the average daily net assets of the Class A, B, C, M, R and X shares, respectively. PIMS has contractually agreed through November 30, 2012 to limit such expenses to 0.25% and 0.50% of the average daily net assets of the Class A and Class R shares, respectively.
Management has received the maximum allowable amount of sales charges for Class X in accordance with regulatory limits. As such, any contingent deferred sales charges received by the Manager are contributed back into the Fund and included in the Statement of Changes and Financial Highlights as a contribution to capital.
PIMS has advised the Fund that it has received $44,965 in front-end sales charges resulting from sales of Class A shares during the six months ended January 31, 2012. From these fees, PIMS paid such sales charges to broker-dealers, which in turn paid
| | |
| 68 | | Visit our website at www.prudentialfunds.com |
commissions to salespersons and incurred other distribution costs. PIMS has advised the Fund that for the six months ended January 31, 2012, it has received $12, $21,280 and $1,640 in contingent deferred sales charges imposed upon certain redemptions by Class A, Class B and Class C shareholders, respectively.
PIMS and PI are indirect, wholly-owned subsidiaries of Prudential Financial, Inc. (“Prudential”).
Note 3. Other Transactions with Affiliates
Prudential Mutual Fund Services LLC (“PMFS”), an affiliate of PI, and an indirect, wholly-owned subsidiary of Prudential, serves as the Fund’s transfer agent. Transfer agent fees and expenses in the Statement of Operations include certain out-of-pocket expenses paid to non-affiliates, where applicable.
The Fund invests in the Prudential Taxable Core Money Market Fund (the “Core Fund”), a portfolio of Prudential Investment Portfolios 2, registered under the 1940 Act, and managed by PI. Earnings from the Core Fund are disclosed on the Statement of Operations as affiliated dividend income.
Note 4. Portfolio Securities
Purchases and sales of portfolio securities, excluding short-term investments and U.S. government securities, for the six months ended January 31, 2012, aggregated $149,950,139 and $155,813,811, respectively.
Transactions in options written during the six months ended January 31, 2012 were as follows:
| | | | | | | | |
| | | Notional
Amount | | | Premiums
Received | |
Options outstanding at July 31, 2011 | | | 38,900,000 | | | $ | 127,833 | |
Written swap options | | | 82,000,000 | | | | 49,924 | |
Expired swap options | | | (35,700,000 | ) | | | (61,893 | ) |
Closed swap options | | | (83,300,000 | ) | | | (103,950 | ) |
| | | | | | | | |
Options outstanding at January 31, 2012 | | | 1,900,000 | | | $ | 11,914 | |
| | | | | | | | |
| | | | |
| Target Asset Allocation Funds/Target Moderate Allocation Fund | | | 69 | |
Notes to Financial Statements
(Unaudited) continued
Note 5. Distributions and Tax Information
The United States federal income tax basis of the Fund’s investments and the net unrealized appreciation as of January 31, 2012 were as follows:
| | | | | | |
Tax Basis | | Appreciation | | Depreciation | | Net
Unrealized
Appreciation |
| $276,608,903 | | $32,450,660 | | $(8,822,453) | | $23,628,207 |
The difference between book basis and tax basis were primarily attributable to deferred losses on wash sales and straddles as of the most recent fiscal year end.
For federal income tax purposes, the Fund had a capital loss carryforward as of July 31, 2011 of approximately $36,209,000 which expires in 2018. The Fund utilized approximately $17,395,000 of its capital loss carryforward to offset net taxable gains realized in the year ended July 31, 2011. Accordingly, no capital gains distributions are expected to be paid to shareholders until net gains have been realized in excess of such carryforward. Under the recently enacted Regulated Investment Company Modernization Act of 2010, the Fund is permitted to carryforward capital losses incurred in taxable years beginning after December 22, 2010 (“post-enactment losses”) for an unlimited period. However, any post-enactment losses are required to be utilized before the utilization of losses incurred prior to the effective date of the Act. As a result of this ordering rule, capital loss carryforwards related to the taxable years beginning prior to the effective date of the Act may have an increased likelihood to expire unused. Additionally, post-enactment capital losses that are carried forward will retain their character as either short-term or long-term capital losses rather than being considered all short-term as under previous law.
The Fund has elected to treat post-October currency losses of approximately $23,000 as having been incurred in the following fiscal year (July 31, 2012).
Management has analyzed the Fund’s tax positions taken on federal income tax returns for all open tax years and has concluded that no provision for income tax is required in the Fund’s financial statements for the current reporting period. The Fund’s federal and state income and federal excise tax returns for tax years for which the applicable statutes of limitations have not expired are subject to examination by the Internal Revenue Service and state departments of revenue.
| | |
| 70 | | Visit our website at www.prudentialfunds.com |
Note 6. Capital
The Fund offers Class A, Class B, Class C, Class M, Class R, Class X and Class Z shares. Class A shares are subject to a maximum front-end sales charge of 5.50%. Investors who purchase $1 million or more of Class A shares and sell these shares within 12 months of purchase are not subject to an initial sales charge but are subject to a contingent deferred sales charge (CDSC) of 1%. The Class A CDSC is waived for purchases by certain retirement or benefit plans. Class B shares are subject to a CDSC of 5%, which decreases by 1% annually to 1% in the fifth and sixth years and 0% in the seventh year. Class B shares automatically convert to Class A shares on a quarterly basis approximately seven years after purchase. The CDSC for Class C shares is 1% for shares redeemed within 12 months of purchase. Class M shares are generally closed to new purchases. Class M shares are subject to a CDSC of 6%, which decreases by 1% annually to 2% in the fifth and sixth years and 1% in the seventh year. Class M shares automatically convert to Class A shares approximately eight years after purchase. Class X shares are generally closed to new purchases. Class X shares are subject to a CDSC of 6%, which decreases by 1% annually to 4% in the third and fourth years, by 1% annually to 2% in the sixth and seventh years, and 1% in the eighth year. Class X shares automatically convert to Class A shares on a monthly basis approximately ten years after purchase. An exchange privilege is also available for shareholders who qualify to purchase Class A shares at net asset value. Class R and Class Z shares are not subject to any sales or redemption charge and are offered exclusively for sale to a limited group of investors.
As of January 31, 2012, Prudential owns 231 shares of Class R.
The Fund has authorized an unlimited number of shares of beneficial interest at $.001 par value per share.
| | | | |
| Target Asset Allocation Funds/Target Moderate Allocation Fund | | | 71 | |
Notes to Financial Statements
(Unaudited) continued
Transactions in shares of beneficial interest were as follows:
| | | | | | | | |
Class A | | Shares | | | Amount | |
Six Months ended January 31, 2012: | | | | | | | | |
Shares sold | | | 633,279 | | | $ | 6,620,503 | |
Shares issued in reinvestment of dividends and distributions | | | 179,082 | | | | 1,846,340 | |
Shares reacquired | | | (1,674,976 | ) | | | (17,651,510 | ) |
| | | | | | | | |
Net increase (decrease) in shares outstanding before conversion | | | (862,615 | ) | | | (9,184,667 | ) |
Shares issued upon conversion from Class B, Class M, and Class X | | | 469,672 | | | | 4,917,941 | |
| | | | | | | | |
Net increase (decrease) in shares outstanding | | | (392,943 | ) | | $ | (4,266,726 | ) |
| | | | | | | | |
Year ended July 31, 2011: | | | | | | | | |
Shares sold | | | 2,790,222 | | | $ | 30,000,283 | |
Shares issued in reinvestment of dividends and distributions | | | 144,675 | | | | 1,535,007 | |
Shares reacquired | | | (3,545,393 | ) | | | (38,281,566 | ) |
| | | | | | | | |
Net increase (decrease) in shares outstanding before conversion | | | (610,496 | ) | | | (6,746,276 | ) |
Shares issued upon conversion from Class B, Class M, and Class X | | | 1,641,072 | | | | 17,573,237 | |
| | | | | | | | |
Net increase (decrease) in shares outstanding | | | 1,030,576 | | | $ | 10,826,961 | |
| | | | | | | | |
Class B | | | | | | |
Six Months ended January 31, 2012: | | | | | | | | |
Shares sold | | | 96,935 | | | $ | 1,014,937 | |
Shares issued in reinvestment of dividends and distributions | | | 7,309 | | | | 75,352 | |
Shares reacquired | | | (207,841 | ) | | | (2,172,575 | ) |
| | | | | | | | |
Net increase (decrease) in shares outstanding before conversion | | | (103,597 | ) | | | (1,082,286 | ) |
Shares reacquired upon conversion into Class A | | | (431,714 | ) | | | (4,485,420 | ) |
| | | | | | | | |
Net increase (decrease) in shares outstanding | | | (535,311 | ) | | $ | (5,567,706 | ) |
| | | | | | | | |
Year ended July 31, 2011: | | | | | | | | |
Shares sold | | | 235,993 | | | $ | 2,535,186 | |
Shares issued in reinvestment of dividends and distributions | | | 6,640 | | | | 70,448 | |
Shares reacquired | | | (729,893 | ) | | | (7,818,396 | ) |
| | | | | | | | |
Net increase (decrease) in shares outstanding before conversion | | | (487,260 | ) | | | (5,212,762 | ) |
Shares reacquired upon conversion into Class A | | | (1,531,200 | ) | | | (16,301,175 | ) |
| | | | | | | | |
Net increase (decrease) in shares outstanding | | | (2,018,460 | ) | | $ | (21,513,937 | ) |
| | | | | | | | |
| | |
| 72 | | Visit our website at www.prudentialfunds.com |
| | | | | | | | |
Class C | | Shares | | | Amount | |
Six Months ended January 31, 2012: | | | | | | | | |
Shares sold | | | 116,059 | | | $ | 1,203,745 | |
Shares issued in reinvestment of dividends and distributions | | | 11,846 | | | | 122,017 | |
Shares reacquired | | | (550,215 | ) | | | (5,752,426 | ) |
| | | | | | | | |
Net increase (decrease) in shares outstanding | | | (422,310 | ) | | $ | (4,426,664 | ) |
| | | | | | | | |
Year ended July 31, 2011: | | | | | | | | |
Shares sold | | | 250,223 | | | $ | 2,671,216 | |
Shares issued in reinvestment of dividends and distributions | | | 8,274 | | | | 87,786 | |
Shares reacquired | | | (1,352,186 | ) | | | (14,447,212 | ) |
| | | | | | | | |
Net increase (decrease) in shares outstanding | | | (1,093,689 | ) | | $ | (11,688,210 | ) |
| | | | | | | | |
Class M | | | | | | |
Six Months ended January 31, 2012: | | | | | | | | |
Shares sold | | | — | | | $ | — | |
Shares issued in reinvestment of dividends and distributions | | | 17 | | | | 177 | |
Shares reacquired | | | (1,355 | ) | | | (13,808 | ) |
| | | | | | | | |
Net increase (decrease) in shares outstanding before conversion | | | (1,338 | ) | | | (13,631 | ) |
Shares reacquired upon conversion into Class A | | | (14,481 | ) | | | (151,676 | ) |
| | | | | | | | |
Net increase (decrease) in shares outstanding | | | (15,819 | ) | | $ | (165,307 | ) |
| | | | | | | | |
Year ended July 31, 2011: | | | | | | | | |
Shares sold | | | 1,397 | | | $ | 15,182 | |
Shares issued in reinvestment of dividends and distributions | | | 121 | | | | 1,280 | |
Shares reacquired | | | (12,374 | ) | | | (129,538 | ) |
| | | | | | | | |
Net increase (decrease) in shares outstanding before conversion | | | (10,856 | ) | | | (113,076 | ) |
Shares reacquired upon conversion into Class A | | | (80,339 | ) | | | (868,923 | ) |
| | | | | | | | |
Net increase (decrease) in shares outstanding | | | (91,195 | ) | | $ | (981,999 | ) |
| | | | | | | | |
Class R | | | | | | |
Six Months ended January 31, 2012: | | | | | | | | |
Shares sold | | | 533 | | | $ | 5,575 | |
Shares issued in reinvestment of dividends and distributions | | | 214 | | | | 2,203 | |
Shares reacquired | | | (4,032 | ) | | | (42,188 | ) |
| | | | | | | | |
Net increase (decrease) in shares outstanding | | | (3,285 | ) | | $ | (34,410 | ) |
| | | | | | | | |
Year ended July 31, 2011: | | | | | | | | |
Shares sold | | | 4,174 | | | $ | 45,180 | |
Shares issued in reinvestment of dividends and distributions | | | 289 | | | | 3,071 | |
Shares reacquired | | | (32,380 | ) | | | (356,928 | ) |
| | | | | | | | |
Net increase (decrease) in shares outstanding | | | (27,917 | ) | | $ | (308,677 | ) |
| | | | | | | | |
| | | | |
| Target Asset Allocation Funds/Target Moderate Allocation Fund | | | 73 | |
Notes to Financial Statements
(Unaudited) continued
| | | | | | | | |
Class X | | Shares | | | Amount | |
Six Months ended January 31, 2012: | | | | | | | | |
Shares sold | | | 1,476 | | | $ | 15,508 | |
Shares issued in reinvestment of dividends and distributions | | | 570 | | | | 5,882 | |
Shares reacquired | | | (7,719 | ) | | | (80,873 | ) |
| | | | | | | | |
Net increase (decrease) in shares outstanding | | | (5,673 | ) | | | (59,483 | ) |
Shares reacquired upon conversion into Class A | | | (26,299 | ) | | | (280,845 | ) |
| | | | | | | | |
Net increase (decrease) in shares outstanding | | | (31,972 | ) | | $ | (340,328 | ) |
| | | | | | | | |
Year ended July 31, 2011: | | | | | | | | |
Shares sold | | | 2,816 | | | $ | 30,635 | |
Shares issued in reinvestment of dividends and distributions | | | 963 | | | | 10,215 | |
Shares reacquired | | | (41,526 | ) | | | (444,203 | ) |
| | | | | | | | |
Net increase (decrease) in shares outstanding | | | (37,747 | ) | | | (403,353 | ) |
Shares reacquired upon conversion into Class A | | | (37,075 | ) | | | (403,139 | ) |
| | | | | | | | |
Net increase (decrease) in shares outstanding | | | (74,822 | ) | | $ | (806,492 | ) |
| | | | | | | | |
Class Z | | | | | | |
Six Months ended January 31, 2012: | | | | | | | | |
Shares sold | | | 8,812 | | | $ | 93,311 | |
Shares issued in reinvestment of dividends and distributions | | | 3,460 | | | | 35,671 | |
Shares reacquired | | | (38,284 | ) | | | (409,042 | ) |
| | | | | | | | |
Net increase (decrease) in shares outstanding | | | (26,012 | ) | | $ | (280,060 | ) |
| | | | | | | | |
Year ended July 31, 2011: | | | | | | | | |
Shares sold | | | 24,117 | | | $ | 264,663 | |
Shares issued in reinvestment of dividends and distributions | | | 3,670 | | | | 38,971 | |
Shares reacquired | | | (98,769 | ) | | | (1,063,515 | ) |
| | | | | | | | |
Net increase (decrease) in shares outstanding | | | (70,982 | ) | | $ | (759,881 | ) |
| | | | | | | | |
Note 7. Borrowings
The Trust, along with other affiliated registered investment companies (the “Funds”), is a party to a Syndicated Credit Agreement (“SCA”) with a group of banks. The purpose of the SCA is to provide an alternative source of temporary funding for capital share redemptions. The SCA provides for a commitment of $900 million for the period December 16, 2011 through December 14, 2012. The Funds pay an annualized commitment fee of 0.08% of the unused portion of the SCA. Prior to December 16, 2011, the Funds had another Syndicated Credit Agreement with a $750 million commitment with an annualized commitment fee of 0.10% of the unused portion. Interest on any borrowings under these SCAs is paid at contracted
| | |
| 74 | | Visit our website at www.prudentialfunds.com |
market rates. The commitment fee for the unused amount is accrued daily and paid quarterly.
The Fund did not utilize the SCA during the six months ended January 31, 2012.
The average daily balance of reverse repurchase agreements outstanding during the six months ended January 31, 2012 was $2,796,500 at a weighted average interest rate of approximately 2.00%. The average daily balance is based on the number of days the Fund had an outstanding balance. The maximum amount of total reverse repurchase agreements outstanding at any month-end during the period was $2,796,500 as of January 31, 2012 which was 1% of total assets.
Note 8. New Accounting Pronouncement
In April 2011, the Financial Accounting Standards Board (“FASB”) issued Accounting Standards Update (“ASU”) No. 2011-03 “Reconsideration of Effective Control for Repurchase Agreements.” The objective of ASU 2011-03 is to improve the accounting for repurchase agreements and other agreements that both entitle and obligate a transferor to repurchase or redeem financial assets before their maturity. Under previous guidance, whether or not to account for a transaction as a sale was based on, in part, if the entity maintained effective control over the transferred financial assets. ASU 2011-03 removes the transferor’s ability criterion from the effective control assessment. This guidance is effective prospectively for interim and annual reporting periods beginning on or after December 15, 2011. At this time, management is evaluating the implications of ASU No. 2011-03 and its impact on the financial statements has not been determined.
In May 2011, the FASB issued ASU No. 2011-04 “Amendments to Achieve Common Fair Value Measurement and Disclosure Requirements in U.S. GAAP and IFRSs.” ASU 2011-04 includes common requirements for measurement of and disclosure about fair value between U.S. GAAP and IFRS. ASU 2011-04 will require reporting entities to disclose quantitative information about the unobservable inputs used in the fair value measurements categorized within Level 3 of the fair value hierarchy. In addition, ASU 2011-04 will require reporting entities to make disclosures about amounts and reasons for all transfers in and out of Level 1 and Level 2 fair value measurements. The new and revised disclosures are effective for interim and annual reporting periods beginning after December 15, 2011. At this time, management is evaluating the implications of ASU No. 2011-04 and its impact on the financial statements has not been determined.
| | | | |
| Target Asset Allocation Funds/Target Moderate Allocation Fund | | | 75 | |
Financial Highlights
(Unaudited)
| | | | | | | | | | | | | | | | | | | | | | | | | | |
Class A Shares | |
| | | Six Months
Ended
January 31, | | | | | Year Ended July 31, | |
| | | 2012(b) | | | | | 2011(b) | | | 2010(b) | | | 2009(b) | | | 2008(b) | | | 2007(b) | |
| Per Share Operating Performance: | | | | | | | | | | | | | | | | | | | | | | | | | | |
| Net Asset Value, Beginning Of Period | | | $11.12 | | | | | | $9.88 | | | | $8.97 | | | | $10.72 | | | | $12.75 | | | | $11.92 | |
| Income (loss) from investment operations: | | | | | | | | | | | | | | | | | | | | | | | | | | |
| Net investment income | | | .06 | | | | | | .13 | | | | .14 | | | | .19 | | | | .25 | | | | .22 | |
| Net realized and unrealized gain (loss) on investment transactions | | | (.15 | ) | | | | | 1.20 | | | | .90 | | | | (1.59 | ) | | | (1.05 | ) | | | 1.31 | |
| Total from investment operations | | | (.09 | ) | | | | | 1.33 | | | | 1.04 | | | | (1.40 | ) | | | (.80 | ) | | | 1.53 | |
| Less Dividends and Distributions: | | | | | | | | | | | | | | | | | | | | | | | | | | |
| Dividends from net investment income | | | (.11 | ) | | | | | (.09 | ) | | | (.13 | ) | | | (.25 | ) | | | (.24 | ) | | | (.22 | ) |
| Distributions from net realized gains | | | - | | | | | | - | | | | - | | | | (.10 | ) | | | (.99 | ) | | | (.48 | ) |
| Total dividends and distributions | | | (.11 | ) | | | | | (.09 | ) | | | (.13 | ) | | | (.35 | ) | | | (1.23 | ) | | | (.70 | ) |
| Net asset value, end of period | | | $10.92 | | | | | | $11.12 | | | | $9.88 | | | | $8.97 | | | | $10.72 | | | | $12.75 | |
| Total Return(a) | | | (.77)% | | | | | | 13.51% | | | | 11.67% | | | | (12.78)% | | | | (7.02)% | | | | 13.03% | |
| |
| Ratios/Supplemental Data: | |
| Net assets, end of period (000) | | | $189,188 | | | | | | $196,985 | | | | $164,925 | | | | $142,715 | | | | $162,212 | | | | $165,073 | |
| Average net assets (000) | | | $183,927 | | | | | | $186,704 | | | | $159,007 | | | | $131,169 | | | | $169,156 | | | | $154,791 | |
| Ratios to average net assets(d): | | | | | | | | | | | | | | | | | | | | | | | | | | |
| Expenses, including distribution and service (12b-1) fees(c) | | | 1.43% | (f) | | | | | 1.37% | | | | 1.41% | | | | 1.48% | (e) | | | 1.39% | | | | 1.18% | |
| Expenses, excluding distribution and service (12b-1) fees | | | 1.18% | (f) | | | | | 1.12% | | | | 1.16% | | | | 1.23% | (e) | | | 1.14% | | | | .93% | |
| Net investment income | | | 1.10% | (f) | | | | | 1.16% | | | | 1.39% | | | | 2.18% | | | | 2.05% | | | | 1.72% | |
| Portfolio turnover rate | | | 66% | (g) | | | | | 151% | | | | 140% | | | | 249% | | | | 213% | | | | 195% | |
(a) Total return does not consider the effects of sales loads. Total return is calculated assuming a purchase of a share on the first day and a sale on the last day of each period reported and includes reinvestment of dividends and distributions. Total returns may reflect adjustments to conform to generally accepted accounting principles. Total returns for periods less than one full year are not annualized.
(b) Calculated based upon average shares outstanding during the period.
(c) The distributor of the Fund has contractually agreed to limit its distribution and service (12b-1) fees to .25% of the average daily net assets of the Class A shares.
(d) Does not include expenses of the underlying portfolios in which the Fund invests.
(e) Includes interest expense of .03%.
(f) Annualized.
(g) Not annualized.
See Notes to Financial Statements.
| | |
| 76 | | Visit our website at www.prudentialfunds.com |
| | | | | | | | | | | | | | | | | | | | | | | | | | |
Class B Shares | |
| | | Six Months
Ended
January 31, | | | | | Year Ended July 31, | |
| | | 2012(b) | | | | | 2011(b) | | | 2010(b) | | | 2009(b) | | | 2008(b) | | | 2007(b) | |
| Per Share Operating Performance: | | | | | | | | | | | | | | | | | | | | | | | | | | |
| Net Asset Value, Beginning Of Period | | | $11.06 | | | | | | $9.84 | | | | $8.97 | | | | $10.66 | | | | $12.70 | | | | $11.87 | |
| Income (loss) from investment operations: | | | | | | | | | | | | | | | | | | | | | | | | | | |
| Net investment income | | | .02 | | | | | | .04 | | | | .06 | | | | .13 | | | | .16 | | | | .12 | |
| Net realized and unrealized gain (loss) on investment transactions | | | (.14 | ) | | | | | 1.20 | | | | .91 | | | | (1.58 | ) | | | (1.04 | ) | | | 1.32 | |
| Total from investment operations | | | (.12 | ) | | | | | 1.24 | | | | .97 | | | | (1.45 | ) | | | (.88 | ) | | | 1.44 | |
| Less Dividends and Distributions: | | | | | | | | | | | | | | | | | | | | | | | | | | |
| Dividends from net investment income | | | (.03 | ) | | | | | (.02 | ) | | | (.10 | ) | | | (.14 | ) | | | (.17 | ) | | | (.13 | ) |
| Distributions from net realized gains | | | - | | | | | | - | | | | - | | | | (.10 | ) | | | (.99 | ) | | | (.48 | ) |
| Total dividends and distributions | | | (.03 | ) | | | | | (.02 | ) | | | (.10 | ) | | | (.24 | ) | | | (1.16 | ) | | | (.61 | ) |
| Net asset value, end of period | | | $10.91 | | | | | | $11.06 | | | | $9.84 | | | | $8.97 | | | | $10.66 | | | | $12.70 | |
| Total Return(a) | | | (1.10)% | | | | | | 12.57% | | | | 10.82% | | | | (13.43)% | | | | (7.72)% | | | | 12.27% | |
| |
| Ratios/Supplemental Data: | | | | | | | | | | | | | | | | | | | | |
| Net assets, end of period (000) | | | $30,602 | | | | | | $36,955 | | | | $52,726 | | | | $67,013 | | | | $110,784 | | | | $156,676 | |
| Average net assets (000) | | | $32,046 | | | | | | $46,927 | | | | $62,087 | | | | $76,425 | | | | $139,512 | | | | $167,764 | |
| Ratios to average net assets(c): | | | | | | | | | | | | | | | | | | | | | | | | | | |
| Expenses, including distribution and service (12b-1) fees | | | 2.18% | (e) | | | | | 2.12% | | | | 2.16% | | | | 2.23% | (d) | | | 2.14% | | | | 1.93% | |
| Expenses, excluding distribution and service (12b-1) fees | | | 1.18% | (e) | | | | | 1.12% | | | | 1.16% | | | | 1.23% | (d) | | | 1.14% | | | | .93% | |
| Net investment income | | | .36% | (e) | | | | | .41% | | | | .65% | | | | 1.46% | | | | 1.30% | | | | .97% | |
(a) Total return does not consider the effects of sales loads. Total return is calculated assuming a purchase of a share on the first day and a sale on the last day of each period reported and includes reinvestment of dividends and distributions. Total returns may reflect adjustments to conform to generally accepted accounting principles. Total returns for periods less than one full year are not annualized.
(b) Calculated based upon average shares outstanding during the period.
(c) Does not include expenses of the underlying portfolios in which the Fund invests.
(d) Includes interest expense of .03%.
(e) Annualized.
See Notes to Financial Statements.
| | | | |
| Target Asset Allocation Funds/Target Moderate Allocation Fund | | | 77 | |
Financial Highlights
(Unaudited) continued
| | | | | | | | | | | | | | | | | | | | | | | | | | |
| Class C Shares | |
| | | Six Months
Ended
January 31, | | | | | Year Ended July 31, | |
| | | 2012(b) | | | | | 2011(b) | | | 2010(b) | | | 2009(b) | | | 2008(b) | | | 2007(b) | |
| Per Share Operating Performance: | | | | | | | | | | | | | | | | | | | | | | | | | | |
| Net Asset Value, Beginning Of Period | | | $11.06 | | | | | | $9.84 | | | | $8.97 | | | | $10.66 | | | | $12.70 | | | | $11.87 | |
| Income (loss) from investment operations: | | | | | | | | | | | | | | | | | | | | | | | | | | |
| Net investment income | | | .02 | | | | | | .04 | | | | .06 | | | | .12 | | | | .16 | | | | .12 | |
| Net realized and unrealized gain (loss) on investment transactions | | | (.14 | ) | | | | | 1.20 | | | | .91 | | | | (1.57 | ) | | | (1.04 | ) | | | 1.32 | |
| Total from investment operations | | | (.12 | ) | | | | | 1.24 | | | | .97 | | | | (1.45 | ) | | | (.88 | ) | | | 1.44 | |
| Less Dividends and Distributions: | | | | | | | | | | | | | | | | | | | | | | | | | | |
| Dividends from net investment income | | | (.03 | ) | | | | | (.02 | ) | | | (.10 | ) | | | (.14 | ) | | | (.17 | ) | | | (.13 | ) |
| Distributions from net realized gains | | | - | | | | | | - | | | | - | | | | (.10 | ) | | | (.99 | ) | | | (.48 | ) |
| Total dividends and distributions | | | (.03 | ) | | | | | (.02 | ) | | | (.10 | ) | | | (.24 | ) | | | (1.16 | ) | | | (.61 | ) |
| Net asset value, end of period | | | $10.91 | | | | | | $11.06 | | | | $9.84 | | | | $8.97 | | | | $10.66 | | | | $12.70 | |
| Total Return(a) | | | (1.10)% | | | | | | 12.57% | | | | 10.82% | | | | (13.43)% | | | | (7.72)% | | | | 12.27% | |
| |
| Ratios/Supplemental Data: | |
| Net assets, end of period (000) | | | $53,411 | | | | | | $58,827 | | | | $63,077 | | | | $68,208 | | | | $100,797 | | | | $128,243 | |
| Average net assets (000) | | | $53,123 | | | | | | $62,754 | | | | $68,051 | | | | $72,815 | | | | $119,437 | | | | $129,699 | |
| Ratios to average net assets(c): | | | | | | | | | | | | | | | | | | | | | | | | | | |
| Expenses, including distribution and service (12b-1) fees | | | 2.18% | (e) | | | | | 2.12% | | | | 2.16% | | | | 2.23% | (d) | | | 2.14% | | | | 1.93% | |
| Expenses, excluding distribution and service (12b-1) fees | | | 1.18% | (e) | | | | | 1.12% | | | | 1.16% | | | | 1.23% | (d) | | | 1.14% | | | | .93% | |
| Net investment income | | | .35% | (e) | | | | | .41% | | | | .64% | | | | 1.45% | | | | 1.30% | | | | .97% | |
(a) Total return does not consider the effects of sales loads. Total return is calculated assuming a purchase of a share on the first day and a sale on the last day of each period reported and includes reinvestment of dividends and distributions. Total returns may reflect adjustments to conform to generally accepted accounting principles. Total returns for periods less than one full year are not annualized.
(b) Calculated based upon average shares outstanding during the period.
(c) Does not include expenses of the underlying portfolios in which the Fund invests.
(d) Includes interest expense of .03%.
(e) Annualized.
See Notes to Financial Statements.
| | |
| 78 | | Visit our website at www.prudentialfunds.com |
| | | | | | | | | | | | | | | | | | | | | | | | | | |
Class M Shares | |
| | | Six Months
Ended
January 31, | | | | | Year Ended July 31, | |
| | | 2012(b) | | | | | 2011(b) | | | 2010(b) | | | 2009(b) | | | 2008(b) | | | 2007(b) | |
| Per Share Operating Performance: | | | | | | | | | | | | | | | | | | | | | | | | | | |
| Net Asset Value, Beginning Of Period | | | $11.04 | | | | | | $9.81 | | | | $8.95 | | | | $10.64 | | | | $12.66 | | | | $11.85 | |
| Income (loss) from investment operations: | | | | | | | | | | | | | | | | | | | | | | | | | | |
| Net investment income | | | .02 | | | | | | .04 | | | | .06 | | | | .13 | | | | .16 | | | | .12 | |
| Net realized and unrealized gain (loss) on investment transactions | | | (.15 | ) | | | | | 1.21 | | | | .90 | | | | (1.58 | ) | | | (1.02 | ) | | | 1.30 | |
| Total from investment operations | | | (.13 | ) | | | | | 1.25 | | | | .96 | | | | (1.45 | ) | | | (.86 | ) | | | 1.42 | |
| Less Dividends and Distributions: | | | | | | | | | | | | | | | | | | | | | | | | | | |
| Dividends from net investment income | | | (.03 | ) | | | | | (.02 | ) | | | (.10 | ) | | | (.14 | ) | | | (.17 | ) | | | (.13 | ) |
| Distributions from net realized gains | | | - | | | | | | - | | | | - | | | | (.10 | ) | | | (.99 | ) | | | (.48 | ) |
| Total dividends and distributions | | | (.03 | ) | | | | | (.02 | ) | | | (.10 | ) | | | (.24 | ) | | | (1.16 | ) | | | (.61 | ) |
| Net asset value, end of period | | | $10.88 | | | | | | $11.04 | | | | $9.81 | | | | $8.95 | | | | $10.64 | | | | $12.66 | |
| Total Return(a) | | | (1.19)% | | | | | | 12.71% | | | | 10.74% | | | | (13.46)% | | | | (7.58)% | | | | 12.21% | |
| |
| Ratios/Supplemental Data: | | | | | | | | | | | | | | | | | | | | |
| Net assets, end of period (000) | | | $55 | | | | | | $230 | | | | $1,100 | | | | $2,083 | | | | $4,709 | | | | $8,277 | |
| Average net assets (000) | | | $132 | | | | | | $702 | | | | $1,717 | | | | $2,764 | | | | $6,746 | | | | $8,529 | |
| Ratios to average net assets(c): | | | | | | | | | | | | | | | | | | | | | | | | | | |
| Expenses, including distribution and service (12b-1) fees | | | 2.18% | (e) | | | | | 2.12% | | | | 2.16% | | | | 2.23% | (d) | | | 2.14% | | | | 1.93% | |
| Expenses, excluding distribution and service (12b-1) fees | | | 1.18% | (e) | | | | | 1.12% | | | | 1.16% | | | | 1.23% | (d) | | | 1.14% | | | | .93% | |
| Net investment income | | | .46% | (e) | | | | | .38% | | | | .64% | | | | 1.47% | | | | 1.29% | | | | .96% | |
(a) Total return does not consider the effects of sales loads. Total return is calculated assuming a purchase of a share on the first day and a sale on the last day of each period reported and includes reinvestment of dividends and distributions. Total returns may reflect adjustments to conform to generally accepted accounting principles. Total returns for periods less than one full year are not annualized.
(b) Calculated based upon average shares outstanding during the period.
(c) Does not include expenses of the underlying portfolios in which the Fund invests.
(d) Includes interest expense of .03%.
(e) Annualized.
See Notes to Financial Statements.
| | | | |
| Target Asset Allocation Funds/Target Moderate Allocation Fund | | | 79 | |
Financial Highlights
(Unaudited) continued
| | | | | | | | | | | | | | | | | | | | | | | | | | |
Class R Shares | |
| | | Six Months
Ended
January 31, | | | | | Year Ended July 31, | |
| | | 2012(b) | | | | | 2011(b) | | | 2010(b) | | | 2009(b) | | | 2008(b) | | | 2007(b) | |
| Per Share Operating Performance: | | | | | | | | | | | | | | | | | | | | | | | | | | |
| Net Asset Value, Beginning Of Period | | | $11.10 | | | | | | $9.87 | | | | $8.97 | | | | $10.73 | | | | $12.76 | | | | $11.93 | |
| Income (loss) from investment operations: | | | | | | | | | | | | | | | | | | | | | | | | | | |
| Net investment income | | | .05 | | | | | | .09 | | | | .11 | | | | .17 | | | | .22 | | | | .18 | |
| Net realized and unrealized gain (loss) on investment transactions | | | (.15 | ) | | | | | 1.21 | | | | .91 | | | | (1.60 | ) | | | (1.05 | ) | | | 1.32 | |
| Total from investment operations | | | (.10 | ) | | | | | 1.30 | | | | 1.02 | | | | (1.43 | ) | | | (.83 | ) | | | 1.50 | |
| Less Dividends and Distributions: | | | | | | | | | | | | | | | | | | | | | | | | | | |
| Dividends from net investment income | | | (.08 | ) | | | | | (.07 | ) | | | (.12 | ) | | | (.23 | ) | | | (.21 | ) | | | (.19 | ) |
| Distributions from net realized gains | | | - | | | | | | - | | | | - | | | | (.10 | ) | | | (.99 | ) | | | (.48 | ) |
| Total dividends and distributions | | | (.08 | ) | | | | | (.07 | ) | | | (.12 | ) | | | (.33 | ) | | | (1.20 | ) | | | (.67 | ) |
| Net asset value, end of period | | | $10.92 | | | | | | $11.10 | | | | $9.87 | | | | $8.97 | | | | $10.73 | | | | $12.76 | |
| Total Return(a) | | | (.85)% | | | | | | 13.16% | | | | 11.43% | | | | (13.03)% | | | | (7.25)% | | | | 12.75% | |
| |
| Ratios/Supplemental Data: | |
| Net assets, end of period (000) | | | $299 | | | | | | $341 | | | | $578 | | | | $761 | | | | $1,950 | | | | $3,995 | |
| Average net assets (000) | | | $304 | | | | | | $497 | | | | $632 | | | | $1,024 | | | | $3,358 | | | | $3,679 | |
| Ratios to average net assets(d): | | | | | | | | | | | | | | | | | | | | | | | | | | |
| Expenses, including distribution and service (12b-1) fees(c) | | | 1.68% | (f) | | | | | 1.62% | | | | 1.66% | | | | 1.73% | (e) | | | 1.64% | | | | 1.43% | |
| Expenses, excluding distribution and service (12b-1) fees | | | 1.18% | (f) | | | | | 1.12% | | | | 1.16% | | | | 1.23% | (e) | | | 1.14% | | | | .93% | |
| Net investment income | | | .86% | (f) | | | | | .89% | | | | 1.15% | | | | 1.97% | | | | 1.78% | | | | 1.46% | |
(a) Total return is calculated assuming a purchase of a share on the first day and a sale on the last day of each period reported and includes reinvestment of dividends and distributions. Total returns may reflect adjustments to conform to generally accepted accounting principles. Total returns for periods less than one full year are not annualized.
(b) Calculated based upon average shares outstanding during the period.
(c) The distributor of the Fund has contractually agreed to limit its distribution and service (12b-1) fees to .50% of the average daily net assets of the Class R shares.
(d) Does not include expenses of the underlying portfolios in which the Fund invests.
(e) Includes interest expense of .03%.
(f) Annualized.
See Notes to Financial Statements.
| | |
| 80 | | Visit our website at www.prudentialfunds.com |
| | | | | | | | | | | | | | | | | | | | | | | | | | |
Class X Shares | |
| | | Six Months
Ended
January 31, | | | | | Year Ended July 31, | |
| | | 2012(b) | | | | | 2011(b) | | | 2010(b) | | | 2009(b) | | | 2008(b) | | | 2007(b) | |
| Per Share Operating Performance: | | | | | | | | | | | | | | | | | | | | | | | | | | |
| Net Asset Value, Beginning Of Period | | | $11.12 | | | | | | $9.88 | | | | $8.97 | | | | $10.66 | | | | $12.69 | | | | $11.87 | |
| Income (loss) from investment operations: | | | | | | | | | | | | | | | | | | | | | | | | | | |
| Net investment income | | | .06 | | | | | | .12 | | | | .10 | | | | .13 | | | | .16 | | | | .12 | |
| Net realized and unrealized gain (loss) on investment transactions | | | (.15 | ) | | | | | 1.21 | | | | .91 | | | | (1.58 | ) | | | (1.03 | ) | | | 1.31 | |
| Total from investment operations | | | (.09 | ) | | | | | 1.33 | | | | 1.01 | | | | (1.45 | ) | | | (.87 | ) | | | 1.43 | |
| Less Dividends and Distributions: | | | | | | | | | | | | | | | | | | | | | | | | | | |
| Dividends from net investment income | | | (.11 | ) | | | | | (.09 | ) | | | (.10 | ) | | | (.14 | ) | | | (.17 | ) | | | (.13 | ) |
| Distributions from net realized gains | | | - | | | | | | - | | | | - | | | | (.10 | ) | | | (.99 | ) | | | (.48 | ) |
| Total dividends and distributions | | | (.11 | ) | | | | | (.09 | ) | | | (.10 | ) | | | (.24 | ) | | | (1.16 | ) | | | (.61 | ) |
| Capital Contribution | | | - | (e) | | | | | - | (e) | | | - | (e) | | | - | | | | - | | | | - | |
| Net asset value, end of period | | | $10.92 | | | | | | $11.12 | | | | $9.88 | | | | $8.97 | | | | $10.66 | | | | $12.69 | |
| Total Return(a) | | | (.77)% | | | | | | 13.51% | | | | 11.28% | | | | (13.43)% | | | | (7.64)% | | | | 12.19% | |
| |
| Ratios/Supplemental Data: | | | | | | | | | | | | | | | | | | | | |
| Net assets, end of period (000) | | | $414 | | | | | | $777 | | | | $1,430 | | | | $2,235 | | | | $4,299 | | | | $5,617 | |
| Average net assets (000) | | | $614 | | | | | | $1,112 | | | | $1,847 | | | | $2,858 | | | | $5,199 | | | | $5,644 | |
| Ratios to average net assets(c): | | | | | | | | | | | | | | | | | | | | | | | | | | |
| Expenses, including distribution and service (12b-1) fees | | | 1.43% | (f) | | | | | 1.37% | | | | 1.77% | | | | 2.21% | (d) | | | 2.08% | | | | 1.93% | |
| Expenses, excluding distribution and service (12b-1) fees | | | 1.18% | (f) | | | | | 1.12% | | | | 1.16% | | | | 1.23% | (d) | | | 1.14% | | | | .93% | |
| Net investment income | | | 1.14% | (f) | | | | | 1.15% | | | | 1.04% | | | | 1.48% | | | | 1.35% | | | | .96% | |
(a) Total return does not consider the effects of sales loads. Total return is calculated assuming a purchase of a share on the first day and a sale on the last day of each period reported and includes reinvestment of dividends and distributions. Total returns may reflect adjustments to conform to generally accepted accounting principles. Total returns for periods less than one full year are not annualized.
(b) Calculated based upon average shares outstanding during the period.
(c) Does not include expenses of the underlying portfolios in which the Fund invests.
(d) Includes interest expense of .03%.
(e) Less than $.005.
(f) Annualized.
See Notes to Financial Statements.
| | | | |
| Target Asset Allocation Funds/Target Moderate Allocation Fund | | | 81 | |
Financial Highlights
(Unaudited) continued
| | | | | | | | | | | | | | | | | | | | | | | | | | |
| Class Z Shares | |
| | | Six Months
Ended
January 31, | | | | | Year Ended July 31, | |
| | | 2012(b) | | | | | 2011(b) | | | 2010(b) | | | 2009(b) | | | 2008(b) | | | 2007(b) | |
| Per Share Operating Performance: | | | | | | | | | | | | | | | | | | | | | | | | | | |
| Net Asset Value, Beginning Of Period | | | $11.14 | | | | | | $9.90 | | | | $8.98 | | | | $10.74 | | | | $12.77 | | | | $11.94 | |
| Income (loss) from investment operations: | | | | | | | | | | | | | | | | | | | | | | | | | | |
| Net investment income | | | .07 | | | | | | .15 | | | | .16 | | | | .21 | | | | .28 | | | | .25 | |
| Net realized and unrealized gain (loss) on investment transactions | | | (.14 | ) | | | | | 1.21 | | | | .90 | | | | (1.60 | ) | | | (1.05 | ) | | | 1.31 | |
| Total from investment operations | | | (.07 | ) | | | | | 1.36 | | | | 1.06 | | | | (1.39 | ) | | | (.77 | ) | | | 1.56 | |
| Less Dividends and Distributions: | | | | | | | | | | | | | | | | | | | | | | | | | | |
| Dividends from net investment income | | | (.14 | ) | | | | | (.12 | ) | | | (.14 | ) | | | (.27 | ) | | | (.27 | ) | | | (.25 | ) |
| Distributions from net realized gains | | | - | | | | | | - | | | | - | | | | (.10 | ) | | | (.99 | ) | | | (.48 | ) |
| Total dividends and distributions | | | (.14 | ) | | | | | (.12 | ) | | | (.14 | ) | | | (.37 | ) | | | (1.26 | ) | | | (.73 | ) |
| Net asset value, end of period | | | $10.93 | | | | | | $11.14 | | | | $9.90 | | | | $8.98 | | | | $10.74 | | | | $12.77 | |
| Total Return(a) | | | (.60)% | | | | | | 13.75% | | | | 11.90% | | | | (12.55)% | | | | (6.78)% | | | | 13.30% | |
| | | | | |
| Ratios/Supplemental Data: | |
| Net assets, end of period (000) | | | $3,187 | | | | | | $3,539 | | | | $3,848 | | | | $4,786 | | | | $13,558 | | | | $14,902 | |
| Average net assets (000) | | | $3,142 | | | | | | $3,846 | | | | $4,425 | | | | $8,208 | | | | $14,407 | | | | $14,168 | |
| Ratios to average net assets(c): | | | | | | | | | | | | | | | | | | | | | | | | | | |
| Expenses, including distribution and service (12b-1) fees | | | 1.18% | (e) | | | | | 1.12% | | | | 1.16% | | | | 1.23% | (d) | | | 1.14% | | | | .93% | |
| Expenses, excluding distribution and service (12b-1) fees | | | 1.18% | (e) | | | | | 1.12% | | | | 1.16% | | | | 1.23% | (d) | | | 1.14% | | | | .93% | |
| Net investment income | | | 1.35% | (e) | | | | | 1.42% | | | | 1.64% | | | | 2.47% | | | | 2.30% | | | | 1.97% | |
(a) Total return is calculated assuming a purchase of a share on the first day and a sale on the last day of each period reported and includes reinvestment of dividends and distributions. Total returns may reflect adjustments to conform to generally accepted accounting principles. Total returns for periods less than one full year are not annualized.
(b) Calculated based upon average shares outstanding during the period.
(c) Does not include expenses of the underlying portfolios in which the Fund invests.
(d) Includes interest expense of .03%.
(e) Annualized.
See Notes to Financial Statements.
| | |
| 82 | | Visit our website at www.prudentialfunds.com |
| | | | |
| n MAIL | | n TELEPHONE | | n WEBSITE |
Gateway Center Three 100 Mulberry Street Newark, NJ 07102 | | (800) 225-1852 | | www.prudentialfunds.com |
|
| PROXY VOTING |
| The Board of Trustees of the Fund has delegated to the Fund’s investment subadvisers the responsibility for voting any proxies and maintaining proxy recordkeeping with respect to the Fund. A description of these proxy voting policies and procedures is available without charge, upon request, by calling (800) 225-1852. Information regarding how the Fund voted proxies relating to portfolio securities during the most recent 12-month period ended June 30 is available on the Fund’s website and on the website of the Securities and Exchange Commission at www.sec.gov. |
|
| TRUSTEES |
Kevin J. Bannon • Scott E. Benjamin • Linda W. Bynoe • Michael S. Hyland • Douglas H. McCorkindale • Stephen P. Munn • Stuart S. Parker • Richard A. Redeker •
Robin B. Smith • Stephen G. Stoneburn |
|
| OFFICERS |
| Stuart S. Parker, President • Judy A. Rice, Vice President • Scott E. Benjamin, Vice President • Grace C. Torres, Treasurer and Principal Financial and Accounting Officer • Kathryn L. Quirk, Chief Legal Officer • Deborah A. Docs, Secretary • Timothy J. Knierim, Chief Compliance Officer • Valerie M. Simpson, Deputy Chief Compliance Officer • Theresa C. Thompson, Deputy Chief Compliance Officer • Richard W. Kinville, Anti-Money Laundering Compliance Officer • Jonathan D. Shain, Assistant Secretary • Claudia DiGiacomo, Assistant Secretary • John P. Schwartz, Assistant Secretary • Andrew R. French, Assistant Secretary • M. Sadiq Peshimam, Assistant Treasurer • Peter Parrella, Assistant Treasurer |
| | | | |
| MANAGER | | Prudential Investments LLC | | Gateway Center Three 100 Mulberry Street Newark, NJ 07102 |
|
| INVESTMENT SUBADVISERS | | Eagle Asset Management, Inc. | | 880 Carillon Parkway St. Petersburg, FL 33716 |
|
| | EARNEST Partners, LLC | | 1180 Peachtree Street Suite 2300 Atlanta, GA 30309 |
|
| | Eaton Vance Management | | Two International Place Boston, MA 02110 |
|
| | Hotchkis and Wiley Capital Management | | 725 South Figueroa Street 39th Floor Los Angeles, CA 90017 |
|
| | LSV Asset Management | | 155 North Wacker Drive Suite 4600 Chicago, IL 60606 |
|
| | Marsico Capital Management, LLC | | 1200 17th Street Suite 1600 Denver, CO 80202 |
|
| | | | |
| | Massachusetts Financial
Services Company | | 500 Boylston Street
Boston, MA 02116 |
|
| | NFJ Investment Group L.P. | | 2100 Ross Avenue
Dallas, TX 75201 |
|
| | Pacific Investment
Management Company LLC | | 840 Newport Center Drive
Newport Beach, CA 92660 |
|
| | Thornburg Investment
Management, Inc. | | 2300 North Ridgetop Road
Santa Fe, NM 87506 |
|
| | Vaughan Nelson
Investment Management, L.P. | | 600 Travis Street
Suite 6300 Houston, TX 77002 |
|
| DISTRIBUTOR | | Prudential Investment
Management Services LLC | | Gateway Center Three
100 Mulberry Street
Newark, NJ 07102 |
|
| CUSTODIAN | | The Bank of New York Mellon | | One Wall Street
New York, NY 10286 |
|
| TRANSFER AGENT | | Prudential Mutual Fund
Services LLC | | PO Box 9658
Providence, RI 02940 |
|
| INDEPENDENT REGISTERED PUBLIC ACCOUNTING FIRM | | KPMG LLP | | 345 Park Avenue
New York, NY 10154 |
|
| FUND COUNSEL | | Willkie Farr & Gallagher LLP | | 787 Seventh Avenue
New York, NY 10019 |
|
|
An investor should consider the investment objectives, risks, charges, and expenses of the Fund carefully before investing. The prospectus and summary prospectus contain this and other information about the Fund. An investor may obtain a prospectus and summary prospectus by visiting our website at www.prudentialfunds.com or by calling (800) 225-1852. The prospectus and summary prospectus should be read carefully before investing. |
|
| E-DELIVERY |
| To receive your mutual fund documents online, go to www.prudentialfunds.com/edelivery and enroll. Instead of receiving printed documents by mail, you will receive notification via email when new materials are available. You can cancel your enrollment or change your email address at any time by visiting the website address above. |
|
| SHAREHOLDER COMMUNICATIONS WITH TRUSTEES |
| Shareholders can communicate directly with the Board of Trustees by writing to the Chair of the Board, Target Asset Allocation Funds, Prudential Investments, Attn: Board of Trustees, 100 Mulberry Street, Gateway Center Three, Newark, NJ 07102. Shareholders can communicate directly with an individual Trustee by writing to the same address. Communications are not screened before being delivered to the addressee. |
|
| AVAILABILITY OF PORTFOLIO SCHEDULE |
| The Fund files its complete schedule of portfolio holdings with the Securities and Exchange Commission for the first and third quarters of each fiscal year on Form N-Q. The Fund’s Forms N-Q are available on the Commission’s website at www.sec.gov. The Fund’s Forms N-Q may also be reviewed and copied at the Commission’s Public Reference Room in Washington, D.C. Information on the operation and location of the Public Reference Room may be obtained by calling (202) 551-8090. The Fund’s schedule of portfolio holdings as of the end of each calendar month is also available on the Fund’s website no sooner than approximately three business days prior to the end of the following month. |
Mutual Funds:
| | | | |
ARE NOT INSURED BY THE FDIC OR ANY FEDERAL GOVERNMENT AGENCY | | MAY LOSE VALUE | | ARE NOT A DEPOSIT OF OR GUARANTEED BY ANY BANK OR ANY BANK AFFILIATE |

TARGET MODERATE ALLOCATION FUND
| | | | | | | | | | | | | | |
| SHARE CLASS | | A | | B | | C | | M | | R | | X | | Z |
| NASDAQ | | PAMGX | | DMGBX | | PIMGX | | N/A | | SPMRX | | N/A | | PDMZX |
| CUSIP | | 87612A807 | | 87612A880 | | 87612A872 | | 87612A849 | | 87612A864 | | 87612A831 | | 87612A856 |
MFSP504E4 0220862-00001-00

PRUDENTIAL INVESTMENTS»MUTUAL FUNDS
TARGET GROWTH ALLOCATION FUND
SEMIANNUAL REPORT · JANUARY 31, 2012
Objective
Seeks long-term capital appreciation
This report is not authorized for distribution to prospective investors unless preceded or accompanied by a current prospectus.
The views expressed in this report and information about the Fund’s portfolio holdings are for the period covered by this report and are subject to change thereafter.
The accompanying financial statements as of January 31, 2012, were not audited and, accordingly, no auditor’s opinion is expressed on them.
Target Funds, Prudential Investments, Prudential, the Prudential logo, and the Rock symbol are service marks of Prudential Financial, Inc. and its related entities, registered in many jurisdictions worldwide.

March 15, 2012
Dear Shareholder:
After an extraordinary career at Prudential, Judy Rice retired at the end of 2011 as President of Prudential Investments and President and Trustee of the Target Growth Allocation Fund (the Fund). While she will remain as Chairman of Prudential Investments until the end of 2012, I was named to succeed her as President of Prudential Investments and as President and Trustee of the Fund effective January 1, 2012. I previously served as Executive Vice President of Retail Mutual Fund Distribution for Prudential Investments for the past six years.
Since this is my first letter to shareholders, I would like to recognize Judy for her significant contributions and her unflagging commitment to helping investors like you meet the challenges of a rapidly changing investment environment. My goal is to build on Judy’s accomplishments, with a particular focus on delivering the solutions you need to address your financial goals.
On the following pages, you’ll find your semiannual report for the Fund. Target Asset Allocation Funds are managed by institutional-quality asset managers selected, matched, and monitored by a research team from Prudential Investments. We believe the Fund will help you to achieve broad diversification at a targeted risk/return balance with a single investment purchase. We appreciate your continued confidence in us. Keep in mind that diversification and asset allocation do not assure a profit or protect against a loss in a declining market.
Sincerely,

Stuart S. Parker, President
Target Asset Allocation Funds
| | | | |
| Target Asset Allocation Funds/Target Growth Allocation Fund | | | 1 | |
Your Fund’s Performance (Unaudited)
Performance data quoted represent past performance. Past performance does not guarantee future results. The investment return and principal value of an investment will fluctuate, so that an investor’s shares, when redeemed, may be worth more or less than their original cost. Current performance may be lower or higher than the past performance data quoted. An investor may obtain performance data as of the most recent month-end by visiting our website at www.prudentialfunds.com or by calling (800) 225-1852. The maximum initial sales charge is 5.50% (Class A shares). Gross operating expenses: Class A, 1.65%; Class B, 2.35%; Class C, 2.35%; Class M, 2.35%; Class R, 2.10%; Class X, 2.35%; Class Z, 1.35%. Net operating expenses: Class A, 1.60%; Class B, 2.35%; Class C, 2.35%; Class M, 2.35%; Class R, 1.85%; Class X, 1.60%; Class Z, 1.35%, after contractual reduction through 11/30/2012 for Class A and Class R shares.
| | | | | | | | | | | | | | | | | | |
Cumulative Total Returns (Without Sales Charges) as of 1/31/12 |
| | | Six Months | | | One Year | | | Five Years | | | Ten Years | | | Since Inception |
Class A | | | –2.49 | % | | | –1.38 | % | | | –11.40 | % | | | 43.91 | % | | — |
Class B | | | –2.84 | | | | –2.01 | | | | –14.68 | | | | 33.57 | | | — |
Class C | | | –2.75 | | | | –2.01 | | | | –14.59 | | | | 33.70 | | | — |
Class M | | | –2.84 | | | | –2.00 | | | | –14.64 | | | | N/A | | | 19.99% (10/4/04) |
Class R | | | –2.52 | | | | –1.48 | | | | –12.38 | | | | N/A | | | 24.36 (10/4/04) |
Class X | | | –2.40 | | | | –1.29 | | | | –12.59 | | | | N/A | | | 22.69 (10/4/04) |
Class Z | | | –2.27 | | | | –1.01 | | | | –10.27 | | | | 47.75 | | | — |
Customized Blend | | | –0.48 | | | | 1.07 | | | | –1.21 | | | | 55.83 | | | — |
S&P 500 Index | | | 2.70 | | | | 4.19 | | | | 1.65 | | | | 41.36 | | | — |
Lipper Large-Cap Core Funds Average | | | 1.24 | | | | 2.06 | | | | –0.53 | | | | 37.03 | | | — |
|
Average Annual Total Returns (With Sales Charges) as of 12/31/11 | | | |
| | | | | | One Year | | | Five Years | | | Ten Years | | | Since Inception |
Class A | | | | | | | –9.88 | % | | | –4.05 | % | | | 2.32 | % | | — |
Class B | | | | | | | –10.07 | | | | –3.85 | | | | 2.13 | | | — |
Class C | | | | | | | –6.28 | | | | –3.66 | | | | 2.14 | | | — |
Class M | | | | | | | –11.00 | | | | –4.02 | | | | N/A | | | 1.86% (10/4/04) |
Class R | | | | | | | –4.85 | | | | –3.19 | | | | N/A | | | 2.35 (10/4/04) |
Class X | | | | | | | –10.30 | | | | –3.76 | | | | N/A | | | 2.04 (10/4/04) |
Class Z | | | | | | | –4.36 | | | | –2.71 | | | | 3.17 | | | — |
Customized Blend | | | | | | | –1.71 | | | | –0.91 | | | | 3.80 | | | — |
S&P 500 Index | | | | | | | 2.09 | | | | –0.25 | | | | 2.92 | | | — |
Lipper Large-Cap Core
Funds Average | | | | | | | –0.67 | | | | –0.87 | | | | 2.41 | | | — |
| | |
| 2 | | Visit our website at www.prudentialfunds.com |
Source: Prudential Investments LLC and Lipper Inc. Performance figures may reflect fee waivers and/or expense reimbursements. In the absence of such fee waivers and/or expense reimbursements, total returns would be lower.
Inception returns are provided for any share class with less than 10 calendar years of returns.
The average annual total returns take into account applicable sales charges. Class A shares are subject to a maximum front-end sales charge of 5.50%, and a 12b-1 fee of up to 0.30% annually. All investors who purchase Class A shares in an amount of $1 million or more and sell these shares within 12 months of purchase are subject to a contingent deferred sales charge (CDSC) of 1%. The Class A CDSC is waived for purchases by certain retirement and/or benefit plans. Under certain circumstances, an exchange may be made from Class A to Class Z shares of the Fund. Class B shares are subject to a declining CDSC of 5%, 4%, 3%, 2%, 1%, and 1%, respectively, for the first six years after purchase, and a 12b-1 fee of 1% annually. Approximately seven years after purchase, Class B shares will automatically convert to Class A shares on a quarterly basis. Class C shares are not subject to a front-end sales charge, but charge a CDSC of 1% for Class C shares sold within 12 months from the date of purchase and an annual 12b-1 fee of 1%. Class M shares are closed to new purchases. Class M shares are subject to a CDSC of 6%, which decreases by 1% annually to 2% in the fifth and sixth years and to 1% in the seventh year, and a 12b-1 fee of 1% annually. Class M shares automatically convert to Class A shares on a monthly basis approximately eight years after purchase. Class X shares are closed to new purchases. Class X shares are subject to a declining CDSC of 6%, 5%, 4%, 4%, 3%, 2%, 2%, and 1%, respectively, for the first eight years after purchase and a 12b-1 fee of 1% annually. Class X shares automatically convert to Class A shares on a monthly basis approximately 10 years after purchase. Class R and Z shares are not subject to a sales charge. Class R shares are subject to a 12b-1 fee of up to 0.75% annually. Class Z shares are not subject to a 12b-1 fee. The returns in the tables reflect the share class expense structure in effect at the close of the fiscal period. The returns in the tables do not reflect the deduction of taxes that a shareholder would pay on Fund distributions or following the redemption of Fund shares.
Benchmark Definitions
Customized Blend
The Customized Benchmark for the Target Growth Allocation Fund (Customized Blend) is a model portfolio consisting of the Russell 3000® Index (80%) and the Morgan Stanley Capital International Europe, Australasia, and Far East Index (MSCI EAFE ND Index) (20%). Each component of the Customized Blend is an unmanaged index generally considered as representing the performance of the Fund’s asset classes. The Customized Blend is intended to provide a theoretical comparison to the Fund’s performance, based on the amounts allocated to each asset class rather than on amounts allocated to various Fund segments. The Customized Blend does not reflect deductions for any sales charges or operating expenses of a mutual fund. The Russell 3000 Index is an unmanaged index which measures the performance of the 3,000 largest U.S. companies based on total market capitalization, which represents approximately 98% of the investable U.S. equity market. The MSCI EAFE ND Index is an unmanaged weighted index that reflects stock price movements in Europe, Australasia, and the Far East. It gives a broad look at how foreign stock prices have performed. The Fund utilizes the net dividends (ND) version of the MSCI EAFE Index. The net dividends and gross dividends versions of the MSCI EAFE Index differ in that the net dividends returns reflect the impact of the maximum withholding taxes on reinvested dividends, while the gross dividends version does not reflect the impact of withholding taxes on reinvested dividends. These returns do not include the effect of any investment management expenses. These returns would have been lower if they included the effect of these expenses. Investors cannot invest directly in an index. Customized Blend Closest Month-End to Inception cumulative total return as of 1/31/12 is 41.55% for Class M, Class R, and Class X. Customized Blend Closest Month-End to Inception average annual total return as of 12/31/11 is 4.19% for Class M, Class R, and Class X.
| | | | |
| Target Asset Allocation Funds/Target Growth Allocation Fund | | | 3 | |
Your Fund’s Performance (continued)
S&P 500 Index
The Standard & Poor’s 500 Composite Stock Price Index (S&P 500 Index) is an unmanaged index of 500 stocks of large U.S. public companies. It gives an indication of how U.S. stock prices have performed. S&P 500 Index Closest Month-End to Inception cumulative total return as of 1/31/12 is 36.90% for Class M, Class R, and Class X. S&P 500 Index Closest Month-End to Inception average annual total return as of 12/31/11 is 3.80% for Class M, Class R, and Class X.
Lipper Large-Cap Core Funds Average
The Lipper Large-Cap Core Funds Average (Lipper Average) represents funds that, by portfolio practice, invest at least 75% of their equity assets in companies with market capitalizations (on a three-year weighted basis) above Lipper’s USDE large-cap floor. Large-cap core funds have more latitude in the companies in which they invest. These funds typically have an average price-to-earnings ratio, price-to-book ratio, and three-year sales-per-share growth value, compared to the S&P 500 Index. Lipper Average Closest Month-End to Inception cumulative total return as of 1/31/12 is 33.34% for Class M, Class R, and Class X. Lipper Average Closest Month-End to Inception average annual total return as of 12/31/11 is 3.28% for Class M, Class R, and Class X.
Investors cannot invest directly in an index or average. The returns for the Indexes would be lower if they included the effects of sales charges, operating expenses of a mutual fund, or taxes. Returns for the Lipper Average reflect the deduction of operating expenses, but not sales charges or taxes. The Since Inception returns for the Indexes are measured from the closest month-end to inception date, and not from the Fund’s actual inception date.
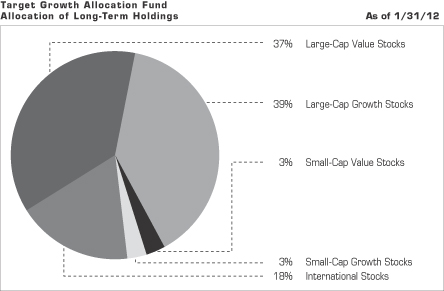
| | |
| 4 | | Visit our website at www.prudentialfunds.com |
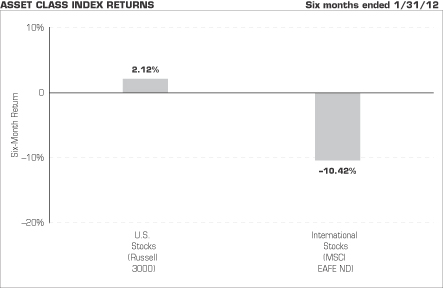
Source: Lipper Inc.
The chart above shows the total returns for six months ended January 31, 2012, of various securities indexes that are generally considered representative of broad market sectors. It does not reflect a mutual fund’s expenses. The performance cited does not represent the performance of the Target Growth Allocation Fund. Past performance is not indicative of future results. Investors cannot invest directly in an index or average.
The Russell 3000 Index is an unmanaged index which measures the performance of the 3,000 largest U.S. companies based on total market capitalization, which represents approximately 98% of the investable U.S. equity market.
The Morgan Stanley Capital International Europe, Australasia, and Far East Index (MSCI EAFE ND Index) is an unmanaged weighted index that reflects stock price movements in Europe, Australasia, and the Far East. It gives a broad look at how foreign stock prices have performed. The Fund utilizes the net dividends (ND) version of the MSCI EAFE Index. The net dividends and gross dividends versions of the MSCI EAFE Index differ in that net dividends returns reflect the impact of the maximum withholding taxes on reinvested dividends, while the gross dividends version does not reflect the impact of withholding taxes on reinvested dividends. These returns do not include the effect of any investment management expenses. These returns would have been lower if they included the effect of these expenses.
| | | | |
| Target Asset Allocation Funds/Target Growth Allocation Fund | | | 5 | |
Fees and Expenses (Unaudited)
As a shareholder of the Fund, you incur two types of costs: (1) transaction costs, including sales charges (loads) on purchase payments and redemptions, as applicable, and (2) ongoing costs, including management fees, distribution and/or service (12b-1) fees, and other Fund expenses, as applicable. This example is intended to help you understand your ongoing costs (in dollars) of investing in the Fund and to compare these costs with the ongoing costs of investing in other mutual funds.
The example is based on an investment of $1,000 invested on August 1, 2011, at the beginning of the period, and held through the six-month period ended January 31, 2012. The example is for illustrative purposes only; you should consult the Prospectus for information on initial and subsequent minimum investment requirements.
The Fund’s transfer agent may charge additional fees to holders of certain accounts that are not included in the expenses shown in the table on the following page. These fees apply to individual retirement accounts (IRAs) and Section 403(b) accounts. As of the close of the six-month period covered by the table, IRA fees included an annual maintenance fee of $15 per account (subject to a maximum annual maintenance fee of $25 for all accounts held by the same shareholder). Section 403(b) accounts are charged an annual $25 fiduciary maintenance fee. Some of the fees may vary in amount, or may be waived, based on your total account balance or the number of Prudential Investments Funds, including the Target Asset Allocation Funds, that you own. You should consider the additional fees that were charged to your Fund account over the six-month period when you estimate the total ongoing expenses paid over the period and the impact of these fees on your ending account value, as these additional expenses are not reflected in the information provided in the expense table. Additional fees have the effect of reducing investment returns.
Actual Expenses
The first line for each share class in the table on the following page provides information about actual account values and actual expenses. You may use the information on this line, together with the amount you invested, to estimate the expenses that you paid over the period. Simply divide your account value by $1,000 (for example, an $8,600 account value ÷ $1,000 = 8.6), then multiply the result by the number on the first line under the heading “Expenses Paid During the Six-Month Period” to estimate the expenses you paid on your account during this period.
Hypothetical Example for Comparison Purposes
The second line for each share class in the table on the following page provides information about hypothetical account values and hypothetical expenses based on the Fund’s actual expense ratio and an assumed rate of return of 5% per year before expenses, which is not the Fund’s actual return. The hypothetical account values and
| | |
| 6 | | Visit our website at www.prudentialfunds.com |
expenses may not be used to estimate the actual ending account balance or expenses you paid for the period. You may use this information to compare the ongoing costs of investing in the Fund and other funds. To do so, compare this 5% hypothetical example with the 5% hypothetical examples that appear in the shareholder reports of the other funds.
Please note that the expenses shown in the table are meant to highlight your ongoing costs only, and do not reflect any transactional costs such as sales charges (loads). Therefore the second line for each share class in the table is useful in comparing ongoing costs only, and will not help you determine the relative total costs of owning different funds. In addition, if these transactional costs were included, your costs would have been higher.
| | | | | | | | | | | | | | | | | | |
Target Growth
Allocation Fund | | Beginning Account
Value
August 1, 2011 | | | Ending Account
Value January 31, 2012 | | | Annualized
Expense Ratio
Based on the
Six-Month Period | | | Expenses Paid
During the
Six-Month Period* | |
| | | | | | | | | | | | | | | | | | |
| Class A | | Actual | | $ | 1,000.00 | | | $ | 975.10 | | | | 1.60 | % | | $ | 7.94 | |
| | | Hypothetical | | $ | 1,000.00 | | | $ | 1,017.09 | | | | 1.60 | % | | $ | 8.11 | |
| | | | | | | | | | | | | | | | | | |
| Class B | | Actual | | $ | 1,000.00 | | | $ | 971.60 | | | | 2.35 | % | | $ | 11.65 | |
| | | Hypothetical | | $ | 1,000.00 | | | $ | 1,013.32 | | | | 2.35 | % | | $ | 11.89 | |
| | | | | | | | | | | | | | | | | | |
| Class C | | Actual | | $ | 1,000.00 | | | $ | 972.50 | | | | 2.35 | % | | $ | 11.65 | |
| | | Hypothetical | | $ | 1,000.00 | | | $ | 1,013.32 | | | | 2.35 | % | | $ | 11.89 | |
| | | | | | | | | | | | | | | | | | |
| Class M | | Actual | | $ | 1,000.00 | | | $ | 971.60 | | | | 2.35 | % | | $ | 11.65 | |
| | | Hypothetical | | $ | 1,000.00 | | | $ | 1,013.32 | | | | 2.35 | % | | $ | 11.89 | |
| | | | | | | | | | | | | | | | | | |
| Class R | | Actual | | $ | 1,000.00 | | | $ | 974.80 | | | | 1.85 | % | | $ | 9.18 | |
| | | Hypothetical | | $ | 1,000.00 | | | $ | 1,015.84 | | | | 1.85 | % | | $ | 9.37 | |
| | | | | | | | | | | | | | | | | | |
| Class X | | Actual | | $ | 1,000.00 | | | $ | 976.00 | | | | 1.60 | % | | $ | 7.95 | |
| | | Hypothetical | | $ | 1,000.00 | | | $ | 1,017.09 | | | | 1.60 | % | | $ | 8.11 | |
| | | | | | | | | | | | | | | | | | |
| Class Z | | Actual | | $ | 1,000.00 | | | $ | 977.30 | | | | 1.35 | % | | $ | 6.71 | |
| | | Hypothetical | | $ | 1,000.00 | | | $ | 1,018.35 | | | | 1.35 | % | | $ | 6.85 | |
* Fund expenses (net of fee waivers or subsidies, if any) for each share class are equal to the annualized expense ratio for each share class (provided in the table), multiplied by the average account value over the period, multiplied by the 184 days in the six-month period ended January 31, 2012, and divided by the 366 days in the Fund’s fiscal year ending July 31, 2012 (to reflect the six-month period). Expenses presented in the table include the expenses of any underlying portfolios in which the Fund may invest.
| | | | |
| Target Asset Allocation Funds/Target Growth Allocation Fund | | | 7 | |
Portfolio of Investments
as of January 31, 2012 (Unaudited)
| | | | | | |
| Shares | | Description | | Value (Note 1) | |
| | | | | | |
LONG-TERM INVESTMENTS 97.1% | | | | |
COMMON STOCKS 96.7% | | | | |
| |
Aerospace & Defense 2.2% | | | | |
| 1,300 | | AAR Corp. | | $ | 27,547 | |
| 37,600 | | BAE Systems PLC (United Kingdom) | | | 182,371 | |
| 4,285 | | Boeing Co. (The) | | | 317,861 | |
| 2,000 | �� | Elbit Systems Ltd. (Israel) | | | 83,384 | |
| 7,620 | | Embraer SA, ADR (Brazil) | | | 208,940 | |
| 7,800 | | Finmeccanica SpA (Italy) | | | 35,097 | |
| 2,125 | | General Dynamics Corp. | | | 146,965 | |
| 4,420 | | Hexcel Corp.* | | | 110,809 | |
| 7,150 | | Honeywell International, Inc. | | | 414,986 | |
| 666 | | Huntington Ingalls Industries, Inc.* | | | 25,095 | |
| 7,320 | | Lockheed Martin Corp. | | | 602,582 | |
| 1,025 | | Moog, Inc. (Class A Stock)* | | | 43,686 | |
| 12,700 | | Northrop Grumman Corp. | | | 737,235 | |
| 13,610 | | Rolls-Royce Holdings PLC (United Kingdom)* | | | 157,740 | |
| 700 | | Teledyne Technologies, Inc.* | | | 39,732 | |
| 1,877 | | Triumph Group, Inc. | | | 117,444 | |
| 6,254 | | United Technologies Corp. | | | 490,001 | |
| | | | | | |
| | | | | 3,741,475 | |
| |
Air Freight & Logistics 0.2% | | | | |
| 1,416 | | Atlas Air Worldwide Holdings, Inc.* | | | 67,451 | |
| 2,100 | | FedEx Corp. | | | 192,129 | |
| | | | | | |
| | | | | 259,580 | |
| |
Airlines 0.2% | | | | |
| 100,100 | | Air New Zealand Ltd. (New Zealand) | | | 75,209 | |
| 44,000 | | Cathay Pacific Airways Ltd. (Hong Kong) | | | 87,146 | |
| 10,915 | | JetBlue Airways Corp.* | | | 64,726 | |
| 54,800 | | Qantas Airways Ltd. (Australia)* | | | 91,631 | |
| | | | | | |
| | | | | 318,712 | |
| |
Apparel & Textile 0.1% | | | | |
| 825 | | Wolverine World Wide, Inc. | | | 32,249 | |
| 27,000 | | Yue Yuen Industrial Holdings Ltd. (Bermuda) | | | 82,686 | |
| | | | | | |
| | | | | 114,935 | |
| |
Auto Components 0.6% | | | | |
| 20,613 | | Johnson Controls, Inc. | | | 654,875 | |
See Notes to Financial Statements.
| | | | |
| Target Asset Allocation Funds/Target Growth Allocation Fund | | | 9 | |
Portfolio of Investments
as of January 31, 2012 (Unaudited) continued
| | | | | | |
| Shares | | Description | | Value (Note 1) | |
| | | | | | |
COMMON STOCKS (Continued) | | | | |
| |
Auto Components (cont’d.) | | | | |
| 7,400 | | Magna International, Inc. (Canada) | | $ | 305,932 | |
| | | | | | |
| | | | | 960,807 | |
| |
Auto Parts & Equipment 0.3% | | | | |
| 1,300 | | Cie Generale des Etablissements Michelin (Class B Stock) (France) | | | 88,934 | |
| 300 | | Georg Fischer AG (Switzerland)* | | | 125,883 | |
| 1,800 | | Keihin Corp. (Japan) | | | 33,133 | |
| 5,234 | | Meritor, Inc.* | | | 32,869 | |
| 2,600 | | Valeo SA (France) | | | 122,042 | |
| 1,079 | | WABCO Holdings, Inc.* | | | 55,946 | |
| 11,000 | | Yokohama Rubber Co. Ltd. (The) (Japan) | | | 65,954 | |
| | | | | | |
| | | | | 524,761 | |
| |
Automobile Manufacturers 0.5% | | | | |
| 1,800 | | Daimler AG (Germany) | | | 99,465 | |
| 3,916 | | Ford Motor Co. | | | 48,637 | |
| 1,048 | | Hyundai Motor Co. (South Korea) | | | 206,176 | |
| 4,000 | | Nissan Shatai Co. Ltd. (Japan) | | | 41,564 | |
| 7,592 | | Toyota Motor Corp. (Japan) | | | 279,894 | |
| 1,300 | | Volkswagen AG (Germany) | | | 210,006 | |
| | | | | | |
| | | | | 885,742 | |
| |
Automobiles | | | | |
| 1,800 | | Harley-Davidson, Inc. | | | 79,542 | |
| |
Banks 0.9% | | | | |
| 7,100 | | Banco Espanol de Credito SA (Spain) | | | 36,220 | |
| 12,800 | | Bank of Queensland Ltd. (Australia) | | | 103,006 | |
| 2,834 | | FirstMerit Corp. | | | 44,465 | |
| 18,000 | | Fukuoka Financial Group, Inc. (Japan) | | | 76,752 | |
| 3,078 | | Julius Baer Group Ltd. (Switzerland)* | | | 125,059 | |
| 2,900 | | KBC Groep NV (Belgium) | | | 54,984 | |
| 87,000 | | Mitsubishi UFJ Financial Group, Inc. (Japan) | | | 398,360 | |
| 29,000 | | Nishi-Nippon City Bank Ltd. (The) (Japan) | | | 84,846 | |
| 13,692 | | Standard Chartered PLC (United Kingdom) | | | 330,973 | |
| 31,786 | | Turkiye Garanti Bankasi A/S (Turkey) | | | 114,847 | |
| 8,900 | | UBS AG (Switzerland)* | | | 121,148 | |
| 624 | | UMB Financial Corp. | | | 24,074 | |
| 1,200 | | United Bankshares, Inc. | | | 33,492 | |
| | | | | | |
| | | | | 1,548,226 | |
See Notes to Financial Statements.
| | |
| 10 | | Visit our website at www.prudentialfunds.com |
| | | | | | |
| Shares | | Description | | Value (Note 1) | |
COMMON STOCKS (Continued) | | | | |
| |
Beverages 0.6% | | | | |
| 1,940 | | Coca-Cola Enterprises, Inc. | | $ | 51,973 | |
| 14,551 | | Diageo PLC (United Kingdom) | | | 321,470 | |
| 1,239 | | Green Mountain Coffee Roasters, Inc.* | | | 66,088 | |
| 4,200 | | Molson Coors Brewing Co. (Class B Stock) | | | 180,138 | |
| 3,243 | | PepsiCo, Inc. | | | 212,968 | |
| 4,501 | | SABMiller PLC (United Kingdom) | | | 170,791 | |
| | | | | | |
| | | | | 1,003,428 | |
| |
Biotechnology 1.6% | | | | |
| 3,850 | | Alexion Pharmaceuticals, Inc.* | | | 295,526 | |
| 7,349 | | Amgen, Inc. | | | 499,070 | |
| 9,717 | | Biogen Idec, Inc.* | | | 1,145,829 | |
| 5,046 | | Celgene Corp.* | | | 366,844 | |
| 4,540 | | Gilead Sciences, Inc.* | | | 221,734 | |
| 1,340 | | Seattle Genetics, Inc.* | | | 25,366 | |
| 1,200 | | United Therapeutics Corp.* | | | 59,016 | |
| | | | | | |
| | | | | 2,613,385 | |
| |
Building Materials & Construction 0.1% | | | | |
| 725 | | Eagle Materials, Inc. | | | 21,322 | |
| 575 | | Lennox International, Inc. | | | 20,815 | |
| 3,930 | | Owens Corning* | | | 132,638 | |
| | | | | | |
| | | | | 174,775 | |
| |
Building Products | | | | |
| 975 | | A.O. Smith Corp. | | | 41,418 | |
| |
Business Services 0.3% | | | | |
| 1,577 | | ICON PLC, ADR (Ireland)* | | | 30,767 | |
| 1,028 | | MasterCard, Inc. (Class A Stock) | | | 365,526 | |
| 1,000 | | URS Corp.* | | | 41,150 | |
| | | | | | |
| | | | | 437,443 | |
| |
Capital Markets 0.5% | | | | |
| 4,001 | | Goldman Sachs Group, Inc. (The) | | | 445,991 | |
| 1,275 | | LPL Investment Holdings, Inc.* | | | 41,884 | |
| 7,875 | | State Street Corp. | | | 308,543 | |
| | | | | | |
| | | | | 796,418 | |
See Notes to Financial Statements.
| | | | |
| Target Asset Allocation Funds/Target Growth Allocation Fund | | | 11 | |
Portfolio of Investments
as of January 31, 2012 (Unaudited) continued
| | | | | | |
| Shares | | Description | | Value (Note 1) | |
| | | | | | |
COMMON STOCKS (Continued) | | | | |
| |
Chemicals 3.7% | | | | |
| 1,621 | | Air Products & Chemicals, Inc. | | $ | 142,697 | |
| 2,490 | | Airgas, Inc. | | | 196,536 | |
| 1,400 | | Arkema SA (France) | | | 113,135 | |
| 17,000 | | Asahi Kasei Corp. (Japan) | | | 107,505 | |
| 2,100 | | BASF SE (Germany) | | | 161,462 | |
| 2,000 | | Bayer AG (Germany) | | | 140,065 | |
| 2,280 | | Celanese Corp. (Class A Stock) | | | 111,059 | |
| 1,000 | | CF Industries Holdings, Inc. | | | 177,380 | |
| 4,000 | | Clariant AG (Switzerland)* | | | 48,582 | |
| 14,421 | | Dow Chemical Co. (The) | | | 483,248 | |
| 6,173 | | Huntsman Corp. | | | 78,582 | |
| 1,565 | | Intrepid Potash, Inc.* | | | 37,388 | |
| 20,500 | | Kingboard Chemical Holdings Ltd. (Cayman Islands) | | | 70,710 | |
| 2,600 | | Koninklijke DSM NV (Netherlands) | | | 133,401 | |
| 725 | | Kraton Performance Polymers, Inc.* | | | 20,619 | |
| 18,160 | | Monsanto Co. | | | 1,490,028 | |
| 7,000 | | Nippon Shokubai Co. Ltd. (Japan) | | | 78,890 | |
| 650 | | Olin Corp. | | | 14,430 | |
| 4,670 | | Potash Corp. of Saskatchewan, Inc. (Canada) | | | 218,276 | |
| 6,301 | | PPG Industries, Inc. | | | 564,443 | |
| 13,648 | | Praxair, Inc. | | | 1,449,418 | |
| 1,223 | | Quaker Chemical Corp. | | | 54,179 | |
| 2,000 | | Scotts Miracle-Gro Co. (The) (Class A Stock) | | | 94,720 | |
| 825 | | Sensient Technologies Corp. | | | 32,686 | |
| 11,000 | | Sumitomo Bakelite Co. Ltd. (Japan) | | | 64,078 | |
| 24,000 | | Toagosei Co. Ltd. (Japan) | | | 100,446 | |
| 325 | | TPC Group, Inc.* | | | 10,676 | |
| 1,400 | | Valspar Corp. (The) | | | 60,536 | |
| | | | | | |
| | | | | 6,255,175 | |
| |
Clothing & Apparel 1.7% | | | | |
| 4,412 | | Adidas AG (Germany) | | | 317,872 | |
| 10,669 | | Coach, Inc. | | | 747,364 | |
| 2,120 | | Deckers Outdoor Corp.* | | | 171,402 | |
| 14,284 | | NIKE, Inc. (Class B Stock) | | | 1,485,393 | |
| 968 | | VF Corp. | | | 127,282 | |
| | | | | | |
| | | | | 2,849,313 | |
| |
Commercial Banks 3.0% | | | | |
| 3,050 | | Associated Banc-Corp. | | | 38,003 | |
See Notes to Financial Statements.
| | |
| 12 | | Visit our website at www.prudentialfunds.com |
| | | | | | |
| Shares | | Description | | Value (Note 1) | |
| | | | | | |
COMMON STOCKS (Continued) | | | | |
| |
Commercial Banks (cont’d.) | | | | |
| 12,700 | | Bank Hapoalim BM (Israel) | | $ | 44,293 | |
| 650 | | Bank of Hawaii Corp. | | | 29,718 | |
| 14,600 | | Bank of Ireland (Ireland)* | | | 2,177 | |
| 23,393 | | Fifth Third Bancorp | | | 304,343 | |
| 24,322 | | KeyCorp | | | 188,982 | |
| 20,007 | | PNC Financial Services Group, Inc. | | | 1,178,813 | |
| 900 | | Prosperity Bancshares, Inc. | | | 37,359 | |
| 23,000 | | Regions Financial Corp. | | | 120,060 | |
| 2,408 | | Societe Generale (France) | | | 64,145 | |
| 11,920 | | Sumitomo Mitsui Trust Holdings, Inc. (Japan) | | | 37,221 | |
| 1,999 | | Trustmark Corp. | | | 47,116 | |
| 300 | | Verwaltungs-und Privat-Bank AG (Liechtenstein) | | | 27,360 | |
| 375 | | Webster Financial Corp. | | | 7,950 | |
| 98,160 | | Wells Fargo & Co. | | | 2,867,254 | |
| | | | | | |
| | | | | 4,994,794 | |
| |
Commercial Services 0.5% | | | | |
| 1,528 | | Acacia Research - Acacia Technologies* | | | 62,892 | |
| 4,100 | | Berendsen PLC (United Kingdom) | | | 29,765 | |
| 525 | | Consolidated Graphics, Inc.* | | | 26,665 | |
| 2,225 | | Corrections Corp. of America* | | | 52,354 | |
| 2,770 | | FleetCor Technologies, Inc.* | | | 94,152 | |
| 3,825 | | GEO Group, Inc. (The)* | | | 67,243 | |
| 2,625 | | KAR Auction Services, Inc.* | | | 38,693 | |
| 925 | | McGrath RentCorp. | | | 29,452 | |
| 3,220 | | Monster Worldwide, Inc.* | | | 23,184 | |
| 5,700 | | Nichii Gakkan Co. (Japan) | | | 68,801 | |
| 1,913 | | PAREXEL International Corp.* | | | 46,103 | |
| 1,418 | | Sotheby’s | | | 47,546 | |
| 6,270 | | Verisk Analytics, Inc. (Class A Stock)* | | | 251,239 | |
| | | | | | |
| | | | | 838,089 | |
| |
Communications Equipment | | | | |
| 800 | | ADTRAN, Inc. | | | 27,704 | |
| 1,825 | | Calix, Inc.* | | | 13,815 | |
| 1,200 | | Cisco Systems, Inc. | | | 23,556 | |
| | | | | | |
| | | | | 65,075 | |
|
Computer Hardware 2.6% | |
| 9,733 | | Apple, Inc.* | | | 4,442,920 | |
See Notes to Financial Statements.
| | | | |
| Target Asset Allocation Funds/Target Growth Allocation Fund | | | 13 | |
Portfolio of Investments
as of January 31, 2012 (Unaudited) continued
| | | | | | |
| Shares | | Description | | Value (Note 1) | |
| | | | | | |
COMMON STOCKS (Continued) | | | | |
| |
Computer Services & Software 2.0% | | | | |
| 15,421 | | Accenture PLC (Class A Stock) (Ireland) | | $ | 884,240 | |
| 3,038 | | Allscripts Healthcare Solutions, Inc.* | | | 58,087 | |
| 6,500 | | Autodesk, Inc.* | | | 234,000 | |
| 5,763 | | Cognizant Technology Solutions Corp. (Class A Stock)* | | | 413,495 | |
| 23,000 | | EMC Corp.* | | | 592,480 | |
| 3,676 | | Fortinet, Inc.* | | | 83,850 | |
| 1,300 | | Global Payments, Inc. | | | 65,026 | |
| 1,213 | | Informatica Corp.* | | | 51,310 | |
| 700 | | Itochu Techno-Solutions Corp. (Japan) | | | 32,373 | |
| 150 | | Manhattan Associates, Inc.* | | | 6,584 | |
| 1,890 | | MSCI, Inc. (Class A Stock)* | | | 61,576 | |
| 3,260 | | Nuance Communications, Inc.* | | | 92,975 | |
| 6,330 | | Red Hat, Inc.* | | | 293,522 | |
| 1,013 | | Riverbed Technology, Inc.* | | | 24,251 | |
| 243 | | salesforce.com, Inc.* | | | 28,382 | |
| 6,079 | | SAP AG (Germany) | | | 367,285 | |
| 4,400 | | Tieto Oyj (Finland) | | | 66,417 | |
| 1,970 | | VeriFone Systems, Inc.* | | | 84,119 | |
| | | | | | |
| | | | | 3,439,972 | |
| |
Computers & Peripherals 0.6% | | | | |
| 1,336 | | 3D Systems Corp.* | | | 25,545 | |
| 31,191 | | Hewlett-Packard Co. | | | 872,724 | |
| 2,325 | | QLogic Corp.* | | | 40,269 | |
| 1,150 | | Super Micro Computer, Inc.* | | | 19,412 | |
| | | | | | |
| | | | | 957,950 | |
| |
Construction 0.1% | | | | |
| 6,200 | | COMSYS Holdings Corp. (Japan) | | | 69,386 | |
| 26,625 | | Downer EDI Ltd. (Australia)* | | | 102,042 | |
| 1,200 | | Meritage Homes Corp.* | | | 29,040 | |
| 697 | | Texas Industries, Inc. | | | 21,788 | |
| | | | | | |
| | | | | 222,256 | |
| |
Consumer Finance 0.5% | | | | |
| 10,655 | | American Express Co. | | | 534,241 | |
| 6,000 | | Capital One Financial Corp. | | | 274,500 | |
| 775 | | First Cash Financial Services, Inc.* | | | 31,194 | |
| | | | | | |
| | | | | 839,935 | |
See Notes to Financial Statements.
| | |
| 14 | | Visit our website at www.prudentialfunds.com |
| | | | | | |
| Shares | | Description | | Value (Note 1) | |
| | | | | | |
COMMON STOCKS (Continued) | | | | |
| |
Consumer Products & Services 0.6% | | | | |
| 710 | | Colgate-Palmolive Co. | | $ | 64,411 | |
| 6,398 | | Estee Lauder Cos., Inc. (The) (Class A Stock) | | | 370,636 | |
| 59,700 | | Pacific Brands Ltd. (Australia) | | | 39,296 | |
| 6,103 | | Reckitt Benckiser Group PLC (United Kingdom) | | | 324,673 | |
| 900 | | Snap-on, Inc. | | | 50,859 | |
| 2,688 | | Vitamin Shoppe, Inc.* | | | 114,885 | |
| | | | | | |
| | | | | 964,760 | |
| |
Containers & Packaging 0.1% | | | | |
| 900 | | Packaging Corp. of America | | | 25,326 | |
| 7,000 | | Rexam PLC (United Kingdom) | | | 41,254 | |
| 1,650 | | Silgan Holdings, Inc. | | | 68,574 | |
| | | | | | |
| | | | | 135,154 | |
| |
Cosmetics & Toiletries 0.1% | | | | |
| 8,020 | | Natura Cosmeticos SA (Brazil) | | | 171,765 | |
| |
Distribution/Wholesale 0.5% | | | | |
| 154,000 | | Li & Fung Ltd. (Bermuda) | | | 336,781 | |
| 1,980 | | LKQ Corp.* | | | 64,548 | |
| 21,000 | | Marubeni Corp. (Japan) | | | 144,922 | |
| 5,000 | | Mitsui & Co. Ltd. (Japan) | | | 84,886 | |
| 10,600 | | Sumitomo Corp. (Japan) | | | 152,283 | |
| 4,800 | | Toyota Tsusho Corp. (Japan) | | | 91,000 | |
| | | | | | |
| | | | | 874,420 | |
| |
Diversified Consumer Services 0.1% | | | | |
| 13,800 | | H&R Block, Inc. | | | 225,768 | |
| |
Diversified Financial Services 2.5% | | | | |
| 1,790 | | Affiliated Managers Group, Inc.* | | | 179,913 | |
| 2,895 | | Ameriprise Financial, Inc. | | | 155,027 | |
| 44,807 | | Bank of America Corp. | | | 319,474 | |
| 1,404 | | BlackRock, Inc. | | | 255,528 | |
| 18,120 | | BM&FBOVESPA SA (Brazil) | | | 113,976 | |
| 22,900 | | Challenger Ltd. (Australia) | | | 107,458 | |
| 23,159 | | Citigroup, Inc. | | | 711,444 | |
| 2,563 | | Duff & Phelps Corp. (Class A Stock) | | | 39,291 | |
| 2,100 | | Fuyo General Lease Co. Ltd. (Japan) | | | 76,980 | |
| 17,700 | | Intermediate Capital Group PLC (United Kingdom) | | | 76,702 | |
See Notes to Financial Statements.
| | | | |
| Target Asset Allocation Funds/Target Growth Allocation Fund | | | 15 | |
Portfolio of Investments
as of January 31, 2012 (Unaudited) continued
| | | | | | |
| Shares | | Description | | Value (Note 1) | |
| | | | | | |
COMMON STOCKS (Continued) | | | | |
| |
Diversified Financial Services (cont’d.) | | | | |
| 57,042 | | JPMorgan Chase & Co. | | $ | 2,127,666 | |
| 9,800 | | Tullett Prebon PLC (United Kingdom) | | | 45,989 | |
| | | | | | |
| | | | | 4,209,448 | |
| |
Diversified Manufacturing Operations 0.3% | | | | |
| 11,717 | | Eaton Corp. | | | 574,485 | |
| |
Diversified Operations 0.3% | | | | |
| 2,855 | | LVMH Moet Hennessy Louis Vuitton SA (France) | | | 461,580 | |
|
Diversified Telecommunication Services 0.7% | |
| 38,152 | | AT&T, Inc. | | | 1,122,050 | |
|
Electric 0.1% | |
| 2,100 | | E.ON AG (Germany) | | | 44,898 | |
| 275 | | Great Plains Energy, Inc. | | | 5,670 | |
| 1,800 | | RWE AG (Germany) | | | 68,845 | |
| | | | | | |
| | | | | 119,413 | |
|
Electric Utilities 1.4% | |
| 18,468 | | American Electric Power Co., Inc. | | | 730,594 | |
| 14,400 | | Edison International | | | 590,976 | |
| 32,300 | | Enel SpA (Italy) | | | 132,073 | |
| 12,500 | | Exelon Corp. | | | 497,250 | |
| 17,041 | | PPL Corp. | | | 473,569 | |
| | | | | | |
| | | | | 2,424,462 | |
|
Electrical Equipment 0.1% | |
| 1,700 | | EnerSys* | | | 49,266 | |
| 3,296 | | GrafTech International Ltd.* | | | 54,120 | |
| | | | | | |
| | | | | 103,386 | |
|
Electronic Components & Equipment 0.4% | |
| 6,580 | | Broadcom Corp. (Class A Stock)* | | | 225,957 | |
| 2,600 | | Checkpoint Systems, Inc.* | | | 27,352 | |
| 1,653 | | Coherent, Inc.* | | | 92,370 | |
| 2,265 | | DTS, Inc.* | | | 64,167 | |
| 998 | | Fanuc Corp. (Japan) | | | 167,730 | |
| 2,400 | | FLIR Systems, Inc. | | | 61,800 | |
| 996 | | Universal Display Corp.* | | | 41,942 | |
See Notes to Financial Statements.
| | |
| 16 | | Visit our website at www.prudentialfunds.com |
| | | | | | |
| Shares | | Description | | Value (Note 1) | |
| | | | | | |
COMMON STOCKS (Continued) | | | | |
| |
Electronic Components & Equipment (cont’d.) | | | | |
| 3,065 | | Universal Electronics, Inc.* | | $ | 56,702 | |
| | | | | | |
| | | | | 738,020 | |
|
Electronic Equipment & Instruments 0.3% | |
| 16,700 | | Corning, Inc. | | | 214,929 | |
| 1,060 | | Itron, Inc.* | | | 41,117 | |
| 525 | | ScanSource, Inc.* | | | 19,724 | |
| 4,575 | | TE Connectivity Ltd. (Switzerland) | | | 156,008 | |
| | | | | | |
| | | | | 431,778 | |
|
Energy Equipment & Services 1.0% | |
| 2,900 | | Diamond Offshore Drilling, Inc. | | | 180,670 | |
| 419 | | Dril-Quip, Inc.* | | | 27,641 | |
| 7,900 | | Ensco PLC, ADR (United Kingdom) | | | 415,856 | |
| 28,503 | | Halliburton Co. | | | 1,048,340 | |
| 700 | | Oil States International, Inc.* | | | 55,783 | |
| 750 | | Unit Corp.* | | | 33,938 | |
| | | | | | |
| | | | | 1,762,228 | |
| |
Engineering & Construction 0.2% | | | | |
| 2,610 | | Fluor Corp. | | | 146,786 | |
| 1,725 | | MasTec, Inc.* | | | 28,100 | |
| 875 | | MYR Group, Inc.* | | | 17,483 | |
| 3,800 | | NCC AB (Class B Stock) (Sweden) | | | 78,542 | |
| | | | | | |
| | | | | 270,911 | |
| |
Entertainment & Leisure 0.7% | | | | |
| 2,056 | | Bally Technologies, Inc.* | | | 86,804 | |
| 7,017 | | Carnival Corp. (Panama) | | | 211,913 | |
| 6,685 | | Carnival PLC (United Kingdom) | | | 199,096 | |
| 4,600 | | Heiwa Corp. (Japan) | | | 82,742 | |
| 4,960 | | Las Vegas Sands Corp.* | | | 243,586 | |
| 1,300 | | Life Time Fitness, Inc.* | | | 63,882 | |
| 4,207 | | Pinnacle Entertainment, Inc.* | | | 40,808 | |
| 3,240 | | Royal Caribbean Cruises Ltd. (Liberia) | | | 88,063 | |
| 9,677 | | Shuffle Master, Inc.* | | | 123,866 | |
| 24,000 | | Thomas Cook Group PLC (United Kingdom) | | | 5,106 | |
| | | | | | |
| | | | | 1,145,866 | |
See Notes to Financial Statements.
| | | | |
| Target Asset Allocation Funds/Target Growth Allocation Fund | | | 17 | |
Portfolio of Investments
as of January 31, 2012 (Unaudited) continued
| | | | | | |
| Shares | | Description | | Value (Note 1) | |
| | | | | | |
COMMON STOCKS (Continued) | | | | |
| |
Environmental Control 0.1% | | | | |
| 1,470 | | Stericycle, Inc.* | | $ | 123,509 | |
| 2,422 | | Waste Connections, Inc. | | | 78,255 | |
| | | | | | |
| | | | | 201,764 | |
| |
Farming & Agriculture | | | | |
| 36,366 | | Chaoda Modern Agriculture Holdings Ltd. (Cayman Islands) | | | 47 | |
| |
Financial - Bank & Trust 1.0% | | | | |
| 2,750 | | Astoria Financial Corp. | | | 22,908 | |
| 7,500 | | Banco Bilbao Vizcaya Argentaria SA (Spain) | | | 65,474 | |
| 13,300 | | Banco Santander SA (Spain) | | | 103,512 | |
| 25,900 | | Barclays PLC (United Kingdom) | | | 86,748 | |
| 2,600 | | BNP Paribas (France) | | | 110,088 | |
| 85,498 | | China Merchants Bank Co. Ltd. (Class H Stock) (China) | | | 188,739 | |
| 9,960 | | Credit Agricole SA (France) | | | 61,376 | |
| 12,760 | | Credit Suisse Group AG (Switzerland)* | | | 331,025 | |
| 2,200 | | Danske Bank A/S (Denmark)* | | | 32,129 | |
| 2,300 | | Deutsche Bank AG (Germany) | | | 97,430 | |
| 3,758 | | Dexia NV/SA (Belgium)* | | | 1,647 | |
| 96,100 | | Mizuho Financial Group, Inc. (Japan) | | | 144,995 | |
| 8,200 | | National Australia Bank Ltd. (Australia) | | | 207,627 | |
| 5,600 | | Sumitomo Mitsui Financial Group, Inc. (Japan) | | | 178,168 | |
| 2,600 | | Svenska Handelsbanken AB (Class A Stock) (Sweden) | | | 77,971 | |
| | | | | | |
| | | | | 1,709,837 | |
| |
Financial Services 2.1% | | | | |
| 6,000 | | DnB ASA (Norway) | | | 63,303 | |
| 1,500 | | Eaton Vance Corp. | | | 38,535 | |
| 4,000 | | Hitachi Capital Corp. (Japan) | | | 60,247 | |
| 13,610 | | Hong Kong Exchanges and Clearing Ltd. (Hong Kong) | | | 236,213 | |
| 241,900 | | Industrial & Commercial Bank of China Ltd. (Class H Stock) (China) | | | 169,370 | |
| 10,900 | | Irish Life & Permanent Group Holdings PLC (Ireland)* | | | 456 | |
| 1,800 | | Jefferies Group, Inc. | | | 27,378 | |
| 700 | | Muenchener Rueckversicherungs-Gesellschaft AG (Germany) | | | 91,197 | |
| 1,950 | | Raymond James Financial, Inc. | | | 68,250 | |
| 41,489 | | U.S. Bancorp | | | 1,170,820 | |
| 15,155 | | Visa, Inc. (Class A Stock) | | | 1,525,199 | |
| | | | | | |
| | | | | 3,450,968 | |
See Notes to Financial Statements.
| | |
| 18 | | Visit our website at www.prudentialfunds.com |
| | | | | | |
| Shares | | Description | | Value (Note 1) | |
| | | | | | |
COMMON STOCKS (Continued) | | | | |
|
Food 1.5% | |
| 5,600 | | Cermaq ASA (Norway)* | | $ | 77,171 | |
| 11,800 | | Dairy Crest Group PLC (United Kingdom) | | | 58,293 | |
| 3,294 | | Danone (France) | | | 203,306 | |
| 2,500 | | Delhaize Group (Belgium) | | | 136,151 | |
| 1,561 | | Fresh Market, Inc. (The)* | | | 67,217 | |
| 2,770 | | General Mills, Inc. | | | 110,329 | |
| 125,375 | | Goodman Fielder Ltd. (Australia) | | | 69,880 | |
| 39,200 | | J. Sainsbury PLC (United Kingdom) | | | 178,148 | |
| 10,200 | | Koninklijke Ahold NV (Netherlands) | | | 135,155 | |
| 14,689 | | Kraft Foods, Inc. (Class A Stock) | | | 562,589 | |
| 34,870 | | Marston’s PLC (United Kingdom) | | | 53,299 | |
| 29,000 | | Morinaga Milk Industry Co. Ltd. (Japan) | | | 115,285 | |
| 9,036 | | Nestle SA (Switzerland) | | | 517,815 | |
| 1,000 | | Nichirei Corp. (Japan) | | | 4,907 | |
| 35,900 | | WM Morrison Supermarkets PLC (United Kingdom) | | | 161,793 | |
| | | | | | |
| | | | | 2,451,338 | |
|
Food & Staples Retailing 1.2% | |
| 1,595 | | BJ’s Restaurants, Inc.* | | | 79,798 | |
| 27,856 | | CVS Caremark Corp. | | | 1,162,988 | |
| 7,500 | | Kroger Co. (The) | | | 178,200 | |
| 12,700 | | Safeway, Inc. | | | 279,146 | |
| 5,901 | | Wal-Mart Stores, Inc. | | | 362,085 | |
| | | | | | |
| | | | | 2,062,217 | |
|
Food Products 0.4% | |
| 13,800 | | ConAgra Foods, Inc. | | | 368,046 | |
| 8,294 | | Unilever NV (Netherlands) | | | 276,605 | |
| | | | | | |
| | | | | 644,651 | |
|
Gas Utilities 0.3% | |
| 1,200 | | Atmos Energy Corp. | | | 38,892 | |
| 6,877 | | Sempra Energy | | | 391,301 | |
| 1,025 | | South Jersey Industries, Inc. | | | 56,252 | |
| | | | | | |
| | | | | 486,445 | |
|
Hand/Machine Tools 0.2% | |
| 900 | | Franklin Electric Co., Inc. | | | 45,054 | |
| 906 | | Regal-Beloit Corp. | | | 51,433 | |
See Notes to Financial Statements.
| | | | |
| Target Asset Allocation Funds/Target Growth Allocation Fund | | | 19 | |
Portfolio of Investments
as of January 31, 2012 (Unaudited) continued
| | | | | | |
| Shares | | Description | | Value (Note 1) | |
| | | | | | |
COMMON STOCKS (Continued) | | | | |
| |
Hand/Machine Tools (cont’d.) | | | | |
| 3,010 | | Stanley Black & Decker, Inc. | | $ | 211,242 | |
| | | | | | |
| | | | | 307,729 | |
|
Healthcare Equipment & Supplies 0.2% | |
| 2,513 | | Arthrocare Corp.* | | | 77,677 | |
| 4,200 | | Medtronic, Inc. | | | 161,994 | |
| 875 | | Teleflex, Inc. | | | 53,541 | |
| 1,356 | | Thoratec Corp.* | | | 39,867 | |
| 800 | | West Pharmaceutical Services, Inc. | | | 32,384 | |
| | | | | | |
| | | | | 365,463 | |
|
Healthcare Products 0.7% | |
| 4,231 | | Bruker Corp.* | | | 60,080 | |
| 800 | | Cantel Medical Corp. | | | 25,256 | |
| 1,657 | | Cepheid, Inc.* | | | 73,007 | |
| 1,375 | | Cooper Cos., Inc. (The) | | | 99,193 | |
| 16,168 | | Covidien PLC (Ireland) | | | 832,652 | |
| 890 | | IDEXX Laboratories, Inc.* | | | 75,285 | |
| | | | | | |
| | | | | 1,165,473 | |
|
Healthcare Providers & Services 0.7% | |
| 1,500 | | Amedisys, Inc.* | | | 15,750 | |
| 7,900 | | CIGNA Corp. | | | 354,157 | |
| 825 | | LifePoint Hospitals, Inc.* | | | 33,157 | |
| 800 | | MEDNAX, Inc.* | | | 56,976 | |
| 525 | | Owens & Minor, Inc. | | | 15,965 | |
| 13,898 | | UnitedHealth Group, Inc. | | | 719,777 | |
| | | | | | |
| | | | | 1,195,782 | |
|
Healthcare Services 0.3% | |
| 525 | | Air Methods Corp.* | | | 44,257 | |
| 2,190 | | AMERIGROUP Corp.* | | | 148,942 | |
| 2,209 | | Centene Corp.* | | | 99,847 | |
| 700 | | Covance, Inc.* | | | 30,667 | |
| 1,500 | | Healthways, Inc.* | | | 11,340 | |
| 1,911 | | Humana, Inc. | | | 170,117 | |
| | | | | | |
| | | | | 505,170 | |
|
Healthcare Technology | |
| 14,700 | | AGFA-Gevaert NV (Belgium)* | | | 26,535 | |
See Notes to Financial Statements.
| | |
| 20 | | Visit our website at www.prudentialfunds.com |
| | | | | | |
| Shares | | Description | | Value (Note 1) | |
| | | | | | |
COMMON STOCKS (Continued) | | | | |
|
Holding Companies 0.1% | |
| 35,000 | | Dah Chong Hong Holdings Ltd. (Hong Kong) | | $ | 44,453 | |
| 72,000 | | First Pacific Co. Ltd. (Bermuda) | | | 82,256 | |
| | | | | | |
| | | | | 126,709 | |
| |
Home Furnishings | | | | |
| 4,400 | | Electrolux AB (Class B Stock) (Sweden) | | | 80,594 | |
| |
Hotels, Restaurants & Leisure 2.1% | | | | |
| 650 | | Choice Hotels International, Inc. | | | 23,621 | |
| 14,463 | | McDonald’s Corp. | | | 1,432,560 | |
| 4,145 | | Orient-Express Hotels Ltd. (Class A Stock) (Bermuda)* | | | 35,067 | |
| 9,064 | | Wynn Resorts Ltd. | | | 1,044,445 | |
| 16,815 | | Yum! Brands, Inc. | | | 1,064,894 | |
| | | | | | |
| | | | | 3,600,587 | |
| |
Household Products 0.1% | | | | |
| 1,300 | | Helen of Troy Ltd. (Bermuda)* | | | 41,821 | |
| 2,400 | | Kimberly-Clark Corp. | | | 171,744 | |
| 500 | | WD-40 Co. | | | 21,870 | |
| | | | | | |
| | | | | 235,435 | |
| |
Independent Power Producers & Energy Traders | | | | |
| 8,200 | | Drax Group PLC (United Kingdom) | | | 68,678 | |
| |
Industrial Conglomerates 0.8% | | | | |
| 67,978 | | General Electric Co. | | | 1,271,868 | |
| |
Industrial Products 0.8% | | | | |
| 1,300 | | Harsco Corp. | | | 28,899 | |
| 21,200 | | Kurabo Industries Ltd. (Japan) | | | 42,834 | |
| 8,145 | | Precision Castparts Corp. | | | 1,333,174 | |
| | | | | | |
| | | | | 1,404,907 | |
| |
Insurance 3.7% | | | | |
| 4,480 | | ACE Ltd. (Switzerland) | | | 311,808 | |
| 3,435 | | Allianz SE (Germany) | | | 377,693 | |
| 36,600 | | Allstate Corp. (The) | | | 1,055,910 | |
| 850 | | American Equity Investment Life Holding Co. | | | 9,801 | |
| 5,584 | | Aon Corp. | | | 270,433 | |
| 20,700 | | Aviva PLC (United Kingdom) | | | 113,971 | |
See Notes to Financial Statements.
| | | | |
| Target Asset Allocation Funds/Target Growth Allocation Fund | | | 21 | |
Portfolio of Investments
as of January 31, 2012 (Unaudited) continued
| | | | | | |
| Shares | | Description | | Value (Note 1) | |
| | | | | | |
COMMON STOCKS (Continued) | | | | |
| |
Insurance (cont’d.) | | | | |
| 1,400 | | Baloise Holding AG (Switzerland) | | $ | 107,376 | |
| 31,500 | | Beazley PLC (United Kingdom) | | | 69,592 | |
| 37,477 | | China Life Insurance Co. Ltd. (Class H Stock) (China) | | | 110,421 | |
| 3,975 | | CNO Financial Group, Inc.* | | | 26,712 | |
| 94 | | Dai-ichi Life Insurance Co. Ltd. (The) (Japan) | | | 98,662 | |
| 1,475 | | Delphi Financial Group, Inc. (Class A Stock) | | | 65,652 | |
| 2,012 | | HCC Insurance Holdings, Inc. | | | 55,853 | |
| 300 | | Helvetia Holding AG (Switzerland) | | | 100,706 | |
| 11,200 | | ING Groep NV, CVA (Netherlands)* | | | 101,935 | |
| 39,300 | | Legal & General Group PLC (United Kingdom) | | | 71,466 | |
| 200 | | Loews Corp. | | | 7,462 | |
| 30,513 | | MetLife, Inc. | | | 1,078,024 | |
| 52,800 | | Old Mutual PLC (United Kingdom) | | | 121,475 | |
| 1,900 | | Protective Life Corp. | | | 47,519 | |
| 1,000 | | Reinsurance Group of America, Inc. | | | 54,490 | |
| 2,500 | | SCOR SE (France) | | | 62,901 | |
| 1,000 | | State Auto Financial Corp. | | | 12,520 | |
| 1,000 | | Swiss Life Holding AG (Switzerland)* | | | 99,294 | |
| 2,400 | | Swiss Re Ltd. (Switzerland)* | | | 130,181 | |
| 1,775 | | Tower Group, Inc. | | | 38,322 | |
| 9,659 | | Travelers Cos., Inc. (The) | | | 563,120 | |
| 1,000 | | United Fire & Casualty Co. | | | 19,630 | |
| 10,000 | | Unum Group | | | 228,300 | |
| 2,048 | | Validus Holdings Ltd. (Bermuda) | | | 65,679 | |
| 26,361 | | XL Group PLC (Ireland) | | | 534,337 | |
| 800 | | Zurich Financial Services AG (Switzerland)* | | | 192,070 | |
| | | | | | |
| | | | | 6,203,315 | |
|
Internet Services 2.5% | |
| 866 | | Amazon.com, Inc.* | | | 168,385 | |
| 1,300 | | Digital River, Inc.* | | | 20,813 | |
| 2,090 | | F5 Networks, Inc.* | | | 250,257 | |
| 3,298 | | Google, Inc. (Class A Stock)* | | | 1,913,203 | |
| 2,675 | | priceline.com, Inc.* | | | 1,416,359 | |
| 6,457 | | Sapient Corp. | | | 83,295 | |
| 6,605 | | Tencent Holdings Ltd. (Cayman Islands) | | | 161,563 | |
| 2,188 | | TIBCO Software, Inc.* | | | 57,041 | |
| 9,077 | | Youku, Inc., ADR (Cayman Islands)* | | | 194,157 | |
| | | | | | |
| | | | | 4,265,073 | |
See Notes to Financial Statements.
| | |
| 22 | | Visit our website at www.prudentialfunds.com |
| | | | | | |
| Shares | | Description | | Value (Note 1) | |
| | | | | | |
COMMON STOCKS (Continued) | | | | |
|
Internet Software & Services 1.5% | |
| 9,205 | | Baidu, Inc., ADR (Cayman Islands)* | | $ | 1,173,821 | |
| 40,820 | | Oracle Corp. | | | 1,151,124 | |
| 2,510 | | VeriSign, Inc. | | | 93,021 | |
| 3,500 | | Yandex NV (Netherlands)* | | | 71,295 | |
| | | | | | |
| | | | | 2,489,261 | |
|
Investment Companies 0.3% | |
| 576,000 | | Hutchison Port Holdings Trust (Singapore) | | | 432,000 | |
| 3,215 | | KKR Financial Holdings LLC | | | 28,453 | |
| | | | | | |
| | | | | 460,453 | |
|
IT Services 0.5% | |
| 1,725 | | Broadridge Financial Solutions, Inc. | | | 41,348 | |
| 475 | | CACI International, Inc. (Class A Stock)* | | | 27,878 | |
| 3,916 | | International Business Machines Corp. | | | 754,222 | |
| 50,600 | | Logica PLC (United Kingdom) | | | 60,439 | |
| | | | | | |
| | | | | 883,887 | |
|
Leisure Equipment & Products 0.1% | |
| 5,900 | | Mattel, Inc. | | | 182,900 | |
|
Life Sciences Tools & Services 0.4% | |
| 11,907 | | Thermo Fisher Scientific, Inc.* | | | 629,880 | |
| |
Machinery 0.9% | | | | |
| 1,925 | | Actuant Corp. (Class A Stock) | | | 48,799 | |
| 8,362 | | Cummins, Inc. | | | 869,648 | |
| 8,400 | | PACCAR, Inc. | | | 371,280 | |
| 2,200 | | Parker Hannifin Corp. | | | 177,496 | |
| 943 | | Twin Disc, Inc. | | | 29,167 | |
| 525 | | Valmont Industries, Inc. | | | 55,078 | |
| | | | | | |
| | | | | 1,551,468 | |
| |
Machinery & Equipment 0.5% | | | | |
| 470 | | Colfax Corp.* | | | 14,269 | |
| 2,316 | | Deere & Co. | | | 199,523 | |
| 8,700 | | Kyowa Exeo Corp. (Japan) | | | 87,206 | |
| 1,900 | | Rheinmetall AG (Germany) | | | 101,884 | |
| 5,441 | | Rockwell Automation, Inc. | | | 423,691 | |
| 1,345 | | Terex Corp.* | | | 26,631 | |
| | | | | | |
| | | | | 853,204 | |
See Notes to Financial Statements.
| | | | |
| Target Asset Allocation Funds/Target Growth Allocation Fund | | | 23 | |
Portfolio of Investments
as of January 31, 2012 (Unaudited) continued
| | | | | | |
| Shares | | Description | | Value (Note 1) | |
| | | | | | |
COMMON STOCKS (Continued) | | | | |
| |
Machinery - Construction & Mining 0.2% | | | | |
| 11,123 | | Komatsu Ltd. (Japan) | | $ | 313,610 | |
| |
Manufacturing 1.2% | | | | |
| 10,500 | | Cookson Group PLC (United Kingdom) | | | 95,470 | |
| 30,787 | | Danaher Corp. | | | 1,616,625 | |
| 2,580 | | Siemens AG (Germany) | | | 243,455 | |
| | | | | | |
| | | | | 1,955,550 | |
| |
Media 3.2% | | | | |
| 50,015 | | British Sky Broadcasting Group PLC (United Kingdom) | | | 543,813 | |
| 8,000 | | CBS Corp. (Class B Stock) | | | 227,840 | |
| 9,960 | | Comcast Corp. (Class A Stock) | | | 264,836 | |
| 28,232 | | Comcast Corp. (Special Class A Stock) | | | 719,634 | |
| 3,810 | | Discovery Communications, Inc. (Class A Stock)* | | | 163,373 | |
| 2,800 | | Interpublic Group of Cos., Inc. (The) | | | 28,924 | |
| 12,890 | | News Corp. (Class A Stock) | | | 242,719 | |
| 8,508 | | Pearson PLC (United Kingdom) | | | 157,262 | |
| 4,188 | | Publicis Groupe SA (France) | | | 210,687 | |
| 47,878 | | Time Warner, Inc. | | | 1,774,359 | |
| 9,650 | | Viacom, Inc. (Class B Stock) | | | 453,936 | |
| 12,740 | | Walt Disney Co. (The) | | | 495,586 | |
| 925 | | Wiley, (John) & Sons, Inc. (Class A Stock) | | | 41,986 | |
| | | | | | |
| | | | | 5,324,955 | |
| |
Medical Supplies & Equipment 0.3% | | | | |
| 3,745 | | Fresenius Medical Care AG & Co. KGaA (Germany) | | | 267,220 | |
| 2,210 | | Quality Systems, Inc. | | | 89,638 | |
| 2,021 | | Sirona Dental Systems, Inc.* | | | 97,715 | |
| 1,800 | | Zimmer Holdings, Inc.* | | | 109,350 | |
| | | | | | |
| | | | | 563,923 | |
|
Metals & Mining 1.6% | |
| 1,700 | | AMCOL International Corp. | | | 48,552 | |
| 3,900 | | ArcelorMittal (Luxembourg) | | | 78,485 | |
| 5,559 | | BHP Billiton Ltd. (Australia) | | | 221,196 | |
| 4,353 | | BHP Billiton Ltd., ADR (Australia) | | | 345,802 | |
| 23,600 | | BlueScope Steel Ltd. (Australia) | | | 10,147 | |
| 10,800 | | Boliden AB (Sweden) | | | 184,644 | |
| 1,297 | | Cloud Peak Energy, Inc.* | | | 24,578 | |
| 17,919 | | Freeport-McMoRan Copper & Gold, Inc. | | | 828,037 | |
See Notes to Financial Statements.
| | |
| 24 | | Visit our website at www.prudentialfunds.com |
| | | | | | |
| Shares | | Description | | Value (Note 1) | |
| | | | | | |
COMMON STOCKS (Continued) | | | | |
|
Metals & Mining (cont’d.) | |
| 2,370 | | Joy Global, Inc. | | $ | 214,935 | |
| 2,236 | | Northwest Pipe Co.* | | | 51,003 | |
| 78,500 | | OneSteel Ltd. (Australia) | | | 61,671 | |
| 2,000 | | Rio Tinto Ltd. (Australia) | | | 146,847 | |
| 2,788 | | RTI International Metals, Inc.* | | | 70,174 | |
| 5,300 | | Sims Metal Management Ltd. (Australia) | | | 84,683 | |
| 3,900 | | ThyssenKrupp AG (Germany) | | | 110,547 | |
| 1,500 | | Timken Co. | | | 73,245 | |
| 4,191 | | Titanium Metals Corp. | | | 64,458 | |
| 1,500 | | Vallourec SA (France) | | | 101,302 | |
| | | | | | |
| | | | | 2,720,306 | |
|
Miscellaneous Manufacturing 0.2% | |
| 3,385 | | Polypore International, Inc.* | | | 128,901 | |
| 318,000 | | Singamas Container Holdings Ltd. (Hong Kong) | | | 71,758 | |
| 8,900 | | Trelleborg AB (Sweden) | | | 83,799 | |
| | | | | | |
| | | | | 284,458 | |
|
Multi-Line Insurance | |
| 4,500 | | AXA SA (France) | | | 68,309 | |
|
Multi-Line Retail 0.4% | |
| 2,189 | | Dollar Tree, Inc.* | | | 185,649 | |
| 6,800 | | J.C. Penney Co., Inc. | | | 282,540 | |
| 4,633 | | Macy’s, Inc. | | | 156,086 | |
| | | | | | |
| | | | | 624,275 | |
|
Multi-Utilities 0.5% | |
| 3,700 | | Dominion Resources, Inc. | | | 185,148 | |
| 375 | | NorthWestern Corp. | | | 13,178 | |
| 22,774 | | Public Service Enterprise Group, Inc. | | | 690,963 | |
| | | | | | |
| | | | | 889,289 | |
|
Office Electronics 0.3% | |
| 4,591 | | Canon, Inc. (Japan) | | | 198,168 | |
| 44,100 | | Xerox Corp. | | | 341,775 | |
| | | | | | |
| | | | | 539,943 | |
|
Oil & Gas 2.5% | |
| 7,744 | | Anadarko Petroleum Corp. | | | 625,096 | |
| 3,938 | | Baker Hughes, Inc. | | | 193,474 | |
See Notes to Financial Statements.
| | | | |
| Target Asset Allocation Funds/Target Growth Allocation Fund | | | 25 | |
Portfolio of Investments
as of January 31, 2012 (Unaudited) continued
| | | | | | |
| Shares | | Description | | Value (Note 1) | |
| | | | | | |
COMMON STOCKS (Continued) | | | | |
|
Oil & Gas (cont’d.) | |
| 13,632 | | BG Group PLC (United Kingdom) | | $ | 306,108 | |
| 9,700 | | Caltex Australia Ltd. (Australia) | | | 131,093 | |
| 3,883 | | Cenovus Energy, Inc. (Canada) | | | 141,696 | |
| 2,301 | | Continental Resources, Inc.* | | | 185,645 | |
| 2,370 | | EQT Corp. | | | 119,732 | |
| 1,247 | | Gulfport Energy Corp.* | | | 40,989 | |
| 3,880 | | Hess Corp. | | | 218,444 | |
| 12,350 | | National Oilwell Varco, Inc. | | | 913,653 | |
| 4,454 | | Oasis Petroleum, Inc.* | | | 150,278 | |
| 2,130 | | Oceaneering International, Inc. | | | 103,497 | |
| 1,390 | | SM Energy Co. | | | 100,886 | |
| 4,700 | | Statoil ASA (Norway) | | | 117,840 | |
| 5,700 | | Total SA (France) | | | 301,254 | |
| 10,300 | | Total SA, ADR (France) | | | 545,591 | |
| | | | | | |
| | | | | 4,195,276 | |
|
Oil, Gas & Consumable Fuels 7.0% | |
| 2,029 | | Air Liquide SA (France) | | | 255,370 | |
| 5,342 | | Apache Corp. | | | 528,217 | |
| 39,800 | | BP PLC (United Kingdom) | | | 295,301 | |
| 3,900 | | Cabot Oil & Gas Corp. | | | 124,410 | |
| 6,970 | | Cameron International Corp.* | | | 370,804 | |
| 5,560 | | Canadian Natural Resources Ltd. (Canada) | | | 220,249 | |
| 13,600 | | Chesapeake Energy Corp. | | | 287,368 | |
| 11,962 | | Chevron Corp. | | | 1,233,043 | |
| 137,725 | | CNOOC Ltd. (Hong Kong) | | | 283,076 | |
| 19,729 | | ConocoPhillips | | | 1,345,715 | |
| 800 | | Core Laboratories NV (Netherlands) | | | 84,984 | |
| 3,460 | | Dresser-Rand Group, Inc.* | | | 177,256 | |
| 10,300 | | ENI SpA (Italy) | | | 227,691 | |
| 7,181 | | Exxon Mobil Corp. | | | 601,337 | |
| 2,090 | | FMC Technologies, Inc.* | | | 106,820 | |
| 12,800 | | JX Holdings, Inc. (Japan) | | | 77,250 | |
| 3,519 | | Lufkin Industries, Inc. | | | 264,699 | |
| 14,500 | | Marathon Oil Corp. | | | 455,155 | |
| 3,450 | | Noble Energy, Inc. | | | 347,312 | |
| 19,940 | | Occidental Petroleum Corp. | | | 1,989,414 | |
| 4,100 | | OMV AG (Austria) | | | 134,423 | |
| 900 | | ONEOK, Inc. | | | 74,844 | |
| 9,754 | | Peabody Energy Corp. | | | 332,514 | |
See Notes to Financial Statements.
| | |
| 26 | | Visit our website at www.prudentialfunds.com |
| | | | | | |
| Shares | | Description | | Value (Note 1) | |
| | | | | | |
COMMON STOCKS (Continued) | | | | |
|
Oil, Gas & Consumable Fuels (cont’d.) | |
| 1,150 | | Pioneer Natural Resources Co. | | $ | 114,195 | |
| 5,300 | | Repsol YPF SA (Spain) | | | 145,585 | |
| 13,300 | | Royal Dutch Shell PLC (Class B Stock) (United Kingdom) | | | 483,817 | |
| 7,700 | | Royal Dutch Shell PLC (Class B Stock), ADR (United Kingdom) | | | 564,718 | |
| 5,622 | | Schlumberger Ltd. (Netherlands) | | | 422,606 | |
| 1,300 | | Swift Energy Co.* | | | 43,095 | |
| 7,800 | | Valero Energy Corp. | | | 187,122 | |
| 1,300 | | WGL Holdings, Inc. | | | 55,445 | |
| | | | | | |
| | | | | 11,833,835 | |
|
Paper & Forest Products 0.2% | |
| 16,400 | | DS Smith PLC (United Kingdom) | | | 58,638 | |
| 6,200 | | International Paper Co. | | | 193,068 | |
| 13,700 | | Mondi PLC (United Kingdom) | | | 109,021 | |
| 2,000 | | Svenska Cellulosa AB (Class B Stock) (Sweden) | | | 33,400 | |
| | | | | | |
| | | | | 394,127 | |
|
Pharmaceuticals 6.8% | |
| 11,170 | | Abbott Laboratories | | | 604,856 | |
| 9,531 | | Allergan, Inc. | | | 837,870 | |
| 2,630 | | AmerisourceBergen Corp. | | | 102,491 | |
| 6,900 | | AstraZeneca PLC (United Kingdom) | | | 332,116 | |
| 869 | | BioMarin Pharmaceutical, Inc.* | | | 30,997 | |
| 16,740 | | Bristol-Myers Squibb Co. | | | 539,698 | |
| 1,402 | | Catalyst Health Solutions, Inc.* | | | 76,774 | |
| 14,100 | | Eli Lilly & Co. | | | 560,334 | |
| 5,600 | | GlaxoSmithKline PLC (United Kingdom) | | | 124,425 | |
| 3,000 | | H. Lundbeck A/S (Denmark) | | | 59,120 | |
| 391 | | Herbalife Ltd. (Cayman Islands) | | | 22,631 | |
| 23,461 | | Johnson & Johnson | | | 1,546,315 | |
| 4,000 | | Kyorin Holdings, Inc. (Japan) | | | 69,536 | |
| 19,149 | | Mead Johnson Nutrition Co. | | | 1,418,749 | |
| 25,498 | | Merck & Co., Inc. | | | 975,553 | |
| 1,000 | | Merck KGaA (Germany) | | | 104,330 | |
| 1,500 | | Miraca Holdings, Inc. (Japan) | | | 56,147 | |
| 7,802 | | Novartis AG (Switzerland) | | | 422,096 | |
| 3,100 | | Novartis AG, ADR (Switzerland) | | | 168,516 | |
| 2,963 | | Novo Nordisk A/S (Class B Stock) (Denmark) | | | 350,345 | |
| 998 | | Onyx Pharmaceuticals, Inc.* | | | 40,858 | |
| 71,751 | | Pfizer, Inc. | | | 1,535,471 | |
See Notes to Financial Statements.
| | | | |
| Target Asset Allocation Funds/Target Growth Allocation Fund | | | 27 | |
Portfolio of Investments
as of January 31, 2012 (Unaudited) continued
| | | | | | |
| Shares | | Description | | Value (Note 1) | |
| | | | | | |
COMMON STOCKS (Continued) | | | | |
|
Pharmaceuticals (cont’d.) | |
| 1,200 | | Roche Holding AG (Switzerland) | | $ | 203,107 | |
| 1,900 | | Salix Pharmaceuticals Ltd.* | | | 91,580 | |
| 4,600 | | Sanofi (France) | | | 339,780 | |
| 5,100 | | Sanofi, ADR (France) | | | 189,363 | |
| 42,299 | | Sinopharm Group Co. Ltd. (Class H Stock) (China) | | | 100,248 | |
| 2,300 | | Teva Pharmaceutical Industries Ltd. (Israel) | | | 103,636 | |
| 9,222 | | Teva Pharmaceutical Industries Ltd., ADR (Israel) | | | 416,189 | |
| 1,188 | | Theravance, Inc.* | | | 21,075 | |
| | | | | | |
| | | | | 11,444,206 | |
|
Professional Services 0.1% | |
| 2,900 | | Manpower, Inc. | | | 116,319 | |
| 900 | | Towers Watson & Co. (Class A Stock) | | | 53,820 | |
| | | | | | |
| | | | | 170,139 | |
| |
Real Estate Investment Trusts 1.4% | | | | |
| 10,190 | | American Tower Corp. | | | 647,167 | |
| 19,200 | | Annaly Capital Management, Inc. | | | 323,328 | |
| 2,658 | | AvalonBay Communities, Inc. | | | 361,515 | |
| 3,417 | | Boston Properties, Inc. | | | 355,539 | |
| 2,200 | | First Potomac Realty Trust | | | 32,736 | |
| 975 | | Government Properties Income Trust | | | 23,498 | |
| 1,300 | | Highwoods Properties, Inc. | | | 43,017 | |
| 1,090 | | Jones Lang LaSalle, Inc. | | | 85,848 | |
| 625 | | LaSalle Hotel Properties | | | 16,906 | |
| 7,675 | | Medical Properties Trust, Inc. | | | 82,276 | |
| 3,158 | | Redwood Trust, Inc. | | | 37,106 | |
| 2,664 | | Simon Property Group, Inc. | | | 361,931 | |
| | | | | | |
| | | | | 2,370,867 | |
| |
Retail 1.3% | | | | |
| 4,400 | | Aoyama Trading Co. Ltd. (Japan) | | | 79,145 | |
| 487 | | AutoZone, Inc.* | | | 169,417 | |
| 4,310 | | Dollar General Corp.* | | | 183,649 | |
| 900 | | EZCORP, Inc. (Class A Stock)* | | | 24,138 | |
| 3,441 | | Genesco, Inc.* | | | 210,142 | |
| 2,978 | | GNC Holdings, Inc. (Class A Stock)* | | | 81,925 | |
| 32,100 | | Home Retail Group PLC (United Kingdom) | | | 54,326 | |
| 2,100 | | K’s Holdings Corp. (Japan) | | | 73,426 | |
| 56,336 | | Kingfisher PLC (United Kingdom) | | | 226,995 | |
See Notes to Financial Statements.
| | |
| 28 | | Visit our website at www.prudentialfunds.com |
| | | | | | |
| Shares | | Description | | Value (Note 1) | |
| | | | | | |
COMMON STOCKS (Continued) | | | | |
| |
Retail (cont’d.) | | | | |
| 1,576 | | Lululemon Athletica, Inc.* | | $ | 99,493 | |
| 29,300 | | Marks & Spencer Group PLC (United Kingdom) | | | 150,886 | |
| 5,631 | | O’Reilly Automotive, Inc.* | | | 458,983 | |
| 1,550 | | Penske Automotive Group, Inc. | | | 34,689 | |
| 1,187 | | Sally Beauty Holdings, Inc.* | | | 24,476 | |
| 317 | | Swatch Group AG (The) (Switzerland) | | | 133,550 | |
| 1,560 | | Tractor Supply Co. | | | 126,001 | |
| 1,100 | | Tsuruha Holdings, Inc. (Japan) | | | 58,954 | |
| | | | | | |
| | | | | 2,190,195 | |
| |
Retail & Merchandising 4.0% | | | | |
| 800 | | Big Lots, Inc.* | | | 31,592 | |
| 3,470 | | Cash America International, Inc. | | | 152,194 | |
| 2,226 | | Chico’s FAS, Inc. | | | 25,466 | |
| 140,385 | | Cie Financiere Richemont SA, ADR (Switzerland) | | | 794,579 | |
| 3,200 | | Circle K Sunkus Co. Ltd. (Japan) | | | 55,125 | |
| 2,560 | | Costco Wholesale Corp. | | | 210,611 | |
| 6,673 | | Kohl’s Corp. | | | 306,891 | |
| 800 | | Next PLC (United Kingdom) | | | 33,016 | |
| 3,480 | | PetSmart, Inc. | | | 185,206 | |
| 3,600 | | Shimachu Co. Ltd. (Japan) | | | 85,631 | |
| 38,794 | | Starbucks Corp. | | | 1,859,396 | |
| 10,598 | | Target Corp. | | | 538,484 | |
| 33,526 | | TJX Cos., Inc. (The) | | | 2,284,462 | |
| 68,800 | | Wal-Mart de Mexico SAB de CV (Class V Stock) (Mexico) | | | 212,458 | |
| | | | | | |
| | | | | 6,775,111 | |
|
Retail Apparel 0.2% | |
| 7,969 | | Hennes & Mauritz AB (Class B Stock) (Sweden) | | | 260,889 | |
|
Retailers - Food & Drug 0.1% | |
| 48,895 | | Tesco PLC (United Kingdom) | | | 246,247 | |
|
Road & Rail | |
| 1,050 | | Werner Enterprises, Inc. | | | 27,437 | |
|
Savings & Loan | |
| 3,550 | | Capitol Federal Financial, Inc. | | | 41,003 | |
|
Semiconductor Components 0.1% | |
| 15,676 | | ARM Holdings PLC (United Kingdom) | | | 150,560 | |
See Notes to Financial Statements.
| | | | |
| Target Asset Allocation Funds/Target Growth Allocation Fund | | | 29 | |
Portfolio of Investments
as of January 31, 2012 (Unaudited) continued
| | | | | | |
| Shares | | Description | | Value (Note 1) | |
| | | | | | |
COMMON STOCKS (Continued) | | | | |
|
Semiconductors 0.7% | |
| 3,480 | | Altera Corp. | | $ | 138,469 | |
| 2,379 | | ASML Holding NV (Netherlands) | | | 102,273 | |
| 800 | | Cabot Microelectronics Corp.* | | | 40,336 | |
| 1,240 | | Cavium, Inc.* | | | 39,854 | |
| 20,900 | | Intel Corp. | | | 552,178 | |
| 2,050 | | Microsemi Corp.* | | | 40,549 | |
| 925 | | OYO Geospace Corp.* | | | 81,409 | |
| 425 | | Silicon Laboratories, Inc.* | | | 18,632 | |
| 6,403 | | Teradyne, Inc.* | | | 104,689 | |
| 2,104 | | Veeco Instruments, Inc.* | | | 51,359 | |
| | | | | | |
| | | | | 1,169,748 | |
|
Semiconductors & Semiconductor Equipment 0.1% | |
| 1,206 | | Cymer, Inc.* | | | 60,047 | |
| 1,200 | | Fairchild Semiconductor International, Inc.* | | | 16,776 | |
| 5,800 | | RF Micro Devices, Inc.* | | | 28,942 | |
| | | | | | |
| | | | | 105,765 | |
|
Software 2.2% | |
| 1,182 | | ANSYS, Inc.* | | | 71,499 | |
| 17,905 | | CA, Inc. | | | 461,591 | |
| 1,910 | | Cerner Corp.* | | | 116,300 | |
| 16,063 | | Check Point Software Technologies Ltd. (Israel)* | | | 904,186 | |
| 750 | | Citrix Systems, Inc.* | | | 48,908 | |
| 8,146 | | Compuware Corp.* | | | 63,865 | |
| 2,596 | | MedAssets, Inc.* | | | 27,414 | |
| 1,191 | | Medidata Solutions, Inc.* | | | 24,892 | |
| 9,500 | | Micro Focus International PLC (United Kingdom) | | | 63,278 | |
| 54,631 | | Microsoft Corp. | | | 1,613,253 | |
| 795 | | Opnet Technologies, Inc. | | | 28,183 | |
| 1,857 | | Progress Software Corp.* | | | 43,324 | |
| 2,603 | | QLIK Technologies, Inc.* | | | 73,405 | |
| 1,075 | | Verint Systems, Inc.* | | | 30,433 | |
| 560 | | VMware, Inc. (Class A Stock)* | | | 51,111 | |
| | | | | | |
| | | | | 3,621,642 | |
| |
Specialty Retail 1.2% | | | | |
| 3,420 | | Aaron’s, Inc. | | | 91,006 | |
| 600 | | DSW, Inc. (Class A Stock) | | | 29,982 | |
| 1,320 | | Francesca’s Holdings Corp.* | | | 29,265 | |
See Notes to Financial Statements.
| | |
| 30 | | Visit our website at www.prudentialfunds.com |
| | | | | | |
| Shares | | Description | | Value (Note 1) | |
| | | | | | |
COMMON STOCKS (Continued) | | | | |
| |
Specialty Retail (cont’d.) | | | | |
| 21,400 | | Gap, Inc. (The) | | $ | 406,172 | |
| 175 | | Group 1 Automotive, Inc. | | | 9,335 | |
| 16,575 | | Home Depot, Inc. (The) | | | 735,764 | |
| 7,237 | | Ross Stores, Inc. | | | 367,784 | |
| 2,040 | | Tiffany & Co. | | | 130,152 | |
| 5,240 | | Urban Outfitters, Inc.* | | | 138,860 | |
| | | | | | |
| | | | | 1,938,320 | |
| |
Steel Producers/Products | | | | |
| 2,300 | | Voestalpine AG (Austria) | | | 75,408 | |
| |
Telecommunications 2.1% | | | | |
| 875 | | Acme Packet, Inc.* | | | 25,576 | |
| 4,300 | | Arris Group, Inc.* | | | 50,224 | |
| 61,900 | | BT Group PLC (United Kingdom) | | | 198,497 | |
| 71,100 | | Cable & Wireless Communications PLC (United Kingdom) | | | 48,065 | |
| 6,717 | | CenturyLink, Inc. | | | 248,730 | |
| 1,179 | | EZchip Semiconductor Ltd. (Israel)* | | | 38,530 | |
| 3,000 | | France Telecom SA (France) | | | 44,990 | |
| 3,096 | | HTC Corp. (Taiwan) | | | 50,802 | |
| 820 | | IPG Photonics Corp.* | | | 43,288 | |
| 61 | | KDDI Corp. (Japan) | | | 386,552 | |
| 12,900 | | Koninklijke KPN NV (Netherlands) | | | 141,402 | |
| 1,996 | | NICE Systems Ltd., ADR (Israel)* | | | 71,776 | |
| 4,300 | | Nippon Telegraph & Telephone Corp. (Japan) | | | 214,944 | |
| 10,600 | | Nokia Oyj (Finland) | | | 52,938 | |
| 70 | | NTT DoCoMo, Inc. (Japan) | | | 124,351 | |
| 23,629 | | QUALCOMM, Inc. | | | 1,389,858 | |
| 1,000 | | SBA Communications Corp. (Class A Stock)* | | | 45,720 | |
| 92,200 | | Telecom Italia SpA (Italy) | | | 93,768 | |
| 3,300 | | Telefonica SA (Spain) | | | 57,540 | |
| 18,000 | | Telstra Corp. Ltd. (Australia) | | | 63,635 | |
| 9,800 | | Vivendi (France) | | | 205,101 | |
| | | | | | |
| | | | | 3,596,287 | |
| |
Textiles, Apparel & Luxury Goods 0.1% | | | | |
| 1,475 | | PVH Corp. | | | 113,855 | |
| 1,594 | | Steven Madden Ltd.* | | | 65,577 | |
| | | | | | |
| | | | | 179,432 | |
See Notes to Financial Statements.
| | | | |
| Target Asset Allocation Funds/Target Growth Allocation Fund | | | 31 | |
Portfolio of Investments
as of January 31, 2012 (Unaudited) continued
| | | | | | |
| Shares | | Description | | Value (Note 1) | |
| | | | | | |
COMMON STOCKS (Continued) | | | | |
|
Thrifts & Mortgage Finance | |
| 2,375 | | Washington Federal, Inc. | | $ | 37,430 | |
|
Tobacco 0.7% | |
| 6,200 | | Altria Group, Inc. | | | 176,080 | |
| 7,139 | | British American Tobacco PLC (United Kingdom) | | | 328,151 | |
| 7,916 | | Philip Morris International, Inc. | | | 591,879 | |
| | | | | | |
| | | | | 1,096,110 | |
|
Trading Companies & Distributors 0.1% | |
| 650 | | United Rentals, Inc.* | | | 24,856 | |
| 975 | | WESCO International, Inc.* | | | 61,308 | |
| | | | | | |
| | | | | 86,164 | |
|
Transportation 1.8% | |
| 1,100 | | Bristow Group, Inc. | | | 53,966 | |
| 3,056 | | Canadian National Railway Co. (Canada) | | | 230,503 | |
| 4,828 | | Expeditors International of Washington, Inc. | | | 215,570 | |
| 4,290 | | Kansas City Southern* | | | 294,466 | |
| 1,300 | | Landstar System, Inc. | | | 66,495 | |
| 19,000 | | Sankyu, Inc. (Japan) | | | 73,038 | |
| 10,000 | | Seino Holding Co. Ltd. (Japan) | | | 76,358 | |
| 17,103 | | Union Pacific Corp. | | | 1,955,044 | |
| | | | | | |
| | | | | 2,965,440 | |
|
Utilities 0.2% | |
| 400 | | El Paso Electric Co. | | | 13,920 | |
| 7,489 | | PG&E Corp. | | | 304,503 | |
| | | | | | |
| | | | | 318,423 | |
|
Wireless Telecommunication Services 0.7% | |
| 146,670 | | Vodafone Group PLC (United Kingdom) | | | 394,756 | |
| 30,061 | | Vodafone Group PLC, ADR (United Kingdom) | | | 814,353 | |
| | | | | | |
| | | | | 1,209,109 | |
| | | | | | |
| | TOTAL COMMON STOCKS
(cost $132,951,454) | | | 162,807,046 | |
| | | | | | |
EXCHANGE TRADED FUND 0.1% | |
| 1,825 | | iShares Russell 2000 Value Index Fund
(cost $118,973) | | | 127,841 | |
| | | | | | |
See Notes to Financial Statements.
| | |
| 32 | | Visit our website at www.prudentialfunds.com |
| | | | | | |
| Shares | | Description | | Value (Note 1) | |
| | | | | | |
PREFERRED STOCKS 0.3% | | | | |
|
Automobile Manufacturers 0.2% | |
| 1,451 | | Volkswagen AG, 1.81% (Germany) | | $ | 256,891 | |
|
Commercial Banks 0.1% | |
| 7,325 | | Wells Fargo & Co., Series J, 8.00%, CVT | | | 213,743 | |
| | | | | | |
| | TOTAL PREFERRED STOCKS
(cost $266,214) | | | 470,634 | |
| | | | | | |
| |
UNAFFILIATED MUTUAL FUND | | | | |
| 4,250 | | Ares Capital Corp.
(cost $56,267) | | | 67,363 | |
| | | | | | |
| | TOTAL LONG-TERM INVESTMENTS
(cost $133,392,908) | | | 163,472,884 | |
| | | | | | |
SHORT-TERM INVESTMENT 3.9% | | | | |
| |
AFFILIATED MONEY MARKET MUTUAL FUND | | | | |
| 6,534,380 | | Prudential Investment Portfolios 2 - Prudential Core
Taxable Money Market Fund
(cost $6,534,380)(a) | | | 6,534,380 | |
| | | | | | |
| | TOTAL INVESTMENTS 101.0%
(cost $139,927,288; Note 5) | | | 170,007,264 | |
| | Liabilities in excess of other assets(b) (1.0)% | | | (1,716,128 | ) |
| | | | | | |
| | NET ASSETS 100% | | $ | 168,291,136 | |
| | | | | | |
The following abbreviations are used in the Portfolio descriptions:
ADR—American Depositary Receipt
CVA—Certificate Van Aandelen (Bearer)
CVT—Convertible Security
EUR—Euro
| * | Non-income producing security. |
| (a) | Prudential Investments LLC, the manager of the Fund, also serves as manager of the Prudential Investment Portfolios 2 - Prudential Core Taxable Money Market Fund. |
| (b) | Includes net unrealized appreciation (depreciation) on the following derivative contracts held at reporting period end: |
See Notes to Financial Statements.
| | | | |
| Target Asset Allocation Funds/Target Growth Allocation Fund | | | 33 | |
Portfolio of Investments
as of January 31, 2012 (Unaudited) continued
Forward foreign currency exchange contracts outstanding at January 31, 2012:
| | | | | | | | | | | | | | | | |
Sale Contracts | | Counterparty | | Notional
Amount
(000) | | Value at
Settlement
Date
Receivable | | | Current
Value | | | Unrealized
Appreciation
(Depreciation) | |
Euro, | | | | | | | | | | | | | | | | |
Expiring 02/23/12 | | Bank of New York Mellon | | EUR 203 | | $ | 261,363 | | | $ | 264,890 | | | $ | (3,527 | ) |
Expiring 05/09/12 | | Bank of New York Mellon | | EUR 548 | | | 751,838 | | | | 716,564 | | | | 35,274 | |
| | | | | | | | | | | | | | | | |
| | | | | | $ | 1,013,201 | | | $ | 981,454 | | | $ | 31,747 | |
| | | | | | | | | | | | | | | | |
Various inputs are used in determining the value of the Portfolio’s investments. These inputs are summarized in the three broad levels listed below.
Level 1—quoted prices generally for securities actively traded on a regulated securities exchange and for open-end mutual funds which trade at daily net asset value.
Level 2—other significant observable inputs (including, but not limited to, quoted prices for similar securities, interest rates, prepayment speeds, foreign currency exchange rates, and amortized cost) generally for debt securities, swaps, forward foreign currency contracts and for foreign stocks priced using vendor modeling tools.
Level 3—significant unobservable inputs for securities valued in accordance with Board approved fair valuation procedures.
See Notes to Financial Statements.
| | |
| 34 | | Visit our website at www.prudentialfunds.com |
The following is a summary of the inputs used as of January 31, 2012 in valuing such portfolio securities:
| | | | | | | | | | | | |
| | | Level 1 | | | Level 2 | | | Level 3 | |
Investments in Securities | | | | | | | | | | | | |
Common Stocks | | $ | 162,806,999 | | | $ | — | | | $ | 47 | |
Exchange Traded Fund | | | 127,841 | | | | — | | | | — | |
Preferred Stocks | | | 470,634 | | | | — | | | | — | |
Unaffiliated Mutual Fund | | | 67,363 | | | | — | | | | — | |
Affiliated Money Market Mutual Fund | | | 6,534,380 | | | | — | | | | — | |
Other Financial Instruments* | | | | | | | | | | | | |
Forward foreign currency exchange contracts | | | — | | | | 31,747 | | | | — | |
| | | | | | | | | | | | |
Total | | $ | 170,007,217 | | | $ | 31,747 | | | $ | 47 | |
| | | | | | | | | | | | |
| * | Other financial instruments are derivative instruments not reflected in the Schedule of Investments, such as futures, forwards and swap contracts, which are recorded at the unrealized appreciation/depreciation on the instrument. |
Fair Value of Level 2 instruments at 07/31/11 was $19,023,236. $18,551,249 was transferred into Level 1 from Level 2 at 01/31/12 as a result of no longer using third-party vendor modeling tools due to significant market movements between the time at which the Portfolio value its securities and the earlier closing of foreign markets.
It is the Portfolio’s policy to recognize transfers in and transfers out at the fair value as of the beginning of the period.
See Notes to Financial Statements.
| | | | |
| Target Asset Allocation Funds/Target Growth Allocation Fund | | | 35 | |
Portfolio of Investments
as of January 31, 2012 (Unaudited) continued
The investment allocation of Portfolio holdings and liabilities in excess of other assets shown as a percentage of net assets as of January 31, 2012 were as follows:
| | | | |
Oil, Gas & Consumable Fuels | | | 7.0 | % |
Pharmaceuticals | | | 6.8 | |
Retail & Merchandising | | | 4.0 | |
Affiliated Money Market Mutual Fund | | | 3.9 | |
Chemicals | | | 3.7 | |
Insurance | | | 3.7 | |
Media | | | 3.2 | |
Commercial Banks | | | 3.1 | |
Computer Hardware | | | 2.6 | |
Internet Services | | | 2.5 | |
Diversified Financial Services | | | 2.5 | |
Oil & Gas | | | 2.5 | |
Aerospace & Defense | | | 2.2 | |
Software | | | 2.2 | |
Hotels, Restaurants & Leisure | | | 2.1 | |
Telecommunications | | | 2.1 | |
Financial Services | | | 2.1 | |
Computer Services & Software | | | 2.0 | |
Transportation | | | 1.8 | |
Clothing & Apparel | | | 1.7 | |
Metals & Mining | | | 1.6 | |
Biotechnology | | | 1.6 | |
Internet Software & Services | | | 1.5 | |
Food | | | 1.5 | |
Electric Utilities | | | 1.4 | |
Real Estate Investment Trusts | | | 1.4 | |
Retail | | | 1.3 | |
Food & Staples Retailing | | | 1.2 | |
Manufacturing | | | 1.2 | |
Specialty Retail | | | 1.2 | |
Energy Equipment & Services | | | 1.0 | |
Financial—Bank & Trust | | | 1.0 | |
Machinery | | | 0.9 | |
Banks | | | 0.9 | |
Industrial Products | | | 0.8 | |
Industrial Conglomerates | | | 0.8 | |
Wireless Telecommunication Services | | | 0.7 | |
Healthcare Providers & Services | | | 0.7 | |
Semiconductors | | | 0.7 | |
Healthcare Products | | | 0.7 | |
Entertainment & Leisure | | | 0.7 | |
Automobile Manufacturers | | | 0.7 | |
Diversified Telecommunication Services | | | 0.7 | |
Tobacco | | | 0.7 | |
Beverages | | | 0.6 | |
Consumer Products & Services | | | 0.6 | % |
Auto Components | | | 0.6 | |
Computers & Peripherals | | | 0.6 | |
Multi-Utilities | | | 0.5 | |
IT Services | | | 0.5 | |
Distribution/Wholesale | | | 0.5 | |
Machinery & Equipment | | | 0.5 | |
Consumer Finance | | | 0.5 | |
Commercial Services | | | 0.5 | |
Capital Markets | | | 0.5 | |
Electronic Components & Equipment | | | 0.4 | |
Food Products | | | 0.4 | |
Life Sciences Tools & Services | | | 0.4 | |
Multi-Line Retail | | | 0.4 | |
Diversified Manufacturing Operations | | | 0.3 | |
Medical Supplies & Equipment | | | 0.3 | |
Office Electronics | | | 0.3 | |
Auto Parts & Equipment | | | 0.3 | |
Healthcare Services | | | 0.3 | |
Gas Utilities | | | 0.3 | |
Diversified Operations | | | 0.3 | |
Investment Companies | | | 0.3 | |
Business Services | | | 0.3 | |
Electronic Equipment & Instruments | | | 0.3 | |
Paper & Forest Products | | | 0.2 | |
Healthcare Equipment & Supplies | | | 0.2 | |
Airlines | | | 0.2 | |
Utilities | | | 0.2 | |
Machinery—Construction & Mining | | | 0.2 | |
Hand/Machine Tools | | | 0.2 | |
Miscellaneous Manufacturing | | | 0.2 | |
Engineering & Construction | | | 0.2 | |
Retail Apparel | | | 0.2 | |
Air Freight & Logistics | | | 0.2 | |
Retailers—Food & Drug | | | 0.1 | |
Household Products | | | 0.1 | |
Diversified Consumer Services | | | 0.1 | |
Construction | | | 0.1 | |
Environmental Control | | | 0.1 | |
Leisure Equipment & Products | | | 0.1 | |
Textiles, Apparel & Luxury Goods | | | 0.1 | |
Building Materials & Construction | | | 0.1 | |
Cosmetics & Toiletries | | | 0.1 | |
Professional Services | | | 0.1 | |
Semiconductor Components | | | 0.1 | |
See Notes to Financial Statements.
| | |
| 36 | | Visit our website at www.prudentialfunds.com |
| | | | |
Industry (cont’d.) | | | |
Containers & Packaging | | | 0.1 | % |
Exchange Traded Funds | | | 0.1 | |
Holding Companies | | | 0.1 | |
Electric | | | 0.1 | |
Apparel & Textile | | | 0.1 | |
Semiconductors & Semiconductor Equipment | | | 0.1 | % |
Electrical Equipment | | | 0.1 | |
Trading Companies & Distributors | | | 0.1 | |
| | | | |
| | | 101.0 | |
Liabilities in excess of other assets | | | (1.0 | ) |
| | | | |
| | | 100.0 | % |
| | | | |
The Fund invested in derivative instruments during the reporting period. The primary type of risk associated with these derivative instruments is foreign exchange risk. The effect of such derivative instruments on the Fund’s financial position and financial performance as reflected in the Statement of Assets and Liabilities and Statement of Operations is presented in the summary below.
Fair values of derivative instruments as of January 31, 2012 as presented in the Statement of Assets and Liabilities:
| | | | | | | | | | | | |
Derivatives not accounted for
as hedging instruments,
carried at fair value | | Asset Derivatives | | | Liability Derivatives | |
| | Balance
Sheet Location | | Fair
Value | | | Balance
Sheet Location | | Fair
Value | |
| Foreign exchange contracts | | Unrealized appreciation on foreign currency exchange contracts | | $ | 35,274 | | | Unrealized depreciation on foreign currency exchange contracts | | $ | 3,527 | |
| | | | | | | | | | | | |
The effects of derivative instruments on the Statement of Operations for the six months ended January 31, 2012 are as follows:
| | | | |
Amount of Realized Gain or (Loss) on Derivatives Recognized in Income | |
Derivatives not accounted for as hedging
instruments, carried at fair value | | Forward
Currency
Contracts | |
Foreign exchange contracts | | $ | 41,283 | |
| | | | |
See Notes to Financial Statements.
| | | | |
| Target Asset Allocation Funds/Target Growth Allocation Fund | | | 37 | |
Portfolio of Investments
as of January 31, 2012 (Unaudited) continued
| | | | |
Change in Unrealized Appreciation or (Depreciation) on Derivatives Recognized in Income | |
Derivatives not accounted for as hedging
instruments, carried at fair value | | Forward
Currency
Contracts | |
Foreign exchange contracts | | $ | 39,910 | |
| | | | |
For the six months ended January 31, 2012, the Fund’s average value at settlement date receivable for forward foreign currency exchange sale contracts was $857,309.
See Notes to Financial Statements.
| | |
| 38 | | Visit our website at www.prudentialfunds.com |
Financial Statements
(Unaudited)
| | |
| JANUARY 31, 2012 | | SEMIANNUAL REPORT |
Target Asset Allocation Funds/
Target Growth Allocation Fund
Statement of Assets and Liabilities
as of January 31, 2012 (Unaudited)
| | | | |
Assets | | | | |
Investments at value: | | | | |
Unaffiliated investments (cost $133,392,908) | | $ | 163,472,884 | |
Affiliated investments (cost $6,534,380) | | | 6,534,380 | |
Foreign currency, at value (cost $227,355) | | | 228,707 | |
Receivable for investments sold | | | 621,829 | |
Dividends receivable | | | 250,798 | |
Tax reclaim receivable | | | 79,178 | |
Receivable for Fund shares sold | | | 71,361 | |
Unrealized appreciation on foreign currency exchange contracts | | | 35,274 | |
Prepaid expenses | | | 2,060 | |
| | | | |
Total assets | | | 171,296,471 | |
| | | | |
| |
Liabilities | | | | |
Payable for investments purchased | | | 2,093,058 | |
Payable for Fund shares reacquired | | | 373,687 | |
Accrued expenses and other liabilities | | | 238,115 | |
Management fee payable | | | 105,754 | |
Payable to custodian | | | 97,059 | |
Distribution fee payable | | | 71,918 | |
Affiliated transfer agent fee payable | | | 18,158 | |
Deferred trustees’ fees | | | 4,059 | |
Unrealized depreciation on foreign currency exchange contracts | | | 3,527 | |
| | | | |
Total liabilities | | | 3,005,335 | |
| | | | |
| |
Net Assets | | $ | 168,291,136 | |
| | | | |
| | | | | |
Net assets were comprised of: | | | | |
Shares of beneficial interest, at par | | $ | 15,532 | |
Paid-in capital, in excess of par | | | 191,897,525 | |
| | | | |
| | | 191,913,057 | |
Undistributed net investment income | | | 50,648 | |
Accumulated net realized loss on investment and foreign currency transactions | | | (53,789,135 | ) |
Net unrealized appreciation on investments and foreign currencies | | | 30,116,566 | |
| | | | |
Net assets, January 31, 2012 | | $ | 168,291,136 | |
| | | | |
See Notes to Financial Statements.
| | |
| 40 | | Visit our website at www.prudentialfunds.com |
| | | | |
Class A: | | | | |
Net asset value and redemption price per share,
($107,495,400 ÷ 9,620,946 shares of common stock issued and outstanding) | | $ | 11.17 | |
Maximum sales charge (5.5% of offering price) | | | .65 | |
| | | | |
Maximum offering price to public | | $ | 11.82 | |
| | | | |
| |
Class B: | | | | |
Net asset value, offering price and redemption price per share,
($20,991,314 ÷ 2,047,788 shares of common stock issued and outstanding) | | $ | 10.25 | |
| | | | |
| |
Class C: | | | | |
Net asset value, offering price and redemption price per share,
($37,825,902 ÷ 3,687,166 shares of common stock issued and outstanding) | | $ | 10.26 | |
| | | | |
| |
Class M: | | | | |
Net asset value, offering price and redemption price per share,
($85,605 ÷ 8,326 shares of common stock issued and outstanding) | | $ | 10.28 | |
| | | | |
| |
Class R: | | | | |
Net asset value, offering price and redemption price per share,
($2,393 ÷ 215.7 shares of common stock issued and outstanding) | | $ | 11.09 | |
| | | | |
| |
Class X: | | | | |
Net asset value, offering price and redemption price per share,
($334,995 ÷ 32,155 shares of common stock issued and outstanding) | | $ | 10.42 | |
| | | | |
| |
Class Z: | | | | |
Net asset value, offering price and redemption price per share,
($1,555,527 ÷ 135,539 shares of common stock issued and outstanding) | | $ | 11.48 | |
| | | | |
See Notes to Financial Statements.
| | | | |
| Target Asset Allocation Funds/Target Growth Allocation Fund | | | 41 | |
Statement of Operations
Six Months Ended January 31, 2012 (Unaudited)
| | | | |
Net Investment Income | | | | |
Income | | | | |
Unaffiliated dividend income (net of foreign withholding taxes $80,203) | | $ | 1,560,018 | |
Affiliated dividend income | | | 22,728 | |
| | | | |
| | | 1,582,746 | |
| | | | |
| |
Expenses | | | | |
Management fee | | | 616,503 | |
Distribution fee—Class A | | | 129,630 | |
Distribution fee—Class B | | | 105,927 | |
Distribution fee—Class C | | | 187,006 | |
Distribution fee—Class M | | | 887 | |
Distribution fee—Class R | | | 6 | |
Distribution fee—Class X | | | 495 | |
Transfer agent’s fees and expenses (including affiliated expense of $63,800) | | | 193,000 | |
Custodian’s fees and expenses | | | 155,000 | |
Registration fees | | | 49,000 | |
Reports to shareholders | | | 25,000 | |
Audit fee | | | 22,000 | |
Legal fee | | | 11,000 | |
Trustees’ fees | | | 7,000 | |
Insurance expense | | | 2,000 | |
Miscellaneous | | | 19,770 | |
| | | | |
Total expenses | | | 1,524,224 | |
| | | | |
Net investment income | | | 58,522 | |
| | | | |
| |
Net Realized And Unrealized Gain (Loss) On Investments And Foreign Currencies | | | | |
Net realized gain (loss) on: | | | | |
Investment transactions | | | (1,031,760 | ) |
Foreign currency transactions | | | 41,571 | |
| | | | |
| | | (990,189 | ) |
| | | | |
Net change in unrealized appreciation (depreciation) on: | | | | |
Investments | | | (4,489,610 | ) |
Foreign currencies | | | 3,061 | |
| | | | |
| | | (4,486,549 | ) |
| | | | |
Net loss on investments | | | (5,476,738 | ) |
| | | | |
Net Decrease In Net Assets Resulting From Operations | | $ | (5,418,216 | ) |
| | | | |
See Notes to Financial Statements.
| | |
| 42 | | Visit our website at www.prudentialfunds.com |
Statement of Changes in Net Assets
(Unaudited)
| | | | | | | | |
| | | Six Months
Ended
January 31, 2012 | | | Year
Ended
July 31, 2011 | |
Increase (Decrease) In Net Assets | | | | | | | | |
Operations | | | | | | | | |
Net investment income | | $ | 58,522 | | | $ | 358,305 | |
Net realized gain (loss) on investment and foreign currency transactions | | | (990,189 | ) | | | 17,984,733 | |
Net change in unrealized appreciation (depreciation) on investments and foreign currencies | | | (4,486,549 | ) | | | 12,131,854 | |
| | | | | | | | |
Net increase (decrease) in net assets resulting from operations | | | (5,418,216 | ) | | | 30,474,892 | |
| | | | | | | | |
| | |
Dividends and distributions (Note 1) | | | | | | | | |
Dividends from net investment income: | | | | | | | | |
Class A | | | (310,413 | ) | | | — | |
Class R | | | (1 | ) | | | — | |
Class X | | | (1,261 | ) | | | — | |
Class Z | | | (7,935 | ) | | | — | |
| | | | | | | | |
| | | (319,610 | ) | | | — | |
| | | | | | | | |
| | |
Capital Contributions (Note 2) | | | | | | | | |
Class X | | | — | | | | 185 | |
| | | | | | | | |
| | |
Fund share transactions (Net of share conversions) (Note 6) | | | | | | | | |
Net proceeds from shares sold | | | 3,583,905 | | | | 16,650,268 | |
Net asset value of shares issued in reinvestment of dividends and distributions | | | 313,586 | | | | — | |
Cost of shares reacquired | | | (14,251,256 | ) | | | (39,310,006 | ) |
| | | | | | | | |
Net decrease in net assets resulting from Fund share transactions | | | (10,353,765 | ) | | | (22,659,738 | ) |
| | | | | | | | |
Total increase (decrease) | | | (16,091,591 | ) | | | 7,815,339 | |
| | |
Net Assets | | | | | | | | |
Beginning of period | | | 184,382,727 | | | | 176,567,388 | |
| | | | | | | | |
End of period (a) | | $ | 168,291,136 | | | $ | 184,382,727 | |
| | | | | | | | |
(a) Includes undistributed net income of: | | $ | 50,648 | | | $ | 311,736 | |
| | | | | | | | |
See Notes to Financial Statements.
| | | | |
| Target Asset Allocation Funds/Target Growth Allocation Fund | | | 43 | |
Notes to Financial Statements
(Unaudited)
Target Asset Allocation Funds (the “Trust”) is registered under the Investment Company Act of 1940, as amended, (“1940 Act”) as an open-end, diversified management investment company presently consisting of three portfolios: Target Moderate Allocation Fund, Target Conservative Allocation Fund and Target Growth Allocation Fund (the “Fund”). These financial statements relate only to Target Growth Allocation Fund. The financial statements of the other portfolios are not presented herein. The Trust was organized as a business trust in Delaware on July 29, 1998.
The Fund uses investment managers (“Subadvisers”), each managing a portion of the Fund’s assets. The following lists the Subadvisers and their respective segment during the six months ended January 31, 2012.
| | |
Fund Segment | | Subadviser |
| Large-cap growth stocks | | Marsico Capital Management, LLC Massachusetts Financial Services Company |
| |
| Large-cap value stocks | | Eaton Vance Management Hotchkis and Wiley Capital Management LLC NFJ Investment Group LLC |
| |
| International stocks | | LSV Asset Management Thornburg Investment Management, Inc. |
| |
| Small/Mid-cap growth stocks | | Eagle Asset Management, Inc. |
| |
| Small/Mid-cap value stocks | | EARNEST Partners, LLC
Vaughan Nelson Investment Management, L.P |
The investment objective of the Fund is to provide long-term capital appreciation.
Note 1. Accounting Policies
The following is a summary of significant accounting policies followed by the Trust in the preparation of its financial statements.
Securities Valuation: Securities listed on a securities exchange (other than options on securities and indices) are valued at the last sale price on such exchange on the day of valuation or, if there was no sale on such day, at the mean between the last reported bid and asked prices, or at the last bid price on such day in the absence of an asked price. Securities traded via NASDAQ are valued at the official closing price provided by NASDAQ. Securities that are actively traded in the over-the-counter
| | |
| 44 | | Visit our website at www.prudentialfunds.com |
market, including listed securities for which the primary market is believed by Prudential Investments LLC (“PI” or “Manager”) in consultation with the subadviser, to be over-the-counter, are valued at market value using prices provided by an independent pricing agent or principal market maker. Futures contracts and options thereon traded on a commodities exchange or board of trade are valued at the last sale price at the close of trading on such exchange or board of trade or, if there was no sale on the applicable commodities exchange or board of trade on such day, at the mean between the most recently quoted prices on such exchange or board of trade or at the last bid price in the absence of an asked price. Prices may be obtained from independent pricing services which use information provided by market makers or estimates of market values obtained from yield data relating to investments or securities with similar characteristics. Securities for which reliable market quotations are not readily available, or whose values have been affected by events occurring after the close of the security’s foreign market and before the Fund’s normal pricing time, are valued at fair value in accordance with the Board of Trustees’ approved fair valuation procedures. When determining the fair valuation of securities, some of the factors influencing the valuation include the nature of any restrictions on disposition of the securities; assessment of the general liquidity of the securities; the issuer’s financial condition and the markets in which it does business; the cost of the investments; the size of the holding and the capitalization of issuer; the prices of any recent transactions or bids offers for such securities or any comparable securities; any available analyst media or other reports or information deemed reliable by the investment adviser regarding the issuer or the markets or industry in which it operates. Using fair value to price securities may result in a value that is different from a security’s most recent closing price and from the price used by other mutual funds to calculate their net asset value.
Investments in open end, non exchange-traded mutual funds are valued at their net asset value as of the close of the New York Stock Exchange on the date of valuation.
Foreign Currency Translation: The books and records of the Fund are maintained in U.S. dollars. Foreign currency amounts are translated into U.S. dollars on the following basis:
(i) market value of investment securities, other assets and liabilities-at the current daily rates of exchange.
(ii) purchases and sales of investment securities, income and expenses-at the rates of exchange prevailing on the respective dates of such transactions.
Although the net assets of the Fund are presented at the foreign exchange rates and market values at the close of the fiscal period, the Fund does not isolate that portion
| | | | |
| Target Asset Allocation Funds/Target Growth Allocation Fund | | | 45 | |
Notes to Financial Statements
(Unaudited) continued
of the results of operations arising as a result of changes in the foreign exchange rates from the fluctuations arising from changes in the market prices of securities held at the end of the period. Similarly, the Fund does not isolate the effect of changes in foreign exchange rates from the fluctuations arising from changes in the market prices of portfolio securities sold during the period. Accordingly, realized foreign currency gains or losses are included in the reported net realized gains or losses on investment transactions.
Net realized gains or losses on foreign currency transactions represent net foreign exchange gains or losses from the holdings of foreign currencies, currency gains or losses realized between the trade date and settlement date on securities transactions, and the difference between the amounts of dividends, interest and foreign withholding taxes recorded on the Fund’s books and the U.S. dollar equivalent amounts actually received or paid. Net unrealized currency gains or losses from valuing foreign currency denominated assets and liabilities (other than investments) at year-end exchange rates are reflected as a component of net unrealized appreciation (depreciation) on investments and foreign currencies.
Foreign security and currency transactions may involve certain considerations and risks not typically associated with those of domestic origin as a result of, among other factors, the possibility of political and economic instability and the level of governmental supervision and regulation of foreign securities markets.
Forward Currency Contracts: A forward currency contract is a commitment to purchase or sell a foreign currency at a future date at a negotiated forward rate. The Fund entered into forward currency contracts in order to hedge its exposure to changes in foreign currency exchange rates on its foreign portfolio holdings or on specific receivables and payables denominated in a foreign currency. The contracts are valued daily at current exchange rates and any unrealized gain or loss is included in the Statement of Assets and Liabilities as unrealized appreciation and/or depreciation on foreign currency contracts. Gain or loss is realized on the settlement date of the contract equal to the difference between the settlement value of the original and renegotiated forward contracts. This gain or loss, if any, is included in net realized gain or loss on foreign currency transactions. Risks may arise upon entering into these contracts from the potential inability of the counterparties to meet the terms of their contracts.
| | |
| 46 | | Visit our website at www.prudentialfunds.com |
The Fund’s maximum risk of loss from counterparty credit risk is the net value of the cash flows to be received from the counterparty at the end of the contract’s life. This risk may be mitigated by having a master netting arrangement between the Fund and the counterparty which may permit the Fund to offset amounts payable by the Fund to the same counterparty against amounts to be received; and by the receipt of collateral from the counterparty by the Fund to cover the Fund’s exposure to the counterparty. However, there is no assurance that such mitigating factors are easily enforceable.
Forward currency contracts involve elements of both market and credit risk in excess of the amounts reflected on the Statement of Assets and Liabilities.
Warrants and Rights: The Fund held warrants and rights acquired either through a direct purchase, including as part of private placement, or pursuant to corporate actions. Warrants and rights entitle the holder to buy a proportionate amount of common stock at a specific price and time through the expiration dates. Such warrants and rights are held as long positions by the Fund until exercised, sold or expired. Warrants and rights are valued at fair value in accordance with the Board approved fair valuation procedures.
Securities Transactions and Net Investment Income: Securities transactions are recorded on the trade date. Realized gains or losses on sales of securities are calculated on the identified cost basis. Dividend income is recorded on the ex-dividend date and interest income, including amortization of premium and accretion of discount on debt securities as required, is recorded on the accrual basis. Expenses are recorded on the accrual basis. Net investment income or loss (other than distribution fees, which are charged directly to respective class) and unrealized and realized gains or losses are allocated daily to each class of shares based upon the relative proportion of net assets of each class at the beginning of the day.
Dividends and Distributions: The Fund expects to pay dividends of net investment income and distributions of net realized capital and currency gains, if any, annually.
Dividends and distributions to shareholders, which are determined in accordance with federal income tax regulations and which may differ from generally accepted accounting principles, are recorded on the ex-dividend date. Permanent book/tax differences relating to income and gains are reclassified amongst undistributed net investment income, accumulated net realized gain or loss and paid-in capital in excess of par as appropriate.
Taxes: It is the Fund’s policy to continue to meet the requirements of the Internal Revenue Code applicable to regulated investment companies and to distribute all of
| | | | |
| Target Asset Allocation Funds/Target Growth Allocation Fund | | | 47 | |
Notes to Financial Statements
(Unaudited) continued
its taxable net investment income and capital gains, if any, to its shareholders. Therefore, no federal income tax provision is required.
Withholding taxes on foreign dividends are recorded net of reclaimable amounts, at the time the related income is earned.
Estimates: The preparation of the financial statements requires management to make estimates and assumptions that affect the reported amounts and disclosures in the financial statements. Actual results could differ from those estimates.
Note 2. Agreements
The Trust has a management agreement with PI. Pursuant to this agreement, PI manages the investment operations of the Fund, administers the Fund’s affairs and supervises the Subadvisers’ performance of all investment advisory services. Pursuant to the advisory agreement, PI pays the cost of compensation of officers of the Fund, occupancy and certain clerical and accounting costs of the Fund. The Fund bears all other costs and expenses. The management fee paid to PI is computed daily and payable monthly at an annual rate of 0.75% of average daily net assets up to $500 million, 0.70% of average daily net assets for the next $500 million and 0.65% of average daily net assets in excess of $1 billion. The effective management fee rate was 0.75% for the six months ended January 31, 2012.
The Fund has a distribution agreement with Prudential Investment Management Services LLC (“PIMS”), which acts as the distributor of the Class A, Class B, Class C, Class R and Class Z shares of the Fund. In addition, the Fund has a distribution agreement with Prudential Annuities Distributors, Inc. (“PAD”), which, together with PIMS, serves as co-distributor of the Class M and Class X shares of the Fund. The Fund compensates PIMS and PAD, as applicable, for distributing and servicing the Fund’s Class A, Class B, Class C, Class M, Class R and Class X shares, pursuant to plans of distribution (the “Class A, B, C, M, R and X Plans”), regardless of expenses actually incurred by PIMS or PAD. The distribution fees are accrued daily and payable monthly. No distribution or service fees are paid to PIMS as distributor of the Class Z shares of the Fund.
Pursuant to the Class A, B, C, M, R and X Plans, the Fund compensates PIMS and PAD, as applicable, for distribution related activities at an annual rate of up to 0.30%,
| | |
| 48 | | Visit our website at www.prudentialfunds.com |
1%, 1%, 1%, 0.75% and 1% of the average daily net assets of the Class A, B, C, M, R and X shares, respectively. PIMS has contractually agreed through November 30, 2012 to limit such expenses to 0.25% and 0.50% of the average daily net assets of the Class A and Class R shares, respectively.
Management has received the maximum allowable amount of sales charges for Class X in accordance with regulatory limits. As such, any contingent deferred sales charges received by the manager are contributed back into the Fund and included in the Statement of Changes and Financial Highlights as a contribution to capital.
PIMS has advised the Fund that it has received $34,613 in front-end sales charges resulting from sales of Class A during the six months ended January 31, 2012. From these fees, PIMS paid such sales charges to broker-dealers which in turn paid commissions to salespersons and incurred other distribution costs.
PIMS has advised the Fund that for the six months ended January 31, 2012, it has received $17, $19,018, and $834 in contingent deferred sales charges imposed upon certain redemptions by Class A, Class B, and Class C shareholders, respectively.
PIMS and PI are indirect, wholly-owned subsidiaries of Prudential Financial, Inc. (“Prudential”).
Note 3. Other Transactions with Affiliates
Prudential Mutual Fund Services LLC (“PMFS”), an affiliate of PI and an indirect, wholly-owned subsidiary of Prudential, serves as the Fund’s transfer agent. Transfer agent fees and expenses in the Statement of Operations include certain out-of-pocket expenses paid to non-affiliates, where applicable.
The Fund invests in the Prudential Taxable Core Money Market Fund (the “Core Fund”), a portfolio of Prudential Investment Portfolios 2, registered under the 1940 Act, as amended, and managed by PI. Earnings from the Portfolio are disclosed on the Statement of Operations as affiliated dividend income.
Note 4. Portfolio Securities
Purchases and sales of portfolio securities, excluding short-term investments and U.S. Government securities, for the six months ended January 31, 2012, aggregated $49,419,061 and $58,812,994, respectively.
| | | | |
| Target Asset Allocation Funds/Target Growth Allocation Fund | | | 49 | |
Notes to Financial Statements
(Unaudited) continued
Note 5. Distributions and Tax Information
The United States federal income tax basis of the Fund’s investments and the net unrealized appreciation as of January 31, 2012 were as follows:
| | | | | | |
Tax Basis | | Appreciation | | Depreciation | | Net
Unrealized
Appreciation |
| $149,614,795 | | $26,450,414 | | $(6,057,945) | | $20,392,469 |
The difference between book basis and tax basis was primarily attributable to deferred losses on wash sales.
For federal income tax purposes, the Fund had a capital loss carryforward as of July 31, 2011 of approximately $43,111,000 of which $1,639,000 expires in 2017 and $41,472,000 expires in 2018. Accordingly, no capital gains distributions are expected to be paid to shareholders until net gains have been realized in excess of such carryforward. Under the recently enacted Regulated Investment Company Modernization Act of 2010, the Fund is permitted to carryforward capital losses incurred in taxable years beginning after December 22, 2010 (“post-enactment losses”) for an unlimited period. However, any post-enactment losses are required to be utilized before the utilization of losses incurred prior to the effective date of the Act. As a result of this ordering rule, capital loss carryforwards related to the taxable years beginning prior to the effective date of the Act may have an increased likelihood to expire unused. Additionally, post-enactment capital losses that are carried forward will retain their character as either short-term or long-term capital losses rather than being considered all short-term as under previous law.
In addition, the Fund has elected to treat net foreign currency losses of approximately $5,000, incurred between November 1, 2010 and July 31, 2011 as being incurred during the year ending July 31, 2012.
Management has analyzed the Fund’s tax positions taken on federal income tax returns for all open tax years and has concluded that no provision for income tax would be required in the Fund’s financial statements for the current reporting period. The Fund’s federal and state income and federal excise tax returns for tax years for which the applicable statutes of limitations have not expired are subject to examination by the Internal Revenue Service and state departments of revenue.
| | |
| 50 | | Visit our website at www.prudentialfunds.com |
Note 6. Capital
The Fund offers Class A, Class B, Class C, Class M, Class R, Class X and Class Z shares. Class A shares are subject to a maximum front-end sales charge of 5.50%. Investors who purchase $1 million or more of Class A shares and sell these shares within 12 months of purchase are not subject to an initial sales charge but are subject to a contingent deferred sales charge (CDSC) of 1%. The Class A CDSC is waived for purchases by certain retirement or benefit plans. Class B shares are subject to a CDSC of 5%, which decreases by 1% annually to 1% in the fifth and sixth years and 0% in the seventh year. Class B shares automatically convert to Class A shares on a quarterly basis approximately seven years after purchase. The CDSC for Class C shares is 1% for shares redeemed within 12 months of purchase. Class M shares are subject to a CDSC of 6%, which decreases by 1% annually to 2% in the fifth and sixth years and 1% in the seventh year. Class M shares are generally closed to new purchases. Class M shares automatically convert to Class A shares on a monthly basis approximately eight years after purchase. Class X shares are generally closed to new purchases. Class X shares are subject to a CDSC of 6%, which decreases by 1% annually to 4% in the third and fourth years, by 1% annually to 2% in the sixth and seventh years, and 1% in the eighth year. Class X shares automatically convert to Class A shares on a monthly basis approximately ten years after purchase. An exchange privilege is also available for shareholders who qualify to purchase Class A shares at net asset value. Class R and Class Z shares are not subject to any sales or redemption charge and are offered exclusively for sale to a limited group of investors.
| | | | |
| Target Asset Allocation Funds/Target Growth Allocation Fund | | | 51 | |
Notes to Financial Statements
(Unaudited) continued
The Fund has authorized an unlimited number of shares of beneficial interest at $.001 par value per share. As of January 31, 2012, Prudential owned 216 Class R shares of the Fund.
| | | | | | | | |
Class A | | Shares | | | Amount | |
Six Months ended January 31, 2012: | | | | | | | | |
Shares sold | | | 186,741 | | | $ | 1,966,442 | |
Shares issued in reinvestment of dividends and distributions | | | 28,375 | | | | 305,036 | |
Shares reacquired | | | (814,937 | ) | | | (8,579,168 | ) |
| | | | | | | | |
Net increase (decrease) in shares outstanding before conversion | | | (599,821 | ) | | | (6,307,690 | ) |
Shares issued upon conversion from Class B, Class M, and Class X | | | 223,551 | | | | 2,322,793 | |
| | | | | | | | |
Net increase (decrease) in shares outstanding | | | (376,270 | ) | | $ | (3,984,897 | ) |
| | | | | | | | |
Year ended July 31, 2011: | | | | | | | | |
Shares sold | | | 1,096,884 | | | $ | 12,074,264 | |
Shares issued in reinvestment of dividends and distributions | | | — | | | | — | |
Shares reacquired | | | (2,086,641 | ) | | | (23,089,117 | ) |
| | | | | | | | |
Net increase (decrease) in shares outstanding before conversion | | | (989,757 | ) | | | (11,014,853 | ) |
Shares issued upon conversion from Class B, Class M, and Class X | | | 714,000 | | | | 7,893,665 | |
| | | | | | | | |
Net increase (decrease) in shares outstanding | | | (275,757 | ) | | $ | (3,121,188 | ) |
| | | | | | | | |
Class B | | | | | | |
Six Months ended January 31, 2012: | | | | | | | | |
Shares sold | | | 82,601 | | | $ | 797,381 | |
Shares issued in reinvestment of dividends and distributions | | | — | | | | — | |
Shares reacquired | | | (159,656 | ) | | | (1,531,912 | ) |
| | | | | | | | |
Net increase (decrease) in shares outstanding before conversion | | | (77,055 | ) | | | (734,531 | ) |
Shares reaquired upon conversion into Class A | | | (210,901 | ) | | | (2,002,862 | ) |
| | | | | | | | |
Net increase (decrease) in shares outstanding | | | (287,956 | ) | | $ | (2,737,393 | ) |
| | | | | | | | |
Year ended July 31, 2011: | | | | | | | | |
Shares sold | | | 194,434 | | | $ | 1,971,991 | |
Shares issued in reinvestment of dividends and distributions | | | — | | | | — | |
Shares reacquired | | | (451,079 | ) | | | (4,560,984 | ) |
| | | | | | | | |
Net increase (decrease) in shares outstanding before conversion | | | (256,645 | ) | | | (2,588,993 | ) |
Shares reaquired upon conversion into Class A | | | (651,116 | ) | | | (6,603,508 | ) |
| | | | | | | | |
Net increase (decrease) in shares outstanding | | | (907,761 | ) | | $ | (9,192,501 | ) |
| | | | | | | | |
| | |
| 52 | | Visit our website at www.prudentialfunds.com |
| | | | | | | | |
Class C | | Shares | | | Amount | |
Six Months ended January 31, 2012: | | | | | | | | |
Shares sold | | | 69,906 | | | $ | 676,673 | |
Shares issued in reinvestment of dividends and distributions | | | — | | | | — | |
Shares reacquired | | | (380,483 | ) | | | (3,681,001 | ) |
| | | | | | | | |
Net increase (decrease) in shares outstanding before conversion | | | (310,577 | ) | | | (3,004,328 | ) |
Shares reaquired upon conversion into Class Z | | | (2,309 | ) | | | (22,621 | ) |
| | | | | | | | |
Net increase (decrease) in shares outstanding | | | (312,886 | ) | | $ | (3,026,949 | ) |
| | | | | | | | |
Year ended July 31, 2011: | | | | | | | | |
Shares sold | | | 192,897 | | | $ | 1,953,151 | |
Shares issued in reinvestment of dividends and distributions | | | — | | | | — | |
Shares reacquired | | | (1,024,910 | ) | | | (10,431,687 | ) |
| | | | | | | | |
Net increase (decrease) in shares outstanding | | | (832,013 | ) | | $ | (8,478,536 | ) |
| | | | | | | | |
Class M | | | | | | |
Six Months ended January 31, 2012: | | | | | | | | |
Shares sold | | | — | | | $ | — | |
Shares issued in reinvestment of dividends and distributions | | | — | | | | — | |
Shares reacquired | | | (3,469 | ) | | | (33,139 | ) |
| | | | | | | | |
Net increase (decrease) in shares outstanding before conversion | | | (3,469 | ) | | | (33,139 | ) |
Shares reaquired upon conversion into Class A | | | (17,372 | ) | | | (170,501 | ) |
| | | | | | | | |
Net increase (decrease) in shares outstanding | | | (20,841 | ) | | $ | (203,640 | ) |
| | | | | | | | |
Year ended July 31, 2011: | | | | | | | | |
Shares sold | | | 814 | | | $ | 8,832 | |
Shares issued in reinvestment of dividends and distributions | | | — | | | | — | |
Shares reacquired | | | (14,203 | ) | | | (138,349 | ) |
| | | | | | | | |
Net increase (decrease) in shares outstanding before conversion | | | (13,389 | ) | | | (129,517 | ) |
Shares reaquired upon conversion into Class A | | | (68,704 | ) | | | (713,787 | ) |
| | | | | | | | |
Net increase (decrease) in shares outstanding | | | (82,093 | ) | | $ | (843,304 | ) |
| | | | | | | | |
Class R | | | | | | |
Six Months ended January 31, 2012: | | | | | | | | |
Shares sold | | | — | | | $ | — | |
Shares issued in reinvestment of dividends and distributions | | | — | (a) | | | 1 | |
Shares reacquired | | | — | | | | — | |
| | | | | | | | |
Net increase (decrease) in shares outstanding | | | — | (a) | | $ | 1 | |
| | | | | | | | |
Year ended July 31, 2011: | | | | | | | | |
Shares sold | | | 1,390 | | | $ | 15,657 | |
Shares issued in reinvestment of dividends and distributions | | | — | | | | — | |
Shares reacquired | | | (9,435 | ) | | | (112,515 | ) |
| | | | | | | | |
Net increase (decrease) in shares outstanding | | | (8,045 | ) | | $ | (96,858 | ) |
| | | | | | | | |
| | | | |
| Target Asset Allocation Funds/Target Growth Allocation Fund | | | 53 | |
Notes to Financial Statements
(Unaudited) continued
| | | | | | | | |
Class X | | Shares | | | Amount | |
Six Months ended January 31, 2012: | | | | | | | | |
Shares sold | | | — | | | $ | — | |
Shares issued in reinvestment of dividends and distributions | | | 126 | | | | 1,261 | |
Shares reacquired | | | (2,705 | ) | | | (26,476 | ) |
| | | | | | | | |
Net increase (decrease) in shares outstanding before conversion | | | (2,579 | ) | | | (25,215 | ) |
Shares reaquired upon conversion into Class A | | | (15,089 | ) | | | (149,430 | ) |
| | | | | | | | |
Net increase (decrease) in shares outstanding | | | (17,668 | ) | | $ | (174,645 | ) |
| | | | | | | | |
Year ended July 31, 2011: | | | | | | | | |
Shares sold | | | 1,750 | | | $ | 18,916 | |
Shares issued in reinvestment of dividends and distributions | | | — | | | | — | |
Shares reacquired | | | (39,910 | ) | | | (390,751 | ) |
| | | | | | | | |
Net increase (decrease) in shares outstanding before conversion | | | (38,160 | ) | | | (371,835 | ) |
Shares reaquired upon conversion into Class A | | | (54,589 | ) | | | (576,370 | ) |
| | | | | | | | |
Net increase (decrease) in shares outstanding | | | (92,749 | ) | | $ | (948,205 | ) |
| | | | | | | | |
Class Z | | | | | | |
Six Months ended January 31, 2012: | | | | | | | | |
Shares sold | | | 13,606 | | | $ | 143,409 | |
Shares issued in reinvestment of dividends and distributions | | | 661 | | | | 7,288 | |
Shares reacquired | | | (37,513 | ) | | | (399,560 | ) |
| | | | | | | | |
Net increase (decrease) in shares outstanding before conversion | | | (23,246 | ) | | | (248,863 | ) |
Shares issued upon conversion from Class C | | | 2,066 | | | | 22,621 | |
| | | | | | | | |
Net increase (decrease) in shares outstanding | | | (21,180 | ) | | $ | (226,242 | ) |
| | | | | | | | |
Year ended July 31, 2011: | | | | | | | | |
Shares sold | | | 52,178 | | | $ | 607,457 | |
Shares issued in reinvestment of dividends and distributions | | | — | | | | — | |
Shares reacquired | | | (51,645 | ) | | | (586,603 | ) |
| | | | | | | | |
Net increase (decrease) in shares outstanding | | | 533 | | | $ | 20,854 | |
| | | | | | | | |
Note 7. Borrowings
The Trust, along with other affiliated registered investment companies (the “Funds”), is a party to a Syndicated Credit Agreement (“SCA”) with a group of banks. The purpose of the SCA is to provide an alternative source of temporary funding for capital share redemptions. The SCA provides for a commitment of $900 million for the period December 16, 2011 through December 14, 2012. The Funds pay an annualized commitment fee of 0.08% of the unused portion of the SCA. Prior to December 16, 2011, the Funds had another Syndicated Credit Agreement of a
| | |
| 54 | | Visit our website at www.prudentialfunds.com |
$750 million commitment with an annualized commitment fee of 0.10% of the unused portion. Interest on any borrowings under these SCAs is paid at contracted market rates. The commitment fee for the unused amount is accrued daily and paid quarterly.
The Fund did not utilize the SCA during the six months ended January 31, 2012.
Note 8. New Accounting Pronouncements
In April 2011, the Financial Accounting Standards Board (“FASB”) issued Accounting Standards Update (“ASU”) No. 2011-03 “Reconsideration of Effective control for Repurchase Agreements.” The objective of ASU 2011-03 is to improve the accounting for repurchase agreements and other agreements that both entitle and obligate a transferor to repurchase or redeem financial assets before their maturity. Under previous guidance, whether or not to account for a transaction as a sale was based on, in part, if the entity maintained effective control over the transferred financial assets. ASU 2011-03 removes the transferor’s ability criterion from the effective control assessment. This guidance is effective prospectively for interim and annual reporting periods beginning on or after December 15, 2011. At this time, management is evaluating the implications of ASU No. 2011-03 and its impact on the financial statements has not been determined.
In May 2011, the FASB issued ASU No. 2011-04 “Amendments to Achieve Common Fair Value Measurement and Disclosure Requirements in U.S. GAAP and IFRSs.” ASU 2011-04 includes common requirements for measurement of and disclosure about fair value between U.S. GAAP and IFRS. ASU 2011-04 will require reporting entities to disclose quantitative information about the unobservable inputs used in the fair value measurements categorized within Level 3 of the fair value hierarchy. In addition, ASU 2011-04 will require reporting entities to make disclosures about amounts and reasons for all transfers in and out of Level 1 and Level 2 fair value measurements. The new and revised disclosures are effective for interim and annual reporting periods beginning after December 15, 2011. At this time, management is evaluating the implications of ASU No. 2011-04 and its impact on the financial statements has not been determined.
| | | | |
| Target Asset Allocation Funds/Target Growth Allocation Fund | | | 55 | |
Financial Highlights
(Unaudited)
| | | | | | | | | | | | | | | | | | | | | | | | | | |
| Class A Shares | |
| | | Six Months
Ended
January 31, | | | | | Year Ended July 31, | |
| | | 2012(b) | | | | 2011(b) | | | 2010(b) | | | 2009(b) | | | 2008(b) | | | 2007(b) | |
| Per Share Operating Performance: | | | | | | | | | | | | | | | | | | | | | | | | | | |
| Net Asset Value, Beginning of Period | | | $11.49 | | | | | | $9.73 | | | | $8.77 | | | | $11.52 | | | | $14.62 | | | | $13.26 | |
| Income (loss) from investment operations: | | | | | | | | | | | | | | | | | | | | | | | | | | |
| Net investment income | | | .02 | | | | | | .05 | | | | .04 | | | | .09 | | | | .13 | | | | .09 | |
| Net realized and unrealized gain (loss) on investments | | | (.31 | ) | | | | | 1.71 | | | | .98 | | | | (2.73 | ) | | | (1.90 | ) | | | 2.12 | |
| Total from investment operations | | | (.29 | ) | | | | | 1.76 | | | | 1.02 | | | | (2.64 | ) | | | (1.77 | ) | | | 2.21 | |
| Less Dividends and Distributions: | | | | | | | | | | | | | | | | | | | | | | | | | | |
| Dividends from net investment income | | | (.03 | ) | | | | | - | | | | (.06 | ) | | | (.11 | ) | | | (.07 | ) | | | (.01 | ) |
| Distributions from net realized gains | | | - | | | | | | - | | | | - | | | | - | (e) | | | (1.26 | ) | | | (.84 | ) |
| Total dividends and distributions | | | (.03 | ) | | | | | - | | | | (.06 | ) | | | (.11 | ) | | | (1.33 | ) | | | (.85 | ) |
| Net asset value, end of period | | | $11.17 | | | | | | $11.49 | | | | $9.73 | | | | $8.77 | | | | $11.52 | | | | $14.62 | |
| Total Return(a) | | | (2.49)% | | | | | | 18.09% | | | | 11.69% | | | | (22.71)% | | | | (13.25)% | | | | 16.93% | |
| |
| Ratios/Supplemental Data: | |
| Net assets, end of period (000) | | | $107,495 | | | | | | $114,839 | | | | $99,938 | | | | $95,405 | | | | $124,579 | | | | $138,579 | |
| Average net assets (000) | | | $103,140 | | | | | | $112,821 | | | | $102,324 | | | | $89,232 | | | | $135,539 | | | | $124,296 | |
| Ratios to average net assets(d): | | | | | | | | | | | | | | | | | | | | | | | | | | |
| Expenses, including distribution and service (12b-1) fees(c) | | | 1.59% | (f) | | | | | 1.51% | | | | 1.57% | | | | 1.58% | | | | 1.36% | | | | 1.35% | |
| Expenses, excluding distribution and service (12b-1) fees | | | 1.34% | (f) | | | | | 1.26% | | | | 1.32% | | | | 1.33% | | | | 1.11% | | | | 1.10% | |
| Net investment income | | | .33% | (f) | | | | | .48% | | | | .38% | | | | 1.03% | | | | 1.01% | | | | .65% | |
| For Class A, B, C, M, R, X and Z shares: | | | | | | | | | | | | | | | | | | | | | | | | | | |
| Portfolio turnover rate | | | 31% | (g) | | | | | 73% | | | | 97% | | | | 135% | | | | 83% | | | | 71% | |
(a) Total return does not consider the effects of sales loads. Total return is calculated assuming a purchase of a share on the first day and a sale on the last day of each period reported and includes reinvestment of dividends and distributions. Total returns may reflect adjustments to conform to generally accepted accounting principles. Total returns for periods less than one full year are not annualized.
(b) Calculations are based on average shares outstanding during the period.
(c) The distributor of the Fund contractually agreed to limit its distribution and service (12b-1) fees to .25% of the average daily assets of the Class A shares.
(d) Does not include expenses of the underlying portfolios in which the Fund invests.
(e) Less than $.005 per share.
(f) Annualized.
(g) Not annualized.
See Notes to Financial Statements.
| | |
| 56 | | Visit our website at www.prudentialfunds.com |
| | | | | | | | | | | | | | | | | | | | | | | | | | |
| Class B Shares | | | | | | |
| | | Six Months
Ended
January 31, | | | | | Year Ended July 31, | |
| | | 2012(b) | | | | 2011(b) | | | 2010(b) | | | 2009(b) | | | 2008(b) | | | 2007(b) | |
| Per Share Operating Performance: | | | | | | | | | | | | | | | | | | | | | | | | | | |
| Net Asset Value, Beginning of Period | | | $10.55 | | | | | | $9.00 | | | | $8.13 | | | | $10.68 | | | | $13.67 | | | | $12.53 | |
| Income (loss) from investment operations: | | | | | | | | | | | | | | | | | | | | | | | | | | |
| Net investment income (loss) | | | (.02 | ) | | | | | (.03 | ) | | | (.03 | ) | | | .02 | | | | .03 | | | | (.01 | ) |
| Net realized and unrealized gain (loss) on investments | | | (.28 | ) | | | | | 1.58 | | | | .91 | | | | (2.52 | ) | | | (1.76 | ) | | | 1.99 | |
| Total from investment operations | | | (.30 | ) | | | | | 1.55 | | | | .88 | | | | (2.50 | ) | | | (1.73 | ) | | | 1.98 | |
| Less Dividends and Distributions: | | | | | | | | | | | | | | | | | | | | | | | | | | |
| Dividends from net investment income | | | - | | | | | | - | | | | (.01 | ) | | | (.05 | ) | | | - | | | | - | |
| Distributions from net realized gains | | | - | | | | | | - | �� | | | - | | | | - | (d) | | | (1.26 | ) | | | (.84 | ) |
| Total dividends and distributions | | | - | | | | | | - | | | | (.01 | ) | | | (.05 | ) | | | (1.26 | ) | | | (.84 | ) |
| Net asset value, end of period | | | $10.25 | | | | | | $10.55 | | | | $9.00 | | | | $8.13 | | | | $10.68 | | | | $13.67 | |
| Total Return(a) | | | (2.84)% | | | | | | 17.22% | | | | 10.80% | | | | (23.29)% | | | | (13.86)% | | | | 16.14% | |
| |
| Ratios/Supplemental Data: | |
| Net assets, end of period (000) | | | $20,991 | | | | | | $24,634 | | | | $29,184 | | | | $33,691 | | | | $58,763 | | | | $93,021 | |
| Average net assets (000) | | | $21,070 | | | | | | $28,562 | | | | $33,068 | | | | $37,140 | | | | $78,596 | | | | $100,142 | |
| Ratios to average net assets(c): | | | | | | | | | | | | | | | | | | | | | | | | | | |
| Expenses, including distribution and service (12b-1) fees | | | 2.34% | (e) | | | | | 2.26% | | | | 2.32% | | | | 2.33% | | | | 2.11% | | | | 2.10% | |
| Expenses, excluding distribution and service (12b-1) fees | | | 1.34% | (e) | | | | | 1.26% | | | | 1.32% | | | | 1.33% | | | | 1.11% | | | | 1.10% | |
| Net investment income (loss) | | | (.40)% | (e) | | | | | (.27)% | | | | (.36)% | | | | .31% | | | | .26% | | | | (.08)% | |
(a) Total return does not consider the effects of sales loads. Total return is calculated assuming a purchase of a share on the first day and a sale on the last day of each period reported and includes reinvestment of dividends and distributions. Total returns may reflect adjustments to conform to generally accepted accounting principles. Total returns for periods less than one full year are not annualized.
| (b) | Calculations are based on average shares outstanding during the period. |
| (c) | Does not include expenses of the underlying portfolios in which the Fund invests. |
| (d) | Less than $.005 per share. |
See Notes to Financial Statements.
| | | | |
| Target Asset Allocation Funds/Target Growth Allocation Fund | | | 57 | |
Financial Highlights
(Unaudited) continued
| | | | | | | | | | | | | | | | | | | | | | | | | | |
| Class C Shares | |
| | | Six Months
Ended
January 31, | | | | | Year Ended July 31, | |
| | | 2012(b) | | | | 2011(b) | | | 2010(b) | | | 2009(b) | | | 2008(b) | | | 2007(b) | |
| Per Share Operating Performance: | | | | | | | | | | | | | | | | | | | | | | | | | | |
| Net Asset Value, Beginning of Period | | | $10.55 | | | | | | $9.00 | | | | $8.13 | | | | $10.68 | | | | $13.67 | | | | $12.53 | |
| Income (loss) from investment operations: | | | | | | | | | | | | | | | | | | | | | | | | | | |
| Net investment income (loss) | | | (.02 | ) | | | | | (.03 | ) | | | (.03 | ) | | | .02 | | | | .03 | | | | (.01 | ) |
| Net realized and unrealized gain (loss) on investments | | | (.27 | ) | | | | | 1.58 | | | | .91 | | | | (2.52 | ) | | | (1.76 | ) | | | 1.99 | |
| Total from investment operations | | | (.29 | ) | | | | | 1.55 | | | | .88 | | | | (2.50 | ) | | | (1.73 | ) | | | 1.98 | |
| Less Dividends and Distributions: | | | | | | | | | | | | | | | | | | | | | | | | | | |
| Dividends from net investment income | | | - | | | | | | - | | | | (.01 | ) | | | (.05 | ) | | | - | | | | - | |
| Distributions from net realized gains | | | - | | | | | | - | | | | - | | | | - | (d) | | | (1.26 | ) | | | (.84 | ) |
| Total dividends and distributions | | | - | | | | | | - | | | | (.01 | ) | | | (.05 | ) | | | (1.26 | ) | | | (.84 | ) |
| Net asset value, end of period | | | $10.26 | | | | | | $10.55 | | | | $9.00 | | | | $8.13 | | | | $10.68 | | | | $13.67 | |
| Total Return(a) | | | (2.75)% | | | | | | 17.22% | | | | 10.80% | | | | (23.29)% | | | | (13.86)% | | | | 16.14% | |
| |
| Ratios/Supplemental Data: | | | | | | | | | | | | | | | | | | | | |
| Net assets, end of period (000) | | | $37,826 | | | | | | $42,214 | | | | $43,511 | | | | $48,649 | | | | $76,714 | | | | $109,912 | |
| Average net assets (000) | | | $37,198 | | | | | | $44,983 | | | | $48,040 | | | | $51,040 | | | | $96,952 | | | | $105,155 | |
| Ratios to average net assets(c): | | | | | | | | | | | | | | | | | | | | | | | | | | |
| Expenses, including distribution and service (12b-1) fees | | | 2.34% | (e) | | | | | 2.26% | | | | 2.32% | | | | 2.33% | | | | 2.11% | | | | 2.10% | |
| Expenses, excluding distribution and service (12b-1) fees | | | 1.34% | (e) | | | | | 1.26% | | | | 1.32% | | | | 1.33% | | | | 1.11% | | | | 1.10% | |
| Net investment income (loss) | | | (.41)% | (e) | | | | | (.27)% | | | | (.37)% | | | | .30% | | | | .26% | | | | (.09)% | |
(a) Total return does not consider the effects of sales loads. Total return is calculated assuming a purchase of a share on the first day and a sale on the last day of each period reported and includes reinvestment of dividends and distributions. Total returns may reflect adjustments to conform to generally accepted accounting principles. Total returns for periods less than one full year are not annualized.
(b) Calculations are based on average shares outstanding during the period.
(c) Does not include expenses of the underlying portfolios in which the Fund invests.
(d) Less than $.005 per share.
(e) Annualized.
See Notes to Financial Statements.
| | |
| 58 | | Visit our website at www.prudentialfunds.com |
| | | | | | | | | | | | | | | | | | | | | | | | | | |
| Class M Shares | |
| | | Six Months
Ended
January 31, | | | | | Year Ended July 31, | |
| | 2012(b) | | | | 2011(b) | | | 2010(b) | | | 2009(b) | | | 2008(b) | | | 2007(b) | |
| Per Share Operating Performance: | | | | | | | | | | | | | | | | | | | | | | | | | | |
| Net Asset Value, Beginning of Period | | | $10.58 | | | | | | $9.02 | | | | $8.15 | | | | $10.70 | | | | $13.70 | | | | $12.54 | |
| Income (loss) from investment operations: | | | | | | | | | | | | | | | | | | | | | | | | | | |
| Net investment income (loss) | | | (.01 | ) | | | | | (.03 | ) | | | (.03 | ) | | | .03 | | | | .03 | | | | (.01 | ) |
| Net realized and unrealized gain (loss) on investments | | | (.29 | ) | | | | | 1.59 | | | | .91 | | | | (2.53 | ) | | | (1.77 | ) | | | 2.01 | |
| Total from investment operations | | | (.30 | ) | | | | | 1.56 | | | | .88 | | | | (2.50 | ) | | | (1.74 | ) | | | 2.00 | |
| Less Dividends and Distributions: | | | | | | | | | | | | | | | | | | | | | | | | | | |
| Dividends from net investment income | | | - | | | | | | - | | | | (.01 | ) | | | (.05 | ) | | | - | | | | - | |
| Distributions from net realized gains | | | - | | | | | | - | | | | - | | | | - | (d) | | | (1.26 | ) | | | (.84 | ) |
| Total dividends and distributions | | | - | | | | | | - | | | | (.01 | ) | | | (.05 | ) | | | (1.26 | ) | | | (.84 | ) |
| Net asset value, end of period | | | $10.28 | | | | | | $10.58 | | | | $9.02 | | | | $8.15 | | | | $10.70 | | | | $13.70 | |
| Total Return(a) | | | (2.84)% | | | | | | 17.29% | | | | 10.77% | | | | (23.24)% | | | | (13.91)% | | | | 16.28% | |
| |
| Ratios/Supplemental Data: | |
| Net assets, end of period (000) | | | $86 | | | | | | $308 | | | | $1,004 | | | | $2,154 | | | | $4,712 | | | | $10,851 | |
| Average net assets (000) | | | $176 | | | | | | $671 | | | | $1,680 | | | | $2,773 | | | | $8,028 | | | | $10,882 | |
| Ratios to average net assets (c): | | | | | | | | | | | | | | | | | | | | | | | | | | |
| Expenses, including distribution and service (12b-1) fees | | | 2.34% | (e) | | | | | 2.26% | | | | 2.32% | | | | 2.33% | | | | 2.11% | | | | 2.10% | |
| Expenses, excluding distribution and service (12b-1) fees | | | 1.34% | (e) | | | | | 1.26% | | | | 1.32% | | | | 1.33% | | | | 1.11% | | | | 1.10% | |
| Net investment income (loss) | | | (.29)% | (e) | | | | | (.32)% | | | | (.36)% | | | | .33% | | | | .25% | | | | (.10)% | |
(a) Total return does not consider the effects of sales loads. Total return is calculated assuming a purchase of a share on the first day and a sale on the last day of each period reported and includes reinvestment of dividends and distributions. Total returns may reflect adjustments to conform to generally accepted accounting principles. Total returns for periods less than one full year are not annualized.
(b) Calculations are based on average shares outstanding during the period.
(c) Does not include expenses of the underlying portfolios in which the Fund invests.
(d) Less than $.005 per share.
(e) Annualized.
See Notes to Financial Statements.
| | | | |
| Target Asset Allocation Funds/Target Growth Allocation Fund | | | 59 | |
Financial Highlights
(Unaudited) continued
| | | | | | | | | | | | | | | | | | | | | | | | | | |
| Class R Shares | |
| | | Six Months
Ended
January 31, | | | | | Year Ended July 31, | |
| | | 2012(b) | | | | 2011(b) | | | 2010(b) | | | 2009(b) | | | 2008(b) | | | 2007(b) | |
| Per Share Operating Performance: | | | | | | | | | | | | | | | | | | | | | | | | | | |
| Net Asset Value, Beginning of Period | | | $11.38 | | | | | | $9.66 | | | | $8.71 | | | | $11.44 | | | | $14.52 | | | | $13.21 | |
| Income (loss) from investment operations: | | | | | | | | | | | | | | | | | | | | | | | | | | |
| Net investment income (loss) | | | .01 | | | | | | .01 | | | | .01 | | | | .07 | | | | .10 | | | | .05 | |
| Net realized and unrealized gain (loss) on investments | | | (.30 | ) | | | | | 1.71 | | | | .98 | | | | (2.71 | ) | | | (1.88 | ) | | | 2.11 | |
| Total from investment operations | | | (.29 | ) | | | | | 1.72 | | | | .99 | | | | (2.64 | ) | | | (1.78 | ) | | | 2.16 | |
| Less Dividends and Distributions: | | | | | | | | | | | | | | | | | | | | | | | | | | |
| Dividends from net investment income | | | - | (d) | | | | | - | | | | (.04 | ) | | | (.09 | ) | | | (.04 | ) | | | (.01 | ) |
| Distributions from net realized gains | | | - | | | | | | - | | | | - | | | | - | (d) | | | (1.26 | ) | | | (.84 | ) |
| Total dividends and distributions | | | - | (d) | | | | | - | | | | (.04 | ) | | | (.09 | ) | | | (1.30 | ) | | | (.85 | ) |
| Net asset value, end of period | | | $11.09 | | | | | | $11.38 | | | | $9.66 | | | | $8.71 | | | | $11.44 | | | | $14.52 | |
| Total Return(a) | | | (2.52)% | | | | | | 17.81% | | | | 11.40% | | | | (22.90)% | | | | (13.42)% | | | | 16.76% | |
| |
| Ratios/Supplemental Data: | |
| Net assets, end of period (000) | | | $2 | | | | | | $2 | | | | $80 | | | | $225 | | | | $323 | | | | $333 | |
| Average net assets (000) | | | $2 | | | | | | $74 | | | | $122 | | | | $203 | | | | $339 | | | | $284 | |
| Ratios to average net assets (c): | | | | | | | | | | | | | | | | | | | | | | | | | | |
| Expenses, including distribution and service (12b-1) fees(e) | | | 1.84% | (f) | | | | | 1.76% | | | | 1.82% | | | | 1.83% | | | | 1.61% | | | | 1.60% | |
| Expenses, excluding distribution and service (12b-1) fees | | | 1.34% | (f) | | | | | 1.26% | | | | 1.32% | | | | 1.33% | | | | 1.11% | | | | 1.10% | |
| Net investment income (loss) | | | .27% | (f) | | | | | .14% | | | | .14% | | | | .82% | | | | .77% | | | | .36% | |
(a) Total return does not consider the effects of sales loads. Total return is calculated assuming a purchase of a share on the first day and a sale on the last day of each period reported and includes reinvestment of dividends and distributions. Total returns may reflect adjustments to conform to generally accepted accounting principles. Total returns for periods less than one full year are not annualized.
(b) Calculations are based on average shares outstanding during the period.
(c) Does not include expenses of the underlying portfolios in which the Fund invests.
(d) Less than $.005 per share.
(e) The distributor of the Fund contractually agreed to limit its distribution and service (12b-1) fees to .50% of the average daily assets of the Class R shares.
(f) Annualized.
See Notes to Financial Statements.
| | |
| 60 | | Visit our website at www.prudentialfunds.com |
| | | | | | | | | | | | | | | | | | | | | | | | | | |
| Class X Shares | |
| | | Six Months
Ended
January 31, | | | | | Year Ended July 31, | |
| | | 2012(b) | | | | 2011(b) | | | 2010(b) | | | 2009(b) | | | 2008(b) | | | 2007(b) | |
| Per Share Operating Performance: | | | | | | | | | | | | | | | | | | | | | | | | | | |
| Net Asset Value, Beginning of Period | | | $10.71 | | | | | | $9.07 | | | | $8.17 | | | | $10.68 | | | | $13.68 | | | | $12.55 | |
| Income (loss) from investment operations: | | | | | | | | | | | | | | | | | | | | | | | | | | |
| Net investment income (loss) | | | .02 | | | | | | .04 | | | | .03 | | | | .04 | | | | .03 | | | | (.01 | ) |
| Net realized and unrealized gain (loss) on investments | | | (.28 | ) | | | | | 1.60 | | | | .93 | | | | (2.50 | ) | | | (1.77 | ) | | | 1.98 | |
| Total from investment operations | | | (.26 | ) | | | | | 1.64 | | | | .96 | | | | (2.46 | ) | | | (1.74 | ) | | | 1.97 | |
| Less Dividends and Distributions: | | | | | | | | | | | | | | | | | | | | | | | | | | |
| Dividends from net investment income | | | (.03 | ) | | | | | - | | | | (.06 | ) | | | (.05 | ) | | | - | | | | - | |
| Distributions from net realized gains | | | - | | | | | | - | | | | - | | | | - | (d) | | | (1.26 | ) | | | (.84 | ) |
| Total dividends and distributions | | | (.03 | ) | | | | | - | | | | (.06 | ) | | | (.05 | ) | | | (1.26 | ) | | | (.84 | ) |
| Capital Contributions | | | - | | | | | | - | (d) | | | - | (d) | | | - | (d) | | | - | | | | - | |
| Net asset value, end of period | | | $10.42 | | | | | | $10.71 | | | | $9.07 | | | | $8.17 | | | | $10.68 | | | | $13.68 | |
| Total Return(a) | | | (2.40)% | | | | | | 18.08% | | | | 11.71% | | | | (22.91)% | | | | (13.93)% | | | | 16.03% | |
| |
| Ratios/Supplemental Data: | |
| Net assets, end of period (000) | | | $335 | | | | | | $534 | | | | $1,293 | | | | $1,705 | | | | $3,759 | | | | $4,613 | |
| Average net assets (000) | | | $394 | | | | | | $846 | | | | $1,593 | | | | $2,123 | | | | $4,440 | | | | $4,643 | |
| Ratios to average net assets(c): | | | | | | | | | | | | | | | | | | | | | | | | | | |
| Expenses, including distribution and service (12b-1) fees | | | 1.59% | (e) | | | | | 1.51% | | | | 1.57% | | | | 2.09% | | | | 2.11% | | | | 2.10% | |
| Expenses, excluding distribution and service (12b-1) fees | | | 1.34% | (e) | | | | | 1.26% | | | | 1.32% | | | | 1.33% | | | | 1.11% | | | | 1.10% | |
| Net investment income (loss) | | | .38% | (e) | | | | | .44% | | | | .39% | | | | .56% | | | | .26% | | | | (.09)% | |
(a) Total return does not consider the effects of sales loads. Total return is calculated assuming a purchase of a share on the first day and a sale on the last day of each period reported and includes reinvestment of dividends and distributions. Total returns may reflect adjustments to conform to generally accepted accounting principles. Total returns for periods less than one full year are not annualized.
(b) Calculations are based on average shares outstanding during the period.
(c) Does not include expenses of the underlying portfolios in which the Fund invests.
(d) Less than $.005 per share.
(e) Annualized.
See Notes to Financial Statements.
| | | | |
| Target Asset Allocation Funds/Target Growth Allocation Fund | | | 61 | |
Financial Highlights
(Unaudited) continued
| | | | | | | | | | | | | | | | | | | | | | | | | | |
| Class Z Shares | |
| | | Six Months
Ended
January 31, | | | | | Year Ended July 31, | |
| | | 2012(b) | | | | 2011(b) | | | 2010(b) | | | 2009(b) | | | 2008(b) | | | 2007(b) | |
| Per Share Operating Performance: | | | | | | | | | | | | | | | | | | | | | | | | | | |
| Net Asset Value, Beginning of Period | | | $11.81 | | | | | | $9.98 | | | | $8.99 | | | | $11.81 | | | | $14.95 | | | | $13.54 | |
| Income (loss) from investment operations: | | | | | | | | | | | | | | | | | | | | | | | | | | |
| Net investment income | | | .03 | | | | | | .08 | | | | .06 | | | | .12 | | | | .17 | | | | .13 | |
| Net realized and unrealized gain (loss) on investments | | | (.30 | ) | | | | | 1.75 | | | | 1.02 | | | | (2.81 | ) | | | (1.94 | ) | | | 2.15 | |
| Total from investment operations | | | (.27 | ) | | | | | 1.83 | | | | 1.08 | | | | (2.69 | ) | | | (1.77 | ) | | | 2.28 | |
| Less Dividends and Distributions: | | | | | | | | | | | | | | | | | | | | | | | | | | |
| Dividends from net investment income | | | (.06 | ) | | | | | - | | | | (.09 | ) | | | (.13 | ) | | | (.11 | ) | | | (.03 | ) |
| Distributions from net realized gains | | | - | | | | | | - | | | | - | | | | - | (d) | | | (1.26 | ) | | | (.84 | ) |
| Total dividends and distributions | | | (.06 | ) | | | | | - | | | | (.09 | ) | | | (.13 | ) | | | (1.37 | ) | | | (.87 | ) |
| Net asset value, end of period | | | $11.48 | | | | | | $11.81 | | | | $9.98 | | | | $8.99 | | | | $11.81 | | | | $14.95 | |
| Total Return(a) | | | (2.27)% | | | | | | 18.34% | | | | 11.98% | | | | (22.54)% | | | | (13.00)% | | | | 17.32% | |
| |
| Ratios/Supplemental Data: | |
| Net assets, end of period (000) | | | $1,556 | | | | | | $1,851 | | | | $1,558 | | | | $1,741 | | | | $5,234 | | | | $8,965 | |
| Average net assets (000) | | | $1,527 | | | | | | $1,707 | | | | $1,600 | | | | $2,938 | | | | $7,414 | | | | $8,670 | |
| Ratios to average net assets(c): | | | | | | | | | | | | | | | | | | | | | | | | | | |
| Expenses, including distribution and service (12b-1) fees | | | 1.34% | (e) | | | | | 1.26% | | | | 1.32% | | | | 1.33% | | | | 1.11% | | | | 1.10% | |
| Expenses, excluding distribution and service (12b-1) fees | | | 1.34% | (e) | | | | | 1.26% | | | | 1.32% | | | | 1.33% | | | | 1.11% | | | | 1.10% | |
| Net investment income | | | .59% | (e) | | | | | .73% | | | | .62% | | | | 1.32% | | | | 1.25% | | | | .91% | |
(a) Total return does not consider the effects of sales loads. Total return is calculated assuming a purchase of a share on the first day and a sale on the last day of each period reported and includes reinvestment of dividends and distributions. Total returns may reflect adjustments to conform to generally accepted accounting principles. Total returns for periods less than one full year are not annualized.
(b) Calculations are based on average shares outstanding during the period.
(c) Does not include expenses of the underlying portfolios in which the Fund invests.
(d) Less than $.005 per share.
(e) Annualized.
See Notes to Financial Statements.
| | |
| 62 | | Visit our website at www.prudentialfunds.com |
| | | | |
| n MAIL | | n TELEPHONE | | n WEBSITE |
Gateway Center Three 100 Mulberry Street Newark, NJ 07102 | | (800) 225-1852 | | www.prudentialfunds.com |
|
| PROXY VOTING |
| The Board of Trustees of the Fund has delegated to the Fund’s investment subadvisers the responsibility for voting any proxies and maintaining proxy recordkeeping with respect to the Fund. A description of these proxy voting policies and procedures is available without charge, upon request, by calling (800) 225-1852. Information regarding how the Fund voted proxies relating to portfolio securities during the most recent 12-month period ended June 30 is available on the Fund’s website and on the website of the Securities and Exchange Commission at www.sec.gov. |
|
| TRUSTEES |
| Kevin J. Bannon • Scott E. Benjamin • Linda W. Bynoe • Michael S. Hyland • Douglas H. McCorkindale • Stephen P. Munn • Stuart S. Parker • Richard A. Redeker • Robin B. Smith • Stephen G. Stoneburn |
|
| OFFICERS |
| Stuart S. Parker, President • Judy A. Rice, Vice President • Scott E. Benjamin, Vice President • Grace C. Torres, Treasurer and Principal Financial and Accounting Officer • Kathryn L. Quirk, Chief Legal Officer • Deborah A. Docs, Secretary • Timothy J. Knierim, Chief Compliance Officer • Valerie M. Simpson, Deputy Chief Compliance Officer • Theresa C. Thompson, Deputy Chief Compliance Officer • Richard W. Kinville, Anti-Money Laundering Compliance Officer • Jonathan D. Shain, Assistant Secretary • Claudia DiGiacomo, Assistant Secretary • John P. Schwartz, Assistant Secretary • Andrew R. French, Assistant Secretary • M. Sadiq Peshimam, Assistant Treasurer • Peter Parrella, Assistant Treasurer |
| | | | |
| MANAGER | | Prudential Investments LLC | | Gateway Center Three
100 Mulberry Street Newark, NJ 07102 |
|
| INVESTMENT SUBADVISERS | | Eagle Asset Management, Inc. | | 880 Carillon Parkway
St. Petersburg, FL 33716 |
|
| | EARNEST Partners, LLC | | 1180 Peachtree Street
Suite 2300 Atlanta, GA 30309 |
|
| | Eaton Vance Management | | Two International Place
Boston, MA 02110 |
|
| | Hotchkis and Wiley Capital
Management | | 725 South Figueroa Street
39th Floor Los Angeles, CA 90017 |
|
| | LSV Asset Management | | 155 North Wacker Drive
Suite 4600 Chicago, IL 60606 |
|
| | Marsico Capital
Management, LLC | | 1200 17th Street
Suite 1600 Denver, CO 80202 |
| | | | |
| | Massachusetts Financial
Services Company | | 500 Boylston Street
Boston, MA 02116 |
|
| | NFJ Investment Group L.P. | | 2100 Ross Avenue
Dallas, TX 75201 |
|
| | Thornburg Investment
Management, Inc. | | 2300 North Ridgetop Road
Santa Fe, NM 87506 |
|
| | Vaughan Nelson Investment
Management, L.P. | | 600 Travis Street
Suite 6300 Houston, TX 77002 |
|
| DISTRIBUTOR | | Prudential Investment
Management Services LLC | | Gateway Center Three
100 Mulberry Street Newark, NJ 07102 |
|
| CUSTODIAN | | The Bank of New York Mellon | | One Wall Street
New York, NY 10286 |
|
| TRANSFER AGENT | | Prudential Mutual Fund
Services LLC | | PO Box 9658
Providence, RI 02940 |
|
| INDEPENDENT REGISTERED PUBLIC ACCOUNTING FIRM | | KPMG LLP | | 345 Park Avenue
New York, NY 10154 |
|
| FUND COUNSEL | | Willkie Farr & Gallagher LLP | | 787 Seventh Avenue
New York, NY 10019 |
|
| An investor should consider the investment objectives, risks, charges, and expenses of the Fund carefully before investing. The prospectus and summary prospectus contain this and other information about the Fund. An investor may obtain a prospectus and summary prospectus by visiting our website at www.prudentialfunds.com or by calling (800) 225-1852. The prospectus and summary prospectus should be read carefully before investing. |
|
| E-DELIVERY |
| To receive your mutual fund documents online, go to www.prudentialfunds.com/edelivery and enroll. Instead of receiving printed documents by mail, you will receive notification via email when new materials are available. You can cancel your enrollment or change your email address at any time by visiting the website address above. |
|
| SHAREHOLDER COMMUNICATIONS WITH TRUSTEES |
| Shareholders can communicate directly with the Board of Trustees by writing to the Chair of the Board, Target Asset Allocation Funds, Prudential Investments, Attn: Board of Trustees, 100 Mulberry Street, Gateway Center Three, Newark, NJ 07102. Shareholders can communicate directly with an individual Trustee by writing to the same address. Communications are not screened before being delivered to the addressee. |
|
| AVAILABILITY OF PORTFOLIO SCHEDULE |
| The Fund files its complete schedule of portfolio holdings with the Securities and Exchange Commission for the first and third quarters of each fiscal year on Form N-Q. The Fund’s Forms N-Q are available on the Commission’s website at www.sec.gov. The Fund’s Forms N-Q may also be reviewed and copied at the Commission’s Public Reference Room in Washington, D.C. Information on the operation and location of the Public Reference Room may be obtained by calling (202) 551-8090. The Fund’s schedule of portfolio holdings as of the end of each calendar month is also available on the Fund’s website no sooner than approximately three business days prior to the end of the following month. |
Mutual Funds:
| | | | |
| ARE NOT INSURED BY THE FDIC OR ANY FEDERAL GOVERNMENT AGENCY | | MAY LOSE VALUE | | ARE NOT A DEPOSIT OF OR GUARANTEED BY ANY BANK OR ANY BANK AFFILIATE |

TARGET GROWTH ALLOCATION FUND
| | | | | | | | | | | | | | |
| SHARE CLASS | | A | | B | | C | | M | | R | | X | | Z |
| NASDAQ | | PHGAX | | PIHGX | | PHGCX | | N/A | | PGARX | | N/A | | PDHZX |
| CUSIP | | 87612A823 | | 87612A815 | | 87612A799 | | 87612A765 | | 87612A781 | | 87612A757 | | 87612A773 |
MFSP504E6 0220861-00001-00
Item 2 – Code of Ethics – Not required, as this is not an annual filing.
Item 3 – Audit Committee Financial Expert – Not required, as this is not an annual filing.
Item 4 – Principal Accountant Fees and Services – Not required, as this is not an annual filing.
Item 5 – Audit Committee of Listed Registrants – Not applicable.
Item 6 – Schedule of Investments – The schedule is included as part of the report to shareholders filed under Item 1 of this Form.
Item 7 – Disclosure of Proxy Voting Policies and Procedures for Closed-End Management Investment Companies – Not applicable.
Item 8 – Portfolio Managers of Closed-End Management Investment Companies – Not applicable.
Item 9 – Purchases of Equity Securities by Closed-End Management Investment Company and Affiliated Purchasers – Not applicable.
Item 10 – Submission of Matters to a Vote of Security Holders – Not applicable.
Item 11 – Controls and Procedures
| | (a) | It is the conclusion of the registrant’s principal executive officer and principal financial officer that the effectiveness of the registrant’s current disclosure controls and procedures (such disclosure controls and procedures having been evaluated within 90 days of the date of this filing) provide reasonable assurance that the information required to be disclosed by the registrant has been recorded, processed, summarized and reported within the time period specified in the Commission’s rules and forms and that the information required to be disclosed by the registrant has been accumulated and communicated to the registrant’s principal executive officer and principal financial officer in order to allow timely decisions regarding required disclosure. |
| | (b) | There has been no significant change in the registrant’s internal control over financial reporting that occurred during the registrant’s most recent fiscal quarter of the period covered by this report that has materially affected, or is likely to materially affect, the registrant’s internal control over financial reporting. |
Item 12 – Exhibits
| | | | | | |
| | (a) | | (1) | | Code of Ethics – Not required, as this is not an annual filing. |
| | | |
| | | | (2) | | Certifications pursuant to Section 302 of the Sarbanes-Oxley Act – Attached hereto as Exhibit EX-99.CERT. |
| | | |
| | | | (3) | | Any written solicitation to purchase securities under Rule 23c-1. – Not applicable. |
| | |
| | (b) | | Certifications pursuant to Section 906 of the Sarbanes-Oxley Act – Attached hereto as Exhibit EX-99.906CERT. |
SIGNATURES
Pursuant to the requirements of the Securities Exchange Act of 1934 and the Investment Company Act of 1940, the registrant has duly caused this report to be signed on its behalf by the undersigned, thereunto duly authorized.
| | |
| Registrant: | | Target Asset Allocation Funds |
| |
| By: | | /s/ Deborah A. Docs |
| | Deborah A. Docs |
| | Secretary |
| |
| Date: | | March 22, 2012 |
Pursuant to the requirements of the Securities Exchange Act of 1934 and the Investment Company Act of 1940, this report has been signed below by the following persons on behalf of the registrant and in the capacities and on the dates indicated.
| | |
| By: | | /s/ Stuart S. Parker |
| | Stuart S. Parker |
| | President and Principal Executive Officer |
| |
| Date: | | March 22, 2012 |
| |
| By: | | /s/ Grace C. Torres |
| | Grace C. Torres |
| | Treasurer and Principal Financial Officer |
| |
| Date: | | March 22, 2012 |