UNITED STATES
SECURITIES AND EXCHANGE COMMISSION
Washington, D.C. 20549
FORM N-CSR
CERTIFIED SHAREHOLDER REPORT OF REGISTERED
MANAGEMENT INVESTMENT COMPANIES
| | |
Investment Company Act file number: | | 811-08915 |
Exact name of registrant as specified in charter: | | Prudential Investment Portfolios 16 |
| Address of principal executive offices: | | Gateway Center 3, |
| | 100 Mulberry Street, Newark, New Jersey 07102 |
| Name and address of agent for service: | | Deborah A. Docs Gateway Center 3, 100 Mulberry Street, Newark, New Jersey 07102 |
| Registrant’s telephone number, including area code: | | 800-225-1852 |
| Date of fiscal year end: | | 7/31/2014 |
| Date of reporting period: | | 1/31/2014 |
| | |
| Item 1 – | | Reports to Stockholders |

PRUDENTIAL INVESTMENTS»MUTUAL FUNDS
TARGET CONSERVATIVE ALLOCATION FUND
SEMIANNUAL REPORT · JANUARY 31, 2014
Fund Type
Balanced/Allocation
Objective
Current income and reasonable level of capital appreciation
This report is not authorized for distribution to prospective investors unless preceded or accompanied by a current prospectus.
The views expressed in this report and information about the Fund’s portfolio holdings are for the period covered by this report and are subject to change thereafter.
The accompanying financial statements as of January 31, 2014, were not audited and, accordingly, no auditor’s opinion is expressed on them.
Mutual funds are distributed by Prudential Investment Management Services LLC (PIMS), a Prudential Financial company. ©2014 Prudential Financial, Inc. and its related entities. Prudential Investments, Prudential, the Prudential logo, Bring Your Challenges, Target, and the Rock symbol are service marks of Prudential Financial, Inc. and its related entities, registered in many jurisdictions worldwide.

March 14, 2014
Dear Shareholder:
We hope you find the semiannual report for the Target Conservative Allocation Fund informative and useful. The report covers performance for the six-month period that ended January 31, 2014.
We recognize that ongoing market volatility may make it a difficult time to be an investor. We continue to believe a prudent response to uncertainty is to maintain a diversified portfolio, including stock and bond mutual funds consistent with your tolerance for risk, time horizon, and financial goals.
A diversified asset allocation offers two potential advantages: It limits your exposure to any particular asset class; plus it provides a better opportunity to invest some of your assets in the right place at the right time. Your financial advisor can help you create a diversified investment plan that may include funds covering all the basic asset classes and that reflects your personal investor profile and risk tolerance. Keep in mind, however, that diversification and asset allocation strategies do not assure a profit or protect against loss in declining markets.
We are dedicated to helping you solve your toughest investment challenges—whether it’s capital growth, reliable income, or protection from market volatility and other risk. We believe our Target Conservative Allocation Fund, which is managed by institutional quality asset managers selected and monitored by our research team, will help you to achieve broad, actively managed diversification at a targeted risk/return balance with a single investment purchase.
Thank you for choosing the Target Conservative Allocation Fund.
Sincerely,

Stuart S. Parker, President
Target Conservative Allocation Fund
| | | | |
| Target Conservative Allocation Fund | | | 1 | |
Your Fund’s Performance (Unaudited)
Performance data quoted represent past performance. Past performance does not guarantee future results. The investment return and principal value of an investment will fluctuate, so that an investor’s shares, when redeemed, may be worth more or less than their original cost. Current performance may be lower or higher than the past performance data quoted. An investor may obtain performance data as of the most recent month-end by visiting our website at www.prudentialfunds.com or by calling (800) 225-1852.
| | | | | | | | | | | | | | | | | | |
Cumulative Total Returns (Without Sales Charges) as of 1/31/14 |
| | | Six Months | | | One Year | | | Five Years | | | Ten Years | | | Since Inception |
Class A | | | 4.69 | % | | | 8.94 | % | | | 69.30 | % | | | 70.30 | % | | — |
Class B | | | 4.28 | | | | 8.08 | | | | 63.15 | | | | 57.97 | | | — |
Class C | | | 4.19 | | | | 7.99 | | | | 63.01 | | | | 57.85 | | | — |
Class R | | | 4.54 | | | | 8.59 | | | | 67.20 | | | | N/A | | | 62.88% (10/4/04) |
Class X | | | 4.28 | | | | 8.08 | | | | 63.15 | | | | N/A | | | 55.73 (10/4/04) |
Class Z | | | 4.83 | | | | 9.25 | | | | 71.51 | | | | 74.69 | | | — |
Customized Blend | | | 4.11 | | | | 8.74 | | | | 69.29 | | | | 79.09 | | | — |
S&P 500 Index | | | 6.85 | | | | 21.51 | | | | 140.50 | | | | 93.60 | | | — |
Lipper Mixed-Asset Target Allocation Conservative Funds Avg. | | | 2.97 | | | | 4.64 | | | | 60.85 | | | | 59.07 | | | — |
| | | | | | | | | | | | | | | | | | |
Average Annual Total Returns (With Sales Charges) as of 12/31/13 |
| | | | | | One Year | | | Five Years | | | Ten Years | | | Since Inception |
Class A | | | | | | | 5.67 | % | | | 9.12 | % | | | 5.11 | % | | — |
Class B | | | | | | | 6.07 | | | | 9.40 | | | | 4.91 | | | — |
Class C | | | | | | | 9.97 | | | | 9.52 | | | | 4.90 | | | — |
Class R | | | | | | | 11.47 | | | | 10.06 | | | | N/A | | | 5.50% (10/4/04) |
Class X | | | | | | | 5.07 | | | | 9.12 | | | | N/A | | | 5.00 (10/4/04) |
Class Z | | | | | | | 12.03 | | | | 10.63 | | | | 5.96 | | | — |
Customized Blend | | | | | | | 11.09 | | | | 10.31 | | | | 6.18 | | | — |
S&P 500 Index | | | | | | | 32.37 | | | | 17.93 | | | | 7.40 | | | — |
Lipper Mixed-Asset Target Allocation Conservative Funds Avg. | | | | | | | 6.76 | | | | 9.58 | | | | 4.86 | | | — |
Source: Prudential Investments LLC and Lipper Inc.
Inception returns are provided for any share class with less than 10 calendar years of returns.
| | |
| 2 | | Visit our website at www.prudentialfunds.com |
The returns in the tables do not reflect the deduction of taxes that a shareholder would pay on Fund distributions or following the redemption of Fund shares. The average annual total returns take into account applicable sales charges, which are described for each share class in the table below.
| | | | | | | | | | | | |
| | Class A | | Class B | | Class C | | Class R | | Class X | | Class Z |
Maximum initial sales charge | | 5.50% of
the public
offering
price | | None | | None | | None | | None | | None |
Contingent Deferred Sales Charge (CDSC) (as a percentage of the lower of original purchase price or sale proceeds) | | 1% on sales
of $1 million
or more
made within
12 months of
purchase | | 5% (Year 1)
4% (Year 2)
3% (Year 3)
2% (Year 4)
1% (Years 5/6)
0% (Year 7) | | 1% on sales
made within
12 months
of purchase | | None | | 6% (Year 1)
5% (Year 2)
4% (Years 3/4)
3% (Year 5)
2% (Years 6/7)
1% (Year 8)
0% (Year 9) | | None |
Annual distribution and service (12b-1) fees (shown as a percentage of average daily net assets) | | .30%
(.25%
currently) | | 1% | | 1% | | .75%
(.50%
currently) | | 1% | | None |
Class X shares are closed to new initial purchases. Class X shares are only available through exchanges from the same class of shares of certain other Prudential Investments funds.
Benchmark Definitions
Customized Blend
The Customized Benchmark for the Target Conservative Allocation Fund (Customized Blend) is a model portfolio consisting of the Russell 3000 Index (40%) and the Barclays U.S. Aggregate Bond Index (60%). The Customized Blend is an unmanaged index generally considered as representing the performance of the Fund’s asset classes. It is intended to provide a theoretical comparison to the Fund’s performance, based on the amounts allocated to each asset class rather than on amounts allocated to various Fund segments. The Customized Blend does not reflect deductions for any sales charges or operating expenses of a mutual fund. The Russell 3000 Index is an unmanaged index which measures the performance of the 3,000 largest U.S. companies based on total market capitalization, which represents approximately 98% of the investable U.S. equity market. The Barclays U.S. Aggregate Bond Index is an unmanaged index of investment-grade securities issued by the U.S. government and its agencies and by corporations with between one and 10 years remaining to maturity. It gives a broad look at how short- and intermediate-term bonds have performed. Customized Blend Closest Month-End to Inception cumulative total return as of 1/31/14 is 76.67% for Class R and Class X. Customized Blend Closest Month-End to Inception average annual total return as of 12/31/13 is 6.39% for Class R and Class X.
| | | | |
| Target Conservative Allocation Fund | | | 3 | |
Your Fund’s Performance (continued)
S&P 500 Index
The Standard & Poor’s 500 Composite Stock Price Index (S&P 500 Index) is an unmanaged index of 500 stocks of large U.S. public companies. It gives an indication of how U.S. stock prices have performed. S&P 500 Index Closest Month-End to Inception cumulative total return as of 1/31/14 is 94.23% for Class R and Class X. S&P 500 Index Closest Month-End to Inception average annual total return as of 12/31/13 is 7.85% for Class R and Class X.
Lipper Mixed-Asset Target Allocation Conservative Funds Average
The Lipper Mixed-Asset Target Allocation Conservative Funds Average (Lipper Average) represents returns based on the average return of all funds in the Lipper Mixed-Asset Target Allocation Conservative Funds category for the periods noted. Funds in the Lipper Average have a primary investment objective of conserving principal by maintaining at all times a balanced portfolio of both stocks and bonds. Mixed-Asset Funds are funds that, by portfolio practice, maintain a mix of between 20% and 40% equity securities, with the remainder invested in bonds, cash, and cash equivalents. Lipper Average Closest Month-End to Inception cumulative total return as of 1/31/14 is 56.73% for Class R and Class X. Lipper Average Closest Month-End to Inception average annual total return as of 12/31/13 is 4.99% for Class R and Class X.
Investors cannot invest directly in an index or average. The returns for the Indexes would be lower if they included the effects of sales charges, operating expenses of a mutual fund, or taxes. Returns for the Lipper Average reflect the deduction of operating expenses, but not sales charges or taxes. The Since Inception returns for the Indexes are measured from the closest month-end to inception date, and not from the Fund’s actual inception date.
| | |
| 4 | | Visit our website at www.prudentialfunds.com |
| | | | |
| Target Conservative Allocation Fund | | | 5 | |
Your Fund’s Performance (continued)
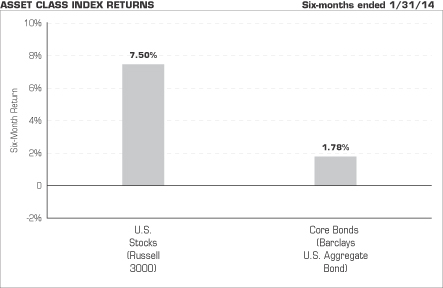
Source: Lipper Inc.
The chart above shows the total returns for six-months ended January 31, 2014, of various securities indexes that are generally considered representative of broad market sectors. It does not reflect a mutual fund’s expenses. The performance cited does not represent the performance of the Target Conservative Allocation Fund. Past performance is not indicative of future results. Investors cannot invest directly in an index or average.
The Russell 3000® Index is an unmanaged index which measures the performance of the 3,000 largest U.S. companies based on total market capitalization, which represents approximately 98% of the investable U.S. equity market.
The Barclays U.S. Aggregate Bond Index is an unmanaged index of investment-grade securities issued by the U.S. Government and its agencies and by corporations with between one and 10 years remaining to maturity. It gives a broad look at how short- and intermediate-term bonds have performed.
| | |
| 6 | | Visit our website at www.prudentialfunds.com |
Fees and Expenses (Unaudited)
As a shareholder of the Fund, you incur two types of costs: (1) transaction costs, including sales charges (loads) on purchase payments and redemptions, as applicable, and (2) ongoing costs, including management fees, distribution and/or service (12b-1) fees, and other Fund expenses, as applicable. This example is intended to help you understand your ongoing costs (in dollars) of investing in the Fund and to compare these costs with the ongoing costs of investing in other mutual funds.
The example is based on an investment of $1,000 invested on August 1, 2013, at the beginning of the period, and held through the six-month period ended January 31, 2014. The example is for illustrative purposes only; you should consult the Prospectus for information on initial and subsequent minimum investment requirements.
Actual Expenses
The first line for each share class in the table on the following page provides information about actual account values and actual expenses. You may use the information on this line, together with the amount you invested, to estimate the expenses that you paid over the period. Simply divide your account value by $1,000 (for example, an $8,600 account value ÷ $1,000 = 8.6), then multiply the result by the number on the first line under the heading “Expenses Paid During the Six-Month Period” to estimate the expenses you paid on your account during this period.
Hypothetical Example for Comparison Purposes
The second line for each share class in the table on the following page provides information about hypothetical account values and hypothetical expenses based on the Fund’s actual expense ratio and an assumed rate of return of 5% per year before expenses, which is not the Fund’s actual return. The hypothetical account values and expenses may not be used to estimate the actual ending account balance or expenses you paid for the period. You may use this information to compare the ongoing costs of investing in the Fund and other funds. To do so, compare this 5% hypothetical example with the 5% hypothetical examples that appear in the shareholder reports of the other funds.
The Fund’s transfer agent may charge additional fees to holders of certain accounts that are not included in the expenses shown in the table on the following page. These fees apply to individual retirement accounts (IRAs) and Section 403(b) accounts. As of the close of the six-month period covered by the table, IRA fees included an annual maintenance fee of $15 per account (subject to a maximum annual maintenance fee of $25 for all accounts held by the same shareholder). Section 403(b) accounts are charged an annual $25 fiduciary maintenance fee. Some of the fees may vary in amount, or may be waived, based on your total account balance or the number of
| | | | |
| Target Conservative Allocation Fund | | | 7 | |
Fees and Expenses (continued)
Prudential Investments Funds, including the Fund, that you own. You should consider the additional fees that were charged to your Fund account over the six-month period when you estimate the total ongoing expenses paid over the period and the impact of these fees on your ending account value, as these additional expenses are not reflected in the information provided in the expense table. Additional fees have the effect of reducing investment returns.
Please note that the expenses shown in the table are meant to highlight your ongoing costs only and do not reflect any transactional costs such as sales charges (loads). Therefore, the second line for each share class in the table is useful in comparing ongoing costs only and will not help you determine the relative total costs of owning different funds. In addition, if these transactional costs were included, your costs would have been higher.
| | | | | | | | | | | | | | | | | | |
Target
Conservative
Allocation Fund | | Beginning Account
Value
August 1, 2013 | | | Ending Account
Value January 31, 2014 | | | Annualized Expense Ratio Based on the Six-Month Period | | | Expenses Paid During the Six-Month Period* | |
| | | | | | | | | | | | | | | | | | |
| Class A | | Actual | | $ | 1,000.00 | | | $ | 1,046.90 | | | | 1.52 | % | | $ | 7.84 | |
| | | Hypothetical | | $ | 1,000.00 | | | $ | 1,017.54 | | | | 1.52 | % | | $ | 7.73 | |
| | | | | | | | | | | | | | | | | | |
| Class B | | Actual | | $ | 1,000.00 | | | $ | 1,042.80 | | | | 2.27 | % | | $ | 11.69 | |
| | | Hypothetical | | $ | 1,000.00 | | | $ | 1,013.76 | | | | 2.27 | % | | $ | 11.52 | |
| | | | | | | | | | | | | | | | | | |
| Class C | | Actual | | $ | 1,000.00 | | | $ | 1,041.90 | | | | 2.27 | % | | $ | 11.68 | |
| | | Hypothetical | | $ | 1,000.00 | | | $ | 1,013.76 | | | | 2.27 | % | | $ | 11.52 | |
| | | | | | | | | | | | | | | | | | |
| Class R | | Actual | | $ | 1,000.00 | | | $ | 1,045.40 | | | | 1.77 | % | | $ | 9.13 | |
| | | Hypothetical | | $ | 1,000.00 | | | $ | 1,016.28 | | | | 1.77 | % | | $ | 9.00 | |
| | | | | | | | | | | | | | | | | | |
| Class X | | Actual | | $ | 1,000.00 | | | $ | 1,042.80 | | | | 2.25 | % | | $ | 11.59 | |
| | | Hypothetical | | $ | 1,000.00 | | | $ | 1,013.86 | | | | 2.25 | % | | $ | 11.42 | |
| | | | | | | | | | | | | | | | | | |
| Class Z | | Actual | | $ | 1,000.00 | | | $ | 1,048.30 | | | | 1.27 | % | | $ | 6.56 | |
| | | Hypothetical | | $ | 1,000.00 | | | $ | 1,018.80 | | | | 1.27 | % | | $ | 6.46 | |
*Fund expenses (net of fee waivers or subsidies, if any) for each share class are equal to the annualized expense ratio for each share class (provided in the table), multiplied by the average account value over the period, multiplied by the 184 days in the six-month period ended January 31, 2014, and divided by the 365 days in the Fund’s fiscal year ending July 31, 2014 (to reflect the six-month period). Expenses presented in the table include the expenses of any underlying portfolios in which the Fund may invest.
| | |
| 8 | | Visit our website at www.prudentialfunds.com |
The Fund’s annualized expense ratios for the period ended January 31, 2014, are as follows:
| | | | | | | | |
| Class | | Gross Operating Expenses | | | Net Operating Expenses | |
A | | | 1.57 | % | | | 1.52 | % |
B | | | 2.27 | | | | 2.27 | |
C | | | 2.27 | | | | 2.27 | |
R | | | 2.02 | | | | 1.77 | |
X | | | 2.25 | | | | 2.25 | |
Z | | | 1.27 | | | | 1.27 | |
Net operating expenses shown above reflect fee waivers and/or expense reimbursements. Additional information on Fund expenses and any fee waivers and/or expense reimbursements can be found in the “Financial Highlights” tables in this report and in the Notes to the Financial Statements in this report.
| | | | |
| Target Conservative Allocation Fund | | | 9 | |
Portfolio of Investments
as of January 31, 2014 (Unaudited)
| | | | | | |
| Shares | | Description | | Value (Note 1) | |
LONG-TERM INVESTMENTS 102.1% | |
| |
COMMON STOCKS 41.0% | | | | |
| |
Aerospace & Defense 1.5% | | | | |
| 510 | | B/E Aerospace, Inc.(a) | | $ | 40,530 | |
| 2,400 | | Boeing Co. (The) | | | 300,624 | |
| 900 | | Embraer SA, ADR (Brazil) | | | 27,621 | |
| 175 | | Esterline Technologies Corp.(a) | | | 18,016 | |
| 1,745 | | Hexcel Corp.(a) | | | 72,732 | |
| 2,590 | | Honeywell International, Inc. | | | 236,286 | |
| 1,300 | | Lockheed Martin Corp. | | | 196,183 | |
| 293 | | Moog, Inc. (Class A Stock)(a) | | | 17,597 | |
| 3,000 | | Northrop Grumman Corp. | | | 346,650 | |
| 1,840 | | Precision Castparts Corp. | | | 468,740 | |
| 187 | | Teledyne Technologies, Inc.(a) | | | 17,180 | |
| | | | | | |
| | | | | 1,742,159 | |
| |
Air Freight & Logistics 0.1% | | | | |
| 2,745 | | Expeditors International of Washington, Inc. | | | 112,161 | |
| |
Airlines | | | | |
| 397 | | American Airlines Group, Inc.(a) | | | 13,320 | |
| 2,366 | | JetBlue Airways Corp.(a) | | | 20,726 | |
| | | | | | |
| | | | | 34,046 | |
| |
Auto Components 0.4% | | | | |
| 3,645 | | Delphi Automotive PLC (United Kingdom) | | | 221,944 | |
| 3,200 | | Johnson Controls, Inc. | | | 147,584 | |
| 900 | | Lear Corp. | | | 65,097 | |
| 600 | | Magna International, Inc. (Canada) | | | 50,910 | |
| 320 | | Tenneco, Inc.(a) | | | 18,189 | |
| | | | | | |
| | | | | 503,724 | |
| |
Automobiles 0.2% | | | | |
| 16,700 | | Ford Motor Co. | | | 249,832 | |
| |
Beverages 0.4% | | | | |
| 1,120 | | Constellation Brands, Inc. (Class A Stock)(a) | | | 85,870 | |
| 3,771 | | Diageo PLC (United Kingdom) | | | 111,834 | |
| 1,700 | | Molson Coors Brewing Co. (Class B Stock) | | | 89,488 | |
| 1,775 | | PepsiCo, Inc. | | | 142,639 | |
| 786 | | Pernod-Ricard SA (France) | | | 84,410 | |
| | | | | | |
| | | | | 514,241 | |
See Notes to Financial Statements.
| | | | |
| Target Conservative Allocation Fund | | | 11 | |
Portfolio of Investments
as of January 31, 2014 (Unaudited) continued
| | | | | | |
| Shares | | Description | | Value (Note 1) | |
COMMON STOCKS (Continued) | | | | |
| |
Biotechnology 1.5% | | | | |
| 553 | | Acorda Therapeutics, Inc.(a) | | $ | 16,231 | |
| 190 | | Aegerion Pharmaceuticals, Inc.(a) | | | 11,396 | |
| 1,840 | | Alexion Pharmaceuticals, Inc.(a) | | | 292,063 | |
| 800 | | Amgen, Inc. | | | 95,160 | |
| 1,278 | | Biogen Idec, Inc.(a) | | | 399,554 | |
| 1,601 | | Celgene Corp.(a) | | | 243,240 | |
| 2,384 | | Cell Therapeutics, Inc.(a) | | | 7,605 | |
| 270 | | Cubist Pharmaceuticals, Inc.(a) | | | 19,734 | |
| 4,950 | | Gilead Sciences, Inc.(a) | | | 399,217 | |
| 20 | | Intercept Pharmaceuticals, Inc.(a) | | | 6,018 | |
| 272 | | Isis Pharmaceuticals, Inc.(a) | | | 13,888 | |
| 225 | | NPS Pharmaceuticals, Inc.(a) | | | 8,050 | |
| 330 | | Ophthotech Corp.(a) | | | 10,194 | |
| 410 | | Regeneron Pharmaceuticals, Inc.(a) | | | 118,322 | |
| 394 | | Seattle Genetics, Inc.(a) | | | 17,675 | |
| 539 | | Theravance, Inc.(a) | | | 19,846 | |
| 469 | | United Therapeutics Corp.(a) | | | 48,129 | |
| | | | | | |
| | | | | 1,726,322 | |
| |
Building Products 0.1% | | | | |
| 200 | | Lennox International, Inc. | | | 17,312 | |
| 1,204 | | PGT, Inc.(a) | | | 12,859 | |
| 270 | | Trex Co., Inc.(a) | | | 18,989 | |
| 328 | | USG Corp.(a) | | | 10,037 | |
| | | | | | |
| | | | | 59,197 | |
| |
Capital Markets 1.0% | | | | |
| 1,115 | | Affiliated Managers Group, Inc.(a) | | | 222,152 | |
| 1,475 | | Ares Capital Corp. | | | 26,122 | |
| 2,000 | | Bank of New York Mellon Corp. (The) | | | 63,920 | |
| 1,408 | | BlackRock, Inc. | | | 423,062 | |
| 369 | | Eaton Vance Corp. | | | 14,048 | |
| 500 | | Goldman Sachs Group, Inc. (The) | | | 82,060 | |
| 400 | | LPL Financial Holdings, Inc. | | | 21,412 | |
| 4,610 | | Morgan Stanley | | | 136,041 | |
| 411 | | Raymond James Financial, Inc. | | | 20,924 | |
| 1,400 | | State Street Corp. | | | 93,730 | |
| 706 | | Stifel Financial Corp.(a) | | | 31,876 | |
| 500 | | TCP Capital Corp. | | | 8,660 | |
| | | | | | |
| | | | | 1,144,007 | |
See Notes to Financial Statements.
| | | | | | |
| Shares | | Description | | Value (Note 1) | |
COMMON STOCKS (Continued) | | | | |
| |
Chemicals 1.2% | | | | |
| 1,210 | | Airgas, Inc. | | $ | 124,920 | |
| 442 | | Cabot Corp. | | | 21,512 | |
| 3,535 | | E.I. du Pont de Nemours & Co. | | | 215,670 | |
| 1,014 | | Huntsman Corp. | | | 22,227 | |
| 3,163 | | Monsanto Co. | | | 337,018 | |
| 500 | | PPG Industries, Inc. | | | 91,180 | |
| 2,455 | | Praxair, Inc. | | | 306,188 | |
| 448 | | Quaker Chemical Corp. | | | 30,961 | |
| 258 | | Scotts Miracle-Gro Co. (The) (Class A Stock) | | | 15,323 | |
| 778 | | Sherwin-Williams Co. (The) | | | 142,576 | |
| 308 | | Valspar Corp. (The) | | | 21,646 | |
| | | | | | |
| | | | | 1,329,221 | |
| |
Commercial Banks 1.0% | | | | |
| 250 | | Associated Banc-Corp. | | | 4,118 | |
| 900 | | BB&T Corp. | | | 33,669 | |
| 450 | | Capital Bank Financial Corp. (Class A Stock)(a) | | | 10,372 | |
| 5,080 | | CIT Group, Inc. | | | 236,474 | |
| 4,300 | | Fifth Third Bancorp | | | 90,386 | |
| 1,305 | | FirstMerit Corp. | | | 26,557 | |
| 325 | | Fulton Financial Corp. | | | 4,014 | |
| 325 | | Hancock Holding Co. | | | 11,245 | |
| 1,300 | | PNC Financial Services Group, Inc. (The) | | | 103,844 | |
| 350 | | Prosperity Bancshares, Inc. | | | 21,896 | |
| 572 | | Trustmark Corp. | | | 13,591 | |
| 307 | | UMB Financial Corp. | | | 18,202 | |
| 400 | | Union First Market Bankshares Corp. | | | 9,228 | |
| 425 | | United Bankshares, Inc. | | | 12,703 | |
| 775 | | Webster Financial Corp. | | | 23,513 | |
| 11,001 | | Wells Fargo & Co. | | | 498,785 | |
| | | | | | |
| | | | | 1,118,597 | |
| |
Commercial Services & Supplies | | | | |
| 725 | | KAR Auction Services, Inc. | | | 20,169 | |
| 100 | | McGrath RentCorp | | | 3,662 | |
| 562 | | Waste Connections, Inc. | | | 22,975 | |
| | | | | | |
| | | | | 46,806 | |
| |
Communications Equipment 0.5% | | | | |
| 709 | | Aruba Networks, Inc.(a) | | | 13,975 | |
See Notes to Financial Statements.
| | | | |
| Target Conservative Allocation Fund | | | 13 | |
Portfolio of Investments
as of January 31, 2014 (Unaudited) continued
| | | | | | |
| Shares | | Description | | Value (Note 1) | |
COMMON STOCKS (Continued) | | | | |
| |
Communications Equipment (cont’d.) | | | | |
| 11,300 | | Cisco Systems, Inc. | | $ | 247,583 | |
| 75 | | CommScope Holding Co., Inc.(a) | | | 1,345 | |
| 742 | | Ixia(a) | | | 9,490 | |
| 225 | | Palo Alto Networks, Inc.(a) | | | 13,376 | |
| 4,450 | | QUALCOMM, Inc. | | | 330,279 | |
| | | | | | |
| | | | | 616,048 | |
| |
Computers & Peripherals 1.2% | | | | |
| 1,158 | | Apple, Inc. | | | 579,695 | |
| 14,319 | | EMC Corp. | | | 347,092 | |
| 7,800 | | Hewlett-Packard Co. | | | 226,200 | |
| 3,410 | | Seagate Technology PLC | | | 180,253 | |
| | | | | | |
| | | | | 1,333,240 | |
| |
Construction & Engineering 0.1% | | | | |
| 593 | | Foster Wheeler AG (Switzerland)(a) | | | 17,778 | |
| 575 | | MasTec, Inc.(a) | | | 20,666 | |
| 513 | | Northwest Pipe Co.(a) | | | 17,996 | |
| 267 | | URS Corp. | | | 13,403 | |
| | | | | | |
| | | | | 69,843 | |
| |
Construction Materials | | | | |
| 470 | | Texas Industries, Inc.(a) | | | 35,353 | |
| |
Consumer Finance 0.7% | | | | |
| 2,910 | | American Express Co. | | | 247,408 | |
| 4,400 | | Capital One Financial Corp. | | | 310,684 | |
| 340 | | Cash America International, Inc. | | | 12,488 | |
| 200 | | First Cash Financial Services, Inc.(a) | | | 9,828 | |
| 7,500 | | SLM Corp. | | | 170,700 | |
| | | | | | |
| | | | | 751,108 | |
| |
Containers & Packaging | | | | |
| 2,100 | | Graphic Packaging Holding Co.(a) | | | 19,950 | |
| 225 | | Packaging Corp. of America | | | 14,535 | |
| 400 | | Silgan Holdings, Inc. | | | 18,332 | |
| | | | | | |
| | | | | 52,817 | |
| |
Distributors | | | | |
| 1,960 | | LKQ Corp.(a) | | | 53,057 | |
See Notes to Financial Statements.
| | | | | | |
| Shares | | Description | | Value (Note 1) | |
COMMON STOCKS (Continued) | | | | |
| |
Diversified Consumer Services | | | | |
| 175 | | Grand Canyon Education, Inc.(a) | | $ | 7,669 | |
| 550 | | Hillenbrand, Inc. | | | 14,888 | |
| 117 | | Sotheby’s | | | 5,607 | |
| | | | | | |
| | | | | 28,164 | |
| |
Diversified Financial Services 1.8% | | | | |
| 26,753 | | Bank of America Corp. | | | 448,113 | |
| 8,555 | | Citigroup, Inc. | | | 405,764 | |
| 4,415 | | CME Group, Inc. | | | 330,065 | |
| 1,556 | | IntercontinentalExchange Group, Inc. | | | 324,877 | |
| 10,100 | | JPMorgan Chase & Co. | | | 559,136 | |
| | | | | | |
| | | | | 2,067,955 | |
| |
Diversified Telecommunication Services 0.3% | | | | |
| 5,300 | | AT&T, Inc. | | | 176,596 | |
| 5,000 | | CenturyLink, Inc. | | | 144,300 | |
| | | | | | |
| | | | | 320,896 | |
| |
Electric Utilities 0.5% | | | | |
| 3,500 | | American Electric Power Co., Inc. | | | 170,835 | |
| 900 | | Edison International | | | 43,344 | |
| 5,700 | | Exelon Corp. | | | 165,300 | |
| 5,200 | | PPL Corp. | | | 158,964 | |
| 1,700 | | Southern Co. (The) | | | 70,108 | |
| | | | | | |
| | | | | 608,551 | |
| |
Electrical Equipment 0.4% | | | | |
| 4,110 | | AMETEK, Inc. | | | 203,116 | |
| 481 | | EnerSys, Inc. | | | 32,737 | |
| 608 | | Franklin Electric Co., Inc. | | | 24,223 | |
| 1,495 | | Roper Industries, Inc. | | | 205,174 | |
| 920 | | Thermon Group Holdings, Inc.(a) | | | 24,913 | |
| | | | | | |
| | | | | 490,163 | |
| |
Electronic Equipment, Instruments & Components 0.4% | | | | |
| 766 | | Checkpoint Systems, Inc.(a) | | | 10,218 | |
| 562 | | Coherent, Inc.(a) | | | 37,564 | |
| 11,800 | | Corning, Inc. | | | 203,078 | |
| 616 | | FLIR Systems, Inc. | | | 19,540 | |
| 1,068 | | InvenSense, Inc.(a) | | | 21,029 | |
See Notes to Financial Statements.
| | | | |
| Target Conservative Allocation Fund | | | 15 | |
Portfolio of Investments
as of January 31, 2014 (Unaudited) continued
| | | | | | |
| Shares | | Description | | Value (Note 1) | |
COMMON STOCKS (Continued) | | | | |
| |
Electronic Equipment, Instruments & Components (cont’d.) | | | | |
| 371 | | IPG Photonics Corp.(a) | | $ | 24,809 | |
| 318 | | Itron, Inc.(a) | | | 12,841 | |
| 426 | | Littelfuse, Inc. | | | 38,127 | |
| 500 | | Sanmina Corp.(a) | | | 8,360 | |
| 875 | | TE Connectivity Ltd. (Switzerland) | | | 49,446 | |
| | | | | | |
| | | | | 425,012 | |
| |
Energy Equipment & Services 0.6% | | | | |
| 325 | | Atwood Oceanics, Inc.(a) | | | 15,405 | |
| 459 | | Bristow Group, Inc. | | | 32,951 | |
| 2,160 | | Cameron International Corp.(a) | | | 129,535 | |
| 140 | | Core Laboratories NV | | | 25,049 | |
| 1,400 | | Ensco PLC (Class A Stock) | | | 70,518 | |
| 650 | | Forum Energy Technologies, Inc.(a) | | | 16,328 | |
| 332 | | Geospace Technologies Corp.(a) | | | 26,401 | |
| 4,185 | | National Oilwell Varco, Inc. | | | 313,917 | |
| 1,314 | | Newpark Resources, Inc.(a) | | | 14,927 | |
| | | | | | |
| | | | | 645,031 | |
| |
Food & Staples Retailing 1.1% | | | | |
| 1,566 | | Costco Wholesale Corp. | | | 175,956 | |
| 7,145 | | CVS Caremark Corp. | | | 483,859 | |
| 448 | | Fresh Market, Inc. (The)(a) | | | 15,662 | |
| 4,300 | | Kroger Co. (The) | | | 155,230 | |
| 871 | | Natural Grocers by Vitamin Cottage, Inc.(a) | | | 33,072 | |
| 2,275 | | Rite Aid Corp.(a) | | | 12,626 | |
| 417 | | United Natural Foods, Inc.(a) | | | 28,177 | |
| 2,700 | | Wal-Mart Stores, Inc. | | | 201,636 | |
| 3,000 | | Walgreen Co. | | | 172,050 | |
| | | | | | |
| | | | | 1,278,268 | |
| |
Food Products 0.6% | | | | |
| 5,400 | | ConAgra Foods, Inc. | | | 171,666 | |
| 1,133 | | Danone (France) | | | 74,799 | |
| 900 | | Kellogg Co. | | | 52,182 | |
| 1,304 | | Mead Johnson Nutrition Co. | | | 100,265 | |
| 6,650 | | Mondelez International, Inc. (Class A Stock) | | | 217,787 | |
| 140 | | Pinnacle Foods, Inc. | | | 3,780 | |
| 1,420 | | WhiteWave Foods Co. (The) (Class A Stock)(a) | | | 34,378 | |
| | | | | | |
| | | | | 654,857 | |
See Notes to Financial Statements.
| | | | | | |
| Shares | | Description | | Value (Note 1) | |
COMMON STOCKS (Continued) | | | | |
| |
Gas Utilities | | | | |
| 275 | | Atmos Energy Corp. | | $ | 13,203 | |
| 129 | | ONEOK, Inc. | | | 8,835 | |
| 318 | | South Jersey Industries, Inc. | | | 16,962 | |
| 431 | | WGL Holdings, Inc. | | | 16,283 | |
| | | | | | |
| | | | | 55,283 | |
| |
Health Care Equipment & Supplies 0.8% | | | | |
| 5,620 | | Abbott Laboratories | | | 206,029 | |
| 250 | | Alere, Inc.(a) | | | 9,475 | |
| 285 | | Align Technology, Inc.(a) | | | 16,935 | |
| 851 | | ArthroCare Corp.(a) | | | 38,618 | |
| 634 | | Cantel Medical Corp. | | | 20,098 | |
| 549 | | Cooper Cos., Inc. (The) | | | 68,230 | |
| 3,138 | | Covidien PLC | | | 214,137 | |
| 75 | | Cyberonics, Inc.(a) | | | 5,010 | |
| 292 | | Endologix, Inc.(a) | | | 4,672 | |
| 375 | | Integra LifeSciences Holdings Corp.(a) | | | 17,422 | |
| 3,200 | | Medtronic, Inc. | | | 180,992 | |
| 201 | | Natus Medical, Inc.(a) | | | 5,204 | |
| 260 | | Sirona Dental Systems, Inc.(a) | | | 18,704 | |
| 179 | | Spectranetics Corp. (The)(a) | | | 4,658 | |
| 200 | | Teleflex, Inc. | | | 18,728 | |
| 823 | | Thoratec Corp.(a) | | | 28,756 | |
| 700 | | Zimmer Holdings, Inc. | | | 65,779 | |
| | | | | | |
| | | | | 923,447 | |
| |
Health Care Providers & Services 1.3% | | | | |
| 570 | | Air Methods Corp.(a) | | | 29,315 | |
| 1,586 | | Catamaran Corp.(a) | | | 77,111 | |
| 863 | | Centene Corp.(a) | | | 52,298 | |
| 2,100 | | Cigna Corp. | | | 181,251 | |
| 375 | | Community Health Systems, Inc.(a) | | | 15,529 | |
| 4,014 | | Express Scripts Holding Co.(a) | | | 299,806 | |
| 654 | | Healthways, Inc.(a) | | | 10,013 | |
| 700 | | Humana, Inc. | | | 68,110 | |
| 150 | | LifePoint Hospitals, Inc.(a) | | | 7,951 | |
| 404 | | MEDNAX, Inc.(a) | | | 22,478 | |
| 29 | | MWI Veterinary Supply, Inc.(a) | | | 5,401 | |
| 474 | | Team Health Holdings, Inc.(a) | | | 20,458 | |
| 7,520 | | UnitedHealth Group, Inc. | | | 543,546 | |
| 1,300 | | WellPoint, Inc. | | | 111,800 | |
| | | | | | |
| | | | | 1,445,067 | |
See Notes to Financial Statements.
| | | | |
| Target Conservative Allocation Fund | | | 17 | |
Portfolio of Investments
as of January 31, 2014 (Unaudited) continued
| | | | | | |
| Shares | | Description | | Value (Note 1) | |
COMMON STOCKS (Continued) | | | | |
| |
Health Care Technology 0.2% | | | | |
| 70 | | athenahealth, Inc.(a) | | $ | 10,318 | |
| 2,878 | | Cerner Corp.(a) | | | 163,729 | |
| 1,888 | | MedAssets, Inc.(a) | | | 41,612 | |
| 96 | | Medidata Solutions, Inc.(a) | | | 6,058 | |
| | | | | | |
| | | | | 221,717 | |
| |
Hotels, Restaurants & Leisure 1.2% | | | | |
| 512 | | Bally Technologies, Inc.(a) | | | 37,540 | |
| 50 | | Bob Evans Farms, Inc. | | | 2,512 | |
| 320 | | Chuy’s Holdings, Inc.(a) | | | 11,558 | |
| 14,712 | | International Game Technology | | | 212,294 | |
| 410 | | International Speedway Corp. (Class A Stock) | | | 13,764 | |
| 300 | | Jack in the Box, Inc.(a) | | | 15,171 | |
| 3,410 | | Las Vegas Sands Corp. | | | 260,933 | |
| 394 | | Life Time Fitness, Inc.(a) | | | 16,217 | |
| 1,780 | | Marriott International, Inc. (Class A Stock) | | | 87,754 | |
| 500 | | McDonald’s Corp. | | | 47,085 | |
| 1,618 | | Orient-Express Hotels Ltd. (Class A Stock)(a) | | | 22,911 | |
| 336 | | Pinnacle Entertainment, Inc.(a) | | | 7,342 | |
| 167 | | Potbelly Corp.(a) | | | 3,786 | |
| 2,390 | | Starbucks Corp. | | | 169,977 | |
| 1,635 | | Wynn Resorts Ltd. | | | 355,482 | |
| 1,926 | | Yum! Brands, Inc. | | | 129,331 | |
| | | | | | |
| | | | | 1,393,657 | |
| |
Household Durables 0.1% | | | | |
| 225 | | Harman International Industries, Inc. | | | 23,272 | |
| 74 | | Helen of Troy Ltd.(a) | | | 4,073 | |
| 414 | | Meritage Homes Corp.(a) | | | 20,108 | |
| 100 | | Ryland Group, Inc. (The) | | | 4,464 | |
| 616 | | Universal Electronics, Inc.(a) | | | 22,016 | |
| | | | | | |
| | | | | 73,933 | |
| |
Household Products 0.1% | | | | |
| 1,928 | | Colgate-Palmolive Co. | | | 118,051 | |
| |
Independent Power Producers & Energy Traders 0.1% | | | | |
| 4,300 | | NRG Energy, Inc. | | | 119,755 | |
See Notes to Financial Statements.
| | | | | | |
| Shares | | Description | | Value (Note 1) | |
COMMON STOCKS (Continued) | | | | |
| |
Industrial Conglomerates 0.6% | | | | |
| 5,988 | | Danaher Corp. | | $ | 445,447 | |
| 10,400 | | General Electric Co. | | | 261,352 | |
| | | | | | |
| | | | | 706,799 | |
| |
Insurance 1.6% | | | | |
| 8,600 | | Allstate Corp. (The) | | | 440,320 | |
| 1,323 | | American Equity Investment Life Holding Co. | | | 29,040 | |
| 11,085 | | American International Group, Inc. | | | 531,637 | |
| 350 | | Aspen Insurance Holdings Ltd. | | | 13,615 | |
| 1,050 | | CNO Financial Group, Inc. | | | 17,787 | |
| 512 | | HCC Insurance Holdings, Inc. | | | 21,970 | |
| 534 | | Horace Mann Educators Corp. | | | 14,899 | |
| 775 | | Maiden Holdings Ltd. | | | 8,509 | |
| 6,135 | | Marsh & McLennan Cos., Inc. | | | 280,431 | |
| 5,310 | | MetLife, Inc. | | | 260,455 | |
| 200 | | Platinum Underwriters Holdings Ltd. | | | 11,368 | |
| 513 | | Protective Life Corp. | | | 25,142 | |
| 257 | | Reinsurance Group of America, Inc. | | | 19,190 | |
| 283 | | State Auto Financial Corp. | | | 5,428 | |
| 1,100 | | Travelers Cos., Inc. (The) | | | 89,408 | |
| 537 | | United Fire Group, Inc. | | | 13,479 | |
| 3,500 | | Unum Group | | | 112,700 | |
| | | | | | |
| | | | | 1,895,378 | |
| |
Internet & Catalog Retail 0.6% | | | | |
| 892 | | Amazon.com, Inc.(a) | | | 319,951 | |
| 350 | | priceline.com, Inc.(a) | | | 400,712 | |
| | | | | | |
| | | | | 720,663 | |
| |
Internet Software & Services 1.9% | | | | |
| 784 | | Angie’s List, Inc.(a) | | | 14,065 | |
| 622 | | Cornerstone OnDemand, Inc.(a) | | | 35,485 | |
| 338 | | Demandware, Inc.(a) | | | 21,524 | |
| 512 | | Digital River, Inc.(a) | | | 9,001 | |
| 234 | | E2open, Inc.(a) | | | 5,604 | |
| 5,090 | | eBay, Inc.(a) | | | 270,788 | |
| 6,320 | | Facebook, Inc. (Class A Stock)(a) | | | 395,442 | |
| 973 | | Google, Inc. (Class A Stock)(a) | | | 1,149,084 | |
| 505 | | LinkedIn Corp. (Class A Stock)(a) | | | 108,681 | |
| 672 | | Marin Software, Inc.(a) | | | 6,633 | |
See Notes to Financial Statements.
| | | | |
| Target Conservative Allocation Fund | | | 19 | |
Portfolio of Investments
as of January 31, 2014 (Unaudited) continued
| | | | | | |
| Shares | | Description | | Value (Note 1) | |
COMMON STOCKS (Continued) | | | | |
| |
Internet Software & Services (cont’d.) | | | | |
| 680 | | Trulia, Inc.(a) | | $ | 23,480 | |
| 520 | | Twitter, Inc.(a) | | | 33,540 | |
| 1,950 | | Yahoo!, Inc.(a) | | | 70,239 | |
| | | | | | |
| | | | | 2,143,566 | |
| |
IT Services 1.6% | | | | |
| 550 | | Broadridge Financial Solutions, Inc. | | | 19,959 | |
| 3,294 | | Cognizant Technology Solutions Corp. (Class A Stock)(a) | | | 319,254 | |
| 275 | | EPAM Systems, Inc.(a) | | | 11,248 | |
| 1,320 | | FleetCor Technologies, Inc.(a) | | | 140,342 | |
| 285 | | Global Payments, Inc. | | | 18,836 | |
| 600 | | International Business Machines Corp. | | | 106,008 | |
| 225 | | Jack Henry & Associates, Inc. | | | 12,551 | |
| 5,537 | | MasterCard, Inc. (Class A Stock) | | | 419,040 | |
| 986 | | Sapient Corp.(a) | | | 15,806 | |
| 700 | | Teradata Corp.(a) | | | 28,784 | |
| 2,515 | | Visa, Inc. (Class A Stock) | | | 541,806 | |
| 14,800 | | Xerox Corp. | | | 160,580 | |
| | | | | | |
| | | | | 1,794,214 | |
| |
Leisure Equipment & Products | | | | |
| 259 | | Polaris Industries, Inc. | | | 32,427 | |
| |
Life Sciences Tools & Services 0.9% | | | | |
| 6,445 | | Agilent Technologies, Inc. | | | 374,777 | |
| 215 | | Covance, Inc.(a) | | | 20,330 | |
| 152 | | Furiex Pharmaceuticals, Inc.(a) | | | 7,047 | |
| 890 | | Illumina, Inc.(a) | | | 135,280 | |
| 244 | | PAREXEL International Corp.(a) | | | 11,910 | |
| 4,132 | | Thermo Fisher Scientific, Inc. | | | 475,758 | |
| | | | | | |
| | | | | 1,025,102 | |
| |
Machinery 0.9% | | | | |
| 400 | | Actuant Corp. (Class A Stock) | | | 13,688 | |
| 187 | | Chart Industries, Inc.(a) | | | 15,977 | |
| 398 | | Colfax Corp.(a) | | | 23,980 | |
| 2,092 | | Cummins, Inc. | | | 265,642 | |
| 5,070 | | Ingersoll-Rand PLC | | | 298,065 | |
| 1,019 | | Joy Global, Inc. | | | 53,793 | |
| 759 | | Manitowoc Co., Inc. (The) | | | 21,594 | |
See Notes to Financial Statements.
| | | | | | |
| Shares | | Description | | Value (Note 1) | |
COMMON STOCKS (Continued) | | | | |
| |
Machinery (cont’d.) | | | | |
| 1,800 | | PACCAR, Inc. | | $ | 100,800 | |
| 800 | | Parker Hannifin Corp. | | | 90,696 | |
| 425 | | Rexnord Corp.(a) | | | 11,042 | |
| 249 | | Snap-on, Inc. | | | 24,937 | |
| 900 | | Stanley Black & Decker, Inc. | | | 69,660 | |
| 359 | | Timken Co. | | | 20,222 | |
| 331 | | TriMas Corp.(a) | | | 11,519 | |
| 1,000 | | Wabash National Corp.(a) | | | 13,710 | |
| 145 | | WABCO Holdings, Inc.(a) | | | 12,502 | |
| 342 | | Woodward, Inc. | | | 14,655 | |
| | | | | | |
| | | | | 1,062,482 | |
| |
Media 2.0% | | | | |
| 490 | | AMC Networks, Inc. (Class A Stock)(a) | | | 31,576 | |
| 1,500 | | CBS Corp. (Class B Stock) | | | 88,080 | |
| 10,616 | | Comcast Corp. (Special Class A Stock) | | | 555,748 | |
| 3,280 | | Discovery Communications, Inc. (Class A Stock)(a) | | | 261,678 | |
| 3,900 | | Interpublic Group of Cos., Inc. (The) | | | 63,648 | |
| 1,020 | | Time Warner Cable, Inc. | | | 135,935 | |
| 5,530 | | Time Warner, Inc. | | | 347,450 | |
| 10,620 | | Twenty-First Century Fox, Inc. | | | 337,928 | |
| 1,810 | | Viacom, Inc. (Class B Stock) | | | 148,601 | |
| 3,860 | | Walt Disney Co. (The) | | | 280,275 | |
| | | | | | |
| | | | | 2,250,919 | |
| |
Metals & Mining 0.2% | | | | |
| 453 | | AMCOL International Corp. | | | 15,434 | |
| 4,700 | | Freeport-McMoRan Copper & Gold, Inc. | | | 152,327 | |
| 200 | | Globe Specialty Metals, Inc. | | | 3,496 | |
| 200 | | Reliance Steel & Aluminum Co. | | | 13,990 | |
| 797 | | RTI International Metals, Inc.(a) | | | 24,802 | |
| | | | | | |
| | | | | 210,049 | |
| |
Multi-Utilities 0.2% | | | | |
| 5,600 | | Public Service Enterprise Group, Inc. | | | 186,704 | |
| |
Multiline Retail 0.2% | | | | |
| 1,700 | | Macy’s, Inc. | | | 90,440 | |
| 3,100 | | Target Corp. | | | 175,584 | |
| | | | | | |
| | | | | 266,024 | |
See Notes to Financial Statements.
| | | | |
| Target Conservative Allocation Fund | | | 21 | |
Portfolio of Investments
as of January 31, 2014 (Unaudited) continued
| | | | | | |
| Shares | | Description | | Value (Note 1) | |
COMMON STOCKS (Continued) | | | | |
| |
Oil, Gas & Consumable Fuels 2.2% | | | | |
| 1,660 | | Anadarko Petroleum Corp. | | $ | 133,945 | |
| 570 | | Antero Resources Corp.(a) | | | 33,482 | |
| 3,280 | | Cabot Oil & Gas Corp. | | | 131,134 | |
| 3,000 | | Chesapeake Energy Corp. | | | 80,730 | |
| 2,300 | | Chevron Corp. | | | 256,749 | |
| 2,400 | | ConocoPhillips | | | 155,880 | |
| 145 | | Diamondback Energy, Inc.(a) | | | 7,537 | |
| 533 | | Gulfport Energy Corp.(a) | | | 32,486 | |
| 3,603 | | HollyFrontier Corp. | | | 166,819 | |
| 7,500 | | Marathon Oil Corp. | | | 245,925 | |
| 3,700 | | Murphy Oil Corp. | | | 209,457 | |
| 1,953 | | Noble Energy, Inc. | | | 121,731 | |
| 525 | | Oasis Petroleum, Inc.(a) | | | 21,950 | |
| 1,241 | | Pioneer Natural Resources Co. | | | 210,126 | |
| 840 | | Rice Energy, Inc.(a) | | | 19,757 | |
| 5,200 | | Royal Dutch Shell PLC, ADR (Netherlands) | | | 359,320 | |
| 794 | | Swift Energy Co.(a) | | | 9,830 | |
| 5,700 | | Total SA, ADR (France) | | | 325,869 | |
| | | | | | |
| | | | | 2,522,727 | |
| |
Paper & Forest Products 0.4% | | | | |
| 175 | | Clearwater Paper Corp.(a) | | | 9,966 | |
| 8,515 | | International Paper Co. | | | 406,506 | |
| | | | | | |
| | | | | 416,472 | |
| |
Personal Products 0.1% | | | | |
| 275 | | Elizabeth Arden, Inc.(a) | | | 7,458 | |
| 1,829 | | Estee Lauder Cos., Inc. (The) (Class A Stock) | | | 125,725 | |
| | | | | | |
| | | | | 133,183 | |
| |
Pharmaceuticals 2.4% | | | | |
| 6,610 | | AbbVie, Inc. | | | 325,410 | |
| 1,480 | | Actavis PLC(a) | | | 279,690 | |
| 4,700 | �� | AstraZeneca PLC, ADR (United Kingdom) | | | 298,450 | |
| 5,450 | | Bristol-Myers Squibb Co. | | | 272,337 | |
| 2,100 | | Eli Lilly & Co. | | | 113,421 | |
| 3,800 | | Johnson & Johnson | | | 336,186 | |
| 4,000 | | Merck & Co., Inc. | | | 211,880 | |
| 1,000 | | Novartis AG, ADR (Switzerland) | | | 79,070 | |
| 1,112 | | Perrigo Co. PLC | | | 173,094 | |
See Notes to Financial Statements.
| | | | | | |
| Shares | | Description | | Value (Note 1) | |
COMMON STOCKS (Continued) | | | | |
| |
Pharmaceuticals (cont’d.) | | | | |
| 5,700 | | Pfizer, Inc. | | $ | 173,280 | |
| 208 | | Salix Pharmaceuticals Ltd.(a) | | | 20,247 | |
| 2,700 | | Sanofi, ADR (France) | | | 132,030 | |
| 1,620 | | Valeant Pharmaceuticals International, Inc.(a) | | | 219,737 | |
| 2,390 | | Zoetis, Inc. | | | 72,560 | |
| | | | | | |
| | | | | 2,707,392 | |
| |
Professional Services 0.1% | | | | |
| 375 | | ICF International, Inc.(a) | | | 12,623 | |
| 400 | | Manpowergroup, Inc. | | | 31,160 | |
| 2,050 | | Verisk Analytics, Inc. (Class A Stock)(a) | | | 130,913 | |
| | | | | | |
| | | | | 174,696 | |
| |
Real Estate Investment Trusts (REITs) 0.5% | | | | |
| 5,164 | | American Tower Corp. | | | 417,664 | |
| 825 | | Excel Trust, Inc. | | | 9,413 | |
| 1,187 | | First Potomac Realty Trust | | | 15,502 | |
| 939 | | Geo Group, Inc. (The) | | | 31,438 | |
| 2,300 | | Hersha Hospitality Trust | | | 12,489 | |
| 200 | | Highwoods Properties, Inc. | | | 7,428 | |
| 1,346 | | Medical Properties Trust, Inc. | | | 17,862 | |
| 878 | | Two Harbors Investment Corp. | | | 8,631 | |
| | | | | | |
| | | | | 520,427 | |
| |
Road & Rail 0.3% | | | | |
| 200 | | Celadon Group, Inc. | | | 4,156 | |
| 325 | | Con-way, Inc. | | | 12,503 | |
| 729 | | Kansas City Southern | | | 76,975 | |
| 284 | | Landstar System, Inc. | | | 16,313 | |
| 1,000 | | Norfolk Southern Corp. | | | 92,590 | |
| 1,039 | | Quality Distribution, Inc.(a) | | | 14,286 | |
| 588 | | Union Pacific Corp. | | | 102,453 | |
| | | | | | |
| | | | | 319,276 | |
| |
Semiconductors & Semiconductor Equipment 0.7% | | | | |
| 5,590 | | Altera Corp. | | | 186,874 | |
| 454 | | Cabot Microelectronics Corp.(a) | | | 18,305 | |
| 667 | | Cavium, Inc.(a) | | | 24,793 | |
| 1,633 | | Entegris, Inc.(a) | | | 17,179 | |
| 348 | | EZchip Semiconductor Ltd. (Israel)(a) | | | 8,488 | |
See Notes to Financial Statements.
| | | | |
| Target Conservative Allocation Fund | | | 23 | |
Portfolio of Investments
as of January 31, 2014 (Unaudited) continued
| | | | | | |
| Shares | | Description | | Value (Note 1) | |
COMMON STOCKS (Continued) | | | | |
| |
Semiconductors & Semiconductor Equipment (cont’d.) | | | | |
| 7,400 | | Intel Corp. | | $ | 181,596 | |
| 497 | | Kulicke & Soffa Industries, Inc. (Singapore)(a) | | | 5,785 | |
| 1,800 | | Linear Technology Corp. | | | 80,172 | |
| 470 | | Monolithic Power Systems, Inc.(a) | | | 15,364 | |
| 775 | | Skyworks Solutions, Inc.(a) | | | 23,444 | |
| 920 | | SunEdison, Inc.(a) | | | 12,797 | |
| 906 | | Teradyne, Inc.(a) | | | 17,042 | |
| 5,960 | | Texas Instruments, Inc. | | | 252,704 | |
| 509 | | Veeco Instruments, Inc.(a) | | | 19,347 | |
| | | | | | |
| | | | | 863,890 | |
| |
Software 2.2% | | | | |
| 175 | | ACI Worldwide, Inc.(a) | | | 10,607 | |
| 514 | | Aspen Technology, Inc.(a) | | | 23,423 | |
| 2,820 | | Autodesk, Inc.(a) | | | 144,525 | |
| 275 | | BroadSoft, Inc.(a) | | | 8,418 | |
| 3,000 | | CA, Inc. | | | 96,240 | |
| 3,365 | | Check Point Software Technologies Ltd. (Israel)(a) | | | 220,172 | |
| 2,893 | | Citrix Systems, Inc.(a) | | | 156,425 | |
| 203 | | Concur Technologies, Inc.(a) | | | 24,632 | |
| 5,910 | | Electronic Arts, Inc.(a) | | | 156,024 | |
| 175 | | Ellie Mae, Inc.(a) | | | 4,568 | |
| 545 | | Epiq Systems, Inc. | | | 7,826 | |
| 300 | | Fair Isaac Corp. | | | 16,308 | |
| 785 | | Fortinet, Inc.(a) | | | 16,642 | |
| 304 | | Guidewire Software, Inc.(a) | | | 14,352 | |
| 401 | | Imperva, Inc.(a) | | | 22,055 | |
| 19,140 | | Microsoft Corp. | | | 724,449 | |
| 481 | | NICE Systems Ltd., ADR (Israel) | | | 18,975 | |
| 10,970 | | Oracle Corp. | | | 404,793 | |
| 1,978 | | PTC, Inc.(a) | | | 70,575 | |
| 463 | | Qlik Technologies, Inc.(a) | | | 12,510 | |
| 385 | | Qualys, Inc.(a) | | | 11,157 | |
| 4,008 | | salesforce.com, Inc.(a) | | | 242,604 | |
| 425 | | SS&C Technologies Holdings, Inc.(a) | | | 16,499 | |
| 1,950 | | TIBCO Software, Inc.(a) | | | 41,515 | |
| 100 | | Ultimate Software Group, Inc. (The)(a) | | | 16,323 | |
| 475 | | Verint Systems, Inc.(a) | | | 21,584 | |
| 660 | | VMware, Inc. (Class A Stock)(a) | | | 59,492 | |
| | | | | | |
| | | | | 2,562,693 | |
See Notes to Financial Statements.
| | | | | | |
| Shares | | Description | | Value (Note 1) | |
COMMON STOCKS (Continued) | | | | |
| |
Specialty Retail 0.9% | | | | |
| 934 | | Aaron’s, Inc. | | $ | 25,115 | |
| 250 | | Abercrombie & Fitch Co. (Class A Stock) | | | 8,845 | |
| 205 | | AutoZone, Inc.(a) | | | 101,487 | |
| 825 | | Chico’s FAS, Inc. | | | 13,695 | |
| 793 | | Genesco, Inc.(a) | | | 55,684 | |
| 300 | | GNC Holdings, Inc. (Class A Stock) | | | 15,333 | |
| 250 | | Group 1 Automotive, Inc. | | | 15,283 | |
| 375 | | Men’s Wearhouse, Inc. (The) | | | 18,015 | |
| 183 | | Outerwall, Inc.(a) | | | 11,769 | |
| 700 | | PetSmart, Inc. | | | 44,100 | |
| 3,670 | | Ross Stores, Inc. | | | 249,230 | |
| 6,000 | | Staples, Inc. | | | 78,960 | |
| 1,270 | | Tiffany & Co. | | | 105,651 | |
| 2,330 | | TJX Cos., Inc. (The) | | | 133,649 | |
| 1,177 | | Tractor Supply Co. | | | 78,282 | |
| 671 | | TravelCenters of America LLC(a) | | | 5,771 | |
| 899 | | Vitamin Shoppe, Inc.(a) | | | 40,293 | |
| | | | | | |
| | | | | 1,001,162 | |
| |
Textiles, Apparel & Luxury Goods 0.6% | | | | |
| 200 | | Deckers Outdoor Corp.(a) | | | 15,590 | |
| 710 | | LVMH Moet Hennessy Louis Vuitton SA (France) | | | 126,305 | |
| 1,390 | | Michael Kors Holdings Ltd.(a) | | | 111,103 | |
| 1,800 | | NIKE, Inc. (Class B Stock) | | | 131,130 | |
| 642 | | PVH Corp. | | | 77,599 | |
| 555 | | Steven Madden Ltd.(a) | | | 18,087 | |
| 3,835 | | VF Corp. | | | 224,156 | |
| 381 | | Vince Holding Corp.(a) | | | 8,900 | |
| 325 | | Wolverine World Wide, Inc. | | | 9,068 | |
| | | | | | |
| | | | | 721,938 | |
| |
Thrifts & Mortgage Finance | | | | |
| 734 | | Astoria Financial Corp. | | | 9,718 | |
| 865 | | Home Loan Servicing Solutions Ltd. | | | 17,750 | |
| 1,180 | | MGIC Investment Corp.(a) | | | 10,018 | |
| | | | | | |
| | | | | 37,486 | |
| |
Tobacco 0.2% | | | | |
| 2,600 | | Altria Group, Inc. | | | 91,572 | |
| 1,220 | | Philip Morris International, Inc. | | | 95,331 | |
| | | | | | |
| | | | | 186,903 | |
See Notes to Financial Statements.
| | | | |
| Target Conservative Allocation Fund | | | 25 | |
Portfolio of Investments
as of January 31, 2014 (Unaudited) continued
| | | | | | |
| Shares | | Description | | Value (Note 1) | |
COMMON STOCKS (Continued) | | | | |
| |
Trading Companies & Distributors 0.1% | | | | |
| 473 | | CAI International, Inc.(a) | | $ | 9,786 | |
| 75 | | DXP Enterprises, Inc.(a) | | | 7,203 | |
| 443 | | GATX Corp. | | | 25,650 | |
| 238 | | TAL International Group, Inc.(a) | | | 10,241 | |
| 175 | | United Rentals, Inc.(a) | | | 14,165 | |
| 150 | | WESCO International, Inc.(a) | | | 12,444 | |
| | | | | | |
| | | | | 79,489 | |
| |
Wireless Telecommunication Services 0.2% | | | | |
| 152 | | SBA Communications Corp. (Class A Stock)(a) | | | 14,098 | |
| 5,700 | | Vodafone Group PLC, ADR (United Kingdom) | | | 211,242 | |
| | | | | | |
| | | | | 225,340 | |
| | | | | | |
| | TOTAL COMMON STOCKS
(cost $32,679,975) | | | 47,128,987 | |
| | | | | | |
| | |
Principal
Amount (000)# | | | | | |
ASSET-BACKED SECURITIES 3.2% | | | | |
|
Collateralized Debt Obligations 1.5% | |
| | Sierra Madre Funding Ltd., (Cayman Islands)
Series 2004-1A, Class ALTB, 144A | | | | |
| 1,042 | | 0.569%(b), 09/07/39(d) | | | 773,547 | |
| | Series 2004-1A, Class A1A, 144A | | | | |
| 439 | | 0.549%(b), 09/07/39(d) | | | 288,106 | |
| | Venture VIII CDO Ltd., Series 2007-8A, Class A2A, 144A | | | | |
| 700 | | 0.461%(b), 07/22/21 | | | 681,047 | |
| | | | | | |
| | | | | 1,742,700 | |
|
Non-Residential Mortgage-Backed Security 0.8% | |
| | SLM Student Loan Trust, Series 2008-9, Class A | | | | |
| 833 | | 1.738%(b), 04/25/23 | | | 860,106 | |
|
Residential Mortgage-Backed Securities 0.9% | |
| | Asset Backed Funding Certificates, Series 2004-OPT5, Class A1 | | | | |
| 211 | | 0.858%(b), 06/25/34 | | | 200,193 | |
| | JPMorgan Mortgage Acquisition Trust, Series 2006-WF1, Class A4 | | | | |
| 808 | | 6.13%, 07/25/36 | | | 495,351 | |
See Notes to Financial Statements.
| | | | | | |
Principal
Amount (000)# | | Description | | Value (Note 1) | |
ASSET-BACKED SECURITIES (Continued) | | | | |
|
Residential Mortgage-Backed Securities (cont’d.) | |
| | Merrill Lynch Mortgage Investors Trust, | | | | |
| | Series 2006-RM5, Class A2A | | | | |
| 82 | | 0.218%(b), 10/25/37 | | $ | 17,309 | |
| | Series 2007-MLN1, Class A2A | | | | |
| 494 | | 0.268%(b), 03/25/37 | | | 309,994 | |
| | Soundview Home Equity Loan Trust, Series 2006-NLC1,
Class A1, 144A | | | | |
| 51 | | 0.218%(b), 11/25/36 | | | 19,513 | |
| | | | | | |
| | | | | 1,042,360 | |
| | | | | | |
| | TOTAL ASSET-BACKED SECURITIES
(cost $3,636,986) | | | 3,645,166 | |
| | | | | | |
| |
CORPORATE BONDS 5.6% | | | | |
|
Airlines 0.3% | |
| | United Airlines, Inc.,
Sr. Unsec’d. Notes, 144A | | | | |
| 300 | | 6.75%, 09/15/15 | | | 308,250 | |
|
Automobile Manufacturers 0.6% | |
| | Daimler Finance North America LLC,
Gtd. Notes, 144A (Germany) | | | | |
| 700 | | 0.858%(b), 03/28/14 | | | 700,613 | |
|
Building & Construction | |
| | Urbi Desarrollos Urbanos SAB de CV,
Gtd. Notes, 144A (Mexico) | | | | |
| 100 | | 9.50%, 01/21/20 | | | 13,000 | |
|
Diversified Financial Services 1.9% | |
| | Bank of America NA,
Sr. Unsec’d. Notes | | | | |
| 800 | | 0.709%(b), 11/14/16 | | | 802,641 | |
| | Citigroup, Inc.,
Sr. Unsec’d. Notes | | | | |
| 600 | | 1.25%, 01/15/16 | | | 602,769 | |
| | Ford Motor Credit Co. LLC,
Sr. Unsec’d. Notes | | | | |
| 200 | | 5.625%, 09/15/15 | | | 214,478 | |
See Notes to Financial Statements.
| | | | |
| Target Conservative Allocation Fund | | | 27 | |
Portfolio of Investments
as of January 31, 2014 (Unaudited) continued
| | | | | | |
Principal
Amount (000)# | | Description | | Value (Note 1) | |
CORPORATE BONDS (Continued) | | | | |
|
Diversified Financial Services (cont’d.) | |
| | JPMorgan Chase & Co.,
Sr. Unsec’d. Notes, MTN | | | | |
| 600 | | 1.10%, 10/15/15 | | $ | 602,566 | |
| | | | | | |
| | | | | 2,222,454 | |
|
Financial—Bank & Trust 1.6% | |
| | Abbey National Treasury Services PLC,
Bank Gtd. Notes, 144A (United Kingdom) | | | | |
| 100 | | 3.875%, 11/10/14 | | | 102,516 | |
| | Banco Santander Brazil SA,
Sr. Unsec’d. Notes, 144A (Brazil) | | | | |
| 600 | | 2.343%(b), 03/18/14(d) | | | 600,028 | |
| | Lloyds TSB Bank PLC,
Jr. Sub. Notes, 144A (United Kingdom) | | | | |
| 800 | | 12.00%(b), 12/29/49 | | | 1,094,000 | |
| | | | | | |
| | | | | 1,796,544 | |
|
Oil, Gas & Consumable Fuels 0.6% | |
| | BP Capital Markets PLC,
Gtd. Notes (United Kingdom) | | | | |
| 400 | | 3.125%, 10/01/15 | | | 416,884 | |
| | Statoil ASA,
Gtd. Notes (Norway) | | | | |
| 300 | | 0.698%(b), 11/08/18 | | | 301,830 | |
| | | | | | |
| | | | | 718,714 | |
| |
Pharmaceuticals 0.5% | | | | |
| 500 | | Cardinal Health, Inc.,
Sr. Unsec’d. Notes
6.00%, 06/15/17 | | | 559,307 | |
| |
Telecommunications 0.1% | | | | |
| 100 | | Verizon Communications, Inc.,
Sr. Unsec’d. Notes
2.50%, 09/15/16 | | | 103,463 | |
| | | | | | |
| | TOTAL CORPORATE BONDS
(cost $6,122,372) | | | 6,422,345 | |
| | | | | | |
See Notes to Financial Statements.
| | | | | | |
Principal
Amount (000)# | | Description | | Value (Note 1) | |
FOREIGN GOVERNMENT BONDS 1.6% | | | | |
| | Spain Government Bond, Bonds (Spain) | | | | |
| EUR 300 | | 2.75%, 03/31/15 | | $ | 413,494 | |
| EUR 500 | | 3.75%, 10/31/15 | | | 706,381 | |
| EUR 500 | | 4.00%, 07/30/15 | | | 704,498 | |
| | | | | | |
| | TOTAL FOREIGN GOVERNMENT BONDS
(cost $1,849,642) | | | 1,824,373 | |
| | | | | | |
| |
MUNICIPAL BONDS 0.5% | | | | |
| |
New York 0.2% | | | | |
| | New York State Thruway Authority, Revenue Bonds | | | | |
| 100 | | 5.00%, 03/15/26 | | | 112,821 | |
| 100 | | 5.00%, 03/15/27 | | | 111,943 | |
| | | | | | |
| | | | | 224,764 | |
| |
Texas 0.3% | | | | |
| | Dallas County Hospital District, Series B, General Obligation Ltd. | | | | |
| 300 | | 6.171%, 08/15/34 | | | 330,657 | |
| | | | | | |
| | TOTAL MUNICIPAL BONDS
(cost $532,782) | | | 555,421 | |
| | | | | | |
| |
RESIDENTIAL MORTGAGE-BACKED SECURITIES 3.1% | | | | |
| | American Home Mortgage Assets Trust, Series 2006-1, Class 2A1 | | | | |
| 241 | | 0.348%(b), 05/25/46 | | | 177,679 | |
| | Bear Stearns Adjustable Rate Mortgage Trust, Series 2007-3, Class 1A1 | | | | |
| 215 | | 2.642%(b), 05/25/47 | | | 179,543 | |
| | Bear Stearns ALT-A Trust,
Series 2005-4, Class 23A2 | | | | |
| 130 | | 2.70%(b), 05/25/35 | | | 131,604 | |
| | Series 2006-2, Class 21A1 | | | | |
| 1,159 | | 2.664%(b), 03/25/36 | | | 769,305 | |
| | Berica ABS SRL, Series 2011-1, Class A1 (Italy) | | | | |
| EUR 334 | | 0.593%(b), 12/30/55 | | | 439,751 | |
| 199 | | Countrywide Alternative Loan Trust, Series 2006-OA9, Class 2A1A
0.367%(b), 07/20/46 | | | 119,144 | |
| 9 | | Fannie Mae REMICS, Series 1992-146, Class PZ
8.00%, 08/25/22 | | | 9,921 | |
| 322 | | FHLMC Structured Pass-Through Securities, Series T-61, Class 1A1
1.54%(b), 07/25/44 | | | 327,328 | |
See Notes to Financial Statements.
| | | | |
| Target Conservative Allocation Fund | | | 29 | |
Portfolio of Investments
as of January 31, 2014 (Unaudited) continued
| | | | | | |
Principal
Amount (000)# | | Description | | Value (Note 1) | |
RESIDENTIAL MORTGAGE-BACKED SECURITIES (Continued) | | | | |
| 9 | | Freddie Mac REMICS, Series 41, Class F
10.00%, 05/15/20 | | $ | 9,753 | |
| 125 | | GSR Mortgage Loan Trust,
Series 2005-AR6, Class 2A1
2.648%(b), 09/25/35 | | | 125,494 | |
| 780 | | Series 2006-OA1, Class 2A2
0.418%(b), 08/25/46 | | | 226,075 | |
| 468 | | HomeBanc Mortgage Trust, Series 2006-1, Class 4A1
5.472%(b), 04/25/37 | | | 379,187 | |
| 409 | | JPMorgan Alternative Loan Trust, Series 2006-A1, Class 4A1
2.612%(b), 03/25/36 | | | 327,466 | |
| 81 | | Vendee Mortgage Trust, Series 2000-1, Class 1A
6.497%(b), 01/15/30 | | | 93,053 | |
| 223 | | Washington Mutual Mortgage Pass-Through Certificates,
Series 2006-AR15, Class 2A
2.283%(b), 11/25/46 | | | 211,131 | |
| | | | | | |
| | TOTAL RESIDENTIAL MORTGAGE-BACKED SECURITIES
(cost $3,594,945) | | | 3,526,434 | |
| | | | | | |
|
U.S. GOVERNMENT AGENCY OBLIGATIONS 14.6% | |
| | Federal Home Loan Mortgage Corp. | | | | |
| 5 | | 2.36%(b), 08/01/23 | | | 4,726 | |
| 123 | | 2.565%(b), 03/01/36 | | | 131,698 | |
| 36 | | 5.50%, 01/01/38 | | | 40,001 | |
| | Federal National Mortgage Assoc. | | | | |
| 135 | | 2.26%(b), 06/01/35 | | | 144,105 | |
| 987 | | 3.50%, 12/01/41 - 04/01/43 | | | 1,003,220 | |
| 24 | | 3.85%(b), 05/01/36 | | | 25,009 | |
| 5,000 | | 4.00%, TBA | | | 5,221,094 | |
| 3,000 | | 4.00%, TBA | | | 3,142,500 | |
| 443 | | 4.50%, 03/01/24 - 07/01/25 | | | 473,706 | |
| 11 | | 5.00%, 06/01/23 | | | 11,852 | |
| 6,000 | | 5.00%, TBA | | | 6,538,828 | |
| 34 | | 7.50%, 01/01/32 | | | 35,459 | |
| | Government National Mortgage Assoc. | | | | |
| 3 | | 1.625%(b), 09/20/22 | | | 3,540 | |
| 15 | | 4.50%, 08/15/33 - 09/15/33 | | | 16,836 | |
| 23 | | 8.50%, 02/20/30 - 06/15/30 | | | 25,880 | |
| | | | | | |
| | TOTAL U.S. GOVERNMENT AGENCY OBLIGATIONS
(cost $16,658,751) | | | 16,818,454 | |
| | | | | | |
See Notes to Financial Statements.
| | | | | | |
Principal
Amount (000)# | | Description | | Value (Note 1) | |
U.S. TREASURY OBLIGATIONS 32.5% | |
| | U.S. Treasury Inflationary Indexed Bonds, TIPS | | | | |
| 2,300 | | 0.125%, 01/15/22 - 01/15/23 | | $ | 2,326,100 | |
| 700 | | 0.375%, 07/15/23 | | | 697,319 | |
| 2,000 | | 2.375%, 01/15/25 | | | 2,933,305 | |
| 300 | | 2.50%, 01/15/29 | | | 396,374 | |
| | U.S. Treasury Notes | | | | |
| 100 | | 0.50%, 07/31/17 | | | 98,469 | |
| 1,100 | | 0.625%, 10/15/16 - 05/31/17 | | | 1,098,922 | |
| 200 | | 0.75%, 12/31/17 - 02/28/18 | | | 196,821 | |
| 1,700 | | 0.875%, 09/15/16 - 04/30/17 | | | 1,707,227 | |
| 100 | | 1.00%, 03/31/17 | | | 100,625 | |
| 1,000 | | 1.25%, 11/30/18 | | | 990,078 | |
| 2,700 | | 1.375%, 07/31/18 | | | 2,704,007 | |
| 23,500 | | 1.50%, 12/31/18 - 01/31/19 | | | 23,506,701 | |
| 400 | | 2.125%, 01/31/21 | | | 399,500 | |
| 100 | | 2.375%, 05/31/18 | | | 104,648 | |
| 100 | | 3.25%, 03/31/17 | | | 107,656 | |
| | | | | | |
| | TOTAL U.S. TREASURY OBLIGATIONS
(cost $37,370,822) | | | 37,367,752 | |
| | | | | | |
| | TOTAL LONG-TERM INVESTMENTS
(cost $102,446,275) | | | 117,288,932 | |
| | | | | | |
|
| Shares | |
SHORT-TERM INVESTMENTS 10.9% | |
|
AFFILIATED MONEY MARKET MUTUAL FUND 4.9% | |
| 5,621,944 | | Prudential Investment Portfolios 2 - Prudential Core Taxable
Money Market Fund
(cost $5,621,944)(e) | | | 5,621,944 | |
| | | | | | |
| |
Principal
Amount (000) | | | |
|
REPURCHASE AGREEMENT(g) 4.7% | |
| 5,400 | | Citigroup Global Markets, Inc.,
0.04% dated 01/31/14,
due 02/03/14 in the amount of $5,400,018
(cost $5,400,000) | | | 5,400,000 | |
| | | | | | |
See Notes to Financial Statements.
| | | | |
| Target Conservative Allocation Fund | | | 31 | |
Portfolio of Investments
as of January 31, 2014 (Unaudited) continued
| | | | | | |
Principal
Amount (000)# | | Description | | Value (Note 1) | |
FOREIGN TREASURY OBLIGATIONS(c) 1.3% | |
| EUR 400 | | Italy Buoni Ordinari del Tesoro
0.715%, 11/14/14 | | $ | 536,716 | |
| EUR 100 | | Italy Buoni Poliennali del Tesoro
6.00%, 11/15/14 | | | 140,418 | |
| EUR 400 | | Italy Certificati di Credito del Tesoro
0.838%, 12/31/14 | | | 536,129 | |
| MXN 21,580 | | Mexico Cetes (Mexico)
3.37%, 03/27/14 | | | 160,561 | |
| MXN 19,300 | | 3.58%, 06/26/14 | | | 142,262 | |
| | | | | | |
| | TOTAL FOREIGN TREASURY OBLIGATIONS
(cost $1,535,382) | | | 1,516,086 | |
| | | | | | |
| | TOTAL SHORT-TERM INVESTMENTS
(cost $12,557,326) | | | 12,538,030 | |
| | | | | | |
| | TOTAL INVESTMENTS, BEFORE OPTIONS WRITTEN 113.0%
(cost $115,003,601; Note 5) | | | 129,826,962 | |
| | | | | | |
| | | | | | | | |
| | | |
Notional
Amount (000)# | | | | Counterparty | | | |
OPTIONS WRITTEN(a) | |
|
Call Options | |
| 100 | | 5 Year CDX.O IG.21 V1,
expiring 03/19/14, Strike Price $60.00 | | JPMorgan Chase | | | (22 | ) |
| 200 | | 10 Year U.S. Treasury Note,
expiring 05/23/14, Strike Price $125.00
| | | | | (1,875 | ) |
| 3,100 | | Interest Rate Swap Options,
Pay a fixed rate of 1.40% and receive a floating rate based on 3-month LIBOR, expiring 03/03/14 | | JPMorgan Chase | | | (826 | ) |
| 200 | | Pay a fixed rate of 2.60% and receive a floating rate based on 3-month LIBOR, expiring 03/03/14 | | Goldman Sachs & Co. | | | (170 | ) |
| 100 | | Pay a fixed rate of 2.65% and receive a floating rate based on 3-month LIBOR, expiring 03/03/14 | | Citigroup Global Markets | | | (149 | ) |
| 200 | | Pay a fixed rate of 2.40% and receive a floating rate based on 3-month LIBOR, expiring 03/17/14 | | Deutsche Bank | | | (34 | ) |
| 600 | | Pay a fixed rate of 1.60% and receive a floating rate based on 3-month LIBOR, expiring 04/28/14 | | Morgan Stanley | | | (1,927 | ) |
See Notes to Financial Statements.
| | | | | | | | |
Notional
Amount (000)# | | Description | | Counterparty | | Value (Note 1) | |
OPTIONS WRITTEN(a) (Continued) | |
|
Call Options (cont’d.) | |
| 400 | | Pay a fixed rate of 1.40% and receive a floating rate based on 3-month LIBOR, expiring 05/06/14 | | Goldman Sachs & Co. | | $ | (379 | ) |
| 500 | | Pay a fixed rate of 1.40% and receive a floating rate based on 3-month LIBOR, expiring 05/06/14 | | Morgan Stanley | | | (474 | ) |
| 500 | | Pay a fixed rate of 1.55% and receive a floating rate based on 3-month LIBOR, expiring 07/28/14 | | Morgan Stanley | | | (1,471 | ) |
| 400 | | Pay a fixed rate of 1.55% and receive a floating rate based on 3-month LIBOR, expiring 07/28/14 | | JPMorgan Chase | | | (1,177 | ) |
| | | | | | | | |
| | | | | | | (8,504 | ) |
| | | | | | | | |
|
Put Options | |
| 5,000 | | 3 Year Euro Dollar Mid-Curve,
expiring 03/14/14,
Strike Price $97.38 | | | | | (688 | ) |
| 100 | | 5 Year CDX.O IG.21 V1,
expiring 03/19/14,
Strike Price $0.90 | | JPMorgan Chase | | | (81 | ) |
| 200 | | 10 Year U.S. Treasury Note,
expiring 05/23/14,
Strike Price $122.00 | | | | | (1,281 | ) |
| 3,100 | | Interest Rate Swap Options,
Receive a fixed rate of 1.80% and pay a floating rate based on 3-month LIBOR, expiring 03/03/14 | | JPMorgan Chase | | | (6,128 | ) |
| 100 | | Receive a fixed rate of 3.10% and pay a floating rate based on 3-month LIBOR, expiring 03/03/14 | | Citigroup Global Markets | | | (124 | ) |
| 300 | | Receive a fixed rate of 3.10% and pay a floating rate based on 3-month LIBOR, expiring 03/03/14 | | Deutsche Bank | | | (372 | ) |
| 200 | | Receive a fixed rate of 2.90% and pay a floating rate based on 3-month LIBOR, expiring 03/17/14 | | Deutsche Bank | | | (1,460 | ) |
| 700 | | Receive a fixed rate of 2.00% and pay a floating rate based on 3-month LIBOR, expiring 03/31/14 | | Morgan Stanley | | | (519 | ) |
| 1,100 | | Receive a fixed rate of 2.00% and pay a floating rate based on 3-month LIBOR, expiring 03/31/14 | | Goldman Sachs & Co. | | | (816 | ) |
See Notes to Financial Statements.
| | | | |
| Target Conservative Allocation Fund | | | 33 | |
Portfolio of Investments
as of January 31, 2014 (Unaudited) continued
| | | | | | | | |
Notional
Amount (000)# | | Description | | Counterparty | | Value (Note 1) | |
OPTIONS WRITTEN(a) (Continued) | |
|
Put Options (cont’d.) | |
| 600 | | Receive a fixed rate of 2.00% and pay a floating rate based on 3-month LIBOR, expiring 04/28/14 | | Morgan Stanley | | $ | (2,138 | ) |
| 400 | | Receive a fixed rate of 1.90% and pay a floating rate based on 3-month LIBOR, expiring 05/06/14 | | Goldman Sachs & Co. | | | (2,206 | ) |
| 700 | | Receive a fixed rate of 2.40% and pay a floating rate based on 3-month LIBOR, expiring 07/28/14 | | Morgan Stanley | | | (3,065 | ) |
| | | | | | | | |
| | | | | | | (18,878 | ) |
| | | | | | | | |
| | TOTAL OPTIONS WRITTEN
(premiums received $55,765) | | | | | (27,382 | ) |
| | | | | | | | |
| | TOTAL INVESTMENTS, NET OF OPTIONS WRITTEN 113.0%
(cost $114,947,836; Note 5) | | | 129,799,580 | |
| | Liabilities in excess of other assets(f) (13.0)% | | | (14,937,339 | ) |
| | | | | | | | |
| | NET ASSETS 100% | | $ | 114,862,241 | |
| | | | | | | | |
The following abbreviations are used in the portfolio descriptions:
144A—Security was purchased pursuant to Rule 144A under the Securities Act of 1933 and may not be resold subject to that rule except to qualified institutional buyers. Unless otherwise noted, 144A securities are deemed to be liquid.
ADR—American Depositary Receipt
CDO—Collaterlized Debt Obligation
CDX—Credit Derivative Index
FHLMC—Federal Home Loan Mortgage Corporation
LIBOR—London Interbank Offered Rate
MTN—Medium Term Note
REMIC—Real Estate Mortgage Investment Conduit
TBA—To Be Announced
TIPS—Treasury Inflation Protected Securities
BRL—Brazilian Real
EUR—Euro
JPY—Japanese Yen
MXN—Mexican Peso
NOK—Norwegian Krone
| # | Principal and notional amount is shown in U.S. dollars unless otherwise stated. |
| (a) | Non-income producing security. |
| (b) | Variable rate instrument. The interest rate shown reflects the rate in effect at January 31, 2014. |
| (c) | Rates shown are the effective yields at purchase date. |
See Notes to Financial Statements.
| (d) | Indicates a security or securities that have been deemed illiquid. |
| (e) | Prudential Investments LLC, the manager of the Fund, also serves as manager of the Prudential Investment Portfolios 2—Prudential Core Taxable Money Market Fund. |
| (g) | Repurchase agreement is collateralized by U.S. Treasury Note (coupon rate 1.000%, maturity date 06/30/19), with the aggregate value, including accrued interest of $5,514,668. |
| (f) | Includes net unrealized appreciation (depreciation) on the following derivative contracts held at reporting period end: |
Futures contracts open at January 31, 2014:
| | | | | | | | | | | | | | | | | | | | |
Number of
Contracts | | | Type | | Expiration
Date | | | Value at
Trade Date | | | Value at
January 31,
2014 | | | Unrealized
Appreciation
(Depreciation)(1) | |
| | | | Long Positions: | | | | | | | | | | | | | | | | |
| | 1 | | | 90 Day Euro Dollar | | | Mar. 2015 | | | $ | 248,613 | | | $ | 248,838 | | | $ | 225 | |
| | 28 | | | 90 Day Euro Dollar | | | Jun. 2015 | | | | 6,959,384 | | | | 6,957,650 | | | | (1,734 | ) |
| | 66 | | | 90 Day Euro Dollar | | | Sep. 2015 | | | | 16,308,090 | | | | 16,369,650 | | | | 61,560 | |
| | 97 | | | 90 Day Euro Dollar | | | Dec. 2015 | | | | 23,994,631 | | | | 24,003,863 | | | | 9,232 | |
| | 36 | | | 90 Day Euro Dollar | | | Mar. 2016 | | | | 8,864,322 | | | | 8,884,800 | | | | 20,478 | |
| | 14 | | | 90 Day Euro Dollar | | | Jun. 2016 | | | | 3,434,370 | | | | 3,445,575 | | | | 11,205 | |
| | 4 | | | 90 Day Euro Dollar | | | Sep. 2016 | | | | 983,367 | | | | 981,750 | | | | (1,617 | ) |
| | 1 | | | 90 Day Euro Dollar | | | Dec. 2016 | | | | 244,882 | | | | 244,763 | | | | (119 | ) |
| | 76 | | | 5 Year U.S. Treasury Notes | | | Mar. 2014 | | | | 9,163,767 | | | | 9,167,500 | | | | 3,733 | |
| | | | | | | | | | | | | | | | | | | | |
| | | | | | | | | | | | | | | | | | $ | 102,963 | |
| | | | | | | | | | | | | | | | | | | | |
| (1) | Cash of $191,000 has been segregated to cover requirements for open futures contracts at January 31, 2014. |
Forward foreign currency exchange contracts outstanding at January 31, 2014:
| | | | | | | | | | | | | | | | | | |
Purchase Contracts | | Counterparty | | Notional
Amount
(000) | | | Value at
Settlement
Date
Payable | | | Current
Value | | | Unrealized
Appreciation
(Depreciation) | |
Brazilian Real, | | | | | | | | | | | | | | | | | | |
Expiring 02/04/14 | | Barclays Capital Group | | BRL | 89 | | | $ | 37,415 | | | $ | 36,800 | | | $ | (615 | ) |
Euro, | | | | | | | | | | | | | | | | | | |
Expiring 02/04/14 | | Credit Suisse First Boston Corp. | | EUR | 998 | | | | 1,363,268 | | | | 1,346,011 | | | | (17,257 | ) |
Expiring 02/04/14 | | Hong Kong & Shanghai Bank | | EUR | 527 | | | | 717,476 | | | | 710,769 | | | | (6,707 | ) |
Mexican Peso, | | | | | | | | | | | | | | | | | | |
Expiring 03/06/14 | | BNP Paribas | | MXN | 454 | | | | 34,734 | | | | 33,857 | | | | (877 | ) |
Norwegian Krone, | | | | | | | | | | | | | | | | | | |
Expiring 02/13/14 | | UBS AG | | NOK | 65 | | | | 10,519 | | | | 10,350 | | | | (169 | ) |
| | | | | | | | | | | | | | | | | | |
| | | | | | | | $ | 2,163,412 | | | $ | 2,137,787 | | | $ | (25,625 | ) |
| | | | | | | | | | | | | | | | | | |
See Notes to Financial Statements.
| | | | |
| Target Conservative Allocation Fund | | | 35 | |
Portfolio of Investments
as of January 31, 2014 (Unaudited) continued
| | | | | | | | | | | | | | | | | | |
Sale Contracts | | Counterparty | | Notional
Amount
(000) | | | Value at
Settlement
Date
Receivable | | | Current
Value | | | Unrealized
Appreciation
(Depreciation) | |
Brazilian Real, | | | | | | | | | | | | | | | | | | |
Expiring 02/04/14 | | Morgan Stanley | | BRL | 89 | | | $ | 37,758 | | | $ | 36,800 | | | $ | 958 | |
Expiring 03/06/14 | | Barclays Capital Group | | BRL | 89 | | | | 37,146 | | | | 36,518 | | | | 628 | |
Euro, | | | | | | | | | | | | | | | | | | |
Expiring 02/04/14 | | Citigroup Global Markets | | EUR | 1,474 | | | | 2,029,210 | | | | 1,987,996 | | | | 41,214 | |
Expiring 02/04/14 | | Citigroup Global Markets | | EUR | 25 | | | | 34,415 | | | | 33,718 | | | | 697 | |
Expiring 02/04/14 | | Citigroup Global Markets | | EUR | 12 | | | | 16,469 | | | | 16,185 | | | | 284 | |
Expiring 02/04/14 | | JPMorgan Chase | | EUR | 14 | | | | 19,138 | | | | 18,882 | | | | 256 | |
Expiring 02/28/14 | | Deutsche Bank AG | | EUR | 100 | | | | 131,886 | | | | 134,871 | | | | (2,985 | ) |
Expiring 02/28/14 | | Goldman Sachs & Co. | | EUR | 797 | | | | 1,066,918 | | | | 1,074,921 | | | | (8,003 | ) |
Expiring 03/04/14 | | Credit Suisse First Boston Corp. | | EUR | 998 | | | | 1,363,233 | | | | 1,346,012 | | | | 17,221 | |
Expiring 03/14/14 | | Goldman Sachs & Co. | | EUR | 697 | | | | 931,052 | | | | 940,054 | | | | (9,002 | ) |
Japanese Yen, | | | | | | | | | | | | | | | | | | |
Expiring 02/18/14 | | Citigroup Global Markets | | JPY | 10,300 | | | | 100,016 | | | | 100,820 | | | | (804 | ) |
Expiring 02/18/14 | | Citigroup Global Markets | | JPY | 10,200 | | | | 99,522 | | | | 99,841 | | | | (319 | ) |
Expiring 02/18/14 | | Deutsche Bank AG | | JPY | 10,500 | | | | 100,520 | | | | 102,778 | | | | (2,258 | ) |
Expiring 02/18/14 | | Deutsche Bank AG | | JPY | 10,400 | | | | 100,156 | | | | 101,799 | | | | (1,643 | ) |
Expiring 02/18/14 | | Hong Kong & Shanghai Bank | | JPY | 9,900 | | | | 99,696 | | | | 96,905 | | | | 2,791 | |
Expiring 02/18/14 | | JPMorgan Chase | | JPY | 5,300 | | | | 50,296 | | | | 51,878 | | | | (1,582 | ) |
Mexican Peso, | | | | | | | | | | | | | | | | | | |
Expiring 03/06/14 | | Morgan Stanley | | MXN | 936 | | | | 70,825 | | | | 69,769 | | | | 1,056 | |
Expiring 03/27/14 | | BNP Paribas | | MXN | 2,140 | | | | 163,950 | | | | 159,304 | | | | 4,646 | |
Expiring 06/26/14 | | BNP Paribas | | MXN | 1,897 | | | | 144,245 | | | | 140,187 | | | | 4,058 | |
| | | | | | | | | | | | | | | | | | |
| | | | | | | | $ | 6,596,451 | | | $ | 6,549,238 | | | $ | 47,213 | |
| | | | | | | | | | | | | | | | | | |
See Notes to Financial Statements.
Interest rate swap agreements outstanding at January 31, 2014:
| | | | | | | | | | | | | | | | | | | | | | | | |
Notional
Amount
(000) | | | Termination
Date | | | Fixed
Rate | | Floating
Rate | | Fair
Value | | | Upfront
Premiums
Paid
(Received) | | | Unrealized
Appreciation | | | Counterparty |
| Over-the-counter swap agreements: | | | | | | | | | | | | | | |
| BRL | 2,900 | | | | 01/02/15 | | | 9.890% | | Brazilian overnight interbank lending rate(1) | | $ | 18,498 | | | $ | — | | | $ | 18,498 | | | Bank of America |
| BRL | 200 | | | | 01/02/15 | | | 9.930% | | Brazilian overnight interbank lending rate(1) | | | 1,354 | | | | 26 | | | | 1,328 | | | Morgan Stanley & Co. |
| MXN | 2,000 | | | | 01/18/19 | | | 5.700% | | Brazilian overnight interbank lending rate(1) | | | (194 | ) | | | (537 | ) | | | 343 | | | Bank of America |
| | | | | | | | | | | | | | | | | | | | | | | | |
| | | | | | | | | | | | $ | 19,658 | | | $ | (511 | ) | | $ | 20,169 | | | |
| | | | | | | | | | | | | | | | | | | | | | | | |
| | | | | | | | | | | | | | | | | | | | | | | | |
Notional
Amount
(000)# | | | | | Termination
Date | | | Fixed
Rate | | Floating Rate | | Value at
Trade Date | | | Value at
January 31,
2014 | | | Unrealized
Depreciation | |
| Exchange-traded swap agreements: | | | | | | | | | | | | |
| | 3,800 | | | | | | 09/21/17 | | | 3.000% | | 3 month LIBOR(1) | | $ | 38,974 | | | $ | 31,569 | | | $ | (7,405 | ) |
| | 2,400 | | | | | | 12/18/43 | | | 3.500% | | 3 month LIBOR(1) | | | 125,203 | | | | 36,810 | | | | (88,393 | ) |
| | | | | | | | | | | | | | | | | | | | | | | | |
| | | | | | | | | | | | | | $ | 164,177 | | | $ | 68,379 | | | $ | (95,798 | ) |
| | | | | | | | | | | | | | | | | | | | | | | | |
| (1) | Fund pays the floating rate and receives the fixed rate. |
| # | Notional amount is shown in U.S. dollars unless otherwise stated. |
See Notes to Financial Statements.
| | | | |
| Target Conservative Allocation Fund | | | 37 | |
Portfolio of Investments
as of January 31, 2014 (Unaudited) continued
Credit default swap agreements outstanding at January 31, 2014:
| | | | | | | | | | | | | | | | | | | | | | | | | | |
Reference
Entity/
Obligation | | Termination
Date | | | Fixed
Rate | | | Notional
Amount
(000)(4)# | | | Fair
Value(3) | | | Upfront
Premiums
Paid
(Received) | | | Unrealized
Appreciation | | | Counterparty |
Over-the-counter credit default swaps on credit indices—Sell Protection(1): | | | |
Dow Jones CDX IG5 10Y Index | | | 12/20/15 | | | | 0.460% | | | | 1,500 | | | $ | 6,853 | | | $ | — | | | $ | 6,853 | | | Morgan Stanley & Co. |
Dow Jones CDX IG5 10Y Index | | | 12/20/15 | �� | | | 0.460% | | | | 470 | | | | 2,100 | | | | — | | | | 2,100 | | | Morgan Stanley & Co. |
| | | | | | | | | | | | | | | | | | | | | | | | | | |
| | | | | | | | | | | | | | $ | 8,953 | | | $ | — | | | $ | 8,953 | | | |
| | | | | | | | | | | | | | | | | | | | | | | | | | |
| | | | | | | | | | | | | | | | | | | | | | | | | | | | |
Reference
Entity/
Obligation | | Termination
Date | | | Fixed
Rate | | | Notional
Amount
(000)(4)# | | | Implied
Credit
Spread at
January 31,
2014(5) | | Fair
Value | | | Upfront
Premiums
Paid
(Received) | | | Unrealized
Appreciation | | | Counterparty |
Credit default swaps on corporate and/or sovereign issues—Sell Protection(1): | | | | | | | |
Federal Republic of Brazil | | | 09/20/16 | | | | 1.000% | | | | 1,400 | | | 1.299% | | $ | (10,047 | ) | | $ | (16,552 | ) | | $ | 6,505 | | | JPMorgan Chase |
United Mexican States | | | 09/20/16 | | | | 1.000% | | | | 1,400 | | | 0.621% | | | 16,481 | | | | 4,736 | | | | 11,745 | | | JPMorgan Chase |
Japan Government | | | 09/20/16 | | | | 1.000% | | | | 400 | | | 0.271% | | | 8,114 | | | | 6,726 | | | | 1,388 | | | Bank of America |
| | | | | | | | | | | | | | | | | | | | | | | | | | | | |
| | | | | | | | | | | | | | | | $ | 14,548 | | | $ | (5,090 | ) | | $ | 19,638 | | | |
| | | | | | | | | | | | | | | | | | | | | | | | | | | | |
The Fund entered into credit default swap agreements on corporate issues, sovereign issues, asset-backed securities and credit indices as the protection seller to provide a measure of protection against the current portfolio of investments’ exposure to market conditions, or to take an active position with respect to the likelihood of a particular issuer’s default or the referenced entity’s credit soundness.
See Notes to Financial Statements.
| | | | | | | | | | | | | | | | | | | | | | | | |
Reference
Entity/
Obligation | | Termination
Date | | | Fixed
Rate | | | Notional
Amount
(000)(4)# | | | Value at
Trade Date | | | Value at
January 31,
2014 | | | Unrealized
Appreciation | |
Exchange-traded credit default swaps—Buy Protection(2): | | | | | | | | | |
Dow Jones CDX IG21 5Y Index | | | 12/20/18 | | | | 1.000% | | | | 900 | | | $ | 9,653 | | | $ | 13,134 | | | $ | 3,481 | |
iTraxx Main20 5Y Index | | | 12/20/18 | | | | 1.000% | | | EUR | 900 | | | | 645 | | | | 11,982 | | | | 11,337 | |
| | | | | | | | | | | | | | | | | | | | | | | | |
| | | | | | | | | | | | | | $ | 10,298 | | | $ | 25,116 | | | $ | 14,818 | |
| | | | | | | | | | | | | | | | | | | | | | | | |
| (1) | If the Fund is a seller of protection, it receives the fixed rate. When a credit event occurs, as defined under the terms of that particular swap agreement, the Fund will either (i) pay to the buyer of protection an amount equal to the notional amount of the swap and take delivery of the referenced obligation or underlying securities comprising the referenced index or (ii) pay a net settlement amount in the form of cash or securities equal to the notional amount of the swap less the recovery value of the referenced obligation or underlying securities comprising the referenced index. |
| (2) | If the Fund is a buyer of protection, it pays the fixed rate. When a credit event occurs, as defined under the terms of that particular swap agreement, the Fund will either (i) receive from the seller of protection an amount equal to the notional amount of the swap and make delivery of the referenced obligation or underlying securities comprising the referenced index or (ii) receive a net settlement amount in the form of cash or securities equal to the notional amount of the swap less the recovery value of the referenced obligation or underlying securities comprising the referenced index. |
| (3) | The fair value of credit default swap agreements on asset-backed securities and credit indices serves as an indicator of the current status of the payment/performance risk and represents the likelihood of an expected liability (or profit) for the credit derivative should the notional amount of the swap agreement be closed/sold as of the reporting date. Increasing fair value in absolute terms, represents a deterioration of the referenced entity’s credit soundness and a greater likelihood of risk of default or other credit event occurring as defined under the terms of the agreement. |
| (4) | Notional amount represents the maximum potential amount the Fund could be required to pay as a seller of credit protection or receive as a buyer of credit protection if a credit event occurs as defined under the terms of that particular swap agreement. |
| (5) | Implied credit spreads, represented in absolute terms, utilized in determining the fair value of credit default swap agreements on corporate issues or sovereign issues of an emerging country as of reporting date serve as an indicator of the current status of the payment/performance risk and represent the likelihood of risk of default for the credit derivative. The implied credit spread of a particular referenced entity reflects the cost of buying/selling protection and may include up-front payments required to be made to enter into the agreement. Wider credit spreads represent a deterioration of the referenced entity’s credit soundness and a greater likelihood of risk of default or other credit event occurring as defined under the terms of the agreement. |
| # | Notional amount is shown in U.S. dollars unless otherwise stated. |
See Notes to Financial Statements.
| | | | |
| Target Conservative Allocation Fund | | | 39 | |
Portfolio of Investments
as of January 31, 2014 (Unaudited) continued
The investment allocation of portfolio holdings and liabilities in excess of other assets shown as a percentage of net assets as of January 31, 2014 were as follows:
| | | | |
U.S. Treasury Obligations | | | 32.5 | % |
U.S. Government Agency Obligations | | | 14.6 | |
Affiliated Money Market Mutual Fund | | | 4.9 | |
Repurchase Agreement | | | 4.7 | |
Residential Mortgage-Backed Securities | | | 4.0 | |
Diversified Financial Services | | | 3.7 | |
Pharmaceuticals | | | 2.9 | |
Oil, Gas & Consumable Fuels | | | 2.8 | |
Software | | | 2.2 | |
Media | | | 2.0 | |
Internet Software & Services | | | 1.9 | |
Insurance | | | 1.6 | |
Foreign Government Bonds | | | 1.6 | |
Financial—Bank & Trust | | | 1.6 | |
IT Services | | | 1.6 | |
Collateralized Debt Obligations | | | 1.5 | |
Aerospace & Defense | | | 1.5 | |
Biotechnology | | | 1.5 | |
Foreign Treasury Obligations | | | 1.3 | |
Health Care Providers & Services | | | 1.3 | |
Hotels, Restaurants & Leisure | | | 1.2 | |
Computers & Peripherals | | | 1.2 | |
Chemicals | | | 1.2 | |
Food & Staples Retailing | | | 1.1 | |
Capital Markets | | | 1.0 | |
Commercial Banks | | | 1.0 | |
Machinery | | | 0.9 | |
Life Sciences Tools & Services | | | 0.9 | |
Specialty Retail | | | 0.9 | |
Health Care Equipment & Supplies | | | 0.8 | |
Non-Residential Mortgage-Backed Security | | | 0.8 | |
Semiconductors & Semiconductor Equipment | | | 0.7 | |
Consumer Finance | | | 0.7 | |
Textiles, Apparel & Luxury Goods | | | 0.6 | |
Internet & Catalog Retail | | | 0.6 | |
Industrial Conglomerates | | | 0.6 | |
Automobile Manufacturers | | | 0.6 | |
Food Products | | | 0.6 | % |
Energy Equipment & Services | | | 0.6 | |
Communications Equipment | | | 0.5 | |
Electric Utilities | | | 0.5 | |
Municipal Bonds | | | 0.5 | |
Real Estate Investment Trusts (REITs) | | | 0.5 | |
Beverages | | | 0.4 | |
Auto Components | | | 0.4 | |
Electrical Equipment | | | 0.4 | |
Electronic Equipment, Instruments & Components | | | 0.4 | |
Paper & Forest Products | | | 0.4 | |
Airlines | | | 0.3 | |
Diversified Telecommunication Services | | | 0.3 | |
Road & Rail | | | 0.3 | |
Multiline Retail | | | 0.2 | |
Automobiles | | | 0.2 | |
Wireless Telecommunication Services | | | 0.2 | |
Health Care Technology | | | 0.2 | |
Metals & Mining | | | 0.2 | |
Tobacco | | | 0.2 | |
Multi-Utilities | | | 0.2 | |
Professional Services | | | 0.1 | |
Personal Products | | | 0.1 | |
Independent Power Producers & Energy Traders | | | 0.1 | |
Household Products | | | 0.1 | |
Air Freight & Logistics | | | 0.1 | |
Telecommunications | | | 0.1 | |
Trading Companies & Distributors | | | 0.1 | |
Household Durables | | | 0.1 | |
Construction & Engineering | | | 0.1 | |
Building Products | | | 0.1 | |
| | | | |
| | | 113.0 | |
Liabilities in excess of other assets | | | (13.0 | ) |
| | | | |
| | | 100.0 | % |
| | | | |
See Notes to Financial Statements.
Various inputs are used in determining the value of the Fund’s investments. These inputs are summarized in the three broad levels listed below.
Level 1—quoted prices generally in active markets for identical securities.
Level 2—other significant observable inputs including, but not limited to, quoted prices for similar securities, interest rates and yield curves, prepayment speeds, foreign currency exchange rates, and amortized cost.
Level 3—significant unobservable inputs for securities valued in accordance with Board approved fair valuation procedures.
The following is a summary of the inputs used as of January 31, 2014 in valuing such portfolio securities:
| | | | | | | | | | | | |
| | | Level 1 | | | Level 2 | | | Level 3 | |
Investments in Securities | | | | | | | | | | | | |
Common Stocks | | $ | 46,731,639 | | | $ | 397,348 | | | $ | — | |
Asset-Backed Securities | | | | | | | | | | | | |
Collateralized Debt Obligations | | | — | | | | 969,153 | | | | 773,547 | |
Non-Residential Mortgage-Backed Security | | | — | | | | 860,106 | | | | — | |
Residential Mortgage-Backed Securities | | | — | | | | 1,042,360 | | | | — | |
Corporate Bonds | | | — | | | | 6,422,345 | | | | — | |
Foreign Government Bonds | | | — | | | | 1,824,373 | | | | — | |
Municipal Bonds | | | — | | | | 555,421 | | | | — | |
Residential Mortgage-Backed Securities | | | — | | | | 3,526,434 | | | | — | |
U.S. Government Agency Obligations | | | — | | | | 16,818,454 | | | | — | |
U.S. Treasury Obligations | | | — | | | | 37,367,752 | | | | — | |
Affiliated Money Market Mutual Fund | | | 5,621,944 | | | | — | | | | — | |
Repurchase Agreement | | | — | | | | 5,400,000 | | | | — | |
Foreign Treasury Obligations | | | — | | | | 1,516,086 | | | | — | |
Options Written | | | (3,844 | ) | | | (22,203 | ) | | | (1,335 | ) |
Other Financial Instruments* | | | | | | | | | | | | |
Futures | | | 102,963 | | | | — | | | | — | |
Forward foreign currency exchange contracts | | | — | | | | 21,588 | | | | — | |
Interest rate swap agreements | | | — | | | | (75,629 | ) | | | — | |
Credit default swap agreements | | | — | | | | 43,409 | | | | — | |
| | | | | | | | | | | | |
Total | | $ | 52,452,702 | | | $ | 76,666,997 | | | $ | 772,212 | |
| | | | | | | | | | | | |
See Notes to Financial Statements.
| | | | |
| Target Conservative Allocation Fund | | | 41 | |
Portfolio of Investments
as of January 31, 2014 (Unaudited) continued
The following is a reconciliation of assets in which significant unobservable inputs (Level 3) were used in determining fair value:
| | | | | | | | |
| | | Asset-Backed
Securities | | | Options
Written | |
Balance as of 7/31/13 | | $ | 1,138,296 | | | $ | — | |
Accrued discounts/premiums | | | (578 | ) | | | — | |
Realized gain (loss) | | | 4,297 | | | | — | |
Change in unrealized appreciation (depreciation)** | | | (32,017 | ) | | | 1,715 | |
Purchases | | | — | | | | (3,050 | ) |
Sales | | | — | | | | — | |
Transfers into Level 3 | | | — | | | | — | |
Transfers out of Level 3 | | | (336,451 | ) | | | — | |
| | | | | | | | |
Balance as of 01/31/14 | | $ | 773,547 | | | $ | (1,335 | ) |
| | | | | | | | |
| * | Other financial instruments are derivative instruments not reflected in the Portfolio of Investments, such as futures, forwards and swap contracts, which are recorded at the unrealized appreciation/depreciation on the instrument. |
| ** | Of which, $(30,302) was included in Net Assets relating to securities held at the reporting period end. |
Level 3 securities as presented in the table above are being fair valued using pricing methodologies approved by the Board of Trustees, which contain unobservable inputs. Such methodologies include, but are not limited to, using prices provided by a single broker/dealer, the cost of the investment, and broker quotes adjusted for changes in yields of comparable U.S. Government and other securities using fixed income securities valuation model.
It is the Fund’s policy to recognize transfers in and transfers out at the fair value as of the beginning of the period. At the reporting period end, 1 Asset-Backed Security transferred out of Level 3 as a result of being valued by an independent pricing source.
The Fund invested in derivative instruments during the reporting period. The primary types of risk associated with these derivative instruments are credit risk, foreign exchange risk and interest rate risk. The effect of such derivative instruments on the Fund’s financial position and financial performance as reflected in the Statement of Assets and Liabilities and Statement of Operations is presented in the summary below.
See Notes to Financial Statements.
Fair values of derivative instruments as of January 31, 2014 as presented in the Statement of Assets and Liabilities:
| | | | | | | | | | | | |
Derivatives not accounted for
as hedging instruments,
carried at fair value | | Asset Derivatives | | | Liability Derivatives | |
| | Balance
Sheet Location | | Fair
Value | | | Balance
Sheet Location | | Fair
Value | |
| Interest rate contracts | | Receivable from broker—variation margin | | $ | 106,433 | * | | Receivable from broker—variation margin | | $ | 99,268 | |
| Interest rate contracts | | Premiums paid for swap agreements | | | 26 | | | Premiums received for swap agreements | | | 537 | |
| Interest rate contracts | | Unrealized appreciation on over-the-counter swap agreements | | | 20,169 | | | Options written, at value | | | 27,279 | |
| Foreign exchange contracts | | Unrealized appreciation on foreign currency exchange contracts | | | 73,809 | | | Unrealized depreciation on foreign currency exchange contracts | | | 52,221 | |
| Credit contracts | | Unrealized appreciation on over-the-counter swap agreements | | | 28,591 | | | — | | | — | |
| Credit contracts | | Premiums paid for swap agreements | | | 11,462 | | | Premiums received for swap agreements | | | 16,552 | |
| Credit contracts | | Receivable from broker—variation margin | | | 14,818 | * | | Outstanding options written, at value | | | 103 | |
| | | | | | | | | | | | |
Total | | | | $ | 255,308 | | | | | $ | 195,960 | |
| | | | | | | | | | | | |
| * | Includes cumulative appreciation/depreciation as reported in schedule of open futures and exchange-traded swap contracts. Only unsettled variation margin receivable (payable) is reported within the Statement of Assets and Liabilities. |
See Notes to Financial Statements.
| | | | |
| Target Conservative Allocation Fund | | | 43 | |
Portfolio of Investments
as of January 31, 2014 (Unaudited) continued
The effects of derivative instruments on the Statement of Operations for the six months ended January 31, 2014 are as follows:
| | | | | | | | | | | | | | | | | | | | |
Amount of Realized Gain or (Loss) on Derivatives Recognized in Income | |
Derivatives not accounted for
as hedging instruments,
carried at fair value | | Futures | | | Written
Options | | | Swaps | | | Forward
Currency
Contracts(1) | | | Total | |
Interest rate contracts | | $ | 202,797 | | | $ | 63,822 | | | $ | (79,293 | ) | | $ | — | | | $ | 187,326 | |
Foreign exchange contracts | | | (412 | ) | | | — | | | | — | | | | (136,216 | ) | | | (136,628 | ) |
Credit contracts | | | — | | | | — | | | | (595,520 | ) | | | — | | | | (595,520 | ) |
| | | | | | | | | | | | | | | | | | | | |
Total | | $ | 202,385 | | | $ | 63,822 | | | $ | (674,813 | ) | | $ | (136,216 | ) | | $ | (544,822 | ) |
| | | | | | | | | | | | | | | | | | | | |
|
Change in Unrealized Appreciation or (Depreciation) on Derivatives Recognized in Income | |
Derivatives not accounted for
as hedging instruments,
carried at fair value | | Futures | | | Written
Options | | | Swaps | | | Forward
Currency
Contracts(2) | | | Total | |
Interest rate contracts | | $ | (10,761 | ) | | $ | 150,143 | | | $ | (179,982 | ) | | $ | — | | | $ | (40,600 | ) |
Foreign exchange contracts | | | — | | | | — | | | | — | | | | 52,133 | | | | 52,133 | |
Credit contracts | | | — | | | | 102 | | | | 742,212 | | | | — | | | | 742,314 | |
| | | | | | | | | | | | | | | | | | | | |
Total | | $ | (10,761 | ) | | $ | 150,245 | | | $ | 562,230 | | | $ | 52,133 | | | $ | 753,847 | |
| | | | | | | | | | | | | | | | | | | | |
| (1) | Included in net realized gain (loss) on foreign currency transactions in the Statement of Operations. |
| (2) | Included in net change in unrealized appreciation (depreciation) on foreign currencies in the Statement of Operations. |
See Notes to Financial Statements.
For the six months ended January 31, 2014, the Fund’s average volume of derivative activities are as follows:
| | | | | | | | | | | | | | |
Written
Options(1) | | | Futures
Contracts—
Long
Positions(2) | | | Futures
Contracts—
Short
Positions(2) | | | Forward
Foreign
Currency
Exchange
Purchase
Contracts(3) | |
| $ | 38,807 | | | $ | 40,482,599 | | | $ | 2,527,479 | | | $ | 3,727,081 | |
| | | | | | | | | | | | | | |
Forward
Foreign
Currency
Exchange
Sale
Contracts(4) | | | Interest Rate
Swap
Agreements(5) | | | Credit Default
Swap
Agreements—Buy
Protection(5) | | | Credit Default
Swap
Agreements—Sell
Protection(5) | |
| $ | 8,654,139 | | | $ | 9,881,671 | | | $ | 10,607,929 | | | $ | 4,103,333 | |
| (3) | Value at Settlement Date Payable. |
| (4) | Value at Settlement Date Receivable. |
See Notes to Financial Statements.
| | | | |
| Target Conservative Allocation Fund | | | 45 | |
Portfolio of Investments
as of January 31, 2014 (Unaudited) continued
The Fund invested in financial instruments and derivatives during the reporting period that are either offset in accordance with current requirements or are subject to enforceable master netting arrangements or similar agreements that permit offsetting as well as instruments subject to collateral arrangements. The information about offsetting and related netting arrangements for assets and liabilities is presented in the summary below.
Offsetting of financial instrument and derivative assets and liabilities:
| | | | | | | | | | | | | | | | |
Description | | Gross Amounts
Recognized | | | Gross Amounts
not subject to
netting | | | Gross Amounts
Offset in the
Statement of
Financial Position | | | Net Amounts
Presented in the
Statement of
Financial Position | |
Assets: | | | | | | | | | | | | | | | | |
Repurchase agreements | | $ | 5,400,000 | | | $ | — | | | $ | — | | | $ | 5,400,000 | |
Exchange-traded and cleared derivatives | | | 14,712 | | | | — | | | | — | | | | 14,712 | |
Over-the-counter derivatives* | | | 122,569 | | | | — | | | | — | | | | 122,569 | |
| | | | | | | | | | | | | | | | |
| | | | | | | | | | | | | | | 5,537,281 | |
| | | | | | | | | | | | | | | | |
Liabilities: | | | | | | | | | | | | | | | | |
Exchange-traded and cleared derivatives | | | (3,844 | ) | | | — | | | | — | | | | (3,844 | ) |
Over-the-counter derivatives* | | | (75,759) | | | | — | | | | — | | | | (75,759 | ) |
| | | | | | | | | | | | | | | | |
| | | | | | | | | | | | | | | (79,603 | ) |
| | | | | | | | | | | | | | | | |
Collateral Amounts Pledged/(Received): | | | | | | | | | | | | | | | | |
Repurchase Agreements | | | | (5,400,000 | ) |
Exchange-traded and cleared derivatives | | | | — | |
Over-the-counter derivatives | | | | — | |
| | | | | | | | | | | | | | | | |
Net Amount | | | $ | 57,678 | |
| | | | | | | | | | | | | | | | |
| * | Over-the-counter derivatives may consist of forward foreign currency exchange contracts, options contracts and swap agreements. The amounts disclosed above represent the exposure to one or more counterparties. For further detail on individual derivative contracts and the corresponding unrealized appreciation (depreciation) by counterparty, see the Portfolio of Investments. |
See Notes to Financial Statements.
PRUDENTIAL INVESTMENTS»MUTUAL FUNDS
FINANCIAL STATEMENTS
(UNAUDITED)
SEMIANNUAL REPORT · JANUARY 31, 2014
Target Conservative Allocation Fund
Statement of Assets and Liabilities
January 31, 2014 (Unaudited)
| | | | |
Assets | | | | |
Investments at value: | | | | |
Unaffiliated Investments (cost $109,381,657) | | $ | 124,205,018 | |
Affiliated Investments (cost $5,621,944) | | | 5,621,944 | |
Foreign currency, at value (cost $46,071) | | | 45,511 | |
Deposit with broker | | | 562,000 | |
Receivable for investments sold | | | 41,356,235 | |
Dividends and interest receivable | | | 395,911 | |
Receivable for Fund shares sold | | | 81,026 | |
Unrealized appreciation on foreign currency exchange contracts | | | 73,809 | |
Unrealized appreciation on over-the-counter swap agreements | | | 48,760 | |
Receivable from broker—variation margin | | | 14,712 | |
Premiums paid for swap agreements | | | 11,488 | |
Tax reclaim receivable | | | 3,430 | |
Prepaid expenses | | | 806 | |
| | | | |
Total assets | | | 172,420,650 | |
| | | | |
| |
Liabilities | | | | |
Payable for investments purchased | | | 56,915,101 | |
Payable for Fund shares reacquired | | | 254,017 | |
Accrued expenses and other liabilities | | | 169,233 | |
Management fee payable | | | 73,671 | |
Unrealized depreciation on foreign currency exchange contracts | | | 52,221 | |
Distribution fee payable | | | 39,027 | |
Outstanding options written (premiums received $55,765) | | | 27,382 | |
Premiums received for swap agreements | | | 17,089 | |
Affiliated transfer agent fee payable | | | 4,694 | |
Payable to custodian | | | 3,326 | |
Deferred trustees’ fees | | | 2,648 | |
| | | | |
Total liabilities | | | 57,558,409 | |
| | | | |
| |
Net Assets | | $ | 114,862,241 | |
| | | | |
| | | | | |
Net assets were comprised of: | | | | |
Shares of beneficial interest, at par | | $ | 10,120 | |
Paid-in capital, in excess of par | | | 100,037,704 | |
| | | | |
| | | 100,047,824 | |
Distributions in excess of net investment income | | | (145,913 | ) |
Accumulated net realized gain on investment and foreign currency transactions | | | 17,465 | |
Net unrealized appreciation on investments and foreign currencies | | | 14,942,865 | |
| | | | |
Net assets, January 31, 2014 | | $ | 114,862,241 | |
| | | | |
See Notes to Financial Statements.
| | | | |
Class A: | | | | |
Net asset value and redemption price per share,
($86,556,460 / 7,607,294 shares of common stock issued and outstanding) | | $ | 11.38 | |
Maximum sales charge (5.5% of offering price) | | | .66 | |
| | | | |
Maximum offering price to public | | $ | 12.04 | |
| | | | |
| |
Class B: | | | | |
Net asset value, offering price and redemption price per share,
($5,962,010 / 530,483 shares of common stock issued and outstanding) | | $ | 11.24 | |
| | | | |
| |
Class C: | | | | |
Net asset value, offering price and redemption price per share,
($17,926,427 / 1,595,492 shares of common stock issued and outstanding) | | $ | 11.24 | |
| | | | |
| |
Class R: | | | | |
Net asset value, offering price and redemption price per share,
($275,201 / 24,221 shares of common stock issued and outstanding) | | $ | 11.36 | |
| | | | |
| |
Class X: | | | | |
Net asset value, offering price and redemption price per share,
($9,534 / 848 shares of common stock issued and outstanding) | | $ | 11.24 | |
| | | | |
| |
Class Z: | | | | |
Net asset value, offering price and redemption price per share,
($4,132,609 / 361,369 shares of common stock issued and outstanding) | | $ | 11.44 | |
| | | | |
See Notes to Financial Statements.
| | | | |
| Target Conservative Allocation Fund | | | 49 | |
Statement of Operations
Six Months Ended January 31, 2014 (Unaudited)
| | | | |
Net Income | | | | |
Income | | | | |
Interest income | | $ | 611,063 | |
Unaffiliated dividend income (net of foreign withholding taxes $3,198) | | | 399,874 | |
Affiliated dividend income | | | 2,457 | |
| | | | |
| | | 1,013,394 | |
| | | | |
| |
Expenses | | | | |
Management fee | | | 431,392 | |
Distribution fee—Class A | | | 130,772 | |
Distribution fee—Class B | | | 30,254 | |
Distribution fee—Class C | | | 88,453 | |
Distribution fee—Class R | | | 1,005 | |
Distribution fee—Class X | | | 95 | |
Custodian’s fees and expenses | | | 101,000 | |
Transfer agent’s fees and expenses (including affiliated expense of $20,000) | | | 69,000 | |
Registration fees | | | 40,000 | |
Audit fee | | | 34,000 | |
Reports to shareholders | | | 24,000 | |
Legal fees | | | 10,000 | |
Trustees’ fees | | | 6,000 | |
Insurance expense | | | 1,000 | |
Miscellaneous | | | 11,953 | |
| | | | |
Total expenses | | | 978,924 | |
Less: Distribution fee waiver—Class A (Note 2) | | | (21,795 | ) |
Distribution fee waiver—Class R (Note 2) | | | (335 | ) |
| | | | |
Net expenses | | | 956,794 | |
| | | | |
Net investment income | | | 56,600 | |
| | | | |
| |
Net Realized And Unrealized Gain (Loss) On Investments And Foreign Currencies | | | | |
Net realized gain (loss) on: | | | | |
Investment transactions | | | 3,304,427 | |
Options written transactions | | | 63,822 | |
Foreign currency transactions | | | 89,831 | |
Futures transactions | | | 202,385 | |
Swap agreement transactions | | | (674,813 | ) |
Short sale transactions | | | (14,062 | ) |
| | | | |
| | | 2,971,590 | |
| | | | |
Net change in unrealized appreciation (depreciation) on: | | | | |
Investments | | | 1,309,503 | |
Options written | | | 150,245 | |
Foreign currencies | | | 51,246 | |
Futures | | | (10,761 | ) |
Swaps | | | 562,230 | |
Short sales | | | 5,742 | |
| | | | |
| | | 2,068,205 | |
| | | | |
Net gain on investments | | | 5,039,795 | |
| | | | |
Net Increase In Net Assets Resulting From Operations | | $ | 5,096,395 | |
| | | | |
See Notes to Financial Statements.
Statement of Changes in Net Assets
(Unaudited)
| | | | | | | | |
| | | Six Months
Ended
January 31, 2014 | | | Year
Ended
July 31, 2013 | |
Increase (Decrease) In Net Assets | | | | | | | | |
Operations | | | | | | | | |
Net investment income | | $ | 56,600 | | | $ | 1,248,168 | |
Net realized gain on investment and foreign currency transactions | | | 2,971,590 | | | | 7,706,493 | |
Net change in unrealized appreciation (depreciation) on investments and foreign currencies | | | 2,068,205 | | | | 1,076,821 | |
| | | | | | | | |
Net increase in net assets resulting from operations | | | 5,096,395 | | | | 10,031,482 | |
| | | | | | | | |
| | |
Dividends and Distributions (Note 1) | | | | | | | | |
Dividends from net investment income: | | | | | | | | |
Class A | | | (878,177 | ) | | | (1,063,150 | ) |
Class B | | | (18,695 | ) | | | (38,679 | ) |
Class C | | | (55,854 | ) | | | (95,255 | ) |
Class R | | | (2,119 | ) | | | (2,478 | ) |
Class X | | | (39 | ) | | | (448 | ) |
Class Z | | | (47,825 | ) | | | (48,212 | ) |
| | | | | | | | |
| | | (1,002,709 | ) | | | (1,248,222 | ) |
| | | | | | | | |
Distributions from net realized gains: | | | | | | | | |
Class A | | | (4,242,605 | ) | | | — | |
Class B | | | (294,626 | ) | | | — | |
Class C | | | (880,228 | ) | | | — | |
Class R | | | (13,414 | ) | | | — | |
Class X | | | (618 | ) | | | — | |
Class Z | | | (186,922 | ) | | | — | |
| | | | | | | | |
| | | (5,618,413 | ) | | | — | |
| | | | | | | | |
| | |
Fund share transactions (Net of share conversions) (Note 6) | | | | | | | | |
Net proceeds from shares sold | | | 6,786,774 | | | | 6,604,022 | |
Net asset value of shares issued in reinvestment of dividends and distributions | | | 6,396,213 | | | | 1,212,105 | |
Cost of shares reacquired | | | (9,784,261 | ) | | | (19,166,696 | ) |
| | | | | | | | |
Net increase (decrease) in net assets resulting from Fund share transactions | | | 3,398,726 | | | | (11,350,569 | ) |
| | | | | | | | |
Total increase (decrease) | | | 1,873,999 | | | | (2,567,309 | ) |
| | |
Net Assets | | | | | | | | |
Beginning of period | | | 112,988,242 | | | | 115,555,551 | |
| | | | | | | | |
End of period(a) | | $ | 114,862,241 | | | $ | 112,988,242 | |
| | | | | | | | |
(a) Includes undistributed net income of: | | $ | — | | | $ | 800,196 | |
| | | | | | | | |
See Notes to Financial Statements.
| | | | |
| Target Conservative Allocation Fund | | | 51 | |
Notes to Financial Statements
(Unaudited)
Prudential Investment Portfolios 16 (formerly known as Target Asset Allocation Funds) (the “Trust”) is registered under the Investment Company Act of 1940, as amended, (“1940 Act”) as an open-end, diversified management investment company presently consisting of two funds: Prudential Defensive Equity Fund and Target Conservative Allocation Fund (the “Fund”). These financial statements relate only to Target Conservative Allocation Fund. The financial statements of the other fund are not presented herein. The Trust was organized as a business trust in Delaware on July 29, 1998.
The Fund uses investment managers (“Subadvisors”), each managing a portion of the Fund’s assets. The following lists the Subadvisors and their respective segment during the six months ended January 31, 2014.
| | |
Fund Segment | | Subadvisors |
| Large-cap value stocks | | Epoch Investment Partners, Inc.
Hotchkis and Wiley Capital Management, LLC
NFJ Investment Group LLC |
| |
| Large-cap growth stocks | | Massachusetts Financial Services Company |
| |
| Core fixed income bonds | | Pacific Investment Management Company LLC |
| |
| Small-cap value stocks | | EARNEST Partners, LLC
Vaughan Nelson Investment Management, L.P. |
| |
| Small-cap growth stocks | | Eagle Asset Management, Inc. |
The investment objective of the Fund is to seek to provide current income and a reasonable level of capital appreciation.
Note 1. Accounting Policies
The following accounting policies conform to U.S. generally accepted accounting principles. The Trust consistently follow such policies in the preparation of its financial statements.
Security Valuation: The Fund holds securities and other assets that are fair valued at the close of each day the New York Stock Exchange (“NYSE”) is open for trading. Fair value is the price that would be received to sell an asset or paid to transfer a liability in an orderly transaction between market participants on the measurement date. The Board of Trustees (the “Board”) has adopted Valuation Procedures for security valuation under which fair valuation responsibilities have been delegated to
Prudential Investments LLC (“PI”). Under the current Valuation Procedures, the established Valuation Committee is responsible for supervising the valuation of portfolio securities and other assets. The Valuation Procedures permit the Fund to utilize independent pricing vendor services, quotations from market makers, and alternative valuation methods when market quotations are either not readily available or not representative of fair value. A record of the Valuation Committee’s actions is subject to the Board’s review, approval, and ratification at its next regularly-scheduled quarterly meeting.
Various inputs determine how the Fund’s investments are valued, all of which are categorized according to the three broad levels (Level 1, 2, or 3) detailed in the table following the Portfolio of Investments.
Common stocks, exchange-traded funds, and derivative instruments that are traded on a national securities exchange are valued at the last sale price as of the close of trading on the applicable exchange. Securities traded via NASDAQ are valued at the NASDAQ official closing price. To the extent these securities are valued at the last sale price or NASDAQ official closing price; they are classified as Level 1 in the fair value hierarchy.
In the event that no sale or official closing price on valuation date exists, these securities are generally valued at the mean between the last reported bid and asked prices, or at the last bid price in the absence of an asked price. These securities are classified as Level 2 in the fair value hierarchy, as the inputs are observable and considered to be significant to the valuation.
Common stocks traded on foreign securities exchanges are valued using pricing vendor services that provide model prices derived using adjustment factors based on information such as local closing price, relevant general and sector indices, currency fluctuations, depositary receipts, and futures, as applicable. Securities valued using such model prices are classified as Level 2 in the fair value hierarchy, as the adjustment factors are observable and considered to be significant to the valuation.
Investments in open-end, non-exchange-traded mutual funds are valued at their net asset values as of the close of the NYSE on the date of valuation. These securities are classified as Level 1 in the fair value hierarchy since they may be purchased or sold at their net asset values on the date of valuation.
Fixed income securities traded in the over-the-counter market are generally valued at prices provided by approved independent pricing vendors. The pricing vendors
provide these prices after evaluating observable inputs including, but not limited to
| | | | |
| Target Conservative Allocation Fund | | | 53 | |
Notes to Financial Statements
(Unaudited) continued
yield curves, yield spreads, credit ratings, deal terms, tranche level attributes, default rates, cash flows, prepayment speeds, broker/dealer quotations, and reported trades. Securities valued using such vendor prices are classified as Level 2 in the fair value hierarchy.
Over-the-counter derivative instruments are generally valued using pricing vendor services, which derive the valuation based on inputs such as underlying asset prices, indices, spreads, interest rates, and exchange rates. These instruments are categorized as Level 2 in the fair value hierarchy.
Fund securities and other assets that cannot be priced according to the methods described above are valued based on pricing methodologies approved by the Board of Trustees. In the event that significant unobservable inputs are used when determining such valuations, the securities will be classified as Level 3 in the fair value hierarchy.
When determining the fair value of securities, some of the factors influencing the valuation include: the nature of any restrictions on disposition of the securities; assessment of the general liquidity of the securities; the issuer’s financial condition and the markets in which it does business; the cost of the investment; the size of the holding and the capitalization of the issuer; the prices of any recent transactions or bids/offers for such securities or any comparable securities; any available analyst media or other reports or information deemed reliable by the investment adviser regarding the issuer or the markets or industry in which it operates. Using fair value to price securities may result in a value that is different from a security’s most recent closing price and from the price used by other mutual funds to calculate their net asset values.
Foreign Currency Translation: The books and records of the Fund are maintained in U.S. dollars. Foreign currency amounts are translated into U.S. Dollars on the following basis:
(i) market value of investment securities, other assets and liabilities—at the current daily rates of exchange.
(ii) purchases and sales of investment securities, income and expenses—at the rate of exchange prevailing on the respective dates of such transactions.
Although the net assets of the Fund are presented at the foreign exchange rates and market values at the close of the period, the Fund does not isolate that portion of the results of operations arising as a result of changes in the foreign exchange rates from the fluctuations arising from changes in the market prices of securities held at the end of the period. Similarly, the Fund does not isolate the effect of changes in foreign exchange rates from the fluctuations arising from changes in the market prices of portfolio securities sold during the period. Accordingly, realized foreign currency gains or losses are included in the reported net realized gains or losses on investment transactions.
Net realized gains or losses on foreign currency transactions represent net foreign exchange gains or losses from the holding of foreign currencies, currency gains or losses realized between the trade and settlement dates on security transactions, and the difference between the amounts of dividends, interest and foreign withholding taxes recorded on the Fund’s books and the U.S. dollar equivalent amounts actually received or paid. Net unrealized currency gains or losses from valuing foreign currency denominated assets and liabilities (other than investments) at period end exchange rates are reflected as a component of net unrealized appreciation (depreciation) on investments and foreign currencies. Foreign security and currency transactions may involve certain considerations and risks not typically associated with those of domestic origin as a result of, among other factors, the possibility of political and economic instability and the level of governmental supervision and regulation of foreign securities markets.
Forward Currency Contracts: A forward currency contract is a commitment to purchase or sell a foreign currency at a future date at a negotiated forward rate between two parties. The Fund entered into forward currency contracts in order to hedge its exposure to changes in foreign currency exchange rates on its foreign portfolio holdings or on specific receivables and payables denominated in a foreign currency and to gain exposure to certain currencies. The contracts are valued daily at current exchange rates and any unrealized gain or loss is included in the Statement of Assets and Liabilities as unrealized appreciation or depreciation on foreign currencies. Gain or loss is realized on the settlement date of the contract equal to the difference between the settlement value of the original and negotiated forward contracts. This gain or loss, if any, is included in net realized gain (loss) on foreign currency transactions. Forward currency contracts involve risks from currency exchange rate and credit risk in excess of the amounts reflected on the Statement of Assets and Liabilities. Upon entering into these contracts, risks may arise from the potential inability of the counterparties to meet the terms of their contracts. The Fund’s maximum risk of loss from counterparty credit risk is the net value of the cash flows to be received from the counterparty at the end of the contract’s life. This risk may be mitigated by having a master netting arrangement between the Fund and the
| | | | |
| Target Conservative Allocation Fund | | | 55 | |
Notes to Financial Statements
(Unaudited) continued
counterparty which may permit the Fund to offset amounts payable by the Fund to the same counterparty against amounts to be received; and by the receipt of collateral from the counterparty by the Fund to cover the Fund’s exposure to the counterparty. However, there is no assurance that such mitigating factors are easily enforceable.
Short Sales: The Fund may sell a security it does not own in anticipation of a decline in the market value of that security (short sale). When the Fund makes a short sale, it will borrow the security sold short and deliver it to the broker-dealer through which it made the short sale as collateral for its obligation to deliver the security upon conclusion of the sale. The Fund may have to pay a fee to borrow the particular securities and may be obligated to return any interest or dividends received on such borrowed securities. Dividends declared on short positions open are recorded on the ex-date and interest payable is accrued daily on fixed income securities sold short, both of which are recorded as an expense.
A gain, limited to the price at which the Fund sold the security short, or a loss, unlimited in magnitude, will be recognized upon the termination of a short sale if the market price at termination is less than or greater than, respectively, the proceeds originally received.
Options: The Fund purchased and wrote options in order to hedge against adverse market movements or fluctuations in value caused by changes in prevailing interest rates and foreign currency exchange rates, with respect to securities or financial instruments which the Fund currently owns or intends to purchase. The Fund also used purchased options to gain exposure to certain securities and foreign currencies. The Fund’s principal reason for writing options is to realize, through receipt of premiums, a greater current return than would be realized on the underlying security alone. When the Fund purchases an option, it pays a premium and an amount equal to that premium is recorded as an asset. When the Fund writes an option, it receives a premium and an amount equal to that premium is recorded as a liability. The asset or liability is adjusted daily to reflect the current market value of the option.
If an option expires unexercised, the Fund realizes a gain or loss to the extent of the premium received or paid. If an option is exercised, the premium received or paid is recorded as an adjustment to the proceeds from the sale or the cost of the purchase in determining whether the Fund has realized a gain or loss. The difference between the premium and the amount received or paid on at a closing purchase or sale transaction is also treated as a realized gain or loss. Gain or loss on purchased options
is included in net realized gain or loss on investment transactions. Gain or loss on written options is presented separately as net realized gain or loss on options written.
The Fund, as writer of an option, may have no control over whether the underlying securities or currencies may be sold (called) or purchased (put). As a result, the Fund bears the market risk of an unfavorable change in the price of the security or currency underlying the written option. Over-the-counter options involve the risk of the potential inability of the counterparties to meet the terms of their contracts. When a Fund writes an option on a swap contract, an amount equal to any premium received by the Fund is recorded as a liability and is subsequently adjusted to the current market value of the written option on the swap. If a call option on a swap is exercised, the Fund becomes obligated to pay a fixed interest rate (noted as the strike price) and receive a variable interest rate on a notional amount. If a put option on a swap is exercised, the Fund becomes obligated to pay a variable interest rate and receive a fixed interest rate (noted as the strike price) on a notional amount. Premiums received from writing options on swaps that expire or are exercised are treated as realized gains upon the expiration or exercise of such options on swaps. The risk associated with writing put and call options on swaps, is that the Fund will be obligated to be party to a swap agreement if an option on a swap is exercised.
Financial Futures Contracts: A financial futures contract is an agreement to purchase (long) or sell (short) an agreed amount of securities at a set price for delivery on a future date. Upon entering into a financial futures contract, the Fund is required to pledge to the broker an amount of cash and/or other assets equal to a certain percentage of the contract amount. This amount is known as the “initial margin.” Subsequent payments known as “variation margin,” are made or received by the Fund each day, depending on the daily fluctuations in the value of the underlying security. Such variation margin is recorded for financial statement purposes on a daily basis as unrealized gain or loss. When the contract expires or is closed, the gain or loss is realized and is presented in the Statement of Operations as net realized gain or loss on financial futures contracts.
The Fund invests in financial futures contracts in order to hedge its existing portfolio securities, or securities the Fund intends to purchase, against fluctuations in value caused by changes in prevailing interest rates or market conditions. Should interest rates move unexpectedly, the Fund may not achieve the anticipated benefits of the financial futures contracts and may realize a loss. The use of futures transactions involves the risk of imperfect correlation in movements in the price of futures contracts, interest rates and the underlying hedged assets.
| | | | |
| Target Conservative Allocation Fund | | | 57 | |
Notes to Financial Statements
(Unaudited) continued
With exchange-traded futures and option contracts, there is minimal counterparty credit risk to the Fund since the exchanges’ clearinghouse acts as counterparty to all exchange traded futures and options and guarantees the futures and options against default.
Swap Agreements: The Fund entered into credit default and interest rate swap agreements. A swap agreement is an agreement to exchange the return generated by one instrument for the return generated by another instrument. Swap agreements are negotiated in the over-the-counter market and may be executed either directly with counterparty (“OTC Traded”) or through a central clearing facility, such as a registered commodities exchange (“Exchange Traded”). Swap agreements are valued daily at current market value and any change in value is included in the net unrealized appreciation or depreciation on investments. Upon entering into an exchange traded swap, the Fund pledges with the clearing broker an initial margin and thereafter, pays or receives an amount, known as “variation margin”, based on daily changes in valuation of swap contract. Payments received or paid by the Fund are recorded as realized gains or losses upon termination or maturity of the swap. Risk of loss may exceed amounts recognized on the statements of assets and liabilities. Swap agreements outstanding at reporting date, if any, are listed on the Portfolio of Investments.
Interest Rate Swaps: Interest rate swaps represent an agreement between counterparties to exchange cash flows based on the difference between two interest rates, applied to a notional principal amount for a specified period. The Fund is subject to interest rate risk exposure in the normal course of pursuing its investment objectives. The Fund used interest rate swaps to maintain its ability to generate steady cash flow by receiving a stream of fixed rate payments and to increase exposure to prevailing market rates by receiving floating rate payments. The Fund’s maximum risk of loss from counterparty credit risk is the discounted net value of the cash flows to be received from the counterparty over the contract’s remaining life.
Credit Default Swaps: Credit default swaps involve one party (the protection buyer) making a stream of payments to another party (the protection seller) in exchange for the right to receive a specified payment in the event of a default or as a result of a default (collectively a “credit event”) for the referenced entity, typically corporate issues or sovereign issues of an emerging country, on its obligation; or in the event of a write-down, principal shortfall, interest shortfall or default of all or part of the referenced entities comprising a credit index.
The Fund is subject to credit risk in the normal course of pursuing its investment objectives. The Fund entered into credit default swaps to provide a measure of protection against defaults of the issuers. The Fund used credit default swaps on credit indices to hedge a portfolio of credit default swaps or bonds, which is less expensive than it would be to buy many credit default swaps to achieve a similar effect. The Fund’s maximum risk of loss from counterparty credit risk for purchased credit default swaps is the inability of the counterparty to honor the contract up to the notional value based on credit event.
As a seller of protection on credit default swap agreements, the Fund generally receives an agreed upon payment from the buyer of protection throughout the term of the swap, provided no credit event occurs. As the seller, the Fund effectively increases its investment risk because, in addition to its total net assets, the Fund may be subject to investment exposure on the notional amount of the swap.
The maximum amount of the payment that the Fund, as a seller of protection, could be required to make under a credit default swap agreement would be equal to the notional amount of the underlying security or index contract as a result of a credit event. This potential amount will be partially offset by any recovery values of the respective referenced obligations, or net amounts received from the settlement of buy protection credit default swap agreements which the Fund entered for the same referenced entity or index. As a buyer of protection, the Fund generally receives an amount up to the notional value of the swap if a credit event occurs.
Implied credit spreads, represented in absolute terms, utilized in determining the market value of credit default swap agreements on corporate or sovereign issues of an emerging country as of period end are disclosed in the footnotes to the Portfolio of Investments, if applicable. These spreads serve as indicators of the current status of the payment/performance risk and represent the likelihood of default risk for the credit derivative. The implied credit spread of a particular referenced entity reflects the cost of buying/selling protection and may include upfront payments required to enter into the agreement. For credit default swap agreements on asset-backed securities and credit indices, the quoted market prices and resulting values serve as indicators of the current status of the payment/performance risk. Wider credit spreads and increased market value in absolute terms, when compared to the notional amount of the swap, represent a deterioration of the referenced entity’s credit soundness and a greater likelihood of risk of default or other credit event occurring as defined under the terms of the agreement.
Master Netting Arrangements: The Fund is subject to various Master Agreements, or netting arrangements, with select counterparties. A master netting arrangement
| | | | |
| Target Conservative Allocation Fund | | | 59 | |
Notes to Financial Statements
(Unaudited) continued
between the Fund and the counterparty permits the Fund to offset amounts payable by the Fund to the same counterparty against amounts to be received; and by the receipt of collateral from the counterparty by the Fund to cover the Fund’s exposure to the counterparty. However, there is no assurance that such mitigating factors are easily enforceable. The right to set-off exists when all the conditions are met such that each of the parties owes the other a determinable amount, the reporting party has the right to set-off the amount owed with the amount owed by the other party, the reporting party intends to set-off, and the right of set-off is enforceable by law. During the reporting period, no instances occurred where the right to set-off existed and management has not elected to offset.
The Fund is a party to ISDA (International Swaps and Derivatives Association, Inc.) Master Agreements (Master Agreements) with certain counterparties that govern over-the-counter derivative and foreign exchange contracts entered into from time to time. The Master Agreements may contain provisions regarding, among other things, the parties’ general obligations, representations, agreements, collateral requirements, events of default and early termination. With respect to certain counterparties, in accordance with the terms of the Master Agreements, collateral posted to the Fund is held in a segregated account by the Fund’s custodian and with respect to those amounts which can be sold or re-pledged, are presented in the Portfolio of Investments. Collateral pledged by the Fund is segregated by the Fund’s custodian and identified in the Portfolio of Investments. Collateral can be in the form of cash or debt securities issued by the U.S. Government or related agencies or other securities as agreed to by the Fund and the applicable counterparty. Collateral requirements are determined based on the Fund’s net position with each counterparty. Termination events applicable to the Fund may occur upon a decline in the Fund’s net assets below a specified threshold over a certain period of time. Termination events applicable to counterparties may occur upon a decline in the counterparty’s long-term and short-term credit ratings below a specified level. In each case, upon occurrence, the other party may elect to terminate early and cause settlement of all derivative and foreign exchange contracts outstanding, including the payment of any losses and costs resulting from such early termination, as reasonably determined by the terminating party. Any decision by one or more of the Fund’s counterparties to elect early termination could impact the Fund’s future derivative activity.
In addition to each instrument’s primary underlying risk exposure (e.g. interest rate, credit, equity or foreign exchange, etc.), swap agreements involve, to varying degrees,
elements of credit, market and documentation risk. Such risks involve the possibility that no liquid market for these agreements will exist, the counterparty to the agreement may default on its obligation to perform or disagree on the contractual terms of the agreement, and changes in net interest rates will be unfavorable. In connection with these agreements, securities in the portfolio may be identified or received as collateral from the counterparty in accordance with the terms of the respective swap agreements to provide or receive assets of value and to serve as recourse in the event of default or bankruptcy/insolvency of either party. Such over-the-counter derivative agreements include conditions which, when materialized, give the counterparty the right to cause an early termination of the transactions under those agreements. Any election by the counterparty for early termination of the contract(s) may impact the amounts reported on financial statements.
As of January 31, 2014, the Fund has not met conditions under such agreements, which give the counterparty the right to call for an early termination.
Forward currency contracts, written options, short sales, swaps and financial futures contracts involve elements of both market and credit risk in excess of the amounts reflected on the Statement of Assets and Liabilities. Such risks may be mitigated by engaging in master netting arrangements.
When Issued/Delayed Delivery Securities: The Fund may purchase or sell securities on a when-issued or delayed delivery basis. These transactions involve a commitment by the Fund to purchase or sell securities for a predetermined price or yield, with payment and delivery taking place beyond the customary settlement period. When delayed delivery purchases are outstanding, the Fund will set aside and maintain until the settlement date in a segregated account, liquid assets in an amount sufficient to meet the purchase price. When purchasing a security on a delayed delivery basis, the Fund assumes the rights and risks of ownership of the security, including the risk of price and yield fluctuations, and takes such fluctuations into account when determining its net asset value. The Fund may dispose of or renegotiate a delayed delivery transaction subsequent to establishment, and may sell when-issued securities before they are delivered, which may result in a capital gain or loss. When selling a security on a delayed-delivery basis, the Fund forfeits its eligibility to realize future gains and losses with respect to the security.
Repurchase Agreements: In connection with transactions in repurchase agreements with United States financial institutions, it is the Fund’s policy that its custodian or designated subcustodians under triparty repurchase agreements, as the case may be, take possession of the underlying collateral securities, the value of which exceeds the principal amount of the repurchase transaction, including accrued interest. To the
| | | | |
| Target Conservative Allocation Fund | | | 61 | |
Notes to Financial Statements
(Unaudited) continued
extent that any repurchase transaction exceeds one business day, the value of the collateral is marked-to-market on a daily basis to ensure the adequacy of the collateral. If the seller defaults and the value of the collateral declines or if bankruptcy proceedings are commenced with respect to the seller of the security, realization of the collateral by the Fund may be delayed or limited.
REITs: The Fund invests in real estate investment trusts (“REITs”), which report information on the source of their distributions annually. Based on current and historical information, a portion of distributions received from REITs during the period is estimated to be dividend income, capital gain or return of capital and recorded accordingly. These estimates are adjusted periodically when the actual source of distributions is disclosed by the REITs.
Securities Transactions and Net Investment Income: Securities transactions are recorded on the trade date. Realized gains or losses from investment and currency transactions on sales of portfolio securities are calculated on the identified cost basis. Dividend income is recorded on the ex-dividend date and interest income, including amortization of premium and accretion of discount on debt securities, as required, is recorded on the accrual basis. Expenses are recorded on an accrual basis, which may require the use of certain estimates by management, that may differ from actual. Net investment income or loss (other than distribution fees which are charged directly to its respective class), unrealized and realized gains or losses, are allocated daily to each class of shares based upon the relative proportion of adjusted net assets of each class at the beginning of the day.
Dividends and Distributions: The Fund expects to pay dividends of net investment income and distributions of net realized capital and currency gains, if any, annually. Dividends and distributions to shareholders, which are determined in accordance with federal income tax regulations and which may differ from generally accepted accounting principles, are recorded on the ex-dividend date. Permanent book/tax differences relating to income and gains are reclassified amongst undistributed net investment income, accumulated net realized gain or loss and paid in capital in excess of par as appropriate.
Taxes: It is the Fund’s policy to continue to meet the requirements of the Internal Revenue Code applicable to regulated investment companies and to distribute all of its taxable net investment income and capital gains, if any, to its shareholders. Therefore, no federal income tax provision is required. Withholding taxes on foreign dividends are recorded net of reclaimable amounts, at the time the related income is earned.
Estimates: The preparation of the financial statements requires management to make estimates and assumptions that affect the reported amounts and disclosures in the financial statements. Actual results could differ from those estimates.
Note 2. Agreements
The Trust has a management agreement with PI. Pursuant to this agreement, PI manages the investment operations of the Fund, administers the Fund’s affairs and supervises the Subadvisers’ performance of all investment advisory services. Pursuant to the advisory agreement, PI pays the cost of compensation of officers of the Fund, occupancy and certain clerical and accounting costs of the Fund. The Fund bears all other costs and expenses. The management fee paid to PI is computed daily and payable monthly at an annual rate of .75% of average daily net assets up to $500 million, .70% of average daily net assets for the next $500 million and .65% of average daily net assets in excess of $1 billion. The effective management fee rate was .75% for the six months ended January 31, 2014.
The Fund has a distribution agreement with Prudential Investment Management Services LLC (“PIMS”), which acts as the distributor of the Class A, Class B, Class C, Class R and Class Z shares of the Fund. In addition, the Fund has a distribution agreement with Prudential Annuities Distributors, Inc. (“PAD”), which, together with PIMS, serves as co-distributor of the Class X shares of the Fund. The Fund compensates PIMS and PAD, as applicable, for distributing and servicing the Fund’s Class A, Class B, Class C, Class R and Class X shares, pursuant to plans of distribution (the “Distribution Plans”), regardless of expenses actually incurred by PIMS or PAD. The distribution fees are accrued daily and payable monthly. No distribution or service fees are paid to PIMS as distributor of the Class Z shares of the Fund. Pursuant to the Distribution Plans, the Fund compensates PIMS and PAD, as applicable, for distribution related activities at an annual rate of up to .30%, 1%, 1%, .75% and 1% of the average daily net assets of the Class A, B, C, R and X shares, respectively. PIMS has contractually agreed through November 30, 2014 to limit such expenses to .25% and .50% of the average daily net assets of the Class A and Class R shares, respectively.
| | | | |
| Target Conservative Allocation Fund | | | 63 | |
Notes to Financial Statements
(Unaudited) continued
PIMS has advised the Fund that it has received $49,973 in front-end sales charges resulting from sales of Class A shares during the six months ended January 31, 2014. From these fees, PIMS paid such sales charges to broker-dealers, which in turn paid commissions to sales persons and incurred other distribution costs. PIMS has advised the Fund that for the six months ended January 31, 2014, it has received $3,138 and $96 in contingent deferred sales charges imposed upon certain redemptions by Class B and Class C, respectively.
PIMS and PI are indirect, wholly-owned subsidiaries of Prudential Financial, Inc. (“Prudential”).
Note 3. Other Transactions with Affiliates
Prudential Mutual Fund Services LLC (“PMFS”), an affiliate of PI, and an indirect, wholly-owned subsidiary of Prudential, serves as the Fund’s transfer agent. Transfer agent fees and expenses in the Statement of Operations include certain out-of-pocket expenses paid to non-affiliates, where applicable. The Fund invests in the Prudential Core Taxable Money Market Fund (the “Core Fund”), a portfolio of Prudential Investment Portfolios 2, registered under the 1940 Act, and managed by PI. Earnings from the Core Fund are disclosed on the Statement of Operations as affiliated dividend income.
Note 4. Portfolio Securities
Purchases and sales of portfolio securities, excluding short-term investments and U.S. Government investments, for the six months ended January 31, 2014, aggregated $171,371,514 and $185,858,707, respectively.
Transactions in options written during the six months ended January 31, 2014, were as follows:
| | | | | | |
| | | Notional
Amount
(000) | | Premium
Received | |
Options outstanding at July 31, 2013 | | 11,900 | | $ | 35,860 | |
Written options | | 26,000 | | | 83,727 | |
Expired options | | (19,100) | | | (63,822 | ) |
Closed options | | — | | | — | |
| | | | | | |
Options outstanding at January 31, 2014 | | 18,800 | | $ | 55,765 | |
| | | | | | |
Note 5. Tax Information
The United States federal income tax basis of investments and the net unrealized appreciation as of January 31, 2014 were as follows:
| | | | |
Tax Basis | | $ | 116,468,252 | |
| | | | |
Appreciation | | | 14,440,388 | |
Depreciation | | | (1,081,678 | ) |
| | | | |
Net Unrealized Appreciation | | $ | 13,358,710 | |
| | | | |
The book basis may differ from tax basis due to certain tax related adjustments.
Management has analyzed the Fund’s tax positions taken on federal income tax returns for all open tax years and has concluded that no provision for income tax is required in the Fund’s financial statements for the current reporting period. The Fund’s federal and state income and federal excise tax returns for tax years for which the applicable statutes of limitations have not expired are subject to examination by the Internal Revenue Service and state departments of revenue.
Note 6. Capital
The Fund offers Class A, Class B, Class C, Class R, Class X and Class Z shares. Class A shares are subject to a maximum front-end sales charge of 5.50%. Investors who purchase $1 million or more of Class A shares and sell these shares within 12 months of purchase are not subject to an initial sales charge but are subject to a contingent deferred sales charge (CDSC) of 1%. The Class A CDSC is waived for purchases by certain retirement or benefit plans. Class B shares are subject to a CDSC of 5%, which decreases by 1% annually to 1% in the fifth and sixth years and 0% in the seventh year. Class B shares automatically convert to Class A shares on a quarterly basis approximately seven years after purchase. The CDSC for Class C shares is 1% for shares redeemed within 12 months of purchase. Class X shares are generally closed to new purchases. Class X shares are subject to a CDSC of 6%, which decreases by 1% annually to 4% in the third and fourth years, by 1% annually to 2% in the sixth and seventh years, and 1% in the eighth year. Class X shares automatically convert to Class A shares on a monthly basis approximately ten years after purchase. An exchange privilege is also available for shareholders who qualify to purchase Class A shares at net asset value. Class R and Class Z shares are not subject to any sales or redemption charge and are offered exclusively for sale to a limited group of investors.
| | | | |
| Target Conservative Allocation Fund | | | 65 | |
Notes to Financial Statements
(Unaudited) continued
Under certain circumstances, an exchange may be made from specified share classes of the Fund to one or more other share classes of the Fund as presented in the table of transactions in shares of beneficial interest.
The Fund has authorized an unlimited number of shares of beneficial interest at $.001 par value per share. As of January 31, 2014, Prudential owned 267 shares of Class R shares.
Transactions in shares of beneficial interest were as follows:
| | | | | | | | |
Class A | | Shares | | | Amount | |
Six months ended January 31, 2014: | | | | | | | | |
Shares sold | | | 296,409 | | | $ | 3,444,749 | |
Shares issued in reinvestment of dividends and distributions | | | 439,256 | | | | 4,994,342 | |
Shares reacquired | | | (669,319 | ) | | | (7,831,260 | ) |
| | | | | | | | |
Net increase (decrease) in shares outstanding before conversion | | | 66,346 | | | | 607,831 | |
Shares issued upon conversion from Class B and Class X | | | 63,992 | | | | 750,921 | |
| | | | | | | | |
Net increase (decrease) in shares outstanding | | | 130,338 | | | $ | 1,358,752 | |
| | | | | | | | |
Year ended July 31, 2013: | | | | | | | | |
Shares sold | | | 348,103 | | | $ | 3,906,801 | |
Shares issued in reinvestment of dividends and distributions | | | 95,006 | | | | 1,036,538 | |
Shares reacquired | | | (1,238,956 | ) | | | (13,750,435 | ) |
| | | | | | | | |
Net increase (decrease) in shares outstanding before conversion | | | (795,847 | ) | | | (8,807,096 | ) |
Shares issued upon conversion from Class B and Class X | | | 197,388 | | | | 2,211,060 | |
| | | | | | | | |
Net increase (decrease) in shares outstanding | | | (598,459 | ) | | $ | (6,596,036 | ) |
| | | | | | | | |
Class B | | | | | | |
Six months ended January 31, 2014: | | | | | | | | |
Shares sold | | | 66,546 | | | $ | 766,544 | |
Shares issued in reinvestment of dividends and distributions | | | 26,609 | | | | 299,083 | |
Shares reacquired | | | (27,423 | ) | | | (316,423 | ) |
| | | | | | | | |
Net increase (decrease) in shares outstanding before conversion | | | 65,732 | | | | 749,204 | |
Shares reacquired upon conversion into Class A | | | (63,439 | ) | | | (732,294 | ) |
| | | | | | | | |
Net increase (decrease) in shares outstanding | | | 2,293 | | | $ | 16,910 | |
| | | | | | | | |
Year ended July 31, 2013: | | | | | | | | |
Shares sold | | | 59,208 | | | $ | 652,664 | |
Shares issued in reinvestment of dividends and distributions | | | 3,483 | | | | 37,617 | |
Shares reacquired | | | (85,990 | ) | | | (939,746 | ) |
| | | | | | | | |
Net increase (decrease) in shares outstanding before conversion | | | (23,299 | ) | | | (249,465 | ) |
Shares reacquired upon conversion into Class A | | | (193,915 | ) | | | (2,140,610 | ) |
| | | | | | | | |
Net increase (decrease) in shares outstanding | | | (217,214 | ) | | $ | (2,390,075 | ) |
| | | | | | | | |
| | | | | | | | |
Class C | | Shares | | | Amount | |
Six months ended January 31, 2014: | | | | | | | | |
Shares sold | | | 104,916 | | | $ | 1,201,287 | |
Shares issued in reinvestment of dividends and distributions | | | 79,867 | | | | 896,911 | |
Shares reacquired | | | (102,316 | ) | | | (1,179,322 | ) |
| | | | | | | | |
Net increase (decrease) in shares outstanding | | | 82,467 | | | | 918,876 | |
| | | | | | | | |
Year ended July 31, 2013: | | | | | | | | |
Shares sold | | | 98,615 | | | $ | 1,082,458 | |
Shares issued in reinvestment of dividends and distributions | | | 8,436 | | | | 91,029 | |
Shares reacquired | | | (236,573 | ) | | | (2,595,119 | ) |
| | | | | | | | |
Net increase (decrease) in shares outstanding | | | (129,522 | ) | | $ | (1,421,632 | ) |
| | | | | | | | |
Class R | | | | | | |
Six months ended January 31, 2014: | | | | | | | | |
Shares sold | | | 8,922 | | | $ | 103,246 | |
Shares issued in reinvestment of dividends and distributions | | | 1,313 | | | | 14,901 | |
Shares reacquired | | | (527 | ) | | | (6,170 | ) |
| | | | | | | | |
Net increase (decrease) in shares outstanding | | | 9,708 | | | $ | 111,977 | |
| | | | | | | | |
Year ended July 31, 2013: | | | | | | | | |
Shares sold | | | 1,856 | | | $ | 20,510 | |
Shares issued in reinvestment of dividends and distributions | | | 227 | | | | 2,478 | |
Shares reacquired | | | (9,241 | ) | | | (101,405 | ) |
| | | | | | | | |
Net increase (decrease) in shares outstanding | | | (7,158 | ) | | $ | (78,417 | ) |
| | | | | | | | |
Class X | | | | | | |
Six months ended January 31, 2014: | | | | | | | | |
Shares sold | | | 144 | | | $ | 1,700 | |
Shares issued in reinvestment of dividends and distributions | | | 59 | | | | 658 | |
Shares reacquired | | | (173 | ) | | | (2,044 | ) |
| | | | | | | | |
Net increase (decrease) in shares outstanding before conversion | | | 30 | | | | 314 | |
Shares reacquired upon conversion into Class A | | | (1,612 | ) | | | (18,627 | ) |
| | | | | | | | |
Net increase (decrease) in shares outstanding | | | (1,582 | ) | | $ | (18,313 | ) |
| | | | | | | | |
Year ended July 31, 2013: | | | | | | | | |
Shares sold | | | 824 | | | $ | 8,955 | |
Shares issued in reinvestment of dividends and distributions | | | 42 | | | | 448 | |
Shares reacquired | | | (920 | ) | | | (9,920 | ) |
| | | | | | | | |
Net increase (decrease) in shares outstanding before conversion | | | (54 | ) | | | (517 | ) |
Shares reacquired upon conversion into Class A | | | (6,325 | ) | | | (70,450 | ) |
| | | | | | | | |
Net increase (decrease) in shares outstanding | | | (6,379 | ) | | $ | (70,967 | ) |
| | | | | | | | |
| | | | |
| Target Conservative Allocation Fund | | | 67 | |
Notes to Financial Statements
(Unaudited) continued
| | | | | | | | |
Class Z | | Shares | | | Amount | |
Six months ended January 31, 2014: | | | | | | | | |
Shares sold | | | 109,465 | | | $ | 1,269,248 | |
Shares issued in reinvestment of dividends and distributions | | | 16,665 | | | | 190,318 | |
Shares reacquired | | | (38,213 | ) | | | (449,042 | ) |
| | | | | | | | |
Net increase (decrease) in shares outstanding | | | 87,917 | | | $ | 1,010,524 | |
| | | | | | | | |
Year ended July 31, 2013: | | | | | | | | |
Shares sold | | | 82,063 | | | $ | 932,634 | |
Shares issued in reinvestment of dividends and distributions | | | 4,014 | | | | 43,995 | |
Shares reacquired | | | (158,262 | ) | | | (1,770,071 | ) |
| | | | | | | | |
Net increase (decrease) in shares outstanding | | | (72,185 | ) | | $ | (793,442 | ) |
| | | | | | | | |
Note 7. Borrowings
The Fund, along with other affiliated registered investment companies (the “Funds”), is a party to a Syndicated Credit Agreement (“SCA”) with a group of banks. The purpose of the SCA is to provide an alternative source of temporary funding for capital share redemptions. The SCA provides for a commitment of $900 million for the period November 5, 2013 through November 4, 2014. The Funds pay an annualized commitment fee of 0.08% of the unused portion of the SCA. Prior to November 5, 2013, the Funds had another Syndicated Credit Agreement with substantially similar terms. Interest on any borrowings under these SCAs is paid at contracted market rates. The commitment fee for the unused amount is accrued daily and paid quarterly.
The Fund did not utilize the SCA during the six months ended January 31, 2014.
Financial Highlights
(Unaudited)
| | | | | | | | | | | | | | | | | | | | | | | | | | |
| Class A Shares | |
| | | Six Months
Ended
January 31, | | | | | Year Ended July 31, | |
| | | 2014(c) | | | | | 2013(c) | | | 2012(c) | | | 2011(c) | | | 2010(c) | | | 2009(c) | |
| Per Share Operating Performance: | | | | | | | | | | | | | | | | | | | | | | | |
| Net Asset Value, Beginning of Period | | | $11.55 | | | | | | $10.69 | | | | $10.30 | | | | $9.53 | | | | $8.48 | | | | $9.84 | |
| Income (loss) from investment operations: | | | | | | | | | | | | | | | | | | | | | | | |
| Net investment income | | | .01 | | | | | | .14 | | | | .17 | | | | .16 | | | | .18 | | | | .23 | |
| Net realized and unrealized gain (loss) on investments | | | .53 | | | | | | .86 | | | | .38 | | | | .79 | | | | .90 | | | | (.92 | ) |
| Total from investment operations | | | .54 | | | | | | 1.00 | | | | .55 | | | | .95 | | | | 1.08 | | | | (.69 | ) |
| Less Dividends and Distributions: | | | | | | | | | | | | | | | | | | | | | | | | | | |
| Dividends from net investment income | | | (.12 | ) | | | | | (.14 | ) | | | (.16 | ) | | | (.18 | ) | | | (.03 | ) | | | (.37 | ) |
| Tax return of capital | | | - | | | | | | - | | | | - | | | | - | | | | - | | | | (.05 | ) |
| Distributions from net realized gains on investments | | | (.59 | ) | | | | | - | | | | - | | | | - | | | | - | | | | (.25 | ) |
| Total dividends and distributions | | | (.71 | ) | | | | | (.14 | ) | | | (.16 | ) | | | (.18 | ) | | | (.03 | ) | | | (.67 | ) |
| Net asset value, end of period | | | $11.38 | | | | | | $11.55 | | | | $10.69 | | | | $10.30 | | | | $9.53 | | | | $8.48 | |
| Total Return(a) | | | 4.69% | | | | | | 9.41% | | | | 5.53% | | | | 10.04% | | | | 12.72% | | | | (6.36)% | |
| |
| Ratios/Supplemental Data: | | | | | | | | | | | | | | | | | | | | |
| Net assets, end of period (000) | | | $86,556 | | | | | | $86,386 | | | | $86,352 | | | | $86,746 | | | | $75,228 | | | | $63,491 | |
| Average net assets (000) | | | $86,471 | | | | | | $85,636 | | | | $84,243 | | | | $83,395 | | | | $70,865 | | | | $59,479 | |
| Ratios to average net assets(d): | | | | | | | | | | | | | | | | | | | | | | | | | | |
| Expenses after waivers and/or expense reimbursement(g) | | | 1.52% | (e) | | | | | 1.52% | | | | 1.54% | | | | 1.52% | | | | 1.52% | | | | 1.64% | (b) |
| Expenses before waivers and/or expense reimbursement | | | 1.57% | (e) | | | | | 1.57% | | | | 1.59% | | | | 1.57% | | | | 1.57% | | | | 1.69% | (b) |
| Net investment income | | | .25% | (e) | | | | | 1.25% | | | | 1.64% | | | | 1.59% | | | | 2.00% | | | | 2.76% | |
| Portfolio turnover rate | | | 241% | (f) | | | | | 210% | | | | 248% | | | | 188% | | | | 200% | | | | 356% | |
(a) Total return does not consider the effects of sales loads. Total return is calculated assuming a purchase of a share on the first day and a sale on the last day of each period reported and includes reinvestment of dividends and distributions. Total returns may reflect adjustments to conform to generally accepted accounting principles. Total returns for periods less than one full year are not annualized.
(b) Includes interest expense of .06%.
(c) Calculated based upon the average shares outstanding during the period.
(d) Does not include expenses of the underlying portfolio in which the Fund invests.
(e) Annualized.
(f) Not annualized.
(g) The distributor of the Fund has contractually agreed to limit its distribution and service (12b-1) fees to .25% of the average daily net assets of the Class A shares.
See Notes to Financial Statements.
| | | | |
| Target Conservative Allocation Fund | | | 69 | |
Financial Highlights
(Unaudited) continued
| | | | | | | | | | | | | | | | | | | | | | | | | | |
| Class B Shares | |
| | | Six Months
Ended
January 31, | | | | | Year Ended July 31, | |
| | | 2014(b) | | | | | 2013(b) | | | 2012(b) | | | 2011(b) | | | 2010(b) | | | 2009(b) | |
| Per Share Operating Performance: | | | | | | | | | | | | | | | | | | | | | | | |
| Net Asset Value, Beginning of Period | | | $11.38 | | | | | | $10.54 | | | | $10.15 | | | | $9.41 | | | | $8.43 | | | | $9.82 | |
| Income (loss) from investment operations: | | | | | | | | | | | | | | | | | | | | | | | |
| Net investment income (loss) | | | (.03 | ) | | | | | .06 | | | | .09 | | | | .08 | | | | .11 | | | | .17 | |
| Net realized and unrealized gain (loss) on investments | | | .52 | | | | | | .84 | | | | .39 | | | | .78 | | | | .89 | | | | (.92 | ) |
| Total from investment operations | | | .49 | | | | | | .90 | | | | .48 | | | | .86 | | | | 1.00 | | | | (.75 | ) |
| Less Dividends and Distributions: | | | | | | | | | | | | | | | | | | | | | | | | | | |
| Dividends from net investment income | | | (.04 | ) | | | | | (.06 | ) | | | (.09 | ) | | | (.12 | ) | | | (.02 | ) | | | (.34 | ) |
| Tax return of capital | | | - | | | | | | - | | | | - | | | | - | | | | - | | | | (.05 | ) |
| Distributions from net realized gains on investments | | | (.59 | ) | | | | | - | | | | - | | | | - | | | | - | | | | (.25 | ) |
| Total dividends and distributions | | | (.63 | ) | | | | | (.06 | ) | | | (.09 | ) | | | (.12 | ) | | | (.02 | ) | | | (.64 | ) |
| Net asset value, end of period | | | $11.24 | | | | | | $11.38 | | | | $10.54 | | | | $10.15 | | | | $9.41 | | | | $8.43 | |
| Total Return(a) | | | 4.28% | | | | | | 8.57% | | | | 4.86% | | | | 9.20% | | | | 11.82% | | | | (7.05)% | |
| |
| Ratios/Supplemental Data: | | | | | | | | | | | | | | | | | | | | |
| Net assets, end of period (000) | | | $5,962 | | | | | | $6,012 | | | | $7,856 | | | | $13,995 | | | | $23,212 | | | | $32,609 | |
| Average net assets (000) | | | $6,001 | | | | | | $6,958 | | | | $10,840 | | | | $18,900 | | | | $28,746 | | | | $39,077 | |
| Ratios to average net assets(c): | | | | | | | | | | | | | | | | | | | | | | | | | | |
| Expenses | | | 2.27% | (e) | | | | | 2.27% | | | | 2.29% | | | | 2.27% | | | | 2.27% | | | | 2.39% | (d) |
| Net investment income (loss) | | | (.50)% | (e) | | | | | .52% | | | | .93% | | | | .82% | | | | 1.26% | | | | 2.08% | |
| Portfolio turnover rate | | | 241% | (f) | | | | | 210% | | | | 248% | | | | 188% | | | | 200% | | | | 356% | |
(a) Total return does not consider the effects of sales loads. Total return is calculated assuming a purchase of a share on the first day and a sale on the last day of each period reported and includes reinvestment of dividends and distributions. Total returns may reflect adjustments to conform to generally accepted accounting principles. Total returns for periods less than one full year are not annualized.
(b) Calculated based upon the average shares outstanding during the period.
(c) Does not include expenses of the underlying portfolio in which the Fund invests.
(d) Includes interest expense of .06%.
(e) Annualized.
(f) Not annualized.
See Notes to Financial Statements.
| | | | | | | | | | | | | | | | | | | | | | | | | | |
| Class C Shares | | | | | | | | | | | | | | | | | | | | |
| | | Six Months
Ended
January 31, | | | | | Year Ended July 31, | |
| | | 2014(b) | | | | | 2013(b) | | | 2012(b) | | | 2011(b) | | | 2010(b) | | | 2009(b) | |
| Per Share Operating Performance: | | | | | | | | | | | | | | | | | | | | | | | | | | |
| Net Asset Value, Beginning of Period | | | $11.38 | | | | | | $10.54 | | | | $10.15 | | | | $9.41 | | | | $8.43 | | | | $9.82 | |
| Income (loss) from investment operations: | | | | | | | | | | | | | | | | | | | | | | | | | | |
| Net investment income (loss) | | | (.03 | ) | | | | | .06 | | | | .09 | | | | .08 | | | | .11 | | | | .17 | |
| Net realized and unrealized gain (loss) on investments | | | .52 | | | | | | .84 | | | | .39 | | | | .78 | | | | .89 | | | | (.92 | ) |
| Total from investment operations | | | .49 | | | | | | .90 | | | | .48 | | | | .86 | | | | 1.00 | | | | (.75 | ) |
| Less Dividends and Distributions: | | | | | | | | | | | | | | | | | | | | | | | | | | |
| Dividends from net investment income | | | (.04 | ) | | | | | (.06 | ) | | | (.09 | ) | | | (.12 | ) | | | (.02 | ) | | | (.34 | ) |
| Tax return of capital | | | - | | | | | | - | | | | - | | | | - | | | | - | | | | (.05 | ) |
| Distributions from net realized gains on investments | | | (.59 | ) | | | | | - | | | | - | | | | - | | | | - | | | | (.25 | ) |
| Total dividends and distributions | | | (.63 | ) | | | | | (.06 | ) | | | (.09 | ) | | | (.12 | ) | | | (.02 | ) | | | (.64 | ) |
| Net asset value, end of period | | | $11.24 | | | | | | $11.38 | | | | $10.54 | | | | $10.15 | | | | $9.41 | | | | $8.43 | |
| Total Return(a) | | | 4.28% | | | | | | 8.57% | | | | 4.86% | | | | 9.20% | | | | 11.82% | | | | (7.05)% | |
| |
| Ratios/Supplemental Data: | | | | | | | | | | | | | | | | | | | | |
| Net assets, end of period (000) | | | $17,926 | | | | | | $17,217 | | | | $17,307 | | | | $19,133 | | | | $20,499 | | | | $21,777 | |
| Average net assets (000) | | | $17,546 | | | | | | $17,251 | | | | $17,651 | | | | $20,208 | | | | $21,746 | | | | $23,090 | |
| Ratios to average net assets(c): | | | | | | | | | | | | | | | | | | | | | | | | | | |
| Expenses | | | 2.27% | (e) | | | | | 2.27% | | | | 2.29% | | | | 2.27% | | | | 2.27% | | | | 2.39% | (d) |
| Net investment income (loss) | | | (.51)% | (e) | | | | | .51% | | | | .89% | | | | .83% | | | | 1.26% | | | | 2.04% | |
| Portfolio turnover rate | | | 241% | (f) | | | | | 210% | | | | 248% | | | | 188% | | | | 200% | | | | 356% | |
(a) Total return does not consider the effects of sales loads. Total return is calculated assuming a purchase of a share on the first day and a sale on the last day of each period reported and includes reinvestment of dividends and distributions. Total returns may reflect adjustments to conform to generally accepted accounting principles. Total returns for periods less than one full year are not annualized.
(b) Calculated based upon the average shares outstanding during the period.
(c) Does not include expenses of the underlying portfolio in which the Fund invests.
(d) Includes interest expense of .06%.
(e) Annualized.
(f) Not annualized.
See Notes to Financial Statements.
| | | | |
| Target Conservative Allocation Fund | | | 71 | |
Financial Highlights
(Unaudited) continued
| | | | | | | | | | | | | | | | | | | | | | | | | | |
| Class R Shares | |
| | | Six Months
Ended
January 31, | | | | | Year Ended July 31, | |
| | | 2014(c) | | | | | 2013(c) | | | 2012(c) | | | 2011(c) | | | 2010(c) | | | 2009(c) | |
| Per Share Operating Performance: | | | | | | | | | | | | | | | | | | | | | | | |
| Net Asset Value, Beginning of Period | | | $11.52 | | | | | | $10.67 | | | | $10.28 | | | | $9.51 | | | | $8.48 | | | | $9.85 | |
| Income (loss) from investment operations: | | | | | | | | | | | | | | | | | | | | | | | |
| Net investment income | | | - | (g) | | | | | .11 | | | | .14 | | | | .13 | | | | .16 | | | | .24 | |
| Net realized and unrealized gain (loss) on investments | | | .52 | | | | | | .85 | | | | .39 | | | | .80 | | | | .89 | | | | (.95 | ) |
| Total from investment operations | | | .52 | | | | | | .96 | | | | .53 | | | | .93 | | | | 1.05 | | | | (.71 | ) |
| Less Dividends and Distributions: | | | | | | | | | | | | | | | | | | | | | | | | | | |
| Dividends from net investment income | | | (.09 | ) | | | | | (.11 | ) | | | (.14 | ) | | | (.16 | ) | | | (.02 | ) | | | (.36 | ) |
| Tax return of capital | | | - | | | | | | - | | | | - | | | | - | | | | - | | | | (.05 | ) |
| Distributions from net realized gains on investments | | | (.59 | ) | | | | | - | | | | - | | | | - | | | | - | | | | (.25 | ) |
| Total dividends and distributions | | | (.68 | ) | | | | | (.11 | ) | | | (.14 | ) | | | (.16 | ) | | | (.02 | ) | | | (.66 | ) |
| Net asset value, end of period | | | $11.36 | | | | | | $11.52 | | | | $10.67 | | | | $10.28 | | | | $9.51 | | | | $8.48 | |
| Total Return(a) | | | 4.54% | | | | | | 9.07% | | | | 5.29% | | | | 9.84% | | | | 12.44% | | | | (6.59)% | |
| |
| Ratios/Supplemental Data: | | | | | | | | | | | | | | | | | | | | |
| Net assets, end of period (000) | | | $275 | | | | | | $167 | | | | $231 | | | | $232 | | | | $687 | | | | $721 | |
| Average net assets (000) | | | $266 | | | | | | $196 | | | | $219 | | | | $669 | | | | $686 | | | | $1,255 | |
| Ratios to average net assets(d): | | | | | | | | | | | | | | | | | | | | | | | | | | |
| Expenses after waivers and/or expense reimbursement(i) | | | 1.77% | (e) | | | | | 1.77% | | | | 1.79% | | | | 1.77% | | | | 1.77% | | | | 1.89% | (b) |
| Expenses before waivers and/or expense reimbursement | | | 2.02% | (e) | | | | | 2.02% | | | | 2.04% | | | | 2.02% | | | | 2.02% | | | | 2.14% | (b) |
| Net investment income | | | - | (e)(h) | | | | | 1.04% | | | | 1.39% | | | | 1.29% | | | | 1.76% | | | | 2.70% | |
| Portfolio turnover rate | | | 241% | (f) | | | | | 210% | | | | 248% | | | | 188% | | | | 200% | | | | 356% | |
(a) Total return is calculated assuming a purchase of a share on the first day and a sale on the last day of each period reported and includes reinvestment of dividends and distributions. Total returns may reflect adjustments to conform to generally accepted accounting principles. Total returns for periods less than one full year are not annualized.
(b) Includes interest expense of .06%.
(c) Calculated based upon the average shares outstanding during the period.
(d) Does not include expenses of the underlying portfolio in which the Fund invests.
(e) Annualized.
(f) Not annualized.
(g) Less than $.005.
(h) Less than .005%.
(i) The distributor of the Fund has contractually agreed to limit its distribution and service (12b-1) fees to .50% of the average daily net assets of the Class R shares.
See Notes to Financial Statements.
| | | | | | | | | | | | | | | | | | | | | | | | | | |
| Class X Shares | | | | | | | | | | | | | | | | | | |
| | | Six Months
Ended
January 31, | | | | | Year Ended July 31, | |
| | | 2014(b) | | | | | 2013(b) | | | 2012(b) | | | 2011(b) | | | 2010(b) | | | 2009(b) | |
| Per Share Operating Performance: | | | | | | | | | | | | | | | | | | | | | | | | | | |
| Net Asset Value, Beginning of Period | | | $11.38 | | | | | | $10.54 | | | | $10.16 | | | | $9.41 | | | | $8.43 | | | | $9.82 | |
| Income (loss) from investment operations: | | | | | | | | | | | | | | | | | | | | | | | | | | |
| Net investment income (loss) | | | (.02 | ) | | | | | .06 | | | | .09 | | | | .08 | | | | .12 | | | | .18 | |
| Net realized and unrealized gain (loss) on investments | | | .51 | | | | | | .84 | | | | .38 | | | | .79 | | | | .88 | | | | (.93 | ) |
| Total from investment operations | | | .49 | | | | | | .90 | | | | .47 | | | | .87 | | | | 1.00 | | | | (.75 | ) |
| Less Dividends and Distributions: | | | | | | | | | | | | | | | | | | | | | | | | | | |
| Dividends from net investment income | | | (.04 | ) | | | | | (.06 | ) | | | (.09 | ) | | | (.12 | ) | | | (.02 | ) | | | (.34 | ) |
| Tax return of capital | | | - | | | | | | - | | | | - | | | | - | | | | - | | | | (.05 | ) |
| Distributions from net realized gains on investments | | | (.59 | ) | | | | | - | | | | - | | | | - | | | | - | | | | (.25 | ) |
| Total dividends and distributions | | | (.63 | ) | | | | | (.06 | ) | | | (.09 | ) | | | (.12 | ) | | | (.02 | ) | | | (.64 | ) |
| Net asset value, end of period | | | $11.24 | | | | | | $11.38 | | | | $10.54 | | | | $10.16 | | | | $9.41 | | | | $8.43 | |
| Total Return(a) | | | 4.28% | | | | | | 8.57% | | | | 4.75% | | | | 9.31% | | | | 11.82% | | | | (7.05)% | |
| |
| Ratios/Supplemental Data: | | | | | | | | | | | | | | | | | | | | |
| Net assets, end of period (000) | | | $10 | | | | | | $28 | | | | $93 | | | | $123 | | | | $769 | | | | $977 | |
| Average net assets (000) | | | $19 | | | | | | $69 | | | | $108 | | | | $391 | | | | $863 | | | | $1,342 | |
| Ratios to average net assets(c): | | | | | | | | | | | | | | | | | | | | | | | | | | |
| Expenses | | | 2.25% | (e) | | | | | 2.27% | | | | 2.29% | | | | 2.27% | | | | 2.27% | | | | 2.37% | (d) |
| Net investment income (loss) | | | (.42)% | (e) | | | | | .57% | | | | .90% | | | | .78% | | | | 1.26% | | | | 2.13% | |
| Portfolio turnover rate | | | 241% | (f) | | | | | 210% | | | | 248% | | | | 188% | | | | 200% | | | | 356% | |
(a) Total return does not consider the effects of sales loads. Total return is calculated assuming a purchase of a share on the first day and a sale on the last day of each period reported and includes reinvestment of dividends and distributions. Total returns may reflect adjustments to conform to generally accepted accounting principles. Total returns for periods less than one full year are not annualized.
(b) Calculated based upon the average shares outstanding during the period.
(c) Does not include expenses of the underlying portfolio in which the Fund invests.
(d) Includes interest expense of .06%.
(e) Annualized.
(f) Not annualized.
See Notes to Financial Statements.
| | | | |
| Target Conservative Allocation Fund | | | 73 | |
Financial Highlights
(Unaudited) continued
| | | | | | | | | | | | | | | | | | | | | | | | | | |
| Class Z Shares | | | | | | | | | | | | | | | | | | |
| | | Six Months
Ended
January 31, | | | | | Year Ended July 31, | |
| | | 2014(b) | | | | | 2013(b) | | | 2012(b) | | | 2011(b) | | | 2010(b) | | | 2009(b) | |
| Per Share Operating Performance: | | | | | | | | | | | | | | | | | | | | | | | | | | |
| Net Asset Value, Beginning of Period | | | $11.62 | | | | | | $10.75 | | | | $10.35 | | | | $9.57 | | | | $8.50 | | | | $9.85 | |
| Income (loss) from investment operations: | | | | | | | | | | | | | | | | | | | | | | | | | | |
| Net investment income | | | .03 | | | | | | .17 | | | | .20 | | | | .19 | | | | .21 | | | | .26 | |
| Net realized and unrealized gain (loss) on investments | | | .53 | | | | | | .87 | | | | .39 | | | | .79 | | | | .89 | | | | (.93 | ) |
| Total from investment operations | | | .56 | | | | | | 1.04 | | | | .59 | | | | .98 | | | | 1.10 | | | | (.67 | ) |
| Less Dividends and Distributions: | | | | | | | | | | | | | | | | | | | | | | | | | | |
| Dividends from net investment income | | | (.15 | ) | | | | | (.17 | ) | | | (.19 | ) | | | (.20 | ) | | | (.03 | ) | | | (.38 | ) |
| Tax return of capital | | | - | | | | | | - | | | | - | | | | - | | | | - | | | | (.05 | ) |
| Distributions from net realized gains on investments | | | (.59 | ) | | | | | - | | | | - | | | | - | | | | - | | | | (.25 | ) |
| Total dividends and distributions | | | (.74 | ) | | | | | (.17 | ) | | | (.19 | ) | | | (.20 | ) | | | (.03 | ) | | | (.68 | ) |
| Net asset value, end of period | | | $11.44 | | | | | | $11.62 | | | | $10.75 | | | | $10.35 | | | | $9.57 | | | | $8.50 | |
| Total Return(a) | | | 4.83% | | | | | | 9.72% | | | | 5.85% | | | | 10.31% | | | | 12.97% | | | | (6.14)% | |
| |
| Ratios/Supplemental Data: | | | | | | | | | | | | | | | | | | | | |
| Net assets, end of period (000) | | | $4,133 | | | | | | $3,178 | | | | $3,717 | | | | $3,921 | | | | $2,877 | | | | $3,156 | |
| Average net assets (000) | | | $3,797 | | | | | | $3,181 | | | | $4,379 | | | | $3,567 | | | | $3,031 | | | | $3,809 | |
| Ratios to average net assets(c): | | | | | | | | | | | | | | | | | | | | | | | | | | |
| Expenses | | | 1.27% | (e) | | | | | 1.27% | | | | 1.29% | | | | 1.27% | | | | 1.27% | | | | 1.39% | (d) |
| Net investment income | | | .48% | (e) | | | | | 1.51% | | | | 1.90% | | | | 1.84% | | | | 2.26% | | | | 3.10% | |
| Portfolio turnover rate | | | 241% | (f) | | | | | 210% | | | | 248% | | | | 188% | | | | 200% | | | | 356% | |
(a) Total return is calculated assuming a purchase of a share on the first day and a sale on the last day of each period reported and includes reinvestment of dividends and distributions. Total returns may reflect adjustments to conform to generally accepted accounting principles. Total returns for periods less than one full year are not annualized.
(b) Calculated based upon the average shares outstanding during the period.
(c) Does not include expenses of the underlying portfolio in which the Fund invests.
(d) Includes interest expense of .06%.
(e) Annualized.
(f) Not annualized.
See Notes to Financial Statements.
| | | | |
| n MAIL | | n TELEPHONE | | n WEBSITE |
Gateway Center Three 100 Mulberry Street Newark, NJ 07102 | | (800) 225-1852
| | www.prudentialfunds.com |
|
| PROXY VOTING |
| The Board of Trustees of the Fund has delegated to the Fund’s investment subadvisers the responsibility for voting any proxies and maintaining proxy recordkeeping with respect to the Fund. A description of these proxy voting policies and procedures is available without charge, upon request, by calling (800) 225-1852. Information regarding how the Fund voted proxies relating to portfolio securities during the most recent 12-month period ended June 30 is available on the Fund’s website and on the Securities and Exchange Commission’s website. |
|
| TRUSTEES |
| Ellen S. Alberding • Kevin J. Bannon • Scott E. Benjamin • Linda W. Bynoe • Keith F. Hartstein • Michael S. Hyland • Douglas H. McCorkindale • Stephen P. Munn • Stuart S. Parker • James E. Quinn • Richard A. Redeker • Robin B. Smith • Stephen G. Stoneburn |
|
| OFFICERS |
| Stuart S. Parker, President • Scott E. Benjamin, Vice President • Grace C. Torres, Treasurer and Principal Financial and Accounting Officer • Raymond A. O’Hara, Chief Legal Officer • Deborah A. Docs, Secretary • Lee D. Augsburger, Chief Compliance Officer • Theresa C. Thompson, Deputy Chief Compliance Officer • Richard W. Kinville, Anti-Money Laundering Compliance Officer • Jonathan D. Shain, Assistant Secretary • Claudia DiGiacomo, Assistant Secretary • Amanda S. Ryan, Assistant Secretary • Andrew R. French, Assistant Secretary • M. Sadiq Peshimam, Assistant Treasurer • Peter Parrella, Assistant Treasurer |
| | | | |
| MANAGER | | Prudential Investments LLC | | Gateway Center Three
100 Mulberry Street Newark, NJ 07102 |
|
| INVESTMENT SUBADVISERS | | Eagle Asset Management, Inc. | | 880 Carillon Parkway
St. Petersburg, FL 33716 |
|
| | EARNEST Partners, LLC | | 1180 Peachtree Street
Suite 2300 Atlanta, GA 30309 |
|
| | Epoch Investment
Partners, Inc. | | 399 Park Avenue
New York, NY 10022 |
|
| | Hotchkis & Wiley Capital
Management, LLC | | 725 South Figueroa Street
39th Floor Los Angeles, CA 90017 |
|
| | Massachusetts Financial
Services Company | | 111 Huntington Avenue
Boston, MA 02199 |
|
| | NFJ Investment Group LLC
| | 2100 Ross Avenue
Dallas, TX 75201 |
|
| | Pacific Investment
Management Company LLC | | 840 Newport Center Drive
Newport Beach, CA 92660 |
|
| | | | |
| | Vaughan Nelson Investment
Management, L.P. | | 600 Travis Street
Suite 6300 Houston, TX 77002 |
|
| DISTRIBUTOR | | Prudential Investment
Management Services LLC | | Gateway Center Three
100 Mulberry Street Newark, NJ 07102 |
|
| CUSTODIAN | | The Bank of New York Mellon | | One Wall Street
New York, NY 10286 |
|
| TRANSFER AGENT | | Prudential Mutual Fund
Services LLC | | PO Box 9658
Providence, RI 02940 |
|
INDEPENDENT REGISTERED
PUBLIC ACCOUNTING FIRM | | KPMG LLP | | 345 Park Avenue
New York, NY 10154 |
|
| FUND COUNSEL | | Willkie Farr & Gallagher LLP | | 787 Seventh Avenue
New York, NY 10019 |
|
| An investor should consider the investment objectives, risks, charges, and expenses of the Fund carefully before investing. The prospectus and summary prospectus contain this and other information about the Fund. An investor may obtain a prospectus and summary prospectus by visiting our website at www.prudentialfunds.com or by calling (800) 225-1852. The prospectus and summary prospectus should be read carefully before investing. |
|
| E-DELIVERY |
| To receive your mutual fund documents online, go to www.prudentialfunds.com/edelivery and enroll. Instead of receiving printed documents by mail, you will receive notification via email when new materials are available. You can cancel your enrollment or change your email address at any time by visiting the website address above. |
|
| SHAREHOLDER COMMUNICATIONS WITH TRUSTEES |
| Shareholders can communicate directly with the Board of Trustees by writing to the Chair of the Board, Target Conservative Allocation Fund, Prudential Investments, Attn: Board of Trustees, 100 Mulberry Street, Gateway Center Three, Newark, NJ 07102. Shareholders can communicate directly with an individual Trustee by writing to the same address. Communications are not screened before being delivered to the addressee. |
|
| AVAILABILITY OF PORTFOLIO SCHEDULE |
| The Fund files its complete schedule of portfolio holdings with the Securities and Exchange Commission for the first and third quarters of each fiscal year on Form N-Q. The Fund’s Forms N-Q are available on the Commission’s website at www.sec.gov. The Fund’s Forms N-Q may also be reviewed and copied at the Commission’s Public Reference Room in Washington, D.C. Information on the operation and location of the Public Reference Room may be obtained by calling 1-800-SEC-0330. The Fund’s schedule of portfolio holdings is also available on the Fund’s website as of the end of each month. |
Mutual Funds:
| | | | |
ARE NOT INSURED BY THE FDIC OR ANY
FEDERAL GOVERNMENT AGENCY | | MAY LOSE VALUE | | ARE NOT A DEPOSIT OF OR GUARANTEED
BY ANY BANK OR ANY BANK AFFILIATE |

TARGET CONSERVATIVE ALLOCATION FUND
| | | | | | | | | | | | |
| SHARE CLASS | | A | | B | | C | | R | | X | | Z |
| NASDAQ | | PCGAX | | PBCFX | | PCCFX | | PCLRX | | N/A | | PDCZX |
| CUSIP | | 74442X108 | | 74442X207 | | 74442X306 | | 74442X405 | | 74442X603 | | 74442X504 |
MFSP504E2 0259065-00001-00

PRUDENTIAL INVESTMENTS»MUTUAL FUNDS
PRUDENTIAL DEFENSIVE EQUITY FUND
SEMIANNUAL REPORT · JANUARY 31, 2014
Fund Type
Defensive Equity
Objective
Long-term capital appreciation
This report is not authorized for distribution to prospective investors unless preceded or accompanied by a current prospectus.
The views expressed in this report and information about the Fund’s portfolio holdings are for the period covered by this report and are subject to change thereafter.
The accompanying financial statements as of January 31, 2014, were not audited and, accordingly, no auditor’s opinion is expressed on them.
Mutual funds are distributed by Prudential Investment Management Services LLC (PIMS), a Prudential Financial company. Quantitative Management Associates LLC (QMA) is wholly owned subsidiary of Prudential Investment Management, Inc. (PIM). QMA and PIM are registered investment advisers and Prudential Financial companies. ©2014 Prudential Financial, Inc. and its related entities. Prudential Investments, Prudential, the Prudential logo, Bring Your Challenges, and the Rock symbol are service marks of Prudential Financial, Inc. and its related entities, registered in many jurisdictions worldwide.

March 14, 2014
Dear Shareholder:
We hope you find the semiannual report for the Prudential Defensive Equity Fund informative and useful. The report covers performance for the six-month period that ended January 31, 2014.
We recognize that ongoing market volatility may make it a difficult time to be an investor. We continue to believe a prudent response to uncertainty is to maintain a diversified portfolio of funds consistent with your tolerance for risk, time horizon, and financial goals.
Your financial advisor can help you create a diversified investment plan that may include funds covering all the basic asset classes and that reflects your personal investor profile and risk tolerance. Keep in mind, however, that diversification and asset allocation strategies do not assure a profit or protect against loss in declining markets.
Prudential Investments® is dedicated to helping you solve your toughest investment challenges—whether it’s capital growth, reliable income, or protection from market volatility and other risks. We offer the expertise of Prudential Financial’s affiliated asset managers* that strive to be leaders in a broad range of funds to help you stay on course to the future you envision. They also manage money for major corporations and pension funds around the world, which means you benefit from the same expertise, innovation, and attention to risk demanded by today’s most sophisticated investors.
Thank you for choosing the Prudential Investments family of funds.
Sincerely,

Stuart S. Parker, President
Prudential Defensive Equity Fund
*Most of Prudential Investments’ equity funds are advised by Jennison Associates LLC, Quantitative Management Associates LLC (QMA), or Prudential Real Estate Investors. Prudential Investments’ fixed income and money market funds are advised by Prudential Investment Management, Inc. (PIM) through its Prudential Fixed Income unit. Jennison Associates, QMA, and PIM are registered investment advisers and Prudential Financial companies. Prudential Real Estate Investors is a unit of PIM.
| | | | |
| Prudential Defensive Equity Fund | | | 1 | |
Your Fund’s Performance (Unaudited)
Performance data quoted represent past performance. Past performance does not guarantee future results. The investment return and principal value of an investment will fluctuate, so that an investor’s shares, when redeemed, may be worth more or less than their original cost. Current performance may be lower or higher than the past performance data quoted. An investor may obtain performance data as of the most recent month-end by visiting our website at www.prudentialfunds.com or by calling (800) 225-1852.
| | | | | | | | | | | | | | | | | | |
Cumulative Total Returns (Without Sales Charges) as of 1/31/14 |
| | | Six Months | | | One Year | | | Five Years | | | Ten Years | | | Since Inception |
Class A | | | 4.08 | % | | | 11.91 | % | | | 83.89 | % | | | 73.00 | % | | — |
Class B | | | 3.68 | | | | 11.15 | | | | 77.25 | | | | 60.60 | | | — |
Class C | | | 3.68 | | | | 11.15 | | | | 77.25 | | | | 60.60 | | | — |
Class R | | | 3.92 | | | | 11.65 | | | | 81.64 | | | | N/A | | | 65.86% (10/4/04) |
Class X | | | 4.08 | | | | 11.91 | | | | 82.71 | | | | N/A | | | 63.44 (10/4/04) |
Class Z | | | 4.15 | | | | 12.16 | | | | 86.00 | | | | 77.34 | | | — |
S&P 500 Index | | | 6.85 | | | | 21.51 | | | | 140.50 | | | | 93.60 | | | — |
Russell 1000® Defensive Index | | | 5.69 | | | | 19.88 | | | | 119.77 | | | | 100.02 | | | — |
Customized Blend Index* | | | 5.55 | | | | 13.06 | | | | 93.79 | | | | 89.14 | | | — |
Lipper Large-Cap Core Funds Avg. | | | 6.57 | | | | 20.43 | | | | 128.95 | | | | 87.79 | | | — |
| | | | | | | | | | | | | | | | | | |
Average Annual Total Returns (With Sales Charges) as of 12/31/13 |
| | | | | | One Year | | | Five Years | | | Ten Years | | | Since Inception |
Class A | | | | | | | 13.32 | % | | | 11.08 | % | | | 5.60 | % | | — |
Class B | | | | | | | 13.91 | | | | 11.36 | | | | 5.40 | | | — |
Class C | | | | | | | 18.01 | | | | 11.49 | | | | 5.40 | | | — |
Class R | | | | | | | 19.54 | | | | 12.05 | | | | N/A | | | 6.02% (10/4/04) |
Class X | | | | | | | 13.91 | | | | 11.79 | | | | N/A | | | 5.86 (10/4/04) |
Class Z | | | | | | | 20.17 | | | | 12.60 | | | | 6.46 | | | — |
S&P 500 Index | | | | | | | 32.37 | | | | 17.93 | | | | 7.40 | | | — |
Russell 1000 Defensive Index | | | | | | | 30.90 | | | | 16.09 | | | | 7.69 | | | — |
Customized Blend Index* | | | | | | | 18.74 | | | | 13.13 | | | | 6.92 | | | — |
Lipper Large-Cap Core Funds Avg. | | | | | | | 31.38 | | | | 16.90 | | | | 6.98 | | | — |
*Effective May 8, 2013, the Fund’s investment strategy and policies were changed and Quantitative Management Associates LLC (QMA) became the subadviser to the Fund. The Fund’s performance prior to May 8, 2013 is not attributable to QMA or to the Fund’s current investment strategies. The Fund no longer compares its performance to the Customized Blend Index because the Fund’s manager believes that the Russell 1000 Defensive Index and the Lipper Large-Cap Core Funds Average provide a more appropriate basis for performance comparisons in light of the Fund’s adoption of new investment policies and strategies.
Source: Prudential Investments LLC and Lipper, Inc.
Inception returns are provided for any share class with less than 10 calendar years of returns.
| | |
| 2 | | Visit our website at www.prudentialfunds.com |
The returns in the tables do not reflect the deduction of taxes that a shareholder would pay on Fund distributions or following the redemption of Fund shares. The average annual total returns take into account applicable sales charges, which are described for each share class in the table below.
| | | | | | | | | | | | |
| | Class A | | Class B | | Class C | | Class R | | Class X | | Class Z |
Maximum initial sales charge | | 5.50% of the public offering price | | None | | None | | None | | None | | None |
Contingent Deferred Sales Charge (CDSC) (as a percentage of the lower of original purchase price or sale proceeds) | | 1% on sales of $1 million or more made within 12 months of purchase | | 5% (Year 1)
4% (Year 2)
3% (Year 3)
2% (Year 4)
1% (Years 5/6)
0% (Year 7) | | 1% on sales
made
within
12 months
of purchase | | None | | 6% (Year 1)
5% (Year 2)
4% (Years 3/4)
3% (Year 5)
2% (Years 6/7)
1% (Year 8)
0% (Year 9) | | None |
Annual distribution and service (12b-1) fees (shown as a percentage of average daily net assets) | | .30%
(.25% currently) | | 1% | | 1% | | .75%
(.50%
currently) | | 1% | | None |
Class X shares are closed to new initial purchases. Class X shares are only available through exchanges from the same class of shares of certain other Prudential Investments Funds.
Benchmark Definitions
S&P 500 Index
The Standard & Poor’s 500 Composite Stock Price Index (S&P 500 Index) is an unmanaged index of 500 stocks of large U.S. public companies. It gives an indication of how U.S. stock prices have performed. S&P 500 Index Closest Month-End to Inception cumulative total return as of 1/31/14 is 94.23% for Class R and Class X. S&P 500 Index Closest Month-End to Inception average annual total return as of 12/31/13 is 7.85% for Class R and Class X.
Russell 1000 Defensive Index
The Russell 1000 Defensive Index is unmanaged and measures the performance of the large-cap defensive segment of the U.S. equity universe. It includes those Russell 1000 Index companies with relatively stable business conditions which are less sensitive to economic cycles, credit cycles, and market volatility based on their stability variables. Stability is measured in terms of volatility (price and earnings), leverage, and return on assets. An investment cannot be made directly in an index. Russell 1000 Defensive Index Closest Month-End to Inception cumulative total return as of 1/31/14 is 92.22% for Class R and Class X. Russell 1000 Defensive Index Closest Month-End to Inception average annual total return as of 12/31/13 is 7.72% for Class R and Class X.
| | | | |
| Prudential Defensive Equity Fund | | | 3 | |
Your Fund’s Performance (continued)
Customized Blend Index
The Customized Benchmark (Customized Blend Index) for the Target Moderate Allocation Fund (the former name of the Prudential Defensive Equity Fund) is a model portfolio consisting of the Russell 3000® Index (52%), Morgan Stanley Capital International Europe, Australasia, and Far East Index (MSCI EAFE ND Index) (13%), and the Barclays U.S. Aggregate Bond Index (35%). Each component of the Customized Blend Index is an unmanaged index generally considered as representing the performance of the Fund’s asset classes. The Customized Blend is intended to provide a theoretical comparison to the Fund’s performance, based on the amounts allocated to each asset class rather than on amounts allocated to various Fund segments. The Customized Blend Index does not reflect deductions for any sales charges or operating expenses of a mutual fund. The Russell 3000 Index is an unmanaged index which measures the performance of the 3,000 largest U.S. companies based on total market capitalization, which represents approximately 98% of the investable U.S. equity market. The MSCI EAFE ND Index is an unmanaged weighted index that reflects stock price movements in Europe, Australasia, and the Far East. It gives a broad look at how foreign stock prices have performed. The Fund utilizes the net dividends (ND) version of the MSCI EAFE Index. The net dividends and gross dividends versions of the MSCI EAFE Index differ in that the net dividends returns reflect the impact of the maximum withholding taxes on reinvested dividends, while the gross dividends returns do not reflect the impact of the maximum withholding taxes on reinvested dividends. These returns do not include the effect of any investment management expenses. These returns would have been lower if they included the effect of these expenses. The Barclays U.S. Aggregate Bond Index is an unmanaged index of investment-grade securities issued by the U.S. Government and its agencies and by corporations with between one and 10 years remaining to maturity. It gives a broad look at how short- and intermediate-term bonds have performed. Customized Blend Index Closest Month-End to Inception cumulative total return as of 1/31/14 is 87.18% for Class R and Class X. Customized Blend Index Closest Month-End to Inception average annual total return as of 12/31/13 is 7.20% for Class R and Class X.
Lipper Large-Cap Core Funds Average
The Lipper Large-Cap Core Funds Average (Lipper Average) represents returns based on the average return of all funds in the Lipper Large-Cap Core Funds category for the periods noted. Funds in the Lipper Average invest in a variety of market capitalization ranges without concentrating 75% of their equity assets in any one market capitalization range over an extended period of time. Lipper Average Closest Month-End to Inception cumulative total return as of 1/31/14 is 87.76% for Class R and Class X. Lipper Average Closest Month-End to Inception average annual total return as of 12/31/13 is 7.40% for Class R and Class X.
Investors cannot invest directly in an index or average. The returns for the Indexes would be lower if they included the effects of sales charges, operating expenses of a mutual fund, or taxes. Returns for the Lipper Average reflect the deduction of operating expenses, but not sales charges or taxes. The Since Inception returns for the Indexes are measured from the closest month-end to inception date, and not from the Fund’s actual inception date.
| | | | |
Five Largest Holdings expressed as a percentage of net assets as of 1/31/14 | | | | |
Exxon Mobil Corp., Oil, Gas & Consumable Fuels | | | 2.8 | % |
Procter & Gamble Co. (The), Household Products | | | 2.3 | |
Johnson & Johnson, Pharmaceuticals | | | 1.9 | |
General Electric Co., Industrial Conglomerates | | | 1.8 | |
Coca-Cola Co. (The), Beverages | | | 1.6 | |
Holdings reflect only long-term investments and are subject to change.
| | |
| 4 | | Visit our website at www.prudentialfunds.com |
| | | | |
Five Largest Industries expressed as a percentage of net assets as of 1/31/14 | | | | |
Oil, Gas & Consumable Fuels | | | 9.1 | % |
Pharmaceuticals | | | 7.1 | |
Food & Staples Retailing | | | 4.1 | |
Media | | | 3.9 | |
Beverages | | | 3.8 | |
Industry weightings reflect only long-term investments and are subject to change.
| | | | |
| Prudential Defensive Equity Fund | | | 5 | |
Fees and Expenses (Unaudited)
As a shareholder of the Fund, you incur two types of costs: (1) transaction costs, including sales charges (loads) on purchase payments and redemptions, as applicable, and (2) ongoing costs, including management fees, distribution and/or service (12b-1) fees, and other Fund expenses, as applicable. This example is intended to help you understand your ongoing costs (in dollars) of investing in the Fund and to compare these costs with the ongoing costs of investing in other mutual funds.
The example is based on an investment of $1,000 invested on August 1, 2013, at the beginning of the period, and held through the six-month period ended January 31, 2014. The example is for illustrative purposes only; you should consult the Prospectus for information on initial and subsequent minimum investment requirements.
Actual Expenses
The first line for each share class in the table on the following page provides information about actual account values and actual expenses. You may use the information on this line, together with the amount you invested, to estimate the expenses that you paid over the period. Simply divide your account value by $1,000 (for example, an $8,600 account value ÷ $1,000 = 8.6), then multiply the result by the number on the first line under the heading “Expenses Paid During the Six-Month Period” to estimate the expenses you paid on your account during this period.
Hypothetical Example for Comparison Purposes
The second line for each share class in the table on the following page provides information about hypothetical account values and hypothetical expenses based on the Fund’s actual expense ratio and an assumed rate of return of 5% per year before expenses, which is not the Fund’s actual return. The hypothetical account values and expenses may not be used to estimate the actual ending account balance or expenses you paid for the period. You may use this information to compare the ongoing costs of investing in the Fund and other funds. To do so, compare this 5% hypothetical example with the 5% hypothetical examples that appear in the shareholder reports of the other funds.
The Fund’s transfer agent may charge additional fees to holders of certain accounts that are not included in the expenses shown in the table on the following page. These fees apply to individual retirement accounts (IRAs) and Section 403(b) accounts. As of the close of the six-month period covered by the table, IRA fees included an annual maintenance fee of $15 per account (subject to a maximum annual maintenance fee of $25 for all accounts held by the same shareholder). Section 403(b) accounts are charged an annual $25 fiduciary maintenance fee. Some of the fees may vary in amount, or may be waived, based on your total account balance or the number of
| | |
| 6 | | Visit our website at www.prudentialfunds.com |
Prudential Investments Funds, including the Fund, that you own. You should consider the additional fees that were charged to your Fund account over the six-month period when you estimate the total ongoing expenses paid over the period and the impact of these fees on your ending account value, as these additional expenses are not reflected in the information provided in the expense table. Additional fees have the effect of reducing investment returns.
Please note that the expenses shown in the table are meant to highlight your ongoing costs only and do not reflect any transactional costs such as sales charges (loads). Therefore, the second line for each share class in the table is useful in comparing ongoing costs only and will not help you determine the relative total costs of owning different funds. In addition, if these transactional costs were included, your costs would have been higher.
| | | | | | | | | | | | | | | | | | |
Prudential Defensive
Equity Fund | | Beginning Account
Value
August 1, 2013 | | | Ending Account
Value January 31, 2014 | | | Annualized
Expense Ratio
Based on the
Six-Month Period | | | Expenses Paid
During the
Six-Month Period* | |
| | | | | | | | | | | | | | | | | | |
| Class A | | Actual | | $ | 1,000.00 | | | $ | 1,040.80 | | | | 1.33 | % | | $ | 6.84 | |
| | | Hypothetical | | $ | 1,000.00 | | | $ | 1,018.45 | | | | 1.33 | % | | $ | 6.77 | |
| | | | | | | | | | | | | | | | | | |
| Class B | | Actual | | $ | 1,000.00 | | | $ | 1,036.80 | | | | 2.08 | % | | $ | 10.68 | |
| | | Hypothetical | | $ | 1,000.00 | | | $ | 1,014.67 | | | | 2.08 | % | | $ | 10.56 | |
| | | | | | | | | | | | | | | | | | |
| Class C | | Actual | | $ | 1,000.00 | | | $ | 1,036.80 | | | | 2.08 | % | | $ | 10.68 | |
| | | Hypothetical | | $ | 1,000.00 | | | $ | 1,014.67 | | | | 2.08 | % | | $ | 10.56 | |
| | | | | | | | | | | | | | | | | | |
| Class R | | Actual | | $ | 1,000.00 | | | $ | 1,039.20 | | | | 1.58 | % | | $ | 8.12 | |
| | | Hypothetical | | $ | 1,000.00 | | | $ | 1,017.19 | | | | 1.58 | % | | $ | 8.03 | |
| | | | | | | | | | | | | | | | | | |
| Class X | | Actual | | $ | 1,000.00 | | | $ | 1,040.80 | | | | 1.33 | % | | $ | 6.84 | |
| | | Hypothetical | | $ | 1,000.00 | | | $ | 1,018.45 | | | | 1.33 | % | | $ | 6.77 | |
| | | | | | | | | | | | | | | | | | |
| Class Z | | Actual | | $ | 1,000.00 | | | $ | 1,041.50 | | | | 1.08 | % | | $ | 5.56 | |
| | | Hypothetical | | $ | 1,000.00 | | | $ | 1,019.71 | | | | 1.08 | % | | $ | 5.50 | |
*Fund expenses (net of fee waivers or subsidies, if any) for each share class are equal to the annualized expense ratio for each share class (provided in the table), multiplied by the average account value over the period, multiplied by the 184 days in the six-month period ended January 31, 2014, and divided by the 365 days in the Fund’s fiscal year ending July 31, 2014 (to reflect the six-month period). Expenses presented in the table include the expenses of any underlying portfolios in which the Fund may invest.
| | | | |
| Prudential Defensive Equity Fund | | | 7 | |
Fees and Expenses (continued)
The Fund’s annualized expense ratios for the period ended January 31, 2014, are as follows:
| | | | | | | | |
| Class | | Gross Operating Expenses | | | Net Operating Expenses | |
A | | | 1.38 | % | | | 1.33 | % |
B | | | 2.08 | | | | 2.08 | |
C | | | 2.08 | | | | 2.08 | |
R | | | 1.83 | | | | 1.58 | |
X | | | 2.08 | | | | 1.33 | |
Z | | | 1.08 | | | | 1.08 | |
Net operating expenses shown above reflect fee waivers and/or expense reimbursements. Additional information on Fund expenses and any fee waivers and/or expense reimbursements can be found in the “Financial Highlights” tables in this report and in the Notes to the Financial Statements in this report.
| | |
| 8 | | Visit our website at www.prudentialfunds.com |
Portfolio of Investments
as of January 31, 2014 (Unaudited)
| | | | | | |
| Shares | | Description | | Value (Note 1) | |
LONG-TERM INVESTMENTS 95.5% | | | | |
| |
COMMON STOCKS | | | | |
| |
Aerospace & Defense 3.2% | | | | |
| 12,360 | | Boeing Co. (The) | | $ | 1,548,214 | |
| 6,000 | | General Dynamics Corp. | | | 607,860 | |
| 14,000 | | Honeywell International, Inc. | | | 1,277,220 | |
| 1,590 | | L-3 Communications Holdings, Inc. | | | 176,601 | |
| 4,810 | | Lockheed Martin Corp. | | | 725,877 | |
| 3,970 | | Northrop Grumman Corp. | | | 458,733 | |
| 2,600 | | Precision Castparts Corp. | | | 662,350 | |
| 5,700 | | Raytheon Co. | | | 541,899 | |
| 2,400 | | Rockwell Collins, Inc. | | | 181,344 | |
| 5,000 | | Textron, Inc. | | | 177,500 | |
| 15,090 | | United Technologies Corp. | | | 1,720,562 | |
| | | | | | |
| | | | | 8,078,160 | |
| |
Air Freight & Logistics 0.9% | | | | |
| 2,700 | | C.H. Robinson Worldwide, Inc. | | | 158,058 | |
| 3,700 | | Expeditors International of Washington, Inc. | | | 151,182 | |
| 5,320 | | FedEx Corp. | | | 709,262 | |
| 12,780 | | United Parcel Service, Inc. (Class B Stock) | | | 1,217,040 | |
| | | | | | |
| | | | | 2,235,542 | |
| |
Airlines 0.3% | | | | |
| 15,200 | | Delta Air Lines, Inc. | | | 465,272 | |
| 12,400 | | Southwest Airlines Co. | | | 259,780 | |
| | | | | | |
| | | | | 725,052 | |
| |
Auto Components 0.4% | | | | |
| 3,860 | | BorgWarner, Inc. | | | 207,282 | |
| 4,700 | | Delphi Automotive PLC (United Kingdom) | | | 286,183 | |
| 4,100 | | Goodyear Tire & Rubber Co. (The) | | | 97,006 | |
| 11,500 | | Johnson Controls, Inc. | | | 530,380 | |
| | | | | | |
| | | | | 1,120,851 | |
| |
Automobiles 0.8% | | | | |
| 66,200 | | Ford Motor Co. | | | 990,352 | |
| 19,100 | | General Motors Co.* | | | 689,128 | |
| 3,700 | | Harley-Davidson, Inc. | | | 228,253 | |
| | | | | | |
| | | | | 1,907,733 | |
See Notes to Financial Statements.
| | | | |
| Prudential Defensive Equity Fund | | | 9 | |
Portfolio of Investments
as of January 31, 2014 (Unaudited) continued
| | | | | | |
| Shares | | Description | | Value (Note 1) | |
COMMON STOCKS (Continued) | | | | |
| |
Beverages 3.8% | | | | |
| 4,500 | | Beam, Inc. | | $ | 374,850 | |
| 4,500 | | Brown-Forman Corp. (Class B Stock) | | | 346,500 | |
| 105,300 | | Coca-Cola Co. (The) | | | 3,982,446 | |
| 6,700 | | Coca-Cola Enterprises, Inc. | | | 290,043 | |
| 4,600 | | Constellation Brands, Inc. (Class A Stock)* | | | 352,682 | |
| 5,600 | | Dr. Pepper Snapple Group, Inc. | | | 268,128 | |
| 4,400 | | Molson Coors Brewing Co. (Class B Stock) | | | 231,616 | |
| 3,800 | | Monster Beverage Corp.* | | | 258,020 | |
| 42,600 | | PepsiCo, Inc. | | | 3,423,336 | |
| | | | | | |
| | | | | 9,527,621 | |
| |
Biotechnology 3.1% | | | | |
| 3,650 | | Alexion Pharmaceuticals, Inc.* | | | 579,365 | |
| 14,010 | | Amgen, Inc. | | | 1,666,489 | |
| 4,390 | | Biogen Idec, Inc.* | | | 1,372,490 | |
| 7,660 | | Celgene Corp.* | | | 1,163,784 | |
| 28,500 | | Gilead Sciences, Inc.* | | | 2,298,525 | |
| 1,460 | | Regeneron Pharmaceuticals, Inc.* | | | 421,341 | |
| 4,400 | | Vertex Pharmaceuticals, Inc.* | | | 347,776 | |
| | | | | | |
| | | | | 7,849,770 | |
| |
Building Products 0.1% | | | | |
| 1,566 | | Allegion PLC* | | | 77,282 | |
| 6,300 | | Masco Corp. | | | 133,308 | |
| | | | | | |
| | | | | 210,590 | |
| |
Capital Markets 1.4% | | | | |
| 2,040 | | Ameriprise Financial, Inc. | | | 215,506 | |
| 11,900 | | Bank of New York Mellon Corp. (The) | | | 380,324 | |
| 1,320 | | BlackRock, Inc. | | | 396,620 | |
| 12,000 | | Charles Schwab Corp. (The) | | | 297,840 | |
| 3,200 | | E*Trade Financial Corp.* | | | 64,064 | |
| 4,190 | | Franklin Resources, Inc. | | | 217,922 | |
| 4,340 | | Goldman Sachs Group, Inc. (The) | | | 712,281 | |
| 4,700 | | Invesco Ltd. | | | 156,275 | |
| 1,200 | | Legg Mason, Inc. | | | 50,820 | |
| 14,300 | | Morgan Stanley | | | 421,993 | |
| 2,400 | | Northern Trust Corp. | | | 144,528 | |
See Notes to Financial Statements.
| | | | | | |
| Shares | | Description | | Value (Note 1) | |
COMMON STOCKS (Continued) | | | | |
| |
Capital Markets (cont’d.) | | | | |
| 4,600 | | State Street Corp. | | $ | 307,970 | |
| 2,700 | | T. Rowe Price Group, Inc. | | | 211,788 | |
| | | | | | |
| | | | | 3,577,931 | |
| |
Chemicals 1.4% | | | | |
| 1,820 | | Air Products & Chemicals, Inc. | | | 191,355 | |
| 570 | | Airgas, Inc. | | | 58,847 | |
| 500 | | CF Industries Holdings, Inc. | | | 115,430 | |
| 10,400 | | Dow Chemical Co. (The) | | | 473,304 | |
| 8,000 | | E.I. du Pont de Nemours & Co. | | | 488,080 | |
| 1,300 | | Eastman Chemical Co. | | | 101,348 | |
| 2,330 | | Ecolab, Inc. | | | 234,258 | |
| 1,200 | | FMC Corp. | | | 84,756 | |
| 700 | | International Flavors & Fragrances, Inc. | | | 60,676 | |
| 3,800 | | LyondellBasell Industries NV (Class A Stock) | | | 299,288 | |
| 4,520 | | Monsanto Co. | | | 481,606 | |
| 2,900 | | Mosaic Co. (The) | | | 129,514 | |
| 1,220 | | PPG Industries, Inc. | | | 222,479 | |
| 2,530 | | Praxair, Inc. | | | 315,542 | |
| 740 | | Sherwin-Williams Co. (The) | | | 135,612 | |
| 1,000 | | Sigma-Aldrich Corp. | | | 92,970 | |
| | | | | | |
| | | | | 3,485,065 | |
| |
Commercial Banks 1.9% | | | | |
| 7,300 | | BB&T Corp. | | | 273,093 | |
| 2,000 | | Comerica, Inc. | | | 91,600 | |
| 9,200 | | Fifth Third Bancorp | | | 193,384 | |
| 9,000 | | Huntington Bancshares, Inc. | | | 81,630 | |
| 9,500 | | KeyCorp | | | 121,220 | |
| 1,380 | | M&T Bank Corp. | | | 153,884 | |
| 5,500 | | PNC Financial Services Group, Inc. | | | 439,340 | |
| 14,600 | | Regions Financial Corp. | | | 148,482 | |
| 5,600 | | SunTrust Banks, Inc. | | | 207,312 | |
| 18,800 | | U.S. Bancorp | | | 746,924 | |
| 49,100 | | Wells Fargo & Co. | | | 2,226,194 | |
| 2,000 | | Zions Bancorporation | | | 57,500 | |
| | | | | | |
| | | | | 4,740,563 | |
See Notes to Financial Statements.
| | | | |
| Prudential Defensive Equity Fund | | | 11 | |
Portfolio of Investments
as of January 31, 2014 (Unaudited) continued
| | | | | | |
| Shares | | Description | | Value (Note 1) | |
COMMON STOCKS (Continued) | | | | |
| |
Commercial Services & Supplies 0.6% | | | | |
| 3,600 | | ADT Corp. (The) | | $ | 108,144 | |
| 1,800 | | Cintas Corp. | | | 102,726 | |
| 3,000 | | Iron Mountain, Inc. | | | 79,230 | |
| 3,600 | | Pitney Bowes, Inc. | | | 90,648 | |
| 4,800 | | Republic Services, Inc. | | | 153,744 | |
| 1,530 | | Stericycle, Inc.* | | | 179,102 | |
| 8,300 | | Tyco International Ltd. | | | 336,067 | |
| 7,800 | | Waste Management, Inc. | | | 325,884 | |
| | | | | | |
| | | | | 1,375,545 | |
| |
Communications Equipment 0.7% | | | | |
| 34,500 | | Cisco Systems, Inc. | | | 755,895 | |
| 500 | | F5 Networks, Inc.* | | | 53,500 | |
| 700 | | Harris Corp. | | | 48,538 | |
| 3,200 | | Juniper Networks, Inc.* | | | 85,152 | |
| 1,500 | | Motorola Solutions, Inc. | | | 95,700 | |
| 10,900 | | QUALCOMM, Inc. | | | 808,998 | |
| | | | | | |
| | | | | 1,847,783 | |
| |
Computers & Peripherals 1.6% | | | | |
| 5,810 | | Apple, Inc. | | | 2,908,486 | |
| 13,200 | | EMC Corp. | | | 319,968 | |
| 12,400 | | Hewlett-Packard Co. | | | 359,600 | |
| 2,200 | | NetApp, Inc. | | | 93,148 | |
| 1,500 | | SanDisk Corp. | | | 104,325 | |
| 2,100 | | Seagate Technology PLC | | | 111,006 | |
| 1,400 | | Western Digital Corp. | | | 120,638 | |
| | | | | | |
| | | | | 4,017,171 | |
| |
Construction & Engineering 0.2% | | | | |
| 2,900 | | Fluor Corp. | | | 220,284 | |
| 2,400 | | Jacobs Engineering Group, Inc.* | | | 145,704 | |
| 3,800 | | Quanta Services, Inc.* | | | 118,446 | |
| | | | | | |
| | | | | 484,434 | |
| |
Construction Materials | | | | |
| 1,100 | | Vulcan Materials Co. | | | 67,903 | |
See Notes to Financial Statements.
| | | | | | |
| Shares | | Description | | Value (Note 1) | |
COMMON STOCKS (Continued) | | | | |
| |
Consumer Finance 0.6% | | | | |
| 9,500 | | American Express Co. | | $ | 807,690 | |
| 6,000 | | Capital One Financial Corp. | | | 423,660 | |
| 5,000 | | Discover Financial Services | | | 268,250 | |
| 4,600 | | SLM Corp. | | | 104,696 | |
| | | | | | |
| | | | | 1,604,296 | |
| |
Containers & Packaging 0.1% | | | | |
| 800 | | Avery Dennison Corp. | | | 39,416 | |
| 1,200 | | Ball Corp. | | | 61,428 | |
| 900 | | Bemis Co., Inc. | | | 34,659 | |
| 1,500 | | MeadWestvaco Corp. | | | 54,105 | |
| 1,400 | | Owens-Illinois, Inc.* | | | 44,856 | |
| 1,700 | | Sealed Air Corp. | | | 53,023 | |
| | | | | | |
| | | | | 287,487 | |
| |
Distributors 0.1% | | | | |
| 2,600 | | Genuine Parts Co. | | | 213,850 | |
| |
Diversified Consumer Services 0.1% | | | | |
| 80 | | Graham Holdings Co. | | | 50,085 | |
| 4,500 | | H&R Block, Inc. | | | 136,800 | |
| | | | | | |
| | | | | 186,885 | |
| |
Diversified Financial Services 3.4% | | | | |
| 109,400 | | Bank of America Corp. | | | 1,832,450 | |
| 18,450 | | Berkshire Hathaway, Inc. (Class B Stock)* | | | 2,059,020 | |
| 31,100 | | Citigroup, Inc. | | | 1,475,073 | |
| 3,300 | | CME Group, Inc. | | | 246,708 | |
| 1,206 | | IntercontinentalExchange Group, Inc. | | | 251,801 | |
| 38,500 | | JPMorgan Chase & Co. | | | 2,131,360 | |
| 3,300 | | Leucadia National Corp. | | | 90,189 | |
| 2,900 | | McGraw Hill Financial, Inc. | | | 220,516 | |
| 2,000 | | Moody’s Corp. | | | 149,160 | |
| 1,300 | | NASDAQ OMX Group, Inc. (The) | | | 49,595 | |
| | | | | | |
| | | | | 8,505,872 | |
| |
Diversified Telecommunication Services 1.8% | | | | |
| 69,000 | | AT&T, Inc. | | | 2,299,080 | |
| 7,700 | | CenturyLink, Inc. | | | 222,222 | |
| 13,000 | | Frontier Communications Corp. | | | 61,100 | |
See Notes to Financial Statements.
| | | | |
| Prudential Defensive Equity Fund | | | 13 | |
Portfolio of Investments
as of January 31, 2014 (Unaudited) continued
| | | | | | |
| Shares | | Description | | Value (Note 1) | |
COMMON STOCKS (Continued) | | | | |
| |
Diversified Telecommunication Services (cont’d.) | | | | |
| 37,500 | | Verizon Communications, Inc. | | $ | 1,800,750 | |
| 7,800 | | Windstream Holdings, Inc. | | | 58,344 | |
| | | | | | |
| | | | | 4,441,496 | |
| |
Electric Utilities 2.2% | | | | |
| 10,000 | | American Electric Power Co., Inc. | | | 488,100 | |
| 14,500 | | Duke Energy Corp. | | | 1,023,990 | |
| 6,700 | | Edison International | | | 322,672 | |
| 3,700 | | Entergy Corp. | | | 233,211 | |
| 17,600 | | Exelon Corp. | | | 510,400 | |
| 8,600 | | FirstEnergy Corp. | | | 270,814 | |
| 8,900 | | NextEra Energy, Inc. | | | 818,177 | |
| 6,500 | | Northeast Utilities | | | 284,700 | |
| 5,100 | | Pepco Holdings, Inc. | | | 99,093 | |
| 2,300 | | Pinnacle West Capital Corp. | | | 121,049 | |
| 12,900 | | PPL Corp. | | | 394,353 | |
| 18,100 | | Southern Co. (The) | | | 746,444 | |
| 10,200 | | Xcel Energy, Inc. | | | 294,882 | |
| | | | | | |
| | | | | 5,607,885 | |
| |
Electrical Equipment 0.9% | | | | |
| 4,400 | | AMETEK, Inc. | | | 217,448 | |
| 8,500 | | Eaton Corp. PLC | | | 621,265 | |
| 12,600 | | Emerson Electric Co. | | | 830,844 | |
| 2,480 | | Rockwell Automation, Inc. | | | 284,803 | |
| 1,780 | | Roper Industries, Inc. | | | 244,287 | |
| | | | | | |
| | | | | 2,198,647 | |
| |
Electronic Equipment, Instruments & Components 0.2% | | | | |
| 1,000 | | Amphenol Corp. (Class A Stock) | | | 86,880 | |
| 9,300 | | Corning, Inc. | | | 160,053 | |
| 900 | | FLIR Systems, Inc. | | | 28,548 | |
| 1,100 | | Jabil Circuit, Inc. | | | 19,767 | |
| 2,600 | | TE Connectivity Ltd. (Switzerland) | | | 146,926 | |
| | | | | | |
| | | | | 442,174 | |
| |
Energy Equipment & Services 2.1% | | | | |
| 7,800 | | Baker Hughes, Inc. | | | 441,792 | |
| 4,200 | | Cameron International Corp.* | | | 251,874 | |
| 1,200 | | Diamond Offshore Drilling, Inc. | | | 58,248 | |
See Notes to Financial Statements.
| | | | | | |
| Shares | | Description | | Value (Note 1) | |
COMMON STOCKS (Continued) | | | | |
| |
Energy Equipment & Services (cont’d.) | | | | |
| 4,100 | | Ensco PLC (Class A Stock) | | $ | 206,517 | |
| 4,200 | | FMC Technologies, Inc.* | | | 207,648 | |
| 14,900 | | Halliburton Co. | | | 730,249 | |
| 1,900 | | Helmerich & Payne, Inc. | | | 167,276 | |
| 4,500 | | Nabors Industries Ltd. | | | 76,860 | |
| 7,500 | | National Oilwell Varco, Inc. | | | 562,575 | |
| 4,400 | | Noble Corp PLC | | | 136,532 | |
| 2,200 | | Rowan Cos. PLC (Class A Stock)* | | | 69,014 | |
| 23,100 | | Schlumberger Ltd. | | | 2,022,867 | |
| 5,900 | | Transocean Ltd. | | | 255,352 | |
| | | | | | |
| | | | | 5,186,804 | |
| |
Food & Staples Retailing 4.1% | | | | |
| 12,120 | | Costco Wholesale Corp. | | | 1,361,803 | |
| 33,000 | | CVS Caremark Corp. | | | 2,234,760 | |
| 14,400 | | Kroger Co. (The) | | | 519,840 | |
| 6,800 | | Safeway, Inc. | | | 212,432 | |
| 16,100 | | Sysco Corp. | | | 564,788 | |
| 44,900 | | Wal-Mart Stores, Inc. | | | 3,353,132 | |
| 24,200 | | Walgreen Co. | | | 1,387,870 | |
| 10,300 | | Whole Foods Market, Inc. | | | 538,278 | |
| | | | | | |
| | | | | 10,172,903 | |
| |
Food Products 2.7% | | | | |
| 18,200 | | Archer-Daniels-Midland Co. | | | 718,536 | |
| 5,000 | | Campbell Soup Co. | | | 206,050 | |
| 11,700 | | ConAgra Foods, Inc. | | | 371,943 | |
| 17,600 | | General Mills, Inc. | | | 845,152 | |
| 4,200 | | Hershey Co. (The) | | | 417,480 | |
| 3,700 | | Hormel Foods Corp. | | | 168,128 | |
| 2,920 | | J.M. Smucker Co. (The) | | | 281,459 | |
| 7,100 | | Kellogg Co. | | | 411,658 | |
| 16,500 | | Kraft Foods Group, Inc. | | | 863,775 | |
| 3,700 | | McCormick & Co., Inc. | | | 237,466 | |
| 5,600 | | Mead Johnson Nutrition Co. | | | 430,584 | |
| 48,600 | | Mondelez International, Inc. (Class A Stock) | | | 1,591,650 | |
| 7,500 | | Tyson Foods, Inc. (Class A Stock) | | | 280,500 | |
| | | | | | |
| | | | | 6,824,381 | |
See Notes to Financial Statements.
| | | | |
| Prudential Defensive Equity Fund | | | 15 | |
Portfolio of Investments
as of January 31, 2014 (Unaudited) continued
| | | | | | |
| Shares | | Description | | Value (Note 1) | |
COMMON STOCKS (Continued) | | | | |
| |
Gas Utilities 0.2% | | | | |
| 2,400 | | AGL Resources, Inc. | | $ | 114,672 | |
| 4,200 | | ONEOK, Inc. | | | 287,658 | |
| | | | | | |
| | | | | 402,330 | |
| |
Health Care Equipment & Supplies 2.5% | | | | |
| 28,700 | | Abbott Laboratories | | | 1,052,142 | |
| 10,100 | | Baxter International, Inc. | | | 689,830 | |
| 3,610 | | Becton, Dickinson and Co. | | | 390,313 | |
| 24,800 | | Boston Scientific Corp.* | | | 335,544 | |
| 1,450 | | C.R. Bard, Inc. | | | 187,906 | |
| 3,900 | | CareFusion Corp.* | | | 159,003 | |
| 8,600 | | Covidien PLC | | | 586,864 | |
| 2,600 | | DENTSPLY International, Inc. | | | 119,964 | |
| 2,000 | | Edwards Lifesciences Corp.* | | | 130,240 | |
| 710 | | Intuitive Surgical, Inc.* | | | 289,382 | |
| 18,500 | | Medtronic, Inc. | | | 1,046,360 | |
| 5,400 | | St. Jude Medical, Inc. | | | 327,942 | |
| 5,500 | | Stryker Corp. | | | 426,800 | |
| 2,000 | | Varian Medical Systems, Inc.* | | | 162,620 | |
| 3,200 | | Zimmer Holdings, Inc. | | | 300,704 | |
| | | | | | |
| | | | | 6,205,614 | |
| |
Health Care Providers & Services 2.5% | | | | |
| 6,800 | | Aetna, Inc. | | | 464,644 | |
| 4,300 | | AmerisourceBergen Corp. | | | 289,046 | |
| 6,400 | | Cardinal Health, Inc. | | | 435,328 | |
| 5,200 | | CIGNA Corp. | | | 448,812 | |
| 3,280 | | DaVita Healthcare Partners, Inc.* | | | 212,970 | |
| 15,000 | | Express Scripts Holding Co.* | | | 1,120,350 | |
| 2,900 | | Humana, Inc. | | | 282,170 | |
| 1,630 | | Laboratory Corp. of America Holdings* | | | 146,423 | |
| 4,270 | | McKesson Corp. | | | 744,731 | |
| 1,500 | | Patterson Cos., Inc. | | | 59,940 | |
| 2,700 | | Quest Diagnostics, Inc. | | | 141,750 | |
| 1,800 | | Tenet Healthcare Corp.* | | | 82,818 | |
| 18,700 | | UnitedHealth Group, Inc. | | | 1,351,636 | |
| 5,500 | | WellPoint, Inc. | | | 473,000 | |
| | | | | | |
| | | | | 6,253,618 | |
See Notes to Financial Statements.
| | | | | | |
| Shares | | Description | | Value (Note 1) | |
COMMON STOCKS (Continued) | | | | |
| |
Health Care Technology 0.1% | | | | |
| 5,500 | | Cerner Corp.* | | $ | 312,895 | |
| |
Hotels, Restaurants & Leisure 1.8% | | | | |
| 7,300 | | Carnival Corp. | | | 286,087 | |
| 520 | | Chipotle Mexican Grill, Inc.* | | | 287,019 | |
| 2,200 | | Darden Restaurants, Inc. | | | 108,768 | |
| 4,100 | | International Game Technology | | | 59,163 | |
| 3,800 | | Marriott International, Inc. (Class A Stock) | | | 187,340 | |
| 16,700 | | McDonald’s Corp. | | | 1,572,639 | |
| 12,700 | | Starbucks Corp. | | | 903,224 | |
| 3,200 | | Starwood Hotels & Resorts Worldwide, Inc. | | | 239,072 | |
| 2,200 | | Wyndham Worldwide Corp. | | | 156,068 | |
| 1,360 | | Wynn Resorts Ltd. | | | 295,691 | |
| 7,500 | | Yum! Brands, Inc. | | | 503,625 | |
| | | | | | |
| | | | | 4,598,696 | |
| |
Household Durables 0.4% | | | | |
| 4,700 | | D.R. Horton, Inc.* | | | 110,356 | |
| 2,100 | | Garmin Ltd. | | | 94,605 | |
| 1,100 | | Harman International Industries, Inc. | | | 113,773 | |
| 2,300 | | Leggett & Platt, Inc. | | | 69,046 | |
| 2,800 | | Lennar Corp. (Class A Stock) | | | 112,448 | |
| 1,030 | | Mohawk Industries, Inc.* | | | 146,445 | |
| 4,800 | | Newell Rubbermaid, Inc. | | | 148,320 | |
| 5,700 | | PulteGroup, Inc. | | | 115,824 | |
| 1,320 | | Whirlpool Corp. | | | 175,956 | |
| | | | | | |
| | | | | 1,086,773 | |
| |
Household Products 3.5% | | | | |
| 3,600 | | Clorox Co. (The) | | | 317,772 | |
| 24,400 | | Colgate-Palmolive Co. | | | 1,494,012 | |
| 10,590 | | Kimberly-Clark Corp. | | | 1,158,228 | |
| 75,400 | | Procter & Gamble Co. (The) | | | 5,777,148 | |
| | | | | | |
| | | | | 8,747,160 | |
| |
Independent Power Producers & Energy Traders 0.2% | | | | |
| 13,500 | | AES Corp. (The) | | | 189,810 | |
| 6,600 | | NRG Energy, Inc. | | | 183,810 | |
| | | | | | |
| | | | | 373,620 | |
See Notes to Financial Statements.
| | | | |
| Prudential Defensive Equity Fund | | | 17 | |
Portfolio of Investments
as of January 31, 2014 (Unaudited) continued
| | | | | | |
| Shares | | Description | | Value (Note 1) | |
COMMON STOCKS (Continued) | | | | |
| |
Industrial Conglomerates 2.7% | | | | |
| 11,440 | | 3M Co. | | $ | 1,466,494 | |
| 10,700 | | Danaher Corp. | | | 795,973 | |
| 180,800 | | General Electric Co. | | | 4,543,504 | |
| | | | | | |
| | | | | 6,805,971 | |
| |
Insurance 1.8% | | | | |
| 3,530 | | ACE Ltd. | | | 331,149 | |
| 4,900 | | Aflac, Inc. | | | 307,622 | |
| 4,700 | | Allstate Corp. (The) | | | 240,640 | |
| 15,200 | | American International Group, Inc. | | | 728,992 | |
| 3,200 | | Aon PLC (United Kingdom) | | | 257,472 | |
| 800 | | Assurant, Inc. | | | 52,280 | |
| 2,700 | | Chubb Corp. (The) | | | 228,258 | |
| 1,600 | | Cincinnati Financial Corp. | | | 77,520 | |
| 5,400 | | Genworth Financial, Inc. (Class A Stock)* | | | 79,650 | |
| 4,700 | | Hartford Financial Services Group, Inc. (The) | | | 156,275 | |
| 2,800 | | Lincoln National Corp. | | | 134,484 | |
| 3,200 | | Loews Corp. | | | 142,688 | |
| 5,700 | | Marsh & McLennan Cos., Inc. | | | 260,547 | |
| 11,600 | | MetLife, Inc. | | | 568,980 | |
| 2,900 | | Principal Financial Group, Inc. | | | 126,353 | |
| 5,800 | | Progressive Corp. (The) | | | 134,792 | |
| 1,000 | | Torchmark Corp. | | | 75,150 | |
| 3,800 | | Travelers Cos., Inc. (The) | | | 308,864 | |
| 2,800 | | Unum Group | | | 90,160 | |
| 3,000 | | XL Group PLC (Ireland) | | | 86,220 | |
| | | | | | |
| | | | | 4,388,096 | |
| |
Internet & Catalog Retail 1.6% | | | | |
| 6,230 | | Amazon.com, Inc.* | | | 2,234,639 | |
| 1,700 | | Expedia, Inc. | | | 110,466 | |
| 1,000 | | Netflix, Inc.* | | | 409,330 | |
| 870 | | priceline.com, Inc.* | | | 996,054 | |
| 1,900 | | Tripadvisor, Inc.* | | | 146,661 | |
| | | | | | |
| | | | | 3,897,150 | |
| |
Internet Software & Services 1.4% | | | | |
| 1,100 | | Akamai Technologies, Inc.* | | | 52,448 | |
| 7,500 | | eBay, Inc.* | | | 399,000 | |
| 10,600 | | Facebook, Inc. (Class A Stock)* | | | 663,242 | |
See Notes to Financial Statements.
| | | | | | |
| Shares | | Description | | Value (Note 1) | |
COMMON STOCKS (Continued) | | | | |
| |
Internet Software & Services (cont’d.) | | | | |
| 1,820 | | Google, Inc. (Class A Stock)* | | $ | 2,149,365 | |
| 800 | | VeriSign, Inc.* | | | 47,000 | |
| 6,100 | | Yahoo!, Inc.* | | | 219,722 | |
| | | | | | |
| | | | | 3,530,777 | |
| |
IT Services 1.5% | | | | |
| 4,100 | | Accenture PLC (Class A Stock) | | | 327,508 | |
| 320 | | Alliance Data Systems Corp.* | | | 76,691 | |
| 3,100 | | Automatic Data Processing, Inc. | | | 237,460 | |
| 1,960 | | Cognizant Technology Solutions Corp. (Class A Stock)* | | | 189,963 | |
| 900 | | Computer Sciences Corp. | | | 54,369 | |
| 1,900 | | Fidelity National Information Services, Inc. | | | 96,330 | |
| 1,660 | | Fiserv, Inc.* | | | 93,043 | |
| 6,590 | | International Business Machines Corp. | | | 1,164,321 | |
| 6,700 | | MasterCard, Inc. (Class A Stock) | | | 507,056 | |
| 2,100 | | Paychex, Inc. | | | 87,822 | |
| 1,000 | | Teradata Corp.* | | | 41,120 | |
| 1,000 | | Total System Services, Inc. | | | 29,880 | |
| 3,290 | | Visa, Inc. (Class A Stock) | | | 708,765 | |
| 3,500 | | Western Union Co. (The) | | | 53,900 | |
| | | | | | |
| | | | | 3,668,228 | |
| |
Leisure Equipment & Products 0.1% | | | | |
| 1,900 | | Hasbro, Inc. | | | 93,328 | |
| 5,700 | | Mattel, Inc. | | | 215,688 | |
| | | | | | |
| | | | | 309,016 | |
| |
Life Sciences Tools & Services 0.7% | | | | |
| 6,100 | | Agilent Technologies, Inc. | | | 354,715 | |
| 3,200 | | Life Technologies Corp.* | | | 243,424 | |
| 2,100 | | PerkinElmer, Inc. | | | 91,560 | |
| 6,720 | | Thermo Fisher Scientific, Inc. | | | 773,741 | |
| 1,650 | | Waters Corp.* | | | 178,645 | |
| | | | | | |
| | | | | 1,642,085 | |
| |
Machinery 2.0% | | | | |
| 11,400 | | Caterpillar, Inc. | | | 1,070,574 | |
| 3,120 | | Cummins, Inc. | | | 396,178 | |
| 6,900 | | Deere & Co. | | | 593,124 | |
| 3,100 | | Dover Corp. | | | 268,336 | |
See Notes to Financial Statements.
| | | | |
| Prudential Defensive Equity Fund | | | 19 | |
Portfolio of Investments
as of January 31, 2014 (Unaudited) continued
| | | | | | |
| Shares | | Description | | Value (Note 1) | |
COMMON STOCKS (Continued) | | | | |
| |
Machinery (cont’d.) | | | | |
| 2,500 | | Flowserve Corp. | | $ | 180,825 | |
| 7,300 | | Illinois Tool Works, Inc. | | | 575,751 | |
| 4,800 | | Ingersoll-Rand PLC | | | 282,192 | |
| 1,900 | | Joy Global, Inc. | | | 100,301 | |
| 6,300 | | PACCAR, Inc. | | | 352,800 | |
| 2,000 | | Pall Corp. | | | 160,200 | |
| 2,670 | | Parker Hannifin Corp. | | | 302,698 | |
| 3,600 | | Pentair Ltd. | | | 267,588 | |
| 1,040 | | Snap-on, Inc. | | | 104,156 | |
| 2,800 | | Stanley Black & Decker, Inc. | | | 216,720 | |
| 3,300 | | Xylem, Inc. | | | 110,088 | |
| | | | | | |
| | | | | 4,981,531 | |
| |
Media 3.9% | | | | |
| 3,500 | | Cablevision Systems Corp. (Class A Stock) | | | 56,140 | |
| 9,400 | | CBS Corp. (Class B Stock) | | | 551,968 | |
| 43,800 | | Comcast Corp. (Class A Stock) | | | 2,384,910 | |
| 8,200 | | DIRECTV* | | | 569,326 | |
| 3,800 | | Discovery Communications, Inc. (Class A Stock)* | | | 303,164 | |
| 3,800 | | Gannett Co., Inc. | | | 104,614 | |
| 6,900 | | Interpublic Group of Cos., Inc. (The) | | | 112,608 | |
| 8,350 | | News Corp. (Class A Stock)* | | | 133,266 | |
| 4,300 | | Omnicom Group, Inc. | | | 312,094 | |
| 1,900 | | Scripps Networks Interactive, Inc. (Class A Stock) | | | 137,788 | |
| 4,740 | | Time Warner Cable, Inc. | | | 631,700 | |
| 15,200 | | Time Warner, Inc. | | | 955,016 | |
| 32,900 | | Twenty-First Century Fox, Inc. | | | 1,046,878 | |
| 6,800 | | Viacom, Inc. (Class B Stock) | | | 558,280 | |
| 27,500 | | Walt Disney Co. (The) | | | 1,996,775 | |
| | | | | | |
| | | | | 9,854,527 | |
| |
Metals & Mining 0.3% | | | | |
| 9,100 | | Alcoa, Inc. | | | 104,741 | |
| 900 | | Allegheny Technologies, Inc. | | | 28,296 | |
| 1,300 | | Cliffs Natural Resources, Inc. | | | 25,116 | |
| 8,900 | | Freeport-McMoRan Copper & Gold, Inc. | | | 288,449 | |
| 4,200 | | Newmont Mining Corp. | | | 90,720 | |
| 2,700 | | Nucor Corp. | | | 130,545 | |
| 1,200 | | United States Steel Corp. | | | 31,332 | |
| | | | | | |
| | | | | 699,199 | |
See Notes to Financial Statements.
| | | | | | |
| Shares | | Description | | Value (Note 1) | |
COMMON STOCKS (Continued) | | | | |
| |
Multi-Utilities 1.5% | | | | |
| 5,000 | | Ameren Corp. | | $ | 189,200 | |
| 8,800 | | CenterPoint Energy, Inc. | | | 205,920 | |
| 5,400 | | CMS Energy Corp. | | | 150,066 | |
| 6,000 | | Consolidated Edison, Inc. | | | 326,460 | |
| 11,900 | | Dominion Resources, Inc. | | | 808,129 | |
| 3,600 | | DTE Energy Co. | | | 245,592 | |
| 1,600 | | Integrys Energy Group, Inc. | | | 86,944 | |
| 6,400 | | NiSource, Inc. | | | 219,968 | |
| 9,200 | | PG&E Corp. | | | 387,780 | |
| 10,400 | | Public Service Enterprise Group, Inc. | | | 346,736 | |
| 2,900 | | SCANA Corp. | | | 137,083 | |
| 4,700 | | Sempra Energy | | | 435,737 | |
| 4,200 | | TECO Energy, Inc. | | | 68,796 | |
| 4,600 | | Wisconsin Energy Corp. | | | 196,282 | |
| | | | | | |
| | | | | 3,804,693 | |
| |
Multiline Retail 0.7% | | | | |
| 4,900 | | Dollar General Corp.* | | | 275,968 | |
| 3,500 | | Dollar Tree, Inc.* | | | 176,820 | |
| 1,600 | | Family Dollar Stores, Inc. | | | 98,912 | |
| 3,400 | | Kohl’s Corp. | | | 172,142 | |
| 6,200 | | Macy’s, Inc. | | | 329,840 | |
| 2,400 | | Nordstrom, Inc. | | | 137,880 | |
| 10,600 | | Target Corp. | | | 600,384 | |
| | | | | | |
| | | | | 1,791,946 | |
| |
Office Electronics | | | | |
| 7,400 | | Xerox Corp. | | | 80,290 | |
| |
Oil, Gas & Consumable Fuels 9.1% | | | | |
| 8,900 | | Anadarko Petroleum Corp. | | | 718,141 | |
| 7,000 | | Apache Corp. | | | 561,820 | |
| 7,400 | | Cabot Oil & Gas Corp. | | | 295,852 | |
| 8,800 | | Chesapeake Energy Corp. | | | 236,808 | |
| 33,780 | | Chevron Corp. | | | 3,770,861 | |
| 21,500 | | ConocoPhillips | | | 1,396,425 | |
| 4,000 | | CONSOL Energy, Inc. | | | 149,400 | |
| 6,400 | | Denbury Resources, Inc.* | | | 102,848 | |
| 6,700 | | Devon Energy Corp. | | | 396,774 | |
| 4,800 | | EOG Resources, Inc. | | | 793,152 | |
See Notes to Financial Statements.
| | | | |
| Prudential Defensive Equity Fund | | | 21 | |
Portfolio of Investments
as of January 31, 2014 (Unaudited) continued
| | | | | | |
| Shares | | Description | | Value (Note 1) | |
COMMON STOCKS (Continued) | | | | |
| |
Oil, Gas & Consumable Fuels (cont’d.) | | | | |
| 2,700 | | EQT Corp. | | $ | 250,587 | |
| 76,730 | | Exxon Mobil Corp. | | | 7,071,437 | |
| 5,000 | | Hess Corp. | | | 377,450 | |
| 11,800 | | Kinder Morgan, Inc. | | | 401,318 | |
| 12,200 | | Marathon Oil Corp. | | | 400,038 | |
| 5,300 | | Marathon Petroleum Corp. | | | 461,365 | |
| 3,100 | | Murphy Oil Corp. | | | 175,491 | |
| 2,300 | | Newfield Exploration Co.* | | | 56,971 | |
| 6,300 | | Noble Energy, Inc. | | | 392,679 | |
| 14,200 | | Occidental Petroleum Corp. | | | 1,243,494 | |
| 4,700 | | Peabody Energy Corp. | | | 80,135 | |
| 10,500 | | Phillips 66 | | | 767,445 | |
| 2,510 | | Pioneer Natural Resources Co. | | | 424,993 | |
| 3,100 | | QEP Resources, Inc. | | | 95,759 | |
| 2,900 | | Range Resources Corp. | | | 249,951 | |
| 6,100 | | Southwestern Energy Co.* | | | 248,209 | |
| 11,700 | | Spectra Energy Corp. | | | 420,615 | |
| 2,300 | | Tesoro Corp. | | | 118,496 | |
| 9,500 | | Valero Energy Corp. | | | 485,450 | |
| 12,000 | | Williams Cos., Inc. (The) | | | 485,880 | |
| 3,500 | | WPX Energy, Inc.* | | | 66,675 | |
| | | | | | |
| | | | | 22,696,519 | |
| |
Paper & Forest Products 0.1% | | | | |
| 3,800 | | International Paper Co. | | | 181,412 | |
| |
Personal Products 0.3% | | | | |
| 12,000 | | Avon Products, Inc. | | | 178,680 | |
| 7,100 | | Estee Lauder Cos., Inc. (The) (Class A Stock) | | | 488,054 | |
| | | | | | |
| | | | | 666,734 | |
| |
Pharmaceuticals 7.1% | | | | |
| 29,500 | | AbbVie, Inc. | | | 1,452,285 | |
| 3,240 | | Actavis PLC* | | | 612,295 | |
| 5,520 | | Allergan, Inc. | | | 632,592 | |
| 30,600 | | Bristol-Myers Squibb Co. | | | 1,529,082 | |
| 18,400 | | Eli Lilly & Co. | | | 993,784 | |
| 4,400 | | Forest Laboratories, Inc.* | | | 291,720 | |
| 3,100 | | Hospira, Inc.* | | | 136,431 | |
| 52,400 | | Johnson & Johnson | | | 4,635,828 | |
See Notes to Financial Statements.
| | | | | | |
| Shares | | Description | | Value (Note 1) | |
COMMON STOCKS (Continued) | | | | |
| |
Pharmaceuticals (cont’d.) | | | | |
| 54,300 | | Merck & Co., Inc. | | $ | 2,876,271 | |
| 7,100 | | Mylan, Inc.* | | | 322,411 | |
| 2,470 | | Perrigo Co. PLC | | | 384,480 | |
| 120,300 | | Pfizer, Inc. | | | 3,657,120 | |
| 9,200 | | Zoetis, Inc. | | | 279,312 | |
| | | | | | |
| | | | | 17,803,611 | |
| |
Professional Services 0.2% | | | | |
| 680 | | Dun & Bradstreet Corp. (The) | | | 74,800 | |
| 2,200 | | Equifax, Inc. | | | 154,132 | |
| 4,500 | | Nielsen Holdings NV | | | 190,305 | |
| 2,500 | | Robert Half International, Inc. | | | 104,450 | |
| | | | | | |
| | | | | 523,687 | |
| |
Real Estate Investment Trusts (REITs) 1.3% | | | | |
| 4,100 | | American Tower Corp. | | | 331,608 | |
| 1,700 | | Apartment Investment & Management Co. (Class A Stock) | | | 47,549 | |
| 1,290 | | AvalonBay Communities, Inc. | | | 159,315 | |
| 1,620 | | Boston Properties, Inc. | | | 175,106 | |
| 3,500 | | Equity Residential | | | 193,830 | |
| 5,700 | | General Growth Properties, Inc. | | | 114,798 | |
| 4,800 | | HCP, Inc. | | | 187,920 | |
| 3,000 | | Health Care REIT, Inc. | | | 173,760 | |
| 8,000 | | Host Hotels & Resorts, Inc. | | | 147,120 | |
| 4,400 | | Kimco Realty Corp. | | | 92,004 | |
| 1,500 | | Macerich Co. (The) | | | 84,900 | |
| 1,900 | | Plum Creek Timber Co., Inc. | | | 81,833 | |
| 5,200 | | Prologis, Inc. | | | 201,552 | |
| 1,520 | | Public Storage | | | 239,537 | |
| 3,210 | | Simon Property Group, Inc. | | | 497,036 | |
| 3,100 | | Ventas, Inc. | | | 193,409 | |
| 1,900 | | Vornado Realty Trust | | | 174,477 | |
| 6,100 | | Weyerhaeuser Co. | | | 182,268 | |
| | | | | | |
| | | | | 3,278,022 | |
| |
Real Estate Management & Development | | | | |
| 3,000 | | CBRE Group, Inc. (Class A Stock)* | | | 79,620 | |
See Notes to Financial Statements.
| | | | |
| Prudential Defensive Equity Fund | | | 23 | |
Portfolio of Investments
as of January 31, 2014 (Unaudited) continued
| | | | | | |
| Shares | | Description | | Value (Note 1) | |
COMMON STOCKS (Continued) | | | | |
| |
Road & Rail 1.1% | | | | |
| 18,100 | | CSX Corp. | | $ | 487,071 | |
| 1,970 | | Kansas City Southern | | | 208,012 | |
| 5,500 | | Norfolk Southern Corp. | | | 509,245 | |
| 1,000 | | Ryder System, Inc. | | | 71,190 | |
| 8,240 | | Union Pacific Corp. | | | 1,435,738 | |
| | | | | | |
| | | | | 2,711,256 | |
| |
Semiconductors & Semiconductor Equipment 0.8% | | | | |
| 2,000 | | Altera Corp. | | | 66,860 | |
| 2,000 | | Analog Devices, Inc. | | | 96,540 | |
| 7,700 | | Applied Materials, Inc. | | | 129,514 | |
| 3,400 | | Broadcom Corp. (Class A Stock) | | | 101,184 | |
| 500 | | First Solar, Inc.* | | | 25,290 | |
| 32,100 | | Intel Corp. | | | 787,734 | |
| 1,100 | | KLA-Tencor Corp. | | | 67,617 | |
| 1,000 | | Lam Research Corp.* | | | 50,610 | |
| 1,500 | | Linear Technology Corp. | | | 66,810 | |
| 3,500 | | LSI Corp. | | | 38,605 | |
| 1,300 | | Microchip Technology, Inc. | | | 58,318 | |
| 6,700 | | Micron Technology, Inc.* | | | 154,368 | |
| 3,700 | | NVIDIA Corp. | | | 58,090 | |
| 7,100 | | Texas Instruments, Inc. | | | 301,040 | |
| 1,700 | | Xilinx, Inc. | | | 78,914 | |
| | | | | | |
| | | | | 2,081,494 | |
| |
Software 1.5% | | | | |
| 3,000 | | Adobe Systems, Inc.* | | | 177,570 | |
| 1,400 | | Autodesk, Inc.* | | | 71,750 | |
| 2,100 | | CA, Inc. | | | 67,368 | |
| 1,200 | | Citrix Systems, Inc.* | | | 64,884 | |
| 1,900 | | Electronic Arts, Inc.* | | | 50,160 | |
| 1,900 | | Intuit, Inc. | | | 139,175 | |
| 49,000 | | Microsoft Corp. | | | 1,854,650 | |
| 22,600 | | Oracle Corp. | | | 833,940 | |
| 1,200 | | Red Hat, Inc.* | | | 67,800 | |
| 3,600 | | Salesforce.com, Inc.* | | | 217,908 | |
| 4,400 | | Symantec Corp. | | | 94,204 | |
| | | | | | |
| | | | | 3,639,409 | |
See Notes to Financial Statements.
| | | | | | |
| Shares | | Description | | Value (Note 1) | |
COMMON STOCKS (Continued) | | | | |
| |
Specialty Retail 2.2% | | | | |
| 1,100 | | AutoNation, Inc.* | | $ | 54,329 | |
| 580 | | AutoZone, Inc.* | | | 287,135 | |
| 3,600 | | Bed Bath & Beyond, Inc.* | | | 229,860 | |
| 4,600 | �� | Best Buy Co., Inc. | | | 108,284 | |
| 3,700 | | CarMax, Inc.* | | | 166,907 | |
| 2,000 | | GameStop Corp. (Class A Stock) | | | 70,140 | |
| 4,400 | | Gap, Inc. (The) | | | 167,552 | |
| 23,700 | | Home Depot, Inc. (The) | | | 1,821,345 | |
| 4,100 | | L Brands, Inc. | | | 214,676 | |
| 17,600 | | Lowe’s Cos., Inc. | | | 814,704 | |
| 1,800 | | O’Reilly Automotive, Inc.* | | | 235,764 | |
| 1,800 | | PetSmart, Inc. | | | 113,400 | |
| 3,600 | | Ross Stores, Inc. | | | 244,476 | |
| 11,000 | | Staples, Inc. | | | 144,760 | |
| 1,900 | | Tiffany & Co. | | | 158,061 | |
| 11,900 | | TJX Cos., Inc. (The) | | | 682,584 | |
| 1,800 | | Urban Outfitters, Inc.* | | | 64,476 | |
| | | | | | |
| | | | | 5,578,453 | |
| |
Textiles, Apparel & Luxury Goods 0.9% | | | | |
| 4,700 | | Coach, Inc. | | | 225,083 | |
| 830 | | Fossil Group, Inc.* | | | 92,819 | |
| 3,000 | | Michael Kors Holdings Ltd.* | | | 239,790 | |
| 12,600 | | NIKE, Inc. (Class B Stock) | | | 917,910 | |
| 1,370 | | PVH Corp. | | | 165,592 | |
| 1,000 | | Ralph Lauren Corp. | | | 156,890 | |
| 5,920 | | VF Corp. | | | 346,024 | |
| | | | | | |
| | | | | 2,144,108 | |
| |
Thrifts & Mortgage Finance | | | | |
| 5,400 | | Hudson City Bancorp, Inc. | | | 48,816 | |
| 3,600 | | People’s United Financial, Inc. | | | 51,156 | |
| | | | | | |
| | | | | 99,972 | |
| |
Tobacco 2.5% | | | | |
| 55,500 | | Altria Group, Inc. | | | 1,954,710 | |
| 10,200 | | Lorillard, Inc. | | | 502,044 | |
| 44,500 | | Philip Morris International, Inc. | | | 3,477,230 | |
| 8,700 | | Reynolds American, Inc. | | | 421,950 | |
| | | | | | |
| | | | | 6,355,934 | |
See Notes to Financial Statements.
| | | | |
| Prudential Defensive Equity Fund | | | 25 | |
Portfolio of Investments
as of January 31, 2014 (Unaudited) continued
| | | | | | |
| Shares | | Description | | Value (Note 1) | |
COMMON STOCKS (Continued) | | | | |
| |
Trading Companies & Distributors 0.2% | | | | |
| 4,900 | | Fastenal Co. | | $ | 215,257 | |
| 1,110 | | W.W. Grainger, Inc. | | | 260,273 | |
| | | | | | |
| | | | | 475,530 | |
| |
Wireless Telecommunication Services 0.1% | | | | |
| 4,400 | | Crown Castle International Corp.* | | | 312,224 | |
| | | | | | |
| | TOTAL LONG-TERM INVESTMENTS
(cost $209,575,719) | | | 238,986,594 | |
| | | | | | |
| |
Principal
Amount (000)# | | | |
SHORT-TERM INVESTMENTS 4.8% | | | | |
| |
U.S. TREASURY OBLIGATIONS(a)(b) 0.7% | | | | |
| | U.S. Treasury Bills | | | | |
| 1,300 | | 0.02%, 03/20/14 | | | 1,299,944 | |
| 500 | | 0.04%, 03/20/14 | | | 499,978 | |
| | | | | | |
| | TOTAL U.S. TREASURY OBLIGATIONS
(cost $1,799,942) | | | 1,799,922 | |
| | | | | | |
| |
| Shares | | | |
AFFILIATED MONEY MARKET MUTUAL FUND 4.1% | | | | |
| 10,140,726 | | Prudential Investment Portfolios 2 - Prudential Core Taxable Money Market Fund
(cost $10,140,726)(c) | | | 10,140,726 | |
| | | | | | |
| | TOTAL SHORT-TERM INVESTMENTS
(cost $11,940,668) | | | 11,940,648 | |
| | | | | | |
| | TOTAL INVESTMENTS 100.3%
(cost $221,516,387; Note 5) | | | 250,927,242 | |
| | Liabilities in excess of other assets(d) (0.3)% | | | (635,240 | ) |
| | | | | | |
| | NET ASSETS 100% | | $ | 250,292,002 | |
| | | | | | |
The following abbreviations are used in the portfolio descriptions:
NASDAQ—National Association for Securities Dealers Automated Quotations
REIT—Real Estate Investment Trust
| # | Principal amount is shown in U.S. dollars unless otherwise stated. |
| * | Non-income producing security. |
| (a) | Represents security, or a portion thereof, segregated as collateral for futures contracts. |
| (b) | Rates shown are the effective yields at purchase date. |
See Notes to Financial Statements.
| (c) | Prudential Investments LLC, the manager of the Fund, also serves as manager of the Prudential Investment Portfolios 2 - Prudential Core Taxable Money Market Fund. |
| (d) | Includes net unrealized appreciation (depreciation) on the following derivative contracts held at reporting period end: |
Futures contracts open at January 31, 2014:
| | | | | | | | | | | | | | | | | | | | |
Number of
Contracts | | | Type | | Expiration
Date | | | Value at
Trade Date | | | Value at
January 31,
2014 | | | Unrealized
Appreciation
(Depreciation) | |
| | | | Long Positions: | | | | | | | | | | | | | | | | |
| | 32 | | | S&P 500 E-Mini | | | Mar. 2014 | | | $ | 2,830,000 | | | $ | 2,842,560 | | | $ | 12,560 | |
| | 8 | | | S&P 500 Index | | | Mar. 2014 | | | | 3,580,788 | | | | 3,553,200 | | | | (27,588 | ) |
| | 255 | | | CBOE Volatility Index | | | Feb. 2014 | | | | 3,951,600 | | | | 4,488,000 | | | | 536,400 | |
| | | | | | | | | | | | | | | | | | | | |
| | | | | | | | | | | | | | | | | | $ | 521,372 | |
| | | | | | | | | | | | | | | | | | | | |
Various inputs are used in determining the value of the Fund's investments. These inputs are summarized in the three broad levels listed below.
Level 1—quoted prices generally in active markets for identical securities.
Level 2—other significant observable inputs including, but not limited to, quoted prices for similar securities, interest rates and yield curves, prepayment speeds, foreign currency exchange rates, and amortized cost.
Level 3—significant unobservable inputs for securities valued in accordance with Board approved fair valuation procedures.
The following is a summary of the inputs used as of January 31, 2014 in valuing such portfolio securities:
| | | | | | | | | | | | |
| | | Level 1 | | | Level 2 | | | Level 3 | |
Investments in Securities | | | | | | | | | | | | |
Common Stocks: | | | | | | | | | | | | |
Aerospace & Defense | | $ | 8,078,160 | | | $ | — | | | $ | — | |
Air Freight & Logistics | | | 2,235,542 | | | | — | | | | — | |
Airlines | | | 725,052 | | | | — | | | | — | |
Auto Components | | | 1,120,851 | | | | — | | | | — | |
Automobiles | | | 1,907,733 | | | | — | | | | — | |
Beverages | | | 9,527,621 | | | | — | | | | — | |
Biotechnology | | | 7,849,770 | | | | — | | | | — | |
Building Products | | | 210,590 | | | | — | | | | — | |
Capital Markets | | | 3,577,931 | | | | — | | | | — | |
See Notes to Financial Statements.
| | | | |
| Prudential Defensive Equity Fund | | | 27 | |
Portfolio of Investments
as of January 31, 2014 (Unaudited) continued
| | | | | | | | | | | | |
| | | Level 1 | | | Level 2 | | | Level 3 | |
Common Stocks (continued): | | | | | |
Chemicals | | $ | 3,485,065 | | | $ | — | | | $ | — | |
Commercial Banks | | | 4,740,563 | | | | — | | | | — | |
Commercial Services & Supplies | | | 1,375,545 | | | | — | | | | — | |
Communications Equipment | | | 1,847,783 | | | | — | | | | — | |
Computers & Peripherals | | | 4,017,171 | | | | — | | | | — | |
Construction & Engineering | | | 484,434 | | | | — | | | | — | |
Construction Materials | | | 67,903 | | | | — | | | | — | |
Consumer Finance | | | 1,604,296 | | | | — | | | | — | |
Containers & Packaging | | | 287,487 | | | | — | | | | — | |
Distributors | | | 213,850 | | | | — | | | | — | |
Diversified Consumer Services | | | 186,885 | | | | — | | | | — | |
Diversified Financial Services | | | 8,505,872 | | | | — | | | | — | |
Diversified Telecommunication Services | | | 4,441,496 | | | | — | | | | — | |
Electric Utilities | | | 5,607,885 | | | | — | | | | — | |
Electrical Equipment | | | 2,198,647 | | | | — | | | | — | |
Electronic Equipment, Instruments & Components | | | 442,174 | | | | — | | | | — | |
Energy Equipment & Services | | | 5,186,804 | | | | — | | | | — | |
Food & Staples Retailing | | | 10,172,903 | | | | — | | | | — | |
Food Products | | | 6,824,381 | | | | — | | | | — | |
Gas Utilities | | | 402,330 | | | | — | | | | — | |
Health Care Equipment & Supplies | | | 6,205,614 | | | | — | | | | — | |
Health Care Providers & Services | | | 6,253,618 | | | | — | | | | — | |
Health Care Technology | | | 312,895 | | | | — | | | | — | |
Hotels, Restaurants & Leisure | | | 4,598,696 | | | | — | | | | — | |
Household Durables | | | 1,086,773 | | | | — | | | | — | |
Household Products | | | 8,747,160 | | | | — | | | | — | |
Independent Power Producers & Energy Traders | | | 373,620 | | | | — | | | | — | |
Industrial Conglomerates | | | 6,805,971 | | | | — | | | | — | |
Insurance | | | 4,388,096 | | | | — | | | | — | |
Internet & Catalog Retail | | | 3,897,150 | | | | — | | | | — | |
Internet Software & Services | | | 3,530,777 | | | | — | | | | — | |
IT Services | | | 3,668,228 | | | | — | | | | — | |
Leisure Equipment & Products | | | 309,016 | | | | — | | | | — | |
Life Sciences Tools & Services | | | 1,642,085 | | | | — | | | | — | |
Machinery | | | 4,981,531 | | | | — | | | | — | |
Media | | | 9,854,527 | | | | — | | | | — | |
Metals & Mining | | | 699,199 | | | | — | | | | — | |
Multi-Utilities | | | 3,804,693 | | | | — | | | | — | |
Multiline Retail | | | 1,791,946 | | | | — | | | | — | |
Office Electronics | | | 80,290 | | | | — | | | | — | |
Oil, Gas & Consumable Fuels | | | 22,696,519 | | | | — | | | | — | |
Paper & Forest Products | | | 181,412 | | | | — | | | | — | |
Personal Products | | | 666,734 | | | | — | | | | — | |
See Notes to Financial Statements.
| | | | | | | | | | | | |
| | | Level 1 | | | Level 2 | | | Level 3 | |
Common Stocks (continued): | | | | | |
Pharmaceuticals | | $ | 17,803,611 | | | $ | — | | | $ | — | |
Professional Services | | | 523,687 | | | | — | | | | — | |
Real Estate Investment Trusts (REITs) | | | 3,278,022 | | | | — | | | | — | |
Real Estate Management & Development | | | 79,620 | | | | — | | | | — | |
Road & Rail | | | 2,711,256 | | | | — | | | | — | |
Semiconductors & Semiconductor Equipment | | | 2,081,494 | | | | — | | | | — | |
Software | | | 3,639,409 | | | | — | | | | — | |
Specialty Retail | | | 5,578,453 | | | | — | | | | — | |
Textiles, Apparel & Luxury Goods | | | 2,144,108 | | | | — | | | | — | |
Thrifts & Mortgage Finance | | | 99,972 | | | | — | | | | — | |
Tobacco | | | 6,355,934 | | | | — | | | | — | |
Trading Companies & Distributors | | | 475,530 | | | | — | | | | — | |
Wireless Telecommunication Services | | | 312,224 | | | | — | | | | — | |
U.S. Treasury Obligations | | | — | | | | 1,799,922 | | | | — | |
Affiliated Money Market Mutual Fund | | | 10,140,726 | | | | — | | | | — | |
Other Financial Instruments* | | | | | | | | | | | | |
Futures | | | 521,372 | | | | — | | | | — | |
| | | | | | | | | | | | |
Total | | $ | 249,648,692 | | | $ | 1,799,922 | | | $ | — | |
| | | | | | | | | | | | |
| * | Other financial instruments are derivative instruments not reflected in the Portfolio of Investments, such as futures, forwards and swap contracts, which are recorded at the unrealized appreciation/depreciation on the instrument. |
The investment allocation of Portfolio holdings and liabilities in excess of other assets shown as a percentage of net assets as of January 31, 2014 were as follows:
| | | | |
Oil, Gas & Consumable Fuels | | | 9.1 | % |
Pharmaceuticals | | | 7.1 | |
Food & Staples Retailing | | | 4.1 | |
Affiliated Money Market Mutual Fund | | | 4.1 | |
Media | | | 3.9 | |
Beverages | | | 3.8 | |
Household Products | | | 3.5 | |
Diversified Financial Services | | | 3.4 | |
Aerospace & Defense | | | 3.2 | |
Biotechnology | | | 3.1 | |
Food Products | | | 2.7 | |
Industrial Conglomerates | | | 2.7 | |
Tobacco | | | 2.5 | |
Health Care Providers & Services | | | 2.5 | |
Health Care Equipment & Supplies | | | 2.5 | |
Electric Utilities | | | 2.2 | |
Specialty Retail | | | 2.2 | |
Energy Equipment & Services | | | 2.1 | |
Machinery | | | 2.0 | % |
Commercial Banks | | | 1.9 | |
Hotels, Restaurants & Leisure | | | 1.8 | |
Diversified Telecommunication Services | | | 1.8 | |
Insurance | | | 1.8 | |
Computers & Peripherals | | | 1.6 | |
Internet & Catalog Retail | | | 1.6 | |
Multi-Utilities | | | 1.5 | |
IT Services | | | 1.5 | |
Software | | | 1.5 | |
Capital Markets | | | 1.4 | |
Internet Software & Services | | | 1.4 | |
Chemicals | | | 1.4 | |
Real Estate Investment Trusts (REITs) | | | 1.3 | |
Road & Rail | | | 1.1 | |
Air Freight & Logistics | | | 0.9 | |
Electrical Equipment | | | 0.9 | |
Textiles, Apparel & Luxury Goods | | | 0.9 | |
See Notes to Financial Statements.
| | | | |
| Prudential Defensive Equity Fund | | | 29 | |
Portfolio of Investments
as of January 31, 2014 (Unaudited) continued
| | | | |
Semiconductors & Semiconductor Equipment | | | 0.8 | % |
Automobiles | | | 0.8 | |
Communications Equipment | | | 0.7 | |
U.S. Treasury Obligations | | | 0.7 | |
Multiline Retail | | | 0.7 | |
Life Sciences Tools & Services | | | 0.7 | |
Consumer Finance | | | 0.6 | |
Commercial Services & Supplies | | | 0.6 | |
Auto Components | | | 0.4 | |
Household Durables | | | 0.4 | |
Airlines | | | 0.3 | |
Metals & Mining | | | 0.3 | |
Personal Products | | | 0.3 | |
Professional Services | | | 0.2 | |
Construction & Engineering | | | 0.2 | |
Trading Companies & Distributors | | | 0.2 | |
Electronic Equipment, Instruments & Components | | | 0.2 | |
Gas Utilities | | | 0.2 | % |
Independent Power Producers & Energy Traders | | | 0.2 | |
Health Care Technology | | | 0.1 | |
Wireless Telecommunication Services | | | 0.1 | |
Leisure Equipment & Products | | | 0.1 | |
Containers & Packaging | | | 0.1 | |
Distributors | | | 0.1 | |
Building Products | | | 0.1 | |
Diversified Consumer Services | | | 0.1 | |
Paper & Forest Products | | | 0.1 | |
| | | | |
| | | 100.3 | |
Liabilities in excess of other assets | | | (0.3 | ) |
| | | | |
| | | 100.0 | % |
| | | | |
The Fund invested in various derivative instruments during the reporting period. The primary types of risk associated with these derivative instruments are equity risk and interest rate risk. The effect of such derivative instruments on the Fund's financial position and financial performance as reflected in the Statement of Assets and Liabilities and Statement of Operations is presented in the summary below.
Fair values of derivative instruments as of January 31, 2014 as presented in the Statement of Assets and Liabilities:
| | | | | | | | | | | | |
Derivatives not accounted for
as hedging instruments,
carried at fair value | | Asset Derivatives | | | Liability Derivatives | |
| | Balance
Sheet Location | | Fair
Value | | | Balance
Sheet Location | | Fair
Value | |
| Equity contracts | | Due from broker-variation margin | | $ | 548,960 | * | | Due from broker-variation margin | | $ | 27,568 | * |
| | | | | | | | | | | | |
| * | Includes cumulative appreciation/depreciation as reported in schedule of open futures and exchange-traded swap contracts. Only unsettled variation margin receivable (payable) is reported within the Statement of Assets and Liabilities. |
See Notes to Financial Statements.
The effects of derivative instruments on the Statement of Operations for the six months ended January 31, 2014 are as follows:
| | | | |
Amount of Realized Gain or (Loss) on Derivatives Recognized in Income | |
Derivatives not accounted for as hedging instruments, carried at fair value | | Futures | |
Equity contracts | | $ | 686,006 | |
| | | | |
|
Change in Unrealized Appreciation or (Depreciation) on Derivatives Recognized in Income | |
Derivatives not accounted for as hedging instruments, carried at fair value | | Futures | |
Equity contracts | | $ | 53,879 | |
| | | | |
For the six months ended January 31, 2014, the Fund’s average value at trade date for futures long position was $10,728,041.
The Fund invested in derivatives during the reporting period that are either offset in accordance with current requirements or are subject to enforceable master netting arrangements or similar agreements that permit offsetting as well as instruments subject to collateral arrangements. The information about offsetting and related netting arrangements for assets and liabilities is presented in the summary below.
Offsetting of derivative assets and liabilities:
| | | | | | | | | | | | | | | | |
Description | | Gross Amounts
Recognized | | | Gross Amounts
not subject to
netting | | | Gross Amounts
Offset in the
Statement of
Financial Position | | | Net Amounts
Presented in the
Statement of
Financial Position | |
Assets: | | | | | | | | | | | | | | | | |
Exchange-traded and cleared derivatives | | $ | 225,690 | | | $ | — | | | $ | — | | | $ | 225,690 | |
Collateral Amounts Pledged/(Received): | | | | | | | | | | | | | | | | |
Exchange-traded and
cleared derivatives | | | | — | |
| | | | | | | | | | | | | | | | |
Net Amount | | | $ | 225,690 | |
| | | | | | | | | | | | | | | | |
See Notes to Financial Statements.
| | | | |
| Prudential Defensive Equity Fund | | | 31 | |
Statement of Assets and Liabilities
January 31, 2014 (Unaudited)
| | | | |
Assets | | | | |
Investments at value: | | | | |
Unaffiliated investments (cost $211,375,661) | | $ | 240,786,516 | |
Affiliated investments (cost $10,140,726) | | | 10,140,726 | |
Dividends and interest receivable | | | 296,449 | |
Due from broker-variation margin | | | 225,690 | |
Tax reclaim receivable | | | 72,635 | |
Receivable for Fund shares sold | | | 69,298 | |
Prepaid expenses | | | 1,735 | |
| | | | |
Total assets | | | 251,593,049 | |
| | | | |
| |
Liabilities | | | | |
Payable for Fund shares reacquired | | | 768,515 | |
Accrued expenses and other liabilities | | | 235,926 | |
Management fee payable | | | 164,299 | |
Distribution fee payable | | | 98,425 | |
Affiliated transfer agent fee payable | | | 31,234 | |
Deferred trustees’ fees | | | 2,648 | |
| | | | |
Total liabilities | | | 1,301,047 | |
| | | | |
| |
Net Assets | | $ | 250,292,002 | |
| | | | |
| | | | | |
Net assets were comprised of: | | | | |
Shares of beneficial interest, at par | | $ | 19,856 | |
Paid-in capital, in excess of par | | | 222,546,523 | |
| | | | |
| | | 222,566,379 | |
Accumulated net investment loss | | | (80,401 | ) |
Accumulated net realized loss on investment and foreign currency transactions | | | (2,128,550 | ) |
Net unrealized appreciation on investments and foreign currencies | | | 29,934,574 | |
| | | | |
Net assets, January 31, 2014 | | $ | 250,292,002 | |
| | | | |
See Notes to Financial Statements.
| | | | |
| |
Class A: | | | | |
Net asset value and redemption price per share,
($178,501,695 / 14,153,500 shares of common stock issued and outstanding) | | $ | 12.61 | |
Maximum sales charge (5.5% of offering price) | | | .73 | |
| | | | |
Maximum offering price to public | | $ | 13.34 | |
| | | | |
| |
Class B: | | | | |
Net asset value, offering price and redemption price per share,
($19,348,195 / 1,536,964 shares of common stock issued and outstanding) | | $ | 12.59 | |
| | | | |
| |
Class C: | | | | |
Net asset value, offering price and redemption price per share,
($48,400,043 / 3,845,417 shares of common stock issued and outstanding) | | $ | 12.59 | |
| | | | |
| |
Class R: | | | | |
Net asset value, offering price and redemption price per share,
($380,334 / 30,166 shares of common stock issued and outstanding) | | $ | 12.61 | |
| | | | |
| |
Class X: | | | | |
Net asset value, offering price and redemption price per share,
($46,641 / 3,698 shares of common stock issued and outstanding) | | $ | 12.61 | |
| | | | |
| |
Class Z: | | | | |
Net asset value, offering price and redemption price per share,
($3,615,094 / 286,344 shares of common stock issued and outstanding) | | $ | 12.63 | |
| | | | |
See Notes to Financial Statements.
| | | | |
| Prudential Defensive Equity Fund | | | 33 | |
Statement of Operations
Six Months Ended January 31, 2014 (Unaudited)
| | | | |
Net Income | | | | |
Income | | | | |
Unaffiliated dividend income (net of foreign withholding taxes $11,284) | | $ | 2,687,125 | |
Interest income | | | 1,017 | |
| | | | |
| | | 2,688,142 | |
| | | | |
| |
Expenses | | | | |
Management fee | | | 955,269 | |
Distribution fee—Class A | | | 272,192 | |
Distribution fee—Class B | | | 100,905 | |
Distribution fee—Class C | | | 245,632 | |
Distribution fee—Class R | | | 1,425 | |
Distribution fee—Class X | | | 91 | |
Transfer agent’s fees and expenses (including affiliated expense of $48,000) | | | 187,000 | |
Custodian’s fees and expenses | | | 106,000 | |
Registration fees | | | 36,000 | |
Audit fee | | | 31,000 | |
Reports to shareholders | | | 29,000 | |
Legal fee | | | 11,000 | |
Trustees’ fees | | | 8,000 | |
Insurance expense | | | 2,000 | |
Miscellaneous | | | 12,001 | |
| | | | |
Total expenses | | | 1,997,515 | |
Less: Distribution fee waiver—Class A (Note 2) | | | (45,365 | ) |
Distribution fee waiver—Class R (Note 2) | | | (475 | ) |
| | | | |
Net Expenses | | | 1,951,675 | |
| | | | |
Net Investment Income | | | 736,467 | |
| | | | |
| |
Net Realized and Unrealized Gain (Loss) on Investments and Foreign Currencies | | | | |
Net realized gain (loss) on: | | | | |
Investment transactions | | | 301,351 | |
Foreign currency transactions | | | (982 | ) |
Futures transactions | | | 686,006 | |
| | | | |
| | | 986,375 | |
| | | | |
Net change in unrealized appreciation (depreciation) on: | | | | |
Investments | | | 7,998,793 | |
Foreign currencies | | | 1,957 | |
Futures | | | 53,879 | |
| | | | |
| | | 8,054,629 | |
| | | | |
Net gain on investments | | | 9,041,004 | |
| | | | |
Net Increase in Net Assets Resulting From Operations | | $ | 9,777,471 | |
| | | | |
See Notes to Financial Statements.
Statement of Changes in Net Assets
(Unaudited)
| | | | | | | | |
| | | Six Months Ended January 31, 2014 | | | Year Ended July 31, 2013 | |
Increase (Decrease) In Net Assets | | | | | | | | |
Operations | | | | | | | | |
Net investment income | | $ | 736,467 | | | $ | 2,086,462 | |
Net realized gain on investment and foreign currency transactions | | | 986,375 | | | | 41,105,566 | |
Net change in unrealized appreciation (depreciation) on investments and foreign currencies | | | 8,054,629 | | | | (5,046,816 | ) |
| | | | | | | | |
Net increase in net assets resulting from operations | | | 9,777,471 | | | | 38,145,212 | |
| | | | | | | | |
| | |
Dividends and distributions (Note 1) | | | | | | | | |
Dividends from net investment income: | | | | | | | | |
Class A | | | (1,706,561 | ) | | | (3,164,951 | ) |
Class B | | | (46,788 | ) | | | (263,105 | ) |
Class C | | | (119,274 | ) | | | (579,854 | ) |
Class R | | | (2,728 | ) | | | (5,392 | ) |
Class X | | | (528 | ) | | | (3,285 | ) |
Class Z | | | (42,064 | ) | | | (75,420 | ) |
| | | | | | | | |
| | | (1,917,943 | ) | | | (4,092,007 | ) |
| | | | | | | | |
Dividends from net realized gain: | | | | | | | | |
Class A | | | (8,953,338 | ) | | | — | |
Class B | | | (956,040 | ) | | | — | |
Class C | | | (2,437,173 | ) | | | — | |
Class R | | | (19,075 | ) | | | — | |
Class X | | | (2,769 | ) | | | — | |
Class Z | | | (176,605 | ) | | | — | |
| | | | | | | | |
| | | (12,545,000 | ) | | | — | |
| | | | | | | | |
| | |
Fund share transactions (Net of share conversions) (Note 6) | | | | | | | | |
Net proceeds from shares sold | | | 8,132,887 | | | | 10,754,031 | |
Net asset value of shares issued in reinvestment of dividends and distributions | | | 14,034,437 | | | | 3,973,284 | |
Cost of shares reacquired | | | (20,167,671 | ) | | | (46,332,983 | ) |
| | | | | | | | |
Net increase (decrease) in net assets resulting from Fund share transactions | | | 1,999,653 | | | | (31,605,668 | ) |
| | | | | | | | |
Total increase (decrease) | | | (2,685,819 | ) | | | 2,447,537 | |
| | |
Net Assets | | | | | | | | |
Beginning of period | | | 252,977,821 | | | | 250,530,284 | |
| | | | | | | | |
End of period (a) | | $ | 250,292,002 | | | $ | 252,977,821 | |
| | | | | | | | |
(a) Includes undistributed net income of: | | $ | — | | | $ | 1,101,075 | |
| | | | | | | | |
See Notes to Financial Statements.
| | | | |
| Prudential Defensive Equity Fund | | | 35 | |
Notes to Financial Statements
(Unaudited)
Prudential Investment Portfolios 16 (the “Trust”) is registered under the Investment Company Act of 1940, as amended, (“1940 Act”) as an open-end, diversified management investment company presently consisting of two portfolios: Prudential Defensive Equity Fund (the “Fund”) and Target Conservative Allocation Fund. These financial statements relate only to Prudential Defensive Equity Fund. The financial statements of the other portfolio are not presented herein. The Trust was organized as a business trust in Delaware on July 29, 1998.
The investment objective of the Fund is to seek long-term capital appreciation.
Note 1. Accounting Policies
The following is a summary of significant accounting policies followed by the Trust in the preparation of its financial statements.
Security Valuation: The Fund holds securities and other assets that are fair valued at the close of each day the New York Stock Exchange (“NYSE”) is open for trading. Fair value is the price that would be received to sell an asset or paid to transfer a liability in an orderly transaction between market participants on the measurement date. The Board of Trustees (the “Board”) has adopted Valuation Procedures for security valuation under which fair valuation responsibilities have been delegated to Prudential Investments LLC (“PI”). Under the current Valuation Procedures, the established Valuation Committee is responsible for supervising the valuation of portfolio securities and other assets. The Valuation Procedures permit the Fund to utilize independent pricing vendor services, quotations from market makers, and alternative valuation methods when market quotations are either not readily available or deemed not representative of fair value. A record of the Valuation Committee’s actions is subject to the Board’s review, approval, and ratification at its next regularly-scheduled quarterly meeting.
Various inputs determine how the Fund’s investments are valued, all of which are categorized according to the three broad levels (Level 1, 2, or 3) detailed in the table following the Portfolio of Investments.
Common stocks, exchange-traded funds, and derivative instruments that are traded on a national securities exchange are valued at the last sale price as of the close of trading on the applicable exchange. Securities traded via NASDAQ are valued at the
NASDAQ official closing price. To the extent these securities are valued at the last sale price or NASDAQ official closing price, they are classified as Level 1 in the fair value hierarchy.
In the event that no sale or official closing price on valuation date exists, these securities are generally valued at the mean between the last reported bid and asked prices, or at the last bid price in the absence of an asked price. These securities are classified as Level 2 in the fair value hierarchy, as the inputs are observable and considered to be significant to the valuation.
Common stocks traded on foreign securities exchanges are valued using pricing vendor services that provide model prices derived using adjustment factors based on information such as local closing price, relevant general and sector indices, currency fluctuations, depositary receipts, and futures, as applicable. Securities valued using such model prices are classified as Level 2 in the fair value hierarchy, as the adjustment factors are observable and considered to be significant to the valuation.
Investments in open-end, non-exchange-traded mutual funds are valued at their net asset values as of the close of the NYSE on the date of valuation. These securities are classified as Level 1 in the fair value hierarchy since they may be purchased or sold at their net asset values on the date of valuation.
Fixed income securities traded in the over-the-counter market are generally valued at prices provided by approved independent pricing vendors. The pricing vendors provide these prices after evaluating observable inputs including, but not limited to yield curves, yield spreads, credit ratings, deal terms, tranche level attributes, default rates, cash flows, prepayment speeds, broker/dealer quotations, and reported trades. Securities valued using such vendor prices are classified as Level 2 in the fair value hierarchy.
Over-the-counter derivative instruments are generally valued using pricing vendor services, which derive the valuation based on inputs such as underlying asset prices, indices, spreads, interest rates, and exchange rates. These instruments are categorized as Level 2 in the fair value hierarchy.
Securities and other assets that cannot be priced according to the methods described above are valued based on pricing methodologies approved by the Board. In the event that significant unobservable inputs are used when determining such valuations, the securities will be classified as Level 3 in the fair value hierarchy.
When determining the fair value of securities, some of the factors influencing the valuation include: the nature of any restrictions on disposition of the securities;
| | | | |
| Prudential Defensive Equity Fund | | | 37 | |
Notes to Financial Statements
(Unaudited) continued
assessment of the general liquidity of the securities; the issuer’s financial condition and the markets in which it does business; the cost of the investment; the size of the holding and the capitalization of the issuer; the prices of any recent transactions or bids/offers for such securities or any comparable securities; any available analyst media or other reports or information deemed reliable by the investment adviser regarding the issuer or the markets or industry in which it operates. Using fair value to price securities may result in a value that is different from a security’s most recent closing price and from the price used by other mutual funds to calculate their net asset values.
Foreign Currency Translation: The books and records of the Fund are maintained in U.S. dollars. Foreign currency amounts are translated into U.S. dollars on the following basis:
(i) market value of investment securities, other assets and liabilities-at the current daily rates of exchange;
(ii) purchases and sales of investment securities, income and expenses-at the rates of exchange prevailing on the respective dates of such transactions.
Although the net assets of the Fund are presented at the foreign exchange rates and market values at the close of the period, the Fund does not isolate that portion of the results of operations arising as a result of changes in the foreign exchange rates from the fluctuations arising from changes in the market prices of securities held at the end of the period. Similarly, the Fund does not isolate the effect of changes in foreign exchange rates from the fluctuations arising from changes in the market prices of portfolio securities sold during the period. Accordingly, realized foreign currency gains or losses are included in the reported net realized gains or losses on investment transactions.
Net realized gains or losses on foreign currency transactions represent net foreign exchange gains or losses from the holding of foreign currencies, currency gains or losses realized between the trade and settlement dates on security transactions, and the difference between the amounts of dividends, interest and foreign withholding taxes recorded on the Fund’s books and the U.S. dollar equivalent amounts actually received or paid. Net unrealized currency gains or losses from valuing foreign currency denominated assets and liabilities (other than investments) at period end exchange rates are reflected as a component of net unrealized appreciation
(depreciation) on investments and foreign currencies. Foreign security and currency transactions may involve certain considerations and risks not typically associated with those of domestic origin as a result of, among other factors, the possibility of political and economic instability and the level of governmental supervision and regulation of foreign securities markets.
Financial Futures Contracts: A financial futures contract is an agreement to purchase (long) or sell (short) an agreed amount of securities at a set price for delivery on a future date. Upon entering into a financial futures contract, the Fund is required to pledge to the broker an amount of cash and/or other assets equal to a certain percentage of the contract amount. This amount is known as the “initial margin.” Subsequent payments known as “variation margin,” are made or received by the Fund each day, depending on the daily fluctuations in the value of the underlying security. Such variation margin is recorded for financial statement purposes on a daily basis as unrealized gain or loss. When the contract expires or is closed, the gain or loss is realized and is presented in the Statement of Operations as net realized gain or loss on financial futures contracts.
The Fund invested in financial futures contracts in order to hedge its existing portfolio securities, or securities the Fund intends to purchase, against fluctuations in value caused by changes in prevailing interest rates, and to manage yield curve and duration. The Fund may not achieve the anticipated benefits of the financial futures contracts and may realize a loss. The use of futures transactions involves the risk of imperfect correlation in movements in the price of futures contracts, interest rates and the underlying hedged assets. Financial futures contracts involve elements of risk in excess of the amounts reflected on the Statement of Assets and Liabilities.
With exchange-traded futures contracts, there is minimal counterparty credit risk to the Fund since the exchanges’ clearinghouse acts as counterparty to all exchange traded futures, and guarantees the futures and options contracts against default.
Master Netting Arrangements: The Fund is subject to various Master Agreements, or netting arrangements, with select counterparties. A master netting arrangement between the Fund and the counterparty permits the Fund to offset amounts payable by the Fund to the same counterparty against amounts to be received; and by the receipt of collateral from the counterparty by the Fund to cover the Fund’s exposure to the counterparty. However, there is no assurance that such mitigating factors are easily enforceable. The right to set-off exists when all the conditions are met such that each of the parties owes the other a determinable amount, the reporting party has the right to set-off the amount owed with the amount owed by the other party, the reporting party intends to set-off, and the right of set-off is enforceable by law. During
| | | | |
| Prudential Defensive Equity Fund | | | 39 | |
Notes to Financial Statements
(Unaudited) continued
the reporting period, no instances occurred where the right to set-off existed and management has not elected to offset.
The Fund is party to ISDA (International Swaps and Derivatives Association, Inc.) Master Agreements (Master Agreements) with certain counterparties that govern over-the-counter derivative and foreign exchange contracts entered into from time to time. The Master Agreements may contain provisions regarding, among other things, the parties’ general obligations, representations, agreements, collateral requirements, events of default and early termination. With respect to certain counterparties, in accordance with the terms of the Master Agreements, collateral posted to the Fund is held in a segregated account by the Fund’s custodian and with respect to those amounts which can be sold or re-pledged, are presented in the Portfolio of Investments. Collateral pledged by the Fund is segregated by the Fund’s custodian and identified in the Portfolio of Investments. Collateral can be in the form of cash or debt securities issued by the U.S. Government or related agencies or other securities as agreed to by the Fund and the applicable counterparty. Collateral requirements are determined based on the Fund’s net position with each counterparty. Termination events applicable to the Fund may occur upon a decline in the Fund’s net assets below a specified threshold over a certain period of time. Termination events applicable to counterparties may occur upon a decline in the counterparty’s long-term and short-term credit ratings below a specified level. In each case, upon occurrence, the other party may elect to terminate early and cause settlement of all derivative and foreign exchange contracts outstanding, including the payment of any losses and costs resulting from such early termination, as reasonably determined by the terminating party. Any decision by one or more of the Fund’s counterparties to elect early termination could impact the Fund’s future derivative activity.
In addition to each instrument’s primary underlying risk exposure (e.g. interest rate, credit, equity or foreign exchange, etc.), swap agreements involve, to varying degrees, elements of credit, market and documentation risk. Such risks involve the possibility that no liquid market for these agreements will exist, the counterparty to the agreement may default on its obligation to perform or disagree on the contractual terms of the agreement, and changes in net interest rates will be unfavorable. In connection with these agreements, securities in the portfolio may be identified or received as collateral from the counterparty in accordance with the terms of the respective swap agreements to provide or receive assets of value and to serve as recourse in the event of default or bankruptcy/insolvency of either party. Such over-
the-counter derivative agreements include conditions which, when materialized, give the counterparty the right to cause an early termination of the transactions under those agreements. Any election by the counterparty for early termination of the contract(s) may impact the amounts reported on financial statements.
As of January 31, 2014, the Fund has not met conditions under such agreements, which give the counterparty the right to call for an early termination.
Forward currency contracts, written options, short sales, swaps and financial futures contracts involve elements of both market and credit risk in excess of the amounts reflected on the Statement of Assets and Liabilities.
Securities Transactions and Net Investment Income: Securities transactions are recorded on the trade date. Realized gains or losses from investment and currency transactions on sales of portfolio securities are calculated on the identified cost basis. Dividend income is recorded on the ex-dividend date and interest income, including amortization of premium and accretion of discount on debt securities, as required, is recorded on the accrual basis. Expenses are recorded on an accrual basis, which may require the use of certain estimates by management, that may differ from actual. The Fund invests in real estate investment trusts, (“REITs”), which report information on the source of their distributions annually. Based on current and historical information, a portion of distributions received from REITs during the period is estimated to be dividend income, capital gain or return of capital and recorded accordingly. These estimates are adjusted periodically when the actual source of distributions is disclosed by the REITs.
Net investment income or loss (other than distribution fees which are charged directly to its respective class), unrealized and realized gains or losses, are allocated daily to each class of shares based upon the relative proportion of adjusted net assets of each class at the beginning of the day.
Dividends and Distributions: Dividends from net investment income are declared and paid annually. Distributions of net realized capital and currency gains, if any, are declared and paid annually.
Dividends and distributions to shareholders which are determined in accordance with federal income tax regulations and which may differ from generally accepted accounting principles are recorded on the ex-dividend date. Permanent book/tax differences relating to income and gains are reclassified amongst undistributed net investment income, accumulated net realized gain or loss and paid-in capital in excess of par, as appropriate.
| | | | |
| Prudential Defensive Equity Fund | | | 41 | |
Notes to Financial Statements
(Unaudited) continued
Taxes: It is the Fund’s intention to continue to meet the requirements of the Internal Revenue Code applicable to regulated investment companies and to distribute all of its taxable net investment income and capital gains, if any, to its shareholders. Therefore, no federal income tax provision is required. Withholding taxes on foreign dividends are recorded net of reclaimable amounts, at the time the related income is earned.
Estimates: The preparation of the financial statements requires management to make estimates and assumptions that affect the reported amounts and disclosures in the financial statements. Actual results could differ from those estimates.
Note 2. Agreements
The Trust has a management agreement with PI. Pursuant to this agreement, PI has responsibility for all investment advisory services and supervises the subadvisor’s performance of such services. PI has entered into a subadvisory agreement with Quantitative Management Associates LLC (“QMA”). The subadvisory agreement provides that QMA furnishes investment advisory services in connection with the management of the Fund. In connection therewith, QMA is obligated to keep certain books and records of the Fund. PI pays for the services of QMA, the compensation of officers of the Fund, occupancy and certain clerical and bookkeeping costs of the Fund. The Fund bears all other costs and expenses.
The management fee paid to PI is computed daily and payable monthly at an annual rate of .75% of the average daily net assets up to $500 million, .70% of average daily net assets for the next $500 million and .65% of average daily net assets in excess of $1 billion. The effective management fee rate was .75% for the six months ended January 31, 2014.
The Fund has a distribution agreement with Prudential Investment Management Services LLC (“PIMS”), which acts as the distributor of the Class A, Class B, Class C, Class R and Class Z shares of the Fund. In addition, the Fund has a distribution agreement with Prudential Annuities Distributors, Inc. (“PAD”), which, together with PIMS, serves as co-distributor of the Class X shares of the Fund. The Fund compensates PIMS and PAD, as applicable, for distributing and servicing the Fund’s Class A, Class B, Class C, Class R and Class X shares, pursuant to plans of distribution
(the “Distribution Plans”), regardless of expenses actually incurred by PIMS or PAD. The distribution fees are accrued daily and payable monthly. No distribution or service fees are paid to PIMS as distributor of the Class Z shares of the Fund.
Pursuant to the Distribution Plans, the Fund compensates PIMS and PAD, as applicable, for distribution related activities at an annual rate of up to .30%, 1%, 1%, .75% and 1% of the average daily net assets of the Class A, B, C, R and X shares, respectively. PIMS has contractually agreed through November 30, 2014 to limit such expenses to .25% and .50% of the average daily net assets of the Class A and Class R shares, respectively.
Management has received the maximum allowable amount of sales charges for Class X in accordance with regulatory limits. As such, any contingent deferred sales charges received by the Manager are contributed back into the Fund and included in the Financial Highlights as a contribution to capital.
PIMS has advised the Fund that it has received $64,944 in front-end sales charges resulting from sales of Class A shares during the six months ended January 31, 2014. From these fees, PIMS paid such sales charges to broker-dealers, which in turn paid commissions to salespersons and incurred other distribution costs. PIMS has advised the Fund that for the six months ended January 31, 2014, it has received $117, $9,102 and $1,937 in contingent deferred sales charges imposed upon certain redemptions by Class A, Class B and Class C shareholders, respectively.
PIMS and PI are indirect, wholly-owned subsidiaries of Prudential Financial, Inc. (“Prudential”).
Note 3. Other Transactions with Affiliates
Prudential Mutual Fund Services LLC (“PMFS”), an affiliate of PI, and an indirect, wholly-owned subsidiary of Prudential, serves as the Fund’s transfer agent. Transfer agent fees and expenses in the Statement of Operations include certain out-of-pocket expenses paid to non-affiliates, where applicable.
The Fund invests in the Prudential Core Taxable Money Market Fund (the “Core Fund”), a portfolio of Prudential Investment Portfolios 2, registered under the 1940 Act, and managed by PI. Earnings from the Core Fund are disclosed on the Statement of Operations as affiliated dividend income.
| | | | |
| Prudential Defensive Equity Fund | | | 43 | |
Notes to Financial Statements
(Unaudited) continued
Note 4. Portfolio Securities
Purchases and sales of portfolio securities, excluding short-term investments and U.S. government securities, for the six months ended January 31, 2014, aggregated $96,730,154 and $108,549,743, respectively.
Note 5. Tax Information
The United States federal income tax basis of investments and the net unrealized appreciation as of January 31, 2014 were as follows:
| | | | |
Tax Basis | | $ | 224,152,309 | |
| | | | |
Appreciation | | | 30,399,372 | |
Depreciation | | | (3,624,439 | ) |
| | | | |
Net Unrealized Appreciation | | $ | 26,774,933 | |
| | | | |
The book basis may differ from tax basis due to certain tax related adjustments.
The Fund utilized approximately $25,836,000 of its capital loss carryforward to offset net taxable gains realized in the fiscal year ended July 31, 2013.
Management has analyzed the Fund’s tax positions taken on federal income tax returns for all open tax years and has concluded that no provision for income tax is required in the Fund’s financial statements for the current reporting period. The Fund’s federal and state income and federal excise tax returns for tax years for which the applicable statutes of limitations have not expired are subject to examination by the Internal Revenue Service and state departments of revenue.
Note 6. Capital
The Fund offers Class A, Class B, Class C, Class R, Class X and Class Z shares. Class A shares are subject to a maximum front-end sales charge of 5.50%. Investors who purchase $1 million or more of Class A shares and sell these shares within 12 months of purchase are not subject to an initial sales charge but are subject to a contingent deferred sales charge (CDSC) of 1%. The Class A CDSC is waived for purchases by certain retirement or benefit plans. Class B shares are subject to a CDSC of 5%, which decreases by 1% annually to 1% in the fifth and sixth years and 0% in the seventh year. Class B shares automatically convert to Class A shares on a quarterly basis
approximately seven years after purchase. The CDSC for Class C shares is 1% for shares redeemed within 12 months of purchase. Class X shares are generally closed to new purchases. Class X shares are subject to a CDSC of 6%, which decreases by 1% annually to 4% in the third and fourth years, by 1% annually to 2% in the sixth and seventh years, and 1% in the eighth year. Class X shares automatically convert to Class A shares on a monthly basis approximately ten years after purchase. An exchange privilege is also available for shareholders who qualify to purchase Class A shares at net asset value. Class R and Class Z shares are not subject to any sales or redemption charge and are offered exclusively for sale to a limited group of investors.
Under certain circumstances, an exchange may be made from specified share classes of the Fund to one or more other share classes of the Fund as presented in the table of transactions in shares of beneficial interest.
As of January 31, 2014, Prudential owns 249 shares of Class R.
The Fund has authorized an unlimited number of shares of beneficial interest at $.001 par value per share.
Transactions in shares of beneficial interest were as follows:
| | | | | | | | |
Class A | | Shares | | | Amount | |
Six months ended January 31, 2014: | | | | | | | | |
Shares sold | | | 358,800 | | | $ | 4,659,538 | |
Shares issued in reinvestment of dividends and distributions | | | 818,551 | | | | 10,477,454 | |
Shares reacquired | | | (1,151,855 | ) | | | (14,919,013 | ) |
| | | | | | | | |
Net increase (decrease) in shares outstanding before conversion | | | 25,496 | | | | 217,979 | |
Shares issued upon conversion from Class B and Class X | | | 157,931 | | | | 2,059,303 | |
| | | | | | | | |
Net increase (decrease) in shares outstanding | | | 183,427 | | | $ | 2,277,282 | |
| | | | | | | | |
Year ended July 31, 2013: | | | | | | | | |
Shares sold | | | 513,428 | | | $ | 6,198,588 | |
Shares issued in reinvestment of dividends and distributions | | | 267,592 | | | | 3,106,744 | |
Shares reacquired | | | (2,643,619 | ) | | | (31,430,563 | ) |
| | | | | | | | |
Net increase (decrease) in shares outstanding before conversion | | | (1,862,599 | ) | | | (22,125,231 | ) |
Shares issued upon conversion from Class B and Class X | | | 623,668 | | | | 7,526,298 | |
Shares reacquired upon conversion into Class Z | | | (4,119 | ) | | | (48,752 | ) |
| | | | | | | | |
Net increase (decrease) in shares outstanding | | | (1,243,050 | ) | | $ | (14,647,685 | ) |
| | | | | | | | |
| | | | |
| Prudential Defensive Equity Fund | | | 45 | |
Notes to Financial Statements
(Unaudited) continued
| | | | | | | | |
Class B | | Shares | | | Amount | |
Six months ended January 31, 2014: | | | | | | | | |
Shares sold | | | 92,065 | | | $ | 1,188,460 | |
Shares issued in reinvestment of dividends and distributions | | | 77,954 | | | | 997,032 | |
Shares reacquired | | | (101,940 | )�� | | | (1,316,094 | ) |
| | | | | | | | |
Net increase (decrease) in shares outstanding before conversion | | | 68,079 | | | | 869,398 | |
Shares reacquired upon conversion into Class A | | | (154,482 | ) | | | (2,000,663 | ) |
| | | | | | | | |
Net increase (decrease) in shares outstanding | | | (86,403 | ) | | $ | (1,131,265 | ) |
| | | | | | | | |
Year ended July 31, 2013: | | | | | | | | |
Shares sold | | | 178,513 | | | $ | 2,146,514 | |
Shares issued in reinvestment of dividends and distributions | | | 22,454 | | | | 260,470 | |
Shares reacquired | | | (210,118 | ) | | | (2,504,917 | ) |
| | | | | | | | |
Net increase (decrease) in shares outstanding before conversion | | | (9,151 | ) | | | (97,933 | ) |
Shares reacquired upon conversion into Class A | | | (602,753 | ) | | | (7,246,680 | ) |
| | | | | | | | |
Net increase (decrease) in shares outstanding | | | (611,904 | ) | | $ | (7,344,613 | ) |
| | | | | | | | |
Class C | | | | | | |
Six months ended January 31, 2014: | | | | | | | | |
Shares sold | | | 124,193 | | | $ | 1,601,976 | |
Shares issued in reinvestment of dividends and distributions | | | 182,822 | | | | 2,338,297 | |
Shares reacquired | | | (262,566 | ) | | | (3,379,667 | ) |
| | | | | | | | |
Net increase (decrease) in shares outstanding before conversion | | | 44,449 | | | | 560,606 | |
Shares reacquired upon conversion into Class Z | | | (1,607 | ) | | | (21,069 | ) |
| | | | | | | | |
Net increase (decrease) in shares outstanding | | | 42,842 | | | $ | 539,537 | |
| | | | | | | | |
Year ended July 31, 2013: | | | | | | | | |
Shares sold | | | 153,793 | | | $ | 1,850,504 | |
Shares issued in reinvestment of dividends and distributions | | | 45,590 | | | | 528,828 | |
Shares reacquired | | | (929,412 | ) | | | (11,093,358 | ) |
| | | | | | | | |
Net increase (decrease) in shares outstanding before conversion | | | (730,029 | ) | | | (8,714,026 | ) |
Shares reacquired upon conversion into Class Z | | | (1,150 | ) | | | (13,873 | ) |
| | | | | | | | |
Net increase (decrease) in shares outstanding | | | (731,179 | ) | | $ | (8,727,899 | ) |
| | | | | | | | |
| | | | | | | | |
Class R | | Shares | | | Amount | |
Six months ended January 31, 2014: | | | | | | | | |
Shares sold | | | 519 | | | $ | 6,747 | |
Shares issued in reinvestment of dividends and distributions | | | 1,703 | | | | 21,803 | |
Shares reacquired | | | (1,089 | ) | | | (13,987 | ) |
| | | | | | | | |
Net increase (decrease) in shares outstanding | | | 1,133 | | | $ | 14,563 | |
| | | | | | | | |
Year ended July 31, 2013: | | | | | | | | |
Shares sold | | | 778 | | | $ | 9,309 | |
Shares issued in reinvestment of dividends and distributions | | | 464 | | | | 5,393 | |
Shares reacquired | | | — | | | | — | |
| | | | | | | | |
Net increase (decrease) in shares outstanding | | | 1,242 | | | $ | 14,702 | |
| | | | | | | | |
Class X | | | | | | |
Six months ended January 31, 2014: | | | | | | | | |
Shares sold | | | — | | | $ | — | |
Shares issued in reinvestment of dividends and distributions | | | 258 | | | | 3,297 | |
Shares reacquired | | | (2 | ) | | | (23 | ) |
| | | | | | | | |
Net increase (decrease) in shares outstanding | | | 256 | | | $ | 3,274 | |
Shares reacquired upon conversion into Class A | | | (4,512 | ) | | | (58,640 | ) |
| | | | | | | | |
Net increase (decrease) in shares outstanding | | | (4,256 | ) | | $ | (55,366 | ) |
| | | | | | | | |
Year ended July 31, 2013: | | | | | | | | |
Shares sold | | | — | | | $ | — | |
Shares issued in reinvestment of dividends and distributions | | | 283 | | | | 3,285 | |
Shares reacquired | | | (1,501 | ) | | | (18,203 | ) |
| | | | | | | | |
Net increase (decrease) in shares outstanding | | | (1,218 | ) | | | (14,918 | ) |
Shares reacquired upon conversion into Class A | | | (23,520 | ) | | | (279,618 | ) |
| | | | | | | | |
Net increase (decrease) in shares outstanding | | | (24,738 | ) | | $ | (294,536 | ) |
| | | | | | | | |
Class Z | | | | | | |
Six months ended January 31, 2014: | | | | | | | | |
Shares sold | | | 51,902 | | | $ | 676,166 | |
Shares issued in reinvestment of dividends and distributions | | | 15,344 | | | | 196,554 | |
Shares reacquired | | | (42,110 | ) | | | (538,887 | ) |
| | | | | | | | |
Net increase (decrease) in shares outstanding before conversion | | | 25,136 | | | | 333,833 | |
Shares issued upon conversion from Class C | | | 1,591 | | | | 21,069 | |
| | | | | | | | |
Net increase (decrease) in shares outstanding | | | 26,727 | | | | 354,902 | |
| | | | | | | | |
Year ended July 31, 2013: | | | | | | | | |
Shares sold | | | 45,787 | | | $ | 549,116 | |
Shares issued in reinvestment of dividends and distributions | | | 5,906 | | | | 68,564 | |
Shares reacquired | | | (105,415 | ) | | | (1,285,942 | ) |
| | | | | | | | |
Net increase (decrease) in shares outstanding before conversion | | | (53,722 | ) | | | (668,262 | ) |
Shares issued upon conversion from Class A and Class C | | | 5,257 | | | | 62,625 | |
| | | | | | | | |
Net increase (decrease) in shares outstanding | | | (48,465 | ) | | | (605,637 | ) |
| | | | | | | | |
| | | | |
| Prudential Defensive Equity Fund | | | 47 | |
Notes to Financial Statements
(Unaudited) continued
Note 7. Borrowings
The Fund, along with other affiliated registered investment companies (the “Funds”), is a party to a Syndicated Credit Agreement (“SCA”) with a group of banks. The purpose of the SCA is to provide an alternative source of temporary funding for capital share redemptions. The SCA provides for a commitment of $900 million for the period November 5, 2013 through November 4, 2014. The Funds pay an annualized commitment fee of 0.08% on the unused portion of the SCA. Prior to November 5, 2013, the Funds had another SCA with substantially similar terms. Interest on any borrowings under the SCA is paid at contracted market rates. The commitment fee for the unused amount is accrued daily and paid quarterly.
The Fund did not utilize the SCA during the six months ended January 31, 2014.
Financial Highlights
(Unaudited)
| | | | | | | | | | | | | | | | | | | | | | | | | | |
| Class A Shares | |
| | | Six Months
Ended
January 31, | | | | | Year Ended July 31, | |
| | | 2014(b) | | | | | 2013(b) | | | 2012(b) | | | 2011(b) | | | 2010(b) | | | 2009(b) | |
| Per Share Operating Performance: | | | | | | | | | | | | | | | | | | | | | | | |
| Net Asset Value, Beginning of Period | | | $12.86 | | | | | | $11.23 | | | | $11.12 | | | | $9.88 | | | | $8.97 | | | | $10.72 | |
| Income (loss) from investment operations: | | | | | | | | | | | | | | | | | | | | |
| Net investment income | | | .05 | | | | | | .13 | | | | .13 | | | | .13 | | | | .14 | | | | .19 | |
| Net realized and unrealized gain (loss) on investment transactions | | | .49 | | | | | | 1.72 | | | | .09 | | | | 1.20 | | | | .90 | | | | (1.59 | ) |
| Total from investment operations | | | .54 | | | | | | 1.85 | | | | .22 | | | | 1.33 | | | | 1.04 | | | | (1.40 | ) |
| Less Dividends and Distributions: | | | | | | | | | | | | | | | | | | | | | | | |
| Dividends from net investment income | | | (.13 | ) | | | | | (.22 | ) | | | (.11 | ) | | | (.09 | ) | | | (.13 | ) | | | (.25 | ) |
| Distributions from net realized gains | | | (.66 | ) | | | | | - | | | | - | | | | - | | | | - | | | | (.10 | ) |
| Total dividends and distributions | | | (.79 | ) | | | | | (.22 | ) | | | (.11 | ) | | | (.09 | ) | | | (.13 | ) | | | (.35 | ) |
| Net asset value, end of period | | | $12.61 | | | | | | $12.86 | | | | $11.23 | | | | $11.12 | | | | $9.88 | | | | $8.97 | |
| Total Return(a) | | | 4.08% | | | | | | 16.69% | | | | 2.05% | | | | 13.51% | | | | 11.67% | | | | (12.78)% | |
| | | | | |
| Ratios/Supplemental Data: | |
| Net assets, end of period (000) | | | $178,502 | | | | | | $179,711 | | | | $170,788 | | | | $196,985 | | | | $164,925 | | | | $142,715 | |
| Average net assets (000) | | | $179,982 | | | | | | $172,847 | | | | $188,087 | | | | $186,704 | | | | $159,007 | | | | $131,169 | |
| Ratios to average net assets(c)(e): | | | | | | | | | | | | | | | | | | | | | | | | | | |
| Expenses after waivers and/or expense reimbursement | | | 1.33% | (f) | | | | | 1.38% | | | | 1.41% | | | | 1.37% | | | | 1.41% | | | | 1.48% | (d) |
| Expenses before waivers and/or expense reimbursement | | | 1.38% | (f) | | | | | 1.43% | | | | 1.46% | | | | 1.42% | | | | 1.46% | | | | 1.53% | (d) |
| Net investment income | | | .78% | (f) | | | | | 1.05% | | | | 1.19% | | | | 1.16% | | | | 1.39% | | | | 2.18% | |
| Portfolio turnover rate | | | 40% | (g) | | | | | 239% | | | | 174% | | | | 151% | | | | 140% | | | | 249% | |
(a) Total return does not consider the effects of sales loads. Total return is calculated assuming a purchase of a share on the first day and a sale on the last day of each period reported and includes reinvestment of dividends and distributions. Total returns may reflect adjustments to conform to generally accepted accounting principles. Total returns for periods less than one full year are not annualized.
(b) Calculated based upon average shares outstanding during the period.
(c) Does not include expenses of the underlying portfolios in which the Fund invests.
(d) Includes interest expense of .03%.
(e) The distributor of the Fund has contractually agreed to limit its distribution and service (12b-1) fees to .25% of the average net assets of the Class A shares.
(f) Annualized.
(g) Not annualized.
See Notes to Financial Statements.
| | | | |
| Prudential Defensive Equity Fund | | | 49 | |
Financial Highlights
(Unaudited) continued
| | | | | | | | | | | | | | | | | | | | | | | | | | |
| Class B Shares | | | | | | | | | | | | | | | | | | | | |
| | | Six Months
Ended
January 31, | | | | | Year Ended July 31, | |
| | | 2014(b) | | | | | 2013(b) | | | 2012(b) | | | 2011(b) | | | 2010(b) | | | 2009(b) | |
| Per Share Operating Performance: | | | | | | | | | | | | | | | | | | | | | | | | | | |
| Net Asset Value, Beginning of Period | | | $12.80 | | | | | | $11.17 | | | | $11.06 | | | | $9.84 | | | | $8.97 | | | | $10.66 | |
| Income (loss) from investment operations: | | | | | | | | | | | | | | | | | | | | | | | | | | |
| Net investment income | | | - | (g) | | | | | .04 | | | | .05 | | | | .04 | | | | .06 | | | | .13 | |
| Net realized and unrealized gain (loss) on investment transactions | | | .48 | | | | | | 1.73 | | | | .09 | | | | 1.20 | | | | .91 | | | | (1.58 | ) |
| Total from investment operations | | | .48 | | | | | | 1.77 | | | | .14 | | | | 1.24 | | | | .97 | | | | (1.45 | ) |
| Less Dividends and Distributions: | | | | | | | | | | | | | | | | | | | | | | | | | | |
| Dividends from net investment income | | | (.03 | ) | | | | | (.14 | ) | | | (.03 | ) | | | (.02 | ) | | | (.10 | ) | | | (.14 | ) |
| Distributions from net realized gains | | | (.66 | ) | | | | | - | | | | - | | | | - | | | | - | | | | (.10 | ) |
| Total dividends and distributions | | | (.69 | ) | | | | | (.14 | ) | | | (.03 | ) | | | (.02 | ) | | | (.10 | ) | | | (.24 | ) |
| Net asset value, end of period | | | $12.59 | | | | | | $12.80 | | | | $11.17 | | | | $11.06 | | | | $9.84 | | | | $8.97 | |
| Total Return(a) | | | 3.68% | | | | | | 15.94% | | | | 1.26% | | | | 12.57% | | | | 10.82% | | | | (13.43)% | |
| | | | | | | | | | | | | | | | | | | | | | | | | | |
| Ratios/Supplemental Data: | | | | | | | | | | | | | | | | | | | | |
| Net assets, end of period (000) | | | $19,348 | | | | | | $20,780 | | | | $24,968 | | | | $36,955 | | | | $52,726 | | | | $67,013 | |
| Average net assets (000) | | | $20,017 | | | | | | $22,938 | | | | $29,979 | | | | $46,927 | | | | $62,087 | | | | $76,425 | |
| Ratios to average net assets (c): | | | | | | | | | | | | | | | | | | | | | | | | | | |
| Expenses | | | 2.08% | (e) | | | | | 2.13% | | | | 2.16% | | | | 2.12% | | | | 2.16% | | | | 2.23% | (d) |
| Net investment income | | | .04% | (e) | | | | | .30% | | | | .45% | | | | .41% | | | | .65% | | | | 1.46% | |
| Portfolio turnover rate | | | 40% | (f) | | | | | 239% | | | | 174% | | | | 151% | | | | 140% | | | | 249% | |
(a) Total return does not consider the effects of sales loads. Total return is calculated assuming a purchase of a share on the first day and a sale on the last day of each period reported and includes reinvestment of dividends and distributions. Total returns may reflect adjustments to conform to generally accepted accounting principles. Total returns for periods less than one full year are not annualized.
(b) Calculated based upon average shares outstanding during the period.
(c) Does not include expenses of the underlying portfolios in which the Fund invests.
(d) Includes interest expense of .03%.
(e) Annualized.
(f) Not annualized.
(g) Less than $.005.
See Notes to Financial Statements.
| | | | | | | | | | | | | | | | | | | | | | | | | | |
| Class C Shares | | | | | | | | | | | | | | | | | | | | |
| | | Six Months
Ended
January 31, | | | | | Year Ended July 31, | |
| | | 2014(b) | | | | | 2013(b) | | | 2012(b) | | | 2011(b) | | | 2010(b) | | | 2009(b) | |
| Per Share Operating Performance: | | | | | | | | | | | | | | | | | | | | |
| Net Asset Value, Beginning of Period | | | $12.80 | | | | | | $11.17 | | | | $11.06 | | | | $9.84 | | | | $8.97 | | | | $10.66 | |
| Income (loss) from investment operations: | | | | | | | | | | | | | | | | | | | | | | | | | | |
| Net investment income | | | - | (g) | | | | | .04 | | | | .05 | | | | .04 | | | | .06 | | | | .12 | |
| Net realized and unrealized gain (loss) on investment transactions | | | .48 | | | | | | 1.73 | | | | .09 | | | | 1.20 | | | | .91 | | | | (1.57 | ) |
| Total from investment operations | | | .48 | | | | | | 1.77 | | | | .14 | | | | 1.24 | | | | .97 | | | | (1.45 | ) |
| Less Dividends and Distributions: | | | | | | | | | | | | | | | | | | | | | | | | | | |
| Dividends from net investment income | | | (.03 | ) | | | | | (.14 | ) | | | (.03 | ) | | | (.02 | ) | | | (.10 | ) | | | (.14 | ) |
| Distributions from net realized gains | | | (.66 | ) | | | | | - | | | | - | | | | - | | | | - | | | | (.10 | ) |
| Total dividends and distributions | | | (.69 | ) | | | | | (.14 | ) | | | (.03 | ) | | | (.02 | ) | | | (.10 | ) | | | (.24 | ) |
| Net asset value, end of period | | | $12.59 | | | | | | $12.80 | | | | $11.17 | | | | $11.06 | | | | $9.84 | | | | $8.97 | |
| Total Return(a) | | | 3.68% | | | | | | 15.94% | | | | 1.26% | | | | 12.57% | | | | 10.82% | | | | (13.43)% | |
| | | | | |
| Ratios/Supplemental Data: | |
| Net assets, end of period (000) | | | $48,400 | | | | | | $48,666 | | | | $50,632 | | | | $58,827 | | | | $63,077 | | | | $68,208 | |
| Average net assets (000) | | | $48,726 | | | | | | $49,670 | | | | $52,831 | | | | $62,754 | | | | $68,051 | | | | $72,815 | |
| Ratios to average net assets(c): | | | | | | | | | | | | | | | | | | | | | | | | | | |
| Expenses | | | 2.08% | (e) | | | | | 2.13% | | | | 2.16% | | | | 2.12% | | | | 2.16% | | | | 2.23% | (d) |
| Net investment income | | | .03% | (e) | | | | | .30% | | | | .44% | | | | .41% | | | | .64% | | | | 1.45% | |
| Portfolio turnover rate | | | 40% | (f) | | | | | 239% | | | | 174% | | | | 151% | | | | 140% | | | | 249% | |
(a) Total return does not consider the effects of sales loads. Total return is calculated assuming a purchase of a share on the first day and a sale on the last day of each period reported and includes reinvestment of dividends and distributions. Total returns may reflect adjustments to conform to generally accepted accounting principles. Total returns for periods less than one full year are not annualized.
(b) Calculated based upon average shares outstanding during the period.
(c) Does not include expenses of the underlying portfolios in which the Fund invests.
(d) Includes interest expense of .03%.
(e) Annualized.
(f) Not annualized.
See Notes to Financial Statements.
| | | | |
| Prudential Defensive Equity Fund | | | 51 | |
Financial Highlights
(Unaudited) continued
| | | | | | | | | | | | | | | | | | | | | | | | | | |
| Class R Shares | |
| | | Six Months
Ended
January 31, | | | | | Year Ended July 31, | |
| | | 2014(b) | | | | | 2013(b) | | | 2012(b) | | | 2011(b) | | | 2010(b) | | | 2009(b) | |
| Per Share Operating Performance: | | | | | | | | | | | | | | | | | | | | | | | |
| Net Asset Value, Beginning of Period | | | $12.85 | | | | | | $11.21 | | | | $11.10 | | | | $9.87 | | | | $8.97 | | | | $10.73 | |
| Income (loss) from investment operations: | |
| Net investment income | | | .03 | | | | | | .10 | | | | .10 | | | | .09 | | | | .11 | | | | .17 | |
| Net realized and unrealized gain (loss) on investment transactions | | | .48 | | | | | | 1.73 | | | | .09 | | | | 1.21 | | | | .91 | | | | (1.60 | ) |
| Total from investment operations | | | .51 | | | | | | 1.83 | | | | .19 | | | | 1.30 | | | | 1.02 | | | | (1.43 | ) |
| Less Dividends and Distributions: | |
| Dividends from net investment income | | | (.09 | ) | | | | | (.19 | ) | | | (.08 | ) | | | (.07 | ) | | | (.12 | ) | | | (.23 | ) |
| Distributions from net realized gains | | | (.66 | ) | | | | | - | | | | - | | | | - | | | | - | | | | (.10 | ) |
| Total dividends and distributions | | | (.75 | ) | | | | | (.19 | ) | | | (.08 | ) | | | (.07 | ) | | | (.12 | ) | | | (.33 | ) |
| Net asset value, end of period | | | $12.61 | | | | | | $12.85 | | | | $11.21 | | | | $11.10 | | | | $9.87 | | | | $8.97 | |
| Total Return(a) | | | 3.92% | | | | | | 16.52% | | | | 1.78% | | | | 13.16% | | | | 11.43% | | | | (13.03)% | |
| |
| Ratios/Supplemental Data: | |
| Net assets, end of period (000) | | | $380 | | | | | | $373 | | | | $311 | | | | $341 | | | | $578 | | | | $761 | |
| Average net assets (000) | | | $377 | | | | | | $341 | | | | $306 | | | | $497 | | | | $632 | | | | $1,024 | |
| Ratios to average net assets(c)(e): | | | | | | | | | | | | | | | | | | | | | | | | | | |
| Expenses after waivers and/or expense reimbursement | | | 1.58% | (f) | | | | | 1.63% | | | | 1.66% | | | | 1.62% | | | | 1.66% | | | | 1.73% | (d) |
| Expenses before waivers and/or expense reimbursement | | | 1.83% | (f) | | | | | 1.88% | | | | 1.91% | | | | 1.87% | | | | 1.91% | | | | 1.98% | (d) |
| Net investment income | | | .53% | (f) | | | | | .81% | | | | .94% | | | | .89% | | | | 1.15% | | | | 1.97% | |
| Portfolio turnover rate | | | 40% | (g) | | | | | 239% | | | | 174% | | | | 151% | | | | 140% | | | | 249% | |
(a) Total return is calculated assuming a purchase of a share on the first day and a sale on the last day of each period reported and includes reinvestment of dividends and distributions. Total returns may reflect adjustments to conform to generally accepted accounting principles. Total returns for periods less than one full year are not annualized.
(b) Calculated based upon average shares outstanding during the period.
(c) Does not include expenses of the underlying portfolios in which the Fund invests.
(d) Includes interest expense of .03%.
(e) The distributor of the Fund has contractually agreed to limit its distribution and service (12b-1) fees to .50% of the average daily net assets of the Class R shares.
(f) Annualized.
(g) Not annualized.
See Notes to Financial Statements.
| | | | | | | | | | | | | | | | | | | | | | | | | | |
| Class X Shares | | | | | | | | | | | | | | | | | | | | |
| | | Six Months
Ended
January 31, | | | | | Year Ended July 31, | |
| | | 2014(b) | | | | | 2013(b) | | | 2012(b) | | | 2011(b) | | | 2010(b) | | | 2009(b) | |
| Per Share Operating Performance: | | | | | | | | | | | | | | | | | | | | | | | |
| Net Asset Value, Beginning of Period | | | $12.86 | | | | | | $11.22 | | | | $11.12 | | | | $9.88 | | | | $8.97 | | | | $10.66 | |
| Income (loss) from investment operations: | | | | | | | | | | | | | | | | | | | | | | | | | | |
| Net investment income | | | .06 | | | | | | .12 | | | | .13 | | | | .12 | | | | .10 | | | | .13 | |
| Net realized and unrealized gain (loss) on investment transactions | | | .48 | | | | | | 1.74 | | | | .08 | | | | 1.21 | | | | .91 | | | | (1.58 | ) |
| Total from investment operations | | | .54 | | | | | | 1.86 | | | | .21 | | | | 1.33 | | | | 1.01 | | | | (1.45 | ) |
| Less Dividends and Distributions: | | | | | | | | | | | | | | | | | | | | | | | |
| Dividends from net investment income | | | (.13 | ) | | | | | (.22 | ) | | | (.11 | ) | | | (.09 | ) | | | (.10 | ) | | | (.14 | ) |
| Distributions from net realized gains | | | (.66 | ) | | | | | - | | | | - | | | | - | | | | - | | | | (.10 | ) |
| Total dividends and distributions | | | (.79 | ) | | | | | (.22 | ) | | | (.11 | ) | | | (.09 | ) | | | (.10 | ) | | | (.24 | ) |
| Capital Contribution | | | - | | | | | | - | | | | - | (e) | | | - | (e) | | | - | (e) | | | - | |
| Net asset value, end of period | | | $12.61 | | | | | | $12.86 | | | | $11.22 | | | | $11.12 | | | | $9.88 | | | | $8.97 | |
| Total Return(a) | | | 4.08% | | | | | | 16.79% | | | | 1.96% | | | | 13.51% | | | | 11.28% | | | | (13.43)% | |
| |
| Ratios/Supplemental Data: | |
| Net assets, end of period (000) | | | $47 | | | | | | $102 | | | | $367 | | | | $777 | | | | $1,430 | | | | $2,235 | |
| Average net assets (000) | | | $72 | | | | | | $184 | | | | $505 | | | | $1,112 | | | | $1,847 | | | | $2,858 | |
| Ratios to average net assets(c): | | | | | | | | | | | | | | | | | | | | | | | | | | |
| Expenses | | | 1.33% | (f) | | | | | 1.38% | | | | 1.41% | | | | 1.37% | | | | 1.77% | | | | 2.21% | (d) |
| Net investment income | | | .85% | (f) | | | | | 1.02% | | | | 1.20% | | | | 1.15% | | | | 1.04% | | | | 1.48% | |
| Portfolio turnover rate | | | 40% | (g) | | | | | 239% | | | | 174% | | | | 151% | | | | 140% | | | | 249% | |
(a) Total return does not consider the effects of sales loads. Total return is calculated assuming a purchase of a share on the first day and a sale on the last day of each period reported and includes reinvestment of dividends and distributions. Total returns may reflect adjustments to conform to generally accepted accounting principles. Total returns for periods less than one full year are not annualized.
(b) Calculated based upon average shares outstanding during the period.
(c) Does not include expenses of the underlying portfolios in which the Fund invests.
(d) Includes interest expense of .03%.
(e) Less than $.005.
(f) Annualized.
(g) Not annualized.
See Notes to Financial Statements.
| | | | |
| Prudential Defensive Equity Fund | | | 53 | |
Financial Highlights
(Unaudited) continued
| | | | | | | | | | | | | | | | | | | | | | | | | | |
| Class Z Shares | | | | | | | | | | | | | | | | | | | | |
| | | Six Months
Ended
January 31, | | | | | Year Ended July 31, | |
| | | 2014(b) | | | | | 2013(b) | | | 2012(b) | | | 2011(b) | | | 2010(b) | | | 2009(b) | |
| Per Share Operating Performance: | | | | | | | | | | | | | | | | | | | | | | | | | | |
| Net Asset Value, Beginning of Period | | | $12.89 | | | | | | $11.24 | | | | $11.14 | | | | $9.90 | | | | $8.98 | | | | $10.74 | |
| Income (loss) from investment operations: | | | | | | | | | | | | | | | | | | | | | | | | | | |
| Net investment income | | | .07 | | | | | | .16 | | | | .16 | | | | .15 | | | | .16 | | | | .21 | |
| Net realized and unrealized gain (loss) on investment transactions | | | .49 | | | | | | 1.74 | | | | .08 | | | | 1.21 | | | | .90 | | | | (1.60 | ) |
| Total from investment operations | | | .56 | | | | | | 1.90 | | | | .24 | | | | 1.36 | | | | 1.06 | | | | (1.39 | ) |
| Less Dividends and Distributions: | | | | | | | | | | | | | | | | | | | | | | | | | | |
| Dividends from net investment income | | | (.16 | ) | | | | | (.25 | ) | | | (.14 | ) | | | (.12 | ) | | | (.14 | ) | | | (.27 | ) |
| Distributions from net realized gains | | | (.66 | ) | | | | | - | | | | - | | | | - | | | | - | | | | (.10 | ) |
| Total dividends and distributions | | | (.82 | ) | | | | | (.25 | ) | | | (.14 | ) | | | (.12 | ) | | | (.14 | ) | | | (.37 | ) |
| Net asset value, end of period | | | $12.63 | | | | | | $12.89 | | | | $11.24 | | | | $11.14 | | | | $9.90 | | | | $8.98 | |
| Total Return(a) | | | 4.23% | | | | | | 17.13% | | | | 2.22% | | | | 13.75% | | | | 11.90% | | | | (12.55)% | |
| |
| Ratios/Supplemental Data: | |
| Net assets, end of period (000) | | | $3,615 | | | | | | $3,346 | | | | $3,464 | | | | $3,539 | | | | $3,848 | | | | $4,786 | |
| Average net assets (000) | | | $3,488 | | | | | | $3,533 | | | | $3,240 | | | | $3,846 | | | | $4,425 | | | | $8,208 | |
| Ratios to average net assets(c): | | | | | | | | | | | | | | | | | | | | | | | | | | |
| Expenses | | | 1.08% | (e) | | | | | 1.13% | | | | 1.16% | | | | 1.12% | | | | 1.16% | | | | 1.23% | (d) |
| Net investment income | | | 1.02% | (e) | | | | | 1.30% | | | | 1.44% | | | | 1.42% | | | | 1.64% | | | | 2.47% | |
| Portfolio turnover rate | | | 40% | (f) | | | | | 239% | | | | 174% | | | | 151% | | | | 140% | | | | 249% | |
(a) Total return is calculated assuming a purchase of a share on the first day and a sale on the last day of each period reported and includes reinvestment of dividends and distributions. Total returns may reflect adjustments to conform to generally accepted accounting principles. Total returns for periods less than one full year are not annualized.
(b) Calculated based upon average shares outstanding during the period.
(c) Does not include expenses of the underlying portfolios in which the Fund invests.
(d) Includes interest expense of .03%.
(e) Annualized.
(f) Not annualized.
See Notes to Financial Statements.
| | | | |
| n MAIL | | n TELEPHONE | | n WEBSITE |
Gateway Center Three 100 Mulberry Street Newark, NJ 07102 | | (800) 225-1852 | | www.prudentialfunds.com |
|
| PROXY VOTING |
| The Board of Trustees of the Fund has delegated to the Fund’s investment subadviser the responsibility for voting any proxies and maintaining proxy recordkeeping with respect to the Fund. A description of these proxy voting policies and procedures is available without charge, upon request, by calling (800) 225-1852. Information regarding how the Fund voted proxies relating to portfolio securities during the most recent 12-month period ended June 30 is available on the Fund’s website and on the Securities and Exchange Commission’s website. |
|
| TRUSTEES |
| Ellen S. Alberding • Kevin J. Bannon • Scott E. Benjamin • Linda W. Bynoe • Keith F. Hartstein • Michael S. Hyland • Douglas H. McCorkindale • Stephen P. Munn • Stuart S. Parker • James E. Quinn • Richard A. Redeker • Robin B. Smith • Stephen G. Stoneburn |
|
| OFFICERS |
| Stuart S. Parker, President • Scott E. Benjamin, Vice President • Grace C. Torres, Treasurer and Principal Financial and Accounting Officer • Raymond A. O’ Hara, Chief Legal Officer • Deborah A. Docs, Secretary • Lee D. Augsburger, Chief Compliance Officer • Theresa C. Thompson, Deputy Chief Compliance Officer • Richard W. Kinville, Anti-Money Laundering Compliance Officer • Jonathan D. Shain, Assistant Secretary • Claudia DiGiacomo, Assistant Secretary • Amanda S. Ryan, Assistant Secretary • Andrew R. French, Assistant Secretary • M. Sadiq Peshimam, Assistant Treasurer • Peter Parrella, Assistant Treasurer |
| | | | |
| MANAGER | | Prudential Investments LLC | | Gateway Center Three 100 Mulberry Street Newark, NJ 07102 |
|
| INVESTMENT SUBADVISER | | Quantitative Management Associates LLC | | Gateway Center Two 100 Mulberry Street Newark, NJ 07102 |
|
| DISTRIBUTOR | | Prudential Investment
Management Services LLC | | Gateway Center Three
100 Mulberry Street
Newark, NJ 07102 |
|
| CUSTODIAN | | The Bank of New York Mellon | | One Wall Street
New York, NY 10286 |
|
| TRANSFER AGENT | | Prudential Mutual Fund
Services LLC | | PO Box 9658
Providence, RI 02940 |
|
| INDEPENDENT REGISTERED PUBLIC ACCOUNTING FIRM | | KPMG LLP | | 345 Park Avenue
New York, NY 10154 |
|
| FUND COUNSEL | | Willkie Farr & Gallagher LLP | | 787 Seventh Avenue New York, NY 10019 |
|
|
| An investor should consider the investment objectives, risks, charges, and expenses of the Fund carefully before investing. The prospectus and summary prospectus contain this and other information about the Fund. An investor may obtain a prospectus and summary prospectus by visiting our website at www.prudentialfunds.com or by calling (800) 225-1852. The prospectus and summary prospectus should be read carefully before investing. |
|
| E-DELIVERY |
| To receive your mutual fund documents online, go to www.prudentialfunds.com/edelivery and enroll. Instead of receiving printed documents by mail, you will receive notification via email when new materials are available. You can cancel your enrollment or change your email address at any time by visiting the website address above. |
|
| SHAREHOLDER COMMUNICATIONS WITH TRUSTEES |
| Shareholders can communicate directly with the Board of Trustees by writing to the Chair of the Board, Prudential Defensive Equity Fund, Prudential Investments, Attn: Board of Trustees, 100 Mulberry Street, Gateway Center Three, Newark, NJ 07102. Shareholders can communicate directly with an individual Trustee by writing to the same address. Communications are not screened before being delivered to the addressee. |
|
| AVAILABILITY OF PORTFOLIO SCHEDULE |
| The Fund files its complete schedule of portfolio holdings with the Securities and Exchange Commission for the first and third quarters of each fiscal year on Form N-Q. The Fund’s Forms N-Q are available on the Commission’s website at www.sec.gov. The Fund’s Forms N-Q may also be reviewed and copied at the Commission’s Public Reference Room in Washington, D.C. Information on the operation and location of the Public Reference Room may be obtained by calling 1-800-SEC-0330. The Fund’s schedule of portfolio holdings is also available on the Fund’s website as of the end of each month. |
Mutual Funds:
| | | | |
ARE NOT INSURED BY THE FDIC OR ANY FEDERAL GOVERNMENT AGENCY | | MAY LOSE VALUE | | ARE NOT A DEPOSIT OF OR GUARANTEED BY ANY BANK OR ANY BANK AFFILIATE |

PRUDENTIAL DEFENSIVE EQUITY FUND
| | | | | | | | | | | | |
| SHARE CLASS | | A | | B | | C | | R | | X | | Z |
| NASDAQ | | PAMGX | | DMGBX | | PIMGX | | SPMRX | | N/A | | PDMZX |
| CUSIP | | 74442X868 | | 74442X785 | | 74442X793 | | 74442X819 | | 74442X835 | | 74442X827 |
MFSP504E4 0259062-00001-00
| | |
| Item 2 – | | Code of Ethics – Not required, as this is not an annual filing. |
| |
| Item 3 – | | Audit Committee Financial Expert – Not required, as this is not an annual filing. |
| |
| Item 4 – | | Principal Accountant Fees and Services – Not required, as this is not an annual filing. |
| |
| Item 5 – | | Audit Committee of Listed Registrants – Not applicable. |
| |
| Item 6 – | | Schedule of Investments – The schedule is included as part of the report to shareholders filed under Item 1 of this Form. |
| |
| Item 7 – | | Disclosure of Proxy Voting Policies and Procedures for Closed-End Management Investment Companies – Not applicable. |
| |
| Item 8 – | | Portfolio Managers of Closed-End Management Investment Companies – Not applicable. |
| |
| Item 9 – | | Purchases of Equity Securities by Closed-End Management Investment Company and Affiliated Purchasers – Not applicable. |
| |
| Item 10 – | | Submission of Matters to a Vote of Security Holders – Not applicable. |
| |
| Item 11 – | | Controls and Procedures |
| | (a) It is the conclusion of the registrant’s principal executive officer and principal financial officer that the effectiveness of the registrant’s current disclosure controls and procedures (such disclosure controls and procedures having been evaluated within 90 days of the date of this filing) provide reasonable assurance that the information required to be disclosed by the registrant has been recorded, processed, summarized and reported within the time period specified in the Commission’s rules and forms and that the information required to be disclosed by the registrant has been accumulated and communicated to the registrant’s principal executive officer and principal financial officer in order to allow timely decisions regarding required disclosure. (b) There has been no significant change in the registrant’s internal control over financial reporting that occurred during the registrant’s most recent fiscal quarter of the period covered by this report that has materially affected, or is likely to materially affect, the registrant’s internal control over financial reporting. |
| |
| Item 12 – | | Exhibits |
| | (a) (1) Code of Ethics – Not required, as this is not an annual filing. (2) Certifications pursuant to Section 302 of the Sarbanes-Oxley Act – Attached hereto as Exhibit EX-99.CERT. (3) Any written solicitation to purchase securities under Rule 23c-1. – Not applicable. (b) Certifications pursuant to Section 906 of the Sarbanes-Oxley Act – Attached hereto as Exhibit EX-99.906CERT. |
SIGNATURES
Pursuant to the requirements of the Securities Exchange Act of 1934 and the Investment Company Act of 1940, the registrant has duly caused this report to be signed on its behalf by the undersigned, thereunto duly authorized.
| | |
| Registrant: | | Prudential Investment Portfolios 16 |
| |
| By: | | /s/ Deborah A. Docs |
| | Deborah A. Docs |
| | Secretary |
| |
| Date: | | March 21, 2014 |
Pursuant to the requirements of the Securities Exchange Act of 1934 and the Investment Company Act of 1940, this report has been signed below by the following persons on behalf of the registrant and in the capacities and on the dates indicated.
| | |
| By: | | /s/ Stuart S. Parker |
| | Stuart S. Parker |
| | President and Principal Executive Officer |
| |
| Date: | | March 21, 2014 |
| |
| By: | | /s/ Grace C. Torres |
| | Grace C. Torres |
| | Treasurer and Principal Financial Officer |
| |
| Date: | | March 21, 2014 |