UNITED STATES
SECURITIES AND EXCHANGE COMMISSION
Washington, D.C. 20549
FORM N-CSR
CERTIFIED SHAREHOLDER REPORT OF REGISTERED
MANAGEMENT INVESTMENT COMPANIES
Investment Company Act file number | 811-08921 | ||||||
| |||||||
CREDIT SUISSE LARGE CAP BLEND FUND, INC. | |||||||
(Exact name of registrant as specified in charter) | |||||||
| |||||||
Eleven Madison Avenue, New York, New York |
| 10010 | |||||
(Address of principal executive offices) |
| (Zip code) | |||||
| |||||||
J. Kevin Gao, Esq. Credit Suisse Large Cap Blend Fund, Inc. Eleven Madison Avenue New York, New York 10010 | |||||||
(Name and address of agent for service) | |||||||
| |||||||
Registrant’s telephone number, including area code: | (212) 325-2000 |
| |||||
| |||||||
Date of fiscal year end: | December 31st |
| |||||
| |||||||
Date of reporting period: | January 1, 2007 to December 31, 2007 |
| |||||
Item 1. Reports to Stockholders.

CREDIT SUISSE FUNDS
Annual Report
December 31, 2007
n CREDIT SUISSE
LARGE CAP BLEND FUND
The Fund's investment objectives, risks, charges and expenses (which should be considered carefully before investing), and more complete information about the Fund, are provided in the Prospectus, which should be read carefully before investing. You may obtain additional copies by calling 800-927-2874 or by writing to Credit Suisse Funds, P.O. Box 55030, Boston, MA 02205-5030.
Credit Suisse Asset Management Securities, Inc., Distributor, is located at Eleven Madison Avenue, New York, NY 10010. Credit Suisse Funds are advised by Credit Suisse Asset Management, LLC.
Investors in the Credit Suisse Funds should be aware that they may be eligible to purchase Common Class and/or Advisor Class shares (where offered) directly or through certain intermediaries. Such shares are not subject to a sales charge but may be subject to an ongoing service and distribution fee of up to 0.50% of average daily net assets. Investors in the Credit Suisse Funds should also be aware that they may be eligible for a reduction or waiver of the sales charge with respect to Class A, B or C shares (where offered). For more information, please review the relevant prospectuses or consult your financial representative.
The views of the Fund's management are as of the date of the letter and the Fund holdings described in this document are as of December 31, 2007; these views and Fund holdings may have changed subsequent to these dates. Nothing in this document is a recommendation to purchase or sell securities.
Fund shares are not deposits or other obligations of Credit Suisse Asset Management, LLC ("Credit Suisse") or any affiliate, are not FDIC-insured and are not guaranteed by Credit Suisse or any affiliate. Fund investments are subject to investment risks, including loss of your investment.
Credit Suisse Large Cap Blend Fund
Annual Investment Adviser's Report
December 31, 2007 (unaudited)
January 25, 2008
Dear Shareholder:
Performance Summary
01/01/07 – 12/31/07
| Fund & Benchmark | Performance | ||||||
| Common1 | 6.15 | % | |||||
| Class A1,2 | 6.03 | % | |||||
| Class B1,2 | 5.24 | % | |||||
| Class C1,2 | 5.26 | % | |||||
| S&P 500 Index3 | 5.49 | % | |||||
Performance for the Fund's Class A, Class B and Class C Shares is without the maximum sales charge of 5.75%, 4.00% and 1.00%, respectively.2
Market Review: A challenging market on many fronts
For the year ended December 31, 2007, U.S. large-cap stocks gained with the benchmark S&P 500 Index posting a 5.49% total return including dividends. Eight out of the ten economic sectors in the large-cap S&P 500 Index advanced in 2007. Rising global demand and elevated commodity prices boosted the energy and materials sectors to post the highest returns of 32.4% and 20%, respectively. The biggest laggard in the large-cap space was financials (-20.8%), which were negatively impacted by the credit market turmoil and housing market slowdown.
The U.S. Federal Reserve held its benchmark rate at 5.25% until September 2007 when the target federal funds rate was cut by 50 basis points to 4.75%, marking the first cut in four years. The Federal Reserve cut the target rate by another 25 basis points in October and again in December to 4.25%. The cuts were made in an effort to prevent some of the adverse effects on the overall economy from the depressed housing market and tighter lending conditions for both consumers and corporations.
The aggressive lending environment over the past few years led to a rise in mortgage defaults. U.S. home foreclosures rose 68% in November from a year earlier, according to data compiled by RealtyTrac Inc. As a result, the U.S. housing sector weakened significantly in 2007 as mortgage providers tightened their lending standards and some lenders went bankrupt. Home prices in 20 U.S. metropolitan areas dropped in October by the most in at least six years. Property values fell 6.1% from October 2006, according to the S&P/Case-Shiller home-price index.
1
Credit Suisse Large Cap Blend Fund
Annual Investment Adviser's Report (continued)
December 31, 2007 (unaudited)
The Chicago Board Options Exchange Volatility Index (VIX), a measure of expected stock market volatility, reached a five-year low in January 2007. However, market conditions changed rapidly in mid-2007 and the VIX reached a four-year high in November 2007 amid deteriorating conditions in the U.S. housing and credit markets.
Despite the housing market slowdown, the economy grew at a solid 4.9% annual rate in the third quarter of 2007. The personal consumption expenditures (PCE) price index, excluding food and energy, rose 2.2% year-over-year in November. The increase was the biggest since March 2007. The Fed watches the PCE price index for signs of inflation and its preferred range for this gauge is 1.0% to 2.0%.
The labor market also showed signs of weakening in 2007. Non-farm payrolls rose 1.3 million in 2007, compared with gains of 2.3 million in 2006. The unemployment rate rose from 4.7% in November to 5.0% in December 2007, the highest level since November 2005. And, the Reuters/University of Michigan final index of consumer confidence dropped to 75.5 in December, the lowest since October 2005. The gauge has averaged 88 since monthly data were first compiled in 1978.
Strategic Review and Market Outlook: Potential for further rate cuts
The leading positive relative contributors to performance came from stock selection in financials, industrials, and consumer staples. The largest detractors to performance came primarily from stock selection within the healthcare sector, followed closely by information technology and energy groups.
The U.S. Federal Reserve anticipates economic growth will be "somewhat more sluggish" than the 1.8% – 2.5% they had projected for 2008. And, Fed policy makers also expect core inflation to "trend down a bit over the next few years."
The Federal Reserve on January 22, 2008 took significant action between scheduled meetings by cutting rates 75 basis points to 3.50%. The Fed cited the weakening economic outlook and increasing downside risks to growth.
The Fed is scheduled to meet next on January 30 to discuss interest rates. Based on interest-rate futures on January 25, traders expect policy makers to further lower the target rate for overnight lending by 50 to 75 basis points.
In our opinion, U.S. housing markets may remain weak through the first half of 2008. Additionally, expectations for U.S. stock market volatility, as measured by the VIX Index, are for levels above historical averages. The pace of mergers and acquisitions by private equity firms isn't expected to reach the level seen in the first half of 2007, as the availability of debt financing has lessened significantly.
2
Credit Suisse Large Cap Blend Fund
Annual Investment Adviser's Report (continued)
December 31, 2007 (unaudited)
The Credit Suisse Quantitative Equities Group
Jordan Low
Eric Leng
Todd Jablonski
The value of investments generally will fluctuate in response to market movements.
In addition to historical information, this report contains forward-looking statements which may concern, among other things, domestic and foreign market, industry and economic trends and developments and government regulation and their potential impact on the Fund's investments. These statements are subject to risks and uncertainties and actual trends, developments and regulations in the future, and their impact on the Fund could be materially different from those projected, anticipated or implied. The Fund has no obligation to update or revise forward-looking statements.
3
Credit Suisse Large Cap Blend Fund
Annual Investment Adviser's Report (continued)
December 31, 2007 (unaudited)
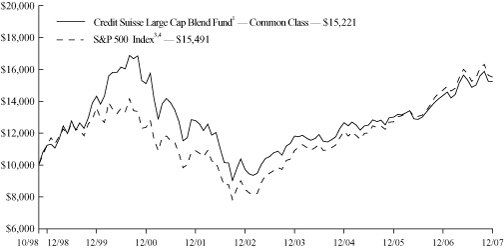
Comparison of Change in Value of $10,000 Investment in the
Credit Suisse Large Cap Blend Fund1 Common Class shares and the
S&P 500 Index3,4 from Inception (10/30/98).
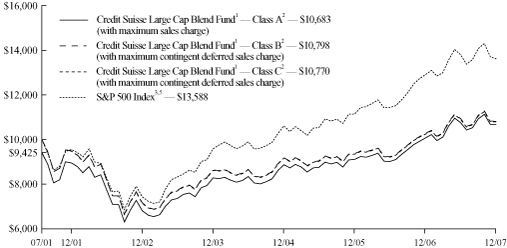
Comparison of Change in Value of $10,000 Investment in the
Credit Suisse Large Cap Blend Fund1 Class A shares2, Class B shares2, Class C shares2 and the S&P 500 Index3,5 from Inception (07/31/01).
4
Credit Suisse Large Cap Blend Fund
Annual Investment Adviser's Report (continued)
December 31, 2007 (unaudited)
Average Annual Returns as of December 31, 20071
| 1 Year | 5 Years | Since Inception | |||||||||||||
| Common Class | 6.15 | % | 9.38 | % | 4.69 | % | |||||||||
| Class A Without Sales Charge | 6.03 | % | 9.37 | % | 1.97 | % | |||||||||
| Class A With Maximum Sales Charge | (0.06 | )% | 8.08 | % | 1.03 | % | |||||||||
| Class B Without CDSC | 5.24 | % | 8.56 | % | 1.20 | % | |||||||||
| Class B With CDSC | 1.52 | % | 8.56 | % | 1.20 | % | |||||||||
| Class C Without CDSC | 5.26 | % | 8.56 | % | 1.16 | % | |||||||||
| Class C With CDSC | 4.33 | % | 8.56 | % | 1.16 | % | |||||||||
Returns represent past performance and include change in share price and reinvestment of dividends and capital gains. Past performance cannot guarantee future results. The current performance of the Fund may be lower or higher than the figures shown. Returns and share prices will fluctuate, and redemption value may be more or less than original cost. The performance results do not reflect the deduction of taxes that a shareholder would pay on fund distributions or the redemption of fund shares. Performance information current to the most recent month-end is available at www.credit-suisse.com/us.
1 Fee waivers and/or expense reimbursements may reduce expenses for the Fund, without which performance would be lower. Waivers and/or reimbursements may be discontinued at any time.
2 Total return for Class A shares for the reporting period, based on offering price (including maximum sales charge of 5.75%) was down 0.06%. Total return for Class B shares for the reporting period, based on redemption value (including contingent deferred sales charge of 4.00%), was 1.52%. Total return for Class C shares for the reporting period, based on redemption value (including contingent deferred sales charge of 1.00%), was 4.33%.
3 The Standard & Poor's 500 Index is an unmanaged index (with no defined investment objective) of common stocks, includes reinvestment of dividends, and is a registered trademark of The McGraw-Hill Companies, Inc. Investors cannot invest directly in an index.
4 Performance for the index is not available for the period October 30, 1998 (commencement of operations). For that reason, performance is shown for the period beginning November 1, 1998.
5 Performance for the index is not available for the period July 31, 2001 (commencement of operations). For that reason performance is shown for the period beginning August 1, 2001.
5
Credit Suisse Large Cap Blend Fund
Annual Investment Adviser's Report (continued)
December 31, 2007 (unaudited)
Information About Your Fund's Expenses
As an investor of the Fund, you incur two types of costs: ongoing expenses and transaction costs. Ongoing expenses include management fees, distribution and service (12b-1) fees and other Fund expenses. Examples of transaction costs include sales charges (loads), redemption fees and account maintenance fees, which are not shown in this section and which would result in higher total expenses. The following table is intended to help you understand your ongoing expenses of investing in the Fund and to help you compare these expenses with the ongoing expenses of investing in other mutual funds. The table is based on an investment of $1,000 made at the beginning of the six month period ended December 31, 2007.
The table illustrates your Fund's expenses in two ways:
• Actual Fund Return. This helps you estimate the actual dollar amount of ongoing expenses paid on a $1,000 investment in the Fund using the Fund's actual return during the period. To estimate the expenses you paid over the period, simply divide your account value by $1,000 (for example, an $8,600 account value divided by $1,000 = 8.6), then multiply the result by the number in the "Expenses Paid per $1,000" line under the share class you hold.
• Hypothetical 5% Fund Return. This helps you to compare your Fund's ongoing expenses with those of other mutual funds using the Fund's actual expense ratio and a hypothetical rate of return of 5% per year before expenses. Examples using a 5% hypothetical fund return may be found in the shareholder reports of other mutual funds. The hypothetical account values and expenses may not be used to estimate the actual ending account balance or expenses you paid for the period.
Please note that the expenses shown in these tables are meant to highlight your ongoing expenses only and do not reflect any transaction costs, such as sales charges (loads) or redemption fees. If these transaction costs had been included, your costs would have been higher. The "Expenses Paid per $1,000" line of the tables is useful in comparing ongoing expenses only and will not help you determine the relative total expenses of owning different funds.
6
Credit Suisse Large Cap Blend Fund
Annual Investment Adviser's Report (continued)
December 31, 2007 (unaudited)
Expenses and Value of a $1,000 Investment
for the six month period ended December 31, 2007
| Actual Fund Return | Common Class | Class A | Class B | Class C | |||||||||||||||
| Beginning Account Value 7/1/07 | $ | 1,000.00 | $ | 1,000.00 | $ | 1,000.00 | $ | 1,000.00 | |||||||||||
| Ending Account Value 12/31/07 | $ | 993.50 | $ | 992.80 | $ | 989.20 | $ | 989.10 | |||||||||||
| Expenses Paid per $1,000* | $ | 6.53 | $ | 6.53 | $ | 10.28 | $ | 10.28 | |||||||||||
| Hypothetical 5% Fund Return | |||||||||||||||||||
| Beginning Account Value 7/1/07 | $ | 1,000.00 | $ | 1,000.00 | $ | 1,000.00 | $ | 1,000.00 | |||||||||||
| Ending Account Value 12/31/07 | $ | 1,018.65 | $ | 1,018.65 | $ | 1,014.87 | $ | 1,014.87 | |||||||||||
| Expenses Paid per $1,000* | $ | 6.61 | $ | 6.61 | $ | 10.41 | $ | 10.41 | |||||||||||
| Common Class | Class A | Class B | Class C | ||||||||||||||||
| Annualized Expense Ratios* | 1.30 | % | 1.30 | % | 2.05 | % | 2.05 | % | |||||||||||
* Expenses are equal to the Fund's annualized expense ratio for each share class, multiplied by the average account value over the period, multiplied by the number of days in the most recent fiscal half year period, then divided by 365.
The "Expense Paid per $1,000" and the "Annualized Expense Ratios" in the tables are based on actual expenses paid by the Fund during the period, net of fee waivers and/or expense reimbursements. If those fee waivers and/or expense reimbursements had not been in effect, the Fund's actual expenses would have been higher.
For more information, please refer to the Fund's prospectus.
7
Credit Suisse Large Cap Blend Fund
Annual Investment Adviser's Report (continued)
December 31, 2007 (unaudited)
SECTOR BREAKDOWN*
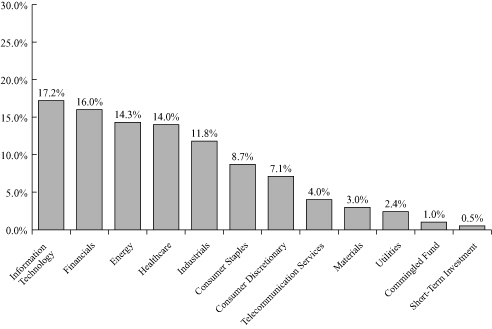
* Expressed as a percentage of total investments (excluding security lending collateral) and may vary over time.
8
Credit Suisse Large Cap Blend Fund
Schedule of Investments
December 31, 2007
| Number of Shares | Value | ||||||||||
| COMMON STOCKS (99.5%) | |||||||||||
| Aerospace & Defense (3.5%) | |||||||||||
| Boeing Co. | 6,300 | $ | 550,998 | ||||||||
| Lockheed Martin Corp. | 3,200 | 336,832 | |||||||||
| Northrop Grumman Corp. | 2,600 | 204,464 | |||||||||
| Raytheon Co. | 6,500 | 394,550 | |||||||||
| Rockwell Collins, Inc. | 4,400 | 316,668 | |||||||||
| United Technologies Corp. | 600 | 45,924 | |||||||||
| 1,849,436 | |||||||||||
| Air Freight & Couriers (0.6%) | |||||||||||
| FedEx Corp. | 3,300 | 294,261 | |||||||||
| United Parcel Service, Inc. Class B§ | 700 | 49,504 | |||||||||
| 343,765 | |||||||||||
| Auto Components (1.2%) | |||||||||||
| Autoliv, Inc.§ | 4,800 | 253,008 | |||||||||
| BorgWarner, Inc.§ | 600 | 29,046 | |||||||||
| Johnson Controls, Inc. | 9,600 | 345,984 | |||||||||
| 628,038 | |||||||||||
| Automobiles (0.3%) | |||||||||||
| Hertz Global Holdings, Inc.*§ | 1,500 | 23,835 | |||||||||
| Thor Industries, Inc.§ | 3,100 | 117,831 | |||||||||
| 141,666 | |||||||||||
| Banks (2.7%) | |||||||||||
| Bank of America Corp. | 12,301 | 507,539 | |||||||||
| Northern Trust Corp.§ | 4,500 | 344,610 | |||||||||
| Wachovia Corp.§ | 1,700 | 64,651 | |||||||||
| Wells Fargo & Co. | 16,900 | 510,211 | |||||||||
| 1,427,011 | |||||||||||
| Beverages (2.5%) | |||||||||||
| Coca-Cola Co. | 6,400 | 392,768 | |||||||||
| Pepsi Bottling Group, Inc.§ | 9,100 | 359,086 | |||||||||
| PepsiCo, Inc. | 7,400 | 561,660 | |||||||||
| 1,313,514 | |||||||||||
| Biotechnology (1.1%) | |||||||||||
| Amgen, Inc.*§ | 7,100 | 329,724 | |||||||||
| Celgene Corp.§ | 3,300 | 152,493 | |||||||||
| Genzyme Corp. | 1,100 | 81,884 | |||||||||
| 564,101 | |||||||||||
| Chemicals (1.4%) | |||||||||||
| Dow Chemical Co.§ | 7,500 | 295,650 | |||||||||
| Hercules, Inc. | 1,500 | 29,025 | |||||||||
| Monsanto Co. | 3,800 | 424,422 | |||||||||
| 749,097 | |||||||||||
See Accompanying Notes to Financial Statements.
9
Credit Suisse Large Cap Blend Fund
Schedule of Investments (continued)
December 31, 2007
| Number of Shares | Value | ||||||||||
| COMMON STOCKS | |||||||||||
| Commercial Services & Supplies (0.5%) | |||||||||||
| Robert Half International, Inc.§ | 1,400 | $ | 37,856 | ||||||||
| Steelcase, Inc. Class A§ | 16,200 | 257,094 | |||||||||
| 294,950 | |||||||||||
| Commingled Fund (1.0%) | |||||||||||
| SPDR Trust Series 1 | 3,600 | 526,356 | |||||||||
| Communications Equipment (2.2%) | |||||||||||
| Cisco Systems, Inc.* | 34,600 | 936,622 | |||||||||
| Juniper Networks, Inc.* | 800 | 26,560 | |||||||||
| QUALCOMM, Inc. | 6,000 | 236,100 | |||||||||
| 1,199,282 | |||||||||||
| Computers & Peripherals (5.1%) | |||||||||||
| Apple Computer, Inc.* | 3,800 | 752,704 | |||||||||
| Dell, Inc.* | 9,300 | 227,943 | |||||||||
| Hewlett-Packard Co. | 12,500 | 631,000 | |||||||||
| International Business Machines Corp. | 3,200 | 345,920 | |||||||||
| Network Appliance, Inc.* | 9,300 | 232,128 | |||||||||
| NVIDIA Corp.* | 7,400 | 251,748 | |||||||||
| Seagate Technology§ | 5,600 | 142,800 | |||||||||
| Western Digital Corp.* | 4,100 | 123,861 | |||||||||
| 2,708,104 | |||||||||||
| Diversified Financials (7.4%) | |||||||||||
| American Express Co. | 500 | 26,010 | |||||||||
| Charles Schwab Corp. | 15,300 | 390,915 | |||||||||
| Citigroup, Inc. | 15,400 | 453,376 | |||||||||
| Federated Investors, Inc. Class B§ | 7,100 | 292,236 | |||||||||
| First Marblehead Corp.§ | 2,800 | 42,840 | |||||||||
| Franklin Resources, Inc. | 3,000 | 343,290 | |||||||||
| Goldman Sachs Group, Inc.§ | 2,100 | 451,605 | |||||||||
| JPMorgan Chase & Co. | 17,700 | 772,605 | |||||||||
| Morgan Stanley§ | 9,500 | 504,545 | |||||||||
| Nymex Holdings, Inc.§ | 1,700 | 227,137 | |||||||||
| State Street Corp.§ | 5,100 | 414,120 | |||||||||
| 3,918,679 | |||||||||||
| Diversified Telecommunication Services (4.0%) | |||||||||||
| AT&T, Inc. | 32,122 | 1,334,990 | |||||||||
| Verizon Communications, Inc. | 18,300 | 799,527 | |||||||||
| 2,134,517 | |||||||||||
| Electric Utilities (2.4%) | |||||||||||
| Constellation Energy Group | 2,300 | 235,819 | |||||||||
| DTE Energy Co.§ | 5,400 | 237,384 | |||||||||
| Edison International§ | 4,100 | 218,817 | |||||||||
| FirstEnergy Corp. | 4,900 | 354,466 | |||||||||
| Public Service Enterprise Group, Inc.* | 2,500 | 245,600 | |||||||||
| 1,292,086 | |||||||||||
See Accompanying Notes to Financial Statements.
10
Credit Suisse Large Cap Blend Fund
Schedule of Investments (continued)
December 31, 2007
| Number of Shares | Value | ||||||||||
| COMMON STOCKS | |||||||||||
| Electrical Equipment (0.6%) | |||||||||||
| Rockwell Automation, Inc.§ | 4,500 | $ | 310,320 | ||||||||
| Electronic Equipment & Instruments (0.3%) | |||||||||||
| Avnet, Inc.*§ | 3,300 | 115,401 | |||||||||
| Waters Corp.* | 700 | 55,349 | |||||||||
| 170,750 | |||||||||||
| Energy Equipment & Services (1.8%) | |||||||||||
| ENSCO International, Inc.§ | 6,400 | 381,568 | |||||||||
| Halliburton Co. | 700 | 26,537 | |||||||||
| National-Oilwell Varco, Inc.* | 2,100 | 154,266 | |||||||||
| Noble Corp.§ | 3,000 | 169,530 | |||||||||
| Schlumberger, Ltd. | 2,200 | 216,414 | |||||||||
| 948,315 | |||||||||||
| Food & Drug Retailing (1.4%) | |||||||||||
| Kroger Co. | 13,400 | 357,914 | |||||||||
| Safeway, Inc.§ | 9,500 | 324,995 | |||||||||
| Sysco Corp. | 1,600 | 49,936 | |||||||||
| 732,845 | |||||||||||
| Food Products (0.2%) | |||||||||||
| Kellogg Co. | 2,300 | 120,589 | |||||||||
| Healthcare Equipment & Supplies (1.3%) | |||||||||||
| Baxter International, Inc. | 4,500 | 261,225 | |||||||||
| Kinetic Concepts, Inc.*§ | 4,400 | 235,664 | |||||||||
| Medtronic, Inc. | 3,600 | 180,972 | |||||||||
| 677,861 | |||||||||||
| Healthcare Providers & Services (3.5%) | |||||||||||
| Aetna, Inc. | 7,200 | 415,656 | |||||||||
| Coventry Health Care, Inc.*§ | 5,300 | 314,025 | |||||||||
| Humana, Inc.* | 4,200 | 316,302 | |||||||||
| McKesson Corp. | 3,700 | 242,387 | |||||||||
| UnitedHealth Group, Inc. | 10,400 | 605,280 | |||||||||
| 1,893,650 | |||||||||||
| Hotels, Restaurants & Leisure (0.1%) | |||||||||||
| Darden Restaurants, Inc.§ | 700 | 19,397 | |||||||||
| McDonald's Corp. | 400 | 23,564 | |||||||||
| 42,961 | |||||||||||
| Household Durables (0.7%) | |||||||||||
| American Greetings Corp. Class A§ | 6,100 | 123,830 | |||||||||
| Whirlpool Corp.§ | 3,300 | 269,379 | |||||||||
| 393,209 | |||||||||||
| Household Products (2.5%) | |||||||||||
| Clorox Co.§ | 5,600 | 364,952 | |||||||||
| Procter & Gamble Co. | 12,900 | 947,118 | |||||||||
| 1,312,070 | |||||||||||
See Accompanying Notes to Financial Statements.
11
Credit Suisse Large Cap Blend Fund
Schedule of Investments (continued)
December 31, 2007
| Number of Shares | Value | ||||||||||
| COMMON STOCKS | |||||||||||
| Industrial Conglomerates (4.1%) | |||||||||||
| 3M Co. | 4,300 | $ | 362,576 | ||||||||
| General Electric Co. | 34,900 | 1,293,743 | |||||||||
| Honeywell International, Inc. | 2,700 | 166,239 | |||||||||
| Tyco International, Ltd. | 9,000 | 356,850 | |||||||||
| 2,179,408 | |||||||||||
| Insurance (5.9%) | |||||||||||
| ACE, Ltd.§ | 4,400 | 271,832 | |||||||||
| Aflac, Inc. | 2,000 | 125,260 | |||||||||
| Allstate Corp. | 1,800 | 94,014 | |||||||||
| American International Group, Inc. | 11,800 | 687,940 | |||||||||
| Aon Corp. | 7,900 | 376,751 | |||||||||
| Assurant, Inc.§ | 4,500 | 301,050 | |||||||||
| Loews Corp. | 7,200 | 362,448 | |||||||||
| Prudential Financial, Inc. | 4,900 | 455,896 | |||||||||
| Torchmark Corp.§ | 3,300 | 199,749 | |||||||||
| Unum Group | 1,100 | 26,169 | |||||||||
| XL Capital, Ltd. Class A§ | 5,300 | 266,643 | |||||||||
| 3,167,752 | |||||||||||
| Internet & Catalog Retail (0.0%) | |||||||||||
| Amazon.com, Inc.*§ | 200 | 18,528 | |||||||||
| Internet Software & Services (1.6%) | |||||||||||
| eBay, Inc.* | 800 | 26,552 | |||||||||
| Google, Inc. Class A* | 1,000 | 691,480 | |||||||||
| IAC/InterActiveCorp*§ | 6,000 | 161,520 | |||||||||
| 879,552 | |||||||||||
| IT Consulting & Services (0.5%) | |||||||||||
| Accenture, Ltd. Class A§ | 7,400 | 266,622 | |||||||||
| Leisure Equipment & Products (0.5%) | |||||||||||
| Mattel, Inc.§ | 14,800 | 281,792 | |||||||||
| Machinery (1.7%) | |||||||||||
| Caterpillar, Inc.§ | 6,300 | 457,128 | |||||||||
| Cummins, Inc. | 2,700 | 343,899 | |||||||||
| Eaton Corp. | 400 | 38,780 | |||||||||
| Manitowoc Company, Inc.§ | 1,000 | 48,830 | |||||||||
| 888,637 | |||||||||||
| Media (2.3%) | |||||||||||
| Comcast Corp. Class A§ | 1,600 | 29,216 | |||||||||
| DIRECTV Group, Inc.* | 11,400 | 263,568 | |||||||||
| News Corp. Class A | 10,400 | 213,096 | |||||||||
| Regal Entertainment Group Class A§ | 11,600 | 209,612 | |||||||||
| Time Warner, Inc. | 1,500 | 24,765 | |||||||||
| Walt Disney Co.§ | 14,800 | 477,744 | |||||||||
| 1,218,001 | |||||||||||
See Accompanying Notes to Financial Statements.
12
Credit Suisse Large Cap Blend Fund
Schedule of Investments (continued)
December 31, 2007
| Number of Shares | Value | ||||||||||
| COMMON STOCKS | |||||||||||
| Metals & Mining (1.2%) | |||||||||||
| Freeport-McMoRan Copper & Gold, Inc. | 4,176 | $ | 427,789 | ||||||||
| Nucor Corp.§ | 3,200 | 189,504 | |||||||||
| 617,293 | |||||||||||
| Multiline Retail (1.0%) | |||||||||||
| Big Lots, Inc.*§ | 2,600 | 41,574 | |||||||||
| Family Dollar Stores, Inc.§ | 9,800 | 188,454 | |||||||||
| Wal-Mart Stores, Inc.§ | 6,300 | 299,439 | |||||||||
| 529,467 | |||||||||||
| Oil & Gas (12.6%) | |||||||||||
| Apache Corp. | 2,100 | 225,834 | |||||||||
| Chevron Corp. | 11,900 | 1,110,627 | |||||||||
| ConocoPhillips | 8,600 | 759,380 | |||||||||
| Devon Energy Corp. | 1,600 | 142,256 | |||||||||
| Exxon Mobil Corp. | 26,000 | 2,435,940 | |||||||||
| Marathon Oil Corp.§ | 7,500 | 456,450 | |||||||||
| Murphy Oil Corp.§ | 2,900 | 246,036 | |||||||||
| Occidental Petroleum Corp. | 7,200 | 554,328 | |||||||||
| Transocean, Inc.* | 3,299 | 472,252 | |||||||||
| Valero Energy Corp. | 4,200 | 294,126 | |||||||||
| 6,697,229 | |||||||||||
| Paper & Forest Products (0.4%) | |||||||||||
| International Paper Co.§ | 7,100 | 229,898 | |||||||||
| Pharmaceuticals (8.1%) | |||||||||||
| Abbott Laboratories | 1,700 | 95,455 | |||||||||
| Bristol-Myers Squibb Co. | 19,000 | 503,880 | |||||||||
| Eli Lilly and Co. | 2,700 | 144,153 | |||||||||
| Forest Laboratories, Inc.* | 4,900 | 178,605 | |||||||||
| Johnson & Johnson | 16,700 | 1,113,890 | |||||||||
| Merck & Company, Inc. | 8,000 | 464,880 | |||||||||
| Pfizer, Inc. | 41,300 | 938,749 | |||||||||
| Schering-Plough Corp. | 16,000 | 426,240 | |||||||||
| Sepracor, Inc.*§ | 10,400 | 273,000 | |||||||||
| Watson Pharmaceuticals, Inc.*§ | 7,300 | 198,122 | |||||||||
| 4,336,974 | |||||||||||
| Road & Rail (0.8%) | |||||||||||
| Union Pacific Corp. | 3,300 | 414,546 | |||||||||
| Semiconductor Equipment & Products (3.1%) | |||||||||||
| Analog Devices, Inc. | 900 | 28,530 | |||||||||
| Intel Corp. | 35,600 | 949,096 | |||||||||
| MEMC Electronic Materials, Inc.* | 2,200 | 194,678 | |||||||||
| Texas Instruments, Inc. | 14,300 | 477,620 | |||||||||
| 1,649,924 | |||||||||||
See Accompanying Notes to Financial Statements.
13
Credit Suisse Large Cap Blend Fund
Schedule of Investments (continued)
December 31, 2007
| Number of Shares | Value | ||||||||||
| COMMON STOCKS | |||||||||||
| Software (4.3%) | |||||||||||
| Autodesk, Inc.* | 5,300 | $ | 263,728 | ||||||||
| Microsoft Corp. | 41,100 | 1,463,160 | |||||||||
| Oracle Corp.* | 25,800 | 582,564 | |||||||||
| 2,309,452 | |||||||||||
| Specialty Retail (0.6%) | |||||||||||
| Bare Escentuals, Inc.*§ | 1,500 | 36,375 | |||||||||
| Best Buy Company, Inc.§ | 1,500 | 78,975 | |||||||||
| RadioShack Corp.§ | 11,000 | 185,460 | |||||||||
| Tiffany & Co.§ | 500 | 23,016 | |||||||||
| 323,826 | |||||||||||
| Textiles & Apparel (0.3%) | |||||||||||
| Nike, Inc. Class B§ | 2,700 | 173,448 | |||||||||
| Tobacco (2.2%) | |||||||||||
| Altria Group, Inc. | 7,700 | 581,966 | |||||||||
| Loews Corp. Carolina Group§ | 3,300 | 281,490 | |||||||||
| UST, Inc.§ | 5,400 | 295,920 | |||||||||
| 1,159,376 | |||||||||||
| TOTAL COMMON STOCKS (Cost $46,902,611) | 53,034,897 | ||||||||||
| SHORT-TERM INVESTMENTS (20.8%) | |||||||||||
| State Street Navigator Prime Portfolio§§ | 10,795,683 | 10,795,683 | |||||||||
| Par (000) | |||||||||||
| State Street Bank and Trust Co. Euro Time Deposit, 3.100%, 1/02/08 | $ | 279 | 279,000 | ||||||||
| TOTAL SHORT-TERM INVESTMENTS (Cost $11,074,683) | 11,074,683 | ||||||||||
| TOTAL INVESTMENTS AT VALUE (120.3%) (Cost $57,977,294) | 64,109,580 | ||||||||||
| LIABILITIES IN EXCESS OF OTHER ASSETS (-20.3%) | (10,833,084 | ) | |||||||||
| NET ASSETS (100.0%) | $ | 53,276,496 | |||||||||
* Non-income producing security.
§ Security or portion thereof is out on loan.
§§ Represents security purchased with cash collateral received for securities on loan.
See Accompanying Notes to Financial Statements.
14
Credit Suisse Large Cap Blend Fund
Statement of Assets and Liabilities
December 31, 2007
| Assets | |||||||
| Investments at value, including collateral for securities on loan of $10,795,683 (Cost $57,977,294) (Note 2) | $ | 64,109,5801 | |||||
| Cash | 581 | ||||||
| Dividend and interest receivable | 93,755 | ||||||
| Receivable for fund shares sold | 125 | ||||||
| Prepaid expenses and other assets | 34,122 | ||||||
| Total Assets | 64,238,163 | ||||||
| Liabilities | |||||||
| Advisory fee payable (Note 3) | 13,409 | ||||||
| Administrative services fee payable (Note 3) | 5,462 | ||||||
| Distribution fee payable (Note 3) | 13,910 | ||||||
| Payable upon return of securities loaned (Note 2) | 10,795,683 | ||||||
| Payable for fund shares redeemed | 78,076 | ||||||
| Directors' fee payable | 800 | ||||||
| Other accrued expenses payable | 54,327 | ||||||
| Total Liabilities | 10,961,667 | ||||||
| Net Assets | |||||||
| Capital stock, $0.001 par value (Note 6) | 4,450 | ||||||
| Paid-in capital (Note 6) | 48,556,128 | ||||||
| Undistributed net investment income | 30,260 | ||||||
| Accumulated net realized loss on investments | (1,446,628 | ) | |||||
| Net unrealized appreciation from investments | 6,132,286 | ||||||
| Net Assets | $ | 53,276,496 | |||||
| Common Shares | |||||||
| Net assets | $ | 1,882,919 | |||||
| Shares outstanding | 157,632 | ||||||
| Net asset value, offering price, and redemption price per share | $ | 11.95 | |||||
| A Shares | |||||||
| Net assets | $ | 47,691,165 | |||||
| Shares outstanding | 3,969,844 | ||||||
| Net asset value and redemption price per share | $ | 12.01 | |||||
| Maximum offering price per share (net asset value/ (1-5.75%)) | $ | 12.74 | |||||
| B Shares | |||||||
| Net assets | $ | 3,086,651 | |||||
| Shares outstanding | 268,609 | ||||||
| Net asset value and offering price per share | $ | 11.49 | |||||
| C Shares | |||||||
| Net assets | $ | 615,761 | |||||
| Shares outstanding | 53,761 | ||||||
| Net asset value and offering price per share | $ | 11.45 | |||||
1 Including $10,553,605 of securities on loan.
See Accompanying Notes to Financial Statements.
15
Credit Suisse Large Cap Blend Fund
Statement of Operations
For the Year Ended December 31, 2007
| Investment Income (Note 2) | |||||||
| Dividends | $ | 1,029,988 | |||||
| Interest | 13,668 | ||||||
| Securities lending | 18,319 | ||||||
| Total investment income | 1,061,975 | ||||||
| Expenses | |||||||
| Investment advisory fees (Note 3) | 285,659 | ||||||
| Administrative services fees (Note 3) | 76,695 | ||||||
| Distribution fees (Note 3) | |||||||
| Common Class | 4,844 | ||||||
| Class A | 126,106 | ||||||
| Class B | 40,118 | ||||||
| Class C | 7,399 | ||||||
| Transfer agent fees (Note 3) | 91,797 | ||||||
| Registration fees | 52,688 | ||||||
| Printing fees (Note 3) | 33,741 | ||||||
| Legal fees | 23,923 | ||||||
| Audit and tax fees | 21,499 | ||||||
| Directors' fees | 21,298 | ||||||
| Custodian fees | 13,099 | ||||||
| Insurance expense | 2,594 | ||||||
| Commitment fees (Note 4) | 1,439 | ||||||
| Miscellaneous expense | 1,357 | ||||||
| Total expenses | 804,256 | ||||||
| Less: fees waived (Note 3) | (37,620 | ) | |||||
| Net expenses | 766,636 | ||||||
| Net investment income | 295,339 | ||||||
| Net Realized and Unrealized Gain from Investments | |||||||
| Net realized gain from investments | 2,416,403 | ||||||
| Net change in unrealized appreciation (depreciation) from investments | 735,659 | ||||||
| Net realized and unrealized gain from investments | 3,152,062 | ||||||
| Net increase in net assets resulting from operations | $ | 3,447,401 | |||||
See Accompanying Notes to Financial Statements.
16
Credit Suisse Large Cap Blend Fund
Statements of Changes in Net Assets
| For the Year Ended December 31, 2007 | For the Year Ended December 31, 2006 | ||||||||||
| From Operations | |||||||||||
| Net investment income | $ | 295,339 | $ | 196,730 | |||||||
| Net realized gain from investments | 2,416,403 | 7,902,930 | |||||||||
| Net change in unrealized appreciation (depreciation) from investments | 735,659 | (2,069,864 | ) | ||||||||
| Net increase in net assets resulting from operations | 3,447,401 | 6,029,796 | |||||||||
| From Dividends and Distributions | |||||||||||
| Dividends from net investment income | |||||||||||
| Common Class shares | (10,166 | ) | (12,718 | ) | |||||||
| Class A shares | (256,321 | ) | (171,613 | ) | |||||||
| Class B shares | (9,098 | ) | — | ||||||||
| Class C shares | (1,822 | ) | — | ||||||||
| Distributions from net realized gains | |||||||||||
| Common Class shares | (204,111 | ) | (118,301 | ) | |||||||
| Class A shares | (5,441,818 | ) | (2,784,526 | ) | |||||||
| Class B shares | (404,278 | ) | (286,047 | ) | |||||||
| Class C shares | (77,674 | ) | (47,762 | ) | |||||||
| Net decrease in net assets resulting from dividends and distributions | (6,405,288 | ) | (3,420,967 | ) | |||||||
| From Capital Share Transactions (Note 6) | |||||||||||
| Proceeds from sale of shares | 1,416,971 | 1,730,284 | |||||||||
| Reinvestment of dividends and distributions | 5,517,132 | 2,949,178 | |||||||||
| Net asset value of shares redeemed | (10,255,828 | ) | (17,192,669 | ) | |||||||
| Net decrease in net assets from capital share transactions | (3,321,725 | ) | (12,513,207 | ) | |||||||
| Net decrease in net assets | (6,279,612 | ) | (9,904,378 | ) | |||||||
| Net Assets | |||||||||||
| Beginning of year | 59,556,108 | 69,460,486 | |||||||||
| End of year | $ | 53,276,496 | $ | 59,556,108 | |||||||
| Undistributed net investment income | $ | 30,260 | $ | 12,399 | |||||||
See Accompanying Notes to Financial Statements.
17
Credit Suisse Large Cap Blend Fund
Financial Highlights
(For a Common Class Share of the Fund Outstanding Throughout Each Period)
| For the Year Ended December 31, | For the Period September 1, 2004 to December 31, | For the Year Ended August 31, | |||||||||||||||||||||||||
| 2007 | 2006 | 2005 | 20041 | 2004 | 2003 | ||||||||||||||||||||||
| Per share data | |||||||||||||||||||||||||||
| Net asset value, beginning of period | $ | 12.71 | $ | 12.23 | $ | 12.45 | $ | 12.01 | $ | 11.42 | $ | 10.66 | |||||||||||||||
| INVESTMENT OPERATIONS | |||||||||||||||||||||||||||
| Net investment income | 0.082 | 0.052 | 0.042 | 0.052 | 0.032 | 0.01 | |||||||||||||||||||||
| Net gain on investments (both realized and unrealized) | 0.68 | 1.22 | 0.30 | 1.21 | 0.57 | 0.76 | |||||||||||||||||||||
| Total from investment operations | 0.76 | 1.27 | 0.34 | 1.26 | 0.60 | 0.77 | |||||||||||||||||||||
| LESS DIVIDENDS AND DISTRIBUTIONS | |||||||||||||||||||||||||||
| Dividends from net investment income | (0.06 | ) | (0.07 | ) | (0.07 | ) | (0.01 | ) | (0.01 | ) | (0.01 | ) | |||||||||||||||
| Distributions from net realized gains | (1.46 | ) | (0.72 | ) | (0.49 | ) | (0.81 | ) | — | — | |||||||||||||||||
| Total dividends and distributions | (1.52 | ) | (0.79 | ) | (0.56 | ) | (0.82 | ) | (0.01 | ) | (0.01 | ) | |||||||||||||||
| Net asset value, end of period | $ | 11.95 | $ | 12.71 | $ | 12.23 | $ | 12.45 | $ | 12.01 | $ | 11.42 | |||||||||||||||
| Total return3 | 6.15 | % | 10.44 | % | 2.70 | % | 10.70 | % | 5.25 | % | 7.26 | % | |||||||||||||||
| RATIOS AND SUPPLEMENTAL DATA | |||||||||||||||||||||||||||
| Net assets, end of period (000s omitted) | $ | 1,883 | $ | 2,202 | $ | 2,809 | $ | 3,471 | $ | 4,383 | $ | 5,653 | �� | ||||||||||||||
| Ratio of expenses to average net assets | 1.28 | % | 1.30 | % | 1.30 | % | 1.30 | %4 | 1.30 | % | 1.25 | % | |||||||||||||||
| Ratio of net investment income to average net assets | 0.58 | % | 0.40 | % | 0.32 | % | 1.37 | %4 | 0.23 | % | 0.17 | % | |||||||||||||||
| Decrease reflected in above operating expense ratios due to waivers/reimbursements | 0.07 | % | 0.26 | % | 0.26 | % | 0.32 | %4 | 0.40 | % | 2.87 | % | |||||||||||||||
| Portfolio turnover rate | 114 | % | 106 | % | 101 | % | 34 | % | 168 | % | 155 | % | |||||||||||||||
1 The Fund changed its fiscal year end from August 31 to December 31.
2 Per share information is calculated using the average shares outstanding method.
3 Total returns are historical and assume changes in share price and reinvestment of all dividends and distributions. Had certain expenses not been reduced during the periods shown, total returns would have been lower. Total returns for periods less than one year are not annualized.
4 Annualized.
See Accompanying Notes to Financial Statements.
18
Credit Suisse Large Cap Blend Fund
Financial Highlights
(For a Class A Share of the Fund Outstanding Throughout Each Period)
| For the Year Ended December 31, | For the Period September 1, 2004 to December 31, | For the Year Ended August 31, | |||||||||||||||||||||||||
| 2007 | 2006 | 2005 | 20041 | 2004 | 2003 | ||||||||||||||||||||||
| Per share data | |||||||||||||||||||||||||||
| Net asset value, beginning of period | $ | 12.78 | $ | 12.26 | $ | 12.48 | $ | 12.04 | $ | 11.44 | $ | 10.67 | |||||||||||||||
| INVESTMENT OPERATIONS | |||||||||||||||||||||||||||
| Net investment income | 0.082 | 0.052 | 0.042 | 0.062 | 0.042 | 0.01 | |||||||||||||||||||||
| Net gain on investments (both realized and unrealized) | 0.67 | 1.23 | 0.30 | 1.20 | 0.57 | 0.77 | |||||||||||||||||||||
| Total from investment operations | 0.75 | 1.28 | 0.34 | 1.26 | 0.61 | 0.78 | |||||||||||||||||||||
| LESS DIVIDENDS AND DISTRIBUTIONS | |||||||||||||||||||||||||||
| Dividends from net investment income | (0.06 | ) | (0.04 | ) | (0.07 | ) | (0.01 | ) | (0.01 | ) | (0.01 | ) | |||||||||||||||
| Distributions from net realized gains | (1.46 | ) | (0.72 | ) | (0.49 | ) | (0.81 | ) | — | — | |||||||||||||||||
| Total dividends and distributions | (1.52 | ) | (0.76 | ) | (0.56 | ) | (0.82 | ) | (0.01 | ) | (0.01 | ) | |||||||||||||||
| Net asset value, end of period | $ | 12.01 | $ | 12.78 | $ | 12.26 | $ | 12.48 | $ | 12.04 | $ | 11.44 | |||||||||||||||
| Total return3 | 6.03 | % | 10.48 | % | 2.69 | % | 10.67 | % | 5.33 | % | 7.28 | % | |||||||||||||||
| RATIOS AND SUPPLEMENTAL DATA | |||||||||||||||||||||||||||
| Net assets, end of period (000s omitted) | $ | 47,691 | $ | 51,493 | $ | 57,200 | $ | 63,160 | $ | 61,089 | $ | 1,778 | |||||||||||||||
| Ratio of expenses to average net assets | 1.28 | % | 1.30 | % | 1.30 | % | 1.30 | %4 | 1.30 | % | 1.25 | % | |||||||||||||||
| Ratio of net investment income to average net assets | 0.58 | % | 0.40 | % | 0.32 | % | 1.37 | %4 | 0.32 | % | 0.22 | % | |||||||||||||||
| Decrease reflected in above operating expense ratios due to waivers/reimbursements | 0.07 | % | 0.26 | % | 0.26 | % | 0.32 | %4 | 0.39 | % | 2.90 | % | |||||||||||||||
| Portfolio turnover rate | 114 | % | 106 | % | 101 | % | 34 | % | 168 | % | 155 | % | |||||||||||||||
1 The Fund has changed its fiscal year from August 31 to December 31.
2 Per share information is calculated using the average shares outstanding method.
3 Total returns are historical and assume changes in share price, reinvestment of all dividends and distributions and no sales charge. Had certain expenses not been reduced during the periods shown, total returns would have been lower. Total returns for periods less than one year are not annualized.
4 Annualized.
See Accompanying Notes to Financial Statements.
19
Credit Suisse Large Cap Blend Fund
Financial Highlights
(For a Class B Share of the Fund Outstanding Throughout Each Period)
| For the Year Ended December 31, | For the Period September 1, 2004 to December 31, | For the Year Ended August 31, | |||||||||||||||||||||||||
| 2007 | 2006 | 2005 | 20041 | 2004 | 2003 | ||||||||||||||||||||||
| Per share data | |||||||||||||||||||||||||||
| Net asset value, beginning of period | $ | 12.35 | $ | 11.92 | $ | 12.18 | $ | 11.78 | $ | 11.27 | $ | 10.59 | |||||||||||||||
| INVESTMENT OPERATIONS | |||||||||||||||||||||||||||
| Net investment income (loss) | (0.02 | )2 | (0.04 | )2 | (0.05 | )2 | 0.022 | (0.05 | )2 | (0.06 | )2 | ||||||||||||||||
| Net gain on investments (both realized and unrealized) | 0.65 | 1.19 | 0.29 | 1.19 | 0.56 | 0.74 | |||||||||||||||||||||
| Total from investment operations | 0.63 | 1.15 | 0.24 | 1.21 | 0.51 | 0.68 | |||||||||||||||||||||
| LESS DIVIDENDS AND DISTRIBUTIONS | |||||||||||||||||||||||||||
| Dividends from net investment income | (0.03 | ) | — | (0.01 | ) | — | — | — | |||||||||||||||||||
| Distributions from net realized gains | (1.46 | ) | (0.72 | ) | (0.49 | ) | (0.81 | ) | — | — | |||||||||||||||||
| Total dividends and distributions | (1.49 | ) | (0.72 | ) | (0.50 | ) | (0.81 | ) | — | — | |||||||||||||||||
| Net asset value, end of period | $ | 11.49 | $ | 12.35 | $ | 11.92 | $ | 12.18 | $ | 11.78 | $ | 11.27 | |||||||||||||||
| Total return3 | 5.24 | % | 9.67 | % | 1.91 | % | 10.44 | % | 4.53 | % | 6.42 | % | |||||||||||||||
| RATIOS AND SUPPLEMENTAL DATA | |||||||||||||||||||||||||||
| Net assets, end of period (000s omitted) | $ | 3,087 | $ | 5,010 | $ | 8,342 | $ | 13,714 | $ | 14,745 | $ | 1,109 | |||||||||||||||
| Ratio of expenses to average net assets | 2.03 | % | 2.05 | % | 2.05 | % | 2.05 | %4 | 2.05 | % | 2.00 | % | |||||||||||||||
| Ratio of net investment income (loss) to average net assets. | (0.19 | )% | (0.35 | )% | (0.44 | )% | 0.62 | %4 | (0.45 | )% | (0.55 | )% | |||||||||||||||
| Decrease reflected in above operating expense ratios due to waivers/reimbursements | 0.06 | % | 0.26 | % | 0.26 | % | 0.32 | %4 | 0.39 | % | 2.90 | % | |||||||||||||||
| Portfolio turnover rate | 114 | % | 106 | % | 101 | % | 34 | % | 168 | % | 155 | % | |||||||||||||||
1 The Fund changed its fiscal year end from August 31 to December 31.
2 Per share information is calculated using the average shares outstanding method.
3 Total returns are historical and assume changes in share price, reinvestment of all dividends and distributions and no sales charge. Had certain expenses not been reduced during the periods shown, total returns would have been lower. Total returns for periods less than one year are not annualized.
4 Annualized.
See Accompanying Notes to Financial Statements.
20
Credit Suisse Large Cap Blend Fund
Financial Highlights
(For a Class C Share of the Fund Outstanding Throughout Each Period)
| For the Year Ended December 31, | For the Period September 1, 2004 to December 31, | For the Year Ended August 31, | |||||||||||||||||||||||||
| 2007 | 2006 | 2005 | 20041 | 2004 | 2003 | ||||||||||||||||||||||
| Per share data | |||||||||||||||||||||||||||
| Net asset value, beginning of period | $ | 12.31 | $ | 11.89 | $ | 12.15 | $ | 11.75 | $ | 11.24 | $ | 10.56 | |||||||||||||||
| INVESTMENT OPERATIONS | |||||||||||||||||||||||||||
| Net investment income (loss) | (0.02 | )2 | (0.04 | )2 | (0.05 | )2 | 0.032 | (0.06 | )2 | (0.06 | )2 | ||||||||||||||||
| Net gain on investments (both realized and unrealized) | 0.65 | 1.18 | 0.29 | 1.18 | 0.57 | 0.74 | |||||||||||||||||||||
| Total from investment operations | 0.63 | 1.14 | 0.24 | 1.21 | 0.51 | 0.68 | |||||||||||||||||||||
| LESS DIVIDENDS AND DSITRIBUTIONS | |||||||||||||||||||||||||||
| Dividends from net investment income | (0.03 | ) | — | (0.01 | ) | — | — | — | |||||||||||||||||||
| Distributions from net realized gains | (1.46 | ) | (0.72 | ) | (0.49 | ) | (0.81 | ) | — | — | |||||||||||||||||
| Total dividends and distributions | (1.49 | ) | (0.72 | ) | (0.50 | ) | (0.81 | ) | — | — | |||||||||||||||||
| Net asset value, end of period | $ | 11.45 | $ | 12.31 | $ | 11.89 | $ | 12.15 | $ | 11.75 | $ | 11.24 | |||||||||||||||
| Total return3 | 5.26 | % | 9.61 | % | 1.91 | % | 10.47 | % | 4.54 | % | 6.44 | % | |||||||||||||||
| RATIOS AND SUPPLEMENTAL DATA | |||||||||||||||||||||||||||
| Net assets, end of period (000s omitted) | $ | 616 | $ | 851 | $ | 1,109 | $ | 1,864 | $ | 2,156 | $ | 441 | |||||||||||||||
| Ratio of expenses to average net assets | 2.03 | % | 2.05 | % | 2.05 | % | 2.05 | %4 | 2.05 | % | 2.00 | % | |||||||||||||||
| Ratio of net investment income (loss) to average net assets | (0.18 | )% | (0.35 | )% | (0.44 | )% | 0.62 | %4 | (0.47 | )% | (0.55 | )% | |||||||||||||||
| Decrease reflected in above operating expense ratios due to waivers/reimbursements | 0.06 | % | 0.26 | % | 0.26 | % | 0.32 | %4 | 0.39 | % | 2.90 | % | |||||||||||||||
| Portfolio turnover rate | 114 | % | 106 | % | 101 | % | 34 | % | 168 | % | 155 | % | |||||||||||||||
1 The Fund changed its fiscal year end from August 31 to December 31.
2 Per share information is calculated using the average shares outstanding method.
3 Total returns are historical and assume changes in share price, reinvestment of all dividends and distributions and no sales charge. Had certain expenses not been reduced during the periods shown, total returns would have been lower. Total returns for periods less than one year are not annualized.
4 Annualized.
See Accompanying Notes to Financial Statements.
21
Credit Suisse Large Cap Blend Fund
Notes to Financial Statements
December 31, 2007
Note 1. Organization
Credit Suisse Large Cap Blend Fund, Inc. (the "Fund") is registered under the Investment Company Act of 1940, as amended (the "1940 Act"), as a diversified, open-end management investment company. The Fund's investment objective is long-term capital appreciation. The Fund was incorporated under the laws of the State of Maryland on July 31, 1998.
The Fund is authorized to offer six classes of shares: Common Class shares, Advisor Class shares, Institutional Class shares, Class A shares, Class B shares and Class C shares. The Fund currently offers Common Class shares, Class A shares, Class B shares and Class C shares. The Fund's Common Class shares are closed to new investors, with certain exceptions as set forth in the prospectus. Each class of shares represents an equal pro rata interest in the Fund, except that they bear different expenses which reflect the differences in the range of services provided to them. Effective October 24, 2002, Institutional Class shares ceased operations. Class A shares are sold subject to a front-end sales charge of up to 5.75%. Class B shares are sold subject to a contingent deferred sales charge which declines from 4.00% to zero depending on the period of time the shares are held. Class C shares are sold subject to a contingent deferred sales charge o f 1.00% if redeemed within the first year of purchase.
Note 2. Significant Accounting Policies
A) SECURITY VALUATION — The net asset value of the Fund is determined daily as of the close of regular trading on the New York Stock Exchange, Inc. (the "Exchange") on each day the Exchange is open for business. Equity investments are valued at market value, which is generally determined using the closing price on the exchange or market on which the security is primarily traded at the time of valuation (the "Valuation Time"). If no sales are reported, equity investments are generally valued at the most recent bid quotation as of the Valuation Time or at the lowest asked quotation in the case of a short sale of securities. Debt securities with a remaining maturity greater than 60 days are valued in accordance with the price supplied by a pricing service, which may use a matrix, formula or other objective method that takes into consideration market indices, yield curves and other specific adjustments. Debt obligations that will mature in 60 days or less are valued on the basis of amortized cost, which approximates market value, unless it is determined that using this method would not represent fair value. Investments in mutual funds are valued at the mutual fund's closing net asset value per share on the day of valuation. Securities and other assets for which market quotations are not
22
Credit Suisse Large Cap Blend Fund
Notes to Financial Statements (continued)
December 31, 2007
Note 2. Significant Accounting Policies
readily available, or whose values have been materially affected by events occurring before the Fund's Valuation Time but after the close of the securities' primary markets, are valued at fair value as determined in good faith by, or under the direction of, the Board of Directors under procedures established by the Board of Directors. The Fund may utilize a service provided by an independent third party which has been approved by the Board of Directors to fair value certain securities. When fair-value pricing is employed, the prices of securities used by a fund to calculate its net asset value may differ from quoted or published prices for the same securities.
B) SECURITY TRANSACTIONS AND INVESTMENT INCOME — Security transactions are accounted for on a trade date basis. Interest income is recorded on the accrual basis. Dividends are recorded on the ex-dividend date. Certain expenses are class-specific expenses and vary by class. Income, expenses (excluding class-specific expenses) and realized/unrealized gains/losses are allocated proportionately to each class of shares based upon the relative net asset value of the outstanding shares of that class. The cost of investments sold is determined by use of the specific identification method for both financial reporting and income tax purposes.
C) DIVIDENDS AND DISTRIBUTIONS TO SHAREHOLDERS — Dividends from net investment income and distributions of net realized capital gains, if any, are declared and paid at least annually. However, to the extent that a net realized capital gain can be reduced by a capital loss carryforward, such gain will not be distributed. Income and capital gain distributions are determined in accordance with federal income tax regulations, which may differ from accounting principles generally accepted in the United States of America ("GAAP").
D) FEDERAL INCOME TAXES — No provision is made for federal taxes as it is the Fund's intention to continue to qualify for and elect the tax treatment applicable to regulated investment companies under the Internal Revenue Code of 1986, as amended, and to make the requisite distributions to its shareholders, which will be sufficient to relieve it from federal income and excise taxes.
E) USE OF ESTIMATES — The preparation of financial statements in conformity with GAAP requires management to make estimates and assumptions that affect the reported amounts of assets and liabilities and disclosure of contingent assets and liabilities at the date of the financial statements and the reported amounts of income and expenses during the reporting period. Actual results could differ from these estimates.
23
Credit Suisse Large Cap Blend Fund
Notes to Financial Statements (continued)
December 31, 2007
Note 2. Significant Accounting Policies
F) SHORT-TERM INVESTMENTS — The Fund, together with other funds/portfolios advised by Credit Suisse Asset Management, LLC ("Credit Suisse"), an indirect, wholly-owned subsidiary of Credit Suisse Group, pools available cash into either a short-term variable rate time deposit issued by State Street Bank and Trust Company ("SSB"), the Fund's custodian, or a money market fund advised by Credit Suisse. The short-term time deposit issued by SSB is a variable rate account classified as a short-term investment.
G) SECURITIES LENDING — Loans of securities are required at all times to be secured by collateral at least equal to 102% of the market value of domestic securities on loan (including any accrued interest thereon) and 105% of the market value of foreign securities on loan (including any accrued interest thereon). Cash collateral received by the Fund in connection with securities lending activity may be pooled together with cash collateral for other funds/portfolios advised by Credit Suisse and may be invested in a variety of investments, including certain Credit Suisse-advised funds, funds advised by SSB, the Fund's securities lending agent, or money market instruments. However, in the event of default or bankruptcy by the other party to the agreement, realization and/or retention of the collateral may be subject to legal proceedings.
SSB has been engaged by the Fund to act as the Fund's securities lending agent. The Fund's securities lending arrangement provides that the Fund and SSB will share the net income earned from securities lending activities. During the year ended December 31, 2007, total earnings from the Fund's investment in cash collateral received in connection with securities lending arrangements were $410,826, of which $388,332 was rebated to borrowers (brokers). The Fund retained $18,319 in income from the cash collateral investment, and SSB, as lending agent, was paid $4,175. The Fund may also be entitled to certain minimum amounts of income from its securities lending activities. Securities lending income is accrued as earned.
Note 3. Transactions with Affiliates and Related Parties
Credit Suisse serves as investment adviser for the Fund. For its investment advisory services, Credit Suisse is entitled to receive a fee from the Fund at an annual rate of 0.50% of the Fund's average daily net assets. For the year ended December 31, 2007, investment advisory fees earned and voluntarily waived for the Fund were $285,659 and $37,620, respectively. Credit Suisse will not recapture from the Fund any fees it waived during the fiscal year ended
24
Credit Suisse Large Cap Blend Fund
Notes to Financial Statements (continued)
December 31, 2007
Note 3. Transactions with Affiliates and Related Parties
December 31, 2007. Fee waivers and reimbursements are voluntary and may be discontinued by Credit Suisse at any time.
Credit Suisse Asset Management Securities, Inc. ("CSAMSI"), an affiliate of Credit Suisse, and SSB serve as co-administrators to the Fund. For its co-administrative services, CSAMSI currently received a fee calculated at an annual rate of 0.09% of the Fund's average daily net assets. For the year ended December 31, 2007, co-administrative services fees earned by CSAMSI were $51,419.
For its co-administrative services, SSB receives a fee, exclusive of out-of-pocket expenses, calculated in total for all the Credit Suisse funds/portfolios co-administered by SSB and allocated based upon relative average net assets of each fund/portfolio, subject to an annual minimum fee. For the year ended December 31, 2007, co-administrative services fees earned by SSB (including out-of-pocket expenses) were $25,276.
In addition to serving as the Fund's co-administrator, CSAMSI currently serves as distributor of the Fund's shares. Pursuant to distribution plans adopted by the Fund pursuant to Rule 12b-1 under the 1940 Act, CSAMSI receives fees for its distribution services. For the Common Class and Class A shares of the Fund, the fee is calculated at an annual rate of 0.25% of the average daily net assets. For Class B and Class C shares of the Fund, the fee is calculated at an annual rate of 1.00% of average daily net assets.
Certain brokers, dealers and financial representatives provide transfer agent related services to the Fund, and receive compensation from Credit Suisse. Credit Suisse is then reimbursed by the Fund. For the year ended December 31, 2007, the Fund reimbursed Credit Suisse $652 which is included in the Fund's transfer agent expense. For the year ended December 31, 2007, CSAMSI and its affiliates advised the Fund that they retained $406 from commissions earned on the sale of the Fund's Class A shares.
Merrill Corporation ("Merrill"), an affiliate of Credit Suisse, has been engaged by the Fund to provide certain financial printing and fulfillment services. For the year ended December 31, 2007, Merrill was paid $30,509 for its services to the Fund.
Note 4. Line of Credit
The Fund, together with other funds/portfolios advised by Credit Suisse (collectively, the "Participating Funds"), participates in a $50 million committed, unsecured line of credit facility ("Credit Facility") for temporary or emergency purposes with Deutsche Bank, A.G. as administrative agent and
25
Credit Suisse Large Cap Blend Fund
Notes to Financial Statements (continued)
December 31, 2007
Note 4. Line of Credit
syndication agent and SSB as operations agent. Under the terms of the Credit Facility, the Participating Funds pay an aggregate commitment fee at a rate of 0.10% per annum on the average unused amount of the Credit Facility, which is allocated among the Participating Funds in such manner as is determined by the governing Boards of the Participating Funds. In addition, the Participating Funds pay interest on borrowings at the Federal Funds rate plus 0.50%. At December 31, 2007, and during the year ended December 31, 2007, the Fund had no borrowings under the Credit Facility.
Note 5. Purchases and Sales of Securities
For the year ended December 31, 2007, purchases and sales of investment securities (excluding short-term investments) were $64,862,748 and $73,622,858, respectively.
Note 6. Capital Share Transactions
The Fund is authorized to issue six billion full and fractional shares of capital stock, $.001 par value per share. Transactions in capital shares for each class were as follows:
| Common | |||||||||||||||||||
| For the Year Ended December 31, 2007 | For the Year Ended December 31, 2006 | ||||||||||||||||||
| Shares | Value | Shares | Value | ||||||||||||||||
| Shares sold | 16,964 | $ | 218,288 | 10,061 | $ | 125,504 | |||||||||||||
| Shares issued in reinvestment of dividends and distributions | 17,277 | 210,141 | 10,187 | 129,287 | |||||||||||||||
| Shares redeemed | (49,817 | ) | (652,456 | ) | (76,744 | ) | (975,291 | ) | |||||||||||
| Net decrease | (15,576 | ) | $ | (224,027 | ) | (56,496 | ) | $ | (720,500 | ) | |||||||||
| Class A | |||||||||||||||||||
| For the Year Ended December 31, 2007 | For the Year Ended December 31, 2006 | ||||||||||||||||||
| Shares | Value | Shares | Value | ||||||||||||||||
| Shares sold | 81,374 | $ | 1,065,293 | 116,132 | $ | 1,455,066 | |||||||||||||
| Shares issued in reinvestment of dividends and distributions | 402,488 | 4,922,014 | 199,756 | 2,542,583 | |||||||||||||||
| Shares redeemed | (543,835 | ) | (7,149,355 | ) | (951,024 | ) | (11,923,669 | ) | |||||||||||
| Net decrease | (59,973 | ) | $ | (1,162,048 | ) | (635,136 | ) | $ | (7,926,020 | ) | |||||||||
26
Credit Suisse Large Cap Blend Fund
Notes to Financial Statements (continued)
December 31, 2007
Note 6. Capital Share Transactions
| Class B | |||||||||||||||||||
| For the Year Ended December 31, 2007 | For the Year Ended December 31, 2006 | ||||||||||||||||||
| Shares | Value | Shares | Value | ||||||||||||||||
| Shares sold | 7,564 | $ | 92,025 | 7,768 | $ | 95,312 | |||||||||||||
| Shares issued in reinvestment of dividends and distributions | 28,316 | 331,808 | 19,948 | 244,363 | |||||||||||||||
| Shares redeemed | (173,086 | ) | (2,167,243 | ) | (321,693 | ) | (3,911,938 | ) | |||||||||||
| Net decrease | (137,206 | ) | $ | (1,743,410 | ) | (293,977 | ) | $ | (3,572,263 | ) | |||||||||
| Class C | |||||||||||||||||||
| For the Year Ended December 31, 2007 | For the Year Ended December 31, 2006 | ||||||||||||||||||
| Shares | Value | Shares | Value | ||||||||||||||||
| Shares sold | 3,468 | $ | 41,365 | 4,458 | $ | 54,402 | |||||||||||||
| Shares issued in reinvestment of dividends and distributions | 4,553 | 53,169 | 2,696 | 32,945 | |||||||||||||||
| Shares redeemed | (23,385 | ) | (286,774 | ) | (31,341 | ) | (381,771 | ) | |||||||||||
| Net decrease | (15,364 | ) | $ | (192,240 | ) | (24,187 | ) | $ | (294,424 | ) | |||||||||
On December 31, 2007, the number of shareholders that held 5% or more of the outstanding shares of each class of the Fund was as follows:
| Number of Shareholders | Approximate Percentage of Outstanding Shares | ||||||||||
| Common Class | 3 | 36 | % | ||||||||
| Class B | 2 | 13 | % | ||||||||
| Class C | 2 | 54 | % | ||||||||
Some of the shareholders are omnibus accounts, which hold shares on behalf of individual shareholders.
Note 7. Federal Income Taxes
Income and capital gain distributions are determined in accordance with federal income tax regulations, which may differ from GAAP.
The tax characteristics of dividends and distributions paid during the years ended December 31, 2007 and 2006, respectively by the Fund were as follows:
| Ordinary Income | Long-Term Capital Gain | ||||||||||||||
| 2007 | 2006 | 2007 | 2006 | ||||||||||||
| $ | 2,323,895 | $ | 710,101 | $ | 4,081,393 | $ | 2,710,866 | ||||||||
27
Credit Suisse Large Cap Blend Fund
Notes to Financial Statements (continued)
December 31, 2007
Note 7. Federal Income Taxes
The tax basis of components of distributable earnings differ from the amounts reflected in the Statement of Assets and Liabilities by temporary book/tax differences. These differences are primarily due to losses deferred on wash sales, deferral of post-October losses and differing treatments of capital loss carryforward acquired from the merger with Credit Suisse Tax Efficient Fund.
At December 31, 2007, the components of distributable earnings on a tax basis for the Fund were as follows:
| Undistributed net investment income | $ | 30,260 | |||||
| Capital loss carryforwards limited due to merger | (1,293,294 | ) | |||||
| Unrealized appreciation | 6,037,228 | ||||||
| Deferral of post-October capital losses | (58,276 | ) | |||||
| $ | 4,715,918 | ||||||
At December 31, 2007, the Fund had capital loss carryforwards available to offset possible future capital gains as follows:
| Expires December 31, | |||||||||||
| 2009 | 2010 | ||||||||||
| $ | 487,796 | $ | 805,498 | ||||||||
During the tax year ended December 31, 2007, the Fund utilized $483,126 of capital loss carryforwards.
It is uncertain that the Fund will realize the full benefit of these losses prior to expiration.
At December 31, 2007, the identified cost for federal income tax purposes, as well as the gross unrealized appreciation from investments for those securities having an excess of value over cost, gross unrealized depreciation from investments for those securities having an excess of cost over value and the net unrealized appreciation from investments were: $58,072,353, $7,909,549, $(1,872,322) and $6,037,227, respectively.
At December 31, 2007, the Fund reclassified $71 from undistributed net investment income and $51,956 from accumulated net realized loss from investments to paid in capital, to adjust for current period permanent book/tax differences which arose principally from differing book/tax treatments of the capital loss carryforward acquired from the merger with Credit Suisse Tax Efficient Fund and dividend redesignations. Net assets were not affected by these reclassifications.
28
Credit Suisse Large Cap Blend Fund
Notes to Financial Statements (continued)
December 31, 2007
Note 8. Contingencies
In the normal course of business, the Fund may provide general indemnifications pursuant to certain contracts and organizational documents. The Fund's maximum exposure under these arrangements is dependent on future claims that may be made against the Fund and, therefore, cannot be estimated; however, based on experience, the risk of loss from such claims is considered remote.
Note 9. Recent Accounting Pronouncements
During June 2006, the Financial Accounting Standards Board ("FASB") issued FASB Interpretation 48 ("FIN 48" or the "Interpretation"), Accounting for Uncertainty in Income Taxes — an interpretation of FASB statement 109. FIN 48 supplements FASB Statement 109, Accounting for Income Taxes, by defining the confidence level that a tax position must meet in order to be recognized in the financial statements. FIN 48 prescribes a comprehensive model for how a fund should recognize, measure, present, and disclose in its financial statements uncertain tax positions that the fund has taken or expects to take on a tax return. FIN 48 requires that the t ax effects of a position be recognized only if it is "more likely than not" to be sustained based solely on its technical merits. Management must be able to conclude that the tax law, regulations, case law, and other objective information regarding the technical merits sufficiently support the position's sustainability with a likelihood of more than 50 percent. During the period ended December 31, 2007, Management has adopted FIN 48. There was no material impact to the financial statements or disclosures thereto as a result of the adoption of this pronouncement.
On September 20, 2006, the FASB released Statement of Financial Accounting Standards No. 157 "Fair Value Measurements" ("FAS 157"). FAS 157 establishes an authoritative definition of fair value, sets out a framework for measuring fair value, and requires additional disclosures about fair-value measurements. The application of FAS 157 is required for fiscal years, beginning after November 15, 2007 and interim periods within those fiscal years. As of December 31, 2007, management does not believe the adoption of FAS 157 will impact the amounts reported in the financial statements, however, additional disclosures will be required in subsequent reports.
29
Credit Suisse Large Cap Blend Fund
Report of Independent Registered Public Accounting Firm
To the Board of Directors and Shareholders of
Credit Suisse Large Cap Blend Fund, Inc.:
In our opinion, the accompanying statement of assets and liabilities, including the schedule of investments, and the related statements of operations and of changes in net assets and the financial highlights present fairly, in all material respects, the financial position of Credit Suisse Large Cap Blend Fund, Inc. (the "Fund") at December 31, 2007, the results of its operations for the year then ended, the changes in its net assets for each of the two years in the period then ended and the financial highlights for each of the years (or periods) presented, in conformity with accounting principles generally accepted in the United States of America. These financial statements and financial highlights (hereafter referred to as "financial statements") are the responsibility of the Fund's management; our responsibility is to express an opinion on these financial statements based on our audits. We conducted our audits of these financial statements in accordance the standards of the Public Company Accounting Oversight Board (United States). Those standards require that we plan and perform the audit to obtain reasonable assurance about whether the financial statements are free of material misstatement. An audit includes examining, on a test basis, evidence supporting the amounts and disclosures in the financial statements, assessing the accounting principles used and significant estimates made by management, and evaluating the overall financial statement presentation. We believe that our audits, which included confirmation of securities at December 31, 2007 by correspondence with the custodian, provide a reasonable basis for our opinion.
PricewaterhouseCoopers LLP
Baltimore, Maryland
February 25, 2008
30
Credit Suisse Large Cap Blend Fund
Board Approval of Advisory Agreement (unaudited)
In approving the renewal of the current Advisory Agreement, the Board of Directors, including the Independent Directors, at a meeting held on November 13 and 14, 2007, considered the following factors with respect to the Large Cap Blend Fund (the "Fund"):
Investment Advisory Fee Rates
The Board reviewed and considered the contractual advisory fee of 0.50% ("Contractual Advisory Fee") in light of the extent and quality of the advisory services provided by Credit Suisse Asset Management, LLC ("Credit Suisse"). The Board also reviewed and considered the fee waivers and/or expense reimbursement arrangements currently in place for the Fund and considered the actual fee rate of 0.49% paid by the Fund after taking waivers and reimbursements into account ("Net Advisory Fee"). The Board acknowledged that voluntary fee waivers and expense reimbursements could be discontinued at any time.
Additionally, the Board received and considered information comparing the Fund's Contractual Advisory Fee, Net Advisory Fee and the Fund's overall expenses with those of funds in both the relevant expense group ("Expense Group") and universe of funds ("Expense Universe") provided by Lipper Inc., an independent provider of investment company data.
Nature, Extent and Quality of the Services under the Advisory Agreement
The Board received and considered information regarding the nature, extent and quality of services provided to the Fund by Credit Suisse under the Advisory Agreement. The Board also noted information received at regular meetings throughout the year related to the services rendered by Credit Suisse. The Board reviewed background information about Credit Suisse, including its Form ADV. The Board considered the background and experience of Credit Suisse's senior management and the expertise of, and the amount of attention given to the Fund by, senior personnel of Credit Suisse. In addition, the Board reviewed the qualifications, backgrounds and responsibilities of the portfolio management team primarily responsible for the day-to-day portfolio management of the Fund and the extent of the resources devoted to research and analysis of actual and potential investments. The Board also received and considered information about the nature, extent and quality of services and fee rates offered to other Credit Suisse clients for comparable services.
31
Credit Suisse Large Cap Blend Fund
Board Approval of Advisory Agreement (unaudited) (continued)
Fund Performance
The Board received and considered the performance results of the Fund over time, along with comparisons both to the relevant performance group ("Performance Group") and universe of funds ("Performance Universe") for the Fund. The Board was provided with a description of the methodology used to arrive at the funds included in the Performance Group and the Performance Universe.
Credit Suisse Profitability
The Board received and considered a profitability analysis of Credit Suisse based on the fees payable under the Advisory Agreement for the Fund, including any fee waivers or fee caps, as well as other relationships between the Fund on the one hand and Credit Suisse affiliates on the other. The Board received profitability information for the other funds in the Credit Suisse family of funds.
Economies of Scale
The Board considered whether economies of scale in the provision of services to the Fund were being passed along to the shareholders. Accordingly, the Board considered whether alternative fee structures (such as breakpoint fee structures) would be more appropriate or reasonable taking into consideration economies of scale or other efficiencies that might accrue from increases in the Fund's asset levels.
Other Benefits to Credit Suisse
The Board considered other benefits received by Credit Suisse and its affiliates as a result of their relationship with the Fund. Such benefits include, among others, research arrangements with brokers who execute transactions on behalf of the Fund, administrative and brokerage relationships with affiliates of Credit Suisse and benefits potentially derived from an increase in Credit Suisse's businesses as a result of its relationship with the Fund (such as the ability to market to shareholders other financial products offered by Credit Suisse and its affiliates).
The Board considered the standards applied in seeking best execution, whether and to what extent soft dollar credits are sought and how any such credits are utilized, any benefits that may be achieved by using an affiliated broker and the existence of quality controls applicable to brokerage allocation procedures. The Board also reviewed Credit Suisse's method for allocating portfolio investment opportunities among its advisory clients.
32
Credit Suisse Large Cap Blend Fund
Board Approval of Advisory Agreement (unaudited) (continued)
Conclusions
In selecting Credit Suisse, and approving the Advisory Agreement and the investment advisory fee under such agreement, the Board concluded that:
• The Contractual Advisory Fee is the lowest in the Expense Group and the Board considered the fee to be reasonable.
• The Fund's performance was below most of its peers in the Performance Group and Performance Universe for the periods reviewed. The Board noted that changes in the investment strategies and portfolio management of the Fund had gone into effect on December 1, 2006 and that it would continue to monitor steps undertaken by Credit Suisse to improve performance.
• Aside from performance (as described above), the Board was satisfied with the nature and extent of the investment advisory services provided to the Fund by Credit Suisse and that, based on dialogue with management and counsel, the services provided by Credit Suisse under the Advisory Agreement are typical of, and consistent with, those provided to similar mutual funds by other investment advisers.
• In light of the costs of providing investment management and other services to the Fund and Credit Suisse's ongoing commitment to the Fund and willingness to waive fees and expenses, the profits and other ancillary benefits that Credit Suisse and its affiliates received were considered reasonable.
• Credit Suisse's profitability based on fees payable under the Advisory Agreement was reasonable in light of the nature, extent and quality of the services provided to the Fund thereunder.
• In light of the relatively small size of the Fund and the amount of the Contractual Advisory Fee, the Fund's current fee structure (without breakpoints) was considered reasonable.
No single factor reviewed by the Board was identified by the Board as the principal factor in determining whether to approve the Advisory Agreement. The Independent Directors were advised by separate independent legal counsel throughout the process.
33
Credit Suisse Large Cap Blend Fund
Information Concerning Directors and Officers (unaudited)
| Name, Address (Year of Birth) | Position(s) Held with Fund | Term of Office1 and Length of Time Served | Principal Occupation(s) During Past Five Years | Number of Portfolios in Fund Complex Overseen by Director | Other Directorships Held by Director | ||||||||||||||||||
| Independent Directors | |||||||||||||||||||||||
| Enrique Arzac c/o Credit Suisse Asset Management, LLC Attn: General Counsel Eleven Madison Avenue New York, New York 10010 (1941) | Director, Nominating Committee Member and Audit Committee Chairman | Since 2005 | Professor of Finance and Economics, Graduate School of Business, Columbia University since 1971. | 35 | Director of Epoch Holding Corporation (an investment management and investment advisory services company); Director of The Adams Express Company (a closed-end investment company); Director of Petroleum and Resources Corporation (a closed-end investment company). | ||||||||||||||||||
| Jeffrey E. Garten2 Box 208200 New Haven, Connecticut 06520-8200 (1946) | Director, Nominating and Audit Committee Member | Since Fund Inception | The Juan Trippe Professor in the Practice of International Trade, Finance and Business from July 2005 to present; Partner and Chairman of Garten Rothkopf (consulting firm) from October 2005 to present; Dean of Yale School of Management from November 1995 to June 2005. | 28 | Director of Aetna, Inc. (insurance company); Director of CarMax Group (used car dealers); Director of Alcan, Inc. (smelting and refining of nonferrous metals company). | ||||||||||||||||||
1 Each Director and Officer serves until his or her respective successor has been duly elected and qualified.
2 Mr. Garten was initially appointed as a Director of the Fund at inception. He resigned as Director on February 3, 2000 and was subsequently reappointed on December 21, 2000.
34
Credit Suisse Large Cap Blend Fund
Information Concerning Directors and Officers (unaudited) (continued)
| Name, Address (Year of Birth) | Position(s) Held with Fund | Term of Office1 and Length of Time Served | Principal Occupation(s) During Past Five Years | Number of Portfolios in Fund Complex Overseen by Director | Other Directorships Held by Director | ||||||||||||||||||
| Independent Directors | |||||||||||||||||||||||
| Peter F. Krogh SFS/ICC 702 Georgetown University Washington, DC 20057 (1937) | Director, Nominating and Audit Committee Member | Since 2001 | Dean Emeritus and Distinguished Professor of International Affairs at the Edmund A. Walsh School of Foreign Service, Georgetown University from June 1995 to present. | 28 | Director of Carlisle Companies Incorporated (diversified manufacturing company). | ||||||||||||||||||
| Steven N. Rappaport Lehigh Court, LLC 555 Madison Avenue 29th Floor New York, New York 10022 (1948) | Chairman of the Board of Directors, Nominating Committee Chairman and Audit Committee Member | Director Since 1999 and Chairman since 2005 | Partner of Lehigh Court, LLC and RZ Capital (private investment firms) from July 2002 to present. | 35 | Director of iCAD, Inc. (surgical and medical instruments and apparatus company); Director of Presstek, Inc. (digital imaging technologies company); Director of Wood Resources, LLC. (plywood manufacturing company). | ||||||||||||||||||
| Interested Director | |||||||||||||||||||||||
| Michael E. Kenneally3 c/o Credit Suisse Asset Management, LLC Attn: General Counsel Eleven Madison Avenue New York, New York 10010 (1954) | Director | Since 2004 | Chairman and Global Chief Executive Officer of Credit Suisse from March 2003 to July 2005; Chairman and Chief Investment Officer of Banc of America Capital Management from 1998 to March 2003. | 28 | None | ||||||||||||||||||
3 Mr. Kenneally is a Director who is an "interested person" of the Fund as defined in the Investment Company Act of 1940, as amended, because he was an officer of Credit Suisse within the last two fiscal years.
35
Credit Suisse Large Cap Blend Fund
Information Concerning Directors and Officers (unaudited) (continued)
Name, Address (Year of Birth) | Position(s) Held with Fund | Term of Office1 and Length of Time Served | Principal Occupation(s) During Past Five Years | ||||||||||||
| Officers | |||||||||||||||
| Lawrence D. Haber c/o Credit Suisse Asset Management, LLC. Attn: General Counsel Eleven Madison Avenue New York, New York 10010 (1951) | Chief Executive Officer and President | Since 2007 | Managing Director and Chief Operating Officer of Credit Suisse; Member of Credit Suisse's Management Committee; Chief Financial Officer of Merrill Lynch Investment Managers from 1997 to 2003. | ||||||||||||
| Michael A. Pignataro Credit Suisse Asset Management, LLC Eleven Madison Avenue New York, New York 10010 (1959) | Chief Financial Officer | Since 1999 | Director and Director of Fund Administration of Credit Suisse; Associated with Credit Suisse or its predecessor since 1984; Officer of other Credit Suisse Funds. | ||||||||||||
| Emidio Morizio Credit Suisse Asset Management, LLC Eleven Madison Avenue New York, New York 10010 (1966) | Chief Compliance Officer | Since 2004 | Director and Global Head of Compliance of Credit Suisse; Associated with Credit Suisse since July 2000; Officer of other Credit Suisse Funds. | ||||||||||||
| J. Kevin Gao Credit Suisse Asset Management, LLC Eleven Madison Avenue New York, New York 10010 (1967) | Chief Legal Officer since 2006, Vice President and Secretary since 2004 | Since 2004 | Director and Legal Counsel of Credit Suisse; Associated with Credit Suisse since July 2003; Associated with the law firm of Willkie Farr & Gallagher LLP from 1998 to 2003; Officer of other Credit Suisse Funds. | ||||||||||||
| Robert Rizza Credit Suisse Asset Management, LLC Eleven Madison Avenue New York, New York 10010 (1965) | Treasurer | Since 2006 | Vice President of Credit Suisse; Associated with Credit Suisse since 1998; Officer of other Credit Suisse Funds. | ||||||||||||
The Statement of Additional Information includes additional information about the Directors and is available, without charge, upon request, by calling 800-927-2874.
36
Credit Suisse Large Cap Blend Fund
December 31, 2007 (unaudited)
Important Tax Information for Corporate Shareholders
Corporate Shareholders should note for the year ended December 31, 2007, the percentage of the Fund's investment income (i.e., net investment income plus short-term capital gains) that qualified for the intercorporate dividends received deduction is 68.37%.
For the fiscal year ended December 31, 2007 certain dividends paid by Large Cap Blend Fund may be subject to a maximum tax rate of 15%, as provided for by the Jobs and Growth Tax Relief Reconciliation Act of 2003. Complete information will be reported in conjunction with your 2007 Form 1099-DIV.
Important Tax Information for Shareholders
During the year ended December 31, 2007, the Fund declared $4,081,393 in dividends that were designated as long-term capital gains dividends.
37
Credit Suisse Large Cap Blend Fund
Proxy Voting and Portfolio Holdings Information (unaudited)
Information regarding how the Fund voted proxies related to its portfolio securities during the 12 month period ended June 30 of each year, as well as the policies and procedures that the Fund uses to determine how to vote proxies relating to its portfolio securities are available:
• By calling 1-800-927-2874
• On the Fund's website, www.credit-suisse.com/us
• On the website of the Securities and Exchange Commission, www.sec.gov.
The Fund files a complete schedule of its portfolio holdings for the first and third quarters of its fiscal year with the SEC on Form N-Q. The Fund's Forms N-Q are available on the SEC's website at www.sec.gov and may be reviewed and copied at the SEC's Public Reference Room in Washington, DC. Information on the operation of the SEC's Public Reference Room may be obtained by calling 1-202-551-8090.
38
This page intentionally left blank
This page intentionally left blank
This page intentionally left blank

P.O. BOX 55030, BOSTON, MA 02205-5030
800-927-2874 n www.credit-suisse.com/us
CREDIT SUISSE ASSET MANAGEMENT SECURITIES, INC., DISTRIBUTOR. LCB-AR-1207
Item 2. Code of Ethics.
The registrant has adopted a code of ethics applicable to its Chief Executive Officer, President, Chief Financial Officer and Chief Accounting Officer, or persons performing similar functions. A copy of the code is filed as Exhibit 12(a)(1) to this Form. There were no amendments to the code during the fiscal year ended December 31, 2007. There were no waivers or implicit waivers from the code granted by the registrant during the fiscal year ended December 31, 2007.
Item 3. Audit Committee Financial Expert.
The registrant’s governing board has determined that it has two audit committee financial experts serving on its audit committee: Enrique R. Arzac and Steven N. Rappaport. Each audit committee financial expert is “independent” for purposes of this item.
Item 4. Principal Accountant Fees and Services.
(a) through (d). The information in the table below is provided for services rendered to the registrant by its independent registered public accounting firm, PricewaterhouseCoopers LLP (“PwC”), for its fiscal years ended December 31, 2006 and December 31, 2007.
|
| 2006 |
| 2007 |
| ||
Audit Fees |
| $ | 15,186 |
| $ | 15,594 |
|
Audit-Related Fees(1) |
| $ | 3,245 |
| $ | 3,340 |
|
Tax Fees(2) |
| $ | 2,515 |
| $ | 2,590 |
|
All Other Fees |
| — |
| — |
| ||
Total |
| $ | 20,946 |
| $ | 21,524 |
|
(1) Services include agreed-upon procedures in connection with the registrant’s semi-annual financial statements ($3,245 for 2006 and $3,340 for 2007).
(2) Tax services in connection with the registrant’s excise tax calculations and review of the registrant’s applicable tax returns.
The information in the table below is provided with respect to non-audit services that directly relate to the registrant’s operations and financial reporting and that were rendered by PwC to the registrant’s investment adviser, Credit Suisse Asset Management, LLC (“Credit Suisse”), and any service provider to the registrant controlling, controlled by or under common control with Credit Suisse that provided ongoing services to the registrant (“Covered Services Provider”), for the registrant’s fiscal years ended December 31, 2006 and December 31, 2007.
2
|
| 2006 |
| 2007 |
|
Audit-Related Fees |
| N/A |
| N/A |
|
Tax Fees |
| N/A |
| N/A |
|
All Other Fees |
| N/A |
| N/A |
|
Total |
| N/A |
| N/A |
|
(e)(1) Pre-Approval Policies and Procedures. The Audit Committee (“Committee”) of the registrant is responsible for pre-approving (i) all audit and permissible non-audit services to be provided by the independent registered public accounting firm to the registrant and (ii) all permissible non-audit services to be provided by the independent registered public accounting firm to Credit Suisse and any Covered Services Provider if the engagement relates directly to the operations and financial reporting of the registrant. The Committee may delegate its responsibility to pre-approve any such audit and permissible non-audit services to the Chairperson of the Committee, and the Chairperson shall report to the Committee, at its next regularly scheduled meeting after the Chairperson’s pre-approval of such services, his or her decision(s). The Committee may also establish detailed pre-approval policies and procedures for pre-approval of such services in accordance with applicable laws, including the delegation of some or all of the Committee’s pre-approval responsibilities to other persons (other than Credit Suisse or the registrant’s officers). Pre-approval by the Committee of any permissible non-audit services shall not be required so long as: (i) the aggregate amount of all such permissible non-audit services provided to the registrant, Credit Suisse and any Covered Services Provider constitutes not more than 5% of the total amount of revenues paid by the registrant to its independent registered public accounting firm during the fiscal year in which the permissible non-audit services are provided; (ii) the permissible non-audit services were not recognized by the registrant at the time of the engagement to be non-audit services; and (iii) such services are promptly brought to the attention of the Committee and approved by the Committee (or its delegate(s)) prior to the completion of the audit.
(e)(2) The information in the table below sets forth the percentages of fees for services (other than audit, review or attest services) rendered by PwC to the registrant for which the pre-approval requirement was waived pursuant to Rule 2-01(c)(7)(i)(C) of Regulation S-X:
|
| 2006 |
| 2007 |
|
Audit-Related Fees |
| N/A |
| N/A |
|
Tax Fees |
| N/A |
| N/A |
|
All Other Fees |
| N/A |
| N/A |
|
Total |
| N/A |
| N/A |
|
3
The information in the table below sets forth the percentages of fees for services (other than audit, review or attest services) rendered by PwC to Credit Suisse and any Covered Services Provider required to be approved pursuant to Rule 2-01(c)(7)(ii) of Regulation S-X, for the registrant’s fiscal years ended December 31, 2006 and December 31, 2007:
|
| 2006 |
| 2007 |
|
Audit-Related Fees |
| N/A |
| N/A |
|
Tax Fees |
| N/A |
| N/A |
|
All Other Fees |
| N/A |
| N/A |
|
Total |
| N/A |
| N/A |
|
(f) Not Applicable.
(g) The aggregate fees billed by PwC for non-audit services rendered to the registrant, Credit Suisse and Covered Service Providers for the fiscal years ended December 31, 2006 and December 31, 2007 were $5,760 and $5,930, respectively.
(h) Not Applicable.
Item 5. Audit Committee of Listed Registrants.
Form N-CSR disclosure requirement is not applicable to the registrant.
Item 6. Schedule of Investments.
Included as part of the report to shareholders filed under Item 1 of this Form.
4
Item 7. Disclosure of Proxy Voting Policies and Procedures for Closed-End Management Investment Companies.
Form N-CSR disclosure requirement is not applicable to the registrant.
Item 8. Portfolio Managers of Closed-End Management Investment Companies.
Form N-CSR disclosure requirement is not applicable to the registrant.
Item 9. Purchases of Equity Securities by Closed-End Management Investment Company and Affiliated Purchasers.
Form N-CSR disclosure requirement is not applicable to the registrant.
Item 10. Submission of Matters to a Vote of Security Holders.
None
Item 11. Controls and Procedures.
(a) As of a date within 90 days from the filing date of this report, the principal executive officer and principal financial officer concluded that the registrant’s disclosure controls and procedures (as defined in Rule 30a-3(c) under the Investment Company Act of 1940 (the “Act”)) were effective based on their evaluation of the disclosure controls and procedures required by Rule 30a-3(b) under the Act and Rules 13a-15(b) or 15d-15(b) under the Securities Exchange Act of 1934.
(b) There were no changes in registrant’s internal control over financial reporting (as defined in Rule 30a-3(d) under the Act) that occurred during the second fiscal quarter of the period covered by this report that have materially affected, or are reasonably likely to materially affect, the registrant’s internal control over financial reporting.
Item 12. Exhibits.
(a)(1) Registrant’s Code of Ethics is an exhibit to this report.
(a)(2) The certifications of the registrant as required by Rule 30a-2(a) under the Act are exhibits to this report.
(a)(3) Not applicable.
(b) The certifications of the registrant as required by Rule 30a-2(b) under the Act are an exhibit to this report.
5
SIGNATURES
Pursuant to the requirements of the Securities Exchange Act of 1934 and the Investment Company Act of 1940, the registrant has duly caused this report to be signed on its behalf by the undersigned, thereunto duly authorized.
CREDIT SUISSE LARGE CAP BLEND FUND, INC. | ||
|
| |
/s/ Lawrence D. Haber |
| |
Name: | Lawrence D. Haber | |
Title: | Chief Executive Officer | |
Date: | March 6, 2008 | |
Pursuant to the requirements of the Securities Exchange Act of 1934 and the Investment Company Act of 1940, this report has been signed below by the following persons on behalf of the registrant and in the capacities and on the dates indicated.
/s/ Lawrence D. Haber |
| |
Name: | Lawrence D. Haber | |
Title: | Chief Executive Officer | |
Date: | March 6, 2008 | |
/s/ Michael A. Pignataro |
| |
Name: | Michael A. Pignataro | |
Title: | Chief Financial Officer | |
Date: | March 6, 2008 | |
6