UNITED STATES
SECURITIES AND EXCHANGE COMMISSION
Washington, D.C. 20549
FORM N-CSR
CERTIFIED SHAREHOLDER REPORT OF REGISTERED
MANAGEMENT INVESTMENT COMPANIES
Investment Company Act file number | 811-08921 | ||||||||
| |||||||||
CREDIT SUISSE LARGE CAP BLEND FUND, INC. | |||||||||
(Exact name of registrant as specified in charter) | |||||||||
| |||||||||
Eleven Madison Avenue, New York, New York |
| 10010 | |||||||
(Address of principal executive offices) |
| (Zip code) | |||||||
| |||||||||
John G. Popp Credit Suisse Large Cap Blend Fund, Inc. Eleven Madison Avenue New York, New York 10010 | |||||||||
(Name and address of agent for service) | |||||||||
| |||||||||
Registrant’s telephone number, including area code: | (212) 325-2000 |
| |||||||
| |||||||||
Date of fiscal year end: | December 31st |
| |||||||
| |||||||||
Date of reporting period: | January 1, 2010 to December 31, 2010 |
| |||||||
Item 1. Reports to Stockholders.

CREDIT SUISSE FUNDS
Annual Report
December 31, 2010
n CREDIT SUISSE
LARGE CAP BLEND FUND, INC.
The Fund's investment objectives, risks, charges and expenses (which should be considered carefully before investing), and more complete information about the Fund, are provided in the Prospectus, which should be read carefully before investing. You may obtain additional copies by calling 877-870-2874 or by writing to Credit Suisse Funds, P.O. Box 55030, Boston, MA 02205-5030.
Credit Suisse Asset Management Securities, Inc., Distributor, is located at Eleven Madison Avenue, New York, NY 10010. Credit Suisse Funds are advised by Credit Suisse Asset Management, LLC.
Investors in the Credit Suisse Funds should be aware that they may be eligible to purchase Common Class shares (where offered) directly or through certain intermediaries. Such shares are not subject to a sales charge but may be subject to an ongoing service and distribution fee of up to 0.25% of average daily net assets. Investors in the Credit Suisse Funds should also be aware that they may be eligible for a reduction or waiver of the sales charge with respect to Class A, B or C shares (where offered). For more information, please review the relevant prospectuses or consult your financial representative.
The views of the Fund's management are as of the date of the letter and the Fund holdings described in this document are as of December 31, 2010; these views and Fund holdings may have changed subsequent to these dates. Nothing in this document is a recommendation to purchase or sell securities.
Fund shares are not deposits or other obligations of Credit Suisse Asset Management, LLC ("Credit Suisse") or any affiliate, are not FDIC-insured and are not guaranteed by Credit Suisse or any affiliate. Fund investments are subject to investment risks, including loss of your investment.
Credit Suisse Large Cap Blend Fund, Inc.
Annual Investment Adviser's Report
December 31, 2010 (unaudited)
February 3, 2011
Performance Summary
01/01/10 – 12/31/10
| Fund & Benchmark | Performance | ||||||
| Common1 | 10.50 | % | |||||
| Class A1,2 | 10.50 | % | |||||
| Class B1,2 | 9.71 | % | |||||
| Class C1,2 | 9.75 | % | |||||
| S&P 500 Index3 | 15.06 | % | |||||
Performance for the Fund's Class A, Class B and Class C Shares is shown without including the effect of the maximum sales charge of 5.75%, 4.00% and 1.00%, respectively.2
Market Review: A positive end to a challenging year
The year ended December 31, 2010, was a volatile one for equities. After three quarters of choppy trading, global equity markets had a robust fourth quarter and, in general, finished the year higher. Fairly encouraging economic data reports and cooperative central bankers in the United States and Europe combined with impressive economic growth in developing regions to help ease investor concerns about the threat of a double-dip recession. This change in sentiment boosted stock prices, especially during the last month of the year. Additionally, the U.S. Federal Reserve's anti-deflationary policy of implementing multiple quantitative easing measures — the first worth approximately $1.7 trillion and the second worth approximately $600 billion — together with the extension of Bush-era tax cuts injected liquidity into the global markets. For the 12-month period, the S&P 500 Index gained 15.06%, while the Dow Jones Industrial Average rose 14.06%.
As of December 31, 2010, the target U.S. Federal Funds rate remained at 0.00%-0.25% and the discount rate held at 0.75%. The Conference Board Consumer Confidence Index (a survey based on a representative sample of 5,000 U.S. households) decreased unexpectedly in December, dropping from 54.3 in November to 52.5 (for context, the Index measured 100 in 1985 meaning complete confidence). In the private sector, employment continued to increase in many industries, as 113,000 jobs were added. Conversely, the public sector continued to lay off workers, losing 10,000 jobs in December. Overall, the unemployment rate decreased to 9.4% in December. Each of the 10 sectors within the S&P 500 posted gains for the year. Consumer discretionary posted the largest increase, gaining 25.72%, while health care was the weakest performer, gaining only 0.71% for the year.
1
Credit Suisse Large Cap Blend Fund, Inc.
Annual Investment Adviser's Report (continued)
December 31, 2010 (unaudited)
Strategic Review and Outlook: Cautiously optimistic for the future
For the year ended December 31, 2010, the Fund underperformed the benchmark despite strong performance. During the year, quantitative models in general were challenged by a prolonged period of high correlation and low volatility. In the United States, as the market oscillated between fears of a double dip recession and hope of potential economic growth, there were fewer opportunities to identify individual stock outperformance. As a result, transaction costs and the volatile environment resulted in underperformance. On a stock and sector basis, stock selection and sector weighting in energy, consumer staples, and materials contributed positively to performance. Conversely, stock selection and sector weighting in health care, utilities and financials detracted from performance.
Although we expect the market to remain challenging in the near term, we are comfortable with our proactive long-term investment process going forward.
Credit Suisse Quantitative Equities Group
Mika Toikka
Timothy Schwider
The value of investments generally will fluctuate in response to market movements.
In addition to historical information, this report contains forward-looking statements, which may concern, among other things, domestic and foreign market, industry and economic trends and developments and government regulation and their potential impact on the Fund's investments. These statements are subject to risks and uncertainties and actual trends, developments and regulations in the future, and their impact on the Fund could be materially different from those projected, anticipated or implied. The Fund has no obligation to update or revise forward-looking statements.
2
Credit Suisse Large Cap Blend Fund, Inc.
Annual Investment Adviser's Report (continued)
December 31, 2010 (unaudited)
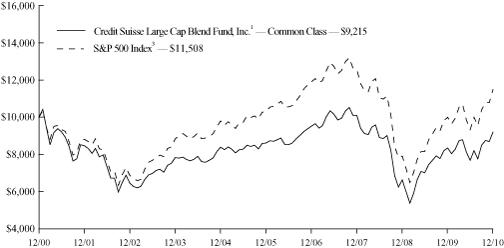
Comparison of Change in Value of $10,000 Investment in the
Credit Suisse Large Cap Blend Fund, Inc.1 Common Class shares
and the S&P 500 Index3 for Ten Years.
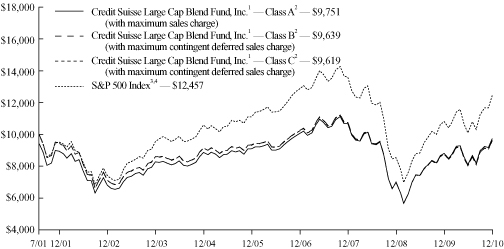
Comparison of Change in Value of $10,000 Investment in the
Credit Suisse Large Cap Blend Fund, Inc.1 Class A shares2, Class B shares2,
Class C shares2 and the S&P 500 Index3,4, from Inception (07/31/01).
3
Credit Suisse Large Cap Blend Fund, Inc.
Annual Investment Adviser's Report (continued)
December 31, 2010 (unaudited)
Average Annual Returns as of December 31, 20101
| 1 Year | 5 Years | 10 Years | Since Inception | ||||||||||||||||
| Common Class5 | 10.50 | % | 1.36 | % | (0.81 | )% | 2.74 | % | |||||||||||
| Class A Without Sales Charge | 10.50 | % | 1.35 | % | — | 0.36 | % | ||||||||||||
| Class A With Maximum Sales Charge | 4.15 | % | 0.15 | % | — | (0.27 | )% | ||||||||||||
| Class B Without CDSC | 9.71 | % | 0.60 | % | — | (0.39 | )% | ||||||||||||
| Class B With CDSC | 5.71 | % | 0.60 | % | — | (0.39 | )% | ||||||||||||
| Class C Without CDSC | 9.75 | % | 0.60 | % | — | (0.41 | )% | ||||||||||||
| Class C With CDSC | 8.75 | % | 0.60 | % | — | (0.41 | )% | ||||||||||||
Returns represent past performance and include change in share price and reinvestment of dividends and capital gains. Past performance cannot guarantee future results. The current performance of the Fund may be lower or higher than the figures shown. Returns and share price will fluctuate, and redemption value may be more or less than original cost. The performance results do not reflect the deduction of taxes that a shareholder would pay on fund distributions or the redemption of fund shares. Performance information current to the most recent month-end is available at www.credit-suisse.com/us.
The annualized gross expense ratios are 0.95% for Common Class shares, 1.40% for Class A shares, 2.14% for Class B shares and 2.18% for Class C shares. The annualized net expense ratios after fee waivers and/or expense reimbursements are 0.95% for Common Class shares, 1.30% for Class A shares, 2.04% for Class B shares and 2.03% for Class C shares.
1 Fee waivers and/or expense reimbursements may reduce expenses for the Fund, without which performance would be lower. Waivers and/or reimbursements may be discontinued at any time.
2 Total return for the Fund's Class A shares for the reporting period, based on offering price (including maximum sales charge of 5.75%), was 4.15%. Total return for the Fund's Class B shares for the reporting period, based on redemption value (including maximum contingent deferred sales charge of 4.00%), was 5.71%. Total return for the Fund's Class C shares for the reporting period, based on redemption value (including maximum contingent deferred sales charge of 1.00%), was 8.75%.
3 The Standard & Poor's 500 Index is an unmanaged index (with no defined investment objective) of common stocks, includes reinvestment of dividends, and is a registered trademark of The McGraw-Hill Companies, Inc. Investors cannot invest directly in an index.
4 Performance for the benchmark is not available for the period beginning July 31, 2001. For that reason, performance for the benchmark is shown for the period beginning August 1, 2001.
5 Inception date 10/30/98.
4
Credit Suisse Large Cap Blend Fund, Inc.
Annual Investment Adviser's Report (continued)
December 31, 2010 (unaudited)
Information About Your Fund's Expenses
As an investor of the Fund, you incur two types of costs: ongoing expenses and transaction costs. Ongoing expenses include management fees, distribution and service (12b-1) fees and other Fund expenses. Examples of transaction costs include sales charges (loads), redemption fees and account maintenance fees, which are not shown in this section and which would result in higher total expenses. The following table is intended to help you understand your ongoing expenses of investing in the Fund and to help you compare these expenses with the ongoing expenses of investing in other mutual funds. The table is based on an investment of $1,000 made at the beginning of the six month period ended December 31, 2010.
The table illustrates your Fund's expenses in two ways:
• Actual Fund Return. This helps you estimate the actual dollar amount of ongoing expenses paid on a $1,000 investment in the Fund using the Fund's actual return during the period. To estimate the expenses you paid over the period, simply divide your account value by $1,000 (for example, an $8,600 account value divided by $1,000 = 8.6), then multiply the result by the number in the "Expenses Paid per $1,000" line under the share class you hold.
• Hypothetical 5% Fund Return. This helps you to compare your Fund's ongoing expenses with those of other mutual funds using the Fund's actual expense ratio and a hypothetical rate of return of 5% per year before expenses. Examples using a 5% hypothetical fund return may be found in the shareholder reports of other mutual funds. The hypothetical account values and expenses may not be used to estimate the actual ending account balance or expenses you paid for the period.
Please note that the expenses shown in these tables are meant to highlight your ongoing expenses only and do not reflect any transaction costs, such as sales charges (loads) or redemption fees. If these transaction costs had been included, your costs would have been higher. The "Expenses Paid per $1,000" line of the tables is useful in comparing ongoing expenses only and will not help you determine the relative total expenses of owning different funds.
5
Credit Suisse Large Cap Blend Fund, Inc.
Annual Investment Adviser's Report (continued)
December 31, 2010 (unaudited)
Expenses and Value for a $1,000 Investment
for the six month period ended December 31, 2010
| Actual Fund Return | Common Class | Class A | Class B | Class C | |||||||||||||||
| Beginning Account Value 7/1/10 | $ | 1,000.00 | $ | 1,000.00 | $ | 1,000.00 | $ | 1,000.00 | |||||||||||
| Ending Account Value 12/31/10 | $ | 1,201.10 | $ | 1,200.40 | $ | 1,196.50 | $ | 1,197.20 | |||||||||||
| Expenses Paid per $1,000* | $ | 5.22 | $ | 7.21 | $ | 11.29 | $ | 11.19 | |||||||||||
| Hypothetical 5% Fund Return | |||||||||||||||||||
| Beginning Account Value 7/1/10 | $ | 1,000.00 | $ | 1,000.00 | $ | 1,000.00 | $ | 1,000.00 | |||||||||||
| Ending Account Value 12/31/10 | $ | 1,020.47 | $ | 1,018.65 | $ | 1,014.92 | $ | 1,015.02 | |||||||||||
| Expenses Paid per $1,000* | $ | 4.79 | $ | 6.61 | $ | 10.36 | $ | 10.26 | |||||||||||
| Common Class | Class A | Class B | Class C | ||||||||||||||||
| Annualized Expense Ratios* | 0.94 | % | 1.30 | % | 2.04 | % | 2.02 | % | |||||||||||
* Expenses are equal to the Fund's annualized expense ratio for each share class, multiplied by the average account value over the period, multiplied by the number of days in the most recent fiscal half year period, then divided by 365.
The "Expenses Paid per $1,000" and the "Annualized Expense Ratios" in the tables are based on actual expenses paid by the Fund during the period, net of fee waivers and/or expense reimbursements. If those fee waivers and/or expense reimbursements had not been in effect, the Fund's actual expenses would have been higher.
For more information, please refer to the Fund's prospectus.
6
Credit Suisse Large Cap Blend Fund, Inc.
Annual Investment Adviser's Report (continued)
December 31, 2010 (unaudited)
SECTOR BREAKDOWN*
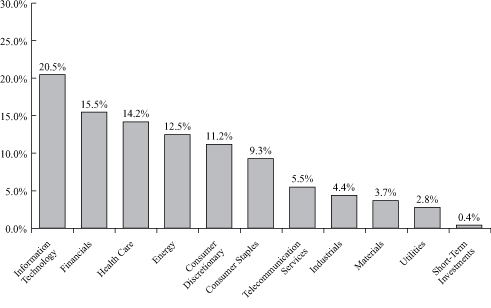
* Expressed as a percentage of total investments (excluding securities lending collateral if applicable) and may vary over time.
7
Credit Suisse Large Cap Blend Fund, Inc.
Schedule of Investments
December 31, 2010
| Number of Shares | Value | ||||||||||
| COMMON STOCKS (99.8%) | |||||||||||
| Aerospace & Defense (0.5%) | |||||||||||
| General Dynamics Corp. | 2,700 | $ | 191,592 | ||||||||
| Goodrich Corp. | 800 | 70,456 | |||||||||
| Honeywell International, Inc. | 2,400 | 127,584 | |||||||||
| ITT Corp. | 1,800 | 93,798 | |||||||||
| L-3 Communications Holdings, Inc. | 900 | 63,441 | |||||||||
| Lockheed Martin Corp. | 2,200 | 153,802 | |||||||||
| Northrop Grumman Corp. | 2,200 | 142,516 | |||||||||
| Precision Castparts Corp. | 400 | 55,684 | |||||||||
| Raytheon Co. | 2,900 | 134,386 | |||||||||
| Rockwell Collins, Inc. | 800 | 46,608 | |||||||||
| The Boeing Co. | 3,100 | 202,306 | |||||||||
| United Technologies Corp. | 3,300 | 259,776 | |||||||||
| 1,541,949 | |||||||||||
| Air Freight & Logistics (0.3%) | |||||||||||
| CH Robinson Worldwide, Inc.§ | 1,200 | 96,228 | |||||||||
| Expeditors International of Washington, Inc. | 1,500 | 81,900 | |||||||||
| FedEx Corp. | 2,400 | 223,224 | |||||||||
| United Parcel Service, Inc. Class B | 7,200 | 522,576 | |||||||||
| 923,928 | |||||||||||
| Airlines (0.1%) | |||||||||||
| AirTran Holdings, Inc.* | 12,500 | 92,375 | |||||||||
| Delta Air Lines, Inc.* | 20,100 | 253,260 | |||||||||
| Southwest Airlines Co. | 6,100 | 79,178 | |||||||||
| 424,813 | |||||||||||
| Auto Components (0.0%) | |||||||||||
| Johnson Controls, Inc. | 2,600 | 99,320 | |||||||||
| Automobiles (2.3%) | |||||||||||
| Ford Motor Co.* | 444,100 | 7,456,439 | |||||||||
| Harley-Davidson, Inc. | 1,800 | 62,406 | |||||||||
| 7,518,845 | |||||||||||
| Beverages (1.9%) | |||||||||||
| Brown-Forman Corp. Class B | 1,600 | 111,392 | |||||||||
| Dr. Pepper Snapple Group, Inc. | 119,700 | 4,208,652 | |||||||||
| Molson Coors Brewing Co. Class B | 1,000 | 50,190 | |||||||||
| PepsiCo, Inc. | 11,588 | 757,044 | |||||||||
| The Coca-Cola Co. | 16,400 | 1,078,628 | |||||||||
| 6,205,906 | |||||||||||
| Biotechnology (3.0%) | |||||||||||
| Alexion Pharmaceuticals, Inc.* | 1,100 | 88,605 | |||||||||
| Amgen, Inc.* | 53,908 | 2,959,549 | |||||||||
| Biogen Idec, Inc.* | 7,700 | 516,285 | |||||||||
| Celgene Corp.* | 5,650 | 334,141 | |||||||||
| Cephalon, Inc.* | 34,239 | 2,113,231 | |||||||||
| Dendreon Corp.* | 1,200 | 41,904 | |||||||||
| Genzyme Corp.* | 4,300 | 306,160 | |||||||||
| Gilead Sciences, Inc.* | 85,300 | 3,091,272 | |||||||||
| United Therapeutics Corp.* | 4,700 | 297,134 | |||||||||
| 9,748,281 | |||||||||||
See Accompanying Notes to Financial Statements.
8
Credit Suisse Large Cap Blend Fund, Inc.
Schedule of Investments (continued)
December 31, 2010
| Number of Shares | Value | ||||||||||
| COMMON STOCKS | |||||||||||
| Capital Markets (3.9%) | |||||||||||
| Ameriprise Financial, Inc. | 177,800 | $ | 10,232,390 | ||||||||
| Federated Investors, Inc. Class B§ | 2,800 | 73,276 | |||||||||
| Franklin Resources, Inc. | 1,100 | 122,331 | |||||||||
| Invesco, Ltd. | 2,400 | 57,744 | |||||||||
| Legg Mason, Inc. | 1,300 | 47,151 | |||||||||
| Morgan Stanley | 10,000 | 272,100 | |||||||||
| Northern Trust Corp. | 1,500 | 83,115 | |||||||||
| State Street Corp. | 3,700 | 171,458 | |||||||||
| T. Rowe Price Group, Inc. | 2,000 | 129,080 | |||||||||
| The Bank of New York Mellon Corp. | 9,100 | 274,820 | |||||||||
| The Charles Schwab Corp. | 8,200 | 140,302 | |||||||||
| The Goldman Sachs Group, Inc. | 3,950 | 664,232 | |||||||||
| Waddell & Reed Financial, Inc. Class A | 14,942 | 527,303 | |||||||||
| 12,795,302 | |||||||||||
| Chemicals (1.5%) | |||||||||||
| Air Products & Chemicals, Inc. | 600 | 54,570 | |||||||||
| CF Industries Holdings, Inc. | 500 | 67,575 | |||||||||
| E.I. Du Pont de Nemours & Co. | 10,200 | 508,776 | |||||||||
| Eastman Chemical Co. | 550 | 46,244 | |||||||||
| Ecolab, Inc. | 1,700 | 85,714 | |||||||||
| International Flavors & Fragrances, Inc. | 856 | 47,585 | |||||||||
| Lubrizol Corp. | 31,453 | 3,361,697 | |||||||||
| Monsanto Co. | 1,500 | 104,460 | |||||||||
| PPG Industries, Inc. | 1,400 | 117,698 | |||||||||
| Praxair, Inc. | 900 | 85,923 | |||||||||
| Sigma-Aldrich Corp. | 900 | 59,904 | |||||||||
| The Dow Chemical Co. | 8,500 | 290,190 | |||||||||
| 4,830,336 | |||||||||||
| Commercial Banks (1.3%) | |||||||||||
| BB&T Corp. | 4,900 | 128,821 | |||||||||
| Comerica, Inc. | 1,400 | 59,136 | |||||||||
| Commerce Bancshares, Inc. | 2,220 | 88,189 | |||||||||
| Cullen/Frost Bankers, Inc. | 1,791 | 109,466 | |||||||||
| Fifth Third Bancorp | 21,400 | 314,152 | |||||||||
| Huntington Bancshares, Inc. | 9,500 | 65,265 | |||||||||
| KeyCorp | 7,800 | 69,030 | |||||||||
| M&T Bank Corp. | 13,900 | 1,209,995 | |||||||||
| PNC Financial Services Group, Inc. | 3,900 | 236,808 | |||||||||
| Popular, Inc.* | 18,100 | 56,834 | |||||||||
| Regions Financial Corp. | 9,900 | 69,300 | |||||||||
| SunTrust Banks, Inc.§ | 3,800 | 112,138 | |||||||||
| Synovus Financial Corp. | 77,600 | 204,864 | |||||||||
| U.S. Bancorp | 14,400 | 388,368 | |||||||||
| Wells Fargo & Co. | 39,600 | 1,227,204 | |||||||||
| 4,339,570 | |||||||||||
See Accompanying Notes to Financial Statements.
9
Credit Suisse Large Cap Blend Fund, Inc.
Schedule of Investments (continued)
December 31, 2010
| Number of Shares | Value | ||||||||||
| COMMON STOCKS | |||||||||||
| Commercial Services & Supplies (0.1%) | |||||||||||
| Republic Services, Inc. | 1,900 | $ | 56,734 | ||||||||
| Stericycle, Inc.* | 600 | 48,552 | |||||||||
| Waste Management, Inc. | 3,600 | 132,732 | |||||||||
| 238,018 | |||||||||||
| Communications Equipment (0.6%) | |||||||||||
| Cisco Systems, Inc.* | 42,500 | 859,775 | |||||||||
| Harris Corp. | 1,100 | 49,830 | |||||||||
| Juniper Networks, Inc.* | 4,300 | 158,756 | |||||||||
| Motorola, Inc.* | 18,700 | 169,609 | |||||||||
| Polycom, Inc.* | 2,500 | 97,450 | |||||||||
| QUALCOMM, Inc. | 8,900 | 440,461 | |||||||||
| Unity Wireless Corp.* | 712,201 | 356 | |||||||||
| 1,776,237 | |||||||||||
| Computers & Peripherals (4.8%) | |||||||||||
| Apple, Inc.* | 39,500 | 12,741,120 | |||||||||
| Dell, Inc.* | 5,500 | 74,525 | |||||||||
| EMC Corp.* | 20,400 | 467,160 | |||||||||
| Hewlett-Packard Co. | 15,600 | 656,760 | |||||||||
| Lexmark International, Inc. Class A* | 43,600 | 1,518,152 | |||||||||
| NetApp, Inc.* | 2,600 | 142,896 | |||||||||
| SanDisk Corp.* | 1,800 | 89,748 | |||||||||
| Western Digital Corp.* | 2,199 | 74,546 | |||||||||
| 15,764,907 | |||||||||||
| Construction & Engineering (0.0%) | |||||||||||
| Fluor Corp. | 1,269 | 84,084 | |||||||||
| Construction Materials (0.0%) | |||||||||||
| Vulcan Materials Co. | 1,100 | 48,796 | |||||||||
| Consumer Finance (2.1%) | |||||||||||
| American Express Co. | 8,300 | 356,236 | |||||||||
| Capital One Financial Corp. | 148,500 | 6,320,160 | |||||||||
| Discover Financial Services | 4,000 | 74,120 | |||||||||
| 6,750,516 | |||||||||||
| Distributors (0.0%) | |||||||||||
| Genuine Parts Co. | 1,300 | 66,742 | |||||||||
| Diversified Consumer Services (1.1%) | |||||||||||
| Career Education Corp.* | 14,324 | 296,937 | |||||||||
| DeVry, Inc. | 64,677 | 3,103,202 | |||||||||
| ITT Educational Services, Inc.* | 1,300 | 82,797 | |||||||||
| Strayer Education, Inc. | 600 | 91,332 | |||||||||
| 3,574,268 | |||||||||||
See Accompanying Notes to Financial Statements.
10
Credit Suisse Large Cap Blend Fund, Inc.
Schedule of Investments (continued)
December 31, 2010
| Number of Shares | Value | ||||||||||
| COMMON STOCKS | |||||||||||
| Diversified Financial Services (2.5%) | |||||||||||
| Bank of America Corp. | 75,594 | $ | 1,008,424 | ||||||||
| Citigroup, Inc.* | 609,600 | 2,883,408 | |||||||||
| CME Group, Inc. | 600 | 193,050 | |||||||||
| IntercontinentalExchange, Inc.* | 500 | 59,575 | |||||||||
| JPMorgan Chase & Co. | 79,500 | 3,372,390 | |||||||||
| Moody's Corp.§ | 26,400 | 700,656 | |||||||||
| NYSE Euronext | 1,600 | 47,968 | |||||||||
| 8,265,471 | |||||||||||
| Diversified Telecommunication Services (5.4%) | |||||||||||
| AT&T, Inc. | 506,005 | 14,866,427 | |||||||||
| CenturyTel, Inc. | 2,600 | 120,042 | |||||||||
| Cincinnati Bell, Inc.* | 21,300 | 59,640 | |||||||||
| Frontier Communications Corp. | 7,892 | 76,789 | |||||||||
| Qwest Communications International, Inc. | 50,600 | 385,066 | |||||||||
| Verizon Communications, Inc. | 54,700 | 1,957,166 | |||||||||
| 17,465,130 | |||||||||||
| Electric Utilities (0.4%) | |||||||||||
| American Electric Power Co., Inc. | 3,600 | 129,528 | |||||||||
| Duke Energy Corp. | 10,500 | 187,005 | |||||||||
| Edison International | 2,500 | 96,500 | |||||||||
| Entergy Corp. | 1,400 | 99,162 | |||||||||
| Exelon Corp. | 5,100 | 212,364 | |||||||||
| FirstEnergy Corp. | 2,800 | 103,656 | |||||||||
| NextEra Energy, Inc. | 3,200 | 166,368 | |||||||||
| PPL Corp. | 3,500 | 92,120 | |||||||||
| Progress Energy, Inc. | 1,900 | 82,612 | |||||||||
| Southern Co. | 6,000 | 229,380 | |||||||||
| 1,398,695 | |||||||||||
| Electrical Equipment (0.1%) | |||||||||||
| Emerson Electric Co. | 2,400 | 137,208 | |||||||||
| Rockwell Automation, Inc. | 1,100 | 78,881 | |||||||||
| Roper Industries, Inc. | 700 | 53,501 | |||||||||
| 269,590 | |||||||||||
| Electronic Equipment, Instruments & Components (0.1%) | |||||||||||
| Amphenol Corp. Class A | 1,300 | 68,614 | |||||||||
| Corning, Inc. | 12,100 | 233,772 | |||||||||
| Dolby Laboratories, Inc. Class A* | 1,500 | 100,050 | |||||||||
| 402,436 | |||||||||||
See Accompanying Notes to Financial Statements.
11
Credit Suisse Large Cap Blend Fund, Inc.
Schedule of Investments (continued)
December 31, 2010
| Number of Shares | Value | ||||||||||
| COMMON STOCKS | |||||||||||
| Energy Equipment & Services (0.5%) | |||||||||||
| Baker Hughes, Inc. | 2,680 | $ | 153,216 | ||||||||
| Cameron International Corp.* | 1,200 | 60,876 | |||||||||
| Diamond Offshore Drilling, Inc. | 2,100 | 140,427 | |||||||||
| Halliburton Co. | 2,900 | 118,407 | |||||||||
| National-Oilwell Varco, Inc. | 3,200 | 215,200 | |||||||||
| Schlumberger, Ltd. | 10,253 | 856,125 | |||||||||
| 1,544,251 | |||||||||||
| Food & Staples Retailing (0.5%) | |||||||||||
| Costco Wholesale Corp. | 1,400 | 101,094 | |||||||||
| CVS Caremark Corp. | 9,400 | 326,838 | |||||||||
| Safeway, Inc. | 2,621 | 58,946 | |||||||||
| Sysco Corp. | 4,400 | 129,360 | |||||||||
| The Kroger Co. | 4,600 | 102,856 | |||||||||
| Wal-Mart Stores, Inc. | 14,700 | 792,771 | |||||||||
| Walgreen Co. | 3,300 | 128,568 | |||||||||
| 1,640,433 | |||||||||||
| Food Products (1.4%) | |||||||||||
| Archer-Daniels-Midland Co. | 4,460 | 134,157 | |||||||||
| ConAgra Foods, Inc. | 3,900 | 88,062 | |||||||||
| General Mills, Inc. | 4,900 | 174,391 | |||||||||
| H.J. Heinz Co. | 1,870 | 92,490 | |||||||||
| Kellogg Co. | 1,900 | 97,052 | |||||||||
| Kraft Foods, Inc. Class A | 12,200 | 384,422 | |||||||||
| Mead Johnson Nutrition Co. | 1,503 | 93,562 | |||||||||
| Sara Lee Corp. | 6,200 | 108,562 | |||||||||
| The Hershey Co. | 1,310 | 61,766 | |||||||||
| The J.M. Smucker Co. | 900 | 59,085 | |||||||||
| Tyson Foods, Inc. Class A | 194,200 | 3,344,124 | |||||||||
| 4,637,673 | |||||||||||
| Gas Utilities (0.0%) | |||||||||||
| ONEOK, Inc. | 1,000 | 55,470 | |||||||||
| Health Care Equipment & Supplies (0.3%) | |||||||||||
| Baxter International, Inc. | 2,200 | 111,364 | |||||||||
| Becton, Dickinson and Co. | 1,800 | 152,136 | |||||||||
| Boston Scientific Corp.* | 11,735 | 88,834 | |||||||||
| CareFusion Corp.* | 2,800 | 71,960 | |||||||||
| CR Bard, Inc. | 700 | 64,239 | |||||||||
| Medtronic, Inc. | 8,465 | 313,967 | |||||||||
| St. Jude Medical, Inc.* | 2,500 | 106,875 | |||||||||
| Stryker Corp. | 1,000 | 53,700 | |||||||||
| Varian Medical Systems, Inc.* | 900 | 62,352 | |||||||||
| Zimmer Holdings, Inc.* | 1,400 | 75,152 | |||||||||
| 1,100,579 | |||||||||||
See Accompanying Notes to Financial Statements.
12
Credit Suisse Large Cap Blend Fund, Inc.
Schedule of Investments (continued)
December 31, 2010
| Number of Shares | Value | ||||||||||
| COMMON STOCKS | |||||||||||
| Health Care Providers & Services (4.0%) | |||||||||||
| Aetna, Inc. | 3,400 | $ | 103,734 | ||||||||
| AmerisourceBergen Corp. | 2,100 | 71,652 | |||||||||
| Cardinal Health, Inc. | 2,700 | 103,437 | |||||||||
| CIGNA Corp. | 2,200 | 80,652 | |||||||||
| DaVita, Inc.* | 700 | 48,643 | |||||||||
| Express Scripts, Inc.* | 21,300 | 1,151,265 | |||||||||
| Humana, Inc.* | 159,100 | 8,709,134 | |||||||||
| Laboratory Corp. of America Holdings* | 800 | 70,336 | |||||||||
| McKesson Corp. | 2,100 | 147,798 | |||||||||
| Medco Health Solutions, Inc.* | 1,400 | 85,778 | |||||||||
| Quest Diagnostics, Inc. | 1,100 | 59,367 | |||||||||
| Tenet Healthcare Corp.* | 14,800 | 99,012 | |||||||||
| UnitedHealth Group, Inc. | 63,200 | 2,282,152 | |||||||||
| WellPoint, Inc.* | 3,128 | 177,858 | |||||||||
| 13,190,818 | |||||||||||
| Hotels, Restaurants & Leisure (0.4%) | |||||||||||
| Carnival Corp. | 3,300 | 152,163 | |||||||||
| Darden Restaurants, Inc. | 921 | 42,771 | |||||||||
| Marriott International, Inc. Class A§ | 2,100 | 87,234 | |||||||||
| McDonald's Corp. | 7,850 | 602,566 | |||||||||
| Starbucks Corp. | 2,400 | 77,112 | |||||||||
| Starwood Hotels & Resorts Worldwide, Inc. | 1,400 | 85,092 | |||||||||
| Wynn Resorts, Ltd. | 500 | 51,920 | |||||||||
| Yum! Brands, Inc. | 1,400 | 68,670 | |||||||||
| 1,167,528 | |||||||||||
| Household Durables (1.1%) | |||||||||||
| Fortune Brands, Inc.§ | 900 | 54,225 | |||||||||
| Harman International Industries, Inc.* | 30,900 | 1,430,670 | |||||||||
| Newell Rubbermaid, Inc. | 4,000 | 72,720 | |||||||||
| Stanley Black & Decker, Inc. | 1,210 | 80,913 | |||||||||
| Whirlpool Corp. | 23,000 | 2,043,090 | |||||||||
| 3,681,618 | |||||||||||
| Household Products (0.5%) | |||||||||||
| Clorox Co. | 1,066 | 67,456 | |||||||||
| Colgate-Palmolive Co. | 1,900 | 152,703 | |||||||||
| Kimberly-Clark Corp. | 1,900 | 119,776 | |||||||||
| The Procter & Gamble Co. | 20,100 | 1,293,033 | |||||||||
| 1,632,968 | |||||||||||
| Independent Power Producers & Energy Traders (1.5%) | |||||||||||
| Constellation Energy Group, Inc. | 160,300 | 4,909,989 | |||||||||
| The AES Corp.* | 4,100 | 49,938 | |||||||||
| 4,959,927 | |||||||||||
See Accompanying Notes to Financial Statements.
13
Credit Suisse Large Cap Blend Fund, Inc.
Schedule of Investments (continued)
December 31, 2010
| Number of Shares | Value | ||||||||||
| COMMON STOCKS | |||||||||||
| Industrial Conglomerates (0.6%) | |||||||||||
| 3M Co. | 5,300 | $ | 457,390 | ||||||||
| General Electric Co. | 75,400 | 1,379,066 | |||||||||
| Tyco International, Ltd.* | 3,427 | 142,015 | |||||||||
| 1,978,471 | |||||||||||
| Insurance (5.4%) | |||||||||||
| ACE, Ltd. | 2,400 | 149,400 | |||||||||
| Aflac, Inc. | 5,200 | 293,436 | |||||||||
| American International Group, Inc.* | 4,100 | 236,242 | |||||||||
| AON Corp. | 2,500 | 115,025 | |||||||||
| Berkshire Hathaway, Inc. Class B* | 162,298 | 13,001,693 | |||||||||
| Chubb Corp. | 3,000 | 178,920 | |||||||||
| First American Financial Corp. | 7,100 | 106,074 | |||||||||
| Genworth Financial, Inc. Class A* | 3,900 | 51,246 | |||||||||
| Hartford Financial Services Group, Inc. | 3,200 | 84,768 | |||||||||
| Lincoln National Corp. | 2,000 | 55,620 | |||||||||
| Loews Corp. | 2,426 | 94,395 | |||||||||
| Marsh & McLennan Cos., Inc. | 4,300 | 117,562 | |||||||||
| MetLife, Inc. | 4,200 | 186,648 | |||||||||
| Principal Financial Group, Inc. | 2,600 | 84,656 | |||||||||
| Prudential Financial, Inc. | 3,700 | 217,227 | |||||||||
| The Allstate Corp. | 4,000 | 127,520 | |||||||||
| The Progressive Corp. | 5,400 | 107,298 | |||||||||
| The Travelers Cos., Inc. | 40,100 | 2,233,971 | |||||||||
| Unum Group | 3,400 | 82,348 | |||||||||
| XL Group PLC | 3,400 | 74,188 | |||||||||
| 17,598,237 | |||||||||||
| Internet & Catalog Retail (1.4%) | |||||||||||
| Amazon.com, Inc.* | 5,100 | 918,000 | |||||||||
| Expedia, Inc. | 144,000 | 3,612,960 | |||||||||
| priceline.com, Inc.* | 300 | 119,865 | |||||||||
| 4,650,825 | |||||||||||
| Internet Software & Services (4.7%) | |||||||||||
| Akamai Technologies, Inc.* | 1,300 | 61,165 | |||||||||
| eBay, Inc.* | 42,300 | 1,177,209 | |||||||||
| Google, Inc. Class A* | 23,600 | 14,017,692 | |||||||||
| Yahoo!, Inc.* | 9,400 | 156,322 | |||||||||
| 15,412,388 | |||||||||||
| IT Services (0.7%) | |||||||||||
| Automatic Data Processing, Inc. | 1,600 | 74,048 | |||||||||
| Cognizant Technology Solutions Corp. Class A* | 900 | 65,961 | |||||||||
| Computer Sciences Corp. | 1,300 | 64,480 | |||||||||
| Fidelity National Information Services, Inc. | 1,700 | 46,563 | |||||||||
| International Business Machines Corp. | 9,050 | 1,328,178 | |||||||||
| Mastercard, Inc. Class A | 800 | 179,288 | |||||||||
| Paychex, Inc. | 2,400 | 74,184 | |||||||||
| The Western Union Co. | 5,000 | 92,850 | |||||||||
| Visa, Inc. Class A | 3,800 | 267,444 | |||||||||
| 2,192,996 | |||||||||||
See Accompanying Notes to Financial Statements.
14
Credit Suisse Large Cap Blend Fund, Inc.
Schedule of Investments (continued)
December 31, 2010
| Number of Shares | Value | ||||||||||
| COMMON STOCKS | |||||||||||
| Leisure Equipment & Products (0.0%) | |||||||||||
| Mattel, Inc. | 2,100 | $ | 53,403 | ||||||||
| Life Sciences Tools & Services (0.3%) | |||||||||||
| Agilent Technologies, Inc.* | 2,600 | 107,718 | |||||||||
| Charles River Laboratories International, Inc.* | 6,700 | 238,118 | |||||||||
| Life Technologies Corp.* | 1,575 | 87,413 | |||||||||
| Techne Corp. | 3,600 | 236,412 | |||||||||
| Thermo Fisher Scientific, Inc.* | 3,100 | 171,616 | |||||||||
| 841,277 | |||||||||||
| Machinery (2.5%) | |||||||||||
| Caterpillar, Inc. | 30,200 | 2,828,532 | |||||||||
| Cummins, Inc. | 1,400 | 154,014 | |||||||||
| Danaher Corp. | 1,800 | 84,906 | |||||||||
| Deere & Co. | 3,400 | 282,370 | |||||||||
| Dover Corp. | 60,600 | 3,542,070 | |||||||||
| Eaton Corp. | 9,900 | 1,004,949 | |||||||||
| Illinois Tool Works, Inc. | 1,300 | 69,420 | |||||||||
| Lincoln Electric Holdings, Inc. | 1,200 | 78,324 | |||||||||
| PACCAR, Inc.§ | 1,100 | 63,162 | |||||||||
| Parker Hannifin Corp. | 1,000 | 86,300 | |||||||||
| 8,194,047 | |||||||||||
| Media (2.7%) | |||||||||||
| CBS Corp. Class B | 5,400 | 102,870 | |||||||||
| Comcast Corp. Class A | 20,600 | 452,582 | |||||||||
| DIRECTV Class A* | 4,100 | 163,713 | |||||||||
| Discovery Communications, Inc. Class A*§ | 2,100 | 87,570 | |||||||||
| News Corp. Class A | 397,900 | 5,793,424 | |||||||||
| Omnicom Group, Inc. | 2,300 | 105,340 | |||||||||
| The Interpublic Group of Cos., Inc.* | 5,600 | 59,472 | |||||||||
| The McGraw-Hill Cos., Inc. | 1,573 | 57,273 | |||||||||
| The Walt Disney Co. | 14,349 | 538,231 | |||||||||
| The Washington Post Co. Class B | 1,603 | 704,518 | |||||||||
| Time Warner Cable, Inc. | 2,800 | 184,884 | |||||||||
| Time Warner, Inc. | 8,600 | 276,662 | |||||||||
| Viacom, Inc. Class B | 3,900 | 154,479 | |||||||||
| 8,681,018 | |||||||||||
| Metals & Mining (2.2%) | |||||||||||
| Alcoa, Inc. | 7,700 | 118,503 | |||||||||
| Cliffs Natural Resources, Inc. | 900 | 70,209 | |||||||||
| Freeport-McMoRan Copper & Gold, Inc. | 6,000 | 720,540 | |||||||||
| Newmont Mining Corp. | 97,700 | 6,001,711 | |||||||||
| Nucor Corp. | 1,800 | 78,876 | |||||||||
| United States Steel Corp. | 1,100 | 64,262 | |||||||||
| 7,054,101 | |||||||||||
See Accompanying Notes to Financial Statements.
15
Credit Suisse Large Cap Blend Fund, Inc.
Schedule of Investments (continued)
December 31, 2010
| Number of Shares | Value | ||||||||||
| COMMON STOCKS | |||||||||||
| Multi-Utilities (0.9%) | |||||||||||
| Ameren Corp. | 1,700 | $ | 47,923 | ||||||||
| Consolidated Edison, Inc. | 2,100 | 104,097 | |||||||||
| Dominion Resources, Inc. | 4,400 | 187,968 | |||||||||
| DTE Energy Co. | 25,600 | 1,160,192 | |||||||||
| Integrys Energy Group, Inc. | 13,600 | 659,736 | |||||||||
| NSTAR | 3,758 | 158,550 | |||||||||
| PG&E Corp. | 2,800 | 133,952 | |||||||||
| Public Service Enterprise Group, Inc. | 3,784 | 120,369 | |||||||||
| Sempra Energy | 1,821 | 95,566 | |||||||||
| Wisconsin Energy Corp. | 900 | 52,974 | |||||||||
| Xcel Energy, Inc. | 3,400 | 80,070 | |||||||||
| 2,801,397 | |||||||||||
| Multiline Retail (0.4%) | |||||||||||
| Big Lots, Inc.* | 19,000 | 578,740 | |||||||||
| Dollar Tree, Inc.* | 3,400 | 190,672 | |||||||||
| Family Dollar Stores, Inc. | 1,100 | 54,681 | |||||||||
| J.C. Penney Co., Inc. | 1,700 | 54,927 | |||||||||
| Kohl's Corp.* | 2,300 | 124,982 | |||||||||
| Macy's, Inc. | 2,800 | 70,840 | |||||||||
| Sears Holdings Corp.*§ | 1,200 | 88,500 | |||||||||
| Target Corp. | 2,444 | 146,958 | |||||||||
| 1,310,300 | |||||||||||
| Office Electronics (0.0%) | |||||||||||
| Xerox Corp. | 11,061 | 127,423 | |||||||||
| Oil, Gas & Consumable Fuels (12.1%) | |||||||||||
| Anadarko Petroleum Corp. | 3,600 | 274,176 | |||||||||
| Apache Corp. | 2,700 | 321,921 | |||||||||
| Arch Coal, Inc. | 4,800 | 168,288 | |||||||||
| Chesapeake Energy Corp. | 4,700 | 121,777 | |||||||||
| Chevron Corp. | 166,600 | 15,202,250 | |||||||||
| ConocoPhillips | 114,500 | 7,797,450 | |||||||||
| Consol Energy, Inc. | 1,300 | 63,362 | |||||||||
| Denbury Resources, Inc.* | 3,147 | 60,076 | |||||||||
| Devon Energy Corp. | 3,400 | 266,934 | |||||||||
| El Paso Corp. | 4,800 | 66,048 | |||||||||
| EOG Resources, Inc. | 800 | 73,128 | |||||||||
| Exxon Mobil Corp. | 81,327 | 5,946,630 | |||||||||
| Hess Corp. | 93,822 | 7,181,136 | |||||||||
| Marathon Oil Corp. | 6,400 | 236,992 | |||||||||
| Murphy Oil Corp. | 1,300 | 96,915 | |||||||||
| Noble Energy, Inc. | 1,200 | 103,296 | |||||||||
| Occidental Petroleum Corp. | 6,200 | 608,220 | |||||||||
| Peabody Energy Corp. | 2,000 | 127,960 | |||||||||
| Pioneer Natural Resources Co. | 900 | 78,138 | |||||||||
| QEP Resources, Inc. | 1,400 | 50,834 | |||||||||
| Range Resources Corp. | 1,200 | 53,976 | |||||||||
| Southwestern Energy Co.* | 2,600 | 97,318 | |||||||||
| Spectra Energy Corp. | 4,700 | 117,453 | |||||||||
| The Williams Cos., Inc. | 3,800 | 93,936 | |||||||||
| Valero Energy Corp. | 4,737 | 109,520 | |||||||||
| 39,317,734 | |||||||||||
See Accompanying Notes to Financial Statements.
16
Credit Suisse Large Cap Blend Fund, Inc.
Schedule of Investments (continued)
December 31, 2010
| Number of Shares | Value | ||||||||||
| COMMON STOCKS | |||||||||||
| Paper & Forest Products (0.0%) | |||||||||||
| International Paper Co. | 3,200 | $ | 87,168 | ||||||||
| Personal Products (1.1%) | |||||||||||
| Alberto-Culver Co. | 3,300 | 122,232 | |||||||||
| Avon Products, Inc. | 3,100 | 90,086 | |||||||||
| The Estee Lauder Cos., Inc. Class A | 41,200 | 3,324,840 | |||||||||
| 3,537,158 | |||||||||||
| Pharmaceuticals (6.7%) | |||||||||||
| Abbott Laboratories | 89,300 | 4,278,363 | |||||||||
| Allergan, Inc. | 1,000 | 68,670 | |||||||||
| Bristol-Myers Squibb Co. | 13,336 | 353,137 | |||||||||
| Eli Lilly & Co. | 306,200 | 10,729,248 | |||||||||
| Endo Pharmaceuticals Holdings, Inc.* | 41,535 | 1,483,215 | |||||||||
| Forest Laboratories, Inc.* | 2,600 | 83,148 | |||||||||
| Hospira, Inc.* | 10,178 | 566,813 | |||||||||
| Johnson & Johnson | 20,150 | 1,246,277 | |||||||||
| King Pharmaceuticals, Inc.* | 66,400 | 932,920 | |||||||||
| Merck & Co., Inc. | 21,147 | 762,138 | |||||||||
| Pfizer, Inc. | 58,707 | 1,027,960 | |||||||||
| Teva Pharmaceutical Industries, Ltd. ADR | 3,022 | 157,537 | |||||||||
| 21,689,426 | |||||||||||
| Real Estate Investment Trusts (0.3%) | |||||||||||
| AvalonBay Communities, Inc. | 531 | 59,764 | |||||||||
| Boston Properties, Inc.§ | 1,000 | 86,100 | |||||||||
| Cousins Properties, Inc. | 16 | 133 | |||||||||
| Equity Residential | 2,100 | 109,095 | |||||||||
| HCP, Inc. | 2,200 | 80,938 | |||||||||
| Host Hotels & Resorts, Inc. | 4,514 | 80,665 | |||||||||
| Kimco Realty Corp. | 3,300 | 59,532 | |||||||||
| ProLogis | 4,100 | 59,204 | |||||||||
| Simon Property Group, Inc.§ | 957 | 95,212 | |||||||||
| Ventas, Inc. | 1,200 | 62,976 | |||||||||
| Vornado Realty Trust | 1,332 | 110,996 | |||||||||
| Weyerhaeuser Co. | 3,943 | 74,641 | |||||||||
| 879,256 | |||||||||||
| Road & Rail (0.2%) | |||||||||||
| CSX Corp. | 2,900 | 187,369 | |||||||||
| Norfolk Southern Corp. | 2,800 | 175,896 | |||||||||
| Union Pacific Corp. | 3,500 | 324,310 | |||||||||
| 687,575 | |||||||||||
See Accompanying Notes to Financial Statements.
17
Credit Suisse Large Cap Blend Fund, Inc.
Schedule of Investments (continued)
December 31, 2010
| Number of Shares | Value | ||||||||||
| COMMON STOCKS | |||||||||||
| Semiconductors & Semiconductor Equipment (5.8%) | |||||||||||
| Altera Corp.§ | 67,600 | $ | 2,405,208 | ||||||||
| Analog Devices, Inc. | 123,100 | 4,637,177 | |||||||||
| Applied Materials, Inc. | 10,400 | 146,120 | |||||||||
| Broadcom Corp. Class A | 3,400 | 148,070 | |||||||||
| First Solar, Inc.*§ | 600 | 78,084 | |||||||||
| Intel Corp. | 523,700 | 11,013,411 | |||||||||
| Microchip Technology, Inc.§ | 2,200 | 75,262 | |||||||||
| Micron Technology, Inc.* | 6,700 | 53,734 | |||||||||
| Texas Instruments, Inc. | 9,300 | 302,250 | |||||||||
| 18,859,316 | |||||||||||
| Software (3.8%) | |||||||||||
| Adobe Systems, Inc.* | 3,900 | 120,042 | |||||||||
| BMC Software, Inc.* | 1,300 | 61,282 | |||||||||
| CA, Inc. | 1,900 | 46,436 | |||||||||
| Citrix Systems, Inc.* | 1,400 | 95,774 | |||||||||
| Intuit, Inc.* | 2,100 | 103,530 | |||||||||
| McAfee, Inc.* | 3,000 | 138,930 | |||||||||
| Microsoft Corp. | 54,450 | 1,520,244 | |||||||||
| Oracle Corp. | 323,220 | 10,116,786 | |||||||||
| Red Hat, Inc.* | 1,400 | 63,910 | |||||||||
| Salesforce.com, Inc.*§ | 800 | 105,600 | |||||||||
| Symantec Corp.* | 5,800 | 97,092 | |||||||||
| 12,469,626 | |||||||||||
| Specialty Retail (1.6%) | |||||||||||
| Bed Bath & Beyond, Inc.* | 2,000 | 98,300 | |||||||||
| Best Buy Co., Inc. | 2,400 | 82,296 | |||||||||
| Home Depot, Inc. | 5,400 | 189,324 | |||||||||
| Lowe's Cos., Inc. | 6,100 | 152,988 | |||||||||
| Ltd Brands, Inc. | 120,300 | 3,696,819 | |||||||||
| PetSmart, Inc. | 3,200 | 127,424 | |||||||||
| Staples, Inc. | 5,500 | 125,235 | |||||||||
| The Gap, Inc. | 3,700 | 81,918 | |||||||||
| TJX Cos., Inc. | 14,200 | 630,338 | |||||||||
| 5,184,642 | |||||||||||
| Textiles, Apparel & Luxury Goods (0.2%) | |||||||||||
| Coach, Inc. | 2,200 | 121,682 | |||||||||
| NIKE, Inc. Class B | 1,152 | 98,404 | |||||||||
| The Warnaco Group, Inc.* | 4,200 | 231,294 | |||||||||
| VF Corp. | 700 | 60,326 | |||||||||
| 511,706 | |||||||||||
| Thrifts & Mortgage Finance (0.0%) | |||||||||||
| NewAlliance Bancshares, Inc. | 4,799 | 71,889 | |||||||||
See Accompanying Notes to Financial Statements.
18
Credit Suisse Large Cap Blend Fund, Inc.
Schedule of Investments (continued)
December 31, 2010
| Number of Shares | Value | ||||||||||
| COMMON STOCKS | |||||||||||
| Tobacco (3.9%) | |||||||||||
| Altria Group, Inc. | 15,100 | $ | 371,762 | ||||||||
| Lorillard, Inc. | 1,200 | 98,472 | |||||||||
| Philip Morris International, Inc. | 208,750 | 12,218,138 | |||||||||
| Reynolds American, Inc. | 2,600 | 84,812 | |||||||||
| 12,773,184 | |||||||||||
| Trading Companies & Distributors (0.0%) | |||||||||||
| Fastenal Co.§ | 1,100 | 65,901 | |||||||||
| WW Grainger, Inc. | 400 | 55,244 | |||||||||
| 121,145 | |||||||||||
| Wireless Telecommunication Services (0.1%) | |||||||||||
| American Tower Corp. Class A* | 1,200 | 61,968 | |||||||||
| Sprint Nextel Corp.*§ | 90,600 | 383,238 | |||||||||
| 445,206 | |||||||||||
| TOTAL COMMON STOCKS (Cost $298,431,452) | 325,675,319 | ||||||||||
| SHORT-TERM INVESTMENTS (0.5%) | |||||||||||
| State Street Navigator Prime Portfolio, 0.3426%§§ | 245,994 | 245,994 | |||||||||
| Par (000) | |||||||||||
| State Street Bank and Trust Co. Euro Time Deposit, 0.010%, 01/03/11 | $ | 1,477 | 1,477,000 | ||||||||
| TOTAL SHORT-TERM INVESTMENTS (Cost $1,722,994) | 1,722,994 | ||||||||||
| TOTAL INVESTMENTS AT VALUE (100.3%) (Cost $300,154,446) | 327,398,313 | ||||||||||
| LIABILITIES IN EXCESS OF OTHER ASSETS (-0.3%) | (951,902 | ) | |||||||||
| NET ASSETS (100.0%) | $ | 326,446,411 | |||||||||
INVESTMENT ABBREVIATION
ADR = American Depositary Receipt
* Non-income producing security.
§ Security or portion thereof is out on loan.
§§ Represents security purchased with cash collateral received for securities on loan. The rate shown is the annualized seven-day yield at December 31, 2010.
See Accompanying Notes to Financial Statements.
19
Credit Suisse Large Cap Blend Fund, Inc.
Statement of Assets and Liabilities
December 31, 2010
| Assets | |||||||
| Investments at value, including collateral for securities on loan of $245,994 (Cost $300,154,446) (Note 2) | $ | 327,398,3131 | |||||
| Cash | 900 | ||||||
| Dividend and interest receivable | 314,972 | ||||||
| Receivable for fund shares sold | 202,620 | ||||||
| Prepaid expenses and other assets | 93,931 | ||||||
| Total Assets | 328,010,736 | ||||||
| Liabilities | |||||||
| Advisory fee payable (Note 3) | 162,765 | ||||||
| Administrative services fee payable (Note 3) | 69,181 | ||||||
| Shareholder servicing/Distribution fee payable (Note 3) | 43,136 | ||||||
| Payable for fund shares redeemed | 735,354 | ||||||
| Payable upon return of securities loaned (Note 2) | 245,994 | ||||||
| Directors' fee payable | 112 | ||||||
| Other accrued expenses payable | 307,783 | ||||||
| Total Liabilities | 1,564,325 | ||||||
| Net Assets | |||||||
| Capital stock, $.001 par value (Note 6) | 30,999 | ||||||
| Paid-in capital (Note 6) | 369,818,791 | ||||||
| Undistributed net investment income | 28,150 | ||||||
| Accumulated net realized gain from investments and foreign currency transactions | (70,675,396 | ) | |||||
| Net unrealized appreciation from investments | 27,243,867 | ||||||
| Net Assets | $ | 326,446,411 | |||||
| Common Shares | |||||||
| Net assets | $ | 133,419,542 | |||||
| Shares outstanding | 12,703,168 | ||||||
| Net asset value, offering price and redemption price per share | $ | 10.50 | |||||
| A Shares | |||||||
| Net assets | $ | 189,454,951 | |||||
| Shares outstanding | 17,940,338 | ||||||
| Net asset value and redemption price per share | $ | 10.56 | |||||
| Maximum offering price per share (net asset value/(1-5.75%)) | $ | 11.20 | |||||
| B Shares | |||||||
| Net assets | $ | 2,188,079 | |||||
| Shares outstanding | 217,500 | ||||||
| Net asset value and offering price per share | $ | 10.06 | |||||
| C Shares | |||||||
| Net assets | $ | 1,383,839 | |||||
| Shares outstanding | 137,960 | ||||||
| Net asset value and offering price per share | $ | 10.03 | |||||
1 Including $241,117 of securities on loan.
See Accompanying Notes to Financial Statements.
20
Credit Suisse Large Cap Blend Fund, Inc.
Statement of Operations
For the Year Ended December 31, 2010
| Investment Income (Note 2) | |||||||
| Dividends | $ | 2,064,429 | |||||
| Interest | 106 | ||||||
| Securities lending | 8,207 | ||||||
| Foreign taxes withheld | (54 | ) | |||||
| Total investment income | 2,072,688 | ||||||
| Expenses | |||||||
| Investment advisory fees (Note 3) | 499,637 | ||||||
| Administrative services fees (Note 3) | 169,364 | ||||||
| Shareholder servicing/Distribution fees (Note 3) | |||||||
| Common Class | 2,434 | ||||||
| Class A | 167,787 | ||||||
| Class B | 7,830 | ||||||
| Class C | 5,239 | ||||||
| Transfer agent fees | 148,581 | ||||||
| Registration fees | 83,481 | ||||||
| Printing fees (Note 3) | 63,525 | ||||||
| Audit and tax fees | 35,734 | ||||||
| Legal fees | 30,629 | ||||||
| Directors' fees | 25,870 | ||||||
| Custodian fees | 18,802 | ||||||
| Insurance expense | 3,062 | ||||||
| Interest expense (Note 4) | 1,039 | ||||||
| Commitment fees (Note 4) | 884 | ||||||
| Miscellaneous expense | 7,665 | ||||||
| Total expenses | 1,271,563 | ||||||
| Less: fees waived (Note 3) | (70,807 | ) | |||||
| Net expenses | 1,200,756 | ||||||
| Net investment income | 871,932 | ||||||
| Net Realized and Unrealized Gain from Investments | |||||||
| Net realized gain from investments | 21,774,334 | ||||||
| Net change in unrealized appreciation (depreciation) from investments | (824,389 | ) | |||||
| Net realized and unrealized gain from investments | 20,949,945 | ||||||
| Net increase in net assets resulting from operations | $ | 21,821,877 | |||||
See Accompanying Notes to Financial Statements.
21
Credit Suisse Large Cap Blend Fund, Inc.
Statements of Changes in Net Assets
| For the Year Ended December 31, 2010 | For the Year Ended December 31, 2009 | ||||||||||
| From Operations | |||||||||||
| Net investment income | $ | 871,932 | $ | 308,614 | |||||||
| Net realized gain from investments and foreign currency transactions | 21,774,334 | 866,874 | |||||||||
| Net change in unrealized appreciation (depreciation) from investments and foreign currency translations | (824,389 | ) | 6,479,961 | ||||||||
| Net increase in net assets resulting from operations | 21,821,877 | 7,655,449 | |||||||||
| From Dividends and Distributions | |||||||||||
| Dividends from net investment income | |||||||||||
| Common Class shares | (397,074 | ) | (11,720 | ) | |||||||
| Class A shares | (461,909 | ) | (302,822 | ) | |||||||
| Class B shares | (34 | ) | (1,492 | ) | |||||||
| Class C shares | (27 | ) | (712 | ) | |||||||
| Distributions from net realized gains | |||||||||||
| Common Class shares | (1,407,901 | ) | — | ||||||||
| Class A shares | (1,939,811 | ) | — | ||||||||
| Class B shares | (23,425 | ) | — | ||||||||
| Class C shares | (15,339 | ) | — | ||||||||
| Net decrease in net assets resulting from dividends and distributions | (4,245,520 | ) | (316,746 | ) | |||||||
| From Capital Share Transactions (Note 6) | |||||||||||
| Proceeds from sale of shares | 3,968,136 | 1,149,305 | |||||||||
| Exchange value of shares due to merger | 294,879,973 | — | |||||||||
| Reinvestment of dividends and distributions | 3,983,310 | 264,468 | |||||||||
| Net asset value of shares redeemed | (29,693,513 | ) | (4,381,229 | ) | |||||||
| Net increase (decrease) in net assets from capital share transactions | 273,137,906 | (2,967,456 | ) | ||||||||
| Net increase in net assets | 290,714,263 | 4,371,247 | |||||||||
| Net Assets | |||||||||||
| Beginning of year | 35,732,148 | 31,360,901 | |||||||||
| End of year | $ | 326,446,411 | $ | 35,732,148 | |||||||
| Undistributed net investment income | $ | 28,150 | $ | 8,022 | |||||||
See Accompanying Notes to Financial Statements.
22
Credit Suisse Large Cap Blend Fund, Inc.
Financial Highlights
(For a Common Class Share of the Fund Outstanding Throughout Each Year)
| For the Year Ended December 31, | |||||||||||||||||||||||
| 2010 | 2009 | 2008 | 2007 | 2006 | |||||||||||||||||||
| Per share data | |||||||||||||||||||||||
| Net asset value, beginning of year | $ | 9.63 | $ | 7.71 | $ | 11.95 | $ | 12.71 | $ | 12.23 | |||||||||||||
| INVESTMENT OPERATIONS | |||||||||||||||||||||||
| Net investment income1 | 0.13 | 0.08 | 0.11 | 0.08 | 0.05 | ||||||||||||||||||
| Net gain (loss) on investments and foreign currency related items (both realized and unrealized) | 0.88 | 1.93 | (4.23 | ) | 0.68 | 1.22 | |||||||||||||||||
| Total from investment operations | 1.01 | 2.01 | (4.12 | ) | 0.76 | 1.27 | |||||||||||||||||
| LESS DIVIDENDS AND DISTRIBUTIONS | |||||||||||||||||||||||
| Dividends from net investment income | (0.03 | ) | (0.09 | ) | (0.12 | ) | (0.06 | ) | (0.07 | ) | |||||||||||||
| Distributions from net realized gains | (0.11 | ) | — | (0.00 | )2 | (1.46 | ) | (0.72 | ) | ||||||||||||||
| Total dividends and distributions | (0.14 | ) | (0.09 | ) | (0.12 | ) | (1.52 | ) | (0.79 | ) | |||||||||||||
| Net asset value, end of year | $ | 10.50 | $ | 9.63 | $ | 7.71 | $ | 11.95 | $ | 12.71 | |||||||||||||
| Total return3 | 10.50 | % | 26.03 | % | (34.46 | )% | 6.15 | % | 10.44 | % | |||||||||||||
| RATIOS AND SUPPLEMENTAL DATA | |||||||||||||||||||||||
| Net assets, end of year (000s omitted) | $ | 133,419 | $ | 1,293 | $ | 1,237 | $ | 1,883 | $ | 2,202 | |||||||||||||
| Ratio of expenses to average net assets | 0.95 | % | 1.30 | % | 1.30 | % | 1.28 | % | 1.30 | % | |||||||||||||
| Ratio of net investment income to average net assets | 1.28 | % | 0.99 | % | 1.10 | % | 0.58 | % | 0.40 | % | |||||||||||||
| Decrease reflected in above operating expense ratios due to waivers/reimbursements | — | % | 0.78 | % | 0.41 | % | 0.07 | % | 0.26 | % | |||||||||||||
| Portfolio turnover rate | 360 | % | 362 | % | 222 | % | 114 | % | 106 | % | |||||||||||||
1 Per share information is calculated using the average shares outstanding method.
2 This amount represents less than $(0.01) per share.
3 Total returns are historical and assume changes in share price and reinvestment of all dividends and distributions. Had certain expenses not been reduced during the years shown, total returns would have been lower.
See Accompanying Notes to Financial Statements.
23
Credit Suisse Large Cap Blend Fund, Inc.
Financial Highlights
(For a Class A Share of the Fund Outstanding Throughout Each Year)
| For the Year Ended December 31, | |||||||||||||||||||||||
| 2010 | 2009 | 2008 | 2007 | 2006 | |||||||||||||||||||
| Per share data | |||||||||||||||||||||||
| Net asset value, beginning of year | $ | 9.68 | $ | 7.75 | $ | 12.01 | $ | 12.78 | $ | 12.26 | |||||||||||||
| INVESTMENT OPERATIONS | |||||||||||||||||||||||
| Net investment income1 | 0.07 | 0.08 | 0.11 | 0.08 | 0.05 | ||||||||||||||||||
| Net gain (loss) on investments and foreign currency related items (both realized and unrealized) | 0.95 | 1.94 | (4.25 | ) | 0.67 | 1.23 | |||||||||||||||||
| Total from investment operations | 1.02 | 2.02 | (4.14 | ) | 0.75 | 1.28 | |||||||||||||||||
| LESS DIVIDENDS AND DISTRIBUTIONS | |||||||||||||||||||||||
| Dividends from net investment income | (0.03 | ) | (0.09 | ) | (0.12 | ) | (0.06 | ) | (0.04 | ) | |||||||||||||
| Distributions from net realized gains | (0.11 | ) | — | (0.00 | )2 | (1.46 | ) | (0.72 | ) | ||||||||||||||
| Total dividends and distributions | (0.14 | ) | (0.09 | ) | (0.12 | ) | (1.52 | ) | (0.76 | ) | |||||||||||||
| Net asset value, end of year | $ | 10.56 | $ | 9.68 | $ | 7.75 | $ | 12.01 | $ | 12.78 | |||||||||||||
| Total return3 | 10.50 | % | 26.02 | % | (34.45 | )% | 6.03 | % | 10.48 | % | |||||||||||||
| RATIOS AND SUPPLEMENTAL DATA | |||||||||||||||||||||||
| Net assets, end of year (000s omitted) | $ | 189,455 | $ | 33,671 | $ | 28,642 | $ | 47,691 | $ | 51,493 | |||||||||||||
| Ratio of expenses to average net assets | 1.30 | % | 1.30 | % | 1.30 | % | 1.28 | % | 1.30 | % | |||||||||||||
| Ratio of net investment income to average net assets | 0.70 | % | 0.99 | % | 1.09 | % | 0.58 | % | 0.40 | % | |||||||||||||
| Decrease reflected in above operating expense ratios due to waivers/reimbursements | 0.10 | % | 0.77 | % | 0.40 | % | 0.07 | % | 0.26 | % | |||||||||||||
| Portfolio turnover rate | 360 | % | 362 | % | 222 | % | 114 | % | 106 | % | |||||||||||||
1 Per share information is calculated using the average shares outstanding method.
2 This amount represents less than $(0.01) per share.
3 Total returns are historical and assume changes in share price, reinvestment of all dividends and distributions and no sales charge. Had certain expenses not been reduced during the years shown, total returns would have been lower.
See Accompanying Notes to Financial Statements.
24
Credit Suisse Large Cap Blend Fund, Inc.
Financial Highlights
(For a Class B Share of the Fund Outstanding Throughout Each Year)
| For the Year Ended December 31, | |||||||||||||||||||||||
| 2010 | 2009 | 2008 | 2007 | 2006 | |||||||||||||||||||
| Per share data | |||||||||||||||||||||||
| Net asset value, beginning of year | $ | 9.27 | $ | 7.43 | $ | 11.49 | $ | 12.35 | $ | 11.92 | |||||||||||||
| INVESTMENT OPERATIONS | |||||||||||||||||||||||
| Net investment income (loss)1 | (0.00 | )2 | 0.02 | 0.03 | (0.02 | ) | (0.04 | ) | |||||||||||||||
| Net gain (loss) on investments and foreign currency related items (both realized and unrealized) | 0.90 | 1.85 | (4.05 | ) | 0.65 | 1.19 | |||||||||||||||||
| Total from investment operations | 0.90 | 1.87 | (4.02 | ) | 0.63 | 1.15 | |||||||||||||||||
| LESS DIVIDENDS AND DISTRIBUTIONS | |||||||||||||||||||||||
| Dividends from net investment income | (0.00 | )2 | (0.03 | ) | (0.04 | ) | (0.03 | ) | — | ||||||||||||||
| Distributions from net realized gains | (0.11 | ) | — | (0.00 | )2 | (1.46 | ) | (0.72 | ) | ||||||||||||||
| Total dividends and distributions | (0.11 | ) | (0.03 | ) | (0.04 | ) | (1.49 | ) | (0.72 | ) | |||||||||||||
| Net asset value, end of year | $ | 10.06 | $ | 9.27 | $ | 7.43 | $ | 11.49 | $ | 12.35 | |||||||||||||
| Total return3 | 9.71 | % | 25.11 | % | (34.97 | )% | 5.24 | % | 9.67 | % | |||||||||||||
| RATIOS AND SUPPLEMENTAL DATA | |||||||||||||||||||||||
| Net assets, end of year (000s omitted) | $ | 2,188 | $ | 500 | $ | 1,201 | $ | 3,087 | $ | 5,010 | |||||||||||||
| Ratio of expenses to average net assets | 2.04 | % | 2.05 | % | 2.05 | % | 2.03 | % | 2.05 | % | |||||||||||||
| Ratio of net investment income (loss) to average net assets | (0.03 | )% | 0.28 | % | 0.25 | % | (0.19 | )% | (0.35 | )% | |||||||||||||
| Decrease reflected in above operating expense ratios due to waivers/reimbursements | 0.10 | % | 0.85 | % | 0.35 | % | 0.06 | % | 0.26 | % | |||||||||||||
| Portfolio turnover rate | 360 | % | 362 | % | 222 | % | 114 | % | 106 | % | |||||||||||||
1 Per share information is calculated using the average shares outstanding method.
2 This amount represents less than $(0.01) per share.
3 Total returns are historical and assume changes in share price, reinvestment of all dividends and distributions and no sales charge. Had certain expenses not been reduced during the years shown, total returns would have been lower.
See Accompanying Notes to Financial Statements.
25
Credit Suisse Large Cap Blend Fund, Inc.
Financial Highlights
(For a Class C Share of the Fund Outstanding Throughout Each Year)
| For the Year Ended December 31, | |||||||||||||||||||||||
| 2010 | 2009 | 2008 | 2007 | 2006 | |||||||||||||||||||
| Per share data | |||||||||||||||||||||||
| Net asset value, beginning of year | $ | 9.24 | $ | 7.41 | $ | 11.45 | $ | 12.31 | $ | 11.89 | |||||||||||||
| INVESTMENT OPERATIONS | |||||||||||||||||||||||
| Net investment income (loss)1 | (0.00 | )2 | 0.02 | 0.03 | (0.02 | ) | (0.04 | ) | |||||||||||||||
| Net gain (loss) on investments and foreign currency related items (both realized and unrealized) | 0.90 | 1.84 | (4.03 | ) | 0.65 | 1.18 | |||||||||||||||||
| Total from investment operations | 0.90 | 1.86 | (4.00 | ) | 0.63 | 1.14 | |||||||||||||||||
| LESS DIVIDENDS AND DISTRIBUTIONS | |||||||||||||||||||||||
| Dividends from net investment income | (0.00 | )2 | (0.03 | ) | (0.04 | ) | (0.03 | ) | — | ||||||||||||||
| Distributions from net realized gains | (0.11 | ) | — | (0.00 | )2 | (1.46 | ) | (0.72 | ) | ||||||||||||||
| Total dividends and distributions | (0.11 | ) | (0.03 | ) | (0.04 | ) | (1.49 | ) | (0.72 | ) | |||||||||||||
| Net asset value, end of year | $ | 10.03 | $ | 9.24 | $ | 7.41 | $ | 11.45 | $ | 12.31 | |||||||||||||
| Total return3 | 9.75 | % | 25.04 | % | (34.91 | )% | 5.26 | % | 9.61 | % | |||||||||||||
| RATIOS AND SUPPLEMENTAL DATA | |||||||||||||||||||||||
| Net assets, end of year (000s omitted) | $ | 1,384 | $ | 268 | $ | 281 | $ | 616 | $ | 851 | |||||||||||||
| Ratio of expenses to average net assets | 2.03 | % | 2.05 | % | 2.05 | % | 2.03 | % | 2.05 | % | |||||||||||||
| Ratio of net investment income (loss) to average net assets | (0.04 | )% | 0.25 | % | 0.31 | % | (0.18 | )% | (0.35 | )% | |||||||||||||
| Decrease reflected in above operating expense ratios due to waivers/reimbursements | 0.15 | % | 0.79 | % | 0.38 | % | 0.06 | % | 0.26 | % | |||||||||||||
| Portfolio turnover rate | 360 | % | 362 | % | 222 | % | 114 | % | 106 | % | |||||||||||||
1 Per share information is calculated using the average shares outstanding method.
2 This amount represents less than $(0.01) per share.
3 Total returns are historical and assume changes in share price, reinvestment of all dividends and distributions and no sales charge. Had certain expenses not been reduced during the years shown, total returns would have been lower.
See Accompanying Notes to Financial Statements.
26
Credit Suisse Large Cap Blend Fund, Inc.
Notes to Financial Statements
December 31, 2010
Note 1. Organization
Credit Suisse Large Cap Blend Fund, Inc. (the "Fund"), is registered under the Investment Company Act of 1940, as amended (the "1940 Act"), as a diversified, open-end management investment company that seeks long-term appreciation of capital. The Fund was incorporated under the laws of the State of Maryland on July 31, 1998.
The Fund offers four classes of shares: Common Class shares, Class A shares, Class B shares and Class C shares. The Fund's Common Class shares are closed to new investors, with certain exceptions as set forth in the prospectus. Each class of shares represents an equal pro rata interest in the Fund, except that they bear different expenses, which reflect the differences in the range of services provided to them. Class A shares are sold subject to a front-end sales charge of 5.75%. Class B shares are sold subject to a contingent deferred sales charge which declines from 4.00% to zero depending on the period of time the shares are held. Class B shares automatically convert to Class A shares after 8 years. Class C shares are sold subject to a contingent deferred sales charge of 1.00% if the shares are redeemed within the first year of purchase.
Note 2. Significant Accounting Policies
A) SECURITY VALUATION — The net asset value of the Fund is determined daily as of the close of regular trading on the New York Stock Exchange, Inc. (the "Exchange") on each day the Exchange is open for business. Equity investments are valued at market value, which is generally determined using the closing price on the exchange or market on which the security is primarily traded at the time of valuation (the "Valuation Time"). If no sales are reported, equity investments are generally valued at the most recent bid quotation as of the Valuation Time or at the lowest asked quotation in the case of a short sale of securities. Equity investments are generally categorized as Level 1. Debt securities with a remaining maturity greater than 60 days are valued in accordance with the price supplied by a pricing service, which may use a matrix, formula or other objective method that takes into consideration market indices, yield curves and other specific adjustments. Debt obligations that will mature in 60 days or less are valued on the basis of amortized cost, which approximates market value, unless it is determined that using this method would not represent fair value. Debt securities are generally categorized as Level 2. Investments in open-end investment companies are valued at their net asset value each business day and are generally categorized as Level 1. Securities and other assets for which market quotations are not readily available, or whose values have been materially affected by events occurring
27
Credit Suisse Large Cap Blend Fund, Inc.
Notes to Financial Statements (continued)
December 31, 2010
Note 2. Significant Accounting Policies
before the Fund's Valuation Time but after the close of the securities' primary markets, are valued at fair value as determined in good faith by, or under the direction of, the Board of Directors under procedures established by the Board of Directors and are generally categorized as Level 3. The Fund may utilize a service provided by an independent third party which has been approved by the Board of Directors to fair value certain securities. When fair value pricing is employed, the prices of securities used by a fund to calculate its net asset value may differ from quoted or published prices for the same securities.
In accordance with the authoritative guidance on fair value measurements and disclosures under accounting principles generally accepted in the United States of America ("GAAP"), the Fund discloses the fair value of its investments in a hierarchy that prioritizes the inputs to valuation techniques used to measure the fair value. In accordance with GAAP, fair value is defined as the price that the Fund would receive upon selling an investment in a timely transaction to an independent buyer in the principal or most advantageous market of the investment. GAAP established a three-tier hierarchy to maximize the use of observable market data and minimize the use of unobservable inputs and to establish classification of fair value measurements for disclosure purposes. Inputs refer broadly to the assumptions that market participants would use in pricing the asset or liability, including assumptions about risk, for example, the risk inherent in a particular valuation technique used to measure fair value including such a pricing model and/or the risk inherent in the inputs to the valuation technique. Inputs may be observable or unobservable. Observable inputs are inputs that reflect the assumptions market participants would use in pricing the asset or liability developed based on market data obtained from sources independent of the reporting entity. Unobservable inputs are inputs that reflect the reporting entity's own assumptions about the assumptions market participants would use in pricing the asset or liability developed based on the best information available in the circumstances. In accordance with the Fund's valuation procedures, factors used in determining value may include, but are not limited to, the type of the security, the size of the holding, the initial cost of the security, the existence of any contractual restrictions on the security's disposition, the price and extent of public trading in similar securities of the issuer or of comparable companies, quotations or evaluated prices from broker-dealers and/or pricing services, information obtained from the issuer, analysts, and/or the appropriate stock exchange (for exchange-traded securities), an analysis of the company's or issuer's financial statements, an evaluation of the forces that influence the issuer and the market(s) in which the security is purchased and sold and with respect to debt
28
Credit Suisse Large Cap Blend Fund, Inc.
Notes to Financial Statements (continued)
December 31, 2010
Note 2. Significant Accounting Policies
securities, the maturity, coupon, creditworthiness, currency denomination, and the movement of the market in which the security is normally traded. The three-tier hierarchy of inputs is summarized in the three broad Levels listed below.
• Level 1 – quoted prices in active markets for identical investments
• Level 2 – other significant observable inputs (including quoted prices for similar investments, interest rates, prepayment speeds, credit risk, etc.)
• Level 3 – significant unobservable inputs (including the Fund's own assumptions in determining the fair value of investments)
The inputs or methodology used for valuing securities are not necessarily an indication of the risk associated with investing in those securities.
The following is a summary of the inputs used as of December 31, 2010 in valuing the Fund's investments carried at value:
| Level 1 | Level 2 | Level 3 | Total | ||||||||||||||||
| Investments in Securities | |||||||||||||||||||
| Common Stocks | $ | 325,675,319 | $ | — | $ | — | $ | 325,675,319 | |||||||||||
| Short-Term Investments | 245,994 | 1,477,000 | — | 1,722,994 | |||||||||||||||
| Other Financial Instruments* | — | — | — | — | |||||||||||||||
| $ | 325,921,313 | $ | 1,477,000 | $ | — | $ | 327,398,313 | ||||||||||||
*Other financial instruments include futures, forwards and swap contracts.
Effective January 1, 2010, the Fund adopted FASB amendments to authoritative guidance which requires the Fund to disclose details of significant transfers in and out of Level 1 and Level 2 measurements and the reasons for the transfers. For the year ended December 31, 2010, there were no significant transfers in and out of Level 1 and Level 2.
B) DERIVATIVE INSTRUMENTS AND HEDGING ACTIVITIES — Effective January 1, 2009, the Fund adopted amendments to authoritative guidance on disclosures about derivative instruments and hedging activities which require that the Fund disclose (a) how and why an entity uses derivative instruments, (b) how derivative instruments and hedging activities are accounted for, and (c) how derivative instruments and related hedging activities affect a fund's financial position, financial performance, and cash flows. The Fund has not entered into any derivative or hedging activities during the period covered by this report.
29
Credit Suisse Large Cap Blend Fund, Inc.
Notes to Financial Statements (continued)
December 31, 2010
Note 2. Significant Accounting Policies
C) SECURITY TRANSACTIONS AND INVESTMENT INCOME — Security transactions are accounted for on a trade date basis. Interest income is recorded on the accrual basis. Dividends are recorded on the ex-dividend date. Certain expenses are class-specific expenses and vary by class. Income, expenses (excluding class-specific expenses) and realized/unrealized gains/losses are allocated proportionately to each class of shares based upon the relative net asset value of the outstanding shares of that class. The cost of investments sold is determined by use of the specific identification method for both financial reporting and income tax purposes.
D) DIVIDENDS AND DISTRIBUTIONS TO SHAREHOLDERS — Dividends from net investment income and distributions of net realized capital gains, if any, are declared and paid at least annually. However, to the extent that a net realized capital gain can be reduced by a capital loss carryforward, such gain will not be distributed. Income and capital gain distributions are determined in accordance with federal income tax regulations, which may differ from GAAP.
E) FEDERAL INCOME TAXES — No provision is made for federal taxes as it is the Fund's intention to continue to qualify for and elect the tax treatment applicable to regulated investment companies under the Internal Revenue Code of 1986, as amended, and to make the requisite distributions to its shareholders, which will be sufficient to relieve it from federal income and excise taxes.
The Fund adopted the authoritative guidance for uncertainty in income taxes and recognizes a tax benefit or liability from an uncertain position only if it is more likely than not that the position is sustainable based solely on its technical merits and consideration of the relevant taxing authority's widely understood administrative practices and procedures. The Fund has reviewed its current tax positions and has determined that no provision for income tax is required in the Fund's financial statements. The Fund's federal tax returns for the prior three fiscal years remain subject to examination by the Internal Revenue Service.
F) USE OF ESTIMATES — The preparation of financial statements in conformity with GAAP requires management to make estimates and assumptions that affect the reported amounts of assets and liabilities and disclosure of contingent assets and liabilities at the date of the financial statements and the reported amounts of income and expenses during the reporting period. Actual results could differ from these estimates.
30
Credit Suisse Large Cap Blend Fund, Inc.
Notes to Financial Statements (continued)
December 31, 2010
Note 2. Significant Accounting Policies
G) SHORT-TERM INVESTMENTS — The Fund, together with other funds/portfolios advised by Credit Suisse Asset Management, LLC ("Credit Suisse"), an indirect, wholly-owned subsidiary of Credit Suisse Group AG, pools available cash into a short-term variable rate time deposit issued by State Street Bank and Trust Company ("SSB"), the Fund's custodian. The short-term time deposit issued by SSB is a variable rate account classified as a short-term investment.
H) SECURITIES LENDING — Loans of securities are required at all times to be secured by collateral at least equal to 102% of the market value of domestic securities on loan (including any accrued interest thereon) and 105% of the market value of foreign securities on loan (including any accrued interest thereon). Cash collateral received by the Fund in connection with securities lending activity may be pooled together with cash collateral for other funds/portfolios advised by Credit Suisse and may be invested in a variety of investments, including funds advised by SSB, the Fund's securities lending agent, or money market instruments. However, in the event of default or bankruptcy by the other party to the agreement, realization and/or retention of the collateral may be subject to legal proceedings.
SSB has been engaged by the Fund to act as the Fund's securities lending agent. The Fund's securities lending arrangement provides that the Fund and SSB will share the net income earned from securities lending activities. During the year ended December 31, 2010, total earnings from the Fund's investment in cash collateral received in connection with securities lending arrangements was $12,343, of which $2,662 was rebated to borrowers (brokers). The Fund retained $8,207 in income from the cash collateral investment, and SSB, as lending agent, was paid $1,474. Securities lending income is accrued as earned.
I) SUBSEQUENT EVENTS — In preparing the financial statements as of December 31, 2010, management considered the impact of subsequent events for potential recognition or disclosure in these financial statements.
Note 3. Transactions with Affiliates and Related Parties
Credit Suisse serves as investment adviser for the Fund. For its investment advisory services, Credit Suisse is entitled to receive a fee from the Fund at an annual rate of 0.50% of the Fund's average daily net assets. For the year ended December 31, 2010, investment advisory fees earned and voluntarily waived were $499,637 and $70,807, respectively. Credit Suisse will not recapture from the Fund any fees it waived during the year ended December 31, 2010. Fee
31
Credit Suisse Large Cap Blend Fund, Inc.
Notes to Financial Statements (continued)
December 31, 2010
Note 3. Transactions with Affiliates and Related Parties
waivers and expense reimbursements are voluntary and may be discontinued by Credit Suisse at any time.
Credit Suisse Asset Management Securities, Inc. ("CSAMSI"), an affiliate of Credit Suisse, and SSB serve as co-administrators to the Fund. For its co-administrative services, CSAMSI currently receives a fee calculated at an annual rate of 0.09% of the Fund's average daily net assets. For the year ended December 31, 2010, co-administrative services fees earned by CSAMSI were $89,934.
For its co-administrative services, SSB receives a fee, exclusive of out-of-pocket expenses, calculated in total for all the Credit Suisse funds/portfolios co-administered by SSB and allocated based upon the relative average net assets of each fund/portfolio, subject to an annual minimum fee. For the year ended December 31, 2010, co-administrative services fees earned by SSB (including out-of-pocket expenses) were $79,430.
In addition to serving as the Fund's co-administrator, CSAMSI currently serves as distributor of the Fund's shares. Pursuant to distribution plans adopted by the Fund pursuant to Rule 12b-1 under the 1940 Act, CSAMSI receives fees for its distribution services. For the Common Class shares of the Fund, the fee was calculated at an annual rate of 0.25% of the average daily net assets through October 10, 2010. Effective October 11, 2010, Common Class shares no longer charge this fee. For the Class A shares of the Fund, the fee is calculated at an annual rate of 0.25% of the average daily net assets. For the Class B and Class C shares of the Fund, the fee is calculated at an annual rate of 1.00% of average daily net assets.
Merrill Corporation ("Merrill"), an affiliate of Credit Suisse, has been engaged by the Fund to provide certain financial printing services. For the year ended December 31, 2010, Merrill was paid $34,520 for its services by the Fund.
Note 4. Line of Credit
The Fund, together with other funds/portfolios advised by Credit Suisse (collectively, the "Participating Funds"), participates in a committed, unsecured line of credit facility ("Credit Facility") for temporary or emergency purposes with SSB. Under the terms of the Credit Facility, the Participating Funds pay an aggregate commitment fee on the average unused amount of the Credit Facility, which is allocated among the Participating Funds in such manner as is determined by the governing Boards of the Participating Funds. In addition,
32
Credit Suisse Large Cap Blend Fund, Inc.
Notes to Financial Statements (continued)
December 31, 2010
Note 4. Line of Credit
the Participating Funds pay interest on borrowings at either the Overnight Federal Funds rate or the Overnight LIBOR rate plus a spread. At December 31, 2010, the Fund had no loans outstanding under the Credit Facility. During the year ended December 31, 2010, the Fund had borrowings under the Credit Facility as follows:
| Average Daily Loan Balance | Weighted Average Interest Rate % | Maximum Daily Loan Outstanding | |||||||||
| $ | 4,076,500 | 1.491 | % | $ | 5,261,000 | ||||||
Note 5. Purchases and Sales of Securities
For the year ended December 31, 2010, purchases and sales of investment securities (excluding short-term investments) were $357,215,532 and $381,334,373, respectively.
Note 6. Capital Share Transactions
The Fund is authorized to issue four billion full and fractional shares of capital stock, $.001 par value per share. Transactions in capital shares for each class were as follows:
| Common Class | |||||||||||||||||||
| For the Year Ended December 31, 2010 | For the Year Ended December 31, 2009 | ||||||||||||||||||
| Shares | Value | Shares | Value | ||||||||||||||||
| Shares sold | 194,337 | $ | 1,994,500 | 13,253 | $ | 109,159 | |||||||||||||
| Shares exchanged due to merger | 13,769,297 | 137,553,921 | — | — | |||||||||||||||
| Shares issued in reinvestment of dividends and distributions | 167,188 | 1,748,715 | 1,185 | 11,480 | |||||||||||||||
| Shares redeemed | (1,561,979 | ) | (16,043,543 | ) | (40,541 | ) | (349,824 | ) | |||||||||||
| Net increase (decrease) | 12,568,843 | $ | 125,253,593 | (26,103 | ) | $ | (229,185 | ) | |||||||||||
| Class A | |||||||||||||||||||
| For the Year Ended December 31, 2010 | For the Year Ended December 31, 2009 | ||||||||||||||||||
| Shares | Value | Shares | Value | ||||||||||||||||
| Shares sold | 194,546 | $ | 1,924,364 | 114,797 | $ | 992,119 | |||||||||||||
| Shares exchanged due to merger | 15,347,297 | 154,195,398 | — | — | |||||||||||||||
| Shares issued in reinvestment of dividends and distributions | 209,662 | 2,203,054 | 25,814 | 251,608 | |||||||||||||||
| Shares redeemed | (1,287,990 | ) | (13,040,006 | ) | (358,829 | ) | (3,060,365 | ) | |||||||||||
| Net increase (decrease) | 14,463,515 | $ | 145,282,810 | (218,218 | ) | $ | (1,816,638 | ) | |||||||||||
33
Credit Suisse Large Cap Blend Fund, Inc.
Notes to Financial Statements (continued)
December 31, 2010
Note 6. Capital Share Transactions
| Class B | |||||||||||||||||||
| For the Year Ended December 31, 2010 | For the Year Ended December 31, 2009 | ||||||||||||||||||
| Shares | Value | Shares | Value | ||||||||||||||||
| Shares sold | 2,681 | $ | 25,793 | 3,963 | $ | 31,034 | |||||||||||||
| Shares exchanged due to merger | 211,845 | 2,027,396 | — | — | |||||||||||||||
| Shares issued in reinvestment of dividends and distributions | 1,979 | 19,728 | 105 | 977 | |||||||||||||||
| Shares redeemed | (52,885 | ) | (509,990 | ) | (111,825 | ) | (888,459 | ) | |||||||||||
| Net increase (decrease) | 163,620 | $ | 1,562,927 | (107,757 | ) | $ | (856,448 | ) | |||||||||||
| Class C | |||||||||||||||||||
| For the Year Ended December 31, 2010 | For the Year Ended December 31, 2009 | ||||||||||||||||||
| Shares | Value | Shares | Value | ||||||||||||||||
| Shares sold | 2,534 | $ | 23,479 | 1,850 | $ | 16,993 | |||||||||||||
| Shares exchanged due to merger | 115,616 | 1,103,258 | — | — | |||||||||||||||
| Shares issued in reinvestment of dividends and distributions | 1,189 | 11,813 | 44 | 403 | |||||||||||||||
| Shares redeemed | (10,417 | ) | (99,974 | ) | (10,745 | ) | (82,581 | ) | |||||||||||
| Net increase (decrease) | 108,922 | $ | 1,038,576 | (8,851 | ) | $ | (65,185 | ) | |||||||||||
On December 31, 2010, the number of shareholders that held 5% or more of the outstanding shares of each class of the Fund was as follows:
| Number of Shareholders | Approximate Percentage of Outstanding Shares | ||||||||||
| Common Class | 3 | 48 | % | ||||||||
| Class A | 1 | 11 | % | ||||||||
| Class B | 3 | 45 | % | ||||||||
| Class C | 4 | 72 | % | ||||||||
Some of the shareholders are omnibus accounts, which hold shares on behalf of individual shareholders.
Note 7. Federal Income Taxes
Income and capital gain distributions are determined in accordance with federal income tax regulations, which may differ from GAAP.
The tax characteristics of dividends and distributions paid during the years ended December 31, 2010 and 2009, respectively, by the Fund were as follows:
| Ordinary Income | Long-Term Capital Gain | ||||||||||||||
| 2010 | 2009 | 2010 | 2009 | ||||||||||||
| $ | 859,044 | $ | 316,746 | $ | 3,386,476 | $ | 0 | ||||||||
34
Credit Suisse Large Cap Blend Fund, Inc.
Notes to Financial Statements (continued)
December 31, 2010
Note 7. Federal Income Taxes
The tax basis components of distributable earnings differ from the amounts reflected in the Statement of Assets and Liabilities by temporary book/tax differences. These differences are primarily due to differing treatments of wash sales, real estate investment trusts and cumulative basis adjustments on partnerships.
At December 31, 2010, the components of distributable earnings on a tax basis were as follows:
| Undistributed net investment income | $ | 15,374 | |||||
| Undistributed capital gains | 4,170,086 | ||||||
| Accumulated realized loss | (68,675,724 | ) | |||||
| Unrealized appreciation | 21,086,885 | ||||||
| $ | (43,403,379 | ) | |||||
At December 31, 2010, the Fund had capital loss carryforwards available to offset possible future capital gains as follows:
| Expires December 31, | |||||||
| 2015 | 2016 | ||||||
| $ | 12,567,359 | $ | 56,108,365 | ||||
During the tax year ended December 31, 2010, the Fund utilized $12,531,966 of the capital loss carryforwards and $46,071,536 of the capital loss carryforwards expired.
It is uncertain whether the Fund will be able to realize the benefits of the capital loss carryforwards before they expire.
Included in the Fund's capital loss carryforwards which expire in 2015 are $1,217,389, $9,817,957, $1,532,013, acquired in the Fund mergers of the Credit Suisse Large Cap Growth Fund, Credit Suisse Large Cap Value Fund and Credit Suisse Mid-Cap Core Fund, Inc., respectively, which are subject to limitations.
Included in the Fund's capital loss carryforwards which expire in 2016 are $11,022,797, $24,633,083, $20,452,485, acquired in the Fund mergers of the Credit Suisse Large Cap Growth Fund, Credit Suisse Large Cap Value Fund and Credit Suisse Mid-Cap Core Fund, Inc., respectively, which are subject to limitations.
At December 31, 2010, the identified cost for federal income tax purposes, as well as the gross unrealized appreciation from investments for those securities
35
Credit Suisse Large Cap Blend Fund, Inc.
Notes to Financial Statements (continued)
December 31, 2010
Note 7. Federal Income Taxes
having an excess of value over cost, gross unrealized depreciation from investments for those securities having an excess of cost over value and the net unrealized appreciation from investments were $306,311,428, $30,626,501, $(9,539,616) and $21,086,885, respectively.
At December 31, 2010, the Fund reclassified $7,240 to undistributed net investment income and $80,767,214 to paid in capital from accumulated net realized loss, to adjust for current period permanent book/tax differences which arose principally from capital loss carryforwards and other temporary book/tax differences from the acquired funds and the expiration of capital loss carryforwards. Net assets were not affected by these reclassifications.
Note 8. Acquisition of Credit Suisse Large Cap Growth Fund, Credit Suisse Large Cap Value Fund and Credit Suisse Mid-Cap Core Fund, Inc.
On October 8, 2010, Credit Suisse Large Cap Blend Fund, Inc. acquired all of the net assets of Credit Suisse Large Cap Growth Fund, Credit Suisse Large Cap Value Fund and Credit Suisse Mid-Cap Core Fund, Inc., each open-end investment companies, pursuant to a plan of reorganization approved by the Board of Trustees/Directors on May 3, 2010. The purpose of the transaction was to combine four funds managed by Credit Suisse with comparable investment objectives and strategies. The acquisition was accomplished by a tax-free exchange of 2,965,536 shares of Credit Suisse Large Cap Growth Fund valued at $51,257,052, 12,370,780 shares of Credit Suisse Large Cap Value Fund valued at $151,560,546 and 2,623,421 shares of Credit Suisse Mid-Cap Core Fund, Inc. valued at $92,062,375 for 29,444,055 shares of Credit Suisse Large Cap Blend Fund, Inc. The investment portfolios of Credit Suisse Large Cap Growth Fund, Credit Suisse Large Cap Value Fund and Credit Suisse Mid-Cap Core Fund, Inc. had a fair value at October 8, 2010 of $51,973,119, $151,648,970 and $92,200,589 and identified costs of $46,562,613, $138,709,260 and $85,462,208, respectively, which were the principal assets acquired by Credit Suisse Large Cap Blend Fund, Inc. For financial reporting purposes, assets received and shares issued by Credit Suisse Large Cap Blend Fund, Inc. were recorded at fair value; however the cost basis of the investments received from Credit Suisse Large Cap Growth Fund, Credit Suisse Large Cap Value Fund and Credit Suisse Mid-Cap Core Fund, Inc. were carried forward to align ongoing reporting of Credit Suisse Large Cap Blend Fund, Inc.'s realized and unrealized gains and losses with amounts distributable to shareholders for tax purposes. Immediately prior to the merger, the net assets of Credit Suisse Large Cap Blend Fund, Inc. were $34,788,604.
36
Credit Suisse Large Cap Blend Fund, Inc.
Notes to Financial Statements (continued)
December 31, 2010
Note 8. Acquisition of Credit Suisse Large Cap Growth Fund, Credit Suisse Large Cap Value Fund and Credit Suisse Mid-Cap Core Fund, Inc.
Credit Suisse Large Cap Blend Fund, Inc. pro forma results of operations for the year ended December 31, 2010 are as follows:
| Net investment income | $ | 2,399,9791 | |||||
| Net gain from investments | 65,946,8662 | ||||||
| Net increase in net assets resulting from operations | $ | 68,346,845 | |||||
Because the combined investment portfolios have been managed as a single integrated portfolio since the acquisition was completed, it is not practicable to separate the amounts of net investment income and net gain on investments of Credit Suisse Large Cap Growth Fund, Credit Suisse Large Cap Value Fund and Credit Suisse Mid-Cap Core Fund, Inc. that have been included in Credit Suisse Large Cap Blend Fund, Inc.'s statement of operations since October 8, 2010.
1 $871,932 as reported, plus $68,964, $995,494 and $175,208 for Credit Suisse Large Cap Growth Fund, Credit Suisse Large Cap Value Fund and Credit Suisse Mid-Cap Core Fund, Inc. respectively, premerger, plus $288,381 of pro-forma gross expenses eliminated.
2 $20,949,945 as reported, plus $9,268,309, $15,488,326 and $20,240,286 for Credit Suisse Large Cap Growth Fund, Credit Suisse Large Cap Value Fund and Credit Suisse Mid-Cap Core Fund, Inc., respectively, premerger.
Note 9. Contingencies
In the normal course of business, the Fund may provide general indemnifications pursuant to certain contracts and organizational documents. The Fund's maximum exposure under these arrangements is dependent on future claims that may be made against the Fund and, therefore, cannot be estimated; however, based on experience, the risk of loss from such claims is considered remote.
37
Credit Suisse Large Cap Blend Fund, Inc.
Report of Independent Registered Public Accounting Firm
To the Board of Directors and Shareholders of
Credit Suisse Large Cap Blend Fund, Inc.:
In our opinion, the accompanying statement of assets and liabilities, including the schedule of investments, and the related statements of operations and of changes in net assets and the financial highlights present fairly, in all material respects, the financial position of Credit Suisse Large Cap Blend Fund, Inc. (the "Fund") at December 31, 2010, the results of its operations for the year then ended and the changes in its net assets and financial highlights for the periods presented, in conformity with accounting principles generally accepted in the United States of America. These financial statements and financial highlights (hereafter referred to as "financial statements") are the responsibility of the Fund's management. Our responsibility is to express an opinion on these financial statements based on our audit. We conducted our audit of these financial statements in accordance with the standards of the Public Company Accounting Oversight Board (United States). Those standards require that we plan and perform the audit to obtain reasonable assurance about whether the financial statements are free of material misstatement. An audit includes examining, on a test basis, evidence supporting the amounts and disclosures in the financial statements, assessing the accounting principles used and significant estimates made by management, and evaluating the overall financial statement presentation. We believe that our audit, which included confirmation of securities at December 31, 2010 by correspondence with the custodian and brokers, provides a reasonable basis for our opinion.
PricewaterhouseCoopers LLP
Boston, Massachusetts
February 22, 2011
38
Credit Suisse Large Cap Blend Fund, Inc.
Board Approval of Advisory Agreement (unaudited)
In approving the renewal of the current Advisory Agreement, the Board of Directors (the "Board") of the Credit Suisse Large Cap Blend Fund, Inc. (the "Fund"), including a majority of the Directors who are not "interested persons" of the Fund as defined in the Investment Company Act of 1940 (the "Independent Directors"), at a meeting held on November 15 and 16, 2010, considered the following factors:
Investment Advisory Fee Rates and Expenses
The Board reviewed and considered the contractual advisory fee rate of 0.50% for the Fund ("Contractual Advisory Fee") in light of the extent and quality of the advisory services provided by Credit Suisse Asset Management, LLC ("Credit Suisse"). The Board also reviewed and considered the voluntary fee waivers currently in place for the Fund and considered the actual fee rate of 0.39% paid by the Fund after taking waivers into account ("Net Advisory Fee") as of September 30, 2010. The Board also considered the merger of other Credit Suisse funds into the Fund. The Board acknowledged that voluntary fee waivers and expense reimbursements could be discontinued at any time.
Additionally, the Board received and considered information comparing the Fund's Contractual Advisory Fee, Net Advisory Fee and the Fund's overall expenses with those of funds in both the relevant expense group ("Expense Group") and universe of funds ("Expense Universe") provided by Lipper Inc., an independent provider of investment company data.
Nature, Extent and Quality of the Services under the Advisory Agreement
The Board received and considered information regarding the nature, extent and quality of services provided to the Fund by Credit Suisse under the Advisory Agreement. The Board also noted information received at regular meetings throughout the year related to the services rendered by Credit Suisse. The Board reviewed background information about Credit Suisse, including its Form ADV. The Board considered the background and experience of Credit Suisse's senior management and the expertise of, and the amount of attention given to the Fund by, senior personnel of Credit Suisse. In addition, the Board reviewed the qualifications, backgrounds and responsibilities of the portfolio management team primarily responsible for the day-to-day portfolio management of the Fund and the extent of the resources devoted to research and analysis of actual and potential investments. The Board evaluated the ability of Credit Suisse, based on its resources, reputation and other attributes, to attract and retain qualified investment professionals, including research,
39
Credit Suisse Large Cap Blend Fund, Inc.
Board Approval of Advisory Agreement (unaudited)(continued)
advisory, and supervisory personnel. The Board also received and considered information about the nature, extent and quality of services and fee rates offered to other Credit Suisse clients for comparable services.
Fund Performance
The Board received and considered performance results of the Fund over time, along with comparisons both to the relevant performance group ("Performance Group") and universe of funds ("Performance Universe") for the Fund. The Board was provided with a description of the methodology used to arrive at the funds included in the Performance Group and the Performance Universe.
Credit Suisse Profitability
The Board received and considered a profitability analysis of Credit Suisse based on the fees payable under the Advisory Agreement for the Fund, including any fee waivers, as well as other relationships between the Fund on the one hand and Credit Suisse affiliates on the other. The Board also considered Credit Suisse's methodology for allocating costs to the Fund, recognizing that cost allocation methodologies are inherently subjective. The Board received profitability information for the other funds in the Credit Suisse family of funds.
Economies of Scale
The Board considered information regarding whether there have been economies of scale with respect to the management of the Fund, whether the Fund has appropriately benefited from any economies of scale, and whether there is potential for realization of any further economies of scale. Accordingly, the Board considered whether breakpoints in the Fund's advisory fee structure would be appropriate or reasonable taking into consideration economies of scale or other efficiencies that might accrue from increases in the Fund's asset levels.
Other Benefits to Credit Suisse
The Board considered other benefits received by Credit Suisse and its affiliates as a result of their relationship with the Fund. Such benefits include, among others, benefits potentially derived from an increase in Credit Suisse's businesses as a result of its relationship with the Fund (such as the ability to market to shareholders other financial products offered by Credit Suisse and its
40
Credit Suisse Large Cap Blend Fund, Inc.
Board Approval of Advisory Agreement (unaudited)(continued)
affiliates) and the fees paid to affiliates of Credit Suisse for co-administration and distribution services.
The Board considered the standards applied in seeking best execution, and reviewed Credit Suisse's method for allocating portfolio investment opportunities among its advisory clients. Credit Suisse confirmed there were no soft dollar arrangements during the past year.
Other Factors and Broader Review
As discussed above, the Board reviews detailed materials received from Credit Suisse as part of the annual re-approval process. The Board also reviews and assesses the quality of the services that the Fund receives throughout the year. In this regard, the Board reviews reports of Credit Suisse at least quarterly, which include, among other things, detailed portfolio and market reviews, detailed fund performance reports and Credit Suisse's compliance procedures.
Conclusions
In selecting Credit Suisse, and approving the Advisory Agreement and the investment advisory fee under such agreement, the Board concluded that:
• The combined Contractual Advisory Fee and co-administration fee were below the median of the Fund's Expense Group and the Net Advisory Fee was the lowest in the Expense Group. The Board concluded the fee was reasonable.
• The Fund's performance was above the median for all periods in its Performance Group and Performance Universe except for the one and five year periods in the Performance Group and Performance Universe. The Board determined that it would continue to monitor steps taken by Credit Suisse to improve performance. The Board noted the changes to the Fund during the past year including the reorganization in which the Fund acquired substantially all of the assets and liabilities of each of the Credit Suisse Large Cap Value Fund, Credit Suisse Large Cap Growth Fund and Credit Suisse Mid Cap Core Fund, Inc.
• Aside from performance (as discussed above), the Board was satisfied with the nature, extent and quality of the investment advisory services provided to the Fund by Credit Suisse and that, based on dialogue with management and counsel, the services provided by Credit Suisse under the Advisory
41
Credit Suisse Large Cap Blend Fund, Inc.
Board Approval of Advisory Agreement (unaudited)(continued)
Agreement are typical of, and consistent with, those provided to similar mutual funds by other investment advisers.
• In light of the costs of providing investment management and other services to the Fund and Credit Suisse's ongoing commitment to the Fund and willingness to waive fees, Credit Suisse's profitability based on fees payable under the Advisory Agreement, as well as other ancillary benefits that Credit Suisse and its affiliates received, were considered reasonable.
• In light of the combined Contractual Advisory Fee and co-administration fee, as well as the fee waivers and the Net Advisory Fee, the Fund's current fee structure (without breakpoints) was considered reasonable.
No single factor reviewed by the Board was identified by the Board as the principal factor in determining whether to approve the Advisory Agreement. The Independent Directors were advised by separate independent legal counsel throughout the process.
42
Credit Suisse Large Cap Blend Fund, Inc.
Information Concerning Directors and Officers (unaudited)
| Name, Address (Year of Birth) | Position(s) Held with Fund | Term of Office1 and Length of Time Served | Principal Occupation(s) During Past Five Years | Number of Portfolios in Fund Complex Overseen by Director | Other Directorships Held by Director | ||||||||||||||||||
| Independent Directors | |||||||||||||||||||||||
| Enrique Arzac c/o Credit Suisse Asset Management, LLC Attn: General Counsel Eleven Madison Avenue New York, New York 10010 (1941) | Director, Audit Committee Chairman and Nominating Committee Member | Since 2005 | Professor of Finance and Economics, Graduate School of Business, Columbia University since 1971. | 9 | Director of Epoch Holding Corporation (an investment management and investment advisory services company); Director of Starcomms PLC., (telecommunications company); Director of Mirae Asset Discovery Funds (6 open-end portfolios); Director of Aberdeen Asia-Pacific Income Investment Company Limited (a Canadian closed-end fund); Director of The Adams Express Company, Petroleum and Resources Corporation, Aberdeen Chile Fund, Inc., Aberdeen Indonesia Fund, Inc., Aberdeen Israel Fund, Inc., Aberdeen Latin America Equity Fund, Inc. and Aberdeen Emerging Markets Telecommunications and Infrastructure Fund, Inc. (each a closed-end investment company). | ||||||||||||||||||
1 Each Director and Officer serves until his or her respective successor has been duly elected and qualified.
43
Credit Suisse Large Cap Blend Fund, Inc.
Information Concerning Directors and Officers (unaudited) (continued)
| Name, Address (Year of Birth) | Position(s) Held with Fund | Term of Office1 and Length of Time Served | Principal Occupation(s) During Past Five Years | Number of Portfolios in Fund Complex Overseen by Director | Other Directorships Held by Director | ||||||||||||||||||
| Independent Directors | |||||||||||||||||||||||
| Jeffrey E. Garten2 Box 208200 New Haven, Connecticut 06520-8200 (1946) | Director, Audit and Nominating Committee Member | Since Fund Inception | The Juan Trippe Professor in the Practice of International Trade, Finance and Business from July 2005 to present; Partner and Chairman of Garten Rothkopf (consulting firm) from October 2005 to present; Dean of Yale School of Management from November 1995 to June 2005. | 7 | Director of Aetna, Inc. (insurance company); Director of CarMax Group (used car dealers); Member of Standard & Poor's Board of Managers. | ||||||||||||||||||
| Peter F. Krogh c/o Credit Suisse Asset Management, LLC Attn: General Counsel Eleven Madison Avenue New York, New York 10010 (1937) | Director, Audit and Nominating Committee Member | Since 2001 | Dean Emeritus and Distinguished Professor of International Affairs at the Edmund A. Walsh School of Foreign Service, Georgetown University from June 1995 to June 2009. | 7 | None | ||||||||||||||||||
2 Mr. Garten was initially appointed as a Director of the Fund at inception. He resigned as Director on February 3, 2000 and was subsequently reappointed on December 21, 2000.
44
Credit Suisse Large Cap Blend Fund, Inc.
Information Concerning Directors and Officers (unaudited) (continued)
| Name, Address (Year of Birth) | Position(s) Held with Fund | Term of Office1 and Length of Time Served | Principal Occupation(s) During Past Five Years | Number of Portfolios in Fund Complex Overseen by Director | Other Directorships Held by Director | ||||||||||||||||||
| Independent Directors | |||||||||||||||||||||||
| Steven N. Rappaport Lehigh Court, LLC 555 Madison Avenue 29th Floor New York, New York 10022 (1948) | Chairman of the Board of Directors, Audit Committee Member and Nominating Committee Chairman | Director since 1999 and Chairman since 2005 | Partner of Lehigh Court, LLC and RZ Capital (private investment firms) from July 2002 to present. | 9 | Director of iCAD, Inc. (a surgical and medical instruments and apparatus company); Director of Presstek, Inc. (digital imaging technologies company); Director of Wood Resources, LLC. (plywood manufacturing company); Director of Aberdeen Chile Fund, Inc., Aberdeen Indonesia Fund, Inc., Aberdeen Israel Fund, Inc., Aberdeen Latin America Equity Fund, Inc. and Aberdeen Emerging Markets Telecommunications and Infrastructure Fund, Inc. (each a closed-end investment company). | ||||||||||||||||||
45
Credit Suisse Large Cap Blend Fund, Inc.
Information Concerning Directors and Officers (unaudited) (continued)
| Name, Address (Year of Birth) | Position(s) Held with Fund | Term of Office1 and Length of Time Served | Principal Occupation(s) During Past Five Years | ||||||||||||
| Officers** | |||||||||||||||
| John G. Popp Credit Suisse Asset Management, LLC Eleven Madison Avenue New York, New York 10010 (1956) | Chief Executive Officer and President | Since 2010 | Managing Director of Credit Suisse; Group Manager and Senior Portfolio Manager for Performing Credit Strategies; Associated with Credit Suisse or its predecessor since 1997; Officer of other Credit Suisse Funds. | ||||||||||||
| Michael A. Pignataro Credit Suisse Asset Management, LLC Eleven Madison Avenue New York, New York 10010 (1959) | Chief Financial Officer | Since 1999 | Director and Director of Fund Administration of Credit Suisse; Associated with Credit Suisse or its predecessor since 1984; Officer of other Credit Suisse Funds. | ||||||||||||
| Emidio Morizio Credit Suisse Asset Management, LLC One Madison Avenue New York, New York 10010 (1966) | Chief Compliance Officer | Since 2004 | Managing Director and Global Head of Compliance of Credit Suisse; Associated with Credit Suisse since July 2000; Officer of other Credit Suisse Funds. | ||||||||||||
| Roger Machlis Credit Suisse Asset Management, LLC One Madison Avenue New York, New York 10010 (1961) | Chief Legal Officer | Since 2010 | Managing Director and General Counsel for Credit Suisse; Associated with Credit Suisse Group AG since 1997; Officer of other Credit Suisse Funds. | ||||||||||||
| Cecilia Chau Credit Suisse Asset Management, LLC Eleven Madison Avenue New York, New York 10010 (1973) | Treasurer | Since 2008 | Vice President of Credit Suisse since 2009; Assistant Vice President of Credit Suisse from June 2007 to December 2008; Associated with Alliance Bernstein L.P. from January 2007 to May 2007; Associated with Credit Suisse from August 2000 to December 2006; Officer of other Credit Suisse Funds. | ||||||||||||
| Karen Regan Credit Suisse Asset Management, LLC Eleven Madison Avenue New York, New York 10010 (1963) | Vice President and Secretary | Since 2010 | Vice President of Credit Suisse; Associated with Credit Suisse since December 2004; Officer of other Credit Suisse Funds | ||||||||||||
** The officers of the Fund shown are officers that make policy decisions.
The Statement of Additional Information includes additional information about the Directors and is available, without charge, upon request, by calling 877-870-2874.
46
Credit Suisse Large Cap Blend Fund, Inc.
Tax Information Letter
December 31, 2010 (unaudited)
Important Tax Information for Corporate Shareholders
Corporate shareholders should note for the year ended December 31, 2010, the percentage of the Fund's investment income (i.e., net investment income plus short-term capital gains) that qualified for the intercorporate dividends received deduction is 100%.
Important Tax Information for Shareholders
For the fiscal year ended December 31, 2010, the Fund designates approximately $859,044, or up to the maximum amount of such dividends allowable pursuant to the Internal Revenue Code, as qualified dividend income eligible for reduced tax rates. These lower rates range from 5% to 15% depending on an individual's tax bracket. If the Fund pays a distribution during calendar year 2010, complete information will be reported in conjunction with Form 1099-DIV.
During the year ended December 31, 2010, the Fund declared $3,386,476 in dividends that were designated as long term capital gains dividends.
47
Credit Suisse Large Cap Blend Fund, Inc.
Proxy Voting and Portfolio Holdings Information (unaudited)
Information regarding how the Fund voted proxies related to its portfolio securities during the 12 month period ended June 30 of each year, as well as the policies and procedures that the Fund uses to determine how to vote proxies relating to its portfolio securities are available:
• By calling 1-877-870-2874
• On the Fund's website, www.credit-suisse.com/us
• On the website of the Securities and Exchange Commission, www.sec.gov.
The Fund files a complete schedule of its portfolio holdings for the first and third quarters of its fiscal year with the SEC on Form N-Q. The Fund's Forms N-Q are available on the SEC's website at www.sec.gov and may be reviewed and copied at the SEC's Public Reference Room in Washington, DC. Information on the operation of the SEC's Public Reference Room may be obtained by calling 1-202-551-8090.
48

P.O. BOX 55030, BOSTON, MA 02205-5030
877-870-2874 n WWW.credit-suisse.com/us
CREDIT SUISSE ASSET MANAGEMENT SECURITIES, INC., DISTRIBUTOR. LCB-AR-1210
Item 2. Code of Ethics.
The registrant has adopted a code of ethics applicable to its Chief Executive Officer, President, Chief Financial Officer and Chief Accounting Officer, or persons performing similar functions. A copy of the code is filed as Exhibit 12(a)(1) to this Form. There were no amendments to the code during the fiscal year ended December 31, 2010. There were no waivers or implicit waivers from the code granted by the registrant during the fiscal year ended December 31, 2010
Item 3. Audit Committee Financial Expert.
The registrant’s governing board has determined that it has two audit committee financial experts serving on its audit committee: Enrique R. Arzac and Steven N. Rappaport. Each audit committee financial expert is “independent” for purposes of this item.
Item 4. Principal Accountant Fees and Services.
(a) through (d). The information in the table below is provided for services rendered to the registrant by its independent registered public accounting firm, PricewaterhouseCoopers LLP (“PwC”), for its fiscal years ended December 31, 2009 and December 31, 2010.
|
| 2009 |
| 2010 |
| ||
Audit Fees |
| $ | 17,500 |
| $ | 30,000 |
|
Audit-Related Fees(1) |
| $ | 3,400 |
| $ | 3,400 |
|
Tax Fees(2) |
| $ | 2,800 |
| $ | 2,800 |
|
All Other Fees |
| — |
| — |
| ||
Total |
| $ | 23,700 |
| $ | 36,200 |
|
(1) Services include agreed-upon procedures in connection with the registrant’s semi-annual financial statements ($3,400 for 2009 and $3,400 for 2010).
(2) Tax services in connection with the registrant’s excise tax calculations and review of the registrant’s applicable tax returns.
The information in the table below is provided with respect to non-audit services that directly relate to the registrant’s operations and financial reporting and that were rendered by PwC to the registrant’s investment adviser, Credit Suisse Asset Management, LLC (“Credit Suisse”), and any service provider to the registrant controlling, controlled by or under common control with Credit Suisse that provided ongoing services to the registrant (“Covered Services Provider”), for the registrant’s fiscal years ended December 31, 2009 and December 31, 2010.
|
| 2009 |
| 2010 |
|
Audit-Related Fees |
| N/A |
| N/A |
|
Tax Fees |
| N/A |
| N/A |
|
All Other Fees |
| N/A |
| N/A |
|
Total |
| N/A |
| N/A |
|
(e)(1) Pre-Approval Policies and Procedures. The Audit Committee (“Committee”) of the registrant is responsible for pre-approving (i) all audit and permissible non-audit services to be provided by the independent registered public accounting firm to the registrant and (ii) all permissible non-audit services to be provided by the independent registered public accounting firm to Credit Suisse and any Covered Services Provider if the engagement relates directly to the operations and financial reporting of the registrant. The Committee may delegate its responsibility to pre-approve any such audit and permissible non-audit services to the Chairperson of the Committee, and the Chairperson shall report to the Committee, at its next regularly scheduled meeting after the Chairperson’s pre-approval of such services, his or her decision(s). The Committee may also establish detailed pre-approval policies and procedures for pre-approval of such services in accordance with applicable laws, including the delegation of some or all of the Committee’s pre-approval responsibilities to other persons (other than Credit Suisse or the registrant’s officers). Pre-approval by the Committee of any permissible non-audit services shall not be required so long as: (i) the aggregate amount of all such permissible non-audit services provided to the registrant, Credit Suisse and any Covered Services Provider constitutes not more than 5% of the total amount of revenues paid by the registrant to its independent registered public accounting firm during the fiscal year in which the permissible non-audit services are provided; (ii) the permissible non-audit services were not recognized by the registrant at the time of the engagement to be non-audit services; and (iii) such services are promptly brought to the attention of the Committee and approved by the Committee (or its delegate(s)) prior to the completion of the audit.
(e)(2) The information in the table below sets forth the percentages of fees for services (other than audit, review or attest services) rendered by PwC to the registrant for which the pre-approval requirement was waived pursuant to Rule 2-01(c)(7)(i)(C) of Regulation S-X:
|
| 2009 |
| 2010 |
|
Audit-Related Fees |
| N/A |
| N/A |
|
Tax Fees |
| N/A |
| N/A |
|
All Other Fees |
| N/A |
| N/A |
|
Total |
| N/A |
| N/A |
|
The information in the table below sets forth the percentages of fees for services (other than audit, review or attest services) rendered by PwC to Credit Suisse and any Covered Services Provider required to be approved pursuant to Rule 2-01(c)(7)(ii) of Regulation S-X, for the registrant’s fiscal years ended December 31, 2009 and December 31, 2010:
|
| 2009 |
| 2010 |
|
Audit-Related Fees |
| N/A |
| N/A |
|
Tax Fees |
| N/A |
| N/A |
|
All Other Fees |
| N/A |
| N/A |
|
Total |
| N/A |
| N/A |
|
(f) Not Applicable.
(g) The aggregate fees billed by PwC for non-audit services rendered to the registrant, Credit Suisse and Covered Service Providers for the fiscal years ended December 31, 2009 and December 31, 2010 were $6,200 and $6,200, respectively.
(h) Not Applicable.
Item 5. Audit Committee of Listed Registrants.
Form N-CSR disclosure requirement is not applicable to the registrant.
Item 6. Schedule of Investments.
Included as part of the report to shareholders filed under Item 1 of this Form.
Item 7. Disclosure of Proxy Voting Policies and Procedures for Closed-End Management Investment Companies.
Form N-CSR disclosure requirement is not applicable to the registrant.
Item 8. Portfolio Managers of Closed-End Management Investment Companies.
Form N-CSR disclosure requirement is not applicable to the registrant.
Item 9. Purchases of Equity Securities by Closed-End Management Investment Company and Affiliated Purchasers.
Form N-CSR disclosure requirement is not applicable to the registrant.
Item 10. Submission of Matters to a Vote of Security Holders.
None
Item 11. Controls and Procedures.
(a) As of a date within 90 days from the filing date of this report, the principal executive officer and principal financial officer concluded that the registrant’s disclosure controls and procedures (as defined in Rule 30a-3(c) under the Investment Company Act of 1940 (the “Act”)) were effective based on their evaluation of the disclosure controls and procedures required by Rule 30a-3(b) under the Act and Rules 13a-15(b) or 15d-15(b) under the Securities Exchange Act of 1934.
(b) There were no changes in registrant’s internal control over financial reporting (as defined in Rule 30a-3(d) under the Act) that occurred during the second fiscal quarter of the period covered by this report that have materially affected, or are reasonably likely to materially affect, the registrant’s internal control over financial reporting.
Item 12. Exhibits.
(a)(1) |
| Registrant’s Code of Ethics is an exhibit to this report. |
|
|
|
(a)(2) |
| The certifications of the registrant as required by Rule 30a-2(a) under the Act are exhibits to this report. |
|
|
|
(a)(3) |
| Not applicable. |
|
|
|
(b) |
| The certifications of the registrant as required by Rule 30a-2(b) under the Act are an exhibit to this report. |
SIGNATURES
Pursuant to the requirements of the Securities Exchange Act of 1934 and the Investment Company Act of 1940, the registrant has duly caused this report to be signed on its behalf by the undersigned, thereunto duly authorized.
| CREDIT SUISSE LARGE CAP BLEND FUND, INC. | |
|
| |
| /s/ John G. Popp |
|
| Name: John G. Popp |
|
| Title: Chief Executive Officer |
|
| Date: March 2, 2011 |
|
Pursuant to the requirements of the Securities Exchange Act of 1934 and the Investment Company Act of 1940, this report has been signed below by the following persons on behalf of the registrant and in the capacities and on the dates indicated.
| /s/ John G. Popp |
|
| Name: John G. Popp |
|
| Title: Chief Executive Officer |
|
| Date: March 2, 2011 |
|
|
|
|
| /s/ Michael A. Pignataro |
|
| Name: Michael A. Pignataro |
|
| Title: Chief Financial Officer |
|
| Date: March 2, 2011 |
|