UNITED STATES
SECURITIES AND EXCHANGE COMMISSION
Washington, D.C. 20549
FORM N-CSR
CERTIFIED SHAREHOLDER REPORT OF REGISTERED MANAGEMENT
INVESTMENT COMPANIES
Investment Company Act file number File No. 811-08961
TIAA-CREF LIFE FUNDS
(Exact name of registrant as specified in charter)
730 Third Avenue, New York, New York 10017
(Address of principal executive offices) (Zip code)
Stewart P. Greene, Esq.
c/o TIAA-CREF
730 Third Avenue,
New York, New York 10017-3206
(Name and address of agent for service)
Registrant’s telephone number, including area code: 212-490-9000
Date of fiscal year end: December 31
Date of reporting period: January 1, 2006 – June 30, 2006
Item 1. Reports to Stockholders.
2006 SEMIANNUAL REPORT
TIAA-CREF
LIFE FUNDS
JUNE 30, 2006
Financial statements (unaudited)
including summary portfolios of investments
Growth Equity Stock Index
Growth & Income Social Choice Equity
International Equity Real Estate Securities
Large-Cap Value Bond
Small-Cap Equity Money Market
SIGN UP FOR ELECTRONIC DELIVERY AT
www.tiaa-cref.org/howto/edelivery.html
The Investment Company Act of 1940 requires the TIAA-CREF Life Separate Account VA-1 (which offers the Personal Annuity Select, Lifetime Variable Select and Single Premium Immediate Annuity contracts) and the TIAA-CREF Life Separate Account VLI-1 (which offers the Variable Universal Life and Intelligent Life contracts) to provide investors with periodic reports on the financial condition and portfolio holdings of the funds in which the accounts invest. The funding vehicles for these accounts are the TIAA-CREF Life Funds. The returns of the TIAA-CREF Life Funds shown here do not reflect the administrative expense and the mortality and expense risk charges deducted under the products mentioned above. Because of these additional deductions, the returns on the investment subaccounts offered through the contracts that invest in these funds are lower, for the same periods, than the figures shown here.
PERFORMANCE OVERVIEW AS OF JUNE 30, 2006
| | | | | | | | | | | |
| | | | | Average annual compound rates of total return | |
| | | Inception date | | 1 year | | | 5 years | | | Since inception | |
EQUITIES | | | | | | | | | | | |
Growth Equity Fund | | 4/3/2000 | | 4.93 | % | | –2.20 | % | | –9.13 | % |
Growth & Income Fund | | 4/3/2000 | | 9.66 | | | 1.79 | | | –1.79 | |
International Equity Fund | | 4/3/2000 | | 30.51 | | | 10.80 | | | 0.76 | |
Large-Cap Value Fund | | 10/28/2002 | | 12.29 | | | — | | | 17.80 | |
Small-Cap Equity Fund | | 10/28/2002 | | 15.40 | | | — | | | 22.39 | |
Stock Index Fund | | 1/4/1999 | | 9.52 | | | 3.51 | | | 3.04 | |
Social Choice Equity Fund | | 4/3/2000 | | 10.79 | | | 3.99 | | | 0.20 | |
Real Estate Securities Fund | | 10/28/2002 | | 13.34 | | | — | | | 26.04 | |
| | | | |
FIXED INCOME | | | | | | | | | | | |
Bond Fund | | 7/8/2003 | | –0.67 | | | — | | | 2.28 | |
Money Market Fund* | | 7/8/2003 | | 4.27 | | | — | | | 2.49 | |
NET ANNUALIZED YIELD
(30-day period ended 6/30/2006)
| | | |
| | | Effective | |
Bond Fund | | 5.34 | % |
NET ANNUALIZED YIELD
(7-day period ended 6/27/2006)
| | | | | | |
| | | Current | | | Effective | |
Money Market Fund* | | 5.07 | % | | 5.20 | % |
| * | Investments in the TIAA-CREF Life Money Market Fund are neither insured nor guaranteed by the Federal Deposit Insurance Corporation or any other government agency. The current yield more closely reflects current earnings than does the total return. We will attempt to maintain a stable net asset value of $1.00 per share for this fund, but it is possible to lose money by investing in the fund. |
The returns quoted represent past performance, which is no guarantee of future results. Returns and the principal value of your investment will fluctuate. Current performance may be higher or lower than that shown above, and you may have a gain or a loss when you redeem your shares. For current performance information, including performance to the most recent month-end, please visit www.tiaa-cref.org, or call 800 223-1200.
Contents
Understanding your TIAA-CREF Life Funds report
This report contains information about TIAA-CREF Life Funds and analyzes their results for the six-month period ended June 30, 2006. It has six main sections:
| | • | | The performance overview on the inside front cover shows the funds’ returns over a variety of time periods. |
| | • | | The letter from Scott Evans, executive vice president and head of Asset Management, describes how TIAA-CREF Life Funds are evolving to serve you better. |
| | • | | The letter from Edward Grzybowski, the chief investment officer of Teachers Advisors, Inc., the funds’ investment adviser, explains how returns from various asset classes differed during the six-month period. |
| | • | | The fund performance section compares each fund’s return with the returns of that fund’s benchmark index and peer group. This section also provides information about risks and expenses. |
| | • | | The summary portfolios of investments list the industries or types of securities in which each fund had investments as of June 30, 2006, and the largest individual issues the fund held on that date. |
| | • | | The financial statements contain detailed information about the operations and financial condition of each fund. |
You can get current performance information at the end of every business day from our automated telephone service or from the TIAA-CREF website.
As always, you should carefully consider the investment objectives, risks, charges and expenses of any fund before investing. Please visit our website at www.tiaa-cref.org, or call 800 223-1200, for contract and fund prospectuses that contain this and other important information. We urge you to read them carefully before investing.
2 | 2006 Semiannual Report TIAA-CREF Life Funds
Keeping pace with your evolving needs
I am pleased to provide you with the 2006 Semiannual Report for the TIAA-CREF Life Funds.
More than ever before, finding value in the global marketplace is a demanding task. To meet that challenge, we are increasing the size of our analyst team by nearly 50% in order to give our research capacity a more global reach. We will continue to deploy all of our resources in a diligent, efficient and risk-controlled manner. Because we are committed to providing you with expert investment management while restraining expenses, we are obsessive about spending each dollar wisely.
As I focus my attention on leading Asset Management at TIAA-CREF, I am pleased to turn over investment policy responsibilities to Edward Grzybowski, who brings to his new position nearly two decades of experience at the company.
As the chief investment officer of Teachers Advisors, Inc., the investment adviser for the TIAA-CREF Life Funds, Ed is charged with building on our heritage of helping to provide financial security through disciplined, low-priced investment management.

Scott C. Evans
Executive Vice President
Ed and I will work with the Asset Management staff with one clear objective: to help maximize the ending balance in your funds, while remaining conscious of risk. That is what our customers in the academic, medical, cultural and research fields have come to expect from TIAA-CREF, and TIAA-CREF Life Funds is dedicated to these same principles.
Whether you choose Life Funds that invest in equities or bonds, whether you use a growth strategy or a value one, you can be sure that—as your investment partner—we will work to help build shareholder value. That’s what it means to provide financial services for the greater good, and we believe that’s one of the reasons why you choose to invest with us.
|
/s/ Scott C. Evans |
| Scott C. Evans |
Executive Vice President |
TIAA-CREF Life Funds 2006 Semiannual Report | 3
Report on TIAA-CREF Life Funds
During the first half of 2006, investors drove stock prices higher and then engaged in a sell-off that erased a sizable portion of the year’s gains. The Russell 3000® Index, which measures the broad U.S. stock market, was up 5.3% in the first quarter but dropped 2% in the second, ending the six-month period with a return of 3.2%.
Investors changed course largely out of fear that higher interest rates and increased energy prices would derail economic growth and reduce corporate profits.
The Federal Reserve reacts to rising prices
The year began with the U.S. economy in high gear. The nation’s Gross Domestic Product jumped by 5.6% in the first quarter of 2006, but this surging growth—along with the rising cost of energy—raised the threat of higher inflation. At the end of March, the Consumer Price Index was up 3.4% from its level of a year earlier.
In response to robust growth and rising inflation, the Federal Reserve continued the credit-tightening policy it began in June 2004. It raised short-term interest rates four times during the first half of 2006, and these hikes helped push longer-term rates higher, too.
The yield on 10-year Treasury notes, which serves as the benchmark for the bond market, went from 4.39% at the end of December 2005 to 5.14% at the end of June 2006.
During the six-month period, returns varied widely among asset classes.
Bonds fade, foreign stocks shine
Rising yields on newly issued bonds reduced the market value of the bonds already held in many investment portfolios. Income from interest on bond holdings offset some of that decline, but the Lehman Brothers U.S. Aggregate Index, which measures the investment-grade bond market, posted a 0.7% loss for the six-month period.
Foreign stocks remained one of the brighter parts of the investment landscape. During the period, a stronger euro and pound boosted the MSCI EAFE® Index to a 10.2% return, in terms of U.S. dollars. The EAFE index tracks 21 stock markets in developed nations outside North America.
Over the five years ended June 30, 2006, the foreign stocks of the EAFE
4 | 2006 Semiannual Report TIAA-CREF Life Funds
index have produced a cumulative return of 61.5%, versus the 18.9% return of U.S. stocks, as measured by the Russell 3000.
Funds post mixed results
During the six-month period, returns varied widely among asset classes, and, accordingly, among the ten TIAA-CREF Life Funds as well.
Returns for the equity funds ranged from –2.7% for the Growth Equity Fund to 12.0% for the Real Estate Securities Fund. The International Equity Fund, which invests in foreign stocks, returned 11.1%.
The decline in U.S. bond prices continued to hamper the fixed-income market. The Bond Fund posted a return of –0.5%.
The Federal Reserve’s ongoing program of rate hikes lifted money market rates throughout the six-month period, and the Money Market Fund posted a gain of 2.4%.
Our strategy is to stay fully invested
Throughout the period, each of our funds remained fully invested in order to participate in any gains achieved by its market segment. At the same time, we continued to pay close attention to costs, delivering highly disciplined investment management along with some of the lowest expense ratios in the industry.

Edward J. Grzybowski
Chief Investment Officer
Teachers Advisors, Inc.
We keep each of our funds faithful to its objectives in order to keep your allocation strategies on track.
|
/s/ Edward J. Grzybowski |
| Edward J. Grzybowski |
Chief Investment Officer Teachers Advisors, Inc. |
TIAA-CREF Life Funds 2006 Semiannual Report | 5
More information on TIAA-CREF Life Funds
Portfolio listings
SEC rules intended to provide investors with more meaningful information about fund performance allow investment companies to list the top holdings of each fund in their annual and semiannual reports instead of providing complete portfolio listings as they did previously. Companies will continue to file complete listings with the SEC, and these will remain available to investors.
You can obtain a complete list of the TIAA-CREF Life Funds’ holdings (called “TIAA-CREF Life Funds Statements of Investments”) as of the most recently completed fiscal quarter (currently for the period ended June 30, 2006) in the following ways:
| | • | | by visiting the TIAA-CREF website at www.tiaa-cref.org; or |
| | • | | by calling TIAA-CREF at 800 842-2776 to request a copy, which will be provided free of charge. |
You can also obtain a complete list of the TIAA-CREF Life Funds’ holdings as of the most recently completed fiscal quarter, and for prior quarter-ends, from the SEC. (Form N-CSR lists holdings as of December 31 or June 30; Form N-Q lists holdings as of March 31 or September 30.) Copies of these forms are available:
| | • | | through the Electronic Data Gathering and Retrieval System (EDGAR) on the SEC’s website at www.sec.gov; or |
| | • | | at the SEC’s Public Reference Room. (Call 800 SEC-0330 for more information.) |
Proxy voting
TIAA-CREF Life Funds’ ownership of stock gives it the right to vote on proxy issues of companies in which it invests. A description of our proxy voting policies and procedures can be found at our website at www.tiaa-cref.org or on the SEC website at www.sec.gov. You may also call us at 800 223-1200 to request a free copy. A report of how the funds voted during the most recently completed twelve-month period ended June 30 can be found at our website or at www.sec.gov.
Contacting TIAA-CREF
There are three easy ways to contact us: by email, using the Contact/Help link at the top of our homepage; by mail at TIAA-CREF, 730 Third Avenue, New York, NY 10017–3206; or by phone at 800 223-1200.
Fund management
TIAA-CREF Life Funds are managed by the portfolio management teams of Teachers Advisors, Inc. The members of these teams are responsible for the day-to-day operations of the funds.
6 | 2006 Semiannual Report TIAA-CREF Life Funds
Special terms
Agency securities are bonds issued by U.S. government entities such as Fannie Mae.
Asset-backed securities are bonds backed by loans or by the outstanding amounts owed to a bank, credit card company or other lender.
Benchmarks (benchmark indexes) are groups of securities, such as the Russell 3000® Index or S&P 500® Index, whose performance can be used as a standard by which to judge the performance of a fund.*
Commercial paper refers to short-term debt obligations issued to investors by banks, corporations and other borrowers. Maturities range from 1 to 270 days.
Expense ratio is the amount that investors pay for the management of a fund. The amount is expressed as a percentage of the fund’s average net assets. Expense ratios do not include front-end or back-end sales charges, if any, or trading costs. See “Total return.”
Inception date is the first date on which investors can invest in a fund. The fund begins to record investment performance on that date.
Market capitalization is the total value of a company’s outstanding stock. It is calculated by multiplying the total number of a company’s outstanding shares by the current market price per share.
Maturity date is the date on which the principal amount of a note, bond or other debt instrument becomes due or payable.
Mortgage-backed securities are bonds that represent an interest in a pool of mortgages usually issued by Ginnie Mae, Fannie Mae or other federal entities.
Overweight holding is a security held by a fund. In terms of market capitalization, its percentage of the fund is larger than that same security’s percentage of the benchmark. See also “Underweight holding.”
Peer groups are groupings of funds with a similar objective whose performance can be compared with the performance of a single fund.
Relative performance is the return of a fund in relation to the return of its benchmark index.
Securities is a general name for stocks (also known as “equities”), bonds (also known as “fixed-income securities”) or other investments.
Total return is the amount an investment provides to investors after expenses are deducted. Total return is expressed as a percentage. It includes any interest or dividends, as well as any change in the market value of the investment.
Underweight holding is a security held by a fund. In terms of market capitalization, its percentage of the fund is smaller than that same security’s percentage of the benchmark. See also “Overweight holding.”
| * | Russell 3000 is a trademark and service mark of the Frank Russell Company. TIAA-CREF products are not promoted or sponsored by, or affiliated with, the Frank Russell Company. S&P 500 is a registered trademark and service mark of the McGraw-Hill Companies, Inc. |
TIAA-CREF Life Funds 2006 Semiannual Report | 7
Understanding investment risk
All investing involves an element of risk. For example, investors in U.S. Treasury bonds, which are generally considered among the safest of investments, face the risk that inflation will erode their principal and interest over time.
Some kinds of risk apply to all investments; other risks only apply to certain types of securities. For example, the price of any publicly traded security, such as a stock or bond, may decline in response to general market or economic conditions. This is referred to as “market risk.” An example of a risk that applies only to bonds is “credit risk”—the possibility that a company may be unable to repay the principal of its bonds or pay interest on them.
In general, funds that invest in stocks are subject to market risk and company risk. Bond funds are subject to market risk, company risk, interest-rate risk, credit risk, prepayment risk, extension risk and income volatility risk. A fund that operates in a limited area of either the stock or bond markets is subject to additional, special risks. For a full explanation of the funds’ risks, please see the prospectus.
The glossary below describes the general risks outlined above, as well as the special risks described in the discussions of each fund.
Company risk is the risk that the earnings prospects and overall financial position of the issuer of a security will deteriorate, causing a decline in the security’s value over short or extended periods of time.
Credit risk (a type of company risk) is the risk that a decline in a company’s overall financial soundness may make it unable to pay principal and interest on bonds when due.
Dividend risk is the risk associated with investments in stocks paying relatively high dividends. These stocks may significantly underperform other stocks during periods of rapid market appreciation.
Extension risk is the risk that the value of certain fixed-income securities will decline because principal payments have not been made as early as possible.
Foreign investment risks are the risks of investing in securities of foreign issuers, in securities or contracts traded on foreign exchanges or in foreign markets, or in securities or contracts payable in foreign currency. Foreign investing involves special risks, including erratic market conditions, economic and political instability, and fluctuations in currency exchange rates. These investment risks may be magnified in emerging markets.
Growth investing risks include the risk that, due to their relatively high valuations, growth stocks will be more volatile than value stocks. In addition, the value of growth stocks is generally a function of their expected earnings growth. If that growth fails to occur or to be sustained, share prices can be adversely affected.
Illiquid security risk is the risk that investments in illiquid securities may be difficult to sell for their fair market value.
Income volatility risk is the risk that the level of current income from a portfolio of fixed-income securities may decline in certain interest-rate environments.
8 | 2006 Semiannual Report TIAA-CREF Life Funds
Index risk is the risk that a fund’s performance will not match the performance of its benchmark index for any particular period of time. Although certain funds attempt to closely track the investment performance of their indexes, they may not duplicate the composition of these indexes. In addition, a fund’s performance, unlike that of its index, is affected by investment and other operating expenses.
Interest-rate risk (a type of market risk) is the risk that bond prices or a fund’s income may decline if interest rates change.
Large-cap risk is the risk that, by focusing on investments in securities of larger companies, a fund may have fewer opportunities to identify securities that the market misprices. In addition, larger companies may grow more slowly than the economy as a whole or not at all.
Market risk is the risk that the price of securities may decline in response to general market and economic conditions or events.
Prepayment risk is the risk that certain fixed-income securities that allow for the prepayment of principal will decline in value, and that a fund’s income will decline as a result.
Real estate investing risks are the risks associated with real estate ownership, including fluctuations in property values, higher expenses or lower income than expected, and potential environmental problems and liability.
Real estate securities risk is the risk that a fund that concentrates its investments in real estate securities and holds securities of relatively few issuers may experience greater fluctuations in value and be subject to a greater risk of loss than other mutual funds.
Reorganization risk is the risk that the stock of a company will lose value because the company is involved in a reorganization or some other special situation.
Risk of socially screened investing is the possibility that, because its social screens exclude some investments, a fund will not be able to take advantage of the same opportunities or market trends as funds that do not use such criteria.
Small-cap risk is the risk that the securities of smaller companies may experience steeper fluctuations in price than those of larger companies. These securities may also have to be sold at a discount from their current market prices or in small lots over an extended period.
Style risk is the risk that a fund’s style—whether growth-investing or value-investing—will pass out of favor in the marketplace for various periods of time.
Value investing risks are the risks that (1) the issuer’s potential business prospects may not be realized; (2) the securities’ potential values may never be recognized by the market; and (3) due to unanticipated problems associated with the issuer or industry, the securities were appropriately priced (or overpriced) when acquired.
TIAA-CREF Life Funds 2006 Semiannual Report | 9
Important information about expenses
DISCLOSURE
Shareholders in the TIAA-CREF Life Funds incur only one of two potential types of costs.
| | • | | Shareholders incur no transaction costs, including sales charges (loads) on purchases, on reinvested dividends or on other distributions. There are also no redemption fees or exchange fees. |
| | • | | However, they do incur ongoing costs, including management fees. |
The TIAA-CREF Life Funds are the underlying investment vehicles for certain variable life insurance and variable annuity contracts issued by TIAA-CREF Life Insurance Company. These contracts have additional administrative expense fees and mortality and expense risk charges. Because of these additional deductions, the costs to investors will be higher than the figures shown in the expense examples.
The examples that appear on the performance pages are intended to help you understand your ongoing costs (in dollars) of investing in each fund. The examples are also designed to help you compare these costs with the ongoing costs of investing in other funds.
The examples assume $1,000 was invested on January 1, 2006, and held for six months until June 30, 2006.
Actual expenses
The first line in each table uses the fund’s actual expenses and its actual rate of return. You may use the information in this line, together with the amount you invested at the beginning of the period, to estimate the expenses that you paid over the six-month period.
Simply divide your fund value by $1,000 (for example, an $8,600 fund value divided by $1,000 = 8.6), then multiply the result by the number in the first line under the heading “Expenses paid” to estimate the expenses you paid during the six-month period.
Hypothetical example for comparison purposes
The second line in the table shows hypothetical fund values and hypothetical expenses based on the fund’s actual expense ratio for the six-month period and an assumed annual rate of return of 5% before expenses—which is not the fund’s actual return.
Do not use the hypothetical fund values and hypothetical expenses to estimate the actual expenses you paid for the period. Instead, you can use this information to compare the ongoing costs of investing in an individual fund with the ongoing costs of other funds. To do so, compare this 5% hypothetical example with the 5% hypothetical examples that appear in the shareholder reports of the other funds.
10 | 2006 Semiannual Report TIAA-CREF Life Funds
Growth Equity Fund | Large-cap growth stocks
DISCUSSION
Performance in the six months ended June 30, 2006
The Growth Equity Fund returned –2.74% for the period, trailing the –0.93% return of the fund’s benchmark, the Russell 1000® Growth Index, and the –1.32% average return of similar funds, as measured by the Morningstar Large Growth category.
Growth sharply lags value
A global stock rally helped lift large-cap growth stocks 3.09% in the first quarter. However, they declined 3.90% in the second quarter, when a spike in the U.S. inflation rate rattled investors and caused a sell-off that hit technology stocks hardest.
For the six-month period, large-cap growth stocks, as measured by the Russell 1000 Growth Index, trailed the 6.56% gain of the Russell 1000 Value Index and the 3.23% rise of the broad-market Russell 3000® Index.
For the ten years ended June 30, 2006, the gap between the average annual returns of large-cap growth and large-cap value stocks widened to almost five and one-half percentage points.
Largest sectors stifle returns
The decline in large-cap growth stocks for the six-month period was driven by losses in the benchmark’s two largest sectors, technology and health care. Comprising more than 40% of the Russell 1000 Growth Index, these sectors fell 6.7% and 5.7%, respectively, and lagged all the other sectors of the benchmark. In contrast, the two largest sectors of the Russell 1000 Value Index, financials and utilities, advanced 4.4% and 9.4%, respectively.
Declining stocks lead to losses
Overweight positions in several stocks that did not perform as anticipated explain much of the fund’s underperformance. These stocks included St. Jude Medical, the largest detractor, as well as eBay and software maker Adobe Systems. A position in Israel’s Teva Pharmaceutical, a stock not included in the benchmark, also hurt performance. Teva was held as an American Depositary Receipt (a receipt for shares of a foreign stock traded on a U.S. exchange).
These declines were partly offset by the positive effects of underweights such as chip maker Intel and UnitedHealth Group, an HMO. A position in oil field services provider Schlumberger Limited, a stock not held in the benchmark, and an overweight in computer company Network Appliance also added value.
On June 30, 2006, foreign securities made up 4.94% of the fund’s total portfolio investments. Many of these securities were held as American Depositary Receipts.
TIAA-CREF Life Funds 2006 Semiannual Report | 11
Growth Equity Fund | Large-cap growth stocks
Investment objective
The fund seeks a favorable long-term return, mainly through capital appreciation, primarily from equity securities.
Special investment risks
In addition to the risks of any equity investment, the fund is subject to special risks, including growth investing risks, large-cap risk, style risk, foreign investment risks and reorganization risk. For a further discussion of risk, please see page 8.
The fund’s benchmark
The Russell 1000® Growth Index is a subset of the Russell 1000 Index, which measures the performance of the stocks of the 1,000 largest companies in the Russell 3000® Index, based on market capitalization. The Russell 1000 Growth Index measures the performance of those stocks of the Russell 1000 with higher price-to-book ratios and higher relative forecasted growth rates. You cannot invest directly in these indexes.
Performance as of June 30, 2006
| | | | | | | | | | | | | | | | | | |
| | | Average annual compound rates of total return* | | | Cumulative rates of total return* | |
| | | 1 year | | | 5 years | | | since inception1 | | | 6 months | | | 5 years | | | since inception1 | |
Growth Equity Fund | | 4.93 | % | | –2.20 | % | | –9.13 | % | | –2.74 | % | | –10.53 | % | | –45.02 | % |
| | | | | | |
Benchmark: | | | | | | | | | | | | | | | | | | |
Russell 1000 Growth Index2 | | 6.12 | | | –0.76 | | | –7.90 | | | –0.93 | | | –3.75 | | | –40.23 | |
| | | | | | |
Peer group: | | | | | | | | | | | | | | | | | | |
Morningstar Large Growth | | 6.83 | | | –0.55 | | | –6.27 | | | –1.32 | | | –1.65 | | | –30.60 | |
| * | The returns quoted represent past performance, which is no guarantee of future results. Returns and the principal value of your investment will fluctuate. Current performance may be higher or lower than that shown above, and you may have a gain or a loss when you redeem your shares. For current performance information, including performance to the most recent month-end, please visit www.tiaa-cref.org/lifefunds, or call 800 223-1200. |
| 1 | Inception date: April 3, 2000 |
| 2 | Russell 1000 and Russell 3000 are trademarks and service marks of the Frank Russell Company. TIAA-CREF products are not promoted or sponsored by, or affiliated with, the Frank Russell Company. |
12 | 2006 Semiannual Report TIAA-CREF Life Funds
PERFORMANCE
$10,000 since April 3, 2000 inception
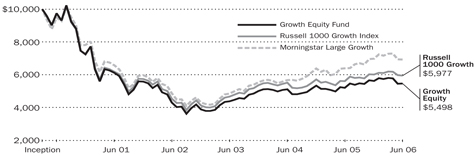
An investment of $10,000 in this fund on April 3, 2000, would be worth $5,498 as of June 30, 2006, including reinvestment of dividends and distributions. For the purpose of comparison, the graph also shows the change in the fund’s benchmark during the same period.
Calendar year total returns
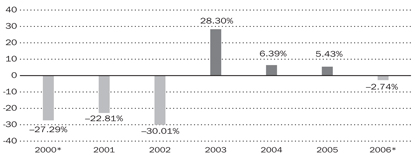
Best quarter: 15.72%, for the quarter ended December 31, 2001
Worst quarter: –22.60%, for the quarter ended March 31, 2001
TIAA-CREF Life Funds 2006 Semiannual Report | 13
Growth Equity Fund | Large-cap growth stocks
PERFORMANCE
Fund expenses–six months ended June 30, 2006
The expense examples that appear below are intended to help you understand your ongoing costs (in dollars) of investing in the fund. They are also designed to help you compare these costs with the ongoing costs of investing in other funds. (The costs shown do not reflect any separate account fees or expenses deducted under the variable annuity or variable life insurance contracts using the TIAA-CREF Life Funds. If those fees or expenses were included, the costs would be higher.)
The examples assume $1,000 was invested on January 1, 2006, and held for six months until June 30, 2006. Please see page 8 for a full description of the assumptions on which these examples are based and an explanation of how you can use this expense information.
| | | | | | | | | | |
| | | Growth Equity Fund expense example |
| | | Starting fund value (1/1/06) | | Ending fund value (6/30/06) | | | Expenses paid† (1/1/06–6/30/06) |
Actual return | | $ | 1,000.00 | | $ | 971.38 | | | $ | 1.22 |
5% annual hypothetical return | | | 1,000.00 | | | 1,023.53 | ‡ | | | 1.26 |
| † | “Expenses paid” is based on the fund’s actual expense ratio for the most recent fiscal half year. The fund’s annualized six-month expense ratio for that period was 0.25%. |
| ‡ | Ending fund value for the hypothetical example would be $1,025.00 before expenses. The table shows the value after subtraction of expenses in order to be comparable with the ending fund value shown for the fund’s actual return. |
Portfolio breakdown by company size
| | |
Capitalization (6/30/2006) | | Percent of Portfolio investments |
Large: over $5 billion | | 96.87 |
Middle: $1 billion–$5 billion | | 2.92 |
Small: under $1 billion | | 0.21 |
| | |
Total | | 100.00 |
Fund facts
| | | | |
Inception date | | | 4/3/2000 | |
Net assets (6/30/2006) | | $ | 27.61 million | |
2006 expense ratio* | | | 0.25 | % |
| * | This fund expense ratio does not include the administrative, mortality and expense risk charges that are deducted under variable annuity or variable life insurance contracts that use the TIAA-CREF Life Funds. For more information on fund deductions and expenses, please see the prospectus. |
14 | 2006 Semiannual Report TIAA-CREF Life Funds
Growth & Income Fund | Large-cap, dividend-paying stocks
DISCUSSION
Performance in the six months ended June 30, 2006
The Growth & Income Fund returned 2.64% for the period, closely tracking the 2.71% return of the fund’s benchmark, the S&P 500® Index, and topping the 2.40% average return of similar funds, as measured by the Morningstar Large Blend category.
S&P trails the broad market
A global stock rally helped lift the large-cap stocks of the S&P 500 4.21% in the first quarter. However, the index slipped 1.44% in the second quarter when a spike in the U.S. inflation rate startled investors. For the six-month period, the S&P 500 trailed the 3.23% return of the broad-market Russell 3000® Index, which benefited from continuing strength in small- and mid-cap issues.
Two large sectors post losses
Although eight of the S&P 500’s ten industry sectors recorded positive returns, two of the largest, information technology and health care—together comprising more than one-quarter of the market capitalization of the index—fell 5.9% and 3.8%, respectively.
The energy sector, which made up about one-tenth of the index, rose 13.7%. The considerably smaller telecommunications services sector was the only other sector with a double-digit gain, rising 13.8%.
Stock selections produce mixed results
The fund’s return slightly trailed the benchmark’s because of numerous stock selections that did not perform as anticipated. These included three stocks in the health care sector that were overweight relative to the benchmark: insurer Cigna, medical products maker Boston Scientific and Coventry Health Care.
The negative effects of these holdings were partly offset by stock selections that added value, relative to the benchmark. The top contributor to performance was French industrial giant Alstom, a stock not included in the index. Successful overweights included Occidental Petroleum, computer graphics company Nvidia and Marathon Oil. Underweights such as UnitedHealth Group, an HMO, and chip maker Intel also helped returns.
On June 30, 2006, foreign securities made up 7.69% of the fund’s total portfolio investments. Many of these securities were held as American Depositary Receipts (receipts for shares of a foreign stock traded on a U.S. exchange).
TIAA-CREF Life Funds 2006 Semiannual Report | 15
Growth & Income Fund | Large-cap, dividend-paying stocks
Investment objective
The fund seeks a favorable long-term total return through both capital appreciation and investment income, primarily from income-producing equity securities.
Special investment risks
In addition to the risks of any equity investment, the fund is subject to special risks, including growth investing risks, style risk, foreign investment risks, large-cap risk and dividend risk. For a further discussion of risk, please see page 8.
The fund’s benchmark
The S&P 500® Index is a market-capitalization-weighted index of the stocks of 500 leading companies in major industries of the U.S. economy. You cannot invest directly in this index.
Performance as of June 30, 2006
| | | | | | | | | | | | | | | | | | |
| | | Average annual compound rates of total return* | | | Cumulative rates of total return* | |
| | | 1 year | | | 5 years | | | since inception1 | | | 6 months | | | 5 years | | | since inception1 | |
Growth & Income Fund | | 9.66 | % | | 1.79 | % | | –1.79 | % | | 2.64 | % | | 9.26 | % | | –10.67 | % |
| | | | | | |
Benchmark: | | | | | | | | | | | | | | | | | | |
S&P 500 Index2 | | 8.63 | | | 2.49 | | | –1.02 | | | 2.71 | | | 13.11 | | | –6.23 | |
| | | | | | |
Peer group: | | | | | | | | | | | | | | | | | | |
Morningstar Large Blend | | 8.85 | | | 2.31 | | | –0.23 | | | 2.40 | | | 12.69 | | | 1.08 | |
| * | The returns quoted represent past performance, which is no guarantee of future results. Returns and the principal value of your investment will fluctuate. Current performance may be higher or lower than that shown above, and you may have a gain or a loss when you redeem your shares. For current performance information, including performance to the most recent month-end, please visit www.tiaa-cref.org/lifefunds, or call 800 223-1200. |
| 1 | Inception date: April 3, 2000 |
| 2 | S&P 500 is a registered trademark and service mark of the McGraw-Hill Companies. |
16 | 2006 Semiannual Report TIAA-CREF Life Funds
PERFORMANCE
$10,000 since April 3, 2000 inception
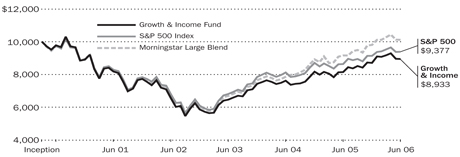
An investment of $10,000 in this fund on April 3, 2000, would be worth $8,933 as of June 30, 2006, including reinvestment of dividends and distributions. For the purpose of comparison, the graph also shows the change in the fund’s benchmark during the same period.
Calendar year total returns
Best quarter: 14.09%, for the quarter ended June 30, 2003
Worst quarter: –16.56%, for the quarter ended September 30, 2002
TIAA-CREF Life Funds 2006 Semiannual Report | 17
Growth & Income Fund | Large-cap, dividend-paying stocks
PERFORMANCE
Fund expenses–six months ended June 30, 2006
The expense examples that appear below are intended to help you understand your ongoing costs (in dollars) of investing in the fund. They are also designed to help you compare these costs with the ongoing costs of investing in other funds. (The costs shown do not reflect any separate account fees or expenses deducted under the variable annuity or variable life insurance contracts using the TIAA-CREF Life Funds. If those fees or expenses were included, the costs would be higher.)
The examples assume $1,000 was invested on January 1, 2006, and held for six months until June 30, 2006. Please see page 10 for a full description of the assumptions on which these examples are based and an explanation of how you can use this expense information.
| | | | | | | | | | |
| | | Growth & Income Fund expense example |
| | | Starting fund value (1/1/06) | | Ending fund value (6/30/06) | | | Expenses paid† (1/1/06–6/30/06) |
Actual return | | $ | 1,000.00 | | $ | 1,025.24 | | | $ | 1.16 |
5% annual hypothetical return | | | 1,000.00 | | | 1,023.63 | ‡ | | | 1.16 |
| † | “Expenses paid” is based on the fund’s actual expense ratio for the most recent fiscal half year. The fund’s annualized six-month expense ratio for that period was 0.23%. |
| ‡ | Ending fund value for the hypothetical example would be $1,025.00 before expenses. The table shows the value after subtraction of expenses in order to be comparable with the ending fund value shown for the fund’s actual return. |
Portfolio breakdown by company size
| | |
Capitalization (6/30/2006) | | Percent of Portfolio investments |
Large: over $5 billion | | 92.54 |
Middle: $1 billion–$5 billion | | 7.09 |
Small: under $1 billion | | 0.37 |
| | |
Total | | 100.00 |
Fund facts
| | | | |
Inception date | | | 4/3/2000 | |
Net assets (6/30/2006) | | $ | 51.81 million | |
2006 expense ratio* | | | 0.23 | % |
| * | This fund expense ratio does not include the administrative, mortality and expense risk charges that are deducted under variable annuity or variable life insurance contracts that use the TIAA-CREF Life Funds. For more information on fund deductions and expenses, please see the prospectus. |
18 | 2006 Semiannual Report TIAA-CREF Life Funds
International Equity Fund | Foreign stocks
DISCUSSION
Performance in the six months ended June 30, 2006
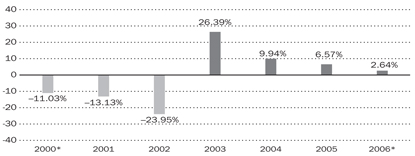
The International Equity Fund returned 11.11% for the period, topping both the 10.16% return of the fund’s benchmark, the MSCI EAFE® Index, and the 8.89% average return of similar funds, as measured by the Morningstar Foreign Large Blend category.
Weak dollar boosts foreign stock gains
Gains for foreign stocks were concentrated in the first quarter of 2006, when the fund’s benchmark jumped 9.40%. Momentum reversed sharply in May, and the benchmark struggled to eke out a positive second quarter. A weaker dollar helped: during the quarter the EAFE lost 4.25% in terms of local currencies but gained 0.70% in dollar terms.
For the six-month period, the dollar’s weakness converted the EAFE’s 3.59% return in local currencies to 10.16% in dollars. This double-digit gain was more than triple the 3.23% return of the broad U.S. stock market, as measured by the Russell 3000® Index.
European stocks drive the benchmark
During the period, the benchmark’s European segment rose 13.58%, fueled by strong performance in France (up 16.06%), the United Kingdom (up 13.61%) and Germany (up 13.41%). Stocks in these three countries constituted more than 40% of the benchmark’s market capitalization. The Pacific segment was up a modest 3.53%, constrained by the relatively tame 1.91% return of the benchmark’s Japanese stocks, which are its largest component.
Successful stock selections lift returns
Positions in many well-performing stocks enabled the fund to outpace its benchmark. Among the largest contributors were overweights in Finnish energy company Fortum, Italian car maker Fiat and British brokerage company Man Group. A position in Swiss private bank Julius Baer, which was not in the benchmark, also aided returns.
The positive effects of these holdings were partly offset by positions in a number of underperforming stocks not listed in the benchmark. These included two Japanese companies, magnet maker Neomax and credit company Orient Corporation, as well as Israel’s Teva Pharmaceutical. Teva was held as an American Depositary Receipt (a receipt for shares of a foreign stock traded on a U.S. exchange). Overweights in Switzerland’s Zurich Financial Services and Germany’s Deutsche Post also detracted from returns.
On June 30, 2006, stocks of companies in emerging markets, which are not included in the benchmark, made up approximately 2.5% of the fund’s total portfolio investments.
TIAA-CREF Life Funds 2006 Semiannual Report | 19
International Equity Fund | Foreign stocks
Investment objective
The fund seeks a favorable long-term total return, mainly through capital appreciation, primarily from equity securities of foreign issuers.
Special investment risks
In addition to the risks of any equity investment, the fund is subject to special risks including foreign investment risks and small-cap risk. For a further discussion of risk, please see page 8.
The fund’s benchmark
The Morgan Stanley Capital International EAFE® (Europe, Australasia, Far East) Index measures the performance of the leading stocks in 21 developed countries outside North America. You cannot invest directly in this index.
Performance as of June 30, 2006
| | | | | | | | | | | | | | | | | | |
| | | Average annual compound rates of total return* | | | Cumulative rates of total return* | |
| | | 1 year | | | 5 years | | | since inception1 | | | 6 months | | | 5 years | | | since inception1 | |
International Equity Fund | | 30.51 | % | | 10.80 | % | | 0.76 | % | | 11.11 | % | | 67.03 | % | | 4.84 | % |
| | | | | | |
Benchmark: | | | | | | | | | | | | | | | | | | |
Morgan Stanley EAFE Index2 | | 26.56 | | | 10.06 | | | 2.75 | | | 10.16 | | | 61.53 | | | 18.51 | |
| | | | | | |
Peer group: | | | | | | | | | | | | | | | | | | |
Morningstar Foreign Large Blend | | 26.39 | | | 8.08 | | | 0.47 | | | 8.89 | | | 48.25 | | | 5.02 | |
| * | The returns quoted represent past performance, which is no guarantee of future results. Returns and the principal value of your investment will fluctuate. Current performance may be higher or lower than that shown above, and you may have a gain or a loss when you redeem your shares. For current performance information, including performance to the most recent month-end, please visit www.tiaa-cref.org/lifefunds, or call 800 223-1200. |
| 1 | Inception date: 4/3/2000 |
| 2 | From May 31, 2001, through May 31, 2002, MSCI published both a “standard” and a “provisional” version of this index while its composition was being revised. The fund used the provisional version from July 1, 2001, through May 31, 2002, and the returns shown above reflect this. EAFE is a trademark of Morgan Stanley Capital International, Inc. |
20 | 2006 Semiannual Report TIAA-CREF Life Funds
PERFORMANCE
$10,000 since April 3, 2000 inception
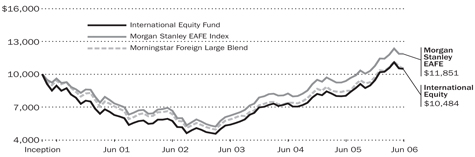
An investment of $10,000 in this fund on April 3, 2000, would be worth $10,484 as of June 30, 2006, including reinvestment of dividends and distributions. For the purpose of comparison, the graph also shows the change in the fund’s benchmark during the same period.
Calendar year total returns
Best quarter: 18.58%, for the quarter ended December 31, 2003
Worst quarter: –19.22%, for the quarter ended September 30, 2002
TIAA-CREF Life Funds 2006 Semiannual Report | 21
International Equity Fund | Foreign stocks
PERFORMANCE
Fund expenses–six months ended June 30, 2006
The expense examples that appear below are intended to help you understand your ongoing costs (in dollars) of investing in the fund. They are also designed to help you compare these costs with the ongoing costs of investing in other funds. (The costs shown do not reflect any separate account fees or expenses deducted under the variable annuity or variable life insurance contracts using the TIAA-CREF Life Funds. If those fees or expenses were included, the costs would be higher.)
The examples assume $1,000 was invested on January 1, 2006, and held for six months until June 30, 2006. Please see page 10 for a full description of the assumptions on which these examples are based and an explanation of how you can use this expense information.
| | | | | | | | | | |
| | | International Equity Fund expense example |
| | | Starting fund value (1/1/06) | | Ending fund value (6/30/06) | | | Expenses paid† (1/1/06–6/30/06) |
Actual return | | $ | 1,000.00 | | $ | 1,109.58 | | | $ | 1.52 |
5% annual hypothetical return | | | 1,000.00 | | | 1,023.33 | ‡ | | | 1.46 |
| † | “Expenses paid” is based on the fund’s actual expense ratio for the most recent fiscal half year. The fund’s annualized six-month expense ratio for that period was 0.29%. |
| ‡ | Ending fund value for the hypothetical example would be $1,025.00 before expenses. The table shows the value after subtraction of expenses in order to be comparable with the ending fund value shown for the fund’s actual return. |
Diversification among world markets
| | |
Holdings by country (6/30/2006) | | Percent of portfolio investments |
Japan | | 23.3 |
Germany | | 21.0 |
United Kingdom | | 13.8 |
France | | 10.8 |
Switzerland | | 8.4 |
Italy | | 5.8 |
Australia | | 4.2 |
Finland | | 3.7 |
United States | | 2.6 |
9 other nations | | 6.4 |
| | |
Total | | 100.0 |
Portfolio breakdown by company size
| | |
Capitalization (6/30/2006) | | Percent of portfolio investments |
Large: over $5 billion | | 79.61 |
Middle: $1 billion–$5 billion | | 17.38 |
Small: under $1 billion | | 3.01 |
| | |
Total | | 100.00 |
Fund facts
| | | | |
| |
Inception date | | | 4/3/2000 | |
Net assets (6/30/2006) | | $ | 89.35 million | |
2006 expense ratio* | | | 0.29 | % |
| * | This fund expense ratio does not include the administrative, mortality and expense risk charges that are deducted under variable annuity or variable life insurance contracts that use the TIAA-CREF Life Funds. For more information on fund deductions and expenses, please see the prospectus. |
22 | 2006 Semiannual Report TIAA-CREF Life Funds
Large-Cap Value Fund | Value stocks of larger companies
DISCUSSION
Performance in the six months ended June 30, 2006
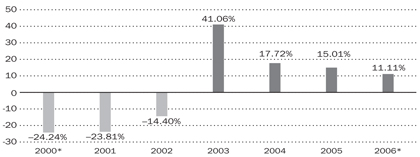
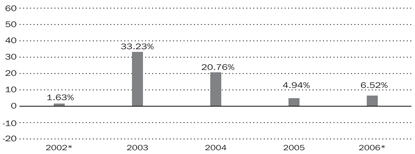
The Large-Cap Value Fund advanced 6.52% for the period, keeping pace with the strong 6.56% return of the fund’s benchmark, the Russell 1000® Value Index, and topping the 4.71% average return of similar funds, as measured by the Morningstar Large Value category.
Value beats growth again
At the end of 2005, the annual return of the Russell 1000 Value Index, which measures large-cap value stocks, had outperformed that of the Russell 1000 Growth Index, which tracks large-cap growth stocks, for six years in a row.
That pattern continued in the first quarter of 2006, when large-cap value returned 5.93%, versus 3.09% for large-cap growth. Furthermore, in the sell-off that began in May, large-cap value stocks held up much better. For the second quarter, large-cap value gained 0.59% while large-cap growth posted a 3.90% loss.
Largest sectors drive gains
During the six-month period, the gains of the Russell 1000 Value Index were boosted by the 9.4% return of its second-largest sector, utilities, and the 13.2% return of its third-largest sector, integrated oils. Together, these two sectors made up nearly a quarter of the index in terms of market capitalization. These outsized gains were tempered by the more modest 4.4% return of the financial sector, which comprised more than a third of the index.
Selections fuel fund’s strong gains
An overweight position, relative to the benchmark, in Sears Holdings was the top contributor to the fund’s gains. Performance was also helped by stock selections that included several nonbenchmark stocks, such as French industrial giant Alstom, semiconductor manufacturer Atmel and computer network provider Brocade Communications.
These positive results were partly offset by positions in stocks that did not perform as anticipated. Four of these were nonbenchmark stocks, including medical products maker Boston Scientific—the largest detractor, RadioShack, and two Japanese companies, conglomerate Sojitz and real estate developer Daikyo.
On June 30, 2006, foreign securities made up 12.51% of the fund’s total portfolio investments. Many of these securities were held as American Depositary Receipts (a receipt for shares of a foreign stock traded on a U.S. exchange).
TIAA-CREF Life Funds 2006 Semiannual Report | 23
Large-Cap Value Fund | Value stocks of larger companies
Investment objective
The fund seeks a favorable long-term total return, mainly through capital appreciation, primarily from equity securities of large domestic companies.
Special investment risks
In addition to the risks of any equity investment, the fund is subject to special risks, including large-cap risk, value investing risks, style risk and foreign investment risks. For a further discussion of risk, please see page 8.
The fund’s benchmark
The Russell 1000® Value Index is a subset of the Russell 1000 Index, which measures the performance of the stocks of the 1,000 largest companies in the Russell 3000® Index, based on market capitalization. The Russell 1000 Value Index measures the performance of those stocks of the Russell 1000 with lower price-to-book ratios and lower relative forecasted growth rates. You cannot invest directly in these indexes.
Performance as of June 30, 2006
| | | | | | | | | | | | |
| | | Average annual compound rates of total return* | | | Cumulative rates of total return* | |
| | | 1 year | | | since inception1 | | | 6 months | | | since inception1 | |
Large-Cap Value Fund | | 12.29 | % | | 17.80 | % | | 6.52 | % | | 82.78 | % |
| | | | |
Benchmark: | | | | | | | | | | | | |
Russell 1000 Value Index2 | | 12.10 | | | 16.31 | | | 6.56 | | | 74.41 | |
| | | | |
Peer group: | | | | | | | | | | | | |
Morningstar Large Value | | 10.29 | | | 14.15 | | | 4.71 | | | 63.21 | |
| * | The returns quoted represent past performance, which is no guarantee of future results. Returns and the principal value of your investment will fluctuate. Current performance may be higher or lower than that shown above, and you may have a gain or a loss when you redeem your shares. For current performance information, including performance to the most recent month-end, please visit www.tiaa-cref.org/lifefunds, or call 800 223-1200. |
| 1 | Inception date: October 28, 2002 |
| 2 | Russell 1000 and Russell 3000 are trademarks and service marks of the Frank Russell Company. TIAA-CREF products are not promoted or sponsored by, or affiliated with, the Frank Russell Company. |
24 | 2006 Semiannual Report TIAA-CREF Life Funds
PERFORMANCE
$10,000 since October 28, 2002 inception
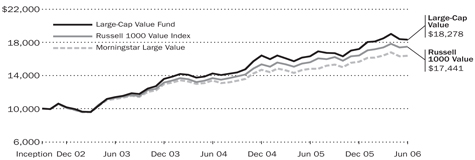
An investment of $10,000 in this fund on October 28, 2002, would have grown to $18,278 as of June 30, 2006, including reinvestment of dividends and distributions. For the purpose of comparison, the graph also shows the change in the fund’s benchmark during the same period.
Calendar year total returns
Best quarter: 18.54%, for the quarter ended June 30, 2003
Worst quarter: –5.76%, for the quarter ended March 31, 2003
TIAA-CREF Life Funds 2006 Semiannual Report | 25
Large-Cap Value Fund | Value stocks of larger companies
PERFORMANCE
Fund expenses–six months ended June 30, 2006
The expense examples that appear below are intended to help you understand your ongoing costs (in dollars) of investing in the fund. They are also designed to help you compare these costs with the ongoing costs of investing in other funds. (The costs shown do not reflect any separate account fees or expenses deducted under the variable annuity or variable life insurance contracts using the TIAA-CREF Life Funds. If those fees or expenses were included, the costs would be higher.)
The examples assume $1,000 was invested on January 1, 2006, and held for six months until June 30, 2006. Please see page 10 for a full description of the assumptions on which these examples are based and an explanation of how you can use this expense information.
| | | | | | | | | | |
| | | Large-Cap Value Fund expense example |
| | | Starting fund value
(1/1/06) | | Ending fund value
(6/30/06) | | | Expenses paid†
(1/1/06–6/30/06) |
Actual return | | $ | 1,000.00 | | $ | 1,063.97 | | | $ | 1.23 |
5% annual hypothetical return | | | 1,000.00 | | | 1,023.59 | ‡ | | | 1.20 |
| † | “Expenses paid” is based on the fund’s actual expense ratio for the most recent fiscal half year. The fund’s annualized six-month expense ratio for that period was 0.24%. |
| ‡ | Ending fund value for the hypothetical example would be $1,025.00 before expenses. The table shows the value after subtraction of expenses in order to be comparable with the ending fund value shown for the fund’s actual return. |
Portfolio breakdown by company size
| | |
Capitalization (6/30/2006) | | Percent of
portfolio
investments |
Large: over $5 billion | | 77.13 |
Middle: $1 billion–$5 billion | | 21.57 |
Small: under $1 billion | | 1.30 |
| | |
Total | | 100.00 |
Fund facts
| | | | |
Inception date | | | 10/28/2002 | |
Net assets (6/30/2006) | | $ | 53.39 million | |
2006 expense ratio* | | | 0.24 | % |
| * | This fund expense ratio does not include the administrative, mortality and expense risk charges that are deducted under variable annuity or variable life insurance contracts that use the TIAA-CREF Life Funds. For more information on fund deductions and expenses, please see the prospectus. |
26 | 2006 Semiannual Report TIAA-CREF Life Funds
Small-Cap Equity Fund | Stocks of smaller companies
DISCUSSION
Performance in the six months ended June 30, 2006
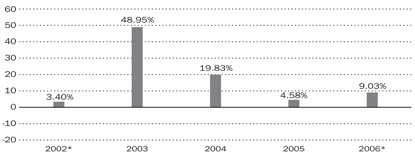
The Small-Cap Equity Fund returned 9.03% for the period, outpacing the 8.21% return of its benchmark, the Russell 2000® Index, and the 7.01% average return of similar funds, as measured by the Morningstar Small Blend category.
Small caps take the lead
For the six-month period, small caps scored gains that were more than twice the 3.23% return of the broad U.S. market, as measured by the Russell 3000® Index.
Small caps lagged large- and mid-cap stocks in 2005, but investors showed a fresh appetite for risk in the first quarter of 2006, and small caps jumped 13.94%. It was more than triple their return for all of 2005.
However, investors became worried over increases in oil prices and in interest rates, and small caps gave back 5.02% in the second quarter. This drop was considerably steeper than that of the overall market, which fell 1.98%.
Three sectors drive returns
For the period, all twelve of the benchmark’s sectors moved upward, and eight posted double-digit gains. The largest contribution to the benchmark’s return came from the 8.9% rise of financial stocks, which made up more than one-fifth of the index in terms of market capitalization on June 30.
Outsized gains in materials and processing (up 17.6%) and in producer durables (up 15.2%) also boosted the benchmark’s performance. The smallest return came from the health care sector (up 0.2%).
Stock picks lift the fund above the benchmark
Advantageous stock weightings enabled the fund to outperform its benchmark during the period. These included overweight holdings, relative to the benchmark, in oil companies Alon USA Energy and Frontier Oil, construction company Emcor and Jones Lang LaSalle, a real estate company.
These positive results were partly offset by overweight positions in several stocks that did not perform as anticipated, such as medical devices maker Thoratec, fashion retailer New York & Company and Internet provider Earthlink. An underweight investment in Hansen Natural, a beverage maker, also reduced returns slightly.
The fund continued to use proprietary mathematical models to evaluate and choose small-cap stocks that appeared to be attractively priced.
TIAA-CREF Life Funds 2006 Semiannual Report | 27
Small-Cap Equity Fund | Stocks of smaller companies
Investment objective
The fund seeks a favorable long-term total return, mainly through capital appreciation, primarily from equity securities of smaller domestic companies.
Special investment risks
In addition to the risks of any equity investment, the fund is subject to small-cap risk. For a further discussion of risk, please see page 8.
The fund’s benchmark
The Russell 2000® Index measures the performance of the stocks of the 2,000 smallest companies in the Russell 3000® Index, based on market capitalization. You cannot invest directly in these indexes.
Performance as of June 30, 2006
| | | | | | | | | | | | |
| | | Average annual compound
rates of total return* | | | Cumulative rates of total return* | |
| | | 1 year | | | since
inception1 | | | 6 months | | | since
inception1 | |
Small-Cap Equity Fund | | 15.40 | % | | 22.39 | % | | 9.03 | % | | 110.44 | % |
| | | | |
Benchmark: | | | | | | | | | | | | |
Russell 2000 Index2 | | 14.58 | | | 21.25 | | | 8.21 | | | 103.33 | |
Peer group: | | | | | | | | | | | | |
Morningstar Small Blend | | 14.11 | | | 20.21 | | | 7.01 | | | 99.39 | |
| * | The returns quoted represent past performance, which is no guarantee of future results. Returns and the principal value of your investment will fluctuate. Current performance may be higher or lower than that shown above, and you may have a gain or a loss when you redeem your shares. For current performance information, including performance to the most recent month-end, please visit www.tiaa-cref.org/lifefunds, or call 800 223-1200. |
| 1 | Inception date: October 28, 2002 |
| 2 | Russell 2000 and Russell 3000 are trademarks and service marks of the Frank Russell Company. TIAA-CREF products are not promoted or sponsored by, or affiliated with, the Frank Russell Company. |
28 | 2006 Semiannual Report TIAA-CREF Life Funds
PERFORMANCE
$10,000 since October 28, 2002 inception
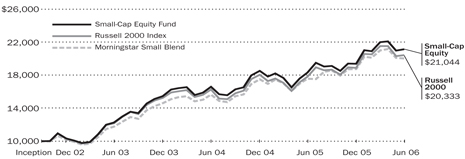
An investment of $10,000 in this fund on October 28, 2002, would have grown to $21,044 as of June 30, 2006, including reinvestment of dividends and distributions. For the purpose of comparison, the graph also shows the change in the fund’s benchmark during the same period.
Calendar year total returns
Best quarter: 23.74%, for the quarter ended June 30, 2003
Worst quarter: –4.67%, for the quarter ended March 31, 2005
TIAA-CREF Life Funds 2006 Semiannual Report | 29
Small-Cap Equity Fund | Stocks of smaller companies
PERFORMANCE
Fund expenses–six months ended June 30, 2006
The expense examples that appear below are intended to help you understand your ongoing costs (in dollars) of investing in the fund. They are also designed to help you compare these costs with the ongoing costs of investing in other funds. (The costs shown do not reflect any separate account fees or expenses deducted under the variable annuity or variable life insurance contracts using the TIAA-CREF Life Funds. If those fees or expenses were included, the costs would be higher.)
The examples assume $1,000 was invested on January 1, 2006, and held for six months until June 30, 2006. Please see page 10 for a full description of the assumptions on which these examples are based and an explanation of how you can use this expense information.
| | | | | | | | | | |
| | | Small-Cap Equity Fund expense example |
| | | Starting fund value
(1/1/06) | | Ending fund value
(6/30/06) | | | Expenses paid†
(1/1/06–6/30/06) |
Actual return | | $ | 1,000.00 | | $ | 1,089.78 | | | $ | 0.52 |
5% annual hypothetical return | | | 1,000.00 | | | 1,024.29 | ‡ | | | 0.50 |
| † | “Expenses paid” is based on the fund’s actual expense ratio for the most recent fiscal half year. The fund’s annualized six-month expense ratio for that period was 0.10%. |
| ‡ | Ending fund value for the hypothetical example would be $1,025.00 before expenses. The table shows the value after subtraction of expenses in order to be comparable with the ending fund value shown for the fund’s actual return. |
Portfolio breakdown by company size
| | |
Capitalization (6/30/2006) | | Percent of
portfolio
investments |
Large: over $5 billion | | 2.62 |
Middle: $1 billion–$5 billion | | 57.79 |
Small: under $1 billion | | 39.59 |
| | |
Total | | 100.00 |
Fund facts
| | | | |
Inception date | | | 10/28/2002 | |
Net assets (6/30/2006) | | $ | 53.55 million | |
2006 expense ratio* | | | 0.10 | % |
| * | This fund expense ratio does not include the administrative, mortality and expense risk charges that are deducted under variable annuity or variable life insurance contracts that use the TIAA-CREF Life Funds. For more information on fund deductions and expenses, please see the prospectus. |
30 | 2006 Semiannual Report TIAA-CREF Life Funds
Stock Index Fund | U.S. stocks
DISCUSSION
Performance in the six months ended June 30, 2006
The Stock Index Fund returned 3.21% for the period, closely tracking the 3.23% return of its benchmark, the Russell 3000® Index, and topping the 2.40% average return of similar funds, as measured by the Morningstar Large Blend category.
Second-quarter slide erodes gains
In response to a strong global economy and healthy corporate earnings growth, the broad U.S. stock market, as measured by the Russell 3000 Index, climbed 5.31% in the first quarter of 2006. Stocks reversed course in the second quarter, however, in reaction to rising interest rates and the threat of inflation. The Russell 3000 fell 1.98%, giving back more than a third of its first-quarter gain. For the six months, the Russell 3000 failed to keep pace with the 10.16% advance of foreign stocks, as measured by the MSCI EAFE® Index.
Technology and health care dampen returns
Nine of the benchmark’s twelve sectors showed positive returns for the six months, and five sectors—utilities, autos and transportation, integrated oils, materials and processing, and “other energy”—produced double-digit gains. However, the benchmark’s overall return was trimmed by losses in technology and health care. These two sectors, which represented more than a quarter of the Russell 3000’s market capitalization on June 30, 2006, fell 4% and 3.3%, respectively. Financials, the largest sector in the benchmark, rose 4.4%, while the second-largest, consumer discretionary, returned just 1%.
Two of the largest stocks post losses
Returns for the benchmark’s five largest companies varied widely, reflecting the divergent performance of their industry sectors. In descending order according to cap size, these stocks performed as follows: ExxonMobil, 10.4%; General Electric, –4.5%; Citigroup, 1.5%; Bank of America, 6.5%; and Microsoft, –10.3%.
Returns for the Russell 3000 were boosted by the 8.21% return of small-cap stocks and the 4.84% return of mid caps. Together, small- and mid-cap stocks made up about one-third of the index on June 30, 2006. Large-cap stocks gained just 2.76%.
For the period, the fund’s return was comparable to that of the benchmark, minus the effects of expenses and of some cash holdings for liquidity. The fund also had a risk profile similar to that of the benchmark.
TIAA-CREF Life Funds 2006 Semiannual Report | 31
Stock Index Fund | U.S. stocks
Investment objective
The fund seeks a favorable long-term total return, mainly from capital appreciation, by investing primarily in a portfolio of equity securities selected to track the overall U.S. equity markets.
Special investment risks
In addition to the risks of any equity investment, the fund is subject to special risks, including index risk and small-cap risk. For a further discussion of risk, please see page 8.
The fund’s benchmark
The Russell 3000® Index measures the performance of the stocks of the 3,000 largest publicly traded U.S. companies, based on market capitalization. The index measures the performance of about 98% of the total market capitalization of the publicly traded U.S. equity market. You cannot invest directly in this index.
Performance as of June 30, 2006
| | | | | | | | | | | | | | | | | | |
| | | Average annual compound
rates of total return* | | | Cumulative rates of total return* | |
| | | 1 year | | | 5 years | | | since
inception1 | | | 6 months | | | 5 years | | | since
inception1 | |
| Stock Index Fund | | 9.52 | % | | 3.51 | % | | 3.04 | % | | 3.21 | % | | 18.83 | % | | 25.23 | % |
| | | | | | |
Benchmark: | | | | | | | | | | | | | | | | | | |
Russell 3000 Index2 | | 9.56 | | | 3.52 | | | 3.01 | | | 3.23 | | | 18.92 | | | 24.92 | |
| | | | | | |
Peer group: | | | | | | | | | | | | | | | | | | |
Morningstar Large Blend | | 8.85 | | | 2.31 | | | 2.60 | | | 2.40 | | | 12.69 | | | 23.33 | |
| * | The returns quoted represent past performance, which is no guarantee of future results. Returns and the principal value of your investment will fluctuate. Current performance may be higher or lower than that shown above, and you may have a gain or a loss when you redeem your shares. For current performance information, including performance to the most recent month-end, please visit www.tiaa-cref.org/lifefunds, or call 800 223-1200. |
| 1 | Inception date: January 4, 1999 |
| 2 | Russell 3000 is a trademark and a service mark of the Frank Russell Company. TIAA-CREF products are not promoted or sponsored by, or affiliated with, the Frank Russell Company. |
32 |�� 2006 Semiannual Report TIAA-CREF Life Funds
PERFORMANCE
$10,000 since January 4, 1999 inception
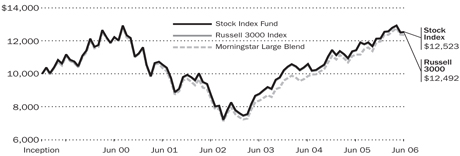
An investment of $10,000 in this fund on January 4, 1999, would have grown to $12,523 as of June 30, 2006, including reinvestment of dividends and distributions. For the purpose of comparison, the graph also shows the change in the fund’s benchmark during the same period.
Calendar year total returns

Best quarter: 16.13%, for the quarter ended June 30, 2003
Worst quarter: –17.05%, for the quarter ended September 30, 2002
TIAA-CREF Life Funds 2006 Semiannual Report | 33
Stock Index Fund | U.S. stocks
PERFORMANCE
Fund expenses–six months ended June 30, 2006
The expense examples that appear below are intended to help you understand your ongoing costs (in dollars) of investing in the fund. They are also designed to help you compare these costs with the ongoing costs of investing in other funds. (The costs shown do not reflect any separate account fees or expenses deducted under the variable annuity or variable life insurance contracts using the TIAA-CREF Life Funds. If those fees or expenses were included, the costs would be higher.)
The examples assume $1,000 was invested on January 1, 2006, and held for six months until June 30, 2006. Please see page 10 for a full description of the assumptions on which these examples are based and an explanation of how you can use this expense information.
| | | | | | | | | | |
| | | Stock Index Fund expense example |
| | | Starting fund value (1/1/06) | | Ending fund value (6/30/06) | | | Expenses paid† (1/1/06–6/30/06) |
Actual return | | $ | 1,000.00 | | $ | 1,031.80 | | | $ | 0.30 |
5% annual hypothetical return | | | 1,000.00 | | | 1,024.49 | ‡ | | | 0.30 |
| † | “Expenses paid” is based on the fund’s actual expense ratio for the most recent fiscal half year. The fund’s annualized six-month expense ratio for that period was 0.06%. |
| ‡ | Ending fund value for the hypothetical example would be $1,025.00 before expenses. The table shows the value after subtraction of expenses in order to be comparable with the ending fund value shown for the fund’s actual return. |
Portfolio breakdown by company size
| | |
Capitalization (6/30/2006) | | Percent of
portfolio
investments |
Large: over $5 billion | | 81.53 |
Middle: $1 billion–$5 billion | | 14.63 |
Small: under $1 billion | | 3.84 |
| | |
Total | | 100.00 |
Fund facts
| | | | |
Inception date | | | 1/4/1999 | |
Net assets (6/30/2006) | | $ | 154.38 million | |
2006 expense ratio* | | | 0.06 | % |
| * | This fund expense ratio does not include the administrative, mortality and expense risk charges that are deducted under variable annuity or variable life insurance contracts that use the TIAA-CREF Life Funds. For more information on fund deductions and expenses, please see the prospectus. |
34 | 2006 Semiannual Report TIAA-CREF Life Funds
Social Choice Equity Fund | Socially screened stocks
DISCUSSION
Performance in the six months ended June 30, 2006
The Social Choice Equity Fund returned 2.71% for the period, trailing the 3.23% gain of its benchmark, the Russell 3000® Index. However, the fund surpassed the 2.40% average return of similar funds, as measured by the Morningstar Large Blend category. Unlike the fund, the benchmark and the Morningstar category do not screen investments according to social criteria.
Social screens hinder performance
The fund’s social screens prevented it from investing in several stocks that are large components of the Russell 3000 in terms of market capitalization. During the period, the net effect of these exclusions was to reduce the fund’s return in relation to the return of its benchmark.
Exclusion of oil stocks trims gains
The largest drag on relative performance during the period was the exclusion of ExxonMobil, which gained 10.4%. The fund’s performance was also reduced by the omission of other well-performing stocks that included Caterpillar, Chevron, ConocoPhillips and agricultural giant Archer Daniels Midland.
However, avoiding General Electric helped returns because the stock fell 4.5%. The omission of Yahoo!, Dow Chemical, insurer American International Group and drug maker Genentech also had positive effects on performance.
Coca-Cola and JPMorgan Chase were dropped from the portfolio during the second quarter because they failed the qualitative social screens used to evaluate stocks. Bank of America was added to the list of major holdings.
Statistical techniques help manage risk
The fund’s managers use statistical techniques to ensure that the portfolio’s risk characteristics resemble those of the index. One method is to overweight or underweight certain stocks relative to each one’s percentage of capitalization within the benchmark.
During the period, relative performance suffered from overweight holdings in chip maker Intel; Medtronic, a medical products manufacturer; and UnitedHealth Group, an HMO. Other overweights, however, including Disney, steel producer Nucor and OGE Energy, a gas and electric company, boosted returns.
TIAA-CREF Life Funds 2006 Semiannual Report | 35
Social Choice Equity Fund | Socially screened stocks
Investment objective
The fund seeks a favorable long-term total return that reflects the investment performance of the overall U.S. stock market while giving special consideration to certain social criteria.
Special investment risks
In addition to the risks of any equity investment, the fund is subject to special risks, including the risk of socially screened investing, index risk and foreign investment risks. For a further discussion of risk, please see page 8.
The fund’s benchmark
The Russell 3000® Index measures the performance of the stocks of the 3,000 largest publicly traded U.S. companies, based on market capitalization. The index measures the performance of about 98% of the total market capitalization of the publicly traded U.S. equity market. You cannot invest directly in this index.
Performance as of June 30, 2006
| | | | | | | | | | | | | | | | | | |
| | | Average annual compound
rates of total return* | | | Cumulative rates of total return* | |
| | | 1 year | | | 5 years | | | since
inception1 | | | 6 months | | | 5 years | | | since
inception1 | |
| Social Choice Equity Fund | | 10.79 | % | | 3.99 | % | | 0.20 | % | | 2.71 | % | | 21.63 | % | | 1.26 | % |
| | | | | | |
Benchmark: | | | | | | | | | | | | | | | | | | |
Russell 3000 Index2 | | 9.56 | | | 3.52 | | | –0.19 | | | 3.23 | | | 18.92 | | | –1.19 | |
| | | | | | |
Peer group: | | | | | | | | | | | | | | | | | | |
Morningstar Large Blend | | 8.85 | | | 2.31 | | | –0.23 | | | 2.40 | | | 12.69 | | | 1.08 | |
| * | The returns quoted represent past performance, which is no guarantee of future results. Returns and the principal value of your investment will fluctuate. Current performance may be higher or lower than that shown above, and you may have a gain or a loss when you redeem your shares. For current performance information, including performance to the most recent month-end, please visit www.tiaa-cref.org/lifefunds, or call 800 223-1200. |
| 1 | Inception date: April 3, 2000 |
| 2 | Russell 3000 is a trademark and a service mark of the Frank Russell Company. TIAA-CREF products are not promoted or sponsored by, or affiliated with, the Frank Russell Company. |
36 | 2006 Semiannual Report TIAA-CREF Life Funds
PERFORMANCE
$10,000 since April 3, 2000 inception
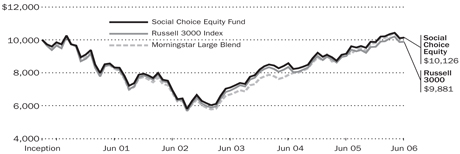
An investment of $10,000 in this fund on April 3, 2000, would be worth $10,126 as of June 30, 2006, including reinvestment of dividends and distributions. For the purpose of comparison, the graph also shows the change in the fund’s benchmark during the same period.
Calendar year total returns
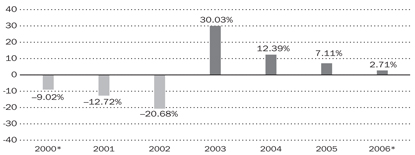
Best quarter: 16.40%, for the quarter ended June 30, 2003
Worst quarter: –16.46%, for the quarter ended September 30, 2002
TIAA-CREF Life Funds 2006 Semiannual Report | 37
Social Choice Equity Fund | Socially screened stocks
PERFORMANCE
Fund expenses–six months ended June 30, 2006
The expense examples that appear below are intended to help you understand your ongoing costs (in dollars) of investing in the fund. They are also designed to help you compare these costs with the ongoing costs of investing in other funds. (The costs shown do not reflect any separate account fees or expenses deducted under the variable annuity or variable life insurance contracts using the TIAA-CREF Life Funds. If those fees or expenses were included, the costs would be higher.)
The examples assume $1,000 was invested on January 1, 2006, and held for six months until June 30, 2006. Please see page 10 for a full description of the assumptions on which these examples are based and an explanation of how you can use this expense information.
| | | | | | | | | | |
| | | Social Choice Equity Fund expense example |
| | | Starting fund value
(1/1/06) | | Ending fund value
(6/30/06) | | | Expenses paid†
(1/1/06–6/30/06) |
Actual return | | $ | 1,000.00 | | $ | 1,026.75 | | | $ | 0.35 |
5% annual hypothetical return | | | 1,000.00 | | | 1,024.44 | ‡ | | | 0.35 |
| † | “Expenses paid” is based on the fund’s actual expense ratio for the most recent fiscal half year. The fund’s annualized six-month expense ratio for that period was 0.07%. |
| ‡ | Ending fund value for the hypothetical example would be $1,025.00 before expenses. The table shows the value after subtraction of expenses in order to be comparable with the ending fund value shown for the fund’s actual return. |
Portfolio breakdown by company size
| | |
Capitalization (6/30/2006) | | Percent of
Portfolio
investments |
Large: over $5 billion | | 83.03 |
Middle: $1 billion–$5 billion | | 13.58 |
Small: under $1 billion | | 3.39 |
| | |
Total | | 100.00 |
Fund facts
| | | | |
Inception date | | | 4/3/2000 | |
Net assets (6/30/2006) | | $ | 32.70 million | |
2006 expense ratio* | | | 0.07 | % |
| * | This fund expense ratio does not include the administrative, mortality and expense risk charges that are deducted under variable annuity or variable life insurance contracts that use the TIAA-CREF Life Funds. For more information on fund deductions and expenses, please see the prospectus. |
38 | 2006 Semiannual Report TIAA-CREF Life Funds
Real Estate Securities Fund | Real estate securities
DISCUSSION
Performance in the six months ended June 30, 2006
The Real Estate Securities Fund returned 12.01% for the period, trailing the 14.08% return of its benchmark, the Dow Jones Wilshire Real Estate Securities Index, and the 12.46% average return of similar funds, as measured by the Morningstar Specialty Real Estate category.
REITs deliver, while other asset classes disappoint
For the six-month period, the return of real estate investment trusts (REITs) was far ahead of the 3.23% gain of the Russell 3000® Index, which tracks the broad U.S. equity market. REITs also trounced the 1.60% rise of high-yield bonds and the 0.72% loss of investment-grade bonds, as measured by the Lehman Brothers U.S. Aggregate Index.
An up-and-down first half for REITs
Three factors helped lift the benchmark to a 15.42% first-quarter surge. First, REITs became a hotbed of mergers-and-acquisition activity; investors hoped to profit if the companies went private. Second, institutional investors who had previously sold REITs and taken profits began buying them again for fear of missing out on another big run-up. Finally, a sharp rise in home prices increased demand for apartment REITs.
In the second quarter, income-seeking investors took advantage of rising interest rates and bought Treasuries instead. In addition, REITs’ own high valuations prompted investors to take profits. The upshot was that the benchmark gave back 1.16%.
Strong gains trail the benchmark
For the six months, the fund’s return was strong in absolute terms and superior to those of many other income-producing assets as well as to returns from the U.S. stock market. However, the fund’s advance lagged the benchmark’s, due in part to overweight selections in office REITs. Holdings in mortgage REITs and specialty finance REITs also hurt returns; by the end of the period, the fund had eliminated nearly all its holdings in these two out-of-benchmark sectors.
Performance was enhanced slightly by underweight holdings in diversified REITs and overweights in industrial REITs.
The fund’s portfolio manager was replaced in February, and a new management team was assembled. This group first used some transitional strategies to make adjustments to the portfolio. Then the team focused on the attributes of particular companies rather than on broad economic conditions in order to add attractively valued benchmark stocks. The goal was to boost relative performance while limiting risk.
TIAA-CREF Life Funds 2006 Semiannual Report | 39
Real Estate Securities Fund | Real estate securities
Investment objective
The fund seeks to obtain a favorable long-term total return through both capital appreciation and current income, by investing primarily in equity and fixed-income securities of companies principally engaged in or related to the real estate industry.
Special investment risks
In addition to the risks of any equity or fixed-income investment, the fund is subject to special risks, including real estate investing risks, real estate securities risk, small-cap risk and foreign investment risks. For a further discussion of risk, please see page 8.
The fund’s benchmark
The Dow Jones Wilshire Real Estate Securities Index measures the performance of publicly traded real estate securities, such as real estate investment trusts and real estate operating companies. You cannot invest directly in this index.
Performance as of June 30, 2006
| | | | | | | | | | | | |
| | | Average annual compound
rates of total return* | | | Cumulative rates of total return* | |
| | | 1 year | | | since
inception1 | | | 6 months | | | since
inception1 | |
| Real Estate Securities Fund | | 13.34 | % | | 26.04 | % | | 12.01 | % | | 134.50 | % |
| | | | |
Benchmark: | | | | | | | | | | | | |
Dow Jones Wilshire Real Estate Securities Index | | 21.85 | | | 28.81 | | | 14.08 | | | 154.01 | |
| | | | |
Peer group: | | | | | | | | | | | | |
Morningstar Specialty Real Estate | | 19.26 | | | 26.75 | | | 12.46 | | | 140.02 | |
| * | The returns quoted represent past performance, which is no guarantee of future results. Returns and the principal value of your investment will fluctuate. Current performance may be higher or lower than that shown above, and you may have a gain or a loss when you redeem your shares. For current performance information, including performance to the most recent month-end, please visit www.tiaa-cref.org/lifefunds, or call 800 223-1200. |
| 1 | Inception date: October 28, 2002 |
40 | 2006 Semiannual Report TIAA-CREF Life Funds
PERFORMANCE
$10,000 since October 28, 2002 inception
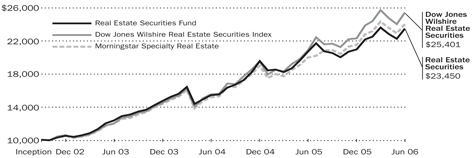
An investment of $10,000 in this fund on October 28, 2002, would have grown to $23,450 as of June 30, 2006, including reinvestment of dividends and distributions. For the purpose of comparison, the graph also shows the change in the fund’s benchmark during the same period.
Calendar year total returns
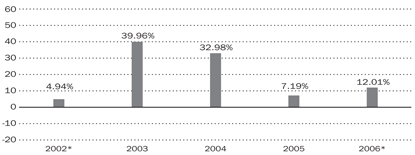
Best quarter: 17.13%, for the quarter ended December 31, 2004
Worst quarter: –6.90%, for the quarter ended March 31, 2005
TIAA-CREF Life Funds 2006 Semiannual Report | 41
Real Estate Securities Fund | Real estate securities
PERFORMANCE
Fund expenses–six months ended June 30, 2006
The expense examples that appear below are intended to help you understand your ongoing costs (in dollars) of investing in the fund. They are also designed to help you compare these costs with the ongoing costs of investing in other funds. (The costs shown do not reflect any separate account fees or expenses deducted under the variable annuity or variable life insurance contracts using the TIAA-CREF Life Funds. If those fees or expenses were included, the costs would be higher.)
The examples assume $1,000 was invested on January 1, 2006, and held for six months until June 30, 2006. Please see page 10 for a full description of the assumptions on which these examples are based and an explanation of how you can use this expense information.
| | | | | | | | | | |
| | | Real Estate Securities Fund expense example |
| | | Starting fund value
(1/1/06) | | Ending fund value
(6/30/06) | | | Expenses paid†
(1/1/06–6/30/06) |
Actual return | | $ | 1,000.00 | | $ | 1,118.79 | | | $ | 1.31 |
5% annual hypothetical return | | | 1,000.00 | | | 1,023.53 | ‡ | | | 1.26 |
| † | “Expenses paid” is based on the fund’s actual expense ratio for the most recent fiscal half year. The fund’s annualized six-month expense ratio for that period was 0.25%. |
| ‡ | Ending fund value for the hypothetical example would be $1,025.00 before expenses. The table shows the value after subtraction of expenses in order to be comparable with the ending fund value shown for the fund’s actual return. |
Portfolio breakdown by company size
| | |
Capitalization (6/30/2006) | | Percent of
portfolio
investments |
Large: over $5 billion | | 49.69 |
Middle: $1 billion–$5 billion | | 35.09 |
Small: under $1 billion | | 15.22 |
| | |
Total | | 100.00 |
Fund facts
| | | | |
Inception date | | | 10/28/2002 | |
Net assets (6/30/2006) | | $ | 81.60 million | |
2006 expense ratio* | | | 0.25 | % |
| * | This fund expense ratio does not include the administrative, mortality and expense risk charges that are deducted under variable annuity or variable life insurance contracts that use the TIAA-CREF Life Funds. For more information on fund deductions and expenses, please see the prospectus. |
42 | 2006 Semiannual Report TIAA-CREF Life Funds
Bond Fund | Intermediate-term bonds
DISCUSSION
Performance in the six months ended June 30, 2006
The Bond Fund returned –0.53% for the period, compared with the –0.72% return of its benchmark, the Lehman Brothers U.S. Aggregate Index. The average return of similar funds, as measured by the Morningstar Intermediate-Term Bond category, was –0.73%.
Short-term rates keep rising
On January 31, the Federal Reserve met for the final time under Alan Greenspan and continued its slow-but-steady tightening of credit, raising the federal funds rate (the rate that banks charge one another for overnight loans) by a quarter point, to 4.50%. Many observers expected the economy to weaken, making further increases unnecessary.
Instead, the economy got stronger. On March 28, with Ben Bernanke at the helm, the Fed mandated another quarter-point boost. At both its January and March meetings, the central bank expressed concerns about the effects of high energy prices and the surging economy.
On May 10, the Fed raised rates yet again, and investors feared that this campaign to subdue inflation would end up tipping the economy into recession. Stock prices tumbled worldwide.
Short-term and long-term yields zigzag
Purchasers of longer-dated bonds usually receive higher yields, which compensate them for the risk that inflation will erode the value of their interest payments. However, when 2006 began, 10-year Treasuries yielded 4.39%—less than the 4.40% for 2-year Treasuries. During the six-month period, both yields advanced, and each took the lead in turn. The 2-year note was ahead in early June and finished with a 5.15% to 5.14% advantage over the 10-year note.
Bond prices, which move inversely to yields, fell during the period, and this drop was only partly offset by rising interest income. Nearly all of the benchmark’s decline came from two sectors: Treasuries, which made up about one-quarter of the index, and corporate bonds, which constituted roughly one-fifth.
The fund’s strategies trim losses
For the period, the fund benefited from an underweight in Treasuries. Also boosting returns were holdings in corporate bonds and mortgage-and asset-backed securities. Both sectors outperformed Treasuries.
TIAA-CREF Life Funds 2006 Semiannual Report | 43
Bond Fund | Intermediate-term bonds
Investment objective
The fund seeks as favorable a long-term total return through income as is consistent with preserving capital, primarily from investment-grade, fixed-income securities.
Special investment risks
In addition to the risks of any fixed-income investment, the fund is subject to special risks, including foreign investment risks and index risk. For a further discussion of risk, please see page 8.
The fund’s benchmark
The Lehman Brothers U.S. Aggregate Index measures the performance of the U.S. investment-grade, fixed-rate bond market, including government and credit securities, agency mortgage pass-through securities, asset-backed securities and commercial mortgage-backed securities. You cannot invest directly in this index.
Performance as of June 30, 2006
| | | | | | | | | | | | |
| | | Average annual compound
rates of total return* | | | Cumulative rates of total return* | |
| | | 1 year | | | since
inception1 | | | 6 months | | | since
inception1 | |
Bond Fund | | –0.67 | % | | 2.24 | % | | –0.53 | % | | 6.84 | % |
| | | | |
Benchmark: | | | | | | | | | | | | |
Lehman Brothers U.S. Aggregate Index | | –0.81 | | | 2.24 | | | –0.72 | | | 6.84 | |
| | | | |
Peer group: | | | | | | | | | | | | |
Morningstar Intermediate-Term Bond | | –0.89 | | | 1.65 | | | –0.73 | | | 5.08 | |
| * | The returns quoted represent past performance, which is no guarantee of future results. Returns and the principal value of your investment will fluctuate. Current performance may be higher or lower than that shown above, and you may have a gain or a loss when you redeem your shares. For current performance information, including performance to the most recent month-end, please visit www.tiaa-cref.org/lifefunds, or call 800 223-1200. |
| 1 | Inception date: July 8, 2003 |
44 | 2006 Semiannual Report TIAA-CREF Life Funds
PERFORMANCE
$10,000 since July 8, 2003 inception
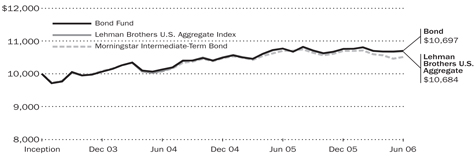
An investment of $10,000 in this fund on July 8, 2003, would have grown to $10,697 as of June 30, 2006, including reinvestment of dividends and distributions. For the purpose of comparison, the graph also shows the change in the fund’s benchmark during the same period.
Calendar year total returns
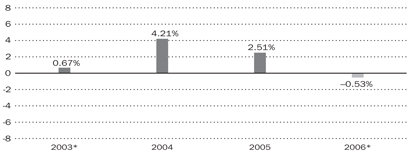
Best quarter: 3.03%, for the quarter ended June 30, 2005
Worst quarter: –2.08%, for the quarter ended June 30, 2004
TIAA-CREF Life Funds 2006 Semiannual Report | 45
Bond Fund | Intermediate-term bonds
PERFORMANCE
Fund expenses–six months ended June 30, 2006
The expense examples that appear below are intended to help you understand your ongoing costs (in dollars) of investing in the fund. They are also designed to help you compare these costs with the ongoing costs of investing in other funds. (The costs shown do not reflect any separate account fees or expenses deducted under the variable annuity or variable life insurance contracts using the TIAA-CREF Life Funds. If those fees or expenses were included, the costs would be higher.)
The examples assume $1,000 was invested on January 1, 2006, and held for six months until June 30, 2006. Please see page 10 for a full description of the assumptions on which these examples are based and an explanation of how you can use this expense information.
| | | | | | | | | | |
| | | Bond Fund expense example |
| | | Starting fund value (1/1/06) | | Ending fund value (6/30/06) | | | Expenses paid† (1/1/06–6/30/06) |
Actual return | | $ | 1,000.00 | | $ | 994.21 | | | $ | 0.49 |
5% annual hypothetical return | | | 1,000.00 | | | 1,024.29 | ‡ | | | 0.50 |
| † | “Expenses paid” is based on the fund’s actual expense ratio for the most recent fiscal half year. The fund’s annualized six-month expense ratio for that period was 0.10%. |
| ‡ | Ending fund value for the hypothetical example would be $1,025.00 before expenses. The table shows the value after subtraction of expenses in order to be comparable with the ending fund value shown for the fund’s actual return. |
Portfolio breakdown by sector (6/30/2006)
| | |
| | | Percent of total net assets |
Mortgage-backed securities* | | 40.6 |
U.S. government securities | | 28.4 |
Corporate bonds | | 25.9 |
Yankees† | | 3.5 |
Money market instruments | | 2.0 |
Other assets & liabilities-net | | –0.4 |
| | |
Total | | 100.0 |
| * | Includes asset-backed, mortgage-backed and commercial mortgage-backed securities. |
| † | Foreign government and corporate bonds denominated in U.S. dollars |
Risk characteristics* (6/30/2006)
| | | | |
| | | Average maturity (in years) | | Option-adjusted duration (in years) |
Bond Fund | | 7.07 | | 4.76 |
Lehman Bros. U.S. Aggregate Index | | 7.20 | | 4.80 |
| * | As calculated using an analytical model developed by CMS BondEdge, a widely recognized risk analytic software package |
Fund facts
| | | | |
Inception date | | | 7/8/2003 | |
Net assets (6/30/2006) | | $ | 68.03 million | |
2006 expense ratio* | | | 0.10 | % |
| * | This fund expense ratio does not include the administrative, mortality and expense risk charges that are deducted under variable annuity or variable life insurance contracts that use the TIAA-CREF Life Funds. For more information on fund deductions and expenses, please see the prospectus. |
46 | 2006 Semiannual Report TIAA-CREF Life Funds
Money Market Fund | Cash equivalents
DISCUSSION
Performance in the six months ended June 30, 2006
The Money Market Fund returned 2.35% for the period, topping the 2.05% return of the iMoneyNet Money Fund Report Averages™—All Taxable, a simple average of over 1,000 taxable money market funds.
Fed keeps boosting rates
The year started with the federal funds rate at 4.25%, after a series of quarter-point hikes that began in June 2004. (The federal funds rate is the rate commercial U.S. banks charge one another for overnight loans.) Over the first half of 2006, the Federal Reserve raised the rate four more times, lifting it to 5.25%, its highest level since March 2001.
The Fed said it was reacting to the inflation threat posed by higher prices for energy and other commodities and to signs that the nation was using a high percentage of its productive capacity. Fuller use of capacity often leads to price increases.
LIBOR turns volatile
During the six-month period, the prospect of additional rate increases caused a wide fluctuation in the shape of the LIBOR curve, indicating that market participants were uncertain about future interest rates. (The LIBOR, the interest rate that banks charge one another for loans on the London market, is the most widely used benchmark for short-term rates.) By the end of June, however, the LIBOR curve had flattened considerably.
Asset allocations boost results
The fund maintained a sizable exposure to commercial paper, despite a decline in its supply in the second quarter. Commercial paper generally offered higher returns without appreciably higher risk. On June 30, 2006, securities of this type accounted for 80.4% of the portfolio.
The fund increased its holdings of certificates of deposits and bank notes, from 3.9% on December 31, 2005, to 9.7% at the end of the six-month period. The remaining 9.9% of the fund was invested in government agency securities, versus 14.1% six months earlier.
On June 30, 2006, foreign securities made up 14% of the fund’s total portfolio investments.
During the period, the weighted average maturity of the fund fluctuated between 34 and 47 days. As of June 27, 2006, it stood at 40 days, versus 38 for the average iMoneyNet fund.
TIAA-CREF Life Funds 2006 Semiannual Report | 47
Money Market Fund | Cash equivalents
Investment objective
The fund seeks high current income consistent with maintaining liquidity and preserving capital.
Special investment risks
The fund is subject to special risks, including income volatility risk, market risk, company risk, credit risk, interest-rate risk, prepayment risk, extension risk and foreign investment risks. For a further discussion of risk, please see page 8.
An investment in the fund is neither insured nor guaranteed by the Federal Deposit Insurance Corporation or any other U.S. government agency. We will attempt to maintain a stable net asset value of $1.00 per share for this fund, but it is possible to lose money by investing in the fund.
Yield and average maturity
| | | | | | | | |
| | | Net annualized yield (for the 7 days ended 6/27/2006) | | | Average maturity (as of 6/27/2006) Days |
| | | Current yield | | | Effective yield | | |
Money Market Fund | | 5.07 | % | | 5.20 | % | | 40 |
| | | |
iMoneyNet Money Fund | | | | | | | | |
Report Averages™–All Taxable | | 4.48 | | | 4.59 | | | 38 |
Performance as of June 30, 2006
| | | | | | | | | | | | |
| | | Average annual compound rates of total return* | | | Cumulative rates of total return* | |
| | | 1 year | | | since inception1 | | | 6 months | | | since inception1 | |
Money Market Fund | | 4.27 | % | | 2.49 | % | | 2.35 | % | | 7.61 | % |
| | | | |
iMoneyNet Money Fund | | | | | | | | | | | | |
Report Averages–All Taxable | | 3.67 | | | 1.94 | | | 2.05 | | | 5.90 | |
| * | The returns quoted represent past performance, which is no guarantee of future results. Returns and the principal value of your investment will fluctuate. Current performance may be higher or lower than that shown above, and you may have a gain or a loss when you redeem your shares. For current performance information, including performance to the most recent month-end, please visit www.tiaa-cref.org/lifefunds, or call 800 223-1200. |
| 1 | Inception date: July 8, 2003 |
48 | 2006 Semiannual Report TIAA-CREF Life Funds
PERFORMANCE
$10,000 since July 8, 2003 inception
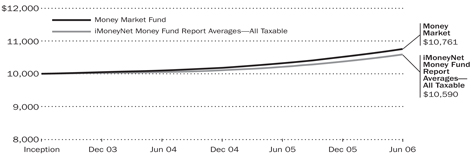
An investment of $10,000 in this fund on July 8, 2003, would have grown to $10,761 as of June 30, 2006, including reinvestment of dividends and distributions. For the purpose of comparison, the graph also shows the change in the fund’s benchmark during the same period.
Calendar year total returns
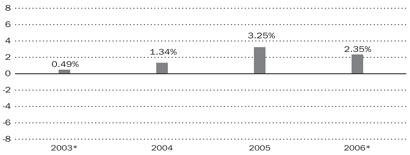
Best quarter: 1.23%, for the quarter ended June 30, 2006
Worst quarter: 0.23%, for the quarter ended September 30, 2003
TIAA-CREF Life Funds 2006 Semiannual Report | 49
Money Market Fund | Cash equivalents
PERFORMANCE
Fund expenses–six months ended June 30, 2006
The expense examples that appear below are intended to help you understand your ongoing costs (in dollars) of investing in the fund. They are also designed to help you compare these costs with the ongoing costs of investing in other funds. (The costs shown do not reflect any separate account fees or expenses deducted under the variable annuity or variable life insurance contracts using the TIAA-CREF Life Funds. If those fees or expenses were included, the costs would be higher.)
The examples assume $1,000 was invested on January 1, 2006, and held for six months until June 30, 2006. Please see page 10 for a full description of the assumptions on which these examples are based and an explanation of how you can use this expense information.
| | | | | | | | | | |
| | | Money Market Fund expense example |
| | | Starting fund value (1/1/06) | | Ending fund value (6/30/06) | | | Expenses paid† (1/1/06–6/30/06) |
Actual return | | $ | 1,000.00 | | $ | 1,023.20 | | | $ | 0.30 |
5% annual hypothetical return | | | 1,000.00 | | | 1,024.49 | ‡ | | | 0.30 |
| † | “Expenses paid” is based on the fund’s actual expense ratio for the most recent fiscal half year. The fund’s annualized six-month expense ratio for that period was 0.06%. |
| ‡ | Ending fund value for the hypothetical example would be $1,025.00 before expenses. The table shows the value after subtraction of expenses in order to be comparable with the ending fund value shown for the fund’s actual return. |
Portfolio breakdown by sector (6/30/2006)
| | |
| | | Percent of portfolio investments |
Commercial paper | | 80.4 |
U.S. agencies | | 9.9 |
Certificates of deposit | | 6.8 |
Bank notes | | 2.9 |
| | |
Total | | 100.0 |
Fund facts
| | | | |
Inception date | | | 7/8/2003 | |
Net assets (6/30/2006) | | $ | 45.04 million | |
2006 expense ratio* | | | 0.06 | % |
| * | This fund expense ratio does not include the administrative, mortality and expense risk charges that are deducted under variable annuity or variable life insurance contracts that use the TIAA-CREF Life Funds. For more information on fund deductions and expenses, please see the prospectus. |
50 | 2006 Semiannual Report TIAA-CREF Life Funds
| | |
| Growth Equity Fund | | Summary portfolio of investments (unaudited) June 30, 2006 |
| | | | | | | | | | | | |
| | | COMPANY
| | | | SHARES
| | VALUE
| | % OF NET
ASSETS
| |
| | | | | | | | | | | | | |
| | | COMMON STOCKS | | | | | | | | | | |
| | | APPAREL AND ACCESSORY STORES | | | | | | $ | 194,191 | | 0.70 | % |
| | | | | | | | |
|
|
|
| | | APPAREL AND OTHER TEXTILE PRODUCTS | | | | | | | 103,706 | | 0.38 | |
| | | | | | | | |
|
|
|
| | | BUILDING MATERIALS AND GARDEN SUPPLIES | | | | | | | | | | |
| | | Lowe’s Cos, Inc | | | | 6,254 | | | 379,430 | | 1.37 | |
| | | | | | | | |
|
|
|
| | | | | | | | | | 379,430 | | 1.37 | |
| | | | | | | | |
|
|
|
| | | BUSINESS SERVICES | | | | | | | | | | |
| * | | Adobe Systems, Inc | | | | 13,767 | | | 417,966 | | 1.51 | |
| * | | Cognizant Technology Solutions Corp | | | | 4,252 | | | 286,457 | | 1.04 | |
| * | | eBay, Inc | | | | 13,803 | | | 404,290 | | 1.47 | |
| * | | Electronic Arts, Inc | | | | 8,090 | | | 348,194 | | 1.26 | |
| * | | Google, Inc (Class A) | | | | 2,115 | | | 886,883 | | 3.21 | |
| | | Microsoft Corp | | | | 15,592 | | | 363,294 | | 1.32 | |
| | | SAP AG. (ADR) | | | | 5,778 | | | 303,461 | | 1.10 | |
| * | | Yahoo!, Inc | | | | 13,068 | | | 431,244 | | 1.56 | |
| | | Other | | | | | | | 275,611 | | 1.00 | |
| | | | | | | | |
|
|
|
| | | | | | | | | | 3,717,400 | | 13.47 | |
| | | | | | | | |
|
|
|
| | | CHEMICALS AND ALLIED PRODUCTS | | | | | | | | | | |
| | | Abbott Laboratories | | | | 14,061 | | | 613,200 | | 2.22 | |
| * | | Amgen, Inc | | | | 9,519 | | | 620,924 | | 2.25 | |
| * | | Genzyme Corp | | | | 4,957 | | | 302,625 | | 1.10 | |
| | | Monsanto Co | | | | 4,015 | | | 338,023 | | 1.22 | |
| * | | Sepracor, Inc | | | | 5,784 | | | 330,498 | | 1.20 | |
| | | Teva Pharmaceutical Industries Ltd (ADR) | | | | 8,274 | | | 261,376 | | 0.94 | |
| | | Wyeth | | | | 7,828 | | | 347,641 | | 1.26 | |
| | | Other | | | | | | | 369,788 | | 1.34 | |
| | | | | | | | |
|
|
|
| | | | | | | | | | 3,184,075 | | 11.53 | |
| | | | | | | | |
|
|
|
| | | COAL MINING | | | | | | | 129,452 | | 0.47 | |
| | | | | | | | |
|
|
|
| | | COMMUNICATIONS | | | | | | | | | | |
| | | AT&T, Inc | | | | 13,119 | | | 365,889 | | 1.33 | |
| | | Other | | | | | | | 538,670 | | 1.95 | |
| | | | | | | | |
|
|
|
| | | | | | | | | | 904,559 | | 3.28 | |
| | | | | | | | |
|
|
|
| | | EATING AND DRINKING PLACES | | | | | | | | | | |
| * | | Starbucks Corp | | | | 8,189 | | | 309,217 | | 1.12 | |
| | | | | | | | |
|
|
|
| | | | | | | | | | 309,217 | | 1.12 | |
| | | | | | | | |
|
|
|
| | | ELECTRIC, GAS, AND SANITARY SERVICES | | | | | | | 207,832 | | 0.75 | |
| | | | | | | | |
|
|
|
| | | ELECTRONIC AND OTHER ELECTRIC EQUIPMENT | | | | | | | | | | |
| * | | Cisco Systems, Inc | | | | 27,069 | | | 528,658 | | 1.91 | |
| | | Emerson Electric Co | | | | 5,629 | | | 471,765 | | 1.71 | |
| | | Intel Corp | | | | 20,943 | | | 396,870 | | 1.44 | |
| | | Motorola, Inc | | | | 12,965 | | | 261,245 | | 0.95 | |
| * | | Network Appliance, Inc | | | | 10,042 | | | 354,483 | | 1.28 | |
| | | Qualcomm, Inc | | | | 16,922 | | | 678,065 | | 2.46 | |
| | | Other | | | | | | | 1,346,981 | | 4.88 | |
| | | | | | | | |
|
|
|
| | | | | | | | | | 4,038,067 | | 14.63 | |
| | | | | | | | |
|
|
|
| | | | |
| SEE NOTES TO FINANCIAL STATEMENTS | | TIAA-CREF Life Funds 2006 Semiannual Report | | 51 |
| | | | |
| Growth Equity Fund | | Summary portfolio of investments (unaudited) June 30, 2006 | | continued |
| | | | | | | | | | | | |
| | | COMPANY
| | | | SHARES
| | VALUE
| | % OF NET
ASSETS
| |
| | | | | | | | | | | | | |
| | | ENGINEERING AND MANAGEMENT SERVICES | | | | | | | | | | |
| | | Paychex, Inc | | | | 10,833 | | $ | 422,270 | | 1.53 | % |
| | | Other | | | | | | | 254,678 | | 0.92 | |
| | | | | | | | |
|
|
|
| | | | | | | | | | 676,948 | | 2.45 | |
| | | | | | | | |
|
|
|
| | | FOOD AND KINDRED PRODUCTS | | | | | | | | | | |
| | | PepsiCo, Inc | | | | 11,168 | | | 670,527 | | 2.43 | |
| | | | | | | | |
|
|
|
| | | | | | | | | | 670,527 | | 2.43 | |
| | | | | | | | |
|
|
|
| | | FURNITURE AND HOMEFURNISHINGS STORES | | | | | | | 251,594 | | 0.91 | |
| | | | | | | | |
|
|
|
| | | GENERAL MERCHANDISE STORES | | | | | | | | | | |
| | | Target Corp | | | | 8,978 | | | 438,755 | | 1.59 | |
| | | Wal-Mart Stores, Inc | | | | 5,878 | | | 283,143 | | 1.02 | |
| | | | | | | | |
|
|
|
| | | | | | | | | | 721,898 | | 2.61 | |
| | | | | | | | |
|
|
|
| | | HEALTH SERVICES | | | | | | | | | | |
| * | | Medco Health Solutions, Inc | | | | 4,921 | | | 281,875 | | 1.02 | |
| | | Other | | | | | | | 97,197 | | 0.35 | |
| | | | | | | | |
|
|
|
| | | | | | | | | | 379,072 | | 1.37 | |
| | | | | | | | |
|
|
|
| | | HOLDING AND OTHER INVESTMENT OFFICES | | | | | | | 240,606 | | 0.87 | |
| | | | | | | | |
|
|
|
| | | HOTELS AND OTHER LODGING PLACES | | | | | | | | | | |
| | | Starwood Hotels & Resorts Worldwide, Inc | | | | 5,675 | | | 342,430 | | 1.24 | |
| | | | | | | | |
|
|
|
| | | | | | | | | | 342,430 | | 1.24 | |
| | | | | | | | |
|
|
|
| | | INDUSTRIAL MACHINERY AND EQUIPMENT | | | | | | | | | | |
| * | | Apple Computer, Inc | | | | 6,188 | | | 353,459 | | 1.28 | |
| | | Other | | | | | | | 685,709 | | 2.48 | |
| | | | | | | | |
|
|
|
| | | | | | | | | | 1,039,168 | | 3.76 | |
| | | | | | | | |
|
|
|
| | | INSTRUMENTS AND RELATED PRODUCTS | | | | | | | | | | |
| * | | Advanced Medical Optics, Inc | | | | 5,642 | | | 286,049 | | 1.04 | |
| * | | St. Jude Medical, Inc | | | | 9,310 | | | 301,830 | | 1.09 | |
| * | | Zimmer Holdings, Inc | | | | 5,904 | | | 334,875 | | 1.21 | |
| | | Other | | | | | | | 165,768 | | 0.60 | |
| | | | | | | | |
|
|
|
| | | | | | | | | | 1,088,522 | | 3.94 | |
| | | | | | | | |
|
|
|
| | | INSURANCE CARRIERS | | | | | | | | | | |
| | | Aetna, Inc | | | | 11,096 | | | 443,063 | | 1.60 | |
| | | Progressive Corp | | | | 11,692 | | | 300,601 | | 1.09 | |
| | | | | | | | |
|
|
|
| | | | | | | | | | 743,664 | | 2.69 | |
| | | | | | | | |
|
|
|
| | | LEATHER AND LEATHER PRODUCTS | | | | | | | | | | |
| * | | Coach, Inc | | | | 9,488 | | | 283,691 | | 1.03 | |
| | | | | | | | |
|
|
|
| | | | | | | | | | 283,691 | | 1.03 | |
| | | | | | | | |
|
|
|
| | | METAL MINING | | | | | | | 146,356 | | 0.53 | |
| | | | | | | | |
|
|
|
| | | MISCELLANEOUS RETAIL | | | | | | | | | | |
| | | CVS Corp | | | | 18,038 | | | 553,767 | | 2.01 | |
| | | | | | | | |
|
|
|
| | | | | | | | | | 553,767 | | 2.01 | |
| | | | | | | | |
|
|
|
| | | MOTION PICTURES | | | | | | | 163,950 | | 0.59 | |
| | | | | | | | |
|
|
|
| | | NONDEPOSITORY INSTITUTIONS | | | | | | | | | | |
| | | American Express Co | | | | 12,176 | | | 648,007 | | 2.35 | |
| | | | | | | | |
|
|
|
| | | | | | | | | | 648,007 | | 2.35 | |
| | | | | | | | |
|
|
|
| | | | |
| 52 | | 2006 Semiannual Report TIAA-CREF Life Funds | | SEE NOTES TO FINANCIAL STATEMENTS |
| | | | |
| Growth Equity Fund | | Summary portfolio of investments (unaudited) June 30, 2006 | | concluded |
| | | | | | | | | | | | |
| | | COMPANY
| | | | SHARES
| | VALUE
| | % OF NET
ASSETS
| |
| | | OIL AND GAS EXTRACTION | | | | | | | | | | |
| | | Halliburton Co | | | | 4,760 | | $ | 353,240 | | 1.28 | % |
| | | Schlumberger Ltd | | | | 5,186 | | | 337,660 | | 1.23 | |
| | | Other | | | | | | | 298,976 | | 1.08 | |
| | | | | | | | |
|
|
|
| | | | | | | | | | 989,876 | | 3.59 | |
| | | | | | | | |
|
|
|
| | | PETROLEUM AND COAL PRODUCTS | | | | | | | 154,420 | | 0.56 | |
| | | | | | | | |
|
|
|
| | | PRIMARY METAL INDUSTRIES | | | | | | | | | | |
| * | | Corning, Inc | | | | 24,251 | | | 586,632 | | 2.13 | |
| | | | | | | | |
|
|
|
| | | | | | | | | | 586,632 | | 2.13 | |
| | | | | | | | |
|
|
|
| | | SECURITY AND COMMODITY BROKERS | | | | | | | | | | |
| | | Charles Schwab Corp | | | | 29,350 | | | 469,013 | | 1.70 | |
| | | Chicago Mercantile Exchange Holdings, Inc | | | | 822 | | | 403,725 | | 1.46 | |
| | | Goldman Sachs Group, Inc | | | | 1,982 | | | 298,152 | | 1.08 | |
| | | Other | | | | | | | 566,374 | | 2.05 | |
| | | | | | | | |
|
|
|
| | | | | | | | | | 1,737,264 | | 6.29 | |
| | | | | | | | |
|
|
|
| | | TOBACCO PRODUCTS | | | | | | | | | | |
| | | Altria Group, Inc | | | | 8,580 | | | 630,029 | | 2.28 | |
| | | | | | | | |
|
|
|
| | | | | | | | | | 630,029 | | 2.28 | |
| | | | | | | | |
|
|
|
| | | TRANSPORTATION BY AIR | | | | | | | 129,781 | | 0.47 | |
| | | | | | | | |
|
|
|
| | | TRANSPORTATION EQUIPMENT | | | | | | | | | | |
| | | Boeing Co | | | | 6,081 | | | 498,095 | | 1.80 | |
| | | United Technologies Corp | | | | 10,317 | | | 654,304 | | 2.37 | |
| | | | | | | | |
|
|
|
| | | | | | | | | | 1,152,399 | | 4.17 | |
| | | | | | | | |
|
|
|
| | | TRANSPORTATION SERVICES | | | | | | | | | | |
| | | CH Robinson Worldwide, Inc | | | | 5,051 | | | 269,218 | | 0.98 | |
| | | | | | | | |
|
|
|
| | | | | | | | | | 269,218 | | 0.98 | |
| | | | | | | | |
|
|
|
| | | TRUCKING AND WAREHOUSING | | | | | | | | | | |
| | | United Parcel Service, Inc (Class B) | | | | 6,302 | | | 518,844 | | 1.88 | |
| | | | | | | | |
|
|
|
| | | | | | | | | | 518,844 | | 1.88 | |
| | | | | | | | |
|
|
|
| | | WHOLESALE TRADE-DURABLE GOODS | | | | | | | 197,051 | | 0.71 | |
| | | | | | | | |
|
|
|
| | | TOTAL COMMON STOCKS | | (Cost $26,809,227) | | | 27,483,643 | | 99.54 | |
| | | | | | | | |
|
|
|
| | | | |
| | | TOTAL PORTFOLIO | | (Cost $26,809,227) | | | 27,483,643 | | 99.54 | |
| | | OTHER ASSETS & LIABILITIES, NET | | | | | | | 125,644 | | 0.46 | |
| | | | | | | | |
|
|
|
| | | | | |
| | | NET ASSETS | | | | | | $ | 27,609,287 | | 100.00 | % |
| | | | | | | | |
|
|
|
ABBREVIATION:
ADR—American Depositary Receipt
For ease of presentation, we have grouped a number of industry classification categories together in the Summary portfolio of investments. Note that the Funds use more specific industry categories in following their investment limitations on industry concentration.
| | | | |
| SEE NOTES TO FINANCIAL STATEMENTS | | TIAA-CREF Life Funds 2006 Semiannual Report | | 53 |
| | |
| Growth & Income Fund | | Summary portfolio of investments (unaudited) June 30, 2006 |
| | | | | | | | | | | | |
| | | COMPANY
| | | | SHARES
| | VALUE
| | % OF NET
ASSETS
| |
| | | | | | | | | | | | | |
| | | COMMON STOCKS | | | | | | | | | | |
| | | AMUSEMENT AND RECREATION SERVICES | | | | | | $ | 164,961 | | 0.32 | % |
| | | | | | | | |
|
|
|
| | | APPAREL AND ACCESSORY STORES | | | | | | | 192,664 | | 0.37 | |
| | | | | | | | |
|
|
|
| | | BUSINESS SERVICES | | | | | | | | | | |
| | | Automatic Data Processing, Inc | | | | 11,165 | | | 506,333 | | 0.98 | |
| | | Microsoft Corp | | | | 34,508 | | | 804,036 | | 1.55 | |
| * | | Yahoo!, Inc | | | | 11,497 | | | 379,401 | | 0.73 | |
| | | Other | | | | | | | 1,191,014 | | 2.30 | |
| | | | | | | | |
|
|
|
| | | | | | | | | | 2,880,784 | | 5.56 | |
| | | | | | | | |
|
|
|
| | | CHEMICALS AND ALLIED PRODUCTS | | | | | | | | | | |
| | | Abbott Laboratories | | | | 10,002 | | | 436,187 | | 0.84 | |
| | | Air Products & Chemicals, Inc | | | | 6,599 | | | 421,808 | | 0.82 | |
| | | Monsanto Co | | | | 5,525 | | | 465,150 | | 0.90 | |
| | | Pfizer, Inc | | | | 30,681 | | | 720,083 | | 1.39 | |
| | | Procter & Gamble Co | | | | 19,715 | | | 1,096,154 | | 2.12 | |
| | | Schering-Plough Corp | | | | 20,474 | | | 389,620 | | 0.75 | |
| | | Wyeth | | | | 13,445 | | | 597,092 | | 1.15 | |
| | | Other | | | | | | | 3,157,165 | | 6.09 | |
| | | | | | | | |
|
|
|
| | | | | | | | | | 7,283,259 | | 14.06 | |
| | | | | | | | |
|
|
|
| | | COAL MINING | | | | | | | 140,534 | | 0.27 | |
| | | | | | | | |
|
|
|
| | | COMMUNICATIONS | | | | | | | | | | |
| | | AT&T, Inc | | | | 23,327 | | | 650,590 | | 1.26 | |
| | | Other | | | | | | | 966,538 | | 1.86 | |
| | | | | | | | |
|
|
|
| | | | | | | | | | 1,617,128 | | 3.12 | |
| | | | | | | | |
|
|
|
| | | DEPOSITORY INSTITUTIONS | | | | | | | | | | |
| | | Bank of America Corp | | | | 23,392 | | | 1,125,155 | | 2.17 | |
| | | Citigroup, Inc | | | | 21,001 | | | 1,013,088 | | 1.96 | |
| | | JPMorgan Chase & Co | | | | 21,770 | | | 914,340 | | 1.76 | |
| | | Marshall & Ilsley Corp | | | | 8,691 | | | 397,526 | | 0.77 | |
| | | Northern Trust Corp | | | | 9,844 | | | 544,373 | | 1.05 | |
| | | US Bancorp | | | | 18,503 | | | 571,373 | | 1.10 | |
| | | Other | | | | | | | 584,423 | | 1.13 | |
| | | | | | | | |
|
|
|
| | | | | | | | | | 5,150,278 | | 9.94 | |
| | | | | | | | |
|
|
|
| | | EATING AND DRINKING PLACES | | | | | | | 326,387 | | 0.63 | |
| | | | | | | | |
|
|
|
| | | ELECTRIC, GAS, AND SANITARY SERVICES | | | | | | | | | | |
| | | Exelon Corp | | | | 9,001 | | | 511,527 | | 0.99 | |
| | | Other | | | | | | | 830,444 | | 1.60 | |
| | | | | | | | |
|
|
|
| | | | | | | | | | 1,341,971 | | 2.59 | |
| | | | | | | | |
|
|
|
| | | ELECTRONIC AND OTHER ELECTRIC EQUIPMENT | | | | | | | | | | |
| * | | Cisco Systems, Inc | | | | 45,444 | | | 887,521 | | 1.71 | |
| | | Emerson Electric Co | | | | 6,675 | | | 559,432 | | 1.08 | |
| | | Honeywell International, Inc | | | | 17,241 | | | 694,812 | | 1.34 | |
| | | Intel Corp | | | | 21,622 | | | 409,737 | | 0.79 | |
| | | Qualcomm, Inc | | | | 14,415 | | | 577,609 | | 1.12 | |
| | | Other | | | | | | | 1,235,958 | | 2.39 | |
| | | | | | | | |
|
|
|
| | | | | | | | | | 4,365,069 | | 8.43 | |
| | | | | | | | |
|
|
|
| | | | |
| 54 | | 2006 Semiannual Report TIAA-CREF Life Funds | | SEE NOTES TO FINANCIAL STATEMENTS |
| | | | |
| Growth & Income Fund | | Summary portfolio of investments (unaudited) June 30, 2006 | | continued |
| | | | | | | | | | | | |
| | | COMPANY
| | | | SHARES
| | VALUE
| | % OF NET
ASSETS
| |
| | | | | | | | | | | | | |
| | | FABRICATED METAL PRODUCTS | | | | | | $ | 250,895 | | 0.48 | % |
| | | | | | | | |
|
|
|
| | | FOOD AND KINDRED PRODUCTS | | | | | | | | | | |
| | | PepsiCo, Inc | | | | 16,029 | | | 962,381 | | 1.86 | |
| | | Other | | | | | | | 566,937 | | 1.09 | |
| | | | | | | | |
|
|
|
| | | | | | | | | | 1,529,318 | | 2.95 | |
| | | | | | | | |
|
|
|
| | | FURNITURE AND FIXTURES | | | | | | | 38,976 | | 0.08 | |
| | | | | | | | |
|
|
|
| | | FURNITURE AND HOMEFURNISHINGS STORES | | | | | | | | | | |
| | | Best Buy Co, Inc | | | | 8,968 | | | 491,805 | | 0.95 | |
| | | Other | | | | | | | 328,914 | | 0.63 | |
| | | | | | | | |
|
|
|
| | | | | | | | | | 820,719 | | 1.58 | |
| | | | | | | | |
|
|
|
| | | GENERAL MERCHANDISE STORES | | | | | | | | | | |
| | | Wal-Mart Stores, Inc | | | | 13,874 | | | 668,311 | | 1.29 | |
| | | Other | | | | | | | 642,366 | | 1.24 | |
| | | | | | | | |
|
|
|
| | | | | | | | | | 1,310,677 | | 2.53 | |
| | | | | | | | |
|
|
|
| | | HEALTH SERVICES | | | | | | | | | | |
| * | | Medco Health Solutions, Inc | | | | 8,540 | | | 489,171 | | 0.94 | |
| | | Other | | | | | | | 725,161 | | 1.40 | |
| | | | | | | | |
|
|
|
| | | | | | | | | | 1,214,332 | | 2.34 | |
| | | | | | | | |
|
|
|
| | | HOLDING AND OTHER INVESTMENT OFFICES | | | | | | | 206,194 | | 0.40 | |
| | | | | | | | |
|
|
|
| | | HOTELS AND OTHER LODGING PLACES | | | | | | | 458,619 | | 0.89 | |
| | | | | | | | |
|
|
|
| | | INDUSTRIAL MACHINERY AND EQUIPMENT | | | | | | | | | | |
| | | 3M Co | | | | 6,508 | | | 525,651 | | 1.01 | |
| * | | Apple Computer, Inc | | | | 7,274 | | | 415,491 | | 0.80 | |
| | | General Electric Co | | | | 44,680 | | | 1,472,653 | | 2.84 | |
| | | Hewlett-Packard Co | | | | 25,342 | | | 802,835 | | 1.55 | |
| | | International Business Machines Corp | | | | 5,327 | | | 409,220 | | 0.79 | |
| | | Other | | | | | | | 587,899 | | 1.14 | |
| | | | | | | | |
|
|
|
| | | | | | | | | | 4,213,749 | | 8.13 | |
| | | | | | | | |
|
|
|
| | | INSTRUMENTS AND RELATED PRODUCTS | | | | | | | 469,512 | | 0.91 | |
| | | | | | | | |
|
|
|
| | | INSURANCE CARRIERS | | | | | | | | | | |
| | | ACE Ltd | | | | 11,486 | | | 581,077 | | 1.12 | |
| | | Aflac, Inc | | | | 11,459 | | | 531,125 | | 1.03 | |
| | | American International Group, Inc | | | | 15,302 | | | 903,583 | | 1.74 | |
| | | Other | | | | | | | 590,807 | | 1.14 | |
| | | | | | | | |
|
|
|
| | | | | | | | | | 2,606,592 | | 5.03 | |
| | | | | | | | |
|
|
|
| | | METAL MINING | | | | | | | 543,503 | | 1.05 | |
| | | | | | | | |
|
|
|
| | | MISCELLANEOUS RETAIL | | | | | | | | | | |
| | | CVS Corp | | | | 12,727 | | | 390,719 | | 0.75 | |
| | | | | | | | |
|
|
|
| | | | | | | | | | 390,719 | | 0.75 | |
| | | | | | | | |
|
|
|
| | | MOTION PICTURES | | | | | | | | | | |
| | | News Corp (Class A) | | | | 30,569 | | | 586,313 | | 1.13 | |
| | | Other | | | | | | | 106,712 | | 0.21 | |
| | | | | | | | |
|
|
|
| | | | | | | | | | 693,025 | | 1.34 | |
| | | | | | | | |
|
|
|
| | | | |
| SEE NOTES TO FINANCIAL STATEMENTS | | TIAA-CREF Life Funds 2006 Semiannual Report | | 55 |
| | | | |
| Growth & Income Fund | | Summary portfolio of investments (unaudited) June 30, 2006 | | continued |
| | | | | | | | | | | | |
| | | COMPANY
| | | | SHARES
| | VALUE
| | % OF NET
ASSETS
| |
| | | NONDEPOSITORY INSTITUTIONS | | | | | | | | | | |
| | | American Express Co | | | | 14,549 | | $ | 774,298 | | 1.50 | % |
| | | Fannie Mae | | | | 9,394 | | | 451,851 | | 0.87 | |
| | | SLM Corp | | | | 8,749 | | | 462,997 | | 0.89 | |
| | | | | | | | |
|
|
|
| | | | | | | | | | 1,689,146 | | 3.26 | |
| | | | | | | | |
|
|
|
| | | OIL AND GAS EXTRACTION | | | | | | | | | | |
| * | | Cameron International Corp | | | | 10,471 | | | 500,200 | | 0.97 | |
| | | Schlumberger Ltd | | | | 11,636 | | | 757,620 | | 1.46 | |
| | | Other | | | | | | | 142,632 | | 0.27 | |
| | | | | | | | |
|
|
|
| | | | | | | | | | 1,400,452 | | 2.70 | |
| | | | | | | | |
|
|
|
| | | PETROLEUM AND COAL PRODUCTS | | | | | | | | | | |
| | | Exxon Mobil Corp | | | | 24,009 | | | 1,472,952 | | 2.84 | |
| | | Marathon Oil Corp | | | | 6,537 | | | 544,532 | | 1.05 | |
| | | Other | | | | | | | 1,595,451 | | 3.08 | |
| | | | | | | | |
|
|
|
| | | | | | | | | | 3,612,935 | | 6.97 | |
| | | | | | | | |
|
|
|
| | | PRINTING AND PUBLISHING | | | | | | | 244,204 | | 0.47 | |
| | | | | | | | |
|
|
|
| | | RAILROAD TRANSPORTATION | | | | | | | 175,732 | | 0.34 | |
| | | | | | | | |
|
|
|
| | | SECURITY AND COMMODITY BROKERS | | | | | | | | | | |
| | | Morgan Stanley | | | | 11,423 | | | 722,048 | | 1.39 | |
| | | Other | | | | | | | 583,388 | | 1.13 | |
| | | | | | | | |
|
|
|
| | | | | | | | | | 1,305,436 | | 2.52 | |
| | | | | | | | |
|
|
|
| | | TOBACCO PRODUCTS | | | | | | | | | | |
| | | Altria Group, Inc | | | | 27,273 | | | 2,002,656 | | 3.87 | |
| | | | | | | | |
|
|
|
| | | | | | | | | | 2,002,656 | | 3.87 | |
| | | | | | | | |
|
|
|
| | | TRANSPORTATION BY AIR | | | | | | | 240,549 | | 0.46 | |
| | | | | | | | |
|
|
|
| | | TRANSPORTATION EQUIPMENT | | | | | | | | | | |
| | | Boeing Co | | | | 6,600 | | | 540,606 | | 1.04 | |
| | | Northrop Grumman Corp | | | | 7,401 | | | 474,108 | | 0.92 | |
| | | United Technologies Corp | | | | 9,127 | | | 578,834 | | 1.12 | |
| | | | | | | | |
|
|
|
| | | | | | | | | | 1,593,548 | | 3.08 | |
| | | | | | | | |
|
|
|
| | | TRANSPORTATION SERVICES | | | | | | | 188,629 | | 0.36 | |
| | | | | | | | |
|
|
|
| | | TRUCKING AND WAREHOUSING | | | | | | | 274,157 | | 0.53 | |
| | | | | | | | |
|
|
|
| | | WHOLESALE TRADE-NONDURABLE GOODS | | | | | | | | | | |
| | | Cardinal Health, Inc | | | | 7,722 | | | 496,756 | | 0.96 | |
| | | | | | | | |
|
|
|
| | | | | | | | | | 496,756 | | 0.96 | |
| | | | | | | | |
|
|
|
| | | TOTAL COMMON STOCKS | | (Cost $47,625,231) | | | 51,434,065 | | 99.27 | |
| | | | | | | | |
|
|
|
| | | | |
| | | TOTAL PORTFOLIO | | (Cost $47,625,231) | | | 51,434,065 | | 99.27 | |
| | | | | | | | |
|
|
|
| | | OTHER ASSETS & LIABILITIES, NET | | | | | | | 377,215 | | 0.73 | |
| | | | | | | | |
|
|
|
| | | | | |
| | | NET ASSETS | | | | | | $ | 51,811,280 | | 100.00 | % |
| | | | | | | | |
|
|
|
| | | | |
| 56 | | 2006 Semiannual Report TIAA-CREF Life Funds | | SEE NOTES TO FINANCIAL STATEMENTS |
| | | | |
| Growth & Income Fund | | Summary portfolio of investments (unaudited) June 30, 2006 | | concluded |
For ease of presentation, we have grouped a number of industry classification categories together in the Summary portfolio of investments. Note that the Funds use more specific industry categories in following their investment limitations on industry concentration.
| | | | |
| SEE NOTES TO FINANCIAL STATEMENTS | | TIAA-CREF Life Funds 2006 Semiannual Report | | 57 |
| | |
| International Equity Fund | | Summary portfolio of investments (unaudited) June 30, 2006 |
| | | | | | | | | | | | |
| | | COMPANY
| | | | SHARES
| | VALUE
| | % OF NET
ASSETS
| |
| | | | | | | | | | | | | |
| | | COMMON STOCKS | | | | | | | | | | |
| | | AGRICULTURAL SERVICES | | | | | | $ | 31,526 | | 0.04 | % |
| | | | | | | | |
|
|
|
| | | APPAREL AND OTHER TEXTILE PRODUCTS | | | | | | | 201,233 | | 0.23 | |
| | | | | | | | |
|
|
|
| | | BUSINESS SERVICES | | | | | | | 721,532 | | 0.81 | |
| | | | | | | | |
|
|
|
| | | CHEMICALS AND ALLIED PRODUCTS | | | | | | | | | | |
| | | Bayer AG. | | | | 104,001 | | | 4,779,332 | | 5.35 | |
| | | Novartis AG. | | | | 14,690 | | | 793,860 | | 0.89 | |
| | | Reckitt Benckiser plc | | | | 46,866 | | | 1,750,957 | | 1.96 | |
| | | Shin-Etsu Chemical Co Ltd | | | | 6,400 | | | 348,231 | | 0.39 | |
| | | Takeda Pharmaceutical Co Ltd | | | | 14,100 | | | 878,205 | | 0.98 | |
| | | Other | | | | | | | 1,761,696 | | 1.97 | |
| | | | | | | | |
|
|
|
| | | | | | | | | | 10,312,281 | | 11.54 | |
| | | | | | | | |
|
|
|
| | | COAL MINING | | | | | | | | | | |
| | | BHP Billiton Ltd | | | | 49,105 | | | 1,057,994 | | 1.18 | |
| | | | | | | | |
|
|
|
| | | | | | | | | | 1,057,994 | | 1.18 | |
| | | | | | | | |
|
|
|
| | | COMMUNICATIONS | | | | | | | | | | |
| | | Royal KPN NV | | | | 108,364 | | | 1,217,939 | | 1.36 | |
| | | Other | | | | | | | 670,573 | | 0.75 | |
| | | | | | | | |
|
|
|
| | | | | | | | | | 1,888,512 | | 2.11 | |
| | | | | | | | |
|
|
|
| | | DEPOSITORY INSTITUTIONS | | | | | | | | | | |
| | | Julius Baer Holding AG. | | | | 33,274 | | | 2,884,652 | | 3.23 | |
| | | Mitsubishi UFJ Financial Group, Inc | | | | 55 | | | 769,803 | | 0.86 | |
| | | Mizuho Financial Group. Inc | | | | 66 | | | 559,454 | | 0.63 | |
| | | Sumitomo Trust & Banking Co Ltd | | | | 39,000 | | | 426,453 | | 0.48 | |
| | | Other | | | | | | | 827,658 | | 0.92 | |
| | | | | | | | |
|
|
|
| | | | | | | | | | 5,468,020 | | 6.12 | |
| | | | | | | | |
|
|
|
| | | ELECTRIC, GAS, AND SANITARY SERVICES | | | | | | | | | | |
| | | Fortum Oyj | | | | 129,208 | | | 3,304,236 | | 3.70 | |
| | | Xinao Gas Holdings Ltd | | | | 601,000 | | | 572,602 | | 0.64 | |
| | | Other | | | | | | | 76,831 | | 0.08 | |
| | | | | | | | |
|
|
|
| | | | | | | | | | 3,953,669 | | 4.42 | |
| | | | | | | | |
|
|
|
| | | ELECTRONIC AND OTHER ELECTRIC EQUIPMENT | | | | | | | | | | |
| | | Sony Corp | | | | 12,700 | | | 561,037 | | 0.63 | |
| | | Other | | | | | | | 1,167,396 | | 1.30 | |
| | | | | | | | |
|
|
|
| | | | | | | | | | 1,728,433 | | 1.93 | |
| | | | | | | | |
|
|
|
| | | FABRICATED METAL PRODUCTS | | | | | | | | | | |
| | | NEOMAX Co Ltd | | | | 17,000 | | | 359,883 | | 0.40 | |
| | | Other | | | | | | | 81,172 | | 0.09 | |
| | | | | | | | |
|
|
|
| | | | | | | | | | 441,055 | | 0.49 | |
| | | | | | | | |
|
|
|
| | | FOOD AND KINDRED PRODUCTS | | | | | | | | | | |
| | | Nisshin Oillio Group Ltd | | | | 122,000 | | | 779,075 | | 0.87 | |
| | | Other | | | | | | | 1,127,009 | | 1.26 | |
| | | | | | | | |
|
|
|
| | | | | | | | | | 1,906,084 | | 2.13 | |
| | | | | | | | |
|
|
|
| | | | |
| 58 | | 2006 Semiannual Report TIAA-CREF Life Funds | | SEE NOTES TO FINANCIAL STATEMENTS |
| | | | |
| International Equity Fund | | Summary portfolio of investments (unaudited) June 30, 2006 | | continued |
| | | | | | | | | | | | |
| | | COMPANY
| | | | SHARES
| | VALUE
| | % OF NET
ASSETS
| |
| | | | | | | | | | | | | |
| | | FOOD STORES | | | | | | | | | | |
| | | Tesco plc | | | | 551,352 | | $ | 3,405,976 | | 3.81 | % |
| | | Other | | | | | | | 159,899 | | 0.18 | |
| | | | | | | | |
|
|
|
| | | | | | | | | | 3,565,875 | | 3.99 | |
| | | | | | | | |
|
|
|
| | | GENERAL BUILDING CONTRACTORS | | | | | | | | | | |
| | | Shanghai Forte Land Co | | | | 1,000,000 | | | 405,562 | | 0.45 | |
| | | Shimizu Corp | | | | 66,000 | | | 370,083 | | 0.42 | |
| | | Other | | | | | | | 328,146 | | 0.37 | |
| | | | | | | | |
|
|
|
| | | | | | | | | | 1,103,791 | | 1.24 | |
| | | | | | | | |
|
|
|
| | | HEAVY CONSTRUCTION, EXCEPT BUILDING | | | | | | | | | | |
| | | Vinci S.A. | | | | 40,147 | | | 4,134,950 | | 4.63 | |
| | | | | | | | |
|
|
|
| | | | | | | | | | 4,134,950 | | 4.63 | |
| | | | | | | | |
|
|
|
| | | HOLDING AND OTHER INVESTMENT OFFICES | | | | | | | | | | |
| | | Collins Stewart Tullett plc | | | | 115,579 | | | 1,622,508 | | 1.82 | |
| | | GEA Group AG. | | | | 146,594 | | | 2,511,728 | | 2.81 | |
| | | iShares MSCI EAFE Index Fund | | | | 35,000 | | | 2,288,650 | | 2.56 | |
| | | Man Group plc | | | | 73,774 | | | 3,476,713 | | 3.89 | |
| | | Other | | | | | | | 156,373 | | 0.17 | |
| | | | | | | | |
|
|
|
| | | | | | | | | | 10,055,972 | | 11.25 | |
| | | | | | | | |
|
|
|
| | | HOTELS AND OTHER LODGING PLACES | | | | | | | | | | |
| | | Accor S.A. | | | | 78,671 | | | 4,787,204 | | 5.36 | |
| | | Other | | | | | | | 56,924 | | 0.06 | |
| | | | | | | | |
|
|
|
| | | | | | | | | | 4,844,128 | | 5.42 | |
| | | | | | | | |
|
|
|
| | | INDUSTRIAL MACHINERY AND EQUIPMENT | | | | | | | | | | |
| | | Canon, Inc | | | | 8,550 | | | 419,591 | | 0.47 | |
| | | Komatsu Ltd | | | | 18,000 | | | 358,221 | | 0.40 | |
| | | Rheinmetall AG. | | | | 38,640 | | | 2,693,177 | | 3.01 | |
| | | Other | | | | | | | 864,493 | | 0.97 | |
| | | | | | | | |
|
|
|
| | | | | | | | | | 4,335,482 | | 4.85 | |
| | | | | | | | |
|
|
|
| | | INSTRUMENTS AND RELATED PRODUCTS | | | | | | | | | | |
| | | Tecan Group AG. | | | | 11,911 | | | 640,763 | | 0.72 | |
| | | Terumo Corp | | | | 14,400 | | | 481,197 | | 0.54 | |
| | | Other | | | | | | | 157,078 | | 0.17 | |
| | | | | | | | |
|
|
|
| | | | | | | | | | 1,279,038 | | 1.43 | |
| | | | | | | | |
|
|
|
| | | INSURANCE AGENTS, BROKERS AND SERVICE | | | | | | | 210,653 | | 0.24 | |
| | | | | | | | |
|
|
|
| | | INSURANCE CARRIERS | | | | | | | | | | |
| | | Aioi Insurance Co Ltd | | | | 88,000 | | | 660,491 | | 0.74 | |
| | | AMP Ltd | | | | 73,590 | | | 499,171 | | 0.56 | |
| | | Fondiaria-Sai S.p.A | | | | 24,195 | | | 988,744 | | 1.11 | |
| | | Zurich Financial Services AG. | | | | 5,764 | | | 1,261,022 | | 1.41 | |
| | | Other | | | | | | | 789,276 | | 0.88 | |
| | | | | | | | |
|
|
|
| | | | | | | | | | 4,198,704 | | 4.70 | |
| | | | | | | | |
|
|
|
| | | METAL MINING | | | | | | | 858,256 | | 0.96 | |
| | | | | | | | |
|
|
|
| | | MISCELLANEOUS MANUFACTURING INDUSTRIES | | | | | | | 297,024 | | 0.33 | |
| | | | | | | | |
|
|
|
| | | NONDEPOSITORY INSTITUTIONS | | | | | | | | | | |
| | | Deutsche Postbank AG. | | | | 40,587 | | | 2,919,700 | | 3.27 | |
| | | | |
| SEE NOTES TO FINANCIAL STATEMENTS | | TIAA-CREF Life Funds 2006 Semiannual Report | | 59 |
| | | | |
| International Equity Fund | | Summary portfolio of investments (unaudited) June 30, 2006 | | continued |
| | | | | | | | | | | | |
| | | COMPANY
| | | | SHARES
| | VALUE
| | % OF NET
ASSETS
| |
| | | | | | | | | | | | | |
| | | NONDEPOSITORY INSTITUTIONS—(continued) | | | | | | | | | | |
| | | Hypo Real Estate Holding AG. | | | | 33,340 | | $ | 2,024,507 | | 2.26 | % |
| | | Other | | | | | | | 349,808 | | 0.39 | |
| | | | | | | | |
|
|
|
| | | | | | | | | | 5,294,015 | | 5.92 | |
| | | | | | | | |
|
|
|
| | | NONMETALLIC MINERALS, EXCEPT FUELS | | | | | | | 219,787 | | 0.25 | |
| | | | | | | | |
|
|
|
| | | OIL AND GAS EXTRACTION | | | | | | | | | | |
| | | PetroChina Co Ltd (Class H) | | | | 423,000 | | | 452,028 | | 0.50 | |
| | | Total S.A. | | | | 8,984 | | | 591,026 | | 0.66 | |
| | | Other | | | | | | | 568,157 | | 0.64 | |
| | | | | | | | |
|
|
|
| | | | | | | | | | 1,611,211 | | 1.80 | |
| | | | | | | | |
|
|
|
| | | PAPER AND ALLIED PRODUCTS | | | | | | | 290,671 | | 0.33 | |
| | | | | | | | |
|
|
|
| | | PETROLEUM AND COAL PRODUCTS | | | | | | | | | | |
| | | BP plc | | | | 47,756 | | | 556,902 | | 0.62 | |
| | | ENI S.p.A. | | | | 30,315 | | | 892,695 | | 1.00 | |
| | | Other | | | | | | | 270,136 | | 0.30 | |
| | | | | | | | |
|
|
|
| | | | | | | | | | 1,719,733 | | 1.92 | |
| | | | | | | | |
|
|
|
| | | PRIMARY METAL INDUSTRIES | | | | | | | | | | |
| | | BHP Billiton plc | | | | 50,725 | | | 984,155 | | 1.10 | |
| | | Other | | | | | | | 212,116 | | 0.24 | |
| | | | | | | | |
|
|
|
| | | | | | | | | | 1,196,271 | | 1.34 | |
| | | | | | | | |
|
|
|
| | | RAILROAD TRANSPORTATION | | | | | | | 327,166 | | 0.37 | |
| | | | | | | | |
|
|
|
| | | REAL ESTATE | | | | | | | | | | |
| | | Tokyo Tatemono Co Ltd | | | | 43,000 | | | 461,164 | | 0.52 | |
| | | Other | | | | | | | 440,674 | | 0.49 | |
| | | | | | | | |
|
|
|
| | | | | | | | | | 901,838 | | 1.01 | |
| | | | | | | | |
|
|
|
| | | SECURITY AND COMMODITY BROKERS | | | | | | | 84,482 | | 0.09 | |
| | | | | | | | |
|
|
|
| | | STONE, CLAY, AND GLASS PRODUCTS | | | | | | | | | | |
| | | Holcim Ltd | | | | 22,130 | | | 1,692,719 | | 1.90 | |
| | | Other | | | | | | | 555,430 | | 0.62 | |
| | | | | | | | |
|
|
|
| | | | | | | | | | 2,248,149 | | 2.52 | |
| | | | | | | | |
|
|
|
| | | TOBACCO PRODUCTS | | | | | | | | | | |
| | | Japan Tobacco, Inc | | | | 114 | | | 415,851 | | 0.47 | |
| | | | | | | | |
|
|
|
| | | | | | | | | | 415,851 | | 0.47 | |
| | | | | | | | |
|
|
|
| | | TRANSPORTATION EQUIPMENT | | | | | | | | | | |
| * | | Fiat S.p.A. | | | | 245,168 | | | 3,263,368 | | 3.65 | |
| | | Honda Motor Co Ltd | | | | 18,200 | | | 577,929 | | 0.65 | |
| | | Toyota Motor Corp | | | | 29,100 | | | 1,524,813 | | 1.71 | |
| | | Other | | | | | | | 1,461,694 | | 1.63 | |
| | | | | | | | |
|
|
|
| | | | | | | | | | 6,827,804 | | 7.64 | |
| | | | | | | | |
|
|
|
| | | TRUCKING AND WAREHOUSING | | | | | | | | | | |
| | | Deutsche Post AG. | | | | 121,925 | | | 3,267,651 | | 3.66 | |
| | | | | | | | |
|
|
|
| | | | | | | | | | 3,267,651 | | 3.66 | |
| | | | | | | | |
|
|
|
| | | WHOLESALE TRADE-DURABLE GOODS | | | | | | | | | | |
| * | | Hagemeyer NV | | | | 146,096 | | | 674,368 | | 0.75 | |
| | | Sumitomo Corp | | | | 29,000 | | | 382,811 | | 0.43 | |
| | | | |
| 60 | | 2006 Semiannual Report TIAA-CREF Life Funds | | SEE NOTES TO FINANCIAL STATEMENTS |
| | | | |
| International Equity Fund | | Summary portfolio of investments (unaudited) June 30, 2006 | | concluded |
| | | | | | | | | | | | |
| | | COMPANY
| | | | SHARES
| | VALUE
| | % OF NET
ASSETS
| |
| | | WHOLESALE TRADE-DURABLE GOODS—(continued) | | | | | | | | | | |
| | | Other | | | | | | $ | 211,943 | | 0.24 | % |
| | | | | | | | |
|
|
|
| | | | | | | | | | 1,269,122 | | 1.42 | |
| | | | | | | | |
|
|
|
| | | WHOLESALE TRADE-NONDURABLE GOODS | | | | | | | 111,936 | | 0.13 | |
| | | | | | | | |
|
|
|
| | | TOTAL COMMON STOCKS | | (Cost $80,945,236) | | | 88,379,899 | | 98.91 | |
| | | | | | | | |
|
|
|
| | | | | |
| | | TOTAL PORTFOLIO | | (Cost $80,945,236) | | | | | 88,379,899 | | 98.91 | |
| | | OTHER ASSETS & LIABILITIES, NET | | | | | | | 972,199 | | 1.09 | |
| | | | | | | | |
|
|
|
| | | | | |
| | | NET ASSETS | | | | | | $ | 89,352,098 | | 100.00 | % |
| | | | | | | | |
|
|
|
For ease of presentation, we have grouped a number of industry classification categories together in the Summary portfolio of investments. Note that the Funds use more specific industry categories in following their investment limitations on industry concentration.
| | | | |
| SEE NOTES TO FINANCIAL STATEMENTS | | TIAA-CREF Life Funds 2006 Semiannual Report | | 61 |
| | | | |
| International Equity Fund | | Summary of market values by country (unaudited) June 30, 2006 | | |
| | | | | | | | | | | | |
| | | DOMESTIC
| | | |
| | VALUE
| | % OF
MARKET
VALUE
| |
| | | UNITED STATES OF AMERICA | | | | | | $ | 2,288,650 | | 2.59 | % |
| | | | | | | | |
|
|
|
| | | TOTAL DOMESTIC | | | | | | | 2,288,650 | | 2.59 | |
| | | | | | | | |
|
|
|
| | | FOREIGN
| | | |
| | | | | |
| | | AUSTRALIA | | | | | | | 3,718,098 | | 4.21 | |
| | | BRAZIL | | | | | | | 363,724 | | 0.41 | |
| | | CHINA | | | | | | | 72,551 | | 0.08 | |
| | | FINLAND | | | | | | | 3,304,236 | | 3.74 | |
| | | FRANCE | | | | | | | 9,521,958 | | 10.77 | |
| | | GERMANY | | | | | | | 18,544,129 | | 20.98 | |
| | | HONG KONG | | | | | | | 1,778,035 | | 2.01 | |
| | | INDIA | | | | | | | 840,631 | | 0.95 | |
| | | INDONESIA | | | | | | | 27,437 | | 0.03 | |
| | | ITALY | | | | | | | 5,144,808 | | 5.82 | |
| | | JAPAN | | | | | | | 20,572,924 | | 23.28 | |
| | | NETHERLANDS | | | | | | | 1,892,307 | | 2.14 | |
| | | REPUBLIC OF KOREA | | | | | | | 74,763 | | 0.08 | |
| | | RUSSIA | | | | | | | 172,499 | | 0.20 | |
| | | SINGAPORE | | | | | | | 511,887 | | 0.58 | |
| | | SWITZERLAND | | | | | | | 7,394,441 | | 8.37 | |
| | | UNITED KINGDOM | | | | | | | 12,156,821 | | 13.76 | |
| | | | | | | | |
|
|
|
| | | TOTAL FOREIGN | | | | | | | 86,091,249 | | 97.41 | |
| | | | | | | | |
|
|
|
| | | | | |
| | | TOTAL PORTFOLIO | | | | | | $ | 88,379,899 | | 100.00 | % |
| | | | | | | | |
|
|
|
| | | | |
| 62 | | 2006 Semiannual Report TIAA-CREF Life Funds | | SEE NOTES TO FINANCIAL STATEMENTS |
| | |
| Large-Cap Value Fund | | Summary portfolio of investments (unaudited) June 30, 2006 |
| | | | | | | | | | | | |
| | | COMPANY
| | | | SHARES
| | VALUE
| | % OF NET
ASSETS
| |
| | | | | | | | | | | | | |
| | | COMMON STOCKS | | | | | | | | | | |
| | | APPAREL AND ACCESSORY STORES | | | | | | | | | | |
| | | Gap, Inc | | | | 71,859 | | $ | 1,250,347 | | 2.34 | % |
| | | | | | | | |
|
|
|
| | | | | | | | | | 1,250,347 | | 2.34 | |
| | | | | | | | |
|
|
|
| | | APPAREL AND OTHER TEXTILE PRODUCTS | | | | | | | 49,151 | | 0.09 | |
| | | | | | | | |
|
|
|
| | | BUSINESS SERVICES | | | | | | | | | | |
| * | | United Rentals, Inc | | | | 13,222 | | | 422,840 | | 0.79 | |
| | | Other | | | | | | | 798,784 | | 1.50 | |
| | | | | | | | |
|
|
|
| | | | | | | | | | 1,221,624 | | 2.29 | |
| | | | | | | | |
|
|
|
| | | CHEMICALS AND ALLIED PRODUCTS | | | | | | | | | | |
| | | Colgate-Palmolive Co | | | | 12,549 | | | 751,685 | | 1.41 | |
| | | Pfizer, Inc | | | | 21,477 | | | 504,065 | | 0.94 | |
| * | | Sepracor, Inc | | | | 7,246 | | | 414,036 | | 0.77 | |
| | | Wyeth | | | | 11,874 | | | 527,324 | | 0.99 | |
| | | Other | | | | | | | 1,071,555 | | 2.01 | |
| | | | | | | | |
|
|
|
| | | | | | | | | | 3,268,665 | | 6.12 | |
| | | | | | | | |
|
|
|
| | | COAL MINING | | | | | | | | | | |
| | | Sasol Ltd (ADR) | | | | 12,172 | | | 470,326 | | 0.88 | |
| | | | | | | | |
|
|
|
| | | | | | | | | | 470,326 | | 0.88 | |
| | | | | | | | |
|
|
|
| | | COMMUNICATIONS | | | | | | | | | | |
| | | AT&T, Inc | | | | 38,232 | | | 1,066,290 | | 2.00 | |
| | | BellSouth Corp | | | | 12,330 | | | 446,346 | | 0.84 | |
| | | Sprint Nextel Corp | | | | 35,947 | | | 718,581 | | 1.34 | |
| | | Other | | | | | | | 257,111 | | 0.48 | |
| | | | | | | | |
|
|
|
| | | | | | | | | | 2,488,328 | | 4.66 | |
| | | | | | | | |
|
|
|
| | | DEPOSITORY INSTITUTIONS | | | | | | | | | | |
| | | Bank of America Corp | | | | 40,877 | | | 1,966,184 | | 3.68 | |
| | | Bank of New York Co, Inc | | | | 17,474 | | | 562,663 | | 1.05 | |
| | | Citigroup, Inc | | | | 8,577 | | | 413,754 | | 0.77 | |
| | | Hudson City Bancorp, Inc | | | | 60,503 | | | 806,505 | | 1.51 | |
| | | JPMorgan Chase & Co | | | | 44,492 | | | 1,868,660 | | 3.50 | |
| | | Marshall & Ilsley Corp | | | | 7,810 | | | 357,229 | | 0.67 | |
| | | South Financial Group, Inc | | | | 16,741 | | | 442,130 | | 0.83 | |
| | | SunTrust Banks, Inc | | | | 13,946 | | | 1,063,520 | | 1.99 | |
| | | US Bancorp | | | | 12,343 | | | 381,152 | | 0.71 | |
| | | Washington Mutual, Inc | | | | 12,003 | | | 547,097 | | 1.03 | |
| | | Wells Fargo & Co | | | | 13,019 | | | 873,315 | | 1.64 | |
| | | Other | | | | | | | 430,293 | | 0.81 | |
| | | | | | | | |
|
|
|
| | | | | | | | | | 9,712,502 | | 18.19 | |
| | | | | | | | |
|
|
|
| | | EATING AND DRINKING PLACES | | | | | | | | | | |
| | | Brinker International, Inc | | | | 17,755 | | | 644,507 | | 1.21 | |
| | | Compass Group plc | | | | 70,935 | | | 344,066 | | 0.64 | |
| | | | | | | | |
|
|
|
| | | | | | | | | | 988,573 | | 1.85 | |
| | | | | | | | |
|
|
|
| | | ELECTRIC, GAS, AND SANITARY SERVICES | | | | | | | | | | |
| | | American Electric Power Co, Inc | | | | 13,932 | | | 477,171 | | 0.89 | |
| | | DPL, Inc | | | | 22,379 | | | 599,757 | | 1.12 | |
| | | | |
| SEE NOTES TO FINANCIAL STATEMENTS | | TIAA-CREF Life Funds 2006 Semiannual Report | | 63 |
| | | | |
| Large-Cap Value Fund | | Summary portfolio of investments (unaudited) June 30, 2006 | | continued |
| | | | | | | | | | | | |
| | | COMPANY
| | | | SHARES
| | VALUE
| | % OF NET
ASSETS
| |
| | | | | | | | | | | | | |
| | | ELECTRIC, GAS, AND SANITARY SERVICES—(continued) | | | | | | | | | | |
| | | Other | | | | | | $ | 1,524,796 | | 2.86 | % |
| | | | | | | | |
|
|
|
| | | | | | | | | | 2,601,724 | | 4.87 | |
| | | | | | | | |
|
|
|
| | | ELECTRONIC AND OTHER ELECTRIC EQUIPMENT | | | | | | | | | | |
| | | Honeywell International, Inc | | | | 30,300 | | | 1,221,090 | | 2.29 | |
| * | | JDS Uniphase Corp | | | | 159,468 | | | 403,454 | | 0.76 | |
| | | Other | | | | | | | 1,598,391 | | 2.99 | |
| | | | | | | | |
|
|
|
| | | | | | | | | | 3,222,935 | | 6.04 | |
| | | | | | | | |
|
|
|
| | | ENGINEERING AND MANAGEMENT SERVICES | | | | | | | 322,281 | | 0.60 | |
| | | | | | | | |
|
|
|
| | | FABRICATED METAL PRODUCTS | | | | | | | 324,140 | | 0.61 | |
| | | | | | | | |
|
|
|
| | | FOOD AND KINDRED PRODUCTS | | | | | | | 105,374 | | 0.20 | |
| | | | | | | | |
|
|
|
| | | FOOD STORES | | | | | | | | | | |
| | | Supervalu, Inc | | | | 23,107 | | | 709,385 | | 1.33 | |
| | | | | | | | |
|
|
|
| | | | | | | | | | 709,385 | | 1.33 | |
| | | | | | | | |
|
|
|
| | | FORESTRY | | | | | | | 189,550 | | 0.36 | |
| | | | | | | | |
|
|
|
| | | GENERAL BUILDING CONTRACTORS | | | | | | | 185,173 | | 0.35 | |
| | | | | | | | |
|
|
|
| | | HEALTH SERVICES | | | | | | | | | | |
| * | | Healthsouth Corp | | | | 94,269 | | | 362,936 | | 0.68 | |
| | | | | | | | |
|
|
|
| | | | | | | | | | 362,936 | | 0.68 | |
| | | | | | | | |
|
|
|
| | | HOLDING AND OTHER INVESTMENT OFFICES | | | | | | | | | | |
| | | New Century Financial Corp | | | | 10,527 | | | 481,610 | | 0.90 | |
| | | Other | | | | | | | 255,442 | | 0.48 | |
| | | | | | | | |
|
|
|
| | | | | | | | | | 737,052 | | 1.38 | |
| | | | | | | | |
|
|
|
| | | HOTELS AND OTHER LODGING PLACES | | | | | | | | | | |
| | | Accor S.A. | | | | 14,183 | | | 863,049 | | 1.62 | |
| | | Other | | | | | | | 147,662 | | 0.27 | |
| | | | | | | | |
|
|
|
| | | | | | | | | | 1,010,711 | | 1.89 | |
| | | | | | | | |
|
|
|
| | | INDUSTRIAL MACHINERY AND EQUIPMENT | | | | | | | | | | |
| * | | Alstom RGPT | | | | 6,556 | | | 598,953 | | 1.12 | |
| | | Hewlett-Packard Co | | | | 32,799 | | | 1,039,072 | | 1.95 | |
| | | | | | | | |
|
|
|
| | | | | | | | | | 1,638,025 | | 3.07 | |
| | | | | | | | |
|
|
|
| | | INSTRUMENTS AND RELATED PRODUCTS | | | | | | | 429,188 | | 0.80 | |
| | | | | | | | |
|
|
|
| | | INSURANCE AGENTS, BROKERS AND SERVICE | | | | | | | 418,692 | | 0.78 | |
| | | | | | | | |
|
|
|
| | | INSURANCE CARRIERS | | | | | | | | | | |
| | | Aetna, Inc | | | | 12,104 | | | 483,313 | | 0.90 | |
| | | American International Group, Inc | | | | 16,368 | | | 966,530 | | 1.81 | |
| | | PartnerRe Ltd | | | | 6,486 | | | 415,428 | | 0.78 | |
| | | St. Paul Travelers Cos, Inc | | | | 21,351 | | | 951,828 | | 1.78 | |
| | | Other | | | | | | | 1,626,339 | | 3.05 | |
| | | | | | | | |
|
|
|
| | | | | | | | | | 4,443,438 | | 8.32 | |
| | | | | | | | |
|
|
|
| | | METAL MINING | | | | | | | 539,840 | | 1.01 | |
| | | | | | | | |
|
|
|
| | | MISCELLANEOUS RETAIL | | | | | | | | | | |
| * | | Sears Holdings Corp | | | | 8,142 | | | 1,260,707 | | 2.36 | |
| | | Other | | | | | | | 264,894 | | 0.50 | |
| | | | | | | | |
|
|
|
| | | | | | | | | | 1,525,601 | | 2.86 | |
| | | | | | | | |
|
|
|
| | | | |
| 64 | | 2006 Semiannual Report TIAA-CREF Life Funds | | SEE NOTES TO FINANCIAL STATEMENTS |
| | | | |
| Large-Cap Value Fund | | Summary portfolio of investments (unaudited) June 30, 2006 | | continued |
| | | | | | | | | | | | |
| | | COMPANY
| | | | SHARES
| | VALUE
| | % OF NET
ASSETS
| |
| | | | | | | | | | | | | |
| | | NONDEPOSITORY INSTITUTIONS | | | | | | | | | | |
| | | Fannie Mae | | | | 19,547 | | $ | 940,211 | | 1.76 | % |
| | | Other | | | | | | | 301,868 | | 0.57 | |
| | | | | | | | |
|
|
|
| | | | | | | | | | 1,242,079 | | 2.33 | |
| | | | | | | | |
|
|
|
| | | OIL AND GAS EXTRACTION | | | | | | | | | | |
| | | Devon Energy Corp | | | | 7,463 | | | 450,840 | | 0.85 | |
| | | Petroleo Brasileiro S.A. (ADR) | | | | 4,652 | | | 415,470 | | 0.78 | |
| | | Other | | | | | | | 781,725 | | 1.46 | |
| | | | | | | | |
|
|
|
| | | | | | | | | | 1,648,035 | | 3.09 | |
| | | | | | | | |
|
|
|
| | | PAPER AND ALLIED PRODUCTS | | | | | | | 280,913 | | 0.53 | |
| | | | | | | | |
|
|
|
| | | PETROLEUM AND COAL PRODUCTS | | | | | | | | | | |
| | | Chevron Corp | | | | 23,663 | | | 1,468,526 | | 2.75 | |
| | | Exxon Mobil Corp | | | | 11,796 | | | 723,685 | | 1.36 | |
| | | Valero Energy Corp | | | | 7,489 | | | 498,168 | | 0.93 | |
| | | Other | | | | | | | 686,866 | | 1.29 | |
| | | | | | | | |
|
|
|
| | | | | | | | | | 3,377,245 | | 6.33 | |
| | | | | | | | |
|
|
|
| | | PRINTING AND PUBLISHING | | | | | | | 325,770 | | 0.61 | |
| | | | | | | | |
|
|
|
| | | SECURITY AND COMMODITY BROKERS | | | | | | | | | | |
| | | Morgan Stanley | | | | 24,289 | | | 1,535,308 | | 2.87 | |
| | | Waddell & Reed Financial, Inc (Class A) | | | | 21,238 | | | 436,653 | | 0.82 | |
| | | Other | | | | | | | 304,182 | | 0.57 | |
| | | | | | | | |
|
|
|
| | | | | | | | | | 2,276,143 | | 4.26 | |
| | | | | | | | |
|
|
|
| | | STONE, CLAY, AND GLASS PRODUCTS | | | | | | | | | | |
| * | | Owens-Illinois, Inc | | | | 22,451 | | | 376,279 | | 0.70 | |
| | | Other | | | | | | | 197,303 | | 0.37 | |
| | | | | | | | |
|
|
|
| | | | | | | | | | 573,582 | | 1.07 | |
| | | | | | | | |
|
|
|
| | | TOBACCO PRODUCTS | | | | | | | | | | |
| | | Altria Group, Inc | | | | 26,407 | | | 1,939,066 | | 3.63 | |
| | | | | | | | |
|
|
|
| | | | | | | | | | 1,939,066 | | 3.63 | |
| | | | | | | | |
|
|
|
| | | TRANSPORTATION BY AIR | | | | | | | 726,358 | | 1.36 | |
| | | | | | | | |
|
|
|
| | | TRANSPORTATION EQUIPMENT | | | | | | | 55,977 | | 0.11 | |
| | | | | | | | |
|
|
|
| | | TRANSPORTATION SERVICES | | | | | | | 295,882 | | 0.55 | |
| | | | | | | | |
|
|
|
| | | TRUCKING AND WAREHOUSING | | | | | | | 157,197 | | 0.30 | |
| | | | | | | | |
|
|
|
| | | WHOLESALE TRADE-DURABLE GOODS | | | | | | | 337,251 | | 0.63 | |
| | | | | | | | |
|
|
|
| | | WHOLESALE TRADE-NONDURABLE GOODS | | | | | | | | | | |
| | | Akzo Nobel NV | | | | 12,978 | | | 699,616 | | 1.31 | |
| | | Cardinal Health, Inc | | | | 11,452 | | | 736,707 | | 1.38 | |
| | | Other | | | | | | | 63,967 | | 0.12 | |
| | | | | | | | |
|
|
|
| | | | | | | | | | 1,500,290 | | 2.81 | |
| | | | | | | | |
|
|
|
| | | TOTAL COMMON STOCKS | | (Cost $47,390,985) | | | 52,951,349 | | 99.18 | |
| | | | | | | | |
|
|
|
| | | | |
| SEE NOTES TO FINANCIAL STATEMENTS | | TIAA-CREF Life Funds 2006 Semiannual Report | | 65 |
| | | | |
| Large-Cap Value Fund | | Summary portfolio of investments (unaudited) June 30, 2006 | | concluded |
| | | | | | | | | | | | |
| | | ISSUER
| | | | SHARES
| | VALUE
| | % OF NET
ASSETS
| |
| | | SHORT-TERM INVESTMENTS | | | | | | | | | | |
| † | | U.S. GOVERNMENT AND AGENCIES DISCOUNT NOTES | | | | | | $ | 150,000 | | 0.28 | % |
| | | | | | | | |
|
|
|
| | | TOTAL SHORT-TERM INVESTMENTS | | (Cost $149,959) | | | 150,000 | | 0.28 | |
| | | | | | | | |
|
|
|
| | | | |
| | | TOTAL PORTFOLIO | | (Cost $47,540,944) | | | 53,101,349 | | 99.46 | |
| | | OTHER ASSETS & LIABILITIES, NET | | | | | | | 285,770 | | 0.54 | |
| | | | | | | | |
|
|
|
| | | | | |
| | | NET ASSETS | | | | | | $ | 53,387,119 | | 100.00 | % |
| | | | | | | | |
|
|
|
| † | Notes have rate of 4.950% and mature on 7/03/06. |
ABBREVIATION:
ADR—American Depositary Receipt
For ease of presentation, we have grouped a number of industry classification categories together in the Summary portfolio of investments. Note that the Funds use more specific industry categories in following their investment limitations on industry concentration.
| | | | |
| 66 | | 2006 Semiannual Report TIAA-CREF Life Funds | | SEE NOTES TO FINANCIAL STATEMENTS |
| | |
| Small-Cap Equity Fund | | Summary portfolio of investments (unaudited) June 30, 2006 |
| | | | | | | | | | | | |
| | | COMPANY
| | | | SHARES
| | VALUE
| | % OF NET
ASSETS
| |
| | | | | | | | | | | | | |
| | | COMMON STOCKS | | | | | | | | | | |
| | | AGRICULTURAL PRODUCTION-CROPS | | | | | | $ | 46,852 | | 0.09 | % |
| | | | | | | | |
|
|
|
| | | AMUSEMENT AND RECREATION SERVICES | | | | | | | 364,900 | | 0.68 | |
| | | | | | | | |
|
|
|
| | | APPAREL AND ACCESSORY STORES | | | | | | | | | | |
| * | | Pacific Sunwear Of California, Inc | | | | 8,467 | | | 151,813 | | 0.28 | |
| * | | Payless Shoesource, Inc | | | | 7,400 | | | 201,058 | | 0.38 | |
| | | Other | | | | | | | 898,514 | | 1.68 | |
| | | | | | | | |
|
|
|
| | | | | | | | | | 1,251,385 | | 2.34 | |
| | | | | | | | |
|
|
|
| | | APPAREL AND OTHER TEXTILE PRODUCTS | | | | | | | | | | |
| | | Phillips-Van Heusen Corp | | | | 3,800 | | | 145,008 | | 0.27 | |
| | | Other | | | | | | | 260,675 | | 0.49 | |
| | | | | | | | |
|
|
|
| | | | | | | | | | 405,683 | | 0.76 | |
| | | | | | | | |
|
|
|
| | | AUTO REPAIR, SERVICES AND PARKING | | | | | | | 174,260 | | 0.32 | |
| | | | | | | | |
|
|
|
| | | AUTOMOTIVE DEALERS AND SERVICE STATIONS | | | | | | | 53,654 | | 0.10 | |
| | | | | | | | |
|
|
|
| | | BUILDING MATERIALS AND GARDEN SUPPLIES | | | | | | | 10,180 | | 0.02 | |
| | | | | | | | |
|
|
|
| | | BUSINESS SERVICES | | | | | | | | | | |
| * | | CNET Networks, Inc | | | | 21,400 | | | 170,772 | | 0.32 | |
| * | | Heidrick & Struggles International, Inc | | | | 4,700 | | | 159,048 | | 0.30 | |
| * | | Manhattan Associates, Inc | | | | 7,000 | | | 142,030 | | 0.26 | |
| * | | Mantech International Corp (Class A) | | | | 5,375 | | | 165,872 | | 0.31 | |
| * | | Spherion Corp | | | | 18,600 | | | 169,632 | | 0.32 | |
| * | | Vignette Corp | | | | 10,400 | | | 151,632 | | 0.28 | |
| | | Other | | | | | | | 4,885,458 | | 9.12 | |
| | | | | | | | |
|
|
|
| | | | | | | | | | 5,844,444 | | 10.91 | |
| | | | | | | | |
|
|
|
| | | CHEMICALS AND ALLIED PRODUCTS | | | | | | | | | | |
| * | | Pioneer Cos, Inc | | | | 5,237 | | | 142,865 | | 0.27 | |
| * | | United Therapeutics Corp | | | | 2,545 | | | 147,025 | | 0.27 | |
| | | Other | | | | | | | 3,003,521 | | 5.61 | |
| | | | | | | | |
|
|
|
| | | | | | | | | | 3,293,411 | | 6.15 | |
| | | | | | | | |
|
|
|
| | | COAL MINING | | | | | | | | | | |
| | | Penn Virginia Corp | | | | 2,800 | | | 195,664 | | 0.37 | |
| | | Other | | | | | | | 113,717 | | 0.21 | |
| | | | | | | | |
|
|
|
| | | | | | | | | | 309,381 | | 0.58 | |
| | | | | | | | |
|
|
|
| | | COMMUNICATIONS | | | | | | | 1,025,412 | | 1.91 | |
| | | | | | | | |
|
|
|
| | | DEPOSITORY INSTITUTIONS | | | | | | | | | | |
| | | First Niagara Financial Group, Inc | | | | 11,950 | | | 167,539 | | 0.31 | |
| * | | FirstFed Financial Corp | | | | 3,600 | | | 207,612 | | 0.39 | |
| | | Greater Bay Bancorp | | | | 6,655 | | | 191,331 | | 0.36 | |
| | | Hanmi Financial Corp | | | | 7,985 | | | 155,228 | | 0.29 | |
| | | MB Financial, Inc | | | | 4,245 | | | 150,103 | | 0.28 | |
| | | Other | | | | | | | 4,262,893 | | 7.96 | |
| | | | | | | | |
|
|
|
| | | | | | | | | | 5,134,706 | | 9.59 | |
| | | | | | | | |
|
|
|
| | | EATING AND DRINKING PLACES | | | | | | | 1,133,982 | | 2.12 | |
| | | | | | | | |
|
|
|
| | | EDUCATIONAL SERVICES | | | | | | | 297,899 | | 0.56 | |
| | | | | | | | |
|
|
|
| | | | |
| SEE NOTES TO FINANCIAL STATEMENTS | | TIAA-CREF Life Funds 2006 Semiannual Report | | 67 |
| | | | |
| Small-Cap Equity Fund | | Summary portfolio of investments (unaudited) June 30, 2006 | | continued |
| | | | | | | | | | | | |
| | | COMPANY
| | | | SHARES
| | VALUE
| | % OF NET
ASSETS
| |
| | | | | | | | | | | | | |
| | | ELECTRIC, GAS, AND SANITARY SERVICES | | | | | | | | | | |
| | | Nicor, Inc | | | | 6,400 | | $ | 265,600 | | 0.50 | % |
| | | NorthWestern Corp | | | | 4,455 | | | 153,029 | | 0.28 | |
| | | Other | | | | | | | 1,284,784 | | 2.40 | |
| | | | | | | | |
|
|
|
| | | | | | | | | | 1,703,413 | | 3.18 | |
| | | | | | | | |
|
|
|
| | | ELECTRONIC AND OTHER ELECTRIC EQUIPMENT | | | | | | | | | | |
| * | | Arris Group, Inc | | | | 17,500 | | | 229,600 | | 0.43 | |
| * | | Atmel Corp | | | | 25,300 | | | 140,415 | | 0.26 | |
| * | | Ikanos Communications, Inc | | | | 10,950 | | | 166,331 | | 0.31 | |
| * | | Plexus Corp | | | | 6,100 | | | 208,681 | | 0.39 | |
| * | | RF Micro Devices, Inc | | | | 30,100 | | | 179,697 | | 0.33 | |
| * | | Zoran Corp | | | | 8,100 | | | 197,154 | | 0.37 | |
| | | Other | | | | | | | 3,056,930 | | 5.71 | |
| | | | | | | | |
|
|
|
| | | | | | | | | | 4,178,808 | | 7.80 | |
| | | | | | | | |
|
|
|
| | | ENGINEERING AND MANAGEMENT SERVICES | | | | | | | 1,047,425 | | 1.96 | |
| | | | | | | | |
|
|
|
| | | FABRICATED METAL PRODUCTS | | | | | | | 462,415 | | 0.86 | |
| | | | | | | | |
|
|
|
| | | FOOD AND KINDRED PRODUCTS | | | | | | | 484,456 | | 0.90 | |
| | | | | | | | |
|
|
|
| | | FOOD STORES | | | | | | | 134,170 | | 0.25 | |
| | | | | | | | |
|
|
|
| | | FURNITURE AND FIXTURES | | | | | | | 501,021 | | 0.94 | |
| | | | | | | | |
|
|
|
| | | FURNITURE AND HOMEFURNISHINGS STORES | | | | | | | 18,732 | | 0.03 | |
| | | | | | | | |
|
|
|
| | | GENERAL BUILDING CONTRACTORS | | | | | | | 197,032 | | 0.37 | |
| | | | | | | | |
|
|
|
| | | GENERAL MERCHANDISE STORES | | | | | | | 371,223 | | 0.69 | |
| | | | | | | | |
|
|
|
| | | HEALTH SERVICES | | | | | | | 918,773 | | 1.72 | |
| | | | | | | | |
|
|
|
| | | HEAVY CONSTRUCTION, EXCEPT BUILDING | | | | | | | 117,702 | | 0.22 | |
| | | | | | | | |
|
|
|
| | | HOLDING AND OTHER INVESTMENT OFFICES | | | | | | | | | | |
| | | BioMed Realty Trust, Inc | | | | 6,824 | | | 204,311 | | 0.38 | |
| | | Colonial Properties Trust | | | | 4,500 | | | 222,300 | | 0.42 | |
| | | Highwoods Properties, Inc | | | | 4,513 | | | 163,280 | | 0.31 | |
| | | Innkeepers U.S.A. Trust | | | | 9,300 | | | 160,704 | | 0.30 | |
| | | iShares Russell 2000 Index Fund | | | | 14,841 | | | 1,067,068 | | 1.99 | |
| | | Taubman Centers, Inc | | | | 3,700 | | | 151,330 | | 0.28 | |
| | | Other | | | | | | | 2,803,054 | | 5.23 | |
| | | | | | | | |
|
|
|
| | | | | | | | | | 4,772,047 | | 8.91 | |
| | | | | | | | |
|
|
|
| | | HOTELS AND OTHER LODGING PLACES | | | | | | | 115,832 | | 0.22 | |
| | | | | | | | |
|
|
|
| | | INDUSTRIAL MACHINERY AND EQUIPMENT | | | | | | | | | | |
| * | | Advanced Digital Information Corp | | | | 16,007 | | | 188,402 | | 0.35 | |
| * | | AGCO Corp | | | | 5,500 | | | 144,760 | | 0.27 | |
| * | | Emulex Corp | | | | 12,700 | | | 206,629 | | 0.39 | |
| | | Other | | | | | | | 1,736,211 | | 3.24 | |
| | | | | | | | |
|
|
|
| | | | | | | | | | 2,276,002 | | 4.25 | |
| | | | | | | | |
|
|
|
| | | INSTRUMENTS AND RELATED PRODUCTS | | | | | | | | | | |
| * | | Intuitive Surgical, Inc | | | | 1,300 | | | 153,361 | | 0.29 | |
| * | | Kyphon, Inc | | | | 3,899 | | | 149,566 | | 0.28 | |
| * | | Varian, Inc | | | | 4,728 | | | 196,259 | | 0.37 | |
| | | | |
| 68 | | 2006 Semiannual Report TIAA-CREF Life Funds | | SEE NOTES TO FINANCIAL STATEMENTS |
| | | | |
| Small-Cap Equity Fund | | Summary portfolio of investments (unaudited) June 30, 2006 | | continued |
| | | | | | | | | | | | |
| | | COMPANY
| | | | SHARES
| | VALUE
| | % OF NET
ASSETS
| |
| | | | | | | | | | | | | |
| | | INSTRUMENTS AND RELATED PRODUCTS—(continued) | | | | | | | | | | |
| | | Other | | | | | | $ | 2,882,652 | | 5.37 | % |
| | | | | | | | |
|
|
|
| | | | | | | | | | 3,381,838 | | 6.31 | |
| | | | | | | | |
|
|
|
| | | INSURANCE AGENTS, BROKERS AND SERVICE | | | | | | | 44,310 | | 0.08 | |
| | | | | | | | |
|
|
|
| | | INSURANCE CARRIERS | | | | | | | 1,601,262 | | 2.99 | |
| | | | | | | | |
|
|
|
| | | JUSTICE, PUBLIC ORDER AND SAFETY | | | | | | | 84,704 | | 0.16 | |
| | | | | | | | |
|
|
|
| | | LEATHER AND LEATHER PRODUCTS | | | | | | | | | | |
| | | Wolverine World Wide, Inc | | | | 6,400 | | | 149,312 | | 0.28 | |
| | | Other | | | | | | | 126,381 | | 0.23 | |
| | | | | | | | |
|
|
|
| | | | | | | | | | 275,693 | | 0.51 | |
| | | | | | | | |
|
|
|
| | | LEGAL SERVICES | | | | | | | 94,110 | | 0.18 | |
| | | | | | | | |
|
|
|
| | | LUMBER AND WOOD PRODUCTS | | | | | | | | | | |
| * | | Champion Enterprises, Inc | | | | 13,400 | | | 147,936 | | 0.28 | |
| | | Other | | | | | | | 182,346 | | 0.34 | |
| | | | | | | | |
|
|
|
| | | | | | | | | | 330,282 | | 0.62 | |
| | | | | | | | |
|
|
|
| | | METAL MINING | | | | | | | 134,793 | | 0.25 | |
| | | | | | | | |
|
|
|
| | | MISCELLANEOUS MANUFACTURING INDUSTRIES | | | | | | | | | | |
| | | Callaway Golf Co | | | | 11,500 | | | 149,385 | | 0.28 | |
| | | Other | | | | | | | 175,717 | | 0.33 | |
| | | | | | | | |
|
|
|
| | | | | | | | | | 325,102 | | 0.61 | |
| | | | | | | | |
|
|
|
| | | MISCELLANEOUS RETAIL | | | | | | | | | | |
| | | Longs Drug Stores Corp | | | | 3,300 | | | 150,546 | | 0.28 | |
| | | Other | | | | | | | 372,797 | | 0.70 | |
| | | | | | | | |
|
|
|
| | | | | | | | | | 523,343 | | 0.98 | |
| | | | | | | | |
|
|
|
| | | MOTION PICTURES | | | | | | | 66,327 | | 0.12 | |
| | | | | | | | |
|
|
|
| | | NONDEPOSITORY INSTITUTIONS | | | | | | | | | | |
| * | | CompuCredit Corp | | | | 4,919 | | | 189,086 | | 0.36 | |
| | | Other | | | | | | | 526,345 | | 0.98 | |
| | | | | | | | |
|
|
|
| | | | | | | | | | 715,431 | | 1.34 | |
| | | | | | | | |
|
|
|
| | | OIL AND GAS EXTRACTION | | | | | | | | | | |
| * | | Hercules Offshore, Inc | | | | 4,578 | | | 160,230 | | 0.30 | |
| | | Other | | | | | | | 979,131 | | 1.83 | |
| | | | | | | | |
|
|
|
| | | | | | | | | | 1,139,361 | | 2.13 | |
| | | | | | | | |
|
|
|
| | | PAPER AND ALLIED PRODUCTS | | | | | | | 88,743 | | 0.17 | |
| | | | | | | | |
|
|
|
| | | PERSONAL SERVICES | | | | | | | 159,834 | | 0.30 | |
| | | | | | | | |
|
|
|
| | | PETROLEUM AND COAL PRODUCTS | | | | | | | | | | |
| | | Alon USA Energy, Inc | | | | 6,100 | | | 191,967 | | 0.36 | |
| | | Other | | | | | | | 327,024 | | 0.61 | |
| | | | | | | | |
|
|
|
| | | | | | | | | | 518,991 | | 0.97 | |
| | | | | | | | |
|
|
|
| | | PRIMARY METAL INDUSTRIES | | | | | | | 1,070,768 | | 2.00 | |
| | | | | | | | |
|
|
|
| | | PRINTING AND PUBLISHING | | | | | | | 510,393 | | 0.95 | |
| | | | | | | | |
|
|
|
| | | REAL ESTATE | | | | | | | | | | |
| | | Jones Lang LaSalle, Inc | | | | 1,700 | | | 148,835 | | 0.28 | |
| | | | |
| SEE NOTES TO FINANCIAL STATEMENTS | | TIAA-CREF Life Funds 2006 Semiannual Report | | 69 |
| | | | |
| Small-Cap Equity Fund | | Summary portfolio of investments (unaudited) June 30, 2006 | | concluded |
| | | | | | | | | | | | | |
| | | COMPANY
| | | | SHARES
| | VALUE
| | % OF NET
ASSETS
| |
| | | | | | | | | | | | | | |
| | | REAL ESTATE—(continued) | | | | | | | | | | | |
| | | Other | | | | | | | $ | 357,606 | | 0.67 | % |
| | | | | | | | | |
|
|
|
| | | | | | | | | | | 506,441 | | 0.95 | |
| | | | | | | | | |
|
|
|
| | | RUBBER AND MISCELLANEOUS PLASTIC PRODUCTS | | | | | | | | 424,094 | | 0.79 | |
| | | | | | | | | |
|
|
|
| | | SECURITY AND COMMODITY BROKERS | | | | | | | | 525,757 | | 0.98 | |
| | | | | | | | | |
|
|
|
| | | SOCIAL SERVICES | | | | | | | | 130,537 | | 0.24 | |
| | | | | | | | | |
|
|
|
| | | SPECIAL TRADE CONTRACTORS | | | | | | | | | | | |
| * | | EMCOR Group, Inc | | | | | 3,300 | | | 160,611 | | 0.30 | |
| | | Other | | | | | | | | 266,223 | | 0.50 | |
| | | | | | | | | |
|
|
|
| | | | | | | | | | | 426,834 | | 0.80 | |
| | | | | | | | | |
|
|
|
| | | STONE, CLAY, AND GLASS PRODUCTS | | | | | | | | 96,580 | | 0.18 | |
| | | | | | | | | |
|
|
|
| | | TEXTILE MILL PRODUCTS | | | | | | | | 78,820 | | 0.15 | |
| | | | | | | | | |
|
|
|
| | | TOBACCO PRODUCTS | | | | | | | | 37,375 | | 0.07 | |
| | | | | | | | | |
|
|
|
| | | TRANSPORTATION BY AIR | | | | | | | | | | | |
| * | | EGL, Inc | | | | | 4,039 | | | 202,758 | | 0.38 | |
| | | Other | | | | | | | | 452,416 | | 0.84 | |
| | | | | | | | | |
|
|
|
| | | | | | | | | | | 655,174 | | 1.22 | |
| | | | | | | | | |
|
|
|
| | | TRANSPORTATION EQUIPMENT | | | | | | | | 1,027,109 | | 1.92 | |
| | | | | | | | | |
|
|
|
| | | TRANSPORTATION SERVICES | | | | | | | | 190,354 | | 0.36 | |
| | | | | | | | | |
|
|
|
| | | TRUCKING AND WAREHOUSING | | | | | | | | 291,150 | | 0.54 | |
| | | | | | | | | |
|
|
|
| | | WATER TRANSPORTATION | | | | | | | | 51,950 | | 0.10 | |
| | | | | | | | | |
|
|
|
| | | WHOLESALE TRADE-DURABLE GOODS | | | | | | | | | | | |
| | | Reliance Steel & Aluminum Co | | | | | 1,900 | | | 157,605 | | 0.29 | |
| | | Other | | | | | | | | 568,021 | | 1.06 | |
| | | | | | | | | |
|
|
|
| | | | | | | | | | | 725,626 | | 1.35 | |
| | | | | | | | | |
|
|
|
| | | WHOLESALE TRADE-NONDURABLE GOODS | | | | | | | | | | | |
| * | | Performance Food Group Co | | | | | 4,978 | | | 151,232 | | 0.28 | |
| | | Other | �� | | | | | | | 247,656 | | 0.46 | |
| | | | | | | | | |
|
|
|
| | | | | | | | | | | 398,888 | | 0.74 | |
| | | | | | | | | |
|
|
|
| | | TOTAL COMMON STOCKS | | (Cost $51,229,073) | | | 53,277,174 | | 99.49 | |
| | | | | | | | | |
|
|
|
| | | | | |
| | | ISSUER
| | | | PRINCIPAL
| | | | | |
| | | SHORT-TERM INVESTMENTS | | | | | | | | | | | |
| | | U.S. GOVERNMENT AND AGENCIES DISCOUNT NOTES | | | | | | | | | | | |
| | | Federal Home Loan Bank (FHLB) 4.950%, 07/03/06 | | | | $ | 200,000 | | | 200,000 | | 0.37 | |
| | | | | | | | | |
|
|
|
| | | TOTAL SHORT-TERM INVESTMENTS | | (Cost $199,946) | | | 200,000 | | 0.37 | |
| | | | | | | | | |
|
|
|
| | | | |
| | | TOTAL PORTFOLIO | | (Cost $51,429,019) | | | 53,477,174 | | 99.86 | |
| | | OTHER ASSETS & LIABILITIES, NET | | | | | | | | 72,840 | | 0.14 | |
| | | | | | | | | |
|
|
|
| | | | | |
| | | NET ASSETS | | | | | | | $ | 53,550,014 | | 100.00 | % |
| | | | | | | | | |
|
|
|
For ease of presentation, we have grouped a number of industry classification categories together in the Summary portfolio of investments. Note that the Funds use more specific industry categories in following their investment limitations on industry concentration.
| | | | |
| 70 | | 2006 Semiannual Report TIAA-CREF Life Funds | | SEE NOTES TO FINANCIAL STATEMENTS |
| | |
| Stock Index Fund | | Summary portfolio of investments (unaudited) June 30, 2006 |
| | | | | | | | | | | | |
| | | COMPANY
| | | | SHARES
| | VALUE
| | % OF NET
ASSETS
| |
| | | | | | | | | | | | | |
| | | COMMON STOCKS | | | | | | | | | | |
| | | AGRICULTURAL PRODUCTION-CROPS | | | | | | $ | 6,049 | | — | %** |
| | | | | | | | |
|
|
|
| | | AGRICULTURAL PRODUCTION-LIVESTOCK | | | | | | | 16,446 | | 0.01 | |
| | | | | | | | |
|
|
|
| | | AMUSEMENT AND RECREATION SERVICES | | | | | | | 402,948 | | 0.26 | |
| | | | | | | | |
|
|
|
| | | APPAREL AND ACCESSORY STORES | | | | | | | 1,060,779 | | 0.69 | |
| | | | | | | | |
|
|
|
| | | APPAREL AND OTHER TEXTILE PRODUCTS | | | | | | | 288,452 | | 0.19 | |
| | | | | | | | |
|
|
|
| | | AUTO REPAIR, SERVICES AND PARKING | | | | | | | 102,757 | | 0.07 | |
| | | | | | | | |
|
|
|
| | | AUTOMOTIVE DEALERS AND SERVICE STATIONS | | | | | | | 268,559 | | 0.17 | |
| | | | | | | | |
|
|
|
| | | BUILDING MATERIALS AND GARDEN SUPPLIES | | | | | | | | | | |
| | | Home Depot, Inc | | | | 23,041 | | | 824,637 | | 0.53 | |
| | | Other | | | | | | | 642,141 | | 0.42 | |
| | | | | | | | |
|
|
|
| | | | | | | | | | 1,466,778 | | 0.95 | |
| | | | | | | | |
|
|
|
| | | BUSINESS SERVICES | | | | | | | | | | |
| * | | Google, Inc (Class A) | | | | 2,272 | | | 952,718 | | 0.62 | |
| | | Microsoft Corp | | | | 96,509 | | | 2,248,660 | | 1.46 | |
| * | | Oracle Corp | | | | 43,241 | | | 626,562 | | 0.40 | |
| | | Other | | | | | | | 7,100,539 | | 4.60 | |
| | | | | | | | |
|
|
|
| | | | | | | | | | 10,928,479 | | 7.08 | |
| | | | | | | | |
|
|
|
| | | CHEMICALS AND ALLIED PRODUCTS | | | | | | | | | | |
| | | Abbott Laboratories | | | | 16,605 | | | 724,144 | | 0.47 | |
| * | | Amgen, Inc | | | | 12,952 | | | 844,859 | | 0.55 | |
| | | Eli Lilly & Co | | | | 10,697 | | | 591,223 | | 0.38 | |
| | | Merck & Co, Inc | | | | 23,744 | | | 864,994 | | 0.56 | |
| | | Pfizer, Inc | | | | 79,712 | | | 1,870,841 | | 1.21 | |
| | | Procter & Gamble Co | | | | 35,486 | | | 1,973,022 | | 1.28 | |
| | | Wyeth | | | | 14,663 | | | 651,184 | | 0.42 | |
| | | Other | | | | | | | 6,624,927 | | 4.29 | |
| | | | | | | | |
|
|
|
| | | | | | | | | | 14,145,194 | | 9.16 | |
| | | | | | | | |
|
|
|
| | | COAL MINING | | | | | | | 412,288 | | 0.27 | |
| | | | | | | | |
|
|
|
| | | COMMUNICATIONS | | | | | | | | | | |
| | | AT&T, Inc | | | | 42,399 | | | 1,182,508 | | 0.77 | |
| | | BellSouth Corp | | | | 19,825 | | | 717,665 | | 0.46 | |
| * | | Comcast Corp (Class A) | | | | 21,223 | | | 694,841 | | 0.45 | |
| | | Sprint Nextel Corp | | | | 31,530 | | | 630,285 | | 0.41 | |
| | | Verizon Communications, Inc | | | | 31,737 | | | 1,062,872 | | 0.69 | |
| | | Other | | | | | | | 2,952,919 | | 1.91 | |
| | | | | | | | |
|
|
|
| | | | | | | | | | 7,241,090 | | 4.69 | |
| | | | | | | | |
|
|
|
| | | DEPOSITORY INSTITUTIONS | | | | | | | | | | |
| | | Bank of America Corp | | | | 49,647 | | | 2,388,021 | | 1.55 | |
| | | Citigroup, Inc | | | | 54,081 | | | 2,608,867 | | 1.69 | |
| | | JPMorgan Chase & Co | | | | 37,801 | | | 1,587,642 | | 1.03 | |
| | | US Bancorp | | | | 19,364 | | | 597,960 | | 0.39 | |
| | | Wachovia Corp | | | | 17,497 | | | 946,238 | | 0.61 | |
| | | Wells Fargo & Co | | | | 18,276 | | | 1,225,954 | | 0.79 | |
| | | Other | | | | | | | 6,410,586 | | 4.15 | |
| | | | | | | | |
|
|
|
| | | | | | | | | | 15,765,268 | | 10.21 | |
| | | | | | | | |
|
|
|
| | | | |
| SEE NOTES TO FINANCIAL STATEMENTS | | TIAA-CREF Life Funds 2006 Semiannual Report | | 71 |
| | | | |
| Stock Index Fund | | Summary portfolio of investments (unaudited) June 30, 2006 | | continued |
| | | | | | | | | | | | |
| | | COMPANY
| | | | SHARES
| | VALUE
| | % OF NET
ASSETS
| |
| | | | | | | | | | | | | |
| | | EATING AND DRINKING PLACES | | | | | | $ | 1,449,326 | | 0.94 | % |
| | | | | | | | |
|
|
|
| | | EDUCATIONAL SERVICES | | | | | | | 216,578 | | 0.14 | |
| | | | | | | | |
|
|
|
| | | ELECTRIC, GAS, AND SANITARY SERVICES | | | | | | | 6,286,839 | | 4.07 | |
| | | | | | | | |
|
|
|
| | | ELECTRONIC AND OTHER ELECTRIC EQUIPMENT | | | | | | | | | | |
| * | | Cisco Systems, Inc | | | | 66,567 | | | 1,300,053 | | 0.84 | |
| | | Intel Corp | | | | 63,285 | | | 1,199,251 | | 0.78 | |
| | | Qualcomm, Inc | | | | 18,235 | | | 730,676 | | 0.47 | |
| | | Other | | | | | | | 5,924,141 | | 3.84 | |
| | | | | | | | |
|
|
|
| | | | | | | | | | 9,154,121 | | 5.93 | |
| | | | | | | | |
|
|
|
| | | ENGINEERING AND MANAGEMENT SERVICES | | | | | | | 1,253,046 | | 0.81 | |
| | | | | | | | |
|
|
|
| | | ENVIRONMENTAL QUALITY AND HOUSING | | | | | | | 2,505 | | — | ** |
| | | | | | | | |
|
|
|
| | | FABRICATED METAL PRODUCTS | | | | | | | 628,151 | | 0.41 | |
| | | | | | | | |
|
|
|
| | | FOOD AND KINDRED PRODUCTS | | | | | | | | | | |
| | | Coca-Cola Co | | | | 22,170 | | | 953,753 | | 0.62 | |
| | | PepsiCo, Inc | | | | 17,978 | | | 1,079,399 | | 0.70 | |
| | | Other | | | | | | | 2,515,898 | | 1.63 | |
| | | | | | | | |
|
|
|
| | | | | | | | | | 4,549,050 | | 2.95 | |
| | | | | | | | |
|
|
|
| | | FOOD STORES | | | | | | | 411,720 | | 0.27 | |
| | | | | | | | |
|
|
|
| | | FORESTRY | | | | | | | 197,575 | | 0.13 | |
| | | | | | | | |
|
|
|
| | | FURNITURE AND FIXTURES | | | | | | | 523,585 | | 0.34 | |
| | | | | | | | |
|
|
|
| | | FURNITURE AND HOMEFURNISHINGS STORES | | | | | | | 548,423 | | 0.36 | |
| | | | | | | | |
|
|
|
| | | GENERAL BUILDING CONTRACTORS | | | | | | | 550,734 | | 0.36 | |
| | | | | | | | |
|
|
|
| | | GENERAL MERCHANDISE STORES | | | | | | | | | | |
| | | Wal-Mart Stores, Inc | | | | 26,748 | | | 1,288,451 | | 0.83 | |
| | | Other | | | | | | | 1,480,080 | | 0.96 | |
| | | | | | | | |
|
|
|
| | | | | | | | | | 2,768,531 | | 1.79 | |
| | | | | | | | |
|
|
|
| | | HEALTH SERVICES | | | | | | | 2,483,461 | | 1.61 | |
| | | | | | | | |
|
|
|
| | | HEAVY CONSTRUCTION, EXCEPT BUILDING | | | | | | | 23,155 | | 0.01 | |
| | | | | | | | |
|
|
|
| | | HOLDING AND OTHER INVESTMENT OFFICES | | | | | | | 4,134,651 | | 2.68 | |
| | | | | | | | |
|
|
|
| | | HOTELS AND OTHER LODGING PLACES | | | | | | | 786,893 | | 0.51 | |
| | | | | | | | |
|
|
|
| | | INDUSTRIAL MACHINERY AND EQUIPMENT | | | | | | | | | | |
| | | 3M Co | | | | 8,203 | | | 662,556 | | 0.43 | |
| * | | Dell, Inc | | | | 25,116 | | | 613,082 | | 0.40 | |
| | | Hewlett-Packard Co | | | | 30,652 | | | 971,055 | | 0.63 | |
| | | International Business Machines Corp | | | | 16,866 | | | 1,295,646 | | 0.84 | |
| | | Other | | | | | | | 4,688,597 | | 3.03 | |
| | | | | | | | |
|
|
|
| | | | | | | | | | 8,230,936 | | 5.33 | |
| | | | | | | | |
|
|
|
| | | INSTRUMENTS AND RELATED PRODUCTS | | | | | | | | | | |
| | | Johnson & Johnson | | | | 32,212 | | | 1,930,143 | | 1.25 | |
| | | Medtronic, Inc | | | | 13,132 | | | 616,153 | | 0.40 | |
| | | Other | | | | | | | 3,750,059 | | 2.43 | |
| | | | | | | | |
|
|
|
| | | | | | | | | | 6,296,355 | | 4.08 | |
| | | | | | | | |
|
|
|
| | | INSURANCE AGENTS, BROKERS AND SERVICE | | | | | | | 666,976 | | 0.43 | |
| | | | | | | | |
|
|
|
| | | | |
| 72 | | 2006 Semiannual Report TIAA-CREF Life Funds | | SEE NOTES TO FINANCIAL STATEMENTS |
| | | | |
| Stock Index Fund | | Summary portfolio of investments (unaudited) June 30, 2006 | | continued |
| | | | | | | | | | | | |
| | | COMPANY
| | | | SHARES
| | VALUE
| | % OF NET
ASSETS
| |
| | | | | | | | | | | | | |
| | | INSURANCE CARRIERS | | | | | | | | | | |
| | | American International Group, Inc | | | | 23,963 | | $ | 1,415,015 | | 0.92 | % |
| | | UnitedHealth Group, Inc | | | | 14,654 | | | 656,206 | | 0.43 | |
| | | Other | | | | | | | 4,929,870 | | 3.19 | |
| | | | | | | | |
|
|
|
| | | | | | | | | | 7,001,091 | | 4.54 | |
| | | | | | | | |
|
|
|
| | | JUSTICE, PUBLIC ORDER AND SAFETY | | | | | | | 25,052 | | 0.02 | |
| | | | | | | | |
|
|
|
| | | LEATHER AND LEATHER PRODUCTS | | | | | | | 177,714 | | 0.12 | |
| | | | | | | | |
|
|
|
| | | LEGAL SERVICES | | | | | | | 17,413 | | 0.01 | |
| | | | | | | | |
|
|
|
| | | LOCAL AND INTERURBAN PASSENGER TRANSIT | | | | | | | 27,821 | | 0.02 | |
| | | | | | | | |
|
|
|
| | | LUMBER AND WOOD PRODUCTS | | | | | | | 58,871 | | 0.04 | |
| | | | | | | | |
|
|
|
| | | METAL MINING | | | | | | | 598,563 | | 0.39 | |
| | | | | | | | |
|
|
|
| | | MISCELLANEOUS MANUFACTURING INDUSTRIES | | | | | | | 309,536 | | 0.20 | |
| | | | | | | | |
|
|
|
| | | MISCELLANEOUS RETAIL | | | | | | | 1,850,274 | | 1.20 | |
| | | | | | | | |
|
|
|
| | | MOTION PICTURES | | | | | | | | | | |
| | | Time Warner, Inc | | | | 45,887 | | | 793,845 | | 0.52 | |
| | | Walt Disney Co | | | | 23,808 | | | 714,240 | | 0.46 | |
| | | Other | | | | | | | 605,623 | | 0.39 | |
| | | | | | | | |
|
|
|
| | | | | | | | | | 2,113,708 | | 1.37 | |
| | | | | | | | |
|
|
|
| | | NONDEPOSITORY INSTITUTIONS | | | | | | | | | | |
| | | American Express Co | | | | 11,771 | | | 626,453 | | 0.40 | |
| | | Other | | | | | | | 2,081,962 | | 1.35 | |
| | | | | | | | |
|
|
|
| | | | | | | | | | 2,708,415 | | 1.75 | |
| | | | | | | | |
|
|
|
| | | NONMETALLIC MINERALS, EXCEPT FUELS | | | | | | | 123,454 | | 0.08 | |
| | | | | | | | |
|
|
|
| | | OIL AND GAS EXTRACTION | | | | | | | 3,723,066 | | 2.41 | |
| | | | | | | | |
|
|
|
| | | PAPER AND ALLIED PRODUCTS | | | | | | | 803,119 | | 0.52 | |
| | | | | | | | |
|
|
|
| | | PERSONAL SERVICES | | | | | | | 248,391 | | 0.16 | |
| | | | | | | | |
|
|
|
| | | PETROLEUM AND COAL PRODUCTS | | | | | | | | | | |
| | | Chevron Corp | | | | 24,113 | | | 1,496,453 | | 0.97 | |
| | | ConocoPhillips | | | | 17,956 | | | 1,176,657 | | 0.76 | |
| | | Exxon Mobil Corp | | | | 65,820 | | | 4,038,057 | | 2.61 | |
| | | Other | | | | | | | 2,172,513 | | 1.41 | |
| | | | | | | | |
|
|
|
| | | | | | | | | | 8,883,680 | | 5.75 | |
| | | | | | | | |
|
|
|
| | | PRIMARY METAL INDUSTRIES | | | | | | | 1,612,239 | | 1.04 | |
| | | | | | | | |
|
|
|
| | | PRINTING AND PUBLISHING | | | | | | | 979,908 | | 0.63 | |
| | | | | | | | |
|
|
|
| | | RAILROAD TRANSPORTATION | | | | | | | 1,053,041 | | 0.68 | |
| | | | | | | | |
|
|
|
| | | REAL ESTATE | | | | | | | 190,426 | | 0.12 | |
| | | | | | | | |
|
|
|
| | | RUBBER AND MISCELLANEOUS PLASTIC PRODUCTS | | | | | | | 236,963 | | 0.15 | |
| | | | | | | | |
|
|
|
| | | SECURITY AND COMMODITY BROKERS | | | | | | | | | | |
| | | Goldman Sachs Group, Inc | | | | 4,166 | | | 626,691 | | 0.40 | |
| | | Merrill Lynch & Co, Inc | | | | 10,069 | | | 700,400 | | 0.45 | |
| | | Morgan Stanley | | | | 11,652 | | | 736,523 | | 0.48 | |
| | | Other | | | | | | | 2,310,406 | | 1.50 | |
| | | | | | | | |
|
|
|
| | | | | | | | | | 4,374,020 | | 2.83 | |
| | | | | | | | |
|
|
|
| | | | |
| SEE NOTES TO FINANCIAL STATEMENTS | | TIAA-CREF Life Funds 2006 Semiannual Report | | 73 |
| | | | |
| Stock Index Fund | | Summary portfolio of investments (unaudited) June 30, 2006 | | concluded |
| | | | | | | | | | | | |
| | | COMPANY
| | | | SHARES
| | VALUE
| | % OF NET
ASSETS
| |
| | | | | | | | | | | | | |
| | | SOCIAL SERVICES | | | | | | $ | 20,870 | | 0.01 | % |
| | | | | | | | |
|
|
|
| | | SPECIAL TRADE CONTRACTORS | | | | | | | 95,976 | | 0.06 | |
| | | | | | | | |
|
|
|
| | | STONE, CLAY, AND GLASS PRODUCTS | | | | | | | 134,884 | | 0.09 | |
| | | | | | | | |
|
|
|
| | | TEXTILE MILL PRODUCTS | | | | | | | 10,708 | | 0.01 | |
| | | | | | | | |
|
|
|
| | | TOBACCO PRODUCTS | | | | | | | | | | |
| | | Altria Group, Inc | | | | 22,717 | | | 1,668,109 | | 1.08 | |
| | | Other | | | | | | | 148,360 | | 0.10 | |
| | | | | | | | |
|
|
|
| | | | | | | | | | 1,816,469 | | 1.18 | |
| | | | | | | | |
|
|
|
| | | TRANSPORTATION BY AIR | | | | | | | 818,185 | | 0.53 | |
| | | | | | | | |
|
|
|
| | | TRANSPORTATION EQUIPMENT | | | | | | | | | | |
| | | Boeing Co | | | | 8,698 | | | 712,453 | | 0.46 | |
| | | United Technologies Corp | | | | 10,997 | | | 697,430 | | 0.45 | |
| | | Other | | | | | | | 2,629,098 | | 1.71 | |
| | | | | | | | |
|
|
|
| | | | | | | | | | 4,038,981 | | 2.62 | |
| | | | | | | | |
|
|
|
| | | TRANSPORTATION SERVICES | | | | | | | 343,022 | | 0.22 | |
| | | | | | | | |
|
|
|
| | | TRUCKING AND WAREHOUSING | | | | | | | | | | |
| | | United Parcel Service, Inc (Class B) | | | | 6,896 | | | 567,748 | | 0.37 | |
| | | Other | | | | | | | 228,308 | | 0.15 | |
| | | | | | | | |
|
|
|
| | | | | | | | | | 796,056 | | 0.52 | |
| | | | | | | | |
|
|
|
| | | WATER TRANSPORTATION | | | | | | | 97,617 | | 0.06 | |
| | | | | | | | |
|
|
|
| | | WHOLESALE TRADE-DURABLE GOODS | | | | | | | | | | |
| | | General Electric Co | | | | 113,124 | | | 3,728,567 | | 2.41 | |
| | | Other | | | | | | | 647,639 | | 0.42 | |
| | | | | | | | |
|
|
|
| | | | | | | | | | 4,376,206 | | 2.83 | |
| | | | | | | | |
|
|
|
| | | WHOLESALE TRADE-NONDURABLE GOODS | | | | | | | 1,211,905 | | 0.79 | |
| | | | | | | | |
|
|
|
| | | TOTAL COMMON STOCKS | | (Cost $145,349,542) | | | 154,145,342 | | 99.85 | |
| | | | | | | | |
|
|
|
| | | SHORT-TERM INVESTMENTS | | | | | | | | | | |
| † | | U.S. GOVERNMENT AND AGENCIES DISCOUNT NOTES | | | | | | | 150,000 | | 0.10 | |
| | | | | | | | |
|
|
|
| | | TOTAL SHORT-TERM INVESTMENTS | | (Cost $149,960) | | | | | 150,000 | | 0.10 | |
| | | | | | | | |
|
|
|
| | | | |
| | | TOTAL PORTFOLIO | | (Cost $145,499,502) | | | 154,295,342 | | 99.95 | |
| | | OTHER ASSETS & LIABILITIES, NET | | | | | | | 84,083 | | 0.05 | |
| | | | | | | | |
|
|
|
| | | | | |
| | | NET ASSETS | | | | | | $ | 154,379,425 | | 100.00 | % |
| | | | | | | | |
|
|
|
| ** | Percentage represents less than 0.01%. |
| † | Notes have rate of 4.950% and mature on 7/03/06. |
For ease of presentation, we have grouped a number of industry classification categories together in the Summary portfolio of investments. Note that the Funds use more specific industry categories in following their investment limitations on industry concentration.
| | | | |
| 74 | | 2006 Semiannual Report TIAA-CREF Life Funds | | SEE NOTES TO FINANCIAL STATEMENTS |
| | |
| Social Choice Equity Fund | | Summary portfolio of investments (unaudited) June 30, 2006 |
| | | | | | | | | | | | |
| | | COMPANY
| | | | SHARES
| | VALUE
| | % OF NET
ASSETS
| |
| | | | | | | | | | | | | |
| | | COMMON STOCKS | | | | | | | | | | |
| | | AGRICULTURAL PRODUCTION-CROPS | | | | | | $ | 3,528 | | 0.01 | % |
| | | | | | | | |
|
|
|
| | | APPAREL AND ACCESSORY STORES | | | | | | | 256,152 | | 0.78 | |
| | | | | | | | |
|
|
|
| | | APPAREL AND OTHER TEXTILE PRODUCTS | | | | | | | 26,056 | | 0.08 | |
| | | | | | | | |
|
|
|
| | | AUTO REPAIR, SERVICES AND PARKING | | | | | | | 11,081 | | 0.03 | |
| | | | | | | | |
|
|
|
| | | AUTOMOTIVE DEALERS AND SERVICE STATIONS | | | | | | | 25,725 | | 0.08 | |
| | | | | | | | |
|
|
|
| | | BUILDING MATERIALS AND GARDEN SUPPLIES | | | | | | | | | | |
| | | Home Depot, Inc | | | | 7,028 | | | 251,532 | | 0.77 | |
| | | Other | | | | | | | 145,608 | | 0.45 | |
| | | | | | | | |
|
|
|
| | | | | | | | | | 397,140 | | 1.22 | |
| | | | | | | | |
|
|
|
| | | BUSINESS SERVICES | | | | | | | | | | |
| * | | Google, Inc (Class A) | | | | 396 | | | 166,055 | | 0.51 | |
| | | Microsoft Corp | | | | 25,950 | | | 604,635 | | 1.85 | |
| | | Other | | | | | | | 1,162,429 | | 3.55 | |
| | | | | | | | |
|
|
|
| | | | | | | | | | 1,933,119 | | 5.91 | |
| | | | | | | | |
|
|
|
| | | CHEMICALS AND ALLIED PRODUCTS | | | | | | | | | | |
| | | Abbott Laboratories | | | | 5,406 | | | 235,756 | | 0.72 | |
| * | | Amgen, Inc | | | | 4,111 | | | 268,161 | | 0.82 | |
| | | Bristol-Myers Squibb Co | | | | 6,909 | | | 178,667 | | 0.55 | |
| | | Merck & Co, Inc | | | | 9,294 | | | 338,580 | | 1.03 | |
| | | Procter & Gamble Co | | | | 10,756 | | | 598,033 | | 1.83 | |
| | | Other | | | | | | | 1,593,381 | | 4.87 | |
| | | | | | | | |
|
|
|
| | | | | | | | | | 3,212,578 | | 9.82 | |
| | | | | | | | |
|
|
|
| | | COMMUNICATIONS | | | | | | | | | | |
| | | AT&T, Inc | | | | 12,911 | | | 360,088 | | 1.10 | |
| | | BellSouth Corp | | | | 6,300 | | | 228,060 | | 0.70 | |
| | | Sprint Nextel Corp | | | | 8,184 | | | 163,598 | | 0.50 | |
| | | Verizon Communications, Inc | | | | 10,976 | | | 367,586 | | 1.12 | |
| | | Other | | | | | | | 571,017 | | 1.75 | |
| | | | | | | | |
|
|
|
| | | | | | | | | | 1,690,349 | | 5.17 | |
| | | | | | | | |
|
|
|
| | | DEPOSITORY INSTITUTIONS | | | | | | | | | | |
| | | Bank of America Corp | | | | 13,050 | | | 627,705 | | 1.92 | |
| | | SunTrust Banks, Inc | | | | 2,000 | | | 152,520 | | 0.47 | |
| | | US Bancorp | | | | 9,300 | | | 287,184 | | 0.88 | |
| | | Wachovia Corp | | | | 6,500 | | | 351,520 | | 1.07 | |
| | | Washington Mutual, Inc | | | | 5,290 | | | 241,118 | | 0.74 | |
| | | Wells Fargo & Co | | | | 6,200 | | | 415,896 | | 1.27 | |
| | | Other | | | | | | | 1,338,828 | | 4.09 | |
| | | | | | | | |
|
|
|
| | | | | | | | | | 3,414,771 | | 10.44 | |
| | | | | | | | |
|
|
|
| | | EATING AND DRINKING PLACES | | | | | | | | | | |
| | | McDonald’s Corp | | | | 7,066 | | | 237,418 | | 0.72 | |
| | | Other | | | | | | | 185,455 | | 0.57 | |
| | | | | | | | |
|
|
|
| | | | | | | | | | 422,873 | | 1.29 | |
| | | | | | | | |
|
|
|
| | | | |
| SEE NOTES TO FINANCIAL STATEMENTS | | TIAA-CREF Life Funds 2006 Semiannual Report | | 75 |
| | | | |
| Social Choice Equity Fund | | Summary portfolio of investments (unaudited) June 30, 2006 | | continued |
| | | | | | | | | | | | |
| | | COMPANY
| | | | SHARES
| | VALUE
| | % OF NET
ASSETS
| |
| | | | | | | | | | | | | |
| | | ELECTRIC, GAS, AND SANITARY SERVICES | | | | | | | | | | |
| | | Kinder Morgan, Inc | | | | 1,615 | | $ | 161,322 | | 0.49 | % |
| | | Other | | | | | | | 1,732,877 | | 5.30 | |
| | | | | | | | |
|
|
|
| | | | | | | | | | 1,894,199 | | 5.79 | |
| | | | | | | | |
|
|
|
| | | ELECTRONIC AND OTHER ELECTRIC EQUIPMENT | | | | | | | | | | |
| * | | Cisco Systems, Inc | | | | 17,600 | | | 343,728 | | 1.05 | |
| | | Emerson Electric Co | | | | 3,178 | | | 266,348 | | 0.82 | |
| | | Intel Corp | | | | 19,509 | | | 369,696 | | 1.13 | |
| | | Motorola, Inc | | | | 7,700 | | | 155,155 | | 0.48 | |
| | | Qualcomm, Inc | | | | 5,000 | | | 200,350 | | 0.61 | |
| | | Other | | | | | | | 654,923 | | 2.00 | |
| | | | | | | | |
|
|
|
| | | | | | | | | | 1,990,200 | | 6.09 | |
| | | | | | | | |
|
|
|
| | | ENGINEERING AND MANAGEMENT SERVICES | | | | | | | 283,546 | | 0.87 | |
| | | | | | | | |
|
|
|
| | | FABRICATED METAL PRODUCTS | | | | | | | | | | |
| | | Illinois Tool Works, Inc | | | | 3,802 | | | 180,595 | | 0.55 | |
| | | Other | | | | | | | 53,973 | | 0.17 | |
| | | | | | | | |
|
|
|
| | | | | | | | | | 234,568 | | 0.72 | |
| | | | | | | | |
|
|
|
| | | FOOD AND KINDRED PRODUCTS | | | | | | | | | | |
| | | PepsiCo, Inc | | | | 6,221 | | | 373,509 | | 1.14 | |
| | | Other | | | | | | | 487,445 | | 1.49 | |
| | | | | | | | |
|
|
|
| | | | | | | | | | 860,954 | | 2.63 | |
| | | | | | | | |
|
|
|
| | | FOOD STORES | | | | | | | 100,815 | | 0.31 | |
| | | | | | | | |
|
|
|
| | | FORESTRY | | | | | | | 35,794 | | 0.11 | |
| | | | | | | | |
|
|
|
| | | FURNITURE AND FIXTURES | | | | | | | 226,534 | | 0.69 | |
| | | | | | | | |
|
|
|
| | | FURNITURE AND HOMEFURNISHINGS STORES | | | | | | | 110,324 | | 0.34 | |
| | | | | | | | |
|
|
|
| | | GENERAL BUILDING CONTRACTORS | | | | | | | 137,872 | | 0.42 | |
| | | | | | | | |
|
|
|
| | | GENERAL MERCHANDISE STORES | | | | | | | | | | |
| | | Target Corp | | | | 3,400 | | | 166,158 | | 0.51 | |
| | | Other | | | | | | | 268,612 | | 0.82 | |
| | | | | | | | |
|
|
|
| | | | | | | | | | 434,770 | | 1.33 | |
| | | | | | | | |
|
|
|
| | | HEALTH SERVICES | | | | | | | | | | |
| * | | WellPoint, Inc | | | | 2,112 | | | 153,690 | | 0.47 | |
| | | Other | | | | | | | 241,995 | | 0.74 | |
| | | | | | | | |
|
|
|
| | | | | | | | | | 395,685 | | 1.21 | |
| | | | | | | | |
|
|
|
| | | HOLDING AND OTHER INVESTMENT OFFICES | | | | | | | 877,557 | | 2.68 | |
| | | | | | | | |
|
|
|
| | | HOTELS AND OTHER LODGING PLACES | | | | | | | 114,015 | | 0.35 | |
| | | | | | | | |
|
|
|
| | | INDUSTRIAL MACHINERY AND EQUIPMENT | | | | | | | | | | |
| | | 3M Co | | | | 4,066 | | | 328,411 | | 1.00 | |
| * | | Dell, Inc | | | | 6,700 | | | 163,547 | | 0.50 | |
| | | Hewlett-Packard Co | | | | 8,619 | | | 273,050 | | 0.84 | |
| | | International Business Machines Corp | | | | 5,600 | | | 430,192 | | 1.32 | |
| | | Other | | | | | | | 866,941 | | 2.65 | |
| | | | | | | | |
|
|
|
| | | | | | | | | | 2,062,141 | | 6.31 | |
| | | | | | | | |
|
|
|
| | | | |
| 76 | | 2006 Semiannual Report TIAA-CREF Life Funds | | SEE NOTES TO FINANCIAL STATEMENTS |
| | | | |
| Social Choice Equity Fund | | Summary portfolio of investments (unaudited) June 30, 2006 | | continued |
| | | | | | | | | | | | |
| | | COMPANY
| | | | SHARES
| | VALUE
| | % OF NET
ASSETS
| |
| | | | | | | | | | | | | |
| | | INSTRUMENTS AND RELATED PRODUCTS | | | | | | | | | | |
| | | Johnson & Johnson | | | | 11,036 | | $ | 661,277 | | 2.02 | % |
| | | Medtronic, Inc | | | | 4,566 | | | 214,237 | | 0.66 | |
| | | Other | | | | | | | 787,577 | | 2.41 | |
| | | | | | | | |
|
|
|
| | | | | | | | | | 1,663,091 | | 5.09 | |
| | | | | | | | |
|
|
|
| | | INSURANCE AGENTS, BROKERS AND SERVICE | | | | | | | 165,068 | | 0.51 | |
| | | | | | | | |
|
|
|
| | | INSURANCE CARRIERS | | | | | | | | | | |
| | | Prudential Financial, Inc | | | | 2,550 | | | 198,135 | | 0.61 | |
| | | St. Paul Travelers Cos, Inc | | | | 3,716 | | | 165,659 | | 0.51 | |
| | | Other | | | | | | | 1,135,530 | | 3.47 | |
| | | | | | | | |
|
|
|
| | | | | | | | | | 1,499,324 | | 4.59 | |
| | | | | | | | |
|
|
|
| | | LEATHER AND LEATHER PRODUCTS | | | | | | | 27,030 | | 0.08 | |
| | | | | | | | |
|
|
|
| | | LUMBER AND WOOD PRODUCTS | | | | | | | 4,416 | | 0.01 | |
| | | | | | | | |
|
|
|
| | | METAL MINING | | | | | | | 27,820 | | 0.09 | |
| | | | | | | | |
|
|
|
| | | MISCELLANEOUS MANUFACTURING INDUSTRIES | | | | | | | 42,578 | | 0.13 | |
| | | | | | | | |
|
|
|
| | | MISCELLANEOUS RETAIL | | | | | | | | | | |
| | | Walgreen Co | | | | 3,700 | | | 165,908 | | 0.51 | |
| | | Other | | | | | | | 268,609 | | 0.82 | |
| | | | | | | | |
|
|
|
| | | | | | | | | | 434,517 | | 1.33 | |
| | | | | | | | |
|
|
|
| | | MOTION PICTURES | | | | | | | | | | |
| | | Time Warner, Inc | | | | 18,864 | | | 326,347 | | 1.00 | |
| | | Walt Disney Co | | | | 8,927 | | | 267,810 | | 0.82 | |
| | | Other | | | | | | | 23,668 | | 0.07 | |
| | | | | | | | |
|
|
|
| | | | | | | | | | 617,825 | | 1.89 | |
| | | | | | | | |
|
|
|
| | | NONDEPOSITORY INSTITUTIONS | | | | | | | | | | |
| | | American Express Co | | | | 5,653 | | | 300,853 | | 0.92 | |
| | | Freddie Mac | | | | 3,400 | | | 193,834 | | 0.59 | |
| | | Other | | | | | | | 500,205 | | 1.53 | |
| | | | | | | | |
|
|
|
| | | | | | | | | | 994,892 | | 3.04 | |
| | | | | | | | |
|
|
|
| | | NONMETALLIC MINERALS, EXCEPT FUELS | | | | | | | 88,249 | | 0.27 | |
| | | | | | | | |
|
|
|
| | | OIL AND GAS EXTRACTION | | | | | | | | | | |
| | | Anadarko Petroleum Corp | | | | 4,212 | | | 200,870 | | 0.62 | |
| | | Apache Corp | | | | 2,702 | | | 184,412 | | 0.56 | |
| | | Devon Energy Corp | | | | 2,934 | | | 177,243 | | 0.54 | |
| | | Other | | | | | | | 1,057,565 | | 3.23 | |
| | | | | | | | |
|
|
|
| | | | | | | | | | 1,620,090 | | 4.95 | |
| | | | | | | | |
|
|
|
| | | PAPER AND ALLIED PRODUCTS | | | | | | | 315,374 | | 0.97 | |
| | | | | | | | |
|
|
|
| | | PETROLEUM AND COAL PRODUCTS | | | | | | | | | | |
| | | Valero Energy Corp | | | | 2,400 | | | 159,648 | | 0.49 | |
| | | Other | | | | | | | 325,044 | | 0.99 | |
| | | | | | | | |
|
|
|
| | | | | | | | | | 484,692 | | 1.48 | |
| | | | | | | | |
|
|
|
| | | PRIMARY METAL INDUSTRIES | | | | | | | 470,440 | | 1.44 | |
| | | | | | | | |
|
|
|
| | | PRINTING AND PUBLISHING | | | | | | | 306,750 | | 0.94 | |
| | | | | | | | |
|
|
|
| | | | |
| SEE NOTES TO FINANCIAL STATEMENTS | | TIAA-CREF Life Funds 2006 Semiannual Report | | 77 |
| | | | |
| Social Choice Equity Fund | | Summary portfolio of investments (unaudited) June 30, 2006 | | concluded |
| | | | | | | | | | | | |
| | | COMPANY
| | | | SHARES
| | VALUE
| | % OF NET
ASSETS
| |
| | | | | | | | | | | | | |
| | | RAILROAD TRANSPORTATION | | | | | | | | | | |
| | | Norfolk Southern Corp | | | | 3,185 | | $ | 169,506 | | 0.52 | % |
| | | Other | | | | | | | 77,034 | | 0.23 | |
| | | | | | | | |
|
|
|
| | | | | | | | | | 246,540 | | 0.75 | |
| | | | | | | | |
|
|
|
| | | REAL ESTATE | | | | | | | 12,527 | | 0.04 | |
| | | | | | | | |
|
|
|
| | | RUBBER AND MISCELLANEOUS PLASTIC PRODUCTS | | | | | | | 11,082 | | 0.03 | |
| | | | | | | | |
|
|
|
| | | SECURITY AND COMMODITY BROKERS | | | | | | | | | | |
| | | Goldman Sachs Group, Inc | | | | 1,610 | | | 242,192 | | 0.74 | |
| | | Merrill Lynch & Co, Inc | | | | 4,336 | | | 301,612 | | 0.92 | |
| | | Other | | | | | | | 471,946 | | 1.45 | |
| | | | | | | | |
|
|
|
| | | | | | | | | | 1,015,750 | | 3.11 | |
| | | | | | | | |
|
|
|
| | | SOCIAL SERVICES | | | | | | | 2,560 | | 0.01 | |
| | | | | | | | |
|
|
|
| | | SPECIAL TRADE CONTRACTORS | | | | | | | 13,067 | | 0.04 | |
| | | | | | | | |
|
|
|
| | | STONE, CLAY, AND GLASS PRODUCTS | | | | | | | 18,550 | | 0.06 | |
| | | | | | | | |
|
|
|
| | | TEXTILE MILL PRODUCTS | | | | | | | 7,882 | | 0.02 | |
| | | | | | | | |
|
|
|
| | | TRANSPORTATION BY AIR | | | | | | | 233,201 | | 0.71 | |
| | | | | | | | |
|
|
|
| | | TRANSPORTATION EQUIPMENT | | | | | | | 353,494 | | 1.08 | |
| | | | | | | | |
|
|
|
| | | TRANSPORTATION SERVICES | | | | | | | 17,047 | | 0.05 | |
| | | | | | | | |
|
|
|
| | | TRUCKING AND WAREHOUSING | | | | | | | | | | |
| | | United Parcel Service, Inc (Class B) | | | | 3,044 | | | 250,613 | | 0.77 | |
| | | | | | | | |
|
|
|
| | | | | | | | | | 250,613 | | 0.77 | |
| | | | | | | | |
|
|
|
| | | WATER TRANSPORTATION | | | | | | | 20,988 | | 0.06 | |
| | | | | | | | |
|
|
|
| | | WHOLESALE TRADE-DURABLE GOODS | | | | | | | 202,879 | | 0.62 | |
| | | | | | | | |
|
|
|
| | | WHOLESALE TRADE-NONDURABLE GOODS | | | | | | | 255,069 | | 0.78 | |
| | | | | | | | |
|
|
|
| | | TOTAL COMMON STOCKS | | (Cost $32,087,367) | | | 32,575,751 | | 99.62 | |
| | | | | | | | |
|
|
|
| | | | |
| | | TOTAL PORTFOLIO | | (Cost $32,087,367) | | | 32,575,751 | | 99.62 | |
| | | OTHER ASSETS & LIABILITIES, NET | | | | | | | 124,785 | | 0.38 | |
| | | | | | | | |
|
|
|
| | | | | |
| | | NET ASSETS | | | | | | $ | 32,700,536 | | 100.00 | % |
| | | | | | | | |
|
|
|
For ease of presentation, we have grouped a number of industry classification categories together in the Summary portfolio of investments. Note that the Funds use more specific industry categories in following their investment limitations on industry concentration.
| | | | |
| 78 | | 2006 Semiannual Report TIAA-CREF Life Funds | | SEE NOTES TO FINANCIAL STATEMENTS |
| | |
| Real Estate Securities Fund | | Summary portfolio of investments (unaudited) June 30, 2006 |
| | | | | | | | | | | | |
| | | COMPANY
| | | | SHARES
| | VALUE
| | % OF NET
ASSETS
| |
| | | | | | | | | | | | | |
| | | COMMON STOCKS | | | | | | | | | | |
| | | HOLDING AND OTHER INVESTMENT OFFICES | | | | | | | | | | |
| | | Alexandria Real Estate Equities, Inc | | | | 9,280 | | $ | 822,950 | | 1.01 | % |
| | | AMB Property Corp | | | | 14,400 | | | 727,920 | | 0.89 | |
| | | Apartment Investment & Management Co (Class A) | | | | 11,500 | | | 499,675 | | 0.61 | |
| | | Archstone-Smith Trust | | | | 50,500 | | | 2,568,935 | | 3.15 | |
| | | AvalonBay Communities, Inc | | | | 17,000 | | | 1,880,540 | | 2.30 | |
| | | BioMed Realty Trust, Inc | | | | 52,000 | | | 1,556,880 | | 1.91 | |
| | | Boston Properties, Inc | | | | 45,500 | | | 4,113,200 | | 5.04 | |
| | | BRE Properties, Inc (Class A) | | | | 13,500 | | | 742,500 | | 0.91 | |
| | | CBL & Associates Properties, Inc | | | | 14,900 | | | 580,057 | | 0.71 | |
| | | Cogdell Spencer, Inc | | | | 68,177 | | | 1,330,133 | | 1.63 | |
| | | Corporate Office Properties Trust | | | | 50,750 | | | 2,135,560 | | 2.62 | |
| | | Developers Diversified Realty Corp | | | | 19,000 | | | 991,420 | | 1.22 | |
| | | EastGroup Properties, Inc | | | | 20,375 | | | 951,105 | | 1.17 | |
| | | Education Realty Trust, Inc | | | | 64,900 | | | 1,080,585 | | 1.32 | |
| | | Equity Office Properties Trust | | | | 43,560 | | | 1,590,376 | | 1.95 | |
| | | Equity Residential | | | | 83,600 | | | 3,739,428 | | 4.58 | |
| | | Essex Property Trust, Inc | | | | 7,000 | | | 781,620 | | 0.96 | |
| | | Extra Space Storage, Inc | | | | 60,000 | | | 974,400 | | 1.19 | |
| | | Federal Realty Investment Trust | | | | 18,000 | | | 1,260,000 | | 1.54 | |
| | | Feldman Mall Properties, Inc | | | | 56,000 | | | 613,760 | | 0.75 | |
| | | First Potomac Realty Trust | | | | 23,000 | | | 685,170 | | 0.84 | |
| | | General Growth Properties, Inc | | | | 46,000 | | | 2,072,760 | | 2.54 | |
| | | Glenborough Realty Trust, Inc | | | | 44,000 | | | 947,760 | | 1.16 | |
| f,v* | | GSC Capital Corp | | | | 20,000 | | | 500,000 | | 0.61 | |
| | | Hersha Hospitality Trust | | | | 55,607 | | | 516,589 | | 0.63 | |
| | | Highwoods Properties, Inc | | | | 20,000 | | | 723,600 | | 0.89 | |
| | | Host Marriott Corp | | | | 98,404 | | | 2,152,095 | | 2.64 | |
| | | iShares Cohen & Steers Realty Majors Index Fund | | | | 30,123 | | | 2,522,500 | | 3.09 | |
| | | iShares Dow Jones US Real Estate Index Fund | | | | 30,918 | | | 2,202,908 | | 2.70 | |
| | | Kilroy Realty Corp | | | | 20,400 | | | 1,473,900 | | 1.81 | |
| | | Kimco Realty Corp | | | | 53,300 | | | 1,944,917 | | 2.38 | |
| | | Macerich Co | | | | 31,000 | | | 2,176,200 | | 2.67 | |
| | | Medical Properties Trust, Inc | | | | 45,000 | | | 496,800 | | 0.61 | |
| | | Mission West Properties, Inc | | | | 35,500 | | | 393,340 | | 0.48 | |
| | | Monmouth REIT (Class A) | | | | 64,529 | | | 520,104 | | 0.64 | |
| | | Pan Pacific Retail Properties, Inc | | | | 10,500 | | | 728,385 | | 0.89 | |
| | | Prologis | | | | 64,500 | | | 3,361,740 | | 4.12 | |
| | | Public Storage, Inc | | | | 30,400 | | | 2,307,360 | | 2.83 | |
| | | Reckson Associates Realty Corp | | | | 28,400 | | | 1,175,192 | | 1.44 | |
| | | Regency Centers Corp | | | | 14,700 | | | 913,605 | | 1.12 | |
| | | Simon Property Group, Inc | | | | 51,900 | | | 4,304,586 | | 5.28 | |
| | | SL Green Realty Corp | | | | 17,100 | | | 1,871,937 | | 2.29 | |
| | | Strategic Hotel Capital, Inc | | | | 30,000 | | | 622,200 | | 0.76 | |
| | | Taubman Centers, Inc | | | | 9,500 | | | 388,550 | | 0.48 | |
| | | Trizec Properties, Inc | | | | 45,000 | | | 1,288,800 | | 1.58 | |
| | | United Dominion Realty Trust, Inc | | | | 32,300 | | | 904,723 | | 1.11 | |
| | | Vornado Realty Trust | | | | 48,500 | | | 4,731,175 | | 5.80 | |
| | | Weingarten Realty Investors | | | | 20,900 | | | 800,052 | | 0.98 | |
| | | Other | | | | | | | 6,638,229 | | 8.14 | |
| | | | | | | | |
|
|
|
| | | | | | | | | | 78,306,221 | | 95.97 | |
| | | | | | | | |
|
|
|
| | | | |
| SEE NOTES TO FINANCIAL STATEMENTS | | TIAA-CREF Life Funds 2006 Semiannual Report | | 79 |
| | | | |
| Real Estate Securities Fund | | Summary portfolio of investments (unaudited) June 30, 2006 | | concluded |
| | | | | | | | | | | | |
| | | COMPANY
| | | | SHARES
| | VALUE
| | % OF NET
ASSETS
| |
| | | | | | | | | | | | | |
| | | HOTELS AND OTHER LODGING PLACES | | | | | | | | | | |
| | | Starwood Hotels & Resorts Worldwide, Inc | | | | 8,200 | | $ | 494,788 | | 0.61 | % |
| | | | | | | | |
|
|
|
| | | | | | | | | | 494,788 | | 0.61 | |
| | | | | | | | |
|
|
|
| | | REAL ESTATE | | | | | | | | | | |
| * | | Brookfield Properties Corp | | | | 55,500 | | | 1,785,435 | | 2.19 | |
| | | Other | | | | | | | 340,000 | | 0.41 | |
| | | | | | | | |
|
|
|
| | | | | | | | | | 2,125,435 | | 2.60 | |
| | | | | | | | |
|
|
|
| | | TOTAL COMMON STOCKS | | (Cost $72,090,334) | | | 80,926,444 | | 99.18 | |
| | | | | | | | |
|
|
|
| | | | |
| | | TOTAL PORTFOLIO | | (Cost $72,090,334) | | | 80,926,444 | | 99.18 | |
| | | OTHER ASSETS & LIABILITIES, NET | | | | | | | 671,227 | | 0.82 | |
| | | | | | | | |
|
|
|
| | | | | |
| | | NET ASSETS | | | | | | $ | 81,597,671 | | 100.00 | % |
| | | | | | | | |
|
|
|
| f | Security is exempt from registration under Rule 144 (A) of the Securities Act of 1933 and may be resold in transaction exempt from registration to qualified institutional buyers. |
| | At June 30, 2006 the value of these securities amounted to $500,000 or 0.61% of net assets. |
| v | Security valued at fair value. |
For ease of presentation, we have grouped a number of industry classification categories together in the Summary portfolio of investments. Note that the Funds use more specific industry categories in following their investment limitations on industry concentration.
Restricted securities held by the Fund are as follows:
| | | | | | | |
SECURITY
| | ACQUISITION
DATE
| | ACQUISITION
COST
| | VALUE
|
| GSC Capital Corp | | 06/24/05 | | $500,000 | | $ | 500,000 |
| | | | |
| 80 | | 2006 Semiannual Report TIAA-CREF Life Funds | | SEE NOTES TO FINANCIAL STATEMENTS |
| | |
| Bond Fund | | Summary portfolio of investments (unaudited) June 30, 2006 |
| | | | | | | | | | | | | |
| | | ISSUER
| | RATING†
| | PRINCIPAL
| | VALUE
| | % OF NET
ASSETS
| |
| | | | | | | | | | | | | | |
| | | BONDS | | | | | | | | | | | |
| | | CORPORATE BONDS | | | | | | | | | | | |
| | | ASSET BACKED | | | | | | | | | | | |
| | | Chase Funding Mortgage Loan Asset-Backed Certificates Series 2004-2 (Class 1B) 5.700%, 02/25/34 | | Baa2 | | $ | 500,000 | | $ | 479,123 | | 0.70 | % |
| | | CIT Group Home Equity Loan Trust Series 2002-2
(Class MF2) 6.390%, 12/25/30 | | A2 | | | 490,829 | | | 488,320 | | 0.72 | |
| v | | Long Beach Asset Holdings Corp Series 2006-4
(Class N1) 5.877%, 06/25/46 | | NR | | | 500,000 | | | 500,000 | | 0.74 | |
| | | Residential Funding Mortgage Securities II, Inc Series 2006-HSA2
(Class AI3) 5.550%, 03/25/36 | | Aaa | | | 1,000,000 | | | 988,859 | | 1.45 | |
| h,v | | Sierra Receivables Funding Co Series 2006-1A
(Class A1) 5.840%, 05/20/18 | | Aaa | | | 500,000 | | | 499,951 | | 0.74 | |
| | | TRAINS 5.940%, 01/25/07 | | A3 | | | 2,119,999 | | | 2,117,202 | | 3.11 | |
| | | TRAINS 6.962%, 01/15/12 | | A3 | | | 3,420,000 | | | 3,556,458 | | 5.23 | |
| | | Other | | | | | | | | 1,621,331 | | 2.38 | |
| | | | | | | | | |
|
|
|
| | | | | | | | | | | 10,251,244 | | 15.07 | |
| | | | | | | | | |
|
|
|
| | | BUILDING MATERIALS AND GARDEN SUPPLIES | | | | | | | | 95,865 | | 0.14 | |
| | | | | | | | | |
|
|
|
| | | CHEMICALS AND ALLIED PRODUCTS | | | | | | | | 328,995 | | 0.48 | |
| | | | | | | | | |
|
|
|
| | | COMMUNICATIONS | | | | | | | | 1,308,677 | | 1.92 | |
| | | | | | | | | |
|
|
|
| | | DEPOSITORY INSTITUTIONS | | | | | | | | 1,666,259 | | 2.45 | |
| | | | | | | | | |
|
|
|
| | | ELECTRIC, GAS, AND SANITARY SERVICES | | | | | | | | 616,687 | | 0.91 | |
| | | | | | | | | |
|
|
|
| | | ELECTRONIC AND OTHER ELECTRIC EQUIPMENT | | | | | | | | 98,105 | | 0.15 | |
| | | | | | | | | |
|
|
|
| | | FOOD AND KINDRED PRODUCTS | | | | | | | | 90,933 | | 0.13 | |
| | | | | | | | | |
|
|
|
| | | GENERAL BUILDING CONTRACTORS | | | | | | | | 182,105 | | 0.27 | |
| | | | | | | | | |
|
|
|
| | | GENERAL MERCHANDISE STORES | | | | | | | | 308,390 | | 0.45 | |
| | | | | | | | | |
|
|
|
| | | HEALTH SERVICES | | | | | | | | 95,596 | | 0.14 | |
| | | | | | | | | |
|
|
|
| | | HOLDING AND OTHER INVESTMENT OFFICES | | | | | | | | 96,410 | | 0.14 | |
| | | | | | | | | |
|
|
|
| | | INSTRUMENTS AND RELATED PRODUCTS | | | | | | | | 91,657 | | 0.14 | |
| | | | | | | | | |
|
|
|
| | | INSURANCE CARRIERS | | | | | | | | 376,748 | | 0.55 | |
| | | | | | | | | |
|
|
|
| | | METAL MINING | | | | | | | | 183,513 | | 0.27 | |
| | | | | | | | | |
|
|
|
| | | MISCELLANEOUS MANUFACTURING INDUSTRIES | | | | | | | | 95,990 | | 0.14 | |
| | | | | | | | | |
|
|
|
| | | MOTION PICTURES | | | | | | | | 191,358 | | 0.28 | |
| | | | | | | | | |
|
|
|
| | | NONDEPOSITORY INSTITUTIONS | | | | | | | | | | | |
| | | General Electric Capital Corp 6.000%, 06/15/12 | | Aaa | | | 500,000 | | | 505,499 | | 0.74 | |
| | | Other | | | | | | | | 1,391,807 | | 2.05 | |
| | | | | | | | | |
|
|
|
| | | | | | | | | | | 1,897,306 | | 2.79 | |
| | | | | | | | | |
|
|
|
| | | OIL AND GAS EXTRACTION | | | | | | | | 450,236 | | 0.66 | |
| | | | | | | | | |
|
|
|
| | | OTHER MORTGAGE BACKED SECURITIES | | | | | | | | | | | |
| | | Bank of America Alternative Loan Trust Series 2004-7
(Class 2A1) 6.000%, 08/25/34 | | Aaa | | | 590,494 | | | 577,025 | | 0.85 | |
| | | JP Morgan Chase Commercial Mortgage Securities Corp Series 2002-C1 (Class A3) 5.376%, 07/12/37 | | Aaa | | | 750,000 | | | 734,627 | | 1.08 | |
| | | | |
| SEE NOTES TO FINANCIAL STATEMENTS | | TIAA-CREF Life Funds 2006 Semiannual Report | | 81 |
| | | | |
| Bond Fund | | Summary portfolio of investments (unaudited) June 30, 2006 | | continued |
| | | | | | | | | | | | | |
| | | ISSUER
| | RATING†
| | PRINCIPAL
| | VALUE
| | % OF NET
ASSETS
| |
| | | | | | | | | | | | | | |
| | | OTHER MORTGAGE BACKED SECURITIES—(continued) | | | | | | | | | | | |
| | | Merrill Lynch Mortgage Trust Series 2004-BPC1
(Class AJ) 4.922%, 10/12/41 | | A | | $ | 500,000 | | $ | 465,970 | | 0.69 | % |
| | | Wells Fargo Mortgage Backed Securities Trust Series 2005-1
(Class 2A1) 5.000%, 01/25/20 | | NR | | | 804,469 | | | 782,838 | | 1.15 | |
| | | Other | | | | | | | | 1,819,935 | | 2.67 | |
| | | | | | | | | |
|
|
|
| | | | | | | | | | | 4,380,395 | | 6.44 | |
| | | | | | | | | |
|
|
|
| | | PAPER AND ALLIED PRODUCTS | | | | | | | | 93,030 | | 0.14 | |
| | | | | | | | | |
|
|
|
| | | PETROLEUM AND COAL PRODUCTS | | | | | | | | 95,923 | | 0.14 | |
| | | | | | | | | |
|
|
|
| | | PIPELINES, EXCEPT NATURAL GAS | | | | | | | | 191,518 | | 0.28 | |
| | | | | | | | | |
|
|
|
| | | PRIMARY METAL INDUSTRIES | | | | | | | | 92,266 | | 0.14 | |
| | | | | | | | | |
|
|
|
| | | RAILROAD TRANSPORTATION | | | | | | | | 49,956 | | 0.07 | |
| | | | | | | | | |
|
|
|
| | | SECURITY AND COMMODITY BROKERS | | | | | | | | 965,511 | | 1.42 | |
| | | | | | | | | |
|
|
|
| | | TRANSPORTATION EQUIPMENT | | | | | | | | 346,823 | | 0.51 | |
| | | | | | | | | |
|
|
|
| | | WHOLESALE TRADE—NONDURABLE | | | | | | | | 94,994 | | 0.14 | |
| | | | | | | | | |
|
|
|
| | | TOTAL CORPORATE BONDS | | (Cost $25,755,888) | | | 24,736,490 | | 36.36 | |
| | | | | | | | | |
|
|
|
| | | GOVERNMENT BONDS | | | | | | | | | | | |
| | | AGENCY SECURITIES | | | | | | | | | | | |
| | | Cal Dive International, Inc4.930%, 02/01/27 | | NR | | | 493,335 | | | 454,791 | | 0.67 | |
| | | Federal Farm Credit Bank (FFCB)3.375%, 07/15/08 | | Aaa | | | 550,000 | | | 528,374 | | 0.78 | |
| | | FFCB4.125%, 04/15/09 | | NR | | | 550,000 | | | 531,779 | | 0.78 | |
| | | Federal Home Loan Mortgage Corp
(FHLMC) 4.375%–5.250%, 11/16/07–06/27/16 | | Aaa-NR | | | 950,000 | | | 942,416 | | 1.39 | |
| | | FHLMC3.500%, 04/28/08 | | Aaa | | | 500,000 | | | 483,047 | | 0.71 | |
| | | FHLMC5.875%, 03/21/11 | | Aa2 | | | 1,000,000 | | | 1,009,523 | | 1.48 | |
| | | FHLMC6.250%, 03/05/12 | | Aaa | | | 1,250,000 | | | 1,251,730 | | 1.84 | |
| | | FHLMC8.250%, 06/01/16 | | NR | | | 575,000 | | | 682,600 | | 1.00 | |
| | | Federal National Mortgage Association
(FNMA)4.125%–6.210%, 01/02/07–08/06/38 | | Aaa-NR | | | 1,037,742 | | | 1,053,578 | | 1.55 | |
| | | FNMA5.210%, 03/16/09 | | Aaa | | | 500,000 | | | 495,071 | | 0.73 | |
| | | FNMA5.800%, 06/07/11 | | Aaa | | | 2,000,000 | | | 1,991,750 | | 2.93 | |
| | | FNMA5.250%, 08/01/12 | | Aa2 | | | 1,000,000 | | | 977,368 | | 1.44 | |
| | | FNMA2.000%, 08/17/12 | | Aaa | | | 500,000 | | | 407,968 | | 0.60 | |
| | | FNMA6.470%, 09/25/12 | | Aaa | | | 500,000 | | | 523,825 | | 0.77 | |
| | | Totem Ocean Trailer Express, Inc4.514%, 12/18/19 | | NR | | | 421,875 | | | 395,554 | | 0.58 | |
| | | Other | | | | | | | | 266,561 | | 0.39 | |
| | | | | | | | | |
|
|
|
| | | | | | | | | | | 11,995,935 | | 17.64 | |
| | | | | | | | | |
|
|
|
| | | FOREIGN GOVERNMENT BONDS | | | | | | | | | | | |
| | | Province of Manitoba Canada4.450%, 04/12/10 | | Aa2 | | | 1,000,000 | | | 967,209 | | 1.42 | |
| | | Province of Saskatchewan Canada8.000%, 02/01/13 | | A3 | | | 500,000 | | | 566,799 | | 0.83 | |
| | | Other | | | | | | | | 1,759,550 | | 2.59 | |
| | | | | | | | | |
|
|
|
| | | | | | | | | | | 3,293,558 | | 4.84 | |
| | | | | | | | | |
|
|
|
| | | MORTGAGE BACKED SECURITIES | | | | | | | | | | | |
| | | Federal Home Loan Mortgage Corp Gold
(FGLMC)5.000%, 02/01/19 | | | | | 529,023 | | | 509,967 | | 0.75 | |
| | | FGLMC5.000%, 07/01/33 | | | | | 501,075 | | | 470,210 | | 0.69 | |
| | | FGLMC6.000%, 11/01/33 | | | | | 689,323 | | | 680,767 | | 1.00 | |
| | | | |
| 82 | | 2006 Semiannual Report TIAA-CREF Life Funds | | SEE NOTES TO FINANCIAL STATEMENTS |
| | | | |
| Bond Fund | | Summary portfolio of investments (unaudited) June 30, 2006 | | concluded |
| | | | | | | | | | | | | | |
| | | ISSUER
| | | | PRINCIPAL
| | VALUE
| | | % OF NET
ASSETS
| |
| | | | | | | | | | | | | | | |
| | | MORTGAGE BACKED SECURITIES–(continued) | | | | | | | | | | | | |
| | | Federal National Mortgage Association
(FNMA)6.341%, 12/01/08 | | | | $ | 460,129 | | $ | 460,674 | | | 0.68 | % |
| | | FNMA4.000%–7.500%, 06/01/13–04/01/36 | | | | | 4,714,536 | | | 4,569,272 | | | 6.72 | |
| | | FNMA4.560%, 01/01/15 | | | | | 1,893,147 | | | 1,767,007 | | | 2.60 | |
| | | FNMA5.500%, 07/01/20 | | | | | 464,197 | | | 456,025 | | | 0.67 | |
| | | FNMA5.500%, 07/01/24 | | | | | 723,205 | | | 702,987 | | | 1.03 | |
| | | FNMA5.500%, 07/01/33 | | | | | 1,019,804 | | | 983,805 | | | 1.45 | |
| | | FNMA5.500%, 07/01/33 | | | | | 642,970 | | | 620,273 | | | 0.91 | |
| | | FNMA4.500%, 09/01/33 | | | | | 490,575 | | | 447,137 | | | 0.66 | |
| | | FNMA6.000%, 10/01/33 | | | | | 742,839 | | | 733,414 | | | 1.08 | |
| | | FNMA5.500%, 11/01/33 | | | | | 1,907,263 | | | 1,839,937 | | | 2.70 | |
| | | FNMA5.000%, 03/01/34 | | | | | 797,611 | | | 749,197 | | | 1.10 | |
| | | FNMA5.000%, 03/01/34 | | | | | 1,431,757 | | | 1,344,851 | | | 1.98 | |
| | | FNMA5.000%, 02/25/35 | | | | | 1,464,009 | | | 1,417,546 | | | 2.08 | |
| h | | FNMA6.000%, 06/01/36 | | | | | 400,000 | | | 393,762 | | | 0.58 | |
| | | Government National Mortgage Association
(GNMA)5.500%, 07/20/33 | | | | | 513,093 | | | 495,873 | | | 0.73 | |
| | | GSR Mortgage Loan Trust Series 2005-6F
(Class 4A3)6.000%, 07/25/35 | | | | | 1,400,000 | | | 1,381,407 | | | 2.03 | |
| | | Other | | | | | | | | 947,615 | | | 1.39 | |
| | | | | | | | | |
|
|
|
| | | | | | | | | | | 20,971,726 | | | 30.83 | |
| | | | | | | | | |
|
|
|
| | | U.S. TREASURY SECURITIES | | | | | | | | | | | | |
| | | United States Treasury Bond8.000%, 11/15/21 | | | | | 2,784,000 | | | 3,561,181 | | | 5.23 | |
| | | United States Treasury Note4.875%, 04/30/08 | | | | | 750,000 | | | 745,928 | | | 1.10 | |
| | | United States Treasury Note2.625%, 05/15/08 | | | | | 500,000 | | | 477,455 | | | 0.70 | |
| | | United States Treasury Note3.625%, 05/15/13 | | | | | 600,000 | | | 548,922 | | | 0.81 | |
| | | Other | | | | | | | | 606,189 | | | 0.89 | |
| | | | | | | | | |
|
|
|
| | | | | | | | | | | 5,939,675 | | | 8.73 | |
| | | | | | | | | |
|
|
|
| | | TOTAL GOVERNMENT BONDS | | (Cost $43,863,320) | | | 42,200,894 | | | 62.04 | |
| | | | | | | | | |
|
|
|
| | | | |
| | | TOTAL BONDS | | (Cost $69,619,208) | | | 66,937,384 | | | 98.40 | |
| | | | | | | | | |
|
|
|
| | | SHORT-TERM INVESTMENTS | | | | | | | | | | | | |
| | | U.S. GOVERNMENT AND AGENCIES DISCOUNT NOTES | | | | | | | | | | | | |
| | | Federal Home Loan Bank (FHLB)4.950%, 07/03/06 | | | | | 1,370,000 | | | 1,370,000 | | | 2.01 | |
| | | | | | | | | |
|
|
|
| | | TOTAL SHORT-TERM INVESTMENTS | | (Cost $1,369,629) | | | 1,370,000 | | | 2.01 | |
| | | | | | | | | |
|
|
|
| | | | |
| | | TOTAL PORTFOLIO | | (Cost $70,988,837) | | | 68,307,384 | | | 100.41 | |
| | | OTHER ASSETS & LIABILITIES, NET | | | | | | | | (282,134 | ) | | (0.41 | ) |
| | | | | | | | | |
|
|
|
| | | NET ASSETS | | | | | | | $ | 68,025,250 | | | 100.00 | % |
| | | | | | | | | |
|
|
|
| † | As provided by Moody’s Investor Service. |
| h | These securities were purchased on a delayed delivery basis. |
| v | Security valued at fair value. |
ABBREVIATION:
NR—Not Rated
For ease of presentation, we have grouped a number of industry classification categories together in the Summary portfolio of investments. Note that the Funds use more specific industry categories in following their investment limitations on industry concentration.
| | | | |
| SEE NOTES TO FINANCIAL STATEMENTS | | TIAA-CREF Life Funds 2006 Semiannual Report | | 83 |
| | |
| Money Market Fund | | Summary portfolio of investments (unaudited) June 30, 2006 |
| | | | | | | | | | | | | |
| | | ISSUER
| | | | PRINCIPAL
| | VALUE
| | % OF NET
ASSETS
| |
| | | | | | | | | | | | | | |
| | | SHORT-TERM INVESTMENTS | | | | | | | | | | | |
| | | BANK NOTES | | | | | | | | | | | |
| | | Harris Trust and Savings Bank 5.170%, 08/07/06 | | | | $ | 1,285,000 | | $ | 1,285,000 | | 2.85 | |
| | | | | | | | | |
|
|
|
| | | | | | | | | | | 1,285,000 | | 2.85 | |
| | | | | | | | | |
|
|
|
| | | CERTIFICATES OF DEPOSIT | | | | | | | | | | | |
| | | American Express Centurion
Bank5.020%–5.070%, 07/3/06–07/20/06 | | | | | 1,020,000 | | | 1,020,002 | | 2.27 | |
| | | Bank of Nova Scotia 5.420%, 09/26/06 | | | | | 965,000 | | | 965,000 | | 2.14 | |
| | | Dexia Bank 5.070%, 07/17/06 | | | | | 1,000,000 | | | 1,000,007 | | 2.22 | |
| | | | | | | | | |
|
|
|
| | | | | | | | | | | 2,985,009 | | 6.63 | |
| | | | | | | | | |
|
|
|
| | | COMMERCIAL PAPER | | | | | | | | | | | |
| | | Abbey National North America LLC 5.030%, 08/14/06 | | | | | 1,300,000 | | | 1,292,008 | | 2.87 | |
| | | Barclays U.S. Funding Corp 5.350%, 09/05/06 | | | | | 1,215,000 | | | 1,203,193 | | 2.67 | |
| | | Calyon4.955%, 08/11/06 | | | | | 950,000 | | | 944,639 | | 2.10 | |
| c | | CC (USA), Inc 5.010%–5.050%, 07/10/06–07/24/06 | | | | | 1,300,000 | | | 1,297,257 | | 2.88 | |
| c | | Ciesco Lp 5.040%–5.320%, 07/13/06–09/19/06 | | | | | 1,300,000 | | | 1,292,689 | | 2.87 | |
| | | Citigroup Funding, Inc 5.000%–5.100%, 07/18/06–08/24/06 | | | | | 1,300,000 | | | 1,293,889 | | 2.87 | |
| c | | Dorada Finance, Inc5.220%, 09/14/06 | | | | | 1,285,000 | | | 1,271,026 | | 2.82 | |
| c | | Edison Asset Securitization,
LLC 4.840%–5.050%, 08/08/06–08/21/06 | | | | | 1,225,000 | | | 1,217,211 | | 2.70 | |
| | | General Electric Capital Corp 5.030%, 08/08/06 | | | | | 600,000 | | | 596,814 | | 1.33 | |
| c | | Govco, Inc 5.000%–5.080%, 7/25/06–08/08/06 | | | | | 1,300,000 | | | 1,292,571 | | 2.87 | |
| c | | Harrier Finance Funding
LLC 5.020%–5.050%, 7/13/06–07/14/06 | | | | | 1,260,000 | | | 1,257,804 | | 2.79 | |
| | | HSBC Finance Corp 5.400%, 11/27/06 | | | | | 1,300,000 | | | 1,270,945 | | 2.82 | |
| | | ING Finance5.100%, 08/25/06 | | | | | 500,000 | | | 496,104 | | 1.10 | |
| c | | Kitty Hawk Funding Corp5.290%, 07/26/06 | | | | | 950,000 | | | 946,517 | | 2.10 | |
| c | | Links Finance LLC5.370%, 09/22/06 | | | | | 1,270,000 | | | 1,254,306 | | 2.79 | |
| | | Paccar Financial Corp5.120%, 08/31/06 | | | | | 1,060,000 | | | 1,050,714 | | 2.33 | |
| c | | Park Avenue Receivables Corp 5.280%, 07/26/06 | | | | | 1,300,000 | | | 1,295,233 | | 2.88 | |
| c | | Pitney Bowes, Inc 5.240%, 07/06/06 | | | | | 840,000 | | | 839,390 | | 1.86 | |
| c | | Preferred Receivables Funding Corp 5.090%, 08/21/06 | | | | | 411,000 | | | 408,036 | | 0.91 | |
| c | | Private Export Funding
Corp 4.660%–5.140%, 07/6/06–09/06/06 | | | | | 1,280,000 | | | 1,271,652 | | 2.82 | |
| | | Rabobank USA Finance Corp4.580%, 07/05/06 | | | | | 1,300,000 | | | 1,299,240 | | 2.89 | |
| c | | Ranger Funding Co LLC 5.120%–5.300%, 07/24/06–08/11/06 | | | | | 1,260,000 | | | 1,253,943 | | 2.78 | |
| c | | Scaldis Capital LLC 4.920%–5.420%, 09/12/06–12/18/06 | | | | | 1,065,000 | | | 1,043,989 | | 2.32 | |
| c | | Sedna Finance, Inc 5.170%, 08/30/06 | | | | | 530,000 | | | 525,433 | | 1.17 | |
| c | | Sheffield Receivables Corp5.210%, 07/27/06 | | | | | 875,000 | | | 871,708 | | 1.94 | |
| | | Shell International Finance B.V.5.000%, 07/31/06 | | | | | 905,000 | | | 901,229 | | 2.00 | |
| c | | Sigma Finance, Inc 5.050%–5.140%, 07/18/06–11/30/06 | | | | | 1,270,000 | | | 1,259,275 | | 2.80 | |
| | | Societe Generale North America,
Inc 4.980%–5.260%, 07/05/06–07/07/06 | | | | | 970,000 | | | 969,318 | | 2.15 | |
| | | Swedish Export Credit Corp 5.120%, 08/03/06 | | | | | 1,000,000 | | | 995,307 | | 2.21 | |
| | | Toronto-Dominion Holdings USA,
Inc 4.800%–5.130%, 08/10/06–10/27/06 | | | | | 1,275,000 | | | 1,262,465 | | 2.80 | |
| | | Toyota Motor Credit Corp 5.100%, 08/24/06 | | | | | 990,000 | | | 982,427 | | 2.18 | |
| | | UBS Finance, (Delaware), Inc 5.100%, 08/21/06 | | | | | 215,000 | | | 213,441 | | 0.47 | |
| c | | Variable Funding Capital Corp 5.140%, 07/27/06 | | | | | 950,000 | | | 946,473 | | 2.10 | |
| c | | Yorktown Capital, LLC 5.130%, 07/20/06 | | | | | 869,000 | | | 866,647 | | 1.92 | |
| | | | | | | | | |
|
|
|
| | | | | | | | | | | 35,182,893 | | 78.11 | |
| | | | | | | | | |
|
|
|
| | | | |
| 84 | | 2006 Semiannual Report TIAA-CREF Life Funds | | SEE NOTES TO FINANCIAL STATEMENTS |
| | | | |
| Money Market Fund | | Summary portfolio of investments (unaudited) June 30, 2006 | | concluded |
| | | | | | | | | | | | | |
| | | ISSUER
| | | | PRINCIPAL
| | VALUE
| | % OF NET
ASSETS
| |
| | | | | | | | | | | | | | |
| | | U.S. GOVERNMENT AGENCIES AND NOTES | | | | | | | | | | | |
| | | Federal Farm Credit Bank (FFCB) 4.720%, 07/19/06 | | | | $ | 144,000 | | $ | 143,660 | | 0.32 | % |
| | | Federal Home Loan Bank
(FHLB) 4.950%–5.210%, 07/21/06–09/01/06 | | | | | 1,055,000 | | | 1,049,154 | | 2.33 | |
| | | Federal Home Loan Mortgage Corp
(FHLMC) 4.790%–5.085%, 08/16/06–09/18/06 | | | | | 1,853,000 | | | 1,839,196 | | 4.08 | |
| | | Federal National Mortgage Association
(FNMA) 3.250%–5.065%, 07/12/06–11/08/06 | | | | | 1,315,000 | | | 1,310,328 | | 2.91 | |
| | | | | | | | | |
|
|
|
| | | | | | | | | | | 4,342,338 | | 9.64 | |
| | | | | | | | | |
|
|
|
| | | SHORT-TERM INVESTMENTS | | (Cost $43,795,240) | | | 43,795,240 | | 97.23 | |
| | | | | | | | | |
|
|
|
| | | | |
| | | TOTAL PORTFOLIO | | (Cost $43,795,240) | | | 43,795,240 | | 97.23 | |
| | | OTHER ASSETS & LIABILITIES, NET | | | | | | | | 1,247,586 | | 2.77 | |
| | | | | | | | | |
|
|
|
| | | | | |
| | | NET ASSETS | | | | | | | $ | 45,042,826 | | 100.00 | % |
| | | | | | | | | |
|
|
|
| c | Commercial Paper issued under the Private Placement exemption under Section 4(2) of the Securities Act of 1933, as amended. |
For ease of presentation, we have grouped a number of industry classification categories together in the Summary portfolio of investments. Note that the Funds use more specific industry categories in following their investment limitations on industry concentration.
| | | | |
| SEE NOTES TO FINANCIAL STATEMENTS | | TIAA-CREF Life Funds 2006 Semiannual Report | | 85 |
| | |
| Statements of assets and liabilities (unaudited) | | TIAA-CREF Life Funds June 30, 2006 |
| | | | | | |
| | | Growth
Equity
Fund | | | |
| | |
ASSETS | | | | | | |
Portfolio investments, at cost | | $ | 26,809,227 | | | |
Net unrealized appreciation of portfolio investments | | | 674,416 | | | |
Portfolio investments, at value | | | 27,483,643 | | | |
Cash | | | 26,190 | | | |
Cash—foreign (cost of $20,314, $19,808, $743,340, $11,634, and $—, respectively) | | | 20,547 | | | |
Receivable from securities transactions | | | 736,272 | | | |
Receivable for Fund shares sold | | | 19,964 | | | |
Dividends and interest receivable | | | 14,629 | | | |
Reclaims receivable | | | 438 | | | |
Total assets | | | 28,301,683 | | | |
| | |
LIABILITIES | | | | | | |
Due to investment advisor | | | 6,354 | | | |
Payable for securities transactions | | | 601,381 | | | |
Payable for Fund shares redeemed | | | 84,661 | | | |
Total liabilities | | | 692,396 | | | |
NET ASSETS | | $ | 27,609,287 | | | |
|
| | |
NET ASSETS CONSIST OF: | | | | | | |
Paid-in-capital | | $ | 65,748,930 | | | |
Accumulated undistributed net investment income | | | 128,781 | | | |
Accumulated undistributed net realized gain (loss) on total investments | | | (38,943,073 | ) | | |
Net unrealized appreciation on total investments | | | 674,649 | | | |
NET ASSETS | | $ | 27,609,287 | | | |
|
Outstanding shares of beneficial interest, unlimited shares authorized ($0.0001 par value) | | | 1,994,768 | | | |
Net asset value per share | | | $13.84 | | | |
|
| | | | |
| 86 | | 2006 Semiannual Report TIAA-CREF Life Funds | | SEE NOTES TO FINANCIAL STATEMENTS |
| | | | | | | | | | | | | | |
| | | Growth &
Income
Fund | | | International
Equity
Fund | | | Large-Cap
Value
Fund | | Small-Cap
Equity
Fund |
| | | | |
| | | | | | | | | | | | | | | |
| | | $ | 47,625,231 | | | $ | 80,945,236 | | | $ | 47,540,944 | | $ | 51,429,019 |
| | | | 3,808,834 | | | | 7,434,663 | | | | 5,560,405 | | | 2,048,155 |
| | | | 51,434,065 | | | | 88,379,899 | | | | 53,101,349 | | | 53,477,174 |
| | | | 26,142 | | | | 48,549 | | | | 4,033 | | | 7,293 |
| | | | 19,666 | | | | 685,788 | | | | 11,545 | | | — |
| | | | 1,933,762 | | | | 1,224,400 | | | | 1,472,114 | | | 7,908,487 |
| | | | 168,582 | | | | 19,740 | | | | 21,092 | | | 66,701 |
| | | | 64,219 | | | | 35,109 | | | | 72,600 | | | 62,419 |
| | | | 4,152 | | | | 129,919 | | | | 1,884 | | | — |
| | | | 53,650,588 | | | | 90,523,404 | | | | 54,684,617 | | | 61,522,074 |
| | | | |
| | | | | | | | | | | | | | | |
| | | | 9,321 | | | | 10,035 | | | | 5,112 | | | 3,462 |
| | | | 1,812,041 | | | | 1,088,841 | | | | 1,279,779 | | | 7,968,598 |
| | | | 17,946 | | | | 72,430 | | | | 12,607 | | | — |
| | | | 1,839,308 | | | | 1,171,306 | | | | 1,297,498 | | | 7,972,060 |
| | | $ | 51,811,280 | | | $ | 89,352,098 | | | $ | 53,387,119 | | $ | 53,550,014 |
|
| | | | |
| | | | | | | | | | | | | | | |
| | | $ | 63,108,585 | | | $ | 87,107,241 | | | $ | 44,858,646 | | $ | 47,026,130 |
| | | | 396,124 | | | | 1,143,158 | | | | 478,089 | | | 250,496 |
| | | | (15,502,239 | ) | | | (6,278,402 | ) | | | 2,490,143 | | | 4,225,233 |
| | | | 3,808,810 | | | | 7,380,101 | | | | 5,560,241 | | | 2,048,155 |
| | | $ | 51,811,280 | | | $ | 89,352,098 | | | $ | 53,387,119 | | $ | 53,550,014 |
|
| | | | 2,340,709 | | | | 4,115,164 | | | | 1,563,868 | | | 1,635,699 |
| | | | $22.13 | | | | $21.71 | | | | $34.14 | | | $32.74 |
|
| | | | |
| SEE NOTES TO FINANCIAL STATEMENTS | | TIAA-CREF Life Funds 2006 Semiannual Report | | 87 |
| | |
| Statements of assets and liabilities (unaudited) | | TIAA-CREF Life Funds June 30, 2006 |
| | | | | | |
| | | Stock
Index
Fund | | | |
| | |
ASSETS | | | | | | |
Portfolio investments, at cost | | $ | 145,499,502 | | | |
Net unrealized appreciation (depreciation) of portfolio investments | | | 8,795,840 | | | |
Portfolio investments, at value | | | 154,295,342 | | | |
Cash | | | 13,316 | | | |
Receivable from securities transactions | | | 3,107,246 | | | |
Receivable for Fund shares sold | | | 143,773 | | | |
Dividends and interest receivable | | | 174,658 | | | |
Total assets | | | 157,734,335 | | | |
| | |
LIABILITIES | | | | | | |
Due to investment advisor | | | 7,461 | | | |
Due to custodian | | | — | | | |
Income distribution payable | | | — | | | |
Payable for securities transactions | | | 3,180,660 | | | |
Payable for Fund shares redeemed | | | 166,789 | | | |
Total liabilities | | | 3,354,910 | | | |
NET ASSETS | | $ | 154,379,425 | | | |
|
| | |
NET ASSETS CONSIST OF: | | | | | | |
Paid-in-capital | | $ | 144,816,104 | | | |
Accumulated undistributed net investment income | | | 1,375,935 | | | |
Accumulated undistributed net realized gain (loss) on total investments | | | (608,454 | ) | | |
Net unrealized appreciation (depreciation) on total investments | | | 8,795,840 | | | |
NET ASSETS | | $ | 154,379,425 | | | |
|
Outstanding shares of beneficial interest, unlimited shares authorized ($0.0001 par value) | | | 5,449,376 | | | |
Net asset value per share | | | $28.33 | | | |
|
| | | | |
| 88 | | 2006 Semiannual Report TIAA-CREF Life Funds | | SEE NOTES TO FINANCIAL STATEMENTS |
concluded
| | | | | | | | | | | | | | | |
| | | Social Choice
Equity
Fund | | | Real Estate
Securities
Fund | | Bond
Fund | | | Money
Market
Fund | |
| | | | |
| | | | | | | | | | | | | | | | |
| | | $ | 32,087,367 | | | $ | 72,090,334 | | $ | 70,988,837 | | | $ | 43,795,240 | |
| | | | 488,384 | | | | 8,836,110 | | | (2,681,453 | ) | | | — | |
| | | | 32,575,751 | | | | 80,926,444 | | | 68,307,384 | | | | 43,795,240 | |
| | | | 58,782 | | | | — | | | 97,862 | | | | 7,982 | |
| | | | 3,340,491 | | | | 731,864 | | | 122,355 | | | | — | |
| | | | 2,687 | | | | 399,443 | | | — | | | | 1,292,095 | |
| | | | 33,699 | | | | 314,131 | | | 521,668 | | | | 32,872 | |
| | | | 36,011,410 | | | | 82,371,882 | | | 69,049,269 | | | | 45,128,189 | |
| | | | |
| | | | | | | | | | | | | | | | |
| | | | 2,056 | | | | 14,414 | | | 7,294 | | | | 3,112 | |
| | | | — | | | | 31,659 | | | — | | | | — | |
| | | | — | | | | — | | | — | | | | 82,251 | |
| | | | 3,298,059 | | | | 728,138 | | | 998,805 | | | | — | |
| | | | 10,759 | | | | — | | | 17,920 | | | | — | |
| | | | 3,310,874 | | | | 774,211 | | | 1,024,019 | | | | 85,363 | |
| | | $ | 32,700,536 | | | $ | 81,597,671 | | $ | 68,025,250 | | | $ | 45,042,826 | |
|
|
| | | | |
| | | | | | | | | | | | | | | | |
| | | $ | 32,042,829 | | | $ | 70,481,534 | | $ | 69,901,840 | | | $ | 45,043,177 | |
| | | | 276,942 | | | | 798,158 | | | 1,581,162 | | | | 181 | |
| | | | (107,619 | ) | | | 1,481,869 | | | (776,299 | ) | | | (532 | ) |
| | | | 488,384 | | | | 8,836,110 | | | (2,681,453 | ) | | | — | |
| | | $ | 32,700,536 | | | $ | 81,597,671 | | $ | 68,025,250 | | | $ | 45,042,826 | |
|
|
| | | | 1,325,333 | | | | 2,351,343 | | | 2,797,852 | | | | 45,043,177 | |
| | | | $24.67 | | | | $34.70 | | | $24.31 | | | | $1.00 | |
|
|
| | | | |
| SEE NOTES TO FINANCIAL STATEMENTS | | TIAA-CREF Life Funds 2006 Semiannual Report | | 89 |
| | |
| Statements of operations (unaudited) | | TIAA-CREF Life Funds For the six months ended June 30, 2006 |
| | | | | | |
| | | Growth
Equity
Fund | | | |
| | |
INVESTMENT INCOME | | | | | | |
Interest | | $ | 1,650 | | | |
Dividends | | | 160,642 | | | |
Foreign taxes withheld | | | (1,323 | ) | | |
Total income | | | 160,969 | | | |
| | |
EXPENSES | | | | | | |
Investment management fees | | | 36,663 | | | |
Net expenses | | | 36,663 | | | |
Net investment income | | | 124,306 | | | |
| | |
NET REALIZED AND UNREALIZED GAIN (LOSS) ON TOTAL INVESTMENTS | | | | | | |
Realized gain (loss) on: | | | | | | |
Portfolio investments | | | 446,423 | | | |
Foreign currency transactions | | | (1,311 | ) | | |
Net realized gain on total investments | | | 445,112 | | | |
Change in unrealized appreciation (depreciation) on: | | | | | | |
Portfolio investments | | | (1,336,877 | ) | | |
Translation of assets (other than portfolio investments) and liabilities denominated in foreign currencies | | | 233 | | | |
Net change in unrealized appreciation (depreciation) on total investments | | | (1,336,644 | ) | | |
Net realized and unrealized gain (loss) on total investments | | | (891,532 | ) | | |
Net increase (decrease) in net assets resulting from operations | | | $(767,226) | | | |
|
| | | | |
| 90 | | 2006 Semiannual Report TIAA-CREF Life Funds | | SEE NOTES TO FINANCIAL STATEMENTS |
| | | | | | | | | | | | | | | | |
| | | Growth &
Income
Fund | | | International
Equity
Fund | | | Large-Cap
Value
Fund | | | Small-Cap
Equity
Fund | |
| | | | |
| | | | | | | | | | | | | | | | | |
| | | $ | 2,080 | | | $ | — | | | $ | 2,303 | | | $ | 5,526 | |
| | | | 450,008 | | | | 1,411,725 | | | | 534,462 | | | | 300,435 | |
| | | | (4,161 | ) | | | (132,115 | ) | | | (4,693 | ) | | | (237 | ) |
| | | | 447,927 | | | | 1,279,610 | | | | 532,072 | | | | 305,724 | |
| | | | |
| | | | | | | | | | | | | | | | | |
| | | | 61,127 | | | | 123,472 | | | | 62,387 | | | | 25,650 | |
| | | | 61,127 | | | | 123,472 | | | | 62,387 | | | | 25,650 | |
| | | | 386,800 | | | | 1,156,138 | | | | 469,685 | | | | 280,074 | |
| | | | |
| | | | | | | | | | | | | | | | | |
| | | | | | | | | | | | | | | | | |
| | | | 915,520 | | | | 7,747,416 | | | | 2,110,741 | | | | 4,355,147 | |
| | | | (3,518 | ) | | | (37,677 | ) | | | 8,358 | | | | — | |
| | | | 912,002 | | | | 7,709,739 | | | | 2,119,099 | | | | 4,355,147 | |
| | | | | | | | | | | | | | | | | |
| | | | 71,739 | | | | (861,561 | ) | | | 634,856 | | | | (596,553 | ) |
| | | | (719 | ) | | | (51,260 | ) | | | 329 | | | | — | |
| | | | 71,020 | | | | (912,821 | ) | | | 635,185 | | | | (596,553 | ) |
| | | | 983,022 | | | | 6,796,918 | | | | 2,754,284 | | | | 3,758,594 | |
| | | | $1,369,822 | | | | $7,953,056 | | | | $3,223,969 | | | | $4,038,668 | |
|
|
| | | | |
| SEE NOTES TO FINANCIAL STATEMENTS | | TIAA-CREF Life Funds 2006 Semiannual Report | | 91 |
| | |
| Statements of operations (unaudited) | | TIAA-CREF Life Funds For the six months ended June 30, 2006 |
| | | | | | |
| | | Stock
Index
Fund | | | |
| | |
INVESTMENT INCOME | | | | | | |
Interest | | $ | 4,783 | | | |
Dividends | | | 1,407,547 | | | |
Foreign taxes withheld | | | (39 | ) | | |
Total income | | | 1,412,291 | | | |
| | |
EXPENSES | | | | | | |
Investment management fees | | | 46,765 | | | |
Net expenses | | | 46,765 | | | |
Net investment income | | | 1,365,526 | | | |
| | |
NET REALIZED AND UNREALIZED GAIN (LOSS) ON TOTAL INVESTMENTS | | | | | | |
Realized gain (loss) on: | | | | | | |
Portfolio investments | | | 2,219,800 | | | |
Net realized gain (loss) on total investments | | | 2,219,800 | | | |
Change in unrealized appreciation (depreciation) on: | | | | | | |
Portfolio investments | | | 1,306,080 | | | |
Futures transactions | | | 7,492 | | | |
Net change in unrealized appreciation (depreciation) on total investments | | | 1,313,572 | | | |
Net realized and unrealized gain (loss) on total investments | | | 3,533,372 | | | |
Net increase (decrease) in net assets resulting from operations | | | $4,898,898 | | | |
|
| | | | |
| 92 | | 2006 Semiannual Report TIAA-CREF Life Funds | | SEE NOTES TO FINANCIAL STATEMENTS |
concluded
| | | | | | | | | | | | | | | | |
| | | Social Choice
Equity
Fund | | | Real Estate
Securities
Fund | | | Bond
Fund | | | Money
Market
Fund | |
| | | | |
| | | | | | | | | | | | | | | | | |
| | | $ | 926 | | | $ | 12,625 | | | $ | 1,614,497 | | | $ | 999,498 | |
| | | | 283,423 | | | | 1,700,469 | | | | — | | | | — | |
| | | | (23 | ) | | | (1,582 | ) | | | — | | | | — | |
| | | | 284,326 | | | | 1,711,512 | | | | 1,614,497 | | | | 999,498 | |
| | | | |
| | | | | | | | | | | | | | | | | |
| | | | 11,606 | | | | 95,649 | | | | 33,335 | | | | 12,583 | |
| | | | 11,606 | | | | 95,649 | | | | 33,335 | | | | 12,583 | |
| | | | 272,720 | | | | 1,615,863 | | | | 1,581,162 | | | | 986,915 | |
| | | | |
| | | | | | | | | | | | | | | | | |
| | | | | | | | | | | | | | | | | |
| | | | 395,689 | | | | 1,127,980 | | | | (286,412 | ) | | | (603 | ) |
| | | | 395,689 | | | | 1,127,980 | | | | (286,412 | ) | | | (603 | ) |
| | | | | | | | | | | | | | | | | |
| | | | 239,455 | | | | 5,784,133 | | | | (1,646,877 | ) | | | — | |
| | | | — | | | | — | | | | — | | | | — | |
| | | | 239,455 | | | | 5,784,133 | | | | (1,646,877 | ) | | | — | |
| | | | 635,144 | | | | 6,912,113 | | | | (1,933,289 | ) | | | (603 | ) |
| | | | $907,864 | | | | $8,527,976 | | | | $(352,127 | ) | | | $986,312 | |
|
|
| | | | |
| SEE NOTES TO FINANCIAL STATEMENTS | | TIAA-CREF Life Funds 2006 Semiannual Report | | 93 |
| | |
| Statements of changes in net assets | | TIAA-CREF Life Funds June 30, 2006 |
| | | | | | | | | | |
| | | Growth Equity Fund
| | | |
| | | For the Six
Months Ended
June 30, 2006 | | | For the
Year Ended
December 31, 2005 | | | |
| | | (unaudited) | | | | | | |
| | | |
CHANGE IN NET ASSETS | | | | | | | | | | |
| | | |
OPERATIONS | | | | | | | | | | |
Net investment income | | $ | 124,306 | | | $ | 181,461 | | | |
Net realized gain (loss) on total investments | | | 445,112 | | | | (983,360 | ) | | |
Net change in unrealized appreciation (depreciation)
on total investments | | | (1,336,644 | ) | | | 2,252,050 | | | |
Net increase (decrease) from operations | | | (767,226 | ) | | | 1,450,151 | | | |
| | | |
DISTRIBUTIONS TO SHAREHOLDERS: | | | | | | | | | | |
From net investment income | | | — | | | | (182,267 | ) | | |
Total distributions | | | — | | | | (182,267 | ) | | |
| | | |
SHAREHOLDER TRANSACTIONS: | | | | | | | | | | |
Subscriptions | | | 1,778,003 | | | | 8,151,931 | | | |
Reinvestment of distributions | | | — | | | | 182,267 | | | |
Redemptions | | | (2,918,464 | ) | | | (8,366,760 | ) | | |
Net increase (decrease) from shareholder transactions | | | (1,140,461 | ) | | | (32,562 | ) | | |
Net increase (decrease) in net assets | | | (1,907,687 | ) | | | 1,235,322 | | | |
| | | |
NET ASSETS | | | | | | | | | | |
Beginning of period | | | 29,516,974 | | | | 28,281,652 | | | |
End of period | | $ | 27,609,287 | | | $ | 29,516,974 | | | |
|
Accumulated undistributed (distributions in excess of)
net investment income included in net assets | | $ | 128,781 | | | $ | 4,475 | | | |
|
| | | |
CHANGE IN FUND SHARES: | | | | | | | | | | |
Shares outstanding, beginning of period | | | 2,074,716 | | | | 2,082,237 | | | |
Shares sold | | | 124,148 | | | | 597,894 | | | |
Shares issued in reinvestment of distributions | | | — | | | | 12,561 | | | |
Shares redeemed | | | (204,096 | ) | | | (617,976 | ) | | |
Total net increase (decrease) in shares outstanding | | | (79,948 | ) | | | (7,521 | ) | | |
Shares outstanding, end of period | | | 1,994,768 | | | | 2,074,716 | | | |
|
| | | | |
| 94 | | 2006 Semiannual Report TIAA-CREF Life Funds | | SEE NOTES TO FINANCIAL STATEMENTS |
| | | | | | | | | | | | | | | | |
| | | Growth & Income Fund
| | | International Equity Fund
| |
| | | For the Six
Months Ended
June 30, 2006 | | | For the
Year Ended
December 31, 2005 | | | For the Six
Months Ended
June 30, 2006 | | | For the
Year Ended
December 31, 2005 | |
| | | (unaudited) | | | | | | (unaudited) | | | | |
| | | | |
| | | | | | | | | | | | | | | | | |
| | | | |
| | | | | | | | | | | | | | | | | |
| | | $ | 386,800 | | | $ | 673,612 | | | $ | 1,156,138 | | | $ | 1,047,698 | |
| | | | 912,002 | | | | 873,138 | | | | 7,709,739 | | | | 5,783,353 | |
| | | | 71,020 | | | | 1,523,151 | | | | (912,821 | ) | | | 1,952,422 | |
| | | | 1,369,822 | | | | 3,069,901 | | | | 7,953,056 | | | | 8,783,473 | |
| | | | |
| | | | | | | | | | | | | | | | | |
| | | | — | | | | (661,771 | ) | | | — | | | | (1,130,293 | ) |
| | | | — | | | | (661,771 | ) | | | — | | | | (1,130,293 | ) |
| | | | |
| | | | | | | | | | | | | | | | | |
| | | | 2,404,211 | | | | 5,090,266 | | | | 15,712,907 | | | | 24,608,052 | |
| | | | — | | | | 661,771 | | | | — | | | | 1,130,293 | |
| | | | (3,589,526 | ) | | | (4,281,803 | ) | | | (6,910,694 | ) | | | (12,945,944 | ) |
| | | | (1,185,315 | ) | | | 1,470,234 | | | | 8,802,213 | | | | 12,792,401 | |
| | | | 184,507 | | | | 3,878,364 | | | | 16,755,269 | | | | 20,445,581 | |
| | | | |
| | | | | | | | | | | | | | | | | |
| | | | 51,626,773 | | | | 47,748,409 | | | | 72,596,829 | | | | 52,151,248 | |
| | | $ | 51,811,280 | | | $ | 51,626,773 | | | $ | 89,352,098 | | | $ | 72,596,829 | |
|
|
| | | $ | 396,124 | | | $ | 9,324 | | | $ | 1,143,158 | | | $ | (12,980 | ) |
|
|
| | | | |
| | | | | | | | | | | | | | | | | |
| | | | 2,394,121 | | | | 2,330,005 | | | | 3,716,157 | | | | 3,023,544 | |
| | | | 107,156 | | | | 243,249 | | | | 726,985 | | | | 1,348,971 | |
| | | | — | | | | 30,176 | | | | — | | | | 57,668 | |
| | | | (160,568 | ) | | | (209,309 | ) | | | (327,978 | ) | | | (714,026 | ) |
| | | | (53,412 | ) | | | 64,116 | | | | 399,007 | | | | 692,613 | |
| | | | 2,340,709 | | | | 2,394,121 | | | | 4,115,164 | | | | 3,716,157 | |
|
|
| | | | |
| SEE NOTES TO FINANCIAL STATEMENTS | | TIAA-CREF Life Funds 2006 Semiannual Report | | 95 |
| | |
| Statements of changes in net assets | | TIAA-CREF Life Funds June 30, 2006 |
| | | | | | | | | | |
| | | Large-Cap Value Fund
| | | |
| | | For the Six
Months Ended
June 30, 2006 | | | For the
Year Ended
December 31, 2005 | | | |
| | | (unaudited) | | | | | | |
| | | |
CHANGE IN NET ASSETS | | | | | | | | | | |
| | | |
OPERATIONS | | | | | | | | | | |
Net investment income | | $ | 469,685 | | | $ | 979,955 | | | |
Net realized gain (loss) on total investments | | | 2,119,099 | | | | 1,864,624 | | | |
Net change in unrealized appreciation (depreciation)
on total investments | | | 635,185 | | | | (642,029 | ) | | |
Net increase from operations | | | 3,223,969 | | | | 2,202,550 | | | |
| | | |
DISTRIBUTIONS TO SHAREHOLDERS: | | | | | | | | | | |
From net investment income | | | — | | | | (971,055 | ) | | |
From net realized gain on total investments | | | — | | | | (2,775,024 | ) | | |
Total distributions | | | — | | | | (3,746,079 | ) | | |
| | | |
SHAREHOLDER TRANSACTIONS: | | | | | | | | | | |
Subscriptions | | | 8,694,844 | | | | 14,205,144 | | | |
Reinvestment of distributions | | | — | | | | 3,746,079 | | | |
Redemptions | | | (7,559,420 | ) | | | (9,807,828 | ) | | |
Net increase (decrease) from shareholder transactions | | | 1,135,424 | | | | 8,143,395 | | | |
Net increase in net assets | | | 4,359,393 | | | | 6,599,866 | | | |
| | | |
NET ASSETS | | | | | | | | | | |
Beginning of period | | | 49,027,726 | | | | 42,427,860 | | | |
End of period | | $ | 53,387,119 | | | $ | 49,027,726 | | | |
|
Accumulated undistributed (distributions in excess of) net investment income included in net assets | | $ | 478,089 | | | $ | 8,404 | | | |
|
| | | |
CHANGE IN FUND SHARES: | | | | | | | | | | |
Shares outstanding, beginning of period | | | 1,530,189 | | | | 1,283,066 | | | |
Shares sold | | | 254,642 | | | | 432,821 | | | |
Shares issued in reinvestment of distributions | | | — | | | | 115,299 | | | |
Shares redeemed | | | (220,963 | ) | | | (300,997 | ) | | |
Total net increase (decrease) in shares outstanding | | | 33,679 | | | | 247,123 | | | |
Shares outstanding, end of period | | | 1,563,868 | | | | 1,530,189 | | | |
|
| | | | |
| 96 | | 2006 Semiannual Report TIAA-CREF Life Funds | | SEE NOTES TO FINANCIAL STATEMENTS |
continued
| | | | | | | | | | | | | | | | |
| | | Small-Cap Equity Fund
| | | Stock Index Fund
| |
| | | For the Six
Months Ended
June 30, 2006 | | | For the
Year Ended
December 31, 2005 | | | For the Six
Months Ended
June 30, 2006 | | | For the
Year Ended
December 31, 2005 | |
| | | (unaudited) | | | | | | (unaudited) | | | | |
| | | | |
| | | | | | | | | | | | | | | | | |
| | | | |
| | | | | | | | | | | | | | | | | |
| | | $ | 280,074 | | | $ | 439,118 | | | $ | 1,365,526 | | | $ | 2,501,204 | |
| | | | 4,355,147 | | | | 4,855,971 | | | | 2,219,800 | | | | (855,636 | ) |
| | | | (596,553 | ) | | | (3,440,435 | ) | | | 1,313,572 | | | | 7,018,490 | |
| | | | 4,038,668 | | | | 1,854,654 | | | | 4,898,898 | | | | 8,664,058 | |
| | | | |
| | | | | | | | | | | | | | | | | |
| | | | — | | | | (468,390 | ) | | | — | | | | (2,495,347 | ) |
| | | | — | | | | (5,969,837 | ) | | | — | | | | — | |
| | | | — | | | | (6,438,227 | ) | | | — | | | | (2,495,347 | ) |
| | | | |
| | | | | | | | | | | | | | | | | |
| | | | 10,515,707 | | | | 20,399,213 | | | | 11,448,638 | | | | 19,610,432 | |
| | | | — | | | | 6,438,227 | | | | — | | | | 2,495,347 | |
| | | | (6,336,726 | ) | | | (19,115,543 | ) | | | (14,903,887 | ) | | | (18,560,759 | ) |
| | | | 4,178,981 | | | | 7,721,897 | | | | (3,455,249 | ) | | | 3,545,020 | |
| | | | 8,217,649 | | | | 3,138,324 | | | | 1,443,649 | | | | 9,713,731 | |
| | | | |
| | | | | | | | | | | | | | | | | |
| | | | 45,332,365 | | | | 42,194,041 | | | | 152,935,776 | | | | 143,222,045 | |
| | | $ | 53,550,014 | | | $ | 45,332,365 | | | $ | 154,379,425 | | | $ | 152,935,776 | |
|
|
| | | $ | 250,496 | | | $ | (29,578 | ) | | $ | 1,375,935 | | | $ | 10,409 | |
|
|
| | | | |
| | | | | | | | | | | | | | | | | |
| | | | 1,510,143 | | | | 1,262,248 | | | | 5,571,382 | | | | 5,442,731 | |
| | | | 318,719 | | | | 631,095 | | | | 402,893 | | | | 740,534 | |
| | | | — | | | | 210,537 | | | | — | | | | 89,503 | |
| | | | (193,163 | ) | | | (593,737 | ) | | | (524,899 | ) | | | (701,386 | ) |
| | | | 125,556 | | | | 247,895 | | | | (122,006 | ) | | | 128,651 | |
| | | | 1,635,699 | | | | 1,510,143 | | | | 5,449,376 | | | | 5,571,382 | |
|
|
| | | | |
| SEE NOTES TO FINANCIAL STATEMENTS | | TIAA-CREF Life Funds 2006 Semiannual Report | | 97 |
| | |
| Statements of changes in net assets | | TIAA-CREF Life Funds June 30, 2006 |
| | | | | | | | | | |
| | | Social Choice Equity Fund
| | | |
| | | For the Six
Months Ended
June 30, 2006 | | | For the
Year Ended
December 31, 2005 | | | |
| | | (unaudited) | | | | | | |
| | | |
CHANGE IN NET ASSETS | | | | | | | | | | |
| | | |
OPERATIONS | | | | | | | | | | |
Net investment income | | $ | 272,720 | | | $ | 474,414 | | | |
Net realized gain (loss) on total investments | | | 395,689 | | | | 96,540 | | | |
Net change in unrealized appreciation (depreciation)
on total investments | | | 239,455 | | | | 1,503,138 | | | |
Net increase (decrease) from operations | | | 907,864 | | | | 2,074,092 | | | |
| | | |
DISTRIBUTIONS TO SHAREHOLDERS: | | | | | | | | | | |
From net investment income | | | — | | | | (470,848 | ) | | |
From net realized gain on total investments | | | — | | | | — | | | |
Total distributions | | | — | | | | (470,848 | ) | | |
| | | |
SHAREHOLDER TRANSACTIONS: | | | | | | | | | | |
Subscriptions | | | 1,784,875 | | | | 4,968,187 | | | |
Reinvestment of distributions | | | — | | | | 470,848 | | | |
Redemptions | | | (2,549,499 | ) | | | (2,090,108 | ) | | |
Total net shareholder transactions | | | (764,624 | ) | | | 3,348,927 | | | |
Total increase in net assets | | | 143,240 | | | | 4,952,171 | | | |
| | | |
NET ASSETS | | | | | | | | | | |
Beginning of period | | | 32,557,296 | | | | 27,605,125 | | | |
End of period | | $ | 32,700,536 | | | $ | 32,557,296 | | | |
|
Accumulated undistributed (distributions in excess of)
net investment income included in net assets | | $ | 276,942 | | | $ | 4,222 | | | |
|
| | | |
CHANGE IN FUND SHARES: | | | | | | | | | | |
Shares outstanding, beginning of period | | | 1,355,681 | | | | 1,213,270 | | | |
Shares sold | | | 71,930 | | | | 215,029 | | | |
Shares issued in reinvestment of distributions | | | — | | | | 19,289 | | | |
Shares redeemed | | | (102,278 | ) | | | (91,907 | ) | | |
Total net increase (decrease) in shares outstanding | | | (30,348 | ) | | | 142,411 | | | |
Shares outstanding, end of period | | | 1,325,333 | | | | 1,355,681 | | | |
|
| | | | |
| 98 | | 2006 Semiannual Report TIAA-CREF Life Funds | | SEE NOTES TO FINANCIAL STATEMENTS |
continued
| | | | | | | | | | | | | | | | |
| | | Real Estate Securities Fund
| | | Bond Fund
| |
| | | For the Six
Months Ended
June 30, 2006 | | | For the
Year Ended
December 31, 2005 | | | For the Six
Months Ended
June 30, 2006 | | | For the
Year Ended
December 31, 2005 | |
| | | (unaudited) | | | | | | (unaudited) | | | | |
| | | | |
| | | | | | | | | | | | | | | | | |
| | | | |
| | | | | | | | | | | | | | | | | |
| | | $ | 1,615,863 | | | $ | 1,851,498 | | | $ | 1,581,162 | | | $ | 2,723,996 | |
| | | | 1,127,980 | | | | 5,262,348 | | | | (286,412 | ) | | | (198,324 | ) |
| | | | 5,784,133 | | | | (2,730,020 | ) | | | (1,646,877 | ) | | | (983,732 | ) |
| | | | 8,527,976 | | | | 4,383,826 | | | | (352,127 | ) | | | 1,541,940 | |
| | | | |
| | | | | | | | | | | | | | | | | |
| | | | — | | | | (2,669,203 | ) | | | — | | | | (2,753,562 | ) |
| | | | — | | | | (7,722,423 | ) | | | — | | | | — | |
| | | | — | | | | (10,391,626 | ) | | | — | | | | (2,753,562 | ) |
| | | | |
| | | | | | | | | | | | | | | | | |
| | | | 10,247,215 | | | | 15,388,692 | | | | 4,006,272 | | | | 10,064,311 | |
| | | | — | | | | 10,391,626 | | | | — | | | | 2,753,562 | |
| | | | (7,836,794 | ) | | | (13,012,062 | ) | | | (2,062,945 | ) | | | (3,547,626 | ) |
| | | | 2,410,421 | | | | 12,768,256 | | | | 1,943,327 | | | | 9,270,247 | |
| | | | 10,938,397 | | | | 6,760,456 | | | | 1,591,200 | | | | 8,058,625 | |
| | | | |
| | | | | | | | | | | | | | | | | |
| | | | 70,659,274 | | | | 63,898,818 | | | | 66,434,050 | | | | 58,375,425 | |
| | | $ | 81,597,671 | | | $ | 70,659,274 | | | $ | 68,025,250 | | | $ | 66,434,050 | |
|
|
| | | $ | 798,158 | | | $ | (817,705 | ) | | $ | 1,581,162 | | | $ | — | |
|
|
| | | | |
| | | | | | | | | | | | | | | | | |
| | | | 2,280,802 | | | | 1,885,376 | | | | 2,717,951 | | | | 2,346,067 | |
| | | | 305,832 | | | | 452,162 | | | | 164,390 | | | | 399,505 | |
| | | | — | | | | 333,385 | | | | — | | | | 112,666 | |
| | | | (235,291 | ) | | | (390,121 | ) | | | (84,489 | ) | | | (140,287 | ) |
| | | | 70,541 | | | | 395,426 | | | | 79,901 | | | | 371,884 | |
| | | | 2,351,343 | | | | 2,280,802 | | | | 2,797,852 | | | | 2,717,951 | |
|
|
| | | | |
| SEE NOTES TO FINANCIAL STATEMENTS | | TIAA-CREF Life Funds 2006 Semiannual Report | | 99 |
| | | | |
| Statements of changes in net assets | | TIAA-CREF Life Funds June 30, 2006 | | concluded |
| | | | | | | | |
| | | Money Market Fund
| |
| | | For the Six
Months Ended
June 30, 2006 | | | For the
Year Ended
December 31, 2005 | |
| | | (unaudited) | | | | |
| | |
CHANGE IN NET ASSETS | | | | | | | | |
| | |
OPERATIONS | | | | | | | | |
Net investment income | | $ | 986,915 | | | $ | 1,140,391 | |
Net realized gain (loss) on total investments | | | (603 | ) | | | 161 | |
Net increase from operations | | | 986,312 | | | | 1,140,552 | |
| | |
DISTRIBUTIONS TO SHAREHOLDERS: | | | | | | | | |
From net investment income | | | (986,734 | ) | | | (1,140,535 | ) |
Total distributions | | | (986,734 | ) | | | (1,140,535 | ) |
| | |
SHAREHOLDER TRANSACTIONS: | | | | | | | | |
Seed money redemptions | | | (7,500,000 | ) | | | — | |
Subscriptions | | | 29,890,053 | | | | 57,852,777 | |
Reinvestment of distributions | | | 521,903 | | | | 499,609 | |
Redemptions | | | (15,054,081 | ) | | | (47,538,316 | ) |
Total net shareholder transactions | | | 7,857,875 | | | | 10,814,070 | |
Total increase in net assets | | | 7,857,453 | | | | 10,814,087 | |
| | |
NET ASSETS | | | | | | | | |
Beginning of period | | | 37,185,373 | | | | 26,371,286 | |
End of period | | $ | 45,042,826 | | | $ | 37,185,373 | |
|
|
Accumulated undistributed net investment income
included in net assets | | $ | 181 | | | $ | — | |
|
|
| | |
CHANGE IN FUND SHARES: | | | | | | | | |
Shares outstanding, beginning of period | | | 37,185,302 | | | | 26,371,232 | |
Seed money shares redeemed | | | (7,500,000 | ) | | | — | |
Shares sold | | | 29,890,053 | | | | 57,852,777 | |
Shares issued in reinvestment of distributions | | | 521,903 | | | | 499,609 | |
Shares redeemed | | | (15,054,081 | ) | | | (47,538,316 | ) |
Total net increase in shares outstanding | | | 7,857,875 | | | | 10,814,070 | |
Shares outstanding, end of period | | | 45,043,177 | | | | 37,185,302 | |
|
|
| | | | |
| 100 | | 2006 Semiannual Report TIAA-CREF Life Funds | | SEE NOTES TO FINANCIAL STATEMENTS |
[This page intentionally left blank.]
| | | | |
| | | TIAA-CREF Life Funds 2006 Semiannual Report | | 101 |
| | |
| Financial highlights | | TIAA-CREF Life Funds June 30, 2006 |
| | | | | | | | | | | | | | | | | | | | | | | | | | |
| | | Growth Equity Fund
| | | |
| | | For the
Six Months
Ended June 30,
2006 | | | For the Years Ended December 31,
| | | |
| | | | 2005 | | | 2004 | | | 2003 | | | 2002 | | | 2001 | | | |
| | | (Unaudited) | | | | | | | | | | | | | | | | | | |
| | | | | | | |
SELECTED PER SHARE DATA | | | | | | | | | | | | | | | | | | | | | | | | | | |
Net asset value, beginning of period | | $ | 14.23 | | | $ | 13.58 | | | $ | 12.88 | | | $ | 10.15 | | | $ | 14.60 | | | $ | 18.97 | | | |
Gain (loss) from investment operations: | | | | | | | | | | | | | | | | | | | | | | | | | | |
Net investment income | | | 0.06 | (a) | | | 0.09 | (a) | | | 0.12 | (a) | | | 0.09 | (a) | | | 0.07 | (a) | | | 0.05 | | | |
Net realized and unrealized gain (loss) on total investments | | | (0.45 | ) | | | 0.65 | | | | 0.70 | | | | 2.78 | | | | (4.45 | ) | | | (4.37 | ) | | |
Total gain (loss) from investment operations | | | (0.39 | ) | | | 0.74 | | | | 0.82 | | | | 2.87 | | | | (4.38 | ) | | | (4.32 | ) | | |
Less distributions from: | | | | | | | | | | | | | | | | | | | | | | | | | | |
Net investment income | | | — | | | | (0.09 | ) | | | (0.12 | ) | | | (0.14 | ) | | | (0.07 | ) | | | (0.05 | ) | | |
Total distributions | | | — | | | | (0.09 | ) | | | (0.12 | ) | | | (0.14 | ) | | | (0.07 | ) | | | (0.05 | ) | | |
Net asset value, end of period | | $ | 13.84 | | | $ | 14.23 | | | $ | 13.58 | | | $ | 12.88 | | | $ | 10.15 | | | $ | 14.60 | | | |
|
| | | | | | | |
TOTAL RETURN | | | (2.74 | )% | | | 5.43 | % | | | 6.39 | % | | | 28.30 | % | | | (30.01 | )% | | | (22.81 | )% | | |
| | | | | | |
RATIOS AND SUPPLEMENTAL DATA | | | | | | | | | | | | | | | | | | | | | | | |
Net assets at end of period (in thousands) | | $ | 27,609 | | | $ | 29,517 | | | $ | 28,282 | | | $ | 28,319 | | | $ | 40,537 | | | $ | 52,519 | | | |
Ratio of expenses to average net assets before expense waiver | | | 0.25 | %(d) | | | 0.26 | %(c) | | | 0.25 | % | | | 0.25 | % | | | 0.43 | %(b) | | | 0.46 | % | | |
Ratio of expenses to average net assets after expense waiver | | | 0.25 | %(d) | | | 0.26 | %(c) | | | 0.25 | % | | | 0.25 | % | | | 0.25 | % | | | 0.25 | % | | |
Ratio of net investment income to average net assets | | | 0.85 | %(d) | | | 0.66 | % | | | 0.95 | % | | | 0.82 | % | | | 0.61 | % | | | 0.35 | % | | |
Portfolio turnover rate | | | 101 | %(d) | | | 106 | % | | | 79 | % | | | 78 | % | | | 54 | % | | | 42 | % | | |
|
| (a) | Based on average shares outstanding. |
| (b) | Waiver was eliminated effective October 28, 2002. |
| (c) | Includes 0.01% of overdraft charges included in interest expense. |
| (d) | The percentages shown for this period are annualized. |
| | | | |
| 102 | | 2006 Semiannual Report TIAA-CREF Life Funds | | SEE NOTES TO FINANCIAL STATEMENTS |
| | | | | | | | | | | | | | | | | | | | | | | | |
| | | Growth & Income Fund
| |
| | | For the
Six Months
Ended
June 30,
2006 | | | For the Years Ended December 31,
| |
| | | | 2005 | | | 2004 | | | 2003 | | | 2002 | | | 2001 | |
| | | (Unaudited) | | | | | | | | | | | | | | | | |
| | | | | | |
| | | | | | | | | | | | | | | | | | | | | | | | | |
| | | $ | 21.56 | | | $ | 20.49 | | | $ | 18.93 | | | $ | 15.22 | | | $ | 20.28 | | | $ | 23.57 | |
| | | | | | | | | | | | | | | | | | | | | | | | | |
| | | | 0.16 | (a) | | | 0.29 | (a) | | | 0.32 | (a) | | | 0.23 | (a) | | | 0.21 | (a) | | | 0.20 | |
| | | | 0.41 | | | | 1.06 | | | | 1.56 | | | | 3.79 | | | | (5.07 | ) | | | (3.29 | ) |
| | | | 0.57 | | | | 1.35 | | | | 1.88 | | | | 4.02 | | | | (4.86 | ) | | | (3.09 | ) |
| | | | | | | | | | | | | | | | | | | | | | | | | |
| | | | — | | | | (0.28 | ) | | | (0.32 | ) | | | (0.31 | ) | | | (0.20 | ) | | | (0.20 | ) |
| | | | — | | | | (0.28 | ) | | | (0.32 | ) | | | (0.31 | ) | | | (0.20 | ) | | | (0.20 | ) |
| | | $ | 22.13 | | | $ | 21.56 | | | $ | 20.49 | | | $ | 18.93 | | | $ | 15.22 | | | $ | 20.28 | |
|
|
| | | | | | |
| | | | 2.64 | % | | | 6.57 | % | | | 9.94 | % | | | 26.39 | % | | | (23.95 | )% | | | (13.13 | )% |
| | | | | | |
| | | | | | | | | | | | | | | | | | | | | | | | | |
| | | $ | 51,811 | | | $ | 51,627 | | | $ | 47,748 | | | $ | 44,403 | | | $ | 51,553 | | | $ | 62,313 | |
| | | | 0.23 | %(d) | | | 0.23 | % | | | 0.23 | % | | | 0.23 | % | | | 0.41 | %(b) | | | 0.44 | % |
| | | | 0.23 | %(d) | | | 0.23 | % | | | 0.23 | % | | | 0.23 | % | | | 0.23 | % | | | 0.23 | % |
| | | | 1.46 | %(d) | | | 1.41 | % | | | 1.66 | % | | | 1.41 | % | | | 1.18 | % | | | 1.04 | % |
| | | | 122 | %(d) | | | 205 | % | | | 85 | % | | | 137 | % | | | 112 | % | | | 62 | % |
|
|
| | | | |
| SEE NOTES TO FINANCIAL STATEMENTS | | TIAA-CREF Life Funds 2006 Semiannual Report | | 103 |
| | |
| Financial highlights | | TIAA-CREF Life Funds June 30, 2006 |
| | | | | | | | | | | | | | | | | | | | | | | | | | |
| | | International Equity Fund
| | | |
| | |
For the
Six Months
Ended
June 30,
2006 | | | For the Years Ended December 31,
| | | |
| | | | 2005 | | | 2004 | | | 2003 | | | 2002 | | | 2001 | | | |
| | | (Unaudited) | | | | | | | | | | | | | | | | | | |
| | | | | | | |
SELECTED PER SHARE DATA | | | | | | | | | | | | | | | | | | | | | | | | | | |
Net asset value, beginning of
period | | $ | 19.54 | | | $ | 17.25 | | | $ | 14.93 | | | $ | 10.76 | | | $ | 12.88 | | | $ | 17.14 | | | |
Gain (loss) from investment operations: | | | | | | | | | | | | | | | | | | | | | | | | | | |
Net investment income | | | 0.29 | (a) | | | 0.31 | (a) | | | 0.29 | (a) | | | 0.26 | (a) | | | 0.20 | (a) | | | 0.18 | | | |
Net realized and unrealized
gain (loss) on total investments | | | 1.88 | | | | 2.28 | | | | 2.35 | | | | 4.15 | | | | (2.06 | ) | | | (4.26 | ) | | |
Total gain (loss) from investment operations | | | 2.17 | | | | 2.59 | | | | 2.64 | | | | 4.41 | | | | (1.86 | ) | | | (4.08 | ) | | |
Less distributions from: | | | | | | | | | | | | | | | | | | | | | | | | | | |
Net investment income | | | — | | | | (0.30 | ) | | | (0.32 | ) | | | (0.24 | ) | | | (0.19 | ) | | | (0.18 | ) | | |
In excess of net investment income | | | — | | | | — | | | | — | | | | — | | | | (0.07 | ) | | | — | | | |
Net realized gains | | | — | | | | — | | | | — | | | | — | | | | — | | | | — | | | |
Total distributions | | | — | | | | (0.30 | ) | | | (0.32 | ) | | | (0.24 | ) | | | (0.26 | ) | | | (0.18 | ) | | |
Net asset value, end of period | | $ | 21.71 | | | $ | 19.54 | | | $ | 17.25 | | | $ | 14.93 | | | $ | 10.76 | | | $ | 12.88 | | | |
|
| | | | | | | |
TOTAL RETURN | | | 11.11 | % | | | 15.01 | % | | | 17.72 | % | | | 41.06 | % | | | (14.40 | )% | | | (23.81 | )% | | |
| | | | | | |
RATIOS AND SUPPLEMENTAL DATA | | | | | | | | | | | | | | | | | | | | | | | |
Net assets at end of period
(in thousands) | | $ | 89,352 | | | $ | 72,597 | | | $ | 52,151 | | | $ | 47,879 | | | $ | 33,738 | | | $ | 35,014 | | | |
Ratio of expenses to average net assets before expense waiver | | | 0.29 | %(d) | | | 0.31 | %(c) | | | 0.29 | % | | | 0.29 | % | | | 0.49 | %(b) | | | 0.53 | % | | |
Ratio of expenses to average net assets after expense waiver | | | 0.29 | %(d) | | | 0.31 | %(c) | | | 0.29 | % | | | 0.29 | % | | | 0.29 | % | | | 0.29 | % | | |
Ratio of net investment income
to average net assets | | | 2.72 | %(d) | | | 1.75 | % | | | 1.87 | % | | | 2.15 | % | | | 1.68 | % | | | 1.33 | % | | |
Portfolio turnover rate | | | 174 | %(d) | | | 153 | % | | | 158 | % | | | 139 | % | | | 53 | % | | | 102 | % | | |
|
| (a) | Based on average shares outstanding. |
| (b) | Waiver was eliminated effective October 28, 2002. |
| (c) | Includes 0.02% of overdraft charges included in interest expense. |
| (d) | The percentages shown for this period are annualized. |
| (e) | Includes 0.01% of overdraft charges included in interest expense. |
| | | | |
| 104 | | 2006 Semiannual Report TIAA-CREF Life Funds | | SEE NOTES TO FINANCIAL STATEMENTS |
continued
| | | | | | | | | | | | | | | | | | | | | | | | |
| | | Large-Cap Value Fund
| |
| | | For the
Six Months
Ended
June 30,
2006 | | | For the Years Ended December 31,
| | | For the Period
October 28, 2002
(effective date
of SEC
registration) to
December 31,
2002 (e) | | | For the Period
September 4, 2002
(commencement
of operations) to
December 31,
2002 (e) | |
| | | | 2005 | | | 2004 | | | 2003 | | | |
| | | (Unaudited) | | | | | | | | | | | | | | | | |
| | | | | | |
| | | | | | | | | | | | | | | | | | | | | | | | | |
| | | $ | 32.04 | | | $ | 33.07 | | | $ | 31.62 | | | $ | 24.84 | | | $ | 24.60 | | | $ | 25.00 | |
| | | | | | | | | | | | | | | | | | | | | | | | | |
| | | | 0.30 | (a) | | | 0.72 | (a) | | | 0.74 | (a) | | | 0.60 | (a) | | | 0.12 | (a) | | | 0.17 | (a) |
| | |
|
1.80 |
| | | 0.95 | | | | 5.82 | | | | 7.65 | | | | 0.28 | | | | (0.17 | ) |
| | |
|
2.10 |
| | | 1.67 | | | | 6.56 | | | | 8.25 | | | | 0.40 | | | | — | |
| | | | | | | | | | | | | | | | | | | | | | | | | |
| | | | — | | | | (0.70 | ) | | | (0.67 | ) | | | (0.57 | ) | | | (0.16 | ) | | | (0.16 | ) |
| | |
|
— |
| | | — | | | | — | | | | — | | | | — | | | | — | |
| | | | — | | | | (2.00 | ) | | | (4.44 | ) | | | (0.90 | ) | | | — | | | | — | |
| | | | — | | | | (2.70 | ) | | | (5.11 | ) | | | (1.47 | ) | | | (0.16 | ) | | | (0.16 | ) |
| | | $ | 34.14 | | | $ | 32.04 | | | $ | 33.07 | | | $ | 31.62 | | | $ | 24.84 | | | $ | 24.84 | |
|
|
| | | | | | |
| | | | 6.52 | % | | | 4.94 | % | | | 20.76 | % | | | 33.23 | % | | | 1.63 | % | | | 0.01 | % |
| | | | | | |
| | | | | | | | | | | | | | | | | | | | | | | | | |
| | | $ | 53,387 | | | $ | 49,028 | | | $ | 42,428 | | | $ | 29,760 | | | $ | 20,178 | | | $ | 20,178 | |
| | |
|
0.24 |
%(d) | | | 0.25 | %(e) | | | 0.24 | % | | | 0.24 | % | | | 0.04 | % | | | 0.08 | % |
| | |
|
0.24 |
%(d) | | | 0.25 | %(e) | | | 0.24 | % | | | 0.24 | % | | | 0.04 | % | | | 0.08 | % |
| | |
|
1.81 |
%(d) | | | 2.17 | % | | | 2.23 | % | | | 2.19 | % | | | 0.46 | % | | | 0.69 | % |
| | | | 122 | %(d) | | | 112 | % | | | 149 | % | | | 159 | % | | | 70 | % | | | 94 | % |
|
|
| | | | |
| SEE NOTES TO FINANCIAL STATEMENTS | | TIAA-CREF Life Funds 2006 Semiannual Report | | 105 |
| | |
| Financial highlights | | TIAA-CREF Life Funds June 30, 2006 |
| | | | | | | | | | | | | | | | | | | | | | | | | | |
| | | Small-Cap Equity Fund
| | | |
| | | For the
Six Months
Ended
June 30,
2006 | | | For the Years Ended
December 31,
| | | For the Period
October 28,
2002
(effective date
of SEC
registration) to
December 31,
2002 (e) | | | For the Period
September 4,
2002
(commencement
of operations) to
December 31,
2002 (e) | | | |
| | | | 2005 | | | 2004 | | | 2003 | | | | | |
| | | (Unaudited) | | | | | | | | | | | | | | | | | | |
| | | | | | |
SELECTED PER SHARE DATA | | | | | | | | | | | | | | | | | | | | | | | |
Net asset value, beginning of period | | $ | 30.02 | | | $ | 33.43 | | | $ | 32.98 | | | $ | 24.63 | | | $ | 23.94 | | | $ | 25.00 | | | |
Gain (loss) from investment operations: | | | | | | | | | | | | | | | | | | | | | | | | | | |
Net investment income | | | 0.18 | (a) | | | 0.33 | (a) | | | 0.39 | (a) | | | 0.39 | (a) | | | 0.08 | (a) | | | 0.13 | (a) | | |
Net realized and unrealized gain (loss) on total investments | | | 2.54 | | | | 1.30 | | | | 6.17 | | | | 11.71 | | | | 0.73 | | | | (0.38 | ) | | |
Total gain (loss) from investment operations | | | 2.72 | | | | 1.63 | | | | 6.56 | | | | 12.10 | | | | 0.81 | | | | (0.25 | ) | | |
Less distributions from: | | | | | | | | | | | | | | | | | | | | | | | | | | |
Net investment income | | | — | | | | (0.37 | ) | | | (0.39 | ) | | | (0.36 | ) | | | (0.12 | ) | | | (0.12 | ) | | |
Net realized gains | | | — | | | | (4.67 | ) | | | (5.72 | ) | | | (3.39 | ) | | | — | | | | — | | | |
Total distributions | | | — | | | | (5.04 | ) | | | (6.11 | ) | | | (3.75 | ) | | | (0.12 | ) | | | (0.12 | ) | | |
Net asset value, end of period | | $ | 32.74 | | | $ | 30.02 | | | $ | 33.43 | | | $ | 32.98 | | | $ | 24.63 | | | $ | 24.63 | | | |
|
| | | | | | | |
TOTAL RETURN | | | 9.03 | % | | | 4.58 | % | | | 19.83 | % | | | 48.95 | % | | | 3.40 | % | | | (0.98 | )% | | |
| | | | | |
RATIOS AND SUPPLEMENTAL DATA | | | | | | | | | | | | | | | | | | | |
Net assets at end of period (in thousands) | | $ | 53,550 | | | $ | 45,332 | | | $ | 42,194 | | | $ | 34,459 | | | $ | 20,044 | | | $ | 20,044 | | | |
Ratio of expenses to average net assets before expense waiver | | | 0.10 | %(d) | | | 0.12 | %(c) | | | 0.10 | % | | | 0.10 | % | | | 0.02 | % | | | 0.03 | % | | |
Ratio of expenses to average net assets after expense waiver | | | 0.10 | %(d) | | | 0.12 | %(c) | | | 0.10 | % | | | 0.10 | % | | | 0.02 | % | | | 0.03 | % | | |
Ratio of net investment income to average net assets | | | 1.09 | %(d) | | | 1.01 | % | | | 1.13 | % | | | 1.32 | % | | | 0.32 | % | | | 0.55 | % | | |
Portfolio turnover rate | | | 324 | %(d) | | | 400 | % | | | 221 | % | | | 237 | % | | | 43 | % | | | 57 | % | | |
|
| (a) | Based on average shares outstanding. |
| (b) | Waiver was eliminated effective October 28, 2002. |
| (c) | Includes 0.02% of overdraft charges included in interest expense. |
| (d) | The percentages shown for this period are annualized. |
| (e) | The percentages shown for this period are not annualized. |
| | | | |
| 106 | | 2006 Semiannual Report TIAA-CREF Life Funds | | SEE NOTES TO FINANCIAL STATEMENTS |
continued
| | | | | | | | | | | | | | | | | | | | | | | | |
| | | Stock Index Fund
| |
| | |
For the Six
Months
Ended
June 30,
2006 | | | For the Years Ended December 31,
| |
| | | | 2005 | | | 2004 | | | 2003 | | | 2002 | | | 2001 | |
| | | (Unaudited) | | | | | | | | | | | | | | | | |
| | | | | | |
| | | | | | | | | | | | | | | | | | | | | | | | | |
| | | $ | 27.45 | | | $ | 26.31 | | | $ | 23.93 | | | $ | 18.86 | | | $ | 24.45 | | | $ | 27.94 | |
| | | | | | | | | | | | | | | | | | | | | | | | | |
| | | | 0.25 | (a) | | | 0.46 | (a) | | | 0.46 | (a) | | | 0.35 | (a) | | | 0.33 | (a) | | | 0.30 | |
| | | | 0.63 | | | | 1.14 | | | | 2.38 | | | | 5.47 | | | | (5.56 | ) | | | (3.50 | ) |
| | | | 0.88 | | | | 1.60 | | | | 2.84 | | | | 5.82 | | | | (5.23 | ) | | | (3.20 | ) |
| | | | | | | | | | | | | | | | | | | | | | | | | |
| | | | — | | | | (0.46 | ) | | | (0.45 | ) | | | (0.36 | ) | | | (0.36 | ) | | | (0.23 | ) |
| | | | — | | | | — | | | | (0.01 | ) | | | (0.39 | ) | | | — | | | | (0.06 | ) |
| | | | — | | | | (0.46 | ) | | | (0.46 | ) | | | (0.75 | ) | | | (0.36 | ) | | | (0.29 | ) |
| | | $ | 28.33 | | | $ | 27.45 | | | $ | 26.31 | | | $ | 23.93 | | | $ | 18.86 | | | $ | 24.45 | |
|
|
| | | | | | |
| | | | 3.21 | % | | | 6.04 | % | | | 11.89 | % | | | 30.85 | % | | | (21.38 | )% | | | (11.44 | )% |
| | | | | | |
| | | | | | | | | | | | | | | | | | | | | | | | | |
| | | $ | 154,379 | | | $ | 152,936 | | | $ | 143,222 | | | $ | 118,320 | | | $ | 88,779 | | | $ | 94,517 | |
| | | | 0.06 | %(d) | | | 0.06 | % | | | 0.06 | % | | | 0.06 | % | | | 0.26 | %(b) | | | 0.30 | % |
| | | | 0.06 | %(d) | | | 0.06 | % | | | 0.06 | % | | | 0.06 | % | | | 0.07 | % | | | 0.07 | % |
| | | | 1.75 | %(d) | | | 1.73 | % | | | 1.88 | % | | | 1.68 | % | | | 1.56 | % | | | 1.28 | % |
| | | | 22 | %(d) | | | 8 | % | | | 12 | % | | | 26 | % | | | 9 | % | | | 8 | % |
|
|
| | | | |
| SEE NOTES TO FINANCIAL STATEMENTS | | TIAA-CREF Life Funds 2006 Semiannual Report | | 107 |
| | |
| Financial highlights | | TIAA-CREF Life Funds June 30, 2006 |
| | | | | | | | | | | | | | | | | | | | | | | | | | |
| | | Social Choice Equity Fund
| | | |
| | |
For the
Six Months
Ended
June 30,
2006 | | | For the Years Ended December 31,
| | | |
| | | | 2005 | | | 2004 | | | 2003 | | | 2002 | | | 2001 | | | |
| | | (Unaudited) | | | | | | | | | | | | | | | | | | |
| | | | | | | |
SELECTED PER SHARE DATA | | | | | | | | | | | | | | | | | | | | | | | | | | |
Net asset value, beginning of period | | $ | 24.02 | | | $ | 22.75 | | | $ | 20.60 | | | $ | 16.09 | | | $ | 20.61 | | | $ | 23.90 | | | |
Gain (loss) from investment operations: | | | | | | | | | | | | | | | | | | | | | | | | | | |
Net investment income | | | 0.20 | (a) | | | 0.38 | (a) | | | 0.39 | (a) | | | 0.29 | (a) | | | 0.26 | (a) | | | 0.24 | | | |
Net realized and unrealized gain (loss) on total investments | | | 0.45 | | | | 1.24 | | | | 2.16 | | | | 4.54 | | | | (4.52 | ) | | | (3.28 | ) | | |
Total gain (loss) from investment operations | | | 0.65 | | | | 1.62 | | | | 2.55 | | | | 4.83 | | | | (4.26 | ) | | | (3.04 | ) | | |
Less distributions from: | | | | | | | | | | | | | | | | | | | | | | | | | | |
Net investment income | | | — | | | | (0.35 | ) | | | (0.40 | ) | | | (0.32 | ) | | | (0.26 | ) | | | (0.22 | ) | | |
Net realized gains | | | — | | | | — | | | | — | | | | — | | | | — | | | | (0.03 | ) | | |
Total distributions | | | — | | | | (0.35 | ) | | | (0.40 | ) | | | (0.32 | ) | | | (0.26 | ) | | | (0.25 | ) | | |
Net asset value, end of period | | $ | 24.67 | | | $ | 24.02 | | | $ | 22.75 | | | $ | 20.60 | | | $ | 16.09 | | | $ | 20.61 | | | |
|
| | | | | | | |
TOTAL RETURN | | | 2.71 | % | | | 7.11 | % | | | 12.39 | % | | | 30.03 | % | | | (20.68 | )% | | | (12.72 | )% | | |
| | | | | | |
RATIOS AND SUPPLEMENTAL DATA | | | | | | | | | | | | | | | | | | | | | | | |
Net assets at end of period (in thousands) | | $ | 32,701 | | | $ | 32,557 | | | $ | 27,605 | | | $ | 26,510 | | | $ | 22,683 | | | $ | 25,333 | | | |
Ratio of expenses to average net assets before expense waiver | | | 0.07 | %(d) | | | 0.07 | % | | | 0.07 | % | | | 0.07 | % | | | 0.34 | %(b) | | | 0.39 | % | | |
Ratio of expenses to average net assets after expense waiver | | | 0.07 | %(d) | | | 0.07 | % | | | 0.07 | % | | | 0.07 | % | | | 0.17 | % | | | 0.18 | % | | |
Ratio of net investment income to average net assets | | | 1.64 | %(d) | | | 1.63 | % | | | 1.82 | % | | | 1.64 | % | | | 1.43 | % | | | 1.15 | % | | |
Portfolio turnover rate | | | 30 | %(d) | | | 8 | % | | | 5 | % | | | 15 | % | | | 27 | % | | | 10 | % | | |
|
| (a) | Based on average shares outstanding. |
| (b) | Waiver was eliminated effective October 28, 2002. |
| (c) | Includes 0.04% of overdraft charges included in interest expense. |
| (d) | The percentages shown for this period are annualized. |
| (e) | The percentages shown for this period are not annualized. |
| | | | |
| 108 | | 2006 Semiannual Report TIAA-CREF Life Funds | | SEE NOTES TO FINANCIAL STATEMENTS |
continued
| | | | | | | | | | | | | | | | | | | | | | | | |
| | | Real Estate Securities Fund
| |
| | | For the
Six Months
Ended
June 30,
2006 | | | For the Years Ended December 31,
| | | For the Period
October 28, 2002
(effective date
of SEC
registration) to
December 31,
2002 (e) | | | For the Period
September 4, 2002
(commencement of
operations) to
December 31,
2002 (e) | |
| | | | 2005 | | | 2004 | | | 2003 | | | |
| | | (Unaudited) | | | | | | | | | | | | | | | | |
| | | | | | |
| | | | | | | | | | | | | | | | | | | | | | | | | |
| | |
$ |
30.98 |
| | $ | 33.89 | | | $ | 30.00 | | | $ | 24.48 | | | $ | 23.67 | | | $ | 25.00 | |
| | | | | | | | | | | | | | | | | | | | | | | | | |
| | | | 0.70 | (a) | | | 0.96 | (a) | | | 1.45 | (a) | | | 1.54 | (a) | | | 0.25 | (a) | | | 0.44 | (a) |
| | |
|
3.02 |
| | | 1.51 | | | | 8.40 | | | | 8.24 | | | | 0.91 | | | | (0.61 | ) |
| | |
|
3.72 |
| | | 2.47 | | | | 9.85 | | | | 9.78 | | | | 1.16 | | | | (0.17 | ) |
| | | | | | | | | | | | | | | | | | | | | | | | | |
| | | | — | | | | (1.38 | ) | | | (1.26 | ) | | | (1.39 | ) | | | (0.31 | ) | | | (0.31 | ) |
| | | | — | | | | (4.00 | ) | | | (4.70 | ) | | | (2.87 | ) | | | (0.04 | ) | | | (0.04 | ) |
| | | | — | | | | (5.38 | ) | | | (5.96 | ) | | | (4.26 | ) | | | (0.35 | ) | | | (0.35 | ) |
| | | $ | 34.70 | | | $ | 30.98 | | | $ | 33.89 | | | $ | 30.00 | | | $ | 24.48 | | | $ | 24.48 | |
|
|
| | | | | | |
| | | | 12.01 | % | | | 7.19 | % | | | 32.98 | % | | | 39.96 | % | | | 4.94 | % | | | (0.65 | )% |
| | | | | | |
| | | | | | | | | | | | | | | | | | | | | | | | | |
| | |
$ |
81,598 |
| | $ | 70,659 | | | $ | 63,899 | | | $ | 35,311 | | | $ | 20,194 | | | $ | 20,194 | |
| | |
|
0.25 |
%(d) | | | 0.29 | %(c) | | | 0.25 | % | | | 0.25 | % | | | 0.04 | % | | | 0.08 | % |
| | |
|
0.25 |
%(d) | | | 0.29 | %(c) | | | 0.25 | % | | | 0.25 | % | | | 0.04 | % | | | 0.08 | % |
| | |
|
4.22 |
%(d) | | | 2.80 | % | | | 4.41 | % | | | 5.32 | % | | | 1.03 | % | | | 1.80 | % |
| | | | 125 | %(d) | | | 239 | % | | | 315 | % | | | 189 | % | | | 100 | % | | | 117 | % |
|
|
| | | | |
| SEE NOTES TO FINANCIAL STATEMENTS | | TIAA-CREF Life Funds 2006 Semiannual Report | | 109 |
| | |
| Financial highlights | | TIAA-CREF Life Funds June 30, 2006 |
| | | | | | | | | | | | | | | | | | |
| | | Bond Fund
| | | |
| | | For the
Six Months
Ended
June 30,
2006 | | | For the Years Ended
December 31,
| | | For the Period
July 8, 2003
(commencement of
operations/
effective date
of SEC
registration) to
December 31,
2003 (e) | | | |
| | | | 2005 | | | 2004 | | | |
| | | (Unaudited) | | | | | | | | | | | | |
| | | | | |
SELECTED PER SHARE DATA | | | | | | | | | | | | | | | | | | |
Net asset value, beginning of period | | $ | 24.44 | | | $ | 24.88 | | | $ | 24.74 | | | $ | 25.00 | | | |
Gain (loss) from investment operations: | | | | | | | | | | | | | | | | | | |
Net investment income | | | 0.57 | (a) | | | 1.10 | (a) | | | 0.95 | (a) | | | 0.40 | (a) | | |
Net realized and unrealized gain (loss) on total investments | | | (0.70 | ) | | | (0.48 | ) | | | 0.09 | | | | (0.24 | ) | | |
Total gain (loss) from investment operations | | | (0.13 | ) | | | 0.62 | | | | 1.04 | | | | 0.16 | | | |
Less distributions from: | | | | | | | | | | | | | | | | | | |
Net investment income | | | — | | | | (1.06 | ) | | | (0.90 | ) | | | (0.40 | ) | | |
Net realized gains | | | — | | | | — | | | | — | | | | (0.02 | ) | | |
Total distributions | | | — | | | | (1.06 | ) | | | (0.90 | ) | | | (0.42 | ) | | |
Net asset value, end of period | | $ | 24.31 | | | $ | 24.44 | | | $ | 24.88 | | | $ | 24.74 | | | |
|
| | | | | |
TOTAL RETURN | | | (0.53 | )% | | | 2.51 | % | | | 4.21 | % | | | 0.67 | % | | |
| | | | | |
RATIOS AND SUPPLEMENTAL DATA | | | | | | | | | | | | | | | | | | |
Net assets at end of period
(in thousands) | | $ | 68,025 | | | $ | 66,434 | | | $ | 58,375 | | | $ | 50,018 | | | |
Ratio of expenses to average net assets | | | 0.10 | %(d) | | | 0.10 | % | | | 0.10 | % | | | 0.05 | % | | |
Ratio of net investment income to average net assets | | | 4.74 | %(d) | | | 4.35 | % | | | 3.78 | % | | | 1.63 | % | | |
Portfolio turnover rate | | | 84 | %(d) | | | 78 | % | | | 103 | % | | | 272 | % | | |
|
| (a) | Based on average shares outstanding. |
| (d) | The percentages shown for this period are annualized. |
| (e) | The percentages shown for this period are not annualized. |
| (f) | Amount represents less than $0.01 per share. |
N/A—Not applicable.
| | | | |
| 110 | | 2006 Semiannual Report TIAA-CREF Life Funds | | SEE NOTES TO FINANCIAL STATEMENTS |
concluded
| | | | | | | | | | | | | | | | |
| | | Money Market Fund
| |
| | | For the
Six Months
Ended
June 30,
2006 | | | For the Years Ended
December 31,
| | | For the Period
July 8, 2003
(commencement of
operations/
effective date
of SEC
registration) to
December 31,
2003 (e) | |
| | | | 2005 | | | 2004 | | |
| | | (Unaudited) | | | | | | | | | | |
| | | | |
| | | | | | | | | | | | | | | | | |
| | | $ | 1.00 | | | $ | 1.00 | | | $ | 1.00 | | | $ | 1.00 | |
| | | | | | | | | | | | | | | | | |
| | | | 0.02 | (a) | | | 0.03 | (a) | | | 0.01 | (a) | | | 0.00 | (a)(f) |
| | |
|
— |
| | | — | | | | — | | | | — | |
| | | | 0.02 | | | | 0.03 | | | | 0.01 | | | | 0.00 | (f) |
| | | | | | | | | | | | | | | | | |
| | | | (0.02 | ) | | | (0.03 | ) | | | (0.01 | ) | | | 0.00 | (f) |
| | | | — | | | | — | | | | — | | | | — | |
| | | | (0.02 | ) | | | (0.03 | ) | | | (0.01 | ) | | | 0.00 | (f) |
| | | $ | 1.00 | | | $ | 1.00 | | | $ | 1.00 | | | $ | 1.00 | |
|
|
| | | | |
| | | | 2.35 | % | | | 3.25 | % | | | 1.34 | % | | | 0.49 | % |
| | | | |
| | | | | | | | | | | | | | | | | |
| | |
$ |
45,043 |
| | $ | 37,185 | | | $ | 26,371 | | | $ | 20,824 | |
| | | | 0.06 | %(d) | | | 0.06 | % | | | 0.06 | % | | | 0.03 | % |
| | |
|
4.71 |
%(d) | | | 3.24 | % | | | 1.35 | % | | | 0.46 | % |
| | | | N/A | | | | N/A | | | | N/A | | | | N/A | |
|
|
| | | | |
| SEE NOTES TO FINANCIAL STATEMENTS | | TIAA-CREF Life Funds 2006 Semiannual Report | | 111 |
| | |
| Notes to financial statements (unaudited) | | TIAA-CREF Life Funds |
Note 1—significant accounting policies
TIAA-CREF Life Funds (the “Funds” or individually, the “Fund”) is a Delaware statutory trust that was organized on August 13, 1998, and is registered with the Securities and Exchange Commission (“Commission”) under the Investment Company Act of 1940 as an open-end management investment company. The Funds consist of ten series (each referred to as a “Fund”). Certain registered separate accounts (“the Account”) of TIAA-CREF Life Insurance Company (“TIAA-CREF Life”), which is a wholly owned subsidiary of Teachers Insurance and Annuity Association of America (“TIAA”), have various sub-accounts which correspond to and invest in the Funds. The Stock Index Fund commenced operations on December 1, 1998. The Growth Equity, Growth & Income, International Equity and Social Choice Equity Funds commenced operations on March 1, 2000. The Large-Cap Value, Small-Cap Equity and Real Estate Securities Funds commenced operations on September 4, 2002. The Bond and Money Market Funds commenced operations on July 8, 2003. TIAA invested seed money in each of the Funds at its commencement of operations. At June 30, 2006, the Accounts and TIAA held the following amounts in the Funds:
| | | | | | |
| | | Investments in Funds Held By:
|
| | | Accounts | | TIAA |
Growth Equity Fund | | $ | 27,608,091 | | $ | — |
Growth & Income Fund | | | 41,697,327 | | | 10,112,204 |
International Equity Fund | | | 65,145,597 | | | 24,194,829 |
Large-Cap Value Fund | | | 30,440,878 | | | 22,940,364 |
Small-Cap Equity Fund | | | 31,324,414 | | | 22,224,178 |
Stock Index Fund | | | 154,375,905 | | | — |
Social Choice Equity Fund | | | 22,017,939 | | | 10,681,940 |
Real Estate Securities Fund | | | 48,809,256 | | | 32,785,784 |
Bond Fund | | | 15,448,386 | | | 52,576,864 |
Money Market Fund | | | 32,542,826 | | | 12,500,000 |
The accompanying financial statements were prepared in accordance with U.S. generally accepted accounting principles which may require the use of estimates made by management. Actual results may differ from those estimates. The following is a summary of the significant accounting policies consistently followed by the Funds.
Valuation of investments: Equity securities listed or traded on a national market or exchange are valued based on their sale price on such market or exchange at the close of business on the date of valuation, or at the mean of the closing bid and asked prices if no sale is reported. Net asset value of underlying funds is calculated as of the close of business of the New York Stock Exchange (generally 4:00 p.m. Eastern Time). Debt securities will generally be valued using prices provided by a pricing service, which may employ various indications of value including but not limited to broker-dealer quotations. Certain debt securities, other than money market instruments, are valued based on the most recent bid price or the equiv - -
| | | | |
| 112 | | 2006 Semiannual Report TIAA-CREF Life Funds | | |
| | |
| Notes to financial statements (unaudited) | | continued |
alent quoted yield for such securities (or those of comparable maturity, quality and type). Money market instruments (other than those in the Money Market Fund), with maturities of one year or less, are valued in the same manner as debt securities or derived from a pricing matrix that has various types of money market instruments along one axis and various maturities along the other. For the Money Market Fund, all of its investments are valued using the amortized cost method. Investments in other registered investment companies are valued at their net asset value. Foreign investments are valued at the closing values of such securities as of the date of valuation under the generally accepted valuation method in the country where traded, converted to U.S. dollars at the prevailing rates of exchange on the date of valuation. Stock and bond index futures and options, which are traded on commodities exchanges, are valued at the last sale price as of the close of such commodities exchanges.
Portfolio securities for which market quotations are not readily available are valued at fair value, as determined in good faith under the direction of the Board of Trustees. Portfolio securities may also be valued at fair value as determined in good faith under the direction of the Board of Trustees if events materially affecting their value occur between the time their price is determined and the time a Fund’s net asset value is calculated. The fair value of securities may be determined with the assistance of a pricing service, which attempts to calculate a fair value for securities based on numerous factors, including correlations of a security’s price with securities indices and other appropriate indicators, such as American Depositary Receipts and futures contracts. Other factors may also be considered in determining fair value, such as fundamental analytical data, market and trading trends, and public trading of similar securities of the issuer or comparable issuers.
Trading in securities on most foreign exchanges and over the counter markets is normally completed before the close of the domestic stock market and may also take place on days when the domestic market is closed. If events materially affecting the value of foreign securities occur between the time when the exchange on which they are traded closes and the time when the Fund’s net assets are calculated, such securities may be valued at fair value in accordance with procedures adopted by the Board of Trustees. The Funds have retained an independent fair value pricing service to assist in the fair valuation process for Funds that primarily invest in international securities.
Accounting for investments: Securities transactions and investments in Underlying Funds are accounted for as of the trade date. Interest income is recorded as earned and includes amortization of discounts and premiums using the effective yield method. Dividend income is recorded on the ex-dividend date or, for certain foreign securities, as soon thereafter as the Funds are informed of the ex-dividend date. Realized gains and losses on securities transactions are based upon the specific identification method for both financial statement and federal income tax purposes.
Accounting for Real Estate Investments Trusts: The Funds may own shares of Real Estate Investment Trusts (“REITs” or individually, “REIT”). The Real Estate
| | | | |
| | | TIAA-CREF Life Funds 2006 Semiannual Report | | 113 |
| | |
| Notes to financial statements (unaudited) | | continued |
Securities Fund invests a substantial portion of its assets in such REITs; therefore it may be more affected by economic developments in the real estate industry than would a general equity fund.
REITs report information on the source of their distributions once per year, in January. Such distributions may include one or more of the following components: ordinary income, long-term capital gains or a return of capital. The Funds have estimated what the components of these REIT distributions are and have reflected these amounts accordingly in the financial statements.
Foreign currency transactions and translation: Portfolio investments and other assets and liabilities denominated in foreign currencies are translated into U.S. dollars at the exchange rates prevailing at the end of the period. Purchases and sales of securities, income receipts and expense payments made in foreign currencies are translated into U.S. dollars at the exchange rates prevailing on the respective dates of the transactions. The effects of changes in foreign currency exchange rates on portfolio investments are included in the net realized and unrealized gains and losses on investments. Net realized gains and losses on foreign currency transactions include maturities of forward foreign currency contracts, disposition of foreign currencies, and currency gains and losses between the accrual and receipt dates of portfolio investment income and between the trade and settlement dates of portfolio investment transactions.
Forward foreign currency contracts: The Funds may use forward foreign currency contracts to facilitate transactions in securities denominated in foreign currencies. Such contracts are entered into directly with a counterparty and are “marked-to-market” at the end of each day’s trading. The Funds are also exposed to credit risk associated with counterparty nonperformance on these forward foreign currency contracts, which is typically limited to the unrealized gain on each open contract.
Forward foreign currency contracts will be used primarily to protect the Funds from adverse currency movements and will generally not be entered into for terms greater than one year. The use of forward foreign currency contracts does not eliminate fluctuations in the underlying prices of a Fund’s investment securities; however, it does establish a rate of exchange that can be achieved in the future. The use of forward foreign currency contracts involves the risk that anticipated currency movements will not be accurately predicted. A forward foreign currency contract would limit the risk of loss due to a decline in the value of a particular currency; however, it also would limit any potential gain that might result should the value of the currency increase instead of decrease. These contracts may involve market risk in excess of the unrealized gain or loss reflected in the Statements of assets and liabilities. In addition, the Funds could be exposed to risks if counterparties to the contracts are unable to meet the terms of their contracts. The use of derivative instruments involves, to varying degrees, elements of market risk in excess of the amount recognized in the Statements of assets and liabilities. There were no open forward foreign currency contracts as of the end of the six month period ended June 30, 2006.
| | | | |
| 114 | | 2006 Semiannual Report TIAA-CREF Life Funds | | |
| | |
| Notes to financial statements (unaudited) | | continued |
Futures contracts: The Funds may use futures contracts to manage exposure to the equity markets or for cash management purposes to remain highly invested in the equity markets while minimizing transaction costs. Buying futures contracts tends to increase exposure to the underlying instrument/index, while selling futures contracts tends to decrease exposure to the underlying instrument/index or hedge other investments. Initial margin deposits are made upon entering into a futures contract and variation margin payments are made or received reflecting changes in the value of the futures contracts. Futures contracts are valued at the last sale price as of the close of the board of trade or exchange on which they are traded. Daily changes in the value of such contracts are reflected in net unrealized gains and losses. Gains or losses are realized upon the expiration or closing of the futures contracts, or if the counterparties do not perform in accordance with contractual provisions.
Risks of investments in futures contracts include the possible adverse movement of the securities or indices underlying the contracts, the possibility that there may not be a liquid secondary market for the contracts, that a change in the value of the contract may not correlate with a change in the value of the underlying securities, or that the counterparty to a contract may default on its obligation to perform. There were no open futures contracts as of the end of the six month period ended June 30, 2006.
Securities purchased on a when-issued or delayed-delivery basis: The Funds may purchase securities on a when-issued or delayed-delivery basis. Securities purchased or sold on a when-issued or delayed-delivery basis may be settled a month or more after trade date; interest income is not accrued until settlement date. At the time a Fund enters into such transactions, it is required to have segregated assets with a current value at least equal to the amount of its when-issued or delayed-delivery purchase commitments. Credit risks exist on these commitments to the extent of any unrealized gains on the underlying securities purchased and any unrealized losses on the underlying securities sold. Market risk exists on these commitments to the same extent as if the securities were owned on a settled basis and gains and losses are recorded and reported in the same manner. In addition to, the normal credit and market risks, transactions with delayed settlement dates may expose the Funds to greater risk that such transactions may not be consummated.
Treasury Inflation-Protected Securities: The Bond Fund invests in Treasury Inflation-Protected Securities (“TIPS”), specially structured bonds in which the principal amount is adjusted daily to keep pace with inflation, as measured by the U.S. Consumer Price Index (“CPI”). The adjustments for interest income due to inflation are reflected in interest income in the Statements of operations. TIPS are backed by the full faith and credit of the U.S. Government. TIPS are subject to interest rate risk. However, because TIPS have better price protection through inflation adjustments, they tend to perform well in a rising interest-rate environment if rates increase due to inflation.
Restricted securities: Restricted securities held by the Funds, if any, may not be sold except in exempt transactions or in a public offering registered under the
| | | | |
| | | TIAA-CREF Life Funds 2006 Semiannual Report | | 115 |
| | |
| Notes to financial statements (unaudited) | | continued |
Securities Act of 1933. The risk of investing in such securities is generally greater than the risk of investing in securities that are widely held and publicly traded.
Distributions to shareholders: Distributions from net investment income, if any, are declared and paid annually for each of the Funds, except for the Money Market Fund, in which case distributions are declared daily and paid monthly. Distributions from realized gains, if any, are declared and paid annually for each of the Funds to the extent they exceed available capital loss carryovers. Accumulated undistributed net investment income and accumulated undistributed net realized gain (loss) on total investments may include temporary and permanent book and tax differences. Temporary differences will reverse in subsequent periods and are generally due to differing book and tax treatments for the timing and recognition of gains and losses on securities, forwards, and futures, including post-October losses. Permanent differences will result in reclassifications among the respective components of net assets and are generally due to REIT adjustments, foreign currency transactions, distribution reclassifications, and gains on certain equity securities designated and issued by “passive foreign investment companies”.
Income taxes: The Funds intend to continue to qualify as regulated investment companies under Subchapter M of the Internal Revenue Code (“Code”) and will not be subject to income taxes to the extent that they distribute all taxable income each year and comply with various other Code requirements. Therefore, no federal income tax provision is required.
The timing and character of income and capital gain distributions are determined in accordance with income tax regulations, which may differ from generally accepted accounting principles. Reclassifications are made to a Fund’s capital accounts for permanent tax differences to reflect income and gains available for distribution (or available capital loss carryforwards) under income tax regulations.
Foreign taxes: The Funds may be subject to foreign taxes on income, gains on investments or currency repatriation, a portion of which may be recoverable. The Funds will accrue such taxes and recoveries as applicable, based upon the current interpretation of tax rules and regulations that exist in the markets in which the Funds invest.
Transactions with affiliates: The Funds may purchase or sell investment securities in transactions with affiliated entities under procedures adopted by the Board of Trustees, pursuant to the Investment Company Act of 1940. These transactions are effected at market rates without incurring broker commissions.
Indemnification: In the normal course of business, each Fund enters into contracts that contain a variety of representations and warranties and that provide general indemnities. A Fund’s maximum exposure under these arrangements is unknown, as this would involve future claims against the Fund that have not yet occurred. Also, under the Funds’ organizational documents, the Trustees and Officers of the TIAA-CREF Life Funds are indemnified against certain liabilities that may arise out of their duties to the TIAA-CREF Life Funds. However, based on experience, the Funds expect the risk of loss due to these warranties and indemnities to be remote.
| | | | |
| 116 | | 2006 Semiannual Report TIAA-CREF Life Funds | | |
| | |
| Notes to financial statements (unaudited) | | continued |
Note 2—management agreement
Teachers Advisors, Inc. (“Advisors”), a wholly owned subsidiary of TIAA and a registered investment adviser, provides investment advisory services for the Funds pursuant to an Investment Management Agreement between Advisors and the Funds. Under the terms of the Investment Management Agreement, each Fund pays a fee for investment management services, based on the average daily net assets of each Fund. During the six months ended June 30, 2006, Advisors received the following annualized percentage of each Fund’s average daily net assets:
| | | |
| | | Investment Management Fee | |
Growth Equity Fund | | 0.25 | % |
Growth & Income Fund | | 0.23 | % |
International Equity Fund | | 0.29 | % |
Large-Cap Value Fund | | 0.24 | % |
Small-Cap Equity Fund | | 0.10 | % |
Stock Index Fund | | 0.06 | % |
Social Choice Equity Fund | | 0.07 | % |
Real Estate Securities Fund | | 0.25 | % |
Bond Fund | | 0.10 | % |
Money Market Fund | | 0.06 | % |
Total investment management fees incurred for each Fund for the six months ended June 30, 2006, are reflected in the Statements of operations.
Note 3—investments
At June 30, 2006, net unrealized appreciation (depreciation) of portfolio investments, consisting of gross unrealized appreciation and gross unrealized depreciation, was as follows:
| | | | | | | | | | | |
| | | Gross Unrealized Appreciation | | Gross Unrealized Depreciation | | | Net Unrealized Appreciation (Depreciation) | |
Growth Equity Fund | | $ | 2,488,235 | | $ | (1,813,819 | ) | | $ | 674,416 | |
Growth & Income Fund | | | 4,901,161 | | | (1,092,327 | ) | | | 3,808,834 | |
International Equity Fund | | | 8,610,793 | | | (1,176,130 | ) | | | 7,434,663 | |
Large-Cap Value Fund | | | 6,602,085 | | | (1,041,680 | ) | | | 5,560,405 | |
Small-Cap Equity Fund | | | 3,997,120 | | | (1,948,965 | ) | | | 2,048,155 | |
Stock Index Fund | | | 33,705,871 | | | (24,910,031 | ) | | | 8,795,840 | |
Social Choice Equity Fund | | | 6,842,309 | | | (6,353,925 | ) | | | 488,384 | |
Real Estate Securities Fund | | | 9,679,183 | | | (843,073 | ) | | | 8,836,110 | |
Bond Fund | | | 16,103 | | | (2,697,556 | ) | | | (2,681,453 | ) |
| | | | |
| | | TIAA-CREF Life Funds 2006 Semiannual Report | | 117 |
| | |
| Notes to financial statements (unaudited) | | continued |
For the six months ended June 30, 2006, purchases and sales of securities, other than short-term money market instruments, for all Funds, except the Money Market Fund, were as follows:
| | | | | | | | | | | | |
| | | Non-Government Purchases | | Government Purchases | | Non-Government Sales | | Government Sales |
Growth Equity Fund | | $ | 14,699,928 | | $ | — | | $ | 15,603,157 | | $ | — |
Growth & Income Fund | | | 32,165,566 | | | — | | | 33,140,308 | | | — |
International Equity Fund | | | 79,605,734 | | | — | | | 73,636,253 | | | — |
Large-Cap Value Fund | | | 33,252,459 | | | — | | | 31,647,648 | | | — |
Small-Cap Equity Fund | | | 87,354,303 | | | — | | | 83,084,294 | | | — |
Stock Index Fund | | | 16,942,068 | | | — | | | 18,585,303 | | | — |
Social Choice Equity Fund | | | 4,929,977 | | | — | | | 5,606,166 | | | — |
Real Estate Securities Fund | | | 51,810,172 | | | — | | | 47,622,553 | | | — |
Bond Fund | | | 8,527,677 | | | 22,335,368 | | | 6,247,788 | | | 20,817,174 |
Note 4—distributions to shareholders
The tax character of distributions paid to shareholders during the year ended December 31, 2005, was as follows:
| | | | | | | | | |
| | | 2005
|
| | | Ordinary Income | | Long-Term Capital Gain | | Total |
Growth Equity Fund | | $ | 182,267 | | $ | | | $ | 182,267 |
Growth & Income Fund | | | 661,771 | | | — | | | 661,771 |
International Equity Fund | | | 1,130,293 | | | — | | | 1,130,293 |
Large-Cap Value Fund | | | 2,272,831 | | | 1,473,248 | | | 3,746,079 |
Small-Cap Equity Fund | | | 2,539,797 | | | 3,898,430 | | | 6,438,227 |
Stock Index Fund | | | 2,495,347 | | | — | | | 2,495,347 |
Social Choice Equity Fund | | | 470,848 | | | — | | | 470,848 |
Real Estate Securities Fund | | | 8,373,076 | | | 2,018,550 | | | 10,391,626 |
Bond Fund | | | 2,753,562 | | | — | | | 2,753,562 |
Money Market Fund | | | 1,140,535 | | | — | | | 1,140,535 |
The tax character of the fiscal year 2006 distributions will be determined at the end of the fiscal year.
| | | | |
| 118 | | 2006 Semiannual Report TIAA-CREF Life Funds | | |
| | |
| Notes to financial statements (unaudited) | | continued |
As of December 31, 2005, the components of accumulated earnings on a tax basis were as follows:
| | | | | | | | | | | | | | | | | | | | | | |
| | | Undistributed
Ordinary
Income | | Undistributed
Long-Term
Capital Gain | | Unrealized
Appreciation
(Depreciation) | | | Capital
Loss
Carryover | | | Post-
October
Losses | | | Total | |
Growth Equity Fund | | $ | 3,464 | | $ | — | | $ | 1,851,752 | | | $ | (39,014,281 | ) | | $ | (213,352 | ) | | $ | (37,372,417 | ) |
Growth & Income Fund | | | 9,845 | | | — | | | 3,211,465 | | | | (15,887,916 | ) | | | (521 | ) | | | (12,667,127 | ) |
International Equity Fund | | | 57,684 | | | — | | | 7,931,777 | | | | (13,663,641 | ) | | | (34,019 | ) | | | (5,708,199 | ) |
Stock Index Fund | | | 32,567 | | | — | | | 5,289,437 | | | | (657,581 | ) | | | — | | | | 4,664,423 | |
Social Choice Equity Fund | | | 7,335 | | | — | | | 239,004 | | | | (496,496 | ) | | | — | | | | (250,157 | ) |
Large-Cap Value Fund | | | 217,838 | | | 351,869 | | | 4,735,388 | | | | — | | | | (591 | ) | | | 5,304,504 | |
Small-Cap Equity Fund | | | 296,008 | | | 319,301 | | | 1,869,907 | | | | — | | | | — | | | | 2,485,216 | |
Real Estate Securities Fund | | | 231,914 | | | 89,102 | | | 2,267,145 | | | | — | | | | — | | | | 2,588,161 | |
Bond Fund | | | — | | | — | | | (1,079,663 | ) | | | (388,407 | ) | | | (56,393 | ) | | | (1,524,463 | ) |
Money Market Fund | | | 71 | | | — | | | — | | | | | | | | — | | | | 71 | |
The difference between book basis and tax basis net investment income, net realized gains and losses and unrealized appreciation and depreciation is attributable primarily to the tax deferral of losses on wash sales, the realization, for tax purposes, of unrealized gains and losses on certain forward foreign currency contracts, on investments in passive foreign investment companies, adjustments for REIT distributions, and the use of capital loss carryovers.
At December 31, 2005, the following funds had capital loss carryovers, which will expire as follows:
| | | | | | | | | | | | | | | | | | | | | |
| | | Date of Expiration
| | |
| | | 12/31/08 | | 12/31/09 | | 12/31/10 | | 12/31/11 | | 12/31/12 | | 12/31/13 | | Total |
Growth Equity Fund | | $ | 212,455 | | $ | 12,578,729 | | $ | 12,297,132 | | $ | 10,153,999 | | $ | 3,010,278 | | $ | 761,688 | | $ | 39,014,281 |
Growth & Income Fund | | | — | | | 1,960,652 | | | 8,825,685 | | | 5,101,579 | | | — | | | — | | $ | 15,887,916 |
International Equity Fund | | | — | | | 4,734,175 | | | 4,809,564 | | | 4,119,902 | | | — | | | — | | $ | 13,663,641 |
Stock Index Fund | | | — | | | — | | | — | | | — | | | — | | | 657,581 | | $ | 657,581 |
Social Choice Equity Fund | | | — | | | — | | | 496,496 | | | — | | | — | | | — | | $ | 496,496 |
Bond Fund | | | — | | | — | | | — | | | — | | | 115,865 | | | 272,542 | | $ | 388,407 |
For the year ended December 31, 2005, the Growth & Income Fund, International Equity Fund, and Social Choice Equity Fund utilized $662,929, $5,590,079, and $96,534, respectively of their capital loss carryover available from prior years.
| | | | |
| | | TIAA-CREF Life Funds 2006 Semiannual Report | | 119 |
| | |
| Notes to financial statements (unaudited) | | concluded |
Note 5—line of credit
Each of the Funds, except the Bond and Money Market Funds, participates in a $1.75 billion unsecured revolving credit facility to be used for temporary purposes, including the funding of shareholder redemptions. Certain affiliated accounts and mutual funds, each of which is managed by Advisors, or an affiliate of Advisors, also participate in this facility. An annual commitment fee for the credit facility is borne by Advisors. Interest associated with any borrowing under the facility by the Funds will be charged to Advisors rates that are based on the Federal Funds Rate in effect during the time of the borrowing. For the six months ended June 30, 2006, there were no borrowings under this credit facility by the Funds.
Note 6—subsequent event
On July 27, 2006, the Funds entered into a four-year agreement with State Street Bank and Trust Company to engage in securities lending transactions. Under the terms of the agreement, the Funds may lend portfolio securities to qualified borrowers consisting of financial institutions and brokers. By lending such securities, the Funds will attempt to increase their net investment income through the receipt of interest on collateral (after rebates and fees). The loans will be secured by collateral equal to at least 102% of the market value of the securities loaned for U.S. securities and 105% of the market value of the securities loaned for foreign securities. All cash collateral will be invested in the State Street Bank Navigator Securities Lending Prime Portfolio.
| | | | |
| 120 | | 2006 Semiannual Report TIAA-CREF Life Funds | | |
Board approval of investment management agreement
TIAA-CREF Life Funds’ Board is responsible for overseeing the TIAA-CREF Life Funds’ corporate policies and for adhering to fiduciary standards under the Investment Company Act of 1940. Most significantly, the Board is responsible for the initial approval and annual renewal of the TIAA-CREF Life Funds’ investment management agreement with Advisors (the “Management Agreement”). Under the Management Agreement, Teachers Advisors, Inc. (“Advisors”) assumes responsibility for providing to, or obtaining for, the TIAA-CREF Life Funds all of the services necessary for their ordinary operation, including investment advisory, transfer agency, dividend disbursing, custody, accounting and administrative services.
In considering whether to renew the Management Agreement, the Board, at its April 3, and May 16, 2006 meetings, reviewed the following factors with respect to each Fund: (1) the nature, extent and quality of services provided by Advisors to each Fund; (2) the investment performance of each Fund; (3) the costs of the services provided to each Fund and the profits realized or to be realized by Advisors and its affiliates from their relationship with the Funds; (4) the extent to which economies of scale have been realized as each Fund grows; (5) whether the level of fees reflects those economies of scale for the benefit of Fund investors; (6) comparisons of services and fees with contracts entered into by Advisors with other clients; and (7) any other benefits derived or anticipated to be derived by Advisors from its relationship with the Funds. The factors should be viewed in their totality, with no single factor being the principal factor in determining whether to approve the renewal of the Management Agreement.
Set forth below are the general factors the Board considered for all of the Funds, followed by an outline of the specific factors the Board considered for each particular Fund.
The Nature, Extent and Quality of Services. The Board considered that Advisors is an experienced investment adviser that has managed the TIAA-CREF Mutual Funds since 1997, the TIAA-CREF Institutional Mutual Funds and the TIAA-CREF Life Funds since 1999. The investment professionals of Advisors have also managed various accounts of the College Retirement Equities Fund (“CREF”) since their inception. Under the Management Agreement, Advisors is responsible for managing the assets of the Funds, including conducting research, recommending investments and placing orders to buy and sell securities for the Funds’ investment portfolios; active and extensive monitoring of the investment portfolios daily by various personnel with specific responsibility for the particular type of investment in question; and reporting on the investment performance of the Funds to the Boards at their scheduled quarterly meetings. The Board considered that Advisors has carried out these responsibilities in a highly professional manner.
The Board considered, among other things, the performance of each of the Funds, as discussed below.
| | | | |
| | | TIAA-CREF Life Funds 2006 Semiannual Report | | 121 |
| | |
| Board approval of investment management agreement | | continued |
Performance. The Board considered the performance of each Fund over the past year, three years, five years and since inception and the Funds’ performance as compared to their peer groups and benchmark indices. The Board considered the comparative performance and expense data for each Fund prepared by an independent third party, Lipper, Inc.’s Global Fiduciary Review unit (“Lipper”) for each pertinent Fund, as well as Fund performance against its performance benchmark. In looking at this data, the Board considered that most of the Funds met their benchmarks over the long-term (when factoring the effect of expenses) and ranked in the top-three quintiles versus their peers, with the exception of the Growth Equity Fund and the Real Estate Securities Fund. For additional detail about each Fund of the TIAA-CREF Life Funds, see the Fund-by-Fund synopsis below.
Cost and Profitability. The Board considered the materials it received reflecting Advisors’ revenues for providing investment management and other services to the Funds and that Advisors is providing these services overall at a loss. The Board noted that the Funds’ unitary fee structure provided no flexibility to the Advisor in the face of rising costs. The Board considered the detailed Fund-by-Fund analysis of Advisors’ profitability with respect to each Fund, calculated for the year ended December 31, 2005, as outlined in the synopsis below. In reviewing the profitability information provided, the Board considered that Advisors runs substantial losses. In addition, the Board considered that Advisors’ revenues are reasonable from a shareholder perspective, but may not be adequate when considering the nature, quality and cost of Advisors’ services to the Funds.
Fees Charged by Other Advisers. The Board considered information regarding fees paid to other advisers for managing similar Funds. The Board received comparative fee information for comparable peer group Funds prepared by Lipper. The Board considered that the proposed advisory fee to be paid to Advisors for its services to each Fund compared favorably to the advisory fees charged to other comparable funds. The Board considered that, for the most part, the fees under Advisors’ current management agreements with the Funds are lower than those of the peer group funds identified by Lipper. See the Fund-by-Fund detail below.
Economies of Scale. The Board considered whether Advisors may experience economies of scale in connection with the operation of each Fund. In making this determination, the Board considered that almost all of the Funds operate at a loss to Advisors. While Advisors experiences certain economies of scale by sharing investment personnel with TIAA-CREF Investment Management, LLC and among the Funds, this generally does not offset these losses. While breakpoints could be an appropriate way for Advisors to share economies of scale with Funds that have substantial assets or that have grown materially over the year, Advisors does not believe there is a direct relationship between the economies of scale realized by the Funds and those realized by Advisors as assets increase. This is largely because any economies of scale realized by Advisors and Investment Management are across a variety of classes, services, and products and not due to the growth of a single Fund.
| | | | |
| 122 | | 2006 Semiannual Report TIAA-CREF Life Funds | | |
| | |
| Board approval of investment management agreement | | continued |
Fee Comparison with Other Advisors Clients. The Board considered that Advisors provides similar investment management services to each of the TIAA-CREF Institutional Mutual Funds, the TIAA-CREF Mutual Funds, TIAA-CREF Life Funds, and TIAA Separate Account VA-1, although distribution channels differ. In addition, Advisors, through its TIAA-CREF Asset Management (TCAM) division, manages large institutional client assets through unregistered commingled Funds and separate accounts with similar investment strategies and investment staff. The Board considered the schedule of fees for each of the comparable Funds, and the fact that the fees Advisors charges are the same or lower than Advisors’ comparable Funds.
Other Benefits. Advisors and its affiliates may benefit from the advisory relationship with the Funds to the extent this relationship results in potential investors viewing the TIAA-CREF group of companies as a leading retirement plan provider in the academic and nonprofit market and a single source for all their financial service needs. Also, certain investment portfolios managed by Advisors are managed in the same manner and by the same personnel as certain CREF accounts, resulting in the possibility for benefits associated with economies of scale.
Fund-by-Fund Factors
The Funds’ trustees considered the following specific factors during their determination to renew the Management Agreement for each Fund listed below:
Growth Equity Fund
| | Ÿ | | The Fund’s contractual management fee is 0.25%. Advisors proposed that the Fund’s actual management fee be 0.25%. The Fund utilizes a unitary pricing structure. |
| | Ÿ | | The Fund’s management fees are in the 1st quintile of its Expense Universe. |
| | Ÿ | | While the Fund outperformed its benchmark over the one-year period, it underperformed its benchmark over the three- and five-year periods and since inception. |
| | Ÿ | | For the one-, two-, three-, four- and five-year periods ended 12/31/05, the Fund was in the 4th quintile of its Performance Universe. |
| | Ÿ | | The Fund received an Overall Morningstar Rating of 2 stars for the one-year period ended 12/31/05. |
| | Ÿ | | Longer-term performance of the Fund was impacted negatively by poor stock selection, so the portfolio team was dismissed and Fund management was taken over by Greg Luttrell and Susan Hirsch. |
| | Ÿ | | Advisors had a net loss on the Fund for the one-year period ended 12/31/05. |
Growth & Income Fund
| | Ÿ | | The Fund’s contractual management fee is 0.23%. Advisors proposed that the Fund’s actual management fee be 0.23%. The Fund utilizes a unitary pricing structure. |
| | Ÿ | | The Fund’s management fees are in the 1st quintile of its Expense Universe. |
| | | | |
| | | TIAA-CREF Life Funds 2006 Semiannual Report | | 123 |
| | |
| Board approval of investment management agreement | | continued |
| | Ÿ | | While the Fund outperformed its benchmark over the one-year period, it underperformed its benchmark over the three- and five-year periods and since inception. |
| | Ÿ | | For the one-, two- and three-year periods ended 12/31/05, the Fund was in the 2nd quintile of its Performance Universe; while, for the four- and five-year periods, the Fund was in the 3rd quintile of its Performance Universe. |
| | Ÿ | | The Fund received an Overall Morningstar Rating of 3 stars for the one-year period ended 12/31/05. |
| | Ÿ | | In March 2005, the Fund’s adviser added a new portfolio manager, Susan Kempler, to the Fund. As a consequence of this change and other factors, for the year ending December 31, 2005, the Fund outperformed its benchmark. |
| | Ÿ | | Advisors had a net loss on the Fund for the one-year period ended 12/31/05. |
Large-Cap Value Fund
| | Ÿ | | The Fund’s contractual management fee is 0.24%. Advisors proposed that the Fund’s actual management fee be 0.24%. The Fund utilizes a unitary pricing structure. |
| | Ÿ | | The Fund’s management fees are in the 1st quintile of its Expense Universe. |
| | Ÿ | | The Fund underperformed its benchmark over the one-year and since-inception periods, but outperformed its benchmark over the three-year period. |
| | Ÿ | | For the one-, two- and three-year periods ended 12/31/05, the Fund was in the 4th, 1st and 2nd quintile of its Performance Universe, respectively. |
| | Ÿ | | The Fund received an Overall Morningstar Rating of 5 stars for the one-year period ended 12/31/05. |
| | Ÿ | | Advisors had a net loss on the Fund for the one-year period ended 12/31/05. |
Small-Cap Equity Fund
| | Ÿ | | The Fund’s contractual management fee is 0.10%. Advisors proposed that the Fund’s actual management fee be 0.10%. The Fund utilizes a unitary pricing structure. |
| | Ÿ | | The Fund’s management fees are in the 1st quintile of its Expense Universe. |
| | Ÿ | | The Fund has outperformed its benchmark over the one- and three-year and since-inception periods, |
| | Ÿ | | For the one- and two-year periods ended 12/31/05, the Fund was in the 3rd quintile of its Performance Universe. |
| | Ÿ | | For the three-year period, the Fund was in the 1st quintile of its Performance Universe. |
| | Ÿ | | The Fund received an Overall Morningstar Rating of 4 stars for the one-year period ended 12/31/05. |
| | Ÿ | | Advisors had a net loss on the Fund for the one-year period ended 12/31/05. |
Stock Index Fund
| | Ÿ | | The Fund’s contractual management fee is 0.06%. Advisors proposed that the Fund’s actual management fee be 0.06%. The Fund utilizes a unitary pricing structure. |
| | Ÿ | | The Fund’s management fees are in the 1st quintile of its Expense Universe. |
| | | | |
| 124 | | 2006 Semiannual Report TIAA-CREF Life Funds | | |
| | |
| Board approval of investment management agreement | | continued |
| | Ÿ | | The Fund’s performance generally matched its benchmark minus the effect of the Fund’s expenses. |
| | Ÿ | | For the one-, two-, three-, four- and five-year periods ended 12/31/05, the Fund was in the 3rd quintile of its Performance Universe. |
| | Ÿ | | The Fund received an Overall Morningstar Rating of 4 stars for the one-year period ended 12/31/05. |
| | Ÿ | | Advisors had a net loss on the Fund for the one-year period ended 12/31/05. |
Social Choice Equity Fund
| | Ÿ | | The Fund’s contractual management fee is 0.07%. Advisors proposed that the Fund’s actual management fee be 0.07%. The Fund utilizes a unitary pricing structure. |
| | Ÿ | | The Fund’s management fees are in the 1st quintile of its Expense Universe. |
| | Ÿ | | The Fund outperformed its benchmark over all prior-year periods and since inception. |
| | Ÿ | | For the one-, three- and five-year periods ended 12/31/05, the Fund was in the 3rd quintile of its Performance Universe. |
| | Ÿ | | For the two- and four-year periods, the Fund was in the 2nd quintile of its Performance Universe. |
| | Ÿ | | The Fund received an Overall Morningstar Rating of 4 stars for the one-year period ended 12/31/05. |
| | Ÿ | | Advisors had a net loss on the Fund for the one-year period ended 12/31/05. |
Real Estate Securities Fund
| | Ÿ | | The Fund’s contractual management fee is 0.25%. Advisors proposed that the Fund’s actual management fee be 0.25%. The Fund utilizes a unitary pricing structure. |
| | Ÿ | | The Fund’s management fees are in the 1st quintile of its Expense Universe. |
| | Ÿ | | The Fund underperformed its benchmark over all prior year periods and since inception. |
| | Ÿ | | For the one-, two- and three-year periods ended 12/31/05, the Fund was in the 5th quintile of its Performance Universe. |
| | Ÿ | | The Fund received an Overall Morningstar Rating of 3 stars for the one-year period ended 12/31/05. |
| | Ÿ | | Following the record of poor performance, the portfolio manager of the Fund was removed and the Fund is being restructured. David Copp joined the team late in 2005. |
| | Ÿ | | Advisors earned a modest profit on the Fund for the one-year period ended 12/31/05. |
International Equity Fund
| | Ÿ | | The Fund’s contractual management fee is 0.29%. Advisors proposed that the Fund’s actual management fee be 0.29%. The Fund utilizes a unitary pricing structure. |
| | Ÿ | | The Fund’s management fees are in the 1st quintile of its Expense Universe. |
| | | | |
| | | TIAA-CREF Life Funds 2006 Semiannual Report | | 125 |
| | |
| Board approval of investment management agreement | | concluded |
| | Ÿ | | The Fund outperformed its benchmark over the one- and three-year periods and underperformed its benchmark over the five-year and since-inception periods. |
| | Ÿ | | For the one- and two-year periods ended 12/31/05, the Fund was in the 3rd quintile of its Performance Universe. |
| | Ÿ | | For the three-, four and five-year periods, the Fund was in the 2nd quintile of its Performance Universe. |
| | Ÿ | | The Fund received an Overall Morningstar Rating of 4 stars for the one-year period ended 12/31/05. |
| | Ÿ | | Advisors had a net loss on the Fund for the one-year period ended 12/31/05. |
Bond Fund
| | Ÿ | | The Fund’s contractual management fee is 0.10%. Advisors proposed that the Fund’s actual management fee be 0.10%. The Fund utilizes a unitary pricing structure. |
| | Ÿ | | The Fund’s management fees are in the 1st quintile of its Expense Universe. |
The Fund’s performance generally matched that of its benchmark over the one-year and since inception periods.
| | Ÿ | | For the one-year period ended 12/31/05, the Fund was in the 1st quintile of its Performance Universe. For the two-year period the Fund was in the 2nd quintile of its Performance Universe. Since inception, the Fund was in the 5th quintile of its Performance Universe. |
| | Ÿ | | The Fund received an Overall Morningstar Rating of 4 stars for the one-year period ended 12/31/05. |
| | Ÿ | | Advisors had a net loss on the Fund for the one-year period ended 12/31/05. |
Money Market Fund
| | Ÿ | | The Fund’s contractual management fee is 0.06%. Advisors proposed that the Fund’s actual management fee be 0.06%. The Fund utilizes a unitary pricing structure. |
| | Ÿ | | The Fund’s management fees are in the 1st quintile of its Expense Universe. |
| | Ÿ | | The Fund outperformed its benchmark over the one- and two-year periods. |
| | Ÿ | | For the one- and two-year periods ended 12/31/05, the Fund was in the 1st quintile of its Performance Universe. Since inception, the Fund was in the 1st quintile of its Performance Universe |
| | Ÿ | | Money market funds are not rated by Morningstar. |
| | Ÿ | | Advisors had a net loss on the Fund for the one-year period ended 12/31/05. |
Based on these factors, and the information provided, the Board approved the continuation of the Management Agreement covering each of the Funds. The trustees were advised by separate independent legal counsel throughout the review process.
| | | | |
| 126 | | 2006 Semiannual Report TIAA-CREF Life Funds | | |
HOW TO REACH US
| | |
TIAA-CREF WEBSITE Account performance, personal account information and transactions, product descriptions, and information about investment choices and income options www.tiaa-cref.org 24 hours a day, 7 days a week AUTOMATED TELEPHONE SERVICE Check account performance and accumulation balances, change allocations, transfer funds and verify credited premiums. 800 842-2252 24 hours a day, 7 days a week TELEPHONE COUNSELING CENTER Retirement saving and planning, income options and payments, and tax reporting 800 842-2776 8 a.m. to 10 p.m. ET, Monday–Friday 9 a.m. to 6 p.m. ET, Saturday | | PLANNING AND SERVICE CENTER TIAA-CREF Mutual Funds, after-tax annuities and life insurance 800 223-1200 8 a.m. to 10 p.m. ET, Monday–Friday FOR HEARING- OR SPEECH-IMPAIRED PARTICIPANTS 800 842-2755 8 a.m. to 10 p.m. ET, Monday–Friday 9 a.m. to 6 p.m. ET, Saturday TIAA-CREF TRUST COMPANY, FSB Asset management, trust administration, estate planning, planned giving and endowment management 888 842-9001 8 a.m. to 5 p.m. CT, Monday–Friday TIAA-CREF TUITION FINANCING, INC. Tuition financing programs 888 381-8283 8 a.m. to 11 p.m. ET, Monday–Friday |
TIAA-CREF Individual & Institutional Services, LLC, and Teachers Personal Investors Services, Inc., distribute securities products. You should consider the investment objectives, risks, charges and expenses carefully before investing. Please call 800 223-1200 or visit www.tiaa-cref.org for a prospectus that contains this and other information. Please read the prospectus carefully before investing. Teachers Insurance and Annuity Association (TIAA), New York, NY, and TIAA-CREF Life Insurance Co., New York, NY, issue insurance and annuities. TIAA-CREF Trust Company, FSB, provides trust services. TIAA-CREF Tuition Financing, Inc. (TFI) is the program manager for 529 college savings plans. Investment products are not FDIC insured, may lose value and are not bank guaranteed.
©2006 Teachers Insurance and Annuity Association–College Retirement Equities Fund (TIAA-CREF), New York, NY 10017

730 Third Avenue
New York, NY 10017-3206
| | |
 Printed on recycled paper Printed on recycled paper | | A10937 |
| C36323 | | 8/06 |
Item 2. Code of Ethics.
The Board of Trustees of the TIAA-CREF Life Funds (the “Registrant”) has a code of ethics for senior financial officers, including its principal executive officer, principal financial officer, principal accounting officer, or controller, and persons performing similar functions, in conformity with rules promulgated under the Sarbanes-Oxley Act of 2002. The code of ethics is filed as an exhibit to this annual report.
During the reporting period, there were no implicit or explicit waivers granted by the Registrant from any provision of the code of ethics.
Item 3. Audit Committee Financial Expert.
There is no change to the Audit Committee Financial Expert.
Item 4. Principal Accountant Fees and Services.
Not applicable for semi-annual reports.
Item 5. Audit Committee of Listed Registrants.
Not Applicable.
Item 6. Schedule of Investments.
TIAA-CREF LIFE FUNDS - GROWTH EQUITY FUND
TIAA-CREF LIFE FUNDS
GROWTH EQUITY
STATEMENT OF INVESTMENTS (Unaudited)
June 30, 2006
| | | | | | | |
SHARES
| | | | COMPANY
| | VALUE
|
| |
COMMON STOCKS - 99.54% | | | |
| APPAREL AND ACCESSORY STORES - 0.70% | | |
| 6,286 | | * | | Chico’s FAS, Inc | | $ | 169,596 |
| 896 | | * | | J Crew Group, Inc | | | 24,595 |
| | | | | | |
|
|
| | | | | TOTAL APPAREL AND ACCESSORY STORES | | 194,191 |
| | | | | | |
|
|
| APPAREL AND OTHER TEXTILE PRODUCTS - 0.38% | | |
| 1,889 | | | | Polo Ralph Lauren Corp | | | 103,706 |
| | | | | | |
|
|
| | | | | TOTAL APPAREL AND OTHER TEXTILE PRODUCTS | | 103,706 |
| | | | | | |
|
|
| BUILDING MATERIALS AND GARDEN SUPPLIES - 1.37% | | |
| 6,254 | | | | Lowe’s Cos, Inc | | | 379,430 |
| | | | | | |
|
|
| | | | | TOTAL BUILDING MATERIALS AND GARDEN SUPPLIES | | 379,430 |
| | | | | | |
|
|
| BUSINESS SERVICES - 13.47% | | |
| 13,767 | | * | | Adobe Systems, Inc | | | 417,966 |
| 4,900 | | * | | Akamai Technologies, Inc | | | 177,331 |
| 4,252 | | * | | Cognizant Technology Solutions Corp | | | 286,457 |
| 13,803 | | * | | eBay, Inc | | | 404,290 |
| 8,090 | | * | | Electronic Arts, Inc | | | 348,194 |
| 2,115 | | * | | Google, Inc (Class A) | | | 886,883 |
| 15,592 | | | | Microsoft Corp | | | 363,294 |
| 4,200 | | * | | Red Hat, Inc | | | 98,280 |
| 5,778 | | | | SAP AG. (ADR) | | | 303,461 |
| 13,068 | | * | | Yahoo!, Inc | | | 431,244 |
| | | | | | |
|
|
| | | | | TOTAL BUSINESS SERVICES | | 3,717,400 |
| | | | | | |
|
|
| CHEMICALS AND ALLIED PRODUCTS - 11.53% | | |
| 14,061 | | | | Abbott Laboratories | | | 613,200 |
| 9,519 | | * | | Amgen, Inc | | | 620,924 |
| 2,302 | | | | Eli Lilly & Co | | | 127,232 |
| 4,957 | | * | | Genzyme Corp | | | 302,625 |
| 4,100 | | * | | Gilead Sciences, Inc | | | 242,556 |
| 4,015 | | | | Monsanto Co | | | 338,023 |
| 5,784 | | * | | Sepracor, Inc | | | 330,498 |
| 8,274 | | | | Teva Pharmaceutical Industries Ltd (ADR) | | | 261,376 |
| 7,828 | | | | Wyeth | | | 347,641 |
| | | | | | |
|
|
| | | | | TOTAL CHEMICALS AND ALLIED PRODUCTS | | 3,184,075 |
| | | | | | |
|
|
| COAL MINING - 0.47% | | |
| 2,322 | | | | Peabody Energy Corp | | | 129,452 |
| | | | | | |
|
|
| | | | | TOTAL COAL MINING | | | 129,452 |
| | | | | | |
|
|
1
TIAA-CREF LIFE FUNDS - GROWTH EQUITY FUND
| | | | | | | |
SHARES
| | | | COMPANY
| | VALUE
|
| |
| COMMUNICATIONS - 3.28% | | |
| 5,574 | | | | America Movil S.A. de C.V. (ADR) | | $ | 185,391 |
| 13,119 | | | | AT&T, Inc | | | 365,889 |
| 6,024 | | | | Sprint Nextel Corp | | | 120,420 |
| 6,951 | | * | | Univision Communications, Inc (Class A) | | | 232,859 |
| | | | | | |
|
|
| | | | | TOTAL COMMUNICATIONS | | 904,559 |
| | | | | | |
|
|
| EATING AND DRINKING PLACES - 1.12% | | |
| 8,189 | | * | | Starbucks Corp | | | 309,217 |
| | | | | | |
|
|
| | | | | TOTAL EATING AND DRINKING PLACES | | 309,217 |
| | | | | | |
|
|
| ELECTRIC, GAS, AND SANITARY SERVICES - 0.75% | | |
| 8,127 | | | | Fortum Oyj | | | 207,832 |
| | | | | | |
|
|
| | | | | TOTAL ELECTRIC, GAS, AND SANITARY SERVICES | | 207,832 |
| | | | | | |
|
|
| ELECTRONIC AND OTHER ELECTRIC EQUIPMENT - 14.63% | | |
| 5,458 | | * | | Broadcom Corp (Class A) | | | 164,013 |
| 27,069 | | * | | Cisco Systems, Inc | | | 528,658 |
| 2,759 | | | | Cooper Industries Ltd (Class A) | | | 256,365 |
| 5,629 | | | | Emerson Electric Co | | | 471,765 |
| 2,848 | | | | Harman International Industries, Inc | | | 243,134 |
| 20,943 | | | | Intel Corp | | | 396,870 |
| 1,211 | | | | Linear Technology Corp | | | 40,556 |
| 86,900 | | * | | Lucent Technologies, Inc | | | 210,298 |
| 5,772 | | * | | Marvell Technology Group Ltd | | | 255,873 |
| 12,965 | | | | Motorola, Inc | | | 261,245 |
| 10,042 | | * | | Network Appliance, Inc | | | 354,483 |
| 16,922 | | | | Qualcomm, Inc | | | 678,065 |
| 5,835 | | | | Texas Instruments, Inc | | | 176,742 |
| | | | | | |
|
|
| | | | | TOTAL ELECTRONIC AND OTHER ELECTRIC EQUIPMENT | | | 4,038,067 |
| | | | | | |
|
|
| ENGINEERING AND MANAGEMENT SERVICES - 2.45% | | |
| 4,172 | | * | | Celgene Corp | | | 197,878 |
| 4,000 | | * | | Keryx Biopharmaceuticals, Inc | | | 56,800 |
| 10,833 | | | | Paychex, Inc | | | 422,270 |
| | | | | | |
|
|
| | | | | TOTAL ENGINEERING AND MANAGEMENT SERVICES | | | 676,948 |
| | | | | | |
|
|
| FOOD AND KINDRED PRODUCTS - 2.43% | | |
| 11,168 | | | | PepsiCo, Inc | | | 670,527 |
| | | | | | |
|
|
| | | | | TOTAL FOOD AND KINDRED PRODUCTS | | 670,527 |
| | | | | | |
|
|
| FURNITURE AND HOMEFURNISHINGS STORES - 0.91% | | |
| 7,585 | | * | | Bed Bath & Beyond, Inc | | | 251,594 |
| | | | | | |
|
|
| | | | | TOTAL FURNITURE AND HOMEFURNISHINGS STORES | | 251,594 |
| | | | | | |
|
|
| GENERAL MERCHANDISE STORES - 2.61% | | |
| 8,978 | | | | Target Corp | | | 438,755 |
| 5,878 | | | | Wal-Mart Stores, Inc | | | 283,143 |
| | | | | | |
|
|
| | | | | TOTAL GENERAL MERCHANDISE STORES | | 721,898 |
| | | | | | |
|
|
2
TIAA-CREF LIFE FUNDS - GROWTH EQUITY FUND
| | | | | | | |
SHARES
| | | | COMPANY
| | VALUE
|
| |
| HEALTH SERVICES - 1.37% | | |
| 1,949 | | | | Caremark Rx, Inc | | $ | 97,197 |
| 4,921 | | * | | Medco Health Solutions, Inc | | | 281,875 |
| | | | | | |
|
|
| | | | | TOTAL HEALTH SERVICES | | | 379,072 |
| | | | | | |
|
|
| HOLDING AND OTHER INVESTMENT OFFICES - 0.87% | | |
| 810 | | | | Alcon, Inc | | | 79,826 |
| 83 | | | | Hugoton Royalty Trust | | | 2,465 |
| 3,130 | | | | iShares Russell 1000 Growth Index Fund | | | 158,315 |
| | | | | | |
|
|
| | | | | TOTAL HOLDING AND OTHER INVESTMENT OFFICES | | 240,606 |
| | | | | | |
|
|
| HOTELS AND OTHER LODGING PLACES - 1.24% | | |
| 5,675 | | | | Starwood Hotels & Resorts Worldwide, Inc | | | 342,430 |
| | | | | | |
|
|
| | | | | TOTAL HOTELS AND OTHER LODGING PLACES | | 342,430 |
| | | | | | |
|
|
| INDUSTRIAL MACHINERY AND EQUIPMENT - 3.76% | | |
| 2,140 | | * | | Alstom RGPT | | | 195,509 |
| 6,188 | | * | | Apple Computer, Inc | | | 353,459 |
| 8,427 | | | | Applied Materials, Inc | | | 137,192 |
| 2,700 | | | | Caterpillar, Inc | | | 201,096 |
| 813 | | | | Deere & Co | | | 67,877 |
| 2,128 | | * | | Rackable Systems, Inc | | | 84,035 |
| | | | | | |
|
|
| | | | | TOTAL INDUSTRIAL MACHINERY AND EQUIPMENT | | 1,039,168 |
| | | | | | |
|
|
| INSTRUMENTS AND RELATED PRODUCTS - 3.94% | | |
| 5,642 | | * | | Advanced Medical Optics, Inc | | | 286,049 |
| 3,533 | | | | Medtronic, Inc | | | 165,768 |
| 9,310 | | * | | St. Jude Medical, Inc | | | 301,830 |
| 5,904 | | * | | Zimmer Holdings, Inc | | | 334,875 |
| | | | | | |
|
|
| | | | | TOTAL INSTRUMENTS AND RELATED PRODUCTS | | 1,088,522 |
| | | | | | |
|
|
| INSURANCE CARRIERS - 2.69% | | |
| 11,096 | | | | Aetna, Inc | | | 443,063 |
| 11,692 | | | | Progressive Corp | | | 300,601 |
| | | | | | |
|
|
| | | | | TOTAL INSURANCE CARRIERS | | 743,664 |
| | | | | | |
|
|
| LEATHER AND LEATHER PRODUCTS - 1.03% | | |
| 9,488 | | * | | Coach, Inc | | | 283,691 |
| | | | | | |
|
|
| | | | | TOTAL LEATHER AND LEATHER PRODUCTS | | 283,691 |
| | | | | | |
|
|
| METAL MINING - 0.53% | | |
| 6,088 | | | | Companhia Vale do Rio Doce (ADR) | | | 146,356 |
| | | | | | |
|
|
| | | | | TOTAL METAL MINING | | 146,356 |
| | | | | | |
|
|
| MISCELLANEOUS RETAIL - 2.01% | | |
| 18,038 | | | | CVS Corp | | | 553,767 |
| | | | | | |
|
|
| | | | | TOTAL MISCELLANEOUS RETAIL | | 553,767 |
| | | | | | |
|
|
3
TIAA-CREF LIFE FUNDS - GROWTH EQUITY FUND
| | | | | | | |
SHARES
| | | | COMPANY
| | VALUE
|
| |
| MOTION PICTURES - 0.59% | | |
| 5,465 | | | | Walt Disney Co | | $ | 163,950 |
| | | | | | |
|
|
| | | | | TOTAL MOTION PICTURES | | 163,950 |
| | | | | | |
|
|
| NONDEPOSITORY INSTITUTIONS - 2.35% | | |
| 12,176 | | | | American Express Co | | | 648,007 |
| | | | | | |
|
|
| | | | | TOTAL NONDEPOSITORY INSTITUTIONS | | | 648,007 |
| | | | | | |
|
|
| OIL AND GAS EXTRACTION - 3.59% | | |
| 4,760 | | | | Halliburton Co | | | 353,240 |
| 1,837 | | | | Noble Energy, Inc | | | 86,082 |
| 5,186 | | | | Schlumberger Ltd | | | 337,660 |
| 4,809 | | | | XTO Energy, Inc | | | 212,894 |
| | | | | | |
|
|
| | | | | TOTAL OIL AND GAS EXTRACTION | | 989,876 |
| | | | | | |
|
|
| PETROLEUM AND COAL PRODUCTS - 0.56% | | |
| 2,227 | | | | EOG Resources, Inc | | | 154,420 |
| | | | | | |
|
|
| | | | | TOTAL PETROLEUM AND COAL PRODUCTS | | 154,420 |
| | | | | | |
|
|
| PRIMARY METAL INDUSTRIES - 2.13% | | |
| 24,251 | | * | | Corning, Inc | | | 586,632 |
| | | | | | |
|
|
| | | | | TOTAL PRIMARY METAL INDUSTRIES | | 586,632 |
| | | | | | |
|
|
| SECURITY AND COMMODITY BROKERS - 6.29% | | |
| 29,350 | | | | Charles Schwab Corp | | | 469,013 |
| 822 | | | | Chicago Mercantile Exchange Holdings, Inc | | | 403,725 |
| 8,890 | | * | | E*Trade Financial Corp | | | 202,870 |
| 1,982 | | | | Goldman Sachs Group, Inc | | | 298,152 |
| 3,188 | | | | Merrill Lynch & Co, Inc | | | 221,757 |
| 9,571 | | | | TD Ameritrade Holding Corp | | | 141,747 |
| | | | | | |
|
|
| | | | | TOTAL SECURITY AND COMMODITY BROKERS | | 1,737,264 |
| | | | | | |
|
|
| TOBACCO PRODUCTS - 2.28% | | |
| 8,580 | | | | Altria Group, Inc | | | 630,029 |
| | | | | | |
|
|
| | | | | TOTAL TOBACCO PRODUCTS | | 630,029 |
| | | | | | |
|
|
| TRANSPORTATION BY AIR - 0.47% | | |
| 7,928 | | | | Southwest Airlines Co | | | 129,781 |
| | | | | | |
|
|
| | | | | TOTAL TRANSPORTATION BY AIR | | 129,781 |
| | | | | | |
|
|
| TRANSPORTATION EQUIPMENT - 4.17% | | |
| 6,081 | | | | Boeing Co | | | 498,095 |
| 10,317 | | | | United Technologies Corp | | | 654,304 |
| | | | | | |
|
|
| | | | | TOTAL TRANSPORTATION EQUIPMENT | | 1,152,399 |
| | | | | | |
|
|
4
TIAA-CREF LIFE FUNDS - GROWTH EQUITY FUND
| | | | | | | |
SHARES
| | | | COMPANY
| | VALUE
|
| |
| TRANSPORTATION SERVICES - 0.98% | | |
| 5,051 | | | | CH Robinson Worldwide, Inc | | $ | 269,218 |
| | | | | | |
|
|
| | | | | TOTAL TRANSPORTATION SERVICES | | 269,218 |
| | | | | | |
|
|
| TRUCKING AND WAREHOUSING - 1.88% | | |
| 6,302 | | | | United Parcel Service, Inc (Class B) | | | 518,844 |
| | | | | | |
|
|
| | | | | TOTAL TRUCKING AND WAREHOUSING | | 518,844 |
| | | | | | |
|
|
| WHOLESALE TRADE-DURABLE GOODS - 0.71% | | |
| 5,116 | | | | General Electric Co | | | 168,623 |
| 412 | | * | | WESCO International, Inc | | | 28,428 |
| | | | | | |
|
|
| | | | | TOTAL WHOLESALE TRADE-DURABLE GOODS | | 197,051 |
| | | | | | |
|
|
| | | | | TOTAL COMMON STOCKS (Cost $26,809,227) | | 27,483,643 |
| | | | | | |
|
|
| | | | | TOTAL PORTFOLIO - 99.54% (Cost $26,809,227) | | 27,483,643 |
| | | | | OTHER ASSETS & LIABILITIES, NET - 0.46% | | 125,644 |
| | | | | | |
|
|
| | | | | NET ASSETS - 100.00% | | $27,609,287 |
| | | | | | |
|
|
ABBREVIATION:
ADR - American Depositary Receipt
For ease of presentation, we have grouped a number of industry classification categories together in the Statement of Investments. Note that the Funds use more specific industry categories in following their investment limitations on industry concentration.
5
TIAA-CREF LIFE FUNDS - Growth & Income Fund
TIAA-CREF LIFE FUNDS
GROWTH & INCOME FUND
STATEMENT OF INVESTMENTS (Unaudited)
June 30, 2006
| | | | | | | |
SHARES
| | | | COMPANY
| | VALUE
|
| |
COMMON STOCKS - 99.27% | | | |
| AMUSEMENT AND RECREATION SERVICES - 0.32% | | |
| 8,670 | | * | | GameLoft | | $ | 64,187 |
| 600 | | | | Nintendo Co Ltd | | | 100,774 |
| | | | | | |
|
|
| | | | | TOTAL AMUSEMENT AND RECREATION SERVICES | | | 164,961 |
| | | | | | |
|
|
| APPAREL AND ACCESSORY STORES - 0.37% | | |
| 3,249 | | | | Abercrombie & Fitch Co (Class A) | | | 180,092 |
| 458 | | * | | J Crew Group, Inc | | | 12,572 |
| | | | | | |
|
|
| | | | | TOTAL APPAREL AND ACCESSORY STORES | | | 192,664 |
| | | | | | |
|
|
| BUSINESS SERVICES - 5.56% | | |
| 5,313 | | * | | Adobe Systems, Inc | | | 161,303 |
| 20,126 | | | | Advanced Semiconductor Engineering, Inc (ADR) | | | 100,026 |
| 11,165 | | | | Automatic Data Processing, Inc | | | 506,333 |
| 5,265 | | * | | eBay, Inc | | | 154,212 |
| 114 | | * | | Gmarket, Inc (ADR) | | | 1,752 |
| 700 | | * | | Google, Inc (Class A) | | | 293,531 |
| 34,508 | | | | Microsoft Corp | | | 804,036 |
| 8,276 | | * | | Redback Networks, Inc | | | 151,782 |
| 6,253 | | | | SAP AG. (ADR) | | | 328,408 |
| 11,497 | | * | | Yahoo!, Inc | | | 379,401 |
| | | | | | |
|
|
| | | | | TOTAL BUSINESS SERVICES | | | 2,880,784 |
| | | | | | |
|
|
| CHEMICALS AND ALLIED PRODUCTS - 14.06% | | |
| 10,002 | | | | Abbott Laboratories | | | 436,187 |
| 6,599 | | | | Air Products & Chemicals, Inc | | | 421,808 |
| 5,915 | | | | Akzo Nobel NV | | | 318,865 |
| 4,122 | | * | | Amgen, Inc | | | 268,878 |
| 4,783 | | | | Colgate-Palmolive Co | | | 286,502 |
| 5,354 | | | | Cytec Industries, Inc | | | 287,296 |
| 3,638 | | | | Du Pont (E.I.) de Nemours & Co | | | 151,341 |
| 6,096 | | | | Eli Lilly & Co | | | 336,926 |
| 5,603 | | * | | Gilead Sciences, Inc | | | 331,473 |
| 5,489 | | * | | Keryx Biopharmaceuticals, Inc | | | 77,944 |
| 8,494 | | | | Merck & Co, Inc | | | 309,436 |
| 5,525 | | | | Monsanto Co | | | 465,150 |
| 5,732 | | | | Novartis AG. (ADR) | | | 309,069 |
| 30,681 | | | | Pfizer, Inc | | | 720,083 |
| 19,715 | | | | Procter & Gamble Co | | | 1,096,154 |
| 1,623 | | | | Roche Holding AG. | | | 267,762 |
| 20,474 | | | | Schering-Plough Corp | | | 389,620 |
| 2,914 | | | | Sigma-Aldrich Corp | | | 211,673 |
| 13,445 | | | | Wyeth | | | 597,092 |
| | | | | | |
|
|
| | | | | TOTAL CHEMICALS AND ALLIED PRODUCTS | | 7,283,259 |
| | | | | | |
|
|
6
TIAA-CREF LIFE FUNDS - Growth & Income Fund
| | | | | | | |
SHARES
| | | | COMPANY
| | VALUE
|
| |
| COAL MINING - 0.27% | | |
| 3,637 | | | | Sasol Ltd (ADR) | | $ | 140,534 |
| | | | | | |
|
|
| | | | | TOTAL COAL MINING | | 140,534 |
| | | | | | |
|
|
| COMMUNICATIONS - 3.12% | | |
| 8,917 | | | | America Movil S.A. de C.V. (ADR) | | | 296,579 |
| 23,327 | | | | AT&T, Inc | | | 650,590 |
| 8,521 | | | | BellSouth Corp | | | 308,460 |
| 18,084 | | | | Sprint Nextel Corp | | | 361,499 |
| | | | | | |
|
|
| | | | | TOTAL COMMUNICATIONS | | 1,617,128 |
| | | | | | |
|
|
| DEPOSITORY INSTITUTIONS - 9.94% | | |
| 23,392 | | | | Bank of America Corp | | | 1,125,155 |
| 21,001 | | | | Citigroup, Inc | | | 1,013,088 |
| 21,770 | | | | JPMorgan Chase & Co | | | 914,340 |
| 8,691 | | | | Marshall & Ilsley Corp | | | 397,526 |
| 9,844 | | | | Northern Trust Corp | | | 544,373 |
| 8,088 | | | | South Financial Group, Inc | | | 213,604 |
| 18,503 | | | | US Bancorp | | | 571,373 |
| 5,528 | | | | Wells Fargo & Co | | | 370,819 |
| | | | | | |
|
|
| | | | | TOTAL DEPOSITORY INSTITUTIONS | | | 5,150,278 |
| | | | | | |
|
|
| EATING AND DRINKING PLACES - 0.63% | | |
| 716 | | * | | Chipotle Mexican Grill, Inc | | | 43,640 |
| 7,488 | | * | | Starbucks Corp | | | 282,747 |
| | | | | | |
|
|
| | | | | TOTAL EATING AND DRINKING PLACES | | 326,387 |
| | | | | | |
|
|
| ELECTRIC, GAS, AND SANITARY SERVICES - 2.59% | | |
| 8,922 | | | | American Electric Power Co, Inc | | | 305,579 |
| 12,066 | | | | DPL, Inc | | | 323,369 |
| 2,848 | | | | Entergy Corp | | | 201,496 |
| 9,001 | | | | Exelon Corp | | | 511,527 |
| | | | | | |
|
|
| | | | | TOTAL ELECTRIC, GAS, AND SANITARY SERVICES | | 1,341,971 |
| | | | | | |
|
|
| ELECTRONIC AND OTHER ELECTRIC EQUIPMENT - 8.43% | | |
| 2,808 | | | | Amphenol Corp (Class A) | | | 157,136 |
| 45,444 | | * | | Cisco Systems, Inc | | | 887,521 |
| 7,996 | | * | | Comverse Technology, Inc | | | 158,081 |
| 6,675 | | | | Emerson Electric Co | | | 559,432 |
| 6,532 | | | | Gamesa Corp Tecnologica S.A. | | | 139,982 |
| 17,241 | | | | Honeywell International, Inc | | | 694,812 |
| 21,622 | | | | Intel Corp | | | 409,737 |
| 71,659 | | * | | JDS Uniphase Corp | | | 181,297 |
| 3,089 | | | | Linear Technology Corp | | | 103,451 |
| 12,506 | | | | Motorola, Inc | | | 251,996 |
| 25,959 | | * | | PMC - Sierra, Inc | | | 244,015 |
| 14,415 | | | | Qualcomm, Inc | | | 577,609 |
| | | | | | |
|
|
| | | | | TOTAL ELECTRONIC AND OTHER ELECTRIC EQUIPMENT | | 4,365,069 |
| | | | | | |
|
|
| FABRICATED METAL PRODUCTS - 0.48% | | |
| 5,282 | | | | Illinois Tool Works, Inc | | | 250,895 |
| | | | | | |
|
|
| | | | | TOTAL FABRICATED METAL PRODUCTS | | 250,895 |
| | | | | | |
|
|
7
TIAA-CREF LIFE FUNDS - Growth & Income Fund
| | | | | | | |
SHARES
| | | | COMPANY
| | VALUE
|
| |
| FOOD AND KINDRED PRODUCTS - 2.95% | | |
| 2,605 | | | | Archer Daniels Midland Co | | $ | 107,534 |
| 5,510 | | | | H.J. Heinz Co | | | 227,122 |
| 741 | | | | Nestle S.A. | | | 232,281 |
| 16,029 | | | | PepsiCo, Inc | | | 962,381 |
| | | | | | |
|
|
| | | | | TOTAL FOOD AND KINDRED PRODUCTS | | 1,529,318 |
| | | | | | |
|
|
| FURNITURE AND FIXTURES - 0.08% | | |
| 1,705 | | * | | BE Aerospace, Inc | | | 38,976 |
| | | | | | |
|
|
| | | | | TOTAL FURNITURE AND FIXTURES | | 38,976 |
| | | | | | |
|
|
| FURNITURE AND HOMEFURNISHINGS STORES - 1.58% | | |
| 9,916 | | * | | Bed Bath & Beyond, Inc | | | 328,914 |
| 8,968 | | | | Best Buy Co, Inc | | | 491,805 |
| | | | | | |
|
|
| | | | | TOTAL FURNITURE AND HOMEFURNISHINGS STORES | | 820,719 |
| | | | | | |
|
|
| GENERAL MERCHANDISE STORES - 2.53% | | |
| 4,842 | | | | Costco Wholesale Corp | | | 276,623 |
| 7,484 | | | | Target Corp | | | 365,743 |
| 13,874 | | | | Wal-Mart Stores, Inc | | | 668,311 |
| | | | | | |
|
|
| | | | | TOTAL GENERAL MERCHANDISE STORES | | 1,310,677 |
| | | | | | |
|
|
| HEALTH SERVICES - 2.34% | | |
| 4,427 | | * | | Coventry Health Care, Inc | | | 243,219 |
| 8,540 | | * | | Medco Health Solutions, Inc | | | 489,171 |
| 5,804 | | | | Omnicare, Inc | | | 275,226 |
| 5,886 | | | | Pharmaceutical Product Development, Inc | | | 206,716 |
| | | | | | |
|
|
| | | | | TOTAL HEALTH SERVICES | | 1,214,332 |
| | | | | | |
|
|
| HOLDING AND OTHER INVESTMENT OFFICES - 0.40% | | |
| 1,620 | | | | SPDR Trust Series 1 | | | 206,194 |
| | | | | | |
|
|
| | | | | TOTAL HOLDING AND OTHER INVESTMENT OFFICES | | 206,194 |
| | | | | | |
|
|
| HOTELS AND OTHER LODGING PLACES - 0.89% | | |
| 4,394 | | | | Accor S.A. | | | 267,379 |
| 2,609 | | * | | Wynn Resorts Ltd | | | 191,240 |
| | | | | | |
|
|
| | | | | TOTAL HOTELS AND OTHER LODGING PLACES | | 458,619 |
| | | | | | |
|
|
| INDUSTRIAL MACHINERY AND EQUIPMENT - 8.13% | | |
| 6,508 | | | | 3M Co | | | 525,651 |
| 4,128 | | * | | Alstom RGPT | | | 377,132 |
| 7,274 | | * | | Apple Computer, Inc | | | 415,491 |
| 5,032 | | * | | Dell, Inc | | | 122,831 |
| 8,016 | | * | | EMC Corp | | | 87,936 |
| 44,680 | | | | General Electric Co | | | 1,472,653 |
| 25,342 | | | | Hewlett-Packard Co | | | 802,835 |
| 5,327 | | | | International Business Machines Corp | | | 409,220 |
| | | | | | |
|
|
| | | | | TOTAL INDUSTRIAL MACHINERY AND EQUIPMENT | | 4,213,749 |
| | | | | | |
|
|
| INSTRUMENTS AND RELATED PRODUCTS - 0.91% | | |
| 4,612 | | * | | Advanced Medical Optics, Inc | | | 233,828 |
| 8,011 | | | | Tektronix, Inc | | | 235,684 |
| | | | | | |
|
|
| | | | | TOTAL INSTRUMENTS AND RELATED PRODUCTS | | 469,512 |
| | | | | | |
|
|
8
TIAA-CREF LIFE FUNDS - Growth & Income Fund
| | | | | | | |
SHARES
| | | | COMPANY
| | VALUE
|
| |
| INSURANCE CARRIERS - 5.03% | | |
| 11,486 | | | | ACE Ltd | | $ | 581,077 |
| 7,062 | | | | Aetna, Inc | | | 281,986 |
| 11,459 | | | | Aflac, Inc | | | 531,125 |
| 15,302 | | | | American International Group, Inc | | | 903,583 |
| 2,668 | | | | Assurant, Inc | | | 129,131 |
| 3,601 | | | | Chubb Corp | | | 179,690 |
| | | | | | |
|
|
| | | | | TOTAL INSURANCE CARRIERS | | 2,606,592 |
| | | | | | |
|
|
| METAL MINING - 1.05% | | |
| 5,057 | | | | Inco Ltd | | | 333,256 |
| 2,559 | | | | Phelps Dodge Corp | | | 210,247 |
| | | | | | |
|
|
| | | | | TOTAL METAL MINING | | | 543,503 |
| | | | | | |
|
|
| MISCELLANEOUS RETAIL - 0.75% | | |
| 12,727 | | | | CVS Corp | | | 390,719 |
| | | | | | |
|
|
| | | | | TOTAL MISCELLANEOUS RETAIL | | 390,719 |
| | | | | | |
|
|
| MOTION PICTURES - 1.34% | | |
| 3,945 | | | | CBS Corp | | | 106,712 |
| 30,569 | | | | News Corp (Class A) | | | 586,313 |
| | | | | | |
|
|
| | | | | TOTAL MOTION PICTURES | | 693,025 |
| | | | | | |
|
|
| NONDEPOSITORY INSTITUTIONS - 3.26% | | |
| 14,549 | | | | American Express Co | | | 774,298 |
| 9,394 | | | | Fannie Mae | | | 451,851 |
| 8,749 | | | | SLM Corp | | | 462,997 |
| | | | | | |
|
|
| | | | | TOTAL NONDEPOSITORY INSTITUTIONS | | 1,689,146 |
| | | | | | |
|
|
| OIL AND GAS EXTRACTION - 2.70% | | |
| 10,471 | | * | | Cameron International Corp | | | 500,200 |
| 1,922 | | | | Halliburton Co | | | 142,632 |
| 11,636 | | | | Schlumberger Ltd | | | 757,620 |
| | | | | | |
|
|
| | | | | TOTAL OIL AND GAS EXTRACTION | | 1,400,452 |
| | | | | | |
|
|
| PETROLEUM AND COAL PRODUCTS - 6.97% | | |
| 5,008 | | | | Apache Corp | | | 341,796 |
| 24,009 | | | | Exxon Mobil Corp | | | 1,472,952 |
| 4,611 | | | | Hess Corp | | | 243,691 |
| 4,862 | | | | Kerr-McGee Corp | | | 337,180 |
| 6,537 | | | | Marathon Oil Corp | | | 544,532 |
| 4,607 | | * | | Newfield Exploration Co | | | 225,467 |
| 4,681 | | | | Noble Energy, Inc | | | 219,352 |
| 3,427 | | | | Valero Energy Corp | | | 227,965 |
| | | | | | |
|
|
| | | | | TOTAL PETROLEUM AND COAL PRODUCTS | | 3,612,935 |
| | | | | | |
|
|
| PRINTING AND PUBLISHING - 0.47% | | |
| 2,589 | | | | Meredith Corp | | | 128,259 |
| 4,336 | | * | | VistaPrint Ltd | | | 115,945 |
| | | | | | |
|
|
| | | | | TOTAL PRINTING AND PUBLISHING | | 244,204 |
| | | | | | |
|
|
9
TIAA-CREF LIFE FUNDS - Growth & Income Fund
| | | | | | | |
SHARES
| | | | COMPANY
| | VALUE
|
| |
| RAILROAD TRANSPORTATION - 0.34% | | |
| 3,302 | | | | Norfolk Southern Corp | | $ | 175,732 |
| | | | | | |
|
|
| | | | | TOTAL RAILROAD TRANSPORTATION | | 175,732 |
| | | | | | |
|
|
| SECURITY AND COMMODITY BROKERS - 2.52% | | |
| 1,858 | | | | Bear Stearns Cos, Inc | | | 260,269 |
| 7,998 | | | | Lazard Ltd | | | 323,119 |
| 11,423 | | | | Morgan Stanley | | | 722,048 |
| | | | | | |
|
|
| | | | | TOTAL SECURITY AND COMMODITY BROKERS | | 1,305,436 |
| | | | | | |
|
|
| TOBACCO PRODUCTS - 3.87% | | |
| 27,273 | | | | Altria Group, Inc | | | 2,002,656 |
| | | | | | |
|
|
| | | | | TOTAL TOBACCO PRODUCTS | | 2,002,656 |
| | | | | | |
|
|
| TRANSPORTATION BY AIR - 0.46% | | |
| 9,463 | | * | | AMR Corp | | | 240,549 |
| | | | | | |
|
|
| | | | | TOTAL TRANSPORTATION BY AIR | | 240,549 |
| | | | | | |
|
|
| TRANSPORTATION EQUIPMENT - 3.08% | | |
| 6,600 | | | | Boeing Co | | | 540,606 |
| 7,401 | | | | Northrop Grumman Corp | | | 474,108 |
| 9,127 | | | | United Technologies Corp | | | 578,834 |
| | | | | | |
|
|
| | | | | TOTAL TRANSPORTATION EQUIPMENT | | 1,593,548 |
| | | | | | |
|
|
| TRANSPORTATION SERVICES - 0.36% | | |
| 3,539 | | | | CH Robinson Worldwide, Inc | | | 188,629 |
| | | | | | |
|
|
| | | | | TOTAL TRANSPORTATION SERVICES | | 188,629 |
| | | | | | |
|
|
| TRUCKING AND WAREHOUSING - 0.53% | | |
| 950 | | | | DSV A/S | | | 158,774 |
| 2,443 | | | | Landstar System, Inc | | | 115,383 |
| | | | | | |
|
|
| | | | | TOTAL TRUCKING AND WAREHOUSING | | 274,157 |
| | | | | | |
|
|
| WHOLESALE TRADE-NONDURABLE GOODS - 0.96% | | |
| 7,722 | | | | Cardinal Health, Inc | | | 496,756 |
| | | | | | |
|
|
| | | | | TOTAL WHOLESALE TRADE-NONDURABLE GOODS | | 496,756 |
| | | | | | |
|
|
| | | | | TOTAL COMMON STOCKS (Cost $47,625,231) | | 51,434,065 |
| | | | | | |
|
|
| | | | | TOTAL PORTFOLIO - 99.27% (Cost $47,625,231) | | 51,434,065 |
| | | | | OTHER ASSETS & LIABILITIES, NET - 0.73% | | 377,215 |
| | | | | | |
|
|
| | | | | NET ASSETS - 100.00% | | $51,811,280 |
| | | | | | |
|
|
ABBREVIATION:
ADR - American Depositary Receipt
For ease of presentation, we have grouped a number of industry classification categories together in the Statement of Investments. Note that the Funds use more specific industry categories in following their investment limitations on industry concentration.
10
TIAA-CREF LIFE FUNDS - International Equity Fund
TIAA-CREF LIFE FUNDS
INTERNATIONAL EQUITY FUND
STATEMENT OF INVESTMENTS (Unaudited)
June 30, 2006
| | | | | | | |
SHARES
| | | | COMPANY
| | VALUE
|
| |
COMMON STOCKS - 98.91% | | | |
| AGRICULTURAL SERVICES - 0.04% | | |
| 9,800 | | | | AWB Ltd | | $ | 31,526 |
| | | | | | |
|
|
| | | | | TOTAL AGRICULTURAL SERVICES | | 31,526 |
| | | | | | |
|
|
| APPAREL AND OTHER TEXTILE PRODUCTS - 0.23% | | |
| 71,000 | | | | Toyobo Co Ltd | | | 201,233 |
| | | | | | |
|
|
| | | | | TOTAL APPAREL AND OTHER TEXTILE PRODUCTS | | 201,233 |
| | | | | | |
|
|
| BUSINESS SERVICES - 0.81% | | |
| 5,000 | | | | Mitsuba Corp | | | 54,061 |
| 34 | | | | NTT Data Corp | | | 147,225 |
| 1,500 | | | | Otsuka Corp | | | 169,269 |
| 542 | | | | SAP AG. | | | 114,350 |
| 5,000 | | | | Secom Co Ltd | | | 236,627 |
| | | | | | |
|
|
| | | | | TOTAL BUSINESS SERVICES | | 721,532 |
| | | | | | |
|
|
| CHEMICALS AND ALLIED PRODUCTS - 11.54% | | |
| 24,000 | | | | Air Water, Inc | | | 242,068 |
| 98,000 | | | | Aluminum Corp of China Ltd | | | 72,551 |
| 225 | | * | | Arkema | | | 8,778 |
| 104,001 | | | | Bayer AG. | | | 4,779,332 |
| 3,997 | | | | Dr Reddy’s Laboratories Ltd | | | 110,078 |
| 19,600 | | * | | Dyno Nobel Ltd | | | 35,822 |
| 6,700 | | | | JSR Corp | | | 169,383 |
| 10,000 | | | | Kaken Pharmaceutical Co Ltd | | | 75,143 |
| 12,500 | | | | Kuraray Co Ltd | | | 139,964 |
| 39,000 | | | | Nippon Paint Co Ltd | | | 184,910 |
| 12,000 | | | | Nippon Shokubai Co Ltd | | | 146,857 |
| 14,690 | | | | Novartis AG. | | | 793,860 |
| 46,866 | | | | Reckitt Benckiser plc | | | 1,750,957 |
| 736 | | | | Roche Holding AG. | | | 121,425 |
| 6,400 | | | | Shin-Etsu Chemical Co Ltd | | | 348,231 |
| 45,200 | | | | Sigma Pharmaceuticals Ltd | | | 87,311 |
| 25,000 | | | | Sumitomo Chemical Co Ltd | | | 208,634 |
| 14,100 | | | | Takeda Pharmaceutical Co Ltd | | | 878,205 |
| 25,000 | | | | Teijin Ltd | | | 158,772 |
| | | | | | |
|
|
| | | | | TOTAL CHEMICALS AND ALLIED PRODUCTS | | 10,312,281 |
| | | | | | |
|
|
11
TIAA-CREF LIFE FUNDS - International Equity Fund
| | | | | | | |
SHARES
| | | | COMPANY
| | VALUE
|
| |
| COAL MINING - 1.18% | | |
| 49,105 | | | | BHP Billiton Ltd | | $ | 1,057,994 |
| | | | | | |
|
|
| | | | | TOTAL COAL MINING | | 1,057,994 |
| | | | | | |
|
|
| COMMUNICATIONS - 2.11% | | |
| 48 | | | | KDDI Corp | | | 295,184 |
| 44 | | | | Nippon Telegraph & Telephone Corp | | | 215,930 |
| 108,364 | | | | Royal KPN NV | | | 1,217,939 |
| 247 | | | | SKY Perfect Communications, Inc | | | 159,459 |
| | | | | | |
|
|
| | | | | TOTAL COMMUNICATIONS | | 1,888,512 |
| | | | | | |
|
|
| DEPOSITORY INSTITUTIONS - 6.12% | | |
| 15,552 | | | | Australia & New Zealand Banking Group Ltd | | | 307,230 |
| 19 | | | | DBS Group Holdings Ltd | | | 217 |
| 7,900 | | | | Hang Seng Bank Ltd | | | 100,187 |
| 6,571 | | | | ICICI Bank Ltd (ADR) | | | 155,404 |
| 33,274 | | | | Julius Baer Holding AG. | | | 2,884,652 |
| 55 | | | | Mitsubishi UFJ Financial Group, Inc | | | 769,803 |
| 66 | | | | Mizuho Financial Group. Inc | | | 559,454 |
| 25 | | | | Sumitomo Mitsui Financial Group, Inc | | | 264,620 |
| 39,000 | | | | Sumitomo Trust & Banking Co Ltd | | | 426,453 |
| | | | | | |
|
|
| | | | | TOTAL DEPOSITORY INSTITUTIONS | | 5,468,020 |
| | | | | | |
|
|
| ELECTRIC, GAS, AND SANITARY SERVICES - 4.42% | | |
| 129,208 | | | | Fortum Oyj | | | 3,304,236 |
| 35,000 | | | | Hong Kong & China Gas Ltd | | | 76,831 |
| 601,000 | | | | Xinao Gas Holdings Ltd | | | 572,602 |
| | | | | | |
|
|
| | | | | TOTAL ELECTRIC, GAS, AND SANITARY SERVICES | | 3,953,669 |
| | | | | | |
|
|
| ELECTRONIC AND OTHER ELECTRIC EQUIPMENT - 1.93% | | |
| 1,400 | | | | Fanuc Ltd | | | 125,898 |
| 800 | | | | Hirose Electric Co Ltd | | | 97,275 |
| 8,900 | | | | Hitachi Maxell Ltd | | | 122,777 |
| 2,600 | | | | Kyocera Corp | | | 201,513 |
| 3,000 | | | | NGK Spark Plug Co Ltd | | | 60,360 |
| 1,000 | | | | Rohm Co Ltd | | | 89,490 |
| 9,894 | | | | Satyam Computer Services Ltd | | | 152,504 |
| 12,700 | | | | Sony Corp | | | 561,037 |
| 3,700 | | | | Sumco Corp | | | 211,031 |
| 1,400 | | | | TDK Corp | | | 106,548 |
| | | | | | |
|
|
| | | | | TOTAL ELECTRONIC AND OTHER ELECTRIC EQUIPMENT | | 1,728,433 |
| | | | | | |
|
|
| FABRICATED METAL PRODUCTS - 0.49% | | |
| 17,000 | | | | NEOMAX Co Ltd | | | 359,883 |
| 7,003 | | | | Tata Steel Ltd | | | 81,172 |
| | | | | | |
|
|
| | | | | TOTAL FABRICATED METAL PRODUCTS | | 441,055 |
| | | | | | |
|
|
12
TIAA-CREF LIFE FUNDS - International Equity Fund
| | | | | | | |
SHARES
| | | | COMPANY
| | VALUE
|
| |
| FOOD AND KINDRED PRODUCTS - 2.13% | | |
| 12,000 | | | | Ajinomoto Co, Inc | | $ | 133,001 |
| 25,697 | | | | Bajaj Hindusthan Ltd | | | 219,128 |
| 900 | | * | | Cosan SA Industria e Comercio | | | 58,011 |
| 74,039 | | | | CSR Ltd | | | 184,274 |
| 33,000 | | | | Meiji Seika Kaisha Ltd | | | 168,298 |
| 21,000 | | | | Mitsui Sugar Co Ltd | | | 79,543 |
| 16,000 | | | | Nichirei Corp | | | 85,658 |
| 39,000 | | | | Nippon Formula Feed Manufacturing Co Ltd | | | 68,233 |
| 122,000 | | | | Nisshin Oillio Group Ltd | | | 779,075 |
| 20,000 | | | | Nosan Corp | | | 59,835 |
| 78,000 | | | | Olam International Ltd | | | 71,028 |
| | | | | | |
|
|
| | | | | TOTAL FOOD AND KINDRED PRODUCTS | | 1,906,084 |
| | | | | | |
|
|
| FOOD STORES - 3.99% | | |
| 551,352 | | | | Tesco plc | | | 3,405,976 |
| 10,681 | | | | Woolworths Ltd | | | 159,899 |
| | | | | | |
|
|
| | | | | TOTAL FOOD STORES | | 3,565,875 |
| | | | | | |
|
|
| GENERAL BUILDING CONTRACTORS - 1.24% | | |
| 2,800 | | | | Daito Trust Construction Co Ltd | | | 155,290 |
| 20,000 | | | | Sekisui Chemical Co Ltd | | | 172,856 |
| 1,000,000 | | | | Shanghai Forte Land Co | | | 405,562 |
| 66,000 | | | | Shimizu Corp | | | 370,083 |
| | | | | | |
|
|
| | | | | TOTAL GENERAL BUILDING CONTRACTORS | | 1,103,791 |
| | | | | | |
|
|
| HEAVY CONSTRUCTION, EXCEPT BUILDING - 4.63% | | |
| 40,147 | | | | Vinci S.A. | | | 4,134,950 |
| | | | | | |
|
|
| | | | | TOTAL HEAVY CONSTRUCTION, EXCEPT BUILDING | | 4,134,950 |
| | | | | | |
|
|
| HOLDING AND OTHER INVESTMENT OFFICES - 11.25% | | |
| 115,579 | | | | Collins Stewart Tullett plc | | | 1,622,508 |
| 146,594 | | | | GEA Group AG. | | | 2,511,728 |
| 10 | | | | Housing Development Finance Corp | | | 248 |
| 35,000 | | | | iShares MSCI EAFE Index Fund | | | 2,288,650 |
| 1,464 | | | | Macquarie Infrastructure Group | | | 3,655 |
| 73,774 | | | | Man Group plc | | | 3,476,713 |
| 221,200 | | | | Noble Group Ltd | | | 152,470 |
| | | | | | |
|
|
| | | | | TOTAL HOLDING AND OTHER INVESTMENT OFFICES | | 10,055,972 |
| | | | | | |
|
|
| HOTELS AND OTHER LODGING PLACES - 5.42% | | |
| 78,671 | | | | Accor S.A. | | | 4,787,204 |
| 2,290 | | | | Indian Hotels Co Ltd | | | 56,924 |
| | | | | | |
|
|
| | | | | TOTAL HOTELS AND OTHER LODGING PLACES | | 4,844,128 |
| | | | | | |
|
|
| INDUSTRIAL MACHINERY AND EQUIPMENT - 4.85% | | |
| 8,550 | | | | Canon, Inc | | | 419,591 |
| 18,000 | | | | Komatsu Ltd | | | 358,221 |
| 9,000 | | | | Melco Holdings, Inc | | | 236,977 |
| 38,640 | | | | Rheinmetall AG. | | | 2,693,177 |
| 6,300 | | | | Tokyo Seimitsu Co Ltd | | | 327,359 |
| 12,500 | | | | Toyota Tsusho Corp | | | 300,157 |
| | | | | | |
|
|
| | | | | TOTAL INDUSTRIAL MACHINERY AND EQUIPMENT | | 4,335,482 |
| | | | | | |
|
|
13
TIAA-CREF LIFE FUNDS - International Equity Fund
| | | | | | | |
SHARES
| | | | COMPANY
| | VALUE
|
| |
| INSTRUMENTS AND RELATED PRODUCTS - 1.43% | | |
| 1,540 | | | | Advantest Corp | | $ | 157,078 |
| 11,911 | | | | Tecan Group AG. | | | 640,763 |
| 14,400 | | | | Terumo Corp | | | 481,197 |
| | | | | | |
|
|
| | | | | TOTAL INSTRUMENTS AND RELATED PRODUCTS | | 1,279,038 |
| | | | | | |
|
|
| INSURANCE AGENTS, BROKERS AND SERVICE - 0.24% | | |
| 13,831 | | | | QBE Insurance Group Ltd | | | 210,653 |
| | | | | | |
|
|
| | | | | TOTAL INSURANCE AGENTS, BROKERS AND SERVICE | | 210,653 |
| | | | | | |
|
|
| INSURANCE CARRIERS - 4.70% | | |
| 88,000 | | | | Aioi Insurance Co Ltd | | | 660,491 |
| 73,590 | | | | AMP Ltd | | | 499,171 |
| 24,195 | | | | Fondiaria-Sai S.p.A | | | 988,744 |
| 9 | | | | Millea Holdings, Inc | | | 167,695 |
| 37,000 | | | | Nipponkoa Insurance Co Ltd | | | 319,783 |
| 10,000 | | | | Sompo Japan Insurance, Inc | | | 139,964 |
| 2,000 | | | | T&D Holdings, Inc | | | 161,834 |
| 5,764 | | | | Zurich Financial Services AG. | | | 1,261,022 |
| | | | | | |
|
|
| | | | | TOTAL INSURANCE CARRIERS | | 4,198,704 |
| | | | | | |
|
|
| METAL MINING - 0.96% | | |
| 5,870 | | | | Companhia Vale do Rio Doce (ADR) | | | 141,115 |
| 7,910 | | | | Energy Resources of Australia Ltd | | | 75,457 |
| 65,525 | | | | Oxiana Ltd | | | 153,834 |
| 11,240 | | * | | Paladin Resources Ltd | | | 34,322 |
| 10,379 | | v* | | Polyus Gold Co (ADR) | | | 172,499 |
| 13,000 | | | | PT International Nickel Indonesia Tbk | | | 27,437 |
| 3,402 | | | | Rio Tinto Ltd | | | 196,641 |
| 57,000 | | * | | Toro Energy Ltd | | | 19,268 |
| 5,062 | | | | Zinifex Ltd | | | 37,683 |
| | | | | | |
|
|
| | | | | TOTAL METAL MINING | | 858,256 |
| | | | | | |
|
|
| MISCELLANEOUS MANUFACTURING INDUSTRIES - 0.33% | | |
| 190,376 | | | | Futuris Corp Ltd | | | 297,024 |
| | | | | | |
|
|
| | | | | TOTAL MISCELLANEOUS MANUFACTURING INDUSTRIES | | 297,024 |
| | | | | | |
|
|
| NONDEPOSITORY INSTITUTIONS - 5.92% | | |
| 40,587 | | | | Deutsche Postbank AG. | | | 2,919,700 |
| 33,340 | | | | Hypo Real Estate Holding AG. | | | 2,024,507 |
| 6,150 | | | | ICICI Bank Ltd | | | 65,173 |
| 87,000 | | | | Orient Corp | | | 284,635 |
| | | | | | |
|
|
| | | | | TOTAL NONDEPOSITORY INSTITUTIONS | | 5,294,015 |
| | | | | | |
|
|
| NONMETALLIC MINERALS, EXCEPT FUELS - 0.25% | | |
| 25,000 | | | | Itochu Corp | | | 219,787 |
| | | | | | |
|
|
| | | | | TOTAL NONMETALLIC MINERALS, EXCEPT FUELS | | 219,787 |
| | | | | | |
|
|
| OIL AND GAS EXTRACTION - 1.80% | | |
| 214,000 | | | | CNOOC Ltd | | | 170,825 |
| 9 | | * | | Inpex Holdings, Inc | | | 79,517 |
| 423,000 | | | | PetroChina Co Ltd (Class H) | | | 452,028 |
| 1,843 | | | | Petroleo Brasileiro S.A. (ADR) | | | 164,598 |
| 8,984 | | | | Total S.A. | | | 591,026 |
| 4,687 | | | | Woodside Petroleum Ltd | | | 153,217 |
| | | | | | |
|
|
| | | | | TOTAL OIL AND GAS EXTRACTION | | 1,611,211 |
| | | | | | |
|
|
14
TIAA-CREF LIFE FUNDS - International Equity Fund
| | | | | | | |
SHARES
| | | | COMPANY
| | VALUE
|
| |
| PAPER AND ALLIED PRODUCTS - 0.33% | | |
| 71 | | | | Nippon Paper Group, Inc | | $ | 290,671 |
| | | | | | |
|
|
| | | | | TOTAL PAPER AND ALLIED PRODUCTS | | 290,671 |
| | | | | | |
|
|
| PETROLEUM AND COAL PRODUCTS - 1.92% | | |
| 47,756 | | | | BP plc | | | 556,902 |
| 30,315 | | | | ENI S.p.A. | | | 892,695 |
| 8,025 | | | | Royal Dutch Shell plc (A Shares) | | | 270,136 |
| | | | | | |
|
|
| | | | | TOTAL PETROLEUM AND COAL PRODUCTS | | 1,719,733 |
| | | | | | |
|
|
| PRIMARY METAL INDUSTRIES - 1.34% | | |
| 50,725 | | | | BHP Billiton plc | | | 984,155 |
| 56,000 | | | | Nippon Steel Corp | | | 212,116 |
| | | | | | |
|
|
| | | | | TOTAL PRIMARY METAL INDUSTRIES | | 1,196,271 |
| | | | | | |
|
|
| RAILROAD TRANSPORTATION - 0.37% | | |
| 44 | | | | East Japan Railway Co | | | 327,166 |
| | | | | | |
|
|
| | | | | TOTAL RAILROAD TRANSPORTATION | | 327,166 |
| | | | | | |
|
|
| REAL ESTATE - 1.01% | | |
| 330 | | | | ORIX Corp | | | 80,685 |
| 11,000 | | | | Sumitomo Realty & Development Co Ltd | | | 271,355 |
| 43,000 | | | | Tokyo Tatemono Co Ltd | | | 461,164 |
| 6,884 | | | | Westfield Group | | | 88,634 |
| | | | | | |
|
|
| | | | | TOTAL REAL ESTATE | | 901,838 |
| | | | | | |
|
|
| SECURITY AND COMMODITY BROKERS - 0.09% | | |
| 1,648 | | | | Macquarie Bank Ltd | | | 84,482 |
| | | | | | |
|
|
| | | | | TOTAL SECURITY AND COMMODITY BROKERS | | 84,482 |
| | | | | | |
|
|
| STONE, CLAY, AND GLASS PRODUCTS - 2.52% | | |
| 22,130 | | | | Holcim Ltd | | | 1,692,719 |
| 10,000 | | | | Krosaki Harima Corp | | | 40,502 |
| 24,000 | | | | NGK Insulators Ltd | | | 280,908 |
| 76,000 | | | | Sumitomo Osaka Cement Co Ltd | | | 234,020 |
| | | | | | |
|
|
| | | | | TOTAL STONE, CLAY, AND GLASS PRODUCTS | | 2,248,149 |
| | | | | | |
|
|
| TOBACCO PRODUCTS - 0.47% | | |
| 114 | | | | Japan Tobacco, Inc | | | 415,851 |
| | | | | | |
|
|
| | | | | TOTAL TOBACCO PRODUCTS | | 415,851 |
| | | | | | |
|
|
| TRANSPORTATION EQUIPMENT - 7.64% | | |
| 4,731 | | | | DaimlerChrysler AG. | | | 233,684 |
| 245,168 | | * | | Fiat S.p.A. | | | 3,263,368 |
| 18,200 | | | | Honda Motor Co Ltd | | | 577,929 |
| 880 | | | | Hyundai Motor Co | | | 74,763 |
| 31,000 | | | | Keppel Corp Ltd | | | 288,172 |
| 22,000 | | | | NHK Spring Co Ltd | | | 253,458 |
| 37,000 | | | | NSK Ltd | | | 307,160 |
| 7,700 | | | | Toyota Industries Corp | | | 304,457 |
| 29,100 | | | | Toyota Motor Corp | | | 1,524,813 |
| | | | | | |
|
|
| | | | | TOTAL TRANSPORTATION EQUIPMENT | | 6,827,804 |
| | | | | | |
|
|
15
TIAA-CREF LIFE FUNDS - International Equity Fund
| | | | | | | |
SHARES
| | | | COMPANY
| | VALUE
|
| |
| TRUCKING AND WAREHOUSING - 3.66% | | |
| 121,925 | | | | Deutsche Post AG. | | $ | 3,267,651 |
| | | | | | |
|
|
| | | | | TOTAL TRUCKING AND WAREHOUSING | | 3,267,651 |
| | | | | | |
|
|
| WHOLESALE TRADE-DURABLE GOODS - 1.42% | | |
| 146,096 | | * | | Hagemeyer NV | | | 674,368 |
| 7,000 | | | | Riso Kagaku Corp | | | 122,469 |
| 29,000 | | | | Sumitomo Corp | | | 382,811 |
| 4,055 | | | | Wolseley plc | | | 89,474 |
| | | | | | |
|
|
| | | | | TOTAL WHOLESALE TRADE-DURABLE GOODS | | 1,269,122 |
| | | | | | |
|
|
| WHOLESALE TRADE-NONDURABLE GOODS - 0.13% | | |
| 5,600 | | | | Mitsubishi Corp | | | 111,936 |
| | | | | | |
|
|
| | | | | TOTAL WHOLESALE TRADE-NONDURABLE GOODS | | 111,936 |
| | | | | | |
|
|
| | | | | TOTAL COMMON STOCKS (Cost $80,945,236) | | 88,379,899 |
| | | | | | |
|
|
| | | | | TOTAL PORTFOLIO - 98.91% (Cost $80,945,236) | | 88,379,899 |
| | | | | OTHER ASSETS & LIABILITIES, NET - 1.09% | | 972,199 |
| | | | | | |
|
|
| | | | | NET ASSETS - 100.00% | | $89,352,098 |
| | | | | | |
|
|
| v | Security valued at fair value. |
ABBREVIATION:
ADR - American Depositary Receipt
For ease of presentation, we have grouped a number of industry classification categories together in the Statement of Investments. Note that the Funds use more specific industry categories in following their investment limitations on industry concentration.
16
TIAA-CREF LIFE FUNDS - Summary of Market Values by Country
TIAA-CREF LIFE FUNDS
INTERNATIONAL EQUITY FUND
SUMMARY OF MARKET VALUES BY COUNTRY (Unaudited)
June 30, 2006
| | | | | | |
| | | VALUE
| | % of MARKET
VALUE
| |
DOMESTIC | | | | | | |
UNITED STATES OF AMERICA | | $ | 2,288,650 | | 2.59 | % |
| | |
|
| |
|
|
TOTAL DOMESTIC | | | 2,288,650 | | 2.59 | |
| | |
|
| |
|
|
FOREIGN | | | | | | |
AUSTRALIA | | | 3,718,098 | | 4.21 | |
BRAZIL | | | 363,724 | | 0.41 | |
CHINA | | | 72,551 | | 0.08 | |
FINLAND | | | 3,304,236 | | 3.74 | |
FRANCE | | | 9,521,958 | | 10.77 | |
GERMANY | | | 18,544,129 | | 20.98 | |
HONG KONG | | | 1,778,035 | | 2.01 | |
INDIA | | | 840,631 | | 0.95 | |
INDONESIA | | | 27,437 | | 0.03 | |
ITALY | | | 5,144,808 | | 5.82 | |
JAPAN | | | 20,572,924 | | 23.28 | |
NETHERLANDS | | | 1,892,307 | | 2.14 | |
REPUBLIC OF KOREA | | | 74,763 | | 0.08 | |
RUSSIA | | | 172,499 | | 0.20 | |
SINGAPORE | | | 511,887 | | 0.58 | |
SWITZERLAND | | | 7,394,441 | | 8.37 | |
UNITED KINGDOM | | | 12,156,821 | | 13.76 | |
| | |
|
| |
|
|
TOTAL FOREIGN | | | 86,091,249 | | 97.41 | |
| | |
|
| |
|
|
TOTAL PORTFOLIO | | $ | 88,379,899 | | 100.00 | % |
| | |
|
| |
|
|
17
TIAA-CREF LIFE FUNDS - Large-Cap Value Fund
TIAA-CREF LIFE FUNDS
LARGE-CAP VALUE FUND
STATEMENT OF INVESTMENTS (Unaudited)
June 30, 2006
| | | | | | | |
SHARES
| | | | COMPANY
| | VALUE
|
| |
COMMON STOCKS - 99.18% | | | |
| APPAREL AND ACCESSORY STORES - 2.34% | | |
| 71,859 | | | | Gap, Inc | | $ | 1,250,347 |
| | | | | | |
|
|
| | | | | TOTAL APPAREL AND ACCESSORY STORES | | 1,250,347 |
| | | | | | |
|
|
| APPAREL AND OTHER TEXTILE PRODUCTS - 0.09% | | |
| 584 | | | | Liz Claiborne, Inc | | | 21,643 |
| 405 | | | | VF Corp | | | 27,508 |
| | | | | | |
|
|
| | | | | TOTAL APPAREL AND OTHER TEXTILE PRODUCTS | | 49,151 |
| | | | | | |
|
|
| BUSINESS SERVICES - 2.29% | | |
| 10,373 | | * | | DynCorp International, Inc | | | 107,672 |
| 8,479 | | * | | Interpublic Group of Cos, Inc | | | 70,800 |
| 42,215 | | * | | Novell, Inc | | | 279,885 |
| 18,562 | | * | | Redback Networks, Inc | | | 340,427 |
| 13,222 | | * | | United Rentals, Inc | | | 422,840 |
| | | | | | |
|
|
| | | | | TOTAL BUSINESS SERVICES | | 1,221,624 |
| | | | | | |
|
|
| CHEMICALS AND ALLIED PRODUCTS - 6.12% | | |
| 7,669 | | | | Bristol-Myers Squibb Co | | | 198,320 |
| 12,549 | | | | Colgate-Palmolive Co | | | 751,685 |
| 5,916 | | | | Du Pont (E.I.) de Nemours & Co | | | 246,106 |
| 21,000 | | * | | Hercules, Inc | | | 320,460 |
| 21,477 | | | | Pfizer, Inc | | | 504,065 |
| 7,246 | | * | | Sepracor, Inc | | | 414,036 |
| 3,350 | | | | Teva Pharmaceutical Industries Ltd (ADR) | | | 105,827 |
| 9 | | | | Tronox, Inc | | | 119 |
| 4,442 | | | | Unilever plc (ADR) | | | 100,123 |
| 4,473 | | | | Unilever plc | | | 100,600 |
| 11,874 | | | | Wyeth | | | 527,324 |
| | | | | | |
|
|
| | | | | TOTAL CHEMICALS AND ALLIED PRODUCTS | | 3,268,665 |
| | | | | | |
|
|
| COAL MINING - 0.88% | | |
| 12,172 | | | | Sasol Ltd (ADR) | | | 470,326 |
| | | | | | |
|
|
| | | | | TOTAL COAL MINING | | 470,326 |
| | | | | | |
|
|
| COMMUNICATIONS - 4.66% | | |
| 38,232 | | | | AT&T, Inc | | | 1,066,290 |
| 12,330 | | | | BellSouth Corp | | | 446,346 |
| 1,970 | | * | | Liberty Media Holding Corp (Interactive) | | | 34,002 |
| 394 | | * | | Liberty Media Holding Corp (Capital) | | | 33,005 |
| 35,947 | | | | Sprint Nextel Corp | | | 718,581 |
| 33,020 | | | | Telecom Corp of New Zealand Ltd | | | 81,395 |
| 3,246 | | | | Verizon Communications, Inc | | | 108,709 |
| | | | | | |
|
|
| | | | | TOTAL COMMUNICATIONS | | 2,488,328 |
| | | | | | |
|
|
18
TIAA-CREF LIFE FUNDS - Large-Cap Value Fund
| | | | | | | |
SHARES
| | | | COMPANY
| | VALUE
|
| |
| DEPOSITORY INSTITUTIONS - 18.19% | | |
| 40,877 | | | | Bank of America Corp | | $ | 1,966,184 |
| 17,474 | | | | Bank of New York Co, Inc | | | 562,663 |
| 8,577 | | | | Citigroup, Inc | | | 413,754 |
| 2,600 | | | | Compass Bancshares, Inc | | | 144,560 |
| 60,503 | | | | Hudson City Bancorp, Inc | | | 806,505 |
| 4,765 | | | | ICICI Bank Ltd (ADR) | | | 112,692 |
| 44,492 | | | | JPMorgan Chase & Co | | | 1,868,660 |
| 7,810 | | | | Marshall & Ilsley Corp | | | 357,229 |
| 86 | | | | National City Corp | | | 3,112 |
| 16,741 | | | | South Financial Group, Inc | | | 442,130 |
| 13,946 | | | | SunTrust Banks, Inc | | | 1,063,520 |
| 4,979 | | | | TCF Financial Corp | | | 131,694 |
| 12,343 | | | | US Bancorp | | | 381,152 |
| 707 | | | | Wachovia Corp | | | 38,235 |
| 12,003 | | | | Washington Mutual, Inc | | | 547,097 |
| 13,019 | | | | Wells Fargo & Co | | | 873,315 |
| | | | | | |
|
|
| | | | | TOTAL DEPOSITORY INSTITUTIONS | | 9,712,502 |
| | | | | | |
|
|
| EATING AND DRINKING PLACES - 1.85% | | |
| 17,755 | | | | Brinker International, Inc | | | 644,507 |
| 70,935 | | | | Compass Group plc | | | 344,066 |
| | | | | | |
|
|
| | | | | TOTAL EATING AND DRINKING PLACES | | 988,573 |
| | | | | | |
|
|
| ELECTRIC, GAS, AND SANITARY SERVICES - 4.87% | | |
| 13,932 | | | | American Electric Power Co, Inc | | | 477,171 |
| 973 | | | | Dominion Resources, Inc | | | 72,771 |
| 22,379 | | | | DPL, Inc | | | 599,757 |
| 3,030 | | | | Duke Energy Corp | | | 88,991 |
| 3,726 | | | | Exelon Corp | | | 211,749 |
| 4,995 | | | | FirstEnergy Corp | | | 270,779 |
| 5,224 | | | | FPL Group, Inc | | | 216,169 |
| 516 | | | | MDU Resources Group, Inc | | | 18,891 |
| 6,840 | | | | Northeast Utilities | | | 141,383 |
| 1,571 | | * | | NRG Energy, Inc | | | 75,691 |
| 3,839 | | | | PPL Corp | | | 124,000 |
| 49,500 | | * | | Sojitz Holdings Corp | | | 195,722 |
| 3,390 | | | | Southern Co | | | 108,650 |
| | | | | | |
|
|
| | | | | TOTAL ELECTRIC, GAS, AND SANITARY SERVICES | | 2,601,724 |
| | | | | | |
|
|
| ELECTRONIC AND OTHER ELECTRIC EQUIPMENT - 6.04% | | |
| 38,646 | | * | | Atmel Corp | | | 214,485 |
| 50,701 | | * | | Brocade Communications Systems, Inc | | | 311,304 |
| 55,839 | | * | | Ciena Corp | | | 268,586 |
| 30,300 | | | | Honeywell International, Inc | | | 1,221,090 |
| 25,901 | | * | | Infineon Technologies AG. (ADR) | | | 289,055 |
| 159,468 | | * | | JDS Uniphase Corp | | | 403,454 |
| 2,730 | | | | L-3 Communications Holdings, Inc | | | 205,897 |
| 22,076 | | | | RadioShack Corp | | | 309,064 |
| | | | | | |
|
|
| | | | | TOTAL ELECTRONIC AND OTHER ELECTRIC EQUIPMENT | | 3,222,935 |
| | | | | | |
|
|
19
TIAA-CREF LIFE FUNDS - Large-Cap Value Fund
| | | | | | | |
SHARES
| | | | COMPANY
| | VALUE
|
| |
| ENGINEERING AND MANAGEMENT SERVICES - 0.60% | | |
| 17,698 | | * | | Infrasource Services, Inc | | $ | 322,281 |
| | | | | | |
|
|
| | | | | TOTAL ENGINEERING AND MANAGEMENT SERVICES | | 322,281 |
| | | | | | |
|
|
| FABRICATED METAL PRODUCTS - 0.61% | | |
| 6,824 | | | | Illinois Tool Works, Inc | | | 324,140 |
| | | | | | |
|
|
| | | | | TOTAL FABRICATED METAL PRODUCTS | | 324,140 |
| | | | | | |
|
|
| FOOD AND KINDRED PRODUCTS - 0.20% | | |
| 3,655 | | * | | Smithfield Foods, Inc | | | 105,374 |
| | | | | | |
|
|
| | | | | TOTAL FOOD AND KINDRED PRODUCTS | | 105,374 |
| | | | | | |
|
|
| FOOD STORES - 1.33% | | |
| 23,107 | | | | Supervalu, Inc | | | 709,385 |
| | | | | | |
|
|
| | | | | TOTAL FOOD STORES | | 709,385 |
| | | | | | |
|
|
| FORESTRY - 0.36% | | |
| 5,000 | | | | Rayonier, Inc | | | 189,550 |
| | | | | | |
|
|
| | | | | TOTAL FORESTRY | | 189,550 |
| | | | | | |
|
|
| GENERAL BUILDING CONTRACTORS - 0.35% | | |
| 42,000 | | * | | Daikyo, Inc | | | 185,173 |
| | | | | | |
|
|
| | | | | TOTAL GENERAL BUILDING CONTRACTORS | | 185,173 |
| | | | | | |
|
|
| HEALTH SERVICES - 0.68% | | |
| 94,269 | | * | | Healthsouth Corp | | | 362,936 |
| | | | | | |
|
|
| | | | | TOTAL HEALTH SERVICES | | 362,936 |
| | | | | | |
|
|
| HOLDING AND OTHER INVESTMENT OFFICES - 1.38% | | |
| 2 | | | | Cross Timbers Royalty Trust | | | 90 |
| 10,527 | | | | New Century Financial Corp | | | 481,610 |
| 7,193 | | | | Plum Creek Timber Co, Inc | | | 255,352 |
| | | | | | |
|
|
| | | | | TOTAL HOLDING AND OTHER INVESTMENT OFFICES | | 737,052 |
| | | | | | |
|
|
| HOTELS AND OTHER LODGING PLACES - 1.89% | | |
| 14,183 | | | | Accor S.A. | | | 863,049 |
| 20,000 | | | | Fujita Kanko, Inc | | | 147,662 |
| | | | | | |
|
|
| | | | | TOTAL HOTELS AND OTHER LODGING PLACES | | 1,010,711 |
| | | | | | |
|
|
| INDUSTRIAL MACHINERY AND EQUIPMENT - 3.07% | | |
| 6,556 | | * | | Alstom RGPT | | | 598,953 |
| 32,799 | | | | Hewlett-Packard Co | | | 1,039,072 |
| | | | | | |
|
|
| | | | | TOTAL INDUSTRIAL MACHINERY AND EQUIPMENT | | 1,638,025 |
| | | | | | |
|
|
| INSTRUMENTS AND RELATED PRODUCTS - 0.80% | | |
| 4,979 | | * | | Boston Scientific Corp | | | 83,846 |
| 7,312 | | * | | Eagle Test Systems, Inc | | | 102,514 |
| 17,432 | | * | | Teradyne, Inc | | | 242,828 |
| | | | | | |
|
|
| | | | | TOTAL INSTRUMENTS AND RELATED PRODUCTS | | 429,188 |
| | | | | | |
|
|
20
TIAA-CREF LIFE FUNDS - Large-Cap Value Fund
| | | | | | | |
SHARES
| | | | COMPANY
| | VALUE
|
| |
| INSURANCE AGENTS, BROKERS AND SERVICE - 0.78% | | |
| 5,902 | | | | AON Corp | | $ | 205,508 |
| 7,928 | | | | Marsh & McLennan Cos, Inc | | | 213,184 |
| | | | | | |
|
|
| | | | | TOTAL INSURANCE AGENTS, BROKERS AND SERVICE | | 418,692 |
| | | | | | |
|
|
| INSURANCE CARRIERS - 8.32% | | |
| 192 | | | | Aegon NV | | | 3,277 |
| 12,104 | | | | Aetna, Inc | | | 483,313 |
| 16,368 | | | | American International Group, Inc | | | 966,530 |
| 6,954 | | | | Aspen Insurance Holdings Ltd | | | 161,959 |
| 10,673 | | | | Axis Capital Holdings Ltd | | | 305,355 |
| 1,565 | | | | Everest Re Group Ltd | | | 135,482 |
| 8,001 | | | | Max Re Capital Ltd | | | 174,742 |
| 6,498 | | * | | Molina Healthcare, Inc | | | 247,249 |
| 17,247 | | | | Montpelier Re Holdings Ltd | | | 298,201 |
| 6,486 | | | | PartnerRe Ltd | | | 415,428 |
| 6,034 | | | | Platinum Underwriters Holdings Ltd | | | 168,831 |
| 21,351 | | | | St. Paul Travelers Cos, Inc | | | 951,828 |
| 2,141 | | | | XL Capital Ltd (Class A) | | | 131,243 |
| | | | | | |
|
|
| | | | | TOTAL INSURANCE CARRIERS | | 4,443,438 |
| | | | | | |
|
|
| METAL MINING - 1.01% | | |
| 1,494 | | * | | Barrick Gold Corp | | | 44,222 |
| 5,120 | | | | Inco Ltd | | | 337,408 |
| 1,217 | | | | MMC Norilsk Nickel (ADR) | | | 158,210 |
| | | | | | |
|
|
| | | | | TOTAL METAL MINING | | 539,840 |
| | | | | | |
|
|
| MISCELLANEOUS RETAIL - 2.86% | | |
| 62,475 | | * | | Rite Aid Corp | | | 264,894 |
| 8,142 | | * | | Sears Holdings Corp | | | 1,260,707 |
| | | | | | |
|
|
| | | | | TOTAL MISCELLANEOUS RETAIL | | 1,525,601 |
| | | | | | |
|
|
| NONDEPOSITORY INSTITUTIONS - 2.33% | | |
| 19,547 | | | | Fannie Mae | | | 940,211 |
| 5,295 | | | | Freddie Mac | | | 301,868 |
| | | | | | |
|
|
| | | | | TOTAL NONDEPOSITORY INSTITUTIONS | | 1,242,079 |
| | | | | | |
|
|
| OIL AND GAS EXTRACTION - 3.09% | | |
| 2,552 | | | | Anadarko Petroleum Corp | | | 121,705 |
| 4,606 | | | | Apache Corp | | | 314,360 |
| 3,200 | | * | | Cheniere Energy, Inc | | | 124,800 |
| 7,463 | | | | Devon Energy Corp | | | 450,840 |
| 440 | | | | Equitable Resources, Inc | | | 14,740 |
| 3,760 | | | | Noble Energy, Inc | | | 176,194 |
| 4,652 | | | | Petroleo Brasileiro S.A. (ADR) | | | 415,470 |
| 418 | | | | Pogo Producing Co | | | 19,270 |
| 274 | | | | W&T Offshore, Inc | | | 10,656 |
| | | | | | |
|
|
| | | | | TOTAL OIL AND GAS EXTRACTION | | 1,648,035 |
| | | | | | |
|
|
21
TIAA-CREF LIFE FUNDS - Large-Cap Value Fund
| | | | | | | |
SHARES
| | | | COMPANY
| | VALUE
|
| |
| PAPER AND ALLIED PRODUCTS - 0.53% | | |
| 1,143 | | * | | Smurfit-Stone Container Corp | | $ | 12,504 |
| 6,261 | | | | Temple-Inland, Inc | | | 268,409 |
| | | | | | |
|
|
| | | | | TOTAL PAPER AND ALLIED PRODUCTS | | 280,913 |
| | | | | | |
|
|
| PETROLEUM AND COAL PRODUCTS - 6.33% | | |
| 23,663 | | | | Chevron Corp | | | 1,468,526 |
| 3,343 | | | | ConocoPhillips | | | 219,067 |
| 11,796 | | | | Exxon Mobil Corp | | | 723,685 |
| 2,154 | | | | Marathon Oil Corp | | | 179,428 |
| 2,812 | | | | Occidental Petroleum Corp | | | 288,371 |
| 7,489 | | | | Valero Energy Corp | | | 498,168 |
| | | | | | |
|
|
| | | | | TOTAL PETROLEUM AND COAL PRODUCTS | | 3,377,245 |
| | | | | | |
|
|
| PRINTING AND PUBLISHING - 0.61% | | |
| 4,836 | | | | Gannett Co, Inc | | | 270,477 |
| 1,705 | | | | Tribune Co | | | 55,293 |
| | | | | | |
|
|
| | | | | TOTAL PRINTING AND PUBLISHING | | 325,770 |
| | | | | | |
|
|
| SECURITY AND COMMODITY BROKERS - 4.26% | | |
| 326 | | | | Janus Capital Group, Inc | | | 5,835 |
| 24,289 | | | | Morgan Stanley | | | 1,535,308 |
| 15,900 | | | | Nomura Holdings, Inc | | | 298,347 |
| 21,238 | | | | Waddell & Reed Financial, Inc (Class A) | | | 436,653 |
| | | | | | |
|
|
| | | | | TOTAL SECURITY AND COMMODITY BROKERS | | 2,276,143 |
| | | | | | |
|
|
| STONE, CLAY, AND GLASS PRODUCTS - 1.07% | | |
| 22,451 | | * | | Owens-Illinois, Inc | | | 376,279 |
| 16,203 | | | | Rinker Group Ltd | | | 197,303 |
| | | | | | |
|
|
| | | | | TOTAL STONE, CLAY, AND GLASS PRODUCTS | | 573,582 |
| | | | | | |
|
|
| TOBACCO PRODUCTS - 3.63% | | |
| 26,407 | | | | Altria Group, Inc | | | 1,939,066 |
| | | | | | |
|
|
| | | | | TOTAL TOBACCO PRODUCTS | | 1,939,066 |
| | | | | | |
|
|
| TRANSPORTATION BY AIR - 1.36% | | |
| 15,172 | | * | | Airtran Holdings, Inc | | | 225,456 |
| 21,823 | | * | | JetBlue Airways Corp | | | 264,931 |
| 4,669 | | * | | US Airways Group, Inc | | | 235,971 |
| | | | | | |
|
|
| | | | | TOTAL TRANSPORTATION BY AIR | | 726,358 |
| | | | | | |
|
|
| TRANSPORTATION EQUIPMENT - 0.11% | | |
| 67 | | | | Genuine Parts Co | | | 2,791 |
| 739 | | * | | Magna International, Inc (Class A) | | | 53,186 |
| | | | | | |
|
|
| | | | | TOTAL TRANSPORTATION EQUIPMENT | | 55,977 |
| | | | | | |
|
|
| TRANSPORTATION SERVICES - 0.55% | | |
| 13,322 | | | | Lear Corp | | | 295,882 |
| | | | | | |
|
|
| | | | | TOTAL TRANSPORTATION SERVICES | | 295,882 |
| | | | | | |
|
|
22
TIAA-CREF LIFE FUNDS - Large-Cap Value Fund
| | | | | | | |
SHARES
| | | | COMPANY
| | VALUE
|
| |
| TRUCKING AND WAREHOUSING - 0.30% | | |
| 3,733 | | * | | YRC Worldwide, Inc | | $ | 157,197 |
| | | | | | |
|
|
| | | | | TOTAL TRUCKING AND WAREHOUSING | | 157,197 |
| | | | | | |
|
|
| WHOLESALE TRADE-DURABLE GOODS - 0.63% | | |
| 7,112 | | | | Omnicare, Inc | | | 337,251 |
| | | | | | |
|
|
| | | | | TOTAL WHOLESALE TRADE-DURABLE GOODS | | 337,251 |
| | | | | | |
|
|
| WHOLESALE TRADE-NONDURABLE GOODS - 2.81% | | |
| 12,978 | | | | Akzo Nobel NV | | | 699,616 |
| 11,452 | | | | Cardinal Health, Inc | | | 736,707 |
| 1,720 | | * | | Dean Foods Co | | | 63,967 |
| | | | | | |
|
|
| | | | | TOTAL WHOLESALE TRADE-NONDURABLE GOODS | | 1,500,290 |
| | | | | | |
|
|
| | | | | TOTAL COMMON STOCKS
(Cost $47,390,985) | | 52,951,349 |
| | | | | | |
|
|
| | | |
PRINCIPAL
| | | | | | |
| |
SHORT-TERM INVESTMENTS - 0.28% | | | |
| U.S. GOVERNMENT AND AGENCIES DISCOUNT NOTES - 0.28% | | |
| $ 150,000 | | | | Federal Home Loan Bank (FHLB) 4.950%, 07/03/06 | | | 150,000 |
| | | | | | |
|
|
| | | | | TOTAL SHORT-TERM INVESTMENTS (Cost $149,959) | | 150,000 |
| | | | | | |
|
|
| | | | | TOTAL PORTFOLIO - 99.46% (Cost $47,540,944) | | 53,101,349 |
| | | | | OTHER ASSETS & LIABILITIES, NET - 0.54% | | | 285,770 |
| | | | | | |
|
|
| | | | | NET ASSETS - 100.00% | | $53,387,119 |
| | | | | | |
|
|
ABBREVIATION:
ADR - American Depositary Receipt
For ease of presentation, we have grouped a number of industry classification categories together in the Statement of Investments. Note that the Funds use more specific industry categories in following their investment limitations on industry concentration.
23
TIAA-CREF LIFE FUNDS - Small-Cap Equity Fund
TIAA-CREF LIFE FUNDS
SMALL-CAP EQUITY FUND
STATEMENT OF INVESTMENTS (Unaudited)
June 30, 2006
| | | | | | | |
SHARES
| | | | COMPANY
| | VALUE
|
| |
COMMON STOCKS - 99.49% | | | |
| AGRICULTURAL PRODUCTION-CROPS - 0.09% | | |
| 3,400 | | | | Chiquita Brands International, Inc | | $ | 46,852 |
| | | | | | |
|
|
| | | | | TOTAL AGRICULTURAL PRODUCTION-CROPS | | 46,852 |
| | | | | | |
|
|
| AMUSEMENT AND RECREATION SERVICES - 0.68% | | |
| 1,845 | | | | Dover Downs Gaming & Entertainment, Inc | | | 36,236 |
| 2,500 | | * | | Live Nation, Inc | | | 50,900 |
| 4,100 | | * | | Multimedia Games, Inc | | | 41,533 |
| 2,500 | | * | | Pinnacle Entertainment, Inc | | | 76,625 |
| 3,600 | | * | | Six Flags, Inc | | | 20,232 |
| 2,100 | | | | Speedway Motorsports, Inc | | | 79,254 |
| 900 | | * | | WMS Industries, Inc | | | 24,651 |
| 2,100 | | | | World Wrestling Entertainment, Inc | | | 35,469 |
| | | | | | |
|
|
| | | | | TOTAL AMUSEMENT AND RECREATION SERVICES | | 364,900 |
| | | | | | |
|
|
| APPAREL AND ACCESSORY STORES - 2.34% | | |
| 3,600 | | * | | Aeropostale, Inc | | | 104,004 |
| 2,800 | | | | Brown Shoe Co, Inc | | | 95,424 |
| 800 | | | | Buckle, Inc | | | 33,496 |
| 2,600 | | * | | Carter’s, Inc | | | 68,718 |
| 650 | | | | Cato Corp (Class A) | | | 16,803 |
| 1,100 | | * | | Charlotte Russe Holding, Inc | | | 26,334 |
| 8,900 | | * | | Charming Shoppes, Inc | | | 100,036 |
| 1,500 | | * | | Children’s Place Retail Stores, Inc | | | 90,075 |
| 828 | | | | Finish Line, Inc (Class A) | | | 9,795 |
| 4,200 | | * | | New York & Co, Inc | | | 41,034 |
| 8,467 | | * | | Pacific Sunwear Of California, Inc | | | 151,813 |
| 7,400 | | * | | Payless Shoesource, Inc | | | 201,058 |
| 690 | | * | | Shoe Carnival, Inc | | | 16,463 |
| 2,680 | | | | Stage Stores, Inc | | | 88,440 |
| 4,300 | | | | Talbots, Inc | | | 79,335 |
| 1,700 | | * | | Too, Inc | | | 65,263 |
| 15,400 | | * | | Wilsons The Leather Experts, Inc | | | 63,294 |
| | | | | | |
|
|
| | | | | TOTAL APPAREL AND ACCESSORY STORES | | 1,251,385 |
| | | | | | |
|
|
| APPAREL AND OTHER TEXTILE PRODUCTS - 0.76% | | |
| 800 | | * | | Columbia Sportswear Co | | | 36,208 |
| 1,100 | | * | | Guess ?, Inc | | | 45,925 |
| 1,700 | | * | | Gymboree Corp | | | 59,092 |
| 1,267 | | * | | Hartmarx Corp | | | 7,602 |
| 2,400 | | | | Kellwood Co | | | 70,248 |
| 3,800 | | | | Phillips-Van Heusen Corp | | | 145,008 |
| 2,227 | | * | | Warnaco Group, Inc | | | 41,600 |
| | | | | | |
|
|
| | | | | TOTAL APPAREL AND OTHER TEXTILE PRODUCTS | | 405,683 |
| | | | | | |
|
|
24
TIAA-CREF LIFE FUNDS - Small-Cap Equity Fund
| | | | | | | |
SHARES
| | | | COMPANY
| | VALUE
|
| |
| AUTO REPAIR, SERVICES AND PARKING - 0.32% | | |
| 1,000 | | * | | Amerco, Inc | | $ | 100,660 |
| 4,600 | | | | Central Parking Corp | | | 73,600 |
| | | | | | |
|
|
| | | | | TOTAL AUTO REPAIR, SERVICES AND PARKING | | 174,260 |
| | | | | | |
|
|
| AUTOMOTIVE DEALERS AND SERVICE STATIONS - 0.10% | | |
| 3,000 | | * | | CSK Auto Corp | | | 35,910 |
| 800 | | | | Sonic Automotive, Inc | | | 17,744 |
| | | | | | |
|
|
| | | | | TOTAL AUTOMOTIVE DEALERS AND SERVICE STATIONS | | 53,654 |
| | | | | | |
|
|
| BUILDING MATERIALS AND GARDEN SUPPLIES - 0.02% | | |
| 500 | | * | | Builders FirstSource, Inc | | | 10,180 |
| | | | | | |
|
|
| | | | | TOTAL BUILDING MATERIALS AND GARDEN SUPPLIES | | 10,180 |
| | | | | | |
|
|
| BUSINESS SERVICES - 10.91% | | |
| 2,500 | | | | Administaff, Inc | | | 89,525 |
| 900 | | * | | Advent Software, Inc | | | 32,463 |
| 4,500 | | * | | Ansoft Corp | | | 92,160 |
| 900 | | * | | Ansys, Inc | | | 43,038 |
| 2,700 | | * | | aQuantive, Inc | | | 68,391 |
| 10,946 | | * | | Arbinet-thexchange, Inc | | | 61,407 |
| 2,100 | | | | Arbitron, Inc | | | 80,493 |
| 422 | | * | | Asset Acceptance Capital Corp | | | 8,356 |
| 4,500 | | * | | Avocent Corp | | | 118,125 |
| 6,231 | | * | | BearingPoint, Inc | | | 52,153 |
| 767 | | | | Blackbaud, Inc | | | 17,411 |
| 1,700 | | | | Brady Corp (Class A) | | | 62,628 |
| 3,400 | | | | Catalina Marketing Corp | | | 96,764 |
| 11,282 | | * | | CBIZ, Inc | | | 83,600 |
| 21,400 | | * | | CNET Networks, Inc | | | 170,772 |
| 1,000 | | * | | Cogent, Inc | | | 15,070 |
| 1,749 | | | | Cognex Corp | | | 45,526 |
| 2,032 | | * | | Covansys Corp | | | 25,542 |
| 451 | | * | | CSG Systems International, Inc | | | 11,158 |
| 1,851 | | * | | Digital Insight Corp | | | 63,471 |
| 2,800 | | * | | Digital River, Inc | | | 113,092 |
| 10,700 | | * | | Earthlink, Inc | | | 92,662 |
| 2,617 | | * | | Entrust, Inc | | | 8,924 |
| 1,600 | | * | | Epicor Software Corp | | | 16,848 |
| 953 | | * | | eSpeed, Inc (Class A) | | | 7,938 |
| 1,400 | | | | Factset Research Systems, Inc | | | 66,220 |
| 1,600 | | * | | Filenet Corp | | | 43,088 |
| 2,300 | | * | | Gartner, Inc (Class A) | | | 32,660 |
| 2,700 | | | | Gevity HR, Inc | | | 71,685 |
| 719 | | * | | Heartland Payment Systems, Inc | | | 20,046 |
| 4,700 | | * | | Heidrick & Struggles International, Inc | | | 159,048 |
| 6,800 | | * | | Hudson Highland Group, Inc | | | 73,372 |
| 9,100 | | * | | Informatica Corp | | | 119,756 |
| 1,305 | | * | | Infospace, Inc | | | 29,584 |
| 5,700 | | * | | Internet Security Systems, Inc | | | 107,445 |
| 3,000 | | * | | inVentiv Health, Inc | | | 86,340 |
| 5,700 | | * | | Keane, Inc | | | 71,250 |
| 3,116 | | | | Kelly Services, Inc (Class A) | | | 84,662 |
| 300 | | * | | Kenexa Corp | | | 9,555 |
| 696 | | * | | Keynote Systems, Inc | | | 7,176 |
25
TIAA-CREF LIFE FUNDS - Small-Cap Equity Fund
| | | | | | | |
SHARES
| | | | COMPANY
| | VALUE
|
| | | |
| 3,353 | | * | | Kronos, Inc | | $ | 121,412 |
| 2,200 | | * | | Labor Ready, Inc | | | 49,830 |
| 20,098 | | * | | Lawson Software, Inc | | | 134,657 |
| 7,000 | | * | | Manhattan Associates, Inc | | | 142,030 |
| 5,375 | | * | | Mantech International Corp (Class A) | | | 165,872 |
| 3,200 | | * | | Mentor Graphics Corp | | | 41,536 |
| 1,200 | | * | | MicroStrategy, Inc | | | 117,024 |
| 2,900 | | | | MoneyGram International, Inc | | | 98,455 |
| 6,500 | | * | | Move, Inc | | | 35,620 |
| 6,000 | | * | | MPS Group, Inc | | | 90,360 |
| 1,955 | | * | | NCO Group, Inc | | | 51,690 |
| 700 | | * | | NetFlix, Inc | | | 19,047 |
| 7,400 | | * | | NIC, Inc | | | 53,502 |
| 3,900 | | * | | Nuance Communications, Inc | | | 39,234 |
| 1,100 | | * | | Open Solutions, Inc | | | 29,271 |
| 1,072 | | * | | Packeteer, Inc | | | 12,156 |
| 3,024 | | * | | Parametric Technology Corp | | | 38,435 |
| 6,800 | | * | | PDF Solutions, Inc | | | 84,388 |
| 2,600 | | * | | Perot Systems Corp (Class A) | | | 37,648 |
| 921 | | * | | Phase Forward, Inc | | | 10,610 |
| 400 | | * | | PRA International | | | 8,908 |
| 3,316 | | * | | Premiere Global Services, Inc | | | 25,036 |
| 3,900 | | * | | Progress Software Corp | | | 91,299 |
| 1,877 | | | | QAD, Inc | | | 14,547 |
| 2,351 | | * | | Quest Software, Inc | | | 33,008 |
| 1,000 | | * | | Radiant Systems, Inc | | | 10,570 |
| 9,700 | | * | | RealNetworks, Inc | | | 103,790 |
| 2,600 | | | | Rollins, Inc | | | 51,064 |
| 3,001 | | * | | S1 Corp | | | 14,405 |
| 4,138 | | * | | Sapient Corp | | | 21,931 |
| 6,700 | | * | | SonicWALL, Inc | | | 60,233 |
| 10,100 | | * | | Sonus Networks, Inc | | | 49,995 |
| 2,100 | | * | | Sotheby’s Holdings, Inc (Class A) | | | 55,125 |
| 18,600 | | * | | Spherion Corp | | | 169,632 |
| 500 | | | | Startek, Inc | | | 7,475 |
| 1,200 | | * | | SYKES Enterprises, Inc | | | 19,392 |
| 3,500 | | | | Talx Corp | | | 76,545 |
| 6,200 | | * | | TeleTech Holdings, Inc | | | 78,492 |
| 2,500 | | * | | THQ, Inc | | | 54,000 |
| 19,300 | | * | | TIBCO Software, Inc | | | 136,065 |
| 2,800 | | * | | TNS, Inc | | | 57,932 |
| 1,800 | | * | | TradeStation Group, Inc | | | 22,806 |
| 1,002 | | * | | Transaction Systems Architects, Inc | | | 41,773 |
| 900 | | * | | Travelzoo, Inc | | | 27,306 |
| 6,793 | | * | | Trizetto Group, Inc | | | 100,468 |
| 1,000 | | * | | Ultimate Software Group, Inc | | | 19,160 |
| 2,000 | | * | | United Rentals, Inc | | | 63,960 |
| 600 | | * | | Universal Compression Holdings, Inc | | | 37,782 |
| 3,500 | | * | | Valueclick, Inc | | | 53,725 |
| 2,700 | | * | | Verint Systems, Inc | | | 78,813 |
| 2,900 | | | | Viad Corp | | | 90,770 |
26
TIAA-CREF LIFE FUNDS - Small-Cap Equity Fund
| | | | | | | |
SHARES
| | | | COMPANY
| | VALUE
|
| | | |
| 10,400 | | * | | Vignette Corp | | $ | 151,632 |
| 8,474 | | * | | webMethods, Inc | | | 83,638 |
| 3,400 | | * | | Websense, Inc | | | 69,836 |
| 3,500 | | * | | Wind River Systems, Inc | | | 31,150 |
| | | | | | |
|
|
| | | | | TOTAL BUSINESS SERVICES | | 5,844,444 |
| | | | | | |
|
|
| CHEMICALS AND ALLIED PRODUCTS - 6.15% | | |
| 7,812 | | * | | Albany Molecular Research, Inc | | | 83,432 |
| 7,100 | | * | | Alkermes, Inc | | | 134,332 |
| 2,400 | | * | | Alnylam Pharmaceuticals, Inc | | | 36,192 |
| 5,700 | | | | Alpharma, Inc (Class A) | | | 137,028 |
| 3,900 | | * | | Andrx Corp | | | 90,441 |
| 1,320 | | * | | Array Biopharma, Inc | | | 11,352 |
| 700 | | * | | Bentley Pharmaceuticals, Inc | | | 7,672 |
| 2,100 | | * | | BioMarin Pharmaceuticals, Inc | | | 30,177 |
| 1,060 | | * | | Chattem, Inc | | | 32,192 |
| 6,805 | | * | | Connetics Corp | | | 80,027 |
| 2,100 | | * | | Curis, Inc | | | 2,835 |
| 500 | | | | Diagnostic Products Corp | | | 29,085 |
| 2,281 | | * | | Durect Corp | | | 8,827 |
| 2,700 | | | | Georgia Gulf Corp | | | 67,554 |
| 2,200 | | | | H.B. Fuller Co | | | 95,854 |
| 2,200 | | * | | Hercules, Inc | | | 33,572 |
| 1,050 | | * | | Hi-Tech Pharmacal Co, Inc | | | 17,398 |
| 3,764 | | * | | Human Genome Sciences, Inc | | | 40,275 |
| 3,700 | | * | | Immucor, Inc | | | 71,151 |
| 4,000 | | | | Koppers Holdings, Inc | | | 79,960 |
| 1,700 | | * | | Kos Pharmaceuticals, Inc | | | 63,954 |
| 2 | | * | | Ligand Pharmaceuticals, Inc (Class B) | | | 17 |
| 7,200 | | | | Mannatech, Inc | | | 90,792 |
| 3,100 | | * | | Medarex, Inc | | | 29,791 |
| 3,458 | | * | | Medicines Co | | | 67,604 |
| 3,700 | | | | Medicis Pharmaceutical Corp (Class A) | | | 88,800 |
| 600 | | | | Meridian Bioscience, Inc | | | 14,970 |
| 1,600 | | * | | MGI Pharma, Inc | | | 34,400 |
| 3,700 | | * | | NBTY, Inc | | | 88,467 |
| 1,500 | | * | | Neurocrine Biosciences, Inc | | | 15,900 |
| 1,900 | | | | NewMarket Corp | | | 93,214 |
| 2,000 | | | | Olin Corp | | | 35,860 |
| 7,946 | | * | | OraSure Technologies, Inc | | | 75,646 |
| 73 | | * | | OSI Pharmaceuticals, Inc | | | 2,406 |
| 3,700 | | * | | Pain Therapeutics, Inc | | | 30,895 |
| 6,600 | | | | Perrigo Co | | | 106,260 |
| 5,900 | | * | | Pharmion Corp | | | 100,477 |
| 5,237 | | * | | Pioneer Cos, Inc | | | 142,865 |
| 14,000 | | * | | PolyOne Corp | | | 122,920 |
| 4,232 | | * | | Pozen, Inc | | | 29,793 |
| 3,000 | | * | | Rockwood Holdings, Inc | | | 69,030 |
| 2,787 | | * | | Sciele Pharma, Inc | | | 64,631 |
| 2,711 | | * | | Serologicals Corp | | | 85,234 |
| 11,796 | | | | Stratagene Corp | | | 72,781 |
| 1,200 | | * | | SurModics, Inc | | | 43,332 |
27
TIAA-CREF LIFE FUNDS - Small-Cap Equity Fund
| | | | | | | |
SHARES
| | | | COMPANY
| | VALUE
|
| | | |
| 3,600 | | | | UAP Holding Corp | | $ | 78,516 |
| 2,545 | | * | | United Therapeutics Corp | | | 147,025 |
| 2,700 | | * | | USANA Health Sciences, Inc | | | 102,330 |
| 1,700 | | | | USEC, Inc | | | 20,145 |
| 3,760 | | * | | Vertex Pharmaceuticals, Inc | | | 138,030 |
| 1,000 | | | | Westlake Chemical Corp | | | 29,800 |
| 10,100 | | * | | WR Grace & Co | | | 118,170 |
| | | | | | |
|
|
| | | | | TOTAL CHEMICALS AND ALLIED PRODUCTS | | 3,293,411 |
| | | | | | |
|
|
| COAL MINING - 0.58% | | |
| 4,600 | | * | | Alpha Natural Resources, Inc | | | 90,252 |
| 500 | | | | Foundation Coal Holdings, Inc | | | 23,465 |
| 2,800 | | | | Penn Virginia Corp | | | 195,664 |
| | | | | | |
|
|
| | | | | TOTAL COAL MINING | | 309,381 |
| | | | | | |
|
|
| COMMUNICATIONS - 1.91% | | |
| 714 | | * | | Audiovox Corp (Class A) | | | 9,753 |
| 2,222 | | * | | Brightpoint, Inc | | | 30,064 |
| 2,400 | | * | | Cbeyond Communications, Inc | | | 52,344 |
| 10,500 | | * | | Cincinnati Bell, Inc | | | 43,050 |
| 6,700 | | | | Citadel Broadcasting Corp | | | 59,630 |
| 17,700 | | * | | Covad Communications Group, Inc | | | 35,577 |
| 2,600 | | | | CT Communications, Inc | | | 59,462 |
| 4,200 | | * | | Dobson Communications Corp (Class A) | | | 32,466 |
| 1,700 | | | | Entercom Communications Corp | | | 44,472 |
| 3,400 | | * | | First Avenue Networks, Inc | | | 36,992 |
| 5,175 | | * | | Foundry Networks, Inc | | | 55,165 |
| 6,500 | | * | | General Communication, Inc (Class A) | | | 80,080 |
| 2,800 | | | | Golden Telecom, Inc | | | 70,980 |
| 3,100 | | * | | NeuStar, Inc | | | 104,625 |
| 1,400 | | | | North Pittsburgh Systems, Inc | | | 38,584 |
| 1 | | v* | | RCN Corp Wts | | | — |
| 1,500 | | | | Salem Communications Corp (Class A) | | | 19,515 |
| 2,950 | | * | | SBA Communications Corp | | | 77,113 |
| 200 | | | | Shenandoah Telecom Co | | | 9,400 |
| 7,200 | | | | Sinclair Broadcast Group, Inc (Class A) | | | 61,632 |
| 4,500 | | * | | Syniverse Holdings, Inc | | | 66,150 |
| 1,578 | | * | | Talk America Holdings, Inc | | | 9,768 |
| 2,765 | | * | | Ubiquitel, Inc | | | 28,590 |
| | | | | | |
|
|
| | | | | TOTAL COMMUNICATIONS | | 1,025,412 |
| | | | | | |
|
|
| DEPOSITORY INSTITUTIONS - 9.59% | | |
| 1,600 | | | | 1st Source Corp | | | 54,128 |
| 751 | | * | | ACE Cash Express, Inc | | | 21,982 |
| 492 | | | | Alabama National Bancorp | | | 33,530 |
| 668 | | | | Anchor Bancorp Wisconsin, Inc | | | 20,154 |
| 692 | | | | Bancfirst Corp | | | 30,967 |
| 1,500 | | | | Bancorpsouth, Inc | | | 40,875 |
| 986 | | | | BankUnited Financial Corp (Class A) | | | 30,093 |
| 2,100 | | | | Boston Private Financial Holdings, Inc | | | 58,590 |
| 488 | | * | | Capital Crossing Bank | | | 12,005 |
| 978 | | | | Cathay General Bancorp | | | 35,580 |
28
TIAA-CREF LIFE FUNDS - Small-Cap Equity Fund
| | | | | | | |
SHARES
| | | | COMPANY
| | VALUE
|
| | | |
| 10,500 | | * | | Centennial Bank Holdings, Inc | | $ | 108,570 |
| 2,400 | | | | Center Financial Corp | | | 56,736 |
| 2,900 | | | | Central Pacific Financial Corp | | | 112,230 |
| 4,300 | | | | Chittenden Corp | | | 111,155 |
| 5,601 | | | | Citizens Banking Corp | | | 136,720 |
| 1,808 | | | | City Holding Co | | | 65,341 |
| 4,300 | | | | Community Bank System, Inc | | | 86,731 |
| 1,000 | | | | Community Trust Bancorp, Inc | | | 34,930 |
| 1,270 | | | | Corus Bankshares, Inc | | | 33,249 |
| 1,629 | | * | | EuroBancshares, Inc | | | 15,752 |
| 900 | | * | | Euronet Worldwide, Inc | | | 34,533 |
| 4,400 | | | | First Bancorp | | | 40,920 |
| 300 | | | | First Citizens Bancshares, Inc (Class A) | | | 60,150 |
| 1,301 | | | | First Community Bancorp, Inc | | | 76,863 |
| 400 | | | | First Community Bancshares, Inc | | | 13,196 |
| 1,299 | | | | First Merchants Corp | | | 31,579 |
| 2,400 | | | | First Midwest Bancorp, Inc | | | 88,992 |
| 11,950 | | | | First Niagara Financial Group, Inc | | | 167,539 |
| 537 | | * | | First Regional Bancorp | | | 47,256 |
| 800 | | | | First Republic Bank | | | 36,640 |
| 3,600 | | * | | FirstFed Financial Corp | | | 207,612 |
| 2,800 | | | | FirstMerit Corp | | | 58,632 |
| 1,750 | | | | Flushing Financial Corp | | | 31,430 |
| 516 | | | | FNB Corp | | | 19,092 |
| 1,300 | | | | Fremont General Corp | | | 24,128 |
| 6,655 | | | | Greater Bay Bancorp | | | 191,331 |
| 7,985 | | | | Hanmi Financial Corp | | | 155,228 |
| 1,389 | | | | Horizon Financial Corp | | | 38,100 |
| 685 | | | | Huntington Bancshares, Inc | | | 16,152 |
| 1,462 | | | | ITLA Capital Corp | | | 76,872 |
| 5,300 | | | | KNBT Bancorp, Inc | | | 87,556 |
| 1,000 | | | | Lakeland Financial Corp | | | 24,290 |
| 1,356 | | | | Macatawa Bank Corp | | | 31,717 |
| 2,023 | | | | MAF Bancorp, Inc | | | 86,665 |
| 1,460 | | | | Marshall & Ilsley Corp | | | 66,780 |
| 4,245 | | | | MB Financial, Inc | | | 150,103 |
| 689 | | | | MBT Financial Corp | | | 11,024 |
| 840 | | | | Mercantile Bank Corp | | | 33,474 |
| 1,600 | | | | Mid-State Bancshares | | | 44,800 |
| 798 | | | | NASB Financial, Inc | | | 26,948 |
| 5,800 | | | | National Penn Bancshares, Inc | | | 115,188 |
| 2,000 | | | | NBT Bancorp, Inc | | | 46,460 |
| 1,584 | | * | | Northern Empire Bancshares | | | 38,016 |
| 3,300 | | | | Old National Bancorp | | | 65,901 |
| 1,700 | | | | Oriental Financial Group, Inc | | | 21,692 |
| 1,600 | | | | Pacific Capital Bancorp | | | 49,792 |
| 2,300 | | | | Pennfed Financial Services, Inc | | | 42,895 |
| 1,000 | | | | PFF Bancorp, Inc | | | 33,160 |
| 3,119 | | | | Placer Sierra Bancshares | | | 72,330 |
| 105 | | | | Premierwest Bancorp | | | 1,515 |
| 2,075 | | | | Provident Bankshares Corp | | | 75,509 |
| 791 | | | | Provident Financial Holdings | | | 23,730 |
29
TIAA-CREF LIFE FUNDS - Small-Cap Equity Fund
| | | | | | | |
SHARES
| | | | COMPANY
| | VALUE
|
| | | |
| 6,900 | | | | Provident Financial Services, Inc | | $ | 123,855 |
| 1,750 | | | | R & G Financial Corp (Class B) | | | 15,033 |
| 10,100 | | | | Republic Bancorp, Inc | | | 125,139 |
| 514 | | | | Republic Bancorp, Inc (Class A) | | | 10,588 |
| 3,300 | | | | S&T Bancorp, Inc | | | 109,659 |
| 1,600 | | | | Santander BanCorp | | | 39,392 |
| 2,680 | | | | Simmons First National Corp (Class A) | | | 77,747 |
| 717 | | | | Southwest Bancorp, Inc | | | 18,284 |
| 400 | | | | State National Bancshares, Inc | | | 15,244 |
| 3,100 | | | | Sterling Bancshares, Inc | | | 58,125 |
| 4,400 | | | | Sterling Financial Corp | | | 96,360 |
| 1,066 | | | | Sterling Financial Corp | | | 32,524 |
| 500 | | | | Suffolk Bancorp | | | 16,375 |
| 2,102 | | * | | SVB Financial Group | | | 95,557 |
| 2,064 | | | | Taylor Capital Group, Inc | | | 84,232 |
| 1,112 | | | | TD Banknorth, Inc | | | 32,748 |
| 3,535 | | | | TierOne Corp | | | 119,377 |
| 993 | | | | Trustmark Corp | | | 30,753 |
| 2,400 | | | | UMB Financial Corp | | | 80,016 |
| 1,800 | | | | Umpqua Holdings Corp | | | 46,170 |
| 736 | | | | United Bankshares, Inc | | | 26,960 |
| 1,100 | | | | United Community Banks, Inc | | | 33,484 |
| 1,100 | | | | Vineyard National Bancorp | | | 29,590 |
| 1,074 | | | | Virginia Financial Group, Inc | | | 45,344 |
| 6,500 | | | | W Holding Co, Inc | | | 43,225 |
| 1,300 | | | | Westamerica Bancorporation | | | 63,661 |
| 2 | | | | Zions Bancorporation | | | 156 |
| | | | | | |
|
|
| | | | | TOTAL DEPOSITORY INSTITUTIONS | | 5,134,706 |
| | | | | | |
|
|
| EATING AND DRINKING PLACES - 2.12% | | |
| 2,800 | | | | Applebees International, Inc | | | 53,816 |
| 2,900 | | | | Bob Evans Farms, Inc | | | 87,029 |
| 1,942 | | * | | Buffalo Wild Wings, Inc | | | 74,398 |
| 1,300 | | | | CBRL Group, Inc | | | 44,096 |
| 1,650 | | * | | CEC Entertainment, Inc | | | 52,998 |
| 7,800 | | | | CKE Restaurants, Inc | | | 129,558 |
| 4,100 | | | | Domino’s Pizza, Inc | | | 101,434 |
| 912 | | | | IHOP Corp | | | 43,849 |
| 1,000 | | * | | Jack in the Box, Inc | | | 39,200 |
| 2,945 | | * | | Krispy Kreme Doughnuts, Inc | | | 23,972 |
| 862 | | | | Lone Star Steakhouse & Saloon, Inc | | | 22,610 |
| 7,051 | | * | | Luby’s, Inc | | | 73,542 |
| 800 | | * | | McCormick & Schmick’s Seafood Restaurants, Inc | | | 19,040 |
| 1,400 | | * | | PF Chang’s China Bistro, Inc | | | 53,228 |
| 3,077 | | * | | Papa John’s International, Inc | | | 102,156 |
| 4,000 | | * | | Rare Hospitality International, Inc | | | 115,040 |
| 4,800 | | * | | Ruth’s Chris Steak House, Inc | | | 98,016 |
| | | | | | |
|
|
| | | | | TOTAL EATING AND DRINKING PLACES | | 1,133,982 |
| | | | | | |
|
|
30
TIAA-CREF LIFE FUNDS - Small-Cap Equity Fund
| | | | | | | |
SHARES
| | | | COMPANY
| | VALUE
|
| |
| EDUCATIONAL SERVICES - 0.56% | | |
| 2,200 | | * | | DeVry, Inc | | $ | 48,334 |
| 4,200 | | * | | Educate, Inc | | | 32,172 |
| 4,981 | | * | | Lincoln Educational Services Corp | | | 85,125 |
| 523 | | | | Strayer Education, Inc | | | 50,794 |
| 3,700 | | * | | Universal Technical Institute, Inc | | | 81,474 |
| | | | | | |
|
|
| | | | | TOTAL EDUCATIONAL SERVICES | | 297,899 |
| | | | | | |
|
|
| ELECTRIC, GAS, AND SANITARY SERVICES - 3.18% | | |
| 800 | | | | Allete, Inc | | | 37,880 |
| 2,500 | | | | American States Water Co | | | 89,125 |
| 900 | | | | Avista Corp | | | 20,547 |
| 1,000 | | | | Black Hills Corp | | | 34,330 |
| 3,225 | | | | Cleco Corp | | | 74,981 |
| 3,790 | | * | | Covanta Holding Corp | | | 66,894 |
| 5,700 | | * | | El Paso Electric Co | | | 114,912 |
| 3,413 | | | | ITC Holdings Corp | | | 90,718 |
| 3,300 | | | | Laclede Group, Inc | | | 113,388 |
| 400 | | | | New Jersey Resources Corp | | | 18,712 |
| 6,400 | | | | Nicor, Inc | | | 265,600 |
| 4,455 | | | | NorthWestern Corp | | | 153,029 |
| 2,380 | | | | Otter Tail Corp | | | 65,045 |
| 2,600 | | * | | Pico Holdings, Inc | | | 83,850 |
| 5,400 | | * | | Pike Electric Corp | | | 104,004 |
| 646 | | | | Resource America, Inc (Class A) | | | 12,306 |
| 3,700 | | * | | Sierra Pacific Resources | | | 51,800 |
| 1,100 | | | | South Jersey Industries, Inc | | | 30,129 |
| 1,700 | | | | UIL Holdings Corp | | | 95,693 |
| 3,600 | | | | Unisource Energy Corp | | | 112,140 |
| 1,400 | | * | | Waste Connections, Inc | | | 50,960 |
| 600 | | | | WGL Holdings, Inc | | | 17,370 |
| | | | | | |
|
|
| | | | | TOTAL ELECTRIC, GAS, AND SANITARY SERVICES | | 1,703,413 |
| | | | | | |
|
|
| ELECTRONIC AND OTHER ELECTRIC EQUIPMENT - 7.80% | | |
| 2,600 | | | | Acuity Brands, Inc | | | 101,166 |
| 1,100 | | * | | Advanced Energy Industries, Inc | | | 14,564 |
| 7,600 | | * | | Aeroflex, Inc | | | 88,692 |
| 12,500 | | * | | Applied Micro Circuits Corp | | | 34,125 |
| 17,500 | | * | | Arris Group, Inc | | | 229,600 |
| 25,300 | | * | | Atmel Corp | | | 140,415 |
| 2,300 | | * | | ATMI, Inc | | | 56,626 |
| 2,100 | | | | Baldor Electric Co | | | 65,709 |
| 2,475 | | * | | Benchmark Electronics, Inc | | | 59,697 |
| 2,900 | | * | | Broadwing Corp | | | 30,015 |
| 12,000 | | * | | Brocade Communications Systems, Inc | | | 73,680 |
| 2,800 | | * | | Comtech Telecommunications Corp | | | 81,956 |
| 19,100 | | * | | Conexant Systems, Inc | | | 47,750 |
| 1,500 | | | | CTS Corp | | | 22,335 |
| 4,600 | | | | Cubic Corp | | | 90,206 |
| 1,300 | | * | | Ditech Networks, Inc | | | 11,336 |
| 1,900 | | * | | EnerSys | | | 39,710 |
31
TIAA-CREF LIFE FUNDS - Small-Cap Equity Fund
| | | | | | | |
SHARES
| | | | COMPANY
| | VALUE
|
| | | |
| 10,100 | | * | | Exar Corp | | $ | 134,027 |
| 2,500 | | * | | Fairchild Semiconductor International, Inc | | | 45,425 |
| 8,800 | | * | | Finisar Corp | | | 28,776 |
| 900 | | | | Franklin Electric Co, Inc | | | 46,476 |
| 10,000 | | * | | Gemstar-TV Guide International, Inc | | | 35,200 |
| 1,100 | | * | | Genlyte Group, Inc | | | 79,673 |
| 900 | | * | | Greatbatch, Inc | | | 21,240 |
| 3,000 | | * | | Harmonic, Inc | | | 13,440 |
| 3,200 | | * | | Hexcel Corp | | | 50,272 |
| 10,950 | | * | | Ikanos Communications, Inc | | | 166,331 |
| 1,400 | | | | Imation Corp | | | 57,470 |
| 2,600 | | * | | iRobot Corp | | | 64,688 |
| 3,500 | | * | | Kemet Corp | | | 32,270 |
| 4,600 | | * | | Lattice Semiconductor Corp | | | 28,428 |
| 900 | | * | | Littelfuse, Inc | | | 30,942 |
| 5,600 | | * | | Mattson Technology, Inc | | | 54,712 |
| 6,300 | | * | | McData Corp (Class A) | | | 25,704 |
| 6,300 | | * | | Monolithic Power Systems, Inc | | | 74,529 |
| 1,500 | | * | | Moog, Inc | | | 51,330 |
| 5,100 | | * | | MRV Communications, Inc | | | 15,861 |
| 338 | | * | | Multi-Fineline Electronix, Inc | | | 11,218 |
| 300 | | | | National Presto Industries, Inc | | | 15,684 |
| 2,100 | | * | | Omnivision Technologies, Inc | | | 44,352 |
| 20,154 | | * | | ON Semiconductor Corp | | | 118,506 |
| 4,500 | | * | | Oplink Communications Inc | | | 82,395 |
| 5,100 | | * | | Pericom Semiconductor Corp | | | 42,330 |
| 2,000 | | | | Plantronics, Inc | | | 44,420 |
| 6,100 | | * | | Plexus Corp | | | 208,681 |
| 8,400 | | * | | PMC - Sierra, Inc | | | 78,960 |
| 3,414 | | * | | Polycom, Inc | | | 74,835 |
| 719 | | * | | Portalplayer, Inc | | | 7,053 |
| 300 | | * | | Powell Industries, Inc | | | 7,179 |
| 5,700 | | * | | Power Integrations, Inc | | | 99,636 |
| 2,000 | | * | | Rambus, Inc | | | 45,620 |
| 30,100 | | * | | RF Micro Devices, Inc | | | 179,697 |
| 1,500 | | * | | Rogers Corp | | | 84,510 |
| 6,200 | | * | | Semtech Corp | | | 89,590 |
| 3,600 | | * | | Silicon Storage Technology, Inc | | | 14,616 |
| 6,359 | | * | | Skyworks Solutions, Inc | | | 35,038 |
| 3,600 | | * | | Standard Microsystems Corp | | | 78,588 |
| 7,200 | | * | | Sycamore Networks, Inc | | | 29,232 |
| 1,944 | | * | | Symmetricom, Inc | | | 13,744 |
| 977 | | * | | Synaptics, Inc | | | 20,908 |
| 1,600 | | | | Technitrol, Inc | | | 37,040 |
| 2,200 | | * | | Trident Microsystems, Inc | | | 41,756 |
| 21,500 | | * | | Triquint Semiconductor, Inc | | | 95,890 |
| 1,687 | | * | | TTM Technologies, Inc | | | 24,411 |
| 5,300 | | | | Vicor Corp | | | 87,821 |
| 600 | | * | | Virage Logic Corp | | | 5,634 |
| 600 | | * | | Zoltek Cos, Inc | | | 17,934 |
| 8,100 | | * | | Zoran Corp | | | 197,154 |
| | | | | | |
|
|
| | | | | TOTAL ELECTRONIC AND OTHER ELECTRIC EQUIPMENT | | 4,178,808 |
| | | | | | |
|
|
32
TIAA-CREF LIFE FUNDS - Small-Cap Equity Fund
| | | | | | | |
SHARES
| | | | COMPANY
| | VALUE
|
| |
| ENGINEERING AND MANAGEMENT SERVICES - 1.96% | | |
| 800 | | * | | Advisory Board Co | | $ | 38,472 |
| 2,500 | | * | | Amylin Pharmaceuticals, Inc | | | 123,425 |
| 2,900 | | | | CDI Corp | | | 84,100 |
| 9,200 | | * | | Digitas, Inc | | | 106,904 |
| 700 | | * | | Essex Corp | | | 12,894 |
| 1,600 | | * | | ICOS Corp | | | 35,184 |
| 3,000 | | * | | Lifecell Corp | | | 92,760 |
| 800 | | | | MAXIMUS, Inc | | | 18,520 |
| 3,100 | | * | | MTC Technologies, Inc | | | 73,253 |
| 1,574 | | * | | Myriad Genetics, Inc | | | 39,744 |
| 3,400 | | * | | Regeneron Pharmaceuticals, Inc | | | 43,588 |
| 2,400 | | * | | Resources Connection, Inc | | | 60,048 |
| 17,081 | | * | | Savient Pharmaceuticals, Inc | | | 89,675 |
| 1,500 | | * | | Shaw Group, Inc | | | 41,700 |
| 3,000 | | * | | Tetra Tech, Inc | | | 53,220 |
| 2,300 | | * | | URS Corp | | | 96,600 |
| 700 | | | | Washington Group International, Inc | | | 37,338 |
| | | | | | |
|
|
| | | | | TOTAL ENGINEERING AND MANAGEMENT SERVICES | | 1,047,425 |
| | | | | | |
|
|
| FABRICATED METAL PRODUCTS - 0.86% | | |
| 1,200 | | | | Aptargroup, Inc | | | 59,532 |
| 2,500 | | | | Commercial Metals Co | | | 64,250 |
| 2,700 | | | | Lifetime Brands, Inc | | | 58,509 |
| 1,700 | | * | | NCI Building Systems, Inc | | | 90,389 |
| 1,126 | | | | Silgan Holdings, Inc | | | 41,673 |
| 1,500 | | | | Simpson Manufacturing Co, Inc | | | 54,075 |
| 1,300 | | | | Valmont Industries, Inc | | | 60,437 |
| 1,000 | | | | Watts Water Technologies, Inc (Class A) | | | 33,550 |
| | | | | | |
|
|
| | | | | TOTAL FABRICATED METAL PRODUCTS | | 462,415 |
| | | | | | |
|
|
| FOOD AND KINDRED PRODUCTS - 0.90% | | |
| 1,300 | | * | | Boston Beer Co, Inc (Class A) | | | 38,077 |
| 2,100 | | | | Corn Products International, Inc | | | 64,260 |
| 3,800 | | * | | Darling International, Inc | | | 17,214 |
| 2,600 | | | | Flowers Foods, Inc | | | 74,464 |
| 1,900 | | * | | Gold Kist, Inc | | | 25,403 |
| 300 | | * | | Hansen Natural Corp | | | 57,111 |
| 1,300 | | | | Imperial Sugar Co | | | 30,836 |
| 2,900 | | * | | M&F Worldwide Corp | | | 46,690 |
| 3,300 | | | | National Beverage Corp | | | 47,355 |
| 400 | | | | Premium Standard Farms, Inc | | | 6,492 |
| 1,800 | | * | | Ralcorp Holdings, Inc | | | 76,554 |
| | | | | | |
|
|
| | | | | TOTAL FOOD AND KINDRED PRODUCTS | | 484,456 |
| | | | | | |
|
|
| FOOD STORES - 0.25% | | |
| 1,600 | | | | Great Atlantic & Pacific Tea Co, Inc | | | 36,352 |
| 1,700 | | * | | Pantry, Inc | | | 97,818 |
| | | | | | |
|
|
| | | | | TOTAL FOOD STORES | | 134,170 |
| | | | | | |
|
|
33
TIAA-CREF LIFE FUNDS - Small-Cap Equity Fund
| | | | | | | |
SHARES
| | | | COMPANY
| | VALUE
|
| |
| FURNITURE AND FIXTURES - 0.94% | | |
| 3,087 | | * | | BE Aerospace, Inc | | $ | 70,569 |
| 1,300 | | | | Ethan Allen Interiors, Inc | | | 47,515 |
| 5,700 | | | | Furniture Brands International, Inc | | | 118,788 |
| 4,500 | | | | Hooker Furniture Corp | | | 75,465 |
| 2,100 | | | | La-Z-Boy, Inc | | | 29,400 |
| 1,603 | | * | | Select Comfort Corp | | | 36,821 |
| 5,109 | | | | Stanley Furniture Co, Inc | | | 122,463 |
| | | | | | |
|
|
| | | | | TOTAL FURNITURE AND FIXTURES | | 501,021 |
| | | | | | |
|
|
FURNITURE AND HOMEFURNISHINGS STORES - 0.03% | | | |
| 500 | | | | Knoll, Inc | | | 9,180 |
| 1,323 | | * | | Trans World Entertainment Corp | | | 9,552 |
| | | | | | |
|
|
| | | | | TOTAL FURNITURE AND HOMEFURNISHINGS STORES | | 18,732 |
| | | | | | |
|
|
| GENERAL BUILDING CONTRACTORS - 0.37% | | |
| 600 | | * | | Avatar Holdings, Inc | | | 34,182 |
| 520 | | | | Brookfield Homes Corp | | | 17,134 |
| 500 | | | | M/I Homes, Inc | | | 17,540 |
| 440 | | * | | Palm Harbor Homes, Inc | | | 7,740 |
| 1,600 | | | | Walter Industries, Inc | | | 92,240 |
| 1,400 | | * | | WCI Communities, Inc | | | 28,196 |
| | | | | | |
|
|
| | | | | TOTAL GENERAL BUILDING CONTRACTORS | | 197,032 |
| | | | | | |
|
|
| GENERAL MERCHANDISE STORES - 0.69% | | |
| 5,900 | | * | | Big Lots, Inc | | | 100,772 |
| 400 | | | | Bon-Ton Stores, Inc | | | 8,752 |
| 3,400 | | | | Casey’s General Stores, Inc | | | 85,034 |
| 2,500 | | * | | Conn’s, Inc | | | 66,375 |
| 7,452 | | | | Stein Mart, Inc | | | 110,290 |
| | | | | | |
|
|
| | | | | TOTAL GENERAL MERCHANDISE STORES | | 371,223 |
| | | | | | |
|
|
| HEALTH SERVICES - 1.72% | | |
| 1,500 | | * | | Alliance Imaging, Inc | | | 9,600 |
| 2,294 | | * | | Allied Healthcare International, Inc | | | 6,148 |
| 738 | | * | | America Service Group, Inc | | | 11,454 |
| 762 | | * | | American Dental Partners, Inc | | | 11,628 |
| 1,800 | | * | | American Retirement Corp | | | 58,986 |
| 4,800 | | * | | Apria Healthcare Group, Inc | | | 90,720 |
| 239 | | * | | Genesis HealthCare Corp | | | 11,321 |
| 1,000 | | * | | Healthways, Inc | | | 52,640 |
| 1,900 | | * | | Kindred Healthcare, Inc | | | 49,400 |
| 1,000 | | * | | LHC Group, Inc | | | 19,920 |
| 985 | | * | | Magellan Health Services, Inc | | | 44,630 |
| 721 | | * | | Medcath Corp | | | 13,584 |
| 300 | | | | National Healthcare Corp | | | 13,365 |
| 1,700 | | * | | Nektar Therapeutics | | | 31,178 |
| 5,000 | | * | | Odyssey HealthCare, Inc | | | 87,850 |
| 51,200 | | * | | PainCare Holdings, Inc | | | 104,960 |
| 1,600 | | * | | Pediatrix Medical Group, Inc | | | 72,480 |
| 4,200 | | * | | Sunrise Senior Living, Inc | | | 116,130 |
| 3,842 | | * | | U.S. Physical Therapy, Inc | | | 56,247 |
| 1,880 | | * | | United Surgical Partners International, Inc | | | 56,532 |
| | | | | | |
|
|
| | | | | TOTAL HEALTH SERVICES | | 918,773 |
| | | | | | |
|
|
34
TIAA-CREF LIFE FUNDS - Small-Cap Equity Fund
| | | | | | | |
SHARES
| | | | COMPANY
| | VALUE
|
| |
| HEAVY CONSTRUCTION, EXCEPT BUILDING - 0.22% | | |
| 2,600 | | | | Granite Construction, Inc | | $ | 117,702 |
| | | | | | |
|
|
| | | | | TOTAL HEAVY CONSTRUCTION, EXCEPT BUILDING | | 117,702 |
| | | | | | |
|
|
| HOLDING AND OTHER INVESTMENT OFFICES - 8.91% | | |
| 2,400 | | | | Agree Realty Corp | | | 81,528 |
| 200 | | * | | Alexander’s, Inc | | | 54,352 |
| 800 | | | | Alexandria Real Estate Equities, Inc | | | 70,944 |
| 3,500 | | | | American Campus Communities, Inc | | | 86,975 |
| 1,800 | | | | Anthracite Capital, Inc | | | 21,888 |
| 2,200 | | | | Anworth Mortgage Asset Corp | | | 18,260 |
| 2,900 | | | | Apollo Investment Corp | | | 53,592 |
| 1,000 | | | | Arbor Realty Trust, Inc | | | 25,050 |
| 3,800 | | | | Ashford Hospitality Trust, Inc | | | 47,956 |
| 6,824 | | | | BioMed Realty Trust, Inc | | | 204,311 |
| 9,400 | | * | | Boykin Lodging Co | | | 102,366 |
| 1,397 | | | | Brandywine Realty Trust | | | 44,941 |
| 100 | | | | Capital Southwest Corp | | | 10,445 |
| 300 | | | | Capital Trust, Inc | | | 10,686 |
| 3,300 | | | | CentraCore Properties Trust | | | 81,675 |
| 4,500 | | | | Colonial Properties Trust | | | 222,300 |
| 3,600 | | | | DiamondRock Hospitality Co | | | 53,316 |
| 500 | | | | Digital Realty Trust, Inc | | | 12,345 |
| 2,200 | | | | EastGroup Properties, Inc | | | 102,696 |
| 900 | | | | Entertainment Properties Trust | | | 38,745 |
| 1,300 | | | | Equity Inns, Inc | | | 21,528 |
| 1,100 | | | | Equity Lifestyle Properties, Inc | | | 48,213 |
| 4,400 | | | | Equity One, Inc | | | 91,960 |
| 5,500 | | | | FelCor Lodging Trust, Inc | | | 119,570 |
| 1,400 | | | | First Potomac Realty Trust | | | 41,706 |
| 500 | | | | Gladstone Capital Corp | | | 10,695 |
| 5,335 | | | | Glimcher Realty Trust | | | 132,361 |
| 800 | | | | Harris & Harris Group, Inc | | | 8,832 |
| 6,900 | | | | Highland Hospitality Corp | | | 97,152 |
| 4,513 | | | | Highwoods Properties, Inc | | | 163,280 |
| 9,300 | | | | Innkeepers U.S.A. Trust | | | 160,704 |
| 2,000 | | | | Investors Real Estate Trust | | | 18,060 |
| 14,841 | | | | iShares Russell 2000 Index Fund | | | 1,067,068 |
| 3,000 | | | | LaSalle Hotel Properties | | | 138,900 |
| 4,500 | | | | LTC Properties, Inc | | | 100,575 |
| 2,040 | | | | Luminent Mortgage Capital, Inc | | | 18,890 |
| 800 | | | | Maguire Properties, Inc | | | 28,136 |
| 1,100 | | | | Medical Properties Trust, Inc | | | 12,144 |
| 1,600 | | | | Mid-America Apartment Communities, Inc | | | 89,200 |
| 1,600 | | | | National Health Investors, Inc | | | 43,024 |
| 5,005 | | | | National Health Realty, Inc | | | 94,845 |
| 7,400 | | | | NorthStar Realty Finance Corp | | | 88,874 |
| 900 | | | | Novastar Financial, Inc | | | 28,449 |
| 4,900 | | | | Omega Healthcare Investors, Inc | | | 64,778 |
| 1,400 | | | | Parkway Properties, Inc | | | 63,700 |
| 2,700 | | | | Pennsylvania Real Estate Investment Trust | | | 108,999 |
| 1,500 | | | | Post Properties, Inc | | | 68,010 |
| 800 | | | | Potlatch Corp | | | 30,200 |
35
TIAA-CREF LIFE FUNDS - Small-Cap Equity Fund
| | | | | | | |
SHARES
| | | | COMPANY
| | VALUE
|
| | | |
| 1,700 | | | | PS Business Parks, Inc | | $ | 100,300 |
| 600 | | | | Ramco-Gershenson Properties | | | 16,158 |
| 1,500 | | | | Senior Housing Properties Trust | | | 26,865 |
| 400 | | | | Sovran Self Storage, Inc | | | 20,316 |
| 800 | | * | | Star Maritime Acquisition Corp | | | 8,128 |
| 1,700 | | | | Sun Communities, Inc | | | 55,301 |
| 3,700 | | | | Taubman Centers, Inc | | | 151,330 |
| 7,300 | | | | Winston Hotels, Inc | | | 89,425 |
| | | | | | |
|
|
| | | | | TOTAL HOLDING AND OTHER INVESTMENT OFFICES | | 4,772,047 |
| | | | | | |
|
|
| HOTELS AND OTHER LODGING PLACES - 0.22% | | |
| 3,500 | | * | | Bluegreen Corp | | | 40,110 |
| 800 | | * | | Gaylord Entertainment Co | | | 34,912 |
| 1,100 | | * | | Vail Resorts, Inc | | | 40,810 |
| | | | | | |
|
|
| | | | | TOTAL HOTELS AND OTHER LODGING PLACES | | 115,832 |
| | | | | | |
|
|
| INDUSTRIAL MACHINERY AND EQUIPMENT - 4.25% | | |
| 1,900 | | | | Actuant Corp | | | 94,905 |
| 16,007 | | * | | Advanced Digital Information Corp | | | 188,402 |
| 5,500 | | * | | AGCO Corp | | | 144,760 |
| 1,600 | | | | Albany International Corp (Class A) | | | 67,824 |
| 700 | | * | | Astec Industries, Inc | | | 23,884 |
| 4,100 | | * | | Axcelis Technologies, Inc | | | 24,190 |
| 2,100 | | | | Black Box Corp | | | 80,493 |
| 3,900 | | | | Briggs & Stratton Corp | | | 121,329 |
| 500 | | | | Cascade Corp | | | 19,775 |
| 3,480 | | * | | Cirrus Logic, Inc | | | 28,327 |
| 1,605 | | * | | Cymer, Inc | | | 74,568 |
| 1,800 | | * | | Dot Hill Systems Corp | | | 6,156 |
| 2,300 | | * | | Electronics for Imaging, Inc | | | 48,024 |
| 12,700 | | * | | Emulex Corp | | | 206,629 |
| 2,000 | | * | | Gardner Denver, Inc | | | 77,000 |
| 700 | | * | | Hydril | | | 54,964 |
| 2,000 | | * | | Intermec, Inc | | | 45,880 |
| 800 | | * | | Intevac, Inc | | | 17,344 |
| 4,100 | | * | | Kadant, Inc | | | 94,300 |
| 1,100 | | | | Kaydon Corp | | | 41,041 |
| 2,300 | | | | Lennox International, Inc | | | 60,904 |
| 500 | | | | Lindsay Manufacturing Co | | | 13,560 |
| 1,600 | | | | Lufkin Industries, Inc | | | 95,088 |
| 1,200 | | | | Manitowoc Co, Inc | | | 53,400 |
| 3,200 | | * | | Micros Systems, Inc | | | 139,776 |
| 1,400 | | | | Modine Manufacturing Co | | | 32,704 |
| 1,250 | | * | | Netgear, Inc | | | 27,063 |
| 2,754 | | | | Nordson Corp | | | 135,442 |
| 800 | | * | | Oil States International, Inc | | | 27,424 |
| 1,000 | | * | | ProQuest Co | | | 12,290 |
| 400 | | * | | Rimage Corp | | | 8,168 |
| 500 | | | | Robbins & Myers, Inc | | | 13,070 |
| 3,700 | | | | Sauer-Danfoss, Inc | | | 94,054 |
| 1,100 | | b* | | Surebeam Corp (Class A) | | | 2 |
| 313 | | | | Tennant Co | | | 15,738 |
| 1,000 | | * | | Ultratech, Inc | | | 15,740 |
| 1,200 | | | | Watsco, Inc | | | 71,784 |
| | | | | | |
|
|
| | | | | TOTAL INDUSTRIAL MACHINERY AND EQUIPMENT | | 2,276,002 |
| | | | | | |
|
|
36
TIAA-CREF LIFE FUNDS - Small-Cap Equity Fund
| | | | | | | |
SHARES
| | | | COMPANY
| | VALUE
|
| |
| INSTRUMENTS AND RELATED PRODUCTS - 6.31% | | |
| 25 | | * | | Advanced Medical Optics, Inc | | $ | 1,268 |
| 5,200 | | * | | Align Technology, Inc | | | 38,428 |
| 7,500 | | * | | American Medical Systems Holdings, Inc | | | 124,875 |
| 300 | | * | | American Science & Engineering, Inc | | | 17,376 |
| 700 | | * | | Anaren, Inc | | | 14,343 |
| 628 | | * | | Angiodynamics, Inc | | | 16,987 |
| 400 | | * | | Argon ST, Inc | | | 10,652 |
| 828 | | | | Arrow International, Inc | | | 27,216 |
| 361 | | * | | Arthrocare Corp | | | 15,166 |
| 897 | | * | | Aspect Medical Systems, Inc | | | 15,644 |
| 1,400 | | * | | Bio-Rad Laboratories, Inc (Class A) | | | 90,916 |
| 600 | | * | | Biosite, Inc | | | 27,396 |
| 1 | | * | | Britesmile, Inc | | | 3 |
| 19,700 | | * | | Bruker BioSciences Corp | | | 105,592 |
| 5,600 | | * | | Caliper Life Sciences, Inc | | | 27,944 |
| 4,800 | | * | | Candela Corp | | | 76,128 |
| 3,300 | | | | CNS, Inc | | | 80,850 |
| 1,239 | | * | | Coherent, Inc | | | 41,791 |
| 900 | | | | Cohu, Inc | | | 15,795 |
| 1,885 | | * | | Conmed Corp | | | 39,020 |
| 2,200 | | | | Datascope Corp | | | 67,848 |
| 1,100 | | * | | DJ Orthopedics, Inc | | | 40,513 |
| 1,000 | | | | DRS Technologies, Inc | | | 48,750 |
| 16,780 | | * | | Encore Medical Corp | | | 80,712 |
| 1,000 | | * | | FEI Co | | | 22,680 |
| 1,200 | | * | | Formfactor, Inc | | | 53,556 |
| 1,910 | | * | | Fossil, Inc | | | 34,399 |
| 767 | | * | | Foxhollow Technologies, Inc | | | 20,954 |
| 2,500 | | * | | Haemonetics Corp | | | 116,275 |
| 10,258 | | * | | HealthTronics, Inc | | | 78,474 |
| 662 | | * | | Hologic, Inc | | | 32,676 |
| 491 | | * | | ICU Medical, Inc | | | 20,740 |
| 900 | | * | | II-VI, Inc | | | 16,470 |
| 1,400 | | * | | Illumina, Inc | | | 41,524 |
| 1,785 | | * | | Integra LifeSciences Holdings Corp | | | 69,276 |
| 1,300 | | * | | Intuitive Surgical, Inc | | | 153,361 |
| 1,100 | | | | Invacare Corp | | | 27,368 |
| 2,350 | | * | | Itron, Inc | | | 139,261 |
| 3,899 | | * | | Kyphon, Inc | | | 149,566 |
| 2,500 | | * | | LTX Corp | | | 17,525 |
| 1,400 | | | | Mentor Corp | | | 60,900 |
| 920 | | * | | Molecular Devices Corp | | | 28,115 |
| 2,200 | | | | MTS Systems Corp | | | 86,922 |
| 900 | | * | | Neurometrix, Inc | | | 27,414 |
| 3,200 | | * | | Newport Corp | | | 51,584 |
| 600 | | * | | Palomar Medical Technologies, Inc | | | 27,378 |
| 700 | | * | | Photon Dynamics, Inc | | | 8,764 |
| 800 | | | | Sirona Dental Systems, Inc | | | 31,696 |
| 347 | | * | | Somanetics Corp | | | 6,628 |
| 4,800 | | | | STERIS Corp | | | 109,728 |
37
TIAA-CREF LIFE FUNDS - Small-Cap Equity Fund
| | | | | | | |
SHARES
| | | | COMPANY
| | VALUE
|
| | | |
| 2,000 | | * | | Symmetry Medical, Inc | | $ | 30,800 |
| 1,200 | | * | | Techne Corp | | | 61,104 |
| 2,200 | | * | | Teledyne Technologies, Inc | | | 72,072 |
| 8,694 | | * | | Thoratec Corp | | | 120,586 |
| 12,991 | | * | | TriPath Imaging, Inc | | | 86,000 |
| 400 | | | | United Industrial Corp | | | 18,100 |
| 4,728 | | * | | Varian, Inc | | | 196,259 |
| 1,100 | | * | | Veeco Instruments, Inc | | | 26,224 |
| 2,226 | | * | | Ventana Medical Systems, Inc | | | 105,023 |
| 1,700 | | * | | Viasys Healthcare, Inc | | | 43,520 |
| 567 | | | | Vital Signs, Inc | | | 28,084 |
| 6,200 | | * | | Vnus Medical Technologies, Inc | | | 51,956 |
| 422 | | | | Young Innovations, Inc | | | 14,867 |
| 2,100 | | * | | Zoll Medical Corp | | | 68,796 |
| | | | | | |
|
|
| | | | | TOTAL INSTRUMENTS AND RELATED PRODUCTS | | 3,381,838 |
| | | | | | |
|
|
| INSURANCE AGENTS, BROKERS AND SERVICE - 0.08% | | |
| 1,000 | | | | National Financial Partners Corp | | | 44,310 |
| | | | | | |
|
|
| | | | | TOTAL INSURANCE AGENTS, BROKERS AND SERVICE | | 44,310 |
| | | | | | |
|
|
| INSURANCE CARRIERS - 2.99% | | |
| 2,546 | | | | Affirmative Insurance Holdings, Inc | | | 39,845 |
| 1,865 | | * | | American Physicians Capital, Inc | | | 98,080 |
| 1,900 | | * | | AMERIGROUP Corp | | | 58,976 |
| 2,700 | | * | | Argonaut Group, Inc | | | 81,108 |
| 600 | | | | Baldwin & Lyons, Inc (Class B) | | | 15,300 |
| 2,180 | | * | | Centene Corp | | | 51,295 |
| 2,970 | | * | | Ceres Group, Inc | | | 18,473 |
| 2,100 | | * | | CNA Surety Corp | | | 36,288 |
| 750 | | | | Delphi Financial Group, Inc (Class A) | | | 27,270 |
| 2,900 | | | | EMC Insurance Group, Inc | | | 83,404 |
| 1,100 | | | | FBL Financial Group, Inc (Class A) | | | 35,640 |
| 2,600 | | * | | First Acceptance Corp | | | 30,628 |
| 400 | | | | Great American Financial Resources, Inc | | | 8,372 |
| 1,382 | | | | Harleysville Group, Inc | | | 43,837 |
| 1,800 | | * | | HealthExtras, Inc | | | 54,396 |
| 3,700 | | | | Horace Mann Educators Corp | | | 62,715 |
| 1,600 | | | | LandAmerica Financial Group, Inc | | | 103,360 |
| 2,300 | | * | | Molina Healthcare, Inc | | | 87,515 |
| 203 | | | | National Western Life Insurance Co (Class A) | | | 48,649 |
| 4,200 | | | | Ohio Casualty Corp | | | 124,866 |
| 3,300 | | | | Phoenix Cos, Inc | | | 46,464 |
| 1,100 | | * | | ProAssurance Corp | | | 52,998 |
| 1,500 | | | | RLI Corp | | | 72,270 |
| 624 | | | | Safety Insurance Group, Inc | | | 29,671 |
| 3,025 | | * | | SeaBright Insurance Holdings, Inc | | | 48,733 |
| 1,500 | | | | State Auto Financial Corp | | | 48,810 |
| 2,000 | | | | Stewart Information Services Corp | | | 72,620 |
| 2,100 | | | | Tower Group, Inc | | | 63,525 |
| 700 | | * | | WellCare Health Plans, Inc | | | 34,335 |
| 550 | | | | Zenith National Insurance Corp | | | 21,819 |
| | | | | | |
|
|
| | | | | TOTAL INSURANCE CARRIERS | | 1,601,262 |
| | | | | | |
|
|
38
TIAA-CREF LIFE FUNDS - Small-Cap Equity Fund
| | | | | | | |
SHARES
| | | | COMPANY
| | VALUE
|
| |
| JUSTICE, PUBLIC ORDER AND SAFETY - 0.16% | | |
| 1,600 | | * | | Corrections Corp of America | | $ | 84,704 |
| | | | | | |
|
|
| | | | | TOTAL JUSTICE, PUBLIC ORDER AND SAFETY | | 84,704 |
| | | | | | |
|
|
| LEATHER AND LEATHER PRODUCTS - 0.51% | | |
| 1,700 | | * | | Genesco, Inc | | | 57,579 |
| 2,000 | | * | | Timberland Co (Class A) | | | 52,200 |
| 715 | | | | Weyco Group, Inc | | | 16,602 |
| 6,400 | | | | Wolverine World Wide, Inc | | | 149,312 |
| | | | | | |
|
|
| | | | | TOTAL LEATHER AND LEATHER PRODUCTS | | 275,693 |
| | | | | | |
|
|
| LEGAL SERVICES - 0.18% | | |
| 3,000 | | * | | FTI Consulting, Inc | | | 80,310 |
| 400 | | | | Pre-Paid Legal Services, Inc | | | 13,800 |
| | | | | | |
|
|
| | | | | TOTAL LEGAL SERVICES | | 94,110 |
| | | | | | |
|
|
| LUMBER AND WOOD PRODUCTS - 0.62% | | |
| 500 | | | | American Woodmark Corp | | | 17,520 |
| 13,400 | | * | | Champion Enterprises, Inc | | | 147,936 |
| 1,800 | | | | Skyline Corp | | | 77,004 |
| 1,400 | | | | Universal Forest Products, Inc | | | 87,822 |
| | | | | | |
|
|
| | | | | TOTAL LUMBER AND WOOD PRODUCTS | | 330,282 |
| | | | | | |
|
|
| METAL MINING - 0.25% | | |
| 1,700 | | | | Cleveland-Cliffs, Inc | | | 134,793 |
| | | | | | |
|
|
| | | | | TOTAL METAL MINING | | 134,793 |
| | | | | | |
|
|
| MISCELLANEOUS MANUFACTURING INDUSTRIES - 0.61% | | |
| 1,100 | | | | Blyth, Inc | | | 20,306 |
| 11,500 | | | | Callaway Golf Co | | | 149,385 |
| 1,000 | | * | | Jakks Pacific, Inc | | | 20,090 |
| 1,000 | | * | | Shuffle Master, Inc | | | 32,780 |
| 4,100 | | | | Yankee Candle Co, Inc | | | 102,541 |
| | | | | | |
|
|
| | | | | TOTAL MISCELLANEOUS MANUFACTURING INDUSTRIES | | 325,102 |
| | | | | | |
|
|
| MISCELLANEOUS RETAIL - 0.98% | | |
| 2,012 | | | | Blair Corp | | | 59,857 |
| 2,700 | | | | Cash America International, Inc | | | 86,400 |
| 1,100 | | * | | Coldwater Creek, Inc | | | 29,436 |
| 3,300 | | | | Longs Drug Stores Corp | | | 150,546 |
| 3,925 | | * | | Petco Animal Supplies, Inc | | | 80,188 |
| 2,077 | | * | | Priceline.com, Inc | | | 62,019 |
| 700 | | * | | Stamps.com, Inc | | | 19,474 |
| 1,700 | | * | | Systemax, Inc | | | 13,260 |
| 920 | | * | | Zale Corp | | | 22,163 |
| | | | | | |
|
|
| | | | | TOTAL MISCELLANEOUS RETAIL | | 523,343 |
| | | | | | |
|
|
| MOTION PICTURES - 0.12% | | |
| 1,840 | | * | | Macrovision Corp | | | 39,597 |
| 1,800 | | * | | Time Warner Telecom, Inc (Class A) | | | 26,730 |
| | | | | | |
|
|
| | | | | TOTAL MOTION PICTURES | | 66,327 |
| | | | | | |
|
|
39
TIAA-CREF LIFE FUNDS - Small-Cap Equity Fund
| | | | | | | | |
SHARES
| | | | COMPANY
| | VALUE
| |
| |
| NONDEPOSITORY INSTITUTIONS - 1.34% | | | |
| 6,400 | | | | Advance America Cash Advance Centers, Inc | | $ | 112,256 | |
| 1,500 | | | | Ares Capital Corp | | | 25,395 | |
| 1,113 | | | | Asta Funding, Inc | | | 41,682 | |
| 8,067 | | | | Beverly Hills Bancorp, Inc | | | 77,605 | |
| 4,919 | | * | | CompuCredit Corp | | | 189,086 | |
| 2,000 | | | | Delta Financial Corp | | | 19,700 | |
| 200 | | b* | | DVI, Inc | | | 1 | |
| 600 | | * | | Encore Capital Group, Inc | | | 7,362 | |
| 3,100 | | | | Financial Federal Corp | | | 86,211 | |
| 4,300 | | * | | Ocwen Financial Corp | | | 54,653 | |
| 800 | | | | Technology Investment Capital Corp | | | 11,720 | |
| 1,200 | | * | | United PanAm Financial Corp | | | 36,480 | |
| 1,500 | | * | | World Acceptance Corp | | | 53,280 | |
| | | | | | |
|
|
|
| | | | | TOTAL NONDEPOSITORY INSTITUTIONS | | 715,431 | |
| | | | | | |
|
|
|
| OIL AND GAS EXTRACTION - 2.13% | | | |
| 3,064 | | * | | Atlas America, Inc | | | 137,298 | |
| 300 | | | | Berry Petroleum Co (Class A) | | | 9,945 | |
| 1,100 | | * | | Bronco Drilling Co, Inc | | | 22,979 | |
| 2,400 | | | | Cabot Oil & Gas Corp (Class A) | | | 117,600 | |
| 1,200 | | * | | Callon Petroleum Co | | | 23,208 | |
| 600 | | * | | Cheniere Energy, Inc | | | 23,400 | |
| 500 | | * | | Clayton Williams Energy, Inc | | | 17,270 | |
| 3,200 | | | | Delta & Pine Land Co | | | 94,080 | |
| 400 | | * | | Energy Partners Ltd | | | 7,580 | |
| 1,700 | | * | | Global Industries Ltd | | | 28,390 | |
| 4,400 | | * | | Grey Wolf, Inc | | | 33,880 | |
| 1,500 | | * | | Harvest Natural Resources, Inc | | | 20,310 | |
| 800 | | * | | Helix Energy Solutions Group, Inc | | | 32,288 | |
| 4,578 | | * | | Hercules Offshore, Inc | | | 160,230 | |
| 500 | | * | | KCS Energy, Inc | | | 14,850 | |
| 2,199 | | * | | Parker Drilling Co | | | 15,789 | |
| 200 | | v* | | PetroCorp | | | (0 | ) |
| 323 | | * | | Petroleum Development Corp | | | 12,177 | |
| 4,600 | | * | | RAM Energy Resources, Inc | | | 26,312 | |
| 500 | | * | | Remington Oil & Gas Corp | | | 21,985 | |
| 3,000 | | | | St. Mary Land & Exploration Co | | | 120,750 | |
| 600 | | * | | Stone Energy Corp | | | 27,930 | |
| 900 | | * | | Superior Energy Services | | | 30,510 | |
| 1,000 | | * | | Swift Energy Co | | | 42,930 | |
| 1,000 | | | | Todco | | | 40,850 | |
| 800 | | * | | Veritas DGC, Inc | | | 41,264 | |
| 400 | | | | W&T Offshore, Inc | | | 15,556 | |
| | | | | | |
|
|
|
| | | | | TOTAL OIL AND GAS EXTRACTION | | 1,139,361 | |
| | | | | | |
|
|
|
| PAPER AND ALLIED PRODUCTS - 0.17% | | | |
| 700 | | | | Greif, Inc (Class A) | | | 52,472 | |
| 1,900 | | | | Longview Fibre Co | | | 36,271 | |
| | | | | | |
|
|
|
| | | | | TOTAL PAPER AND ALLIED PRODUCTS | | 88,743 | |
| | | | | | |
|
|
|
40
TIAA-CREF LIFE FUNDS - Small-Cap Equity Fund
| | | | | | | |
SHARES
| | | | COMPANY
| | VALUE
|
| |
| PERSONAL SERVICES - 0.30% | | |
| 2,500 | | | | Jackson Hewitt Tax Service, Inc | | $ | 78,375 |
| 1,900 | | | | Regis Corp | | | 67,659 |
| 400 | | | | Unifirst Corp | | | 13,800 |
| | | | | | |
|
|
| | | | | TOTAL PERSONAL SERVICES | | 159,834 |
| | | | | | |
|
|
| PETROLEUM AND COAL PRODUCTS - 0.97% | | |
| 6,100 | | | | Alon USA Energy, Inc | | | 191,967 |
| 3,600 | | | | Frontier Oil Corp | | | 116,640 |
| 1,800 | | * | | Giant Industries, Inc | | | 119,790 |
| 800 | | | | Holly Corp | | | 38,560 |
| 200 | | | | Tesoro Corp | | | 14,872 |
| 1,107 | | | | WD-40 Co | | | 37,162 |
| | | | | | |
|
|
| | | | | TOTAL PETROLEUM AND COAL PRODUCTS | | 518,991 |
| | | | | | |
|
|
| PRIMARY METAL INDUSTRIES - 2.00% | | |
| 1,200 | | * | | AK Steel Holding Corp | | | 16,596 |
| 2,300 | | * | | Aleris International, Inc | | | 105,455 |
| 3,500 | | | | Belden CDT, Inc | | | 115,675 |
| 400 | | * | | Brush Engineered Materials, Inc | | | 8,340 |
| 300 | | | | Carpenter Technology Corp | | | 34,650 |
| 800 | | * | | Century Aluminum Co | | | 28,552 |
| 1,000 | | * | | Chaparral Steel Co | | | 72,020 |
| 2,300 | | * | | CommScope, Inc | | | 72,266 |
| 600 | | * | | Encore Wire Corp | | | 21,564 |
| 2,000 | | * | | General Cable Corp | | | 70,000 |
| 1,400 | | * | | Lone Star Technologies, Inc | | | 75,628 |
| 1,264 | | | | Matthews International Corp (Class A) | | | 43,570 |
| 600 | | * | | Maverick Tube Corp | | | 37,914 |
| 1,500 | | | | Mueller Industries, Inc | | | 49,545 |
| 600 | | * | | NS Group, Inc | | | 33,048 |
| 3,200 | | | | Quanex Corp | | | 137,824 |
| 900 | | * | | RTI International Metals, Inc | | | 50,256 |
| 600 | | | | Schnitzer Steel Industries, Inc (Class A) | | | 21,288 |
| 400 | | | | Steel Dynamics, Inc | | | 26,296 |
| 700 | | * | | Superior Essex, Inc | | | 20,951 |
| 1,400 | | | | Worthington Industries, Inc | | | 29,330 |
| | | | | | |
|
|
| | | | | TOTAL PRIMARY METAL INDUSTRIES | | 1,070,768 |
| | | | | | |
|
|
| PRINTING AND PUBLISHING - 0.95% | | |
| 1,300 | | | | Banta Corp | | | 60,229 |
| 3,400 | | | | Belo (A.H.) Corp Series A | | | 53,040 |
| 500 | | * | | Consolidated Graphics, Inc | | | 26,030 |
| 1,100 | | | | John H Harland Co | | | 47,850 |
| 1,300 | | | | Journal Communications, Inc | | | 14,612 |
| 1,600 | | | | Journal Register Co | | | 14,336 |
| 700 | | | | Media General, Inc (Class A) | | | 29,323 |
| 7,600 | | * | | Playboy Enterprises, Inc (Class B) | | | 75,848 |
| 1,900 | | | | Reader’s Digest Association, Inc (Class A) | | | 26,524 |
| 4,125 | | * | | Scholastic Corp | | | 107,126 |
| 700 | | | | Standard Register Co | | | 8,295 |
| 2,000 | | * | | Valassis Communications, Inc | | | 47,180 |
| | | | | | |
|
|
| | | | | TOTAL PRINTING AND PUBLISHING | | 510,393 |
| | | | | | |
|
|
41
TIAA-CREF LIFE FUNDS - Small-Cap Equity Fund
| | | | | | | |
SHARES
| | | | COMPANY
| | VALUE
|
| |
| REAL ESTATE - 0.95% | | |
| 4,000 | | * | | Alderwoods Group, Inc | | $ | 77,840 |
| 2,700 | | * | | California Coastal Communities, Inc | | | 86,400 |
| 400 | | | | Consolidated-Tomoka Land Co | | | 22,056 |
| 5,808 | | * | | Housevalues, Inc | | | 40,249 |
| 1,700 | | | | Jones Lang LaSalle, Inc | | | 148,835 |
| 17,900 | | | | Stewart Enterprises, Inc (Class A) | | | 102,925 |
| 800 | | * | | Trammell Crow Co | | | 28,136 |
| | | | | | |
|
|
| | | | | TOTAL REAL ESTATE | | 506,441 |
| | | | | | |
|
|
| RUBBER AND MISCELLANEOUS PLASTIC PRODUCTS - 0.79% | | |
| 400 | | * | | Deckers Outdoor Corp | | | 15,424 |
| 2,300 | | * | | Jarden Corp | | | 70,035 |
| 3,300 | | | | Schulman (A.), Inc | | | 75,537 |
| 2,539 | | * | | Skechers U.S.A., Inc (Class A) | | | 61,215 |
| 5,900 | | | | Spartech Corp | | | 133,340 |
| 2,500 | | | | Titan International, Inc | | | 46,775 |
| 600 | | | | West Pharmaceutical Services, Inc | | | 21,768 |
| | | | | | |
|
|
| | | | | TOTAL RUBBER AND MISCELLANEOUS PLASTIC PRODUCTS | | 424,094 |
| | | | | | |
|
|
| SECURITY AND COMMODITY BROKERS - 0.98% | | |
| 870 | | * | | GFI Group, Inc | | | 46,937 |
| 1,000 | | | | Greenhill & Co, Inc | | | 60,760 |
| 600 | | * | | IntercontinentalExchange, Inc | | | 34,764 |
| 1,200 | | * | | Investment Technology Group, Inc | | | 61,032 |
| 7,000 | | * | | Knight Capital Group, Inc | | | 106,610 |
| 2,000 | | * | | Morningstar, Inc | | | 82,960 |
| 1,900 | | * | | Nasdaq Stock Market, Inc | | | 56,810 |
| 400 | | * | | Piper Jaffray Cos | | | 24,484 |
| 2,500 | | | | Waddell & Reed Financial, Inc (Class A) | | | 51,400 |
| | | | | | |
|
|
| | | | | TOTAL SECURITY AND COMMODITY BROKERS | | 525,757 |
| | | | | | |
|
|
| SOCIAL SERVICES - 0.24% | | |
| 3,067 | | * | | Bright Horizons Family Solutions, Inc | | | 115,595 |
| 548 | | * | | Providence Service Corp | | | 14,922 |
| 1 | | * | | Res-Care, Inc | | | 20 |
| | | | | | |
|
|
| | | | | TOTAL SOCIAL SERVICES | | 130,537 |
| | | | | | |
|
|
| SPECIAL TRADE CONTRACTORS - 0.80% | | |
| 1,590 | | * | | AsiaInfo Holdings, Inc | | | 6,821 |
| 1,000 | | | | Chemed Corp | | | 54,530 |
| 3,100 | | | | Comfort Systems USA, Inc | | | 44,299 |
| 1,600 | | * | | Dycom Industries, Inc | | | 34,064 |
| 3,300 | | * | | EMCOR Group, Inc | | | 160,611 |
| 7,300 | | * | | Quanta Services, Inc | | | 126,509 |
| | | | | | |
|
|
| | | | | TOTAL SPECIAL TRADE CONTRACTORS | | 426,834 |
| | | | | | |
|
|
| STONE, CLAY, AND GLASS PRODUCTS - 0.18% | | |
| 1,100 | | | | Apogee Enterprises, Inc | | | 16,170 |
| 1,600 | | | | Eagle Materials, Inc | | | 76,000 |
| 600 | | | | Libbey, Inc | | | 4,410 |
| | | | | | |
|
|
| | | | | TOTAL STONE, CLAY, AND GLASS PRODUCTS | | 96,580 |
| | | | | | |
|
|
42
TIAA-CREF LIFE FUNDS - Small-Cap Equity Fund
| | | | | | | |
SHARES
| | | | COMPANY
| | VALUE
|
| |
| TEXTILE MILL PRODUCTS - 0.15% | | |
| 2,000 | | | | Oxford Industries, Inc | | $ | 78,820 |
| | | | | | |
|
|
| | | | | TOTAL TEXTILE MILL PRODUCTS | | 78,820 |
| | | | | | |
|
|
| TOBACCO PRODUCTS - 0.07% | | |
| 2,300 | | | | Vector Group Ltd | | | 37,375 |
| | | | | | |
|
|
| | | | | TOTAL TOBACCO PRODUCTS | | 37,375 |
| | | | | | |
|
|
| TRANSPORTATION BY AIR - 1.22% | | |
| 21,533 | | * | | ABX Air, Inc | | | 130,059 |
| 1,000 | | * | | Bristow Group, Inc | | | 36,000 |
| 3,200 | | * | | Continental Airlines, Inc (Class B) | | | 95,360 |
| 4,039 | | * | | EGL, Inc | | | 202,758 |
| 1,600 | | * | | ExpressJet Holdings, Inc | | | 11,056 |
| 1,574 | | * | | Mesa Air Group, Inc | | | 15,504 |
| 1,330 | | * | | Pinnacle Airlines Corp | | | 9,363 |
| 2,700 | | * | | Republic Airways Holdings, Inc | | | 45,954 |
| 4,400 | | | | Skywest, Inc | | | 109,120 |
| | | | | | |
|
|
| | | | | TOTAL TRANSPORTATION BY AIR | | 655,174 |
| | | | | | |
|
|
| TRANSPORTATION EQUIPMENT - 1.92% | | |
| 2,300 | | | | A.O. Smith Corp | | | 106,628 |
| 1,400 | | * | | Armor Holdings, Inc | | | 76,762 |
| 2,800 | | | | ArvinMeritor, Inc | | | 48,132 |
| 2,100 | | | | Clarcor, Inc | | | 62,559 |
| 3,700 | | | | Federal Signal Corp | | | 56,018 |
| 360 | | | | Freightcar America, Inc | | | 19,984 |
| 1,400 | | | | Group 1 Automotive, Inc | | | 78,876 |
| 6,100 | | | | JLG Industries, Inc | | | 137,250 |
| 962 | | | | Kaman Corp (Class A) | | | 17,508 |
| 1,100 | | | | Monaco Coach Corp | | | 13,970 |
| 2,300 | | * | | Orbital Sciences Corp | | | 37,122 |
| 1,400 | | | | Polaris Industries, Inc | | | 60,620 |
| 1,200 | | * | | Sequa Corp (Class A) | | | 97,800 |
| 1,400 | | | | Trinity Industries, Inc | | | 56,560 |
| 600 | | * | | Triumph Group, Inc | | | 28,800 |
| 5,200 | | * | | Visteon Corp | | | 37,492 |
| 1,300 | | | | Wabash National Corp | | | 19,968 |
| 1,900 | | | | Westinghouse Air Brake Technologies Corp | | | 71,060 |
| | | | | | |
|
|
| | | | | TOTAL TRANSPORTATION EQUIPMENT | | 1,027,109 |
| | | | | | |
|
|
| TRANSPORTATION SERVICES - 0.36% | | |
| 3,496 | | * | | Dynamex, Inc | | | 76,248 |
| 1,658 | | * | | HUB Group, Inc | | | 40,671 |
| 2,254 | | | | Pacer International, Inc | | | 73,435 |
| | | | | | |
|
|
| | | | | TOTAL TRANSPORTATION SERVICES | | 190,354 |
| | | | | | |
|
|
| TRUCKING AND WAREHOUSING - 0.54% | | |
| 1,398 | | | | Arkansas Best Corp | | | 70,194 |
| 2,350 | | | | Forward Air Corp | | | 95,716 |
| 5,196 | | | | Heartland Express, Inc | | | 92,956 |
| 655 | | * | | SCS Transportation, Inc | | | 18,032 |
| 1,000 | | * | | SIRVA, Inc | | | 6,470 |
| 228 | | * | | Universal Truckload Services, Inc | | | 7,782 |
| | | | | | |
|
|
| | | | | TOTAL TRUCKING AND WAREHOUSING | | 291,150 |
| | | | | | |
|
|
43
TIAA-CREF LIFE FUNDS - Small-Cap Equity Fund
| | | | | | | |
SHARES
| | | | COMPANY
| | VALUE
|
| |
| WATER TRANSPORTATION - 0.10% | | |
| 1,000 | | * | | Kirby Corp | | $ | 39,500 |
| 500 | | | | Maritrans, Inc | | | 12,450 |
| | | | | | |
|
|
| | | | | TOTAL WATER TRANSPORTATION | | 51,950 |
| | | | | | |
|
|
| WHOLESALE TRADE-DURABLE GOODS - 1.35% | | |
| 6,971 | | | | Agilysys, Inc | | | 125,478 |
| 4,600 | | | | Applied Industrial Technologies, Inc | | | 111,826 |
| 1,800 | | | | BlueLinx Holdings, Inc | | | 23,454 |
| 1,334 | | | | Building Material Holding Corp | | | 37,179 |
| 800 | | * | | Huttig Building Products, Inc | | | 6,480 |
| 9,000 | | | | IKON Office Solutions, Inc | | | 113,400 |
| 1,170 | | * | | Insight Enterprises, Inc | | | 22,289 |
| 1,365 | | * | | LKQ Corp | | | 25,935 |
| 1,300 | | | | Owens & Minor, Inc | | | 37,180 |
| 1,900 | | | | Reliance Steel & Aluminum Co | | | 157,605 |
| 2,400 | | | | Ryerson Tull, Inc | | | 64,800 |
| | | | | | |
|
|
| | | | | TOTAL WHOLESALE TRADE-DURABLE GOODS | | 725,626 |
| | | | | | |
|
|
| WHOLESALE TRADE-NONDURABLE GOODS - 0.74% | | |
| 1,100 | | | | Kenneth Cole Productions, Inc (Class A) | | | 24,563 |
| 1,387 | | | | K-Swiss, Inc (Class A) | | | 37,033 |
| 1,000 | | | | Myers Industries, Inc | | | 17,190 |
| 2,800 | | | | Nu Skin Enterprises, Inc (Class A) | | | 41,580 |
| 4,978 | | * | | Performance Food Group Co | | | 151,232 |
| 400 | | * | | Perry Ellis International, Inc | | | 10,124 |
| 1,140 | | | | Spartan Stores, Inc | | | 16,678 |
| 400 | | | | The Andersons, Inc | | | 16,644 |
| 1,700 | | * | | United Stationers, Inc | | | 83,844 |
| | | | | | |
|
|
| | | | | TOTAL WHOLESALE TRADE-NONDURABLE GOODS | | 398,888 |
| | | | | | |
|
|
| | | | | TOTAL COMMON STOCKS (Cost $51,229,073) | | 53,277,174 |
| | | | | | |
|
|
PRINCIPAL
| | | | | | |
| |
SHORT-TERM INVESTMENTS - 0.37% | | | |
| U.S. GOVERNMENT AND AGENCIES DISCOUNT NOTES - 0.37% | | |
| $ 200,000 | | | | Federal Home Loan Bank (FHLB) 4.950%, 07/03/06 | | | 200,000 |
| | | | | | |
|
|
| | | | | TOTAL SHORT-TERM INVESTMENTS (Cost $199,946) | | 200,000 |
| | | | | | |
|
|
| | | | | TOTAL PORTFOLIO - 99.86% (Cost $51,429,019) | | 53,477,174 |
| | | | | OTHER ASSETS & LIABILITIES, NET - 0.14% | | 72,840 |
| | | | | | |
|
|
| | | | | NET ASSETS - 100.00% | | $53,550,014 |
| | | | | | |
|
|
| v | Security valued at fair value |
For ease of presentation, we have grouped a number of industry classification categories together in the Statement of Investments. Note that the Funds use more specific industry categories in following their investment limitations on industry concentration.
44
TIAA-CREF LIFE FUNDS - Stock Index Fund
TIAA-CREF LIFE FUNDS
STOCK INDEX FUND
STATEMENT OF INVESTMENTS (Unaudited)
June 30, 2006
| | | | | | | |
SHARES
| | | | COMPANY
| | VALUE
|
| |
COMMON STOCKS - 99.85% | | | |
| AGRICULTURAL PRODUCTION-CROPS - 0.00% ** | | |
| 439 | | | | Chiquita Brands International, Inc | | $ | 6,049 |
| | | | | | |
|
|
| | | | | TOTAL AGRICULTURAL PRODUCTION-CROPS | | 6,049 |
| | | | | | |
|
|
| AGRICULTURAL PRODUCTION-LIVESTOCK - 0.01% | | |
| 439 | | | | Pilgrim’s Pride Corp | | | 11,326 |
| 4 | | | | Seaboard Corp | | | 5,120 |
| | | | | | |
|
|
| | | | | TOTAL AGRICULTURAL PRODUCTION-LIVESTOCK | | 16,446 |
| | | | | | |
|
|
| AMUSEMENT AND RECREATION SERVICES - 0.26% | | |
| 604 | | * | | Bally Technologies, Inc | | | 9,948 |
| 409 | | * | | Bally Total Fitness Holding Corp | | | 2,773 |
| 218 | | * | | Century Casinos, Inc | | | 2,335 |
| 134 | | | | Churchill Downs, Inc | | | 5,018 |
| 267 | | | | Dover Downs Gaming & Entertainment, Inc | | | 5,244 |
| 67 | | | | Dover Motorsports, Inc | | | 393 |
| 1,362 | | | | GTECH Holdings Corp | | | 47,370 |
| 2,010 | | | | Harrah’s Entertainment, Inc | | | 143,072 |
| 414 | | | | International Speedway Corp (Class A) | | | 19,197 |
| 250 | | * | | Lakes Entertainment, Inc | | | 3,023 |
| 256 | | * | | Leapfrog Enterprises, Inc | | | 2,586 |
| 332 | | * | | Life Time Fitness, Inc | | | 15,362 |
| 749 | | * | | Live Nation, Inc | | | 15,250 |
| 500 | | * | | Magna Entertainment Corp (Class A) | | | 2,630 |
| 757 | | * | | Marvel Entertainment, Inc | | | 15,140 |
| 194 | | * | | MTR Gaming Group, Inc | | | 1,820 |
| 488 | | * | | Multimedia Games, Inc | | | 4,943 |
| 786 | | * | | Penn National Gaming, Inc | | | 30,481 |
| 573 | | * | | Pinnacle Entertainment, Inc | | | 17,562 |
| 1,200 | | * | | Six Flags, Inc | | | 6,744 |
| 164 | | | | Speedway Motorsports, Inc | | | 6,189 |
| 1,006 | | | | Warner Music Group Corp | | | 29,657 |
| 859 | | | | Westwood One, Inc | | | 6,442 |
| 295 | | * | | WMS Industries, Inc | | | 8,080 |
| 100 | | | | World Wrestling Entertainment, Inc | | | 1,689 |
| | | | | | |
|
|
| | | | | TOTAL AMUSEMENT AND RECREATION SERVICES | | 402,948 |
| | | | | | |
|
|
| APPAREL AND ACCESSORY STORES - 0.69% | | |
| 944 | | | | Abercrombie & Fitch Co (Class A) | | | 52,326 |
| 589 | | * | | Aeropostale, Inc | | | 17,016 |
| 1,230 | | | | American Eagle Outfitters, Inc | | | 41,869 |
| 840 | | * | | AnnTaylor Stores Corp | | | 36,439 |
| 119 | | | | Bebe Stores, Inc | | | 1,835 |
| 243 | | | | Brown Shoe Co, Inc | | | 8,281 |
| 65 | | | | Buckle, Inc | | | 2,722 |
| 300 | | * | | Cache, Inc | | | 5,202 |
| 528 | | * | | Carter’s, Inc | | | 13,955 |
| 318 | | * | | Casual Male Retail Group, Inc | | | 3,196 |
45
TIAA-CREF LIFE FUNDS - Stock Index Fund
| | | | | | | |
SHARES
| | | | COMPANY
| | VALUE
|
| | | |
| 325 | | | | Cato Corp (Class A) | | $ | 8,401 |
| 270 | | * | | Charlotte Russe Holding, Inc | | | 6,464 |
| 1,400 | | * | | Charming Shoppes, Inc | | | 15,736 |
| 1,896 | | * | | Chico’s FAS, Inc | | | 51,154 |
| 222 | | * | | Children’s Place Retail Stores, Inc | | | 13,331 |
| 390 | | | | Christopher & Banks Corp | | | 11,310 |
| 100 | | * | | Citi Trends, Inc | | | 4,269 |
| 1,078 | | | | Claire’s Stores, Inc | | | 27,500 |
| 46 | | | | DEB Shops, Inc | | | 1,109 |
| 600 | | * | | Dress Barn, Inc | | | 15,210 |
| 200 | | * | | DSW, Inc | | | 7,284 |
| 565 | | | | Finish Line, Inc (Class A) | | | 6,684 |
| 1,692 | | | | Foot Locker, Inc | | | 41,437 |
| 5,852 | | | | Gap, Inc | | | 101,825 |
| 450 | | * | | HOT Topic, Inc | | | 5,179 |
| 242 | | * | | Jo-Ann Stores, Inc | | | 3,545 |
| 180 | | * | | JOS A Bank Clothiers, Inc | | | 4,313 |
| 3,721 | | * | | Kohl’s Corp | | | 219,986 |
| 3,710 | | | | Limited Brands, Inc | | | 94,939 |
| 140 | | * | | New York & Co, Inc | | | 1,368 |
| 2,561 | | | | Nordstrom, Inc | | | 93,476 |
| 875 | | * | | Pacific Sunwear Of California, Inc | | | 15,689 |
| 800 | | * | | Payless Shoesource, Inc | | | 21,736 |
| 1,561 | | | | Ross Stores, Inc | | | 43,786 |
| 66 | | * | | Shoe Carnival, Inc | | | 1,575 |
| 274 | | | | Stage Stores, Inc | | | 9,042 |
| 232 | | | | Talbots, Inc | | | 4,280 |
| 359 | | * | | Too, Inc | | | 13,782 |
| 200 | | * | | Under Armour, Inc | | | 8,524 |
| 1,138 | | * | | Urban Outfitters, Inc | | | 19,904 |
| 1,045 | | * | | The Wet Seal, Inc | | | 5,100 |
| | | | | | |
|
|
| | | | | TOTAL APPAREL AND ACCESSORY STORES | | 1,060,779 |
| | | | | | |
|
|
| APPAREL AND OTHER TEXTILE PRODUCTS - 0.19% | | |
| 165 | | * | | Columbia Sportswear Co | | | 7,468 |
| 217 | | v* | | DHB Industries, Inc | | | 417 |
| 200 | | * | | Guess ?, Inc | | | 8,350 |
| 377 | | * | | Gymboree Corp | | | 13,104 |
| 600 | | * | | Hartmarx Corp | | | 3,600 |
| 1,270 | | | | Jones Apparel Group, Inc | | | 40,373 |
| 300 | | | | Kellwood Co | | | 8,781 |
| 1,180 | | | | Liz Claiborne, Inc | | | 43,731 |
| 300 | | * | | Maidenform Brands, Inc | | | 3,699 |
| 562 | | | | Phillips-Van Heusen Corp | | | 21,446 |
| 663 | | | | Polo Ralph Lauren Corp | | | 36,399 |
| 1,142 | | * | | Quiksilver, Inc | | | 13,909 |
| 477 | | | | Russell Corp | | | 8,662 |
| 141 | | * | | True Religion Apparel, Inc | | | 2,496 |
| 985 | | | | VF Corp | | | 66,901 |
| 488 | | * | | Warnaco Group, Inc | | | 9,116 |
| | | | | | |
|
|
| | | | | TOTAL APPAREL AND OTHER TEXTILE PRODUCTS | | 288,452 |
| | | | | | |
|
|
| AUTO REPAIR, SERVICES AND PARKING - 0.07% | | |
| 100 | | * | | Amerco, Inc | | | 10,066 |
| 100 | | | | Bandag, Inc | | | 3,659 |
| 300 | | | | Central Parking Corp | | | 4,800 |
| 268 | | * | | Dollar Thrifty Automotive Group, Inc | | | 12,079 |
46
TIAA-CREF LIFE FUNDS - Stock Index Fund
| | | | | | | |
SHARES
| | | | COMPANY
| | VALUE
|
| | | |
| 251 | | * | | Midas, Inc | | $ | 4,618 |
| 73 | | | | Monro Muffler, Inc | | | 2,377 |
| 544 | | * | | PHH Corp | | | 14,982 |
| 662 | | | | Ryder System, Inc | | | 38,680 |
| 400 | | * | | Wright Express Corp | | | 11,496 |
| | | | | | |
|
|
| | | | | TOTAL AUTO REPAIR, SERVICES AND PARKING | | 102,757 |
| | | | | | |
|
|
| AUTOMOTIVE DEALERS AND SERVICE STATIONS - 0.17% | | |
| 1,182 | | | | Advance Auto Parts | | | 34,160 |
| 64 | | * | | America’s Car-Mart, Inc | | | 1,300 |
| 200 | | * | | Asbury Automotive Group, Inc | | | 4,188 |
| 1,789 | | * | | Autonation, Inc | | | 38,356 |
| 594 | | * | | Autozone, Inc | | | 52,391 |
| 1,109 | | * | | Carmax, Inc | | | 39,325 |
| 817 | | * | | Copart, Inc | | | 20,065 |
| 495 | | * | | CSK Auto Corp | | | 5,925 |
| 220 | | | | Lithia Motors, Inc (Class A) | | | 6,670 |
| 200 | | * | | MarineMax, Inc | | | 5,246 |
| 1,230 | | * | | O’Reilly Automotive, Inc | | | 38,364 |
| 222 | | * | | Rush Enterprises, Inc (Class A) | | | 4,034 |
| 287 | | | | Sonic Automotive, Inc | | | 6,366 |
| 570 | | | | United Auto Group, Inc | | | 12,169 |
| | | | | | |
|
|
| | | | | TOTAL AUTOMOTIVE DEALERS AND SERVICE STATIONS | | 268,559 |
| | | | | | |
|
|
| BUILDING MATERIALS AND GARDEN SUPPLIES - 0.95% | | |
| 200 | | * | | Builders FirstSource, Inc | | | 4,072 |
| 266 | | * | | Central Garden & Pet Co | | | 11,451 |
| 1,396 | | | | Fastenal Co | | | 56,245 |
| 23,041 | | | | Home Depot, Inc | | | 824,637 |
| 8,441 | | | | Lowe’s Cos, Inc | | | 512,115 |
| 1,227 | | | | Sherwin-Williams Co | | | 58,258 |
| | | | | | |
|
|
| | | | | TOTAL BUILDING MATERIALS AND GARDEN SUPPLIES | | 1,466,778 |
| | | | | | |
|
|
| BUSINESS SERVICES - 7.08% | | |
| 677 | | * | | @Road, Inc | | | 3,737 |
| 523 | | * | | 24/7 Real Media, Inc | | | 4,592 |
| 4,200 | | * | | 3Com Corp | | | 21,504 |
| 128 | | * | | 3D Systems Corp | | | 2,571 |
| 403 | | | | Aaron Rents, Inc | | | 10,833 |
| 347 | | | | ABM Industries, Inc | | | 5,934 |
| 305 | | * | | Acacia Research (Acacia Technologies) | | | 4,288 |
| 3,008 | | * | | Activision, Inc | | | 34,231 |
| 620 | | * | | Actuate Corp | | | 2,505 |
| 927 | | | | Acxiom Corp | | | 23,175 |
| 200 | | | | Administaff, Inc | | | 7,162 |
| 6,562 | | * | | Adobe Systems, Inc | | | 199,222 |
| 300 | | * | | Advent Software, Inc | | | 10,821 |
| 261 | | | | Advo, Inc | | | 6,423 |
| 1,224 | | * | | Affiliated Computer Services, Inc (Class A) | | | 63,171 |
| 455 | | * | | Agile Software Corp | | | 2,885 |
| 1,682 | | * | | Akamai Technologies, Inc | | | 60,872 |
| 883 | | * | | Alliance Data Systems Corp | | | 51,938 |
| 221 | | * | | Altiris, Inc | | | 3,987 |
| 283 | | * | | American Reprographics Co | | | 10,259 |
| 357 | | * | | AMN Healthcare Services, Inc | | | 7,247 |
| 136 | | * | | Ansoft Corp | | | 2,785 |
| 374 | | * | | Ansys, Inc | | | 17,885 |
47
TIAA-CREF LIFE FUNDS - Stock Index Fund
| | | | | | | |
SHARES
| | | | COMPANY
| | VALUE
|
| | | |
| 829 | | * | | aQuantive, Inc | | $ | 20,999 |
| 410 | | | | Arbitron, Inc | | | 15,715 |
| 706 | | * | | Ariba, Inc | | | 5,810 |
| 1,213 | | * | | Art Technology Group, Inc | | | 3,615 |
| 600 | | * | | Aspen Technology, Inc | | | 7,872 |
| 96 | | * | | Asset Acceptance Capital Corp | | | 1,901 |
| 257 | | * | | Audible, Inc | | | 2,336 |
| 2,498 | | * | | Autodesk, Inc | | | 86,081 |
| 6,270 | | | | Automatic Data Processing, Inc | | | 284,344 |
| 484 | | * | | Avocent Corp | | | 12,705 |
| 140 | | * | | Bankrate, Inc | | | 5,286 |
| 4,415 | | * | | BEA Systems, Inc | | | 57,792 |
| 2,100 | | * | | BearingPoint, Inc | | | 17,577 |
| 1,400 | | * | | BISYS Group, Inc | | | 19,180 |
| 479 | | | | Blackbaud, Inc | | | 10,873 |
| 304 | | * | | Blackboard, Inc | | | 8,804 |
| 195 | | * | | Blue Coat Systems, Inc | | | 3,288 |
| 2,501 | | * | | BMC Software, Inc | | | 59,774 |
| 600 | | * | | Borland Software Corp | | | 3,168 |
| 300 | | * | | Bottomline Technologies, Inc | | | 2,442 |
| 436 | | | | Brady Corp (Class A) | | | 16,062 |
| 596 | | | | Brink’s Co | | | 33,620 |
| 5,109 | | | | CA, Inc | | | 104,990 |
| 357 | | * | | CACI International, Inc (Class A) | | | 20,824 |
| 3,072 | | * | | Cadence Design Systems, Inc | | | 52,685 |
| 554 | | | | Catalina Marketing Corp | | | 15,767 |
| 854 | | * | | CBIZ, Inc | | | 6,328 |
| 10,886 | | | | Cendant Corp | | | 177,333 |
| 1,580 | | * | | Ceridian Corp | | | 38,615 |
| 644 | | * | | Cerner Corp | | | 23,899 |
| 873 | | * | | Checkfree Corp | | | 43,266 |
| 972 | | * | | ChoicePoint, Inc | | | 40,600 |
| 846 | | * | | Chordiant Software, Inc | | | 2,563 |
| 532 | | * | | Ciber, Inc | | | 3,506 |
| 2,054 | | * | | Citrix Systems, Inc | | | 82,448 |
| 400 | | * | | Clear Channel Outdoor Holdings, Inc | | | 8,384 |
| 200 | | * | | Click Commerce, Inc | | | 3,946 |
| 3,885 | | * | | CMGI, Inc | | | 4,701 |
| 1,627 | | * | | CNET Networks, Inc | | | 12,983 |
| 250 | | * | | Cogent Communications Group, Inc | | | 2,342 |
| 473 | | * | | Cogent, Inc | | | 7,128 |
| 459 | | | | Cognex Corp | | | 11,948 |
| 1,528 | | * | | Cognizant Technology Solutions Corp | | | 102,941 |
| 65 | | | | Computer Programs & Systems, Inc | | | 2,597 |
| 2,030 | | * | | Computer Sciences Corp | | | 98,333 |
| 4,261 | | * | | Compuware Corp | | | 28,549 |
| 100 | | * | | COMSYS IT Partners, Inc | | | 1,512 |
| 241 | | * | | Concur Technologies, Inc | | | 3,728 |
| 303 | | * | | Convera Corp | | | 2,036 |
| 1,524 | | * | | Convergys Corp | | | 29,718 |
| 183 | | * | | CoStar Group, Inc | | | 10,949 |
| 400 | | * | | Covansys Corp | | | 5,028 |
| 485 | | * | | CSG Systems International, Inc | | | 11,999 |
| 500 | | * | | Cybersource Corp | | | 5,850 |
| 110 | | * | | DealerTrack Holdings, Inc | | | 2,432 |
| 500 | | | | Deluxe Corp | | | 8,740 |
| 500 | | * | | Dendrite International, Inc | | | 4,620 |
48
TIAA-CREF LIFE FUNDS - Stock Index Fund
| | | | | | | |
SHARES
| | | | COMPANY
| | VALUE
|
| | | |
| 430 | | * | | Digital Insight Corp | | $ | 14,745 |
| 389 | | * | | Digital River, Inc | | | 15,712 |
| 664 | | * | | DST Systems, Inc | | | 39,508 |
| 1,405 | | * | | Earthlink, Inc | | | 12,167 |
| 12,810 | | * | | eBay, Inc | | | 375,205 |
| 298 | | * | | Echelon Corp | | | 2,232 |
| 518 | | * | | Eclipsys Corp | | | 9,407 |
| 122 | | * | | eCollege.com, Inc | | | 2,579 |
| 575 | | * | | eFunds Corp | | | 12,679 |
| 100 | | * | | Electro Rent Corp | | | 1,602 |
| 3,377 | | * | | Electronic Arts, Inc | | | 145,346 |
| 5,741 | | | | Electronic Data Systems Corp | | | 138,128 |
| 149 | | * | | Emageon, Inc | | | 2,174 |
| 3,148 | | * | | Emdeon Corp | | | 39,067 |
| 698 | | * | | Epicor Software Corp | | | 7,350 |
| 90 | | * | | EPIQ Systems, Inc | | | 1,498 |
| 1,406 | | | | Equifax, Inc | | | 48,282 |
| 313 | | * | | Equinix, Inc | | | 17,171 |
| 248 | | * | | eSpeed, Inc (Class A) | | | 2,066 |
| 2,495 | | * | | Expedia, Inc | | | 37,350 |
| 460 | | * | | F5 Networks, Inc | | | 24,601 |
| 455 | | | | Factset Research Systems, Inc | | | 21,521 |
| 771 | | | | Fair Isaac Corp | | | 27,995 |
| 313 | | * | | FalconStor Software, Inc | | | 2,182 |
| 1,031 | | | | Fidelity National Information Services, Inc | | | 36,497 |
| 400 | | * | | Filenet Corp | | | 10,772 |
| 113 | | * | | First Advantage Corp | | | 2,628 |
| 8,329 | | | | First Data Corp | | | 375,138 |
| 1,912 | | * | | Fiserv, Inc | | | 86,728 |
| 100 | | * | | Forrester Research, Inc | | | 2,798 |
| 300 | | * | | FTD Group, Inc | | | 4,050 |
| 739 | | * | | Gartner, Inc (Class A) | | | 10,494 |
| 244 | | * | | Gerber Scientific, Inc | | | 3,174 |
| 565 | | * | | Getty Images, Inc | | | 35,883 |
| 252 | | | | Gevity HR, Inc | | | 6,691 |
| 362 | | * | | Global Cash Access, Inc | | | 5,658 |
| 2,272 | | * | | Google, Inc (Class A) | | | 952,718 |
| 180 | | * | | H&E Equipment Services, Inc | | | 5,301 |
| 192 | | | | Healthcare Services Group | | | 4,022 |
| 100 | | * | | Heartland Payment Systems, Inc | | | 2,788 |
| 200 | | * | | Heidrick & Struggles International, Inc | | | 6,768 |
| 326 | | * | | Hudson Highland Group, Inc | | | 3,518 |
| 570 | | * | | Hypercom Corp | | | 5,329 |
| 600 | | * | | Hyperion Solutions Corp | | | 16,560 |
| 213 | | * | | iGate Corp | | | 1,361 |
| 200 | | * | | IHS, Inc | | | 5,926 |
| 2,243 | | | | IMS Health, Inc | | | 60,225 |
| 392 | | * | | Infocrossing, Inc | | | 4,528 |
| 974 | | * | | Informatica Corp | | | 12,818 |
| 367 | | * | | Infospace, Inc | | | 8,320 |
| 311 | | | | infoUSA, Inc | | | 3,206 |
| 300 | | * | | Innovative Solutions & Support, Inc | | | 4,218 |
| 109 | | | | Integral Systems, Inc | | | 2,924 |
| 387 | | * | | Interactive Data Corp | | | 7,775 |
| 311 | | * | | Intergraph Corp | | | 9,793 |
| 3,302 | | * | | Internap Network Services Corp | | | 3,467 |
| 405 | | * | | Internet Capital Group, Inc | | | 3,645 |
49
TIAA-CREF LIFE FUNDS - Stock Index Fund
| | | | | | | |
SHARES
| | | | COMPANY
| | VALUE
|
| | | |
| 452 | | * | | Internet Security Systems, Inc | | $ | 8,520 |
| 200 | | | | Interpool, Inc | | | 4,444 |
| 4,750 | | * | | Interpublic Group of Cos, Inc | | | 39,662 |
| 401 | | * | | Interwoven, Inc | | | 3,441 |
| 1,893 | | * | | Intuit, Inc | | | 114,318 |
| 306 | | * | | inVentiv Health, Inc | | | 8,807 |
| 470 | | * | | Ipass, Inc | | | 2,632 |
| 1,247 | | * | | Iron Mountain, Inc | | | 46,613 |
| 800 | | | | Jack Henry & Associates, Inc | | | 15,728 |
| 245 | | * | | JDA Software Group, Inc | | | 3,437 |
| 6,156 | | * | | Juniper Networks, Inc | | | 98,434 |
| 308 | | * | | Jupitermedia Corp | | | 4,004 |
| 264 | | * | | Kanbay International, Inc | | | 3,839 |
| 500 | | * | | Keane, Inc | | | 6,250 |
| 300 | | | | Kelly Services, Inc (Class A) | | | 8,151 |
| 173 | | * | | Kenexa Corp | | | 5,510 |
| 271 | | * | | Kforce, Inc | | | 4,198 |
| 664 | | * | | KFX, Inc | | | 10,146 |
| 508 | | * | | Kinetic Concepts, Inc | | | 22,428 |
| 155 | | * | | Knot, Inc | | | 3,244 |
| 500 | | * | | Korn/Ferry International | | | 9,795 |
| 398 | | * | | Kronos, Inc | | | 14,412 |
| 550 | | * | | Labor Ready, Inc | | | 12,457 |
| 953 | | * | | Lamar Advertising Co | | | 51,329 |
| 1,343 | | * | | Lawson Software, Inc | | | 8,998 |
| 638 | | * | | Lionbridge Technologies | | | 3,528 |
| 176 | | * | | LoJack Corp | | | 3,319 |
| 570 | | * | | Magma Design Automation, Inc | | | 4,190 |
| 311 | | * | | Manhattan Associates, Inc | | | 6,310 |
| 958 | | | | Manpower, Inc | | | 61,887 |
| 139 | | * | | Mantech International Corp (Class A) | | | 4,290 |
| 215 | | * | | Mapinfo Corp | | | 2,806 |
| 206 | | * | | Marchex, Inc | | | 3,385 |
| 150 | | * | | Marlin Business Services, Inc | | | 3,384 |
| 669 | | * | | Mastercard, Inc | | | 32,112 |
| 1,852 | | * | | McAfee, Inc | | | 44,948 |
| 824 | | * | | Mentor Graphics Corp | | | 10,696 |
| 96,509 | | | | Microsoft Corp | | | 2,248,660 |
| 150 | | * | | MicroStrategy, Inc | | | 14,628 |
| 300 | | * | | Midway Games, Inc | | | 2,427 |
| 1,037 | | | | MoneyGram International, Inc | | | 35,206 |
| 1,346 | | * | | Monster Worldwide, Inc | | | 57,420 |
| 2,049 | | * | | Move, Inc | | | 11,229 |
| 1,117 | | * | | MPS Group, Inc | | | 16,822 |
| 300 | | * | | MRO Software, Inc | | | 6,021 |
| 1,010 | | * | | NAVTEQ Corp | | | 45,127 |
| 287 | | * | | NCO Group, Inc | | | 7,588 |
| 2,012 | | * | | NCR Corp | | | 73,720 |
| 213 | | * | | Neoware, Inc | | | 2,618 |
| 400 | | * | | Ness Technologies, Inc | | | 4,300 |
| 371 | | * | | NetFlix, Inc | | | 10,095 |
| 100 | | * | | Netratings, Inc | | | 1,389 |
| 100 | | * | | Netscout Systems, Inc | | | 892 |
| 310 | | * | | NIC, Inc | | | 2,241 |
| 4,067 | | * | | Novell, Inc | | | 26,964 |
| 1,532 | | * | | Nuance Communications, Inc | | | 15,412 |
| 1,857 | | | | Omnicom Group, Inc | | | 165,440 |
50
TIAA-CREF LIFE FUNDS - Stock Index Fund
| | | | | | | |
SHARES
| | | | COMPANY
| | VALUE
|
| | | |
| 282 | | * | | On Assignment, Inc | | $ | 2,592 |
| 222 | | * | | Online Resources Corp | | | 2,295 |
| 207 | | * | | Open Solutions, Inc | | | 5,508 |
| 903 | | * | | Opsware, Inc | | | 7,441 |
| 43,241 | | * | | Oracle Corp | | | 626,562 |
| 500 | | * | | Packeteer, Inc | | | 5,670 |
| 1,140 | | * | | Parametric Technology Corp | | | 14,489 |
| 300 | | * | | PDF Solutions, Inc | | | 3,723 |
| 202 | | * | | PeopleSupport, Inc | | | 2,719 |
| 187 | | * | | Perficient, Inc | | | 2,311 |
| 808 | | * | | Perot Systems Corp (Class A) | | | 11,700 |
| 300 | | * | | Phase Forward, Inc | | | 3,456 |
| 129 | | * | | Portfolio Recovery Associates, Inc | | | 5,895 |
| 120 | | * | | PRA International | | | 2,672 |
| 762 | | * | | Premiere Global Services, Inc | | | 5,753 |
| 395 | | * | | Progress Software Corp | | | 9,247 |
| 108 | | | | QAD, Inc | | | 837 |
| 140 | | | | Quality Systems, Inc | | | 5,155 |
| 829 | | * | | Quest Software, Inc | | | 11,639 |
| 237 | | * | | Radiant Systems, Inc | | | 2,505 |
| 187 | | * | | Radisys Corp | | | 4,107 |
| 1,196 | | * | | RealNetworks, Inc | | | 12,797 |
| 1,921 | | * | | Red Hat, Inc | | | 44,951 |
| 639 | | * | | Redback Networks, Inc | | | 11,719 |
| 100 | | | | Renaissance Learning, Inc | | | 1,355 |
| 723 | | * | | Rent-A-Center, Inc | | | 17,974 |
| 294 | | * | | Rewards Network, Inc | | | 2,402 |
| 713 | | | | Reynolds & Reynolds Co (Class A) | | | 21,868 |
| 200 | | * | | RightNow Technologies, Inc | | | 3,336 |
| 1,761 | | | | Robert Half International, Inc | | | 73,962 |
| 225 | | | | Rollins, Inc | | | 4,419 |
| 720 | | * | | RSA Security, Inc | | | 19,577 |
| 900 | | * | | S1 Corp | | | 4,320 |
| 264 | | * | | SafeNet, Inc | | | 4,678 |
| 919 | | * | | Salesforce.com, Inc | | | 24,501 |
| 700 | | * | | Sapient Corp | | | 3,710 |
| 618 | | * | | Secure Computing Corp | | | 5,315 |
| 3,353 | | | | ServiceMaster Co | | | 34,636 |
| 101 | | * | | SI International, Inc | | | 3,097 |
| 636 | | * | | Sitel Corp | | | 2,493 |
| 220 | | * | | Smith Micro Software, Inc | | | 3,524 |
| 378 | | * | | Sohu.com, Inc | | | 9,749 |
| 542 | | * | | SonicWALL, Inc | | | 4,873 |
| 2,630 | | * | | Sonus Networks, Inc | | | 13,018 |
| 660 | | * | | Sotheby’s Holdings, Inc (Class A) | | | 17,325 |
| 624 | | * | | Spherion Corp | | | 5,691 |
| 200 | | * | | SPSS, Inc | | | 6,428 |
| 419 | | * | | SRA International, Inc (Class A) | | | 11,158 |
| 100 | | | | Startek, Inc | | | 1,495 |
| 185 | | | | Stellent, Inc | | | 1,767 |
| 73 | | * | | Stratasys, Inc | | | 2,151 |
| 38,034 | | * | | Sun Microsystems, Inc | | | 157,841 |
| 1,054 | | * | | Sybase, Inc | | | 20,448 |
| 200 | | * | | SYKES Enterprises, Inc | | | 3,232 |
| 11,479 | | * | | Symantec Corp | | | 178,384 |
| 134 | | * | | SYNNEX Corp | | | 2,541 |
| 1,602 | | * | | Synopsys, Inc | | | 30,070 |
51
TIAA-CREF LIFE FUNDS - Stock Index Fund
| | | | | | | |
SHARES
| | | | COMPANY
| | VALUE
|
| | | |
| 685 | | * | | Take-Two Interactive Software, Inc | | $ | 7,302 |
| 200 | | * | | TAL International Group, Inc | | | 4,820 |
| 321 | | | | Talx Corp | | | 7,020 |
| 300 | | * | | TeleTech Holdings, Inc | | | 3,798 |
| 196 | | | | TheStreet.com, Inc | | | 2,513 |
| 787 | | * | | THQ, Inc | | | 16,999 |
| 2,110 | | * | | TIBCO Software, Inc | | | 14,875 |
| 259 | | * | | TNS, Inc | | | 5,359 |
| 470 | | | | Total System Services, Inc | | | 9,047 |
| 183 | | * | | TradeStation Group, Inc | | | 2,319 |
| 400 | | * | | Transaction Systems Architects, Inc | | | 16,676 |
| 100 | | * | | Travelzoo, Inc | | | 3,034 |
| 444 | | * | | Trizetto Group, Inc | | | 6,567 |
| 242 | | * | | Ultimate Software Group, Inc | | | 4,637 |
| 3,451 | | * | | Unisys Corp | | | 21,672 |
| 750 | | | | United Online, Inc | | | 9,000 |
| 710 | | * | | United Rentals, Inc | | | 22,706 |
| 329 | | * | | Universal Compression Holdings, Inc | | | 20,717 |
| 678 | | * | | VA Software Corp | | | 2,631 |
| 979 | | * | | Valueclick, Inc | | | 15,028 |
| 248 | | * | | Vasco Data Security International | | | 2,071 |
| 140 | | * | | Verint Systems, Inc | | | 4,087 |
| 2,796 | | * | | VeriSign, Inc | | | 64,783 |
| 95 | | * | | Vertrue, Inc | | | 4,088 |
| 263 | | | | Viad Corp | | | 8,232 |
| 306 | | * | | Vignette Corp | | | 4,461 |
| 100 | | * | | Volt Information Sciences, Inc | | | 4,660 |
| 5,931 | | | | Waste Management, Inc | | | 212,804 |
| 456 | | * | | WebEx Communications, Inc | | | 16,206 |
| 51 | | * | | WebMD Health Corp | | | 2,412 |
| 481 | | * | | WebMethods, Inc | | | 4,747 |
| 564 | | * | | Websense, Inc | | | 11,585 |
| 200 | | * | | WebSideStory, Inc | | | 2,440 |
| 752 | | * | | Wind River Systems, Inc | | | 6,693 |
| 348 | | * | | Witness Systems, Inc | | | 7,019 |
| 15,324 | | * | | Yahoo!, Inc | | | 505,692 |
| | | | | | |
|
|
| | | | | TOTAL BUSINESS SERVICES | | 10,928,479 |
| | | | | | |
|
|
| CHEMICALS AND ALLIED PRODUCTS - 9.16% | | |
| 16,605 | | | | Abbott Laboratories | | | 724,144 |
| 303 | | * | | Abraxis BioScience, Inc | | | 7,223 |
| 300 | | * | | Acadia Pharmaceuticals, Inc | | | 2,532 |
| 100 | | * | | Adams Respiratory Therapeutics, Inc | | | 4,462 |
| 168 | | * | | Adeza Biomedical Corp | | | 2,355 |
| 409 | | * | | Adolor Corp | | | 10,229 |
| 89 | | * | | Advanced Magnetics, Inc | | | 2,690 |
| 2,439 | | | | Air Products & Chemicals, Inc | | | 155,901 |
| 276 | | * | | Albany Molecular Research, Inc | | | 2,948 |
| 426 | | | | Albemarle Corp | | | 20,397 |
| 887 | | | | Alberto-Culver Co | | | 43,215 |
| 400 | | * | | Alexion Pharmaceuticals, Inc | | | 14,448 |
| 851 | | * | | Alkermes, Inc | | | 16,101 |
| 344 | | * | | Alnylam Pharmaceuticals, Inc | | | 5,187 |
| 534 | | | | Alpharma, Inc (Class A) | | | 12,837 |
| 479 | | * | | American Oriental Bioengineering, Inc | | | 2,649 |
| 146 | | | | American Vanguard Corp | | | 2,260 |
| 12,952 | | * | | Amgen, Inc | | | 844,859 |
52
TIAA-CREF LIFE FUNDS - Stock Index Fund
| | | | | | | |
SHARES
| | | | COMPANY
| | VALUE
|
| | | |
| 870 | | * | | Andrx Corp | | $ | 20,175 |
| 200 | | | | Arch Chemicals, Inc | | | 7,210 |
| 492 | | * | | Arena Pharmaceuticals, Inc | | | 5,697 |
| 600 | | * | | Array Biopharma, Inc | | | 5,160 |
| 383 | | * | | Atherogenics, Inc | | | 4,998 |
| 288 | | * | | AVANIR Pharmaceuticals | | | 1,970 |
| 1,026 | | | | Avery Dennison Corp | | | 59,570 |
| 4,897 | | | | Avon Products, Inc | | | 151,807 |
| 123 | | | | Balchem Corp | | | 2,767 |
| 1,154 | | * | | Barr Pharmaceuticals, Inc | | | 55,034 |
| 111 | | * | | Bentley Pharmaceuticals, Inc | | | 1,217 |
| 249 | | * | | BioCryst Pharmaceuticals, Inc | | | 3,568 |
| 800 | | * | | Bioenvision, Inc | | | 4,264 |
| 3,790 | | * | | Biogen Idec, Inc | | | 175,591 |
| 967 | | * | | BioMarin Pharmaceuticals, Inc | | | 13,896 |
| 21,471 | | | | Bristol-Myers Squibb Co | | | 555,240 |
| 696 | | | | Cabot Corp | | | 24,026 |
| 300 | | | | Calgon Carbon Corp | | | 1,827 |
| 206 | | | | Cambrex Corp | | | 4,291 |
| 826 | | | | Celanese Corp (Series A) | | | 16,867 |
| 300 | | * | | Cell Genesys, Inc | | | 1,506 |
| 659 | | * | | Cephalon, Inc | | | 39,606 |
| 500 | | | | CF Industries Holdings, Inc | | | 7,130 |
| 788 | | * | | Charles River Laboratories International, Inc | | | 28,998 |
| 149 | | * | | Chattem, Inc | | | 4,525 |
| 2,512 | | | | Chemtura Corp | | | 23,462 |
| 712 | | | | Church & Dwight Co, Inc | | | 25,931 |
| 1,642 | | | | Clorox Co | | | 100,113 |
| 5,599 | | | | Colgate-Palmolive Co | | | 335,380 |
| 261 | | * | | Combinatorx, Inc | | | 2,294 |
| 300 | | * | | Connetics Corp | | | 3,528 |
| 295 | | * | | Conor Medsystems, Inc | | | 8,139 |
| 300 | | * | | Cotherix, Inc | | | 2,583 |
| 711 | | * | | Cubist Pharmaceuticals, Inc | | | 17,903 |
| 912 | | * | | Cypress Bioscience, Inc | | | 5,600 |
| 433 | | | | Cytec Industries, Inc | | | 23,235 |
| 966 | | | | Dade Behring Holdings, Inc | | | 40,224 |
| 614 | | * | | Dendreon Corp | | | 2,972 |
| 300 | | | | Diagnostic Products Corp | | | 17,451 |
| 131 | | * | | Digene Corp | | | 5,075 |
| 10,462 | | | | Dow Chemical Co | | | 408,332 |
| 10,021 | | | | Du Pont (E.I.) de Nemours & Co | | | 416,874 |
| 698 | | * | | Durect Corp | | | 2,701 |
| 889 | | | | Eastman Chemical Co | | | 48,006 |
| 1,962 | | | | Ecolab, Inc | | | 79,618 |
| 10,697 | | | | Eli Lilly & Co | | | 591,223 |
| 350 | | * | | Elizabeth Arden, Inc | | | 6,258 |
| 600 | | * | | Encysive Pharmaceuticals, Inc | | | 4,158 |
| 400 | | * | | Enzon Pharmaceuticals, Inc | | | 3,016 |
| 1,340 | | | | Estee Lauder Cos (Class A) | | | 51,818 |
| 396 | | | | Ferro Corp | | | 6,320 |
| 427 | | | | FMC Corp | | | 27,495 |
| 3,597 | | * | | Forest Laboratories, Inc | | | 139,168 |
| 5,105 | | * | | Genentech, Inc | | | 417,589 |
| 253 | | * | | Genitope Corp | | | 1,599 |
| 1,467 | | * | | Genta, Inc | | | 2,406 |
| 2,833 | | * | | Genzyme Corp | | | 172,955 |
53
TIAA-CREF LIFE FUNDS - Stock Index Fund
| | | | | | | |
SHARES
| | | | COMPANY
| | VALUE
|
| | | |
| 400 | | | | Georgia Gulf Corp | | $ | 10,008 |
| 1,012 | | * | | Geron Corp | | | 6,983 |
| 4,958 | | * | | Gilead Sciences, Inc | | | 293,315 |
| 300 | | | | H.B. Fuller Co | | | 13,071 |
| 308 | | * | | Hana Biosciences, Inc | | | 2,794 |
| 1,169 | | * | | Hercules, Inc | | | 17,839 |
| 150 | | * | | Hi-Tech Pharmacal Co, Inc | | | 2,485 |
| 1,733 | | * | | Hospira, Inc | | | 74,415 |
| 1,379 | | * | | Human Genome Sciences, Inc | | | 14,755 |
| 982 | | * | | Huntsman Corp | | | 17,008 |
| 135 | | * | | Idenix Pharmaceuticals, Inc | | | 1,269 |
| 398 | | * | | Idexx Laboratories, Inc | | | 29,902 |
| 733 | | * | | ImClone Systems, Inc | | | 28,323 |
| 676 | | * | | Immucor, Inc | | | 12,999 |
| 507 | | * | | Indevus Pharmaceuticals, Inc | | | 2,773 |
| 90 | | | | Innospec, Inc | | | 2,288 |
| 314 | | * | | InterMune, Inc | | | 5,165 |
| 990 | | | | International Flavors & Fragrances, Inc | | | 34,888 |
| 307 | | * | | Inverness Medical Innovations, Inc | | | 8,667 |
| 583 | | * | | Invitrogen Corp | | | 38,519 |
| 2,581 | | * | | King Pharmaceuticals, Inc | | | 43,877 |
| 100 | | | | Koppers Holdings, Inc | | | 1,999 |
| 210 | | * | | Kos Pharmaceuticals, Inc | | | 7,900 |
| 56 | | | | Kronos Worldwide, Inc | | | 1,660 |
| 360 | | * | | KV Pharmaceutical Co (Class A) | | | 6,718 |
| 722 | | | | Lubrizol Corp | | | 28,772 |
| 2,270 | | | | Lyondell Chemical Co | | | 51,438 |
| 287 | | | | MacDermid, Inc | | | 8,266 |
| 342 | | | | Mannatech, Inc | | | 4,313 |
| 300 | | * | | MannKind Corp | | | 6,393 |
| 338 | | * | | Martek Biosciences Corp | | | 9,785 |
| 1,476 | | * | | Medarex, Inc | | | 14,184 |
| 547 | | * | | Medicines Co | | | 10,694 |
| 596 | | | | Medicis Pharmaceutical Corp (Class A) | | | 14,304 |
| 2,715 | | * | | Medimmune, Inc | | | 73,576 |
| 23,744 | | | | Merck & Co, Inc | | | 864,994 |
| 172 | | | | Meridian Bioscience, Inc | | | 4,291 |
| 792 | | * | | MGI Pharma, Inc | | | 17,028 |
| 3,429 | | * | | Millennium Pharmaceuticals, Inc | | | 34,187 |
| 246 | | | | Minerals Technologies, Inc | | | 12,792 |
| 200 | | * | | Momenta Pharmaceuticals, Inc | | | 2,542 |
| 2,956 | | | | Monsanto Co | | | 248,866 |
| 1,431 | | * | | Mosaic Co | | | 22,395 |
| 2,436 | | | | Mylan Laboratories, Inc | | | 48,720 |
| 462 | | * | | Myogen, Inc | | | 13,398 |
| 612 | | * | | Nabi Biopharmaceuticals | | | 3,513 |
| 1,156 | | * | | Nalco Holding Co | | | 20,380 |
| 187 | | * | | Nastech Pharmaceutical Co, Inc | | | 2,955 |
| 580 | | * | | NBTY, Inc | | | 13,868 |
| 559 | | * | | Neurocrine Biosciences, Inc | | | 5,925 |
| 200 | | * | | New River Pharmaceuticals, Inc | | | 5,700 |
| 154 | | | | NewMarket Corp | | | 7,555 |
| 113 | | | | NL Industries, Inc | | | 1,215 |
| 202 | | * | | Northfield Laboratories, Inc | | | 1,998 |
| 665 | | * | | Novavax, Inc | | | 3,352 |
| 200 | | * | | Noven Pharmaceuticals, Inc | | | 3,580 |
| 693 | | * | | NPS Pharmaceuticals, Inc | | | 3,382 |
54
TIAA-CREF LIFE FUNDS - Stock Index Fund
| | | | | | | |
SHARES
| | | | COMPANY
| | VALUE
|
| | | |
| 671 | | * | | Nuvelo, Inc | | $ | 11,172 |
| 739 | | | | Olin Corp | | | 13,250 |
| 298 | | * | | OM Group, Inc | | | 9,193 |
| 448 | | * | | Omnova Solutions, Inc | | | 2,545 |
| 450 | | * | | Onyx Pharmaceuticals, Inc | | | 7,573 |
| 360 | | * | | OraSure Technologies, Inc | | | 3,427 |
| 596 | | * | | OSI Pharmaceuticals, Inc | | | 19,644 |
| 235 | | * | | Pacific Ethanol, Inc | | | 5,433 |
| 300 | | * | | Pain Therapeutics, Inc | | | 2,505 |
| 540 | | * | | Panacos Pharmaceuticals, Inc | | | 2,981 |
| 364 | | * | | Par Pharmaceutical Cos, Inc | | | 6,719 |
| 270 | | * | | Parexel International Corp | | | 7,789 |
| 200 | | * | | Parlux Fragrances, Inc | | | 1,938 |
| 1,273 | | * | | PDL BioPharma, Inc | | | 23,436 |
| 252 | | * | | Penwest Pharmaceuticals Co | | | 5,501 |
| 1,869 | | * | | Peregrine Pharmaceuticals, Inc | | | 2,972 |
| 889 | | | | Perrigo Co | | | 14,313 |
| 199 | | * | | PetMed Express, Inc | | | 2,183 |
| 79,712 | | | | Pfizer, Inc | | | 1,870,841 |
| 258 | | * | | Pharmion Corp | | | 4,394 |
| 118 | | * | | Pioneer Cos, Inc | | | 3,219 |
| 965 | | * | | PolyOne Corp | | | 8,473 |
| 200 | | * | | Pozen, Inc | | | 1,408 |
| 1,802 | | | | PPG Industries, Inc | | | 118,932 |
| 3,515 | | | | Praxair, Inc | | | 189,810 |
| 400 | | * | | Prestige Brands Holdings, Inc | | | 3,988 |
| 35,486 | | | | Procter & Gamble Co | | | 1,973,022 |
| 300 | | * | | Progenics Pharmaceuticals, Inc | | | 7,218 |
| 333 | | * | | Quidel Corp | | | 3,163 |
| 204 | | * | | Renovis, Inc | | | 3,123 |
| 1,335 | | * | | Revlon, Inc (Class A) | | | 1,682 |
| 300 | | * | | Rockwood Holdings, Inc | | | 6,903 |
| 1,790 | | | | Rohm & Haas Co | | | 89,715 |
| 1,300 | | | | RPM International, Inc | | | 23,400 |
| 382 | | * | | Salix Pharmaceuticals Ltd | | | 4,699 |
| 492 | | * | | Santarus, Inc | | | 3,272 |
| 16,173 | | | | Schering-Plough Corp | | | 307,772 |
| 375 | | * | | Sciele Pharma, Inc | | | 8,696 |
| 464 | | | | Scotts Miracle-Gro Co (Class A) | | | 19,636 |
| 600 | | | | Sensient Technologies Corp | | | 12,546 |
| 1,184 | | * | | Sepracor, Inc | | | 67,654 |
| 371 | | * | | Serologicals Corp | | | 11,664 |
| 754 | | | | Sigma-Aldrich Corp | | | 54,771 |
| 428 | | * | | Sirna Therapeutics, Inc | | | 2,440 |
| 100 | | | | Stepan Co | | | 3,158 |
| 900 | | * | | SuperGen, Inc | | | 3,267 |
| 147 | | * | | SurModics, Inc | | | 5,308 |
| 251 | | * | | Tanox, Inc | | | 3,471 |
| 445 | | | | Tronox, Inc | | | 5,861 |
| 500 | | | | UAP Holding Corp | | | 10,905 |
| 240 | | * | | United Therapeutics Corp | | | 13,865 |
| 92 | | * | | USANA Health Sciences, Inc | | | 3,487 |
| 864 | | | | USEC, Inc | | | 10,238 |
| 1,091 | | | | Valeant Pharmaceuticals International | | | 18,460 |
| 1,088 | | | | Valspar Corp | | | 28,734 |
| 868 | | * | | VCA Antech, Inc | | | 27,715 |
| 1,200 | | * | | Vertex Pharmaceuticals, Inc | | | 44,052 |
55
TIAA-CREF LIFE FUNDS - Stock Index Fund
| | | | | | | |
SHARES
| | | | COMPANY
| | VALUE
|
| | | |
| 739 | | * | | Viropharma, Inc | | $ | 6,370 |
| 1,206 | | * | | Watson Pharmaceuticals, Inc | | | 28,076 |
| 220 | | | | Westlake Chemical Corp | | | 6,556 |
| 802 | | * | | WR Grace & Co | | | 9,383 |
| 14,663 | | | | Wyeth | | | 651,184 |
| 200 | | * | | Xenoport, Inc | | | 3,622 |
| 405 | | * | | Zymogenetics, Inc | | | 7,683 |
| | | | | | |
|
|
| | | | | TOTAL CHEMICALS AND ALLIED PRODUCTS | | 14,145,194 |
| | | | | | |
|
|
| COAL MINING - 0.27% | | |
| 565 | | * | | Alpha Natural Resources, Inc | | | 11,085 |
| 1,502 | | | | Arch Coal, Inc | | | 63,640 |
| 1,992 | | | | Consol Energy, Inc | | | 93,066 |
| 496 | | | | Foundation Coal Holdings, Inc | | | 23,277 |
| 1,234 | | * | | International Coal Group, Inc | | | 8,872 |
| 138 | | * | | James River Coal Co | | | 3,656 |
| 848 | | | | Massey Energy Co | | | 30,528 |
| 2,920 | | | | Peabody Energy Corp | | | 162,790 |
| 220 | | | | Penn Virginia Corp | | | 15,374 |
| | | | | | |
|
|
| | | | | TOTAL COAL MINING | | 412,288 |
| | | | | | |
|
|
| COMMUNICATIONS - 4.69% | | |
| 463 | | | | Alaska Communications Systems Group, Inc | | | 5,857 |
| 4,232 | | | | Alltel Corp | | | 270,129 |
| 4,519 | | * | | American Tower Corp (Class A) | | | 140,631 |
| 356 | | | | Anixter International, Inc | | | 16,896 |
| 42,399 | | | | AT&T, Inc | | | 1,182,508 |
| 200 | | * | | Audiovox Corp (Class A) | | | 2,732 |
| 5,053 | | * | | Avaya, Inc | | | 57,705 |
| 19,825 | | | | BellSouth Corp | | | 717,665 |
| 552 | | * | | Brightpoint, Inc | | | 7,469 |
| 2,359 | | | | Cablevision Systems Corp (Class A) | | | 50,601 |
| 178 | | * | | Cbeyond Communications, Inc | | | 3,882 |
| 7,721 | | | | CBS Corp | | | 208,853 |
| 100 | | | | Centennial Communications Corp | | | 520 |
| 1,303 | | | | CenturyTel, Inc | | | 48,406 |
| 3,210 | | * | | Charter Communications, Inc (Class A) | | | 3,627 |
| 3,005 | | * | | Cincinnati Bell, Inc | | | 12,321 |
| 575 | | | | Citadel Broadcasting Corp | | | 5,118 |
| 3,756 | | | | Citizens Communications Co | | | 49,016 |
| 5,522 | | | | Clear Channel Communications, Inc | | | 170,906 |
| 21,223 | | * | | Comcast Corp (Class A) | | | 694,841 |
| 230 | | | | Commonwealth Telephone Enterprises, Inc | | | 7,627 |
| 300 | | | | Consolidated Communications Holdings, Inc | | | 4,989 |
| 3,167 | | * | | Covad Communications Group, Inc | | | 6,366 |
| 496 | | * | | Cox Radio, Inc (Class A) | | | 7,152 |
| 2,416 | | * | | Crown Castle International Corp | | | 83,449 |
| 200 | | * | | Crown Media Holdings, Inc (Class A) | | | 824 |
| 185 | | | | CT Communications, Inc | | | 4,231 |
| 671 | | * | | Cumulus Media, Inc (Class A) | | | 7,160 |
| 8,759 | | * | | DIRECTV Group, Inc | | | 144,524 |
| 1,770 | | * | | Dobson Communications Corp (Class A) | | | 13,682 |
| 2,321 | | * | | EchoStar Communications Corp (Class A) | | | 71,510 |
| 1,622 | | * | | Embarq Corp | | | 66,486 |
| 521 | | * | | Emmis Communications Corp (Class A) | | | 8,148 |
| 421 | | | | Entercom Communications Corp | | | 11,013 |
| 810 | | * | | Entravision Communications Corp (Class A) | | | 6,942 |
56
TIAA-CREF LIFE FUNDS - Stock Index Fund
| | | | | | | |
SHARES
| | | | COMPANY
| | VALUE
|
| | | |
| 300 | | | | Fairpoint Communications, Inc | | $ | 4,320 |
| 594 | | * | | First Avenue Networks, Inc | | | 6,463 |
| 52 | | * | | Fisher Communications, Inc | | | 2,191 |
| 1,429 | | * | | Foundry Networks, Inc | | | 15,233 |
| 464 | | * | | General Communication, Inc (Class A) | | | 5,716 |
| 694 | | | | Global Payments, Inc | | | 33,694 |
| 229 | | | | Golden Telecom, Inc | | | 5,805 |
| 420 | | | | Gray Television, Inc | | | 2,432 |
| 327 | | | | Hearst-Argyle Television, Inc | | | 7,214 |
| 2,006 | | * | | IAC/InterActiveCorp | | | 53,139 |
| 614 | | * | | IDT Corp (Class B) | | | 8,467 |
| 167 | | * | | InPhonic, Inc | | | 1,052 |
| 400 | | | | Iowa Telecommunications Services, Inc | | | 7,568 |
| 180 | | * | | iPCS, Inc | | | 8,694 |
| 500 | | * | | j2 Global Communications, Inc | | | 15,610 |
| 479 | | * | | Leap Wireless International, Inc | | | 22,729 |
| 9,100 | | * | | Level 3 Communications, Inc | | | 40,404 |
| 5,051 | | * | | Liberty Global, Inc | | | 108,597 |
| 7,688 | | * | | Liberty Media Holding Corp (Interactive) | | | 132,695 |
| 1,537 | | * | | Liberty Media Holding Corp (Capital) | | | 128,754 |
| 296 | | * | | Lightbridge, Inc | | | 3,833 |
| 281 | | * | | Lin TV Corp (Class A) | | | 2,122 |
| 100 | | * | | Lodgenet Entertainment Corp | | | 1,865 |
| 573 | | * | | Mastec, Inc | | | 7,569 |
| 493 | | * | | Mediacom Communications Corp | | | 3,071 |
| 679 | | * | | NeuStar, Inc | | | 22,916 |
| 1,498 | | * | | NII Holdings, Inc (Class B) | | | 84,457 |
| 158 | | | | North Pittsburgh Systems, Inc | | | 4,354 |
| 555 | | * | | Novatel Wireless, Inc | | | 5,761 |
| 200 | | * | | NTELOS Holdings Corp | | | 2,890 |
| 746 | | | | PanAmSat Holding Corp | | | 18,635 |
| 597 | | * | | Pegasus Wireless Corp | | | 5,337 |
| 420 | | * | | Price Communications Corp | | | 7,119 |
| 17,203 | | * | | Qwest Communications International, Inc | | | 139,172 |
| 888 | | * | | Radio One, Inc (Class D) | | | 6,571 |
| 242 | | * | | RCN Corp | | | 6,033 |
| 87 | | | | Salem Communications Corp (Class A) | | | 1,132 |
| 89 | | * | | SAVVIS, Inc | | | 2,635 |
| 1,078 | | * | | SBA Communications Corp | | | 28,179 |
| 58 | | | | Shenandoah Telecom Co | | | 2,726 |
| 383 | | | | Sinclair Broadcast Group, Inc (Class A) | | | 3,278 |
| 300 | | * | | Spanish Broadcasting System, Inc (Class A) | | | 1,533 |
| 31,530 | | | | Sprint Nextel Corp | | | 630,285 |
| 122 | | | | SureWest Communications | | | 2,357 |
| 182 | | * | | Syniverse Holdings, Inc | | | 2,675 |
| 211 | | * | | Talk America Holdings, Inc | | | 1,306 |
| 1,250 | | | | Telephone & Data Systems, Inc | | | 51,750 |
| 500 | | * | | Terremark Worldwide, Inc | | | 1,800 |
| 932 | | * | | TiVo, Inc | | | 6,664 |
| 200 | | * | | US Cellular Corp | | | 12,120 |
| 748 | | * | | Ubiquitel, Inc | | | 7,734 |
| 2,328 | | * | | Univision Communications, Inc (Class A) | | | 77,988 |
| 250 | | | | USA Mobility, Inc | | | 4,150 |
| 400 | | | | Valor Communications Group, Inc | | | 4,580 |
| 31,737 | | | | Verizon Communications, Inc | | | 1,062,872 |
| 6,904 | | * | | Viacom, Inc | | | 247,439 |
| 336 | | * | | Vonage Holdings Corp | | | 2,886 |
57
TIAA-CREF LIFE FUNDS - Stock Index Fund
| | | | | | | |
SHARES
| | | | COMPANY
| | VALUE
|
| | | |
| 326 | | * | | West Corp | | $ | 15,619 |
| 1,081 | | * | | Wireless Facilities, Inc | | | 2,973 |
| 2,740 | | * | | XM Satellite Radio Holdings, Inc | | | 40,141 |
| | | | | | |
|
|
| | | | | TOTAL COMMUNICATIONS | | 7,241,090 |
| | | | | | |
|
|
| DEPOSITORY INSTITUTIONS - 10.21% | | |
| 110 | | | | 1st Source Corp | | | 3,721 |
| 96 | | * | | ACE Cash Express, Inc | | | 2,810 |
| 164 | | | | Alabama National Bancorp | | | 11,177 |
| 200 | | | | Amcore Financial, Inc | | | 5,862 |
| 107 | | | | AmericanWest Bancorp | | | 2,424 |
| 108 | | | | Ameris Bancorp | | | 2,499 |
| 3,767 | | | | AmSouth Bancorp | | | 99,637 |
| 300 | | | | Anchor Bancorp Wisconsin, Inc | | | 9,051 |
| 138 | | | | Arrow Financial Corp | | | 3,785 |
| 1,438 | | | | Associated Banc-Corp | | | 45,340 |
| 1,046 | | | | Astoria Financial Corp | | | 31,851 |
| 130 | | | | Bancfirst Corp | | | 5,818 |
| 117 | | * | | Bancorp, Inc | | | 2,926 |
| 823 | | | | Bancorpsouth, Inc | | | 22,427 |
| 106 | | | | BancTrust Financial Group, Inc | | | 2,488 |
| 838 | | | | Bank Mutual Corp | | | 10,240 |
| 49,647 | | | | Bank of America Corp | | | 2,388,021 |
| 125 | | | | Bank of Granite Corp | | | 2,604 |
| 555 | | | | Bank of Hawaii Corp | | | 27,528 |
| 8,288 | | | | Bank of New York Co, Inc | | | 266,874 |
| 102 | | | | Bank of the Ozarks, Inc | | | 3,397 |
| 452 | | | | BankAtlantic Bancorp, Inc (Class A) | | | 6,708 |
| 300 | | | | BankFinancial Corp | | | 5,190 |
| 400 | | | | BankUnited Financial Corp (Class A) | | | 12,208 |
| 79 | | | | Banner Corp | | | 3,045 |
| 5,945 | | | | BB&T Corp | | | 247,253 |
| 57 | | | | Berkshire Hills Bancorp, Inc | | | 2,022 |
| 400 | | * | | BFC Financial Corp | | | 2,768 |
| 237 | | | | BOK Financial Corp | | | 11,772 |
| 381 | | | | Boston Private Financial Holdings, Inc | | | 10,630 |
| 668 | | | | Brookline Bancorp, Inc | | | 9,198 |
| 64 | | | | Cadence Financial Corp | | | 1,425 |
| 74 | | | | Camden National Corp | | | 2,953 |
| 101 | | | | Capital City Bank Group, Inc | | | 3,050 |
| 93 | | | | Capital Corp of the West | | | 2,976 |
| 140 | | | | Capitol Bancorp Ltd | | | 5,453 |
| 332 | | | | Capitol Federal Financial | | | 11,384 |
| 300 | | | | Cardinal Financial Corp | | | 3,486 |
| 243 | | | | Cascade Bancorp | | | 6,928 |
| 518 | | | | Cathay General Bancorp | | | 18,845 |
| 600 | | * | | Centennial Bank Holdings, Inc | | | 6,204 |
| 121 | | | | Center Financial Corp | | | 2,860 |
| 311 | | | | Central Pacific Financial Corp | | | 12,036 |
| 36 | | | | Charter Financial Corp | | | 1,421 |
| 234 | | | | Chemical Financial Corp | | | 7,160 |
| 453 | | | | Chittenden Corp | | | 11,710 |
| 54,081 | | | | Citigroup, Inc | | | 2,608,867 |
| 600 | | | | Citizens Banking Corp | | | 14,646 |
| 93 | | | | Citizens First Bancorp, Inc | | | 2,484 |
| 81 | | | | City Bank | | | 3,779 |
| 155 | | | | City Holding Co | | | 5,602 |
58
TIAA-CREF LIFE FUNDS - Stock Index Fund
| | | | | | | |
SHARES
| | | | COMPANY
| | VALUE
|
| | | |
| 477 | | | | City National Corp | | $ | 31,048 |
| 133 | | | | Coastal Financial Corp | | | 1,734 |
| 150 | | | | CoBiz, Inc | | | 3,378 |
| 1,743 | | | | Colonial Bancgroup, Inc | | | 44,760 |
| 107 | | | | Columbia Bancorp | | | 2,682 |
| 170 | | | | Columbia Banking System, Inc | | | 6,355 |
| 1,767 | | | | Comerica, Inc | | | 91,866 |
| 2,004 | | | | Commerce Bancorp, Inc | | | 71,483 |
| 714 | | | | Commerce Bancshares, Inc | | | 35,736 |
| 538 | | | | Commercial Capital Bancorp, Inc | | | 8,474 |
| 55 | | | | Community Bancorp, Inc | | | 2,327 |
| 400 | | | | Community Bank System, Inc | | | 8,068 |
| 245 | | | | Community Banks, Inc | | | 6,370 |
| 139 | | | | Community Trust Bancorp, Inc | | | 4,855 |
| 1,357 | | | | Compass Bancshares, Inc | | | 75,449 |
| 400 | | | | Corus Bankshares, Inc | | | 10,472 |
| 600 | | | | Cullen/Frost Bankers, Inc | | | 34,380 |
| 560 | | | | CVB Financial Corp | | | 8,770 |
| 309 | | | | Dime Community Bancshares | | | 4,193 |
| 257 | | | | Downey Financial Corp | | | 17,437 |
| 663 | | | | East West Bancorp, Inc | | | 25,134 |
| 90 | | | | Enterprise Financial Services Corp | | | 2,290 |
| 331 | | * | | Euronet Worldwide, Inc | | | 12,700 |
| 100 | | | | Farmers Capital Bank Corp | | | 3,275 |
| 245 | | | | Fidelity Bankshares, Inc | | | 7,796 |
| 5,213 | | | | Fifth Third Bancorp | | | 192,620 |
| 100 | | | | First Bancorp | | | 2,100 |
| 732 | | | | First Bancorp | | | 6,808 |
| 150 | | | | First Busey Corp (Class A) | | | 3,070 |
| 300 | | | | First Charter Corp | | | 7,359 |
| 55 | | | | First Citizens Bancshares, Inc (Class A) | | | 11,027 |
| 739 | | | | First Commonwealth Financial Corp | | | 9,385 |
| 230 | | | | First Community Bancorp, Inc | | | 13,588 |
| 72 | | | | First Community Bancshares, Inc | | | 2,375 |
| 315 | | | | First Financial Bancorp | | | 4,697 |
| 189 | | | | First Financial Bankshares, Inc | | | 6,906 |
| 188 | | | | First Financial Corp | | | 5,642 |
| 133 | | | | First Financial Holdings, Inc | | | 4,256 |
| 1,397 | | | | First Horizon National Corp | | | 56,159 |
| 146 | | | | First Indiana Corp | | | 3,800 |
| 315 | | | | First Merchants Corp | | | 7,658 |
| 545 | | | | First Midwest Bancorp, Inc | | | 20,209 |
| 1,301 | | | | First Niagara Financial Group, Inc | | | 18,240 |
| 58 | | | | First Oak Brook Bancshares, Inc | | | 2,146 |
| 100 | | | | First Place Financial Corp | | | 2,301 |
| 100 | | * | | First Regional Bancorp | | | 8,800 |
| 235 | | | | First Republic Bank | | | 10,763 |
| 88 | | | | First South Bancorp, Inc | | | 3,012 |
| 156 | | | | First State Bancorporation | | | 3,710 |
| 208 | | * | | FirstFed Financial Corp | | | 11,995 |
| 953 | | | | FirstMerit Corp | | | 19,956 |
| 154 | | | | Flag Financial Corp | | | 2,995 |
| 485 | | | | Flagstar Bancorp, Inc | | | 7,741 |
| 150 | | | | Flushing Financial Corp | | | 2,694 |
| 594 | | | | FNB Corp | | | 9,367 |
| 53 | | | | FNB Corp | | | 1,961 |
| 215 | | * | | Franklin Bank Corp | | | 4,341 |
59
TIAA-CREF LIFE FUNDS - Stock Index Fund
| | | | | | | |
SHARES
| | | | COMPANY
| | VALUE
|
| | | |
| 700 | | | | Fremont General Corp | | $ | 12,992 |
| 358 | | | | Frontier Financial Corp | | | 12,168 |
| 1,944 | | | | Fulton Financial Corp | | | 30,948 |
| 58 | | | | GB&T Bancshares, Inc | | | 1,262 |
| 293 | | | | Glacier Bancorp, Inc | | | 8,576 |
| 2,806 | | | | Golden West Financial Corp | | | 208,205 |
| 104 | | | | Great Southern Bancorp, Inc | | | 3,175 |
| 543 | | | | Greater Bay Bancorp | | | 15,611 |
| 95 | | | | Greene County Bancshares, Inc | | | 2,941 |
| 294 | | | | Hancock Holding Co | | | 16,464 |
| 384 | | | | Hanmi Financial Corp | | | 7,465 |
| 200 | | | | Harbor Florida Bancshares, Inc | | | 7,428 |
| 288 | | | | Harleysville National Corp | | | 6,108 |
| 158 | | | | Heartland Financial USA, Inc | | | 4,211 |
| 126 | | | | Heritage Commerce Corp | | | 3,124 |
| 112 | | | | Horizon Financial Corp | | | 3,072 |
| 6,417 | | | | Hudson City Bancorp, Inc | | | 85,539 |
| 2,666 | | | | Huntington Bancshares, Inc | | | 62,864 |
| 125 | | | | IBERIABANK Corp | | | 7,193 |
| 100 | | | | Independent Bank Corp | | | 3,247 |
| 239 | | | | Independent Bank Corp | | | 6,286 |
| 711 | | | | IndyMac Bancorp, Inc | | | 32,599 |
| 161 | | | | Integra Bank Corp | | | 3,502 |
| 117 | | | | Interchange Financial Services Corp | | | 2,633 |
| 613 | | | | International Bancshares Corp | | | 16,845 |
| 579 | | * | | Investors Bancorp, Inc | | | 7,845 |
| 771 | | | | Investors Financial Services Corp | | | 34,618 |
| 300 | | | | Irwin Financial Corp | | | 5,817 |
| 42 | | | | ITLA Capital Corp | | | 2,208 |
| 37,801 | | | | JPMorgan Chase & Co | | | 1,587,642 |
| 227 | | | | Kearny Financial Corp | | | 3,360 |
| 4,399 | | | | Keycorp | | | 156,956 |
| 247 | | | | KNBT Bancorp, Inc | | | 4,080 |
| 120 | | | | Lakeland Bancorp, Inc | | | 1,880 |
| 92 | | | | Lakeland Financial Corp | | | 2,235 |
| 828 | | | | M&T Bank Corp | | | 97,638 |
| 120 | | | | Macatawa Bank Corp | | | 2,807 |
| 445 | | | | MAF Bancorp, Inc | | | 19,064 |
| 86 | | | | MainSource Financial Group, Inc | | | 1,499 |
| 2,678 | | | | Marshall & Ilsley Corp | | | 122,492 |
| 233 | | | | MB Financial, Inc | | | 8,239 |
| 200 | | | | MBT Financial Corp | | | 3,200 |
| 4,500 | | | | Mellon Financial Corp | | | 154,935 |
| 57 | | | | Mercantile Bank Corp | | | 2,271 |
| 1,342 | | | | Mercantile Bankshares Corp | | | 47,869 |
| 200 | | | | Mid-State Bancshares | | | 5,600 |
| 85 | | | | Midwest Banc Holdings, Inc | | | 1,891 |
| 186 | | | | Nara Bancorp, Inc | | | 3,488 |
| 100 | | | | NASB Financial, Inc | | | 3,377 |
| 6,212 | | | | National City Corp | | | 224,812 |
| 556 | | | | National Penn Bancshares, Inc | | | 11,042 |
| 374 | | | | NBT Bancorp, Inc | | | 8,688 |
| 523 | | * | | Net 1 UEPS Technologies, Inc | | | 14,304 |
| 505 | | | | NetBank, Inc | | | 3,348 |
| 3,302 | | | | New York Community Bancorp, Inc | | | 54,516 |
| 1,211 | | | | NewAlliance Bancshares, Inc | | | 17,329 |
| 5,062 | | | | North Fork Bancorporation, Inc | | | 152,721 |
60
TIAA-CREF LIFE FUNDS - Stock Index Fund
| | | | | | | |
SHARES
| | | | COMPANY
| | VALUE
|
| | | |
| 88 | | * | | Northern Empire Bancshares | | $ | 2,112 |
| 2,316 | | | | Northern Trust Corp | | | 128,075 |
| 200 | | | | Northwest Bancorp, Inc | | | 5,300 |
| 150 | | | | OceanFirst Financial Corp | | | 3,333 |
| 869 | | | | Old National Bancorp | | | 17,354 |
| 194 | | | | Old Second Bancorp, Inc | | | 6,014 |
| 100 | | | | Omega Financial Corp | | | 3,131 |
| 165 | | | | Oriental Financial Group, Inc | | | 2,105 |
| 528 | | | | Pacific Capital Bancorp | | | 16,431 |
| 165 | | | | Park National Corp | | | 16,304 |
| 531 | | | | Partners Trust Financial Group, Inc | | | 6,059 |
| 90 | | | | Pennfed Financial Services, Inc | | | 1,679 |
| 75 | | | | Peoples Bancorp, Inc | | | 2,238 |
| 615 | | | | People’s Bank | | | 20,203 |
| 210 | | | | PFF Bancorp, Inc | | | 6,964 |
| 200 | | * | | Pinnacle Financial Partners, Inc | | | 6,086 |
| 126 | | | | Placer Sierra Bancshares | | | 2,922 |
| 3,167 | | | | PNC Financial Services Group, Inc | | | 222,228 |
| 3,026 | | | | Popular, Inc | | | 58,099 |
| 100 | | | | Preferred Bank | | | 5,361 |
| 210 | | | | Premierwest Bancorp | | | 3,030 |
| 228 | | | | PrivateBancorp, Inc | | | 9,441 |
| 228 | | | | Prosperity Bancshares, Inc | | | 7,499 |
| 357 | | | | Provident Bankshares Corp | | | 12,991 |
| 854 | | | | Provident Financial Services, Inc | | | 15,329 |
| 421 | | | | Provident New York Bancorp | | | 5,566 |
| 289 | | | | R & G Financial Corp (Class B) | | | 2,483 |
| 4,960 | | | | Regions Financial Corp | | | 164,275 |
| 130 | | | | Renasant Corp | | | 5,246 |
| 691 | | | | Republic Bancorp, Inc | | | 8,561 |
| 115 | | | | Republic Bancorp, Inc (Class A) | | | 2,369 |
| 45 | | | | Royal Bancshares of Pennsylvania (Class A) | | | 1,093 |
| 300 | | | | S&T Bancorp, Inc | | | 9,969 |
| 210 | | | | S.Y. Bancorp, Inc | | | 5,771 |
| 250 | | | | Sandy Spring Bancorp, Inc | | | 9,015 |
| 121 | | | | Santander BanCorp | | | 2,979 |
| 72 | | | | SCBT Financial Corp | | | 2,567 |
| 102 | | | | Seacoast Banking Corp of Florida | | | 2,716 |
| 200 | | | | Security Bank Corp | | | 4,454 |
| 93 | | | | Shore Bancshares, Inc | | | 2,523 |
| 319 | | * | | Signature Bank | | | 10,329 |
| 108 | | | | Simmons First National Corp (Class A) | | | 3,133 |
| 1,107 | | | | Sky Financial Group, Inc | | | 26,136 |
| 200 | | | | Sound Federal Bancorp, Inc | | | 4,158 |
| 800 | | | | South Financial Group, Inc | | | 21,128 |
| 110 | | | | Southside Bancshares, Inc | | | 2,455 |
| 94 | | | | Southwest Bancorp, Inc | | | 2,397 |
| 4,092 | | | | Sovereign Bancorp, Inc | | | 83,109 |
| 113 | | | | State National Bancshares, Inc | | | 4,306 |
| 3,639 | | | | State Street Corp | | | 211,390 |
| 119 | | | | Sterling Bancorp | | | 2,321 |
| 400 | | | | Sterling Bancshares, Inc | | | 7,500 |
| 320 | | | | Sterling Financial Corp | | | 7,008 |
| 364 | | | | Sterling Financial Corp | | | 11,106 |
| 88 | | | | Suffolk Bancorp | | | 2,882 |
| 114 | | | | Summit Bancshares, Inc | | | 2,418 |
| 128 | | * | | Sun Bancorp, Inc | | | 2,079 |
61
TIAA-CREF LIFE FUNDS - Stock Index Fund
| | | | | | | |
SHARES
| | | | COMPANY
| | VALUE
|
| | | |
| 3,956 | | | | SunTrust Banks, Inc | | $ | 301,685 |
| 496 | | | | Susquehanna Bancshares, Inc | | | 11,854 |
| 400 | | * | | SVB Financial Group | | | 18,184 |
| 2,946 | | | | Synovus Financial Corp | | | 78,894 |
| 66 | | | | Taylor Capital Group, Inc | | | 2,693 |
| 1,433 | | | | TCF Financial Corp | | | 37,903 |
| 1,097 | | | | TD Banknorth, Inc | | | 32,307 |
| 300 | | * | | Texas Capital Bancshares, Inc | | | 6,990 |
| 479 | | | | Texas Regional Bancshares, Inc (Class A) | | | 18,164 |
| 100 | | | | Texas United Bancshares, Inc | | | 2,815 |
| 238 | | | | TierOne Corp | | | 8,037 |
| 119 | | | | Tompkins Trustco, Inc | | | 5,117 |
| 92 | | | | Trico Bancshares | | | 2,519 |
| 626 | | | | Trustco Bank Corp NY | | | 6,899 |
| 491 | | | | Trustmark Corp | | | 15,206 |
| 940 | | | | UCBH Holdings, Inc | | | 15,548 |
| 372 | | | | UMB Financial Corp | | | 12,402 |
| 581 | | | | Umpqua Holdings Corp | | | 14,903 |
| 69 | | | | Union Bankshares Corp | | | 2,977 |
| 582 | | | | UnionBanCal Corp | | | 37,591 |
| 437 | | | | United Bankshares, Inc | | | 16,007 |
| 335 | | | | United Community Banks, Inc | | | 10,197 |
| 400 | | | | United Community Financial Corp | | | 4,800 |
| 121 | | | | Univest Corp of Pennsylvania | | | 3,342 |
| 19,364 | | | | US Bancorp | | | 597,960 |
| 126 | | | | USB Holding Co, Inc | | | 2,835 |
| 1,274 | | | | Valley National Bancorp | | | 32,755 |
| 83 | | | | Vineyard National Bancorp | | | 2,233 |
| 115 | | * | | Virginia Commerce Bancorp | | | 2,749 |
| 67 | | | | Virginia Financial Group, Inc | | | 2,829 |
| 1,166 | | | | W Holding Co, Inc | | | 7,754 |
| 17,497 | | | | Wachovia Corp | | | 946,238 |
| 1,039 | | | | Washington Federal, Inc | | | 24,094 |
| 10,451 | | | | Washington Mutual, Inc | | | 476,357 |
| 138 | | | | Washington Trust Bancorp, Inc | | | 3,825 |
| 573 | | | | Webster Financial Corp | | | 27,183 |
| 18,276 | | | | Wells Fargo & Co | | | 1,225,954 |
| 200 | | | | WesBanco, Inc | | | 6,198 |
| 177 | | | | West Bancorporation, Inc | | | 3,305 |
| 200 | | | | West Coast Bancorp | | | 5,894 |
| 390 | | | | Westamerica Bancorporation | | | 19,098 |
| 143 | | * | | Western Alliance Bancorp | | | 4,974 |
| 51 | | | | Westfield Financial, Inc | | | 1,479 |
| 750 | | | | Whitney Holding Corp | | | 26,528 |
| 162 | | | | Willow Grove Bancorp, Inc | | | 2,577 |
| 772 | | | | Wilmington Trust Corp | | | 32,563 |
| 167 | | | | Wilshire Bancorp, Inc | | | 3,009 |
| 248 | | | | Wintrust Financial Corp | | | 12,611 |
| 100 | | | | WSFS Financial Corp | | | 6,145 |
| 54 | | | | Yardville National Bancorp | | | 1,929 |
| 1,154 | | | | Zions Bancorporation | | | 89,943 |
| | | | | | |
|
|
| | | | | TOTAL DEPOSITORY INSTITUTIONS | | 15,765,268 |
| | | | | | |
|
|
| EATING AND DRINKING PLACES - 0.94% | | |
| 208 | | * | | AFC Enterprises | | | 2,652 |
| 859 | | | | Applebees International, Inc | | | 16,510 |
| 1,286 | | | | Aramark Corp (Class B) | | | 42,579 |
62
TIAA-CREF LIFE FUNDS - Stock Index Fund
| | | | | | | |
SHARES
| | | | COMPANY
| | VALUE
|
| | | |
| 113 | | * | | BJ’s Restaurants, Inc | | $ | 2,524 |
| 500 | | | | Bob Evans Farms, Inc | | | 15,005 |
| 937 | | | | Brinker International, Inc | | | 34,013 |
| 72 | | * | | Buffalo Wild Wings, Inc | | | 2,758 |
| 175 | | * | | California Pizza Kitchen, Inc | | | 4,809 |
| 422 | | | | CBRL Group, Inc | | | 14,314 |
| 343 | | * | | CEC Entertainment, Inc | | | 11,017 |
| 80 | | * | | Chipotle Mexican Grill, Inc | | | 4,876 |
| 622 | | | | CKE Restaurants, Inc | | | 10,331 |
| 366 | | * | | Cosi, Inc | | | 2,280 |
| 1,656 | | | | Darden Restaurants, Inc | | | 65,246 |
| 949 | | * | | Denny’s Corp | | | 3,502 |
| 400 | | | | Domino’s Pizza, Inc | | | 9,896 |
| 182 | | | | IHOP Corp | | | 8,751 |
| 339 | | * | | Jack in the Box, Inc | | | 13,289 |
| 587 | | * | | Krispy Kreme Doughnuts, Inc | | | 4,778 |
| 273 | | | | Landry’s Restaurants, Inc | | | 8,859 |
| 176 | | | | Lone Star Steakhouse & Saloon, Inc | | | 4,616 |
| 244 | | * | | Luby’s, Inc | | | 2,545 |
| 127 | | * | | McCormick & Schmick’s Seafood Restaurants, Inc | | | 3,023 |
| 13,557 | | | | McDonald’s Corp | | | 455,515 |
| 300 | | * | | O’Charleys, Inc | | | 5,100 |
| 667 | | | | OSI Restaurant Partners, Inc | | | 23,078 |
| 277 | | * | | PF Chang’s China Bistro, Inc | | | 10,532 |
| 200 | | * | | Papa John’s International, Inc | | | 6,640 |
| 361 | | * | | Rare Hospitality International, Inc | | | 10,382 |
| 150 | | * | | Red Robin Gourmet Burgers, Inc | | | 6,384 |
| 661 | | | | Ruby Tuesday, Inc | | | 16,135 |
| 200 | | * | | Ruth’s Chris Steak House, Inc | | | 4,084 |
| 450 | | * | | Ryan’s Restaurant Group, Inc | | | 5,360 |
| 1,053 | | * | | Sonic Corp | | | 21,892 |
| 8,447 | | * | | Starbucks Corp | | | 318,959 |
| 442 | | * | | Texas Roadhouse, Inc (Class A) | | | 5,976 |
| 844 | | * | | The Cheesecake Factory, Inc | | | 22,746 |
| 400 | | * | | The Steak N Shake Co | | | 6,056 |
| 357 | | * | | Tim Hortons, Inc | | | 9,193 |
| 672 | | | | Triarc Cos (Class B) | | | 10,503 |
| 1,269 | | | | Wendy’s International, Inc | | | 73,970 |
| 2,957 | | | | Yum! Brands, Inc | | | 148,648 |
| | | | | | |
|
|
| | | | | TOTAL EATING AND DRINKING PLACES | | 1,449,326 |
| | | | | | |
|
|
| EDUCATIONAL SERVICES - 0.14% | | |
| 1,527 | | * | | Apollo Group, Inc (Class A) | | | 78,900 |
| 1,136 | | * | | Career Education Corp | | | 33,955 |
| 942 | | * | | Corinthian Colleges, Inc | | | 13,527 |
| 587 | | * | | DeVry, Inc | | | 12,896 |
| 191 | | * | | Educate, Inc | | | 1,463 |
| 490 | | * | | ITT Educational Services, Inc | | | 32,247 |
| 522 | | * | | Laureate Education, Inc | | | 22,253 |
| 168 | | | | Strayer Education, Inc | | | 16,316 |
| 228 | | * | | Universal Technical Institute, Inc | | | 5,021 |
| | | | | | |
|
|
| | | | | TOTAL EDUCATIONAL SERVICES | | 216,578 |
| | | | | | |
|
|
| ELECTRIC, GAS, AND SANITARY SERVICES - 4.07% | | |
| 7,175 | | * | | AES Corp | | | 132,379 |
| 817 | | | | AGL Resources, Inc | | | 31,144 |
| 1,721 | | * | | Allegheny Energy, Inc | | | 63,797 |
63
TIAA-CREF LIFE FUNDS - Stock Index Fund
| | | | | | | |
SHARES
| | | | COMPANY
| | VALUE
|
| | | |
| 338 | | | | Allete, Inc | | $ | 16,004 |
| 1,320 | | | | Alliant Energy Corp | | | 45,276 |
| 2,531 | | * | | Allied Waste Industries, Inc | | | 28,752 |
| 2,171 | | | | Ameren Corp | | | 109,635 |
| 200 | | | | American Ecology Corp | �� | | 5,300 |
| 4,260 | | | | American Electric Power Co, Inc | | | 145,905 |
| 150 | | | | American States Water Co | | | 5,347 |
| 1,501 | | | | Aqua America, Inc | | | 34,208 |
| 3,770 | | * | | Aquila, Inc | | | 15,872 |
| 846 | | | | Atmos Energy Corp | | | 23,612 |
| 600 | | | | Avista Corp | | | 13,698 |
| 446 | | | | Black Hills Corp | | | 15,311 |
| 148 | | | | California Water Service Group | | | 5,290 |
| 100 | | | | Cascade Natural Gas Corp | | | 2,109 |
| 100 | | * | | Casella Waste Systems, Inc (Class A) | | | 1,309 |
| 3,472 | | | | Centerpoint Energy, Inc | | | 43,400 |
| 250 | | | | CH Energy Group, Inc | | | 12,000 |
| 262 | | * | | Clean Harbors, Inc | | | 10,561 |
| 527 | | | | Cleco Corp | | | 12,253 |
| 2,309 | | * | | CMS Energy Corp | | | 29,878 |
| 2,670 | | | | Consolidated Edison, Inc | | | 118,655 |
| 1,978 | | | | Constellation Energy Group, Inc | | | 107,841 |
| 1,225 | | * | | Covanta Holding Corp | | | 21,621 |
| 96 | | | | Crosstex Energy, Inc | | | 9,128 |
| 3,800 | | | | Dominion Resources, Inc | | | 284,202 |
| 1,447 | | | | DPL, Inc | | | 38,780 |
| 1,941 | | | | DTE Energy Co | | | 79,076 |
| 13,500 | | | | Duke Energy Corp | | | 396,495 |
| 900 | | | | Duquesne Light Holdings, Inc | | | 14,796 |
| 3,694 | | * | | Dynegy, Inc (Class A) | | | 20,206 |
| 3,543 | | | | Edison International | | | 138,177 |
| 7,176 | | | | El Paso Corp | | | 107,640 |
| 600 | | * | | El Paso Electric Co | | | 12,096 |
| 239 | | | | Empire District Electric Co | | | 4,911 |
| 818 | | | | Energen Corp | | | 31,419 |
| 1,611 | | | | Energy East Corp | | | 38,551 |
| 57 | | | | EnergySouth, Inc | | | 1,780 |
| 2,263 | | | | Entergy Corp | | | 160,107 |
| 7,271 | | | | Exelon Corp | | | 413,211 |
| 3,589 | | | | FirstEnergy Corp | | | 194,560 |
| 4,346 | | | | FPL Group, Inc | | | 179,837 |
| 791 | | | | Great Plains Energy, Inc | | | 22,037 |
| 966 | | | | Hawaiian Electric Industries, Inc | | | 26,961 |
| 447 | | | | Idacorp, Inc | | | 15,328 |
| 200 | | | | ITC Holdings Corp | | | 5,316 |
| 1,905 | | | | KeySpan Corp | | | 76,962 |
| 1,159 | | | | Kinder Morgan, Inc | | | 115,773 |
| 200 | | | | Laclede Group, Inc | | | 6,872 |
| 110 | | | | Markwest Hydrocarbon, Inc | | | 2,723 |
| 1,306 | | | | MDU Resources Group, Inc | | | 47,813 |
| 282 | | | | Metal Management, Inc | | | 8,635 |
| 287 | | | | MGE Energy, Inc | | | 8,940 |
| 3,262 | | * | | Mirant Corp | | | 87,422 |
| 860 | | | | National Fuel Gas Co | | | 30,220 |
| 300 | | | | New Jersey Resources Corp | | | 14,034 |
| 431 | | | | Nicor, Inc | | | 17,887 |
| 2,968 | | | | NiSource, Inc | | | 64,821 |
64
TIAA-CREF LIFE FUNDS - Stock Index Fund
| | | | | | | |
SHARES
| | | | COMPANY
| | VALUE
|
| | | |
| 1,671 | | | | Northeast Utilities | | $ | 34,540 |
| 333 | | | | Northwest Natural Gas Co | | | 12,331 |
| 379 | | | | NorthWestern Corp | | | 13,019 |
| 1,450 | | * | | NRG Energy, Inc | | | 69,861 |
| 1,104 | | | | NSTAR | | | 31,574 |
| 983 | | | | OGE Energy Corp | | | 34,434 |
| 1,227 | | | | Oneok, Inc | | | 41,767 |
| 100 | | | | Ormat Technologies, Inc | | | 3,815 |
| 300 | | | | Otter Tail Corp | | | 8,199 |
| 3,808 | | | | PG&E Corp | | | 149,578 |
| 426 | | | | Peoples Energy Corp | | | 15,298 |
| 1,997 | | | | Pepco Holdings, Inc | | | 47,089 |
| 61 | | * | | Pico Holdings, Inc | | | 1,967 |
| 942 | | | | Piedmont Natural Gas Co, Inc | | | 22,891 |
| 200 | | * | | Pike Electric Corp | | | 3,852 |
| 1,096 | | | | Pinnacle West Capital Corp | | | 43,741 |
| 515 | | * | | Plug Power, Inc | | | 2,405 |
| 681 | | | | PNM Resources, Inc | | | 16,998 |
| 291 | | | | Portland General Electric Co | | | 7,266 |
| 4,182 | | | | PPL Corp | | | 135,079 |
| 2,786 | | | | Progress Energy, Inc | | | 119,436 |
| 600 | | v* | | Progress Energy, Inc | | | 6 |
| 2,715 | | | | Public Service Enterprise Group, Inc | | | 179,516 |
| 1,370 | | | | Puget Energy, Inc | | | 29,428 |
| 945 | | | | Questar Corp | | | 76,063 |
| 3,326 | | * | | Reliant Energy, Inc | | | 39,845 |
| 1,294 | | | | Republic Services, Inc | | | 52,200 |
| 115 | | | | Resource America, Inc (Class A) | | | 2,191 |
| 1,289 | | | | SCANA Corp | | | 49,730 |
| 2,850 | | | | Sempra Energy | | | 129,618 |
| 2,073 | | * | | Sierra Pacific Resources | | | 29,022 |
| 138 | | | | SJW Corp | | | 3,512 |
| 260 | | | | South Jersey Industries, Inc | | | 7,121 |
| 8,071 | | | | Southern Co | | | 258,676 |
| 1,008 | | | | Southern Union Co | | | 27,276 |
| 398 | | | | Southwest Gas Corp | | | 12,473 |
| 129 | | | | Southwest Water Co | | | 1,544 |
| 469 | | * | | Stericycle, Inc | | | 30,532 |
| 671 | | | | Synagro Technologies, Inc | | | 2,637 |
| 2,190 | | | | TECO Energy, Inc | | | 32,719 |
| 5,001 | | | | TXU Corp | | | 299,010 |
| 1,162 | | | | UGI Corp | | | 28,608 |
| 154 | | | | UIL Holdings Corp | | | 8,669 |
| 365 | | | | Unisource Energy Corp | | | 11,370 |
| 807 | | | | Vectren Corp | | | 21,991 |
| 483 | | * | | Waste Connections, Inc | | | 17,581 |
| 229 | | * | | Waste Services, Inc | | | 2,059 |
| 1,015 | | | | Westar Energy, Inc | | | 21,366 |
| 688 | | | | Western Gas Resources, Inc | | | 41,177 |
| 514 | | | | WGL Holdings, Inc | | | 14,880 |
| 6,475 | | | | Williams Cos, Inc | | | 151,256 |
| 1,298 | | | | Wisconsin Energy Corp | | | 52,309 |
| 500 | | | | WPS Resources Corp | | | 24,800 |
| 4,413 | | | | Xcel Energy, Inc | | | 84,641 |
| | | | | | |
|
|
| | | | | TOTAL ELECTRIC, GAS, AND SANITARY SERVICES | | 6,286,839 |
| | | | | | |
|
|
65
TIAA-CREF LIFE FUNDS - Stock Index Fund
| | | | | | | |
SHARES
| | | | COMPANY
| | VALUE
|
| |
| ELECTRONIC AND OTHER ELECTRIC EQUIPMENT - 5.93% | | |
| 200 | | * | | Actel Corp | | $ | 2,870 |
| 580 | | | | Acuity Brands, Inc | | | 22,568 |
| 900 | | * | | Adaptec, Inc | | | 3,906 |
| 1,296 | | * | | ADC Telecommunications, Inc | | | 21,851 |
| 743 | | | | Adtran, Inc | | | 16,665 |
| 395 | | * | | Advanced Analogic Technologies, Inc | | | 4,140 |
| 218 | | * | | Advanced Energy Industries, Inc | | | 2,886 |
| 5,205 | | * | | Advanced Micro Devices, Inc | | | 127,106 |
| 950 | | * | | Aeroflex, Inc | | | 11,087 |
| 1,910 | | * | | Agere Systems, Inc | | | 28,077 |
| 4,035 | | * | | Altera Corp | | | 70,814 |
| 1,773 | | | | American Power Conversion Corp | | | 34,556 |
| 259 | | * | | American Superconductor Corp | | | 2,287 |
| 800 | | | | Ametek, Inc | | | 37,904 |
| 632 | | * | | AMIS Holdings, Inc | | | 6,320 |
| 1,105 | | * | | Amkor Technology, Inc | | | 10,453 |
| 974 | | | | Amphenol Corp (Class A) | | | 54,505 |
| 523 | | * | | Anadigics, Inc | | | 3,515 |
| 3,927 | | | | Analog Devices, Inc | | | 126,214 |
| 1,708 | | * | | Andrew Corp | | | 15,133 |
| 3,565 | | * | | Applied Micro Circuits Corp | | | 9,732 |
| 1,300 | | * | | Arris Group, Inc | | | 17,056 |
| 567 | | * | | Atheros Communications, Inc | | | 10,750 |
| 4,854 | | * | | Atmel Corp | | | 26,940 |
| 395 | | * | | ATMI, Inc | | | 9,725 |
| 1,823 | | * | | Avanex Corp | | | 3,208 |
| 1,587 | | * | | Avnet, Inc | | | 31,772 |
| 484 | | | | AVX Corp | | | 7,642 |
| 353 | | | | Baldor Electric Co | | | 11,045 |
| 100 | | | | Bel Fuse, Inc (Class B) | | | 3,281 |
| 750 | | * | | Benchmark Electronics, Inc | | | 18,090 |
| 4,940 | | * | | Broadcom Corp (Class A) | | | 148,447 |
| 912 | | * | | Broadwing Corp | | | 9,439 |
| 3,295 | | * | | Brocade Communications Systems, Inc | | | 20,231 |
| 1,141 | | * | | Capstone Turbine Corp | | | 2,601 |
| 300 | | * | | C-COR, Inc | | | 2,316 |
| 266 | | * | | Ceradyne, Inc | | | 13,164 |
| 500 | | * | | Checkpoint Systems, Inc | | | 11,105 |
| 302 | | * | | China BAK Battery, Inc | | | 2,570 |
| 5,973 | | * | | Ciena Corp | | | 28,730 |
| 66,567 | | * | | Cisco Systems, Inc | | | 1,300,053 |
| 200 | | * | | Color Kinetics, Inc | | | 3,782 |
| 330 | | * | | Comtech Telecommunications Corp | | | 9,659 |
| 2,113 | | * | | Comverse Technology, Inc | | | 41,774 |
| 5,030 | | * | | Conexant Systems, Inc | | | 12,575 |
| 884 | | * | | Cree, Inc | | | 21,004 |
| 300 | | | | CTS Corp | | | 4,467 |
| 300 | | | | Cubic Corp | | | 5,883 |
| 1,519 | | * | | Cypress Semiconductor Corp | | | 22,086 |
| 179 | | * | | Diodes, Inc | | | 7,418 |
| 273 | | * | | Ditech Networks, Inc | | | 2,381 |
| 300 | | * | | Dolby Laboratories, Inc (Class A) | | | 6,990 |
| 289 | | * | | DSP Group, Inc | | | 7,182 |
| 179 | | * | | DTS, Inc | | | 3,487 |
| 300 | | * | | Electro Scientific Industries, Inc | | | 5,397 |
| 700 | | * | | Emcore Corp | | | 6,720 |
| 4,466 | | | | Emerson Electric Co | | | 374,295 |
66
TIAA-CREF LIFE FUNDS - Stock Index Fund
| | | | | | | |
SHARES
| | | | COMPANY
| | VALUE
|
| | | |
| 161 | | * | | EMS Technologies, Inc | | $ | 2,893 |
| 695 | | * | | Energizer Holdings, Inc | | | 40,706 |
| 426 | | * | | Energy Conversion Devices, Inc | | | 15,519 |
| 481 | | * | | EnerSys | | | 10,053 |
| 723 | | * | | Evergreen Solar, Inc | | | 9,385 |
| 520 | | * | | Exar Corp | | | 6,900 |
| 1,414 | | * | | Fairchild Semiconductor International, Inc | | | 25,692 |
| 2,640 | | * | | Finisar Corp | | | 8,633 |
| 234 | | | | Franklin Electric Co, Inc | | | 12,084 |
| 4,343 | | * | | Freescale Semiconductor, Inc (Class B) | | | 127,684 |
| 600 | | * | | FuelCell Energy, Inc | | | 5,748 |
| 3,003 | | * | | Gemstar-TV Guide International, Inc | | | 10,571 |
| 254 | | * | | Genlyte Group, Inc | | | 18,397 |
| 1,200 | | * | | GrafTech International Ltd | | | 6,960 |
| 269 | | * | | Greatbatch, Inc | | | 6,348 |
| 711 | | | | Harman International Industries, Inc | | | 60,698 |
| 1,008 | | * | | Harmonic, Inc | | | 4,516 |
| 1,502 | | | | Harris Corp | | | 62,348 |
| 1,016 | | * | | Hexcel Corp | | | 15,961 |
| 140 | | * | | Hittite Microwave Corp | | | 5,062 |
| 9,017 | | | | Honeywell International, Inc | | | 363,385 |
| 378 | | * | | Hutchinson Technology, Inc | | | 8,176 |
| 225 | | * | | Ikanos Communications, Inc | | | 3,418 |
| 400 | | | | Imation Corp | | | 16,420 |
| 2,142 | | * | | Integrated Device Technology, Inc | | | 30,374 |
| 63,285 | | | | Intel Corp | | | 1,199,251 |
| 600 | | * | | Interdigital Communications Corp | | | 20,946 |
| 938 | | * | | International DisplayWorks, Inc | | | 4,878 |
| 735 | | * | | International Rectifier Corp | | | 28,724 |
| 1,618 | | | | Intersil Corp (Class A) | | | 37,618 |
| 200 | | | | Inter-Tel, Inc | | | 4,212 |
| 359 | | * | | InterVoice, Inc | | | 2,556 |
| 122 | | * | | iRobot Corp | | | 3,035 |
| 257 | | * | | IXYS Corp | | | 2,467 |
| 17,782 | | * | | JDS Uniphase Corp | | | 44,988 |
| 789 | | * | | Kemet Corp | | | 7,275 |
| 1,326 | | | | L-3 Communications Holdings, Inc | | | 100,007 |
| 151 | | * | | Lamson & Sessions Co | | | 4,282 |
| 1,300 | | * | | Lattice Semiconductor Corp | | | 8,034 |
| 462 | | | | Lincoln Electric Holdings, Inc | | | 28,944 |
| 3,317 | | | | Linear Technology Corp | | | 111,086 |
| 200 | | * | | Littelfuse, Inc | | | 6,876 |
| 124 | | * | | Loral Space & Communications, Inc | | | 3,517 |
| 131 | | | | LSI Industries, Inc | | | 2,226 |
| 4,112 | | * | | LSI Logic Corp | | | 36,802 |
| 47,829 | | * | | Lucent Technologies, Inc | | | 115,746 |
| 593 | | * | | Mattson Technology, Inc | | | 5,794 |
| 3,489 | | | | Maxim Integrated Products, Inc | | | 112,032 |
| 158 | | * | | Maxwell Technologies, Inc | | | 3,102 |
| 1,745 | | * | | McData Corp (Class A) | | | 7,120 |
| 169 | | * | | Medis Technologies Ltd | | | 3,427 |
| 1,564 | | * | | MEMC Electronic Materials, Inc | | | 58,650 |
| 223 | | * | | Mercury Computer Systems, Inc | | | 3,432 |
| 300 | | | | Methode Electronics, Inc | | | 3,153 |
| 64 | | * | | Metrologic Instruments, Inc | | | 961 |
| 797 | | * | | Micrel, Inc | | | 7,978 |
| 2,332 | | | | Microchip Technology, Inc | | | 78,239 |
67
TIAA-CREF LIFE FUNDS - Stock Index Fund
| | | | | | | |
SHARES
| | | | COMPANY
| | VALUE
|
| | | |
| 7,893 | | * | | Micron Technology, Inc | | $ | 118,869 |
| 771 | | * | | Microsemi Corp | | | 18,797 |
| 1,000 | | * | | Microtune, Inc | | | 6,260 |
| 1,196 | | * | | Mindspeed Technologies, Inc | | | 2,882 |
| 436 | | * | | MIPS Technologies, Inc | | | 2,647 |
| 500 | | * | | Mobility Electronics, Inc | | | 3,630 |
| 1,511 | | | | Molex, Inc | | | 50,724 |
| 300 | | * | | Monolithic Power Systems, Inc | | | 3,549 |
| 360 | | * | | Moog, Inc | | | 12,319 |
| 26,929 | | | | Motorola, Inc | | | 542,619 |
| 1,945 | | * | | MRV Communications, Inc | | | 6,049 |
| 160 | | * | | Multi-Fineline Electronix, Inc | | | 5,310 |
| 43 | | | | National Presto Industries, Inc | | | 2,248 |
| 3,736 | | | | National Semiconductor Corp | | | 89,104 |
| 200 | | * | | Netlogic Microsystems, Inc | | | 6,450 |
| 4,073 | | * | | Network Appliance, Inc | | | 143,777 |
| 1,397 | | * | | Novellus Systems, Inc | | | 34,506 |
| 3,732 | | * | | Nvidia Corp | | | 79,454 |
| 634 | | * | | Omnivision Technologies, Inc | | | 13,390 |
| 1,689 | | * | | ON Semiconductor Corp | | | 9,931 |
| 1,027 | | * | | Openwave Systems, Inc | | | 11,852 |
| 123 | | * | | Oplink Communications Inc | | | 2,252 |
| 136 | | * | | OSI Systems, Inc | | | 2,417 |
| 157 | | | | Park Electrochemical Corp | | | 4,043 |
| 200 | | * | | Pericom Semiconductor Corp | | | 1,660 |
| 500 | | * | | Photronics, Inc | | | 7,400 |
| 472 | | | | Plantronics, Inc | | | 10,483 |
| 600 | | * | | Plexus Corp | | | 20,526 |
| 410 | | * | | PLX Technology, Inc | | | 5,010 |
| 2,300 | | * | | PMC - Sierra, Inc | | | 21,620 |
| 1,022 | | * | | Polycom, Inc | | | 22,402 |
| 159 | | * | | Portalplayer, Inc | | | 1,560 |
| 61 | | * | | Powell Industries, Inc | | | 1,460 |
| 270 | | * | | Power Integrations, Inc | | | 4,720 |
| 1,100 | | * | | Power-One, Inc | | | 7,260 |
| 1,294 | | * | | Powerwave Technologies, Inc | | | 11,801 |
| 1,796 | | * | | QLogic Corp | | | 30,963 |
| 18,235 | | | | Qualcomm, Inc | | | 730,676 |
| 1,173 | | * | | Quantum Fuel Systems Technologies Worldwide, Inc | | | 3,988 |
| 1,547 | | | | RadioShack Corp | | | 21,658 |
| 192 | | * | | Radyne Corp | | | 2,185 |
| 1,097 | | * | | Rambus, Inc | | | 25,023 |
| 138 | | | | Raven Industries, Inc | | | 4,347 |
| 300 | | | | Regal-Beloit Corp | | | 13,245 |
| 1,976 | | * | | RF Micro Devices, Inc | | | 11,797 |
| 1,860 | | | | Rockwell Collins, Inc | | | 103,918 |
| 200 | | * | | Rogers Corp | | | 11,268 |
| 5,316 | | * | | Sanmina-SCI Corp | | | 24,454 |
| 733 | | * | | Semtech Corp | | | 10,592 |
| 1,131 | | * | | Silicon Image, Inc | | | 12,192 |
| 502 | | * | | Silicon Laboratories, Inc | | | 17,645 |
| 1,350 | | * | | Silicon Storage Technology, Inc | | | 5,481 |
| 271 | | * | | Sirenza Microdevices, Inc | | | 3,290 |
| 15,195 | | * | | Sirius Satellite Radio, Inc | | | 72,176 |
| 1,872 | | * | | Skyworks Solutions, Inc | | | 10,315 |
| 350 | | * | | Spansion, Inc | | | 5,579 |
| 456 | | * | | Spectrum Brands, Inc | | | 5,892 |
68
TIAA-CREF LIFE FUNDS - Stock Index Fund
| | | | | | | |
SHARES
| | | | COMPANY
| | VALUE
|
| | | |
| 300 | | * | | Standard Microsystems Corp | | $ | 6,549 |
| 1,040 | | * | | Stratex Networks, Inc | | | 3,526 |
| 100 | | * | | Sunpower Corp | | | 2,802 |
| 100 | | * | | Supertex, Inc | | | 3,994 |
| 1,936 | | * | | Sycamore Networks, Inc | | | 7,860 |
| 396 | | * | | Symmetricom, Inc | | | 2,800 |
| 172 | | * | | Synaptics, Inc | | | 3,681 |
| 500 | | | | Technitrol, Inc | | | 11,575 |
| 595 | | * | | Tekelec | | | 7,348 |
| 437 | | | | Teleflex, Inc | | | 23,607 |
| 5,056 | | * | | Tellabs, Inc | | | 67,295 |
| 466 | | * | | Tessera Technologies, Inc | | | 12,815 |
| 17,000 | | | | Texas Instruments, Inc | | | 514,930 |
| 679 | | * | | Thomas & Betts Corp | | | 34,833 |
| 2,162 | | * | | Transmeta Corp | | | 3,502 |
| 1,105 | | * | | Transwitch Corp | | | 2,332 |
| 598 | | * | | Trident Microsystems, Inc | | | 11,350 |
| 1,402 | | * | | Triquint Semiconductor, Inc | | | 6,253 |
| 433 | | * | | TTM Technologies, Inc | | | 6,266 |
| 100 | | * | | Ulticom, Inc | | | 1,047 |
| 100 | | * | | Universal Display Corp | | | 1,331 |
| 100 | | * | | Universal Electronics, Inc | | | 1,771 |
| 1,002 | | * | | Utstarcom, Inc | | | 7,806 |
| 627 | | * | | Varian Semiconductor Equipment Associates, Inc | | | 20,446 |
| 219 | | * | | Viasat, Inc | | | 5,624 |
| 200 | | | | Vicor Corp | | | 3,314 |
| 300 | | * | | Virage Logic Corp | | | 2,817 |
| 1,793 | | * | | Vishay Intertechnology, Inc | | | 28,204 |
| 159 | | * | | Volterra Semiconductor Corp | | | 2,426 |
| 755 | | | | Whirlpool Corp | | | 62,401 |
| 3,857 | | | | Xilinx, Inc | | | 87,361 |
| 255 | | * | | Zhone Technologies, Inc | | | 520 |
| 200 | | * | | Zoltek Cos, Inc | | | 5,978 |
| 532 | | * | | Zoran Corp | | | 12,949 |
| | | | | | |
|
|
| | | | | TOTAL ELECTRONIC AND OTHER ELECTRIC EQUIPMENT | | 9,154,121 |
| | | | | | |
|
|
| ENGINEERING AND MANAGEMENT SERVICES - 0.81% | | |
| 188 | | * | | Advisory Board Co | | | 9,041 |
| 1,300 | | * | | Amylin Pharmaceuticals, Inc | | | 64,181 |
| 758 | | * | | Applera Corp (Celera Genomics Group) | | | 9,816 |
| 556 | | * | | Ariad Pharmaceuticals, Inc | | | 2,508 |
| 100 | | | | CDI Corp | | | 2,900 |
| 3,779 | | * | | Celgene Corp | | | 179,238 |
| 436 | | | | Corporate Executive Board Co | | | 43,687 |
| 167 | | * | | CRA International, Inc | | | 7,538 |
| 500 | | * | | CV Therapeutics, Inc | | | 6,985 |
| 728 | | * | | deCODE genetics, Inc | | | 4,506 |
| 300 | | * | | DiamondCluster International, Inc | | | 2,376 |
| 938 | | * | | Digitas, Inc | | | 10,900 |
| 188 | | * | | Diversa Corp | | | 1,816 |
| 723 | | * | | eResearch Technology, Inc | | | 6,579 |
| 180 | | * | | Essex Corp | | | 3,316 |
| 753 | | * | | Exelixis, Inc | | | 7,568 |
| 172 | | * | | Exponent, Inc | | | 2,907 |
| 953 | | | | Fluor Corp | | | 88,562 |
| 594 | | * | | Gen-Probe, Inc | | | 32,064 |
| 340 | | * | | Harris Interactive, Inc | | | 1,938 |
69
TIAA-CREF LIFE FUNDS - Stock Index Fund
| | | | | | | |
SHARES
| | | | COMPANY
| | VALUE
|
| | | |
| 577 | | * | | Hewitt Associates, Inc | | $ | 12,971 |
| 188 | | * | | Huron Consulting Group, Inc | | | 6,597 |
| 678 | | * | | ICOS Corp | | | 14,909 |
| 755 | | * | | Incyte Corp | | | 3,473 |
| 200 | | * | | Infrasource Services, Inc | | | 3,642 |
| 780 | | * | | Isis Pharmaceuticals, Inc | | | 4,719 |
| 637 | | * | | Jacobs Engineering Group, Inc | | | 50,731 |
| 135 | | * | | Kendle International, Inc | | | 4,958 |
| 230 | | * | | Keryx Biopharmaceuticals, Inc | | | 3,266 |
| 84 | | | | Landauer, Inc | | | 4,024 |
| 139 | | * | | LECG Corp | | | 2,567 |
| 673 | | * | | Lexicon Genetics, Inc | | | 2,954 |
| 302 | | * | | Lifecell Corp | | | 9,338 |
| 348 | | * | | Luminex Corp | | | 6,052 |
| 241 | | | | MAXIMUS, Inc | | | 5,579 |
| 317 | | * | | Maxygen, Inc | | | 2,371 |
| 1,275 | | * | | Monogram Biosciences, Inc | | | 2,525 |
| 2,673 | | | | Moody’s Corp | | | 145,572 |
| 60 | | * | | MTC Technologies, Inc | | | 1,418 |
| 364 | | * | | Myriad Genetics, Inc | | | 9,191 |
| 440 | | * | | Navigant Consulting, Inc | | | 9,966 |
| 292 | | * | | Omnicell, Inc | | | 4,035 |
| 3,708 | | | | Paychex, Inc | | | 144,538 |
| 367 | | * | | Per-Se Technologies, Inc | | | 9,241 |
| 1,098 | | | | Pharmaceutical Product Development, Inc | | | 38,562 |
| 1,722 | | | | Quest Diagnostics, Inc | | | 103,182 |
| 560 | | * | | Regeneron Pharmaceuticals, Inc | | | 7,179 |
| 1,490 | | * | | Rentech, Inc | | | 6,928 |
| 514 | | * | | Resources Connection, Inc | | | 12,860 |
| 207 | | * | | Rigel Pharmaceuticals, Inc | | | 2,014 |
| 642 | | * | | Savient Pharmaceuticals, Inc | | | 3,371 |
| 219 | | * | | Senomyx, Inc | | | 3,160 |
| 282 | | * | | SFBC International, Inc | | | 4,275 |
| 821 | | * | | Shaw Group, Inc | | | 22,824 |
| 160 | | * | | Sourcecorp | | | 3,966 |
| 299 | | * | | Symyx Technologies, Inc | | | 7,221 |
| 100 | | * | | Tejon Ranch Co | | | 4,116 |
| 510 | | * | | Telik, Inc | | | 8,415 |
| 677 | | * | | Tetra Tech, Inc | | | 12,010 |
| 148 | | * | | Trimeris, Inc | | | 1,701 |
| 556 | | * | | URS Corp | | | 23,352 |
| 316 | | | | Washington Group International, Inc | | | 16,855 |
| 512 | | | | Watson Wyatt & Co Holdings | | | 17,992 |
| | | | | | |
|
|
| | | | | TOTAL ENGINEERING AND MANAGEMENT SERVICES | | 1,253,046 |
| | | | | | |
|
|
| ENVIRONMENTAL QUALITY AND HOUSING - 0.00% ** | | |
| 406 | | * | | Home Solutions of America, Inc | | | 2,505 |
| | | | | | |
|
|
| | | | | TOTAL ENVIRONMENTAL QUALITY AND HOUSING | | 2,505 |
| | | | | | |
|
|
| FABRICATED METAL PRODUCTS - 0.41% | | |
| 383 | | * | | Alliant Techsystems, Inc | | | 29,242 |
| 84 | | | | Ameron International Corp | | | 5,630 |
| 389 | | | | Aptargroup, Inc | | | 19,298 |
| 1,163 | | | | Ball Corp | | | 43,078 |
| 170 | | | | CIRCOR International, Inc | | | 5,183 |
| 1,236 | | | | Commercial Metals Co | | | 31,765 |
| 132 | | * | | Commercial Vehicle Group, Inc | | | 2,730 |
70
TIAA-CREF LIFE FUNDS - Stock Index Fund
| | | | | | | |
SHARES
| | | | COMPANY
| | VALUE
|
| | | |
| 593 | | | | Crane Co | | $ | 24,669 |
| 1,891 | | * | | Crown Holdings, Inc | | | 29,443 |
| 110 | | | | Dynamic Materials Corp | | | 3,710 |
| 420 | | * | | Griffon Corp | | | 10,962 |
| 190 | | | | Gulf Island Fabrication, Inc | | | 3,808 |
| 5,433 | | | | Illinois Tool Works, Inc | | | 258,067 |
| 155 | | | | Insteel Industries, Inc | | | 3,751 |
| 792 | | * | | Jacuzzi Brands, Inc | | | 6,970 |
| 153 | | * | | Ladish Co, Inc | | | 5,733 |
| 100 | | | | Lifetime Brands, Inc | | | 2,167 |
| 400 | | * | | Mobile Mini, Inc | | | 11,704 |
| 277 | | * | | Mueller Water Products, Inc | | | 4,823 |
| 260 | | * | | NCI Building Systems, Inc | | | 13,824 |
| 1,126 | | | | Pentair, Inc | | | 38,498 |
| 200 | | | | Silgan Holdings, Inc | | | 7,402 |
| 400 | | | | Simpson Manufacturing Co, Inc | | | 14,420 |
| 314 | | * | | Smith & Wesson Holding Corp | | | 2,581 |
| 657 | | | | Snap-On, Inc | | | 26,556 |
| 812 | | * | | Taser International, Inc | | | 6,423 |
| 154 | | | | Valmont Industries, Inc | | | 7,159 |
| 255 | | | | Watts Water Technologies, Inc (Class A) | | | 8,555 |
| | | | | | |
|
|
| | | | | TOTAL FABRICATED METAL PRODUCTS | | 628,151 |
| | | | | | |
|
|
| FOOD AND KINDRED PRODUCTS - 2.95% | | |
| 8,408 | | | | Anheuser-Busch Cos, Inc | | | 383,321 |
| 7,144 | | | | Archer Daniels Midland Co | | | 294,904 |
| 100 | | * | | Boston Beer Co, Inc (Class A) | | | 2,929 |
| 274 | | * | | Burger King Holdings, Inc | | | 4,316 |
| 2,539 | | | | Campbell Soup Co | | | 94,222 |
| 77 | | | | Coca-Cola Bottling Co Consolidated | | | 3,909 |
| 22,170 | | | | Coca-Cola Co | | | 953,753 |
| 3,384 | | | | Coca-Cola Enterprises, Inc | | | 68,932 |
| 5,649 | | | | ConAgra Foods, Inc | | | 124,899 |
| 2,194 | | * | | Constellation Brands, Inc (Class A) | | | 54,850 |
| 918 | | | | Corn Products International, Inc | | | 28,091 |
| 588 | | * | | Darling International, Inc | | | 2,664 |
| 2,062 | | | | Del Monte Foods Co | | | 23,156 |
| 169 | | | | Diamond Foods, Inc | | | 2,716 |
| 200 | | | | Farmer Bros Co | | | 4,336 |
| 635 | | | | Flowers Foods, Inc | | | 18,186 |
| 3,694 | | | | General Mills, Inc | | | 190,832 |
| 546 | | * | | Gold Kist, Inc | | | 7,300 |
| 3,646 | | | | H.J. Heinz Co | | | 150,288 |
| 180 | | * | | Hansen Natural Corp | | | 34,267 |
| 1,936 | | | | Hershey Co | | | 106,616 |
| 858 | | | | Hormel Foods Corp | | | 31,866 |
| 125 | | | | Imperial Sugar Co | | | 2,965 |
| 192 | | | | J&J Snack Foods Corp | | | 6,349 |
| 633 | | | | J.M. Smucker Co | | | 28,295 |
| 236 | | * | | Jones Soda Co | | | 2,124 |
| 2,687 | | | | Kellogg Co | | | 130,131 |
| 2,294 | | | | Kraft Foods, Inc (Class A) | | | 70,885 |
| 317 | | | | Lancaster Colony Corp | | | 12,512 |
| 400 | | | | Lance, Inc | | | 9,208 |
| 107 | | * | | M&F Worldwide Corp | | | 1,723 |
| 1,442 | | | | McCormick & Co, Inc | | | 48,379 |
| 101 | | | | MGP Ingredients, Inc | | | 2,345 |
71
TIAA-CREF LIFE FUNDS - Stock Index Fund
| | | | | | | |
SHARES
| | | | COMPANY
| | VALUE
|
| | | |
| 492 | | | | Molson Coors Brewing Co (Class B) | | $ | 33,397 |
| 149 | | * | | Peet’s Coffee & Tea, Inc | | | 4,498 |
| 1,476 | | | | Pepsi Bottling Group, Inc | | | 47,453 |
| 735 | | | | PepsiAmericas, Inc | | | 16,251 |
| 17,978 | | | | PepsiCo, Inc | | | 1,079,399 |
| 375 | | * | | Ralcorp Holdings, Inc | | | 15,949 |
| 110 | | | | Reddy Ice Holdings, Inc | | | 2,239 |
| 958 | | | | Reynolds American, Inc | | | 110,457 |
| 189 | | | | Sanderson Farms, Inc | | | 5,290 |
| 8,274 | | | | Sara Lee Corp | | | 132,549 |
| 1,076 | | * | | Smithfield Foods, Inc | | | 31,021 |
| 338 | | | | Tootsie Roll Industries, Inc | | | 9,846 |
| 300 | | | | Topps Co, Inc | | | 2,466 |
| 323 | | * | | TreeHouse Foods, Inc | | | 7,716 |
| 2,559 | | | | Tyson Foods, Inc (Class A) | | | 38,027 |
| 2,452 | | | | Wrigley (Wm.) Jr Co | | | 111,223 |
| | | | | | |
|
|
| | | | | TOTAL FOOD AND KINDRED PRODUCTS | | 4,549,050 |
| | | | | | |
|
|
| FOOD STORES - 0.27% | | |
| 15 | | | | Arden Group, Inc (Class A) | | | 1,698 |
| 174 | | | | Great Atlantic & Pacific Tea Co, Inc | | | 3,953 |
| 100 | | | | Ingles Markets, Inc (Class A) | | | 1,700 |
| 7,863 | | | | Kroger Co | | | 171,885 |
| 327 | | * | | Panera Bread Co (Class A) | | | 21,987 |
| 248 | | * | | Pantry, Inc | | | 14,270 |
| 545 | | * | | Pathmark Stores, Inc | | | 5,128 |
| 431 | | | | Ruddick Corp | | | 10,564 |
| 2,236 | | | | Supervalu, Inc | | | 68,645 |
| 188 | | | | Weis Markets, Inc | | | 7,746 |
| 1,532 | | | | Whole Foods Market, Inc | | | 99,028 |
| 261 | | * | | Wild Oats Markets, Inc | | | 5,116 |
| | | | | | |
|
|
| | | | | TOTAL FOOD STORES | | 411,720 |
| | | | | | |
|
|
| FORESTRY - 0.13% | | |
| 834 | | | | Rayonier, Inc | | | 31,617 |
| 2,666 | | | | Weyerhaeuser Co | | | 165,958 |
| | | | | | |
|
|
| | | | | TOTAL FORESTRY | | 197,575 |
| | | | | | |
|
|
| FURNITURE AND FIXTURES - 0.34% | | |
| 761 | | * | | BE Aerospace, Inc | | | 17,396 |
| 369 | | | | Ethan Allen Interiors, Inc | | | 13,487 |
| 642 | | | | Furniture Brands International, Inc | | | 13,379 |
| 800 | | | | Herman Miller, Inc | | | 20,616 |
| 668 | | | | Hillenbrand Industries, Inc | | | 32,398 |
| 572 | | | | HNI Corp | | | 25,940 |
| 64 | | | | Hooker Furniture Corp | | | 1,073 |
| 400 | | * | | Interface, Inc (Class A) | | | 4,580 |
| 2,097 | | | | Johnson Controls, Inc | | | 172,415 |
| 300 | | | | Kimball International, Inc (Class B) | | | 5,913 |
| 500 | | | | La-Z-Boy, Inc | | | 7,000 |
| 1,986 | | | | Leggett & Platt, Inc | | | 49,610 |
| 4,322 | | | | Masco Corp | | | 128,104 |
| 220 | | | | Sealy Corp | | | 2,919 |
| 580 | | * | | Select Comfort Corp | | | 13,323 |
| 94 | | | | Stanley Furniture Co, Inc | | | 2,253 |
| 455 | | * | | Tempur-Pedic International, Inc | | | 6,147 |
| 322 | | * | | Williams Scotsman International, Inc | | | 7,032 |
| | | | | | |
|
|
| | | | | TOTAL FURNITURE AND FIXTURES | | 523,585 |
| | | | | | |
|
|
72
TIAA-CREF LIFE FUNDS - Stock Index Fund
| | | | | | | | |
SHARES
| | | | COMPANY
| | VALUE
| |
| |
| FURNITURE AND HOMEFURNISHINGS STORES - 0.36% | | | |
| 3,069 | | * | | Bed Bath & Beyond, Inc | | $ | 101,799 | |
| 4,377 | | | | Best Buy Co, Inc | | | 240,035 | |
| 1,868 | | | | Circuit City Stores, Inc | | | 50,847 | |
| 227 | | * | | Cost Plus, Inc | | | 3,328 | |
| 713 | | * | | GameStop Corp | | | 29,946 | |
| 259 | | * | | Guitar Center, Inc | | | 11,518 | |
| 166 | | | | Haverty Furniture Cos, Inc | | | 2,604 | |
| 364 | | | | Knoll, Inc | | | 6,683 | |
| 573 | | * | | Mohawk Industries, Inc | | | 40,310 | |
| 1,075 | | | | Pier 1 Imports, Inc | | | 7,503 | |
| 164 | | * | | Restoration Hardware, Inc | | | 1,178 | |
| 838 | | | | Steelcase, Inc (Class A) | | | 13,785 | |
| 228 | | | | Tuesday Morning Corp | | | 2,998 | |
| 1,054 | | | | Williams-Sonoma, Inc | | | 35,889 | |
| | | | | | |
|
|
|
| | | | | TOTAL FURNITURE AND HOMEFURNISHINGS STORES | | 548,423 | |
| | | | | | |
|
|
|
| GENERAL BUILDING CONTRACTORS - 0.36% | | | |
| 39 | | * | | Avatar Holdings, Inc | | | 2,222 | |
| 477 | | | | Beazer Homes USA, Inc | | | 21,880 | |
| 139 | | | | Brookfield Homes Corp | | | 4,580 | |
| 70 | | * | | Cavco Industries, Inc | | | 3,111 | |
| 1,320 | | | | Centex Corp | | | 66,396 | |
| 3,307 | | | | DR Horton, Inc | | | 78,773 | |
| 539 | | * | | Hovnanian Enterprises, Inc (Class A) | | | 16,213 | |
| 857 | | | | KB Home | | | 39,293 | |
| 1,482 | | | | Lennar Corp (Class A) | | | 65,756 | |
| 279 | | | | Levitt Corp (Class A) | | | 4,464 | |
| 111 | | | | M/I Homes, Inc | | | 3,894 | |
| 200 | | v* | | Mascotech (Escrow) | | | (0 | ) |
| 170 | | | | McGrath RentCorp | | | 4,728 | |
| 338 | | | | MDC Holdings, Inc | | | 17,552 | |
| 264 | | * | | Meritage Homes Corp | | | 12,474 | |
| 51 | | * | | NVR, Inc | | | 25,054 | |
| 100 | | * | | Palm Harbor Homes, Inc | | | 1,759 | |
| 173 | | * | | Perini Corp | | | 3,893 | |
| 2,340 | | | | Pulte Homes, Inc | | | 67,369 | |
| 506 | | | | Ryland Group, Inc | | | 22,046 | |
| 670 | | | | Standard-Pacific Corp | | | 17,219 | |
| 155 | | | | Technical Olympic USA, Inc | | | 2,226 | |
| 1,348 | | * | | Toll Brothers, Inc | | | 34,468 | |
| 473 | | | | Walter Industries, Inc | | | 27,268 | |
| 402 | | * | | WCI Communities, Inc | | | 8,096 | |
| | | | | | |
|
|
|
| | | | | TOTAL GENERAL BUILDING CONTRACTORS | | 550,734 | |
| | | | | | |
|
|
|
| GENERAL MERCHANDISE STORES - 1.79% | | | |
| 521 | | * | | 99 Cents Only Stores | | | 5,450 | |
| 1,248 | | * | | Big Lots, Inc | | | 21,316 | |
| 797 | | * | | BJ’s Wholesale Club, Inc | | | 22,595 | |
| 325 | | * | | Cabela’s, Inc | | | 6,260 | |
| 547 | | | | Casey’s General Stores, Inc | | | 13,680 | |
| 100 | | * | | Conn’s, Inc | | | 2,655 | |
| 5,126 | | | | Costco Wholesale Corp | | | 292,848 | |
| 803 | | | | Dillard’s, Inc (Class A) | | | 25,576 | |
| 3,435 | | | | Dollar General Corp | | | 48,021 | |
73
TIAA-CREF LIFE FUNDS - Stock Index Fund
| | | | | | | |
SHARES
| | | | COMPANY
| | VALUE
|
| | | |
| 1,605 | | | | Family Dollar Stores, Inc | | $ | 39,210 |
| 5,935 | | | | Federated Department Stores, Inc | | | 217,221 |
| 480 | | | | Fred’s, Inc | | | 6,408 |
| 2,546 | | | | JC Penney Co, Inc | | | 171,880 |
| 298 | | * | | Retail Ventures, Inc | | | 5,310 |
| 1,433 | | | | Saks, Inc | | | 23,172 |
| 200 | | | | Stein Mart, Inc | | | 2,960 |
| 9,447 | | | | Target Corp | | | 461,675 |
| 4,980 | | | | TJX Cos, Inc | | | 113,843 |
| 26,748 | | | | Wal-Mart Stores, Inc | | | 1,288,451 |
| | | | | | |
|
|
| | | | | TOTAL GENERAL MERCHANDISE STORES | | 2,768,531 |
| | | | | | |
|
|
| HEALTH SERVICES - 1.61% | | |
| 107 | | * | | Alliance Imaging, Inc | | | 685 |
| 216 | | * | | Amedisys, Inc | | | 8,186 |
| 384 | | * | | American Retirement Corp | | | 12,584 |
| 2,283 | | | | AmerisourceBergen Corp | | | 95,703 |
| 282 | | * | | Amsurg Corp | | | 6,416 |
| 575 | | * | | Apria Healthcare Group, Inc | | | 10,868 |
| 300 | | * | | Bio-Reference Labs, Inc | | | 6,528 |
| 184 | | | | Brookdale Senior Living, Inc | | | 8,232 |
| 4,812 | | | | Caremark Rx, Inc | | | 239,974 |
| 1,303 | | | | Cigna Corp | | | 128,359 |
| 1,113 | | * | | Community Health Systems, Inc | | | 40,903 |
| 60 | | * | | Corvel Corp | | | 1,500 |
| 523 | | * | | Covance, Inc | | | 32,018 |
| 1,769 | | * | | Coventry Health Care, Inc | | | 97,189 |
| 296 | | * | | Cross Country Healthcare, Inc | | | 5,384 |
| 1,093 | | * | | DaVita, Inc | | | 54,322 |
| 713 | | * | | Edwards Lifesciences Corp | | | 32,392 |
| 242 | | * | | Enzo Biochem, Inc | | | 3,649 |
| 1,339 | | * | | Express Scripts, Inc | | | 96,060 |
| 344 | | * | | Five Star Quality Care, Inc | | | 3,808 |
| 228 | | * | | Genesis HealthCare Corp | | | 10,800 |
| 300 | | * | | Genomic Health, Inc | | | 3,531 |
| 285 | | * | | Gentiva Health Services, Inc | | | 4,569 |
| 4,212 | | | | HCA, Inc | | | 181,748 |
| 2,618 | | | | Health Management Associates, Inc (Class A) | | | 51,601 |
| 352 | | * | | Healthways, Inc | | | 18,529 |
| 109 | | * | | Horizon Health Corp | | | 2,276 |
| 402 | | * | | Kindred Healthcare, Inc | | | 10,452 |
| 1,357 | | * | | Laboratory Corp of America Holdings | | | 84,446 |
| 216 | | | | LCA-Vision, Inc | | | 11,429 |
| 124 | | * | | LHC Group, Inc | | | 2,470 |
| 580 | | * | | LifePoint Hospitals, Inc | | | 18,635 |
| 1,018 | | * | | Lincare Holdings, Inc | | | 38,521 |
| 404 | | * | | Magellan Health Services, Inc | | | 18,305 |
| 860 | | | | Manor Care, Inc | | | 40,351 |
| 300 | | * | | Matria Healthcare, Inc | | | 6,426 |
| 3,309 | | | | McKesson Corp | | | 156,449 |
| 164 | | * | | Medcath Corp | | | 3,090 |
| 3,287 | | * | | Medco Health Solutions, Inc | | | 188,279 |
| 100 | | | | National Healthcare Corp | | | 4,455 |
| 981 | | * | | Nektar Therapeutics | | | 17,992 |
| 336 | | * | | Odyssey HealthCare, Inc | | | 5,904 |
| 187 | | | | Option Care, Inc | | | 2,240 |
| 514 | | * | | Pediatrix Medical Group, Inc | | | 23,284 |
74
TIAA-CREF LIFE FUNDS - Stock Index Fund
| | | | | | | |
SHARES
| | | | COMPANY
| | VALUE
|
| | | |
| 610 | | * | | Psychiatric Solutions, Inc | | $ | 17,483 |
| 117 | | * | | Radiation Therapy Services, Inc | | | 3,148 |
| 300 | | * | | RehabCare Group, Inc | | | 5,214 |
| 611 | | * | | Sierra Health Services, Inc | | | 27,513 |
| 300 | | * | | Stereotaxis, Inc | | | 3,237 |
| 250 | | * | | Sun Healthcare Group, Inc | | | 2,172 |
| 483 | | * | | Sunrise Senior Living, Inc | | | 13,355 |
| 183 | | * | | Symbion, Inc | | | 3,799 |
| 5,068 | | * | | Tenet Healthcare Corp | | | 35,375 |
| 969 | | * | | Triad Hospitals, Inc | | | 38,353 |
| 448 | | * | | United Surgical Partners International, Inc | | | 13,471 |
| 500 | | | | Universal Health Services, Inc (Class B) | | | 25,130 |
| 121 | | * | | VistaCare, Inc (Class A) | | | 1,464 |
| 6,915 | | * | | WellPoint, Inc | | | 503,205 |
| | | | | | |
|
|
| | | | | TOTAL HEALTH SERVICES | | 2,483,461 |
| | | | | | |
|
|
| HEAVY CONSTRUCTION, EXCEPT BUILDING - 0.01% | | |
| 396 | | | | Granite Construction, Inc | | | 17,927 |
| 223 | | * | | Matrix Service Co | | | 2,551 |
| 97 | | * | | Sterling Construction Co, Inc | | | 2,677 |
| | | | | | |
|
|
| | | | | TOTAL HEAVY CONSTRUCTION, EXCEPT BUILDING | | 23,155 |
| | | | | | |
|
|
| HOLDING AND OTHER INVESTMENT OFFICES - 2.68% | | |
| 700 | | | | Aames Investment Corp | | | 3,493 |
| 400 | | | | Acadia Realty Trust | | | 9,460 |
| 353 | | * | | Affiliated Managers Group, Inc | | | 30,672 |
| 263 | | * | | Affordable Residential Communities | | | 2,827 |
| 79 | | | | Agree Realty Corp | | | 2,684 |
| 28 | | * | | Alexander’s, Inc | | | 7,609 |
| 270 | | | | Alexandria Real Estate Equities, Inc | | | 23,944 |
| 1,450 | | | | Allied Capital Corp | | | 41,716 |
| 957 | | | | AMB Property Corp | | | 48,376 |
| 131 | | | | American Campus Communities, Inc | | | 3,255 |
| 1,336 | | | | American Financial Realty Trust | | | 12,932 |
| 535 | | | | American Home Mortgage Investment Corp | | | 19,720 |
| 1,775 | | | | Annaly Mortgage Management, Inc | | | 22,738 |
| 503 | | | | Anthracite Capital, Inc | | | 6,116 |
| 734 | | | | Anworth Mortgage Asset Corp | | | 6,092 |
| 1,059 | | | | Apartment Investment & Management Co (Class A) | | | 46,014 |
| 880 | | | | Apollo Investment Corp | | | 16,262 |
| 134 | | | | Arbor Realty Trust, Inc | | | 3,357 |
| 2,301 | | | | Archstone-Smith Trust | | | 117,052 |
| 367 | | | | Ashford Hospitality Trust, Inc | | | 4,632 |
| 811 | | | | AvalonBay Communities, Inc | | | 89,713 |
| 630 | | | | BioMed Realty Trust, Inc | | | 18,862 |
| 1,232 | | | | Boston Properties, Inc | | | 111,373 |
| 918 | | | | Brandywine Realty Trust | | | 29,532 |
| 557 | | | | BRE Properties, Inc (Class A) | | | 30,635 |
| 612 | | | | Camden Property Trust | | | 45,013 |
| 241 | | | | Capital Lease Funding, Inc | | | 2,750 |
| 47 | | | | Capital Southwest Corp | | | 4,909 |
| 200 | | | | Capital Trust, Inc | | | 7,124 |
| 603 | | | | CarrAmerica Realty Corp | | | 26,864 |
| 698 | | | | CBL & Associates Properties, Inc | | | 27,173 |
| 400 | | | | Cedar Shopping Centers, Inc | | | 5,888 |
| 65 | | | | CentraCore Properties Trust | | | 1,609 |
| 65 | | | | Cherokee, Inc | | | 2,688 |
75
TIAA-CREF LIFE FUNDS - Stock Index Fund
| | | | | | | |
SHARES
| | | | COMPANY
| | VALUE
|
| | | |
| 487 | | | | Colonial Properties Trust | | $ | 24,058 |
| 364 | | | | Corporate Office Properties Trust | | | 15,317 |
| 426 | | | | Cousins Properties, Inc | | | 13,176 |
| 820 | | | | Crescent Real Estate Equities Co | | | 15,219 |
| 560 | | | | Deerfield Triarc Capital Corp | | | 7,269 |
| 1,155 | | | | Developers Diversified Realty Corp | | | 60,268 |
| 699 | | | | DiamondRock Hospitality Co | | | 10,352 |
| 200 | | | | Digital Realty Trust, Inc | | | 4,938 |
| 1,539 | | | | Duke Realty Corp | | | 54,096 |
| 231 | | | | EastGroup Properties, Inc | | | 10,783 |
| 231 | | | | Education Realty Trust, Inc | | | 3,846 |
| 32 | | * | | Enstar Group, Inc | | | 2,950 |
| 300 | | | | Entertainment Properties Trust | | | 12,915 |
| 587 | | | | Equity Inns, Inc | | | 9,721 |
| 238 | | | | Equity Lifestyle Properties, Inc | | | 10,432 |
| 4,187 | | | | Equity Office Properties Trust | | | 152,867 |
| 415 | | | | Equity One, Inc | | | 8,674 |
| 3,130 | | | | Equity Residential | | | 140,005 |
| 332 | | | | Essex Property Trust, Inc | | | 37,071 |
| 630 | | | | Extra Space Storage, Inc | | | 10,231 |
| 570 | | | | Federal Realty Investment Trust | | | 39,900 |
| 628 | | | | FelCor Lodging Trust, Inc | | | 13,653 |
| 516 | | | | Fieldstone Investment Corp | | | 4,727 |
| 500 | | | | First Industrial Realty Trust, Inc | | | 18,970 |
| 172 | | | | First Potomac Realty Trust | | | 5,124 |
| 538 | | | | Franklin Street Properties Corp | | | 10,588 |
| 1,402 | | | | Friedman Billings Ramsey Group, Inc | | | 15,380 |
| 1,875 | | | | General Growth Properties, Inc | | | 84,488 |
| 164 | | | | Getty Realty Corp | | | 4,664 |
| 81 | | | | Gladstone Capital Corp | | | 1,733 |
| 200 | | | | Gladstone Investment Corp | | | 3,000 |
| 344 | | | | Glenborough Realty Trust, Inc | | | 7,410 |
| 511 | | | | Glimcher Realty Trust | | | 12,678 |
| 158 | | | | Global Signal, Inc | | | 7,319 |
| 300 | | | | GMH Communities Trust | | | 3,954 |
| 143 | | | | Gramercy Capital Corp | | | 3,704 |
| 400 | | | | Harris & Harris Group, Inc | | | 4,416 |
| 1,524 | | | | Health Care Property Investors, Inc | | | 40,752 |
| 674 | | | | Health Care REIT, Inc | | | 23,556 |
| 605 | | | | Healthcare Realty Trust, Inc | | | 19,269 |
| 365 | | | | Heritage Property Investment Trust | | | 12,746 |
| 298 | | | | Hersha Hospitality Trust | | | 2,768 |
| 768 | | | | Highland Hospitality Corp | | | 10,813 |
| 629 | | | | Highwoods Properties, Inc | | | 22,757 |
| 387 | | | | Home Properties, Inc | | | 21,482 |
| 800 | | | | HomeBanc Corp | | | 6,352 |
| 784 | | | | Hospitality Properties Trust | | | 34,433 |
| 5,552 | | | | Host Marriott Corp | | | 121,422 |
| 2,100 | | | | HRPT Properties Trust | | | 24,276 |
| 1 | | | | Hugoton Royalty Trust | | | 30 |
| 862 | | | | IMPAC Mortgage Holdings, Inc | | | 9,637 |
| 710 | | | | Inland Real Estate Corp | | | 10,565 |
| 450 | | | | Innkeepers U.S.A. Trust | | | 7,776 |
| 678 | | | | Investors Real Estate Trust | | | 6,122 |
| 1,231 | | | | iStar Financial, Inc | | | 46,470 |
| 140 | | | | JER Investors Trust, Inc | | | 2,177 |
| 348 | | | | Kilroy Realty Corp | | | 25,143 |
76
TIAA-CREF LIFE FUNDS - Stock Index Fund
| | | | | | | |
SHARES
| | | | COMPANY
| | VALUE
|
| | | |
| 2,301 | | | | Kimco Realty Corp | | $ | 83,963 |
| 205 | | | | Kite Realty Group Trust | | | 3,196 |
| 873 | | | | KKR Financial Corp | | | 18,167 |
| 388 | | | | LaSalle Hotel Properties | | | 17,964 |
| 576 | | | | Lexington Corporate Properties Trust | | | 12,442 |
| 1,000 | | | | Liberty Property Trust | | | 44,200 |
| 249 | | | | LTC Properties, Inc | | | 5,565 |
| 388 | | | | Luminent Mortgage Capital, Inc | | | 3,593 |
| 781 | | | | Macerich Co | | | 54,826 |
| 688 | | | | Mack-Cali Realty Corp | | | 31,593 |
| 361 | | | | Maguire Properties, Inc | | | 12,696 |
| 430 | | | | Medical Properties Trust, Inc | | | 4,747 |
| 808 | | | | MFA Mortgage Investments, Inc | | | 5,559 |
| 261 | | | | Mid-America Apartment Communities, Inc | | | 14,551 |
| 593 | | | | Mills Corp | | | 15,863 |
| 400 | | | | MortgageIT Holdings, Inc | | | 4,824 |
| 200 | | | | National Health Investors, Inc | | | 5,378 |
| 622 | | | | National Retail Properties, Inc | | | 12,409 |
| 800 | | | | Nationwide Health Properties, Inc | | | 18,008 |
| 537 | | | | New Century Financial Corp | | | 24,568 |
| 1,216 | | | | New Plan Excel Realty Trust | | | 30,023 |
| 463 | | | | Newcastle Investment Corp | | | 11,723 |
| 200 | | | | Newkirk Realty Trust, Inc | | | 3,472 |
| 300 | | | | NorthStar Realty Finance Corp | | | 3,603 |
| 357 | | | | Novastar Financial, Inc | | | 11,285 |
| 2,882 | | | | NTL, Inc | | | 71,762 |
| 493 | | | | Omega Healthcare Investors, Inc | | | 6,517 |
| 468 | | | | Pan Pacific Retail Properties, Inc | | | 32,465 |
| 149 | | | | Parkway Properties, Inc | | | 6,780 |
| 385 | | | | Pennsylvania Real Estate Investment Trust | | | 15,542 |
| 2,070 | | | | Plum Creek Timber Co, Inc | | | 73,485 |
| 500 | | | | Post Properties, Inc | | | 22,670 |
| 513 | | | | Potlatch Corp | | | 19,366 |
| 2,643 | | | | Prologis | | | 137,753 |
| 235 | | | | PS Business Parks, Inc | | | 13,865 |
| 898 | | | | Public Storage, Inc | | | 68,158 |
| 298 | | | | RAIT Investment Trust | | | 8,702 |
| 113 | | | | Ramco-Gershenson Properties | | | 3,043 |
| 900 | | | | Realty Income Corp | | | 19,710 |
| 863 | | | | Reckson Associates Realty Corp | | | 35,711 |
| 209 | | | | Redwood Trust, Inc | | | 10,205 |
| 757 | | | | Regency Centers Corp | | | 47,047 |
| 270 | | | | Republic Property Trust | | | 2,668 |
| 200 | | | | Saul Centers, Inc | | | 8,156 |
| 712 | | | | Saxon Capital, Inc | | | 8,145 |
| 630 | | | | Senior Housing Properties Trust | | | 11,283 |
| 533 | | | | Shurgard Storage Centers, Inc (Class A) | | | 33,312 |
| 2,404 | | | | Simon Property Group, Inc | | | 199,388 |
| 192 | | | | Sizeler Property Investors, Inc | | | 3,084 |
| 470 | | | | SL Green Realty Corp | | | 51,451 |
| 187 | | | | Sovran Self Storage, Inc | | | 9,498 |
| 1,500 | | | | SPDR Trust Series 1 | | | 190,920 |
| 715 | | | | Spirit Finance Corp | | | 8,051 |
| 798 | | | | Strategic Hotel Capital, Inc | | | 16,550 |
| 236 | | | | Sun Communities, Inc | | | 7,677 |
| 631 | | | | Sunstone Hotel Investors, Inc | | | 18,337 |
| 290 | | | | Tanger Factory Outlet Centers, Inc | | | 9,387 |
77
TIAA-CREF LIFE FUNDS - Stock Index Fund
| | | | | | | |
SHARES
| | | | COMPANY
| | VALUE
|
| | | |
| 106 | | | | Tarragon Corp | | $ | 1,468 |
| 574 | | | | Taubman Centers, Inc | | | 23,477 |
| 1,225 | | | | Thornburg Mortgage, Inc | | | 34,141 |
| 1,068 | | | | Trizec Properties, Inc | | | 30,587 |
| 620 | | | | Trustreet Properties, Inc | | | 8,178 |
| 1,487 | | | | United Dominion Realty Trust, Inc | | | 41,651 |
| 200 | | | | Universal Health Realty Income Trust | | | 6,270 |
| 213 | | | | Urstadt Biddle Properties, Inc (Class A) | | | 3,470 |
| 499 | | | | U-Store-It Trust | | | 9,411 |
| 1,100 | | | | Ventas, Inc | | | 37,268 |
| 1,329 | | | | Vornado Realty Trust | | | 129,644 |
| 444 | | | | Washington Real Estate Investment Trust | | | 16,295 |
| 842 | | | | Weingarten Realty Investors | | | 32,232 |
| 221 | | | | Windrose Medical Properties Trust | | | 3,227 |
| 400 | | | | Winston Hotels, Inc | | | 4,900 |
| | | | | | |
|
|
| | | | | TOTAL HOLDING AND OTHER INVESTMENT OFFICES | | 4,134,651 |
| | | | | | |
|
|
| HOTELS AND OTHER LODGING PLACES - 0.51% | | |
| 226 | | | | Ameristar Casinos, Inc | | | 4,396 |
| 370 | | * | | Aztar Corp | | | 19,225 |
| 459 | | * | | Bluegreen Corp | | | 5,260 |
| 447 | | | | Boyd Gaming Corp | | | 18,041 |
| 370 | | | | Choice Hotels International, Inc | | | 22,422 |
| 424 | | * | | Gaylord Entertainment Co | | | 18,503 |
| 300 | | * | | Great Wolf Resorts, Inc | | | 3,603 |
| 4,183 | | | | Hilton Hotels Corp | | | 118,295 |
| 162 | | * | | Isle of Capri Casinos, Inc | | | 4,155 |
| 1,510 | | * | | Las Vegas Sands Corp | | | 117,569 |
| 300 | | * | | Lodgian, Inc | | | 4,275 |
| 200 | | | | Marcus Corp | | | 4,176 |
| 3,740 | | | | Marriott International, Inc (Class A) | | | 142,569 |
| 1,316 | | * | | MGM Mirage | | | 53,693 |
| 200 | | * | | Monarch Casino & Resort, Inc | | | 5,624 |
| 190 | | * | | Morgans Hotel Group Co | | | 2,956 |
| 200 | | * | | Riviera Holdings Corp | | | 4,040 |
| 2,333 | | | | Starwood Hotels & Resorts Worldwide, Inc | | | 140,773 |
| 589 | | | | Station Casinos, Inc | | | 40,099 |
| 303 | | * | | Trump Entertainment Resorts, Inc | | | 6,105 |
| 378 | | * | | Vail Resorts, Inc | | | 14,024 |
| 506 | | * | | Wynn Resorts Ltd | | | 37,090 |
| | | | | | |
|
|
| | | | | TOTAL HOTELS AND OTHER LODGING PLACES | | 786,893 |
| | | | | | |
|
|
| INDUSTRIAL MACHINERY AND EQUIPMENT - 5.33% | | |
| 8,203 | | | | 3M Co | | | 662,556 |
| 86 | | | | Aaon, Inc | | | 2,207 |
| 282 | | | | Actuant Corp | | | 14,086 |
| 652 | | * | | Advanced Digital Information Corp | | | 7,674 |
| 961 | | * | | AGCO Corp | | | 25,294 |
| 301 | | | | Albany International Corp (Class A) | | | 12,759 |
| 1,937 | | | | American Standard Cos, Inc | | | 83,814 |
| 9,253 | | * | | Apple Computer, Inc | | | 528,531 |
| 17,069 | | | | Applied Materials, Inc | | | 277,883 |
| 200 | | * | | Astec Industries, Inc | | | 6,824 |
| 140 | | * | | ASV, Inc | | | 3,226 |
| 800 | | * | | Asyst Technologies, Inc | | | 6,024 |
| 900 | | * | | Axcelis Technologies, Inc | | | 5,310 |
| 839 | | | | Black & Decker Corp | | | 70,862 |
78
TIAA-CREF LIFE FUNDS - Stock Index Fund
| | | | | | | |
SHARES
| | | | COMPANY
| | VALUE
|
| | | |
| 243 | | | | Black Box Corp | | $ | 9,314 |
| 315 | | * | | Blount International, Inc | | | 3,786 |
| 547 | | | | Briggs & Stratton Corp | | | 17,017 |
| 693 | | * | | Brooks Automation, Inc | | | 8,177 |
| 300 | | | | Bucyrus International, Inc (Class A) | | | 15,150 |
| 1,292 | | * | | Cameron International Corp | | | 61,719 |
| 339 | | | | Carlisle Cos, Inc | | | 26,883 |
| 126 | | | | Cascade Corp | | | 4,983 |
| 7,284 | | | | Caterpillar, Inc | | | 542,512 |
| 638 | | | | CDW Corp | | | 34,867 |
| 1,000 | | * | | Cirrus Logic, Inc | | | 8,140 |
| 196 | | * | | Columbus McKinnon Corp | | | 4,261 |
| 491 | | | | Cummins, Inc | | | 60,025 |
| 500 | | | | Curtiss-Wright Corp | | | 15,440 |
| 400 | | * | | Cymer, Inc | | | 18,584 |
| 2,552 | | | | Deere & Co | | | 213,066 |
| 25,116 | | * | | Dell, Inc | | | 613,082 |
| 772 | | | | Diebold, Inc | | | 31,359 |
| 818 | | | | Donaldson Co, Inc | | | 27,706 |
| 2,253 | | | | Dover Corp | | | 111,366 |
| 338 | | * | | Dresser-Rand Group, Inc | | | 7,936 |
| 159 | | * | | Dril-Quip, Inc | | | 13,108 |
| 1,646 | | | | Eaton Corp | | | 124,108 |
| 630 | | * | | Electronics for Imaging, Inc | | | 13,154 |
| 25,916 | | * | | EMC Corp | | | 284,299 |
| 1,000 | | * | | Emulex Corp | | | 16,270 |
| 215 | | * | | EnPro Industries, Inc | | | 7,224 |
| 1,363 | | * | | Entegris, Inc | | | 12,989 |
| 1,016 | | * | | Extreme Networks, Inc | | | 4,227 |
| 131 | | * | | Fargo Electronics, Inc | | | 3,326 |
| 381 | | * | | Flow International Corp | | | 5,361 |
| 584 | | * | | Flowserve Corp | | | 33,230 |
| 715 | | * | | FMC Technologies, Inc | | | 48,234 |
| 530 | | * | | Gardner Denver, Inc | | | 20,405 |
| 2,668 | | * | | Gateway, Inc | | | 5,069 |
| 106 | | * | | Gehl Co | | | 2,706 |
| 256 | | * | | Global Imaging Systems, Inc | | | 10,568 |
| 254 | | * | | Goodman Global, Inc | | | 3,856 |
| 125 | | | | Gorman-Rupp Co | | | 3,325 |
| 771 | | | | Graco, Inc | | | 35,451 |
| 1,415 | | * | | Grant Prideco, Inc | | | 63,321 |
| 30,652 | | | | Hewlett-Packard Co | | | 971,055 |
| 201 | | * | | Hydril | | | 15,783 |
| 533 | | | | IDEX Corp | | | 25,158 |
| 515 | | * | | Intermec, Inc | | | 11,814 |
| 16,866 | | | | International Business Machines Corp | | | 1,295,646 |
| 3,710 | | | | International Game Technology | | | 140,757 |
| 278 | | * | | Intevac, Inc | | | 6,027 |
| 1,988 | | | | Jabil Circuit, Inc | | | 50,893 |
| 1,373 | | | | Joy Global, Inc | | | 71,520 |
| 85 | | * | | Kadant, Inc | | | 1,955 |
| 300 | | | | Kaydon Corp | | | 11,193 |
| 458 | | | | Kennametal, Inc | | | 28,510 |
| 348 | | * | | Komag, Inc | | | 16,071 |
| 400 | | * | | Kulicke & Soffa Industries, Inc | | | 2,964 |
| 1,500 | | * | | Lam Research Corp | | | 69,930 |
| 111 | | * | | LB Foster Co | | | 2,694 |
79
TIAA-CREF LIFE FUNDS - Stock Index Fund
| | | | | | | |
SHARES
| | | | COMPANY
| | VALUE
|
| | | |
| 657 | | | | Lennox International, Inc | | $ | 17,397 |
| 1,176 | | * | | Lexmark International, Inc | | | 65,656 |
| 100 | | | | Lindsay Manufacturing Co | | | 2,712 |
| 200 | | | | Lufkin Industries, Inc | | | 11,886 |
| 696 | | | | Manitowoc Co, Inc | | | 30,972 |
| 400 | | * | | Micros Systems, Inc | | | 17,472 |
| 47 | | * | | Middleby Corp | | | 4,068 |
| 500 | | | | Modine Manufacturing Co | | | 11,680 |
| 66 | | | | Nacco Industries, Inc (Class A) | | | 9,069 |
| 158 | | * | | NATCO Group, Inc | | | 6,352 |
| 400 | | * | | Netgear, Inc | | | 8,660 |
| 100 | | | | NN, Inc | | | 1,235 |
| 282 | | | | Nordson Corp | | | 13,869 |
| 540 | | * | | Oil States International, Inc | | | 18,511 |
| 1,385 | | | | Pall Corp | | | 38,780 |
| 888 | | * | | Palm, Inc | | | 14,297 |
| 1,331 | | | | Parker Hannifin Corp | | | 103,286 |
| 448 | | * | | Paxar Corp | | | 9,215 |
| 300 | | * | | ProQuest Co | | | 3,687 |
| 1,916 | | * | | Quantum Corp | | | 5,020 |
| 301 | | * | | Rackable Systems, Inc | | | 11,886 |
| 200 | | * | | RBC Bearings, Inc | | | 4,540 |
| 78 | | | | Robbins & Myers, Inc | | | 2,039 |
| 1,980 | | | | Rockwell Automation, Inc | | | 142,580 |
| 1,316 | | * | | Safeguard Scientifics, Inc | | | 2,843 |
| 2,091 | | * | | SanDisk Corp | | | 106,599 |
| 200 | | | | Sauer-Danfoss, Inc | | | 5,084 |
| 266 | | * | | Scansource, Inc | | | 7,799 |
| 702 | | * | | Scientific Games Corp (Class A) | | | 25,005 |
| 100 | | * | | Semitool, Inc | | | 902 |
| 240 | | * | | Sigma Designs, Inc | | | 2,263 |
| 2,320 | | | | Smith International, Inc | | | 103,170 |
| 10,117 | | * | | Solectron Corp | | | 34,600 |
| 687 | | | | SPX Corp | | | 38,438 |
| 100 | | | | Standex International Corp | | | 3,035 |
| 884 | | | | Stanley Works | | | 41,742 |
| 2,550 | | | | Symbol Technologies, Inc | | | 27,514 |
| 139 | | * | | Tecumseh Products Co (Class A) | | | 2,669 |
| 100 | | | | Tennant Co | | | 5,028 |
| 522 | | * | | Terex Corp | | | 51,521 |
| 918 | | | | Timken Co | | | 30,762 |
| 514 | | | | Toro Co | | | 24,004 |
| 138 | | * | | TurboChef Technologies, Inc | | | 1,535 |
| 200 | | * | | Ultratech, Inc | | | 3,148 |
| 1,402 | | * | | Varian Medical Systems, Inc | | | 66,385 |
| 423 | | * | | VeriFone Holdings, Inc | | | 12,893 |
| 303 | | | | Watsco, Inc | | | 18,125 |
| 2,475 | | * | | Western Digital Corp | | | 49,030 |
| 371 | | | | Woodward Governor Co | | | 11,319 |
| 762 | | * | | Zebra Technologies Corp (Class A) | | | 26,030 |
| | | | | | |
|
|
| | | | | TOTAL INDUSTRIAL MACHINERY AND EQUIPMENT | | 8,230,936 |
| | | | | | |
|
|
| INSTRUMENTS AND RELATED PRODUCTS - 4.08% | | |
| 186 | | * | | Abaxis, Inc | | | 4,161 |
| 400 | | * | | Abiomed, Inc | | | 5,188 |
| 200 | | * | | ADE Corp | | | 6,498 |
| 746 | | * | | Advanced Medical Optics, Inc | | | 37,822 |
80
TIAA-CREF LIFE FUNDS - Stock Index Fund
| | | | | | | |
SHARES
| | | | COMPANY
| | VALUE
|
| | | |
| 766 | | * | | Affymetrix, Inc | | $ | 19,610 |
| 4,727 | | * | | Agilent Technologies, Inc | | | 149,184 |
| 700 | | * | | Align Technology, Inc | | | 5,173 |
| 1,665 | | | | Allergan, Inc | | | 178,588 |
| 728 | | * | | American Medical Systems Holdings, Inc | | | 12,121 |
| 87 | | * | | American Science & Engineering, Inc | | | 5,039 |
| 150 | | | | Analogic Corp | | | 6,992 |
| 200 | | * | | Anaren, Inc | | | 4,098 |
| 131 | | * | | Angiodynamics, Inc | | | 3,544 |
| 2,057 | | | | Applera Corp (Applied Biosystems Group) | | | 66,544 |
| 94 | | * | | Argon ST, Inc | | | 2,503 |
| 272 | | | | Arrow International, Inc | | | 8,941 |
| 300 | | * | | Arthrocare Corp | | | 12,603 |
| 200 | | * | | Aspect Medical Systems, Inc | | | 3,488 |
| 116 | | | | Badger Meter, Inc | | | 3,132 |
| 1,132 | | | | Bard (C.R.), Inc | | | 82,930 |
| 605 | | | | Bausch & Lomb, Inc | | | 29,669 |
| 7,125 | | | | Baxter International, Inc | | | 261,915 |
| 655 | | | | Beckman Coulter, Inc | | | 36,385 |
| 2,691 | | | | Becton Dickinson & Co | | | 164,501 |
| 2,677 | | | | Biomet, Inc | | | 83,763 |
| 208 | | * | | Bio-Rad Laboratories, Inc (Class A) | | | 13,508 |
| 178 | | * | | Biosite, Inc | | | 8,127 |
| 13,441 | | * | | Boston Scientific Corp | | | 226,346 |
| 104 | | * | | Bruker BioSciences Corp | | | 557 |
| 362 | | * | | Candela Corp | | | 5,741 |
| 609 | | * | | Cepheid, Inc | | | 5,913 |
| 298 | | * | | Cerus Corp | | | 2,125 |
| 151 | | | | CNS, Inc | | | 3,700 |
| 324 | | * | | Coherent, Inc | | | 10,929 |
| 200 | | | | Cohu, Inc | | | 3,510 |
| 450 | | * | | Conmed Corp | | | 9,315 |
| 464 | | | | Cooper Cos, Inc | | | 20,551 |
| 1,023 | | * | | Credence Systems Corp | | | 3,581 |
| 200 | | * | | Cyberonics, Inc | | | 4,264 |
| 2,592 | | | | Danaher Corp | | | 166,717 |
| 100 | | | | Datascope Corp | | | 3,084 |
| 897 | | | | Dentsply International, Inc | | | 54,358 |
| 392 | | * | | Depomed, Inc | | | 2,301 |
| 284 | | * | | Dionex Corp | | | 15,523 |
| 190 | | * | | DJ Orthopedics, Inc | | | 6,998 |
| 478 | | | | DRS Technologies, Inc | | | 23,303 |
| 3,037 | | | | Eastman Kodak Co | | | 72,220 |
| 137 | | | | EDO Corp | | | 3,335 |
| 911 | | * | | Encore Medical Corp | | | 4,382 |
| 270 | | * | | ESCO Technologies, Inc | | | 14,432 |
| 266 | | * | | Esterline Technologies Corp | | | 11,063 |
| 160 | | * | | ev3, Inc | | | 2,370 |
| 81 | | * | | Excel Technology, Inc | | | 2,424 |
| 177 | | * | | FEI Co | | | 4,014 |
| 1,341 | | * | | Fisher Scientific International, Inc | | | 97,960 |
| 768 | | * | | Flir Systems, Inc | | | 16,942 |
| 497 | | * | | Formfactor, Inc | | | 22,181 |
| 469 | | * | | Fossil, Inc | | | 8,447 |
| 145 | | * | | Foxhollow Technologies, Inc | | | 3,961 |
| 272 | | * | | Haemonetics Corp | | | 12,651 |
| 360 | | * | | HealthTronics, Inc | | | 2,754 |
81
TIAA-CREF LIFE FUNDS - Stock Index Fund
| | | | | | | |
SHARES
| | | | COMPANY
| | VALUE
|
| | | |
| 219 | | * | | Herley Industries, Inc | | $ | 2,455 |
| 504 | | * | | Hologic, Inc | | | 24,877 |
| 111 | | * | | ICU Medical, Inc | | | 4,689 |
| 193 | | * | | I-Flow Corp | | | 2,088 |
| 200 | | * | | II-VI, Inc | | | 3,660 |
| 383 | | * | | Illumina, Inc | | | 11,360 |
| 900 | | * | | Input/Output, Inc | | | 8,505 |
| 159 | | * | | Integra LifeSciences Holdings Corp | | | 6,171 |
| 388 | | * | | Intermagnetics General Corp | | | 10,468 |
| 139 | | * | | Intralase Corp | | | 2,327 |
| 437 | | * | | Intuitive Surgical, Inc | | | 51,553 |
| 316 | | | | Invacare Corp | | | 7,862 |
| 400 | | * | | Ionatron, Inc | | | 2,540 |
| 170 | | * | | IRIS International, Inc | | | 2,237 |
| 304 | | * | | Itron, Inc | | | 18,015 |
| 345 | | * | | Ixia | | | 3,105 |
| 32,212 | | | | Johnson & Johnson | | | 1,930,143 |
| 66 | | * | | Kensey Nash Corp | | | 1,947 |
| 2,162 | | | | Kla-Tencor Corp | | | 89,874 |
| 731 | | * | | Kopin Corp | | | 2,639 |
| 479 | | * | | Kyphon, Inc | | | 18,374 |
| 211 | | * | | Laserscope | | | 6,501 |
| 522 | | * | | LTX Corp | | | 3,659 |
| 114 | | * | | Measurement Specialties, Inc | | | 2,539 |
| 98 | | * | | Medical Action Industries, Inc | | | 2,165 |
| 13,132 | | | | Medtronic, Inc | | | 616,153 |
| 409 | | | | Mentor Corp | | | 17,792 |
| 187 | | * | | Merit Medical Systems, Inc | | | 2,573 |
| 471 | | * | | Mettler-Toledo International, Inc | | | 28,528 |
| 550 | | * | | Millipore Corp | | | 34,645 |
| 300 | | | | Mine Safety Appliances Co | | | 12,060 |
| 429 | | * | | MKS Instruments, Inc | | | 8,631 |
| 180 | | * | | Molecular Devices Corp | | | 5,501 |
| 200 | | | | Movado Group, Inc | | | 4,590 |
| 282 | | * | | Wright Medical Group, Inc | | | 5,902 |
| 221 | | | | MTS Systems Corp | | | 8,732 |
| 650 | | | | National Instruments Corp | | | 17,810 |
| 200 | | * | | Natus Medical, Inc | | | 1,978 |
| 100 | | * | | Neurometrix, Inc | | | 3,046 |
| 407 | | * | | Newport Corp | | | 6,561 |
| 360 | | * | | NuVasive, Inc | | | 6,563 |
| 200 | | | | Oakley, Inc | | | 3,370 |
| 42 | | * | | OYO Geospace Corp | | | 2,399 |
| 200 | | * | | Palomar Medical Technologies, Inc | | | 9,126 |
| 1,291 | | | | PerkinElmer, Inc | | | 26,982 |
| 200 | | * | | Photon Dynamics, Inc | | | 2,504 |
| 2,470 | | | | Pitney Bowes, Inc | | | 102,011 |
| 306 | | | | PolyMedica Corp | | | 11,004 |
| 828 | | * | | Resmed, Inc | | | 38,875 |
| 764 | | * | | Respironics, Inc | | | 26,144 |
| 162 | | * | | Rofin-Sinar Technologies, Inc | | | 9,310 |
| 988 | | | | Roper Industries, Inc | | | 46,189 |
| 351 | | * | | Rudolph Technologies, Inc | | | 5,089 |
| 561 | | * | | Sirf Technology Holdings, Inc | | | 18,075 |
| 182 | | | | Sirona Dental Systems, Inc | | | 7,211 |
| 326 | | * | | Sonic Solutions, Inc | | | 5,379 |
| 150 | | * | | SonoSite, Inc | | | 5,856 |
82
TIAA-CREF LIFE FUNDS - Stock Index Fund
| | | | | | | |
SHARES
| | | | COMPANY
| | VALUE
|
| | | |
| 330 | | * | | Spectranetics Corp | | $ | 3,538 |
| 3,940 | | * | | St. Jude Medical, Inc | | | 127,735 |
| 800 | | | | STERIS Corp | | | 18,288 |
| 3,286 | | | | Stryker Corp | | | 138,373 |
| 376 | | * | | Symmetry Medical, Inc | | | 5,790 |
| 450 | | * | | Techne Corp | | | 22,914 |
| 993 | | | | Tektronix, Inc | | | 29,214 |
| 385 | | * | | Teledyne Technologies, Inc | | | 12,613 |
| 2,014 | | * | | Teradyne, Inc | | | 28,055 |
| 1,728 | | * | | Thermo Electron Corp | | | 62,623 |
| 800 | | * | | ThermoGenesis Corp | | | 3,296 |
| 483 | | * | | Thoratec Corp | | | 6,699 |
| 594 | | * | | Trimble Navigation Ltd | | | 26,516 |
| 200 | | * | | TriPath Imaging, Inc | | | 1,324 |
| 100 | | | | United Industrial Corp | | | 4,525 |
| 396 | | * | | Varian, Inc | | | 16,438 |
| 262 | | * | | Veeco Instruments, Inc | | | 6,246 |
| 328 | | * | | Ventana Medical Systems, Inc | | | 15,475 |
| 404 | | * | | Viasys Healthcare, Inc | | | 10,342 |
| 320 | | * | | Viisage Technology, Inc | | | 4,851 |
| 200 | | * | | Vital Images, Inc | | | 4,940 |
| 61 | | | | Vital Signs, Inc | | | 3,021 |
| 1,178 | | * | | Waters Corp | | | 52,303 |
| 10,240 | | * | | Xerox Corp | | | 142,438 |
| 300 | | | | X-Rite, Inc | | | 3,297 |
| 43 | | | | Young Innovations, Inc | | | 1,515 |
| 2,700 | | * | | Zimmer Holdings, Inc | | | 153,144 |
| 100 | | * | | Zoll Medical Corp | | | 3,276 |
| 198 | | * | | Zygo Corp | | | 3,245 |
| | | | | | |
|
|
| | | | | TOTAL INSTRUMENTS AND RELATED PRODUCTS | | 6,296,355 |
| | | | | | |
|
|
| INSURANCE AGENTS, BROKERS AND SERVICE - 0.43% | | |
| 3,460 | | | | AON Corp | | | 120,477 |
| 1,188 | | | | Brown & Brown, Inc | | | 34,713 |
| 200 | | | | Clark, Inc | | | 2,640 |
| 245 | | | | Crawford & Co (Class B) | | | 1,759 |
| 1,000 | | | | Gallagher (Arthur J.) & Co | | | 25,340 |
| 3,316 | | | | Hartford Financial Services Group, Inc | | | 280,534 |
| 394 | | | | Hilb Rogal & Hobbs Co | | | 14,684 |
| 97 | | * | | James River Group, Inc | | | 2,415 |
| 5,936 | | | | Marsh & McLennan Cos, Inc | | | 159,619 |
| 378 | | | | National Financial Partners Corp | | | 16,749 |
| 600 | | * | | USI Holdings Corp | | | 8,046 |
| | | | | | |
|
|
| | | | | TOTAL INSURANCE AGENTS, BROKERS AND SERVICE | | 666,976 |
| | | | | | |
|
|
| INSURANCE CARRIERS - 4.54% | | |
| 300 | | | | 21st Century Insurance Group | | | 4,320 |
| 6,168 | | | | Aetna, Inc | | | 246,288 |
| 5,425 | | | | Aflac, Inc | | | 251,449 |
| 321 | | | | Alfa Corp | | | 5,316 |
| 53 | | * | | Alleghany Corp | | | 14,647 |
| 6,913 | | | | Allstate Corp | | | 378,348 |
| 1,149 | | | | Ambac Financial Group, Inc | | | 93,184 |
| 400 | | | | American Equity Investment Life Holding Co | | | 4,264 |
| 619 | | | | American Financial Group, Inc | | | 26,555 |
| 23,963 | | | | American International Group, Inc | | | 1,415,015 |
| 143 | | | | American National Insurance Co | | | 18,550 |
83
TIAA-CREF LIFE FUNDS - Stock Index Fund
| | | | | | | |
SHARES
| | | | COMPANY
| | VALUE
|
| | | |
| 87 | | * | | American Physicians Capital, Inc | | $ | 4,575 |
| 539 | | * | | AMERIGROUP Corp | | | 16,731 |
| 418 | | | | AmerUs Group Co | | | 24,474 |
| 400 | | * | | Argonaut Group, Inc | | | 12,016 |
| 1,403 | | | | Assurant, Inc | | | 67,905 |
| 125 | | | | Baldwin & Lyons, Inc (Class B) | | | 3,187 |
| 161 | | | | Bristol West Holdings, Inc | | | 2,576 |
| 444 | | * | | Centene Corp | | | 10,447 |
| 4,514 | | | | Chubb Corp | | | 225,249 |
| 1,693 | | | | Cincinnati Financial Corp | | | 79,588 |
| 303 | | * | | CNA Financial Corp | | | 9,987 |
| 100 | | * | | CNA Surety Corp | | | 1,728 |
| 556 | | | | Commerce Group, Inc | | | 16,424 |
| 1,557 | | * | | Conseco, Inc | | | 35,967 |
| 394 | | | | Delphi Financial Group, Inc (Class A) | | | 14,326 |
| 168 | | | | Direct General Corp | | | 2,843 |
| 143 | | | | Donegal Group, Inc | | | 2,776 |
| 583 | | | | Erie Indemnity Co (Class A) | | | 30,316 |
| 79 | | | | FBL Financial Group, Inc (Class A) | | | 2,560 |
| 1,901 | | | | Fidelity National Financial, Inc | | | 74,044 |
| 300 | | | | Fidelity National Title Group, Inc | | | 5,901 |
| 180 | | * | | First Acceptance Corp | | | 2,120 |
| 914 | | | | First American Corp | | | 38,635 |
| 210 | | * | | Fpic Insurance Group, Inc | | | 8,138 |
| 4,777 | | | | Genworth Financial, Inc | | | 166,431 |
| 68 | | | | Great American Financial Resources, Inc | | | 1,423 |
| 600 | | | | Hanover Insurance Group, Inc | | | 28,476 |
| 206 | | | | Harleysville Group, Inc | | | 6,534 |
| 1,158 | | | | HCC Insurance Holdings, Inc | | | 34,092 |
| 1,275 | | * | | Health Net, Inc | | | 57,592 |
| 276 | | * | | HealthExtras, Inc | | | 8,341 |
| 320 | | * | | Healthspring, Inc | | | 6,000 |
| 467 | | | | Horace Mann Educators Corp | | | 7,916 |
| 1,774 | | * | | Humana, Inc | | | 95,264 |
| 205 | | | | Infinity Property & Casualty Corp | | | 8,405 |
| 77 | | | | Kansas City Life Insurance Co | | | 3,247 |
| 200 | | | | LandAmerica Financial Group, Inc | | | 12,920 |
| 1,742 | | | | Leucadia National Corp | | | 50,849 |
| 3,060 | | | | Lincoln National Corp | | | 172,706 |
| 4,843 | | | | Loews Corp | | | 171,684 |
| 104 | | * | | Markel Corp | | | 36,088 |
| 1,466 | | | | MBIA, Inc | | | 85,834 |
| 288 | | | | Mercury General Corp | | | 16,235 |
| 4,792 | | | | Metlife, Inc | | | 245,398 |
| 952 | | | | MGIC Investment Corp | | | 61,880 |
| 70 | | | | Midland Co | | | 2,659 |
| 110 | | * | | Molina Healthcare, Inc | | | 4,185 |
| 173 | | | | National Interstate Corp | | | 4,692 |
| 19 | | | | National Western Life Insurance Co (Class A) | | | 4,553 |
| 590 | | | | Nationwide Financial Services, Inc (Class A) | | | 26,007 |
| 117 | | * | | Navigators Group, Inc | | | 5,127 |
| 154 | | | | Odyssey Re Holdings Corp | | | 4,058 |
| 652 | | | | Ohio Casualty Corp | | | 19,384 |
| 2,437 | | | | Old Republic International Corp | | | 52,079 |
| 609 | | * | | Philadelphia Consolidated Holding Co | | | 18,489 |
| 1,122 | | | | Phoenix Cos, Inc | | | 15,798 |
| 400 | | * | | PMA Capital Corp (Class A) | | | 4,120 |
84
TIAA-CREF LIFE FUNDS - Stock Index Fund
| | | | | | | |
SHARES
| | | | COMPANY
| | VALUE
|
| | | |
| 973 | | | | PMI Group, Inc | | $ | 43,376 |
| 200 | | | | Presidential Life Corp | | | 4,916 |
| 3,094 | | | | Principal Financial Group | | | 172,181 |
| 338 | | * | | ProAssurance Corp | | | 16,285 |
| 8,515 | | | | Progressive Corp | | | 218,921 |
| 737 | | | | Protective Life Corp | | | 34,359 |
| 5,353 | | | | Prudential Financial, Inc | | | 415,928 |
| 910 | | | | Radian Group, Inc | | | 56,220 |
| 310 | | | | Reinsurance Group Of America, Inc | | | 15,236 |
| 200 | | | | RLI Corp | | | 9,636 |
| 1,297 | | | | Safeco Corp | | | 73,086 |
| 200 | | | | Safety Insurance Group, Inc | | | 9,510 |
| 109 | | * | | SCPIE Holdings, Inc | | | 2,534 |
| 169 | | * | | SeaBright Insurance Holdings, Inc | | | 2,723 |
| 328 | | | | Selective Insurance Group, Inc | | | 18,325 |
| 7,361 | | | | St. Paul Travelers Cos, Inc | | | 328,153 |
| 648 | | | | Stancorp Financial Group, Inc | | | 32,990 |
| 200 | | | | State Auto Financial Corp | | | 6,508 |
| 200 | | | | Stewart Information Services Corp | | | 7,262 |
| 1,092 | | | | Torchmark Corp | | | 66,306 |
| 176 | | | | Tower Group, Inc | | | 5,324 |
| 312 | | | | Transatlantic Holdings, Inc | | | 17,441 |
| 173 | | * | | Triad Guaranty, Inc | | | 8,456 |
| 234 | | | | United Fire & Casualty Co | | | 7,050 |
| 14,654 | | | | UnitedHealth Group, Inc | | | 656,206 |
| 500 | | | | Unitrin, Inc | | | 21,795 |
| 417 | | * | | Universal American Financial Corp | | | 5,484 |
| 3,132 | | | | UnumProvident Corp | | | 56,783 |
| 356 | | * | | WellCare Health Plans, Inc | | | 17,462 |
| 20 | | | | Wesco Financial Corp | | | 7,620 |
| 1,705 | | | | W.R. Berkley Corp | | | 58,192 |
| 401 | | | | Zenith National Insurance Corp | | | 15,908 |
| | | | | | |
|
|
| | | | | TOTAL INSURANCE CARRIERS | | 7,001,091 |
| | | | | | |
|
|
| JUSTICE, PUBLIC ORDER AND SAFETY - 0.02% | | |
| 407 | | * | | Corrections Corp of America | | | 21,547 |
| 100 | | * | | Geo Group, Inc | | | 3,505 |
| | | | | | |
|
|
| | | | | TOTAL JUSTICE, PUBLIC ORDER AND SAFETY | | 25,052 |
| | | | | | |
|
|
| LEATHER AND LEATHER PRODUCTS - 0.12% | | |
| 4,188 | | * | | Coach, Inc | | | 125,221 |
| 200 | | * | | CROCS, Inc | | | 5,030 |
| 200 | | * | | Genesco, Inc | | | 6,774 |
| 385 | | * | | Iconix Brand Group, Inc | | | 6,291 |
| 150 | | | | Steven Madden Ltd | | | 4,443 |
| 558 | | * | | Timberland Co (Class A) | | | 14,564 |
| 60 | | | | Weyco Group, Inc | | | 1,393 |
| 600 | | | | Wolverine World Wide, Inc | | | 13,998 |
| | | | | | |
|
|
| | | | | TOTAL LEATHER AND LEATHER PRODUCTS | | 177,714 |
| | | | | | |
|
|
| LEGAL SERVICES - 0.01% | | |
| 452 | | * | | FTI Consulting, Inc | | | 12,100 |
| 154 | | | | Pre-Paid Legal Services, Inc | | | 5,313 |
| | | | | | |
|
|
| | | | | TOTAL LEGAL SERVICES | | 17,413 |
| | | | | | |
|
|
| LOCAL AND INTERURBAN PASSENGER TRANSIT - 0.02% | | |
| 1,104 | | | | Laidlaw International, Inc | | | 27,821 |
| | | | | | |
|
|
| | | | | TOTAL LOCAL AND INTERURBAN PASSENGER TRANSIT | | 27,821 |
| | | | | | |
|
|
85
TIAA-CREF LIFE FUNDS - Stock Index Fund
| | | | | | | |
SHARES
| | | | COMPANY
| | VALUE
|
| |
| LUMBER AND WOOD PRODUCTS - 0.04% | | |
| 80 | | | | American Woodmark Corp | | $ | 2,803 |
| 749 | | * | | Champion Enterprises, Inc | | | 8,269 |
| 100 | | | | Deltic Timber Corp | | | 5,637 |
| 1,157 | | | | Louisiana-Pacific Corp | | | 25,338 |
| 100 | | | | Skyline Corp | | | 4,278 |
| 200 | | | | Universal Forest Products, Inc | | | 12,546 |
| | | | | | |
|
|
| | | | | TOTAL LUMBER AND WOOD PRODUCTS | | 58,871 |
| | | | | | |
|
|
| METAL MINING - 0.39% | | |
| 274 | | | | Cleveland-Cliffs, Inc | | | 21,725 |
| 3,160 | | * | | Coeur d’Alene Mines Corp | | | 15,200 |
| 2,049 | | | | Freeport-McMoRan Copper & Gold, Inc (Class A) | | | 113,535 |
| 1,552 | | * | | Hecla Mining Co | | | 8,148 |
| 4,544 | | | | Newmont Mining Corp | | | 240,514 |
| 2,198 | | | | Phelps Dodge Corp | | | 180,588 |
| 168 | | | | Royal Gold, Inc | | | 4,674 |
| 110 | | | | Southern Copper Corp | | | 9,804 |
| 345 | | * | | Stillwater Mining Co | | | 4,375 |
| | | | | | |
|
|
| | | | | TOTAL METAL MINING | | 598,563 |
| | | | | | |
|
|
| MISCELLANEOUS MANUFACTURING INDUSTRIES - 0.20% | | |
| 300 | | | | Blyth, Inc | | | 5,538 |
| 806 | | | | Callaway Golf Co | | | 10,470 |
| 423 | | | | Daktronics, Inc | | | 12,212 |
| 1,594 | | | | Fortune Brands, Inc | | | 113,190 |
| 1,875 | | | | Hasbro, Inc | | | 33,956 |
| 1,200 | | * | | Identix, Inc | | | 8,388 |
| 211 | | * | | Jakks Pacific, Inc | | | 4,239 |
| 506 | | * | | K2, Inc | | | 5,536 |
| 4,259 | | | | Mattel, Inc | | | 70,316 |
| 275 | | | | Nautilus, Inc | | | 4,320 |
| 538 | | * | | Progressive Gaming International Corp | | | 4,196 |
| 191 | | * | | RC2 Corp | | | 7,384 |
| 100 | | * | | Russ Berrie & Co, Inc | | | 1,226 |
| 393 | | * | | Shuffle Master, Inc | | | 12,883 |
| 100 | | * | | Steinway Musical Instruments, Inc | | | 2,452 |
| 529 | | | | Yankee Candle Co, Inc | | | 13,230 |
| | | | | | |
|
|
| | | | | TOTAL MISCELLANEOUS MANUFACTURING INDUSTRIES | | 309,536 |
| | | | | | |
|
|
| MISCELLANEOUS RETAIL - 1.20% | | |
| 198 | | * | | 1-800-FLOWERS.COM, Inc (Class A) | | | 1,142 |
| 110 | | * | | AC Moore Arts & Crafts, Inc | | | 1,794 |
| 3,395 | | * | | Amazon.com, Inc | | | 131,319 |
| 565 | | | | Barnes & Noble, Inc | | | 20,623 |
| 334 | | | | Big 5 Sporting Goods Corp | | | 6,513 |
| 158 | | * | | Blue Nile, Inc | | | 5,081 |
| 155 | | | | Books-A-Million, Inc | | | 2,585 |
| 792 | | | | Borders Group, Inc | | | 14,620 |
| 200 | | * | | Build-A-Bear Workshop, Inc | | | 4,302 |
| 400 | | | | Cash America International, Inc | | | 12,800 |
| 558 | | * | | CKX, Inc | | | 7,572 |
| 557 | | * | | Coldwater Creek, Inc | | | 14,905 |
| 8,912 | | | | CVS Corp | | | 273,598 |
| 137 | | * | | dELiA*s, Inc | | | 1,107 |
86
TIAA-CREF LIFE FUNDS - Stock Index Fund
| | | | | | | |
SHARES
| | | | COMPANY
| | VALUE
|
| | | |
| 368 | | * | | Dick’s Sporting Goods, Inc | | $ | 14,573 |
| 1,155 | | * | | Dollar Tree Stores, Inc | | | 30,608 |
| 1,133 | | * | | Drugstore.com, Inc | | | 3,286 |
| 131 | | * | | Ezcorp, Inc | | | 4,937 |
| 324 | | * | | GSI Commerce, Inc | | | 4,384 |
| 373 | | * | | Hibbett Sporting Goods, Inc | | | 8,915 |
| 300 | | | | Longs Drug Stores Corp | | | 13,686 |
| 1,486 | | | | Michaels Stores, Inc | | | 61,283 |
| 491 | | | | MSC Industrial Direct Co (Class A) | | | 23,357 |
| 333 | | * | | Nutri/System, Inc | | | 20,689 |
| 3,240 | | * | | Office Depot, Inc | | | 123,120 |
| 769 | | | | OfficeMax, Inc | | | 31,337 |
| 93 | | * | | Overstock.com, Inc | | | 1,977 |
| 611 | | * | | Petco Animal Supplies, Inc | | | 12,483 |
| 1,575 | | | | Petsmart, Inc | | | 40,320 |
| 254 | | * | | Priceline.com, Inc | | | 7,584 |
| 5,731 | | * | | Rite Aid Corp | | | 24,299 |
| 954 | | * | | Sears Holdings Corp | | | 147,717 |
| 79 | | * | | Sportsman’s Guide, Inc | | | 2,410 |
| 192 | | * | | Stamps.com, Inc | | | 5,341 |
| 7,922 | | | | Staples, Inc | | | 192,663 |
| 1,527 | | | | Tiffany & Co | | | 50,422 |
| 180 | | * | | Valuevision International, Inc (Class A) | | | 1,985 |
| 10,991 | | | | Walgreen Co | | | 492,836 |
| 362 | | | | World Fuel Services Corp | | | 16,540 |
| 490 | | * | | Zale Corp | | | 11,804 |
| 100 | | * | | Zumiez, Inc | | | 3,757 |
| | | | | | |
|
|
| | | | | TOTAL MISCELLANEOUS RETAIL | | 1,850,274 |
| | | | | | |
|
|
| MOTION PICTURES - 1.37% | | |
| 466 | | * | | Avid Technology, Inc | | | 15,532 |
| 1,979 | | * | | Blockbuster, Inc (Class A) | | | 9,855 |
| 100 | | | | Carmike Cinemas, Inc | | | 2,108 |
| 3,011 | | * | | Discovery Holding Co (Class A) | | | 44,051 |
| 428 | | * | | DreamWorks Animation SKG, Inc (Class A) | | | 9,801 |
| 171 | | * | | Gaiam, Inc | | | 2,397 |
| 524 | | * | | Macrovision Corp | | | 11,276 |
| 25,166 | | | | News Corp (Class A) | | | 482,684 |
| 687 | | | | Regal Entertainment Group (Class A) | | | 13,960 |
| 45,887 | | | | Time Warner, Inc | | | 793,845 |
| 940 | | * | | Time Warner Telecom, Inc (Class A) | | | 13,959 |
| 23,808 | | | | Walt Disney Co | | | 714,240 |
| | | | | | |
|
|
| | | | | TOTAL MOTION PICTURES | | 2,113,708 |
| | | | | | |
|
|
| NONDEPOSITORY INSTITUTIONS - 1.75% | | |
| 163 | | * | | Accredited Home Lenders Holding Co | | | 7,793 |
| 700 | | | | Advance America Cash Advance Centers, Inc | | | 12,278 |
| 199 | | | | Advanta Corp (Class B) | | | 7,154 |
| 1,546 | | | | American Capital Strategies Ltd | | | 51,760 |
| 11,771 | | | | American Express Co | | | 626,453 |
| 1,465 | | * | | AmeriCredit Corp | | | 40,903 |
| 410 | | | | Ares Capital Corp | | | 6,941 |
| 111 | | | | Asta Funding, Inc | | | 4,157 |
| 3,288 | | | | Capital One Financial Corp | | | 280,960 |
| 964 | | | | CapitalSource, Inc | | | 22,615 |
| 555 | | | | CharterMac | | | 10,384 |
| 2,151 | | | | CIT Group, Inc | | | 112,476 |
87
TIAA-CREF LIFE FUNDS - Stock Index Fund
| | | | | | | |
SHARES
| | | | COMPANY
| | VALUE
|
| | | |
| 218 | | * | | CompuCredit Corp | | $ | 8,380 |
| 6,525 | | | | Countrywide Financial Corp | | | 248,472 |
| 104 | | * | | Credit Acceptance Corp | | | 2,823 |
| 859 | | | | Doral Financial Corp | | | 5,506 |
| 10,554 | | | | Fannie Mae | | | 507,647 |
| 160 | | | | Federal Agricultural Mortgage Corp (Class C) | | | 4,432 |
| 274 | | | | Financial Federal Corp | | | 7,620 |
| 250 | | * | | First Cash Financial Services, Inc | | | 4,938 |
| 331 | | | | First Marblehead Corp | | | 18,847 |
| 7,528 | | | | Freddie Mac | | | 429,171 |
| 499 | | * | | INVESTools, Inc | | | 3,962 |
| 505 | | | | MCG Capital Corp | | | 8,030 |
| 200 | | * | | Nelnet, Inc | | | 8,110 |
| 300 | | | | NGP Capital Resources Co | | | 4,389 |
| 300 | | * | | Ocwen Financial Corp | | | 3,813 |
| 4,471 | | | | SLM Corp | | | 236,605 |
| 42 | | | | Student Loan Corp | | | 8,484 |
| 200 | | | | Technology Investment Capital Corp | | | 2,930 |
| 109 | | * | | United PanAm Financial Corp | | | 3,314 |
| 199 | | * | | World Acceptance Corp | | | 7,068 |
| | | | | | |
|
|
| | | | | TOTAL NONDEPOSITORY INSTITUTIONS | | 2,708,415 |
| | | | | | |
|
|
| NONMETALLIC MINERALS, EXCEPT FUELS - 0.08% | | |
| 200 | | | | AMCOL International Corp | | | 5,270 |
| 350 | | | | Compass Minerals International, Inc | | | 8,733 |
| 495 | | | | Florida Rock Industries, Inc | | | 24,587 |
| 1,088 | | | | Vulcan Materials Co | | | 84,864 |
| | | | | | |
|
|
| | | | | TOTAL NONMETALLIC MINERALS, EXCEPT FUELS | | 123,454 |
| | | | | | |
|
|
| OIL AND GAS EXTRACTION - 2.41% | | |
| 4,989 | | | | Anadarko Petroleum Corp | | | 237,925 |
| 3,592 | | | | Apache Corp | | | 245,154 |
| 117 | | * | | Arena Resources, Inc | | | 4,012 |
| 252 | | * | | Atlas America, Inc | | | 11,292 |
| 191 | | * | | ATP Oil & Gas Corp | | | 8,009 |
| 282 | | * | | Atwood Oceanics, Inc | | | 13,987 |
| 727 | | * | | Aurora Oil & Gas Corp | | | 2,908 |
| 3,683 | | | | Baker Hughes, Inc | | | 301,454 |
| 130 | | * | | Basic Energy Services, Inc | | | 3,974 |
| 400 | | | | Berry Petroleum Co (Class A) | | | 13,260 |
| 310 | | * | | Bill Barrett Corp | | | 9,179 |
| 3,522 | | | | BJ Services Co | | | 131,230 |
| 184 | | * | | Bois d’Arc Energy, Inc | | | 3,030 |
| 400 | | * | | Brigham Exploration Co | | | 3,164 |
| 200 | | * | | Bronco Drilling Co, Inc | | | 4,178 |
| 525 | | | | Cabot Oil & Gas Corp (Class A) | | | 25,725 |
| 230 | | * | | Callon Petroleum Co | | | 4,448 |
| 202 | | * | | Carrizo Oil & Gas, Inc | | | 6,325 |
| 564 | | * | | Cheniere Energy, Inc | | | 21,996 |
| 3,747 | | | | Chesapeake Energy Corp | | | 113,347 |
| 900 | | | | Cimarex Energy Co | | | 38,700 |
| 100 | | * | | Clayton Williams Energy, Inc | | | 3,454 |
| 303 | | * | | CNX Gas Corp | | | 9,090 |
| 284 | | * | | Complete Production Services, Inc | | | 6,714 |
| 432 | | * | | Comstock Resources, Inc | | | 12,900 |
| 80 | | * | | Dawson Geophysical Co | | | 2,462 |
| 399 | | | | Delta & Pine Land Co | | | 11,731 |
88
TIAA-CREF LIFE FUNDS - Stock Index Fund
| | | | | | | |
SHARES
| | | | COMPANY
| | VALUE
|
| | | |
| 500 | | * | | Delta Petroleum Corp | | $ | 8,565 |
| 1,296 | | * | | Denbury Resources, Inc | | | 41,044 |
| 4,785 | | | | Devon Energy Corp | | | 289,062 |
| 630 | | | | Diamond Offshore Drilling, Inc | | | 52,876 |
| 300 | | * | | Edge Petroleum Corp | | | 5,994 |
| 520 | | * | | Encore Acquisition Co | | | 13,952 |
| 464 | | * | | Energy Partners Ltd | | | 8,793 |
| 1,653 | | | | ENSCO International, Inc | | | 76,071 |
| 1,290 | | | | Equitable Resources, Inc | | | 43,215 |
| 420 | | * | | EXCO Resources, Inc | | | 4,788 |
| 311 | | * | | Exploration Co of Delaware, Inc | | | 3,315 |
| 559 | | * | | Forest Oil Corp | | | 18,536 |
| 1,187 | | * | | Gasco Energy, Inc | | | 5,282 |
| 900 | | * | | Global Industries Ltd | | | 15,030 |
| 87 | | * | | GMX Resources, Inc | | | 2,690 |
| 111 | | * | | Goodrich Petroleum Corp | | | 3,151 |
| 2,200 | | * | | Grey Wolf, Inc | | | 16,940 |
| 5,616 | | | | Halliburton Co | | | 416,763 |
| 1,111 | | * | | Hanover Compressor Co | | | 20,865 |
| 318 | | * | | Harvest Natural Resources, Inc | | | 4,306 |
| 856 | | * | | Helix Energy Solutions Group, Inc | | | 34,548 |
| 586 | | | | Helmerich & Payne, Inc | | | 35,312 |
| 200 | | * | | Hercules Offshore, Inc | | | 7,000 |
| 291 | | * | | Houston Exploration Co | | | 17,806 |
| 607 | | * | | KCS Energy, Inc | | | 18,028 |
| 793 | | * | | Mariner Energy, Inc | | | 14,567 |
| 254 | | * | | McMoRan Exploration Co | | | 4,470 |
| 910 | | * | | Meridian Resource Corp | | | 3,185 |
| 173 | | * | | Metretek Technologies, Inc | | | 2,972 |
| 1,914 | | * | | National Oilwell Varco, Inc | | | 121,194 |
| 1,371 | | * | | Newfield Exploration Co | | | 67,097 |
| 1,000 | | * | | Newpark Resources, Inc | | | 6,150 |
| 1,948 | | | | Noble Energy, Inc | | | 91,283 |
| 548 | | * | | Oceaneering International, Inc | | | 25,126 |
| 522 | | * | | Parallel Petroleum Corp | | | 12,899 |
| 1,200 | | * | | Parker Drilling Co | | | 8,616 |
| 1,800 | | | | Patterson-UTI Energy, Inc | | | 50,958 |
| 556 | | * | | PetroHawk Energy Corp | | | 7,006 |
| 165 | | * | | Petroleum Development Corp | | | 6,221 |
| 435 | | * | | Petroquest Energy, Inc | | | 5,342 |
| 452 | | * | | Pioneer Drilling Co | | | 6,979 |
| 1,444 | | | | Pioneer Natural Resources Co | | | 67,016 |
| 819 | | * | | Plains Exploration & Production Co | | | 33,202 |
| 664 | | | | Pogo Producing Co | | | 30,610 |
| 1,760 | | * | | Pride International, Inc | | | 54,965 |
| 209 | | * | | Quest Resource Corp | | | 2,832 |
| 679 | | * | | Quicksilver Resources, Inc | | | 24,994 |
| 1,430 | | | | Range Resources Corp | | | 38,882 |
| 315 | | * | | Remington Oil & Gas Corp | | | 13,851 |
| 607 | | * | | Rosetta Resources, Inc | | | 10,088 |
| 1,179 | | | | Rowan Cos, Inc | | | 41,961 |
| 225 | | | | RPC, Inc | | | 5,463 |
| 245 | | * | | SEACOR Holdings, Inc | | | 20,115 |
| 1,884 | | * | | Southwestern Energy Co | | | 58,705 |
| 600 | | | | St. Mary Land & Exploration Co | | | 24,150 |
| 296 | | * | | Stone Energy Corp | | | 13,779 |
| 373 | | * | | Sulphco, Inc | | | 2,671 |
89
TIAA-CREF LIFE FUNDS - Stock Index Fund
| | | | | | | |
SHARES
| | | | COMPANY
| | VALUE
|
| | | |
| 821 | | * | | Superior Energy Services | | $ | 27,832 |
| 70 | | * | | Superior Well Services, Inc | | | 1,743 |
| 270 | | * | | Swift Energy Co | | | 11,591 |
| 391 | | * | | Syntroleum Corp | | | 2,373 |
| 810 | | * | | Tetra Technologies, Inc | | | 24,535 |
| 665 | | | | Tidewater, Inc | | | 32,718 |
| 672 | | | | Todco | | | 27,451 |
| 248 | | * | | Toreador Resources Corp | | | 6,976 |
| 754 | | * | | Transmeridian Exploration, Inc | | | 4,298 |
| 500 | | * | | Transmontaigne, Inc | | | 5,605 |
| 127 | | * | | Trico Marine Services, Inc | | | 4,318 |
| 300 | | * | | Union Drilling, Inc | | | 4,458 |
| 486 | | * | | Unit Corp | | | 27,649 |
| 621 | | * | | Vaalco Energy, Inc | | | 6,061 |
| 350 | | * | | Veritas DGC, Inc | | | 18,053 |
| 136 | | | | W&T Offshore, Inc | | | 5,289 |
| 580 | | * | | Warren Resources, Inc | | | 8,329 |
| 104 | | * | | Warrior Energy Service Corp | | | 2,530 |
| 347 | | * | | W-H Energy Services, Inc | | | 17,638 |
| 413 | | * | | Whiting Petroleum Corp | | | 17,292 |
| 3,962 | | | | XTO Energy, Inc | | | 175,398 |
| | | | | | |
|
|
| | | | | TOTAL OIL AND GAS EXTRACTION | | 3,723,066 |
| | | | | | |
|
|
| PAPER AND ALLIED PRODUCTS - 0.52% | | |
| 1,090 | | | | Bemis Co | | | 33,376 |
| 591 | | | | Bowater, Inc | | | 13,445 |
| 600 | | * | | Buckeye Technologies, Inc | | | 4,584 |
| 200 | | * | | Caraustar Industries, Inc | | | 1,800 |
| 676 | | * | | Cenveo, Inc | | | 12,134 |
| 151 | | | | Chesapeake Corp | | | 2,478 |
| 397 | | | | Glatfelter | | | 6,300 |
| 556 | | * | | Graphic Packaging Corp | | | 2,107 |
| 166 | | | | Greif, Inc (Class A) | | | 12,443 |
| 5,432 | | | | International Paper Co | | | 175,454 |
| 5,001 | | | | Kimberly-Clark Corp | | | 308,562 |
| 500 | | | | Longview Fibre Co | | | 9,545 |
| 2,052 | | | | MeadWestvaco Corp | | | 57,312 |
| 500 | | * | | Mercer International, Inc | | | 4,340 |
| 162 | | | | Neenah Paper, Inc | | | 4,933 |
| 886 | | | | Packaging Corp of America | | | 19,510 |
| 424 | | * | | Playtex Products, Inc | | | 4,422 |
| 390 | | | | Rock-Tenn Co (Class A) | | | 6,221 |
| 136 | | | | Schweitzer-Mauduit International, Inc | | | 2,944 |
| 2,686 | | * | | Smurfit-Stone Container Corp | | | 29,385 |
| 1,093 | | | | Sonoco Products Co | | | 34,593 |
| 1,238 | | | | Temple-Inland, Inc | | | 53,073 |
| 334 | | | | Wausau Paper Corp | | | 4,158 |
| | | | | | |
|
|
| | | | | TOTAL PAPER AND ALLIED PRODUCTS | | 803,119 |
| | | | | | |
|
|
| PERSONAL SERVICES - 0.16% | | |
| 1,556 | | | | Cintas Corp | | | 61,867 |
| 300 | | | | Coinmach Service Corp | | | 3,075 |
| 300 | | * | | Coinstar, Inc | | | 7,182 |
| 187 | | | | G & K Services, Inc (Class A) | | | 6,414 |
| 3,572 | | | | H&R Block, Inc | | | 85,228 |
| 500 | | | | Jackson Hewitt Tax Service, Inc | | | 15,675 |
| 542 | | | | Regis Corp | | | 19,301 |
90
TIAA-CREF LIFE FUNDS - Stock Index Fund
| | | | | | | |
SHARES
| | | | COMPANY
| | VALUE
|
| | | |
| 3,415 | | | | Service Corp International | | $ | 27,798 |
| 100 | | | | Unifirst Corp | | | 3,450 |
| 450 | | | | Weight Watchers International, Inc | | | 18,401 |
| | | | | | |
|
|
| | | | | TOTAL PERSONAL SERVICES | | 248,391 |
| | | | | | |
|
|
| PETROLEUM AND COAL PRODUCTS - 5.75% | | |
| 200 | | | | Alon USA Energy, Inc | | | 6,294 |
| 692 | | | | Ashland, Inc | | | 46,156 |
| 24,113 | | | | Chevron Corp | | | 1,496,453 |
| 17,956 | | | | ConocoPhillips | | | 1,176,657 |
| 200 | | | | ElkCorp | | | 5,554 |
| 2,639 | | | | EOG Resources, Inc | | | 182,988 |
| 65,820 | | | | Exxon Mobil Corp | | | 4,038,057 |
| 1,200 | | | | Frontier Oil Corp | | | 38,880 |
| 150 | | * | | Giant Industries, Inc | | | 9,983 |
| 474 | | * | | Headwaters, Inc | | | 12,115 |
| 2,633 | | | | Hess Corp | | | 139,154 |
| 524 | | | | Holly Corp | | | 25,257 |
| 2,479 | | | | Kerr-McGee Corp | | | 171,919 |
| 3,969 | | | | Marathon Oil Corp | | | 330,618 |
| 2,029 | | | | Murphy Oil Corp | | | 113,340 |
| 4,659 | | | | Occidental Petroleum Corp | | | 477,780 |
| 1,474 | | | | Sunoco, Inc | | | 102,133 |
| 747 | | | | Tesoro Corp | | | 55,547 |
| 6,694 | | | | Valero Energy Corp | | | 445,285 |
| 174 | | | | WD-40 Co | | | 5,841 |
| 170 | | | | Western Refining, Inc | | | 3,669 |
| | | | | | |
|
|
| | | | | TOTAL PETROLEUM AND COAL PRODUCTS | | 8,883,680 |
| | | | | | |
|
|
| PRIMARY METAL INDUSTRIES - 1.04% | | |
| 1,400 | | * | | AK Steel Holding Corp | | | 19,362 |
| 9,466 | | | | Alcoa, Inc | | | 306,320 |
| 400 | | * | | Aleris International, Inc | | | 18,340 |
| 1,122 | | | | Allegheny Technologies, Inc | | | 77,687 |
| 400 | | | | Belden CDT, Inc | | | 13,220 |
| 300 | | * | | Brush Engineered Materials, Inc | | | 6,255 |
| 260 | | | | Carpenter Technology Corp | | | 30,030 |
| 256 | | * | | Century Aluminum Co | | | 9,137 |
| 241 | | * | | Chaparral Steel Co | | | 17,357 |
| 572 | | * | | CommScope, Inc | | | 17,972 |
| 16,945 | | * | | Corning, Inc | | | 409,900 |
| 255 | | * | | Encore Wire Corp | | | 9,165 |
| 490 | | * | | General Cable Corp | | | 17,150 |
| 250 | | | | Gibraltar Industries, Inc | | | 7,250 |
| 649 | | | | Hubbell, Inc (Class B) | | | 30,925 |
| 355 | | * | | Lone Star Technologies, Inc | | | 19,177 |
| 337 | | | | Matthews International Corp (Class A) | | | 11,616 |
| 443 | | * | | Maverick Tube Corp | | | 27,993 |
| 372 | | | | Mueller Industries, Inc | | | 12,287 |
| 300 | | * | | NS Group, Inc | | | 16,524 |
| 3,427 | | | | Nucor Corp | | | 185,915 |
| 89 | | | | Olympic Steel, Inc | | | 3,150 |
| 422 | | * | | Oregon Steel Mills, Inc | | | 21,379 |
| 1,471 | | | | Precision Castparts Corp | | | 87,907 |
| 450 | | | | Quanex Corp | | | 19,382 |
| 240 | | * | | RTI International Metals, Inc | | | 13,402 |
| 281 | | | | Schnitzer Steel Industries, Inc (Class A) | | | 9,970 |
91
TIAA-CREF LIFE FUNDS - Stock Index Fund
| | | | | | | |
SHARES
| | | | COMPANY
| | VALUE
|
| | | |
| 530 | | | | Steel Dynamics, Inc | | $ | 34,842 |
| 200 | | | | Steel Technologies, Inc | | | 3,888 |
| 179 | | * | | Superior Essex, Inc | | | 5,357 |
| 241 | | | | Texas Industries, Inc | | | 12,797 |
| 807 | | * | | Titanium Metals Corp | | | 27,745 |
| 314 | | | | Tredegar Corp | | | 4,967 |
| 1,205 | | | | United States Steel Corp | | | 84,495 |
| 200 | | * | | Wheeling-Pittsburgh Corp | | | 3,978 |
| 735 | | | | Worthington Industries, Inc | | | 15,398 |
| | | | | | |
|
|
| | | | | TOTAL PRIMARY METAL INDUSTRIES | | 1,612,239 |
| | | | | | |
|
|
| PRINTING AND PUBLISHING - 0.63% | | |
| 464 | | * | | ACCO Brands Corp | | | 10,162 |
| 600 | | | | American Greetings Corp (Class A) | | | 12,606 |
| 230 | | | | Banta Corp | | | 10,656 |
| 1,146 | | | | Belo (A.H.) Corp Series A | | | 17,878 |
| 300 | | | | Bowne & Co, Inc | | | 4,290 |
| 100 | | * | | Consolidated Graphics, Inc | | | 5,206 |
| 73 | | | | Courier Corp | | | 2,921 |
| 46 | | | | CSS Industries, Inc | | | 1,323 |
| 594 | | | | Dow Jones & Co, Inc | | | 20,796 |
| 721 | | * | | Dun & Bradstreet Corp | | | 50,239 |
| 269 | | | | Ennis, Inc | | | 5,294 |
| 961 | | | | EW Scripps Co | | | 41,458 |
| 2,587 | | | | Gannett Co, Inc | | | 144,691 |
| 700 | | | | Harte-Hanks, Inc | | | 17,948 |
| 621 | | | | Hollinger International, Inc | | | 4,987 |
| 268 | | | | John H Harland Co | | | 11,658 |
| 600 | | | | John Wiley & Sons, Inc (Class A) | | | 19,920 |
| 474 | | | | Journal Communications, Inc | | | 5,328 |
| 446 | | | | Journal Register Co | | | 3,996 |
| 478 | | | | Lee Enterprises, Inc | | | 12,882 |
| 239 | | * | | Martha Stewart Living Omnimedia, Inc (Class A) | | | 3,994 |
| 671 | | | | McClatchy Co (Class A) | | | 26,921 |
| 3,927 | | | | McGraw-Hill Cos, Inc | | | 197,253 |
| 232 | | | | Media General, Inc (Class A) | | | 9,718 |
| 387 | | | | Meredith Corp | | | 19,172 |
| 1,452 | | | | New York Times Co (Class A) | | | 35,632 |
| 100 | | * | | Playboy Enterprises, Inc (Class B) | | | 998 |
| 300 | | * | | Presstek, Inc | | | 2,793 |
| 1,202 | | * | | Primedia, Inc | | | 2,200 |
| 645 | | | | R.H. Donnelley Corp | | | 34,875 |
| 2,310 | | | | R.R. Donnelley & Sons Co | | | 73,805 |
| 973 | | | | Reader’s Digest Association, Inc (Class A) | | | 13,583 |
| 100 | | | | Schawk, Inc | | | 1,750 |
| 300 | | * | | Scholastic Corp | | | 7,791 |
| 235 | | | | Standard Register Co | | | 2,785 |
| 2,617 | | | | Tribune Co | | | 84,869 |
| 554 | | * | | Valassis Communications, Inc | | | 13,069 |
| 57 | | | | Washington Post Co (Class B) | | | 44,461 |
| | | | | | |
|
|
| | | | | TOTAL PRINTING AND PUBLISHING | | 979,908 |
| | | | | | |
|
|
| RAILROAD TRANSPORTATION - 0.68% | | |
| 3,995 | | | | Burlington Northern Santa Fe Corp | | | 316,604 |
| 2,411 | | | | CSX Corp | | | 169,831 |
| 342 | | | | Florida East Coast Industries | | | 17,897 |
| 369 | | * | | Genesee & Wyoming, Inc (Class A) | | | 13,088 |
92
TIAA-CREF LIFE FUNDS - Stock Index Fund
| | | | | | | |
SHARES
| | | | COMPANY
| | VALUE
|
| | | |
| 850 | | * | | Kansas City Southern Industries, Inc | | $ | 23,545 |
| 4,511 | | | | Norfolk Southern Corp | | | 240,075 |
| 2,926 | | | | Union Pacific Corp | | | 272,001 |
| | | | | | |
|
|
| | | | | TOTAL RAILROAD TRANSPORTATION | | 1,053,041 |
| | | | | | |
|
|
| REAL ESTATE - 0.12% | | |
| 367 | | * | | Alderwoods Group, Inc | | | 7,142 |
| 82 | | * | | California Coastal Communities, Inc | | | 2,624 |
| 2,010 | | * | | CB Richard Ellis Group, Inc | | | 50,049 |
| 59 | | | | Consolidated-Tomoka Land Co | | | 3,253 |
| 760 | | | | Forest City Enterprises, Inc (Class A) | | | 37,932 |
| 389 | | | | Jones Lang LaSalle, Inc | | | 34,057 |
| 803 | | | | St. Joe Co | | | 37,372 |
| 1,142 | | | | Stewart Enterprises, Inc (Class A) | | | 6,567 |
| 325 | | * | | Trammell Crow Co | | | 11,430 |
| | | | | | |
|
|
| | | | | TOTAL REAL ESTATE | | 190,426 |
| | | | | | |
|
|
| RUBBER AND MISCELLANEOUS PLASTIC PRODUCT - 0.15% | | |
| 78 | | * | | AEP Industries, Inc | | | 2,607 |
| 101 | | * | | Applied Films Corp | | | 2,877 |
| 600 | | | | Cooper Tire & Rubber Co | | | 6,684 |
| 100 | | * | | Deckers Outdoor Corp | | | 3,856 |
| 1,761 | | * | | Goodyear Tire & Rubber Co | | | 19,547 |
| 626 | | * | | Jarden Corp | | | 19,062 |
| 3,056 | | | | Newell Rubbermaid, Inc | | | 78,936 |
| 115 | | | | PW Eagle, Inc | | | 3,478 |
| 353 | | | | Schulman (A.), Inc | | | 8,080 |
| 891 | | | | Sealed Air Corp | | | 46,403 |
| 310 | | * | | Skechers U.S.A., Inc (Class A) | | | 7,474 |
| 267 | | | | Spartech Corp | | | 6,034 |
| 200 | | | | Titan International, Inc | | | 3,742 |
| 122 | | * | | Trex Co, Inc | | | 3,159 |
| 661 | | | | Tupperware Corp | | | 13,015 |
| 331 | | | | West Pharmaceutical Services, Inc | | | 12,009 |
| | | | | | |
|
|
| | | | | TOTAL RUBBER AND MISCELLANEOUS PLASTIC PRODUCT | | 236,963 |
| | | | | | |
|
|
| SECURITY AND COMMODITY BROKERS - 2.83% | | |
| 850 | | | | A.G. Edwards, Inc | | | 47,022 |
| 2,353 | | | | Ameriprise Financial, Inc | | | 105,109 |
| 1,313 | | | | Bear Stearns Cos, Inc | | | 183,925 |
| 215 | | | | BlackRock, Inc | | | 29,922 |
| 200 | | | | Calamos Asset Management, Inc (Class A) | | | 5,798 |
| 575 | | * | | Cbot Holdings, Inc | | | 68,764 |
| 11,423 | | | | Charles Schwab Corp | | | 182,540 |
| 377 | | | | Chicago Mercantile Exchange Holdings, Inc | | | 185,164 |
| 144 | | | | Cohen & Steers, Inc | | | 3,398 |
| 4,641 | | * | | E*Trade Financial Corp | | | 105,908 |
| 1,507 | | | | Eaton Vance Corp | | | 37,615 |
| 943 | | | | Federated Investors, Inc (Class B) | | | 29,705 |
| 1,856 | | | | Franklin Resources, Inc | | | 161,119 |
| 69 | | | | GAMCO Investors, Inc | | | 2,536 |
| 100 | | * | | GFI Group, Inc | | | 5,395 |
| 4,166 | | | | Goldman Sachs Group, Inc | | | 626,691 |
| 191 | | | | Greenhill & Co, Inc | | | 11,605 |
| 200 | | * | | IntercontinentalExchange, Inc | | | 11,588 |
| 416 | | | | International Securities Exchange, Inc | | | 15,837 |
| 452 | | * | | Investment Technology Group, Inc | | | 22,989 |
93
TIAA-CREF LIFE FUNDS - Stock Index Fund
| | | | | | | |
SHARES
| | | | COMPANY
| | VALUE
|
| | | |
| 2,426 | | | | Janus Capital Group, Inc | | $ | 43,425 |
| 1,289 | | | | Jefferies Group, Inc | | | 38,193 |
| 1,234 | | * | | Knight Capital Group, Inc | | | 18,794 |
| 600 | | * | | LaBranche & Co, Inc | | | 7,266 |
| 1,387 | | | | Legg Mason, Inc | | | 138,034 |
| 5,865 | | | | Lehman Brothers Holdings, Inc | | | 382,105 |
| 239 | | * | | MarketAxess Holdings, Inc | | | 2,631 |
| 10,069 | | | | Merrill Lynch & Co, Inc | | | 700,400 |
| 11,652 | | | | Morgan Stanley | | | 736,523 |
| 154 | | * | | Morningstar, Inc | | | 6,388 |
| 1,026 | | * | | Nasdaq Stock Market, Inc | | | 30,677 |
| 861 | | | | Nuveen Investments, Inc | | | 37,066 |
| 1,695 | | * | | NYSE Group, Inc | | | 116,074 |
| 300 | | | | optionsXpress Holdings, Inc | | | 6,993 |
| 190 | | * | | Piper Jaffray Cos | | | 11,630 |
| 970 | | | | Raymond James Financial, Inc | | | 29,362 |
| 680 | | | | SEI Investments Co | | | 33,238 |
| 100 | | * | | Stifel Financial Corp | | | 3,531 |
| 121 | | | | SWS Group, Inc | | | 2,919 |
| 2,894 | | | | T Rowe Price Group, Inc | | | 109,422 |
| 3,706 | | | | TD Ameritrade Holding Corp | | | 54,886 |
| 200 | | * | | Thomas Weisel Partners Group, Inc | | | 3,802 |
| 877 | | | | Waddell & Reed Financial, Inc (Class A) | | | 18,031 |
| | | | | | |
|
|
| | | | | TOTAL SECURITY AND COMMODITY BROKERS | | 4,374,020 |
| | | | | | |
|
|
| SOCIAL SERVICES - 0.01% | | |
| 250 | | * | | Bright Horizons Family Solutions, Inc | | | 9,423 |
| 236 | | * | | Capital Senior Living Corp | | | 2,426 |
| 97 | | * | | Providence Service Corp | | | 2,641 |
| 319 | | * | | Res-Care, Inc | | | 6,380 |
| | | | | | |
|
|
| | | | | TOTAL SOCIAL SERVICES | | 20,870 |
| | | | | | |
|
|
| SPECIAL TRADE CONTRACTORS - 0.06% | | |
| 100 | | | | Alico, Inc | | | 5,511 |
| 266 | | | | Chemed Corp | | | 14,505 |
| 409 | | | | Comfort Systems USA, Inc | | | 5,845 |
| 596 | | * | | Dycom Industries, Inc | | | 12,689 |
| 372 | | * | | EMCOR Group, Inc | | | 18,105 |
| 400 | | * | | Insituform Technologies, Inc (Class A) | | | 9,156 |
| 167 | | * | | Integrated Electrical Services, Inc | | | 2,917 |
| 120 | | * | | Layne Christensen Co | | | 3,402 |
| 1,376 | | * | | Quanta Services, Inc | | | 23,846 |
| | | | | | |
|
|
| | | | | TOTAL SPECIAL TRADE CONTRACTORS | | 95,976 |
| | | | | | |
|
|
| STONE, CLAY, AND GLASS PRODUCTS - 0.09% | | |
| 311 | | | | Apogee Enterprises, Inc | | | 4,572 |
| 280 | | * | | Cabot Microelectronics Corp | | | 8,487 |
| 202 | | | | CARBO Ceramics, Inc | | | 9,924 |
| 582 | | | | Eagle Materials, Inc | | | 27,645 |
| 1,800 | | | | Gentex Corp | | | 25,200 |
| 1,609 | | * | | Owens-Illinois, Inc | | | 26,967 |
| 363 | | * | | US Concrete, Inc | | | 4,011 |
| 385 | | b* | | USG Corp | | | 28,078 |
| | | | | | |
|
|
| | | | | TOTAL STONE, CLAY, AND GLASS PRODUCTS | | 134,884 |
| | | | | | |
|
|
| TEXTILE MILL PRODUCTS - 0.01% | | |
| 200 | | | | Oxford Industries, Inc | | | 7,882 |
| 300 | | | | Xerium Technologies, Inc | | | 2,826 |
| | | | | | |
|
|
| | | | | TOTAL TEXTILE MILL PRODUCTS | | 10,708 |
| | | | | | |
|
|
94
TIAA-CREF LIFE FUNDS - Stock Index Fund
| | | | | | | |
SHARES
| | | | COMPANY
| | VALUE
|
| |
| TOBACCO PRODUCTS - 1.18% | | |
| 22,717 | | | | Altria Group, Inc | | $ | 1,668,109 |
| 1,015 | | | | Loews Corp (Carolina Group) | | | 52,141 |
| 341 | | | | Universal Corp | | | 12,692 |
| 1,757 | | | | UST, Inc | | | 79,399 |
| 254 | | | | Vector Group Ltd | | | 4,128 |
| | | | | | |
|
|
| | | | | TOTAL TOBACCO PRODUCTS | | 1,816,469 |
| | | | | | |
|
|
| TRANSPORTATION BY AIR - 0.53% | | |
| 608 | | * | | ABX Air, Inc | | | 3,672 |
| 114 | | * | | Air Methods Corp | | | 2,985 |
| 995 | | * | | Airtran Holdings, Inc | | | 14,786 |
| 458 | | * | | Alaska Air Group, Inc | | | 18,054 |
| 2,294 | | * | | AMR Corp | | | 58,313 |
| 218 | | * | | Atlas Air Worldwide Holdings, Inc | | | 10,691 |
| 281 | | * | | Bristow Group, Inc | | | 10,116 |
| 920 | | * | | Continental Airlines, Inc (Class B) | | | 27,416 |
| 356 | | * | | EGL, Inc | | | 17,871 |
| 622 | | * | | ExpressJet Holdings, Inc | | | 4,298 |
| 3,336 | | | | FedEx Corp | | | 389,845 |
| 550 | | * | | Frontier Airlines Holdings, Inc | | | 3,966 |
| 1,884 | | * | | JetBlue Airways Corp | | | 22,872 |
| 200 | | * | | Mesa Air Group, Inc | | | 1,970 |
| 149 | | * | | PHI, Inc | | | 4,947 |
| 300 | | * | | Republic Airways Holdings, Inc | | | 5,106 |
| 692 | | | | Skywest, Inc | | | 17,162 |
| 8,410 | | | | Southwest Airlines Co | | | 137,672 |
| 1,065 | | * | | UAL Corp | | | 33,036 |
| 661 | | * | | US Airways Group, Inc | | | 33,407 |
| | | | | | |
|
|
| | | | | TOTAL TRANSPORTATION BY AIR | | 818,185 |
| | | | | | |
|
|
| TRANSPORTATION EQUIPMENT - 2.62% | | |
| 335 | | * | | AAR Corp | | | 7,447 |
| 300 | | * | | Accuride Corp | | | 3,741 |
| 148 | | * | | Aftermarket Technology Corp | | | 3,678 |
| 449 | | | | American Axle & Manufacturing Holdings, Inc | | | 7,682 |
| 90 | | | | American Railcar Industries, Inc | | | 2,980 |
| 223 | | | | A.O. Smith Corp | | | 10,338 |
| 200 | | | | Arctic Cat, Inc | | | 3,902 |
| 365 | | * | | Armor Holdings, Inc | | | 20,013 |
| 738 | | | | ArvinMeritor, Inc | | | 12,686 |
| 939 | | | | Autoliv, Inc | | | 53,119 |
| 356 | | * | | Aviall, Inc | | | 16,917 |
| 8,698 | | | | Boeing Co | | | 712,453 |
| 1,075 | | | | Brunswick Corp | | | 35,744 |
| 540 | | | | Clarcor, Inc | | | 16,087 |
| 520 | | | | Federal Signal Corp | | | 7,873 |
| 570 | | * | | Fleetwood Enterprises, Inc | | | 4,298 |
| 19,288 | | | | Ford Motor Co | | | 133,666 |
| 100 | | | | Freightcar America, Inc | | | 5,551 |
| 575 | | * | | GenCorp, Inc | | | 9,217 |
| 4,406 | | | | General Dynamics Corp | | | 288,417 |
| 5,100 | | | | General Motors Corp | | | 151,929 |
| 111 | | * | | GenTek, Inc | | | 2,980 |
95
TIAA-CREF LIFE FUNDS - Stock Index Fund
| | | | | | | |
SHARES
| | | | COMPANY
| | VALUE
|
| | | |
| 1,878 | | | | Genuine Parts Co | | $ | 78,237 |
| 1,292 | | | | Goodrich Corp | | | 52,055 |
| 110 | | | | Greenbrier Cos, Inc | | | 3,601 |
| 300 | | | | Group 1 Automotive, Inc | | | 16,902 |
| 2,922 | | | | Harley-Davidson, Inc | | | 160,389 |
| 468 | | | | Harsco Corp | | | 36,485 |
| 225 | | | | Heico Corp | | | 6,379 |
| 239 | | * | | IMPCO Technologies, Inc | | | 2,550 |
| 2,050 | | | | ITT Industries, Inc | | | 101,475 |
| 1,080 | | | | JLG Industries, Inc | | | 24,300 |
| 200 | | * | | K&F Industries Holdings, Inc | | | 3,546 |
| 200 | | | | Kaman Corp (Class A) | | | 3,640 |
| 3,984 | | | | Lockheed Martin Corp | | | 285,812 |
| 483 | | | | Martin Marietta Materials, Inc | | | 44,025 |
| 220 | | | | Monaco Coach Corp | | | 2,794 |
| 654 | | * | | Navistar International Corp | | | 16,095 |
| 3,739 | | | | Northrop Grumman Corp | | | 239,520 |
| 485 | | * | | Orbital Sciences Corp | | | 7,828 |
| 768 | | | | Oshkosh Truck Corp | | | 36,495 |
| 1,860 | | | | Paccar, Inc | | | 153,227 |
| 1,642 | | * | | Pactiv Corp | | | 40,640 |
| 457 | | | | Polaris Industries, Inc | | | 19,788 |
| 4,855 | | | | Raytheon Co | | | 216,387 |
| 89 | | * | | Sequa Corp (Class A) | | | 7,254 |
| 200 | | | | Superior Industries International, Inc | | | 3,658 |
| 547 | | * | | Tenneco, Inc | | | 14,222 |
| 1,413 | | | | Textron, Inc | | | 130,250 |
| 400 | | | | Thor Industries, Inc | | | 19,380 |
| 122 | | * | | TransDigm Group, Inc | | | 2,922 |
| 804 | | | | Trinity Industries, Inc | | | 32,482 |
| 229 | | * | | Triumph Group, Inc | | | 10,992 |
| 456 | | * | | TRW Automotive Holdings Corp | | | 12,440 |
| 10,997 | | | | United Technologies Corp | | | 697,430 |
| 1,603 | | * | | Visteon Corp | | | 11,558 |
| 270 | | | | Wabash National Corp | | | 4,147 |
| 492 | | | | Westinghouse Air Brake Technologies Corp | | | 18,401 |
| 353 | | | | Winnebago Industries, Inc | | | 10,957 |
| | | | | | |
|
|
| | | | | TOTAL TRANSPORTATION EQUIPMENT | | 4,038,981 |
| | | | | | |
|
|
| TRANSPORTATION SERVICES - 0.22% | | |
| 184 | | | | Ambassadors Group, Inc | | | 5,314 |
| 1,891 | | | | CH Robinson Worldwide, Inc | | | 100,790 |
| 121 | | * | | Dynamex, Inc | | | 2,639 |
| 2,382 | | | | Expeditors International Washington, Inc | | | 133,416 |
| 538 | | | | GATX Corp | | | 22,865 |
| 500 | | * | | HUB Group, Inc | | | 12,265 |
| 711 | | | | Lear Corp | | | 15,791 |
| 169 | | * | | Navigant International, Inc | | | 2,709 |
| 400 | | | | Pacer International, Inc | | | 13,032 |
| 262 | | * | | RailAmerica, Inc | | | 2,741 |
| 1,430 | | | | Sabre Holdings Corp | | | 31,460 |
| | | | | | |
|
|
| | | | | TOTAL TRANSPORTATION SERVICES | | 343,022 |
| | | | | | |
|
|
| TRUCKING AND WAREHOUSING - 0.52% | | |
| 300 | | | | Arkansas Best Corp | | | 15,063 |
| 250 | | * | | Celadon Group, Inc | | | 5,510 |
| 612 | | | | Con-way, Inc | | | 35,453 |
96
TIAA-CREF LIFE FUNDS - Stock Index Fund
| | | | | | | |
SHARES
| | | | COMPANY
| | VALUE
|
| | | |
| 289 | | | | Forward Air Corp | | $ | 11,771 |
| 770 | | | | Heartland Express, Inc | | | 13,775 |
| 1,272 | | | | J.B. Hunt Transport Services, Inc | | | 31,686 |
| 690 | | | | Landstar System, Inc | | | 32,589 |
| 160 | | * | | Marten Transport Ltd | | | 3,478 |
| 262 | | * | | Old Dominion Freight Line | | | 9,849 |
| 60 | | * | | P.A.M. Transportation Services, Inc | | | 1,733 |
| 133 | | * | | SCS Transportation, Inc | | | 3,661 |
| 215 | | * | | SIRVA, Inc | | | 1,391 |
| 579 | | * | | Swift Transportation Co, Inc | | | 18,389 |
| 200 | | * | | U.S. Xpress Enterprises, Inc (Class A) | | | 5,404 |
| 6,896 | | | | United Parcel Service, Inc (Class B) | | | 567,748 |
| 200 | | * | | USA Truck, Inc | | | 3,564 |
| 457 | | | | Werner Enterprises, Inc | | | 9,263 |
| 611 | | * | | YRC Worldwide, Inc | | | 25,729 |
| | | | | | |
|
|
| | | | | TOTAL TRUCKING AND WAREHOUSING | | 796,056 |
| | | | | | |
|
|
| WATER TRANSPORTATION - 0.06% | | |
| 464 | | | | Alexander & Baldwin, Inc | | | 20,541 |
| 336 | | * | | American Commercial Lines, Inc | | | 20,244 |
| 200 | | * | | Gulfmark Offshore, Inc | | | 5,166 |
| 151 | | | | Horizon Lines, Inc | | | 2,419 |
| 253 | | * | | Hornbeck Offshore Services, Inc | | | 8,987 |
| 512 | | * | | Kirby Corp | | | 20,224 |
| 92 | | | | Maritrans, Inc | | | 2,291 |
| 300 | | | | Overseas Shipholding Group, Inc | | | 17,745 |
| | | | | | |
|
|
| | | | | TOTAL WATER TRANSPORTATION | | 97,617 |
| | | | | | |
|
|
| WHOLESALE TRADE-DURABLE GOODS - 2.83% | | |
| 1,016 | | | | Adesa, Inc | | | 22,596 |
| 400 | | | | Agilysys, Inc | | | 7,200 |
| 450 | | | | Applied Industrial Technologies, Inc | | | 10,940 |
| 1,374 | | * | | Arrow Electronics, Inc | | | 44,243 |
| 480 | | | | Barnes Group, Inc | | | 9,576 |
| 474 | | * | | Beacon Roofing Supply, Inc | | | 10,433 |
| 300 | | | | BlueLinx Holdings, Inc | | | 3,909 |
| 592 | | | | BorgWarner, Inc | | | 38,539 |
| 296 | | | | Building Material Holding Corp | | | 8,250 |
| 200 | | | | Castle (A.M.) & Co | | | 6,450 |
| 244 | | * | | Conceptus, Inc | | | 3,328 |
| 1,300 | | * | | Cytyc Corp | | | 32,968 |
| 400 | | * | | Digi International, Inc | | | 5,012 |
| 130 | | * | | Drew Industries, Inc | | | 4,212 |
| 113,124 | | | | General Electric Co | | | 3,728,567 |
| 480 | | * | | Genesis Microchip, Inc | | | 5,549 |
| 1,300 | | | | IKON Office Solutions, Inc | | | 16,380 |
| 1,526 | | * | | Ingram Micro, Inc (Class A) | | | 27,666 |
| 468 | | * | | Insight Enterprises, Inc | | | 8,915 |
| 297 | | * | | Interline Brands, Inc | | | 6,944 |
| 164 | | * | | Keystone Automotive Industries, Inc | | | 6,924 |
| 600 | | | | Knight Transportation, Inc | | | 12,120 |
| 45 | | | | Lawson Products, Inc | | | 1,774 |
| 489 | | * | | LKQ Corp | | | 9,291 |
| 300 | | * | | Merge Technologies, Inc | | | 3,693 |
| 100 | | * | | MWI Veterinary Supply, Inc | | | 3,643 |
| 1,319 | | | | Omnicare, Inc | | | 62,547 |
| 419 | | | | Owens & Minor, Inc | | | 11,983 |
97
TIAA-CREF LIFE FUNDS - Stock Index Fund
| | | | | | | |
SHARES
| | | | COMPANY
| | VALUE
|
| | | |
| 1,552 | | * | | Patterson Cos, Inc | | $ | 54,211 |
| 614 | | | | PEP Boys-Manny Moe & Jack | | | 7,202 |
| 567 | | | | Pool Corp | | | 24,738 |
| 731 | | * | | PSS World Medical, Inc | | | 12,902 |
| 335 | | | | Reliance Steel & Aluminum Co | | | 27,788 |
| 300 | | | | Ryerson Tull, Inc | | | 8,100 |
| 616 | | * | | Tech Data Corp | | | 23,599 |
| 296 | | * | | Tyler Technologies, Inc | | | 3,315 |
| 840 | | | | W.W. Grainger, Inc | | | 63,193 |
| 525 | | * | | WESCO International, Inc | | | 36,225 |
| 95 | | * | | West Marine, Inc | | | 1,281 |
| | | | | | |
|
|
| | | | | TOTAL WHOLESALE TRADE-DURABLE GOODS | | 4,376,206 |
| | | | | | |
|
|
| WHOLESALE TRADE-NONDURABLE GOODS - 0.79% | | |
| 736 | | | | Airgas, Inc | | | 27,416 |
| 850 | | | | Alliance One International, Inc | | | 3,774 |
| 503 | | * | | Allscripts Healthcare Solutions, Inc | | | 8,828 |
| 607 | | | | Brown-Forman Corp (Class B) | | | 43,370 |
| 4,552 | | | | Cardinal Health, Inc | | | 292,830 |
| 466 | | * | | Central European Distribution Corp | | | 11,725 |
| 108 | | * | | Core-Mark Holding Co, Inc | | | 3,866 |
| 1,480 | | * | | Dean Foods Co | | | 55,041 |
| 1,446 | | * | | Endo Pharmaceuticals Holdings, Inc | | | 47,689 |
| 100 | | * | | Green Mountain Coffee Roasters, Inc | | | 4,017 |
| 317 | | * | | Hain Celestial Group, Inc | | | 8,166 |
| 936 | | * | | Henry Schein, Inc | | | 43,739 |
| 100 | | | | Kenneth Cole Productions, Inc (Class A) | | | 2,233 |
| 330 | | | | K-Swiss, Inc (Class A) | | | 8,811 |
| 511 | | | | Men’s Wearhouse, Inc | | | 15,483 |
| 286 | | | | Myers Industries, Inc | | | 4,916 |
| 180 | | | | Nash Finch Co | | | 3,832 |
| 2,047 | | | | Nike, Inc (Class B) | | | 165,807 |
| 559 | | | | Nu Skin Enterprises, Inc (Class A) | | | 8,301 |
| 113 | | * | | Nuco2, Inc | | | 2,717 |
| 493 | | * | | Performance Food Group Co | | | 14,977 |
| 200 | | * | | Perry Ellis International, Inc | | | 5,062 |
| 4,897 | | | | Safeway, Inc | | | 127,322 |
| 241 | | * | | School Specialty, Inc | | | 7,676 |
| 100 | | * | | Smart & Final, Inc | | | 1,684 |
| 348 | | * | | Source Interlink Cos, Inc | | | 4,141 |
| 217 | | | | Spartan Stores, Inc | | | 3,175 |
| 400 | | | | Stride Rite Corp | | | 5,276 |
| 6,730 | | | | Sysco Corp | | | 205,669 |
| 1,240 | | * | | Terra Industries, Inc | | | 7,899 |
| 140 | | | | The Andersons, Inc | | | 5,825 |
| 390 | | * | | Tractor Supply Co | | | 21,555 |
| 433 | | * | | United Natural Foods, Inc | | | 14,298 |
| 360 | | * | | United Stationers, Inc | | | 17,755 |
| 100 | | | | Valhi, Inc | | | 2,455 |
| 143 | | * | | Volcom, Inc | | | 4,575 |
| | | | | | |
|
|
| | | | | TOTAL WHOLESALE TRADE-NONDURABLE GOODS | | 1,211,905 |
| | | | | | |
|
|
| | | | | TOTAL COMMON STOCKS (Cost $145,349,542) | | 154,145,342 |
| | | | | | |
|
|
98
TIAA-CREF LIFE FUNDS - Stock Index Fund
| | | | | | | |
PRINCIPAL
| | | | ISSUER
| | VALUE
|
| |
SHORT-TERM INVESTMENTS - 0.10% | | | |
| U.S. GOVERNMENT AND AGENCIES DISCOUNT NOTES - 0.10% | | |
| $ 150,000 | | | | Federal Home Loan Bank (FHLB) 4.950%, 07/03/06 | | $ | 150,000 |
| | | | | | |
|
|
| | | | | TOTAL SHORT-TERM INVESTMENTS (Cost $149,960) | | 150,000 |
| | | | | | |
|
|
| | | | | TOTAL PORTFOLIO - 99.95% (Cost $145,499,502) | | 154,295,342 |
| | | | | OTHER ASSETS & LIABILITIES, NET - 0.05% | | 84,083 |
| | | | | | �� |
|
|
| | | | | NET ASSETS - 100.00% | | $154,379,425 |
| | | | | | |
|
|
| ** | Percentage represents less than 0.01% |
| v | Security valued at fair value |
For ease of presentation, we have grouped a number of industry classification categories together in the Statement of Investments. Note that the Funds use more specific industry categories in following their investment limitations on industry concentration.
99
TIAA-CREF LIFE FUNDS - Social Choice Equity Fund
TIAA-CREF LIFE FUNDS
SOCIAL CHOICE EQUITY FUND
STATEMENT OF INVESTMENTS (Unaudited)
June 30, 2006
| | | | | | | |
SHARES
| | | | COMPANY
| | VALUE
|
| |
COMMON STOCKS - 99.62% | | | |
| AGRICULTURAL PRODUCTION-CROPS - 0.01% | | |
| 256 | | | | Chiquita Brands International, Inc | | $ | 3,528 |
| | | | | | |
|
|
| | | | | TOTAL AGRICULTURAL PRODUCTION-CROPS | | 3,528 |
| | | | | | |
|
|
| APPAREL AND ACCESSORY STORES - 0.78% | | |
| 400 | | | | American Eagle Outfitters, Inc | | | 13,616 |
| 89 | | * | | AnnTaylor Stores Corp | | | 3,861 |
| 100 | | * | | Charming Shoppes, Inc | | | 1,124 |
| 400 | | * | | Chico’s FAS, Inc | | | 10,792 |
| 400 | | | | Foot Locker, Inc | | | 9,796 |
| 3,091 | | | | Gap, Inc | | | 53,783 |
| 1,200 | | * | | Kohl’s Corp | | | 70,944 |
| 1,800 | | | | Limited Brands, Inc | | | 46,062 |
| 800 | | | | Nordstrom, Inc | | | 29,200 |
| 400 | | | | Ross Stores, Inc | | | 11,220 |
| 329 | | * | | Urban Outfitters, Inc | | | 5,754 |
| | | | | | |
|
|
| | | | | TOTAL APPAREL AND ACCESSORY STORES | | 256,152 |
| | | | | | |
|
|
| APPAREL AND OTHER TEXTILE PRODUCTS - 0.08% | | |
| 300 | | | | Liz Claiborne, Inc | | | 11,118 |
| 200 | | | | Phillips-Van Heusen Corp | | | 7,632 |
| 100 | | | | Polo Ralph Lauren Corp | | | 5,490 |
| 100 | | | | Russell Corp | | | 1,816 |
| | | | | | |
|
|
| | | | | TOTAL APPAREL AND OTHER TEXTILE PRODUCTS | | 26,056 |
| | | | | | |
|
|
| AUTO REPAIR, SERVICES AND PARKING - 0.03% | | |
| 67 | | | | Bandag, Inc | | | 2,452 |
| 68 | | | | Ryder System, Inc | | | 3,973 |
| 162 | | * | | Wright Express Corp | | | 4,656 |
| | | | | | |
|
|
| | | | | TOTAL AUTO REPAIR, SERVICES AND PARKING | | 11,081 |
| | | | | | |
|
|
| AUTOMOTIVE DEALERS AND SERVICE STATIONS - 0.08% | | |
| 200 | | * | | Autozone, Inc | | | 17,640 |
| 228 | | * | | Carmax, Inc | | | 8,085 |
| | | | | | |
|
|
| | | | | TOTAL AUTOMOTIVE DEALERS AND SERVICE STATIONS | | 25,725 |
| | | | | | |
|
|
| BUILDING MATERIALS AND GARDEN SUPPLIES - 1.22% | | |
| 7,028 | | | | Home Depot, Inc | | | 251,532 |
| 2,400 | | | | Lowe’s Cos, Inc | | | 145,608 |
| | | | | | |
|
|
| | | | | TOTAL BUILDING MATERIALS AND GARDEN SUPPLIES | | 397,140 |
| | | | | | |
|
|
| BUSINESS SERVICES - 5.91% | | |
| 622 | | * | | 24/7 Real Media, Inc | | | 5,461 |
| 140 | | * | | 3Com Corp | | | 717 |
| 1,241 | | * | | Activision, Inc | | | 14,123 |
| 1,494 | | * | | Adobe Systems, Inc | | | 45,358 |
| 257 | | * | | Akamai Technologies, Inc | | | 9,301 |
| 249 | | * | | Alliance Data Systems Corp | | | 14,646 |
| 181 | | * | | Altiris, Inc | | | 3,265 |
| 114 | | * | | aQuantive, Inc | | | 2,888 |
| 337 | | * | | Ariba, Inc | | | 2,774 |
| 1,116 | | * | | Art Technology Group, Inc | | | 3,326 |
| 659 | | * | | @Road, Inc | | | 3,638 |
| 372 | | * | | Audible, Inc | | | 3,381 |
| 400 | | * | | Autodesk, Inc | | | 13,784 |
100
TIAA-CREF LIFE FUNDS - Social Choice Equity Fund
| | | | | | | |
SHARES
| | | | COMPANY
| | VALUE
|
| | | |
| 3,083 | | | | Automatic Data Processing, Inc | | $ | 139,814 |
| 733 | | * | | BEA Systems, Inc | | | 9,595 |
| 744 | | * | | BearingPoint, Inc | | | 6,227 |
| 271 | | * | | BISYS Group, Inc | | | 3,713 |
| 100 | | * | | Blue Coat Systems, Inc | | | 1,686 |
| 370 | | * | | Bottomline Technologies, Inc | | | 3,012 |
| 200 | | * | | Cerner Corp | | | 7,422 |
| 100 | | * | | Checkfree Corp | | | 4,956 |
| 785 | | * | | Chordiant Software, Inc | | | 2,379 |
| 190 | | * | | Ciber, Inc | | | 1,252 |
| 377 | | * | | Click Commerce, Inc | | | 7,438 |
| 2,141 | | * | | CMGI, Inc | | | 2,591 |
| 274 | | * | | CNET Networks, Inc | | | 2,187 |
| 1,121 | | * | | Cogent Communications Group, Inc | | | 10,504 |
| 460 | | * | | Cogent, Inc | | | 6,932 |
| 593 | | * | | Compuware Corp | | | 3,973 |
| 700 | | * | | Convergys Corp | | | 13,650 |
| 100 | | * | | CSG Systems International, Inc | | | 2,474 |
| 157 | | * | | Digital River, Inc | | | 6,341 |
| 400 | | * | | DST Systems, Inc | | | 23,800 |
| 647 | | * | | Earthlink, Inc | | | 5,603 |
| 3,364 | | * | | eBay, Inc | | | 98,532 |
| 800 | | * | | Electronic Arts, Inc | | | 34,432 |
| 966 | | * | | Emdeon Corp | | | 11,988 |
| 100 | | * | | Equinix, Inc | | | 5,486 |
| 868 | | * | | Expedia, Inc | | | 12,994 |
| 169 | | | | Fair Isaac Corp | | | 6,136 |
| 700 | | * | | Fiserv, Inc | | | 31,752 |
| 46 | | * | | Getty Images, Inc | | | 2,921 |
| 396 | | * | | Google, Inc (Class A) | | | 166,055 |
| 200 | | | | Jack Henry & Associates, Inc | | | 3,932 |
| 111 | | * | | Hyperion Solutions Corp | | | 3,064 |
| 850 | | | | IMS Health, Inc | | | 22,823 |
| 257 | | * | | Infocrossing, Inc | | | 2,968 |
| 336 | | * | | Informatica Corp | | | 4,422 |
| 1,850 | | * | | Innovative Solutions & Support, Inc | | | 26,011 |
| 4,002 | | * | | Internap Network Services Corp | | | 4,202 |
| 171 | | * | | Internet Security Systems, Inc | | | 3,223 |
| 450 | | * | | Interwoven, Inc | | | 3,861 |
| 424 | | * | | Intuit, Inc | | | 25,605 |
| 246 | | * | | Iron Mountain, Inc | | | 9,195 |
| 136 | | * | | Jupitermedia Corp | | | 1,768 |
| 216 | | * | | Kanbay International, Inc | | | 3,141 |
| 464 | | * | | KFX, Inc | | | 7,090 |
| 200 | | * | | Kinetic Concepts, Inc | | | 8,830 |
| 300 | | * | | Lamar Advertising Co | | | 16,158 |
| 626 | | * | | Lawson Software, Inc | | | 4,194 |
| 242 | | * | | Lionbridge Technologies | | | 1,338 |
| 205 | | * | | Liquidity Services, Inc | | | 3,192 |
| 498 | | * | | Magma Design Automation, Inc | | | 3,660 |
| 100 | | | | Manpower, Inc | | | 6,460 |
| 249 | | * | | Marchex, Inc | | | 4,091 |
| 271 | | * | | Mentor Graphics Corp | | | 3,518 |
| 25,950 | | | | Microsoft Corp | | | 604,635 |
| 448 | | | | MoneyGram International, Inc | | | 15,210 |
| 544 | | * | | Monster Worldwide, Inc | | | 23,207 |
| 900 | | * | | Novell, Inc | | | 5,967 |
| 86 | | * | | Nuance Communications, Inc | | | 865 |
| 900 | | | | Omnicom Group, Inc | | | 80,181 |
| 457 | | * | | Opsware, Inc | | | 3,766 |
| 290 | | * | | Parametric Technology Corp | | | 3,686 |
| 268 | | * | | PDF Solutions, Inc | | | 3,326 |
| 72 | | * | | Portfolio Recovery Associates, Inc | | | 3,290 |
101
TIAA-CREF LIFE FUNDS - Social Choice Equity Fund
| | | | | | | |
SHARES
| | | | COMPANY
| | VALUE
|
| | | |
| 303 | | * | | Quest Software, Inc | | $ | 4,254 |
| 819 | | * | | RealNetworks, Inc | | | 8,763 |
| 600 | | | | Robert Half International, Inc | | | 25,200 |
| 254 | | * | | RSA Security, Inc | | | 6,906 |
| 200 | | * | | Salesforce.com, Inc | | | 5,332 |
| 500 | | * | | Sapient Corp | | | 2,650 |
| 411 | | | | ServiceMaster Co | | | 4,246 |
| 196 | | * | | Smith Micro Software, Inc | | | 3,140 |
| 231 | | * | | Sohu.com, Inc | | | 5,957 |
| 363 | | * | | SonicWALL, Inc | | | 3,263 |
| 1,340 | | * | | Sonus Networks, Inc | | | 6,633 |
| 520 | | * | | Spherion Corp | | | 4,742 |
| 600 | | | | Startek, Inc | | | 8,970 |
| 384 | | | | Stellent, Inc | | | 3,667 |
| 8,700 | | * | | Sun Microsystems, Inc | | | 36,105 |
| 173 | | * | | Sybase, Inc | | | 3,356 |
| 3,119 | | * | | Symantec Corp | | | 48,469 |
| 1,069 | | * | | TIBCO Software, Inc | | | 7,536 |
| 859 | | * | | Tiens Biotech Group USA, Inc | | | 3,677 |
| 700 | | | | Total System Services, Inc | | | 13,475 |
| 165 | | * | | Travelzoo, Inc | | | 5,006 |
| 600 | | * | | Unisys Corp | | | 3,768 |
| 249 | | | | United Online, Inc | | | 2,988 |
| 228 | | * | | United Rentals, Inc | | | 7,291 |
| 400 | | * | | Valueclick, Inc | | | 6,140 |
| 273 | | * | | Vasco Data Security International | | | 2,280 |
| 700 | | * | | VeriSign, Inc | | | 16,219 |
| 148 | | * | | WebEx Communications, Inc | | | 5,260 |
| 200 | | * | | WebSideStory, Inc | | | 2,440 |
| | | | | | |
|
|
| | | | | TOTAL BUSINESS SERVICES | | 1,933,119 |
| | | | | | |
|
|
| CHEMICALS AND ALLIED PRODUCTS - 9.82% | | |
| 5,406 | | | | Abbott Laboratories | | | 235,756 |
| 400 | | * | | Abraxis BioScience, Inc | | | 9,536 |
| 100 | | * | | Adolor Corp | | | 2,501 |
| 1,033 | | * | | ADVENTRX Pharmaceuticals, Inc | | | 3,275 |
| 1,900 | | | | Air Products & Chemicals, Inc | | | 121,448 |
| 100 | | * | | Alexion Pharmaceuticals, Inc | | | 3,612 |
| 100 | | * | | Alkermes, Inc | | | 1,892 |
| 4,111 | | * | | Amgen, Inc | | | 268,161 |
| 100 | | * | | Atherogenics, Inc | | | 1,305 |
| 89 | | * | | AVANIR Pharmaceuticals | | | 609 |
| 1,000 | | | | Avery Dennison Corp | | | 58,060 |
| 1,300 | | | | Avon Products, Inc | | | 40,300 |
| 525 | | * | | Barr Pharmaceuticals, Inc | | | 25,037 |
| 600 | | * | | Bentley Pharmaceuticals, Inc | | | 6,576 |
| 200 | | * | | Bioenvision, Inc | | | 1,066 |
| 400 | | * | | BioMarin Pharmaceuticals, Inc | | | 5,748 |
| 302 | | * | | Bradley Pharmaceuticals, Inc | | | 3,080 |
| 6,909 | | | | Bristol-Myers Squibb Co | | | 178,667 |
| 325 | | | | Cabot Corp | | | 11,219 |
| 420 | | * | | Caraco Pharmaceutical Laboratories Ltd | | | 3,843 |
| 100 | | * | | Cephalon, Inc | | | 6,010 |
| 339 | | | | Clorox Co | | | 20,669 |
| 2,103 | | | | Colgate-Palmolive Co | | | 125,970 |
| 568 | | * | | Combinatorx, Inc | | | 4,993 |
| 431 | | * | | Connetics Corp | | | 5,069 |
| 200 | | | | Dade Behring Holdings, Inc | | | 8,328 |
| 504 | | * | | Dendreon Corp | | | 2,439 |
| 274 | | | | Diagnostic Products Corp | | | 15,938 |
| 93 | | * | | Digene Corp | | | 3,603 |
| 3,076 | | * | | Durect Corp | | | 11,904 |
| 1,600 | | | | Ecolab, Inc | | | 64,928 |
102
TIAA-CREF LIFE FUNDS - Social Choice Equity Fund
| | | | | | | |
SHARES
| | | | COMPANY
| | VALUE
|
| | | |
| 300 | | * | | Encysive Pharmaceuticals, Inc | | $ | 2,079 |
| 1,700 | | * | | Forest Laboratories, Inc | | | 65,773 |
| 1,511 | | * | | Genentech, Inc | | | 123,600 |
| 808 | | * | | Genzyme Corp | | | 49,328 |
| 300 | | * | | Geron Corp | | | 2,070 |
| 1,594 | | * | | Gilead Sciences, Inc | | | 94,301 |
| 268 | | | | H.B. Fuller Co | | | 11,677 |
| 279 | | * | | Hospira, Inc | | | 11,980 |
| 500 | | * | | Human Genome Sciences, Inc | | | 5,350 |
| 294 | | * | | Huntsman Corp | | | 5,092 |
| 261 | | * | | Inverness Medical Innovations, Inc | | | 7,368 |
| 100 | | * | | Invitrogen Corp | | | 6,607 |
| 1,196 | | * | | King Pharmaceuticals, Inc | | | 20,332 |
| 100 | | * | | Kos Pharmaceuticals, Inc | | | 3,762 |
| 300 | | | | Lubrizol Corp | | | 11,955 |
| 200 | | | | Mannatech, Inc | | | 2,522 |
| 200 | | * | | Medarex, Inc | | | 1,922 |
| 600 | | | | Medicis Pharmaceutical Corp (Class A) | | | 14,400 |
| 668 | | * | | Medimmune, Inc | | | 18,103 |
| 9,294 | | | | Merck & Co, Inc | | | 338,580 |
| 200 | | * | | MGI Pharma, Inc | | | 4,300 |
| 800 | | * | | Millennium Pharmaceuticals, Inc | | | 7,976 |
| 1,501 | | | | Mylan Laboratories, Inc | | | 30,020 |
| 400 | | * | | Nabi Biopharmaceuticals | | | 2,296 |
| 118 | | * | | Nastech Pharmaceutical Co, Inc | | | 1,864 |
| 238 | | * | | Neurocrine Biosciences, Inc | | | 2,523 |
| 442 | | * | | Noven Pharmaceuticals, Inc | | | 7,912 |
| 100 | | * | | NPS Pharmaceuticals, Inc | | | 488 |
| 100 | | * | | Nuvelo, Inc | | | 1,665 |
| 200 | | * | | OraSure Technologies, Inc | | | 1,904 |
| 126 | | * | | Pacific Ethanol, Inc | | | 2,913 |
| 200 | | * | | Par Pharmaceutical Cos, Inc | | | 3,692 |
| 200 | | * | | PDL BioPharma, Inc | | | 3,682 |
| 400 | | * | | Penwest Pharmaceuticals Co | | | 8,732 |
| 1,206 | | | | Perrigo Co | | | 19,417 |
| 200 | | * | | Pharmion Corp | | | 3,406 |
| 200 | | * | | Pozen, Inc | | | 1,408 |
| 475 | | | | PPG Industries, Inc | | | 31,350 |
| 2,250 | | | | Praxair, Inc | | | 121,500 |
| 731 | | * | | Prestige Brands Holdings, Inc | | | 7,288 |
| 10,756 | | | | Procter & Gamble Co | | | 598,033 |
| 227 | | * | | Progenics Pharmaceuticals, Inc | | | 5,462 |
| 330 | | * | | Renovis, Inc | | | 5,052 |
| 1,335 | | | | Rohm & Haas Co | | | 66,910 |
| 500 | | | | RPM International, Inc | | | 9,000 |
| 450 | | * | | Salix Pharmaceuticals Ltd | | | 5,535 |
| 5,380 | | | | Schering-Plough Corp | | | 102,381 |
| 200 | | * | | Sepracor, Inc | | | 11,428 |
| 500 | | | | Sigma-Aldrich Corp | | | 36,320 |
| 186 | | * | | Somaxon Pharmaceuticals, Inc | | | 2,903 |
| 500 | | * | | SuperGen, Inc | | | 1,815 |
| 200 | | * | | Tanox, Inc | | | 2,766 |
| 58 | | * | | United Therapeutics Corp | | | 3,351 |
| 300 | | | | Valspar Corp | | | 7,923 |
| 303 | | * | | VCA Antech, Inc | | | 9,675 |
| 200 | | * | | Vertex Pharmaceuticals, Inc | | | 7,342 |
| 600 | | * | | Watson Pharmaceuticals, Inc | | | 13,968 |
| 529 | | * | | Zymogenetics, Inc | | | 10,035 |
| | | | | | |
|
|
| | | | | TOTAL CHEMICALS AND ALLIED PRODUCTS | | 3,212,578 |
| | | | | | |
|
|
| COMMUNICATIONS - 5.17% | | |
| 1,251 | | | | Alltel Corp | | | 79,851 |
| 800 | | * | | American Tower Corp (Class A) | | | 24,896 |
103
TIAA-CREF LIFE FUNDS - Social Choice Equity Fund
| | | | | | | |
SHARES
| | | | COMPANY
| | VALUE
|
| | | |
| 12,911 | | | | AT&T, Inc | | $ | 360,088 |
| 6,300 | | | | BellSouth Corp | | | 228,060 |
| 1,184 | | | | Cablevision Systems Corp (Class A) | | | 25,397 |
| 1,600 | | | | Citadel Broadcasting Corp | | | 14,240 |
| 100 | | | | Citizens Communications Co | | | 1,305 |
| 283 | | * | | Crown Castle International Corp | | | 9,775 |
| 733 | | * | | Crown Media Holdings, Inc (Class A) | | | 3,020 |
| 409 | | * | | Embarq Corp | | | 16,765 |
| 200 | | | | Entercom Communications Corp | | | 5,232 |
| 418 | | * | | Entravision Communications Corp (Class A) | | | 3,582 |
| 100 | | * | | Fisher Communications, Inc | | | 4,213 |
| 150 | | | | Global Payments, Inc | | | 7,283 |
| 960 | | | | Gray Television, Inc | | | 5,558 |
| 1,244 | | * | | IAC/InterActiveCorp | | | 32,954 |
| 1,135 | | * | | Level 3 Communications, Inc | | | 5,039 |
| 1,812 | | * | | Liberty Global, Inc | | | 38,958 |
| 3,274 | | * | | Liberty Media Holding Corp (Interactive) | | | 56,509 |
| 774 | | * | | Liberty Media Holding Corp (Capital) | | | 64,838 |
| 717 | | * | | Lin TV Corp (Class A) | | | 5,413 |
| 487 | | * | | Mediacom Communications Corp | | | 3,034 |
| 120 | | * | | NeuStar, Inc | | | 4,050 |
| 300 | | * | | NII Holdings, Inc (Class B) | | | 16,914 |
| 200 | | * | | Novatel Wireless, Inc | | | 2,076 |
| 829 | | * | | Radio One, Inc (Class D) | | | 6,135 |
| 113 | | * | | SAVVIS, Inc | | | 3,346 |
| 133 | | * | | SBA Communications Corp | | | 3,477 |
| 1,152 | | * | | Spanish Broadcasting System, Inc (Class A) | | | 5,887 |
| 8,184 | | | | Sprint Nextel Corp | | | 163,598 |
| 902 | | * | | Terremark Worldwide, Inc | | | 3,247 |
| 279 | | * | | TiVo, Inc | | | 1,995 |
| 900 | | * | | Univision Communications, Inc (Class A) | | | 30,150 |
| 10,976 | | | | Verizon Communications, Inc | | | 367,586 |
| 2,107 | | * | | Viacom, Inc | | | 75,515 |
| 94 | | * | | West Corp | | | 4,503 |
| 400 | | * | | XM Satellite Radio Holdings, Inc | | | 5,860 |
| | | | | | |
|
|
| | | | | TOTAL COMMUNICATIONS | | 1,690,349 |
| | | | | | |
|
|
| DEPOSITORY INSTITUTIONS - 10.44% | | |
| 1,500 | | | | AmSouth Bancorp | | | 39,675 |
| 13,050 | | | | Bank of America Corp | | | 627,705 |
| 3,100 | | | | BB&T Corp | | | 128,929 |
| 800 | | | | Comerica, Inc | | | 41,592 |
| 500 | | | | Commerce Bancorp, Inc | | | 17,835 |
| 200 | | | | Compass Bancshares, Inc | | | 11,120 |
| 3,200 | | | | Fifth Third Bancorp | | | 118,240 |
| 200 | | | | First Horizon National Corp | | | 8,040 |
| 400 | | | | Fremont General Corp | | | 7,424 |
| 1,200 | | | | Golden West Financial Corp | | | 89,040 |
| 300 | | | | IndyMac Bancorp, Inc | | | 13,755 |
| 2,600 | | | | Keycorp | | | 92,768 |
| 300 | | | | M&T Bank Corp | | | 35,376 |
| 900 | | | | Marshall & Ilsley Corp | | | 41,166 |
| 1,900 | | | | Mellon Financial Corp | | | 65,417 |
| 3,954 | | | | National City Corp | | | 143,095 |
| 577 | | | | New York Community Bancorp, Inc | | | 9,526 |
| 2,259 | | | | North Fork Bancorporation, Inc | | | 68,154 |
| 700 | | | | Northern Trust Corp | | | 38,710 |
| 1,549 | | | | PNC Financial Services Group, Inc | | | 108,694 |
| 520 | | | | Popular, Inc | | | 9,984 |
| 313 | | * | | QC Holdings, Inc | | | 4,229 |
| 2,864 | | | | Regions Financial Corp | | | 94,856 |
| 630 | | | | Sovereign Bancorp, Inc | | | 12,795 |
| 1,500 | | | | State Street Corp | | | 87,135 |
104
TIAA-CREF LIFE FUNDS - Social Choice Equity Fund
| | | | | | | |
SHARES
| | | | COMPANY
| | VALUE
|
| | | |
| 2,000 | | | | SunTrust Banks, Inc | | $ | 152,520 |
| 900 | | | | Synovus Financial Corp | | | 24,102 |
| 9,300 | | | | US Bancorp | | | 287,184 |
| 300 | | | | UnionBanCal Corp | | | 19,377 |
| 6,500 | | | | Wachovia Corp | | | 351,520 |
| 5,290 | | | | Washington Mutual, Inc | �� | | 241,118 |
| 6,200 | | | | Wells Fargo & Co | | | 415,896 |
| 100 | | | | Zions Bancorporation | | | 7,794 |
| | | | | | |
|
|
| | | | | TOTAL DEPOSITORY INSTITUTIONS | | 3,414,771 |
| | | | | | |
|
|
| EATING AND DRINKING PLACES - 1.29% | | |
| 900 | | * | | AFC Enterprises | | | 11,475 |
| 400 | | | | Applebees International, Inc | | | 7,688 |
| 493 | | | | Darden Restaurants, Inc | | | 19,424 |
| 7,066 | | | | McDonald’s Corp | | | 237,418 |
| 47 | | | | OSI Restaurant Partners, Inc | | | 1,626 |
| 3,234 | | * | | Starbucks Corp | | | 122,116 |
| 219 | | * | | Tim Hortons, Inc | | | 5,639 |
| 300 | | | | Wendy’s International, Inc | | | 17,487 |
| | | | | | |
|
|
| | | | | TOTAL EATING AND DRINKING PLACES | | 422,873 |
| | | | | | |
|
|
| ELECTRIC, GAS, AND SANITARY SERVICES - 5.79% | | |
| 2,950 | | * | | AES Corp | | | 54,428 |
| 1,096 | | | | AGL Resources, Inc | | | 41,780 |
| 1,233 | | | | Allete, Inc | | | 58,383 |
| 421 | | | | Alliant Energy Corp | | | 14,440 |
| 800 | | | | Aqua America, Inc | | | 18,232 |
| 1,100 | | | | Atmos Energy Corp | | | 30,701 |
| 2,028 | | | | Avista Corp | | | 46,299 |
| 500 | | | | Cascade Natural Gas Corp | | | 10,545 |
| 1,447 | | | | Cleco Corp | | | 33,643 |
| 1,739 | | | | Consolidated Edison, Inc | | | 77,281 |
| 200 | | | | Crosstex Energy, Inc | | | 19,016 |
| 447 | | | | Duquesne Light Holdings, Inc | | | 7,349 |
| 2,382 | | | | El Paso Corp | | | 35,730 |
| 2,300 | | | | Empire District Electric Co | | | 47,265 |
| 300 | | | | Energen Corp | | | 11,523 |
| 436 | | | | Energy East Corp | | | 10,433 |
| 200 | | | | EnergySouth, Inc | | | 6,246 |
| 2,200 | | | | Hawaiian Electric Industries, Inc | | | 61,402 |
| 2,200 | | | | Idacorp, Inc | | | 75,438 |
| 2,445 | | | | KeySpan Corp | | | 98,778 |
| 1,615 | | | | Kinder Morgan, Inc | | | 161,322 |
| 400 | | | | Markwest Hydrocarbon, Inc | | | 9,900 |
| 400 | | | | Metal Management, Inc | | | 12,248 |
| 500 | | | | MGE Energy, Inc | | | 15,575 |
| 2,000 | | | | National Fuel Gas Co | | | 70,280 |
| 792 | | | | Nicor, Inc | | | 32,868 |
| 4,686 | | | | NiSource, Inc | | | 102,342 |
| 393 | | | | Northeast Utilities | | | 8,123 |
| 719 | | * | | NRG Energy, Inc | | | 34,641 |
| 4,200 | | | | OGE Energy Corp | | | 147,126 |
| 733 | | | | Otter Tail Corp | | | 20,033 |
| 4,300 | | | | Pepco Holdings, Inc | | | 101,394 |
| 1,000 | | | | Piedmont Natural Gas Co, Inc | | | 24,300 |
| 4,159 | | | | Puget Energy, Inc | | | 89,335 |
| 826 | | | | Questar Corp | | | 66,485 |
| 200 | | | | Resource America, Inc (Class A) | | | 3,810 |
| 2,000 | | * | | Sierra Pacific Resources | | | 28,000 |
| 500 | | | | South Jersey Industries, Inc | | | 13,695 |
| 1,065 | | | | Synagro Technologies, Inc | | | 4,186 |
| 1,076 | | | | TECO Energy, Inc | | | 16,075 |
| 400 | | | | UGI Corp | | | 9,848 |
105
TIAA-CREF LIFE FUNDS - Social Choice Equity Fund
| | | | | | | |
SHARES
| | | | COMPANY
| | VALUE
|
| | | |
| 1,155 | | | | Unisource Energy Corp | | $ | 35,978 |
| 511 | | * | | Waste Services, Inc | | | 4,594 |
| 600 | | | | Western Gas Resources, Inc | | | 35,910 |
| 287 | | | | WGL Holdings, Inc | | | 8,309 |
| 3,378 | | | | Williams Cos, Inc | | | 78,910 |
| | | | | | |
|
|
| | | | | TOTAL ELECTRIC, GAS, AND SANITARY SERVICES | | 1,894,199 |
| | | | | | |
|
|
| ELECTRONIC AND OTHER ELECTRIC EQUIPMENT - 6.09% | | |
| 1,162 | | * | | Advanced Micro Devices, Inc | | | 28,376 |
| 292 | | * | | Agere Systems, Inc | | | 4,292 |
| 700 | | | | American Power Conversion Corp | | | 13,643 |
| 312 | | | | Ametek, Inc | | | 14,783 |
| 537 | | * | | Arris Group, Inc | | | 7,045 |
| 215 | | * | | Atheros Communications, Inc | | | 4,076 |
| 161 | | | | Baldor Electric Co | | | 5,038 |
| 147 | | * | | Benchmark Electronics, Inc | | | 3,546 |
| 500 | | * | | Brocade Communications Systems, Inc | | | 3,070 |
| 408 | | * | | CalAmp Corp | | | 3,627 |
| 240 | | * | | C-COR, Inc | | | 1,853 |
| 17,600 | | * | | Cisco Systems, Inc | | | 343,728 |
| 2,976 | | * | | Conexant Systems, Inc | | | 7,440 |
| 308 | | * | | Cree, Inc | | | 7,318 |
| 100 | | * | | Ditech Networks, Inc | | | 872 |
| 178 | | * | | Dolby Laboratories, Inc (Class A) | | | 4,147 |
| 427 | | * | | Emcore Corp | | | 4,099 |
| 3,178 | | | | Emerson Electric Co | | | 266,348 |
| 1,100 | | * | | Finisar Corp | | | 3,597 |
| 900 | | * | | Freescale Semiconductor, Inc (Class B) | | | 26,460 |
| 312 | | * | | FuelCell Energy, Inc | | | 2,989 |
| 100 | | | | Harman International Industries, Inc | | | 8,537 |
| 300 | | * | | Harmonic, Inc | | | 1,344 |
| 19,509 | | | | Intel Corp | | | 369,696 |
| 100 | | * | | Interdigital Communications Corp | | | 3,491 |
| 600 | | * | | InterVoice, Inc | | | 4,272 |
| 512 | | * | | Lattice Semiconductor Corp | | | 3,164 |
| 77 | | | | Lincoln Electric Holdings, Inc | | | 4,824 |
| 175 | | * | | Loral Space & Communications, Inc | | | 4,963 |
| 1,277 | | * | | LSI Logic Corp | | | 11,429 |
| 14,900 | | * | | Lucent Technologies, Inc | | | 36,058 |
| 155 | | * | | McData Corp (Class A) | | | 632 |
| 181 | | * | | Medis Technologies Ltd | | | 3,671 |
| 1,550 | | * | | Micron Technology, Inc | | | 23,343 |
| 800 | | | | Molex, Inc | | | 26,856 |
| 391 | | * | | MoSys, Inc | | | 3,058 |
| 7,700 | | | | Motorola, Inc | | | 155,155 |
| 1,600 | | * | | MRV Communications, Inc | | | 4,976 |
| 1,200 | | | | National Semiconductor Corp | | | 28,620 |
| 236 | | * | | Novellus Systems, Inc | | | 5,829 |
| 214 | | * | | Omnivision Technologies, Inc | | | 4,520 |
| 951 | | * | | ON Semiconductor Corp | | | 5,592 |
| 1,800 | | * | | Optical Communication Products, Inc | | | 3,618 |
| 293 | | | | Plantronics, Inc | | | 6,508 |
| 149 | | * | | Plexus Corp | | | 5,097 |
| 357 | | * | | Polycom, Inc | | | 7,825 |
| 200 | | * | | Power-One, Inc | | | 1,320 |
| 621 | | * | | Powerwave Technologies, Inc | | | 5,664 |
| 441 | | * | | QLogic Corp | | | 7,603 |
| 5,000 | | | | Qualcomm, Inc | | | 200,350 |
| 504 | | * | | Quantum Fuel Systems Technologies Worldwide, Inc | | | 1,714 |
| 200 | | | | RadioShack Corp | | | 2,800 |
| 706 | | * | | RF Micro Devices, Inc | | | 4,215 |
| 760 | | * | | Silicon Storage Technology, Inc | | | 3,086 |
| 3,571 | | * | | Sirius Satellite Radio, Inc | | | 16,962 |
106
TIAA-CREF LIFE FUNDS - Social Choice Equity Fund
| | | | | | | |
SHARES
| | | | COMPANY
| | VALUE
|
| | | |
| 105 | | * | | Sunpower Corp | | $ | 2,942 |
| 400 | | * | | Sycamore Networks, Inc | | | 1,624 |
| 568 | | * | | Symmetricom, Inc | | | 4,016 |
| 312 | | * | | Tekelec | | | 3,853 |
| 200 | | | | Teleflex, Inc | | | 10,804 |
| 1,300 | | * | | Tellabs, Inc | | | 17,303 |
| 135 | | * | | Tessera Technologies, Inc | | | 3,713 |
| 4,974 | | | | Texas Instruments, Inc | | | 150,662 |
| 338 | | * | | Thomas & Betts Corp | | | 17,339 |
| 1,944 | | * | | Transmeta Corp | | | 3,149 |
| 233 | | * | | Trident Microsystems, Inc | | | 4,422 |
| 944 | | * | | Triquint Semiconductor, Inc | | | 4,210 |
| 184 | | * | | TTM Technologies, Inc | | | 2,662 |
| 100 | | | | Whirlpool Corp | | | 8,265 |
| 800 | | | | Xilinx, Inc | | | 18,120 |
| 625 | | * | | Zhone Technologies, Inc | | | 1,275 |
| 111 | | * | | Zoran Corp | | | 2,702 |
| | | | | | |
|
|
| | | | | TOTAL ELECTRONIC AND OTHER ELECTRIC EQUIPMENT | | 1,990,200 |
| | | | | | |
|
|
| ENGINEERING AND MANAGEMENT SERVICES - 0.87% | | |
| 200 | | * | | Amylin Pharmaceuticals, Inc | | | 9,874 |
| 200 | | * | | Applera Corp (Celera Genomics Group) | | | 2,590 |
| 200 | | * | | Ariad Pharmaceuticals, Inc | | | 902 |
| 880 | | * | | Celgene Corp | | | 41,738 |
| 42 | | | | Corporate Executive Board Co | | | 4,208 |
| 100 | | * | | CV Therapeutics, Inc | | | 1,397 |
| 87 | | * | | Digitas, Inc | | | 1,011 |
| 716 | | * | | Harris Interactive, Inc | | | 4,081 |
| 200 | | * | | ICOS Corp | | | 4,398 |
| 767 | | * | | Incyte Corp | | | 3,528 |
| 435 | | * | | Isis Pharmaceuticals, Inc | | | 2,632 |
| 100 | | * | | Lexicon Genetics, Inc | | | 439 |
| 1,234 | | | | Moody’s Corp | | | 67,204 |
| 139 | | * | | Navigant Consulting, Inc | | | 3,148 |
| 1,352 | | | | Paychex, Inc | | | 52,701 |
| 496 | | | | Pharmaceutical Product Development, Inc | | | 17,420 |
| 865 | | | | Quest Diagnostics, Inc | | | 51,831 |
| 211 | | * | | Regeneron Pharmaceuticals, Inc | | | 2,705 |
| 792 | | * | | Rentech, Inc | | | 3,683 |
| 100 | | * | | Symyx Technologies, Inc | | | 2,415 |
| 318 | | * | | Tetra Tech, Inc | | | 5,641 |
| | | | | | |
|
|
| | | | | TOTAL ENGINEERING AND MANAGEMENT SERVICES | | 283,546 |
| | | | | | |
|
|
| FABRICATED METAL PRODUCTS - 0.72% | | |
| 720 | | | | Commercial Metals Co | | | 18,504 |
| 258 | | | | Dynamic Materials Corp | | | 8,702 |
| 100 | | | | Gulf Island Fabrication, Inc | | | 2,004 |
| 3,802 | | | | Illinois Tool Works, Inc | | | 180,595 |
| 100 | | * | | Jacuzzi Brands, Inc | | | 880 |
| 200 | | | | Pentair, Inc | | | 6,838 |
| 300 | | | | Silgan Holdings, Inc | | | 11,103 |
| 147 | | | | Snap-On, Inc | | | 5,942 |
| | | | | | |
|
|
| | | | | TOTAL FABRICATED METAL PRODUCTS | | 234,568 |
| | | | | | |
|
|
| FOOD AND KINDRED PRODUCTS - 2.63% | | |
| 1,403 | | | | Campbell Soup Co | | | 52,065 |
| 1,262 | | | | Coca-Cola Enterprises, Inc | | | 25,707 |
| 1,600 | | | | General Mills, Inc | | | 82,656 |
| 1,908 | | | | H.J. Heinz Co | | | 78,648 |
| 31 | | * | | Hansen Natural Corp | | | 5,901 |
| 964 | | | | Hershey Co | | | 53,087 |
| 1,864 | | | | Kellogg Co | | | 90,274 |
| 300 | | | | Pepsi Bottling Group, Inc | | | 9,645 |
107
TIAA-CREF LIFE FUNDS - Social Choice Equity Fund
| | | | | | | |
SHARES
| | | | COMPANY
| | VALUE
|
| | | |
| 6,221 | | | | PepsiCo, Inc | | $ | 373,509 |
| 2,399 | | | | Sara Lee Corp | | | 38,432 |
| 1,125 | | | | Wrigley (Wm.) Jr Co | | | 51,030 |
| | | | | | |
|
|
| | | | | TOTAL FOOD AND KINDRED PRODUCTS | | 860,954 |
| | | | | | |
|
|
| FOOD STORES - 0.31% | | |
| 3,000 | | | | Kroger Co | | | 65,580 |
| 400 | | * | | Pathmark Stores, Inc | | | 3,764 |
| 604 | | | | Supervalu, Inc | | | 18,543 |
| 200 | | | | Whole Foods Market, Inc | | | 12,928 |
| | | | | | |
|
|
| | | | | TOTAL FOOD STORES | | 100,815 |
| | | | | | |
|
|
| FORESTRY - 0.11% | | |
| 575 | | | | Weyerhaeuser Co | | | 35,794 |
| | | | | | |
|
|
| | | | | TOTAL FORESTRY | | 35,794 |
| | | | | | |
|
|
| FURNITURE AND FIXTURES - 0.69% | | |
| 1,500 | | * | | BE Aerospace, Inc | | | 34,290 |
| 200 | | | | Hillenbrand Industries, Inc | | | 9,700 |
| 1,200 | | | | Johnson Controls, Inc | | | 98,664 |
| 700 | | | | Leggett & Platt, Inc | | | 17,486 |
| 2,240 | | | | Masco Corp | | | 66,394 |
| | | | | | |
|
|
| | | | | TOTAL FURNITURE AND FIXTURES | | 226,534 |
| | | | | | |
|
|
| FURNITURE AND HOMEFURNISHINGS STORES - 0.34% | | |
| 865 | | * | | Bed Bath & Beyond, Inc | | | 28,692 |
| 1,050 | | | | Best Buy Co, Inc | | | 57,582 |
| 500 | | | | Circuit City Stores, Inc | | | 13,610 |
| 100 | | * | | Mohawk Industries, Inc | | | 7,035 |
| 100 | | | | Williams-Sonoma, Inc | | | 3,405 |
| | | | | | |
|
|
| | | | | TOTAL FURNITURE AND HOMEFURNISHINGS STORES | | 110,324 |
| | | | | | |
|
|
| GENERAL BUILDING CONTRACTORS - 0.42% | | |
| 100 | | | | Beazer Homes USA, Inc | | | 4,587 |
| 400 | | | | Centex Corp | | | 20,120 |
| 1,241 | | | | DR Horton, Inc | | | 29,560 |
| 180 | | * | | Hovnanian Enterprises, Inc (Class A) | | | 5,414 |
| 400 | | | | Lennar Corp (Class A) | | | 17,748 |
| 20 | | | | Lennar Corp (Class B) | | | 816 |
| 7 | | * | | NVR, Inc | | | 3,439 |
| 1,100 | | | | Pulte Homes, Inc | | | 31,669 |
| 200 | | | | Ryland Group, Inc | | | 8,714 |
| 300 | | | | Standard-Pacific Corp | | | 7,710 |
| 200 | | * | | Toll Brothers, Inc | | | 5,114 |
| 148 | | * | | WCI Communities, Inc | | | 2,981 |
| | | | | | |
|
|
| | | | | TOTAL GENERAL BUILDING CONTRACTORS | | 137,872 |
| | | | | | |
|
|
| GENERAL MERCHANDISE STORES - 1.33% | | |
| 100 | | * | | Big Lots, Inc | | | 1,708 |
| 2,300 | | | | Costco Wholesale Corp | | | 131,399 |
| 853 | | | | Dollar General Corp | | | 11,925 |
| 700 | | | | Family Dollar Stores, Inc | | | 17,101 |
| 900 | | | | JC Penney Co, Inc | | | 60,759 |
| 2,000 | | | | TJX Cos, Inc | | | 45,720 |
| 3,400 | | | | Target Corp | | | 166,158 |
| | | | | | |
|
|
| | | | | TOTAL GENERAL MERCHANDISE STORES | | 434,770 |
| | | | | | |
|
|
| HEALTH SERVICES - 1.21% | | |
| 613 | | * | | Alliance Imaging, Inc | | | 3,923 |
| 238 | | * | | American Retirement Corp | | | 7,799 |
| 186 | | * | | Amsurg Corp | | | 4,232 |
108
TIAA-CREF LIFE FUNDS - Social Choice Equity Fund
| | | | | | | |
SHARES
| | | | COMPANY
| | VALUE
|
| | | |
| 190 | | | | Brookdale Senior Living, Inc | | $ | 8,501 |
| 497 | | * | | Community Health Systems, Inc | | | 18,265 |
| 247 | | * | | DaVita, Inc | | | 12,276 |
| 100 | | * | | Edwards Lifesciences Corp | | | 4,543 |
| 400 | | * | | Express Scripts, Inc | | | 28,696 |
| 316 | | * | | Five Star Quality Care, Inc | | | 3,498 |
| 73 | | * | | Genesis HealthCare Corp | | | 3,458 |
| 700 | | | | Health Management Associates, Inc (Class A) | | | 13,797 |
| 161 | | * | | Healthways, Inc | | | 8,475 |
| 651 | | * | | Hythiam, Inc | | | 4,537 |
| 200 | | * | | Laboratory Corp of America Holdings | | | 12,446 |
| 337 | | * | | LifePoint Hospitals, Inc | | | 10,828 |
| 153 | | * | | Lincare Holdings, Inc | | | 5,790 |
| 251 | | * | | Medcath Corp | | | 4,729 |
| 300 | | * | | Nektar Therapeutics | | | 5,502 |
| 163 | | * | | Odyssey HealthCare, Inc | | | 2,864 |
| 296 | | | | Option Care, Inc | | | 3,546 |
| 185 | | * | | Pediatrix Medical Group, Inc | | | 8,380 |
| 334 | | * | | Psychiatric Solutions, Inc | | | 9,571 |
| 304 | | * | | RehabCare Group, Inc | | | 5,284 |
| 301 | | * | | Sierra Health Services, Inc | | | 13,554 |
| 337 | | * | | Sunrise Senior Living, Inc | | | 9,318 |
| 200 | | * | | Symbion, Inc | | | 4,152 |
| 100 | | * | | Triad Hospitals, Inc | | | 3,958 |
| 292 | | | | Universal Health Services, Inc (Class B) | | | 14,676 |
| 446 | | * | | VistaCare, Inc (Class A) | | | 5,397 |
| 2,112 | | * | | WellPoint, Inc | | | 153,690 |
| | | | | | |
|
|
| | | | | TOTAL HEALTH SERVICES | | 395,685 |
| | | | | | |
|
|
| HOLDING AND OTHER INVESTMENT OFFICES - 2.68% | | |
| 1,640 | | | | Allied Capital Corp | | | 47,183 |
| 300 | | | | AMB Property Corp | | | 15,165 |
| 800 | | | | Anworth Mortgage Asset Corp | | | 6,640 |
| 917 | | | | Archstone-Smith Trust | | | 46,648 |
| 100 | | | | AvalonBay Communities, Inc | | | 11,062 |
| 300 | | | | Boston Properties, Inc | | | 27,120 |
| 500 | | | | Crescent Real Estate Equities Co | | | 9,280 |
| 500 | | | | Developers Diversified Realty Corp | | | 26,090 |
| 902 | | | | Duke Realty Corp | | | 31,705 |
| 3,646 | | | | Equity Office Properties Trust | | | 133,115 |
| 1,718 | | | | Equity Residential | | | 76,846 |
| 400 | | | | General Growth Properties, Inc | | | 18,024 |
| 400 | | | | Harris & Harris Group, Inc | | | 4,416 |
| 300 | | | | Health Care Property Investors, Inc | | | 8,022 |
| 1,300 | | | | Host Marriott Corp | | | 28,431 |
| 700 | | | | HRPT Properties Trust | | | 8,092 |
| 800 | | | | iStar Financial, Inc | | | 30,200 |
| 1,200 | | | | Kimco Realty Corp | | | 43,788 |
| 300 | | | | Liberty Property Trust | | | 13,260 |
| 2,000 | | | | Luminent Mortgage Capital, Inc | | | 18,520 |
| 400 | | | | New Plan Excel Realty Trust | | | 9,876 |
| 250 | | | | NTL, Inc | | | 6,225 |
| 1,000 | | | | Prologis | | | 52,120 |
| 600 | | | | Public Storage, Inc | | | 45,540 |
| 1,000 | | | | Simon Property Group, Inc | | | 82,940 |
| 600 | | | | Vornado Realty Trust | | | 58,530 |
| 489 | | | | Weingarten Realty Investors | | | 18,719 |
| | | | | | |
|
|
| | | | | TOTAL HOLDING AND OTHER INVESTMENT OFFICES | | 877,557 |
| | | | | | |
|
|
| HOTELS AND OTHER LODGING PLACES - 0.35% | | |
| 800 | | | | Choice Hotels International, Inc | | | 48,480 |
| 500 | | * | | Gaylord Entertainment Co | | | 21,820 |
| 1,201 | | * | | Great Wolf Resorts, Inc | | | 14,424 |
| 1,200 | | * | | Lodgian, Inc | | | 17,100 |
| 200 | | | | Marcus Corp | | | 4,176 |
109
TIAA-CREF LIFE FUNDS - Social Choice Equity Fund
| | | | | | | |
SHARES
| | | | COMPANY
| | VALUE
|
| | | |
| 342 | | * | | Morgans Hotel Group Co | | $ | 5,321 |
| 261 | | * | | Outdoor Channel Holdings, Inc | | | 2,694 |
| | | | | | |
|
|
| | | | | TOTAL HOTELS AND OTHER LODGING PLACES | | 114,015 |
| | | | | | |
|
|
| INDUSTRIAL MACHINERY AND EQUIPMENT - 6.31% | | |
| 4,066 | | | | 3M Co | | | 328,411 |
| 300 | | * | | AGCO Corp | | | 7,896 |
| 900 | | | | American Standard Cos, Inc | | | 38,943 |
| 2,142 | | * | | Apple Computer, Inc | | | 122,351 |
| 5,600 | | | | Applied Materials, Inc | | | 91,168 |
| 699 | | * | | Axcelis Technologies, Inc | | | 4,124 |
| 400 | | | | Black & Decker Corp | | | 33,784 |
| 200 | | | | Briggs & Stratton Corp | | | 6,222 |
| 400 | | * | | Cameron International Corp | | | 19,108 |
| 100 | | | | CDW Corp | | | 5,465 |
| 334 | | | | Cummins, Inc | | | 40,832 |
| 1,500 | | | | Deere & Co | | | 125,235 |
| 6,700 | | * | | Dell, Inc | | | 163,547 |
| 6,841 | | * | | EMC Corp | | | 75,046 |
| 138 | | * | | Emulex Corp | | | 2,245 |
| 241 | | * | | Entegris, Inc | | | 2,297 |
| 300 | | * | | FMC Technologies, Inc | | | 20,238 |
| 283 | | | | Graco, Inc | | | 13,012 |
| 690 | | * | | Grant Prideco, Inc | | | 30,877 |
| 8,619 | | | | Hewlett-Packard Co | | | 273,050 |
| 5,600 | | | | International Business Machines Corp | | | 430,192 |
| 124 | | * | | Intevac, Inc | | | 2,688 |
| 104 | | * | | Komag, Inc | | | 4,803 |
| 74 | | * | | Lam Research Corp | | | 3,450 |
| 300 | | * | | Lexmark International, Inc | | | 16,749 |
| 258 | | | | Manitowoc Co, Inc | | | 11,481 |
| 292 | | | | Modine Manufacturing Co | | | 6,821 |
| 400 | | | | Nordson Corp | | | 19,672 |
| 300 | | | | Pall Corp | | | 8,400 |
| 208 | | * | | ProQuest Co | | | 2,556 |
| 71 | | * | | Rackable Systems, Inc | | | 2,804 |
| 508 | | * | | Semitool, Inc | | | 4,582 |
| 988 | | | | Smith International, Inc | | | 43,936 |
| 3,788 | | * | | Solectron Corp | | | 12,955 |
| 200 | | | | SPX Corp | | | 11,190 |
| 600 | | | | Stanley Works | | | 28,332 |
| 500 | | | | Tennant Co | | | 25,140 |
| 83 | | * | | TurboChef Technologies, Inc | | | 923 |
| 170 | | * | | Ultratech, Inc | | | 2,676 |
| 400 | | * | | Varian Medical Systems, Inc | | | 18,940 |
| | | | | | |
|
|
| | | | | TOTAL INDUSTRIAL MACHINERY AND EQUIPMENT | | 2,062,141 |
| | | | | | |
|
|
| INSTRUMENTS AND RELATED PRODUCTS - 5.09% | | |
| 177 | | * | | Advanced Medical Optics, Inc | | | 8,974 |
| 100 | | * | | Affymetrix, Inc | | | 2,560 |
| 400 | | | | Bard (C.R.), Inc | | | 29,304 |
| 283 | | | | Bausch & Lomb, Inc | | | 13,878 |
| 3,100 | | | | Baxter International, Inc | | | 113,956 |
| 200 | | | | Beckman Coulter, Inc | | | 11,110 |
| 1,300 | | | | Becton Dickinson & Co | | | 79,469 |
| 1,100 | | | | Biomet, Inc | | | 34,419 |
| 4,335 | | * | | Boston Scientific Corp | | | 73,001 |
| 200 | | * | | Bruker BioSciences Corp | | | 1,072 |
| 365 | | * | | Cepheid, Inc | | | 3,544 |
| 1,075 | | * | | Credence Systems Corp | | | 3,763 |
| 300 | | | | Dentsply International, Inc | | | 18,180 |
| 760 | | * | | Depomed, Inc | | | 4,461 |
| 256 | | * | | Fisher Scientific International, Inc | | | 18,701 |
110
TIAA-CREF LIFE FUNDS - Social Choice Equity Fund
| | | | | | | |
SHARES
| | | | COMPANY
| | VALUE
|
| | | |
| 104 | | * | | Formfactor, Inc | | $ | 4,642 |
| 77 | | * | | Hologic, Inc | | | 3,801 |
| 564 | | * | | Input/Output, Inc | | | 5,330 |
| 90 | | * | | Intuitive Surgical, Inc | | | 10,617 |
| 361 | | * | | Ixia | | | 3,249 |
| 11,036 | | | | Johnson & Johnson | | | 661,277 |
| 500 | | | | Kla-Tencor Corp | | | 20,785 |
| 598 | | * | | LTX Corp | | | 4,192 |
| 4,566 | | | | Medtronic, Inc | | | 214,237 |
| 200 | | * | | Millipore Corp | | | 12,598 |
| 71 | | * | | MKS Instruments, Inc | | | 1,428 |
| 200 | | | | Movado Group, Inc | | | 4,590 |
| 1,200 | | | | Pitney Bowes, Inc | | | 49,560 |
| 178 | | | | Roper Industries, Inc | | | 8,322 |
| 1,400 | | * | | St. Jude Medical, Inc | | | 45,388 |
| 1,400 | | | | Stryker Corp | | | 58,954 |
| 300 | | | | Tektronix, Inc | | | 8,826 |
| 700 | | * | | Thermo Electron Corp | | | 25,368 |
| 300 | | * | | TriPath Imaging, Inc | | | 1,986 |
| 300 | | * | | Waters Corp | | | 13,320 |
| 2,673 | | * | | Xerox Corp | | | 37,181 |
| 900 | | * | | Zimmer Holdings, Inc | | | 51,048 |
| | | | | | |
|
|
| | | | | TOTAL INSTRUMENTS AND RELATED PRODUCTS | | 1,663,091 |
| | | | | | |
|
|
| INSURANCE AGENTS, BROKERS AND SERVICE - 0.51% | | |
| 200 | | | | Brown & Brown, Inc | | | 5,844 |
| 309 | | | | Clark, Inc | | | 4,079 |
| 1,000 | | | | Crawford & Co (Class B) | | | 7,180 |
| 1,749 | | | | Hartford Financial Services Group, Inc | | | 147,965 |
| | | | | | |
|
|
| | | | | TOTAL INSURANCE AGENTS, BROKERS AND SERVICE | | 165,068 |
| | | | | | |
|
|
| INSURANCE CARRIERS - 4.59% | | |
| 1,964 | | | | Aetna, Inc | | | 78,423 |
| 3,100 | | | | Aflac, Inc | | | 143,685 |
| 87 | | * | | Alleghany Corp | | | 24,043 |
| 700 | | | | Ambac Financial Group, Inc | | | 56,770 |
| 400 | | | | American Financial Group, Inc | | | 17,160 |
| 320 | | * | | AMERIGROUP Corp | | | 9,933 |
| 413 | | | | Assurant, Inc | | | 19,989 |
| 263 | | * | | Centene Corp | | | 6,188 |
| 2,800 | | | | Chubb Corp | | | 139,720 |
| 2,061 | | | | Cincinnati Financial Corp | | | 96,888 |
| 100 | | | | Erie Indemnity Co (Class A) | | | 5,200 |
| 150 | | | | Hanover Insurance Group, Inc | | | 7,119 |
| 400 | | | | HCC Insurance Holdings, Inc | | | 11,776 |
| 183 | | * | | HealthExtras, Inc | | | 5,530 |
| 2,018 | | | | Lincoln National Corp | | | 113,896 |
| 700 | | | | MBIA, Inc | | | 40,985 |
| 200 | | | | Mercury General Corp | | | 11,274 |
| 300 | | | | MGIC Investment Corp | | | 19,500 |
| 177 | | * | | Molina Healthcare, Inc | | | 6,735 |
| 300 | | | | Nationwide Financial Services, Inc (Class A) | | | 13,224 |
| 468 | | | | Phoenix Cos, Inc | | | 6,589 |
| 100 | | * | | PMA Capital Corp (Class A) | | | 1,030 |
| 200 | | | | PMI Group, Inc | | | 8,916 |
| 1,800 | | | | Principal Financial Group | | | 100,170 |
| 3,600 | | | | Progressive Corp | | | 92,556 |
| 300 | | | | Protective Life Corp | | | 13,986 |
| 2,550 | | | | Prudential Financial, Inc | | | 198,135 |
| 100 | | | | Radian Group, Inc | | | 6,178 |
| 1,000 | | | | Safeco Corp | | | 56,350 |
| 3,716 | | | | St. Paul Travelers Cos, Inc | | | 165,659 |
| 234 | | * | | WellCare Health Plans, Inc | | | 11,478 |
| 300 | | | | W.R. Berkley Corp | | | 10,239 |
| | | | | | |
|
|
| | | | | TOTAL INSURANCE CARRIERS | | 1,499,324 |
| | | | | | |
|
|
111
TIAA-CREF LIFE FUNDS - Social Choice Equity Fund
| | | | | | | |
SHARES
| | | | COMPANY
| | VALUE
|
| |
| LEATHER AND LEATHER PRODUCTS - 0.08% | | |
| 904 | | * | | Coach, Inc | | $ | 27,030 |
| | | | | | |
|
|
| | | | | TOTAL LEATHER AND LEATHER PRODUCTS | | 27,030 |
| | | | | | |
|
|
| LUMBER AND WOOD PRODUCTS - 0.01% | | |
| 400 | | * | | Champion Enterprises, Inc | | | 4,416 |
| | | | | | |
|
|
| | | | | TOTAL LUMBER AND WOOD PRODUCTS | | 4,416 |
| | | | | | |
|
|
| METAL MINING - 0.09% | | |
| 1,000 | | | | Royal Gold, Inc | | | 27,820 |
| | | | | | |
|
|
| | | | | TOTAL METAL MINING | | 27,820 |
| | | | | | |
|
|
| MISCELLANEOUS MANUFACTURING INDUSTRIES - 0.13% | | |
| 200 | | | | Callaway Golf Co | | | 2,598 |
| 271 | | * | | K2, Inc | | | 2,965 |
| 2,242 | | | | Mattel, Inc | | | 37,015 |
| | | | | | |
|
|
| | | | | TOTAL MISCELLANEOUS MANUFACTURING INDUSTRIES | | 42,578 |
| | | | | | |
|
|
| MISCELLANEOUS RETAIL - 1.33% | | |
| 886 | | * | | Amazon.com, Inc | | | 34,270 |
| 3,000 | | | | CVS Corp | | | 92,100 |
| 188 | | * | | GSI Commerce, Inc | | | 2,544 |
| 200 | | | | Michaels Stores, Inc | | | 8,248 |
| 700 | | * | | Office Depot, Inc | | | 26,600 |
| 200 | | | | Petsmart, Inc | | | 5,120 |
| 16 | | * | | Priceline.com, Inc | | | 478 |
| 2,460 | | | | Staples, Inc | | | 59,827 |
| 300 | | | | Tiffany & Co | | | 9,906 |
| 3,700 | | | | Walgreen Co | | | 165,908 |
| 646 | | | | World Fuel Services Corp | | | 29,516 |
| | | | | | |
|
|
| | | | | TOTAL MISCELLANEOUS RETAIL | | 434,517 |
| | | | | | |
|
|
| MOTION PICTURES - 1.89% | | |
| 97 | | * | | Avid Technology, Inc | | | 3,233 |
| 1,119 | | * | | Discovery Holding Co (Class A) | | | 16,371 |
| 200 | | | | Regal Entertainment Group (Class A) | | | 4,064 |
| 18,864 | | | | Time Warner, Inc | | | 326,347 |
| 8,927 | | | | Walt Disney Co | | | 267,810 |
| | | | | | |
|
|
| | | | | TOTAL MOTION PICTURES | | 617,825 |
| | | | | | |
|
|
| NONDEPOSITORY INSTITUTIONS - 3.04% | | |
| 174 | | * | | Accredited Home Lenders Holding Co | | | 8,319 |
| 200 | | | | Advanta Corp (Class A) | | | 6,558 |
| 1,099 | | | | American Capital Strategies Ltd | | | 36,794 |
| 5,653 | | | | American Express Co | | | 300,853 |
| 300 | | * | | AmeriCredit Corp | | | 8,376 |
| 112 | | | | Asta Funding, Inc | | | 4,194 |
| 1,250 | | | | Capital One Financial Corp | | | 106,812 |
| 500 | | | | CapitalSource, Inc | | | 11,730 |
| 1,123 | | | | CIT Group, Inc | | | 58,722 |
| 138 | | * | | CompuCredit Corp | | | 5,305 |
| 2,300 | | | | Countrywide Financial Corp | | | 87,584 |
| 115 | | * | | Credit Acceptance Corp | | | 3,121 |
| 800 | | | | Doral Financial Corp | | | 5,128 |
| 101 | | | | Federal Agricultural Mortgage Corp (Class C) | | | 2,798 |
| 100 | | | | First Marblehead Corp | | | 5,694 |
| 3,400 | | | | Freddie Mac | | | 193,834 |
| 900 | | | | MCG Capital Corp | | | 14,310 |
| 495 | | | | Medallion Financial Corp | | | 6,415 |
| 202 | | * | | Nelnet, Inc | | | 8,191 |
112
TIAA-CREF LIFE FUNDS - Social Choice Equity Fund
| | | | | | | |
SHARES
| | | | COMPANY
| | VALUE
|
| | | |
| 2,200 | | | | SLM Corp | | $ | 116,424 |
| 105 | | * | | World Acceptance Corp | | | 3,730 |
| | | | | | |
|
|
| | | | | TOTAL NONDEPOSITORY INSTITUTIONS | | 994,892 |
| | | | | | |
|
|
| NONMETALLIC MINERALS, EXCEPT FUELS - 0.27% | | |
| 900 | | | | AMCOL International Corp | | | 23,715 |
| 200 | | | | Florida Rock Industries, Inc | | | 9,934 |
| 700 | | | | Vulcan Materials Co | | | 54,600 |
| | | | | | |
|
|
| | | | | TOTAL NONMETALLIC MINERALS, EXCEPT FUELS | | 88,249 |
| | | | | | |
|
|
| OIL AND GAS EXTRACTION - 4.95% | | | |
| 4,212 | | | | Anadarko Petroleum Corp | | | 200,870 |
| 2,702 | | | | Apache Corp | | | 184,412 |
| 177 | | * | | Atlas America, Inc | | | 7,931 |
| 530 | | | | Baker Hughes, Inc | | | 43,381 |
| 400 | | | | Berry Petroleum Co (Class A) | | | 13,260 |
| 500 | | | | Cabot Oil & Gas Corp (Class A) | | | 24,500 |
| 600 | | * | | Callon Petroleum Co | | | 11,604 |
| 400 | | * | | Cheniere Energy, Inc | | | 15,600 |
| 1,491 | | | | Chesapeake Energy Corp | | | 45,103 |
| 615 | | | | Cimarex Energy Co | | | 26,445 |
| 300 | | * | | Delta Petroleum Corp | | | 5,139 |
| 1,200 | | * | | Denbury Resources, Inc | | | 38,004 |
| 2,934 | | | | Devon Energy Corp | | | 177,243 |
| 400 | | * | | Edge Petroleum Corp | | | 7,992 |
| 300 | | * | | Encore Acquisition Co | | | 8,049 |
| 500 | | * | | Energy Partners Ltd | | | 9,475 |
| 800 | | | | ENSCO International, Inc | | | 36,816 |
| 1,900 | | | | Equitable Resources, Inc | | | 63,650 |
| 399 | | * | | Forest Oil Corp | | | 13,231 |
| 900 | | * | | Global Industries Ltd | | | 15,030 |
| 1,800 | | * | | Grey Wolf, Inc | | | 13,860 |
| 400 | | * | | Helix Energy Solutions Group, Inc | | | 16,144 |
| 404 | | | | Helmerich & Payne, Inc | | | 24,345 |
| 118 | | * | | Houston Exploration Co | | | 7,220 |
| 500 | | * | | KCS Energy, Inc | | | 14,850 |
| 1,100 | | * | | Meridian Resource Corp | | | 3,850 |
| 683 | | * | | National Oilwell Varco, Inc | | | 43,248 |
| 600 | | * | | Newfield Exploration Co | | | 29,364 |
| 1,554 | | | | Noble Energy, Inc | | | 72,820 |
| 929 | | * | | PetroHawk Energy Corp | | | 11,705 |
| 200 | | * | | Petroleum Development Corp | | | 7,540 |
| 1,009 | | | | Pioneer Natural Resources Co | | | 46,828 |
| 529 | | * | | Plains Exploration & Production Co | | | 21,446 |
| 500 | | | | Pogo Producing Co | | | 23,050 |
| 1,100 | | * | | Pride International, Inc | | | 34,353 |
| 400 | | * | | Quicksilver Resources, Inc | | | 14,724 |
| 600 | | | | Range Resources Corp | | | 16,314 |
| 300 | | * | | Remington Oil & Gas Corp | | | 13,191 |
| 359 | | | | Rowan Cos, Inc | | | 12,777 |
| 189 | | * | | Southwestern Energy Co | | | 5,889 |
| 500 | | | | St. Mary Land & Exploration Co | | | 20,125 |
| 100 | | * | | Stone Energy Corp | | | 4,655 |
| 400 | | * | | Swift Energy Co | | | 17,172 |
| 500 | | | | Tidewater, Inc | | | 24,600 |
| 104 | | * | | Toreador Resources Corp | | | 2,925 |
| 2,291 | | * | | Transmontaigne, Inc | | | 25,682 |
| 300 | | * | | Unit Corp | | | 17,067 |
| 500 | | | | W&T Offshore, Inc | | | 19,445 |
| 300 | | * | | Whiting Petroleum Corp | | | 12,561 |
| 2,137 | | | | XTO Energy, Inc | | | 94,605 |
| | | | | | |
|
|
| | | | | TOTAL OIL AND GAS EXTRACTION | | 1,620,090 |
| | | | | | |
|
|
| PAPER AND ALLIED PRODUCTS - 0.97% | | |
| 400 | | | | Bemis Co | | | 12,248 |
113
TIAA-CREF LIFE FUNDS - Social Choice Equity Fund
| | | | | | | |
SHARES
| | | | COMPANY
| | VALUE
|
| | | |
| 400 | | | | Bowater, Inc | | $ | 9,100 |
| 1,496 | | | | International Paper Co | | | 48,321 |
| 2,200 | | | | Kimberly-Clark Corp | | | 135,740 |
| 1,800 | | | | MeadWestvaco Corp | | | 50,274 |
| 300 | | | | Packaging Corp of America | | | 6,606 |
| 1,000 | | | | Sonoco Products Co | | | 31,650 |
| 500 | | | | Temple-Inland, Inc | | | 21,435 |
| | | | | | |
|
|
| | | | | TOTAL PAPER AND ALLIED PRODUCTS | | 315,374 |
| | | | | | |
|
|
| PETROLEUM AND COAL PRODUCTS - 1.48% | | |
| 162 | | | | Alon USA Energy, Inc | | | 5,098 |
| 1,476 | | | | EOG Resources, Inc | | | 102,346 |
| 1,024 | | | | Frontier Oil Corp | | | 33,178 |
| 148 | | * | | Headwaters, Inc | | | 3,783 |
| 959 | | | | Hess Corp | | | 50,683 |
| 253 | | | | Holly Corp | | | 12,194 |
| 867 | | | | Murphy Oil Corp | | | 48,431 |
| 900 | | | | Sunoco, Inc | | | 62,361 |
| 2,400 | | | | Valero Energy Corp | | | 159,648 |
| 323 | | | | Western Refining, Inc | | | 6,970 |
| | | | | | |
|
|
| | | | | TOTAL PETROLEUM AND COAL PRODUCTS | | 484,692 |
| | | | | | |
|
|
| PRIMARY METAL INDUSTRIES - 1.44% | | |
| 400 | | * | | Aleris International, Inc | | | 18,340 |
| 213 | | * | | Brush Engineered Materials, Inc | | | 4,441 |
| 489 | | * | | Century Aluminum Co | | | 17,452 |
| 121 | | * | | Chaparral Steel Co | | | 8,714 |
| 177 | | * | | CommScope, Inc | | | 5,561 |
| 4,227 | | * | | Corning, Inc | | | 102,251 |
| 350 | | | | Gibraltar Industries, Inc | | | 10,150 |
| 300 | | | | Hubbell, Inc (Class B) | | | 14,295 |
| 300 | | * | | Lone Star Technologies, Inc | | | 16,206 |
| 200 | | * | | Maverick Tube Corp | | | 12,638 |
| 397 | | | | Mueller Industries, Inc | | | 13,113 |
| 500 | | * | | NS Group, Inc | | | 27,540 |
| 1,786 | | | | Nucor Corp | | | 96,891 |
| 139 | | | | Olympic Steel, Inc | | | 4,919 |
| 150 | | | | Quanex Corp | | | 6,461 |
| 259 | | | | Steel Dynamics, Inc | | | 17,027 |
| 300 | | | | Steel Technologies, Inc | | | 5,832 |
| 500 | | | | Tredegar Corp | | | 7,910 |
| 528 | | | | United States Steel Corp | | | 37,023 |
| 400 | | * | | Wheeling-Pittsburgh Corp | | | 7,956 |
| 1,705 | | | | Worthington Industries, Inc | | | 35,720 |
| | | | | | |
|
|
| | | | | TOTAL PRIMARY METAL INDUSTRIES | | 470,440 |
| | | | | | |
|
|
| PRINTING AND PUBLISHING - 0.94% | | |
| 200 | | | | Dow Jones & Co, Inc | | | 7,002 |
| 200 | | * | | Dun & Bradstreet Corp | | | 13,936 |
| 400 | | | | EW Scripps Co | | | 17,256 |
| 2,186 | | | | McGraw-Hill Cos, Inc | | | 109,803 |
| 522 | | | | New York Times Co (Class A) | | | 12,810 |
| 72 | | | | R.H. Donnelley Corp | | | 3,893 |
| 1,975 | | | | Tribune Co | | | 64,049 |
| 100 | | | | Washington Post Co (Class B) | | | 78,001 |
| | | | | | |
|
|
| | | | | TOTAL PRINTING AND PUBLISHING | | 306,750 |
| | | | | | |
|
|
| RAILROAD TRANSPORTATION - 0.75% | | |
| 897 | | | | CSX Corp | | | 63,184 |
| 500 | | * | | Kansas City Southern Industries, Inc | | | 13,850 |
| 3,185 | | | | Norfolk Southern Corp | | | 169,506 |
| | | | | | |
|
|
| | | | | TOTAL RAILROAD TRANSPORTATION | | 246,540 |
| | | | | | |
|
|
114
TIAA-CREF LIFE FUNDS - Social Choice Equity Fund
| | | | | | | |
SHARES
| | | | COMPANY
| | VALUE
|
| |
| REAL ESTATE - 0.04% | | |
| 480 | | * | | CB Richard Ellis Group, Inc | | $ | 11,952 |
| 100 | | | | Stewart Enterprises, Inc (Class A) | | | 575 |
| | | | | | |
|
|
| | | | | TOTAL REAL ESTATE | | 12,527 |
| | | | | | |
|
|
| RUBBER AND MISCELLANEOUS PLASTIC PRODUCTS - 0.03% | | |
| 200 | | | | Cooper Tire & Rubber Co | | | 2,228 |
| 170 | | | | Sealed Air Corp | | | 8,854 |
| | | | | | |
|
|
| | | | | TOTAL RUBBER AND MISCELLANEOUS PLASTIC PRODUCTS | | 11,082 |
| | | | | | |
|
|
| SECURITY AND COMMODITY BROKERS - 3.11% | | |
| 300 | | | | A.G. Edwards, Inc | | | 16,596 |
| 692 | | | | Ameriprise Financial, Inc | | | 30,912 |
| 101 | | * | | Cbot Holdings, Inc | | | 12,079 |
| 4,100 | | | | Charles Schwab Corp | | | 65,518 |
| 100 | | | | Chicago Mercantile Exchange Holdings, Inc | | | 49,115 |
| 1,237 | | * | | E*Trade Financial Corp | | | 28,228 |
| 200 | | | | Eaton Vance Corp | | | 4,992 |
| 300 | | | | Federated Investors, Inc (Class B) | | | 9,450 |
| 1,300 | | | | Franklin Resources, Inc | | | 112,853 |
| 1,610 | | | | Goldman Sachs Group, Inc | | | 242,192 |
| 137 | | | | International Securities Exchange, Inc | | | 5,216 |
| 500 | | | | Janus Capital Group, Inc | | | 8,950 |
| 90 | | | | Jefferies Group, Inc | | | 2,667 |
| 300 | | | | Legg Mason, Inc | | | 29,856 |
| 4,336 | | | | Merrill Lynch & Co, Inc | | | 301,612 |
| 188 | | * | | Nasdaq Stock Market, Inc | | | 5,621 |
| 436 | | * | | NYSE Group, Inc | | | 29,857 |
| 300 | | | | SEI Investments Co | | | 14,664 |
| 1,200 | | | | T Rowe Price Group, Inc | | | 45,372 |
| | | | | | |
|
|
| | | | | TOTAL SECURITY AND COMMODITY BROKERS | | 1,015,750 |
| | | | | | |
|
|
| SOCIAL SERVICES - 0.01% | | |
| 249 | | * | | Capital Senior Living Corp | | | 2,560 |
| | | | | | |
|
|
| | | | | TOTAL SOCIAL SERVICES | | 2,560 |
| | | | | | |
|
|
| SPECIAL TRADE CONTRACTORS - 0.04% | | |
| 75 | | | | Chemed Corp | | | 4,090 |
| 518 | | * | | Quanta Services, Inc | | | 8,977 |
| | | | | | |
|
|
| | | | | TOTAL SPECIAL TRADE CONTRACTORS | | 13,067 |
| | | | | | |
|
|
| STONE, CLAY, AND GLASS PRODUCTS - 0.06% | | |
| 100 | | | | Apogee Enterprises, Inc | | | 1,470 |
| 51 | | * | | Cabot Microelectronics Corp | | | 1,546 |
| 150 | | | | CARBO Ceramics, Inc | | | 7,369 |
| 54 | | | | Eagle Materials, Inc | | | 2,565 |
| 400 | | | | Gentex Corp | | | 5,600 |
| | | | | | |
|
|
| | | | | TOTAL STONE, CLAY, AND GLASS PRODUCTS | | 18,550 |
| | | | | | |
|
|
| TEXTILE MILL PRODUCTS - 0.02% | | |
| 200 | | | | Oxford Industries, Inc | | | 7,882 |
| | | | | | |
|
|
| | | | | TOTAL TEXTILE MILL PRODUCTS | | 7,882 |
| | | | | | |
|
|
| TRANSPORTATION BY AIR - 0.71% | | |
| 101 | | * | | Air Methods Corp | | | 2,644 |
| 200 | | * | | Airtran Holdings, Inc | | | 2,972 |
| 185 | | * | | Alaska Air Group, Inc | | | 7,293 |
| 700 | | * | | Continental Airlines, Inc (Class B) | | | 20,860 |
| 1,034 | | * | | ExpressJet Holdings, Inc | | | 7,145 |
| 1,038 | | | | FedEx Corp | | | 121,301 |
| 321 | | * | | Frontier Airlines Holdings, Inc | | | 2,314 |
115
TIAA-CREF LIFE FUNDS - Social Choice Equity Fund
| | | | | | | |
SHARES
| | | | COMPANY
| | VALUE
|
| | | |
| 225 | | * | | JetBlue Airways Corp | | $ | 2,731 |
| 390 | | * | | Mesa Air Group, Inc | | | 3,841 |
| 267 | | | | Skywest, Inc | | | 6,622 |
| 3,389 | | | | Southwest Airlines Co | | | 55,478 |
| | | | | | |
|
|
| | | | | TOTAL TRANSPORTATION BY AIR | | 233,201 |
| | | | | | |
|
|
| TRANSPORTATION EQUIPMENT - 1.08% | | |
| 200 | | | | American Axle & Manufacturing Holdings, Inc | | | 3,422 |
| 400 | | | | ArvinMeritor, Inc | | | 6,876 |
| 800 | | | | Autoliv, Inc | | | 45,256 |
| 1,100 | | * | | Aviall, Inc | | | 52,272 |
| 558 | | | | Brunswick Corp | | | 18,553 |
| 1,400 | | | | Genuine Parts Co | | | 58,324 |
| 1,329 | | | | Harley-Davidson, Inc | | | 72,949 |
| 230 | | | | Harsco Corp | | | 17,931 |
| 400 | | | | JLG Industries, Inc | | | 9,000 |
| 58 | | | | Martin Marietta Materials, Inc | | | 5,287 |
| 282 | | * | | Navistar International Corp | | | 6,940 |
| 200 | | | | Superior Industries International, Inc | | | 3,658 |
| 800 | | * | | Tenneco, Inc | | | 20,800 |
| 400 | | * | | TRW Automotive Holdings Corp | | | 10,912 |
| 1,400 | | * | | Visteon Corp | | | 10,094 |
| 300 | | | | Westinghouse Air Brake Technologies Corp | | | 11,220 |
| | | | | | |
|
|
| | | | | TOTAL TRANSPORTATION EQUIPMENT | | 353,494 |
| | | | | | |
|
|
| TRANSPORTATION SERVICES - 0.05% | | |
| 139 | | | | Expeditors International Washington, Inc | | | 7,785 |
| 421 | | | | Sabre Holdings Corp | | | 9,262 |
| | | | | | |
|
|
| | | | | TOTAL TRANSPORTATION SERVICES | | 17,047 |
| | | | | | |
|
|
| TRUCKING AND WAREHOUSING - 0.77% | | |
| 3,044 | | | | United Parcel Service, Inc (Class B) | | | 250,613 |
| | | | | | |
|
|
| | | | | TOTAL TRUCKING AND WAREHOUSING | | 250,613 |
| | | | | | |
|
|
| WATER TRANSPORTATION - 0.06% | | |
| 400 | | * | | Gulfmark Offshore, Inc | | | 10,332 |
| 300 | | * | | Hornbeck Offshore Services, Inc | | | 10,656 |
| | | | | | |
|
|
| | | | | TOTAL WATER TRANSPORTATION | | 20,988 |
| | | | | | |
|
|
| WHOLESALE TRADE-DURABLE GOODS - 0.62% | | |
| 600 | | | | Adesa, Inc | | | 13,344 |
| 800 | | | | Barnes Group, Inc | | | 15,960 |
| 100 | | | | BorgWarner, Inc | | | 6,510 |
| 400 | | | | Castle (A.M.) & Co | | | 12,900 |
| 100 | | * | | Cytyc Corp | | | 2,536 |
| 200 | | | | IKON Office Solutions, Inc | | | 2,520 |
| 104 | | * | | MWI Veterinary Supply, Inc | | | 3,789 |
| 300 | | | | Omnicare, Inc | | | 14,226 |
| 400 | | * | | Patterson Cos, Inc | | | 13,972 |
| 450 | | | | Reliance Steel & Aluminum Co | | | 37,328 |
| 1,005 | | | | Ryerson Tull, Inc | | | 27,135 |
| 600 | | | | W.W. Grainger, Inc | | | 45,138 |
| 109 | | * | | WESCO International, Inc | | | 7,521 |
| | | | | | |
|
|
| | | | | TOTAL WHOLESALE TRADE-DURABLE GOODS | | 202,879 |
| | | | | | |
|
|
| WHOLESALE TRADE-NONDURABLE GOODS - 0.78% | | |
| 623 | | * | | Akorn, Inc | | | 2,480 |
| 600 | | * | | Allscripts Healthcare Solutions, Inc | | | 10,530 |
| 500 | | * | | Endo Pharmaceuticals Holdings, Inc | | | 16,490 |
| 1,200 | | | | Nike, Inc (Class B) | | | 97,200 |
| 1,808 | | | | Safeway, Inc | | | 47,008 |
| 200 | | | | Stride Rite Corp | | | 2,638 |
| 2,576 | | | | Sysco Corp | | | 78,723 |
116
TIAA-CREF LIFE FUNDS - Social Choice Equity Fund
| | | | | | | |
SHARES
| | | | COMPANY
| | VALUE
|
| | | |
| | | | | TOTAL WHOLESALE TRADE-NONDURABLE GOODS | | $ | 255,069 |
| | | | | | |
|
|
| | | | | TOTAL COMMON STOCKS (Cost $32,087,367) | | 32,575,751 |
| | | | | | |
|
|
| | | | | TOTAL PORTFOLIO - 99.62% (Cost $32,087,367) | | 32,575,751 |
| | | | | OTHER ASSETS & LIABILITIES, NET - 0.38% | | 124,785 |
| | | | | | |
|
|
| | | | | NET ASSETS - 100.00% | | $32,700,536 |
| | | | | | |
|
|
For ease of presentation, we have grouped a number of industry classification categories together in the Statement of Investments. Note that the Funds use more specific industry categories in following their investment limitations on industry concentration.
117
TIAA-CREF LIFE FUNDS - Real Estate Securities Fund
TIAA-CREF LIFE FUNDS
REAL ESTATE SECURITIES FUND
STATEMENT OF INVESTMENTS (Unaudited)
June 30, 2006
| | | | | | | |
SHARES
| | | | COMPANY
| | VALUE
|
| |
COMMON STOCKS - 99.18% | | | |
| HOLDING AND OTHER INVESTMENT OFFICES - 95.97% | | |
| 9,700 | | * | | Affordable Residential Communities | | $ | 104,275 |
| 9,280 | | | | Alexandria Real Estate Equities, Inc | | | 822,950 |
| 14,400 | | | | AMB Property Corp | | | 727,920 |
| 11,500 | | | | Apartment Investment & Management Co (Class A) | | | 499,675 |
| 50,500 | | | | Archstone-Smith Trust | | | 2,568,935 |
| 5,000 | | | | Ashford Hospitality Trust, Inc | | | 63,100 |
| 17,000 | | | | AvalonBay Communities, Inc | | | 1,880,540 |
| 52,000 | | | | BioMed Realty Trust, Inc | | | 1,556,880 |
| 22,500 | | | | BNP Residential Properties, Inc | | | 383,625 |
| 45,500 | | | | Boston Properties, Inc | | | 4,113,200 |
| 13,500 | | | | BRE Properties, Inc (Class A) | | | 742,500 |
| 14,900 | | | | CBL & Associates Properties, Inc | | | 580,057 |
| 25,000 | | f,v | | CBRE Realty Finance, Inc | | | 375,000 |
| 10,000 | | | | Cedar Shopping Centers, Inc | | | 147,200 |
| 68,177 | | | | Cogdell Spencer, Inc | | | 1,330,133 |
| 14,000 | | | | Columbia Equity Trust, Inc | | | 215,040 |
| 50,750 | | | | Corporate Office Properties Trust | | | 2,135,560 |
| 15,000 | | f,v | | Crystal River Capital, Inc | | | 375,000 |
| 25,000 | | f,v* | | Deerfield Triarc Capital Corp | | | 324,500 |
| 19,000 | | | | Developers Diversified Realty Corp | | | 991,420 |
| 25,000 | | f,v | | DiamondRock Hospitality Co | | | 370,250 |
| 10,400 | | | | Digital Realty Trust, Inc | | | 256,776 |
| 20,375 | | | | EastGroup Properties, Inc | | | 951,105 |
| 64,900 | | | | Education Realty Trust, Inc | | | 1,080,585 |
| 43,560 | | | | Equity Office Properties Trust | | | 1,590,376 |
| 6,000 | | | | Equity One, Inc | | | 125,400 |
| 83,600 | | | | Equity Residential | | | 3,739,428 |
| 7,000 | | | | Essex Property Trust, Inc | | | 781,620 |
| 60,000 | | | | Extra Space Storage, Inc | | | 974,400 |
| 18,000 | | | | Federal Realty Investment Trust | | | 1,260,000 |
| 56,000 | | | | Feldman Mall Properties, Inc | | | 613,760 |
| 23,000 | | | | First Potomac Realty Trust | | | 685,170 |
| 46,000 | | | | General Growth Properties, Inc | | | 2,072,760 |
| 44,000 | | | | Glenborough Realty Trust, Inc | | | 947,760 |
| 9,057 | | | | GMH Communities Trust | | | 119,371 |
| 20,000 | | f,v* | | GSC Capital Corp | | | 500,000 |
| 55,607 | | | | Hersha Hospitality Trust | | | 516,589 |
| 23,000 | | | | Highland Hospitality Corp | | | 323,840 |
| 20,000 | | | | Highwoods Properties, Inc | | | 723,600 |
| 98,404 | | | | Host Marriott Corp | | | 2,152,095 |
| 30,123 | | | | iShares Cohen & Steers Realty Majors Index Fund | | | 2,522,500 |
| 30,918 | | | | iShares Dow Jones US Real Estate Index Fund | | | 2,202,908 |
| 20,400 | | | | Kilroy Realty Corp | | | 1,473,900 |
| 53,300 | | | | Kimco Realty Corp | | | 1,944,917 |
| 14,413 | | | | Kite Realty Group Trust | | | 224,699 |
| 12,400 | | | | KKR Financial Corp | | | 258,044 |
| 7,700 | | | | LaSalle Hotel Properties | | | 356,510 |
| 9,500 | | | | Lexington Corporate Properties Trust | | | 205,200 |
| 7,500 | | | | Liberty Property Trust | | | 331,500 |
| 15,000 | | | | LTC Properties, Inc | | | 335,250 |
| 31,000 | | | | Macerich Co | | | 2,176,200 |
| 45,000 | | | | Medical Properties Trust, Inc | | | 496,800 |
| 12,700 | | | | Mills Corp | | | 339,725 |
| 35,500 | | | | Mission West Properties, Inc | | | 393,340 |
| 64,529 | | | | Monmouth REIT (Class A) | | | 520,104 |
118
TIAA-CREF LIFE FUNDS - Real Estate Securities Fund
| | | | | | | |
SHARES
| | | | COMPANY
| | VALUE
|
| 12,000 | | | | New Plan Excel Realty Trust | | $ | 296,280 |
| 10,500 | | | | Pan Pacific Retail Properties, Inc | | | 728,385 |
| 30,000 | | f,v* | | People’s Choice Financial Corp | | | 300,000 |
| 64,500 | | | | Prologis | | | 3,361,740 |
| 30,400 | | | | Public Storage, Inc | | | 2,307,360 |
| 28,400 | | | | Reckson Associates Realty Corp | | | 1,175,192 |
| 14,700 | | | | Regency Centers Corp | | | 913,605 |
| 5,800 | | | | Shurgard Storage Centers, Inc (Class A) | | | 362,500 |
| 51,900 | | | | Simon Property Group, Inc | | | 4,304,586 |
| 17,100 | | | | SL Green Realty Corp | | | 1,871,937 |
| 30,000 | | | | Strategic Hotel Capital, Inc | | | 622,200 |
| 9,500 | | | | Taubman Centers, Inc | | | 388,550 |
| 45,000 | | | | Trizec Properties, Inc | | | 1,288,800 |
| 32,300 | | | | United Dominion Realty Trust, Inc | | | 904,723 |
| 12,900 | | | | U-Store-It Trust | | | 243,294 |
| 48,500 | | | | Vornado Realty Trust | | | 4,731,175 |
| 5,500 | | | | Washington Real Estate Investment Trust | | | 201,850 |
| 20,900 | | | | Weingarten Realty Investors | | | 800,052 |
| | | | | | |
|
|
| | | | | TOTAL HOLDING AND OTHER INVESTMENT OFFICES | | 78,306,221 |
| | | | | | |
|
|
| HOTELS AND OTHER LODGING PLACES - 0.61% | | |
| 8,200 | | | | Starwood Hotels & Resorts Worldwide, Inc | | | 494,788 |
| | | | | | |
|
|
| | | | | TOTAL HOTELS AND OTHER LODGING PLACES | | 494,788 |
| | | | | | |
|
|
| REAL ESTATE - 2.60% | | |
| 40,000 | | f,v | | Asset Capital Corp, Inc | | | 340,000 |
| 55,500 | | * | | Brookfield Properties Corp | | | 1,785,435 |
| | | | | | |
|
|
| | | | | TOTAL REAL ESTATE | | 2,125,435 |
| | | | | | |
|
|
| | | | | TOTAL COMMON STOCKS (Cost $72,090,334) | | 80,926,444 |
| | | | | | |
|
|
| | | | | TOTAL PORTFOLIO - 99.18% (Cost $72,090,334) | | 80,926,444 |
| | | | | OTHER ASSETS & LIABILITIES, NET - 0.82% | | 671,227 |
| | | | | | |
|
|
| | | | | NET ASSETS - 100.00% | | $81,597,671 |
| | | | | | |
|
|
| f | Security is exempt from registration under Rule 144 (A) of the Securities Act of 1933 and may be resold in transaction exempt from registration to qualified institutional buyers. |
| | At June 30, 2006 the value of these securities amounted to $2,584,750 or 3.17% of net assets. |
| v | Security valued at fair value. |
For ease of presentation, we have grouped a number of industry classification categories together in the Statement of Investments. Note that the Funds use more specific industry categories in following their investment limitations on industry concentration.
Restricted securities held by the Fund are as follows:
| | | | | | | | |
SECURITY
| | ACQUISITION
DATE
| | ACQUISITION
COST
| | VALUE
|
Asset Capital Corp, Inc | | 06/23/05 | | $ | 340,000 | | $ | 340,000 |
CBRE Realty Finance, Inc | | 06/02/05 | | | 375,000 | | | 375,000 |
Crystal River Capital, Inc | | 03/09/05 | | | 375,000 | | | 375,000 |
GSC Capital Corp | | 06/24/05 | | | 500,000 | | | 500,000 |
People’s Choice Financial Corp | | 12/21/04 | | | 300,000 | | | 300,000 |
119
TIAA-CREF LIFE FUNDS - Bond Fund
TIAA-CREF LIFE FUNDS
BOND FUND
STATEMENT OF INVESTMENTS (Unaudited)
June 30, 2006
| | | | | | | | | | | | | | |
PRINCIPAL
| | | | ISSUER
| | RATE
| | | MATURITY
DATE
| | RATING +
| | VALUE
|
| | | | | |
BONDS - 98.40% | | | | | | | | | | | | |
| | | | |
CORPORATE BONDS - 36.36% | | | | | | | | | | |
| ASSET BACKED - 15.07% | | | | | | | | | |
| $400,000 | | | | Centex Home Equity Series 2004-C (Class AF5) | | 5.980 | % | | 06/25/34 | | Aaa | | $ | 381,582 |
| 55,529 | | | | Chase Funding Mortgage Loan Asset-Backed Certificates Series 2004-2 (Class 1A2) | | 3.777 | | | 01/25/22 | | Aaa | | | 55,335 |
| 500,000 | | | | Chase Funding Mortgage Loan Asset-Backed Certificates Series 2004-2 (Class 1B) | | 5.700 | | | 02/25/34 | | Baa2 | | | 479,123 |
| 250,000 | | | | CIT Equipment Collateral Series 2005-VT1 (Class A4) | | 4.360 | | | 11/20/12 | | Aaa | | | 245,014 |
| 490,829 | | | | CIT Group Home Equity Loan Trust Series 2002-2 (Class MF2) | | 6.390 | | | 12/25/30 | | A2 | | | 488,320 |
| 250,000 | | | | GMAC Mortgage Corporation Loan Trust 2006-HLTV A3 | | 5.590 | | | 03/01/30 | | Aaa | | | 247,349 |
| 250,000 | | | | GMAC Mortgage Corporation Loan Trust 2006-HLTV A4 | | 5.810 | | | 03/01/36 | | Aaa | | | 245,563 |
| 500,000 | | v | | Long Beach Asset Holdings Corp Series 2006-4 (Class N1) | | 5.877 | | | 06/25/46 | | NR | | | 500,000 |
| 350,000 | | | | Marriott Vacation Club Owner Trust Series 2006-1A (Class A) | | 5.737 | | | 04/20/28 | | Aaa | | | 348,259 |
| 100,000 | | | | Residential Funding Mortgage Securities II, Inc Series 2006-HI1 (Class M2) | | 6.060 | | | 02/25/36 | | Aa2 | | | 98,229 |
| 1,000,000 | | | | Residential Funding Mortgage Securities II, Inc Series 2006-HSA2 (Class AI3) | | 5.550 | | | 03/25/36 | | Aaa | | | 988,859 |
| 500,000 | | h,v | | Sierra Receivables Funding Co Series 2006-1A (Class A1) | | 5.840 | | | 05/20/18 | | Aaa | | | 499,951 |
| 2,119,999 | | | | TRAINS | | 5.940 | | | 01/25/07 | | A3 | | | 2,117,202 |
| 3,420,000 | | | | TRAINS | | 6.962 | | | 01/15/12 | | A3 | | | 3,556,458 |
| | | | | | | | | | | | | |
|
|
| | | | | TOTAL ASSET BACKED | | | | | | | | | 10,251,244 |
| | | | | | | | | | | | | |
|
|
| BUILDING MATERIALS AND GARDEN SUPPLIES - 0.14% | | | | | | | | | |
| 100,000 | | | | Home Depot, Inc | | 5.400 | | | 03/01/16 | | Aa3 | | | 95,865 |
| | | | | | | | | | | | | |
|
|
| | | | | TOTAL BUILDING MATERIALS AND GARDEN SUPPLIES | | | | | | | | | | 95,865 |
| | | | | | | | | | | | | |
|
|
| CHEMICALS AND ALLIED PRODUCTS - 0.48% | | | | | | | | | |
| 150,000 | | | | Abbott Laboratories | | 5.600 | | | 05/15/11 | | Aa3 | | | 149,114 |
| 100,000 | | | | Genentech, Inc | | 5.250 | | | 07/15/35 | | A1 | | | 86,130 |
| 100,000 | | | | Lubrizol Corp | | 5.500 | | | 10/01/14 | | Baa3 | | | 93,751 |
| | | | | | | | | | | | | |
|
|
| | | | | TOTAL CHEMICALS AND ALLIED PRODUCTS | | | | | | | | | 328,995 |
| | | | | | | | | | | | | |
|
|
| COMMUNICATIONS - 1.92% | | | | | | | | | |
| 100,000 | | | | AT&T, Inc | | 6.150 | | | 09/15/34 | | A2 | | | 91,809 |
| 100,000 | | | | BellSouth Corp | | 6.875 | | | 10/15/31 | | A2 | | | 99,146 |
| 100,000 | | | | Comcast Corp | | 6.500 | | | 11/15/35 | | Baa2 | | | 94,433 |
| 100,000 | | | | COX Communications, Inc | | 5.450 | | | 12/15/14 | | Baa3 | | | 92,705 |
| 100,000 | | | | Deutsche Telekom International Finance BV | | 8.250 | | | 06/15/30 | | Aa2 | | | 115,500 |
| 100,000 | | | | New Cingular Wireless Services, Inc | | 8.750 | | | 03/01/31 | | Baa2 | | | 121,958 |
| 100,000 | | | | Sprint Capital Corp | | 8.750 | | | 03/15/32 | | Baa3 | | | 120,911 |
| 100,000 | | | | Telecom Italia Capital S.A. | | 6.375 | | | 11/15/33 | | Baa2 | | | 90,228 |
| 100,000 | | | | Verizon Global Funding Corp | | 7.375 | | | 09/01/12 | | A2 | | | 106,363 |
| 100,000 | | | | Verizon Global Funding Corp | | 5.850 | | | 09/15/35 | | A3 | | | 86,579 |
| 200,000 | | | | Viacom, Inc | | 5.750 | | | 04/30/11 | | Baa3 | | | 196,516 |
| 100,000 | | | | Vodafone Group plc | | 6.250 | | | 11/30/32 | | A3 | | | 92,529 |
| | | | | | | | | | | | | |
|
|
| | | | | TOTAL COMMUNICATIONS | | | | | | | | | 1,308,677 |
| | | | | | | | | | | | | |
|
|
| DEPOSITORY INSTITUTIONS - 2.45% | | | | | | | | | |
| 100,000 | | | | Bank of America Corp | | 5.375 | | | 06/15/14 | | Aa2 | | | 96,896 |
120
TIAA-CREF LIFE FUNDS - Bond Fund
| | | | | | | | | | | | | | |
PRINCIPAL
| | | | ISSUER
| | RATE
| | | MATURITY
DATE
| | RATING +
| | VALUE
|
| | | | | | |
| 100,000 | | | | Bank of America NA | | 6.000 | % | | 06/15/16 | | Aa2 | | $ | 100,310 |
| 100,000 | | | | Bank One Corp | | 5.900 | | | 11/15/11 | | A1 | | | 100,317 |
| 225,000 | | | | Citigroup, Inc | | 5.125 | | | 05/05/14 | | Aa1 | | | 214,314 |
| 200,000 | | | | Citigroup, Inc | | 5.875 | | | 02/22/33 | | Aa2 | | | 186,013 |
| 250,000 | | | | M&I Marshall & Ilsley Bank | | 4.400 | | | 03/15/10 | | Aa3 | | | 239,031 |
| 100,000 | | | | MBNA America Bank NA | | 4.625 | | | 08/03/09 | | Baa1 | | | 97,098 |
| 150,000 | | | | Union Bank of California NA | | 5.950 | | | 05/11/16 | | A2 | | | 148,137 |
| 100,000 | | h | | US Bank NA | | 5.700 | | | 12/15/08 | | Aa2 | | | 99,990 |
| 100,000 | | | | Wachovia Capital Trust III | | 5.800 | | | 12/30/49 | | A2 | | | 97,040 |
| 100,000 | | | | Wachovia Corp | | 5.250 | | | 08/01/14 | | A1 | | | 95,071 |
| 100,000 | | | | Washington Mutual Bank | | 4.500 | | | 08/25/08 | | A2 | | | 97,493 |
| 100,000 | | | | Wells Fargo & Co | | 4.950 | | | 10/16/13 | | Aa2 | | | 94,549 |
| | | | | | | | | | | | | |
|
|
| | | | | TOTAL DEPOSITORY INSTITUTIONS | | | | | | | | | 1,666,259 |
| | | | | | | | | | | | | |
|
|
| ELECTRIC, GAS, AND SANITARY SERVICES - 0.91% | | | | | | | | | |
| 100,000 | | | | Atmos Energy Corp | | 4.000 | | | 10/15/09 | | Baa3 | | | 95,074 |
| 100,000 | | | | Consolidated Edison Co of New York | | 5.375 | | | 12/15/15 | | A1 | | | 95,895 |
| 100,000 | | | | FirstEnergy Corp | | 6.450 | | | 11/15/11 | | Baa2 | | | 101,808 |
| 100,000 | | | | Florida Power & Light Co | | 4.850 | | | 02/01/13 | | Aa3 | | | 94,918 |
| 50,000 | | | | Northern States Power Co | | 6.250 | | | 06/01/36 | | A2 | | | 49,621 |
| 100,000 | | | | Southern California Edison Co | | 5.350 | | | 07/15/35 | | A3 | | | 86,624 |
| 100,000 | | | | Virginia Electric and Power Co | | 4.750 | | | 03/01/13 | | A3 | | | 92,747 |
| | | | | | | | | | | | | |
|
|
| | | | | TOTAL ELECTRIC, GAS, AND SANITARY SERVICES | | | | | | | | | | 616,687 |
| | | | | | | | | | | | | |
|
|
| ELECTRONIC AND OTHER ELECTRIC EQUIPMENT - 0.15% | | | | | | | | | |
| 100,000 | | | | Cisco Systems, Inc | | 5.250 | | | 02/22/11 | | A1 | | | 98,105 |
| | | | | | | | | | | | | |
|
|
| | | | | TOTAL ELECTRONIC AND OTHER ELECTRIC EQUIPMENT | | | | | | | | | | 98,105 |
| | | | | | | | | | | | | |
|
|
| FOOD AND KINDRED PRODUCTS - 0.13% | | | | | | | | | |
| 100,000 | | | | Bunge Ltd Finance Corp | | 5.100 | | | 07/15/15 | | Baa2 | | | 90,933 |
| | | | | | | | | | | | | |
|
|
| | | | | TOTAL FOOD AND KINDRED PRODUCTS | | | | | | | | | 90,933 |
| | | | | | | | | | | | | |
|
|
| GENERAL BUILDING CONTRACTORS - 0.27% | | | | | | | | | |
| 100,000 | | | | Centex Corp | | 5.250 | | | 06/15/15 | | Baa2 | | | 89,303 |
| 50,000 | | | | KB Home | | 6.250 | | | 06/15/15 | | Ba1 | | | 44,457 |
| 50,000 | | | | Lennar Corp | | 6.500 | | | 04/15/16 | | Baa2 | | | 48,345 |
| | | | | | | | | | | | | |
|
|
| | | | | TOTAL GENERAL BUILDING CONTRACTORS | | | | | | | | | 182,105 |
| | | | | | | | | | | | | |
|
|
| GENERAL MERCHANDISE STORES - 0.45% | | | | | | | | | |
| 220,000 | | | | Sears Roebuck Acceptance | | 6.750 | | | 08/15/11 | | A3 | | | 214,325 |
| 100,000 | | | | Wal-Mart Stores, Inc | | 4.125 | | | 02/15/11 | | Aa2 | | | 94,065 |
| | | | | | | | | | | | | |
|
|
| | | | | TOTAL GENERAL MERCHANDISE STORES | | | | | | | | | 308,390 |
| | | | | | | | | | | | | |
|
|
| HEALTH SERVICES - 0.14% | | | | | | | | | |
| 100,000 | | | | Laboratory Corp of America Holdings | | 5.625 | | | 12/15/15 | | Baa3 | | | 95,596 |
| | | | | | | | | | | | | |
|
|
| | | | | TOTAL HEALTH SERVICES | | | | | | | | | 95,596 |
| | | | | | | | | | | | | |
|
|
| HOLDING AND OTHER INVESTMENT OFFICES - 0.14% | | | | | | | | | |
| 100,000 | | | | iStar Financial, Inc | | 5.700 | | | 03/01/14 | | Ba1 | | | 96,410 |
| | | | | | | | | | | | | |
|
|
| | | | | TOTAL HOLDING AND OTHER INVESTMENT OFFICES | | | | | | | | | | 96,410 |
| | | | | | | | | | | | | |
|
|
| INSTRUMENTS AND RELATED PRODUCTS - 0.14% | | | | | | | | | |
| 100,000 | | | | Medtronic, Inc | | 4.750 | | | 09/15/15 | | A1 | | | 91,657 |
| | | | | | | | | | | | | |
|
|
121
TIAA-CREF LIFE FUNDS - Bond Fund
| | | | | | | | | | | | | | |
PRINCIPAL
| | | | ISSUER
| | RATE
| | | MATURITY
DATE
| | RATING +
| | VALUE
|
| | | | | | |
| | | | | TOTAL INSTRUMENTS AND RELATED PRODUCTS | | | | | | | | | $ | 91,657 |
| | | | | | | | | | | | | |
|
|
| INSURANCE CARRIERS - 0.55% | | | | | | | | | |
| 100,000 | | | | American International Group, Inc | | 5.050 | % | | 10/01/15 | | NR | | | 93,197 |
| 100,000 | | | | Metlife, Inc | | 5.000 | | | 06/15/15 | | A2 | | | 92,568 |
| 100,000 | | | | Travelers Property Casualty Corp | | 6.375 | | | 03/15/33 | | A2 | | | 94,481 |
| 100,000 | | | | WellPoint, Inc | | 5.000 | | | 01/15/11 | | Baa1 | | | 96,502 |
| | | | | | | | | | | | | |
|
|
| | | | | TOTAL INSURANCE CARRIERS | | | | | | | | | 376,748 |
| | | | | | | | | | | | | |
|
|
| METAL MINING - 0.27% | | | | | | | | | |
| 100,000 | | | | Barrick Gold Finance Co | | 4.875 | | | 11/15/14 | | Baa1 | | | 92,126 |
| 100,000 | | g | | Corp Nacional del Cobre de Chile - CODELCO | | 4.750 | | | 10/15/14 | | Aa3 | | | 91,387 |
| | | | | | | | | | | | | |
|
|
| | | | | TOTAL METAL MINING | | | | | | | | | 183,513 |
| | | | | | | | | | | | | |
|
|
| MISCELLANEOUS MANUFACTURING INDUSTRIES - 0.14% | | | | | | | | | |
| 100,000 | | g | | Controladora Mabe SA CV | | 6.500 | | | 12/15/15 | | NR | | | 95,990 |
| | | | | | | | | | | | | |
|
|
| | | | | TOTAL MISCELLANEOUS MANUFACTURING INDUSTRIES | | | | | | | | | | 95,990 |
| | | | | | | | | | | | | |
|
|
| MOTION PICTURES - 0.28% | | | | | | | | | |
| 100,000 | | | | News America, Inc | | 5.300 | | | 12/15/14 | | Baa3 | | | 94,909 |
| 100,000 | | | | Historic TW, Inc | | 6.625 | | | 05/15/29 | | Baa1 | | | 96,449 |
| | | | | | | | | | | | | |
|
|
| | | | | TOTAL MOTION PICTURES | | | | | | | | | 191,358 |
| | | | | | | | | | | | | |
|
|
| NONDEPOSITORY INSTITUTIONS - 2.79% | | | | | | | | | |
| 200,000 | | | | Caterpillar Financial Services Corp | | 2.700 | | | 07/15/08 | | A2 | | | 188,819 |
| 148,000 | | | | Ford Motor Credit Co | | 9.750 | | | 09/15/10 | | Ba2 | | | 144,209 |
| 500,000 | | | | General Electric Capital Corp | | 6.000 | | | 06/15/12 | | Aaa | | | 505,499 |
| 100,000 | | | | HSBC Finance Corp | | 5.250 | | | 01/14/11 | | Aa3 | | | 97,681 |
| 250,000 | | | | HSBC Finance Corp | | 5.700 | | | 06/01/11 | | Aa3 | | | 248,311 |
| 200,000 | | | | HSBC Finance Corp | | 5.500 | | | 01/19/16 | | A1 | | | 190,730 |
| 100,000 | | | | John Deere Capital Corp | | 7.000 | | | 03/15/12 | | A3 | | | 105,210 |
| 100,000 | | | | MBNA Corp | | 6.125 | | | 03/01/13 | | Aa2 | | | 101,334 |
| 100,000 | | | | Residential Capital Corp | | 6.125 | | | 11/21/08 | | Baa3 | | | 98,670 |
| 125,000 | | | | Residential Capital Corp | | 6.500 | | | 04/17/13 | | Baa3 | | | 122,384 |
| 100,000 | | | | Toyota Motor Credit Corp | | 2.875 | | | 08/01/08 | | Aaa | | | 94,459 |
| | | | | | | | | | | | | |
|
|
| | | | | TOTAL NONDEPOSITORY INSTITUTIONS | | | | | | | | | 1,897,306 |
| | | | | | | | | | | | | |
|
|
| OIL AND GAS EXTRACTION - 0.66% | | | | | | | | | |
| 100,000 | | | | Baker Hughes, Inc | | 6.875 | | | 01/15/29 | | A2 | | | 107,170 |
| 50,000 | | | | BJ Services Co | | 5.750 | | | 06/01/11 | | Baa1 | | | 49,517 |
| 100,000 | | | | Burlington Resources Finance Co | | 7.200 | | | 08/15/31 | | A2 | | | 111,052 |
| 100,000 | | | | Petro-Canada | | 5.950 | | | 05/15/35 | | NR | | | 91,701 |
| 100,000 | | | | XTO Energy, Inc | | 6.100 | | | 04/01/36 | | Baa3 | | | 90,796 |
| | | | | | | | | | | | | |
|
|
| | | | | TOTAL OIL AND GAS EXTRACTION | | | | | | | | | 450,236 |
| | | | | | | | | | | | | |
|
|
| OTHER MORTGAGE BACKED SECURITIES - 6.44% | | | | | | | | | |
| 25,000 | | | | Banc of America Commercial Mortgage, Inc Series 2005-6 (Class AJ) | | 5.354 | | | 09/10/47 | | Aaa | | | 23,726 |
| 196,747 | | | | Banc of America Mortgage Securities Series 2006-1 (Class A8) | | 6.000 | | | 05/01/36 | | Aaa | | | 196,120 |
| 590,494 | | | | Bank of America Alternative Loan Trust Series 2004-7 (Class 2A1) | | 6.000 | | | 08/25/34 | | Aaa | | | 577,025 |
| 90,000 | | | | Bear Stearns Commercial Mortgage Securities Series 2005-PW10 (Class AJ) | | 5.614 | | | 12/11/40 | | Aaa | | | 87,236 |
| 100,000 | | | | Bear Stearns Commercial Mortgage Securities Series 2006-PW11 (Class A4) | | 5.625 | | | 03/11/39 | | NR | | | 97,507 |
122
TIAA-CREF LIFE FUNDS - Bond Fund
| | | | | | | | | | | | | | |
PRINCIPAL
| | | | ISSUER
| | RATE
| | | MATURITY
DATE
| | RATING +
| | VALUE
|
| | | | | | |
| 150,000 | | | | Bear Stearns Commercial Mortgage Securities Series 2006-T22 (Class A4) | | 5.634 | % | | 04/12/38 | | Aaa | | $ | 146,682 |
| 50,000 | | | | Countrywide Alternative Loan Trust Series 2005-J8 (Class 1A5) | | 5.500 | | | 07/25/35 | | Aaa | | | 46,896 |
| 282,262 | | | | Countrywide Home Loan Mortgage Pass Through Trust Series 2005-17 (Class 1A10) | | 5.250 | | | 09/25/35 | | NR | | | 276,534 |
| 100,000 | | | | Credit Suisse Mortgage Capital Certificates Series 2006-C1 (Class A4) | | 5.609 | | | 02/15/39 | | Aaa | | | 97,574 |
| 50,000 | | | | Credit Suisse Mortgage Capital Certificates Series 2006-C2 (Class A3) | | 5.848 | | | 03/15/39 | | Aaa | | | 49,382 |
| 150,122 | | | | First Horizon Asset Securities, Inc Series 2003-9 (Class 1A4) | | 5.500 | | | 11/25/33 | | NR | | | 148,090 |
| 750,000 | | | | JP Morgan Chase Commercial Mortgage Securities Corp Series 2002-C1 (Class A3) | | 5.376 | | | 07/12/37 | | Aaa | | | 734,627 |
| 500,000 | | | | Merrill Lynch Mortgage Trust Series 2004-BPC1 (Class AJ) | | 4.922 | | | 10/12/41 | | A | | | 465,970 |
| 55,000 | | | | Merrill Lynch Mortgage Trust Series 2005-LC1 (Class A4) | | 5.291 | | | 01/12/44 | | Aaa | | | 52,642 |
| 75,000 | | | | Merrill Lynch Mortgage Trust Series 2006-C1 (Class A4) | | 5.844 | | | 05/12/39 | | NR | | | 74,228 |
| 75,000 | | | | Merrill Lynch/Countrywide Commercial Mortgage Trust Series 2006-1 (Class A4) | | 5.620 | | | 02/12/39 | | NR | | | 73,020 |
| 200,000 | | | | Morgan Stanley Capital I Series 2005-HQ5 (Class A2) | | 4.809 | | | 01/14/42 | | NR | | | 194,272 |
| 100,000 | | | | Morgan Stanley Capital I Series 2006-HQ8 (Class AJ) | | 5.641 | | | 03/12/44 | | Aaa | | | 97,035 |
| 50,000 | | | | Morgan Stanley Capital I Series 2006-IQ11 (Class AJ) | | 5.779 | | | 10/15/42 | | NR | | | 49,431 |
| 50,000 | | | | Morgan Stanley Capital I Series 2006-T21 (Class AJ) | | 5.273 | | | 10/12/52 | | Aaa | | | 47,547 |
| 804,469 | | | | Wells Fargo Mortgage Backed Securities Trust Series 2005-1 (Class 2A1) | | 5.000 | | | 01/25/20 | | Aaa | | | 782,838 |
| 65,170 | | | | Wells Fargo Mortgage Backed Securities Trust Series 2005-5 (Class 1A1) | | 5.000 | | | 05/25/20 | | Aaa | | | 62,013 |
| | | | | | | | | | | | | |
|
|
| | | | | TOTAL OTHER MORTGAGE BACKED SECURITIES | | | | | | | | | | 4,380,395 |
| | | | | | | | | | | | | |
|
|
| PAPER AND ALLIED PRODUCTS - 0.14% | | | | | | | | | |
| 100,000 | | | | Bemis Co | | 4.875 | | | 04/01/12 | | Baa1 | | | 93,030 |
| | | | | | | | | | | | | |
|
|
| | | | | TOTAL PAPER AND ALLIED PRODUCTS | | | | | | | | | 93,030 |
| | | | | | | | | | | | | |
|
|
| PETROLEUM AND COAL PRODUCTS - 0.14% | | | | | | | | | |
| 100,000 | | | | ConocoPhillips | | 5.900 | | | 10/15/32 | | A1 | | | 95,923 |
| | | | | | | | | | | | | |
|
|
| | | | | TOTAL PETROLEUM AND COAL PRODUCTS | | | | | | | | | 95,923 |
| | | | | | | | | | | | | |
|
|
| PIPELINES, EXCEPT NATURAL GAS - 0.28% | | | | | | | | | |
| 100,000 | | | | Enterprise Products Operating Lp | | 4.000 | | | 10/15/07 | | Baa3 | | | 97,869 |
| 100,000 | | | | TransCanada Corp | | 5.850 | | | 03/15/36 | | A2 | | | 93,649 |
| | | | | | | | | | | | | |
|
|
| | | | | TOTAL PIPELINES, EXCEPT NATURAL GAS | | | | | | | | | 191,518 |
| | | | | | | | | | | | | |
|
|
| PRIMARY METAL INDUSTRIES - 0.14% | | | | | | | | | |
| 100,000 | | | | Alcan, Inc | | 5.000 | | | 06/01/15 | | NR | | | 92,266 |
| | | | | | | | | | | | | |
|
|
| | | | | TOTAL PRIMARY METAL INDUSTRIES | | | | | | | | | 92,266 |
| | | | | | | | | | | | | |
|
|
| RAILROAD TRANSPORTATION - 0.07% | | | | | | | | | |
| 50,000 | | | | Canadian National Railway Co | | 6.200 | | | 06/01/36 | | A3 | | | 49,956 |
| | | | | | | | | | | | | |
|
|
| | | | | TOTAL RAILROAD TRANSPORTATION | | | | | | | | | 49,956 |
| | | | | | | | | | | | | |
|
|
123
TIAA-CREF LIFE FUNDS - Bond Fund
| | | | | | | | | | | | | | |
PRINCIPAL
| | | | ISSUER
| | RATE
| | | MATURITY
DATE
| | RATING +
| | VALUE
|
| | | | |
| SECURITY AND COMMODITY BROKERS - 1.42% | | | | | | | | | |
| 100,000 | | | | Credit Suisse First Boston USA, Inc | | 5.250 | % | | 03/02/11 | | Aa3 | | $ | 97,615 |
| 100,000 | | | | Goldman Sachs Group Lp | | 4.500 | | | 06/15/10 | | Aa3 | | | 95,533 |
| 100,000 | | | | Goldman Sachs Group, Inc | | 5.500 | | | 11/15/14 | | Aa3 | | | 96,050 |
| 100,000 | | | | Goldman Sachs Group, Inc | | 5.350 | | | 01/15/16 | | Aa3 | | | 94,368 |
| 100,000 | | | | Goldman Sachs Group, Inc | | 6.450 | | | 05/01/36 | | A1 | | | 95,586 |
| 100,000 | | | | Lehman Brothers Holdings, Inc | | 6.625 | | | 01/18/12 | | A1 | | | 103,342 |
| 100,000 | | | | Lehman Brothers Holdings, Inc | | 5.500 | | | 04/04/16 | | A1 | | | 95,636 |
| 100,000 | | | | Merrill Lynch & Co, Inc | | 4.790 | | | 08/04/10 | | Aa3 | | | 96,508 |
| 100,000 | | | | Merrill Lynch & Co, Inc | | 6.050 | | | 05/16/16 | | A1 | | | 99,344 |
| 100,000 | | | | Morgan Stanley | | 4.750 | | | 04/01/14 | | A1 | | | 91,529 |
| | | | | | | | | | | | | |
|
|
| | | | | TOTAL SECURITY AND COMMODITY BROKERS | | | | | | | | | 965,511 |
| | | | | | | | | | | | | |
|
|
| TRANSPORTATION EQUIPMENT - 0.51% | | | | | | | | | |
| 100,000 | | g | | BAE Systems Holdings, Inc | | 6.400 | | | 12/15/11 | | Baa2 | | | 101,804 |
| 100,000 | | | | Boeing Co | | 6.125 | | | 02/15/33 | | A2 | | | 100,767 |
| 100,000 | | | | General Dynamics Corp | | 3.000 | | | 05/15/08 | | A2 | | | 95,311 |
| 50,000 | | | | United Technologies Corp | | 6.050 | | | 06/01/36 | | A2 | | | 48,941 |
| | | | | | | | | | | | | |
|
|
| | | | | TOTAL TRANSPORTATION EQUIPMENT | | | | | | | | | 346,823 |
| | | | | | | | | | | | | |
|
|
| WHOLESALE TRADE-NONDURABLE GOODS - 0.14% | | | | | | | | | |
| 100,000 | | | | Procter & Gamble Co | | 4.950 | | | 08/15/14 | | Aa3 | | | 94,994 |
| | | | | | | | | | | | | |
|
|
| | | | | TOTAL WHOLESALE TRADE-NONDURABLE GOODS | | | | | | | | | | 94,994 |
| | | | | | | | | | | | | |
|
|
| | | | | TOTAL CORPORATE BONDS (Cost $25,755,888) | | | | | | | | | 24,736,490 |
| | | | | | | | | | | | | |
|
|
| | | | |
GOVERNMENT BONDS - 62.04% | | | | | | | | | | |
| AGENCY SECURITIES - 17.64% | | | | | | | | | |
| 493,335 | | | | Cal Dive International, Inc | | 4.930 | | | 02/01/27 | | NR | | | 454,791 |
| 550,000 | | | | Federal Farm Credit Bank (FFCB) | | 3.375 | | | 07/15/08 | | Aaa | | | 528,374 |
| 550,000 | | | | FFCB | | 4.125 | | | 04/15/09 | | NR | | | 531,779 |
| 100,000 | | | | FFCB | | 5.375 | | | 07/18/11 | | Aaa | | | 99,712 |
| 175,000 | | | | FFCB | | 4.875 | | | 12/16/15 | | NR | | | 166,849 |
| 100,000 | | | | Federal Home Loan Mortgage Corp (FHLMC) | | 4.375 | | | 11/16/07 | | Aaa | | | 98,545 |
| 100,000 | | | | FHLMC | | 4.625 | | | 02/21/08 | | Aaa | | | 98,690 |
| 500,000 | | | | FHLMC | | 3.500 | | | 04/28/08 | | Aaa | | | 483,047 |
| 250,000 | | | | FHLMC | | 5.250 | | | 05/21/09 | | NR | | | 248,747 |
| 1,000,000 | | | | FHLMC | | 5.875 | | | 03/21/11 | | Aa2 | | | 1,009,523 |
| 300,000 | | | | FHLMC | | 5.250 | | | 07/18/11 | | NR | | | 296,939 |
| 1,250,000 | | | | FHLMC | | 6.250 | | | 03/05/12 | | Aaa | | | 1,251,730 |
| 575,000 | | | | FHLMC | | 8.250 | | | 06/01/16 | | NR | | | 682,600 |
| 200,000 | | | | FHLMC | | 5.750 | | | 06/27/16 | | Aa2 | | | 199,495 |
| 250,000 | | | | Federal National Mortgage Association (FNMA) | | 4.750 | | | 01/02/07 | | Aa2 | | | 248,923 |
| 500,000 | | | | FNMA | | 5.210 | | | 03/16/09 | | Aaa | | | 495,071 |
| 2,000,000 | | | | FNMA | | 5.800 | | | 06/07/11 | | Aaa | | | 1,991,750 |
| 200,000 | | | | FNMA | | 4.125 | | | 01/30/12 | | Aaa | | | 186,601 |
| 1,000,000 | | | | FNMA | | 5.250 | | | 08/01/12 | | Aa2 | | | 977,368 |
| 500,000 | | | | FNMA | | 2.000 | | | 08/17/12 | | Aaa | | | 407,968 |
| 500,000 | | | | FNMA | | 6.470 | | | 09/25/12 | | Aaa | | | 523,825 |
| 247,742 | | | | FNMA | | 6.500 | | | 04/01/36 | | NR | | | 249,066 |
| 340,000 | | | | FNMA | | 6.210 | | | 08/06/38 | | Aaa | | | 368,988 |
| 421,875 | | | | Totem Ocean Trailer Express, Inc | | 4.514 | | | 12/18/19 | | NR | | | 395,554 |
| | | | | | | | | | | | | |
|
|
| | | | | TOTAL AGENCY SECURITIES | | | | | | | | | 11,995,935 |
| | | | | | | | | | | | | |
|
|
124
TIAA-CREF LIFE FUNDS - Bond Fund
| | | | | | | | | | | | | | |
PRINCIPAL
| | | | ISSUER
| | RATE
| | | MATURITY
DATE
| | RATING +
| | VALUE
|
| | | | |
| FOREIGN GOVERNMENT BONDS - 4.84% | | | | | | | | | |
| 250,000 | | | | Canada Mortgage & Housing Corp | | 4.800 | % | | 10/01/10 | | Aaa | | $ | 244,363 |
| 100,000 | | | | China Development Bank | | 5.000 | | | 10/15/15 | | A2 | | | 93,372 |
| 100,000 | | | | Development Bank of Japan | | 4.250 | | | 06/09/15 | | Aaa | | | 90,549 |
| 200,000 | | | | Egypt Government AID Bonds | | 4.450 | | | 09/15/15 | | Aaa | | | 185,652 |
| 150,000 | | | | Eksportfinans A/S | | 5.500 | | | 05/25/16 | | Aaa | | | 148,544 |
| 100,000 | | | | European Investment Bank | | 4.875 | | | 02/15/36 | | Aaa | | | 88,719 |
| 250,000 | | | | Federal Republic of Germany | | 3.875 | | | 06/01/10 | | Aaa | | | 238,170 |
| 100,000 | | | | Kreditanstalt fuer Wiederaufbau | | 5.125 | | | 03/14/16 | | Aaa | | | 97,066 |
| 100,000 | | | | Landwirtschaftliche Rentenbank | | 5.250 | | | 07/15/11 | | Aaa | | | 98,949 |
| 100,000 | | | | Mexico Government International Bond | | 5.625 | | | 01/15/17 | | Baa1 | | | 93,632 |
| 100,000 | | | | Mexico Government International Bond | | 6.750 | | | 09/27/34 | | Baa1 | | | 97,250 |
| 1,000,000 | | | | Province of Manitoba Canada | | 4.450 | | | 04/12/10 | | Aa2 | | | 967,209 |
| 100,000 | | | | Province of Ontario | | 4.750 | | | 01/19/16 | | Aa2 | | | 93,857 |
| 200,000 | | | | Province of Quebec Canada | | 5.000 | | | 03/01/16 | | A1 | | | 189,427 |
| 500,000 | | | | Province of Saskatchewan Canada | | 8.000 | | | 02/01/13 | | A3 | | | 566,799 |
| | | | | | | | | | | | | |
|
|
| | | | | TOTAL FOREIGN GOVERNMENT BONDS | | | | | | | | | 3,293,558 |
| | | | | | | | | | | | | |
|
|
| MORTGAGE BACKED SECURITIES - 30.83% | | | | | | | | | |
| 61,144 | | | | Federal Home Loan Mortgage Corp (FHLMC) | | 5.500 | | | 09/15/32 | | | | | 57,557 |
| 529,023 | | | | Federal Home Loan Mortgage Corp Gold (FGLMC) | | 5.000 | | | 02/01/19 | | | | | 509,967 |
| 501,075 | | | | FGLMC | | 5.000 | | | 07/01/33 | | | | | 470,210 |
| 373,759 | | | | FGLMC | | 5.000 | | | 11/01/33 | | | | | 350,737 |
| 689,323 | | | | FGLMC | | 6.000 | | | 11/01/33 | | | | | 680,767 |
| 99,913 | | | | FGLMC | | 6.500 | | | 05/01/36 | | | | | 100,509 |
| 460,129 | | | | Federal National Mortgage Association (FNMA) | | 6.341 | | | 12/01/08 | | | | | 460,674 |
| 46,754 | | | | FNMA | | 5.000 | | | 06/01/13 | | | | | 45,468 |
| 150,000 | | | | FNMA | | 4.000 | | | 02/25/19 | | | | | 130,254 |
| 1,893,147 | | | | FNMA | | 4.560 | | | 01/01/15 | | | | | 1,767,007 |
| 369,567 | | | | FNMA | | 6.000 | | | 02/01/18 | | | | | 371,028 |
| 180,450 | | | | FNMA | | 5.500 | | | 04/01/18 | | | | | 177,391 |
| 132,328 | | | | FNMA | | 5.500 | | | 05/01/18 | | | | | 130,085 |
| 210,838 | | | | FNMA | | 4.500 | | | 03/01/19 | | | | | 199,540 |
| 464,197 | | | | FNMA | | 5.500 | | | 07/01/20 | | | | | 456,025 |
| 329,456 | | | | FNMA | | 4.500 | | | 12/01/20 | | | | | 311,415 |
| 312,052 | | | | FNMA | | 5.500 | | | 02/01/24 | | | | | 303,812 |
| 723,205 | | | | FNMA | | 5.500 | | | 07/01/24 | | | | | 702,987 |
| 26,547 | | | | FNMA | | 5.500 | | | 09/01/24 | | | | | 25,805 |
| 290,997 | | | | FNMA | | 5.500 | | | 07/01/33 | | | | | 280,726 |
| 1,019,804 | | | | FNMA | | 5.500 | | | 07/01/33 | | | | | 983,805 |
| 642,970 | | | | FNMA | | 5.500 | | | 07/01/33 | | | | | 620,273 |
| 393,247 | | | | FNMA | | 4.500 | | | 08/01/33 | | | | | 358,327 |
| 490,575 | | | | FNMA | | 4.500 | | | 09/01/33 | | | | | 447,137 |
| 742,839 | | | | FNMA | | 6.000 | | | 10/01/33 | | | | | 733,414 |
| 360,570 | | | | FNMA | | 5.000 | | | 11/01/33 | | | | | 338,685 |
| 1,907,263 | | | | FNMA | | 5.500 | | | 11/01/33 | | | | | 1,839,937 |
| 797,611 | | | | FNMA | | 5.000 | | | 03/01/34 | | | | | 749,197 |
| 1,431,757 | | | | FNMA | | 5.000 | | | 03/01/34 | | | | | 1,344,851 |
| 374,444 | | | | FNMA | | 4.350 | | | 03/25/34 | | | | | 355,517 |
| 230,566 | | | | FNMA | | 5.500 | | | 04/01/34 | | | | | 222,048 |
| 112,430 | | | | FNMA | | 6.500 | | | 02/01/35 | | | | | 113,089 |
| 1,464,009 | | | | FNMA | | 5.000 | | | 02/25/35 | | | | | 1,417,546 |
| 107,650 | | | | FNMA | | 7.500 | | | 06/01/35 | | | | | 111,314 |
| 172,378 | | | | FNMA | | 5.500 | | | 07/01/35 | | | | | 165,685 |
| 207,812 | | | | FNMA | | 7.500 | | | 07/01/35 | | | | | 214,884 |
| 125,209 | | | | FNMA | | 6.500 | | | 01/01/36 | | | | | 125,884 |
| 294,574 | | | | FNMA | | 7.000 | | | 01/01/36 | | | | | 300,116 |
| 286,667 | | | | FNMA | | 6.500 | | | 04/01/36 | | | | | 288,199 |
| 400,000 | | h | | FNMA | | 6.000 | | | 06/01/36 | | | | | 393,762 |
| 513,093 | | | | Government National Mortgage Association (GNMA) | | 5.500 | | | 07/20/33 | | | | | 495,873 |
125
TIAA-CREF LIFE FUNDS - Bond Fund
| | | | | | | | | | | | | | |
PRINCIPAL
| | | | ISSUER
| | RATE
| | | MATURITY
DATE
| | RATING +
| | VALUE
|
| | | | | | |
| 98,468 | | | | GNMA | | 5.000 | % | | 03/15/34 | | | | $ | 93,303 |
| 364,635 | | | | GNMA | | 5.000 | | | 06/15/34 | | | | | 345,509 |
| 1,400,000 | | | | GSR Mortgage Loan Trust Series 2005-6F (Class 4A3) | | 6.000 | | | 07/25/35 | | | | | 1,381,407 |
| | | | | | | | | | | | | |
|
|
| | | | | TOTAL MORTGAGE BACKED SECURITIES | | | | | | | | | 20,971,726 |
| | | | | | | | | | | | | |
|
|
| U.S. TREASURY SECURITIES - 8.73% | | | | | | | | | |
| 2,784,000 | | | | United States Treasury Bond | | 8.000 | | | 11/15/21 | | | | | 3,561,181 |
| 190,718 | | k | | United States Treasury Inflation Indexed Bonds | | 3.375 | | | 01/15/07 | | | | | 191,210 |
| 307,078 | | k | | United States Treasury Inflation Indexed Bonds | | 3.875 | | | 01/15/09 | | | | | 318,065 |
| 750,000 | | | | United States Treasury Note | | 4.875 | | | 04/30/08 | | | | | 745,928 |
| 500,000 | | | | United States Treasury Note | | 2.625 | | | 05/15/08 | | | | | 477,455 |
| 100,000 | | | | United States Treasury Note | | 4.000 | | | 06/15/09 | | | | | 96,914 |
| 600,000 | | | | United States Treasury Note | | 3.625 | | | 05/15/13 | | | | | 548,922 |
| | | | | | | | | | | | | |
|
|
| | | | | TOTAL U.S. TREASURY SECURITIES | | | | | | | | | 5,939,675 |
| | | | | | | | | | | | | |
|
|
| | | | | TOTAL GOVERNMENT BONDS (Cost $43,863,320) | | | | | | | | | 42,200,894 |
| | | | | | | | | | | | | |
|
|
| | | | | TOTAL BONDS (Cost $69,619,208) | | | | | | | | | 66,937,384 |
| | | | | | | | | | | | | |
|
|
| | | | |
SHORT-TERM INVESTMENTS - 2.01% | | | | | | | | | | |
| U.S. GOVERNMENT AND AGENCIES DISCOUNT NOTES - 2.01% | | | | | | | | | |
| $1,370,000 | | | | Federal Home Loan Bank (FHLB) | | 4.950 | | | 07/03/06 | | | | | 1,370,000 |
| | | | | | | | | | | | | |
|
|
| | | | | TOTAL SHORT-TERM INVESTMENTS (Cost $1,369,629) | | | | | | | | | 1,370,000 |
| | | | | | | | | | | | | |
|
|
| | | | | TOTAL PORTFOLIO - 100.41% (Cost $70,988,837) | | | | | | | | | 68,307,384 |
| | | | | OTHER ASSETS & LIABILITIES, NET - (0.41 )% | | | | | | | | | (282,134) |
| | | | | | | | | | | | | |
|
|
| | | | | NET ASSETS - 100.00% | | | | | | | | | $68,025,250 |
| | | | | | | | | | | | | |
|
|
| + | As provided by Moody’s Investors Service (unaudited) |
| g | Security is exempt from registration under Rule 144 (A) of the Securities Act of 1933 and may be resold in transactions exempt from registration to qualified institutional buyers. At June 30, 2006, the value of these securities amounted to $289,181 or 0.43% of net assets. |
| h | These securities were purchased on a delayed delivery basis. |
| k | Principal amount for interest accrual purposes is periodically adjusted based on changes in the Consumer Price Index. |
| v | Security valued at fair value. |
ABBREVIATION:
NR - Not Rated
For ease of presentation,we have grouped a number of industry classification categories together in the Statement of Investments. Note that the Funds use more specific industry categories in following their investment limitations on industry concentration.
126
TIAA-CREF LIFE FUNDS - Money Market Fund
TIAA-CREF LIFE FUNDS
MONEY MARKET FUND
STATEMENT OF INVESTMENTS (Unaudited)
June 30, 2006
| | | | | | | | | | | | |
PRINCIPAL
| | | | ISSUER
| | RATE
| | | MATURITY
DATE
| | VALUE
|
| | | |
SHORT-TERM INVESTMENTS - 97.23% | | | | | | | | |
| BANK NOTES - 2.85% | | | | | | | |
| $1,285,000 | | | | Harris Trust and Savings Bank | | 0.517 | % | | 08/07/06 | | $ | 1,285,000 |
| | | | | | | | | | | |
|
|
| | | | | TOTAL BANK NOTES | | | | | | | 1,285,000 |
| | | | | | | | | | | |
|
|
| CERTIFICATES OF DEPOSIT - 6.63% | | | | | | | |
| 700,000 | | | | American Express Centurion Bank | | 5.070 | | | 07/03/06 | | | 700,000 |
| 320,000 | | | | American Express Centurion Bank | | 5.020 | | | 07/20/06 | | | 320,002 |
| 965,000 | | | | Bank of Nova Scotia | | 5.420 | | | 09/26/06 | | | 965,000 |
| 1,000,000 | | | | Dexia Bank | | 5.070 | | | 07/17/06 | | | 1,000,007 |
| | | | | | | | | | | |
|
|
| | | | | TOTAL CERTIFICATES OF DEPOSIT | | | | | | | 2,985,009 |
| | | | | | | | | | | |
|
|
| COMMERICAL PAPER - 78.11% | | | | | | | |
| 1,300,000 | | | | Abbey National North America LLC | | 5.030 | | | 08/14/06 | | | 1,292,008 |
| 1,215,000 | | | | Barclays U.S. Funding Corp | | 5.350 | | | 09/05/06 | | | 1,203,193 |
| 950,000 | | | | Calyon | | 4.955 | | | 08/11/06 | | | 944,639 |
| 370,000 | | c | | CC (USA), Inc | | 5.010 | | | 07/24/06 | | | 368,804 |
| 550,000 | | c | | CC (USA), Inc | | 5.030 | | | 07/10/06 | | | 549,306 |
| 380,000 | | c | | CC (USA), Inc | | 5.050 | | | 07/17/06 | | | 379,147 |
| 400,000 | | c | | Ciesco Lp | | 5.040 | | | 07/13/06 | | | 399,328 |
| 400,000 | | c | | Ciesco Lp | | 5.050 | | | 07/14/06 | | | 399,272 |
| 500,000 | | c | | Ciesco Lp | | 5.320 | | | 09/19/06 | | | 494,089 |
| 725,000 | | | | Citigroup Funding, Inc | | 5.000 | | | 07/18/06 | | | 723,288 |
| 575,000 | | | | Citigroup Funding, Inc | | 5.100 | | | 08/24/06 | | | 570,601 |
| 1,285,000 | | c | | Dorada Finance, Inc | | 5.220 | | | 09/14/06 | | | 1,271,026 |
| 825,000 | | c | | Edison Asset Securitization, LLC | | 4.840 | | | 08/21/06 | | | 819,343 |
| 400,000 | | c | | Edison Asset Securitization, LLC | | 5.050 | | | 08/08/06 | | | 397,868 |
| 600,000 | | | | General Electric Capital Corp | | 5.030 | | | 08/08/06 | | | 596,814 |
| 400,000 | | c | | Govco, Inc | | 5.000 | | | 07/25/06 | | | 398,667 |
| 900,000 | | c | | Govco, Inc | | 5.080 | | | 08/18/06 | | | 893,904 |
| 710,000 | | c | | Harrier Finance Funding LLC | | 5.020 | | | 07/13/06 | | | 708,807 |
| 550,000 | | c | | Harrier Finance Funding LLC | | 5.050 | | | 07/14/06 | | | 548,997 |
| 1,300,000 | | | | HSBC Finance Corp | | 5.400 | | | 11/27/06 | | | 1,270,945 |
| 500,000 | | | | ING Finance | | 5.100 | | | 08/25/06 | | | 496,104 |
| 950,000 | | c | | Kitty Hawk Funding Corp | | 5.290 | | | 07/26/06 | | | 946,517 |
| 1,270,000 | | c | | Links Finance LLC | | 5.370 | | | 09/22/06 | | | 1,254,306 |
| 1,060,000 | | | | Paccar Financial Corp | | 5.120 | | | 08/31/06 | | | 1,050,714 |
| 1,300,000 | | c | | Park Avenue Receivables Corp | | 5.280 | | | 07/26/06 | | | 1,295,233 |
| 840,000 | | c | | Pitney Bowes, Inc | | 5.240 | | | 07/06/06 | | | 839,390 |
| 411,000 | | c | | Preferred Receivables Funding Corp | | 5.090 | | | 08/21/06 | | | 408,036 |
| 300,000 | | c | | Private Export Funding Corp | | 4.660 | | | 07/06/06 | | | 299,800 |
| 300,000 | | c | | Private Export Funding Corp | | 5.020 | | | 08/09/06 | | | 298,357 |
| 680,000 | | c | | Private Export Funding Corp | | 5.140 | | | 09/06/06 | | | 673,495 |
| 1,300,000 | | | | Rabobank USA Finance Corp | | 4.580 | | | 07/05/06 | | | 1,299,240 |
| 560,000 | | c | | Ranger Funding Co LLC | | 5.120 | | | 07/24/06 | | | 558,168 |
| 700,000 | | c | | Ranger Funding Co LLC | | 5.300 | | | 08/11/06 | | | 695,775 |
| 400,000 | | c | | Scaldis Capital LLC | | 4.920 | | | 09/12/06 | | | 396,009 |
| 665,000 | | c | | Scaldis Capital LLC | | 5.420 | | | 12/18/06 | | | 647,980 |
| 530,000 | | c | | Sedna Finance, Inc | | 5.170 | | | 08/30/06 | | | 525,433 |
| 875,000 | | c | | Sheffield Receivables Corp | | 5.210 | | | 07/27/06 | | | 871,708 |
127
TIAA-CREF LIFE FUNDS - Money Market Fund
| | | | | | | | | | | | |
PRINCIPAL
| | | | ISSUER
| | RATE
| | | MATURITY
DATE
| | VALUE
|
| | | | | |
| 905,000 | | | | Shell International Finance B.V. | | 5.000 | % | | 07/31/06 | | $ | 901,229 |
| 870,000 | | c | | Sigma Finance, Inc | | 5.050 | | | 07/18/06 | | | 867,956 |
| 400,000 | | c | | Sigma Finance, Inc | | 5.140 | | | 11/30/06 | | | 391,319 |
| 470,000 | | | | Societe Generale North America, Inc | | 4.980 | | | 07/07/06 | | | 469,610 |
| 500,000 | | | | Societe Generale North America, Inc | | 5.260 | | | 07/05/06 | | | 499,708 |
| 1,000,000 | | | | Swedish Export Credit Corp | | 5.120 | | | 08/03/06 | | | 995,307 |
| 525,000 | | | | Toronto-Dominion Holdings USA, Inc | | 4.800 | | | 10/27/06 | | | 516,740 |
| 750,000 | | | | Toronto-Dominion Holdings USA, Inc | | 5.130 | | | 08/10/06 | | | 745,725 |
| 990,000 | | | | Toyota Motor Credit Corp | | 5.100 | | | 08/24/06 | | | 982,427 |
| 215,000 | | | | UBS Finance, (Delaware), Inc | | 5.100 | | | 08/21/06 | | | 213,441 |
| 950,000 | | c | | Variable Funding Capital Corp | | 5.140 | | | 07/27/06 | | | 946,473 |
| 869,000 | | c | | Yorktown Capital, LLC | | 5.130 | | | 07/20/06 | | | 866,647 |
| | | | | | | | | | | |
|
|
| | | | | TOTAL COMMERICAL PAPER | | | | | | | 35,182,893 |
| | | | | | | | | | | |
|
|
| U.S. GOVERNMENT AND AGENCIES DISCOUNT NOTES - 9.64% | | | | | | | |
| 144,000 | | | | Federal Farm Credit Bank (FFCB) | | 4.720 | | | 07/19/06 | | | 143,660 |
| 428,000 | | | | Federal Home Loan Bank (FHLB) | | 4.950 | | | 08/18/06 | | | 425,284 |
| 402,000 | | | | FHLB | | 4.975 | | | 07/21/06 | | | 400,889 |
| 225,000 | | | | FHLB | | 5.210 | | | 09/01/06 | | | 222,981 |
| 160,000 | | | | Federal Home Loan Mortgage Corp (FHLMC) | | 4.790 | | | 09/18/06 | | | 158,262 |
| 85,000 | | | | FHLMC | | 4.800 | | | 09/12/06 | | | 84,155 |
| 1,000,000 | | | | FHLMC | | 4.940 | | | 08/16/06 | | | 993,688 |
| 120,000 | | | | FHLMC | | 4.940 | | | 08/21/06 | | | 119,158 |
| 488,000 | | | | FHLMC | | 5.085 | | | 08/29/06 | | | 483,933 |
| 1,000,000 | | | | Federal National Mortgage Association (FNMA) | | 3.250 | | | 07/12/06 | | | 999,429 |
| 99,000 | | | | FNMA | | 5.000 | | | 07/12/06 | | | 98,850 |
| 216,000 | | | | FNMA | | 5.065 | | | 11/08/06 | | | 212,049 |
| | | | | | | | | | | |
|
|
| | | | | TOTAL U.S. GOVERNMENT AND AGENCIES DISCOUNT
NOTES | | | | | | | 4,342,338 |
| | | | | | | | | | | |
|
|
| | | | | SHORT-TERM INVESTMENTS (Cost $43,795,240) | | | | | | | 43,795,240 |
| | | | | | | | | | | |
|
|
| | | | | TOTAL PORTFOLIO - 97.23% (Cost $43,795,240) | | | | | | | 43,795,240 |
| | | | | OTHER ASSETS & LIABILITIES, NET - 2.77% | | | | | | | 1,247,586 |
| | | | | | | | | | | |
|
|
| | | | | NET ASSETS - 100.00% | | | | | | | $45,042,826 |
| | | | | | | | | | | |
|
|
| c | Commerical Paper issued under the Private Placement exemption under Section 4(2) of the Securities Act of 1933, as amended. |
For ease of presentation, we have grouped a number of industry classification categories together in the Statement of Investments. Note that the Funds use more specific industry categories in following their investment limitations on industry concentration.
128
Item 7. Disclosure of Proxy Voting Policies and Procedures for Closed-End Management Investment Companies.
Not Applicable.
Item 8. Portfolio Mangers of Closed-End Management Investment Companies.
Not Applicable.
Item 9. Purchases of Equity Securities by Closed-End Management Investment Company and Affiliated Purchasers.
Not Applicable.
Item 10. Submission of Matters to a Vote of Security Holders.
None.
Item 11. Controls and Procedures.
(a) Evaluation of disclosure controls and procedures. An evaluation was performed within 90 days from the date hereof under the supervision of the registrant’s management, including the principal executive officer and principal financial officer, of the effectiveness of the design and operation of the registrant’s disclosure controls and procedures. Based on that evaluation, the registrant’s management, including the principal executive officer and principal financial officer, concluded that the registrant’s disclosure controls and procedures were effective for this semi-annual reporting period.
(b) Changes in internal controls. There were no changes in the registrant’s internal controls over financial reporting that occurred during the registrant’s first fiscal half-year that materially affected, or are reasonably likely to materially affect, the registrant’s internal control over financial reporting.
Item 12. Exhibits.
12(a)(2)(i) Section 302 certification of the principal executive officer (EX-99.CERT)
12(a)(2)(ii) Section 302 certification of the principal financial officer (EX-99.CERT)
12(b) Section 906 certification (EX-99.906CERT)
SIGNATURES
Pursuant to the requirements of the Securities Exchange Act of 1934 and the Investment Company Act of 1940, the registrant has duly caused this report to be signed on its behalf by the undersigned, thereunto duly authorized.
| | | | |
| | TIAA-CREF LIFE FUNDS |
| | |
| Date: August 28, 2006 | | By: | | /s/ Scott C. Evans |
| | | | Scott C. Evans |
| | | | Executive Vice President |
Pursuant to the requirements of the Securities Exchange Act of 1934 and the Investment Company Act of 1940, this report has been signed below by the following persons on behalf of the registrant and in the capacities and on the dates indicated.
| | | | |
| Date: August 28, 2006 | | By: | | /s/ Scott C. Evans |
| | | | Scott C. Evans |
| | | | Executive Vice President |
| | | | (principal executive officer) |
| | |
| Date: August 23, 2006 | | By: | | /s/ Georganne C. Proctor |
| | | | Georganne C. Proctor |
| | | | Executive Vice President and Chief Financial Officer |
| | | | (principal financial officer) |
EXHIBIT LIST
12(a)(2)(i) Section 302 certification of the principal executive officer (EX-99.CERT)
12(a)(2)(ii) Section 302 certification of the principal financial officer (EX-99.CERT)
12(b) Section 906 certification (EX-99.906CERT)