UNITED STATES
SECURITIES AND EXCHANGE COMMISSION
Washington, D.C. 20549
FORM N-CSR
CERTIFIED SHAREHOLDER REPORT OF REGISTERED
MANAGEMENT INVESTMENT COMPANIES
Investment Company Act file number File No. 811-08961
TIAA-CREF LIFE FUNDS
| (Exact name of Registrant as specified in charter) |
| 730 Third Avenue, New York, New York | 10017-3206 | |
| (Address of principal executive offices) | (Zip code) |
Stewart P. Greene, Esq.
c/o TIAA-CREF
730 Third Avenue
New York, New York 10017-3206
| (Name and address of agent for service) |
Registrant’s telephone number, including area code: 212-490-9000
Date of fiscal year end: December 31
Date of reporting period: June 30, 2008
| Item 1. | Reports to Stockholders. |
PERFORMANCE OVERVIEW AS OF JUNE 30, 2008
The TIAA-CREF Life Funds serve as investment vehicles for the TIAA-CREF Life Separate Account VA-1 (which offers Personal Annuity Select, Lifetime Variable Select and Single Premium Immediate Annuity contracts) and TIAA-CREF Life Separate Account VLI-1 (which offers the Variable Universal Life and Intelligent Life contracts). The returns of the TIAA-CREF Life Funds shown in this report do not reflect the administrative expense and the mortality and expense risk charges deducted by the products mentioned above. Because of these additional deductions, the returns on the investment subaccounts offered through the contracts that invest in these funds are lower, for the same periods, than the figures shown here.
| Total return | Average annual total return | ||||||||||
| Inception date | 1 year | 5 years | Since inception* | ||||||||
EQUITIES | |||||||||||
Growth Equity Fund | 4/3/2000 | 0.62 | % | 8.18 | % | –4.72 | % | ||||
Growth & Income Fund | 4/3/2000 | –4.09 | 10.79 | 0.90 | |||||||
International Equity Fund | 4/3/2000 | –14.78 | 17.29 | 2.66 | |||||||
Large-Cap Value Fund | 10/28/2002 | –22.03 | 9.39 | 10.74 | |||||||
Small-Cap Equity Fund | 10/28/2002 | –17.59 | 10.28 | 13.18 | |||||||
Stock Index Fund | 1/4/1999 | –12.60 | 8.32 | 2.93 | |||||||
Social Choice Equity Fund | 4/3/2000 | –11.64 | 8.36 | 0.67 | |||||||
Real Estate Securities Fund | 10/28/2002 | –15.27 | 12.69 | 15.42 | |||||||
FIXED INCOME | |||||||||||
Bond Fund | 7/8/2003 | 4.62 | — | 3.52 | |||||||
Money Market Fund† | 7/8/2003 | 4.29 | — | 3.43 | |||||||
NET ANNUALIZED YIELD (30-day period ended 6/30/2008) | NET ANNUALIZED YIELD (7-day period ended 6/24/2008) | ||||||||||
| Effective | Current | Effective | |||||||||
Bond Fund | 5.42 | % | Money Market Fund† | 2.41 | % | 2.43 | % | ||||
| * | The performance shown is computed from the inception date of the fund (the date on which the fund became publicly available). Previously, performance for the fund was computed from the net asset value per share on the day prior to the inception date. |
| † | Investments in the TIAA-CREF Life Money Market Fund are neither insured nor guaranteed by the Federal Deposit Insurance Corporation or any other government agency. The current yield more closely reflects current earnings than does the total return. We will attempt to maintain a stable net asset value of $1.00 per share for this fund, but it is possible to lose money by investing in the fund. |
The returns in this report show past performance, which is no guarantee of future results. Returns and the principal value of your investment will fluctuate. Current performance may be higher or lower than that shown, and you may have a gain or a loss when you redeem your shares. For current performance information, including performance to the most recent month-end, please visit www.tiaa-cref.org, or call 800 223-1200.
UNDERSTANDING YOUR TIAA-CREF LIFE FUNDS REPORT
This report contains information about the TIAA-CREF Life Funds and describes the funds’ results for the six months ended June 30, 2008. The report contains five main sections:
| • | The performance overview on the inside front cover shows the funds’ returns over a variety of time periods. |
| • | The report on the TIAA-CREF Life Funds from Edward Grzybowski, the chief investment officer of Teachers Advisors, Inc., the funds’ investment adviser, explains how returns among various types of investments differed during the six-month period. |
| • | The fund performance section compares each fund’s return with the returns of that fund’s benchmark index and peer group. This section includes fund profiles that provide fund statistics at a glance, as well as portfolio composition tables that show breakdowns of each fund’s holdings by industry or security type. |
| • | The summary portfolios of investments list the industries or types of securities in which each fund had investments as of June 30, 2008, and the largest individual holdings the fund held on that date. |
| • | The financial statements contain detailed information about the operations and financial condition of each fund. |
As always, you should carefully consider the investment objectives, risks, charges and expenses of any fund before investing. For a prospectus that contains this and other important information, please visit our website at www.tiaa-cref.org, or call 800 223-1200. We urge you to read the prospectus carefully before investing.
| 2 | ||
| 4 | ||
| 5 | ||
| 6 | ||
Fund performance | ||
| 7 | ||
| 11 | ||
| 15 | ||
| 19 | ||
| 23 | ||
| 27 | ||
| 31 | ||
| 35 | ||
| 39 | ||
| 43 | ||
| 47 | ||
| Financial statements | ||
| 86 | ||
| 90 | ||
| 94 | ||
| 101 | ||
| 111 | ||
| 121 | ||
| 122 | ||
| Inside back cover | ||
REPORT ON THE TIAA-CREF LIFE FUNDS
Global stock markets entered 2008 having completed five consecutive years of impressive gains. The MSCI World Index SM, which tracks stock performance in 23 developed nations, including the United States, posted an average annual return of 17% over that time—a cumulative rate of 119%.
However, stock prices started to drop in the second half of 2007, and that slide continued and intensified during the first half of 2008.
Investor sentiment changed because of concerns about the U.S. economy and about the rising price of oil—which climbed above $140 per barrel in June. In the second quarter, gross domestic product was estimated as growing at an annual rate of 1.9%—significantly below the nation’s long-term growth rate.
For the first six months of 2008, the broad U.S. stock market, as measured by the Russell 3000® Index, lost 11.1%. Foreign stocks, as measured by the MSCI EAFE® Index, fell 11.0% in terms of dollars.
Bond returns suffer, too
Bonds fared better than stocks; bond returns were positive for the six months. The Lehman Brothers U.S. Aggregate Index, which measures the broad U.S. investment-grade, fixed-rate bond market, returned just 1.1%—far below the historical norm for a six-month period.
The Lehman index gained 2.2% in the first quarter. In the second quarter, amid heightened inflation fears and an end to the Federal Reserve’s string of short-term interest rate cuts, the index fell 1.0%.
Seven out of ten funds outperform their peers
When markets are down, the performance of an investment fund in relation to its peers takes on even greater importance. During the first half of 2008, seven of the ten TIAA-CREF Life Funds performed better than the average returns of their peers, as defined by their respective Morningstar categories—or, in the case of the Money Market Fund, better than the average U.S. taxable money market fund.
In absolute terms, the best result came from the Money Market Fund, which returned 1.6% for the six-month period, ahead of the prevailing money market average, as measured by iMoneyNet.
The eight funds that invest in stocks all participated in the market’s decline. Of these eight, six declined less than the average returns of their respective Morningstar categories and five declined less than the returns of their respective benchmarks. Returns ranged from –4.8% for the Real Estate Securities Fund to –18.0% for the International Equity Fund.
2 2008 Semiannual Report ¡ TIAA-CREF Life Funds
The Bond Fund’s –0.1% return lagged that of its benchmark, but the fund held up better than its Morningstar category average, which posted a loss of 0.7%.
How diversified is your portfolio?
While no investment strategy can guarantee against loss, diversifying your assets can help limit your losses when declines occur in one investment area or asset class but not in others. It can also help ensure that, when a given area or asset class does well, you will be able to share in its rewards.
Generally stocks produce higher returns than bonds over the long term. During 2007, however, U.S. investment-grade bonds, as measured by the Lehman aggregate index, returned 7.0%, while the stocks of the Russell 3000 earned just 5.1%. Diversification enables an investor to take advantage of unexpected results like these.
That is why TIAA-CREF Life Funds offer a range of investment options that includes stocks, bonds and the money market. With stocks, we also give you an opportunity to diversify among both domestic and foreign stocks.
With U.S. stocks, you can choose a broad-based fund or one that focuses on a particular part of the market, such as the Growth & Income Fund, which concentrates on stocks of larger companies.

Edward J. Grzybowski
Chief Investment Officer
Teachers Advisors, Inc.
Some investors may decide that they want both, seeking to balance the benefits of broad diversification with the opportunities that a concentration in one part of the market may provide.
Our goal is to give you options that can be combined to create a broadly diversified portfolio with the potential for consistent growth. Of course, the right mix depends on your financial needs, your time horizon and your attitude toward risk.
If you would like help finding the combination that’s best for you, please visit our website or call us.
 |
| Edward J. Grzybowski |
| Chief Investment Officer |
| Teachers Advisors, Inc. |
TIAA-CREF Life Funds ¡ 2008 Semiannual Report 3
MORE INFORMATION ON THE TIAA-CREF LIFE FUNDS
Portfolio listings
Securities and Exchange Commission (SEC) rules intended to provide investors with more meaningful information about fund performance allow investment companies to list the top holdings of each fund in their annual and semiannual reports instead of providing complete portfolio listings. The funds file complete portfolio listings with the SEC and they are available to the public.
You can obtain a complete list of the TIAA-CREF Life Funds’ holdings (called “TIAA-CREF Life Funds Statements of Investments”) as of the most recently completed fiscal quarter (currently for the period ended June 30, 2008) in the following ways:
| • | By visiting our website at www.tiaa-cref.org; or |
| • | By calling us at 800 842-2776 to request a copy, which will be provided free of charge. |
You can also obtain a complete list of the TIAA-CREF Life Funds’ holdings as of the most recently completed fiscal quarter, and for prior quarter-ends, from the SEC. (Form N-CSR lists holdings as of December 31 or June 30; Form N-Q lists holdings as of March 31 or September 30.) Copies of these forms are available:
| • | Through the Electronic Data Gathering and Retrieval System (EDGAR) on the SEC’s website at www.sec.gov; or |
| • | At the SEC’s Public Reference Room. (Call 800 SEC-0330 for more information.) |
Proxy voting
TIAA-CREF Life Funds’ ownership of stock gives them the right to vote on proxy issues of companies in which they invest. A description of our proxy voting policies and procedures can be found on our website at www.tiaa-cref.org or on the SEC website at www.sec.gov. You may also call us at 800 223-1200 to request a free copy. A report of how the funds voted during the most recently completed twelve-month period ended June 30 can be found on our website or on Form N-PX at www.sec.gov.
Contacting TIAA-CREF
There are three easy ways to contact us: by e-mail, using the Contact Us link at the top of our home page; by mail at TIAA-CREF, 730 Third Avenue, New York, NY 10017–3206; or by phone at 800 223-1200.
Fund management
TIAA-CREF Life Funds are managed by the portfolio management teams of Teachers Advisors, Inc. The members of these teams are responsible for the day-to-day investment management of the funds.
4 2008 Semiannual Report ¡ TIAA-CREF Life Funds
Agency securities are bonds issued by U.S. government entities such as Fannie Mae.
Asset-backed securities are bonds backed by loans or by the outstanding amounts owed to a bank, credit card company or other lender.
Benchmarks (benchmark indexes) are groups of securities, such as the Russell 3000® Index or S&P 500® Index, whose performance can be used as a standard by which to judge the performance of a fund.*
Commercial paper refers to short-term debt obligations issued to investors by banks, corporations or other borrowers. Maturities range from 1 to 270 days.
Emerging markets are countries with relatively low per capita income levels and above-average economic growth rates or prospects for growth.
Expense ratio is a measure of the annual amount that investors pay for the management of a mutual fund. It is expressed as a percentage of the fund’s average net assets. Expense ratios do not include front-end or back-end sales charges, if any, or trading costs. See “Total return.”
Market capitalization is the total value of a company’s outstanding stock, calculated by multiplying the number of outstanding shares by the current market price per share.
Maturity date is the date on which the principal amount of a note, bond or other debt instrument becomes due or payable.
Mortgage-backed securities are bonds that represent an interest in a pool of mortgages usually issued by Ginnie Mae, Fannie Mae or other federal entities.
Overweight holding is a security that forms a larger percentage of a fund, in terms of market capitalization, than that security’s percentage of the benchmark. See also “Underweight holding.”
Peer groups are groupings of mutual funds with similar objectives whose performance can be compared with that of an individual mutual fund with a similar objective.
Portfolio turnover rate is calculated by dividing the market value of securities bought and sold during a given period by the average value of the fund’s assets during that period.
Price/earnings ratio (P/E) is calculated by dividing the market value of a portfolio’s assets by its earnings per share over a twelve-month period.
Relative performance is the return of a fund in relation to that of its benchmark.
Securities is a general name for stocks (also known as “equities”), bonds (also known as “fixed-income securities”) or other marketable investments.
Total return is the amount an investment provides to investors after expenses are deducted. Total return is expressed as a percentage. It includes any interest or dividends, as well as any change in the market value of the investment.
Underweight holding is a security that forms a smaller percentage of a fund, in terms of market capitalization, than that security’s percentage of the benchmark. See also “Overweight holding.”
| * | Russell 3000 is a trademark and service mark of Russell Investment Group. TIAA-CREF products are not promoted or sponsored by, or affiliated with, Russell Investment Group. S&P 500 is a registered trademark and service mark of the McGraw-Hill Companies, Inc. |
TIAA-CREF Life Funds ¡ 2008 Semiannual Report 5
IMPORTANT INFORMATION ABOUT EXPENSES
Shareholders in the TIAA-CREF Life Funds incur only one of two potential types of costs.
| • | Shareholders incur no transaction costs, including sales charges (loads) on purchases, on reinvested dividends or on other distributions. There are also no redemption fees or exchange fees. |
| • | However, they do incur ongoing costs, including management fees. |
The TIAA-CREF Life Funds are the underlying investment vehicles for certain variable life insurance and variable annuity contracts issued by TIAA-CREF Life Insurance Company. These contracts have additional administrative expense fees and mortality and expense risk charges. Because of these additional deductions, the costs to investors will be higher than the figures shown in the expense examples.
The examples that appear on the performance pages are intended to help you understand your ongoing costs (in U.S. dollars) of investing in each fund. The examples are also designed to help you compare these costs with the ongoing costs of investing in other funds.
The examples assume $1,000 was invested on January 1, 2008, and held for six months until June 30, 2008.
Actual expenses
The first line in each table uses the fund’s actual expenses and its actual rate of return. You may use the information in this line, together with the amount you invested at the beginning of the period, to estimate the expenses that you paid over the six-month period.
Simply divide your fund value by $1,000 (for example, an $8,600 fund value divided by $1,000 = 8.6), then multiply the result by the number in the first line under the heading “Expenses paid” to estimate the expenses you paid during the six-month period.
Hypothetical example for comparison purposes
The second line in the table shows hypothetical fund values and expenses based on the fund’s actual expense ratio for the six-month period and an assumed 5% per year rate of return before expenses. This was not the fund’s actual return.
This hypothetical example cannot be used to estimate the actual expenses you paid for the period but rather allows you to compare the ongoing costs of investing in this fund with the costs of other funds. To do so compare our 5% hypothetical example with the 5% hypothetical examples that appear in the shareholder reports of other funds.
6 2008 Semiannual Report ¡ TIAA-CREF Life Funds
GROWTH EQUITY FUNDLARGE-CAPGROWTHSTOCKS
PERFORMANCE IN THE SIX MONTHS ENDED JUNE 30, 2008
The Growth Equity Fund returned –9.82% for the period, compared with the –9.06% return of its benchmark, the Russell 1000® Growth Index, and the –10.38% average return of the fund’s peer group, the Morningstar Large Growth category.
Large-cap growth fares better than large-cap value
For the six-month period, large-cap growth stocks held up better than large-cap value issues, which lost 13.57%, as measured by the Russell 1000 Value Index. For the twelve months ended June 30, 2008, the large-cap growth category posted a 5.96% loss—far less than the 18.78% decline seen among large-cap value stocks.
For the ten years ended June 30, however, the Russell 1000 Growth Index posted an average annual return of 0.96% versus the 4.91% average return of the Russell 1000 Value Index.
Declines in most sectors drive down the benchmark
Ten of the benchmark’s twelve industry sectors registered negative returns, with seven producing double-digit losses. The benchmark’s two largest sectors—technology (down 12.3%) and consumer discretionary (down 12.2%)—were among the biggest detractors from performance. Together these sectors constituted almost 40% of the benchmark’s market capitalization at the end of June.
Only two sectors in the index, “other energy” and materials and processing, posted gains, rising 19.8% and 2.1%, respectively.
Stock selections trim relative performance
The fund underperformed its benchmark largely because of various overweight holdings that failed to perform as anticipated. Chief among these were Hologic, a maker of medical imaging systems, drugmaker Merck, MGM Mirage and International Game Technology. An out-of-benchmark position in Renewable Energy, a Norwegian solar energy company, also detracted from relative performance.
The negative effects of these holdings were partially mitigated by a number of successful overweight stock selections, including agricultural giant Monsanto and energy provider Denbury Resources. An underweight position in Microsoft also aided returns.
On June 30, 2008, foreign securities made up 12.41% of the fund’s total portfolio investments. Many of these securities were held as American Depositary Receipts, which are receipts for shares of a foreign stock traded on a U.S. exchange.
TIAA-CREF Life Funds ¡ 2008 Semiannual Report 7
GROWTH EQUITY FUNDLARGE-CAPGROWTHSTOCKS
INVESTMENT OBJECTIVE
The fund seeks a favorable long-term return, mainly through capital appreciation, primarily from equity securities.
PRINCIPAL INVESTMENT RISKS
The fund is subject to market risk, company risk, growth investing risk, style risk, large-cap risk, reorganization risk and foreign investment risk. For a detailed discussion of risk, please see the prospectus.
THE FUND’S BENCHMARK
The Russell 1000®Growth Index is a subset of the Russell 1000 Index, which measures the performance of the stocks of the 1,000 largest companies in the Russell 3000®Index, based on market capitalization. The Russell 1000 Growth Index measures the performance of those stocks of the Russell 1000 Index with higher price/book ratios and higher relative forecasted growth rates. You cannot invest directly in these indexes.
PERFORMANCE AS OF JUNE 30, 2008
| Total return | Average annual total return | |||||||||||
| 6 months | 1 year | 5 years | Since inception | |||||||||
Growth Equity Fund (inception: 4/3/2000) | –9.82 | % | 0.62 | % | 8.18 | % | –4.72 | %* | ||||
Russell 1000 Growth Index | –9.06 | –5.96 | 7.32 | –4.57 | * | |||||||
Morningstar Large Growth | –10.38 | –6.02 | 7.81 | –2.51 | ||||||||
| * | The performance shown is computed from the inception date of the fund (the date on which the fund became publicly available). Previously, performance for the fund was computed from the net asset value per share on the day prior to the inception date. |
The returns in this report show past performance, which is no guarantee of future results. Returns and the principal value of your investment will fluctuate. Current performance may be higher or lower than that shown, and you may have a gain or a loss when you redeem your shares. For current performance information, including performance to the most recent month-end, please visit www.tiaa-cref.org.
Russell 1000 and Russell 3000 are trademarks and service marks of Russell Investment Group. TIAA-CREF products are not promoted or sponsored by, or affiliated with, Russell Investment Group.
8 2008 Semiannual Report ¡ TIAA-CREF Life Funds
$10,000 SINCE APRIL 3, 2000 INCEPTION
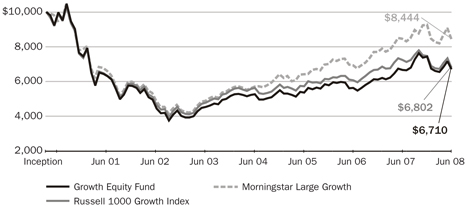
An investment of $10,000 in this fund on April 3, 2000, would be worth $6,710 as of June 30, 2008, including reinvestment of dividends and distributions. For the purpose of comparison, the graph also shows the change in the values of the fund’s benchmark and peer group during the same period.
CALENDAR YEAR TOTAL RETURN
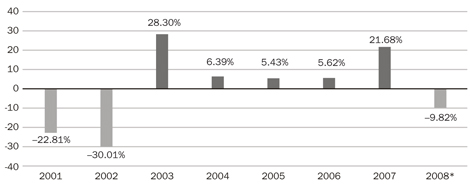
| * | Partial year |
TIAA-CREF Life Funds ¡ 2008 Semiannual Report 9
GROWTH EQUITY FUND LARGE-CAPGROWTHSTOCKS
EXPENSE EXAMPLE
Six months ended June 30, 2008
Growth Equity Fund | Starting fund value (1/1/08) | Ending fund value (6/30/08) | Expenses paid* (1/1/08– 6/30/08) | |||||||
Actual return | $ | 1,000.00 | $ | 901.80 | $ | 1.32 | ||||
5% annual hypothetical return | 1,000.00 | 1,023.45 | † | 1.41 | ||||||
| * | “Expenses paid” is equal to the fund’s annualized expense ratio of 0.28%, multiplied by the average fund value over the six-month period, multiplied by 182/366. There were 182 days in the first half of 2008. |
| † | Ending fund value for the hypothetical example would be $1,024.86 before expenses. The table shows the value after subtraction of expenses in order to be comparable with the ending fund value shown for the fund’s actual return. |
For more information about this expense example, please see page 6.
FUND PROFILE
Net assets | $ | 37.60 million | ||
Number of holdings | 82 | |||
Portfolio turnover rate | 126 | % | ||
Weighted median market capitalization | $ | 34.5 billion | ||
P/E ratio (weighted 12-month trailing average) | 23.8 | |||
Dividend yield | 0.81 | % | ||
2008 expense ratio‡ | 0.28 | % |
| ‡ | This fund expense ratio does not include the administrative, mortality and expense risk charges that are deducted under variable annuity or variable life insurance contracts that use the TIAA-CREF Life Funds. For more information on fund deductions and expenses, please see the variable product prospectus. |
PORTFOLIO COMPOSITION
| % of portfolio investments | ||
Technology | 30.2 | |
Health care | 16.2 | |
Consumer products & services | 15.8 | |
Manufacturing & materials | 15.4 | |
Energy | 13.2 | |
Financial | 9.0 | |
Utilities | 0.2 | |
Total | 100.0 |
HOLDINGS BY COMPANY SIZE
| % of portfolio investments | ||
Over $15 billion | 75.55 | |
$4 billion–$15 billion | 23.14 | |
Under $4 billion | 1.31 | |
Total | 100.00 |
10 2008 Semiannual Report ¡ TIAA-CREF Life Funds
GROWTH & INCOME FUND LARGE-CAP,DIVIDEND-PAYINGSTOCKS
PERFORMANCE IN THE SIX MONTHS ENDED JUNE 30, 2008
The Growth & Income Fund returned –10.43% for the period, compared with the –11.91% return of its benchmark, the S&P 500® Index, and the –11.18% average return of the fund’s peer group, the Morningstar Large Blend category.
Large-cap stocks fare worse than the broad market
For the first half of 2008, the S&P 500 Index, which contains mostly large-cap stocks, suffered a greater decline than the broad-based Russell 3000® Index, which fell 11.05%. This happened because, unlike the Russell 3000, the S&P 500 includes few small-cap stocks. The small-cap component of the Russell 3000, which makes up nearly one-tenth of that index, declined 9.37%.
For the ten years ended June 30, 2008, the S&P 500 Index produced an average annual return of 2.88%—less than the 3.51% return of the Russell 3000 Index.
Financial and technology sectors drive down the benchmark
For the six-month period, eight of the benchmark’s ten industry sectors posted negative returns, with six registering double-digit losses. Prolonged weakness in financials and information technology, the benchmark’s two largest sectors, led to returns for these sectors of –29.7% and –13.1%, respectively. Combined, the two sectors made up about one-third of the benchmark’s market capitalization as of June 30, 2008.
These losses were partially offset by a positive contribution from the energy sector, which made up about one-sixth of the market capitalization of the index, and gained 8.9%.
Stock choices boost relative performance
The fund held up better than its benchmark because of numerous favorable stock selections that included a number of nonbenchmark issues. Among these were Mosaic, one of the world’s largest fertilizer producers; Elan, an Irish biotech company; Activision, a video game maker; and Anglo-American, a U.K.-based mining company. Overweight positions in Devon Energy and Cabot Oil and Gas also helped relative returns.
These positive effects were partly offset by other holdings that reduced relative performance, including overweight positions in Bear Stearns, Fannie Mae and drugmaker Merck.
On June 30, 2008, foreign securities made up 7.96% of the fund’s total portfolio investments. Many of these securities were held as American Depositary Receipts, which are receipts for shares of a foreign stock traded on a U.S. exchange.
TIAA-CREF Life Funds ¡ 2008 Semiannual Report 11
GROWTH & INCOME FUND LARGE-CAP,DIVIDEND-PAYINGSTOCKS
INVESTMENT OBJECTIVE
The fund seeks a favorable long-term total return through both capital appreciation and investment income, primarily from income-producing equity securities.
PRINCIPAL INVESTMENT RISKS
The fund is subject to market risk, company risk, style risk, foreign investment risk, growth investing risk and large-cap risk. In addition, it is subject to the risks associated with stocks paying relatively high dividends; they may underper-form other stocks during periods of rapid market appreciation. For a detailed discussion of risk, please see the prospectus.
THE FUND’S BENCHMARK
The S&P 500®Index is a market-capitalization-weighted index of the stocks of 500 leading companies in major industries of the U.S. economy. You cannot invest directly in this index.
PERFORMANCE AS OF JUNE 30, 2008
| Total return | Average annual total return | |||||||||||
| 6 months | 1 year | 5 years | Since inception | |||||||||
Growth & Income Fund (inception: 4/3/2000) | –10.43 | % | –4.09 | % | 10.79 | % | 0.90 | %* | ||||
S&P 500 Index | –11.91 | –13.12 | 7.58 | –0.27 | * | |||||||
Morningstar Large Blend | –11.18 | –12.27 | 7.64 | 0.78 | ||||||||
| * | The performance shown is computed from the inception date of the fund (the date on which the fund became publicly available). Previously, performance for the fund was computed from the net asset value per share on the day prior to the inception date. |
The returns in this report show past performance, which is no guarantee of future results. Returns and the principal value of your investment will fluctuate. Current performance may be higher or lower than that shown, and you may have a gain or a loss when you redeem your shares. For current performance information, including performance to the most recent month-end, please visit www.tiaa-cref.org.
S&P 500 is a registered trademark and service mark of the McGraw-Hill Companies.
12 2008 Semiannual Report ¡ TIAA-CREF Life Funds
$10,000 SINCE APRIL 3, 2000 INCEPTION
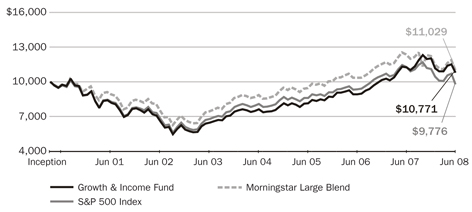
An investment of $10,000 in this fund on April 3, 2000, would have grown to $10,771 as of June 30, 2008, including reinvestment of dividends and distributions. For the purpose of comparison, the graph also shows the change in the values of the fund’s benchmark and peer group during the same period.
CALENDAR YEAR TOTAL RETURN
| * | Partial year |
TIAA-CREF Life Funds ¡ 2008 Semiannual Report 13
GROWTH & INCOME FUND LARGE-CAP,DIVIDEND-PAYINGSTOCKS
EXPENSE EXAMPLE
Six months ended June 30, 2008
Growth & Income Fund | Starting fund value (1/1/08) | Ending fund value (6/30/08) | Expenses paid* (1/1/08– 6/30/08) | |||||||
Actual return | $ | 1,000.00 | $ | 895.70 | $ | 1.08 | ||||
5% annual hypothetical return | 1,000.00 | 1,023.70 | † | 1.16 | ||||||
| * | “Expenses paid” is equal to the fund’s annualized expense ratio of 0.23%, multiplied by the average fund value over the six-month period, multiplied by 182/366. There were 182 days in the first half of 2008. |
| † | Ending fund value for the hypothetical example would be $1,024.86 before expenses. The table shows the value after subtraction of expenses in order to be comparable with the ending fund value shown for the fund’s actual return. |
For more information about this expense example, please see page 6.
FUND PROFILE
Net assets | $ | 73.58 million | ||
Number of holdings | 140 | |||
Portfolio turnover rate | 68 | % | ||
Weighted median market capitalization | $ | 48.8 billion | ||
P/E ratio (weighted 12-monthtrailing average) | 18.5 | |||
Dividend yield | 1.85 | % | ||
2008 expense ratio‡ | 0.23 | % |
‡ | This fund expense ratio does not include the administrative, mortality and expense risk charges that are deducted under variable annuity or variable life insurance contracts that use the TIAA-CREF Life Funds. For more information on fund deductions and expenses, please see the variable product prospectus. |
PORTFOLIO COMPOSITION
| % of portfolio investments | ||
Technology | 19.9 | |
Manufacturing & materials | 19.0 | |
Consumer products & services | 18.4 | |
Energy | 13.9 | |
Health care | 13.3 | |
Financial | 11.8 | |
Utilities | 3.7 | |
Total | 100.0 |
HOLDINGS BY COMPANY SIZE
| % of portfolio investments | ||
Over $15 billion | 81.66 | |
$4 billion–$15 billion | 11.74 | |
Under $4 billion | 6.60 | |
Total | 100.00 |
14 2008 Semiannual Report ¡ TIAA-CREF Life Funds
INTERNATIONAL EQUITY FUND FOREIGNSTOCKS
PERFORMANCE IN THE SIX MONTHS ENDED JUNE 30, 2008
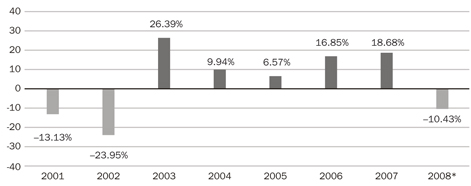
The International Equity Fund returned –18.03% for the period, compared with the –10.96% return of the fund’s benchmark, the MSCI EAFE® Index, and the –10.71% average return of the fund’s peer group, the Morningstar Foreign Large Blend category.
Foreign and U.S. stocks fall together
Rattled by soaring oil prices, continued problems in the credit markets and investor doubts about global growth, foreign stocks posted a double-digit loss in the first six months of 2008. For the period, the drop in the EAFE index was in line with the 11.05% decline of the Russell 3000® Index, which measures the broad U.S. stock market.
For U.S. investors, foreign stock losses were cushioned by a weaker dollar. The rising value of the euro and pound during the period trimmed nearly five percentage points from the 15.70% loss of the EAFE in terms of local currencies, resulting in a 10.96% decline in dollars.
For the ten years ended June 30, 2008, the average annual return of the EAFE index was 5.83% in dollars, versus 3.51% for the Russell 3000 Index.
European stocks lose the most ground
During the period, the EAFE’s European segment lost 12.4% in dollar terms. British, French and German stocks fell 11.2%, 12.0% and 13.9%, respectively. In the Pacific segment, Japanese stocks lost 5.5%, while other Pacific stocks tumbled 11.7%.
Stock selections produce negative results
The fund’s decline was larger than its benchmark’s because of numerous stock selections that performed poorly. Among the primary detractors were overweight positions in Swiss financial services provider UBS, Italian car maker Fiat and Japanese real estate developer Urban. Underweights that detracted from performance included Swiss drug-maker Novartis and Australian mining company BHP Billiton.
The negative effects of these holdings more than offset positive contributions from positions that included overweights in German drug maker Bayer and British finan-cial company Man Group and two nonbenchmark holdings, German industrial equipment manufacturer Krones and Russian fertilizer producer Uralkali. Underweights in stocks such as Finnish mobile phone manufacturer Nokia and Royal Bank of Scotland also helped.
As of June 30, 2008, stocks of companies in emerging markets, which are not in the benchmark, made up 9.1% of the fund’s total portfolio investments.
TIAA-CREF Life Funds ¡ 2008 Semiannual Report 15
INTERNATIONAL EQUITY FUNDFOREIGNSTOCKS
INVESTMENT OBJECTIVE
The fund seeks a favorable long-term total return, mainly through capital appreciation, primarily from equity securities of foreign issuers.
PRINCIPAL INVESTMENT RISKS
The fund is subject to foreign investment risk, market risk, company risk, and small company risk. For a detailed discussion of risk, please see the prospectus.
THE FUND’S BENCHMARK
The MSCI EAFE®(Europe, Australasia, Far East) Index measures the performance of the leading stocks in 21 developed countries outside North America. You cannot invest directly in this index.
PERFORMANCE AS OF JUNE 30, 2008
| Total return | Average annual total return | |||||||||||
| 6 months | 1 year | 5 years | Since inception | |||||||||
International Equity Fund (inception: 4/3/2000) | –18.03 | % | –14.78 | % | 17.29 | % | 2.66 | %* | ||||
MSCI EAFE Index | –10.96 | –10.61 | 16.65 | 3.66 | * | |||||||
Morningstar Foreign Large Blend | –10.71 | –9.04 | 15.90 | 2.73 | ||||||||
| * | The performance shown is computed from the inception date of the fund (the date on which the fund became publicly available). Previously, performance for the fund was computed from the net asset value per share on the day prior to the inception date. |
The returns in this report show past performance, which is no guarantee of future results. Returns and the principal value of your investment will fluctuate. Current performance may be higher or lower than that shown, and you may have a gain or a loss when you redeem your shares. For current performance information, including performance to the most recent month-end, please visit www.tiaa-cref.org.
EAFE is a trademark of MSCI, Inc.
16 2008 Semiannual Report ¡ TIAA-CREF Life Funds
$10,000 SINCE APRIL 3, 2000 INCEPTION
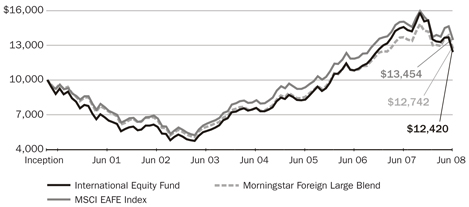
An investment of $10,000 in this fund on April 3, 2000, would have grown to $12,420 as of June 30, 2008, including reinvestment of dividends and distributions. For the purpose of comparison, the graph also shows the change in the values of the fund’s benchmark and peer group during the same period.
CALENDAR YEAR TOTAL RETURN
| * | Partial year |
TIAA-CREF Life Funds ¡ 2008 Semiannual Report 17
INTERNATIONAL EQUITY FUND FOREIGNSTOCKS
EXPENSE EXAMPLE
Six months ended June 30, 2008
International Equity Fund | Starting fund value (1/1/08) | Ending fund value (6/30/08) | Expenses paid* (1/1/08– 6/30/08) | |||||||
Actual return | $ | 1,000.00 | $ | 819.70 | $ | 1.45 | ||||
5% annual hypothetical return | 1,000.00 | 1,023.25 | † | 1.61 | ||||||
| * | “Expenses paid” is equal to the fund’s annualized expense ratio of 0.32%, multiplied by the average fund value over the six-month period, multiplied by 182/366. There were 182 days in the first half of 2008. |
† | Ending fund value for the hypothetical example would be $1,024.86 before expenses. The table shows the value after subtraction of expenses in order to be comparable with the ending fund value shown for the fund’s actual return. |
For more information about this expense example, please see page 6.
FUND PROFILE
Net assets | $ | 121.27 million | ||
Number of holdings | 116 | |||
Portfolio turnover rate | 113 | % | ||
Weighted median market capitalization | $ | 31.5 billion | ||
P/E ratio (weighted 12-month trailing average) | 12.8 | |||
Dividend yield | 2.75 | % | ||
2008 expense ratio‡ | 0.32 | % |
| ‡ | This fund expense ratio does not include the administrative, mortality and expense risk charges that are deducted under variable annuity or variable life insurance contracts that use the TIAA-CREF Life Funds. For more information on fund deductions and expenses, please see the variable product prospectus. |
HOLDINGS BY COMPANY SIZE
| % of portfolio investments | ||
Over $15 billion | 68.95 | |
$4 billion–$15 billion | 16.25 | |
Under $4 billion | 14.80 | |
Total | 100.00 |
HOLDINGS BY COMPANY
Country | % of portfolio investments | |
Germany | 23.0 | |
Japan | 20.0 | |
United Kingdom | 14.1 | |
France | 12.1 | |
Switzerland | 9.1 | |
China | 5.1 | |
Italy | 4.1 | |
Russia | 2.7 | |
Hong Kong | 2.6 | |
7 other nations | 7.2 | |
Total | 100.0 |
PORTFOLIO COMPOSITION
| % of portfolio investments | ||
Manufacturing & materials | 35.8 | |
Consumer products & services | 21.2 | |
Financial | 20.8 | |
Utilities | 7.4 | |
Energy | 6.6 | |
Technology | 4.7 | |
Health care | 3.5 | |
Total | 100.0 |
18 2008 Semiannual Report ¡ TIAA-CREF Life Funds
LARGE-CAP VALUE FUND VALUESTOCKSOFLARGERCOMPANIES
PERFORMANCE IN THE SIX MONTHS ENDED JUNE 30, 2008
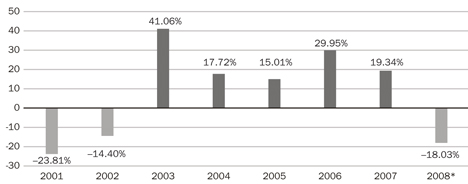
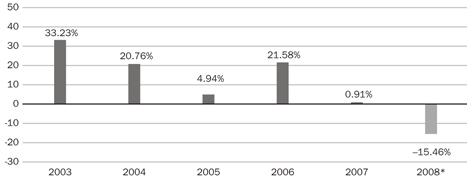
The Large-Cap Value Fund returned –15.46% for the period, compared with the –13.57% return of its benchmark, the Russell 1000® Value Index, and the –13.04% average return of the fund’s peer group, the Morningstar Large Value category.
Large-cap value stocks trail large-cap growth
For the six-month period, large-cap value stocks lagged mid-cap and small-cap value issues, which dropped 8.58% and 9.84%, respectively. (Investment-style and capitalization-size returns are based on the Russell indexes.) Large-cap value stocks also lagged large-cap growth issues, as measured by the Russell 1000 Growth Index, by more than four-and-a-half percentage points.
Over the last decade, however, large-cap value significantly outperformed large-cap growth. For the ten years ended June 30, 2008, the Russell 1000 Value Index posted an average annual return of 4.91%—more than five times the 0.96% average annual return of the Russell 1000 Growth Index.
Most sectors record losses
For the period, ten of the Russell 1000 Value Index’s twelve sectors registered negative returns, with seven producing double-digit losses. Two of the benchmark’s largest sectors, financials and utilities, drove performance; they dropped 29.2% and 9.7%, respectively. Together these two sectors made up more than 40% of the benchmark, in terms of market capitalization, as of June 30, 2008.
The only two sectors in the index with positive returns were “other energy” and integrated oils, which gained 29.6% and 2.5%, respectively.
Stock selections reduce performance
The fund lagged its benchmark for the period because of numerous stock selections that failed to perform as anticipated. These included overweight positions in Bear Stearns and Fannie Mae. Underweight positions in ConocoPhilips and ExxonMobil also detracted from returns.
These negative effects were partly offset by the positive contributions to relative performance from other positions. Among the most significant were holdings in Darden Restaurants and XTO Energy, two nonbenchmark stocks, and underweight positions in Bank of America and insurer American International Group.
On June 30, 2008, foreign securities made up 5.34% of the fund’s total portfolio investments. Many of these securities were held as American Depositary Receipts, which are receipts for shares of a foreign stock traded on a U.S. exchange.
TIAA-CREF Life Funds ¡ 2008 Semiannual Report 19
LARGE-CAP VALUE FUND VALUESTOCKSOFLARGERCOMPANIES
INVESTMENT OBJECTIVE
The fund seeks a favorable long-term total return, mainly through capital appreciation, primarily from equity securities of large domestic companies.
PRINCIPAL INVESTMENT RISKS
The fund is subject to market risk, company risk, large-cap risk, value investing risk, style risk, reorganization risk and foreign investment risk. For a detailed discussion of risk, please see the prospectus.
THE FUND’S BENCHMARK
The Russell 1000®Value Index is a subset of the Russell 1000 Index, which measures the performance of the stocks of the 1,000 largest companies in the Russell 3000®Index, based on market capitalization. The Russell 1000 Value Index measures the performance of those stocks of the Russell 1000 Index with lower price/book ratios and lower relative forecasted growth rates. You cannot invest directly in these indexes.
PERFORMANCE AS OF JUNE 30, 2008
| Total return | Average annual total return | |||||||||||
| 6 months | 1 year | 5 years | Since inception | |||||||||
Large-Cap Value Fund (inception: 10/28/2002) | –15.46 | % | –22.03 | % | 9.39 | % | 10.74 | %* | ||||
Russell 1000 Value Index | –13.57 | –18.78 | 8.91 | 10.16 | * | |||||||
Morningstar Large Value | –13.04 | –17.88 | 7.77 | 9.10 | ||||||||
| * | The performance shown is computed from the inception date of the fund (the date on which the fund became publicly available). Previously, performance for the fund was computed from the net asset value per share on the day prior to the inception date. |
The returns in this report show past performance, which is no guarantee of future results. Returns and the principal value of your investment will fluctuate. Current performance may be higher or lower than that shown, and you may have a gain or a loss when you redeem your shares. For current performance information, including performance to the most recent month-end, please visit www.tiaa-cref.org.
Russell 1000 and Russell 3000 are trademarks and service marks of Russell Investment Group. TIAA-CREF products are not promoted or sponsored by, or affiliated with, Russell Investment Group.
20 2008 Semiannual Report ¡ TIAA-CREF Life Funds
$10,000 SINCE OCTOBER 28, 2002 INCEPTION
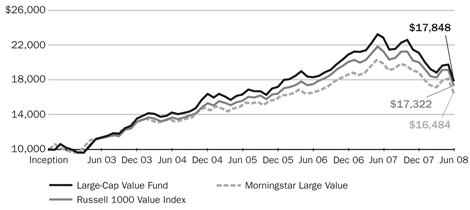
An investment of $10,000 in this fund on October 28, 2002, would have grown to $17,848 as of June 30, 2008, including reinvestment of dividends and distributions. For the purpose of comparison, the graph also shows the change in the values of the fund’s benchmark and peer group during the same period.
CALENDAR YEAR TOTAL RETURN
| * | Partial year |
TIAA-CREF Life Funds ¡ 2008 Semiannual Report 21
LARGE-CAP VALUE FUNDVALUESTOCKSOFLARGERCOMPANIES
EXPENSE EXAMPLE
Six months ended June 30, 2008
Large-Cap Value Fund | Starting fund value (1/1/08) | Ending fund value (6/30/08) | Expenses paid* (1/1/08– 6/30/08) | |||||||
Actual return | $ | 1,000.00 | $ | 845.40 | $ | 1.19 | ||||
5% annual hypothetical return | 1,000.00 | 1,023.55 | † | 1.31 | ||||||
| * | “Expenses paid” is equal to the fund’s annualized expense ratio of 0.26%, multiplied by the average fund value over the six-month period, multiplied by 182/366. There were 182 days in the first half of 2008. |
| † | Ending fund value for the hypothetical example would be $1,024.86 before expenses. The table shows the value after subtraction of expenses in order to be comparable with the ending fund value shown for the fund’s actual return. |
For more information about this expense example, please see page 6.
FUND PROFILE
Net assets | $ | 57.83 million | ||
Number of holdings | 197 | |||
Portfolio turnover rate | 83 | % | ||
Weighted median market capitalization | $ | 35.0 billion | ||
P/E ratio (weighted 12-month trailing average) | 15.0 | |||
Dividend yield | 2.55 | % | ||
2008 expense ratio‡ | 0.26 | % |
| ‡ | This fund expense ratio does not include the administrative, mortality and expense risk charges that are deducted under variable annuity or variable life insurance contracts that use the TIAA-CREF Life Funds. For more information on fund deductions and expenses, please see the variable product prospectus. |
PORTFOLIO COMPOSITION
| % of portfolio investments | ||
Financial | 23.3 | |
Energy | 17.6 | |
Consumer products & services | 16.1 | |
Manufacturing & materials | 14.9 | |
Health care | 11.8 | |
Technology | 10.4 | |
Utilities | 5.6 | |
Short-term investments | 0.3 | |
Total | 100.0 |
HOLDINGS BY COMPANY SIZE
| % of portfolio investments | ||
Over $15 billion | 67.42 | |
$4 billion–$15 billion | 20.18 | |
Under $4 billion | 12.40 | |
Total | 100.00 |
22 2008 Semiannual Report ¡ TIAA-CREF Life Funds
SMALL-CAP EQUITY FUNDSTOCKSOFSMALLERCOMPANIES
PERFORMANCE IN THE SIX MONTHS ENDED JUNE 30, 2008
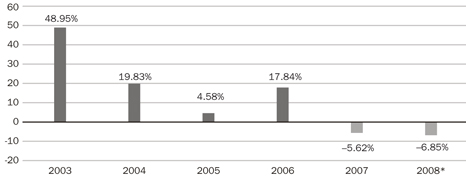
The Small-Cap Equity Fund returned –6.85% for the period, compared with the –9.37% return of its benchmark, the Russell 2000® Index, and the –8.93% average return of the fund’s peer group, the Morningstar Small Blend category.
Small caps fare better than the broader market
For the six-month period, small-cap stocks held up better than the broad U.S. stock market, as measured by the Russell 3000® Index, which dropped 11.05%. Small caps benefited from a strong rally in May, when the Russell 2000 rose 4.59%, versus a 2.05% rise in the broader market.
Within the small-cap category, growth stocks fell 8.93% during the six months, while value stocks lost 9.84%.
For the ten-year period ended June 30, 2008, the Russell 2000 Index posted an average annual return of 5.53%—more than two percentage points greater than the 3.51% average annual return of the Russell 3000.
Three largest sectors post steep declines
The benchmark’s return was driven by outsized losses in its three largest sectors—financials, technology and consumer discretionary, which fell 18.0%, 16.0% and 14.8%, respectively. These sectors made up about one-half of the index in terms of market capitalization as of June 30, 2008.
Three sectors reported positive results: integrated oils, “other energy” and a miscellaneous sector. However, together they comprised only about eight percent of the benchmark, so their effect was small.
Stock choices keep the fund above the benchmark
The fund was able to limit its decline, relative to the benchmark, because of numerous successful stock selections. Among them were overweight holdings in coal mining company Alpha Natural Resources, energy exploration firm Clayton Williams Energy and oil producer PetroQuest Energy. Underweighting regional bank UCBH Holdings also boosted returns.
These positive results were partly offset by several overweight holdings that performed poorly. These included financial data provider GFI Group and mobile technology company SiRF Technology. An underweight position in solar energy technology company Energy Conversion Devices also reduced returns.
The fund continued to use proprietary mathematical models to select small-cap stocks that appeared to be attractively priced.
TIAA-CREF Life Funds ¡ 2008 Semiannual Report 23
SMALL-CAP EQUITY FUNDSTOCKSOFSMALLERCOMPANIES
INVESTMENT OBJECTIVE
The fund seeks a favorable long-term total return, mainly through capital appreciation, primarily from equity securities of smaller domestic companies.
PRINCIPAL INVESTMENT RISKS
The fund is subject to market risk, company risk and small-cap risk. For a detailed discussion of risk, please see the prospectus.
THE FUND’S BENCHMARK
The Russell 2000®Index measures the performance of the stocks of the 2,000 smallest companies in the Russell 3000®Index, based on market capitalization. You cannot invest directly in these indexes.
PERFORMANCE AS OF JUNE 30, 2008
| Total return | Average annual total return | |||||||||||
| 6 months | 1 year | 5 years | Since inception | |||||||||
Small-Cap Equity Fund (inception: 10/28/2002) | –6.85 | % | –17.59 | % | 10.28 | % | 13.18 | %* | ||||
Russell 2000 Index | –9.37 | –16.19 | 10.28 | 13.02 | * | |||||||
Morningstar Small Blend | –8.93 | –17.03 | 10.62 | 12.59 | ||||||||
| * | The performance shown is computed from the inception date of the fund (the date on which the fund became publicly available). Previously, performance for the fund was computed from the net asset value per share on the day prior to the inception date. |
The returns in this report show past performance, which is no guarantee of future results. Returns and the principal value of your investment will fluctuate. Current performance may be higher or lower than that shown, and you may have a gain or a loss when you redeem your shares. For current performance information, including performance to the most recent month-end, please visit www.tiaa-cref.org.
Russell 2000 and Russell 3000 are trademarks and service marks of Russell Investment Group. TIAA-CREF products are not promoted or sponsored by, or affiliated with, Russell Investment Group.
24 2008 Semiannual Report ¡ TIAA-CREF Life Funds
$10,000 SINCE OCTOBER 28, 2002 INCEPTION
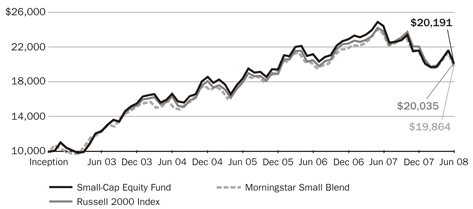
An investment of $10,000 in this fund on October 28, 2002, would have grown to $20,191 as of June 30, 2008, including reinvestment of dividends and distributions. For the purpose of comparison, the graph also shows the change in the values of the fund’s benchmark and peer group during the same period.
CALENDAR YEAR TOTAL RETURN
| * | Partial year |
TIAA-CREF Life Funds ¡ 2008 Semiannual Report 25
SMALL-CAP EQUITY FUNDSTOCKSOFSMALLERCOMPANIES
EXPENSE EXAMPLE
Six months ended June 30, 2008
Small-Cap Equity Fund | Starting fund value (1/1/08) | Ending fund value (6/30/08) | Expenses paid* (1/1/08– 6/30/08) | |||||||
Actual return | $ | 1,000.00 | $ | 931.50 | $ | 0.53 | ||||
5% annual hypothetical return | 1,000.00 | 1,024.31 | † | 0.55 | ||||||
| * | “Expenses paid” is equal to the fund’s annualized expense ratio of 0.11%, multiplied by the average fund value over the six-month period, multiplied by 182/366. There were 182 days in the first half of 2008. |
| † | Ending fund value for the hypothetical example would be $1,024.86 before expenses. The table shows the value after subtraction of expenses in order to be comparable with the ending fund value shown for the fund’s actual return. |
For more information about this expense example, please see page 6.
FUND PROFILE
Net assets | $ | 47.23 million | ||
Number of holdings | 731 | |||
Portfolio turnover rate | 66 | % | ||
Weighted median market capitalization | $ | 1.0 billion | ||
P/E ratio (weighted 12-month trailing average) | 18.6 | |||
Dividend yield | 0.99 | % | ||
2008 expense ratio‡ | 0.11 | % |
| ‡ | This fund expense ratio does not include the administrative, mortality and expense risk charges that are deducted under variable annuity or variable life insurance contracts that use the TIAA-CREF Life Funds. For more information on fund deductions and expenses, please see the variable product prospectus. |
PORTFOLIO COMPOSITION
| % of portfolio investments | ||
Manufacturing & materials | 24.3 | |
Technology | 21.0 | |
Financial | 16.7 | |
Consumer products & services | 13.9 | |
Health care | 12.6 | |
Energy | 8.4 | |
Utilities | 3.1 | |
Total | 100.0 |
HOLDINGS BY COMPANY SIZE
| % of portfolio investments | ||
$4 billion–$15 billion | 3.27 | |
Under $4 billion | 96.73 | |
Total | 100.00 |
26 2008 Semiannual Report ¡ TIAA-CREF Life Funds
PERFORMANCE IN THE SIX MONTHS ENDED JUNE 30, 2008
The Stock Index Fund returned –10.98% for the period, compared with the –11.05% return of its benchmark, the Russell 3000® Index, and the –11.18% average return of the fund’s peer group, the Morningstar Large Blend category.
Broad market slump intensifies
After declining 1.84% during the second half of 2007, the U.S. equity market, as measured by the Russell 3000 Index, posted a double-digit loss for the first half of 2008. Most of the drop occurred during the year’s first quarter, when the index fell 9.52% on investor concerns about deteriorating conditions in the credit markets and soaring energy prices. Stocks rebounded in April and May, but a June sell-off resulted in an 8.25% decline—the largest monthly loss for U.S. stocks since September 2002.
For the six months, growth outperformed value across all three capitalization sizes. The mid caps of the Russell 3000 held up best, falling 7.57%, followed by small-cap issues, which dropped 9.37%, and large-cap stocks, which declined 11.20%.
Domestic equities were largely in line with foreign stocks, which fell 10.96% in dollar terms, as measured by the MSCI EAFE® Index. For the ten years ended June 30, 2008, the average annual return of the Russell 3000 Index was 3.51%—more than two percentage points below the 5.83% average gain of the EAFE.
Only energy sectors are spared
For the period, ten of the benchmark’s twelve industry sectors retreated, with seven posting double-digit losses. Results were driven by outsized declines in its three largest sectors—financials, technology and consumer discretionary, which fell 26.1%, 12.7% and 12.4%, respectively. On June 30, 2008, these sectors made up more than 40% of the benchmark, in terms of market capitalization.
Only the “other energy” and integrated oils sectors advanced, gaining 24.8% and 1.8%, respectively.
Largest stocks generally post poor results
In descending order according to capitalization size, the five largest stocks in the benchmark performed as follows: ExxonMobil, –6.4%; General Electric, –26.9%; Microsoft, –23.2%; Chevron, 5.8%; and AT&T, –18.7%.
For the period, the fund’s return was similar to that of its benchmark, despite the effects of expenses and of some cash holdings for liquidity. The fund had a risk profile similar to that of its benchmark.
TIAA-CREF Life Funds ¡ 2008 Semiannual Report 27
STOCK INDEX FUNDU.S.STOCKS
INVESTMENT OBJECTIVE
The fund seeks a favorable long-term total return, mainly from capital appreciation, by investing primarily in a portfolio of equity securities selected to track the overall U.S. equity markets.
PRINCIPAL INVESTMENT RISKS
The fund is subject to market risk, company risk and index risk. For a detailed discussion of risk, please see the prospectus.
THE FUND’S BENCHMARK
The Russell 3000®Index measures the performance of the stocks of the 3,000 largest publicly traded U.S. companies, based on market capitalization. The index measures the performance of about 98% of the total market capitalization of the publicly traded U.S. equity market. You cannot invest directly in this index.
PERFORMANCE AS OF JUNE 30, 2008
| Total return | Average annual total return | |||||||||||
| 6 months | 1 year | 5 years | Since inception | |||||||||
Stock Index Fund (inception: 1/4/1999) | –10.98 | % | –12.60 | % | 8.32 | % | 2.93 | %* | ||||
Russell 3000 Index | –11.05 | –12.69 | 8.37 | 2.90 | * | |||||||
Morningstar Large Blend | –11.18 | –12.27 | 7.64 | 2.88 | ||||||||
| * | The performance shown is computed from the inception date of the fund (the date on which the fund became publicly available). Previously, performance for the fund was computed from the net asset value per share on the day prior to the inception date. |
The returns in this report show past performance, which is no guarantee of future results. Returns and the principal value of your investment will fluctuate. Current performance may be higher or lower than that shown, and you may have a gain or a loss when you redeem your shares. For current performance information, including performance to the most recent month-end, please visit www.tiaa-cref.org.
Russell 3000 is a trademark and service mark of Russell Investment Group. TIAA-CREF products are not promoted or sponsored by, or affiliated with, Russell Investment Group.
28 2008 Semiannual Report ¡ TIAA-CREF Life Funds
$10,000 SINCE JANUARY 4, 1999 INCEPTION
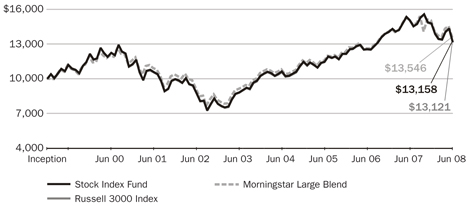
An investment of $10,000 in this fund on January 4, 1999, would have grown to $13,158 as of June 30, 2008, including reinvestment of dividends and distributions. For the purpose of comparison, the graph also shows the change in the values of the fund’s benchmark and peer group during the same period.
CALENDAR YEAR TOTAL RETURN
| * | Partial year |
TIAA-CREF Life Funds ¡ 2008 Semiannual Report 29
STOCK INDEX FUNDU.S.STOCKS
EXPENSE EXAMPLE
Six months ended June 30, 2008
Stock Index Fund | Starting fund value (1/1/08) | Ending fund value (6/30/08) | Expenses paid* (1/1/08– 6/30/08) | |||||||
Actual return | $ | 1,000.00 | $ | 890.20 | $ | 0.28 | ||||
5% annual hypothetical return | 1,000.00 | 1,024.56 | † | 0.30 | ||||||
| * | “Expenses paid” is equal to the fund’s annualized expense ratio of 0.06%, multiplied by the average fund value over the six-month period, multiplied by 182/366. There were 182 days in the first half of 2008. |
| † | Ending fund value for the hypothetical example would be $1,024.86 before expenses. The table shows the value after subtraction of expenses in order to be comparable with the ending fund value shown for the fund’s actual return. |
For more information about this expense example, please see page 6.
FUND PROFILE
Net assets | $ | 161.75 million | ||
Number of holdings | 2,807 | |||
Portfolio turnover rate | 3 | % | ||
Weighted median market capitalization | $ | 32.3 billion | ||
P/E ratio (weighted 12-month trailing average) | 16.9 | |||
Dividend yield | 1.92 | % | ||
2008 expense ratio‡ | 0.06 | % |
| ‡ | This fund expense ratio does not include the administrative, mortality and expense risk charges that are deducted under variable annuity or variable life insurance contracts that use the TIAA-CREF Life Funds. For more information on fund deductions and expenses, please see the variable product prospectus. |
PORTFOLIO COMPOSITION
| % of portfolio investments | ||
Technology | 18.9 | |
Consumer products & services | 17.6 | |
Manufacturing & materials | 17.4 | |
Financial | 14.7 | |
Energy | 14.1 | |
Health Care | 11.3 | |
Utilities | 4.5 | |
Short-term investments | 1.5 | |
Total | 100.0 |
HOLDINGS BY COMPANY SIZE
| % of portfolio investments | ||
Over $15 billion | 66.37 | |
$4 billion–$15 billion | 18.74 | |
Under $4 billion | 14.89 | |
Total | 100.00 |
30 2008 Semiannual Report ¡ TIAA-CREF Life Funds
SOCIAL CHOICE EQUITY FUNDSOCIALLYSCREENEDSTOCKS
PERFORMANCE IN THE SIX MONTHS ENDED JUNE 30, 2008
The Social Choice Equity Fund returned –9.77% for the period, compared with the –11.05% return of its benchmark, the Russell 3000® Index, and the –11.18% average return of the fund’s peer group, the Morningstar Large Blend category. Neither the benchmark nor the Morningstar category screens investments according to social criteria, as the fund does.
Exclusion of major stocks lifts return
Because of its social screens, the fund did not invest in several stocks that were sizable components of the Russell 3000 Index in terms of market capitalization. The exclusion of these stocks produced mixed results, but the net effect was to increase the fund’s return compared with the return of its benchmark.
Despite its negative return, the fund held up better than its benchmark, largely because it avoided the stocks of three large financial companies: Lehman Brothers (down 68.8%), American International Group (down 53.6%) and Citigroup (down 40.6%). During the six-month period, the financial sector came under increased pressure because of deteriorating conditions in the credit markets and continued weakness in the U.S. housing market. Avoiding General Electric, which fell 26.9%, also helped relative performance.
However, these positive contributions were partly offset by the exclusion of Chevron, ExxonMobil and ConocoPhillips, energy stocks that did well during a period of steadily rising oil and gas prices. The absence of Wal-Mart, whose stock climbed 17.9%, also weighed on the fund’s return.
Strategies help limit risk
Because the fund’s social screens prevent it from investing in some of the stocks within the Russell 3000, the fund’s managers use statistical techniques to help ensure that the risk characteristics of the portfolio resemble those of the index. One method is to overweight or underweight certain stocks relative to each one’s percentage of capitalization within the benchmark.
During the six months, the fund’s relative performance was enhanced by overweight positions in a number of energy companies: Apache, Devon Energy, EOG Resources and Chesapeake Energy. An overweight holding in United States Steel also helped.
Other overweight holdings detracted from relative performance. Chief among these were WellPoint, a health benefits company, Wachovia and drugmaker Merck.
TIAA-CREF Life Funds ¡ 2008 Semiannual Report 31
SOCIAL CHOICE EQUITY FUNDSOCIALLYSCREENEDSTOCKS
INVESTMENT OBJECTIVE
The fund seeks a favorable long-term total return that reflects the investment performance of the overall U.S. stock market while giving special consideration to certain social criteria.
PRINCIPAL INVESTMENT RISKS
The fund is subject to market risk, company risk, the risk of socially screened investing, index risk and foreign investment risk. For a detailed discussion of risk, please see the prospectus.
THE FUND’S BENCHMARK
The Russell 3000®Index measures the performance of the stocks of the 3,000 largest publicly traded U.S. companies, based on market capitalization. The index measures the performance of about 98% of the total market capitalization of the publicly traded U.S. equity market. You cannot invest directly in this index.
PERFORMANCE AS OF JUNE 30, 2008
| Total return | Average annual total return | |||||||||||
| 6 months | 1 year | 5 years | Since inception | |||||||||
Social Choice Equity Fund (inception: 4/3/2000) | –9.77 | % | –11.64 | % | 8.36 | % | 0.67 | %* | ||||
Russell 3000 Index | –11.05 | –12.69 | 8.37 | 0.49 | * | |||||||
Morningstar Large Blend | –11.18 | –12.27 | 7.64 | 0.78 | ||||||||
| * | The performance shown is computed from the inception date of the fund (the date on which the fund became publicly available). Previously, performance for the fund was computed from the net asset value per share on the day prior to the inception date. |
The returns in this report show past performance, which is no guarantee of future results. Returns and the principal value of your investment will fluctuate. Current performance may be higher or lower than that shown, and you may have a gain or a loss when you redeem your shares. For current performance information, including performance to the most recent month-end, please visit www.tiaa-cref.org.
Russell 3000 is a trademark and service mark of Russell Investment Group. TIAA-CREF products are not promoted or sponsored by, or affiliated with, Russell Investment Group.
32 2008 Semiannual Report ¡ TIAA-CREF Life Funds
$10,000 SINCE APRIL 3, 2000 INCEPTION
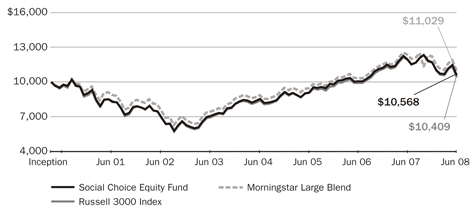
An investment of $10,000 in this fund on April 3, 2000, would have grown to $10,568 as of June 30, 2008, including reinvestment of dividends and distributions. For the purpose of comparison, the graph also shows the change in the values of the fund’s benchmark and peer group during the same period.
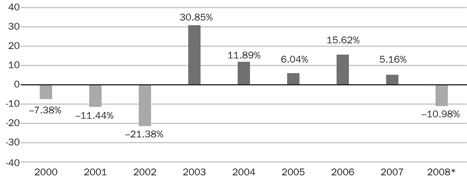
CALENDAR YEAR TOTAL RETURN
| * | Partial year |
TIAA-CREF Life Funds ¡ 2008 Semiannual Report 33
SOCIAL CHOICE EQUITY FUNDSOCIALLYSCREENEDSTOCKS
EXPENSE EXAMPLE
Six months ended June 30, 2008
Social Choice Equity Fund | Starting fund value (1/1/08) | Ending fund value (6/30/08) | Expenses paid* (1/1/08– 6/30/08) | |||||||
Actual return | $ | 1,000.00 | $ | 902.30 | $ | 0.33 | ||||
5% annual hypothetical return | 1,000.00 | 1,024.51 | † | 0.35 | ||||||
| * | “Expenses paid” is equal to the fund’s annualized expense ratio of 0.07%, multiplied by the average fund value over the six-month period, multiplied by 182/366. There were 182 days in the first half of 2008. |
| † | Ending fund value for the hypothetical example would be $1,024.86 before expenses. The table shows the value after subtraction of expenses in order to be comparable with the ending fund value shown for the fund’s actual return. |
For more information about this expense example, please see page 6.
FUND PROFILE
Net assets | $ | 33.80 million | ||
Number of holdings | 821 | |||
Portfolio turnover rate | 12 | % | ||
Weighted median market capitalization | $ | 23.6 billion | ||
P/E ratio (weighted 12-month trailing average) | 16.7 | |||
Dividend yield | 1.80 | % | ||
2008 expense ratio‡ | 0.07 | % |
| ‡ | This fund expense ratio does not include the administrative, mortality and expense risk charges that are deducted under variable annuity or variable life insurance contracts that use the TIAA-CREF Life Funds. For more information on fund deductions and expenses, please see the variable product prospectus. |
PORTFOLIO COMPOSITION
| % of portfolio investments | ||
Consumer products & services | 19.0 | |
Technology | 18.8 | |
Financial | 16.3 | |
Manufacturing & materials | 14.7 | |
Energy | 13.0 | |
Health care | 11.7 | |
Utilities | 6.5 | |
Total | 100.0 |
HOLDINGS BY COMPANY SIZE
| % of portfolio investments | ||
Over $15 billion | 64.15 | |
$4 billion–$15 billion | 23.41 | |
Under $4 billion | 12.44 | |
Total | 100.00 |
34 2008 Semiannual Report ¡ TIAA-CREF Life Funds
REAL ESTATE SECURITIES FUNDREALESTATESECURITIES
PERFORMANCE IN THE SIX MONTHS ENDED JUNE 30, 2008
The Real Estate Securities Fund returned –4.75% for the period, compared with the –3.41% return of its benchmark, the Dow Jones Wilshire Real Estate Securities Index, and the –7.82% average return of the fund’s peer group, the Morningstar Specialty Real Estate category.
REITs recover, only to decline
After declining 0.39% in January and 3.83% in February, the benchmark rose 6.60% in March, for a 2.12% first-quarter return. April and May saw 6.14% and 0.23% increases, respectively. But the sharp decline of 11.09% in June, the largest one-month drop in over four years, contributed to a second-quarter loss of 5.41%.
The sell-off in REITs was not surprising, since higher food and energy prices led to reduced traffic at retail stores, and rising unemployment decreased demand for new office space. Many tenants trimmed expansion plans, but rental income remained fairly stable.
REITs hold up better than the broad stock market
After dropping 9.52% in the first quarter, the broad U.S. stock market, as measured by the Russell 3000® Index, declined a further 1.69% in the second, posting an 11.05% decline for the six-month period. Meanwhile, investment-grade, fixed-rate bonds, as represented by the Lehman Brothers U.S. Aggregate Index, returned 1.13% for the six months.
Over the five years ended June 30, 2008, however, REITs generated an average annual return of 14.88%, compared with 8.37% for the Russell index and 3.85% for the Lehman index.
Stock selections trim losses
Despite its negative return and underperformance relative to the benchmark, the fund outperformed its peer group for the period. Key contributors included out-of-benchmark holdings in Mission West Properties, a manager of research and development properties, and Entertainment Properties Trust, owner of movie theaters and retail centers. Relative performance was also helped by underweight positions, including General Growth Properties, one of the nation’s largest mall operators.
These positive contributions were more than offset by overweight positions that included Federal Realty Investment Trust and Post Properties. Returns were also reduced by stocks such as property developer Greentown China Holdings, an out-of-benchmark issue, and Liberty Property Trust, an underweight position.
TIAA-CREF Life Funds ¡ 2008 Semiannual Report 35
REAL ESTATE SECURITIES FUNDREALESTATESECURITIES
INVESTMENT OBJECTIVE
The fund seeks to obtain a favorable long-term total return through both capital appreciation and current income, by investing primarily in equity and fixed-income securities of companies principally engaged in or related to the real estate industry.
PRINCIPAL INVESTMENT RISKS
The fund is subject to market risk, company risk, real estate investing risk, real estate securities risk, small-cap risk, foreign investment risk, interest-rate risk and income volatility risk. For a detailed discussion of risk, please see the prospectus.
THE FUND’S BENCHMARK
The Dow Jones Wilshire Real Estate Securities Index measures the performance of publicly traded real estate securities, such as real estate investment trusts and real estate operating companies. You cannot invest directly in this index.
PERFORMANCE AS OF JUNE 30, 2008
| Total return | Average annual total return | |||||||||||
| 6 months | 1 year | 5 years | Since inception | |||||||||
Real Estate Securities Fund (inception: 10/28/2002) | –4.75 | % | –15.27 | % | 12.69 | % | 15.42 | %* | ||||
Dow Jones Wilshire Real Estate Securities Index† | –3.41 | –15.42 | 14.88 | 16.83 | * | |||||||
Morningstar Specialty Real Estate | –7.82 | –17.34 | 13.50 | 15.55 | ||||||||
| * | The performance shown is computed from the inception date of the fund (the date on which the fund became publicly available). Previously, performance for the fund was computed from the net asset value per share on the day prior to the inception date. |
| † | For periods prior to July 1, 2007, the performance shown above and in the graph reflects the full market capitalization weighted version of the index, which was terminated by Dow Jones Wilshire on June 30, 2007. As of July 1, 2007, performance reflects the float-adjusted market capitalization version of the index, which is based on the shares of stock that are unrestricted and available for trading. |
The returns in this report show past performance, which is no guarantee of future results. Returns and the principal value of your investment will fluctuate. Current performance may be higher or lower than that shown, and you may have a gain or a loss when you redeem your shares. For current performance information, including performance to the most recent month-end, please visit www.tiaa-cref.org.
36 2008 Semiannual Report ¡ TIAA-CREF Life Funds
$10,000 SINCE OCTOBER 28, 2002 INCEPTION
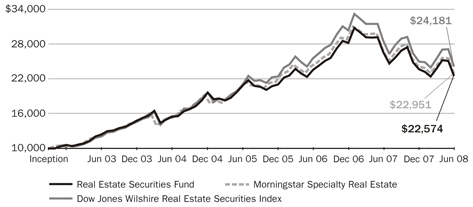
An investment of $10,000 in this fund on October 28, 2002, would have grown to $22,574 as of June 30, 2008, including reinvestment of dividends and distributions. For the purpose of comparison, the graph also shows the change in the values of the fund’s benchmark and peer group during the same period.
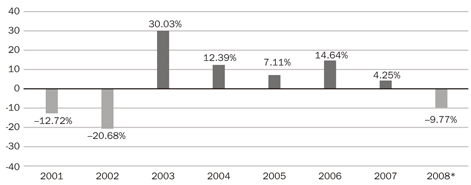
CALENDAR YEAR TOTAL RETURN
| * | Partial year |
TIAA-CREF Life Funds ¡ 2008 Semiannual Report 37
REAL ESTATE SECURITIES FUNDREALESTATESECURITIES
EXPENSE EXAMPLE
Six months ended June 30, 2008
Real Estate Securities Fund | Starting fund value (1/1/08) | Ending fund value (6/30/08) | Expenses paid* (1/1/08– 6/30/08) | |||||||
Actual return | $ | 1,000.00 | $ | 952.50 | $ | 1.26 | ||||
5% annual hypothetical return | 1,000.00 | 1,023.55 | † | 1.31 | ||||||
| * | “Expenses paid” is equal to the fund’s annualized expense ratio of 0.26%, multiplied by the average fund value over the six-month period, multiplied by 182/366. There were 182 days in the first half of 2008. |
| † | Ending fund value for the hypothetical example would be $1,024.86 before expenses. The table shows the value after subtraction of expenses in order to be comparable with the ending fund value shown for the fund’s actual return. |
For more information about this expense example, please see page 6.
FUND PROFILE
Net assets | $ | 68.76 million | ||
Number of holdings | 49 | |||
Portfolio turnover rate | 36 | % | ||
Weighted median market capitalization | $ | 5.9 billion | ||
P/E ratio (weighted 12-month trailing average) | 30.8 | |||
Dividend yield | 4.32 | % | ||
2008 expense ratio‡ | 0.26 | % |
| ‡ | This fund expense ratio does not include the administrative, mortality and expense risk charges that are deducted under variable annuity or variable life insurance contracts that use the TIAA-CREF Life Funds. For more information on fund deductions and expenses, please see the variable product prospectus. |
PORTFOLIO COMPOSITION
| % of portfolio investments | ||
Specialized | 69.9 | |
Retail | 10.4 | |
Office | 6.3 | |
Residential | 5.1 | |
Industrial | 3.6 | |
Diversified | 2.0 | |
Real estate management & development | 1.4 | |
Short-term investments | 0.5 | |
Hotels, restaurants & leisure | 0.3 | |
Office electronics | 0.3 | |
Mortgage | 0.2 | |
Total | 100.0 |
HOLDINGS BY COMPANY SIZE
| % of portfolio investments | ||
Over $15 billion | 10.30 | |
$4 billion–$15 billion | 58.03 | |
Under $4 billion | 31.67 | |
Total | 100.00 |
38 2008 Semiannual Report ¡ TIAA-CREF Life Funds
BOND FUNDINTERMEDIATE-TERMBONDS
PERFORMANCE IN THE SIX MONTHS ENDED JUNE 30, 2008
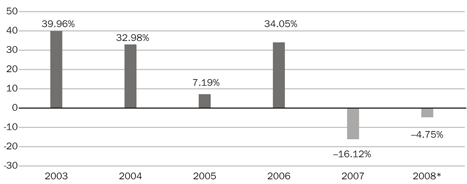
The Bond Fund returned –0.12% for the period, compared with the 1.13% gain of its benchmark, the Lehman Brothers U.S. Aggregate Index, and the –0.73% average return of the fund’s peer group, the Morningstar Intermediate-Term Bond category.
Second-quarter loss dampens bond returns
During the six-month period, the Federal Reserve lowered the federal funds rate (the interest rate U.S. commercial banks charge one another for overnight loans) four times, dropping the rate from 4.25% at the beginning of the year to 2.00%. The Fed’s actions were part of a larger effort to stimulate the overall economy and provide stability to the financial markets.
The Lehman Brothers U.S. Aggregate Index, which measures the broad U.S. investment-grade, fixed-rate bond market, endured a bumpy ride during the six months. The index rose 2.17% in the first quarter, only to give back part of that return with a 1.02% loss in the second quarter.
A short-lived rally in stocks set off a rally in corporate bonds and asset-backed securities in April and May, but in June investors resumed their recent preference for U.S. Treasuries because of their higher credit quality and greater liquidity. Treasuries were the best performing component of the Lehman index during the period, returning 2.23%.
Treasury yields fall
As investor demand for Treasuries rose, the price of Treasury bonds climbed, sending yields lower. The 2-year Treasury yield declined from 3.05% at the beginning of January to 2.63% at the end of the second quarter. Meanwhile, the 10-year Treasury yield remained relatively flat—moving down from 4.04% to 3.99% at the end of the period.
Sector allocations trim the fund’s return
The fund trailed its benchmark primarily because of an underweight position in U.S. Treasuries and overweights in mortgage- and asset-backed securities, whose returns lagged those of government securities. Reduced market liquidity within the mortgage-backed sector also clipped returns.
Although thousands of individual security downgrades were reported in the asset-backed sector during the period, the fund’s asset-backed holdings experienced very few of them, and the underlying assets in those securities continued to perform well.
TIAA-CREF Life Funds ¡ 2008 Semiannual Report 39
BOND FUNDINTERMEDIATE-TERMBONDS
INVESTMENT OBJECTIVE
The fund seeks as favorable a long-term total return through income as is consistent with preserving capital, primarily from investment-grade, fixed-income securities.
PRINCIPAL INVESTMENT RISKS
The fund is subject to income volatility risk, credit risk, interest-rate risk, call risk, company risk, prepayment risk, extension risk, index risk and foreign investment risk. For a detailed discussion of risk, please see the prospectus.
THE FUND’S BENCHMARK
The Lehman Brothers U.S. Aggregate Index measures the performance of the U.S. investment-grade, fixed-rate bond market, including government and credit securities, agency mortgage pass-through securities, asset-backed securities and commercial mortgage-backed securities. You cannot invest directly in this index.
PERFORMANCE AS OF JUNE 30, 2008
| Total return | Average annual total return | ||||||||
| 6 months | 1 year | Since inception | |||||||
Bond Fund (inception: 7/8/2003) | –0.12 | % | 4.62 | % | 3.52 | %* | |||
Lehman Brothers U.S. Aggregate Index | 1.13 | 7.12 | 3.99 | * | |||||
Morningstar Intermediate-Term Bond | –0.73 | 3.38 | 3.01 | ||||||
| * | The performance shown is computed from the inception date of the fund (the date on which the fund became publicly available). Previously, performance for the fund was computed from the net asset value per share on the day prior to the inception date. |
The returns in this report show past performance, which is no guarantee of future results. Returns and the principal value of your investment will fluctuate. Current performance may be higher or lower than that shown, and you may have a gain or a loss when you redeem your shares. For current performance information, including performance to the most recent month-end, please visit www.tiaa-cref.org.
40 2008 Semiannual Report ¡ TIAA-CREF Life Funds
$10,000 SINCE JULY 8, 2003 INCEPTION
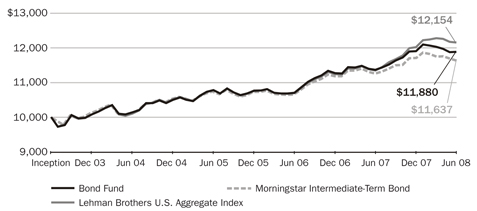
An investment of $10,000 in this fund on July 8, 2003, would have grown to $11,880 as of June 30, 2008, including reinvestment of dividends and distributions. For the purpose of comparison, the graph also shows the change in the values of the fund’s benchmark and peer group during the same period.
CALENDAR YEAR TOTAL RETURN
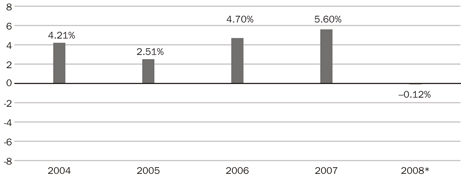
| * | Partial year |
TIAA-CREF Life Funds ¡ 2008 Semiannual Report 41
BOND FUNDINTERMEDIATE-TERMBONDS
EXPENSE EXAMPLE
Six months ended June 30, 2008
Bond Fund | Starting fund value (1/1/08) | Ending fund value (6/30/08) | Expenses paid* (1/1/08– 6/30/08) | |||||||
Actual return | $ | 1,000.00 | $ | 998.80 | $ | 0.50 | ||||
5% annual hypothetical return | 1,000.00 | 1,024.36 | † | 0.50 | ||||||
| * | “Expenses paid” is equal to the fund’s annualized expense ratio of 0.10%, multiplied by the average fund value over the six-month period, multiplied by 182/366. There were 182 days in the first half of 2008. |
| † | Ending fund value for the hypothetical example would be $1,024.86 before expenses. The table shows the value after subtraction of expenses in order to be comparable with the ending fund value shown for the fund’s actual return. |
For more information about this expense example, please see page 6.
FUND PROFILE
Net assets | $ | 90.90 million | ||
Number of issues | 367 | |||
Portfolio turnover rate | 45 | % | ||
Average quality | Aa1/Aa2 | |||
Option-adjusted duration | 4.48 years | |||
Average coupon | 5.24 | % | ||
Average yield to maturity | 5.99 | % | ||
Average maturity | 6.94 years | |||
2008 expense ratio‡ | 0.10 | % |
| ‡ | This fund expense ratio does not include the administrative, mortality and expense risk charges that are deducted under variable annuity or variable life insurance contracts that use the TIAA-CREF Life Funds. For more information on fund deductions and expenses, please see the variable product prospectus. |
PORTFOLIO COMPOSITION
| % of portfolio investments | ||
Mortgage-backed securities and commercial mortgage-backed securities | 41.3 | |
Corporate bonds | 17.7 | |
Asset-backed securities | 10.9 | |
U.S. agency securities | 10.6 | |
U.S. Treasury securities | 8.9 | |
Foreign government and corporate bonds denominated in U.S. dollars | 8.0 | |
Short-term investments | 1.7 | |
Preferred stock | 0.9 | |
Total | 100.0 |
42 2008 Semiannual Report ¡ TIAA-CREF Life Funds
MONEY MARKET FUNDCASHEQUIVALENTS
PERFORMANCE IN THE SIX MONTHS ENDED JUNE 30, 2008
The Money Market Fund returned 1.64% for the period, compared with the 1.27% gain of the iMoneyNet Money Fund Report Averages™—All Taxable, a simple average of over 1,000 taxable money market funds.
The Fed stops reducing rates
In the first half of 2008, the Federal Reserve lowered the federal funds rate four times, three of which were in the first quarter. (The federal funds rate is the interest rate U.S. commercial banks charge one another for overnight loans.) The rate has remained at 2.00% since April 30, 2008.
Economic growth was subdued during the first part of 2008. At the same time, soaring oil and commodity prices rekindled concerns that inflation would increase. But continued problems in the credit and housing markets made it increasingly unlikely that the Fed would seek to reduce inflationary pressure by raising short-term rates.
LIBOR declines in the first half
LIBOR decreased significantly during the period in response to the overall reduction in short-term rates by the Federal Reserve and in anticipation that rates would remain low in reaction to continued turmoil in the financial markets. (LIBOR, a measure of the interest rate that banks charge one another for loans in the London market, is the most widely used benchmark for short-term rates.) LIBOR for one-month deposits decreased from 4.60% on December 31, 2007, to 2.46% at the end of the period; for twelve-month deposits, LIBOR decreased from 4.22% to 3.31%.
The fund stays the course
The fund maintained its investments in securities with longer maturities to benefit from the higher yields they provided. As a result, on June 24, 2008, the fund’s weighted average maturity was 51 days, versus 45 days for the average iMoneyNet fund.
At the end of the period, the portion of the fund’s portfolio invested in commercial paper was 59.8%, down slightly from 61.6% six months earlier. (Commercial paper can offer higher returns without significant additional risk.) U.S. agency securities rose to 27.6% from 24.1%, while certificates of deposit rose from 5.9% to 9.9%. Floating-rate securities declined to 0.9% from 3.2%.
On June 30, 2008, foreign securities made up 14.37% of the fund’s total portfolio investments.
TIAA-CREF Life Funds ¡ 2008 Semiannual Report 43
MONEY MARKET FUNDCASHEQUIVALENTS
INVESTMENT OBJECTIVE
The fund seeks high current income consistent with maintaining liquidity and preserving capital.
PRINCIPAL INVESTMENT RISKS
The fund is subject to current income volatility risk, market risk, company risk, credit risk, interest-rate risk, call risk, prepayment risk, extension risk and foreign investment risk. An investment in the fund is neither insured nor guaranteed by the Federal Deposit Insurance Corporation or any other government agency. We will attempt to maintain a stable net asset value of $1.00 per share for this fund, but it is possible to lose money by investing in the fund. For a detailed discussion of risk, please see the prospectus.
NET ANNUALIZED YIELD FOR THE 7 DAYS ENDED JUNE 24, 2008*
| Current yield | Effective yield | |||||
Money Market Fund | 2.41 | % | 2.43 | % | ||
iMoneyNet Money Fund Report AveragesTM—All Taxable | 1.84 | 1.86 |
The current yield more closely reflects current earnings than does the total return.
| * | iMoneyNet reports its 7-day yields as of Tuesday of each week. |
PERFORMANCE AS OF JUNE 30, 2008
| Total return | Average annual total return | ||||||||
| 6 months | 1 year | Since inception | |||||||
Money Market Fund (inception: 7/8/2003) | 1.64 | % | 4.29 | % | 3.43 | %† | |||
iMoneyNet Money Fund Report Averages—All Taxable | 1.27 | 3.56 | 2.83 | ‡ | |||||
† | The performance shown is computed from the inception date of the fund (the date on which the fund became publicly available). Previously, performance for the fund was computed from the net asset value per share on the day prior to the inception date. |
‡ | The performance shown above and in the accompanying graph is computed from 6/30/2003, the date closest to the inception date of the Money Market Fund for which iMoneyNet returns are calculated. |
The returns in this report show past performance, which is no guarantee of future results. Returns and the principal value of your investment will fluctuate. Current performance may be higher or lower than that shown, and you may have a gain or a loss when you redeem your shares. For current performance information, including performance to the most recent month-end, please visit www.tiaa-cref.org.
44 2008 Semiannual Report ¡ TIAA-CREF Life Funds
$10,000 SINCE JULY 8, 2003 INCEPTION
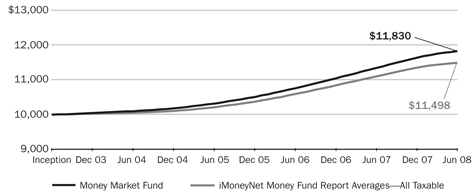
An investment of $10,000 in this fund on July 8, 2003, would have grown to $11,830 as of June 30, 2008, including reinvestment of dividends and distributions. For the purpose of comparison, the graph also shows the change in the value of the average iMoneyNet fund during the same period.
CALENDAR YEAR TOTAL RETURN
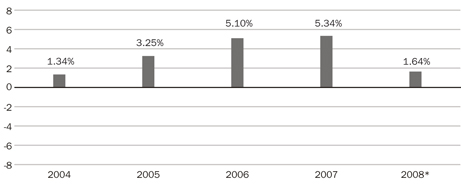
| * | Partial year |
TIAA-CREF Life Funds ¡ 2008 Semiannual Report 45
MONEY MARKET FUNDCASHEQUIVALENTS
EXPENSE EXAMPLE
Six months ended June 30, 2008
Money Market Fund | Starting fund value (1/1/08) | Ending fund value (6/30/08) | Expenses paid* (1/1/08– 6/30/08) | |||||||
Actual return | $ | 1,000.00 | $ | 1,016.40 | $ | 0.30 | ||||
5% annual hypothetical return | 1,000.00 | 1,024.56 | † | 0.30 | ||||||
| * | “Expenses paid” is equal to the fund’s annualized expense ratio of 0.06%, multiplied by the average fund value over the six-month period, multiplied by 182/366. There were 182 days in the first half of 2008. |
| † | Ending fund value for the hypothetical example would be $1,024.86 before expenses. The table shows the value after subtraction of expenses in order to be comparable with the ending fund value shown for the fund’s actual return. |
For more information about this expense example, please see page 6.
FUND PROFILE
Net assets | $ | 110.86 million | ||
2008 expense ratio‡ | 0.06 | % |
| ‡ | This fund expense ratio does not include the administrative, mortality and expense risk charges that are deducted under variable annuity or variable life insurance contracts that use the TIAA-CREF Life Funds. For more information on fund deductions and expenses, please see the variable product prospectus. |
PORTFOLIO COMPOSITION
% of portfolio investments | ||
Commercial paper | 59.8 | |
U.S. agency securities | 27.6 | |
Certificates of deposit | 9.9 | |
Floating-rate securities | 0.9 | |
Banker’s acceptances | 0.9 | |
Bank notes | 0.9 | |
Total | 100.0 | |
46 2008 Semiannual Report ¡ TIAA-CREF Life Funds
SUMMARY PORTFOLIO OF INVESTMENTS (UNAUDITED)
GROWTH EQUITY FUND n JUNE 30, 2008
| Shares | Company | Value | % of net assets | |||||||||
| COMMON STOCKS | ||||||||||||
| AMUSEMENT AND RECREATION SERVICES | ||||||||||||
| 1,400 | Nintendo Co Ltd | $ | 793,902 | 2.11 | % | |||||||
| 793,902 | 2.11 | |||||||||||
| BUILDING MATERIALS AND GARDEN SUPPLIES e | 151,869 | 0.40 | ||||||||||
| BUSINESS SERVICES | ||||||||||||
| 11,855 | * | Adobe Systems, Inc | 466,968 | 1.24 | ||||||||
| 16,395 | e* | eBay, Inc | 448,075 | 1.19 | ||||||||
| 101,221 | Experian Group Ltd | 748,626 | 1.99 | |||||||||
| 2,146 | * | Google, Inc (Class A) | 1,129,697 | 3.00 | ||||||||
| 17,608 | e* | Intuit, Inc | 485,453 | 1.29 | ||||||||
| 1,690 | e | Mastercard, Inc (Class A) | 448,729 | 1.19 | ||||||||
| 4,080 | e | Omnicom Group, Inc | 183,110 | 0.49 | ||||||||
| 22,905 | * | Oracle Corp | 481,005 | 1.28 | ||||||||
| e* | Other | 569,056 | 1.52 | |||||||||
| 4,960,719 | 13.19 | |||||||||||
| CHEMICALS AND ALLIED PRODUCTS | ||||||||||||
| 11,135 | Abbott Laboratories | 589,821 | 1.57 | |||||||||
| 27,077 | e | Avon Products, Inc | 975,314 | 2.60 | ||||||||
| 9,752 | e | Colgate-Palmolive Co | 673,863 | 1.79 | ||||||||
| 7,492 | * | Genentech, Inc | 568,643 | 1.51 | ||||||||
| 22,005 | * | Gilead Sciences, Inc | 1,165,165 | 3.10 | ||||||||
| 15,827 | Merck & Co, Inc | 596,520 | 1.59 | |||||||||
| 9,316 | Monsanto Co | 1,177,915 | 3.13 | |||||||||
| 4,352 | Praxair, Inc | 410,132 | 1.09 | |||||||||
| 17,489 | Teva Pharmaceutical Industries Ltd (ADR) | 800,996 | 2.13 | |||||||||
| Other | 586,743 | 1.56 | ||||||||||
| 7,545,112 | 20.07 | |||||||||||
| COAL MINING | ||||||||||||
| 7,042 | e | Sasol Ltd (ADR) | 415,055 | 1.10 | ||||||||
| Other | 273,307 | 0.73 | ||||||||||
| 688,362 | 1.83 | |||||||||||
| COMMUNICATIONS | ||||||||||||
| 14,002 | * | American Tower Corp (Class A) | 591,585 | 1.57 | ||||||||
| 591,585 | 1.57 | |||||||||||
| DEPOSITORY INSTITUTIONS | ||||||||||||
| 22,378 | e | Western Union Co | 553,184 | 1.47 | ||||||||
| 553,184 | 1.47 | |||||||||||
| EATING AND DRINKING PLACES e | 214,751 | 0.57 | ||||||||||
| ELECTRIC, GAS, AND SANITARY SERVICES | 58,040 | 0.15 | ||||||||||
| ELECTRONIC AND OTHER ELECTRIC EQUIPMENT | ||||||||||||
| 4,452 | * | Apple Computer, Inc | 745,443 | 1.98 | ||||||||
| 24,388 | e* | Cisco Systems, Inc | 567,265 | 1.51 | ||||||||
| 31,741 | Intel Corp | 681,797 | 1.81 | |||||||||
| 23,805 | e* | Marvell Technology Group Ltd | 420,396 | 1.12 | ||||||||
| See notes to financial statements | TIAA-CREF Life Funds n 2008 Semiannual Report | 47 |
| SUMMARY PORTFOLIO OF INVESTMENTS (UNAUDITED) | continued |
GROWTH EQUITY FUND n JUNE 30, 2008
| Shares | Company | Value | % of net assets | |||||||||
| ELECTRONIC AND OTHER ELECTRIC EQUIPMENT – continued | ||||||||||||
| 27,180 | Qualcomm, Inc | $ | 1,205,977 | 3.21 | % | |||||||
| 6,952 | * | Research In Motion Ltd | 812,689 | 2.16 | ||||||||
| Other | 307,110 | 0.82 | ||||||||||
| 4,740,677 | 12.61 | |||||||||||
| ENGINEERING AND MANAGEMENT SERVICES | ||||||||||||
| 13,746 | * | Celgene Corp | 877,957 | 2.33 | ||||||||
| 4,968 | e* | Jacobs Engineering Group, Inc | 400,918 | 1.07 | ||||||||
| * | Other | 170,626 | 0.45 | |||||||||
| 1,449,501 | 3.85 | |||||||||||
| FOOD AND KINDRED PRODUCTS e | 390,600 | 1.04 | ||||||||||
| GENERAL MERCHANDISE STORES | ||||||||||||
| 19,289 | e | TJX Cos, Inc | 607,025 | 1.62 | ||||||||
| 8,058 | Wal-Mart Stores, Inc | 452,860 | 1.20 | |||||||||
| Other | 258,713 | 0.69 | ||||||||||
| 1,318,598 | 3.51 | |||||||||||
| HOLDING AND OTHER INVESTMENT OFFICES * | 133,919 | 0.36 | ||||||||||
| HOTELS AND OTHER LODGING PLACES * | 93,604 | 0.25 | ||||||||||
| INDUSTRIAL MACHINERY AND EQUIPMENT | ||||||||||||
| 20,861 | e | Applied Materials, Inc | 398,236 | 1.06 | ||||||||
| 352 | e,m,v* | Other | 551,114 | 1.47 | ||||||||
| 949,350 | 2.53 | |||||||||||
| INSTRUMENTS AND RELATED PRODUCTS | ||||||||||||
| 14,961 | * | Agilent Technologies, Inc | 531,714 | 1.41 | ||||||||
| 11,550 | e | Allergan, Inc | 601,178 | 1.60 | ||||||||
| 16,891 | Emerson Electric Co | 835,260 | 2.22 | |||||||||
| 21,387 | * | Hologic, Inc | 466,237 | 1.24 | ||||||||
| 1,783 | e* | Intuitive Surgical, Inc | 480,340 | 1.28 | ||||||||
| * | Other | 574,315 | 1.53 | |||||||||
| 3,489,044 | 9.28 | |||||||||||
| INSURANCE CARRIERS | ||||||||||||
| 7,797 | Aflac, Inc | 489,652 | 1.30 | |||||||||
| * | Other | 184,441 | 0.49 | |||||||||
| 674,093 | 1.79 | |||||||||||
| METAL MINING | ||||||||||||
| 7,525 | Anglo American plc | 528,513 | 1.41 | |||||||||
| 528,513 | 1.41 | |||||||||||
| MISCELLANEOUS RETAIL | ||||||||||||
| 9,848 | e* | Amazon.com, Inc | 722,154 | 1.92 | ||||||||
| 19,330 | CVS Corp | 764,888 | 2.03 | |||||||||
| 25,125 | e | Staples, Inc | 596,719 | 1.59 | ||||||||
| 2,083,761 | 5.54 | |||||||||||
| 48 | 2008 Semiannual Report n TIAA-CREF Life Funds | See notes to financial statements |
| SUMMARY PORTFOLIO OF INVESTMENTS (UNAUDITED) | concluded |
GROWTH EQUITY FUND n JUNE 30, 2008
| Shares | Company | Value | % of net assets | ||||||||||
| OIL AND GAS EXTRACTION | |||||||||||||
| 30,896 | e* | Denbury Resources, Inc | $ | 1,127,704 | 3.00 | % | |||||||
| 16,949 | * | Nabors Industries Ltd | 834,399 | 2.22 | |||||||||
| 6,383 | e* | National Oilwell Varco, Inc | 566,300 | 1.51 | |||||||||
| e | Other | 964,446 | 2.56 | ||||||||||
| 3,492,849 | 9.29 | ||||||||||||
| PETROLEUM AND COAL PRODUCTS | |||||||||||||
| 3,054 | Apache Corp | 424,506 | 1.13 | ||||||||||
| 3,419 | Devon Energy Corp | 410,827 | 1.09 | ||||||||||
| e | Other | 306,333 | 0.82 | ||||||||||
| 1,141,666 | 3.04 | ||||||||||||
| PRIMARY METAL INDUSTRIES | 501,979 | 1.34 | |||||||||||
| RAILROAD TRANSPORTATION e | 200,679 | 0.53 | |||||||||||
| SECURITY AND COMMODITY BROKERS | |||||||||||||
| 35,254 | Charles Schwab Corp | 724,117 | 1.93 | ||||||||||
| 4,168 | e* | IntercontinentalExchange, Inc | 475,152 | 1.26 | |||||||||
| 1,199,269 | 3.19 | ||||||||||||
| TRANSPORTATION EQUIPMENT | |||||||||||||
| 6,467 | Boeing Co | 425,011 | 1.13 | ||||||||||
| e* | Other | 28,075 | 0.07 | ||||||||||
| 453,086 | 1.20 | ||||||||||||
| TOTAL COMMON STOCKS | (Cost $38,286,840) | 38,398,712 | 102.12 | ||||||||||
| SHORT-TERM INVESTMENTS | |||||||||||||
| INVESTMENT OF CASH COLLATERAL FOR SECURITIES LOANED | |||||||||||||
| 10,728,037 | State Street Navigator Securities Lending Prime Portfolio | 10,728,037 | 28.53 | ||||||||||
| TOTAL SHORT-TERM INVESTMENTS | (Cost $10,728,037) | 10,728,037 | 28.53 | ||||||||||
| TOTAL PORTFOLIO | (Cost $49,014,877) | 49,126,749 | 130.65 | ||||||||||
| OTHER ASSETS & LIABILITIES, NET | (11,523,496 | ) | (30.65 | ) | |||||||||
| NET ASSETS | $ | 37,603,253 | 100.00 | % | |||||||||
| * | Non-income producing. |
| e | All or a portion of these securities are out on loan. |
| m | Indicates a security that has been deemed illiquid. |
| v | Security valued at fair value. |
ABBREVIATION:
| ADR | American Depositary Receipt |
| Plc | Public Limited Company |
For ease of presentation, we have grouped a number of industry classification categories together in the Summary portfolio of investments. Note that the funds use more specific industry categories in following their investment limitations on industry concentration. The grouped categories can carry footnotes which can pertain to only a portion of the securities within that group.
| See notes to financial statements | TIAA-CREF Life Funds n 2008 Semiannual Report | 49 |
SUMMARY PORTFOLIO OF INVESTMENTS (UNAUDITED)
GROWTH & INCOME FUND n JUNE 30, 2008
| Shares | Company | Value | % of net assets | |||||||||
| COMMON STOCKS | ||||||||||||
| AMUSEMENT AND RECREATION SERVICES | ||||||||||||
| 18,777 | * | Activision, Inc | $ | 639,732 | 0.87 | % | ||||||
| e* | Other | 869,892 | 1.18 | |||||||||
| 1,509,624 | 2.05 | |||||||||||
| APPAREL AND ACCESSORY STORES e* | 507,776 | 0.69 | ||||||||||
| BUILDING MATERIALS AND GARDEN SUPPLIES e | 348,630 | 0.47 | ||||||||||
| BUSINESS SERVICES | ||||||||||||
| 1,859 | * | Google, Inc (Class A) | 978,615 | 1.33 | ||||||||
| 42,196 | Microsoft Corp | 1,160,812 | 1.58 | |||||||||
| 41,138 | * | Oracle Corp | 863,898 | 1.17 | ||||||||
| e* | Other | 1,835,535 | 2.50 | |||||||||
| 4,838,860 | 6.58 | |||||||||||
| CHEMICALS AND ALLIED PRODUCTS | ||||||||||||
| 23,850 | Abbott Laboratories | 1,263,335 | 1.72 | |||||||||
| 15,013 | e | Du Pont (E.I.) de Nemours & Co | 643,908 | 0.88 | ||||||||
| 16,980 | * | Gilead Sciences, Inc | 899,091 | 1.22 | ||||||||
| 6,950 | e | Monsanto Co | 878,758 | 1.19 | ||||||||
| 17,475 | Procter & Gamble Co | 1,062,655 | 1.44 | |||||||||
| e* | Other | 7,077,556 | 9.62 | |||||||||
| 11,825,303 | 16.07 | |||||||||||
| COAL MINING | 378,439 | 0.51 | ||||||||||
| COMMUNICATIONS | ||||||||||||
| 28,960 | AT&T, Inc | 975,662 | 1.32 | |||||||||
| 23,632 | Verizon Communications, Inc | 836,573 | 1.14 | |||||||||
| e* | Other | 751,552 | 1.02 | |||||||||
| 2,563,787 | 3.48 | |||||||||||
| DEPOSITORY INSTITUTIONS | ||||||||||||
| 40,190 | Citigroup, Inc | 673,584 | 0.91 | |||||||||
| 19,937 | e | JPMorgan Chase & Co | 684,038 | 0.93 | ||||||||
| 9,942 | Northern Trust Corp | 681,723 | 0.93 | |||||||||
| 27,473 | Wells Fargo & Co | 652,484 | 0.89 | |||||||||
| e | Other | 1,585,819 | 2.15 | |||||||||
| 4,277,648 | 5.81 | |||||||||||
| EATING AND DRINKING PLACES e* | 1,147,103 | 1.56 | ||||||||||
| ELECTRIC, GAS, AND SANITARY SERVICES | ||||||||||||
| 9,610 | Exelon Corp | 864,516 | 1.18 | |||||||||
| 11,978 | e | PPL Corp | 626,090 | 0.85 | ||||||||
| 13,955 | e | Public Service Enterprise Group, Inc | 640,953 | 0.87 | ||||||||
| e | Other | 567,610 | 0.77 | |||||||||
| 2,699,169 | 3.67 | |||||||||||
| ELECTRONIC AND OTHER ELECTRIC EQUIPMENT | ||||||||||||
| 5,612 | * | Apple Computer, Inc | 939,673 | 1.28 | ||||||||
| 35,285 | * | Cisco Systems, Inc | 820,729 | 1.11 | ||||||||
| 50 | 2008 Semiannual Report n TIAA-CREF Life Funds | See notes to financial statements |
| SUMMARY PORTFOLIO OF INVESTMENTS (UNAUDITED) | continued |
GROWTH & INCOME FUND n JUNE 30, 2008
| Shares | Company | Value | % of net assets | |||||||||
| ELECTRONIC AND OTHER ELECTRIC EQUIPMENT – continued | ||||||||||||
| 13,267 | Honeywell International, Inc | $ | 667,065 | 0.91 | % | |||||||
| 40,322 | Intel Corp | 866,117 | 1.18 | |||||||||
| 23,653 | Qualcomm, Inc | 1,049,484 | 1.43 | |||||||||
| e* | Other | 1,777,817 | 2.41 | |||||||||
| 6,120,885 | 8.32 | |||||||||||
| ENGINEERING AND MANAGEMENT SERVICES e* | 315,685 | 0.43 | ||||||||||
| FABRICATED METAL PRODUCTS e | 389,808 | 0.53 | ||||||||||
| FOOD AND KINDRED PRODUCTS | ||||||||||||
| 18,655 | Coca-Cola Co | 969,687 | 1.32 | |||||||||
| 12,310 | General Mills, Inc | 748,079 | 1.02 | |||||||||
| 10,342 | PepsiCo, Inc | 657,648 | 0.89 | |||||||||
| e* | Other | 992,350 | 1.35 | |||||||||
| 3,367,764 | 4.58 | |||||||||||
| FOOD STORES | 151,539 | 0.21 | ||||||||||
| GENERAL BUILDING CONTRACTORS e | 302,488 | 0.41 | ||||||||||
| GENERAL MERCHANDISE STORES | ||||||||||||
| 21,035 | TJX Cos, Inc | 661,971 | 0.9 | |||||||||
| 18,926 | Wal-Mart Stores, Inc | 1,063,641 | 1.44 | |||||||||
| e* | Other | 312,706 | 0.43 | |||||||||
| 2,038,318 | 2.77 | |||||||||||
| HEALTH SERVICES | ||||||||||||
| 13,668 | e | Cardinal Health, Inc | 704,995 | 0.96 | ||||||||
| 13,298 | * | Medco Health Solutions, Inc | 627,666 | 0.85 | ||||||||
| e | Other | 216,157 | 0.29 | |||||||||
| 1,548,818 | 2.10 | |||||||||||
| INDUSTRIAL MACHINERY AND EQUIPMENT | ||||||||||||
| 60,611 | General Electric Co | 1,617,708 | 2.20 | |||||||||
| 19,067 | Hewlett-Packard Co | 842,952 | 1.15 | |||||||||
| 6,964 | International Business Machines Corp | 825,443 | 1.12 | |||||||||
| e,m,v* | Other | 1,497,521 | 2.03 | |||||||||
| 4,783,624 | 6.50 | |||||||||||
| INSTRUMENTS AND RELATED PRODUCTS | ||||||||||||
| 12,772 | Emerson Electric Co | 631,575 | 0.86 | |||||||||
| 17,122 | Johnson & Johnson | 1,101,629 | 1.50 | |||||||||
| e* | Other | 1,230,712 | 1.67 | |||||||||
| 2,963,916 | 4.03 | |||||||||||
| INSURANCE AGENTS, BROKERS AND SERVICE e | 559,779 | 0.76 | ||||||||||
| INSURANCE CARRIERS | ||||||||||||
| 15,669 | * | ACE Ltd | 863,205 | 1.17 | ||||||||
| e | Other | 1,429,709 | 1.94 | |||||||||
| 2,292,914 | 3.11 | |||||||||||
| See notes to financial statements | TIAA-CREF Life Funds n 2008 Semiannual Report | 51 |
| SUMMARY PORTFOLIO OF INVESTMENTS (UNAUDITED) | continued |
GROWTH & INCOME FUND n JUNE 30, 2008
| Shares | Company | Value | % of net assets | |||||||||
| LEGAL SERVICES | ||||||||||||
| 9,434 | e* | FTI Consulting, Inc | $ | 645,852 | 0.88 | % | ||||||
| 645,852 | 0.88 | |||||||||||
| METAL MINING | 1,000,128 | 1.36 | ||||||||||
| MISCELLANEOUS MANUFACTURING INDUSTRIES e | 144,380 | 0.20 | ||||||||||
| MISCELLANEOUS RETAIL | ||||||||||||
| 16,659 | CVS Corp | 659,197 | 0.90 | |||||||||
| 659,197 | 0.90 | |||||||||||
| MOTION PICTURES * | 352,260 | 0.48 | ||||||||||
| NONDEPOSITORY INSTITUTIONS e* | 424,245 | 0.58 | ||||||||||
| OIL AND GAS EXTRACTION | ||||||||||||
| 11,187 | e* | Cameron International Corp | 619,200 | 0.84 | ||||||||
| 14,268 | Halliburton Co | 757,203 | 1.03 | |||||||||
| 11,579 | Schlumberger Ltd | 1,243,932 | 1.69 | |||||||||
| 2,620,335 | 3.56 | |||||||||||
| PETROLEUM AND COAL PRODUCTS | ||||||||||||
| 6,055 | Apache Corp | 841,645 | 1.14 | |||||||||
| 14,900 | Chevron Corp | 1,477,037 | 2.01 | |||||||||
| 6,073 | Devon Energy Corp | 729,732 | 0.99 | |||||||||
| 25,462 | Exxon Mobil Corp | 2,243,966 | 3.05 | |||||||||
| e | Other | 2,247,899 | 3.06 | |||||||||
| 7,540,279 | 10.25 | |||||||||||
| RAILROAD TRANSPORTATION | ||||||||||||
| 9,204 | e | Union Pacific Corp | 694,902 | 0.94 | ||||||||
| 694,902 | 0.94 | |||||||||||
| SECURITY AND COMMODITY BROKERS e | 1,404,806 | 1.91 | ||||||||||
| TOBACCO PRODUCTS | ||||||||||||
| 26,699 | Philip Morris International, Inc | 1,318,664 | 1.79 | |||||||||
| 1,318,664 | 1.79 | |||||||||||
| TRANSPORTATION EQUIPMENT e | 1,705,923 | 2.32 | ||||||||||
| WATER TRANSPORTATION | 103,195 | 0.14 | ||||||||||
| WHOLESALE TRADE-NONDURABLE GOODS | 222,978 | 0.30 | ||||||||||
| 927,973 | 1.26 | |||||||||||
| TOTAL COMMON STOCKS | (Cost $71,210,903) | 73,769,021 | 100.25 | |||||||||
| 52 | 2008 Semiannual Report n TIAA-CREF Life Funds | See notes to financial statements |
| SUMMARY PORTFOLIO OF INVESTMENTS (UNAUDITED) | concluded |
GROWTH & INCOME FUND n JUNE 30, 2008
| Shares | Company | Value | % of net assets | ||||||||||
| SHORT-TERM INVESTMENTS | |||||||||||||
| INVESTMENT OF CASH COLLATERAL FOR SECURITIES LOANED | |||||||||||||
| 19,680,784 | State Street Navigator Securities Lending Prime Portfolio | $ | 19,680,784 | 26.75 | % | ||||||||
| TOTAL SHORT-TERM INVESTMENTS | (Cost $19,680,784) | 19,680,784 | 26.75 | ||||||||||
| TOTAL PORTFOLIO | (Cost $90,891,687) | 93,449,805 | 127.00 | ||||||||||
| OTHER ASSETS & LIABILITIES, NET | (19,866,670 | ) | (27.00 | ) | |||||||||
| NET ASSETS | $ | 73,583,135 | 100.00 | % | |||||||||
| * | Non-income producing. |
| e | All or a portion of these securities are out on loan. |
| m | Indicates a security that has been deemed illiquid. |
| v | Security valued at fair value. |
For ease of presentation, we have grouped a number of industry classification categories together in the Summary portfolio of investments. Note that the funds use more specific industry categories in following their investment limitations on industry concentration. The grouped categories can carry footnotes which can pertain to only a portion of the securities within that group.
| See notes to financial statements | TIAA-CREF Life Funds n 2008 Semiannual Report | 53 |
SUMMARY PORTFOLIO OF INVESTMENTS (UNAUDITED)
INTERNATIONAL EQUITY FUND n JUNE 30, 2008
| Shares | Company | Value | % of net assets | |||||||||
| COMMON STOCKS | ||||||||||||
| AMUSEMENT AND RECREATION SERVICES | $ | 623,780 | 0.51 | % | ||||||||
| BUSINESS SERVICES | 468,123 | 0.39 | ||||||||||
| CHEMICALS AND ALLIED PRODUCTS | ||||||||||||
| 47,900 | Daiichi Sankyo Co Ltd | 1,319,568 | 1.09 | |||||||||
| 61,427 | Lanxess AG. | 2,523,045 | 2.08 | |||||||||
| 47,396 | Reckitt Benckiser Group plc | 2,393,894 | 1.97 | |||||||||
| 4,852,000 | e | Sinochem Hong Kong Holding Ltd | 3,768,879 | 3.11 | ||||||||
| 3,188 | Syngenta AG. | 1,032,825 | 0.85 | |||||||||
| Other | 1,451,096 | 1.20 | ||||||||||
| 12,489,307 | 10.30 | |||||||||||
| COMMUNICATIONS | ||||||||||||
| 441,401 | BT Group plc | 1,748,703 | 1.44 | |||||||||
| 102,682 | Deutsche Telekom AG. | 1,682,979 | 1.39 | |||||||||
| Other | 182,008 | 0.15 | ||||||||||
| 3,613,690 | 2.98 | |||||||||||
| DEPOSITORY INSTITUTIONS | ||||||||||||
| 10,082 | Deutsche Bank AG. | 870,326 | 0.72 | |||||||||
| 4,725 | Komercni Banka A.S. | 1,100,546 | 0.91 | |||||||||
| 122,200 | Mitsubishi UFJ Financial Group, Inc | 1,079,935 | 0.89 | |||||||||
| 276 | Mizuho Financial Group, Inc | 1,284,182 | 1.05 | |||||||||
| 108 | e | Sumitomo Mitsui Financial Group, Inc | 812,182 | 0.67 | ||||||||
| 253,505 | * | UBS A.G. | 5,282,598 | 4.36 | ||||||||
| e,v* | Other | 1,042,600 | 0.86 | |||||||||
| 11,472,369 | 9.46 | |||||||||||
| ELECTRIC, GAS, AND SANITARY SERVICES | ||||||||||||
| 63,568 | Electricite de France | 6,021,845 | 4.97 | |||||||||
| 15,568 | Fortum Oyj | 787,981 | 0.65 | |||||||||
| 222,261 | e | Iberdrola S.A. | 2,961,358 | 2.44 | ||||||||
| Other | 288,406 | 0.24 | ||||||||||
| 10,059,590 | 8.30 | |||||||||||
| ELECTRONIC AND OTHER ELECTRIC EQUIPMENT | ||||||||||||
| 58,010 | Smiths Group plc | 1,249,930 | 1.03 | |||||||||
| 18,700 | Sony Corp | 819,689 | 0.67 | |||||||||
| e | Other | 626,484 | 0.52 | |||||||||
| 2,696,103 | 2.22 | |||||||||||
| ENGINEERING AND MANAGEMENT SERVICES | 690,553 | 0.57 | ||||||||||
| FOOD AND KINDRED PRODUCTS | ||||||||||||
| 118,700 | e | Asahi Breweries Ltd | 2,218,920 | 1.83 | ||||||||
| 54,988 | e | Groupe Danone | 3,847,733 | 3.17 | ||||||||
| 34,300 | e | Yakult Honsha Co Ltd | 966,242 | 0.80 | ||||||||
| 7,032,895 | 5.80 | |||||||||||
| FOOD STORES | 36,957 | 0.03 | ||||||||||
| 54 | 2008 Semiannual Report n TIAA-CREF Life Funds | See notes to financial statements |
| SUMMARY PORTFOLIO OF INVESTMENTS (UNAUDITED) | continued |
INTERNATIONAL EQUITY FUND n JUNE 30, 2008
| Shares | Company | Value | % of net assets | |||||||||
| GENERAL BUILDING CONTRACTORS | ||||||||||||
| 36,436 | e | Vinci S.A. | $ | 2,224,922 | 1.84 | % | ||||||
| 2,224,922 | 1.84 | |||||||||||
| HOLDING AND OTHER INVESTMENT OFFICES | ||||||||||||
| 197,000 | Japan Asia Investment Co Ltd | 825,671 | 0.68 | |||||||||
| Other | 7,531 | 0.01 | ||||||||||
| 833,202 | 0.69 | |||||||||||
| HOTELS AND OTHER LODGING PLACES | ||||||||||||
| 38,724 | e | Accor S.A. | 2,572,427 | 2.12 | ||||||||
| 2,572,427 | 2.12 | |||||||||||
| INDUSTRIAL MACHINERY AND EQUIPMENT | ||||||||||||
| 20,370 | e | Canon, Inc | 1,048,564 | 0.87 | ||||||||
| 17,500 | Daikin Industries Ltd | 884,850 | 0.73 | |||||||||
| 42,926 | GEA Group AG. | 1,515,596 | 1.25 | |||||||||
| 26,430 | Komatsu Ltd | 738,087 | 0.61 | |||||||||
| 29,414 | Krones AG. | 2,514,398 | 2.07 | |||||||||
| 11,932 | Rheinmetall AG. | 861,308 | 0.71 | |||||||||
| e | Other | 1,060,788 | 0.87 | |||||||||
| 8,623,591 | 7.11 | |||||||||||
| INSTRUMENTS AND RELATED PRODUCTS | ||||||||||||
| 19,701 | e | Phonak Holding AG. | 1,625,923 | 1.34 | ||||||||
| 1,625,923 | 1.34 | |||||||||||
| INSURANCE CARRIERS | ||||||||||||
| 22,973 | Allianz AG. | 4,041,021 | 3.34 | |||||||||
| Other | 27,615 | 0.02 | ||||||||||
| 4,068,636 | 3.36 | |||||||||||
| METAL MINING | ||||||||||||
| 136,311 | MMC Norilsk Nickel (ADR) | 3,433,891 | 2.83 | |||||||||
| e | Other | 743,918 | 0.62 | |||||||||
| 4,177,809 | 3.45 | |||||||||||
| MISCELLANEOUS RETAIL | ||||||||||||
| 199,000 | Hutchison Whampoa Ltd | 2,006,775 | 1.65 | |||||||||
| Other | 34,300 | 0.03 | ||||||||||
| 2,041,075 | 1.68 | |||||||||||
| NONDEPOSITORY INSTITUTIONS | ||||||||||||
| 11,422 | Deutsche Postbank AG. | 1,004,152 | 0.83 | |||||||||
| e | Other | 1,153,760 | 0.95 | |||||||||
| 2,157,912 | 1.78 | |||||||||||
| OIL AND GAS EXTRACTION | ||||||||||||
| 132,531 | BG Group plc | 3,444,166 | 2.84 | |||||||||
| Other | 508,863 | 0.42 | ||||||||||
| 3,953,029 | 3.26 | |||||||||||
| See notes to financial statements | TIAA-CREF Life Funds n 2008 Semiannual Report | 55 |
| SUMMARY PORTFOLIO OF INVESTMENTS (UNAUDITED) | continued |
INTERNATIONAL EQUITY FUND n JUNE 30, 2008
| Shares | Company | Value | % of net assets | |||||||||
| PETROLEUM AND COAL PRODUCTS | ||||||||||||
| 274,628 | BP plc | $ | 3,183,120 | 2.63 | % | |||||||
| 283 | Other | 269,711 | 0.22 | |||||||||
| 3,452,831 | 2.85 | |||||||||||
| PRIMARY METAL INDUSTRIES | 619,472 | 0.51 | ||||||||||
| RAILROAD TRANSPORTATION | ||||||||||||
| 81 | Central Japan Railway Co | 892,819 | 0.74 | |||||||||
| Other | 625,106 | 0.51 | ||||||||||
| 1,517,925 | 1.25 | |||||||||||
| REAL ESTATE e | 901,072 | 0.74 | ||||||||||
| RUBBER AND MISCELLANEOUS PLASTIC PRODUCTS | ||||||||||||
| 106,036 | Bayer AG. | 8,921,675 | 7.36 | |||||||||
| 8,921,675 | 7.36 | |||||||||||
| SECURITY AND COMMODITY BROKERS | ||||||||||||
| 45,727 | Credit Suisse Group | 2,081,355 | 1.72 | |||||||||
| 77,400 | Hong Kong Exchanges and Clearing Ltd | 1,133,810 | 0.93 | |||||||||
| 247,330 | Man Group plc | 3,055,368 | 2.52 | |||||||||
| e | Other | 572,483 | 0.47 | |||||||||
| 6,843,016 | 5.64 | |||||||||||
| STONE, CLAY, AND GLASS PRODUCTS | ||||||||||||
| 893,000 | Nippon Sheet Glass Co Ltd | 4,425,945 | 3.65 | |||||||||
| * | Other | 109,752 | 0.09 | |||||||||
| 4,535,697 | 3.74 | |||||||||||
| TOBACCO PRODUCTS | ||||||||||||
| 2,666,631 | Huabao International Holdings Ltd | 2,531,788 | 2.09 | |||||||||
| Other | 86,960 | 0.07 | ||||||||||
| 2,618,748 | 2.16 | |||||||||||
| TRANSPORTATION BY AIR | 34,019 | 0.03 | ||||||||||
| TRANSPORTATION EQUIPMENT | ||||||||||||
| 288,251 | e | Fiat S.p.A. | 4,691,836 | 3.87 | ||||||||
| 42,100 | e | Honda Motor Co Ltd | 1,436,732 | 1.18 | ||||||||
| 27,020 | Toyota Motor Corp | 1,275,452 | 1.05 | |||||||||
| Other | 21,354 | 0.02 | ||||||||||
| 7,425,374 | 6.12 | |||||||||||
| TRUCKING AND WAREHOUSING | ||||||||||||
| 178,550 | Deutsche Post AG. | 4,661,780 | 3.84 | |||||||||
| 4,661,780 | 3.84 | |||||||||||
| WATER TRANSPORTATION | 110,375 | 0.09 | ||||||||||
| WHOLESALE TRADE-DURABLE GOODS e | 363,758 | 0.30 | ||||||||||
| WHOLESALE TRADE-NONDURABLE GOODS | ||||||||||||
| 524,375 | Foster’s Group Ltd | 2,549,216 | 2.10 | |||||||||
| 2,549,216 | 2.10 | |||||||||||
| TOTAL COMMON STOCKS | (Cost $132,826,942) | 126,016,851 | 103.92 | |||||||||
| 56 | 2008 Semiannual Report n TIAA-CREF Life Funds | See notes to financial statements |
| SUMMARY PORTFOLIO OF INVESTMENTS (UNAUDITED) | concluded |
INTERNATIONAL EQUITY FUND n JUNE 30, 2008
| Shares | Company | Value | % of net assets | ||||||||||
| SHORT-TERM INVESTMENTS | |||||||||||||
| INVESTMENT OF CASH COLLATERAL FOR SECURITIES LOANED | |||||||||||||
| 14,898,371 | State Street Navigator Securities Lending Prime Portfolio | $ | 14,898,371 | 12.28 | % | ||||||||
| TOTAL SHORT-TERM INVESTMENTS | (Cost $14,898,371) | 14,898,371 | 12.28 | ||||||||||
| TOTAL PORTFOLIO | (Cost $147,725,313) | 140,915,222 | 116.20 | ||||||||||
| OTHER ASSETS & LIABILITIES, NET | (19,649,922 | ) | (16.20 | ) | |||||||||
| NET ASSETS | $ | 121,265,300 | 100.00 | % | |||||||||
| * | Non-income producing. |
| e | All or a portion of these securities are out on loan. |
| v | Security valued at fair value. |
ABBREVIATION:
| ADR | American Depositary Receipt |
| Plc | Public Limited Company |
For ease of presentation, we have grouped a number of industry classification categories together in the Summary portfolio of investments. Note that the funds use more specific industry categories in following their investment limitations on industry concentration. The grouped categories can carry footnotes which can pertain to only a portion of the securities within that group.
| See notes to financial statements | TIAA-CREF Life Funds n 2008 Semiannual Report | 57 |
SUMMARY OF MARKET VALUES BY COUNTRY (UNAUDITED)
INTERNATIONAL EQUITY FUND n JUNE 30, 2008
| Country | Value | % of market value | ||||
| DOMESTIC | ||||||
| UNITED STATES | $ | 14,898,371 | 10.57 | % | ||
TOTAL DOMESTIC | 14,898,371 | 10.57 | ||||
| FOREIGN | ||||||
| AUSTRALIA | 2,963,527 | 2.10 | ||||
| CHINA | 6,410,419 | 4.55 | ||||
| CZECH REPUBLIC | 1,100,546 | 0.78 | ||||
| FINLAND | 787,981 | 0.56 | ||||
| FRANCE | 15,267,307 | 10.84 | ||||
| GERMANY | 28,942,308 | 20.54 | ||||
| HONG KONG | 3,140,586 | 2.23 | ||||
| INDIA | 468,477 | 0.33 | ||||
| ITALY | 5,154,678 | 3.66 | ||||
| JAPAN | 25,234,483 | 17.91 | ||||
| RUSSIA | 3,433,891 | 2.44 | ||||
| SINGAPORE | 663,052 | 0.47 | ||||
| SPAIN | 2,961,358 | 2.10 | ||||
| SWEDEN | 271,010 | 0.19 | ||||
| SWITZERLAND | 11,442,095 | 8.12 | ||||
| UNITED KINGDOM | 17,775,133 | 12.61 | ||||
TOTAL FOREIGN | 126,016,851 | 89.43 | ||||
TOTAL PORTFOLIO | $ | 140,915,222 | 100.00 | % | ||
| 58 | 2008 Semiannual Report n TIAA-CREF Life Funds | See notes to financial statements |
SUMMARY PORTFOLIO OF INVESTMENTS (UNAUDITED)
LARGE-CAP VALUE FUND n JUNE 30, 2008
| Shares | Company | Value | % of net assets | |||||||||
| COMMON STOCKS | ||||||||||||
| AGRICULTURAL PRODUCTION-LIVESTOCK e | $ | 159,024 | 0.28 | % | ||||||||
| AMUSEMENT AND RECREATION SERVICES | 239,210 | 0.42 | ||||||||||
| APPAREL AND ACCESSORY STORES | ||||||||||||
| 24,321 | e | Gap, Inc | 405,431 | 0.70 | ||||||||
| e* | Other | 447,927 | 0.78 | |||||||||
| 853,358 | 1.48 | |||||||||||
| APPAREL AND OTHER TEXTILE PRODUCTS e | 37,092 | 0.07 | ||||||||||
| BUILDING MATERIALS AND GARDEN SUPPLIES | ||||||||||||
| 20,739 | Home Depot, Inc | 485,707 | 0.84 | |||||||||
| Other | 141,059 | 0.24 | ||||||||||
| 626,766 | 1.08 | |||||||||||
| BUSINESS SERVICES e* | 1,229,530 | 2.13 | ||||||||||
| CHEMICALS AND ALLIED PRODUCTS | ||||||||||||
| 14,336 | Abbott Laboratories | 759,378 | 1.31 | |||||||||
| 12,463 | e | Clorox Co | 650,569 | 1.13 | ||||||||
| 11,415 | e | Du Pont (E.I.) de Nemours & Co | 489,589 | 0.85 | ||||||||
| 26,558 | Merck & Co, Inc | 1,000,971 | 1.73 | |||||||||
| 31,651 | e | Mylan Laboratories, Inc | 382,028 | 0.66 | ||||||||
| 32,205 | Pfizer, Inc | 562,621 | 0.97 | |||||||||
| e* | Other | 2,554,453 | 4.42 | |||||||||
| 6,399,609 | 11.07 | |||||||||||
| COAL MINING e | 256,666 | 0.44 | ||||||||||
| COMMUNICATIONS | ||||||||||||
| 26,673 | AT&T, Inc | 898,613 | 1.55 | |||||||||
| 21,557 | e | Comcast Corp (Class A) | 408,936 | 0.71 | ||||||||
| 51,331 | e | Sprint Nextel Corp | 487,645 | 0.84 | ||||||||
| 28,582 | Verizon Communications, Inc | 1,011,803 | 1.75 | |||||||||
| e,v* | Other | 612,386 | 1.06 | |||||||||
| 3,419,383 | 5.91 | |||||||||||
| DEPOSITORY INSTITUTIONS | ||||||||||||
| 24,357 | Bank of America Corp | 581,402 | 1.01 | |||||||||
| 54,671 | Citigroup, Inc | 916,286 | 1.58 | |||||||||
| 42,996 | JPMorgan Chase & Co | 1,475,193 | 2.55 | |||||||||
| 78,390 | e | National City Corp | 373,920 | 0.65 | ||||||||
| 49,751 | e | TCF Financial Corp | 598,505 | 1.03 | ||||||||
| 39,035 | Wells Fargo & Co | 927,081 | 1.60 | |||||||||
| e | Other | 1,253,152 | 2.17 | |||||||||
| 6,125,539 | 10.59 | |||||||||||
| EATING AND DRINKING PLACES | ||||||||||||
| 20,696 | e | Darden Restaurants, Inc | 661,030 | 1.14 | ||||||||
| 661,030 | 1.14 | |||||||||||
| ELECTRIC, GAS, AND SANITARY SERVICES | ||||||||||||
| 36,897 | e* | Allied Waste Industries, Inc | 465,640 | 0.81 | ||||||||
| See notes to financial statements | TIAA-CREF Life Funds n 2008 Semiannual Report | 59 |
| SUMMARY PORTFOLIO OF INVESTMENTS (UNAUDITED) | continued |
LARGE-CAP VALUE FUND n JUNE 30, 2008
| Shares | Company | Value | % of net assets | |||||||||
| ELECTRIC, GAS, AND SANITARY SERVICES – continued | ||||||||||||
| 4,837 | Exelon Corp | $ | 435,137 | 0.75 | % | |||||||
| 7,852 | e | FPL Group, Inc | 514,934 | 0.89 | ||||||||
| 13,367 | e | PPL Corp | 698,693 | 1.20 | ||||||||
| e | Other | 1,489,993 | 2.58 | |||||||||
| 3,604,397 | 6.23 | |||||||||||
| ELECTRONIC AND OTHER ELECTRIC EQUIPMENT | ||||||||||||
| 41,923 | Maxim Integrated Products, Inc | 886,671 | 1.53 | |||||||||
| e* | Other | 702,921 | 1.22 | |||||||||
| 1,589,592 | 2.75 | |||||||||||
| ENGINEERING AND MANAGEMENT SERVICES e* | 889,485 | 1.54 | ||||||||||
| FABRICATED METAL PRODUCTS e* | 556,324 | 0.96 | ||||||||||
| FOOD AND KINDRED PRODUCTS | ||||||||||||
| 14,198 | Kraft Foods, Inc (Class A) | 403,933 | 0.70 | |||||||||
| 11,373 | PepsiCo, Inc | 723,209 | 1.25 | |||||||||
| e | Other | 1,148,014 | 1.98 | |||||||||
| 2,275,156 | 3.93 | |||||||||||
| FOOD STORES | 69,808 | 0.12 | ||||||||||
| FORESTRY e | 212,300 | 0.37 | ||||||||||
| FURNITURE AND FIXTURES e | 183,129 | 0.32 | ||||||||||
| GENERAL BUILDING CONTRACTORS e | 115,375 | 0.20 | ||||||||||
| GENERAL MERCHANDISE STORES e | 441,463 | 0.76 | ||||||||||
| HEALTH SERVICES * | 324,634 | 0.56 | ||||||||||
| HOLDING AND OTHER INVESTMENT OFFICES | ||||||||||||
| 21,546 | e | Blackstone Group LP | 392,353 | 0.68 | ||||||||
| e* | Other | 538,787 | 0.93 | |||||||||
| 931,140 | 1.61 | |||||||||||
| INDUSTRIAL MACHINERY AND EQUIPMENT | ||||||||||||
| 85,730 | General Electric Co | 2,288,134 | 3.96 | |||||||||
| e* | Other | 639,909 | 1.10 | |||||||||
| 2,928,043 | 5.06 | |||||||||||
| INSTRUMENTS AND RELATED PRODUCTS | ||||||||||||
| 9,162 | Johnson & Johnson | 589,483 | 1.02 | |||||||||
| e* | Other | 904,076 | 1.56 | |||||||||
| 1,493,559 | 2.58 | |||||||||||
| INSURANCE AGENTS, BROKERS AND SERVICE | 311,163 | 0.54 | ||||||||||
| INSURANCE CARRIERS | ||||||||||||
| 17,865 | e | Aetna, Inc | 724,068 | 1.25 | ||||||||
| 13,313 | Lincoln National Corp | 603,345 | 1.04 | |||||||||
| 9,490 | Travelers Cos, Inc | 411,866 | 0.71 | |||||||||
| e* | Other | 2,051,090 | 3.55 | |||||||||
| 3,790,369 | 6.55 | |||||||||||
| 60 | 2008 Semiannual Report n TIAA-CREF Life Funds | See notes to financial statements |
| SUMMARY PORTFOLIO OF INVESTMENTS (UNAUDITED) | continued |
LARGE-CAP VALUE FUND n JUNE 30, 2008
| Shares | Company | Value | % of net assets | |||||||||
| METAL MINING | ||||||||||||
| 4,342 | Freeport-McMoRan Copper & Gold, Inc (Class B) | $ | 508,839 | 0.88 | % | |||||||
| Other | 334,315 | 0.58 | ||||||||||
| 843,154 | 1.46 | |||||||||||
| MISCELLANEOUS MANUFACTURING INDUSTRIES | 10,591 | 0.02 | ||||||||||
| MISCELLANEOUS RETAIL | 110,440 | 0.19 | ||||||||||
| MOTION PICTURES | 580,307 | 1.00 | ||||||||||
| NONDEPOSITORY INSTITUTIONS | ||||||||||||
| 27,364 | e* | Fannie Mae | 533,872 | 0.92 | ||||||||
| e | Other | 192,293 | 0.34 | |||||||||
| 726,165 | 1.26 | |||||||||||
| OIL AND GAS EXTRACTION | ||||||||||||
| 7,212 | e | XTO Energy, Inc | 494,094 | 0.85 | ||||||||
| e* | Other | 1,273,811 | 2.21 | |||||||||
| 1,767,905 | 3.06 | |||||||||||
| PAPER AND ALLIED PRODUCTS e* | 218,438 | 0.38 | ||||||||||
| PETROLEUM AND COAL PRODUCTS | ||||||||||||
| 6,924 | Apache Corp | 962,436 | 1.66 | |||||||||
| 7,249 | Cabot Oil & Gas Corp | 490,975 | 0.85 | |||||||||
| 24,805 | Chevron Corp | 2,458,920 | 4.25 | |||||||||
| 7,143 | ConocoPhillips | 674,228 | 1.17 | |||||||||
| 11,763 | Exxon Mobil Corp | 1,036,673 | 1.79 | |||||||||
| 13,239 | Marathon Oil Corp | 686,707 | 1.19 | |||||||||
| 6,455 | e | Occidental Petroleum Corp | 580,046 | 1.00 | ||||||||
| 7,807 | Petroleo Brasileiro S.A. (ADR) | 552,970 | 0.96 | |||||||||
| e* | Other | 857,638 | 1.48 | |||||||||
| 8,300,593 | 14.35 | |||||||||||
| PIPELINES, EXCEPT NATURAL GAS | ||||||||||||
| 1,515 | Spectra Energy Corp | 43,541 | 0.08 | |||||||||
| 43,541 | 0.08 | |||||||||||
| PRIMARY METAL INDUSTRIES | ||||||||||||
| 268 | Vallourec | 93,727 | 0.16 | |||||||||
| 93,727 | 0.16 | |||||||||||
| RAILROAD TRANSPORTATION | 284,635 | 0.49 | ||||||||||
| REAL ESTATE * | 126,042 | 0.22 | ||||||||||
| SECURITY AND COMMODITY BROKERS | ||||||||||||
| 19,492 | Charles Schwab Corp | 400,366 | 0.69 | |||||||||
| 4,124 | Franklin Resources, Inc | 377,965 | 0.65 | |||||||||
| 4,482 | Goldman Sachs Group, Inc | 783,902 | 1.36 | |||||||||
| e | Other | 692,216 | 1.20 | |||||||||
| 2,254,449 | 3.90 | |||||||||||
| See notes to financial statements | TIAA-CREF Life Funds n 2008 Semiannual Report | 61 |
| SUMMARY PORTFOLIO OF INVESTMENTS (UNAUDITED) | concluded |
LARGE-CAP VALUE FUND n JUNE 30, 2008
| Shares | Company | Value | % of net assets | ||||||||||
| TOBACCO PRODUCTS | |||||||||||||
| 11,279 | Philip Morris International, Inc | $ | 557,070 | 0.96 | % | ||||||||
| 557,070 | 0.96 | ||||||||||||
| TRANSPORTATION BY AIR e | 23,600 | 0.04 | |||||||||||
| TRANSPORTATION EQUIPMENT | |||||||||||||
| 8,098 | Northrop Grumman Corp | 541,756 | 0.94 | ||||||||||
| e* | Other | 140,225 | 0.24 | ||||||||||
| 681,981 | 1.18 | ||||||||||||
| TRANSPORTATION SERVICES e | 233,934 | 0.40 | |||||||||||
| WATER TRANSPORTATION e | 264,809 | 0.46 | |||||||||||
| WHOLESALE TRADE-NONDURABLE GOODS | |||||||||||||
| 16,074 | e | Cardinal Health, Inc | 829,097 | 1.43 | |||||||||
| e* | Other | 202,664 | 0.35 | ||||||||||
| 1,031,761 | 1.78 | ||||||||||||
| TOTAL COMMON STOCKS | (Cost $61,985,637) | 57,876,286 | 100.08 | ||||||||||
| SHORT-TERM INVESTMENTS | |||||||||||||
| U.S. GOVERNMENT AND AGENCIES DISCOUNT NOTES † | 200,000 | 0.35 | |||||||||||
| INVESTMENT OF CASH COLLATERAL FOR SECURITIES LOANED | |||||||||||||
| 17,198,310 | State Street Navigator Securities Lending Prime Portfolio | 17,198,310 | 29.74 | ||||||||||
| TOTAL SHORT-TERM INVESTMENTS | (Cost $17,398,310) | 17,398,310 | 30.09 | ||||||||||
| TOTAL PORTFOLIO | (Cost $79,383,947) | 75,274,596 | 130.17 | ||||||||||
| OTHER ASSETS & LIABILITIES, NET | (17,447,329 | ) | (30.17 | ) | |||||||||
| NET ASSETS | $ | 57,827,267 | 100.00 | % | |||||||||
| * | Non-income producing. |
† | Notes mature 7/01/08. |
| e | All or a portion of these securities are out on loan. |
| v | Security valued at fair value. |
ABBREVIATION:
| ADR | American Depositary Receipt |
| LP | Limited Partnership |
For ease of presentation, we have grouped a number of industry classification categories together in the Summary portfolio of investments. Note that the funds use more specific industry categories in following their investment limitations on industry concentration. The grouped categories can carry footnotes which can pertain to only a portion of the securities within that group.
| 62 | 2008 Semiannual Report n TIAA-CREF Life Funds | See notes to financial statements |
SUMMARY PORTFOLIO OF INVESTMENTS (UNAUDITED)
SMALL-CAP EQUITY FUND n JUNE 30, 2008
| Shares | Company | Value | % of net assets | |||||||||
| COMMON STOCKS | ||||||||||||
| AGRICULTURAL PRODUCTION-CROPS * | $ | 29,885 | 0.06 | % | ||||||||
| AGRICULTURAL PRODUCTION-LIVESTOCK e | 112,001 | 0.24 | ||||||||||
| AMUSEMENT AND RECREATION SERVICES e* | 226,099 | 0.48 | ||||||||||
| APPAREL AND ACCESSORY STORES | ||||||||||||
| 4,890 | e* | Aeropostale, Inc | 153,204 | 0.32 | ||||||||
| e* | Other | 725,038 | 1.54 | |||||||||
| 878,242 | 1.86 | |||||||||||
| APPAREL AND OTHER TEXTILE PRODUCTS e* | 408,795 | 0.87 | ||||||||||
| AUTO REPAIR, SERVICES AND PARKING * | 100,478 | 0.21 | ||||||||||
| BUILDING MATERIALS AND GARDEN SUPPLIES * | 7,358 | 0.02 | ||||||||||
| BUSINESS SERVICES | ||||||||||||
| 19,176 | e* | Earthlink, Inc | 165,872 | 0.35 | ||||||||
| 7,710 | * | Gartner, Inc | 159,751 | 0.34 | ||||||||
| 6,460 | e* | Manhattan Associates, Inc | 153,296 | 0.32 | ||||||||
| 3,233 | * | Mantech International Corp (Class A) | 155,572 | 0.33 | ||||||||
| 4,366 | * | SPSS, Inc | 158,791 | 0.34 | ||||||||
| 6,950 | e* | Sybase, Inc | 204,469 | 0.43 | ||||||||
| e* | Other | 4,656,712 | 9.86 | |||||||||
| 5,654,463 | 11.97 | |||||||||||
| CHEMICALS AND ALLIED PRODUCTS | ||||||||||||
| 8,190 | Ferro Corp | 153,644 | 0.33 | |||||||||
| 4,820 | Innophos Holdings, Inc | 153,999 | 0.33 | |||||||||
| 5,344 | e* | OSI Pharmaceuticals, Inc | 220,814 | 0.47 | ||||||||
| e* | Other | 3,229,347 | 6.83 | |||||||||
| 3,757,804 | 7.96 | |||||||||||
| COAL MINING * | 211,081 | 0.45 | ||||||||||
| COMMUNICATIONS | ||||||||||||
| 2,810 | e* | Anixter International, Inc | 167,167 | 0.35 | ||||||||
| 22,065 | * | Centennial Communications Corp | 154,234 | 0.33 | ||||||||
| 41,350 | e* | Cincinnati Bell, Inc | 164,573 | 0.35 | ||||||||
| e* | Other | 724,233 | 1.53 | |||||||||
| 1,210,207 | 2.56 | |||||||||||
| DEPOSITORY INSTITUTIONS | ||||||||||||
| 5,862 | e | Prosperity Bancshares, Inc | 156,691 | 0.33 | ||||||||
| 3,260 | e* | SVB Financial Group | 156,839 | 0.33 | ||||||||
| e* | Other | 2,292,645 | 4.86 | |||||||||
| 2,606,175 | 5.52 | |||||||||||
| EATING AND DRINKING PLACES e* | 658,073 | 1.39 | ||||||||||
| EDUCATIONAL SERVICES e* | 158,051 | 0.33 | ||||||||||
| ELECTRIC, GAS, AND SANITARY SERVICES | ||||||||||||
| 8,930 | e* | El Paso Electric Co | 176,814 | 0.37 | ||||||||
| 6,454 | Southwest Gas Corp | 191,877 | 0.41 | |||||||||
| See notes to financial statements | TIAA-CREF Life Funds n 2008 Semiannual Report | 63 |
| SUMMARY PORTFOLIO OF INVESTMENTS (UNAUDITED) | continued |
SMALL-CAP EQUITY FUND n JUNE 30, 2008
| Shares | Company | Value | % of net assets | |||||||||
| ELECTRIC, GAS, AND SANITARY SERVICES – continued | ||||||||||||
| 5,950 | e | UIL Holdings Corp | $ | 174,990 | 0.37 | % | ||||||
| e* | Other | 1,013,951 | 2.15 | |||||||||
| 1,557,632 | 3.30 | |||||||||||
| ELECTRONIC AND OTHER ELECTRIC EQUIPMENT | ||||||||||||
| 3,950 | e | Acuity Brands, Inc | 189,916 | 0.40 | ||||||||
| 9,130 | e* | GrafTech International Ltd | 244,958 | 0.52 | ||||||||
| e* | Other | 3,631,997 | 7.69 | |||||||||
| 4,066,871 | 8.61 | |||||||||||
| ENGINEERING AND MANAGEMENT SERVICES | ||||||||||||
| 4,209 | e | Watson Wyatt & Co Holdings (Class A) | 222,614 | 0.47 | ||||||||
| e* | Other | 741,706 | 1.57 | |||||||||
| 964,320 | 2.04 | |||||||||||
| FABRICATED METAL PRODUCTS | ||||||||||||
| 3,863 | * | Chart Industries, Inc | 187,896 | 0.40 | ||||||||
| 4,069 | e | Gulf Island Fabrication, Inc | 199,096 | 0.42 | ||||||||
| e* | Other | 226,373 | 0.48 | |||||||||
| 613,365 | 1.30 | |||||||||||
| FOOD AND KINDRED PRODUCTS | ||||||||||||
| 9,630 | e* | Darling International, Inc | 159,088 | 0.34 | ||||||||
| e* | Other | 288,550 | 0.61 | |||||||||
| 447,638 | 0.95 | |||||||||||
| FOOD STORES e* | 105,843 | 0.22 | ||||||||||
| FURNITURE AND FIXTURES | ||||||||||||
| 6,713 | e | Herman Miller, Inc | 167,087 | 0.35 | ||||||||
| e | Other | 48,845 | 0.11 | |||||||||
| 215,932 | 0.46 | |||||||||||
| FURNITURE AND HOMEFURNISHINGS STORES * | 145,519 | 0.31 | ||||||||||
| GENERAL BUILDING CONTRACTORS e* | 211,146 | 0.45 | ||||||||||
| GENERAL MERCHANDISE STORES * | 128,884 | 0.27 | ||||||||||
| HEALTH SERVICES e* | 377,724 | 0.80 | ||||||||||
| HEAVY CONSTRUCTION, EXCEPT BUILDING e* | 160,790 | 0.34 | ||||||||||
| HOLDING AND OTHER INVESTMENT OFFICES | ||||||||||||
| 3,000 | e | iShares Russell 2000 Index Fund | 207,090 | 0.44 | ||||||||
| 3,192 | e | Mid-America Apartment Communities, Inc | 162,920 | 0.34 | ||||||||
| 3,395 | PS Business Parks, Inc | 175,182 | 0.37 | |||||||||
| 10,132 | e | Sunstone Hotel Investors, Inc | 168,191 | 0.36 | ||||||||
| 4,280 | e | Tanger Factory Outlet Centers, Inc | 153,780 | 0.33 | ||||||||
| e | Other | 2,096,228 | 4.43 | |||||||||
| 2,963,391 | 6.27 | |||||||||||
| HOTELS AND OTHER LODGING PLACES * | 15,845 | 0.03 | ||||||||||
| INDUSTRIAL MACHINERY AND EQUIPMENT | ||||||||||||
| 4,321 | e* | EnPro Industries, Inc | 161,346 | 0.34 | ||||||||
| 64 | 2008 Semiannual Report n TIAA-CREF Life Funds | See notes to financial statements |
| SUMMARY PORTFOLIO OF INVESTMENTS (UNAUDITED) | continued |
SMALL-CAP EQUITY FUND n JUNE 30, 2008
| Shares | Company | Value | % of net assets | |||||||||
| INDUSTRIAL MACHINERY AND EQUIPMENT – continued | ||||||||||||
| 3,530 | Robbins & Myers, Inc | $ | 176,041 | 0.37 | % | |||||||
| e* | Other | 2,372,521 | 5.03 | |||||||||
| 2,709,908 | 5.74 | |||||||||||
| INSTRUMENTS AND RELATED PRODUCTS | ||||||||||||
| 6,960 | STERIS Corp | 200,170 | 0.42 | |||||||||
| 3,902 | * | Teledyne Technologies, Inc | 190,379 | 0.40 | ||||||||
| 3,438 | Varian, Inc | 175,544 | 0.37 | |||||||||
| Other | 2,475,599 | 5.25 | ||||||||||
| 3,041,692 | 6.44 | |||||||||||
| INSURANCE AGENTS, BROKERS AND SERVICE e | 43,986 | 0.09 | ||||||||||
| INSURANCE CARRIERS | ||||||||||||
| 5,000 | e | Platinum Underwriters Holdings Ltd | 163,050 | 0.35 | ||||||||
| e* | Other | 1,673,170 | 3.54 | |||||||||
| 1,836,220 | 3.89 | |||||||||||
| LEATHER AND LEATHER PRODUCTS e* | 154,346 | 0.33 | ||||||||||
| LEGAL SERVICES * | 52,562 | 0.11 | ||||||||||
| LOCAL AND INTERURBAN PASSENGER TRANSIT e* | 48,655 | 0.10 | ||||||||||
| LUMBER AND WOOD PRODUCTS e* | 35,100 | 0.07 | ||||||||||
| METAL MINING | ||||||||||||
| 6,400 | * | Rosetta Resources, Inc | 182,400 | 0.39 | ||||||||
| e* | Other | 117,005 | 0.24 | |||||||||
| 299,405 | 0.63 | |||||||||||
| MISCELLANEOUS MANUFACTURING INDUSTRIES e* | 277,027 | 0.59 | ||||||||||
| MISCELLANEOUS RETAIL e* | 534,921 | 1.13 | ||||||||||
| MOTION PICTURES e* | 81,481 | 0.17 | ||||||||||
| NONDEPOSITORY INSTITUTIONS b* | 108,454 | 0.23 | ||||||||||
| NONMETALLIC MINERALS, EXCEPT FUELS | 145,008 | 0.31 | ||||||||||
| OIL AND GAS EXTRACTION | ||||||||||||
| * | Comstock Resources, Inc | 187,772 | 0.40 | |||||||||
| e* | Energy Partners Ltd | 167,402 | 0.35 | |||||||||
| 2,340 | Penn Virginia Corp | 176,483 | 0.37 | |||||||||
| 3,280 | e* | Stone Energy Corp | 216,185 | 0.46 | ||||||||
| 3,100 | e* | Swift Energy Co | 204,786 | 0.43 | ||||||||
| 1,620 | * | W-H Energy Services, Inc | 155,099 | 0.33 | ||||||||
| e,m,v* | Other | 1,799,971 | 3.82 | |||||||||
| 2,907,698 | 6.16 | |||||||||||
| PAPER AND ALLIED PRODUCTS e* | 182,062 | 0.39 | ||||||||||
| PERSONAL SERVICES * | 21,964 | 0.05 | ||||||||||
| PETROLEUM AND COAL PRODUCTS e* | 175,530 | 0.37 | ||||||||||
| PRIMARY METAL INDUSTRIES e* | 749,734 | 1.59 | ||||||||||
| PRINTING AND PUBLISHING e* | 505,415 | 1.07 | ||||||||||
| See notes to financial statements | TIAA-CREF Life Funds n 2008 Semiannual Report | 65 |
| SUMMARY PORTFOLIO OF INVESTMENTS (UNAUDITED) | continued |
SMALL-CAP EQUITY FUND n JUNE 30, 2008
| Shares | Company | Value | % of net assets | |||||||||
| REAL ESTATE e* | $ | 64,862 | 0.14 | % | ||||||||
| RUBBER AND MISCELLANEOUS PLASTIC PRODUCTS | ||||||||||||
| 5,690 | e | Tupperware Corp | 194,712 | 0.41 | ||||||||
| e* | Other | 293,466 | 0.62 | |||||||||
| 488,178 | 1.03 | |||||||||||
| SECURITY AND COMMODITY BROKERS e* | 733,368 | 1.55 | ||||||||||
| SOCIAL SERVICES * | 15,424 | 0.03 | ||||||||||
| SPECIAL TRADE CONTRACTORS | ||||||||||||
| 7,910 | * | EMCOR Group, Inc | 225,672 | 0.48 | ||||||||
| e* | Other | 300,096 | 0.63 | |||||||||
| 525,768 | 1.11 | |||||||||||
| STONE, CLAY, AND GLASS PRODUCTS e | 118,960 | 0.25 | ||||||||||
| TEXTILE MILL PRODUCTS | 33,660 | 0.07 | ||||||||||
| TOBACCO PRODUCTS e | 85,918 | 0.18 | ||||||||||
| TRANSPORTATION BY AIR e* | 90,921 | 0.19 | ||||||||||
| TRANSPORTATION EQUIPMENT | ||||||||||||
| 4,140 | e | Westinghouse Air Brake Technologies Corp | 201,287 | 0.43 | ||||||||
| e* | Other | 817,027 | 1.73 | |||||||||
| 1,018,314 | 2.16 | |||||||||||
| TRANSPORTATION SERVICES | ||||||||||||
| 8,620 | e | Pacer International, Inc | 185,416 | 0.39 | ||||||||
| e* | Other | 254,208 | 0.54 | |||||||||
| 439,624 | 0.93 | |||||||||||
| TRUCKING AND WAREHOUSING e* | 105,015 | 0.22 | ||||||||||
| WATER TRANSPORTATION e* | 281,185 | 0.60 | ||||||||||
| WHOLESALE TRADE-DURABLE GOODS | ||||||||||||
| 3,630 | e | Owens & Minor, Inc | 165,855 | 0.35 | ||||||||
| e* | Other | 696,895 | 1.48 | |||||||||
| 862,750 | 1.83 | |||||||||||
| WHOLESALE TRADE-NONDURABLE GOODS | ||||||||||||
| 6,933 | e | Spartan Stores, Inc | 159,459 | 0.34 | ||||||||
| e* | Other | 120,737 | 0.26 | |||||||||
| 280,196 | 0.60 | |||||||||||
| TOTAL COMMON STOCKS | (Cost $49,229,336) | 47,048,923 | 99.62 | |||||||||
| 66 | 2008 Semiannual Report n TIAA-CREF Life Funds | See notes to financial statements |
| SUMMARY PORTFOLIO OF INVESTMENTS (UNAUDITED) | concluded |
SMALL-CAP EQUITY FUND n JUNE 30, 2008
| Shares | Company | Value | % of net assets | ||||||||||
| SHORT-TERM INVESTMENTS | |||||||||||||
| INVESTMENT OF CASH COLLATERAL FOR SECURITIES LOANED | |||||||||||||
| 14,080,276 | State Street Navigator Securities Lending Prime Portfolio | $ | 14,080,276 | 29.81 | % | ||||||||
| TOTAL SHORT-TERM INVESTMENTS | (Cost $14,080,276) | 14,080,276 | 29.81 | ||||||||||
| TOTAL PORTFOLIO | (Cost $63,309,612) | 61,129,199 | 129.43 | ||||||||||
| OTHER ASSETS & LIABILITIES, NET | (13,901,143 | ) | (29.43 | ) | |||||||||
| NET ASSETS | $ | 47,228,056 | 100.00 | % | |||||||||
| * | Non-income producing. |
| b | In bankruptcy. |
| e | All or a portion of these securities are out on loan. |
| m | Indicates a security has been deemed illiquid. |
| v | Security valued at fair value. |
For ease of presentation, we have grouped a number of industry classification categories together in the Summary portfolio of investments. Note that the funds use more specific industry categories in following their investment limitations on industry concentration. The grouped categories can carry footnotes which can pertain to only a portion of the securities within that group.
| See notes to financial statements | TIAA-CREF Life Funds n 2008 Semiannual Report | 67 |
SUMMARY PORTFOLIO OF INVESTMENTS (UNAUDITED)
STOCK INDEX FUND n JUNE 30, 2008
| Shares | Company | Value | % of net assets | |||||||||
| COMMON STOCKS | ||||||||||||
| AGRICULTURAL PRODUCTION-CROPS e* | $ | 6,660 | 0.01 | % | ||||||||
| AGRICULTURAL PRODUCTION-LIVESTOCK e | 18,505 | 0.01 | ||||||||||
| AGRICULTURAL SERVICES e* | 2,096 | 0.00 | ** | |||||||||
| AMUSEMENT AND RECREATION SERVICES | ||||||||||||
| 21,678 | Walt Disney Co | 676,354 | 0.42 | |||||||||
| e,v* | Other | 260,020 | 0.16 | |||||||||
| 936,374 | 0.58 | |||||||||||
| APPAREL AND ACCESSORY STORES e* | 784,571 | 0.49 | ||||||||||
| APPAREL AND OTHER TEXTILE PRODUCTS e* | 258,565 | 0.16 | ||||||||||
| AUTO REPAIR, SERVICES AND PARKING e* | 125,487 | 0.08 | ||||||||||
| AUTOMOTIVE DEALERS AND SERVICE STATIONS e* | 234,356 | 0.14 | ||||||||||
| BUILDING MATERIALS AND GARDEN SUPPLIES e* | 860,320 | 0.53 | ||||||||||
| BUSINESS SERVICES | ||||||||||||
| 2,694 | * | Google, Inc (Class A) | 1,418,175 | 0.88 | ||||||||
| 91,339 | d | Microsoft Corp | 2,512,736 | 1.55 | ||||||||
| 44,200 | * | Oracle Corp | 928,200 | 0.57 | ||||||||
| e* | Other | 6,970,872 | 4.31 | |||||||||
| 11,829,983 | 7.31 | |||||||||||
| CHEMICALS AND ALLIED PRODUCTS | ||||||||||||
| 17,533 | Abbott Laboratories | 928,723 | 0.58 | |||||||||
| 12,388 | * | Amgen, Inc | 584,218 | 0.36 | ||||||||
| 10,494 | * | Gilead Sciences, Inc | 555,657 | 0.34 | ||||||||
| 24,421 | Merck & Co, Inc | 920,427 | 0.57 | |||||||||
| 6,244 | Monsanto Co | 789,491 | 0.49 | |||||||||
| 76,974 | Pfizer, Inc | 1,344,736 | 0.83 | |||||||||
| 34,735 | Procter & Gamble Co | 2,112,235 | 1.31 | |||||||||
| 15,169 | Wyeth | 727,505 | 0.45 | |||||||||
| e* | Other | 7,253,546 | 4.48 | |||||||||
| 15,216,538 | 9.41 | |||||||||||
| COAL MINING e* | 837,366 | 0.52 | ||||||||||
| COMMUNICATIONS | ||||||||||||
| 67,592 | AT&T, Inc | 2,277,174 | 1.41 | |||||||||
| 31,901 | Comcast Corp (Class A) | 605,162 | 0.37 | |||||||||
| 32,434 | Verizon Communications, Inc | 1,148,164 | 0.71 | |||||||||
| e* | Other | 2,632,437 | 1.63 | |||||||||
| 6,662,937 | 4.12 | |||||||||||
| DEPOSITORY INSTITUTIONS | ||||||||||||
| 50,712 | Bank of America Corp | 1,210,495 | 0.75 | |||||||||
| 61,940 | Citigroup, Inc | 1,038,114 | 0.64 | |||||||||
| 39,133 | JPMorgan Chase & Co | 1,342,663 | 0.83 | |||||||||
| 19,772 | e | US Bancorp | 551,441 | 0.34 | ||||||||
| 37,574 | Wells Fargo & Co | 892,383 | 0.55 | |||||||||
| e,v* | Other | 4,025,155 | 2.49 | |||||||||
| 9,060,251 | 5.60 | |||||||||||
| 68 | 2008 Semiannual Report n TIAA-CREF Life Funds | See notes to financial statements |
SUMMARY PORTFOLIO OF INVESTMENTS (UNAUDITED)
STOCK INDEX FUND n JUNE 30, 2008 | continued |
| Shares | Company | Value | % of net assets | |||||||||
| EATING AND DRINKING PLACES | ||||||||||||
| 12,896 | McDonald’s Corp | $ | 725,013 | 0.45 | % | |||||||
| e* | Other | 674,685 | 0.42 | |||||||||
| 1,399,698 | 0.87 | |||||||||||
| EDUCATIONAL SERVICES e* | 210,770 | 0.13 | ||||||||||
| ELECTRIC, GAS, AND SANITARY SERVICES | ||||||||||||
| 7,626 | Exelon Corp | 686,035 | 0.42 | |||||||||
| e,m,v* | Other | 6,808,003 | 4.21 | |||||||||
| 7,494,038 | 4.63 | |||||||||||
| ELECTRONIC AND OTHER ELECTRIC EQUIPMENT | ||||||||||||
| 10,031 | * | Apple Computer, Inc | 1,679,591 | 1.04 | ||||||||
| 67,211 | * | Cisco Systems, Inc | 1,563,328 | 0.97 | ||||||||
| 65,173 | Intel Corp | 1,399,916 | 0.86 | |||||||||
| 18,416 | Qualcomm, Inc | 817,118 | 0.50 | |||||||||
| e* | Other | 5,010,623 | 3.10 | |||||||||
| 10,470,576 | 6.47 | |||||||||||
| ENGINEERING AND MANAGEMENT SERVICES e* | 1,717,050 | 1.06 | ||||||||||
| FABRICATED METAL PRODUCTS e* | 909,604 | 0.56 | ||||||||||
| FOOD AND KINDRED PRODUCTS | ||||||||||||
| 26,240 | Coca-Cola Co | 1,363,955 | 0.84 | |||||||||
| 18,046 | PepsiCo, Inc | 1,147,545 | 0.71 | |||||||||
| e* | Other | 3,279,091 | 2.03 | |||||||||
| 5,790,591 | 3.58 | |||||||||||
| FOOD STORES e* | 534,879 | 0.33 | ||||||||||
| FORESTRY e | 167,396 | 0.10 | ||||||||||
| FURNITURE AND FIXTURES e | 381,424 | 0.24 | ||||||||||
| FURNITURE AND HOME FURNISHINGS STORES e* | 243,453 | 0.15 | ||||||||||
| GENERAL BUILDING CONTRACTORS e* | 319,072 | 0.20 | ||||||||||
| GENERAL MERCHANDISE STORES | ||||||||||||
| 25,528 | Wal-Mart Stores, Inc | 1,434,674 | 0.89 | |||||||||
| e* | Other | 1,240,576 | 0.76 | |||||||||
| 2,675,250 | 1.65 | |||||||||||
| HEALTH SERVICES e* | 1,880,622 | 1.16 | ||||||||||
| HEAVY CONSTRUCTION, EXCEPT BUILDING e* | 156,025 | 0.10 | ||||||||||
| HOLDING AND OTHER INVESTMENT OFFICES e* | 3,756,479 | 2.32 | ||||||||||
| HOTELS AND OTHER LODGING PLACES e* | 455,453 | 0.28 | ||||||||||
| INDUSTRIAL MACHINERY AND EQUIPMENT | ||||||||||||
| 113,405 | General Electric Co | 3,026,779 | 1.87 | |||||||||
| 28,043 | Hewlett-Packard Co | 1,239,781 | 0.77 | |||||||||
| 15,594 | International Business Machines Corp | 1,848,357 | 1.14 | |||||||||
| e,m,v* | Other | 4,857,783 | 3.00 | |||||||||
| 10,972,700 | 6.78 | |||||||||||
| See notes to financial statements | TIAA-CREF Life Funds n 2008 Semiannual Report | 69 |
SUMMARY PORTFOLIO OF INVESTMENTS (UNAUDITED)
STOCK INDEX FUND n JUNE 30, 2008 | continued |
| Shares | Company | Value | % of net assets | |||||||||
| INSTRUMENTS AND RELATED PRODUCTS | ||||||||||||
| 32,063 | Johnson & Johnson | $ | 2,062,933 | 1.27 | % | |||||||
| 12,777 | Medtronic, Inc | 661,210 | 0.41 | |||||||||
| e* | Other | 5,255,887 | 3.25 | |||||||||
| 7,980,030 | 4.93 | |||||||||||
| INSURANCE AGENTS, BROKERS AND SERVICE e* | 671,818 | 0.42 | ||||||||||
| INSURANCE CARRIERS | ||||||||||||
| 25,995 | American International Group, Inc | 687,828 | 0.42 | |||||||||
| e* | Other | 4,979,789 | 3.08 | |||||||||
| 5,667,617 | 3.50 | |||||||||||
| JUSTICE, PUBLIC ORDER AND SAFETY e* | 12,600 | 0.01 | ||||||||||
| LEATHER AND LEATHER PRODUCTS e* | 167,749 | 0.10 | ||||||||||
| LEGAL SERVICES e* | 43,360 | 0.03 | ||||||||||
| LOCAL AND INTERURBAN PASSENGER TRANSIT e* | 2,286 | 0.00 | ** | |||||||||
| LUMBER AND WOOD PRODUCTS e* | 31,384 | 0.02 | ||||||||||
| METAL MINING e* | 1,158,927 | 0.72 | ||||||||||
| MISCELLANEOUS MANUFACTURING INDUSTRIES e* | 520,603 | 0.32 | ||||||||||
| MISCELLANEOUS RETAIL | ||||||||||||
| 16,263 | CVS Corp | 643,527 | 0.40 | |||||||||
| e* | Other | 1,411,887 | 0.87 | |||||||||
| 2,055,414 | 1.27 | |||||||||||
| MOTION PICTURES | ||||||||||||
| 40,711 | Time Warner, Inc | 602,523 | 0.37 | |||||||||
| 466 | e* | Other | 897,639 | 0.56 | ||||||||
| 1,500,162 | 0.93 | |||||||||||
| NONDEPOSITORY INSTITUTIONS e* | 1,507,947 | 0.93 | ||||||||||
| NONMETALLIC MINERALS, EXCEPT FUELS e* | 112,598 | 0.07 | ||||||||||
| OIL AND GAS EXTRACTION | ||||||||||||
| 13,575 | Schlumberger Ltd | 1,458,362 | 0.90 | |||||||||
| e* | Other | 7,132,520 | 4.41 | |||||||||
| 8,590,882 | 5.31 | |||||||||||
| PAPER AND ALLIED PRODUCTS e* | 659,507 | 0.41 | ||||||||||
| PERSONAL SERVICES e* | 221,372 | 0.14 | ||||||||||
| PETROLEUM AND COAL PRODUCTS | ||||||||||||
| 23,556 | Chevron Corp | 2,335,106 | 1.44 | |||||||||
| 17,552 | ConocoPhillips | 1,656,733 | 1.02 | |||||||||
| 5,077 | Devon Energy Corp | 610,052 | 0.38 | |||||||||
| 60,361 | Exxon Mobil Corp | 5,319,615 | 3.29 | |||||||||
| 9,474 | Occidental Petroleum Corp | 851,334 | 0.53 | |||||||||
| e* | Other | 2,790,875 | 1.73 | |||||||||
| 13,563,715 | 8.39 | |||||||||||
| 70 | 2008 Semiannual Report n TIAA-CREF Life Funds | See notes to financial statements |
SUMMARY PORTFOLIO OF INVESTMENTS (UNAUDITED)
STOCK INDEX FUND n JUNE 30, 2008 | continued |
| Shares | Company | Value | % of net assets | |||||||||
| PIPELINES, EXCEPT NATURAL GAS | $ | 206,066 | 0.13 | % | ||||||||
| PRIMARY METAL INDUSTRIES e* | 2,004,997 | 1.24 | ||||||||||
| PRINTING AND PUBLISHING e* | 601,085 | 0.37 | ||||||||||
| RAILROAD TRANSPORTATION * | 1,365,644 | 0.84 | ||||||||||
| REAL ESTATE e* | 158,693 | 0.10 | ||||||||||
| RUBBER AND MISCELLANEOUS PLASTIC PRODUCTS e* | 473,483 | 0.29 | ||||||||||
| SECURITY AND COMMODITY BROKERS | ||||||||||||
| 4,485 | Goldman Sachs Group, Inc | 784,427 | 0.48 | |||||||||
| e* | Other | 3,000,021 | 1.86 | |||||||||
| 3,784,448 | 2.34 | |||||||||||
| SOCIAL SERVICES e* | 9,499 | 0.01 | ||||||||||
| SPECIAL TRADE CONTRACTORS e* | 134,974 | 0.08 | ||||||||||
| STONE, CLAY, AND GLASS PRODUCTS | ||||||||||||
| 8,013 | 3M Co | 557,625 | 0.34 | |||||||||
| e* | Other | 188,420 | 0.12 | |||||||||
| 746,045 | 0.46 | |||||||||||
| TEXTILE MILL PRODUCTS e | 5,018 | 0.00 | ** | |||||||||
| TOBACCO PRODUCTS | ||||||||||||
| 24,000 | Philip Morris International, Inc | 1,185,360 | 0.73 | |||||||||
| e* | Other | 727,025 | 0.45 | |||||||||
| 1,912,385 | 1.18 | |||||||||||
| TRANSPORTATION BY AIR e* | 530,600 | 0.33 | ||||||||||
| TRANSPORTATION EQUIPMENT | ||||||||||||
| 8,549 | Boeing Co | 561,840 | 0.35 | |||||||||
| 11,073 | United Technologies Corp | 683,204 | 0.42 | |||||||||
| e* | Other | 2,360,132 | 1.46 | |||||||||
| 3,605,176 | 2.23 | |||||||||||
| TRANSPORTATION SERVICES e* | 315,801 | 0.20 | ||||||||||
| TRUCKING AND WAREHOUSING e* | 630,743 | 0.39 | ||||||||||
| WATER TRANSPORTATION e* | 457,425 | 0.28 | ||||||||||
| WHOLESALE TRADE-DURABLE GOODS e* | 597,936 | 0.37 | ||||||||||
| WHOLESALE TRADE-NONDURABLE GOODS e* | 933,912 | 0.58 | ||||||||||
| TOTAL COMMON STOCKS | (Cost $148,341,121) | 159,310,990 | 98.49 | |||||||||
| MUTUAL FUNDS e | ||||||||||||
| TOTAL MUTUAL FUNDS | (Cost $2,712) | 2,456 | 0.00 | ** | ||||||||
| See notes to financial statements | TIAA-CREF Life Funds n 2008 Semiannual Report | 71 |
SUMMARY PORTFOLIO OF INVESTMENTS (UNAUDITED)
STOCK INDEX FUND n JUNE 30, 2008 | concluded |
| Principal | Issuer | Value | % of net assets | ||||||||||
| SHORT TERM INVESTMENTS | |||||||||||||
| U.S. GOVERNMENT AND AGENCIES DISCOUNT NOTES | |||||||||||||
| $2,390,000 | Federal Home Loan Bank (FHLB), 07/01/08 | $ | 2,390,000 | 1.48 | % | ||||||||
| Shares | Company | ||||||||||||
| INVESTMENT OF CASH COLLATERAL FOR SECURITIES LOANED | |||||||||||||
| 27,980,528 | State Street Navigator Securities Lending Prime Portfolio | 27,980,528 | 17.30 | ||||||||||
| TOTAL SHORT-TERM INVESTMENTS | (Cost $30,370,528) | 30,370,528 | 18.78 | ||||||||||
| TOTAL PORTFOLIO | (Cost $178,714,361) | 189,683,974 | 117.27 | ||||||||||
| OTHER ASSETS & LIABILITIES, NET | (27,938,969 | ) | (17.27 | ) | |||||||||
| NET ASSETS | $ | 161,745,005 | 100.00 | % | |||||||||
| * | Non-income producing |
| ** | Percentage is less than 0.01%. |
| d | All or a portion of these securities have been segregated by the custodian to cover margin or other requirements on open futures contracts in the amount of $2,512,736. |
| e | All or a portion of these securities are out on loan. |
| m | Indicates a security has been deemed illiquid. |
| v | Securities valued at fair value. |
For ease of presentation, we have grouped a number of industry classification categories together in the Summary portfolio of investments. Note that the funds use more specific industry categories in following their investment limitations on industry concentration. The grouped categories can carry footnotes which can pertain to only a portion of the securities within that group.
| 72 | 2008 Semiannual Report n TIAA-CREF Life Funds | See notes to financial statements |
SUMMARY PORTFOLIO OF INVESTMENTS (UNAUDITED)
SOCIAL CHOICE EQUITY FUND n JUNE 30, 2008
| Shares | Company | Value | % of net assets | |||||||||
| COMMON STOCKS | ||||||||||||
| AMUSEMENT AND RECREATION SERVICES | ||||||||||||
| 9,327 | Walt Disney Co | $ | 291,002 | 0.86 | % | |||||||
| APPAREL AND ACCESSORY STORES * | 186,250 | 0.55 | ||||||||||
| APPAREL AND OTHER TEXTILE PRODUCTS | 39,201 | 0.12 | ||||||||||
| AUTO REPAIR, SERVICES AND PARKING * | 13,924 | 0.04 | ||||||||||
| AUTOMOTIVE DEALERS AND SERVICE STATIONS * | 30,673 | 0.09 | ||||||||||
| BUILDING MATERIALS AND GARDEN SUPPLIES | ||||||||||||
| 8,128 | Home Depot, Inc | 190,358 | 0.56 | |||||||||
| Other | 107,693 | 0.32 | ||||||||||
| 298,051 | 0.88 | |||||||||||
| BUSINESS SERVICES | ||||||||||||
| 619 | * | Google, Inc (Class A) | 325,854 | 0.96 | ||||||||
| 25,029 | Microsoft Corp | 688,548 | 2.04 | |||||||||
| v* | Other | 1,179,088 | 3.50 | |||||||||
| 2,193,490 | 6.50 | |||||||||||
| CHEMICALS AND ALLIED PRODUCTS | ||||||||||||
| 1,900 | Air Products & Chemicals, Inc | 187,834 | 0.56 | |||||||||
| 4,511 | * | Amgen, Inc | 212,739 | 0.63 | ||||||||
| 2,403 | Colgate-Palmolive Co | 166,047 | 0.49 | |||||||||
| 3,388 | * | Gilead Sciences, Inc | 179,395 | 0.53 | ||||||||
| 4,392 | Eli Lilly & Co | 202,735 | 0.60 | |||||||||
| 2,250 | Praxair, Inc | 212,040 | 0.63 | |||||||||
| 9,956 | Procter & Gamble Co | 605,424 | 1.79 | |||||||||
| 4,597 | Wyeth | 220,472 | 0.65 | |||||||||
| * | Other | 1,189,218 | 3.51 | |||||||||
| 3,175,904 | 9.39 | |||||||||||
| COMMUNICATIONS | ||||||||||||
| 10,476 | Verizon Communications, Inc | 370,850 | 1.10 | |||||||||
| * | Other | 1,041,413 | 3.08 | |||||||||
| 1,412,263 | 4.18 | |||||||||||
| DEPOSITORY INSTITUTIONS | ||||||||||||
| 14,350 | Bank of America Corp | 342,535 | 1.01 | |||||||||
| 4,474 | Bank of New York Mellon Corp | 169,251 | 0.50 | |||||||||
| 9,200 | US Bancorp | 256,588 | 0.76 | |||||||||
| 13,987 | Wells Fargo & Co | 332,191 | 0.98 | |||||||||
| v* | Other | 800,407 | 2.37 | |||||||||
| 1,900,972 | 5.62 | |||||||||||
| EATING AND DRINKING PLACES | ||||||||||||
| 6,166 | McDonald’s Corp | 346,653 | 1.23 | |||||||||
| * | Other | 94,796 | 0.08 | |||||||||
| 441,449 | 1.31 | |||||||||||
| EDUCATIONAL SERVICES * | 4,958 | 0.01 | ||||||||||
| ELECTRIC, GAS, AND SANITARY SERVICES * | 2,228,585 | 6.59 | ||||||||||
| See notes to financial statements | TIAA-CREF Life Funds n 2008 Semiannual Report | 73 |
SUMMARY PORTFOLIO OF INVESTMENTS (UNAUDITED)
SOCIAL CHOICE EQUITY FUND n JUNE 30, 2008 | continued |
| Shares | Company | Value | % of net assets | |||||||||
| ELECTRONIC AND OTHER ELECTRIC EQUIPMENT | ||||||||||||
| 18,668 | * | Cisco Systems, Inc | $ | 434,218 | 1.28 | % | ||||||
| 19,609 | Intel Corp | 421,201 | 1.25 | |||||||||
| 6,100 | Qualcomm, Inc | 270,657 | 0.80 | |||||||||
| * | Other | 718,766 | 2.13 | |||||||||
| 1,844,842 | 5.46 | |||||||||||
| ENGINEERING AND MANAGEMENT SERVICES * | 208,526 | 0.62 | ||||||||||
| FABRICATED METAL PRODUCTS | ||||||||||||
| 4,002 | Illinois Tool Works, Inc | 190,135 | 0.56 | |||||||||
| Other | 84,314 | 0.25 | ||||||||||
| 274,449 | 0.81 | |||||||||||
| FOOD AND KINDRED PRODUCTS | ||||||||||||
| 6,453 | Kraft Foods, Inc (Class A) | 183,588 | 0.54 | |||||||||
| 6,521 | PepsiCo, Inc | 414,670 | 1.23 | |||||||||
| * | Other | 620,892 | 1.84 | |||||||||
| 1,219,150 | 3.61 | |||||||||||
| FOOD STORES * | 77,599 | 0.23 | ||||||||||
| FORESTRY | 48,736 | 0.14 | ||||||||||
| FURNITURE AND FIXTURES | 177,243 | 0.52 | ||||||||||
| FURNITURE AND HOME FURNISHINGS STORES * | 40,741 | 0.12 | ||||||||||
| GENERAL BUILDING CONTRACTORS * | 22,434 | 0.07 | ||||||||||
| GENERAL MERCHANDISE STORES | ||||||||||||
| 3,860 | Target Corp | 179,451 | 0.53 | |||||||||
| Other | 273,911 | 0.81 | ||||||||||
| 453,362 | 1.34 | |||||||||||
| HEALTH SERVICES * | 252,009 | 0.75 | ||||||||||
| HEAVY CONSTRUCTION, EXCEPT BUILDING * | 45,509 | 0.13 | ||||||||||
| HOLDING AND OTHER INVESTMENT OFFICES * | 670,714 | 1.98 | ||||||||||
| HOTELS AND OTHER LODGING PLACES * | 96,003 | 0.28 | ||||||||||
| INDUSTRIAL MACHINERY AND EQUIPMENT | ||||||||||||
| 2,700 | Deere & Co | 194,751 | 0.58 | |||||||||
| 9,219 | Hewlett-Packard Co | 407,572 | 1.21 | |||||||||
| 4,834 | International Business Machines Corp | 572,974 | 1.70 | |||||||||
| * | Other | 915,238 | 2.69 | |||||||||
| 2,090,535 | 6.18 | |||||||||||
| INSTRUMENTS AND RELATED PRODUCTS | ||||||||||||
| 3,100 | Baxter International, Inc | 198,214 | 0.59 | |||||||||
| 5,556 | Emerson Electric Co | 274,744 | 0.81 | |||||||||
| 9,736 | Johnson & Johnson | 626,414 | 1.85 | |||||||||
| 5,566 | Medtronic, Inc | 288,041 | 0.85 | |||||||||
| * | Other | 1,033,498 | 3.06 | |||||||||
| 2,420,911 | 7.16 | |||||||||||
| INSURANCE AGENTS, BROKERS AND SERVICES * | 200,871 | 0.59 | ||||||||||
| 74 | 2008 Semiannual Report n TIAA-CREF Life Funds | See notes to financial statements |
SUMMARY PORTFOLIO OF INVESTMENTS (UNAUDITED)
SOCIAL CHOICE EQUITY FUND n JUNE 30, 2008 | continued |
| Shares | Company | Value | % of net assets | |||||||||
| INSURANCE CARRIERS | ||||||||||||
| 3,600 | Aflac, Inc | $ | 226,067 | 0.67 | % | |||||||
| 4,016 | Travelers Cos, Inc | 174,294 | 0.52 | |||||||||
| * | Other | 973,369 | 2.87 | |||||||||
| 1,373,730 | 4.06 | |||||||||||
| LEATHER AND LEATHER PRODUCTS * | 34,194 | 0.10 | ||||||||||
| LEGAL SERVICES * | 8,763 | 0.03 | ||||||||||
| LUMBER AND WOOD PRODUCTS * | 2,340 | 0.01 | ||||||||||
| METAL MINING * | 36,196 | 0.11 | ||||||||||
| MISCELLANEOUS MANUFACTURING INDUSTRIES | 113,120 | 0.33 | ||||||||||
| MISCELLANEOUS RETAIL | ||||||||||||
| 4,426 | CVS Corp | 175,137 | 0.52 | |||||||||
| * | Other | 345,859 | 1.02 | |||||||||
| 520,996 | 1.54 | |||||||||||
| MOTION PICTURES | ||||||||||||
| 17,064 | Time Warner, Inc | 252,547 | 0.75 | |||||||||
| * | Other | 136,060 | 0.40 | |||||||||
| 388,607 | 1.15 | |||||||||||
| NONDEPOSITORY INSTITUTIONS | ||||||||||||
| 5,353 | American Express Co | 201,648 | 0.60 | |||||||||
| * | Other | 236,259 | 0.69 | |||||||||
| 437,907 | 1.29 | |||||||||||
| NONMETALLIC MINERALS, EXCEPT FUELS | 74,313 | 0.22 | ||||||||||
| OIL AND GAS EXTRACTION | ||||||||||||
| 2,791 | Chesapeake Energy Corp | 184,094 | 0.54 | |||||||||
| 1,957 | * | National Oilwell Varco, Inc | 173,625 | 0.51 | ||||||||
| 1,806 | Transocean, Inc | 275,216 | 0.82 | |||||||||
| 3,121 | XTO Energy, Inc | 213,820 | 0.63 | |||||||||
| * | Other | 1,627,599 | 4.82 | |||||||||
| 2,474,354 | 7.32 | |||||||||||
| PAPER AND ALLIED PRODUCTS * | 272,016 | 0.80 | ||||||||||
| PETROLEUM AND COAL PRODUCTS | ||||||||||||
| 2,302 | Apache Corp | 319,978 | 0.95 | |||||||||
| 2,534 | Devon Energy Corp | 304,485 | 0.90 | |||||||||
| 1,676 | EOG Resources, Inc | 219,891 | 0.65 | |||||||||
| 1,559 | Hess Corp | 196,730 | 0.58 | |||||||||
| 1,754 | Noble Energy, Inc | 176,382 | 0.52 | |||||||||
| * | Other | 421,133 | 1.25 | |||||||||
| 1,638,599 | 4.85 | |||||||||||
| PIPELINES, EXCEPT NATURAL GAS | 134,245 | 0.40 | ||||||||||
| PRIMARY METAL INDUSTRIES * | 687,743 | 2.04 | ||||||||||
| PRINTING AND PUBLISHING * | 188,899 | 0.56 | ||||||||||
| See notes to financial statements | TIAA-CREF Life Funds n 2008 Semiannual Report | 75 |
SUMMARY PORTFOLIO OF INVESTMENTS (UNAUDITED)
SOCIAL CHOICE EQUITY FUND n JUNE 30, 2008 | concluded |
| Shares | Company | Value | % of net assets | |||||||||
| RAILROAD TRANSPORTATION | ||||||||||||
| 2,985 | Norfolk Southern Corp | $ | 187,070 | 0.55 | % | |||||||
| * | Other | 178,643 | 0.53 | |||||||||
| 365,713 | 1.08 | |||||||||||
| REAL ESTATE * | 13,098 | 0.04 | ||||||||||
| RUBBER AND MISCELLANEOUS PLASTIC PRODUCTS | �� | 149,527 | 0.44 | |||||||||
| SECURITY AND COMMODITY BROKERS | ||||||||||||
| 1,610 | Goldman Sachs Group, Inc | 281,589 | 0.83 | |||||||||
| * | Other | 674,236 | 2.00 | |||||||||
| 955,825 | 2.83 | |||||||||||
| SOCIAL SERVICES * | 5,188 | 0.02 | ||||||||||
| SPECIAL TRADE CONTRACTORS * | 19,980 | 0.06 | ||||||||||
| STONE, CLAY, AND GLASS PRODUCTS | ||||||||||||
| 3,766 | 3M Co | 262,076 | 0.78 | |||||||||
| * | Other | 36,777 | 0.11 | |||||||||
| 298,853 | 0.89 | |||||||||||
| TEXTILE MILL PRODUCTS | 3,830 | 0.01 | ||||||||||
| TRANSPORTATION BY AIR v* | 227,252 | 0.67 | ||||||||||
| TRANSPORTATION EQUIPMENT * | 305,155 | 0.90 | ||||||||||
| TRANSPORTATION SERVICES * | 16,227 | 0.05 | ||||||||||
| TRUCKING AND WAREHOUSING | ||||||||||||
| 4,044 | United Parcel Service, Inc (Class B) | 248,585 | 0.74 | |||||||||
| WATER TRANSPORTATION * | 40,225 | 0.12 | ||||||||||
| WHOLESALE TRADE-DURABLE GOODS * | 211,347 | 0.63 | ||||||||||
| WHOLESALE TRADE-NONDURABLE GOODS * | 161,285 | 0.48 | ||||||||||
| TOTAL COMMON STOCKS | (Cost $33,445,336) | 33,768,468 | 99.90 | |||||||||
| TOTAL PORTFOLIO | (Cost $33,445,336) | 33,768,468 | 99.90 | |||||||||
| OTHER ASSETS & LIABILITIES, NET | 34,033 | 0.10 | ||||||||||
| NET ASSETS | $ | 33,802,501 | 100.00 | % | ||||||||
| * | Non-income producing. |
| v | Security valued at fair value. |
For ease of presentation, we have grouped a number of industry classification categories together in the Summary portfolio of investments. Note that the funds use more specific industry categories in following their investment limitations on industry concentration. The grouped categories can carry footnotes which can pertain to only a portion of the securities within that group.
| 76 | 2008 Semiannual Report n TIAA-CREF Life Funds | See notes to financial statements |
SUMMARY PORTFOLIO OF INVESTMENTS (UNAUDITED)
REAL ESTATE SECURITIES FUND n JUNE 30, 2008
| Shares | Company | Value | % of net assets | |||||||||
| COMMON STOCKS | ||||||||||||
| HOLDING AND OTHER INVESTMENT OFFICES | ||||||||||||
| 14,000 | e | Acadia Realty Trust | $ | 324,100 | 0.47 | % | ||||||
| 16,350 | Alexandria Real Estate Equities, Inc | 1,591,509 | 2.31 | |||||||||
| 31,700 | e | AMB Property Corp | 1,597,046 | 2.32 | ||||||||
| 13,900 | American Campus Communities, Inc | 386,976 | 0.56 | |||||||||
| 18,700 | e | AvalonBay Communities, Inc | 1,667,292 | 2.43 | ||||||||
| 31,800 | e | BioMed Realty Trust, Inc | 780,054 | 1.13 | ||||||||
| 5,344 | Boardwalk Real Estate Investment Trust | 199,935 | 0.29 | |||||||||
| 46,600 | e | Boston Properties, Inc | 4,204,252 | 6.11 | ||||||||
| 29,400 | e | Camden Property Trust | 1,301,244 | 1.89 | ||||||||
| 13,900 | e | Corporate Office Properties Trust | 477,187 | 0.69 | ||||||||
| 65,000 | e | DCT Industrial Trust, Inc | 538,200 | 0.78 | ||||||||
| 13,200 | e | Digital Realty Trust, Inc | 540,012 | 0.79 | ||||||||
| 18,800 | Douglas Emmett, Inc | 413,036 | 0.60 | |||||||||
| 38,484 | Duke Realty Corp | 863,966 | 1.26 | |||||||||
| 23,900 | e | EastGroup Properties, Inc | 1,025,310 | 1.49 | ||||||||
| 4,000 | Equity Lifestyle Properties, Inc | 176,000 | 0.26 | |||||||||
| 50,000 | Equity Residential | 1,913,500 | 2.78 | |||||||||
| 18,900 | e | Essex Property Trust, Inc | 2,012,850 | 2.93 | ||||||||
| 42,500 | e | Federal Realty Investment Trust | 2,932,500 | 4.27 | ||||||||
| 45,600 | e | General Growth Properties, Inc | 1,597,368 | 2.32 | ||||||||
| 35,000 | e | Gramercy Capital Corp | 405,650 | 0.59 | ||||||||
| 70,800 | HCP, Inc | 2,252,148 | 3.28 | |||||||||
| 6,600 | Highwoods Properties, Inc | 207,372 | 0.30 | |||||||||
| 138,000 | e | Host Marriott Corp | 1,883,700 | 2.74 | ||||||||
| 14,200 | Kilroy Realty Corp | 667,826 | 0.97 | |||||||||
| 47,600 | e | Kimco Realty Corp | 1,643,152 | 2.39 | ||||||||
| 15,000 | Liberty Property Trust | 497,250 | 0.72 | |||||||||
| 36,300 | Macerich Co | 2,255,319 | 3.28 | |||||||||
| 87,250 | e | Mission West Properties, Inc | 956,260 | 1.39 | ||||||||
| 35,000 | Nationwide Health Properties, Inc | 1,102,150 | 1.60 | |||||||||
| 42,800 | e | Post Properties, Inc | 1,273,300 | 1.85 | ||||||||
| 73,700 | Prologis | 4,005,595 | 5.83 | |||||||||
| 34,000 | e | Public Storage, Inc | 2,746,860 | 3.99 | ||||||||
| 36,000 | Regency Centers Corp | 2,128,320 | 3.10 | |||||||||
| 78,600 | Simon Property Group, Inc | 7,065,354 | 10.28 | |||||||||
| 21,500 | SL Green Realty Corp | 1,778,480 | 2.59 | |||||||||
| 39,900 | e | Strategic Hotels & Resorts, Inc | 373,860 | 0.54 | ||||||||
| 11,424 | e | Sunstone Hotel Investors, Inc | 189,635 | 0.28 | ||||||||
| 45,000 | Taubman Centers, Inc | 2,189,250 | 3.18 | |||||||||
| 36,500 | e | UDR, Inc | 816,870 | 1.19 | ||||||||
| 51,600 | Ventas, Inc | 2,196,612 | 3.20 | |||||||||
| 39,700 | Vornado Realty Trust | 3,493,600 | 5.08 | |||||||||
| e,g,m* | Other | 267,615 | 0.39 | |||||||||
| 64,938,515 | 94.44 | |||||||||||
| HOTELS AND OTHER LODGING PLACES | ||||||||||||
| 14,600 | Starwood Hotels & Resorts Worldwide, Inc | 585,022 | 0.85 | |||||||||
| 585,022 | 0.85 | |||||||||||
| See notes to financial statements | TIAA-CREF Life Funds n 2008 Semiannual Report | 77 |
SUMMARY PORTFOLIO OF INVESTMENTS (UNAUDITED)
REAL ESTATE SECURITIES FUND n JUNE 30, 2008 | concluded |
| Shares | Company | Value | % of net assets | ||||||||||
| REAL ESTATE | |||||||||||||
| 40,000 | g,m,v* | Asset Capital Corp, Inc | $ | 204,400 | 0.30 | % | |||||||
| 20,000 | British Land Co plc | 281,257 | 0.41 | ||||||||||
| 35,100 | Brookfield Properties Co | 624,429 | 0.91 | ||||||||||
| 48,700 | e | Thomas Properties Group, Inc | 479,208 | 0.69 | |||||||||
| 1,589,294 | 2.31 | ||||||||||||
| SECURITY AND COMMODITY BROKERS | |||||||||||||
| 53,000 | e* | Corrections Corp of America | 1,455,910 | 2.12 | |||||||||
| 1,455,910 | 2.12 | ||||||||||||
| TOTAL COMMON STOCKS | (Cost $74,315,185) | 68,568,741 | 99.72 | ||||||||||
| Principal | Issuer | ||||||||||||
| SHORT-TERM INVESTMENTS | |||||||||||||
| U.S. GOVERNMENT AND AGENCIES DISCOUNT NOTES | |||||||||||||
| $1,050,000 | Federal Home Loan Bank (FHLB), 07/01/08 | 1,050,000 | 1.53 | ||||||||||
| 1,050,000 | 1.53 | ||||||||||||
| Shares | Company | ||||||||||||
| INVESTMENT OF CASH COLLATERAL FOR SECURITIES LOANED | |||||||||||||
| 2,153,509 | State Street Navigator Securities Lending Prime Portfolio | 2,153,509 | 3.13 | ||||||||||
| 2,153,509 | 3.13 | ||||||||||||
| TOTAL SHORT-TERM INVESTMENTS | (Cost $3,203,509) | 3,203,509 | 4.66 | ||||||||||
| TOTAL PORTFOLIO | (Cost $77,518,694) | 71,772,250 | 104.38 | ||||||||||
| OTHER ASSETS & LIABILITIES, NET | (3,008,399 | ) | (4.38 | ) | |||||||||
| NET ASSETS | $ | 68,763,851 | 100.00 | % | |||||||||
| * | Non-income producing. |
| e | All or a portion of these securities are out on loan. |
| g | Security is exempt from registration under Rule 144 (A) of the Securities Act of 1933 and may be resold in transaction exempt from registration to qualified institutional buyers. At June 30, 2008, the value of these securities amounted to $204,400 or 0.30% of net assets. |
| m | Indicates a security has been deemed illiquid. |
| v | Security valued at fair value. |
For ease of presentation, we have grouped a number of industry classification categories together in the Summary portfolio of investments. Note that the funds use more specific industry categories in following their investment limitations on industry concentration. The grouped categories can carry footnotes which can pertain to only a portion of the securities within that group.
| 78 | 2008 Semiannual Report n TIAA-CREF Life Funds | See notes to financial statements |
| SUMMARY PORTFOLIO OF INVESTMENTS (UNAUDITED) |
BOND FUND n JUNE 30, 2008
| Principal | Issuer | Rating+ | Value | % of net assets | |||||||||||
| BONDS | |||||||||||||||
| CORPORATE BONDS | |||||||||||||||
| AMUSEMENT AND RECREATION SERVICES e | $ | 104,464 | 0.11 | % | |||||||||||
| BUILDING MATERIALS AND GARDEN SUPPLIES e | 47,956 | 0.05 | |||||||||||||
| BUSINESS SERVICES e | 198,263 | 0.22 | |||||||||||||
| CHEMICALS AND ALLIED PRODUCTS e | 613,559 | 0.67 | |||||||||||||
| COMMUNICATIONS e | 1,906,723 | 2.10 | |||||||||||||
| DEPOSITORY INSTITUTIONS | |||||||||||||||
| $ | 810,000 | g | BA Covered Bond Issuer | 5.500%, 06/14/12 | Aaa | 840,456 | 0.92 | ||||||||
| 1,000,000 | g | Banco Bilbao Vizcaya Argentaria S.A. | 5.750%, 07/20/17 | Aaa | 1,055,657 | 1.16 | |||||||||
| 500,000 | Banco Nacional de Comercio Exterior SNC | 3.875%, 01/21/09 | A1 | 498,750 | 0.55 | ||||||||||
| 900,000 | g | Depfa ACS Bank | 5.125%, 03/16/37 | Aaa | 854,847 | 0.94 | |||||||||
| e,g,i | Other | 2,814,446 | 3.10 | ||||||||||||
| 6,064,156 | 6.67 | ||||||||||||||
| EATING AND DRINKING PLACES | 24,391 | 0.03 | |||||||||||||
| ELECTRIC, GAS, AND SANITARY SERVICES e | 1,094,843 | 1.20 | |||||||||||||
| ELECTRONIC AND OTHER ELECTRIC EQUIPMENT | 258,105 | 0.28 | |||||||||||||
| FOOD AND KINDRED PRODUCTS e,g | 699,199 | 0.77 | |||||||||||||
| FOOD STORES | 152,432 | 0.17 | |||||||||||||
| GENERAL MERCHANDISE STORES e | 524,654 | 0.58 | |||||||||||||
| HEALTH SERVICES | 99,059 | 0.11 | |||||||||||||
| HOLDING AND OTHER INVESTMENT OFFICES e | 98,318 | 0.11 | |||||||||||||
| INDUSTRIAL MACHINERY AND EQUIPMENT | 199,960 | 0.22 | |||||||||||||
| INSTRUMENTS AND RELATED PRODUCTS | 200,893 | 0.22 | |||||||||||||
| INSURANCE CARRIERS i,g | 661,677 | 0.73 | |||||||||||||
| METAL MINING g | 244,234 | 0.27 | |||||||||||||
| MOTION PICTURES | 90,998 | 0.10 | |||||||||||||
| NONDEPOSITORY INSTITUTIONS e | 1,559,923 | 1.72 | |||||||||||||
| NONMETALLIC MINERALS, EXCEPT FUELS | 25,329 | 0.03 | |||||||||||||
| OIL AND GAS EXTRACTION e,g | |||||||||||||||
| 500,000 | g | Pemex Project Funding Master Trust | 6.625%, 06/15/38 | Baa1 | 511,898 | 0.56 | |||||||||
| e,g | Other | 1,138,803 | 1.26 | ||||||||||||
| 1,650,701 | 1.82 | ||||||||||||||
| PAPER AND ALLIED PRODUCTS e | 232,154 | 0.26 | |||||||||||||
| PETROLEUM AND COAL PRODUCTS | 45,842 | 0.05 | |||||||||||||
| PIPELINES, EXCEPT NATURAL GAS g | 139,177 | 0.15 | |||||||||||||
| PRIMARY METAL INDUSTRIES g | 293,576 | 0.32 | |||||||||||||
| PRINTING AND PUBLISHING | 383,977 | 0.42 | |||||||||||||
| RAILROAD TRANSPORTATION g | 139,605 | 0.15 | |||||||||||||
| SECURITY AND COMMODITY BROKERS i | 1,655,295 | 1.82 | |||||||||||||
| See notes to financial statements | TIAA-CREF Life Funds n 2008 Semiannual Report | 79 |
| SUMMARY PORTFOLIO OF INVESTMENTS (UNAUDITED) | continued |
BOND FUND n JUNE 30, 2008
| Principal | Issuer | Rating+ | Value | % of net assets | |||||||||||
| TRANSPORTATION BY AIR | $ | 99,661 | 0.11 | % | |||||||||||
| TRANSPORTATION EQUIPMENT g | 324,149 | 0.36 | |||||||||||||
| WHOLESALE TRADE-NONDURABLE GOODS | 62,473 | 0.07 | |||||||||||||
| TOTAL CORPORATE BONDS | (Cost $20,473,575) | 19,895,746 | 21.89 | ||||||||||||
| GOVERNMENT BONDS | |||||||||||||||
| AGENCY SECURITIES | |||||||||||||||
| $ | 550,000 | Federal Farm Credit Bank (FFCB) | 3.375%, 07/15/08 | Aaa | 550,163 | 0.61 | |||||||||
| 550,000 | FFCB | 4.125%, 04/15/09 | Aaa | 555,413 | 0.61 | ||||||||||
| 600,000 | FFCB | 2.625%, 04/21/11 | Aaa | 585,596 | 0.64 | ||||||||||
| 1,000,000 | Federal Home Loan Bank (FHLB) | 5.000%, 10/16/09 | Aaa | 1,006,063 | 1.11 | ||||||||||
| 1,000,000 | Federal Home Loan Mortgage Corp (FHLMC) | 3.500%, 05/29/13 | Aaa | 971,686 | 1.07 | ||||||||||
| 1,500,000 | FHLMC | 5.125%, 10/18/16 | Aaa | 1,542,440 | 1.70 | ||||||||||
| 1,575,000 | FHLMC | 5.125%, 11/17/17 | Aaa | 1,618,097 | 1.78 | ||||||||||
| 1,000,000 | Federal National Mortgage Association (FNMA) | 5.100%, 09/10/09 | Aaa | 1,004,200 | 1.10 | ||||||||||
| 500,000 | FNMA | 5.375%, 06/12/17 | Aaa | 522,679 | 0.58 | ||||||||||
| Other | 1,166,414 | 1.28 | |||||||||||||
| 9,522,751 | 10.48 | ||||||||||||||
| FOREIGN GOVERNMENT BONDS | |||||||||||||||
| 1,000,000 | e | Province of Manitoba Canada | 4.450%, 04/12/10 | Aa1 | 1,018,411 | 1.12 | |||||||||
| 500,000 | Province of Saskatchewan Canada | 8.000%, 02/01/13 | Aa1 | 580,253 | 0.64 | ||||||||||
| e,g | Other | 2,090,006 | 2.30 | ||||||||||||
| 3,688,670 | 4.06 | ||||||||||||||
| MORTGAGE BACKED SECURITIES | |||||||||||||||
| 526,138 | Federal Home Loan Mortgage Corp Gold (FGLMC) | 6.000%, 11/01/33 | 534,513 | 0.59 | |||||||||||
| 617,415 | FGLMC | 5.500%, 04/01/37 | 608,830 | 0.67 | |||||||||||
| 715,409 | FGLMC | 5.500%, 05/01/37 | 705,461 | 0.78 | |||||||||||
| 564,670 | i | FHLMC | 5.800%, 07/01/36 | 576,907 | 0.63 | ||||||||||
| 1,678,911 | Federal National Mortgage Association (FNMA) | 4.557%, 01/01/15 | 1,633,587 | 1.80 | |||||||||||
| 522,577 | FNMA | 5.500%, 07/01/24 | 521,890 | 0.57 | |||||||||||
| 859,992 | FNMA | 5.500%, 07/01/33 | 852,719 | 0.94 | |||||||||||
| 525,596 | FNMA | 5.500%, 07/01/33 | 521,152 | 0.57 | |||||||||||
| 634,865 | FNMA | 6.000%, 10/01/33 | 644,177 | 0.71 | |||||||||||
| 1,480,912 | FNMA | 5.500%, 11/01/33 | 1,468,389 | 1.61 | |||||||||||
| 648,071 | FNMA | 5.000%, 03/01/34 | 625,199 | 0.69 | |||||||||||
| 1,163,354 | FNMA | 5.000%, 03/01/34 | 1,122,296 | 1.23 | |||||||||||
| 1,224,062 | FNMA | 5.000%, 02/25/35 | 1,226,364 | 1.35 | |||||||||||
| 582,747 | FNMA | 5.500%, 02/01/37 | 575,452 | 0.63 | |||||||||||
| 1,776,395 | FNMA | 5.500%, 02/01/38 | 1,753,046 | 1.93 | |||||||||||
| 640,259 | FNMA | 5.500%, 02/01/38 | 631,843 | 0.70 | |||||||||||
| i | Other | 16,570,739 | 18.23 | ||||||||||||
| 30,572,564 | 33.63 | ||||||||||||||
| U.S. TREASURY SECURITIES | |||||||||||||||
| 550,000 | United States Treasury Bond | 2.625%, 05/31/10 | 550,344 | 0.60 | |||||||||||
| 1,165,000 | United States Treasury Bond | 3.500%, 05/31/13 | 1,173,647 | 1.29 | |||||||||||
| 538,000 | United States Treasury Bond | 3.875%, 05/15/18 | 533,503 | 0.59 | |||||||||||
| 80 | 2008 Semiannual Report n TIAA-CREF Life Funds | See notes to financial statements |
| SUMMARY PORTFOLIO OF INVESTMENTS (UNAUDITED) | continued |
BOND FUND n JUNE 30, 2008
| Principal | Issuer | Rating+ | Value | % of net assets | ||||||||||
| U.S. TREASURY SECURITIES – continued | ||||||||||||||
| $ 800,000 | United States Treasury Bond | 4.375%, 02/15/38 | $ | 779,750 | 0.86 | % | ||||||||
| 3,197,118 | United States Treasury Inflation Indexed Bonds | 0.875%, 04/15/10 | 3,252,320 | 3.58 | ||||||||||
| 541,045 | United States Treasury Inflation Indexed Bonds | 2.375%, 04/15/11 | 573,296 | 0.63 | ||||||||||
| j | Other | 1,176,217 | 1.29 | |||||||||||
| 8,039,077 | 8.84 | |||||||||||||
| TOTAL GOVERNMENT BONDS | (Cost $51,931,308) | 51,823,062 | 57.01 | |||||||||||
| TOTAL BONDS | (Cost $72,404,883) | 71,718,808 | 78.90 | |||||||||||
| STRUCTURED ASSETS | ||||||||||||||
| ASSET BACKED | ||||||||||||||
| 500,000 | AmeriCredit Automobile Receivables Trust Series 2007-BF (Class A3A) | 5.160%, 04/06/12 | Aaa | 499,681 | 0.55 | |||||||||
| 644,940 | Centex Home Equity Series 2002-A (Class AF6) | 5.540%, 01/25/32 | Aaa | 628,275 | 0.69 | |||||||||
| 1,000,000 | Flagstar Home Equity Loan Trust Series 2007-1A (Class AF3) | 5.781%, 01/25/35 | A2 | 792,810 | 0.87 | |||||||||
| 562,871 | HFC Home Equity Loan Asset Backed Certificates Series 2007-1 (Class A1F) | 5.910%, 03/20/36 | Aaa | 563,984 | 0.62 | |||||||||
| 1,000,000 | Household Automotive Trust Series 2006-3 (Class A4) | 5.340%, 09/17/13 | Aaa | 1,004,260 | 1.11 | |||||||||
| 499,787 | Marriott Vacation Club Owner Trust Series 2006-2A (Class A) | 5.362%, 10/20/28 | Aaa | 480,944 | 0.53 | |||||||||
| 815,330 | m, v | Sonic Capital LLC Series 2006-1A (Class A2) | 5.096%, 12/20/31 | Aa3 | 742,715 | 0.82 | ||||||||
| i,m,v | Other | 4,413,585 | 4.85 | |||||||||||
| 9,126,254 | 10.04 | |||||||||||||
| OTHER MORTGAGE BACKED SECURITIES | ||||||||||||||
| 750,000 | JP Morgan Chase Commercial Mortgage Securities Corp Series 2002-C1 (Class A3) | 5.376%, 07/12/37 | Aaa | 756,116 | 0.83 | |||||||||
| 630,678 | Wells Fargo Mortgage Backed Securities Trust Series 2005-1 (Class 2A1) | 5.000%, 01/25/20 | Aaa | 604,269 | 0.67 | |||||||||
| g,i | Other | 5,444,277 | 5.99 | |||||||||||
| 6,804,662 | 7.49 | |||||||||||||
| TOTAL STRUCTURED ASSETS | (Cost $17,238,745) | 15,930,916 | 17.53 | |||||||||||
| Shares | Company | |||||||||||||
| PREFERRED STOCKS | ||||||||||||||
| DEPOSITORY INSTITUTIONS e | 80,000 | 0.09 | ||||||||||||
| NONDEPOSITORY INSTITUTIONS | ||||||||||||||
| 24,609 | e | Federal National Mortgage Association (FNMA) | 8.250%, 12/30/49 | Aa3 | 564,777 | 0.62 | ||||||||
| e | Other | 158,436 | 0.17 | |||||||||||
| 723,213 | 0.79 | |||||||||||||
| TOTAL PREFERRED STOCKS | (Cost $878,225) | 803,213 | 0.88 | |||||||||||
| See notes to financial statements | TIAA-CREF Life Funds n 2008 Semiannual Report | 81 |
| SUMMARY PORTFOLIO OF INVESTMENTS (UNAUDITED) | concluded |
BOND FUND n JUNE 30, 2008
| Principal | Issuer | Value | % of net assets | ||||||||||
| SHORT TERM INVESTMENTS | |||||||||||||
| U.S. GOVERNMENT AND AGENCIES DISCOUNT NOTES – 1.65% | |||||||||||||
| $1,500,000 | Federal Home Loan Bank (FHLB) | 0.000%, 07/01/08 | $ | 1,500,000 | 1.65 | % | |||||||
| Shares | Company | ||||||||||||
| INVESTMENT OF CASH COLLATERAL FOR SECURITIES LOANED – 5.06% | |||||||||||||
| 4,595,336 | State Street Navigator Securities Lending Prime Portfolio | 4,595,336 | 5.06 | ||||||||||
| TOTAL SHORT TERM INVESTMENTS | (Cost $6,095,336) | 6,095,336 | 6.71 | ||||||||||
| TOTAL PORTFOLIO | (Cost $96,617,189) | 94,548,273 | 104.02 | ||||||||||
| OTHER ASSETS & LIABILITIES, NET | (3,649,895 | ) | (4.02 | ) | |||||||||
| NET ASSETS | $ | 90,898,378 | 100.00 | % | |||||||||
| + | As provided by Moody’s Investors Service (unaudited). |
| e | All or a portion of these securities are out on loan. |
| g | Security is exempt from registration under Rule 144 (A) of the Securities Act of 1933 and may be resold in transactions exempt from registration to qualified institutional buyers. |
At June 30, 2008, the value of these securities amounted to $5,476,972 or 6.03% of net assets.
| i | Floating rate or variable rate securities reflects the rate as of June 30, 2008. |
| j | Zero coupon. |
| m | Indicates a security that has been deemed illiquid. |
| v | Security valued at fair value. |
For ease of presentation, we have grouped a number of industry classification categories together in the Summary portfolio of investments. Note that the funds use more specific industry categories in following their investment limitations on industry concentration. The grouped categories can carry footnotes which can pertain to only a portion of the securities within that group.
| 82 | 2008 Semiannual Report n TIAA-CREF Life Funds | See notes to financial statements |
SUMMARY PORTFOLIO OF INVESTMENTS (UNAUDITED)
MONEY MARKET FUND n JUNE 30, 2008
| Principal | Issuer | Value | % of net assets | |||||||||
| SHORT TERM INVESTMENTS | ||||||||||||
| BANK ACCEPTANCES | ||||||||||||
| $ 1,536,000 | JPMorgan Chase Bank NA | 0.000%, 07/07/08–09/04/08 | $ | 1,531,128 | 1.38 | % | ||||||
| 1,000,000 | Wachovia Bank NA | 0.000%, 07/08/08 | 999,553 | 0.90 | ||||||||
| 2,530,681 | 2.28 | |||||||||||
| CERTIFICATES OF DEPOSIT | ||||||||||||
| 500,000 | Abbey National Treasury | 2.600%, 08/11/08 | 500,011 | 0.45 | ||||||||
| 2,800,000 | American Express Bank FSB | 2.690–4.080%, 07/14/08–8/21/08 | 2,800,052 | 2.53 | ||||||||
| 1,000,000 | Banco Bilbao Vizcaya Argentaria S.A. | 2.945%, 07/23/08 | 1,000,003 | 0.90 | ||||||||
| 2,145,000 | Bank of Montreal | 2.650–2.800%, 09/03/08–09/24/08 | 2,145,087 | 1.94 | ||||||||
| 2,050,000 | Bank of Nova Scotia | 2.550%, 08/13/08 | 2,050,000 | 1.85 | ||||||||
| 1,415,000 | Canadian Imperial Bank | 2.635%, 08/20/08 | 1,415,000 | 1.28 | ||||||||
| 1,000,000 | Deutsche Bank AG. | 2.720%, 07/31/08 | 1,000,000 | 0.90 | ||||||||
| 1,000,000 | Dexia Credit Local S.A. | 2.630%, 08/26/08 | 1,000,031 | 0.90 | ||||||||
| 1,930,000 | Toronto Dominion Bank | 2.500–2.950%, 08/14/08–08/27/08 | 1,930,000 | 1.74 | ||||||||
| 13,840,184 | 12.49 | |||||||||||
| COMMERCIAL PAPER | ||||||||||||
| 2,710,000 | American Honda Finance Corp | 08/04/08–09/05/08 | 2,699,902 | 2.44 | ||||||||
| 2,450,000 | Bank of America Corp | 07/01/08–09/09/08 | 2,441,622 | 2.20 | ||||||||
| 1,000,000 | Bank of Nova Scotia | 10/03/08 | 992,846 | 0.90 | ||||||||
| 2,350,000 | Bank of Scotland plc | 07/08/08–08/06/08 | 2,346,955 | 2.12 | ||||||||
| 955,000 | Canadian Imperial Holding, Inc | 09/19/08 | 948,994 | 0.86 | ||||||||
| 2,390,000 | Ciesco LLC | 07/01/08–07/29/08 | 2,387,374 | 2.15 | ||||||||
| 2,710,000 | Citigroup Funding, Inc | 07/18/08–08/15/08 | 2,702,567 | 2.44 | ||||||||
| 1,580,000 | Coca-Cola Co | 07/09/08 | 1,579,242 | 1.43 | ||||||||
| 2,445,000 | Danske Corp | 07/14/08–07/22/08 | 2,441,904 | 2.20 | ||||||||
| 1,200,000 | Dexia Delaware LLC | 08/12/08–09/25/08 | 1,195,405 | 1.08 | ||||||||
| 2,100,000 | Edison Asset Securitization LLC | 07/15/08–08/19/08 | 2,096,309 | 1.89 | ||||||||
| 2,980,000 | General Electric Capital Corp | 08/25/08–10/30/08 | 2,964,076 | 2.67 | ||||||||
| 400,000 | General Electric Co | 09/02/08 | 398,334 | 0.36 | ||||||||
| 3,385,000 | Govco LLC | 07/21/08–12/17/08 | 3,361,945 | 3.03 | ||||||||
| 2,900,000 | HSBC Finance Corp | 07/09/08–09/02/08 | 2,893,327 | 2.61 | ||||||||
| 1,900,000 | ING US Funding LLC | 07/10/08–07/17/08 | 1,898,251 | 1.71 | ||||||||
| 1,790,000 | JPMorgan Chase & Co | 07/21/08–08/05/08 | 1,786,685 | 1.61 | ||||||||
| 2,942,000 | Kitty Hawk Funding Corp | 07/17/08–10/02/08 | 2,931,913 | 2.65 | ||||||||
| 2,095,000 | Lloyds Bank plc | 07/01/08–10/17/08 | 2,087,746 | 1.88 | ||||||||
| 2,425,000 | Nestle Capital Corp | 07/07/08–03/10/09 | 2,415,460 | 2.18 | ||||||||
| 1,195,000 | Paccar Financial Corp | 07/11/08 | 1,194,306 | 1.08 | ||||||||
| 2,000,000 | Pfizer, Inc | 08/06/08–08/28/08 | 1,993,872 | 1.80 | ||||||||
| 1,500,000 | Private Export Funding Corp | 09/03/08–09/04/08 | 1,494,188 | 1.35 | ||||||||
| 870,000 | Procter & Gamble International | 08/05/08 | 868,148 | 0.78 | ||||||||
| 2,715,000 | Rabobank USA Financial Corp | 07/07/08–09/15/08 | 2,708,646 | 2.44 | ||||||||
| 2,000,000 | Ranger Funding Co LLC | 07/10/05–08/20/08 | 1,995,635 | 1.80 | ||||||||
| 325,000 | Societe Generale North America, Inc | 07/11/08 | 324,642 | 0.29 | ||||||||
| 800,000 | Svensk Exportkredit AB | 08/22/08 | 797,492 | 0.72 | ||||||||
| 3,600,000 | Toyota Motor Credit Corp | 09/16/08–10/29/08 | 3,578,065 | 3.23 | ||||||||
| 1,000,000 | Unilever Capital Corp | 10/20/08 | 991,798 | 0.89 | ||||||||
| See notes to financial statements | TIAA-CREF Life Funds n 2008 Semiannual Report | 83 |
| SUMMARY PORTFOLIO OF INVESTMENTS (UNAUDITED) | concluded |
MONEY MARKET FUND n JUNE 30, 2008
| Principal | Issuer | Value | % of net assets | |||||||||
| COMMERCIAL PAPER – continued | ||||||||||||
| $ 1,000,000 | Wells Fargo & Co | 07/22/08 | $ | 998,781 | 0.90 | % | ||||||
| 3,196,000 | Yorktown Capital LLC | 07/03/08–08/19/08 | 3,190,237 | 2.88 | ||||||||
| 62,706,667 | 56.57 | |||||||||||
| U.S. GOVERNMENT AND AGENCIES DISCOUNT NOTES | ||||||||||||
| 5,256,000 | Federal Home Loan Bank (FHLB) | 07/02/08–12/03/08 | 5,229,919 | 4.72 | ||||||||
| 11,273,000 | Federal Home Loan Mortgage Corp (FHLMC) | 07/07/08–11/05/08 | 11,223,189 | 10.12 | ||||||||
| 366,000 | FHLMC | 01/05/09 | 360,935 | 0.32 | ||||||||
| 13,764,000 | Federal National Mortgage Association (FNMA) | 07/25/08–11/28/08 | 13,719,725 | 12.38 | ||||||||
| 30,533,768 | 27.54 | |||||||||||
| VARIABLE NOTE | ||||||||||||
| 1,000,000 | i | Wachovia Bank NA | 2.990%, 11/25/08 | 1,000,000 | 0.90 | |||||||
| TOTAL SHORT-TERM INVESTMENTS | (Cost $110,611,300) | 110,611,300 | 99.78 | |||||||||
| TOTAL PORTFOLIO | (Cost $110,611,300) | 110,611,300 | 99.78 | |||||||||
| OTHER ASSETS & LIABILITIES, NET | 248,604 | 0.22 | ||||||||||
| NET ASSETS | $ | 110,859,904 | 100.00 | % | ||||||||
| i | Floating rate or variable rate securities reflects the rate in effect as of June 30, 2008. |
ABBREVIATION:
LLC Limited Liability Company
For ease of presentation, we have grouped a number of industry classification categories together in the Summary portfolio of investments. Note that the funds use more specific industry categories in following their investment limitations on industry concentration. The grouped categories can carry footnotes which can pertain to only a portion of the securities within that group.
| 84 | 2008 Semiannual Report n TIAA-CREF Life Funds | See notes to financial statements |
[This page intentionally left blank.]
| TIAA-CREF Life Funds n 2008 Semiannual Report | 85 |
STATEMENTS OF ASSETS AND LIABILITIES (UNAUDITED)
TIAA-CREF LIFE FUNDS n JUNE 30, 2008
| Growth Equity Fund | ||||||
ASSETS | ||||||
Portfolio investments, at cost | $ | 49,014,877 | ||||
Net unrealized appreciation (depreciation) of portfolio investments | 111,872 | |||||
Portfolio investments, at value* | 49,126,749 | |||||
Cash | — | |||||
Cash – foreign** | 17,258 | |||||
Receivable from securities transactions | 1,418,087 | |||||
Receivable from Fund shares sold | 9,864 | |||||
Dividends and interest receivable | 42,545 | |||||
Reclaims receivable | 5,353 | |||||
Total assets | 50,619,856 | |||||
LIABILITIES | ||||||
Management fees payable | 8,258 | |||||
Trustee fees payable | 388 | |||||
Due to custodian | 903,606 | |||||
Payable for collateral for securities on loan | 10,728,037 | |||||
Payable for securities transactions | 1,237,901 | |||||
Payable for Fund shares redeemed | 138,413 | |||||
Total liabilities | 13,016,603 | |||||
NET ASSETS | $ | 37,603,253 | ||||
NET ASSETS CONSIST OF: | ||||||
Paid-in-capital | $ | 71,833,414 | ||||
Undistributed (accumulated) net investment income (loss) | 171,950 | |||||
Undistributed (accumulated) net realized gain (loss) on total investments | (34,515,146 | ) | ||||
Net unrealized appreciation (depreciation) on total investments | 113,035 | |||||
NET ASSETS | $ | 37,603,253 | ||||
Outstanding shares of beneficial interest, | 2,314,710 | |||||
Net asset value per share | $16.25 | |||||
* Includes securities loaned of: | $ | 10,420,438 | ||||
** Cost: | $17,156 | |||||
| 86 | 2008 Semiannual Report n TIAA-CREF Life Funds | See notes to financial statements |
| Growth & Income Fund | International Equity Fund | Large-Cap Value Fund | Small-Cap Equity Fund | |||||||||||||
| $ | 90,891,687 | $ | 147,725,313 | $ | 79,383,947 | $ | 63,309,612 | |||||||||
| 2,558,118 | (6,810,091 | ) | (4,109,351 | ) | (2,180,413 | ) | ||||||||||
| 93,449,805 | 140,915,222 | 75,274,596 | 61,129,199 | |||||||||||||
| — | — | 5,170 | — | |||||||||||||
| 17,863 | 894,802 | 4,946 | — | |||||||||||||
| 276,582 | 5,001,043 | 1,913,786 | 6,208,941 | |||||||||||||
| 80,597 | 51,586 | — | 64,406 | |||||||||||||
| 95,523 | 200,651 | 107,279 | 61,796 | |||||||||||||
| 2,428 | 82,723 | 1,418 | — | |||||||||||||
| 93,922,798 | 147,146,027 | 77,307,195 | 67,464,342 | |||||||||||||
| 14,486 | 30,756 | 12,093 | 4,096 | |||||||||||||
| 388 | 388 | 388 | 388 | |||||||||||||
| 16,213 | 2,271,790 | — | 103,045 | |||||||||||||
| 19,680,784 | 14,898,371 | 17,198,310 | 14,080,276 | |||||||||||||
| 305,502 | 8,299,509 | 2,175,751 | 6,048,481 | |||||||||||||
| 322,290 | 379,913 | 93,386 | — | |||||||||||||
| 20,339,663 | 25,880,727 | 19,479,928 | 20,236,286 | |||||||||||||
| $ | 73,583,135 | $ | 121,265,300 | $ | 57,827,267 | $ | 47,228,056 | |||||||||
| $ | 76,653,761 | $ | 141,093,587 | $ | 66,946,183 | $ | 53,586,509 | |||||||||
| 675,285 | 2,497,590 | 661,386 | 228,033 | |||||||||||||
| (6,304,990 | ) | (15,531,327 | ) | (5,673,016 | ) | (4,469,808 | ) | |||||||||
| 2,559,079 | (6,794,550 | ) | (4,107,286 | ) | (2,116,678 | ) | ||||||||||
| $ | 73,583,135 | $ | 121,265,300 | $ | 57,827,267 | $ | 47,228,056 | |||||||||
| | 2,826,718 | | 6,158,717 | 2,185,649 | 1,865,948 | |||||||||||
| $26.03 | $19.69 | $26.46 | $25.31 | |||||||||||||
| $ | 19,132,999 | $ | 14,137,223 | $ | 16,677,124 | $ | 13,526,163 | |||||||||
| $ | 17,826 | $ | 884,056 | $ | 4,907 | $ | — | |||||||||
| See notes to financial statements | TIAA-CREF Life Funds n 2008 Semiannual Report | 87 |
STATEMENTS OF ASSETS AND LIABILITIES (UNAUDITED)
TIAA-CREF LIFE FUNDS n JUNE 30, 2008
| Stock Index Fund | ||||||
ASSETS | ||||||
Portfolio investments, at cost | $ | 178,714,361 | ||||
Net unrealized appreciation (depreciation) of portfolio investments | 10,969,613 | |||||
Portfolio investments, at value* | 189,683,974 | |||||
Cash | 22,434 | |||||
Cash – foreign** | — | |||||
Receivable from securities transactions | 2,863,826 | |||||
Receivable from Fund shares sold | 16,109 | |||||
Dividends and interest receivable | 194,964 | |||||
Reclaims receivable | 22,298 | |||||
Total assets | 192,803,605 | |||||
LIABILITIES | ||||||
Management fees payable | 8,376 | |||||
Trustee fees payable | 388 | |||||
Due to custodian | 200 | |||||
Payable for collateral for securities on loan | 27,980,528 | |||||
Payable for securities transactions | 2,890,375 | |||||
Payable for Fund shares redeemed | 177,253 | |||||
Payable for variation margin on open futures contracts | 1,480 | |||||
Total liabilities | 31,058,600 | |||||
NET ASSETS | $ | 161,745,005 | ||||
NET ASSETS CONSIST OF: | ||||||
Paid-in-capital | $ | 154,088,996 | ||||
Undistributed (accumulated) net investment income (loss) | 1,624,694 | |||||
Undistributed (accumulated) net realized gain (loss) on total investments | (4,868,846 | ) | ||||
Net unrealized appreciation (depreciation) on total investments | 10,900,161 | |||||
NET ASSETS | $ | 161,745,005 | ||||
Outstanding shares of beneficial interest, | 5,731,699 | |||||
Net asset value per share | $28.22 | |||||
* Includes securities loaned of: | $ | 27,024,961 | ||||
** Cost: | $ | — | ||||
| 88 | 2008 Semiannual Report n TIAA-CREF Life Funds | See notes to financial statements |
| concluded |
| Social Choice Equity Fund | Real Estate Securities Fund | Bond Fund | Money Market Fund | |||||||||||||
| $ | 33,445,336 | $ | 77,518,694 | $ | 96,617,189 | $ | 110,611,300 | |||||||||
| 323,132 | (5,746,444 | ) | (2,068,916 | ) | — | |||||||||||
| 33,768,468 | 71,772,250 | 94,548,273 | 110,611,300 | |||||||||||||
| — | 6,573 | 8,200 | 5,123 | |||||||||||||
| — | 4,420 | — | — | |||||||||||||
| 3,575,810 | — | 198,601 | — | |||||||||||||
| 9,437 | 530 | 221,539 | 272,809 | |||||||||||||
| 37,750 | 318,437 | 727,986 | 73,205 | |||||||||||||
| — | — | — | — | |||||||||||||
| 37,391,465 | 72,102,210 | 95,704,599 | 110,962,437 | |||||||||||||
| 2,038 | 15,138 | 7,364 | 5,268 | |||||||||||||
| 388 | 388 | 388 | 388 | |||||||||||||
| 2,659 | — | — | — | |||||||||||||
| — | 2,153,509 | 4,595,336 | — | |||||||||||||
| 3,576,117 | 1,077,040 | 202,960 | — | |||||||||||||
| 7,762 | 92,284 | 173 | 96,877 | |||||||||||||
| — | — | — | — | |||||||||||||
| 3,588,964 | 3,338,359 | 4,806,221 | 102,533 | |||||||||||||
| $ | 33,802,501 | $ | 68,763,851 | $ | 90,898,378 | $ | 110,859,904 | |||||||||
| $ | 33,614,382 | $ | 81,727,576 | $ | 92,423,671 | $ | 110,860,319 | |||||||||
| 323,041 | (865,960 | ) | 2,389,626 | 71 | ||||||||||||
| (462,137 | ) | (6,758,232 | ) | (1,846,002 | ) | (486 | ) | |||||||||
| 327,215 | (5,339,533 | ) | (2,068,917 | ) | — | |||||||||||
| $ | 33,802,501 | $ | 68,763,851 | $ | 90,898,378 | $ | 110,859,904 | |||||||||
| | 1,381,350 | | 2,724,707 | 3,707,831 | 110,860,319 | |||||||||||
| $24.47 | $25.24 | $24.52 | $1.00 | |||||||||||||
| $ | — | $ | 2,107,118 | $ | 4,499,823 | $ | — | |||||||||
| $ | — | $ | 4,433 | $ | — | $ | — | |||||||||
| See notes to financial statements | TIAA-CREF Life Funds n 2008 Semiannual Report | 89 |
STATEMENTS OF OPERATIONS (UNAUDITED)
TIAA-CREF LIFE FUNDS n FOR THE PERIOD ENDED JUNE 30, 2008
| Growth Equity Fund | ||||||
INVESTMENT INCOME | ||||||
Dividends | $ | 227,320 | ||||
Foreign taxes withheld | (5,424 | ) | ||||
Interest | 2,183 | |||||
Income from securities lending | 19,176 | |||||
Total income | 243,255 | |||||
EXPENSES | ||||||
Investment management fees | 47,740 | |||||
Trustee fees | 648 | |||||
Interest expense | 5,140 | |||||
Net expenses | 53,528 | |||||
Net investment income | 189,727 | |||||
NET REALIZED AND UNREALIZED GAIN (LOSS) | ||||||
Realized gain (loss): | ||||||
Portfolio investments | 499,362 | |||||
Futures transactions | — | |||||
Foreign currency transactions | (753 | ) | ||||
Net realized gain (loss) on total investments | 498,609 | |||||
Change in unrealized appreciation (depreciation) on: | ||||||
Portfolio investments | (4,943,308 | ) | ||||
Futures transactions | — | |||||
Translation of assets (other than portfolio investments) and | 1,101 | |||||
Net change in unrealized depreciation on total investments | (4,942,207 | ) | ||||
Net realized and unrealized loss on total investments | (4,443,598 | ) | ||||
Net decrease in net assets resulting from operations | $ | (4,253,871 | ) | |||
| 90 | 2008 Semiannual Report n TIAA-CREF Life Funds | See notes to financial statements |
| Growth & Income Fund | International Equity Fund | Large-Cap Value Fund | Small-Cap Equity Fund | |||||||||||||
| $ | 699,311 | $ | 2,848,361 | $ | 785,228 | $ | 251,717 | |||||||||
| (5,883 | ) | (345,547 | ) | (4,391 | ) | (12 | ) | |||||||||
| 3,240 | 17,191 | 1,703 | 384 | |||||||||||||
| 48,666 | 160,880 | 51,204 | 61,111 | |||||||||||||
| 745,334 | 2,680,885 | 833,744 | 313,200 | |||||||||||||
| 88,246 | 197,710 | 75,784 | 23,950 | |||||||||||||
| 648 | 648 | 648 | 648 | |||||||||||||
| 756 | 18,790 | 6,386 | 1,349 | |||||||||||||
| 89,650 | 217,148 | 82,818 | 25,947 | |||||||||||||
| 655,684 | 2,463,737 | 750,926 | 287,253 | |||||||||||||
| 4,060,786 | (18,459,611 | ) | (5,624,875 | ) | (3,009,655 | ) | ||||||||||
| — | — | — | (136 | ) | ||||||||||||
| (1,206 | ) | (102,712 | ) | (264 | ) | — | ||||||||||
| 4,059,580 | (18,562,323 | ) | (5,625,139 | ) | (3,009,791 | ) | ||||||||||
| (13,491,248 | ) | (12,333,649 | ) | (6,011,559 | ) | (822,333 | ) | |||||||||
| — | — | — | — | |||||||||||||
| 132 |
| 13,495 | 205 | — | |||||||||||
| (13,491,116 | ) | (12,320,154 | ) | (6,011,354 | ) | (822,333 | ) | |||||||||
| (9,431,536 | ) | (30,882,477 | ) | (11,636,493 | ) | (3,832,124 | ) | |||||||||
| $ | (8,775,852 | ) | $ | (28,418,740 | ) | $ | (10,885,567 | ) | $ | (3,544,871 | ) | |||||
| See notes to financial statements | TIAA-CREF Life Funds n 2008 Semiannual Report | 91 |
STATEMENTS OF OPERATIONS (UNAUDITED)
TIAA-CREF LIFE FUNDS n FOR THE PERIOD ENDED JUNE 30, 2008
Stock Index Fund | ||||||
INVESTMENT INCOME | ||||||
Dividends | $ | 1,614,639 | ||||
Foreign taxes withheld | (176 | ) | ||||
Interest | 13,935 | |||||
Income from securities lending | 93,867 | |||||
Total income | 1,722,265 | |||||
EXPENSES | ||||||
Investment management fees | 50,751 | |||||
Trustee fees | 648 | |||||
Interest expense | 447 | |||||
Net expenses | 51,846 | |||||
Net investment income | 1,670,419 | |||||
NET REALIZED AND UNREALIZED GAIN (LOSS) | ||||||
Realized gain (loss): | ||||||
Portfolio investments | (2,160,685 | ) | ||||
Futures transactions | (165,980 | ) | ||||
Foreign currency transactions | (8 | ) | ||||
Net realized loss on total investments | (2,326,673 | ) | ||||
Change in unrealized appreciation (depreciation) on: | ||||||
Portfolio investments | (19,472,200 | ) | ||||
Futures transactions | (94,673 | ) | ||||
Translation of assets (other than portfolio investments) and | 1 | |||||
Net change in unrealized depreciation on total investments | (19,566,872 | ) | ||||
Net realized and unrealized loss on total investments | (21,893,545 | ) | ||||
Net increase (decrease) in net assets resulting from operations | $ | (20,223,126 | ) | |||
| 92 | 2008 Semiannual Report n TIAA-CREF Life Funds | See notes to financial statements |
| concluded |
Social Equity Fund | Real Estate Securities Fund | Bond Fund | Money Market Fund | ||||||||||||
| $ | 342,564 | $ | 871,719 | $ | 39,121 | $ | — | ||||||||
| (17 | ) | (2,449 | ) | — | — | ||||||||||
| 458 | 8,372 | 2,382,171 | 1,705,827 | ||||||||||||
| — | 5,201 | 12,158 | — | ||||||||||||
| 343,005 | 882,843 | 2,433,450 | 1,705,827 | ||||||||||||
| 12,324 | 90,371 | 44,542 | 30,867 | ||||||||||||
| 648 | 648 | 648 | 648 | ||||||||||||
| 98 | 2,460 | 1,302 | 811 | ||||||||||||
| 13,070 | 93,479 | 46,492 | 32,326 | ||||||||||||
| 329,935 | 789,364 | 2,386,958 | 1,673,501 | ||||||||||||
| (406,003 | ) | (6,089,848 | ) | (671,770 | ) | — | |||||||||
| — | — | — | — | ||||||||||||
| (3 | ) | (902 | ) | — | — | ||||||||||
| (406,006 | ) | (6,090,750 | ) | (671,770 | ) | — | |||||||||
| (3,628,528 | ) | 1,556,609 | (1,875,814 | ) | — | ||||||||||
| — | — | — | — | ||||||||||||
| — | (3 | ) | — | — | |||||||||||
| (3,628,528 | ) | 1,556,606 | (1,875,814 | ) | — | ||||||||||
| (4,034,534 | ) | (4,534,144 | ) | (2,547,584 | ) | — | |||||||||
| $ | (3,704,599 | ) | $ | (3,744,780 | ) | $ | (160,626 | ) | $ | 1,673,501 | |||||
| See notes to financial statements | TIAA-CREF Life Funds n 2008 Semiannual Report | 93 |
STATEMENTS OF CHANGES IN NET ASSETS
TIAA-CREF LIFE FUNDS n FOR THE PERIOD OR YEAR ENDED
| Growth Equity Fund | ||||||||||
| June 30, 2008 | December 31, 2007 | |||||||||
| (unaudited) | ||||||||||
CHANGE IN NET ASSETS | ||||||||||
Net investment income | $ | 189,727 | $ | 265,447 | ||||||
Net realized gain (loss) on total investments | 498,609 | 3,689,738 | ||||||||
Net change in unrealized appreciation (depreciation) on total investments | (4,942,207 | ) | 2,427,118 | |||||||
Net increase (decrease) from operations | (4,253,871 | ) | 6,382,303 | |||||||
DISTRIBUTIONS TO SHAREHOLDERS | ||||||||||
From net investment income | — | (284,965 | ) | |||||||
From net realized gain on total investments | — | — | ||||||||
Total distributions | — | (284,965 | ) | |||||||
SHAREHOLDER TRANSACTIONS | ||||||||||
Subscriptions | 7,521,277 | 13,688,417 | ||||||||
Reinvestment of distributions | — | 284,965 | ||||||||
Redemptions | (8,039,792 | ) | (5,874,596 | ) | ||||||
Net increase (decrease) from shareholder transactions | (518,515 | ) | 8,098,786 | |||||||
Net increase (decrease) in net assets | (4,772,386 | ) | 14,196,124 | |||||||
NET ASSETS | ||||||||||
Beginning of period | 42,375,639 | 28,179,515 | ||||||||
End of period | $ | 37,603,253 | $ | 42,375,639 | ||||||
Undistributed (accumulated) net investment income (loss) included in net assets | $ | 171,950 | $ | (17,777 | ) | |||||
CHANGE IN FUND SHARES | ||||||||||
Shares outstanding, beginning of period | 2,351,772 | 1,889,545 | ||||||||
Shares sold | 452,084 | 809,746 | ||||||||
Shares issued in reinvestment of distributions | — | 15,796 | ||||||||
Shares redeemed | (489,146 | ) | (363,315 | ) | ||||||
Total net increase (decrease) in shares outstanding | (37,062 | ) | 462,227 | |||||||
Shares outstanding, end of period | 2,314,710 | 2,351,772 | ||||||||
| 94 | 2008 Semiannual Report n TIAA-CREF Life Funds | See notes to financial statements |
| Growth & Income Fund | International Equity Fund | |||||||||||||||
| June 30, 2008 | December 31, 2007 | June 30, 2008 | December 31, 2007 | |||||||||||||
| (unaudited) | (unaudited) | |||||||||||||||
| $ | 655,684 | $ | 1,100,640 | $ | 2,463,737 | $ | 2,087,200 | |||||||||
| 4,059,580 | 4,037,700 | (18,562,323 | ) | 30,021,510 | ||||||||||||
| (13,491,116 | ) | 6,598,439 | (12,320,154 | ) | (9,392,395 | ) | ||||||||||
| (8,775,852 | ) | 11,736,779 | (28,418,740 | ) | 22,716,315 | |||||||||||
| — | (1,130,983 | ) | — | (2,853,454 | ) | |||||||||||
| — | — | — | (27,442,566 | ) | ||||||||||||
| — | (1,130,983 | ) | — | (30,296,020 | ) | |||||||||||
| 4,439,577 | 18,372,776 | 9,422,036 | 41,552,125 | |||||||||||||
| — | 1,130,983 | — | 30,296,020 | |||||||||||||
| (5,914,917 | ) | (6,072,812 | ) | (19,782,663 | ) | (15,365,649 | ) | |||||||||
| (1,475,340 | ) | 13,430,947 | (10,360,627 | ) | 56,482,496 | |||||||||||
| (10,251,192 | ) | 24,036,743 | (38,779,367 | ) | 48,902,791 | |||||||||||
| 83,834,327 | 59,797,584 | 160,044,667 | 111,141,876 | |||||||||||||
| $ | 73,583,135 | $ | 83,834,327 | $ | 121,265,300 | $ | 160,044,667 | |||||||||
| $ | 675,285 | | $ | 19,601 | $ | 2,497,590 | $ | 33,853 | ||||||||
| 2,884,439 | 2,408,900 | 6,663,208 | 4,443,877 | |||||||||||||
| 162,533 | 661,329 | 442,298 | 1,486,707 | |||||||||||||
| — | 38,705 | — | 1,296,364 | |||||||||||||
| (220,254 | ) | (224,495 | ) | (946,789 | ) | (563,740 | ) | |||||||||
| (57,721 | ) | 475,539 | (504,491 | ) | 2,219,331 | |||||||||||
| 2,826,718 | 2,884,439 | 6,158,717 | 6,663,208 | |||||||||||||
| See notes to financial statements | TIAA-CREF Life Funds n 2008 Semiannual Report | 95 |
STATEMENTS OF CHANGES IN NET ASSETS
TIAA-CREF LIFE FUNDS n FOR THE PERIOD OR YEAR ENDED
| Large-Cap Value Fund | ||||||||||
| June 30, 2008 | December 31, 2007 | |||||||||
| (unaudited) | ||||||||||
CHANGE IN NET ASSETS | ||||||||||
Net investment income | $ | 750,926 | $ | 1,393,025 | ||||||
Net realized gain (loss) on total investments | (5,625,139 | ) | 6,901,514 | |||||||
Net change in unrealized appreciation (depreciation) on total investments | (6,011,354 | ) | (8,027,220 | ) | ||||||
Net increase (decrease) from operations | (10,885,567 | ) | 267,319 | |||||||
DISTRIBUTIONS TO SHAREHOLDERS | ||||||||||
From net investment income | — | (1,495,301 | ) | |||||||
From net realized gain on total investments | — | (8,487,242 | ) | |||||||
From tax return of capital | — | — | ||||||||
Total distributions | — | (9,982,543 | ) | |||||||
SHAREHOLDER TRANSACTIONS | ||||||||||
Subscriptions | 3,873,278 | 18,187,744 | ||||||||
Reinvestment of distributions | — | 9,982,543 | ||||||||
Redemptions | (6,510,910 | ) | (14,021,344 | ) | ||||||
Net increase (decrease) from shareholder transactions | (2,637,632 | ) | 14,148,943 | |||||||
Net increase (decrease) in net assets | (13,523,199 | ) | 4,433,719 | |||||||
NET ASSETS | ||||||||||
Beginning of period | 71,350,466 | 66,916,747 | ||||||||
End of period | $ | 57,827,267 | $ | 71,350,466 | ||||||
Undistributed (accumulated) net investment income (loss) included in net assets | $ | 661,386 | $ | (89,540 | ) | |||||
CHANGE IN FUND SHARES | ||||||||||
Shares outstanding, beginning of period | 2,279,364 | 1,857,587 | ||||||||
Shares sold | 134,214 | 479,784 | ||||||||
Shares issued in reinvestment of distributions | — | 316,504 | ||||||||
Shares redeemed | (227,929 | ) | (374,511 | ) | ||||||
Total net increase (decrease) in shares outstanding | (93,715 | ) | 421,777 | |||||||
Shares outstanding, end of period | 2,185,649 | 2,279,364 | ||||||||
| 96 | 2008 Semiannual Report n TIAA-CREF Life Funds | See notes to financial statements |
| continued |
| Small-Cap Equity Fund | Stock Index Fund | |||||||||||||||
| June 30, 2008 | December 31, 2007 | June 30, 2008 | December 31, 2007 | |||||||||||||
| (unaudited) | (unaudited) | |||||||||||||||
| $ | 287,253 | $ | 651,103 | $ | 1,670,419 | $ | 3,336,504 | |||||||||
| (3,009,791 | ) | 2,288,935 | (2,326,673 | ) | 1,386,767 | |||||||||||
| (822,333 | ) | (6,036,428 | ) | (19,566,872 | ) | 4,314,334 | ||||||||||
| (3,544,871 | ) | (3,096,390 | ) | (20,223,126 | ) | 9,037,605 | ||||||||||
| — | (747,834 | ) | — | (3,398,505 | ) | |||||||||||
| — | (4,565,281 | ) | — | (1,389,670 | ) | |||||||||||
| — | (152,007 | ) | — | — | ||||||||||||
| — | (5,465,122 | ) | — | (4,788,175 | ) | |||||||||||
| 3,156,641 | 8,716,338 | 7,149,846 | 28,104,158 | |||||||||||||
| — | 5,465,122 | — | 4,788,175 | |||||||||||||
| (4,251,961 | ) | (10,941,923 | ) | (9,520,829 | ) | (23,817,958 | ) | |||||||||
| (1,095,320 | ) | 3,239,537 | (2,370,983 | ) | 9,074,375 | |||||||||||
| (4,640,191 | ) | (5,321,975 | ) | (22,594,109 | ) | 13,323,805 | ||||||||||
| 51,868,247 | 57,190,222 | 184,339,114 | 171,015,309 | |||||||||||||
| $ | 47,228,056 | $ | 51,868,247 | $ | 161,745,005 | $ | 184,339,114 | |||||||||
| $ | 228,033 | | $ | (59,220 | ) | $ | 1,624,694 | $ | (45,725 | ) | ||||||
| 1,909,111 | 1,780,575 | 5,814,633 | 5,527,062 | |||||||||||||
| 123,818 | 268,473 | 241,367 | 866,447 | |||||||||||||
| — | 196,799 | — | 149,304 | |||||||||||||
| (166,981 | ) | (336,736 | ) | (324,301 | ) | (728,180 | ) | |||||||||
| (43,163 | ) | 128,536 | (82,934 | ) | 287,571 | |||||||||||
| 1,865,948 | 1,909,111 | 5,731,699 | 5,814,633 | |||||||||||||
| See notes to financial statements | TIAA-CREF Life Funds n 2008 Semiannual Report | 97 |
STATEMENTS OF CHANGES IN NET ASSETS
TIAA-CREF LIFE FUNDS n FOR THE PERIOD OR YEAR ENDED
| Social Choice Equity Fund | ||||||||||
| June 30, 2008 | December 31, 2007 | |||||||||
| (unaudited) | ||||||||||
CHANGE IN NET ASSETS | ||||||||||
Net investment income | $ | 329,935 | $ | 689,486 | ||||||
Net realized gain (loss) on total investments | (406,006 | ) | 1,097,726 | |||||||
Net change in unrealized appreciation (depreciation) on | (3,628,528 | ) | (240,933 | ) | ||||||
Net increase (decrease) from operations | (3,704,599 | ) | 1,546,279 | |||||||
DISTRIBUTIONS TO SHAREHOLDERS | ||||||||||
From net investment income | — | (696,022 | ) | |||||||
From net realized gain on total investments | — | (628,557 | ) | |||||||
Total distributions | — | (1,324,579 | ) | |||||||
SHAREHOLDER TRANSACTIONS | ||||||||||
Subscriptions | 1,101,661 | 3,927,667 | ||||||||
Reinvestment of distributions | — | 1,324,579 | ||||||||
Redemptions | (1,477,183 | ) | (3,522,345 | ) | ||||||
Net increase (decrease) from shareholder transactions | (375,522 | ) | 1,729,901 | |||||||
Net increase (decrease) in net assets | (4,080,121 | ) | 1,951,601 | |||||||
NET ASSETS | ||||||||||
Beginning of period | 37,882,622 | 35,931,021 | ||||||||
End of period | $ | 33,802,501 | $ | 37,882,622 | ||||||
Undistributed (accumulated) net investment income (loss) included in net assets | $ | 323,041 | $ | (6,894 | ) | |||||
CHANGE IN FUND SHARES | ||||||||||
Shares outstanding, beginning of period | 1,396,635 | 1,333,916 | ||||||||
Shares sold | 43,365 | 139,844 | ||||||||
Shares issued in reinvestment of distributions | — | 48,272 | ||||||||
Shares redeemed | (58,650 | ) | (125,397 | ) | ||||||
Total net increase (decrease) in shares outstanding | (15,285 | ) | 62,719 | |||||||
Shares outstanding, end of period | 1,381,350 | 1,396,635 | ||||||||
| 98 | 2008 Semiannual Report n TIAA-CREF Life Funds | See notes to financial statements |
| continued |
| Real Estate Securities Fund | Bond Fund | |||||||||||||||
| June 30, 2008 | December 31, 2007 | June 30, 2008 | December 31, 2007 | |||||||||||||
| (unaudited) | (unaudited) | |||||||||||||||
| $ | 789,364 | $ | 1,585,970 | $ | 2,386,958 | $ | 4,070,813 | |||||||||
| (6,090,750 | ) | 8,245,842 | (671,770 | ) | (334,769 | ) | ||||||||||
| | 1,556,606 | | (25,455,990 | ) | (1,875,814 | ) | 645,424 | |||||||||
| (3,744,780 | ) | (15,624,178 | ) | (160,626 | ) | 4,381,468 | ||||||||||
| — | (3,084,353 | ) | — | (4,093,995 | ) | |||||||||||
| — | (9,760,527 | ) | — | — | ||||||||||||
| — | (12,844,880 | ) | — | (4,093,995 | ) | |||||||||||
| 4,672,506 | 15,641,922 | 8,381,835 | 14,341,160 | |||||||||||||
| — | 12,844,881 | — | 4,093,995 | |||||||||||||
| (6,915,148 | ) | (29,971,649 | ) | (3,984,239 | ) | (3,822,073 | ) | |||||||||
| (2,242,642 | ) | (1,484,846 | ) | 4,397,596 | 14,613,082 | |||||||||||
| (5,987,422 | ) | (29,953,904 | ) | 4,236,970 | 14,900,555 | |||||||||||
| 74,751,273 | 104,705,177 | 86,661,408 | 71,760,853 | |||||||||||||
| $ | 68,763,851 | $ | 74,751,273 | $ | 90,898,378 | $ | 86,661,408 | |||||||||
| $ | (865,960 | ) | $ | (1,655,324 | ) | $ | 2,389,626 | $ | 2,668 | |||||||
| 2,821,270 | 2,752,773 | 3,529,610 | 2,939,711 | |||||||||||||
| 171,360 | 401,665 | 338,950 | 574,943 | |||||||||||||
| — | 480,183 | — | 168,062 | |||||||||||||
| (267,923 | ) | (813,351 | ) | (160,729 | ) | (153,106 | ) | |||||||||
| (96,563 | ) | 68,497 | 178,221 | 589,899 | ||||||||||||
| 2,724,707 | 2,821,270 | 3,707,831 | 3,529,610 | |||||||||||||
| See notes to financial statements | TIAA-CREF Life Funds n 2008 Semiannual Report | 99 |
| STATEMENTS OF CHANGES IN NET ASSETS | concluded |
TIAA-CREF LIFE FUNDS n FOR THE PERIOD OR YEAR ENDED
| Money Market Fund | ||||||||
| June 30, 2008 | December 31, 2007 | |||||||
| (unaudited) | ||||||||
CHANGE IN NET ASSETS | ||||||||
Net investment income | $ | 1,673,501 | $ | 3,985,575 | ||||
Net realized gain on total investments | — | 29 | ||||||
Net increase from operations | 1,673,501 | 3,985,604 | ||||||
DISTRIBUTIONS TO SHAREHOLDERS | ||||||||
From net investment income | (1,673,501 | ) | (3,985,575 | ) | ||||
Total distributions | (1,673,501 | ) | (3,985,575 | ) | ||||
SHAREHOLDER TRANSACTIONS | ||||||||
Subscriptions | 35,163,381 | 73,781,955 | ||||||
Reinvestment of distributions | 1,673,766 | 3,994,462 | ||||||
Redemptions | (26,421,531 | ) | (31,225,919 | ) | ||||
Net increase from shareholder transactions | 10,415,616 | 46,550,498 | ||||||
Net increase in net assets | 10,415,616 | 46,550,527 | ||||||
NET ASSETS | ||||||||
Beginning of period | 100,444,288 | 53,893,761 | ||||||
End of period | $ | 110,859,904 | $ | 100,444,288 | ||||
Undistributed net investment income included in net assets | $ | 71 | $ | 71 | ||||
CHANGE IN FUND SHARES | ||||||||
Shares outstanding, beginning of period | 100,444,703 | 53,894,205 | ||||||
Shares sold | 35,163,381 | 73,781,955 | ||||||
Shares issued in reinvestment of distributions | 1,673,766 | 3,994,462 | ||||||
Shares redeemed | (26,421,531 | ) | (31,225,919 | ) | ||||
Total net increase in shares outstanding | 10,415,616 | 46,550,498 | ||||||
Shares outstanding, end of period | 110,860,319 | 100,444,703 | ||||||
| 100 | 2008 Semiannual Report n TIAA-CREF Life Funds | See notes to financial statements |
TIAA-CREF LIFE FUNDS n FOR THE PERIOD OR YEAR ENDED
| Growth Equity Fund | ||||||||||||||||||||||||
| 6/30/08 | 12/31/07 | 12/31/06 | 12/31/05 | 12/31/04 | 12/31/03 | |||||||||||||||||||
| (unaudited) | ||||||||||||||||||||||||
FOR A SHARE OUTSTANDING THROUGHOUT EACH PERIOD |
| |||||||||||||||||||||||
Net asset value, beginning of period | $ | 18.02 | $ | 14.91 | $ | 14.23 | $ | 13.58 | $ | 12.88 | $ | 10.15 | ||||||||||||
Gain (loss) from investment operations: |
| |||||||||||||||||||||||
Net investment income(a) | 0.08 | 0.13 | 0.11 | 0.09 | 0.12 | 0.09 | ||||||||||||||||||
Net realized and unrealized gain (loss) on total investments | (1.85 | ) | 3.10 | 0.69 | 0.65 | 0.70 | 2.78 | |||||||||||||||||
Total gain (loss) from investment operations | (1.77 | ) | 3.23 | 0.80 | 0.74 | 0.82 | 2.87 | |||||||||||||||||
Less distributions from: |
| |||||||||||||||||||||||
Net investment income | — | (0.12 | ) | (0.12 | ) | (0.09 | ) | (0.12 | ) | (0.14 | ) | |||||||||||||
Total distributions | — | (0.12 | ) | (0.12 | ) | (0.09 | ) | (0.12 | ) | (0.14 | ) | |||||||||||||
Net asset value, end of period | $ | 16.25 | $ | 18.02 | $ | 14.91 | $ | 14.23 | $ | 13.58 | $ | 12.88 | ||||||||||||
TOTAL RETURN(b) | (9.82)% | 21.68% | 5.62% | 5.43% | 6.39% | 28.30% | ||||||||||||||||||
RATIOS AND SUPPLEMENTAL DATA |
| |||||||||||||||||||||||
Net assets at end of period (in thousands) | $ | 37,603 | $ | 42,376 | $ | 28,180 | $ | 29,517 | $ | 28,282 | $ | 28,319 | ||||||||||||
Ratio of expenses to average net assets | 0.28% | (c) | 0.26% | 0.25% | 0.26% | 0.25% | 0.25% | |||||||||||||||||
Ratio of net investment income to average net assets | 0.99% | (c) | 0.81% | 0.79% | 0.66% | 0.95% | 0.82% | |||||||||||||||||
Portfolio turnover rate(b) | 126% | 154% | 98% | 106% | 79% | 78% | ||||||||||||||||||
| (a) | Based on average shares outstanding. |
| (b) | The percentages shown for this period are not annualized. |
| (c) | The percentages shown for this period are annualized. |
| See notes to financial statements | TIAA-CREF Life Funds n 2008 Semiannual Report | 101 |
| FINANCIAL HIGHLIGHTS | continued |
TIAA-CREF LIFE FUNDS n FOR THE PERIOD OR YEAR ENDED
| Growth & Income Fund | ||||||||||||||||||||||||
| 6/30/08 | 12/31/07 | 12/31/06 | 12/31/05 | 12/31/04 | 12/31/03 | |||||||||||||||||||
| (unaudited) | ||||||||||||||||||||||||
FOR A SHARE OUTSTANDING THROUGHOUT EACH PERIOD |
| |||||||||||||||||||||||
Net asset value, beginning of period | $ | 29.06 | $ | 24.82 | $ | 21.56 | $ | 20.49 | $ | 18.93 | $ | 15.22 | ||||||||||||
Gain (loss) from investment operations: |
| |||||||||||||||||||||||
Net investment income(a) | 0.23 | 0.43 | 0.37 | 0.29 | 0.32 | 0.23 | ||||||||||||||||||
Net realized and unrealized gain (loss) on total investments | (3.26 | ) | 4.21 | 3.26 | 1.06 | 1.56 | 3.79 | |||||||||||||||||
Total gain (loss) from investment operations | (3.03 | ) | 4.64 | 3.63 | 1.35 | 1.88 | 4.02 | |||||||||||||||||
Less distributions from: |
| |||||||||||||||||||||||
Net investment income | — | (0.40 | ) | (0.37 | ) | (0.28 | ) | (0.32 | ) | (0.31 | ) | |||||||||||||
Total distributions | — | (0.40 | ) | (0.37 | ) | (0.28 | ) | (0.32 | ) | (0.31 | ) | |||||||||||||
Net asset value, end of period | $ | 26.03 | $ | 29.06 | $ | 24.82 | $ | 21.56 | $ | 20.49 | $ | 18.93 | ||||||||||||
TOTAL RETURN(b) | (10.43)% | 18.68% | 16.85% | 6.57% | 9.94% | 26.39% | ||||||||||||||||||
RATIOS AND SUPPLEMENTAL DATA |
| |||||||||||||||||||||||
Net assets at end of period (in thousands) | $ | 73,583 | $ | 83,834 | $ | 59,798 | $ | 51,627 | $ | 47,748 | $ | 44,403 | ||||||||||||
Ratio of expenses to average net assets | 0.23% | (c) | 0.24% | 0.23% | 0.23% | 0.23% | 0.23% | |||||||||||||||||
Ratio of net investment income to average net assets | 1.71% | (c) | 1.56% | 1.63% | 1.41% | 1.66% | 1.41% | |||||||||||||||||
Portfolio turnover rate(b) | 68% | 88% | 119% | 205% | 85% | 137% | ||||||||||||||||||
| (a) | Based on average shares outstanding. |
| (b) | The percentages shown for this period are not annualized. |
| (c) | The percentages shown for this period are annualized. |
| 102 | 2008 Semiannual Report n TIAA-CREF Life Funds | See notes to financial statements |
| FINANCIAL HIGHLIGHTS | continued |
TIAA-CREF LIFE FUNDS n FOR THE PERIOD OR YEAR ENDED
| International Equity Fund | ||||||||||||||||||||||||
| 6/30/08 | 12/31/07 | 12/31/06 | 12/31/05 | 12/31/04 | 12/31/03 | |||||||||||||||||||
| (unaudited) | ||||||||||||||||||||||||
FOR A SHARE OUTSTANDING THROUGHOUT EACH PERIOD |
| |||||||||||||||||||||||
Net asset value, beginning of period | $ | 24.02 | $ | 25.01 | $ | 19.54 | $ | 17.25 | $ | 14.93 | $ | 10.76 | ||||||||||||
Gain (loss) from investment operations: |
| |||||||||||||||||||||||
Net investment income(a) | 0.38 | 0.42 | 0.35 | 0.31 | 0.29 | 0.26 | ||||||||||||||||||
Net realized and unrealized gain (loss) on total investments | (4.71 | ) | 4.26 | 5.50 | 2.28 | 2.35 | 4.15 | |||||||||||||||||
Total gain (loss) from investment operations | (4.33 | ) | 4.68 | 5.85 | 2.59 | 2.64 | 4.41 | |||||||||||||||||
Less distributions from: |
| |||||||||||||||||||||||
Net investment income | — | (0.53 | ) | (0.38 | ) | (0.30 | ) | (0.32 | ) | (0.24 | ) | |||||||||||||
Net realized gains | — | (5.14 | ) | — | — | — | — | |||||||||||||||||
Total distributions | — | (5.67 | ) | (0.38 | ) | (0.30 | ) | (0.32 | ) | (0.24 | ) | |||||||||||||
Net asset value, end of period | $ | 19.69 | $ | 24.02 | $ | 25.01 | $ | 19.54 | $ | 17.25 | $ | 14.93 | ||||||||||||
TOTAL RETURN(b) | (18.03)% | 19.34% | 29.95% | 15.01% | 17.72% | 41.06% | ||||||||||||||||||
RATIOS AND SUPPLEMENTAL DATA |
| |||||||||||||||||||||||
Net assets at end of period (in thousands) | $ | 121,265 | $ | 160,045 | $ | 111,142 | $ | 72,597 | $ | 52,151 | $ | 47,879 | ||||||||||||
Ratio of expenses to average net assets | 0.32% | (c) | 0.33% | 0.29% | 0.31% | 0.29% | 0.29% | |||||||||||||||||
Ratio of net investment income to average net assets | 3.62% | (c) | 1.51% | 1.59% | 1.75% | 1.87% | 2.15% | |||||||||||||||||
Portfolio turnover rate(b) | 113% | 190% | 146% | 153% | 158% | 139% | ||||||||||||||||||
| (a) | Based on average shares outstanding. |
| (b) | The percentages shown for this period are not annualized. |
| (c) | The percentages shown for this period are annualized. |
| See notes to financial statements | TIAA-CREF Life Funds n 2008 Semiannual Report | 103 |
| FINANCIAL HIGHLIGHTS | continued |
TIAA-CREF LIFE FUNDS n FOR THE PERIOD OR YEAR ENDED
| Large-Cap Value Fund | ||||||||||||||||||||||||
| 6/30/08 | 12/31/07 | 12/31/06 | 12/31/05 | 12/31/04 | 12/31/03 | |||||||||||||||||||
| (unaudited) | ||||||||||||||||||||||||
FOR A SHARE OUTSTANDING THROUGHOUT EACH PERIOD |
| |||||||||||||||||||||||
Net asset value, beginning of period | $ | 31.30 | $ | 36.02 | $ | 32.04 | $ | 33.07 | $ | 31.62 | $ | 24.84 | ||||||||||||
Gain (loss) from investment operations: |
| |||||||||||||||||||||||
Net investment income(a) | 0.34 | 0.71 | 0.64 | 0.72 | 0.74 | 0.60 | ||||||||||||||||||
Net realized and unrealized gain (loss) on total investments | (5.18 | ) | (0.34 | ) | 6.26 | 0.95 | 5.82 | 7.65 | ||||||||||||||||
Total gain (loss) from investment operations | (4.84 | ) | 0.37 | 6.90 | 1.67 | 6.56 | 8.25 | |||||||||||||||||
Less distributions from: |
| |||||||||||||||||||||||
Net investment income | — | (0.76 | ) | (0.61 | ) | (0.70 | ) | (0.67 | ) | (0.57 | ) | |||||||||||||
Net realized gains | — | (4.33 | ) | (2.31 | ) | (2.00 | ) | (4.44 | ) | (0.90 | ) | |||||||||||||
Total distributions | — | (5.09 | ) | (2.92 | ) | (2.70 | ) | (5.11 | ) | (1.47 | ) | |||||||||||||
Net asset value, end of period | $ | 26.46 | $ | 31.30 | $ | 36.02 | $ | 32.04 | $ | 33.07 | $ | 31.62 | ||||||||||||
TOTAL RETURN(b) | (15.46)% | 0.91% | 21.58% | 4.94% | 20.76% | 33.23% | ||||||||||||||||||
RATIOS AND SUPPLEMENTAL DATA |
| |||||||||||||||||||||||
Net assets at end of period (in thousands) | $ | 57,827 | $ | 71,350 | $ | 66,917 | $ | 49,028 | $ | 42,428 | $ | 29,760 | ||||||||||||
Ratio of expenses to average net assets | 0.26% | (c) | 0.27% | 0.24% | 0.25% | 0.24% | 0.24% | |||||||||||||||||
Ratio of net investment income to average net assets | 2.38% | (c) | 1.88% | 1.83% | 2.17% | 2.23% | 2.19% | |||||||||||||||||
Portfolio turnover rate(b) | 83% | 133% | 102% | 112% | 149% | 159% | ||||||||||||||||||
| (a) | Based on average shares outstanding. |
| (b) | The percentages shown for this period are not annualized. |
| (c) | The percentages shown for this period are annualized. |
| 104 | 2008 Semiannual Report n TIAA-CREF Life Funds | See notes to financial statements |
| FINANCIAL HIGHLIGHTS | continued |
TIAA-CREF LIFE FUNDS n FOR THE PERIOD OR YEAR ENDED
| Small-Cap Equity Fund | ||||||||||||||||||||||||
| 6/30/08 | 12/31/07 | 12/31/06 | 12/31/05 | 12/31/04 | 12/31/03 | |||||||||||||||||||
| (unaudited) | ||||||||||||||||||||||||
FOR A SHARE OUTSTANDING THROUGHOUT EACH PERIOD |
| |||||||||||||||||||||||
Net asset value, beginning of period | $ | 27.17 | $ | 32.12 | $ | 30.02 | $ | 33.43 | $ | 32.98 | $ | 24.63 | ||||||||||||
Gain (loss) from investment operations: |
| |||||||||||||||||||||||
Net investment income(a) | 0.15 | 0.37 | 0.37 | 0.33 | 0.39 | 0.39 | ||||||||||||||||||
Net realized and unrealized gain (loss) on total investments | (2.01 | ) | (2.10 | ) | 4.95 | 1.30 | 6.17 | 11.71 | ||||||||||||||||
Total gain (loss) from investment operations | (1.86 | ) | (1.73 | ) | 5.32 | 1.63 | 6.56 | 12.10 | ||||||||||||||||
Less distributions from: |
| |||||||||||||||||||||||
Net investment income | — | (0.44 | ) | (0.38 | ) | (0.37 | ) | (0.39 | ) | (0.36 | ) | |||||||||||||
Net realized gains | — | (2.69 | ) | (2.84 | ) | (4.67 | ) | (5.72 | ) | (3.39 | ) | |||||||||||||
Tax return of capital | — | (0.09 | ) | — | — | — | — | |||||||||||||||||
Total distributions | — | (3.22 | ) | (3.22 | ) | (5.04 | ) | (6.11 | ) | (3.75 | ) | |||||||||||||
Net asset value, | $ | 25.31 | $ | 27.17 | $ | 32.12 | $ | 30.02 | $ | 33.43 | $ | 32.98 | ||||||||||||
TOTAL RETURN(b) | (6.85)% | (5.62 | )% | 17.84% | 4.58% | 19.83% | 48.95% | |||||||||||||||||
RATIOS AND SUPPLEMENTAL DATA |
| |||||||||||||||||||||||
Net assets at end of period (in thousands) | $ | 47,228 | $ | 51,868 | $ | 57,190 | $ | 45,332 | $ | 42,194 | $ | 34,459 | ||||||||||||
Ratio of expenses to average net assets | 0.11% | (c) | 0.11% | 0.10% | 0.12% | 0.10% | 0.10% | |||||||||||||||||
Ratio of net investment income to average net assets | 1.20% | (c) | 1.13% | 1.12% | 1.01% | 1.13% | 1.32% | |||||||||||||||||
Portfolio turnover rate(b) | 66% | 135% | 246% | 400% | 221% | 237% | ||||||||||||||||||
| (a) | Based on average shares outstanding. |
| (b) | The percentages shown for this period are not annualized. |
| (c) | The percentages shown for this period are annualized. |
| See notes to financial statements | TIAA-CREF Life Funds n 2008 Semiannual Report | 105 |
| FINANCIAL HIGHLIGHTS | continued |
TIAA-CREF LIFE FUNDS n FOR THE PERIOD OR YEAR ENDED
| Stock Index Fund | ||||||||||||||||||||||||
| 6/30/08 | 12/31/07 | 12/31/06 | 12/31/05 | 12/31/04 | 12/31/03 | |||||||||||||||||||
| (unaudited) | ||||||||||||||||||||||||
FOR A SHARE OUTSTANDING THROUGHOUT EACH PERIOD |
| |||||||||||||||||||||||
Net asset value, beginning of period | $ | 31.70 | $ | 30.94 | $ | 27.45 | $ | 26.31 | $ | 23.93 | $ | 18.86 | ||||||||||||
Gain (loss) from investment operations: |
| |||||||||||||||||||||||
Net investment income(a) | 0.29 | 0.59 | 0.51 | 0.46 | 0.46 | 0.35 | ||||||||||||||||||
Net realized and unrealized gain (loss) on total investments | (3.77 | ) | 1.02 | 3.77 | 1.14 | 2.38 | 5.47 | |||||||||||||||||
Total gain (loss) from investment operations | (3.48 | ) | 1.61 | 4.28 | 1.60 | 2.84 | 5.82 | |||||||||||||||||
Less distributions from: |
| |||||||||||||||||||||||
Net investment income | — | (0.60 | ) | (0.52 | ) | (0.46 | ) | (0.45 | ) | (0.36 | ) | |||||||||||||
Net realized gains | — | (0.25 | ) | (0.27 | ) | — | (0.01 | ) | (0.39 | ) | ||||||||||||||
Total distributions | — | (0.85 | ) | (0.79 | ) | (0.46 | ) | (0.46 | ) | (0.75 | ) | |||||||||||||
Net asset value, end of period | $ | 28.22 | $ | 31.70 | $ | 30.94 | $ | 27.45 | $ | 26.31 | $ | 23.93 | ||||||||||||
TOTAL RETURN(b) | (10.98)% | 5.16% | 15.62% | 6.04% | 11.89% | 30.85% | ||||||||||||||||||
RATIOS AND SUPPLEMENTAL DATA |
| |||||||||||||||||||||||
Net assets at end of period (in thousands) | $ | 161,745 | $ | 184,339 | $ | 171,015 | $ | 152,936 | $ | 143,222 | $ | 118,320 | ||||||||||||
Ratio of expenses to average net assets | 0.06% | (c) | 0.06% | 0.06% | 0.06% | 0.06% | 0.06% | |||||||||||||||||
Ratio of net investment income to average net assets | 1.98% | (c) | 1.82% | 1.75% | 1.73% | 1.88% | 1.68% | |||||||||||||||||
Portfolio turnover rate(b) | 3% | 13% | 14% | 8% | 12% | 26% | ||||||||||||||||||
| (a) | Based on average shares outstanding. |
| (b) | The percentages shown for this period are not annualized. |
| (c) | The percentages shown for this period are annualized. |
| 106 | 2008 Semiannual Report n TIAA-CREF Life Funds | See notes to financial statements |
| FINANCIAL HIGHLIGHTS | continued |
TIAA-CREF LIFE FUNDS n FOR THE PERIOD OR YEAR ENDED
| Social Choice Equity Fund | ||||||||||||||||||||||||
| 6/30/08 | 12/31/07 | 12/31/06 | 12/31/05 | 12/31/04 | 12/31/03 | |||||||||||||||||||
| (unaudited) | ||||||||||||||||||||||||
FOR A SHARE OUTSTANDING THROUGHOUT EACH PERIOD |
| |||||||||||||||||||||||
Net asset value, beginning of period | $ | 27.12 | $ | 26.94 | $ | 24.02 | $ | 22.75 | $ | 20.60 | $ | 16.09 | ||||||||||||
Gain (loss) from investment operations: |
| |||||||||||||||||||||||
Net investment income(a) | 0.24 | 0.51 | 0.43 | 0.38 | 0.39 | 0.29 | ||||||||||||||||||
Net realized and unrealized gain (loss) on total investments | (2.89 | ) | 0.64 | 3.08 | 1.24 | 2.16 | 4.54 | |||||||||||||||||
Total gain (loss) from investment operations | (2.65 | ) | 1.15 | 3.51 | 1.62 | 2.55 | 4.83 | |||||||||||||||||
Less distributions from: |
| |||||||||||||||||||||||
Net investment income | — | (0.51 | ) | (0.43 | ) | (0.35 | ) | (0.40 | ) | (0.32 | ) | |||||||||||||
Net realized gains | — | (0.46 | ) | (0.16 | ) | — | — | — | ||||||||||||||||
Total distributions | — | (0.97 | ) | (0.59 | ) | (0.35 | ) | (0.40 | ) | (0.32 | ) | |||||||||||||
Net asset value, end of period | $ | 24.47 | $ | 27.12 | $ | 26.94 | $ | 24.02 | $ | 22.75 | $ | 20.60 | ||||||||||||
TOTAL RETURN(b) | (9.77)% | 4.25% | 14.64% | 7.11% | 12.39% | 30.03% | ||||||||||||||||||
RATIOS AND SUPPLEMENTAL DATA |
| |||||||||||||||||||||||
Net assets at end of period (in thousands) | $ | 33,803 | $ | 37,883 | $ | 35,931 | $ | 32,557 | $ | 27,605 | $ | 26,510 | ||||||||||||
Ratio of expenses to average net assets | 0.07% | (c) | 0.07% | 0.07% | 0.07% | 0.07% | 0.07% | |||||||||||||||||
Ratio of net investment income to average net assets | 1.88% | (c) | 1.81% | 1.69% | 1.63% | 1.82% | 1.64% | |||||||||||||||||
Portfolio turnover rate(b) | 12% | 12% | 19% | 8% | 5% | 15% | ||||||||||||||||||
| (a) | Based on average shares outstanding. |
| (b) | The percentages shown for this period are not annualized. |
| (c) | The percentages shown for this period are annualized. |
| See notes to financial statements | TIAA-CREF Life Funds n 2008 Semiannual Report | 107 |
| FINANCIAL HIGHLIGHTS | continued |
TIAA-CREF LIFE FUNDS n FOR THE PERIOD OR YEAR ENDED
| Real Estate Securities Fund | ||||||||||||||||||||||||
| 6/30/08 | 12/31/07 | 12/31/06 | 12/31/05 | 12/31/04 | 12/31/03 | |||||||||||||||||||
| (unaudited) | ||||||||||||||||||||||||
FOR A SHARE OUTSTANDING THROUGHOUT EACH PERIOD |
| |||||||||||||||||||||||
Net asset value, beginning of period | $ | 26.50 | $ | 38.04 | $ | 30.98 | $ | 33.89 | $ | 30.00 | $ | 24.48 | ||||||||||||
Gain (loss) from investment operations: |
| |||||||||||||||||||||||
Net investment income(a) | 0.29 | 0.60 | 0.82 | 0.96 | 1.45 | 1.54 | ||||||||||||||||||
Net realized and unrealized gain (loss) on total investments | (1.55 | ) | (6.68 | ) | 9.63 | 1.51 | 8.40 | 8.24 | ||||||||||||||||
Total gain (loss) from investment operations | (1.26 | ) | (6.08 | ) | 10.45 | 2.47 | 9.85 | 9.78 | ||||||||||||||||
Less distributions from: |
| |||||||||||||||||||||||
Net investment income | — | (1.31 | ) | (1.09 | ) | (1.38 | ) | (1.26 | ) | (1.39 | ) | |||||||||||||
Net realized gains | — | (4.15 | ) | (2.30 | ) | (4.00 | ) | (4.70 | ) | (2.87 | ) | |||||||||||||
Total distributions | — | (5.46 | ) | (3.39 | ) | (5.38 | ) | (5.96 | ) | (4.26 | ) | |||||||||||||
Net asset value, end of period | $ | 25.24 | $ | 26.50 | $ | 38.04 | $ | 30.98 | $ | 33.89 | $ | 30.00 | ||||||||||||
TOTAL RETURN(b) | (4.75)% | (16.12 | )% | 34.05% | 7.19% | 32.98% | 39.96% | |||||||||||||||||
RATIOS AND SUPPLEMENTAL DATA |
| |||||||||||||||||||||||
Net assets at end of period (in thousands) | $ | 68,764 | $ | 74,751 | $ | 104,705 | $ | 70,659 | $ | 63,899 | $ | 35,311 | ||||||||||||
Ratio of expenses to average net assets | 0.26% | (c) | 0.27% | 0.25% | 0.29% | 0.25% | 0.25% | |||||||||||||||||
Ratio of net investment income to average net assets | 2.18% | (c) | 1.62% | 2.30% | 2.80% | 4.41% | 5.32% | |||||||||||||||||
Portfolio turnover rate(b) | 36% | 111% | 117% | 239% | 315% | 189% | ||||||||||||||||||
| (a) | Based on average shares outstanding. |
| (b) | The percentages shown for this period are not annualized. |
| (c) | The percentages shown for this period are annualized. |
| 108 | 2008 Semiannual Report n TIAA-CREF Life Funds | See notes to financial statements |
| FINANCIAL HIGHLIGHTS | continued |
TIAA-CREF LIFE FUNDS n FOR THE PERIOD OR YEAR ENDED
| Bond Fund | ||||||||||||||||||||||||
| 6/30/08 | 12/31/07 | 12/31/06 | 12/31/05 | 12/31/04 | 12/31/03(b) | |||||||||||||||||||
| (unaudited) | ||||||||||||||||||||||||
FOR A SHARE OUTSTANDING THROUGHOUT EACH PERIOD |
| |||||||||||||||||||||||
Net asset value, beginning of period | $ | 24.55 | $ | 24.41 | $ | 24.44 | $ | 24.88 | $ | 24.74 | $ | 25.00 | ||||||||||||
Gain (loss) from investment operations: |
| |||||||||||||||||||||||
Net investment income(a) | 0.66 | 1.29 | 1.21 | 1.10 | 0.95 | 0.40 | ||||||||||||||||||
Net realized and unrealized gain (loss) on total investments | (0.69 | ) | 0.07 | (0.06 | ) | (0.48 | ) | 0.09 | (0.24 | ) | ||||||||||||||
Total gain (loss) from investment operations | (0.03 | ) | 1.36 | 1.15 | 0.62 | 1.04 | 0.16 | |||||||||||||||||
Less distributions from: |
| |||||||||||||||||||||||
Net investment income | — | (1.22 | ) | (1.18 | ) | (1.06 | ) | (0.90 | ) | (0.40 | ) | |||||||||||||
Net realized gains | — | — | — | — | — | (0.02 | ) | |||||||||||||||||
Total distributions | — | (1.22 | ) | (1.18 | ) | (1.06 | ) | (0.90 | ) | (0.42 | ) | |||||||||||||
Net asset value, end of period | $ | 24.52 | $ | 24.55 | $ | 24.41 | $ | 24.44 | $ | 24.88 | $ | 24.74 | ||||||||||||
TOTAL RETURN(c) | (0.12)% | 5.60% | 4.70% | 2.51% | 4.21% | 0.67% | ||||||||||||||||||
RATIOS AND SUPPLEMENTAL DATA |
| |||||||||||||||||||||||
Net assets at end of period (in thousands) | $ | 90,898 | $ | 86,661 | $ | 71,761 | $ | 66,434 | $ | 58,375 | $ | 50,018 | ||||||||||||
Ratio of expenses to average net assets | 0.10% | (d) | 0.10% | 0.10% | 0.10% | 0.10% | 0.05% | (d) | ||||||||||||||||
Ratio of net investment income to average net assets | 5.36% | (d) | 5.18% | 4.88% | 4.35% | 3.78% | 1.63% | (d) | ||||||||||||||||
Portfolio turnover rate(c) | 45% | 97% | 76% | 78% | 103% | 272% | ||||||||||||||||||
| (a) | Based on average shares outstanding. |
| (b) | For the period July 8, 2003 (commencement of operations/effective date of SEC registration) |
| (c) | The percentages shown for this period are not annualized. |
| (d) | The percentages shown for this period are annualized. |
| See notes to financial statements | TIAA-CREF Life Funds n 2008 Semiannual Report | 109 |
| FINANCIAL HIGHLIGHTS | concluded |
TIAA-CREF LIFE FUNDS n FOR THE PERIOD OR YEAR ENDED
| Money Market Fund | ||||||||||||||||||||||||
| 6/30/08 | 12/31/07 | 12/31/06 | 12/31/05 | 12/31/04 | 12/31/03(b) | |||||||||||||||||||
| (unaudited) | ||||||||||||||||||||||||
FOR A SHARE OUTSTANDING THROUGHOUT EACH PERIOD |
| |||||||||||||||||||||||
Net asset value, beginning of period | $ | 1.00 | $ | 1.00 | $ | 1.00 | $ | 1.00 | $ | 1.00 | $ | 1.00 | ||||||||||||
Gain from investment operations: |
| |||||||||||||||||||||||
Net investment income(a) | 0.02 | 0.05 | 0.05 | 0.03 | 0.01 | 0.00 | (d) | |||||||||||||||||
Total gain from investment operations | 0.02 | 0.05 | 0.05 | 0.03 | 0.01 | 0.00 | (d) | |||||||||||||||||
Less distributions from: |
| |||||||||||||||||||||||
Net investment income | (0.02 | ) | (0.05 | ) | (0.05 | ) | (0.03 | ) | (0.01 | ) | 0.00 | (d) | ||||||||||||
Total distributions | (0.02 | ) | (0.05 | ) | (0.05 | ) | (0.03 | ) | (0.01 | ) | 0.00 | (d) | ||||||||||||
Net asset value, end of period | $ | 1.00 | $ | 1.00 | $ | 1.00 | $ | 1.00 | $ | 1.00 | $ | 1.00 | ||||||||||||
TOTAL RETURN(c) | 1.64% | 5.34% | 5.10% | 3.25% | 1.34% | 0.49% | ||||||||||||||||||
RATIOS AND SUPPLEMENTAL DATA |
| |||||||||||||||||||||||
Net assets at end of period (in thousands) | $ | 110,860 | $ | 100,444 | $ | 53,894 | $ | 37,185 | $ | 26,371 | $ | 20,824 | ||||||||||||
Ratio of expenses to average net assets | 0.06% | (e) | 0.06% | 0.06% | 0.06% | 0.06% | 0.03% | (e) | ||||||||||||||||
Ratio of net investment income to average net assets | 3.25% | (e) | 5.19% | 4.99% | 3.24% | 1.35% | 0.46% | (e) | ||||||||||||||||
| (a) | Based on average shares outstanding. |
| (b) | For the period July 8, 2003 (commencement of operations/effective date of SEC registration). |
| (c) | The percentages shown for this period are not annualized. |
| (d) | Amount represents less than $0.01 per share. |
| (e) | The percentages shown for this period are annualized. |
| 110 | 2008 Semiannual Report n TIAA-CREF Life Funds | See notes to financial statements |
NOTES TO FINANCIAL STATEMENTS (UNAUDITED)
TIAA-CREF LIFE FUNDS
Note 1—organization and significant accounting policies
TIAA-CREF Life Funds (the “Funds” or individually, the “Fund”) is a Delaware statutory trust that was organized on August 13, 1998, and is registered with the Securities and Exchange Commission (“Commission”) under the Investment Company Act of 1940 as an open-end management investment company. The Funds consist of ten series (each referred to as a “Fund”). Certain registered separate accounts (the “Account”) of TIAA-CREF Life Insurance Company (“TIAA-CREF Life”), which is a wholly owned subsidiary of Teachers Insurance and Annuity Association of America (“TIAA”), have various sub-accounts which correspond to and invest in the Funds.
This report should be read in conjunction with the current prospectus, which contains more complete information about the Funds.
At the commencement of operations of each of these Funds, TIAA, an affiliate, invested in each Fund. As of June 30, 2008, TIAA had investments in the Funds as follows:
| Fund | Investments in Funds Held By TIAA | Percentage of Net Assets | ||||
Growth Equity | $ | — | — | % | ||
Growth & Income | 12,237,631 | 16.63 | ||||
International Equity | 27,682,762 | 22.83 | ||||
Large-Cap Value | 22,336,686 | 38.63 | ||||
Small-Cap Equity | 21,118,905 | 44.72 | ||||
Stock Index | — | — | ||||
Social Choice Equity | 11,215,039 | 33.18 | ||||
Real Estate Securities | 31,348,571 | 45.59 | ||||
Bond | 58,370,360 | 64.21 | ||||
Money Market | — | — | ||||
The accompanying financial statements were prepared in accordance with U.S. generally accepted accounting principles (“GAAP”) which may require the use of estimates made by management. Actual results may differ from those estimates. The following is a summary of the significant accounting policies consistently followed by the Funds.
Valuation of investments: Equity securities listed or traded on a national market or exchange are valued based on their sale price on such market or exchange at the close of business on the date of valuation, or at the mean of the closing bid and asked prices if no sale is reported. Debt securities will generally be valued using prices provided by a pricing service which may employ various indications of value including but not limited to broker-dealer quotations. Certain debt securities, other than money market instruments, are valued based on the most recent bid price or the equivalent quoted yield for such securities (or those of comparable maturity, quality and type). Money market instruments (other than those in the Money Market Fund), with maturities of one year or less, are valued in the same manner as debt securities or derived from a pricing matrix that has various types of money market instruments along one axis and various maturities along the other. For the
| TIAA-CREF Life Funds n 2008 Semiannual Report | 111 |
| NOTES TO FINANCIAL STATEMENTS (UNAUDITED) |
Money Market Fund, all of its investments are valued using amortized cost. Investments in other registered investment companies are valued at their net asset value on the valuation date. Net asset value of underlying funds is calculated as of the close of business of the New York Stock Exchange (generally 4:00 pm Eastern Time). Foreign investments are valued at the closing values of such securities as of the date of valuation under the generally accepted valuation method in the country where traded, converted to U.S. dollars at the prevailing rates of exchange on the date of valuation. If events materially affecting the value of foreign securities occur between the time when the exchange on which they are traded closes and the time when the Fund’s net assets are calculated, such securities may be valued at fair value in accordance with procedures adopted by the Board of Trustees. Stock and bond index futures and options, which are traded on commodities exchanges, are valued at the last sales price as of the close of such commodities exchanges.
Portfolio securities for which market quotations are not readily available are valued at fair value, as determined in good faith under the direction of the Board of Trustees.
Accounting for investments: Securities transactions are accounted for as of the trade date. Interest income is recorded as earned and includes accretion of discounts and amortization of premiums using the effective yield method. Dividend income is recorded on the ex-dividend date or, for certain foreign securities, as soon thereafter as the Funds are informed of the ex-dividend date. Realized gains and losses on securities transactions are based upon the specific identification method.
Distributions received from Real Estate Investment Trusts (“REITs”) are recorded on the ex-dividend date. Each REIT reports annually the tax character of its distributions. Dividend income, realized gains and unrealized appreciation (depreciation) reflect the amounts of taxable income, capital gain and return of capital reported by each REIT, and management’s estimates of such amounts for REIT distributions for which actual information has not been reported.
Mortgage dollar roll transactions: The Funds may enter into mortgage dollar rolls in which the Fund sells mortgage-backed securities for delivery and contracts to repurchase substantially similar (same type, coupon, and maturity) securities on a specified future date. During the roll period, the Fund forgoes principal and interest paid on the securities. The Funds’ policy is to record the dollar rolls using “to be announced” mortgage-backed securities as purchase and sale transactions. Any difference between the purchase and sale price is recorded as a realized gain or loss on the trade date of the sale transaction. At the time a Fund enters into such transactions, it is required to have segregated assets with a current value at least equal to the amount of its dollar roll commitments. In addition, the Funds may receive compensation that is recorded as deferred income and amortized to income over the roll period. The counterparty receives all principal and interest payments, including prepayments, made in respect of a security subject to such a contract while it is the holder. Dollar rolls may be renewed with a new purchase and repurchase price and a cash settlement made on settlement date without
| 112 | 2008 Semiannual Report n TIAA-CREF Life Funds |
| continued |
physical delivery of the securities subject to the contract. The Funds engage in dollar rolls for the purpose of enhancing their yields.
Cash: The Funds may hold cash in its account with the custodian. The Funds, throughout the year, may have a cash overdraft balance. A fee is incurred on this overdraft.
Foreign currency transactions and translation: Portfolio investments and other assets and liabilities denominated in foreign currencies are translated into U.S. dollars at the exchange rates prevailing at the end of the period. Purchases and sales of securities, income receipts and expense payments made in foreign currencies are translated into U.S. dollars at the exchange rates prevailing on the respective dates of the transactions. The effects of changes in foreign currency exchange rates are included in the net realized and unrealized gains and losses on investments. Net realized gains and losses on foreign currency transactions include maturities of forward foreign currency contracts, disposition of foreign currencies, and currency gains and losses between the accrual and receipt dates of portfolio investment income and between the trade and settlement dates of portfolio investment transactions.
Forward foreign currency contracts: The Funds may use forward foreign currency contracts to facilitate transactions in securities denominated in foreign currencies. Such contracts are entered into directly with the counterparty and are “marked-to-market” at the end of each day’s trading. The Funds are also exposed to credit risk associated with counterparty non-performance on these forward foreign currency contracts which is typically limited to the unrealized gain on each open contract.
Forward foreign currency contracts will be used primarily to protect the Funds from adverse currency movements and will generally not be entered into for terms greater than one year. The use of forward foreign currency contracts involves the risk that anticipated currency movements will not be accurately predicted. A forward foreign currency contract would limit the risk of loss due to a decline in the value of a particular currency; however, it also would limit any potential gain that might result should the value of the currency increase instead of decrease. These contracts may involve market risk in excess of the unrealized gain or loss reflected in the Statements of assets and liabilities. There were no open forward foreign currency contracts for the period ended June 30, 2008.
Securities lending: The Funds may lend portfolio securities to qualified financial institutions and brokers. By lending such securities, the Funds attempt to increase their net investment income through the receipt of interest (after rebates and fees) on collateral. Such income is reflected separately on the Statement of Operations. The value of loaned securities and the liability related to the cash collateral received are reflected on the Statements of Assets and Liabilities. These loans are secured by collateral equal to at least 102% of the market value of the securities loaned for U.S. securities and 105% of the market value of securities loaned for foreign securities. All cash collateral is invested in the State Street Navigator
| TIAA-CREF Life Funds n 2008 Semiannual Report | 113 |
| NOTES TO FINANCIAL STATEMENTS (UNAUDITED) |
Securities Lending Prime Portfolio. The market value of the loaned securities is determined at the close of each business day, and any additional required collateral is delivered to the Funds before the end of the following business day. The value of loaned securities and the liability related to the cash collateral received are reflected on the Statements of Assets and Liabilities.
Futures contracts: The Funds may use futures contracts to manage exposure to the equity markets or for cash management purposes to remain highly invested in the equity markets while minimizing transaction costs. Buying futures contracts tends to increase exposure to the underlying instrument/index, while selling futures contracts tends to decrease exposure to the underlying instrument/index or hedge other investments. Initial margin deposits are made upon entering into a futures contract and variation margin payments are made or received reflecting changes in the value of the futures contracts. Futures contracts are valued at the last sales price as of the close of the board of trade or exchange on which they are traded. Daily changes in the value of such contracts are reflected in net unrealized gains and losses. Gains or losses are realized upon the expiration or closing of the futures contracts, or if the counterparties do not perform in accordance with contractual provisions.
Risks of investments in futures contracts include the possible adverse movement of the securities or indices underlying the contracts, the possibility that there may not be a liquid secondary market for the contracts, that a change in the value of the contract may not correlate with a change in the value of the underlying securities, or that the counterparty to a contract may default on its obligation to perform.
Securities purchased on a when-issued or delayed delivery basis: The Funds may purchase securities on a when-issued or delayed-delivery basis. Securities purchased or sold on a when-issued or delayed-delivery basis may be settled a month or more after trade date; interest income is not accrued until settlement date. At the time a Fund enters into such transactions, it is required to have segregated assets with a current value at least equal to the amount of its when-issued or delayed-delivery purchase commitments. Credit risks exist on these commitments to the extent of any unrealized gains on the underlying securities purchased and any unrealized losses on the underlying securities sold. Market risk exists on these commitments to the same extent as if the securities were owned on a settled basis and gains and losses are recorded and reported in the same manner. In addition to the normal credit and market risks, transactions with delayed settlement dates may expose the Funds to greater risk that such transactions may not be consummated.
Treasury Inflation-Protected Securities: The Funds may invest in Treasury Inflation-Protected Securities (“TIPS”), specially structured bonds in which the principal amount is adjusted daily to keep pace with inflation, as measured by the U.S. Consumer Price Index. The adjustments for interest income due to inflation are reflected in interest income in the Statement of Operations.
| 114 | 2008 Semiannual Report n TIAA-CREF Life Funds |
| continued |
Restricted securities: Restricted securities held by the Funds, if any, may not be sold except in exempt transactions or in a public offering registered under the Securities Act of 1933. The risk of investing in such securities is generally greater than the risk of investing in securities which are widely held and publicly traded.
Distributions to shareholders: Distributions to shareholders, which are determined in accordance with income tax regulations, are recorded on the ex-dividend date. Distributions from net investment income, if any, are declared and paid annually for each of the Funds, except for the Money Market Fund, where distributions are declared daily and paid monthly. Distributions from realized gains, if any, are declared and paid annually for each of the Funds.
Accumulated undistributed net investment income and accumulated undistributed net realized gain (loss) on investments may include temporary and permanent book and tax differences. Temporary differences will reverse in subsequent periods and are generally due to differing book and tax treatments for the timing and recognition of gains and losses on securities, forwards, and futures, including Post October losses. Permanent differences will result in reclassifications among the respective components of net assets and are generally due to REITs adjustments, foreign currency transactions, distribution reclassification, and gains on certain equity securities designated and issued by “passive foreign investment companies”.
Income taxes: The Funds intend to continue to qualify as regulated investment companies under Subchapter M of the Internal Revenue Code (“Code”) and will not be subject to income taxes to the extent that they distribute all taxable income each year and comply with various other Code requirements. Therefore, no federal income tax provision is required.
The timing and character of income and capital gain distributions are determined in accordance with income tax regulations, which may differ from GAAP. Reclassifications are made to a Fund’s capital accounts for permanent tax differences to reflect income and gains available for distribution (or available capital loss carryforwards) under income tax regulations.
Foreign taxes: The Funds may be subject to foreign taxes on income, gains on investments or currency repatriation, a portion of which may be recoverable. The Funds will accrue such taxes and recoveries as applicable, based upon the current interpretation of tax rules and regulations that exist in the markets in which the Funds invest.
Transactions with affiliates: The Funds may purchase or sell investment securities in transactions with affiliated entities under procedures adopted by the Board of Trustees, pursuant to the Investment Company Act of 1940. These transactions are effected at market rates without incurring broker commissions.
Fair value measurement: In September 2006, the Financial Accounting Standards Board (“FASB”) issued Statement of Account Standards No. 157, “Fair Value Measurement” (“SFAS 157”). SFAS 157 defines fair value, establishes a frame work for measure fair value under GAAP and expands disclosure about fair value
| TIAA-CREF Life Funds n 2008 Semiannual Report | 115 |
| NOTES TO FINANCIAL STATEMENTS (UNAUDITED) |
measurements. SFAS 157 is effective for financial statements issued for fiscal years beginning after November 15, 2007.
Various inputs are used in determining the value of the Funds’ investments. These inputs are summarized in the three broad levels below:
| • | Level 1—quoted prices in active markets for identical securities |
| • | Level 2—other significant observable inputs (including quoted prices for similar securities, interest rates, credit risk, etc.) |
| • | Level 3—significant unobservable inputs (including the Funds’ own assumptions in determining the fair value of investments) |
The inputs or methodology used for valuing securities are not necessarily an indication of the risk associated with investing in those securities. The following is a summary of the inputs used to value the Funds’ investments as of June 30, 2008:
| Investments in Securities | Other Financial Instruments* | |||||
Growth Equity | ||||||
Level 1 | $ | 46,850,067 | $ | — | ||
Level 2 | 2,276,682 | — | ||||
Level 3 | — | — | ||||
Total | $ | 49,126,749 | $ | — | ||
Growth & Income | ||||||
Level 1 | $ | 89,763,401 | $ | — | ||
Level 2 | 3,686,404 | — | ||||
Level 3 | — | — | ||||
Total | $ | 93,449,805 | $ | — | ||
International Equity | ||||||
Level 1 | $ | 14,898,372 | $ | — | ||
Level 2 | 126,016,850 | — | ||||
Level 3 | — | — | ||||
Total | $ | 140,915,222 | $ | — | ||
Large-Cap Value | ||||||
Level 1 | $ | 73,305,154 | $ | — | ||
Level 2 | 1,969,442 | — | ||||
Level 3 | — | — | ||||
Total | $ | 75,274,596 | $ | — | ||
Small-Cap Equity | ||||||
Level 1 | $ | 61,129,199 | $ | — | ||
Level 2 | — | — | ||||
Level 3 | — | — | ||||
Total | $ | 61,129,199 | $ | — | ||
| 116 | 2008 Semiannual Report n TIAA-CREF Life Funds |
| continued |
| Investments in Securities | Other Financial Instruments* | ||||||
Stock Index | |||||||
Level 1 | $ | 187,293,968 | ($ | 95,918 | ) | ||
Level 2 | 2,390,000 | — | |||||
Level 3 | 6 | — | |||||
Total | $ | 189,683,974 | ($ | 95,918 | ) | ||
Social Choice Equity | |||||||
Level 1 | $ | 33,768,468 | $ | — | |||
Level 2 | — | — | |||||
Level 3 | — | — | |||||
Total | $ | 33,768,468 | $ | — | |||
Real Estate Securities | |||||||
Level 1 | $ | 70,036,664 | $ | — | |||
Level 2 | 1,531,186 | — | |||||
Level 3 | 204,400 | — | |||||
Total | $ | 71,772,250 | $ | — | |||
Bond | |||||||
Level 1 | $ | 5,398,549 | $ | — | |||
Level 2 | 89,149,724 | — | |||||
Level 3 | — | — | |||||
Total | $ | 94,548,273 | $ | — | |||
Money Market | |||||||
Level 1 | $ | — | $ | — | |||
Level 2 | 110,611,300 | — | |||||
Level 3 | — | — | |||||
Total | $ | 110,611,300 | $ | — | |||
| * | Other financial instruments are derivative instruments not reflected in the statement of investments, such as futures, forwards and swap contracts, which are valued at the unrealized appreciation/depreciation on the instrument. |
Indemnification: In the normal course of business, each Fund enters into contracts that contain a variety of representations and warranties and which provide general indemnities. A Fund’s maximum exposure under these arrangements is unknown, as this would involve future claims against the Fund that have not yet occurred.
Also, under the Funds’ organizational documents, the trustees and officers of the Funds are indemnified against certain liabilities that may arise out of their duties to the Funds. However, based on experience, the Funds expect the risk of loss due to these warranties and indemnities to be remote.
Note 2—investment adviser and affiliates management agreement
Teachers Advisors, Inc. (“Advisors”), a wholly owned subsidiary of TIAA and a registered investment adviser, provides investment advisory services for the Funds pursuant to an Investment Management Agreement between Advisors and the Funds. Under the terms of the Investment Management Agreement, each
| TIAA-CREF Life Funds n 2008 Semiannual Report | 117 |
| NOTES TO FINANCIAL STATEMENTS (UNAUDITED) |
Fund pays a fee for investment management services, based on the average daily net assets of each Fund. For the period ended June 30, 2008, Advisors received the following annualized percentage of each Fund’s average daily net assets:
| Fund | Investment Management Fee | |
Growth Equity | 0.25% | |
Growth & Income | 0.23% | |
International Equity | 0.29% | |
Large-Cap Value | 0.24% | |
Small-Cap Equity | 0.10% | |
Stock Index | 0.06% | |
Social Choice Equity | 0.07% | |
Real Estate Securities | 0.25% | |
Bond | 0.10% | |
Money Market | 0.06% |
Total investment management fees incurred for each Fund for the period ended June 30, 2008, are reflected in the Statements of Operations.
Note 3—investments
At June 30, 2008, net unrealized appreciation (depreciation) based on aggregate cost of portfolio investments for federal income tax purposes, consisting of gross unrealized appreciation and gross unrealized depreciation, was as follows:
| Fund | Tax Cost | Gross Unrealized Appreciation | Gross Unrealized Depreciation | Net Unrealized Appreciation/ Depreciation | ||||||||||
Growth Equity | $ | 49,080,314 | $ | 2,289,093 | $ | (2,242,658 | ) | $ | 46,435 | |||||
Growth & Income | 91,148,351 | 8,632,000 | (6,330,546 | ) | 2,301,454 | |||||||||
International Equity | 151,923,603 | 4,973,090 | (15,981,471 | ) | (11,008,381 | ) | ||||||||
Large-Cap Value | 81,438,579 | 3,042,089 | (9,206,072 | ) | (6,163,983 | ) | ||||||||
Small-Cap Equity | 63,463,876 | 3,925,989 | (6,260,666 | ) | (2,334,677 | ) | ||||||||
Stock Index | 181,564,081 | 39,663,566 | (31,543,673 | ) | 8,119,893 | |||||||||
Social Choice Equity | 33,538,676 | 7,442,378 | (7,212,586 | ) | 229,792 | |||||||||
Real Estate Securities | 79,479,282 | 2,090,103 | (9,797,135 | ) | (7,707,032 | ) | ||||||||
Bond | 96,625,849 | 595,412 | (2,672,988 | ) | (2,077,576 | ) | ||||||||
At June 30, 2008, the following Fund held open futures contracts:
| Fund | Future | Number of Contracts | Market Value | Expiration Date | Unrealized Loss | ||||||||
Stock Index | E-mini S&P 500 Index | 28 | $ | 1,793,540 | September 08 | $ | (78,757 | ) | |||||
| E-mini S&P 400 Index | 2 | 164,240 | September 08 | (6,654 | ) | ||||||||
| E-mini Russell 2000 Index | 4 | 276,680 | September 08 | (10,507 | ) | ||||||||
| $ | 2,234,460 | $ | (95,918 | ) | |||||||||
| 118 | 2008 Semiannual Report n TIAA-CREF Life Funds |
| continued |
For the six months ended June 30, 2008, purchases and sales proceeds of investments, other than short-term investments, were as follows:
| Fund | Non-Government Purchases | Government Purchases | Non-Government Sales | Government Sales | ||||||||
Growth Equity | $ | 49,793,495 | $ | — | $ | 48,520,568 | $ | — | ||||
Growth & Income | 52,408,766 | — | 52,524,248 | — | ||||||||
International Equity | 153,799,669 | — | 155,602,391 | — | ||||||||
Large-Cap Value | 52,928,687 | — | 54,676,951 | — | ||||||||
Small-Cap Equity | 31,950,847 | — | 32,485,363 | — | ||||||||
Stock Index | 4,603,429 | — | 6,075,963 | — | ||||||||
Social Choice Equity | 4,343,012 | — | 4,364,798 | — | ||||||||
Real Estate Securities | 26,082,515 | — | 26,607,636 | — | ||||||||
Bond | 10,805,277 | 37,325,221 | 13,168,059 | 26,589,498 | ||||||||
Note 4—trustee fees
Each Fund pays the trustees, all of whom are independent, certain remuneration for their services, plus travel and other expenses incurred in attending Board meetings. Trustees may elect to participate in a deferred compensation plan and defer all or a portion of their compensation. In addition, trustees also participate in a long-term compensation plan. [Amounts deferred may be invested notionally in certain TIAA-CREF products selected by the trustees.] Trustees’ fees, including any deferred and long-term compensation, incurred for the period ended June 30, 2008 are reflected in the Statements of Operations.
Note 5—distributions to shareholders
The tax character of distributions paid to shareholders during the year ended December 31, 2007 was as follows:
| 2007 | ||||||||||||
| Fund | Ordinary Income | Long-Term Capital Gain | Return of Capital | Total | ||||||||
Growth Equity | $ | 284,965 | $ | — | $ | — | $ | 284,965 | ||||
Growth & Income | 1,130,983 | — | — | 1,130,983 | ||||||||
International Equity | 16,489,097 | 13,806,923 | — | 30,296,020 | ||||||||
Large-Cap Value | 2,836,644 | 7,145,899 | — | 9,982,543 | ||||||||
Small-Cap Equity | 2,898,540 | 2,414,575 | 152,007 | 5,465,122 | ||||||||
Stock Index | 3,536,312 | 1,251,863 | — | 4,788,175 | ||||||||
Social Choice Equity | 855,836 | 468,743 | — | 1,324,579 | ||||||||
Real Estate Securities | 4,272,693 | 8,572,187 | — | 12,844,880 | ||||||||
Bond | 4,093,995 | — | — | 4,093,995 | ||||||||
Money Market | 3,985,575 | — | — | 3,985,575 | ||||||||
| TIAA-CREF Life Funds n 2008 Semiannual Report | 119 |
| NOTES TO FINANCIAL STATEMENTS (UNAUDITED) | concluded |
Note 6—line of credit
Each of the Funds, except the Bond and Money Market Funds, participate in a $1.25 billion unsecured revolving credit facility that can be used for temporary purposes, including the funding of shareholder redemptions. Certain affiliated accounts and mutual funds, each of which is managed by Advisors, or an affiliate of Advisors, also participate in this facility. Interest associated with any borrowing under the facility is charged to the Funds at rates which are based on the Federal Funds Rate in effect during the time of the borrowing. The Funds are not liable for borrowings under the facility by affiliated accounts or mutual funds. For the period ended June 30, 2008 there were no borrowings under this credit facility by the Funds.
Note 7—in-kind transactions
For the period ended June 30, 2008, there were no in-kind transactions consisting of marketable securities.
Note 8—new accounting pronouncement
In March 2008, FASB issued Statement of Accounting Standards No. 161, “Disclosures about Derivative Instruments and Hedging Activities—an amendment of FASB Statement No. 133” (“SFAS 161”). SFAS 161 requires enhanced disclosures about a fund’s derivative and hedging activities thereby improving the transparency of the financial reporting. SFAS 161 is effective for financial statements issued for fiscal years and interim periods beginning after November 15, 2008. Management is currently evaluating the impact the adoption of SFAS 161 will have on the presentation of the Funds’ financial statements.
| 120 | 2008 Semiannual Report n TIAA-CREF Life Funds |
2007 SPECIAL MEETING (UNAUDITED)
TIAA-CREF LIFE FUNDS
Below are updated results from the special meeting of shareholders that took place on September 17, 2007.
Trustees
The results below were certified by Broadridge Financial Solutions, Inc., independent tabulator for the TIAA-CREF Life Funds.
On September 17, 2007, at a special meeting of shareholders, the following persons were elected to serve on the Board:
| Nominee | Dollars for | Percent | Dollars against | Percent | Dollars abstain | Percent | ||||||||||||
| Forrest Berkley | $ | 936,865,847.00 | 97.755 | % | $ | 2,348,034.70 | 0.245 | % | $ | 19,167,630.24 | 2.000 | % | ||||||
| Nancy A. Eckl | 939,213,881.70 | 98.000 | 0.00 | 0.000 | 19,167,630.24 | 2.000 | ||||||||||||
| Eugene Flood, Jr. | 939,213,881.70 | 98.000 | 0.00 | 0.000 | 19,167,630.24 | 2.000 | ||||||||||||
| Howell E. Jackson | 939,213,881.70 | 98.000 | 0.00 | 0.000 | 19,167,630.24 | 2.000 | ||||||||||||
| Nancy L. Jacob | 936,865,847.00 | 97.755 | 2,348,034.70 | 0.245 | 19,167,630.24 | 2.000 | ||||||||||||
| Bridget A. Macaskill | 936,865,847.00 | 97.755 | 2,348,034.70 | 0.245 | 19,167,630.24 | 2.000 | ||||||||||||
| James M. Poterba | 936,865,847.00 | 97.755 | 2,348,034.70 | 0.245 | 19,167,630.24 | 2.000 | ||||||||||||
| Maceo K. Sloan | 923,093,904.67 | 96.318 | 19,023,873.01 | 1.985 | 16,263,734.26 | 1.697 | ||||||||||||
| Laura T. Starks | 929,553,396.06 | 96.992 | 13,283,167.76 | 1.386 | 15,544,948.12 | 1.622 | ||||||||||||
Nancy A. Eckl was elected to office. Forrest Berkley, Eugene Flood, Jr., Howell E. Jackson, Nancy L. Jacob, Bridget A. Macaskill, James M. Poterba, Maceo K. Sloan and Laura T. Starks continued in office.
| TIAA-CREF Life Funds n 2008 Semiannual Report | 121 |
MANAGEMENT AGREEMENT
The Board of Trustees (the “Board” or the “Trustees”) of the TIAA-CREF Life Funds (the “Funds”) is responsible for overseeing the Funds’ corporate policies and for adhering to fiduciary standards under the Investment Company Act of 1940, as amended (the “1940 Act”), and other applicable laws. Among its duties, the Board is responsible for determining annually whether to renew the investment management agreement (the “Agreement”) between the Funds and Teachers Advisors, Inc. (“TAI”). Under the Agreement, TAI is responsible for providing to (or obtaining for) each Fund all of the services necessary for its ordinary operation, including investment advisory, transfer agency, dividend disbursing, custody, accounting and administrative services.
Section 15(c) of the 1940 Act provides that, after an initial period, the Agreement for each Fund will remain in effect only if the Board, including a majority of those Trustees who have no direct or indirect interest in the Agreement, and who are not “interested persons” of the Fund, as that term is defined in the 1940 Act, annually renews that Agreement. All of the Trustees are deemed to be independent persons for this purpose.
OVERVIEW OF THE RENEWAL PROCESS
The Board held a meeting on April 2, 2008, at which it considered the annual renewal of the Agreement using its previously-established process. As part of this process, the Board delegated certain duties to its Operations Committee. Among these duties, the Operations Committee works with management and legal counsel to the Trustees to develop additional guidelines and specific requests relating to the types of information to be provided to the Committee and to all Trustees in connection with the proposed contract renewals, and then to help evaluate the information provided in response to those guidelines. During a series of meetings held prior to April 2, 2008, the Operations Committee reviewed such guidelines and requests in consultation with management representatives and input from other Trustees and legal counsel to the Trustees and legal counsel to management, and then evaluated the information produced in accordance with those guidelines.
Among other matters, the Operations Committee followed guidelines regarding reports to be provided to all Trustees with respect to each Fund by the Global Fiduciary Review unit of Lipper, Inc. (“Lipper”). Lipper is an independent provider of investment company data that is widely recognized as a leading source of independent data used by independent directors and trustees of investment companies during their annual advisory contract renewal processes.
As a result of instructions by the Operations Committee on behalf of the Board, Lipper produced, among other information, extensive performance and expense comparison data regarding each Fund, including data relating to each Fund’s management fee rates, total expense ratios, short-term and long-term investment performance and, as applicable, brokerage commission costs and portfolio turnover rates. Lipper also compared much of this data for each Fund against a universe of investment companies and against a more selective peer group of
| 122 | 2008 Semiannual Report n TIAA-CREF Life Funds |
mutual funds that underlie variable insurance products with similar investment objectives and strategies and, in the case of the investment performance data, against one or more appropriate broad-based benchmark indices. In each case, Lipper summarized the methodologies employed by it to provide the data contained in its reports. In addition, Lipper represented to the Board that its reports were designed specifically to provide the Board with the fee, expense and performance information that is necessary to help the Board satisfy its duties under Section 15 of the 1940 Act.
Among other matters, the Operations Committee also utilized a framework of factors that could be considered by the Trustees in order to evaluate the reasonableness of any profits earned by TAI with respect to its services to each Fund pursuant to the Agreement. In this connection, the Operations Committee emphasized that different Trustees could, and likely would, give different weight to different factors when evaluating the profits, if any, realized by TAI.
In advance of the Board meeting held on April 2, 2008, independent legal counsel for the Trustees requested on behalf of the Board, and TAI provided, extensive information that was designed to assist the Board in its consideration of whether to renew each Fund’s Agreement. In addition to the data provided by Lipper as described above, this information included, but was not limited to, the following: (1) further information relating to each Fund’s investment performance, including performance ratings provided by Morningstar, Inc. (“Morningstar”), which is a widely recognized mutual fund ranking service, and a narrative analysis of each Fund’s performance relative to its applicable benchmarks and peer groups, together with an explanation of any special events that had a material impact on performance during the prior year; (2) a description of any fee waiver or expense reimbursement arrangements that were in place during the prior year and the extent to which such arrangements would be continued or modified in the coming year; (3) a comparison of each Fund’s fees under the Agreement as compared to any other comparable accounts managed by TAI or its affiliates; (4) any “fall-out” benefits that accrued to TAI or its affiliates due to their relationship with the Funds aside from TAI’s direct fee payments pursuant to the Agreement; (5) information regarding TAI’s financial resources, senior professional personnel, overall staffing levels, portfolio manager compensation arrangements, disaster recovery plans, insurance coverage, compliance programs, any material pending litigation or compliance issues, portfolio trading and best execution practices, and any actual and potential conflicts of interests confronted by TAI in connection with rendering services to the Funds; (6) information as to any profits earned by TAI in connection with its services pursuant to the Agreement; (7) a copy of the Agreement and certain related service agreements between the Funds and affiliates of TAI; (8) a copy of TAI’s SEC Form ADV registration statement (which was presented to the Trustees’ counsel only); and (9) proposed narrative explanations of reasons why the Board should renew the Agreement.
| TIAA-CREF Life Funds n 2008 Semiannual Report | 123 |
BOARD APPROVAL OF INVESTMENT
MANAGEMENT AGREEMENT
In considering whether to renew the Agreement, the Board, with assistance from its Operations Committee, reviewed various factors with respect to each Fund, including: (1) the nature, extent and quality of services provided by TAI to each Fund; (2) the investment performance of each Fund; (3) the costs of the services provided to each Fund and the profits (if any) realized by TAI and its affiliates from their relationship with the Funds; (4) the extent to which economies of scale have been realized as each Fund grows; (5) whether the fee schedules set forth in the Agreement reflect any such economies of scale for the benefit of Fund investors; (6) comparisons of services and fees with contracts entered into by TAI with other clients; and (7) any other benefits derived or anticipated to be derived by TAI or its affiliates from their relationship with the Funds. As a general matter, the Trustees viewed these factors in their totality, with no single factor being the principal factor in determining whether to renew the Agreement.
In reaching its decisions regarding the renewal of each Fund’s Agreement, the Board took into account the information described above, other information provided to the Board in connection with this process, and relevant information provided to the Board and to its Committees on an ongoing basis in connection with the Board’s general oversight duties with respect to the Funds. In addition, the Board received and considered information from Kirkpatrick & Lockhart Preston Gates Ellis LLP, its independent legal counsel, as to certain relevant guidelines that relate to the renewal process under Section 15(c) of the 1940 Act and certain other legal authorities.
While the Board considered the Agreement for all Funds at the same meeting on April 2, 2008, the Board received and considered Fund-specific information on a Fund-by-Fund basis and made its renewal determinations on a Fund-by-Fund basis. In deciding whether to renew each Agreement, each Trustee may have accorded different weight to different factors and, thus, each Trustee may have had a different basis for his or her ultimate decision to vote to renew each Fund’s Agreement.
At its meeting on April 2, 2008, the Board voted unanimously to renew the particular Agreement for each Fund. Set forth below are the general factors the Board considered for all of the Funds, followed by an outline of the specific factors the Board considered for each particular Fund.
THE NATURE, EXTENT AND QUALITY OF SERVICES
The Board considered that TAI is an experienced investment adviser that has managed the Funds since their operations commenced. Investment professionals at TAI also manage various accounts of the College Retirement Equities Fund (“CREF”). Under the Agreement, TAI is responsible for, among other duties: managing the assets of the Funds, including conducting research, recommending investments and placing orders to buy and sell securities for the Funds’ investment portfolios; active daily monitoring of the investment portfolios by various personnel with specific responsibility for the particular types of investments in question; and reporting on the investment performance of the Funds to the Boards
| 124 | 2008 Semiannual Report n TIAA-CREF Life Funds |
| continued |
on a regular basis. The Board considered that TAI has carried out these responsibilities in a professional manner.
The Board also considered, among other factors, the performance of each of the Funds, as discussed below. In the course of its review of the quality of TAI’s services, the Board examined the investment performance of each Fund and concluded that it was reasonable when compared with Fund benchmarks and peer groups of mutual funds that underlie variable insurance products, and that, in the case of underperforming Funds, TAI represented that it had taken or was planning to implement affirmative steps to enhance the investment performance.
In addition, the Board considered the nature and quality of non-portfolio management services provided by TAI and its affiliates. In this regard, the Board considered its ongoing efforts to review the performance of certain affiliated and unaffiliated service providers, including improvements in services provided by those firms or outsourcing efforts to other firms.
INVESTMENT PERFORMANCE
The Board considered the investment performance of each Fund, as applicable, over one-, two-, three-, four- and five-year periods. The Board also considered each Fund’s performance as compared to its peer groups and benchmark indices. In this regard, the Board considered that most of the Funds achieved performance that compares favorably to their benchmarks (after considering the effect of expenses incurred to operate the Funds) and, with some exceptions, ranked in the top three performance quintiles versus their peer groups of mutual funds that underlie variable insurance products. (For additional detail regarding each Fund’s performance, see the Fund-by-Fund synopsis below.) The Board considered that in those cases in which Funds had underperformed their benchmarks or peer groups of mutual funds that underlie variable insurance products, TAI had taken reasonable remedial actions or represented that it was in the process of taking such actions. Thus, the Board concluded that, under the totality of circumstances considered, the investment performance of each Fund was reasonable. The Board also considered its ongoing efforts to review best execution and portfolio turnover practices of TAI with respect to certain Funds to assess whether those practices continue to be in the best interests of those Funds.
COST AND PROFITABILITY
The Board considered financial and profitability data relating to TAI for the calendar year 2007. The Board considered each Fund’s unitary fee structure under which TAI is obligated to provide (or arrange and pay for) all of the services necessary for each Fund’s ordinary operations, including investment advisory, transfer agency, dividend disbursing, custody, accounting and administrative services. The Board considered TAI’s profit calculations with respect to its services to each Fund both before and after taking into account the costs incurred directly or indirectly by TAI in connection with the distribution of shares of the
| TIAA-CREF Life Funds n 2008 Semiannual Report | 125 |
BOARD APPROVAL OF INVESTMENT
MANAGEMENT AGREEMENT
Funds. The Board considered that TAI has consistently incurred losses based on its services to each of the Funds under the Agreement. Among other considerations, the Board acknowledged the reasonableness of having fee rates which permit TAI to maintain and improve the quality of services provided to the Funds. In this connection, the Board noted its ongoing efforts to examine the level of personnel and other resources available to portfolio management functions so as to assess whether sufficient resources are being devoted to these functions.
FEES CHARGED BY OTHER ADVISERS
The Board considered information regarding fees paid to other advisers for managing similar funds that underlie variable insurance products, as analyzed by Lipper. The Board determined that the management fee rates charged to the Funds under the Agreement typically were lower or significantly lower than the management fee rates charged by many or most comparable mutual funds that underlie variable insurance products. Based on all factors considered, the Board determined that the fee rates under each Agreement were reasonable in relation to those charged by appropriate groups of comparable mutual funds that underlie variable insurance products.
ECONOMIES OF SCALE
The Board considered whether TAI has or would experience economies of scale in connection with the operation of each Fund. In this connection, the Board considered that TAI had incurred operating losses in 2007 with respect to its services provided to each of the Funds. The Board determined that current fee rates at current asset levels were low compared to peer groups of mutual funds that underlie variable insurance products. Thus, the Board determined that the Funds’ fee schedules were reasonable in light of current economies of scale considerations and current asset levels.
FEE COMPARISON WITH OTHER TAI CLIENTS
The Board considered that TAI and its affiliates provide similar investment management services to other affiliated investment companies. In addition, TAI, through its TIAA-CREF Asset Management division, manages large institutional client assets through unregistered commingled funds and separate accounts with similar investment strategies and investment staff. The Board considered the schedule of fees for each of these funds. The Board also considered TAI’s representation that, while management fee rates may differ for comparable funds, this is due in part to the unitary nature of each Fund’s fees and to the fact that some of the comparable funds are offered through products that charge additional fees to its investors. In this connection, the Board considered TAI’s representation that because the comparable funds target different types of investors and use different distribution channels, these factors justify different pricing schedules.
| 126 | 2008 Semiannual Report n TIAA-CREF Life Funds |
| continued |
OTHER BENEFITS
The Board also considered additional benefits to the Funds and to TAI and its affiliates arising from the Agreement. For example, TAI and its affiliates may benefit from the advisory relationship with the Funds to the extent this relationship results in potential investors viewing the TIAA-CREF group of companies as a leading retirement plan provider in the academic and nonprofit market and a single source for all their financial service needs. Also, certain Funds managed by TAI or its affiliates are managed in the same manner and by the same personnel as certain of the CREF Accounts, resulting in certain benefits associated with economies of scale.
FUND-BY FUND FACTORS
The Funds’ Trustees considered the following specific factors (among others) during their determination to renew the Agreement for each Fund described in this Report. If a Fund is described in the following discussions as being in the “1st” quintile, it is in the best of five groups (that is, the group has the best performance or the lowest expenses, as the case may be). References below to quintiles are based on data provided to the Board in the reports prepared by Lipper. All periods referenced below end as of December 31, 2007. Under the Morningstar rating system, 5 stars is the highest rating category and 1 star is the lowest rating category.
INTERNATIONAL EQUITY FUND
| • | The Fund’s contractual management fee is 0.29% of average daily net assets. The Fund utilizes a unitary pricing structure. |
| • | The Fund’s management fees and total expenses were in the 1st quintile of the group of comparable funds selected by Lipper for expense comparison purposes (“Expense Group”) and the universe of comparable funds identified by Lipper for expense comparison purposes (“Expense Universe”). |
| • | For the one-, two-, three-, four- and five-year periods, the Fund was in the 1st quintile of the group of comparable funds selected by Lipper for performance comparison purposes (“Performance Group”) and the universe of comparable funds identified by Lipper for expense comparison purposes (“Performance Universe”). |
| • | The Fund received an Overall Morningstar Rating of 5 stars. |
| • | Chris Semenuk was promoted to lead portfolio manager, Amy Hatta was added to the portfolio management team and the team de-emphasized its previous individual regional focus. |
| • | TAI incurred a net loss with respect to its services to the Fund for the one-year period. |
GROWTH EQUITY FUND
| • | The Fund’s contractual management fee is 0.25% of average daily net assets. The Fund utilizes a unitary pricing structure. |
| • | The Fund’s management fees and total expenses were in the 1st quintile of its Expense Group and Expense Universe. |
| TIAA-CREF Life Funds n 2008 Semiannual Report | 127 |
BOARD APPROVAL OF INVESTMENT
MANAGEMENT AGREEMENT
| • | For the one-, two- and three-year periods, the Fund was in the 1st quintile of its Performance Group and Performance Universe and in the 2nd quintile of its Performance Group and Universe during the four- and five-year periods. |
| • | The Fund received an Overall Morningstar Rating of 3 stars. |
| • | Susan Hirsch was added as lead portfolio manager and Andrea Mitroff was added to the portfolio management team upon the departure of Greg Luttrell from TCIM. |
| • | TAI incurred a net loss with respect to its services to the Fund for the one-year period. |
GROWTH & INCOME FUND
| • | The Fund’s contractual management fee is 0.23% of average daily net assets. The Fund utilizes a unitary pricing structure. |
| • | The Fund’s management fees and total expenses were in the 1st quintile of its Expense Group and Expense Universe. |
| • | For the one-, two-, three-, four- and five-year periods, the Fund was in the 1st quintile of its Performance Group and Performance Universe. |
| • | The Fund received an Overall Morningstar Rating of 5 stars. |
| • | TAI incurred a net loss with respect to its services to the Fund for the one-year period. |
LARGE-CAP VALUE FUND
| • | The Fund’s contractual management fee is 0.24% of average daily net assets. The Fund utilizes a unitary pricing structure. |
| • | The Fund’s management fees and total expenses were in the 1st quintile of its Expense Group and Expense Universe. |
| • | For the one-year period, the Fund was in the 3rd quintile of its Performance Group and Performance Universe. |
| • | For two- and three-year periods, the Fund was in the 1st and 2nd quintiles of its Performance Group and Performance Universe. |
| • | The Fund received an Overall Morningstar Rating of 4 stars. |
| • | TAI incurred a net loss with respect to its services to the Fund for the one-year period. |
STOCK INDEX FUND
| • | The Fund’s contractual management fee is 0.06% of average daily net assets. The Fund utilizes a unitary pricing structure. |
| • | The Fund’s management fees and total expenses were in the 1st quintile of its Expense Group and Expense Universe. |
| • | For the one-year period, the Fund was in the 2nd quintile of its Performance Group, and in the 1st quintile of its Performance Group for the two- and three-year periods. The Fund was in the 3rd quintile of its Performance Universe for the one-, two-, three-, four- and five-year periods. |
| • | The Fund received an Overall Morningstar Rating of 4 stars. |
| • | TAI incurred a net loss with respect to its services to the Fund for the one-year period. |
| 128 | 2008 Semiannual Report n TIAA-CREF Life Funds |
| continued |
SOCIAL CHOICE EQUITY FUND
| • | The Fund’s contractual management fee is 0.07% of average daily net assets. The Fund utilizes a unitary pricing structure. |
| • | The Fund’s management fees and total expenses were in the 1st quintile of its Expense Group and Expense Universe. |
| • | For the one- and two-year periods, the Fund was in the 4th quintile of its Performance Group and Performance Universe. |
| • | For the three-, four- and five-year periods, the Fund was in the 3rd quintile of its Performance Group and Performance Universe. |
| • | The Fund received an Overall Morningstar Rating of 4 stars. |
| • | TAI incurred a net loss with respect to its services to the Fund for the one-year period. |
SMALL-CAP EQUITY FUND
| • | The Fund’s contractual management fee is 0.10% of average daily net assets. The Fund utilizes a unitary pricing structure. |
| • | The Fund’s management fees and total expenses were in the 1st quintile of its Expense Group and Expense Universe. |
| • | For the one-, two-, three-, four- and five-year periods, the Fund was in the 5th, 4th, 3rd, 3rd, and 1st quintile of its Performance Group, respectively. |
| • | For the one-, two- three- and four-year periods, the Fund was in the 4th quintile of its Performance Universe. |
| • | The Fund received an Overall Morningstar Rating of 3 stars. |
| • | TAI incurred a net loss with respect to its services to the Fund for the one-year period. |
REAL ESTATE SECURITIES FUND
| • | The Fund’s contractual management fee is 0.25% of average daily net assets. The Fund utilizes a unitary pricing structure. |
| • | The Fund’s management fees and total expenses were in the 1st quintile of its Expense Group and Expense Universe. |
| • | For the one-year period, the Fund was in the 3rd quintile of its Performance Group and Performance Universe. |
| • | For the two-year period, the Fund was in the 4th quintile of its Performance Group and Performance Universe, while the Fund ranked in the 5th quintile of its Performance Group and Universe for the three-, four- and five-year periods. |
| • | The Fund received an Overall Morningstar Rating of 2 stars. |
| • | TAI incurred a net loss with respect to its services to the Fund for the one-year period. |
BOND FUND
| • | The Fund’s contractual management fee is 0.10% of average daily net assets. The Fund utilizes a unitary pricing structure. |
| • | The Fund’s management fees and total expenses were in the 1st quintile of its Expense Group and Expense Universe. |
| TIAA-CREF Life Funds n 2008 Semiannual Report | 129 |
BOARD APPROVAL OF INVESTMENT
MANAGEMENT AGREEMENT | concluded |
| • | For the one-year period, the Fund was in the 3rd quintile of its Performance Group and Performance Universe. |
| • | For the three-year period, the Fund was in the 2nd quintile of its Performance Group and Performance Universe. |
| • | The Fund received an Overall Morningstar Rating of 4 stars. |
| • | TAI incurred a net loss with respect to its services to the Fund for the one-year period. |
MONEY MARKET FUND
| • | The Fund’s contractual management fee is 0.06% of average daily net assets. The Fund utilizes a unitary pricing structure. |
| • | The Fund’s management fees and total expenses were in the 1st quintile of its Expense Group and Expense Universe. |
| • | For the one-, two-, three- and four-year periods, the Fund was in the 1st quintile of its Performance Group and Performance Universe. |
| • | Money market funds are not rated by Morningstar. |
| • | TAI incurred a net loss with respect to its services to the Fund for the one-year period. |
Based primarily on the foregoing factors and considerations, the Board renewed the Agreement.
| 130 | 2008 Semiannual Report n TIAA-CREF Life Funds |
TIAA-CREF WEBSITE
Account performance, personal account information and transactions, product descriptions, and information about investment choices and income options
www.tiaa-cref.org
24 hours a day, 7 days a week
AUTOMATED TELEPHONE SERVICE
Check account performance and accumulation balances, change allocations, transfer funds and verify credited premiums
800 842-2252
24 hours a day, 7 days a week
TELEPHONE COUNSELING CENTER
Retirement saving and planning, income options and payments, and tax reporting
800 842-2776
8 a.m. to 10 p.m. ET, Monday–Friday
9 a.m. to 6 p.m. ET, Saturday
PLANNING AND SERVICE CENTER
TIAA-CREF mutual funds
800 223-1200
8 a.m. to 10 p.m. ET, Monday-Friday
INSURANCE PLANNING CENTER
After-tax annuities and life insurance
877 825-0411
8 a.m. to 8 p.m. ET, Monday–Friday
FOR HEARING- OR SPEECH-IMPAIRED PARTICIPANTS
800 842-2755
8 a.m. to 10 p.m. ET, Monday–Friday
9 a.m. to 6 p.m. ET, Saturday
TIAA-CREF BROKERAGE SERVICES
Self-directed brokerage accounts for investing in stocks, bonds and mutual funds
800 927-3059
8 a.m. to 7 p.m. ET, Monday–Friday
TIAA-CREF TRUST COMPANY, FSB
Asset management, trust administration, estate planning, planned giving and endowment management
888 842-9001
9 a.m. to 6 p.m. ET, Monday–Friday
ADVISOR SERVICES
888 842-0318
8 a.m. to 7:30 p.m. ET, Monday–Friday
You should carefully consider the investment objectives, risks, charges and expenses of any fund before investing. For a prospectus that contains this and other important information, please visit www.tiaa-cref.org, or call 800 223-1200. Please read the prospectus carefully before investing. Investment products are not FDIC insured, may lose value and are not bank guaranteed. TIAA-CREF Individual & Institutional Services, LLC and Teachers Personal Investors Services, Inc., members FINRA/SIPC, distribute securities products. Teachers Insurance and Annuity Association (TIAA), New York, NY, and TIAA-CREF Life Insurance Co., New York, NY, issue insurance and annuities. TIAA-CREF Brokerage Services is a division of TIAA-CREF Individual & Institutional Services, LLC. TIAA-CREF Trust Company, FSB provides trust services.
©2008 Teachers Insurance and Annuity Association—College Retirement Equities Fund (TIAA-CREF), New York, NY 10017-3206

730 Third Avenue
New York, NY 10017-3206
 C41961
A10937 (8/08)
| Item 2. | Code of Ethics. |
Not applicable.
| Item 3. | Audit Committee Financial Expert. |
Not applicable.
| Item 4. | Principal Accountant Fees and Services. |
Not Applicable.
| Item 5. | Audit Committee of Listed Registrants. |
Not Applicable.
| Item 6. | Schedule of Investments. |
TIAA-CREF LIFE FUNDS - Growth Equity Fund
TIAA-CREF LIFE FUNDS
GROWTH EQUITY FUND
STATEMENT OF INVESTMENTS (unaudited)
June 30, 2008
SHARES | COMPANY | VALUE | |||||
COMMON STOCKS - 102.12% | |||||||
AMUSEMENT AND RECREATION SERVICES - 2.11% | |||||||
1,400 | Nintendo Co Ltd | $ | 793,902 | ||||
TOTAL AMUSEMENT AND RECREATION SERVICES | 793,902 | ||||||
BUILDING MATERIALS AND GARDEN SUPPLIES - 0.40% | |||||||
7,319 | e | Lowe’s Cos, Inc | 151,869 | ||||
TOTAL BUILDING MATERIALS AND GARDEN SUPPLIES | 151,869 | ||||||
BUSINESS SERVICES - 13.19% | |||||||
11,855 | * | Adobe Systems, Inc | 466,968 | ||||
16,395 | e* | eBay, Inc | 448,075 | ||||
101,221 | Experian Group Ltd | 748,626 | |||||
2,146 | * | Google, Inc (Class A) | 1,129,697 | ||||
17,608 | e* | Intuit, Inc | 485,453 | ||||
1,690 | e | Mastercard, Inc (Class A) | 448,729 | ||||
4,080 | e | Omnicom Group, Inc | 183,110 | ||||
22,905 | * | Oracle Corp | 481,005 | ||||
1,339 | * | Sohu.com, Inc | 94,319 | ||||
1,918 | Visa, Inc (Class A) | 155,953 | |||||
15,430 | e* | Yahoo!, Inc | 318,784 | ||||
TOTAL BUSINESS SERVICES | 4,960,719 | ||||||
CHEMICALS AND ALLIED PRODUCTS - 20.07% | |||||||
11,135 | Abbott Laboratories | 589,821 | |||||
3,990 | Air Products & Chemicals, Inc | 394,451 | |||||
27,077 | e | Avon Products, Inc | 975,314 | ||||
2,435 | Celanese Corp (Series A) | 111,182 | |||||
9,752 | e | Colgate-Palmolive Co | 673,863 | ||||
7,492 | * | Genentech, Inc | 568,643 | ||||
22,005 | * | Gilead Sciences, Inc | 1,165,165 | ||||
15,827 | Merck & Co, Inc | 596,520 | |||||
9,316 | Monsanto Co | 1,177,915 | |||||
6,720 | Mylan Laboratories, Inc | 81,110 | |||||
4,352 | Praxair, Inc | 410,132 | |||||
17,489 | Teva Pharmaceutical Industries Ltd (ADR) | 800,996 | |||||
TOTAL CHEMICALS AND ALLIED PRODUCTS | 7,545,112 | ||||||
COAL MINING - 1.83% | |||||||
3,104 | Peabody Energy Corp | 273,307 | |||||
7,042 | e | Sasol Ltd (ADR) | 415,055 | ||||
TOTAL COAL MINING | 688,362 | ||||||
COMMUNICATIONS - 1.57% | |||||||
14,002 | * | American Tower Corp (Class A) | 591,585 | ||||
TOTAL COMMUNICATIONS | 591,585 | ||||||
DEPOSITORY INSTITUTIONS - 1.47% | |||||||
22,378 | e | Western Union Co | 553,184 | ||||
TOTAL DEPOSITORY INSTITUTIONS | 553,184 | ||||||
1
TIAA-CREF LIFE FUNDS - Growth Equity Fund
SHARES | COMPANY | VALUE | ||||||
EATING AND DRINKING PLACES - 0.57% | ||||||||
6,120 | e | Yum! Brands, Inc | $ | 214,751 | ||||
TOTAL EATING AND DRINKING PLACES | 214,751 | |||||||
ELECTRIC, GAS, AND SANITARY SERVICES - 0.15% | ||||||||
817 | Questar Corp | 58,040 | ||||||
TOTAL ELECTRIC, GAS, AND SANITARY SERVICES | 58,040 | |||||||
ELECTRONIC AND OTHER ELECTRIC EQUIPMENT - 12.61% | ||||||||
7,823 | Altera Corp | 161,936 | ||||||
4,452 | * | Apple Computer, Inc | 745,443 | |||||
24,388 | e* | Cisco Systems, Inc | 567,265 | |||||
31,741 | Intel Corp | 681,797 | ||||||
23,805 | e* | Marvell Technology Group Ltd | 420,396 | |||||
7,755 | * | Nvidia Corp | 145,174 | |||||
27,180 | Qualcomm, Inc | 1,205,977 | ||||||
6,952 | * | Research In Motion Ltd | 812,689 | |||||
TOTAL ELECTRONIC AND OTHER ELECTRIC EQUIPMENT | 4,740,677 | |||||||
ENGINEERING AND MANAGEMENT SERVICES - 3.85% | ||||||||
13,746 | * | Celgene Corp | 877,957 | |||||
4,968 | e* | Jacobs Engineering Group, Inc | 400,918 | |||||
1,966 | * | Shaw Group, Inc | 121,479 | |||||
1,171 | * | URS Corp | 49,147 | |||||
TOTAL ENGINEERING AND MANAGEMENT SERVICES | 1,449,501 | |||||||
FOOD AND KINDRED PRODUCTS - 1.04% | ||||||||
8,163 | e | H.J. Heinz Co | 390,600 | |||||
TOTAL FOOD AND KINDRED PRODUCTS | 390,600 | |||||||
GENERAL MERCHANDISE STORES - 3.51% | ||||||||
13,322 | Macy’s, Inc | 258,713 | ||||||
19,289 | e | TJX Cos, Inc | 607,025 | |||||
8,058 | Wal-Mart Stores, Inc | 452,860 | ||||||
TOTAL GENERAL MERCHANDISE STORES | 1,318,598 | |||||||
HOLDING AND OTHER INVESTMENT OFFICES - 0.36% | ||||||||
1,487 | * | Affiliated Managers Group, Inc | 133,919 | |||||
TOTAL HOLDING AND OTHER INVESTMENT OFFICES | 133,919 | |||||||
HOTELS AND OTHER LODGING PLACES - 0.25% | ||||||||
2,762 | * | MGM Mirage | 93,604 | |||||
TOTAL HOTELS AND OTHER LODGING PLACES | 93,604 | |||||||
INDUSTRIAL MACHINERY AND EQUIPMENT - 2.53% | ||||||||
20,861 | e | Applied Materials, Inc | 398,236 | |||||
11,553 | e* | EMC Corp | 169,714 | |||||
8,627 | Hewlett-Packard Co | 381,400 | ||||||
352 | m,v* | Seagate Technology | (0 | ) | ||||
TOTAL INDUSTRIAL MACHINERY AND EQUIPMENT | 949,350 | |||||||
2
TIAA-CREF LIFE FUNDS - Growth Equity Fund
SHARES | COMPANY | VALUE | |||||
INSTRUMENTS AND RELATED PRODUCTS - 9.28% | |||||||
14,961 | * | Agilent Technologies, Inc | $ | 531,714 | |||
11,550 | e | Allergan, Inc | 601,178 | ||||
16,891 | Emerson Electric Co | 835,260 | |||||
8,674 | * | Flir Systems, Inc | 351,904 | ||||
21,387 | * | Hologic, Inc | 466,237 | ||||
1,783 | e* | Intuitive Surgical, Inc | 480,340 | ||||
3,376 | Roper Industries, Inc | 222,411 | |||||
TOTAL INSTRUMENTS AND RELATED PRODUCTS | 3,489,044 | ||||||
INSURANCE CARRIERS - 1.79% | |||||||
3,348 | e* | ACE Ltd | 184,441 | ||||
7,797 | Aflac, Inc | 489,652 | |||||
TOTAL INSURANCE CARRIERS | 674,093 | ||||||
METAL MINING - 1.41% | |||||||
7,525 | Anglo American plc | 528,513 | |||||
TOTAL METAL MINING | 528,513 | ||||||
MISCELLANEOUS RETAIL - 5.54% | |||||||
9,848 | e* | Amazon.com, Inc | 722,154 | ||||
19,330 | CVS Corp | 764,888 | |||||
25,125 | e | Staples, Inc | 596,719 | ||||
TOTAL MISCELLANEOUS RETAIL | 2,083,761 | ||||||
OIL AND GAS EXTRACTION - 9.29% | |||||||
2,085 | Chesapeake Energy Corp | 137,527 | |||||
30,896 | e* | Denbury Resources, Inc | 1,127,704 | ||||
16,949 | * | Nabors Industries Ltd | 834,399 | ||||
6,383 | e* | National Oilwell Varco, Inc | 566,300 | ||||
3,127 | Petroleo Brasileiro S.A (ADR) | 181,210 | |||||
2,820 | Schlumberger Ltd | 302,953 | |||||
5,003 | e | XTO Energy, Inc | 342,756 | ||||
TOTAL OIL AND GAS EXTRACTION | 3,492,849 | ||||||
PETROLEUM AND COAL PRODUCTS - 3.04% | |||||||
3,054 | Apache Corp | 424,506 | |||||
3,419 | Devon Energy Corp | 410,827 | |||||
3,409 | e | Occidental Petroleum Corp | 306,333 | ||||
TOTAL PETROLEUM AND COAL PRODUCTS | 1,141,666 | ||||||
PRIMARY METAL INDUSTRIES - 1.34% | |||||||
3,075 | Precision Castparts Corp | 296,338 | |||||
588 | Vallourec | 205,641 | |||||
TOTAL PRIMARY METAL INDUSTRIES | 501,979 | ||||||
RAILROAD TRANSPORTATION - 0.53% | |||||||
2,658 | e | Union Pacific Corp | 200,679 | ||||
TOTAL RAILROAD TRANSPORTATION | 200,679 | ||||||
3
TIAA-CREF LIFE FUNDS - Growth Equity Fund
SHARES | COMPANY | VALUE | |||||
SECURITY AND COMMODITY BROKERS - 3.19% | |||||||
35,254 | Charles Schwab Corp | $ 724,117 | |||||
4,168 | e* | IntercontinentalExchange, Inc | 475,152 | ||||
TOTAL SECURITY AND COMMODITY BROKERS | 1,199,269 | ||||||
TRANSPORTATION EQUIPMENT - 1.20% | |||||||
6,467 | Boeing Co | 425,011 | |||||
1,464 | e* | Spirit Aerosystems Holdings, Inc (Class A) | 28,075 | ||||
TOTAL TRANSPORTATION EQUIPMENT | 453,086 | ||||||
| TOTAL COMMON STOCKS (Cost $38,286,840) | 38,398,712 | ||||||
SHORT-TERM INVESTMENTS - 28.53% | |||||||
INVESTMENT OF CASH COLLATERAL FOR SECURITIES LOANED - 28.53% | |||||||
10,728,037 | State Street Navigator Securities Lending Prime Portfolio | 10,728,037 | |||||
| TOTAL SHORT-TERM INVESTMENTS (Cost $10,728,037) | 10,728,037 | ||||||
| TOTAL PORTFOLIO - 130.65% (Cost $49,014,877) | 49,126,749 | ||||||
OTHER ASSETS & LIABILITIES, NET - (30.65)% | (11,523,496 | ) | |||||
NET ASSETS - 100.00% | $37,603,253 | ||||||
| * | Non-income producing |
| e | All or a portion of these securities are out on loan. |
| m | Indicates a security that has been deemed illiquid. |
| v | Security valued at fair value. |
ABBREVIATION:
ADR—American Depositary Receipt
Plc— Public Limited Company
4
TIAA-CREF LIFE FUNDS - Growth & Income Fund
TIAA-CREF LIFE FUNDS
GROWTH & INCOME FUND
STATEMENT OF INVESTMENTS (unaudited)
June 30, 2008
SHARES | COMPANY | VALUE | |||||
COMMON STOCKS - 100.25% | |||||||
AMUSEMENT AND RECREATION SERVICES - 2.05% | |||||||
18,777 | * | Activision, Inc | $ | 639,732 | |||
834 | Nintendo Co Ltd | 472,939 | |||||
13,334 | e* | WMS Industries, Inc | 396,953 | ||||
TOTAL AMUSEMENT AND RECREATION SERVICES | 1,509,624 | ||||||
APPAREL AND ACCESSORY STORES - 0.69% | |||||||
14,805 | e | Gap, Inc | 246,799 | ||||
7,906 | e* | J Crew Group, Inc | 260,977 | ||||
TOTAL APPAREL AND ACCESSORY STORES | 507,776 | ||||||
BUILDING MATERIALS AND GARDEN SUPPLIES - 0.47% | |||||||
14,886 | e | Home Depot, Inc | 348,630 | ||||
TOTAL BUILDING MATERIALS AND GARDEN SUPPLIES | 348,630 | ||||||
BUSINESS SERVICES - 6.58% | |||||||
6,424 | e* | Affiliated Computer Services, Inc (Class A) | 343,620 | ||||
7,837 | * | Check Point Software Technologies | 185,502 | ||||
3,711 | e | Ctrip.com International Ltd (ADR) | 169,890 | ||||
16,253 | e* | eBay, Inc | 444,194 | ||||
1,859 | * | Google, Inc (Class A) | 978,615 | ||||
811 | e | Mastercard, Inc (Class A) | 215,337 | ||||
42,196 | Microsoft Corp | 1,160,812 | |||||
41,138 | * | Oracle Corp | 863,898 | ||||
2,832 | Visa, Inc (Class A) | 230,270 | |||||
11,942 | * | Yahoo!, Inc | 246,722 | ||||
TOTAL BUSINESS SERVICES | 4,838,860 | ||||||
CHEMICALS AND ALLIED PRODUCTS - 16.07% | |||||||
23,850 | Abbott Laboratories | 1,263,335 | |||||
2,421 | Akzo Nobel NV | 165,678 | |||||
8,348 | * | Amgen, Inc | 393,692 | ||||
9,539 | e | Avon Products, Inc | 343,595 | ||||
7,108 | Bayer AG. | 598,054 | |||||
20,703 | Bristol-Myers Squibb Co | 425,033 | |||||
8,214 | * | Celgene Corp | 524,628 | ||||
7,719 | e* | Chattem, Inc | 502,121 | ||||
5,300 | e | Clorox Co | 276,660 | ||||
7,763 | Colgate-Palmolive Co | 536,423 | |||||
15,013 | e | Du Pont (E.I.) de Nemours & Co | 643,908 | ||||
10,752 | e* | Elan Corp plc (ADR) | 382,234 | ||||
5,424 | e* | Genentech, Inc | 411,682 | ||||
8,211 | * | Genzyme Corp | 591,356 | ||||
16,980 | * | Gilead Sciences, Inc | 899,091 | ||||
15,211 | Merck & Co, Inc | 573,303 | |||||
6,950 | e | Monsanto Co | 878,758 | ||||
3,036 | Mosaic Co | 439,309 | |||||
3,153 | * | NBTY, Inc | 101,085 | ||||
4,989 | Praxair, Inc | 470,163 | |||||
5
TIAA-CREF LIFE FUNDS - Growth & Income Fund
SHARES | COMPANY | VALUE | |||||
17,475 | Procter & Gamble Co | $ | 1,062,655 | ||||
3,153 | e | Sherwin-Williams Co | 144,817 | ||||
11,556 | e* | Valeant Pharmaceuticals International | 197,723 | ||||
TOTAL CHEMICALS AND ALLIED PRODUCTS | 11,825,303 | ||||||
COAL MINING - 0.51% | |||||||
4,298 | Peabody Energy Corp | 378,439 | |||||
TOTAL COAL MINING | 378,439 | ||||||
COMMUNICATIONS - 3.48% | |||||||
3,946 | America Movil S.A. de C.V. (ADR) (Series L) | 208,152 | |||||
28,960 | AT&T, Inc | 975,662 | |||||
19,410 | e* | Citizens Communications Co | 220,109 | ||||
8,430 | Scripps Networks Interactive (Class A) | 323,291 | |||||
23,632 | Verizon Communications, Inc | 836,573 | |||||
TOTAL COMMUNICATIONS | 2,563,787 | ||||||
DEPOSITORY INSTITUTIONS - 5.81% | |||||||
23,933 | Bank of America Corp | 571,281 | |||||
40,190 | Citigroup, Inc | 673,584 | |||||
19,937 | e | JPMorgan Chase & Co | 684,038 | ||||
4,859 | e | M&T Bank Corp | 342,754 | ||||
9,942 | Northern Trust Corp | 681,723 | |||||
16,590 | e | TCF Financial Corp | 199,578 | ||||
16,931 | e | US Bancorp | 472,206 | ||||
27,473 | Wells Fargo & Co | 652,484 | |||||
TOTAL DEPOSITORY INSTITUTIONS | 4,277,648 | ||||||
EATING AND DRINKING PLACES - 1.56% | |||||||
2,652 | * | Chipotle Mexican Grill, Inc (Class A) | 219,108 | ||||
13,387 | e | Darden Restaurants, Inc | 427,581 | ||||
8,901 | McDonald’s Corp | 500,414 | |||||
TOTAL EATING AND DRINKING PLACES | 1,147,103 | ||||||
ELECTRIC, GAS, AND SANITARY SERVICES - 3.67% | |||||||
9,610 | Exelon Corp | 864,516 | |||||
11,978 | e | PPL Corp | 626,090 | ||||
13,955 | e | Public Service Enterprise Group, Inc | 640,953 | ||||
7,990 | e | Questar Corp | 567,610 | ||||
TOTAL ELECTRIC, GAS, AND SANITARY SERVICES | 2,699,169 | ||||||
ELECTRONIC AND OTHER ELECTRIC EQUIPMENT - 8.32% | |||||||
5,612 | * | Apple Computer, Inc | 939,673 | ||||
13,049 | e* | Broadcom Corp (Class A) | 356,107 | ||||
35,285 | * | Cisco Systems, Inc | 820,729 | ||||
1,653 | e* | First Solar, Inc | 450,971 | ||||
8,367 | Gamesa Corp Tecnologica S.A. | 409,621 | |||||
3,638 | e | Harris Corp | 183,683 | ||||
13,267 | Honeywell International, Inc | 667,065 | |||||
40,322 | Intel Corp | 866,117 | |||||
14,636 | * | Marvell Technology Group Ltd | 258,472 | ||||
91 | * | Nortel Networks Corp | 748 | ||||
15,453 | e* | PMC - Sierra, Inc | 118,215 | ||||
23,653 | Qualcomm, Inc | 1,049,484 | |||||
TOTAL ELECTRONIC AND OTHER ELECTRIC EQUIPMENT | 6,120,885 | ||||||
6
TIAA-CREF LIFE FUNDS - Growth & Income Fund
SHARES | COMPANY | VALUE | ||||||
ENGINEERING AND MANAGEMENT SERVICES - 0.43% | ||||||||
5,109 | e* | Shaw Group, Inc | $ | 315,685 | ||||
TOTAL ENGINEERING AND MANAGEMENT SERVICES | 315,685 | |||||||
FABRICATED METAL PRODUCTS - 0.53% | ||||||||
11,131 | e | Pentair, Inc | 389,808 | |||||
TOTAL FABRICATED METAL PRODUCTS | 389,808 | |||||||
FOOD AND KINDRED PRODUCTS - 4.58% | ||||||||
18,655 | Coca-Cola Co | 969,687 | ||||||
12,310 | General Mills, Inc | 748,079 | ||||||
5,620 | e* | Hansen Natural Corp | 161,968 | |||||
9,933 | Kraft Foods, Inc (Class A) | 282,594 | ||||||
10,342 | PepsiCo, Inc | 657,648 | ||||||
8,683 | e* | TreeHouse Foods, Inc | 210,650 | |||||
11,866 | Unilever plc | 337,138 | ||||||
TOTAL FOOD AND KINDRED PRODUCTS | 3,367,764 | |||||||
FOOD STORES - 0.21% | ||||||||
5,249 | Kroger Co | 151,539 | ||||||
TOTAL FOOD STORES | 151,539 | |||||||
GENERAL BUILDING CONTRACTORS - 0.41% | ||||||||
17,166 | e | Amec plc | 302,488 | |||||
TOTAL GENERAL BUILDING CONTRACTORS | 302,488 | |||||||
GENERAL MERCHANDISE STORES - 2.77% | ||||||||
2,615 | e | Costco Wholesale Corp | 183,416 | |||||
11,775 | e* | Saks, Inc | 129,290 | |||||
21,035 | TJX Cos, Inc | 661,971 | ||||||
18,926 | Wal-Mart Stores, Inc | 1,063,641 | ||||||
TOTAL GENERAL MERCHANDISE STORES | 2,038,318 | |||||||
HEALTH SERVICES - 2.10% | ||||||||
13,668 | e | Cardinal Health, Inc | 704,995 | |||||
13,298 | * | Medco Health Solutions, Inc | 627,666 | |||||
5,792 | e | Mindray Medical International Ltd (ADR) | 216,157 | |||||
TOTAL HEALTH SERVICES | 1,548,818 | |||||||
INDUSTRIAL MACHINERY AND EQUIPMENT - 6.50% | ||||||||
1,935 | Alstom RGPT | 443,706 | ||||||
13,228 | e | Applied Materials, Inc | 252,523 | |||||
11,109 | e | Deere & Co | 801,292 | |||||
60,611 | General Electric Co | 1,617,708 | ||||||
19,067 | Hewlett-Packard Co | 842,952 | ||||||
6,964 | International Business Machines Corp | 825,443 | ||||||
582 | m,v* | Seagate Technology | (0 | ) | ||||
TOTAL INDUSTRIAL MACHINERY AND EQUIPMENT | 4,783,624 | |||||||
INSTRUMENTS AND RELATED PRODUCTS - 4.03% | ||||||||
11,207 | Covidien Ltd | 536,703 | ||||||
12,772 | Emerson Electric Co | 631,575 | ||||||
17,122 | Johnson & Johnson | 1,101,629 | ||||||
7
TIAA-CREF LIFE FUNDS - Growth & Income Fund
SHARES | COMPANY | VALUE | |||||
10,226 | e | Medtronic, Inc | $ | 529,196 | |||
3,378 | e* | Teledyne Technologies, Inc | 164,813 | ||||
TOTAL INSTRUMENTS AND RELATED PRODUCTS | 2,963,916 | ||||||
INSURANCE AGENTS, BROKERS AND SERVICE - 0.76% | |||||||
12,185 | e | AON Corp | 559,779 | ||||
TOTAL INSURANCE AGENTS, BROKERS AND SERVICE | 559,779 | ||||||
INSURANCE CARRIERS - 3.11% | |||||||
15,669 | * | ACE Ltd | 863,205 | ||||
12,784 | Aetna, Inc | 518,136 | |||||
7,237 | Aflac, Inc | 454,484 | |||||
13,078 | e | American International Group, Inc | 346,044 | ||||
5,401 | e | XL Capital Ltd (Class A) | 111,045 | ||||
TOTAL INSURANCE CARRIERS | 2,292,914 | ||||||
LEGAL SERVICES - 0.88% | |||||||
9,434 | e* | FTI Consulting, Inc | 645,852 | ||||
TOTAL LEGAL SERVICES | 645,852 | ||||||
METAL MINING - 1.36% | |||||||
8,465 | Anglo American plc | 594,533 | |||||
3,461 | Freeport-McMoRan Copper & Gold, Inc (Class B) | 405,595 | |||||
TOTAL METAL MINING | 1,000,128 | ||||||
MISCELLANEOUS MANUFACTURING INDUSTRIES - 0.20% | |||||||
4,042 | e | Hasbro, Inc | 144,380 | ||||
TOTAL MISCELLANEOUS MANUFACTURING INDUSTRIES | 144,380 | ||||||
MISCELLANEOUS RETAIL - 0.90% | |||||||
16,659 | CVS Corp | 659,197 | |||||
TOTAL MISCELLANEOUS RETAIL | 659,197 | ||||||
MOTION PICTURES - 0.48% | |||||||
16,041 | * | Discovery Holding Co (Class A) | 352,260 | ||||
TOTAL MOTION PICTURES | 352,260 | ||||||
NONDEPOSITORY INSTITUTIONS - 0.58% | |||||||
21,745 | e* | Fannie Mae | 424,245 | ||||
TOTAL NONDEPOSITORY INSTITUTIONS | 424,245 | ||||||
OIL AND GAS EXTRACTION - 3.56% | |||||||
11,187 | e* | Cameron International Corp | 619,200 | ||||
14,268 | Halliburton Co | 757,203 | |||||
11,579 | Schlumberger Ltd | 1,243,932 | |||||
TOTAL OIL AND GAS EXTRACTION | 2,620,335 | ||||||
PETROLEUM AND COAL PRODUCTS - 10.25% | |||||||
6,055 | Apache Corp | 841,645 | |||||
8,359 | Cabot Oil & Gas Corp | 566,155 | |||||
14,900 | Chevron Corp | 1,477,037 | |||||
6,073 | Devon Energy Corp | 729,732 | |||||
25,462 | Exxon Mobil Corp | 2,243,966 | |||||
2,603 | Hess Corp | 328,473 | |||||
1,418 | LUKOIL (ADR) | 139,260 | |||||
8
TIAA-CREF LIFE FUNDS - Growth & Income Fund
SHARES | COMPANY | VALUE | |||||
10,033 | Marathon Oil Corp | $ 520,412 | |||||
4,330 | e | Occidental Petroleum Corp | 389,094 | ||||
2,249 | Petroleo Brasileiro S.A. (ADR) | 159,297 | |||||
1,335 | Walter Industries, Inc | 145,208 | |||||
TOTAL PETROLEUM AND COAL PRODUCTS | 7,540,279 | ||||||
RAILROAD TRANSPORTATION - 0.94% | |||||||
9,204 | e | Union Pacific Corp | 694,902 | ||||
TOTAL RAILROAD TRANSPORTATION | 694,902 | ||||||
SECURITY AND COMMODITY BROKERS - 1.91% | |||||||
2,006 | e | BlackRock, Inc | 355,062 | ||||
2,218 | Goldman Sachs Group, Inc | 387,928 | |||||
8,809 | e | Lazard Ltd (Class A) | 300,827 | ||||
10,008 | e | Morgan Stanley | 360,989 | ||||
TOTAL SECURITY AND COMMODITY BROKERS | 1,404,806 | ||||||
TOBACCO PRODUCTS - 1.79% | |||||||
26,699 | Philip Morris International, Inc | 1,318,664 | |||||
TOTAL TOBACCO PRODUCTS | 1,318,664 | ||||||
TRANSPORTATION EQUIPMENT - 2.32% | |||||||
5,930 | e | Boeing Co | 389,720 | ||||
5,231 | Harsco Corp | 284,619 | |||||
7,231 | Northrop Grumman Corp | 483,754 | |||||
9,734 | e | Raytheon Co | 547,830 | ||||
TOTAL TRANSPORTATION EQUIPMENT | 1,705,923 | ||||||
WATER TRANSPORTATION - 0.14% | |||||||
3,238 | K-Sea Transportation Partners LP | 103,195 | |||||
TOTAL WATER TRANSPORTATION | 103,195 | ||||||
WHOLESALE TRADE-NONDURABLE GOODS - 0.30% | |||||||
3,860 | Gazprom (ADR) | 222,978 | |||||
TOTAL WHOLESALE TRADE-NONDURABLE GOODS | 222,978 | ||||||
| TOTAL COMMON STOCKS (Cost $71,210,903) | 73,769,021 | ||||||
SHORT-TERM INVESTMENTS - 26.75% | |||||||
INVESTMENT OF CASH COLLATERAL FOR SECURITIES LOANED -26.75% | |||||||
19,680,784 | State Street Navigator Securities Lending Prime Portfolio | 19,680,784 | |||||
| TOTAL SHORT-TERM INVESTMENTS (Cost $19,680,784) | 19,680,784 | ||||||
| TOTAL PORTFOLIO - 127.00% (Cost $90,891,687) | 93,449,805 | ||||||
OTHER ASSETS & LIABILITIES, NET - (27.00)% | (19,866,670 | ) | |||||
NET ASSETS - 100.00% | $73,583,135 | ||||||
| * | Non-income producing |
| e | All or a portion of these securities are out on loan. |
| m | Indicates a security that has been deemed illiquid. |
| v | Security valued at fair value. |
ABBREVIATION:
ADR—American Depositary Receipt
9
TIAA-CREF LIFE FUNDS - International Equity Fund
TIAA-CREF LIFE FUNDS
INTERNATIONAL EQUITY FUND
STATEMENT OF INVESTMENTS (unaudited)
June 30, 2008
SHARES | COMPANY | VALUE | |||||
COMMON STOCKS - 103.92% | |||||||
AMUSEMENT AND RECREATION SERVICES - 0.51% | |||||||
1,100 | Nintendo Co Ltd | $ | 623,780 | ||||
TOTAL AMUSEMENT AND RECREATION SERVICES | 623,780 | ||||||
BUSINESS SERVICES - 0.39% | |||||||
7 | NTT Data Corp | 27,405 | |||||
46,121 | WPP Group plc | 440,718 | |||||
TOTAL BUSINESS SERVICES | 468,123 | ||||||
CHEMICALS AND ALLIED PRODUCTS - 10.30% | |||||||
254,716 | Dabur India Ltd | 468,477 | |||||
47,900 | Daiichi Sankyo Co Ltd | 1,319,568 | |||||
61,427 | Lanxess AG. | 2,523,045 | |||||
47,396 | Reckitt Benckiser Group plc | 2,393,894 | |||||
50 | Shin-Etsu Chemical Co Ltd | 3,103 | |||||
4,852,000 | e | Sinochem Hong Kong Holding Ltd | 3,768,879 | ||||
28,172 | SSL International plc | 249,849 | |||||
3,188 | Syngenta AG. | 1,032,825 | |||||
206,000 | UBE Industries Ltd | 729,667 | |||||
TOTAL CHEMICALS AND ALLIED PRODUCTS | 12,489,307 | ||||||
COMMUNICATIONS - 2.98% | |||||||
441,401 | BT Group plc | 1,748,703 | |||||
102,682 | Deutsche Telekom AG. | 1,682,979 | |||||
8 | Nippon Telegraph & Telephone Corp | 39,474 | |||||
20 | NTT DoCoMo, Inc | 29,335 | |||||
6,000 | Singapore Telecommunications Ltd | 15,994 | |||||
32,992 | Vodafone Group plc | 97,205 | |||||
TOTAL COMMUNICATIONS | 3,613,690 | ||||||
DEPOSITORY INSTITUTIONS - 9.46% | |||||||
1,431 | Australia & New Zealand Banking Group Ltd | 25,719 | |||||
984 | Commonwealth Bank of Australia | 37,942 | |||||
3,017 | DBS Group Holdings Ltd | 41,975 | |||||
10,082 | Deutsche Bank AG. | 870,326 | |||||
10,868 | Julius Baer Holding AG. | 728,840 | |||||
4,725 | Komercni Banka A.S. | 1,100,546 | |||||
122,200 | Mitsubishi UFJ Financial Group, Inc | 1,079,935 | |||||
276 | Mizuho Financial Group, Inc | 1,284,182 | |||||
1,243 | National Australia Bank Ltd | 31,562 | |||||
3,000 | Oversea-Chinese Banking Corp | 18,070 | |||||
1,040 | e | Societe Generale | 90,167 | ||||
108 | e | Sumitomo Mitsui Financial Group, Inc | 812,182 | ||||
253,505 | * | UBS A.G. | 5,282,598 | ||||
1 | v* | UBS AG. | 1 | ||||
3,000 | United Overseas Bank Ltd | 41,185 | |||||
1,413 | Westpac Banking Corp | 27,139 | |||||
TOTAL DEPOSITORY INSTITUTIONS | 11,472,369 | ||||||
10
TIAA-CREF LIFE FUNDS - International Equity Fund
SHARES | COMPANY | VALUE | |||||
ELECTRIC, GAS, AND SANITARY SERVICES - 8.30% | |||||||
700 | Chubu Electric Power Co, Inc | $ | 17,098 | ||||
63,568 | Electricite de France | 6,021,845 | |||||
15,568 | Fortum Oyj | 787,981 | |||||
222,261 | e | Iberdrola S.A. | 2,961,358 | ||||
700 | Kansai Electric Power Co, Inc | 16,399 | |||||
9,900 | Tokyo Electric Power Co, Inc | 254,909 | |||||
TOTAL ELECTRIC, GAS, AND SANITARY SERVICES | 10,059,590 | ||||||
ELECTRONIC AND OTHER ELECTRIC EQUIPMENT - 2.22% | |||||||
25,000 | e | Hosiden Corp | 533,161 | ||||
2,200 | Ibiden Co Ltd | 80,115 | |||||
90 | Kyocera Corp | 8,490 | |||||
100 | Murata Manufacturing Co Ltd | 4,718 | |||||
58,010 | Smiths Group plc | 1,249,930 | |||||
18,700 | Sony Corp | 819,689 | |||||
TOTAL ELECTRONIC AND OTHER ELECTRIC EQUIPMENT | 2,696,103 | ||||||
ENGINEERING AND MANAGEMENT SERVICES - 0.57% | |||||||
10,362 | Tecan Group AG. | 690,553 | |||||
TOTAL ENGINEERING AND MANAGEMENT SERVICES | 690,553 | ||||||
FOOD AND KINDRED PRODUCTS - 5.80% | |||||||
118,700 | e | Asahi Breweries Ltd | 2,218,920 | ||||
54,988 | e | Groupe Danone | 3,847,733 | ||||
34,300 | e | Yakult Honsha Co Ltd | 966,242 | ||||
TOTAL FOOD AND KINDRED PRODUCTS | 7,032,895 | ||||||
FOOD STORES - 0.03% | |||||||
1,577 | Woolworths Ltd | 36,957 | |||||
TOTAL FOOD STORES | 36,957 | ||||||
GENERAL BUILDING CONTRACTORS - 1.84% | |||||||
36,436 | e | Vinci S.A. | 2,224,922 | ||||
TOTAL GENERAL BUILDING CONTRACTORS | 2,224,922 | ||||||
HOLDING AND OTHER INVESTMENT OFFICES - 0.69% | |||||||
197,000 | Japan Asia Investment Co Ltd | 825,671 | |||||
1 | Nomura Real Estate Office Fund, Inc | 7,531 | |||||
TOTAL HOLDING AND OTHER INVESTMENT OFFICES | 833,202 | ||||||
HOTELS AND OTHER LODGING PLACES - 2.12% | |||||||
38,724 | e | Accor S.A. | 2,572,427 | ||||
TOTAL HOTELS AND OTHER LODGING PLACES | 2,572,427 | ||||||
INDUSTRIAL MACHINERY AND EQUIPMENT - 7.11% | |||||||
20,370 | e | Canon, Inc | 1,048,564 | ||||
17,500 | Daikin Industries Ltd | 884,850 | |||||
6,900 | Fanuc Ltd | 674,801 | |||||
1,140 | FUJIFILM Holdings Corp | 39,268 | |||||
42,926 | GEA Group AG. | 1,515,596 | |||||
26,430 | Komatsu Ltd | 738,087 | |||||
29,414 | Krones AG. | 2,514,398 | |||||
2,300 | e | Modec, Inc | 75,031 | ||||
11,932 | Rheinmetall AG. | 861,308 | |||||
11
TIAA-CREF LIFE FUNDS - International Equity Fund
SHARES | COMPANY | VALUE | |||||
17,389 | e | SKF AB (B Shares) | $ | 271,010 | |||
100 | Sumitomo Heavy Industries Ltd | 678 | |||||
TOTAL INDUSTRIAL MACHINERY AND EQUIPMENT | 8,623,591 | ||||||
INSTRUMENTS AND RELATED PRODUCTS - 1.34% | |||||||
19,701 | e | Phonak Holding AG. | 1,625,923 | ||||
TOTAL INSTRUMENTS AND RELATED PRODUCTS | 1,625,923 | ||||||
INSURANCE CARRIERS - 3.36% | |||||||
22,973 | Allianz AG. | 4,041,021 | |||||
799 | Mitsui Sumitomo Insurance Group Holdings, Inc | 27,615 | |||||
TOTAL INSURANCE CARRIERS | 4,068,636 | ||||||
METAL MINING - 3.45% | |||||||
8,335 | Anglo American plc | 585,402 | |||||
2,700 | BHP Billiton Ltd | 114,913 | |||||
136,311 | MMC Norilsk Nickel (ADR) | 3,433,891 | |||||
337 | e | Rio Tinto Ltd | 43,603 | ||||
TOTAL METAL MINING | 4,177,809 | ||||||
MISCELLANEOUS RETAIL - 1.68% | |||||||
199,000 | Hutchison Whampoa Ltd | 2,006,775 | |||||
2,217 | Origin Energy Ltd | 34,300 | |||||
TOTAL MISCELLANEOUS RETAIL | 2,041,075 | ||||||
NONDEPOSITORY INSTITUTIONS - 1.78% | |||||||
11,422 | Deutsche Postbank AG. | 1,004,152 | |||||
456 | e | Kenedix, Inc | 559,579 | ||||
1,411 | ORIX Corp | 202,093 | |||||
45,986 | Tullett Prebon plc | 392,088 | |||||
TOTAL NONDEPOSITORY INSTITUTIONS | 2,157,912 | ||||||
OIL AND GAS EXTRACTION - 3.26% | |||||||
132,531 | BG Group plc | 3,444,166 | |||||
9,903 | Saipem S.p.A. | 462,842 | |||||
712 | Woodside Petroleum Ltd | 46,021 | |||||
TOTAL OIL AND GAS EXTRACTION | 3,953,029 | ||||||
PETROLEUM AND COAL PRODUCTS - 2.85% | |||||||
274,628 | BP plc | 3,183,120 | |||||
5,992 | Royal Dutch Shell plc (A Shares) | 245,623 | |||||
283 | Total S.A. | 24,088 | |||||
TOTAL PETROLEUM AND COAL PRODUCTS | 3,452,831 | ||||||
PRIMARY METAL INDUSTRIES - 0.51% | |||||||
10,100 | Nippon Steel Corp | 54,738 | |||||
5,000 | Sumitomo Metal Industries Ltd | 22,014 | |||||
3,700 | Sumitomo Metal Mining Co Ltd | 56,596 | |||||
1,390 | Vallourec | 486,124 | |||||
TOTAL PRIMARY METAL INDUSTRIES | 619,472 | ||||||
12
TIAA-CREF LIFE FUNDS - International Equity Fund
SHARES | COMPANY | VALUE | |||||
RAILROAD TRANSPORTATION - 1.25% | |||||||
81 | Central Japan Railway Co | $ | 892,819 | ||||
7 | East Japan Railway Co | 57,017 | |||||
55,088 | Firstgroup plc | 568,089 | |||||
TOTAL RAILROAD TRANSPORTATION | 1,517,925 | ||||||
REAL ESTATE - 0.74% | |||||||
332 | e | Risa Partners, Inc | 506,947 | ||||
19,000 | Sumitomo Realty & Development Co Ltd | 377,968 | |||||
1,034 | Westfield Group | 16,157 | |||||
TOTAL REAL ESTATE | 901,072 | ||||||
RUBBER AND MISCELLANEOUS PLASTIC PRODUCTS - 7.36% | |||||||
106,036 | Bayer AG. | 8,921,675 | |||||
TOTAL RUBBER AND MISCELLANEOUS PLASTIC PRODUCTS | 8,921,675 | ||||||
SECURITY AND COMMODITY BROKERS - 5.64% | |||||||
45,727 | Credit Suisse Group | 2,081,355 | |||||
77,400 | Hong Kong Exchanges and Clearing Ltd | 1,133,810 | |||||
247,330 | Man Group plc | 3,055,368 | |||||
1,800 | Nomura Holdings, Inc | 26,655 | |||||
107,000 | e | Singapore Exchange Ltd | 545,828 | ||||
TOTAL SECURITY AND COMMODITY BROKERS | 6,843,016 | ||||||
STONE, CLAY, AND GLASS PRODUCTS - 3.74% | |||||||
893,000 | Nippon Sheet Glass Co Ltd | 4,425,945 | |||||
150,000 | * | Zhejiang Glass Co Ltd | 109,752 | ||||
TOTAL STONE, CLAY, AND GLASS PRODUCTS | 4,535,697 | ||||||
TOBACCO PRODUCTS - 2.16% | |||||||
2,521 | British American Tobacco plc | 86,960 | |||||
2,666,631 | Huabao International Holdings Ltd | 2,531,788 | |||||
TOTAL TOBACCO PRODUCTS | 2,618,748 | ||||||
TRANSPORTATION BY AIR - 0.03% | |||||||
1,489 | SABMiller plc | 34,019 | |||||
TOTAL TRANSPORTATION BY AIR | 34,019 | ||||||
TRANSPORTATION EQUIPMENT - 6.12% | |||||||
620 | Denso Corp | 21,354 | |||||
288,251 | e | Fiat S.p.A. | 4,691,836 | ||||
42,100 | e | Honda Motor Co Ltd | 1,436,732 | ||||
27,020 | Toyota Motor Corp | 1,275,452 | |||||
TOTAL TRANSPORTATION EQUIPMENT | 7,425,374 | ||||||
TRUCKING AND WAREHOUSING - 3.84% | |||||||
178,550 | Deutsche Post AG. | 4,661,780 | |||||
TOTAL TRUCKING AND WAREHOUSING | 4,661,780 | ||||||
WATER TRANSPORTATION - 0.09% | |||||||
1,421 | Hamburger Hafen und Logistik AG. | 110,375 | |||||
TOTAL WATER TRANSPORTATION | 110,375 | ||||||
WHOLESALE TRADE-DURABLE GOODS - 0.30% | |||||||
4,117 | e | Kloeckner & Co AG. | 235,654 | ||||
1,340 | Mitsubishi Corp | 44,154 | |||||
13
TIAA-CREF LIFE FUNDS - International Equity Fund
SHARES | COMPANY | VALUE | ||||||
3,000 | Mitsui & Co Ltd | $ | 66,213 | |||||
1,350 | e | Sumitomo Corp | 17,737 | |||||
TOTAL WHOLESALE TRADE-DURABLE GOODS | 363,758 | |||||||
WHOLESALE TRADE-NONDURABLE GOODS - 2.10% | ||||||||
524,375 | Foster’s Group Ltd | 2,549,216 | ||||||
TOTAL WHOLESALE TRADE-NONDURABLE GOODS | 2,549,216 | |||||||
| TOTAL COMMON STOCKS (Cost $132,826,942) | 126,016,851 | |||||||
SHORT-TERM INVESTMENTS - 12.28% | ||||||||
INVESTMENT OF CASH COLLATERAL FOR SECURITIES LOANED -12.28% | ||||||||
14,898,371 | State Street Navigator Securities Lending Prime Portfolio | 14,898,371 | ||||||
TOTAL INVESTMENT OF CASH COLLATERAL FOR SECURITIES LOANED | 14,898,371 | |||||||
| TOTAL SHORT-TERM INVESTMENTS (Cost $14,898,371) | 14,898,371 | |||||||
| TOTAL PORTFOLIO - 116.20% (Cost $147,725,313) | 140,915,222 | |||||||
OTHER ASSETS & LIABILITIES, NET - (16.20)% | (19,649,922 | ) | ||||||
NET ASSETS - 100.00% | $121,265,300 | |||||||
| * | Non-income producing |
| e | All or a portion of these securities are out on loan. |
| v | Security valued at fair value. |
ABBREVIATION:
ADR—American Depositary Receipt
Plc— Public Limited Company
14
TIAA-CREF LIFE FUNDS - International Equity Fund
TIAA-CREF LIFE FUNDS
INTERNATIONAL EQUITY FUND
SUMMARY OF MARKET VALUES BY COUNTRY (Unaudited)
June 30, 2008
VALUE | % OF MARKET VALUE | |||||
DOMESTIC | ||||||
UNITED STATES | $ | 14,898,371 | 10.57 | % | ||
TOTAL DOMESTIC | 14,898,371 | 10.57 | ||||
FOREIGN | ||||||
AUSTRALIA | 2,963,527 | 2.10 | ||||
CHINA | 6,410,419 | 4.55 | ||||
CZECH REPUBLIC | 1,100,546 | 0.78 | ||||
FINLAND | 787,981 | 0.56 | ||||
FRANCE | 15,267,307 | 10.84 | ||||
GERMANY | 28,942,308 | 20.54 | ||||
HONG KONG | 3,140,586 | 2.23 | ||||
INDIA | 468,477 | 0.33 | ||||
ITALY | 5,154,678 | 3.66 | ||||
JAPAN | 25,234,483 | 17.91 | ||||
RUSSIA | 3,433,891 | 2.44 | ||||
SINGAPORE | 663,052 | 0.47 | ||||
SPAIN | 2,961,358 | 2.10 | ||||
SWEDEN | 271,010 | 0.19 | ||||
SWITZERLAND | 11,442,095 | 8.12 | ||||
UNITED KINGDOM | 17,775,133 | 12.61 | ||||
TOTAL FOREIGN | 126,016,851 | 89.43 | ||||
TOTAL PORTFOLIO | $ | 140,915,222 | 100.00 | % | ||
15
TIAA-CREF LIFE FUND - Large-Cap Value Fund
TIAA-CREF LIFE FUNDS
LARGE-CAP VALUE FUND
STATEMENT OF INVESTMENTS (Unaudited)
June 30, 2008
SHARES | COMPANY | VALUE | |||||
COMMON STOCKS - 100.08% | |||||||
AGRICULTURAL PRODUCTION-LIVESTOCK - 0.28% | |||||||
12,242 | e | Pilgrim’s Pride Corp | $ | 159,024 | |||
TOTAL AGRICULTURAL PRODUCTION-LIVESTOCK | 159,024 | ||||||
AMUSEMENT AND RECREATION SERVICES - 0.42% | |||||||
7,667 | Walt Disney Co | 239,210 | |||||
TOTAL AMUSEMENT AND RECREATION SERVICES | 239,210 | ||||||
APPAREL AND ACCESSORY STORES - 1.48% | |||||||
6,890 | e* | AnnTaylor Stores Corp | 165,084 | ||||
24,321 | e | Gap, Inc | 405,431 | ||||
7,064 | e* | Kohl’s Corp | 282,843 | ||||
TOTAL APPAREL AND ACCESSORY STORES | 853,358 | ||||||
APPAREL AND OTHER TEXTILE PRODUCTS - 0.07% | |||||||
584 | e | Liz Claiborne, Inc | 8,264 | ||||
405 | e | VF Corp | 28,828 | ||||
TOTAL APPAREL AND OTHER TEXTILE PRODUCTS | 37,092 | ||||||
BUILDING MATERIALS AND GARDEN SUPPLIES - 1.08% | |||||||
20,739 | Home Depot, Inc | 485,707 | |||||
6,798 | Lowe’s Cos, Inc | 141,059 | |||||
TOTAL BUILDING MATERIALS AND GARDEN SUPPLIES | 626,766 | ||||||
BUSINESS SERVICES - 2.13% | |||||||
6,617 | e* | Affiliated Computer Services, Inc (Class A) | 353,943 | ||||
5,011 | * | Autonomy Corp plc | 89,826 | ||||
5,937 | CA, Inc | 137,085 | |||||
8,994 | e* | Cavium Networks, Inc | 188,874 | ||||
9,826 | * | Oracle Corp | 206,346 | ||||
1,553,556 | Solomon Systech International Ltd | 74,737 | |||||
2,198 | Visa, Inc (Class A) | 178,719 | |||||
TOTAL BUSINESS SERVICES | 1,229,530 | ||||||
CHEMICALS AND ALLIED PRODUCTS - 11.07% | |||||||
14,336 | Abbott Laboratories | 759,378 | |||||
4,537 | Akzo Nobel NV | 310,483 | |||||
9,269 | e | Alberto-Culver Co | 243,497 | ||||
6,440 | * | Amgen, Inc | 303,710 | ||||
5,972 | e | Avon Products, Inc | 215,111 | ||||
5,864 | Celanese Corp (Series A) | 267,750 | |||||
12,463 | e | Clorox Co | 650,569 | ||||
2,542 | Colgate-Palmolive Co | 175,652 | |||||
9,096 | e | Dow Chemical Co | 317,541 | ||||
11,415 | e | Du Pont (E.I.) de Nemours & Co | 489,589 | ||||
1,988 | * | Genentech, Inc | 150,889 | ||||
27,352 | e* | Keryx Biopharmaceuticals, Inc | 13,402 | ||||
26,558 | Merck & Co, Inc | 1,000,971 | |||||
31,651 | e | Mylan Laboratories, Inc | 382,028 | ||||
16
TIAA-CREF LIFE FUNDS - Large-Cap Value Fund
SHARES | COMPANY | VALUE | |||||
32,205 | Pfizer, Inc | $ | 562,621 | ||||
2,005 | e | PPG Industries, Inc | 115,027 | ||||
9 | e | Tronox, Inc (Class B) | 27 | ||||
17,474 | e* | Verasun Energy Corp | 72,168 | ||||
7,698 | Wyeth | 369,196 | |||||
TOTAL CHEMICALS AND ALLIED PRODUCTS | 6,399,609 | ||||||
COAL MINING - 0.44% | |||||||
2,915 | e | Peabody Energy Corp | 256,666 | ||||
TOTAL COAL MINING | 256,666 | ||||||
COMMUNICATIONS - 5.91% | |||||||
26,673 | AT&T, Inc | 898,613 | |||||
21,557 | e | Comcast Corp (Class A) | 408,936 | ||||
520 | e | Fairpoint Communications, Inc | 3,749 | ||||
394 | e* | Liberty Media Corp - Capital (Series A) | 5,674 | ||||
1,576 | * | Liberty Media Corp - Entertainment (Series A) | 38,186 | ||||
1,970 | e* | Liberty Media Holding Corp (Interactive A) | 29,077 | ||||
41,948 | * | SONAECOM - SGPS S.A. | 139,355 | ||||
51,331 | e | Sprint Nextel Corp | 487,645 | ||||
8,579 | e* | Time Warner Cable, Inc (Class A) | 227,172 | ||||
1,411,900 | v* | True Corp PCL | 169,173 | ||||
28,582 | Verizon Communications, Inc | 1,011,803 | |||||
TOTAL COMMUNICATIONS | 3,419,383 | ||||||
DEPOSITORY INSTITUTIONS - 10.59% | |||||||
57,037 | AMMB Holdings BHD | 55,624 | |||||
4,648 | e | Astoria Financial Corp | 93,332 | ||||
24,357 | Bank of America Corp | 581,402 | |||||
4,184 | e | Bank of New York Mellon Corp | 158,281 | ||||
3,295 | e | BB&T Corp | 75,027 | ||||
54,671 | Citigroup, Inc | 916,286 | |||||
29,798 | e | First Horizon National Corp | 221,399 | ||||
42,996 | JPMorgan Chase & Co | 1,475,193 | |||||
2,820 | e | M&T Bank Corp | 198,923 | ||||
78,390 | e | National City Corp | 373,920 | ||||
4,265 | PNC Financial Services Group, Inc | 243,532 | |||||
5,716 | e | SunTrust Banks, Inc | 207,034 | ||||
49,751 | e | TCF Financial Corp | 598,505 | ||||
39,035 | Wells Fargo & Co | 927,081 | |||||
TOTAL DEPOSITORY INSTITUTIONS | 6,125,539 | ||||||
EATING AND DRINKING PLACES - 1.14% | |||||||
20,696 | e | Darden Restaurants, Inc | 661,030 | ||||
TOTAL EATING AND DRINKING PLACES | 661,030 | ||||||
ELECTRIC, GAS, AND SANITARY SERVICES - 6.23% | |||||||
36,897 | e* | Allied Waste Industries, Inc | 465,640 | ||||
20,998 | e | CMS Energy Corp | 312,870 | ||||
1,946 | Dominion Resources, Inc | 92,416 | |||||
4,837 | Exelon Corp | 435,137 | |||||
2,138 | FirstEnergy Corp | 176,022 | |||||
7,852 | e | FPL Group, Inc | 514,934 | ||||
774 | MDU Resources Group, Inc | 26,982 | |||||
4,836 | e | PG&E Corp | 191,941 | ||||
13,367 | e | PPL Corp | 698,693 | ||||
2,400 | e | Progress Energy, Inc | 100,392 | ||||
17
TIAA-CREF LIFE FUNDS - Large-Cap Value Fund
SHARES | COMPANY | VALUE | |||||
7,635 | e | Public Service Enterprise Group, Inc | $ | 350,676 | |||
3,360 | e | Questar Corp | 238,694 | ||||
TOTAL ELECTRIC, GAS, AND SANITARY SERVICES | 3,604,397 | ||||||
ELECTRONIC AND OTHER ELECTRIC EQUIPMENT - 2.75% | |||||||
5,614 | e* | Ciena Corp | 130,076 | ||||
4,368 | Honeywell International, Inc | 219,623 | |||||
10,371 | e* | Marvell Technology Group Ltd | 183,152 | ||||
41,923 | Maxim Integrated Products, Inc | 886,671 | |||||
3,833 | Qualcomm, Inc | 170,070 | |||||
TOTAL ELECTRONIC AND OTHER ELECTRIC EQUIPMENT | 1,589,592 | ||||||
ENGINEERING AND MANAGEMENT SERVICES - 1.54% | |||||||
40 | e* | Affymax, Inc | 636 | ||||
11,719 | e* | Genpact Ltd | 174,847 | ||||
232 | KBR, Inc | 8,099 | |||||
8,164 | e* | SAIC, Inc | 169,893 | ||||
5,034 | e* | Shaw Group, Inc | 311,051 | ||||
5,360 | e* | URS Corp | 224,959 | ||||
TOTAL ENGINEERING AND MANAGEMENT SERVICES | 889,485 | ||||||
FABRICATED METAL PRODUCTS - 0.96% | |||||||
10,004 | * | Crown Holdings, Inc | 260,004 | ||||
6,237 | e | Illinois Tool Works, Inc | 296,320 | ||||
TOTAL FABRICATED METAL PRODUCTS | 556,324 | ||||||
FOOD AND KINDRED PRODUCTS - 3.93% | |||||||
2,937 | Archer Daniels Midland Co | 99,124 | |||||
1,483 | Coca-Cola Co | 77,086 | |||||
5,404 | General Mills, Inc | 328,401 | |||||
5,644 | e | Hershey Co | 185,010 | ||||
14,198 | Kraft Foods, Inc (Class A) | 403,933 | |||||
3,290 | e | Molson Coors Brewing Co (Class B) | 178,746 | ||||
11,373 | PepsiCo, Inc | 723,209 | |||||
18,718 | e | Tyson Foods, Inc (Class A) | 279,647 | ||||
TOTAL FOOD AND KINDRED PRODUCTS | 2,275,156 | ||||||
FOOD STORES - 0.12% | |||||||
2,418 | Kroger Co | 69,808 | |||||
TOTAL FOOD STORES | 69,808 | ||||||
FORESTRY - 0.37% | |||||||
5,000 | e | Rayonier, Inc | 212,300 | ||||
TOTAL FORESTRY | 212,300 | ||||||
FURNITURE AND FIXTURES - 0.32% | |||||||
11,642 | e | Masco Corp | 183,129 | ||||
TOTAL FURNITURE AND FIXTURES | 183,129 | ||||||
GENERAL BUILDING CONTRACTORS - 0.20% | |||||||
5,290 | e | Ryland Group, Inc | 115,375 | ||||
TOTAL GENERAL BUILDING CONTRACTORS | 115,375 | ||||||
GENERAL MERCHANDISE STORES - 0.76% | |||||||
3,787 | e | JC Penney Co, Inc | 137,430 | ||||
9,917 | Macy’s, Inc | 192,588 | |||||
1,983 | Wal-Mart Stores, Inc | 111,445 | |||||
18
TIAA-CREF LIFE FUNDS - Large-Cap Value Fund
SHARES | COMPANY | VALUE | |||||
TOTAL GENERAL MERCHANDISE STORES | $ | 441,463 | |||||
HEALTH SERVICES - 0.56% | |||||||
19,521 | * | Healthsouth Corp | 324,634 | ||||
TOTAL HEALTH SERVICES | 324,634 | ||||||
HOLDING AND OTHER INVESTMENT OFFICES - 1.61% | |||||||
21,546 | e | Blackstone Group LP | 392,353 | ||||
1,690 | e | Boston Properties, Inc | 152,472 | ||||
2 | e | Cross Timbers Royalty Trust | 120 | ||||
411 | e* | HFF, Inc (Class A) | 2,339 | ||||
4,347 | e | Plum Creek Timber Co, Inc | 185,660 | ||||
895 | Simon Property Group, Inc | 80,452 | |||||
1,338 | e | Vornado Realty Trust | 117,744 | ||||
TOTAL HOLDING AND OTHER INVESTMENT OFFICES | 931,140 | ||||||
INDUSTRIAL MACHINERY AND EQUIPMENT - 5.06% | |||||||
30,390 | * | Brocade Communications Systems, Inc | 250,414 | ||||
85,730 | General Electric Co | 2,288,134 | |||||
4,637 | International Game Technology | 115,832 | |||||
3,849 | e* | Riverbed Technology, Inc | 52,808 | ||||
9,725 | * | Verigy Ltd | 220,855 | ||||
TOTAL INDUSTRIAL MACHINERY AND EQUIPMENT | 2,928,043 | ||||||
INSTRUMENTS AND RELATED PRODUCTS - 2.58% | |||||||
3,399 | * | Agilent Technologies, Inc | 120,800 | ||||
6,650 | Covidien Ltd | 318,469 | |||||
4,412 | e* | Eagle Test Systems, Inc | 49,414 | ||||
4,000 | e* | Hologic, Inc | 87,200 | ||||
9,162 | Johnson & Johnson | 589,483 | |||||
3,943 | * | St. Jude Medical, Inc | 161,190 | ||||
1,441 | * | Thermo Electron Corp | 80,307 | ||||
1,274 | * | Zimmer Holdings, Inc | 86,696 | ||||
TOTAL INSTRUMENTS AND RELATED PRODUCTS | 1,493,559 | ||||||
INSURANCE AGENTS, BROKERS AND SERVICE - 0.54% | |||||||
4,819 | Hartford Financial Services Group, Inc | 311,163 | |||||
TOTAL INSURANCE AGENTS, BROKERS AND SERVICE | 311,163 | ||||||
INSURANCE CARRIERS - 6.55% | |||||||
3,226 | * | ACE Ltd | 177,720 | ||||
3 | Aegon NV | 39 | |||||
17,865 | e | Aetna, Inc | 724,068 | ||||
3,735 | Allstate Corp | 170,279 | |||||
13,201 | e | American International Group, Inc | 349,298 | ||||
664 | e | Aspen Insurance Holdings Ltd | 15,717 | ||||
5,269 | Genworth Financial, Inc (Class A) | 93,841 | |||||
7,497 | * | Health Net, Inc | 180,378 | ||||
13,313 | Lincoln National Corp | 603,345 | |||||
6,801 | e | Max Re Capital Ltd | 145,065 | ||||
6,281 | e | MGIC Investment Corp | 38,377 | ||||
7,677 | e | Platinum Underwriters Holdings Ltd | 250,347 | ||||
7,722 | e | Principal Financial Group | 324,092 | ||||
1,662 | e | Prudential Financial, Inc | 99,288 | ||||
9,490 | Travelers Cos, Inc | 411,866 | |||||
10,051 | e | XL Capital Ltd (Class A) | 206,649 | ||||
TOTAL INSURANCE CARRIERS | 3,790,369 | ||||||
19
TIAA-CREF LIFE FUNDS - Large-Cap Value Fund
SHARES | COMPANY | VALUE | |||||
METAL MINING - 1.46% | |||||||
4,760 | Anglo American plc | $ | 334,315 | ||||
4,342 | Freeport-McMoRan Copper & Gold, Inc (Class B) | 508,839 | |||||
TOTAL METAL MINING | 843,154 | ||||||
MISCELLANEOUS MANUFACTURING INDUSTRIES - 0.02% | |||||||
161 | * | Intrepid Potash, Inc | 10,591 | ||||
TOTAL MISCELLANEOUS MANUFACTURING INDUSTRIES | 10,591 | ||||||
MISCELLANEOUS RETAIL - 0.19% | |||||||
2,791 | CVS Corp | 110,440 | |||||
TOTAL MISCELLANEOUS RETAIL | 110,440 | ||||||
MOTION PICTURES - 1.00% | |||||||
20,221 | News Corp (Class A) | 304,124 | |||||
18,661 | Time Warner, Inc | 276,183 | |||||
TOTAL MOTION PICTURES | 580,307 | ||||||
NONDEPOSITORY INSTITUTIONS - 1.26% | |||||||
5,059 | e | Capital One Financial Corp | 192,293 | ||||
27,364 | e* | Fannie Mae | 533,872 | ||||
TOTAL NONDEPOSITORY INSTITUTIONS | 726,165 | ||||||
OIL AND GAS EXTRACTION - 3.06% | |||||||
2,440 | Anadarko Petroleum Corp | 182,610 | |||||
5,536 | BJ Services Co | 176,820 | |||||
352 | e | Baker Hughes, Inc | 30,744 | ||||
5,403 | e | Chesapeake Energy Corp | 356,382 | ||||
1,142 | e | Equitable Resources, Inc | 78,867 | ||||
4,977 | Halliburton Co | 264,129 | |||||
12,000 | * | Integra Group Holdings (GDR) | 132,034 | ||||
496 | e* | Plains Exploration & Production Co | 36,193 | ||||
274 | e | W&T Offshore, Inc | 16,032 | ||||
7,212 | e | XTO Energy, Inc | 494,094 | ||||
TOTAL OIL AND GAS EXTRACTION | 1,767,905 | ||||||
PAPER AND ALLIED PRODUCTS - 0.38% | |||||||
3,200 | e | MeadWestvaco Corp | 76,288 | ||||
695 | Mondi Ltd | 4,289 | |||||
1,143 | e* | Smurfit-Stone Container Corp | 4,652 | ||||
4,304 | Sonoco Products Co | 133,209 | |||||
TOTAL PAPER AND ALLIED PRODUCTS | 218,438 | ||||||
PETROLEUM AND COAL PRODUCTS - 14.35% | |||||||
6,924 | Apache Corp | 962,436 | |||||
7,249 | Cabot Oil & Gas Corp | 490,975 | |||||
24,805 | Chevron Corp | 2,458,920 | |||||
7,143 | ConocoPhillips | 674,228 | |||||
3,025 | Devon Energy Corp | 363,484 | |||||
1,531 | e | EOG Resources, Inc | 200,867 | ||||
11,763 | Exxon Mobil Corp | 1,036,673 | |||||
1,228 | LUKOIL (ADR) | 120,600 | |||||
13,239 | Marathon Oil Corp | 686,707 | |||||
6,455 | e | Occidental Petroleum Corp | 580,046 | ||||
7,807 | Petroleo Brasileiro S.A. (ADR) | 552,970 | |||||
2,674 | e* | SandRidge Energy, Inc | 172,687 | ||||
TOTAL PETROLEUM AND COAL PRODUCTS | 8,300,593 | ||||||
20
TIAA-CREF LIFE FUNDS - Large-Cap Value Fund
SHARES | COMPANY | VALUE | |||||
PIPELINES, EXCEPT NATURAL GAS - 0.08% | |||||||
1,515 | Spectra Energy Corp | $ | 43,541 | ||||
TOTAL PIPELINES, EXCEPT NATURAL GAS | 43,541 | ||||||
PRIMARY METAL INDUSTRIES - 0.16% | |||||||
268 | Vallourec | 93,727 | |||||
TOTAL PRIMARY METAL INDUSTRIES | 93,727 | ||||||
RAILROAD TRANSPORTATION - 0.49% | |||||||
3,770 | Union Pacific Corp | 284,635 | |||||
TOTAL RAILROAD TRANSPORTATION | 284,635 | ||||||
REAL ESTATE - 0.22% | |||||||
105,567 | * | Unitech Corporate Parks plc | 126,042 | ||||
TOTAL REAL ESTATE | 126,042 | ||||||
SECURITY AND COMMODITY BROKERS - 3.90% | |||||||
19,492 | Charles Schwab Corp | 400,366 | |||||
4,124 | Franklin Resources, Inc | 377,965 | |||||
4,482 | Goldman Sachs Group, Inc | 783,902 | |||||
6,908 | e | Invesco Ltd | 165,654 | ||||
5,313 | e | Janus Capital Group, Inc | 140,635 | ||||
5,087 | e | Lehman Brothers Holdings, Inc | 100,773 | ||||
3,594 | Merrill Lynch & Co, Inc | 113,966 | |||||
4,746 | e | Morgan Stanley | 171,188 | ||||
TOTAL SECURITY AND COMMODITY BROKERS | 2,254,449 | ||||||
TOBACCO PRODUCTS - 0.96% | |||||||
11,279 | Philip Morris International, Inc | 557,070 | |||||
TOTAL TOBACCO PRODUCTS | 557,070 | ||||||
TRANSPORTATION BY AIR - 0.04% | |||||||
4,521 | e | UAL Corp | 23,600 | ||||
TOTAL TRANSPORTATION BY AIR | 23,600 | ||||||
TRANSPORTATION EQUIPMENT - 1.18% | |||||||
28,600 | e* | Ford Motor Co | 137,566 | ||||
67 | e | Genuine Parts Co | 2,659 | ||||
8,098 | Northrop Grumman Corp | 541,756 | |||||
TOTAL TRANSPORTATION EQUIPMENT | 681,981 | ||||||
TRANSPORTATION SERVICES - 0.40% | |||||||
11,726 | e | UTI Worldwide, Inc | 233,934 | ||||
TOTAL TRANSPORTATION SERVICES | 233,934 | ||||||
WATER TRANSPORTATION - 0.46% | |||||||
11,785 | e | Royal Caribbean Cruises Ltd | 264,809 | ||||
TOTAL WATER TRANSPORTATION | 264,809 | ||||||
WHOLESALE TRADE-NONDURABLE GOODS - 1.78% | |||||||
16,074 | e | Cardinal Health, Inc | 829,097 | ||||
4,233 | e* | Dean Foods Co | 83,051 | ||||
2,064 | Gazprom (ADR) | 119,232 | |||||
162 | e | Idearc, Inc | 381 | ||||
21
TIAA-CREF LIFE FUNDS - Large-Cap Value Fund
SHARES | COMPANY | VALUE | |||||
TOTAL WHOLESALE TRADE-NONDURABLE GOODS | $ 1,031,761 | ||||||
| TOTAL COMMON STOCKS (Cost $61,985,637) | 57,876,286 | ||||||
PRINCIPAL | ISSUER | ||||||
SHORT-TERM INVESTMENTS - 30.09% | |||||||
U.S. GOVERNMENT AND AGENCIES DISCOUNT NOTES - 0.35% | |||||||
$ 200,000 | Federal Home Loan Bank (FHLB), 7/01/08 | 200,000 | |||||
TOTAL U.S. GOVERNMENT AND AGENCIES DISCOUNT NOTES | 200,000 | ||||||
SHARES | COMPANY | ||||||
INVESTMENT OF CASH COLLATERAL FOR SECURITIES LOANED - 29.74% | |||||||
17,198,310 | State Street Navigator Securities Lending Prime Portfolio | 17,198,310 | |||||
TOTAL INVESTMENT OF CASH COLLATERAL FOR SECURITIES LOANED | 17,198,310 | ||||||
| TOTAL SHORT-TERM INVESTMENTS (Cost $17,398,310) | 17,398,310 | ||||||
| TOTAL PORTFOLIO - 130.17% (Cost $79,383,947) | 75,274,596 | ||||||
OTHER ASSETS & LIABILITIES, NET - (30.17)% | (17,447,329 | ) | |||||
| NET ASSETS - 100.00% | $57,827,267 | ||||||
| * | Non-income producing |
| e | All or a portion of these securities are out on loan. |
| v | Security valued at fair value. |
| ABBREVIATION: |
ADR - American Depositary Receipt
GDR - Global Depositary Receipt
Plc - Public Limited Company
22
TIAA-CREF LIFE FUNDS - Small-Cap Equity Fund
TIAA-CREF LIFE FUNDS
SMALL-CAP EQUITY FUND
STATEMENT OF INVESTMENTS (Unaudited)
June 30, 2008
SHARES | COMPANY | VALUE | |||||
COMMON STOCKS - 99.62% | |||||||
AGRICULTURAL PRODUCTION-CROPS - 0.06% | |||||||
1,970 | * | Chiquita Brands International, Inc | $ | 29,885 | |||
TOTAL AGRICULTURAL PRODUCTION-CROPS | 29,885 | ||||||
AGRICULTURAL PRODUCTION-LIVESTOCK - 0.24% | |||||||
3,395 | e | Cal-Maine Foods, Inc | 112,001 | ||||
TOTAL AGRICULTURAL PRODUCTION-LIVESTOCK | 112,001 | ||||||
AMUSEMENT AND RECREATION SERVICES - 0.48% | |||||||
3,530 | e* | Bally Technologies, Inc | 119,314 | ||||
136 | e | Dover Downs Gaming & Entertainment, Inc | 873 | ||||
24,200 | * | Six Flags, Inc | 27,830 | ||||
2,304 | e* | Town Sports International Holdings, Inc | 21,519 | ||||
1,900 | e* | WMS Industries, Inc | 56,563 | ||||
TOTAL AMUSEMENT AND RECREATION SERVICES | 226,099 | ||||||
APPAREL AND ACCESSORY STORES - 1.86% | |||||||
4,890 | e* | Aeropostale, Inc | 153,204 | ||||
1,100 | e | Buckle, Inc | 50,303 | ||||
5,700 | e* | Carter’s, Inc | 78,774 | ||||
226 | Cato Corp (Class A) | 3,218 | |||||
3,610 | e* | Charlotte Russe Holding, Inc | 64,114 | ||||
3,060 | e* | Children’s Place Retail Stores, Inc | 110,466 | ||||
2,900 | Christopher & Banks Corp | 19,720 | |||||
2,800 | e* | Collective Brands, Inc | 32,564 | ||||
4,040 | e* | Dress Barn, Inc | 54,055 | ||||
4,700 | * | HOT Topic, Inc | 25,427 | ||||
1,910 | e* | J Crew Group, Inc | 63,049 | ||||
2,500 | e* | JOS A Bank Clothiers, Inc | 66,875 | ||||
4,000 | * | New York & Co, Inc | 36,520 | ||||
2,000 | e* | Tween Brands, Inc | 32,920 | ||||
18,246 | e* | Wet Seal, Inc (Class A) | 87,033 | ||||
TOTAL APPAREL AND ACCESSORY STORES | 878,242 | ||||||
APPAREL AND OTHER TEXTILE PRODUCTS - 0.87% | |||||||
2,292 | * | G-III Apparel Group Ltd | 28,283 | ||||
3,449 | e* | Gymboree Corp | 138,201 | ||||
3,200 | * | Maidenform Brands, Inc | 43,200 | ||||
9,640 | * | Quiksilver, Inc | 94,665 | ||||
2,370 | e* | Warnaco Group, Inc | 104,446 | ||||
TOTAL APPAREL AND OTHER TEXTILE PRODUCTS | 408,795 | ||||||
AUTO REPAIR, SERVICES AND PARKING - 0.21% | |||||||
4,800 | * | Exide Technologies | 80,448 | ||||
1,300 | * | Midas, Inc | 17,550 | ||||
100 | * | Wright Express Corp | 2,480 | ||||
TOTAL AUTO REPAIR, SERVICES AND PARKING | 100,478 | ||||||
BUILDING MATERIALS AND GARDEN SUPPLIES - 0.02% | |||||||
1,300 | * | Builders FirstSource, Inc | 6,903 | ||||
100 | * | Central Garden & Pet Co | 455 | ||||
TOTAL BUILDING MATERIALS AND GARDEN SUPPLIES | 7,358 | ||||||
23
TIAA-CREF LIFE FUNDS - Small-Cap Equity Fund
SHARES | COMPANY | VALUE | |||||
BUSINESS SERVICES - 11.97% | |||||||
58,090 | e* | 3Com Corp | $ | 123,151 | |||
2,319 | e | Aaron Rents, Inc | 51,783 | ||||
2,335 | e | ABM Industries, Inc | 51,954 | ||||
14,153 | e* | Actuate Corp | 55,338 | ||||
4,770 | Administaff, Inc | 133,035 | |||||
5,990 | e* | American Reprographics Co | 99,734 | ||||
694 | * | Ansoft Corp | 25,262 | ||||
1,400 | * | Blackboard, Inc | 53,522 | ||||
4,300 | e* | Blue Coat Systems, Inc | 60,673 | ||||
1,400 | * | Bottomline Technologies, Inc | 13,622 | ||||
1,000 | Brady Corp (Class A) | 34,530 | |||||
1,200 | * | CACI International, Inc (Class A) | 54,924 | ||||
5,900 | * | Ciber, Inc | 36,639 | ||||
1,700 | * | CMGI, Inc | 18,020 | ||||
3,000 | e* | Commvault Systems, Inc | 49,920 | ||||
2,570 | e | Compass Diversified Trust | 29,375 | ||||
9,749 | e* | CSG Systems International, Inc | 107,434 | ||||
200 | e* | DealerTrack Holdings, Inc | 2,822 | ||||
4,050 | e | Deluxe Corp | 72,171 | ||||
3,329 | e* | Dice Holdings, Inc | 27,498 | ||||
2,710 | e* | Digital River, Inc | 104,552 | ||||
3,000 | * | DynCorp International, Inc (Class A) | 45,450 | ||||
19,176 | e* | Earthlink, Inc | 165,872 | ||||
4,240 | e* | Eclipsys Corp | 77,846 | ||||
14,800 | * | Evergreen Energy, Inc | 25,752 | ||||
5,500 | e* | FalconStor Software, Inc | 38,940 | ||||
900 | * | Forrester Research, Inc | 27,792 | ||||
7,710 | * | Gartner, Inc | 159,751 | ||||
1,800 | * | Gerber Scientific, Inc | 20,484 | ||||
5,800 | e* | Global Cash Access, Inc | 39,788 | ||||
5,730 | e* | Global Sources Ltd | 86,981 | ||||
6,480 | e* | H&E Equipment Services, Inc | 77,890 | ||||
5,950 | e | Heartland Payment Systems, Inc | 140,420 | ||||
2,210 | e | Heidrick & Struggles International, Inc | 61,084 | ||||
2,300 | infoGROUP, Inc | 10,097 | |||||
2,350 | e* | Informatica Corp | 35,344 | ||||
105 | Infospace, Inc | 875 | |||||
1,600 | * | Interactive Intelligence, Inc | 18,624 | ||||
6,300 | * | Internap Network Services Corp | 29,484 | ||||
4,800 | e* | Interwoven, Inc | 57,648 | ||||
700 | e | Jack Henry & Associates, Inc | 15,148 | ||||
6,430 | * | JDA Software Group, Inc | 116,383 | ||||
2,400 | * | Kenexa Corp | 45,216 | ||||
700 | * | Keynote Systems, Inc | 9,016 | ||||
3,385 | e* | Kforce, Inc | 28,739 | ||||
1,300 | e* | Korn/Ferry International | 20,449 | ||||
8,400 | * | Lawson Software, Inc | 61,068 | ||||
4,600 | * | Limelight Networks, Inc | 17,572 | ||||
1,500 | * | Liquidity Services, Inc | 17,295 | ||||
4,100 | * | Magma Design Automation, Inc | 24,887 | ||||
6,460 | e* | Manhattan Associates, Inc | 153,296 | ||||
3,233 | * | Mantech International Corp (Class A) | 155,572 | ||||
1,226 | * | MicroStrategy, Inc (Class A) | 79,384 | ||||
800 | * | Monotype Imaging Holdings, Inc | 9,744 | ||||
12,470 | e* | MPS Group, Inc | 132,556 | ||||
300 | * | NCI, Inc (Class A) | 6,864 | ||||
24
TIAA-CREF LIFE FUNDS - Small-Cap Equity Fund
SHARES | COMPANY | VALUE | |||||
1,939 | * | Ness Technologies, Inc | $ | 19,623 | |||
2,310 | e* | NetFlix, Inc | 60,222 | ||||
4,597 | e* | On Assignment, Inc | 36,868 | ||||
1,100 | * | Online Resources Corp | 9,185 | ||||
5,937 | e* | Parametric Technology Corp | 98,970 | ||||
6,200 | e* | Perficient, Inc | 59,892 | ||||
6,453 | * | Perot Systems Corp (Class A) | 96,860 | ||||
7,740 | * | Premiere Global Services, Inc | 112,849 | ||||
5,250 | * | Progress Software Corp | 134,243 | ||||
9,900 | e* | Quest Software, Inc | 146,619 | ||||
2,200 | * | Radisys Corp | 19,932 | ||||
5,840 | e* | Rent-A-Center, Inc | 120,129 | ||||
2,600 | Rollins, Inc | 38,532 | |||||
19,030 | e* | Sapient Corp | 122,173 | ||||
2,900 | * | Secure Computing Corp | 12,006 | ||||
800 | e* | Sonus Networks, Inc | 2,736 | ||||
1,740 | e | Sotheby’s | 45,884 | ||||
4,366 | * | SPSS, Inc | 158,791 | ||||
1,600 | * | SuccessFactors, Inc | 17,520 | ||||
6,950 | e* | Sybase, Inc | 204,469 | ||||
6,730 | e* | SYKES Enterprises, Inc | 126,928 | ||||
4,439 | e* | SYNNEX Corp | 111,375 | ||||
3,000 | * | Take-Two Interactive Software, Inc | 76,710 | ||||
6,716 | * | TeleTech Holdings, Inc | 134,051 | ||||
2,400 | e* | THQ, Inc | 48,624 | ||||
3,833 | e* | TIBCO Software, Inc | 29,322 | ||||
11,379 | e | United Online, Inc | 114,131 | ||||
5,910 | e* | Valueclick, Inc | 89,537 | ||||
2,572 | e* | Virtusa Corp | 26,054 | ||||
5,678 | e* | Websense, Inc | 95,618 | ||||
6,000 | * | Wind River Systems, Inc | 65,340 | ||||
TOTAL BUSINESS SERVICES | 5,654,463 | ||||||
CHEMICALS AND ALLIED PRODUCTS - 7.96% | |||||||
2,300 | e* | Acorda Therapeutics, Inc | 75,509 | ||||
5,600 | * | Adolor Corp | 30,688 | ||||
4,485 | * | Albany Molecular Research, Inc | 59,516 | ||||
1,100 | e* | Alexion Pharmaceuticals, Inc | 79,750 | ||||
3,400 | * | Alkermes, Inc | 42,024 | ||||
2,465 | e* | Alnylam Pharmaceuticals, Inc | 65,889 | ||||
1,000 | e* | Alpharma, Inc (Class A) | 22,530 | ||||
6,080 | * | American Oriental Bioengineering, Inc | 60,010 | ||||
4,600 | Applera Corp | 52,256 | |||||
2,759 | Arch Chemicals, Inc | 91,461 | |||||
2,700 | * | Arqule, Inc | 8,775 | ||||
500 | e* | Auxilium Pharmaceuticals, Inc | 16,810 | ||||
700 | * | Avant Immunotherapeutics, Inc | 10,192 | ||||
200 | e* | Bentley Pharmaceuticals, Inc | 3,230 | ||||
800 | * | Biodel, Inc | 10,400 | ||||
1,500 | * | BioMimetic Therapeutics, Inc | 17,880 | ||||
400 | e* | Caraco Pharmaceutical Laboratories Ltd | 5,280 | ||||
2,600 | e* | Cell Genesys, Inc | 6,760 | ||||
465 | CF Industries Holdings, Inc | 71,052 | |||||
1,780 | e* | Chattem, Inc | 115,789 | ||||
8,050 | e* | Cubist Pharmaceuticals, Inc | 143,773 | ||||
5,600 | e* | Dendreon Corp | 24,920 | ||||
2,200 | * | Elizabeth Arden, Inc | 33,396 | ||||
1,800 | e* | Emergent Biosolutions, Inc | 17,874 | ||||
8,190 | Ferro Corp | 153,644 | |||||
25
TIAA-CREF LIFE FUNDS - Small-Cap Equity Fund
SHARES | COMPANY | VALUE | |||||
6,800 | * | Geron Corp | $ | 23,460 | |||
7,200 | e* | Halozyme Therapeutics, Inc | 38,736 | ||||
4,200 | e | Hercules, Inc | 71,106 | ||||
2,100 | * | Idenix Pharmaceuticals, Inc | 15,267 | ||||
700 | * | Idera Pharmaceuticals, Inc | 10,227 | ||||
2,244 | * | Immucor, Inc | 58,075 | ||||
4,820 | Innophos Holdings, Inc | 153,999 | |||||
4,400 | e | Innospec, Inc | 82,808 | ||||
2,300 | * | Inspire Pharmaceuticals, Inc | 9,844 | ||||
3,306 | e | Koppers Holdings, Inc | 138,422 | ||||
1,500 | * | Landec Corp | 9,705 | ||||
3,572 | e* | Martek Biosciences Corp | 120,412 | ||||
7,471 | e* | Medicines Co | 148,075 | ||||
7,100 | e | Medicis Pharmaceutical Corp (Class A) | 147,538 | ||||
1,450 | e | Minerals Technologies, Inc | 92,206 | ||||
1,100 | * | Momenta Pharmaceuticals, Inc | 13,530 | ||||
5,518 | e* | Nabi Biopharmaceuticals | 21,741 | ||||
2,900 | * | Neurocrine Biosciences, Inc | 12,151 | ||||
1,580 | e | NewMarket Corp | 104,643 | ||||
800 | e* | Noven Pharmaceuticals, Inc | 8,552 | ||||
1,800 | * | NPS Pharmaceuticals, Inc | 8,010 | ||||
5,000 | e* | Obagi Medical Products, Inc | 42,750 | ||||
1,700 | e | Olin Corp | 44,506 | ||||
1,720 | e* | OM Group, Inc | 56,399 | ||||
382 | e* | Omrix Biopharmaceuticals, Inc | 6,013 | ||||
1,350 | e* | Onyx Pharmaceuticals, Inc | 48,060 | ||||
1,100 | * | Orexigen Therapeutics, Inc | 8,679 | ||||
5,344 | e* | OSI Pharmaceuticals, Inc | 220,814 | ||||
700 | * | Osiris Therapeutics, Inc | 8,995 | ||||
3,333 | e* | Pain Therapeutics, Inc | 26,331 | ||||
1,483 | e | Perrigo Co | 47,115 | ||||
4,373 | e* | PetMed Express, Inc | 53,569 | ||||
2,760 | e* | Pozen, Inc | 30,029 | ||||
4,800 | * | Prestige Brands Holdings, Inc | 51,168 | ||||
1,900 | * | Salix Pharmaceuticals Ltd | 13,357 | ||||
6,913 | e | Sciele Pharma, Inc | 133,767 | ||||
1,460 | e* | United Therapeutics Corp | 142,715 | ||||
2,480 | e* | Valeant Pharmaceuticals International | 42,433 | ||||
11,490 | e* | Viropharma, Inc | 127,079 | ||||
5,057 | e* | WR Grace & Co | 118,789 | ||||
700 | e* | Xenoport, Inc | 27,321 | ||||
TOTAL CHEMICALS AND ALLIED PRODUCTS | 3,757,804 | ||||||
COAL MINING - 0.45% | |||||||
550 | * | Alpha Natural Resources, Inc | 57,360 | ||||
5,700 | * | International Coal Group, Inc | 74,385 | ||||
1,100 | * | James River Coal Co | 64,559 | ||||
700 | * | Westmoreland Coal Co | 14,777 | ||||
TOTAL COAL MINING | 211,081 | ||||||
COMMUNICATIONS - 2.56% | |||||||
2,810 | e* | Anixter International, Inc | 167,167 | ||||
3,291 | e | Atlantic Tele-Network, Inc | 90,535 | ||||
4,000 | e* | Brightpoint, Inc | 29,200 | ||||
22,065 | * | Centennial Communications Corp | 154,234 | ||||
41,350 | e* | Cincinnati Bell, Inc | 164,573 | ||||
2,827 | e* | Cox Radio, Inc (Class A) | 33,359 | ||||
2,000 | * | Cumulus Media, Inc (Class A) | 7,880 | ||||
9,715 | * | Foundry Networks, Inc | 114,831 | ||||
26
TIAA-CREF LIFE FUNDS - Small-Cap Equity Fund
SHARES | COMPANY | VALUE | |||||
5,500 | IDT Corp (Class B) | $ | 9,350 | ||||
2,400 | * | iPCS, Inc | 71,112 | ||||
5,200 | e * | j2 Global Communications, Inc | 119,600 | ||||
500 | * | Neutral Tandem, Inc | 8,750 | ||||
6,400 | e * | Novatel Wireless, Inc | 71,232 | ||||
5,070 | NTELOS Holdings Corp | 128,626 | |||||
1,600 | * | TeleCommunication Systems, Inc | 7,408 | ||||
2,500 | USA Mobility, Inc | 18,875 | |||||
4,900 | * | Virgin Mobile USA, Inc | 13,475 | ||||
TOTAL COMMUNICATIONS | 1,210,207 | ||||||
DEPOSITORY INSTITUTIONS - 5.52% | |||||||
1,200 | e | 1st Source Corp | 19,320 | ||||
3,040 | e | Ameris Bancorp | 26,448 | ||||
1,172 | e | Bancfirst Corp | 50,162 | ||||
100 | e | Bank Mutual Corp | 1,004 | ||||
1,316 | e | Bank of the Ozarks, Inc | 19,556 | ||||
3,709 | e | Banner Corp | 32,862 | ||||
2,700 | e | Berkshire Hills Bancorp, Inc | 63,855 | ||||
1,016 | e | Chemical Financial Corp | 20,726 | ||||
4,902 | Columbia Banking System, Inc | 94,756 | |||||
3,163 | e | Community Trust Bancorp, Inc | 83,060 | ||||
298 | e | First Bancorp | 3,767 | ||||
4,260 | e | First Financial Bancorp | 39,192 | ||||
1,840 | e | First Financial Bankshares, Inc | 84,290 | ||||
3,850 | First Merchants Corp | 69,878 | |||||
11,524 | First Niagara Financial Group, Inc | 148,199 | |||||
1,830 | e | First Place Financial Corp | 17,202 | ||||
1,100 | Greene County Bancshares, Inc | 15,422 | |||||
2,685 | e | Hanmi Financial Corp | 13,989 | ||||
400 | Home Bancshares, Inc | 8,992 | |||||
2,870 | e | Integra Bank Corp | 22,472 | ||||
900 | Lakeland Bancorp, Inc | 10,962 | |||||
400 | Lakeland Financial Corp | 7,632 | |||||
900 | MainSource Financial Group, Inc | 13,950 | |||||
2,000 | e | Nara Bancorp, Inc | 21,460 | ||||
2,200 | e | NBT Bancorp, Inc | 45,342 | ||||
3,800 | * | Net 1 UEPS Technologies, Inc | 92,340 | ||||
5,430 | e | Northwest Bancorp, Inc | 118,483 | ||||
500 | e | Old Second Bancorp, Inc | 5,810 | ||||
800 | * | Pinnacle Financial Partners, Inc | 16,072 | ||||
5,862 | e | Prosperity Bancshares, Inc | 156,691 | ||||
2,000 | Provident Financial Services, Inc | 28,020 | |||||
1,670 | e | Renasant Corp | 24,599 | ||||
1,665 | Republic Bancorp, Inc (Class A) | 40,959 | |||||
800 | Sandy Spring Bancorp, Inc | 13,264 | |||||
2,400 | Santander BanCorp | 25,464 | |||||
982 | e | SCBT Financial Corp | 28,046 | ||||
1,100 | e | Sierra Bancorp | 18,150 | ||||
3,130 | Simmons First National Corp (Class A) | 87,546 | |||||
5,975 | e | Southwest Bancorp, Inc | 68,713 | ||||
12,238 | e | Sterling Bancshares, Inc | 111,243 | ||||
5,000 | e | Sterling Financial Corp | 20,700 | ||||
100 | Suffolk Bancorp | 2,938 | |||||
5,712 | e* | Sun Bancorp, Inc | 57,977 | ||||
3,260 | e* | SVB Financial Group | 156,839 | ||||
6,520 | e* | Texas Capital Bancshares, Inc | 104,320 | ||||
4,690 | e | Trustmark Corp | 82,779 | ||||
1,930 | UMB Financial Corp | 98,951 | |||||
27
TIAA-CREF LIFE FUNDS - Small-Cap Equity Fund
SHARES | COMPANY | VALUE | |||||
8,120 | e | Umpqua Holdings Corp | $ | 98,496 | |||
3,400 | e | United Community Banks, Inc | 29,002 | ||||
2,200 | Westamerica Bancorporation | 115,698 | |||||
8,002 | e | Wilshire Bancorp, Inc | 68,577 | ||||
TOTAL DEPOSITORY INSTITUTIONS | 2,606,175 | ||||||
EATING AND DRINKING PLACES - 1.39% | |||||||
2,500 | e* | AFC Enterprises | 19,975 | ||||
4,760 | e | Bob Evans Farms, Inc | 136,136 | ||||
1,000 | * | California Pizza Kitchen, Inc | 11,190 | ||||
2,450 | e* | CEC Entertainment, Inc | 68,625 | ||||
900 | CKE Restaurants, Inc | 11,223 | |||||
24,177 | e* | Denny’s Corp | 68,663 | ||||
4,920 | e* | Jack in the Box, Inc | 110,257 | ||||
9,500 | * | Krispy Kreme Doughnuts, Inc | 47,405 | ||||
4,842 | e* | Papa John’s International, Inc | 128,749 | ||||
2,500 | e* | PF Chang’s China Bistro, Inc | 55,850 | ||||
TOTAL EATING AND DRINKING PLACES | 658,073 | ||||||
EDUCATIONAL SERVICES - 0.33% | |||||||
1,200 | * | American Public Education, Inc | 46,848 | ||||
850 | e | DeVry, Inc | 45,577 | ||||
500 | * | Learning Tree International, Inc | 8,550 | ||||
273 | Strayer Education, Inc | 57,076 | |||||
TOTAL EDUCATIONAL SERVICES | 158,051 | ||||||
ELECTRIC, GAS, AND SANITARY SERVICES - 3.30% | |||||||
1,860 | e | American States Water Co | 64,988 | ||||
2,620 | Avista Corp | 56,225 | |||||
400 | Chesapeake Utilities Corp | 10,288 | |||||
1,980 | e* | Clean Harbors, Inc | 140,699 | ||||
8,930 | e* | El Paso Electric Co | 176,814 | ||||
2,900 | e | New Jersey Resources Corp | 94,685 | ||||
2,000 | e | Northwest Natural Gas Co | 92,520 | ||||
1,365 | NorthWestern Corp | 34,698 | |||||
800 | e | Otter Tail Corp | 31,064 | ||||
4,900 | Piedmont Natural Gas Co, Inc | 128,184 | |||||
6,613 | Portland General Electric Co | 148,925 | |||||
6,454 | Southwest Gas Corp | 191,877 | |||||
5,950 | e | UIL Holdings Corp | 174,990 | ||||
2,020 | Unisource Energy Corp | 62,640 | |||||
4,290 | WGL Holdings, Inc | 149,035 | |||||
TOTAL ELECTRIC, GAS, AND SANITARY SERVICES | 1,557,632 | ||||||
ELECTRONIC AND OTHER ELECTRIC EQUIPMENT - 8.61% | |||||||
1,900 | * | Acme Packet, Inc | 14,744 | ||||
2,000 | * | Actel Corp | 33,700 | ||||
3,950 | e | Acuity Brands, Inc | 189,916 | ||||
8,200 | * | Advanced Analogic Technologies, Inc | 33,866 | ||||
2,500 | e* �� | American Superconductor Corp | 89,625 | ||||
11,970 | e* | Amkor Technology, Inc | 124,608 | ||||
4,800 | e* | Anadigics, Inc | 47,280 | ||||
1,653 | e* | Arris Group, Inc | 13,968 | ||||
3,190 | e* | Atheros Communications, Inc | 95,700 | ||||
10,900 | * | Avanex Corp | 12,317 | ||||
2,000 | e* | AZZ, Inc | 79,800 | ||||
2,850 | e | Baldor Electric Co | 99,693 | ||||
6,500 | * | Benchmark Electronics, Inc | 106,210 | ||||
4,300 | * | BigBand Networks, Inc | 20,339 | ||||
28
TIAA-CREF LIFE FUNDS - Small-Cap Equity Fund
SHARES | COMPANY | VALUE | |||||
2,400 | e * | Ceradyne, Inc | $ | 82,320 | |||
1,700 | e * | Checkpoint Systems, Inc | 35,496 | ||||
2,300 | Cubic Corp | 51,244 | |||||
1,800 | * | Energy Conversion Devices, Inc | 132,552 | ||||
9,130 | e* | GrafTech International Ltd | 244,958 | ||||
10,510 | e* | Harmonic, Inc | 99,950 | ||||
2,900 | * | InterVoice, Inc | 16,530 | ||||
700 | * | IXYS Corp | 8,358 | ||||
1,700 | e* | Littelfuse, Inc | 53,635 | ||||
1,500 | * | Mercury Computer Systems, Inc | 11,295 | ||||
12,713 | Methode Electronics, Inc | 132,851 | |||||
4,270 | e* | Microsemi Corp | 107,519 | ||||
3,500 | * | Microvision, Inc | 9,625 | ||||
1,200 | e* | MIPS Technologies, Inc | 4,500 | ||||
2,860 | * | Monolithic Power Systems, Inc | 61,833 | ||||
1,307 | e* | Moog, Inc (Class A) | 48,673 | ||||
3,148 | e* | Multi-Fineline Electronix, Inc | 87,105 | ||||
400 | * | NVE Corp | 12,664 | ||||
4,756 | e* | Omnivision Technologies, Inc | 57,500 | ||||
5,444 | e* | ON Semiconductor Corp | 49,921 | ||||
1,600 | * | Oplink Communications, Inc | 15,360 | ||||
2,029 | * | OSI Systems, Inc | 43,461 | ||||
1,900 | Park Electrochemical Corp | 46,189 | |||||
3,000 | e* | Pericom Semiconductor Corp | 44,520 | ||||
600 | e | Plantronics, Inc | 13,392 | ||||
5,260 | e* | Plexus Corp | 145,597 | ||||
14,020 | e* | PMC - Sierra, Inc | 107,253 | ||||
6,230 | e* | Polycom, Inc | 151,763 | ||||
5,840 | e* | Polypore International, Inc | 147,927 | ||||
7,100 | * | Quantum Fuel Systems Technologies Worldwide, Inc | 21,868 | ||||
2,210 | Regal-Beloit Corp | 93,373 | |||||
7,600 | * | Semtech Corp | 106,932 | ||||
13,144 | e* | Silicon Image, Inc | 95,294 | ||||
15,637 | e* | Silicon Storage Technology, Inc | 43,314 | ||||
9,090 | e* | Skyworks Solutions, Inc | 89,718 | ||||
11,800 | * | Spansion, Inc (Class A) | 26,550 | ||||
2,700 | e* | Standard Microsystems Corp | 73,305 | ||||
3,513 | e* | Stoneridge, Inc | 59,932 | ||||
1,380 | e* | Synaptics, Inc | 52,067 | ||||
1,650 | e | Technitrol, Inc | 28,034 | ||||
4,000 | e* | Tekelec | 58,840 | ||||
4,700 | e* | Tessera Technologies, Inc | 76,939 | ||||
11,500 | e* | Trident Microsystems, Inc | 41,975 | ||||
13,147 | * | Triquint Semiconductor, Inc | 79,671 | ||||
5,670 | * | TTM Technologies, Inc | 74,901 | ||||
4,100 | * | US Geothermal, Inc | 12,054 | ||||
5,000 | * | Utstarcom, Inc | 27,350 | ||||
940 | * | Viasat, Inc | 18,997 | ||||
TOTAL ELECTRONIC AND OTHER ELECTRIC EQUIPMENT | 4,066,871 | ||||||
ENGINEERING AND MANAGEMENT SERVICES - 2.04% | |||||||
2,300 | e* | Aecom Technology Corp | 74,819 | ||||
5,700 | * | Ariad Pharmaceuticals, Inc | 13,680 | ||||
500 | e* | comScore, Inc | 10,910 | ||||
900 | * | CRA International, Inc | 32,535 | ||||
13,990 | e* | Exelixis, Inc | 69,950 | ||||
600 | * | ICF International, Inc | 9,972 | ||||
2,700 | e* | Isis Pharmaceuticals, Inc | 36,801 | ||||
1,100 | * | Kendle International, Inc | 39,963 | ||||
29
TIAA-CREF LIFE FUNDS - Small-Cap Equity Fund
SHARES | COMPANY | VALUE | |||||
200 | * | LECG Corp | $ | 1,748 | |||
2,142 | e* | Luminex Corp | 44,018 | ||||
500 | MAXIMUS, Inc | 17,410 | |||||
2,730 | e* | Myriad Genetics, Inc | 124,270 | ||||
2,533 | e* | PharmaNet Development Group, Inc | 39,945 | ||||
6,500 | e* | Regeneron Pharmaceuticals, Inc | 93,860 | ||||
4,800 | e* | SAIC, Inc | 99,888 | ||||
3,775 | e* | Seattle Genetics, Inc | 31,937 | ||||
4,209 | e | Watson Wyatt & Co Holdings (Class A) | 222,614 | ||||
TOTAL ENGINEERING AND MANAGEMENT SERVICES | 964,320 | ||||||
FABRICATED METAL PRODUCTS - 1.30% | |||||||
3,863 | * | Chart Industries, Inc | 187,896 | ||||
1,630 | e | CIRCOR International, Inc | 79,854 | ||||
4,069 | e | Gulf Island Fabrication, Inc | 199,096 | ||||
2,200 | * | NCI Building Systems, Inc | 80,806 | ||||
500 | * | Park-Ohio Holdings Corp | 7,380 | ||||
2,600 | * | Trimas Corp | 15,574 | ||||
410 | e | Valmont Industries, Inc | 42,759 | ||||
TOTAL FABRICATED METAL PRODUCTS | 613,365 | ||||||
FOOD AND KINDRED PRODUCTS - 0.95% | |||||||
9,630 | e* | Darling International, Inc | 159,088 | ||||
1,500 | Diamond Foods, Inc | 34,560 | |||||
5,020 | e | Flowers Foods, Inc | 142,267 | ||||
1,500 | e | National Beverage Corp | 10,905 | ||||
600 | * | Omega Protein Corp | 8,970 | ||||
1,000 | e* | Ralcorp Holdings, Inc | 49,440 | ||||
3,100 | Reddy Ice Holdings, Inc | 42,408 | |||||
TOTAL FOOD AND KINDRED PRODUCTS | 447,638 | ||||||
FOOD STORES - 0.22% | |||||||
540 | e | Ingles Markets, Inc (Class A) | 12,598 | ||||
2,492 | Ruddick Corp | 85,501 | |||||
800 | * | Susser Holdings Corp | 7,744 | ||||
TOTAL FOOD STORES | 105,843 | ||||||
FURNITURE AND FIXTURES - 0.46% | |||||||
6,713 | e | Herman Miller, Inc | 167,087 | ||||
900 | Kimball International, Inc (Class B) | 7,452 | |||||
5,300 | e | Tempur-Pedic International, Inc | 41,393 | ||||
TOTAL FURNITURE AND FIXTURES | 215,932 | ||||||
FURNITURE AND HOMEFURNISHINGS STORES - 0.31% | |||||||
1,600 | * | hhgregg, Inc | 16,000 | ||||
10,660 | Knoll, Inc | 129,519 | |||||
TOTAL FURNITURE AND HOMEFURNISHINGS STORES | 145,519 | ||||||
GENERAL BUILDING CONTRACTORS - 0.45% | |||||||
1,900 | Beazer Homes USA, Inc | 10,583 | |||||
4,390 | e* | Perini Corp | 145,090 | ||||
510 | Walter Industries, Inc | 55,473 | |||||
TOTAL GENERAL BUILDING CONTRACTORS | 211,146 | ||||||
GENERAL MERCHANDISE STORES - 0.27% | |||||||
3,400 | Casey’s General Stores, Inc | 78,778 | |||||
3,118 | * | Conn’s, Inc | 50,106 | ||||
TOTAL GENERAL MERCHANDISE STORES | 128,884 | ||||||
30
TIAA-CREF LIFE FUNDS - Small-Cap Equity Fund
SHARES | COMPANY | VALUE | |||||
HEALTH SERVICES - 0.80% | |||||||
1,300 | * | Amsurg Corp | $ | 31,655 | |||
4,700 | e* | CryoLife, Inc | 53,768 | ||||
5,159 | * | Enzo Biochem, Inc | 57,884 | ||||
3,200 | * | Five Star Quality Care, Inc | 15,136 | ||||
1,600 | e* | Genoptix, Inc | 50,480 | ||||
1,430 | * | Healthsouth Corp | 23,781 | ||||
4,000 | * | Immunomedics, Inc | 8,520 | ||||
2,200 | * | LHC Group, Inc | 51,150 | ||||
600 | * | Life Sciences Research, Inc | 16,944 | ||||
2,600 | * | Nighthawk Radiology Holdings, Inc | 18,408 | ||||
417 | e* | Odyssey HealthCare, Inc | 4,062 | ||||
1,400 | * | RehabCare Group, Inc | 22,442 | ||||
2,900 | * | Stereotaxis, Inc | 15,544 | ||||
600 | * | Virtual Radiologic Corp | 7,950 | ||||
TOTAL HEALTH SERVICES | 377,724 | ||||||
HEAVY CONSTRUCTION, EXCEPT BUILDING - 0.34% | |||||||
2,540 | e | Granite Construction, Inc | 80,086 | ||||
2,983 | e* | Matrix Service Co | 68,788 | ||||
600 | * | Sterling Construction Co, Inc | 11,916 | ||||
TOTAL HEAVY CONSTRUCTION, EXCEPT BUILDING | 160,790 | ||||||
HOLDING AND OTHER INVESTMENT OFFICES - 6.27% | |||||||
1,429 | e | Agree Realty Corp | 31,509 | ||||
8,360 | e | Anthracite Capital, Inc | 58,854 | ||||
6,750 | Anworth Mortgage Asset Corp | 43,943 | |||||
12,440 | e | Ashford Hospitality Trust, Inc | 57,473 | ||||
3,700 | Capital Lease Funding, Inc | 27,713 | |||||
2,600 | Cedar Shopping Centers, Inc | 30,472 | |||||
1,910 | e | Corporate Office Properties Trust | 65,570 | ||||
13,680 | e | DiamondRock Hospitality Co | 148,975 | ||||
1,900 | EastGroup Properties, Inc | 81,510 | |||||
1,700 | e | Entertainment Properties Trust | 84,048 | ||||
2,360 | Equity Lifestyle Properties, Inc | 103,840 | |||||
2,400 | e | Extra Space Storage, Inc | 36,864 | ||||
8,937 | e | FelCor Lodging Trust, Inc | 93,839 | ||||
2,000 | First Potomac Realty Trust | 30,480 | |||||
2,100 | Glimcher Realty Trust | 23,478 | |||||
7,400 | e | Hersha Hospitality Trust | 55,870 | ||||
4,170 | e | Highwoods Properties, Inc | 131,021 | ||||
32 | Home Properties, Inc | 1,538 | |||||
1,500 | Investors Real Estate Trust | 14,310 | |||||
3,000 | e | iShares Russell 2000 Index Fund | 207,090 | ||||
3,000 | Kite Realty Group Trust | 37,500 | |||||
2,000 | e | LTC Properties, Inc | 51,120 | ||||
10,000 | e | MFA Mortgage Investments, Inc | 65,200 | ||||
3,192 | e | Mid-America Apartment Communities, Inc | 162,920 | ||||
2,210 | e | Mission West Properties, Inc | 24,222 | ||||
5,000 | e | NorthStar Realty Finance Corp | 41,600 | ||||
2,520 | Omega Healthcare Investors, Inc | 41,958 | |||||
1,200 | e | Post Properties, Inc | 35,700 | ||||
3,161 | Potlatch Corp | 142,624 | |||||
1,800 | Prospect Capital Corp | 23,724 | |||||
3,395 | PS Business Parks, Inc | 175,182 | |||||
2,200 | e | Realty Income Corp | 50,072 | ||||
2,430 | Saul Centers, Inc | 114,186 | |||||
5,450 | e | Senior Housing Properties Trust | 106,439 | ||||
1,576 | Sovran Self Storage, Inc | 65,499 | |||||
31
TIAA-CREF LIFE FUNDS - Small-Cap Equity Fund
SHARES | COMPANY | VALUE | |||||
10,800 | e | Strategic Hotels & Resorts, Inc | $ | 101,196 | |||
1,600 | Sun Communities, Inc | 29,168 | |||||
10,132 | e | Sunstone Hotel Investors, Inc | 168,191 | ||||
4,280 | e | Tanger Factory Outlet Centers, Inc | 153,780 | ||||
3,050 | Urstadt Biddle Properties, Inc (Class A) | 44,713 | |||||
TOTAL HOLDING AND OTHER INVESTMENT OFFICES | 2,963,391 | ||||||
HOTELS AND OTHER LODGING PLACES - 0.03% | |||||||
2,000 | * | Great Wolf Resorts, Inc | 8,740 | ||||
700 | * | Riviera Holdings Corp | 7,105 | ||||
TOTAL HOTELS AND OTHER LODGING PLACES | 15,845 | ||||||
INDUSTRIAL MACHINERY AND EQUIPMENT - 5.74% | |||||||
4,000 | e | Actuant Corp (Class A) | 125,400 | ||||
400 | Alamo Group, Inc | 8,236 | |||||
3,400 | e* | Altra Holdings, Inc | 57,154 | ||||
3,062 | e | Ampco-Pittsburgh Corp | 136,198 | ||||
1,753 | e* | Astec Industries, Inc | 56,341 | ||||
1,200 | Black Box Corp | 32,628 | |||||
5,400 | * | Cirrus Logic, Inc | 30,024 | ||||
2,400 | e* | Columbus McKinnon Corp | 57,792 | ||||
2,300 | * | Cray, Inc | 10,672 | ||||
2,780 | e | Curtiss-Wright Corp | 124,377 | ||||
1,000 | e* | Dril-Quip, Inc | 63,000 | ||||
10,860 | e* | Emulex Corp | 126,519 | ||||
3,878 | * | ENGlobal Corp | 55,223 | ||||
4,321 | e* | EnPro Industries, Inc | 161,346 | ||||
9,100 | * | Extreme Networks, Inc | 25,844 | ||||
300 | Graham Corp | 22,233 | |||||
2,850 | * | Intermec, Inc | 60,078 | ||||
400 | * | Kadant, Inc | 9,040 | ||||
8,400 | * | Kulicke & Soffa Industries, Inc | 61,236 | ||||
470 | e | Lindsay Manufacturing Co | 39,936 | ||||
1,561 | e | Lufkin Industries, Inc | 130,000 | ||||
4,800 | e* | Micros Systems, Inc | 146,352 | ||||
5,400 | e | Modine Manufacturing Co | 66,798 | ||||
391 | Nacco Industries, Inc (Class A) | 29,071 | |||||
1,140 | e* | NATCO Group, Inc (Class A) | 62,164 | ||||
3,200 | e* | Netgear, Inc | 44,352 | ||||
1,200 | NN, Inc | 16,728 | |||||
900 | Nordson Corp | 65,601 | |||||
760 | e* | Oil States International, Inc | 48,214 | ||||
47,839 | e* | Quantum Corp | 64,583 | ||||
4,000 | * | Rackable Systems, Inc | 53,600 | ||||
61 | * | Rimage Corp | 756 | ||||
5,600 | * | Riverbed Technology, Inc | 76,832 | ||||
3,530 | Robbins & Myers, Inc | 176,041 | |||||
8,100 | e* | Safeguard Scientifics, Inc | 10,044 | ||||
2,260 | e | Sauer-Danfoss, Inc | 70,399 | ||||
2,760 | e* | Scansource, Inc | 73,858 | ||||
1,100 | Standex International Corp | 22,814 | |||||
1,570 | * | Super Micro Computer, Inc | 11,587 | ||||
1,000 | * | T-3 Energy Services, Inc | 79,470 | ||||
1,820 | e | Tennant Co | 54,727 | ||||
4,000 | Woodward Governor Co | 142,640 | |||||
TOTAL INDUSTRIAL MACHINERY AND EQUIPMENT | 2,709,908 | ||||||
INSTRUMENTS AND RELATED PRODUCTS - 6.44% | |||||||
2,000 | * | Affymetrix, Inc | 20,580 | ||||
32
TIAA-CREF LIFE FUNDS - Small-Cap Equity Fund
SHARES | COMPANY | VALUE | |||||
800 | Analogic Corp | $ | 50,456 | ||||
2,600 | * | Anaren, Inc | 27,482 | ||||
1,300 | * | Angiodynamics, Inc | 17,706 | ||||
1,700 | e* | Arthrocare Corp | 69,377 | ||||
1,700 | * | Bio-Rad Laboratories, Inc (Class A) | 137,513 | ||||
6,807 | e* | Bruker BioSciences Corp | 87,470 | ||||
1,600 | * | Cantel Medical Corp | 16,192 | ||||
3,830 | e* | Cepheid, Inc | 107,700 | ||||
4,330 | e* | Conmed Corp | 114,962 | ||||
5,900 | e* | Cynosure, Inc (Class A) | 116,938 | ||||
1,060 | * | Dionex Corp | 70,352 | ||||
600 | * | Exactech, Inc | 15,426 | ||||
3,542 | e* | FARO Technologies, Inc | 89,152 | ||||
2,440 | e* | Flir Systems, Inc | 98,991 | ||||
5,010 | e* | Fossil, Inc | 145,641 | ||||
810 | e* | Haemonetics Corp | 44,923 | ||||
3,200 | e* | I-Flow Corp | 32,480 | ||||
3,350 | e* | II-VI, Inc | 116,982 | ||||
550 | e* | Illumina, Inc | 47,911 | ||||
2,400 | e | Invacare Corp | 49,056 | ||||
7,500 | e* | ION Geophysical Corp | 130,875 | ||||
800 | * | Kensey Nash Corp | 25,640 | ||||
1,800 | * | Lydall, Inc | 22,590 | ||||
3,000 | e* | Masimo Corp | 103,050 | ||||
1,300 | * | Medical Action Industries, Inc | 13,481 | ||||
6,870 | * | Merit Medical Systems, Inc | 100,989 | ||||
2,590 | e | Mine Safety Appliances Co | 103,574 | ||||
5,030 | Movado Group, Inc | 99,594 | |||||
2,997 | e | MTS Systems Corp | 107,532 | ||||
1,900 | * | NxStage Medical, Inc | 7,296 | ||||
800 | e* | Rofin-Sinar Technologies, Inc | 24,160 | ||||
1,100 | * | Somanetics Corp | 23,320 | ||||
600 | * | SonoSite, Inc | 16,806 | ||||
6,960 | STERIS Corp | 200,170 | |||||
800 | * | Synovis Life Technologies, Inc | 15,064 | ||||
3,902 | * | Teledyne Technologies, Inc | 190,379 | ||||
3,438 | * | Varian, Inc | 175,544 | ||||
8,836 | e* | Vivus, Inc | 59,024 | ||||
1,100 | * | Vnus Medical Technologies, Inc | 22,011 | ||||
2,700 | * | Volcano Corp | 32,940 | ||||
2,567 | * | Zoll Medical Corp | 86,431 | ||||
400 | e* | Zygo Corp | 3,932 | ||||
TOTAL INSTRUMENTS AND RELATED PRODUCTS | 3,041,692 | ||||||
INSURANCE AGENTS, BROKERS AND SERVICE - 0.09% | |||||||
100 | Hilb Rogal & Hobbs Co | 4,346 | |||||
2,000 | e | National Financial Partners Corp | 39,640 | ||||
TOTAL INSURANCE AGENTS, BROKERS AND SERVICE | 43,986 | ||||||
INSURANCE CARRIERS - 3.89% | |||||||
5,760 | e* | AMERIGROUP Corp | 119,808 | ||||
7,990 | e* | Amerisafe, Inc | 127,361 | ||||
1,441 | * | Argo Group International Holdings Ltd | 48,360 | ||||
6,050 | e | Aspen Insurance Holdings Ltd | 143,204 | ||||
4,740 | e | Assured Guaranty Ltd | 85,273 | ||||
1,500 | Castlepoint Holdings Ltd | 13,635 | |||||
7,890 | * | Centene Corp | 132,473 | ||||
4,830 | e* | CNA Surety Corp | 61,051 | ||||
3,200 | * | Darwin Professional Underwriters, Inc | 98,560 | ||||
33
TIAA-CREF LIFE FUNDS - Small-Cap Equity Fund
SHARES | COMPANY | VALUE | |||||
4,200 | e* | Hallmark Financial Services | $ | 40,614 | |||
3,000 | e* | HealthExtras, Inc | 90,420 | ||||
6,470 | e* | Healthspring, Inc | 109,214 | ||||
4,200 | Meadowbrook Insurance Group, Inc | 22,260 | |||||
3,980 | e* | Molina Healthcare, Inc | 96,873 | ||||
600 | e | National Interstate Corp | 11,028 | ||||
1,136 | * | Navigators Group, Inc | 61,401 | ||||
4,150 | e | Odyssey Re Holdings Corp | 147,325 | ||||
5,000 | e | Platinum Underwriters Holdings Ltd | 163,050 | ||||
1,500 | * | PMA Capital Corp (Class A) | 13,815 | ||||
200 | e | Presidential Life Corp | 3,084 | ||||
6,178 | e* | Primus Guaranty Ltd | 17,978 | ||||
1,100 | * | SeaBright Insurance Holdings, Inc | 15,928 | ||||
600 | Tower Group, Inc | 12,714 | |||||
6,506 | e* | Universal American Financial Corp | 66,491 | ||||
6,320 | e | Validus Holdings Ltd | 134,300 | ||||
TOTAL INSURANCE CARRIERS | 1,836,220 | ||||||
LEATHER AND LEATHER PRODUCTS - 0.33% | |||||||
2,100 | * | Steven Madden Ltd | 38,598 | ||||
4,340 | e | Wolverine World Wide, Inc | 115,748 | ||||
TOTAL LEATHER AND LEATHER PRODUCTS | 154,346 | ||||||
LEGAL SERVICES - 0.11% | |||||||
1,294 | * | Pre-Paid Legal Services, Inc | 52,562 | ||||
TOTAL LEGAL SERVICES | 52,562 | ||||||
LOCAL AND INTERURBAN PASSENGER TRANSIT - 0.10% | |||||||
2,150 | e* | Emergency Medical Services Corp (Class A) | 48,655 | ||||
TOTAL LOCAL AND INTERURBAN PASSENGER TRANSIT | 48,655 | ||||||
LUMBER AND WOOD PRODUCTS - 0.07% | |||||||
6,000 | e* | Champion Enterprises, Inc | 35,100 | ||||
TOTAL LUMBER AND WOOD PRODUCTS | 35,100 | ||||||
METAL MINING - 0.63% | |||||||
200 | e* | Apex Silver Mines Ltd | 982 | ||||
3,000 | e* | Coeur d’Alene Mines Corp | 8,700 | ||||
11,590 | e* | Hecla Mining Co | 107,323 | ||||
6,400 | * | Rosetta Resources, Inc | 182,400 | ||||
TOTAL METAL MINING | 299,405 | ||||||
MISCELLANEOUS MANUFACTURING INDUSTRIES - 0.59% | |||||||
4,100 | e | Blyth, Inc | 49,323 | ||||
9,620 | e | Callaway Golf Co | 113,805 | ||||
2,400 | e* | Jakks Pacific, Inc | 52,440 | ||||
7,000 | Nautilus, Inc | 35,560 | |||||
730 | e* | RC2 Corp | 13,549 | ||||
2,500 | * | Shuffle Master, Inc | 12,350 | ||||
TOTAL MISCELLANEOUS MANUFACTURING INDUSTRIES | 277,027 | ||||||
MISCELLANEOUS RETAIL - 1.13% | |||||||
10,700 | * | 1-800-FLOWERS.COM, Inc (Class A) | 69,015 | ||||
1,150 | Cash America International, Inc | 35,650 | |||||
10,187 | * | Ezcorp, Inc (Class A) | 129,884 | ||||
2,700 | * | Fuqi International, Inc | 23,652 | ||||
2,930 | Longs Drug Stores Corp | 123,382 | |||||
1,300 | * | PC Connection, Inc | 12,103 | ||||
1,500 | * | PC Mall, Inc | 20,340 | ||||
34
TIAA-CREF LIFE FUNDS - Small-Cap Equity Fund
SHARES | COMPANY | VALUE | |||||
4,985 | e | Systemax, Inc | $ | 87,985 | |||
1,500 | World Fuel Services Corp | 32,910 | |||||
TOTAL MISCELLANEOUS RETAIL | 534,921 | ||||||
MOTION PICTURES - 0.17% | |||||||
9,571 | e* | Blockbuster, Inc (Class A) | 23,928 | ||||
677 | e* | Macrovision Solutions Corp | 10,128 | ||||
3,300 | National CineMedia, Inc | 35,178 | |||||
764 | e* | tw telecom inc | 12,247 | ||||
TOTAL MOTION PICTURES | 81,481 | ||||||
NONDEPOSITORY INSTITUTIONS - 0.23% | |||||||
4,924 | Advance America Cash Advance Centers, Inc | 25,014 | |||||
200 | b* | DVI, Inc | 0 | ||||
1,400 | * | Encore Capital Group, Inc | 12,362 | ||||
1,800 | Kohlberg Capital Corp | 18,000 | |||||
1,100 | * | Mitcham Industries, Inc | 18,788 | ||||
1,200 | Patriot Capital Funding, Inc | 7,500 | |||||
3,800 | * | thinkorswim Group, Inc | 26,790 | ||||
TOTAL NONDEPOSITORY INSTITUTIONS | 108,454 | ||||||
NONMETALLIC MINERALS, EXCEPT FUELS - 0.31% | |||||||
1,800 | Compass Minerals International, Inc | 145,008 | |||||
TOTAL NONMETALLIC MINERALS, EXCEPT FUELS | 145,008 | ||||||
OIL AND GAS EXTRACTION - 6.16% | |||||||
7,800 | * | Abraxas Petroleum Corp | 42,198 | ||||
1,100 | * | Approach Resources, Inc | 29,469 | ||||
1,900 | * | ATP Oil & Gas Corp | 74,993 | ||||
410 | e* | Atwood Oceanics, Inc | 50,979 | ||||
4,500 | * | Basic Energy Services, Inc | 141,750 | ||||
2,490 | e | Berry Petroleum Co (Class A) | 146,611 | ||||
1,260 | * | Clayton Williams Energy, Inc | 138,537 | ||||
2,000 | e* | Complete Production Services, Inc | 72,840 | ||||
2,224 | * | Comstock Resources, Inc | 187,772 | ||||
2,900 | * | Concho Resources, Inc | 108,170 | ||||
1,351 | e* | Dawson Geophysical Co | 80,330 | ||||
650 | e* | Encore Acquisition Co | 48,874 | ||||
9,300 | * | Endeavour International Corp | 20,181 | ||||
11,220 | e* | Energy Partners Ltd | 167,402 | ||||
9,000 | * | Energy XXI Bermuda Ltd | 62,280 | ||||
2,200 | * | Gasco Energy, Inc | 9,130 | ||||
500 | * | Geokinetics, Inc | 9,055 | ||||
14,162 | e* | Grey Wolf, Inc | 127,883 | ||||
2,760 | e* | Mariner Energy, Inc | 102,037 | ||||
2,914 | e* | McMoRan Exploration Co | 80,193 | ||||
8,700 | * | Meridian Resource Corp | 25,665 | ||||
300 | Panhandle Oil and Gas, Inc | 10,158 | |||||
2,340 | Penn Virginia Corp | 176,483 | |||||
200 | m,v* | Petrocorp, Inc | 0 | ||||
1,199 | * | PetroHawk Energy Corp | 55,526 | ||||
4,448 | e* | Petroquest Energy, Inc | 119,651 | ||||
3,000 | * | Quest Resource Corp | 34,230 | ||||
3,280 | e* | Stone Energy Corp | 216,185 | ||||
3,100 | e* | Swift Energy Co | 204,786 | ||||
2,100 | * | Union Drilling, Inc | 45,528 | ||||
2,400 | e* | Vaalco Energy, Inc | 20,328 | ||||
1,620 | * | W-H Energy Services, Inc | 155,099 | ||||
443 | * | Whiting Petroleum Corp | 46,993 | ||||
35
TIAA-CREF LIFE FUNDS - Small-Cap Equity Fund
SHARES | COMPANY | VALUE | |||||
2,200 | * | Willbros Group, Inc | $ | 96,382 | |||
TOTAL OIL AND GAS EXTRACTION | 2,907,698 | ||||||
PAPER AND ALLIED PRODUCTS - 0.39% | |||||||
2,373 | * | Buckeye Technologies, Inc | 20,076 | ||||
817 | Greif, Inc (Class A) | 52,313 | |||||
3,657 | e | Rock-Tenn Co (Class A) | 109,673 | ||||
TOTAL PAPER AND ALLIED PRODUCTS | 182,062 | ||||||
PERSONAL SERVICES - 0.05% | |||||||
3,400 | * | Sally Beauty Holdings, Inc | 21,964 | ||||
TOTAL PERSONAL SERVICES | 21,964 | ||||||
PETROLEUM AND COAL PRODUCTS - 0.37% | |||||||
5,460 | e | Alon USA Energy, Inc | 65,302 | ||||
3,621 | * | CVR Energy, Inc | 69,704 | ||||
4,400 | Delek US Holdings, Inc | 40,524 | |||||
TOTAL PETROLEUM AND COAL PRODUCTS | 175,530 | ||||||
PRIMARY METAL INDUSTRIES - 1.59% | |||||||
4,520 | e | Belden CDT, Inc | 153,138 | ||||
1,100 | e* | Century Aluminum Co | 73,139 | ||||
2,300 | * | General Steel Holdings, Inc | 36,156 | ||||
1,173 | Matthews International Corp (Class A) | 53,090 | |||||
4,710 | e | Mueller Industries, Inc | 151,662 | ||||
1,100 | Olympic Steel, Inc | 83,512 | |||||
920 | Schnitzer Steel Industries, Inc (Class A) | 105,432 | |||||
600 | * | Superior Essex, Inc | 26,778 | ||||
974 | * | Universal Stainless & Alloy | 36,077 | ||||
1,500 | Worthington Industries, Inc | 30,750 | |||||
TOTAL PRIMARY METAL INDUSTRIES | 749,734 | ||||||
PRINTING AND PUBLISHING - 1.07% | |||||||
800 | e* | ACCO Brands Corp | 8,984 | ||||
5,000 | e | Bowne & Co, Inc | 63,750 | ||||
2,600 | e* | Consolidated Graphics, Inc | 128,102 | ||||
700 | CSS Industries, Inc | 16,954 | |||||
6,200 | Ennis, Inc | 97,030 | |||||
1,800 | e | Standard Register Co | 16,974 | ||||
6,750 | e* | Valassis Communications, Inc | 84,510 | ||||
3,330 | e* | VistaPrint Ltd | 89,111 | ||||
TOTAL PRINTING AND PUBLISHING | 505,415 | ||||||
REAL ESTATE - 0.14% | |||||||
5,740 | e* | LoopNet, Inc | 64,862 | ||||
TOTAL REAL ESTATE | 64,862 | ||||||
RUBBER AND MISCELLANEOUS PLASTIC PRODUCTS - 1.03% | |||||||
850 | e* | Deckers Outdoor Corp | 118,320 | ||||
1,500 | e | Schulman (A.), Inc | 34,545 | ||||
3,830 | * | Skechers U.S.A., Inc (Class A) | 75,681 | ||||
5,690 | e | Tupperware Corp | 194,712 | ||||
1,500 | e | West Pharmaceutical Services, Inc | 64,920 | ||||
TOTAL RUBBER AND MISCELLANEOUS PLASTIC PRODUCTS | 488,178 | ||||||
SECURITY AND COMMODITY BROKERS - 1.55% | |||||||
1,000 | * | Duff & Phelps Corp | 16,560 | ||||
5,900 | e | Evercore Partners, Inc (Class A) | 56,050 | ||||
2,400 | e* | FCStone Group, Inc | 67,032 | ||||
36
TIAA-CREF LIFE FUNDS - Small-Cap Equity Fund
SHARES | COMPANY | VALUE | |||||
1,600 | GAMCO Investors, Inc (Class A) | $ | 79,392 | ||||
10,460 | e | GFI Group, Inc | 94,245 | ||||
3,030 | * | Interactive Brokers Group, Inc (Class A) | 97,354 | ||||
6,900 | e* | Knight Capital Group, Inc (Class A) | 124,062 | ||||
1,800 | * | LaBranche & Co, Inc | 12,744 | ||||
1,600 | e | optionsXpress Holdings, Inc | 35,744 | ||||
2,610 | * | Stifel Financial Corp | 89,758 | ||||
3,638 | e | SWS Group, Inc | 60,427 | ||||
TOTAL SECURITY AND COMMODITY BROKERS | 733,368 | ||||||
SOCIAL SERVICES - 0.03% | |||||||
1,600 | * | Capital Senior Living Corp | 12,064 | ||||
189 | * | Res-Care, Inc | 3,360 | ||||
TOTAL SOCIAL SERVICES | 15,424 | ||||||
SPECIAL TRADE CONTRACTORS - 1.11% | |||||||
6,346 | e* | AsiaInfo Holdings, Inc | 75,010 | ||||
2,400 | e | Chemed Corp | 87,864 | ||||
10,210 | e | Comfort Systems USA, Inc | 137,222 | ||||
7,910 | * | EMCOR Group, Inc | 225,672 | ||||
TOTAL SPECIAL TRADE CONTRACTORS | 525,768 | ||||||
STONE, CLAY, AND GLASS PRODUCTS - 0.25% | |||||||
5,750 | e | Apogee Enterprises, Inc | 92,920 | ||||
3,500 | Libbey, Inc | 26,040 | |||||
TOTAL STONE, CLAY, AND GLASS PRODUCTS | 118,960 | ||||||
TEXTILE MILL PRODUCTS - 0.07% | |||||||
8,500 | Xerium Technologies, Inc | 33,660 | |||||
TOTAL TEXTILE MILL PRODUCTS | 33,660 | ||||||
TOBACCO PRODUCTS - 0.18% | |||||||
1,900 | e | Universal Corp | 85,918 | ||||
TOTAL TOBACCO PRODUCTS | 85,918 | ||||||
TRANSPORTATION BY AIR - 0.19% | |||||||
1,200 | e* | Allegiant Travel Co | 22,308 | ||||
100 | e* | PHI, Inc | 4,017 | ||||
2,340 | e* | Republic Airways Holdings, Inc | 20,264 | ||||
1,400 | e | Skywest, Inc | 17,710 | ||||
5,100 | UAL Corp | 26,622 | |||||
TOTAL TRANSPORTATION BY AIR | 90,921 | ||||||
TRANSPORTATION EQUIPMENT - 2.16% | |||||||
3,030 | e | American Railcar Industries, Inc | 50,843 | ||||
2,508 | e* | Amerigon, Inc | 17,832 | ||||
5,849 | e | ArvinMeritor, Inc | 72,996 | ||||
2,000 | * | ATC Technology Corp | �� | 46,560 | |||
10,697 | e* | Cogo Group, Inc | 97,450 | ||||
1,700 | Ducommun, Inc | 39,032 | |||||
1,350 | e | Heico Corp | 43,929 | ||||
600 | * | LMI Aerospace, Inc | 10,542 | ||||
4,250 | e* | Orbital Sciences Corp | 100,130 | ||||
2,440 | e | Polaris Industries, Inc | 98,527 | ||||
2,500 | e | Spartan Motors, Inc | 18,675 | ||||
4,560 | e* | Tenneco, Inc | 61,697 | ||||
2,350 | e | Triumph Group, Inc | 110,685 | ||||
18,300 | * | Visteon Corp | 48,129 | ||||
4,140 | e | Westinghouse Air Brake Technologies Corp | 201,287 | ||||
37
TIAA-CREF LIFE FUNDS - Small-Cap Equity Fund
SHARES | COMPANY | VALUE | ||||||
TOTAL TRANSPORTATION EQUIPMENT | $ | 1,018,314 | ||||||
TRANSPORTATION SERVICES - 0.93% | ||||||||
500 | * | Dynamex, Inc | 13,405 | |||||
4,438 | e* | HUB Group, Inc (Class A) | 151,469 | |||||
6,300 | * | Lear Corp | 89,334 | |||||
8,620 | e | Pacer International, Inc | 185,416 | |||||
TOTAL TRANSPORTATION SERVICES | 439,624 | |||||||
TRUCKING AND WAREHOUSING - 0.22% | ||||||||
2,284 | e | Arkansas Best Corp | 83,686 | |||||
1,000 | * | Saia, Inc | 10,920 | |||||
700 | * | YRC Worldwide, Inc | 10,409 | |||||
TOTAL TRUCKING AND WAREHOUSING | 105,015 | |||||||
WATER TRANSPORTATION - 0.60% | ||||||||
1,540 | e | Genco Shipping & Trading Ltd | 100,408 | |||||
800 | * | International Shipholding Corp | 18,752 | |||||
2,520 | e* | TBS International Ltd (Class A) | 100,674 | |||||
2,100 | Teekay Tankers Ltd | 48,741 | ||||||
1,000 | e* | Ultrapetrol Bahamas Ltd | 12,610 | |||||
TOTAL WATER TRANSPORTATION | 281,185 | |||||||
WHOLESALE TRADE-DURABLE GOODS - 1.83% | ||||||||
6,120 | e | Applied Industrial Technologies, Inc | 147,920 | |||||
5,560 | e | Barnes Group, Inc | 128,380 | |||||
1,970 | e | Castle (A.M.) & Co | 56,362 | |||||
1,500 | * | Digi International, Inc | 11,775 | |||||
4,170 | e* | Drew Industries, Inc | 66,512 | |||||
1,695 | e | Houston Wire & Cable Co | 33,731 | |||||
5,500 | e | IKON Office Solutions, Inc | 62,040 | |||||
1,100 | * | Insight Enterprises, Inc | 12,903 | |||||
1,626 | e* | MWI Veterinary Supply, Inc | 53,837 | |||||
3,630 | e | Owens & Minor, Inc | 165,855 | |||||
4,858 | * | PSS World Medical, Inc | 79,185 | |||||
1,600 | * | Solera Holdings, Inc | 44,250 | |||||
TOTAL WHOLESALE TRADE-DURABLE GOODS | 862,750 | |||||||
WHOLESALE TRADE-NONDURABLE GOODS - 0.60% | ||||||||
1,400 | e* | Fresh Del Monte Produce, Inc | 32,990 | |||||
3,200 | * | LSB Industries, Inc | 63,360 | |||||
6,933 | e | Spartan Stores, Inc | 159,459 | |||||
660 | e* | United Stationers, Inc | 24,387 | |||||
TOTAL WHOLESALE TRADE-NONDURABLE GOODS | 280,196 | |||||||
| TOTAL COMMON STOCKS (Cost $49,229,336) | 47,048,923 | |||||||
SHORT-TERM INVESTMENTS - 29.81% | ||||||||
INVESTMENT OF CASH COLLATERAL FOR SECURITIES LOANED - 29.81% | ||||||||
14,080,276 | 14,080,276 | |||||||
| TOTAL SHORT-TERM INVESTMENTS (Cost $14,080,276) | 14,080,276 | |||||||
| TOTAL PORTFOLIO - 129.43% (Cost $63,309,612) | 61,129,199 | |||||||
OTHER ASSETS & LIABILITIES, NET - (29.43)% | (13,901,143 | ) | ||||||
38
TIAA-CREF LIFE FUNDS - Small-Cap Equity Fund
SHARES | COMPANY | VALUE | ||||
| NET ASSETS - 100.00% | $47,228,056 | |||||
| * | Non-income producing. |
| b | In bankruptcy. |
| e | All or a portion of these securities are out on loan. |
| m | Indicates a security has been deemed illiquid. |
| v | Security valued at fair value. |
39
TIAA-CREF LIFE FUNDS - Stock Index Fund
TIAA-CREF LIFE FUNDS
STOCK INDEX FUND
STATEMENT OF INVESTMENTS (unaudited)
June 30, 2008
SHARES | COMPANY | VALUE | |||||
COMMON STOCKS - 98.49% | |||||||
AGRICULTURAL PRODUCTION-CROPS - 0.01% | |||||||
439 | e* | Chiquita Brands International, Inc | $ | 6,660 | |||
TOTAL AGRICULTURAL PRODUCTION-CROPS | 6,660 | ||||||
AGRICULTURAL PRODUCTION-LIVESTOCK - 0.01% | |||||||
200 | e | Cal-Maine Foods, Inc | 6,598 | ||||
439 | e | Pilgrim’s Pride Corp | 5,703 | ||||
4 | e | Seaboard Corp | 6,204 | ||||
TOTAL AGRICULTURAL PRODUCTION-LIVESTOCK | 18,505 | ||||||
AGRICULTURAL SERVICES - 0.00%** | |||||||
130 | e* | Cadiz, Inc | 2,096 | ||||
TOTAL AGRICULTURAL SERVICES | 2,096 | ||||||
AMUSEMENT AND RECREATION SERVICES - 0.58% | |||||||
3,318 | * | Activision, Inc | 113,044 | ||||
604 | e* | Bally Technologies, Inc | 20,415 | ||||
134 | e | Churchill Downs, Inc | 4,673 | ||||
267 | e | Dover Downs Gaming & Entertainment, Inc | 1,714 | ||||
338 | International Speedway Corp (Class A) | 13,192 | |||||
256 | e* | Leapfrog Enterprises, Inc | 2,130 | ||||
387 | e* | Life Time Fitness, Inc | 11,436 | ||||
749 | e* | Live Nation, Inc | 7,924 | ||||
593 | e* | Marvel Entertainment, Inc | 19,059 | ||||
843 | * | Penn National Gaming, Inc | 27,102 | ||||
793 | e* | Pinnacle Entertainment, Inc | 8,319 | ||||
1,200 | e* | Six Flags, Inc | 1,380 | ||||
164 | e | Speedway Motorsports, Inc | 3,342 | ||||
178 | e* | Town Sports International Holdings, Inc | 1,663 | ||||
21,678 | Walt Disney Co | 676,354 | |||||
675 | e | Warner Music Group Corp | 4,820 | ||||
859 | v* | Westwood One, Inc | 1,039 | ||||
500 | e* | WMS Industries, Inc | 14,885 | ||||
251 | e | World Wrestling Entertainment, Inc | 3,883 | ||||
TOTAL AMUSEMENT AND RECREATION SERVICES | 936,374 | ||||||
APPAREL AND ACCESSORY STORES - 0.49% | |||||||
944 | e | Abercrombie & Fitch Co (Class A) | 59,170 | ||||
763 | e* | Aeropostale, Inc | 23,905 | ||||
1,966 | American Eagle Outfitters, Inc | 26,797 | |||||
671 | e* | AnnTaylor Stores Corp | 16,077 | ||||
380 | e | Bebe Stores, Inc | 3,652 | ||||
482 | e | Brown Shoe Co, Inc | 6,531 | ||||
97 | e | Buckle, Inc | 4,436 | ||||
300 | * | Cache, Inc | 3,210 | ||||
638 | * | Carter’s, Inc | 8,817 | ||||
318 | e* | Casual Male Retail Group, Inc | 970 | ||||
325 | Cato Corp (Class A) | 4,628 | |||||
40
TIAA-CREF LIFE FUNDS - Stock Index Fund
SHARES | COMPANY | VALUE | |||||
270 | * | Charlotte Russe Holding, Inc | $ | 4,795 | |||
1,400 | e* | Charming Shoppes, Inc | 6,426 | ||||
1,896 | e* | Chico’s FAS, Inc | 10,182 | ||||
222 | e* | Children’s Place Retail Stores, Inc | 8,014 | ||||
390 | e | Christopher & Banks Corp | 2,652 | ||||
380 | e* | Citi Trends, Inc | 8,611 | ||||
733 | e* | Collective Brands, Inc | 8,525 | ||||
600 | * | Dress Barn, Inc | 8,028 | ||||
200 | * | DSW, Inc (Class A) | 2,356 | ||||
681 | Finish Line, Inc (Class A) | 5,925 | |||||
1,692 | Foot Locker, Inc | 21,065 | |||||
5,541 | Gap, Inc | 92,368 | |||||
1,034 | e* | Hanesbrands, Inc | 28,063 | ||||
450 | * | HOT Topic, Inc | 2,435 | ||||
510 | e* | J Crew Group, Inc | 16,835 | ||||
242 | e* | Jo-Ann Stores, Inc | 5,573 | ||||
180 | e* | JOS A Bank Clothiers, Inc | 4,815 | ||||
3,515 | * | Kohl’s Corp | 140,741 | ||||
3,240 | Limited Brands, Inc | 54,594 | |||||
512 | * | New York & Co, Inc | 4,675 | ||||
2,071 | e | Nordstrom, Inc | 62,751 | ||||
675 | e* | Pacific Sunwear Of California, Inc | 5,758 | ||||
1,561 | Ross Stores, Inc | 55,447 | |||||
66 | e* | Shoe Carnival, Inc | 778 | ||||
411 | Stage Stores, Inc | 4,796 | |||||
232 | e | Talbots, Inc | 2,689 | ||||
359 | e* | Tween Brands, Inc | 5,909 | ||||
311 | e* | Under Armour, Inc (Class A) | 7,974 | ||||
1,238 | e* | Urban Outfitters, Inc | 38,613 | ||||
1,045 | e* | Wet Seal, Inc (Class A) | 4,985 | ||||
TOTAL APPAREL AND ACCESSORY STORES | 784,571 | ||||||
APPAREL AND OTHER TEXTILE PRODUCTS - 0.16% | |||||||
165 | e | Columbia Sportswear Co | 6,064 | ||||
340 | e* | G-III Apparel Group Ltd | 4,196 | ||||
686 | Guess ?, Inc | 25,691 | |||||
323 | * | Gymboree Corp | 12,943 | ||||
984 | e | Jones Apparel Group, Inc | 13,530 | ||||
1,079 | e | Liz Claiborne, Inc | 15,268 | ||||
150 | e* | Lululemon Athletica, Inc | 4,359 | ||||
300 | * | Maidenform Brands, Inc | 4,050 | ||||
583 | Phillips-Van Heusen Corp | 21,349 | |||||
663 | Polo Ralph Lauren Corp | 41,623 | |||||
1,365 | * | Quiksilver, Inc | 13,404 | ||||
141 | * | True Religion Apparel, Inc | 3,758 | ||||
995 | VF Corp | 70,824 | |||||
488 | * | Warnaco Group, Inc | 21,506 | ||||
TOTAL APPAREL AND OTHER TEXTILE PRODUCTS | 258,565 | ||||||
AUTO REPAIR, SERVICES AND PARKING - 0.08% | |||||||
100 | e* | Amerco, Inc | 4,768 | ||||
268 | * | Dollar Thrifty Automotive Group, Inc | 2,533 | ||||
816 | * | Exide Technologies | 13,676 | ||||
261 | * | Federal Mogul Corp (Class A) | 4,210 | ||||
3,615 | * | Hertz Global Holdings, Inc | 34,704 | ||||
251 | e* | Midas, Inc | 3,389 | ||||
349 | e | Monro Muffler, Inc | 5,406 | ||||
41
TIAA-CREF LIFE FUNDS - Stock Index Fund
SHARES | COMPANY | VALUE | |||||
655 | e | Ryder System, Inc | $ | 45,116 | |||
97 | * | Standard Parking Corp | 1,765 | ||||
400 | * | Wright Express Corp | 9,920 | ||||
TOTAL AUTO REPAIR, SERVICES AND PARKING | 125,487 | ||||||
AUTOMOTIVE DEALERS AND SERVICE STATIONS - 0.14% | |||||||
1,084 | Advance Auto Parts | 42,092 | |||||
359 | Asbury Automotive Group, Inc | 4,613 | |||||
1,314 | e* | Autonation, Inc | 13,166 | ||||
467 | e* | Autozone, Inc | 56,512 | ||||
2,342 | e* | Carmax, Inc | 33,233 | ||||
763 | * | Copart, Inc | 32,672 | ||||
495 | e* | CSK Auto Corp | 5,188 | ||||
200 | e* | MarineMax, Inc | 1,434 | ||||
1,313 | * | O’Reilly Automotive, Inc | 29,346 | ||||
570 | e | Penske Auto Group, Inc | 8,402 | ||||
333 | e* | Rush Enterprises, Inc (Class A) | 3,999 | ||||
287 | e | Sonic Automotive, Inc (Class A) | 3,699 | ||||
TOTAL AUTOMOTIVE DEALERS AND SERVICE STATIONS | 234,356 | ||||||
BUILDING MATERIALS AND GARDEN SUPPLIES - 0.53% | |||||||
200 | e* | Builders FirstSource, Inc | 1,062 | ||||
798 | e* | Central Garden and Pet Co (Class A) | 3,272 | ||||
1,436 | e | Fastenal Co | 61,978 | ||||
19,168 | Home Depot, Inc | 448,915 | |||||
16,631 | Lowe’s Cos, Inc | 345,093 | |||||
TOTAL BUILDING MATERIALS AND GARDEN SUPPLIES | 860,320 | ||||||
BUSINESS SERVICES - 7.31% | |||||||
4,200 | * | 3Com Corp | 8,904 | ||||
128 | e* | 3D Systems Corp | 1,216 | ||||
556 | e | Aaron Rents, Inc | 12,415 | ||||
474 | e | ABM Industries, Inc | 10,547 | ||||
6,794 | Accenture Ltd (Class A) | 276,652 | |||||
400 | e* | ACI Worldwide, Inc | 7,036 | ||||
620 | e* | Actuate Corp | 2,424 | ||||
741 | e | Acxiom Corp | 8,514 | ||||
200 | e | Administaff, Inc | 5,578 | ||||
6,150 | * | Adobe Systems, Inc | 242,249 | ||||
300 | e* | Advent Software, Inc | 10,824 | ||||
1,024 | * | Affiliated Computer Services, Inc (Class A) | 54,774 | ||||
269 | e | Aircastle Ltd | 2,262 | ||||
1,807 | e* | Akamai Technologies, Inc | 62,866 | ||||
883 | e* | Alliance Data Systems Corp | 49,934 | ||||
2,332 | * | Amdocs Ltd | 68,607 | ||||
412 | e* | American Reprographics Co | 6,860 | ||||
357 | * | AMN Healthcare Services, Inc | 6,040 | ||||
136 | * | Ansoft Corp | 4,950 | ||||
845 | * | Ansys, Inc | 39,816 | ||||
410 | Arbitron, Inc | 19,475 | |||||
968 | e* | Ariba, Inc | 14,239 | ||||
1,213 | * | Art Technology Group, Inc | 3,882 | ||||
96 | e | Asset Acceptance Capital Corp | 1,173 | ||||
234 | * | athenahealth, Inc | 7,198 | ||||
2,655 | * | Autodesk, Inc | 89,766 | ||||
5,922 | Automatic Data Processing, Inc | 248,132 | |||||
1,088 | * | Avis Budget Group, Inc | 9,107 | ||||
42
TIAA-CREF LIFE FUNDS - Stock Index Fund
SHARES | COMPANY | VALUE | |||||
484 | e* | Avocent Corp | $ | 9,002 | |||
140 | e* | Bankrate, Inc | 5,470 | ||||
2,100 | ev* | BearingPoint, Inc | 1,722 | ||||
248 | * | BGC Partners, Inc (Class A) | 1,872 | ||||
479 | Blackbaud, Inc | 10,251 | |||||
353 | * | Blackboard, Inc | 13,495 | ||||
390 | * | Blue Coat Systems, Inc | 5,503 | ||||
2,197 | * | BMC Software, Inc | 79,092 | ||||
300 | * | Bottomline Technologies, Inc | 2,919 | ||||
797 | e* | BPZ Energy, Inc | 23,432 | ||||
549 | Brady Corp (Class A) | 18,957 | |||||
477 | Brink’s Co | 31,205 | |||||
4,485 | CA, Inc | 103,559 | |||||
357 | * | CACI International, Inc (Class A) | 16,340 | ||||
3,072 | * | Cadence Design Systems, Inc | 31,027 | ||||
333 | * | Callidus Software, Inc | 1,665 | ||||
161 | * | Capella Education Co | 9,604 | ||||
342 | e* | Cavium Networks, Inc | 7,182 | ||||
854 | e* | CBIZ, Inc | 6,789 | ||||
768 | e* | Cerner Corp | 34,698 | ||||
783 | * | ChoicePoint, Inc | 37,741 | ||||
338 | e* | Chordiant Software, Inc | 1,690 | ||||
532 | * | Ciber, Inc | 3,304 | ||||
2,090 | * | Citrix Systems, Inc | 61,467 | ||||
400 | * | Clear Channel Outdoor Holdings, Inc (Class A) | 7,132 | ||||
118 | * | Clinical Data, Inc | 1,684 | ||||
529 | e* | CMGI, Inc | 5,607 | ||||
706 | e* | Cogent Communications Group, Inc | 9,460 | ||||
473 | e* | Cogent, Inc | 5,378 | ||||
459 | e | Cognex Corp | 10,580 | ||||
3,324 | * | Cognizant Technology Solutions Corp (Class A) | 108,063 | ||||
487 | * | Commvault Systems, Inc | 8,104 | ||||
227 | e | Compass Diversified Trust | 2,595 | ||||
165 | * | Compellent Technologies, Inc | 1,871 | ||||
65 | Computer Programs & Systems, Inc | 1,126 | |||||
1,718 | * | Computer Sciences Corp | 80,471 | ||||
3,298 | * | Compuware Corp | 31,463 | ||||
100 | e* | COMSYS IT Partners, Inc | 912 | ||||
491 | e* | Concur Technologies, Inc | 16,316 | ||||
234 | * | Constant Contact, Inc | 4,411 | ||||
1,409 | * | Convergys Corp | 20,938 | ||||
222 | e* | CoStar Group, Inc | 9,868 | ||||
485 | * | CSG Systems International, Inc | 5,345 | ||||
843 | * | Cybersource Corp | 14,103 | ||||
377 | e* | Data Domain, Inc | 8,795 | ||||
485 | e* | DealerTrack Holdings, Inc | 6,843 | ||||
567 | Deluxe Corp | 10,104 | |||||
232 | * | Digimarc Corp | 3,285 | ||||
453 | * | Digital River, Inc | 17,477 | ||||
259 | * | DivX, Inc | 1,901 | ||||
202 | * | Double-Take Software, Inc | 2,775 | ||||
509 | e* | DST Systems, Inc | 28,020 | ||||
372 | e* | DynCorp International, Inc (Class A) | 5,636 | ||||
1,405 | * | Earthlink, Inc | 12,153 | ||||
12,924 | * | eBay, Inc | 353,213 | ||||
24 | * | Ebix, Inc | 1,865 | ||||
330 | e* | Echelon Corp | 3,597 | ||||
43
TIAA-CREF LIFE FUNDS - Stock Index Fund
SHARES | COMPANY | VALUE | |||||
621 | e* | Eclipsys Corp | $ | 11,402 | |||
248 | e | Electro Rent Corp | 3,110 | ||||
3,624 | * | Electronic Arts, Inc | 161,014 | ||||
5,835 | Electronic Data Systems Corp | 143,774 | |||||
714 | * | Entrust, Inc | 2,099 | ||||
698 | e* | Epicor Software Corp | 4,823 | ||||
405 | e* | EPIQ Systems, Inc | 5,751 | ||||
1,500 | Equifax, Inc | 50,430 | |||||
435 | e* | Equinix, Inc | 38,811 | ||||
1,464 | e* | Evergreen Energy, Inc | 2,547 | ||||
250 | e* | ExlService Holdings, Inc | 3,508 | ||||
2,359 | * | Expedia, Inc | 43,358 | ||||
920 | e* | F5 Networks, Inc | 26,146 | ||||
486 | e | Factset Research Systems, Inc | 27,391 | ||||
659 | e | Fair Isaac Corp | 13,687 | ||||
313 | e* | FalconStor Software, Inc | 2,216 | ||||
2,182 | Fidelity National Information Services, Inc | 80,538 | |||||
113 | e* | First Advantage Corp (Class A) | 1,791 | ||||
1,865 | * | Fiserv, Inc | 84,615 | ||||
178 | * | Forrester Research, Inc | 5,497 | ||||
300 | FTD Group, Inc | 3,999 | |||||
739 | e* | Gartner, Inc | 15,312 | ||||
244 | e* | Gerber Scientific, Inc | 2,777 | ||||
565 | * | Getty Images, Inc | 19,170 | ||||
252 | e | Gevity HR, Inc | 1,356 | ||||
362 | e* | Global Cash Access, Inc | 2,483 | ||||
190 | e* | Global Sources Ltd | 2,884 | ||||
2,694 | * | Google, Inc (Class A) | 1,418,175 | ||||
180 | e* | H&E Equipment Services, Inc | 2,164 | ||||
476 | * | Hackett Group, Inc | 2,732 | ||||
740 | e | Healthcare Services Group | 11,255 | ||||
310 | e | Heartland Payment Systems, Inc | 7,316 | ||||
200 | e | Heidrick & Struggles International, Inc | 5,528 | ||||
2,084 | e* | HLTH Corp | 23,591 | ||||
227 | e* | HMS Holdings Corp | 4,874 | ||||
326 | * | Hudson Highland Group, Inc | 3,413 | ||||
570 | * | Hypercom Corp | 2,508 | ||||
400 | e* | i2 Technologies, Inc | 4,972 | ||||
213 | * | iGate Corp | 1,732 | ||||
492 | e* | IHS, Inc (Class A) | 34,243 | ||||
2,061 | IMS Health, Inc | 48,021 | |||||
311 | infoGROUP, Inc | 1,365 | |||||
974 | * | Informatica Corp | 14,649 | ||||
367 | Infospace, Inc | 3,057 | |||||
259 | e* | Innerworkings, Inc | 3,098 | ||||
87 | e | Integral Systems, Inc | 3,367 | ||||
387 | Interactive Data Corp | 9,725 | |||||
144 | e* | Interactive Intelligence, Inc | 1,676 | ||||
538 | e* | Internap Network Services Corp | 2,518 | ||||
405 | e* | Internet Capital Group, Inc | 3,131 | ||||
5,198 | e* | Interpublic Group of Cos, Inc | 44,703 | ||||
401 | * | Interwoven, Inc | 4,816 | ||||
3,650 | * | Intuit, Inc | 100,631 | ||||
377 | e* | inVentiv Health, Inc | 10,477 | ||||
2,090 | e* | Iron Mountain, Inc | 55,490 | ||||
800 | e | Jack Henry & Associates, Inc | 17,312 | ||||
245 | * | JDA Software Group, Inc | 4,435 | ||||
44
TIAA-CREF LIFE FUNDS - Stock Index Fund
SHARES | COMPANY | VALUE | |||||
5,853 | * | Juniper Networks, Inc | $ | 129,820 | |||
300 | e | Kelly Services, Inc (Class A) | 5,799 | ||||
276 | e* | Kenexa Corp | 5,200 | ||||
168 | e* | Keynote Systems, Inc | 2,164 | ||||
271 | * | Kforce, Inc | 2,301 | ||||
644 | e* | Kinetic Concepts, Inc | 25,702 | ||||
298 | e* | Knot, Inc | 2,914 | ||||
500 | e* | Korn/Ferry International | 7,865 | ||||
905 | e* | Lamar Advertising Co (Class A) | 32,607 | ||||
1,343 | * | Lawson Software, Inc | 9,764 | ||||
1,850 | e* | Limelight Networks, Inc | 7,067 | ||||
163 | * | Liquidity Services, Inc | 1,879 | ||||
570 | e* | Magma Design Automation, Inc | 3,460 | ||||
311 | * | Manhattan Associates, Inc | 7,380 | ||||
925 | Manpower, Inc | 53,872 | |||||
309 | * | Mantech International Corp (Class A) | 14,869 | ||||
206 | e | Marchex, Inc (Class B) | 2,538 | ||||
844 | Mastercard, Inc (Class A) | 224,099 | |||||
1,833 | * | McAfee, Inc | 62,377 | ||||
1,031 | e* | Mentor Graphics Corp | 16,290 | ||||
91,339 | d | Microsoft Corp | 2,512,736 | ||||
100 | * | MicroStrategy, Inc (Class A) | 6,475 | ||||
300 | e* | Midway Games, Inc | 660 | ||||
165 | * | Monotype Imaging Holdings, Inc | 2,010 | ||||
1,346 | e* | Monster Worldwide, Inc | 27,741 | ||||
3,079 | * | Move, Inc | 7,174 | ||||
1,117 | * | MPS Group, Inc | 11,874 | ||||
477 | e* | MSC.Software Corp | 5,237 | ||||
1,071 | * | NAVTEQ Corp | 82,467 | ||||
74 | * | NCI, Inc (Class A) | 1,693 | ||||
2,098 | * | NCR Corp | 52,870 | ||||
400 | * | Ness Technologies, Inc | 4,048 | ||||
510 | e* | NetFlix, Inc | 13,296 | ||||
341 | * | Netscout Systems, Inc | 3,642 | ||||
310 | e | NIC, Inc | 2,117 | ||||
4,067 | * | Novell, Inc | 23,955 | ||||
1,877 | * | Nuance Communications, Inc | 29,413 | ||||
3,758 | Omnicom Group, Inc | 168,659 | |||||
531 | e* | Omniture, Inc | 9,861 | ||||
282 | e* | On Assignment, Inc | 2,262 | ||||
222 | e* | Online Resources Corp | 1,854 | ||||
44,200 | * | Oracle Corp | 928,200 | ||||
1,404 | * | Parametric Technology Corp | 23,405 | ||||
237 | PC-Tel, Inc | 2,273 | |||||
162 | Pegasystems, Inc | 2,181 | |||||
202 | * | PeopleSupport, Inc | 1,717 | ||||
320 | e* | Perficient, Inc | 3,091 | ||||
953 | * | Perot Systems Corp (Class A) | 14,305 | ||||
640 | * | Phase Forward, Inc | 11,501 | ||||
306 | * | Phoenix Technologies Ltd | 3,366 | ||||
176 | e* | Portfolio Recovery Associates, Inc | 6,600 | ||||
762 | * | Premiere Global Services, Inc | 11,110 | ||||
476 | * | Progress Software Corp | 12,171 | ||||
147 | * | PROS Holdings, Inc | 1,651 | ||||
108 | e | QAD, Inc | 731 | ||||
199 | e | Quality Systems, Inc | 5,827 | ||||
829 | e* | Quest Software, Inc | 12,277 | ||||
45
TIAA-CREF LIFE FUNDS - Stock Index Fund
SHARES | COMPANY | VALUE | |||||
237 | * | Radiant Systems, Inc | $ | 2,543 | |||
187 | * | Radisys Corp | 1,694 | ||||
754 | e* | Raser Technologies, Inc | 7,344 | ||||
1,196 | * | RealNetworks, Inc | 7,894 | ||||
2,113 | e* | Red Hat, Inc | 43,718 | ||||
100 | e | Renaissance Learning, Inc | 1,121 | ||||
770 | * | Rent-A-Center, Inc | 15,839 | ||||
200 | * | RightNow Technologies, Inc | 2,734 | ||||
230 | e* | Riskmetrics Group Inc | 4,517 | ||||
1,625 | e | Robert Half International, Inc | 38,951 | ||||
466 | Rollins, Inc | 6,906 | |||||
230 | e* | RSC Holdings, Inc | 2,130 | ||||
792 | * | S1 Corp | 5,995 | ||||
1,100 | e* | Salesforce.com, Inc | 75,053 | ||||
996 | * | Sapient Corp | 6,394 | ||||
618 | e* | Secure Computing Corp | 2,559 | ||||
101 | e* | SI International, Inc | 2,115 | ||||
620 | e* | Smith Micro Software, Inc | 3,534 | ||||
351 | e* | Sohu.com, Inc | 24,724 | ||||
542 | * | SonicWALL, Inc | 3,496 | ||||
3,028 | e* | Sonus Networks, Inc | 10,356 | ||||
720 | e | Sotheby’s | 18,986 | ||||
235 | * | Sourcefire, Inc | 1,817 | ||||
624 | * | Spherion Corp | 2,883 | ||||
200 | e* | SPSS, Inc | 7,274 | ||||
419 | * | SRA International, Inc (Class A) | 9,411 | ||||
234 | e* | Stratasys, Inc | 4,320 | ||||
255 | * | SuccessFactors, Inc | 2,792 | ||||
8,985 | e* | Sun Microsystems, Inc | 97,757 | ||||
513 | * | SupportSoft, Inc | 1,667 | ||||
1,054 | e* | Sybase, Inc | 31,009 | ||||
356 | * | SYKES Enterprises, Inc | 6,714 | ||||
9,587 | * | Symantec Corp | 185,508 | ||||
203 | e* | Synchronoss Technologies, Inc | 1,833 | ||||
134 | e* | SYNNEX Corp | 3,362 | ||||
1,602 | * | Synopsys, Inc | 38,304 | ||||
140 | e | Syntel, Inc | 4,721 | ||||
925 | * | Take-Two Interactive Software, Inc | 23,652 | ||||
200 | e | TAL International Group, Inc | 4,548 | ||||
177 | e* | Taleo Corp (Class A) | 3,467 | ||||
455 | * | TeleTech Holdings, Inc | 9,082 | ||||
112 | Textainer Group Holdings Ltd | 2,187 | |||||
196 | e | TheStreet.com, Inc | 1,276 | ||||
787 | e* | THQ, Inc | 15,945 | ||||
2,110 | * | TIBCO Software, Inc | 16,142 | ||||
259 | e* | TNS, Inc | 6,206 | ||||
1,857 | e | Total System Services, Inc | 41,263 | ||||
359 | e* | TradeStation Group, Inc | 3,644 | ||||
444 | e* | Trizetto Group, Inc | 9,493 | ||||
550 | e* | TrueBlue, Inc | 7,266 | ||||
242 | e* | Ultimate Software Group, Inc | 8,622 | ||||
3,813 | * | Unisys Corp | 15,061 | ||||
750 | e | United Online, Inc | 7,523 | ||||
1,054 | * | United Rentals, Inc | 20,669 | ||||
1,094 | * | Valueclick, Inc | 16,574 | ||||
248 | e* | Vasco Data Security International | 2,611 | ||||
2,198 | * | VeriSign, Inc | 83,084 | ||||
46
TIAA-CREF LIFE FUNDS - Stock Index Fund
SHARES | COMPANY | VALUE | |||||
263 | Viad Corp | $ | 6,783 | ||||
306 | e* | Vignette Corp | 3,672 | ||||
5,062 | Visa, Inc (Class A) | 411,591 | |||||
471 | e* | VMware, Inc (Class A) | 25,368 | ||||
142 | * | Vocus, Inc | 4,568 | ||||
150 | e* | Volt Information Sciences, Inc | 1,787 | ||||
5,583 | Waste Management, Inc | 210,535 | |||||
51 | e* | WebMD Health Corp (Class A) | 1,423 | ||||
564 | * | Websense, Inc | 9,498 | ||||
309 | * | Website Pros, Inc | 2,574 | ||||
752 | * | Wind River Systems, Inc | 8,189 | ||||
15,649 | * | Yahoo!, Inc | 323,308 | ||||
TOTAL BUSINESS SERVICES | 11,829,983 | ||||||
CHEMICALS AND ALLIED PRODUCTS - 9.41% | |||||||
17,533 | Abbott Laboratories | 928,723 | |||||
75 | * | Abraxis Bioscience, Inc | 4,760 | ||||
300 | e* | Acadia Pharmaceuticals, Inc | 1,107 | ||||
552 | e* | Acorda Therapeutics, Inc | 18,122 | ||||
524 | * | Adolor Corp | 2,872 | ||||
2,397 | e | Air Products & Chemicals, Inc | 236,967 | ||||
276 | * | Albany Molecular Research, Inc | 3,663 | ||||
1,040 | Albemarle Corp | 41,506 | |||||
1,000 | e | Alberto-Culver Co | 26,270 | ||||
438 | e* | Alexion Pharmaceuticals, Inc | 31,755 | ||||
1,288 | e* | Alkermes, Inc | 15,920 | ||||
468 | e* | Allos Therapeutics, Inc | 3,234 | ||||
344 | e* | Alnylam Pharmaceuticals, Inc | 9,195 | ||||
534 | e* | Alpharma, Inc (Class A) | 12,031 | ||||
157 | e* | AMAG Pharmaceuticals, Inc | 5,354 | ||||
702 | e* | American Oriental Bioengineering, Inc | 6,929 | ||||
146 | e | American Vanguard Corp | 1,796 | ||||
12,388 | * | Amgen, Inc | 584,218 | ||||
303 | e* | APP Pharmaceuticals, Inc | 5,066 | ||||
340 | e | Arch Chemicals, Inc | 11,271 | ||||
492 | e* | Arena Pharmaceuticals, Inc | 2,553 | ||||
364 | e* | Arqule, Inc | 1,183 | ||||
600 | e* | Array Biopharma, Inc | 2,820 | ||||
600 | e* | Auxilium Pharmaceuticals, Inc | 20,172 | ||||
175 | * | Avant Immunotherapeutics, Inc | 2,548 | ||||
550 | e* | Aventine Renewable Energy Holdings, Inc | 2,420 | ||||
1,116 | Avery Dennison Corp | 49,026 | |||||
4,980 | Avon Products, Inc | 179,380 | |||||
184 | e | Balchem Corp | 4,256 | ||||
1,229 | * | Barr Pharmaceuticals, Inc | 55,403 | ||||
222 | e* | Bentley Pharmaceuticals, Inc | 3,585 | ||||
125 | * | Biodel, Inc | 1,625 | ||||
3,245 | * | Biogen Idec, Inc | 181,363 | ||||
1,137 | e* | BioMarin Pharmaceuticals, Inc | 32,950 | ||||
730 | e* | BioMimetic Therapeutics, Inc | 8,702 | ||||
22,341 | Bristol-Myers Squibb Co | 458,661 | |||||
696 | e | Cabot Corp | 16,920 | ||||
730 | e* | Calgon Carbon Corp | 11,286 | ||||
206 | * | Cambrex Corp | 1,209 | ||||
1,505 | Celanese Corp (Series A) | 68,718 | |||||
2,250 | e* | Cell Genesys, Inc | 5,850 | ||||
764 | e* | Cephalon, Inc | 50,951 | ||||
47
TIAA-CREF LIFE FUNDS - Stock Index Fund
SHARES | COMPANY | VALUE | |||||
641 | CF Industries Holdings, Inc | $ | 97,945 | ||||
749 | * | Charles River Laboratories International, Inc | 47,876 | ||||
249 | e* | Chattem, Inc | 16,197 | ||||
2,762 | Chemtura Corp | 16,130 | |||||
789 | e | Church & Dwight Co, Inc | 44,460 | ||||
1,568 | Clorox Co | 81,850 | |||||
5,777 | Colgate-Palmolive Co | 399,191 | |||||
554 | * | Columbia Laboratories, Inc | 1,828 | ||||
171 | * | Cougar Biotechnology, Inc | 4,075 | ||||
711 | * | Cubist Pharmaceuticals, Inc | 12,698 | ||||
565 | e* | Cypress Bioscience, Inc | 4,062 | ||||
525 | Cytec Industries, Inc | 28,644 | |||||
1,113 | e* | Dendreon Corp | 4,953 | ||||
3,461 | e* | Discovery Laboratories, Inc | 5,711 | ||||
10,586 | e | Dow Chemical Co | 369,557 | ||||
10,248 | Du Pont (E.I.) de Nemours & Co | 439,537 | |||||
698 | e* | Durect Corp | 2,562 | ||||
868 | Eastman Chemical Co | 59,770 | |||||
2,062 | Ecolab, Inc | 88,645 | |||||
11,292 | Eli Lilly & Co | 521,239 | |||||
350 | e* | Elizabeth Arden, Inc | 5,313 | ||||
400 | e* | Enzon Pharmaceuticals, Inc | 2,848 | ||||
1,158 | e | Estee Lauder Cos (Class A) | 53,789 | ||||
494 | Ferro Corp | 9,267 | |||||
854 | FMC Corp | 66,134 | |||||
3,498 | * | Forest Laboratories, Inc | 121,521 | ||||
5,297 | * | Genentech, Inc | 402,042 | ||||
3,042 | * | Genzyme Corp | 219,085 | ||||
1,012 | e* | Geron Corp | 3,491 | ||||
10,494 | * | Gilead Sciences, Inc | 555,657 | ||||
400 | e* | GTx, Inc | 5,740 | ||||
603 | H.B. Fuller Co | 13,531 | |||||
705 | e* | Halozyme Therapeutics, Inc | 3,793 | ||||
1,449 | Hercules, Inc | 24,532 | |||||
1,809 | e* | Hospira, Inc | 72,559 | ||||
1,379 | e* | Human Genome Sciences, Inc | 7,185 | ||||
1,847 | Huntsman Corp | 21,056 | |||||
325 | * | ICO, Inc | 1,957 | ||||
135 | e* | Idenix Pharmaceuticals, Inc | 981 | ||||
237 | * | Idera Pharmaceuticals, Inc | 3,463 | ||||
720 | * | Idexx Laboratories, Inc | 35,093 | ||||
675 | e* | ImClone Systems, Inc | 27,311 | ||||
866 | * | Immucor, Inc | 22,412 | ||||
507 | e* | Indevus Pharmaceuticals, Inc | 796 | ||||
229 | Innophos Holdings, Inc | 7,317 | |||||
262 | Innospec, Inc | 4,931 | |||||
472 | * | Inspire Pharmaceuticals, Inc | 2,020 | ||||
140 | e | Inter Parfums, Inc | 2,100 | ||||
314 | e* | InterMune, Inc | 4,120 | ||||
910 | International Flavors & Fragrances, Inc | 35,545 | |||||
868 | e* | Inverness Medical Innovations, Inc | 28,792 | ||||
1,048 | e* | Invitrogen Corp | 41,144 | ||||
453 | e* | Javelin Pharmaceuticals, Inc | 1,051 | ||||
162 | e | Kaiser Aluminum Corp | 8,672 | ||||
2,812 | e* | King Pharmaceuticals, Inc | 29,442 | ||||
239 | Koppers Holdings, Inc | 10,007 | |||||
360 | * | KV Pharmaceutical Co (Class A) | 6,959 | ||||
48
TIAA-CREF LIFE FUNDS - Stock Index Fund
SHARES | COMPANY | VALUE | |||||
230 | e* | Landec Corp | $ | 1,488 | |||
993 | e* | Ligand Pharmaceuticals, Inc (Class B) | 2,582 | ||||
776 | Lubrizol Corp | 35,952 | |||||
342 | e | Mannatech, Inc | 1,860 | ||||
300 | e* | MannKind Corp | 900 | ||||
338 | e* | Martek Biosciences Corp | 11,394 | ||||
1,476 | e* | Medarex, Inc | 9,756 | ||||
547 | * | Medicines Co | 10,842 | ||||
596 | e | Medicis Pharmaceutical Corp (Class A) | 12,385 | ||||
232 | e* | Medivation, Inc | 2,745 | ||||
24,421 | Merck & Co, Inc | 920,427 | |||||
433 | e | Meridian Bioscience, Inc | 11,656 | ||||
246 | e | Minerals Technologies, Inc | 15,643 | ||||
571 | e* | Momenta Pharmaceuticals, Inc | 7,023 | ||||
6,244 | Monsanto Co | 789,491 | |||||
1,791 | Mosaic Co | 259,158 | |||||
3,428 | e | Mylan Laboratories, Inc | 41,376 | ||||
612 | e* | Nabi Biopharmaceuticals | 2,411 | ||||
1,607 | e | Nalco Holding Co | 33,988 | ||||
580 | * | NBTY, Inc | 18,595 | ||||
559 | e* | Neurocrine Biosciences, Inc | 2,342 | ||||
154 | e | NewMarket Corp | 10,199 | ||||
113 | e | NL Industries, Inc | 1,077 | ||||
200 | e* | Noven Pharmaceuticals, Inc | 2,138 | ||||
544 | * | NPS Pharmaceuticals, Inc | 2,421 | ||||
203 | * | Obagi Medical Products, Inc | 1,736 | ||||
850 | e | Olin Corp | 22,253 | ||||
346 | * | OM Group, Inc | 11,345 | ||||
151 | e* | Omrix Biopharmaceuticals, Inc | 2,377 | ||||
600 | e* | Onyx Pharmaceuticals, Inc | 21,360 | ||||
278 | * | Optimer Pharmaceuticals, Inc | 2,255 | ||||
360 | e* | OraSure Technologies, Inc | 1,346 | ||||
224 | * | Orexigen Therapeutics, Inc | 1,767 | ||||
651 | e* | OSI Pharmaceuticals, Inc | 26,899 | ||||
170 | * | Osiris Therapeutics, Inc | 2,185 | ||||
235 | e* | Pacific Ethanol, Inc | 425 | ||||
300 | e* | Pain Therapeutics, Inc | 2,370 | ||||
364 | e* | Par Pharmaceutical Cos, Inc | 5,908 | ||||
647 | * | Parexel International Corp | 17,023 | ||||
1,273 | PDL BioPharma, Inc | 13,519 | |||||
889 | e | Perrigo Co | 28,244 | ||||
199 | e* | PetMed Express, Inc | 2,438 | ||||
76,974 | Pfizer, Inc | 1,344,736 | |||||
176 | * | Pharmasset, Inc | 3,323 | ||||
321 | * | PharMerica Corp | 7,251 | ||||
965 | * | PolyOne Corp | 6,726 | ||||
200 | e* | Pozen, Inc | 2,176 | ||||
1,886 | PPG Industries, Inc | 108,200 | |||||
3,562 | Praxair, Inc | 335,683 | |||||
400 | * | Prestige Brands Holdings, Inc | 4,264 | ||||
34,735 | Procter & Gamble Co | 2,112,235 | |||||
300 | e* | Progenics Pharmaceuticals, Inc | 4,761 | ||||
622 | * | Questcor Pharmaceuticals, Inc | 2,886 | ||||
333 | e* | Quidel Corp | 5,501 | ||||
475 | * | Rockwood Holdings, Inc | 16,530 | ||||
1,509 | e | Rohm & Haas Co | 70,078 | ||||
1,385 | e | RPM International, Inc | 28,531 | ||||
49
TIAA-CREF LIFE FUNDS - Stock Index Fund
SHARES | COMPANY | VALUE | |||||
382 | e* | Salix Pharmaceuticals Ltd | $ | 2,685 | |||
18,446 | Schering-Plough Corp | 363,202 | |||||
375 | e | Sciele Pharma, Inc | 7,256 | ||||
464 | Scotts Miracle-Gro Co (Class A) | 8,152 | |||||
600 | e | Sensient Technologies Corp | 16,896 | ||||
1,184 | e* | Sepracor, Inc | 23,585 | ||||
1,145 | e | Sherwin-Williams Co | 52,590 | ||||
1,466 | Sigma-Aldrich Corp | 78,959 | |||||
688 | * | Solutia, Inc | 8,820 | ||||
100 | Stepan Co | 4,562 | |||||
147 | e* | SurModics, Inc | 6,591 | ||||
584 | * | Theravance, Inc | 6,932 | ||||
498 | * | Third Wave Technologies, Inc | 5,558 | ||||
225 | * | Ulta Salon Cosmetics & Fragrance, Inc | 2,529 | ||||
240 | * | United Therapeutics Corp | 23,460 | ||||
92 | e* | USANA Health Sciences, Inc | 2,472 | ||||
1,324 | e* | USEC, Inc | 8,050 | ||||
1,091 | e* | Valeant Pharmaceuticals International | 18,667 | ||||
1,144 | e | Valspar Corp | 21,633 | ||||
1,018 | e* | VCA Antech, Inc | 28,280 | ||||
708 | e* | Verasun Energy Corp | 2,924 | ||||
1,601 | * | Vertex Pharmaceuticals, Inc | 53,585 | ||||
739 | e* | Viropharma, Inc | 8,173 | ||||
994 | e* | Warner Chilcott Ltd (Class A) | 16,848 | ||||
1,189 | * | Watson Pharmaceuticals, Inc | 32,305 | ||||
220 | e | Westlake Chemical Corp | 3,269 | ||||
802 | e* | WR Grace & Co | 18,839 | ||||
15,169 | Wyeth | 727,505 | |||||
288 | * | Xenoport, Inc | 11,241 | ||||
1,452 | e* | XOMA Ltd | 2,454 | ||||
405 | e* | Zymogenetics, Inc | 3,410 | ||||
TOTAL CHEMICALS AND ALLIED PRODUCTS | 15,216,538 | ||||||
COAL MINING - 0.52% | |||||||
799 | * | Alpha Natural Resources, Inc | 83,328 | ||||
1,642 | e | Arch Coal, Inc | 123,199 | ||||
2,082 | Consol Energy, Inc | 233,954 | |||||
1,314 | e* | International Coal Group, Inc | 17,148 | ||||
288 | * | James River Coal Co | 16,903 | ||||
917 | Massey Energy Co | 85,969 | |||||
293 | * | National Coal Corp | 2,599 | ||||
3,089 | e | Peabody Energy Corp | 271,986 | ||||
108 | * | Westmoreland Coal Co | 2,280 | ||||
TOTAL COAL MINING | 837,366 | ||||||
COMMUNICATIONS - 4.12% | |||||||
463 | e | Alaska Communications Systems Group, Inc | 5,528 | ||||
4,540 | * | American Tower Corp (Class A) | 191,815 | ||||
356 | e* | Anixter International, Inc | 21,178 | ||||
580 | * | Aruba Networks, Inc | 3,033 | ||||
67,592 | AT&T, Inc | 2,277,174 | |||||
105 | e | Atlantic Tele-Network, Inc | 2,889 | ||||
200 | e* | Audiovox Corp (Class A) | 1,964 | ||||
552 | e* | Brightpoint, Inc | 4,030 | ||||
2,521 | e* | Cablevision Systems Corp (Class A) | 56,975 | ||||
178 | e* | Cbeyond Communications, Inc | 2,852 | ||||
766 | * | Centennial Communications Corp | 5,354 | ||||
50
TIAA-CREF LIFE FUNDS - Stock Index Fund
SHARES | COMPANY | VALUE | |||||
410 | * | Central European Media Enterprises Ltd (Class A) | $ | 37,117 | |||
1,226 | * | CenturyTel, Inc | 43,633 | ||||
4,638 | e* | Charter Communications, Inc (Class A) | 4,870 | ||||
3,005 | * | Cincinnati Bell, Inc | 11,960 | ||||
2,372 | e* | Citadel Broadcasting Corp | 2,894 | ||||
4,179 | e* | Citizens Communications Co | 47,390 | ||||
5,632 | e | Clear Channel Communications, Inc | 198,246 | ||||
765 | e* | Clearwire Corp (Class A) | 9,914 | ||||
31,901 | Comcast Corp (Class A) | 605,162 | |||||
305 | e | Consolidated Communications Holdings, Inc | 4,541 | ||||
496 | e* | Cox Radio, Inc (Class A) | 5,853 | ||||
3,142 | e* | Crown Castle International Corp | 121,690 | ||||
200 | e* | Crown Media Holdings, Inc (Class A) | 948 | ||||
567 | * | CTC Media, Inc | 13,982 | ||||
671 | e* | Cumulus Media, Inc (Class A) | 2,644 | ||||
145 | e* | DG FastChannel, Inc | 2,501 | ||||
6,782 | e* | DIRECTV Group, Inc | 175,722 | ||||
2,386 | * | DISH Network Corp (Class A) | 69,862 | ||||
1,677 | Embarq Corp | 79,272 | |||||
421 | e | Entercom Communications Corp (Class A) | 2,955 | ||||
810 | e* | Entravision Communications Corp (Class A) | 3,256 | ||||
922 | e | Fairpoint Communications, Inc | 6,648 | ||||
1,894 | e* | FiberTower Corp | 2,652 | ||||
52 | e | Fisher Communications, Inc | 1,791 | ||||
1,594 | * | Foundry Networks, Inc | 18,841 | ||||
464 | e* | General Communication, Inc (Class A) | 3,188 | ||||
193 | e* | GeoEye, Inc | 3,418 | ||||
267 | * | Global Crossing Ltd | 4,790 | ||||
882 | Global Payments, Inc | 41,101 | |||||
420 | e | Gray Television, Inc | 1,205 | ||||
327 | e | Hearst-Argyle Television, Inc | 6,278 | ||||
71 | e* | Hughes Communications, Inc | 3,485 | ||||
1,912 | * | IAC/InterActiveCorp | 36,863 | ||||
361 | e | Ibasis, Inc | 1,184 | ||||
1,142 | e* | ICO Global Communications Holdings Ltd | 3,723 | ||||
614 | e | IDT Corp (Class B) | 1,044 | ||||
400 | e | Iowa Telecommunications Services, Inc | 7,044 | ||||
180 | * | iPCS, Inc | 5,333 | ||||
680 | e* | j2 Global Communications, Inc | 15,640 | ||||
284 | e* | Knology, Inc | 3,121 | ||||
598 | e* | Leap Wireless International, Inc | 25,816 | ||||
17,634 | e* | Level 3 Communications, Inc | 52,020 | ||||
3,741 | e* | Liberty Global, Inc (Class A) | 117,580 | ||||
1,471 | e* | Liberty Media Corp - Capital (Series A) | 21,182 | ||||
5,884 | * | Liberty Media Corp - Entertainment (Series A) | 142,569 | ||||
6,761 | * | Liberty Media Holding Corp (Interactive A) | 99,792 | ||||
281 | e* | Lin TV Corp (Class A) | 1,675 | ||||
573 | * | Mastec, Inc | 6,108 | ||||
493 | e* | Mediacom Communications Corp (Class A) | 2,633 | ||||
2,696 | e* | MetroPCS Communications, Inc | 47,746 | ||||
832 | e* | NeuStar, Inc (Class A) | 17,938 | ||||
189 | * | Neutral Tandem, Inc | 3,308 | ||||
301 | e* | Nextwave Wireless, Inc | 1,216 | ||||
1,953 | * | NII Holdings, Inc | 92,748 | ||||
435 | e* | Novatel Wireless, Inc | 4,842 | ||||
307 | NTELOS Holdings Corp | 7,789 | |||||
1,022 | e* | Orbcomm, Inc | 5,825 | ||||
51
TIAA-CREF LIFE FUNDS - Stock Index Fund
SHARES | COMPANY | VALUE | |||||
1,409 | e* | PAETEC Holding Corp | $ | 8,947 | |||
18,248 | e | Qwest Communications International, Inc | 71,715 | ||||
429 | e* | RCN Corp | 4,625 | ||||
132 | e* | Rural Cellular Corp (Class A) | 5,875 | ||||
423 | e* | SAVVIS, Inc | 5,461 | ||||
1,278 | * | SBA Communications Corp (Class A) | 46,021 | ||||
174 | e | Shenandoah Telecom Co | 2,265 | ||||
383 | e | Sinclair Broadcast Group, Inc (Class A) | 2,911 | ||||
31,933 | Sprint Nextel Corp | 303,364 | |||||
137 | e* | Switch & Data Facilities Co, Inc | 2,328 | ||||
586 | * | Syniverse Holdings, Inc | 9,493 | ||||
370 | * | TeleCommunication Systems, Inc | 1,713 | ||||
1,183 | Telephone & Data Systems, Inc | 55,920 | |||||
500 | e* | Terremark Worldwide, Inc | 2,730 | ||||
654 | * | TerreStar Corp | 2,603 | ||||
1,742 | e* | Time Warner Cable, Inc (Class A) | 46,128 | ||||
932 | e* | TiVo, Inc | 5,750 | ||||
200 | * | US Cellular Corp | 11,310 | ||||
250 | USA Mobility, Inc | 1,888 | |||||
32,434 | Verizon Communications, Inc | 1,148,164 | |||||
336 | e* | Vonage Holdings Corp | 558 | ||||
4,813 | e | Windstream Corp | 59,392 | ||||
3,627 | e* | XM Satellite Radio Holdings, Inc (Class A) | 28,436 | ||||
TOTAL COMMUNICATIONS | 6,662,937 | ||||||
DEPOSITORY INSTITUTIONS - 5.60% | |||||||
121 | e | 1st Source Corp | 1,948 | ||||
278 | Abington Bancorp, Inc | 2,535 | |||||
202 | e | Amcore Financial, Inc | 1,147 | ||||
108 | e | Ameris Bancorp | 940 | ||||
300 | e | Anchor Bancorp Wisconsin, Inc | 2,103 | ||||
100 | Arrow Financial Corp | 1,813 | |||||
1,394 | e | Associated Banc-Corp | 26,890 | ||||
951 | Astoria Financial Corp | 19,096 | |||||
130 | e | Bancfirst Corp | 5,564 | ||||
298 | e | Banco Latinoamericano de Exportaciones S.A. | 4,825 | ||||
937 | e | Bancorpsouth, Inc | 16,388 | ||||
838 | e | Bank Mutual Corp | 8,414 | ||||
50,712 | Bank of America Corp | 1,210,495 | |||||
664 | Bank of Hawaii Corp | 31,739 | |||||
12,863 | Bank of New York Mellon Corp | 486,607 | |||||
102 | e | Bank of the Ozarks, Inc | 1,516 | ||||
300 | e | BankFinancial Corp | 3,903 | ||||
79 | e | Banner Corp | 700 | ||||
6,277 | e | BB&T Corp | 142,927 | ||||
300 | e* | Beneficial Mutual Bancorp, Inc | 3,321 | ||||
57 | Berkshire Hills Bancorp, Inc | 1,348 | |||||
290 | e | BOK Financial Corp | 15,501 | ||||
381 | e | Boston Private Financial Holdings, Inc | 2,160 | ||||
668 | e | Brookline Bancorp, Inc | 6,379 | ||||
87 | Camden National Corp | 2,025 | |||||
101 | e | Capital City Bank Group, Inc | 2,198 | ||||
140 | e | Capitol Bancorp Ltd | 1,256 | ||||
332 | e | Capitol Federal Financial | 12,487 | ||||
286 | Cardinal Financial Corp | 1,790 | |||||
303 | e | Cascade Bancorp | 2,333 | ||||
75 | e | Cass Information Systems, Inc | 2,402 | ||||
52
TIAA-CREF LIFE FUNDS - Stock Index Fund
SHARES | COMPANY | VALUE | |||||
518 | e | Cathay General Bancorp | $ | 5,631 | |||
311 | e | Central Pacific Financial Corp | 3,315 | ||||
234 | e | Chemical Financial Corp | 4,774 | ||||
61,940 | Citigroup, Inc | 1,038,114 | |||||
101 | Citizens & Northern Corp | 1,673 | |||||
955 | e | Citizens Banking Corp | 2,693 | ||||
121 | e | City Bank | 1,041 | ||||
155 | e | City Holding Co | 6,319 | ||||
477 | e | City National Corp | 20,067 | ||||
150 | e | CoBiz, Inc | 987 | ||||
1,743 | Colonial Bancgroup, Inc | 7,704 | |||||
170 | e | Columbia Banking System, Inc | 3,286 | ||||
1,712 | e | Comerica, Inc | 43,879 | ||||
810 | e | Commerce Bancshares, Inc | 32,125 | ||||
400 | e | Community Bank System, Inc | 8,248 | ||||
139 | e | Community Trust Bancorp, Inc | 3,650 | ||||
400 | e | Corus Bankshares, Inc | 1,664 | ||||
776 | e | Cullen/Frost Bankers, Inc | 38,684 | ||||
616 | e | CVB Financial Corp | 5,815 | ||||
309 | Dime Community Bancshares | 5,102 | |||||
300 | e* | Dollar Financial Corp | 4,533 | ||||
257 | e | Downey Financial Corp | 712 | ||||
833 | e | East West Bancorp, Inc | 5,881 | ||||
90 | e | Enterprise Financial Services Corp | 1,697 | ||||
197 | ESSA Bancorp, Inc | 2,466 | |||||
589 | e* | Euronet Worldwide, Inc | 9,954 | ||||
5,714 | e | Fifth Third Bancorp | 58,177 | ||||
126 | Financial Institutions, Inc | 2,024 | |||||
100 | e | First Bancorp | 1,264 | ||||
1,292 | e | First Bancorp | 8,191 | ||||
291 | e | First Busey Corp | 3,847 | ||||
70 | First Citizens Bancshares, Inc (Class A) | 9,764 | |||||
739 | e | First Commonwealth Financial Corp | 6,895 | ||||
72 | e | First Community Bancshares, Inc | 2,030 | ||||
315 | e | First Financial Bancorp | 2,898 | ||||
235 | e | First Financial Bankshares, Inc | 10,765 | ||||
188 | e | First Financial Corp | 5,755 | ||||
133 | e | First Financial Holdings, Inc | 2,285 | ||||
261 | First Financial Northwest, Inc | 2,592 | |||||
2,229 | e | First Horizon National Corp | 16,561 | ||||
315 | e | First Merchants Corp | 5,717 | ||||
545 | e | First Midwest Bancorp, Inc | 10,164 | ||||
1,301 | e | First Niagara Financial Group, Inc | 16,731 | ||||
100 | e | First Place Financial Corp | 940 | ||||
88 | e | First South Bancorp, Inc | 1,133 | ||||
208 | e* | FirstFed Financial Corp | 1,672 | ||||
953 | FirstMerit Corp | 15,543 | |||||
485 | e | Flagstar Bancorp, Inc | 1,460 | ||||
243 | Flushing Financial Corp | 4,605 | |||||
979 | e | FNB Corp | 11,533 | ||||
537 | e | Frontier Financial Corp | 4,575 | ||||
1,944 | e | Fulton Financial Corp | 19,537 | ||||
580 | e | Glacier Bancorp, Inc | 9,274 | ||||
95 | e | Greene County Bancshares, Inc | 1,332 | ||||
600 | e* | Guaranty Bancorp | 2,160 | ||||
294 | e | Hancock Holding Co | 11,551 | ||||
384 | e | Hanmi Financial Corp | 2,001 | ||||
53
TIAA-CREF LIFE FUNDS - Stock Index Fund
SHARES | COMPANY | VALUE | |||||
302 | e | Harleysville National Corp | $ | 3,370 | |||
158 | e | Heartland Financial USA, Inc | 2,874 | ||||
126 | e | Heritage Commerce Corp | 1,247 | ||||
127 | e | Home Bancshares, Inc | 2,855 | ||||
5,959 | Hudson City Bancorp, Inc | 99,396 | |||||
4,292 | e | Huntington Bancshares, Inc | 24,765 | ||||
125 | e | IBERIABANK Corp | 5,559 | ||||
184 | e | Independent Bank Corp | 4,387 | ||||
752 | ev | IndyMac Bancorp, Inc | 421 | ||||
161 | e | Integra Bank Corp | 1,261 | ||||
674 | e | International Bancshares Corp | 14,403 | ||||
579 | * | Investors Bancorp, Inc | 7,562 | ||||
39,133 | JPMorgan Chase & Co | 1,342,663 | |||||
227 | e | Kearny Financial Corp | 2,497 | ||||
4,529 | Keycorp | 49,728 | |||||
132 | e | Lakeland Bancorp, Inc | 1,608 | ||||
92 | e | Lakeland Financial Corp | 1,755 | ||||
747 | e | M&T Bank Corp | 52,693 | ||||
216 | e | MainSource Financial Group, Inc | 3,348 | ||||
2,974 | e | Marshall & Ilsley Corp | 45,591 | ||||
400 | e | MB Financial, Inc | 8,988 | ||||
991 | * | Metavante Technologies, Inc | 22,416 | ||||
85 | e | Midwest Banc Holdings, Inc | 414 | ||||
186 | e | Nara Bancorp, Inc | 1,996 | ||||
100 | e | NASB Financial, Inc | 1,778 | ||||
7,837 | e | National City Corp | 37,382 | ||||
842 | e | National Penn Bancshares, Inc | 11,182 | ||||
374 | e | NBT Bancorp, Inc | 7,708 | ||||
523 | e* | Net 1 UEPS Technologies, Inc | 12,709 | ||||
3,411 | e | New York Community Bancorp, Inc | 60,852 | ||||
1,211 | e | NewAlliance Bancshares, Inc | 15,113 | ||||
2,500 | Northern Trust Corp | 171,425 | |||||
227 | * | Northfield Bancorp, Inc | 2,440 | ||||
200 | e | Northwest Bancorp, Inc | 4,364 | ||||
97 | OceanFirst Financial Corp | 1,751 | |||||
869 | e | Old National Bancorp | 12,392 | ||||
350 | e | Old Second Bancorp, Inc | 4,067 | ||||
273 | Oriental Financial Group, Inc | 3,893 | |||||
152 | * | Oritani Financial Corp | 2,432 | ||||
528 | e | Pacific Capital Bancorp | 7,276 | ||||
270 | e | PacWest Bancorp | 4,018 | ||||
165 | e | Park National Corp | 8,894 | ||||
95 | Peapack Gladstone Financial Corp | 2,087 | |||||
75 | e | Peoples Bancorp, Inc | 1,424 | ||||
3,933 | People’s United Financial, Inc | 61,355 | |||||
200 | e* | Pinnacle Financial Partners, Inc | 4,018 | ||||
3,935 | PNC Financial Services Group, Inc | 224,689 | |||||
3,066 | Popular, Inc | 20,205 | |||||
228 | e | PrivateBancorp, Inc | 6,927 | ||||
449 | e | Prosperity Bancshares, Inc | 12,002 | ||||
357 | e | Provident Bankshares Corp | 2,278 | ||||
854 | Provident Financial Services, Inc | 11,965 | |||||
421 | e | Provident New York Bancorp | 4,656 | ||||
8,011 | e | Regions Financial Corp | 87,400 | ||||
195 | e | Renasant Corp | 2,872 | ||||
120 | e | Republic Bancorp, Inc (Class A) | 2,952 | ||||
300 | e | S&T Bancorp, Inc | 8,718 | ||||
54
TIAA-CREF LIFE FUNDS - Stock Index Fund
SHARES | COMPANY | VALUE | |||||
210 | e | S.Y. Bancorp, Inc | $ | 4,486 | |||
250 | e | Sandy Spring Bancorp, Inc | 4,145 | ||||
121 | Santander BanCorp | 1,284 | |||||
75 | SCBT Financial Corp | 2,142 | |||||
102 | e | Seacoast Banking Corp of Florida | 792 | ||||
98 | Shore Bancshares, Inc | 1,835 | |||||
319 | * | Signature Bank | 8,217 | ||||
108 | e | Simmons First National Corp (Class A) | 3,021 | ||||
110 | Smithtown Bancorp, Inc | 1,788 | |||||
800 | e | South Financial Group, Inc | 3,136 | ||||
121 | Southside Bancshares, Inc | 2,231 | |||||
94 | Southwest Bancorp, Inc | 1,081 | |||||
5,264 | e | Sovereign Bancorp, Inc | 38,743 | ||||
163 | State Bancorp, Inc | 2,038 | |||||
4,448 | State Street Corp | 284,628 | |||||
256 | StellarOne Corp | 3,738 | |||||
119 | e | Sterling Bancorp | 1,422 | ||||
808 | Sterling Bancshares, Inc | 7,345 | |||||
561 | e | Sterling Financial Corp | 2,323 | ||||
88 | e | Suffolk Bancorp | 2,585 | ||||
140 | e* | Sun Bancorp, Inc | 1,421 | ||||
4,062 | e | SunTrust Banks, Inc | 147,126 | ||||
979 | e | Susquehanna Bancshares, Inc | 13,403 | ||||
400 | e* | SVB Financial Group | 19,244 | ||||
3,166 | e | Synovus Financial Corp | 27,639 | ||||
1,433 | e | TCF Financial Corp | 17,239 | ||||
300 | e* | Texas Capital Bancshares, Inc | 4,800 | ||||
1,177 | e | TFS Financial Corp | 13,641 | ||||
119 | e | Tompkins Trustco, Inc | 4,427 | ||||
232 | TowneBank | 3,494 | |||||
92 | e | Trico Bancshares | 1,007 | ||||
852 | e | Trustco Bank Corp NY | 6,322 | ||||
491 | e | Trustmark Corp | 8,666 | ||||
1,089 | e | UCBH Holdings, Inc | 2,450 | ||||
372 | UMB Financial Corp | 19,072 | |||||
581 | e | Umpqua Holdings Corp | 7,048 | ||||
103 | e | Union Bankshares Corp | 1,534 | ||||
482 | UnionBanCal Corp | 19,482 | |||||
437 | e | United Bankshares, Inc | 10,029 | ||||
335 | e | United Community Banks, Inc | 2,858 | ||||
400 | e | United Community Financial Corp | 1,500 | ||||
201 | United Financial Bancorp, Inc | 2,245 | |||||
121 | e | Univest Corp of Pennsylvania | 2,403 | ||||
19,772 | e | US Bancorp | 551,441 | ||||
1,581 | e | Valley National Bancorp | 24,932 | ||||
124 | ViewPoint Financial Group | 1,825 | |||||
1,166 | e | W Holding Co, Inc | 933 | ||||
24,589 | e | Wachovia Corp | 381,867 | ||||
958 | e | Washington Federal, Inc | 17,340 | ||||
12,164 | e | Washington Mutual, Inc | 59,969 | ||||
138 | e | Washington Trust Bancorp, Inc | 2,719 | ||||
770 | e | Webster Financial Corp | 14,322 | ||||
37,574 | Wells Fargo & Co | 892,383 | |||||
301 | e | WesBanco, Inc | 5,162 | ||||
189 | West Bancorporation, Inc | 1,644 | |||||
200 | West Coast Bancorp | 1,734 | |||||
390 | e | Westamerica Bancorporation | 20,510 | ||||
55
TIAA-CREF LIFE FUNDS - Stock Index Fund
SHARES | COMPANY | VALUE | |||||
143 | e* | Western Alliance Bancorp | $ | 1,110 | |||
8,764 | Western Union Co | 216,646 | |||||
366 | e | Westfield Financial, Inc | 3,312 | ||||
750 | e | Whitney Holding Corp | 13,725 | ||||
772 | e | Wilmington Trust Corp | 20,412 | ||||
167 | e | Wilshire Bancorp, Inc | 1,431 | ||||
248 | e | Wintrust Financial Corp | 5,915 | ||||
100 | e | WSFS Financial Corp | 4,460 | ||||
135 | Yadkin Valley Financial Corp | 1,613 | |||||
1,272 | e | Zions Bancorporation | 40,055 | ||||
TOTAL DEPOSITORY INSTITUTIONS | 9,060,251 | ||||||
EATING AND DRINKING PLACES - 0.87% | |||||||
208 | e* | AFC Enterprises | 1,662 | ||||
113 | e* | BJ’s Restaurants, Inc | 1,099 | ||||
460 | e | Bob Evans Farms, Inc | 13,156 | ||||
1,150 | Brinker International, Inc | 21,735 | |||||
144 | e* | Buffalo Wild Wings, Inc | 3,576 | ||||
911 | Burger King Holdings, Inc | 24,406 | |||||
262 | e* | California Pizza Kitchen, Inc | 2,932 | ||||
365 | e | CBRL Group, Inc | 8,946 | ||||
343 | e* | CEC Entertainment, Inc | 9,607 | ||||
844 | e* | Cheesecake Factory | 13,428 | ||||
369 | * | Chipotle Mexican Grill, Inc (Class A) | 30,487 | ||||
622 | CKE Restaurants, Inc | 7,756 | |||||
1,556 | e | Darden Restaurants, Inc | 49,699 | ||||
949 | e* | Denny’s Corp | 2,695 | ||||
182 | e | DineEquity, Inc | 6,800 | ||||
400 | e* | Domino’s Pizza, Inc | 4,600 | ||||
678 | e* | Jack in the Box, Inc | 15,194 | ||||
587 | e* | Krispy Kreme Doughnuts, Inc | 2,929 | ||||
273 | e | Landry’s Restaurants, Inc | 4,906 | ||||
12,896 | McDonald’s Corp | 725,013 | |||||
300 | O’Charleys, Inc | 3,018 | |||||
200 | e* | Papa John’s International, Inc | 5,318 | ||||
277 | e* | PF Chang’s China Bistro, Inc | 6,188 | ||||
150 | e* | Red Robin Gourmet Burgers, Inc | 4,161 | ||||
661 | e | Ruby Tuesday, Inc | 3,569 | ||||
200 | e* | Ruth’s Chris Steak House, Inc | 1,036 | ||||
729 | e* | Sonic Corp | 10,789 | ||||
8,279 | * | Starbucks Corp | 130,311 | ||||
400 | e* | Steak N Shake Co | 2,532 | ||||
442 | e* | Texas Roadhouse, Inc (Class A) | 3,965 | ||||
2,104 | e | Tim Hortons, Inc | 60,364 | ||||
672 | e | Triarc Cos (Class B) | 4,254 | ||||
895 | e | Wendy’s International, Inc | 24,362 | ||||
5,392 | Yum! Brands, Inc | 189,205 | |||||
TOTAL EATING AND DRINKING PLACES | 1,399,698 | ||||||
EDUCATIONAL SERVICES - 0.13% | |||||||
126 | * | American Public Education, Inc | 4,919 | ||||
1,541 | * | Apollo Group, Inc (Class A) | 68,205 | ||||
1,003 | e* | Career Education Corp | 14,654 | ||||
942 | e* | Corinthian Colleges, Inc | 10,937 | ||||
696 | e | DeVry, Inc | 37,320 | ||||
445 | e* | ITT Educational Services, Inc | 36,770 | ||||
168 | Strayer Education, Inc | 35,124 | |||||
56
TIAA-CREF LIFE FUNDS - Stock Index Fund
SHARES | COMPANY | VALUE | |||||
228 | e* | Universal Technical Institute, Inc | $ | 2,841 | |||
TOTAL EDUCATIONAL SERVICES | 210,770 | ||||||
ELECTRIC, GAS, AND SANITARY SERVICES - 4.63% | |||||||
7,565 | * | AES Corp | 145,324 | ||||
871 | AGL Resources, Inc | 30,119 | |||||
1,871 | Allegheny Energy, Inc | 93,756 | |||||
338 | Allete, Inc | 14,196 | |||||
1,255 | Alliant Energy Corp | 42,996 | |||||
4,084 | * | Allied Waste Industries, Inc | 51,540 | ||||
2,387 | e | Ameren Corp | 100,803 | ||||
200 | e | American Ecology Corp | 5,906 | ||||
4,510 | American Electric Power Co, Inc | 181,437 | |||||
150 | e | American States Water Co | 5,241 | ||||
720 | American Water Works Co, Inc | 15,970 | |||||
1,501 | Aqua America, Inc | 23,971 | |||||
4,288 | * | Aquila, Inc | 16,166 | ||||
1,066 | Atmos Energy Corp | 29,390 | |||||
600 | Avista Corp | 12,876 | |||||
986 | * | Beacon Power Corp | 2,051 | ||||
446 | Black Hills Corp | 14,299 | |||||
225 | e | California Water Service Group | 7,373 | ||||
3,727 | * | Calpine Corp | 84,081 | ||||
252 | e* | Casella Waste Systems, Inc (Class A) | 3,072 | ||||
3,734 | Centerpoint Energy, Inc | 59,931 | |||||
110 | Central Vermont Public Service Corp | 2,131 | |||||
250 | e | CH Energy Group, Inc | 8,893 | ||||
76 | Chesapeake Utilities Corp | 1,955 | |||||
245 | * | Clean Energy Fuels Corp | 2,815 | ||||
225 | * | Clean Harbors, Inc | 15,989 | ||||
655 | Cleco Corp | 15,281 | |||||
2,460 | e | CMS Energy Corp | 36,654 | ||||
98 | Connecticut Water Service, Inc | 2,195 | |||||
3,080 | e | Consolidated Edison, Inc | 120,397 | ||||
160 | e | Consolidated Water Co, Inc | 3,168 | ||||
2,030 | Constellation Energy Group, Inc | 166,663 | |||||
1,373 | * | Covanta Holding Corp | 36,645 | ||||
456 | e | Crosstex Energy, Inc | 15,805 | ||||
6,604 | Dominion Resources, Inc | 313,624 | |||||
1,497 | e | DPL, Inc | 39,491 | ||||
2,056 | e | DTE Energy Co | 87,257 | ||||
14,280 | Duke Energy Corp | 248,186 | |||||
5,637 | * | Dynegy, Inc (Class A) | 48,196 | ||||
3,684 | Edison International | 189,284 | |||||
7,853 | El Paso Corp | 170,724 | |||||
600 | * | El Paso Electric Co | 11,880 | ||||
388 | Empire District Electric Co | 7,194 | |||||
818 | Energen Corp | 63,829 | |||||
1,733 | Energy East Corp | 42,840 | |||||
340 | EnergySolutions, Inc | 7,599 | |||||
57 | e | EnergySouth, Inc | 2,796 | ||||
109 | * | EnerNOC, Inc | 1,957 | ||||
2,179 | Entergy Corp | 262,526 | |||||
7,626 | Exelon Corp | 686,035 | |||||
3,454 | FirstEnergy Corp | 284,368 | |||||
4,606 | FPL Group, Inc | 302,061 | |||||
1,141 | e | Great Plains Energy, Inc | 28,844 | ||||
57
TIAA-CREF LIFE FUNDS - Stock Index Fund
SHARES | COMPANY | VALUE | |||||
966 | e | Hawaiian Electric Industries, Inc | $ | 23,889 | |||
515 | e | Idacorp, Inc | 14,878 | ||||
851 | e | Integrys Energy Group, Inc | 43,256 | ||||
555 | e | ITC Holdings Corp | 28,366 | ||||
250 | e | Laclede Group, Inc | 10,093 | ||||
1,959 | MDU Resources Group, Inc | 68,291 | |||||
287 | e | MGE Energy, Inc | 9,362 | ||||
155 | Middlesex Water Co | 2,571 | |||||
2,358 | e* | Mirant Corp | 92,316 | ||||
923 | e | National Fuel Gas Co | 54,900 | ||||
663 | e | New Jersey Resources Corp | 21,647 | ||||
493 | e | Nicor, Inc | 20,997 | ||||
3,108 | e | NiSource, Inc | 55,695 | ||||
1,766 | Northeast Utilities | 45,086 | |||||
333 | e | Northwest Natural Gas Co | 15,405 | ||||
379 | NorthWestern Corp | 9,634 | |||||
2,651 | * | NRG Energy, Inc | 113,728 | ||||
1,294 | NSTAR | 43,763 | |||||
1,047 | OGE Energy Corp | 33,200 | |||||
1,227 | Oneok, Inc | 59,914 | |||||
240 | e | Ormat Technologies, Inc | 11,803 | ||||
300 | e | Otter Tail Corp | 11,649 | ||||
2,289 | Pepco Holdings, Inc | 58,713 | |||||
3,984 | e | PG&E Corp | 158,125 | ||||
167 | e* | Pico Holdings, Inc | 7,256 | ||||
1,017 | Piedmont Natural Gas Co, Inc | 26,605 | |||||
200 | e* | Pike Electric Corp | 3,322 | ||||
1,096 | Pinnacle West Capital Corp | 33,724 | |||||
910 | * | Plug Power, Inc | 2,139 | ||||
871 | PNM Resources, Inc | 10,417 | |||||
712 | e | Portland General Electric Co | 16,034 | ||||
4,245 | PPL Corp | 221,886 | |||||
2,961 | Progress Energy, Inc | 123,859 | |||||
600 | m,v* | Progress Energy, Inc | 6 | ||||
5,750 | Public Service Enterprise Group, Inc | 264,098 | |||||
1,475 | Puget Energy, Inc | 35,385 | |||||
1,972 | Questar Corp | 140,091 | |||||
3,828 | * | Reliant Energy, Inc | 81,422 | ||||
1,739 | e | Republic Services, Inc | 51,648 | ||||
115 | e | Resource America, Inc (Class A) | 1,072 | ||||
1,436 | e | SCANA Corp | 53,132 | ||||
2,849 | Sempra Energy | 160,826 | |||||
2,662 | Sierra Pacific Resources | 33,834 | |||||
138 | e | SJW Corp | 3,643 | ||||
340 | e | South Jersey Industries, Inc | 12,702 | ||||
8,688 | Southern Co | 303,385 | |||||
1,218 | Southern Union Co | 32,910 | |||||
494 | Southwest Gas Corp | 14,687 | |||||
129 | e | Southwest Water Co | 1,293 | ||||
980 | * | Stericycle, Inc | 50,666 | ||||
2,190 | e | TECO Energy, Inc | 47,063 | ||||
1,162 | UGI Corp | 33,361 | |||||
256 | e | UIL Holdings Corp | 7,529 | ||||
365 | Unisource Energy Corp | 11,319 | |||||
1,078 | e | Vectren Corp | 33,644 | ||||
796 | * | Waste Connections, Inc | 25,416 | ||||
229 | e* | Waste Services, Inc | 1,612 | ||||
58
TIAA-CREF LIFE FUNDS - Stock Index Fund
SHARES | COMPANY | VALUE | |||||
1,195 | e | Westar Energy, Inc | $ | 25,704 | |||
561 | e | WGL Holdings, Inc | 19,489 | ||||
6,649 | Williams Cos, Inc | 268,021 | |||||
1,446 | Wisconsin Energy Corp | 65,388 | |||||
4,703 | Xcel Energy, Inc | 94,389 | |||||
TOTAL ELECTRIC, GAS, AND SANITARY SERVICES | 7,494,038 | ||||||
ELECTRONIC AND OTHER ELECTRIC EQUIPMENT - 6.47% | |||||||
244 | e* | Acme Packet, Inc | 1,893 | ||||
200 | * | Actel Corp | 3,370 | ||||
468 | e | Acuity Brands, Inc | 22,501 | ||||
900 | e* | Adaptec, Inc | 2,880 | ||||
1,296 | e* | ADC Telecommunications, Inc | 19,142 | ||||
743 | Adtran, Inc | 17,713 | |||||
395 | * | Advanced Analogic Technologies, Inc | 1,631 | ||||
472 | * | Advanced Battery Technologies, Inc | 2,723 | ||||
504 | * | Advanced Energy Industries, Inc | 6,905 | ||||
6,784 | e* | Advanced Micro Devices, Inc | 39,551 | ||||
3,409 | Altera Corp | 70,566 | |||||
569 | e* | American Superconductor Corp | 20,399 | ||||
1,200 | Ametek, Inc | 56,664 | |||||
1,245 | e* | Amkor Technology, Inc | 12,960 | ||||
1,994 | Amphenol Corp (Class A) | 89,491 | |||||
891 | e* | Anadigics, Inc | 8,776 | ||||
3,302 | Analog Devices, Inc | 104,905 | |||||
10,031 | * | Apple Computer, Inc | 1,679,591 | ||||
891 | e* | Applied Micro Circuits Corp | 7,627 | ||||
144 | Applied Signal Technology, Inc | 1,967 | |||||
1,549 | * | Arris Group, Inc | 13,089 | ||||
632 | e* | Atheros Communications, Inc | 18,960 | ||||
5,300 | * | Atmel Corp | 18,444 | ||||
395 | * | ATMI, Inc | 11,028 | ||||
1,823 | e* | Avanex Corp | 2,060 | ||||
1,731 | * | Avnet, Inc | 47,222 | ||||
484 | e | AVX Corp | 5,474 | ||||
129 | * | AZZ, Inc | 5,147 | ||||
500 | e | Baldor Electric Co | 17,490 | ||||
100 | e | Bel Fuse, Inc (Class B) | 2,471 | ||||
750 | * | Benchmark Electronics, Inc | 12,255 | ||||
386 | * | BigBand Networks, Inc | 1,826 | ||||
1,136 | * | Bookham, Inc | 1,920 | ||||
5,836 | * | Broadcom Corp (Class A) | 159,264 | ||||
1,643 | * | Capstone Turbine Corp | 6,884 | ||||
321 | e* | Ceradyne, Inc | 11,010 | ||||
234 | * | Ceva, Inc | 1,865 | ||||
500 | * | Checkpoint Systems, Inc | 10,440 | ||||
311 | * | China Security & Surveillance Technology, Inc | 4,192 | ||||
932 | e* | Ciena Corp | 21,594 | ||||
67,211 | * | Cisco Systems, Inc | 1,563,328 | ||||
330 | * | Comtech Telecommunications Corp | 16,170 | ||||
1,978 | Cooper Industries Ltd (Class A) | 78,131 | |||||
1,009 | e* | Cree, Inc | 23,015 | ||||
300 | CTS Corp | 3,015 | |||||
170 | Cubic Corp | 3,788 | |||||
1,711 | e* | Cypress Semiconductor Corp | 42,347 | ||||
332 | e* | Diodes, Inc | 9,176 | ||||
574 | * | Dolby Laboratories, Inc (Class A) | 23,132 | ||||
59
TIAA-CREF LIFE FUNDS - Stock Index Fund
SHARES | COMPANY | VALUE | |||||
289 | * | DSP Group, Inc | $ | 2,023 | |||
179 | e* | DTS, Inc | 5,606 | ||||
1,803 | Eaton Corp | 153,201 | |||||
485 | e* | EchoStar Corp (Class A) | 15,142 | ||||
300 | * | Electro Scientific Industries, Inc | 4,251 | ||||
834 | * | Emcore Corp | 5,221 | ||||
161 | * | EMS Technologies, Inc | 3,516 | ||||
617 | e* | Energizer Holdings, Inc | 45,097 | ||||
447 | * | Energy Conversion Devices, Inc | 32,917 | ||||
481 | * | EnerSys | 16,465 | ||||
1,378 | e* | Evergreen Solar, Inc | 13,353 | ||||
520 | e* | Exar Corp | 3,921 | ||||
1,414 | * | Fairchild Semiconductor International, Inc | 16,586 | ||||
2,640 | e* | Finisar Corp | 3,142 | ||||
503 | * | First Solar, Inc | 137,228 | ||||
234 | e | Franklin Electric Co, Inc | 9,075 | ||||
1,210 | e* | FuelCell Energy, Inc | 8,591 | ||||
228 | * | Globecomm Systems, Inc | 1,883 | ||||
1,200 | * | GrafTech International Ltd | 32,196 | ||||
269 | e* | Greatbatch, Inc | 4,654 | ||||
662 | e | Harman International Industries, Inc | 27,400 | ||||
1,008 | * | Harmonic, Inc | 9,586 | ||||
1,532 | Harris Corp | 77,351 | |||||
260 | e* | Harris Stratex Networks, Inc (Class A) | 2,467 | ||||
334 | e* | Helen of Troy Ltd | 5,384 | ||||
1,016 | e* | Hexcel Corp | 19,609 | ||||
223 | * | Hittite Microwave Corp | 7,943 | ||||
8,436 | Honeywell International, Inc | 424,162 | |||||
378 | e* | Hutchinson Technology, Inc | 5,080 | ||||
400 | e | Imation Corp | 9,168 | ||||
708 | e* | Infinera Corp | 6,245 | ||||
1,945 | * | Integrated Device Technology, Inc | 19,333 | ||||
65,173 | Intel Corp | 1,399,916 | |||||
564 | e* | InterDigital, Inc | 13,716 | ||||
915 | * | International Rectifier Corp | 17,568 | ||||
1,411 | Intersil Corp (Class A) | 34,316 | |||||
359 | e* | InterVoice, Inc | 2,046 | ||||
217 | * | IPG Photonics Corp | 4,082 | ||||
122 | e* | iRobot Corp | 1,676 | ||||
257 | * | IXYS Corp | 3,069 | ||||
681 | e* | Jarden Corp | 12,421 | ||||
2,562 | e* | JDS Uniphase Corp | 29,104 | ||||
789 | e* | Kemet Corp | 2,556 | ||||
1,396 | L-3 Communications Holdings, Inc | 126,855 | |||||
1,300 | e* | Lattice Semiconductor Corp | 4,069 | ||||
475 | Lincoln Electric Holdings, Inc | 37,383 | |||||
2,445 | e | Linear Technology Corp | 79,634 | ||||
200 | * | Littelfuse, Inc | 6,310 | ||||
124 | * | Loral Space & Communications, Inc | 2,185 | ||||
131 | LSI Industries, Inc | 1,064 | |||||
7,263 | e* | LSI Logic Corp | 44,595 | ||||
5,518 | * | Marvell Technology Group Ltd | 97,448 | ||||
593 | e* | Mattson Technology, Inc | 2,823 | ||||
211 | * | Maxwell Technologies, Inc | 2,241 | ||||
518 | e* | Medis Technologies Ltd | 1,746 | ||||
2,536 | * | MEMC Electronic Materials, Inc | 156,065 | ||||
223 | e* | Mercury Computer Systems, Inc | 1,679 | ||||
60
TIAA-CREF LIFE FUNDS - Stock Index Fund
SHARES | COMPANY | VALUE | |||||
300 | Methode Electronics, Inc | $ | 3,135 | ||||
797 | e | Micrel, Inc | 7,293 | ||||
2,137 | e | Microchip Technology, Inc | 65,264 | ||||
8,593 | e* | Micron Technology, Inc | 51,558 | ||||
771 | e* | Microsemi Corp | 19,414 | ||||
1,000 | e* | Microtune, Inc | 3,460 | ||||
625 | * | Microvision, Inc | 1,719 | ||||
436 | e* | MIPS Technologies, Inc | 1,635 | ||||
1,511 | e | Molex, Inc | 36,884 | ||||
300 | * | Monolithic Power Systems, Inc | 6,486 | ||||
510 | e* | Moog, Inc (Class A) | 18,992 | ||||
26,320 | Motorola, Inc | 193,189 | |||||
1,945 | e* | MRV Communications, Inc | 2,315 | ||||
160 | e* | Multi-Fineline Electronix, Inc | 4,427 | ||||
43 | e | National Presto Industries, Inc | 2,760 | ||||
2,758 | National Semiconductor Corp | 56,649 | |||||
3,909 | e* | NetApp, Inc | 84,669 | ||||
200 | e* | Netlogic Microsystems, Inc | 6,640 | ||||
1,139 | * | Novellus Systems, Inc | 24,135 | ||||
6,163 | * | Nvidia Corp | 115,371 | ||||
634 | e* | Omnivision Technologies, Inc | 7,665 | ||||
4,506 | e* | ON Semiconductor Corp | 41,320 | ||||
123 | * | Oplink Communications, Inc | 1,181 | ||||
205 | e* | OpNext, Inc | 1,103 | ||||
136 | e* | OSI Systems, Inc | 2,913 | ||||
232 | e | Park Electrochemical Corp | 5,640 | ||||
265 | * | Parkervision, Inc | 2,631 | ||||
200 | * | Pericom Semiconductor Corp | 2,968 | ||||
500 | e* | Photronics, Inc | 3,520 | ||||
554 | e | Plantronics, Inc | 12,365 | ||||
600 | * | Plexus Corp | 16,608 | ||||
410 | e* | PLX Technology, Inc | 3,128 | ||||
2,300 | e* | PMC - Sierra, Inc | 17,595 | ||||
1,022 | * | Polycom, Inc | 24,896 | ||||
184 | * | Polypore International, Inc | 4,661 | ||||
61 | * | Powell Industries, Inc | 3,075 | ||||
343 | * | Power Integrations, Inc | 10,842 | ||||
1,100 | e* | Power-One, Inc | 2,079 | ||||
1,294 | e* | Powerwave Technologies, Inc | 5,500 | ||||
1,796 | e* | QLogic Corp | 26,204 | ||||
18,416 | Qualcomm, Inc | 817,118 | |||||
822 | * | Quantum Fuel Systems Technologies Worldwide, Inc | 2,532 | ||||
1,485 | e | RadioShack Corp | 18,221 | ||||
218 | * | Radyne Corp | 2,492 | ||||
1,152 | e* | Rambus, Inc | 21,969 | ||||
138 | Raven Industries, Inc | 4,524 | |||||
420 | e | Regal-Beloit Corp | 17,745 | ||||
3,137 | e* | RF Micro Devices, Inc | 9,097 | ||||
200 | * | Rogers Corp | 7,518 | ||||
149 | * | Rubicon Technology, Inc | 3,028 | ||||
7,966 | * | Sanmina-SCI Corp | 10,196 | ||||
334 | e* | Seachange International, Inc | 2,391 | ||||
733 | * | Semtech Corp | 10,313 | ||||
495 | * | ShoreTel, Inc | 2,188 | ||||
1,131 | e* | Silicon Image, Inc | 8,200 | ||||
601 | * | Silicon Laboratories, Inc | 21,690 | ||||
1,350 | e* | Silicon Storage Technology, Inc | 3,740 | ||||
61
TIAA-CREF LIFE FUNDS - Stock Index Fund
SHARES | COMPANY | VALUE | |||||
17,195 | e* | Sirius Satellite Radio, Inc | $ | 33,014 | |||
1,872 | e* | Skyworks Solutions, Inc | 18,477 | ||||
549 | e* | Smart Modular Technologies WWH, Inc | 2,103 | ||||
1,064 | e* | Spansion, Inc (Class A) | 2,394 | ||||
456 | e* | Spectrum Brands, Inc | 1,163 | ||||
300 | e* | Standard Microsystems Corp | 8,145 | ||||
341 | e* | Starent Networks Corp | 4,290 | ||||
171 | * | Stoneridge, Inc | 2,917 | ||||
423 | e* | Sunpower Corp (Class A) | 30,448 | ||||
100 | e* | Supertex, Inc | 2,334 | ||||
1,936 | * | Sycamore Networks, Inc | 6,234 | ||||
396 | e* | Symmetricom, Inc | 1,521 | ||||
283 | e* | Synaptics, Inc | 10,678 | ||||
227 | * | Synthesis Energy Systems, Inc | 2,043 | ||||
500 | Technitrol, Inc | 8,495 | |||||
163 | e* | Techwell, Inc | 2,008 | ||||
744 | * | Tekelec | 10,944 | ||||
437 | Teleflex, Inc | 24,293 | |||||
4,811 | e* | Tellabs, Inc | 22,371 | ||||
520 | * | Tessera Technologies, Inc | 8,512 | ||||
14,974 | Texas Instruments, Inc | 421,668 | |||||
645 | * | Thomas & Betts Corp | 24,413 | ||||
140 | * | Transmeta Corp | 1,933 | ||||
598 | * | Trident Microsystems, Inc | 2,183 | ||||
1,402 | * | Triquint Semiconductor, Inc | 8,496 | ||||
433 | * | TTM Technologies, Inc | 5,720 | ||||
5,439 | Tyco Electronics Ltd | 194,825 | |||||
209 | * | Ultra Clean Holdings | 1,664 | ||||
269 | e* | Universal Display Corp | 3,314 | ||||
100 | e* | Universal Electronics, Inc | 2,090 | ||||
1,960 | e* | Utstarcom, Inc | 10,721 | ||||
581 | * | Valence Technology, Inc | 2,574 | ||||
846 | e* | Varian Semiconductor Equipment Associates, Inc | 29,458 | ||||
219 | * | Viasat, Inc | 4,426 | ||||
200 | e | Vicor Corp | 1,996 | ||||
1,891 | * | Vishay Intertechnology, Inc | 16,773 | ||||
288 | e* | Volterra Semiconductor Corp | 4,971 | ||||
855 | e | Whirlpool Corp | 52,779 | ||||
3,179 | e | Xilinx, Inc | 80,270 | ||||
350 | e* | Zoltek Cos, Inc | 8,488 | ||||
532 | * | Zoran Corp | 6,224 | ||||
TOTAL ELECTRONIC AND OTHER ELECTRIC EQUIPMENT | 10,470,576 | ||||||
ENGINEERING AND MANAGEMENT SERVICES - 1.06% | |||||||
188 | * | Advisory Board Co | 7,394 | ||||
846 | e* | Aecom Technology Corp | 27,520 | ||||
116 | * | Affymax, Inc | 1,846 | ||||
1,568 | e* | Amylin Pharmaceuticals, Inc | 39,812 | ||||
906 | Applera Corp (Celera Genomics Group) | 10,292 | |||||
556 | e* | Ariad Pharmaceuticals, Inc | 1,334 | ||||
100 | CDI Corp | 2,544 | |||||
4,851 | * | Celgene Corp | 309,833 | ||||
210 | * | China Architectural Engineering, Inc | 2,052 | ||||
205 | * | comScore, Inc | 4,473 | ||||
117 | e* | Cornell Cos, Inc | 2,821 | ||||
387 | Corporate Executive Board Co | 16,273 | |||||
167 | e* | CRA International, Inc | 6,037 | ||||
62
TIAA-CREF LIFE FUNDS - Stock Index Fund
SHARES | COMPANY | VALUE | |||||
865 | * | CV Therapeutics, Inc | $ | 7,119 | |||
641 | * | Dyax Corp | 1,987 | ||||
723 | * | eResearch Technology, Inc | 12,609 | ||||
1,064 | e* | Exelixis, Inc | 5,320 | ||||
172 | * | Exponent, Inc | 5,403 | ||||
1,003 | Fluor Corp | 186,638 | |||||
408 | * | Furmanite Corp | 3,256 | ||||
692 | e* | Genpact Ltd | 10,325 | ||||
594 | * | Gen-Probe, Inc | 28,203 | ||||
237 | * | Greenfield Online, Inc | 3,536 | ||||
1,037 | * | Hewitt Associates, Inc (Class A) | 39,748 | ||||
270 | * | Hill International, Inc | 4,439 | ||||
188 | e* | Huron Consulting Group, Inc | 8,524 | ||||
1,305 | e* | Incyte Corp | 9,931 | ||||
1,170 | e* | Isis Pharmaceuticals, Inc | 15,947 | ||||
1,364 | * | Jacobs Engineering Group, Inc | 110,075 | ||||
1,971 | KBR, Inc | 68,808 | |||||
135 | * | Kendle International, Inc | 4,905 | ||||
84 | Landauer, Inc | 4,724 | |||||
139 | * | LECG Corp | 1,215 | ||||
954 | * | Lexicon Pharmaceuticals, Inc | 1,526 | ||||
348 | e* | Luminex Corp | 7,151 | ||||
241 | MAXIMUS, Inc | 8,392 | |||||
317 | e* | Maxygen, Inc | 1,075 | ||||
2,576 | * | McDermott International, Inc | 159,429 | ||||
80 | * | Michael Baker Corp | 1,750 | ||||
2,243 | e | Moody’s Corp | 77,249 | ||||
506 | e* | Myriad Genetics, Inc | 23,033 | ||||
631 | * | Navigant Consulting, Inc | 12,342 | ||||
292 | e* | Omnicell, Inc | 3,849 | ||||
3,683 | Paychex, Inc | 115,204 | |||||
282 | * | PharmaNet Development Group, Inc | 4,447 | ||||
1,632 | e | Quest Diagnostics, Inc | 79,103 | ||||
693 | e* | Regeneron Pharmaceuticals, Inc | 10,007 | ||||
1,490 | e* | Rentech, Inc | 2,831 | ||||
514 | Resources Connection, Inc | 10,460 | |||||
517 | * | Rigel Pharmaceuticals, Inc | 11,715 | ||||
611 | * | RTI Biologics, Inc | 5,346 | ||||
2,100 | * | SAIC, Inc | 43,701 | ||||
410 | * | Sangamo Biosciences, Inc | 4,080 | ||||
560 | e* | Savient Pharmaceuticals, Inc | 14,168 | ||||
694 | e* | Seattle Genetics, Inc | 5,871 | ||||
515 | * | Sequenom, Inc | 8,219 | ||||
882 | e* | Shaw Group, Inc | 54,499 | ||||
99 | * | Stanley, Inc | 3,318 | ||||
299 | * | Symyx Technologies, Inc | 2,087 | ||||
100 | e* | Tejon Ranch Co | 3,606 | ||||
677 | * | Tetra Tech, Inc | 15,314 | ||||
840 | * | URS Corp | 35,255 | ||||
512 | Watson Wyatt & Co Holdings (Class A) | 27,080 | |||||
TOTAL ENGINEERING AND MANAGEMENT SERVICES | 1,717,050 | ||||||
FABRICATED METAL PRODUCTS - 0.56% | |||||||
383 | e* | Alliant Techsystems, Inc | 38,943 | ||||
105 | e | Ameron International Corp | 12,598 | ||||
778 | Aptargroup, Inc | 32,637 | |||||
1,163 | Ball Corp | 55,522 | |||||
63
TIAA-CREF LIFE FUNDS - Stock Index Fund
SHARES | COMPANY | VALUE | |||||
323 | * | Chart Industries, Inc | $ | 15,711 | |||
170 | e | CIRCOR International, Inc | 8,328 | ||||
1,236 | e | Commercial Metals Co | 46,597 | ||||
132 | e* | Commercial Vehicle Group, Inc | 1,234 | ||||
593 | Crane Co | 22,848 | |||||
1,813 | * | Crown Holdings, Inc | 47,120 | ||||
270 | e | Dynamic Materials Corp | 8,897 | ||||
420 | e* | Griffon Corp | 3,679 | ||||
190 | Gulf Island Fabrication, Inc | 9,297 | |||||
5,280 | Illinois Tool Works, Inc | 250,853 | |||||
155 | e | Insteel Industries, Inc | 2,838 | ||||
153 | e* | Ladish Co, Inc | 3,150 | ||||
400 | e* | Mobile Mini, Inc | 8,000 | ||||
1,254 | e | Mueller Water Products, Inc (Class A) | 10,120 | ||||
260 | e* | NCI Building Systems, Inc | 9,550 | ||||
1,908 | Parker Hannifin Corp | 136,079 | |||||
220 | e* | Park-Ohio Holdings Corp | 3,247 | ||||
1,126 | e | Pentair, Inc | 39,433 | ||||
450 | Quanex Building Products Corp | 6,687 | |||||
262 | Silgan Holdings, Inc | 13,294 | |||||
400 | e | Simpson Manufacturing Co, Inc | 9,496 | ||||
314 | e* | Smith & Wesson Holding Corp | 1,636 | ||||
657 | Snap-On, Inc | 34,171 | |||||
892 | Stanley Works | 39,988 | |||||
122 | e | Sun Hydraulics Corp | 3,937 | ||||
812 | e* | Taser International, Inc | 4,052 | ||||
203 | e | Valmont Industries, Inc | 21,171 | ||||
341 | e | Watts Water Technologies, Inc (Class A) | 8,491 | ||||
TOTAL FABRICATED METAL PRODUCTS | 909,604 | ||||||
FOOD AND KINDRED PRODUCTS - 3.58% | |||||||
228 | * | AgFeed Industries, Inc | 3,413 | ||||
8,153 | Anheuser-Busch Cos, Inc | 506,464 | |||||
7,324 | Archer Daniels Midland Co | 247,185 | |||||
226 | B&G Foods, Inc (Class A) | 2,111 | |||||
100 | e* | Boston Beer Co, Inc (Class A) | 4,068 | ||||
1,392 | e | Bunge Ltd | 149,904 | ||||
2,699 | Campbell Soup Co | 90,309 | |||||
77 | e | Coca-Cola Bottling Co Consolidated | 2,847 | ||||
26,240 | Coca-Cola Co | 1,363,955 | |||||
3,623 | Coca-Cola Enterprises, Inc | 62,678 | |||||
5,690 | ConAgra Foods, Inc | 109,703 | |||||
2,101 | * | Constellation Brands, Inc (Class A) | 41,726 | ||||
828 | Corn Products International, Inc | 40,663 | |||||
878 | * | Darling International, Inc | 14,505 | ||||
2,062 | Del Monte Foods Co | 14,640 | |||||
182 | Diamond Foods, Inc | 4,193 | |||||
2,887 | * | Dr Pepper Snapple Group, Inc | 60,569 | ||||
200 | e | Farmer Bros Co | 4,230 | ||||
952 | Flowers Foods, Inc | 26,980 | |||||
3,668 | General Mills, Inc | 222,904 | |||||
3,587 | H.J. Heinz Co | 171,638 | |||||
826 | e* | Hansen Natural Corp | 23,805 | ||||
1,846 | e | Hershey Co | 60,512 | ||||
810 | Hormel Foods Corp | 28,034 | |||||
125 | e | Imperial Sugar Co | 1,941 | ||||
192 | e | J&J Snack Foods Corp | 5,263 | ||||
64
TIAA-CREF LIFE FUNDS - Stock Index Fund
SHARES | COMPANY | VALUE | |||||
633 | J.M. Smucker Co | $ | 25,725 | ||||
2,694 | Kellogg Co | 129,366 | |||||
17,249 | Kraft Foods, Inc (Class A) | 490,734 | |||||
317 | Lancaster Colony Corp | 9,599 | |||||
400 | e | Lance, Inc | 7,508 | ||||
107 | e* | M&F Worldwide Corp | 4,206 | ||||
1,421 | e | McCormick & Co, Inc | 50,673 | ||||
1,344 | Molson Coors Brewing Co (Class B) | 73,020 | |||||
211 | * | Omega Protein Corp | 3,154 | ||||
149 | e* | Peet’s Coffee & Tea, Inc | 2,953 | ||||
129 | Penford Corp | 1,920 | |||||
1,656 | Pepsi Bottling Group, Inc | 46,236 | |||||
737 | PepsiAmericas, Inc | 14,578 | |||||
18,046 | PepsiCo, Inc | 1,147,545 | |||||
343 | e* | Ralcorp Holdings, Inc | 16,958 | ||||
236 | e | Reddy Ice Holdings, Inc | 3,228 | ||||
1,964 | e | Reynolds American, Inc | 91,660 | ||||
189 | e | Sanderson Farms, Inc | 6,524 | ||||
8,050 | Sara Lee Corp | 98,613 | |||||
718 | * | Smart Balance, Inc | 5,177 | ||||
1,266 | e* | Smithfield Foods, Inc | 25,168 | ||||
358 | e | Tootsie Roll Industries, Inc | 8,997 | ||||
323 | e* | TreeHouse Foods, Inc | 7,836 | ||||
2,963 | Tyson Foods, Inc (Class A) | 44,267 | |||||
2,709 | Wrigley (Wm.) Jr Co | 210,706 | |||||
TOTAL FOOD AND KINDRED PRODUCTS | 5,790,591 | ||||||
FOOD STORES - 0.33% | |||||||
15 | e | Arden Group, Inc (Class A) | 1,901 | ||||
403 | e* | Great Atlantic & Pacific Tea Co, Inc | 9,196 | ||||
100 | e | Ingles Markets, Inc (Class A) | 2,333 | ||||
7,517 | Kroger Co | 217,016 | |||||
327 | e* | Panera Bread Co (Class A) | 15,127 | ||||
248 | e* | Pantry, Inc | 2,644 | ||||
431 | e | Ruddick Corp | 14,788 | ||||
5,033 | Safeway, Inc | 143,692 | |||||
2,450 | * | Supervalu, Inc | 75,681 | ||||
188 | e | Weis Markets, Inc | 6,104 | ||||
1,546 | e | Whole Foods Market, Inc | 36,625 | ||||
610 | * | Winn-Dixie Stores, Inc | 9,772 | ||||
TOTAL FOOD STORES | 534,879 | ||||||
FORESTRY - 0.10% | |||||||
988 | e | Rayonier, Inc | 41,950 | ||||
2,453 | e | Weyerhaeuser Co | 125,446 | ||||
TOTAL FORESTRY | 167,396 | ||||||
FURNITURE AND FIXTURES - 0.24% | |||||||
279 | e | Ethan Allen Interiors, Inc | 6,863 | ||||
642 | e | Furniture Brands International, Inc | 8,577 | ||||
700 | e | Herman Miller, Inc | 17,423 | ||||
808 | e | Hill-Rom Holdings, Inc | 21,800 | ||||
567 | HNI Corp | 10,013 | |||||
64 | e | Hooker Furniture Corp | 1,108 | ||||
597 | Interface, Inc (Class A) | 7,480 | |||||
6,717 | Johnson Controls, Inc | 192,644 | |||||
300 | Kimball International, Inc (Class B) | 2,484 | |||||
65
TIAA-CREF LIFE FUNDS - Stock Index Fund
SHARES | COMPANY | VALUE | |||||
500 | La-Z-Boy, Inc | $ | 3,825 | ||||
1,986 | e | Leggett & Platt, Inc | 33,305 | ||||
4,134 | e | Masco Corp | 65,028 | ||||
508 | e | Sealy Corp | 2,916 | ||||
1,019 | e | Tempur-Pedic International, Inc | 7,958 | ||||
TOTAL FURNITURE AND FIXTURES | 381,424 | ||||||
FURNITURE AND HOMEFURNISHINGS STORES - 0.15% | |||||||
2,945 | e* | Bed Bath & Beyond, Inc | 82,755 | ||||
1,868 | e | Circuit City Stores, Inc | 5,399 | ||||
1,778 | * | GameStop Corp (Class A) | 71,831 | ||||
166 | e | Haverty Furniture Cos, Inc | 1,667 | ||||
546 | Knoll, Inc | 6,634 | |||||
643 | e* | Mohawk Industries, Inc | 41,216 | ||||
1,075 | e* | Pier 1 Imports, Inc | 3,698 | ||||
838 | e | Steelcase, Inc (Class A) | 8,405 | ||||
228 | Tuesday Morning Corp | 937 | |||||
1,054 | e | Williams-Sonoma, Inc | 20,911 | ||||
TOTAL FURNITURE AND HOMEFURNISHINGS STORES | 243,453 | ||||||
GENERAL BUILDING CONTRACTORS - 0.20% | |||||||
100 | e | Amrep Corp | 4,759 | ||||
39 | e* | Avatar Holdings, Inc | 1,181 | ||||
917 | e | Beazer Homes USA, Inc | 5,108 | ||||
139 | e | Brookfield Homes Corp | 1,707 | ||||
72 | * | Cavco Industries, Inc | 2,357 | ||||
1,320 | e | Centex Corp | 17,648 | ||||
3,593 | e | DR Horton, Inc | 38,984 | ||||
439 | e* | Hovnanian Enterprises, Inc (Class A) | 2,406 | ||||
857 | e | KB Home | 14,509 | ||||
1,474 | e | Lennar Corp (Class A) | 18,189 | ||||
451 | e | M/I Homes, Inc | 7,094 | ||||
274 | McGrath RentCorp | 6,738 | |||||
388 | MDC Holdings, Inc | 15,155 | |||||
594 | e* | Meritage Homes Corp | 9,011 | ||||
50 | e* | NVR, Inc | 25,004 | ||||
100 | e* | Palm Harbor Homes, Inc | 553 | ||||
316 | e* | Perini Corp | 10,444 | ||||
2,600 | e | Pulte Homes, Inc | 25,038 | ||||
506 | Ryland Group, Inc | 11,036 | |||||
1,250 | e | Standard-Pacific Corp | 4,225 | ||||
160 | e* | Team, Inc | 5,491 | ||||
1,474 | e* | Toll Brothers, Inc | 27,608 | ||||
596 | Walter Industries, Inc | 64,827 | |||||
TOTAL GENERAL BUILDING CONTRACTORS | 319,072 | ||||||
GENERAL MERCHANDISE STORES - 1.65% | |||||||
521 | e* | 99 Cents Only Stores | 3,439 | ||||
961 | e* | Big Lots, Inc | 30,022 | ||||
713 | e* | BJ’s Wholesale Club, Inc | 27,593 | ||||
547 | Casey’s General Stores, Inc | 12,674 | |||||
100 | e* | Conn’s, Inc | 1,607 | ||||
4,929 | Costco Wholesale Corp | 345,720 | |||||
670 | e | Dillard’s, Inc (Class A) | 7,752 | ||||
1,650 | e | Family Dollar Stores, Inc | 32,901 | ||||
480 | e | Fred’s, Inc | 5,395 | ||||
2,561 | JC Penney Co, Inc | 92,939 | |||||
66
TIAA-CREF LIFE FUNDS - Stock Index Fund
SHARES | COMPANY | VALUE | |||||
4,765 | Macy’s, Inc | $ | 92,536 | ||||
298 | e* | Retail Ventures, Inc | 1,371 | ||||
1,641 | e* | Saks, Inc | 18,018 | ||||
200 | e | Stein Mart, Inc | 902 | ||||
8,973 | Target Corp | 417,155 | |||||
4,784 | TJX Cos, Inc | 150,552 | |||||
25,528 | Wal-Mart Stores, Inc | 1,434,674 | |||||
TOTAL GENERAL MERCHANDISE STORES | 2,675,250 | ||||||
HEALTH SERVICES - 1.16% | |||||||
107 | * | Alliance Imaging, Inc | 928 | ||||
72 | * | Almost Family, Inc | 1,915 | ||||
288 | e* | Amedisys, Inc | 14,521 | ||||
1,903 | AmerisourceBergen Corp | 76,101 | |||||
542 | * | Amsurg Corp | 13,198 | ||||
569 | e* | Apria Healthcare Group, Inc | 11,033 | ||||
664 | e* | Assisted Living Concepts, Inc (A Shares) | 3,652 | ||||
300 | e* | Bio-Reference Labs, Inc | 6,693 | ||||
384 | e | Brookdale Senior Living, Inc | 7,818 | ||||
3,197 | Cigna Corp | 113,142 | |||||
1,047 | * | Community Health Systems, Inc | 34,530 | ||||
90 | * | Corvel Corp | 3,048 | ||||
716 | * | Covance, Inc | 61,590 | ||||
1,712 | * | Coventry Health Care, Inc | 52,079 | ||||
296 | * | Cross Country Healthcare, Inc | 4,265 | ||||
253 | * | CryoLife, Inc | 2,894 | ||||
1,203 | * | DaVita, Inc | 63,915 | ||||
660 | * | Edwards Lifesciences Corp | 40,946 | ||||
280 | e* | eHealth, Inc | 4,945 | ||||
280 | e* | Emeritus Corp | 4,094 | ||||
242 | * | Enzo Biochem, Inc | 2,715 | ||||
2,394 | * | Express Scripts, Inc | 150,152 | ||||
357 | * | Five Star Quality Care, Inc | 1,689 | ||||
300 | e* | Genomic Health, Inc | 5,745 | ||||
95 | * | Genoptix, Inc | 2,997 | ||||
285 | e* | Gentiva Health Services, Inc | 5,429 | ||||
2,818 | e* | Health Management Associates, Inc (Class A) | 18,345 | ||||
790 | * | Healthsouth Corp | 13,138 | ||||
402 | e* | Healthways, Inc | 11,899 | ||||
3,404 | e* | Immunomedics, Inc | 7,251 | ||||
402 | * | Kindred Healthcare, Inc | 11,562 | ||||
1,277 | * | Laboratory Corp of America Holdings | 88,918 | ||||
124 | * | LHC Group, Inc | 2,883 | ||||
100 | * | Life Sciences Research, Inc | 2,824 | ||||
634 | e* | LifePoint Hospitals, Inc | 17,942 | ||||
836 | * | Lincare Holdings, Inc | 23,742 | ||||
488 | * | Magellan Health Services, Inc | 18,071 | ||||
3,155 | McKesson Corp | 176,396 | |||||
164 | * | Medcath Corp | 2,949 | ||||
5,765 | * | Medco Health Solutions, Inc | 272,108 | ||||
100 | e | National Healthcare Corp | 4,583 | ||||
981 | e* | Nektar Therapeutics | 3,286 | ||||
235 | e* | Nighthawk Radiology Holdings, Inc | 1,664 | ||||
336 | e* | Odyssey HealthCare, Inc | 3,273 | ||||
1,211 | e | Omnicare, Inc | 31,752 | ||||
538 | * | Pediatrix Medical Group, Inc | 26,486 | ||||
1,098 | Pharmaceutical Product Development, Inc | 47,104 | |||||
67
TIAA-CREF LIFE FUNDS - Stock Index Fund
SHARES | COMPANY | VALUE | |||||
610 | e* | Psychiatric Solutions, Inc | $ | 23,082 | |||
300 | * | RehabCare Group, Inc | 4,809 | ||||
246 | e* | Skilled Healthcare Group, Inc (Class A) | 3,301 | ||||
300 | e* | Stereotaxis, Inc | 1,608 | ||||
722 | * | Sun Healthcare Group, Inc | 9,668 | ||||
483 | e* | Sunrise Senior Living, Inc | 10,858 | ||||
5,457 | e* | Tenet Healthcare Corp | 30,341 | ||||
527 | e | Universal Health Services, Inc (Class B) | 33,317 | ||||
133 | * | US Physical Therapy, Inc | 2,183 | ||||
5,985 | * | WellPoint, Inc | 285,245 | ||||
TOTAL HEALTH SERVICES | 1,880,622 | ||||||
HEAVY CONSTRUCTION, EXCEPT BUILDING - 0.10% | |||||||
250 | * | Comverge, Inc | 3,495 | ||||
1,636 | * | Foster Wheeler Ltd | 119,673 | ||||
396 | e | Granite Construction, Inc | 12,486 | ||||
670 | e | Great Lakes Dredge & Dock Corp | 4,094 | ||||
440 | * | Matrix Service Co | 10,146 | ||||
247 | * | Orion Marine Group, Inc | 3,490 | ||||
133 | * | Sterling Construction Co, Inc | 2,641 | ||||
TOTAL HEAVY CONSTRUCTION, EXCEPT BUILDING | 156,025 | ||||||
HOLDING AND OTHER INVESTMENT OFFICES - 2.32% | |||||||
400 | e | Acadia Realty Trust | 9,260 | ||||
466 | e* | Affiliated Managers Group, Inc | 41,968 | ||||
79 | e | Agree Realty Corp | 1,742 | ||||
24 | e* | Alexander’s, Inc | 7,454 | ||||
392 | e | Alexandria Real Estate Equities, Inc | 38,157 | ||||
1,832 | e | Allied Capital Corp | 25,446 | ||||
1,200 | e | AMB Property Corp | 60,456 | ||||
374 | * | American Apparel, Inc | 2,487 | ||||
503 | e | American Campus Communities, Inc | 14,029 | ||||
110 | American Capital Agency Corp | 1,830 | |||||
6,212 | Annaly Mortgage Management, Inc | 96,348 | |||||
503 | e | Anthracite Capital, Inc | 3,541 | ||||
734 | Anworth Mortgage Asset Corp | 4,778 | |||||
1,105 | e | Apartment Investment & Management Co (Class A) | 37,636 | ||||
1,618 | e | Apollo Investment Corp | 23,186 | ||||
134 | e | Arbor Realty Trust, Inc | 1,202 | ||||
1,067 | e | Ashford Hospitality Trust, Inc | 4,930 | ||||
167 | Associated Estates Realty Corp | 1,789 | |||||
872 | e | AvalonBay Communities, Inc | 77,748 | ||||
675 | e | BioMed Realty Trust, Inc | 16,558 | ||||
1,181 | e | Boston Properties, Inc | 106,550 | ||||
918 | e | Brandywine Realty Trust | 14,468 | ||||
557 | e | BRE Properties, Inc (Class A) | 24,107 | ||||
612 | e | Camden Property Trust | 27,087 | ||||
472 | e | Capital Lease Funding, Inc | 3,535 | ||||
47 | e | Capital Southwest Corp | 4,899 | ||||
200 | e | Capital Trust, Inc (Class A) | 3,842 | ||||
608 | Capstead Mortgage Corp | 6,597 | |||||
698 | e | CBL & Associates Properties, Inc | 15,942 | ||||
400 | Cedar Shopping Centers, Inc | 4,688 | |||||
65 | e | Cherokee, Inc | 1,310 | ||||
507 | e | Colonial Properties Trust | 10,150 | ||||
429 | e | Corporate Office Properties Trust | 14,728 | ||||
529 | Cousins Properties, Inc | 12,220 | |||||
68
TIAA-CREF LIFE FUNDS - Stock Index Fund
SHARES | COMPANY | VALUE | |||||
209 | Danvers Bancorp, Inc | $ | 2,299 | ||||
1,850 | e | DCT Industrial Trust, Inc | 15,318 | ||||
1,405 | e | Developers Diversified Realty Corp | 48,768 | ||||
1,064 | e | DiamondRock Hospitality Co | 11,587 | ||||
753 | e | Digital Realty Trust, Inc | 30,805 | ||||
1,381 | e | Douglas Emmett, Inc | 30,341 | ||||
1,556 | Duke Realty Corp | 34,932 | |||||
451 | e | EastGroup Properties, Inc | 19,348 | ||||
231 | Education Realty Trust, Inc | 2,691 | |||||
350 | e | Entertainment Properties Trust | 17,304 | ||||
238 | Equity Lifestyle Properties, Inc | 10,472 | |||||
415 | e | Equity One, Inc | 8,528 | ||||
3,080 | Equity Residential | 117,872 | |||||
291 | e | Essex Property Trust, Inc | 30,992 | ||||
903 | e | Extra Space Storage, Inc | 13,870 | ||||
697 | e | Federal Realty Investment Trust | 48,093 | ||||
628 | e | FelCor Lodging Trust, Inc | 6,594 | ||||
500 | e | First Industrial Realty Trust, Inc | 13,735 | ||||
172 | e | First Potomac Realty Trust | 2,621 | ||||
538 | e | Franklin Street Properties Corp | 6,800 | ||||
2,050 | e | Friedman Billings Ramsey Group, Inc (Class A) | 3,075 | ||||
2,579 | e | General Growth Properties, Inc | 90,342 | ||||
164 | e | Getty Realty Corp | 2,363 | ||||
239 | e | Gladstone Capital Corp | 3,642 | ||||
252 | Gladstone Investment Corp | 1,620 | |||||
511 | e | Glimcher Realty Trust | 5,713 | ||||
574 | e | Gramercy Capital Corp | 6,653 | ||||
132 | Hatteras Financial Corp | 3,035 | |||||
2,599 | e | HCP, Inc | 82,674 | ||||
1,023 | Health Care REIT, Inc | 45,524 | |||||
605 | Healthcare Realty Trust, Inc | 14,381 | |||||
298 | e | Hersha Hospitality Trust | 2,250 | ||||
629 | Highwoods Properties, Inc | 19,763 | |||||
1,026 | e* | Hilltop Holdings, Inc | 10,578 | ||||
424 | Home Properties, Inc | 20,377 | |||||
1,066 | e | Hospitality Properties Trust | 26,074 | ||||
5,912 | e | Host Marriott Corp | 80,699 | ||||
2,467 | HRPT Properties Trust | 16,702 | |||||
710 | e | Inland Real Estate Corp | 10,238 | ||||
678 | e | Investors Real Estate Trust | 6,468 | ||||
5,730 | e | iShares Russell 3000 Index Fund | 429,177 | ||||
1,431 | e | iStar Financial, Inc | 18,904 | ||||
284 | e | JER Investors Trust, Inc | 1,789 | ||||
348 | e | Kilroy Realty Corp | 16,366 | ||||
2,453 | e | Kimco Realty Corp | 84,678 | ||||
715 | e | Kite Realty Group Trust | 8,938 | ||||
442 | e | LaSalle Hotel Properties | 11,107 | ||||
736 | e | Lexington Corporate Properties Trust | 10,032 | ||||
1,005 | e | Liberty Property Trust | 33,316 | ||||
249 | LTC Properties, Inc | 6,364 | |||||
781 | e | Macerich Co | 48,524 | ||||
749 | Mack-Cali Realty Corp | 25,593 | |||||
527 | e | Maguire Properties, Inc | 6,414 | ||||
950 | Medical Properties Trust, Inc | 9,614 | |||||
1,250 | * | Meruelo Maddux Properties, Inc | 2,725 | ||||
1,708 | MFA Mortgage Investments, Inc | 11,136 | |||||
298 | e | Mid-America Apartment Communities, Inc | 15,210 | ||||
69
TIAA-CREF LIFE FUNDS - Stock Index Fund
SHARES | COMPANY | VALUE | |||||
220 | e | Mission West Properties, Inc | $ | 2,411 | |||
520 | MVC Capital, Inc | 7,119 | |||||
200 | National Health Investors, Inc | 5,702 | |||||
839 | National Retail Properties, Inc | 17,535 | |||||
1,097 | e | Nationwide Health Properties, Inc | 34,545 | ||||
463 | e | Newcastle Investment Corp | 3,246 | ||||
800 | e | NorthStar Realty Finance Corp | 6,656 | ||||
735 | Omega Healthcare Investors, Inc | 12,238 | |||||
149 | Parkway Properties, Inc | 5,026 | |||||
216 | e | PennantPark Investment Corp | 1,557 | ||||
385 | e | Pennsylvania Real Estate Investment Trust | 8,909 | ||||
1,970 | e | Plum Creek Timber Co, Inc | 84,139 | ||||
500 | e | Post Properties, Inc | 14,875 | ||||
449 | e | Potlatch Corp | 20,259 | ||||
2,913 | e | Prologis | 158,322 | ||||
218 | e | Prospect Capital Corp | 2,873 | ||||
235 | PS Business Parks, Inc | 12,126 | |||||
1,440 | Public Storage, Inc | 116,338 | |||||
1,238 | e | RAIT Investment Trust | 9,186 | ||||
201 | Ramco-Gershenson Properties | 4,129 | |||||
1,149 | e | Realty Income Corp | 26,151 | ||||
379 | Redwood Trust, Inc | 8,637 | |||||
795 | Regency Centers Corp | 47,000 | |||||
500 | e | Resource Capital Corp | 3,605 | ||||
200 | Saul Centers, Inc | 9,398 | |||||
1,080 | e | Senior Housing Properties Trust | 21,092 | ||||
2,494 | Simon Property Group, Inc | 224,186 | |||||
649 | SL Green Realty Corp | 53,685 | |||||
249 | Sovran Self Storage, Inc | 10,348 | |||||
798 | e | Strategic Hotels & Resorts, Inc | 7,477 | ||||
236 | e | Sun Communities, Inc | 4,302 | ||||
631 | e | Sunstone Hotel Investors, Inc | 10,475 | ||||
357 | e | Tanger Factory Outlet Centers, Inc | 12,827 | ||||
694 | e | Taubman Centers, Inc | 33,763 | ||||
1,487 | e | UDR, Inc | 33,279 | ||||
200 | Universal Health Realty Income Trust | 6,000 | |||||
213 | e | Urstadt Biddle Properties, Inc (Class A) | 3,123 | ||||
499 | U-Store-It Trust | 5,963 | |||||
1,470 | Ventas, Inc | 62,578 | |||||
3,345 | e | Virgin Media, Inc | 45,525 | ||||
1,509 | e | Vornado Realty Trust | 132,792 | ||||
745 | WABCO Holdings, Inc | 34,613 | |||||
562 | e | Washington Real Estate Investment Trust | 16,888 | ||||
842 | e | Weingarten Realty Investors | 25,529 | ||||
1,210 | Winthrop Realty Trust | 4,356 | |||||
TOTAL HOLDING AND OTHER INVESTMENT OFFICES | 3,756,479 | ||||||
HOTELS AND OTHER LODGING PLACES - 0.28% | |||||||
436 | e | Ameristar Casinos, Inc | 6,026 | ||||
459 | e* | Bluegreen Corp | 2,777 | ||||
584 | e | Boyd Gaming Corp | 7,335 | ||||
370 | e | Choice Hotels International, Inc | 9,805 | ||||
424 | e* | Gaylord Entertainment Co | 10,159 | ||||
300 | e* | Great Wolf Resorts, Inc | 1,311 | ||||
162 | e* | Isle of Capri Casinos, Inc | 776 | ||||
1,201 | e* | Las Vegas Sands Corp | 56,975 | ||||
300 | * | Lodgian, Inc | 2,349 | ||||
70
TIAA-CREF LIFE FUNDS - Stock Index Fund
SHARES | COMPANY | VALUE | |||||
200 | Marcus Corp | $ | 2,990 | ||||
3,396 | e | Marriott International, Inc (Class A) | 89,111 | ||||
1,409 | e* | MGM Mirage | 47,751 | ||||
200 | e* | Monarch Casino & Resort, Inc | 2,360 | ||||
510 | e* | Morgans Hotel Group Co | 5,253 | ||||
465 | e | Orient-Express Hotels Ltd (Class A) | 20,200 | ||||
200 | e* | Riviera Holdings Corp | 2,030 | ||||
2,143 | Starwood Hotels & Resorts Worldwide, Inc | 85,870 | |||||
378 | e* | Vail Resorts, Inc | 16,190 | ||||
1,996 | Wyndham Worldwide Corp | 35,748 | |||||
620 | e | Wynn Resorts Ltd | 50,437 | ||||
TOTAL HOTELS AND OTHER LODGING PLACES | 455,453 | ||||||
INDUSTRIAL MACHINERY AND EQUIPMENT - 6.78% | |||||||
302 | * | 3PAR, Inc | 2,368 | ||||
129 | e | Aaon, Inc | 2,485 | ||||
637 | e | Actuant Corp (Class A) | 19,970 | ||||
1,043 | e* | AGCO Corp | 54,664 | ||||
301 | e | Albany International Corp (Class A) | 8,729 | ||||
400 | * | Allis-Chalmers Energy, Inc | 7,120 | ||||
296 | * | Altra Holdings, Inc | 4,976 | ||||
79 | Ampco-Pittsburgh Corp | 3,514 | |||||
15,397 | Applied Materials, Inc | 293,929 | |||||
200 | e* | Astec Industries, Inc | 6,428 | ||||
800 | e* | Asyst Technologies, Inc | 2,856 | ||||
280 | * | AuthenTec, Inc | 2,918 | ||||
900 | * | Axcelis Technologies, Inc | 4,392 | ||||
722 | e | Black & Decker Corp | 41,522 | ||||
243 | Black Box Corp | 6,607 | |||||
315 | * | Blount International, Inc | 3,657 | ||||
100 | * | Bolt Technology Corp | 2,257 | ||||
547 | e | Briggs & Stratton Corp | 6,936 | ||||
4,603 | * | Brocade Communications Systems, Inc | 37,929 | ||||
831 | * | Brooks Automation, Inc | 6,872 | ||||
842 | Bucyrus International, Inc (Class A) | 61,483 | |||||
678 | e | Carlisle Cos, Inc | 19,662 | ||||
126 | e | Cascade Corp | 5,332 | ||||
6,998 | e | Caterpillar, Inc | 516,592 | ||||
1,000 | e* | Cirrus Logic, Inc | 5,560 | ||||
242 | * | Colfax Corp | 6,072 | ||||
196 | * | Columbus McKinnon Corp | 4,720 | ||||
347 | e* | Cray, Inc | 1,610 | ||||
2,311 | Cummins, Inc | 151,417 | |||||
500 | Curtiss-Wright Corp | 22,370 | |||||
400 | e* | Cymer, Inc | 10,752 | ||||
4,904 | Deere & Co | 353,726 | |||||
20,810 | * | Dell, Inc | 455,323 | ||||
772 | Diebold, Inc | 27,468 | |||||
978 | Donaldson Co, Inc | 43,658 | |||||
2,154 | Dover Corp | 104,189 | |||||
938 | * | Dresser-Rand Group, Inc | 36,676 | ||||
352 | * | Dril-Quip, Inc | 22,176 | ||||
630 | * | Electronics for Imaging, Inc | 9,198 | ||||
23,520 | * | EMC Corp | 345,509 | ||||
1,000 | * | Emulex Corp | 11,650 | ||||
408 | * | Ener1, Inc | 3,027 | ||||
507 | e* | ENGlobal Corp | 7,220 | ||||
71
TIAA-CREF LIFE FUNDS - Stock Index Fund
SHARES | COMPANY | VALUE | |||||
215 | e* | EnPro Industries, Inc | $ | 8,028 | |||
1,363 | e* | Entegris, Inc | 8,928 | ||||
1,016 | e* | Extreme Networks, Inc | 2,885 | ||||
562 | e* | Flotek Industries, Inc | 11,588 | ||||
413 | e* | Flow International Corp | 3,221 | ||||
623 | Flowserve Corp | 85,164 | |||||
1,430 | * | FMC Technologies, Inc | 110,010 | ||||
190 | e* | Fuel Tech, Inc | 3,348 | ||||
655 | * | Gardner Denver, Inc | 37,204 | ||||
106 | * | Gehl Co | 1,568 | ||||
113,405 | General Electric Co | 3,026,779 | |||||
194 | e | Gorman-Rupp Co | 7,729 | ||||
771 | e | Graco, Inc | 29,352 | ||||
57 | Graham Corp | 4,224 | |||||
28,043 | Hewlett-Packard Co | 1,239,781 | |||||
60 | e* | Hurco Cos, Inc | 1,853 | ||||
939 | IDEX Corp | 34,593 | |||||
289 | e* | Immersion Corp | 1,968 | ||||
3,537 | Ingersoll-Rand Co Ltd (Class A) | 132,409 | |||||
664 | e* | Intermec, Inc | 13,997 | ||||
15,594 | International Business Machines Corp | 1,848,357 | |||||
3,589 | International Game Technology | 89,653 | |||||
278 | e* | Intevac, Inc | 3,136 | ||||
2,078 | ITT Industries, Inc | 131,600 | |||||
2,356 | Jabil Circuit, Inc | 38,662 | |||||
1,220 | Joy Global, Inc | 92,513 | |||||
85 | * | Kadant, Inc | 1,921 | ||||
300 | e | Kaydon Corp | 15,423 | ||||
857 | Kennametal, Inc | 27,895 | |||||
64 | * | Key Technology, Inc | 2,036 | ||||
631 | * | Kulicke & Soffa Industries, Inc | 4,600 | ||||
1,422 | * | Lam Research Corp | 51,405 | ||||
657 | Lennox International, Inc | 19,027 | |||||
1,076 | e* | Lexmark International, Inc (Class A) | 35,971 | ||||
136 | e | Lindsay Manufacturing Co | 11,556 | ||||
200 | Lufkin Industries, Inc | 16,656 | |||||
1,392 | Manitowoc Co, Inc | 45,282 | |||||
171 | Met-Pro Corp | 2,283 | |||||
1,000 | * | Micros Systems, Inc | 30,490 | ||||
192 | e* | Middleby Corp | 8,431 | ||||
500 | e | Modine Manufacturing Co | 6,185 | ||||
66 | Nacco Industries, Inc (Class A) | 4,907 | |||||
227 | * | NATCO Group, Inc (Class A) | 12,378 | ||||
136 | * | Natural Gas Services Group, Inc | 4,145 | ||||
451 | * | Netezza Corp | 5,177 | ||||
400 | * | Netgear, Inc | 5,544 | ||||
179 | NN, Inc | 2,495 | |||||
369 | Nordson Corp | 26,896 | |||||
540 | * | Oil States International, Inc | 34,258 | ||||
1,385 | Pall Corp | 54,957 | |||||
1,132 | e | Palm, Inc | 6,101 | ||||
72 | * | Peerless Manufacturing Co | 3,375 | ||||
1,916 | e* | Quantum Corp | 2,587 | ||||
301 | * | Rackable Systems, Inc | 4,033 | ||||
200 | * | RBC Bearings, Inc | 6,664 | ||||
113 | e* | Rimage Corp | 1,400 | ||||
475 | e* | Riverbed Technology, Inc | 6,517 | ||||
72
TIAA-CREF LIFE FUNDS - Stock Index Fund
SHARES | COMPANY | VALUE | ||||||
310 | Robbins & Myers, Inc | $ | 15,460 | |||||
1,656 | Rockwell Automation, Inc | 72,417 | ||||||
1,316 | e* | Safeguard Scientifics, Inc | 1,632 | |||||
2,558 | * | SanDisk Corp | 47,835 | |||||
200 | e | Sauer-Danfoss, Inc | 6,230 | |||||
266 | e* | Scansource, Inc | 7,118 | |||||
702 | e* | Scientific Games Corp (Class A) | 20,793 | |||||
1,500 | m,v* | Seagate Technology | (0 | ) | ||||
5,517 | Seagate Technology, Inc | 105,540 | ||||||
100 | e* | Semitool, Inc | 751 | |||||
417 | e* | Sigma Designs, Inc | 5,792 | |||||
608 | SPX Corp | 80,092 | ||||||
100 | e | Standex International Corp | 2,074 | |||||
790 | e* | STEC, Inc | 8,113 | |||||
258 | * | Super Micro Computer, Inc | 1,904 | |||||
142 | * | T-3 Energy Services, Inc | 11,285 | |||||
208 | * | Tecumseh Products Co (Class A) | 6,818 | |||||
200 | Tennant Co | 6,014 | ||||||
2,098 | * | Teradata Corp | 48,548 | |||||
1,127 | * | Terex Corp | 57,894 | |||||
156 | * | Thermadyne Holdings Corp | 2,307 | |||||
1,037 | Timken Co | 34,159 | ||||||
426 | e | Toro Co | 14,173 | |||||
555 | e* | TurboChef Technologies, Inc | 2,653 | |||||
100 | e | Twin Disc, Inc | 2,093 | |||||
200 | e* | Ultratech, Inc | 3,104 | |||||
1,552 | e* | Varian Medical Systems, Inc | 80,471 | |||||
678 | e* | VeriFone Holdings, Inc | 8,102 | |||||
280 | e | Watsco, Inc | 11,704 | |||||
2,428 | e* | Western Digital Corp | 83,839 | |||||
680 | Woodward Governor Co | 24,249 | ||||||
762 | * | Zebra Technologies Corp (Class A) | 24,872 | |||||
TOTAL INDUSTRIAL MACHINERY AND EQUIPMENT | 10,972,700 | |||||||
INSTRUMENTS AND RELATED PRODUCTS - 4.93% | ||||||||
247 | e* | Abaxis, Inc | 5,960 | |||||
400 | e* | Abiomed, Inc | 7,100 | |||||
419 | e* | Accuray, Inc | 3,055 | |||||
708 | e* | Advanced Medical Optics, Inc | 13,268 | |||||
766 | * | Affymetrix, Inc | 7,882 | |||||
4,237 | * | Agilent Technologies, Inc | 150,583 | |||||
700 | e* | Align Technology, Inc | 7,343 | |||||
3,464 | Allergan, Inc | 180,301 | ||||||
728 | e* | American Medical Systems Holdings, Inc | 10,884 | |||||
87 | e | American Science & Engineering, Inc | 4,483 | |||||
150 | Analogic Corp | 9,461 | ||||||
200 | * | Anaren, Inc | 2,114 | |||||
275 | * | Angiodynamics, Inc | 3,746 | |||||
2,057 | Applied Biosystems, Inc | 68,868 | ||||||
94 | e* | Argon ST, Inc | 2,331 | |||||
300 | e* | Arthrocare Corp | 12,243 | |||||
99 | * | Axsys Technologies, Inc | 5,152 | |||||
166 | e | Badger Meter, Inc | 8,388 | |||||
1,129 | Bard (C.R.), Inc | 99,296 | ||||||
7,137 | Baxter International, Inc | 456,340 | ||||||
745 | Beckman Coulter, Inc | 50,310 | ||||||
2,792 | Becton Dickinson & Co | 226,990 | ||||||
73
TIAA-CREF LIFE FUNDS - Stock Index Fund
SHARES | COMPANY | VALUE | |||||
208 | * | Bio-Rad Laboratories, Inc (Class A) | $ | 16,825 | |||
16,637 | * | Boston Scientific Corp | 204,469 | ||||
762 | * | Bruker BioSciences Corp | 9,792 | ||||
146 | * | Cantel Medical Corp | 1,478 | ||||
223 | * | Cardiac Science Corp | 1,829 | ||||
609 | * | Cepheid, Inc | 17,125 | ||||
271 | * | Coherent, Inc | 8,100 | ||||
200 | Cohu, Inc | 2,936 | |||||
450 | * | Conmed Corp | 11,948 | ||||
512 | e | Cooper Cos, Inc | 19,021 | ||||
5,626 | Covidien Ltd | 269,429 | |||||
200 | e* | Cyberonics, Inc | 4,340 | ||||
85 | e* | Cynosure, Inc (Class A) | 1,685 | ||||
2,809 | Danaher Corp | 217,136 | |||||
149 | e | Datascope Corp | 7,003 | ||||
1,822 | Dentsply International, Inc | 67,050 | |||||
567 | * | Depomed, Inc | 1,820 | ||||
296 | * | DexCom, Inc | 1,788 | ||||
284 | e* | Dionex Corp | 18,849 | ||||
446 | e | DRS Technologies, Inc | 35,109 | ||||
41 | * | DXP Enterprises, Inc | 1,707 | ||||
3,150 | e | Eastman Kodak Co | 45,455 | ||||
8,884 | Emerson Electric Co | 439,314 | |||||
270 | * | ESCO Technologies, Inc | 12,668 | ||||
333 | * | Esterline Technologies Corp | 16,404 | ||||
801 | e * | ev3, Inc | 7,593 | ||||
78 | * | Exactech, Inc | 2,005 | ||||
81 | * | Excel Technology, Inc | 1,808 | ||||
163 | e* | FARO Technologies, Inc | 4,103 | ||||
386 | e* | FEI Co | 8,793 | ||||
1,536 | e* | Flir Systems, Inc | 62,316 | ||||
497 | e* | Formfactor, Inc | 9,160 | ||||
469 | e* | Fossil, Inc | 13,634 | ||||
1,458 | e | Garmin Ltd | 62,461 | ||||
392 | * | Haemonetics Corp | 21,740 | ||||
259 | * | Hanger Orthopedic Group, Inc | 4,271 | ||||
153 | * | Herley Industries, Inc | 2,032 | ||||
698 | e | Hillenbrand, Inc | 14,937 | ||||
2,784 | e* | Hologic, Inc | 60,691 | ||||
111 | * | ICU Medical, Inc | 2,540 | ||||
193 | e* | I-Flow Corp | 1,959 | ||||
276 | e* | II-VI, Inc | 9,638 | ||||
632 | e* | Illumina, Inc | 55,054 | ||||
205 | * | Insulet Corp | 3,225 | ||||
289 | e* | Integra LifeSciences Holdings Corp | 12,855 | ||||
434 | * | Intuitive Surgical, Inc | 116,920 | ||||
316 | e | Invacare Corp | 6,459 | ||||
900 | e* | ION Geophysical Corp | 15,705 | ||||
205 | * | IRIS International, Inc | 3,208 | ||||
388 | e* | Itron, Inc | 38,160 | ||||
345 | * | Ixia | 2,398 | ||||
32,063 | Johnson & Johnson | 2,062,933 | |||||
66 | e* | Kensey Nash Corp | 2,115 | ||||
1,934 | e | Kla-Tencor Corp | 78,733 | ||||
800 | * | Kopin Corp | 2,296 | ||||
27 | * | K-Tron International, Inc | 3,499 | ||||
699 | e* | L-1 Identity Solutions, Inc | 9,311 | ||||
74
TIAA-CREF LIFE FUNDS - Stock Index Fund
SHARES | COMPANY | VALUE | |||||
138 | * | LaBarge, Inc | $ | 1,794 | |||
522 | e* | LTX Corp | 1,148 | ||||
193 | * | Lydall, Inc | 2,422 | ||||
523 | e* | Masimo Corp | 17,965 | ||||
114 | e* | Measurement Specialties, Inc | 2,005 | ||||
147 | * | Medical Action Industries, Inc | 1,524 | ||||
12,777 | Medtronic, Inc | 661,210 | |||||
409 | e | Mentor Corp | 11,378 | ||||
310 | * | Merit Medical Systems, Inc | 4,557 | ||||
414 | * | Mettler-Toledo International, Inc | 39,272 | ||||
167 | e* | Micrus Endovascular Corp | 2,341 | ||||
681 | * | Millipore Corp | 46,213 | ||||
352 | e | Mine Safety Appliances Co | 14,076 | ||||
550 | * | MKS Instruments, Inc | 12,045 | ||||
200 | e | Movado Group, Inc | 3,960 | ||||
221 | e | MTS Systems Corp | 7,929 | ||||
650 | National Instruments Corp | 18,441 | |||||
316 | e* | Natus Medical, Inc | 6,617 | ||||
167 | * | Neogen Corp | 3,823 | ||||
407 | e* | Newport Corp | 4,636 | ||||
404 | * | NuVasive, Inc | 18,043 | ||||
222 | e* | NxStage Medical, Inc | 852 | ||||
181 | e* | Orthofix International NV | 5,240 | ||||
42 | e* | OYO Geospace Corp | 2,475 | ||||
200 | e* | Palomar Medical Technologies, Inc | 1,996 | ||||
1,291 | PerkinElmer, Inc | 35,954 | |||||
196 | * | Photon Dynamics Inc | 2,956 | ||||
2,432 | Pitney Bowes, Inc | 82,931 | |||||
878 | e* | Resmed, Inc | 31,380 | ||||
1,827 | Rockwell Collins, Inc | 87,623 | |||||
324 | e* | Rofin-Sinar Technologies, Inc | 9,785 | ||||
1,017 | Roper Industries, Inc | 67,000 | |||||
351 | e* | Rudolph Technologies, Inc | 2,703 | ||||
561 | e* | Sirf Technology Holdings, Inc | 2,424 | ||||
182 | e* | Sirona Dental Systems, Inc | 4,717 | ||||
142 | * | Somanetics Corp | 3,010 | ||||
326 | e* | Sonic Solutions, Inc | 1,943 | ||||
150 | e* | SonoSite, Inc | 4,202 | ||||
330 | * | Spectranetics Corp | 3,254 | ||||
3,854 | * | St. Jude Medical, Inc | 157,552 | ||||
800 | STERIS Corp | 23,008 | |||||
3,501 | Stryker Corp | 220,143 | |||||
376 | * | Symmetry Medical, Inc | 6,099 | ||||
146 | * | Synovis Life Technologies, Inc | 2,749 | ||||
450 | * | Techne Corp | 34,826 | ||||
385 | * | Teledyne Technologies, Inc | 18,784 | ||||
2,014 | * | Teradyne, Inc | 22,295 | ||||
4,780 | * | Thermo Electron Corp | 266,389 | ||||
616 | e* | Thoratec Corp | 10,712 | ||||
144 | * | Trans1, Inc | 2,170 | ||||
1,381 | e* | Trimble Navigation Ltd | 49,302 | ||||
379 | * | Varian, Inc | 19,352 | ||||
362 | e* | Veeco Instruments, Inc | 5,821 | ||||
200 | * | Vital Images, Inc | 2,488 | ||||
119 | e | Vital Signs, Inc | 6,757 | ||||
623 | e* | Vivus, Inc | 4,162 | ||||
146 | * | Vnus Medical Technologies, Inc | 2,921 | ||||
75
TIAA-CREF LIFE FUNDS - Stock Index Fund
SHARES | COMPANY | VALUE | |||||
541 | * | Volcano Corp | $ | 6,600 | |||
1,139 | * | Waters Corp | 73,466 | ||||
391 | e* | Wright Medical Group, Inc | 11,108 | ||||
10,279 | Xerox Corp | 139,383 | |||||
2,667 | * | Zimmer Holdings, Inc | 181,489 | ||||
200 | e* | Zoll Medical Corp | 6,734 | ||||
198 | * | Zygo Corp | 1,946 | ||||
TOTAL INSTRUMENTS AND RELATED PRODUCTS | 7,980,030 | ||||||
INSURANCE AGENTS, BROKERS AND SERVICE - 0.42% | |||||||
3,388 | AON Corp | 155,645 | |||||
1,316 | Brown & Brown, Inc | 22,885 | |||||
245 | e* | Crawford & Co (Class B) | 1,958 | ||||
1,275 | e | Gallagher (Arthur J.) & Co | 30,728 | ||||
3,595 | Hartford Financial Services Group, Inc | 232,129 | |||||
394 | Hilb Rogal & Hobbs Co | 17,123 | |||||
5,926 | Marsh & McLennan Cos, Inc | 157,335 | |||||
378 | e | National Financial Partners Corp | 7,492 | ||||
271 | e* | United America Indemnity Ltd (Class A) | 3,623 | ||||
100 | White Mountains Insurance Group Ltd | 42,900 | |||||
TOTAL INSURANCE AGENTS, BROKERS AND SERVICE | 671,818 | ||||||
INSURANCE CARRIERS - 3.50% | |||||||
3,726 | * | ACE Ltd | 205,265 | ||||
5,527 | Aetna, Inc | 224,009 | |||||
5,437 | Aflac, Inc | 341,444 | |||||
61 | e* | Alleghany Corp | 20,255 | ||||
555 | Allied World Assurance Holdings Ltd | 21,989 | |||||
6,265 | Allstate Corp | 285,621 | |||||
3,286 | e | Ambac Financial Group, Inc | 4,403 | ||||
629 | e | American Equity Investment Life Holding Co | 5,126 | ||||
928 | American Financial Group, Inc | 24,824 | |||||
25,995 | American International Group, Inc | 687,828 | |||||
167 | American National Insurance Co | 16,369 | |||||
130 | American Physicians Capital, Inc | 6,297 | |||||
118 | * | American Safety Insurance Holdings Ltd | 1,697 | ||||
606 | * | AMERIGROUP Corp | 12,605 | ||||
202 | * | Amerisafe, Inc | 3,220 | ||||
398 | e | Amtrust Financial Services, Inc | 5,015 | ||||
557 | * | Arch Capital Group Ltd | 36,940 | ||||
322 | * | Argo Group International Holdings Ltd | 10,806 | ||||
961 | Aspen Insurance Holdings Ltd | 22,747 | |||||
1,325 | Assurant, Inc | 87,397 | |||||
742 | e | Assured Guaranty Ltd | 13,349 | ||||
1,691 | Axis Capital Holdings Ltd | 50,409 | |||||
125 | e | Baldwin & Lyons, Inc (Class B) | 2,185 | ||||
377 | Castlepoint Holdings Ltd | 3,427 | |||||
444 | * | Centene Corp | 7,455 | ||||
4,157 | Chubb Corp | 203,735 | |||||
1,660 | e | Cincinnati Financial Corp | 42,164 | ||||
387 | e* | Citizens, Inc | 2,372 | ||||
303 | e | CNA Financial Corp | 7,620 | ||||
100 | * | CNA Surety Corp | 1,264 | ||||
2,054 | * | Conseco, Inc | 20,376 | ||||
89 | * | Darwin Professional Underwriters, Inc | 2,741 | ||||
476 | e | Delphi Financial Group, Inc (Class A) | 11,015 | ||||
143 | e | Donegal Group, Inc (Class A) | 2,269 | ||||
76
TIAA-CREF LIFE FUNDS - Stock Index Fund
SHARES | COMPANY | VALUE | |||||
620 | Employers Holdings, Inc | $ | 12,834 | ||||
641 | e | Endurance Specialty Holdings Ltd | 19,736 | ||||
76 | e* | Enstar Group Ltd | 6,650 | ||||
363 | e | Erie Indemnity Co (Class A) | 16,752 | ||||
704 | Everest Re Group Ltd | 56,116 | |||||
155 | FBL Financial Group, Inc (Class A) | 3,081 | |||||
2,428 | e | Fidelity National Title Group, Inc (Class A) | 30,593 | ||||
180 | e* | First Acceptance Corp | 576 | ||||
1,057 | e | First American Corp | 27,905 | ||||
136 | e* | First Mercury Financial Corp | 2,399 | ||||
346 | Flagstone Reinsurance Holdings Ltd | 4,079 | |||||
210 | e* | Fpic Insurance Group, Inc | 9,517 | ||||
4,970 | Genworth Financial, Inc (Class A) | 88,516 | |||||
327 | * | Greenlight Capital Re Ltd (Class A) | 7,475 | ||||
600 | Hanover Insurance Group, Inc | 25,500 | |||||
206 | Harleysville Group, Inc | 6,969 | |||||
1,378 | HCC Insurance Holdings, Inc | 29,131 | |||||
1,227 | * | Health Net, Inc | 29,522 | ||||
398 | * | HealthExtras, Inc | 11,996 | ||||
521 | * | Healthspring, Inc | 8,794 | ||||
467 | Horace Mann Educators Corp | 6,547 | |||||
1,894 | * | Humana, Inc | 75,324 | ||||
205 | e | Infinity Property & Casualty Corp | 8,512 | ||||
647 | IPC Holdings Ltd | 17,178 | |||||
77 | Kansas City Life Insurance Co | 3,215 | |||||
200 | e | LandAmerica Financial Group, Inc | 4,438 | ||||
1,882 | e | Leucadia National Corp | 88,341 | ||||
2,903 | Lincoln National Corp | 131,564 | |||||
3,572 | e | Loews Corp | 167,527 | ||||
553 | Maiden Holdings Ltd | 3,539 | |||||
116 | * | Markel Corp | 42,572 | ||||
662 | e | Max Re Capital Ltd | 14,120 | ||||
2,532 | e | MBIA, Inc | 11,115 | ||||
288 | e | Meadowbrook Insurance Group, Inc | 1,526 | ||||
303 | e | Mercury General Corp | 14,156 | ||||
5,141 | Metlife, Inc | 271,291 | |||||
1,399 | e | MGIC Investment Corp | 8,548 | ||||
110 | * | Molina Healthcare, Inc | 2,677 | ||||
1,226 | e | Montpelier Re Holdings Ltd | 18,084 | ||||
173 | e | National Interstate Corp | 3,180 | ||||
19 | e | National Western Life Insurance Co (Class A) | 4,152 | ||||
590 | e | Nationwide Financial Services, Inc (Class A) | 28,326 | ||||
149 | * | Navigators Group, Inc | 8,053 | ||||
65 | e | NYMAGIC, Inc | 1,245 | ||||
311 | e | Odyssey Re Holdings Corp | 11,041 | ||||
2,437 | e | Old Republic International Corp | 28,854 | ||||
313 | e | OneBeacon Insurance Group Ltd | 5,499 | ||||
619 | e | PartnerRe Ltd | 42,791 | ||||
609 | * | Philadelphia Consolidated Holding Co | 20,688 | ||||
1,122 | e | Phoenix Cos, Inc | 8,538 | ||||
654 | Platinum Underwriters Holdings Ltd | 21,327 | |||||
400 | * | PMA Capital Corp (Class A) | 3,684 | ||||
973 | e | PMI Group, Inc | 1,897 | ||||
200 | e | Presidential Life Corp | 3,084 | ||||
499 | e* | Primus Guaranty Ltd | 1,452 | ||||
2,944 | e | Principal Financial Group | 123,560 | ||||
338 | * | ProAssurance Corp | 16,261 | ||||
77
TIAA-CREF LIFE FUNDS - Stock Index Fund
SHARES | COMPANY | VALUE | |||||
152 | Procentury Corp | $ | 2,408 | ||||
7,712 | Progressive Corp | 144,369 | |||||
887 | Protective Life Corp | 33,750 | |||||
4,937 | Prudential Financial, Inc | 294,936 | |||||
794 | Quanta Capital Holdings Ltd | 2,096 | |||||
910 | Radian Group, Inc | 1,320 | |||||
310 | e | Reinsurance Group Of America, Inc | 13,491 | ||||
735 | RenaissanceRe Holdings Ltd | 32,832 | |||||
200 | e | RLI Corp | 9,894 | ||||
1,023 | Safeco Corp | 68,705 | |||||
200 | e | Safety Insurance Group, Inc | 7,130 | ||||
100 | * | SCPIE Holdings Inc | 2,799 | ||||
169 | * | SeaBright Insurance Holdings, Inc | 2,447 | ||||
656 | Selective Insurance Group, Inc | 12,307 | |||||
628 | Stancorp Financial Group, Inc | 29,491 | |||||
200 | e | State Auto Financial Corp | 4,786 | ||||
200 | e | Stewart Information Services Corp | 3,868 | ||||
1,044 | Torchmark Corp | 61,231 | |||||
176 | Tower Group, Inc | 3,729 | |||||
334 | Transatlantic Holdings, Inc | 18,861 | |||||
6,882 | Travelers Cos, Inc | 298,679 | |||||
130 | e* | Triple-S Management Corp (Class B) | 2,126 | ||||
234 | e | United Fire & Casualty Co | 6,302 | ||||
13,978 | UnitedHealth Group, Inc | 366,923 | |||||
500 | e | Unitrin, Inc | 13,785 | ||||
417 | e* | Universal American Financial Corp | 4,262 | ||||
3,938 | UnumProvident Corp | 80,532 | |||||
462 | e | Validus Holdings Ltd | 9,818 | ||||
1,629 | W.R. Berkley Corp | 39,357 | |||||
481 | * | WellCare Health Plans, Inc | 17,388 | ||||
15 | Wesco Financial Corp | 5,730 | |||||
2,037 | XL Capital Ltd (Class A) | 41,881 | |||||
401 | Zenith National Insurance Corp | 14,099 | |||||
TOTAL INSURANCE CARRIERS | 5,667,617 | ||||||
JUSTICE, PUBLIC ORDER AND SAFETY - 0.01% | |||||||
560 | e* | Geo Group, Inc | 12,600 | ||||
TOTAL JUSTICE, PUBLIC ORDER AND SAFETY | 12,600 | ||||||
LEATHER AND LEATHER PRODUCTS - 0.10% | |||||||
3,885 | * | Coach, Inc | 112,199 | ||||
960 | e* | CROCS, Inc | 7,690 | ||||
344 | e* | Genesco, Inc | 10,619 | ||||
643 | e* | Iconix Brand Group, Inc | 7,767 | ||||
150 | * | Steven Madden Ltd | 2,757 | ||||
558 | e* | Timberland Co (Class A) | 9,123 | ||||
60 | e | Weyco Group, Inc | 1,592 | ||||
600 | e | Wolverine World Wide, Inc | 16,002 | ||||
TOTAL LEATHER AND LEATHER PRODUCTS | 167,749 | ||||||
LEGAL SERVICES - 0.03% | |||||||
542 | e* | FTI Consulting, Inc | 37,105 | ||||
154 | e* | Pre-Paid Legal Services, Inc | 6,255 | ||||
TOTAL LEGAL SERVICES | 43,360 | ||||||
LOCAL AND INTERURBAN PASSENGER TRANSIT - 0.00%** | |||||||
101 | e* | Emergency Medical Services Corp (Class A) | 2,286 | ||||
78
TIAA-CREF LIFE FUNDS - Stock Index Fund
SHARES | COMPANY | VALUE | |||||
TOTAL LOCAL AND INTERURBAN PASSENGER TRANSIT | $ | 2,286 | |||||
LUMBER AND WOOD PRODUCTS - 0.02% | |||||||
80 | e | American Woodmark Corp | 1,690 | ||||
1,056 | e* | Champion Enterprises, Inc | 6,178 | ||||
100 | e | Deltic Timber Corp | 5,351 | ||||
1,157 | e | Louisiana-Pacific Corp | 9,823 | ||||
100 | e | Skyline Corp | 2,350 | ||||
200 | e | Universal Forest Products, Inc | 5,992 | ||||
TOTAL LUMBER AND WOOD PRODUCTS | 31,384 | ||||||
METAL MINING - 0.72% | |||||||
502 | * | Allied Nevada Gold Corp | 2,957 | ||||
627 | e* | Apex Silver Mines Ltd | 3,079 | ||||
1,040 | Cleveland-Cliffs, Inc | 123,958 | |||||
6,278 | e* | Coeur d’Alene Mines Corp | 18,206 | ||||
496 | Foundation Coal Holdings, Inc | 43,936 | |||||
4,352 | Freeport-McMoRan Copper & Gold, Inc (Class B) | 510,011 | |||||
1,552 | e* | Hecla Mining Co | 14,372 | ||||
4,945 | e | Newmont Mining Corp | 257,931 | ||||
303 | e* | Patriot Coal Corp | 46,447 | ||||
607 | * | Rosetta Resources, Inc | 17,300 | ||||
384 | Royal Gold, Inc | 12,042 | |||||
690 | e* | ShengdaTech, Inc | 6,852 | ||||
839 | e | Southern Copper Corp | 89,463 | ||||
656 | e* | Stillwater Mining Co | 7,760 | ||||
1,250 | e* | Uranium Resources, Inc | 4,613 | ||||
TOTAL METAL MINING | 1,158,927 | ||||||
MISCELLANEOUS MANUFACTURING INDUSTRIES - 0.32% | |||||||
213 | e | Armstrong World Industries, Inc | 6,224 | ||||
300 | e | Blyth, Inc | 3,609 | ||||
806 | e | Callaway Golf Co | 9,535 | ||||
423 | e | Daktronics, Inc | 8,532 | ||||
1,752 | Fortune Brands, Inc | 109,342 | |||||
1,404 | e | Hasbro, Inc | 50,151 | ||||
392 | * | Intrepid Potash, Inc | 25,786 | ||||
311 | e* | Jakks Pacific, Inc | 6,795 | ||||
4,122 | Mattel, Inc | 70,569 | |||||
275 | e | Nautilus, Inc | 1,397 | ||||
191 | * | RC2 Corp | 3,545 | ||||
100 | * | Russ Berrie & Co, Inc | 797 | ||||
393 | e* | Shuffle Master, Inc | 1,941 | ||||
100 | e* | Steinway Musical Instruments, Inc | 2,640 | ||||
5,488 | e | Tyco International Ltd | 219,740 | ||||
TOTAL MISCELLANEOUS MANUFACTURING INDUSTRIES | 520,603 | ||||||
MISCELLANEOUS RETAIL - 1.27% | |||||||
198 | * | 1-800-FLOWERS.COM, Inc (Class A) | 1,277 | ||||
3,582 | * | Amazon.com, Inc | 262,668 | ||||
409 | e | Barnes & Noble, Inc | 10,160 | ||||
3,801 | Best Buy Co, Inc | 150,520 | |||||
334 | e | Big 5 Sporting Goods Corp | 2,528 | ||||
158 | e* | Blue Nile, Inc | 6,718 | ||||
792 | e | Borders Group, Inc | 4,752 | ||||
200 | e* | Build-A-Bear Workshop, Inc | 1,454 | ||||
585 | e* | Cabela’s, Inc | 6,441 | ||||
79
TIAA-CREF LIFE FUNDS - Stock Index Fund
SHARES | COMPANY | VALUE | |||||
400 | Cash America International, Inc | $ | 12,400 | ||||
558 | e* | CKX, Inc | 4,883 | ||||
657 | e* | Coldwater Creek, Inc | 3,469 | ||||
16,263 | CVS Corp | 643,527 | |||||
886 | e* | Dick’s Sporting Goods, Inc | 15,718 | ||||
1,067 | * | Dollar Tree, Inc | 34,880 | ||||
969 | * | Drugstore.Com | 1,841 | ||||
393 | * | Ezcorp, Inc (Class A) | 5,011 | ||||
324 | e* | GSI Commerce, Inc | 4,416 | ||||
373 | e* | Hibbett Sports, Inc | 7,870 | ||||
359 | Longs Drug Stores Corp | 15,117 | |||||
497 | MSC Industrial Direct Co (Class A) | 21,923 | |||||
473 | e | Nutri/System, Inc | 6,688 | ||||
3,008 | * | Office Depot, Inc | 32,908 | ||||
769 | e | OfficeMax, Inc | 10,689 | ||||
176 | e* | Overstock.com, Inc | 4,567 | ||||
1,486 | e | Petsmart, Inc | 29,646 | ||||
422 | e* | Priceline.com, Inc | 48,724 | ||||
145 | e | Pricesmart, Inc | 2,868 | ||||
6,114 | e* | Rite Aid Corp | 9,721 | ||||
671 | e* | Sears Holdings Corp | 49,426 | ||||
160 | e* | Shutterfly, Inc | 1,954 | ||||
192 | e* | Stamps.com, Inc | 2,396 | ||||
7,990 | Staples, Inc | 189,763 | |||||
220 | e | Systemax, Inc | 3,883 | ||||
1,436 | e | Tiffany & Co | 58,517 | ||||
11,268 | Walgreen Co | 366,323 | |||||
362 | World Fuel Services Corp | 7,942 | |||||
490 | e* | Zale Corp | 9,256 | ||||
155 | * | Zumiez, Inc | 2,570 | ||||
TOTAL MISCELLANEOUS RETAIL | 2,055,414 | ||||||
MOTION PICTURES - 0.93% | |||||||
466 | e* | Avid Technology, Inc | 7,917 | ||||
1,979 | e* | Blockbuster, Inc (Class A) | 4,948 | ||||
6,711 | CBS Corp (Class B) | 130,797 | |||||
306 | e | Cinemark Holdings, Inc | 3,996 | ||||
3,197 | * | Discovery Holding Co (Class A) | 70,206 | ||||
909 | * | DreamWorks Animation SKG, Inc (Class A) | 27,097 | ||||
171 | e* | Gaiam, Inc (Class A) | 2,310 | ||||
850 | e* | Macrovision Solutions Corp | 12,716 | ||||
460 | National CineMedia, Inc | 4,904 | |||||
26,348 | News Corp (Class A) | 396,274 | |||||
912 | e | Regal Entertainment Group (Class A) | 13,935 | ||||
40,711 | Time Warner, Inc | 602,523 | |||||
1,640 | e* | tw telecom inc | 26,289 | ||||
6,426 | * | Viacom, Inc (Class B) | 196,250 | ||||
TOTAL MOTION PICTURES | 1,500,162 | ||||||
NONDEPOSITORY INSTITUTIONS - 0.93% | |||||||
700 | e | Advance America Cash Advance Centers, Inc | 3,556 | ||||
403 | e | Advanta Corp (Class B) | 2,535 | ||||
2,310 | American Capital Ltd | 54,909 | |||||
11,453 | American Express Co | 431,435 | |||||
1,288 | e* | AmeriCredit Corp | 11,103 | ||||
1,297 | e | Ares Capital Corp | 13,074 | ||||
400 | e* | Boise, Inc | 1,540 | ||||
80
TIAA-CREF LIFE FUNDS - Stock Index Fund
SHARES | COMPANY | VALUE | |||||
4,267 | e | Capital One Financial Corp | $ | 162,189 | |||
1,828 | e | CapitalSource, Inc | 20,254 | ||||
370 | e | Chimera Investment Corp | 3,334 | ||||
3,188 | e | CIT Group, Inc | 21,710 | ||||
218 | e* | CompuCredit Corp | 1,308 | ||||
6,651 | Countrywide Financial Corp | 28,267 | |||||
103 | e* | Credit Acceptance Corp | 2,633 | ||||
5,495 | e | Discover Financial Services | 72,369 | ||||
12,111 | e* | Fannie Mae | 236,286 | ||||
160 | e | Federal Agricultural Mortgage Corp (Class C) | 3,965 | ||||
274 | e | Financial Federal Corp | 6,017 | ||||
250 | e* | First Cash Financial Services, Inc | 3,748 | ||||
641 | e | First Marblehead Corp | 1,647 | ||||
7,508 | e | Freddie Mac | 123,131 | ||||
1,040 | e | GLG Partners, Inc | 8,112 | ||||
386 | e* | Guaranty Financial Group, Inc | 2,073 | ||||
255 | e | Hercules Technology Growth Capital, Inc | 2,277 | ||||
187 | Kohlberg Capital Corp | 1,870 | |||||
778 | e | MCG Capital Corp | 3,096 | ||||
289 | e* | Mercadolibre, Inc | 9,968 | ||||
115 | * | Mitcham Industries, Inc | 1,964 | ||||
200 | e | Nelnet, Inc (Class A) | 2,246 | ||||
300 | e | NGP Capital Resources Co | 4,623 | ||||
300 | e* | Ocwen Financial Corp | 1,395 | ||||
199 | e | Patriot Capital Funding, Inc | 1,244 | ||||
544 | * | PHH Corp | 8,350 | ||||
5,310 | * | SLM Corp | 102,749 | ||||
42 | e | Student Loan Corp | 4,119 | ||||
2,838 | Textron, Inc | 136,025 | |||||
838 | e* | thinkorswim Group, Inc | 5,908 | ||||
40 | e | TICC Capital Corp | 218 | ||||
199 | e* | World Acceptance Corp | 6,700 | ||||
TOTAL NONDEPOSITORY INSTITUTIONS | 1,507,947 | ||||||
NONMETALLIC MINERALS, EXCEPT FUELS - 0.07% | |||||||
292 | e | AMCOL International Corp | 8,310 | ||||
350 | Compass Minerals International, Inc | 28,196 | |||||
1,260 | e* | General Moly, Inc | 9,916 | ||||
1,107 | e | Vulcan Materials Co | 66,176 | ||||
TOTAL NONMETALLIC MINERALS, EXCEPT FUELS | 112,598 | ||||||
OIL AND GAS EXTRACTION - 5.31% | |||||||
468 | * | Abraxas Petroleum Corp | 2,532 | ||||
5,283 | Anadarko Petroleum Corp | 395,380 | |||||
280 | e | APCO Argentina, Inc | 8,106 | ||||
104 | * | Approach Resources, Inc | 2,786 | ||||
399 | * | Arena Resources, Inc | 21,075 | ||||
508 | Atlas America, Inc | 22,908 | |||||
314 | * | ATP Oil & Gas Corp | 12,394 | ||||
282 | * | Atwood Oceanics, Inc | 35,064 | ||||
3,504 | Baker Hughes, Inc | 306,039 | |||||
448 | * | Basic Energy Services, Inc | 14,112 | ||||
487 | e | Berry Petroleum Co (Class A) | 28,675 | ||||
417 | * | Bill Barrett Corp | 24,774 | ||||
3,343 | BJ Services Co | 106,775 | |||||
426 | * | BMB Munai, Inc | 2,530 | ||||
184 | * | Bois d’Arc Energy, Inc | 4,473 | ||||
81
TIAA-CREF LIFE FUNDS - Stock Index Fund
SHARES | COMPANY | VALUE | |||||
523 | e* | Brigham Exploration Co | $ | 8,279 | |||
610 | e* | Bronco Drilling Co, Inc | 11,212 | ||||
630 | e* | Cal Dive International, Inc | 9,003 | ||||
230 | e* | Callon Petroleum Co | 6,293 | ||||
2,408 | * | Cameron International Corp | 133,283 | ||||
433 | * | Cano Petroleum, Inc | 3,438 | ||||
312 | e* | Carrizo Oil & Gas, Inc | 21,244 | ||||
599 | e* | Cheniere Energy, Inc | 2,618 | ||||
6,148 | e | Chesapeake Energy Corp | 405,522 | ||||
900 | Cimarex Energy Co | 62,703 | |||||
90 | e* | Clayton Williams Energy, Inc | 9,896 | ||||
303 | * | CNX Gas Corp | 12,738 | ||||
548 | * | Complete Production Services, Inc | 19,958 | ||||
469 | * | Comstock Resources, Inc | 39,598 | ||||
567 | * | Concho Resources, Inc | 21,149 | ||||
145 | e* | Contango Oil & Gas Co | 13,473 | ||||
340 | e* | Continental Resources, Inc | 23,569 | ||||
80 | * | Dawson Geophysical Co | 4,757 | ||||
892 | e* | Delta Petroleum Corp | 22,764 | ||||
2,753 | * | Denbury Resources, Inc | 100,485 | ||||
783 | e | Diamond Offshore Drilling, Inc | 108,947 | ||||
93 | * | Double Eagle Petroleum Co | 1,695 | ||||
591 | * | Encore Acquisition Co | 44,437 | ||||
1,293 | * | Endeavour International Corp | 2,806 | ||||
453 | * | Energy Partners Ltd | 6,759 | ||||
802 | * | Energy XXI Bermuda Ltd | 5,550 | ||||
1,653 | ENSCO International, Inc | 133,463 | |||||
1,410 | Equitable Resources, Inc | 97,375 | |||||
849 | e* | EXCO Resources, Inc | 31,337 | ||||
747 | e* | Exterran Holdings, Inc | 53,403 | ||||
893 | e* | Forest Oil Corp | 66,529 | ||||
386 | e* | FX Energy, Inc | 2,034 | ||||
1,074 | * | Gasco Energy, Inc | 4,457 | ||||
1,000 | e* | GeoGlobal Resources, Inc | 2,130 | ||||
207 | * | Geomet, Inc | 1,962 | ||||
1,315 | * | Global Industries Ltd | 23,578 | ||||
267 | e* | GMX Resources, Inc | 19,785 | ||||
321 | e* | Goodrich Petroleum Corp | 26,617 | ||||
2,200 | e* | Grey Wolf, Inc | 19,866 | ||||
520 | * | Gulfport Energy Corp | 8,564 | ||||
10,042 | Halliburton Co | 532,929 | |||||
318 | e* | Harvest Natural Resources, Inc | 3,517 | ||||
1,044 | e* | Helix Energy Solutions Group, Inc | 43,472 | ||||
1,188 | Helmerich & Payne, Inc | 85,560 | |||||
1,011 | * | Hercules Offshore, Inc | 38,438 | ||||
1,423 | * | Key Energy Services, Inc | 27,635 | ||||
1,000 | e* | Mariner Energy, Inc | 36,970 | ||||
594 | e* | McMoRan Exploration Co | 16,347 | ||||
910 | * | Meridian Resource Corp | 2,685 | ||||
3,234 | e* | Nabors Industries Ltd | 159,210 | ||||
4,724 | * | National Oilwell Varco, Inc | 419,113 | ||||
1,000 | e* | Newpark Resources, Inc | 7,860 | ||||
3,030 | Noble Corp | 196,829 | |||||
226 | * | Northern Oil And Gas, Inc | 3,001 | ||||
597 | * | Oceaneering International, Inc | 45,999 | ||||
2,675 | e* | Oilsands Quest, Inc | 17,388 | ||||
85 | Panhandle Oil and Gas, Inc | 2,878 | |||||
82
TIAA-CREF LIFE FUNDS - Stock Index Fund
SHARES | COMPANY | VALUE | |||||
522 | * | Parallel Petroleum Corp | $ | 10,508 | |||
1,200 | e* | Parker Drilling Co | 12,012 | ||||
1,800 | e | Patterson-UTI Energy, Inc | 64,872 | ||||
440 | Penn Virginia Corp | 33,185 | |||||
2,358 | * | PetroHawk Energy Corp | 109,199 | ||||
165 | * | Petroleum Development Corp | 10,971 | ||||
435 | e* | Petroquest Energy, Inc | 11,702 | ||||
568 | e* | Pioneer Drilling Co | 10,684 | ||||
1,352 | e | Pioneer Natural Resources Co | 105,835 | ||||
1,223 | * | Plains Exploration & Production Co | 89,242 | ||||
1,930 | * | Pride International, Inc | 91,270 | ||||
222 | * | Quest Resource Corp | 2,533 | ||||
1,098 | e* | Quicksilver Resources, Inc | 42,427 | ||||
421 | * | RAM Energy Resources, Inc | 2,652 | ||||
1,730 | Range Resources Corp | 113,384 | |||||
188 | * | Rex Energy Corp | 4,963 | ||||
1,280 | e | Rowan Cos, Inc | 59,840 | ||||
337 | e | RPC, Inc | 5,662 | ||||
13,575 | Schlumberger Ltd | 1,458,362 | |||||
234 | e* | SEACOR Holdings, Inc | 20,945 | ||||
2,282 | e | Smith International, Inc | 189,725 | ||||
3,892 | * | Southwestern Energy Co | 185,298 | ||||
699 | e | St. Mary Land & Exploration Co | 45,183 | ||||
323 | * | Stone Energy Corp | 21,289 | ||||
1,233 | e* | Sulphco, Inc | 2,799 | ||||
868 | * | Superior Energy Services | 47,862 | ||||
174 | e* | Superior Well Services, Inc | 5,518 | ||||
327 | e* | Swift Energy Co | 21,602 | ||||
810 | * | Tetra Technologies, Inc | 19,205 | ||||
617 | Tidewater, Inc | 40,124 | |||||
248 | e* | Toreador Resources Corp | 2,115 | ||||
3,616 | Transocean, Inc | 551,042 | |||||
127 | e* | Trico Marine Services, Inc | 4,625 | ||||
264 | * | Tri-Valley Corp | 1,962 | ||||
311 | e* | TXCO Resources, Inc | 3,657 | ||||
300 | * | Union Drilling, Inc | 6,504 | ||||
520 | * | Unit Corp | 43,144 | ||||
621 | e* | Vaalco Energy, Inc | 5,260 | ||||
231 | * | Venoco, Inc | 5,362 | ||||
289 | e | W&T Offshore, Inc | 16,909 | ||||
580 | * | Warren Resources, Inc | 8,514 | ||||
7,731 | * | Weatherford International Ltd | 383,380 | ||||
347 | * | W-H Energy Services, Inc | 33,222 | ||||
444 | * | Whiting Petroleum Corp | 47,100 | ||||
442 | * | Willbros Group, Inc | 19,364 | ||||
5,826 | XTO Energy, Inc | 399,139 | |||||
TOTAL OIL AND GAS EXTRACTION | 8,590,882 | ||||||
PAPER AND ALLIED PRODUCTS - 0.41% | |||||||
607 | e | AbitibiBowater, Inc | 5,663 | ||||
1,131 | e | Bemis Co | 25,357 | ||||
600 | * | Buckeye Technologies, Inc | 5,076 | ||||
676 | * | Cenveo, Inc | 6,605 | ||||
5,529 | * | Domtar Corporation | 30,133 | ||||
397 | e | Glatfelter | 5,363 | ||||
1,659 | e* | Graphic Packaging Holding Co | 3,351 | ||||
378 | e | Greif, Inc (Class A) | 24,203 | ||||
83
TIAA-CREF LIFE FUNDS - Stock Index Fund
SHARES | COMPANY | VALUE | |||||
4,965 | e | International Paper Co | $ | 115,685 | |||
4,762 | Kimberly-Clark Corp | 284,672 | |||||
1,977 | e | MeadWestvaco Corp | 47,132 | ||||
500 | e* | Mercer International, Inc | 3,740 | ||||
162 | e | Neenah Paper, Inc | 2,707 | ||||
1,183 | Packaging Corp of America | 25,446 | |||||
390 | Rock-Tenn Co (Class A) | 11,696 | |||||
136 | e | �� | Schweitzer-Mauduit International, Inc | 2,292 | |||
2,686 | e* | Smurfit-Stone Container Corp | 10,932 | ||||
1,093 | Sonoco Products Co | 33,828 | |||||
1,158 | e | Temple-Inland, Inc | 13,051 | ||||
334 | e | Wausau Paper Corp | 2,575 | ||||
TOTAL PAPER AND ALLIED PRODUCTS | 659,507 | ||||||
PERSONAL SERVICES - 0.14% | |||||||
83 | Angelica Corp | 1,765 | |||||
1,502 | Cintas Corp | 39,818 | |||||
300 | e* | Coinstar, Inc | 9,813 | ||||
387 | e | G & K Services, Inc (Class A) | 11,788 | ||||
3,704 | H&R Block, Inc | 79,266 | |||||
300 | e | Jackson Hewitt Tax Service, Inc | 3,666 | ||||
542 | Regis Corp | 14,282 | |||||
887 | e* | Sally Beauty Holdings, Inc | 5,730 | ||||
2,964 | e | Service Corp International | 29,225 | ||||
185 | e* | Steiner Leisure Ltd | 5,245 | ||||
155 | Unifirst Corp | 6,922 | |||||
389 | Weight Watchers International, Inc | 13,852 | |||||
TOTAL PERSONAL SERVICES | 221,372 | ||||||
PETROLEUM AND COAL PRODUCTS - 8.39% | |||||||
142 | e | Alon USA Energy, Inc | 1,698 | ||||
419 | * | American Oil & Gas, Inc | 1,642 | ||||
3,796 | Apache Corp | 527,644 | |||||
717 | Ashland, Inc | 34,559 | |||||
1,079 | Cabot Oil & Gas Corp | 73,081 | |||||
23,556 | Chevron Corp | 2,335,106 | |||||
17,552 | ConocoPhillips | 1,656,733 | |||||
220 | * | CVR Energy, Inc | 4,235 | ||||
69 | Delek US Holdings, Inc | 635 | |||||
5,077 | Devon Energy Corp | 610,052 | |||||
2,836 | EOG Resources, Inc | 372,083 | |||||
60,361 | Exxon Mobil Corp | 5,319,615 | |||||
1,200 | Frontier Oil Corp | 28,692 | |||||
1,080 | * | Gran Tierra Energy, Inc | 8,608 | ||||
474 | e* | Headwaters, Inc | 5,579 | ||||
3,200 | Hess Corp | 403,808 | |||||
524 | e | Holly Corp | 19,346 | ||||
8,074 | Marathon Oil Corp | 418,798 | |||||
2,129 | Murphy Oil Corp | 208,748 | |||||
1,511 | * | Newfield Exploration Co | 98,593 | ||||
1,850 | Noble Energy, Inc | 186,036 | |||||
9,474 | Occidental Petroleum Corp | 851,334 | |||||
116 | Quaker Chemical Corp | 3,093 | |||||
840 | e* | SandRidge Energy, Inc | 54,247 | ||||
1,331 | e | Sunoco, Inc | 54,158 | ||||
1,494 | e | Tesoro Corp | 29,536 | ||||
6,013 | Valero Energy Corp | 247,615 | |||||
84
TIAA-CREF LIFE FUNDS - Stock Index Fund
SHARES | COMPANY | VALUE | |||||
174 | e | WD-40 Co | $ | 5,090 | |||
283 | e | Western Refining, Inc | 3,351 | ||||
TOTAL PETROLEUM AND COAL PRODUCTS | 13,563,715 | ||||||
PIPELINES, EXCEPT NATURAL GAS - 0.13% | |||||||
7,170 | Spectra Energy Corp | 206,066 | |||||
TOTAL PIPELINES, EXCEPT NATURAL GAS | 206,066 | ||||||
PRIMARY METAL INDUSTRIES - 1.24% | |||||||
1,349 | AK Steel Holding Corp | 93,081 | |||||
9,231 | Alcoa, Inc | 328,808 | |||||
1,122 | e | Allegheny Technologies, Inc | 66,512 | ||||
500 | e | Belden CDT, Inc | 16,940 | ||||
300 | e* | Brush Engineered Materials, Inc | 7,326 | ||||
574 | Carpenter Technology Corp | 25,055 | |||||
376 | e* | Century Aluminum Co | 25,000 | ||||
514 | e* | Coleman Cable, Inc | 5,304 | ||||
794 | e* | CommScope, Inc | 41,899 | ||||
17,851 | Corning, Inc | 411,466 | |||||
255 | e | Encore Wire Corp | 5,403 | ||||
533 | e* | Esmark, Inc | 10,191 | ||||
161 | * | Fushi Copperweld, Inc | 3,821 | ||||
571 | e* | General Cable Corp | 34,745 | ||||
250 | e | Gibraltar Industries, Inc | 3,993 | ||||
128 | e* | Haynes International, Inc | 7,366 | ||||
391 | * | Horsehead Holding Corp | 4,755 | ||||
649 | e | Hubbell, Inc (Class B) | 25,876 | ||||
111 | * | LB Foster Co (Class A) | 3,685 | ||||
337 | e | Matthews International Corp (Class A) | 15,253 | ||||
277 | * | Metalico, Inc | 4,853 | ||||
372 | Mueller Industries, Inc | 11,978 | |||||
96 | e* | Northwest Pipe Co | 5,357 | ||||
3,570 | Nucor Corp | 266,572 | |||||
89 | e | Olympic Steel, Inc | 6,757 | ||||
1,555 | Precision Castparts Corp | 149,855 | |||||
240 | * | RTI International Metals, Inc | 8,549 | ||||
246 | e | Schnitzer Steel Industries, Inc (Class A) | 28,192 | ||||
1,908 | e | Steel Dynamics, Inc | 74,546 | ||||
226 | * | Superior Essex, Inc | 10,086 | ||||
298 | e | Texas Industries, Inc | 16,727 | ||||
973 | e | Titanium Metals Corp | 13,612 | ||||
314 | e | Tredegar Corp | 4,616 | ||||
1,348 | United States Steel Corp | 249,083 | |||||
72 | e* | Universal Stainless & Alloy | 2,667 | ||||
735 | e | Worthington Industries, Inc | 15,068 | ||||
TOTAL PRIMARY METAL INDUSTRIES | 2,004,997 | ||||||
PRINTING AND PUBLISHING - 0.37% | |||||||
594 | e* | ACCO Brands Corp | 6,671 | ||||
189 | e | AH Belo Corp (Class A) | 1,077 | ||||
600 | American Greetings Corp (Class A) | 7,404 | |||||
946 | Belo (A.H.) Corp (Class A) | 6,915 | |||||
300 | Bowne & Co, Inc | 3,825 | |||||
100 | * | Consolidated Graphics, Inc | 4,927 | ||||
73 | e | Courier Corp | 1,466 | ||||
46 | e | CSS Industries, Inc | 1,114 | ||||
245 | * | Dolan Media Co | 4,459 | ||||
85
TIAA-CREF LIFE FUNDS - Stock Index Fund
SHARES | COMPANY | VALUE | |||||
635 | Dun & Bradstreet Corp | $ | 55,651 | ||||
269 | Ennis, Inc | 4,210 | |||||
1,065 | e* | EW Scripps Co (Class A) | 44,240 | ||||
2,605 | e | Gannett Co, Inc | 56,450 | ||||
165 | e | GateHouse Media, Inc | 406 | ||||
700 | e | Harte-Hanks, Inc | 8,015 | ||||
531 | e | John Wiley & Sons, Inc (Class A) | 23,911 | ||||
474 | e | Journal Communications, Inc (Class A) | 2,285 | ||||
478 | e | Lee Enterprises, Inc | 1,907 | ||||
239 | e* | Martha Stewart Living Omnimedia, Inc (Class A) | 1,769 | ||||
571 | e | McClatchy Co (Class A) | 3,871 | ||||
3,654 | e | McGraw-Hill Cos, Inc | 146,598 | ||||
235 | Media General, Inc (Class A) | 2,808 | |||||
480 | e | Meredith Corp | 13,579 | ||||
500 | * | MSCI, Inc | 18,145 | ||||
105 | Multi-Color Corp | 2,204 | |||||
1,565 | e | New York Times Co (Class A) | 24,085 | ||||
100 | e* | Playboy Enterprises, Inc (Class B) | 494 | ||||
322 | * | Presstek, Inc | 1,597 | ||||
485 | e | Primedia, Inc | 2,260 | ||||
816 | e* | R.H. Donnelley Corp | 2,448 | ||||
2,448 | R.R. Donnelley & Sons Co | 72,681 | |||||
100 | e | Schawk, Inc | 1,199 | ||||
376 | e | Scholastic Corp | 10,776 | ||||
235 | e | Standard Register Co | 2,216 | ||||
554 | e* | Valassis Communications, Inc | 6,936 | ||||
470 | e* | VistaPrint Ltd | 12,577 | ||||
68 | e | Washington Post Co (Class B) | 39,909 | ||||
TOTAL PRINTING AND PUBLISHING | 601,085 | ||||||
RAILROAD TRANSPORTATION - 0.84% | |||||||
3,203 | Burlington Northern Santa Fe Corp | 319,948 | |||||
4,574 | CSX Corp | 287,293 | |||||
369 | * | Genesee & Wyoming, Inc (Class A) | 12,553 | ||||
850 | * | Kansas City Southern Industries, Inc | 37,392 | ||||
4,222 | Norfolk Southern Corp | 264,593 | |||||
5,879 | Union Pacific Corp | 443,865 | |||||
TOTAL RAILROAD TRANSPORTATION | 1,365,644 | ||||||
REAL ESTATE - 0.10% | |||||||
1,955 | e* | CB Richard Ellis Group, Inc (Class A) | 37,536 | ||||
59 | e | Consolidated-Tomoka Land Co | 2,482 | ||||
390 | e | DuPont Fabros Technology, Inc | 7,270 | ||||
843 | e | Forest City Enterprises, Inc (Class A) | 27,161 | ||||
386 | e* | Forestar Real Estate Group, Inc | 7,353 | ||||
111 | e* | FX Real Estate and Entertainment, Inc | 211 | ||||
680 | e | Grubb & Ellis Co | 2,618 | ||||
389 | e | Jones Lang LaSalle, Inc | 23,414 | ||||
297 | e* | LoopNet, Inc | 3,356 | ||||
1,063 | e | St. Joe Co | 36,482 | ||||
1,142 | Stewart Enterprises, Inc (Class A) | 8,222 | |||||
263 | e | Thomas Properties Group, Inc | 2,588 | ||||
TOTAL REAL ESTATE | 158,693 | ||||||
RUBBER AND MISCELLANEOUS PLASTIC PRODUCTS - 0.29% | |||||||
78 | e* | AEP Industries, Inc | 1,355 | ||||
700 | e | Cooper Tire & Rubber Co | 5,488 | ||||
86
TIAA-CREF LIFE FUNDS - Stock Index Fund
SHARES | COMPANY | VALUE | |||||
140 | * | Deckers Outdoor Corp | $ | 19,488 | |||
2,711 | e* | Goodyear Tire & Rubber Co | 48,337 | ||||
158 | e* | Metabolix, Inc | 1,548 | ||||
3,056 | Newell Rubbermaid, Inc | 51,310 | |||||
4,043 | Nike, Inc (Class B) | 241,003 | |||||
353 | Schulman (A.), Inc | 8,130 | |||||
1,782 | e | Sealed Air Corp | 33,876 | ||||
377 | * | Skechers U.S.A., Inc (Class A) | 7,450 | ||||
267 | e | Spartech Corp | 2,518 | ||||
410 | e | Titan International, Inc | 14,604 | ||||
122 | e* | Trex Co, Inc | 1,431 | ||||
661 | Tupperware Corp | 22,619 | |||||
331 | e | West Pharmaceutical Services, Inc | 14,326 | ||||
TOTAL RUBBER AND MISCELLANEOUS PLASTIC PRODUCTS | 473,483 | ||||||
SECURITY AND COMMODITY BROKERS - 2.34% | |||||||
2,526 | Ameriprise Financial, Inc | 102,732 | |||||
198 | e | BlackRock, Inc | 35,046 | ||||
1,592 | e | Broadridge Financial Solutions, Inc | 33,512 | ||||
200 | e | Calamos Asset Management, Inc (Class A) | 3,406 | ||||
10,634 | Charles Schwab Corp | 218,422 | |||||
621 | e* | CME Group, Inc | 237,961 | ||||
144 | e | Cohen & Steers, Inc | 3,740 | ||||
1,460 | * | Corrections Corp of America | 40,106 | ||||
22 | * | Diamond Hill Investment Group, Inc | 1,837 | ||||
116 | * | Duff & Phelps Corp | 1,921 | ||||
5,056 | e* | E*Trade Financial Corp | 15,876 | ||||
1,207 | e | Eaton Vance Corp | 47,990 | ||||
95 | e | Evercore Partners, Inc (Class A) | 903 | ||||
300 | e* | FBR Capital Markets Corp | 1,509 | ||||
259 | e* | FCStone Group, Inc | 7,234 | ||||
991 | e | Federated Investors, Inc (Class B) | 34,110 | ||||
1,898 | Franklin Resources, Inc | 173,952 | |||||
69 | e | GAMCO Investors, Inc (Class A) | 3,424 | ||||
704 | e | GFI Group, Inc | 6,343 | ||||
4,485 | Goldman Sachs Group, Inc | 784,427 | |||||
191 | e | Greenhill & Co, Inc | 10,287 | ||||
441 | e* | Interactive Brokers Group, Inc (Class A) | 14,169 | ||||
803 | * | IntercontinentalExchange, Inc | 91,542 | ||||
4,850 | e | Invesco Ltd | 116,303 | ||||
452 | * | Investment Technology Group, Inc | 15,124 | ||||
2,042 | Janus Capital Group, Inc | 54,052 | |||||
1,431 | e | Jefferies Group, Inc | 24,069 | ||||
300 | e* | KBW, Inc | 6,174 | ||||
1,234 | * | Knight Capital Group, Inc (Class A) | 22,187 | ||||
600 | e* | LaBranche & Co, Inc | 4,248 | ||||
1,077 | e* | Ladenburg Thalmann Financial Services, Inc | 1,626 | ||||
565 | e | Lazard Ltd (Class A) | 19,295 | ||||
1,561 | Legg Mason, Inc | 68,013 | |||||
6,047 | e | Lehman Brothers Holdings, Inc | 119,791 | ||||
239 | * | MarketAxess Holdings, Inc | 1,807 | ||||
11,082 | Merrill Lynch & Co, Inc | 351,410 | |||||
1,470 | e* | MF Global Ltd | 9,276 | ||||
12,601 | Morgan Stanley | 454,518 | |||||
184 | e* | Morningstar, Inc | 13,254 | ||||
1,571 | e* | Nasdaq Stock Market, Inc | 41,710 | ||||
1,040 | e | Nymex Holdings, Inc | 87,859 | ||||
87
TIAA-CREF LIFE FUNDS - Stock Index Fund
SHARES | COMPANY | VALUE | |||||
3,001 | NYSE Euronext | $ | 152,031 | ||||
480 | optionsXpress Holdings, Inc | 10,723 | |||||
300 | * | Penson Worldwide, Inc | 3,585 | ||||
190 | e* | Piper Jaffray Cos | 5,573 | ||||
1,150 | e | Raymond James Financial, Inc | 30,349 | ||||
209 | e | Sanders Morris Harris Group, Inc | 1,417 | ||||
1,360 | SEI Investments Co | 31,987 | |||||
244 | * | Stifel Financial Corp | 8,408 | ||||
181 | e | SWS Group, Inc | 3,006 | ||||
2,954 | e | T Rowe Price Group, Inc | 166,812 | ||||
2,718 | e* | TD Ameritrade Holding Corp | 49,169 | ||||
200 | e* | Thomas Weisel Partners Group, Inc | 1,094 | ||||
126 | e | US Global Investors, Inc (Class A) | 2,111 | ||||
988 | Waddell & Reed Financial, Inc (Class A) | 34,590 | |||||
61 | Westwood Holdings Group, Inc | 2,428 | |||||
TOTAL SECURITY AND COMMODITY BROKERS | 3,784,448 | ||||||
SOCIAL SERVICES - 0.01% | |||||||
236 | e* | Capital Senior Living Corp | 1,779 | ||||
97 | e* | Providence Service Corp | 2,048 | ||||
319 | * | Res-Care, Inc | 5,672 | ||||
TOTAL SOCIAL SERVICES | 9,499 | ||||||
SPECIAL TRADE CONTRACTORS - 0.08% | |||||||
100 | e | Alico, Inc | 3,466 | ||||
337 | e* | AsiaInfo Holdings, Inc | 3,983 | ||||
266 | e | Chemed Corp | 9,738 | ||||
409 | e | Comfort Systems USA, Inc | 5,497 | ||||
596 | * | Dycom Industries, Inc | 8,654 | ||||
744 | * | EMCOR Group, Inc | 21,226 | ||||
400 | e* | Insituform Technologies, Inc (Class A) | 6,092 | ||||
167 | e* | Integrated Electrical Services, Inc | 2,872 | ||||
220 | e* | Layne Christensen Co | 9,634 | ||||
1,918 | * | Quanta Services, Inc | 63,812 | ||||
TOTAL SPECIAL TRADE CONTRACTORS | 134,974 | ||||||
STONE, CLAY, AND GLASS PRODUCTS - 0.46% | |||||||
8,013 | 3M Co | 557,625 | |||||
311 | e | Apogee Enterprises, Inc | 5,026 | ||||
280 | * | Cabot Microelectronics Corp | 9,282 | ||||
234 | e | CARBO Ceramics, Inc | 13,654 | ||||
582 | e | Eagle Materials, Inc | 14,742 | ||||
1,606 | e | Gentex Corp | 23,191 | ||||
154 | Libbey, Inc | 1,146 | |||||
868 | e* | Owens Corning, Inc | 19,747 | ||||
1,819 | * | Owens-Illinois, Inc | 75,834 | ||||
363 | e* | US Concrete, Inc | 1,728 | ||||
814 | e* | USG Corp | 24,070 | ||||
TOTAL STONE, CLAY, AND GLASS PRODUCTS | 746,045 | ||||||
TEXTILE MILL PRODUCTS - 0.00%** | |||||||
200 | e | Oxford Industries, Inc | 3,830 | ||||
300 | e | Xerium Technologies, Inc | 1,188 | ||||
TOTAL TEXTILE MILL PRODUCTS | 5,018 | ||||||
TOBACCO PRODUCTS - 1.18% | |||||||
23,922 | Altria Group, Inc | 491,836 | |||||
88
TIAA-CREF LIFE FUNDS - Stock Index Fund
SHARES | COMPANY | VALUE | |||||
1,771 | * | Lorillard, Inc | $ | 122,482 | |||
24,000 | Philip Morris International, Inc | 1,185,360 | |||||
341 | e | Universal Corp | 15,420 | ||||
1,692 | e | UST, Inc | 92,400 | ||||
303 | e | Vector Group Ltd | 4,887 | ||||
TOTAL TOBACCO PRODUCTS | 1,912,385 | ||||||
TRANSPORTATION BY AIR - 0.33% | |||||||
114 | e* | Air Methods Corp | 2,850 | ||||
995 | e* | Airtran Holdings, Inc | 2,030 | ||||
458 | e* | Alaska Air Group, Inc | 7,026 | ||||
153 | * | Allegiant Travel Co | 2,844 | ||||
2,844 | e* | AMR Corp | 14,561 | ||||
211 | e* | Atlas Air Worldwide Holdings, Inc | 10,436 | ||||
281 | e* | Bristow Group, Inc | 13,907 | ||||
1,243 | e* | Continental Airlines, Inc (Class B) | 12,567 | ||||
339 | Copa Holdings S.A. (Class A) | 9,546 | |||||
3,310 | e* | Delta Air Lines, Inc | 18,867 | ||||
3,504 | FedEx Corp | 276,080 | |||||
457 | * | Hawaiian Holdings, Inc | 3,176 | ||||
1,884 | e* | JetBlue Airways Corp | 7,027 | ||||
2,882 | * | Northwest Airlines Corp | 19,194 | ||||
149 | e* | PHI, Inc | 5,985 | ||||
620 | e* | Republic Airways Holdings, Inc | 5,369 | ||||
692 | e | Skywest, Inc | 8,754 | ||||
7,835 | Southwest Airlines Co | 102,168 | |||||
1,265 | e | UAL Corp | 6,603 | ||||
644 | e* | US Airways Group, Inc | 1,610 | ||||
TOTAL TRANSPORTATION BY AIR | 530,600 | ||||||
TRANSPORTATION EQUIPMENT - 2.23% | |||||||
223 | e | A.O. Smith Corp | 7,321 | ||||
408 | e* | AAR Corp | 5,520 | ||||
300 | e* | Accuride Corp | 1,275 | ||||
118 | * | Aerovironment, Inc | 3,207 | ||||
449 | e | American Axle & Manufacturing Holdings, Inc | 3,588 | ||||
90 | e | American Railcar Industries, Inc | 1,510 | ||||
234 | e* | Amerigon, Inc | 1,664 | ||||
738 | e | ArvinMeritor, Inc | 9,210 | ||||
237 | * | ATC Technology Corp | 5,517 | ||||
871 | Autoliv, Inc | 40,606 | |||||
1,031 | * | BE Aerospace, Inc | 24,012 | ||||
8,549 | Boeing Co | 561,840 | |||||
975 | e | Brunswick Corp | 10,335 | ||||
540 | e | Clarcor, Inc | 18,954 | ||||
211 | * | Cogo Group, Inc | 1,922 | ||||
1,129 | * | Dana Holding Corp | 6,040 | ||||
121 | Ducommun, Inc | 2,778 | |||||
520 | e | Federal Signal Corp | 6,240 | ||||
570 | e* | Fleetwood Enterprises, Inc | 1,493 | ||||
744 | e* | Force Protection, Inc | 2,463 | ||||
24,682 | e* | Ford Motor Co | 118,720 | ||||
227 | e | Freightcar America, Inc | 8,059 | ||||
140 | * | Fuel Systems Solutions, Inc | 5,390 | ||||
575 | e* | GenCorp, Inc | 4,117 | ||||
4,534 | General Dynamics Corp | 381,733 | |||||
5,466 | e | General Motors Corp | 62,859 | ||||
89
TIAA-CREF LIFE FUNDS - Stock Index Fund
SHARES | COMPANY | VALUE | |||||
111 | e* | GenTek, Inc | $ | 2,985 | |||
1,864 | Genuine Parts Co | 73,964 | |||||
1,402 | Goodrich Corp | 66,539 | |||||
110 | e | Greenbrier Cos, Inc | 2,233 | ||||
300 | e | Group 1 Automotive, Inc | 5,961 | ||||
2,677 | Harley-Davidson, Inc | 97,068 | |||||
936 | Harsco Corp | 50,928 | |||||
2,375 | e* | Hayes Lemmerz International, Inc | 6,745 | ||||
225 | e | Heico Corp | 7,322 | ||||
380 | Kaman Corp | 8,649 | |||||
101 | * | LMI Aerospace, Inc | 1,775 | ||||
3,741 | Lockheed Martin Corp | 369,087 | |||||
3,891 | Northrop Grumman Corp | 260,308 | |||||
706 | * | Orbital Sciences Corp | 16,633 | ||||
850 | e | Oshkosh Truck Corp | 17,587 | ||||
4,153 | Paccar, Inc | 173,720 | |||||
1,493 | * | Pactiv Corp | 31,696 | ||||
433 | e | Polaris Industries, Inc | 17,485 | ||||
4,812 | Raytheon Co | 270,819 | |||||
355 | e | Spartan Motors, Inc | 2,652 | ||||
1,096 | * | Spirit Aerosystems Holdings, Inc (Class A) | 21,021 | ||||
200 | e | Superior Industries International, Inc | 3,376 | ||||
547 | * | Tenneco, Inc | 7,401 | ||||
400 | e | Thor Industries, Inc | 8,504 | ||||
376 | e* | TransDigm Group, Inc | 12,630 | ||||
964 | e | Trinity Industries, Inc | 33,441 | ||||
229 | e | Triumph Group, Inc | 10,786 | ||||
569 | * | TRW Automotive Holdings Corp | 10,509 | ||||
11,073 | United Technologies Corp | 683,204 | |||||
1,603 | e* | Visteon Corp | 4,216 | ||||
270 | e | Wabash National Corp | 2,041 | ||||
492 | Westinghouse Air Brake Technologies Corp | 23,921 | |||||
353 | e | Winnebago Industries, Inc | 3,597 | ||||
TOTAL TRANSPORTATION EQUIPMENT | 3,605,176 | ||||||
TRANSPORTATION SERVICES - 0.20% | |||||||
184 | e | Ambassadors Group, Inc | 2,745 | ||||
1,891 | CH Robinson Worldwide, Inc | 103,702 | |||||
121 | * | Dynamex, Inc | 3,244 | ||||
2,422 | Expeditors International Washington, Inc | 104,146 | |||||
538 | GATX Corp | 23,850 | |||||
500 | * | HUB Group, Inc (Class A) | 17,065 | ||||
875 | * | Lear Corp | 12,408 | ||||
830 | e* | Orbitz Worldwide, Inc | 4,158 | ||||
400 | Pacer International, Inc | 8,604 | |||||
482 | e | Ship Finance International Ltd | 14,233 | ||||
1,085 | e | UTI Worldwide, Inc | 21,646 | ||||
| TOTAL TRANSPORTATION SERVICES | 315,801 | ||||||
TRUCKING AND WAREHOUSING - 0.39% | |||||||
300 | e | Arkansas Best Corp | 10,992 | ||||
250 | e* | Celadon Group, Inc | 2,498 | ||||
512 | Con-way, Inc | 24,197 | |||||
289 | e | Forward Air Corp | 9,999 | ||||
770 | e | Heartland Express, Inc | 11,481 | ||||
1,049 | e | J.B. Hunt Transport Services, Inc | 34,911 | ||||
662 | Landstar System, Inc | 36,556 | |||||
90
TIAA-CREF LIFE FUNDS - Stock Index Fund
SHARES | COMPANY | VALUE | |||||
160 | * | Marten Transport Ltd | $ | 2,555 | |||
472 | e* | Old Dominion Freight Line | 14,169 | ||||
133 | * | Saia, Inc | 1,452 | ||||
7,545 | United Parcel Service, Inc (Class B) | 463,791 | |||||
457 | e | Werner Enterprises, Inc | 8,491 | ||||
649 | e* | YRC Worldwide, Inc | 9,651 | ||||
TOTAL TRUCKING AND WAREHOUSING | 630,743 | ||||||
WATER TRANSPORTATION - 0.28% | |||||||
| 464 | Alexander & Baldwin, Inc | 21,135 | |||||
672 | e* | American Commercial Lines, Inc | 7,345 | ||||
148 | e | Arlington Tankers Ltd | 3,437 | ||||
4,954 | e | Carnival Corp | 163,284 | ||||
449 | DHT Maritime, Inc | 4,503 | |||||
530 | e | Eagle Bulk Shipping, Inc | 15,672 | ||||
550 | e | Frontline Ltd | 38,379 | ||||
194 | e | Genco Shipping & Trading Ltd | 12,649 | ||||
315 | e | General Maritime Corp | 8,184 | ||||
383 | e | Golar LNG Ltd | 5,933 | ||||
249 | * | Gulfmark Offshore, Inc | 14,487 | ||||
369 | e | Horizon Lines, Inc (Class A) | 3,672 | ||||
253 | e* | Hornbeck Offshore Services, Inc | 14,297 | ||||
584 | e* | Kirby Corp | 28,032 | ||||
185 | Knightsbridge Tankers Ltd | 5,959 | |||||
389 | e | Nordic American Tanker Shipping | 15,101 | ||||
438 | e* | Odyssey Marine Exploration, Inc | 1,734 | ||||
314 | e | Overseas Shipholding Group, Inc | 24,969 | ||||
1,568 | e | Royal Caribbean Cruises Ltd | 35,233 | ||||
160 | * | TBS International Ltd (Class A) | 6,392 | ||||
480 | e | Teekay Corp | 21,686 | ||||
140 | e | Teekay Tankers Ltd | 3,249 | ||||
166 | e* | Ultrapetrol Bahamas Ltd | 2,093 | ||||
TOTAL WATER TRANSPORTATION | 457,425 | ||||||
WHOLESALE TRADE-DURABLE GOODS - 0.37% | |||||||
400 | e | Agilysys, Inc | 4,536 | ||||
450 | Applied Industrial Technologies, Inc | 10,877 | |||||
1,424 | * | Arrow Electronics, Inc | 43,745 | ||||
480 | e | Barnes Group, Inc | 11,083 | ||||
474 | e* | Beacon Roofing Supply, Inc | 5,029 | ||||
1,214 | e | BorgWarner, Inc | 53,877 | ||||
200 | e | Castle (A.M.) & Co | 5,722 | ||||
128 | * | Chindex International, Inc | 1,878 | ||||
342 | e* | Conceptus, Inc | 6,324 | ||||
229 | * | DemandTec, Inc | 1,720 | ||||
400 | * | Digi International, Inc | 3,140 | ||||
290 | e* | Drew Industries, Inc | 4,626 | ||||
191 | * | Hansen Medical, Inc | 3,194 | ||||
186 | e | Houston Wire & Cable Co | 3,701 | ||||
1,300 | IKON Office Solutions, Inc | 14,664 | |||||
1,833 | * | Ingram Micro, Inc (Class A) | 32,536 | ||||
718 | * | Insight Enterprises, Inc | 8,422 | ||||
297 | * | Interline Brands, Inc | 4,731 | ||||
600 | e | Knight Transportation, Inc | 10,980 | ||||
45 | e | Lawson Products, Inc | 1,115 | ||||
1,427 | * | LKQ Corp | 25,786 | ||||
467 | e | Martin Marietta Materials, Inc | 48,377 | ||||
91
TIAA-CREF LIFE FUNDS - Stock Index Fund
SHARES | COMPANY | VALUE | |||||
160 | * | MedAssets, Inc | $ | 2,728 | |||
100 | e * | MWI Veterinary Supply, Inc | 3,311 | ||||
468 | e | Owens & Minor, Inc | 21,383 | ||||
1,474 | e * | Patterson Cos, Inc | 43,321 | ||||
614 | e | PEP Boys-Manny Moe & Jack | 5,354 | ||||
567 | e | Pool Corp | 10,070 | ||||
731 | e * | PSS World Medical, Inc | 11,915 | ||||
689 | Reliance Steel & Aluminum Co | 53,115 | |||||
585 | * | Solera Holdings, Inc | 16,181 | ||||
616 | * | Tech Data Corp | 20,876 | ||||
82 | * | Titan Machinery, Inc | 2,568 | ||||
466 | e * | TomoTherapy, Inc | 4,161 | ||||
432 | e * | Tyler Technologies, Inc | 5,862 | ||||
871 | W.W. Grainger, Inc | 71,248 | |||||
494 | * | WESCO International, Inc | 19,780 | ||||
TOTAL WHOLESALE TRADE-DURABLE GOODS | 597,936 | ||||||
WHOLESALE TRADE-NONDURABLE GOODS - 0.58% | |||||||
282 | Aceto Corp | 2,154 | |||||
943 | Airgas, Inc | 55,062 | |||||
1,200 | e * | Akorn, Inc | 3,972 | ||||
850 | e * | Alliance One International, Inc | 4,344 | ||||
605 | e * | Allscripts Healthcare Solutions, Inc | 7,508 | ||||
207 | e | Andersons, Inc | 8,427 | ||||
578 | e * | Bare Escentuals, Inc | 10,826 | ||||
299 | e * | BMP Sunstone Corp | 1,704 | ||||
897 | e | Brown-Forman Corp (Class B) | 67,786 | ||||
4,140 | Cardinal Health, Inc | 213,541 | |||||
418 | e * | Central European Distribution Corp | 30,995 | ||||
108 | e * | Core-Mark Holding Co, Inc | 2,830 | ||||
1,480 | * | Dean Foods Co | 29,038 | ||||
1,365 | * | Endo Pharmaceuticals Holdings, Inc | 33,019 | ||||
476 | e * | Fresh Del Monte Produce, Inc | 11,219 | ||||
300 | e * | Green Mountain Coffee Roasters, Inc | 11,271 | ||||
435 | e * | Hain Celestial Group, Inc | 10,214 | ||||
1,050 | * | Henry Schein, Inc | 54,149 | ||||
702 | Herbalife Ltd | 27,203 | |||||
1,606 | e | Idearc, Inc | 3,774 | ||||
100 | e | Kenneth Cole Productions, Inc (Class A) | 1,270 | ||||
330 | e | K-Swiss, Inc (Class A) | 4,851 | ||||
161 | * | LSB Industries, Inc | 3,188 | ||||
593 | e | Men’s Wearhouse, Inc | 9,660 | ||||
286 | Myers Industries, Inc | 2,331 | |||||
180 | e | Nash Finch Co | 6,169 | ||||
559 | Nu Skin Enterprises, Inc (Class A) | 8,340 | |||||
300 | e * | Perry Ellis International, Inc | 6,366 | ||||
241 | e * | School Specialty, Inc | 7,165 | ||||
217 | Spartan Stores, Inc | 4,991 | |||||
114 | * | Synutra International, Inc | 3,684 | ||||
7,000 | Sysco Corp | 192,570 | |||||
1,014 | Terra Industries, Inc | 50,041 | |||||
390 | e * | Tractor Supply Co | 11,326 | ||||
433 | e * | United Natural Foods, Inc | 8,435 | ||||
323 | * | United Stationers, Inc | 11,935 | ||||
100 | e | Valhi, Inc | 2,725 | ||||
143 | e * | Volcom, Inc | 3,422 | ||||
260 | e | Zep, Inc | 3,869 | ||||
92
TIAA-CREF LIFE FUNDS - Stock Index Fund
SHARES | COMPANY | VALUE | |||||
203 | * | Zhongpin, Inc | $ 2,538 | ||||
TOTAL WHOLESALE TRADE-NONDURABLE GOODS | 933,912 | ||||||
| TOTAL COMMON STOCKS (Cost $148,341,121) | 159,310,990 | ||||||
MUTUAL FUND - 0.00%** | |||||||
107 | e | Kayne Anderson Energy Development Co (Cost $2,712) | 2,456 | ||||
PRINCIPAL | ISSUER | ||||||
SHORT TERM INVESTMENTS - 18.78% | |||||||
U.S. GOVERNMENT AND AGENCIES DISCOUNT NOTES - 1.48% | |||||||
$2,390,000 | Federal Home Loan Bank (FHLB), 07/01/08 | 2,390,000 | |||||
SHARES | COMPANY | ||||||
INVESTMENT OF CASH COLLATERAL FOR SECURITES LOANED - 17.30% | |||||||
27,980,528 | State Street Navigator Securities Lending Primc Portfolio | 27,980,528 | |||||
| TOTAL SHORT-TERM INVESTMENTS (Cost $30,370,528) | 30,370,528 | ||||||
| TOTAL PORTFOLIO - 117.27% (Cost $178,714,361) | 189,683,974 | ||||||
OTHER ASSETS & LIABILITIES, NET - (17.27)% | (27,938,969 | ) | |||||
NET ASSETS - 100.0% | $161,745,005 | ||||||
| * | Non-income producing |
| e | All or a portion of these securities are out on loan. |
| d | All or a portion of these securities have been segregated by the custodian to cover margin or other requirements on open futures contracts in the amount of $2,512,736. |
| m | Indicates a security has been deemed illiquid. |
| v | Securities valued at fair value. |
93
TIAA-CREF LIFE FUNDS - Social Choice Equity Fund
TIAA-CREF LIFE FUNDS
SOCIAL CHOICE EQUITY
STATEMENT OF INVESTMENTS (unaudited)
June 30, 2008
SHARES | COMPANY | VALUE | |||||
COMMON STOCKS - 99.90% | |||||||
AMUSEMENT AND RECREATION SERVICES - 0.86% | |||||||
9,327 | Walt Disney Co | $ | 291,002 | ||||
TOTAL AMUSEMENT AND RECREATION SERVICES | 291,002 | ||||||
APPAREL AND ACCESSORY STORES - 0.55% | |||||||
600 | American Eagle Outfitters, Inc | 8,178 | |||||
89 | * | AnnTaylor Stores Corp | 2,132 | ||||
100 | * | Charming Shoppes, Inc | 459 | ||||
400 | * | Chico’s FAS, Inc | 2,148 | ||||
400 | Foot Locker, Inc | 4,980 | |||||
3,091 | Gap, Inc | 51,527 | |||||
1,200 | * | Kohl’s Corp | 48,048 | ||||
1,800 | Limited Brands, Inc | 30,330 | |||||
800 | Nordstrom, Inc | 24,240 | |||||
400 | Ross Stores, Inc | 14,208 | |||||
TOTAL APPAREL AND ACCESSORY STORES | 186,250 | ||||||
APPAREL AND OTHER TEXTILE PRODUCTS - 0.12% | |||||||
300 | Liz Claiborne, Inc | 4,245 | |||||
200 | Phillips-Van Heusen Corp | 7,324 | |||||
100 | Polo Ralph Lauren Corp | 6,278 | |||||
300 | VF Corp | 21,354 | |||||
TOTAL APPAREL AND OTHER TEXTILE PRODUCTS | 39,201 | ||||||
AUTO REPAIR, SERVICES AND PARKING - 0.04% | |||||||
544 | * | Hertz Global Holdings, Inc | 5,222 | ||||
68 | Ryder System, Inc | 4,684 | |||||
162 | * | Wright Express Corp | 4,018 | ||||
TOTAL AUTO REPAIR, SERVICES AND PARKING | 13,924 | ||||||
AUTOMOTIVE DEALERS AND SERVICE STATIONS - 0.09% | |||||||
200 | * | Autozone, Inc | 24,202 | ||||
456 | * | Carmax, Inc | 6,471 | ||||
TOTAL AUTOMOTIVE DEALERS AND SERVICE STATIONS | 30,673 | ||||||
BUILDING MATERIALS AND GARDEN SUPPLIES - 0.88% | |||||||
8,128 | Home Depot, Inc | 190,358 | |||||
5,190 | Lowe’s Cos, Inc | 107,693 | |||||
TOTAL BUILDING MATERIALS AND GARDEN SUPPLIES | 298,051 | ||||||
BUSINESS SERVICES - 6.50% | |||||||
140 | * | 3Com Corp | 297 | ||||
301 | * | 3D Systems Corp | 2,860 | ||||
1,893 | * | Adobe Systems, Inc | 74,565 | ||||
330 | Aircastle Ltd | 2,775 | |||||
463 | * | Akamai Technologies, Inc | 16,108 | ||||
249 | * | Alliance Data Systems Corp | 14,081 | ||||
1,116 | * | Art Technology Group, Inc | 3,571 | ||||
600 | * | Autodesk, Inc | 20,286 | ||||
3,583 | Automatic Data Processing, Inc | 150,128 | |||||
744 | v* | BearingPoint, Inc | 610 | ||||
200 | * | Blue Coat Systems, Inc | 2,822 | ||||
764 | * | BMC Software, Inc | 27,504 | ||||
370 | * | Bottomline Technologies, Inc | 3,600 | ||||
404 | * | BPZ Energy, Inc | 11,878 | ||||
200 | * | Cerner Corp | 9,036 | ||||
94
TIAA-CREF LIFE FUNDS - Social Choice Equity Fund
SHARES | COMPANY | VALUE | |||||
190 | * | Ciber, Inc | $ | 1,180 | |||
491 | * | Citrix Systems, Inc | 14,440 | ||||
214 | * | CMGI, Inc | 2,268 | ||||
460 | * | Cogent, Inc | 5,230 | ||||
593 | * | Compuware Corp | 5,657 | ||||
514 | * | COMSYS IT Partners, Inc | 4,688 | ||||
100 | * | CSG Systems International, Inc | 1,102 | ||||
400 | * | DST Systems, Inc | 22,020 | ||||
647 | * | Earthlink, Inc | 5,597 | ||||
3,364 | * | eBay, Inc | 91,938 | ||||
100 | * | Equinix, Inc | 8,922 | ||||
868 | * | Expedia, Inc | 15,954 | ||||
169 | Fair Isaac Corp | 3,510 | |||||
46 | * | Getty Images, Inc | 1,561 | ||||
678 | Gevity HR, Inc | 3,648 | |||||
619 | * | Google, Inc (Class A) | 325,854 | ||||
200 | Jack Henry & Associates, Inc | 4,328 | |||||
850 | IMS Health, Inc | 19,805 | |||||
336 | * | Informatica Corp | 5,053 | ||||
2,350 | * | Innovative Solutions & Support, Inc | 15,158 | ||||
400 | * | Internap Network Services Corp | 1,872 | ||||
450 | * | Interwoven, Inc | 5,405 | ||||
1,148 | * | Intuit, Inc | 31,650 | ||||
369 | * | Iron Mountain, Inc | 9,797 | ||||
200 | * | Kinetic Concepts, Inc | 7,982 | ||||
300 | * | Lamar Advertising Co (Class A) | 10,809 | ||||
626 | * | Lawson Software, Inc | 4,551 | ||||
242 | * | Lionbridge Technologies | 624 | ||||
205 | * | Liquidity Services, Inc | 2,364 | ||||
498 | * | Magma Design Automation, Inc | 3,023 | ||||
170 | Manpower, Inc | 9,901 | |||||
249 | Marchex, Inc (Class B) | 3,068 | |||||
271 | * | Mentor Graphics Corp | 4,282 | ||||
25,029 | Microsoft Corp | 688,548 | |||||
2,745 | v | MoneyGram International, Inc | 2,498 | ||||
544 | * | Monster Worldwide, Inc | 11,212 | ||||
531 | * | Network Equipment Technologies, Inc | 1,885 | ||||
1,600 | NIC, Inc | 10,928 | |||||
1,918 | * | Novell, Inc | 11,297 | ||||
594 | * | Nuance Communications, Inc | 9,308 | ||||
1,800 | Omnicom Group, Inc | 80,784 | |||||
98 | * | Omniture, Inc | 1,820 | ||||
290 | * | Parametric Technology Corp | 4,834 | ||||
268 | * | PDF Solutions, Inc | 1,595 | ||||
395 | * | PeopleSupport, Inc | 3,358 | ||||
975 | * | Radisys Corp | 8,834 | ||||
819 | * | RealNetworks, Inc | 5,405 | ||||
645 | * | Red Hat, Inc | 13,345 | ||||
600 | Robert Half International, Inc | 14,382 | |||||
452 | * | S1 Corp | 3,422 | ||||
375 | * | Salesforce.com, Inc | 25,586 | ||||
500 | * | Sapient Corp | 3,210 | ||||
196 | * | Smith Micro Software, Inc | 1,117 | ||||
363 | * | SonicWALL, Inc | 2,341 | ||||
1,340 | * | Sonus Networks, Inc | 4,583 | ||||
3,229 | * | Sun Microsystems, Inc | 35,132 | ||||
173 | * | Sybase, Inc | 5,090 | ||||
4,019 | * | Symantec Corp | 77,768 | ||||
1,069 | * | TIBCO Software, Inc | 8,178 | ||||
480 | * | TNS, Inc | 11,501 | ||||
1,135 | Total System Services, Inc | 25,220 | |||||
600 | * | Unisys Corp | 2,370 | ||||
249 | United Online, Inc | 2,497 | |||||
273 | * | Vasco Data Security International | 2,875 | ||||
417 | * | Vignette Corp | 5,004 | ||||
597 | * | VirnetX Holding Corp | 2,806 | ||||
1,370 | Visa, Inc (Class A) | 111,395 | |||||
95
TIAA-CREF LIFE FUNDS - Social Choice Equity Fund
SHARES | COMPANY | VALUE | |||||
TOTAL BUSINESS SERVICES | $ | 2,193,490 | |||||
CHEMICALS AND ALLIED PRODUCTS - 9.39% | |||||||
1,900 | Air Products & Chemicals, Inc | 187,834 | |||||
100 | * | Alexion Pharmaceuticals, Inc | 7,250 | ||||
795 | * | Alexza Pharmaceuticals, Inc | 3,132 | ||||
100 | * | Alkermes, Inc | 1,236 | ||||
4,511 | * | Amgen, Inc | 212,739 | ||||
101 | * | Auxilium Pharmaceuticals, Inc | 3,396 | ||||
1,000 | Avery Dennison Corp | 43,930 | |||||
1,300 | Avon Products, Inc | 46,826 | |||||
525 | * | Barr Pharmaceuticals, Inc | 23,667 | ||||
600 | * | Bentley Pharmaceuticals, Inc | 9,690 | ||||
301 | * | Biodel, Inc | 3,913 | ||||
1,030 | * | Biogen Idec, Inc | 57,567 | ||||
400 | * | BioMarin Pharmaceuticals, Inc | 11,592 | ||||
402 | * | BioMimetic Therapeutics, Inc | 4,792 | ||||
7,609 | Bristol-Myers Squibb Co | 156,213 | |||||
255 | * | Calgon Carbon Corp | 3,942 | ||||
420 | * | Caraco Pharmaceutical Laboratories Ltd | 5,544 | ||||
633 | * | Cell Genesys, Inc | 1,646 | ||||
339 | Clorox Co | 17,696 | |||||
2,403 | Colgate-Palmolive Co | 166,047 | |||||
175 | * | Cypress Bioscience, Inc | 1,258 | ||||
504 | * | Dendreon Corp | 2,243 | ||||
3,076 | * | Durect Corp | 11,289 | ||||
1,600 | Ecolab, Inc | 68,784 | |||||
2,111 | * | Genentech, Inc | 160,225 | ||||
1,008 | * | Genzyme Corp | 72,596 | ||||
300 | * | Geron Corp | 1,035 | ||||
3,388 | * | Gilead Sciences, Inc | 179,395 | ||||
537 | H.B. Fuller Co | 12,050 | |||||
500 | * | Human Genome Sciences, Inc | 2,605 | ||||
240 | * | Idexx Laboratories, Inc | 11,698 | ||||
182 | Innophos Holdings, Inc | 5,815 | |||||
261 | * | Inverness Medical Innovations, Inc | 8,657 | ||||
200 | * | Invitrogen Corp | 7,852 | ||||
1,754 | * | Javelin Pharmaceuticals, Inc | 4,069 | ||||
4,392 | Eli Lilly & Co | 202,735 | |||||
300 | Lubrizol Corp | 13,899 | |||||
200 | * | Medarex, Inc | 1,322 | ||||
300 | Nalco Holding Co | 6,345 | |||||
238 | * | Neurocrine Biosciences, Inc | 997 | ||||
442 | * | Noven Pharmaceuticals, Inc | 4,725 | ||||
200 | * | OraSure Technologies, Inc | 748 | ||||
200 | * | Par Pharmaceutical Cos, Inc | 3,246 | ||||
200 | PDL BioPharma, Inc | 2,124 | |||||
552 | Perrigo Co | 17,537 | |||||
232 | * | Pharmasset, Inc | 4,380 | ||||
193 | * | PharMerica Corp | 4,360 | ||||
200 | * | Pozen, Inc | 2,176 | ||||
875 | PPG Industries, Inc | 50,199 | |||||
2,250 | Praxair, Inc | 212,040 | |||||
731 | * | Prestige Brands Holdings, Inc | 7,792 | ||||
9,956 | Procter & Gamble Co | 605,424 | |||||
227 | * | Progenics Pharmaceuticals, Inc | 3,602 | ||||
1,635 | Rohm & Haas Co | 75,929 | |||||
500 | RPM International, Inc | 10,300 | |||||
450 | * | Salix Pharmaceuticals Ltd | 3,164 | ||||
5,380 | Schering-Plough Corp | 105,932 | |||||
437 | Sciele Pharma, Inc | 8,456 | |||||
200 | * | Sepracor, Inc | 3,984 | ||||
1,000 | Sigma-Aldrich Corp | 53,860 | |||||
500 | * | SuperGen, Inc | 1,025 | ||||
58 | * | United Therapeutics Corp | 5,670 | ||||
300 | Valspar Corp | 5,673 | |||||
303 | * | VCA Antech, Inc | 8,417 | ||||
96
TIAA-CREF LIFE FUNDS - Social Choice Equity Fund
SHARES | COMPANY | VALUE | |||||
200 | * | Vertex Pharmaceuticals, Inc | $ | 6,694 | |||
4,597 | Wyeth | 220,472 | |||||
529 | * | Zymogenetics, Inc | 4,454 | ||||
TOTAL CHEMICALS AND ALLIED PRODUCTS | 3,175,904 | ||||||
COMMUNICATIONS - 4.18% | |||||||
1,026 | Alaska Communications Systems Group, Inc | 12,250 | |||||
2,074 | * | American Tower Corp (Class A) | 87,627 | ||||
656 | * | Centennial Communications Corp | 4,585 | ||||
6,471 | * | Citizens Communications Co | 73,381 | ||||
749 | * | Cox Radio, Inc (Class A) | 8,838 | ||||
1,825 | * | Crown Castle International Corp | 70,682 | ||||
125 | * | DG FastChannel, Inc | 2,156 | ||||
3,704 | * | DIRECTV Group, Inc | 95,971 | ||||
1,335 | Embarq Corp | 63,105 | |||||
200 | Entercom Communications Corp (Class A) | 1,404 | |||||
2,364 | * | Entravision Communications Corp (Class A) | 9,503 | ||||
2,481 | Fairpoint Communications, Inc | 17,888 | |||||
5,400 | * | FiberTower Corp | 7,560 | ||||
100 | Fisher Communications, Inc | 3,444 | |||||
383 | * | GeoEye, Inc | 6,783 | ||||
2,921 | Gray Television, Inc | 8,383 | |||||
1,244 | * | IAC/InterActiveCorp | 23,984 | ||||
1,481 | * | ICO Global Communications Holdings Ltd | 4,828 | ||||
170 | * | iPCS, Inc | 5,037 | ||||
449 | * | Leap Wireless International, Inc | 19,383 | ||||
1,812 | * | Liberty Global, Inc (Class A) | 56,951 | ||||
3,096 | * | Liberty Media Corp - Entertainment (Series A) | 75,016 | ||||
3,274 | * | Liberty Media Holding Corp (Interactive A) | 48,324 | ||||
1,929 | * | Liberty Media Corp - Capital (Series A) | 27,778 | ||||
1,349 | * | Lin TV Corp (Class A) | 8,040 | ||||
487 | * | Mediacom Communications Corp (Class A) | 2,601 | ||||
879 | * | MetroPCS Communications, Inc | 15,567 | ||||
120 | * | NeuStar, Inc (Class A) | 2,587 | ||||
661 | * | NII Holdings, Inc | 31,391 | ||||
274 | NTELOS Holdings Corp | 6,951 | |||||
103 | * | Rural Cellular Corp (Class A) | 4,585 | ||||
10,111 | Sprint Nextel Corp | 96,055 | |||||
718 | SureWest Communications | 6,053 | |||||
388 | * | Syniverse Holdings, Inc | 6,286 | ||||
902 | * | Terremark Worldwide, Inc | 4,925 | ||||
719 | * | TerreStar Corp | 2,862 | ||||
2,000 | * | Time Warner Cable, Inc (Class A) | 52,960 | ||||
279 | * | TiVo, Inc | 1,721 | ||||
10,476 | Verizon Communications, Inc | 370,850 | |||||
4,612 | Windstream Corp | 56,912 | |||||
900 | * | XM Satellite Radio Holdings, Inc (Class A) | 7,056 | ||||
TOTAL COMMUNICATIONS | 1,412,263 | ||||||
DEPOSITORY INSTITUTIONS - 5.62% | |||||||
14,350 | Bank of America Corp | 342,535 | |||||
4,474 | Bank of New York Mellon Corp | 169,251 | |||||
1,325 | BankAtlantic Bancorp, Inc (Class A) | 2,332 | |||||
3,500 | BB&T Corp | 79,695 | |||||
200 | City National Corp | 8,414 | |||||
698 | Colonial Bancgroup, Inc | 3,085 | |||||
800 | Comerica, Inc | 20,504 | |||||
4,100 | Fifth Third Bancorp | 41,738 | |||||
950 | First Horizon National Corp | 7,059 | |||||
2,096 | Flagstar Bancorp, Inc | 6,309 | |||||
1,381 | Hudson City Bancorp, Inc | 23,035 | |||||
3,788 | v | IndyMac Bancorp, Inc | 2,121 | ||||
2,600 | Keycorp | 28,548 | |||||
640 | M&T Bank Corp | 45,146 | |||||
1,400 | Marshall & Ilsley Corp | 21,462 | |||||
300 | * | Metavante Technologies, Inc | 6,786 | ||||
1,346 | New York Community Bancorp, Inc | 24,013 | |||||
97
TIAA-CREF LIFE FUNDS - Social Choice Equity Fund
SHARES | COMPANY | VALUE | |||||
900 | Northern Trust Corp | $ | 61,713 | ||||
2,249 | PNC Financial Services Group, Inc | 128,418 | |||||
526 | Popular, Inc | 3,466 | |||||
4,160 | Regions Financial Corp | 45,386 | |||||
2,604 | Sovereign Bancorp, Inc | 19,165 | |||||
1,500 | State Street Corp | 95,985 | |||||
2,300 | SunTrust Banks, Inc | 83,306 | |||||
900 | Synovus Financial Corp | 7,857 | |||||
9,200 | US Bancorp | 256,588 | |||||
1,847 | UCBH Holdings, Inc | 4,156 | |||||
5,590 | Washington Mutual, Inc | 27,559 | |||||
13,987 | Wells Fargo & Co | 332,191 | |||||
100 | Zions Bancorporation | 3,149 | |||||
TOTAL DEPOSITORY INSTITUTIONS | 1,900,972 | ||||||
EATING AND DRINKING PLACES - 1.31% | |||||||
900 | * | AFC Enterprises | 7,191 | ||||
793 | Darden Restaurants, Inc | 25,328 | |||||
13 | DineEquity, Inc | 486 | |||||
6,166 | McDonald’s Corp | 346,653 | |||||
3,234 | * | Starbucks Corp | 50,903 | ||||
400 | Wendy’s International, Inc | 10,888 | |||||
TOTAL EATING AND DRINKING PLACES | 441,449 | ||||||
EDUCATIONAL SERVICES - 0.01% | |||||||
60 | * | ITT Educational Services, Inc | 4,958 | ||||
TOTAL EDUCATIONAL SERVICES | 4,958 | ||||||
ELECTRIC, GAS, AND SANITARY SERVICES - 6.59% | |||||||
3,672 | * | AES Corp | 70,539 | ||||
1,096 | AGL Resources, Inc | 37,900 | |||||
921 | Alliant Energy Corp | 31,553 | |||||
800 | Aqua America, Inc | 12,776 | |||||
1,100 | Atmos Energy Corp | 30,327 | |||||
2,028 | Avista Corp | 43,521 | |||||
947 | * | Calpine Corp | 21,364 | ||||
1,760 | Centerpoint Energy, Inc | 28,248 | |||||
364 | Central Vermont Public Service Corp | 7,051 | |||||
1,362 | * | Clean Energy Fuels Corp | 15,649 | ||||
2,217 | Cleco Corp | 51,723 | |||||
3,139 | Consolidated Edison, Inc | 122,704 | |||||
600 | Crosstex Energy, Inc | 20,796 | |||||
1,254 | Edison International | 64,431 | |||||
4,082 | El Paso Corp | 88,743 | |||||
300 | Energen Corp | 23,409 | |||||
1,736 | Energy East Corp | 42,914 | |||||
200 | EnergySouth, Inc | 9,812 | |||||
1,567 | FPL Group, Inc | 102,764 | |||||
2,200 | Hawaiian Electric Industries, Inc | 54,406 | |||||
2,000 | Idacorp, Inc | 57,780 | |||||
500 | MGE Energy, Inc | 16,310 | |||||
1,500 | National Fuel Gas Co | 89,220 | |||||
592 | Nicor, Inc | 25,213 | |||||
4,686 | NiSource, Inc | 83,973 | |||||
1,093 | Northeast Utilities | 27,904 | |||||
1,211 | * | NRG Energy, Inc | 51,952 | ||||
900 | NSTAR | 30,438 | |||||
3,000 | OGE Energy Corp | 95,130 | |||||
800 | Oneok, Inc | 39,064 | |||||
1,057 | PG&E Corp | 41,952 | |||||
4,800 | Pepco Holdings, Inc | 123,120 | |||||
1,010 | Piedmont Natural Gas Co, Inc | 26,422 | |||||
640 | Pinnacle West Capital Corp | 19,693 | |||||
1,669 | PPL Corp | 87,239 | |||||
1,550 | Public Service Enterprise Group, Inc | 71,192 | |||||
1,652 | Questar Corp | 117,358 | |||||
1,009 | Resource America, Inc (Class A) | 9,404 | |||||
98
TIAA-CREF LIFE FUNDS - Social Choice Equity Fund
SHARES | COMPANY | VALUE | |||||
914 | Sempra Energy | $ | 51,595 | ||||
2,900 | Sierra Pacific Resources | 36,859 | |||||
500 | South Jersey Industries, Inc | 18,680 | |||||
2,976 | TECO Energy, Inc | 63,954 | |||||
400 | UGI Corp | 11,484 | |||||
200 | UIL Holdings Corp | 5,882 | |||||
287 | WGL Holdings, Inc | 9,970 | |||||
3,378 | Williams Cos, Inc | 136,167 | |||||
TOTAL ELECTRIC, GAS, AND SANITARY SERVICES | 2,228,585 | ||||||
ELECTRONIC AND OTHER ELECTRIC EQUIPMENT - 5.46% | |||||||
2,047 | * | Adaptec, Inc | 6,550 | ||||
277 | * | Advanced Energy Industries, Inc | 3,795 | ||||
1,662 | * | Advanced Micro Devices, Inc | 9,689 | ||||
1,368 | Ametek, Inc | 64,597 | |||||
281 | * | Avnet, Inc | 7,666 | ||||
161 | Baldor Electric Co | 5,632 | |||||
147 | * | Benchmark Electronics, Inc | 2,402 | ||||
18,668 | * | Cisco Systems, Inc | 434,218 | ||||
297 | * | Conexant Systems, Inc | 1,337 | ||||
308 | * | Cree, Inc | 7,025 | ||||
178 | * | Dolby Laboratories, Inc (Class A) | 7,173 | ||||
506 | Eaton Corp | 42,995 | |||||
81 | * | Energy Conversion Devices, Inc | 5,965 | ||||
1,100 | * | Finisar Corp | 1,309 | ||||
172 | * | First Solar, Inc | 46,925 | ||||
312 | * | FuelCell Energy, Inc | 2,215 | ||||
377 | * | GrafTech International Ltd | 10,115 | ||||
100 | Harman International Industries, Inc | 4,139 | |||||
300 | * | Harmonic, Inc | 2,853 | ||||
530 | * | Hutchinson Technology, Inc | 7,123 | ||||
19,609 | Intel Corp | 421,201 | |||||
100 | * | InterDigital, Inc | 2,432 | ||||
600 | * | InterVoice, Inc | 3,420 | ||||
512 | * | Lattice Semiconductor Corp | 1,603 | ||||
77 | Lincoln Electric Holdings, Inc | 6,060 | |||||
538 | * | Loral Space & Communications, Inc | 9,480 | ||||
2,267 | * | LSI Logic Corp | 13,919 | ||||
181 | * | Medis Technologies Ltd | 610 | ||||
2,856 | * | Micron Technology, Inc | 17,136 | ||||
8,640 | Motorola, Inc | 63,418 | |||||
1,151 | * | NetApp, Inc | 24,931 | ||||
1,509 | * | ON Semiconductor Corp | 13,838 | ||||
645 | * | Oplink Communications, Inc | 6,192 | ||||
505 | * | Optium Corp | 3,676 | ||||
293 | Plantronics, Inc | 6,540 | |||||
357 | * | Polycom, Inc | 8,697 | ||||
200 | * | Power-One, Inc | 378 | ||||
621 | * | Powerwave Technologies, Inc | 2,639 | ||||
441 | * | QLogic Corp | 6,434 | ||||
6,100 | Qualcomm, Inc | 270,657 | |||||
586 | * | Quantum Fuel Systems Technologies Worldwide, Inc | 1,805 | ||||
200 | RadioShack Corp | 2,454 | |||||
706 | * | RF Micro Devices, Inc | 2,047 | ||||
760 | * | Silicon Storage Technology, Inc | 2,105 | ||||
7,971 | * | Sirius Satellite Radio, Inc | 15,304 | ||||
487 | * | Skyworks Solutions, Inc | 4,807 | ||||
823 | * | Spansion, Inc (Class A) | 1,852 | ||||
168 | * | Sunpower Corp (Class A) | 12,093 | ||||
400 | * | Sycamore Networks, Inc | 1,288 | ||||
568 | * | Symmetricom, Inc | 2,181 | ||||
94 | * | Synaptics, Inc | 3,547 | ||||
312 | * | Tekelec | 4,590 | ||||
240 | Teleflex, Inc | 13,342 | |||||
1,300 | * | Tellabs, Inc | 6,045 | ||||
135 | * | Tessera Technologies, Inc | 2,210 | ||||
5,674 | Texas Instruments, Inc | 159,780 | |||||
99
TIAA-CREF LIFE FUNDS - Social Choice Equity Fund
SHARES | COMPANY | VALUE | |||||
338 | * | Thomas & Betts Corp | $ | 12,793 | |||
944 | * | Triquint Semiconductor, Inc | 5,721 | ||||
184 | * | TTM Technologies, Inc | 2,431 | ||||
693 | * | Utstarcom, Inc | 3,791 | ||||
100 | Whirlpool Corp | 6,173 | |||||
800 | Xilinx, Inc | 20,200 | |||||
111 | * | Zoran Corp | 1,299 | ||||
TOTAL ELECTRONIC AND OTHER ELECTRIC EQUIPMENT | 1,844,842 | ||||||
ENGINEERING AND MANAGEMENT SERVICES - 0.62% | |||||||
200 | * | Amylin Pharmaceuticals, Inc | 5,078 | ||||
906 | Applera Corp (Celera Genomics Group) | 2,272 | |||||
200 | * | Ariad Pharmaceuticals, Inc | 480 | ||||
1,147 | * | Celgene Corp | 73,259 | ||||
42 | Corporate Executive Board Co | 1,766 | |||||
100 | * | CV Therapeutics, Inc | 823 | ||||
200 | * | Hewitt Associates, Inc (Class A) | 7,666 | ||||
767 | * | Incyte Corp | 5,837 | ||||
435 | * | Isis Pharmaceuticals, Inc | 5,929 | ||||
139 | * | Navigant Consulting, Inc | 2,719 | ||||
1,352 | Paychex, Inc | 42,291 | |||||
865 | Quest Diagnostics, Inc | 41,927 | |||||
211 | * | Regeneron Pharmaceuticals, Inc | 3,047 | ||||
3,969 | * | Rentech, Inc | 7,541 | ||||
100 | * | Symyx Technologies, Inc | 698 | ||||
318 | * | Tetra Tech, Inc | 7,193 | ||||
TOTAL ENGINEERING AND MANAGEMENT SERVICES | 208,526 | ||||||
FABRICATED METAL PRODUCTS - 0.81% | |||||||
150 | Quanex Building Products Corp | 2,229 | |||||
720 | Commercial Metals Co | 27,144 | |||||
258 | Dynamic Materials Corp | 8,501 | |||||
100 | Gulf Island Fabrication, Inc | 4,893 | |||||
4,002 | Illinois Tool Works, Inc | 190,135 | |||||
200 | Pentair, Inc | 7,004 | |||||
147 | Snap-On, Inc | 7,645 | |||||
600 | Stanley Works | 26,898 | |||||
TOTAL FABRICATED METAL PRODUCTS | 274,449 | ||||||
FOOD AND KINDRED PRODUCTS - 3.61% | |||||||
1,603 | Campbell Soup Co | 53,636 | |||||
2,700 | General Mills, Inc | 164,079 | |||||
1,908 | H.J. Heinz Co | 91,298 | |||||
124 | * | Hansen Natural Corp | 3,574 | ||||
964 | Hershey Co | 31,600 | |||||
2,664 | Kellogg Co | 127,925 | |||||
6,453 | Kraft Foods, Inc (Class A) | 183,588 | |||||
6,521 | PepsiCo, Inc | 414,670 | |||||
2,399 | Sara Lee Corp | 29,388 | |||||
1,535 | Wrigley (Wm.) Jr Co | 119,392 | |||||
TOTAL FOOD AND KINDRED PRODUCTS | 1,219,150 | ||||||
FOOD STORES - 0.23% | |||||||
51 | * | Great Atlantic & Pacific Tea Co, Inc | 1,164 | ||||
1,808 | Safeway, Inc | 51,618 | |||||
604 | * | Supervalu, Inc | 18,658 | ||||
260 | Whole Foods Market, Inc | 6,159 | |||||
TOTAL FOOD STORES | 77,599 | ||||||
100
TIAA-CREF LIFE FUNDS - Social Choice Equity Fund
SHARES | COMPANY | VALUE | |||||
FORESTRY - 0.14% | |||||||
953 | Weyerhaeuser Co | $ | 48,736 | ||||
TOTAL FORESTRY | 48,736 | ||||||
FURNITURE AND FIXTURES - 0.52% | |||||||
470 | Hill-Rom Holdings, Inc | 12,681 | |||||
4,100 | Johnson Controls, Inc | 117,588 | |||||
700 | Leggett & Platt, Inc | 11,739 | |||||
2,240 | Masco Corp | 35,235 | |||||
TOTAL FURNITURE AND FIXTURES | 177,243 | ||||||
FURNITURE AND HOMEFURNISHINGS STORES - 0.12% | |||||||
865 | * | Bed Bath & Beyond, Inc | 24,307 | ||||
199 | * | GameStop Corp (Class A) | 8,040 | ||||
100 | * | Mohawk Industries, Inc | 6,410 | ||||
100 | Williams-Sonoma, Inc | 1,984 | |||||
TOTAL FURNITURE AND HOMEFURNISHINGS STORES | 40,741 | ||||||
GENERAL BUILDING CONTRACTORS - 0.07% | |||||||
400 | Centex Corp | 5,348 | |||||
180 | * | Hovnanian Enterprises, Inc (Class A) | 986 | ||||
400 | Lennar Corp (Class A) | 4,936 | |||||
169 | M/I Homes, Inc | 2,658 | |||||
300 | Standard-Pacific Corp | 1,014 | |||||
400 | * | Toll Brothers, Inc | 7,492 | ||||
TOTAL GENERAL BUILDING CONTRACTORS | 22,434 | ||||||
GENERAL MERCHANDISE STORES - 1.34% | |||||||
2,300 | Costco Wholesale Corp | 161,322 | |||||
940 | JC Penney Co, Inc | 34,113 | |||||
800 | Macy’s, Inc | 15,536 | |||||
3,860 | Target Corp | 179,451 | |||||
2,000 | TJX Cos, Inc | 62,940 | |||||
TOTAL GENERAL MERCHANDISE STORES | 453,362 | ||||||
HEALTH SERVICES - 0.75% | |||||||
186 | * | Amsurg Corp | 4,529 | ||||
112 | * | Corvel Corp | 3,793 | ||||
100 | * | Edwards Lifesciences Corp | 6,204 | ||||
791 | * | Five Star Quality Care, Inc | 3,741 | ||||
161 | * | Healthways, Inc | 4,766 | ||||
600 | * | Laboratory Corp of America Holdings | 41,778 | ||||
421 | LCA-Vision, Inc | 2,008 | |||||
337 | * | LifePoint Hospitals, Inc | 9,537 | ||||
1,668 | * | Nektar Therapeutics | 5,588 | ||||
185 | * | Pediatrix Medical Group, Inc | 9,108 | ||||
334 | * | Psychiatric Solutions, Inc | 12,639 | ||||
3,112 | * | WellPoint, Inc | 148,318 | ||||
TOTAL HEALTH SERVICES | 252,009 | ||||||
HEAVY CONSTRUCTION, EXCEPT BUILDING - 0.13% | |||||||
572 | * | Foster Wheeler Ltd | 41,842 | ||||
159 | * | Matrix Service Co | 3,667 | ||||
TOTAL HEAVY CONSTRUCTION, EXCEPT BUILDING | 45,509 | ||||||
HOLDING AND OTHER INVESTMENT OFFICES - 1.98% | |||||||
442 | Alesco Financial, Inc | 884 | |||||
2,412 | Annaly Mortgage Management, Inc | 37,410 | |||||
800 | Anworth Mortgage Asset Corp | 5,208 | |||||
1,347 | Ashford Hospitality Trust, Inc | 6,223 | |||||
180 | AvalonBay Communities, Inc | 16,049 | |||||
101
TIAA-CREF LIFE FUNDS - Social Choice Equity Fund
SHARES | COMPANY | VALUE | |||||
370 | Boston Properties, Inc | $ | 33,381 | ||||
441 | Capstead Mortgage Corp | 4,785 | |||||
1,664 | CBRE Realty Finance, Inc | 5,724 | |||||
1,009 | Duke Realty Corp | 22,652 | |||||
1,918 | Equity Residential | 73,402 | |||||
796 | General Growth Properties, Inc | 27,884 | |||||
300 | HCP, Inc | 9,543 | |||||
140 | Hospitality Properties Trust | 3,424 | |||||
1,940 | Host Marriott Corp | 26,481 | |||||
700 | HRPT Properties Trust | 4,739 | |||||
800 | iStar Financial, Inc | 10,568 | |||||
260 | JER Investors Trust, Inc | 1,638 | |||||
1,200 | Kimco Realty Corp | 41,424 | |||||
300 | Liberty Property Trust | 9,945 | |||||
557 | * | NexCen Brands, Inc | 312 | ||||
1,786 | NorthStar Realty Finance Corp | 14,860 | |||||
1,000 | Prologis | 54,350 | |||||
600 | Public Storage, Inc | 48,474 | |||||
213 | RAIT Investment Trust | 1,580 | |||||
1,050 | Simon Property Group, Inc | 94,385 | |||||
2,062 | Virgin Media, Inc | 28,064 | |||||
600 | Vornado Realty Trust | 52,800 | |||||
300 | WABCO Holdings, Inc | 13,938 | |||||
679 | Weingarten Realty Investors | 20,587 | |||||
TOTAL HOLDING AND OTHER INVESTMENT OFFICES | 670,714 | ||||||
HOTELS AND OTHER LODGING PLACES - 0.28% | |||||||
600 | Choice Hotels International, Inc | 15,900 | |||||
500 | * | Gaylord Entertainment Co | 11,980 | ||||
1,201 | * | Great Wolf Resorts, Inc | 5,248 | ||||
1,200 | * | Lodgian, Inc | 9,396 | ||||
200 | Marcus Corp | 2,990 | |||||
1,240 | Marriott International, Inc (Class A) | 32,538 | |||||
448 | Starwood Hotels & Resorts Worldwide, Inc | 17,951 | |||||
TOTAL HOTELS AND OTHER LODGING PLACES | 96,003 | ||||||
INDUSTRIAL MACHINERY AND EQUIPMENT - 6.18% | |||||||
400 | * | AGCO Corp | 20,964 | ||||
88 | * | Allis-Chalmers Energy, Inc | 1,566 | ||||
5,600 | Applied Materials, Inc | 106,904 | |||||
699 | * | Axcelis Technologies, Inc | 3,411 | ||||
400 | Black & Decker Corp | 23,004 | |||||
200 | Briggs & Stratton Corp | 2,536 | |||||
1,961 | * | Brocade Communications Systems, Inc | 16,159 | ||||
2,056 | Caterpillar, Inc | 151,774 | |||||
1,082 | * | Cray, Inc | 5,020 | ||||
1,336 | Cummins, Inc | 87,535 | |||||
2,700 | Deere & Co | 194,751 | |||||
7,480 | * | Dell, Inc | 163,662 | ||||
138 | * | Emulex Corp | 1,608 | ||||
241 | * | Entegris, Inc | 1,579 | ||||
82 | * | Flotek Industries, Inc | 1,691 | ||||
600 | * | FMC Technologies, Inc | 46,158 | ||||
283 | Graco, Inc | 10,774 | |||||
9,219 | Hewlett-Packard Co | 407,572 | |||||
772 | * | Immersion Corp | 5,257 | ||||
607 | Ingersoll-Rand Co Ltd (Class A) | 22,720 | |||||
4,834 | International Business Machines Corp | 572,974 | |||||
124 | * | Intevac, Inc | 1,399 | ||||
364 | * | Lam Research Corp | 13,159 | ||||
300 | * | Lexmark International, Inc (Class A) | 10,029 | ||||
102
TIAA-CREF LIFE FUNDS - Social Choice Equity Fund
SHARES | COMPANY | VALUE | |||||
516 | Manitowoc Co, Inc | $ | 16,785 | ||||
292 | Modine Manufacturing Co | 3,612 | |||||
400 | Nordson Corp | 29,156 | |||||
300 | Pall Corp | 11,904 | |||||
1,149 | Palm, Inc | 6,193 | |||||
2,748 | * | Quantum Corp | 3,710 | ||||
71 | * | Rackable Systems, Inc | 951 | ||||
278 | Rockwell Automation, Inc | 12,157 | |||||
2,812 | Seagate Technology, Inc | 53,794 | |||||
508 | * | Semitool, Inc | 3,815 | ||||
210 | * | Sigma Designs, Inc | 2,917 | ||||
406 | * | STEC, Inc | 4,170 | ||||
132 | * | Tecumseh Products Co (Class A) | 4,327 | ||||
1,000 | Tennant Co | 30,070 | |||||
214 | * | Terex Corp | 10,993 | ||||
83 | * | TurboChef Technologies, Inc | 397 | ||||
170 | * | Ultratech, Inc | 2,638 | ||||
400 | * | Varian Medical Systems, Inc | 20,740 | ||||
TOTAL INDUSTRIAL MACHINERY AND EQUIPMENT | 2,090,535 | ||||||
INSTRUMENTS AND RELATED PRODUCTS - 7.16% | |||||||
470 | Hillenbrand, Inc | 10,058 | |||||
177 | * | Advanced Medical Optics, Inc | 3,317 | ||||
100 | * | Affymetrix, Inc | 1,029 | ||||
1,539 | * | Agilent Technologies, Inc | 54,696 | ||||
1,298 | Allergan, Inc | 67,561 | |||||
400 | Bard (C.R.), Inc | 35,180 | |||||
3,100 | Baxter International, Inc | 198,214 | |||||
370 | Beckman Coulter, Inc | 24,986 | |||||
1,500 | Becton Dickinson & Co | 121,950 | |||||
200 | * | Bruker BioSciences Corp | 2,570 | ||||
584 | * | Cardiac Science Corp | 4,789 | ||||
365 | * | Cepheid, Inc | 10,264 | ||||
1,121 | Danaher Corp | 86,653 | |||||
600 | Dentsply International, Inc | 22,080 | |||||
5,556 | Emerson Electric Co | 274,744 | |||||
396 | * | Flir Systems, Inc | 16,066 | ||||
104 | * | Formfactor, Inc | 1,917 | ||||
601 | Garmin Ltd | 25,747 | |||||
871 | * | Hologic, Inc | 18,988 | ||||
112 | * | Illumina, Inc | 9,756 | ||||
139 | * | Intuitive Surgical, Inc | 37,447 | ||||
564 | * | ION Geophysical Corp | 9,842 | ||||
361 | * | Ixia | 2,509 | ||||
9,736 | Johnson & Johnson | 626,414 | |||||
598 | * | LTX Corp | 1,316 | ||||
5,566 | Medtronic, Inc | 288,041 | |||||
200 | * | Millipore Corp | 13,572 | ||||
71 | * | MKS Instruments, Inc | 1,555 | ||||
200 | Movado Group, Inc | 3,960 | |||||
212 | * | Natus Medical, Inc | 4,439 | ||||
1,200 | Pitney Bowes, Inc | 40,920 | |||||
178 | Roper Industries, Inc | 11,727 | |||||
1,400 | * | St. Jude Medical, Inc | 57,232 | ||||
1,500 | Stryker Corp | 94,320 | |||||
103
TIAA-CREF LIFE FUNDS - Social Choice Equity Fund
SHARES | COMPANY | VALUE | |||||
1,532 | * | Thermo Electron Corp | $ | 85,378 | |||
260 | * | Trimble Navigation Ltd | 9,282 | ||||
636 | * | Vivus, Inc | 4,248 | ||||
300 | * | Waters Corp | 19,350 | ||||
4,244 | Xerox Corp | 57,549 | |||||
900 | * | Zimmer Holdings, Inc | 61,245 | ||||
TOTAL INSTRUMENTS AND RELATED PRODUCTS | 2,420,911 | ||||||
INSURANCE AGENTS, BROKERS AND SERVICES - 0.59% | |||||||
1,359 | AON Corp | 62,432 | |||||
1,576 | * | Crawford & Co (Class B) | 12,592 | ||||
1,949 | Hartford Financial Services Group, Inc | 125,847 | |||||
TOTAL INSURANCE AGENTS, BROKERS AND SERVICES | 200,871 | ||||||
INSURANCE CARRIERS - 4.06% | |||||||
2,494 | Aetna, Inc | 101,082 | |||||
3,600 | Aflac, Inc | 226,067 | |||||
700 | Ambac Financial Group, Inc | 938 | |||||
100 | * | Arch Capital Group Ltd | 6,632 | ||||
853 | Aspen Insurance Holdings Ltd | 20,191 | |||||
613 | Assurant, Inc | 40,433 | |||||
700 | W.R. Berkley Corp | 16,912 | |||||
263 | * | Centene Corp | 4,416 | ||||
3,300 | Chubb Corp | 161,733 | |||||
2,061 | Cincinnati Financial Corp | 52,349 | |||||
332 | Endurance Specialty Holdings Ltd | 10,222 | |||||
100 | Erie Indemnity Co (Class A) | 4,615 | |||||
1,970 | Genworth Financial, Inc (Class A) | 35,086 | |||||
150 | Hanover Insurance Group, Inc | 6,375 | |||||
183 | * | HealthExtras, Inc | 5,516 | ||||
737 | * | Humana, Inc | 29,310 | ||||
835 | Leucadia National Corp | 39,195 | |||||
2,018 | Lincoln National Corp | 91,456 | |||||
30 | * | Markel Corp | 11,010 | ||||
700 | MBIA, Inc | 3,073 | |||||
360 | MGIC Investment Corp | 2,200 | |||||
177 | * | Molina Healthcare, Inc | 4,308 | ||||
765 | Montpelier Re Holdings Ltd | 11,284 | |||||
300 | Nationwide Financial Services, Inc (Class A) | 14,403 | |||||
468 | Phoenix Cos, Inc | 3,561 | |||||
347 | Platinum Underwriters Holdings Ltd | 11,316 | |||||
200 | PMI Group, Inc | 390 | |||||
1,800 | Principal Financial Group | 75,546 | |||||
3,900 | Progressive Corp | 73,008 | |||||
300 | Protective Life Corp | 11,415 | |||||
220 | Radian Group, Inc | 319 | |||||
1,100 | Safeco Corp | 73,876 | |||||
4,016 | Travelers Cos, Inc | 174,294 | |||||
1,457 | UnumProvident Corp | 29,796 | |||||
1,041 | XL Capital Ltd (Class A) | 21,403 | |||||
TOTAL INSURANCE CARRIERS | 1,373,730 | ||||||
LEATHER AND LEATHER PRODUCTS - 0.10% | |||||||
1,184 | * | Coach, Inc | 34,194 | ||||
TOTAL LEATHER AND LEATHER PRODUCTS | 34,194 | ||||||
LEGAL SERVICES - 0.03% | |||||||
128 | * | FTI Consulting, Inc | 8,763 | ||||
TOTAL LEGAL SERVICES | 8,763 | ||||||
104
TIAA-CREF LIFE FUNDS - Social Choice Equity Fund
SHARES | COMPANY | VALUE | |||||
LUMBER AND WOOD PRODUCTS - 0.01% | |||||||
400 | * | Champion Enterprises, Inc | $ | 2,340 | |||
TOTAL LUMBER AND WOOD PRODUCTS | 2,340 | ||||||
METAL MINING - 0.11% | |||||||
821 | * | Allied Nevada Gold Corp | 4,836 | ||||
1,000 | Royal Gold, Inc | 31,360 | |||||
TOTAL METAL MINING | 36,196 | ||||||
MISCELLANEOUS MANUFACTURING INDUSTRIES - 0.33% | |||||||
318 | Armstrong World Industries, Inc | 9,292 | |||||
200 | Callaway Golf Co | 2,366 | |||||
2,982 | Mattel, Inc | 51,052 | |||||
1,259 | Tyco International Ltd | 50,410 | |||||
TOTAL MISCELLANEOUS MANUFACTURING INDUSTRIES | 113,120 | ||||||
MISCELLANEOUS RETAIL - 1.54% | |||||||
986 | * | Amazon.com, Inc | 72,303 | ||||
1,050 | Best Buy Co, Inc | 41,580 | |||||
4,426 | CVS Corp | 175,137 | |||||
188 | * | GSI Commerce, Inc | 2,562 | ||||
790 | * | Hibbett Sports, Inc | 16,669 | ||||
700 | * | Office Depot, Inc | 7,658 | ||||
200 | Petsmart, Inc | 3,990 | |||||
88 | * | Priceline.com, Inc | 10,160 | ||||
2,460 | Staples, Inc | 58,425 | |||||
300 | Tiffany & Co | 12,225 | |||||
3,700 | Walgreen Co | 120,287 | |||||
TOTAL MISCELLANEOUS RETAIL | 520,996 | ||||||
MOTION PICTURES - 1.15% | |||||||
97 | * | Avid Technology, Inc | 1,648 | ||||
1,119 | * | Discovery Holding Co (Class A) | 24,573 | ||||
200 | Regal Entertainment Group (Class A) | 3,056 | |||||
17,064 | Time Warner, Inc | 252,547 | |||||
361 | * | tw telecom inc | 5,787 | ||||
3,307 | * | Viacom, Inc (Class B) | 100,996 | ||||
TOTAL MOTION PICTURES | 388,607 | ||||||
NONDEPOSITORY INSTITUTIONS - 1.29% | |||||||
5,353 | American Express Co | 201,648 | |||||
756 | * | AmeriCredit Corp | 6,517 | ||||
1,809 | Capital One Financial Corp | 68,760 | |||||
500 | CapitalSource, Inc | 5,540 | |||||
2,742 | Centerline Holding Co | 4,579 | |||||
2,202 | CIT Group, Inc | 14,996 | |||||
2,202 | Discover Financial Services | 29,000 | |||||
279 | Federal Agricultural Mortgage Corp (Class C) | 6,914 | |||||
3,900 | Freddie Mac | 63,960 | |||||
1,477 | * | Guaranty Financial Group, Inc | 7,931 | ||||
106 | * | thinkorswim Group, Inc | 747 | ||||
1,872 | Medallion Financial Corp | 17,634 | |||||
1,040 | * | NewStar Financial, Inc | 6,146 | ||||
105 | * | World Acceptance Corp | 3,535 | ||||
TOTAL NONDEPOSITORY INSTITUTIONS | 437,907 | ||||||
105
TIAA-CREF LIFE FUNDS - Social Choice Equity Fund
SHARES | COMPANY | VALUE | |||||
NONMETALLIC MINERALS, EXCEPT FUELS - 0.22% | |||||||
900 | AMCOL International Corp | $ | 25,614 | ||||
68 | Compass Minerals International, Inc | 5,478 | |||||
723 | Vulcan Materials Co | 43,221 | |||||
TOTAL NONMETALLIC MINERALS, EXCEPT FUELS | 74,313 | ||||||
OIL AND GAS EXTRACTION - 7.32% | |||||||
378 | Atlas America, Inc | 17,029 | |||||
122 | * | ATP Oil & Gas Corp | 4,815 | ||||
400 | Berry Petroleum Co (Class A) | 23,552 | |||||
395 | * | Bronco Drilling Co, Inc | 7,260 | ||||
1,029 | * | Callon Petroleum Co | 28,153 | ||||
800 | * | Cameron International Corp | 44,280 | ||||
400 | * | Cheniere Energy, Inc | 1,748 | ||||
2,791 | Chesapeake Energy Corp | 184,094 | |||||
615 | Cimarex Energy Co | 42,847 | |||||
225 | * | Complete Production Services, Inc | 8,195 | ||||
325 | * | Contango Oil & Gas Co | 30,199 | ||||
112 | * | Dawson Geophysical Co | 6,660 | ||||
300 | * | Delta Petroleum Corp | 7,656 | ||||
2,400 | * | Denbury Resources, Inc | 87,600 | ||||
400 | * | Edge Petroleum Corp | 2,156 | ||||
300 | * | Encore Acquisition Co | 22,557 | ||||
980 | ENSCO International, Inc | 79,125 | |||||
2,200 | Equitable Resources, Inc | 151,932 | |||||
124 | * | EXCO Resources, Inc | 4,577 | ||||
249 | * | Geokinetics, Inc | 4,509 | ||||
591 | * | Geomet, Inc | 5,603 | ||||
900 | * | Global Industries Ltd | 16,137 | ||||
92 | * | GMX Resources, Inc | 6,817 | ||||
369 | * | Goodrich Petroleum Corp | 30,597 | ||||
1,800 | * | Grey Wolf, Inc | 16,254 | ||||
530 | * | Helix Energy Solutions Group, Inc | 22,069 | ||||
1,008 | Helmerich & Payne, Inc | 72,596 | |||||
683 | * | McMoRan Exploration Co | 18,796 | ||||
2,560 | * | Meridian Resource Corp | 7,552 | ||||
880 | * | Nabors Industries Ltd | 43,322 | ||||
1,957 | * | National Oilwell Varco, Inc | 173,625 | ||||
964 | Noble Corp | 62,621 | |||||
753 | * | Parker Drilling Co | 7,538 | ||||
1,754 | * | PetroHawk Energy Corp | 81,228 | ||||
200 | * | Petroleum Development Corp | 13,298 | ||||
415 | * | Petroquest Energy, Inc | 11,164 | ||||
697 | * | Pioneer Drilling Co | 13,111 | ||||
1,009 | Pioneer Natural Resources Co | 78,985 | |||||
1,122 | * | Plains Exploration & Production Co | 81,872 | ||||
1,100 | * | Pride International, Inc | 52,019 | ||||
800 | * | Quicksilver Resources, Inc | 30,912 | ||||
600 | Range Resources Corp | 39,324 | |||||
988 | Smith International, Inc | 82,142 | |||||
778 | * | Southwestern Energy Co | 37,041 | ||||
500 | St. Mary Land & Exploration Co | 32,320 | |||||
100 | * | Stone Energy Corp | 6,591 | ||||
2,287 | * | Sulphco, Inc | 5,191 | ||||
400 | * | Swift Energy Co | 26,424 | ||||
106
TIAA-CREF LIFE FUNDS - Social Choice Equity Fund
SHARES | COMPANY | VALUE | |||||
426 | * | Toreador Resources Corp | $ | 3,634 | |||
1,806 | Transocean, Inc | 275,216 | |||||
424 | * | TXCO Resources, Inc | 4,986 | ||||
300 | * | Unit Corp | 24,891 | ||||
374 | * | Venoco, Inc | 8,681 | ||||
500 | W&T Offshore, Inc | 29,255 | |||||
967 | * | Weatherford International Ltd | 47,954 | ||||
300 | * | Whiting Petroleum Corp | 31,824 | ||||
3,121 | XTO Energy, Inc | 213,820 | |||||
TOTAL OIL AND GAS EXTRACTION | 2,474,354 | ||||||
PAPER AND ALLIED PRODUCTS - 0.80% | |||||||
400 | Bemis Co | 8,968 | |||||
150 | * | Buckeye Technologies, Inc | 1,269 | ||||
1,245 | * | Domtar Corporation | 6,785 | ||||
1,496 | International Paper Co | 34,857 | |||||
2,400 | Kimberly-Clark Corp | 143,472 | |||||
1,800 | MeadWestvaco Corp | 42,912 | |||||
300 | Packaging Corp of America | 6,453 | |||||
700 | Sonoco Products Co | 21,665 | |||||
500 | Temple-Inland, Inc | 5,635 | |||||
TOTAL PAPER AND ALLIED PRODUCTS | 272,016 | ||||||
PETROLEUM AND COAL PRODUCTS - 4.85% | |||||||
222 | Alon USA Energy, Inc | 2,655 | |||||
2,302 | Apache Corp | 319,978 | |||||
100 | Ashland, Inc | 4,820 | |||||
700 | Cabot Oil & Gas Corp | 47,411 | |||||
2,534 | Devon Energy Corp | 304,485 | |||||
1,676 | EOG Resources, Inc | 219,891 | |||||
1,559 | Hess Corp | 196,730 | |||||
1,567 | Murphy Oil Corp | 153,644 | |||||
600 | * | Newfield Exploration Co | 39,150 | ||||
1,754 | Noble Energy, Inc | 176,382 | |||||
1,000 | Sunoco, Inc | 40,690 | |||||
3,000 | Valero Energy Corp | 123,540 | |||||
779 | Western Refining, Inc | 9,223 | |||||
TOTAL PETROLEUM AND COAL PRODUCTS | 1,638,599 | ||||||
PIPELINES, EXCEPT NATURAL GAS - 0.40% | |||||||
4,671 | Spectra Energy Corp | 134,245 | |||||
TOTAL PIPELINES, EXCEPT NATURAL GAS | 134,245 | ||||||
PRIMARY METAL INDUSTRIES - 2.04% | |||||||
2,074 | Alcoa, Inc | 73,876 | |||||
190 | Allegheny Technologies, Inc | 11,263 | |||||
489 | * | Century Aluminum Co | 32,514 | ||||
5,868 | Corning, Inc | 135,257 | |||||
400 | * | LB Foster Co (Class A) | 13,280 | ||||
350 | Gibraltar Industries, Inc | 5,590 | |||||
300 | Hubbell, Inc (Class B) | 11,961 | |||||
1,986 | Nucor Corp | 148,295 | |||||
139 | Olympic Steel, Inc | 10,553 | |||||
1,276 | Steel Dynamics, Inc | 49,853 | |||||
500 | Tredegar Corp | 7,350 | |||||
828 | United States Steel Corp | 152,998 | |||||
1,705 | Worthington Industries, Inc | 34,953 | |||||
TOTAL PRIMARY METAL INDUSTRIES | 687,743 | ||||||
107
TIAA-CREF LIFE FUNDS - Social Choice Equity Fund
SHARES | COMPANY | VALUE | |||||
PRINTING AND PUBLISHING - 0.56% | |||||||
400 | Dun & Bradstreet Corp | $ | 35,056 | ||||
2,109 | Journal Communications, Inc (Class A) | 10,165 | |||||
200 | Meredith Corp | 5,658 | |||||
1,322 | New York Times Co (Class A) | 20,346 | |||||
1,318 | * | R.H. Donnelley Corp | 3,954 | ||||
600 | R.R. Donnelley & Sons Co | 17,814 | |||||
700 | * | EW Scripps Co (Class A) | 29,078 | ||||
863 | Standard Register Co | 8,138 | |||||
100 | Washington Post Co (Class B) | 58,690 | |||||
TOTAL PRINTING AND PUBLISHING | 188,899 | ||||||
RAILROAD TRANSPORTATION - 1.08% | |||||||
2,494 | CSX Corp | 156,648 | |||||
500 | * | Kansas City Southern Industries, Inc | 21,995 | ||||
2,985 | Norfolk Southern Corp | 187,070 | |||||
TOTAL RAILROAD TRANSPORTATION | 365,713 | ||||||
REAL ESTATE - 0.04% | |||||||
480 | * | CB Richard Ellis Group, Inc (Class A) | 9,216 | ||||
166 | * | Forestar Real Estate Group, Inc | 3,162 | ||||
100 | Stewart Enterprises, Inc (Class A) | 720 | |||||
TOTAL REAL ESTATE | 13,098 | ||||||
RUBBER AND MISCELLANEOUS PLASTIC PRODUCTS - 0.44% | |||||||
2,400 | Nike, Inc (Class B) | 143,064 | |||||
340 | Sealed Air Corp | 6,463 | |||||
RUBBER AND MISCELLANEOUS PLASTIC PRODUCTS | 149,527 | ||||||
SECURITY AND COMMODITY BROKERS - 2.83% | |||||||
692 | Ameriprise Financial, Inc | 28,144 | |||||
211 | BlackRock, Inc | 37,347 | |||||
683 | Broadridge Financial Solutions, Inc | 14,377 | |||||
4,100 | Charles Schwab Corp | 84,214 | |||||
201 | * | CME Group, Inc | 77,021 | ||||
388 | * | Duff & Phelps Corp | 6,425 | ||||
200 | Eaton Vance Corp | 7,952 | |||||
363 | Evercore Partners, Inc (Class A) | 3,449 | |||||
300 | Federated Investors, Inc (Class B) | 10,326 | |||||
1,300 | Franklin Resources, Inc | 119,145 | |||||
1,610 | Goldman Sachs Group, Inc | 281,589 | |||||
205 | * | IntercontinentalExchange, Inc | 23,370 | ||||
2,274 | Invesco Ltd | 54,531 | |||||
2,034 | * | Ladenburg Thalmann Financial Services, Inc | 3,071 | ||||
406 | Lazard Ltd (Class A) | 13,865 | |||||
556 | Legg Mason, Inc | 24,225 | |||||
542 | * | Nasdaq Stock Market, Inc | 14,390 | ||||
180 | Nymex Holdings, Inc | 15,206 | |||||
1,006 | NYSE Euronext | 50,964 | |||||
600 | SEI Investments Co | 14,112 | |||||
1,200 | T Rowe Price Group, Inc | 67,764 | |||||
259 | US Global Investors, Inc (Class A) | 4,338 | |||||
TOTAL SECURITY AND COMMODITY BROKERS | 955,825 | ||||||
108
TIAA-CREF LIFE FUNDS - Social Choice Equity Fund
SHARES | COMPANY | VALUE | |||||
SOCIAL SERVICES - 0.02% | |||||||
688 | * | Capital Senior Living Corp | $ | 5,188 | |||
TOTAL SOCIAL SERVICES | 5,188 | ||||||
SPECIAL TRADE CONTRACTORS - 0.06% | |||||||
75 | Chemed Corp | 2,746 | |||||
518 | * | Quanta Services, Inc | 17,234 | ||||
TOTAL SPECIAL TRADE CONTRACTORS | 19,980 | ||||||
STONE, CLAY, AND GLASS PRODUCTS - 0.89% | |||||||
3,766 | 3M Co | 262,076 | |||||
100 | Apogee Enterprises, Inc | 1,616 | |||||
51 | * | Cabot Microelectronics Corp | 1,691 | ||||
150 | CARBO Ceramics, Inc | 8,753 | |||||
54 | Eagle Materials, Inc | 1,368 | |||||
400 | Gentex Corp | 5,776 | |||||
241 | * | Owens Corning, Inc | 5,483 | ||||
290 | * | Owens-Illinois, Inc | 12,090 | ||||
TOTAL STONE, CLAY, AND GLASS PRODUCTS | 298,853 | ||||||
TEXTILE MILL PRODUCTS - 0.01% | |||||||
200 | Oxford Industries, Inc | 3,830 | |||||
TOTAL TEXTILE MILL PRODUCTS | 3,830 | ||||||
TRANSPORTATION BY AIR - 0.67% | |||||||
101 | * | Air Methods Corp | 2,525 | ||||
2,987 | * | Airtran Holdings, Inc | 6,093 | ||||
700 | * | Continental Airlines, Inc (Class B) | 7,077 | ||||
2,034 | * | Delta Air Lines, Inc | 11,594 | ||||
5,819 | v* | ExpressJet Holdings, Inc | 3,259 | ||||
1,538 | FedEx Corp | 121,179 | |||||
3,057 | * | JetBlue Airways Corp | 11,403 | ||||
267 | Skywest, Inc | 3,378 | |||||
4,089 | Southwest Airlines Co | 53,321 | |||||
1,422 | UAL Corp | 7,423 | |||||
TOTAL TRANSPORTATION BY AIR | 227,252 | ||||||
TRANSPORTATION EQUIPMENT - 0.90% | |||||||
200 | American Axle & Manufacturing Holdings, Inc | 1,598 | |||||
400 | ArvinMeritor, Inc | 4,992 | |||||
1,670 | * | BE Aerospace, Inc | 38,894 | ||||
64 | * | Fuel Systems Solutions, Inc | 2,464 | ||||
1,400 | Genuine Parts Co | 55,552 | |||||
1,329 | Harley-Davidson, Inc | 48,190 | |||||
660 | Harsco Corp | 35,911 | |||||
791 | * | Hayes Lemmerz International, Inc | 2,246 | ||||
1,360 | Paccar, Inc | 56,889 | |||||
1,353 | * | Spirit Aerosystems Holdings, Inc (Class A) | 25,951 | ||||
200 | Superior Industries International, Inc | 3,376 | |||||
800 | * | Tenneco, Inc | 10,824 | ||||
1,400 | * | Visteon Corp | 3,682 | ||||
300 | Westinghouse Air Brake Technologies Corp | 14,586 | |||||
TOTAL TRANSPORTATION EQUIPMENT | 305,155 | ||||||
TRANSPORTATION SERVICES - 0.05% | |||||||
150 | CH Robinson Worldwide, Inc | 8,226 | |||||
139 | Expeditors International Washington, Inc | 5,977 | |||||
109
TIAA-CREF LIFE FUNDS - Social Choice Equity Fund
SHARES | COMPANY | VALUE | ||||
404 | * | Orbitz Worldwide, Inc | $ 2,024 | |||
TOTAL TRANSPORTATION SERVICES | 16,227 | |||||
TRUCKING AND WAREHOUSING - 0.74% | ||||||
4,044 | United Parcel Service, Inc (Class B) | 248,585 | ||||
TOTAL TRUCKING AND WAREHOUSING | 248,585 | |||||
WATER TRANSPORTATION - 0.12% | ||||||
400 | * | Gulfmark Offshore, Inc | 23,272 | |||
300 | * | Hornbeck Offshore Services, Inc | 16,953 | |||
TOTAL WATER TRANSPORTATION | 40,225 | |||||
WHOLESALE TRADE-DURABLE GOODS - 0.63% | ||||||
465 | * | Chindex International, Inc | 6,822 | |||
932 | Agilysys, Inc | 10,569 | ||||
800 | Barnes Group, Inc | 18,472 | ||||
400 | BorgWarner, Inc | 17,752 | ||||
400 | Castle (A.M.) & Co | 11,444 | ||||
200 | IKON Office Solutions, Inc | 2,256 | ||||
58 | Martin Marietta Materials, Inc | 6,008 | ||||
104 | * | MWI Veterinary Supply, Inc | 3,443 | |||
400 | * | Patterson Cos, Inc | 11,756 | |||
900 | Reliance Steel & Aluminum Co | 69,381 | ||||
600 | W.W. Grainger, Inc | 49,080 | ||||
109 | * | WESCO International, Inc | 4,364 | |||
TOTAL WHOLESALE TRADE-DURABLE GOODS | 211,347 | |||||
WHOLESALE TRADE-NONDURABLE GOODS - 0.48% | ||||||
623 | * | Akorn, Inc | 2,062 | |||
600 | * | Allscripts Healthcare Solutions, Inc | 7,446 | |||
500 | * | Endo Pharmaceuticals Holdings, Inc | 12,095 | |||
586 | Herbalife Ltd | 22,708 | ||||
2,061 | Idearc, Inc | 4,843 | ||||
4,076 | Sysco Corp | 112,131 | ||||
TOTAL WHOLESALE TRADE-NONDURABLE GOODS | 161,285 | |||||
| TOTAL COMMON STOCKS (Cost $33,445,336) | 33,768,468 | |||||
| TOTAL PORTFOLIO - 99.90% (Cost $33,445,336) | 33,768,468 | |||||
OTHER ASSETS & LIABILITIES, NET - .10% | 34,033 | |||||
| NET ASSETS - 100.00% | $33,802,501 | |||||
| * | Non-income producing |
| v | Security valued at fair value. |
110
TIAA-CREF LIFE FUNDS - Real Estate Securities Fund
TIAA-CREF LIFE FUNDS
REAL ESTATE SECURITIES FUND
STATEMENT OF INVESTMENTS (unaudited)
June 30, 2008
SHARES | COMPANY | VALUE | |||||
COMMON STOCKS - 99.72% | |||||||
HOLDING AND OTHER INVESTMENT OFFICES - 94.44% | |||||||
14,000 | e | Acadia Realty Trust | $ | 324,100 | |||
16,350 | Alexandria Real Estate Equities, Inc | 1,591,509 | |||||
31,700 | e | AMB Property Corp | 1,597,046 | ||||
13,900 | American Campus Communities, Inc | 386,976 | |||||
8,000 | e | American Land Lease, Inc | 152,000 | ||||
18,700 | e | AvalonBay Communities, Inc | 1,667,292 | ||||
31,800 | e | BioMed Realty Trust, Inc | 780,054 | ||||
5,344 | Boardwalk Real Estate Investment Trust | 199,935 | |||||
46,600 | e | Boston Properties, Inc | 4,204,252 | ||||
29,400 | e | Camden Property Trust | 1,301,244 | ||||
13,900 | e | Corporate Office Properties Trust | 477,187 | ||||
65,000 | e | DCT Industrial Trust, Inc | 538,200 | ||||
13,200 | e | Digital Realty Trust, Inc | 540,012 | ||||
18,800 | Douglas Emmett, Inc | 413,036 | |||||
38,484 | Duke Realty Corp | 863,966 | |||||
23,900 | e | EastGroup Properties, Inc | 1,025,310 | ||||
4,000 | Equity Lifestyle Properties, Inc | 176,000 | |||||
50,000 | Equity Residential | 1,913,500 | |||||
18,900 | e | Essex Property Trust, Inc | 2,012,850 | ||||
42,500 | e | Federal Realty Investment Trust | 2,932,500 | ||||
45,600 | e | General Growth Properties, Inc | 1,597,368 | ||||
35,000 | e | Gramercy Capital Corp | 405,650 | ||||
20,000 | g,m* | GSC Capital Corp | 0 | ||||
70,800 | HCP, Inc | 2,252,148 | |||||
6,600 | Highwoods Properties, Inc | 207,372 | |||||
138,000 | e | Host Marriott Corp | 1,883,700 | ||||
14,200 | Kilroy Realty Corp | 667,826 | |||||
47,600 | e | Kimco Realty Corp | 1,643,152 | ||||
15,000 | Liberty Property Trust | 497,250 | |||||
36,300 | Macerich Co | 2,255,319 | |||||
9,500 | e* | Maguire Properties, Inc | 115,615 | ||||
87,250 | e | Mission West Properties, Inc | 956,260 | ||||
35,000 | Nationwide Health Properties, Inc | 1,102,150 | |||||
28,800 | g,m* | People’s Choice Financial Corp | 0 | ||||
42,800 | e | Post Properties, Inc | 1,273,300 | ||||
73,700 | Prologis | 4,005,595 | |||||
34,000 | e | Public Storage, Inc | 2,746,860 | ||||
36,000 | Regency Centers Corp | 2,128,320 | |||||
78,600 | Simon Property Group, Inc | 7,065,354 | |||||
21,500 | SL Green Realty Corp | 1,778,480 | |||||
39,900 | e | Strategic Hotels & Resorts, Inc | 373,860 | ||||
11,424 | e | Sunstone Hotel Investors, Inc | 189,635 | ||||
45,000 | Taubman Centers, Inc | 2,189,250 | |||||
36,500 | e | UDR, Inc | 816,870 | ||||
51,600 | Ventas, Inc | 2,196,612 | |||||
39,700 | Vornado Realty Trust | 3,493,600 | |||||
TOTAL HOLDING AND OTHER INVESTMENT OFFICES | 64,938,515 | ||||||
HOTELS AND OTHER LODGING PLACES - 0.85% | |||||||
14,600 | Starwood Hotels & Resorts Worldwide, Inc | 585,022 | |||||
TOTAL HOTELS AND OTHER LODGING PLACES | 585,022 | ||||||
111
TIAA-CREF LIFE FUNDS - Real Estate Securities Fund
SHARES | COMPANY | VALUE | ||||
REAL ESTATE - 2.31% | ||||||
40,000 | g,m,v* | Asset Capital Corp, Inc | 204,400 | |||
20,000 | British Land Co plc | 281,257 | ||||
35,100 | Brookfield Properties Co | 624,429 | ||||
48,700 | e | Thomas Properties Group, Inc | 479,208 | |||
TOTAL REAL ESTATE | 1,589,294 | |||||
SECURITY AND COMMODITY BROKERS - 2.12% | ||||||
SHARES | COMPANY | VALUE | |||||
53,000 | e* | Corrections Corp of America | $ 1,455,910 | ||||
TOTAL SECURITY AND COMMODITY BROKERS | 1,455,910 | ||||||
| TOTAL COMMON STOCKS (Cost $74,315,185) | 68,568,741 | ||||||
PRINCIPAL | ISSUER | VALUE | |||||
SHORT-TERM INVESTMENTS - 4.66% | |||||||
U.S. GOVERNMENT AND AGENCIES DISCOUNT NOTES - 1.53% | |||||||
| $ 1,050,000 | Federal Home Loan Bank (FHLB), 07/01/08 | 1,050,000 | |||||
TOTAL U.S. GOVERNMENT AND AGENCIES DISCOUNT NOTES | 1,050,000 | ||||||
SHARES | COMPANY | ||||||
INVESTMENT OF CASH COLLATERAL FOR SECURITIES LOANED - 3.13% | |||||||
2,153,509 | State Street Navigator Securities Lending Prime Portfolio | 2,153,509 | |||||
TOTAL INVESTMENT OF CASH COLLATERAL FOR SECURITIES LOANED | 2,153,509 | ||||||
| TOTAL SHORT-TERM INVESTMENTS (Cost $3,203,509) | 3,203,509 | ||||||
| TOTAL PORTFOLIO - 104.38% (Cost $77,518,694) | 71,772,250 | ||||||
OTHER ASSETS & LIABILITIES, NET - (4.38)% | (3,008,399 | ) | |||||
| NET ASSETS - 100.00% | $68,763,851 | ||||||
| * | Non-income producing |
| e | All or a portion of these securities are out on loan. |
| g | Security is exempt from registration under Rule 144 (A) of the Securities Act of 1933 and may be resold in transaction exempt from registration to qualified institutional buyers. |
At June 30, 2008, the value of these securities amounted to $204,400 or 0.30% of net assets.
| m | Indicates a security has been deemed illiquid |
| v | Security valued at fair value. |
112
TIAA-CREF LIFE FUNDS - Bond Fund
TIAA-CREF LIFE FUNDS
BOND FUND
STATEMENT OF INVESTMENTS (unaudited)
June 30, 2008
PRINCIPAL | ISSUER | RATE | MATURITY DATE | MOODY’S RATING+ | VALUE | |||||||||
BONDS - 78.90% | ||||||||||||||
CORPORATE BONDS - 21.89% | ||||||||||||||
AMUSEMENT AND RECREATION SERVICES - 0.11% | ||||||||||||||
| $ 100,000 | e | Walt Disney Co | 5.700 | % | 07/15/11 | A2 | $ | 104,464 | ||||||
TOTAL AMUSEMENT AND RECREATION SERVICES | 104,464 | |||||||||||||
BUILDING MATERIALS AND GARDEN SUPPLIES - 0.05% | ||||||||||||||
| 50,000 | e | Home Depot, Inc | 5.250 | 12/16/13 | Baa1 | 47,956 | ||||||||
TOTAL BUILDING MATERIALS AND GARDEN SUPPLIES | 47,956 | |||||||||||||
BUSINESS SERVICES - 0.22% | ||||||||||||||
| 63,000 | Lamar Media Corp | 6.625 | 08/15/15 | Ba3 | 57,330 | |||||||||
| 50,000 | Oracle Corp | 4.950 | 04/15/13 | A2 | 50,483 | |||||||||
| 90,000 | e | Sungard Data Systems, Inc | 10.250 | 08/15/15 | Caa1 | 90,450 | ||||||||
TOTAL BUSINESS SERVICES | 198,263 | |||||||||||||
CHEMICALS AND ALLIED PRODUCTS - 0.67% | ||||||||||||||
| 50,000 | Abbott Laboratories | 5.600 | 05/15/11 | A1 | 52,286 | |||||||||
| 100,000 | Air Products & Chemicals, Inc | 4.150 | 02/01/13 | A2 | 97,795 | |||||||||
| 50,000 | Amgen, Inc | 5.850 | 06/01/17 | A3 | 49,248 | |||||||||
| 50,000 | e | Bristol-Myers Squibb Co | 5.450 | 05/01/18 | A2 | 49,323 | ||||||||
| 25,000 | Bristol-Myers Squibb Co | 6.125 | 05/01/38 | A2 | 24,249 | |||||||||
| 75,000 | GlaxoSmithKline Capital, Inc | 5.650 | 05/15/18 | A1 | 74,714 | |||||||||
| 35,000 | GlaxoSmithKline Capital, Inc | 6.375 | 05/15/38 | A1 | 34,742 | |||||||||
| 50,000 | Johnson & Johnson | 5.850 | 07/15/38 | Aaa | 50,851 | |||||||||
| 125,000 | Johnson & Johnson | 5.950 | 08/15/37 | Aaa | 129,769 | |||||||||
| 50,000 | Praxair, Inc | 5.250 | 11/15/14 | A2 | 50,582 | |||||||||
TOTAL CHEMICALS AND ALLIED PRODUCTS | 613,559 | |||||||||||||
COMMUNICATIONS - 2.10% | ||||||||||||||
| 150,000 | Alamosa Delaware, Inc | 8.500 | 01/31/12 | Baa3 | 148,500 | |||||||||
| 100,000 | America Movil SAB de C.V. | 6.125 | 11/15/37 | A3 | 90,975 | |||||||||
| 100,000 | AT&T, Inc | 6.150 | 09/15/34 | A2 | 93,437 | |||||||||
| 50,000 | AT&T, Inc | 6.500 | 09/01/37 | A2 | 48,391 | |||||||||
| 100,000 | e | BellSouth Corp | 6.875 | 10/15/31 | A2 | 99,894 | ||||||||
| 75,000 | Comcast Corp | 6.400 | 05/15/38 | Baa2 | 69,185 | |||||||||
| 100,000 | Comcast Corp | 6.500 | 11/15/35 | Baa2 | 95,063 | |||||||||
| 100,000 | Deutsche Telekom International Finance BV | 8.750 | 06/15/30 | Baa1 | 114,738 | |||||||||
| 100,000 | New Cingular Wireless Services, Inc | 8.750 | 03/01/31 | A2 | 118,658 | |||||||||
| 100,000 | Rogers Wireless, Inc | 7.500 | 03/15/15 | Baa3 | 105,859 | |||||||||
| 100,000 | Sprint Capital Corp | 8.750 | 03/15/32 | Baa3 | 95,250 | |||||||||
| 75,000 | Telecom Italia Capital S.A. | 4.950 | 09/30/14 | Baa2 | 68,644 | |||||||||
| 25,000 | Telecom Italia Capital S.A. | 6.999 | 06/04/18 | Baa2 | 25,213 | |||||||||
| 100,000 | Telefonica Emisiones SAU | 6.221 | 07/03/17 | Baa1 | 99,952 | |||||||||
| 100,000 | Time Warner Cable, Inc | 5.400 | 07/02/12 | Baa2 | 98,990 | |||||||||
| 100,000 | Time Warner Cable, Inc | 5.850 | 05/01/17 | Baa2 | 94,980 | |||||||||
| 100,000 | Verizon Communications, Inc | 5.250 | 04/15/13 | A3 | 99,425 | |||||||||
| 50,000 | Verizon Communications, Inc | 6.400 | 02/15/38 | A3 | 46,544 | |||||||||
| 200,000 | Viacom, Inc | 5.750 | 04/30/11 | Baa3 | 200,466 | |||||||||
| 100,000 | e | Vodafone Group plc | 6.250 | 11/30/32 | Baa1 | 92,559 | ||||||||
TOTAL COMMUNICATIONS | 1,906,723 | |||||||||||||
113
TIAA-CREF LIFE FUNDS - Bond Fund
PRINCIPAL | ISSUER | RATE | MATURITY DATE | MOODY’S RATING+ | VALUE | ||||||||
DEPOSITORY INSTITUTIONS - 6.67% | |||||||||||||
| 810,000 | g | BA Covered Bond Issuer | 5.500 | 06/14/12 | Aaa | $ | 840,456 | ||||||
| 1,000,000 | g | Banco Bilbao Vizcaya Argentaria S.A. | 5.750 | 07/20/17 | Aaa | 1,055,657 | |||||||
| 500,000 | Banco Nacional de Comercio Exterior SNC | 3.875 | 01/21/09 | A1 | 498,750 | ||||||||
| 25,000 | Bank of America Corp | 4.900 | 05/01/13 | Aa2 | 24,126 | ||||||||
| 75,000 | Bank of America Corp | 5.650 | 05/01/18 | Aa2 | 70,019 | ||||||||
| 200,000 | Bank of America NA | 5.300 | 03/15/17 | Aa1 | 183,590 | ||||||||
| 100,000 | Bank One Corp | 5.250 | 01/30/13 | Aa3 | 98,340 | ||||||||
| 50,000 | i | BB&T Capital Trust IV | 6.820 | 06/12/57 | A1 | 42,486 | |||||||
| 100,000 | Citigroup, Inc | 5.100 | 09/29/11 | Aa3 | 98,837 | ||||||||
| 225,000 | Citigroup, Inc | 5.125 | 05/05/14 | Aa3 | 214,863 | ||||||||
| 75,000 | Citigroup, Inc | 6.875 | 03/05/38 | Aa3 | 72,375 | ||||||||
| 150,000 | Credit Suisse | 5.000 | 05/15/13 | Aa1 | 145,975 | ||||||||
| 900,000 | g | Depfa ACS Bank | 5.125 | 03/16/37 | Aaa | 854,847 | |||||||
| 100,000 | Deutsche Bank AG. | 4.875 | 05/20/13 | Aa1 | 98,371 | ||||||||
| 200,000 | HSBC Holdings plc | 6.500 | 09/15/37 | Aa3 | 182,317 | ||||||||
| 100,000 | i | Huntington Capital III | 6.650 | 05/15/37 | Baa1 | 62,970 | |||||||
| 200,000 | JPMorgan Chase & Co | 6.400 | 05/15/38 | Aa2 | 185,507 | ||||||||
| 250,000 | M&I Marshall & Ilsley Bank | 4.400 | 03/15/10 | Aa3 | 245,056 | ||||||||
| 50,000 | National City Corp | 4.000 | 02/01/11 | A1 | 40,438 | ||||||||
| 250,000 | g | Nationwide Building Society | 5.500 | 07/18/12 | Aaa | 253,732 | |||||||
| 100,000 | g,i | Royal Bank of Scotland Group plc | 6.990 | 12/30/49 | Aa1 | 90,003 | |||||||
| 150,000 | Union Bank of California NA | 5.950 | 05/11/16 | A1 | 142,289 | ||||||||
| 100,000 | US Bank NA | 5.700 | 12/15/08 | Aa2 | 101,014 | ||||||||
| 150,000 | eg | VTB Capital S.A. | 6.875 | 05/29/18 | A2 | 146,250 | |||||||
| 25,000 | Wachovia Bank NA | 4.800 | 11/01/14 | Aa2 | 22,639 | ||||||||
| 100,000 | Wachovia Bank NA | 5.850 | 02/01/37 | Aa2 | 79,602 | ||||||||
| 25,000 | Wachovia Corp | 5.500 | 05/01/13 | Aa3 | 23,928 | ||||||||
| 50,000 | i | Wachovia Corp | 7.980 | 12/30/49 | A2 | 45,920 | |||||||
| 50,000 | Wells Fargo & Co | 4.375 | 01/31/13 | Aa1 | 48,415 | ||||||||
| 100,000 | e | Wells Fargo Bank NA | 4.750 | 02/09/15 | Aa1 | 95,384 | |||||||
TOTAL DEPOSITORY INSTITUTIONS | 6,064,156 | ||||||||||||
EATING AND DRINKING PLACES - 0.03% | |||||||||||||
| 25,000 | McDonald’s Corp | 5.350 | 03/01/18 | A3 | 24,391 | ||||||||
TOTAL EATING AND DRINKING PLACES | 24,391 | ||||||||||||
ELECTRIC, GAS, AND SANITARY SERVICES - 1.20% | |||||||||||||
| 125,000 | American Water Capital Corp | 6.085 | 10/15/17 | Baa2 | 119,900 | ||||||||
| 100,000 | Centerpoint Energy, Inc | 6.500 | 05/01/18 | Ba1 | 97,667 | ||||||||
| 100,000 | Exelon Generation Co LLC | 6.200 | 10/01/17 | A3 | 97,400 | ||||||||
| 100,000 | e | Florida Power & Light Co | 4.850 | 02/01/13 | Aa3 | 100,257 | |||||||
| 100,000 | Kinder Morgan Energy Partners LP | 5.950 | 02/15/18 | Baa2 | 97,425 | ||||||||
| 50,000 | Midamerican Energy Co | 5.800 | 10/15/36 | A2 | 46,508 | ||||||||
| 100,000 | e | Nevada Power Co | 6.650 | 04/01/36 | Baa3 | 96,520 | |||||||
| 50,000 | Northern States Power Co | 6.250 | 06/01/36 | A2 | 51,112 | ||||||||
| 103,000 | Progress Energy, Inc | 7.100 | 03/01/11 | Baa2 | 108,381 | ||||||||
| 50,000 | Sempra Energy | 6.150 | 06/15/18 | Baa1 | 49,530 | ||||||||
| 100,000 | Texas Eastern Transmission LP | 7.300 | 12/01/10 | A3 | 106,755 | ||||||||
| 25,000 | Veolia Environnement | 5.250 | 06/03/13 | A3 | 24,977 | ||||||||
| 100,000 | e | Virginia Electric and Power Co | 4.750 | 03/01/13 | Baa1 | 98,411 | |||||||
TOTAL ELECTRIC, GAS, AND SANITARY SERVICES | 1,094,843 | ||||||||||||
ELECTRONIC AND OTHER ELECTRIC EQUIPMENT - 0.28% | |||||||||||||
| 250,000 | Koninklijke Philips Electronics NV | 6.875 | 03/11/38 | A3 | 258,105 | ||||||||
TOTAL ELECTRONIC AND OTHER ELECTRIC EQUIPMENT | 258,105 | ||||||||||||
114
TIAA-CREF LIFE FUNDS - Bond Fund
PRINCIPAL | ISSUER | RATE | MATURITY DATE | MOODY’S RATING+ | VALUE | ||||||||
FOOD AND KINDRED PRODUCTS - 0.77% | |||||||||||||
| 50,000 | Archer-Daniels-Midland Co | 5.450 | 03/15/18 | A2 | $ | 48,782 | |||||||
| 60,000 | Bottling Group LLC | 4.625 | 11/15/12 | Aa2 | 60,671 | ||||||||
| 100,000 | Bunge Ltd Finance Corp | 5.100 | 07/15/15 | Baa2 | 90,949 | ||||||||
| 98,000 | e | ConAgra Foods, Inc | 5.819 | 06/15/17 | Baa2 | 98,193 | |||||||
| 62,000 | ConAgra Foods, Inc | 6.750 | 09/15/11 | Baa1 | 64,560 | ||||||||
| 50,000 | g | Dr. Pepper Snapple Group, Inc | 6.820 | 05/01/18 | Baa3 | 50,206 | |||||||
| 25,000 | eg | Dr. Pepper Snapple Group, Inc | 7.450 | 05/01/38 | Baa3 | 26,235 | |||||||
| 100,000 | Kraft Foods, Inc | 6.000 | 02/11/13 | Baa2 | 101,032 | ||||||||
| 50,000 | Kraft Foods, Inc | 6.125 | 08/23/18 | Baa2 | 48,421 | ||||||||
| 110,000 | g | Miller Brewing Co | 4.250 | 08/15/08 | Baa1 | 110,150 | |||||||
TOTAL FOOD AND KINDRED PRODUCTS | 699,199 | ||||||||||||
FOOD STORES - 0.17% | |||||||||||||
| 50,000 | Delhaize Group | 6.500 | 06/15/17 | Baa3 | 50,436 | ||||||||
| 100,000 | Kroger Co | 6.400 | 08/15/17 | Baa2 | 101,996 | ||||||||
TOTAL FOOD STORES | 152,432 | ||||||||||||
GENERAL MERCHANDISE STORES - 0.58% | |||||||||||||
| 100,000 | JC Penney Corp, Inc | 5.750 | 02/15/18 | Baa3 | 89,222 | ||||||||
| 50,000 | Macys Retail Holdings, Inc | 7.875 | 07/15/15 | Baa3 | 50,366 | ||||||||
| 220,000 | Sears Roebuck Acceptance | 6.750 | 08/15/11 | Ba2 | 211,772 | ||||||||
| 50,000 | e | Target Corp | 6.000 | 01/15/18 | A2 | 50,179 | |||||||
| 25,000 | Wal-Mart Stores, Inc | 4.250 | 04/15/13 | Aa2 | 24,860 | ||||||||
| 100,000 | Wal-Mart Stores, Inc | 6.200 | 04/15/38 | Aa2 | 98,255 | ||||||||
TOTAL GENERAL MERCHANDISE STORES | 524,654 | ||||||||||||
HEALTH SERVICES - 0.11% | |||||||||||||
| 100,000 | Quest Diagnostics, Inc | 6.400 | 07/01/17 | Baa3 | 99,059 | ||||||||
TOTAL HEALTH SERVICES | 99,059 | ||||||||||||
HOLDING AND OTHER INVESTMENT OFFICES - 0.11% | |||||||||||||
| 15,000 | e | BHP Billiton Finance Ltd | 5.400 | 03/29/17 | A1 | 14,318 | |||||||
| 100,000 | iStar Financial, Inc | 5.700 | 03/01/14 | Baa2 | 84,000 | ||||||||
TOTAL HOLDING AND OTHER INVESTMENT OFFICES | 98,318 | ||||||||||||
INDUSTRIAL MACHINERY AND EQUIPMENT - 0.22% | |||||||||||||
| 200,000 | Caterpillar Financial Services Corp | 2.700 | 07/15/08 | A2 | 199,960 | ||||||||
TOTAL INDUSTRIAL MACHINERY AND EQUIPMENT | 199,960 | ||||||||||||
INSTRUMENTS AND RELATED PRODUCTS - 0.22% | |||||||||||||
| 100,000 | Medtronic, Inc | 4.750 | 09/15/15 | A1 | 97,052 | ||||||||
| 100,000 | Xerox Corp | 7.625 | 06/15/13 | Baa2 | 103,841 | ||||||||
TOTAL INSTRUMENTS AND RELATED PRODUCTS | 200,893 | ||||||||||||
INSURANCE CARRIERS - 0.73% | |||||||||||||
| 100,000 | American International Group, Inc | 5.050 | 10/01/15 | Aa2 | 90,608 | ||||||||
| 100,000 | Chubb Corp | 6.000 | 05/11/37 | A2 | 90,984 | ||||||||
| 100,000 | i | Chubb Corp | 6.375 | 03/29/67 | A3 | 91,475 | |||||||
| 100,000 | Metlife, Inc | 5.000 | 06/15/15 | A2 | 97,152 | ||||||||
| 100,000 | g | Principal Life Global Funding I | 5.125 | 10/15/13 | Aa2 | 98,618 | |||||||
| 100,000 | g | Prudential Funding LLC | 6.750 | 09/15/23 | A1 | 97,330 | |||||||
| 100,000 | Travelers Property Casualty Corp | 6.375 | 03/15/33 | A2 | 95,510 | ||||||||
TOTAL INSURANCE CARRIERS | 661,677 | ||||||||||||
115
TIAA-CREF LIFE FUNDS - Bond Fund
PRINCIPAL | ISSUER | RATE | MATURITY DATE | MOODY’S RATING+ | VALUE | ||||||||
METAL MINING - 0.27% | |||||||||||||
| 50,000 | Barrick Gold Finance Co | 4.875 | 11/15/14 | Baa1 | $ | 47,639 | |||||||
| 100,000 | g | Corp Nacional del Cobre de Chile - CODELCO | 4.750 | 10/15/14 | Aa3 | 96,166 | |||||||
| 50,000 | Rio Tinto Finance USA Ltd | 5.875 | 07/15/13 | A3 | 50,277 | ||||||||
| 50,000 | Rio Tinto Finance USA Ltd | 6.500 | 07/15/18 | A3 | 50,152 | ||||||||
TOTAL METAL MINING | 244,234 | ||||||||||||
MOTION PICTURES - 0.10% | |||||||||||||
| 100,000 | Historic TW, Inc | 6.625 | 05/15/29 | Baa2 | 90,998 | ||||||||
TOTAL MOTION PICTURES | 90,998 | ||||||||||||
NONDEPOSITORY INSTITUTIONS - 1.72% | |||||||||||||
| 450,000 | General Electric Capital Corp | 5.500 | 06/04/14 | Aaa | 459,261 | ||||||||
| 50,000 | General Electric Capital Corp | 6.000 | 06/15/12 | Aaa | 51,669 | ||||||||
| 200,000 | e | HSBC Finance Corp | 4.750 | 07/15/13 | Aa3 | 191,028 | |||||||
| 100,000 | HSBC Finance Corp | 5.250 | 01/14/11 | Aa3 | 100,240 | ||||||||
| 125,000 | HSBC Finance Corp | 5.900 | 06/19/12 | Aa3 | 125,499 | ||||||||
| 100,000 | International Lease Finance Corp | 5.650 | 06/01/14 | A1 | 86,867 | ||||||||
| 50,000 | International Lease Finance Corp | 6.625 | 11/15/13 | A1 | 44,925 | ||||||||
| 300,000 | Kreditanstalt fuer Wiederaufbau | 4.500 | 07/16/18 | NR | 297,653 | ||||||||
| 100,000 | e | MBNA Corp | 6.125 | 03/01/13 | Aa2 | 102,805 | |||||||
| 100,000 | e | Toyota Motor Credit Corp | 2.875 | 08/01/08 | Aaa | 99,976 | |||||||
TOTAL NONDEPOSITORY INSTITUTIONS | 1,559,923 | ||||||||||||
NONMETALLIC MINERALS, EXCEPT FUELS - 0.03% | |||||||||||||
| 25,000 | Vulcan Materials Co | 6.300 | 06/15/13 | A3 | 25,329 | ||||||||
TOTAL NONMETALLIC MINERALS, EXCEPT FUELS | 25,329 | ||||||||||||
OIL AND GAS EXTRACTION - 1.82% | |||||||||||||
| 100,000 | Baker Hughes, Inc | 6.875 | 01/15/29 | A2 | 108,879 | ||||||||
| 50,000 | BJ Services Co | 5.750 | 06/01/11 | Baa1 | 50,529 | ||||||||
| 100,000 | Burlington Resources Finance Co | 7.200 | 08/15/31 | A2 | 113,392 | ||||||||
| 100,000 | e | Canadian Natural Resources Ltd | 5.150 | 02/01/13 | Baa2 | 100,173 | |||||||
| 100,000 | Husky Energy, Inc | 6.800 | 09/15/37 | Baa2 | 99,072 | ||||||||
| 100,000 | Nexen, Inc | 6.400 | 05/15/37 | Baa2 | 94,684 | ||||||||
| 250,000 | eg | Pemex Projec Funding Master Trust | 5.750 | 03/01/18 | Baa1 | 246,875 | |||||||
| 500,000 | g | Pemex Projec Funding Master Trust | 6.625 | 06/15/38 | Baa1 | 511,898 | |||||||
| 125,000 | Petrobras International Finance Co | 5.875 | 03/01/18 | Baa1 | 120,243 | ||||||||
| 100,000 | Weatherford International, Inc | 5.950 | 06/15/12 | Baa1 | 101,976 | ||||||||
| 100,000 | e | XTO Energy, Inc | 6.250 | 04/15/13 | Baa2 | 102,980 | |||||||
TOTAL OIL AND GAS EXTRACTION | 1,650,701 | ||||||||||||
PAPER AND ALLIED PRODUCTS - 0.26% | |||||||||||||
| 90,000 | e | Cenveo Corp | 7.875 | 12/01/13 | B3 | 75,150 | |||||||
| 50,000 | International Paper Co | 7.400 | 06/15/14 | Baa3 | 49,904 | ||||||||
| 100,000 | Kimberly-Clark Corp | 6.625 | 08/01/37 | A2 | 107,100 | ||||||||
TOTAL PAPER AND ALLIED PRODUCTS | 232,154 | ||||||||||||
PETROLEUM AND COAL PRODUCTS - 0.05% | |||||||||||||
| 50,000 | Valero Energy Corp | 6.625 | 06/15/37 | Baa3 | 45,842 | ||||||||
TOTAL PETROLEUM AND COAL PRODUCTS | 45,842 | ||||||||||||
PIPELINES, EXCEPT NATURAL GAS - 0.15% | |||||||||||||
| 50,000 | g | Rockies Express Pipeline LLC | 6.250 | 07/15/13 | Baa3 | 50,550 | |||||||
| 100,000 | TransCanada Pipelines Ltd | 5.850 | 03/15/36 | A2 | 88,627 | ||||||||
TOTAL PIPELINES, EXCEPT NATURAL GAS | 139,177 | ||||||||||||
116
TIAA-CREF LIFE FUNDS - Bond Fund
PRINCIPAL | ISSUER | RATE | MATURITY DATE | MOODY’S RATING+ | VALUE | ||||||||
PRIMARY METAL INDUSTRIES - 0.32% | |||||||||||||
| 100,000 | g | ArcelorMittal | 5.375 | 06/01/13 | Baa2 | $ | 98,468 | ||||||
| 100,000 | g | Xstrata Finance Canada Ltd | 5.500 | 11/16/11 | Baa2 | 98,918 | |||||||
| 100,000 | g | Xstrata Finance Canada Ltd | 6.900 | 11/15/37 | Baa2 | 96,190 | |||||||
TOTAL PRIMARY METAL INDUSTRIES | 293,576 | ||||||||||||
PRINTING AND PUBLISHING - 0.42% | |||||||||||||
| 100,000 | Idearc, Inc | 8.000 | 11/15/16 | B3 | 62,875 | ||||||||
| 122,000 | Morris Publishing Group LLC | 7.000 | 08/01/13 | B2 | 74,420 | ||||||||
| 100,000 | News America, Inc | 5.300 | 12/15/14 | Baa2 | 98,025 | ||||||||
| 100,000 | Thomson Corp | 5.700 | 10/01/14 | Baa1 | 98,456 | ||||||||
50,000 | Thomson Corp | 5.950 | 07/15/13 | Baa1 | 50,201 | ||||||||
TOTAL PRINTING AND PUBLISHING | 383,977 | ||||||||||||
RAILROAD TRANSPORTATION - 0.15% | |||||||||||||
100,000 | Norfolk Southern Corp | 5.590 | 05/17/25 | Baa1 | 90,396 | ||||||||
50,000 | g | Norfolk Southern Corp | 5.750 | 04/01/18 | Baa1 | 49,209 | |||||||
TOTAL RAILROAD TRANSPORTATION | 139,605 | ||||||||||||
SECURITY AND COMMODITY BROKERS - 1.82% | |||||||||||||
100,000 | Bear Stearns Cos, Inc | 6.400 | 10/02/17 | Baa1 | 98,819 | ||||||||
100,000 | Eaton Vance Corp | 6.500 | 10/02/17 | A3 | 100,882 | ||||||||
100,000 | i | Goldman Sachs Capital II | 5.793 | 12/30/49 | A2 | 69,536 | |||||||
100,000 | Goldman Sachs Group, Inc | 5.150 | 01/15/14 | Aa3 | 96,797 | ||||||||
25,000 | Goldman Sachs Group, Inc | 5.950 | 01/18/18 | Aa3 | 23,999 | ||||||||
50,000 | Goldman Sachs Group, Inc | 6.150 | 04/01/18 | Aa3 | 48,508 | ||||||||
25,000 | Goldman Sachs Group, Inc | 6.750 | 10/01/37 | A1 | 22,869 | ||||||||
100,000 | i | Lehman Brothers Holdings Capital Trust V | 5.857 | 12/30/49 | A3 | 65,250 | |||||||
100,000 | Lehman Brothers Holdings, Inc | 5.250 | 02/06/12 | A1 | 94,633 | ||||||||
50,000 | i | Lehman Brothers Holdings, Inc | 6.000 | 05/03/32 | A2 | 38,227 | |||||||
50,000 | Lehman Brothers Holdings, Inc | 6.875 | 05/02/18 | A1 | 48,405 | ||||||||
75,000 | Lehman Brothers Holdings, Inc | 7.500 | 05/11/38 | A2 | 69,568 | ||||||||
125,000 | Merrill Lynch & Co, Inc | 6.875 | 04/25/18 | A1 | 118,966 | ||||||||
250,000 | Morgan Stanley | 5.550 | 04/27/17 | Aa3 | 223,599 | ||||||||
100,000 | Morgan Stanley | 5.750 | 10/18/16 | Aa3 | 92,437 | ||||||||
480,000 | g | Nuveen Investments, Inc | 10.500 | 11/15/15 | B3 | 442,800 | |||||||
TOTAL SECURITY AND COMMODITY BROKERS | 1,655,295 | ||||||||||||
TRANSPORTATION BY AIR - 0.11% | |||||||||||||
100,000 | FedEx Corp | 3.500 | 04/01/09 | Baa2 | 99,661 | ||||||||
TOTAL TRANSPORTATION BY AIR | 99,661 | ||||||||||||
TRANSPORTATION EQUIPMENT - 0.36% | |||||||||||||
100,000 | g | BAE Systems Holdings, Inc | 6.400 | 12/15/11 | Baa2 | 102,819 | |||||||
100,000 | Boeing Co | 6.125 | 02/15/33 | A2 | 101,202 | ||||||||
75,000 | Honeywell International, Inc | 5.700 | 03/15/37 | A2 | 70,661 | ||||||||
50,000 | Lockheed Martin Corp | 6.150 | 09/01/36 | Baa1 | 49,467 | ||||||||
TOTAL TRANSPORTATION EQUIPMENT | 324,149 | ||||||||||||
WHOLESALE TRADE-NONDURABLE GOODS - 0.07% | |||||||||||||
65,000 | Procter & Gamble Co | 5.550 | 03/05/37 | Aa3 | 62,473 | ||||||||
TOTAL WHOLESALE TRADE-NONDURABLE GOODS | 62,473 | ||||||||||||
| TOTAL CORPORATE BONDS (Cost $20,473,575) | 19,895,746 | ||||||||||||
117
TIAA-CREF LIFE FUNDS - Bond Fund
PRINCIPAL | ISSUER | RATE | MATURITY DATE | MOODY’S RATING+ | VALUE | ||||||||
GOVERNMENT BONDS - 57.01% | |||||||||||||
AGENCY SECURITIES - 10.48% | |||||||||||||
550,000 | Federal Farm Credit Bank (FFCB) | 3.375 | 07/15/08 | Aaa | $ | 550,163 | |||||||
550,000 | FFCB | 4.125 | 04/15/09 | Aaa | 555,413 | ||||||||
600,000 | FFCB | 2.625 | 04/21/11 | Aaa | 585,596 | ||||||||
1,000,000 | Federal Home Loan Bank (FHLB) | 5.000 | 10/16/09 | Aaa | 1,006,063 | ||||||||
1,000,000 | Federal Home Loan Mortgage Corp (FHLMC) | 3.500 | 05/29/13 | Aaa | 971,686 | ||||||||
400,000 | FHLMC | 3.750 | 06/28/13 | Aaa | 392,670 | ||||||||
200,000 | FHLMC | 5.750 | 06/27/16 | Aa2 | 202,447 | ||||||||
1,500,000 | FHLMC | 5.125 | 10/18/16 | Aaa | 1,542,440 | ||||||||
1,575,000 | FHLMC | 5.125 | 11/17/17 | Aaa | 1,618,097 | ||||||||
1,000,000 | Federal National Mortgage Association (FNMA) | 5.100 | 09/10/09 | Aaa | 1,004,200 | ||||||||
100,000 | FNMA | 2.375 | 05/20/10 | Aaa | 98,566 | ||||||||
500,000 | FNMA | 5.375 | 06/12/17 | Aaa | 522,679 | ||||||||
100,000 | FNMA | 5.625 | 07/15/37 | Aaa | 106,330 | ||||||||
359,375 | Totem Ocean Trailer Express, Inc | 4.514 | 12/18/19 | NR | 366,401 | ||||||||
TOTAL AGENCY SECURITIES | 9,522,751 | ||||||||||||
FOREIGN GOVERNMENT BONDS - 4.06% | |||||||||||||
250,000 | e | Canada Mortgage & Housing Corp | 4.800 | 10/01/10 | Aaa | 258,201 | |||||||
100,000 | e | China Development Bank | 5.000 | 10/15/15 | A1 | 97,739 | |||||||
100,000 | Development Bank of Japan | 4.250 | 06/09/15 | Aaa | 99,950 | ||||||||
100,000 | Eksportfinans A/S | 5.000 | 02/14/12 | Aaa | 103,038 | ||||||||
100,000 | g | Emirate of Abu Dhabi | 5.500 | 08/02/12 | Aa2 | 102,241 | |||||||
100,000 | e | European Investment Bank | 4.875 | 02/15/36 | Aaa | 98,384 | |||||||
250,000 | Federal Republic of Germany | 3.875 | 06/01/10 | Aaa | 251,225 | ||||||||
200,000 | e | Federative Republic of Brazil | 6.000 | 01/17/17 | Ba1 | 203,900 | |||||||
250,000 | Federative Republic of Brazil | 8.000 | 01/15/18 | NR | 277,625 | ||||||||
100,000 | Hellenic Republic Government International Bond | 4.625 | 06/25/13 | A1 | 99,938 | ||||||||
100,000 | Landwirtschaftliche Rentenbank | 5.250 | 07/02/12 | Aaa | 105,270 | ||||||||
100,000 | Mexico Government International Bond | 6.050 | 01/11/40 | Baa1 | 96,150 | ||||||||
1,000,000 | e | Province of Manitoba Canada | 4.450 | 04/12/10 | Aa1 | 1,018,411 | |||||||
190,000 | Province of Ontario | 3.375 | 05/20/11 | Aa1 | 188,425 | ||||||||
110,000 | e | Province of Quebec Canada | 4.625 | 05/14/18 | Aa2 | 107,920 | |||||||
500,000 | Province of Saskatchewan Canada | 8.000 | 02/01/13 | Aa1 | 580,253 | ||||||||
TOTAL FOREIGN GOVERNMENT BONDS | 3,688,670 | ||||||||||||
MORTGAGE BACKED SECURITIES - 33.63% | |||||||||||||
358,815 | Federal Home Loan Mortgage Corp Gold (FGLMC) | 5.000 | 02/01/19 | 357,081 | |||||||||
276,083 | FGLMC | 4.500 | 07/01/20 | 268,526 | |||||||||
100,856 | FGLMC | 4.500 | 07/01/33 | 94,019 | |||||||||
345,595 | FGLMC | 5.000 | 07/01/33 | 333,290 | |||||||||
288,098 | FGLMC | 5.000 | 11/01/33 | 277,840 | |||||||||
526,138 | FGLMC | 6.000 | 11/01/33 | 534,513 | |||||||||
74,737 | FGLMC | 6.500 | 05/01/36 | 77,142 | |||||||||
139,199 | FGLMC | 6.500 | 12/01/36 | 142,589 | |||||||||
617,415 | FGLMC | 5.500 | 04/01/37 | 608,830 | |||||||||
715,409 | FGLMC | 5.500 | 05/01/37 | 705,461 | |||||||||
368,410 | FGLMC | 6.000 | 08/01/37 | 372,548 | |||||||||
196,368 | FGLMC | 6.500 | 09/01/37 | 202,624 | |||||||||
153,720 | FGLMC | 6.500 | 05/01/38 | 158,618 | |||||||||
111,744 | i | Federal Home Loan Mortgage Corp (FHLMC) | 5.060 | 02/01/36 | 112,848 | ||||||||
564,670 | i | FHLMC | 5.800 | 07/01/36 | 576,907 | ||||||||
76,420 | i | FHLMC | 5.924 | 09/01/36 | 78,067 | ||||||||
340,722 | i | FHLMC | 6.106 | 09/01/36 | 348,785 | ||||||||
118
TIAA-CREF LIFE FUNDS - Bond Fund
PRINCIPAL | ISSUER | RATE | MATURITY DATE | MOODY’S RATING+ | VALUE | ||||||||
98,462 | i | FHLMC | 5.005 | 09/01/36 | $ | 98,722 | |||||||
267,348 | i | FHLMC | 5.708 | 03/01/37 | 270,392 | ||||||||
445,643 | i | FHLMC | 5.878 | 04/01/37 | 453,341 | ||||||||
254,119 | i | FHLMC | 6.079 | 05/01/37 | 258,563 | ||||||||
258,460 | Federal National Mortgage Association (FNMA) | 6.261 | 12/01/08 | 259,957 | |||||||||
26,683 | FNMA | 5.000 | 06/01/13 | 26,835 | |||||||||
1,678,911 | FNMA | 4.557 | 01/01/15 | 1,633,587 | |||||||||
129,829 | FNMA | 5.500 | 04/01/18 | 131,874 | |||||||||
96,521 | FNMA | 5.500 | 05/01/18 | 97,939 | |||||||||
150,000 | FNMA | 4.000 | 02/25/19 | 139,548 | |||||||||
144,321 | FNMA | 4.500 | 03/01/19 | 140,777 | |||||||||
325,890 | FNMA | 5.500 | 07/01/20 | 330,470 | |||||||||
241,969 | FNMA | 4.500 | 12/01/20 | 235,421 | |||||||||
156,340 | FNMA | 4.500 | 03/01/23 | 151,230 | |||||||||
385,125 | FNMA | 5.000 | 04/01/23 | 381,309 | |||||||||
227,548 | FNMA | 5.500 | 02/01/24 | 227,401 | |||||||||
522,577 | FNMA | 5.500 | 07/01/24 | 521,890 | |||||||||
19,406 | FNMA | 5.500 | 09/01/24 | 19,381 | |||||||||
163,859 | FNMA | 5.500 | 01/01/33 | 162,576 | |||||||||
859,992 | FNMA | 5.500 | 07/01/33 | 852,719 | |||||||||
225,518 | FNMA | 5.500 | 07/01/33 | 223,612 | |||||||||
525,596 | FNMA | 5.500 | 07/01/33 | 521,152 | |||||||||
334,230 | FNMA | 4.500 | 08/01/33 | 311,422 | |||||||||
419,717 | FNMA | 4.500 | 09/01/33 | 391,337 | |||||||||
634,865 | FNMA | 6.000 | 10/01/33 | 644,177 | |||||||||
1,480,912 | FNMA | 5.500 | 11/01/33 | 1,468,389 | |||||||||
294,102 | FNMA | 5.000 | 11/01/33 | 283,722 | |||||||||
648,071 | FNMA | 5.000 | 03/01/34 | 625,199 | |||||||||
1,163,354 | FNMA | 5.000 | 03/01/34 | 1,122,296 | |||||||||
168,788 | FNMA | 5.500 | 04/01/34 | 167,045 | |||||||||
96,716 | FNMA | 5.000 | 08/01/34 | 93,331 | |||||||||
64,584 | FNMA | 6.500 | 02/01/35 | 66,743 | |||||||||
1,224,062 | FNMA | 5.000 | 02/25/35 | 1,226,364 | |||||||||
290,965 | FNMA | 5.500 | 04/01/35 | 287,959 | |||||||||
460,249 | FNMA | 4.500 | 05/01/35 | 428,841 | |||||||||
93,647 | FNMA | 7.500 | 06/01/35 | 99,938 | |||||||||
113,617 | FNMA | 5.500 | 07/01/35 | 112,337 | |||||||||
50,502 | FNMA | 7.500 | 07/01/35 | 53,895 | |||||||||
159,080 | FNMA | 5.000 | 08/01/35 | 153,019 | |||||||||
431,057 | FNMA | 5.500 | 09/01/35 | 427,412 | |||||||||
154,134 | FNMA | 5.500 | 10/01/35 | 152,397 | |||||||||
327,398 | FNMA | 6.000 | 06/01/36 | 333,213 | |||||||||
294,960 | i | FNMA | 5.986 | 07/01/36 | 300,674 | ||||||||
413,182 | i | FNMA | 5.976 | 07/01/36 | 421,900 | ||||||||
161,669 | FNMA | 6.500 | 09/01/36 | 166,668 | |||||||||
230,508 | FNMA | 6.000 | 10/01/36 | 232,881 | |||||||||
131,559 | FNMA | 6.500 | 12/01/36 | 134,599 | |||||||||
129,820 | FNMA | 5.000 | 02/01/37 | 124,562 | |||||||||
582,747 | FNMA | 5.500 | 02/01/37 | 575,452 | |||||||||
141,522 | FNMA | 7.000 | 02/01/37 | 148,505 | |||||||||
462,561 | FNMA | 5.500 | 03/01/37 | 456,528 | |||||||||
391,616 | FNMA | 6.500 | 03/01/37 | 403,641 | |||||||||
221,358 | FNMA | 7.000 | 04/01/37 | 232,280 | |||||||||
254,746 | FNMA | 6.000 | 07/01/37 | 257,314 | |||||||||
119
TIAA-CREF LIFE FUNDS - Bond Fund
PRINCIPAL | ISSUER | RATE | MATURITY DATE | MOODY’S RATING+ | VALUE | ||||||||
57,152 | FNMA | 6.500 | 08/01/37 | $ | 58,908 | ||||||||
285,894 | FNMA | 6.500 | 10/01/37 | 294,673 | |||||||||
237,341 | FNMA | 6.500 | 11/01/37 | 244,629 | |||||||||
144,302 | FNMA | 7.000 | 11/01/37 | 151,422 | |||||||||
232,899 | FNMA | 5.500 | 01/01/38 | 229,862 | |||||||||
27,189 | FNMA | 6.500 | 01/01/38 | 28,024 | |||||||||
1,776,395 | FNMA | 5.500 | 02/01/38 | 1,753,046 | |||||||||
640,259 | FNMA | 5.500 | 02/01/38 | 631,843 | |||||||||
16,940 | FNMA | 6.500 | 02/01/38 | 17,460 | |||||||||
149,479 | FNMA | 6.000 | 03/01/38 | 150,971 | |||||||||
32,901 | FNMA | 6.500 | 03/01/38 | 33,908 | |||||||||
232,230 | FNMA | 6.500 | 03/01/38 | 239,338 | |||||||||
384,286 | FNMA | 6.500 | 03/01/38 | 396,048 | |||||||||
106,853 | FNMA | 6.500 | 03/01/38 | 110,124 | |||||||||
74,362 | FNMA | 6.500 | 03/01/38 | 76,639 | |||||||||
65,790 | FNMA | 7.000 | 03/01/38 | 69,037 | |||||||||
104,683 | FNMA | 7.000 | 03/01/38 | 109,850 | |||||||||
47,959 | FNMA | 7.000 | 03/01/38 | 50,326 | |||||||||
368,037 | Government National Mortgage Association (GNMA) | 5.500 | 07/20/33 | 366,280 | |||||||||
58,728 | GNMA | 5.000 | 03/15/34 | 57,121 | |||||||||
290,180 | GNMA | 5.000 | 06/15/34 | 282,238 | |||||||||
494,817 | GNMA | 5.000 | 01/15/38 | 480,268 | |||||||||
449,543 | GNMA | 5.500 | 05/15/38 | 448,125 | |||||||||
TOTAL MORTGAGE BACKED SECURITIES | 30,572,564 | ||||||||||||
U.S. TREASURY SECURITIES - 8.84% | |||||||||||||
550,000 | United States Treasury Bond | 2.625 | 05/31/10 | 550,344 | |||||||||
199,000 | United States Treasury Bond | 2.500 | 03/31/13 | 191,988 | |||||||||
99,000 | United States Treasury Bond | 3.125 | 04/30/13 | 98,172 | |||||||||
1,165,000 | United States Treasury Bond | 3.500 | 05/31/13 | 1,173,647 | |||||||||
136,000 | United States Treasury Bond | 4.000 | 02/15/15 | 142,088 | |||||||||
17,000 | United States Treasury Bond | 3.500 | 02/15/18 | 16,364 | |||||||||
538,000 | United States Treasury Bond | 3.875 | 05/15/18 | 533,503 | |||||||||
93,000 | United States Treasury Bond | 8.000 | 11/15/21 | 126,139 | |||||||||
184,000 | United States Treasury Bond | 5.000 | 05/15/37 | 197,743 | |||||||||
800,000 | United States Treasury Bond | 4.375 | 02/15/38 | 779,750 | |||||||||
3,197,118 | United States Treasury Inflation Indexed Bonds | 0.875 | 04/15/10 | 3,252,320 | |||||||||
541,045 | United States Treasury Inflation Indexed Bonds | 2.375 | 04/15/11 | 573,296 | |||||||||
1,000,000 | j | United States Treasury Strip Principal | 08/15/27 | 403,723 | |||||||||
TOTAL U.S. TREASURY SECURITIES | 8,039,077 | ||||||||||||
| TOTAL GOVERNMENT BONDS (Cost $51,931,308) | 51,823,062 | ||||||||||||
STRUCTURED ASSETS - 17.53% | |||||||||||||
ASSET BACKED - 10.04% | |||||||||||||
250,000 | AmeriCredit Automobile Receivables Trust Series 2006-AF (Class A4) | 5.640 | 09/06/13 | Aaa | 251,785 | ||||||||
500,000 | AmeriCredit Automobile Receivables Trust Series 2007-BF (Class A3A) | 5.160 | 04/06/12 | Aaa | 499,681 | ||||||||
200,000 | Capital One Auto Finance Trust Series 2007-B (Class A3A) | 5.030 | 04/15/12 | A3 | 195,004 | ||||||||
644,940 | Centex Home Equity Series 2002-A (Class AF6) | 5.540 | 01/25/32 | Aaa | 628,275 | ||||||||
400,000 | Centex Home Equity Series 2004-C (Class AF5) | 5.980 | 06/25/34 | Aaa | 355,096 | ||||||||
424,754 | i | Chase Funding Loan Acquisition Trust Series 2001-C2 (Class IA5) | 6.468 | 02/25/13 | Aaa | 402,854 | |||||||
120
TIAA-CREF LIFE FUNDS - Bond Fund
PRINCIPAL | ISSUER | RATE | MATURITY DATE | MOODY’S RATING+ | VALUE | ||||||||
394,902 | i | Chase Funding Mortgage Loan Asset-Backed Certificates Series 2004-2 (Class 1B) | 5.700 | 02/25/35 | Baa2 | $ | 188,130 | ||||||
341,152 | CIT Group Home Equity Loan Trust Series 2002-2 (Class MF2) | 6.390 | 12/25/30 | A3 | 228,009 | ||||||||
75,000 | Countrywide Alternative Loan Trust Series 2004-29CB (Class A7) | 5.375 | 01/25/35 | NR | 71,477 | ||||||||
103,094 | Countrywide Alternative Loan Trust Series 2004-30CB (Class 1A15) | 5.500 | 08/25/16 | Aaa | 95,949 | ||||||||
1,000,000 | Flagstar Home Equity Loan Trust Series 2007-1A (Class AF3) | 5.781 | 01/25/35 | A2 | 792,810 | ||||||||
47,129 | i | GE Capital Commercial Mortgage Corp | 5.512 | 11/10/45 | Aaa | 45,000 | |||||||
250,000 | GMAC Mortgage Corporation Loan Trust 2006-HLTV A3 | 5.590 | 10/25/29 | Baa3 | 203,623 | ||||||||
250,000 | GMAC Mortgage Corporation Loan Trust 2006-HLTV A4 | 5.810 | 10/25/29 | Baa3 | 135,463 | ||||||||
84,983 | i | GSAA Trust Series 2004-3 (Class AF3) | 5.691 | 04/25/34 | Aaa | 85,120 | |||||||
562,871 | HFC Home Equity Loan Asset Backed Certificates Series 2007-1 (Class A1F) | 5.910 | 03/20/36 | Aaa | 563,984 | ||||||||
1,000,000 | Household Automotive Trust Series 2006-3 (Class A4) | 5.340 | 09/17/13 | Aaa | 1,004,260 | ||||||||
250,000 | JPMorgan Auto Receivables Trust Series 2007-A (Class A3) | 5.190 | 02/15/11 | Aaa | 251,932 | ||||||||
172,853 | Marriott Vacation Club Owner Trust Series 2006-1A (Class A) | 5.737 | 04/20/28 | Aaa | 167,414 | ||||||||
499,787 | Marriott Vacation Club Owner Trust Series 2006-2A (Class A) | 5.362 | 10/20/28 | Aaa | 480,944 | ||||||||
29,522 | m, v | New York City Tax Lien Series 2006-AA (Class A) | 5.930 | 11/10/19 | Aaa | 29,559 | |||||||
100,000 | Private Export Funding Corp | 3.550 | 04/15/13 | Aaa | 96,855 | ||||||||
250,000 | Renaissance Home Equity Loan Trust Series 2006-3 (Class AF3) | 5.586 | 11/25/36 | Aaa | 239,160 | ||||||||
100,000 | Residential Accredit Loans, Inc Series 2005-QS17 (Class A1) | 6.000 | 12/25/35 | Aaa | 83,536 | ||||||||
100,000 | Residential Funding Mortgage Securities II, Inc Series 2006-HI1 (Class M2) | 6.060 | 02/25/36 | Aa2 | 53,815 | ||||||||
250,000 | Residential Funding Mortgage Securities II, Inc Series 2006-HI5 (Class A2) | 5.520 | 04/25/21 | A3 | 187,340 | ||||||||
161,536 | m | Sierra Receivables Funding Co Series 2006-1A (Class A1) | 5.840 | 05/20/18 | A2 | 153,468 | |||||||
815,330 | m, v | Sonic Capital LLC Series 2006-1A (Class A2) | 5.096 | 12/20/31 | Aa3 | 742,715 | |||||||
259,889 | m, v | Wachovia Amortization Controlled Heloc NIM Series 2006-N1 (Class N1) | 5.683 | 08/12/47 | NR | 249,185 | |||||||
453,935 | Wachovia Auto Loan Owner Trust Series 2006-2A (Class A3) | 5.230 | 08/22/11 | Aaa | 457,211 | ||||||||
112,905 | i | Wells Fargo Mortgage Backed Securities Trust Series 2006-AR2 (Class 2A3) | 5.106 | 03/25/36 | NR | 109,375 | |||||||
83,961 | i | Wells Fargo Mortgage Backed Securities Trust Series 2006-AR4 (Class 1A1) | 5.858 | 04/25/36 | NR | 77,225 | |||||||
TOTAL ASSET BACKED | 9,126,254 | ||||||||||||
OTHER MORTGAGE BACKED SECURITIES - 7.49% | |||||||||||||
50,000 | Banc of America Commercial Mortgage, Inc Series 2006-6 (Class AJ) | 5.421 | 10/10/45 | Aaa | 40,205 | ||||||||
200,000 | i | Banc of America Commercial Mortgage, Inc Series 2007-2 (Class A2) | 5.634 | 04/10/49 | NR | 196,330 | |||||||
121
TIAA-CREF LIFE FUNDS - Bond Fund
PRINCIPAL | ISSUER | RATE | MATURITY DATE | MOODY’S RATING+ | VALUE | ||||||||
110,535 | Banc of America Mortgage Securities, Inc Series 2006-1 (Class A8) | 6.000 | 05/25/36 | Aaa | $ | 110,970 | |||||||
397,267 | Bank of America Alternative Loan Trust Series 2004-7 (Class 2A1) | 6.000 | 08/25/34 | Aaa | 398,013 | ||||||||
175,000 | Bear Stearns Commercial Mortgage Securities Series 2006-PW13 (Class A4) | 5.540 | 09/11/41 | NR | 167,610 | ||||||||
150,000 | i | Bear Stearns Commercial Mortgage Securities Series 2006-T22 (Class A4) | 5.631 | 04/12/38 | Aaa | 144,961 | |||||||
75,000 | Bear Stearns Commercial Mortgage Securities Series 2006-T24 (Class A4) | 5.537 | 10/12/41 | Aaa | 71,761 | ||||||||
93,000 | i | Bear Stearns Commercial Mortgage Securities Series 2007-PW16 (Class AJ) | 5.902 | 06/11/40 | Aaa | 74,104 | |||||||
62,422 | i | Bear Stearns Commercial Mortgage Securities Series 2007-PW17 (Class AM) | 5.915 | 06/11/50 | NR | 57,147 | |||||||
65,000 | i | Bear Stearns Commercial Mortgage Securities Series 2007-T28 (Class AJ) | 6.175 | 09/11/42 | NR | 52,407 | |||||||
100,000 | Citigroup/Deutsche Bank Commercial Mortgage Trust Series 2006-CD3 (Class A5) | 5.617 | 10/15/48 | Aaa | 96,092 | ||||||||
201,528 | Countrywide Home Loan Mortgage Pass Through Trust Series 2005-17 (Class 1A10) | 5.250 | 09/25/35 | NR | 199,028 | ||||||||
100,000 | Credit Suisse Mortgage Capital Certificates Series 2006-C4 (Class A3) | 5.467 | 09/15/39 | Aaa | 95,057 | ||||||||
250,000 | Credit Suisse Mortgage Capital Certificates Series 2006-C5 (Class A3) | 5.311 | 12/15/39 | Aaa | 234,781 | ||||||||
15,832 | i | Credit Suisse Mortgage Capital Certificates Series 2006-TF2A (Class A1) | 2.571 | 10/15/21 | Aaa | 15,173 | |||||||
95,000 | i | Credit Suisse Mortgage Capital Certificates Series 2007-C1 (Class AJ) | 5.457 | 02/15/40 | Aaa | 74,196 | |||||||
65,000 | i | Credit Suisse Mortgage Capital Certificates Series 2007-C3 (Class AM) | 5.913 | 06/15/39 | Aaa | 59,093 | |||||||
108,817 | First Horizon Asset Securities, Inc Series 2003-9 (Class 1A4) | 5.500 | 11/25/33 | NR | 108,354 | ||||||||
200,000 | Greenwich Capital Commercial Funding Corp Series 2007-GG11 (Class A2) | 5.597 | 12/10/49 | NR | 194,430 | ||||||||
20,000 | Greenwich Capital Commercial Funding Corp Series 2007-GG11 (Class A4) | 5.736 | 12/10/49 | NR | 18,906 | ||||||||
100,000 | GS Mortgage Securities Corp II Series 2006-GG8 (Class A2) | 5.479 | 11/10/39 | Aaa | 99,166 | ||||||||
50,000 | GS Mortgage Securities Corp II Series 2006-GG8 (Class A4) | 5.560 | 11/10/39 | Aaa | 47,867 | ||||||||
250,000 | i | GS Mortgage Securities Corp II Series 2007-GG10 (Class A2) | 5.778 | 08/10/45 | Aaa | 246,736 | |||||||
95,000 | i | GS Mortgage Securities Corp II Series 2007-GG10 (Class A4) | 5.993 | 08/10/45 | Aaa | 90,840 | |||||||
750,000 | JP Morgan Chase Commercial Mortgage Securities Corp Series 2002-C1 (Class A3) | 5.376 | 07/12/37 | Aaa | 756,116 | ||||||||
150,000 | i | JP Morgan Chase Commercial Mortgage Securities Corp Series 2006-LDP7 (Class A2) | 6.051 | 04/15/45 | Aaa | 150,819 | |||||||
100,000 | JP Morgan Chase Commercial Mortgage Securities Corp Series 2007-CB18 (Class A4) | 5.440 | 06/12/47 | Aaa | 93,010 | ||||||||
65,000 | i | JP Morgan Chase Commercial Mortgage Securities Corp Series 2007-CB19 (Class AM) | 5.937 | 02/12/49 | Aaa | 59,252 | |||||||
50,000 | i | JP Morgan Chase Commercial Mortgage Securities Corp Series 2008-C2 (Class AM) | 6.799 | 02/12/51 | Aaa | 48,065 | |||||||
122
TIAA-CREF LIFE FUNDS - Bond Fund
PRINCIPAL | ISSUER | RATE | MATURITY DATE | MOODY’S RATING+ | VALUE | ||||||||
90,000 | i | LB-UBS Commercial Mortgage Trust Series 2007-C2 (Class AJ) | 5.562 | 02/15/40 | NR | $ | 70,730 | ||||||
65,000 | i | LB-UBS Commercial Mortgage Trust Series 2008-C1 (Class A2) | 6.317 | 04/15/41 | Aaa | 63,382 | |||||||
500,000 | i | Merrill Lynch Mortgage Trust Series 2004-BPC1 (Class AJ) | 4.922 | 10/12/41 | NR | 437,727 | |||||||
41,024 | i | Merrill Lynch Mortgage Trust Series 2005-CIP1 (Class AM) | 5.107 | 07/12/38 | Aaa | 38,565 | |||||||
75,000 | i | Merrill Lynch Mortgage Trust Series 2006-C1 (Class A4) | 5.842 | 05/12/39 | NR | 72,973 | |||||||
80,000 | i | Merrill Lynch Mortgage Trust Series 2008-C1 (Class AJ) | 6.266 | 02/12/51 | Aaa | 67,009 | |||||||
50,000 | i | Merrill Lynch Mortgage Trust Series 2008-C1 (Class AM) | 6.266 | 02/12/51 | Aaa | 47,145 | |||||||
35,000 | g, i | Merrill Lynch Mortgage Trust Series 2008-C1 (Class C) | 6.266 | 02/12/51 | Aa2 | 24,171 | |||||||
75,000 | i | Merrill Lynch/Countrywide Commercial Mortgage Trust Series 2006-1 (Class A4) | 5.603 | 02/12/39 | �� | NR | 71,970 | ||||||
105,000 | Merrill Lynch/Countrywide Commercial Mortgage Trust Series 2007-5 (Class A4) | 5.378 | 08/12/48 | Aaa | 97,284 | ||||||||
65,000 | i | Merrill Lynch/Countrywide Commercial Mortgage Trust Series 2007-8 (Class AM) | 6.156 | 08/12/49 | NR | 59,087 | |||||||
50,000 | i | Merrill Lynch/Countrywide Commercial Mortgage Trust Series 2007-9 (Class AM) | 5.856 | 09/12/49 | NR | 45,528 | |||||||
200,000 | Morgan Stanley Capital I Series 2005-HQ5 (Class A2) | 4.809 | 01/14/42 | NR | 199,721 | ||||||||
102,000 | i | Morgan Stanley Capital I Series 2006-HQ9 (Class A4) | 5.731 | 07/12/44 | NR | 98,890 | |||||||
50,000 | i | Morgan Stanley Capital I Series 2006-IQ11 (Class AJ) | 5.948 | 10/15/42 | NR | 41,688 | |||||||
250,000 | Morgan Stanley Capital I Series 2007-HQ11 (Class A31) | 5.439 | 02/12/44 | Aaa | 239,370 | ||||||||
85,000 | Morgan Stanley Capital I Series 2007-IQ13 (Class A4) | 5.364 | 03/15/44 | NR | 78,582 | ||||||||
90,000 | i | Wachovia Bank Commercial Mortgage Trust Series 2006-WL7A (Class A2) | 2.591 | 09/15/21 | Aaa | 84,810 | |||||||
100,000 | i | Wachovia Bank Commercial Mortgage Trust Series 2007-C30 (Class AJ) | 5.413 | 12/15/43 | Aaa | 77,775 | |||||||
100,000 | Wachovia Bank Commercial Mortgage Trust Series 2007-C30 (Class AM) | 5.383 | 12/15/43 | Aaa | 88,630 | ||||||||
200,000 | Wachovia Bank Commercial Mortgage Trust Series 2007-C31 (Class A2) | 5.421 | 04/15/47 | Aaa | 194,867 | ||||||||
630,678 | Wells Fargo Mortgage Backed Securities Trust Series 2005-1 (Class 2A1) | 5.000 | 01/25/20 | Aaa | 604,269 | ||||||||
TOTAL OTHER MORTGAGE BACKED SECURITIES | 6,804,662 | ||||||||||||
| TOTAL STRUCTURED ASSETS (Cost $17,238,745) | 15,930,916 | ||||||||||||
123
TIAA-CREF LIFE FUNDS - Bond Fund
SHARES | COMPANY | |||||||||||
PREFERRED STOCKS - 0.88% | ||||||||||||
DEPOSITORY INSTITUTIONS - 0.09% | ||||||||||||
4,000 | e | Bank of America Corp | 6.204 | 12/30/49 | $ 80,000 | |||||||
| 80,000 | ||||||||||||
NONDEPOSITORY INSTITUTIONS - 0.79% | ||||||||||||
24,609 | e | Federal National Mortgage Association (FNMA) | 8.250 | 12/30/49 | Aa3 | 564,777 | ||||||
6,520 | e | Federal Home Loan Mortgage Corp (FHLMC) | 8.375 | 12/30/49 | Aa3 | 158,436 | ||||||
| 723,213 | ||||||||||||
| TOTAL PREFERRED STOCKS (Cost $878,225) | 803,213 | |||||||||||
PRINCIPAL | ISSUER | |||||||||||
SHORT TERM INVESTMENTS - 6.71% | ||||||||||||
U.S. GOVERNMENT AND AGENCIES DISCOUNT NOTES - 1.65% | ||||||||||||
$1,500,000 | Federal Home Loan Bank (FHLB) | 0.000 | 07/01/08 | 1,500,000 | ||||||||
SHARES | COMPANY | |||||||||||
INVESTMENT OF CASH COLLATERAL FOR SECURITIES LOANED - 5.06% | ||||||||||||
4,595,336 | State Street Navigator Securities Lending Prime Portfolio | 4,595,336 | ||||||||||
| TOTAL SHORT TERM INVESTMENTS (Cost $6,095,336) | 6,095,336 | |||||||||||
| TOTAL PORTFOLIO - 104.02% | 94,548,273 | |||||||||||
(Cost $96,617,189) | ||||||||||||
OTHER ASSETS & LIABILITIES, NET (4.02)% | $(3,649,895) | |||||||||||
| NET ASSETS - 100.00% | $90,898,378 | |||||||||||
| + | As provided by Moody’s Investors Service (unaudited). |
| e | All or a portion of these securities are out on loan. |
| g | Security is exempt from registration under Rule 144 (A) of the Securities Act of 1933 and may be resold in transactions exempt from registration to qualified institutional buyers. |
At June 30, 2008, the value of these securities amounted to $5,543,789 or 6.03% of net assets.
| i | Floating rate or variable rate securities reflects the rate as of June 30, 2008. |
| j | Zero coupon |
| m | Indicates a security that has been deemed illiquid. |
| v | Security valued at fair value. |
| ABBREVIATION: |
NR - Not Rated
124
TIAA-CREF LIFE FUNDS - Money Market Fund
TIAA-CREF LIFE FUNDS
MONEY MARKET FUND
STATEMENT OF INVESTMENTS (unaudited)
June 30, 2008
PRINCIPAL | ISSUER | RATE | MATURITY DATE | VALUE | ||||||||
| SHORT TERM INVESTMENTS - 99.78% | ||||||||||||
| BANK ACCEPTANCES - 2.28% | ||||||||||||
| $1,110,000 | JPMorgan Chase Bank NA | 0.000 | % | 09/04/08 | $ | 1,105,290 | ||||||
| 426,000 | JPMorgan Chase Bank NA | 0.000 | 07/07/08 | 425,838 | ||||||||
| 1,000,000 | Wachovia Bank NA | 0.000 | 07/08/08 | 999,553 | ||||||||
TOTAL BANKERS ACCEPTANCE | 2,530,681 | |||||||||||
| CERTIFICATES OF DEPOSIT - 12.49% | ||||||||||||
| 500,000 | Abbey National Treasury | 2.600 | 08/11/08 | 500,011 | ||||||||
| 1,500,000 | American Express Bank FSB | 2.690 | 08/21/08 | 1,500,042 | ||||||||
| 300,000 | American Express Bank FSB | 2.900 | 07/21/08 | 300,003 | ||||||||
| 1,000,000 | American Express Bank FSB | 4.080 | 07/14/08 | 1,000,007 | ||||||||
| 1,000,000 | Banco Bilbao Vizcaya Argentaria S.A. | 2.945 | 07/23/08 | 1,000,003 | ||||||||
| 1,145,000 | Bank of Montreal | 2.650 | 09/03/08 | 1,145,040 | ||||||||
| 1,000,000 | Bank of Montreal | 2.800 | 09/24/08 | 1,000,047 | ||||||||
| 2,050,000 | Bank of Nova Scotia | 2.550 | 08/13/08 | 2,050,000 | ||||||||
| 1,415,000 | Canadian Imperial Bank | 2.635 | 08/20/08 | 1,415,000 | ||||||||
| 1,000,000 | Deutsche Bank AG. | 2.720 | 07/31/08 | 1,000,000 | ||||||||
| 1,000,000 | Dexia Credit Local S.A. | 2.630 | 08/26/08 | 1,000,031 | ||||||||
| 1,000,000 | Toronto Dominion Bank | 2.500 | 08/14/08 | 1,000,000 | ||||||||
| 930,000 | Toronto Dominion Bank | 2.950 | 08/27/08 | 930,000 | ||||||||
TOTAL CERTIFICATES OF DEPOSIT | 13,840,184 | |||||||||||
| COMMERCIAL PAPER - 56.57% | ||||||||||||
| 2,000,000 | American Honda Finance Corp | 09/05/08 | 1,991,310 | |||||||||
| 710,000 | American Honda Finance Corp | 08/04/08 | 708,592 | |||||||||
| 550,000 | Bank of America Corp | 07/01/08 | 550,000 | |||||||||
| 400,000 | Bank of America Corp | 08/11/08 | 398,834 | |||||||||
| 500,000 | Bank of America Corp | 08/26/08 | 498,024 | |||||||||
| 1,000,000 | Bank of America Corp | 09/09/08 | 994,764 | |||||||||
| 1,000,000 | Bank of Nova Scotia | 10/03/08 | 992,846 | |||||||||
| 850,000 | Bank of Scotland plc | 08/06/08 | 847,748 | |||||||||
| 1,500,000 | Bank of Scotland plc | 07/08/08 | 1,499,207 | |||||||||
| 955,000 | Canadian Imperial Holding, Inc | 09/19/08 | 948,994 | |||||||||
| 650,000 | Ciesco LLC | 07/01/08 | 650,000 | |||||||||
| 500,000 | Ciesco LLC | 07/03/08 | 499,930 | |||||||||
| 1,240,000 | Ciesco LLC | 07/29/08 | 1,237,444 | |||||||||
| 1,000,000 | Citigroup Funding, Inc | 08/11/08 | 997,039 | |||||||||
| 1,210,000 | Citigroup Funding, Inc | 08/15/08 | 1,206,189 | |||||||||
| 500,000 | Citigroup Funding, Inc | 07/18/08 | 499,339 | |||||||||
| 1,580,000 | Coca-Cola Co | 07/09/08 | 1,579,242 | |||||||||
| 500,000 | Danske Corp | 07/14/08 | 499,522 | |||||||||
| 750,000 | Danske Corp | 07/15/08 | 749,271 | |||||||||
| 465,000 | Danske Corp | 07/21/08 | 464,354 | |||||||||
| 730,000 | Danske Corp | 07/22/08 | 728,757 | |||||||||
| 960,000 | Dexia Delaware LLC | 08/12/08 | 957,010 | |||||||||
| 240,000 | Dexia Delaware LLC | 09/25/08 | 238,395 | |||||||||
| 600,000 | Edison Asset Securitization LLC | 08/19/08 | 597,942 | |||||||||
| 1,500,000 | Edison Asset Securitization LLC | 07/15/08 | 1,498,367 | |||||||||
| 1,980,000 | General Electric Capital Corp | 08/25/08 | 1,972,680 | |||||||||
| 1,000,000 | General Electric Capital Corp | 10/30/08 | 991,396 | |||||||||
| 400,000 | General Electric Co | 09/02/08 | 398,334 | |||||||||
| 400,000 | Govco LLC | 07/21/08 | 399,373 | |||||||||
125
TIAA-CREF LIFE FUNDS - Money Market Fund
PRINCIPAL | ISSUER | RATE | MATURITY DATE | VALUE | |||||||
| 500,000 | Govco LLC | 09/12/08 | $ | 497,283 | |||||||
| 1,985,000 | Govco LLC | 09/23/08 | 1,972,448 | ||||||||
| 500,000 | Govco LLC | 12/17/08 | 492,841 | ||||||||
| 1,000,000 | HSBC Finance Corp | 09/02/08 | 995,590 | ||||||||
| 1,400,000 | HSBC Finance Corp | 07/09/08 | 1,399,166 | ||||||||
| 500,000 | HSBC Finance Corp | 08/12/08 | 498,571 | ||||||||
| 900,000 | ING US Funding LLC | 07/10/08 | 899,422 | ||||||||
| 1,000,000 | ING US Funding LLC | 07/17/08 | 998,829 | ||||||||
| 500,000 | JPMorgan Chase & Co | 07/21/08 | 499,278 | ||||||||
| 740,000 | JPMorgan Chase & Co | 07/24/08 | 738,771 | ||||||||
| 550,000 | JPMorgan Chase & Co | 08/05/08 | 548,636 | ||||||||
| 782,000 | Kitty Hawk Funding Corp | 07/17/08 | 781,051 | ||||||||
| 1,160,000 | Kitty Hawk Funding Corp | 07/24/08 | 1,158,147 | ||||||||
| 1,000,000 | Kitty Hawk Funding Corp | 10/02/08 | 992,715 | ||||||||
| 595,000 | Lloyds Bank plc | 07/01/08 | 595,000 | ||||||||
| 700,000 | Lloyds Bank plc | 07/23/08 | 698,866 | ||||||||
| 800,000 | Lloyds Bank plc | 10/17/08 | 793,880 | ||||||||
| 400,000 | Nestle Capital Corp | 03/10/09 | 393,308 | ||||||||
| 570,000 | Nestle Capital Corp | 07/07/08 | 569,796 | ||||||||
| 310,000 | Nestle Capital Corp | 07/16/08 | 309,729 | ||||||||
| 500,000 | Nestle Capital Corp | 08/04/08 | 499,032 | ||||||||
| 645,000 | Nestle Capital Corp | 08/07/08 | 643,595 | ||||||||
| 1,195,000 | Paccar Financial Corp | 07/11/08 | 1,194,306 | ||||||||
| 1,000,000 | Pfizer, Inc | 08/06/08 | 997,980 | ||||||||
| 1,000,000 | Pfizer, Inc | 08/28/08 | 995,892 | ||||||||
| 500,000 | Private Export Funding Corp | 09/03/08 | 498,178 | ||||||||
| 1,000,000 | Private Export Funding Corp | 09/04/08 | 996,010 | ||||||||
| 870,000 | Procter & Gamble International | 08/05/08 | 868,148 | ||||||||
| 1,200,000 | Rabobank USA Financial Corp | 07/07/08 | 1,199,506 | ||||||||
| 900,000 | Rabobank USA Financial Corp | 08/12/08 | 897,386 | ||||||||
| 615,000 | Rabobank USA Financial Corp | 09/15/08 | 611,754 | ||||||||
| 1,000,000 | Ranger Funding Co LLC | 07/10/08 | 999,288 | ||||||||
| 1,000,000 | Ranger Funding Co LLC | 08/20/08 | 996,347 | ||||||||
| 325,000 | Societe Generale North America, Inc | 07/11/08 | 324,642 | ||||||||
| 800,000 | Svensk Exportkredit AB | 08/22/08 | 797,492 | ||||||||
| 1,700,000 | Toyota Motor Credit Corp | 09/26/08 | 1,689,524 | ||||||||
| 1,400,000 | Toyota Motor Credit Corp | 09/16/08 | 1,392,724 | ||||||||
| 500,000 | Toyota Motor Credit Corp | 10/29/08 | 495,817 | ||||||||
| 1,000,000 | Unilever Capital Corp | 10/20/08 | 991,798 | ||||||||
| 1,000,000 | Wells Fargo & Co | 07/22/08 | 998,781 | ||||||||
| 650,000 | Yorktown Capital LLC | 07/03/08 | 649,903 | ||||||||
| 1,046,000 | Yorktown Capital LLC | 07/16/08 | 1,044,858 | ||||||||
| 1,000,000 | Yorktown Capital LLC | 08/07/08 | 997,225 | ||||||||
| 500,000 | Yorktown Capital LLC | 08/19/08 | 498,251 | ||||||||
TOTAL COMMERCIAL PAPER | 62,706,667 | ||||||||||
| U.S. GOVERNMENT AND AGENCIES DISCOUNT NOTES - 27.54% | |||||||||||
| 480,000 | Federal Home Loan Bank (FHLB) | 08/01/08 | 479,128 | ||||||||
| 507,000 | Federal Home Loan Bank (FHLB) | 08/13/08 | 505,722 | ||||||||
| 620,000 | Federal Home Loan Bank (FHLB) | 09/24/08 | 616,516 | ||||||||
| 650,000 | Federal Home Loan Bank (FHLB) | 10/01/08 | 645,930 | ||||||||
| 200,000 | Federal Home Loan Bank (FHLB) | 10/27/08 | 198,610 | ||||||||
| 514,000 | Federal Home Loan Bank (FHLB) | 11/06/08 | 510,162 | ||||||||
| 1,085,000 | Federal Home Loan Bank (FHLB) | 07/02/08 | 1,084,940 | ||||||||
| 200,000 | Federal Home Loan Bank (FHLB) | 07/21/08 | 199,761 | ||||||||
| 1,000,000 | Federal Home Loan Bank (FHLB) | 12/03/08 | 989,150 | ||||||||
126
TIAA-CREF LIFE FUNDS - Money Market Fund
PRINCIPAL | ISSUER | RATE | MATURITY DATE | VALUE | |||||||
| 861,000 | Federal Home Loan Mortgage Corp (FHLMC) | 07/07/08 | $ 860,700 | ||||||||
| 1,000,000 | Federal Home Loan Mortgage Corp (FHLMC) | 07/11/08 | 999,417 | ||||||||
| 380,000 | Federal Home Loan Mortgage Corp (FHLMC) | 07/28/08 | 379,413 | ||||||||
| 772,000 | Federal Home Loan Mortgage Corp (FHLMC) | 08/06/08 | 770,410 | ||||||||
| 470,000 | Federal Home Loan Mortgage Corp (FHLMC) | 09/05/08 | 468,208 | ||||||||
| 2,500,000 | Federal Home Loan Mortgage Corp (FHLMC) | 09/25/08 | 2,486,682 | ||||||||
| 1,190,000 | Federal Home Loan Mortgage Corp (FHLMC) | 11/05/08 | 1,179,379 | ||||||||
| 366,000 | Federal Home Loan Mortgage Corp (FHLMC) | 01/05/09 | 360,935 | ||||||||
| 775,000 | Federal Home Loan Mortgage Corp (FHLMC) | 09/15/08 | 771,564 | ||||||||
| 2,325,000 | Federal Home Loan Mortgage Corp (FHLMC) | 09/22/08 | 2,313,475 | ||||||||
| 1,000,000 | Federal Home Loan Mortgage Corp (FHLMC) | 09/29/08 | 993,941 | ||||||||
| 1,085,000 | Federal National Mortgage Association (FNMA) | 07/28/08 | 1,083,291 | ||||||||
| 1,390,000 | Federal National Mortgage Association (FNMA) | 08/18/08 | 1,386,256 | ||||||||
| 465,000 | Federal National Mortgage Association (FNMA) | 07/16/08 | 464,601 | ||||||||
| 1,400,000 | Federal National Mortgage Association (FNMA) | 07/25/08 | 1,398,031 | ||||||||
| 1,000,000 | Federal National Mortgage Association (FNMA) | 07/30/08 | 998,389 | ||||||||
| 789,000 | Federal National Mortgage Association (FNMA) | 07/31/08 | 787,613 | ||||||||
| 1,500,000 | Federal National Mortgage Association (FNMA) | 08/08/08 | 1,496,564 | ||||||||
| 1,275,000 | Federal National Mortgage Association (FNMA) | 08/27/08 | 1,270,801 | ||||||||
| 1,340,000 | Federal National Mortgage Association (FNMA) | 08/29/08 | 1,335,059 | ||||||||
| 235,000 | Federal National Mortgage Association (FNMA) | 11/28/08 | 232,533 | ||||||||
| 1,070,000 | Federal National Mortgage Association (FNMA) | 09/29/08 | 1,064,062 | ||||||||
| 2,215,000 | Federal National Mortgage Association (FNMA) | 09/30/08 | 2,202,525 | ||||||||
TOTAL U.S. GOVERNMENT AND AGENCIES DISCOUNT NOTES | 30,533,768 | ||||||||||
| VARIABLE NOTE - 0.90% | |||||||||||
| 1,000,000 | i | Wachovia Bank NA | 2.990 | 11/25/08 | 1,000,000 | ||||||
TOTAL VARIABLE NOTE | 1,000,000 | ||||||||||
| TOTAL SHORT-TERM INVESTMENTS (Cost $110,611,300) | 110,611,300 | ||||||||||
| TOTAL PORTFOLIO - 99.78% (Cost $110,611,300) | 110,611,300 | ||||||||||
OTHER ASSETS & LIABILITIES, NET - 0.22% | 248,604 | ||||||||||
| NET ASSETS - 100.0% | $ | 110,859,904 | |||||||||
| i | Floating rate or variable rate securities reflects the rate in effect as of June 30, 2008. |
127
| Item 7. | Disclosure of Proxy Voting Policies and Procedures for Closed-End Management Investment Companies. |
Not Applicable.
| Item 8. | Portfolio Managers of Closed-End Management Investment Companies. |
Not Applicable.
| Item 9. | Purchases of Equity Securities by Closed-End Management Investment Company and Affiliated Purchasers. |
Not Applicable.
| Item 10. | Submission of Matters to a Vote of Security Holders. |
There were no material changes to the procedures by which shareholders may recommend nominees to the Registrant’s Board of Trustees.
| Item 11. | Controls and Procedures. |
(a) An evaluation was performed within 90 days from the date hereof under the supervision of the Registrant’s management, including the principal executive officer and principal financial officer, of the effectiveness of the design and operation of the Registrant’s disclosure controls and procedures. Based on that evaluation, the Registrant’s management, including the principal executive officer and principal financial officer, concluded that the Registrant’s disclosure controls and procedures were effective for this semi-annual reporting period.
(b) There were no changes in the Registrant’s internal control over financial reporting that occurred during the Registrant’s first fiscal half-year that materially affected, or are reasonably likely to materially affect, the Registrant’s internal control over financial reporting.
| Item 12. | Exhibits. |
| 12(a)(2)(i) | Section 302 certification of the principal executive officer | |
| 12(a)(2)(ii) | Section 302 certification of the principal financial officer | |
| 12(b) | Section 906 certification of principal executive officer and principal financial officer | |
SIGNATURES
Pursuant to the requirements of the Securities Exchange Act of 1934 and the Investment Company Act of 1940, the Registrant has duly caused this report to be signed on its behalf by the undersigned, thereunto duly authorized.
| TIAA-CREF LIFE FUNDS | ||||||||
| Dated: August 21, 2008 | By: | /s/ Scott C. Evans | ||||||
| Scott C. Evans | ||||||||
| Principal Executive Officer and President | ||||||||
Pursuant to the requirements of the Securities Exchange Act of 1934 and the Investment Company Act of 1940, this report has been signed below by the following persons on behalf of the Registrant and in the capacities and on the dates indicated.
| Dated: August 21, 2008 | By: | /s/ Scott C. Evans | ||||||
| Scott C. Evans | ||||||||
| Principal Executive Officer and President | ||||||||
| (principal executive officer) | ||||||||
| Dated: August 21, 2008 | By: | /s/ Phillip G. Goff | ||||||
| Phillip G. Goff | ||||||||
Principal Financial Officer, Principal Accounting Officer and Treasurer | ||||||||
| (principal financial officer) | ||||||||
EXHIBIT INDEX
| Item 12. | Exhibits. |
| 12(a)(2)(i) | Section 302 certification of the principal executive officer | |
| 12(a)(2)(ii) | Section 302 certification of the principal financial officer | |
| 12(b) | Section 906 certification of principal executive officer and principal financial officer | |