UNITED STATES
SECURITIES AND EXCHANGE COMMISSION
Washington, DC 20549
FORM N-CSR
CERTIFIED SHAREHOLDER REPORT OF REGISTERED MANAGEMENT
INVESTMENT COMPANIES
Investment Company Act file number File No. 811-08961
TIAA-CREF LIFE FUNDS
(Exact Name of Registrant as specified in charter)
730 Third Avenue, New York, New York 10017-3206
(Address of Principal Executive Offices) (Zip code)
John M. McCann, Esq.
F. Scott Thomas, Esq.
c/o TIAA-CREF
8500 Andrew Carnegie Blvd.
Charlotte, North Carolina 28262-8500
(Name and address of agent for service)
Registrant’s telephone number, including area code: 704-595-1000
Date of fiscal year end: December 31
Date of reporting period: December 31, 2013
Item 1. Reports to Stockholders.
Understanding your TIAA-CREF Life Funds report
This annual report contains information about the ten TIAA-CREF Life Funds and describes the funds’ results for the twelve months ended December 31, 2013. The report contains three main sections:
| | • | | The fund performance section compares each fund’s investment returns with those of its benchmark index. |
| | • | | The summary portfolios of investments list the industries and types of securities in which each fund had investments as of December 31, 2013. |
| | • | | The financial statements provide detailed information about the operations and financial condition of each fund. |
The views and opinions expressed in this report are through the end of the period, as stated on the cover of this report. They are subject to change at any time based on a variety of factors. As such, they are not guarantees of future performance or investment results and should not be taken as investment advice. The risks of investing in the TIAA-CREF Life Funds vary from fund to fund; to see the risks of investing in an individual fund, please refer to that fund’s latest prospectus.
As always, you should carefully consider the investment objectives, risks, charges and expenses of any fund before investing. For a prospectus that contains this and other important information, please visit our website at tiaa-cref.org, or call 800 223-1200. We urge you to read the prospectus carefully before investing.
2 2013 Annual Report ¡ TIAA-CREF Life Funds
Information on the TIAA-CREF Life Funds
Portfolio holdings
Securities and Exchange Commission (SEC) rules allow investment companies to list the top holdings of each fund in their annual and semiannual reports, instead of providing complete portfolio listings. The TIAA-CREF Life Funds also file complete portfolio listings with the SEC, and they are available to the public.
You can obtain a complete list of the TIAA-CREF Life Funds’ portfolio holdings (Schedules of Investments) as of the most recently completed fiscal quarter in the following ways:
| | • | | By visiting our website at tiaa-cref.org; or |
| | • | | By calling us at 800 842-2252 to request a copy free of charge. |
You can also obtain a complete list of the TIAA-CREF Life Funds’ portfolio holdings as of the most recently completed fiscal quarter, and for prior quarter-ends, from our SEC Form N-CSR and Form N-Q filings. Form N-CSR filings are as of December 31 or June 30; Form N-Q filings are as of March 31 or September 30. Copies of these forms are available:
| | • | | Through the Electronic Data Gathering and Retrieval System (EDGAR) on the SEC’s website at www.sec.gov; or |
| | • | | From the SEC’s Office of Investor Education and Advocacy. (Call 202 551-8090 for more information.) |
Proxy voting
TIAA-CREF Life Funds’ ownership of stock gives it the right to vote on proxy issues of companies in which it invests. A description of our proxy voting policies and procedures can be found on our website at tiaa-cref.org or on the SEC’s website at www.sec.gov. You can also call us at 800 223-1200 to request a free copy. A report of how the funds voted during the most recently completed twelve-month period ended June 30 can be found on our website or on Form N-PX at www.sec.gov.
Contacting TIAA-CREF
There are three easy ways to contact us: by email, using the Contact Us link at the top of our home page; by mail at TIAA-CREF, 730 Third Avenue, New York, NY 10017–3206; or by phone at 800 223-1200.
Fund management
TIAA-CREF Life Funds are managed by the portfolio management teams of Teachers Advisors, Inc. The members of these teams are responsible for the day-to-day investment management of the funds.
TIAA-CREF Life Funds ¡ 2013 Annual Report 3
About the funds’ benchmarks
Equity Indexes
Broad market indexes
The Russell 3000® Index measures the performance of the stocks of the 3,000 largest publicly traded U.S. companies, based on market capitalization. The index measures the performance of about 98% of the total market capitalization of the publicly traded U.S. equity market.
The MSCI EAFE Index measures the performance of the leading stocks in 21 developed market countries outside North America—in Europe, Australasia and the Far East.
Large-cap indexes
The S&P 500® Index is a market-capitalization-weighted index of the stocks of 500 leading companies in leading industries of the U.S. economy.
The Russell 1000® Growth Index is a subset of the Russell 1000 Index, which measures the performance of the stocks of the 1,000 largest companies in the Russell 3000 Index, based on market capitalization. The Russell 1000 Growth Index measures the performance of those stocks of the Russell 1000 Index with higher relative forecasted growth rates and price/book ratios.
The Russell 1000 Value Index is a subset of the Russell 1000 Index, which measures the performance of the stocks of the 1,000 largest companies in the Russell 3000 Index, based on market capitalization. The Russell 1000 Value Index measures the performance of those stocks of the Russell 1000 Index with lower relative forecasted growth rates and price/book ratios.
Small-cap index
The Russell 2000® Index measures the performance of the stocks of the 2,000 smallest companies in the Russell 3000 Index, based on market capitalization.
Specialty equity index
The FTSE NAREIT All Equity REITs Index measures the performance of certain publicly traded real estate investment trusts in the United States that own, manage and lease investment-grade commercial real estate.
4 2013 Annual Report ¡ TIAA-CREF Life Funds
About the funds’ benchmarks
Fixed-income Index
The Barclays U.S. Aggregate Bond Index measures the performance of the domestic investment-grade, fixed-rate bond market, including government and corporate securities, agency mortgage pass-through securities, asset-backed securities and commercial mortgage-backed securities.
You cannot invest directly in any index. Index returns do not include a deduction for fees or expenses.
Russell 1000, Russell 2000 and Russell 3000 are trademarks and service marks of Russell Investments. TIAA-CREF products are not promoted or sponsored by, or affiliated with, Russell Investments. MSCI makes no express or implied warranties or representations and shall have no liability whatsoever with respect to any MSCI data contained herein. This report is not approved, reviewed or produced by MSCI. S&P 500 is a registered trademark and service mark of the McGraw-Hill Companies, Inc. FTSE is a trademark of London Stock Exchange plc and The Financial Times Limited.
TIAA-CREF Life Funds ¡ 2013 Annual Report 5
Important information about expenses
All shareholders of the TIAA-CREF Life Funds incur ongoing costs, including management fees and other fund expenses.
The TIAA-CREF Life Funds are the underlying investment vehicles for certain variable life insurance and variable annuity contracts issued by TIAA-CREF Life Insurance Company. These contracts have additional administrative expense fees and mortality and expense risk charges. Because of these additional deductions, the costs to investors will be higher than the figures shown in the expense examples. Information about these additional charges can be found in the product prospectuses.
The expense examples that appear on the performance pages are intended to help you understand your ongoing costs only (in U.S. dollars) and do not reflect transactional costs incurred by the fund for buying and selling securities. The examples are designed to help you compare these ongoing costs with the ongoing costs of investing in other mutual funds. Shareholders of the TIAA-CREF Life Funds do not incur a sales charge on purchases, on reinvested dividends or other distributions.
The examples are based on an investment of $1,000 invested at the beginning of the six-month period and held for the entire period (July 1, 2013–December 31, 2013).
Actual expenses
The first line in each table uses the fund’s actual expenses and its actual rate of return. You may use the information in this line, together with the amount you invested, to estimate the expenses that you paid over the six-month period.
Simply divide your account value by $1,000 (for example, an $8,600 account value divided by $1,000 = 8.6), then multiply the result by the number in the first line under the heading “Expenses paid during period” to estimate the expenses you paid during the six-month period. Some funds have a contractual fee reimbursement. Had these not been in effect, fund expenses would have been higher.
Hypothetical example for comparison purposes
The second line shows hypothetical account values and expenses based on the fund’s actual expense ratio for the six-month period and an assumed 5% per year rate of return before expenses. This was not the fund’s actual return.
This hypothetical example cannot be used to estimate the actual expenses you paid for the period but rather allows you to compare the ongoing costs of investing in the fund with that of other funds. To do so, compare this 5% hypothetical example with the 5% hypothetical examples that appear in the shareholder reports of other mutual funds.
6 2013 Annual Report ¡ TIAA-CREF Life Funds
Growth Equity Fund
Performance for the twelve months ended December 31, 2013
The Growth Equity Fund returned 39.94% for the year, compared with the 33.48% return of its benchmark, the Russell 1000® Growth Index.
The broad U.S. stock market, as measured by the Russell 3000® Index, soared 33.55% in 2013. Investors were emboldened by the strengthening domestic economy: unemployment fell, housing prices climbed and consumer spending rose. At the same time, the Federal Reserve’s efforts to stimulate the economy by keeping interest rates low further increased investor appetite for riskier assets.
Large-cap growth stocks participated in the strong rally but fell just short of the robust gains registered by the broad U.S. equity market. Within the growth category, large-cap issues trailed their small- and mid-cap counterparts, which advanced 43.30% and 35.74%, respectively. (Returns by investment style and capitalization size are based on the Russell indexes.)
For the ten years ended December 31, 2013, the Russell 1000 Growth Index registered an average annual gain of 7.83%, slightly trailing the 7.88% average return of the Russell 3000 Index over the same period.
Strong stock choices boost the fund’s relative performance
For the year, all ten industry sectors of the fund’s benchmark achieved double-digit gains, including five that climbed more than 30%. The benchmark’s second-largest sector, consumer discretionary, advanced 44.5% and easily made the biggest contribution to the benchmark’s rise. An improving U.S. economy, coupled with strengthening consumer confidence, lifted investor sentiment for consumer discretionary issues. Substantial contributions from health care (up 48.2%), industrials (up 41.2%) and information technology (up 26.2%) further enhanced the benchmark’s gain. Together, these four sectors made up more than 70% of the index’s total market capitalization on December 31, 2013.
The fund generated a double-digit gain and outpaced its benchmark by almost six-and-a-half percentage points on the strength of numerous successful stock selections. Among the largest positive contributions were overweight positions in three surging biotechnology companies: Celgene (up 115.3%), Gilead Sciences (up 104.5%) and Biogen Idec (up 91.0%). The fund also benefited from favorable overweight holdings in Facebook and casino operator Las Vegas Sands. The exclusion of IBM helped as well.
These positive contributions were partly offset by less successful stock choices. Chief among these were overweight investments in medical equipment maker Edwards Lifesciences, auction site eBay and software provider Red Hat. Underweight positions in pharmaceutical giant Bristol-Myers Squibb and biotechnology firm Amgen also hurt relative results slightly.
TIAA-CREF Life Funds ¡ 2013 Annual Report 7
Growth Equity Fund
Performance as of December 31, 2013
| | | | | | | | | | | | | | | | |
| | | | | | Total
return | | | Average annual
total return | |
| | | Inception date | | | 1 year | | | 5 years | | | 10 years | |
Growth Equity Fund | | | 4/3/2000 | | | | 39.94 | % | | | 20.70 | % | | | 8.15 | % |
Russell 1000® Growth Index | | | — | | | | 33.48 | | | | 20.39 | | | | 7.83 | |
The returns in this report show past performance, which is no guarantee of future results. Returns and the principal value of your investment will fluctuate. Current performance may be higher or lower than that shown, and you may have a gain or a loss when you redeem your shares. For current performance information, including performance to the most recent month-end, please visit tiaa-cref.org. Performance may reflect waivers or reimbursements of certain expenses. Absent these waivers or reimbursement arrangements, performance may be lower.
You cannot invest directly in any index. Index returns do not include a deduction for fees or expenses.
$10,000 over 10 years
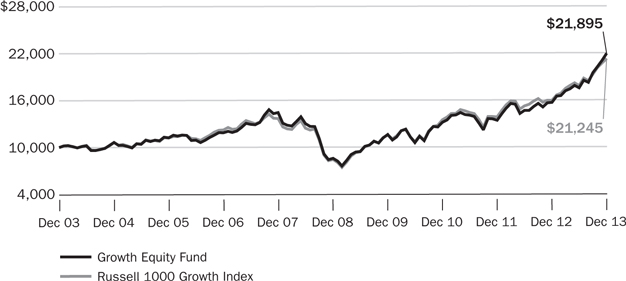
For the purpose of comparison, the graph also shows the change in the value of the fund’s benchmark during the same period.
8 2013 Annual Report ¡ TIAA-CREF Life Funds
Growth Equity Fund
Expense example
Six months ended December 31, 2013
| | | | | | | | | | | | |
| Growth Equity Fund | | Beginning
account value
(7/1/13) | | | Ending
account value
(12/31/13) | | | Expenses paid during period* (7/1/13–12/31/13) | |
Actual return | | | $1,000.00 | | | | $1,251.02 | | | | $2.95 | |
5% annual hypothetical return | | | 1,000.00 | | | | 1,022.58 | | | | 2.65 | |
| * | “Expenses paid during period” is based on the fund’s actual expense ratio for the most recent fiscal half-year, multiplied by the average account value over the six-month period, multiplied by 184/365. There were 184 days in the six months ended December 31, 2013. The fund’s annualized six-month expense ratio for that period was 0.52%. The expense charges of the fund may at times reflect a reimbursement. Please see the prospectus for an explanation, including the date on which this reimbursement is scheduled to end. Without such reimbursement, the expenses of the fund would be higher and its performance lower. |
For more information about this expense example, please see page 6.
Portfolio composition
| | | | |
| Sector | | % of net assets
as of 12/31/2013 | |
Information technology | | | 31.4 | |
Consumer discretionary | | | 20.2 | |
Health care | | | 19.5 | |
Industrials | | | 11.4 | |
Financials | | | 6.8 | |
Materials | | | 3.9 | |
Consumer staples | | | 2.3 | |
Telecommunication services | | | 2.3 | |
Energy | | | 1.2 | |
Short-term investments,
other assets & liabilities, net | | | 1.0 | |
Total | | | 100.0 | |
Holdings by company size
| | | | |
| Market capitalization | | % of equity investments
as of 12/31/2013 | |
More than $50 billion | | | 51.5 | |
More than $15 billion–$50 billion | | | 28.8 | |
More than $2 billion–$15 billion | | | 19.7 | |
Total | | | 100.0 | |
TIAA-CREF Life Funds ¡ 2013 Annual Report 9
Growth & Income Fund
Performance for the twelve months ended December 31, 2013
The Growth & Income Fund returned 34.38% for the year, compared with the 32.39% return of its benchmark, the S&P 500® Index.
For the year, the large-cap stocks that make up the S&P 500 Index generated robust gains as a strengthening domestic economy increased investor appetite for riskier investments. At the same time, investors cheered the Federal Reserve’s continuing efforts to stimulate the economy by keeping interest rates low.
Despite its strong advance, the fund’s benchmark trailed the 33.55% gain of the Russell 3000® Index. The broad U.S. equity market index benefited from a sizable position in small- and mid-cap issues, which outpaced the large-cap stocks of the S&P 500. During the year, increasingly optimistic investors favored smaller-cap stocks because of their higher return potential.
For the ten years ended December 31, 2013, the S&P 500 Index produced an average annual gain of 7.41% but lagged the 7.88% average return of the Russell 3000 Index.
Favorable stock selections bolster the fund’s results
All ten industry sectors of the benchmark achieved double-digit gains for the year. The biggest contributions came from the financials and consumer discretionary sectors, which soared 35.6% and 43.1%, respectively. Robust results from health care (up 41.5%) and industrials (up 40.7%) also made substantial contributions. Information technology, the benchmark’s largest sector at period-end, returned 28.4% and enhanced index returns as well. Together, these five sectors made up more than 70% of the benchmark’s total market capitalization on December 31, 2013.
Amid the rising market, the more defensive utilities and telecommunications sectors lagged, with returns of 13.2% and 11.5%, respectively.
For the year, the fund produced a strong absolute return and outpaced its benchmark by nearly two percentage points on the strength of numerous favorable stock choices. Overweight investments in Netflix and biotechnology firm Gilead Sciences, both of which posted triple-digit gains, were especially beneficial. Out-of-benchmark positions in French telecommunications equipment and services provider Alcatel-Lucent and Jazz Pharmaceuticals also helped relative results.
These positive effects were partly offset by less favorable selections, particularly within the information technology sector. Chief among these were underweight holdings in Hewlett-Packard and Microsoft, as well as an overweight investment in fiber optics maker JDS Uniphase. Underweight positions in two well-performing credit card issuers, Visa and MasterCard, trimmed returns slightly as well.
10 2013 Annual Report ¡ TIAA-CREF Life Funds
Growth & Income Fund
Performance as of December 31, 2013
| | | | | | | | | | | | | | | | | | | | |
| | | | | Total
return | | Average annual
total return |
| | | Inception date | | 1 year | | 5 years | | 10 years |
Growth & Income Fund | | | | 4/3/2000 | | | | | 34.38 | % | | | | 18.47 | % | | | | 9.48 | % |
S&P 500 Index | | | | — | | | | | 32.39 | | | | | 17.94 | | | | | 7.41 | |
The returns in this report show past performance, which is no guarantee of future results. Returns and the principal value of your investment will fluctuate. Current performance may be higher or lower than that shown, and you may have a gain or a loss when you redeem your shares. For current performance information, including performance to the most recent month-end, please visit tiaa-cref.org. Performance may reflect waivers or reimbursements of certain expenses. Absent these waivers or reimbursement arrangements, performance may be lower.
You cannot invest directly in any index. Index returns do not include a deduction for fees or expenses.
$10,000 over 10 years

For the purpose of comparison, the graph also shows the change in the value of the fund’s benchmark during the same period.
TIAA-CREF Life Funds ¡ 2013 Annual Report 11
Growth & Income Fund
Expense example
Six months ended December 31, 2013
| | | | | | | | | | | | |
| Growth & Income Fund | | Beginning
account value
(7/1/13) | | | Ending
account value
(12/31/13) | | | Expenses paid
during period*
(7/1/13–12/31/13) | |
Actual return | | | $1,000.00 | | | | $1,187.75 | | | | $2.87 | |
5% annual hypothetical return | | | 1,000.00 | | | | 1,022.58 | | | | 2.65 | |
| * | “Expenses paid during period” is based on the fund’s actual expense ratio for the most recent fiscal half-year, multiplied by the average account value over the six-month period, multiplied by 184/365. There were 184 days in the six months ended December 31, 2013. The fund’s annualized six-month expense ratio for that period was 0.52%. The expense charges of the fund may at times reflect a reimbursement. Please see the prospectus for an explanation, including the date on which this reimbursement is scheduled to end. Without such reimbursement, the expenses of the fund would be higher and its performance lower. |
For more information about this expense example, please see page 6.
Portfolio composition
| | | | |
| Sector | | % of net assets
as of 12/31/2013 | |
Consumer discretionary | | | 19.3 | |
Information technology | | | 16.7 | |
Health care | | | 16.7 | |
Financials | | | 13.3 | |
Industrials | | | 10.6 | |
Consumer staples | | | 8.3 | |
Energy | | | 7.7 | |
Materials | | | 3.9 | |
Telecommunication services | | | 2.0 | |
Utilities | | | 1.6 | |
Short-term investments,
other assets & liabilities, net | | | –0.1 | |
Total | | | 100.0 | |
Holdings by company size
| | | | |
| Market capitalization | | % of equity investments
as of 12/31/2013 | |
More than $50 billion | | | 43.3 | |
More than $15 billion–$50 billion | | | 29.2 | |
More than $2 billion–$15 billion | | | 25.7 | |
$2 billion or less | | | 1.8 | |
Total | | | 100.0 | |
12 2013 Annual Report ¡ TIAA-CREF Life Funds
Large-Cap Value Fund
Performance for the twelve months ended December 31, 2013
The Large-Cap Value Fund returned 34.31% for the year, compared with the 32.53% return of its benchmark, the Russell 1000® Value Index.
The broad U.S. stock market, as measured by the Russell 3000® Index, soared 33.55% in 2013. Investors were emboldened by the strengthening domestic economy: unemployment fell, housing prices climbed and consumer spending rose. At the same time, the Federal Reserve’s efforts to stimulate the economy by keeping interest rates low further increased investor appetite for riskier assets.
During the year, large-cap value stocks participated in the strong rally but trailed the 33.48% advance of large-cap growth issues by almost a full percentage point. Within the value category, large-cap stocks lagged both small- and mid-cap equities, which gained 34.52% and 33.46%, respectively. (Returns by investment style and capitalization size are based on the Russell indexes.)
For the ten years ended December 31, 2013, the Russell 1000 Value Index posted an average annual return of 7.58%, below the 7.83% average gain of the Russell 1000 Growth Index.
Stock selections propel the fund above its benchmark
All ten industry sectors of the fund’s benchmark achieved double-digit gains for the year, including six that soared more than 30%. The benchmark’s largest sector, financials, gained 33.6% and easily made the biggest contribution to the benchmark’s rise. Robust results from the information technology (up 48.3%), industrials (up 43.2%) and health care (up 36.6%) sectors made substantial contributions as well. Together, these four sectors comprised more than three-fifths of the benchmark’s total market capitalization at year-end.
Amid the surging market, the more defensive utilities and telecommunications sectors lagged, with returns of 14.0% and 12.7%, respectively.
For the year, the fund posted a strong absolute gain and outpaced its benchmark on the strength of numerous successful stock choices. The largest positive contributions to relative performance came from overweight investments in electronics retailer Best Buy and Green Mountain Coffee Roasters, whose shares rose an impressive 244.2% and 82.7%, respectively. Favorable out-of-benchmark holdings in airline AMR, personal care products distributor Nu Skin and French telecommunications equipment and services provider Alcatel-Lucent also bolstered returns.
Other positions, however, detracted from relative performance. Chief among these were overweight investments in J.C. Penney, international mining company Cliffs Natural Resources and coal and natural gas producer Walter Energy, all of which posted double-digit losses for the year. A nonbenchmark stake in Israeli drug maker Teva trimmed results as well.
TIAA-CREF Life Funds ¡ 2013 Annual Report 13
Large-Cap Value Fund
Performance as of December 31, 2013
| | | | | | | | | | | | | | | | |
| | | | | | Total
return | | | Average annual
total return | |
| | | Inception date | | | 1 year | | | 5 years | | | 10 years | |
Large-Cap Value Fund | | | 10/28/2002 | | | | 34.31 | % | | | 18.75 | % | | | 8.08 | % |
Russell 1000® Value Index | | | — | | | | 32.53 | | | | 16.67 | | | | 7.58 | |
The returns in this report show past performance, which is no guarantee of future results. Returns and the principal value of your investment will fluctuate. Current performance may be higher or lower than that shown, and you may have a gain or a loss when you redeem your shares. For current performance information, including performance to the most recent month-end, please visit tiaa-cref.org. Performance may reflect waivers or reimbursements of certain expenses. Absent these waivers or reimbursement arrangements, performance may be lower.
You cannot invest directly in any index. Index returns do not include a deduction for fees or expenses.
$10,000 over 10 years
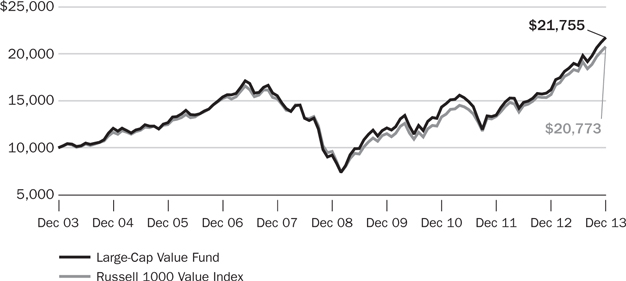
For the purpose of comparison, the graph also shows the change in the value of the fund’s benchmark during the same period.
14 2013 Annual Report ¡ TIAA-CREF Life Funds
Large-Cap Value Fund
Expense example
Six months ended December 31, 2013
| | | | | | | | | | | | |
| Large-Cap Value Fund | | Beginning
account value
(7/1/13) | | | Ending
account value
(12/31/13) | | | Expenses paid
during period*
(7/1/13–12/31/13) | |
Actual return | | | $1,000.00 | | | | $1,158.29 | | | | $2.83 | |
5% annual hypothetical return | | | 1,000.00 | | | | 1,022.58 | | | | 2.65 | |
| * | “Expenses paid during period” is based on the fund’s actual expense ratio for the most recent fiscal half-year, multiplied by the average account value over the six-month period, multiplied by 184/365. There were 184 days in the six months ended December 31, 2013. The fund’s annualized six-month expense ratio for that period was 0.52%. The expense charges of the fund may at times reflect a reimbursement. Please see the prospectus for an explanation, including the date on which this reimbursement is scheduled to end. Without such reimbursement, the expenses of the fund would be higher and its performance lower. |
For more information about this expense example, please see page 6.
Portfolio composition
| | | | |
| Sector | | % of net assets
as of 12/31/2013 | |
Financials | | | 24.3 | |
Health care | | | 13.8 | |
Energy | | | 13.7 | |
Information technology | | | 11.0 | |
Industrials | | | 10.7 | |
Consumer discretionary | | | 9.5 | |
Consumer staples | | | 5.3 | |
Materials | | | 3.8 | |
Utilities | | | 3.7 | |
Telecommunication services | | | 3.5 | |
Short-term investments,
other assets & liabilities, net | | | 0.7 | |
Total | | | 100.0 | |
Holdings by company size
| | | | |
| Market capitalization | | % of equity investments
as of 12/31/2013 | |
More than $50 billion | | | 44.9 | |
More than $15 billion–$50 billion | | | 20.9 | |
More than $2 billion–$15 billion | | | 31.5 | |
$2 billion or less | | | 2.7 | |
Total | | | 100.0 | |
TIAA-CREF Life Funds ¡ 2013 Annual Report 15
Real Estate Securities Fund
Performance for the twelve months ended December 31, 2013
The Real Estate Securities Fund returned 1.89% for the year, compared with the 2.86% return of its benchmark, the FTSE NAREIT All Equity REITs Index.
Real estate investment trusts (REITs) struggled in 2013, significantly underperforming the 33.55% return of the broad U.S. stock market, as measured by the Russell 3000® Index.
REITs gained 8.10% in the first quarter but declined in each of the next three quarters of the year. The downward trend started when investors began to worry that the Federal Reserve might soon taper its accommodative policies, which are designed to stimulate the economy by lowering long-term interest rates. When the Fed seemed to confirm these fears in May and June, interest-rate-sensitive assets, such as REITs, sold off. At the same time, yields on U.S. Treasury securities climbed, making them more attractive for some income-oriented investors.
Because REITs are required to distribute most of their taxable income as dividends, they have traditionally competed with bonds for investors seeking current income. For the year, REITs outperformed the –2.02% return of the domestic investment-grade, fixed-rate bond market, as measured by the Barclays U.S. Aggregate Bond Index. For the ten years ended December 31, 2013, REITs posted an average annual gain of 8.61%, outpacing both the 4.55% average return of the Barclays aggregate index as well as the 7.88% return of the Russell 3000 Index.
Stock selections dampen the fund’s relative return
For the year, all but three of the benchmark’s 14 property sectors posted positive results, with two generating double-digit gains. The largest positive contributions came from the lodging and resorts sector (up 27.2%), which was boosted by improving economic conditions. The self-storage (up 9.5%) and office (up 5.6%) sectors were also strong contributors. Together, these three sectors made up more than one-fifth of the index’s total market capitalization at year-end. The largest detractors were the health care and apartment sectors, which returned –7.1% and –6.2%, respectively.
The fund lagged its benchmark because of several stock choices that did not perform as anticipated. Chief among these were an underweight stake in paper manufacturer Weyerhaeuser and overweight holdings in two residential REITs: apartment owners AvalonBay Communities and Post Properties.
These negative effects were partly offset by positive contributions from a nonbenchmark position in Thomas Properties and overweights in office REIT SL Green and Strategic Hotels & Resorts.
During the period, the fund owned the stocks of several companies that are not REITs but that engage in real estate-related activities.
16 2013 Annual Report ¡ TIAA-CREF Life Funds
Real Estate Securities Fund
Performance as of December 31, 2013
| | | | | | | | | | | | | | | | |
| | | | | | Total
return | | | Average annual
total return | |
| | | Inception date | | | 1 year | | | 5 years | | | 10 years | |
Real Estate Securities Fund | | | 10/28/2002 | | | | 1.89 | % | | | 16.41 | % | | | 7.78 | % |
FTSE NAREIT All Equity REITs Index | | | — | | | | 2.86 | | | | 16.90 | | | | 8.61 | |
The returns in this report show past performance, which is no guarantee of future results. Returns and the principal value of your investment will fluctuate. Current performance may be higher or lower than that shown, and you may have a gain or a loss when you redeem your shares. For current performance information, including performance to the most recent month-end, please visit tiaa-cref.org. Performance may reflect waivers or reimbursements of certain expenses. Absent these waivers or reimbursement arrangements, performance may be lower.
You cannot invest directly in any index. Index returns do not include a deduction for fees or expenses.
$10,000 over 10 years
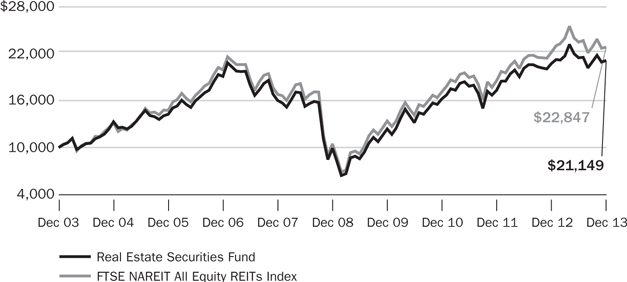
For the purpose of comparison, the graph also shows the change in the value of the fund’s benchmark during the same period.
TIAA-CREF Life Funds ¡ 2013 Annual Report 17
Real Estate Securities Fund
Expense example
Six months ended December 31, 2013
| | | | | | | | | | | | |
| Real Estate Securities Fund | | Beginning
account value
(7/1/13) | | | Ending
account value
(12/31/13) | | | Expenses paid during period*
(7/1/13–12/31/13) | |
Actual return | | | $1,000.00 | | | | $ 984.01 | | | | $2.85 | |
5% annual hypothetical return | | | 1,000.00 | | | | 1,022.33 | | | | 2.91 | |
| * | “Expenses paid during period” is based on the fund’s actual expense ratio for the most recent fiscal half-year, multiplied by the average account value over the six-month period, multiplied by 184/365. There were 184 days in the six months ended December 31, 2013. The fund’s annualized six-month expense ratio for that period was 0.57%. The expense charges of the fund may at times reflect a reimbursement. Please see the prospectus for an explanation, including the date on which this reimbursement is scheduled to end. Without such reimbursement, the expenses of the fund would be higher and its performance lower. |
For more information about this expense example, please see page 6.
Portfolio composition
| | | | |
| Sector | | % of net assets
as of 12/31/2013 | |
Specialized REITs | | | 31.4 | |
Retail REITs | | | 22.5 | |
Residential REITs | | | 16.7 | |
Office REITs | | | 11.0 | |
Industrial REITs | | | 7.4 | |
Diversified REITs | | | 5.2 | |
Security & alarm services | | | 1.2 | |
Real estate services | | | 1.0 | |
Mortgage REITs | | | 0.6 | |
Hotels, resorts & cruise lines | | | 0.5 | |
Publishing | | | 0.4 | |
Diversified real estate activities | | | 0.3 | |
Real estate operating companies | | | 0.3 | |
Short-term investments,
other assets & liabilities, net | | | 1.5 | |
Total | | | 100.0 | |
Holdings by company size
| | | | |
| Market capitalization | | % of equity investments
as of 12/31/2013 | |
More than $15 billion–$50 billion | | | 57.1 | |
More than $2 billion–$15 billion | | | 32.3 | |
$2 billion or less | | | 10.6 | |
Total | | | 100.0 | |
18 2013 Annual Report ¡ TIAA-CREF Life Funds
Small-Cap Equity Fund
Performance for the twelve months ended December 31, 2013
The Small-Cap Equity Fund returned 39.87% for the year, compared with the 38.82% return of its benchmark, the Russell 2000® Index.
The broad U.S. stock market, as measured by the Russell 3000® Index, soared 33.55% in 2013. Investors were emboldened by the strengthening domestic economy: unemployment fell, housing prices climbed and consumer spending rose. At the same time, the Federal Reserve’s efforts to stimulate the economy by keeping interest rates low further increased investor appetite for riskier assets.
Investors’ willingness to take on additional risk was particularly beneficial for small-cap stocks, which outperformed the broad U.S. equity market by more than five percentage points for the year. Within the small-cap category, growth issues strongly outpaced their value counterparts, 43.30% to 34.52%. (Returns by capitalization size and investment style are based on the Russell indexes.)
For the ten years ended December 31, 2013, the Russell 2000 Index posted an average annual gain of 9.07%, significantly higher than the 7.88% average return of the Russell 3000 Index.
Strong stock selections boost the fund’s relative performance
For the year, all ten industry sectors of the Russell 2000 Index generated double-digit gains, and five soared more than 40%. The benchmark’s strong advance was in large part driven by substantial contributions from its three largest sectors: financials (up 30.5%), information technology (up 44.1%) and industrials (up 43.5%). The robust return of the sizable health care sector, which gained 50.8%, further drove the index higher. Together, these four sectors constituted more than two-thirds of the benchmark’s total market capitalization on December 31, 2013.
The fund produced an impressive double-digit gain and outpaced its benchmark by more than one percentage point on the strength of numerous favorable stock choices. These included overweight investments in surging software provider Medidata, casino operator Boyd Gaming and drugstore chain Rite Aid, whose shares soared a remarkable 272.1% following a series of better-than-expected quarterly earnings results. Nonbenchmark positions in aerospace and defense products manufacturer Alliant Techsystems and SVB Financial also bolstered relative returns.
These contributions were partly offset by stock selections that did not perform as expected, including an out-of-benchmark holding in real estate investment trust Home Properties and an underweight position in Isis Pharmaceuticals. Overweight investments in slumping medical device maker Thoratec (down 2.5%) and wireless network provider Aruba Networks (down 13.7%) trimmed relative results as well.
TIAA-CREF Life Funds ¡ 2013 Annual Report 19
Small-Cap Equity Fund
Performance as of December 31, 2013
| | | | | | | | | | | | | | | | |
| | | | | | Total
return | | | Average annual
total return | |
| | | Inception date | | | 1 year | | | 5 years | | | 10 years | |
Small-Cap Equity Fund | | | 10/28/2002 | | | | 39.87 | % | | | 20.00 | % | | | 8.89 | % |
Russell 2000® Index | | | — | | | | 38.82 | | | | 20.08 | | | | 9.07 | |
The returns in this report show past performance, which is no guarantee of future results. Returns and the principal value of your investment will fluctuate. Current performance may be higher or lower than that shown, and you may have a gain or a loss when you redeem your shares. For current performance information, including performance to the most recent month-end, please visit tiaa-cref.org. Performance may reflect waivers or reimbursements of certain expenses. Absent these waivers or reimbursement arrangements, performance may be lower.
You cannot invest directly in any index. Index returns do not include a deduction for fees or expenses.
$10,000 over 10 years
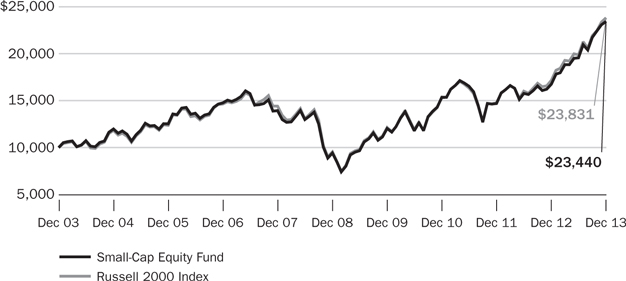
For the purpose of comparison, the graph also shows the change in the value of the fund’s benchmark during the same period.
20 2013 Annual Report ¡ TIAA-CREF Life Funds
Small-Cap Equity Fund
Expense example
Six months ended December 31, 2013
| | | | | | | | | | | | |
| Small-Cap Equity Fund | | Beginning
account value
(7/1/13) | | | Ending
account value
(12/31/13) | | | Expenses paid
during period*
(7/1/13–12/31/13) | |
Actual return | | | $1,000.00 | | | | $1,198.06 | | | | $3.05 | |
5% annual hypothetical return | | | 1,000.00 | | | | 1,022.43 | | | | 2.80 | |
| * | “Expenses paid during period” is based on the fund’s actual expense ratio for the most recent fiscal half-year, multiplied by the average account value over the six-month period, multiplied by 184/365. There were 184 days in the six months ended December 31, 2013. The fund’s annualized six-month expense ratio for that period was 0.55%. The expense charges of the fund may at times reflect a reimbursement. Please see the prospectus for an explanation, including the date on which this reimbursement is scheduled to end. Without such reimbursement, the expenses of the fund would be higher and its performance lower. |
For more information about this expense example, please see page 6.
Portfolio composition
| | | | |
| Sector | | % of net assets
as of 12/31/2013 | |
Financials | | | 21.5 | |
Information technology | | | 17.9 | |
Industrials | | | 15.3 | |
Consumer discretionary | | | 14.4 | |
Health care | | | 11.8 | |
Energy | | | 5.7 | |
Materials | | | 5.3 | |
Consumer staples | | | 3.2 | |
Utilities | | | 2.6 | |
Telecommunication services | | | 0.5 | |
Short-term investments,
other assets & liabilities, net | | | 1.8 | |
Total | | | 100.0 | |
Holdings by company size
| | | | |
| Market capitalization | | % of equity investments
as of 12/31/2013 | |
More than $15 billion–$50 billion | | | 0.2 | |
More than $2 billion–$15 billion | | | 44.7 | |
$2 billion or less | | | 55.1 | |
Total | | | 100.0 | |
TIAA-CREF Life Funds ¡ 2013 Annual Report 21
Social Choice Equity Fund
Performance for the twelve months ended December 31, 2013
The Social Choice Equity Fund returned 34.13% for the year, compared with the 33.55% return of its benchmark, the Russell 3000® Index. The fund uses certain environmental, social and governance criteria, while the benchmark does not.
Because of its criteria, the fund did not invest in a number of stocks included in the Russell index. The net effect of avoiding these companies was to help the fund outpace its benchmark.
The biggest contribution to the fund’s relative performance came from the exclusion of Apple, the benchmark’s largest stock in terms of market capitalization on December 31, 2013. Apple, whose stock rose 8.1% for the year, substantially lagged the broad U.S. stock market on concerns about increased competition and slowing growth rates. Relative results were also aided by avoiding AT&T, Philip Morris International, Coca-Cola and two energy giants, Exxon Mobil and Chevron.
These positive effects were partly offset by the exclusion of Facebook, Boeing and Amazon. Relative performance was also adversely affected by the absence of biotechnology firm Celgene, which, along with the rest of the benchmark’s health care sector, performed exceptionally well for the year.
Successful stock choices enhance the fund’s relative results
To compensate for the fund’s exclusion of some stocks within the Russell 3000 Index, its managers use quantitative (mathematical) modeling and other techniques in an attempt to match the overall risk characteristics of the portfolio with those of the index.
For the period, the fund’s return was boosted by overweight positions in three well-performing information technology stocks: Yahoo (up 103.2%), Hewlett-Packard (up 101.1%) and Xerox (up 82.7%). Overweight investments in two biotechnology firms, Gilead Sciences and Biogen Idec, both of which easily outpaced the broad U.S. stock market, also bolstered the fund’s results.
The positive effects of these holdings were limited by results from other investments that did not perform as anticipated. These included overweight holdings in Ariad Pharmaceuticals and telecommunications firm CenturyLink, both of which suffered double-digit losses for the year. Overweight positions in two information technology heavyweights—EMC (up 0.2%) and IBM (down 0.2%)—detracted from the fund’s relative performance as well.
22 2013 Annual Report ¡ TIAA-CREF Life Funds
Social Choice Equity Fund
Performance as of December 31, 2013
| | | | | | | | | | | | | | | | |
| | | | | | Total
return | | | Average annual
total return | |
| | | Inception date | | | 1 year | | | 5 years | | | 10 years | |
Social Choice Equity Fund | | | 4/3/2000 | | | | 34.13 | % | | | 18.63 | % | | | 8.01 | % |
Russell 3000 Index | | | — | | | | 33.55 | | | | 18.71 | | | | 7.88 | |
The returns in this report show past performance, which is no guarantee of future results. Returns and the principal value of your investment will fluctuate. Current performance may be higher or lower than that shown, and you may have a gain or a loss when you redeem your shares. For current performance information, including performance to the most recent month-end, please visit tiaa-cref.org. Performance may reflect waivers or reimbursements of certain expenses. Absent these waivers or reimbursement arrangements, performance may be lower.
You cannot invest directly in any index. Index returns do not include a deduction for fees or expenses.
$10,000 over 10 years
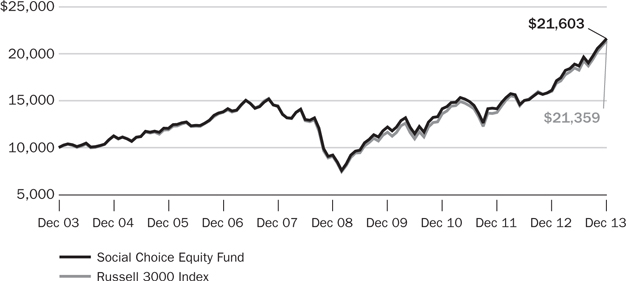
For the purpose of comparison, the graph also shows the change in the value of the fund’s benchmark during the same period.
TIAA-CREF Life Funds ¡ 2013 Annual Report 23
Social Choice Equity Fund
Expense example
Six months ended December 31, 2013
| | | | | | | | | | | | |
| Social Choice Equity Fund | | Beginning
account value
(7/1/13) | | | Ending
account value
(12/31/13) | | | Expenses paid
during period*
(7/1/13–12/31/13) | |
Actual return | | | $1,000.00 | | | | $1,155.75 | | | | $1.20 | |
5% annual hypothetical return | | | 1,000.00 | | | | 1,024.10 | | | | 1.12 | |
| * | “Expenses paid during period” is based on the fund’s actual expense ratio for the most recent fiscal half-year, multiplied by the average account value over the six-month period, multiplied by 184/365. There were 184 days in the six months ended December 31, 2013. The fund’s annualized six-month expense ratio for that period was 0.22%. The expense charges of the fund may at times reflect a reimbursement. Please see the prospectus for an explanation, including the date on which this reimbursement is scheduled to end. Without such reimbursement, the expenses of the fund would be higher and its performance lower. |
For more information about this expense example, please see page 6.
Portfolio composition
| | | | |
| Sector | | % of net assets
as of 12/31/2013 | |
Financials | | | 20.2 | |
Information technology | | | 16.3 | |
Consumer discretionary | | | 13.2 | |
Health care | | | 10.9 | |
Industrials | | | 10.7 | |
Energy | | | 10.2 | |
Consumer staples | | | 7.8 | |
Materials | | | 4.8 | |
Utilities | | | 3.7 | |
Telecommunication services | | | 1.3 | |
Short-term investments,
other assets & liabilities, net | | | 0.9 | |
Total | | | 100.0 | |
Holdings by company size
| | | | |
| Market capitalization | | % of equity investments
as of 12/31/2013 | |
More than $50 billion | | | 33.2 | |
More than $15 billion–$50 billion | | | 46.2 | |
More than $2 billion–$15 billion | | | 18.5 | |
$2 billion or less | | | 2.1 | |
Total | | | 100.0 | |
24 2013 Annual Report ¡ TIAA-CREF Life Funds
Stock Index Fund
Performance for the twelve months ended December 31, 2013
The Stock Index Fund returned 33.43% for the year, compared with the 33.55% return of its benchmark, the Russell 3000® Index.
For the twelve-month period, the fund’s return trailed that of its benchmark index, primarily because of the effect of expenses. The fund’s return includes a deduction for expenses, while the benchmark’s does not. The fund had a risk profile similar to that of its benchmark.
The broad U.S. stock market, as measured by the Russell 3000 Index, soared 33.55% in 2013. Investors were emboldened by the strengthening domestic economy: unemployment fell, housing prices climbed and consumer spending rose. At the same time, the Federal Reserve’s efforts to stimulate the economy by keeping interest rates low further increased investor appetite for riskier assets.
Amid signs of an improving economy, optimistic investors favored small-capitalization stocks because of their higher return potential. Small caps gained 38.82% during the period, outpacing mid- and large-cap equities, which rose 34.76% and 33.11%, respectively. Growth issues within the Russell 3000 topped their value counterparts, 34.23% to 32.69%. (Returns by market capitalization and investment style are based on the Russell indexes.)
Financial and consumer discretionary stocks propel the benchmark higher
For the year, all ten industry sectors of the Russell 3000 Index scored double-digit gains, including seven that climbed more than 25%. The benchmark’s second- and third-largest sectors, financials and consumer discretionary, advanced 32.8% and 44.5%, respectively, and made the biggest contributions to the benchmark’s rise. The 30.9% gain of information technology stocks, the index’s largest sector, also made a substantial contribution, as did outsized results from health care (up 42.8%) and industrial (up 42.2%) issues. Together, these five sectors constituted more than 70% of the benchmark’s total market capitalization on December 31, 2013.
During the period, all of the five largest stocks in the index registered gains, and three surpassed the return of the broad U.S. stock market. Google was the best performer; its stock climbed 58.4% as the company expanded its core advertising business within the mobile device market. Microsoft and General Electric followed with gains of 44.3% and 37.9%, respectively. Exxon Mobil (up 20.1%) also posted a strong advance but failed to keep pace in a surging market environment. Apple, the index’s largest individual component in terms of market capitalization at period-end, substantially lagged; it returned 8.1%.
TIAA-CREF Life Funds ¡ 2013 Annual Report 25
Stock Index Fund
Performance as of December 31, 2013
| | | | | | | | | | | | | | | | |
| | | | | | Total
return | | | Average annual
total return | |
| | | Inception date | | | 1 year | | | 5 years | | | 10 years | |
Stock Index Fund | | | 1/4/1999 | | | | 33.43 | % | | | 18.63 | % | | | 7.87 | % |
Russell 3000® Index | | | — | | | | 33.55 | | | | 18.71 | | | | 7.88 | |
The returns in this report show past performance, which is no guarantee of future results. Returns and the principal value of your investment will fluctuate. Current performance may be higher or lower than that shown, and you may have a gain or a loss when you redeem your shares. For current performance information, including performance to the most recent month-end, please visit tiaa-cref.org. Performance may reflect waivers or reimbursements of certain expenses. Absent these waivers or reimbursement arrangements, performance may be lower.
You cannot invest directly in any index. Index returns do not include a deduction for fees or expenses.
$10,000 over 10 years

For the purpose of comparison, the graph also shows the change in the value of the fund’s benchmark during the same period.
26 2013 Annual Report ¡ TIAA-CREF Life Funds
Stock Index Fund
Expense example
Six months ended December 31, 2013
| | | | | | | | | | | | |
| Stock Index Fund | | Beginning
account value
(7/1/13) | | | Ending
account value
(12/31/13) | | | Expenses paid
during period*
(7/1/13–12/31/13) | |
Actual return | | | $1,000.00 | | | | $1,170.34 | | | | $0.49 | |
5% annual hypothetical return | | | 1,000.00 | | | | 1,024.75 | | | | 0.46 | |
| * | “Expenses paid during period” is based on the fund’s actual expense ratio for the most recent fiscal half-year, multiplied by the average account value over the six-month period, multiplied by 184/365. There were 184 days in the six months ended December 31, 2013. The fund’s annualized six-month expense ratio for that period was 0.09%. The expense charges of the fund may at times reflect a reimbursement. Please see the prospectus for an explanation, including the date on which this reimbursement is scheduled to end. Without such reimbursement, the expenses of the fund would be higher and its performance lower. |
For more information about this expense example, please see page 6.
Portfolio composition
| | | | |
| Sector | | % of net assets
as of 12/31/2013 | |
Information technology | | | 17.9 | |
Financials | | | 17.3 | |
Consumer discretionary | | | 13.3 | |
Health care | | | 12.5 | |
Industrials | | | 11.7 | |
Energy | | | 9.2 | |
Consumer staples | | | 8.4 | |
Materials | | | 3.8 | |
Utilities | | | 2.9 | |
Telecommunication services | | | 2.1 | |
Short-term investments,
other assets & liabilities, net | | | 0.9 | |
Total | | | 100.0 | |
Holdings by company size
| | | | |
| Market capitalization | | % of equity investments
as of 12/31/2013 | |
More than $50 billion | | | 48.1 | |
More than $15 billion–$50 billion | | | 24.0 | |
More than $2 billion–$15 billion | | | 22.5 | |
$2 billion or less | | | 5.4 | |
Total | | | 100.0 | |
TIAA-CREF Life Funds ¡ 2013 Annual Report 27
International Equity Fund
Performance for the twelve months ended December 31, 2013
The International Equity Fund returned 24.15% for the year, compared with the 22.78% return of its benchmark, the MSCI EAFE Index.
Foreign stocks climbed in 2013, with the MSCI EAFE Index adding to its 17.32% advance in 2012. Gains were concentrated in the second half of the year, when investors welcomed easy monetary policies from some of the world’s major central banks and improvements in the U.S. and European economies. Despite its strong results, however, the EAFE index, which measures stock performance in 21 developed market nations outside North America, lagged the 33.55% surge of U.S. stocks, as measured by the Russell 3000® Index.
Japanese equities—the index’s second-largest country component in terms of market capitalization at year-end—gained 27.2% and made the greatest contribution to the benchmark’s rise. Because of its size within the index, Great Britain, the EAFE’s largest national component, made the second-largest contribution even though its 20.7% return trailed that of the index. Impressive gains from Germany (up 31.4%), Switzerland (up 26.6%) and France (up 26.3%) also aided results.
A stronger dollar relative to the yen lowered returns for U.S. investors. In terms of local currencies, the MSCI EAFE Index gained 26.93% for the year.
Stock choices propel the fund above its benchmark
For the period, the fund outpaced its benchmark by more than one percentage point because of successful stock selections. These included overweight positions in three British companies—Lloyds Banking Group, online supermarket Ocado and industrial conglomerate Essentra. Overweights in Swiss employment agency Adecco and German drug maker Bayer boosted relative results as well.
These positive effects were partly offset by unfavorable stock choices, such as overweight holdings in German chemical producer Lanxess and British cruise ship operator Carnival. An overweight in India’s HDFC Bank also detracted.
The fund’s returns may sometimes diverge from the returns of its benchmark index more than would be expected. This divergence may be the result of the fund’s fair value pricing adjustments or of the timing of foreign currency valuations. Many foreign exchanges close for trading before the fund’s net asset value (NAV) is calculated (generally 4 p.m. ET). In the intervening hours, the values of foreign securities can change, and these changes are not reflected immediately in the returns of the fund’s benchmark. These changes are, however, taken into account to value the fund’s portfolio holdings at the time the fund’s NAV is calculated; these are known as fair value pricing adjustments.
28 2013 Annual Report ¡ TIAA-CREF Life Funds
International Equity Fund
Performance as of December 31, 2013
| | | | | | | | | | | | | | | | |
| | | | | | Total
return | | | Average annual
total return | |
| | | Inception date | | | 1 year | | | 5 years | | | 10 years | |
International Equity Fund | | | 4/3/2000 | | | | 24.15 | % | | | 14.35 | % | | | 7.46 | % |
MSCI EAFE Index | | | — | | | | 22.78 | | | | 12.44 | | | | 6.91 | |
The returns in this report show past performance, which is no guarantee of future results. Returns and the principal value of your investment will fluctuate. Current performance may be higher or lower than that shown, and you may have a gain or a loss when you redeem your shares. For current performance information, including performance to the most recent month-end, please visit tiaa-cref.org. Performance may reflect waivers or reimbursements of certain expenses. Absent these waivers or reimbursement arrangements, performance may be lower.
You cannot invest directly in any index. Index returns do not include a deduction for fees or expenses.
$10,000 over 10 years

For the purpose of comparison, the graph also shows the change in the value of the fund’s benchmark during the same period.
TIAA-CREF Life Funds ¡ 2013 Annual Report 29
International Equity Fund
Expense example
Six months ended December 31, 2013
| | | | | | | | | | | | |
| International Equity Fund | | Beginning
account value
(7/1/13) | | | Ending
account value
(12/31/13) | | | Expenses paid
during period*
(7/1/13–12/31/13) | |
Actual return | | | $1,000.00 | | | | $1,201.03 | | | | $3.33 | |
5% annual hypothetical return | | | 1,000.00 | | | | 1,022.18 | | | | 3.06 | |
| * | “Expenses paid during period” is based on the fund’s actual expense ratio for the most recent fiscal half-year, multiplied by the average account value over the six-month period, multiplied by 184/365. There were 184 days in the six months ended December 31, 2013. The fund’s annualized six-month expense ratio for that period was 0.60%. The expense charges of the fund may at times reflect a reimbursement. Please see the prospectus for an explanation, including the date on which this reimbursement is scheduled to end. Without such reimbursement, the expenses of the fund would be higher and its performance lower. |
For more information about this expense example, please see page 6.
Portfolio composition
| | | | |
| Sector | | % of net assets
as of 12/31/2013 | |
Industrials | | | 26.8 | |
Consumer discretionary | | | 23.9 | |
Financials | | | 18.0 | |
Health care | | | 7.7 | |
Information technology | | | 7.5 | |
Consumer staples | | | 7.0 | |
Telecommunication services | | | 3.3 | |
Materials | | | 3.3 | |
Utilities | | | 1.2 | |
Energy | | | 0.2 | |
Short-term investments,
other assets & liabilities, net | | | 1.1 | |
Total | | | 100.0 | |
Holdings by company size
| | | | |
| Market capitalization | | % of equity investments
as of 12/31/2013 | |
More than $50 billion | | | 21.5 | |
More than $15 billion–$50 billion | | | 32.2 | |
More than $2 billion–$15 billion | | | 44.4 | |
$2 billion or less | | | 1.9 | |
Total | | | 100.0 | |
Holdings by country
| | | | |
| | | % of portfolio investments
as of 12/31/2013 | |
United Kingdom | | | 22.9 | |
France | | | 20.5 | |
Japan | | | 13.1 | |
Germany | | | 10.0 | |
Switzerland | | | 7.9 | |
India | | | 6.9 | |
Sweden | | | 5.8 | |
Greece | | | 5.1 | |
7 other nations | | | 6.9 | |
Short-term investments | | | 0.9 | |
Total | | | 100.0 | |
30 2013 Annual Report ¡ TIAA-CREF Life Funds
Bond Fund
Performance for the twelve months ended December 31, 2013
The Bond Fund returned –1.54% for the year, compared with the –2.02% return of its benchmark, the Barclays U.S. Aggregate Bond Index.
The nation’s gross domestic product grew at an estimated annual rate of 4.1% in the third quarter of 2013, versus 2.5% in the second quarter and 1.1% in the first. Unemployment ended the year at 6.7%, down from 7.9% twelve months earlier. As the U.S. economy showed increasing signs of improvement, many investors left the relative safety of high-quality bonds to seek higher returns in riskier assets, such as stocks and below-investment-grade corporate securities.
At the same time, the Federal Reserve kept investors guessing about when it might begin reducing its massive bond buying program, designed to stimulate economic growth by restraining long-term interest rates. Investment-grade, fixed-rate bonds, as measured by the Barclays U.S. Aggregate Bond Index, fell sharply in May and June, in response to the Fed’s “taper talk.” They rallied in the fall, however, following the Fed’s surprise announcement that it would maintain its accommodative stance. At year-end, bond prices fell modestly when the Fed decided to reduce its bond purchases by $10 billion—to $75 billion a month.
Treasuries lead the benchmark’s atypical retreat
Although the decline in the Barclays aggregate index was disappointing, it was only the third such calendar-year retreat in the index’s 37-year history.
U.S. Treasury securities, the benchmark’s largest sector, recorded the biggest loss for the year, returning –2.5%, as falling bond prices pushed up their yields. Yields on 10-year Treasuries went from 1.78% as the year opened to 3.04% on December 31, 2013.
U.S. mortgage-backed securities, which constituted almost one-third of the index’s total market capitalization, returned –1.4%. Corporate bonds, which represented about one-fifth of the benchmark, returned –1.5%. Commercial mortgage-backed securities posted a small gain, 0.2%, while asset-backed and U.S. agency securities returned –0.3% and –1.6%, respectively.
In the challenging environment for bonds, the fund held up better than its benchmark index. The fund benefited most from a significantly underweight position in—and advantageous security selections among—U.S. Treasuries, which lagged the broad bond market for the year. Successful choices among government-related credit securities also helped, as did advantageous positioning and outperforming choices among asset-backed, commercial mortgage-backed and corporate bonds.
Partly offsetting these positive effects were unfavorable investments in mortgage-backed securities and government-related agency issues.
TIAA-CREF Life Funds ¡ 2013 Annual Report 31
Bond Fund
Performance as of December 31, 2013
| | | | | | | | | | | | | | | | |
| | | | | | Total
return | | | Average annual
total return | |
| | | Inception date | | | 1 year | | | 5 years | | | 10 years | |
Bond Fund | | | 7/8/2003 | | | | –1.54 | % | | | 5.14 | % | | | 4.30 | % |
Barclays U.S. Aggregate Bond Index | | | — | | | | –2.02 | | | | 4.44 | | | | 4.55 | |
The returns in this report show past performance, which is no guarantee of future results. Returns and the principal value of your investment will fluctuate. Current performance may be higher or lower than that shown, and you may have a gain or a loss when you redeem your shares. For current performance information, including performance to the most recent month-end, please visit tiaa-cref.org. Performance may reflect waivers or reimbursements of certain expenses. Absent these waivers or reimbursement arrangements, performance may be lower.
You cannot invest directly in any index. Index returns do not include a deduction for fees or expenses.
$10,000 over 10 years
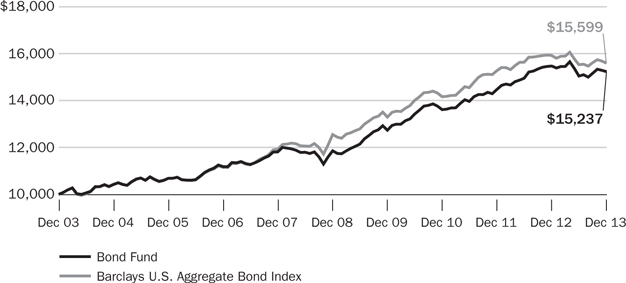
For the purpose of comparison, the graph also shows the change in the value of the fund’s benchmark during the same period.
32 2013 Annual Report ¡ TIAA-CREF Life Funds
Bond Fund
Expense example
Six months ended December 31, 2013
| | | | | | | | | | | | |
| Bond Fund | | Beginning
account value
(7/1/13) | | | Ending
account value
(12/31/13) | | | Expenses paid
during period*
(7/1/13–12/31/13) | |
Actual return | | | $1,000.00 | | | | $1,012.44 | | | | $1.78 | |
5% annual hypothetical return | | | 1,000.00 | | | | 1,023.44 | | | | 1.79 | |
| * | “Expenses paid during period” is based on the fund’s actual expense ratio for the most recent fiscal half-year, multiplied by the average account value over the six-month period, multiplied by 184/365. There were 184 days in the six months ended December 31, 2013. The fund’s annualized six-month expense ratio for that period was 0.35%. The expense charges of the fund may at times reflect a reimbursement. Please see the prospectus for an explanation, including the date on which this reimbursement is scheduled to end. Without such reimbursement, the expenses of the fund would be higher and its performance lower. |
For more information about this expense example, please see page 6.
Portfolio composition
| | | | |
% of net assets as of 12/31/2013 | |
Corporate bonds | | | 27.3 | |
U.S. Treasury securities | | | 25.6 | |
Mortgage-backed securities† | | | 20.5 | |
Foreign government & corporate bonds denominated in U.S. dollars | | | 12.6 | |
Commercial mortgage-backed securities | | | 4.3 | |
Asset-backed securities | | | 4.3 | |
Municipal bonds | | | 1.0 | |
Bank loan obligations | | | 0.4 | |
Preferred stock | | | 0.1 | |
U.S. agency securities | | | 0.1 | |
Short-term investments,
other assets & liabilities, net | | | 3.8 | |
Total | | | 100.0 | |
| † | Includes mortgage pass-through securities and collateralized mortgage obligations |
Holdings by maturity
| | | | |
% of fixed-income investments (excluding
short-term investments) as of 12/31/2013 | |
Less than 1 year | | | 4.5 | |
1–3 years | | | 23.6 | |
3–5 years | | | 21.4 | |
5–10 years | | | 41.4 | |
Over 10 years | | | 9.1 | |
Total | | | 100.0 | |
Holdings by credit quality‡
| | | | |
% of fixed-income investments (excluding
short-term investments) as of 12/31/2013 | |
Aaa/AAA | | | 49.9 | |
Aa/AA | | | 4.2 | |
A/A | | | 12.8 | |
Baa/BBB | | | 23.3 | |
Ba/BB | | | 5.8 | |
B/B | | | 3.6 | |
Below B/B | | | 0.2 | |
Non-rated | | | 0.2 | |
Total | | | 100.0 | |
| ‡ | Credit quality ratings are based on the Barclays methodology, which uses the median rating of those compiled by the Moody’s, Standard & Poor’s and Fitch ratings agencies. If ratings are available from only two of these agencies, the lower rating is used. When only one rating is available, that one is used. These ratings are subject to change with- out notice. |
TIAA-CREF Life Funds ¡ 2013 Annual Report 33
Money Market Fund
Performance for the twelve months ended December 31, 2013
The Money Market Fund returned 0.01% for the year, compared with the 0.02% return of the iMoneyNet Money Fund Report Averages™—All Taxable, a simple average of over 1,000 taxable money market funds. The iMoneyNet average is not an index, and its return reflects the deduction of expenses charged by the funds included in the average.
In 2013, supplies of money market instruments shrank, boosting prices and lowering yields. Issuance of U.S. Treasury and agency securities was greatly curtailed, as budget cuts, higher tax receipts and large dividend payments by government-sponsored entities Fannie Mae and Freddie Mac reduced the federal government’s borrowing needs. In addition, the Federal Reserve’s large-scale purchases of government securities, intended to stimulate the economy by lowering interest rates, left fewer investment opportunities for other investors.
In the private sector, yields fell on repurchase agreements, which often use Treasuries as collateral. Issuance of commercial paper decreased, as businesses reported sufficient cash. Concerned that already-low yields might turn negative, the Fed introduced a reverse repurchase agreement program, lending its holdings as collateral on an overnight basis to create a floor on very short interest rates.
Declining yields pose challenges for money managers
For the year, the Fed kept its target federal funds rate—the interest rate U.S. commercial banks charge one another for overnight loans—near 0%. Six-month Treasury yields fell from 0.11% at year-end 2012 to 0.10% one year later.
LIBOR yields also declined. (LIBOR is an indicator of the interest rates that banks expect to pay to other banks for loans on the London market.) The three-month rate dropped from 0.31% to 0.25%. Although the inquiry continued into LIBOR’s manipulation by several major banks, it remained the reference rate for a substantial number of money market transactions.
Amid falling yields and diminished supplies, the fund sought advantageous investment opportunities while complying with SEC regulations. The fund maintained more than half of its portfolio in U.S. Treasury and agency securities. For higher yields, it purchased longer-term U.S. government floating-rate securities and selectively invested in high-quality Pacific Rim banks in addition to Canadian and Australian institutions. On December 31, 2013, the fund’s weighted average maturity was 52 days, versus 47 days for the average iMoneyNet fund.
In response to exceptionally low interest rates, part or all of the Money Market Fund’s investment management fees were voluntarily waived during the year to prevent the fund’s yield from turning negative.
34 2013 Annual Report ¡ TIAA-CREF Life Funds
Money Market Fund
Net annualized yield for the 7 days ended December 31, 2013*
| | | | | | | | |
| | | Current yield | | | Effective yield | |
Money Market Fund† | | | 0.00 | % | | | 0.00 | % |
iMoneyNet Money Fund Report Averages—All Taxable‡ | | | 0.01 | | | | 0.01 | |
The current yield more closely reflects current earnings than does the total return.
| * | Typically, iMoneyNet reports its 7-day yields as of Tuesday of each week. |
Performance as of December 31, 2013
| | | | | | | | | | | | | | | | |
| | | | | | Total
return | | | Average annual
total return | |
| | | Inception date | | | 1 year | | | 5 years | | | 10 years | |
Money Market Fund† | | | 7/8/2003 | | | | 0.01 | % | | | 0.14 | % | | | 1.84 | % |
iMoneyNet Money Fund Report Averages—All Taxable‡ | | | — | | | | 0.02 | | | | 0.06 | | | | 1.48 | |
The returns in this report show past performance, which is no guarantee of future results. Returns and the principal value of your investment will fluctuate. Current performance may be higher or lower than that shown, and you may have a gain or a loss when you redeem your shares. For current performance information, including performance to the most recent month-end, please visit tiaa-cref.org. Performance may reflect waivers or reimbursements of certain expenses. Absent these waivers or reimbursement arrangements, performance may be lower.
Investments in the TIAA-CREF Life Money Market Fund are neither insured nor guaranteed by the Federal Deposit Insurance Corporation (FDIC) or any other government agency. Although the fund seeks to preserve the value of your investment at $1.00 per share, it is possible to lose money by investing in the fund. For a detailed discussion of risk, please see the prospectus.
| † | Beginning May 29, 2013, part or all of the investment management fees of the TIAA-CREF Life Money Market Fund are being voluntarily waived. Without this waiver, the total returns and 7-day current and effective net annualized yields would have been lower. This voluntary fee waiver may be discontinued at any time without notice. |
| ‡ | The iMoneyNet Money Fund Report Averages—All Taxable category is a simple average of over 1,000 taxable money market funds. You cannot invest in it directly. |
TIAA-CREF Life Funds ¡ 2013 Annual Report 35
Money Market Fund
Expense example
Six months ended December 31, 2013
| | | | | | | | | | | | |
| Money Market Fund | | Beginning
account value
(7/1/13) | | | Ending
account value
(12/31/13) | | | Expenses paid
during period*
(7/1/13–12/31/13) | |
Actual return | | | $1,000.00 | | | | $1,000.00 | | | | $0.60 | |
5% annual hypothetical return | | | 1,000.00 | | | | 1,024.60 | | | | 0.61 | |
| * | “Expenses paid during period” is based on the fund’s actual expense ratio for the most recent fiscal half-year, multiplied by the average account value over the six-month period, multiplied by 184/365. There were 184 days in the six months ended December 31, 2013. The fund’s annualized six-month expense ratio for that period was 0.12%. The expense charges of the fund reflect a voluntary waiver and may at times reflect a reimbursement. Please see the prospectus for an explanation, including the date on which this reimbursement is scheduled to end. Without such waiver and reimbursement, the expenses of the fund would be higher and its performance lower. |
For more information about this expense example, please see page 6.
Portfolio composition
| | | | |
| | | % of net assets as of 12/31/2013 | |
U.S. government agency securities | | | 40.8 | |
Commercial paper | | | 33.5 | |
U.S. Treasury securities | | | 16.5 | |
Floating rate securities, government | | | 5.3 | |
Certificates of deposit | | | 4.7 | |
Other assets & liabilities, net | | | –0.8 | |
Total | | | 100.0 | |
36 2013 Annual Report ¡ TIAA-CREF Life Funds
| | |
| Summary portfolio of investments | | |
Growth Equity Fund § December 31, 2013
| | | | | | | | | | | | | | | | |
| Shares | | | | | Company | | | | Value | | | % of net
assets | |
| | | | | | | | | | | | | | | | |
| | COMMON STOCKS | | | | | | | | |
| | AUTOMOBILES & COMPONENTS | | | | | | | | |
| | 14,179 | | | * | | General Motors Co | | | | $ | 579,496 | | | | 0.9 | % |
| | | | | | Other | | | | | 286,474 | | | | 0.5 | |
| | | | | | | | | | | | |
| | | | | | | | | | | 865,970 | | | | 1.4 | |
| | | | | | | | | | | | |
| | CAPITAL GOODS | | | | | | | | |
| | 6,607 | | | | | Boeing Co | | | | | 901,790 | | | | 1.5 | |
| | 3,746 | | | | | Precision Castparts Corp | | | | | 1,008,798 | | | | 1.6 | |
| | 4,124 | | | | | Roper Industries, Inc | | | | | 571,916 | | | | 0.9 | |
| | 3,020 | | | | | W.W. Grainger, Inc | | | | | 771,368 | | | | 1.2 | |
| | | | | | Other | | | | | 409,236 | | | | 0.7 | |
| | | | | | | | | | | | |
| | | | | | | | | | | 3,663,108 | | | | 5.9 | |
| | | | | | | | | | | | |
| | COMMERCIAL & PROFESSIONAL SERVICES | | | | | | | | |
| | 22,794 | | | | | Nielsen Holdings NV | | | | | 1,046,017 | | | | 1.7 | |
| | 8,581 | | | * | | Verisk Analytics, Inc | | | | | 563,943 | | | | 0.9 | |
| | | | | | | | | | | | |
| | | | | | | | | | | 1,609,960 | | | | 2.6 | |
| | | | | | | | | | | | |
| | CONSUMER DURABLES & APPAREL | | | | | | | | |
| | 3,330 | | | | | LVMH Moet Hennessy Louis Vuitton S.A. | | | | | 608,371 | | | | 1.0 | |
| | 7,923 | | | | | Nike, Inc (Class B) | | | | | 623,065 | | | | 1.0 | |
| | | | | | Other | | | | | 645,530 | | | | 1.0 | |
| | | | | | | | | | | | |
| | | | | | | | | | | 1,876,966 | | | | 3.0 | |
| | | | | | | | | | | | |
| | CONSUMER SERVICES | | | | | | | | |
| | 16,585 | | | | | Las Vegas Sands Corp | | | | | 1,308,059 | | | | 2.1 | |
| | 12,426 | | | | | Starbucks Corp | | | | | 974,074 | | | | 1.6 | |
| | | | | | Other | | | | | 316,035 | | | | 0.5 | |
| | | | | | | | | | | | |
| | | | | | | | | | | 2,598,168 | | | | 4.2 | |
| | | | | | | | | | | | |
| | DIVERSIFIED FINANCIALS | | | | | | | | |
| | 5,580 | | | | | Ameriprise Financial, Inc | | | | | 641,979 | | | | 1.0 | |
| | 4,040 | | | | | Goldman Sachs Group, Inc | | | | | 716,131 | | | | 1.2 | |
| | 3,185 | | | | | IntercontinentalExchange Group, Inc | | | | | 716,370 | | | | 1.2 | |
| | 7,998 | | | | | Moody’s Corp | | | | | 627,603 | | | | 1.0 | |
| | | | | | Other | | | | | 1,111,691 | | | | 1.8 | |
| | | | | | | | | | | | |
| | | | | | | | | | | 3,813,774 | | | | 6.2 | |
| | | | | | | | | | | | |
| | ENERGY | | | | | | | | |
| | 3,149 | | | | | EOG Resources, Inc | | | | | 528,528 | | | | 0.8 | |
| | | | | | Other | | | | | 226,807 | | | | 0.4 | |
| | | | | | | | | | | | |
| | | | | | | | | | | 755,335 | | | | 1.2 | |
| | | | | | | | | | | | |
| | FOOD & STAPLES RETAILING | | | | | | | | |
| | 5,206 | | | | | Costco Wholesale Corp | | | | | 619,566 | | | | 1.0 | |
| | | | | | | | | | | | |
| | | | | | | | | | | 619,566 | | | | 1.0 | |
| | | | | | | | | | | | |
| | FOOD, BEVERAGE & TOBACCO | | | 291,546 | | | | 0.5 | |
| | | | | | | | | | | | |
| | HEALTH CARE EQUIPMENT & SERVICES | | | 752,497 | | | | 1.2 | |
| | | | | | | | | | | | |
| | | | | | |
| See notes to financial statements | | TIAA-CREF Life Funds § 2013 Annual Report | | | 37 | |
| | |
| Summary portfolio of investments | | continued |
Growth Equity Fund § December 31, 2013
| | | | | | | | | | | | | | | | |
| Shares | | | | | Company | | | | Value | | | % of net
assets | |
| | | | | | | | | | | | | | | | |
| | HOUSEHOLD & PERSONAL PRODUCTS | | | | | | | | |
| | 2,813 | | | | | L’Oreal S.A. | | | | $ | 493,999 | | | | 0.8 | % |
| | | | | | | | | | | | |
| | | | | | | | | | | 493,999 | | | | 0.8 | |
| | | | | | | | | | | | |
| | MATERIALS | | | | | | | | |
| | 13,548 | | | | | Monsanto Co | | | | | 1,579,019 | | | | 2.6 | |
| | | | | | Other | | | | | 804,847 | | | | 1.3 | |
| | | | | | | | | | | | |
| | | | | | | | | | | 2,383,866 | | | | 3.9 | |
| | | | | | | | | | | | |
| | MEDIA | | | | | | | | |
| | 19,190 | | | | | Comcast Corp (Class A) | | | | | 997,208 | | | | 1.6 | |
| | 12,171 | | | * | | Discovery Communications, Inc (Class A) | | | | | 1,100,502 | | | | 1.8 | |
| | 16,048 | | | | | Twenty-First Century Fox, Inc | | | | | 564,569 | | | | 0.9 | |
| | | | | | Other | | | | | 551,584 | | | | 0.9 | |
| | | | | | | | | | | | |
| | | | | | | | | | | 3,213,863 | | | | 5.2 | |
| | | | | | | | | | | | |
| | PHARMACEUTICALS, BIOTECHNOLOGY & LIFE SCIENCES | | | | | | | | |
| | 4,525 | | | * | | Alexion Pharmaceuticals, Inc | | | | | 602,096 | | | | 1.0 | |
| | 6,767 | | | | | Bayer AG. | | | | | 950,158 | | | | 1.5 | |
| | 6,403 | | | * | | Biogen Idec, Inc | | | | | 1,791,239 | | | | 2.9 | |
| | 7,231 | | | * | | Celgene Corp | | | | | 1,221,750 | | | | 2.0 | |
| | 26,141 | | | * | | Gilead Sciences, Inc | | | | | 1,964,496 | | | | 3.2 | |
| | 4,674 | | | * | | Illumina, Inc | | | | | 517,038 | | | | 0.8 | |
| | 7,255 | | | | | Novartis AG. (ADR) | | | | | 583,157 | | | | 0.9 | |
| | 8,536 | | | | | Perrigo Co plc | | | | | 1,309,935 | | | | 2.1 | |
| | 3,479 | | | | | Roche Holding AG. | | | | | 974,559 | | | | 1.6 | |
| | 6,747 | | | * | | Salix Pharmaceuticals Ltd | | | | | 606,825 | | | | 1.0 | |
| | 19,812 | | | | | Zoetis Inc | | | | | 647,654 | | | | 1.1 | |
| | | | | | Other | | | | | 124,527 | | | | 0.2 | |
| | | | | | | | | | | | |
| | | | | | | | | | | 11,293,434 | | | | 18.3 | |
| | | | | | | | | | | | |
| | REAL ESTATE | | | 383,491 | | | | 0.6 | |
| | | | | | | | | | | | |
| | RETAILING | | | | | | | | |
| | 5,309 | | | * | | Amazon.com, Inc | | | | | 2,117,176 | | | | 3.4 | |
| | | | | | Other | | | | | 1,816,464 | | | | 3.0 | |
| | | | | | | | | | | | |
| | | | | | | | | | | 3,933,640 | | | | 6.4 | |
| | | | | | | | | | | | |
| | SEMICONDUCTORS & SEMICONDUCTOR EQUIPMENT | | | | | | | | |
| | 12,657 | | | | | ARM Holdings plc (ADR) | | | | | 692,844 | | | | 1.1 | |
| | 13,391 | | | | | Xilinx, Inc | | | | | 614,915 | | | | 1.0 | |
| | | | | | Other | | | | | 381,908 | | | | 0.6 | |
| | | | | | | | | | | | |
| | | | | | | | | | | 1,689,667 | | | | 2.7 | |
| | | | | | | | | | | | |
| | SOFTWARE & SERVICES | | | | | | | | |
| | 26,137 | | | * | | Adobe Systems, Inc | | | | | 1,565,084 | | | | 2.5 | |
| | 17,084 | | | * | | eBay, Inc | | | | | 937,741 | | | | 1.5 | |
| | 32,549 | | | * | | Facebook, Inc | | | | | 1,779,128 | | | | 2.9 | |
| | 2,476 | | | * | | Google, Inc (Class A) | | | | | 2,774,878 | | | | 4.5 | |
| | 22,937 | | | | | Intuit, Inc | | | | | 1,750,552 | | | | 2.8 | |
| | 2,097 | | | | | Mastercard, Inc (Class A) | | | | | 1,751,960 | | | | 2.8 | |
| | 22,663 | | | * | | Red Hat, Inc | | | | | 1,270,034 | | | | 2.1 | |
| | | | |
| 38 | | 2013 Annual Report § TIAA-CREF Life Funds | | See notes to financial statements |
| | |
| Summary portfolio of investments | | concluded |
Growth Equity Fund § December 31, 2013
| | | | | | | | | | | | | | | | |
| Shares | | | | | Company | | | | Value | | | % of net
assets | |
| | | | | | | | | | | | | | | | |
| | SOFTWARE & SERVICES—continued | | | | | | | | |
| | 6,297 | | | | | Visa, Inc (Class A) | | | | $ | 1,402,216 | | | | 2.3 | % |
| | 8,401 | | | * | | VMware, Inc (Class A) | | | | | 753,654 | | | | 1.2 | |
| | 15,362 | | | * | | Yahoo!, Inc | | | | | 621,239 | | | | 1.0 | |
| | | | | | Other | | | | | 675,869 | | | | 1.1 | |
| | | | | | | | | | | | |
| | | | | | | | | | | 15,282,355 | | | | 24.7 | |
| | | | | | | | | | | | |
| | TECHNOLOGY HARDWARE & EQUIPMENT | | | | | | | | |
| | 3,568 | | | | | Apple, Inc | | | | | 2,002,041 | | | | 3.2 | |
| | | | | | Other | | | | | 483,412 | | | | 0.8 | |
| | | | | | | | | | | | |
| | | | | | | | | | | 2,485,453 | | | | 4.0 | |
| | | | | | | | | | | | |
| | TELECOMMUNICATION SERVICES | | | | | | | | |
| | 12,100 | | | | | Softbank Corp | | | | | 1,061,784 | | | | 1.7 | |
| | | | | | Other | | | | | 327,216 | | | | 0.6 | |
| | | | | | | | | | | | |
| | | | | | | | | | | 1,389,000 | | | | 2.3 | |
| | | | | | | | | | | | |
| | TRANSPORTATION | | | | | | | | |
| | 9,528 | | | | | Kansas City Southern Industries, Inc | | | | | 1,179,852 | | | | 1.9 | |
| | | | | | Other | | | | | 580,918 | | | | 1.0 | |
| | | | | | | | | | | | |
| | | | | | | | | | | 1,760,770 | | | | 2.9 | |
| | | | | | | | | | | | |
| | | | | | TOTAL COMMON STOCKS | | (Cost $45,925,943) | | | 61,156,428 | | | | 99.0 | |
| | | | | | | | | | | | |
| | |
| | SHORT-TERM INVESTMENTS | | | | | | | | |
| | INVESTMENTS IN REGISTERED INVESTMENT COMPANIES | | | | | | | | |
| | 124,709 | | | c | | TIAA-CREF Short Term Lending Portfolio of the State Street Navigator Securities Lending Trust | | | | | 124,709 | | | | 0.2 | |
| | | | | | | | | | | | |
| | | | | | | | | | | 124,709 | | | | 0.2 | |
| | | | | | | | | | | | |
| | | | | | TOTAL SHORT-TERM INVESTMENTS | | (Cost $124,709) | | | 124,709 | | | | 0.2 | |
| | | | | | | | | | | | |
| | | | | |
| | | | | | TOTAL PORTFOLIO | | (Cost $46,050,652) | | | 61,281,137 | | | | 99.2 | |
| | | | | | OTHER ASSETS & LIABILITIES, NET | | | | | 521,357 | | | | 0.8 | |
| | | | | | | | | | | | |
| | | | | | NET ASSETS | | | | $ | 61,802,494 | | | | 100.0 | % |
| | | | | | | | | | |
ABBREVIATION(S):
ADR American Depositary Receipt
| c | Investments made with cash collateral received from securities on loan. |
The aggregate value of securities on loan is $122,349.
“Other” securities represent the aggregate value, by category, of securities that are not among the 50 largest holdings and, in total for any issuer, represent 1% or less of net assets.
For ease of presentation, a number of classification categories have been grouped together in the Summary Portfolio of Investments. Note that the Fund uses more specific categories in following its investment limitations on investment concentrations.
| | | | | | |
| See notes to financial statements | | TIAA-CREF Life Funds § 2013 Annual Report | | | 39 | |
| | |
| Summary portfolio of investments | | |
Growth & Income Fund § December 31, 2013
| | | | | | | | | | | | | | | | |
| Shares | | | | | Company | | | | Value | | | % of net
assets | |
| | | | | | | | | | | | | | | | |
| | COMMON STOCKS | | | | | | | | |
| | AUTOMOBILES & COMPONENTS | | | | | | | | | | |
| | 13,891 | | | | | Delphi Automotive plc | | | | $ | 835,266 | | | | 0.6 | % |
| | 19,306 | | | | | Johnson Controls, Inc | | | | | 990,398 | | | | 0.8 | |
| | | | | | | | | | | | |
| | | | | | | | | | | 1,825,664 | | | | 1.4 | |
| | | | | | | | | | | | |
| | BANKS | | | | | | | | | | |
| | 34,132 | | | | | Wells Fargo & Co | | | | | 1,549,593 | | | | 1.2 | |
| | | | | | Other | | | | | 1,585,412 | | | | 1.2 | |
| | | | | | | | | | | | |
| | | | | | | | | | | 3,135,005 | | | | 2.4 | |
| | | | | | | | | | | | |
| | CAPITAL GOODS | | | | | | | | | | |
| | 10,166 | | | | | Danaher Corp | | | | | 784,815 | | | | 0.6 | |
| | 13,953 | | | | | Eaton Corp | | | | | 1,062,102 | | | | 0.8 | |
| | 127,132 | | | | | General Electric Co | | | | | 3,563,510 | | | | 2.7 | |
| | 18,222 | | | | | Honeywell International, Inc | | | | | 1,664,944 | | | | 1.2 | |
| | | | | | Other | | | | | 3,508,088 | | | | 2.7 | |
| | | | | | | | | | | | |
| | | | | | | | | | | 10,583,459 | | | | 8.0 | |
| | | | | | | | | | | | |
| | COMMERCIAL & PROFESSIONAL SERVICES | | | | | 512,717 | | | | 0.4 | |
| | | | | | | | | | | | |
| | CONSUMER DURABLES & APPAREL | | | | | | | | | | |
| | 12,798 | | | * | | Jarden Corp | | | | | 785,157 | | | | 0.6 | |
| | | | | | Other | | | | | 3,537,161 | | | | 2.7 | |
| | | | | | | | | | | | |
| | | | | | | | | | | 4,322,318 | | | | 3.3 | |
| | | | | | | | | | | | |
| | CONSUMER SERVICES | | | | | 2,426,627 | | | | 1.7 | |
| | | | | | | | | | | | |
| | DIVERSIFIED FINANCIALS | | | | | | | | | | |
| | 119,407 | | | | | Bank of America Corp | | | | | 1,859,167 | | | | 1.4 | |
| | 40,103 | | | | | Citigroup, Inc | | | | | 2,089,767 | | | | 1.6 | |
| | 21,260 | | | | | Discover Financial Services | | | | | 1,189,497 | | | | 0.9 | |
| | 20,008 | | | | | JPMorgan Chase & Co | | | | | 1,170,068 | | | | 0.9 | |
| | 29,224 | | | | | Morgan Stanley | | | | | 916,465 | | | | 0.7 | |
| | 12,220 | | | | | State Street Corp | | | | | 896,826 | | | | 0.7 | |
| | | | | | Other | | | | | 1,856,744 | | | | 1.4 | |
| | | | | | | | | | | | |
| | | | | | | | | | | 9,978,534 | | | | 7.6 | |
| | | | | | | | | | | | |
| | ENERGY | | | | | | | | | | |
| | 22,903 | | | | | Chevron Corp | | | | | 2,860,814 | | | | 2.2 | |
| | 6,355 | | | | | EOG Resources, Inc | | | | | 1,066,623 | | | | 0.8 | |
| | 24,444 | | | | | Halliburton Co | | | | | 1,240,533 | | | | 0.9 | |
| | 10,908 | | | | | Phillips 66 | | | | | 841,334 | | | | 0.6 | |
| | | | | | Other | | | | | 4,060,743 | | | | 3.2 | |
| | | | | | | | | | | | |
| | | | | | | | | | | 10,070,047 | | | | 7.7 | |
| | | | | | | | | | | | |
| | FOOD & STAPLES RETAILING | | | | | 595,420 | | | | 0.5 | |
| | | | | | | | | | | | |
| | FOOD, BEVERAGE & TOBACCO | | | | | | | | | | |
| | 24,873 | | | | | Altria Group, Inc | | | | | 954,874 | | | | 0.7 | |
| | 11,422 | | | | | Hershey Co | | | | | 1,110,561 | | | | 0.8 | |
| | 23,625 | | | | | PepsiCo, Inc | | | | | 1,959,458 | | | | 1.5 | |
| | | | |
| 40 | | 2013 Annual Report § TIAA-CREF Life Funds | | See notes to financial statements |
| | |
| Summary portfolio of investments | | continued |
Growth & Income Fund § December 31, 2013
| | | | | | | | | | | | | | | | |
| Shares | | | | | Company | | | | Value | | | % of net
assets | |
| | | | | | | | | | | | | | | | |
| | FOOD, BEVERAGE & TOBACCO—continued | | | | | | | | | | |
| | | | | | Other | | | | $ | 3,264,661 | | | | 2.5 | % |
| | | | | | | | | | | | |
| | | | | | | | | | | 7,289,554 | | | | 5.5 | |
| | | | | | | | | | | | |
| | HEALTH CARE EQUIPMENT & SERVICES | | | | | | | | | | |
| | 19,102 | | | | | Aetna, Inc | | | | | 1,310,206 | | | | 1.0 | |
| | 11,950 | | | | | Zimmer Holdings, Inc | | | | | 1,113,620 | | | | 0.9 | |
| | | | | | Other | | | | | 1,481,248 | | | | 1.1 | |
| | | | | | | | | | | | |
| | | | | | | | | | | 3,905,074 | | | | 3.0 | |
| | | | | | | | | | | | |
| | HOUSEHOLD & PERSONAL PRODUCTS | | | | | | | | | | |
| | 14,958 | | | | | Procter & Gamble Co | | | | | 1,217,731 | | | | 0.9 | |
| | | | | | Other | | | | | 1,788,130 | | | | 1.4 | |
| | | | | | | | | | | | |
| | | | | | | | | | | 3,005,861 | | | | 2.3 | |
| | | | | | | | | | | | |
| | INSURANCE | | | | | | | | | | |
| | 11,649 | | | | | ACE Ltd | | | | | 1,206,021 | | | | 0.9 | |
| | 27,332 | | | | | Hartford Financial Services Group, Inc | | | | | 990,238 | | | | 0.8 | |
| | 18,637 | | | | | Metlife, Inc | | | | | 1,004,907 | | | | 0.8 | |
| | | | | | Other | | | | | 819,178 | | | | 0.6 | |
| | | | | | | | | | | | |
| | | | | | | | | | | 4,020,344 | | | | 3.1 | |
| | | | | | | | | | | | |
| | MATERIALS | | | | | | | | | | |
| | 4,107 | | | | | PPG Industries, Inc | | | | | 778,934 | | | | 0.6 | |
| | | | | | Other | | | | | 4,309,341 | | | | 3.3 | |
| | | | | | | | | | | | |
| | | | | | | | | | | 5,088,275 | | | | 3.9 | |
| | | | | | | | | | | | |
| | MEDIA | | | | | | | | | | |
| | 17,875 | | | | | CBS Corp (Class B) | | | | | 1,139,353 | | | | 0.9 | |
| | 38,958 | | | | | Comcast Corp (Class A) | | | | | 2,024,453 | | | | 1.5 | |
| | 14,216 | | | * | | Walt Disney Co | | | | | 1,086,102 | | | | 0.8 | |
| | | | | | Other | | | | | 1,812,288 | | | | 1.4 | |
| | | | | | | | | | | | |
| | | | | | | | | | | 6,062,196 | | | | 4.6 | |
| | | | | | | | | | | | |
| | PHARMACEUTICALS, BIOTECHNOLOGY & LIFE SCIENCES | | | | | | | | | | |
| | 5,449 | | | * | | Actavis plc | | | | | 915,432 | | | | 0.7 | |
| | 21,553 | | | | | Bristol-Myers Squibb Co | | | | | 1,145,542 | | | | 0.9 | |
| | 5,073 | | | * | | Celgene Corp | | | | | 857,134 | | | | 0.6 | |
| | 29,271 | | | * | | Gilead Sciences, Inc | | | | | 2,199,716 | | | | 1.7 | |
| | 33,600 | | | | | Johnson & Johnson | | | | | 3,077,424 | | | | 2.3 | |
| | 23,578 | | | | | Merck & Co, Inc | | | | | 1,180,079 | | | | 0.9 | |
| | | | | | Other | | | | | 8,680,367 | | | | 6.6 | |
| | | | | | | | | | | | |
| | | | | | | | | | | 18,055,694 | | | | 13.7 | |
| | | | | | | | | | | | |
| | REAL ESTATE | | | | | 372,121 | | | | 0.3 | |
| | | | | | | | | | | | |
| | RETAILING | | | | | | | | | | |
| | 4,603 | | | * | | Amazon.com, Inc | | | | | 1,835,630 | | | | 1.4 | |
| | 21,849 | | | | | Home Depot, Inc | | | | | 1,799,047 | | | | 1.4 | |
| | 15,184 | | | | | Macy’s, Inc | | | | | 810,826 | | | | 0.6 | |
| | 673 | | | * | | Priceline.com, Inc | | | | | 782,295 | | | | 0.6 | |
| | | | | | |
| See notes to financial statements | | TIAA-CREF Life Funds § 2013 Annual Report | | | 41 | |
| | |
| Summary portfolio of investments | | continued |
Growth & Income Fund § December 31, 2013
| | | | | | | | | | | | | | | | |
| Shares | | | | | Company | | | | Value | | | % of net
assets | |
| | | | | | | | | | | | | | | | |
| | RETAILING—continued | | | | | | | | | | |
| | 16,417 | | | | | TJX Companies, Inc | | | | $ | 1,046,255 | | | | 0.8 | % |
| | | | | | Other | | | | | 4,500,683 | | | | 3.4 | |
| | | | | | | | | | | | |
| | | | | | | | | | | 10,774,736 | | | | 8.2 | |
| | | | | | | | | | | | |
| | SEMICONDUCTORS & SEMICONDUCTOR EQUIPMENT | | | | | 3,264,813 | | | | 2.5 | |
| | | | | | | | | | | | |
| | SOFTWARE & SERVICES | | | | | | | | | | |
| | 3,343 | | | * | | Alliance Data Systems Corp | | | | | 878,975 | | | | 0.7 | |
| | 2,730 | | | * | | Google, Inc (Class A) | | | | | 3,059,538 | | | | 2.3 | |
| | 61,292 | | | | | Microsoft Corp | | | | | 2,294,160 | | | | 1.7 | |
| | | | | | Other | | | | | 5,238,343 | | | | 4.0 | |
| | | | | | | | | | | | |
| | | | | | | | | | | 11,471,016 | | | | 8.7 | |
| | | | | | | | | | | | |
| | TECHNOLOGY HARDWARE & EQUIPMENT | | | | | | | | | | |
| | 7,726 | | | | | Apple, Inc | | | | | 4,335,136 | | | | 3.3 | |
| | | | | | Other | | | | | 2,957,983 | | | | 2.2 | |
| | | | | | | | | | | | |
| | | | | | | | | | | 7,293,119 | | | | 5.5 | |
| | | | | | | | | | | | |
| | TELECOMMUNICATION SERVICES | | | | | | | | | | |
| | 28,302 | | | | | Verizon Communications, Inc | | | | | 1,390,760 | | | | 1.1 | |
| | | | | | Other | | | | | 1,232,810 | | | | 0.9 | |
| | | | | | | | | | | | |
| | | | | | | | | | | 2,623,570 | | | | 2.0 | |
| | | | | | | | | | | | |
| | TRANSPORTATION | | | | | | | | | | |
| | 6,037 | | | | | Canadian Pacific Railway Ltd | | | | | 913,519 | | | | 0.7 | |
| | 37,042 | | | | | Delta Air Lines, Inc | | | | | 1,017,544 | | | | 0.8 | |
| | | | | | Other | | | | | 958,916 | | | | 0.7 | |
| | | | | | | | | | | | |
| | | | | | | | | | | 2,889,979 | | | | 2.2 | |
| | | | | | | | | | | | �� |
| | UTILITIES | | | | | 2,163,757 | | | | 1.6 | |
| | | | | | | | | | | | |
| | | | | | TOTAL COMMON STOCKS | | (Cost $100,876,399) | | | 131,729,900 | | | | 100.1 | |
| | | | | | | | | | | | |
| | | |
| | SHORT-TERM INVESTMENTS | | | | | | | | | | |
| | INVESTMENTS IN REGISTERED INVESTMENT COMPANIES | | | | | | | | | | |
| | 2,330,602 | | | c | | TIAA-CREF Short Term Lending Portfolio of the State Street Navigator Securities Lending Trust | | | | | 2,330,602 | | | | 1.8 | |
| | | | | | | | | | | | |
| | | | | | | | | | | 2,330,602 | | | | 1.8 | |
| | | | | | | | | | | | |
| | | | | | TOTAL SHORT-TERM INVESTMENTS | | (Cost $2,330,602) | | | 2,330,602 | | | | 1.8 | |
| | | | | | | | | | | | |
| | | | | |
| | | | | | TOTAL PORTFOLIO | | (Cost $103,207,001) | | | 134,060,502 | | | | 101.9 | |
| | | | | | OTHER ASSETS & LIABILITIES, NET | | | | | (2,463,317 | ) | | | (1.9 | ) |
| | | | | | | | | | | | |
| | | | | | NET ASSETS | | | | $ | 131,597,185 | | | | 100.0 | % |
| | | | | | | | | | |
| c | Investments made with cash collateral received from securities on loan. |
The aggregate value of securities on loan is $2,264,386.
| | | | |
| 42 | | 2013 Annual Report § TIAA-CREF Life Funds | | See notes to financial statements |
| | |
| Summary portfolio of investments | | concluded |
Growth & Income Fund § December 31, 2013
“Other” securities represent the aggregate value, by category, of securities that are not among the 50 largest holdings and, in total for any issuer, represent 1% or less of net assets.
For ease of presentation, a number of classification categories have been grouped together in the Summary Portfolio of Investments. Note that the Fund uses more specific categories in following its investment limitations on investment concentrations.
| | | | | | |
| See notes to financial statements | | TIAA-CREF Life Funds § 2013 Annual Report | | | 43 | |
| | |
| Summary portfolio of investments | | |
Large-Cap Value Fund § December 31, 2013
| | | | | | | | | | | | | | | | |
| Shares | | | | | Company | | | | Value | | | % of net
assets | |
| | | | | | | | | | | | | | | | |
| | COMMON STOCKS | | | | | | | | | | |
| | AUTOMOBILES & COMPONENTS | | | | $ | 491,687 | | | | 0.5 | % |
| | | | | | | | | | | | |
| | BANKS | | | | | | | | | | |
| | 68,392 | | | | | Keycorp | | | | | 917,821 | | | | 0.9 | |
| | 44,464 | | | | | TCF Financial Corp | | | | | 722,540 | | | | 0.7 | |
| | 61,687 | | | | | Wells Fargo & Co | | | | | 2,800,590 | | | | 2.7 | |
| | | | | | Other | | | | | 1,103,787 | | | | 1.0 | |
| | | | | | | | | | | | |
| | | | | | | | | | | 5,544,738 | | | | 5.3 | |
| | | | | | | | | | | | |
| | CAPITAL GOODS | | | | | | | | | | |
| | 19,375 | | | * | | Foster Wheeler AG. | | | | | 639,763 | | | | 0.6 | |
| | 151,839 | | | | | General Electric Co | | | | | 4,256,047 | | | | 4.1 | |
| | 17,013 | | | e | | Joy Global, Inc | | | | | 995,090 | | | | 1.0 | |
| | 8,807 | | | | | SPX Corp | | | | | 877,265 | | | | 0.8 | |
| | | | | | Other | | | | | 1,619,280 | | | | 1.5 | |
| | | | | | | | | | | | |
| | | | | | | | | | | 8,387,445 | | | | 8.0 | |
| | | | | | | | | | | | |
| | COMMERCIAL & PROFESSIONAL SERVICES | | | | | 357,593 | | | | 0.3 | |
| | | | | | | | | | | | |
| | CONSUMER DURABLES & APPAREL | | | | | | | | | | |
| | 13,221 | | | | | Hasbro, Inc | | | | | 727,287 | | | | 0.7 | |
| | 12,451 | | | * | | Jarden Corp | | | | | 763,869 | | | | 0.7 | |
| | 46,384 | | | | | Pulte Homes, Inc | | | | | 944,842 | | | | 0.9 | |
| | | | | | Other | | | | | 324,664 | | | | 0.3 | |
| | | | | | | | | | | | |
| | | | | | | | | | | 2,760,662 | | | | 2.6 | |
| | | | | | | | | | | | |
| | CONSUMER SERVICES | | | | | | | | | | |
| | 18,887 | | | | | Carnival Corp | | | | | 758,691 | | | | 0.7 | |
| | | | | | Other | | | | | 1,620,048 | | | | 1.6 | |
| | | | | | | | | | | | |
| | | | | | | | | | | 2,378,739 | | | | 2.3 | |
| | | | | | | | | | | | |
| | DIVERSIFIED FINANCIALS | | | | | | | | | | |
| | 87,246 | | | | | Bank of America Corp | | | | | 1,358,420 | | | | 1.3 | |
| | 40,931 | | | | | Citigroup, Inc | | | | | 2,132,914 | | | | 2.0 | |
| | 6,872 | | | | | Goldman Sachs Group, Inc | | | | | 1,218,131 | | | | 1.2 | |
| | 17,627 | | | | | JPMorgan Chase & Co | | | | | 1,030,827 | | | | 1.0 | |
| | 18,032 | | | | | Legg Mason, Inc | | | | | 784,031 | | | | 0.8 | |
| | 33,996 | | | | | Morgan Stanley | | | | | 1,066,115 | | | | 1.0 | |
| | 18,304 | | | | | State Street Corp | | | | | 1,343,331 | | | | 1.3 | |
| | | | | | Other | | | | | 784,010 | | | | 0.6 | |
| | | | | | | | | | | | |
| | | | | | | | | | | 9,717,779 | | | | 9.2 | |
| | | | | | | | | | | | |
| | ENERGY | | | | | | | | | | |
| | 17,328 | | | | | Baker Hughes, Inc | | | | | 957,545 | | | | 0.9 | |
| | 14,927 | | | | | Chevron Corp | | | | | 1,864,532 | | | | 1.8 | |
| | 16,056 | | | | | ConocoPhillips | | | | | 1,134,356 | | | | 1.1 | |
| | 24,377 | | | | | Exxon Mobil Corp | | | | | 2,466,952 | | | | 2.3 | |
| | 10,426 | | | | | Occidental Petroleum Corp | | | | | 991,513 | | | | 0.9 | |
| | 115,134 | | | | | Tailsman Energy, Inc | | | | | 1,341,311 | | | | 1.3 | |
| | | | | | Other | | | | | 5,622,882 | | | | 5.4 | |
| | | | | | | | | | | | |
| | | | | | | | | | | 14,379,091 | | | | 13.7 | |
| | | | | | | | | | | | |
| | | | |
| 44 | | 2013 Annual Report § TIAA-CREF Life Funds | | See notes to financial statements |
| | |
| Summary portfolio of investments | | continued |
Large-Cap Value Fund § December 31, 2013
| | | | | | | | | | | | | | | | |
| Shares | | | | | Company | | | | Value | | | % of net
assets | |
| | | | | | | | | | | | | | | | |
| | FOOD & STAPLES RETAILING | | | | | | | | | | |
| | 10,862 | | | | | CVS Corp | | | | $ | 777,393 | | | | 0.7 | % |
| | | | | | Other | | | | | 725,006 | | | | 0.7 | |
| | | | | | | | | | | | |
| | | | | | | | | | | 1,502,399 | | | | 1.4 | |
| | | | | | | | | | | | |
| | FOOD, BEVERAGE & TOBACCO | | | | | 1,370,913 | | | | 1.3 | |
| | | | | | | | | | | | |
| | HEALTH CARE EQUIPMENT & SERVICES | | | | | | | | | | |
| | 11,681 | | | | | Covidien plc | | | | | 795,476 | | | | 0.8 | |
| | 17,320 | | | * | | Express Scripts Holding Co | | | | | 1,216,557 | | | | 1.2 | |
| | 30,880 | | | * | | Hologic, Inc | | | | | 690,168 | | | | 0.6 | |
| | 22,510 | | | | | UnitedHealth Group, Inc | | | | | 1,695,003 | | | | 1.6 | |
| | | | | | Other | | | | | 1,656,397 | | | | 1.6 | |
| | | | | | | | | | | | |
| | | | | | | | | | | 6,053,601 | | | | 5.8 | |
| | | | | | | | | | | | |
| | HOUSEHOLD & PERSONAL PRODUCTS | | | | | | | | | | |
| | 19,449 | | | | | Procter & Gamble Co | | | | | 1,583,343 | | | | 1.5 | |
| | | | | | Other | | | | | 1,114,747 | | | | 1.1 | |
| | | | | | | | | | | | |
| | | | | | | | | | | 2,698,090 | | | | 2.6 | |
| | | | | | | | | | | | |
| | INSURANCE | | | | | | | | | | |
| | 9,533 | | | | | ACE Ltd | | | | | 986,951 | | | | 0.9 | |
| | 19,591 | | | | | American International Group, Inc | | | | | 1,000,120 | | | | 1.0 | |
| | 9,518 | | | * | | Berkshire Hathaway, Inc (Class B) | | | | | 1,128,454 | | | | 1.1 | |
| | 22,259 | | | | | Hartford Financial Services Group, Inc | | | | | 806,444 | | | | 0.8 | |
| | 15,679 | | | | | Metlife, Inc | | | | | 845,412 | | | | 0.8 | |
| | | | | | Other | | | | | 2,664,998 | | | | 2.5 | |
| | | | | | | | | | | | |
| | | | | | | | | | | 7,432,379 | | | | 7.1 | |
| | | | | | | | | | | | |
| | MATERIALS | | | | | | | | | | |
| | 34,400 | | | e | | Cliffs Natural Resources, Inc | | | | | 901,624 | | | | 0.8 | |
| | | | | | Other | | | | | 3,036,476 | | | | 3.0 | |
| | | | | | | | | | | | |
| | | | | | | | | | | 3,938,100 | | | | 3.8 | |
| | | | | | | | | | | | |
| | MEDIA | | | | | | | | | | |
| | 11,054 | | | | | Time Warner, Inc | | | | | 770,685 | | | | 0.7 | |
| | | | | | Other | | | | | 903,107 | | | | 0.9 | |
| | | | | | | | | | | | |
| | | | | | | | | | | 1,673,792 | | | | 1.6 | |
| | | | | | | | | | | | |
| | PHARMACEUTICALS, BIOTECHNOLOGY & LIFE SCIENCES | | | | | | | | | | |
| | 30,176 | | | | | Johnson & Johnson | | | | | 2,763,820 | | | | 2.6 | |
| | 35,295 | | | | | Merck & Co, Inc | | | | | 1,766,515 | | | | 1.7 | |
| | 41,798 | | | | | Pfizer, Inc | | | | | 1,280,272 | | | | 1.2 | |
| | | | | | Other | | | | | 2,638,452 | | | | 2.5 | |
| | | | | | | | | | | | |
| | | | | | | | | | | 8,449,059 | | | | 8.0 | |
| | | | | | | | | | | | |
| | REAL ESTATE | | | | | 2,888,088 | | | | 2.7 | |
| | | | | | | | | | | | |
| | RETAILING | | | | | 2,623,118 | | | | 2.5 | |
| | | | | | | | | | | | |
| | SEMICONDUCTORS & SEMICONDUCTOR EQUIPMENT | | | | | 2,528,244 | | | | 2.4 | |
| | | | | | | | | | | | |
| | | | | | |
| See notes to financial statements | | TIAA-CREF Life Funds § 2013 Annual Report | | | 45 | |
| | |
| Summary portfolio of investments | | continued |
Large-Cap Value Fund § December 31, 2013
| | | | | | | | | | | | | | | | |
| Shares | | | | | Company | | | | Value | | | % of net
assets | |
| | | | | | | | | | | | | | | | |
| | SOFTWARE & SERVICES | | | | | | | | | | |
| | 24,947 | | | | | Microsoft Corp | | | | $ | 933,766 | | | | 0.9 | % |
| | 20,494 | | | * | | Yahoo!, Inc | | | | | 828,778 | | | | 0.8 | |
| | | | | | Other | | | | | 1,968,457 | | | | 1.9 | |
| | | | | | | | | | | | |
| | | | | | | | | | | 3,731,001 | | | | 3.6 | |
| | | | | | | | | | | | |
| | TECHNOLOGY HARDWARE & EQUIPMENT | | | | | | | | | | |
| | 2,121 | | | | | Apple, Inc | | | | | 1,190,114 | | | | 1.2 | |
| | 47,593 | | | | | Cisco Systems, Inc | | | | | 1,068,463 | | | | 1.0 | |
| | 32,820 | | | | | Hewlett-Packard Co | | | | | 918,303 | | | | 0.9 | |
| | 107,234 | | | * | | Nokia Corp | | | | | 869,668 | | | | 0.8 | |
| | | | | | Other | | | | | 1,175,327 | | | | 1.1 | |
| | | | | | | | | | | | |
| | | | | | | | | | | 5,221,875 | | | | 5.0 | |
| | | | | | | | | | | | |
| | TELECOMMUNICATION SERVICES | | | | | | | | | | |
| | 63,778 | | | | | AT&T, Inc | | | | | 2,242,434 | | | | 2.2 | |
| | 19,372 | | | * | | Level 3 Communications, Inc | | | | | 642,569 | | | | 0.6 | |
| | | | | | Other | | | | | 741,259 | | | | 0.7 | |
| | | | | | | | | | | | |
| | | | | | | | | | | 3,626,262 | | | | 3.5 | |
| | | | | | | | | | | | |
| | TRANSPORTATION | | | | | 2,496,850 | | | | 2.4 | |
| | | | | | | | | | | | |
| | UTILITIES | | | | | | | | | | |
| | 8,810 | | | | | NextEra Energy, Inc | | | | | 754,312 | | | | 0.7 | |
| | | | | | Other | | | | | 3,087,275 | | | | 3.0 | |
| | | | | | | | | | | | |
| | | | | | | | | | | 3,841,587 | | | | 3.7 | |
| | | | | | | | | | | | |
| | | | | | TOTAL COMMON STOCKS | | (Cost $87,799,398) | | | 104,093,092 | | | | 99.3 | |
| | | | | | | | | | | | |
| | | |
| | RIGHTS/WARRANTS | | | | | | | | | | |
| | ENERGY | | | | | 6,312 | | | | 0.0 | |
| | | | | | | | | | | | |
| | | | | | TOTAL RIGHTS/WARRANTS | | (Cost $0) | | | 6,312 | | | | 0.0 | |
| | | | | | | | | | | | |
| | | |
| | SHORT-TERM INVESTMENTS | | | | | | | | | | |
| | INVESTMENTS IN REGISTERED INVESTMENT COMPANIES | | | | | | | | | | |
| | 3,244,120 | | | c | | TIAA-CREF Short Term Lending Portfolio of the State Street Navigator Securities Lending Trust | | | | | 3,244,120 | | | | 3.1 | |
| | | | | | | | | | | | |
| | | | | | | | | | | 3,244,120 | | | | 3.1 | |
| | | | | | | | | | | | |
| | | | | | TOTAL SHORT-TERM INVESTMENTS | | (Cost $3,244,120) | | | 3,244,120 | | | | 3.1 | |
| | | | | | | | | | | | |
| | | | | |
| | | | | | TOTAL PORTFOLIO | | (Cost $91,043,518) | | | 107,343,524 | | | | 102.4 | |
| | | | | | OTHER ASSETS & LIABILITIES, NET | | | | | (2,474,643 | ) | | | (2.4 | ) |
| | | | | | | | | | | | |
| | | | | | NET ASSETS | | | | $ | 104,868,881 | | | | 100.0 | % |
| | | | | | | | | | |
| c | Investments made with cash collateral received from securities on loan. |
| e | All or a portion of these securities are out on loan. The aggregate value of securities on loan, including those in “Other,” is $3,137,622. |
| | | | |
| 46 | | 2013 Annual Report § TIAA-CREF Life Funds | | See notes to financial statements |
| | |
| Summary portfolio of investments | | concluded |
Large-Cap Value Fund § December 31, 2013
“Other” securities represent the aggregate value, by category, of securities that are not among the 50 largest holdings and, in total for any issuer, represent 1% or less of net assets.
For ease of presentation, a number of classification categories have been grouped together in the Summary Portfolio of Investments. Note that the Fund uses more specific categories in following its investment limitations on investment concentrations.
| | | | | | |
| See notes to financial statements | | TIAA-CREF Life Funds § 2013 Annual Report | | | 47 | |
| | |
| Summary portfolio of investments | | |
Real Estate Securities Fund § December 31, 2013
| | | | | | | | | | | | | | | | |
| Shares | | | | | Company | | | | Value | | | % of net
assets | |
| | | | | | | | | | | | | | | | |
| | COMMON STOCKS | |
| | DIVERSIFIED REAL ESTATE ACTIVITIES | | | | $ | 303,524 | | | | 0.3 | % |
| | | | | | | | | | | | |
| | DIVERSIFIED REITS | | | | | | | | | | |
| | 40,000 | | | | | Retail Opportunities Investment Corp | | | | | 588,800 | | | | 0.6 | |
| | 135,000 | | | | | Spirit Realty Capital, Inc | | | | | 1,327,050 | | | | 1.4 | |
| | 14,000 | | | | | Vornado Realty Trust | | | | | 1,243,060 | | | | 1.3 | |
| | 25,000 | | | | | WP Carey, Inc | | | | | 1,533,750 | | | | 1.6 | |
| | | | | | Other | | | | | 300,800 | | | | 0.3 | |
| | | | | | | | | | | | |
| | | | | | | | | | | 4,993,460 | | | | 5.2 | |
| | | | | | | | | | | | |
| | HOTELS, RESORTS & CRUISE LINES | | | | | | | | | | |
| | 30,000 | | | * | | Orient-Express Hotels Ltd (Class A) | | | | | 453,300 | | | | 0.5 | |
| | | | | | | | | | | | |
| | | | | | | | | | | 453,300 | | | | 0.5 | |
| | | | | | | | | | | | |
| | INDUSTRIAL REITS | | | | | | | | | | |
| | 18,000 | | | | | EastGroup Properties, Inc | | | | | 1,042,740 | | | | 1.1 | |
| | 27,000 | | | | | First Industrial Realty Trust, Inc | | | | | 471,150 | | | | 0.5 | |
| | 130,000 | | | | | Prologis, Inc | | | | | 4,803,500 | | | | 5.0 | |
| | | | | | Other | | | | | 797,200 | | | | 0.8 | |
| | | | | | | | | | | | |
| | | | | | | | | | | 7,114,590 | | | | 7.4 | |
| | | | | | | | | | | | |
| | MORTGAGE REITS | | | | | 546,000 | | | | 0.6 | |
| | | | | | | | | | | | |
| | OFFICE REITS | | | | | | | | | | |
| | 38,000 | | | | | Boston Properties, Inc | | | | | 3,814,060 | | | | 3.9 | |
| | 15,000 | | | | | Digital Realty Trust, Inc | | | | | 736,800 | | | | 0.8 | |
| | 25,000 | | | | | HRPT Properties Trust | | | | | 582,750 | | | | 0.6 | |
| | 15,000 | | | | | Kilroy Realty Corp | | | | | 752,700 | | | | 0.8 | |
| | 100,000 | | | | | Parkway Properties, Inc | | | | | 1,929,000 | | | | 2.0 | |
| | 30,000 | | | | | SL Green Realty Corp | | | | | 2,771,400 | | | | 2.9 | |
| | | | | | | | | | | | |
| | | | | | | | | | | 10,586,710 | | | | 11.0 | |
| | | | | | | | | | | | |
| | PUBLISHING | | | | | 363,316 | | | | 0.4 | |
| | | | | | | | | | | | |
| | REAL ESTATE OPERATING COMPANIES | | | | | 240,880 | | | | 0.3 | |
| | | | | | | | | | | | |
| | REAL ESTATE SERVICES | | | | | | | | | | |
| | 20,000 | | | | | Kennedy-Wilson Holdings, Inc | | | | | 445,000 | | | | 0.5 | |
| | 11,000 | | | * | | Realogy Holdings Corp | | | | | 544,170 | | | | 0.5 | |
| | | | | | | | | | | | |
| | | | | | | | | | | 989,170 | | | | 1.0 | |
| | | | | | | | | | | | |
| | RESIDENTIAL REITS | | | | | | | | | | |
| | 15,000 | | | | | American Campus Communities, Inc | | | | | 483,150 | | | | 0.5 | |
| | 35,000 | | | * | | American Homes 4 Rent | | | | | 567,000 | | | | 0.6 | |
| | 40,000 | | | | | AvalonBay Communities, Inc | | | | | 4,729,200 | | | | 4.9 | |
| | 10,000 | | | | | BRE Properties, Inc (Class A) | | | | | 547,100 | | | | 0.6 | |
| | 100,000 | | | | | Education Realty Trust, Inc | | | | | 882,000 | | | | 0.9 | |
| | 25,000 | | | | | Equity Lifestyle Properties, Inc | | | | | 905,750 | | | | 0.9 | |
| | 90,000 | | | | | Equity Residential | | | | | 4,668,300 | | | | 4.9 | |
| | 10,000 | | | | | Essex Property Trust, Inc | | | | | 1,435,100 | | | | 1.5 | |
| | 18,000 | | | | | Post Properties, Inc | | | | | 814,140 | | | | 0.8 | |
| | | | |
| 48 | | 2013 Annual Report § TIAA-CREF Life Funds | | See notes to financial statements |
| | |
| Summary portfolio of investments | | continued |
Real Estate Securities Fund § December 31, 2013
| | | | | | | | | | | | | | | | |
| Shares | | | | | Company | | | | Value | | | % of net
assets | |
| | | | | | | | | | | | | | | | |
| | RESIDENTIAL REITS—continued | | | | | | | | |
| | 15,000 | | | | | Sun Communities, Inc | | | | $ | 639,600 | | | | 0.7 | % |
| | | | | | Other | | | | | 428,960 | | | | 0.4 | |
| | | | | | | | | | | | |
| | | | | | | | | | | 16,100,300 | | | | 16.7 | |
| | | | | | | | | | | | |
| | RETAIL REITS | | | | | | | | | | |
| | 50,000 | | | | | Cole Real Estate Investment, Inc | | | | | 702,000 | | | | 0.7 | |
| | 105,000 | | | | | DDR Corp | | | | | 1,613,850 | | | | 1.7 | |
| | 40,000 | | | | | Equity One, Inc | | | | | 897,600 | | | | 0.9 | |
| | 15,000 | | | | | Federal Realty Investment Trust | | | | | 1,521,150 | | | | 1.6 | |
| | 200,000 | | | | | General Growth Properties, Inc | | | | | 4,014,000 | | | | 4.2 | |
| | 15,000 | | | | | Regency Centers Corp | | | | | 694,500 | | | | 0.7 | |
| | 79,000 | | | | | Simon Property Group, Inc | | | | | 12,020,640 | | | | 12.5 | |
| | | | | | Other | | | | | 189,800 | | | | 0.2 | |
| | | | | | | | | | | | |
| | | | | | | | | | | 21,653,540 | | | | 22.5 | |
| | | | | | | | | | | | |
| | SECURITY & ALARM SERVICES | | | | | | | | | | |
| | 35,000 | | | | | Corrections Corp of America | | | | | 1,122,450 | | | | 1.2 | |
| | | | | | | | | | | | |
| | | | | | | | | | | 1,122,450 | | | | 1.2 | |
| | | | | | | | | | | | |
| | SPECIALIZED REITS | | | | | | | | | | |
| | 75,000 | | | | | American Tower Corp | | | | | 5,986,500 | | | | 6.2 | |
| | 35,000 | | | | | CubeSmart | | | | | 557,900 | | | | 0.6 | |
| | 35,000 | | | | | Extra Space Storage, Inc | | | | | 1,474,550 | | | | 1.5 | |
| | 75,000 | | | | | HCP, Inc | | | | | 2,724,000 | | | | 2.8 | |
| | 40,000 | | | | | Health Care REIT, Inc | | | | | 2,142,800 | | | | 2.2 | |
| | 40,000 | | | | | Healthcare Realty Trust, Inc | | | | | 852,400 | | | | 0.9 | |
| | 100,000 | | | | | Host Marriott Corp | | | | | 1,944,000 | | | | 2.1 | |
| | 25,000 | | | | | Plum Creek Timber Co, Inc | | | | | 1,162,750 | | | | 1.2 | |
| | 25,000 | | | | | Potlatch Corp | | | | | 1,043,500 | | | | 1.1 | |
| | 28,000 | | | | | Public Storage, Inc | | | | | 4,214,560 | | | | 4.4 | |
| | 20,000 | | | | | Rayonier, Inc | | | | | 842,000 | | | | 0.9 | |
| | 40,000 | | | | | RLJ Lodging Trust | | | | | 972,800 | | | | 1.0 | |
| | 135,000 | | | * | | Strategic Hotels & Resorts, Inc | | | | | 1,275,750 | | | | 1.3 | |
| | 75,000 | | | | | Sunstone Hotel Investors, Inc | | | | | 1,005,000 | | | | 1.0 | |
| | 52,500 | | | | | Ventas, Inc | | | | | 3,007,200 | | | | 3.2 | |
| | 25,000 | | | | | Weyerhaeuser Co | | | | | 789,250 | | | | 0.8 | |
| | | | | | Other | | | | | 254,050 | | | | 0.2 | |
| | | | | | | | | | | | |
| | | | | | | | | | | 30,249,010 | | | | 31.4 | |
| | | | | | | | | | | | |
| | | | | | TOTAL COMMON STOCKS | | (Cost $87,106,654) | | | 94,716,250 | | | | 98.5 | |
| | | | | | | | | | | | |
| | | | | |
| | | | | | TOTAL PORTFOLIO | | (Cost $87,106,654) | | | 94,716,250 | | | | 98.5 | |
| | | | | | OTHER ASSETS & LIABILITIES, NET | | | | | 1,486,007 | | | | 1.5 | |
| | | | | | | | | | | | |
| | | | | | NET ASSETS | | | | $ | 96,202,257 | | | | 100.0 | % |
| | | | | | | | | | | | |
| | | | | | |
| See notes to financial statements | | TIAA-CREF Life Funds § 2013 Annual Report | | | 49 | |
| | |
| Summary portfolio of investments | | concluded |
Real Estate Securities Fund § December 31, 2013
ABBREVIATION(S):
REIT Real Estate Investment Trust
“Other” securities represent the aggregate value, by category, of securities that are not among the 50 largest holdings and, in total for any issuer, represent 1% or less of net assets.
For ease of presentation, a number of classification categories have been grouped together in the Summary Portfolio of Investments. Note that the Fund uses more specific categories in following its investment limitations on investment concentrations.
| | | | |
| 50 | | 2013 Annual Report § TIAA-CREF Life Funds | | See notes to financial statements |
| | |
| Summary portfolio of investments | | |
Small-Cap Equity Fund § December 31, 2013
| | | | | | | | | | | | | | | | |
| Shares | | | | | Company | | | | Value | | | % of net
assets | |
| | | | | | | | | | | | | | | | |
| | COMMON STOCKS | | | | | | | | |
| | AUTOMOBILES & COMPONENTS | | | | | | | | |
| | 7,559 | | | * | | Tenneco, Inc | | | | $ | 427,613 | | | | 0.8 | % |
| | | | | | Other | | | | | 87,381 | | | | 0.2 | |
| | | | | | | | | | | | |
| | | | | | | | | | | 514,994 | | | | 1.0 | |
| | | | | | | | | | | | |
| | BANKS | | | | | | | | | | |
| | 18,749 | | | | | FirstMerit Corp | | | | | 416,790 | | | | 0.8 | |
| | 12,844 | | | | | Home Loan Servicing Solutions Ltd | | | | | 295,027 | | | | 0.6 | |
| | 5,622 | | | | | Prosperity Bancshares, Inc | | | | | 356,379 | | | | 0.7 | |
| | 3,426 | | | * | | SVB Financial Group | | | | | 359,250 | | | | 0.7 | |
| | 15,707 | | | e | | Umpqua Holdings Corp | | | | | 300,632 | | | | 0.6 | |
| | | | | | Other | | | | | 2,495,267 | | | | 4.8 | |
| | | | | | | | | | | | |
| | | | | | | | | | | 4,223,345 | | | | 8.2 | |
| | | | | | | | | | | | |
| | CAPITAL GOODS | | | | | | | | | | |
| | 3,250 | | | | | Alliant Techsystems, Inc | | | | | 395,460 | | | | 0.8 | |
| | 4,463 | | | | | Curtiss-Wright Corp | | | | | 277,732 | | | | 0.6 | |
| | 4,329 | | | | | EnerSys | | | | | 303,420 | | | | 0.6 | |
| | 17,250 | | | | | Exelis, Inc | | | | | 328,785 | | | | 0.6 | |
| | 3,593 | | | | | Huntington Ingalls | | | | | 323,406 | | | | 0.6 | |
| | 3,680 | | | * | | Teledyne Technologies, Inc | | | | | 338,045 | | | | 0.7 | |
| | 3,280 | | | * | | WABCO Holdings, Inc | | | | | 306,385 | | | | 0.6 | |
| | | | | | Other | | | | | 2,634,405 | | | | 5.1 | |
| | | | | | | | | | | | |
| | | | | | | | | | | 4,907,638 | | | | 9.6 | |
| | | | | | | | | | | | |
| | COMMERCIAL & PROFESSIONAL SERVICES | | | | | | | | | | |
| | 6,038 | | | * | | WageWorks, Inc | | | | | 358,899 | | | | 0.7 | |
| | | | | | Other | | | | | 1,401,581 | | | | 2.7 | |
| | | | | | | | | | | | |
| | | | | | | | | | | 1,760,480 | | | | 3.4 | |
| | | | | | | | | | | | |
| | CONSUMER DURABLES & APPAREL | | | | | | | | | | |
| | 8,060 | | | | | Brunswick Corp | | | | | 371,244 | | | | 0.7 | |
| | | | | | Other | | | | | 1,058,283 | | | | 2.1 | |
| | | | | | | | | | | | |
| | | | | | | | | | | 1,429,527 | | | | 2.8 | |
| | | | | | | | | | | | |
| | CONSUMER SERVICES | | | | | | | | | | |
| | 11,225 | | | | | Hillenbrand, Inc | | | | | 330,239 | | | | 0.6 | |
| | 5,460 | | | * | | Marriott Vacations Worldwide Corp | | | | | 288,070 | | | | 0.6 | |
| | | | | | Other | | | | | 1,297,108 | | | | 2.5 | |
| | | | | | | | | | | | |
| | | | | | | | | | | 1,915,417 | | | | 3.7 | |
| | | | | | | | | | | | |
| | DIVERSIFIED FINANCIALS | | | | | | | | | | |
| | 38,709 | | | | | Apollo Investment Corp | | | | | 328,252 | | | | 0.7 | |
| | | | | | Other | | | | | 1,497,676 | | | | 2.9 | |
| | | | | | | | | | | | |
| | | | | | | | | | | 1,825,928 | | | | 3.6 | |
| | | | | | | | | | | | |
| | ENERGY | | | | | | | | | | |
| | 4,914 | | | | | Bristow Group, Inc | | | | | 368,845 | | | | 0.7 | |
| | 36,074 | | | * | | Penn Virginia Corp | | | | | 340,178 | | | | 0.7 | |
| | 4,089 | | | | | Targa Resources Investments, Inc | | | | | 360,527 | | | | 0.7 | |
| | | | | | Other | | | | | 1,878,162 | | | | 3.6 | |
| | | | | | | | | | | | |
| | | | | | | | | | | 2,947,712 | | | | 5.7 | |
| | | | | | | | | | | | |
| | | | | | |
| See notes to financial statements | | TIAA-CREF Life Funds § 2013 Annual Report | | | 51 | |
| | |
| Summary portfolio of investments | | continued |
Small-Cap Equity Fund § December 31, 2013
| | | | | | | | | | | | | | | | |
| Shares | | | | | Company | | | | Value | | | % of net
assets | |
| | | | | | | | | | | | | | | | |
| | FOOD & STAPLES RETAILING | | | | $ | 315,534 | | | | 0.6 | % |
| | | | | | | | | | | | |
| | FOOD, BEVERAGE & TOBACCO | | | | | 1,076,971 | | | | 2.1 | |
| | | | | | | | | | | | |
| | HEALTH CARE EQUIPMENT & SERVICES | | | | | | | | | | |
| | 5,111 | | | * | | Cyberonics, Inc | | | | | 334,821 | | | | 0.6 | |
| | 6,582 | | | * | | Medidata Solutions, Inc | | | | | 398,672 | | | | 0.8 | |
| | 7,800 | | | * | | Team Health Holdings, Inc | | | | | 355,290 | | | | 0.7 | |
| | | | | | Other | | | | | 2,463,738 | | | | 4.8 | |
| | | | | | | | | | | | |
| | | | | | | | | | | 3,552,521 | | | | 6.9 | |
| | | | | | | | | | | | |
| | HOUSEHOLD & PERSONAL PRODUCTS | | | | | 270,744 | | | | 0.5 | |
| | | | | | | | | | | | |
| | INSURANCE | | | | | | | | | | |
| | 5,529 | | | e | | HCI Group, Inc | | | | | 295,801 | | | | 0.6 | |
| | 5,220 | | | | | Platinum Underwriters Holdings Ltd | | | | | 319,882 | | | | 0.6 | |
| | | | | | Other | | | | | 864,244 | | | | 1.7 | |
| | | | | | | | | | | | |
| | | | | | | | | | | 1,479,927 | | | | 2.9 | |
| | | | | | | | | | | | |
| | MATERIALS | | | | | | | | | | |
| | 5,128 | | | | | Minerals Technologies, Inc | | | | | 308,039 | | | | 0.6 | |
| | | | | | Other | | | | | 2,390,767 | | | | 4.7 | |
| | | | | | | | | | | | |
| | | | | | | | | | | 2,698,806 | | | | 5.3 | |
| | | | | | | | | | | | |
| | MEDIA | | | | | | | | | | |
| | 5,464 | | | * | | Lamar Advertising Co (Class A) | | | | | 285,494 | | | | 0.6 | |
| | 20,300 | | | * | | Live Nation, Inc | | | | | 401,128 | | | | 0.8 | |
| | | | | | Other | | | | | 779,834 | | | | 1.5 | |
| | | | | | | | | | | | |
| | | | | | | | | | | 1,466,456 | | | | 2.9 | |
| | | | | | | | | | | | |
| | PHARMACEUTICALS, BIOTECHNOLOGY & LIFE SCIENCES | | | | | | | | | | |
| | 7,584 | | | * | | Medicines Co | | | | | 292,894 | | | | 0.6 | |
| | 6,860 | | | * | | Parexel International Corp | | | | | 309,935 | | | | 0.6 | |
| | | | | | Other | | | | | 1,895,310 | | | | 3.7 | |
| | | | | | | | | | | | |
| | | | | | | | | | | 2,498,139 | | | | 4.9 | |
| | | | | | | | | | | | |
| | REAL ESTATE | | | | | | | | | | |
| | 13,170 | | | | | DuPont Fabros Technology, Inc | | | | | 325,431 | | | | 0.6 | |
| | 13,193 | | | | | RLJ Lodging Trust | | | | | 320,854 | | | | 0.6 | |
| | | | | | Other | | | | | 2,907,337 | | | | 5.7 | |
| | | | | | | | | | | | |
| | | | | | | | | | | 3,553,622 | | | | 6.9 | |
| | | | | | | | | | | | |
| | RETAILING | | | | | | | | | | | | | | | |
| | 4,991 | | | * | | Children’s Place Retail Stores, Inc | | | | | 284,337 | | | | 0.6 | |
| | 6,877 | | | | | Penske Auto Group, Inc | | | | | 324,320 | | | | 0.6 | |
| | | | | | Other | | | | | 1,482,738 | | | | 2.9 | |
| | | | | | | | | | | | |
| | | | | | | | | | | 2,091,395 | | | | 4.1 | |
| | | | | | | | | | | | |
| | SEMICONDUCTORS & SEMICONDUCTOR EQUIPMENT | | | | | | | | | | |
| | 8,037 | | | * | | Cavium Networks, Inc | | | | | 277,357 | | | | 0.5 | |
| | | | | | Other | | | | | 1,384,869 | | | | 2.7 | |
| | | | | | | | | | | | |
| | | | | | | | | | | 1,662,226 | | | | 3.2 | |
| | | | | | | | | | | | |
| | | | |
| 52 | | 2013 Annual Report § TIAA-CREF Life Funds | | See notes to financial statements |
| | |
| Summary portfolio of investments | | concluded |
Small-Cap Equity Fund § December 31, 2013
| | | | | | | | | | | | | | | | |
| Shares | | | | | Company | | | | Value | | | % of net
assets | |
| | | | | | | | | | | | | | | | |
| | SOFTWARE & SERVICES | | | | | | | | | | |
| | 9,900 | | | * | | Aspen Technology, Inc | | | | $ | 413,820 | | | | 0.8 | % |
| | 4,734 | | | * | | Commvault Systems, Inc | | | | | 354,482 | | | | 0.7 | |
| | 5,000 | | | * | | Demandware, Inc | | | | | 320,600 | | | | 0.6 | |
| | 8,719 | | | * | | Infoblox, Inc | | | | | 287,901 | | | | 0.6 | |
| | 3,673 | | | * | | Manhattan Associates, Inc | | | | | 431,504 | | | | 0.9 | |
| | 8,638 | | | | | MAXIMUS, Inc | | | | | 379,986 | | | | 0.7 | |
| | 23,846 | | | * | | TiVo, Inc | | | | | 312,860 | | | | 0.6 | |
| | 9,327 | | | *,e | | WebMD Health Corp (Class A) | | | | | 368,416 | | | | 0.7 | |
| | | | | | Other | | | | | 1,966,589 | | | | 3.8 | |
| | | | | | | | | | | | |
| | | | | | | | | | | 4,836,158 | | | | 9.4 | |
| | | | | | | | | | | | |
| | TECHNOLOGY HARDWARE & EQUIPMENT | | | | | | | | | | |
| | 15,500 | | | * | | ARRIS Group, Inc | | | | | 377,658 | | | | 0.7 | |
| | 25,273 | | | * | | QLogic Corp | | | | | 298,980 | | | | 0.6 | |
| | 6,567 | | | *,e | | Synaptics, Inc | | | | | 340,236 | | | | 0.7 | |
| | | | | | Other | | | | | 1,666,711 | | | | 3.2 | |
| | | | | | | | | | | | |
| | | | | | | | | | | 2,683,585 | | | | 5.2 | |
| | | | | | | | | | | | |
| | TELECOMMUNICATION SERVICES | | | | | 273,055 | | | | 0.5 | |
| | | | | | | | | | | | |
| | TRANSPORTATION | | | | | | | | | | |
| | 10,059 | | | | | Arkansas Best Corp | | | | | 338,787 | | | | 0.7 | |
| | 16,380 | | | *,e | | Swift Transportation Co, Inc | | | | | 363,800 | | | | 0.7 | |
| | | | | | Other | | | | | 484,482 | | | | 0.8 | |
| | | | | | | | | | | | |
| | | | | | | | | | | 1,187,069 | | | | 2.2 | |
| | | | | | | | | | | | |
| | UTILITIES | | | | | 1,342,217 | | | | 2.6 | |
| | | | | | | | | | | | |
| | | | | | TOTAL COMMON STOCKS | | (Cost $40,356,823) | | | 50,513,466 | | | | 98.2 | |
| | | | | | | | | | | | |
| | | |
| | SHORT-TERM INVESTMENTS | | | | | | | | | | |
| | INVESTMENTS IN REGISTERED INVESTMENT COMPANIES | | | | | | | | | | |
| | 4,549,816 | | | c | | TIAA-CREF Short Term Lending Portfolio of the State Street Navigator Securities Lending Trust | | | | | 4,549,816 | | | | 8.8 | |
| | | | | | | | | | | | |
| | | | | | | | | | | 4,549,816 | | | | 8.8 | |
| | | | | | | | | | | | |
| | | | | | TOTAL SHORT-TERM INVESTMENTS | | (Cost $4,549,816) | | | 4,549,816 | | | | 8.8 | |
| | | | | | | | | | | | |
| | | | | |
| | | | | | TOTAL PORTFOLIO | | (Cost $44,906,639) | | | 55,063,282 | | | | 107.0 | |
| | | | | | OTHER ASSETS & LIABILITIES, NET | | | | | (3,626,645 | ) | | | (7.0 | ) |
| | | | | | | | | | | | |
| | | | | | NET ASSETS | | | | $ | 51,436,637 | | | | 100.0 | % |
| | | | | | | | | | |
| c | Investments made with cash collateral received from securities on loan. |
| e | All or a portion of these securities are out on loan. The aggregate value of securities on loan, including those in “Other,” is $4,461,821. |
“Other” securities represent the aggregate value, by category, of securities that are not among the 50 largest holdings and, in total for any issuer, represent 1% or less of net assets.
For ease of presentation, a number of classification categories have been grouped together in the Summary Portfolio of Investments. Note that the Fund uses more specific categories in following its investment limitations on investment concentrations.
| | | | | | |
| See notes to financial statements | | TIAA-CREF Life Funds § 2013 Annual Report | | | 53 | |
| | |
| Summary portfolio of investments | | |
Social Choice Equity Fund § December 31, 2013
| | | | | | | | | | | | | | | | |
| Shares | | | | | Company | | | | Value | | | % of net
assets | |
| | | | | | | | | | | | | | | | |
| | COMMON STOCKS | | | | | | | | |
| | AUTOMOBILES & COMPONENTS | | | | | | | | |
| | 28,628 | | | | | Ford Motor Co | | | | $ | 441,730 | | | | 0.7 | % |
| | | | | | Other | | | | | 668,955 | | | | 1.0 | |
| | | | | | | | | | | | |
| | | | | | | | | | | 1,110,685 | | | | 1.7 | |
| | | | | | | | | | | | |
| | BANKS | | | | | | | | | | |
| | 5,307 | | | | | PNC Financial Services Group, Inc | | | | | 411,717 | | | | 0.6 | |
| | 13,031 | | | | | US Bancorp | | | | | 526,452 | | | | 0.8 | |
| | | | | | Other | | | | | 1,323,261 | | | | 2.1 | |
| | | | | | | | | | | | |
| | | | | | | | | | | 2,261,430 | | | | 3.5 | |
| | | | | | | | | | | | |
| | CAPITAL GOODS | | | | | | | | | | |
| | 4,381 | | | | | 3M Co | | | | | 614,435 | | | | 1.0 | |
| | 5,752 | | | | | Danaher Corp | | | | | 444,055 | | | | 0.7 | |
| | 6,715 | | | | | Emerson Electric Co | | | | | 471,259 | | | | 0.7 | |
| | 4,828 | | | | | Illinois Tool Works, Inc | | | | | 405,938 | | | | 0.6 | |
| | 1,640 | | | | | Precision Castparts Corp | | | | | 441,652 | | | | 0.7 | |
| | | | | | Other | | | | | 2,787,142 | | | | 4.3 | |
| | | | | | | | | | | | |
| | | | | | | | | | | 5,164,481 | | | | 8.0 | |
| | | | | | | | | | | | |
| | COMMERCIAL & PROFESSIONAL SERVICES | | | | | 392,119 | | | | 0.6 | |
| | | | | | | | | | | | |
| | CONSUMER DURABLES & APPAREL | | | | | 798,176 | | | | 1.2 | |
| | | | | | | | | | | | |
| | CONSUMER SERVICES | | | | | | | | | | |
| | 5,745 | | | | | McDonald’s Corp | | | | | 557,437 | | | | 0.9 | |
| | 6,173 | | | | | Starbucks Corp | | | | | 483,902 | | | | 0.7 | |
| | | | | | Other | | | | | 501,613 | | | | 0.8 | |
| | | | | | | | | | | | |
| | | | | | | | | | | 1,542,952 | | | | 2.4 | |
| | | | | | | | | | | | |
| | DIVERSIFIED FINANCIALS | | | | | | | | | | |
| | 6,435 | | | | | American Express Co | | | | | 583,847 | | | | 0.9 | |
| | 12,182 | | | | | Bank of New York Mellon Corp | | | | | 425,639 | | | | 0.6 | |
| | 1,351 | | | | | BlackRock, Inc | | | | | 427,551 | | | | 0.7 | |
| | 5,819 | | | | | Capital One Financial Corp | | | | | 445,794 | | | | 0.7 | |
| | | | | | Other | | | | | 3,017,194 | | | | 4.6 | |
| | | | | | | | | | | | |
| | | | | | | | | | | 4,900,025 | | | | 7.5 | |
| | | | | | | | | | | | |
| | ENERGY | | | | | | | | | | |
| | 2,524 | | | | | EOG Resources, Inc | | | | | 423,628 | | | | 0.7 | |
| | 4,404 | | | | | Occidental Petroleum Corp | | | | | 418,820 | | | | 0.6 | |
| | | | | | Other | | | | | 5,764,511 | | | | 8.9 | |
| | | | | | | | | | | | |
| | | | | | | | | | | 6,606,959 | | | | 10.2 | |
| | | | | | | | | | | | |
| | FOOD & STAPLES RETAILING | | | | | 675,611 | | | | 1.0 | |
| | | | | | | | | | | | |
| | FOOD, BEVERAGE & TOBACCO | | | | | | | | | | |
| | 12,385 | | | | | Mondelez International, Inc | | | | | 437,190 | | | | 0.7 | |
| | 8,218 | | | | | PepsiCo, Inc | | | | | 681,601 | | | | 1.0 | |
| | | | | | Other | | | | | 1,172,712 | | | | 1.8 | |
| | | | | | | | | | | | |
| | | | | | | | | | | 2,291,503 | | | | 3.5 | |
| | | | | | | | | | | | |
| | | | |
| 54 | | 2013 Annual Report § TIAA-CREF Life Funds | | See notes to financial statements |
| | |
| Summary portfolio of investments | | continued |
Social Choice Equity Fund § December 31, 2013
| | | | | | | | | | | | | | | | |
| Shares | | | | | Company | | | | Value | | | % of net
assets | |
| | | | | | | | | | | | | | | | |
| | HEALTH CARE EQUIPMENT & SERVICES | | | | | | | | | | |
| | 12,277 | | | | | Abbott Laboratories | | | | $ | 470,578 | | | | 0.8 | % |
| | 7,993 | | | | | Medtronic, Inc | | | | | 458,718 | | | | 0.7 | |
| | | | | | Other | | | | | 1,246,361 | | | | 1.9 | |
| | | | | | | | | | | | |
| | | | | | | | | | | 2,175,657 | | | | 3.4 | |
| | | | | | | | | | | | |
| | HOUSEHOLD & PERSONAL PRODUCTS | | | | | | | | | | |
| | 7,301 | | | | | Colgate-Palmolive Co | | | | | 476,098 | | | | 0.8 | |
| | 11,993 | | | | | Procter & Gamble Co | | | | | 976,350 | | | | 1.5 | |
| | | | | | Other | | | | | 668,165 | | | | 1.0 | |
| | | | | | | | | | | | |
| | | | | | | | | | | 2,120,613 | | | | 3.3 | |
| | | | | | | | | | | | |
| | INSURANCE | | | | | | | | | | |
| | 8,051 | | | * | | Berkshire Hathaway, Inc (Class B) | | | | | 954,527 | | | | 1.5 | |
| | 4,873 | | | | | Prudential Financial, Inc | | | | | 449,388 | | | | 0.7 | |
| | 4,362 | | | | | Travelers Cos, Inc | | | | | 394,935 | | | | 0.6 | |
| | | | | | Other | | | | | 1,945,898 | | | | 3.0 | |
| | | | | | | | | | | | |
| | | | | | | | | | | 3,744,748 | | | | 5.8 | |
| | | | | | | | | | | | |
| | MATERIALS | | | | | | | | | | |
| | 3,153 | | | | | Praxair, Inc | | | | | 409,984 | | | | 0.6 | |
| | | | | | Other | | | | | 2,731,197 | | | | 4.2 | |
| | | | | | | | | | | | |
| | | | | | | | | | | 3,141,181 | | | | 4.8 | |
| | | | | | | | | | | | |
| | MEDIA | | | | | | | | | | |
| | 3,257 | | | | | Time Warner Cable, Inc | | | | | 441,323 | | | | 0.7 | |
| | 7,105 | | | | | Time Warner, Inc | | | | | 495,361 | | | | 0.8 | |
| | | | | | Other | | | | | 1,115,389 | | | | 1.7 | |
| | | | | | | | | | | | |
| | | | | | | | | | | 2,052,073 | | | | 3.2 | |
| | | | | | | | | | | | |
| | PHARMACEUTICALS, BIOTECHNOLOGY & LIFE SCIENCES | | | | | | | | | | |
| | 1,795 | | | * | | Biogen Idec, Inc | | | | | 502,151 | | | | 0.8 | |
| | 10,998 | | | | | Bristol-Myers Squibb Co | | | | | 584,544 | | | | 0.9 | |
| | 8,909 | | | * | | Gilead Sciences, Inc | | | | | 669,511 | | | | 1.0 | |
| | 11,763 | | | | | Johnson & Johnson | | | | | 1,077,373 | | | | 1.6 | |
| | 15,512 | | | | | Merck & Co, Inc | | | | | 776,376 | | | | 1.2 | |
| | | | | | Other | | | | | 1,279,511 | | | | 2.0 | |
| | | | | | | | | | | | |
| | | | | | | | | | | 4,889,466 | | | | 7.5 | |
| | | | | | | | | | | | |
| | REAL ESTATE | | | | | | | | | | |
| | 2,592 | | | | | Simon Property Group, Inc | | | | | 394,399 | | | | 0.6 | |
| | | | | | Other | | | | | 1,751,017 | | | | 2.7 | |
| | | | | | | | | | | | |
| | | | | | | | | | | 2,145,416 | | | | 3.3 | |
| | | | | | | | | | | | |
| | RETAILING | | | | | | | | | | |
| | 9,519 | | | | | Lowe’s Companies, Inc | | | | | 471,667 | | | | 0.7 | |
| | 7,126 | | | | | TJX Companies, Inc | | | | | 454,140 | | | | 0.7 | |
| | | | | | Other | | | | | 2,150,004 | | | | 3.3 | |
| | | | | | | | | | | | |
| | | | | | | | | | | 3,075,811 | | | | 4.7 | |
| | | | | | | | | | | | |
| | SEMICONDUCTORS & SEMICONDUCTOR EQUIPMENT | | | | | | | | | | |
| | 27,197 | | | | | Intel Corp | | | | | 706,034 | | | | 1.1 | |
| | 10,327 | | | | | Texas Instruments, Inc | | | | | 453,459 | | | | 0.7 | |
| | | | | | |
| See notes to financial statements | | TIAA-CREF Life Funds § 2013 Annual Report | | | 55 | |
| | |
| Summary portfolio of investments | | concluded |
Social Choice Equity Fund § December 31, 2013
| | | | | | | | | | | | | | | | |
| Shares | | | | | Company | | | | Value | | | % of net
assets | |
| | | | | | | | | | | | | | | | |
| | SEMICONDUCTORS & SEMICONDUCTOR EQUIPMENT—continued | | | | | | | | | | |
| | | | | | Other | | | | $ | 521,303 | | | | 0.8 | % |
| | | | | | | | | | | | |
| | | | | | | | | | | 1,680,796 | | | | 2.6 | |
| | | | | | | | | | | | |
| | SOFTWARE & SERVICES | | | | | | | | | | |
| | 5,486 | | | | | Accenture plc | | | | | 451,059 | | | | 0.7 | |
| | 4,203 | | | * | | Cognizant Technology Solutions Corp (Class A) | | | | | 424,419 | | | | 0.7 | |
| | 1,112 | | | * | | Google, Inc (Class A) | | | | | 1,246,229 | | | | 1.9 | |
| | 4,831 | | | | | International Business Machines Corp | | | | | 906,151 | | | | 1.4 | |
| | 19,339 | | | | | Oracle Corp | | | | | 739,910 | | | | 1.1 | |
| | 10,275 | | | * | | Yahoo!, Inc | | | | | 415,521 | | | | 0.6 | |
| | | | | | Other | | | | | 1,790,722 | | | | 2.8 | |
| | | | | | | | | | | | |
| | | | | | | | | | | 5,974,011 | | | | 9.2 | |
| | | | | | | | | | | | |
| | TECHNOLOGY HARDWARE & EQUIPMENT | | | | | | | | | | |
| | 28,486 | | | | | Cisco Systems, Inc | | | | | 639,511 | | | | 1.0 | |
| | 17,556 | | | | | EMC Corp | | | | | 441,533 | | | | 0.7 | |
| | 17,027 | | | | | Hewlett-Packard Co | | | | | 476,416 | | | | 0.7 | |
| | 8,637 | | | | | Qualcomm, Inc | | | | | 641,297 | | | | 1.0 | |
| | | | | | Other | | | | | 715,142 | | | | 1.1 | |
| | | | | | | | | | | | |
| | | | | | | | | | | 2,913,899 | | | | 4.5 | |
| | | | | | | | | | | | |
| | TELECOMMUNICATION SERVICES | | | | | 865,723 | | | | 1.3 | |
| | | | | | | | | | | | |
| | TRANSPORTATION | | | | | | | | | | |
| | 5,115 | | | | | United Parcel Service, Inc (Class B) | | | | | 537,484 | | | | 0.8 | |
| | | | | | Other | | | | | 870,745 | | | | 1.4 | |
| | | | | | | | | | | | |
| | | | | | | | | | | 1,408,229 | | | | 2.2 | |
| | | | | | | | | | | | |
| | UTILITIES | | | | | | | | | | |
| | 4,575 | | | | | NextEra Energy, Inc | | | | | 391,712 | | | | 0.6 | |
| | | | | | Other | | | | | 2,022,911 | | | | 3.1 | |
| | | | | | | | | | | | |
| | | | | | | | | | | 2,414,623 | | | | 3.7 | |
| | | | | | | | | | | | |
| | | | | | TOTAL COMMON STOCKS | | (Cost $44,742,366) | | | 64,346,187 | | | | 99.1 | |
| | | | | | | | | | | | |
| | | | | |
| | | | | | TOTAL PORTFOLIO | | (Cost $44,742,366) | | | 64,346,187 | | | | 99.1 | |
| | | | | | OTHER ASSETS & LIABILITIES, NET | | | | | 584,737 | | | | 0.9 | |
| | | | | | | | | | | | |
| | | | | | NET ASSETS | | | | $ | 64,930,924 | | | | 100.0 | % |
| | | | | | | | | | | | |
“Other” securities represent the aggregate value, by category, of securities that are not among the 50 largest holdings and, in total for any issuer, represent 1% or less of net assets.
For ease of presentation, a number of classification categories have been grouped together in the Summary Portfolio of Investments. Note that the Fund uses more specific categories in following its investment limitations on investment concentrations.
| | | | |
| 56 | | 2013 Annual Report § TIAA-CREF Life Funds | | See notes to financial statements |
| | |
| Summary portfolio of investments | | |
Stock Index Fund § December 31, 2013
| | | | | | | | | | | | | | | | |
| Shares | | | | | Company | | | | Value | | | % of net
assets | |
| | | | | | | | | | | | | | | | |
| | COMMON STOCKS | | | | | | | | | | |
| | AUTOMOBILES & COMPONENTS | | | | $ | 3,210,349 | | | | 1.1 | % |
| | | | | | | | | | | | |
| | BANKS | | | | | | | | | | |
| | 65,653 | | | | | Wells Fargo & Co | | | | | 2,980,646 | | | | 1.0 | |
| | | | | | Other | | | | | 6,749,911 | | | | 2.4 | |
| | | | | | | | | | | | |
| | | | | | | | | | | 9,730,557 | | | | 3.4 | |
| | | | | | | | | | | | |
| | CAPITAL GOODS | | | | | | | | | | |
| | 9,465 | | | | | 3M Co | | | | | 1,327,466 | | | | 0.5 | |
| | 10,293 | | | | | Boeing Co | | | | | 1,404,892 | | | | 0.5 | |
| | 140,720 | | | | | General Electric Co | | | | | 3,944,382 | | | | 1.4 | |
| | 12,589 | | | | | United Technologies Corp | | | | | 1,432,628 | | | | 0.5 | |
| | | | | | Other | | | | | 16,165,837 | | | | 5.7 | |
| | | | | | | | | | | | |
| | | | | | | | | | | 24,275,205 | | | | 8.6 | |
| | | | | | | | | | | | |
| | COMMERCIAL & PROFESSIONAL SERVICES | | | | | 2,896,990 | | | | 1.0 | |
| | | | | | | | | | | | |
| | CONSUMER DURABLES & APPAREL | | | | | 4,612,605 | | | | 1.6 | |
| | | | | | | | | | | | |
| | CONSUMER SERVICES | | | | | | | | | | |
| | 13,736 | | | | | McDonald’s Corp | | | | | 1,332,804 | | | | 0.5 | |
| | | | | | Other | | | | | 4,831,073 | | | | 1.7 | |
| | | | | | | | | | | | |
| | | | | | | | | | | 6,163,877 | | | | 2.2 | |
| | | | | | | | | | | | |
| | DIVERSIFIED FINANCIALS | | | | | | | | | | |
| | 12,914 | | | | | American Express Co | | | | | 1,171,687 | | | | 0.4 | |
| | 145,043 | | | | | Bank of America Corp | | | | | 2,258,320 | | | | 0.8 | |
| | 41,283 | | | | | Citigroup, Inc | | | | | 2,151,257 | | | | 0.7 | |
| | 6,299 | | | | | Goldman Sachs Group, Inc | | | | | 1,116,561 | | | | 0.4 | |
| | 51,496 | | | | | JPMorgan Chase & Co | | | | | 3,011,486 | | | | 1.1 | |
| | | | | | Other | | | | | 8,785,832 | | | | 3.1 | |
| | | | | | | | | | | | |
| | | | | | | | | | | 18,495,143 | | | | 6.5 | |
| | | | | | | | | | | | |
| | ENERGY | | | | | | | | | | |
| | 26,242 | | | | | Chevron Corp | | | | | 3,277,888 | | | | 1.1 | |
| | 16,540 | | | | | ConocoPhillips | | | | | 1,168,551 | | | | 0.4 | |
| | 60,436 | | | d | | Exxon Mobil Corp | | | | | 6,116,123 | | | | 2.2 | |
| | 10,919 | | | | | Occidental Petroleum Corp | | | | | 1,038,397 | | | | 0.4 | |
| | 17,736 | | | | | Schlumberger Ltd | | | | | 1,598,191 | | | | 0.6 | |
| | | | | | Other | | | | | 12,838,959 | | | | 4.5 | |
| | | | | | | | | | | | |
| | | | | | | | | | | 26,038,109 | | | | 9.2 | |
| | | | | | | | | | | | |
| | FOOD & STAPLES RETAILING | | | | | | | | | | |
| | 16,355 | | | | | CVS Corp | | | | | 1,170,527 | | | | 0.4 | |
| | 22,007 | | | | | Wal-Mart Stores, Inc | | | | | 1,731,731 | | | | 0.6 | |
| | | | | | Other | | | | | 2,764,655 | | | | 1.0 | |
| | | | | | | | | | | | |
| | | | | | | | | | | 5,666,913 | | | | 2.0 | |
| | | | | | | | | | | | |
| | | | | | |
| See notes to financial statements | | TIAA-CREF Life Funds § 2013 Annual Report | | | 57 | |
| | |
| Summary portfolio of investments | | continued |
Stock Index Fund § December 31, 2013
| | | | | | | | | | | | | | | | |
| Shares | | | | | Company | | | | Value | | | % of��net
assets | |
| | | | | | | | | | | | | | | | |
| | FOOD, BEVERAGE & TOBACCO | | | | | | | | | | |
| | 51,464 | | | | | Coca-Cola Co | | | | $ | 2,125,978 | | | | 0.7 | % |
| | 20,966 | | | | | PepsiCo, Inc | | | | | 1,738,920 | | | | 0.6 | |
| | 22,153 | | | | | Philip Morris International, Inc | | | | | 1,930,191 | | | | 0.7 | |
| | | | | | Other | | | | | 6,998,865 | | | | 2.5 | |
| | | | | | | | | | | | |
| | | | | | | | | | | 12,793,954 | | | | 4.5 | |
| | | | | | | | | | | | |
| | HEALTH CARE EQUIPMENT & SERVICES | | | | | | | | | | |
| | 13,859 | | | | | UnitedHealth Group, Inc | | | | | 1,043,583 | | | | 0.4 | |
| | | | | | Other | | | | | 11,557,305 | | | | 4.1 | |
| | | | | | | | | | | | |
| | | | | | | | | | | 12,600,888 | | | | 4.5 | |
| | | | | | | | | | | | |
| | HOUSEHOLD & PERSONAL PRODUCTS | | | | | | | | | | |
| | 37,327 | | | | | Procter & Gamble Co | | | | | 3,038,791 | | | | 1.1 | |
| | | | | | Other | | | | | 2,386,003 | | | | 0.8 | |
| | | | | | | | | | | | |
| | | | | | | | | | | 5,424,794 | | | | 1.9 | |
| | | | | | | | | | | | |
| | INSURANCE | | | | | | | | | | |
| | 24,521 | | | * | | Berkshire Hathaway, Inc (Class B) | | | | | 2,907,210 | | | | 1.0 | |
| | | | | | Other | | | | | 8,996,090 | | | | 3.2 | |
| | | | | | | | | | | | |
| | | | | | | | | | | 11,903,300 | | | | 4.2 | |
| | | | | | | | | | | | |
| | MATERIALS | | | | | 10,645,770 | | | | 3.8 | |
| | | | | | | | | | | | |
| | MEDIA | | | | | | | | | | |
| | 34,982 | | | | | Comcast Corp (Class A) | | | | | 1,817,840 | | | | 0.6 | |
| | 24,026 | | | * | | Walt Disney Co | | | | | 1,835,586 | | | | 0.7 | |
| | | | | | Other | | | | | 7,286,090 | | | | 2.6 | |
| | | | | | | | | | | | |
| | | | | | | | | | | 10,939,516 | | | | 3.9 | |
| | | | | | | | | | | | |
| | PHARMACEUTICALS, BIOTECHNOLOGY & LIFE SCIENCES | | | | | | | | | | |
| | 21,568 | | | | | AbbVie, Inc | | | | | 1,139,006 | | | | 0.4 | |
| | 10,289 | | | | | Amgen, Inc | | | | | 1,174,592 | | | | 0.4 | |
| | 22,543 | | | | | Bristol-Myers Squibb Co | | | | | 1,198,160 | | | | 0.4 | |
| | 20,869 | | | * | | Gilead Sciences, Inc | | | | | 1,568,305 | | | | 0.6 | |
| | 38,233 | | | | | Johnson & Johnson | | | | | 3,501,761 | | | | 1.2 | |
| | 41,020 | | | | | Merck & Co, Inc | | | | | 2,053,051 | | | | 0.7 | |
| | 90,670 | | | | | Pfizer, Inc | | | | | 2,777,222 | | | | 1.0 | |
| | | | | | Other | | | | | 9,356,953 | | | | 3.3 | |
| | | | | | | | | | | | |
| | | | | | | | | | | 22,769,050 | | | | 8.0 | |
| | | | | | | | | | | | |
| | REAL ESTATE | | | | | 8,858,945 | | | | 3.1 | |
| | | | | | | | | | | | |
| | RETAILING | | | | | | | | | | |
| | 5,004 | | | * | | Amazon.com, Inc | | | | | 1,995,545 | | | | 0.7 | |
| | 19,699 | | | | | Home Depot, Inc | | | | | 1,622,016 | | | | 0.6 | |
| | | | | | Other | | | | | 9,253,368 | | | | 3.3 | |
| | | | | | | | | | | | |
| | | | | | | | | | | 12,870,929 | | | | 4.6 | |
| | | | | | | | | | | | |
| | | | |
| 58 | | 2013 Annual Report § TIAA-CREF Life Funds | | See notes to financial statements |
| | |
| Summary portfolio of investments | | continued |
Stock Index Fund § December 31, 2013
| | | | | | | | | | | | | | | | |
| Shares | | | | | Company | | | | Value | | | % of net
assets | |
| | | | | | | | | | | | | | | | |
| | SEMICONDUCTORS & SEMICONDUCTOR EQUIPMENT | | | | | | | | | | |
| | 67,958 | | | | | Intel Corp | | | | $ | 1,764,190 | | | | 0.6 | % |
| | | | | | Other | | | | | 4,289,231 | | | | 1.5 | |
| | | | | | | | | | | | |
| | | | | | | | | | | 6,053,421 | | | | 2.1 | |
| | | | | | | | | | | | |
| | SOFTWARE & SERVICES | | | | | | | | | | |
| | 23,167 | | | * | | Facebook, Inc | | | | | 1,266,308 | | | | 0.4 | |
| | 3,660 | | | * | | Google, Inc (Class A) | | | | | 4,101,799 | | | | 1.4 | |
| | 14,101 | | | | | International Business Machines Corp | | | | | 2,644,925 | | | | 0.9 | |
| | 1,603 | | | | | Mastercard, Inc (Class A) | | | | | 1,339,243 | | | | 0.5 | |
| | 113,410 | | | | | Microsoft Corp | | | | | 4,244,936 | | | | 1.5 | |
| | 48,382 | | | | | Oracle Corp | | | | | 1,851,095 | | | | 0.7 | |
| | 7,152 | | | | | Visa, Inc (Class A) | | | | | 1,592,607 | | | | 0.6 | |
| | | | | | Other | | | | | 11,572,304 | | | | 4.1 | |
| | | | | | | | | | | | |
| | | | | | | | | | | 28,613,217 | | | | 10.1 | |
| | | | | | | | | | | | |
| | TECHNOLOGY HARDWARE & EQUIPMENT | | | | | | | | | | |
| | 12,731 | | | | | Apple, Inc | | | | | 7,143,491 | | | | 2.5 | |
| | 72,703 | | | | | Cisco Systems, Inc | | | | | 1,632,182 | | | | 0.6 | |
| | 23,615 | | | | | Qualcomm, Inc | | | | | 1,753,414 | | | | 0.6 | |
| | | | | | Other | | | | | 5,716,960 | | | | 2.0 | |
| | | | | | | | | | | | |
| | | | | | | | | | | 16,246,047 | | | | 5.7 | |
| | | | | | | | | | | | |
| | TELECOMMUNICATION SERVICES | | | | | | | | | | |
| | 72,875 | | | | | AT&T, Inc | | | | | 2,562,285 | | | | 0.9 | |
| | 38,896 | | | | | Verizon Communications, Inc | | | | | 1,911,350 | | | | 0.7 | |
| | | | | | Other | | | | | 1,452,990 | | | | 0.5 | |
| | | | | | | | | | | | |
| | | | | | | | | | | 5,926,625 | | | | 2.1 | |
| | | | | | | | | | | | |
| | TRANSPORTATION | | | | | | | | | | |
| | 6,413 | | | | | Union Pacific Corp | | | | | 1,077,384 | | | | 0.4 | |
| | | | | | Other | | | | | 4,738,199 | | | | 1.7 | |
| | | | | | | | | | | | |
| | | | | | | | | | | 5,815,583 | | | | 2.1 | |
| | | | | | | | | | | | |
| | UTILITIES | | | | | 8,155,930 | | | | 2.9 | |
| | | | | | | | | | | | |
| | | | | | TOTAL COMMON STOCKS | | (Cost $179,389,417) | | | 280,707,717 | | | | 99.1 | |
| | | | | | | | | | | | |
| | | |
| | RIGHTS/WARRANTS | | | | | | | | | | |
| | ENERGY | | | | | 243 | | | | 0.0 | |
| | | | | | | | | | | | |
| | PHARMACEUTICALS, BIOTECHNOLOGY & LIFE SCIENCES | | | | | 177 | | | | 0.0 | |
| | | | | | | | | | | | |
| | | | | | TOTAL RIGHTS/WARRANTS | | (Cost $0) | | | 420 | | | | 0.0 | |
| | | | | | | | | | | | |
| | | | | | |
| See notes to financial statements | | TIAA-CREF Life Funds § 2013 Annual Report | | | 59 | |
| | |
| Summary portfolio of investments | | concluded |
Stock Index Fund § December 31, 2013
| | | | | | | | | | | | | | | | |
| Shares | | | | | Company | | | | Value | | | % of net
assets | |
| | | | | | | | | | | | | | | | |
| | SHORT-TERM INVESTMENTS | | | | | | | | | | |
| | INVESTMENTS IN REGISTERED INVESTMENT COMPANIES | | | | | | | | |
| | 6,943,725 | | | c | | TIAA-CREF Short Term Lending Portfolio of the State Street Navigator Securities Lending Trust | | | | $ | 6,943,725 | | | | 2.5 | % |
| | | | | | | | | | | | |
| | | | | | | | | | | 6,943,725 | | | | 2.5 | |
| | | | | | | | | | | | |
| | | | | | TOTAL SHORT-TERM INVESTMENTS | | (Cost $6,943,725) | | | 6,943,725 | | | | 2.5 | |
| | | | | | | | | | | | |
| | | | | |
| | | | | | TOTAL PORTFOLIO | | (Cost $186,333,142) | | | 287,651,862 | | | | 101.6 | |
| | | | | | OTHER ASSETS & LIABILITIES, NET | | | | | (4,535,339 | ) | | | (1.6 | ) |
| | | | | | | | | | | | |
| | | | | | NET ASSETS | | | | $ | 283,116,523 | | | | 100.0 | % |
| | | | | | | | | | | | |
| c | Investments made with cash collateral received from securities on loan. |
| d | All or a portion of these securities have been segregated to cover margin requirements on open futures transactions. |
The aggregate value of securities on loan is $6,781,019.
“Other” securities represent the aggregate value, by category, of securities that are not among the 50 largest holdings and, in total for any issuer, represent 1% or less of net assets.
For ease of presentation, a number of classification categories have been grouped together in the Summary Portfolio of Investments. Note that the Fund uses more specific categories in following its investment limitations on investment concentrations.
| | | | |
| 60 | | 2013 Annual Report § TIAA-CREF Life Funds | | See notes to financial statements |
| | |
| Summary portfolio of investments | | |
International Equity Fund § December 31, 2013
| | | | | | | | | | | | | | | | |
| Shares | | | | | Company | | | | Value | | | % of net
assets | |
| | | | | | | | | | | | | | | | |
| | COMMON STOCKS | | | | | | | | |
| | FRANCE | | | | | | | | |
| | 80,842 | | | | | Accor S.A. | | | | $ | 3,818,156 | | | | 3.9 | % |
| | 13,716 | | | | | BNP Paribas | | | | | 1,069,947 | | | | 1.1 | |
| | 58,086 | | | | | Bouygues S.A. | | | | | 2,196,568 | | | | 2.2 | |
| | 49,438 | | | | | Compagnie de Saint-Gobain | | | | | 2,723,392 | | | | 2.8 | |
| | 13,147 | | | | | Compagnie Generale d’Optique Essilor International S.A. | | | | | 1,398,937 | | | | 1.4 | |
| | 28,024 | | | | | European Aeronautic Defence and Space Co | | | | | 2,151,407 | | | | 2.2 | |
| | 35,662 | | | | | Renault S.A. | | | | | 2,869,948 | | | | 2.9 | |
| | 28,898 | | | | | Societe Television Francaise 1 | | | | | 556,913 | | | | 0.6 | |
| | 84,449 | | | | | Vivendi Universal S.A. | | | | | 2,227,545 | | | | 2.3 | |
| | | | | | Other | | | | | 1,054,856 | | | | 1.1 | |
| | | | | | | | | | | | |
| | | | | | | | | | | 20,067,669 | | | | 20.5 | |
| | | | | | | | | | | | |
| | GERMANY | | | | | | | | | | | | | | | |
| | 29,271 | | | | | Bayer AG. | | | | | 4,109,955 | | | | 4.2 | |
| | 10,912 | | | | | Henkel KGaA (Preference) | | | | | 1,268,350 | | | | 1.3 | |
| | 51,393 | | | | | SAP AG. | | | | | 4,456,881 | | | | 4.5 | |
| | | | | | | | | | | | |
| | | | | | | | | | | 9,835,186 | | | | 10.0 | |
| | | | | | | | | | | | |
| | GREECE | | | | | | | | | | | | | | | |
| | 76,311 | | | * | | Hellenic Telecommunications Organization S.A. | | | | | 1,016,391 | | | | 1.0 | |
| | 321,940 | | | * | | National Bank of Greece S.A. | | | | | 1,728,388 | | | | 1.8 | |
| | 1,001,555 | | | * | | Piraeus Bank S.A. | | | | | 2,117,552 | | | | 2.2 | |
| | | | | | | | | | | | |
| | | | | | | | | | | 4,862,331 | | | | 5.0 | |
| | | | | | | | | | | | |
| | HONG KONG | | | | | 8,408 | | | | 0.0 | |
| | | | | | | | | | | | |
| | INDIA | | | | | | | | | | | | | | | |
| | 13,811 | | | | | Eicher Motors Ltd | | | | | 1,111,009 | | | | 1.1 | |
| | 125,140 | | | | | HDFC Bank Ltd | | | | | 1,349,947 | | | | 1.4 | |
| | 89,242 | | | | | IndusInd Bank Ltd | | | | | 608,558 | | | | 0.6 | |
| | 117,347 | | | | | Larsen & Toubro Ltd | | | | | 2,035,242 | | | | 2.1 | |
| | 227,687 | | | | | Mahindra & Mahindra Financial Services Ltd | | | | | 1,183,223 | | | | 1.2 | |
| | | | | | Other | | | | | 429,330 | | | | 0.4 | |
| | | | | | | | | | | | |
| | | | | | | | | | | 6,717,309 | | | | 6.8 | |
| | | | | | | | | | | | |
| | INDONESIA | | | | | | | | | | | | | | | |
| | 976,500 | | | | | PT Indofood Sukses Makmur Tbk | | | | | 530,672 | | | | 0.5 | |
| | | | | | | | | | | | |
| | | | | | | | | | | 530,672 | | | | 0.5 | |
| | | | | | | | | | | | |
| | ITALY | | | | | 336,810 | | | | 0.3 | |
| | | | | | | | | | | | |
| | JAPAN | | | | | | | | | | | | | | | |
| | 25,000 | | | | | Daiwa House Industry Co Ltd | | | | | 484,380 | | | | 0.5 | |
| | 8,200 | | | | | Don Quijote Co Ltd | | | | | 497,085 | | | | 0.5 | |
| | 59,000 | | | | | Hoya Corp | | | | | 1,640,901 | | | | 1.7 | |
| | 601,000 | | | * | | Mazda Motor Corp | | | | | 3,114,419 | | | | 3.2 | |
| | 63,125 | | | * | | Olympus Corp | | | | | 2,002,119 | | | | 2.0 | |
| | 3,400 | | | | | Oriental Land Co Ltd | | | | | 490,327 | | | | 0.5 | |
| | 38,000 | | | | | Sekisui House Ltd | | | | | 531,741 | | | | 0.5 | |
| | | | | | |
| See notes to financial statements | | TIAA-CREF Life Funds § 2013 Annual Report | | | 61 | |
| | |
| Summary portfolio of investments | | continued |
International Equity Fund § December 31, 2013
| | | | | | | | | | | | | | | | |
| Shares | | | | | Company | | | | Value | | | % of net
assets | |
| | | | | | | | | | | | | | | | |
| | JAPAN—continued | | | | | | | | | | |
| | 226,000 | | | | | Sumitomo Heavy Industries Ltd | | | | $ | 1,041,376 | | | | 1.1 | % |
| | 12,300 | | | | | Toyota Motor Corp | | | | | 749,993 | | | | 0.8 | |
| | | | | | Other | | | | | 2,268,533 | | | | 2.3 | |
| | | | | | | | | | | | |
| | | | | | | | | | | 12,820,874 | | | | 13.1 | |
| | | | | | | | | | | | |
| | MEXICO | | | | | 59,477 | | | | 0.1 | |
| | | | | | | | | | | | |
| | NETHERLANDS | | | | | | | | | | | | | | | |
| | 161,615 | | | * | | ING Groep NV | | | | | 2,257,523 | | | | 2.3 | |
| | | | | | Other | | | | | 361,516 | | | | 0.4 | |
| | | | | | | | | | | | |
| | | | | | | | | | | 2,619,039 | | | | 2.7 | |
| | | | | | | | | | | | |
| | SINGAPORE | | | | | | | | | | | | | | | |
| | 882,000 | | | e | | Genting International plc | | | | | 1,048,863 | | | | 1.1 | |
| | | | | | | | | | | | |
| | | | | | | | | | | 1,048,863 | | | | 1.1 | |
| | | | | | | | | | | | |
| | SPAIN | | | | | | | | | | | | | | | |
| | 172,085 | | | | | Banco Bilbao Vizcaya Argentaria S.A. | | | | | 2,128,783 | | | | 2.2 | |
| | | | | | | | | | | | |
| | | | | | | | | | | 2,128,783 | | | | 2.2 | |
| | | | | | | | | | | | |
| | SWEDEN | | | | | | | | | | | | | | | |
| | 140,648 | | | | | SKF AB (B Shares) | | | | | 3,688,548 | | | | 3.7 | |
| | 48,548 | | | | | Trelleborg AB (B Shares) | | | | | 966,801 | | | | 1.0 | |
| | 81,544 | | | | | Volvo AB (B Shares) | | | | | 1,072,987 | | | | 1.1 | |
| | | | | | | | | | | | |
| | | | | | | | | | | 5,728,336 | | | | 5.8 | |
| | | | | | | | | | | | |
| | SWITZERLAND | | | | | | | | | | | | | | | |
| | 55,722 | | | | | Adecco S.A. | | | | | 4,423,584 | | | | 4.5 | |
| | 2,867 | | | | | Burckhardt Compression Holding AG. | | | | | 1,256,653 | | | | 1.3 | |
| | 68,807 | | | | | Clariant AG. | | | | | 1,259,378 | | | | 1.3 | |
| | | | | | Other | | | | | 753,486 | | | | 0.7 | |
| | | | | | | | | | | | |
| | | | | | | | | | | 7,693,101 | | | | 7.8 | |
| | | | | | | | | | | | |
| | UNITED KINGDOM | | | | | | | | | | | | |
| | 383,454 | | | | | British Sky Broadcasting plc | | | | | 5,359,237 | | | | 5.5 | |
| | 91,393 | | | | | Drax Group plc | | | | | 1,212,644 | | | | 1.2 | |
| | 126,994 | | | | | Filtrona plc | | | | | 1,809,068 | | | | 1.8 | |
| | 1,786,422 | | | * | | Lloyds TSB Group plc | | | | | 2,344,119 | | | | 2.4 | |
| | 598,237 | | | | | Man Group plc | | | | | 845,118 | | | | 0.9 | |
| | 261,770 | | | * | | Ocado Ltd | | | | | 1,919,928 | | | | 1.9 | |
| | 11,205 | | | | | Reckitt Benckiser Group plc | | | | | 890,079 | | | | 0.9 | |
| | 44,423 | | | | | Reed Elsevier plc | | | | | 662,507 | | | | 0.7 | |
| | 297,279 | | | * | | Royal Mail plc | | | | | 2,805,991 | | | | 2.9 | |
| | 305,936 | | | | | Tate & Lyle plc | | | | | 4,103,943 | | | | 4.2 | |
| | | | | | Other | | | | | 540,125 | | | | 0.5 | |
| | | | | | | | | | | | |
| | | | | | | | | | | 22,492,759 | | | | 22.9 | |
| | | | | | | | | | | | |
| | | | | | TOTAL COMMON STOCKS | | (Cost $85,208,251) | | | 96,949,617 | | | | 98.8 | |
| | | | | | | | | | | | |
| | | |
| | RIGHTS/WARRANTS | | | | | | | | | | |
| | GREECE | | | | | 114,727 | | | | 0.1 | |
| | | | | | | | | | | | |
| | | | | | TOTAL RIGHTS/WARRANTS | | (Cost $90,493) | | | 114,727 | | | | 0.1 | |
| | | | | | | | | | | | |
| | | | |
| 62 | | 2013 Annual Report § TIAA-CREF Life Funds | | See notes to financial statements |
| | |
| Summary portfolio of investments | | concluded |
International Equity Fund § December 31, 2013
| | | | | | | | | | | | | | | | |
| Shares | | | | | Company | | | | Value | | | % of net
assets | |
| | | | | | | | | | | | | | | | |
| | SHORT-TERM INVESTMENTS | | | | | | | | | | |
| | INVESTMENTS IN REGISTERED INVESTMENT COMPANIES | | | | | | | | | | |
| | 873,168 | | | c | | TIAA-CREF Short Term Lending Portfolio of the State Street Navigator Securities Lending Trust | | | | $ | 873,168 | | | | 0.9 | % |
| | | | | | | | | | | | |
| | | | | | | | | | | 873,168 | | | | 0.9 | |
| | | | | | | | | | | | |
| | | | | | TOTAL SHORT-TERM INVESTMENTS | | (Cost $873,168) | | | 873,168 | | | | 0.9 | |
| | | | | | | | | | | | |
| | | | | |
| | | | | | TOTAL PORTFOLIO | | (Cost $86,171,912) | | | 97,937,512 | | | | 99.8 | |
| | | | | | OTHER ASSETS & LIABILITIES, NET | | | | | 168,329 | | | | 0.2 | |
| | | | | | | | | | | | |
| | | | | | NET ASSETS | | | | $ | 98,105,841 | | | | 100.0 | % |
| | | | | | | | | | |
| c | Investments made with cash collateral received from securities on loan. |
| e | All or a portion of these securities are out on loan. The aggregate value of securities on loan including those in “Other,” is $828,040. |
“Other” securities represent the aggregate value, by category, of securities that are not among the 50 largest holdings and, in total for any issuer, represent 1% or less of net assets.
For ease of presentation, a number of classification categories have been grouped together in the Summary Portfolio of Investments. Note that the Fund uses more specific categories in following its investment limitations on investment concentrations.
| | | | | | |
| See notes to financial statements | | TIAA-CREF Life Funds § 2013 Annual Report | | | 63 | |
| | |
| Summary of market values by sector | | |
International Equity Fund § December 31, 2013
| | | | | | | | |
| Sector | | Value | | | % of net
assets | |
| INDUSTRIALS | | $ | 26,427,156 | | | | 26.8 | % |
| CONSUMER DISCRETIONARY | | | 23,474,425 | | | | 23.9 | |
| FINANCIALS | | | 17,618,956 | | | | 18.0 | |
| HEALTH CARE | | | 7,511,011 | | | | 7.7 | |
| INFORMATION TECHNOLOGY | | | 7,389,136 | | | | 7.5 | |
| CONSUMER STAPLES | | | 6,827,769 | | | | 7.0 | |
| TELECOMMUNICATION SERVICES | | | 3,243,936 | | | | 3.3 | |
| MATERIALS | | | 3,193,489 | | | | 3.3 | |
| UTILITIES | | | 1,212,644 | | | | 1.2 | |
| ENERGY | | | 165,822 | | | | 0.2 | |
| SHORT-TERM INVESTMENTS | | | 873,168 | | | | 0.9 | |
| OTHER ASSETS & LIABILITES, NET | | | 168,329 | | | | 0.2 | |
| | | | |
NET ASSETS | | $ | 98,105,841 | | | | 100.0 | % |
| | | | |
| | | | |
| 64 | | 2013 Annual Report § TIAA-CREF Life Funds | | See notes to financial statements |
| | |
| Summary portfolio of investments | | |
Bond Fund § December 31, 2013
| | | | | | | | | | | | | | | | |
| Principal | | | | | Issuer | | | | Value | | | % of net
assets | |
| | | | | | | | | | | | | | | | |
| | BANK LOAN OBLIGATIONS | | | | | | | | |
| | CAPITAL GOODS | | | | $ | 199,697 | | | | 0.1 | % |
| | | | | | | | | | | | |
| | CONSUMER SERVICES | | | | | 226,312 | | | | 0.1 | |
| | | | | | | | | | | | |
| | MEDIA | | | | | 297,747 | | | | 0.2 | |
| | | | | | | | | | | | |
| | | | | | TOTAL BANK LOAN OBLIGATIONS | | (Cost $720,497) | | | 723,756 | | | | 0.4 | |
| | | | | | | | | | | | |
| | BONDS | | | | | | | | |
| | CORPORATE BONDS | | | | | | | | |
| | BANKS | | | | | | | | |
| | $ 600,000 | | | | | PNC Bank NA | | 2.950%, 01/30/23 | | | 552,188 | | | | 0.3 | |
| | | | | | Other | | | | | 6,206,668 | | | | 3.3 | |
| | | | | | | | | | | | |
| | | | | | | | | | | 6,758,856 | | | | 3.6 | |
| | | | | | | | | | | | |
| | CAPITAL GOODS | | | 2,149,655 | | | | 1.1 | |
| | | | | | | | | | | | |
| | COMMERCIAL & PROFESSIONAL SERVICES | | | 776,175 | | | | 0.4 | |
| | | | | | | | | | | | |
| | CONSUMER DURABLES & APPAREL | | | 1,017,558 | | | | 0.5 | |
| | | | | | | | | | | | |
| | CONSUMER SERVICES | | | 780,407 | | | | 0.4 | |
| | | | | | | | | | | | |
| | DIVERSIFIED FINANCIALS | | | | | | | | |
| | 1,325,000 | | | | | American Express Credit Corp | | 1.300%, 07/29/16 | | | 1,335,253 | | | | 0.7 | |
| | 1,275,000 | | | | | American Express Credit Corp | | 2.125%, 07/27/18 | | | 1,277,141 | | | | 0.7 | |
| | 750,000 | | | | | General Electric Capital Corp | | 3.100%, 01/09/23 | | | 711,568 | | | | 0.4 | |
| | | | | | Other | | | | | 7,434,031 | | | | 3.9 | |
| | | | | | | | | | | | |
| | | | | | | | | | | 10,757,993 | | | | 5.7 | |
| | | | | | | | | | | | |
| | ENERGY | | | 7,844,378 | | | | 4.2 | |
| | | | | | | | | | | | |
| | FOOD & STAPLES RETAILING | | | 475,835 | | | | 0.3 | |
| | | | | | | | | | | | |
| | FOOD, BEVERAGE & TOBACCO | | | 2,339,601 | | | | 1.2 | |
| | | | | | | | | | | | |
| | HEALTH CARE EQUIPMENT & SERVICES | | | | | | | | |
| | 500,000 | | | | | Express Scripts Holding Co | | 2.100%, 02/12/15 | | | 507,247 | | | | 0.2 | |
| | | | | | Other | | | | | 1,463,195 | | | | 0.8 | |
| | | | | | | | | | | | |
| | | | | | | | | | | 1,970,442 | | | | 1.0 | |
| | | | | | | | | | | | |
| | HOUSEHOLD & PERSONAL PRODUCTS | | | 121,321 | | | | 0.1 | |
| | | | | | | | | | | | |
| | INSURANCE | | | 4,317,122 | | | | 2.3 | |
| | | | | | | | | | | | |
| | MATERIALS | | | | | | | | |
| | 500,000 | | | | | International Paper Co | | 4.750%, 02/15/22 | | | 524,210 | | | | 0.3 | |
| | | | | | Other | | | | | 3,115,220 | | | | 1.6 | |
| | | | | | | | | | | | |
| | | | | | | | | | | 3,639,430 | | | | 1.9 | |
| | | | | | | | | | | | |
| | MEDIA | | | | | | | | |
| | 675,000 | | | | | Comcast Corp | | 4.250%, 01/15/33 | | | 627,021 | | | | 0.3 | |
| | | | | | Other | | | | | 3,473,389 | | | | 1.8 | |
| | | | | | | | | | | | |
| | | | | | | | | | | 4,100,410 | | | | 2.1 | |
| | | | | | | | | | | | |
| | | | | | |
| See notes to financial statements | | TIAA-CREF Life Funds § 2013 Annual Report | | | 65 | |
| | |
| Summary portfolio of investments | | continued |
Bond Fund § December 31, 2013
| | | | | | | | | | | | | | | | |
| Principal | | | | | Issuer | | | | Value | | | % of net
assets | |
| | | | | | | | | | | | | | | | |
| | PHARMACEUTICALS, BIOTECHNOLOGY & LIFE SCIENCES | | $ | 1,184,385 | | | | 0.6 | % |
| | | | | | | | | | | | |
| | REAL ESTATE | | | 1,837,646 | | | | 1.0 | |
| | | | | | | | | | | | |
| | RETAILING | | | | | | | | |
| | $ 725,000 | | | | | O’Reilly Automotive, Inc | | 3.800%, 09/01/22 | | | 699,710 | | | | 0.4 | |
| | 510,000 | | | g | | QVC, Inc | | 7.375%, 10/15/20 | | | 549,826 | | | | 0.3 | |
| | | | | | Other | | | | | 2,136,030 | | | | 1.1 | |
| | | | | | | | | | | | |
| | | | | | | | | | | 3,385,566 | | | | 1.8 | |
| | | | | | | | | | | | |
| | SOFTWARE & SERVICES | | | | | | | | |
| | 1,170,000 | | | | | Fidelity National Information Services, Inc | | 5.000%, 03/15/22 | | | 1,194,863 | | | | 0.6 | |
| | | | | | Other | | | | | 451,238 | | | | 0.3 | |
| | | | | | | | | | | | |
| | | | | | | | | | | 1,646,101 | | | | 0.9 | |
| | | | | | | | | | | | |
| | TECHNOLOGY HARDWARE & EQUIPMENT | | | 2,264,394 | | | | 1.2 | |
| | | | | | | | | | | | |
| | TELECOMMUNICATION SERVICES | | | | | | | | |
| | 600,000 | | | | | Verizon Communications, Inc | | 0.700%, 11/02/15 | | | 598,326 | | | | 0.3 | |
| | 625,000 | | | | | Verizon Communications, Inc | | 3.650%, 09/14/18 | | | 661,603 | | | | 0.4 | |
| | 875,000 | | | | | Verizon Communications, Inc | | 6.550%, 09/15/43 | | | 1,023,714 | | | | 0.5 | |
| | | | | | Other | | | | | 2,492,999 | | | | 1.3 | |
| | | | | | | | | | | | |
| | | | | | | | | | | 4,776,642 | | | | 2.5 | |
| | | | | | | | | | | | |
| | TRANSPORTATION | | | 1,330,675 | | | | 0.7 | |
| | | | | | | | | | | | |
| | UTILITIES | | | 6,235,410 | | | | 3.4 | |
| | | | | | | | | | | | |
| | | | | | TOTAL CORPORATE BONDS | | (Cost $69,737,265) | | | 69,710,002 | | | | 36.9 | |
| | | | | | | | | | | | |
| | GOVERNMENT BONDS | | | | | | | | |
| | AGENCY SECURITIES | | | 378,581 | | | | 0.1 | |
| | | | | | | | | | | | |
| | FOREIGN GOVERNMENT BONDS | | | 5,658,815 | | | | 3.0 | |
| | | | | | | | | | | | |
| | MORTGAGE BACKED | | | | | | | | |
| | 601,340 | | | | | Federal Home Loan Mortgage Corp Gold (FGLMC) | | 4.500%, 12/01/39 | | | 639,138 | | | | 0.3 | |
| | 562,951 | | | | | Federal National Mortgage Association (FNMA) | | 4.828%, 01/01/15 | | | 562,793 | | | | 0.3 | |
| | 751,115 | | | | | FNMA | | 5.500%, 02/01/24 | | | 824,943 | | | | 0.4 | |
| | 521,341 | | | | | FNMA | | 3.000%, 01/01/27 | | | 532,620 | | | | 0.3 | |
| | 1,167,674 | | | | | FNMA | | 2.500%, 10/01/27 | | | 1,159,609 | | | | 0.6 | |
| | 938,239 | | | | | FNMA | | 3.000%, 03/01/28 | | | 959,018 | | | | 0.5 | |
| | 795,217 | | | | | FNMA | | 4.000%, 12/01/40 | | | 820,362 | | | | 0.4 | |
| | 568,983 | | | | | FNMA | | 4.000%, 02/01/41 | | | 586,141 | | | | 0.3 | |
| | 666,371 | | | | | FNMA | | 3.500%, 12/01/41 | | | 662,652 | | | | 0.4 | |
| | 1,132,468 | | | | | FNMA | | 3.000%, 04/01/42 | | | 1,076,326 | | | | 0.6 | |
| | 1,883,678 | | | | | FNMA | | 3.500%, 06/01/42 | | | 1,873,711 | | | | 1.0 | |
| | 931,007 | | | | | FNMA | | 3.000%, 11/01/42 | | | 884,837 | | | | 0.5 | |
| | 1,867,550 | | | | | FNMA | | 3.000%, 12/01/42 | | | 1,775,393 | | | | 0.9 | |
| | 14,756,414 | | | i | | FNMA | | 2.379%–7.500%, 04/01/18–07/01/42 | | | 15,581,381 | | | | 8.2 | |
| | 565,923 | | | | | Government National Mortgage Association (GNMA) | | 4.500%, 04/20/40 | | | 607,795 | | | | 0.3 | |
| | 797,092 | | | | | GNMA | | 4.000%, 09/15/41 | | | 829,315 | | | | 0.5 | |
| | | | |
| 66 | | 2013 Annual Report § TIAA-CREF Life Funds | | See notes to financial statements |
| | |
| Summary portfolio of investments | | continued |
Bond Fund § December 31, 2013
| | | | | | | | | | | | | | | | |
| Principal | | | | | Issuer | | | | Value | | | % of net
assets | |
| | | | | | | | | | | | | | | | |
| | MORTGAGE BACKED—continued | | | | | | | | |
| | $ 911,844 | | | | | GNMA | | 3.000%, 09/15/42 | | $ | 882,338 | | | | 0.5 | % |
| | 1,880,185 | | | | | GNMA | | 3.500%, 11/15/42 | | | 1,901,285 | | | | 1.0 | |
| | 964,244 | | | | | GNMA | | 3.000%, 02/20/43 | | | 933,493 | | | | 0.5 | |
| | 3,531,195 | | | | | GNMA | | 3.500%–6.000%, 07/15/33–12/20/41 | | | 3,781,448 | | | | 2.0 | |
| | | | | | Other | | | | | 1,944,622 | | | | 1.0 | |
| | | | | | | | | | | | |
| | | | | | | | | | | 38,819,220 | | | | 20.5 | |
| | | | | | | | | | | | |
| | MUNICIPAL BONDS | | | 1,878,676 | | | | 1.0 | |
| | | | | | | | | | | | |
| | U.S. TREASURY SECURITIES | | | | | | | | |
| | 2,380,000 | | | | | United States Treasury Bond | | 3.625%, 08/15/43 | | | 2,247,612 | | | | 1.2 | |
| | 1,000,000 | | | | | United States Treasury Bond | | 3.750%, 11/15/43 | | | 966,562 | | | | 0.5 | |
| | 1,000,000 | | | | | United States Treasury Note | | 0.250%, 05/31/14 | | | 1,000,586 | | | | 0.5 | |
| | 3,050,000 | | | | | United States Treasury Note | | 0.250%, 06/30/14 | | | 3,052,382 | | | | 1.6 | |
| | 1,000,000 | | | | | United States Treasury Note | | 0.250%, 09/30/14 | | | 1,000,820 | | | | 0.5 | |
| | 524,000 | | | | | United States Treasury Note | | 0.125%, 12/31/14 | | | 523,837 | | | | 0.3 | |
| | 1,385,000 | | | | | United States Treasury Note | | 0.250%, 01/31/15 | | | 1,386,136 | | | | 0.7 | |
| | 4,900,000 | | | | | United States Treasury Note | | 0.250%, 02/28/15 | | | 4,903,062 | | | | 2.6 | |
| | 2,115,000 | | | | | United States Treasury Note | | 0.250%, 05/31/15 | | | 2,115,992 | | | | 1.1 | |
| | 10,664,000 | | | | | United States Treasury Note | | 0.375%, 11/15/15 | | | 10,670,249 | | | | 5.7 | |
| | 5,510,000 | | | | | United States Treasury Note | | 0.500%, 06/15/16 | | | 5,504,402 | | | | 2.9 | |
| | 520,000 | | | | | United States Treasury Note | | 0.875%, 01/31/18 | | | 510,088 | | | | 0.3 | |
| | 6,641,500 | | | | | United States Treasury Note | | 1.250%, 11/30/18 | | | 6,499,332 | | | | 3.4 | |
| | 7,015,000 | | | | | United States Treasury Note | | 2.750%, 11/15/23 | | | 6,862,641 | | | | 3.6 | |
| | | | | | Other | | | | | 1,286,956 | | | | 0.7 | |
| | | | | | | | | | | | |
| | | | | | | | | | | 48,530,657 | | | | 25.6 | |
| | | | | | | | | | | | |
| | | | | | TOTAL GOVERNMENT BONDS | | (Cost $95,910,831) | | | 95,265,949 | | | | 50.2 | |
| | | | | | | | | | | | |
| | STRUCTURED ASSETS | | | | | | | | |
| | ASSET BACKED | | | | | | | | |
| | 1,460,625 | | | | | Dominos Pizza Master Issuer LLC | | 5.216%, 01/25/42 | | | 1,548,176 | | | | 0.8 | |
| | | | | | Series 2012-1A (Class A2) | | | | | | | | | | |
| | | | | | Other | | | | | 6,598,590 | | | | 3.5 | |
| | | | | | | | | | | | |
| | | | | | | | | | | 8,146,766 | | | | 4.3 | |
| | | | | | | | | | | | |
| | OTHER MORTGAGE BACKED | | | | | | | | |
| | 730,000 | | | | | Credit Suisse Mortgage Capital Certificates | | | | | | | | | | |
| | | | | | Series 2006-C4 (Class AM) | | 5.509%, 09/15/39 | | | 783,837 | | | | 0.4 | |
| | 1,060,000 | | | | | Wachovia Bank Commercial Mortgage Trust | | | | | | | | | | |
| | | | | | Series 2007-C30 (Class AM) | | 5.383%, 12/15/43 | | | 1,140,553 | | | | 0.6 | |
| | 780,000 | | | | | Wachovia Bank Commercial Mortgage Trust | | | | | | | | | | |
| | | | | | Series 2007-C34 (Class AM) | | 5.818%, 05/15/46 | | | 855,233 | | | | 0.4 | |
| | | | | | Other | | | | | 5,419,611 | | | | 2.9 | |
| | | | | | | | | | | | |
| | | | | | | | | | | 8,199,234 | | | | 4.3 | |
| | | | | | | | | | | | |
| | | | | | TOTAL STRUCTURED ASSETS | | (Cost $16,239,202) | | | 16,346,000 | | | | 8.6 | |
| | | | | | | | | | | | |
| | | | | | TOTAL BONDS | | (Cost $181,887,298) | | | 181,321,951 | | | | 95.7 | |
| | | | | | | | | | | | |
| | | | | | |
| See notes to financial statements | | TIAA-CREF Life Funds § 2013 Annual Report | | | 67 | |
| | |
| Summary portfolio of investments | | concluded |
Bond Fund § December 31, 2013
| | | | | | | | | | | | | | | | |
| Shares | | | | | Company | | | | Value | | | % of net
assets | |
| | | | | | | | | | | | | | | | |
| | PREFERRED STOCKS | | | | | | | | | | |
| | BANKS | | $ | 200,556 | | | | 0.1 | % |
| | | | | | | | | | | | |
| | | | | | TOTAL PREFERRED STOCKS | | (Cost $569,550) | | | 200,556 | | | | 0.1 | |
| | | | | | | | | | | | |
| | | | | |
| Principal | | | | | Issuer | | | | | | | | |
| | SHORT-TERM INVESTMENTS | | | | | | | | | | |
| | TREASURY DEBT | | | | | | | | |
| | $ 3,800,000 | | | | | United States Treasury Bill | | 0.083%–0.108%, 07/24/14 | | | 3,798,340 | | | | 2.0 | |
| | | | | | | | | | | | |
| | | | 3,798,340 | | | | 2.0 | |
| | | | | | | | | | | | |
| | | | | | TOTAL SHORT-TERM INVESTMENTS | | (Cost $3,797,958) | | | 3,798,340 | | | | 2.0 | |
| | | | | | | | | | | | |
| | | | | |
| | | | | | TOTAL PORTFOLIO | | (Cost $186,975,303) | | | 186,044,603 | | | | 98.2 | |
| | | | | | OTHER ASSETS & LIABILITIES, NET | | | | | 3,363,997 | | | | 1.8 | |
| | | | | | | | | | | | |
| | | | | | NET ASSETS | | | | $ | 189,408,600 | | | | 100.0 | % |
| | | | | | | | | | |
| g | Security is exempt from registration under Rule 144(A) of the Securities Act of 1933. Such securities are deemed liquid and may be resold in transactions exempt from registration to qualified institutional buyers. At 12/31/2013, the aggregate value of these securities, including those in “Other,” was $24,139,582, or 12.7% of net assets. |
| i | Floating or variable rate security. Coupon rate reflects the rate at period end. |
“Other” securities represent the aggregate value, by category, of securities that are not among the 50 largest holdings and, in total for any issuer, represent 1% or less of net assets.
For ease of presentation, a number of classification categories have been grouped together in the Summary Portfolio of Investments. Note that the Fund uses more specific categories in following its investment limitations on investment concentrations.
| | | | |
| 68 | | 2013 Annual Report § TIAA-CREF Life Funds | | See notes to financial statements |
| | |
| Summary portfolio of investments | | |
Money Market Fund § December 31, 2013
| | | | | | | | | | | | | | | | |
| Principal | | | | | Issuer | | | | Value | | | % of net
assets | |
| | | | | | | | | | | | | | | | |
| | SHORT-TERM INVESTMENTS | | | | | | | | | | |
| | CERTIFICATE OF DEPOSIT | | | | | | | | | | |
| | $ 900,000 | | | | | Banco Del Estado De Chile | | 0.210%, 02/11/14–02/20/14 | | $ | 900,000 | | | | 1.2 | % |
| | 1,000,000 | | | | | Toronto-Dominion Bank | | 0.150%–0.170%, 01/06/14–03/11/14 | | | 1,000,000 | | | | 1.4 | |
| | 1,000,000 | | | | | Wells Fargo Bank NA | | 0.130%, 02/10/14 | | | 1,000,000 | | | | 1.4 | |
| | | | | | Other | | | | | 550,000 | | | | 0.7 | |
| | | | | | | | | | | | |
| | | | | | | | | | | 3,450,000 | | | | 4.7 | |
| | | | | | | �� | | | | | |
| | COMMERCIAL PAPER | | | | | | | | | | |
| | 1,500,000 | | | | | American Honda Finance Corp | | 0.090%–0.130%, 01/10/14–03/05/14 | | | 1,499,799 | | | | 2.1 | |
| | 830,000 | | | y | | Australia & New Zealand Banking Group Ltd | | 0.180%, 03/20/14 | | | 829,676 | | | | 1.1 | |
| | 750,000 | | | y | | Coca-Cola Co | | 0.120%–0.140%, 02/27/14 | | | 749,850 | | | | 1.0 | |
| | 1,150,000 | | | y | | Coca-Cola Co | | 0.130%–0.150%, 01/06/14–01/23/14 | | | 1,149,925 | | | | 1.6 | |
| | 700,000 | | | y | | DBS Bank Ltd | | 0.200%, 01/06/14 | | | 699,981 | | | | 1.0 | |
| | 750,000 | | | y | | DBS Bank Ltd | | 0.165%–0.250%, 01/07/14–04/01/14 | | | 749,830 | | | | 1.0 | |
| | 1,850,000 | | | y | | Fairway Finance LLC | | 0.160%–0.190%, 01/29/14–03/03/14 | | | 1,849,659 | | | | 2.5 | |
| | 1,350,000 | | | | | General Electric Capital Corp | | 0.120%–0.140%, 03/04/14–03/24/14 | | | 1,349,665 | | | | 1.9 | |
| | 755,000 | | | y | | International Business Machines Corp | | 0.150%, 01/07/14 | | | 754,981 | | | | 1.0 | |
| | 1,275,000 | | | y | | Province of Quebec Canada | | 0.080%–0.110%, 01/14/14–02/25/14 | | | 1,274,849 | | | | 1.7 | |
| | 700,000 | | | y | | PSP Capital, Inc | | 0.150%, 03/20/14 | | | 699,772 | | | | 1.0 | |
| | 800,000 | | | y | | PSP Capital, Inc | | 0.130%, 01/29/14–02/11/14 | | | 799,896 | | | | 1.1 | |
| | 900,000 | | | | | Shell International Finance BV | | 4.000%, 03/21/14 | | | 907,348 | | | | 1.2 | |
| | 1,050,000 | | | y | | Standard Chartered Bank | | 0.150%–0.173%, 01/14/14–03/10/14 | | | 1,049,760 | | | | 1.4 | |
| | 590,000 | | | | | Toyota Motor Credit Corp | | 0.140%, 03/05/14 | | | 589,855 | | | | 0.8 | |
| | 1,000,000 | | | | | Toyota Motor Credit Corp | | 0.160%–0.180%, 03/07/14–04/10/14 | | | 999,608 | | | | 1.4 | |
| | 610,000 | | | y | | United Overseas Bank Ltd | | 0.185%, 03/14/14 | | | 609,774 | | | | 0.8 | |
| | 900,000 | | | y | | United Overseas Bank Ltd | | 0.160%–0.170%, 01/07/14–01/14/14 | | | 899,960 | | | | 1.2 | |
| | 875,000 | | | y | | Wal-Mart Stores, Inc | | 0.125%, 01/28/14 | | | 874,918 | | | | 1.2 | |
| | | | | | Other | | | | | 6,258,922 | | | | 8.5 | |
| | | | | | | | | | | | |
| | | | | | | | | | | 24,598,028 | | | | 33.5 | |
| | | | | | | | | | | | |
| | GOVERNMENT AGENCY DEBT | | | | | | | | | | |
| | 1,205,000 | | | | | Federal Home Loan Bank (FHLB) | | 0.070%–0.195%, 01/13/14 | | | 1,204,962 | | | | 1.6 | |
| | 700,000 | | | | | FHLB | | 0.050%–0.085%, 01/22/14 | | | 699,973 | | | | 0.9 | |
| | 1,660,000 | | | | | FHLB | | 0.065%–0.095%, 02/05/14 | | | 1,659,877 | | | | 2.3 | |
| | 1,775,000 | | | | | FHLB | | 0.080%–0.085%, 02/19/14 | | | 1,774,798 | | | | 2.4 | |
| | 700,000 | | | | | FHLB | | 0.098%–0.100%, 03/12/14 | | | 699,865 | | | | 0.9 | |
| | 750,000 | | | | | FHLB | | 0.105%–0.145%, 01/02/14 | | | 749,997 | | | | 1.0 | |
| | 1,307,000 | | | | | FHLB | | 0.035%–0.065%, 01/08/14 | | | 1,306,986 | | | | 1.8 | |
| | 1,000,000 | | | | | FHLB | | 0.050%–0.070%, 01/09/14 | | | 999,986 | | | | 1.4 | |
| | 1,000,000 | | | | | FHLB | | 0.055%, 01/10/14 | | | 999,986 | | | | 1.4 | |
| | 1,000,000 | | | | | FHLB | | 0.140%, 01/17/14 | | | 999,938 | | | | 1.4 | |
| | 665,000 | | | | | FHLB | | 0.070%–0.080%, 01/24/14 | | | 664,968 | | | | 0.9 | |
| | 1,000,000 | | | | | FHLB | | 0.055%–0.080%, 02/07/14 | | | 999,929 | | | | 1.4 | |
| | 950,000 | | | | | FHLB | | 0.070%–0.083%, 02/14/14 | | | 949,912 | | | | 1.3 | |
| | 1,000,000 | | | | | FHLB | | 0.095%, 03/14/14 | | | 999,810 | | | | 1.4 | |
| | 600,000 | | | | | FHLB | | 0.100%, 03/21/14 | | | 599,868 | | | | 0.8 | |
| | 1,000,000 | | | | | FHLB | | 0.060%, 04/02/14 | | | 999,848 | | | | 1.4 | |
| | 3,875,000 | | | | | FHLB | | 0.065%–0.135%, 01/21/14–04/04/14 | | | 3,874,462 | | | | 5.3 | |
| | | | | | |
| See notes to financial statements | | TIAA-CREF Life Funds § 2013 Annual Report | | | 69 | |
| | |
| Summary portfolio of investments | | continued |
Money Market Fund § December 31, 2013
| | | | | | | | | | | | | | | | |
| Principal | | | | | Issuer | | | | Value | | | % of net
assets | |
| | | | | | | | | | | | | | | | |
| | GOVERNMENT AGENCY DEBT—continued | | | | | | | | |
| | $1,135,000 | | | | | Federal Home Loan Mortgage Corp (FHLMC) | | 0.050%–0.160%, 01/27/14 | | $ | 1,134,936 | | | | 1.5 | % |
| | 1,310,000 | | | | | FHLMC | | 0.090%–0.140%, 02/04/14 | | | 1,309,879 | | | | 1.8 | |
| | 695,000 | | | | | FHLMC | | 0.090%–0.140%, 02/24/14 | | | 694,884 | | | | 0.9 | |
| | 2,492,000 | | | | | FHLMC | | 0.060%–0.160%, 01/13/14–04/07/14 | | | 2,491,672 | | | | 3.4 | |
| | 725,000 | | | | | Federal National Mortgage Association (FNMA) | | 0.070%, 01/03/14 | | | 724,997 | | | | 1.0 | |
| | 1,100,000 | | | | | FNMA | | 0.100%, 02/24/14 | | | 1,099,835 | | | | 1.5 | |
| | 1,283,000 | | | | | FNMA | | 0.090%–0.150%, 02/26/14 | | | 1,282,755 | | | | 1.7 | |
| | 1,025,000 | | | | | FNMA | | 0.045%–0.085%, 01/15/14–02/12/14 | | | 1,024,964 | | | | 1.4 | |
| | | | | | | | | | | | |
| | | | | | | | | | | 29,949,087 | | | | 40.8 | |
| | | | | | | | | | | | |
| | TREASURY DEBT | | | | | | | | | | |
| | 582,000 | | | | | United States Treasury Bill | | 0.031%–0.033%, 01/09/14 | | | 581,996 | | | | 0.8 | |
| | 800,000 | | | | | United States Treasury Bill | | 0.041%–0.050%, 01/16/14 | | | 799,984 | | | | 1.1 | |
| | 525,000 | | | | | United States Treasury Bill | | 0.032%–0.037%, 01/23/14 | | | 524,989 | | | | 0.7 | |
| | 725,000 | | | | | United States Treasury Bill | | 0.058%–0.150%, 02/06/14 | | | 724,943 | | | | 1.0 | |
| | 955,000 | | | | | United States Treasury Bill | | 0.076%–0.086%, 06/26/14 | | | 954,611 | | | | 1.3 | |
| | 900,000 | | | | | United States Treasury Bill | | 0.089%–0.095%, 08/21/14 | | | 899,466 | | | | 1.2 | |
| | 1,324,000 | | | | | United States Treasury Bill | | 0.031%–0.091%, 01/02/14–09/18/14 | | | 1,323,807 | | | | 1.8 | |
| | 600,000 | | | | | United States Treasury Note | | 1.000%, 01/15/14 | | | 600,217 | | | | 0.8 | |
| | 500,000 | | | | | United States Treasury Note | | 0.250%, 01/31/14 | | | 500,052 | | | | 0.7 | |
| | 699,000 | | | | | United States Treasury Note | | 0.250%, 02/28/14 | | | 699,189 | | | | 1.0 | |
| | 550,000 | | | | | United States Treasury Note | | 1.250%, 04/15/14 | | | 551,818 | | | | 0.7 | |
| | 509,000 | | | | | United States Treasury Note | | 0.250%, 04/30/14 | | | 509,198 | | | | 0.7 | |
| | 550,000 | | | | | United States Treasury Note | | 1.000%, 05/15/14 | | | 551,732 | | | | 0.7 | |
| | 500,000 | | | | | United States Treasury Note | | 0.250%, 06/30/14 | | | 500,296 | | | | 0.7 | |
| | 660,000 | | | | | United States Treasury Note | | 0.625%, 07/15/14 | | | 661,764 | | | | 0.9 | |
| | 500,000 | | | | | United States Treasury Note | | 0.125%, 07/31/14 | | | 500,027 | | | | 0.7 | |
| | 1,230,000 | | | | | United States Treasury Note | | 0.250%–0.750%, 03/31/14–12/15/14 | | | 1,231,985 | | | | 1.7 | |
| | | | | | | | | | | | |
| | | | | | | | | | | 12,116,074 | | | | 16.5 | |
| | | | | | | | | | | | |
| | VARIABLE RATE SECURITIES | | | | | | | | | | |
| | 500,000 | | | i | | Federal Farm Credit Bank (FFCB) | | 0.211%, 01/07/14 | | | 500,063 | | | | 0.7 | |
| | 500,000 | | | i | | FFCB | | 0.200%, 01/01/14 | | | 500,201 | | | | 0.7 | |
| | 900,000 | | | i | | FFCB | | 0.120%–0.180%, 01/01/14–10/27/14 | | | 899,927 | | | | 1.2 | |
| | 500,000 | | | i | | Federal Home Loan Bank (FHLB) | | 0.220%, 02/14/14 | | | 500,287 | | | | 0.7 | |
| | | | | | Other | | | | | 1,499,987 | | | | 2.0 | |
| | | | | | | | | | | | |
| | | | | | | | | | | 3,900,465 | | | | 5.3 | |
| | | | | | | | | | | | |
| | | | | | TOTAL SHORT-TERM INVESTMENTS | | (Cost $74,013,654) | | | 74,013,654 | | | | 100.8 | |
| | | | | | | | | | | | |
| | | | | |
| | | | | | TOTAL PORTFOLIO | | (Cost $74,013,654) | | | 74,013,654 | | | | 100.8 | |
| | | | | | OTHER ASSETS & LIABILITIES, NET | | | | | (607,409 | ) | | | (0.8 | ) |
| | | | | | | | | | | | |
| | | | | | NET ASSETS | | | | $ | 73,406,245 | | | | 100.0 | % |
| | | | | | | | | | |
| i | Floating or variable rate security. Coupon rate reflects the rate at period end. |
| y | Security exempt from registration under Section 4(2) of the Securities Act of 1933. Such securities are deemed to be liquid and may be sold in transactions exempt from registration only to dealers in that program or other “accredited investors.” At 12/31/2013, the aggregate value of these securities, including those in “Other,” was $17,132,008, or 23.3% of net assets. |
| | | | |
| 70 | | 2013 Annual Report § TIAA-CREF Life Funds | | See notes to financial statements |
| | |
| Summary portfolio of investments | | concluded |
Money Market Fund § December 31, 2013
“Other” securities represent the aggregate value, by category, of securities that are not among the 50 largest holdings and, in total for any issuer, represent 1% or less of net assets.
For ease of presentation, a number of classification categories have been grouped together in the Summary Portfolio of Investments. Note that the Fund uses more specific categories in following its investment limitations on investment concentrations.
| | | | | | |
| See notes to financial statements | | TIAA-CREF Life Funds § 2013 Annual Report | | | 71 | |
| | |
| Statements of assets and liabilities | | |
TIAA-CREF Life Funds § December 31, 2013
| | | | | | |
| | | Growth
Equity
Fund | | | |
|
| | |
ASSETS | | | | | | |
Portfolio investments, at value†* | | $ | 61,281,137 | | | |
Cash | | | 1,109,886 | | | |
Receivable from securities transactions | | | 105,503 | | | |
Receivable from Fund shares sold | | | 12,966 | | | |
Dividends and interest receivable | | | 12,963 | | | |
Due from affiliates | | | 627 | | | |
Other | | | 3,479 | | | |
|
Total assets | | | 62,526,561 | | | |
|
| | |
LIABILITIES | | | | | | |
Management fees payable | | | 3,802 | | | |
Due to affiliates | | | 715 | | | |
Payable for collateral for securities loaned | | | 124,709 | | | |
Payable for securities transactions | | | 473,058 | | | |
Payable for Fund shares redeemed | | | 111,095 | | | |
Accrued expenses and other payables | | | 10,688 | | | |
|
Total liabilities | | | 724,067 | | | |
|
NET ASSETS | | $ | 61,802,494 | | | |
|
| | |
NET ASSETS CONSIST OF: | | | | | | |
Paid-in-capital | | $ | 46,092,925 | | | |
Undistributed net investment income (loss) | | | 28,592 | | | |
Accumulated net realized gain (loss) on total investments | | | 450,469 | | | |
Net unrealized appreciation (depreciation) on total investments | | | 15,230,508 | | | |
|
NET ASSETS | | $ | 61,802,494 | | | |
|
| | |
Outstanding shares of beneficial interest,
unlimited shares authorized ($.0001 par value) | | | 2,343,676 | | | |
|
Net asset value per share | | | $26.37 | | | |
|
| | |
† Includes securities loaned of | | $ | 122,349 | | | |
* Portfolio investments, cost | | $ | 46,050,652 | | | |
| | | | |
| 72 | | 2013 Annual Report § TIAA-CREF Life Funds | | See notes to financial statements |
| | | | | | | | | | | | | | | | |
| | | Growth &
Income
Fund | | | Large-Cap
Value
Fund | | | Real Estate
Securities
Fund | | | Small-Cap
Equity
Fund | |
| | | | |
| | | | |
| | | | | | | | | | | | | | | | |
| | $ | 134,060,502 | | | $ | 107,343,524 | | | $ | 94,716,250 | | | $ | 55,063,282 | |
| | | 447,521 | | | | 657,835 | | | | 979,351 | | | | 22,327 | |
| | | 219,489 | | | | — | | | | 84,071 | | | | 663,762 | |
| | | 68,598 | | | | 49,229 | | | | 50,092 | | | | 566,631 | |
| | | 132,029 | | | | 118,931 | | | | 444,916 | | | | 52,207 | |
| | | 664 | | | | 460 | | | | 395 | | | | 814 | |
| | | 5,245 | | | | 4,534 | | | | 5,014 | | | | 3,914 | |
| |
| | | 134,934,048 | | | | 108,174,513 | | | | 96,280,089 | | | | 56,372,937 | |
| |
| | | | |
| | | | | | | | | | | | | | | | |
| | | 8,111 | | | | 6,431 | | | | 6,610 | | | | 3,340 | |
| | | 1,481 | | | | 814 | | | | 1,364 | | | | 586 | |
| | | 2,330,602 | | | | 3,244,120 | | | | — | | | | 4,549,816 | |
| | | 356,177 | | | | — | | | | — | | | | 328,035 | |
| | | 621,363 | | | | 44,286 | | | | 54,286 | | | | 39,647 | |
| | | 19,129 | | | | 9,981 | | | | 15,572 | | | | 14,876 | |
| |
| | | 3,336,863 | | | | 3,305,632 | | | | 77,832 | | | | 4,936,300 | |
| |
| | $ | 131,597,185 | | | $ | 104,868,881 | | | $ | 96,202,257 | | | $ | 51,436,637 | |
| |
| | | | |
| | | | | | | | | | | | | | | | |
| | $ | 99,340,607 | | | $ | 87,904,795 | | | $ | 91,590,492 | | | $ | 39,444,007 | |
| | | 25,149 | | | | 17,123 | | | | 303,355 | | | | 28,841 | |
| | | 1,377,470 | | | | 646,739 | | | | (3,301,186 | ) | | | 1,807,146 | |
| | | 30,853,959 | | | | 16,300,224 | | | | 7,609,596 | | | | 10,156,643 | |
| |
| | $ | 131,597,185 | | | $ | 104,868,881 | | | $ | 96,202,257 | | | $ | 51,436,637 | |
| |
| | | | |
| | | 3,555,013 | | |
|
2,862,433 |
| | | 3,276,507 | | | | 1,416,165 | |
| |
| | | $37.02 | | | | $36.64 | | | | $29.36 | | | | $36.32 | |
| |
| | | | |
| | $ | 2,264,386 | | | $ | 3,137,622 | | | $ | — | | | $ | 4,461,821 | |
| | $ | 103,207,001 | | | $ | 91,043,518 | | | $ | 87,106,654 | | | $ | 44,906,639 | |
| | | | | | |
| See notes to financial statements | | TIAA-CREF Life Funds § 2013 Annual Report | | | 73 | |
| | |
| Statements of assets and liabilities | | |
TIAA-CREF Life Funds § December 31, 2013
| | | | | | |
| | | Social Choice
Equity Fund | | | |
|
| | |
ASSETS | | | | | | |
Portfolio investments, at value†* | | $ | 64,346,187 | | | |
Cash | | | 526,122 | | | |
Cash—foreign‡ | | | — | | | |
Receivable from securities transactions | | | — | | | |
Receivable from Fund shares sold | | | 28,479 | | | |
Dividends and interest receivable | | | 91,511 | | | |
Due from affiliates | | | 440 | | | |
Receivable for variation margin on open futures contracts | | | — | | | |
Other | | | 3,402 | | | |
|
Total assets | | | 64,996,141 | | | |
|
| | |
LIABILITIES | | | | | | |
Management fees payable | | | 1,329 | | | |
Due to affiliates | | | 501 | | | |
Payable for collateral for securities loaned | | | — | | | |
Payable for securities transactions | | | — | | | |
Payable for Fund shares redeemed | | | 53,478 | | | |
Accrued expenses and other payables | | | 9,909 | | | |
|
Total liabilities | | | 65,217 | | | |
|
NET ASSETS | | $ | 64,930,924 | | | |
|
| | |
NET ASSETS CONSIST OF: | | | | | | |
Paid-in-capital | | $ | 45,319,926 | | | |
Undistributed net investment income (loss) | | | 218,156 | | | |
Accumulated net realized gain (loss) on total investments | | | (210,979 | ) | | |
Net unrealized appreciation (depreciation) on total investments | | | 19,603,821 | | | |
|
NET ASSETS | | $ | 64,930,924 | | | |
|
| | |
Outstanding shares of beneficial interest,
unlimited sharesauthorized ($.0001 par value) | | | 1,784,069 | | | |
|
Net asset value per share | | | $36.39 | | | |
|
| | |
† Includes securities loaned of | | $ | — | | | |
* Portfolio investments, cost | | $ | 44,742,366 | | | |
‡ Foreign cash, cost | | $ | — | | | |
| | | | |
| 74 | | 2013 Annual Report § TIAA-CREF Life Funds | | See notes to financial statements |
| | | | | | | | | | | | | | | | |
| | | Stock Index Fund | | | International
Equity Fund | | | Bond Fund | | | Money Market Fund | |
| |
| | | | |
| | | | | | | | | | | | | | | | |
| | $ | 287,651,862 | | | $ | 97,937,512 | | | $ | 186,044,603 | | | $ | 74,013,654 | |
| | | 2,240,245 | | | | 1,131,765 | | | | 3,327,495 | | | | 23,786 | |
| | | — | | | | 6,784 | | | | — | | | | — | |
| | | 20,262 | | | | 1,740,539 | | | | 87,312 | | | | — | |
| | | 300,437 | | | | 127,400 | | | | 64,235 | | | | 5,017 | |
| | | 380,052 | | | | 63,660 | | | | 1,107,923 | | | | 21,623 | |
| | | 1,207 | | | | 1,083 | | | | 1,416 | | | | 1,161 | |
| | | 7,221 | | | | — | | | | — | | | | — | |
| | | 9,759 | | | | 5,643 | | | | 6,548 | | | | 2,912 | |
| |
| | | 290,611,045 | | | | 101,014,386 | | | | 190,639,532 | | | | 74,068,153 | |
| |
| | | | |
| | | | | | | | | | | | | | | | |
| | | 2,319 | | | | 6,676 | | | | 7,776 | | | | 1,014 | |
| | | 3,362 | | | | 750 | | | | 1,557 | | | | 648 | |
| | | 6,943,725 | | | | 873,168 | | | | — | | | | — | |
| | | — | | | | 1,890,367 | | | | 1,065,101 | | | | — | |
| | | 514,201 | | | | 59,175 | | | | 117,822 | | | | 646,856 | |
| | | 30,915 | | | | 78,409 | | | | 38,676 | | | | 13,390 | |
| |
| | | 7,494,522 | | | | 2,908,545 | | | | 1,230,932 | | | | 661,908 | |
| |
| | $ | 283,116,523 | | | $ | 98,105,841 | | | $ | 189,408,600 | | | $ | 73,406,245 | |
| |
| | | | |
| | | | | | | | | | | | | | | | |
| | $ | 185,749,318 | | | $ | 120,172,992 | | | $ | 190,396,426 | | | $ | 73,407,375 | |
| | | 434,397 | | | | 1,192,680 | | | | (5,859 | ) | | | (1,130 | ) |
| | | (4,425,664 | ) | | | (34,979,352 | ) | | | (51,267 | ) | | | — | |
| | | 101,358,472 | | | | 11,719,521 | | | | (930,700 | ) | | | — | |
| |
| | $ | 283,116,523 | | | $ | 98,105,841 | | | $ | 189,408,600 | | | $ | 73,406,245 | |
| |
| |
| | | | |
| | | 6,867,968 | | | | 4,868,347 | | | | 7,589,003 | | | | 73,404,091 | |
| |
| | | $41.22 | | | | $20.15 | | | | $24.96 | | | | $1.00 | |
| |
| | | | |
| | $ | 6,781,019 | | | $ | 828,040 | | | $ | – | | | $ | – | |
| | $ | 186,333,142 | | | $ | 86,171,912 | | | $ | 186,975,303 | | | $ | 74,013,654 | |
| | $ | — | | | $ | 6,784 | | | $ | – | | | $ | – | |
| | | | | | |
| See notes to financial statements | | TIAA-CREF Life Funds § 2013 Annual Report | | | 75 | |
TIAA-CREF Life Funds § For the year ended December 31, 2013
| | | | | | |
| | | Growth
Equity
Fund | | | |
|
| | |
INVESTMENT INCOME | | | | | | |
Dividends* | | $ | 401,837 | | | |
Interest | | | 52 | | | |
Income from securities lending | | | 16,711 | | | |
|
Total income | | | 418,600 | | | |
|
| | |
EXPENSES | | | | | | |
Management fees | | | 230,825 | | | |
Shareholder servicing | | | 3,700 | | | |
Professional fees | | | 39,757 | | | |
Custody and accounting fees | | | 24,009 | | | |
Fund administration fees | | | 11,115 | | | |
Shareholder reports | | | 10,823 | | | |
Compliance fees | | | 9,542 | | | |
Trustee fees and expenses | | | 578 | | | |
Other expenses | | | 6,924 | | | |
|
Total expenses | | | 337,273 | | | |
Less: Expenses reimbursed by the investment adviser | | | (69,786 | ) | | |
|
Net expenses | | | 267,487 | | | |
|
| | |
Net investment income (loss) | | | 151,113 | | | |
|
| | |
NET REALIZED AND UNREALIZED GAIN (LOSS) ON TOTAL INVESTMENTS | | | | | | |
Realized gain (loss): | | | | | | |
Portfolio investments | | | 6,638,232 | | | |
Futures transactions | | | — | | | |
Written options | | | (774 | ) | | |
Foreign currency transactions | | | (880 | ) | | |
|
Net realized gain (loss) on total investments | | | 6,636,578 | | | |
|
| | |
Change in unrealized appreciation (depreciation) on: | | | | | | |
Portfolio investments | | | 10,691,963 | | | |
Futures transactions | | | — | | | |
Written options | | | — | | | |
Translation of assets (other than portfolio investments) and
liabilities denominated in foreign currencies | | | 23 | | | |
|
Net change in unrealized appreciation (depreciation) on total investments | | | 10,691,986 | | | |
|
Net realized and unrealized gain (loss) on total investments | | | 17,328,564 | | | |
|
Net increase (decrease) in net assets from operations | | $ | 17,479,677 | | | |
|
| | |
* Net of foreign withholding taxes of | | $ | 6,599 | | | |
| | | | |
| 76 | | 2013 Annual Report § TIAA-CREF Life Funds | | See notes to financial statements |
| | | | | | | | | | | | | | | | |
Growth &
Income
Fund | | | Large-Cap
Value
Fund | | | Real Estate
Securities
Fund | | | Small-Cap
Equity
Fund | |
| | | | | | | | |
| | | | |
| | | | | | | | | | | | | | | | |
| | $ | 1,835,282 | | | $ | 1,802,096 | | | $ | 2,319,029 | | | $ | 525,516 | |
| | | 76 | | | | 159 | | | | 139 | | | | 18 | |
| | | 21,978 | | | | 49,096 | | | | — | | | | 31,198 | |
| |
| | | 1,857,336 | | | | 1,851,351 | | | | 2,319,168 | | | | 556,732 | |
| |
| | | | |
| | | | | | | | | | | | | | | | |
| | | 501,779 | | | | 404,354 | | | | 505,426 | | | | 209,234 | |
| | | 4,365 | | | | 3,722 | | | | 3,773 | | | | 3,046 | |
| | | 40,738 | | | | 40,082 | | | | 41,667 | | | | 36,168 | |
| | | 53,878 | | | | 30,093 | | | | 14,525 | | | | 27,428 | |
| | | 24,585 | | | | 20,033 | | | | 24,285 | | | | 10,062 | |
| | | 19,083 | | | | 17,738 | | | | 20,513 | | | | 11,554 | |
| | | 21,137 | | | | 16,578 | | | | 20,607 | | | | 8,484 | |
| | | 1,313 | | | | 1,038 | | | | 1,206 | | | | 570 | |
| | | 14,456 | | | | 8,377 | | | | 6,708 | | | | 12,807 | |
| |
| | | 681,334 | | | | 542,015 | | | | 638,710 | | | | 319,353 | |
| | | (101,293 | ) | | | (74,689 | ) | | | (62,155 | ) | | | (77,733 | ) |
| |
| | | 580,041 | | | | 467,326 | | | | 576,555 | | | | 241,620 | |
| |
| | | | |
| | | 1,277,295 | | | | 1,384,025 | | | | 1,742,613 | | | | 315,112 | |
| |
| | | | |
| | | | | | | | | | | | | | | | |
| | | | | | | | | | | | | | | | |
| | | 12,534,095 | | | | 11,139,000 | | | | 5,941,463 | | | | 9,464,008 | |
| | | — | | | | — | | | | — | | | | 147,240 | |
| | | 112,662 | | | | — | | | | 19,387 | | | | — | |
| | | (6,454 | ) | | | (605 | ) | | | (55 | ) | | | — | |
| |
| | | 12,640,303 | | | | 11,138,395 | | | | 5,960,795 | | | | 9,611,248 | |
| |
| | | | |
| | | | | | | | | | | | | | | | |
| | | 18,960,514 | | | | 13,331,356 | | | | (6,043,030 | ) | | | 5,446,988 | |
| | | — | | | | — | | | | — | | | | (10,413 | ) |
| | | 2,577 | | | | — | | | | — | | | | — | |
| | | 475 | | | | 226 | | | | — | | | | — | |
| |
| | | 18,963,566 | | | | 13,331,582 | | | | (6,043,030 | ) | | | 5,436,575 | |
| |
| | | 31,603,869 | | | | 24,469,977 | | | | (82,235 | ) | | | 15,047,823 | |
| |
| | $ | 32,881,164 | | | $ | 25,854,002 | | | $ | 1,660,378 | | | $ | 15,362,935 | |
| |
| | | | |
| | $ | 12,776 | | | $ | 11,210 | | | $ | — | | | $ | — | |
| | | | | | |
| See notes to financial statements | | TIAA-CREF Life Funds § 2013 Annual Report | | | 77 | |
TIAA-CREF Life Funds § For the year ended December 31, 2013
| | | | | | |
| | | Social Choice
Equity
Fund | | | |
|
| | |
INVESTMENT INCOME | | | | | | |
Dividends* | | $ | 1,052,351 | | | |
Interest | | | 42 | | | |
Income from securities lending | | | — | | | |
|
Total income | | | 1,052,393 | | | |
|
| | |
EXPENSES | | | | | | |
Management fees | | | 83,049 | | | |
Shareholder servicing | | | 4,270 | | | |
Professional fees | | | 34,320 | | | |
Custody and accounting fees | | | 17,009 | | | |
Fund administration fees | | | 12,193 | | | |
Shareholder reports | | | 11,284 | | | |
Compliance fees | | | 10,185 | | | |
Trustee fees and expenses | | | 675 | | | |
Other expenses | | | 7,698 | | | |
|
Total expenses | | | 180,683 | | | |
Less: Expenses reimbursed by the investment adviser | | | (58,754 | ) | | |
Fee waiver by investment adviser | | | — | | | |
|
Net expenses | | | 121,929 | | | |
|
| | |
Net investment income (loss) | | | 930,464 | | | |
|
| | |
NET REALIZED AND UNREALIZED GAIN (LOSS) ON TOTAL INVESTMENTS | | | | | | |
Realized gain (loss): | | | | | | |
Portfolio investments | | | 883,035 | | | |
Futures transactions | | | — | | | |
Foreign currency transactions | | | — | | | |
|
Net realized gain (loss) on total investments | | | 883,035 | | | |
|
| | |
Change in unrealized appreciation (depreciation) on: | | | | | | |
Portfolio investments** | | | 14,033,026 | | | |
Futures transactions | | | — | | | |
Translation of assets (other than portfolio investments) and
liabilities denominated in foreign currencies | | | — | | | |
|
Net change in unrealized appreciation (depreciation) on total investments | | | 14,033,026 | | | |
|
Net realized and unrealized gain (loss) on total investments | | | 14,916,061 | | | |
|
Net increase (decrease) in net assets from operations | | $ | 15,846,525 | | | |
|
| | |
* Net of foreign withholding taxes of | | $ | 615 | | | |
** Includes net change in unrealized foreign capital gains taxes of | | $ | — | | | |
| | | | |
| 78 | | 2013 Annual Report § TIAA-CREF Life Funds | | See notes to financial statements |
| | | | | | | | | | | | | | | | |
| | | Stock
Index
Fund | | | International
Equity
Fund | | | Bond Fund | | | Money
Market
Fund | |
| |
| | | | |
| | | | | | | | | | | | | | | | |
| | $ | 4,778,577 | | | $ | 1,973,695 | | | $ | — | | | $ | — | |
| | | 87 | | | | 109 | | | | 5,235,762 | | | | 94,053 | |
| | | 85,763 | | | | 64,763 | | | | — | | | | — | |
| |
| | | 4,864,427 | | | | 2,038,567 | | | | 5,235,762 | | | | 94,053 | |
| |
| | | | |
| | | | | | | | | | | | | | | | |
| | | 146,434 | | | | 425,949 | | | | 558,495 | | | | 69,403 | |
| | | 3,836 | | | | 3,614 | | | | 3,571 | | | | 2,477 | |
| | | 54,622 | | �� | | 46,487 | | | | 60,491 | | | | 32,292 | |
| | | 42,159 | | | | 68,662 | | | | 72,036 | | | | 36,962 | |
| | | 54,995 | | | | 16,796 | | | | 46,080 | | | | 15,890 | |
| | | 37,230 | | | | 12,756 | | | | 33,329 | | | | 10,945 | |
| | | 46,848 | | | | 14,634 | | | | 37,002 | | | | 12,859 | |
| | | 2,819 | | | | 1,023 | | | | 2,198 | | | | 807 | |
| | | 13,642 | | | | 38,786 | | | | 7,961 | | | | 5,286 | |
| |
| | | 402,585 | | | | 628,707 | | | | 821,163 | | | | 186,921 | |
| | | (182,767 | ) | | | (116,947 | ) | | | (169,480 | ) | | | (82,755 | ) |
| | | — | | | | — | | | | — | | | | (13,508 | ) |
| |
| | | 219,818 | | | | 511,760 | | | | 651,683 | | | | 90,658 | |
| |
| | | | |
| | | 4,644,609 | | | | 1,526,807 | | | | 4,584,079 | | | | 3,395 | |
| |
| | | | |
| | | | | | | | | | | | | | | | |
| | | | | | | | | | | | | | | | |
| | | (2,103,486 | ) | | | 12,520,873 | | | | 757,179 | | | | 476 | |
| | | 547,567 | | | | — | | | | — | | | | — | |
| | | (3 | ) | | | (14,930 | ) | | | — | | | | — | |
| |
| | | (1,555,922 | ) | | | 12,505,943 | | | | 757,179 | | | | 476 | |
| |
| |
| | | | |
| | | | | | | | | | | | | | | | |
| | | 66,592,383 | | | | 4,791,939 | | | | (8,267,305 | ) | | | — | |
| | | 45,093 | | | | — | | | | — | | | | — | |
| | | — | | | | 1,824 | | | | — | | | | — | |
| |
| | | 66,637,476 | | | | 4,793,763 | | | | (8,267,305 | ) | | | — | |
| |
| | | 65,081,554 | | | | 17,299,706 | | | | (7,510,126 | ) | | | 476 | |
| |
| | $ | 69,726,163 | | | $ | 18,826,513 | | | $ | (2,926,047 | ) | | $ | 3,871 | |
| |
| | | | |
| | $ | 2,051 | | | $ | 130,256 | | | $ | — | | | $ | — | |
| | $ | — | | | $ | (45,024 | ) | | $ | — | | | $ | — | |
| | | | | | |
| See notes to financial statements | | TIAA-CREF Life Funds § 2013 Annual Report | | | 79 | |
| | |
| Statements of changes in net assets | | |
TIAA-CREF Life Funds § For the year ended
| | | | | | | | | | |
| | | Growth Equity Fund | | | |
| | | December 31, 2013 | | | December 31, 2012 | | | |
|
| | | |
OPERATIONS | | | | | | | | | | |
Net investment income (loss) | | $ | 151,113 | | | $ | 302,005 | | | |
Net realized gain (loss) on total investments | | | 6,636,578 | | | | 5,035,591 | | | |
Net change in unrealized appreciation (depreciation) on total investments | | | 10,691,986 | | | | 1,397,561 | | | |
|
Net increase (decrease) in net assets from operations | | | 17,479,677 | | | | 6,735,157 | | | |
|
| | | |
DISTRIBUTIONS TO SHAREHOLDERS | | | | | | | | | | |
From net investment income | | | (146,110 | ) | | | (298,477 | ) | | |
From realized gains | | | — | | | | — | | | |
|
Total distributions | | | (146,110 | ) | | | (298,477 | ) | | |
|
| | | |
SHAREHOLDER TRANSACTIONS | | | | | | | | | | |
Subscriptions | | | 12,704,978 | | | | 4,455,947 | | | |
Reinvestments of distributions | | | 146,110 | | | | 298,477 | | | |
Redemptions | | | (11,092,599 | ) | | | (9,430,961 | ) | | |
|
Net increase (decrease) from shareholder transactions | | | 1,758,489 | | | | (4,676,537 | ) | | |
|
| | | |
Net increase (decrease) in net assets | | | 19,092,056 | | | | 1,760,143 | | | |
| | | |
NET ASSETS | | | | | | | | | | |
Beginning of period | | | 42,710,438 | | | | 40,950,295 | | | |
|
End of period | | $ | 61,802,494 | | | $ | 42,710,438 | | | |
|
Undistributed net investment income (loss) included in net assets | | $ | 28,592 | | | $ | 11,641 | | | |
|
| | | |
CHANGE IN FUND SHARES | | | | | | | | | | |
Shares sold | | | 581,401 | | | | 245,328 | | | |
Shares reinvested | | | 5,624 | | | | 15,784 | | | |
Shares redeemed | | | (504,339 | ) | | | (518,843 | ) | | |
|
Net increase (decrease) from shareholder transactions | | | 82,686 | | | | (257,731 | ) | | |
|
| | | | |
| 80 | | 2013 Annual Report § TIAA-CREF Life Funds | | See notes to financial statements |
| | | | | | | | | | | | | | | | |
| | | Growth & Income Fund | | | Large-Cap Value Fund | |
| | | December 31, 2013 | | | December 31, 2012 | | | December 31, 2013 | | | December 31, 2012 | |
| |
| | | | |
| | | | | | | | | | | | | | | | |
| | $ | 1,277,295 | | | $ | 1,228,296 | | | $ | 1,384,025 | | | $ | 1,322,958 | |
| | | 12,640,303 | | | | 4,796,619 | | | | 11,138,395 | | | | 5,608,997 | |
| | | | |
| | | 18,963,566 | | | | 6,673,967 | | | | 13,331,582 | | | | 5,095,012 | |
| |
| | | 32,881,164 | | | | 12,698,882 | | | | 25,854,002 | | | | 12,026,967 | |
| |
| | | | |
| | | | | | | | | | | | | | | | |
| | | (1,261,991 | ) | | | (1,589,188 | ) | | | (1,826,448 | ) | | | (1,313,141 | ) |
| | | (10,840,812 | ) | | | — | | | | (5,541,114 | ) | | | — | |
| |
| | | (12,102,803 | ) | | | (1,589,188 | ) | | | (7,367,562 | ) | | | (1,313,141 | ) |
| |
| | | | |
| | | | | | | | | | | | | | | | |
| | | 18,964,713 | | | | 15,446,847 | | | | 17,381,922 | | | | 6,067,463 | |
| | | 12,102,803 | | | | 1,589,188 | | | | 7,367,562 | | | | 1,313,141 | |
| | | (12,657,368 | ) | | | (11,977,388 | ) | | | (10,057,671 | ) | | | (6,844,318 | ) |
| |
| | | 18,410,148 | | | | 5,058,647 | | | | 14,691,813 | | | | 536,286 | |
| |
| | | | |
| | | 39,188,509 | | | | 16,168,341 | | | | 33,178,253 | | | | 11,250,112 | |
| | | | |
| | | | | | | | | | | | | | | | |
| | | 92,408,676 | | | | 76,240,335 | | | | 71,690,628 | | | | 60,440,516 | |
| |
| | $ | 131,597,185 | | | $ | 92,408,676 | | | $ | 104,868,881 | | | $ | 71,690,628 | |
| |
| |
$ |
25,149 |
| | $ | 20,885 | | | $ | 17,123 | | | $ | 493,302 | |
| |
| | | | |
| | | | | | | | | | | | | | | | |
| | | 535,343 | | | | 522,888 | | | | 507,173 | | | | 216,423 | |
| | | 332,769 | | | | 52,293 | | | | 204,996 | | | | 44,710 | |
| | | (356,162 | ) | | | (404,918 | ) | | | (289,165 | ) | | | (247,176 | ) |
| |
| | | 511,950 | | | | 170,263 | | | | 423,004 | | | | 13,957 | |
| |
| | | | | | |
| See notes to financial statements | | TIAA-CREF Life Funds § 2013 Annual Report | | | 81 | |
| | |
| Statements of changes in net assets | | |
TIAA-CREF Life Funds § For the year ended
| | | | | | | | | | |
| | | Real Estate Securities Fund | | | |
| | | December 31, 2013 | | | December 31, 2012 | | | |
|
| | | |
OPERATIONS | | | | | | | | | | |
Net investment income (loss) | | $ | 1,742,613 | | | $ | 1,441,752 | | | |
Net realized gain (loss) on total investments | | | 5,960,795 | | | | 6,045,404 | | | |
Net change in unrealized appreciation (depreciation) on total investments | | | (6,043,030 | ) | | | 8,126,182 | | | |
|
Net increase (decrease) in net assets from operations | | | 1,660,378 | | | | 15,613,338 | | | |
|
| | | |
DISTRIBUTIONS TO SHAREHOLDERS | | | | | | | | | | |
From net investment income | | | (1,755,633 | ) | | | (1,696,190 | ) | | |
From realized gains | | | — | | | | — | | | |
|
Total distributions | | | (1,755,633 | ) | | | (1,696,190 | ) | | |
|
| | | |
SHAREHOLDER TRANSACTIONS | | | | | | | | | | |
Subscriptions | | | 11,354,641 | | | | 11,678,264 | | | |
Reinvestments of distributions | | | 1,755,633 | | | | 1,696,190 | | | |
Redemptions | | | (13,233,580 | ) | | | (10,405,385 | ) | | |
|
Net increase (decrease) from shareholder transactions | | | (123,306 | ) | | | 2,969,069 | | | |
|
| | | |
Net increase (decrease) in net assets | | | (218,561 | ) | | | 16,886,217 | | | |
| | | |
NET ASSETS | | | | | | | | | | |
Beginning of period | | | 96,420,818 | | | | 79,534,601 | | | |
|
End of period | | $ | 96,202,257 | | | $ | 96,420,818 | | | |
|
Undistributed net investment income (loss) included in net assets | | $ | 303,355 | | | $ | 222,038 | | | |
|
| | | |
CHANGE IN FUND SHARES | | | | | | | | | | |
Shares sold | | | 368,888 | | | | 409,017 | | | |
Shares reinvested | | | 59,960 | | | | 57,970 | | | |
Shares redeemed | | | (437,064 | ) | | | (370,698 | ) | | |
|
Net increase (decrease) from shareholder transactions | | | (8,216 | ) | | | 96,289 | | | |
|
| | | | |
| 82 | | 2013 Annual Report § TIAA-CREF Life Funds | | See notes to financial statements |
| | | | | | | | | | | | | | | | |
| | | Small-Cap Equity Fund | | | Social Choice Equity Fund | |
| | | December 31, 2013 | | | December 31, 2012 | | | December 31, 2013 | | | December 31, 2012 | |
| |
| | | | |
| | | | | | | | | | | | | |
| | $ | 315,112 | | | $ | 641,649 | | | $ | 930,464 | | | $ | 886,159 | |
| | | 9,611,248 | | | | 3,306,497 | | | | 883,035 | | | | 1,201,280 | |
| | | | |
| | | 5,436,575 | | | | 3,621,020 | | | | 14,033,026 | | | | 3,215,257 | |
| |
| | | 15,362,935 | | | | 7,569,166 | | | | 15,846,525 | | | | 5,302,696 | |
| |
| | | | |
| | | | | | | | | | | | | | | | |
| | | (300,228 | ) | | | (672,128 | ) | | | (925,671 | ) | | | (824,772 | ) |
| | | (7,659,492 | ) | | | — | | | | — | | | | — | |
| |
| | | (7,959,720 | ) | | | (672,128 | ) | | | (925,671 | ) | | | (824,772 | ) |
| |
| | | | |
| | | | | | | | | | | | | | | | |
| | | 10,804,358 | | | | 4,209,450 | | | | 9,555,816 | | | | 3,961,395 | |
| | | 7,959,720 | | | | 672,128 | | | | 925,671 | | | | 824,772 | |
| | | (34,811,928 | ) | | | (7,088,125 | ) | | | (4,163,827 | ) | | | (2,866,927 | ) |
| |
| | | (16,047,850 | ) | | | (2,206,547 | ) | | | 6,317,660 | | | | 1,919,240 | |
| |
| | | | |
| | | (8,644,635 | ) | | | 4,690,491 | | | | 21,238,514 | | | | 6,397,164 | |
| | | | |
| | | | | | | | | | | | | | | | |
| | | 60,081,272 | | | | 55,390,781 | | | | 43,692,410 | | | | 37,295,246 | |
| |
| | $ | 51,436,637 | | | $ | 60,081,272 | | | $ | 64,930,924 | | | $ | 43,692,410 | |
| |
| | | | |
| | $ | 28,841 | | | $ | (32,650 | ) | | $ | 218,156 | | | $ | 217,207 | |
| |
| | | | |
| | | | | | | | | | | | | | | | |
| | | 289,282 | | | | 141,142 | | | | 299,024 | | | | 148,244 | |
| | | 222,463 | | | | 21,815 | | | | 25,871 | | | | 29,872 | |
| | | (1,041,968 | ) | | | (239,442 | ) | | | (127,711 | ) | | | (106,869 | ) |
| |
| | | (530,223 | ) | | | (76,485 | ) | | | 197,184 | | | | 71,247 | |
| |
| | | | | | |
| See notes to financial statements | | TIAA-CREF Life Funds § 2013 Annual Report | | | 83 | |
| | |
| Statements of changes in net assets | | |
TIAA-CREF Life Funds § For the year ended
| | | | | | | | | | |
| | | Stock Index Fund | | | |
| | | December 31, 2013 | | | December 31, 2012 | | | |
|
| | | |
OPERATIONS | | | | | | | | | | |
Net investment income (loss) | | $ | 4,644,609 | | | $ | 4,361,145 | | | |
Net realized gain (loss) on total investments | | | (1,555,922 | ) | | | 2,930,112 | | | |
Net change in unrealized appreciation (depreciation) on total investments | | | 66,637,476 | | | | 22,028,074 | | | |
|
Net increase (decrease) in net assets from operations | | | 69,726,163 | | | | 29,319,331 | | | |
|
| | | |
DISTRIBUTIONS TO SHAREHOLDERS | | | | | | | | | | |
From net investment income | | | (4,754,611 | ) | | | (4,344,154 | ) | | |
From realized gains | | | (426,093 | ) | | | (1,283,210 | ) | | |
|
Total distributions | | | (5,180,704 | ) | | | (5,627,364 | ) | | |
|
| | | |
SHAREHOLDER TRANSACTIONS | | | | | | | | | | |
Subscriptions | | | 29,996,781 | | | | 21,175,293 | | | |
Reinvestments of distributions | | | 5,180,704 | | | | 5,627,364 | | | |
Redemptions | | | (23,696,144 | ) | | | (23,660,941 | ) | | |
|
Net increase (decrease) from shareholder transactions | | | 11,481,341 | | | | 3,141,716 | | | |
|
| | | |
Net increase (decrease) in net assets | | | 76,026,800 | | | | 26,833,683 | | | |
| | | |
NET ASSETS | | | | | | | | | | |
Beginning of period | | | 207,089,723 | | | | 180,256,040 | | | |
|
End of period | | $ | 283,116,523 | | | $ | 207,089,723 | | | |
|
Undistributed net investment income (loss) included in net assets | | $ | 434,397 | | | $ | 545,119 | | | |
|
| | | |
CHANGE IN FUND SHARES | | | | | | | | | | |
Shares sold | | | 815,818 | | | | 684,667 | | | |
Shares reinvested | | | 127,824 | | | | 178,420 | | | |
Shares redeemed | | | (653,330 | ) | | | (767,386 | ) | | |
|
Net increase (decrease) from shareholder transactions | | | 290,312 | | | | 95,701 | | | |
|
| | | | |
| 84 | | 2013 Annual Report § TIAA-CREF Life Funds | | See notes to financial statements |
| | | | | | | | | | | | | | | | |
| | | International Equity Fund | | | Bond Fund | |
| | | December 31, 2013 | | | December 31, 2012 | | | December 31, 2013 | | | December 31, 2012 | |
| |
| | | | |
| | | | | | | | | | | | | | | | |
| | $ | 1,526,807 | | | $ | 1,891,116 | | | $ | 4,584,079 | | | $ | 4,985,438 | |
| | | 12,505,943 | | | | 1,439,688 | | | | 757,179 | | | | 3,392,532 | |
| |
|
4,793,763 |
| | | 19,976,725 | | | | (8,267,305 | ) | | | 2,979,381 | |
| |
| | | 18,826,513 | | | | 23,307,529 | | | | (2,926,047 | ) | | | 11,357,351 | |
| |
| | | | |
| | | | | | | | | | | | | | | | |
| | | (2,126,383 | ) | | | (1,219,392 | ) | | | (4,584,976 | ) | | | (4,986,269 | ) |
| | | — | | | | — | | | | (1,216,376 | ) | | | (3,221,472 | ) |
| |
| | | (2,126,383 | ) | | | (1,219,392 | ) | | | (5,801,352 | ) | | | (8,207,741 | ) |
| |
| | | | |
| | | | | | | | | | | | | | | | |
| | | 11,682,643 | | | | 15,111,568 | | | | 21,619,485 | | | | 24,296,772 | |
| | | 2,126,383 | | | | 1,219,392 | | | | 5,801,352 | | | | 8,207,741 | |
| | | (9,424,619 | ) | | | (42,672,375 | ) | | | (13,847,856 | ) | | | (9,227,257 | ) |
| |
| | | 4,384,407 | | | | (26,341,415 | ) | | | 13,572,981 | | | | 23,277,256 | |
| |
| | | | |
| | | 21,084,537 | | | | (4,253,278 | ) | | | 4,845,582 | | | | 26,426,866 | |
| | | | |
| | | | | | | | | | | | | | | | |
| | | 77,021,304 | | | | 81,274,582 | | | | 184,563,018 | | | | 158,136,152 | |
| |
| | $ | 98,105,841 | | | $ | 77,021,304 | | | $ | 189,408,600 | | | $ | 184,563,018 | |
| |
| |
$ |
1,192,680 |
| | $ | 1,807,186 | | | $ | (5,859 | ) | | $ | (4,747 | ) |
| |
| | | | |
| | | | | | | | | | | | | | | | |
| | | 641,863 | | | | 1,006,115 | | | | 836,639 | | | | 916,029 | |
| | | 108,600 | | | | 73,903 | | | | 231,868 | | | | 314,232 | |
| | | (521,661 | ) | | | (2,764,871 | ) | | | (537,143 | ) | | | (349,303 | ) |
| |
| | | 228,802 | | | | (1,684,853 | ) | | | 531,364 | | | | 880,958 | |
| |
| | | | | | |
| See notes to financial statements | | TIAA-CREF Life Funds § 2013 Annual Report | | | 85 | |
| | |
| Statements of changes in net assets | | concluded |
TIAA-CREF Life Funds § For the year ended
| | | | | | | | |
| | | Money Market Fund | |
| | | December 31, 2013 | | | December 31, 2012 | |
| |
| | |
OPERATIONS | | | | | | | | |
Net investment income (loss) | | $ | 3,395 | | | $ | 14,189 | |
Net realized gain (loss) on total investments | | | 476 | | | | 154 | |
Net change in unrealized appreciation (depreciation) on total investments | | | — | | | | — | |
| |
Net increase (decrease) in net assets from operations | | | 3,871 | | | | 14,343 | |
| |
| | |
DISTRIBUTIONS TO SHAREHOLDERS | | | | | | | | |
From net investment income | | | (3,395 | ) | | | (14,189 | ) |
From realized gains | | | — | | | | — | |
| |
Total distributions | | | (3,395 | ) | | | (14,189 | ) |
| |
| | |
SHAREHOLDER TRANSACTIONS | | | | | | | | |
Subscriptions | | | 124,270,750 | | | | 75,744,818 | |
Reinvestments of distributions | | | 3,395 | | | | 14,189 | |
Redemptions | | | (113,466,820 | ) | | | (72,983,200 | ) |
| |
Net increase (decrease) from shareholder transactions | | | 10,807,325 | | | | 2,775,807 | |
| |
| | |
Net increase (decrease) in net assets | | | 10,807,801 | | | | 2,775,961 | |
| | |
NET ASSETS | | | | | | | | |
Beginning of period | | | 62,598,444 | | | | 59,822,483 | |
| |
End of period | | $ | 73,406,245 | | | $ | 62,598,444 | |
| |
Undistributed net investment income (loss) included in net assets | | $ | (1,130 | ) | | $ | (1,606 | ) |
| |
| | |
CHANGE IN FUND SHARES | | | | | | | | |
Shares sold | | | 124,270,750 | | | | 75,744,818 | |
Shares reinvested | | | 3,395 | | | | 14,189 | |
Shares redeemed | | | (113,466,820 | ) | | | (72,983,200 | ) |
| |
Net increase (decrease) from shareholder transactions | | | 10,807,325 | | | | 2,775,807 | |
| |
| | | | |
| 86 | | 2013 Annual Report § TIAA-CREF Life Funds | | See notes to financial statements |
[This page intentionally left blank.]
| | | | |
| TIAA-CREF Life Funds § 2013 Annual Report | | | 87 | |
TIAA-CREF Life Funds
| | | | | | | | | | | | | | | | | | | | | | | | | | | | | | |
| | | | | | Selected per share data |
| | | | | | | | | Gain (loss) from investment operations: | | | Less distributions from: | | | |
| | | For the
year
ended | | | Net asset
value,
beginning
of period | | | Net investment
income
(loss)a | | | Net realized
& unrealized
gain (loss) on total
investments | | | Total
gain (loss) from
investment
operations | | | Net
investment
income | | | Net
realized
gains | | | |
| | | | | | |
GROWTH EQUITY FUND | | | | | | | | | | | | | | | | | | | | | | | |
| | | 12/31/13 | | | $ | 18.89 | | | $ | 0.07 | | | | $7.47 | | | | $7.54 | | | $ | (0.06 | ) | | $ | — | | | |
| | | 12/31/12 | | | | 16.26 | | | | 0.12 | | | | 2.64 | | | | 2.76 | | | | (0.13 | ) | | | — | | | |
| | | 12/31/11 | | | | 16.01 | | | | 0.05 | | | | 0.25 | | | | 0.30 | | | | (0.05 | ) | | | — | | | |
| | | 12/31/10 | | | | 14.18 | | | | 0.07 | | | | 1.83 | | | | 1.90 | | | | (0.07 | ) | | | — | | | |
| | | | 12/31/09 | | | | 10.55 | | | | 0.11 | | | | 3.63 | | | | 3.74 | | | | (0.11 | ) | | | — | | | |
| | | | | | |
GROWTH & INCOME FUND | | | | | | | | | | | | | | | | | | | | | | | |
| | | 12/31/13 | | | | 30.37 | | | | 0.40 | | | | 9.98 | | | | 10.38 | | | | (0.39 | ) | | | (3.34 | ) | | |
| | | 12/31/12 | | | | 26.54 | | | | 0.42 | | | | 3.94 | | | | 4.36 | | | | (0.53 | ) | | | — | | | |
| | | 12/31/11 | | | | 26.07 | | | | 0.29 | | | | 0.47 | | | | 0.76 | | | | (0.29 | ) | | | — | | | |
| | | 12/31/10 | | | | 23.27 | | | | 0.30 | | | | 2.82 | | | | 3.12 | | | | (0.32 | ) | | | — | | | |
| | | | 12/31/09 | | | | 18.50 | | | | 0.36 | | | | 4.77 | | | | 5.13 | | | | (0.36 | ) | | | — | | | |
| | | | | | |
LARGE-CAP VALUE FUND | | | | | | | | | | | | | | | | | | | | | | | |
| | | 12/31/13 | | | | 29.39 | | | | 0.54 | | | | 9.49 | | | | 10.03 | | | | (0.69 | ) | | | (2.09 | ) | | |
| | | 12/31/12 | | | | 24.92 | | | | 0.55 | | | | 4.47 | | | | 5.02 | | | | (0.55 | ) | | | — | | | |
| | | 12/31/11 | | | | 26.95 | | | | 0.41 | | | | (2.03 | ) | | | (1.62 | ) | | | (0.41 | ) | | | — | | | |
| | | 12/31/10 | | | | 23.11 | | | | 0.37 | | | | 3.87 | | | | 4.24 | | | | (0.40 | ) | | | — | | | |
| | | | 12/31/09 | | | | 17.87 | | | | 0.42 | | | | 5.20 | | | | 5.62 | | | | (0.38 | ) | | | — | | | |
| | | | | | |
REAL ESTATE SECURITIES FUND | | | | | | | | | | | | | | | | | | | | | | | |
| | | 12/31/13 | | | | 29.35 | | | | 0.53 | | | | 0.02 | | | | 0.55 | | | | (0.54 | ) | | | — | | | |
| | | 12/31/12 | | | | 24.94 | | | | 0.45 | | | | 4.48 | | | | 4.93 | | | | (0.52 | ) | | | — | | | |
| | | 12/31/11 | | | | 23.67 | | | | 0.38 | | | | 1.20 | | | | 1.58 | | | | (0.31 | ) | | | — | | | |
| | | 12/31/10 | | | | 18.43 | | | | 0.35 | | | | 5.37 | | | | 5.72 | | | | (0.48 | ) | | | — | | | |
| | | | 12/31/09 | | | | 15.24 | | | | 0.49 | | | | 3.32 | | | | 3.81 | | | | (0.62 | ) | | | — | | | |
| | | | | |
SMALL-CAP EQUITY FUND | | | | | | | | | | | | | | | | | | | |
| | | 12/31/13 | | | | 30.87 | | | | 0.27 | | | | 11.93 | | | | 12.20 | | | | (0.25 | ) | | | (6.50 | ) | | |
| | | 12/31/12 | | | | 27.38 | | | | 0.32 | | | | 3.52 | | | | 3.84 | | | | (0.35 | ) | | | — | | | |
| | | 12/31/11 | | | | 28.76 | | | | 0.14 | | | | (1.36 | ) | | | (1.22 | ) | | | (0.16 | ) | | | — | | | |
| | | 12/31/10 | | | | 22.70 | | | | 0.19 | | | | 6.06 | | | | 6.25 | | | | (0.19 | ) | | | — | | | |
| | | | 12/31/09 | | | | 17.99 | | | | 0.25 | | | | 4.74 | | | | 4.99 | | | | (0.28 | ) | | | — | | | |
| | | | | | |
SOCIAL CHOICE EQUITY FUND | | | | | | | | | | | | | | | | | | | | | | | |
| | | 12/31/13 | | | | 27.53 | | | | 0.55 | | | | 8.84 | | | | 9.39 | | | | (0.53 | ) | | | — | | | |
| | | 12/31/12 | | | | 24.61 | | | | 0.58 | | | | 2.87 | | | | 3.45 | | | | (0.53 | ) | | | — | | | |
| | | 12/31/11 | | | | 25.07 | | | | 0.43 | | | | (0.45 | ) | | | (0.02 | ) | | | (0.44 | ) | | | — | | | |
| | | 12/31/10 | | | | 21.99 | | | | 0.43 | | | | 3.09 | | | | 3.52 | | | | (0.44 | ) | | | — | | | |
| | | | 12/31/09 | | | | 16.91 | | | | 0.40 | | | | 5.09 | | | | 5.49 | | | | (0.41 | ) | | | — | | | |
| | | | |
| 88 | | 2013 Annual Report § TIAA-CREF Life Funds | | See notes to financial statements |
| | | | | | | | | | | | | | | | | | | | | | | | | | | | | | | | |
| | | | | | Ratios and supplemental data | |
| | | | | | |
| | | | | | | | | | | | | | | Ratios to average net assets | | | | |
| | | Total
dividends
and
distributions | | | Net asset
value,
end of
period | | | Total
return | | | Net assets
at end of
period
(in thousands) | | | Gross
expenses | | | Net
expenses | | | Net
investment
income
(loss) | | | Portfolio
turnover
rate | |
| | | | | | | | |
| | | | | | | | | | | | | | | | | | | | | | | | | | | | | | | | |
| | | $(0.06) | | | $ | 26.37 | | | | 39.94 | % | | | $61,802 | | | | 0.66 | % | | | 0.52 | % | | | 0.29 | % | | | 105 | % |
| | | (0.13) | | | | 18.89 | | | | 16.99 | | | | 42,710 | | | | 0.74 | | | | 0.52 | | | | 0.69 | | | | 155 | |
| | | (0.05) | | | | 16.26 | | | | 1.85 | | | | 40,950 | | | | 0.76 | | | | 0.52 | | | | 0.29 | | | | 136 | |
| | | (0.07) | | | | 16.01 | | | | 13.42 | | | | 37,552 | | | | 0.63 | | | | 0.43 | | | | 0.48 | | | | 208 | |
| | | | (0.11) | | | | 14.18 | | | | 35.47 | | | | 36,230 | | | | 0.26 | | | | 0.26 | | | | 0.98 | | | | 257 | |
| | | | | | | | |
| | | | | | | | | | | | | | | | | | | | | | | | | | | | | | | | |
| | | (3.73) | | | | 37.02 | | | | 34.38 | | | | 131,597 | | | | 0.61 | | | | 0.52 | | | | 1.15 | | | | 141 | |
| | | (0.53) | | | | 30.37 | | | | 16.43 | | | | 92,409 | | | | 0.69 | | | | 0.52 | | | | 1.41 | | | | 115 | |
| | | (0.29) | | | | 26.54 | | | | 2.96 | | | | 76,240 | | | | 0.70 | | | | 0.52 | | | | 1.09 | | | | 109 | |
| | | (0.32) | | | | 26.07 | | | | 13.41 | | | | 72,029 | | | | 0.56 | | | | 0.42 | | | | 1.26 | | | | 138 | |
| | | | (0.36) | | | | 23.27 | | | | 27.76 | | | | 65,719 | | | | 0.23 | | | | 0.23 | | | | 1.77 | | | | 141 | |
| | | | | | | | |
| | | | | | | | | | | | | | | | | | | | | | | | | | | | | | | | |
| | | (2.78) | | | | 36.64 | | | | 34.31 | | | | 104,869 | | | | 0.60 | | | | 0.52 | | | | 1.54 | | | | 58 | |
| | | (0.55) | | | | 29.39 | | | | 20.14 | | | | 71,691 | | | | 0.70 | | | | 0.52 | | | | 1.99 | | | | 77 | |
| | | (0.41) | | | | 24.92 | | | | (5.95 | ) | | | 60,441 | | | | 0.71 | | | | 0.52 | | | | 1.56 | | | | 80 | |
| | | (0.40) | | | | 26.95 | | | | 18.36 | | | | 64,277 | | | | 0.59 | | | | 0.43 | | | | 1.52 | | | | 102 | |
| | | | (0.38) | | | | 23.11 | | | | 31.45 | | | | 54,447 | | | | 0.25 | | | | 0.25 | | | | 2.12 | | | | 149 | |
| | | | | | | | |
| | | | | | | | | | | | | | | | | | | | | | | | | | | | | | | | |
| | | (0.54) | | | | 29.36 | | | | 1.89 | | | | 96,202 | | | | 0.63 | | | | 0.57 | | | | 1.72 | | | | 58 | |
| | | (0.52) | | | | 29.35 | | | | 19.79 | | | | 96,421 | | | | 0.71 | | | | 0.57 | | | | 1.59 | | | | 65 | |
| | | (0.31) | | | | 24.94 | | | | 6.73 | | | | 79,535 | | | | 0.71 | | | | 0.57 | | | | 1.53 | | | | 58 | |
| | | (0.48) | | | | 23.67 | | | | 31.16 | | | | 73,759 | | | | 0.60 | | | | 0.48 | | | | 1.63 | | | | 66 | |
| | | | (0.62) | | | | 18.43 | | | | 25.11 | | | | 53,565 | | | | 0.25 | | | | 0.25 | | | | 3.37 | | | | 65 | |
| | | | | | | | |
| | | | | | | | | | | | | | | | | | | | | | | | | | | | | | | | |
| | | (6.75) | | | | 36.32 | | | | 39.87 | | | | 51,437 | | | | 0.73 | | | | 0.55 | | | | 0.72 | | | | 87 | |
| | | (0.35) | | | | 30.87 | | | | 14.02 | | | | 60,081 | | | | 0.75 | | | | 0.55 | | | | 1.08 | | | | 118 | |
| | | (0.16) | | | | 27.38 | | | | (4.23 | ) | | | 55,391 | | | | 0.76 | | | | 0.55 | | | | 0.48 | | | | 100 | |
| | | (0.19) | | | | 28.76 | | | | 27.55 | | | | 60,435 | | | | 0.58 | | | | 0.41 | | | | 0.75 | | | | 98 | |
| | | | (0.28) | | | | 22.70 | | | | 27.75 | | | | 42,921 | | | | 0.11 | | | | 0.11 | | | | 1.33 | | | | 107 | |
| | | | | | | | |
| | | | | | | | | | | | | | | | | | | | | | | | | | | | | | | | |
| | | (0.53) | | | | 36.39 | | | | 34.13 | | | | 64,931 | | | | 0.33 | | | | 0.22 | | | | 1.68 | | | | 11 | |
| | | (0.53) | | | | 27.53 | | | | 14.01 | | | | 43,692 | | | | 0.43 | | | | 0.22 | | | | 2.16 | | | | 16 | |
| | | (0.44) | | | | 24.61 | | | | (0.05 | ) | | | 37,295 | | | | 0.49 | | | | 0.22 | | | | 1.71 | | | | 18 | |
| | | (0.44) | | | | 25.07 | | | | 16.01 | | | | 35,344 | | | | 0.42 | | | | 0.17 | | | | 1.87 | | | | 18 | |
| | | | (0.41) | | | | 21.99 | | | | 32.51 | | | | 30,929 | | | | 0.08 | | | | 0.08 | | | | 2.20 | | | | 15 | |
| | | | | | |
| See notes to financial statements | | TIAA-CREF Life Funds § 2013 Annual Report | | | 89 | |
TIAA-CREF Life Funds
| | | | | | | | | | | | | | | | | | | | | | | | | | | | | | |
| | | | | | Selected per share data | | | | | | | | | |
| | | | | | | | | Gain (loss) from investment operations: | | | | | | | | | |
| | | For the
year
ended | | | Net asset
value,
beginning
of period | | | Net
investment
income
(loss)a | | | Net realized
& unrealized
gain (loss) on total
investments | | | Total
gain (loss) from
investment
operations | | | Less distributions from: | | | |
| | | | | | | Net
investment
income | | | Net
realized
gains | | | |
| | | | | | | | |
STOCK INDEX FUND | | | | | | | | | | | | | | | | | | | | | | | | | | | |
| | | 12/31/13 | | | $ | 31.48 | | | $ | 0.70 | | | $ | 9.81 | | | $ | 10.51 | | | $ | (0.71 | ) | | $ | (0.06 | ) | | |
| | | 12/31/12 | | | | 27.81 | | | | 0.68 | | | | 3.87 | | | | 4.55 | | | | (0.68 | ) | | | (0.20 | ) | | |
| | | 12/31/11 | | | | 28.09 | | | | 0.53 | | | | (0.28 | ) | | | 0.25 | | | | (0.53 | ) | | | — | | | |
| | | 12/31/10 | | | | 24.46 | | | | 0.47 | | | | 3.63 | | | | 4.10 | | | | (0.47 | ) | | | — | | | |
| | | | 12/31/09 | | | | 19.39 | | | | 0.44 | | | | 5.05 | | | | 5.49 | | | | (0.42 | ) | | | — | | | |
| | | | | | |
INTERNATIONAL EQUITY FUND | | | | | | | | | | | | | | | | | | | | | | | |
| | | 12/31/13 | | | | 16.60 | | | | 0.33 | | | | 3.67 | | | | 4.00 | | | | (0.45 | ) | | | — | | | |
| | | 12/31/12 | | | | 12.85 | | | | 0.32 | | | | 3.70 | | | | 4.02 | | | | (0.27 | ) | | | — | | | |
| | | 12/31/11 | | | | 17.24 | | | | 0.28 | | | | (4.41 | ) | | | (4.13 | ) | | | (0.26 | ) | | | — | | | |
| | | 12/31/10 | | | | 14.58 | | | | 0.19 | | | | 2.67 | | | | 2.86 | | | | (0.20 | ) | | | — | | | |
| | | | 12/31/09 | | | | 11.43 | | | | 0.22 | | | | 3.40 | | | | 3.62 | | | | (0.47 | ) | | | — | | | |
| | | | | | | |
BOND FUND | | | | | | | | | | | | | | | | | | | | | | | | | | | |
| | | 12/31/13 | | | | 26.15 | | | | 0.64 | | | | (1.04 | ) | | | (0.40 | ) | | | (0.62 | ) | | | (0.17 | ) | | |
| | | 12/31/12 | | | | 25.60 | | | | 0.77 | | | | 1.00 | | | | 1.77 | | | | (0.74 | ) | | | (0.48 | ) | | |
| | | 12/31/11 | | | | 24.88 | | | | 0.87 | | | | 0.70 | | | | 1.57 | | | | (0.85 | ) | | | — | | | |
| | | 12/31/10 | | | | 24.13 | | | | 0.93 | | | | 0.73 | | | | 1.66 | | | | (0.91 | ) | | | — | | | |
| | | | 12/31/09 | | | | 23.38 | | | | 1.06 | | | | 0.68 | | | | 1.74 | | | | (0.99 | ) | | | — | | | |
| | | | | | | |
MONEY MARKET FUND | | | | | | | | | | | | | | | | | | | | | | | | | | | |
| | | 12/31/13 | | | | 1.00 | | | | 0.00 | d | | | 0.00 | d | | | 0.00 | d | | | (0.00 | )d | | | — | | | |
| | | 12/31/12 | | | | 1.00 | | | | 0.00 | d | | | 0.00 | d | | | 0.00 | d | | | (0.00 | )d | | | — | | | |
| | | 12/31/11 | | | | 1.00 | | | | 0.00 | d | | | 0.00 | d | | | 0.00 | d | | | (0.00 | )d | | | — | | | |
| | | 12/31/10 | | | | 1.00 | | | | 0.00 | d | | | 0.00 | d | | | 0.00 | d | | | (0.00 | )d | | | — | | | |
| | | | 12/31/09 | | | | 1.00 | | | | 0.01 | | | | 0.00 | d | | | 0.01 | | | | (0.01 | ) | | | — | | | |
| a | Based on average shares outstanding. |
| d | Amount represents less than $0.01 per share. |
| | | | |
| 90 | | 2013 Annual Report § TIAA-CREF Life Funds | | See notes to financial statements |
| | | | | | | | | | | | | | | | | | | | | | | | | | | | | | | | |
| | | | | | Ratios and supplemental data | |
| | | | | | |
| | | | | | | | | | | | | | | Ratios to average net assets | | | | |
| | | Total
dividends
and
distributions | | | Net asset
value,
end of
period | | | Total
return | | | Net assets at end of period
(in thousands) | | | Gross
expenses | | | Net
expenses | | | Net
investment
income
(loss) | | | Portfolio
turnover
rate | |
| | | | | | | | |
| | | | | | | | | | | | | | | | | | | | | | | | | | | | | | | | |
| | | $(0.77) | | | $ | 41.22 | | | | 33.43 | % | | $ | 283,117 | | | | 0.16 | % | | | 0.09 | % | | | 1.90 | % | | | 5 | % |
| | | (0.88) | | | | 31.48 | | | | 16.35 | | | | 207,090 | | | | 0.25 | | | | 0.09 | | | | 2.22 | | | | 6 | |
| | | (0.53) | | | | 27.81 | | | | 0.95 | | | | 180,256 | | | | 0.26 | | | | 0.09 | | | | 1.85 | | | | 6 | |
| | | (0.47) | | | | 28.09 | | | | 16.79 | | | | 177,274 | | | | 0.21 | | | | 0.08 | | | | 1.86 | | | | 7 | |
| | | | (0.42) | | | | 24.46 | | | | 28.36 | | | | 152,314 | | | | 0.06 | | | | 0.06 | | | | 2.11 | | | | 7 | |
| | | | | | | | |
| | | | | | | | | | | | | | | | | | | | | | | | | | | | | | | | |
| | | (0.45) | | | | 20.15 | | | | 24.15 | | | | 98,106 | | | | 0.74 | | | | 0.60 | | | | 1.79 | | | | 133 | |
| | | (0.27) | | | | 16.60 | | | | 31.27 | | | | 77,021 | | | | 0.80 | | | | 0.60 | | | | 2.21 | | | | 111 | |
| | | (0.26) | | | | 12.85 | | | | (23.88 | ) | | | 81,275 | | | | 0.81 | | | | 0.60 | | | | 1.77 | | | | 108 | |
| | | (0.20) | | | | 17.24 | | | | 19.63 | | | | 111,732 | | | | 0.65 | | | | 0.50 | | | | 1.30 | | | | 117 | |
| | | | (0.47) | | | | 14.58 | | | | 31.74 | | | | 94,015 | | | | 0.30 | | | | 0.30 | | | | 1.78 | | | | 116 | |
| | | | | | | | |
| | | | | | | | | | | | | | | | | | | | | | | | | | | | | | | | |
| | | (0.79) | | | | 24.96 | | | | (1.54 | ) | | | 189,409 | | | | 0.44 | | | | 0.35 | | | | 2.46 | | | | 133 | |
| | | (1.22) | | | | 26.15 | | | | 6.91 | | | | 184,563 | | | | 0.53 | | | | 0.35 | | | | 2.92 | | | | 174 | |
| | | (0.85) | | | | 25.60 | | | | 6.31 | | | | 158,136 | | | | 0.53 | | | | 0.35 | | | | 3.41 | | | | 92 | |
| | | (0.91) | | | | 24.88 | | | | 6.91 | | | | 137,000 | | | | 0.41 | | | | 0.27 | | | | 3.66 | | | | 67 | |
| | | | (0.99) | | | | 24.13 | | | | 7.40 | | | | 115,865 | | | | 0.10 | | | | 0.10 | | | | 4.41 | | | | 147 | |
| | | | | | | | |
| | | | | | | | | | | | | | | | | | | | | | | | | | | | | | | | |
| | | (0.00) | d | | | 1.00 | | | | 0.01 | | | | 73,406 | | | | 0.27 | | | | 0.13 | | | | 0.00 | | | | — | |
| | | (0.00) | d | | | 1.00 | | | | 0.02 | | | | 62,598 | | | | 0.39 | | | | 0.15 | | | | 0.02 | | | | — | |
| | | (0.00) | d | | | 1.00 | | | | 0.03 | | | | 59,822 | | | | 0.39 | | | | 0.15 | | | | 0.03 | | | | — | |
| | | (0.00) | d | | | 1.00 | | | | 0.12 | | | | 61,766 | | | | 0.27 | | | | 0.12 | | | | 0.12 | | | | — | |
| | | | (0.01) | | | | 1.00 | | | | 0.54 | | | | 74,102 | | | | 0.09 | | | | 0.09 | | | | 0.58 | | | | — | |
| | | | | | |
| See notes to financial statements | | TIAA-CREF Life Funds § 2013 Annual Report | | | 91 | |
| | |
| Notes to financial statements | | |
TIAA-CREF Life Funds
Note 1— organization and significant accounting policies
TIAA-CREF Life Funds (the “Trust”) is a Delaware statutory trust that is registered with the Securities and Exchange Commission (“Commission”) under the Investment Company Act of 1940, as amended (“1940 Act”), as an open-end management investment company. The Trust consists of the following funds: Growth Equity Fund, Growth & Income Fund, Large-Cap Value Fund, Real Estate Securities Fund, Small-Cap Equity Fund, Social Choice Equity Fund, Stock Index Fund, International Equity Fund, Bond Fund and the Money Market Fund (collectively the “Funds” or individually, the “Fund”). The Funds are currently available only through the purchase of variable annuity contracts or variable life insurance policies issued by TIAA-CREF Life Insurance Company (“TIAA-CREF Life”).
The accompanying financial statements were prepared in accordance with accounting principles generally accepted in the United States of America (“U.S. GAAP”), which may require the use of estimates made by management and the evaluation of subsequent events. Actual results may differ from those estimates. The Net Asset Value per share (“NAV”) for financial reporting purposes may differ from the NAV for processing transactions. The NAV for financial reporting purposes includes security and shareholder transactions through the date of the report. Total return is computed based on the NAV used for processing transactions. The following is a summary of the significant accounting policies consistently followed by the Funds.
Security valuation: For all Funds (other than the Money Market Fund), investments in securities are recorded at their estimated fair value as described in the valuation of investments note to the financial statements. Investments held by the Money Market Fund are recorded at amortized cost, which approximates fair value. The amortized cost of an instrument is determined by valuing it at its original cost and thereafter accreting or amortizing any discount or premium to its face value at a constant rate until maturity.
Investments and investment income: Securities transactions are accounted for as of the trade date for financial reporting purposes. Interest income is recorded as earned and includes accretion of discounts and amortization of premiums using the effective yield method. Dividend income is recorded on the ex-dividend date. Foreign dividend income is recorded on the ex-dividend date or as soon as possible after the Funds determine the existence of a dividend declaration after exercising reasonable due diligence. Realized gains and losses on securities transactions are based upon the specific identification method. Distributions received on securities that represent a return of capital or capital gain are recorded as a reduction of cost of investments and/or as a realized gain. The Funds estimate the components of distributions received that may be considered return of capital distributions or capital gain distributions.
Most expenses of the Trust can be directly attributed to a fund. Expenses that cannot be directly attributed are allocated to each fund in the Trust based upon the average net assets of each fund.
| | |
| 92 | | 2013 Annual Report § TIAA-CREF Life Funds |
Foreign currency transactions and translation: Assets, including investments, and liabilities denominated in foreign currencies are translated into U.S. dollar values each day using exchange rates obtained from an independent third party. Purchases and sales of securities, income and expenses are translated into U.S. dollars at the prevailing exchange rate on the date of the transaction. The effect of changes in foreign currency exchange rates on realized and unrealized security gains and losses is reflected as a component of security gains and losses.
Distributions to shareholders: Distributions to shareholders, which are determined in accordance with income tax regulations, are recorded on the ex-dividend date.
Income taxes: Each Fund is treated separately for income tax purposes. The Funds intend to continue to qualify as regulated investment companies under Subchapter M of the Internal Revenue Code (“Code”) and will not be subject to income taxes to the extent that they distribute all taxable income each year and comply with various other Code requirements. The Funds file income tax returns in U.S. federal jurisdictions and applicable state and local jurisdictions. A fund’s federal income tax returns are generally subject to examination for a period of three fiscal years after filed. State and local tax returns may be subject to examination for an additional period of time depending on the jurisdiction. Management has analyzed the Funds’ tax positions taken for all open federal income tax years and has concluded that no provision for federal income tax is required in the Funds’ financial statements.
The timing and character of income and capital gain distributions are determined in accordance with income tax regulations, which may differ from U.S. GAAP. Reclassifications are made to a Fund’s capital accounts for permanent tax differences to reflect income and gains available for distribution (or available capital loss carryforwards) under income tax regulations.
For the year ended December 31, 2013, permanent book and tax differences resulting primarily from differing treatments for foreign currency transactions, dividend reclassifications, and gains and losses from the sale of stock in passive foreign investment companies were identified and reclassified among the components of certain Funds’ net assets. Net investment income and net realized gains (losses), as disclosed on the Statement of Operations, and net assets were not affected by these reclassifications.
Foreign taxes: The Funds may be subject to foreign taxes on income, gains on investments or currency repatriation, a portion of which may be recoverable. The Funds will accrue such taxes and recoveries as applicable, based upon the current interpretation of tax rules and regulations that exist in the markets in which the Funds invest.
Trustee compensation: The Funds pay the members of the Board of Trustees (“Board”), all of whom are independent, certain remuneration for their services, plus travel and other expenses. Trustees may elect to participate in a deferred compensation plan and defer all or a portion of their compensation. In addition, trustees participate in a long-term compensation plan. Amounts deferred are retained by the Funds until paid. The investment of deferred amounts and the offsetting payable to the trustees are
| | | | |
| TIAA-CREF Life Funds § 2013 Annual Report | | | 93 | |
| | |
| Notes to financial statements | | |
included in other assets and accrued expenses and other payables in the accompanying Statements of Assets and Liabilities. Trustees’ fees, including any deferred and long-term compensation incurred, are reflected in the Statements of Operations.
New accounting pronouncement: In June 2013, the Financial Accounting Standards Board issued Accounting Standard Update No. 2013-08 Financial Services—Investment Companies (Topic 946): Amendments to the Scope, Measurement, and Disclosure Requirements (the “Update”). The Update modifies the criteria used in determining an investment company under U.S. GAAP and establishes certain measurement and disclosure requirements. The Update establishes that an entity regulated under the 1940 Act is automatically an investment company under U.S. GAAP. The Update is effective for interim and annual reporting periods beginning after December 15, 2013. The Funds expect to adopt these new disclosure requirements for the June 30, 2014 semiannual report. Management has reviewed the new requirements and has determined the adoption of the Update will not have a material impact on the Funds’ financial statements and notes disclosures.
Note 2—valuation of investments
Portfolio investments are valued at fair value utilizing various valuation methods approved by the Board. U.S. GAAP establishes a hierarchy that prioritizes market inputs to valuation methods. The three levels of inputs are:
| • | | Level 1—quoted prices in active markets for identical securities |
| • | | Level 2—other significant observable inputs (including quoted prices for similar securities, interest rates, credit spreads, etc.) |
| • | | Level 3—significant unobservable inputs (including the Funds’ own assumptions in determining the fair value of investments) |
The availability of observable inputs can vary from security to security and is affected by a wide variety of factors including, for example, the type of security, whether the security is new and not yet established in the marketplace, the liquidity of markets and other characteristics particular to the security. To the extent that valuation is based on models or inputs that are less observable or unobservable in the market, the determination of fair value requires more judgment. Accordingly, the degree of judgment exercised in determining fair value is greatest for instruments categorized in Level 3. The inputs or methodology used for valuing securities are not necessarily an indication of the risk associated with investing in those securities.
A description of the valuation techniques applied to the Funds’ major categories of assets and liabilities measured at fair value follows:
Exchange-traded equity securities, common and preferred stock: Equity securities listed or traded on a national market or exchange are valued based on their sale price on such market or exchange at the close of business on the date of valuation, or at the mean of the closing bid and asked prices if no sale is reported. To the extent these securities are actively traded and valuation adjustments are not applied, they are categorized in Level 1 of the fair value hierarchy. Foreign investments are valued at the last sale price or official closing price reported on the
| | |
| 94 | | 2013 Annual Report § TIAA-CREF Life Funds |
exchange where traded and converted to U.S. dollars at the prevailing rates of exchange on the date of valuation. For events affecting the value of foreign securities between the time when the exchange on which they are traded closes and the time when the Funds’ net assets are calculated, such securities will be valued at fair value in accordance with procedures adopted by the Board. Foreign securities are generally categorized in Level 2 of the fair value hierarchy.
Debt securities: Debt securities will generally be valued using prices provided by a pricing service that may employ various indications of value including but not limited to broker-dealer quotations. Certain debt securities, other than money market instruments, are valued based on the most recent bid price or the equivalent quoted yield for such securities (or those of comparable maturity, quality and type). Debt securities are generally categorized in Level 2 of the fair value hierarchy; in instances where prices, yields or any other key inputs are unobservable, they are categorized in Level 3 of the hierarchy.
Short-term investments: Short-term investments, excluding investments in registered investment companies, with maturities of 60 days or less are valued at amortized cost. Short-term investments (other than those in the Money Market Fund) with maturities in excess of 60 days are valued in the same manner as debt securities. Short-term investments are generally categorized in Level 2 of the fair value hierarchy. Short-term investments in the Money Market Fund are all valued at amortized cost. Money Market Fund investments are categorized as Level 2 in the fair value hierarchy.
Investments in registered investment companies: These investments are valued at their net asset value on the valuation date. These investments are categorized in Level 1 of the fair value hierarchy.
Futures contracts: Stock and bond index futures, which are traded on commodity exchanges, are valued at the last sale price as of the close of such commodity exchanges and are categorized in Level 1 of the fair value hierarchy.
Options: Purchased and written options listed or traded on a national market or exchange are valued at the last sale price as of the close of such exchange or at the mean of the closing bid and asked prices if no sale is reported. To the extent these securities are actively traded and valuation adjustments are not applied, they are categorized in Level 1 of the fair value hierarchy.
Any portfolio security for which market quotations are not readily available or for which the above valuation procedures are deemed not to reflect fair value are valued at fair value, as determined in good faith using procedures approved by the Board. To the extent the inputs are observable and timely, the values would be categorized in Level 2 of the fair value hierarchy; otherwise they would be categorized as Level 3.
Transfers between levels are recognized at the end of the reporting period. For the year ended December 31, 2013, there were no material transfers between levels by the Funds.
As of December 31, 2013, 100% of the value of investments in the Small-Cap Equity and Social Choice Equity Funds was valued based on Level 1 inputs.
| | | | |
| TIAA-CREF Life Funds § 2013 Annual Report | | | 95 | |
| | |
| Notes to financial statements | | |
As of December 31, 2013, 100% of the value of investments in the Money Market Fund was valued based on Level 2 inputs.
The following table summarizes the market value of the Funds’ investments as of December 31, 2013 based on the inputs used to value them:
| | | | | | | | | | | | | | | | |
| Fund | | Level 1 | | | Level 2 | | | Level 3 | | | Total | |
| |
Growth Equity | | | | | | | | | | | | | | | | |
Equity investments: | | | | | | | | | | | | | | | | |
Consumer discretionary | | $ | 11,418,439 | | | $ | 1,070,168 | | | $ | — | | | $ | 12,488,607 | |
Consumer staples | | | 911,112 | | | | 493,999 | | | | — | | | | 1,405,111 | |
Health care | | | 10,121,214 | | | | 1,924,717 | | | | — | | | | 12,045,931 | |
Telecommunication services | | | 327,216 | | | | 1,061,784 | | | | — | | | | 1,389,000 | |
All other equity investments* | | | 33,827,779 | | | | — | | | | — | | | | 33,827,779 | |
Short-term investments | | | 124,709 | | | | — | | | | — | | | | 124,709 | |
| |
Total | | $ | 56,730,469 | | | $ | 4,550,668 | | | $ | — | | | $ | 61,281,137 | |
| |
Growth & Income | | | | | | | | | | | | | | | | |
Equity investments: | | | | | | | | | | | | | | | | |
Consumer discretionary | | $ | 24,630,545 | | | $ | 780,996 | | | $ | — | | | $ | 25,411,541 | |
Consumer staples | | | 8,374,548 | | | | 2,516,287 | | | | — | | | | 10,890,835 | |
Energy | | | 9,678,458 | | | | 391,589 | | | | — | | | | 10,070,047 | |
Financials | | | 16,658,806 | | | | 847,198 | | | | — | | | | 17,506,004 | |
Health care | | | 19,205,895 | | | | 2,754,873 | | | | — | | | | 21,960,768 | |
Information technology | | | 21,827,827 | | | | 201,121 | | | | — | | | | 22,028,948 | |
Materials | | | 4,764,831 | | | | 323,444 | | | | — | | | | 5,088,275 | |
Telecommunication services | | | 2,370,136 | | | | 253,434 | | | | — | | | | 2,623,570 | |
All other equity investments* | | | 16,149,912 | | | | — | | | | — | | | | 16,149,912 | |
Short-term investments | | | 2,330,602 | | | | — | | | | — | | | | 2,330,602 | |
| |
Total | | $ | 125,991,560 | | | $ | 8,068,942 | | | $ | — | | | $ | 134,060,502 | |
| |
Large-Cap Value | | | | | | | | | | | | | | | | |
Equity investments: | | | | | | | | | | | | | | | | |
Consumer discretionary | | $ | 9,752,718 | | | $ | 175,281 | | | $ | — | | | $ | 9,927,999 | |
Consumer staples | | | 4,233,112 | | | | 1,338,289 | | | | — | | | | 5,571,401 | |
Financials | | | 25,471,302 | | | | 111,681 | | | | — | | | | 25,582,983 | |
Health care | | | 12,897,583 | | | | 1,605,078 | | | | — | | | | 14,502,661 | |
Industrials | | | 10,945,944 | | | | 295,944 | | | | — | | | | 11,241,888 | |
Materials | | | 3,486,202 | | | | 451,898 | | | | — | | | | 3,938,100 | |
Telecommunication services | | | 3,203,644 | | | | 422,618 | | | | — | | | | 3,626,262 | |
All other equity investments* | | | 29,708,110 | | | | — | | | | — | | | | 29,708,110 | |
Short-term investments | | | 3,244,120 | | | | — | | | | — | | | | 3,244,120 | |
| |
Total | | $ | 102,942,735 | | | $ | 4,400,789 | | | $ | — | | | $ | 107,343,524 | |
| |
Real Estate Securities | | | | | | | | | | | | | | | | |
Equity investments: | | | | | | | | | | | | | | | | |
Diversified real estate activities | | $ | — | | | $ | 303,524 | | | $ | — | | | $ | 303,524 | |
Publishing | | | — | | | | 363,316 | | | | — | | | | 363,316 | |
All other equity investments* | | | 94,049,410 | | | | — | | | | — | | | | 94,049,410 | |
| |
Total | | $ | 94,049,410 | | | $ | 666,840 | | | $ | — | | | $ | 94,716,250 | |
| |
| | |
| 96 | | 2013 Annual Report § TIAA-CREF Life Funds |
| | | | | | | | | | | | | | | | |
| Fund | | Level 1 | | | Level 2 | | | Level 3 | | | Total | |
| |
Stock Index | | | | | | | | | | | | | | | | |
Equity investments: | | | | | | | | | | | | | | | | |
Energy | | $ | 26,033,753 | | | $ | — | | | $ | 4,599 | | | $ | 26,038,352 | |
Health care | | | 35,369,939 | | | | — | | | | 177 | | | | 35,370,116 | |
All other equity investments* | | | 219,299,669 | | | | — | | | | — | | | | 219,299,669 | |
Short-term investments | | | 6,943,725 | | | | — | | | | — | | | | 6,943,725 | |
Futures** | | | 39,753 | | | | — | | | | — | | | | 39,753 | |
| |
Total | | $ | 287,686,839 | | | $ | — | | | $ | 4,776 | | | $ | 287,691,615 | |
| |
International Equity | | | | | | | | | | | | | | | | |
Equity investments: | | | | | | | | | | | | | | | | |
Asia | | $ | — | | | $ | 19,538,183 | | | $ | — | | | $ | 19,538,183 | |
Europe | | | — | | | | 75,541,932 | | | | — | | | | 75,541,932 | |
All other equity investments* | | | — | | | | 1,984,229 | | | | — | | | | 1,984,229 | |
Short-term investments | | | 873,168 | | | | — | | | | — | | | | 873,168 | |
| |
Total | | $ | 873,168 | | | $ | 97,064,344 | | | $ | — | | | $ | 97,937,512 | |
| |
Bond | | | | | | | | | | | | | | | | |
Bank loan obligations | | $ | — | | | $ | 723,756 | | | $ | — | | | $ | 723,756 | |
Corporate bonds | | | — | | | | 69,710,002 | | | | — | | | | 69,710,002 | |
Government bonds | | | — | | | | 95,265,949 | | | | — | | | | 95,265,949 | |
Structured assets | | | — | | | | 16,346,000 | | | | — | | | | 16,346,000 | |
Preferred stocks | | | 200,556 | | | | — | | | | — | | | | 200,556 | |
Short-term investments | | | — | | | | 3,798,340 | | | | — | | | | 3,798,340 | |
| |
Total | | $ | 200,556 | | | $ | 185,844,047 | | | $ | — | | | $ | 186,044,603 | |
| |
| * | For detailed categories, please see the accompanying Summary portfolio of investments. |
| ** | Derivative instruments are not reflected in the Summary portfolio of investments. |
Note 3—derivative instruments
As defined by U.S. GAAP, a derivative is a financial instrument whose value is derived from an underlying security price, foreign exchange rate, interest rate, index of prices or rates, or other variables. Derivatives require little or no initial investment and permit or require net settlement. The Funds value derivatives at fair value.
At December 31, 2013, the following Funds have invested in derivative contracts which are reflected in the Statements of Assets and Liabilities as follows:
| | | | | | | | | | | | | | | | |
| | | Asset derivatives | | | | | Liabilities derivatives | |
| Derivative contracts | | Location | | | Fair value
amount | | | | | Location | | Fair value
amount | |
| |
Stock Index Fund | | | | | | | | | | | | | | | | |
Equity contracts | | | Futures | * | | $ | 39,753 | | | | | | | $ | — | |
| |
| * | The fair value presented includes cumulative gain (loss) on open futures contracts; however, the value reflected on the accompanying Statements of Assets and Liabilities is only the receivable for variation margin on open futures contracts. |
| | | | |
| TIAA-CREF Life Funds § 2013 Annual Report | | | 97 | |
| | |
| Notes to financial statements | | |
For the year ended December 31, 2013, the effect of derivative contracts on the Funds’ Statements of Operations was as follows:
| | | | | | | | | | | | |
| Derivative contracts | | Location | | | Realized
gain (loss) | | | Change in
unrealized
appreciation
(depreciation) | |
| |
Growth Equity Fund | | | | | | | | | | | | |
Equity contracts | | | Written options | | | $ | (774 | ) | | $ | — | |
| |
Growth & Income Fund | | | | | | | | | | | | |
Equity contracts | | | Written options | | | | 112,662 | | | | 2,577 | |
| |
Real Estate Securities Fund | | | | | | | | | | | | |
Equity contracts | | | Written options | | | | 19,387 | | | | — | |
| |
Small-Cap Equity Fund | | | | | | | | | | | | |
Equity contracts | | | Futures transactions | | | | 147,240 | | | | (10,413 | ) |
| |
Stock Index Fund | | | | | | | | | | | | |
Equity contracts | | | Futures transactions | | | | 547,567 | | | | 45,093 | |
| |
Futures contracts: Certain Funds are subject to equity price risk in the normal course of pursuing their investment objectives. The Funds may use futures contracts to manage exposure to the equity markets and for cash management purposes to remain highly invested in these markets while minimizing transaction costs. Buying futures contracts tends to increase exposure to the underlying instrument/index, while selling futures contracts tends to decrease exposure to the underlying instrument/index or hedge other investments. Initial margin deposits are made upon entering into a futures contract, and variation margin payments are made or received, reflecting daily changes in the value of the futures contracts. Daily changes in the value of such contracts are reflected in net unrealized gains and losses. Gains or losses are realized upon the expiration or closing of the futures contracts or if the counterparties do not perform in accordance with contractual provisions. With futures, there is minimal counterparty credit risk to the Funds, since futures are exchange-traded and the exchange’s clearinghouse, as counterparty to all exchange-traded funds, guarantees the futures against default. During the year ended December 31, 2013, the Small-Cap Equity Fund and the Stock Index Fund had exposure to futures contracts, based on underlying notional values, generally between 0% and 2% of net assets.
At December 31, 2013, the Stock Index Fund held the following open futures contracts:
| | | | | | | | | | | | | | | | |
| Fund | | Futures | | Number of
contracts | | | Settlement
value | | | Expiration date | | Unrealized
gain (loss) | |
| |
Stock Index | | S&P 500 Index E-Mini | | | 18 | | | $ | 1,656,990 | | | March 2014 | | $ | 33,771 | |
| | S&P Mid-Cap E-Mini
400 Index | | | 2 | | | | 267,880 | | | March 2014 | | | 3,076 | |
| | Russell 2000 Mini Index | | | 2 | | | | 232,280 | | | March 2014 | | | 2,906 | |
| |
Total | | | | | 22 | | | $ | 2,157,150 | | | | | $ | 39,753 | |
| |
| | |
| 98 | | 2013 Annual Report § TIAA-CREF Life Funds |
Options: Certain Funds are subject to equity price risk in the normal course of pursuing their investment objectives. The Funds use options contracts for hedging and cash management purposes and to seek to increase total return. Call and put options give the holder the right, in return for a premium paid, to purchase or sell, respectively, a security at a specified exercise price at any time during the period of the option. Written options are separately reflected as a liability in the Statements of Assets and Liabilities. Premiums on unexercised, expired options are recorded as realized gains or losses; premiums on exercised options are recorded as an adjustment to the proceeds from the sale or cost of the purchase. The difference between the premium and the amount received or paid in a closing transaction is also treated as a realized gain or loss. Risks related to the use of options include possible illiquidity of the options markets, price movements in underlying security values, and losses that may exceed amounts recognized on the Statements of Assets and Liabilities. During the year ended December 31, 2013, the Growth Equity Fund and the Growth & Income Fund had exposure to options, based on underlying nominal values, generally between 0% and 1% of net assets. During the year ended December 31, 2013, the Real Estate Securities Fund had exposure to options, based on underlying nominal values, generally between 0% to 3% of net assets.
There were no written options outstanding as of December 31, 2013.
Transactions in written options and related premiums received during the year ended December 31, 2013, were as follows:
| | | | | | | | |
| | | Number of contracts | | | Premiums | |
| |
Growth Equity Fund | | | | | | | | |
Outstanding at beginning of period | | | — | | | $ | — | |
Written | | | 75 | | | | 5,265 | |
Purchased | | | (15 | ) | | | (2,021 | ) |
Exercised | | | (5 | ) | | | (577 | ) |
Expired | | | (55 | ) | | | (2,667 | ) |
| |
Outstanding at end of period | | | — | | | $ | — | |
| |
Growth & Income Fund | | | | | | | | |
Outstanding at beginning of period | | | 15 | | | $ | 2,716 | |
Written | | | 3,160 | | | | 128,272 | |
Purchased | | | (665 | ) | | | (28,077 | ) |
Exercised | | | (836 | ) | | | (35,148 | ) |
Expired | | | (1,674 | ) | | | (67,763 | ) |
| |
Outstanding at end of period | | | — | | | $ | — | |
| |
Real Estate Securities Fund | | | | | | | | |
Outstanding at beginning of period | | | — | | | $ | — | |
Written | | | 230 | | | | 35,186 | |
Purchased | | | — | | | | — | |
Exercised | | | — | | | | — | |
Expired | | | (230 | ) | | | (35,186 | ) |
| |
Outstanding at end of period | | | — | | | $ | — | |
| |
| | | | |
| TIAA-CREF Life Funds § 2013 Annual Report | | | 99 | |
| | |
| Notes to financial statements | | |
Note 4—investment adviser and affiliates
Teachers Advisors, Inc. (“Advisors”), a wholly owned subsidiary of Teachers Insurance and Annuity Association of America (“TIAA”) and a registered investment adviser, provides investment advisory services for the Funds pursuant to an Investment Advisory Agreement between Advisors and the Funds. The Funds have also entered into an Administrative Service Agreement with Advisors under which the Funds pay Advisors for its costs in providing certain administrative and operational oversight services to the Funds.
Teachers Personal Investors Services, Inc. (“TPIS”), which is a wholly owned indirect subsidiary of TIAA, distributes the Funds’ shares. Under the terms of the distribution agreement, TPIS is not compensated. TPIS does not currently enter into agreements, or otherwise pay, other intermediaries to sell shares of the Funds.
Beginning May 29, 2013, Advisors began waiving a portion of the investment management fees for the Money Market Fund. This waiver is voluntary in nature and can be discontinued at any time. The amounts waived are disclosed on the Statements of Operations.
As part of the Advisory Agreement, Advisors has agreed to reimburse each Fund if its total expense ratio (excluding interest, taxes, brokerage and other transactional expenses, acquired fund fees and expenses and extraordinary expenses) exceeds certain percentages. As of December 31, 2013, the investment management fees and maximum expense amounts (after waivers and reimbursements) are equal to the following noted annual percentage of average daily net assets:
| | | | | | | | |
| Fund | | Investment
management
fee | | | Maximum
expense
amounts* | |
| |
Growth Equity | | | 0.45% | | | | 0.52% | |
Growth & Income | | | 0.45% | | | | 0.52% | |
Large-Cap Value | | | 0.45% | | | | 0.52% | |
Real Estate Securities | | | 0.50% | | | | 0.57% | |
Small-Cap Equity | | | 0.48% | | | | 0.55% | |
Social Choice Equity | | | 0.15% | | | | 0.22% | |
Stock Index | | | 0.06% | | | | 0.09% | |
International Equity | | | 0.50% | | | | 0.60% | |
Bond | | | 0.30% | | | | 0.35% | |
Money Market | | | 0.10% | | | | 0.15% | |
| |
| * | Maximum expense amounts reflect the majority of expenses, excluding interest, taxes, brokerage and other transactional expenses, acquired fund fees and expenses and extraordinary expenses. The expense reimbursement arrangements will continue through at least April 30, 2014. The reimbursement arrangements can only be changed with the approval of the Board of Trustees. |
The Funds may purchase or sell investment securities in transactions with affiliated entities under procedures adopted by the Board, pursuant to the 1940 Act. These transactions are effected at market rates without incurring broker commissions.
Certain registered separate accounts of TIAA-CREF Life, which is a wholly owned subsidiary of TIAA, have various sub-accounts which invest in the Funds. Additionally,
| | |
| 100 | | 2013 Annual Report § TIAA-CREF Life Funds |
at the commencement of operations of each Fund, TIAA, an affiliate, invested in each Fund. During the year ended December 31, 2013, TIAA received total proceeds of $28,863,147 from the full redemption of its investment in the Small-Cap Equity Fund.
The following is the percentage of the Funds’ shares owned by affiliates as of December 31, 2013:
| | | | | | | | | | | | |
| Fund | | Investments
held by
TIAA-CREF Life | | | Investments
in funds
held by TIAA | | | Percentage
of shares | |
| |
Growth Equity | | | 100 | % | | | — | % | | | 100 | % |
Growth & Income | | | 84 | | | | 16 | | | | 100 | |
Large-Cap Value | | | 65 | | | | 35 | | | | 100 | |
Real Estate Securities | | | 55 | | | | 45 | | | | 100 | |
Small-Cap Equity | | | 100 | | | | — | | | | 100 | |
Social Choice Equity | | | 71 | | | | 29 | | | | 100 | |
Stock Index | | | 100 | | | | — | | | | 100 | |
International Equity | | | 100 | | | | — | | | | 100 | |
Bond | | | 60 | | | | 40 | | | | 100 | |
Money Market | | | 100 | | | | — | | | | 100 | |
| |
Note 5—investments
Securities lending: Certain Funds may lend their securities to qualified institutional borrowers to earn additional income. A Fund receives collateral (in the form of cash, Treasury securities or other collateral permitted by applicable law) against the loaned securities and maintains collateral in an amount not less than 100% of the market value of loaned securities during the period of the loan; any additional collateral required due to changes in security values is delivered to the Fund the next business day. Cash collateral received by a Fund will generally be invested in high-quality short-term instruments, or in one or more funds maintained by the securities lending agent for the purpose of investing cash collateral. The value of the loaned securities and the liability to return the cash collateral received are reflected in the Statements of Assets and Liabilities. Securities lending income consists of earnings on invested collateral and lending fees, net of any rebates to the borrower and compensation to the lending agent. Such income is reflected separately in the Statements of Operations. In lending its securities, the Fund bears the market risk with respect to the collateral investment as well as the securities loaned and also bears the risk that the counterparty may default on its obligations to the Fund.
Securities purchased on a when-issued or delayed-delivery basis: The Funds may purchase securities on a when-issued or delayed-delivery basis. Securities purchased or sold on a when-issued or delayed-delivery basis may be settled a month or more after trade date; interest income is not accrued until settlement date. At the time a Fund enters into such transactions, it is required to have segregated assets with a current value at least equal to the amount of its when-issued or delayed-delivery purchase commitments.
Restricted securities: Restricted securities held by the Funds, if any, may not be sold except in exempt transactions or in a public offering registered under the
| | | | |
| TIAA-CREF Life Funds § 2013 Annual Report | | | 101 | |
| | |
| Notes to financial statements | | |
Securities Act of 1933. The risk of investing in such securities is generally greater than the risk of investing in securities that are widely held and publicly traded.
Net unrealized appreciation (depreciation): At December 31, 2013, net unrealized appreciation (depreciation) based on the aggregate cost of portfolio investments for federal income tax purposes, consisting of gross unrealized appreciation and gross unrealized depreciation, was as follows:
| | | | | | | | | | | | | | | | |
| Fund | | Tax cost | | | Gross
unrealized
appreciation | | | Gross
unrealized
depreciation | | | Net
unrealized
appreciation
(depreciation) | |
| |
Growth Equity | | $ | 46,054,782 | | | $ | 15,391,421 | | | $ | (165,066 | ) | | $ | 15,226,355 | |
Growth & Income | | | 103,826,962 | | | | 30,610,359 | | | | (376,819 | ) | | | 30,233,540 | |
Large-Cap Value | | | 91,995,670 | | | | 17,952,277 | | | | (2,604,423 | ) | | | 15,347,854 | |
Real Estate Securities | | | 88,392,326 | | | | 10,077,750 | | | | (3,753,826 | ) | | | 6,323,924 | |
Small-Cap Equity | | | 44,981,782 | | | | 10,734,322 | | | | (652,822 | ) | | | 10,081,500 | |
Social Choice Equity | | | 44,808,888 | | | | 21,774,740 | | | | (2,237,441 | ) | | | 19,537,299 | |
Stock Index | | | 190,747,981 | | | | 111,691,752 | | | | (14,787,871 | ) | | | 96,903,881 | |
International Equity | | | 86,276,112 | | | | 12,801,763 | | | | (1,140,363 | ) | | | 11,661,400 | |
Bond | | | 187,015,759 | | | | 2,745,478 | | | | (3,716,634 | ) | | | (971,156 | ) |
| |
Purchases and sales: Purchases and sales of securities (other than short-term instruments) for all of the Funds for the year ended December 31, 2013, were as follows:
| | | | | | | | | | | | | | | | |
| Fund | | Non-U.S.
government
purchases | | | U.S.
government
purchases | | | Non-U.S.
government
sales | | | U.S.
government
sales | |
| |
Growth Equity | | $ | 54,190,884 | | | $ | — | | | $ | 52,990,377 | | | $ | — | |
Growth & Income | | | 164,117,780 | | | | — | | | | 155,974,226 | | | | — | |
Large-Cap Value | | | 59,989,825 | | | | — | | | | 50,974,861 | | | | — | |
Real Estate Securities | | | 59,111,465 | | | | — | | | | 56,824,442 | | | | — | |
Small-Cap Equity | | | 37,486,900 | | | | — | | | | 61,443,997 | | | | — | |
Social Choice Equity | | | 11,795,831 | | | | — | | | | 5,801,609 | | | | — | |
Stock Index | | | 22,873,837 | | | | — | | | | 11,903,063 | | | | — | |
International Equity | | | 111,660,191 | | | | — | | | | 108,465,309 | | | | — | |
Bond | | | 114,095,618 | | | | 152,047,085 | | | | 118,226,908 | | | | 121,734,819 | |
| |
| | |
| 102 | | 2013 Annual Report § TIAA-CREF Life Funds |
Note 6—distributions to shareholders and other tax items
The tax character of distributions paid to shareholders during the years ended December 31, 2013 and December 31, 2012 was as follows:
| | | | | | | | | | | | | | | | | | | | | | | | | | |
| | | 12/31/2013 | | | | | 12/31/2012 | |
| Fund | | Ordinary
income | | | Long-term
capital
gains | | | Total | | | | | Ordinary
income | | | Long-term
capital
gains | | | Total | |
| |
Growth Equity | | $ | 146,110 | | | $ | — | | | $ | 146,110 | | | | | $ | 298,477 | | | $ | — | | | $ | 298,477 | |
Growth & Income | | | 6,093,318 | | | | 6,009,485 | | | | 12,102,803 | | | | | | 1,583,060 | | | | 6,128 | | | | 1,589,188 | |
Large-Cap Value | | | 2,496,381 | | | | 4,871,181 | | | | 7,367,562 | | | | | | 1,313,141 | | | | — | | | | 1,313,141 | |
Real Estate Securities | | | 1,755,633 | | | | — | | | | 1,755,633 | | | | | | 1,696,190 | | | | — | | | | 1,696,190 | |
Small-Cap Equity | | | 4,470,648 | | | | 3,489,072 | | | | 7,959,720 | | | | | | 672,128 | | | | — | | | | 672,128 | |
Social Choice Equity | | | 925,671 | | | | — | | | | 925,671 | | | | | | 824,772 | | | | — | | | | 824,772 | |
Stock Index | | | 4,754,638 | | | | 426,066 | | | | 5,180,704 | | | | | | 4,344,154 | | | | 1,283,210 | | | | 5,627,364 | |
International Equity | | | 2,126,383 | | | | — | | | | 2,126,383 | | | | | | 1,219,392 | | | | — | | | | 1,219,392 | |
Bond | | | 4,725,828 | | | | 1,075,524 | | | | 5,801,352 | | | | | | 6,398,349 | | | | 1,809,392 | | | | 8,207,741 | |
Money Market | | | 3,395 | | | | — | | | | 3,395 | | | | | | 14,189 | | | | — | | | | 14,189 | |
| |
As of December 31, 2013, the components of accumulated earnings on a tax basis were as follows:
| | | | | | | | | | | | | | | | | | | | | | | | |
| Fund | | Undistributed (overdistributed) ordinary income | | | Undistributed
long-term
capital gains | | | Unrealized appreciation (depreciation) | | | Capital loss
carryover | | | Late- year
loss deferrals | | | Total | |
| |
| Growth Equity | | $ | (26,590 | ) | | $ | 487,022 | | | $ | 15,226,380 | | | $ | — | | | $ | (354 | ) | | $ | 15,686,458 | |
| Growth & Income | | | 890,711 | | | | 1,138,632 | | | | 30,233,995 | | | | — | | | | (1,514 | ) | | | 32,261,824 | |
| Large-Cap Value | | | 593,050 | | | | 1,027,647 | | | | 15,348,070 | | | | — | | | | (147 | ) | | | 16,968,620 | |
| Real Estate Securities | | | 303,869 | | | | — | | | | 6,323,921 | | | | (2,011,012 | ) | | | — | | | | 4,616,778 | |
| Small-Cap Equity | | | 758,322 | | | | 1,174,906 | | | | 10,081,498 | | | | — | | | | (18,183 | ) | | | 11,996,543 | |
| Social Choice Equity | | | 201,718 | | | | — | | | | 19,537,301 | | | | (124,619 | ) | | | — | | | | 19,614,400 | |
| Stock Index | | | 473,090 | | | | — | | | | 96,903,874 | | | | — | | | | — | | | | 97,376,964 | |
| International Equity | | | 1,200,259 | | | | — | | | | 11,615,324 | | | | (34,875,154 | ) | | | (1,937 | ) | | | (22,061,508 | ) |
| Bond | | | 2,406 | | | | 57,636 | | | | (971,156 | ) | | | — | | | | (68,447 | ) | | | (979,561 | ) |
| Money Market | | | 1,782 | | | | — | | | | — | | | | — | | | | — | | | | 1,782 | |
| |
The difference between book basis and tax basis net investment income, net realized gains and losses, and unrealized appreciation and depreciation is attributable primarily to the tax deferral of losses on wash sales, the realization, for tax purposes, of unrealized gains on investments in passive foreign investment companies, the utilization of capital loss carryovers, and the treatment of short-term gain as ordinary income for tax purposes.
| | | | |
| TIAA-CREF Life Funds § 2013 Annual Report | | | 103 | |
| | |
| Notes to financial statements | | concluded |
At December 31, 2013, the following Funds had capital loss carryovers, which will expire as follows:
| | | | | | | | | | | | |
| | | Real Estate
Securities | | | Social Choice
Equity | | | International
Equity | |
| |
12/31/16 | | $ | — | | | $ | — | | | $ | 12,711,261 | |
12/31/17 | | | 2,011,012 | | | | 103,370 | | | | 22,163,893 | |
12/31/18 | | | — | | | | 21,249 | | | | — | |
| |
Total | | $ | 2,011,012 | | | $ | 124,619 | | | $ | 34,875,154 | |
| |
For the year ended December 31, 2013, the Growth Equity Fund, Large-Cap Value Fund, Real Estate Securities Fund, Small-Cap Equity Fund, Social Choice Equity Fund, and International Equity Fund utilized $6,149,137, $3,932,592, $5,169,351, $58,212, $864,199, and $12,218,163 respectively, of their capital loss carryover from prior years.
Under the Regulated Investment Company Modernization Act of 2010, the Funds will be permitted to carry forward capital losses incurred in taxable years beginning after December 22, 2010 for an unlimited period. However, any losses incurred during those future years will be required to be utilized prior to the losses incurred in pre-enactment tax years. As a result of this ordering rule, pre-enactment capital loss carryovers may be more likely to expire unused. Additionally, post-enactment capital losses that are carried forward will retain their character as either short-term or long-term capital losses rather than being considered all short-term as under previous law.
Note 7—line of credit
Each of the Funds, except the Money Market Fund, participates in a $1.5 billion unsecured revolving credit facility that can be used for temporary purposes, including, without limitation, the funding of shareholder redemptions. This facility expired June 2013. A new facility was entered into on June 25, 2013 expiring June 24, 2014. Certain affiliated accounts and mutual funds, each of which is managed by Advisors, or an affiliate of Advisors, also participate in this facility. An annual commitment fee for the credit facility is borne by the participating accounts and mutual funds on a pro rata basis. Interest associated with any borrowing under the facility is charged to the borrowing accounts or funds at a specified rate of interest. The Funds are not liable for borrowings under the facility by other affiliated accounts or mutual funds. For the year ended December 31, 2013, there were no borrowings under this credit facility by the Funds.
Note 8—indemnification
In the normal course of business, each Fund enters into contracts that contain a variety of representations and warranties and that provide general indemnities. A Fund’s maximum exposure under these arrangements is unknown, as this would involve future claims against the Fund that have not yet occurred. Also, under the Funds’ organizational documents, the trustees and officers of the Funds are indemnified against certain liabilities that may arise out of their duties to the Funds. However, based on experience, the Funds expect the risk of loss due to these warranties and indemnities to be unlikely.
| | |
| 104 | | 2013 Annual Report § TIAA-CREF Life Funds |
| | |
Report of independent registered public accounting firm | | |
To the Board of Trustees and Shareholders of TIAA-CREF Life Funds:
In our opinion, the accompanying statements of assets and liabilities, including the summary portfolios of investments, and the related statements of operations and of changes in net assets and the financial highlights present fairly, in all material respects, the financial position of the Growth Equity Fund, Growth & Income Fund, Large-Cap Value Fund, Real Estate Securities Fund, Small-Cap Equity Fund, Social Choice Equity Fund, Stock Index Fund, International Equity Fund, Bond Fund, and Money Market Fund (constituting TIAA-CREF Life Funds, hereafter collectively referred to as the “Funds”) at December 31, 2013, the results of each of their operations for the year then ended, the changes in each of their net assets for each of the two years in the period then ended and the financial highlights for each of the five years in the period then ended, in conformity with accounting principles generally accepted in the United States of America. These financial statements and financial highlights (hereafter referred to as “financial statements”) are the responsibility of the Funds’ management; our responsibility is to express an opinion on these financial statements based on our audits. We conducted our audits of these financial statements in accordance with the standards of the Public Company Accounting Oversight Board (United States). Those standards require that we plan and perform the audit to obtain reasonable assurance about whether the financial statements are free of material misstatement. An audit includes examining, on a test basis, evidence supporting the amounts and disclosures in the financial statements, assessing the accounting principles used and significant estimates made by management, and evaluating the overall financial statement presentation. We believe that our audits, which included confirmation of securities at December 31, 2013 by correspondence with the custodian and brokers, provide a reasonable basis for our opinion.
/s/ PricewaterhouseCoopers LLP
Baltimore, Maryland
February 19, 2014
| | | | |
| TIAA-CREF Life Funds § 2013 Annual Report | | | 105 | |
| | |
| Trustees and officers (unaudited) | | |
TIAA-CREF Life Funds § December 31, 2013
Trustees
| | | | | | | | | | |
Name, address and date of birth (“DOB”) | | Position(s)
held with fund | | Term of office and length of time served | | Principal occupation(s) during past 5 years | | Number of
portfolios
in fund
complex
overseen
by trustee | | Other directorship(s) held by trustee |
Forrest Berkley c/o Corporate Secretary 730 Third Avenue New York, NY 10017-3206 DOB: 4/25/54 | | Trustee | | Indefinite term.
Trustee since 2006. | | Retired Partner (since 2006), Former Partner (1990-2005) and Head of Global Product Management (2003–2005), GMO (formerly, Grantham, Mayo, Van Otterloo & Co.) (investment management); and member of asset allocation portfolio management team, GMO (2003–2005). | | 78 | | Director of GMO; Director, the Maine Coast Heritage Trust; Investment Committee member, Maine Community Foundation and the Elmina B. Sewall Foundation, and Director of the Maine Chapter of the Nature Conservancy. |
Nancy A. Eckl c/o Corporate Secretary 730 Third Avenue New York, NY 10017-3206 DOB: 10/6/62 | | Trustee | | Indefinite term.
Trustee since 2007. | | Vice President (1990-2006), American Beacon Advisors, Inc., and Vice President of certain funds advised by American Beacon Advisors, Inc. | | 78 | | Independent Director, The Lazard Funds, Inc., Lazard Retirement Series, Inc., Lazard Global Total Return and Income Fund, Inc. and Lazard World Dividend & Income Fund, Inc.; Independent Member of the Boards of Lazard Alternative Strategies Fund, LLC and Lazard Alternative Strategies 1099 Fund. |
Michael A. Forrester c/o Corporate Secretary 730 Third Avenue New York, NY 10017-3206 DOB: 11/5/67 | | Trustee | | Indefinite term.
Trustee since 2007. | | Chief Operating Officer, Copper Rock Capital Partners, LLC (since 2007); Chief Operating Officer, DDJ Capital Management (2003–2006). | | 78 | | Director of Copper Rock Capital Partners, LLC (investment adviser). |
| | |
| 106 | | 2013 Annual Report § TIAA-CREF Life Funds |
| | | | | | | | | | |
Howell E. Jackson c/o Corporate Secretary 730 Third Avenue New York, NY 10017-3206
DOB: 1/4/54 | | Chairman of the Board and Trustee | | Indefinite term.
Trustee since 2005; Chairman for term ending December 31, 2015. Chairman since 2013. | | James S. Reid, Jr. Professor of Law (since 2004), Senior Advisor to the President and Provost (2010–2012), Acting Dean (2009), Vice Dean for Budget (2003–2006) and on the faculty (since 1989) of Harvard Law School. | | 78 | | Director, D2D Fund. |
Nancy L. Jacob c/o Corporate Secretary 730 Third Avenue New York, NY 10017-3206 DOB: 1/15/43 | | Trustee | | Indefinite term.
Trustee since 2001. | | Principal, NL Jacob Consultant (economic and business consultant) (2012–present). President and Founder (2006–2012) of NLJ Advisors, Inc. (investment adviser); President and Managing Principal, Windermere Investment Associates (1997–2006). | | 78 | | None |
Thomas J. Kenny c/o Corporate Secretary 730 Third Avenue New York, NY 10017-3206 DOB: 3/27/63 | | Trustee | | Indefinite term.
Trustee since 2011. | | Partner (2004–2010) and Managing Director (1999–2010), Goldman Sachs Asset Management. | | 78 | | Director, Sansum Clinic; Investment committee member, College of Mount Saint Vincent and Cottage Health System; Member, United States Olympics Paralympics Advisory Committee, University of California at Santa Barbara Arts and Lectures Advisory Council; Trustee and Treasurer, Crane County Day School. |
Bridget A. Macaskill c/o Corporate Secretary 730 Third Avenue New York, NY 10017-3206 DOB: 8/5/48 | | Trustee | | Indefinite term.
Trustee since 2003. | | Chief Executive Officer (since 2010), President and Chief Operating Officer (since 2009), First Eagle Investment Management, LLC; Former Principal, BAM Consulting LLC (2003–2009); Former Independent Consultant for Merrill Lynch (2003–2009). | | 78 | | Director, Arnhold and S. Bleichroeder Holdings; First Eagle Investment Management, LLC; American Legacy Foundation (Investment Committee); University of Edinburgh (Campaign Board); the North Shore Land Alliance and Close Brothers Group plc. |
James M. Poterba c/o Corporate Secretary 730 Third Avenue New York, NY 10017-3206 DOB: 7/13/58 | | Trustee | | Indefinite term.
Trustee since 2006. | | President and Chief Executive Officer, National Bureau of Economic Research (“NBER”) (since 2008); Mitsui Professor of Economics, Massachusetts Institute of Technology (“MIT”) (since 1996), Former Head (2006–2008) and Associate Head (1994–2000 and 2001–2006), Economics Department of MIT; and Former Program Director, NBER (1990–2008). | | 78 | | Director, The Alfred P. Sloan Foundation and National Bureau of Economic Research; Member, Congressional Budget Office Panel of Economic Advisers. |
| | | | |
| TIAA-CREF Life Funds § 2013 Annual Report | | | 107 | |
| | |
| Trustees and officers (unaudited) | | continued |
TIAA-CREF Life Funds § December 31, 2013
Trustees—concluded
| | | | | | | | | | |
Name, address and date of birth (“DOB”) | | Position(s)
held with fund | | Term of office and length of time served | | Principal occupation(s) during past 5 years | | Number of
portfolios
in fund
complex
overseen
by trustee | | Other directorship(s) held by trustee |
Maceo K. Sloan c/o Corporate Secretary 730 Third Avenue New York, NY 10017-3206 DOB: 10/18/49 | | Trustee | | Indefinite term.
Trustee since 2001. | | Chairman, President and Chief Executive Officer, Sloan Financial Group, Inc. (since 1991); Chairman and Chief Executive Officer (since 1991) and Chief Investment Officer (1991–2013), NCM Capital Management Group, Inc.; Chairman and Chief Executive Officer (since 2003) and Chief Investment Officer (2003-2013), NCM Capital Advisers Inc.; and Chairman, President and Principal Executive Officer, NCM Capital Investment Trust (2007–2012). | | 78 | | Director, SCANA Corporation (energy holding company); Member, Duke Children’s Hospital and Health Center National Board of Advisors. |
Laura T. Starks c/o Corporate Secretary 730 Third Avenue New York, NY 10017-3206 DOB: 2/17/50 | | Trustee | | Indefinite term.
Trustee since 2006. | | Associate Dean for Research (since 2011), McCombs School of Business, University of Texas at Austin (“McCombs”), and Director, AIM Investment Center at McCombs (since 2000). Charles E. and Sarah M. Seay Regents Chair in Finance (since 2002); Professor, University of Texas at Austin (since 1987). Chairman, Department of Finance, University of Texas at Austin (2002–2011). | | 78 | | Member of the Board of Governors of the Investment Company Institute, the Governing Council of Independent Directors Council (an association for mutual fund directors), and Investment Advisory Committee, Employees Retirement System of Texas. |
| | |
| 108 | | 2013 Annual Report § TIAA-CREF Life Funds |
Officers
| | | | | | |
Name, address and date of birth (“DOB”) | | Position(s)
held with fund | | Term of office and length of
time served | | Principal occupation(s) during past 5 years |
Brandon Becker TIAA-CREF 730 Third Avenue New York, NY 10017-3206 DOB: 3/19/54 | | Executive Vice President and Chief Legal Officer | | One year term. Executive Vice President and Chief Legal Officer since 2009. | | Executive Vice President and Chief Legal Officer of Teachers Insurance and Annuity Association of America (“TIAA”), and College Retirement Equities Fund (“CREF”), TIAA Separate Account VA-1, TIAA-CREF Funds, and TIAA-CREF Life Funds (collectively, the “TIAA-CREF Fund Complex”) (since 2009). Partner, Wilmer Cutler Pickering Hale & Dorr LLP (1996–2009). |
Richard S. Biegen TIAA-CREF 730 Third Avenue New York, NY 10017-3206 DOB: 5/8/62 | | Chief Compliance Officer | | One-year term. Vice President and Chief Compliance Officer since 2008. | | Chief Compliance Officer of the TIAA-CREF Fund Complex and TIAA Separate Account VA-3 (since 2008). Vice President, Senior Compliance Officer (2008–2011) and Managing Director, Senior Compliance Officer (since 2011) of Asset Management Compliance of TIAA. Chief Compliance Officer of TIAA-CREF Investment Management, LLC (“Investment Management”) (since 2008). Chief Compliance Officer (2008), Vice President, Senior Compliance Officer (2008–2011) and Managing Director, Senior Compliance Officer (since 2011) of Teachers Advisors, Inc. (“Advisors”). Managing Director and Senior Compliance Officer of TIAA-CREF Alternatives Advisors, LLC (“TCAA”) (since 2011). Managing Director and Senior Compliance Officer of TIAA-CREF Alternatives Services, LLC (“TCAS”) (since 2011). Interim Chief Compliance Officer for TIAA-CREF Life Insurance Company Separate Accounts VA-1, VLI-I and VLI-2 (since 2013). Interim Chief Compliance Officer for Covariance Capital Management, Inc. (“Covariance”) (since 2013). |
Carol Deckbar TIAA-CREF 730 Third Avenue New York, NY 10017-3206 DOB: 9/13/62 | | Executive Vice President | | One-year term. Executive Vice President since 2013. | | Executive Vice President (since 2013), Chief Operating Officer (“COO”) of Asset Management (since 2012) of TIAA and Executive Vice President of the TIAA-CREF Fund Complex (since 2013). Interim Head of Asset Management, TIAA (2012–2013). Senior Vice President, Investment Products, TIAA (2009–2012). Managing Director, Mutual Fund Products, TIAA (2007–2009). Senior Managing Director, President, and COO of Advisors and Investment Management (since 2012). Director of Advisors (since 2008). Manager, President, and COO of TCAA and TCAS (since 2011). Director (since 2011) of TIAA-CREF Asset Management (“TCAM”). Manager of TIAA-CREF Individual and Institutional Services, LLC (since 2010). Director of Westchester Group Investment Management, Inc. (since 2011). Manager of Beaver Investment Holdings, LLC (since 2012). Director of GreenWood Resources, Inc. (since 2012). Director of TH RE Administration Ltd., TH RE FCACO Ltd., TH RE AIFM group Ltd, and TH RE Group Holdings Ltd. (since 2013). |
| | | | |
| TIAA-CREF Life Funds § 2013 Annual Report | | | 109 | |
| | |
| Trustees and officers (unaudited) | | continued |
TIAA-CREF Life Funds § December 31, 2013
Officers—continued
| | | | | | |
Name, address and date of birth (“DOB”) | | Position(s)
held with fund | | Term of office and length of time served | | Principal occupation(s) during past 5 years |
Phillip G. Goff TIAA-CREF 730 Third Avenue New York, NY 10017-3206 DOB: 11/22/63 | | Principal Financial Officer, Principal Accounting Officer and Treasurer | | One-year term. Principal Financial Officer, Principal Accounting Officer and Treasurer since 2007. | | Treasurer of CREF (since 2008); Principal Financial Officer, Principal Accounting Officer and Treasurer of the TIAA-CREF Funds and TIAA-CREF Life Funds (since 2007) and Chief Financial Officer and Principal Accounting Officer (since 2009) and Treasurer (since 2008) of TIAA Separate Account VA-1. Senior Vice President (since 2010) and Funds Treasurer (since 2006) of TIAA. Director of Advisors (since 2008). Director of TIAA-CREF Asset Management (“TCAM”) (since 2011). Senior Vice President (since 2010) and Funds Treasurer (since 2007) of Advisors and Investment Management. Assistant Treasurer of TIAA-CREF Life Insurance Company (“TC Life”) (since 2012). Director of TIAA-CREF Trust Company, FSB (“Trust”) (since 2008). Director, Senior Vice President and Funds Treasurer of TCAA (since 2011). Director, Senior Vice President and Funds Treasurer of TCAS (since 2011). |
Stephen Gruppo TIAA-CREF 730 Third Avenue New York, NY 10017-3206 DOB: 9/25/59 | | Executive Vice President | | One-year term. Executive Vice President since 2009. | | Executive Vice President, Chief Risk Officer (since 2013) of TIAA and Executive Vice President of the TIAA-CREF Fund Complex (since 2009). Executive Vice President, Head of Risk Management of TIAA (2009–2013). Executive Vice President, Risk Management (since 2009), Senior Managing Director of Advisors and Investment Management (2006–2009) and Head of Credit Risk Management of Advisors and Investment Management (2005–2006). Senior Managing Director, Acting Head of Risk Management of TIAA and Senior Managing Director of the TIAA-CREF Fund Complex (2008–2009). Executive Vice President, Risk Management of TCAA (since 2011). Executive Vice President, Risk Management of TCAS (since 2011). Senior Managing Director, Chief Credit Risk Officer (2004–2008) of TIAA. |
| | |
| 110 | | 2013 Annual Report § TIAA-CREF Life Funds |
| | | | | | |
Robert G. Leary TIAA-CREF 730 Third Avenue New York, NY 10017-3206 DOB: 3/20/61 | | President and Principal Executive Officer since 2013 | | One-year term. President and Principal Executive Officer since 2013 | | President and Principal Executive Officer of the TIAA-CREF Funds and TIAA-CREF Life Funds (since 2013). Executive Vice President and President of Asset Management (since 2013) of TIAA and Executive Vice President of CREF and VA-1 (since 2013). Director, President & CEO of Advisors (since 2013). Manager, President & CEO of Investment Management (since 2013). Director of TH RE Ltd (since 2013). Director, President & CEO of TPIS (since 2013). Director of TIAA International Holdings 1 Ltd, TIAA International Holdings 2 Ltd, and TIAA International Holdings 3 Ltd (since 2013). Director, President & CEO of TCAM, Inc. (since 2013). Former Executive Vice President of TIAA-CREF Funds and TIAA-CREF Life Funds (June-September 2013). Former Representative, Securities Research, Inc. (February-May 2013). President and Chief Operating Officer, U.S., ING Americas (2011-2012). Chief Executive Officer, ING Insurance US (2010-2011). Chairman and Chief Executive Officer, ING Investment Management, Americas (2007-2009). Executive Vice President, AIG Financial Products Corp. (1995-2007). |
Ronald R. Pressman TIAA-CREF 730 Third Avenue New York, NY 10017-3206 DOB: 4/11/58 | | Executive Vice President | | One-year term.
Executive Vice President since 2012. | | Executive Vice President and Chief Operating Officer (since 2012) of TIAA, and Executive Vice President of the TIAA-CREF Funds Complex (since 2012). Director, Covariance (since 2012). Manager, TIAA-CREF Life Insurance Company (since 2012). Manager, Kaspick & Company, LLC (“Kaspick”) (since 2012). President and Chief Executive Officer of General Electric Capital Real Estate (2007-2011). |
Phillip T. Rollock TIAA-CREF 730 Third Avenue New York, NY 10017-3206 DOB: 3/31/62 | | Senior Managing Director and Corporate Secretary | | One-year term. Senior Managing Director and Corporate Secretary since 2012. | | Senior Managing Director and Corporate Secretary of TIAA and the TIAA-CREF Fund Complex (since 2012). Senior Vice President of TIAA and the TIAA-CREF Fund Complex (2012-2013). Managing Director, Retirement and Individual Financial Services (2010-2012) and Vice President, Product Development and Management, Institutional Client Services (2006-2010) of TIAA. |
| | | | |
| TIAA-CREF Life Funds § 2013 Annual Report | | | 111 | |
| | |
| Trustees and officers (unaudited) | | concluded |
TIAA-CREF Life Funds § December 31, 2013
Officers—concluded
| | | | | | |
Name, address and date of birth (“DOB”) | | Position(s)
held with fund | | Term of office and length of time served | | Principal occupation(s) during past 5 years |
Otha T. Spriggs, III TIAA-CREF 730 Third Avenue New York, NY 10017-3206 DOB: 2/16/51 | | Executive Vice President | | One-year term. Executive Vice President since 2012. | | Executive Vice President and Chief Human Resources Officer (since 2012) of TIAA and Executive Vice President of the TIAA-CREF Fund Complex (since 2012). Senior Vice President of Human Resources, Boston Scientific (2010-2012); President of Integrated People Solutions (2009-2010); Senior Vice President, Human Resources and various human resources leadership roles, CIGNA Corp. (2001-2009). |
Edward D. Van Dolsen TIAA-CREF 730 Third Avenue New York, NY 10017-3206 DOB: 4/21/58 | | Executive Vice President | | One year term.
Executive Vice
President since 2006. | | Executive Vice President, President of Retirement and Individual Financial Services (since 2011) of TIAA, and Executive Vice President (since 2008) of the TIAA-CREF Fund Complex. Chief Operating Officer (2010-2011), Executive Vice President, Product Development and Management (2009–2010), Executive Vice President, Institutional Client Services (2006–2009), Executive Vice President, Product Management (2005–2006), and Senior Vice President, Pension Products (2003–2005) of TIAA. Director of Covariance (since 2010). Director (since 2007), Chairman and President (since 2012) of TCT Holdings, Inc. Director (2007-2011) and Executive Vice President (2008–2010) of TCAM. Manager (since 2006), President and CEO (2006–2010) of Redwood. Director of Tuition Financing (2008–2009) and Executive Vice President of TC Life (2009-2010). |
Constance K. Weaver TIAA-CREF 730 Third Avenue New York, NY 10017-3206 DOB: 9/26/52 | | Executive Vice President | | One-year term. Executive Vice President since 2010. | | Executive Vice President, Chief Marketing Officer of TIAA and Executive Vice President of the TIAA-CREF Fund Complex (since 2010); Chief Communications Officer of TIAA (2010–2011). Senior Vice President, The Hartford Financial Services Group, Inc. (2008–2010). |
The Funds’ Statement of Additional Information (SAI) includes additional information about the Funds’ trustees and is available, without charge, through our website, tiaa-cref.org, or by telephone at 800 223-1200.
| | |
| 112 | | 2013 Annual Report § TIAA-CREF Life Funds |
| | |
| Important tax information (unaudited) | | |
TIAA-CREF Life Funds
For the fiscal year ended December 31, 2013, the TIAA-CREF Life Funds designate the following distribution amounts (or the maximum amount allowable) as being from Section 1250 gains and net long-term capital gains.
| | | | | | | | | | | | |
| Fund | | Section 1250
gains | | | Long-term
capital
gains | | | Total | |
| |
Growth Equity | | $ | — | | | $ | — | | | $ | — | |
Growth & Income | | | — | | | | 6,009,485 | | | | 6,009,485 | |
Large-Cap Value | | | — | | | | 4,871,181 | | | | 4,871,181 | |
Real Estate Securities | | | — | | | | — | | | | — | |
Small-Cap Equity | | | — | | | | 3,489,072 | | | | 3,489,072 | |
Social Choice Equity | | | — | | | | — | | | | — | |
Stock Index | | | — | | | | 426,066 | | | | 426,066 | |
International Equity | | | — | | | | — | | | | — | |
Bond | | | — | | | | 1,075,524 | | | | 1,075,524 | |
Money Market | | | — | | | | — | | | | — | |
| |
For the fiscal year ended December 31, 2013, the TIAA-CREF Life Funds designate the following percentages (or maximum amount allowable) of ordinary income dividends paid as qualifying for the corporate dividends received deduction.
| | | | |
| Fund | | Percentage | |
| |
Growth Equity | | | 100.00 | % |
Growth & Income | | | 22.23 | % |
Large-Cap Value | | | 64.95 | % |
Real Estate Securities | | | 2.01 | % |
Small-Cap Equity | | | 6.12 | % |
Social Choice Equity | | | 99.72 | % |
Stock Index | | | 87.99 | % |
| |
The TIAA-CREF Life International Equity Fund received income from foreign sources during the year ended December 31, 2013 of $1,371,744 ($0.28188 per share), and paid taxes to foreign countries during the year ended December 31, 2013 of $26,631 ($0.00547 per share).
| | | | |
| TIAA-CREF Life Funds § 2013 Annual Report | | | 113 | |
| | |
Additional information about
index providers | | |
Russell Indexes
The Russell 3000® Index is a trademark/service mark of the Russell Investment Group. The Russell Investment Group is the owner of the copyrights relating to the Russell Indexes and is the source and owner of the data contained or reflected in the performance values relating to the Russell Indexes. The funds are not promoted by, nor in any way affiliated with, the Russell Investment Group. The Russell Investment Group is not responsible for and has not reviewed the funds nor any associated literature or publications and the Russell Investment Group makes no representation or warranty, express or implied, as to their accuracy, or completeness.
Russell reserves the right, at any time and without notice, to alter, amend, terminate or in any way change the Russell Indexes. Russell has no obligation to take the needs of any particular fund or its participants or any other product or person into consideration in determining, composing or calculating any of the Russell Indexes.
Russell’s publication of the Russell Indexes in no way suggests or implies an opinion by Russell as to the attractiveness or appropriateness of investment in any or all securities upon which the Russell Indexes are based. RUSSELL MAKES NO REPRESENTATION, WARRANTY OR GUARANTEE REGARDING THE USE OR THE RESULTS OF USE OF THE RUSSELL INDEXES OR ANY DATA INCLUDED THEREIN, OR ANY SECURITIES (OR COMBINATION THEREOF) COMPRISING THE RUSSELL INDEXES. RUSSELL MAKES NO OTHER EXPRESS OR IMPLIED WARRANTY, AND EXPRESSLY DISCLAIMS ANY WARRANTY, OF ANY KIND, INCLUDING WITHOUT LIMITATION, ANY WARRANTY OF MERCHANTABILITY OR FITNESS FOR A PARTICULAR PURPOSE WITH RESPECT TO THE RUSSELL INDEX(ES) OR ANY DATA OR ANY SECURITY (OR COMBINATION THEREOF) INCLUDED THEREIN.
MSCI Indexes
The funds are not sponsored, endorsed, sold or promoted by MSCI Inc. (“MSCI”), any of its affiliates, any of its information providers or any other third party involved in, or related to, compiling, computing or creating any MSCI index (collectively, the “MSCI Parties”). The MSCI indexes are the exclusive property of MSCI. MSCI and the MSCI index names are service mark(s) of MSCI or its affiliates and have been licensed for use for certain purposes by Teachers Advisors, Inc. None of the MSCI parties makes any representation or warranty, express or implied, to the issuer or owners of these funds or any other person or entity regarding the advisability of investing in funds generally or in these funds particularly or the ability of any MSCI index to track corresponding stock market performance. MSCI or its affiliates are the licensors of certain trademarks, service marks and trade names and of the MSCI indexes which are determined, composed and calculated by MSCI without regard to these funds or the issuer or owners of these funds or any other person or entity. None of the MSCI parties has any obligation to take the needs of the issuer or owners of these funds or any other person or entity into consideration in determining, composing or calculating the MSCI indexes. None of the MSCI parties is responsible for or has participated in the determination of the timing of, prices at, or quantities of these funds to be issued or in the determination or calculation of the equation by or the consideration into which these funds is redeemable. Further, none of the MSCI parties has any obligation or liability to the issuer or owners of
| | |
| 114 | | 2013 Annual Report § TIAA-CREF Life Funds |
these funds or any other person or entity in connection with the administration, marketing or offering of these funds.
ALTHOUGH MSCI SHALL OBTAIN INFORMATION FOR INCLUSION IN OR FOR USE IN THE CALCULATION OF THE MSCI INDEXES FROM SOURCES THAT MSCI CONSIDERS RELIABLE, NONE OF THE MSCI PARTIES WARRANTS OR GUARANTEES THE ORIGINALITY, ACCURACY AND/OR THE COMPLETENESS OF ANY MSCI INDEX OR ANY DATA INCLUDED THEREIN. NONE OF THE MSCI PARTIES MAKES ANY WARRANTY, EXPRESS OR IMPLIED, AS TO RESULTS TO BE OBTAINED BY THE ISSUER OF THESE FUNDS, OWNERS OF THESE FUNDS, OR ANY OTHER PERSON OR ENTITY, FROM THE USE OF ANY MSCI INDEX OR ANY DATA INCLUDED THEREIN. NONE OF THE MSCI PARTIES SHALL HAVE ANY LIABILITY FOR ANY ERRORS, OMISSIONS OR INTERRUPTIONS OF OR IN CONNECTION WITH ANY MSCI INDEX OR ANY DATA INCLUDED THEREIN. FURTHER, NONE OF THE MSCI PARTIES MAKES ANY EXPRESS OR IMPLIED WARRANTIES OF ANY KIND, AND THE MSCI PARTIES HEREBY EXPRESSLY DISCLAIM ALL WARRANTIES OF MERCHANTABILITY AND FITNESS FOR A PARTICULAR PURPOSE, WITH RESPECT TO EACH MSCI INDEX AND ANY DATA INCLUDED THEREIN. WITHOUT LIMITING ANY OF THE FOREGOING, IN NO EVENT SHALL ANY OF THE MSCI PARTIES HAVE ANY LIABILITY FOR ANY DIRECT, INDIRECT, SPECIAL, PUNITIVE, CONSEQUENTIAL OR ANY OTHER DAMAGES (INCLUDING LOST PROFITS) EVEN IF NOTIFIED OF THE POSSIBILITY OF SUCH DAMAGES.
No purchaser, seller or holder of these securities, products or funds, or any other person or entity, should use or refer to any MSCI trade name, trademark or service mark to sponsor, endorse, market or promote these securities without first contacting MSCI to determine whether MSCI’s permission is required. Under no circumstances may any person or entity claim any affiliation with MSCI without the prior written permission of MSCI.
| | | | |
| TIAA-CREF Life Funds § 2013 Annual Report | | | 115 | |
[This page intentionally left blank.]
[This page intentionally left blank.]
[This page intentionally left blank.]
[This page intentionally left blank.]
[This page intentionally left blank.]
[This page intentionally left blank.]
[This page intentionally left blank.]
How to reach us
TIAA-CREF website
Account performance, personal account information and transactions, product descriptions, and information about investment choices and income options
tiaa-cref.org
24 hours a day, 7 days a week
Automated telephone service
Check account performance and accumulation balances, change allocations, transfer funds and verify credited premiums
800 842-2252
24 hours a day, 7 days a week
National contact center
Retirement saving and planning, income options and payments, beneficiary services and tax reporting
800 842-2252
8 a.m. to 10 p.m. (ET), Monday–Friday
9 a.m. to 6 p.m. (ET), Saturday
Planning and service center
TIAA-CREF mutual funds
800 223-1200
8 a.m. to 10 p.m. (ET), Monday–Friday
Insurance planning center
After-tax annuities and life insurance
For an existing policy or contract
800 223-1200
To apply for a new policy or contract
877 825-0411
8 a.m. to 8 p.m. (ET), Monday–Friday
For the hearing- or
speech-impaired
800 842-2755
8 a.m. to 10 p.m. (ET), Monday–Friday
9 a.m. to 6 p.m. (ET), Saturday
TIAA-CREF brokerage services
Self-directed brokerage accounts for investing
in stocks, bonds and mutual funds
800 927-3059
8 a.m. to 7 p.m. (ET), Monday–Friday
TIAA-CREF Trust Company, FSB
Asset management, trust administration,
estate planning, planned giving and
endowment management
888 842-9001
9 a.m. to 6 p.m. (ET), Monday–Friday
Advisor services
888 842-0318
8 a.m. to 7:30 p.m. (ET), Monday–Friday
You should carefully consider the investment objectives, risks, charges and expenses of any fund before investing. For a prospectus that contains this and other important information, please visit tiaa-cref.org, or call 800 223-1200. Please read the prospectus carefully before investing. Investment, insurance and annuity products are not FDIC insured, are not bank guaranteed, are not bank deposits, are not insured by any federal government agency, are not a condition to any banking service
or activity, and may lose value. TIAA-CREF Brokerage Services is a division of TIAA-CREF Individual & Institutional Services, LLC. TIAA-CREF Individual & Institutional Services, LLC, and Teachers Personal Investors Services, Inc., members FINRA, distribute securities products. Insurance and annuity products are issued by TIAA-CREF Life Insurance Company, New York, NY. TIAA-CREF Trust Company, FSB provides trust services.
© 2014 Teachers Insurance and Annuity Association of America—College Retirement Equities Fund (TIAA-CREF), 730 Third Avenue, New York, NY 10017-3206.
| | | | |
 | | 730 Third Avenue New York, NY 10017-3206 | | |
| | |
| | | | |
 | | |
| |
 Printed on paper containing recycled fiber Printed on paper containing recycled fiber
| | |
| |
| eDelivery will save trees, conserve paper and reduce mailbox clutter. | | |
| Sign up today at www.tiaa-cref.org/eDelivery | | |
| | |
| | 730 Third Avenue New York, NY 10017-3206 |
| |
| | |
C14512 | | A10847 (2/14) |
Item 2. Code of Ethics.
2(a) The Board of Trustees of the TIAA-CREF Life Funds (the “Registrant”) has adopted a code of ethics for senior financial officers, including the Registrant’s principal executive officer, principal financial officer, principal accounting officer, or controller, and persons performing similar functions, in conformity with rules promulgated under the Sarbanes-Oxley Act of 2002.
2(b) No response required.
2(c) During the reporting period, there were no amendments to the code of ethics.
2(d) During the reporting period, there were no implicit or explicit waivers granted by the Registrant from any provision of the code of ethics.
2(e) Not applicable.
2(f) A copy of the current code of ethics is filed as an exhibit to this Form N-CSR.
Item 3. Audit Committee Financial Expert.
3(a)(1) The Registrant’s Board of Trustees has determined that the Registrant has at least one audit committee financial expert serving on its Audit and Compliance Committee.
3(a)(2) Nancy A. Eckl is the Registrant’s audit committee financial expert and is “independent” for purposes of Item 3 of Form N-CSR.
Item 4. Principal Accountant Fees and Services.
PricewaterhouseCoopers LLP (“PwC”) performs independent audits of the Registrant’s financial statements. To maintain auditor independence and avoid the appearance of conflicts of interest, the Registrant, as a policy, does not engage PwC for management advisory or consulting services.
4(a) Audit Fees.
For the fiscal years ended December 31, 2013 and December 31, 2012, PwC’s aggregate fees for the audit of the Registrant’s annual financial statements were $265,750 and $317,500, respectively.
4(b) Audit Related Fees.
For the fiscal years ended December 31, 2013 and December 31, 2012, PwC’s aggregate fees for services related to the performance of the audit of the Registrant’s annual financial statements were $0 and $0, respectively.
For the fiscal years ended December 31, 2013 and December 31, 2012, the Audit-Related Fees billed by PwC to Teachers Advisors, Inc. (“Advisors”) or to any entity controlling, controlled by or under common control with Advisors that provides ongoing services to the Registrant (collectively, “Fund Service Providers”) were $0 and $0, respectively.
4(c) Tax Fees.
For the fiscal years ended December 31, 2013 and December 31, 2012, PwC’s aggregate fees for tax services billed to the Registrant were $119,200 and $116,640, respectively.
For the fiscal years ended December 31, 2013 and December 31, 2012, PwC’s aggregate fees for tax services billed to the Fund Service Providers were $0 and $0, respectively.
4(d) All Other Fees.
For the fiscal years ended December 31, 2013 and December 31, 2012, PwC’s aggregate fees for all other services billed to the Registrant were $4,300 and $1,500, respectively.
For the fiscal years ended December 31, 2013 and December 31, 2012, PwC’s aggregate fees for all other services billed to the Fund Service Providers were $0 and $0, respectively.
4(e)(1) Preapproval Policy.
The Registrant’s audit and compliance committee (“Audit Committee”) has adopted a Preapproval Policy for External Audit Firm Services (the “Policy”). The Policy describes the types of services that may be provided by the independent auditor to the Registrant and certain of its affiliates without impairing the auditor’s independence. Under the Policy, the Audit Committee is required to preapprove all services to be performed by the Registrant’s independent auditor in order to ensure that such services do not impair the auditor’s independence.
The Policy requires the Audit Committee to: (i) appoint the independent auditor to perform the financial statements audit for the Registrant and certain of its affiliates, including approving the terms of the engagement, and (ii) preapprove the audit, audit-related, tax and other services to be provided by the independent auditor to the Registrant and certain of its affiliates and the fees to be charged for provision of such services from year to year.
4(e)(2) Services provided pursuant to paragraph (c)(7)(i)(C) of Rule 2-01 of Regulation S-X (the “de minimis exception”):
Audit-Related Fees:
There were no amounts that were approved by the Audit Committee pursuant to the de minimis exception for the fiscal years ended December 31, 2013 and December 31, 2012 on behalf of the Registrant.
There were no amounts that were approved by the Audit Committee pursuant to the de minimis exception for the fiscal years ended December 31, 2013 and December 31, 2012 on behalf of the Fund Service Providers that relate directly to the operations and financial reporting of the Registrant.
Tax Fees:
There were no amounts that were approved by the Audit Committee pursuant to the de minimis exception for the fiscal years ended December 31, 2013 and December 31, 2012 on behalf of the Registrant.
There were no amounts that were approved by the Audit Committee pursuant to the de minimis exception for the fiscal years ended December 31, 2013 and December 31, 2012 on behalf of the Fund Service Providers that relate directly to the operations and financial reporting of the Registrant.
All Other Fees:
There were no amounts that were approved by the Audit Committee pursuant to the de minimis exception for the fiscal years ended December 31, 2013 and December 31, 2012 on behalf of the Registrant.
There were no amounts that were approved by the Audit Committee pursuant to the de minimis exception for the fiscal years ended December 31, 2013 and December 31, 2012 on behalf of the Fund Service Providers that relate directly to the operations and financial reporting of the Registrant.
4(f) The percentage of hours expended by PwC’s engagement to audit the Registrant’s financial statements for the most recent fiscal year attributable to work performed by persons other than PwC’s full-time, permanent employees was less than 50%.
4(g) Non-Audit Fees for Related Entities.
For the fiscal years ended December 31, 2013 and December 31, 2012, aggregate non-audit fees billed to the Registrant and to its Fund Service Providers by PwC were $394,070 and $417,730, respectively.
4(h) The Registrant’s Audit Committee has considered whether the non-audit services that were rendered by PwC to the Registrant’s Fund Service Providers that were not pre-approved pursuant to paragraph (c)(7)(ii) of Rule 2-01 of Regulation S-X are compatible with maintaining PwC’s independence.
Item 5. Audited Committee of Listed Registrants.
Not Applicable.
Item 6. Schedule of Investments.
TIAA-CREF LIFE FUNDS - Growth Equity Fund
TIAA-CREF LIFE FUNDS
GROWTH EQUITY FUND
SCHEDULE OF INVESTMENTS
December 31, 2013
| | | | | | | | |
SHARES | | | | COMPANY | | VALUE | |
| | | | | | | | |
COMMON STOCKS - 99.0% | | | | |
| |
AUTOMOBILES & COMPONENTS - 1.4% | | | | |
14,179 | | * | | General Motors Co | | $ | 579,496 | |
1,905 | | * | | Tesla Motors, Inc | | | 286,474 | |
| | | | | | | | |
| | | | TOTAL AUTOMOBILES & COMPONENTS | | | 865,970 | |
| | | | | | | | |
| |
CAPITAL GOODS - 5.9% | | | | |
6,607 | | | | Boeing Co | | | 901,790 | |
2,903 | | | | Cummins, Inc | | | 409,236 | |
3,746 | | | | Precision Castparts Corp | | | 1,008,798 | |
4,124 | | | | Roper Industries, Inc | | | 571,916 | |
3,020 | | | | W.W. Grainger, Inc | | | 771,368 | |
| | | | | | | | |
| | | | TOTAL CAPITAL GOODS | | | 3,663,108 | |
| | | | | | | | |
| |
COMMERCIAL & PROFESSIONAL SERVICES - 2.6% | | | | |
22,794 | | | | Nielsen Holdings NV | | | 1,046,017 | |
8,581 | | * | | Verisk Analytics, Inc | | | 563,943 | |
| | | | | | | | |
| | | | TOTAL COMMERCIAL & PROFESSIONAL SERVICES | | | 1,609,960 | |
| | | | | | | | |
| |
CONSUMER DURABLES & APPAREL - 3.0% | | | | |
3,340 | | | | Hasbro, Inc | | | 183,733 | |
8,617 | | | | Luxottica Group S.p.A. | | | 461,797 | |
3,330 | | | | LVMH Moet Hennessy Louis Vuitton S.A. | | | 608,371 | |
7,923 | | | | Nike, Inc (Class B) | | | 623,065 | |
| | | | | | | | |
| | | | TOTAL CONSUMER DURABLES & APPAREL | | | 1,876,966 | |
| | | | | | | | |
| |
CONSUMER SERVICES - 4.2% | | | | |
459 | | * | | Chipotle Mexican Grill, Inc (Class A) | | | 244,546 | |
3,213 | | * | | Hilton Worldwide Holdings, Inc | | | 71,489 | |
16,585 | | | | Las Vegas Sands Corp | | | 1,308,059 | |
12,426 | | | | Starbucks Corp | | | 974,074 | |
| | | | | | | | |
| | | | TOTAL CONSUMER SERVICES | | | 2,598,168 | |
| | | | | | | | |
| |
DIVERSIFIED FINANCIALS - 6.2% | | | | |
2,236 | | * | | Affiliated Managers Group, Inc | | | 484,944 | |
5,580 | | | | Ameriprise Financial, Inc | | | 641,979 | |
5,652 | | | | Apollo Management LP | | | 178,660 | |
14,225 | | | | Blackstone Group LP | | | 448,087 | |
4,040 | | | | Goldman Sachs Group, Inc | | | 716,131 | |
3,185 | | | | IntercontinentalExchange Group, Inc | | | 716,370 | |
7,998 | | | | Moody’s Corp | | | 627,603 | |
| | | | | | | | |
| | | | TOTAL DIVERSIFIED FINANCIALS | | | 3,813,774 | |
| | | | | | | | |
| |
ENERGY - 1.2% | | | | |
3,149 | | | | EOG Resources, Inc | | | 528,528 | |
2,517 | | | | Schlumberger Ltd | | | 226,807 | |
| | | | | | | | |
| | | | TOTAL ENERGY | | | 755,335 | |
| | | | | | | | |
| |
FOOD & STAPLES RETAILING - 1.0% | | | | |
5,206 | | | | Costco Wholesale Corp | | | 619,566 | |
| | | | | | | | |
| | | | TOTAL FOOD & STAPLES RETAILING | | | 619,566 | |
| | | | | | | | |
1
TIAA-CREF LIFE FUNDS - Growth Equity Fund
| | | | | | | | |
SHARES | | | | COMPANY | | VALUE | |
| | | | | | | | |
FOOD, BEVERAGE & TOBACCO - 0.5% | | | | |
4,302 | | * | | Monster Beverage Corp | | $ | 291,546 | |
| | | | | | | | |
| | | | TOTAL FOOD, BEVERAGE & TOBACCO | | | 291,546 | |
| | | | | | | | |
| |
HEALTH CARE EQUIPMENT & SERVICES - 1.2% | | | | |
5,944 | | * | | Cerner Corp | | | 331,318 | |
2,842 | | * | | Edwards Lifesciences Corp | | | 186,890 | |
610 | | * | | Intuitive Surgical, Inc | | | 234,289 | |
| | | | | | | | |
| | | | TOTAL HEALTH CARE EQUIPMENT & SERVICES | | | 752,497 | |
| | | | | | | | |
| |
HOUSEHOLD & PERSONAL PRODUCTS - 0.8% | | | | |
2,813 | | | | L’Oreal S.A. | | | 493,999 | |
| | | | | | | | |
| | | | TOTAL HOUSEHOLD & PERSONAL PRODUCTS | | | 493,999 | |
| | | | | | | | |
| |
MATERIALS - 3.9% | | | | |
5,838 | | | | LyondellBasell Industries AF S.C.A | | | 468,675 | |
13,548 | | | | Monsanto Co | | | 1,579,019 | |
1,832 | | | | Sherwin-Williams Co | | | 336,172 | |
| | | | | | | | |
| | | | TOTAL MATERIALS | | | 2,383,866 | |
| | | | | | | | |
| |
MEDIA - 5.2% | | | | |
3,828 | | | | CBS Corp (Class B) | | | 243,997 | |
19,190 | | | | Comcast Corp (Class A) | | | 997,208 | |
12,171 | | * | | Discovery Communications, Inc (Class A) | | | 1,100,502 | |
3,974 | | * | | Tribune Co | | | 307,587 | |
16,048 | | | | Twenty-First Century Fox, Inc | | | 564,569 | |
| | | | | | | | |
| | | | TOTAL MEDIA | | | 3,213,863 | |
| | | | | | | | |
| |
PHARMACEUTICALS, BIOTECHNOLOGY & LIFE SCIENCES - 18.3% | | | | |
4,525 | | * | | Alexion Pharmaceuticals, Inc | | | 602,096 | |
6,767 | | | | Bayer AG. | | | 950,158 | |
6,403 | | * | | Biogen Idec, Inc | | | 1,791,239 | |
7,231 | | * | | Celgene Corp | | | 1,221,750 | |
26,141 | | * | | Gilead Sciences, Inc | | | 1,964,496 | |
4,674 | | * | | Illumina, Inc | | | 517,038 | |
7,255 | | | | Novartis AG. (ADR) | | | 583,157 | |
8,536 | | | | Perrigo Co plc | | | 1,309,935 | |
2,287 | | e | | Questcor Pharmaceuticals, Inc | | | 124,527 | |
3,479 | | | | Roche Holding AG. | | | 974,559 | |
6,747 | | * | | Salix Pharmaceuticals Ltd | | | 606,825 | |
19,812 | | | | Zoetis Inc | | | 647,654 | |
| | | | | | | | |
| | | | TOTAL PHARMACEUTICALS, BIOTECHNOLOGY & LIFE SCIENCES | | | 11,293,434 | |
| | | | | | | | |
REAL ESTATE - 0.6% | | | | |
7,752 | | * | | Realogy Holdings Corp | | | 383,491 | |
| | | | | | | | |
| | | | TOTAL REAL ESTATE | | | 383,491 | |
| | | | | | | | |
| |
RETAILING - 6.4% | | | | |
5,309 | | * | | Amazon.com, Inc | | | 2,117,176 | |
10,264 | | * | | Carmax, Inc | | | 482,613 | |
4,684 | | | | Expedia, Inc | | | 326,288 | |
32,151 | | * | | Groupon, Inc | | | 378,417 | |
10,680 | | * | | Liberty Interactive Corp | | | 313,458 | |
519 | | * | | NetFlix, Inc | | | 191,080 | |
1,291 | | * | | Ulta Salon Cosmetics & Fragrance, Inc | | | 124,608 | |
| | | | | | | | |
| | | | TOTAL RETAILING | | | 3,933,640 | |
| | | | | | | | |
| |
SEMICONDUCTORS & SEMICONDUCTOR EQUIPMENT - 2.7% | | | | |
12,657 | | | | ARM Holdings plc (ADR) | | | 692,844 | |
8,315 | | * | | NXP Semiconductors NV | | | 381,908 | |
13,391 | | | | Xilinx, Inc | | | 614,915 | |
| | | | | | | | |
| | | | TOTAL SEMICONDUCTORS & SEMICONDUCTOR EQUIPMENT | | | 1,689,667 | |
| | | | | | | | |
2
TIAA-CREF LIFE FUNDS - Growth Equity Fund
| | | | | | | | |
SHARES | | | | COMPANY | | VALUE | |
SOFTWARE & SERVICES - 24.7% | | | | |
26,137 | | * | | Adobe Systems, Inc | | $ | 1,565,084 | |
17,084 | | * | | eBay, Inc | | | 937,741 | |
32,549 | | * | | Facebook, Inc | | | 1,779,128 | |
2,476 | | * | | Google, Inc (Class A) | | | 2,774,878 | |
22,937 | | | | Intuit, Inc | | | 1,750,552 | |
1,359 | | * | | LinkedIn Corp | | | 294,672 | |
2,097 | | | | Mastercard, Inc (Class A) | | | 1,751,960 | |
22,663 | | * | | Red Hat, Inc | | | 1,270,034 | |
6,907 | | * | | Salesforce.com, Inc | | | 381,197 | |
6,297 | | | | Visa, Inc (Class A) | | | 1,402,216 | |
8,401 | | * | | VMware, Inc (Class A) | | | 753,654 | |
15,362 | | * | | Yahoo!, Inc | | | 621,239 | |
| | | | | | | | |
| | | | TOTAL SOFTWARE & SERVICES | | | 15,282,355 | |
| | | | | | | | |
| |
TECHNOLOGY HARDWARE & EQUIPMENT - 4.0% | | | | |
69,885 | | | | Alcatel-Lucent (ADR) | | | 307,494 | |
3,568 | | | | Apple, Inc | | | 2,002,041 | |
1,306 | | * | | Stratasys Ltd | | | 175,918 | |
| | | | | | | | |
| | | | TOTAL TECHNOLOGY HARDWARE & EQUIPMENT | | | 2,485,453 | |
| | | | | | | | |
| |
TELECOMMUNICATION SERVICES - 2.3% | | | | |
12,100 | | | | Softbank Corp | | | 1,061,784 | |
9,727 | | * | | T-Mobile US, Inc | | | 327,216 | |
| | | | | | | | |
| | | | TOTAL TELECOMMUNICATION SERVICES | | | 1,389,000 | |
| | | | | | | | |
| |
TRANSPORTATION - 2.9% | | | | |
12,271 | | | | Delta Air Lines, Inc | | | 337,084 | |
1,696 | | | | FedEx Corp | | | 243,834 | |
9,528 | | | | Kansas City Southern Industries, Inc | | | 1,179,852 | |
| | | | | | | | |
| | | | TOTAL TRANSPORTATION | | | 1,760,770 | |
| | | | | | | | |
| | | | TOTAL COMMON STOCKS
(Cost $45,925,943) | | | 61,156,428 | |
| | | | | | | | |
| |
SHORT-TERM INVESTMENTS - 0.2% | | | | |
| |
INVESTMENTS IN REGISTERED INVESTMENT COMPANIES - 0.2% | | | | |
124,709 | | c | | TIAA-CREF Short Term Lending Portfolio of the State Street Navigator Securities Lending Trust | | | 124,709 | |
| | | | | | | | |
| | | | TOTAL INVESTMENTS IN REGISTERED INVESTMENT COMPANIES | | | 124,709 | |
| | | | | | | | |
| | | | TOTAL SHORT-TERM INVESTMENTS
(Cost $124,709) | | | 124,709 | |
| | | | | | | | |
| | | | TOTAL INVESTMENTS - 99.2%
(Cost $46,050,652) | | | 61,281,137 | |
| | | | OTHER ASSETS & LIABILITIES, NET - 0.8% | | | 521,357 | |
| | | | | | | | |
| | | | NET ASSETS - 100.0% | | $ | 61,802,494 | |
| | | | | | | | |
Abbreviation(s):
| ADR American | Depositary Receipt |
| c | Investments made with cash collateral received from securities on loan. |
| e | All or a portion of these securities are out on loan. The aggregate value of securities on loan is $122,349. |
3
TIAA-CREF LIFE FUNDS - Growth & Income Fund
TIAA-CREF LIFE FUNDS
GROWTH & INCOME FUND
SCHEDULE OF INVESTMENTS
December 31, 2013
| | | | | | | | |
SHARES | | | | COMPANY | | VALUE | |
| | | | | | | | |
COMMON STOCKS - 100.1% | | | | |
| |
AUTOMOBILES & COMPONENTS - 1.4% | | | | |
13,891 | | | | Delphi Automotive plc | | $ | 835,266 | |
19,306 | | | | Johnson Controls, Inc | | | 990,398 | |
| | | | | | | | |
| | | | TOTAL AUTOMOBILES & COMPONENTS | | | 1,825,664 | |
| | | | | | | | |
| |
BANKS - 2.4% | | | | |
7,296 | | | | BNP Paribas | | | 569,141 | |
9,382 | | | | CIT Group, Inc | | | 489,083 | |
8,209 | | | | East West Bancorp, Inc | | | 287,069 | |
9,980 | | * | | Essent Group Ltd | | | 240,119 | |
34,132 | | | | Wells Fargo & Co | | | 1,549,593 | |
| | | | | | | | |
| | | | TOTAL BANKS | | | 3,135,005 | |
| | | | | | | | |
| |
CAPITAL GOODS - 8.0% | | | | |
5,601 | | * | | BE Aerospace, Inc | | | 487,455 | |
5,520 | | | | Boeing Co | | | 753,425 | |
10,166 | | | | Danaher Corp | | | 784,815 | |
13,953 | | | | Eaton Corp | | | 1,062,102 | |
2,033 | | * | | Esterline Technologies Corp | | | 207,285 | |
127,132 | | | | General Electric Co | | | 3,563,510 | |
18,222 | | | | Honeywell International, Inc | | | 1,664,944 | |
12,378 | | | | ITT Corp | | | 537,453 | |
5,525 | | | | Roper Industries, Inc | | | 766,207 | |
5,293 | | * | | Teledyne Technologies, Inc | | | 486,215 | |
2,891 | | * | | WABCO Holdings, Inc | | | 270,048 | |
| | | | | | | | |
| | | | TOTAL CAPITAL GOODS | | | 10,583,459 | |
| | | | | | | | |
| |
COMMERCIAL & PROFESSIONAL SERVICES - 0.4% | | | | |
22,005 | | e | | Pitney Bowes, Inc | | | 512,717 | |
| | | | | | | | |
| | | | TOTAL COMMERCIAL & PROFESSIONAL SERVICES | | | 512,717 | |
| | | | | | | | |
| |
CONSUMER DURABLES & APPAREL - 3.3% | | | | |
10,028 | | * | | DR Horton, Inc | | | 223,825 | |
4,396 | | | | Harman International Industries, Inc | | | 359,813 | |
7,328 | | | | Hasbro, Inc | | | 403,113 | |
12,798 | | * | | Jarden Corp | | | 785,157 | |
3,311 | | * | | Mohawk Industries, Inc | | | 493,008 | |
23,553 | | | | Newell Rubbermaid, Inc | | | 763,353 | |
30 | | | | Prada S.p.A | | | 268 | |
5,981 | | *,e | | SodaStream International Ltd | | | 296,897 | |
3,284 | | | | Whirlpool Corp | | | 515,128 | |
14,186 | | | | Wolverine World Wide, Inc | | | 481,756 | |
| | | | | | | | |
| | | | TOTAL CONSUMER DURABLES & APPAREL | | | 4,322,318 | |
| | | | | | | | |
CONSUMER SERVICES - 1.7% | | | | |
7,282 | | | | Accor S.A. | | | 343,928 | |
6,972 | | * | | Chuy’s Holdings, Inc | | | 251,131 | |
18,721 | | * | | Extended Stay America, Inc | | | 491,613 | |
6,967 | | * | | Hilton Worldwide Holdings, Inc | | | 155,016 | |
8,870 | | | | Las Vegas Sands Corp | | | 699,577 | |
8,714 | | * | | Orient-Express Hotels Ltd (Class A) | | | 131,669 | |
9,606 | | | | Six Flags Entertainment Corp | | | 353,693 | |
| | | | | | | | |
| | | | TOTAL CONSUMER SERVICES | | | 2,426,627 | |
| | | | | | | | |
4
TIAA-CREF LIFE FUNDS - Growth & Income Fund
| | | | | | | | |
SHARES | | | | COMPANY | | VALUE | |
| | | | | | | | |
DIVERSIFIED FINANCIALS - 7.6% | | | | |
5,178 | | | | Ameriprise Financial, Inc | | $ | 595,729 | |
119,407 | | | | Bank of America Corp | | | 1,859,167 | |
14,602 | | | | Blackstone Group LP | | | 459,963 | |
40,103 | | | | Citigroup, Inc | | | 2,089,767 | |
21,260 | | | | Discover Financial Services | | | 1,189,497 | |
19,906 | | * | | ING Groep NV | | | 278,057 | |
14,368 | | | | Invesco Ltd | | | 522,995 | |
20,008 | | | | JPMorgan Chase & Co | | | 1,170,068 | |
29,224 | | | | Morgan Stanley | | | 916,465 | |
12,220 | | | | State Street Corp | | | 896,826 | |
| | | | | | | | |
| | | | TOTAL DIVERSIFIED FINANCIALS | | | 9,978,534 | |
| | | | | | | | |
| |
ENERGY - 7.7% | | | | |
3,306 | | | | Anadarko Petroleum Corp | | | 262,232 | |
6,149 | | * | | Antero Resources Corp | | | 390,092 | |
9,406 | | * | | Cheniere Energy, Inc | | | 405,587 | |
22,903 | | | | Chevron Corp | | | 2,860,814 | |
9,685 | | | | Consol Energy, Inc | | | 368,417 | |
6,355 | | | | EOG Resources, Inc | | | 1,066,623 | |
24,444 | | | | Halliburton Co | | | 1,240,533 | |
8,058 | | | | Hess Corp | | | 668,814 | |
6,715 | | | | Marathon Petroleum Corp | | | 615,967 | |
12,795 | | e | | Peyto Energy Trust | | | 391,589 | |
10,908 | | | | Phillips 66 | | | 841,334 | |
11,539 | | | | Spectra Energy Corp | | | 411,019 | |
46,955 | | | | Tailsman Energy, Inc | | | 547,026 | |
| | | | | | | | |
| | | | TOTAL ENERGY | | | 10,070,047 | |
| | | | | | | | |
| |
FOOD & STAPLES RETAILING - 0.5% | | | | |
64,432 | | * | | Rite Aid Corp | | | 326,026 | |
7,010 | | * | | Sprouts Farmers Market, Inc | | | 269,394 | |
| | | | | | | | |
| | | | TOTAL FOOD & STAPLES RETAILING | | | 595,420 | |
| | | | | | | | |
| |
FOOD, BEVERAGE & TOBACCO - 5.5% | | | | |
24,873 | | | | Altria Group, Inc | | | 954,874 | |
50,651 | | | | Britvic plc | | | 581,508 | |
6,003 | | | | Brown-Forman Corp (Class B) | | | 453,647 | |
10,852 | | * | | Constellation Brands, Inc (Class A) | | | 763,764 | |
5,936 | | | | Groupe Danone | | | 428,234 | |
6,617 | | * | | Hain Celestial Group, Inc | | | 600,691 | |
11,422 | | | | Hershey Co | | | 1,110,561 | |
23,625 | | | | PepsiCo, Inc | | | 1,959,458 | |
8,486 | | | | SABMiller plc | | | 436,817 | |
| | | | | | | | |
| | | | TOTAL FOOD, BEVERAGE & TOBACCO | | | 7,289,554 | |
| | | | | | | | |
| |
HEALTH CARE EQUIPMENT & SERVICES - 3.0% | | | | |
19,102 | | | | Aetna, Inc | | | 1,310,206 | |
9,640 | | * | | Cerner Corp | | | 537,334 | |
15,520 | | * | | Olympus Corp | | | 492,244 | |
12,287 | | * | | Premier, Inc | | | 451,670 | |
11,950 | | | | Zimmer Holdings, Inc | | �� | 1,113,620 | |
| | | | | | | | |
| | | | TOTAL HEALTH CARE EQUIPMENT & SERVICES | | | 3,905,074 | |
| | | | | | | | |
| |
HOUSEHOLD & PERSONAL PRODUCTS - 2.3% | | | | |
6,640 | | | | Beiersdorf AG. | | | 673,194 | |
9,538 | | | | Estee Lauder Cos (Class A) | | | 718,402 | |
2,258 | | | | L’Oreal S.A. | | | 396,534 | |
14,958 | | | | Procter & Gamble Co | | | 1,217,731 | |
| | | | | | | | |
| | | | TOTAL HOUSEHOLD & PERSONAL PRODUCTS | | | 3,005,861 | |
| | | | | | | | |
5
TIAA-CREF LIFE FUNDS - Growth & Income Fund
| | | | | | | | |
SHARES | | | | COMPANY | | VALUE | |
| | | | | | | | |
INSURANCE - 3.1% | | | | |
11,649 | | | | ACE Ltd | | $ | 1,206,021 | |
8,152 | | | | Aflac, Inc | | | 544,554 | |
8,463 | | | | Fidelity National Title Group, Inc (Class A) | | | 274,624 | |
27,332 | | | | Hartford Financial Services Group, Inc | | | 990,238 | |
18,637 | | | | Metlife, Inc | | | 1,004,907 | |
| | | | | | | | |
| | | | TOTAL INSURANCE | | | 4,020,344 | |
| | | | | | | | |
| |
MATERIALS - 3.9% | | | | |
4,171 | | | | Akzo Nobel NV | | | 323,444 | |
2,552 | | | | Carpenter Technology Corp | | | 158,734 | |
14,829 | | | | Cliffs Natural Resources, Inc | | | 388,668 | |
22,261 | | e | | Companhia Vale do Rio Doce (ADR) | | | 339,480 | |
16,406 | | | | Dow Chemical Co | | | 728,426 | |
8,182 | | | | Freeport-McMoRan Copper & Gold, Inc (Class B) | | | 308,789 | |
25,766 | | | | Huntsman Corp | | | 633,844 | |
9,014 | | | | LyondellBasell Industries AF S.C.A | | | 723,644 | |
6,043 | | | | Monsanto Co | | | 704,312 | |
4,107 | | | | PPG Industries, Inc | | | 778,934 | |
| | | | | | | | |
| | | | TOTAL MATERIALS | | | 5,088,275 | |
| | | | | | | | |
| |
MEDIA - 4.6% | | | | |
17,875 | | | | CBS Corp (Class B) | | | 1,139,353 | |
38,958 | | | | Comcast Corp (Class A) | | | 2,024,453 | |
9,925 | | * | | DISH Network Corp (Class A) | | | 574,856 | |
7,613 | | * | | DreamWorks Animation SKG, Inc (Class A) | | | 270,261 | |
10,464 | | *,e | | Lions Gate Entertainment Corp | | | 331,290 | |
3,114 | | | | Time Warner Cable, Inc | | | 421,947 | |
2,764 | | * | | Tribune Co | | | 213,934 | |
14,216 | | * | | Walt Disney Co | | | 1,086,102 | |
| | | | | | | | |
| | | | TOTAL MEDIA | | | 6,062,196 | |
| | | | | | | | |
| |
PHARMACEUTICALS, BIOTECHNOLOGY & LIFE SCIENCES - 13.7% | | | | |
5,449 | | * | | Actavis plc | | | 915,432 | |
4,250 | | * | | Aegerion Pharmaceuticals, Inc | | | 301,580 | |
5,594 | | * | | Alexion Pharmaceuticals, Inc | | | 744,338 | |
4,556 | | | | Amgen, Inc | | | 520,113 | |
4,899 | | | | Bayer AG. | | | 687,871 | |
1,888 | | * | | Biogen Idec, Inc | | | 528,168 | |
3,695 | | * | | Biovail Corp | | | 433,793 | |
39,032 | | * | | Biovitrum AB | | | 404,945 | |
21,553 | | | | Bristol-Myers Squibb Co | | | 1,145,542 | |
5,073 | | * | | Celgene Corp | | | 857,134 | |
2,952 | | | | Gerresheimer AG. | | | 206,831 | |
29,271 | | * | | Gilead Sciences, Inc | | | 2,199,716 | |
5,483 | | * | | Illumina, Inc | | | 606,529 | |
5,495 | | * | | Jazz Pharmaceuticals plc | | | 695,447 | |
33,600 | | | | Johnson & Johnson | | | 3,077,424 | |
2,401 | | * | | Ligand Pharmaceuticals, Inc (Class B) | | | 126,293 | |
5,878 | | * | | Medivation, Inc | | | 375,134 | |
23,578 | | | | Merck & Co, Inc | | | 1,180,079 | |
12,083 | | * | | Mylan Laboratories, Inc | | | 524,402 | |
7,943 | | | | Novartis AG. | | | 636,626 | |
6,758 | | * | | Salix Pharmaceuticals Ltd | | | 607,814 | |
6,925 | | | | Shire Ltd | | | 326,356 | |
5,373 | | * | | Vertex Pharmaceuticals, Inc | | | 399,214 | |
16,975 | | | | Zoetis Inc | | | 554,913 | |
| | | | | | | | |
| | | | TOTAL PHARMACEUTICALS, BIOTECHNOLOGY & LIFE SCIENCES | | | 18,055,694 | |
| | | | | | | | |
| |
REAL ESTATE - 0.3% | | | | |
4,662 | | | | American Tower Corp | | | 372,121 | |
| | | | | | | | |
| | | | TOTAL REAL ESTATE | | | 372,121 | |
| | | | | | | | |
6
TIAA-CREF LIFE FUNDS - Growth & Income Fund
| | | | | | | | |
SHARES | | | | COMPANY | | VALUE | |
| | | | | | | | |
RETAILING - 8.2% | | | | |
4,603 | | * | | Amazon.com, Inc | | $ | 1,835,630 | |
16,875 | | | | Best Buy Co, Inc | | | 672,975 | |
4,968 | | *,e | | Container Store Group, Inc | | | 231,559 | |
9,128 | | * | | Ctrip.com International Ltd (ADR) | | | 452,931 | |
8,222 | | | | GameStop Corp (Class A) | | | 405,016 | |
44,021 | | * | | Groupon, Inc | | | 518,127 | |
21,849 | | | | Home Depot, Inc | | | 1,799,047 | |
15,184 | | | | Macy’s, Inc | | | 810,826 | |
1,919 | | * | | NetFlix, Inc | | | 706,518 | |
673 | | * | | Priceline.com, Inc | | | 782,295 | |
4,067 | | * | | Restoration Hardware Holdings, Inc | | | 273,709 | |
6,350 | | | | Ross Stores, Inc | | | 475,806 | |
16,417 | | | | TJX Companies, Inc | | | 1,046,255 | |
5,615 | | | | Williams-Sonoma, Inc | | | 327,242 | |
9,742 | | * | | Yoox S.p.A | | | 436,800 | |
| | | | | | | | |
| | | | TOTAL RETAILING | | | 10,774,736 | |
| | | | | | | | |
| |
SEMICONDUCTORS & SEMICONDUCTOR EQUIPMENT - 2.5% | | | | |
35,773 | | | | Applied Materials, Inc | | | 632,824 | |
11,061 | | | | ARM Holdings plc | | | 201,121 | |
7,773 | | | | Avago Technologies Ltd | | | 411,114 | |
11,433 | | *,e | | JinkoSolar Holding Co Ltd (ADR) | | | 334,987 | |
14,743 | | * | | NXP Semiconductors NV | | | 677,146 | |
11,282 | | *,e | | SunPower Corp | | | 336,316 | |
14,619 | | | | Xilinx, Inc | | | 671,305 | |
| | | | | | | | |
| | | | TOTAL SEMICONDUCTORS & SEMICONDUCTOR EQUIPMENT | | | 3,264,813 | |
| | | | | | | | |
| |
SOFTWARE & SERVICES - 8.7% | | | | |
3,343 | | * | | Alliance Data Systems Corp | | | 878,975 | |
7,291 | | * | | Citrix Systems, Inc | | | 461,156 | |
40,110 | | | | Compuware Corp | | | 449,633 | |
14,001 | | * | | Facebook, Inc | | | 765,295 | |
11,426 | | * | | First American Corp | | | 405,966 | |
18,613 | | * | | Fortinet, Inc | | | 356,067 | |
2,730 | | * | | Google, Inc (Class A) | | | 3,059,538 | |
61,292 | | | | Microsoft Corp | | | 2,294,160 | |
9,927 | | * | | Pandora Media, Inc | | | 264,058 | |
12,633 | | * | | Salesforce.com, Inc | | | 697,215 | |
4,244 | | * | | Splunk, Inc | | | 291,435 | |
25,215 | | * | | Take-Two Interactive Software, Inc | | | 437,984 | |
5,251 | | * | | VMware, Inc (Class A) | | | 471,067 | |
15,788 | | * | | Yahoo!, Inc | | | 638,467 | |
| | | | | | | | |
| | | | TOTAL SOFTWARE & SERVICES | | | 11,471,016 | |
| | | | | | | | |
| |
TECHNOLOGY HARDWARE & EQUIPMENT - 5.5% | | | | |
138,988 | | | | Alcatel-Lucent (ADR) | | | 611,547 | |
7,726 | | | | Apple, Inc | | | 4,335,136 | |
16,043 | | | | Cisco Systems, Inc | | | 360,165 | |
8,244 | | * | | F5 Networks, Inc | | | 749,050 | |
43,654 | | * | | JDS Uniphase Corp | | | 566,629 | |
33,225 | | * | | Nokia Corp | | | 269,455 | |
2,978 | | * | | Stratasys Ltd | | | 401,137 | |
| | | | | | | | |
| | | | TOTAL TECHNOLOGY HARDWARE & EQUIPMENT | | | 7,293,119 | |
| | | | | | | | |
| |
TELECOMMUNICATION SERVICES - 2.0% | | | | |
18,503 | | * | | T-Mobile US, Inc | | | 622,441 | |
28,302 | | | | Verizon Communications, Inc | | | 1,390,760 | |
9,608 | | | | Vivendi Universal S.A. | | | 253,434 | |
9,080 | | | | Vodafone Group plc (ADR) | | | 356,935 | |
| | | | | | | | |
| | | | TOTAL TELECOMMUNICATION SERVICES | | | 2,623,570 | |
| | | | | | | | |
7
TIAA-CREF LIFE FUNDS - Growth & Income Fund
| | | | | | | | |
SHARES | | | | COMPANY | | VALUE | |
| | | | | | | | |
TRANSPORTATION - 2.2% | | | | |
10,623 | | *,e | | American Airlines Group, Inc | | $ | 268,231 | |
6,037 | | | | Canadian Pacific Railway Ltd | | | 913,519 | |
37,042 | | | | Delta Air Lines, Inc | | | 1,017,544 | |
4,491 | | | | Kansas City Southern Industries, Inc | | | 556,120 | |
2,538 | | * | | Old Dominion Freight Line | | | 134,565 | |
| | | | | | | | |
| | | | TOTAL TRANSPORTATION | | | 2,889,979 | |
| | | | | | | | |
| |
UTILITIES - 1.6% | | | | |
10,039 | | | | American Water Works Co, Inc | | | 424,248 | |
13,775 | | * | | Calpine Corp | | | 268,750 | |
8,930 | | | | NextEra Energy, Inc | | | 764,587 | |
9,051 | | | | NRG Yield, Inc | | | 362,130 | |
5,533 | | | | Oneok, Inc | | | 344,042 | |
| | | | | | | | |
| | | | TOTAL UTILITIES | | | 2,163,757 | |
| | | | | | | | |
| | | | TOTAL COMMON STOCKS
(Cost $100,876,399) | | | 131,729,900 | |
| | | | | | | | |
| |
SHORT-TERM INVESTMENTS - 1.8% | | | | |
| |
INVESTMENTS IN REGISTERED INVESTMENT COMPANIES - 1.8% | | | | |
2,330,602 | | c | | TIAA-CREF Short Term Lending Portfolio of the State Street Navigator Securities Lending Trust | | | 2,330,602 | |
| | | | | | | | |
| | | | TOTAL INVESTMENTS IN REGISTERED INVESTMENT COMPANIES | | | 2,330,602 | |
| | | | | | | | |
| | | | TOTAL SHORT-TERM INVESTMENTS
(Cost $2,330,602) | | | 2,330,602 | |
| | | | | | | | |
| | | | TOTAL INVESTMENTS - 101.9%
(Cost $103,207,001) | | | 134,060,502 | |
| | | | OTHER ASSETS & LIABILITIES, NET - (1.9)% | | | (2,463,317 | ) |
| | | | | | | | |
| | | | NET ASSETS - 100.0% | | $ | 131,597,185 | |
| | | | | | | | |
Abbreviation(s):
ADR American Depositary Receipt
| c | Investments made with cash collateral received from securities on loan. |
| e | All or a portion of these securities are out on loan. The aggregate value of securities on loan is $2,264,386. |
8
TIAA-CREF LIFE FUNDS - Large-Cap Value Fund
TIAA-CREF LIFE FUNDS
LARGE-CAP VALUE FUND
SCHEDULE OF INVESTMENTS
December 31, 2013
| | | | | | | | |
SHARES | | | | COMPANY | | VALUE | |
| | | | | | | | |
COMMON STOCKS—99.3% | | | | |
| |
AUTOMOBILES & COMPONENTS - 0.5% | | | | |
12,035 | | * | | American Axle & Manufacturing Holdings, Inc | | $ | 246,116 | |
4,084 | | | | Delphi Automotive plc | | | 245,571 | |
| | | | | | | | |
| | | | TOTAL AUTOMOBILES & COMPONENTS | | | 491,687 | |
| | | | | | | | |
| |
BANKS - 5.3% | | | | |
78,201 | | * | | Banco Espirito Santo S.A. | | | 111,681 | |
5,679 | | * | | Essent Group Ltd | | | 136,636 | |
34,555 | | | | Huntington Bancshares, Inc | | | 333,456 | |
68,392 | | | | Keycorp | | | 917,821 | |
52,782 | | | | Regions Financial Corp | | | 522,014 | |
44,464 | | | | TCF Financial Corp | | | 722,540 | |
61,687 | | | | Wells Fargo & Co | | | 2,800,590 | |
| | | | | | | | |
| | | | TOTAL BANKS | | | 5,544,738 | |
| | | | | | | | |
| |
CAPITAL GOODS - 8.0% | | | | |
19,375 | | * | | Foster Wheeler AG. | | | 639,763 | |
6,483 | | | | General Dynamics Corp | | | 619,451 | |
151,839 | | | | General Electric Co | | | 4,256,047 | |
17,013 | | e | | Joy Global, Inc | | | 995,090 | |
1,342 | | | | L-3 Communications Holdings, Inc | | | 143,406 | |
4,378 | | *,e | | Polypore International, Inc | | | 170,304 | |
8,807 | | | | SPX Corp | | | 877,265 | |
12,426 | | | | Textron, Inc | | | 456,780 | |
8,081 | | * | | USG Corp | | | 229,339 | |
| | | | | | | | |
| | | | TOTAL CAPITAL GOODS | | | 8,387,445 | |
| | | | | | | | |
| |
COMMERCIAL & PROFESSIONAL SERVICES - 0.3% | | | | |
8,836 | | | | ADT Corp | | | 357,593 | |
| | | | | | | | |
| | | | TOTAL COMMERCIAL & PROFESSIONAL SERVICES | | | 357,593 | |
| | | | | | | | |
| |
CONSUMER DURABLES & APPAREL - 2.6% | | | | |
3,844 | | * | | Deckers Outdoor Corp | | | 324,664 | |
13,221 | | | | Hasbro, Inc | | | 727,287 | |
12,451 | | * | | Jarden Corp | | | 763,869 | |
46,384 | | | | Pulte Homes, Inc | | | 944,842 | |
| | | | | | | | |
| | | | TOTAL CONSUMER DURABLES & APPAREL | | | 2,760,662 | |
| | | | | | | | |
| |
CONSUMER SERVICES - 2.3% | | | | |
18,887 | | | | Carnival Corp | | | 758,691 | |
3,994 | | | | Darden Restaurants, Inc | | | 217,154 | |
23,219 | | * | | Extended Stay America, Inc | | | 609,731 | |
9,096 | | | | Interval Leisure Group, Inc | | | 281,066 | |
4,570 | | | | Las Vegas Sands Corp | | | 360,436 | |
4,119 | | | | Six Flags Entertainment Corp | | | 151,661 | |
| | | | | | | | |
| | | | TOTAL CONSUMER SERVICES | | | 2,378,739 | |
| | | | | | | | |
| |
DIVERSIFIED FINANCIALS - 9.2% | | | | |
7,610 | | | | Apollo Management LP | | | 240,552 | |
87,246 | | | | Bank of America Corp | | | 1,358,420 | |
11,333 | | | | Blackstone Group LP | | | 356,989 | |
2,434 | | | | Capital One Financial Corp | | | 186,469 | |
40,931 | | | | Citigroup, Inc | | | 2,132,914 | |
6,872 | | | | Goldman Sachs Group, Inc | | | 1,218,131 | |
9
TIAA-CREF LIFE FUNDS - Large-Cap Value Fund
| | | | | | | | |
SHARES | | | | COMPANY | | VALUE | |
| | | | | | | | |
17,627 | | | | JPMorgan Chase & Co | | $ | 1,030,827 | |
18,032 | | | | Legg Mason, Inc | | | 784,031 | |
33,996 | | | | Morgan Stanley | | | 1,066,115 | |
18,304 | | | | State Street Corp | | | 1,343,331 | |
| | | | | | | | |
| | | | TOTAL DIVERSIFIED FINANCIALS | | | 9,717,779 | |
| | | | | | | | |
| |
ENERGY - 13.7% | | | | |
5,801 | | | | Anadarko Petroleum Corp | | | 460,135 | |
7,377 | | * | | Antero Resources Corp | | | 467,997 | |
17,328 | | | | Baker Hughes, Inc | | | 957,545 | |
11,271 | | | | Chesapeake Energy Corp | | | 305,895 | |
14,927 | | | | Chevron Corp | | | 1,864,532 | |
10,912 | | * | | Cobalt International Energy, Inc | | | 179,502 | |
16,056 | | | | ConocoPhillips | | | 1,134,356 | |
5,884 | | * | | Dresser-Rand Group, Inc | | | 350,863 | |
39,452 | | e | | EXCO Resources, Inc | | | 209,490 | |
24,377 | | | | Exxon Mobil Corp | | | 2,466,952 | |
2,483 | | | | Hess Corp | | | 206,089 | |
35,678 | | * | | Kodiak Oil & Gas Corp | | | 399,950 | |
7,796 | | | | Marathon Oil Corp | | | 275,199 | |
20,232 | | * | | Matador Resources Co | | | 377,125 | |
19,392 | | | | Nabors Industries Ltd | | | 329,470 | |
10,426 | | | | Occidental Petroleum Corp | | | 991,513 | |
3,872 | | | | Phillips 66 | | | 298,647 | |
15,464 | | | | Spectra Energy Corp | | | 550,828 | |
115,134 | | | | Tailsman Energy, Inc | | | 1,341,311 | |
40,797 | | * | | Weatherford International Ltd | | | 631,946 | |
15,031 | | | | Williams Cos, Inc | | | 579,746 | |
| | | | | | | | |
| | | | TOTAL ENERGY | | | 14,379,091 | |
| | | | | | | | |
| |
FOOD & STAPLES RETAILING - 1.4% | | | | |
3,855 | | e | | Cia Brasileira de Distribuicao Grupo Pao de Acucar (ADR) | | | 172,203 | |
10,862 | | | | CVS Corp | | | 777,393 | |
9,624 | | | | Walgreen Co | | | 552,803 | |
| | | | | | | | |
| | | | TOTAL FOOD & STAPLES RETAILING | | | 1,502,399 | |
| | | | | | | | |
| |
FOOD, BEVERAGE & TOBACCO - 1.3% | | | | |
17,282 | | | | Mondelez International, Inc | | | 610,055 | |
4,126 | | e | | Remy Cointreau S.A. | | | 346,587 | |
8,048 | | | | SABMiller plc | | | 414,271 | |
| | | | | | | | |
| | | | TOTAL FOOD, BEVERAGE & TOBACCO | | | 1,370,913 | |
| | | | | | | | |
| |
HEALTH CARE EQUIPMENT & SERVICES - 5.8% | | | | |
11,107 | | | | Abbott Laboratories | | | 425,731 | |
22,655 | | * | | Boston Scientific Corp | | | 272,313 | |
11,681 | | | | Covidien plc | | | 795,476 | |
17,320 | | * | | Express Scripts Holding Co | | | 1,216,557 | |
30,880 | | * | | Hologic, Inc | | | 690,168 | |
13,500 | | * | | Olympus Corp | | | 428,176 | |
22,510 | | | | UnitedHealth Group, Inc | | | 1,695,003 | |
3,459 | | * | | WellCare Health Plans, Inc | | | 243,583 | |
3,102 | | | | WellPoint, Inc | | | 286,594 | |
| | | | | | | | |
| | | | TOTAL HEALTH CARE EQUIPMENT & SERVICES | | | 6,053,601 | |
| | | | | | | | |
| |
HOUSEHOLD & PERSONAL PRODUCTS - 2.6% | | | | |
31,203 | | | | Avon Products, Inc | | | 537,316 | |
3,629 | | | | Beiersdorf AG. | | | 367,925 | |
1,193 | | | | L’Oreal S.A. | | | 209,506 | |
19,449 | | | | Procter & Gamble Co | | | 1,583,343 | |
| | | | | | | | |
| | | | TOTAL HOUSEHOLD & PERSONAL PRODUCTS | | | 2,698,090 | |
| | | | | | | | |
10
TIAA-CREF LIFE FUNDS - Large-Cap Value Fund
| | | | | | | | |
SHARES | | | | COMPANY | | VALUE | |
| | | | | | | | |
INSURANCE - 7.1% | | | | |
9,533 | | | | ACE Ltd | | $ | 986,951 | |
8,945 | | | | Allstate Corp | | | 487,860 | |
19,591 | | | | American International Group, Inc | | | 1,000,120 | |
9,518 | | * | | Berkshire Hathaway, Inc (Class B) | | | 1,128,454 | |
22,259 | | | | Hartford Financial Services Group, Inc | | | 806,444 | |
10,549 | | | | Marsh & McLennan Cos, Inc | | | 510,150 | |
15,679 | | | | Metlife, Inc | | | 845,412 | |
10,955 | | | | Principal Financial Group | | | 540,191 | |
5,998 | | | | Prudential Financial, Inc | | | 553,136 | |
6,336 | | | | Travelers Cos, Inc | | | 573,661 | |
| | | | | | | | |
| | | | TOTAL INSURANCE | | | 7,432,379 | |
| | | | | | | | |
| |
MATERIALS - 3.8% | | | | |
3,077 | | | | Akzo Nobel NV | | | 238,609 | |
10,246 | | | | Axiall Corp | | | 486,070 | |
7,753 | | | | Celanese Corp (Series A) | | | 428,818 | |
34,400 | | e | | Cliffs Natural Resources, Inc | | | 901,624 | |
14,060 | | * | | Constellium NV | | | 327,176 | |
11,882 | | | | Freeport-McMoRan Copper & Gold, Inc (Class B) | | | 448,427 | |
4,999 | | | | LyondellBasell Industries AF S.C.A | | | 401,320 | |
10,417 | | | | PolyOne Corp | | | 368,241 | |
1,924 | | | | Wacker Chemie AG. | | | 213,290 | |
7,488 | | e | | Walter Energy, Inc | | | 124,525 | |
| | | | | | | | |
| | | | TOTAL MATERIALS | | | 3,938,100 | |
| | | | | | | | |
| |
MEDIA - 1.6% | | | | |
3,168 | | | | Time Warner Cable, Inc | | | 429,264 | |
11,054 | | | | Time Warner, Inc | | | 770,685 | |
6,122 | | * | | Tribune Co | | | 473,843 | |
| | | | | | | | |
| | | | TOTAL MEDIA | | | 1,673,792 | |
| | | | | | | | |
| |
PHARMACEUTICALS, BIOTECHNOLOGY & LIFE SCIENCES - 8.0% | | | | |
2,887 | | | | Bayer AG. | | | 405,365 | |
31,823 | | * | | Biovitrum AB | | | 330,154 | |
116 | | *,e | | Foundation Medicine, Inc | | | 2,763 | |
30,176 | | | | Johnson & Johnson | | | 2,763,820 | |
2,381 | | * | | Medivation, Inc | | | 151,955 | |
35,295 | | | | Merck & Co, Inc | | | 1,766,515 | |
6,904 | | * | | Mylan Laboratories, Inc | | | 299,634 | |
6,001 | | | | Novartis AG. (ADR) | | | 482,360 | |
41,798 | | | | Pfizer, Inc | | | 1,280,272 | |
4,133 | | | | Sanofi-Aventis | | | 441,383 | |
16,055 | | | | Zoetis Inc | | | 524,838 | |
| | | | | | | | |
| | | | TOTAL PHARMACEUTICALS, BIOTECHNOLOGY & LIFE SCIENCES | | | 8,449,059 | |
| | | | | | | | |
| |
REAL ESTATE - 2.7% | | | | |
10,855 | | * | | Forest City Enterprises, Inc (Class A) | | | 207,331 | |
5,706 | | | | Liberty Property Trust | | | 193,262 | |
8,164 | | | | Mack-Cali Realty Corp | | | 175,363 | |
3,807 | | | | Potlatch Corp | | | 158,904 | |
12,181 | | * | | Realogy Holdings Corp | | | 602,594 | |
2,915 | | | | Simon Property Group, Inc | | | 443,546 | |
3,781 | | | | SL Green Realty Corp | | | 349,289 | |
17,084 | | | | Starwood Property Trust, Inc | | | 473,227 | |
3,205 | | | | Vornado Realty Trust | | | 284,572 | |
| | | | | | | | |
| | | | TOTAL REAL ESTATE | | | 2,888,088 | |
| | | | | | | | |
| |
RETAILING - 2.5% | | | | |
13,913 | | | | Best Buy Co, Inc | | | 554,850 | |
5,137 | | * | | Conn’s, Inc | | | 404,744 | |
7,169 | | | | Expedia, Inc | | | 499,393 | |
11
TIAA-CREF LIFE FUNDS - Large-Cap Value Fund
| | | | | | | | |
SHARES | | | | COMPANY | | VALUE | |
| | | | | | | | |
29,896 | | * | | Groupon, Inc | | $ | 351,876 | |
387,050 | | e | | Hengdeli Holdings Ltd | | | 91,467 | |
13,602 | | *,e | | JC Penney Co, Inc | | | 124,458 | |
45,000 | | | | Lifestyle International Holdings Ltd | | | 83,334 | |
2,325 | | *,e | | Lifestyle Properties Development Ltd | | | 480 | |
32,254 | | | | Staples, Inc | | | 512,516 | |
| | | | | | | | |
| | | | TOTAL RETAILING | | | 2,623,118 | |
| | | | | | | | |
| |
SEMICONDUCTORS & SEMICONDUCTOR EQUIPMENT - 2.4% | | | | |
8,322 | | | | Broadcom Corp (Class A) | | | 246,747 | |
23,414 | | * | | Freescale Semiconductor Holdings Ltd | | | 375,795 | |
15,998 | | | | Intel Corp | | | 415,308 | |
7,931 | | * | | International Rectifier Corp | | | 206,761 | |
6,251 | | * | | Lam Research Corp | | | 340,367 | |
66,037 | | * | | ON Semiconductor Corp | | | 544,145 | |
15,788 | | * | | Semtech Corp | | | 399,121 | |
| | | | | | | | |
| | | | TOTAL SEMICONDUCTORS & SEMICONDUCTOR EQUIPMENT | | | 2,528,244 | |
| | | | | | | | |
| |
SOFTWARE & SERVICES - 3.6% | | | | |
2,463 | | | | DST Systems, Inc | | | 223,493 | |
6,333 | | * | | eBay, Inc | | | 347,618 | |
14,840 | | * | | Fortinet, Inc | | | 283,889 | |
24,947 | | | | Microsoft Corp | | | 933,766 | |
6,561 | | * | | Rackspace Hosting, Inc | | | 256,732 | |
8,870 | | * | | Teradata Corp | | | 403,496 | |
3,808 | | *,e | | VistaPrint Ltd | | | 216,485 | |
20,494 | | * | | Yahoo!, Inc | | | 828,778 | |
62,301 | | * | | Zynga, Inc | | | 236,744 | |
| | | | | | | | |
| | | | TOTAL SOFTWARE & SERVICES | | | 3,731,001 | |
| | | | | | | | |
| |
TECHNOLOGY HARDWARE & EQUIPMENT - 5.0% | | | | |
86,575 | | | | Alcatel-Lucent (ADR) | | | 380,930 | |
2,121 | | | | Apple, Inc | | | 1,190,114 | |
7,489 | | * | | Ciena Corp | | | 179,212 | |
47,593 | | | | Cisco Systems, Inc | | | 1,068,463 | |
10,644 | | | | Corning, Inc | | | 189,676 | |
8,815 | | | | EMC Corp | | | 221,697 | |
32,820 | | | | Hewlett-Packard Co | | | 918,303 | |
15,702 | | * | | JDS Uniphase Corp | | | 203,812 | |
107,234 | | * | | Nokia Corp | | | 869,668 | |
| | | | | | | | |
| | | | TOTAL TECHNOLOGY HARDWARE & EQUIPMENT | | | 5,221,875 | |
| | | | | | | | |
| |
TELECOMMUNICATION SERVICES - 3.5% | | | | |
63,778 | | | | AT&T, Inc | | | 2,242,434 | |
19,372 | | * | | Level 3 Communications, Inc | | | 642,569 | |
12,360 | | | | Telephone & Data Systems, Inc | | | 318,641 | |
107,340 | | | | Vodafone Group plc | | | 422,618 | |
| | | | | | | | |
| | | | TOTAL TELECOMMUNICATION SERVICES | | | 3,626,262 | |
| | | | | | | | |
| |
TRANSPORTATION - 2.4% | | | | |
146,000 | | | | Air China Ltd | | | 109,326 | |
1,064 | | *,e | | American Airlines Group, Inc | | | 26,866 | |
15,994 | | *,b,m | | AMR Corp (Escrow) | | | 186,618 | |
14,715 | | | | Con-Way, Inc | | | 584,333 | |
4,298 | | | | FedEx Corp | | | 617,923 | |
19,919 | | * | | Hertz Global Holdings, Inc | | | 570,082 | |
6,648 | | * | | UAL Corp | | | 251,494 | |
8,554 | | | | UTI Worldwide, Inc | | | 150,208 | |
| | | | | | | | |
| | | | TOTAL TRANSPORTATION | | | 2,496,850 | |
| | | | | | | | |
12
TIAA-CREF LIFE FUNDS - Large-Cap Value Fund
| | | | | | | | |
SHARES | | | | COMPANY | | VALUE | |
| | | | | | | | |
UTILITIES - 3.7% | | | | |
19,384 | | * | | Calpine Corp | | $ | 378,182 | |
23,343 | | | | Centerpoint Energy, Inc | | | 541,091 | |
7,036 | | | | Consolidated Edison, Inc | | | 388,950 | |
6,872 | | | | Duke Energy Corp | | | 474,237 | |
5,202 | | | | Edison International | | | 240,852 | |
10,135 | | | | Exelon Corp | | | 277,598 | |
4,713 | | | | FirstEnergy Corp | | | 155,435 | |
8,810 | | | | NextEra Energy, Inc | | | 754,312 | |
5,225 | | | | NRG Energy, Inc | | | 150,062 | |
5,712 | | | | PG&E Corp | | | 230,079 | |
2,794 | | | | Sempra Energy | | | 250,789 | |
| | | | | | | | |
| | | | TOTAL UTILITIES | | | 3,841,587 | |
| | | | | | | | |
| | | | TOTAL COMMON STOCKS
(Cost $87,799,398) | | | 104,093,092 | |
| | | | | | | | |
| |
RIGHTS / WARRANTS - 0.0% | | | | |
| |
ENERGY - 0.0% | | | | |
39,452 | | | | EXCO Resources, Inc | | | 6,312 | |
| | | | | | | | |
| | | | TOTAL ENERGY | | | 6,312 | |
| | | | | | | | |
| | | | TOTAL RIGHTS / WARRANTS
(Cost $0) | | | 6,312 | |
| | | | | | | | |
| |
SHORT-TERM INVESTMENTS - 3.1% | | | | |
| |
INVESTMENTS IN REGISTERED INVESTMENT COMPANIES - 3.1% | | | | |
3,244,120 | | c | | TIAA-CREF Short Term Lending Portfolio of the State Street Navigator Securities Lending Trust | | | 3,244,120 | |
| | | | | | | | |
| | | | TOTAL INVESTMENTS IN REGISTERED INVESTMENT COMPANIES | | | 3,244,120 | |
| | | | | | | | |
| | | | TOTAL SHORT-TERM INVESTMENTS
(Cost $3,244,120) | | | 3,244,120 | |
| | | | | | | | |
| | | | TOTAL INVESTMENTS - 102.4%
(Cost $91,043,518) | | | 107,343,524 | |
| | | | OTHER ASSETS & LIABILITIES, NET - (2.4)% | | | (2,474,643 | ) |
| | | | | | | | |
| | | | NET ASSETS - 100.0% | | $ | 104,868,881 | |
| | | | | | | | |
Abbreviation(s):
| ADR | American Depositary Receipt |
| c | Investments made with cash collateral received from securities on loan. |
| e | All or a portion of these securities are out on loan. The aggregate value of securities on loan is $3,137,622. |
| m | Indicates a security that has been deemed illiquid. |
13
TIAA-CREF LIFE FUNDS - Real Estate Securities Fund
TIAA-CREF LIFE FUNDS
REAL ESTATE SECURITIES FUND
SCHEDULE OF INVESTMENTS
December 31, 2013
| | | | | | | | |
SHARES | | | | COMPANY | | VALUE | |
| | | | | | | | |
COMMON STOCKS - 98.5% | | | | |
| |
DIVERSIFIED REAL ESTATE ACTIVITIES - 0.3% | | | | |
60,000 | | | | Hang Lung Group Ltd | | $ | 303,524 | |
| | | | | | | | |
| | | | TOTAL DIVERSIFIED REAL ESTATE ACTIVITIES | | | 303,524 | |
| | | | | | | | |
| |
DIVERSIFIED REITS - 5.2% | | | | |
20,000 | | | | Duke Realty Corp | | | 300,800 | |
40,000 | | | | Retail Opportunities Investment Corp | | | 588,800 | |
135,000 | | | | Spirit Realty Capital, Inc | | | 1,327,050 | |
14,000 | | | | Vornado Realty Trust | | | 1,243,060 | |
25,000 | | | | WP Carey, Inc | | | 1,533,750 | |
| | | | | | | | |
| | | | TOTAL DIVERSIFIED REITS | | | 4,993,460 | |
| | | | | | | | |
| |
HOTELS, RESORTS & CRUISE LINES - 0.5% | | | | |
30,000 | | * | | Orient-Express Hotels Ltd (Class A) | | | 453,300 | |
| | | | | | | | |
| | | | TOTAL HOTELS, RESORTS & CRUISE LINES | | | 453,300 | |
| | | | | | | | |
| |
INDUSTRIAL REITS - 7.4% | | | | |
18,000 | | | | EastGroup Properties, Inc | | | 1,042,740 | |
27,000 | | | | First Industrial Realty Trust, Inc | | | 471,150 | |
130,000 | | | | Prologis, Inc | | | 4,803,500 | |
20,000 | | | | STAG Industrial, Inc | | | 407,800 | |
22,000 | | | | Terreno Realty Corp | | | 389,400 | |
| | | | | | | | |
| | | | TOTAL INDUSTRIAL REITS | | | 7,114,590 | |
| | | | | | | | |
| |
MORTGAGE REITS - 0.6% | | | | |
20,000 | | | | NorthStar Realty Finance Corp | | | 269,000 | |
10,000 | | | | Starwood Property Trust, Inc | | | 277,000 | |
| | | | | | | | |
| | | | TOTAL MORTGAGE REITS | | | 546,000 | |
| | | | | | | | |
| |
OFFICE REITS - 11.0% | | | | |
38,000 | | | | Boston Properties, Inc | | | 3,814,060 | |
15,000 | | | | Digital Realty Trust, Inc | | | 736,800 | |
25,000 | | | | HRPT Properties Trust | | | 582,750 | |
15,000 | | | | Kilroy Realty Corp | | | 752,700 | |
100,000 | | | | Parkway Properties, Inc | | | 1,929,000 | |
30,000 | | | | SL Green Realty Corp | | | 2,771,400 | |
| | | | | | | | |
| | | | TOTAL OFFICE REITS | | | 10,586,710 | |
| | | | | | | | |
| |
OTHER DIVERSIFIED FINANCIAL SERVICES - 0.0% | | | | |
28,800 | | *,b,m | | People’s Choice Financial Corp | | | 0 | |
| | | | | | | | |
| | | | TOTAL OTHER DIVERSIFIED FINANCIAL SERVICES | | | 0 | |
| | | | | | | | |
| |
PUBLISHING - 0.4% | | | | |
8,000 | | | | Rightmove plc | | | 363,316 | |
| | | | | | | | |
| | | | TOTAL PUBLISHING | | | 363,316 | |
| | | | | | | | |
| |
REAL ESTATE OPERATING COMPANIES - 0.3% | | | | |
8,000 | | | | Altisource Residential Corp | | | 240,880 | |
| | | | | | | | |
| | | | TOTAL REAL ESTATE OPERATING COMPANIES | | | 240,880 | |
| | | | | | | | |
REAL ESTATE SERVICES - 1.0% | | | | |
20,000 | | | | Kennedy-Wilson Holdings, Inc | | | 445,000 | |
11,000 | | * | | Realogy Holdings Corp | | | 544,170 | |
| | | | | | | | |
| | | | TOTAL REAL ESTATE SERVICES | | | 989,170 | |
| | | | | | | | |
14
TIAA-CREF LIFE FUNDS - Real Estate Securities Fund
| | | | | | | | |
SHARES | | | | COMPANY | | VALUE | |
| | | | | | | | |
| |
RESIDENTIAL REITS - 16.7% | | | | |
15,000 | | | | American Campus Communities, Inc | | $ | 483,150 | |
35,000 | | * | | American Homes 4 Rent | | | 567,000 | |
40,000 | | | | AvalonBay Communities, Inc | | | 4,729,200 | |
10,000 | | | | BRE Properties, Inc (Class A) | | | 547,100 | |
100,000 | | | | Education Realty Trust, Inc | | | 882,000 | |
25,000 | | | | Equity Lifestyle Properties, Inc | | | 905,750 | |
90,000 | | | | Equity Residential | | | 4,668,300 | |
10,000 | | | | Essex Property Trust, Inc | | | 1,435,100 | |
8,000 | | | | Home Properties, Inc | | | 428,960 | |
18,000 | | | | Post Properties, Inc | | | 814,140 | |
15,000 | | | | Sun Communities, Inc | | | 639,600 | |
| | | | | | | | |
| | | | TOTAL RESIDENTIAL REITS | | | 16,100,300 | |
| | | | | | | | |
| |
RETAIL REITS - 22.5% | | | | |
50,000 | | | | Cole Real Estate Investment, Inc | | | 702,000 | |
105,000 | | | | DDR Corp | | | 1,613,850 | |
40,000 | | | | Equity One, Inc | | | 897,600 | |
15,000 | | | | Federal Realty Investment Trust | | | 1,521,150 | |
200,000 | | | | General Growth Properties, Inc | | | 4,014,000 | |
10,000 | | | | Pennsylvania REIT | | | 189,800 | |
15,000 | | | | Regency Centers Corp | | | 694,500 | |
79,000 | | | | Simon Property Group, Inc | | | 12,020,640 | |
| | | | | | | | |
| | | | TOTAL RETAIL REITS | | | 21,653,540 | |
| | | | | | | | |
| |
SECURITY & ALARM SERVICES - 1.2% | | | | |
35,000 | | | | Corrections Corp of America | | | 1,122,450 | |
| | | | | | | | |
| | | | TOTAL SECURITY & ALARM SERVICES | | | 1,122,450 | |
| | | | | | | | |
| |
SPECIALIZED REITS - 31.4% | | | | |
75,000 | | | | American Tower Corp | | | 5,986,500 | |
35,000 | | | | CubeSmart | | | 557,900 | |
35,000 | | | | Extra Space Storage, Inc | | | 1,474,550 | |
5,000 | | * | | Gaming and Leisure Properties, Inc | | | 254,050 | |
75,000 | | | | HCP, Inc | | | 2,724,000 | |
40,000 | | | | Health Care REIT, Inc | | | 2,142,800 | |
40,000 | | | | Healthcare Realty Trust, Inc | | | 852,400 | |
100,000 | | | | Host Marriott Corp | | | 1,944,000 | |
25,000 | | | | Plum Creek Timber Co, Inc | | | 1,162,750 | |
25,000 | | | | Potlatch Corp | | | 1,043,500 | |
28,000 | | | | Public Storage, Inc | | | 4,214,560 | |
20,000 | | | | Rayonier, Inc | | | 842,000 | |
40,000 | | | | RLJ Lodging Trust | | | 972,800 | |
135,000 | | * | | Strategic Hotels & Resorts, Inc | | | 1,275,750 | |
75,000 | | | | Sunstone Hotel Investors, Inc | | | 1,005,000 | |
52,500 | | | | Ventas, Inc | | | 3,007,200 | |
25,000 | | | | Weyerhaeuser Co | | | 789,250 | |
| | | | | | | | |
| | | | TOTAL SPECIALIZED REITS | | | 30,249,010 | |
| | | | | | | | |
| | | | TOTAL COMMON STOCKS
(Cost $87,106,654) | | | 94,716,250 | |
| | | | | | | | |
| | | | TOTAL INVESTMENTS - 98.5%
(Cost $87,106,654) | | | 94,716,250 | |
| | | | OTHER ASSETS & LIABILITIES, NET—1.5% | | | 1,486,007 | |
| | | | | | | | |
| | | | NET ASSETS - 100.0% | | $ | 96,202,257 | |
| | | | | | | | |
Abbreviation(s):
| REIT | Real Estate Investment Trust |
| m | Indicates a security that has been deemed illiquid. |
15
TIAA-CREF LIFE FUNDS - Small-Cap Equity Fund
TIAA-CREF LIFE FUNDS
SMALL-CAP EQUITY FUND
SCHEDULE OF INVESTMENTS
December 31, 2013
| | | | | | | | |
SHARES | | | | COMPANY | | VALUE | |
| | | | | | | | |
COMMON STOCKS - 98.2% | |
|
AUTOMOBILES & COMPONENTS - 1.0% | |
69 | | | | Dana Holding Corp | | $ | 1,354 | |
4,170 | | | | Superior Industries International, Inc | | | 86,027 | |
7,559 | | * | | Tenneco, Inc | | | 427,613 | |
| | | | | | | | |
| | | | TOTAL AUTOMOBILES & COMPONENTS | | | 514,994 | |
| | | | | | | | |
|
BANKS - 8.2% | |
16,330 | | | | Brookline Bancorp, Inc | | | 156,278 | |
19,300 | | | | Capitol Federal Financial | | | 233,723 | |
4,700 | | | | Cathay General Bancorp | | | 125,631 | |
5,933 | | | | Columbia Banking System, Inc | | | 163,217 | |
3,727 | | | | Community Bank System, Inc | | | 147,887 | |
18,749 | | | | FirstMerit Corp | | | 416,790 | |
12,844 | | | | Home Loan Servicing Solutions Ltd | | | 295,027 | |
21,081 | | | | National Penn Bancshares, Inc | | | 238,848 | |
8,515 | | | | Oritani Financial Corp | | | 136,666 | |
7,900 | | | | PrivateBancorp, Inc | | | 228,547 | |
5,622 | | | | Prosperity Bancshares, Inc | | | 356,379 | |
13,800 | | | | Provident Financial Services, Inc | | | 266,616 | |
14,480 | | e | | Radian Group, Inc | | | 204,458 | |
20,972 | | | | Susquehanna Bancshares, Inc | | | 269,280 | |
3,426 | | * | | SVB Financial Group | | | 359,250 | |
15,707 | | e | | Umpqua Holdings Corp | | | 300,632 | |
4,860 | | | | Webster Financial Corp | | | 151,535 | |
3,742 | | | | Wintrust Financial Corp | | | 172,581 | |
| | | | | | | | |
| | | | TOTAL BANKS | | | 4,223,345 | |
| | | | | | | | |
|
CAPITAL GOODS - 9.6% | |
2,410 | | | | Acuity Brands, Inc | | | 263,461 | |
3,250 | | | | Alliant Techsystems, Inc | | | 395,460 | |
3,100 | | * | | American Woodmark Corp | | | 122,543 | |
866 | | | | Ampco-Pittsburgh Corp | | | 16,844 | |
5,450 | | | | Applied Industrial Technologies, Inc | | | 267,540 | |
4,629 | | | | Brady Corp (Class A) | | | 143,175 | |
7,089 | | | | Comfort Systems USA, Inc | | | 137,456 | |
2,223 | | | | Cubic Corp | | | 117,063 | |
4,463 | | | | Curtiss-Wright Corp | | | 277,732 | |
1,522 | | * | | DXP Enterprises, Inc | | | 175,334 | |
3,470 | | * | | Dycom Industries, Inc | | | 96,431 | |
4,329 | | | | EnerSys | | | 303,420 | |
17,250 | | | | Exelis, Inc | | | 328,785 | |
87 | | * | | Federal Signal Corp | | | 1,275 | |
910 | | | | Graco, Inc | | | 71,089 | |
3,593 | | | | Huntington Ingalls | | | 323,406 | |
2,000 | | | | Kadant, Inc | | | 81,040 | |
2,040 | | | | LB Foster Co (Class A) | | | 96,472 | |
2,070 | | * | | Moog, Inc (Class A) | | | 140,636 | |
2,920 | | | | Mueller Industries, Inc | | | 183,989 | |
2,780 | | * | | NCI Building Systems, Inc | | | 48,761 | |
6,336 | | * | | Pike Electric Corp | | | 66,972 | |
2,839 | | *,e | | Proto Labs, Inc | | | 202,080 | |
3,680 | | * | | Teledyne Technologies, Inc | | | 338,045 | |
3,246 | | * | | Trex Co, Inc | | | 258,154 | |
3,280 | | * | | WABCO Holdings, Inc | | | 306,385 | |
1,500 | | | | Watsco, Inc | | | 144,090 | |
| | | | | | | | |
| | | | TOTAL CAPITAL GOODS | | | 4,907,638 | |
| | | | | | | | |
16
TIAA-CREF LIFE FUNDS - Small-Cap Equity Fund
| | | | | | | | |
SHARES | | | | COMPANY | | VALUE | |
| | | | | | | | |
COMMERCIAL & PROFESSIONAL SERVICES - 3.4% | |
1,677 | | * | | Advisory Board Co | | $ | 106,775 | |
5,130 | | | | Brink’s Co | | | 175,138 | |
2,320 | | | | Exponent, Inc | | | 179,661 | |
7,662 | | * | | Korn/Ferry International | | | 200,132 | |
6,638 | | | | Rollins, Inc | | | 201,065 | |
13,279 | | * | | RPX Corp | | | 224,415 | |
8,371 | | * | | TrueBlue, Inc | | | 215,804 | |
3,549 | | | | Viad Corp | | | 98,591 | |
6,038 | | * | | WageWorks, Inc | | | 358,899 | |
| | | | | | | | |
| | | | TOTAL COMMERCIAL & PROFESSIONAL SERVICES | | | 1,760,480 | |
| | | | | | | | |
|
CONSUMER DURABLES & APPAREL - 2.8% | |
8,139 | | *,e | | Beazer Homes USA, Inc | | | 198,754 | |
8,060 | | | | Brunswick Corp | | | 371,244 | |
9,027 | | * | | CROCS, Inc | | | 143,710 | |
7,600 | | | | La-Z-Boy, Inc | | | 235,600 | |
13,600 | | * | | Standard-Pacific Corp | | | 123,080 | |
6,864 | | * | | Steven Madden Ltd | | | 251,154 | |
4,700 | | * | | Tumi Holdings, Inc | | | 105,985 | |
| | | | | | | | |
| | | | TOTAL CONSUMER DURABLES & APPAREL | | | 1,429,527 | |
| | | | | | | | |
|
CONSUMER SERVICES - 3.7% | |
11,225 | | | | Hillenbrand, Inc | | | 330,239 | |
4,205 | | * | | Hyatt Hotels Corp | | | 207,979 | |
5,460 | | * | | Marriott Vacations Worldwide Corp | | | 288,070 | |
8,770 | | * | | MGM Mirage | | | 206,271 | |
5,470 | | * | | Multimedia Games, Inc | | | 171,539 | |
8,302 | | * | | Orient-Express Hotels Ltd (Class A) | | | 125,443 | |
3,890 | | | | Papa John’s International, Inc | | | 176,606 | |
14,616 | | | | Service Corp International | | | 264,988 | |
5,190 | | | | Texas Roadhouse, Inc (Class A) | | | 144,282 | |
| | | | | | | | |
| | | | TOTAL CONSUMER SERVICES | | | 1,915,417 | |
| | | | | | | | |
|
DIVERSIFIED FINANCIALS - 3.6% | |
38,709 | | | | Apollo Investment Corp | | | 328,252 | |
266 | | e | | Cohen & Steers, Inc | | | 10,656 | |
2,308 | | | | Financial Engines, Inc | | | 160,360 | |
1,109 | | | | Friedman Billings Ramsey Group, Inc (Class A) | | | 29,267 | |
3,165 | | e | | FXCM, Inc | | | 56,464 | |
8,300 | | *,e | | GSV Capital Corp | | | 100,347 | |
840 | | | | iShares Russell 2000 Index Fund | | | 96,860 | |
17,657 | | | | Janus Capital Group, Inc | | | 218,417 | |
3,080 | | | | MarketAxess Holdings, Inc | | | 205,960 | |
4,800 | | * | | Portfolio Recovery Associates, Inc | | | 253,632 | |
8,460 | | e | | Prospect Capital Corp | | | 94,921 | |
11,019 | | | | TCP Capital Corp | | | 184,899 | |
4,850 | | * | | WisdomTree Investments, Inc | | | 85,893 | |
| | | | | | | | |
| | | | TOTAL DIVERSIFIED FINANCIALS | | | 1,825,928 | |
| | | | | | | | |
|
ENERGY - 5.7% | |
5,360 | | | | Alon USA Energy, Inc | | | 88,654 | |
17,800 | | * | | Alpha Natural Resources, Inc | | | 127,092 | |
18,300 | | e | | Arch Coal, Inc | | | 81,435 | |
4,914 | | | | Bristow Group, Inc | | | 368,845 | |
5,560 | | | | Comstock Resources, Inc | | | 101,692 | |
7,427 | | | | Delek US Holdings, Inc | | | 255,563 | |
2,346 | | | | Energy XXI Bermuda Ltd | | | 63,483 | |
5,100 | | | | Green Plains Renewable Energy, Inc | | | 98,889 | |
36,074 | | * | | Penn Virginia Corp | | | 340,178 | |
8,752 | | * | | Renewable Energy Group, Inc | | | 100,298 | |
9,620 | | e | | RPC, Inc | | | 171,717 | |
5,576 | | * | | Stone Energy Corp | | | 192,874 | |
1,128 | | *,e | | Swift Energy Co | | | 15,228 | |
17
TIAA-CREF LIFE FUNDS - Small-Cap Equity Fund
| | | | | | | | |
SHARES | | | | COMPANY | | VALUE | |
| | | | | | | | |
4,089 | | | | Targa Resources Investments, Inc | | $ | 360,527 | |
20,199 | | * | | Vaalco Energy, Inc | | | 139,171 | |
5,833 | | | | W&T Offshore, Inc | | | 93,328 | |
5,180 | | e | | Western Refining, Inc | | | 219,684 | |
13,700 | | * | | Willbros Group, Inc | | | 129,054 | |
| | | | | | | | |
| | | | TOTAL ENERGY | | | 2,947,712 | |
| | | | | | | | |
|
FOOD & STAPLES RETAILING - 0.6% | |
53,550 | | * | | Rite Aid Corp | | | 270,963 | |
848 | | | | Weis Markets, Inc | | | 44,571 | |
| | | | | | | | |
| | | | TOTAL FOOD & STAPLES RETAILING | | | 315,534 | |
| | | | | | | | |
|
FOOD, BEVERAGE & TOBACCO - 2.1% | |
3,163 | | *,e | | Annie’s, Inc | | | 136,135 | |
622 | | *,e | | Boston Beer Co, Inc (Class A) | | | 150,393 | |
8,200 | | * | | Darling International, Inc | | | 171,216 | |
2,470 | | * | | Diamond Foods, Inc | | | 63,825 | |
4,880 | | | | Fresh Del Monte Produce, Inc | | | 138,104 | |
1,861 | | | | J&J Snack Foods Corp | | | 164,866 | |
3,490 | | | | Sanderson Farms, Inc | | | 252,432 | |
| | | | | | | | |
| | | | TOTAL FOOD, BEVERAGE & TOBACCO | | | 1,076,971 | |
| | | | | | | | |
|
HEALTH CARE EQUIPMENT & SERVICES - 6.9% | |
4,420 | | * | | Align Technology, Inc | | | 252,603 | |
542 | | * | | Amedisys, Inc | | | 7,929 | |
10,696 | | * | | AMN Healthcare Services, Inc | | | 157,231 | |
1,267 | | | | Analogic Corp | | | 112,206 | |
3,429 | | * | | Arthrocare Corp | | | 137,983 | |
2,484 | | | | Cantel Medical Corp | | | 84,232 | |
3,116 | | | | Computer Programs & Systems, Inc | | | 192,600 | |
5,111 | | * | | Cyberonics, Inc | | | 334,821 | |
4,832 | | * | | Cynosure, Inc (Class A) | | | 128,918 | |
2,437 | | * | | HealthStream, Inc | | | 79,861 | |
1,900 | | * | | ICU Medical, Inc | | | 121,049 | |
4,394 | | * | | Masimo Corp | | | 128,437 | |
6,582 | | * | | Medidata Solutions, Inc | | | 398,672 | |
1,612 | | * | | MWI Veterinary Supply, Inc | | | 274,991 | |
4,400 | | * | | NuVasive, Inc | | | 142,252 | |
5,036 | | * | | Omnicell, Inc | | | 128,569 | |
7,800 | | * | | Team Health Holdings, Inc | | | 355,290 | |
6,739 | | * | | Thoratec Corp | | | 246,647 | |
3,809 | | * | | WellCare Health Plans, Inc | | | 268,230 | |
| | | | | | | | |
| | | | TOTAL HEALTH CARE EQUIPMENT & SERVICES | | | 3,552,521 | |
| | | | | | | | |
|
HOUSEHOLD & PERSONAL PRODUCTS - 0.5% | |
2,876 | | | | Inter Parfums, Inc | | | 102,989 | |
6,420 | | * | | Medifast, Inc | | | 167,755 | |
| | | | | | | | |
| | | | TOTAL HOUSEHOLD & PERSONAL PRODUCTS | | | 270,744 | |
| | | | | | | | |
|
INSURANCE - 2.9% | |
2,800 | | * | | AMBAC Financial Group, Inc | | | 68,768 | |
1,870 | | | | American Financial Group, Inc | | | 107,936 | |
241 | | | | Conseco, Inc | | | 4,263 | |
4,274 | | | | Employers Holdings, Inc | | | 135,272 | |
5,398 | | | | First American Financial Corp | | | 152,224 | |
5,529 | | e | | HCI Group, Inc | | | 295,801 | |
5,220 | | | | Platinum Underwriters Holdings Ltd | | | 319,882 | |
1,500 | | | | RenaissanceRe Holdings Ltd | | | 146,010 | |
8,750 | | * | | Third Point Reinsurance Ltd | | | 162,138 | |
6,052 | | | | Universal Insurance Holdings, Inc | | | 87,633 | |
| | | | | | | | |
| | | | TOTAL INSURANCE | | | 1,479,927 | |
| | | | | | | | |
18
TIAA-CREF LIFE FUNDS - Small-Cap Equity Fund
| | | | | | | | |
SHARES | | | | COMPANY | | VALUE | |
| | | | | | | | |
MATERIALS - 5.3% | |
2,593 | | | | A. Schulman, Inc | | $ | 91,429 | |
2,866 | | | | Aptargroup, Inc | | | 194,343 | |
2,000 | | | | Avery Dennison Corp | | | 100,380 | |
48 | | * | | Balchem Corp | | | 2,818 | |
4,186 | | * | | Boise Cascade Co | | | 123,403 | |
9,610 | | * | | Coeur d’Alene Mines Corp | | | 104,268 | |
8,597 | | | | Globe Specialty Metals, Inc | | | 154,832 | |
5,128 | | | | Minerals Technologies, Inc | | | 308,039 | |
8,161 | | | | Myers Industries, Inc | | | 172,360 | |
4,954 | | * | | OM Group, Inc | | | 180,375 | |
1,433 | | | | Quaker Chemical Corp | | | 110,441 | |
10,479 | | *,e | | Resolute Forest Products | | | 167,874 | |
3,989 | | * | | RTI International Metals, Inc | | | 136,464 | |
5,707 | | | | Schnitzer Steel Industries, Inc (Class A) | | | 186,448 | |
4,245 | | | | Schweitzer-Mauduit International, Inc | | | 218,490 | |
8,450 | | * | | Stillwater Mining Co | | | 104,273 | |
5,180 | | * | | SunCoke Energy, Inc | | | 118,156 | |
5,333 | | | | Worthington Industries, Inc | | | 224,413 | |
| | | | | | | | |
| | | | TOTAL MATERIALS | | | 2,698,806 | |
| | | | | | | | |
|
MEDIA - 2.9% | |
2,062 | | * | | AMC Entertainment Holdings, Inc | | | 42,374 | |
5,864 | | | | Cinemark Holdings, Inc | | | 195,447 | |
8,010 | | *,e | | Digital Generation, Inc | | | 102,127 | |
8,262 | | * | | EW Scripps Co (Class A) | | | 179,451 | |
10,409 | | * | | Journal Communications, Inc (Class A) | | | 96,908 | |
5,464 | | * | | Lamar Advertising Co (Class A) | | | 285,494 | |
20,300 | | * | | Live Nation, Inc | | | 401,128 | |
2,840 | | * | | Madison Square Garden, Inc | | | 163,527 | |
| | | | | | | | |
| | | | TOTAL MEDIA | | | 1,466,456 | |
| | | | | | | | |
|
PHARMACEUTICALS, BIOTECHNOLOGY & LIFE SCIENCES - 4.9% | |
4,500 | | *,e | | Acadia Pharmaceuticals, Inc | | | 112,455 | |
6,500 | | * | | Acorda Therapeutics, Inc | | | 189,800 | |
12,882 | | * | | Affymetrix, Inc | | | 110,399 | |
4,399 | | * | | AMAG Pharmaceuticals, Inc | | | 106,764 | |
12,000 | | *,e | | Arena Pharmaceuticals, Inc | | | 70,200 | |
18,120 | | * | | Array Biopharma, Inc | | | 90,781 | |
5,930 | | * | | Auxilium Pharmaceuticals, Inc | | | 122,988 | |
1,600 | | * | | Celldex Therapeutics, Inc | | | 38,736 | |
4,356 | | *,e | | Cepheid, Inc | | | 203,512 | |
1,400 | | * | | Clovis Oncology, Inc | | | 84,378 | |
910 | | *,e | | Epizyme, Inc | | | 18,928 | |
4,611 | | * | | Genomic Health, Inc | | | 134,964 | |
5,379 | | * | | Impax Laboratories, Inc | | | 135,228 | |
2,000 | | * | | Insys Therapeutics, Inc | | | 77,420 | |
1,270 | | *,e | | Isis Pharmaceuticals, Inc | | | 50,597 | |
7,584 | | * | | Medicines Co | | | 292,894 | |
5,220 | | * | | NPS Pharmaceuticals, Inc | | | 158,479 | |
13,680 | | *,e | | Orexigen Therapeutics, Inc | | | 77,019 | |
6,860 | | * | | Parexel International Corp | | | 309,935 | |
10,310 | | e | | PDL BioPharma, Inc | | | 87,016 | |
471 | | e | | Questcor Pharmaceuticals, Inc | | | 25,646 | |
| | | | | | | | |
| | | | TOTAL PHARMACEUTICALS, BIOTECHNOLOGY & LIFE SCIENCES | | | 2,498,139 | |
| | | | | | | | |
|
REAL ESTATE - 6.9% | |
6,321 | | | | Chesapeake Lodging Trust | | | 159,858 | |
23,394 | | | | Cousins Properties, Inc | | | 240,958 | |
16,577 | | | | CubeSmart | | | 264,237 | |
13,170 | | | | DuPont Fabros Technology, Inc | | | 325,431 | |
3,770 | | | | EastGroup Properties, Inc | | | 218,396 | |
6,580 | | | | Extra Space Storage, Inc | | | 277,215 | |
1,518 | | | | Government Properties Income Trust | | | 37,722 | |
19
TIAA-CREF LIFE FUNDS - Small-Cap Equity Fund
| | | | | | | | |
SHARES | | | | COMPANY | | VALUE | |
| | | | | | | | |
3,604 | | | | LTC Properties, Inc | | $ | 127,546 | |
21,700 | | | | New Residential Investment Corp | | | 144,956 | |
4,150 | | | | Omega Healthcare Investors, Inc | | | 123,670 | |
6,294 | | | | Parkway Properties, Inc | | | 121,411 | |
2,459 | | | | PS Business Parks, Inc | | | 187,917 | |
17,848 | | | | RAIT Investment Trust | | | 160,097 | |
7,100 | | | | Retail Opportunities Investment Corp | | | 104,512 | |
13,193 | | | | RLJ Lodging Trust | | | 320,854 | |
1,882 | | | | Saul Centers, Inc | | | 89,828 | |
4,217 | | | | Sovran Self Storage, Inc | | | 274,822 | |
5,150 | | | | Sun Communities, Inc | | | 219,596 | |
11,537 | | | | Sunstone Hotel Investors, Inc | | | 154,596 | |
| | | | | | | | |
| | | | TOTAL REAL ESTATE | | | 3,553,622 | |
| | | | | | | | |
|
RETAILING - 4.1% | |
2,100 | | * | | Ann Taylor Stores Corp | | | 76,776 | |
3,700 | | * | | Barnes & Noble, Inc | | | 55,315 | |
5,763 | | | | Big 5 Sporting Goods Corp | | | 114,223 | |
4,991 | | * | | Children’s Place Retail Stores, Inc | | | 284,337 | |
16,606 | | * | | Christopher & Banks Corp | | | 141,815 | |
3,170 | | * | | Express Parent LLC | | | 59,184 | |
4,200 | | | | Finish Line, Inc (Class A) | | | 118,314 | |
3,207 | | *,e | | Five Below, Inc | | | 138,542 | |
3,120 | | * | | HomeAway, Inc | | | 127,546 | |
4,900 | | * | | Kirkland’s, Inc | | | 115,983 | |
16,000 | | * | | Orbitz Worldwide, Inc | | | 114,880 | |
3,528 | | *,e | | Overstock.com, Inc | | | 108,627 | |
6,877 | | | | Penske Auto Group, Inc | | | 324,320 | |
5,400 | | | | Pier 1 Imports, Inc | | | 124,632 | |
15,800 | | *,e | | RadioShack Corp | | | 41,080 | |
5,065 | | *,e | | RetailMeNot, Inc | | | 145,821 | |
| | | | | | | | |
| | | | TOTAL RETAILING | | | 2,091,395 | |
| | | | | | | | |
|
SEMICONDUCTORS & SEMICONDUCTOR EQUIPMENT - 3.2% | |
7,988 | | * | | Advanced Energy Industries, Inc | | | 182,605 | |
3,758 | | * | | Ambarella, Inc | | | 127,509 | |
3,452 | | * | | ATMI, Inc | | | 104,285 | |
8,037 | | * | | Cavium Networks, Inc | | | 277,357 | |
30,590 | | * | | Entropic Communications, Inc | | | 144,079 | |
1,775 | | * | | Hittite Microwave Corp | | | 109,571 | |
16,383 | | * | | Integrated Device Technology, Inc | | | 166,943 | |
35,808 | | * | | Lattice Semiconductor Corp | | | 197,302 | |
19,583 | | * | | Rambus, Inc | | | 185,451 | |
25,114 | | * | | Silicon Image, Inc | | | 154,451 | |
437 | | * | | Ultratech, Inc | | | 12,673 | |
| | | | | | | | |
| | | | TOTAL SEMICONDUCTORS & SEMICONDUCTOR EQUIPMENT | | | 1,662,226 | |
| | | | | | | | |
|
SOFTWARE & SERVICES - 9.4% | |
9,900 | | * | | Aspen Technology, Inc | | | 413,820 | |
4,734 | | * | | Commvault Systems, Inc | | | 354,482 | |
5,000 | | * | | Demandware, Inc | | | 320,600 | |
2,857 | | | | DST Systems, Inc | | | 259,244 | |
2,249 | | | | Forrester Research, Inc | | | 86,047 | |
1,030 | | * | | Gartner, Inc | | | 73,181 | |
3,924 | | * | | Gigamon, Inc | | | 110,186 | |
8,719 | | * | | Infoblox, Inc | | | 287,901 | |
7,058 | | * | | LogMeIn, Inc | | | 236,796 | |
3,673 | | * | | Manhattan Associates, Inc | | | 431,504 | |
6,390 | | * | | Marketo, Inc | | | 236,877 | |
8,638 | | | | MAXIMUS, Inc | | | 379,986 | |
12,400 | | * | | Monster Worldwide, Inc | | | 88,412 | |
3,193 | | * | | PROS Holdings, Inc | | | 127,401 | |
2,216 | | * | | Rally Software Development Corp | | | 43,101 | |
4,496 | | * | | Responsys, Inc | | | 123,235 | |
20
TIAA-CREF LIFE FUNDS - Small-Cap Equity Fund
| | | | | | | | |
SHARES | | | | COMPANY | | VALUE | |
| | | | | | | | |
2,000 | | * | | Seachange International, Inc | | $ | 24,320 | |
2,899 | | * | | Syntel, Inc | | | 263,664 | |
23,846 | | * | | TiVo, Inc | | | 312,860 | |
1,941 | | * | | Virtusa Corp | | | 73,933 | |
9,327 | | *,e | | WebMD Health Corp (Class A) | | | 368,416 | |
8,045 | | * | | Xoom Corp | | | 220,192 | |
| | | | | | | | |
| | | | TOTAL SOFTWARE & SERVICES | | | 4,836,158 | |
| | | | | | | | |
|
TECHNOLOGY HARDWARE & EQUIPMENT - 5.2% | |
8,567 | | e | | Alliance Fiber Optic Products, Inc | | | 128,933 | |
15,500 | | * | | ARRIS Group, Inc | | | 377,658 | |
7,750 | | * | | Aruba Networks, Inc | | | 138,725 | |
7,005 | | * | | Benchmark Electronics, Inc | | | 161,675 | |
11,700 | | * | | Calix Networks, Inc | | | 112,788 | |
4,930 | | * | | Datalink Corp | | | 53,737 | |
4,200 | | * | | Electronics for Imaging, Inc | | | 162,666 | |
17,665 | | * | | Extreme Networks, Inc | | | 123,655 | |
6,970 | | * | | Finisar Corp | | | 166,722 | |
11,567 | | * | | Immersion Corp | | | 120,066 | |
4,498 | | *,e | | InvenSense, Inc | | | 93,468 | |
4,086 | | * | | Plexus Corp | | | 176,883 | |
25,273 | | * | | QLogic Corp | | | 298,980 | |
28,650 | | * | | Sonus Networks, Inc | | | 90,248 | |
6,567 | | *,e | | Synaptics, Inc | | | 340,236 | |
2,984 | | *,e | | Ubiquiti Networks, Inc | | | 137,145 | |
| | | | | | | | |
| | | | TOTAL TECHNOLOGY HARDWARE & EQUIPMENT | | | 2,683,585 | |
| | | | | | | | |
|
TELECOMMUNICATION SERVICES - 0.5% | |
19,050 | | * | | 8x8, Inc | | | 193,548 | |
6,860 | | * | | Premiere Global Services, Inc | | | 79,507 | |
| | | | | | | | |
| | | | TOTAL TELECOMMUNICATION SERVICES | | | 273,055 | |
| | | | | | | | |
|
TRANSPORTATION - 2.2% | |
729 | | * | | Amerco, Inc | | | 173,385 | |
10,059 | | | | Arkansas Best Corp | | | 338,787 | |
5,907 | | | | Matson, Inc | | | 154,232 | |
14,674 | | * | | Republic Airways Holdings, Inc | | | 156,865 | |
16,380 | | *,e | | Swift Transportation Co, Inc | | | 363,800 | |
| | | | | | | | |
| | | | TOTAL TRANSPORTATION | | | 1,187,069 | |
| | | | | | | | |
|
UTILITIES - 2.6% | |
6,940 | | | | American States Water Co | | | 199,386 | |
8,373 | | | | Avista Corp | | | 236,035 | |
4,194 | | | | Black Hills Corp | | | 220,227 | |
4,917 | | | | Empire District Electric Co | | | 111,567 | |
4,731 | | | | New Jersey Resources Corp | | | 218,761 | |
4,158 | | | | NorthWestern Corp | | | 180,125 | |
3,150 | | | | Southwest Gas Corp | | | 176,116 | |
| | | | | | | | |
| | | | TOTAL UTILITIES | | | 1,342,217 | |
| | | | | | | | |
| | | | TOTAL COMMON STOCKS
(Cost $40,356,823) | | | 50,513,466 | |
| | | | | | | | |
|
SHORT-TERM INVESTMENTS - 8.8% | |
|
INVESTMENTS IN REGISTERED INVESTMENT COMPANIES - 8.8% | |
4,549,816 | | c | | TIAA-CREF Short Term Lending Portfolio of the State Street Navigator Securities Lending Trust | | | 4,549,816 | |
| | | | | | | | |
| | | | TOTAL INVESTMENTS IN REGISTERED INVESTMENT COMPANIES | | | 4,549,816 | |
| | | | | | | | |
| | | | TOTAL SHORT-TERM INVESTMENTS
(Cost $4,549,816) | | | 4,549,816 | |
| | | | | | | | |
| | | | TOTAL INVESTMENTS - 107.0%
(Cost $44,906,639) | | | 55,063,282 | |
| | | | OTHER ASSETS & LIABILITIES, NET - (7.0)% | | | (3,626,645 | ) |
| | | | | | | | |
| | | | NET ASSETS - 100.0% | | $ | 51,436,637 | |
| | | | | | | | |
| c | Investments made with cash collateral received from securities on loan. |
| e | All or a portion of these securities are out on loan. The aggregate value of securities on loan is $4,461,821. |
21
TIAA-CREF LIFE FUNDS - Social Choice Equity Fund
TIAA-CREF LIFE FUNDS
SOCIAL CHOICE EQUITY FUND
SCHEDULE OF INVESTMENTS
December 31, 2013
| | | | | | | | |
SHARES | | | | COMPANY | | VALUE | |
| | | | | | | | |
COMMON STOCKS - 99.1% | | | | |
| |
AUTOMOBILES & COMPONENTS - 1.7% | | | | |
650 | | | | BorgWarner, Inc | | $ | 36,341 | |
28,628 | | | | Ford Motor Co | | | 441,730 | |
2,462 | | | | Harley-Davidson, Inc | | | 170,469 | |
7,559 | | | | Johnson Controls, Inc | | | 387,777 | |
292 | | * | | Modine Manufacturing Co | | | 3,743 | |
1,073 | | * | | Tenneco, Inc | | | 60,700 | |
66 | | * | | Tesla Motors, Inc | | | 9,925 | |
| | | | | | | | |
| | | | TOTAL AUTOMOBILES & COMPONENTS | | | 1,110,685 | |
| | | | | | | | |
| |
BANKS - 3.5% | | | | |
470 | | | | Associated Banc-Corp | | | 8,178 | |
196 | | | | Bank of Hawaii Corp | | | 11,591 | |
10,122 | | | | BB&T Corp | | | 377,753 | |
200 | | | | Boston Private Financial Holdings, Inc | | | 2,524 | |
363 | | | | CapitalSource, Inc | | | 5,216 | |
38 | | | | Capitol Federal Financial | | | 460 | |
72 | | | | Centerstate Banks of Florida, Inc | | | 731 | |
91 | | | | CIT Group, Inc | | | 4,744 | |
1,565 | | | | Comerica, Inc | | | 74,400 | |
22 | | | | Community Bank System, Inc | | | 873 | |
69 | | | | Cullen/Frost Bankers, Inc | | | 5,136 | |
1,357 | | | | Huntington Bancshares, Inc | | | 13,095 | |
88 | | | | IBERIABANK Corp | | | 5,531 | |
19,629 | | | | Keycorp | | | 263,421 | |
2,700 | | | | M&T Bank Corp | | | 314,334 | |
528 | | * | | MGIC Investment Corp | | | 4,456 | |
1,477 | | | | New York Community Bancorp, Inc | | | 24,888 | |
145 | | | | Old National Bancorp | | | 2,229 | |
18 | | | | Peoples Bancorp, Inc | | | 405 | |
189 | | | | People’s United Financial, Inc | | | 2,858 | |
5,307 | | | | PNC Financial Services Group, Inc | | | 411,717 | |
844 | | * | | Popular, Inc | | | 24,248 | |
188 | | | | PrivateBancorp, Inc | | | 5,439 | |
355 | | | | Provident Financial Services, Inc | | | 6,859 | |
6,559 | | | | Radian Group, Inc | | | 92,613 | |
2,378 | | * | | Sun Bancorp, Inc | | | 8,371 | |
160 | | | | Susquehanna Bancshares, Inc | | | 2,054 | |
269 | | * | | SVB Financial Group | | | 28,207 | |
31 | | | | TCF Financial Corp | | | 504 | |
50 | | | | UMB Financial Corp | | | 3,214 | |
102 | | | | United Bankshares, Inc | | | 3,208 | |
13,031 | | | | US Bancorp | | | 526,452 | |
107 | | | | Webster Financial Corp | | | 3,336 | |
49 | | | | Westamerica Bancorporation | | | 2,767 | |
1,000 | | | | Wilshire Bancorp, Inc | | | 10,930 | |
290 | | | | Zions Bancorporation | | | 8,688 | |
| | | | | | | | |
| | | | TOTAL BANKS | | | 2,261,430 | |
| | | | | | | | |
| |
CAPITAL GOODS - 8.0% | | | | |
4,381 | | | | 3M Co | | | 614,435 | |
178 | | | | A.O. Smith Corp | | | 9,601 | |
103 | | | | Actuant Corp (Class A) | | | 3,774 | |
39 | | | | Acuity Brands, Inc | | | 4,264 | |
5,350 | | | | Ametek, Inc | | | 281,785 | |
17 | | | | Applied Industrial Technologies, Inc | | | 835 | |
22
TIAA-CREF LIFE FUNDS - Social Choice Equity Fund
| | | | | | | | |
SHARES | | | | COMPANY | | VALUE | |
| | | | | | | | |
400 | | * | | ArvinMeritor, Inc | | $ | 4,172 | |
90 | | | | Astec Industries, Inc | | | 3,477 | |
1,080 | | | | Barnes Group, Inc | | | 41,375 | |
200 | | | | Briggs & Stratton Corp | | | 4,352 | |
1,027 | | * | | Builders FirstSource, Inc | | | 7,333 | |
33 | | * | | Chart Industries, Inc | | | 3,156 | |
12 | | | | Clarcor, Inc | | | 772 | |
81 | | * | | Colfax Corp | | | 5,159 | |
2,121 | | | | Cummins, Inc | | | 298,997 | |
5,752 | | | | Danaher Corp | | | 444,055 | |
4,223 | | | | Deere & Co | | | 385,687 | |
644 | | | | Dover Corp | | | 62,172 | |
3,342 | | | | Eaton Corp | | | 254,393 | |
6,715 | | | | Emerson Electric Co | | | 471,259 | |
1,660 | | | | Fastenal Co | | | 78,867 | |
639 | | | | Graco, Inc | | | 49,919 | |
117 | | * | | Hexcel Corp | | | 5,229 | |
4,828 | | | | Illinois Tool Works, Inc | | | 405,938 | |
1,285 | | | | Ingersoll-Rand plc | | | 79,156 | |
80 | | * | | Layne Christensen Co | | | 1,366 | |
245 | | | | Lincoln Electric Holdings, Inc | | | 17,478 | |
4,732 | | | | Masco Corp | | | 107,748 | |
59 | | | | MSC Industrial Direct Co (Class A) | | | 4,771 | |
1,316 | | | | Nordson Corp | | | 97,779 | |
1,604 | | * | | Owens Corning, Inc | | | 65,315 | |
3,140 | | | | Paccar, Inc | | | 185,794 | |
380 | | | | Pall Corp | | | 32,433 | |
319 | | | | Parker Hannifin Corp | | | 41,036 | |
1,138 | | | | Pentair Ltd | | | 88,388 | |
342 | | * | | Polypore International, Inc | | | 13,304 | |
1,640 | | | | Precision Castparts Corp | | | 441,652 | |
1,131 | | * | | Quanta Services, Inc | | | 35,694 | |
939 | | | | Rockwell Automation, Inc | | | 110,952 | |
337 | | | | Rockwell Collins, Inc | | | 24,911 | |
400 | | | | Roper Industries, Inc | | | 55,472 | |
147 | | | | Snap-On, Inc | | | 16,099 | |
1,930 | | * | | Spirit Aerosystems Holdings, Inc (Class A) | | | 65,774 | |
55 | | | | TAL International Group, Inc | | | 3,154 | |
994 | | | | Tennant Co | | | 67,403 | |
143 | | | | Timken Co | | | 7,875 | |
377 | | * | | United Rentals, Inc | | | 29,387 | |
23 | | | | Valmont Industries, Inc | | | 3,430 | |
44 | | | | W.W. Grainger, Inc | | | 11,238 | |
326 | | * | | WABCO Holdings, Inc | | | 30,452 | |
8 | | | | Watsco, Inc | | | 768 | |
264 | | * | | WESCO International, Inc | | | 24,042 | |
666 | | | | Westinghouse Air Brake Technologies Corp | | | 49,464 | |
179 | | | | Woodward Governor Co | | | 8,164 | |
86 | | | | Xylem, Inc | | | 2,976 | |
| | | | | | | | |
| | | | TOTAL CAPITAL GOODS | | | 5,164,481 | |
| | | | | | | | |
| |
COMMERCIAL & PROFESSIONAL SERVICES - 0.6% | | | | |
1,916 | | * | | ACCO Brands Corp | | | 12,876 | |
93 | | | | Corporate Executive Board Co | | | 7,201 | |
160 | | | | Deluxe Corp | | | 8,350 | |
837 | | | | Dun & Bradstreet Corp | | | 102,742 | |
217 | | | | Equifax, Inc | | | 14,993 | |
168 | | | | HNI Corp | | | 6,524 | |
73 | | * | | IHS, Inc (Class A) | | | 8,738 | |
190 | | | | Interface, Inc | | | 4,172 | |
1,174 | | | | Iron Mountain, Inc | | | 35,631 | |
291 | | | | Manpower, Inc | | | 24,985 | |
178 | | | | R.R. Donnelley & Sons Co | | | 3,610 | |
1,573 | | | | Robert Half International, Inc | | | 66,050 | |
160 | | * | | RPX Corp | | | 2,704 | |
23
TIAA-CREF LIFE FUNDS - Social Choice Equity Fund
| | | | | | | | |
SHARES | | | | COMPANY | | VALUE | |
| | | | | | | | |
431 | | * | | Tetra Tech, Inc | | $ | 12,059 | |
1,816 | | | | Waste Management, Inc | | | 81,484 | |
| | | | | | | | |
| | | | TOTAL COMMERCIAL & PROFESSIONAL SERVICES | | | 392,119 | |
| | | | | | | | |
| |
CONSUMER DURABLES & APPAREL - 1.2% | | | | |
200 | | | | Callaway Golf Co | | | 1,686 | |
91 | | | | Carter’s, Inc | | | 6,533 | |
5 | | | | Columbia Sportswear Co | | | 394 | |
14 | | * | | Deckers Outdoor Corp | | | 1,182 | |
13 | | | | Hasbro, Inc | | | 715 | |
16 | | * | | Iconix Brand Group, Inc | | | 635 | |
5,425 | | | | Mattel, Inc | | | 258,121 | |
72 | | * | | Meritage Homes Corp | | | 3,455 | |
95 | | * | | Mohawk Industries, Inc | | | 14,146 | |
200 | | | | Movado Group, Inc | | | 8,802 | |
4,980 | | | | Nike, Inc (Class B) | | | 391,627 | |
152 | | | | Oxford Industries, Inc | | | 12,262 | |
270 | | | | Ryland Group, Inc | | | 11,721 | |
71 | | * | | Tempur-Pedic International, Inc | | | 3,831 | |
128 | | | | Tupperware Corp | | | 12,100 | |
202 | | * | | Under Armour, Inc (Class A) | | | 17,635 | |
624 | | | | VF Corp | | | 38,900 | |
92 | | | | Whirlpool Corp | | | 14,431 | |
| | | | | | | | |
| | | | TOTAL CONSUMER DURABLES & APPAREL | | | 798,176 | |
| | | | | | | | |
| |
CONSUMER SERVICES - 2.4% | | | | |
288 | | * | | AFC Enterprises | | | 11,088 | |
55 | | | | Bob Evans Farms, Inc | | | 2,782 | |
200 | | | | Brinker International, Inc | | | 9,268 | |
75 | | * | | Chipotle Mexican Grill, Inc (Class A) | | | 39,958 | |
1,063 | | | | Choice Hotels International, Inc | | | 52,204 | |
835 | | | | Darden Restaurants, Inc | | | 45,399 | |
13 | | | | DineEquity, Inc | | | 1,086 | |
128 | | | | Domino’s Pizza, Inc | | | 8,915 | |
60 | | | | Dunkin Brands Group, Inc | | | 2,892 | |
3,814 | | | | Marriott International, Inc (Class A) | | | 188,259 | |
5,745 | | | | McDonald’s Corp | | | 557,437 | |
29 | | * | | Panera Bread Co (Class A) | | | 5,124 | |
333 | | | | Royal Caribbean Cruises Ltd | | | 15,791 | |
177 | | * | | Sonic Corp | | | 3,574 | |
6,173 | | | | Starbucks Corp | | | 483,902 | |
1,368 | | | | Starwood Hotels & Resorts Worldwide, Inc | | | 108,688 | |
91 | | * | | Strayer Education, Inc | | | 3,137 | |
6 | | | | Vail Resorts, Inc | | | 451 | |
91 | | | | Weight Watchers International, Inc | | | 2,997 | |
| | | | | | | | |
| | | | TOTAL CONSUMER SERVICES | | | 1,542,952 | |
| | | | | | | | |
| |
DIVERSIFIED FINANCIALS - 7.5% | | | | |
2,432 | | * | | American Capital Ltd | | | 38,036 | |
6,435 | | | | American Express Co | | | 583,847 | |
12,182 | | | | Bank of New York Mellon Corp | | | 425,639 | |
1,351 | | | | BlackRock, Inc | | | 427,551 | |
5,819 | | | | Capital One Financial Corp | | | 445,794 | |
14,645 | | | | Charles Schwab Corp | | | 380,770 | |
3,236 | | | | CME Group, Inc | | | 253,897 | |
6,875 | | | | Discover Financial Services | | | 384,656 | |
491 | | | | Evercore Partners, Inc (Class A) | | | 29,352 | |
6,420 | | | | Franklin Resources, Inc | | | 370,627 | |
221 | | * | | Green Dot Corp | | | 5,558 | |
1,368 | | | | IntercontinentalExchange Group, Inc | | | 307,691 | |
5,235 | | | | Invesco Ltd | | | 190,554 | |
466 | | | | Janus Capital Group, Inc | | | 5,764 | |
566 | | | | Legg Mason, Inc | | | 24,610 | |
171 | | | | Main Street Capital Corp | | | 5,590 | |
785 | | | | NASDAQ Stock Market, Inc | | | 31,243 | |
24
TIAA-CREF LIFE FUNDS - Social Choice Equity Fund
| | | | | | | | |
SHARES | | | | COMPANY | | VALUE | |
| | | | | | | | |
5,586 | | | | Northern Trust Corp | | $ | 345,717 | |
176 | | * | | PHH Corp | | | 4,286 | |
474 | | | | Prospect Capital Corp | | | 5,318 | |
5,229 | | | | State Street Corp | | | 383,756 | |
2,941 | | | | T Rowe Price Group, Inc | | | 246,368 | |
123 | | | | Triangle Capital Corp | | | 3,401 | |
| | | | | | | | |
| | | | TOTAL DIVERSIFIED FINANCIALS | | | 4,900,025 | |
| | | | | | | | |
| |
ENERGY - 10.2% | | | | |
3,246 | | | | Apache Corp | | | 278,961 | |
108 | | * | | Atwood Oceanics, Inc | | | 5,766 | |
113 | | * | | C&J Energy Services, Inc | | | 2,610 | |
2,759 | | * | | Cameron International Corp | | | 164,243 | |
136 | | * | | Carrizo Oil & Gas, Inc | | | 6,089 | |
1,544 | | * | | Cheniere Energy, Inc | | | 66,577 | |
1,000 | | | | Cimarex Energy Co | | | 104,910 | |
2,376 | | * | | Clean Energy Fuels Corp | | | 30,603 | |
246 | | | | Comstock Resources, Inc | | | 4,499 | |
299 | | * | | Concho Resources, Inc | | | 32,292 | |
433 | | * | | Contango Oil & Gas Co | | | 20,464 | |
1,459 | | * | | Continental Resources, Inc | | | 164,167 | |
135 | | | | CVR Energy, Inc | | | 5,863 | |
112 | | * | | Dawson Geophysical Co | | | 3,788 | |
4,785 | | * | | Denbury Resources, Inc | | | 78,618 | |
4,478 | | | | Devon Energy Corp | | | 277,054 | |
2,524 | | | | EOG Resources, Inc | | | 423,628 | |
3,191 | | | | Equitable Resources, Inc | | | 286,488 | |
49 | | * | | Exterran Holdings, Inc | | | 1,676 | |
2,547 | | * | | FMC Technologies, Inc | | | 132,979 | |
66 | | * | | Geospace Technologies Corp | | | 6,259 | |
1,802 | | * | | Hercules Offshore, Inc | | | 11,767 | |
3,784 | | | | Hess Corp | | | 314,072 | |
1,557 | | * | | Hornbeck Offshore Services, Inc | | | 76,651 | |
564 | | * | | ION Geophysical Corp | | | 1,861 | |
344 | | * | | Key Energy Services, Inc | | | 2,718 | |
277 | | * | | Kinder Morgan Management LLC | | | 20,958 | |
6,768 | | * | | Kodiak Oil & Gas Corp | | | 75,869 | |
7,812 | | | | Marathon Oil Corp | | | 275,764 | |
4,029 | | | | Marathon Petroleum Corp | | | 369,580 | |
159 | | * | | Matrix Service Co | | | 3,891 | |
4,874 | | | | National Oilwell Varco, Inc | | | 387,629 | |
103 | | * | | Natural Gas Services Group, Inc | | | 2,840 | |
1,861 | | | | Noble Corp plc | | | 69,732 | |
4,874 | | | | Noble Energy, Inc | | | 331,968 | |
230 | | * | | Northern Oil And Gas, Inc | | | 3,466 | |
166 | | * | | Oasis Petroleum, Inc | | | 7,797 | |
4,404 | | | | Occidental Petroleum Corp | | | 418,820 | |
307 | | | | Oceaneering International, Inc | | | 24,216 | |
279 | | * | | Oil States International, Inc | | | 28,380 | |
259 | | * | | PDC Energy, Inc | | | 13,784 | |
415 | | * | | Petroquest Energy, Inc | | | 1,793 | |
4,958 | | | | Phillips 66 | | | 382,411 | |
1,740 | | | | Pioneer Natural Resources Co | | | 320,282 | |
2,882 | | | | Questar Market Resources, Inc | | | 88,333 | |
846 | | * | | Quicksilver Resources, Inc | | | 2,597 | |
1,298 | | | | Range Resources Corp | | | 109,434 | |
233 | | * | | Rex Energy Corp | | | 4,592 | |
5 | | * | | SEACOR Holdings, Inc | | | 456 | |
284 | | * | | Solazyme, Inc | | | 3,093 | |
3,361 | | * | | Southwestern Energy Co | | | 132,188 | |
9,636 | | | | Spectra Energy Corp | | | 343,234 | |
1,071 | | | | St. Mary Land & Exploration Co | | | 89,011 | |
695 | | * | | Superior Energy Services | | | 18,494 | |
640 | | * | | Ultra Petroleum Corp | | | 13,856 | |
463 | | * | | Unit Corp | | | 23,900 | |
9,478 | | * | | Weatherford International Ltd | | | 146,814 | |
25
TIAA-CREF LIFE FUNDS - Social Choice Equity Fund
| | | | | | | | |
SHARES | | | | COMPANY | | VALUE | |
| | | | | | | | |
3,173 | | | | Western Refining, Inc | | $ | 134,567 | |
1,252 | | * | | Whiting Petroleum Corp | | | 77,461 | |
4,541 | | | | Williams Cos, Inc | | | 175,146 | |
| | | | | | | | |
| | | | TOTAL ENERGY | | | 6,606,959 | |
| | | | | | | | |
| |
FOOD & STAPLES RETAILING - 1.0% | | | | |
123 | | | | Casey’s General Stores, Inc | | | 8,640 | |
8 | | | | Harris Teeter Supermarkets, Inc | | | 395 | |
3,726 | | | | Kroger Co | | | 147,289 | |
3,254 | | | | Safeway, Inc | | | 105,983 | |
128 | | | | Spartan Stores, Inc | | | 3,108 | |
8,404 | | | | Sysco Corp | | | 303,384 | |
1,847 | | | | Whole Foods Market, Inc | | | 106,812 | |
| | | | | | | | |
| | | | TOTAL FOOD & STAPLES RETAILING | | | 675,611 | |
| | | | | | | | |
| |
FOOD, BEVERAGE & TOBACCO - 3.5% | | | | |
125 | | | | Bunge Ltd | | | 10,264 | |
2,696 | | | | Campbell Soup Co | | | 116,683 | |
1,284 | | | | ConAgra Foods, Inc | | | 43,271 | |
151 | | * | | Darling International, Inc | | | 3,153 | |
302 | | | | Dr Pepper Snapple Group, Inc | | | 14,713 | |
127 | | | | Flowers Foods, Inc | | | 2,727 | |
7,459 | | | | General Mills, Inc | | | 372,279 | |
636 | | * | | Green Mountain Coffee Roasters, Inc | | | 48,069 | |
45 | | * | | Hain Celestial Group, Inc | | | 4,085 | |
610 | | | | Hillshire Brands Co | | | 20,398 | |
168 | | | | Hormel Foods Corp | | | 7,589 | |
413 | | | | J.M. Smucker Co | | | 42,795 | |
5,342 | | | | Kellogg Co | | | 326,236 | |
1,396 | | | | Kraft Foods Group, Inc | | | 75,272 | |
51 | | | | Lancaster Colony Corp | | | 4,496 | |
194 | | | | McCormick & Co, Inc | | | 13,370 | |
771 | | | | Mead Johnson Nutrition Co | | | 64,579 | |
12,385 | | | | Mondelez International, Inc | | | 437,190 | |
8,218 | | | | PepsiCo, Inc | | | 681,601 | |
84 | | | | Tootsie Roll Industries, Inc | | | 2,733 | |
| | | | | | | | |
| | | | TOTAL FOOD, BEVERAGE & TOBACCO | | | 2,291,503 | |
| | | | | | | | |
| |
HEALTH CARE EQUIPMENT & SERVICES - 3.4% | | | | |
12,277 | | | | Abbott Laboratories | | | 470,578 | |
4,697 | | | | Aetna, Inc | | | 322,167 | |
79 | | * | | Align Technology, Inc | | | 4,515 | |
648 | | * | | Amedisys, Inc | | | 9,480 | |
67 | | | | AmerisourceBergen Corp | | | 4,711 | |
55 | | * | | Amsurg Corp | | | 2,526 | |
3,211 | | | | Becton Dickinson & Co | | | 354,783 | |
263 | | * | | BioScrip, Inc | | | 1,946 | |
97 | | * | | Brookdale Senior Living, Inc | | | 2,637 | |
527 | | * | | Centene Corp | | | 31,067 | |
188 | | * | | Cerner Corp | | | 10,479 | |
41 | | | | Chemed Corp | | | 3,142 | |
1,900 | | | | Cigna Corp | | | 166,212 | |
55 | | | | Dentsply International, Inc | | | 2,666 | |
121 | | * | | Edwards Lifesciences Corp | | | 7,957 | |
220 | | * | | ExamWorks Group, Inc | | | 6,571 | |
85 | | * | | Greatbatch, Inc | | | 3,760 | |
147 | | * | | Henry Schein, Inc | | | 16,796 | |
84 | | * | | HMS Holdings Corp | | | 1,909 | |
1,218 | | | | Humana, Inc | | | 125,722 | |
418 | | * | | Idexx Laboratories, Inc | | | 44,463 | |
33 | | | | Invacare Corp | | | 766 | |
599 | | * | | Inverness Medical Innovations, Inc | | | 21,684 | |
548 | | * | | LifePoint Hospitals, Inc | | | 28,956 | |
7,993 | | | | Medtronic, Inc | | | 458,718 | |
534 | | * | | Molina Healthcare, Inc | | | 18,557 | |
70 | | * | | MWI Veterinary Supply, Inc | | | 11,941 | |
26
TIAA-CREF LIFE FUNDS - Social Choice Equity Fund
| | | | | | | | |
SHARES | | | | COMPANY | | VALUE | |
| | | | | | | | |
61 | | | | Owens & Minor, Inc | | $ | 2,230 | |
807 | | | | Patterson Cos, Inc | | | 33,248 | |
35 | | * | | Sirona Dental Systems, Inc | | | 2,457 | |
193 | | * | | Vocera Communications, Inc | | | 3,013 | |
| | | | | | | | |
| | | | TOTAL HEALTH CARE EQUIPMENT & SERVICES | | | 2,175,657 | |
| | | | | | | | |
| |
HOUSEHOLD & PERSONAL PRODUCTS - 3.3% | | | | |
171 | | | | Avon Products, Inc | | | 2,945 | |
448 | | | | Clorox Co | | | 41,556 | |
7,301 | | | | Colgate-Palmolive Co | | | 476,098 | |
2,902 | | | | Estee Lauder Cos (Class A) | | | 218,579 | |
227 | | | | Herbalife Ltd | | | 17,865 | |
3,401 | | | | Kimberly-Clark Corp | | | 355,268 | |
350 | | * | | Medifast, Inc | | | 9,146 | |
165 | | | | Nu Skin Enterprises, Inc (Class A) | | | 22,806 | |
11,993 | | | | Procter & Gamble Co | | | 976,350 | |
| | | | | | | | |
| | | | TOTAL HOUSEHOLD & PERSONAL PRODUCTS | | | 2,120,613 | |
| | | | | | | | |
| |
INSURANCE - 5.8% | | | | |
3,774 | | | | ACE Ltd | | | 390,722 | |
5,724 | | | | Aflac, Inc | | | 382,363 | |
105 | | | | Arthur J. Gallagher & Co | | | 4,928 | |
1,350 | | | | Aspen Insurance Holdings Ltd | | | 55,768 | |
239 | | | | Axis Capital Holdings Ltd | | | 11,369 | |
8,051 | | * | | Berkshire Hathaway, Inc (Class B) | | | 954,527 | |
3,814 | | | | Chubb Corp | | | 368,547 | |
155 | | | | Endurance Specialty Holdings Ltd | | | 9,094 | |
6,015 | | * | | Genworth Financial, Inc (Class A) | | | 93,413 | |
1,383 | | | | Marsh & McLennan Cos, Inc | | | 66,882 | |
1,181 | | | | Montpelier Re Holdings Ltd | | | 34,367 | |
107 | | | | PartnerRe Ltd | | | 11,281 | |
522 | | | | Platinum Underwriters Holdings Ltd | | | 31,988 | |
138 | | | | Primerica, Inc | | | 5,922 | |
3,673 | | | | Principal Financial Group | | | 181,116 | |
14 | | | | ProAssurance Corp | | | 679 | |
9,695 | | | | Progressive Corp | | | 264,383 | |
425 | | | | Protective Life Corp | | | 21,530 | |
4,873 | | | | Prudential Financial, Inc | | | 449,388 | |
40 | | | | RenaissanceRe Holdings Ltd | | | 3,894 | |
8 | | | | RLI Corp | | | 779 | |
18 | | | | Selective Insurance Group, Inc | | | 487 | |
36 | | | | Stancorp Financial Group, Inc | | | 2,385 | |
124 | | | | Stewart Information Services Corp | | | 4,001 | |
4,362 | | | | Travelers Cos, Inc | | | 394,935 | |
| | | | | | | | |
| | | | TOTAL INSURANCE | | | 3,744,748 | |
| | | | | | | | |
| |
MATERIALS - 4.8% | | | | |
19 | | * | | AEP Industries, Inc | | | 1,004 | |
3,152 | | | | Air Products & Chemicals, Inc | | | 352,331 | |
7,597 | | | | Alcoa, Inc | | | 80,756 | |
1,222 | | * | | Allied Nevada Gold Corp | | | 4,338 | |
1,205 | | | | AMCOL International Corp | | | 40,946 | |
204 | | | | Aptargroup, Inc | | | 13,833 | |
1,830 | | | | Avery Dennison Corp | | | 91,848 | |
611 | | | | Ball Corp | | | 31,564 | |
528 | | | | Bemis Co, Inc | | | 21,627 | |
64 | | | | Carpenter Technology Corp | | | 3,981 | |
456 | | | | Celanese Corp (Series A) | | | 25,221 | |
18 | | * | | Clearwater Paper Corp | | | 945 | |
1,284 | | | | Commercial Metals Co | | | 26,104 | |
110 | | | | Compass Minerals International, Inc | | | 8,805 | |
46 | | | | Domtar Corp | | | 4,340 | |
344 | | | | Eastman Chemical Co | | | 27,761 | |
3,648 | | | | Ecolab, Inc | | | 380,377 | |
265 | | * | | Flotek Industries, Inc | | | 5,319 | |
27
TIAA-CREF LIFE FUNDS - Social Choice Equity Fund
| | | | | | | | |
SHARES | | | | COMPANY | | VALUE | |
| | | | | | | | |
895 | | | | H.B. Fuller Co | | $ | 46,576 | |
182 | | | | Innophos Holdings, Inc | | | 8,845 | |
72 | | | | International Flavors & Fragrances, Inc | | | 6,191 | |
2,464 | | | | International Paper Co | | | 120,810 | |
97 | | * | | Landec Corp | | | 1,176 | |
1,627 | | * | | Louisiana-Pacific Corp | | | 30,116 | |
4,443 | | | | LyondellBasell Industries AF S.C.A | | | 356,684 | |
168 | | * | | McEwen Mining, Inc | | | 329 | |
2,132 | | | | MeadWestvaco Corp | | | 78,735 | |
392 | | | | Minerals Technologies, Inc | | | 23,547 | |
1,091 | | | | Mosaic Co | | | 51,572 | |
5,545 | | | | Nucor Corp | | | 295,992 | |
634 | | * | | Owens-Illinois, Inc | | | 22,684 | |
3,153 | | | | Praxair, Inc | | | 409,984 | |
22,059 | | * | | Rentech, Inc | | | 38,603 | |
54 | | | | Rock-Tenn Co (Class A) | | | 5,671 | |
124 | | | | Rockwood Holdings, Inc | | | 8,918 | |
1,460 | | | | Royal Gold, Inc | | | 67,262 | |
157 | | | | Sealed Air Corp | | | 5,346 | |
241 | | | | Sherwin-Williams Co | | | 44,223 | |
2,135 | | | | Sigma-Aldrich Corp | | | 200,711 | |
147 | | | | Sonoco Products Co | | | 6,133 | |
586 | | * | | Stillwater Mining Co | | | 7,231 | |
500 | | | | Tredegar Corp | | | 14,405 | |
580 | | | | Valspar Corp | | | 41,348 | |
79 | | | | Wausau Paper Corp | | | 1,002 | |
2,994 | | | | Worthington Industries, Inc | | | 125,987 | |
| | | | | | | | |
| | | | TOTAL MATERIALS | | | 3,141,181 | |
| | | | | | | | |
| |
MEDIA - 3.2% | | | | |
1,779 | | | | Cablevision Systems Corp (Class A) | | | 31,897 | |
156 | | | | Cinemark Holdings, Inc | | | 5,199 | |
1,847 | | * | | Digital Generation, Inc | | | 23,549 | |
4,048 | | * | | Discovery Communications, Inc (Class A) | | | 366,020 | |
592 | | * | | Discovery Communications, Inc (Class C) | | | 49,645 | |
496 | | * | | DreamWorks Animation SKG, Inc (Class A) | | | 17,608 | |
83 | | | | John Wiley & Sons, Inc (Class A) | | | 4,582 | |
2,109 | | * | | Journal Communications, Inc (Class A) | | | 19,635 | |
697 | | * | | Liberty Global plc | | | 58,771 | |
4,043 | | * | | Liberty Global plc (Class A) | | | 359,787 | |
690 | | * | | Liberty Media Corp | | | 101,051 | |
98 | | * | | Madison Square Garden, Inc | | | 5,643 | |
2,863 | | * | | McClatchy Co (Class A) | | | 9,734 | |
2,180 | | | | New York Times Co (Class A) | | | 34,597 | |
149 | | | | Scripps Networks Interactive (Class A) | | | 12,875 | |
3,257 | | | | Time Warner Cable, Inc | | | 441,323 | |
7,105 | | | | Time Warner, Inc | | | 495,361 | |
432 | | | | Valassis Communications, Inc | | | 14,796 | |
| | | | | | | | |
| | | | TOTAL MEDIA | | | 2,052,073 | |
| | | | | | | | |
| |
PHARMACEUTICALS, BIOTECHNOLOGY & LIFE SCIENCES - 7.5% | | | | |
100 | | * | | Affymetrix, Inc | | | 857 | |
3,909 | | | | Agilent Technologies, Inc | | | 223,556 | |
1,059 | | * | | Akorn, Inc | | | 26,083 | |
3,353 | | | | Amgen, Inc | | | 382,778 | |
101 | | * | | Auxilium Pharmaceuticals, Inc | | | 2,095 | |
1,795 | | * | | Biogen Idec, Inc | | | 502,151 | |
10,998 | | | | Bristol-Myers Squibb Co | | | 584,544 | |
541 | | * | | Cambrex Corp | | | 9,646 | |
555 | | * | | Cepheid, Inc | | | 25,930 | |
1,354 | | * | | Endo Pharmaceuticals Holdings, Inc | | | 91,341 | |
8,909 | | * | | Gilead Sciences, Inc | | | 669,511 | |
1,131 | | * | | Incyte Corp | | | 57,262 | |
11,763 | | | | Johnson & Johnson | | | 1,077,373 | |
1,420 | | * | | Life Technologies Corp | | | 107,636 | |
28
TIAA-CREF LIFE FUNDS - Social Choice Equity Fund
| | | | | | | | |
SHARES | | | | COMPANY | | VALUE | |
| | | | | | | | |
15,512 | | | | Merck & Co, Inc | | $ | 776,376 | |
2,213 | | * | | Nektar Therapeutics | | | 25,118 | |
1,489 | | | | PDL BioPharma, Inc | | | 12,567 | |
122 | | | | PerkinElmer, Inc | | | 5,030 | |
853 | | * | | Salix Pharmaceuticals Ltd | | | 76,719 | |
839 | | * | | Sangamo Biosciences, Inc | | | 11,654 | |
70 | | | | Techne Corp | | | 6,627 | |
317 | | | | Thermo Electron Corp | | | 35,298 | |
165 | | * | | United Therapeutics Corp | | | 18,658 | |
1,015 | | * | | Vertex Pharmaceuticals, Inc | | | 75,414 | |
94 | | * | | Viropharma, Inc | | | 4,686 | |
2,319 | | * | | Vivus, Inc | | | 21,056 | |
595 | | * | | Waters Corp | | | 59,500 | |
| | | | | | | | |
| | | | TOTAL PHARMACEUTICALS, BIOTECHNOLOGY & LIFE SCIENCES | | | 4,889,466 | |
| | | | | | | | |
| |
REAL ESTATE - 3.3% | | | | |
83 | | | | American Campus Communities, Inc | | | 2,673 | |
4,414 | | | | American Tower Corp | | | 352,325 | |
11,274 | | | | Annaly Capital Management, Inc | | | 112,402 | |
1,114 | | | | Boston Properties, Inc | | | 111,812 | |
1,824 | | * | | CBRE Group, Inc | | | 47,971 | |
165 | | | | Douglas Emmett, Inc | | | 3,843 | |
1,443 | | | | Duke Realty Corp | | | 21,703 | |
29 | | | | Equity One, Inc | | | 651 | |
1,247 | | | | Equity Residential | | | 64,682 | |
178 | | | | Federal Realty Investment Trust | | | 18,051 | |
2,714 | | | | First Industrial Realty Trust, Inc | | | 47,359 | |
5,451 | | | | HCP, Inc | | | 197,980 | |
881 | | | | Health Care REIT, Inc | | | 47,195 | |
89 | | | | Healthcare Realty Trust, Inc | | | 1,897 | |
7,259 | | | | Host Marriott Corp | | | 141,115 | |
15 | | | | Jones Lang LaSalle, Inc | | | 1,536 | |
14 | | | | Kilroy Realty Corp | | | 703 | |
125 | | | | LaSalle Hotel Properties | | | 3,858 | |
325 | | | | Liberty Property Trust | | | 11,008 | |
426 | | | | Macerich Co | | | 25,087 | |
213 | | | | Mid-America Apartment Communities, Inc | | | 12,938 | |
282 | | | | Piedmont Office Realty Trust, Inc | | | 4,659 | |
105 | | | | Post Properties, Inc | | | 4,749 | |
6,774 | | | | Prologis, Inc | | | 250,299 | |
2,664 | | | | RAIT Investment Trust | | | 23,896 | |
930 | | | | Ryman Hospitality Properties | | | 38,855 | |
2,592 | �� | | | Simon Property Group, Inc | | | 394,399 | |
1,347 | | | | Ventas, Inc | | | 77,156 | |
1,399 | | | | Vornado Realty Trust | | | 124,217 | |
17 | | | | Washington REIT | | | 397 | |
| | | | | | | | |
| | | | TOTAL REAL ESTATE | | | 2,145,416 | |
| | | | | | | | |
| |
RETAILING - 4.7% | | | | |
77 | | | | Aaron’s, Inc | | | 2,264 | |
162 | | | | Advance Auto Parts, Inc | | | 17,930 | |
1,224 | | | | American Eagle Outfitters, Inc | | | 17,626 | |
316 | | * | | Ann Taylor Stores Corp | | | 11,553 | |
495 | | * | | AutoZone, Inc | | | 236,580 | |
149 | | * | | Barnes & Noble, Inc | | | 2,227 | |
2,160 | | * | | Bed Bath & Beyond, Inc | | | 173,448 | |
1,674 | | | | Best Buy Co, Inc | | | 66,759 | |
62 | | * | | Cabela’s, Inc | | | 4,133 | |
757 | | * | | Carmax, Inc | | | 35,594 | |
8 | | | | Chico’s FAS, Inc | | | 151 | |
650 | | | | Foot Locker, Inc | | | 26,936 | |
6 | | | | GameStop Corp (Class A) | | | 295 | |
5,189 | | | | Gap, Inc | | | 202,786 | |
45 | | * | | Genesco, Inc | | | 3,288 | |
2,621 | | | | Genuine Parts Co | | | 218,041 | |
29
TIAA-CREF LIFE FUNDS - Social Choice Equity Fund
| | | | | | | | |
SHARES | | | | COMPANY | | VALUE | |
| | | | | | | | |
184 | | | | GNC Holdings, Inc | | $ | 10,755 | |
388 | | | | HSN, Inc | | | 24,172 | |
2,388 | | | | Kohl’s Corp | | | 135,519 | |
7,799 | | * | | Liberty Interactive Corp | | | 228,901 | |
38 | | * | | LKQ Corp | | | 1,250 | |
9,519 | | | | Lowe’s Companies, Inc | | | 471,667 | |
2,077 | | | | Macy’s, Inc | | | 110,912 | |
16 | | | | Men’s Wearhouse, Inc | | | 817 | |
625 | | | | Nordstrom, Inc | | | 38,625 | |
1,890 | | * | | Office Depot, Inc | | | 9,998 | |
73 | | * | | O’Reilly Automotive, Inc | | | 9,396 | |
69 | | * | | Outerwall, Inc | | | 4,642 | |
376 | | | | Petsmart, Inc | | | 27,354 | |
278 | | | | Pier 1 Imports, Inc | | | 6,416 | |
160 | | | | Ross Stores, Inc | | | 11,989 | |
184 | | * | | Sally Beauty Holdings, Inc | | | 5,562 | |
71 | | * | | Shutterfly, Inc | | | 3,616 | |
144 | | | | Signet Jewelers Ltd | | | 11,333 | |
5,903 | | | | Staples, Inc | | | 93,799 | |
6,044 | | | | Target Corp | | | 382,404 | |
135 | | | | Tiffany & Co | | | 12,525 | |
7,126 | | | | TJX Companies, Inc | | | 454,140 | |
7 | | | | Williams-Sonoma, Inc | | | 408 | |
| | | | | | | | |
| | | | TOTAL RETAILING | | | 3,075,811 | |
| | | | | | | | |
| |
SEMICONDUCTORS & SEMICONDUCTOR EQUIPMENT - 2.6% | | | | |
645 | | * | | Advanced Energy Industries, Inc | | | 14,745 | |
652 | | * | | Advanced Micro Devices, Inc | | | 2,523 | |
563 | | | | Analog Devices, Inc | | | 28,674 | |
19,723 | �� | | | Applied Materials, Inc | | | 348,900 | |
125 | | * | | Cirrus Logic, Inc | | | 2,554 | |
174 | | | | Cypress Semiconductor Corp | | | 1,827 | |
27,197 | | | | Intel Corp | | | 706,034 | |
170 | | * | | Lam Research Corp | | | 9,256 | |
111 | | | | Microchip Technology, Inc | | | 4,967 | |
134 | | | | MKS Instruments, Inc | | | 4,012 | |
4,943 | | * | | ON Semiconductor Corp | | | 40,730 | |
706 | | * | | RF Micro Devices, Inc | | | 3,643 | |
910 | | * | | Skyworks Solutions, Inc | | | 25,990 | |
937 | | * | | SunPower Corp | | | 27,932 | |
315 | | * | | Teradyne, Inc | | | 5,550 | |
10,327 | | | | Texas Instruments, Inc | | | 453,459 | |
| | | | | | | | |
| | | | TOTAL SEMICONDUCTORS & SEMICONDUCTOR EQUIPMENT | | | 1,680,796 | |
| | | | | | | | |
| |
SOFTWARE & SERVICES - 9.2% | | | | |
5,486 | | | | Accenture plc | | | 451,059 | |
5,332 | | * | | Adobe Systems, Inc | | | 319,280 | |
313 | | * | | Angie’s List, Inc | | | 4,742 | |
2,001 | | * | | AOL, Inc | | | 93,287 | |
1,937 | | * | | Autodesk, Inc | | | 97,489 | |
1,228 | | | | Broadridge Financial Solutions, Inc | | | 48,531 | |
4,890 | | | | CA, Inc | | | 164,548 | |
191 | | * | | Cadence Design Systems, Inc | | | 2,678 | |
4,203 | | * | | Cognizant Technology Solutions Corp (Class A) | | | 424,419 | |
847 | | | | Compuware Corp | | | 9,495 | |
155 | | | | Convergys Corp | | | 3,263 | |
49 | | | | Factset Research Systems, Inc | | | 5,320 | |
54 | | | | Fair Isaac Corp | | | 3,393 | |
239 | | * | | Fortinet, Inc | | | 4,572 | |
104 | | | | Global Payments, Inc | | | 6,759 | |
1,112 | | * | | Google, Inc (Class A) | | | 1,246,229 | |
883 | | * | | Informatica Corp | | | 36,645 | |
4,831 | | | | International Business Machines Corp | | | 906,151 | |
4,063 | | | | Intuit, Inc | | | 310,088 | |
278 | | * | | Liquidity Services, Inc | | | 6,299 | |
30
TIAA-CREF LIFE FUNDS - Social Choice Equity Fund
| | | | | | | | |
SHARES | | | | COMPANY | | VALUE | |
| | | | | | | | |
55 | | * | | NetSuite, Inc | | $ | 5,666 | |
189 | | * | | NeuStar, Inc (Class A) | | | 9,424 | |
49 | | * | | OpenTable, Inc | | | 3,889 | |
19,339 | | | | Oracle Corp | | | 739,910 | |
2,442 | | * | | QuinStreet, Inc | | | 21,221 | |
6,281 | | * | | Salesforce.com, Inc | | | 346,648 | |
233 | | * | | ServiceSource International LLC | | | 1,953 | |
123 | | * | | SolarWinds, Inc | | | 4,653 | |
9,866 | | | | Symantec Corp | | | 232,640 | |
59 | | * | | Syntel, Inc | | | 5,366 | |
340 | | * | | Teradata Corp | | | 15,467 | |
146 | | * | | Ultimate Software Group, Inc | | | 22,370 | |
150 | | * | | Unisys Corp | | | 5,036 | |
10,275 | | * | | Yahoo!, Inc | | | 415,521 | |
| | | | | | | | |
| | | | TOTAL SOFTWARE & SERVICES | | | 5,974,011 | |
| | | | | | | | |
| |
TECHNOLOGY HARDWARE & EQUIPMENT - 4.5% | | | | |
914 | | * | | Aruba Networks, Inc | | | 16,361 | |
97 | | * | | Avid Technology, Inc | | | 790 | |
41 | | | | Belden CDT, Inc | | | 2,888 | |
147 | | * | | Benchmark Electronics, Inc | | | 3,393 | |
28,486 | | | | Cisco Systems, Inc | | | 639,511 | |
42 | | * | | Cognex Corp | | | 1,604 | |
2,052 | | | | Corning, Inc | | | 36,567 | |
1,868 | | * | | Cray, Inc | | | 51,295 | |
9 | | * | | DTS, Inc | | | 216 | |
17,556 | | | | EMC Corp | | | 441,533 | |
810 | | * | | Finisar Corp | | | 19,375 | |
707 | | * | | Flextronics International Ltd | | | 5,493 | |
293 | | * | | Fusion-io, Inc | | | 2,611 | |
17,027 | | | | Hewlett-Packard Co | | | 476,416 | |
345 | | * | | Ingram Micro, Inc (Class A) | | | 8,094 | |
169 | | | | InterDigital, Inc | | | 4,984 | |
236 | | * | | IPG Photonics Corp | | | 18,316 | |
14 | | * | | Itron, Inc | | | 580 | |
462 | | | | Jabil Circuit, Inc | | | 8,057 | |
449 | | | | Lexmark International, Inc (Class A) | | | 15,948 | |
1,956 | | | | Motorola, Inc | | | 132,030 | |
60 | | * | | Netgear, Inc | | | 1,976 | |
645 | | * | | Oplink Communications, Inc | | | 11,997 | |
340 | | | | Plantronics, Inc | | | 15,793 | |
885 | | * | | Polycom, Inc | | | 9,939 | |
494 | | * | | QLogic Corp | | | 5,844 | |
8,637 | | | | Qualcomm, Inc | | | 641,297 | |
227 | | * | | RealD, Inc | | | 1,939 | |
172 | | * | | Super Micro Computer, Inc | | | 2,951 | |
26 | | * | | Tech Data Corp | | | 1,342 | |
184 | | * | | TTM Technologies, Inc | | | 1,579 | |
87 | | * | | Universal Display Corp | | | 2,989 | |
74 | | * | | Vishay Precision Group, Inc | | | 1,102 | |
27,041 | | | | Xerox Corp | | | 329,089 | |
| | | | | | | | |
| | | | TOTAL TECHNOLOGY HARDWARE & EQUIPMENT | | | 2,913,899 | |
| | | | | | | | |
| |
TELECOMMUNICATION SERVICES - 1.3% | | | | |
9,790 | | | | CenturyTel, Inc | | | 311,811 | |
1,541 | | * | | Cincinnati Bell, Inc | | | 5,486 | |
3,315 | | * | | Crown Castle International Corp | | | 243,420 | |
16,434 | | | | Frontier Communications Corp | | | 76,418 | |
234 | | * | | Level 3 Communications, Inc | | | 7,762 | |
252 | | * | | SBA Communications Corp (Class A) | | | 22,640 | |
9,355 | | * | | Sprint Corp | | | 100,566 | |
674 | | * | | tw telecom inc (Class A) | | | 20,537 | |
5,000 | | * | | Vonage Holdings Corp | | | 16,650 | |
7,573 | | | | Windstream Holdings, Inc | | | 60,433 | |
| | | | | | | | |
| | | | TOTAL TELECOMMUNICATION SERVICES | | | 865,723 | |
| | | | | | | | |
31
TIAA-CREF LIFE FUNDS - Social Choice Equity Fund
| | | | | | | | |
SHARES | | | | COMPANY | | VALUE | |
| | | | | | | | |
TRANSPORTATION - 2.2% | | | | |
89 | | | | Alaska Air Group, Inc | | $ | 6,530 | |
52 | | * | | Allegiant Travel Co | | | 5,483 | |
195 | | * | | Avis Budget Group, Inc | | | 7,882 | |
326 | | | | CH Robinson Worldwide, Inc | | | 19,019 | |
10,716 | | | | CSX Corp | | | 308,299 | |
128 | | | | Expeditors International of Washington, Inc | | | 5,664 | |
34 | | * | | Genesee & Wyoming, Inc (Class A) | | | 3,266 | |
61 | | | | J.B. Hunt Transport Services, Inc | | | 4,715 | |
8 | | * | | Kirby Corp | | | 794 | |
2,629 | | | | Norfolk Southern Corp | | | 244,050 | |
6 | | | | Ryder System, Inc | | | 443 | |
1,575 | | | | Union Pacific Corp | | | 264,600 | |
5,115 | | | | United Parcel Service, Inc (Class B) | | | 537,484 | |
| | | | | | | | |
| | | | TOTAL TRANSPORTATION | | | 1,408,229 | |
| | | | | | | | |
| |
UTILITIES - 3.7% | | | | |
184 | | | | American States Water Co | | | 5,286 | |
102 | | | | American Water Works Co, Inc | | | 4,311 | |
2,528 | | * | | Calpine Corp | | | 49,321 | |
2,497 | | | | Centerpoint Energy, Inc | | | 57,881 | |
3,891 | | | | Cleco Corp | | | 181,398 | |
4,677 | | | | Consolidated Edison, Inc | | | 258,545 | |
1,810 | | | | Duke Energy Corp | | | 124,908 | |
57 | | | | Integrys Energy Group, Inc | | | 3,101 | |
148 | | | | ITC Holdings Corp | | | 14,181 | |
103 | | | | MDU Resources Group, Inc | | | 3,147 | |
591 | | | | MGE Energy, Inc | | | 34,219 | |
291 | | | | New Jersey Resources Corp | | | 13,456 | |
4,575 | | | | NextEra Energy, Inc | | | 391,712 | |
6,308 | | | | NiSource, Inc | | | 207,407 | |
3,345 | | | | Northeast Utilities | | | 141,795 | |
162 | | | | Northwest Natural Gas Co | | | 6,937 | |
1,573 | | | | Oneok, Inc | | | 97,809 | |
8,461 | | | | Pepco Holdings, Inc | | | 161,859 | |
5,350 | | | | PG&E Corp | | | 215,498 | |
2,270 | | | | Piedmont Natural Gas Co, Inc | | | 75,273 | |
88 | | | | Pinnacle West Capital Corp | | | 4,657 | |
2,561 | | | | Sempra Energy | | | 229,875 | |
211 | | | | SJW Corp | | | 6,286 | |
690 | | | | South Jersey Industries, Inc | | | 38,612 | |
449 | | | | TECO Energy, Inc | | | 7,741 | |
77 | | | | UGI Corp | | | 3,192 | |
524 | | | | WGL Holdings, Inc | | | 20,991 | |
414 | | | | Wisconsin Energy Corp | | | 17,115 | |
1,364 | | | | Xcel Energy, Inc | | | 38,110 | |
| | | | | | | | |
| | | | TOTAL UTILITIES | | | 2,414,623 | |
| | | | | | | | |
| | | | TOTAL COMMON STOCKS
(Cost $44,742,366) | | | 64,346,187 | |
| | | | | | | | |
| | | | TOTAL INVESTMENTS - 99.1%
(Cost $44,742,366) | | | 64,346,187 | |
| | | | OTHER ASSETS & LIABILITIES, NET - 0.9% | | | 584,737 | |
| | | | | | | | |
| | | | NET ASSETS - 100.0% | | $ | 64,930,924 | |
| | | | | | | | |
Abbreviation(s):
| REIT | Real Estate Investment Trust |
32
TIAA-CREF LIFE FUNDS - Stock Index Fund
TIAA-CREF LIFE FUNDS
STOCK INDEX FUND
SCHEDULE OF INVESTMENTS
December 31, 2013
| | | | | | | | |
SHARES | | | | COMPANY | | VALUE | |
| | | | | | | | |
COMMON STOCKS - 99.1% | | | | |
| |
AUTOMOBILES & COMPONENTS - 1.1% | | | | |
406 | | | | Allison Transmission Holdings, Inc | | $ | 11,210 | |
1,234 | | * | | American Axle & Manufacturing Holdings, Inc | | | 25,235 | |
2,968 | | | | BorgWarner, Inc | | | 165,941 | |
901 | | | | Cooper Tire & Rubber Co | | | 21,660 | |
2,007 | | | | Dana Holding Corp | | | 39,377 | |
4,101 | | | | Delphi Automotive plc | | | 246,593 | |
376 | | * | | Dorman Products, Inc | | | 21,082 | |
290 | | * | | Drew Industries, Inc | | | 14,848 | |
395 | | * | | Federal Mogul Corp (Class A) | | | 7,773 | |
51,548 | | | | Ford Motor Co | | | 795,386 | |
280 | | * | | Fuel Systems Solutions, Inc | | | 3,884 | |
11,288 | | * | | General Motors Co | | | 461,340 | |
2,027 | | | | Gentex Corp | | | 66,871 | |
507 | | * | | Gentherm, Inc | | | 13,593 | |
3,354 | | | | Goodyear Tire & Rubber Co | | | 79,993 | |
2,938 | | | | Harley-Davidson, Inc | | | 203,427 | |
8,952 | | | | Johnson Controls, Inc | | | 459,238 | |
1,212 | | | | Lear Corp | | | 98,136 | |
850 | | * | | Modine Manufacturing Co | | | 10,897 | |
180 | | | | Remy International, Inc | | | 4,198 | |
202 | | * | | Shiloh Industries, Inc | | | 3,939 | |
355 | | | | Spartan Motors, Inc | | | 2,378 | |
260 | | | | Standard Motor Products, Inc | | | 9,568 | |
627 | | * | | Stoneridge, Inc | | | 7,994 | |
280 | | | | Superior Industries International, Inc | | | 5,776 | |
796 | | * | | Tenneco, Inc | | | 45,030 | |
1,146 | | *,e | | Tesla Motors, Inc | | | 172,335 | |
632 | | | | Thor Industries, Inc | | | 34,905 | |
209 | | * | | Tower International, Inc | | | 4,473 | |
1,479 | | * | | TRW Automotive Holdings Corp | | | 110,023 | |
654 | | * | | Visteon Corp | | | 53,556 | |
353 | | * | | Winnebago Industries, Inc | | | 9,690 | |
| | | | | | | | |
| | | | TOTAL AUTOMOBILES & COMPONENTS | | | 3,210,349 | |
| | | | | | | | |
| |
BANKS - 3.4% | | | | |
180 | | | | 1st Source Corp | | | 5,749 | |
266 | | | | 1st United Bancorp, Inc | | | 2,024 | |
90 | | | | Access National Corp | | | 1,346 | |
98 | | | | American National Bankshares, Inc | | | 2,573 | |
283 | | * | | Ameris Bancorp | | | 5,974 | |
77 | | | | Ames National Corp | | | 1,724 | |
430 | | | | Apollo Residential Mortgage | | | 6,355 | |
112 | | e | | Arrow Financial Corp | | | 2,975 | |
2,146 | | | | Associated Banc-Corp | | | 37,340 | |
1,174 | | | | Astoria Financial Corp | | | 16,236 | |
110 | | e | | Banc of California, Inc | | | 1,475 | |
130 | | | | Bancfirst Corp | | | 7,288 | |
464 | | | | Banco Latinoamericano de Exportaciones S.A. (Class E) | | | 13,001 | |
1,197 | | | | Bancorpsouth, Inc | | | 30,428 | |
838 | | | | Bank Mutual Corp | | | 5,874 | |
762 | | | | Bank of Hawaii Corp | | | 45,065 | |
70 | | | | Bank of Kentucky Financial Corp | | | 2,583 | |
61 | | | | Bank of Marin Bancorp | | | 2,647 | |
442 | | | | Bank of the Ozarks, Inc | | | 25,013 | |
300 | | | | BankFinancial Corp | | | 2,748 | |
845 | | | | BankUnited | | | 27,817 | |
33
TIAA-CREF LIFE FUNDS - Stock Index Fund
| | | | | | | | |
SHARES | | | | COMPANY | | VALUE | |
| | | | | | | | |
203 | | | | Banner Corp | | $ | 9,098 | |
50 | | | | Bar Harbor Bankshares | | | 2,000 | |
9,205 | | | | BB&T Corp | | | 343,531 | |
982 | | | | BBCN Bancorp, Inc | | | 16,291 | |
392 | | * | | Beneficial Mutual Bancorp, Inc | | | 4,281 | |
280 | | | | Berkshire Hills Bancorp, Inc | | | 7,636 | |
233 | | e | | BNC Bancorp | | | 3,994 | |
160 | | * | | BofI Holding, Inc | | | 12,549 | |
410 | | | | BOK Financial Corp | | | 27,191 | |
826 | | | | Boston Private Financial Holdings, Inc | | | 10,424 | |
75 | | | | Bridge Bancorp, Inc | | | 1,950 | |
771 | | | | Brookline Bancorp, Inc | | | 7,378 | |
86 | | | | Bryn Mawr Bank Corp | | | 2,596 | |
40 | | | | C&F Financial Corp | | | 1,827 | |
87 | | | | Camden National Corp | | | 3,673 | |
321 | | * | | Capital Bank Financial Corp | | | 7,303 | |
101 | | * | | Capital City Bank Group, Inc | | | 1,189 | |
2,970 | | | | CapitalSource, Inc | | | 42,679 | |
2,530 | | | | Capitol Federal Financial | | | 30,638 | |
286 | | | | Cardinal Financial Corp | | | 5,148 | |
1,028 | | | | Cathay General Bancorp | | | 27,478 | |
150 | | | | Center Bancorp, Inc | | | 2,814 | |
261 | | | | Centerstate Banks of Florida, Inc | | | 2,649 | |
188 | | | | Central Pacific Financial Corp | | | 3,775 | |
168 | | | | Century Bancorp, Inc | | | 5,586 | |
301 | | | | Charter Financial Corp | | | 3,242 | |
438 | | | | Chemical Financial Corp | | | 13,871 | |
2,829 | | | | CIT Group, Inc | | | 147,476 | |
101 | | | | Citizens & Northern Corp | | | 2,084 | |
262 | | e | | City Holding Co | | | 12,138 | |
647 | | | | City National Corp | | | 51,255 | |
112 | | | | Clifton Savings Bancorp, Inc | | | 1,434 | |
105 | | | | CNB Financial Corp | | | 1,995 | |
395 | | | | CoBiz, Inc | | | 4,724 | |
674 | | | | Columbia Banking System, Inc | | | 18,542 | |
2,545 | | | | Comerica, Inc | | | 120,989 | |
1,165 | | | | Commerce Bancshares, Inc | | | 52,320 | |
628 | | | | Community Bank System, Inc | | | 24,919 | |
182 | | | | Community Trust Bancorp, Inc | | | 8,219 | |
130 | | * | | CommunityOne Bancorp | | | 1,658 | |
732 | | e | | Cullen/Frost Bankers, Inc | | | 54,483 | |
262 | | * | | Customers Bancorp, Inc | | | 5,361 | |
1,117 | | | | CVB Financial Corp | | | 19,067 | |
309 | | | | Dime Community Bancshares | | | 5,228 | |
268 | | * | | Doral Financial Corp | | | 4,197 | |
288 | | * | | Eagle Bancorp, Inc | | | 8,821 | |
1,835 | | | | East West Bancorp, Inc | | | 64,170 | |
90 | | | | Enterprise Financial Services Corp | | | 1,838 | |
158 | | | | ESB Financial Corp | | | 2,244 | |
197 | | | | ESSA Bancorp, Inc | | | 2,277 | |
1,060 | | | | EverBank Financial Corp | | | 19,440 | |
115 | | | | Federal Agricultural Mortgage Corp (Class C) | | | 3,939 | |
124 | | | | Fidelity Southern Corp | | | 2,060 | |
11,484 | | | | Fifth Third Bancorp | | | 241,509 | |
126 | | | | Financial Institutions, Inc | | | 3,113 | |
174 | | | | First Bancorp (NC) | | | 2,892 | |
906 | | * | | First Bancorp (Puerto Rico) | | | 5,608 | |
107 | | | | First Bancorp, Inc | | | 1,864 | |
625 | | | | First Busey Corp | | | 3,625 | |
139 | | | | First Citizens Bancshares, Inc (Class A) | | | 30,946 | |
1,229 | | | | First Commonwealth Financial Corp | | | 10,840 | |
189 | | | | First Community Bancshares, Inc | | | 3,156 | |
570 | | | | First Connecticut Bancorp | | | 9,188 | |
120 | | | | First Defiance Financial Corp | | | 3,116 | |
40 | | *,e | | First Federal Bancshares of Arkansas, Inc | | | 348 | |
34
TIAA-CREF LIFE FUNDS - Stock Index Fund
| | | | | | | | |
SHARES | | | | COMPANY | | VALUE | |
| | | | | | | | |
747 | | | | First Financial Bancorp | | $ | 13,020 | |
448 | | e | | First Financial Bankshares, Inc | | | 29,711 | |
188 | | | | First Financial Corp | | | 6,873 | |
337 | | | | First Financial Holdings, Inc | | | 22,414 | |
200 | | | | First Financial Northwest, Inc | | | 2,074 | |
3,872 | | | | First Horizon National Corp | | | 45,109 | |
149 | | | | First Interstate Bancsystem, Inc | | | 4,227 | |
557 | | | | First Merchants Corp | | | 12,677 | |
1,807 | | | | First Midwest Bancorp, Inc | | | 31,677 | |
4,523 | | | | First Niagara Financial Group, Inc | | | 48,034 | |
66 | | | | First of Long Island Corp | | | 2,829 | |
1,652 | | | | First Republic Bank | | | 86,482 | |
2,172 | | | | FirstMerit Corp | | | 48,284 | |
255 | | * | | Flagstar Bancorp, Inc | | | 5,003 | |
358 | | | | Flushing Financial Corp | | | 7,411 | |
2,437 | | | | FNB Corp | | | 30,755 | |
185 | | | | Fox Chase Bancorp, Inc | | | 3,215 | |
170 | | * | | Franklin Financial Corp | | | 3,363 | |
2,887 | | | | Fulton Financial Corp | | | 37,762 | |
133 | | | | German American Bancorp, Inc | | | 3,791 | |
860 | | | | Glacier Bancorp, Inc | | | 25,619 | |
135 | | | | Great Southern Bancorp, Inc | | | 4,105 | |
185 | | | | Guaranty Bancorp | | | 2,599 | |
222 | | * | | Hampton Roads Bankshares, Inc | | | 389 | |
1,366 | | | | Hancock Holding Co | | | 50,105 | |
610 | | | | Hanmi Financial Corp | | | 13,353 | |
158 | | | | Heartland Financial USA, Inc | | | 4,549 | |
121 | | | | Heritage Financial Corp | | | 2,070 | |
260 | | * | | Heritage Oaks Bancorp | | | 1,950 | |
20 | | | | Hingham Institution for Savings | | | 1,570 | |
90 | | * | | Home Bancorp, Inc | | | 1,697 | |
532 | | | | Home Bancshares, Inc | | | 19,870 | |
199 | | | | Home Federal Bancorp, Inc | | | 2,965 | |
745 | | | | Home Loan Servicing Solutions Ltd | | | 17,113 | |
108 | | | | HomeStreet, Inc | | | 2,160 | |
265 | | * | | HomeTrust Bancshares, Inc | | | 4,237 | |
75 | | | | Horizon Bancorp | | | 1,900 | |
6,700 | | | | Hudson City Bancorp, Inc | | | 63,181 | |
171 | | | | Hudson Valley Holding Corp | | | 3,480 | |
10,738 | | | | Huntington Bancshares, Inc | | | 103,622 | |
463 | | | | IBERIABANK Corp | | | 29,100 | |
252 | | | | Independent Bank Corp | | | 9,876 | |
674 | | | | International Bancshares Corp | | | 17,787 | |
666 | | | | Investors Bancorp, Inc | | | 17,024 | |
227 | | * | | Kearny Financial Corp | | | 2,640 | |
13,313 | | | | Keycorp | | | 178,660 | |
274 | | | | Lakeland Bancorp, Inc | | | 3,389 | |
350 | | | | Lakeland Financial Corp | | | 13,650 | |
1,830 | | e | | M&T Bank Corp | | | 213,049 | |
216 | | | | MainSource Financial Group, Inc | | | 3,894 | |
661 | | | | MB Financial, Inc | | | 21,212 | |
107 | | | | Mercantile Bank Corp | | | 2,309 | |
60 | | | | Merchants Bancshares, Inc | | | 2,010 | |
119 | | * | | Meridian Interstate Bancorp, Inc | | | 2,687 | |
198 | | | | MetroCorp Bancshares, Inc | | | 2,984 | |
4,168 | | * | | MGIC Investment Corp | | | 35,178 | |
70 | | | | Middleburg Financial Corp | | | 1,263 | |
56 | | | | Midsouth Bancorp, Inc | | | 1,000 | |
90 | | | | MidWestOne Financial Group, Inc | | | 2,448 | |
50 | | * | | NASB Financial, Inc | | | 1,510 | |
684 | | | | National Bank Holdings Corp | | | 14,638 | |
84 | | | | National Bankshares, Inc | | | 3,099 | |
1,529 | | | | National Penn Bancshares, Inc | | | 17,324 | |
243 | | *,e | | Nationstar Mortgage Holdings, Inc | | | 8,981 | |
738 | | | | NBT Bancorp, Inc | | | 19,114 | |
35
TIAA-CREF LIFE FUNDS - Stock Index Fund
| | | | | | | | |
SHARES | | | | COMPANY | | VALUE | |
| | | | | | | | |
5,893 | | e | | New York Community Bancorp, Inc | | $ | 99,297 | |
758 | | | | Northfield Bancorp, Inc | | | 10,006 | |
80 | | | | Northrim BanCorp, Inc | | | 2,099 | |
1,214 | | | | Northwest Bancshares, Inc | | | 17,943 | |
97 | | | | OceanFirst Financial Corp | | | 1,662 | |
1,538 | | * | | Ocwen Financial Corp | | | 85,282 | |
596 | | | | OFG Bancorp | | | 10,335 | |
1,471 | | | | Old National Bancorp | | | 22,609 | |
148 | | * | | OmniAmerican Bancorp, Inc | | | 3,164 | |
670 | | | | Oritani Financial Corp | | | 10,754 | |
154 | | | | Pacific Continental Corp | | | 2,455 | |
208 | | * | | Pacific Premier Bancorp, Inc | | | 3,274 | |
449 | | e | | PacWest Bancorp | | | 18,957 | |
165 | | | | Park National Corp | | | 14,037 | |
360 | | | | Park Sterling Bank | | | 2,570 | |
139 | | | | Peapack Gladstone Financial Corp | | | 2,655 | |
47 | | | | Penns Woods Bancorp, Inc | | | 2,397 | |
164 | | * | | Pennsylvania Commerce Bancorp, Inc | | | 3,533 | |
165 | | * | | PennyMac Financial Services, Inc | | | 2,896 | |
75 | | | | Peoples Bancorp, Inc | | | 1,688 | |
4,548 | | | | People��s United Financial, Inc | | | 68,766 | |
400 | | | | Pinnacle Financial Partners, Inc | | | 13,012 | |
7,358 | | | | PNC Financial Services Group, Inc | | | 570,834 | |
1,355 | | * | | Popular, Inc | | | 38,929 | |
147 | | * | | Preferred Bank | | | 2,947 | |
767 | | | | PrivateBancorp, Inc | | | 22,189 | |
789 | | | | Prosperity Bancshares, Inc | | | 50,015 | |
120 | | | | Provident Financial Holdings, Inc | | | 1,800 | |
753 | | | | Provident Financial Services, Inc | | | 14,548 | |
2,407 | | e | | Radian Group, Inc | | | 33,987 | |
18,532 | | | | Regions Financial Corp | | | 183,281 | |
323 | | | | Renasant Corp | | | 10,162 | |
120 | | | | Republic Bancorp, Inc (Class A) | | | 2,945 | |
807 | | | | Rockville Financial, Inc | | | 11,467 | |
300 | | | | S&T Bancorp, Inc | | | 7,593 | |
210 | | | | S.Y. Bancorp, Inc | | | 6,703 | |
250 | | | | Sandy Spring Bancorp, Inc | | | 7,048 | |
180 | | * | | Seacoast Banking Corp of Florida | | | 2,196 | |
87 | | | | Sierra Bancorp | | | 1,400 | |
615 | | * | | Signature Bank | | | 66,063 | |
207 | | | | Simmons First National Corp (Class A) | | | 7,690 | |
216 | | e | | Southside Bancshares, Inc | | | 5,905 | |
383 | | * | | Southwest Bancorp, Inc | | | 6,097 | |
397 | | | | State Bank & Trust Co | | | 7,221 | |
256 | | | | StellarOne Corp | | | 6,162 | |
822 | | | | Sterling Bancorp/DE | | | 10,990 | |
755 | | | | Sterling Financial Corp | | | 25,730 | |
88 | | * | | Suffolk Bancorp | | | 1,830 | |
470 | | * | | Sun Bancorp, Inc | | | 1,654 | |
7,046 | | | | SunTrust Banks, Inc | | | 259,363 | |
3,135 | | | | Susquehanna Bancshares, Inc | | | 40,253 | |
591 | | * | | SVB Financial Group | | | 61,972 | |
13,047 | | | | Synovus Financial Corp | | | 46,969 | |
137 | | * | | Taylor Capital Group, Inc | | | 3,641 | |
2,148 | | | | TCF Financial Corp | | | 34,905 | |
150 | | | | Territorial Bancorp, Inc | | | 3,480 | |
505 | | * | | Texas Capital Bancshares, Inc | | | 31,411 | |
2,222 | | * | | TFS Financial Corp | | | 26,920 | |
434 | | * | | The Bancorp, Inc | | | 7,773 | |
259 | | | | Tompkins Trustco, Inc | | | 13,310 | |
238 | | e | | TowneBank | | | 3,663 | |
80 | | * | | Tree.com, Inc | | | 2,627 | |
171 | | | | Trico Bancshares | | | 4,851 | |
1,974 | | | | Trustco Bank Corp NY | | | 14,173 | |
885 | | | | Trustmark Corp | | | 23,753 | |
493 | | | | UMB Financial Corp | | | 31,690 | |
36
TIAA-CREF LIFE FUNDS - Stock Index Fund
| | | | | | | | |
SHARES | | | | COMPANY | | VALUE | |
| | | | | | | | |
1,383 | | e | | Umpqua Holdings Corp | | $ | 26,471 | |
167 | | e | | Union Bankshares Corp | | | 4,143 | |
1,119 | | e | | United Bankshares, Inc | | | 35,193 | |
526 | | * | | United Community Banks, Inc | | | 9,337 | |
201 | | | | United Financial Bancorp, Inc | | | 3,797 | |
198 | | | | Univest Corp of Pennsylvania | | | 4,095 | |
25,426 | | | | US Bancorp | | | 1,027,210 | |
2,837 | | e | | Valley National Bancorp | | | 28,710 | |
30 | | * | | VantageSouth Bancshares, Inc | | | 158 | |
426 | | | | ViewPoint Financial Group | | | 11,694 | |
253 | | * | | Virginia Commerce Bancorp | | | 4,298 | |
138 | | * | | Walker & Dunlop, Inc | | | 2,231 | |
113 | | | | Washington Banking Co | | | 2,004 | |
1,416 | | | | Washington Federal, Inc | | | 32,979 | |
138 | | | | Washington Trust Bancorp, Inc | | | 5,136 | |
90 | | * | | Waterstone Financial, Inc | | | 999 | |
1,184 | | | | Webster Financial Corp | | | 36,917 | |
65,653 | | | | Wells Fargo & Co | | | 2,980,646 | |
301 | | | | WesBanco, Inc | | | 9,632 | |
189 | | | | West Bancorporation, Inc | | | 2,990 | |
398 | | e | | Westamerica Bancorporation | | | 22,471 | |
965 | | * | | Western Alliance Bancorp | | | 23,025 | |
366 | | | | Westfield Financial, Inc | | | 2,730 | |
2,417 | | | | Wilshire Bancorp, Inc | | | 26,418 | |
461 | | | | Wintrust Financial Corp | | | 21,261 | |
100 | | | | WSFS Financial Corp | | | 7,753 | |
189 | | * | | Yadkin Financial Corp | | | 3,221 | |
2,581 | | | | Zions Bancorporation | | | 77,327 | |
| | | | | | | | |
| | | | TOTAL BANKS | | | 9,730,557 | |
| | | | | | | | |
| |
CAPITAL GOODS - 8.6% | | | | |
9,465 | | | | 3M Co | | | 1,327,466 | |
1,080 | | | | A.O. Smith Corp | | | 58,255 | |
834 | | | | Aaon, Inc | | | 26,646 | |
468 | | | | AAR Corp | | | 13,109 | |
1,371 | | * | | Accuride Corp | | | 5,114 | |
282 | | | | Aceto Corp | | | 7,053 | |
956 | | | | Actuant Corp (Class A) | | | 35,028 | |
572 | | | | Acuity Brands, Inc | | | 62,531 | |
1,391 | | * | | Aecom Technology Corp | | | 40,937 | |
466 | | * | | Aegion Corp | | | 10,201 | |
484 | | * | | Aerovironment, Inc | | | 14,099 | |
1,275 | | | | AGCO Corp | | | 75,467 | |
858 | | | | Air Lease Corp | | | 26,667 | |
892 | | | | Aircastle Ltd | | | 17,091 | |
78 | | | | Alamo Group, Inc | | | 4,734 | |
541 | | | | Albany International Corp (Class A) | | | 19,438 | |
1,298 | | * | | Allegion plc | | | 57,359 | |
429 | | | | Alliant Techsystems, Inc | | | 52,201 | |
296 | | | | Altra Holdings, Inc | | | 10,129 | |
224 | | * | | Ameresco, Inc | | | 2,164 | |
313 | | e | | American Railcar Industries, Inc | | | 14,320 | |
140 | | | | American Science & Engineering, Inc | | | 10,067 | |
2,074 | | *,e | | American Superconductor Corp | | | 3,401 | |
125 | | * | | American Woodmark Corp | | | 4,941 | |
3,194 | | | | Ametek, Inc | | | 168,228 | |
79 | | | | Ampco-Pittsburgh Corp | | | 1,537 | |
410 | | * | | API Technologies Corp | | | 1,398 | |
437 | | | | Apogee Enterprises, Inc | | | 15,693 | |
611 | | | | Applied Industrial Technologies, Inc | | | 29,994 | |
89 | | | | Argan, Inc | | | 2,453 | |
362 | | * | | Armstrong World Industries, Inc | | | 20,855 | |
1,622 | | * | | ArvinMeritor, Inc | | | 16,917 | |
463 | | | | Astec Industries, Inc | | | 17,886 | |
122 | | * | | Astronics Corp | | | 6,222 | |
37
TIAA-CREF LIFE FUNDS - Stock Index Fund
| | | | | | | | |
SHARES | | | | COMPANY | | VALUE | |
| | | | | | | | |
376 | | | | AZZ, Inc | | $ | 18,371 | |
1,463 | | | | Babcock & Wilcox Co | | | 50,020 | |
677 | | | | Barnes Group, Inc | | | 25,936 | |
1,296 | | * | | BE Aerospace, Inc | | | 112,791 | |
752 | | * | | Beacon Roofing Supply, Inc | | | 30,291 | |
570 | | * | | Blount International, Inc | | | 8,248 | |
421 | | * | | Bluelinx Holdings, Inc | | | 821 | |
10,293 | | | | Boeing Co | | | 1,404,892 | |
586 | | | | Brady Corp (Class A) | | | 18,125 | |
600 | | | | Briggs & Stratton Corp | | | 13,056 | |
1,363 | | * | | Builders FirstSource, Inc | | | 9,732 | |
232 | | * | | CAI International, Inc | | | 5,468 | |
7,608 | | *,e | | Capstone Turbine Corp | | | 9,814 | |
833 | | | | Carlisle Cos, Inc | | | 66,140 | |
8,938 | | | | Caterpillar, Inc | | | 811,660 | |
405 | | * | | Chart Industries, Inc | | | 38,734 | |
1,335 | | | | Chicago Bridge & Iron Co NV | | | 110,992 | |
230 | | | | CIRCOR International, Inc | | | 18,579 | |
757 | | | | Clarcor, Inc | | | 48,713 | |
250 | | | | Coleman Cable, Inc | | | 6,555 | |
1,121 | | * | | Colfax Corp | | | 71,396 | |
196 | | * | | Columbus McKinnon Corp | | | 5,319 | |
409 | | | | Comfort Systems USA, Inc | | | 7,930 | |
301 | | * | | Commercial Vehicle Group, Inc | | | 2,188 | |
636 | | | | Crane Co | | | 42,771 | |
262 | | | | Cubic Corp | | | 13,797 | |
2,474 | | | | Cummins, Inc | | | 348,760 | |
654 | | | | Curtiss-Wright Corp | | | 40,698 | |
8,299 | | | | Danaher Corp | | | 640,683 | |
5,422 | | | | Deere & Co | | | 495,191 | |
979 | | * | | DigitalGlobe, Inc | | | 40,286 | |
2,099 | | | | Donaldson Co, Inc | | | 91,223 | |
296 | | | | Douglas Dynamics, Inc | | | 4,979 | |
2,244 | | | | Dover Corp | | | 216,636 | |
139 | | * | | Ducommun, Inc | | | 4,144 | |
124 | | * | | DXP Enterprises, Inc | | | 14,285 | |
596 | | * | | Dycom Industries, Inc | | | 16,563 | |
270 | | | | Dynamic Materials Corp | | | 5,870 | |
6,200 | | | | Eaton Corp | | | 471,944 | |
923 | | | | EMCOR Group, Inc | | | 39,172 | |
9,429 | | | | Emerson Electric Co | | | 661,727 | |
255 | | | | Encore Wire Corp | | | 13,821 | |
404 | | *,e | | Energy Recovery, Inc | | | 2,246 | |
649 | | | | EnerSys | | | 45,488 | |
206 | | * | | Engility Holdings, Inc | | | 6,880 | |
100 | | *,e | | Enphase Energy, Inc | | | 634 | |
277 | | * | | EnPro Industries, Inc | | | 15,969 | |
317 | | | | ESCO Technologies, Inc | | | 10,860 | |
388 | | * | | Esterline Technologies Corp | | | 39,560 | |
2,455 | | | | Exelis, Inc | | | 46,792 | |
4,049 | | | | Fastenal Co | | | 192,368 | |
743 | | * | | Federal Signal Corp | | | 10,885 | |
413 | | * | | Flow International Corp | | | 1,669 | |
1,877 | | | | Flowserve Corp | | | 147,964 | |
2,309 | | | | Fluor Corp | | | 185,390 | |
2,162 | | | | Fortune Brands Home & Security, Inc | | | 98,803 | |
554 | | | | Franklin Electric Co, Inc | | | 24,731 | |
227 | | | | Freightcar America, Inc | | | 6,043 | |
6,474 | | *,e | | FuelCell Energy, Inc | | | 9,128 | |
408 | | * | | Furmanite Corp | | | 4,333 | |
763 | | | | GATX Corp | | | 39,806 | |
794 | | *,e | | GenCorp, Inc | | | 14,308 | |
825 | | | | Generac Holdings, Inc | | | 46,728 | |
640 | | | | General Cable Corp | | | 18,822 | |
4,139 | | | | General Dynamics Corp | | | 395,481 | |
38
TIAA-CREF LIFE FUNDS - Stock Index Fund
| | | | | | | | |
SHARES | | | | COMPANY | | VALUE | |
| | | | | | | | |
140,720 | | | | General Electric Co | | $ | 3,944,382 | |
726 | | * | | Gibraltar Industries, Inc | | | 13,496 | |
278 | | | | Global Brass & Copper Holdings, Inc | | | 4,601 | |
199 | | | | Global Power Equipment Group, Inc | | | 3,894 | |
302 | | | | Gorman-Rupp Co | | | 10,096 | |
825 | | | | Graco, Inc | | | 64,449 | |
1,560 | | *,e | | GrafTech International Ltd | | | 17,519 | |
128 | | | | Graham Corp | | | 4,645 | |
466 | | | | Granite Construction, Inc | | | 16,301 | |
670 | | * | | Great Lakes Dredge & Dock Corp | | | 6,164 | |
419 | | * | | Greenbrier Cos, Inc | | | 13,760 | |
686 | | | | Griffon Corp | | | 9,062 | |
334 | | * | | H&E Equipment Services, Inc | | | 9,896 | |
150 | | | | Hardinge, Inc | | | 2,170 | |
969 | | | | Harsco Corp | | | 27,161 | |
679 | | * | | HD Supply Holdings, Inc | | | 16,303 | |
960 | | | | Heico Corp | | | 55,632 | |
1,310 | | * | | Hexcel Corp | | | 58,544 | |
10,824 | | | | Honeywell International, Inc | | | 988,989 | |
186 | | | | Houston Wire & Cable Co | | | 2,489 | |
778 | | | | Hubbell, Inc (Class B) | | | 84,724 | |
656 | | | | Huntington Ingalls | | | 59,047 | |
78 | | | | Hurco Cos, Inc | | | 1,951 | |
132 | | | | Hyster-Yale Materials Handling, Inc | | | 12,297 | |
1,088 | | | | IDEX Corp | | | 80,349 | |
646 | | * | | II-VI, Inc | | | 11,370 | |
4,954 | | | | Illinois Tool Works, Inc | | | 416,532 | |
3,895 | | | | Ingersoll-Rand plc | | | 239,932 | |
155 | | | | Insteel Industries, Inc | | | 3,523 | |
1,538 | | | | ITT Corp | | | 66,780 | |
1,705 | | * | | Jacobs Engineering Group, Inc | | | 107,398 | |
308 | | | | John Bean Technologies Corp | | | 9,034 | |
1,396 | | e | | Joy Global, Inc | | | 81,652 | |
148 | | | | Kadant, Inc | | | 5,997 | |
380 | | | | Kaman Corp | | | 15,097 | |
1,895 | | | | KBR, Inc | | | 60,432 | |
983 | | | | Kennametal, Inc | | | 51,185 | |
424 | | *,e | | KEYW Holding Corp | | | 5,699 | |
294 | | * | | Kratos Defense & Security Solutions, Inc | | | 2,258 | |
1,217 | | | | L-3 Communications Holdings, Inc | | | 130,049 | |
220 | | *,e | | Layne Christensen Co | | | 3,758 | |
111 | | | | LB Foster Co (Class A) | | | 5,249 | |
702 | | | | Lennox International, Inc | | | 59,712 | |
1,128 | | | | Lincoln Electric Holdings, Inc | | | 80,472 | |
265 | | e | | Lindsay Manufacturing Co | | | 21,929 | |
101 | | * | | LMI Aerospace, Inc | | | 1,489 | |
3,499 | | | | Lockheed Martin Corp | | | 520,161 | |
131 | | | | LSI Industries, Inc | | | 1,136 | |
201 | | * | | Lydall, Inc | | | 3,542 | |
727 | | * | | Manitex International, Inc | | | 11,545 | |
1,843 | | | | Manitowoc Co, Inc | | | 42,979 | |
4,628 | | | | Masco Corp | | | 105,380 | |
844 | | * | | Mastec, Inc | | | 27,616 | |
238 | | * | | Middleby Corp | | | 57,113 | |
115 | | | | Miller Industries, Inc | | | 2,142 | |
595 | | * | | Moog, Inc (Class A) | | | 40,424 | |
1,174 | | * | | MRC Global, Inc | | | 37,873 | |
705 | | | | MSC Industrial Direct Co (Class A) | | | 57,013 | |
447 | | | | Mueller Industries, Inc | | | 28,165 | |
3,673 | | | | Mueller Water Products, Inc (Class A) | | | 34,416 | |
209 | | * | | MYR Group, Inc | | | 5,242 | |
58 | | * | | National Presto Industries, Inc | | | 4,669 | |
755 | | * | | Navistar International Corp | | | 28,833 | |
532 | | * | | NCI Building Systems, Inc | | | 9,331 | |
202 | | | | NN, Inc | | | 4,078 | |
39
TIAA-CREF LIFE FUNDS - Stock Index Fund
| | | | | | | | |
SHARES | | | | COMPANY | | VALUE | |
| | | | | | | | |
814 | | | | Nordson Corp | | $ | 60,480 | |
100 | | * | | Nortek, Inc | | | 7,460 | |
3,020 | | | | Northrop Grumman Corp | | | 346,122 | |
96 | | * | | Northwest Pipe Co | | | 3,625 | |
706 | | * | | Orbital Sciences Corp | | | 16,450 | |
434 | | * | | Orion Marine Group, Inc | | | 5,221 | |
1,154 | | | | Oshkosh Truck Corp | | | 58,139 | |
1,547 | | * | | Owens Corning, Inc | | | 62,994 | |
4,632 | | | | Paccar, Inc | | | 274,075 | |
1,472 | | | | Pall Corp | | | 125,635 | |
1,939 | | | | Parker Hannifin Corp | | | 249,433 | |
338 | | * | | Patrick Industries, Inc | | | 9,778 | |
2,713 | | | | Pentair Ltd | | | 210,719 | |
593 | | * | | Perini Corp | | | 15,596 | |
250 | | * | | Pgt, Inc | | | 2,530 | |
200 | | * | | Pike Electric Corp | | | 2,114 | |
211 | | *,e | | Ply Gem Holdings, Inc | | | 3,804 | |
144 | | * | | PMFG, Inc | | | 1,303 | |
591 | | *,e | | Polypore International, Inc | | | 22,990 | |
94 | | | | Powell Industries, Inc | | | 6,297 | |
249 | | * | | PowerSecure International, Inc | | | 4,275 | |
2,038 | | | | Precision Castparts Corp | | | 548,833 | |
28 | | | | Preformed Line Products Co | | | 2,048 | |
460 | | | | Primoris Services Corp | | | 14,320 | |
222 | | *,e | | Proto Labs, Inc | | | 15,802 | |
450 | | | | Quanex Building Products Corp | | | 8,964 | |
2,673 | | * | | Quanta Services, Inc | | | 84,360 | |
460 | | | | Raven Industries, Inc | | | 18,924 | |
4,437 | | | | Raytheon Co | | | 402,436 | |
517 | | * | | RBC Bearings, Inc | | | 36,578 | |
583 | | | | Regal-Beloit Corp | | | 42,979 | |
2,974 | | *,e | | Revolution Lighting Technologies, Inc | | | 10,186 | |
362 | | * | | Rexnord Corp | | | 9,778 | |
1,820 | | | | Rockwell Automation, Inc | | | 215,051 | |
1,908 | | | | Rockwell Collins, Inc | | | 141,039 | |
1,377 | | | | Roper Industries, Inc | | | 190,962 | |
454 | | * | | Rush Enterprises, Inc (Class A) | | | 13,461 | |
927 | | | | Simpson Manufacturing Co, Inc | | | 34,049 | |
738 | | | | Snap-On, Inc | | | 80,826 | |
426 | | * | | SolarCity Corp | | | 24,205 | |
1,597 | | * | | Spirit Aerosystems Holdings, Inc (Class A) | | | 54,426 | |
643 | | | | SPX Corp | | | 64,049 | |
151 | | | | Standex International Corp | | | 9,495 | |
2,123 | | | | Stanley Works | | | 171,305 | |
133 | | * | | Sterling Construction Co, Inc | | | 1,560 | |
279 | | | | Sun Hydraulics Corp | | | 11,392 | |
444 | | e | | TAL International Group, Inc | | | 25,463 | |
812 | | * | | Taser International, Inc | | | 12,895 | |
241 | | * | | Tecumseh Products Co (Class A) | | | 2,181 | |
466 | | * | | Teledyne Technologies, Inc | | | 42,807 | |
200 | | | | Tennant Co | | | 13,562 | |
1,486 | | | | Terex Corp | | | 62,397 | |
246 | | e | | Textainer Group Holdings Ltd | | | 9,894 | |
3,648 | | | | Textron, Inc | | | 134,100 | |
81 | | *,e | | The ExOne Company | | | 4,897 | |
356 | | * | | Thermon Group Holdings | | | 9,729 | |
1,085 | | | | Timken Co | | | 59,751 | |
887 | | e | | Titan International, Inc | | | 15,948 | |
282 | | *,e | | Titan Machinery, Inc | | | 5,025 | |
795 | | | | Toro Co | | | 50,562 | |
748 | | | | TransDigm Group, Inc | | | 120,443 | |
286 | | * | | Trex Co, Inc | | | 22,746 | |
609 | | * | | Trimas Corp | | | 24,293 | |
1,142 | | | | Trinity Industries, Inc | | | 62,262 | |
680 | | | | Triumph Group, Inc | | | 51,728 | |
100 | | | | Twin Disc, Inc | | | 2,589 | |
40
TIAA-CREF LIFE FUNDS - Stock Index Fund
| | | | | | | | |
SHARES | | | | COMPANY | | VALUE | |
| | | | | | | | |
1,214 | | * | | United Rentals, Inc | | $ | 94,631 | |
12,589 | | | | United Technologies Corp | | | 1,432,628 | |
233 | | | | Universal Forest Products, Inc | | | 12,149 | |
959 | | | | URS Corp | | | 50,817 | |
911 | | * | | USG Corp | | | 25,854 | |
391 | | | | Valmont Industries, Inc | | | 58,306 | |
200 | | * | | Vicor Corp | | | 2,684 | |
835 | | | | W.W. Grainger, Inc | | | 213,276 | |
1,287 | | * | | Wabash National Corp | | | 15,894 | |
766 | | * | | WABCO Holdings, Inc | | | 71,552 | |
367 | | | | Watsco, Inc | | | 35,254 | |
478 | | | | Watts Water Technologies, Inc (Class A) | | | 29,574 | |
578 | | *,e | | WESCO International, Inc | | | 52,638 | |
1,369 | | | | Westinghouse Air Brake Technologies Corp | | | 101,676 | |
880 | | | | Woodward Governor Co | | | 40,137 | |
710 | | * | | Xerium Technologies, Inc | | | 11,708 | |
2,461 | | | | Xylem, Inc | | | 85,151 | |
| | | | | | | | |
| | | | TOTAL CAPITAL GOODS | | | 24,275,205 | |
| | | | | | | | |
| |
COMMERCIAL & PROFESSIONAL SERVICES - 1.0% | | | | |
655 | | | | ABM Industries, Inc | | | 18,726 | |
611 | | e | | Acacia Research (Acacia Technologies) | | | 8,884 | |
1,386 | | * | | ACCO Brands Corp | | | 9,314 | |
217 | | e | | Acorn Energy, Inc | | | 883 | |
335 | | | | Administaff, Inc | | | 12,104 | |
3,151 | | | | ADT Corp | | | 127,521 | |
466 | | * | | Advisory Board Co | | | 29,670 | |
200 | | | | American Ecology Corp | | | 7,438 | |
412 | | * | | ARC Document Solutions, Inc | | | 3,387 | |
97 | | | | Barrett Business Services, Inc | | | 8,996 | |
550 | | | | Brink’s Co | | | 18,777 | |
3,008 | | * | | Casella Waste Systems, Inc (Class A) | | | 17,446 | |
854 | | * | | CBIZ, Inc | | | 7,788 | |
100 | | | | CDI Corp | | | 1,853 | |
131 | | e | | Ceco Environmental Corp | | | 2,118 | |
676 | | *,e | | Cenveo, Inc | | | 2,325 | |
1,396 | | | | Cintas Corp | | | 83,188 | |
890 | | * | | Clean Harbors, Inc | | | 53,364 | |
100 | | * | | Consolidated Graphics, Inc | | | 6,744 | |
1,448 | | * | | Copart, Inc | | | 53,069 | |
451 | | | | Corporate Executive Board Co | | | 34,921 | |
1,641 | | | | Corrections Corp of America | | | 52,627 | |
73 | | | | Courier Corp | | | 1,321 | |
1,387 | | | | Covanta Holding Corp | | | 24,619 | |
167 | | * | | CRA International, Inc | | | 3,307 | |
649 | | | | Deluxe Corp | | | 33,871 | |
535 | | | | Dun & Bradstreet Corp | | | 65,671 | |
236 | | * | | EnerNOC, Inc | | | 4,062 | |
269 | | | | Ennis, Inc | | | 4,761 | |
1,695 | | | | Equifax, Inc | | | 117,108 | |
172 | | | | Exponent, Inc | | | 13,320 | |
148 | | * | | Franklin Covey Co | | | 2,942 | |
571 | | * | | FTI Consulting, Inc | | | 23,491 | |
387 | | | | G & K Services, Inc (Class A) | | | 24,083 | |
889 | | | | Geo Group, Inc | | | 28,644 | |
191 | | * | | GP Strategies Corp | | | 5,690 | |
825 | | | | Healthcare Services Group | | | 23,405 | |
200 | | | | Heidrick & Struggles International, Inc | | | 4,028 | |
380 | | * | | Heritage-Crystal Clean, Inc | | | 7,786 | |
1,006 | | | | Herman Miller, Inc | | | 29,697 | |
567 | | | | HNI Corp | | | 22,017 | |
279 | | * | | Huron Consulting Group, Inc | | | 17,499 | |
209 | | * | | ICF International, Inc | | | 7,254 | |
2,113 | | * | | ICO Global Communications Holdings Ltd | | | 4,247 | |
41
TIAA-CREF LIFE FUNDS - Stock Index Fund
| | | | | | | | |
SHARES | | | | COMPANY | | VALUE | |
| | | | | | | | |
912 | | * | | IHS, Inc (Class A) | | $ | 109,166 | |
1,253 | | * | | Innerworkings, Inc | | | 9,761 | |
897 | | | | Interface, Inc | | | 19,698 | |
110 | | | | Intersections, Inc | | | 857 | |
2,231 | | | | Iron Mountain, Inc | | | 67,711 | |
995 | | | | KAR Auction Services, Inc | | | 29,402 | |
300 | | | | Kelly Services, Inc (Class A) | | | 7,482 | |
366 | | | | Kforce, Inc | | | 7,488 | |
300 | | | | Kimball International, Inc (Class B) | | | 4,509 | |
669 | | | | Knoll, Inc | | | 12,249 | |
641 | | * | | Korn/Ferry International | | | 16,743 | |
1,102 | | | | Manpower, Inc | | | 94,618 | |
274 | | | | McGrath RentCorp | | | 10,905 | |
352 | | | | Mine Safety Appliances Co | | | 18,026 | |
172 | | * | | Mistras Group, Inc | | | 3,591 | |
505 | | * | | Mobile Mini, Inc | | | 20,796 | |
105 | | | | Multi-Color Corp | | | 3,963 | |
631 | | * | | Navigant Consulting, Inc | | | 12,115 | |
2,994 | | | | Nielsen Holdings NV | | | 137,395 | |
113 | | | | NL Industries, Inc | | | 1,263 | |
817 | | *,e | | Odyssey Marine Exploration, Inc | | | 1,650 | |
549 | | * | | On Assignment, Inc | | | 19,171 | |
295 | | * | | Performant Financial Corp | | | 3,039 | |
2,976 | | e | | Pitney Bowes, Inc | | | 69,341 | |
313 | | e | | Quad | | | 8,523 | |
2,354 | | e | | R.R. Donnelley & Sons Co | | | 47,739 | |
3,548 | | | | Republic Services, Inc | | | 117,794 | |
514 | | | | Resources Connection, Inc | | | 7,366 | |
1,973 | | | | Robert Half International, Inc | | | 82,846 | |
772 | | | | Rollins, Inc | | | 23,384 | |
421 | | * | | RPX Corp | | | 7,115 | |
100 | | | | Schawk, Inc (Class A) | | | 1,487 | |
189 | | * | | SP Plus Corp | | | 4,922 | |
1,106 | | | | Steelcase, Inc (Class A) | | | 17,541 | |
1,147 | | * | | Stericycle, Inc | | | 133,247 | |
1,065 | | *,e | | Swisher Hygiene, Inc | | | 548 | |
390 | | * | | Team, Inc | | | 16,513 | |
804 | | * | | Tetra Tech, Inc | | | 22,496 | |
854 | | * | | Towers Watson & Co | | | 108,979 | |
220 | | * | | TRC Cos, Inc | | | 1,571 | |
550 | | * | | TrueBlue, Inc | | | 14,179 | |
224 | | | | Unifirst Corp | | | 23,968 | |
612 | | | | United Stationers, Inc | | | 28,085 | |
2,085 | | * | | Verisk Analytics, Inc | | | 137,026 | |
263 | | | | Viad Corp | | | 7,306 | |
48 | | | | VSE Corp | | | 2,304 | |
326 | | * | | WageWorks, Inc | | | 19,377 | |
1,597 | | | | Waste Connections, Inc | | | 69,677 | |
6,127 | | | | Waste Management, Inc | | | 274,919 | |
279 | | | | West Corp | | | 7,173 | |
| | | | | | | | |
| | | | TOTAL COMMERCIAL & PROFESSIONAL SERVICES | | | 2,896,990 | |
| | | | | | | | |
| |
CONSUMER DURABLES & APPAREL - 1.6% | | | | |
3,782 | | *,e | | American Apparel, Inc | | | 4,652 | |
148 | | | | Arctic Cat, Inc | | | 8,433 | |
140 | | | | Bassett Furniture Industries, Inc | | | 2,139 | |
556 | | *,e | | Beazer Homes USA, Inc | | | 13,578 | |
271 | | *,e | | Black Diamond, Inc | | | 3,612 | |
150 | | e | | Blyth, Inc | | | 1,632 | |
1,238 | | | | Brunswick Corp | | | 57,022 | |
806 | | | | Callaway Golf Co | | | 6,795 | |
778 | | | | Carter’s, Inc | | | 55,853 | |
72 | | * | | Cavco Industries, Inc | | | 4,946 | |
3,990 | | | | Coach, Inc | | | 223,959 | |
273 | | | | Columbia Sportswear Co | | | 21,499 | |
42
TIAA-CREF LIFE FUNDS - Stock Index Fund
| | | | | | | | |
SHARES | | | | COMPANY | | VALUE | |
| | | | | | | | |
120 | | * | | Costa, Inc | | $ | 2,608 | |
1,231 | | * | | CROCS, Inc | | | 19,598 | |
46 | | | | CSS Industries, Inc | | | 1,319 | |
110 | | | | Culp, Inc | | | 2,249 | |
474 | | * | | Deckers Outdoor Corp | | | 40,034 | |
3,689 | | * | | DR Horton, Inc | | | 82,338 | |
279 | | e | | Ethan Allen Interiors, Inc | | | 8,487 | |
539 | | * | | EveryWare Global, Inc | | | 4,463 | |
1,572 | | * | | Fifth & Pacific Cos, Inc | | | 50,414 | |
60 | | | | Flexsteel Industries, Inc | | | 1,844 | |
683 | | * | | Fossil Group, Inc | | | 81,919 | |
1,610 | | e | | Garmin Ltd | | | 74,414 | |
271 | | * | | G-III Apparel Group Ltd | | | 19,997 | |
1,270 | | | | Hanesbrands, Inc | | | 89,243 | |
932 | | | | Harman International Industries, Inc | | | 76,284 | |
1,546 | | | | Hasbro, Inc | | | 85,045 | |
477 | | * | | Helen of Troy Ltd | | | 23,616 | |
140 | | | | Hooker Furniture Corp | | | 2,335 | |
1,946 | | *,e | | Hovnanian Enterprises, Inc (Class A) | | | 12,883 | |
784 | | * | | Iconix Brand Group, Inc | | | 31,125 | |
429 | | * | | iRobot Corp | | | 14,916 | |
257 | | e | | Jakks Pacific, Inc | | | 1,730 | |
1,721 | | * | | Jarden Corp | | | 105,583 | |
1,084 | | | | Jones Apparel Group, Inc | | | 16,217 | |
1,193 | | e | | KB Home | | | 21,808 | |
978 | | | | La-Z-Boy, Inc | | | 30,318 | |
636 | | *,e | | Leapfrog Enterprises, Inc | | | 5,050 | |
1,876 | | | | Leggett & Platt, Inc | | | 58,043 | |
2,133 | | e | | Lennar Corp (Class A) | | | 84,381 | |
193 | | * | | Libbey, Inc | | | 4,053 | |
112 | | | | Lifetime Brands, Inc | | | 1,762 | |
385 | | * | | M/I Homes, Inc | | | 9,798 | |
4,530 | | | | Mattel, Inc | | | 215,537 | |
441 | | * | | MDC Holdings, Inc | | | 14,218 | |
475 | | * | | Meritage Homes Corp | | | 22,795 | |
2,643 | | * | | Michael Kors Holdings Ltd | | | 214,585 | |
785 | | * | | Mohawk Industries, Inc | | | 116,886 | |
200 | | | | Movado Group, Inc | | | 8,802 | |
66 | | | | Nacco Industries, Inc (Class A) | | | 4,105 | |
398 | | * | | Nautilus, Inc | | | 3,355 | |
3,773 | | | | Newell Rubbermaid, Inc | | | 122,283 | |
9,468 | | | | Nike, Inc (Class B) | | | 744,564 | |
66 | | * | | NVR, Inc | | | 67,717 | |
200 | | | | Oxford Industries, Inc | | | 16,134 | |
161 | | * | | Perry Ellis International, Inc | | | 2,542 | |
1,044 | | | | Phillips-Van Heusen Corp | | | 142,005 | |
881 | | | | Polaris Industries, Inc | | | 128,309 | |
567 | | | | Pool Corp | | | 32,965 | |
5,088 | | | | Pulte Homes, Inc | | | 103,643 | |
2,135 | | * | | Quiksilver, Inc | | | 18,724 | |
887 | | | | Ralph Lauren Corp | | | 156,618 | |
101 | | | | RG Barry Corp | | | 1,949 | |
602 | | | | Ryland Group, Inc | | | 26,133 | |
602 | | * | | Skechers U.S.A., Inc (Class A) | | | 19,944 | |
208 | | * | | Skullcandy, Inc | | | 1,500 | |
1,107 | | *,e | | Smith & Wesson Holding Corp | | | 14,933 | |
1,997 | | * | | Standard-Pacific Corp | | | 18,073 | |
972 | | * | | Steven Madden Ltd | | | 35,565 | |
365 | | e | | Sturm Ruger & Co, Inc | | | 26,678 | |
415 | | * | | Taylor Morrison Home Corp | | | 9,317 | |
798 | | * | | Tempur-Pedic International, Inc | | | 43,060 | |
2,217 | | * | | Toll Brothers, Inc | | | 82,029 | |
186 | | * | | TRI Pointe Homes, Inc | | | 3,707 | |
1,203 | | * | | Tumi Holdings, Inc | | | 27,128 | |
709 | | | | Tupperware Corp | | | 67,022 | |
43
TIAA-CREF LIFE FUNDS - Stock Index Fund
| | | | | | | | |
SHARES | | | | COMPANY | | VALUE | |
| | | | | | | | |
1,101 | | * | | Under Armour, Inc (Class A) | | $ | 96,117 | |
340 | | * | | Unifi, Inc | | | 9,262 | |
166 | | * | | Universal Electronics, Inc | | | 6,326 | |
246 | | * | | Vera Bradley, Inc | | | 5,914 | |
4,596 | | | | VF Corp | | | 286,515 | |
219 | | | | Weyco Group, Inc | | | 6,445 | |
1,073 | | | | Whirlpool Corp | | | 168,311 | |
183 | | * | | William Lyon Homes, Inc | | | 4,052 | |
1,318 | | | | Wolverine World Wide, Inc | | | 44,759 | |
939 | | * | | Zagg, Inc | | | 4,085 | |
| | | | | | | | |
| | | | TOTAL CONSUMER DURABLES & APPAREL | | | 4,612,605 | |
| | | | | | | | |
| |
CONSUMER SERVICES - 2.2% | | | | |
306 | | * | | AFC Enterprises | | | 11,781 | |
224 | | * | | American Public Education, Inc | | | 9,737 | |
1,296 | | * | | Apollo Group, Inc (Class A) | | | 35,407 | |
159 | | * | | Ascent Media Corp (Series A) | | | 13,604 | |
569 | | * | | Bally Technologies, Inc | | | 44,638 | |
298 | | * | | BJ’s Restaurants, Inc | | | 9,256 | |
725 | | * | | Bloomin’ Brands, Inc | | | 17,407 | |
379 | | | | Bob Evans Farms, Inc | | | 19,174 | |
1,324 | | * | | Boyd Gaming Corp | | | 14,908 | |
141 | | * | | Bravo Brio Restaurant Group, Inc | | | 2,294 | |
192 | | * | | Bridgepoint Education, Inc | | | 3,400 | |
167 | | * | | Bright Horizons Family Solutions | | | 6,136 | |
931 | | | | Brinker International, Inc | | | 43,143 | |
246 | | * | | Buffalo Wild Wings, Inc | | | 36,211 | |
1,316 | | | | Burger King Worldwide, Inc | | | 30,084 | |
540 | | * | | Caesars Entertainment Corp | | | 11,632 | |
202 | | * | | Capella Education Co | | | 13,421 | |
812 | | * | | Career Education Corp | | | 4,628 | |
5,652 | | | | Carnival Corp | | | 227,041 | |
200 | | | | Carriage Services, Inc | | | 3,906 | |
288 | | | | CBRL Group, Inc | | | 31,700 | |
272 | | | | CEC Entertainment, Inc | | | 12,044 | |
746 | | | | Cheesecake Factory | | | 36,009 | |
442 | | * | | Chipotle Mexican Grill, Inc (Class A) | | | 235,489 | |
464 | | e | | Choice Hotels International, Inc | | | 22,787 | |
250 | | * | | Churchill Downs, Inc | | | 22,412 | |
215 | | * | | Chuy’s Holdings, Inc | | | 7,744 | |
3,661 | | *,e | | Corinthian Colleges, Inc | | | 6,517 | |
1,863 | | | | Darden Restaurants, Inc | | | 101,291 | |
136 | | * | | Del Frisco’s Restaurant Group, Inc | | | 3,206 | |
949 | | * | | Denny’s Corp | | | 6,823 | |
854 | | | | DeVry, Inc | | | 30,317 | |
247 | | * | | Diamond Resorts International, Inc | | | 4,560 | |
223 | | | | DineEquity, Inc | | | 18,632 | |
767 | | | | Domino’s Pizza, Inc | | | 53,422 | |
1,398 | | | | Dunkin Brands Group, Inc | | | 67,384 | |
519 | | *,e | | Education Management Corp | | | 5,237 | |
200 | | * | | Fiesta Restaurant Group, Inc | | | 10,448 | |
54 | | * | | Graham Holdings Co | | | 35,819 | |
595 | | * | | Grand Canyon Education, Inc | | | 25,942 | |
3,866 | | | | H&R Block, Inc | | | 112,269 | |
856 | | | | Hillenbrand, Inc | | | 25,184 | |
715 | | * | | Hyatt Hotels Corp | | | 35,364 | |
80 | | *,e | | Ignite Restaurant Group, Inc | | | 1,000 | |
3,498 | | | | International Game Technology | | | 63,524 | |
548 | | | | International Speedway Corp (Class A) | | | 19,449 | |
474 | | | | Interval Leisure Group, Inc | | | 14,647 | |
244 | | * | | Isle of Capri Casinos, Inc | | | 2,196 | |
351 | | *,e | | ITT Educational Services, Inc | | | 11,787 | |
678 | | * | | Jack in the Box, Inc | | | 33,914 | |
147 | | * | | Jamba, Inc | | | 1,827 | |
310 | | *,e | | K12, Inc | | | 6,743 | |
44
TIAA-CREF LIFE FUNDS - Stock Index Fund
| | | | | | | | |
SHARES | | | | COMPANY | | VALUE | |
| | | | | | | | |
865 | | * | | Krispy Kreme Doughnuts, Inc | | $ | 16,686 | |
5,291 | | | | Las Vegas Sands Corp | | | 417,301 | |
545 | | *,e | | Life Time Fitness, Inc | | | 25,615 | |
1,262 | | * | | LifeLock, Inc | | | 20,709 | |
288 | | | | Lincoln Educational Services Corp | | | 1,434 | |
140 | | | | Mac-Gray Corp | | | 2,972 | |
200 | | | | Marcus Corp | | | 2,688 | |
3,054 | | | | Marriott International, Inc (Class A) | | | 150,745 | |
345 | | * | | Marriott Vacations Worldwide Corp | | | 18,202 | |
367 | | | | Matthews International Corp (Class A) | | | 15,638 | |
13,736 | | | | McDonald’s Corp | | | 1,332,804 | |
5,009 | | * | | MGM Mirage | | | 117,812 | |
200 | | * | | Monarch Casino & Resort, Inc | | | 4,016 | |
510 | | * | | Morgans Hotel Group Co | | | 4,146 | |
322 | | * | | Multimedia Games, Inc | | | 10,098 | |
30 | | * | | Nathan’s Famous, Inc | | | 1,512 | |
628 | | * | | Norwegian Cruise Line Holdings Ltd | | | 22,275 | |
2,121 | | * | | Orient-Express Hotels Ltd (Class A) | | | 32,048 | |
374 | | * | | Panera Bread Co (Class A) | | | 66,082 | |
526 | | | | Papa John’s International, Inc | | | 23,880 | |
861 | | * | | Penn National Gaming, Inc | | | 12,338 | |
793 | | * | | Pinnacle Entertainment, Inc | | | 20,610 | |
150 | | * | | Red Robin Gourmet Burgers, Inc | | | 11,031 | |
674 | | | | Regis Corp | | | 9,780 | |
2,213 | | | | Royal Caribbean Cruises Ltd | | | 104,940 | |
779 | | * | | Ruby Tuesday, Inc | | | 5,398 | |
473 | | | | Ruth’s Chris Steak House, Inc | | | 6,721 | |
774 | | * | | Scientific Games Corp (Class A) | | | 13,104 | |
402 | | | | SeaWorld Entertainment, Inc | | | 11,566 | |
2,758 | | | | Service Corp International | | | 50,003 | |
1,104 | | | | Six Flags Entertainment Corp | | | 40,649 | |
729 | | * | | Sonic Corp | | | 14,719 | |
897 | | | | Sotheby’s (Class A) | | | 47,720 | |
164 | | | | Speedway Motorsports, Inc | | | 3,255 | |
9,810 | | | | Starbucks Corp | | | 769,006 | |
2,550 | | | | Starwood Hotels & Resorts Worldwide, Inc | | | 202,598 | |
24 | | * | | Steak N Shake Co | | | 12,159 | |
185 | | * | | Steiner Leisure Ltd | | | 9,100 | |
171 | | * | | Strayer Education, Inc | | | 5,894 | |
823 | | | | Texas Roadhouse, Inc (Class A) | | | 22,879 | |
250 | | | | Town Sports International Holdings, Inc | | | 3,690 | |
228 | | | | Universal Technical Institute, Inc | | | 3,171 | |
437 | | | | Vail Resorts, Inc | | | 32,876 | |
795 | | | | Weight Watchers International, Inc | | | 26,179 | |
3,949 | | | | Wendy’s | | | 34,435 | |
1,783 | | | | Wyndham Worldwide Corp | | | 131,389 | |
1,043 | | | | Wynn Resorts Ltd | | | 202,561 | |
5,898 | | | | Yum! Brands, Inc | | | 445,948 | |
| | | | | | | | |
| | | | TOTAL CONSUMER SERVICES | | | 6,163,877 | |
| | | | | | | | |
| |
DIVERSIFIED FINANCIALS - 6.5% | | | | |
747 | | * | | Affiliated Managers Group, Inc | | | 162,009 | |
4,010 | | * | | American Capital Ltd | | | 62,716 | |
12,914 | | | | American Express Co | | | 1,171,687 | |
2,644 | | | | Ameriprise Financial, Inc | | | 304,192 | |
2,935 | | | | Apollo Investment Corp | | | 24,889 | |
3,521 | | | | Ares Capital Corp | | | 62,568 | |
167 | | | | Artisan Partners Asset Management, Inc | | | 10,887 | |
145,043 | | | | Bank of America Corp | | | 2,258,320 | |
15,252 | | | | Bank of New York Mellon Corp | | | 532,905 | |
1,263 | | | | BGC Partners, Inc (Class A) | | | 7,654 | |
942 | | | | BlackRock Kelso Capital Corp | | | 8,789 | |
1,816 | | | | BlackRock, Inc | | | 574,709 | |
200 | | | | Calamos Asset Management, Inc (Class A) | | | 2,368 | |
45
TIAA-CREF LIFE FUNDS - Stock Index Fund
| | | | | | | | |
SHARES | | | | COMPANY | | VALUE | |
| | | | | | | | |
7,633 | | | | Capital One Financial Corp | | $ | 584,764 | |
188 | | | | Capital Southwest Corp | | | 6,556 | |
400 | | e | | Cash America International, Inc | | | 15,320 | |
1,112 | | | | CBOE Holdings, Inc | | | 57,780 | |
15,247 | | | | Charles Schwab Corp | | | 396,422 | |
41,283 | | | | Citigroup, Inc | | | 2,151,257 | |
4,368 | | | | CME Group, Inc | | | 342,713 | |
207 | | e | | Cohen & Steers, Inc | | | 8,292 | |
888 | | * | | Cowen Group, Inc | | | 3,472 | |
98 | | * | | Credit Acceptance Corp | | | 12,739 | |
22 | | | | Diamond Hill Investment Group, Inc | | | 2,603 | |
6,909 | | | | Discover Financial Services | | | 386,559 | |
586 | | * | | Dollar Financial Corp | | | 6,710 | |
3,622 | | * | | E*Trade Financial Corp | | | 71,136 | |
1,602 | | | | Eaton Vance Corp | | | 68,550 | |
302 | | *,e | | Encore Capital Group, Inc | | | 15,179 | |
364 | | | | Evercore Partners, Inc (Class A) | | | 21,760 | |
545 | | * | | Ezcorp, Inc (Class A) | | | 6,371 | |
163 | | * | | FBR & Co | | | 4,300 | |
1,318 | | e | | Federated Investors, Inc (Class B) | | | 37,958 | |
149 | | e | | Fidus Investment Corp | | | 3,239 | |
1,653 | | | | Fifth Street Finance Corp | | | 15,290 | |
642 | | | | Financial Engines, Inc | | | 44,606 | |
363 | | * | | First Cash Financial Services, Inc | | | 22,448 | |
64 | | * | | First Marblehead Corp | | | 473 | |
110 | | | | Firsthand Technology Value Fund, Inc | | | 2,549 | |
5,741 | | | | Franklin Resources, Inc | | | 331,428 | |
208 | | | | Friedman Billings Ramsey Group, Inc (Class A) | | | 5,489 | |
482 | | e | | FXCM, Inc | | | 8,599 | |
69 | | | | GAMCO Investors, Inc (Class A) | | | 6,001 | |
704 | | | | GFI Group, Inc | | | 2,753 | |
239 | | | | Gladstone Capital Corp | | | 2,294 | |
252 | | | | Gladstone Investment Corp | | | 2,031 | |
6,299 | | | | Goldman Sachs Group, Inc | | | 1,116,561 | |
450 | | e | | Golub Capital BDC, Inc | | | 8,599 | |
276 | | * | | Green Dot Corp | | | 6,941 | |
354 | | | | Greenhill & Co, Inc | | | 20,511 | |
240 | | *,e | | GSV Capital Corp | | | 2,902 | |
808 | | e | | Hercules Technology Growth Capital, Inc | | | 13,251 | |
409 | | * | | HFF, Inc (Class A) | | | 10,982 | |
80 | | | | Horizon Technology Finance Corp | | | 1,137 | |
987 | | | | ING US, Inc | | | 34,693 | |
610 | | | | Interactive Brokers Group, Inc (Class A) | | | 14,847 | |
1,611 | | | | IntercontinentalExchange Group, Inc | | | 362,346 | |
153 | | * | | International Assets Holding Corp | | | 2,837 | |
405 | | * | | Internet Capital Group, Inc | | | 7,545 | |
5,829 | | | | Invesco Ltd | | | 212,176 | |
524 | | * | | Investment Technology Group, Inc | | | 10,773 | |
5,850 | | e | | iShares Russell 3000 Index Fund | | | 647,302 | |
2,289 | | | | Janus Capital Group, Inc | | | 28,315 | |
173 | | | | JMP Group, Inc | | | 1,280 | |
51,496 | | | | JPMorgan Chase & Co | | | 3,011,486 | |
240 | | e | | KCAP Financial, Inc | | | 1,937 | |
961 | | * | | KCG Holdings, Inc | | | 11,494 | |
1,144 | | * | | Ladenburg Thalmann Financial Services, Inc | | | 3,581 | |
1,683 | | | | Lazard Ltd (Class A) | | | 76,274 | |
1,523 | | | | Legg Mason, Inc | | | 66,220 | |
3,959 | | | | Leucadia National Corp | | | 112,198 | |
741 | | | | LPL Financial Holdings, Inc | | | 34,849 | |
459 | | | | Main Street Capital Corp | | | 15,005 | |
175 | | | | Manning & Napier, Inc | | | 3,089 | |
463 | | | | MarketAxess Holdings, Inc | | | 30,961 | |
102 | | | | Marlin Business Services Corp | | | 2,570 | |
778 | | | | MCG Capital Corp | | | 3,423 | |
175 | | | | Medallion Financial Corp | | | 2,511 | |
46
TIAA-CREF LIFE FUNDS - Stock Index Fund
| | | | | | | | |
SHARES | | | | COMPANY | | VALUE | |
| | | | | | | | |
212 | | | | Medley Capital Corp | | $ | 2,936 | |
2,722 | | | | Moody’s Corp | | | 213,595 | |
20,806 | | | | Morgan Stanley | | | 652,476 | |
1,580 | | * | | MSCI, Inc (Class A) | | | 69,078 | |
407 | | | | MVC Capital, Inc | | | 5,494 | |
1,500 | | | | NASDAQ Stock Market, Inc | | | 59,700 | |
320 | | | | Nelnet, Inc (Class A) | | | 13,485 | |
413 | | | | New Mountain Finance Corp | | | 6,212 | |
341 | | * | | NewStar Financial, Inc | | | 6,060 | |
300 | | | | NGP Capital Resources Co | | | 2,241 | |
120 | | | | Nicholas Financial, Inc | | | 1,889 | |
3,299 | | | | Northern Trust Corp | | | 204,175 | |
116 | | | | Oppenheimer Holdings, Inc | | | 2,874 | |
725 | | | | PennantPark Investment Corp | | | 8,410 | |
639 | | * | | PHH Corp | | | 15,560 | |
272 | | * | | Pico Holdings, Inc | | | 6,286 | |
236 | | * | | Piper Jaffray Cos | | | 9,334 | |
666 | | * | | Portfolio Recovery Associates, Inc | | | 35,191 | |
3,190 | | e | | Prospect Capital Corp | | | 35,792 | |
90 | | | | Pzena Investment Management, Inc (Class A) | | | 1,058 | |
1,719 | | | | Raymond James Financial, Inc | | | 89,715 | |
60 | | * | | Regional Management Corp | | | 2,036 | |
150 | | | | Resource America, Inc (Class A) | | | 1,404 | |
219 | | * | | Safeguard Scientifics, Inc | | | 4,400 | |
1,892 | | | | SEI Investments Co | | | 65,709 | |
5,829 | | | | SLM Corp | | | 153,186 | |
586 | | | | Solar Capital Ltd | | | 13,214 | |
125 | | | | Solar Senior Capital Ltd | | | 2,277 | |
6,376 | | | | State Street Corp | | | 467,935 | |
154 | | | | Stellus Capital Investment Corp | | | 2,302 | |
831 | | * | | Stifel Financial Corp | | | 39,822 | |
289 | | * | | SWS Group, Inc | | | 1,757 | |
3,579 | | | | T Rowe Price Group, Inc | | | 299,813 | |
343 | | | | TCP Capital Corp | | | 5,756 | |
3,381 | | | | TD Ameritrade Holding Corp | | | 103,594 | |
343 | | | | THL Credit, Inc | | | 5,656 | |
692 | | e | | TICC Capital Corp | | | 7,155 | |
517 | | | | Triangle Capital Corp | | | 14,295 | |
80 | | * | | Virtus Investment Partners, Inc | | | 16,004 | |
1,207 | | | | Waddell & Reed Financial, Inc (Class A) | | | 78,600 | |
462 | | * | | Walter Investment Management Corp | | | 16,336 | |
61 | | | | Westwood Holdings Group, Inc | | | 3,776 | |
1,321 | | * | | WisdomTree Investments, Inc | | | 23,395 | |
174 | | *,e | | World Acceptance Corp | | | 15,230 | |
| | | | | | | | |
| | | | TOTAL DIVERSIFIED FINANCIALS | | | 18,495,143 | |
| | | | | | | | |
| |
ENERGY - 9.2% | | | | |
2,642 | | * | | Abraxas Petroleum Corp | | | 8,666 | |
30 | | | | Adams Resources & Energy, Inc | | | 2,055 | |
429 | | | | Alon USA Energy, Inc | | | 7,096 | |
3,062 | | * | | Alpha Natural Resources, Inc | | | 21,863 | |
1,985 | | *,e | | Amyris Biotechnologies, Inc | | | 10,501 | |
6,473 | | | | Anadarko Petroleum Corp | | | 513,438 | |
250 | | * | | Antero Resources Corp | | | 15,860 | |
5,227 | | | | Apache Corp | | | 449,208 | |
180 | | * | | APCO Argentina, Inc | | | 2,806 | |
503 | | *,e | | Approach Resources, Inc | | | 9,703 | |
3,374 | | e | | Arch Coal, Inc | | | 15,014 | |
246 | | * | | Athlon Energy, Inc | | | 7,441 | |
814 | | * | | Atwood Oceanics, Inc | | | 43,459 | |
5,653 | | | | Baker Hughes, Inc | | | 312,385 | |
658 | | * | | Basic Energy Services, Inc | | | 10,383 | |
901 | | *,e | | Bill Barrett Corp | | | 24,129 | |
412 | | | | Bolt Technology Corp | | | 9,068 | |
47
TIAA-CREF LIFE FUNDS - Stock Index Fund
| | | | | | | | |
SHARES | | | | COMPANY | | VALUE | |
| | | | | | | | |
517 | | * | | Bonanza Creek Energy, Inc | | $ | 22,474 | |
3,876 | | *,e | | BPZ Energy, Inc | | | 7,054 | |
590 | | | | Bristow Group, Inc | | | 44,285 | |
929 | | *,e | | C&J Energy Services, Inc | | | 21,460 | |
5,530 | | | | Cabot Oil & Gas Corp | | | 214,343 | |
4,328 | | *,e | | Cal Dive International, Inc | | | 8,699 | |
1,747 | | * | | Callon Petroleum Co | | | 11,408 | |
3,191 | | * | | Cameron International Corp | | | 189,960 | |
324 | | e | | CARBO Ceramics, Inc | | | 37,756 | |
714 | | * | | Carrizo Oil & Gas, Inc | | | 31,966 | |
3,265 | | * | | Cheniere Energy, Inc | | | 140,787 | |
7,835 | | | | Chesapeake Energy Corp | | | 212,642 | |
26,242 | | | | Chevron Corp | | | 3,277,888 | |
1,183 | | | | Cimarex Energy Co | | | 124,109 | |
90 | | * | | Clayton Williams Energy, Inc | | | 7,376 | |
839 | | *,e | | Clean Energy Fuels Corp | | | 10,806 | |
755 | | * | | Cloud Peak Energy, Inc | | | 13,590 | |
3,862 | | * | | Cobalt International Energy, Inc | | | 63,530 | |
870 | | | | Comstock Resources, Inc | | | 15,912 | |
1,328 | | * | | Concho Resources, Inc | | | 143,424 | |
16,540 | | | | ConocoPhillips | | | 1,168,551 | |
2,890 | | | | Consol Energy, Inc | | | 109,936 | |
368 | | * | | Contango Oil & Gas Co | | | 17,392 | |
560 | | *,e | | Continental Resources, Inc | | | 63,011 | |
628 | | | | Crosstex Energy, Inc | | | 22,708 | |
212 | | | | CVR Energy, Inc | | | 9,207 | |
213 | | * | | Dawson Geophysical Co | | | 7,204 | |
486 | | | | Delek US Holdings, Inc | | | 16,723 | |
5,212 | | * | | Denbury Resources, Inc | | | 85,633 | |
5,495 | | | | Devon Energy Corp | | | 339,976 | |
904 | | | | Diamond Offshore Drilling, Inc | | | 51,456 | |
393 | | * | | Diamondback Energy, Inc | | | 20,774 | |
1,104 | | * | | Dresser-Rand Group, Inc | | | 65,832 | |
510 | | * | | Dril-Quip, Inc | | | 56,064 | |
1,061 | | * | | Emerald Oil, Inc | | | 8,127 | |
780 | | *,e | | Endeavour International Corp | | | 4,095 | |
915 | | | | Energen Corp | | | 64,736 | |
1,096 | | | | Energy XXI Bermuda Ltd | | | 29,658 | |
3,539 | | | | EOG Resources, Inc | | | 593,986 | |
422 | | * | | EPL Oil & Gas, Inc | | | 12,027 | |
1,667 | | | | Equal Energy Ltd | | | 8,902 | |
1,921 | | | | Equitable Resources, Inc | | | 172,467 | |
272 | | * | | Era Group, Inc | | | 8,394 | |
468 | | | | Evolution Petroleum Corp | | | 5,775 | |
1,522 | | e | | EXCO Resources, Inc | | | 8,082 | |
747 | | * | | Exterran Holdings, Inc | | | 25,547 | |
60,436 | | d | | Exxon Mobil Corp | | | 6,116,123 | |
3,113 | | * | | FMC Technologies, Inc | | | 162,530 | |
1,851 | | * | | Forest Oil Corp | | | 6,682 | |
772 | | * | | Forum Energy Technologies, Inc | | | 21,817 | |
467 | | | | Frank’s International NV | | | 12,609 | |
743 | | *,e | | Frontline Ltd | | | 2,779 | |
1,633 | | *,e | | FX Energy, Inc | | | 5,977 | |
581 | | | | GasLog Ltd | | | 9,929 | |
1,809 | | * | | Gastar Exploration Ltd | | | 12,518 | |
164 | | * | | Geospace Technologies Corp | | | 15,552 | |
690 | | * | | Global Geophysical Services, Inc | | | 1,111 | |
764 | | e | | Golar LNG Ltd | | | 27,726 | |
555 | | *,e | | Goodrich Petroleum Corp | | | 9,446 | |
569 | | | | Green Plains Renewable Energy, Inc | | | 11,033 | |
190 | | | | Gulf Island Fabrication, Inc | | | 4,412 | |
359 | | | | Gulfmark Offshore, Inc | | | 16,920 | |
1,126 | | * | | Gulfport Energy Corp | | | 71,107 | |
4,352 | | *,e | | Halcon Resources Corp | | | 16,799 | |
649 | | | | Hallador Petroleum Co | | | 5,231 | |
48
TIAA-CREF LIFE FUNDS - Stock Index Fund
| | | | | | | | |
SHARES | | | | COMPANY | | VALUE | |
| | | | | | | | |
11,453 | | | | Halliburton Co | | $ | 581,240 | |
1,541 | | * | | Helix Energy Solutions Group, Inc | | | 35,720 | |
1,306 | | | | Helmerich & Payne, Inc | | | 109,808 | |
2,303 | | * | | Hercules Offshore, Inc | | | 15,039 | |
3,937 | | | | Hess Corp | | | 326,771 | |
2,758 | | | | Holly Corp | | | 137,045 | |
613 | | * | | Hornbeck Offshore Services, Inc | | | 30,178 | |
3,120 | | * | | ION Geophysical Corp | | | 10,296 | |
13 | | *,e | | Isramco, Inc | | | 1,652 | |
322 | | * | | Jones Energy, Inc (Class A) | | | 4,663 | |
2,635 | | * | | Key Energy Services, Inc | | | 20,816 | |
8,686 | | | | Kinder Morgan, Inc | | | 312,696 | |
1,319 | | *,e | | KiOR, Inc (Class A) | | | 2,216 | |
185 | | | | Knightsbridge Tankers Ltd | | | 1,700 | |
3,714 | | * | | Kodiak Oil & Gas Corp | | | 41,634 | |
1,636 | | * | | Kosmos Energy LLC | | | 18,290 | |
3,066 | | *,e,m | | L&L Energy, Inc | | | 4,599 | |
747 | | * | | Laredo Petroleum Holdings, Inc | | | 20,684 | |
3,031 | | *,e | | Magnum Hunter Resources Corp | | | 22,157 | |
9,298 | | | | Marathon Oil Corp | | | 328,219 | |
4,240 | | | | Marathon Petroleum Corp | | | 388,935 | |
1,143 | | * | | Matador Resources Co | | | 21,306 | |
440 | | * | | Matrix Service Co | | | 10,767 | |
2,913 | | *,e | | McDermott International, Inc | | | 26,683 | |
783 | | *,e | | Midstates Petroleum Co, Inc | | | 5,183 | |
1,226 | | *,e | | Miller Petroleum, Inc | | | 8,631 | |
120 | | * | | Mitcham Industries, Inc | | | 2,125 | |
2,523 | | | | Murphy Oil Corp | | | 163,692 | |
4,057 | | | | Nabors Industries Ltd | | | 68,928 | |
5,535 | | | | National Oilwell Varco, Inc | | | 440,199 | |
351 | | * | | Natural Gas Services Group, Inc | | | 9,677 | |
1,843 | | * | | Newfield Exploration Co | | | 45,393 | |
1,250 | | * | | Newpark Resources, Inc | | | 15,363 | |
4,703 | | | | Noble Energy, Inc | | | 320,321 | |
319 | | e | | Nordic American Tanker Shipping | | | 3,094 | |
911 | | * | | Northern Oil And Gas, Inc | | | 13,729 | |
479 | | *,e | | Nuverra Environmental Solutions, Inc | | | 8,042 | |
1,306 | | * | | Oasis Petroleum, Inc | | | 61,343 | |
10,919 | | | | Occidental Petroleum Corp | | | 1,038,397 | |
1,376 | | | | Oceaneering International, Inc | | | 108,539 | |
721 | | * | | Oil States International, Inc | | | 73,340 | |
85 | | | | Panhandle Oil and Gas, Inc (Class A) | | | 2,840 | |
1,722 | | * | | Parker Drilling Co | | | 14,000 | |
1,923 | | | | Patterson-UTI Energy, Inc | | | 48,690 | |
332 | | e | | PBF Energy, Inc | | | 10,445 | |
540 | | * | | PDC Energy, Inc | | | 28,739 | |
3,699 | | | | Peabody Energy Corp | | | 72,241 | |
1,680 | | * | | Penn Virginia Corp | | | 15,842 | |
815 | | * | | Petroquest Energy, Inc | | | 3,521 | |
149 | | * | | PHI, Inc | | | 6,467 | |
8,265 | | | | Phillips 66 | | | 637,479 | |
1,260 | | * | | Pioneer Energy Services Corp | | | 10,093 | |
1,821 | | | | Pioneer Natural Resources Co | | | 335,191 | |
2,264 | | | | Questar Market Resources, Inc | | | 69,392 | |
2,381 | | *,e | | Quicksilver Resources, Inc | | | 7,310 | |
2,070 | | | | Range Resources Corp | | | 174,522 | |
376 | | * | | Renewable Energy Group, Inc | | | 4,309 | |
1,056 | | *,e | | Resolute Energy Corp | | | 9,536 | |
727 | | * | | Rex Energy Corp | | | 14,329 | |
92 | | * | | Rex Stores Corp | | | 4,113 | |
354 | | * | | RigNet, Inc | | | 16,967 | |
851 | | * | | Rosetta Resources, Inc | | | 40,882 | |
1,533 | | * | | Rowan Cos plc | | | 54,207 | |
1,354 | | e | | RPC, Inc | | | 24,169 | |
717 | | *,e | | Sanchez Energy Corp | | | 17,574 | |
49
TIAA-CREF LIFE FUNDS - Stock Index Fund
| | | | | | | | |
SHARES | | | | COMPANY | | VALUE | |
| | | | | | | | |
7,671 | | *,e | | SandRidge Energy, Inc | | $ | 46,563 | |
17,736 | | | | Schlumberger Ltd | | | 1,598,191 | |
2,117 | | | | Scorpio Tankers, Inc | | | 24,959 | |
272 | | * | | SEACOR Holdings, Inc | | | 24,806 | |
4,780 | | e | | Seadrill Ltd | | | 196,362 | |
666 | | | | SemGroup Corp | | | 43,443 | |
1,204 | | e | | Ship Finance International Ltd | | | 19,722 | |
1,127 | | *,e | | Solazyme, Inc | | | 12,273 | |
4,435 | | * | | Southwestern Energy Co | | | 174,429 | |
9,074 | | | | Spectra Energy Corp | | | 323,216 | |
844 | | | | St. Mary Land & Exploration Co | | | 70,145 | |
656 | | * | | Stone Energy Corp | | | 22,691 | |
2,001 | | * | | Superior Energy Services | | | 53,247 | |
652 | | *,e | | Swift Energy Co | | | 8,802 | |
1,246 | | * | | Synergy Resources Corp | | | 11,538 | |
467 | | | | Targa Resources Investments, Inc | | | 41,175 | |
480 | | | | Teekay Corp | | | 23,045 | |
800 | | e | | Teekay Tankers Ltd (Class A) | | | 3,144 | |
746 | | * | | Tesco Corp | | | 14,756 | |
1,780 | | | | Tesoro Corp | | | 104,130 | |
1,305 | | * | | Tetra Technologies, Inc | | | 16,130 | |
784 | | * | | TGC Industries, Inc | | | 5,723 | |
645 | | | | Tidewater, Inc | | | 38,229 | |
1,272 | | *,e | | Triangle Petroleum Corp | | | 10,583 | |
2,216 | | *,e | | Ultra Petroleum Corp | | | 47,976 | |
786 | | * | | Unit Corp | | | 40,573 | |
1,254 | | *,e | | Uranium Energy Corp | | | 2,508 | |
7,767 | | *,e | | Ur-Energy, Inc | | | 10,718 | |
1,418 | | * | | Vaalco Energy, Inc | | | 9,770 | |
7,380 | | | | Valero Energy Corp | | | 371,952 | |
5,036 | | *,e | | Vantage Drilling Co | | | 9,266 | |
927 | | | | W&T Offshore, Inc | | | 14,832 | |
2,335 | | * | | Warren Resources, Inc | | | 7,332 | |
714 | | e | | Western Refining, Inc | | | 30,281 | |
125 | | * | | Westmoreland Coal Co | | | 2,411 | |
1,594 | | * | | Whiting Petroleum Corp | | | 98,621 | |
1,032 | | * | | Willbros Group, Inc | | | 9,721 | |
8,826 | | | | Williams Cos, Inc | | | 340,419 | |
997 | | e | | World Fuel Services Corp | | | 43,031 | |
2,822 | | * | | WPX Energy, Inc | | | 57,512 | |
2,938 | | *,e | | ZaZa Energy Corp | | | 2,808 | |
| | | | | | | | |
| | | | TOTAL ENERGY | | | 26,038,109 | |
| | | | | | | | |
| |
FOOD & STAPLES RETAILING - 2.0% | | | | |
324 | | | | Andersons, Inc | | | 28,891 | |
15 | | | | Arden Group, Inc (Class A) | | | 1,898 | |
496 | | | | Casey’s General Stores, Inc | | | 34,844 | |
300 | | * | | Chefs’ Warehouse Holdings, Inc | | | 8,748 | |
5,948 | | | | Costco Wholesale Corp | | | 707,871 | |
16,355 | | | | CVS Corp | | | 1,170,527 | |
205 | | *,e | | Fairway Group Holdings Corp | | | 3,715 | |
538 | | * | | Fresh Market, Inc | | | 21,789 | |
773 | | | | Harris Teeter Supermarkets, Inc | | | 38,148 | |
100 | | | | Ingles Markets, Inc (Class A) | | | 2,710 | |
6,823 | | | | Kroger Co | | | 269,713 | |
95 | | *,e | | Natural Grocers by Vitamin C | | | 4,033 | |
248 | | * | | Pantry, Inc | | | 4,161 | |
319 | | | | Pricesmart, Inc | | | 36,857 | |
10,341 | | * | | Rite Aid Corp | | | 52,325 | |
245 | | e | | Roundy’s, Inc | | | 2,416 | |
3,058 | | | | Safeway, Inc | | | 99,599 | |
626 | | | | Spartan Stores, Inc | | | 15,199 | |
294 | | * | | Sprouts Farmers Market, Inc | | | 11,298 | |
2,809 | | *,e | | Supervalu, Inc | | | 20,478 | |
238 | | * | | Susser Holdings Corp | | | 15,587 | |
50
TIAA-CREF LIFE FUNDS - Stock Index Fund
| | | | | | | | |
SHARES | | | | COMPANY | | VALUE | |
| | | | | | | | |
8,330 | | | | Sysco Corp | | $ | 300,713 | |
668 | | * | | United Natural Foods, Inc | | | 50,360 | |
77 | | | | Village Super Market (Class A) | | | 2,388 | |
12,841 | | | | Walgreen Co | | | 737,587 | |
22,007 | | | | Wal-Mart Stores, Inc | | | 1,731,731 | |
228 | | | | Weis Markets, Inc | | | 11,984 | |
4,865 | | | | Whole Foods Market, Inc | | | 281,343 | |
| | | | | | | | |
| | | | TOTAL FOOD & STAPLES RETAILING | | | 5,666,913 | |
| | | | | | | | |
| |
FOOD, BEVERAGE & TOBACCO - 4.5% | | | | |
100 | | | | Alico, Inc | | | 3,887 | |
2,325 | | * | | Alliance One International, Inc | | | 7,091 | |
26,843 | | | | Altria Group, Inc | | | 1,030,503 | |
178 | | *,e | | Annie’s, Inc | | | 7,661 | |
8,810 | | | | Archer Daniels Midland Co | | | 382,354 | |
743 | | | | B&G Foods, Inc (Class A) | | | 25,195 | |
2,097 | | | | Beam, Inc | | | 142,722 | |
133 | | * | | Boston Beer Co, Inc (Class A) | | | 32,158 | |
718 | | * | | Boulder Brands, Inc | | | 11,388 | |
2,080 | | | | Brown-Forman Corp (Class B) | | | 157,186 | |
2,013 | | | | Bunge Ltd | | | 165,287 | |
271 | | | | Calavo Growers, Inc | | | 8,200 | |
200 | | | | Cal-Maine Foods, Inc | | | 12,046 | |
2,303 | | e | | Campbell Soup Co | | | 99,674 | |
536 | | * | | Chiquita Brands International, Inc | | | 6,271 | |
77 | | | | Coca-Cola Bottling Co Consolidated | | | 5,636 | |
51,464 | | | | Coca-Cola Co | | | 2,125,978 | |
3,596 | | | | Coca-Cola Enterprises, Inc | | | 158,692 | |
5,649 | | | | ConAgra Foods, Inc | | | 190,371 | |
1,990 | | * | | Constellation Brands, Inc (Class A) | | | 140,056 | |
1,888 | | * | | Darling International, Inc | | | 39,421 | |
1,170 | | * | | Dean Foods Co | | | 20,112 | |
262 | | * | | Diamond Foods, Inc | | | 6,770 | |
2,677 | | | | Dr Pepper Snapple Group, Inc | | | 130,423 | |
200 | | * | | Farmer Bros Co | | | 4,652 | |
2,326 | | | | Flowers Foods, Inc | | | 49,939 | |
603 | | | | Fresh Del Monte Produce, Inc | | | 17,065 | |
8,411 | | | | General Mills, Inc | | | 419,793 | |
2,022 | | *,e | | Green Mountain Coffee Roasters, Inc | | | 152,823 | |
38 | | | | Griffin Land & Nurseries, Inc (Class A) | | | 1,268 | |
490 | | * | | Hain Celestial Group, Inc | | | 44,482 | |
1,967 | | | | Hershey Co | | | 191,251 | |
1,613 | | | | Hillshire Brands Co | | | 53,939 | |
1,774 | | | | Hormel Foods Corp | | | 80,132 | |
1,023 | | | | Ingredion, Inc | | | 70,035 | |
170 | | * | | Inventure Foods, Inc | | | 2,254 | |
360 | | | | J&J Snack Foods Corp | | | 31,892 | |
1,408 | | | | J.M. Smucker Co | | | 145,897 | |
100 | | | | John B. Sanfilippo & Son, Inc | | | 2,468 | |
3,385 | | | | Kellogg Co | | | 206,722 | |
8,058 | | | | Kraft Foods Group, Inc | | | 434,487 | |
260 | | | | Lancaster Colony Corp | | | 22,919 | |
870 | | | | Lance, Inc | | | 24,986 | |
101 | | | | Limoneira Co | | | 2,686 | |
5,134 | | | | Lorillard, Inc | | | 260,191 | |
1,852 | | | | McCormick & Co, Inc | | | 127,640 | |
2,651 | | | | Mead Johnson Nutrition Co | | | 222,048 | |
1,834 | | | | Molson Coors Brewing Co (Class B) | | | 102,979 | |
23,831 | | | | Mondelez International, Inc | | | 841,234 | |
1,883 | | * | | Monster Beverage Corp | | | 127,611 | |
129 | | * | | National Beverage Corp | | | 2,601 | |
245 | | * | | Omega Protein Corp | | | 3,011 | |
20,966 | | | | PepsiCo, Inc | | | 1,738,920 | |
22,153 | | | | Philip Morris International, Inc | | | 1,930,191 | |
707 | | * | | Pilgrim’s Pride Corp | | | 11,489 | |
51
TIAA-CREF LIFE FUNDS - Stock Index Fund
| | | | | | | | |
SHARES | | | | COMPANY | | VALUE | |
| | | | | | | | |
437 | | | | Pinnacle Foods, Inc | | $ | 12,000 | |
430 | | * | | Post Holdings, Inc | | | 21,186 | |
4,299 | | | | Reynolds American, Inc | | | 214,907 | |
507 | | | | Sanderson Farms, Inc | | | 36,671 | |
4 | | * | | Seaboard Corp | | | 11,180 | |
232 | | * | | Seneca Foods Corp | | | 7,399 | |
215 | | *,e | | Synutra International, Inc | | | 1,909 | |
412 | | e | | Tootsie Roll Industries, Inc | | | 13,407 | |
511 | | * | | TreeHouse Foods, Inc | | | 35,218 | |
3,645 | | | | Tyson Foods, Inc (Class A) | | | 121,962 | |
465 | | e | | Universal Corp | | | 25,389 | |
877 | | e | | Vector Group Ltd | | | 14,357 | |
1,817 | | * | | WhiteWave Foods Co (Class A) | | | 41,682 | |
| | | | | | | | |
| | | | TOTAL FOOD, BEVERAGE & TOBACCO | | | 12,793,954 | |
| | | | | | | | |
| |
HEALTH CARE EQUIPMENT & SERVICES - 4.5% | | | | |
247 | | * | | Abaxis, Inc | | | 9,885 | |
21,220 | | | | Abbott Laboratories | | | 813,363 | |
400 | | * | | Abiomed, Inc | | | 10,696 | |
672 | | * | | Acadia Healthcare Co, Inc | | | 31,806 | |
716 | | *,e | | Accretive Health, Inc | | | 6,559 | |
682 | | *,e | | Accuray, Inc | | | 5,940 | |
5,336 | | | | Aetna, Inc | | | 365,996 | |
489 | | * | | Air Methods Corp | | | 28,523 | |
910 | | * | | Align Technology, Inc | | | 52,006 | |
2,366 | | * | | Allscripts Healthcare Solutions, Inc | | | 36,578 | |
72 | | * | | Almost Family, Inc | | | 2,328 | |
620 | | * | | Alphatec Holdings, Inc | | | 1,246 | |
341 | | * | | Amedisys, Inc | | | 4,989 | |
3,257 | | | | AmerisourceBergen Corp | | | 229,000 | |
602 | | * | | AMN Healthcare Services, Inc | | | 8,849 | |
451 | | * | | Amsurg Corp | | | 20,710 | |
150 | | | | Analogic Corp | | | 13,284 | |
275 | | * | | Angiodynamics, Inc | | | 4,727 | |
148 | | * | | Anika Therapeutics, Inc | | | 5,648 | |
2,094 | | * | | Antares Pharma, Inc | | | 9,381 | |
325 | | * | | Arthrocare Corp | | | 13,078 | |
481 | | *,e | | athenahealth, Inc | | | 64,694 | |
170 | | * | | AtriCure, Inc | | | 3,176 | |
51 | | | | Atrion Corp | | | 15,109 | |
1,143 | | | | Bard (C.R.), Inc | | | 153,093 | |
7,475 | | | | Baxter International, Inc | | | 519,886 | |
2,703 | | | | Becton Dickinson & Co | | | 298,654 | |
412 | | *,e | | Bio-Reference Labs, Inc | | | 10,522 | |
763 | | * | | BioScrip, Inc | | | 5,646 | |
17,865 | | * | | Boston Scientific Corp | | | 214,737 | |
1,300 | | * | | Brookdale Senior Living, Inc | | | 35,334 | |
625 | | | | Cantel Medical Corp | | | 21,194 | |
517 | | * | | Capital Senior Living Corp | | | 12,403 | |
4,849 | | | | Cardinal Health, Inc | | | 323,962 | |
280 | | * | | Cardiovascular Systems, Inc | | | 9,601 | |
2,866 | | * | | CareFusion Corp | | | 114,124 | |
2,701 | | * | | Catamaran Corp | | | 128,243 | |
707 | | * | | Centene Corp | | | 41,678 | |
4,085 | | * | | Cerner Corp | | | 227,698 | |
449 | | *,e | | Cerus Corp | | | 2,896 | |
281 | | e | | Chemed Corp | | | 21,530 | |
128 | | * | | Chindex International, Inc | | | 2,231 | |
4,011 | | | | Cigna Corp | | | 350,882 | |
1,183 | | * | | Community Health Systems, Inc | | | 46,456 | |
185 | | | | Computer Programs & Systems, Inc | | | 11,435 | |
450 | | | | Conmed Corp | | | 19,125 | |
659 | | | | Cooper Cos, Inc | | | 81,611 | |
180 | | * | | Corvel Corp | | | 8,406 | |
6,572 | | | | Covidien plc | | | 447,553 | |
52
TIAA-CREF LIFE FUNDS - Stock Index Fund
| | | | | | | | |
SHARES | | | | COMPANY | | VALUE | |
| | | | | | | | |
296 | | * | | Cross Country Healthcare, Inc | | $ | 2,954 | |
253 | | | | CryoLife, Inc | | | 2,806 | |
327 | | * | | Cyberonics, Inc | | | 21,422 | |
141 | | * | | Cynosure, Inc (Class A) | | | 3,762 | |
2,597 | | * | | DaVita, Inc | | | 164,572 | |
1,881 | | | | Dentsply International, Inc | | | 91,191 | |
120 | | * | | Derma Sciences, Inc | | | 1,298 | |
874 | | * | | DexCom, Inc | | | 30,948 | |
1,631 | | * | | Edwards Lifesciences Corp | | | 107,255 | |
524 | | * | | Emeritus Corp | | | 11,334 | |
697 | | * | | Endologix, Inc | | | 12,156 | |
270 | | | | Ensign Group, Inc | | | 11,953 | |
263 | | * | | Envision Healthcare Holdings, Inc | | | 9,342 | |
78 | | * | | Exactech, Inc | | | 1,853 | |
338 | | * | | ExamWorks Group, Inc | | | 10,096 | |
11,290 | | * | | Express Scripts Holding Co | | | 793,010 | |
374 | | * | | Five Star Quality Care, Inc | | | 2,053 | |
389 | | * | | GenMark Diagnostics, Inc | | | 5,178 | |
456 | | * | | Gentiva Health Services, Inc | | | 5,659 | |
717 | | * | | Globus Medical, Inc | | | 14,469 | |
269 | | * | | Greatbatch, Inc | | | 11,901 | |
720 | | * | | Haemonetics Corp | | | 30,334 | |
414 | | * | | Hanger Orthopedic Group, Inc | | | 16,287 | |
3,673 | | * | | HCA Holdings, Inc | | | 175,239 | |
3,375 | | * | | Health Management Associates, Inc (Class A) | | | 44,212 | |
1,061 | | * | | Health Net, Inc | | | 31,480 | |
1,191 | | | | Healthsouth Corp | | | 39,684 | |
190 | | * | | HealthStream, Inc | | | 6,226 | |
402 | | * | | Healthways, Inc | | | 6,171 | |
241 | | * | | HeartWare International, Inc | | | 22,644 | |
1,198 | | * | | Henry Schein, Inc | | | 136,883 | |
836 | | | | Hill-Rom Holdings, Inc | | | 34,560 | |
1,092 | | * | | HMS Holdings Corp | | | 24,821 | |
3,527 | | * | | Hologic, Inc | | | 78,828 | |
2,092 | | | | Humana, Inc | | | 215,936 | |
239 | | * | | ICU Medical, Inc | | | 15,227 | |
720 | | * | | Idexx Laboratories, Inc | | | 76,586 | |
702 | | * | | Insulet Corp | | | 26,044 | |
289 | | * | | Integra LifeSciences Holdings Corp | | | 13,788 | |
537 | | * | | Intuitive Surgical, Inc | | | 206,251 | |
316 | | | | Invacare Corp | | | 7,334 | |
1,041 | | * | | Inverness Medical Innovations, Inc | | | 37,684 | |
220 | | * | | IPC The Hospitalist Co, Inc | | | 13,066 | |
613 | | | | Kindred Healthcare, Inc | | | 12,101 | |
1,324 | | * | | Laboratory Corp of America Holdings | | | 120,974 | |
174 | | | | Landauer, Inc | | | 9,154 | |
267 | | * | | LHC Group, Inc | | | 6,419 | |
654 | | * | | LifePoint Hospitals, Inc | | | 34,557 | |
405 | | * | | Magellan Health Services, Inc | | | 24,264 | |
611 | | * | | Masimo Corp | | | 17,860 | |
3,157 | | | | McKesson Corp | | | 509,540 | |
746 | | * | | MedAssets, Inc | | | 14,793 | |
698 | | * | | Medidata Solutions, Inc | | | 42,278 | |
13,823 | | | | Medtronic, Inc | | | 793,302 | |
1,254 | | * | | Merge Healthcare, Inc | | | 2,909 | |
489 | | e | | Meridian Bioscience, Inc | | | 12,973 | |
538 | | * | | Merit Medical Systems, Inc | | | 8,468 | |
349 | | * | | Molina Healthcare, Inc | | | 12,128 | |
161 | | * | | MWI Veterinary Supply, Inc | | | 27,465 | |
212 | | | | National Healthcare Corp | | | 11,429 | |
316 | | * | | Natus Medical, Inc | | | 7,110 | |
451 | | * | | Neogen Corp | | | 20,611 | |
581 | | * | | NuVasive, Inc | | | 18,784 | |
742 | | * | | NxStage Medical, Inc | | | 7,420 | |
1,375 | | | | Omnicare, Inc | | | 82,995 | |
387 | | * | | Omnicell, Inc | | | 9,880 | |
53
TIAA-CREF LIFE FUNDS - Stock Index Fund
| | | | | | | | |
SHARES | | | | COMPANY | | VALUE | |
| | | | | | | | |
609 | | * | | OraSure Technologies, Inc | | $ | 3,831 | |
239 | | * | | Orthofix International NV | | | 5,454 | |
864 | | e | | Owens & Minor, Inc | | | 31,588 | |
1,289 | | | | Patterson Cos, Inc | | | 53,107 | |
1,484 | | * | | Pediatrix Medical Group, Inc | | | 79,216 | |
373 | | * | | PharMerica Corp | | | 8,020 | |
164 | | *,e | | PhotoMedex, Inc | | | 2,124 | |
97 | | * | | Providence Service Corp | | | 2,495 | |
452 | | | | Quality Systems, Inc | | | 9,519 | |
2,169 | | | | Quest Diagnostics, Inc | | | 116,128 | |
333 | | *,e | | Quidel Corp | | | 10,286 | |
1,903 | | e | | Resmed, Inc | | | 89,593 | |
198 | | *,e | | Rockwell Medical Technologies, Inc | | | 2,067 | |
611 | | * | | RTI Biologics, Inc | | | 2,163 | |
1,073 | | | | Select Medical Holdings Corp | | | 12,458 | |
768 | | * | | Sirona Dental Systems, Inc | | | 53,914 | |
246 | | * | | Skilled Healthcare Group, Inc (Class A) | | | 1,183 | |
685 | | * | | Solta Medical, Inc | | | 2,021 | |
526 | | * | | Spectranetics Corp | | | 13,150 | |
3,753 | | | | St. Jude Medical, Inc | | | 232,498 | |
407 | | * | | Staar Surgical Co | | | 6,589 | |
745 | | | | STERIS Corp | | | 35,797 | |
4,620 | | | | Stryker Corp | | | 347,147 | |
147 | | * | | SurModics, Inc | | | 3,585 | |
376 | | * | | Symmetry Medical, Inc | | | 3,790 | |
903 | | * | | Team Health Holdings, Inc | | | 41,132 | |
343 | | *,e | | TearLab Corp | | | 3,204 | |
578 | | | | Teleflex, Inc | | | 54,251 | |
1,361 | | * | | Tenet Healthcare Corp | | | 57,325 | |
748 | | * | | Thoratec Corp | | | 27,377 | |
348 | | * | | Tornier BV | | | 6,539 | |
246 | | * | | Triple-S Management Corp (Class B) | | | 4,782 | |
584 | | *,e | | Unilife Corp | | | 2,570 | |
13,859 | | | | UnitedHealth Group, Inc | | | 1,043,583 | |
417 | | | | Universal American Corp | | | 3,044 | |
1,161 | | | | Universal Health Services, Inc (Class B) | | | 94,343 | |
133 | | | | US Physical Therapy, Inc | | | 4,690 | |
40 | | | | Utah Medical Products, Inc | | | 2,286 | |
1,534 | | * | | Varian Medical Systems, Inc | | | 119,176 | |
200 | | * | | Vascular Solutions, Inc | | | 4,630 | |
1,163 | | * | | VCA Antech, Inc | | | 36,472 | |
275 | | * | | Vocera Communications, Inc | | | 4,293 | |
677 | | *,e | | Volcano Corp | | | 14,792 | |
648 | | * | | WellCare Health Plans, Inc | | | 45,632 | |
3,948 | | | | WellPoint, Inc | | | 364,756 | |
980 | | | | West Pharmaceutical Services, Inc | | | 48,079 | |
456 | | * | | Wright Medical Group, Inc | | | 14,004 | |
245 | | * | | Zeltiq Aesthetics, Inc | | | 4,633 | |
2,395 | | | | Zimmer Holdings, Inc | | | 223,190 | |
| | | | | | | | |
| | | | TOTAL HEALTH CARE EQUIPMENT & SERVICES | | | 12,600,888 | |
| | | | | | | | |
| |
HOUSEHOLD & PERSONAL PRODUCTS - 1.9% | | | | |
5,566 | | | | Avon Products, Inc | | | 95,847 | |
798 | | * | | Central Garden and Pet Co (Class A) | | | 5,386 | |
1,950 | | | | Church & Dwight Co, Inc | | | 129,246 | |
1,757 | | | | Clorox Co | | | 162,979 | |
12,231 | | | | Colgate-Palmolive Co | | | 797,584 | |
773 | | | | Coty, Inc | | | 11,788 | |
350 | | * | | Elizabeth Arden, Inc | | | 12,407 | |
830 | | | | Energizer Holdings, Inc | | | 89,839 | |
3,015 | | | | Estee Lauder Cos (Class A) | | | 227,090 | |
204 | | | | Female Health Co | | | 1,734 | |
532 | | * | | Harbinger Group, Inc | | | 6,304 | |
1,140 | | e | | Herbalife Ltd | | | 89,718 | |
294 | | | | Inter Parfums, Inc | | | 10,528 | |
54
TIAA-CREF LIFE FUNDS - Stock Index Fund
| | | | | | | | |
SHARES | | | | COMPANY | | VALUE | |
| | | | | | | | |
5,045 | | | | Kimberly-Clark Corp | | $ | 527,001 | |
3,963 | | *,e | | Lifevantage Corp | | | 6,539 | |
152 | | * | | Medifast, Inc | | | 3,972 | |
140 | | | | Nature’s Sunshine Products, Inc | | | 2,425 | |
842 | | | | Nu Skin Enterprises, Inc (Class A) | | | 116,381 | |
127 | | * | | Nutraceutical International Corp | | | 3,401 | |
63 | | | | Oil-Dri Corp of America | | | 2,384 | |
70 | | | | Orchids Paper Products Co | | | 2,299 | |
37,327 | | | | Procter & Gamble Co | | | 3,038,791 | |
716 | | * | | Revlon, Inc (Class A) | | | 17,871 | |
291 | | | | Spectrum Brands, Inc | | | 20,530 | |
5,236 | | *,e | | Star Scientific, Inc | | | 6,074 | |
92 | | *,e | | USANA Health Sciences, Inc | | | 6,953 | |
398 | | | | WD-40 Co | | | 29,723 | |
| | | | | | | | |
| | | | TOTAL HOUSEHOLD & PERSONAL PRODUCTS | | | 5,424,794 | |
| | | | | | | | |
| |
INSURANCE - 4.2% | | | | |
4,670 | | | | ACE Ltd | | | 483,485 | |
6,502 | | | | Aflac, Inc | | | 434,334 | |
220 | | * | | Alleghany Corp | | | 87,991 | |
453 | | | | Allied World Assurance Co Holdings Ltd | | | 51,103 | |
6,518 | | | | Allstate Corp | | | 355,492 | |
587 | | * | | AMBAC Financial Group, Inc | | | 14,417 | |
836 | | | | American Equity Investment Life Holding Co | | | 22,054 | |
1,020 | | | | American Financial Group, Inc | | | 58,874 | |
20,295 | | | | American International Group, Inc | | | 1,036,060 | |
85 | | | | American National Insurance Co | | | 9,736 | |
202 | | | | Amerisafe, Inc | | | 8,532 | |
354 | | e | | Amtrust Financial Services, Inc | | | 11,572 | |
4,351 | | | | Aon plc | | | 365,005 | |
1,780 | | * | | Arch Capital Group Ltd | | | 106,248 | |
411 | | | | Argo Group International Holdings Ltd | | | 19,107 | |
1,771 | | | | Arthur J. Gallagher & Co | | | 83,113 | |
906 | | | | Aspen Insurance Holdings Ltd | | | 37,427 | |
1,096 | | | | Assurant, Inc | | | 72,742 | |
2,211 | | | | Assured Guaranty Ltd | | | 52,157 | |
1,609 | | | | Axis Capital Holdings Ltd | | | 76,540 | |
125 | | | | Baldwin & Lyons, Inc (Class B) | | | 3,415 | |
24,521 | | * | | Berkshire Hathaway, Inc (Class B) | | | 2,907,210 | |
1,536 | | | | Brown & Brown, Inc | | | 48,215 | |
3,571 | | | | Chubb Corp | | | 345,066 | |
2,243 | | | | Cincinnati Financial Corp | | | 117,466 | |
387 | | * | | Citizens, Inc (Class A) | | | 3,386 | |
303 | | | | CNA Financial Corp | | | 12,996 | |
2,903 | | | | Conseco, Inc | | | 51,354 | |
245 | | | | Crawford & Co (Class B) | | | 2,264 | |
143 | | | | Donegal Group, Inc (Class A) | | | 2,274 | |
80 | | | | Eastern Insurance Holdings, Inc | | | 1,959 | |
280 | | * | | eHealth, Inc | | | 13,017 | |
60 | | | | EMC Insurance Group, Inc | | | 1,837 | |
620 | | | | Employers Holdings, Inc | | | 19,623 | |
551 | | | | Endurance Specialty Holdings Ltd | | | 32,327 | |
108 | | * | | Enstar Group Ltd | | | 15,002 | |
531 | | | | Erie Indemnity Co (Class A) | | | 38,827 | |
670 | | | | Everest Re Group Ltd | | | 104,433 | |
155 | | | | FBL Financial Group, Inc (Class A) | | | 6,942 | |
3,338 | | | | Fidelity National Title Group, Inc (Class A) | | | 108,318 | |
1,423 | | | | First American Financial Corp | | | 40,129 | |
6,368 | | * | | Genworth Financial, Inc (Class A) | | | 98,895 | |
327 | | * | | Greenlight Capital Re Ltd (Class A) | | | 11,023 | |
136 | | * | | Hallmark Financial Services | | | 1,208 | |
539 | | | | Hanover Insurance Group, Inc | | | 32,184 | |
5,950 | | | | Hartford Financial Services Group, Inc | | | 215,569 | |
1,326 | | | | HCC Insurance Holdings, Inc | | | 61,182 | |
90 | | e | | HCI Group, Inc | | | 4,815 | |
55
TIAA-CREF LIFE FUNDS - Stock Index Fund
| | | | | | | | |
SHARES | | | | COMPANY | | VALUE | |
| | | | | | | | |
932 | | * | | Health Insurance Innovations, Inc | | $ | 9,423 | |
808 | | * | | Hilltop Holdings, Inc | | | 18,689 | |
467 | | | | Horace Mann Educators Corp | | | 14,729 | |
205 | | | | Infinity Property & Casualty Corp | | | 14,709 | |
20 | | | | Investors Title Co | | | 1,620 | |
77 | | | | Kansas City Life Insurance Co | | | 3,676 | |
614 | | | | Kemper Corp | | | 25,100 | |
3,518 | | | | Lincoln National Corp | | | 181,599 | |
3,940 | | | | Loews Corp | | | 190,066 | |
553 | | | | Maiden Holdings Ltd | | | 6,044 | |
191 | | * | | Markel Corp | | | 110,847 | |
7,686 | | | | Marsh & McLennan Cos, Inc | | | 371,695 | |
1,717 | | * | | MBIA, Inc | | | 20,501 | |
694 | | | | Meadowbrook Insurance Group, Inc | | | 4,830 | |
361 | | | | Mercury General Corp | | | 17,945 | |
11,906 | | | | Metlife, Inc | | | 641,972 | |
751 | | | | Montpelier Re Holdings Ltd | | | 21,854 | |
173 | | | | National Interstate Corp | | | 3,979 | |
27 | | | | National Western Life Insurance Co (Class A) | | | 6,036 | |
149 | | * | | Navigators Group, Inc | | | 9,411 | |
3,288 | | | | Old Republic International Corp | | | 56,784 | |
313 | | | | OneBeacon Insurance Group Ltd (Class A) | | | 4,952 | |
756 | | | | PartnerRe Ltd | | | 79,705 | |
83 | | * | | Phoenix Cos, Inc | | | 5,096 | |
486 | | | | Platinum Underwriters Holdings Ltd | | | 29,782 | |
747 | | | | Primerica, Inc | | | 32,054 | |
3,879 | | | | Principal Financial Group | | | 191,273 | |
800 | | | | ProAssurance Corp | | | 38,784 | |
8,325 | | | | Progressive Corp | | | 227,023 | |
1,036 | | | | Protective Life Corp | | | 52,484 | |
6,062 | | | | Prudential Financial, Inc | | | 559,038 | |
960 | | | | Reinsurance Group of America, Inc (Class A) | | | 74,314 | |
583 | | | | RenaissanceRe Holdings Ltd | | | 56,749 | |
268 | | | | RLI Corp | | | 26,098 | |
200 | | | | Safety Insurance Group, Inc | | | 11,260 | |
656 | | | | Selective Insurance Group, Inc | | | 17,751 | |
628 | | | | Stancorp Financial Group, Inc | | | 41,605 | |
200 | | | | State Auto Financial Corp | | | 4,248 | |
200 | | | | Stewart Information Services Corp | | | 6,454 | |
1,030 | | | | Symetra Financial Corp | | | 19,529 | |
1,281 | | | | Torchmark Corp | | | 100,110 | |
354 | | e | | Tower Group International Ltd | | | 1,197 | |
5,258 | | | | Travelers Cos, Inc | | | 476,059 | |
257 | | * | | United America Indemnity Ltd | | | 6,502 | |
234 | | | | United Fire & Casualty Co | | | 6,706 | |
384 | | | | Universal Insurance Holdings, Inc | | | 5,560 | |
3,525 | | | | UnumProvident Corp | | | 123,657 | |
1,352 | | | | Validus Holdings Ltd | | | 54,472 | |
1,419 | | | | W.R. Berkley Corp | | | 61,570 | |
78 | | | | White Mountains Insurance Group Ltd | | | 47,040 | |
3,888 | | | | XL Capital Ltd | | | 123,794 | |
| | | | | | | | |
| | | | TOTAL INSURANCE | | | 11,903,300 | |
| | | | | | | | |
| |
MATERIALS - 3.8% | | | | |
412 | | | | A. Schulman, Inc | | | 14,527 | |
242 | | * | | Advanced Emissions Solutions, Inc | | | 13,124 | |
78 | | * | | AEP Industries, Inc | | | 4,121 | |
2,723 | | | | Air Products & Chemicals, Inc | | | 304,377 | |
859 | | | | Airgas, Inc | | | 96,079 | |
2,596 | | *,e | | AK Steel Holding Corp | | | 21,287 | |
1,140 | | | | Albemarle Corp | | | 72,265 | |
14,463 | | | | Alcoa, Inc | | | 153,742 | |
1,401 | | | | Allegheny Technologies, Inc | | | 49,918 | |
1,470 | | *,e | | Allied Nevada Gold Corp | | | 5,218 | |
532 | | | | AMCOL International Corp | | | 18,077 | |
56
TIAA-CREF LIFE FUNDS - Stock Index Fund
| | | | | | | | |
SHARES | | | | COMPANY | | VALUE | |
| | | | | | | | |
158 | | * | | American Pacific Corp | | $ | 5,887 | |
350 | | | | American Vanguard Corp | | | 8,501 | |
1,019 | | | | Aptargroup, Inc | | | 69,098 | |
254 | | * | | Arabian American Development Co | | | 3,188 | |
1,042 | | | | Ashland, Inc | | | 101,116 | |
1,360 | | | | Avery Dennison Corp | | | 68,258 | |
932 | | | | Axiall Corp | | | 44,214 | |
437 | | * | | Balchem Corp | | | 25,652 | |
1,951 | | | | Ball Corp | | | 100,789 | |
1,348 | | | | Bemis Co, Inc | | | 55,214 | |
714 | | * | | Berry Plastics Group, Inc | | | 16,986 | |
182 | | * | | Boise Cascade Co | | | 5,365 | |
300 | | | | Brush Engineered Materials, Inc | | | 9,255 | |
989 | | | | Cabot Corp | | | 50,835 | |
730 | | * | | Calgon Carbon Corp | | | 15,016 | |
574 | | | | Carpenter Technology Corp | | | 35,703 | |
200 | | * | | Castle (A.M.) & Co | | | 2,954 | |
2,073 | | | | Celanese Corp (Series A) | | | 114,658 | |
742 | | * | | Century Aluminum Co | | | 7,761 | |
777 | | | | CF Industries Holdings, Inc | | | 181,072 | |
1,194 | | * | | Chemtura | | | 33,336 | |
316 | | * | | Clearwater Paper Corp | | | 16,590 | |
2,110 | | e | | Cliffs Natural Resources, Inc | | | 55,303 | |
1,418 | | * | | Coeur d’Alene Mines Corp | | | 15,385 | |
1,538 | | | | Commercial Metals Co | | | 31,268 | |
452 | | | | Compass Minerals International, Inc | | | 36,183 | |
2,052 | | * | | Crown Holdings, Inc | | | 91,458 | |
562 | | | | Cytec Industries, Inc | | | 52,356 | |
127 | | | | Deltic Timber Corp | | | 8,628 | |
458 | | | | Domtar Corp | | | 43,208 | |
16,362 | | | | Dow Chemical Co | | | 726,473 | |
12,095 | | | | Du Pont (E.I.) de Nemours & Co | | | 785,812 | |
633 | | | | Eagle Materials, Inc | | | 49,013 | |
1,996 | | | | Eastman Chemical Co | | | 161,077 | |
3,445 | | | | Ecolab, Inc | | | 359,210 | |
1,134 | | * | | Ferro Corp | | | 14,549 | |
835 | | * | | Flotek Industries, Inc | | | 16,758 | |
1,903 | | | | FMC Corp | | | 143,600 | |
13,991 | | | | Freeport-McMoRan Copper & Gold, Inc (Class B) | | | 528,020 | |
235 | | | | FutureFuel Corp | | | 3,713 | |
1,260 | | * | | General Moly, Inc | | | 1,688 | |
553 | | | | Glatfelter | | | 15,285 | |
743 | | | | Globe Specialty Metals, Inc | | | 13,381 | |
1,339 | | e | | Gold Resource Corp | | | 6,066 | |
2,745 | | * | | Graphic Packaging Holding Co | | | 26,352 | |
417 | | | | Greif, Inc (Class A) | | | 21,851 | |
3,572 | | * | | GSE Holding, Inc | | | 7,394 | |
723 | | | | H.B. Fuller Co | | | 37,625 | |
107 | | | | Hawkins, Inc | | | 3,979 | |
128 | | | | Haynes International, Inc | | | 7,071 | |
770 | | * | | Headwaters, Inc | | | 7,538 | |
4,927 | | e | | Hecla Mining Co | | | 15,175 | |
716 | | * | | Horsehead Holding Corp | | | 11,606 | |
2,580 | | | | Huntsman Corp | | | 63,468 | |
435 | | | | Innophos Holdings, Inc | | | 21,141 | |
412 | | | | Innospec, Inc | | | 19,043 | |
1,075 | | | | International Flavors & Fragrances, Inc | | | 92,428 | |
6,030 | | | | International Paper Co | | | 295,651 | |
650 | | *,e | | Intrepid Potash, Inc | | | 10,296 | |
245 | | | | Kaiser Aluminum Corp | | | 17,209 | |
603 | | * | | Kapstone Paper and Packaging Corp | | | 33,684 | |
75 | | | | KMG Chemicals, Inc | | | 1,267 | |
239 | | | | Koppers Holdings, Inc | | | 10,934 | |
396 | | * | | Kraton Polymers LLC | | | 9,128 | |
274 | | | | Kronos Worldwide, Inc | | | 5,220 | |
565 | | * | | Landec Corp | | | 6,848 | |
57
TIAA-CREF LIFE FUNDS - Stock Index Fund
| | | | | | | | |
SHARES | | | | COMPANY | | VALUE | |
| | | | | | | | |
1,743 | | * | | Louisiana-Pacific Corp | | $ | 32,263 | |
229 | | * | | LSB Industries, Inc | | | 9,394 | |
5,303 | | | | LyondellBasell Industries AF S.C.A | | | 425,725 | |
658 | | | | Martin Marietta Materials, Inc | | | 65,761 | |
2,273 | | | | MeadWestvaco Corp | | | 83,942 | |
5,301 | | * | | Midway Gold Corp | | | 4,294 | |
492 | | | | Minerals Technologies, Inc | | | 29,554 | |
3,981 | | *,e | | Molycorp, Inc | | | 22,373 | |
7,136 | | | | Monsanto Co | | | 831,701 | |
4,060 | | | | Mosaic Co | | | 191,916 | |
426 | | | | Myers Industries, Inc | | | 8,997 | |
162 | | | | Neenah Paper, Inc | | | 6,929 | |
129 | | | | NewMarket Corp | | | 43,105 | |
6,322 | | | | Newmont Mining Corp | | | 145,596 | |
1,642 | | | | Noranda Aluminium Holding Corp | | | 5,402 | |
4,128 | | | | Nucor Corp | | | 220,353 | |
1,054 | | e | | Olin Corp | | | 30,408 | |
286 | | | | Olympic Steel, Inc | | | 8,288 | |
346 | | * | | OM Group, Inc | | | 12,598 | |
511 | | * | | Omnova Solutions, Inc | | | 4,655 | |
2,097 | | * | | Owens-Illinois, Inc | | | 75,031 | |
1,277 | | | | Packaging Corp of America | | | 80,809 | |
3,632 | | *,e | | Paramount Gold and Silver Corp | | | 3,384 | |
1,229 | | | | PolyOne Corp | | | 43,445 | |
1,872 | | | | PPG Industries, Inc | | | 355,044 | |
4,093 | | | | Praxair, Inc | | | 532,213 | |
166 | | | | Quaker Chemical Corp | | | 12,794 | |
985 | | | | Reliance Steel & Aluminum Co | | | 74,702 | |
4,829 | | * | | Rentech, Inc | | | 8,451 | |
944 | | *,e | | Resolute Forest Products | | | 15,123 | |
975 | | | | Rock-Tenn Co (Class A) | | | 102,385 | |
1,021 | | | | Rockwood Holdings, Inc | | | 73,430 | |
838 | | | | Royal Gold, Inc | | | 38,607 | |
1,667 | | | | RPM International, Inc | | | 69,197 | |
362 | | * | | RTI International Metals, Inc | | | 12,384 | |
246 | | | | Schnitzer Steel Industries, Inc (Class A) | | | 8,037 | |
442 | | | | Schweitzer-Mauduit International, Inc | | | 22,750 | |
701 | | | | Scotts Miracle-Gro Co (Class A) | | | 43,616 | |
2,568 | | | | Sealed Air Corp | | | 87,440 | |
694 | | | | Sensient Technologies Corp | | | 33,673 | |
1,259 | | | | Sherwin-Williams Co | | | 231,026 | |
1,656 | | | | Sigma-Aldrich Corp | | | 155,681 | |
581 | | | | Silgan Holdings, Inc | | | 27,900 | |
1,370 | | | | Sonoco Products Co | | | 57,156 | |
2,137 | | | | Southern Copper Corp (NY) | | | 61,353 | |
2,782 | | | | Steel Dynamics, Inc | | | 54,360 | |
291 | | | | Stepan Co | | | 19,098 | |
1,755 | | * | | Stillwater Mining Co | | | 21,657 | |
798 | | * | | SunCoke Energy, Inc | | | 18,202 | |
1,028 | | * | | Tahoe Resources, Inc | | | 17,106 | |
209 | | * | | Taminco Corp | | | 4,224 | |
298 | | * | | Texas Industries, Inc | | | 20,496 | |
508 | | | | Tredegar Corp | | | 14,635 | |
70 | | * | | UFP Technologies, Inc | | | 1,765 | |
30 | | * | | United States Lime & Minerals, Inc | | | 1,835 | |
1,888 | | e | | United States Steel Corp | | | 55,696 | |
72 | | * | | Universal Stainless & Alloy | | | 2,596 | |
179 | | * | | US Concrete, Inc | | | 4,051 | |
280 | | | | US Silica Holdings Inc | | | 9,551 | |
1,192 | | | | Valspar Corp | | | 84,978 | |
1,685 | | | | Vulcan Materials Co | | | 100,123 | |
952 | | e | | Walter Energy, Inc | | | 15,832 | |
784 | | | | Wausau Paper Corp | | | 9,941 | |
273 | | | | Westlake Chemical Corp | | | 33,325 | |
735 | | | | Worthington Industries, Inc | | | 30,929 | |
58
TIAA-CREF LIFE FUNDS - Stock Index Fund
| | | | | | | | |
SHARES | | | | COMPANY | | VALUE | |
| | | | | | | | |
995 | | * | | WR Grace & Co | | $ | 98,376 | |
260 | | | | Zep, Inc | | | 4,722 | |
350 | | * | | Zoltek Cos, Inc | | | 5,862 | |
| | | | | | | | |
| | | | TOTAL MATERIALS | | | 10,645,770 | |
| | | | | | | | |
| |
MEDIA - 3.9% | | | | |
790 | | * | | AMC Networks, Inc | | | 53,807 | |
60 | | * | | Beasley Broadcasting Group, Inc | | | 524 | |
3,439 | | | | Cablevision Systems Corp (Class A) | | | 61,661 | |
409 | | * | | Carmike Cinemas, Inc | | | 11,387 | |
8,048 | | | | CBS Corp (Class B) | | | 512,980 | |
1,543 | | *,e | | Central European Media Enterprises Ltd (Class A) (NASDAQ) | | | 5,925 | |
857 | | * | | Charter Communications, Inc | | | 117,203 | |
1,721 | | | | Cinemark Holdings, Inc | | | 57,361 | |
400 | | | | Clear Channel Outdoor Holdings, Inc (Class A) | | | 4,056 | |
34,982 | | | | Comcast Corp (Class A) | | | 1,817,840 | |
1,524 | | * | | Crown Media Holdings, Inc (Class A) | | | 5,380 | |
2,220 | | * | | Cumulus Media, Inc (Class A) | | | 17,161 | |
46 | | * | | Daily Journal Corp | | | 8,510 | |
219 | | *,e | | Dex Media, Inc | | | 1,485 | |
300 | | *,e | | Digital Generation, Inc | | | 3,825 | |
6,849 | | * | | DIRECTV | | | 473,197 | |
3,193 | | * | | Discovery Communications, Inc (Class A) | | | 288,711 | |
2,710 | | * | | DISH Network Corp (Class A) | | | 156,963 | |
943 | | * | | DreamWorks Animation SKG, Inc (Class A) | | | 33,477 | |
285 | | * | | Entercom Communications Corp (Class A) | | | 2,995 | |
1,561 | | | | Entravision Communications Corp (Class A) | | | 9,506 | |
354 | | * | | EW Scripps Co (Class A) | | | 7,689 | |
3,009 | | | | Gannett Co, Inc | | | 89,006 | |
137 | | * | | Global Sources Ltd | | | 1,114 | |
1,896 | | * | | Gray Television, Inc | | | 28,212 | |
700 | | | | Harte-Hanks, Inc | | | 5,474 | |
5,693 | | | | Interpublic Group of Cos, Inc | | | 100,766 | |
596 | | | | John Wiley & Sons, Inc (Class A) | | | 32,899 | |
949 | | * | | Journal Communications, Inc (Class A) | | | 8,835 | |
1,122 | | * | | Lamar Advertising Co (Class A) | | | 58,625 | |
5,234 | | * | | Liberty Global plc (Class A) | | | 465,774 | |
1,324 | | * | | Liberty Media Corp | | | 193,900 | |
1,303 | | *,e | | Lions Gate Entertainment Corp | | | 41,253 | |
1,699 | | * | | Live Nation, Inc | | | 33,572 | |
292 | | * | | Loral Space & Communications, Inc | | | 23,646 | |
800 | | * | | Madison Square Garden, Inc | | | 46,064 | |
239 | | *,e | | Martha Stewart Living Omnimedia, Inc (Class A) | | | 1,004 | |
2,225 | | *,e | | McClatchy Co (Class A) | | | 7,565 | |
3,781 | | | | McGraw-Hill Cos, Inc | | | 295,674 | |
475 | | | | MDC Partners, Inc | | | 12,117 | |
269 | | *,e | | Media General, Inc (Class A) | | | 6,079 | |
426 | | | | Meredith Corp | | | 22,067 | |
303 | | | | Morningstar, Inc | | | 23,661 | |
760 | | | | National CineMedia, Inc | | | 15,170 | |
1,565 | | e | | New York Times Co (Class A) | | | 24,837 | |
6,516 | | * | | News Corp | | | 117,418 | |
558 | | | | Nexstar Broadcasting Group, Inc (Class A) | | | 31,097 | |
3,604 | | | | Omnicom Group, Inc | | | 268,029 | |
120 | | *,e | | ReachLocal, Inc | | | 1,525 | |
210 | | * | | Reading International, Inc | | | 1,573 | |
1,342 | | e | | Regal Entertainment Group (Class A) | | | 26,102 | |
114 | | * | | Rentrak Corp | | | 4,319 | |
142 | | | | Saga Communications, Inc | | | 7,143 | |
130 | | | | Salem Communications | | | 1,131 | |
365 | | | | Scholastic Corp | | | 12,414 | |
1,437 | | | | Scripps Networks Interactive (Class A) | | | 124,171 | |
899 | | | | Sinclair Broadcast Group, Inc (Class A) | | | 32,121 | |
40,787 | | *,e | | Sirius XM Holdings, Inc | | | 142,347 | |
1,521 | | * | | Starz-Liberty Capital | | | 44,474 | |
59
TIAA-CREF LIFE FUNDS - Stock Index Fund
| | | | | | | | |
SHARES | | | | COMPANY | | VALUE | |
| | | | | | | | |
4,900 | | | | Thomson Corp | | $ | 185,318 | |
3,943 | | | | Time Warner Cable, Inc | | | 534,277 | |
12,624 | | | | Time Warner, Inc | | | 880,145 | |
26,561 | | | | Twenty-First Century Fox, Inc | | | 934,416 | |
601 | | e | | Valassis Communications, Inc | | | 20,584 | |
6,208 | | | | Viacom, Inc (Class B) | | | 542,207 | |
24,026 | | * | | Walt Disney Co | | | 1,835,586 | |
251 | | | | World Wrestling Entertainment, Inc (Class A) | | | 4,162 | |
| | | | | | | | |
| | | | TOTAL MEDIA | | | 10,939,516 | |
| | | | | | | | |
| |
PHARMACEUTICALS, BIOTECHNOLOGY & LIFE SCIENCES - 8.0% | | | | |
21,568 | | | | AbbVie, Inc | | | 1,139,006 | |
923 | | * | | Acadia Pharmaceuticals, Inc | | | 23,066 | |
1,268 | | *,e | | Achillion Pharmaceuticals, Inc | | | 4,210 | |
533 | | * | | Acorda Therapeutics, Inc | | | 15,564 | |
2,434 | | * | | Actavis plc | | | 408,912 | |
373 | | * | | Aegerion Pharmaceuticals, Inc | | | 26,468 | |
766 | | * | | Affymetrix, Inc | | | 6,565 | |
4,551 | | | | Agilent Technologies, Inc | | | 260,272 | |
973 | | *,e | | Akorn, Inc | | | 23,965 | |
309 | | * | | Albany Molecular Research, Inc | | | 3,115 | |
2,691 | | * | | Alexion Pharmaceuticals, Inc | | | 358,064 | |
1,659 | | * | | Alkermes plc | | | 67,455 | |
4,158 | | | | Allergan, Inc | | | 461,871 | |
820 | | * | | Alnylam Pharmaceuticals, Inc | | | 52,751 | |
252 | | * | | AMAG Pharmaceuticals, Inc | | | 6,116 | |
10,289 | | | | Amgen, Inc | | | 1,174,592 | |
380 | | *,e | | Amicus Therapeutics, Inc | | | 893 | |
250 | | *,e | | Ampio Pharmaceuticals, Inc | | | 1,782 | |
3,077 | | *,e | | Arena Pharmaceuticals, Inc | | | 18,000 | |
950 | | *,e | | Ariad Pharmaceuticals, Inc | | | 6,479 | |
744 | | * | | Arqule, Inc | | | 1,600 | |
1,535 | | * | | Array Biopharma, Inc | | | 7,690 | |
567 | | * | | Auxilium Pharmaceuticals, Inc | | | 11,760 | |
1,563 | | * | | AVANIR Pharmaceuticals, Inc | | | 5,252 | |
489 | | * | | AVEO Pharmaceuticals, Inc | | | 900 | |
270 | | *,e | | BioDelivery Sciences International, Inc | | | 1,590 | |
3,266 | | * | | Biogen Idec, Inc | | | 913,663 | |
1,970 | | * | | BioMarin Pharmaceuticals, Inc | | | 138,432 | |
268 | | * | | Bio-Rad Laboratories, Inc (Class A) | | | 33,127 | |
252 | | *,e | | Biotime, Inc | | | 907 | |
22,543 | | | | Bristol-Myers Squibb Co | | | 1,198,160 | |
1,435 | | * | | Bruker BioSciences Corp | | | 28,370 | |
814 | | * | | Cadence Pharmaceuticals, Inc | | | 7,367 | |
396 | | * | | Cambrex Corp | | | 7,061 | |
5,738 | | * | | Celgene Corp | | | 969,492 | |
1,056 | | * | | Celldex Therapeutics, Inc | | | 25,566 | |
835 | | *,e | | Cepheid, Inc | | | 39,011 | |
716 | | * | | Charles River Laboratories International, Inc | | | 37,977 | |
316 | | *,e | | ChemoCentryx, Inc | | | 1,830 | |
115 | | * | | Chimerix, Inc | | | 1,738 | |
250 | | * | | Clovis Oncology, Inc | | | 15,067 | |
492 | | *,e | | Corcept Therapeutics, Inc | | | 1,584 | |
170 | | *,e | | Coronado Biosciences, Inc | | | 447 | |
746 | | * | | Covance, Inc | | | 65,693 | |
857 | | * | | Cubist Pharmaceuticals, Inc | | | 59,022 | |
754 | | *,e | | Curis, Inc | | | 2,126 | |
327 | | * | | Cytokinetics, Inc | | | 2,125 | |
335 | | *,e | | Cytori Therapeutics, Inc | | | 861 | |
2,347 | | *,e | | Dendreon Corp | | | 7,018 | |
567 | | * | | Depomed, Inc | | | 5,999 | |
1,197 | | * | | Dyax Corp | | | 9,013 | |
2,418 | | *,e | | Dynavax Technologies Corp | | | 4,739 | |
13,605 | | | | Eli Lilly & Co | | | 693,855 | |
553 | | * | | Emergent Biosolutions, Inc | | | 12,713 | |
60
TIAA-CREF LIFE FUNDS - Stock Index Fund
| | | | | | | | |
SHARES | | | | COMPANY | | VALUE | |
| | | | | | | | |
1,490 | | * | | Endo Pharmaceuticals Holdings, Inc | | $ | 100,515 | |
379 | | *,e | | Endocyte, Inc | | | 4,051 | |
551 | | | | Enzon Pharmaceuticals, Inc | | | 639 | |
718 | | * | | Exact Sciences Corp | | | 8,393 | |
2,025 | | *,e | | Exelixis, Inc | | | 12,413 | |
259 | | * | | Fluidigm Corp | | | 9,925 | |
3,764 | | * | | Forest Laboratories, Inc | | | 225,953 | |
104 | | * | | Furiex Pharmaceuticals Inc | | | 4,369 | |
1,383 | | * | | Galena Biopharma, Inc | | | 6,860 | |
270 | | *,e | | Genomic Health, Inc | | | 7,903 | |
1,585 | | * | | Geron Corp | | | 7,513 | |
20,869 | | * | | Gilead Sciences, Inc | | | 1,568,305 | |
1,148 | | *,e | | Halozyme Therapeutics, Inc | | | 17,209 | |
72 | | * | | Harvard Apparatus Regenerative Technology, Inc | | | 342 | |
290 | | * | | Harvard Bioscience, Inc | | | 1,363 | |
118 | | * | | Hi-Tech Pharmacal Co, Inc | | | 5,120 | |
697 | | *,e | | Horizon Pharma, Inc | | | 5,311 | |
2,169 | | * | | Hospira, Inc | | | 89,536 | |
115 | | *,e | | Hyperion Therapeutics, Inc | | | 2,325 | |
931 | | *,e | | Idenix Pharmaceuticals, Inc | | | 5,567 | |
1,631 | | *,e | | Illumina, Inc | | | 180,421 | |
977 | | *,e | | Immunogen, Inc | | | 14,333 | |
1,809 | | *,e | | Immunomedics, Inc | | | 8,321 | |
854 | | * | | Impax Laboratories, Inc | | | 21,470 | |
1,345 | | * | | Incyte Corp | | | 68,097 | |
629 | | * | | Infinity Pharmaceuticals, Inc | | | 8,686 | |
367 | | * | | Insmed, Inc | | | 6,243 | |
96 | | * | | Insys Therapeutics, Inc | | | 3,716 | |
176 | | * | | Intercept Pharmaceuticals, Inc | | | 12,017 | |
1,068 | | * | | InterMune, Inc | | | 15,732 | |
1,888 | | *,e | | Ironwood Pharmaceuticals, Inc | | | 21,920 | |
1,480 | | *,e | | Isis Pharmaceuticals, Inc | | | 58,963 | |
681 | | * | | Jazz Pharmaceuticals plc | | | 86,187 | |
38,233 | | | | Johnson & Johnson | | | 3,501,761 | |
1,264 | | *,e | | Keryx Biopharmaceuticals, Inc | | | 16,369 | |
343 | | *,e | | KYTHERA Biopharmaceuticals, Inc | | | 12,777 | |
253 | | * | | Lannett Co, Inc | | | 8,374 | |
10,111 | | * | | Lexicon Pharmaceuticals, Inc | | | 18,200 | |
2,387 | | * | | Life Technologies Corp | | | 180,935 | |
230 | | *,e | | Ligand Pharmaceuticals, Inc (Class B) | | | 12,098 | |
588 | | * | | Luminex Corp | | | 11,407 | |
780 | | * | | Mallinckrodt plc | | | 40,763 | |
1,780 | | *,e | | MannKind Corp | | | 9,274 | |
828 | | * | | Medicines Co | | | 31,977 | |
983 | | * | | Medivation, Inc | | | 62,735 | |
41,020 | | | | Merck & Co, Inc | | | 2,053,051 | |
1,198 | | *,e | | Merrimack Pharmaceuticals, Inc | | | 6,397 | |
413 | | * | | Mettler-Toledo International, Inc | | | 100,190 | |
1,119 | | *,e | | MiMedx Group, Inc | | | 9,780 | |
571 | | * | | Momenta Pharmaceuticals, Inc | | | 10,095 | |
5,049 | | * | | Mylan Laboratories, Inc | | | 219,127 | |
1,132 | | *,e | | Myriad Genetics, Inc | | | 23,749 | |
1,084 | | *,e | | Navidea Biopharmaceuticals, Inc | | | 2,244 | |
1,670 | | * | | Nektar Therapeutics | | | 18,954 | |
851 | | * | | Neurocrine Biosciences, Inc | | | 7,948 | |
164 | | *,e | | NewLink Genetics Corp | | | 3,610 | |
2,515 | | * | | Novavax, Inc | | | 12,877 | |
1,471 | | * | | NPS Pharmaceuticals, Inc | | | 44,660 | |
291 | | *,e | | Omeros Corp | | | 3,285 | |
120 | | * | | OncoGenex Pharmaceutical, Inc | | | 1,001 | |
2,803 | | *,e | | Opko Health, Inc | | | 23,657 | |
1,247 | | *,e | | Orexigen Therapeutics, Inc | | | 7,021 | |
170 | | * | | Osiris Therapeutics, Inc | | | 2,734 | |
424 | | * | | Pacific Biosciences of California, Inc | | | 2,218 | |
364 | | *,e | | Pacira Pharmaceuticals, Inc | | | 20,926 | |
61
TIAA-CREF LIFE FUNDS - Stock Index Fund
| | | | | | | | |
SHARES | | | | COMPANY | | VALUE | |
| | | | | | | | |
762 | | * | | Parexel International Corp | | $ | 34,427 | |
1,837 | | e | | PDL BioPharma, Inc | | | 15,504 | |
1,810 | | *,e | | Peregrine Pharmaceuticals, Inc | | | 2,516 | |
1,408 | | | | PerkinElmer, Inc | | | 58,052 | |
1,662 | | | | Perrigo Co plc | | | 255,050 | |
90,670 | | | | Pfizer, Inc | | | 2,777,222 | |
796 | | * | | Pharmacyclics, Inc | | | 84,201 | |
131 | | * | | Portola Pharmaceuticals, Inc | | | 3,373 | |
322 | | | | Pozen, Inc | | | 2,589 | |
621 | | * | | Prestige Brands Holdings, Inc | | | 22,232 | |
300 | | * | | Progenics Pharmaceuticals, Inc | | | 1,599 | |
193 | | * | | Prothena Corp plc | | | 5,118 | |
292 | | * | | Puma Biotechnology, Inc | | | 30,231 | |
3,176 | | * | | Qiagen NV (NASDAQ) | | | 75,621 | |
698 | | e | | Questcor Pharmaceuticals, Inc | | | 38,006 | |
343 | | * | | Quintiles Transnational Holdings, Inc | | | 15,895 | |
716 | | *,e | | Raptor Pharmaceutical Corp | | | 9,322 | |
1,102 | | * | | Regeneron Pharmaceuticals, Inc | | | 303,314 | |
390 | | * | | Repligen Corp | | | 5,320 | |
190 | | *,e | | Repros Therapeutics, Inc | | | 3,477 | |
854 | | * | | Rigel Pharmaceuticals, Inc | | | 2,434 | |
214 | | * | | Sagent Pharmaceuticals | | | 5,431 | |
805 | | * | | Salix Pharmaceuticals Ltd | | | 72,402 | |
410 | | *,e | | Sangamo Biosciences, Inc | | | 5,695 | |
420 | | *,e | | Sarepta Therapeutics, Inc | | | 8,555 | |
716 | | * | | Sciclone Pharmaceuticals, Inc | | | 3,609 | |
1,317 | | *,e | | Seattle Genetics, Inc | | | 52,535 | |
1,228 | | *,e | | Sequenom, Inc | | | 2,874 | |
310 | | *,e | | SIGA Technologies, Inc | | | 1,014 | |
823 | | *,e | | Spectrum Pharmaceuticals, Inc | | | 7,284 | |
119 | | * | | Stemline Therapeutics, Inc | | | 2,332 | |
1,007 | | *,e | | Sunesis Pharmaceuticals, Inc | | | 4,773 | |
40 | | *,e | | Supernus Pharmaceuticals, Inc | | | 302 | |
222 | | *,e | | Synageva BioPharma Corp | | | 14,368 | |
3,237 | | *,e | | Synergy Pharmaceuticals, Inc | | | 18,224 | |
271 | | * | | Synta Pharmaceuticals Corp | | | 1,420 | |
286 | | * | | Targacept, Inc | | | 1,187 | |
554 | | | | Techne Corp | | | 52,447 | |
173 | | * | | TESARO, Inc | | | 4,886 | |
4,380 | | * | | TherapeuticsMD, Inc | | | 22,820 | |
959 | | *,e | | Theravance, Inc | | | 34,188 | |
5,000 | | | | Thermo Electron Corp | | | 556,750 | |
582 | | * | | Threshold Pharmaceuticals, Inc | | | 2,718 | |
657 | | * | | United Therapeutics Corp | | | 74,294 | |
317 | | * | | Vanda Pharmaceuticals, Inc | | | 3,934 | |
182 | | * | | Verastem, Inc | | | 2,075 | |
3,177 | | * | | Vertex Pharmaceuticals, Inc | | | 236,051 | |
423 | | * | | Vical, Inc | | | 499 | |
931 | | * | | Viropharma, Inc | | | 46,410 | |
1,259 | | *,e | | Vivus, Inc | | | 11,432 | |
1,157 | | * | | Waters Corp | | | 115,700 | |
288 | | * | | Xenoport, Inc | | | 1,656 | |
852 | | *,e | | XOMA Corp | | | 5,734 | |
599 | | *,e | | ZIOPHARM Oncology, Inc | | | 2,600 | |
6,318 | | | | Zoetis Inc | | | 206,535 | |
| | | | | | | | |
| | | | TOTAL PHARMACEUTICALS, BIOTECHNOLOGY & LIFE SCIENCES | | | 22,769,050 | |
| | | | | | | | |
| | |
REAL ESTATE - 3.1% | | | | | | |
719 | | | | Acadia Realty Trust | | | 17,853 | |
370 | | | | AG Mortgage Investment Trust | | | 5,787 | |
171 | | | | Agree Realty Corp | | | 4,962 | |
519 | | | | Alexander & Baldwin, Inc | | | 21,658 | |
24 | | | | Alexander’s, Inc | | | 7,920 | |
939 | | | | Alexandria Real Estate Equities, Inc | | | 59,739 | |
331 | | | | Altisource Residential Corp | | | 9,966 | |
62
TIAA-CREF LIFE FUNDS - Stock Index Fund
| | | | | | | | |
SHARES | | | | COMPANY | | VALUE | |
| | | | | | | | |
393 | | | | American Assets Trust,Inc | | $ | 12,352 | |
1,376 | | | | American Campus Communities, Inc | | | 44,321 | |
5,197 | | | | American Capital Agency Corp | | | 100,250 | |
836 | | | | American Capital Mortgage, Inc | | | 14,597 | |
783 | | * | | American Homes 4 Rent | | | 12,685 | |
2,013 | | | | American Realty Capital Properties, Inc | | | 25,887 | |
177 | | * | | American Residential Properties, Inc | | | 3,037 | |
5,538 | | | | American Tower Corp | | | 442,043 | |
207 | | | | AmREIT, Inc (Class B) | | | 3,478 | |
12,431 | | | | Annaly Capital Management, Inc | | | 123,937 | |
1,733 | | | | Anworth Mortgage Asset Corp | | | 7,296 | |
1,892 | | | | Apartment Investment & Management Co (Class A) | | | 49,022 | |
433 | | | | Apollo Commercial Real Estate Finance, Inc | | | 7,036 | |
100 | | | | Ares Commercial Real Estate Corp | | | 1,310 | |
244 | | | | Armada Hoffler Properties, Inc | | | 2,264 | |
4,902 | | | | ARMOUR Residential REIT, Inc | | | 19,657 | |
252 | | * | | Ashford Hospitality Prime, Inc | | | 4,586 | |
1,263 | | | | Ashford Hospitality Trust, Inc | | | 10,458 | |
672 | | | | Associated Estates Realty Corp | | | 10,786 | |
110 | | * | | AV Homes, Inc | | | 1,999 | |
1,789 | | | | AvalonBay Communities, Inc | | | 211,513 | |
152 | | | | Aviv REIT, Inc | | | 3,602 | |
2,448 | | | | BioMed Realty Trust, Inc | | | 44,358 | |
2,116 | | | | Boston Properties, Inc | | | 212,383 | |
2,048 | | | | Brandywine Realty Trust | | | 28,856 | |
1,096 | | | | BRE Properties, Inc (Class A) | | | 59,962 | |
1,079 | | | | Camden Property Trust | | | 61,374 | |
1,317 | | | | Campus Crest Communities, Inc | | | 12,393 | |
1,194 | | | | Capstead Mortgage Corp | | | 14,424 | |
2,043 | | | | CBL & Associates Properties, Inc | | | 36,692 | |
4,068 | | * | | CBRE Group, Inc | | | 106,988 | |
1,018 | | | | Cedar Shopping Centers, Inc | | | 6,373 | |
3,262 | | | | Chambers Street Properties | | | 24,954 | |
105 | | | | Chatham Lodging Trust | | | 2,147 | |
691 | | | | Chesapeake Lodging Trust | | | 17,475 | |
13,015 | | | | Chimera Investment Corp | | | 40,347 | |
844 | | | | Colony Financial, Inc | | | 17,125 | |
77 | | | | Consolidated-Tomoka Land Co | | | 2,794 | |
238 | | | | Coresite Realty | | | 7,661 | |
1,194 | | | | Corporate Office Properties Trust | | | 28,286 | |
2,382 | | | | Cousins Properties, Inc | | | 24,535 | |
1,746 | | | | CubeSmart | | | 27,831 | |
254 | | | | CyrusOne, Inc | | | 5,672 | |
2,264 | | | | CYS Investments, Inc | | | 16,776 | |
3,999 | | | | DCT Industrial Trust, Inc | | | 28,513 | |
4,313 | | | | DDR Corp | | | 66,291 | |
2,598 | | | | DiamondRock Hospitality Co | | | 30,007 | |
1,851 | | | | Digital Realty Trust, Inc | | | 90,921 | |
1,862 | | | | Douglas Emmett, Inc | | | 43,366 | |
4,573 | | | | Duke Realty Corp | | | 68,778 | |
734 | | | | DuPont Fabros Technology, Inc | | | 18,137 | |
1,055 | | | | Dynex Capital, Inc | | | 8,440 | |
361 | | | | EastGroup Properties, Inc | | | 20,913 | |
1,317 | | | | Education Realty Trust, Inc | | | 11,616 | |
730 | | | | Entertainment Properties Trust | | | 35,887 | |
1,120 | | | | Equity Lifestyle Properties, Inc | | | 40,578 | |
693 | | | | Equity One, Inc | | | 15,551 | |
4,981 | | | | Equity Residential | | | 258,364 | |
536 | | | | Essex Property Trust, Inc | | | 76,921 | |
629 | | | | Excel Trust, Inc | | | 7,164 | |
1,582 | | | | Extra Space Storage, Inc | | | 66,650 | |
920 | | | | Federal Realty Investment Trust | | | 93,297 | |
2,088 | | * | | FelCor Lodging Trust, Inc | | | 17,038 | |
1,406 | | | | First Industrial Realty Trust, Inc | | | 24,535 | |
627 | | | | First Potomac Realty Trust | | | 7,292 | |
2,072 | | * | | Forest City Enterprises, Inc (Class A) | | | 39,575 | |
63
TIAA-CREF LIFE FUNDS - Stock Index Fund
| | | | | | | | |
SHARES | | | | COMPANY | | VALUE | |
| | | | | | | | |
498 | | * | | Forestar Real Estate Group, Inc | | $ | 10,592 | |
1,181 | | | | Franklin Street Properties Corp | | | 14,113 | |
861 | | * | | Gaming and Leisure Properties, Inc | | | 43,747 | |
8,390 | | | | General Growth Properties, Inc | | | 168,387 | |
404 | | | | Getty Realty Corp | | | 7,422 | |
579 | | | | Gladstone Commercial Corp | | | 10,405 | |
1,772 | | | | Glimcher Realty Trust | | | 16,586 | |
625 | | | | Government Properties Income Trust | | | 15,531 | |
580 | | * | | Gramercy Property Trust, Inc | | | 3,335 | |
1,296 | | | | Hatteras Financial Corp | | | 21,177 | |
5,927 | | | | HCP, Inc | | | 215,269 | |
4,042 | | | | Health Care REIT, Inc | | | 216,530 | |
1,183 | | | | Healthcare Realty Trust, Inc | | | 25,210 | |
1,456 | | | | Healthcare Trust of America, Inc | | | 14,327 | |
3,082 | | | | Hersha Hospitality Trust | | | 17,167 | |
1,279 | | | | Highwoods Properties, Inc | | | 46,261 | |
804 | | | | Home Properties, Inc | | | 43,110 | |
1,837 | | | | Hospitality Properties Trust | | | 49,654 | |
10,666 | | | | Host Marriott Corp | | | 207,347 | |
519 | | * | | Howard Hughes Corp | | | 62,332 | |
1,534 | | | | HRPT Properties Trust | | | 35,758 | |
467 | | | | Hudson Pacific Properties | | | 10,213 | |
1,113 | | | | Inland Real Estate Corp | | | 11,709 | |
1,779 | | | | Invesco Mortgage Capital, Inc | | | 26,116 | |
1,317 | | | | Investors Real Estate Trust | | | 11,300 | |
1,264 | | * | | iStar Financial, Inc | | | 18,037 | |
174 | | | | JAVELIN Mortgage Investment Corp | | | 2,424 | |
578 | | | | Jones Lang LaSalle, Inc | | | 59,181 | |
741 | | | | Kennedy-Wilson Holdings, Inc | | | 16,487 | |
1,156 | | | | Kilroy Realty Corp | | | 58,008 | |
5,886 | | | | Kimco Realty Corp | | | 116,249 | |
1,214 | | | | Kite Realty Group Trust | | | 7,976 | |
1,327 | | | | LaSalle Hotel Properties | | | 40,951 | |
2,617 | | | | Lexington Corporate Properties Trust | | | 26,720 | |
1,824 | | | | Liberty Property Trust | | | 61,779 | |
458 | | | | LTC Properties, Inc | | | 16,209 | |
1,839 | | | | Macerich Co | | | 108,299 | |
1,118 | | | | Mack-Cali Realty Corp | | | 24,015 | |
1,859 | | | | Medical Properties Trust, Inc | | | 22,717 | |
4,747 | | | | MFA Mortgage Investments, Inc | | | 33,514 | |
1,004 | | | | Mid-America Apartment Communities, Inc | | | 60,983 | |
516 | | | | Monmouth Real Estate Investment Corp (Class A) | | | 4,690 | |
417 | | | | National Health Investors, Inc | | | 23,394 | |
1,591 | | | | National Retail Properties, Inc | | | 48,255 | |
5,224 | | | | New Residential Investment Corp | | | 34,896 | |
939 | | | | New York Mortgage Trust, Inc | | | 6,564 | |
2,419 | | | | NorthStar Realty Finance Corp | | | 32,536 | |
1,749 | | | | Omega Healthcare Investors, Inc | | | 52,120 | |
498 | | | | One Liberty Properties, Inc | | | 10,025 | |
725 | | | | Parkway Properties, Inc | | | 13,989 | |
843 | | | | Pebblebrook Hotel Trust | | | 25,931 | |
892 | | | | Pennsylvania REIT | | | 16,930 | |
1,022 | | | | Pennymac Mortgage Investment Trust | | | 23,465 | |
2,149 | | | | Piedmont Office Realty Trust, Inc | | | 35,501 | |
2,300 | | | | Plum Creek Timber Co, Inc | | | 106,973 | |
745 | | | | Post Properties, Inc | | | 33,696 | |
481 | | | | Potlatch Corp | | | 20,077 | |
6,972 | | | | Prologis, Inc | | | 257,615 | |
235 | | | | PS Business Parks, Inc | | | 17,959 | |
2,002 | | | | Public Storage, Inc | | | 301,341 | |
1,095 | | | | RAIT Investment Trust | | | 9,822 | |
838 | | | | Ramco-Gershenson Properties | | | 13,190 | |
1,780 | | | | Rayonier, Inc | | | 74,938 | |
1,827 | | * | | Realogy Holdings Corp | | | 90,382 | |
2,844 | | | | Realty Income Corp | | | 106,167 | |
1,075 | | | | Redwood Trust, Inc | | | 20,823 | |
64
TIAA-CREF LIFE FUNDS - Stock Index Fund
| | | | | | | | |
SHARES | | | | COMPANY | | VALUE | |
| | | | | | | | |
1,287 | | | | Regency Centers Corp | | $ | 59,588 | |
1,691 | | | | Resource Capital Corp | | | 10,028 | |
1,198 | | | | Retail Opportunities Investment Corp | | | 17,635 | |
1,665 | | | | Retail Properties of America, Inc | | | 21,179 | |
1,620 | | | | RLJ Lodging Trust | | | 39,398 | |
262 | | | | Rouse Properties, Inc | | | 5,814 | |
580 | | | | Ryman Hospitality Properties | | | 24,232 | |
539 | | | | Sabra Healthcare REIT, Inc | | | 14,089 | |
133 | | | | Saul Centers, Inc | | | 6,348 | |
292 | | | | Select Income REIT | | | 7,808 | |
2,500 | | | | Senior Housing Properties Trust | | | 55,575 | |
454 | | | | Silver Bay Realty Trust Corp | | | 7,259 | |
4,294 | | | | Simon Property Group, Inc | | | 653,375 | |
1,298 | | | | SL Green Realty Corp | | | 119,909 | |
413 | | | | Sovran Self Storage, Inc | | | 26,915 | |
5,445 | | | | Spirit Realty Capital, Inc | | | 53,524 | |
810 | | *,e | | St. Joe Co | | | 15,544 | |
534 | | | | STAG Industrial, Inc | | | 10,888 | |
2,140 | | | | Starwood Property Trust, Inc | | | 59,278 | |
2,727 | | * | | Strategic Hotels & Resorts, Inc | | | 25,770 | |
2,233 | | | | Summit Hotel Properties, Inc | | | 20,097 | |
493 | | | | Sun Communities, Inc | | | 21,022 | |
2,146 | | | | Sunstone Hotel Investors, Inc | | | 28,756 | |
1,271 | | | | Tanger Factory Outlet Centers, Inc | | | 40,697 | |
914 | | | | Taubman Centers, Inc | | | 58,423 | |
156 | | * | | Tejon Ranch Co | | | 5,735 | |
247 | | | | Terreno Realty Corp | | | 4,372 | |
4,797 | | | | Two Harbors Investment Corp | | | 44,516 | |
3,535 | | | | UDR, Inc | | | 82,542 | |
120 | | | | UMH Properties, Inc | | | 1,130 | |
200 | | | | Universal Health Realty Income Trust | | | 8,012 | |
447 | | | | Urstadt Biddle Properties, Inc (Class A) | | | 8,247 | |
3,846 | | | | Ventas, Inc | | | 220,299 | |
2,584 | | | | Vornado Realty Trust | | | 229,433 | |
820 | | | | Washington REIT | | | 19,155 | �� |
1,598 | | | | Weingarten Realty Investors | | | 43,817 | |
320 | | | | Western Asset Mortgage Capital Corp | | | 4,762 | |
8,230 | | | | Weyerhaeuser Co | | | 259,821 | |
550 | | | | Whitestone REIT | | | 7,354 | |
242 | | | | Winthrop Realty Trust | | | 2,674 | |
754 | | | | WP Carey, Inc | | | 46,258 | |
| | | | | | | | |
| | | | TOTAL REAL ESTATE | | | 8,858,945 | |
| | | | | | | | |
| |
RETAILING - 4.6% | | | | |
1,152 | | * | | 1-800-FLOWERS.COM, Inc (Class A) | | | 6,232 | |
998 | | | | Aaron’s, Inc | | | 29,341 | |
1,026 | | e | | Abercrombie & Fitch Co (Class A) | | | 33,766 | |
1,033 | | | | Advance Auto Parts, Inc | | | 114,332 | |
1,127 | | *,e | | Aeropostale, Inc | | | 10,244 | |
5,004 | | * | | Amazon.com, Inc | | | 1,995,545 | |
2,498 | | | | American Eagle Outfitters, Inc | | | 35,971 | |
122 | | * | | America’s Car-Mart, Inc | | | 5,152 | |
867 | | * | | Ann Taylor Stores Corp | | | 31,698 | |
510 | | * | | Asbury Automotive Group, Inc | | | 27,407 | |
2,042 | | * | | Ascena Retail Group, Inc | | | 43,209 | |
673 | | * | | Audiovox Corp (Class A) | | | 11,239 | |
667 | | * | | Autonation, Inc | | | 33,143 | |
495 | | * | | AutoZone, Inc | | | 236,580 | |
477 | | * | | Barnes & Noble, Inc | | | 7,131 | |
380 | | | | Bebe Stores, Inc | | | 2,022 | |
2,867 | | * | | Bed Bath & Beyond, Inc | | | 230,220 | |
3,698 | | | | Best Buy Co, Inc | | | 147,476 | |
334 | | | | Big 5 Sporting Goods Corp | | | 6,620 | |
766 | | * | | Big Lots, Inc | | | 24,734 | |
158 | | *,e | | Blue Nile, Inc | | | 7,440 | |
65
TIAA-CREF LIFE FUNDS - Stock Index Fund
| | | | | | | | |
SHARES | | | | COMPANY | | VALUE | |
| | | | | | | | |
1,372 | | *,e | | Body Central Corp | | $ | 5,406 | |
359 | | e | | Bon-Ton Stores, Inc | | | 5,845 | |
657 | | | | Brown Shoe Co, Inc | | | 18,488 | |
408 | | e | | Buckle, Inc | | | 21,445 | |
617 | | * | | Cabela’s, Inc | | | 41,129 | |
2,896 | | * | | Carmax, Inc | | | 136,170 | |
525 | | | | Cato Corp (Class A) | | | 16,695 | |
2,122 | | | | Chico’s FAS, Inc | | | 39,978 | |
335 | | * | | Children’s Place Retail Stores, Inc | | | 19,085 | |
469 | | * | | Christopher & Banks Corp | | | 4,005 | |
243 | | * | | Citi Trends, Inc | | | 4,131 | |
319 | | * | | Conn’s, Inc | | | 25,134 | |
138 | | *,e | | Container Store Group, Inc | | | 6,432 | |
190 | | | | Core-Mark Holding Co, Inc | | | 14,427 | |
798 | | e | | CST Brands, Inc | | | 29,303 | |
264 | | | | Destination Maternity Corp | | | 7,888 | |
514 | | * | | Destination XL Group, Inc | | | 3,377 | |
1,304 | | | | Dick’s Sporting Goods, Inc | | | 75,762 | |
374 | | | | Dillard’s, Inc (Class A) | | | 36,357 | |
4,251 | | * | | Dollar General Corp | | | 256,420 | |
2,944 | | * | | Dollar Tree, Inc | | | 166,100 | |
930 | | | | DSW, Inc (Class A) | | | 39,739 | |
1,583 | | | | Expedia, Inc | | | 110,272 | |
1,135 | | * | | Express Parent LLC | | | 21,190 | |
1,404 | | | | Family Dollar Stores, Inc | | | 91,218 | |
681 | | | | Finish Line, Inc (Class A) | | | 19,184 | |
430 | | *,e | | Five Below, Inc | | | 18,576 | |
1,926 | | | | Foot Locker, Inc | | | 79,813 | |
580 | | *,e | | Francesca’s Holdings Corp | | | 10,678 | |
480 | | | | Fred’s, Inc (Class A) | | | 8,890 | |
211 | | *,e | | FTD Cos, Inc | | | 6,874 | |
1,560 | | | | GameStop Corp (Class A) | | | 76,846 | |
3,660 | | | | Gap, Inc | | | 143,033 | |
311 | | * | | Genesco, Inc | | | 22,722 | |
2,165 | | | | Genuine Parts Co | | | 180,106 | |
1,273 | | | | GNC Holdings, Inc | | | 74,407 | |
683 | | | | Gordmans Stores, Inc | | | 5,239 | |
300 | | | | Group 1 Automotive, Inc | | | 21,306 | |
5,505 | | * | | Groupon, Inc | | | 64,794 | |
822 | | | | Guess?, Inc | | | 25,540 | |
323 | | | | Haverty Furniture Cos, Inc | | | 10,110 | |
176 | | *,e | | HHgregg, Inc | | | 2,459 | |
335 | | *,e | | Hibbett Sports, Inc | | | 22,515 | |
19,699 | | | | Home Depot, Inc | | | 1,622,016 | |
739 | | * | | HomeAway, Inc | | | 30,210 | |
475 | | | | HSN, Inc | | | 29,593 | |
3,202 | | *,e | | JC Penney Co, Inc | | | 29,298 | |
349 | | * | | JOS A Bank Clothiers, Inc | | | 19,101 | |
145 | | * | | Kirkland’s, Inc | | | 3,432 | |
2,910 | | | | Kohl’s Corp | | | 165,143 | |
3,064 | | | | L Brands, Inc | | | 189,508 | |
7,017 | | * | | Liberty Interactive Corp | | | 205,949 | |
490 | | * | | Liberty Ventures | | | 60,069 | |
291 | | | | Lithia Motors, Inc (Class A) | | | 20,201 | |
3,907 | | * | | LKQ Corp | | | 128,540 | |
14,533 | | | | Lowe’s Companies, Inc | | | 720,110 | |
351 | | *,e | | Lumber Liquidators, Inc | | | 36,114 | |
5,030 | | | | Macy’s, Inc | | | 268,602 | |
257 | | * | | MarineMax, Inc | | | 4,133 | |
249 | | *,e | | Mattress Firm Holding Corp | | | 10,717 | |
661 | | | | Men’s Wearhouse, Inc | | | 33,764 | |
412 | | e | | Monro Muffler, Inc | | | 23,220 | |
630 | | * | | Murphy USA, Inc | | | 26,183 | |
681 | | * | | NetFlix, Inc | | | 250,724 | |
512 | | * | | New York & Co, Inc | | | 2,237 | |
1,902 | | | | Nordstrom, Inc | | | 117,544 | |
66
TIAA-CREF LIFE FUNDS - Stock Index Fund
| | | | | | | | |
SHARES | | | | COMPANY | | VALUE | |
| | | | | | | | |
414 | | | | Nutri/System, Inc | | $ | 6,806 | |
6,590 | | * | | Office Depot, Inc | | | 34,861 | |
482 | | * | | Orbitz Worldwide, Inc | | | 3,461 | |
1,450 | | * | | O’Reilly Automotive, Inc | | | 186,630 | |
397 | | *,e | | Outerwall, Inc | | | 26,706 | |
176 | | *,e | | Overstock.com, Inc | | | 5,419 | |
1,372 | | * | | Pacific Sunwear Of California, Inc | | | 4,582 | |
688 | | | | Penske Auto Group, Inc | | | 32,446 | |
614 | | * | | PEP Boys - Manny Moe & Jack | | | 7,454 | |
278 | | e | | PetMed Express, Inc | | | 4,623 | |
1,451 | | | | Petsmart, Inc | | | 105,560 | |
1,228 | | | | Pier 1 Imports, Inc | | | 28,342 | |
711 | | * | | Priceline.com, Inc | | | 826,466 | |
1,485 | | *,e | | RadioShack Corp | | | 3,861 | |
793 | | | | Rent-A-Center, Inc | | | 26,439 | |
232 | | * | | Restoration Hardware Holdings, Inc | | | 15,614 | |
2,876 | | | | Ross Stores, Inc | | | 215,499 | |
2,169 | | * | | Sally Beauty Holdings, Inc | | | 65,569 | |
567 | | *,e | | Sears Holdings Corp | | | 27,806 | |
159 | | * | | Sears Hometown and Outlet Stores, Inc | | | 4,055 | |
1,046 | | * | | Select Comfort Corp | | | 22,060 | |
326 | | | | Shoe Carnival, Inc | | | 9,457 | |
497 | | *,e | | Shutterfly, Inc | | | 25,312 | |
1,178 | | | | Signet Jewelers Ltd | | | 92,709 | |
481 | | | | Sonic Automotive, Inc (Class A) | | | 11,775 | |
411 | | | | Stage Stores, Inc | | | 9,132 | |
8,991 | | | | Staples, Inc | | | 142,867 | |
524 | | | | Stein Mart, Inc | | | 7,048 | |
151 | | * | | Systemax, Inc | | | 1,699 | |
8,697 | | | | Target Corp | | | 550,259 | |
1,464 | | | | Tiffany & Co | | | 135,830 | |
239 | | *,e | | Tile Shop Holdings, Inc | | | 4,319 | |
120 | | * | | Tilly’s, Inc | | | 1,374 | |
9,440 | | | | TJX Companies, Inc | | | 601,611 | |
1,832 | | | | Tractor Supply Co | | | 142,127 | |
1,609 | | * | | TripAdvisor, Inc | | | 133,273 | |
567 | | * | | Tuesday Morning Corp | | | 9,049 | |
864 | | * | | Ulta Salon Cosmetics & Fragrance, Inc | | | 83,393 | |
1,468 | | * | | Urban Outfitters, Inc | | | 54,463 | |
512 | | * | | Valuevision International, Inc (Class A) | | | 3,579 | |
280 | | * | | Vitacost.com, Inc | | | 1,621 | |
425 | | * | | Vitamin Shoppe, Inc | | | 22,104 | |
178 | | * | | West Marine, Inc | | | 2,533 | |
1,045 | | * | | Wet Seal, Inc (Class A) | | | 2,853 | |
524 | | * | | WEX, Inc | | | 51,892 | |
1,247 | | | | Williams-Sonoma, Inc | | | 72,675 | |
783 | | * | | Zale Corp | | | 12,348 | |
245 | | * | | Zumiez, Inc | | | 6,370 | |
| | | | | | | | |
| | | | TOTAL RETAILING | | | 12,870,929 | |
| | | | | | | | |
|
SEMICONDUCTORS & SEMICONDUCTOR EQUIPMENT - 2.1% | |
504 | | * | | Advanced Energy Industries, Inc | | | 11,521 | |
10,309 | | *,e | | Advanced Micro Devices, Inc | | | 39,896 | |
183 | | * | | Alpha & Omega Semiconductor Ltd | | | 1,411 | |
4,196 | | | | Altera Corp | | | 136,496 | |
239 | | * | | Ambarella, Inc | | | 8,109 | |
1,245 | | *,e | | Amkor Technology, Inc | | | 7,632 | |
891 | | * | | Anadigics, Inc | | | 1,639 | |
4,262 | | | | Analog Devices, Inc | | | 217,064 | |
16,573 | | | | Applied Materials, Inc | | | 293,176 | |
891 | | * | | Applied Micro Circuits Corp | | | 11,922 | |
5,710 | | * | | Atmel Corp | | | 44,709 | |
395 | | * | | ATMI, Inc | | | 11,933 | |
3,226 | | | | Avago Technologies Ltd | | | 170,623 | |
4,761 | | * | | Axcelis Technologies, Inc | | | 11,617 | |
67
TIAA-CREF LIFE FUNDS - Stock Index Fund
| | | | | | | | |
SHARES | | | | COMPANY | | VALUE | |
| | | | | | | | |
8,083 | | | | Broadcom Corp (Class A) | | $ | 239,661 | |
831 | | | | Brooks Automation, Inc | | | 8,717 | |
285 | | * | | Cabot Microelectronics Corp | | | 13,024 | |
664 | | * | | Cavium Networks, Inc | | | 22,915 | |
234 | | * | | Ceva, Inc | | | 3,561 | |
821 | | *,e | | Cirrus Logic, Inc | | | 16,773 | |
280 | | | | Cohu, Inc | | | 2,940 | |
1,547 | | * | | Cree, Inc | | | 96,796 | |
2,072 | | | | Cypress Semiconductor Corp | | | 21,756 | |
395 | | * | | Diodes, Inc | | | 9,306 | |
289 | | * | | DSP Group, Inc | | | 2,806 | |
1,676 | | * | | Entegris, Inc | | | 19,442 | |
903 | | * | | Entropic Communications, Inc | | | 4,253 | |
520 | | * | | Exar Corp | | | 6,131 | |
1,829 | | * | | Fairchild Semiconductor International, Inc | | | 24,417 | |
1,005 | | * | | First Solar, Inc | | | 54,913 | |
593 | | * | | Formfactor, Inc | | | 3,570 | |
740 | | * | | Freescale Semiconductor Holdings Ltd | | | 11,877 | |
234 | | * | | GSI Technology, Inc | | | 1,554 | |
1,568 | | *,e | | GT Solar International, Inc | | | 13,673 | |
459 | | * | | Hittite Microwave Corp | | | 28,334 | |
252 | | * | | Inphi Corp | | | 3,251 | |
1,945 | | * | | Integrated Device Technology, Inc | | | 19,820 | |
306 | | * | | Integrated Silicon Solution, Inc | | | 3,700 | |
67,958 | | | | Intel Corp | | | 1,764,190 | |
853 | | * | | International Rectifier Corp | | | 22,238 | |
1,619 | | | | Intersil Corp (Class A) | | | 18,570 | |
257 | | | | IXYS Corp | | | 3,333 | |
2,306 | | | | Kla-Tencor Corp | | | 148,645 | |
800 | | * | | Kopin Corp | | | 3,376 | |
2,143 | | * | | Lam Research Corp | | | 116,686 | |
1,300 | | * | | Lattice Semiconductor Corp | | | 7,163 | |
3,060 | | | | Linear Technology Corp | | | 139,383 | |
7,345 | | | | LSI Logic Corp | | | 80,942 | |
584 | | * | | LTX-Credence Corp | | | 4,666 | |
80 | | * | | MA-COM Technology Solutions | | | 1,359 | |
5,232 | | | | Marvell Technology Group Ltd | | | 75,236 | |
4,082 | | | | Maxim Integrated Products, Inc | | | 113,929 | |
87 | | * | | MaxLinear, Inc | | | 907 | |
797 | | | | Micrel, Inc | | | 7,866 | |
2,750 | | e | | Microchip Technology, Inc | | | 123,062 | |
13,894 | | * | | Micron Technology, Inc | | | 302,333 | |
1,221 | | * | | Microsemi Corp | | | 30,464 | |
698 | | | | MKS Instruments, Inc | | | 20,898 | |
666 | | * | | Monolithic Power Systems, Inc | | | 23,084 | |
316 | | * | | MoSys, Inc | | | 1,744 | |
214 | | * | | Nanometrics, Inc | | | 4,077 | |
55 | | * | | NVE Corp | | | 3,205 | |
7,587 | | | | Nvidia Corp | | | 121,544 | |
721 | | * | | Omnivision Technologies, Inc | | | 12,401 | |
5,763 | | * | | ON Semiconductor Corp | | | 47,487 | |
268 | | * | | PDF Solutions, Inc | | | 6,866 | |
347 | | * | | Peregrine Semiconductor Corp | | | 2,571 | |
304 | | * | | Pericom Semiconductor Corp | | | 2,693 | |
666 | | * | | Photronics, Inc | | | 6,014 | |
410 | | * | | PLX Technology, Inc | | | 2,698 | |
2,763 | | * | | PMC - Sierra, Inc | | | 17,766 | |
358 | | | | Power Integrations, Inc | | | 19,984 | |
1,317 | | * | | Rambus, Inc | | | 12,472 | |
3,667 | | * | | RF Micro Devices, Inc | | | 18,922 | |
149 | | *,e | | Rubicon Technology, Inc | | | 1,483 | |
351 | | * | | Rudolph Technologies, Inc | | | 4,121 | |
936 | | * | | Semtech Corp | | | 23,662 | |
373 | | * | | Sigma Designs, Inc | | | 1,761 | |
1,131 | | * | | Silicon Image, Inc | | | 6,956 | |
618 | | * | | Silicon Laboratories, Inc | | | 26,766 | |
68
TIAA-CREF LIFE FUNDS - Stock Index Fund
| | | | | | | | |
SHARES | | | | COMPANY | | VALUE | |
| | | | | | | | |
2,712 | | * | | Skyworks Solutions, Inc | | $ | 77,455 | |
622 | | * | | Spansion, Inc | | | 8,640 | |
3,604 | | * | | SunEdison, Inc | | | 47,032 | |
589 | | *,e | | SunPower Corp | | | 17,558 | |
100 | | * | | Supertex, Inc | | | 2,505 | |
2,565 | | * | | Teradyne, Inc | | | 45,195 | |
605 | | | | Tessera Technologies, Inc | | | 11,925 | |
15,320 | | | | Texas Instruments, Inc | | | 672,701 | |
1,986 | | * | | Triquint Semiconductor, Inc | | | 16,563 | |
267 | | * | | Ultra Clean Holdings | | | 2,678 | |
367 | | * | | Ultratech, Inc | | | 10,643 | |
512 | | * | | Veeco Instruments, Inc | | | 16,850 | |
3,685 | | | | Xilinx, Inc | | | 169,215 | |
| | | | | | | | |
| | | | TOTAL SEMICONDUCTORS & SEMICONDUCTOR EQUIPMENT | | | 6,053,421 | |
| | | | | | | | |
|
SOFTWARE & SERVICES - 10.1% | |
552 | | * | | Accelrys, Inc | | | 5,266 | |
8,764 | | | | Accenture plc | | | 720,576 | |
503 | | * | | ACI Worldwide, Inc | | | 32,695 | |
3,514 | | | | Activision Blizzard, Inc | | | 62,655 | |
620 | | * | | Actuate Corp | | | 4,780 | |
1,008 | | * | | Acxiom Corp | | | 37,276 | |
6,982 | | * | | Adobe Systems, Inc | | | 418,082 | |
374 | | | | Advent Software, Inc | | | 13,086 | |
2,499 | | * | | Akamai Technologies, Inc | | | 117,903 | |
695 | | * | | Alliance Data Systems Corp | | | 182,736 | |
2,269 | | | | Amdocs Ltd | | | 93,574 | |
276 | | | | American Software, Inc (Class A) | | | 2,724 | |
555 | | *,e | | Angie’s List, Inc | | | 8,408 | |
1,221 | | * | | Ansys, Inc | | | 106,471 | |
1,190 | | * | | AOL, Inc | | | 55,478 | |
1,185 | | * | | Aspen Technology, Inc | | | 49,533 | |
3,179 | | * | | Autodesk, Inc | | | 159,999 | |
6,663 | | | | Automatic Data Processing, Inc | | | 538,437 | |
315 | | * | | AVG Technologies NV | | | 5,421 | |
588 | | * | | Bankrate, Inc | | | 10,549 | |
636 | | *,e | | Bazaarvoice, Inc | | | 5,037 | |
538 | | | | Blackbaud, Inc | | | 20,256 | |
148 | | * | | Blackhawk Network Holdings, Inc | | | 3,738 | |
540 | | * | | Blucora, Inc | | | 15,746 | |
294 | | | | Booz Allen Hamilton Holding Co | | | 5,630 | |
421 | | * | | Bottomline Technologies, Inc | | | 15,223 | |
357 | | * | | Brightcove, Inc | | | 5,048 | |
1,649 | | | | Broadridge Financial Solutions, Inc | | | 65,168 | |
440 | | * | | BroadSoft, Inc | | | 12,030 | |
4,568 | | | | CA, Inc | | | 153,713 | |
349 | | *,e | | CACI International, Inc (Class A) | | | 25,554 | |
3,718 | | * | | Cadence Design Systems, Inc | | | 52,126 | |
370 | | * | | Callidus Software, Inc | | | 5,080 | |
531 | | * | | Cardtronics, Inc | | | 23,072 | |
90 | | | | Cass Information Systems, Inc | | | 6,061 | |
834 | | * | | Ciber, Inc | | | 3,453 | |
2,579 | | * | | Citrix Systems, Inc | | | 163,122 | |
4,143 | | * | | Cognizant Technology Solutions Corp (Class A) | | | 418,360 | |
610 | | * | | Commvault Systems, Inc | | | 45,677 | |
2,128 | | | | Computer Sciences Corp | | | 118,913 | |
174 | | | | Computer Task Group, Inc | | | 3,289 | |
2,948 | | | | Compuware Corp | | | 33,047 | |
399 | | * | | comScore, Inc | | | 11,415 | |
276 | | * | | Comverse, Inc | | | 10,709 | |
611 | | *,e | | Concur Technologies, Inc | | | 63,043 | |
342 | | * | | Constant Contact, Inc | | | 10,626 | |
1,480 | | | | Convergys Corp | | | 31,154 | |
530 | | * | | Cornerstone OnDemand, Inc | | | 28,270 | |
374 | | * | | CoStar Group, Inc | | | 69,033 | |
69
TIAA-CREF LIFE FUNDS - Stock Index Fund
| | | | | | | | |
SHARES | | | | COMPANY | | VALUE | |
| | | | | | | | |
485 | | | | CSG Systems International, Inc | | $ | 14,259 | |
571 | | * | | DealerTrack Holdings, Inc | | | 27,454 | |
379 | | * | | Demand Media, Inc | | | 2,187 | |
210 | | * | | Demandware, Inc | | | 13,465 | |
606 | | * | | Dice Holdings, Inc | | | 4,393 | |
453 | | * | | Digital River, Inc | | | 8,380 | |
85 | | | | DMRC Corp | | | 1,637 | |
483 | | | | DST Systems, Inc | | | 43,827 | |
190 | | *,e | | E2open, Inc | | | 4,543 | |
1,405 | | | | Earthlink, Inc | | | 7,123 | |
17,733 | | * | | eBay, Inc | | | 973,364 | |
4,056 | | * | | Electronic Arts, Inc | | | 93,045 | |
280 | | *,e | | Ellie Mae, Inc | | | 7,524 | |
269 | | * | | Envestnet, Inc | | | 10,841 | |
285 | | * | | EPAM Systems, Inc | | | 9,958 | |
405 | | | | EPIQ Systems, Inc | | | 6,565 | |
51 | | * | | ePlus, Inc | | | 2,899 | |
703 | | * | | Equinix, Inc | | | 124,747 | |
589 | | * | | Euronet Worldwide, Inc | | | 28,184 | |
388 | | | | EVERTEC, Inc | | | 9,568 | |
430 | | * | | ExlService Holdings, Inc | | | 11,877 | |
23,167 | | * | | Facebook, Inc | | | 1,266,308 | |
590 | | e | | Factset Research Systems, Inc | | | 64,062 | |
557 | | | | Fair Isaac Corp | | | 35,002 | |
4,041 | | | | Fidelity National Information Services, Inc | | | 216,921 | |
1,356 | | * | | First American Corp | | | 48,179 | |
3,656 | | * | | Fiserv, Inc | | | 215,887 | |
986 | | * | | FleetCor Technologies, Inc | | | 115,530 | |
215 | | * | | FleetMatics Group plc | | | 9,299 | |
178 | | | | Forrester Research, Inc | | | 6,810 | |
1,660 | | * | | Fortinet, Inc | | | 31,756 | |
1,309 | | * | | Gartner, Inc | | | 93,004 | |
2,209 | | * | | Genpact Ltd | | | 40,579 | |
824 | | * | | Global Cash Access, Inc | | | 8,232 | |
281 | | * | | Global Eagle Entertainment, Inc | | | 4,178 | |
1,032 | | | | Global Payments, Inc | | | 67,070 | |
531 | | *,e | | Glu Mobile, Inc | | | 2,066 | |
3,660 | | * | | Google, Inc (Class A) | | | 4,101,799 | |
551 | | * | | Guidewire Software, Inc | | | 27,038 | |
476 | | | | Hackett Group, Inc | | | 2,956 | |
451 | | e | | Heartland Payment Systems, Inc | | | 22,478 | |
384 | | * | | Higher One Holdings, Inc | | | 3,748 | |
1,028 | | | | IAC/InterActiveCorp | | | 70,613 | |
384 | | * | | iGate Corp | | | 15,421 | |
266 | | * | | Imperva, Inc | | | 12,803 | |
655 | | * | | Infoblox, Inc | | | 21,628 | |
1,414 | | * | | Informatica Corp | | | 58,681 | |
202 | | * | | Interactive Intelligence, Inc | | | 13,607 | |
538 | | * | | Internap Network Services Corp | | | 4,046 | |
14,101 | | | | International Business Machines Corp | | | 2,644,925 | |
4,061 | | | | Intuit, Inc | | | 309,936 | |
601 | | e | | j2 Global, Inc | | | 30,056 | |
1,107 | | | | Jack Henry & Associates, Inc | | | 65,545 | |
522 | | * | | Jive Software, Inc | | | 5,872 | |
298 | | * | | Knot, Inc | | | 4,428 | |
958 | | | | Leidos Holdings, Inc | | | 44,537 | |
1,154 | | | | Lender Processing Services, Inc | | | 43,137 | |
884 | | * | | Limelight Networks, Inc | | | 1,750 | |
1,371 | | * | | LinkedIn Corp | | | 297,274 | |
704 | | * | | Lionbridge Technologies | | | 4,196 | |
325 | | *,e | | Liquidity Services, Inc | | | 7,364 | |
697 | | * | | Liveperson, Inc | | | 10,330 | |
252 | | * | | LogMeIn, Inc | | | 8,455 | |
187 | | *,e | | magicJack VocalTec Ltd | | | 2,229 | |
311 | | * | | Manhattan Associates, Inc | | | 36,536 | |
292 | | | | Mantech International Corp (Class A) | | | 8,740 | |
70
TIAA-CREF LIFE FUNDS - Stock Index Fund
| | | | | | | | |
SHARES | | | | COMPANY | | VALUE | |
| | | | | | | | |
206 | | * | | Marchex, Inc (Class B) | | $ | 1,782 | |
1,603 | | | | Mastercard, Inc (Class A) | | | 1,339,243 | |
964 | | | | MAXIMUS, Inc | | | 42,406 | |
1,291 | | | | Mentor Graphics Corp | | | 31,074 | |
1,095 | | * | | Micros Systems, Inc | | | 62,820 | |
113,410 | | | | Microsoft Corp | | | 4,244,936 | |
100 | | * | | MicroStrategy, Inc (Class A) | | | 12,424 | |
461 | | *,e | | Millennial Media, Inc | | | 3,351 | |
1,455 | | *,e | | Mitek Systems, Inc | | | 8,643 | |
105 | | * | | Model N, Inc | | | 1,238 | |
529 | | * | | ModusLink Global Solutions, Inc | | | 3,031 | |
278 | | * | | MoneyGram International, Inc | | | 5,777 | |
443 | | | | Monotype Imaging Holdings, Inc | | | 14,114 | |
1,800 | | * | | Monster Worldwide, Inc | | | 12,834 | |
696 | | * | | Move, Inc | | | 11,129 | |
467 | | * | | Netscout Systems, Inc | | | 13,819 | |
458 | | * | | NetSuite, Inc | | | 47,183 | |
874 | | * | | NeuStar, Inc (Class A) | | | 43,578 | |
1,070 | | * | | NIC, Inc | | | 26,611 | |
3,423 | | * | | Nuance Communications, Inc | | | 52,030 | |
293 | | *,e | | OpenTable, Inc | | | 23,255 | |
48,382 | | | | Oracle Corp | | | 1,851,095 | |
1,919 | | * | | Pandora Media, Inc | | | 51,045 | |
4,510 | | | | Paychex, Inc | | | 205,340 | |
162 | | | | Pegasystems, Inc | | | 7,967 | |
320 | | * | | Perficient, Inc | | | 7,494 | |
240 | | * | | PRG-Schultz International, Inc | | | 1,613 | |
831 | | * | | Progress Software Corp | | | 21,465 | |
282 | | * | | Proofpoint, Inc | | | 9,354 | |
283 | | * | | PROS Holdings, Inc | | | 11,292 | |
1,520 | | * | | PTC, Inc | | | 53,793 | |
43 | | | | QAD, Inc (Class A) | | | 759 | |
1,081 | | * | | QLIK Technologies, Inc | | | 28,787 | |
201 | | * | | Qualys, Inc | | | 4,645 | |
335 | | * | | QuinStreet, Inc | | | 2,911 | |
1,702 | | * | | Rackspace Hosting, Inc | | | 66,599 | |
299 | | * | | RealNetworks, Inc | | | 2,257 | |
606 | | *,e | | RealPage, Inc | | | 14,168 | |
2,731 | | * | | Red Hat, Inc | | | 153,045 | |
453 | | * | | Responsys, Inc | | | 12,417 | |
127 | | * | | Rosetta Stone, Inc | | | 1,552 | |
1,436 | | * | | Rovi Corp | | | 28,275 | |
8,253 | | * | | Salesforce.com, Inc | | | 455,483 | |
170 | | | | Sapiens International Corp NV | | | 1,311 | |
1,557 | | * | | Sapient Corp | | | 27,030 | |
547 | | | | Science Applications International Corp | | | 18,089 | |
303 | | * | | Sciquest, Inc | | | 8,629 | |
334 | | * | | Seachange International, Inc | | | 4,061 | |
1,193 | | * | | ServiceNow, Inc | | | 66,820 | |
634 | | * | | ServiceSource International LLC | | | 5,313 | |
98 | | *,e | | Shutterstock, Inc | | | 8,196 | |
860 | | * | | SolarWinds, Inc | | | 32,534 | |
977 | | | | Solera Holdings, Inc | | | 69,133 | |
150 | | *,e | | Spark Networks, Inc | | | 924 | |
1,343 | | * | | Splunk, Inc | | | 92,224 | |
235 | | * | | SPS Commerce, Inc | | | 15,345 | |
765 | | * | | SS&C Technologies Holdings, Inc | | | 33,859 | |
192 | | * | | Stamps.com, Inc | | | 8,083 | |
513 | | * | | SupportSoft, Inc | | | 1,944 | |
460 | | * | | Sykes Enterprises, Inc | | | 10,033 | |
9,764 | | | | Symantec Corp | | | 230,235 | |
328 | | * | | Synchronoss Technologies, Inc | | | 10,191 | |
2,017 | | * | | Synopsys, Inc | | | 81,830 | |
190 | | * | | Syntel, Inc | | | 17,280 | |
402 | | * | | TA Indigo Holding Corp | | | 4,868 | |
123 | | * | | Tableau Software, Inc | | | 8,478 | |
71
TIAA-CREF LIFE FUNDS - Stock Index Fund
| | | | | | | | |
SHARES | | | | COMPANY | | VALUE | |
| | | | | | | | |
925 | | * | | Take-Two Interactive Software, Inc | | $ | 16,067 | |
383 | | *,e | | Tangoe, Inc | | | 6,898 | |
205 | | * | | TeleNav, Inc | | | 1,351 | |
455 | | * | | TeleTech Holdings, Inc | | | 10,893 | |
2,396 | | * | | Teradata Corp | | | 108,994 | |
2,110 | | * | | TIBCO Software, Inc | | | 47,433 | |
1,671 | | * | | TiVo, Inc | | | 21,924 | |
2,318 | | | | Total System Services, Inc | | | 77,143 | |
174 | | * | | Travelzoo, Inc | | | 3,710 | |
360 | | *,e | | Trulia, Inc | | | 12,697 | |
683 | | *,e | | Twitter, Inc | | | 43,473 | |
432 | | * | | Tyler Technologies, Inc | | | 44,120 | |
362 | | * | | Ultimate Software Group, Inc | | | 55,466 | |
586 | | * | | Unisys Corp | | | 19,672 | |
150 | | | | United Online, Inc | | | 2,064 | |
1,081 | | * | | Unwired Planet, Inc | | | 1,492 | |
1,094 | | * | | Valueclick, Inc | | | 25,567 | |
1,310 | | * | | Vantiv, Inc | | | 42,719 | |
248 | | * | | Vasco Data Security International | | | 1,917 | |
1,365 | | * | | VeriFone Systems, Inc | | | 36,609 | |
691 | | * | | Verint Systems, Inc | | | 29,672 | |
1,932 | | * | | VeriSign, Inc | | | 115,495 | |
574 | | *,e | | VirnetX Holding Corp | | | 11,141 | |
265 | | * | | Virtusa Corp | | | 10,094 | |
7,152 | | | | Visa, Inc (Class A) | | | 1,592,607 | |
527 | | *,e | | VistaPrint Ltd | | | 29,960 | |
1,286 | | * | | VMware, Inc (Class A) | | | 115,367 | |
202 | | * | | Vocus, Inc | | | 2,301 | |
852 | | *,e | | Vringo, Inc | | | 2,522 | |
552 | | *,e | | WebMD Health Corp (Class A) | | | 21,804 | |
552 | | * | | Website Pros, Inc | | | 17,548 | |
7,919 | | | | Western Union Co | | | 136,603 | |
583 | | * | | Workday, Inc | | | 48,482 | |
12,391 | | * | | Yahoo!, Inc | | | 501,092 | |
387 | | * | | Yelp, Inc | | | 26,684 | |
367 | | *,e | | Zillow, Inc | | | 29,995 | |
743 | | * | | Zix Corp | | | 3,388 | |
7,662 | | * | | Zynga, Inc | | | 29,116 | |
| | | | | | | | |
| | | | TOTAL SOFTWARE & SERVICES | | | 28,613,217 | |
| | | | | | | | |
|
TECHNOLOGY HARDWARE & EQUIPMENT - 5.7% | |
1,447 | | *,e | | 3D Systems Corp | | | 134,470 | |
806 | | | | Adtran, Inc | | | 21,770 | |
400 | | * | | Agilysys, Inc | | | 5,568 | |
398 | | e | | Alliance Fiber Optic Products, Inc | | | 5,990 | |
2,215 | | | | Amphenol Corp (Class A) | | | 197,534 | |
200 | | * | | Anaren, Inc | | | 5,598 | |
356 | | * | | Anixter International, Inc | | | 31,983 | |
12,731 | | | | Apple, Inc | | | 7,143,491 | |
1,549 | | * | | ARRIS Group, Inc | | | 37,741 | |
1,424 | | * | | Arrow Electronics, Inc | | | 77,252 | |
1,423 | | * | | Aruba Networks, Inc | | | 25,472 | |
80 | | * | | Audience, Inc | | | 931 | |
424 | | * | | Avid Technology, Inc | | | 3,456 | |
1,830 | | | | Avnet, Inc | | | 80,721 | |
583 | | | | AVX Corp | | | 8,121 | |
245 | | * | | AX Holding Corp | | | 1,593 | |
258 | | | | Badger Meter, Inc | | | 14,061 | |
100 | | | | Bel Fuse, Inc (Class B) | | | 2,131 | |
565 | | | | Belden CDT, Inc | | | 39,804 | |
750 | | * | | Benchmark Electronics, Inc | | | 17,310 | |
226 | | | | Black Box Corp | | | 6,735 | |
5,865 | | * | | Brocade Communications Systems, Inc | | | 52,023 | |
358 | | * | | CalAmp Corp | | | 10,013 | |
469 | | * | | Calix Networks, Inc | | | 4,521 | |
72
TIAA-CREF LIFE FUNDS - Stock Index Fund
| | | | | | | | |
SHARES | | | | COMPANY | | VALUE | |
| | | | | | | | |
500 | | * | | Checkpoint Systems, Inc | | $ | 7,885 | |
1,254 | | * | | Ciena Corp | | | 30,008 | |
72,703 | | | | Cisco Systems, Inc | | | 1,632,182 | |
1,084 | | * | | Cognex Corp | | | 41,387 | |
306 | | * | | Coherent, Inc | | | 22,763 | |
330 | | | | Comtech Telecommunications Corp | | | 10,402 | |
19,277 | | | | Corning, Inc | | | 343,516 | |
518 | | * | | Cray, Inc | | | 14,224 | |
409 | | | | CTS Corp | | | 8,143 | |
423 | | | | Daktronics, Inc | | | 6,633 | |
185 | | * | | Datalink Corp | | | 2,017 | |
932 | | | | Diebold, Inc | | | 30,765 | |
400 | | * | | Digi International, Inc | | | 4,848 | |
769 | | *,e | | Dolby Laboratories, Inc (Class A) | | | 29,653 | |
196 | | * | | DTS, Inc | | | 4,700 | |
485 | | * | | EchoStar Corp (Class A) | | | 24,114 | |
248 | | | | Electro Rent Corp | | | 4,593 | |
300 | | | | Electro Scientific Industries, Inc | | | 3,138 | |
630 | | * | | Electronics for Imaging, Inc | | | 24,400 | |
29,057 | | | | EMC Corp | | | 730,784 | |
1,000 | | * | | Emulex Corp | | | 7,160 | |
1,016 | | * | | Extreme Networks, Inc | | | 7,112 | |
1,125 | | * | | F5 Networks, Inc | | | 102,218 | |
252 | | * | | Fabrinet | | | 5,181 | |
215 | | * | | FARO Technologies, Inc | | | 12,535 | |
574 | | | | FEI Co | | | 51,293 | |
1,138 | | * | | Finisar Corp | | | 27,221 | |
1,943 | | | | Flir Systems, Inc | | | 58,484 | |
1,128 | | * | | Fusion-io, Inc | | | 10,051 | |
327 | | * | | GSI Group, Inc | | | 3,676 | |
1,150 | | * | | Harmonic, Inc | | | 8,487 | |
1,483 | | | | Harris Corp | | | 103,528 | |
670 | | * | | Harris Stratex Networks, Inc (Class A) | | | 1,514 | |
25,953 | | | | Hewlett-Packard Co | | | 726,165 | |
1,947 | | * | | Hutchinson Technology, Inc | | | 6,230 | |
400 | | * | | Imation Corp | | | 1,872 | |
289 | | * | | Immersion Corp | | | 3,000 | |
1,519 | | *,e | | Infinera Corp | | | 14,856 | |
2,058 | | * | | Ingram Micro, Inc (Class A) | | | 48,281 | |
655 | | * | | Insight Enterprises, Inc | | | 14,875 | |
564 | | e | | InterDigital, Inc | | | 16,632 | |
750 | | *,e | | InvenSense, Inc | | | 15,585 | |
407 | | *,e | | IPG Photonics Corp | | | 31,587 | |
477 | | * | | Itron, Inc | | | 19,762 | |
743 | | * | | Ixia | | | 9,889 | |
2,660 | | | | Jabil Circuit, Inc | | | 46,390 | |
3,054 | | * | | JDS Uniphase Corp | | | 39,641 | |
7,406 | | * | | Juniper Networks, Inc | | | 167,153 | |
1,680 | | * | | Kemet Corp | | | 9,475 | |
172 | | * | | KVH Industries, Inc | | | 2,241 | |
871 | | e | | Lexmark International, Inc (Class A) | | | 30,938 | |
261 | | | | Littelfuse, Inc | | | 24,255 | |
315 | | * | | Maxwell Technologies, Inc | | | 2,448 | |
187 | | * | | Measurement Specialties, Inc | | | 11,349 | |
375 | | * | | Mercury Computer Systems, Inc | | | 4,106 | |
30 | | | | Mesa Laboratories, Inc | | | 2,357 | |
447 | | | | Methode Electronics, Inc | | | 15,283 | |
3,405 | | | | Motorola, Inc | | | 229,838 | |
221 | | | | MTS Systems Corp | | | 15,746 | |
160 | | * | | Multi-Fineline Electronix, Inc | | | 2,222 | |
1,200 | | | | National Instruments Corp | | | 38,424 | |
2,397 | | * | | NCR Corp | | | 81,642 | |
290 | | *,e | | Neonode, Inc | | | 1,833 | |
4,695 | | | | NetApp, Inc | | | 193,152 | |
454 | | * | | Netgear, Inc | | | 14,955 | |
407 | | * | | Newport Corp | | | 7,355 | |
73
TIAA-CREF LIFE FUNDS - Stock Index Fund
| | | | | | | | |
SHARES | | | | COMPANY | | VALUE | |
| | | | | | | | |
252 | | * | | Oplink Communications, Inc | | $ | 4,687 | |
252 | | * | | OSI Systems, Inc | | | 13,384 | |
542 | | * | | Palo Alto Networks, Inc | | | 31,149 | |
232 | | | | Park Electrochemical Corp | | | 6,663 | |
935 | | *,e | | Parkervision, Inc | | | 4,254 | |
196 | | | | PC Connection, Inc | | | 4,871 | |
230 | | | | PC-Tel, Inc | | | 2,201 | |
554 | | | | Plantronics, Inc | | | 25,733 | |
511 | | * | | Plexus Corp | | | 22,121 | |
2,192 | | * | | Polycom, Inc | | | 24,616 | |
248 | | *,e | | Procera Networks, Inc | | | 3,725 | |
1,437 | | * | | QLogic Corp | | | 17,000 | |
23,615 | | | | Qualcomm, Inc | | | 1,753,414 | |
4,721 | | * | | Quantum Corp | | | 5,665 | |
301 | | * | | Rackable Systems, Inc | | | 4,036 | |
187 | | * | | Radisys Corp | | | 428 | |
485 | | * | | RealD, Inc | | | 4,142 | |
181 | | | | Richardson Electronics Ltd | | | 2,056 | |
2,138 | | * | | Riverbed Technology, Inc | | | 38,655 | |
383 | | * | | Rofin-Sinar Technologies, Inc | | | 10,349 | |
200 | | * | | Rogers Corp | | | 12,300 | |
571 | | * | | Ruckus Wireless, Inc | | | 8,108 | |
3,191 | | | | SanDisk Corp | | | 225,093 | |
958 | | * | | Sanmina Corp | | | 15,999 | |
321 | | * | | Scansource, Inc | | | 13,620 | |
495 | | * | | ShoreTel, Inc | | | 4,594 | |
3,028 | | * | | Sonus Networks, Inc | | | 9,538 | |
416 | | * | | Stratasys Ltd | | | 56,035 | |
258 | | * | | Super Micro Computer, Inc | | | 4,427 | |
424 | | *,e | | Synaptics, Inc | | | 21,967 | |
313 | | * | | SYNNEX Corp | | | 21,096 | |
546 | | * | | Tech Data Corp | | | 28,174 | |
70 | | | | Tessco Technologies, Inc | | | 2,822 | |
3,538 | | * | | Trimble Navigation Ltd | | | 122,769 | |
971 | | * | | TTM Technologies, Inc | | | 8,331 | |
166 | | *,e | | Ubiquiti Networks, Inc | | | 7,629 | |
527 | | *,e | | Universal Display Corp | | | 18,108 | |
529 | | * | | Viasat, Inc | | | 33,142 | |
1,895 | | * | | Vishay Intertechnology, Inc | | | 25,128 | |
161 | | * | | Vishay Precision Group, Inc | | | 2,397 | |
662 | | * | | Westell Technologies, Inc | | | 2,681 | |
2,772 | | | | Western Digital Corp | | | 232,571 | |
16,106 | | | | Xerox Corp | | | 196,010 | |
721 | | * | | Zebra Technologies Corp (Class A) | | | 38,992 | |
198 | | * | | Zygo Corp | | | 2,926 | |
| | | | | | | | |
| | | | TOTAL TECHNOLOGY HARDWARE & EQUIPMENT | | | 16,246,047 | |
| | | | | | | | |
| |
TELECOMMUNICATION SERVICES - 2.1% | | | | |
754 | | * | | 8x8, Inc | | | 7,661 | |
72,875 | | | | AT&T, Inc | | | 2,562,285 | |
105 | | | | Atlantic Tele-Network, Inc | | | 5,940 | |
201 | | * | | Boingo Wireless, Inc | | | 1,288 | |
277 | | * | | Cbeyond Communications, Inc | | | 1,911 | |
8,675 | | | | CenturyTel, Inc | | | 276,299 | |
3,005 | | * | | Cincinnati Bell, Inc | | | 10,698 | |
706 | | | | Cogent Communications Group, Inc | | | 28,529 | |
526 | | e | | Consolidated Communications Holdings, Inc | | | 10,325 | |
4,711 | | * | | Crown Castle International Corp | | | 345,929 | |
269 | | *,e | | Fairpoint Communications, Inc | | | 3,042 | |
13,108 | | e | | Frontier Communications Corp | | | 60,952 | |
464 | | * | | General Communication, Inc (Class A) | | | 5,174 | |
126 | | * | | Hawaiian Telcom Holdco, Inc | | | 3,701 | |
170 | | | | HickoryTech Corp | | | 2,181 | |
164 | | | | IDT Corp (Class B) | | | 2,931 | |
686 | | * | | inContact, Inc | | | 5,358 | |
74
TIAA-CREF LIFE FUNDS - Stock Index Fund
| | | | | | | | |
SHARES | | | | COMPANY | | VALUE | |
| | | | | | | | |
391 | | | | Inteliquent, Inc | | $ | 4,465 | |
504 | | * | | Intelsat S.A. | | | 11,360 | |
641 | | *,e | | Iridium Communications, Inc | | | 4,013 | |
710 | | * | | Leap Wireless International, Inc | | | 12,354 | |
2,188 | | * | | Level 3 Communications, Inc | | | 72,576 | |
181 | | | | Lumos Networks Corp | | | 3,801 | |
2,115 | | *,e | | NII Holdings, Inc (Class B) | | | 5,816 | |
181 | | | | NTELOS Holdings Corp | | | 3,662 | |
430 | | * | | Orbcomm, Inc | | | 2,726 | |
762 | | * | | Premiere Global Services, Inc | | | 8,832 | |
1,798 | | * | | SBA Communications Corp (Class A) | | | 161,532 | |
364 | | | | Shenandoah Telecom Co | | | 9,344 | |
12,219 | | * | | Sprint Corp | | | 131,354 | |
82 | | * | | Straight Path Communications, Inc | | | 672 | |
1,221 | | | | Telephone & Data Systems, Inc | | | 31,477 | |
2,257 | | * | | T-Mobile US, Inc | | | 75,925 | |
420 | | *,e | | Towerstream Corp | | | 1,243 | |
1,990 | | * | | tw telecom inc (Class A) | | | 60,635 | |
200 | | | | US Cellular Corp | | | 8,364 | |
250 | | | | USA Mobility, Inc | | | 3,570 | |
38,896 | | | | Verizon Communications, Inc | | | 1,911,350 | |
1,236 | | * | | Vonage Holdings Corp | | | 4,116 | |
7,924 | | e | | Windstream Holdings, Inc | | | 63,234 | |
| | | | | | | | |
| | | | TOTAL TELECOMMUNICATION SERVICES | | | 5,926,625 | |
| | | | | | | | |
| |
TRANSPORTATION - 2.1% | | | | |
776 | | * | | Air Transport Services Group, Inc | | | 6,278 | |
1,055 | | | | Alaska Air Group, Inc | | | 77,405 | |
215 | | * | | Allegiant Travel Co | | | 22,670 | |
100 | | * | | Amerco, Inc | | | 23,784 | |
2,604 | | *,e | | American Airlines Group, Inc | | | 65,751 | |
300 | | | | Arkansas Best Corp | | | 10,104 | |
331 | | * | | Atlas Air Worldwide Holdings, Inc | | | 13,621 | |
1,415 | | * | | Avis Budget Group, Inc | | | 57,194 | |
250 | | | | Celadon Group, Inc | | | 4,870 | |
2,175 | | | | CH Robinson Worldwide, Inc | | | 126,889 | |
795 | | | | Con-Way, Inc | | | 31,569 | |
448 | | | | Copa Holdings S.A. (Class A) | | | 71,729 | |
13,408 | | | | CSX Corp | | | 385,748 | |
11,596 | | | | Delta Air Lines, Inc | | | 318,542 | |
134 | | * | | Echo Global Logistics, Inc | | | 2,878 | |
2,852 | | | | Expeditors International of Washington, Inc | | | 126,201 | |
4,308 | | | | FedEx Corp | | | 619,361 | |
548 | | | | Forward Air Corp | | | 24,063 | |
566 | | * | | Genesee & Wyoming, Inc (Class A) | | | 54,364 | |
633 | | *,e | | Hawaiian Holdings, Inc | | | 6,096 | |
666 | | | | Heartland Express, Inc | | | 13,067 | |
4,872 | | * | | Hertz Global Holdings, Inc | | | 139,437 | |
500 | | * | | Hub Group, Inc (Class A) | | | 19,940 | |
64 | | | | International Shipholding Corp | | | 1,888 | |
1,276 | | | | J.B. Hunt Transport Services, Inc | | | 98,635 | |
2,933 | | *,e | | JetBlue Airways Corp | | | 25,077 | |
1,445 | | | | Kansas City Southern Industries, Inc | | | 178,934 | |
734 | | * | | Kirby Corp | | | 72,850 | |
691 | | | | Knight Transportation, Inc | | | 12,673 | |
644 | | * | | Landstar System, Inc | | | 36,998 | |
576 | | | | Marten Transport Ltd | | | 11,629 | |
519 | | | | Matson, Inc | | | 13,551 | |
4,137 | | | | Norfolk Southern Corp | | | 384,038 | |
931 | | * | | Old Dominion Freight Line | | | 49,362 | |
443 | | * | | Pacer International, Inc | | | 3,659 | |
96 | | * | | Park-Ohio Holdings Corp | | | 5,030 | |
48 | | * | | Patriot Transportation Holding, Inc | | | 1,992 | |
772 | | * | | Quality Distribution, Inc | | | 9,905 | |
908 | | * | | Republic Airways Holdings, Inc | | | 9,707 | |
75
TIAA-CREF LIFE FUNDS - Stock Index Fund
| | | | | | | | |
SHARES | | | | COMPANY | | VALUE | |
| | | | | | | | |
231 | | * | | Roadrunner Transportation Services Holdings, Inc | | $ | 6,225 | |
655 | | | | Ryder System, Inc | | | 48,326 | |
358 | | * | | Saia, Inc | | | 11,474 | |
692 | | | | Skywest, Inc | | | 10,262 | |
9,469 | | | | Southwest Airlines Co | | | 178,396 | |
1,033 | | * | | Spirit Airlines, Inc | | | 46,909 | |
985 | | *,e | | Swift Transportation Co, Inc | | | 21,877 | |
4,736 | | * | | UAL Corp | | | 179,163 | |
6,413 | | | | Union Pacific Corp | | | 1,077,384 | |
9,765 | | | | United Parcel Service, Inc (Class B) | | | 1,026,106 | |
68 | | | | Universal Truckload Services, Inc | | | 2,075 | |
1,203 | | | | UTI Worldwide, Inc | | | 21,125 | |
511 | | | | Werner Enterprises, Inc | | | 12,637 | |
546 | | * | | Wesco Aircraft Holdings, Inc | | | 11,968 | |
575 | | *,e | | XPO Logistics, Inc | | | 15,117 | |
521 | | *,e | | YRC Worldwide, Inc | | | 9,050 | |
| | | | | | | | |
| | | | TOTAL TRANSPORTATION | | | 5,815,583 | |
| | | | | | | | |
| |
UTILITIES - 2.9% | | | | |
8,134 | | | | AES Corp | | | 118,024 | |
1,553 | | | | AGL Resources, Inc | | | 73,348 | |
597 | | | | Allete, Inc | | | 29,778 | |
1,575 | | | | Alliant Energy Corp | | | 81,270 | |
3,162 | | | | Ameren Corp | | | 114,338 | |
6,494 | | | | American Electric Power Co, Inc | | | 303,530 | |
893 | | | | American States Water Co | | | 25,656 | |
2,339 | | | | American Water Works Co, Inc | | | 98,846 | |
2,303 | | | | Aqua America, Inc | | | 54,328 | |
77 | | | | Artesian Resources Corp | | | 1,767 | |
1,866 | | | | Atlantic Power Corp | | | 6,494 | |
1,189 | | | | Atmos Energy Corp | | | 54,004 | |
912 | | | | Avista Corp | | | 25,709 | |
557 | | | | Black Hills Corp | | | 29,248 | |
1,228 | | | | California Water Service Group | | | 28,330 | |
5,138 | | * | | Calpine Corp | | | 100,242 | |
5,553 | | | | Centerpoint Energy, Inc | | | 128,719 | |
107 | | | | Chesapeake Utilities Corp | | | 6,422 | |
937 | | | | Cleco Corp | | | 43,683 | |
3,466 | | | | CMS Energy Corp | | | 92,785 | |
98 | | | | Connecticut Water Service, Inc | | | 3,480 | |
3,841 | | | | Consolidated Edison, Inc | | | 212,330 | |
160 | | | | Consolidated Water Co, Inc | | | 2,256 | |
90 | | | | Delta Natural Gas Co, Inc | | | 2,014 | |
8,045 | | | | Dominion Resources, Inc | | | 520,431 | |
2,254 | | | | DTE Energy Co | | | 149,643 | |
9,563 | | | | Duke Energy Corp | | | 659,943 | |
1,312 | | *,e | | Dynegy, Inc | | | 28,234 | |
4,173 | | | | Edison International | | | 193,210 | |
600 | | | | El Paso Electric Co | | | 21,066 | |
1,184 | | | | Empire District Electric Co | | | 26,865 | |
2,379 | | | | Entergy Corp | | | 150,519 | |
11,226 | | | | Exelon Corp | | | 307,480 | |
5,665 | | | | FirstEnergy Corp | | | 186,832 | |
780 | | * | | Genie Energy Ltd | | | 7,964 | |
2,017 | | | | Great Plains Energy, Inc | | | 48,892 | |
1,618 | | e | | Hawaiian Electric Industries, Inc | | | 42,165 | |
750 | | | | Idacorp, Inc | | | 38,880 | |
1,029 | | | | Integrys Energy Group, Inc | | | 55,988 | |
695 | | | | ITC Holdings Corp | | | 66,595 | |
584 | | | | Laclede Group, Inc | | | 26,595 | |
2,402 | | | | MDU Resources Group, Inc | | | 73,381 | |
560 | | | | MGE Energy, Inc | | | 32,424 | |
155 | | | | Middlesex Water Co | | | 3,246 | |
960 | | | | National Fuel Gas Co | | | 68,544 | |
646 | | | | New Jersey Resources Corp | | | 29,871 | |
76
TIAA-CREF LIFE FUNDS - Stock Index Fund
| | | | | | | | |
SHARES | | | | COMPANY | | VALUE | |
| | | | | | | | |
5,590 | | | | NextEra Energy, Inc | | $ | 478,616 | |
4,022 | | | | NiSource, Inc | | | 132,243 | |
4,073 | | | | Northeast Utilities | | | 172,654 | |
333 | | | | Northwest Natural Gas Co | | | 14,259 | |
691 | | | | NorthWestern Corp | | | 29,934 | |
4,229 | | | | NRG Energy, Inc | | | 121,457 | |
402 | | | | NRG Yield, Inc | | | 16,084 | |
2,582 | | | | OGE Energy Corp | | | 87,530 | |
2,664 | | | | Oneok, Inc | | | 165,648 | |
240 | | | | Ormat Technologies, Inc | | | 6,530 | |
540 | | | | Otter Tail Corp | | | 15,806 | |
304 | | * | | Pattern Energy Group, Inc | | | 9,214 | |
3,306 | | e | | Pepco Holdings, Inc | | | 63,244 | |
5,797 | | | | PG&E Corp | | | 233,503 | |
992 | | | | Piedmont Natural Gas Co, Inc | | | 32,895 | |
1,599 | | | | Pinnacle West Capital Corp | | | 84,619 | |
1,049 | | | | PNM Resources, Inc | | | 25,302 | |
1,142 | | | | Portland General Electric Co | | | 34,488 | |
8,198 | | | | PPL Corp | | | 246,678 | |
6,572 | | | | Public Service Enterprise Group, Inc | | | 210,567 | |
2,481 | | | | Questar Corp | | | 57,038 | |
1,959 | | | | SCANA Corp | | | 91,936 | |
3,192 | | | | Sempra Energy | | | 286,514 | |
322 | | | | SJW Corp | | | 9,592 | |
487 | | | | South Jersey Industries, Inc | | | 27,253 | |
11,450 | | | | Southern Co | | | 470,710 | |
587 | | | | Southwest Gas Corp | | | 32,819 | |
2,812 | | e | | TECO Energy, Inc | | | 48,479 | |
1,493 | | | | UGI Corp | | | 61,900 | |
895 | | | | UIL Holdings Corp | | | 34,681 | |
126 | | | | Unitil Corp | | | 3,842 | |
692 | | | | UNS Energy Corp | | | 41,416 | |
1,082 | | | | Vectren Corp | | | 38,411 | |
1,868 | | | | Westar Energy, Inc | | | 60,094 | |
691 | | | | WGL Holdings, Inc | | | 27,681 | |
2,979 | | | | Wisconsin Energy Corp | | | 123,152 | |
6,471 | | | | Xcel Energy, Inc | | | 180,800 | |
142 | | | | York Water Co | | | 2,972 | |
| | | | | | | | |
| | | | TOTAL UTILITIES | | | 8,155,930 | |
| | | | | | | | |
| | | | TOTAL COMMON STOCKS
(Cost $179,389,417) | | | 280,707,717 | |
| | | | | | | | |
|
RIGHTS / WARRANTS - 0.0% | |
| |
ENERGY - 0.0% | | | | |
1,522 | | | | EXCO Resources, Inc | | | 243 | |
303 | | e,m | | Magnum Hunter Resources Corp | | | 0 | |
| | | | | | | | |
| | | | TOTAL ENERGY | | | 243 | |
| | | | | | | | |
PHARMACEUTICALS, BIOTECHNOLOGY & LIFE SCIENCES - 0.0% | | | | |
118 | | *,m | | Forest Laboratories, Inc CVR | | | 112 | |
499 | | m | | Trius Therapeutics, Inc | | | 65 | |
| | | | | | | | |
| | | | TOTAL PHARMACEUTICALS, BIOTECHNOLOGY & LIFE SCIENCES | | | 177 | |
| | | | | | | | |
| |
SOFTWARE & SERVICES - 0.0% | | | | |
299 | | *,m | | Gerber Scientific, Inc | | | 0 | |
| | | | | | | | |
| | | | TOTAL SOFTWARE & SERVICES | | | 0 | |
| | | | | | | | |
| | | | TOTAL RIGHTS / WARRANTS
(Cost $0) | | | 420 | |
| | | | | | | | |
77
TIAA-CREF LIFE FUNDS - Stock Index Fund
| | | | | | | | |
SHARES | | | | COMPANY | | VALUE | |
| | | | | | | | |
| |
SHORT-TERM INVESTMENTS - 2.5% | | | | |
| |
INVESTMENTS IN REGISTERED INVESTMENT COMPANIES - 2.5% | | | | |
6,943,725 | | c | | TIAA-CREF Short Term Lending Portfolio of the State Street Navigator Securities Lending Trust | | $ | 6,943,725 | |
| | | | | | | | |
| | | | TOTAL INVESTMENTS IN REGISTERED INVESTMENT COMPANIES | | | 6,943,725 | |
| | | | | | | | |
| | | | TOTAL SHORT-TERM INVESTMENTS
(Cost $6,943,725) | | | 6,943,725 | |
| | | | | | | | |
| | | | TOTAL INVESTMENTS - 101.6%
(Cost $186,333,142) | | | 287,651,862 | |
| | | | OTHER ASSETS & LIABILITIES, NET - (1.6)% | | | (4,535,339 | ) |
| | | | | | | | |
| | | | NET ASSETS - 100.0% | | $ | 283,116,523 | |
| | | | | | | | |
Abbreviation(s):
| REIT | Real Estate Investment Trust |
| c | Investments made with cash collateral received from securities on loan. |
| d | All or a portion of these securities have been segregated to cover margin requirements on open futures transactions. |
| e | All or a portion of these securities are out on loan. The aggregate value of securities on loan is $6,781,019. |
| m | Indicates a security that has been deemed illiquid. |
78
TIAA-CREF LIFE FUNDS - International Equity Fund
TIAA-CREF LIFE FUNDS
INTERNATIONAL EQUITY FUND
SCHEDULE OF INVESTMENTS
December 31, 2013
| | | | | | | | |
SHARES | | | | COMPANY | | VALUE | |
| | | | | | | | |
COMMON STOCKS - 98.8% | |
|
FRANCE - 20.5% | |
80,842 | | | | Accor S.A. | | $ | 3,818,156 | |
1,853 | | e | | Atos Origin S.A. | | | 167,889 | |
13,716 | | | | BNP Paribas | | | 1,069,947 | |
58,086 | | | | Bouygues S.A. | | | 2,196,568 | |
49,438 | | | | Compagnie de Saint-Gobain | | | 2,723,392 | |
13,147 | | | | Compagnie Generale d’Optique Essilor International S.A. | | | 1,398,937 | |
4,095 | | | | Eiffage S.A. | | | 236,016 | |
28,024 | | | | European Aeronautic Defence and Space Co | | | 2,151,407 | |
2,367 | | | | Nexity | | | 89,323 | |
5,183 | | * | | Numericable SAS | | | 188,239 | |
35,662 | | | | Renault S.A. | | | 2,869,948 | |
28,898 | | | | Societe Television Francaise 1 | | | 556,913 | |
899 | | | | Technip S.A. | | | 86,538 | |
4,364 | | | | Vinci S.A. | | | 286,851 | |
84,449 | | | | Vivendi Universal S.A. | | | 2,227,545 | |
| | | | | | | | |
| | | | TOTAL FRANCE | | | 20,067,669 | |
| | | | | | | | |
|
GERMANY - 10.0% | |
29,271 | | | | Bayer AG. | | | 4,109,955 | |
10,912 | | | | Henkel KGaA (Preference) | | | 1,268,350 | |
51,393 | | | | SAP AG. | | | 4,456,881 | |
| | | | | | | | |
| | | | TOTAL GERMANY | | | 9,835,186 | |
| | | | | | | | |
|
GREECE - 5.0% | |
76,311 | | * | | Hellenic Telecommunications Organization S.A. | | | 1,016,391 | |
321,940 | | * | | National Bank of Greece S.A. | | | 1,728,388 | |
1,001,555 | | * | | Piraeus Bank S.A. | | | 2,117,552 | |
| | | | | | | | |
| | | | TOTAL GREECE | | | 4,862,331 | |
| | | | | | | | |
|
HONG KONG - 0.0% | |
503 | | | | Hong Kong Exchanges and Clearing Ltd | | | 8,408 | |
| | | | | | | | |
| | | | TOTAL HONG KONG | | | 8,408 | |
| | | | | | | | |
|
INDIA - 6.8% | |
13,811 | | | | Eicher Motors Ltd | | | 1,111,009 | |
125,140 | | | | HDFC Bank Ltd | | | 1,349,947 | |
89,242 | | | | IndusInd Bank Ltd | | | 608,558 | |
18,393 | | * | | Just Dial Ltd | | | 429,330 | |
117,347 | | | | Larsen & Toubro Ltd | | | 2,035,242 | |
227,687 | | | | Mahindra & Mahindra Financial Services Ltd | | | 1,183,223 | |
| | | | | | | | |
| | | | TOTAL INDIA | | | 6,717,309 | |
| | | | | | | | |
|
INDONESIA - 0.5% | |
| | | | | | | | |
976,500 | | | | PT Indofood Sukses Makmur Tbk | | | 530,672 | |
| | | | | | | | |
| | | | TOTAL INDONESIA | | | 530,672 | |
| | | | | | | | |
| |
ITALY - 0.3% | | | | |
45,659 | | | | UniCredit S.p.A | | | 336,810 | |
| | | | | | | | |
| | | | TOTAL ITALY | | | 336,810 | |
| | | | | | | | |
| |
JAPAN - 13.1% | | | | |
1,600 | | | | Daikin Industries Ltd | | | 99,844 | |
25,000 | | | | Daiwa House Industry Co Ltd | | | 484,380 | |
6,622 | | | | Denso Corp | | | 349,831 | |
79
TIAA-CREF LIFE FUNDS - International Equity Fund
| | | | | | | | |
SHARES | | | | COMPANY | | VALUE | |
| | | | | | | | |
8,200 | | | | Don Quijote Co Ltd | | $ | 497,085 | |
550 | | | | Fanuc Ltd | | | 100,782 | |
1,100 | | | | Fast Retailing Co Ltd | | | 454,325 | |
59,000 | | | | Hoya Corp | | | 1,640,901 | |
53,000 | | | | J Front Retailing Co Ltd | | | 402,072 | |
1,103 | | | | Kao Corp | | | 34,725 | |
980 | | | | Komatsu Ltd | | | 20,121 | |
19,000 | | | | Matsui Securities Co Ltd | | | 244,033 | |
601,000 | | * | | Mazda Motor Corp | | | 3,114,419 | |
993 | | | | Mitsubishi Corp | | | 19,064 | |
8,016 | | | | Mitsubishi Electric Corp | | | 100,797 | |
11,000 | | | | Mitsubishi Heavy Industries Ltd | | | 68,129 | |
29,153 | | | | Mitsubishi UFJ Financial Group, Inc | | | 193,558 | |
5,000 | | | | Mitsui Trust Holdings, Inc | | | 26,456 | |
550 | | | | Nitto Denko Corp | | | 23,257 | |
1,050 | | | | NOK Corp | | | 17,198 | |
1,453 | | | | Nomura Holdings, Inc | | | 11,229 | |
63,125 | | * | | Olympus Corp | | | 2,002,119 | |
3,400 | | | | Oriental Land Co Ltd | | | 490,327 | |
38,000 | | | | Sekisui House Ltd | | | 531,741 | |
950 | | e | | Sony Corp | | | 16,376 | |
1,750 | | | | Sumitomo Corp | | | 21,994 | |
226,000 | | | | Sumitomo Heavy Industries Ltd | | | 1,041,376 | |
2,200 | | | | Sumitomo Metal Mining Co Ltd | | | 28,827 | |
2,000 | | | | Suruga Bank Ltd | | | 35,915 | |
12,300 | | | | Toyota Motor Corp | | | 749,993 | |
| | | | | | | | |
| | | | TOTAL JAPAN | | | 12,820,874 | |
| | | | | | | | |
| |
MEXICO - 0.1% | | | | |
8,500 | | e | | Grupo Financiero Banorte S.A. de C.V. | | | 59,477 | |
| | | | | | | | |
| | | | TOTAL MEXICO | | | 59,477 | |
| | | | | | | | |
| |
NETHERLANDS - 2.7% | | | | |
3,794 | | | | ASML Holding NV | | | 355,352 | |
161,615 | | * | | ING Groep NV | | | 2,257,523 | |
172 | | | | Royal Dutch Shell plc (A Shares) | | | 6,164 | |
| | | | | | | | |
| | | | TOTAL NETHERLANDS | | | 2,619,039 | |
| | | | | | | | |
| |
SINGAPORE - 1.1% | | | | |
882,000 | | e | | Genting International plc | | | 1,048,863 | |
| | | | | | | | |
| | | | TOTAL SINGAPORE | | | 1,048,863 | |
| | | | | | | | |
| |
SPAIN - 2.2% | | | | |
172,085 | | | | Banco Bilbao Vizcaya Argentaria S.A. | | | 2,128,783 | |
| | | | | | | | |
| | | | TOTAL SPAIN | | | 2,128,783 | |
| | | | | | | | |
| |
SWEDEN - 5.8% | | | | |
140,648 | | | | SKF AB (B Shares) | | | 3,688,548 | |
48,548 | | | | Trelleborg AB (B Shares) | | | 966,801 | |
81,544 | | | | Volvo AB (B Shares) | | | 1,072,987 | |
| | | | | | | | |
| | | | TOTAL SWEDEN | | | 5,728,336 | |
| | | | | | | | |
| |
SWITZERLAND - 7.8% | | | | |
55,722 | | | | Adecco S.A. | | | 4,423,584 | |
2,867 | | | | Burckhardt Compression Holding AG. | | | 1,256,653 | |
68,807 | | | | Clariant AG. | | | 1,259,378 | |
51 | | | | Givaudan S.A. | | | 72,959 | |
2,998 | | | | Swatch Group AG. Reg | | | 337,943 | |
17,892 | | | | UBS AG. (Switzerland) | | | 342,584 | |
| | | | | | | | |
| | | | TOTAL SWITZERLAND | | | 7,693,101 | |
| | | | | | | | |
80
TIAA-CREF LIFE FUNDS - International Equity Fund
| | | | | | | | |
SHARES | | | | COMPANY | | VALUE | |
| | | | | | | | |
UNITED KINGDOM - 22.9% | | | | |
18,632 | | | | ARM Holdings plc | | $ | 338,783 | |
28,356 | | | | Barclays plc | | | 128,223 | |
3,398 | | | | BG Group plc | | | 73,119 | |
383,454 | | | | British Sky Broadcasting plc | | | 5,359,237 | |
91,393 | | | | Drax Group plc | | | 1,212,644 | |
126,994 | | | | Filtrona plc | | | 1,809,068 | |
1,786,422 | | * | | Lloyds TSB Group plc | | | 2,344,119 | |
598,237 | | | | Man Group plc | | | 845,118 | |
261,770 | | * | | Ocado Ltd | | | 1,919,928 | |
11,205 | | | | Reckitt Benckiser Group plc | | | 890,079 | |
44,423 | | | | Reed Elsevier plc | | | 662,507 | |
297,279 | | * | | Royal Mail plc | | | 2,805,991 | |
305,936 | | | | Tate & Lyle plc | | | 4,103,943 | |
| | | | | | | | |
| | | | TOTAL UNITED KINGDOM | | | 22,492,759 | |
| | | | | | | | |
| | | | TOTAL COMMON STOCKS (Cost $85,208,251) | | | 96,949,617 | |
| | | | | | | | |
| |
RIGHTS / WARRANTS - 0.1% | | | | |
| |
GREECE - 0.1% | | | | |
109,300 | | | | Piraeus Bank S.A. | | | 114,727 | |
| | | | | | | | |
| | | | TOTAL GREECE | | | 114,727 | |
| | | | | | | | |
| | | | TOTAL RIGHTS / WARRANTS (Cost $90,493) | | | 114,727 | |
| | | | | | | | |
| |
SHORT-TERM INVESTMENTS - 0.9% | | | | |
| |
INVESTMENTS IN REGISTERED INVESTMENT COMPANIES - 0.9% | | | | |
873,168 | | c | | TIAA-CREF Short Term Lending Portfolio of the State Street Navigator Securities Lending Trust | | | 873,168 | |
| | | | | | | | |
| | | | TOTAL INVESTMENTS IN REGISTERED INVESTMENT COMPANIES | | | 873,168 | |
| | | | | | | | |
| | | | TOTAL SHORT-TERM INVESTMENTS (Cost $873,168) | | | 873,168 | |
| | | | | | | | |
| | | | TOTAL INVESTMENTS - 99.8% (Cost $86,171,912) | | | 97,937,512 | |
| | | | OTHER ASSETS & LIABILITIES, NET - 0.2% | | | 168,329 | |
| | | | | | | | |
| | | | NET ASSETS - 100.0% | | $ | 98,105,841 | |
| | | | | | | | |
| c | Investments made with cash collateral received from securities on loan. |
| e | All or a portion of these securities are out on loan. The aggregate value of securities on loan is $828,040. |
81
TIAA-CREF LIFE FUNDS - International Equity Fund
TIAA-CREF LIFE FUNDS
INTERNATIONAL EQUITY FUND
SUMMARY OF MARKET VALUES BY SECTOR
December 31, 2013
| | | | | | | | |
SECTOR | | VALUE | | | % OF
NET
ASSETS | |
INDUSTRIALS | | $ | 26,427,156 | | | | 26.8 | % |
CONSUMER DISCRETIONARY | | | 23,474,425 | | | | 23.9 | |
FINANCIALS | | | 17,618,956 | | | | 18.0 | |
HEALTH CARE | | | 7,511,011 | | | | 7.7 | |
INFORMATION TECHNOLOGY | | | 7,389,136 | | | | 7.5 | |
CONSUMER STAPLES | | | 6,827,769 | | | | 7.0 | |
TELECOMMUNICATION SERVICES | | | 3,243,936 | | | | 3.3 | |
MATERIALS | | | 3,193,489 | | | | 3.3 | |
UTILITIES | �� | | 1,212,644 | | | | 1.2 | |
ENERGY | | | 165,822 | | | | 0.2 | |
SHORT-TERM INVESTMENTS | | | 873,168 | | | | 0.9 | |
OTHER ASSETS & LIABILITIES, NET | | | 168,329 | | | | 0.2 | |
| | | | | | | | |
NET ASSETS | | $ | 98,105,841 | | | | 100.0 | % |
| | | | | | | | |
82
TIAA-CREF LIFE FUNDS - Bond Fund
TIAA-CREF LIFE FUNDS
BOND FUND
SCHEDULE OF INVESTMENTS
December 31, 2013
| | | | | | | | | | | | | | | | |
PRINCIPAL | | | | ISSUER | | RATE | | | MATURITY
DATE | | | VALUE | |
| | | | | | | | | | | | | | |
BANK LOAN OBLIGATIONS - 0.4% | | | | | | | | | | | | |
| | | |
CAPITAL GOODS - 0.1% | | | | | | | | | | | | |
$199,000 | | i | | Apex Tool Group LLC | | | 4.500 | % | | | 01/31/20 | | | $ | 199,697 | |
| | | | | | | | | | | | | | | | |
| | | | TOTAL CAPITAL GOODS | | | | 199,697 | |
| | | | | | | | | | | | | | | | |
| | | |
CONSUMER SERVICES - 0.1% | | | | | | | | | | | | |
225,000 | | i | | ARAMARK Corp | | | 4.000 | | | | 09/07/19 | | | | 226,312 | |
| | | | | | | | | | | | | | | | |
| | | | TOTAL CONSUMER SERVICES | | | | 226,312 | |
| | | | | | | | | | | | | | | | |
| | | |
MEDIA - 0.2% | | | | | | | | | | | | |
99,250 | | i | | Univision Communications, Inc | | | 4.000 | | | | 03/01/20 | | | | 99,622 | |
198,000 | | i | | Windstream Corp | | | 3.500 | | | | 01/23/20 | | | | 198,125 | |
| | | | | | | | | | | | | | | | |
| | | | TOTAL MEDIA | | | | 297,747 | |
| | | | | | | | | | | | | | | | |
| | | | TOTAL BANK LOAN OBLIGATIONS (Cost $720,497) | | | | | | | | | | | 723,756 | |
| | | | | | | | | | | | | | | | |
| | | |
BONDS - 95.7% | | | | | | | | | | | | |
| | | |
CORPORATE BONDS - 36.9% | | | | | | | | | | | | |
| | | |
BANKS - 3.6% | | | | | | | | | | | | |
200,000 | | g | | Banco de Credito del Peru | | | 5.375 | | | | 09/16/20 | | | | 208,000 | |
150,000 | | g | | Banco del Estado de Chile | | | 3.875 | | | | 02/08/22 | | | | 146,419 | |
200,000 | | g | | Banco Santander Mexico S.A. Institucion de Banca Multiple Grupo Financiero Santander | | | 4.125 | | | | 11/09/22 | | | | 188,500 | |
110,000 | | | | Bancolombia S.A. | | | 5.950 | | | | 06/03/21 | | | | 114,400 | |
150,000 | | g | | Bank of Tokyo-Mitsubishi UFJ Ltd | | | 2.350 | | | | 02/23/17 | | | | 152,247 | |
50,000 | | | | BB&T Corp | | | 2.050 | | | | 06/19/18 | | | | 49,502 | |
250,000 | | | | BDO Unibank, Inc | | | 4.500 | | | | 02/16/17 | | | | 259,375 | |
200,000 | | g | | Caixa Economica Federal | | | 2.375 | | | | 11/06/17 | | | | 185,750 | |
60,000 | | | | Capital One Bank USA NA | | | 3.375 | | | | 02/15/23 | | | | 55,781 | |
75,000 | | | | Capital One Financial Corp | | | 1.000 | | | | 11/06/15 | | | | 74,967 | |
100,000 | | | | Citigroup, Inc | | | 6.675 | | | | 09/13/43 | | | | 115,063 | |
75,000 | | | | Cooperatieve Centrale Raiffeisen-Boerenleenbank BA | | | 3.875 | | | | 02/08/22 | | | | 75,409 | |
100,000 | | | | Cooperatieve Centrale Raiffeisen-Boerenleenbank BA | | | 3.950 | | | | 11/09/22 | | | | 96,899 | |
125,000 | | | | Cooperatieve Centrale Raiffeisen-Boerenleenbank BA | | | 4.625 | | | | 12/01/23 | | | | 125,877 | |
300,000 | | | | Cooperatieve Centrale Raiffeisen-Boerenleenbank BA | | | 5.750 | | | | 12/01/43 | | | | 318,026 | |
50,000 | | g | | HSBC Bank plc | | | 1.500 | | | | 05/15/18 | | | | 48,823 | |
150,000 | | g | | HSBC Bank plc | | | 4.125 | | | | 08/12/20 | | | | 158,713 | |
225,000 | | | | HSBC USA, Inc | | | 2.375 | | | | 02/13/15 | | | | 229,583 | |
150,000 | | | | HSBC USA, Inc | | | 1.625 | | | | 01/16/18 | | | | 147,909 | |
200,000 | | g | | Hutchison Whampoa International 11 Ltd | | | 4.625 | | | | 01/13/22 | | | | 204,292 | |
60,000 | | | | JPMorgan Chase & Co | | | 5.125 | | | | 09/15/14 | | | | 61,816 | |
100,000 | | i | | JPMorgan Chase & Co | | | 5.150 | | | | 12/30/49 | | | | 89,750 | |
50,000 | | | | PNC Bank NA | | | 2.700 | | | | 11/01/22 | | | | 45,323 | |
600,000 | | | | PNC Bank NA | | | 2.950 | | | | 01/30/23 | | | | 552,188 | |
100,000 | | | | PNC Funding Corp | | | 5.125 | | | | 02/08/20 | | | | 112,316 | |
140,000 | | g,i | | Rabobank Nederland NV | | | 11.000 | | | | 12/30/49 | | | | 185,325 | |
500,000 | | | | Royal Bank of Canada | | | 1.200 | | | | 09/19/17 | | | | 495,416 | |
175,000 | | | | Royal Bank of Canada | | | 2.200 | | | | 07/27/18 | | | | 175,711 | |
100,000 | | g | | Sumitomo Mitsui Banking Corp | | | 3.150 | | | | 07/22/15 | | | | 103,406 | |
50,000 | | | | Toronto-Dominion Bank | | | 2.500 | | | | 07/14/16 | | | | 51,864 | |
200,000 | | g | | Turkiye Halk Bankasi AS. | | | 3.875 | | | | 02/05/20 | | | | 174,980 | |
200,000 | | g | | Turkiye Is Bankasi | | | 5.500 | | | | 04/21/19 | | | | 197,840 | |
150,000 | | | | Union Bank NA | | | 2.125 | | | | 06/16/17 | | | | 150,691 | |
125,000 | | | | UnionBanCal Corp | | | 3.500 | | | | 06/18/22 | | | | 122,611 | |
200,000 | | | | US Bancorp | | | 1.650 | | | | 05/15/17 | | | | 200,420 | |
83
TIAA-CREF LIFE FUNDS - Bond Fund
| | | | | | | | | | | | | | | | |
PRINCIPAL | | | | ISSUER | | RATE | | | MATURITY
DATE | | | VALUE | |
| | | | | | | | | | | | | | |
$125,000 | | | | US Bancorp | | | 2.950 | % | | | 07/15/22 | | | $ | 116,141 | |
350,000 | | | | Wells Fargo & Co | | | 1.500 | | | | 07/01/15 | | | | 354,922 | |
200,000 | | | | Wells Fargo & Co | | | 1.500 | | | | 01/16/18 | | | | 198,708 | |
250,000 | | | | Wells Fargo & Co | | | 5.375 | | | | 11/02/43 | | | | 256,002 | |
102,000 | | g | | Wells Fargo & Co | | | 5.606 | | | | 01/15/44 | | | | 105,946 | |
50,000 | | | | Westpac Banking Corp | | | 3.000 | | | | 08/04/15 | | | | 51,945 | |
| | | | | | | | | | | | | | | | |
| | | | TOTAL BANKS | | | | 6,758,856 | |
| | | | | | | | | | | | | | | | |
| | | |
CAPITAL GOODS - 1.1% | | | | | | | | | | | | |
200,000 | | | | Caterpillar, Inc | | | 1.375 | | | | 05/27/14 | | | | 200,775 | |
250,000 | | | | Caterpillar, Inc | | | 1.500 | | | | 06/26/17 | | | | 248,788 | |
155,000 | | | | Crown Americas LLC | | | 4.500 | | | | 01/15/23 | | | | 144,925 | |
100,000 | | g | | EADS Finance BV | | | 2.700 | | | | 04/17/23 | | | | 91,708 | |
200,000 | | | | Eaton Corp | | | 1.500 | | | | 11/02/17 | | | | 196,066 | |
100,000 | | | | Eaton Corp | | | 4.000 | | | | 11/02/32 | | | | 91,841 | |
100,000 | | g | | Schaeffler Finance BV | | | 4.750 | | | | 05/15/21 | | | | 99,750 | |
150,000 | | | | Seagate HDD Cayman | | | 7.000 | | | | 11/01/21 | | | | 165,563 | |
300,000 | | g | | Seagate HDD Cayman | | | 4.750 | | | | 06/01/23 | | | | 280,500 | |
111,000 | | g | | Sealed Air Corp | | | 8.125 | | | | 09/15/19 | | | | 124,598 | |
111,000 | | g | | Sealed Air Corp | | | 8.375 | | | | 09/15/21 | | | | 125,985 | |
70,000 | | g | | Sealed Air Corp | | | 5.250 | | | | 04/01/23 | | | | 68,075 | |
120,000 | | | | SPX Corp | | | 6.875 | | | | 09/01/17 | | | | 135,600 | |
125,000 | | | | United Technologies Corp | | | 1.800 | | | | 06/01/17 | | | | 126,927 | |
50,000 | | | | United Technologies Corp | | | 4.500 | | | | 06/01/42 | | | | 48,554 | |
| | | | | | | | | | | | | | | | |
| | | | TOTAL CAPITAL GOODS | | | | 2,149,655 | |
| | | | | | | | | | | | | | | | |
| | | |
COMMERCIAL & PROFESSIONAL SERVICES - 0.4% | | | | | | | | | | | | |
100,000 | | g | | ADT Corp | | | 6.250 | | | | 10/15/21 | | | | 105,000 | |
75,000 | | | | Republic Services, Inc | | | 3.800 | | | | 05/15/18 | | | | 79,435 | |
250,000 | | | | Republic Services, Inc | | | 3.550 | | | | 06/01/22 | | | | 241,059 | |
250,000 | | | | Waste Management, Inc | | | 2.600 | | | | 09/01/16 | | | | 258,043 | |
100,000 | | | | Waste Management, Inc | | | 2.900 | | | �� | 09/15/22 | | | | 92,638 | |
| | | | | | | | | | | | | | | | |
| | | | TOTAL COMMERCIAL & PROFESSIONAL SERVICES | | | | 776,175 | |
| | | | | | | | | | | | | | | | |
| | | |
CONSUMER DURABLES & APPAREL - 0.5% | | | | | | | | | | | | |
275,000 | | | | DR Horton, Inc | | | 4.750 | | | | 05/15/17 | | | | 290,812 | |
130,000 | | | | Hanesbrands, Inc | | | 6.375 | | | | 12/15/20 | | | | 142,025 | |
100,000 | | | | Phillips-Van Heusen Corp | | | 7.375 | | | | 05/15/20 | | | | 110,125 | |
400,000 | | | | PVH Corp | | | 4.500 | | | | 12/15/22 | | | | 379,000 | |
100,000 | | | | Whirlpool Corp | | | 3.700 | | | | 03/01/23 | | | | 95,596 | |
| | | | | | | | | | | | | | | | |
| | | | TOTAL CONSUMER DURABLES & APPAREL | | | | 1,017,558 | |
| | | | | | | | | | | | | | | | |
| | | |
CONSUMER SERVICES - 0.4% | | | | | | | | | | | | |
| 100,000 | | | | Ameristar Casinos, Inc | | | 7.500 | | | | 04/15/21 | | | | 108,500 | |
100,000 | | g | | ARAMARK Corp | | | 5.750 | | | | 03/15/20 | | | | 104,500 | |
150,000 | | | | DineEquity, Inc | | | 9.500 | | | | 10/30/18 | | | | 166,500 | |
50,000 | | g | | GLP Capital LP | | | 4.375 | | | | 11/01/18 | | | | 51,125 | |
150,000 | | g | | SABMiller Holdings, Inc | | | 3.750 | | | | 01/15/22 | | | | 150,559 | |
100,000 | | g | | SABMiller Holdings, Inc | | | 4.950 | | | | 01/15/42 | | | | 99,325 | |
100,000 | | | | Walt Disney Co | | | 0.450 | | | | 12/01/15 | | | | 99,898 | |
| | | | | | | | | | | | | | | | |
| | | | TOTAL CONSUMER SERVICES | | | | 780,407 | |
| | | | | | | | | | | | | | | | |
| | | |
DIVERSIFIED FINANCIALS - 5.7% | | | | | | | | | | | | |
100,000 | | g | | Abbey National Treasury Services plc | | | 3.875 | | | | 11/10/14 | | | | 102,731 | |
40,000 | | | | Abbey National Treasury Services plc | | | 4.000 | | | | 04/27/16 | | | | 42,472 | |
125,000 | | | | American Express Centurion Bank | | | 6.000 | | | | 09/13/17 | | | | 143,409 | |
1,325,000 | | | | American Express Credit Corp | | | 1.300 | | | | 07/29/16 | | | | 1,335,253 | |
1,275,000 | | | | American Express Credit Corp | | | 2.125 | | | | 07/27/18 | | | | 1,277,141 | |
100,000 | | g | | Bangkok Bank PCL | | | 4.800 | | | | 10/18/20 | | | | 103,175 | |
200,000 | | | | Bank of America Corp | | | 5.300 | | | | 03/15/17 | | | | 220,444 | |
475,000 | | | | Bank of America Corp | | | 4.100 | | | | 07/24/23 | | | | 477,015 | |
150,000 | | | | Bank of America Corp | | | 5.875 | | | | 02/07/42 | | | | 171,553 | |
84
TIAA-CREF LIFE FUNDS - Bond Fund
| | | | | | | | | | | | | | | | |
PRINCIPAL �� | | | | ISSUER | | RATE | | | MATURITY
DATE | | | VALUE | |
| | | | | | | | | | | | | | |
$ 50,000 | | | | Bank of New York Mellon Corp | | | 5.450 | % | | | 05/15/19 | | | $ | 56,809 | |
150,000 | | g | | BBVA Bancomer S.A. | | | 4.500 | | | | 03/10/16 | | | | 159,000 | |
50,000 | | | | BlackRock, Inc | | | 3.500 | | | | 12/10/14 | | | | 51,461 | |
150,000 | | | | BlackRock, Inc | | | 4.250 | | | | 05/24/21 | | | | 158,712 | |
400,000 | | | | Capital One Financial Corp | | | 4.750 | | | | 07/15/21 | | | | 425,340 | |
50,000 | | | | Citigroup, Inc | | | 5.000 | | | | 09/15/14 | | | | 51,424 | |
34,000 | | | | Citigroup, Inc | | | 5.500 | | | | 10/15/14 | | | | 35,263 | |
100,000 | | | | Citigroup, Inc | | | 2.250 | | | | 08/07/15 | | | | 102,078 | |
350,000 | | | | Citigroup, Inc | | | 3.500 | | | | 05/15/23 | | | | 326,127 | |
400,000 | | | | Citigroup, Inc | | | 4.950 | | | | 11/07/43 | | | | 398,435 | |
200,000 | | | | Export-Import Bank of Korea | | | 2.875 | | | | 09/17/18 | | | | 202,362 | |
65,000 | | | | Ford Motor Credit Co LLC | | | 4.250 | | | | 02/03/17 | | | | 69,925 | |
250,000 | | | | Ford Motor Credit Co LLC | | | 3.000 | | | | 06/12/17 | | | | 259,829 | |
35,000 | | | | Ford Motor Credit Co LLC | | | 6.625 | | | | 08/15/17 | | | | 40,545 | |
225,000 | | | | Ford Motor Credit Co LLC | | | 4.375 | | | | 08/06/23 | | | | 226,206 | |
750,000 | | | | General Electric Capital Corp | | | 3.100 | | | | 01/09/23 | | | | 711,568 | |
125,000 | | g | | General Motors Financial Co, Inc | | | 2.750 | | | | 05/15/16 | | | | 126,562 | |
150,000 | | | | Goldman Sachs Group, Inc | | | 3.300 | | | | 05/03/15 | | | | 154,549 | |
25,000 | | | | Goldman Sachs Group, Inc | | | 6.750 | | | | 10/01/37 | | | | 27,814 | |
50,000 | | | | Goldman Sachs Group, Inc | | | 6.250 | | | | 02/01/41 | | | | 57,620 | |
100,000 | | g | | Hyundai Capital America, Inc | | | 3.750 | | | | 04/06/16 | | | | 104,738 | |
200,000 | | g | | Hyundai Capital Services, Inc | | | 3.500 | | | | 09/13/17 | | | | 206,753 | |
35,000 | | g | | International Lease Finance Corp | | | 6.500 | | | | 09/01/14 | | | | 36,181 | |
130,000 | | | | International Lease Finance Corp | | | 5.750 | | | | 05/15/16 | | | | 139,263 | |
100,000 | | | | International Lease Finance Corp | | | 3.875 | | | | 04/15/18 | | | | 100,250 | |
150,000 | | | | International Lease Finance Corp | | | 5.875 | | | | 08/15/22 | | | | 149,625 | |
200,000 | | g | | Inversiones CMPC S.A. | | | 4.375 | | | | 05/15/23 | | | | 186,387 | |
200,000 | | | | Merrill Lynch & Co, Inc | | | 6.400 | | | | 08/28/17 | | | | 230,581 | |
325,000 | | | | Morgan Stanley | | | 1.750 | | | | 02/25/16 | | | | 329,363 | |
250,000 | | | | Morgan Stanley | | | 6.375 | | | | 07/24/42 | | | | 292,820 | |
50,000 | | | | National Rural Utilities Cooperative Finance Corp | | | 10.375 | | | | 11/01/18 | | | | 67,619 | |
100,000 | | g | | Perrigo Co Ltd | | | 4.000 | | | | 11/15/23 | | | | 98,110 | |
100,000 | | g | | Perrigo Co Ltd | | | 5.300 | | | | 11/15/43 | | | | 98,155 | |
75,000 | | | | State Street Corp | | | 4.300 | | | | 05/30/14 | | | | 76,205 | |
125,000 | | | | State Street Corp | | | 3.100 | | | | 05/15/23 | | | | 116,226 | |
75,000 | | | | Sumitomo Mitsui Banking Corp | | | 2.500 | | | | 07/19/18 | | | | 75,333 | |
100,000 | | | | SunTrust Bank | | | 2.750 | | | | 05/01/23 | | | | 90,668 | |
100,000 | | | | Toyota Motor Credit Corp | | | 2.050 | | | | 01/12/17 | | | | 102,199 | |
200,000 | | g | | Turkiye Vakiflar Bankasi Tao | | | 3.750 | | | | 04/15/18 | | | | 187,300 | |
250,000 | | g | | UBS AG. | | | 1.875 | | | | 01/23/15 | | | | 253,500 | |
175,000 | | | | Unilever Capital Corp | | | 2.200 | | | | 03/06/19 | | | | 174,775 | |
50,000 | | | | Unilever Capital Corp | | | 4.250 | | | | 02/10/21 | | | | 53,620 | |
70,000 | | g | | Waha Aerospace BV | | | 3.925 | | | | 07/28/20 | | | | 73,500 | |
| | | | | | | | | | | | | | | | |
| | | | TOTAL DIVERSIFIED FINANCIALS | | | | 10,757,993 | |
| | | | | | | | | | | | | | | | |
| | | |
ENERGY - 4.2% | | | | | | | | | | | | |
50,000 | | | | Anadarko Petroleum Corp | | | 5.950 | | | | 09/15/16 | | | | 55,703 | |
30,000 | | | | Anadarko Petroleum Corp | | | 6.950 | | | | 06/15/19 | | | | 35,707 | |
100,000 | | | | Apache Corp | | | 1.750 | | | | 04/15/17 | | | | 100,202 | |
205,000 | | | | Apache Corp | | | 4.750 | | | | 04/15/43 | | | | 198,839 | |
375,000 | | | | Ashland, Inc | | | 3.875 | | | | 04/15/18 | | | | 379,687 | |
250,000 | | | | BP Capital Markets plc | | | 1.375 | | | | 05/10/18 | | | | 242,637 | |
250,000 | | | | Chevron Corp | | | 2.355 | | | | 12/05/22 | | | | 227,397 | |
155,000 | | | | Cimarex Energy Co | | | 5.875 | | | | 05/01/22 | | | | 163,912 | |
100,000 | | | | Cloud Peak Energy Resources LLC | | | 8.250 | | | | 12/15/17 | | | | 104,375 | |
150,000 | | | | Concho Resources, Inc | | | 5.500 | | | | 04/01/23 | | | | 154,500 | |
100,000 | | | | ConocoPhillips | | | 6.500 | | | | 02/01/39 | | | | 125,402 | |
105,000 | | | | Continental Resources, Inc | | | 5.000 | | | | 09/15/22 | | | | 109,069 | |
175,000 | | | | Devon Energy Corp | | | 1.875 | | | | 05/15/17 | | | | 176,275 | |
50,000 | | | | Devon Energy Corp | | | 5.600 | | | | 07/15/41 | | | | 52,105 | |
50,000 | | | | Devon Energy Corp | | | 4.750 | | | | 05/15/42 | | | | 46,365 | |
110,000 | | | | Ecopetrol S.A. | | | 4.250 | | | | 09/18/18 | | | | 116,050 | |
60,000 | | | | Ecopetrol S.A. | | | 5.875 | | | | 09/18/23 | | | | 63,300 | |
300,000 | | g | | EDC Finance Ltd | | | 4.875 | | | | 04/17/20 | | | | 291,375 | |
85
TIAA-CREF LIFE FUNDS - Bond Fund
| | | | | | | | | | | | | | | | |
PRINCIPAL | | | | ISSUER | | RATE | | | MATURITY
DATE | | | VALUE | |
| | | | | | | | | | | | | | |
$ 25,000 | | | | Enbridge Energy Partners LP | | | 5.200 | % | | | 03/15/20 | | | $ | 26,836 | |
25,000 | | | | Enterprise Products Operating LLC | | | 5.000 | | | | 03/01/15 | | | | 26,186 | |
250,000 | | | | Enterprise Products Operating LLC | | | 4.850 | | | | 03/15/44 | | | | 235,100 | |
75,000 | | | | EOG Resources, Inc | | | 2.625 | | | | 03/15/23 | | | | 68,233 | |
200,000 | | g | | Gazprom Neft OAO | | | 4.375 | | | | 09/19/22 | | | | 183,250 | |
200,000 | | g | | Gazprom OAO Via Gaz Capital S.A. | | | 3.850 | | | | 02/06/20 | | | | 193,000 | |
75,000 | | | | Hess Corp | | | 5.600 | | | | 02/15/41 | | | | 78,159 | |
350,000 | | g | | Indo Energy Finance II BV | | | 6.375 | | | | 01/24/23 | | | | 287,875 | |
50,000 | | | | Marathon Petroleum Corp | | | 3.500 | | | | 03/01/16 | | | | 52,211 | |
50,000 | | | | Newfield Exploration Co | | | 5.625 | | | | 07/01/24 | | | | 49,750 | |
150,000 | | | | Noble Energy, Inc | | | 5.250 | | | | 11/15/43 | | | | 149,877 | |
25,000 | | | | Noble Holding International Ltd | | | 3.450 | | | | 08/01/15 | | | | 25,923 | |
75,000 | | | | Noble Holding International Ltd | | | 4.900 | | | | 08/01/20 | | | | 79,153 | |
100,000 | | g | | Pacific Rubiales Energy Corp | | | 5.375 | | | | 01/26/19 | | | | 100,750 | |
110,000 | | | | Pemex Project Funding Master Trust | | | 6.625 | | | | 06/15/35 | | | | 115,775 | |
200,000 | | g | | Pertamina Persero PT | | | 4.300 | | | | 05/20/23 | | | | 174,000 | |
100,000 | | i | | Petrobras Global Finance BV | | | 1.857 | | | | 05/20/16 | | | | 99,750 | |
100,000 | | i | | Petrobras Global Finance BV | | | 2.384 | | | | 01/15/19 | | | | 98,000 | |
100,000 | | | | Petrobras International Finance Co | | | 3.875 | | | | 01/27/16 | | | | 102,946 | |
175,000 | | | | Petrobras International Finance Co | | | 3.500 | | | | 02/06/17 | | | | 176,601 | |
60,000 | | | | Petrobras International Finance Co | | | 7.875 | | | | 03/15/19 | | | | 67,965 | |
50,000 | | | | Petroleos Mexicanos | | | 4.875 | | | | 03/15/15 | | | | 52,350 | |
250,000 | | | | Petroleos Mexicanos | | | 3.500 | | | | 07/18/18 | | | | 256,562 | |
20,000 | | | | Petroleos Mexicanos | | | 8.000 | | | | 05/03/19 | | | | 24,200 | |
90,000 | | | | Petroleos Mexicanos | | | 5.500 | | | | 01/21/21 | | | | 96,750 | |
200,000 | | | | Petroleos Mexicanos | | | 3.500 | | | | 01/30/23 | | | | 183,250 | |
110,000 | | | | Petroleos Mexicanos | | | 6.500 | | | | 06/02/41 | | | | 114,950 | |
125,000 | | | | Petroleos Mexicanos | | | 5.500 | | | | 06/27/44 | | | | 114,062 | |
100,000 | | g | | Petroleum Co of Trinidad & Tobago Ltd | | | 9.750 | | | | 08/14/19 | | | | 125,250 | |
100,000 | | | | Phillips 66 | | | 1.950 | | | | 03/05/15 | | | | 101,393 | |
45,000 | | | | Precision Drilling Corp | | | 6.500 | | | | 12/15/21 | | | | 47,925 | |
200,000 | | g | | PTT Exploration & Production PCL | | | 3.707 | | | | 09/16/18 | | | | 203,109 | |
200,000 | | g | | PTTEP Canada International Finance Ltd | | | 5.692 | | | | 04/05/21 | | | | 213,128 | |
200,000 | | g | | Rosneft Oil Co via Rosneft International Finance Ltd | | | 4.199 | | | | 03/06/22 | | | | 183,500 | |
125,000 | | g | | Schlumberger Investment S.A. | | | 2.400 | | | | 08/01/22 | | | | 114,566 | |
75,000 | | | | Shell International Finance BV | | | 4.300 | | | | 09/22/19 | | | | 82,209 | |
75,000 | | | | Shell International Finance BV | | | 4.550 | | | | 08/12/43 | | | | 73,151 | |
25,000 | | | | Statoil ASA | | | 2.900 | | | | 10/15/14 | | | | 25,504 | |
100,000 | | | | Statoil ASA | | | 1.200 | | | | 01/17/18 | | | | 97,611 | |
200,000 | | | | Statoil ASA | | | 2.450 | | | | 01/17/23 | | | | 182,303 | |
100,000 | | | | Total Capital Canada Ltd | | | 1.450 | | | | 01/15/18 | | | | 98,861 | |
150,000 | | | | Total Capital International S.A. | | | 1.500 | | | | 02/17/17 | | | | 150,274 | |
100,000 | | | | TransCanada Pipelines Ltd | | | 5.850 | | | | 03/15/36 | | | | 108,841 | |
85,000 | | | | Vale Overseas Ltd | | | 4.375 | | | | 01/11/22 | | | | 82,585 | |
25,000 | | | | Vale Overseas Ltd | | | 6.875 | | | | 11/21/36 | | | | 25,819 | |
50,000 | | | | Valero Energy Corp | | | 4.500 | | | | 02/01/15 | | | | 51,985 | |
| | | | | | | | | | | | | | | | |
| | | | TOTAL ENERGY | | | | 7,844,378 | |
| | | | | | | | | | | | | | | | |
| | | |
FOOD & STAPLES RETAILING - 0.3% | | | | | | | | | | | | |
50,000 | | | | CVS Caremark Corp | | | 3.250 | | | | 05/18/15 | | | | 51,683 | |
125,000 | | | | CVS Caremark Corp | | | 4.000 | | | | 12/05/23 | | | | 124,736 | |
100,000 | | | | CVS Caremark Corp | | | 5.300 | | | | 12/05/43 | | | | 103,416 | |
200,000 | | | | Ingles Markets, Inc | | | 5.750 | | | | 06/15/23 | | | | 196,000 | |
| | | | | | | | | | | | | | | | |
| | | | TOTAL FOOD & STAPLES RETAILING | | | | 475,835 | |
| | | | | | | | | | | | | | | | |
| | | |
FOOD, BEVERAGE & TOBACCO - 1.2% | | | | | | | | | | | | |
200,000 | | | | Anheuser-Busch InBev Worldwide, Inc | | | 2.875 | | | | 02/15/16 | | | | 208,200 | |
200,000 | | | | Anheuser-Busch InBev Worldwide, Inc | | | 1.375 | | | | 07/15/17 | | | | 199,580 | |
125,000 | | | | Anheuser-Busch InBev Worldwide, Inc | | | 2.500 | | | | 07/15/22 | | | | 115,621 | |
25,000 | | | | Campbell Soup Co | | | 2.500 | | | | 08/02/22 | | | | 22,054 | |
375,000 | | | | Coca-Cola Co | | | 3.200 | | | | 11/01/23 | | | | 360,683 | |
100,000 | | | | ConAgra Foods, Inc | | | 1.300 | | | | 01/25/16 | | | | 100,173 | |
150,000 | | g | | Corp Lindley S.A. | | | 6.750 | | | | 11/23/21 | | | | 158,250 | |
86
TIAA-CREF LIFE FUNDS - Bond Fund
| | | | | | | | | | | | | | | | |
PRINCIPAL | | | | ISSUER | | RATE | | | MATURITY
DATE | | | VALUE | |
| | | | | | | | | | | | | | |
$150,000 | | | | Diageo Capital plc | | | 2.625 | % | | | 04/29/23 | | | $ | 136,759 | |
200,000 | | g | | Embotelladora Andina S.A. | | | 5.000 | | | | 10/01/23 | | | | 200,662 | |
55,000 | | | | General Mills, Inc | | | 5.200 | | | | 03/17/15 | | | | 57,990 | |
300,000 | | g | | Grupo Bimbo SAB de C.V. | | | 4.500 | | | | 01/25/22 | | | | 297,477 | |
135,000 | | | | Kraft Foods, Inc | | | 6.500 | | | | 02/09/40 | | | | 161,325 | |
5,000 | | | | PepsiCo, Inc | | | 7.900 | | | | 11/01/18 | | | | 6,250 | |
175,000 | | g | | Pernod Ricard S.A. | | | 4.250 | | | | 07/15/22 | | | | 174,554 | |
32,000 | | g | | Pernod-Ricard S.A. | | | 5.750 | | | | 04/07/21 | | | | 35,273 | |
100,000 | | | | TreeHouse Foods, Inc | | | 7.750 | | | | 03/01/18 | | | | 104,750 | |
| | | | | | | | | | | | | | | | |
| | | | TOTAL FOOD, BEVERAGE & TOBACCO | | | | 2,339,601 | |
| | | | | | | | | | | | | | | | |
| | | |
HEALTH CARE EQUIPMENT & SERVICES - 1.0% | | | | | | | | | | | | |
110,000 | | | | Baxter International, Inc | | | 3.200 | | | | 06/15/23 | | | | 105,088 | |
50,000 | | | | Becton Dickinson & Co | | | 1.750 | | | | 11/08/16 | | | | 50,930 | |
100,000 | | | | Covidien International Finance S.A. | | | 1.350 | | | | 05/29/15 | | | | 100,733 | |
100,000 | | | | Covidien International Finance S.A. | | | 3.200 | | | | 06/15/22 | | | | 96,429 | |
175,000 | | | | Edwards Lifesciences Corp | | | 2.875 | | | | 10/15/18 | | | | 173,979 | |
500,000 | | | | Express Scripts Holding Co | | | 2.100 | | | | 02/12/15 | | | | 507,247 | |
100,000 | | | | Express Scripts Holding Co | | | 3.900 | | | | 02/15/22 | | | | 100,095 | |
130,000 | | g | | Fresenius Medical Care Capital Trust | | | 5.750 | | | | 02/15/21 | | | | 137,800 | |
40,000 | | | | HCA, Inc | | | 6.500 | | | | 02/15/20 | | | | 43,950 | |
150,000 | | | | HCA, Inc | | | 5.875 | | | | 03/15/22 | | | | 154,875 | |
100,000 | | g | | Mallinckrodt International Finance S.A. | | | 3.500 | | | | 04/15/18 | | | | 98,099 | |
75,000 | | | | Thermo Fisher Scientific, Inc | | | 2.250 | | | | 08/15/16 | | | | 76,701 | |
100,000 | | | | Thermo Fisher Scientific, Inc | | | 2.400 | | | | 02/01/19 | | | | 99,069 | |
100,000 | | | | Thermo Fisher Scientific, Inc | | | 4.150 | | | | 02/01/24 | | | | 99,050 | |
125,000 | | | | Thermo Fisher Scientific, Inc | | | 5.300 | | | | 02/01/44 | | | | 126,397 | |
| | | | | | | | | | | | | | | | |
| | | | TOTAL HEALTH CARE EQUIPMENT & SERVICES | | | | 1,970,442 | |
| | | | | | | | | | | | | | | | |
| | | |
HOUSEHOLD & PERSONAL PRODUCTS - 0.1% | | | | | | | | | | | | |
75,000 | | | | Clorox Co | | | 3.800 | | | | 11/15/21 | | | | 75,476 | |
50,000 | | | | Colgate-Palmolive Co | | | 2.300 | | | | 05/03/22 | | | | 45,845 | |
| | | | | | | | | | | | | | | | |
| | | | TOTAL HOUSEHOLD & PERSONAL PRODUCTS | | | | 121,321 | |
| | | | | | | | | | | | | | | | |
| | | |
INSURANCE - 2.3% | | | | | | | | | | | | |
50,000 | | | | ACE INA Holdings, Inc | | | 5.875 | | | | 06/15/14 | | | | 51,224 | |
125,000 | | | | Aetna, Inc | | | 1.500 | | | | 11/15/17 | | | | 123,161 | |
100,000 | | | | Allstate Corp | | | 3.150 | | | | 06/15/23 | | | | 94,834 | |
100,000 | | | | Allstate Corp | | | 4.500 | | | | 06/15/43 | | | | 94,617 | |
125,000 | | | | Berkshire Hathaway Finance Corp | | | 1.300 | | | | 05/15/18 | | | | 122,148 | |
250,000 | | g,i | | Caelus Re Ltd | | | 5.316 | | | | 03/07/16 | | | | 253,450 | |
100,000 | | | | Chubb Corp | | | 6.000 | | | | 05/11/37 | | | | 116,815 | |
20,000 | | | | CIGNA Corp | | | 5.125 | | | | 06/15/20 | | | | 22,183 | |
100,000 | | | | CIGNA Corp | | | 4.500 | | | | 03/15/21 | | | | 106,274 | |
425,000 | | g | | Five Corners Funding Trust | | | 4.419 | | | | 11/15/23 | | | | 418,932 | |
75,000 | | | | Hartford Financial Services Group, Inc | | | 4.000 | | | | 03/30/15 | | | | 77,917 | |
100,000 | | | | Hartford Financial Services Group, Inc | | | 4.000 | | | | 10/15/17 | | | | 106,362 | |
25,000 | | | | Lincoln National Corp | | | 7.000 | | | | 06/15/40 | | | | 31,322 | |
50,000 | | g | | MetLife Institutional Funding II | | | 1.625 | | | | 04/02/15 | | | | 50,565 | |
100,000 | | | | MetLife, Inc | | | 6.750 | | | | 06/01/16 | | | | 113,703 | |
300,000 | | | | MetLife, Inc | | | 4.368 | | | | 09/15/23 | | | | 306,266 | |
100,000 | | | | Principal Financial Group, Inc | | | 1.850 | | | | 11/15/17 | | | | 99,096 | |
150,000 | | | | Progressive Corp | | | 3.750 | | | | 08/23/21 | | | | 152,936 | |
175,000 | | | | Prudential Financial, Inc | | | 5.400 | | | | 06/13/35 | | | | 180,752 | |
100,000 | | | | Prudential Financial, Inc | | | 5.100 | | | | 08/15/43 | | | | 99,316 | |
475,000 | | i | | Prudential Financial, Inc | | | 5.200 | | | | 03/15/44 | | | | 459,563 | |
100,000 | | g | | Prudential Funding LLC | | | 6.750 | | | | 09/15/23 | | | | 120,086 | |
100,000 | | g | | Swiss Re Treasury US Corp | | | 2.875 | | | | 12/06/22 | | | | 92,080 | |
125,000 | | g | | Swiss Re Treasury US Corp | | | 4.250 | | | | 12/06/42 | | | | 107,418 | |
25,000 | | | | Travelers Cos, Inc | | | 5.800 | | | | 05/15/18 | | | | 28,799 | |
125,000 | | | | UnitedHealth Group, Inc | | | 0.850 | | | | 10/15/15 | | | | 125,500 | |
100,000 | | | | UnitedHealth Group, Inc | | | 1.400 | | | | 10/15/17 | | | | 98,737 | |
125,000 | | | | UnitedHealth Group, Inc | | | 3.950 | | | | 10/15/42 | | | | 106,008 | |
87
TIAA-CREF LIFE FUNDS - Bond Fund
| | | | | | | | | | | | | | | | |
PRINCIPAL | | | | ISSUER | | RATE | | | MATURITY
DATE | | | VALUE | |
| | | | | | | | | | | | | | |
$250,000 | | | | WellPoint, Inc | | | 3.125 | % | | | 05/15/22 | | | $ | 234,470 | |
150,000 | | | | WellPoint, Inc | | | 4.625 | | | | 05/15/42 | | | | 138,632 | |
150,000 | | | | Willis Group Holdings plc | | | 4.125 | | | | 03/15/16 | | | | 157,040 | |
25,000 | | | | WR Berkley Corp | | | 5.375 | | | | 09/15/20 | | | | 26,916 | |
| | | | | | | | | | | | | | | | |
| | | | TOTAL INSURANCE | | | | 4,317,122 | |
| | | | | | | | | | | | | | | | |
| | | |
MATERIALS - 1.9% | | | | | | | | | | | | |
35,000 | | | | Air Products & Chemicals, Inc | | | 4.375 | | | | 08/21/19 | | | | 37,880 | |
10,000 | | | | Airgas, Inc | | | 4.500 | | | | 09/15/14 | | | | 10,259 | |
35,000 | | | | ArcelorMittal | | | 4.250 | | | | 08/05/15 | | | | 36,225 | |
60,000 | | | | ArcelorMittal | | | 5.000 | | | | 02/25/17 | | | | 64,350 | |
32,000 | | | | Ball Corp | | | 6.750 | | | | 09/15/20 | | | | 34,800 | |
375,000 | | | | Ball Corp | | | 4.000 | | | | 11/15/23 | | | | 335,625 | |
125,000 | | | | Barrick North America Finance LLC | | | 4.400 | | | | 05/30/21 | | | | 120,356 | |
100,000 | | | | Corning, Inc | | | 1.450 | | | | 11/15/17 | | | | 98,564 | |
200,000 | | g | | Corp Nacional del Cobre de Chile-CODELCO | | | 3.875 | | | | 11/03/21 | | | | 195,615 | |
200,000 | | g | | Corp Nacional del Cobre de Chile-CODELCO | | | 3.000 | | | | 07/17/22 | | | | 179,903 | |
207,000 | | | | Crown Americas LLC | | | 6.250 | | | | 02/01/21 | | | | 224,595 | |
125,000 | | | | Freeport-McMoRan Copper & Gold, Inc | | | 2.375 | | | | 03/15/18 | | | | 124,695 | |
200,000 | | g | | Glencore Funding LLC | | | 2.500 | | | | 01/15/19 | | | | 193,663 | |
500,000 | | | | International Paper Co | | | 4.750 | | | | 02/15/22 | | | | 524,210 | |
50,000 | | | | International Paper Co | | | 7.300 | | | | 11/15/39 | | | | 61,736 | |
50,000 | | | | Rio Tinto Finance USA Ltd | | | 2.250 | | | | 09/20/16 | | | | 51,459 | |
135,000 | | | | Rio Tinto Finance USA plc | | | 2.250 | | | | 12/14/18 | | | | 134,334 | |
150,000 | | | | Rio Tinto Finance USA plc | | | 2.875 | | | | 08/21/22 | | | | 139,804 | |
295,000 | | | | Rock Tenn Co | | | 3.500 | | | | 03/01/20 | | | | 290,157 | |
100,000 | | | | Rosetta Resources, Inc | | | 5.625 | | | | 05/01/21 | | | | 99,750 | |
225,000 | | | | Sherwin-Williams Co | | | 1.350 | | | | 12/15/17 | | | | 219,085 | |
100,000 | | | | Teck Resources Ltd | | | 2.500 | | | | 02/01/18 | | | | 100,604 | |
150,000 | | | | Teck Resources Ltd | | | 3.750 | | | | 02/01/23 | | | | 139,819 | |
25,000 | | | | Teck Resources Ltd | | | 6.000 | | | | 08/15/40 | | | | 23,897 | |
25,000 | | | | Teck Resources Ltd | | | 5.200 | | | | 03/01/42 | | | | 22,065 | |
200,000 | | g | | Turkiye Sise ve Cam Fabrikalari AS. | | | 4.250 | | | | 05/09/20 | | | | 175,980 | |
| | | | | | | | | | | | | | | | |
| | | | TOTAL MATERIALS | | | | 3,639,430 | |
| | | | | | | | | | | | | | | | |
| | | |
MEDIA - 2.1% | | | | | | | | | | | | |
100,000 | | | | Cinemark USA, Inc | | | 4.875 | | | | 06/01/23 | | | | 94,000 | |
675,000 | | | | Comcast Corp | | | 4.250 | | | | 01/15/33 | | | | 627,021 | |
100,000 | | | | DIRECTV Holdings LLC | | | 2.400 | | | | 03/15/17 | | | | 101,806 | |
150,000 | | | | DIRECTV Holdings LLC | | | 3.800 | | | | 03/15/22 | | | | 144,095 | |
100,000 | | | | Discovery Communications LLC | | | 3.300 | | | | 05/15/22 | | | | 94,680 | |
125,000 | | | | Discovery Communications LLC | | | 4.875 | | | | 04/01/43 | | | | 115,311 | |
175,000 | | | | DISH DBS Corp | | | 4.250 | | | | 04/01/18 | | | | 178,500 | |
200,000 | | | | Grupo Televisa S.A. | | | 6.000 | | | | 05/15/18 | | | | 222,764 | |
320,000 | | | | Lamar Media Corp | | | 7.875 | | | | 04/15/18 | | | | 338,000 | |
100,000 | | | | Lamar Media Corp | | | 5.875 | | | | 02/01/22 | | | | 102,500 | |
100,000 | | g | | NBC Universal Enterprise, Inc | | | 1.662 | | | | 04/15/18 | | | | 97,666 | |
125,000 | | g | | NBC Universal Enterprise, Inc | | | 1.974 | | | | 04/15/19 | | | | 122,272 | |
500,000 | | | | News America, Inc | | | 3.000 | | | | 09/15/22 | | | | 470,026 | |
50,000 | | | | News America, Inc | | | 6.900 | | | | 08/15/39 | | | | 59,592 | |
35,000 | | | | Nielsen Finance LLC | | | 7.750 | | | | 10/15/18 | | | | 37,800 | |
225,000 | | | | Time Warner Cable, Inc | | | 8.250 | | | | 04/01/19 | | | | 263,589 | |
45,000 | | | | Time Warner Cable, Inc | | | 4.500 | | | | 09/15/42 | | | | 34,090 | |
50,000 | | | | Time Warner, Inc | | | 3.150 | | | | 07/15/15 | | | | 51,800 | |
50,000 | | | | Time Warner, Inc | | | 6.500 | | | | 11/15/36 | | | | 56,494 | |
250,000 | | | | Time Warner, Inc | | | 4.900 | | | | 06/15/42 | | | | 237,323 | |
200,000 | | g | | Univision Communications, Inc | | | 5.125 | | | | 05/15/23 | | | | 199,750 | |
200,000 | | | | Viacom, Inc | | | 1.250 | | | | 02/27/15 | | | | 200,996 | |
115,000 | | | | Viacom, Inc | | | 2.500 | | | | 12/15/16 | | | | 118,932 | |
125,000 | | | | Viacom, Inc | | | 5.850 | | | | 09/01/43 | | | | 131,403 | |
| | | | | | | | | | | | | | | | |
| | | | TOTAL MEDIA | | | | 4,100,410 | |
| | | | | | | | | | | | | | | | |
88
TIAA-CREF LIFE FUNDS - Bond Fund
| | | | | | | | | | | | | | | | |
PRINCIPAL | | | | ISSUER | | RATE | | | MATURITY
DATE | | | VALUE | |
| | | | | | | | | | | | | | |
PHARMACEUTICALS, BIOTECHNOLOGY & LIFE SCIENCES - 0.6% | | | | | | | | | | | | |
$170,000 | | | | Endo Pharmaceuticals Holdings, Inc | | | 7.000 | % | | | 07/15/19 | | | $ | 181,900 | |
65,000 | | | | Life Technologies Corp | | | 3.500 | | | | 01/15/16 | | | | 67,707 | |
50,000 | | | | Mead Johnson Nutrition Co | | | 5.900 | | | | 11/01/39 | | | | 53,859 | |
125,000 | | | | Mylan, Inc | | | 2.550 | | | | 03/28/19 | | | | 123,752 | |
172,000 | | g | | Mylan, Inc | | | 7.875 | | | | 07/15/20 | | | | 194,625 | |
150,000 | | | | NBTY, Inc | | | 9.000 | | | | 10/01/18 | | | | 164,438 | |
100,000 | | g | | Valeant Pharmaceuticals International, Inc | | | 6.375 | | | | 10/15/20 | | | | 105,375 | |
100,000 | | g | | Valeant Pharmaceuticals International, Inc | | | 5.625 | | | | 12/01/21 | | | | 100,500 | |
100,000 | | | | Watson Pharmaceuticals, Inc | | | 1.875 | | | | 10/01/17 | | | | 98,957 | |
100,000 | | | | Watson Pharmaceuticals, Inc | | | 3.250 | | | | 10/01/22 | | | | 93,272 | |
| | | | | | | | | | | | | | | | |
| | | | TOTAL PHARMACEUTICALS, BIOTECHNOLOGY & LIFE SCIENCES | | | | 1,184,385 | |
| | | | | | | | | | | | | | | | |
| | | |
REAL ESTATE - 1.0% | | | | | | | | | | | | |
30,000 | | | | AMB Property LP | | | 4.500 | | | | 08/15/17 | | | | 32,401 | |
35,000 | | | | Camden Property Trust | | | 4.625 | | | | 06/15/21 | | | | 36,683 | |
100,000 | | | | Camden Property Trust | | | 2.950 | | | | 12/15/22 | | | | 90,364 | |
100,000 | | g | | DCT Industrial Operating Partnership LP | | | 4.500 | | | | 10/15/23 | | | | 97,169 | |
100,000 | | | | Developers Diversified Realty Corp | | | 4.750 | | | | 04/15/18 | | | | 107,874 | |
40,000 | | | | Developers Diversified Realty Corp | | | 7.875 | | | | 09/01/20 | | | | 49,415 | |
100,000 | | | | Federal Realty Investment Trust | | | 3.000 | | | | 08/01/22 | | | | 93,450 | |
200,000 | | | | Federal Realty Investment Trust | | | 2.750 | | | | 06/01/23 | | | | 179,733 | |
25,000 | | | | Healthcare Realty Trust, Inc | | | 5.750 | | | | 01/15/21 | | | | 27,170 | |
100,000 | | | | Healthcare Realty Trust, Inc | | | 3.750 | | | | 04/15/23 | | | | 92,517 | |
100,000 | | | | Healthcare Trust of America Holdings LP | | | 3.700 | | | | 04/15/23 | | | | 92,145 | |
225,000 | | | | Kilroy Realty LP | | | 3.800 | | | | 01/15/23 | | | | 209,825 | |
100,000 | | | | Mid-America Apartments LP | | | 4.300 | | | | 10/15/23 | | | | 97,224 | |
50,000 | | | | National Retail Properties, Inc | | | 5.500 | | | | 07/15/21 | | | | 54,352 | |
100,000 | | | | National Retail Properties, Inc | | | 3.300 | | | | 04/15/23 | | | | 90,788 | |
25,000 | | | | Simon Property Group LP | | | 5.250 | | | | 12/01/16 | | | | 27,671 | |
100,000 | | | | Simon Property Group LP | | | 2.800 | | | | 01/30/17 | | | | 103,431 | |
40,000 | | | | Simon Property Group LP | | | 10.350 | | | | 04/01/19 | | | | 54,127 | |
15,000 | | | | Ventas Realty LP | | | 3.125 | | | | 11/30/15 | | | | 15,600 | |
150,000 | | | | Ventas Realty LP | | | 2.000 | | | | 02/15/18 | | | | 147,451 | |
50,000 | | | | Ventas Realty LP | | | 3.250 | | | | 08/15/22 | | | | 46,324 | |
100,000 | | | | Weingarten Realty Investors | | | 3.500 | | | | 04/15/23 | | | | 91,932 | |
| | | | | | | | | | | | | | | | |
| | | | TOTAL REAL ESTATE | | | | 1,837,646 | |
| | | | | | | | | | | | | | | | |
RETAILING - 1.8% | | | | | | | | | | | | |
200,000 | | | | AmeriGas Finance LLC | | | 3.750 | | | | 05/01/21 | | | | 188,000 | |
130,000 | | | | AmeriGas Partners LP | | | 6.250 | | | | 08/20/19 | | | | 139,750 | |
100,000 | | g | | Avis Budget Rental Car Funding AESOP LLC | | | 2.054 | | | | 08/20/16 | | | | 101,492 | |
100,000 | | g | | BC Mountain LLC | | | 7.000 | | | | 02/01/21 | | | | 101,000 | |
125,000 | | | | Home Depot, Inc | | | 2.250 | | | | 09/10/18 | | | | 126,719 | |
132,000 | | | | Limited Brands, Inc | | | 6.625 | | | | 04/01/21 | | | | 144,870 | |
205,000 | | | | Limited Brands, Inc | | | 5.625 | | | | 02/15/22 | | | | 209,612 | |
225,000 | | | | Macy’s Retail Holdings, Inc | | | 2.875 | | | | 02/15/23 | | | | 203,630 | |
35,000 | | | | O’Reilly Automotive, Inc | | | 4.625 | | | | 09/15/21 | | | | 36,111 | |
725,000 | | | | O’Reilly Automotive, Inc | | | 3.800 | | | | 09/01/22 | | | | 699,710 | |
100,000 | | g | | QVC, Inc | | | 7.500 | | | | 10/01/19 | | | | 107,785 | |
510,000 | | g | | QVC, Inc | | | 7.375 | | | | 10/15/20 | | | | 549,826 | |
100,000 | | | | QVC, Inc | | | 5.125 | | | | 07/02/22 | | | | 98,911 | |
385,000 | | | | Sally Holdings LLC | | | 5.750 | | | | 06/01/22 | | | | 400,400 | |
100,000 | | | | Sonic Automotive, Inc | | | 5.000 | | | | 05/15/23 | | | | 93,750 | |
200,000 | | g | | WEX, Inc | | | 4.750 | | | | 02/01/23 | | | | 184,000 | |
| | | | | | | | | | | | | | | | |
| | | | TOTAL RETAILING | | | | 3,385,566 | |
| | | | | | | | | | | | | | | | |
| | | |
SOFTWARE & SERVICES - 0.9% | | | | | | | | | | | | |
100,000 | | g | | Activision Blizzard, Inc | | | 5.625 | | | | 09/15/21 | | | | 103,500 | |
100,000 | | | | Equinix, Inc | | | 4.875 | | | | 04/01/20 | | | | 99,500 | |
1,170,000 | | | | Fidelity National Information Services, Inc | | | 5.000 | | | | 03/15/22 | | | | 1,194,863 | |
100,000 | | g | | NCR Escrow Corp | | | 5.875 | | | | 12/15/21 | | | | 101,875 | |
50,000 | | | | Oracle Corp | | | 3.750 | | | | 07/08/14 | | | | 50,863 | |
100,000 | | | | VeriSign, Inc | | | 4.625 | | | | 05/01/23 | | | | 95,500 | |
| | | | | | | | | | | | | | | | |
| | | | TOTAL SOFTWARE & SERVICES | | | | 1,646,101 | |
| | | | | | | | | | | | | | | | |
89
TIAA-CREF LIFE FUNDS - Bond Fund
| | | | | | | | | | | | | | | | |
PRINCIPAL | | | | ISSUER | | RATE | | | MATURITY
DATE | | | VALUE | |
| | | | | | | | | | | | | | |
TECHNOLOGY HARDWARE & EQUIPMENT - 1.2% | | | | | | | | | | | | |
$ 50,000 | | | | American Tower Corp | | | 4.700 | % | | | 03/15/22 | | | $ | 49,977 | |
50,000 | | | | Amphenol Corp | | | 4.750 | | | | 11/15/14 | | | | 51,665 | |
130,000 | | | | Brocade Communications Systems, Inc | | | 6.875 | | | | 01/15/20 | | | | 139,425 | |
100,000 | | | | CC Holdings GS V LLC | | | 2.381 | | | | 12/15/17 | | | | 99,048 | |
82,000 | | | | Flextronics International Ltd | | | 4.625 | | | | 02/15/20 | | | | 79,950 | |
500,000 | | | | General Electric Co | | | 0.850 | | | | 10/09/15 | | | | 502,335 | |
250,000 | | | | General Electric Co | | | 2.700 | | | | 10/09/22 | | | | 234,000 | |
100,000 | | | | General Electric Co | | | 4.125 | | | | 10/09/42 | | | | 92,386 | |
282,000 | | | | Jabil Circuit, Inc | | | 5.625 | | | | 12/15/20 | | | | 292,575 | |
100,000 | | | | L-3 Communications Corp | | | 4.950 | | | | 02/15/21 | | | | 104,595 | |
150,000 | | g | | NXP BV | | | 3.750 | | | | 06/01/18 | | | | 151,125 | |
100,000 | | | | Scientific Games Corp | | | 8.125 | | | | 09/15/18 | | | | 107,250 | |
32,000 | | | | Scientific Games Corp | | | 9.250 | | | | 06/15/19 | | | | 34,320 | |
100,000 | | | | Tyco Electronics Group S.A. | | | 2.375 | | | | 12/17/18 | | | | 98,609 | |
150,000 | | g | | WESCO Distribution, Inc | | | 5.375 | | | | 12/15/21 | | | | 150,000 | |
25,000 | | | | Xerox Corp | | | 8.250 | | | | 05/15/14 | | | | 25,670 | |
50,000 | | | | Xerox Corp | | | 4.500 | | | | 05/15/21 | | | | 51,464 | |
| | | | | | | | | | | | | | | | |
| | | | TOTAL TECHNOLOGY HARDWARE & EQUIPMENT | | | | 2,264,394 | |
| | | | | | | | | | | | | | | | |
| | | |
TELECOMMUNICATION SERVICES - 2.5% | | | | | | | | | | | | |
300,000 | | | | American Tower Corp | | | 3.500 | | | | 01/31/23 | | | | 273,523 | |
125,000 | | | | AT&T, Inc | | | 1.400 | | | | 12/01/17 | | | | 123,231 | |
150,000 | | | | AT&T, Inc | | | 2.625 | | | | 12/01/22 | | | | 135,339 | |
175,000 | | | | Cellco Partnership | | | 8.500 | | | | 11/15/18 | | | | 221,573 | |
100,000 | | | | CenturyLink, Inc | | | 6.750 | | | | 12/01/23 | | | | 101,250 | |
100,000 | | | | Deutsche Telekom International Finance BV | | | 8.750 | | | | 06/15/30 | | | | 141,078 | |
75,000 | | g | | Deutsche Telekom International Finance BV | | | 4.875 | | | | 03/06/42 | | | | 71,572 | |
125,000 | | g | | Intelsat Jackson Holdings S.A. | | | 5.500 | | | | 08/01/23 | | | | 118,906 | |
100,000 | | g | | SES | | | 3.600 | | | | 04/04/23 | | | | 93,172 | |
100,000 | | g | | Sprint Corp | | | 7.250 | | | | 09/15/21 | | | | 107,375 | |
33,000 | | | | Telecom Italia Capital S.A. | | | 6.175 | | | | 06/18/14 | | | | 33,742 | |
150,000 | | | | Telefonica Emisiones SAU | | | 3.992 | | | | 02/16/16 | | | | 157,560 | |
150,000 | | | | Telefonica Emisiones SAU | | | 3.192 | | | | 04/27/18 | | | | 152,763 | |
125,000 | | | | Telefonica Emisiones SAU | | | 4.570 | | | | 04/27/23 | | | | 123,261 | |
100,000 | | | | Telefonos de Mexico SAB de C.V. | | | 5.500 | | | | 11/15/19 | | | | 109,250 | |
600,000 | | | | Verizon Communications, Inc | | | 0.700 | | | | 11/02/15 | | | | 598,326 | |
625,000 | | | | Verizon Communications, Inc | | | 3.650 | | | | 09/14/18 | | | | 661,603 | |
26,000 | | | | Verizon Communications, Inc | | | 8.750 | | | | 11/01/18 | | | | 33,269 | |
375,000 | | | | Verizon Communications, Inc | | | 5.150 | | | | 09/15/23 | | | | 402,635 | |
875,000 | | | | Verizon Communications, Inc | | | 6.550 | | | | 09/15/43 | | | | 1,023,714 | |
100,000 | | | | Windstream Corp | | | 6.375 | | | | 08/01/23 | | | | 93,500 | |
| | | | | | | | | | | | | | | | |
| | | | TOTAL TELECOMMUNICATION SERVICES | | | | 4,776,642 | |
| | | | | | | | | | | | | | | | |
| | | |
TRANSPORTATION - 0.7% | | | | | | | | | | | | |
165,000 | | g | | Asciano Finance Ltd | | | 5.000 | | | | 04/07/18 | | | | 174,937 | |
200,000 | | g | | DP World Ltd | | | 6.850 | | | | 07/02/37 | | | | 196,500 | |
227,000 | | g | | Embraer Overseas Ltd | | | 5.696 | | | | 09/16/23 | | | | 227,000 | |
100,000 | | g | | ERAC USA Finance LLC | | | 3.300 | | | | 10/15/22 | | | | 92,913 | |
100,000 | | g | | ERAC USA Finance LLC | | | 5.625 | | | | 03/15/42 | | | | 102,135 | |
100,000 | | | | Hertz Corp | | | 4.250 | | | | 04/01/18 | | | | 102,500 | |
100,000 | | | | Kansas City Southern de Mexico S.A. de C.V. | | | 2.350 | | | | 05/15/20 | | | | 93,162 | |
100,000 | | g | | Kansas City Southern Railway | | | 4.300 | | | | 05/15/43 | | | | 87,267 | |
75,000 | | | | Northrop Grumman Corp | | | 3.250 | | | | 08/01/23 | | | | 69,957 | |
100,000 | | | | United Parcel Service, Inc | | | 3.125 | | | | 01/15/21 | | | | 100,120 | |
100,000 | | | | United Parcel Service, Inc | | | 3.625 | | | | 10/01/42 | | | | 84,184 | |
| | | | | | | | | | | | | | | | |
| | | | TOTAL TRANSPORTATION | | | | 1,330,675 | |
| | | | | | | | | | | | | | | | |
| | | |
UTILITIES - 3.4% | | | | | | | | | | | | |
100,000 | | | | AES Corp | | | 7.375 | | | | 07/01/21 | | | | 112,750 | |
100,000 | | | | AES Corp | | | 4.875 | | | | 05/15/23 | | | | 93,500 | |
100,000 | | | | AGL Capital Corp | | | 4.400 | | | | 06/01/43 | | | | 90,166 | |
100,000 | | | | Alabama Power Co | | | 3.550 | | | | 12/01/23 | | | | 98,146 | |
90
TIAA-CREF LIFE FUNDS - Bond Fund
| | | | | | | | | | | | | | | | |
PRINCIPAL | | | | ISSUER | | RATE | | | MATURITY
DATE | | | VALUE | |
| | | | | | | | | | | | | | |
$ 75,000 | | | | Alliant Energy Corp | | | 4.000 | % | | | 10/15/14 | | | $ | 76,966 | |
75,000 | | | | Atmos Energy Corp | | | 8.500 | | | | 03/15/19 | | | | 96,109 | |
150,000 | | | | Atmos Energy Corp | | | 4.150 | | | | 01/15/43 | | | | 134,921 | |
200,000 | | | | Black Hills Corp | | | 4.250 | | | | 11/30/23 | | | | 199,097 | |
155,000 | | g | | Calpine Corp | | | 7.500 | | | | 02/15/21 | | | | 169,144 | |
200,000 | | | | Carolina Power & Light Co | | | 5.300 | | | | 01/15/19 | | | | 227,484 | |
200,000 | | | | CLP Power Hong Kong Financing Ltd | | | 3.375 | | | | 10/26/27 | | | | 168,280 | |
100,000 | | | | CMS Energy Corp | | | 4.700 | | | | 03/31/43 | | | | 93,303 | |
200,000 | | g | | Comision Federal de Electricidad | | | 4.875 | | | | 01/15/24 | | | | 198,500 | |
150,000 | | | | Commonwealth Edison Co | | | 4.000 | | | | 08/01/20 | | | | 159,299 | |
25,000 | | | | Connecticut Light & Power Co | | | 5.500 | | | | 02/01/19 | | | | 28,637 | |
150,000 | | | | Consolidated Edison Co of New York, Inc | | | 3.950 | | | | 03/01/43 | | | | 132,343 | |
50,000 | | g | | Dominion Gas Holdings LLC | | | 3.550 | | | | 11/01/23 | | | | 48,161 | |
75,000 | | g | | Dominion Gas Holdings LLC | | | 4.800 | | | | 11/01/43 | | | | 72,513 | |
15,000 | | | | Duke Energy Carolinas LLC | | | 4.300 | | | | 06/15/20 | | | | 16,085 | |
75,000 | | | | Duke Energy Ohio, Inc | | | 3.800 | | | | 09/01/23 | | | | 74,963 | |
175,000 | | | | Florida Power & Light Co | | | 2.750 | | | | 06/01/23 | | | | 163,802 | |
50,000 | | | | Indiana Michigan Power Co | | | 7.000 | | | | 03/15/19 | | | | 59,464 | |
25,000 | | | | Integrys Energy Group, Inc | | | 4.170 | | | | 11/01/20 | | | | 25,923 | |
300,000 | | g | | Israel Electric Corp Ltd | | | 7.250 | | | | 01/15/19 | | | | 333,375 | |
200,000 | | g | | KazMunayGas National Co JSC | | | 4.400 | | | | 04/30/23 | | | | 185,500 | |
100,000 | | | | LG&E and KU Energy LLC | | | 3.750 | | | | 11/15/20 | | | | 101,171 | |
100,000 | | g | | MidAmerican Energy Holdings Co | | | 5.150 | | | | 11/15/43 | | | | 100,833 | |
50,000 | | | | NiSource Finance Corp | | | 4.800 | | | | 02/15/44 | | | | 45,113 | |
100,000 | | | | Northeast Utilities | | | 1.450 | | | | 05/01/18 | | | | 96,854 | |
200,000 | | | | NTPC Ltd | | | 5.625 | | | | 07/14/21 | | | | 198,626 | |
100,000 | | | | Oncor Electric Delivery Co LLC | | | 4.550 | | | | 12/01/41 | | | | 94,053 | |
150,000 | | | | ONEOK Partners LP | | | 3.375 | | | | 10/01/22 | | | | 140,222 | |
175,000 | | | | Pacific Gas & Electric Co | | | 3.850 | | | | 11/15/23 | | | | 174,059 | |
125,000 | | | | PacifiCorp | | | 2.950 | | | | 02/01/22 | | | | 120,148 | |
75,000 | | | | Pepco Holdings, Inc | | | 2.700 | | | | 10/01/15 | | | | 76,904 | |
200,000 | | g | | Perusahaan Listrik Negara PT | | | 5.500 | | | | 11/22/21 | | | | 192,500 | |
50,000 | | | | PG&E Corp | | | 5.750 | | | | 04/01/14 | | | | 50,617 | |
300,000 | | | | PPL Capital Funding, Inc | | | 4.200 | | | | 06/15/22 | | | | 299,450 | |
250,000 | | | | PPL Electric Utilities Corp | | | 3.000 | | | | 09/15/21 | | | | 246,004 | |
50,000 | | | | Progress Energy, Inc | | | 7.050 | | | | 03/15/19 | | | | 59,930 | |
75,000 | | | | Public Service Co of Colorado | | | 3.200 | | | | 11/15/20 | | | | 75,386 | |
80,000 | | | | Public Service Co of Colorado | | | 4.750 | | | | 08/15/41 | | | | 80,799 | |
100,000 | | | | Public Service Co of Oklahoma | | | 5.150 | | | | 12/01/19 | | | | 110,786 | |
175,000 | | | | Public Service Electric & Gas Co | | | 2.375 | | | | 05/15/23 | | | | 157,354 | |
32,000 | | | | Questar Market Resources, Inc | | | 6.875 | | | | 03/01/21 | | | | 34,320 | |
75,000 | | | | San Diego Gas & Electric Co | | | 3.000 | | | | 08/15/21 | | | | 73,913 | |
50,000 | | | | Sempra Energy | | | 6.000 | | | | 10/15/39 | | | | 54,923 | |
100,000 | | | | Tampa Electric Co | | | 4.100 | | | | 06/15/42 | | | | 89,986 | |
55,000 | | | | Virginia Electric and Power Co | | | 2.950 | | | | 01/15/22 | | | | 53,138 | |
100,000 | | | | Virginia Electric and Power Co | | | 4.650 | | | | 08/15/43 | | | | 99,598 | |
50,000 | | | | Williams Partners LP | | | 3.800 | | | | 02/15/15 | | | | 51,656 | |
75,000 | | | | Williams Partners LP | | | 4.000 | | | | 11/15/21 | | | | 74,071 | |
100,000 | | | | Williams Partners LP | | | 4.500 | | | | 11/15/23 | | | | 99,321 | |
75,000 | | | | Williams Partners LP | | | 5.800 | | | | 11/15/43 | | | | 76,555 | |
50,000 | | | | Xcel Energy, Inc | | | 4.800 | | | | 09/15/41 | | | | 48,689 | |
| | | | | | | | | | | | | | | | |
| | | | TOTAL UTILITIES | | | | | | | | | | | 6,235,410 | |
| | | | | | | | | | | | | | | | |
| | | | TOTAL CORPORATE BONDS
(Cost $69,737,265) | | | | | | | | | | | 69,710,002 | |
| | | | | | | | | | | | | | | | |
| | | |
GOVERNMENT BONDS - 50.2% | | | | | | | | | | | | |
| | | |
AGENCY SECURITIES - 0.1% | | | | | | | | | | | | |
200,000 | | | | Amber Circle Funding Ltd | | | 3.250 | | | | 12/04/22 | | | | 182,000 | |
187,500 | | | | Totem Ocean Trailer Express, Inc | | | 4.514 | | | | 12/18/19 | | | | 196,581 | |
| | | | | | | | | | | | | | | | |
| | | | TOTAL AGENCY SECURITIES | | | | | | | | | | | 378,581 | |
| | | | | | | | | | | | | | | | |
91
TIAA-CREF LIFE FUNDS - Bond Fund
| | | | | | | | | | | | | | | | |
PRINCIPAL | | | | ISSUER | | RATE | | | MATURITY
DATE | | | VALUE | |
| | | | | | | | | | | | | | |
FOREIGN GOVERNMENT BONDS - 3.0% | | | | | | | | | | | | |
$200,000 | | g | | Brazil Minas SPE via State of Minas Gerais | | | 5.333 | % | | | 02/15/28 | | | $ | 185,500 | |
100,000 | | | | Brazilian Government International Bond | | | 2.625 | | | | 01/05/23 | | | | 86,000 | |
25,000 | | | | Brazilian Government International Bond | | | 7.125 | | | | 01/20/37 | | | | 28,625 | |
150,000 | | | | Canada Government International Bond | | | 2.375 | | | | 09/10/14 | | | | 152,223 | |
250,000 | | | | Canada Government International Bond | | | 0.875 | | | | 02/14/17 | | | | 250,004 | |
200,000 | | | | Colombia Government International Bond | | | 2.625 | | | | 03/15/23 | | | | 175,200 | |
200,000 | | | | Colombia Government International Bond | | | 4.000 | | | | 02/26/24 | | | | 192,800 | |
200,000 | | g | | Croatia Government International Bond | | | 6.250 | | | | 04/27/17 | | | | 213,000 | |
100,000 | | | | European Investment Bank | | | 4.875 | | | | 02/15/36 | | | | 109,286 | |
200,000 | | | | Export-Import Bank of Korea | | | 1.250 | | | | 11/20/15 | | | | 200,616 | |
200,000 | | | | Export-Import Bank of Korea | | | 1.750 | | | | 02/27/18 | | | | 194,612 | |
175,000 | | | | Federative Republic of Brazil | | | 6.000 | | | | 01/17/17 | | | | 193,900 | |
100,000 | | | | Hungary Government International Bond | | | 5.750 | | | | 11/22/23 | | | | 100,500 | |
200,000 | | g | | Indonesia Government International Bond | | | 3.750 | | | | 04/25/22 | | | | 180,250 | |
35,000 | | | | Italy Government International Bond | | | 6.875 | | | | 09/27/23 | | | | 41,488 | |
200,000 | | g,i | | Kommunalbanken AS. | | | 0.417 | | | | 02/20/18 | | | | 199,753 | |
200,000 | | | | Korea Development Bank | | | 1.500 | | | | 01/22/18 | | | | 191,767 | |
250,000 | | g | | Korea Housing Finance Corp | | | 1.625 | | | | 09/15/18 | | | | 235,704 | |
200,000 | | g | | Namibia International Bonds | | | 5.500 | | | | 11/03/21 | | | | 204,000 | |
100,000 | | | | Panama Government International Bond | | | 5.200 | | | | 01/30/20 | | | | 108,875 | |
25,000 | | | | Peruvian Government International Bond | | | 7.350 | | | | 07/21/25 | | | | 31,500 | |
80,000 | | | | Poland Government International Bond | | | 3.875 | | | | 07/16/15 | | | | 83,704 | |
30,000 | | | | Poland Government International Bond | | | 6.375 | | | | 07/15/19 | | | | 35,062 | |
195,000 | | | | Poland Government International Bond | | | 3.000 | | | | 03/17/23 | | | | 177,548 | |
300,000 | | | | Province of Ontario Canada | | | 4.100 | | | | 06/16/14 | | | | 305,190 | |
300,000 | | | | Province of Ontario Canada | | | 2.950 | | | | 02/05/15 | | | | 308,358 | |
100,000 | | | | Qatar Government International Bond | | | 5.250 | | | | 01/20/20 | | | | 111,750 | |
200,000 | | g | | Republic of Trinidad & Tobago | | | 4.375 | | | | 01/16/24 | | | | 205,300 | |
60,000 | | g | | Romanian Government International Bond | | | 6.750 | | | | 02/07/22 | | | | 68,100 | |
200,000 | | g | | Romanian Government International Bond | | | 4.375 | | | | 08/22/23 | | | | 193,000 | |
100,000 | | | | South Africa Government International Bond | | | 6.875 | | | | 05/27/19 | | | | 114,375 | |
100,000 | | | | South Africa Government International Bond | | | 4.665 | | | | 01/17/24 | | | | 95,625 | |
225,000 | | | | South Africa Government International Bond | | | 5.875 | | | | 09/16/25 | | | | 234,000 | |
200,000 | | g | | Sri Lanka Government International Bond | | | 5.875 | | | | 07/25/22 | | | | 187,000 | |
100,000 | | | | Turkey Government International Bond | | | 5.625 | | | | 03/30/21 | | | | 100,400 | |
100,000 | | | | United Mexican States | | | 5.125 | | | | 01/15/20 | | | | 110,800 | |
53,000 | | | | Uruguay Government International Bond | | | 4.500 | | | | 08/14/24 | | | | 53,000 | |
| | | | | | | | | | | | | | | | |
| | | | TOTAL FOREIGN GOVERNMENT BONDS | | | | | | | | | | | 5,658,815 | |
| | | | | | | | | | | | | | | | |
| | | |
MORTGAGE BACKED - 20.5% | | | | | | | | | | | | |
27,195 | | i | | Federal Home Loan Mortgage Corp (FHLMC) | | | 2.427 | | | | 02/01/36 | | | | 28,955 | |
96,695 | | i | | FHLMC | | | 2.375 | | | | 07/01/36 | | | | 102,769 | |
78,042 | | i | | FHLMC | | | 2.259 | | | | 09/01/36 | | | | 83,413 | |
23,550 | | i | | FHLMC | | | 2.368 | | | | 09/01/36 | | | | 25,225 | |
28,248 | | i | | FHLMC | | | 2.420 | | | | 09/01/36 | | | | 30,055 | |
59,512 | | i | | FHLMC | | | 2.633 | | | | 03/01/37 | | | | 63,575 | |
54,103 | | i | | FHLMC | | | 6.010 | | | | 04/01/37 | | | | 57,357 | |
4,417 | | i | | FHLMC | | | 6.080 | | | | 05/01/37 | | | | 4,605 | |
104,076 | | | | FHLMC (Interest Only) | | | 3.000 | | | | 08/15/42 | | | | 84,437 | |
110,664 | | | | Federal Home Loan Mortgage Corp Gold (FGLMC) | | | 5.000 | | | | 02/01/19 | | | | 117,221 | |
11,221 | | | | FGLMC | | | 4.500 | | | | 01/01/20 | | | | 11,897 | |
50,794 | | | | FGLMC | | | 4.500 | | | | 07/01/20 | | | | 55,061 | |
11,322 | | | | FGLMC | | | 5.000 | | | | 04/01/23 | | | | 12,223 | |
37,711 | | | | FGLMC | | | 4.000 | | | | 07/01/24 | | | | 39,820 | |
13,765 | | | | FGLMC | | | 4.500 | | | | 09/01/24 | | | | 14,765 | |
3,330 | | | | FGLMC | | | 6.000 | | | | 03/01/33 | | | | 3,673 | |
122,992 | | | | FGLMC | | | 5.000 | | | | 11/01/33 | | | | 135,610 | |
207,394 | | | | FGLMC | | | 6.000 | | | | 11/01/33 | | | | 230,085 | |
32,146 | | | | FGLMC | | | 5.000 | | | | 05/01/34 | | | | 34,814 | |
24,212 | | | | FGLMC | | | 6.000 | | | | 09/01/34 | | | | 27,100 | |
15,488 | | | | FGLMC | | | 6.000 | | | | 04/01/35 | | | | 17,112 | |
9,940 | | | | FGLMC | | | 5.000 | | | | 02/01/36 | | | | 10,736 | |
1,384 | | | | FGLMC | | | 6.500 | | | | 05/01/36 | | | | 1,538 | |
92
TIAA-CREF LIFE FUNDS - Bond Fund
| | | | | | | | | | | | | | | | |
PRINCIPAL | | | | ISSUER | | RATE | | | MATURITY
DATE | | | VALUE | |
| | | | | | | | | | | | | | |
$ 83,518 | | | | FGLMC | | | 6.000 | % | | | 08/01/37 | | | $ | 92,828 | |
24,034 | | | | FGLMC | | | 6.500 | | | | 09/01/37 | | | | 26,726 | |
19,487 | | | | FGLMC | | | 6.500 | | | | 11/01/37 | | | | 21,675 | |
53,960 | | | | FGLMC | | | 5.000 | | | | 04/01/38 | | | | 58,290 | |
13,958 | | | | FGLMC | | | 6.500 | | | | 05/01/38 | | | | 15,511 | |
17,892 | | | | FGLMC | | | 5.500 | | | | 01/01/39 | | | | 19,500 | |
42,099 | | | | FGLMC | | | 5.000 | | | | 07/01/39 | | | | 45,382 | |
601,340 | | | | FGLMC | | | 4.500 | | | | 12/01/39 | | | | 639,138 | |
74,035 | | | | FGLMC | | | 5.000 | | | | 01/01/40 | | | | 79,835 | |
369,589 | | | | FGLMC | | | 4.500 | | | | 07/01/40 | | | | 392,829 | |
562,951 | | | | Federal National Mortgage Association (FNMA) | | | 4.828 | | | | 01/01/15 | | | | 562,793 | |
26,800 | | | | FNMA | | | 5.500 | | | | 04/01/18 | | | | 28,654 | |
25,915 | | | | FNMA | | | 5.500 | | | | 05/01/18 | | | | 27,543 | |
90,719 | | | | FNMA | | | 4.000 | | | | 02/25/19 | | | | 95,434 | |
22,730 | | | | FNMA | | | 4.500 | | | | 03/01/19 | | | | 24,191 | |
10,780 | | | | FNMA | | | 4.500 | | | | 06/01/19 | | | | 11,475 | |
108,464 | | | | FNMA | | | 5.500 | | | | 07/01/20 | | | | 118,479 | |
5,603 | | | | FNMA | | | 4.500 | | | | 11/01/20 | | | | 5,966 | |
42,681 | | | | FNMA | | | 4.500 | | | | 12/01/20 | | | | 46,399 | |
11,353 | | | | FNMA | | | 5.000 | | | | 12/01/20 | | | | 12,229 | |
176,110 | | | | FNMA | | | 6.000 | | | | 08/01/21 | | | | 191,506 | |
115,458 | | | | FNMA | | | 2.500 | | | | 03/01/23 | | | | 117,880 | |
9,603 | | | | FNMA | | | 4.500 | | | | 03/01/23 | | | | 10,233 | |
41,420 | | | | FNMA | | | 5.000 | | | | 04/01/23 | | | | 44,692 | |
19,107 | | | | FNMA | | | 4.500 | | | | 06/01/23 | | | | 20,359 | |
10,246 | | | | FNMA | | | 5.000 | | | | 07/01/23 | | | | 10,909 | |
26,385 | | | | FNMA | | | 5.000 | | | | 07/01/23 | | | | 28,489 | |
751,115 | | | | FNMA | | | 5.500 | | | | 02/01/24 | | | | 824,943 | |
29,816 | | | | FNMA | | | 4.500 | | | | 04/01/24 | | | | 31,731 | |
20,646 | | | | FNMA | | | 4.000 | | | | 05/01/24 | | | | 21,890 | |
116,188 | | | | FNMA | | | 5.500 | | | | 07/01/24 | | | | 127,678 | |
4,040 | | | | FNMA | | | 5.500 | | | | 09/01/24 | | | | 4,440 | |
148,127 | | | | FNMA | | | 4.000 | | | | 02/01/25 | | | | 156,989 | |
267,413 | | | | FNMA | | | 3.500 | | | | 01/01/26 | | | | 279,943 | |
382,970 | | | | FNMA | | | 2.500 | | | | 01/01/27 | | | | 380,340 | |
521,341 | | | | FNMA | | | 3.000 | | | | 01/01/27 | | | | 532,620 | |
207,113 | | | | FNMA | | | 3.000 | | | | 01/01/27 | | | | 211,588 | |
1,167,674 | | | | FNMA | | | 2.500 | | | | 10/01/27 | | | | 1,159,609 | |
938,239 | | | | FNMA | | | 3.000 | | | | 03/01/28 | | | | 959,018 | |
468,361 | | | | FNMA | | | 2.500 | | | | 04/01/28 | | | | 464,071 | |
452,465 | | | | FNMA | | | 3.500 | | | | 06/01/32 | | | | 460,764 | |
22,734 | | | | FNMA | | | 6.500 | | | | 07/01/32 | | | | 25,494 | |
24,557 | | | | FNMA | | | 5.500 | | | | 01/01/33 | | | | 27,052 | |
388,769 | | | | FNMA | | | 5.500 | | | | 07/01/33 | | | | 435,082 | |
33,687 | | | | FNMA | | | 5.500 | | | | 07/01/33 | | | | 37,137 | |
193,560 | | | | FNMA | | | 5.500 | | | | 07/01/33 | | | | 215,951 | |
47,793 | | | | FNMA | | | 6.000 | | | | 10/01/33 | | | | 52,920 | |
54,897 | | | | FNMA | | | 5.000 | | | | 11/01/33 | | | | 59,805 | |
288,245 | | | | FNMA | | | 5.500 | | | | 11/01/33 | | | | 318,089 | |
37,950 | | | | FNMA | | | 5.500 | | | | 04/01/34 | | | | 42,034 | |
17,310 | | | | FNMA | | | 5.000 | | | | 08/01/34 | | | | 18,810 | |
15,180 | | | | FNMA | | | 5.000 | | | | 11/01/34 | | | | 16,509 | |
27,570 | | | | FNMA | | | 6.500 | | | | 02/01/35 | | | | 30,677 | |
62,188 | | | | FNMA | | | 5.500 | | | | 04/01/35 | | | | 68,402 | |
11,941 | | | | FNMA | | | 7.500 | | | | 06/01/35 | | | | 13,062 | |
25,986 | | | | FNMA | | | 5.500 | | | | 07/01/35 | | | | 28,776 | |
17,138 | | | | FNMA | | | 7.500 | | | | 07/01/35 | | | | 17,977 | |
19,315 | | | | FNMA | | | 4.500 | | | | 08/01/35 | | | | 20,509 | |
30,549 | | | | FNMA | | | 5.000 | | | | 08/01/35 | | | | 33,151 | |
82,579 | | | | FNMA | | | 5.500 | | | | 09/01/35 | | | | 90,891 | |
29,800 | | | | FNMA | | | 5.500 | | | | 10/01/35 | | | | 32,769 | |
29,290 | | | | FNMA | | | 5.000 | | | | 02/01/36 | | | | 31,789 | |
84,593 | | | | FNMA | | | 6.000 | | | | 04/01/36 | | | | 94,119 | |
68,357 | | | | FNMA | | | 6.000 | | | | 06/01/36 | | | | 75,986 | |
57,547 | | i | | FNMA | | | 2.379 | | | | 07/01/36 | | | | 61,922 | |
93
TIAA-CREF LIFE FUNDS - Bond Fund
| | | | | | | | | | | | | | | | |
PRINCIPAL | | | | ISSUER | | RATE | | | MATURITY
DATE | | | VALUE | |
| | | | | | | | | | | | | | |
$ 16,067 | | | | FNMA | | | 6.500 | % | | | 09/01/36 | | | $ | 17,840 | |
17,811 | | | | FNMA | | | 6.000 | | | | 12/01/36 | | | | 19,760 | |
11,623 | | | | FNMA | | | 5.000 | | | | 02/01/37 | | | | 12,597 | |
65,816 | | | | FNMA | | | 5.500 | | | | 02/01/37 | | | | 72,303 | |
25,472 | | | | FNMA | | | 7.000 | | | | 02/01/37 | | | | 28,871 | |
30,669 | | | | FNMA | | | 5.500 | | | | 03/01/37 | | | | 33,664 | |
45,217 | | | | FNMA | | | 7.000 | | | | 04/01/37 | | | | 48,780 | |
3,410 | | | | FNMA | | | 5.500 | | | | 06/01/37 | | | | 3,743 | |
8,446 | | | | FNMA | | | 6.500 | | | | 08/01/37 | | | | 9,378 | |
66,842 | | | | FNMA | | | 6.000 | | | | 09/01/37 | | | | 74,076 | |
10,641 | | | | FNMA | | | 6.000 | | | | 11/01/37 | | | | 11,771 | |
8,041 | | | | FNMA | | | 7.000 | | | | 11/01/37 | | | | 8,891 | |
21,686 | | | | FNMA | | | 5.500 | | | | 01/01/38 | | | | 23,803 | |
126,919 | | | | FNMA | | | 5.500 | | | | 02/01/38 | | | | 139,312 | |
50,091 | | | | FNMA | | | 5.500 | | | | 02/01/38 | | | | 55,000 | |
1,459 | | | | FNMA | | | 6.500 | | | | 02/01/38 | | | | 1,623 | |
4,262 | | | | FNMA | | | 6.500 | | | | 03/01/38 | | | | 4,733 | |
53,870 | | | | FNMA | | | 5.000 | | | | 04/01/38 | | | | 58,404 | |
80,905 | | | | FNMA | | | 5.000 | | | | 04/01/38 | | | | 87,763 | |
36,131 | | | | FNMA | | | 6.000 | | | | 04/01/38 | | | | 39,970 | |
88,682 | | | | FNMA | | | 5.500 | | | | 05/01/38 | | | | 97,456 | |
66,511 | | | | FNMA | | | 5.500 | | | | 06/01/38 | | | | 73,005 | |
210,385 | | | | FNMA | | | 6.000 | | | | 07/01/38 | | | | 232,944 | |
191,376 | | | | FNMA | | | 6.000 | | | | 10/01/38 | | | | 211,709 | |
99,370 | | | | FNMA | | | 4.000 | | | | 01/01/39 | | | | 102,329 | |
25,047 | | | | FNMA | | | 4.500 | | | | 01/01/39 | | | | 26,516 | |
20,939 | | | | FNMA | | | 5.500 | | | | 01/01/39 | | | | 22,984 | |
13,145 | | | | FNMA | | | 6.000 | | | | 01/01/39 | | | | 14,542 | |
17,218 | | | | FNMA | | | 6.000 | | | | 01/01/39 | | | | 19,047 | |
46,432 | | | | FNMA | | | 4.000 | | | | 02/01/39 | | | | 47,827 | |
35,182 | | | | FNMA | | | 4.500 | | | | 02/01/39 | | | | 37,251 | |
188,414 | | | | FNMA | | | 4.500 | | | | 02/01/39 | | | | 199,615 | |
16,750 | | | | FNMA | | | 5.500 | | | | 02/01/39 | | | | 18,386 | |
346,594 | | | | FNMA | | | 4.500 | | | | 04/01/39 | | | | 367,041 | |
23,687 | | | | FNMA | | | 5.000 | | | | 04/01/39 | | | | 25,672 | |
287,146 | | | | FNMA | | | 4.000 | | | | 05/01/39 | | | | 296,417 | |
186,537 | | | | FNMA | | | 4.500 | | | | 06/01/39 | | | | 197,601 | |
294,610 | | | | FNMA | | | 4.000 | | | | 07/01/39 | | | | 303,359 | |
191,915 | | | | FNMA | | | 6.500 | | | | 07/01/39 | | | | 219,467 | |
245,690 | | | | FNMA | | | 4.000 | | | | 08/01/39 | | | | 252,974 | |
179,282 | | | | FNMA | | | 4.500 | | | | 08/01/39 | | | | 189,957 | |
268,744 | | | | FNMA | | | 6.000 | | | | 09/01/39 | | | | 298,077 | |
123,870 | | | | FNMA | | | 4.500 | | | | 10/01/39 | | | | 131,261 | |
148,776 | | | | FNMA | | | 4.500 | | | | 11/01/39 | | | | 157,642 | |
148,225 | | | | FNMA | | | 4.500 | | | | 11/01/39 | | | | 157,097 | |
126,270 | | | | FNMA | | | 5.000 | | | | 11/01/39 | | | | 137,058 | |
158,130 | | | | FNMA | | | 5.000 | | | | 03/01/40 | | | | 173,306 | |
415,825 | | | | FNMA | | | 5.000 | | | | 05/01/40 | | | | 454,789 | |
295,970 | | | | FNMA | | | 5.000 | | | | 06/01/40 | | | | 323,110 | |
144,280 | | | | FNMA | | | 4.500 | | | | 07/01/40 | | | | 152,918 | |
158,952 | | | | FNMA | | | 4.500 | | | | 07/01/40 | | | | 168,491 | |
293,037 | | | | FNMA | | | 5.500 | | | | 07/01/40 | | | | 322,810 | |
244,747 | | | | FNMA | | | 4.500 | | | | 11/01/40 | | | | 259,969 | |
235,620 | | | | FNMA | | | 5.000 | | | | 11/01/40 | | | | 257,250 | |
795,217 | | | | FNMA | | | 4.000 | | | | 12/01/40 | | | | 820,362 | |
100,711 | | | | FNMA | | | 4.000 | | | | 12/01/40 | | | | 103,737 | |
255,423 | | | | FNMA | | | 4.500 | | | | 12/01/40 | | | | 270,686 | |
341,003 | | | | FNMA | | | 3.500 | | | | 01/01/41 | | | | 339,212 | |
568,983 | | | | FNMA | | | 4.000 | | | | 02/01/41 | | | | 586,141 | |
183,260 | | | | FNMA | | | 4.000 | | | | 02/01/41 | | | | 188,789 | |
269,051 | | | | FNMA | | | 5.000 | | | | 02/01/41 | | | | 297,251 | |
188,660 | | | | FNMA | | | 4.000 | | | | 04/01/41 | | | | 194,606 | |
337,570 | | | | FNMA | | | 4.500 | | | | 04/01/41 | | | | 358,698 | |
104,173 | | | | FNMA | | | 4.000 | | | | 08/01/41 | | | | 107,297 | |
335,691 | | | | FNMA | | | 4.000 | | | | 08/01/41 | | | | 345,794 | |
94
TIAA-CREF LIFE FUNDS - Bond Fund
| | | | | | | | | | | | | | | | |
PRINCIPAL | | | | ISSUER | | RATE | | | MATURITY
DATE | | | VALUE | |
| | | | | | | | | | | | | | |
$ 202,629 | | | | FNMA | | | 4.000 | % | | | 09/01/41 | | | $ | 209,019 | |
163,040 | | | | FNMA | | | 3.500 | | | | 10/01/41 | | | | 162,131 | |
181,899 | | | | FNMA | | | 4.000 | | | | 11/01/41 | | | | 187,373 | |
666,371 | | | | FNMA | | | 3.500 | | | | 12/01/41 | | | | 662,652 | |
266,591 | | | | FNMA | | | 3.500 | | | | 12/01/41 | | | | 265,103 | |
378,279 | | | | FNMA | | | 3.500 | | | | 02/01/42 | | | | 376,169 | |
1,132,468 | | | | FNMA | | | 3.000 | | | | 04/01/42 | | | | 1,076,326 | |
267,717 | | | | FNMA | | | 3.500 | | | | 04/01/42 | | | | 266,556 | |
1,883,678 | | | | FNMA | | | 3.500 | | | | 06/01/42 | | | | 1,873,711 | |
445,932 | | | | FNMA | | | 3.000 | | | | 07/01/42 | | | | 424,016 | |
931,007 | | | | FNMA | | | 3.000 | | | | 11/01/42 | | | | 884,837 | |
1,867,550 | | | | FNMA | | | 3.000 | | | | 12/01/42 | | | | 1,775,393 | |
13,990 | | | | Government National Mortgage Association (GNMA) | | | 5.500 | | | | 07/15/33 | | | | 15,540 | |
107,903 | | | | GNMA | | | 5.500 | | | | 07/20/33 | | | | 119,777 | |
13,805 | | | | GNMA | | | 5.000 | | | | 03/15/34 | | | | 14,971 | |
133,763 | | | | GNMA | | | 5.000 | | | | 06/15/34 | | | | 148,410 | |
75,769 | | | | GNMA | | | 5.500 | | | | 02/15/37 | | | | 83,307 | |
46,207 | | | | GNMA | | | 5.000 | | | | 01/15/38 | | | | 50,204 | |
19,908 | | | | GNMA | | | 5.000 | | | | 04/15/38 | | | | 21,608 | |
51,682 | | | | GNMA | | | 5.500 | | | | 05/15/38 | | | | 56,842 | |
12,375 | | | | GNMA | | | 6.000 | | | | 08/15/38 | | | | 13,773 | |
12,010 | | | | GNMA | | | 6.000 | | | | 08/20/38 | | | | 13,523 | |
241,085 | | | | GNMA | | | 5.500 | | | | 07/15/39 | | | | 264,898 | |
84,857 | | | | GNMA | | | 4.500 | | | | 07/20/39 | | | | 91,124 | |
27,093 | | | | GNMA | | | 5.000 | | | | 07/20/39 | | | | 29,417 | |
35,208 | | | | GNMA | | | 4.000 | | | | 08/15/39 | | | | 36,632 | |
410,625 | | | | GNMA | | | 4.500 | | | | 03/15/40 | | | | 439,134 | |
86,425 | | | | GNMA | | | 4.500 | | | | 04/15/40 | | | | 92,416 | |
60,354 | | | | GNMA | | | 5.000 | | | | 04/15/40 | | | | 65,489 | |
222,331 | | | | GNMA | | | 5.000 | | | | 04/15/40 | | | | 241,958 | |
565,923 | | | | GNMA | | | 4.500 | | | | 04/20/40 | | | | 607,795 | |
354,312 | | | | GNMA | | | 4.500 | | | | 05/15/40 | | | | 378,598 | |
275,638 | | | | GNMA | | | 5.000 | | | | 05/20/40 | | | | 301,624 | |
237,736 | | | | GNMA | | | 4.500 | | | | 06/15/40 | | | | 254,378 | |
222,063 | | | | GNMA | | | 5.000 | | | | 06/15/40 | | | | 241,504 | |
399,623 | | | | GNMA | | | 4.000 | | | | 07/15/40 | | | | 415,866 | |
797,092 | | | | GNMA | | | 4.000 | | | | 09/15/41 | | | | 829,315 | |
386,431 | | | | GNMA | | | 3.500 | | | | 12/20/41 | | | | 390,455 | |
911,844 | | | | GNMA | | | 3.000 | | | | 09/15/42 | | | | 882,338 | |
1,880,185 | | | | GNMA | | | 3.500 | | | | 11/15/42 | | | | 1,901,285 | |
964,244 | | | | GNMA | | | 3.000 | | | | 02/20/43 | | | | 933,493 | |
| | | | | | | | | | | | | | | | |
| | | | TOTAL MORTGAGE BACKED | | | | | | | | | | | 38,819,220 | |
| | | | | | | | | | | | | | | | |
| | | |
MUNICIPAL BONDS - 1.0% | | | | | | | | | | | | |
250,000 | | | | Florida Hurricane Catastrophe Fund Finance Corp | | | 1.298 | | | | 07/01/16 | | | | 250,287 | |
200,000 | | | | New York State Urban Development Corp | | | 0.550 | | | | 03/15/16 | | | | 198,306 | |
200,000 | | | | New York State Urban Development Corp | | | 1.350 | | | | 03/15/18 | | | | 195,458 | |
200,000 | | | | State of California | | | 0.850 | | | | 02/01/15 | | | | 200,192 | |
100,000 | | | | State of California | | | 5.450 | | | | 04/01/15 | | | | 106,026 | |
200,000 | | | | State of California | | | 1.050 | | | | 02/01/16 | | | | 200,534 | |
100,000 | | | | State of California | | | 5.950 | | | | 04/01/16 | | | | 110,721 | |
200,000 | | | | State of Illinois | | | 4.511 | | | | 03/01/15 | | | | 207,256 | |
200,000 | | | | State of Illinois | | | 4.875 | | | | 07/01/16 | | | | 212,666 | |
200,000 | | | | University of Massachusetts Building Authority | | | 0.770 | | | | 11/01/16 | | | | 197,230 | |
| | | | | | | | | | | | | | | | |
| | | | TOTAL MUNICIPAL BONDS | | | | | | | | | | | 1,878,676 | |
| | | | | | | | | | | | | | | | |
| | | |
U.S. TREASURY SECURITIES - 25.6% | | | | | | | | | | | | |
585,000 | | | | United States Treasury Bond | | | 2.875 | | | | 05/15/43 | | | | 474,124 | |
2,380,000 | | | | United States Treasury Bond | | | 3.625 | | | | 08/15/43 | | | | 2,247,612 | |
1,000,000 | | | | United States Treasury Bond | | | 3.750 | | | | 11/15/43 | | | | 966,562 | |
1,000,000 | | | | United States Treasury Note | | | 0.250 | | | | 05/31/14 | | | | 1,000,586 | |
3,050,000 | | | | United States Treasury Note | | | 0.250 | | | | 06/30/14 | | | | 3,052,382 | |
1,000,000 | | | | United States Treasury Note | | | 0.250 | | | | 09/30/14 | | | | 1,000,820 | |
524,000 | | | | United States Treasury Note | | | 0.125 | | | | 12/31/14 | | | | 523,837 | |
1,385,000 | | | | United States Treasury Note | | | 0.250 | | | | 01/31/15 | | | | 1,386,136 | |
95
TIAA-CREF LIFE FUNDS - Bond Fund
| | | | | | | | | | | | | | | | |
PRINCIPAL | | | | ISSUER | | RATE | | | MATURITY
DATE | | | VALUE | |
| | | | | | | | | | | | | | |
$ 4,900,000 | | | | United States Treasury Note | | | 0.250 | % | | | 02/28/15 | | | $ | 4,903,062 | |
2,115,000 | | | | United States Treasury Note | | | 0.250 | | | | 05/31/15 | | | | 2,115,992 | |
430,000 | | | | United States Treasury Note | | | 0.250 | | | | 10/31/15 | | | | 429,396 | |
10,664,000 | | | | United States Treasury Note | | | 0.375 | | | | 11/15/15 | | | | 10,670,249 | |
5,510,000 | | | | United States Treasury Note | | | 0.500 | | | | 06/15/16 | | | | 5,504,402 | |
385,000 | | | | United States Treasury Note | | | 0.625 | | | | 12/15/16 | | | | 383,436 | |
520,000 | | | | United States Treasury Note | | | 0.875 | | | | 01/31/18 | | | | 510,088 | |
6,641,500 | | | | United States Treasury Note | | | 1.250 | | | | 11/30/18 | | | | 6,499,332 | |
7,015,000 | | | | United States Treasury Note | | | 2.750 | | | | 11/15/23 | | | | 6,862,641 | |
| | | | | | | | | | | | | | | | |
| | | | TOTAL U.S. TREASURY SECURITIES | | | | | | | | | | | 48,530,657 | |
| | | | | | | | | | | | | | | | |
| | | | TOTAL GOVERNMENT BONDS
(Cost $95,910,831) | | | | | | | | | | | 95,265,949 | |
| | | | | | | | | | | | | | | | |
| | | |
STRUCTURED ASSETS - 8.6% | | | | | | | | | | | | |
| | | |
ASSET BACKED - 4.3% | | | | | | | | | | | | |
250,000 | | g | | Ally Master Owner Trust | | | 4.250 | | | | 04/15/17 | | | | 259,760 | |
| | | | Series - 2010 2 (Class A) | | | | | | | | | | | | |
250,000 | | g | | Ally Master Owner Trust | | | 4.590 | | | | 04/15/17 | | | | 258,948 | |
| | | | Series - 2010 2 (Class B) | | | | | | | | | | | | |
250,000 | | g | | Avis Budget Rental Car Funding AESOP LLC | | | 4.640 | | | | 05/20/16 | | | | 261,104 | |
| | | | Series - 2010 3A (Class A) | | | | | | | | | | | | |
200,000 | | g | | Avis Budget Rental Car Funding AESOP LLC | | | 4.740 | | | | 11/20/17 | | | | 213,302 | |
| | | | Series - 2011 3A (Class B) | | | | | | | | | | | | |
200,000 | | g | | Avis Budget Rental Car Funding AESOP LLC | | | 3.040 | | | | 03/20/19 | | | | 201,803 | |
| | | | Series - 2012 3A (Class B) | | | | | | | | | | | | |
40,218 | | i | | Bear Stearns Asset Backed Securities Trust | | | 0.905 | | | | 11/25/39 | | | | 39,496 | |
| | | | Series - 2005 SD3 (Class 2A1) | | | | | | | | | | | | |
150,345 | | | | Centex Home Equity | | | 5.540 | | | | 01/25/32 | | | | 150,111 | |
| | | | Series - 2002 A (Class AF6) | | | | | | | | | | | | |
175,000 | | g,i | | DB/UBS Mortgage Trust | | | 5.557 | | | | 11/10/46 | | | | 188,796 | |
| | | | Series - 2011 LC1A (Class C) | | | | | | | | | | | | |
1,460,625 | | g | | Dominos Pizza Master Issuer LLC | | | 5.216 | | | | 01/25/42 | | | | 1,548,176 | |
| | | | Series - 2012 1A (Class A2) | | | | | | | | | | | | |
83,944 | | g,i | | Flagstar Home Equity Loan Trust | | | 5.781 | | | | 01/25/35 | | | | 83,936 | |
| | | | Series - 2007 1A (Class AF3) | | | | | | | | | | | | |
75,000 | | | | Ford Credit Auto Owner Trust | | | 3.210 | | | | 07/15/17 | | | | 77,327 | |
| | | | Series - 2011 A (Class D) | | | | | | | | | | | | |
200,000 | | | | Ford Credit Auto Owner Trust | | | 2.930 | | | | 10/15/18 | | | | 207,419 | |
| | | | Series - 2012 B (Class D) | | | | | | | | | | | | |
200,000 | | | | Ford Credit Auto Owner Trust | | | 2.430 | | | | 01/15/19 | | | | 205,414 | |
| | | | Series - 2012 C (Class D) | | | | | | | | | | | | |
260,000 | | | | Ford Credit Auto Owner Trust | | | 1.860 | | | | 08/15/19 | | | | 257,438 | |
| | | | Series - 2013 A (Class D) | | | | | | | | | | | | |
200,000 | | g | | Ford Credit Floorplan Master Owner Trust | | | 2.960 | | | | 02/15/16 | | | | 201,413 | |
| | | | Series - 2011 1 (Class D) | | | | | | | | | | | | |
100,000 | | g | | Hertz Vehicle Financing LLC | | | 4.170 | | | | 03/25/16 | | | | 102,391 | |
| | | | Series - 2011 1A (Class B1) | | | | | | | | | | | | |
250,000 | | g | | Hertz Vehicle Financing LLC | | | 5.290 | | | | 03/25/16 | | | | 261,426 | |
| | | | Series - 2009 2A (Class A2) | | | | | | | | | | | | |
400,000 | | g | | Hertz Vehicle Financing LLC | | | 5.930 | | | | 03/25/16 | | | | 416,872 | |
| | | | Series - 0 2A (Class B2) | | | | | | | | | | | | |
184,041 | | | | Lehman XS Trust | | | 6.500 | | | | 06/25/46 | | | | 141,366 | |
| | | | Series - 2006 13 (Class 2A1) | | | | | | | | | | | | |
9,847 | | i | | Long Beach Mortgage Loan Trust | | | 0.915 | | | | 02/25/35 | | | | 9,806 | |
| | | | Series - 2005 1 (Class M1) | | | | | | | | | | | | |
250,000 | | g | | Rental Car Finance Corp | | | 2.510 | | | | 02/25/16 | | | | 253,174 | |
| | | | Series - 2011 1A (Class A1) | | | | | | | | | | | | |
15,179 | | i | | Residential Asset Securities Corp | | | 0.595 | | | | 04/25/35 | | | | 15,034 | |
| | | | Series - 2005 KS3 (Class M3) | | | | | | | | | | | | |
100,000 | | i | | Residential Funding Mortgage Securities II, Inc | | | 6.060 | | | | 02/25/36 | | | | 105,308 | |
| | | | Series - 2006 HI1 (Class M2) | | | | | | | | | | | | |
250,000 | | | | Santander Drive Auto Receivables Trust | | | 3.870 | | | | 02/15/18 | | | | 262,406 | |
| | | | Series - 2012 2 (Class D) | | | | | | | | | | | | |
96
TIAA-CREF LIFE FUNDS - Bond Fund
| | | | | | | | | | | | | | | | |
PRINCIPAL | | | | ISSUER | | RATE | | | MATURITY
DATE | | | VALUE | |
| | | | | | | | | | | | | | |
$ 41,363 | | i | | Securitized Asset Backed Receivables LLC | | | 0.465 | % | | | 10/25/35 | | | $ | 40,333 | |
| | | | Series - 2006 OP1 (Class A2C) | | | | | | | | | | | | |
90,341 | | g | | Sierra Receivables Funding Co LLC | | | 3.350 | | | | 04/20/26 | | | | 92,424 | |
| | | | Series - 2011 1A (Class A) | | | | | | | | | | | | |
91,374 | | g | | Sierra Receivables Funding Co LLC | | | 4.250 | | | | 05/20/28 | | | | 93,764 | |
| | | | Series - 2011 2A (Class B) | | | | | | | | | | | | |
86,527 | | g | | Sierra Receivables Funding Co LLC | | | 3.420 | | | | 03/20/29 | | | | 87,817 | |
| | | | Series - 2012 2A (Class B) | | | | | | | | | | | | |
150,998 | | g | | Sierra Receivables Funding Co LLC | | | 1.590 | | | | 11/20/29 | | | | 150,273 | |
| | | | Series - 2013 1A (Class A) | | | | | | | | | | | | |
241,597 | | g | | Sierra Receivables Funding Co LLC | | | 2.390 | | | | 11/20/29 | | | | 242,066 | |
| | | | Series - 2013 1A (Class B) | | | | | | | | | | | | |
415,000 | | g | | SLM Student Loan Trust | | | 4.370 | | | | 04/17/28 | | | | 440,591 | |
| | | | Series - 2011 A (Class A2) | | | | | | | | | | | | |
105,000 | | g | | SLM Student Loan Trust | | | 3.740 | | | | 02/15/29 | | | | 109,514 | |
| | | | Series - 2011 B (Class A2) | | | | | | | | | | | | |
400,000 | | g | | SLM Student Loan Trust | | | 3.830 | | | | 01/17/45 | | | | 415,044 | |
| | | | Series - 2012 A (Class A2) | | | | | | | | | | | | |
58,101 | | i | | Soundview Home Equity Loan Trust | | | 0.465 | | | | 11/25/35 | | | | 57,317 | |
| | | | Series - 2005 OPT3 (Class A4) | | | | | | | | | | | | |
12,067 | | i | | Structured Asset Investment Loan Trust | | | 0.765 | | | | 05/25/35 | | | | 12,022 | |
| | | | Series - 2005 4 (Class M1) | | | | | | | | | | | | |
149,517 | | g,i | | Structured Asset Securities Corp | | | 0.385 | | | | 10/25/36 | | | | 144,249 | |
| | | | Series - 2006 GEL4 (Class A2) | | | | | | | | | | | | |
200,000 | | g,i | | Vitality Re IV Ltd | | | 2.816 | | | | 01/09/17 | | | | 203,820 | |
| | | | Series - 2013 IV B (Class ) | | | | | | | | | | | | |
125,000 | | g | | Volvo Financial Equipment LLC | | | 0.740 | | | | 03/15/17 | | | | 124,897 | |
| | | | Series - 2013 1A (Class A3) | | | | | | | | | | | | |
100,000 | | g | | Vornado DP LLC | | | 5.280 | | | | 09/13/28 | | | | 108,129 | |
| | | | Series - 2010 VNO (Class C) | | | | | | | | | | | | |
87,865 | | g,m | | Wachovia Amortization Controlled Heloc NIM | | | 5.683 | | | | 08/12/47 | | | | 88,304 | |
| | | | Series - 2006 N1 (Class N1) | | | | | | | | | | | | |
14,118 | | i | | Wells Fargo Home Equity Trust | | | 0.305 | | | | 07/25/36 | | | | 13,976 | |
| | | | Series - 2006 2 (Class A3) | | | | | | | | | | | | |
| | | | | | | | | | | | | | | | |
| | | | TOTAL ASSET BACKED | | | | 8,146,766 | |
| | | | | | | | | | | | | | | | |
| | | |
OTHER MORTGAGE BACKED - 4.3% | | | | | | | | | | | | |
70,000 | | | | Banc of America Commercial Mortgage Trust | | | 5.390 | | | | 10/10/45 | | | | 75,865 | |
| | | | Series - 2006 6 (Class AM) | | | | | | | | | | | | |
130,000 | | i | | Bear Stearns Commercial Mortgage Securities | | | 5.582 | | | | 09/11/41 | | | | 141,933 | |
| | | | Series - 2006 PW13 (Class AM) | | | | | | | | | | | | |
30,000 | | i | | Bear Stearns Commercial Mortgage Securities | | | 5.959 | | | | 09/11/42 | | | | 32,073 | |
| | | | Series - 2007 T28 (Class AJ) | | | | | | | | | | | | |
370,000 | | | | Bear Stearns Commercial Mortgage Securities | | | 5.363 | | | | 02/11/44 | | | | 380,982 | |
| | | | Series - 2007 PW15 (Class AM) | | | | | | | | | | | | |
235,000 | | i | | Commercial Mortgage Pass Through Certificates | | | 5.650 | | | | 12/10/49 | | | | 261,886 | |
| | | | Series - 2007 C9 (Class AM) | | | | | | | | | | | | |
38,605 | | | | Countrywide Alternative Loan Trust | | | 5.500 | | | | 08/25/16 | | | | 39,158 | |
| | | | Series - 2004 30CB (Class 1A15) | | | | | | | | | | | | |
2,962 | | | | Countrywide Home Loan Mortgage Pass Through Trust | | | 5.250 | | | | 05/25/35 | | | | 2,959 | |
| | | | Series - 2005 12 (Class 1A5) | | | | | | | | | | | | |
250,000 | | i | | Credit Suisse Commercial Mortgage Trust | | | 5.760 | | | | 09/15/39 | | | | 260,627 | |
| | | | Series - 2007 C4 (Class AM) | | | | | | | | | | | | |
250,000 | | | | Credit Suisse First Boston Mortgage Securities Corp | | | 4.771 | | | | 07/15/37 | | | | 257,598 | |
| | | | Series - 2005 C3 (Class AJ) | | | | | | | | | | | | |
60,000 | | i | | Credit Suisse First Boston Mortgage Securities Corp | | | 5.100 | | | | 08/15/38 | | | | 61,751 | |
| | | | Series - 2005 C5 (Class C) | | | | | | | | | | | | |
125,000 | | g | | Credit Suisse Mortgage Capital Certificates | | | 5.626 | | | | 05/15/23 | | | | 136,433 | |
| | | | Series - 2006 OMA (Class D) | | | | | | | | | | | | |
730,000 | | | | Credit Suisse Mortgage Capital Certificates | | | 5.509 | | | | 09/15/39 | | | | 783,837 | |
| | | | Series - 2006 C4 (Class AM) | | | | | | | | | | | | |
75,000 | | g | | Credit Suisse Mortgage Capital Certificates | | | 5.383 | | | | 02/15/40 | | | | 78,440 | |
| | | | Series - 2009 RR1 (Class A3C) | | | | | | | | | | | | |
59,924 | | i | | HarborView Mortgage Loan Trust | | | 0.386 | | | | 07/19/47 | | | | 49,894 | |
| | | | Series - 2007 4 (Class 2A1) | | | | | | | | | | | | |
97
TIAA-CREF LIFE FUNDS - Bond Fund
| | | | | | | | | | | | | | | | |
PRINCIPAL | | | | ISSUER | | RATE | | | MATURITY
DATE | | | VALUE | |
| | | | | | | | | | | | | | |
$100,000 | | g,i | | JP Morgan Chase Commercial Mortgage Securities Corp | | | 5.259 | % | | | 07/15/46 | | | $ | 105,937 | |
| | | | Series - 2011 C4 (Class C) | | | | | | | | | | | | |
228,329 | | | | JP Morgan Chase Commercial Mortgage Securities Corp | | | 0.730 | | | | 12/15/47 | | | | 226,273 | |
| | | | Series - 2013 C10 (Class A1) | | | | | | | | | | | | |
450,000 | | i | | JP Morgan Chase Commercial Mortgage Securities Corp | | | 5.932 | | | | 02/15/51 | | | | 474,649 | |
| | | | Series - 2007 C1 (Class AM) | | | | | | | | | | | | |
370,000 | | i | | JP Morgan Chase Commercial Mortgage Securities Trust | | | 4.911 | | | | 07/15/42 | | | | 371,021 | |
| | | | Series - 2005 LDP2 (Class C) | | | | | | | | | | | | |
225,000 | | i | | JP Morgan Chase Commercial Mortgage Securities Trust | | | 6.192 | | | | 02/15/51 | | | | 249,394 | |
| | | | Series - 2007 LD12 (Class AM) | | | | | | | | | | | | |
60,000 | | | | LB-UBS Commercial Mortgage Trust | | | 5.378 | | | | 11/15/38 | | | | 64,802 | |
| | | | Series - 2006 C7 (Class AM) | | | | | | | | | | | | |
350,000 | | i | | LB-UBS Commercial Mortgage Trust | | | 5.493 | | | | 02/15/40 | | | | 369,337 | |
| | | | Series - 2007 C2 (Class AM) | | | | | | | | | | | | |
275,000 | | i | | LB-UBS Commercial Mortgage Trust | | | 5.057 | | | | 09/15/40 | | | | 287,511 | |
| | | | Series - 2005 C5 (Class AJ) | | | | | | | | | | | | |
170,000 | | i | | Merrill Lynch Mortgage Trust | | | 6.263 | | | | 02/12/51 | | | | 183,522 | |
| | | | Series - 0 C1 (Class AJA) | | | | | | | | | | | | |
90,000 | | g,i | | Morgan Stanley Capital I | | | 5.810 | | | | 08/12/41 | | | | 94,654 | |
| | | | Series - 2006 T23 (Class B) | | | | | | | | | | | | |
55,000 | | i | | Morgan Stanley Capital I | | | 5.832 | | | | 07/12/44 | | | | 57,988 | |
| | | | Series - 2006 HQ9 (Class B) | | | | | | | | | | | | |
100,000 | | i | | Morgan Stanley Capital I | | | 5.842 | | | | 07/12/44 | | | | 101,642 | |
| | | | Series - 2006 HQ9 (Class C) | | | | | | | | | | | | |
22,000 | | g,i | | Morgan Stanley Capital I | | | 5.252 | | | | 09/15/47 | | | | 22,653 | |
| | | | Series - 2011 C1 (Class D) | | | | | | | | | | | | |
63,945 | | | | Residential Accredit Loans, Inc | | | 4.350 | | | | 03/25/34 | | | | 65,012 | |
| | | | Series - 2004 QS4 (Class A1) | | | | | | | | | | | | |
56,663 | | g,i | | Springleaf Mortgage Loan Trust | | | 2.667 | | | | 09/25/57 | | | | 57,899 | |
| | | | Series - 2012 1A (Class A) | | | | | | | | | | | | |
67,257 | | g,i | | Springleaf Mortgage Loan Trust | | | 2.220 | | | | 10/25/57 | | | | 68,516 | |
| | | | Series - 0 2A (Class A) | | | | | | | | | | | | |
1,060,000 | | | | Wachovia Bank Commercial Mortgage Trust | | | 5.383 | | | | 12/15/43 | | | | 1,140,553 | |
| | | | Series - 2007 C30 (Class AM) | | | | | | | | | | | | |
780,000 | | i | | Wachovia Bank Commercial Mortgage Trust | | | 5.818 | | | | 05/15/46 | | | | 855,233 | |
| | | | Series - 2007 C34 (Class AM) | | | | | | | | | | | | |
55,000 | | | | Wachovia Bank Commercial Mortgage Trust | | | 5.500 | | | | 04/15/47 | | | | 60,798 | |
| | | | Series - 2007 C31 (Class A5) | | | | | | | | | | | | |
150,000 | | i | | Wachovia Bank Commercial Mortgage Trust | | | 5.591 | | | | 04/15/47 | | | | 163,318 | |
| | | | Series - 2007 C31 (Class AM) | | | | | | | | | | | | |
250,000 | | i | | Wachovia Bank Commercial Mortgage Trust | | | 5.660 | | | | 04/15/47 | | | | 248,129 | |
| | | | Series - 2007 C31 (Class AJ) | | | | | | | | | | | | |
105,922 | | i | | WaMu Mortgage Pass-Through Certificates | | | 0.515 | | | | 12/25/45 | | | | 93,771 | |
| | | | Series - 2005 AR19 (Class A1B3) | | | | | | | | | | | | |
50,000 | | g,i | | Wells Fargo Mortgage Backed Securities Trust | | | 5.276 | | | | 11/15/43 | | | | 54,119 | |
| | | | Series - 2010 C1 (Class B) | | | | | | | | | | | | |
221,295 | | | | WF-RBS Commercial Mortgage Trust | | | 0.735 | | | | 03/15/48 | | | | 219,067 | |
| | | | Series - 2013 C12 (Class A1) | | | | | | | | | | | | |
| | | | | | | | | | | | | | | | |
| | | | TOTAL OTHER MORTGAGE BACKED | | | | 8,199,234 | |
| | | | | | | | | | | | | | | | |
| | | | TOTAL STRUCTURED ASSETS (Cost $16,239,202) | | | | | | | | | | | 16,346,000 | |
| | | | | | | | | | | | | | | | |
| | | | TOTAL BONDS (Cost $181,887,298) | | | | | | | | | | | 181,321,951 | |
| | | | | | | | | | | | | | | | |
| | | | |
SHARES | | COMPANY | | | | | | | | | |
| | | | | | | | | | | | | | | | |
PREFERRED STOCKS - 0.1% | | | | | | | | | | | | |
| | | |
BANKS - 0.1% | | | | | | | | | | | | |
5,517 | | * | | Federal Home Loan Mortgage Corp (FHLMC) | | | 8.375 | | | | 12/30/49 | | | | 49,487 | |
17,265 | | * | | Federal National Mortgage Association (FNMA) | | | 8.250 | | | | 12/30/49 | | | | 151,069 | |
| | | | | | | | | | | | | | | | |
| | | | TOTAL BANKS | | | | 200,556 | |
| | | | | | | | | | | | | | | | |
| | | | TOTAL PREFERRED STOCKS
(Cost $569,550) | | | | | | | | | | | 200,556 | |
| | | | | | | | | | | | | | | | |
98
TIAA-CREF LIFE FUNDS - Bond Fund
| | | | | | | | | | | | | | | | |
PRINCIPAL | | | | ISSUER | | RATE | | | MATURITY
DATE | | | VALUE | |
| | | | | | | | | | | | | | |
SHORT-TERM INVESTMENTS - 2.0% | | | | | | | | | | | | |
| | | |
TREASURY DEBT - 2.0% | | | | | | | | | | | | |
$3,800,000 | | | | United States Treasury Bill | | | 0.083-0.108 | % | | | 07/24/14 | | | $ | 3,798,340 | |
| | | | | | | | | | | | | | | | |
| | | | TOTAL TREASURY DEBT | | | | 3,798,340 | |
| | | | | | | | | | | | | | | | |
| | | | TOTAL SHORT-TERM INVESTMENTS
(Cost $3,797,958) | | | | | | | | | | | 3,798,340 | |
| | | | | | | | | | | | | | | | |
| | | | TOTAL INVESTMENTS - 98.2% (Cost $186,975,303) | | | | | | | | | | | 186,044,603 | |
| | | | OTHER ASSETS & LIABILITIES, NET - 1.8% | | | | | | | | | | | 3,363,997 | |
| | | | | | | | | | | | | | | | |
| | | | NET ASSETS - 100.0% | | | | | | | | | | $ | 189,408,600 | |
| | | | | | | | | | | | | | | | |
Abbreviation(s):
| g | Security is exempt from registration under Rule 144(A) of the Securities Act of 1933 and may be resold in transactions exempt from registration to qualified institutional buyers. At December 31, 2013, the total value of these securities amounted to $24,139,582 or 12.7% of net assets. |
| i | Floating or variable rate security. Coupon reflects the rate at period end. |
| m | Indicates a security that has been deemed illiquid. |
99
TIAA-CREF LIFE FUNDS - Money Market Fund
TIAA-CREF LIFE FUNDS
MONEY MARKET FUND
SCHEDULE OF INVESTMENTS
December 31, 2013
| | | | | | | | | | | | | | | | |
PRINCIPAL | | | | ISSUER | | RATE | | | MATURITY
DATE | | | VALUE | |
| �� | | | | | | | | | | | | | | | |
SHORT-TERM INVESTMENTS - 100.8% | | | | | | | | | |
| | |
CERTIFICATE OF DEPOSIT - 4.7% | | | | | | | | | |
$ 400,000 | | | | Banco Del Estado De Chile | | | 0.210 | % | | | 02/11/14 | | | $ | 400,000 | |
500,000 | | | | Banco Del Estado De Chile | | | 0.210 | | | | 02/20/14 | | | | 500,000 | |
500,000 | | | | Toronto-Dominion Bank | | | 0.150 | | | | 01/06/14 | | | | 500,000 | |
500,000 | | | | Toronto-Dominion Bank | | | 0.170 | | | | 03/11/14 | | | | 500,000 | |
250,000 | | | | Wells Fargo Bank NA | | | 0.130 | | | | 02/06/14 | | | | 250,000 | |
1,000,000 | | | | Wells Fargo Bank NA | | | 0.130 | | | | 02/10/14 | | | | 1,000,000 | |
300,000 | | | | Wells Fargo Bank NA | | | 0.160 | | | | 03/03/14 | | | | 300,000 | |
| | | | | | | | | | | | | | | | |
| | | | TOTAL CERTIFICATE OF DEPOSIT | | | | | | | | | | | 3,450,000 | |
| | | | | | | | | | | | | | | | |
| | |
COMMERCIAL PAPER - 33.5% | | | | | | | | | |
500,000 | | | | American Honda Finance Corp | | | 0.090 | | | | 01/10/14 | | | | 499,989 | |
500,000 | | | | American Honda Finance Corp | | | 0.100 | | | | 02/25/14 | | | | 499,924 | |
500,000 | | | | American Honda Finance Corp | | | 0.130 | | | | 03/05/14 | | | | 499,886 | |
400,000 | | y | | Australia & New Zealand Banking Group Ltd | | | 0.180 | | | | 03/19/14 | | | | 399,846 | |
830,000 | | y | | Australia & New Zealand Banking Group Ltd | | | 0.180 | | | | 03/20/14 | | | | 829,676 | |
500,000 | | | | Bank of Nova Scotia | | | 0.170 | | | | 02/25/14 | | | | 499,870 | |
250,000 | | y | | Bedford Row Funding Corp | | | 0.220 | | | | 02/03/14 | | | | 249,950 | |
300,000 | | y | | Coca-Cola Co | | | 0.150 | | | | 01/06/14 | | | | 299,994 | |
350,000 | | y | | Coca-Cola Co | | | 0.150 | | | | 01/21/14 | | | | 349,971 | |
500,000 | | y | | Coca-Cola Co | | | 0.130 | | | | 01/23/14 | | | | 499,960 | |
750,000 | | y | | Coca-Cola Co | | | 0.120-0.140 | | | | 02/27/14 | | | | 749,850 | |
395,000 | | y | | Commonwealth Bank of Australia | | | 0.175 | | | | 01/06/14 | | | | 394,991 | |
700,000 | | y | | DBS Bank Ltd | | | 0.200 | | | | 01/06/14 | | | | 699,981 | |
500,000 | | y | | DBS Bank Ltd | | | 0.165 | | | | 01/07/14 | | | | 499,986 | |
250,000 | | y | | DBS Bank Ltd | | | 0.250 | | | | 04/01/14 | | | | 249,844 | |
500,000 | | | | Exxon Mobil Corp | | | 0.085 | | | | 01/21/14 | | | | 499,976 | |
500,000 | | y | | Fairway Finance LLC | | | 0.160 | | | | 01/29/14 | | | | 499,938 | |
500,000 | | y | | Fairway Finance LLC | | | 0.190 | | | | 01/30/14 | | | | 499,923 | |
450,000 | | y | | Fairway Finance LLC | | | 0.175 | | | | 02/13/14 | | | | 449,906 | |
400,000 | | y | | Fairway Finance LLC | | | 0.160 | | | | 03/03/14 | | | | 399,892 | |
500,000 | | | | General Electric Capital Corp | | | 0.140 | | | | 03/04/14 | | | | 499,879 | |
500,000 | | | | General Electric Capital Corp | | | 0.120 | | | | 03/13/14 | | | | 499,882 | |
350,000 | | | | General Electric Capital Corp | | | 0.120 | | | | 03/24/14 | | | | 349,904 | |
755,000 | | y | | International Business Machines Corp | | | 0.150 | | | | 01/07/14 | | | | 754,981 | |
344,000 | | | | JPMorgan Chase Bank NA | | | 0.180 | | | | 01/13/14 | | | | 343,979 | |
168,000 | | | | JPMorgan Chase Bank NA | | | 0.180 | | | | 01/15/14 | | | | 167,988 | |
108,000 | | | | JPMorgan Chase Bank NA | | | 0.200 | | | | 02/18/14 | | | | 107,971 | |
365,000 | | y | | Liberty Street Funding LLC | | | 0.180 | | | | 02/18/14 | | | | 364,913 | |
500,000 | | y | | National Australia Funding Delaware, Inc | | | 0.120 | | | | 01/02/14 | | | | 499,998 | |
350,000 | | y | | Nestle Capital Corp | | | 0.095 | | | | 02/11/14 | | | | 349,962 | |
300,000 | | y | | Nestle Capital Corp | | | 0.105 | | | | 02/13/14 | | | | 299,962 | |
250,000 | | y | | Old Line Funding LLC | | | 0.240 | | | | 02/12/14 | | | | 249,930 | |
300,000 | | y | | Old Line Funding LLC | | | 0.180 | | | | 02/25/14 | | | | 299,918 | |
250,000 | | y | | Private Export Funding Corp | | | 0.250 | | | | 04/07/14 | | | | 249,833 | |
500,000 | | y | | Procter & Gamble Co | | | 0.090 | | | | 03/04/14 | | | | 499,923 | |
500,000 | | | | Province of Ontario Canada | | | 0.090 | | | | 02/03/14 | | | | 499,959 | |
300,000 | | y | | Province of Quebec Canada | | | 0.080 | | | | 01/14/14 | | | | 299,991 | |
500,000 | | y | | Province of Quebec Canada | | | 0.110 | | | | 02/11/14 | | | | 499,938 | |
475,000 | | y | | Province of Quebec Canada | | | 0.110 | | | | 02/25/14 | | | | 474,920 | |
300,000 | | y | | PSP Capital, Inc | | | 0.130 | | | | 01/29/14 | | | | 299,970 | |
500,000 | | y | | PSP Capital, Inc | | | 0.130 | | | | 02/11/14 | | | | 499,926 | |
700,000 | | y | | PSP Capital, Inc | | | 0.150 | | | | 03/20/14 | | | | 699,772 | |
900,000 | | | | Shell International Finance BV | | | 4.000 | | | | 03/21/14 | | | | 907,348 | |
250,000 | | y | | Standard Chartered Bank | | | 0.160 | | | | 01/14/14 | | | | 249,985 | |
400,000 | | y | | Standard Chartered Bank | | | 0.150 | | | | 02/27/14 | | | | 399,905 | |
100
TIAA-CREF LIFE FUNDS - Money Market Fund
| | | | | | | | | | | | | | | | |
PRINCIPAL | | | | ISSUER | | RATE | | | MATURITY
DATE | | | VALUE | |
| | | | | | | | | | | | | | | | |
$ 400,000 | | y | | Standard Chartered Bank | | | 0.173 | % | | | 03/10/14 | | | $ | 399,870 | |
280,000 | | y | | Toronto-Dominion Holdings USA, Inc | | | 0.150 | | | | 02/10/14 | | | | 279,953 | |
590,000 | | | | Toyota Motor Credit Corp | | | 0.140 | | | | 03/05/14 | | | | 589,855 | |
500,000 | | | | Toyota Motor Credit Corp | | | 0.160 | | | | 03/07/14 | | | | 499,856 | |
500,000 | | | | Toyota Motor Credit Corp | | | 0.180 | | | | 04/10/14 | | | | 499,752 | |
400,000 | | y | | United Overseas Bank Ltd | | | 0.170 | | | | 01/07/14 | | | | 399,989 | |
500,000 | | y | | United Overseas Bank Ltd | | | 0.160 | | | | 01/14/14 | | | | 499,971 | |
610,000 | | y | | United Overseas Bank Ltd | | | 0.185 | | | | 03/14/14 | | | | 609,774 | |
875,000 | | y | | Wal-Mart Stores, Inc | | | 0.125 | | | | 01/28/14 | | | | 874,918 | |
| | | | | | | | | | | | | | | | |
| | | | TOTAL COMMERCIAL PAPER | | | | | | | | | | | 24,598,028 | |
| | | | | | | | | | | | | | | | |
| | |
GOVERNMENT AGENCY DEBT - 40.8% | | | | | | | | | |
750,000 | | | | Federal Home Loan Bank (FHLB) | | | 0.105-0.145 | | | | 01/02/14 | | | | 749,997 | |
1,307,000 | | | | FHLB | | | 0.035-0.065 | | | | 01/08/14 | | | | 1,306,986 | |
1,000,000 | | | | FHLB | | | 0.050-0.070 | | | | 01/09/14 | | | | 999,986 | |
1,000,000 | | | | FHLB | | | 0.055 | | | | 01/10/14 | | | | 999,986 | |
1,205,000 | | | | FHLB | | | 0.070-0.195 | | | | 01/13/14 | | | | 1,204,962 | |
1,000,000 | | | | FHLB | | | 0.140 | | | | 01/17/14 | | | | 999,938 | |
400,000 | | | | FHLB | | | 0.090-0.135 | | | | 01/21/14 | | | | 399,977 | |
700,000 | | | | FHLB | | | 0.050-0.085 | | | | 01/22/14 | | | | 699,973 | |
665,000 | | | | FHLB | | | 0.070-0.080 | | | | 01/24/14 | | | | 664,968 | |
465,000 | | | | FHLB | | | 0.070-0.100 | | | | 01/28/14 | | | | 464,971 | |
400,000 | | | | FHLB | | | 0.075 | | | | 01/31/14 | | | | 399,975 | |
225,000 | | | | FHLB | | | 0.075 | | | | 02/03/14 | | | | 224,985 | |
1,660,000 | | | | FHLB | | | 0.065-0.095 | | | | 02/05/14 | | | | 1,659,877 | |
1,000,000 | | | | FHLB | | | 0.055-0.080 | | | | 02/07/14 | | | | 999,929 | |
950,000 | | | | FHLB | | | 0.070-0.083 | | | | 02/14/14 | | | | 949,912 | |
1,775,000 | | | | FHLB | | | 0.080-0.085 | | | | 02/19/14 | | | | 1,774,798 | |
120,000 | | | | FHLB | | | 0.070 | | | | 02/21/14 | | | | 119,988 | |
500,000 | | | | FHLB | | | 0.065 | | | | 02/28/14 | | | | 499,948 | |
500,000 | | | | FHLB | | | 0.080 | | | | 03/07/14 | | | | 499,928 | |
700,000 | | | | FHLB | | | 0.098-0.100 | | | | 03/12/14 | | | | 699,865 | |
1,000,000 | | | | FHLB | | | 0.095 | | | | 03/14/14 | | | | 999,810 | |
600,000 | | | | FHLB | | | 0.100 | | | | 03/21/14 | | | | 599,868 | |
365,000 | | | | FHLB | | | 0.085 | | | | 03/26/14 | | | | 364,928 | |
400,000 | | | | FHLB | | | 0.100 | | | | 03/28/14 | | | | 399,904 | |
1,000,000 | | | | FHLB | | | 0.060 | | | | 04/02/14 | | | | 999,848 | |
500,000 | | | | FHLB | | | 0.110 | | | | 04/04/14 | | | | 499,858 | |
100,000 | | | | Federal Home Loan Mortgage Corp (FHLMC) | | | 0.060 | | | | 01/13/14 | | | | 99,998 | |
300,000 | | | | FHLMC | | | 0.130 | | | | 01/14/14 | | | | 299,986 | |
200,000 | | | | FHLMC | | | 0.160 | | | | 01/15/14 | | | | 199,987 | |
115,000 | | | | FHLMC | | | 0.130 | | | | 01/23/14 | | | | 114,991 | |
1,135,000 | | | | FHLMC | | | 0.050-0.160 | | | | 01/27/14 | | | | 1,134,936 | |
1,310,000 | | | | FHLMC | | | 0.090-0.140 | | | | 02/04/14 | | | | 1,309,879 | |
500,000 | | | | FHLMC | | | 0.065 | | | | 02/14/14 | | | | 499,960 | |
277,000 | | | | FHLMC | | | 0.085 | | | | 02/18/14 | | | | 276,969 | |
695,000 | | | | FHLMC | | | 0.090-0.140 | | | | 02/24/14 | | | | 694,884 | |
500,000 | | | | FHLMC | | | 0.090 | | | | 03/11/14 | | | | 499,914 | |
500,000 | | | | FHLMC | | | 0.100 | | | | 04/07/14 | | | | 499,867 | |
725,000 | | | | Federal National Mortgage Association (FNMA) | | | 0.070 | | | | 01/03/14 | | | | 724,997 | |
500,000 | | | | FNMA | | | 0.045 | | | | 01/15/14 | | | | 499,991 | |
400,000 | | | | FNMA | | | 0.065 | | | | 01/22/14 | | | | 399,985 | |
125,000 | | | | FNMA | | | 0.085 | | | | 02/12/14 | | | | 124,988 | |
1,100,000 | | | | FNMA | | | 0.100 | | | | 02/24/14 | | | | 1,099,835 | |
1,283,000 | | | | FNMA | | | 0.090-0.150 | | | | 02/26/14 | | | | 1,282,755 | |
| | | | | | | | | | | | | | | | |
| | | | TOTAL GOVERNMENT AGENCY DEBT | | | | | | | | | | | 29,949,087 | |
| | | | | | | | | | | | | | | | |
| | |
TREASURY DEBT - 16.5% | | | | | | | | | |
250,000 | | | | United States Treasury Bill | | | 0.033 | | | | 01/02/14 | | | | 250,000 | |
582,000 | | | | United States Treasury Bill | | | 0.031-0.033 | | | | 01/09/14 | | | | 581,996 | |
800,000 | | | | United States Treasury Bill | | | 0.041-0.050 | | | | 01/16/14 | | | | 799,984 | |
525,000 | | | | United States Treasury Bill | | | 0.032-0.037 | | | | 01/23/14 | | | | 524,989 | |
500,000 | | | | United States Treasury Bill | | | 0.031-0.039 | | | | 01/30/14 | | | | 499,986 | |
725,000 | | | | United States Treasury Bill | | | 0.058-0.150 | | | | 02/06/14 | | | | 724,943 | |
101
TIAA-CREF LIFE FUNDS - Money Market Fund
| | | | | | | | | | | | | | | | |
PRINCIPAL | | | | ISSUER | | RATE | | | MATURITY
DATE | | | VALUE | |
| | | | | | | | | | | | | | | | |
$ 45,000 | | | | United States Treasury Bill | | | 0.042 | % | | | 02/27/14 | | | $ | 44,997 | |
84,000 | | | | United States Treasury Bill | | | 0.038 | | | | 03/20/14 | | | | 83,993 | |
140,000 | | | | United States Treasury Bill | | | 0.035 | | | | 03/27/14 | | | | 139,989 | |
160,000 | | | | United States Treasury Bill | | | 0.091 | | | | 06/05/14 | | | | 159,937 | |
955,000 | | | | United States Treasury Bill | | | 0.076-0.086 | | | | 06/26/14 | | | | 954,611 | |
900,000 | | | | United States Treasury Bill | | | 0.089-0.095 | | | | 08/21/14 | | | | 899,466 | |
145,000 | | | | United States Treasury Bill | | | 0.091 | | | | 09/18/14 | | | | 144,905 | |
600,000 | | | | United States Treasury Note | | | 1.000 | | | | 01/15/14 | | | | 600,217 | |
500,000 | | | | United States Treasury Note | | | 0.250 | | | | 01/31/14 | | | | 500,052 | |
699,000 | | | | United States Treasury Note | | | 0.250 | | | | 02/28/14 | | | | 699,189 | |
335,000 | | | | United States Treasury Note | | | 0.250 | | | | 03/31/14 | | | | 335,104 | |
550,000 | | | | United States Treasury Note | | | 1.250 | | | | 04/15/14 | | | | 551,818 | |
509,000 | | | | United States Treasury Note | | | 0.250 | | | | 04/30/14 | | | | 509,198 | |
550,000 | | | | United States Treasury Note | | | 1.000 | | | | 05/15/14 | | | | 551,732 | |
350,000 | | | | United States Treasury Note | | | 0.750 | | | | 06/15/14 | | | | 351,007 | |
500,000 | | | | United States Treasury Note | | | 0.250 | | | | 06/30/14 | | | | 500,296 | |
660,000 | | | | United States Treasury Note | | | 0.625 | | | | 07/15/14 | | | | 661,764 | |
500,000 | | | | United States Treasury Note | | | 0.125 | | | | 07/31/14 | | | | 500,027 | |
300,000 | | | | United States Treasury Note | | | 0.500 | | | | 08/15/14 | | | | 300,695 | |
145,000 | | | | United States Treasury Note | | | 0.250 | | | | 09/15/14 | | | | 145,083 | |
100,000 | | | | United States Treasury Note | | | 0.250 | | | | 12/15/14 | | | | 100,096 | |
| | | | | | | | | | | | | | | | |
| | | | TOTAL TREASURY DEBT | | | | | | | | | | | 12,116,074 | |
| | | | | | | | | | | | | | | | |
| | |
VARIABLE RATE SECURITIES - 5.3% | | | | | | | | | |
500,000 | | i | | Canadian Imperial Bank of Commerce | | | 0.275 | | | | 01/03/14 | | | | 500,001 | |
500,000 | | i | | Federal Farm Credit Bank (FFCB) | | | 0.180 | | | | 01/01/14 | | | | 499,927 | |
500,000 | | i | | FFCB | | | 0.200 | | | | 01/01/14 | | | | 500,201 | |
500,000 | | i | | FFCB | | | 0.211 | | | | 01/07/14 | | | | 500,063 | |
400,000 | | i | | FFCB | | | 0.120 | | | | 10/27/14 | | | | 400,000 | |
500,000 | | i | | Federal Home Loan Bank (FHLB) | | | 0.200 | | | | 01/01/14 | | | | 500,000 | |
500,000 | | i | | FHLB | | | 0.220 | | | | 02/14/14 | | | | 500,287 | |
200,000 | | i | | Federal National Mortgage Association (FNMA) | | | 0.147 | | | | 06/20/14 | | | | 199,986 | |
300,000 | | i | | Royal Bank of Canada | | | 0.280 | | | | 06/10/14 | | | | 300,000 | |
| | | | | | | | | | | | | | | | |
| | | | TOTAL VARIABLE RATE SECURITIES | | | | | | | | | | | 3,900,465 | |
| | | | | | | | | | | | | | | | |
| | | | TOTAL SHORT-TERM INVESTMENTS
(Cost $74,013,654) | | | | | | | | | | | 74,013,654 | |
| | | | | | | | | | | | | | | | |
| | | | TOTAL INVESTMENTS - 100.8%
(Cost $74,013,654) | | | | | | | | | | | 74,013,654 | |
| | | | OTHER ASSETS & LIABILITIES, NET - (0.8)% | | | | | | | | | | | (607,409 | ) |
| | | | | | | | | | | | | | | | |
| | | | NET ASSETS - 100.0% | | | | | | | | | | $ | 73,406,245 | |
| | | | | | | | | | | | | | | | |
| i | Floating or variable rate security. Coupon reflects the rate at period end. |
| y | Security exempt from registration under Section 4(2) of the Securities Act of 1933. Such securities are deemed liquid and may be sold in transactions exempt from registration only to dealers in that program or other “accredited investors.“At 12/31/2013, the aggregate value of these securities was $17,132,008 or 23.3% of net assets. |
102
Report of Independent Registered Public Accounting Firm
To the Board of Trustees and Shareholders of the TIAA-CREF Life Funds:
We have audited, in accordance with the standards of the Public Company Accounting Oversight Board (United States), the financial statements of the Growth Equity Fund, Growth & Income Fund, Large-Cap Value Fund, Real Estate Securities Fund, Small-Cap Equity Fund, Social Choice Equity Fund, Stock Index Fund, International Equity Fund, Bond Fund, and Money Market Fund (constituting TIAA-CREF Life Funds, hereafter referred to as the “Funds” or each individually referred to as the “Fund”), at December 31, 2013 and for the year then ended, and have issued our unqualified report thereon dated February 19, 2014 (which report and financial statements are included in Item 1 of this Certified Shareholder Report on Form N-CSR). Our audits included an audit of each of the Fund’s schedule of investments in securities (the “Schedules”) as of December 31, 2013 appearing in Item 6 of this Form N-CSR. The Schedules are the responsibility of the Funds’ management. Our responsibility is to express an opinion on these Schedules based on our audits.
In our opinion, the Schedules referred to above, when read in conjunction with the financial statements of the Funds referred to above, present fairly, in all material respects, the information set forth therein.
/s/ PricewaterhouseCoopers LLP
Baltimore, Maryland
February 19, 2014
103
[THIS PAGE INTENTIONALLY LEFT BLANK]
Item 7. Disclosure of Proxy Voting Policies and Procedures for Closed-End Management Investment Companies.
Not Applicable.
Item 8. Portfolio Managers of Closed-End Management Investment Companies.
Not Applicable.
Item 9. Purchases of Equity Securities by Closed-End Management Investment Company and Affiliated Purchasers.
Not Applicable.
Item 10. Submission of Matters to a Vote of Security Holders.
There were no material changes to the procedures by which shareholders may recommend nominees to the Registrant’s Board of Trustees.
Item 11. Controls and Procedures.
(a) An evaluation was performed within 90 days of the filing date of the report under the supervision of the Registrant’s management, including the principal executive officer and principal financial officer, of the effectiveness of the design and operation of the Registrant’s disclosure controls and procedures. Based on that evaluation, the Registrant’s management, including the principal executive officer and principal financial officer, concluded that the Registrant’s disclosure controls and procedures were effective for this annual reporting period.
(b) There were no changes in the Registrant’s internal control over financial reporting that occurred during the Registrant’s annual period covered by this report that materially affected, or are reasonably likely to materially affect, the Registrant’s internal control over financial reporting.
Item 12. Exhibits.
12(a)(1) Copy of current Code of Ethics
12(a)(2)(i) Section 302 certification of the principal executive officer
12(a)(2)(ii) Section 302 certification of the principal financial officer
12(b) Section 906 certification of principal executive officer and principal financial officer
SIGNATURES
Pursuant to the requirements of the Securities Exchange Act of 1934 and the Investment Company Act of 1940, the Registrant has duly caused this report to be signed on its behalf by the undersigned, thereunto duly authorized.
| | | | | | |
| | | | TIAA-CREF LIFE FUNDS |
| | | |
| Dated: February 19, 2014 | | | | By: | | /s/ Robert G. Leary |
| | | | | | Robert G. Leary |
| | | | | | President and Principal Executive Officer |
Pursuant to the requirements of the Securities Exchange Act of 1934 and the Investment Company Act of 1940, this report has been signed below by the following persons on behalf of the Registrant and in the capacities and on the dates indicated.
| | | | | | |
| | | |
| Dated: February 19, 2014 | | | | By: | | /s/ Robert G. Leary |
| | | | | | Robert G. Leary |
| | | | | | President and Principal Executive Officer
(principal executive officer) |
| | | | |
| | | |
| Dated: February 19, 2014 | | | | By: | | /s/ Phillip G. Goff |
| | | | | | Phillip G. Goff |
| | | | | | Principal Financial Officer, Principal Accounting
Officer and Treasurer |
| | | | | | (principal financial officer) |
EXHIBIT INDEX
Item 12. Exhibits.
12(a)(1) Copy of current SOX code of ethics for Senior Financial Officers
12(a)(2)(i) Section 302 certification of the principal executive officer
12(a)(2)(ii) Section 302 certification of the principal financial officer
12(b) Section 906 certification of principal executive officer and principal financial officer